


Bahasa
Halaman
Hukum

ANALYSIS OF TORNADO CHARACTERISTICS IN THE STATE OF SÃO PAULO FOR THE IMPROVEMENT OF AN AUTOMATIC ALERT SYSTEM
P3R.9
Gerhard Held1*, Ana Maria Gomes1, Kleber P. Naccarato2, Osmar Pinto Jr.2, Ernani de Lima Nascimento3, Adelmo Antonio Correia1 and Isabela P.V.O. Marcelino4
1 Instituto de Pesquisas Meteorológicas, Universidade Estadual Paulista, Bauru, S.P., Brazil 2 Grupo de Eletricidade Atmosférica, Instituto de Pesquisas Espaciais, São José dos Campos, S.P.
3 Instituto Tecnológico SIMEPAR, Universidade Federal do Paraná, Curitiba, PR 4 Instituto de Geociências, Universidade Estadual de Campinas, Campinas, S.P.
1. INTRODUCTION
The structures of severe storms in the State of
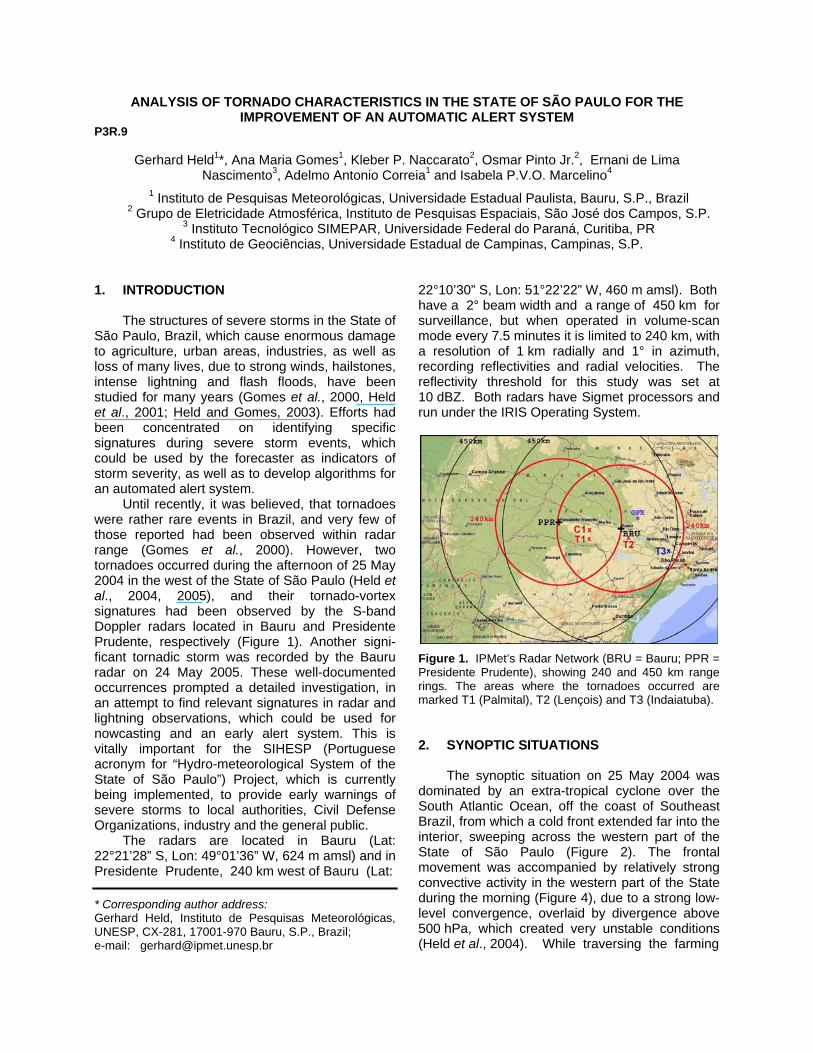
São Paulo, Brazil, which cause enormous damage to agriculture, urban areas, industries, as well as loss of many lives, due to strong winds, hailstones, intense lightning and flash floods, have been studied for many years (Gomes et al., 2000, Held et al., 2001; Held and Gomes, 2003). Efforts had been concentrated on identifying specific signatures during severe storm events, which could be used by the forecaster as indicators of storm severity, as well as to develop algorithms for an automated alert system. Until recently, it was believed, that tornadoes were rather rare events in Brazil, and very few of those reported had been observed within radar range (Gomes et al., 2000). However, two tornadoes occurred during the afternoon of 25 May 2004 in the west of the State of São Paulo (Held et al., 2004, 2005), and their tornado-vortex signatures had been observed by the S-band Doppler radars located in Bauru and Presidente Prudente, respectively (Figure 1). Another signi-ficant tornadic storm was recorded by the Bauru radar on 24 May 2005. These well-documented occurrences prompted a detailed investigation, in an attempt to find relevant signatures in radar and lightning observations, which could be used for nowcasting and an early alert system. This is vitally important for the SIHESP (Portuguese acronym for “Hydro-meteorological System of the State of São Paulo”) Project, which is currently being implemented, to provide early warnings of severe storms to local authorities, Civil Defense Organizations, industry and the general public. The radars are located in Bauru (Lat: 22°21’28” S, Lon: 49°01’36” W, 624 m amsl) and in Presidente Prudente, 240 km west of Bauru (Lat:
* Corresponding author address: Gerhard Held, Instituto de Pesquisas Meteorológicas, UNESP, CX-281, 17001-970 Bauru, S.P., Brazil; e-mail: [email protected]
22°10’30” S, Lon: 51°22’22” W, 460 m amsl). Both have a 2° beam width and a range of 450 km for surveillance, but when operated in volume-scan mode every 7.5 minutes it is limited to 240 km, with a resolution of 1 km radially and 1° in azimuth, recording reflectivities and radial velocities. The reflectivity threshold for this study was set at 10 dBZ. Both radars have Sigmet processors and run under the IRIS Operating System.
Figure 1. IPMet’s Radar Network (BRU = Bauru; PPR = Presidente Prudente), showing 240 and 450 km range rings. The areas where the tornadoes occurred are marked T1 (Palmital), T2 (Lençois) and T3 (Indaiatuba). 2. SYNOPTIC SITUATIONS The synoptic situation on 25 May 2004 was dominated by an extra-tropical cyclone over the South Atlantic Ocean, off the coast of Southeast Brazil, from which a cold front extended far into the interior, sweeping across the western part of the State of São Paulo (Figure 2). The frontal movement was accompanied by relatively strong convective activity in the western part of the State during the morning (Figure 4), due to a strong low-level convergence, overlaid by divergence above 500 hPa, which created very unstable conditions (Held et al., 2004). While traversing the farming
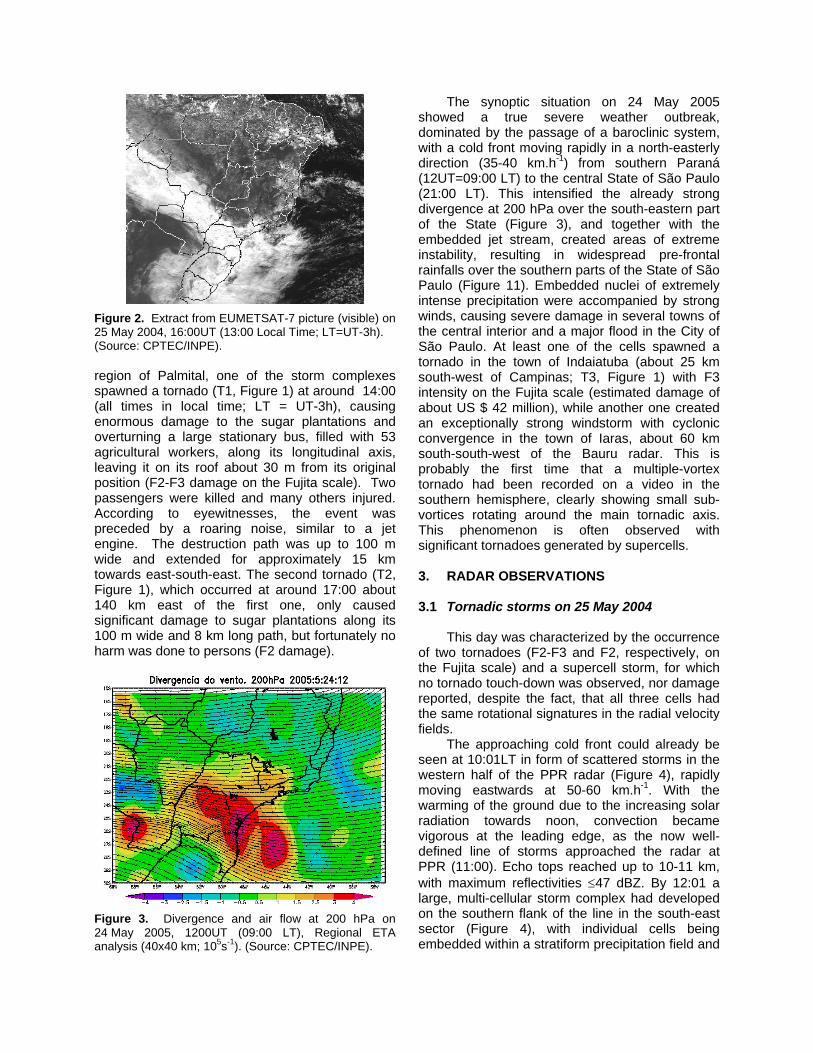
Figure 2. Extract from EUMETSAT-7 picture (visible) on 25 May 2004, 16:00UT (13:00 Local Time; LT=UT-3h). (Source: CPTEC/INPE). region of Palmital, one of the storm complexes spawned a tornado (T1, Figure 1) at around 14:00 (all times in local time; LT = UT-3h), causing enormous damage to the sugar plantations and overturning a large stationary bus, filled with 53 agricultural workers, along its longitudinal axis, leaving it on its roof about 30 m from its original position (F2-F3 damage on the Fujita scale). Two passengers were killed and many others injured. According to eyewitnesses, the event was preceded by a roaring noise, similar to a jet engine. The destruction path was up to 100 m wide and extended for approximately 15 km towards east-south-east. The second tornado (T2, Figure 1), which occurred at around 17:00 about 140 km east of the first one, only caused significant damage to sugar plantations along its 100 m wide and 8 km long path, but fortunately no harm was done to persons (F2 damage).
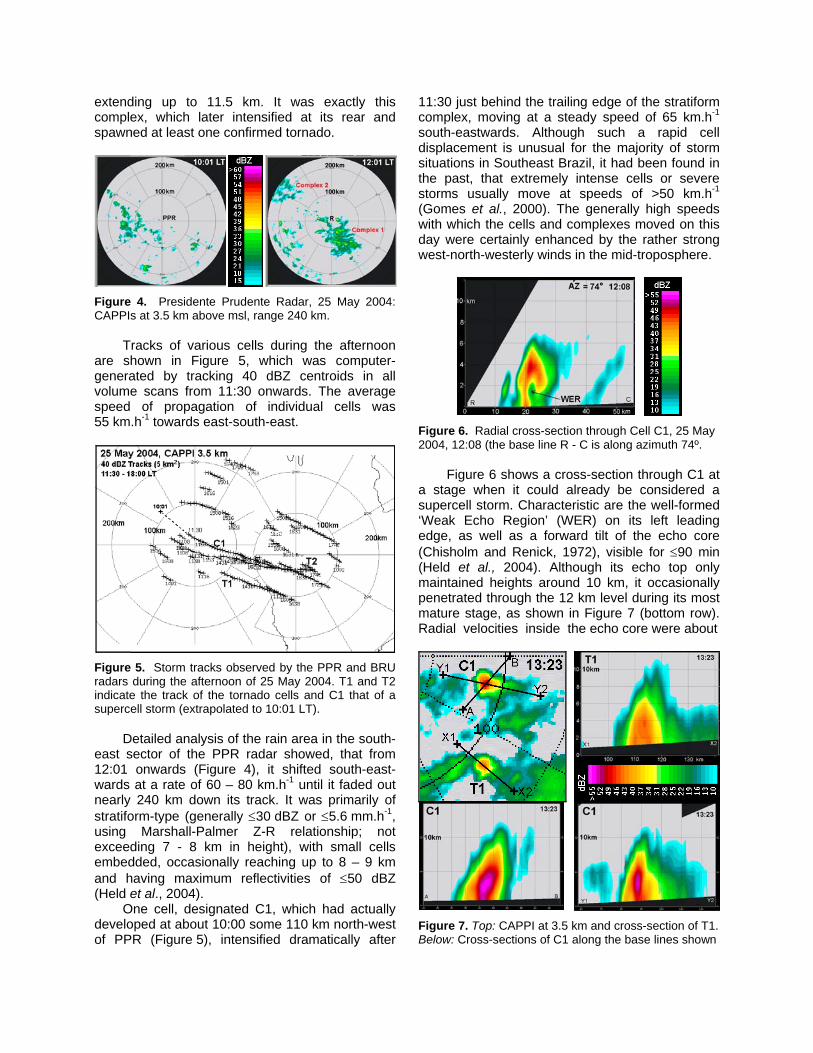
Figure 3. Divergence and air flow at 200 hPa on 24 May 2005, 1200UT (09:00 LT), Regional ETA analysis (40x40 km; 105s-1). (Source: CPTEC/INPE).
The synoptic situation on 24 May 2005 showed a true severe weather outbreak, dominated by the passage of a baroclinic system, with a cold front moving rapidly in a north-easterly direction (35-40 km.h-1) from southern Paraná (12UT=09:00 LT) to the central State of São Paulo (21:00 LT). This intensified the already strong divergence at 200 hPa over the south-eastern part of the State (Figure 3), and together with the embedded jet stream, created areas of extreme instability, resulting in widespread pre-frontal rainfalls over the southern parts of the State of São Paulo (Figure 11). Embedded nuclei of extremely intense precipitation were accompanied by strong winds, causing severe damage in several towns of the central interior and a major flood in the City of São Paulo. At least one of the cells spawned a tornado in the town of Indaiatuba (about 25 km south-west of Campinas; T3, Figure 1) with F3 intensity on the Fujita scale (estimated damage of about US $ 42 million), while another one created an exceptionally strong windstorm with cyclonic convergence in the town of Iaras, about 60 km south-south-west of the Bauru radar. This is probably the first time that a multiple-vortex tornado had been recorded on a video in the southern hemisphere, clearly showing small sub-vortices rotating around the main tornadic axis. This phenomenon is often observed with significant tornadoes generated by supercells. 3. RADAR OBSERVATIONS 3.1 Tornadic storms on 25 May 2004
This day was characterized by the occurrence
of two tornadoes (F2-F3 and F2, respectively, on the Fujita scale) and a supercell storm, for which no tornado touch-down was observed, nor damage reported, despite the fact, that all three cells had the same rotational signatures in the radial velocity fields.
The approaching cold front could already be seen at 10:01LT in form of scattered storms in the western half of the PPR radar (Figure 4), rapidly moving eastwards at 50-60 km.h-1. With the warming of the ground due to the increasing solar radiation towards noon, convection became vigorous at the leading edge, as the now well-defined line of storms approached the radar at PPR (11:00). Echo tops reached up to 10-11 km, with maximum reflectivities ≤47 dBZ. By 12:01 a large, multi-cellular storm complex had developed on the southern flank of the line in the south-east sector (Figure 4), with individual cells being embedded within a stratiform precipitation field and
extending up to 11.5 km. It was exactly this complex, which later intensified at its rear and spawned at least one confirmed tornado.
Figure 4. Presidente Prudente Radar, 25 May 2004: CAPPIs at 3.5 km above msl, range 240 km. Tracks of various cells during the afternoon are shown in Figure 5, which was computer-generated by tracking 40 dBZ centroids in all volume scans from 11:30 onwards. The average speed of propagation of individual cells was 55 km.h-1 towards east-south-east.
Figure 5. Storm tracks observed by the PPR and BRU radars during the afternoon of 25 May 2004. T1 and T2 indicate the track of the tornado cells and C1 that of a supercell storm (extrapolated to 10:01 LT).
Detailed analysis of the rain area in the south-east sector of the PPR radar showed, that from 12:01 onwards (Figure 4), it shifted south-east-wards at a rate of 60 – 80 km.h-1 until it faded out nearly 240 km down its track. It was primarily of stratiform-type (generally ≤30 dBZ or ≤5.6 mm.h-1, using Marshall-Palmer Z-R relationship; not exceeding 7 - 8 km in height), with small cells embedded, occasionally reaching up to 8 – 9 km and having maximum reflectivities of ≤50 dBZ (Held et al., 2004).
One cell, designated C1, which had actually developed at about 10:00 some 110 km north-west of PPR (Figure 5), intensified dramatically after
11:30 just behind the trailing edge of the stratiform complex, moving at a steady speed of 65 km.h-1 south-eastwards. Although such a rapid cell displacement is unusual for the majority of storm situations in Southeast Brazil, it had been found in the past, that extremely intense cells or severe storms usually move at speeds of >50 km.h-1 (Gomes et al., 2000). The generally high speeds with which the cells and complexes moved on this day were certainly enhanced by the rather strong west-north-westerly winds in the mid-troposphere.
Figure 6. Radial cross-section through Cell C1, 25 May 2004, 12:08 (the base line R - C is along azimuth 74º.
Figure 6 shows a cross-section through C1 at a stage when it could already be considered a supercell storm. Characteristic are the well-formed ‘Weak Echo Region’ (WER) on its left leading edge, as well as a forward tilt of the echo core (Chisholm and Renick, 1972), visible for ≤90 min (Held et al., 2004). Although its echo top only maintained heights around 10 km, it occasionally penetrated through the 12 km level during its most mature stage, as shown in Figure 7 (bottom row). Radial velocities inside the echo core were about
Figure 7. Top: CAPPI at 3.5 km and cross-section of T1. Below: Cross-sections of C1 along the base lines shown
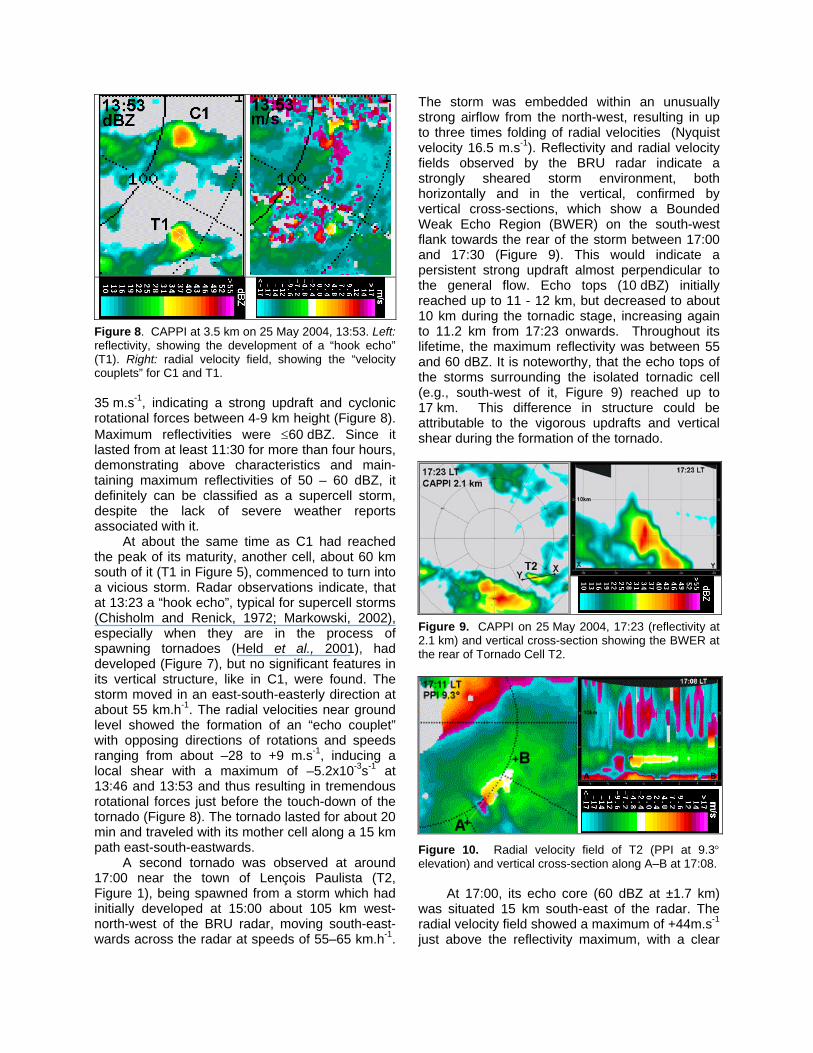
Figure 8. CAPPI at 3.5 km on 25 May 2004, 13:53. Left: reflectivity, showing the development of a “hook echo” (T1). Right: radial velocity field, showing the “velocity couplets” for C1 and T1. 35 m.s-1, indicating a strong updraft and cyclonic rotational forces between 4-9 km height (Figure 8). Maximum reflectivities were ≤60 dBZ. Since it lasted from at least 11:30 for more than four hours, demonstrating above characteristics and main-taining maximum reflectivities of 50 – 60 dBZ, it definitely can be classified as a supercell storm, despite the lack of severe weather reports associated with it. At about the same time as C1 had reached the peak of its maturity, another cell, about 60 km south of it (T1 in Figure 5), commenced to turn into a vicious storm. Radar observations indicate, that at 13:23 a “hook echo”, typical for supercell storms (Chisholm and Renick, 1972; Markowski, 2002), especially when they are in the process of spawning tornadoes (Held et al., 2001), had developed (Figure 7), but no significant features in its vertical structure, like in C1, were found. The storm moved in an east-south-easterly direction at about 55 km.h-1. The radial velocities near ground level showed the formation of an “echo couplet” with opposing directions of rotations and speeds ranging from about –28 to +9 m.s-1, inducing a local shear with a maximum of –5.2x10⁻³s-1 at 13:46 and 13:53 and thus resulting in tremendous rotational forces just before the touch-down of the tornado (Figure 8). The tornado lasted for about 20 min and traveled with its mother cell along a 15 km path east-south-eastwards.
A second tornado was observed at around 17:00 near the town of Lençois Paulista (T2, Figure 1), being spawned from a storm which had initially developed at 15:00 about 105 km west-north-west of the BRU radar, moving south-east-wards across the radar at speeds of 55–65 km.h-1.
The storm was embedded within an unusually strong airflow from the north-west, resulting in up to three times folding of radial velocities (Nyquist velocity 16.5 m.s-1). Reflectivity and radial velocity fields observed by the BRU radar indicate a strongly sheared storm environment, both horizontally and in the vertical, confirmed by vertical cross-sections, which show a Bounded Weak Echo Region (BWER) on the south-west flank towards the rear of the storm between 17:00 and 17:30 (Figure 9). This would indicate a persistent strong updraft almost perpendicular to the general flow. Echo tops (10 dBZ) initially reached up to 11 - 12 km, but decreased to about 10 km during the tornadic stage, increasing again to 11.2 km from 17:23 onwards. Throughout its lifetime, the maximum reflectivity was between 55 and 60 dBZ. It is noteworthy, that the echo tops of the storms surrounding the isolated tornadic cell (e.g., south-west of it, Figure 9) reached up to 17 km. This difference in structure could be attributable to the vigorous updrafts and vertical shear during the formation of the tornado.
Figure 9. CAPPI on 25 May 2004, 17:23 (reflectivity at 2.1 km) and vertical cross-section showing the BWER at the rear of Tornado Cell T2.
Figure 10. Radial velocity field of T2 (PPI at 9.3° elevation) and vertical cross-section along A–B at 17:08.
At 17:00, its echo core (60 dBZ at ±1.7 km) was situated 15 km south-east of the radar. The radial velocity field showed a maximum of +44m.s-1 just above the reflectivity maximum, with a clear
indication of cyclonic rotation on the 11º elevation PPI, with a local shear of –3.0 x10⁻²s-1 at around 2 km. As the storm continued along its track, the rotational signature intensified to reach a maximum of –5.0 x10⁻²s-1 at 17:16 between 2 and 4 km and began to decrease in intensity and descend from 17:23 onwards (Figure 10). The path of the tornado was about 8 km long and 100 m wide.
3.2 Tornadic storms on 24 May 2005
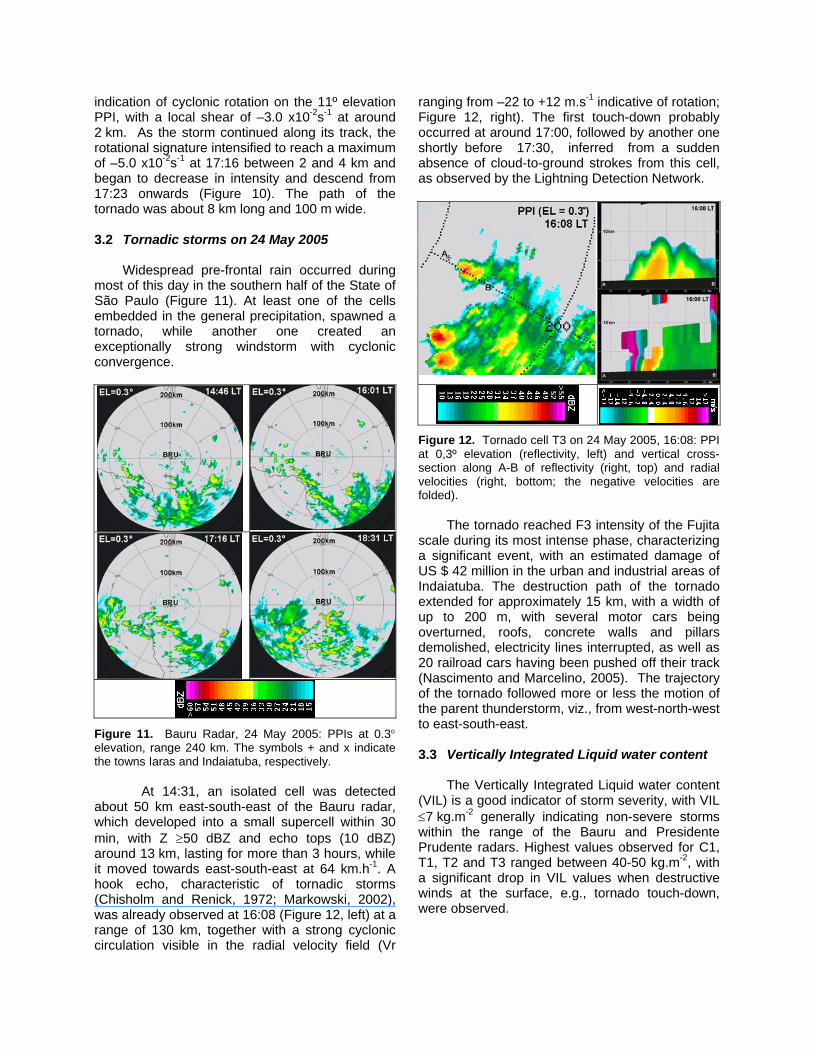
Widespread pre-frontal rain occurred during most of this day in the southern half of the State of São Paulo (Figure 11). At least one of the cells embedded in the general precipitation, spawned a tornado, while another one created an exceptionally strong windstorm with cyclonic convergence.
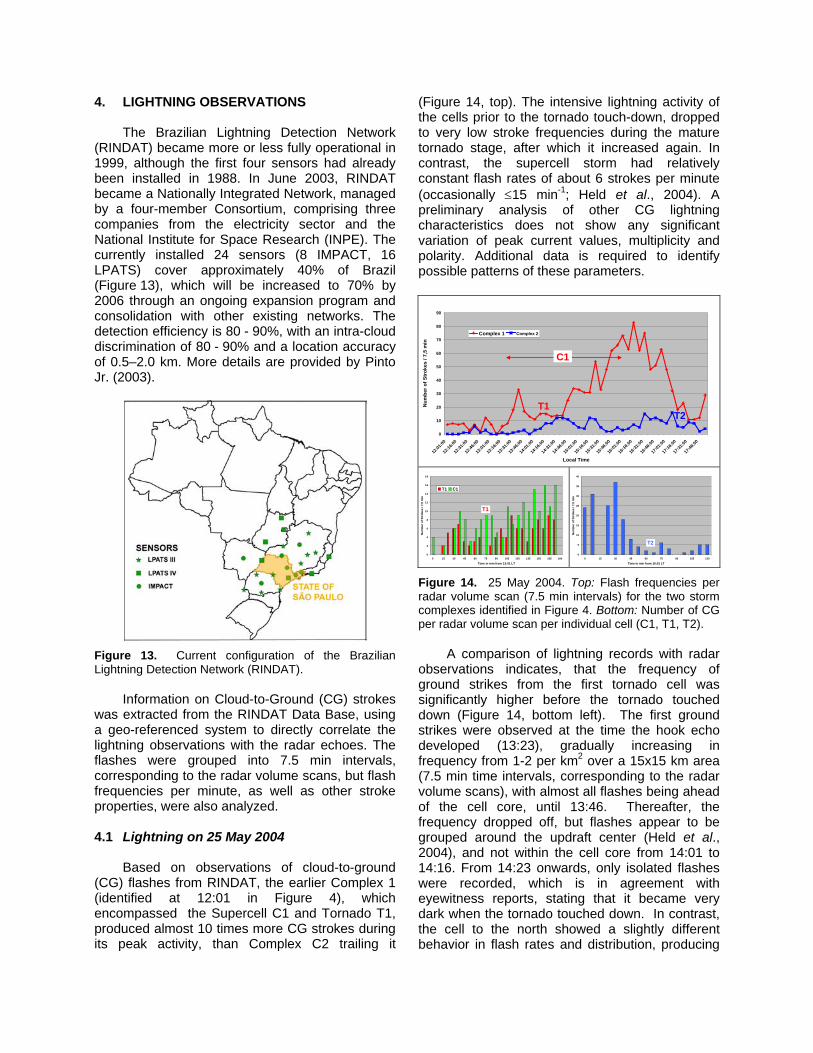
Figure 11. Bauru Radar, 24 May 2005: PPIs at 0.3° elevation, range 240 km. The symbols + and x indicate the towns Iaras and Indaiatuba, respectively. At 14:31, an isolated cell was detected about 50 km east-south-east of the Bauru radar, which developed into a small supercell within 30 min, with Z ≥50 dBZ and echo tops (10 dBZ) around 13 km, lasting for more than 3 hours, while it moved towards east-south-east at 64 km.h-1. A hook echo, characteristic of tornadic storms (Chisholm and Renick, 1972; Markowski, 2002), was already observed at 16:08 (Figure 12, left) at a range of 130 km, together with a strong cyclonic circulation visible in the radial velocity field (Vr
ranging from –22 to +12 m.s-1 indicative of rotation; Figure 12, right). The first touch-down probably occurred at around 17:00, followed by another one shortly before 17:30, inferred from a sudden absence of cloud-to-ground strokes from this cell, as observed by the Lightning Detection Network.
Figure 12. Tornado cell T3 on 24 May 2005, 16:08: PPI at 0,3º elevation (reflectivity, left) and vertical cross-section along A-B of reflectivity (right, top) and radial velocities (right, bottom; the negative velocities are folded).
The tornado reached F3 intensity of the Fujita
scale during its most intense phase, characterizing a significant event, with an estimated damage of US $ 42 million in the urban and industrial areas of Indaiatuba. The destruction path of the tornado extended for approximately 15 km, with a width of up to 200 m, with several motor cars being overturned, roofs, concrete walls and pillars demolished, electricity lines interrupted, as well as 20 railroad cars having been pushed off their track (Nascimento and Marcelino, 2005). The trajectory of the tornado followed more or less the motion of the parent thunderstorm, viz., from west-north-west to east-south-east.
3.3 Vertically Integrated Liquid water content The Vertically Integrated Liquid water content (VIL) is a good indicator of storm severity, with VIL ≤7 kg.m-2 generally indicating non-severe storms within the range of the Bauru and Presidente Prudente radars. Highest values observed for C1, T1, T2 and T3 ranged between 40-50 kg.m-2, with a significant drop in VIL values when destructive winds at the surface, e.g., tornado touch-down, were observed.
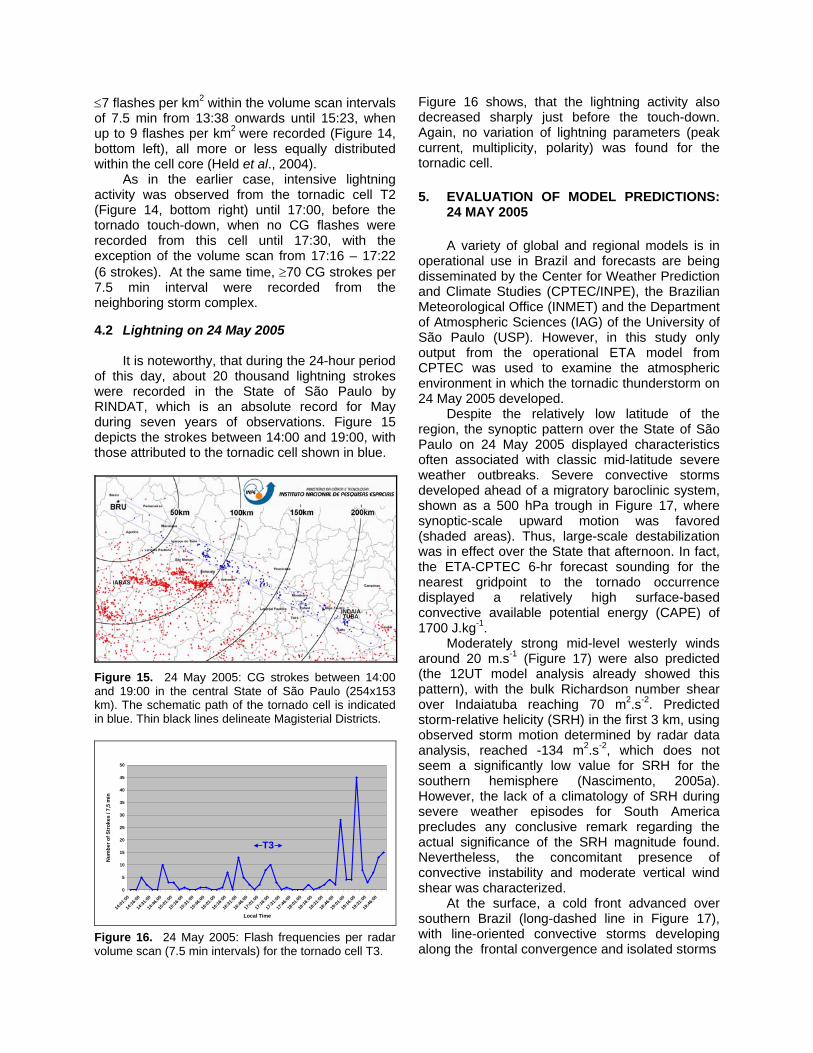
4. LIGHTNING OBSERVATIONS The Brazilian Lightning Detection Network (RINDAT) became more or less fully operational in 1999, although the first four sensors had already been installed in 1988. In June 2003, RINDAT became a Nationally Integrated Network, managed by a four-member Consortium, comprising three companies from the electricity sector and the National Institute for Space Research (INPE). The currently installed 24 sensors (8 IMPACT, 16 LPATS) cover approximately 40% of Brazil (Figure 13), which will be increased to 70% by 2006 through an ongoing expansion program and consolidation with other existing networks. The detection efficiency is 80 - 90%, with an intra-cloud discrimination of 80 - 90% and a location accuracy of 0.5–2.0 km. More details are provided by Pinto Jr. (2003).
Figure 13. Current configuration of the Brazilian Lightning Detection Network (RINDAT). Information on Cloud-to-Ground (CG) strokes was extracted from the RINDAT Data Base, using a geo-referenced system to directly correlate the lightning observations with the radar echoes. The flashes were grouped into 7.5 min intervals, corresponding to the radar volume scans, but flash frequencies per minute, as well as other stroke properties, were also analyzed. 4.1 Lightning on 25 May 2004 Based on observations of cloud-to-ground (CG) flashes from RINDAT, the earlier Complex 1 (identified at 12:01 in Figure 4), which encompassed the Supercell C1 and Tornado T1, produced almost 10 times more CG strokes during its peak activity, than Complex C2 trailing it
(Figure 14, top). The intensive lightning activity of the cells prior to the tornado touch-down, dropped to very low stroke frequencies during the mature tornado stage, after which it increased again. In contrast, the supercell storm had relatively constant flash rates of about 6 strokes per minute (occasionally ≤15 min-1; Held et al., 2004). A preliminary analysis of other CG lightning characteristics does not show any significant variation of peak current values, multiplicity and polarity. Additional data is required to identify possible patterns of these parameters.
0
10
20
30
40
50
60
70
80
90
12:01
:00
12:16
:00
12:31
:00
12:46
:00
13:01
:00
13:16
:00
13:31
:00
13:46
:00
14:01
:00
14:16
:00
14:31
:00
14:46
:00
15:01
:00
15:16
:00
15:31
:00
15:46
:00
16:01
:00
16:16
:00
16:31
:00
16:46
:00
17:01
:00
17:16
:00
17:31
:00
17:46
:00
Local Time
Num
ber o
f Str
okes
/ 7,
5 m
in
Complex 1 Complex 2
C1
T1T2
0
2
4
6
8
10
12
14
16
18
0 15 30 45 60 75 90 105 120 135 150 165 180
Time in min from 13:01 LT
Num
ber o
f Str
okes
/ 7,
5 m
in
T1 C1
T1
0
5
10
15
20
25
30
35
40
0 15 30 45 60 75 90 105 120
Time in min from 16:01 LT
Num
ber o
f Str
okes
/ 7,
5 m
in
T2
Figure 14. 25 May 2004. Top: Flash frequencies per radar volume scan (7.5 min intervals) for the two storm complexes identified in Figure 4. Bottom: Number of CG per radar volume scan per individual cell (C1, T1, T2). A comparison of lightning records with radar observations indicates, that the frequency of ground strikes from the first tornado cell was significantly higher before the tornado touched down (Figure 14, bottom left). The first ground strikes were observed at the time the hook echo developed (13:23), gradually increasing in frequency from 1-2 per km2 over a 15x15 km area (7.5 min time intervals, corresponding to the radar volume scans), with almost all flashes being ahead of the cell core, until 13:46. Thereafter, the frequency dropped off, but flashes appear to be grouped around the updraft center (Held et al., 2004), and not within the cell core from 14:01 to 14:16. From 14:23 onwards, only isolated flashes were recorded, which is in agreement with eyewitness reports, stating that it became very dark when the tornado touched down. In contrast, the cell to the north showed a slightly different behavior in flash rates and distribution, producing
≤7 flashes per km2 within the volume scan intervals of 7.5 min from 13:38 onwards until 15:23, when up to 9 flashes per km2 were recorded (Figure 14, bottom left), all more or less equally distributed within the cell core (Held et al., 2004). As in the earlier case, intensive lightning activity was observed from the tornadic cell T2 (Figure 14, bottom right) until 17:00, before the tornado touch-down, when no CG flashes were recorded from this cell until 17:30, with the exception of the volume scan from 17:16 – 17:22 (6 strokes). At the same time, ≥70 CG strokes per 7.5 min interval were recorded from the neighboring storm complex. 4.2 Lightning on 24 May 2005 It is noteworthy, that during the 24-hour period of this day, about 20 thousand lightning strokes were recorded in the State of São Paulo by RINDAT, which is an absolute record for May during seven years of observations. Figure 15 depicts the strokes between 14:00 and 19:00, with those attributed to the tornadic cell shown in blue.
Figure 15. 24 May 2005: CG strokes between 14:00 and 19:00 in the central State of São Paulo (254x153 km). The schematic path of the tornado cell is indicated in blue. Thin black lines delineate Magisterial Districts.
0
5
10
15
20
25
30
35
40
45
50
14:01
:00
14:16
:00
14:31
:00
14:46
:00
15:01
:00
15:16
:00
15:31
:00
15:46
:00
16:01
:00
16:16
:00
16:31
:00
16:46
:00
17:01
:00
17:16
:00
17:31
:00
17:46
:00
18:01
:00
18:16
:00
18:31
:00
18:46
:00
19:01
:00
19:16
:00
19:31
:00
19:46
:00
Local Time
Num
ber o
f Str
okes
/ 7,
5 m
in
T3
Figure 16. 24 May 2005: Flash frequencies per radar volume scan (7.5 min intervals) for the tornado cell T3.
Figure 16 shows, that the lightning activity also decreased sharply just before the touch-down. Again, no variation of lightning parameters (peak current, multiplicity, polarity) was found for the tornadic cell. 5. EVALUATION OF MODEL PREDICTIONS:
24 MAY 2005 A variety of global and regional models is in operational use in Brazil and forecasts are being disseminated by the Center for Weather Prediction and Climate Studies (CPTEC/INPE), the Brazilian Meteorological Office (INMET) and the Department of Atmospheric Sciences (IAG) of the University of São Paulo (USP). However, in this study only output from the operational ETA model from CPTEC was used to examine the atmospheric environment in which the tornadic thunderstorm on 24 May 2005 developed. Despite the relatively low latitude of the region, the synoptic pattern over the State of São Paulo on 24 May 2005 displayed characteristics often associated with classic mid-latitude severe weather outbreaks. Severe convective storms developed ahead of a migratory baroclinic system, shown as a 500 hPa trough in Figure 17, where synoptic-scale upward motion was favored (shaded areas). Thus, large-scale destabilization was in effect over the State that afternoon. In fact, the ETA-CPTEC 6-hr forecast sounding for the nearest gridpoint to the tornado occurrence displayed a relatively high surface-based convective available potential energy (CAPE) of 1700 J.kg-1. Moderately strong mid-level westerly winds around 20 m.s-1 (Figure 17) were also predicted (the 12UT model analysis already showed this pattern), with the bulk Richardson number shear over Indaiatuba reaching 70 m2.s-2. Predicted storm-relative helicity (SRH) in the first 3 km, using observed storm motion determined by radar data analysis, reached -134 m2.s-2, which does not seem a significantly low value for SRH for the southern hemisphere (Nascimento, 2005a). However, the lack of a climatology of SRH during severe weather episodes for South America precludes any conclusive remark regarding the actual significance of the SRH magnitude found. Nevertheless, the concomitant presence of convective instability and moderate vertical wind shear was characterized. At the surface, a cold front advanced over southern Brazil (long-dashed line in Figure 17), with line-oriented convective storms developing along the frontal convergence and isolated storms
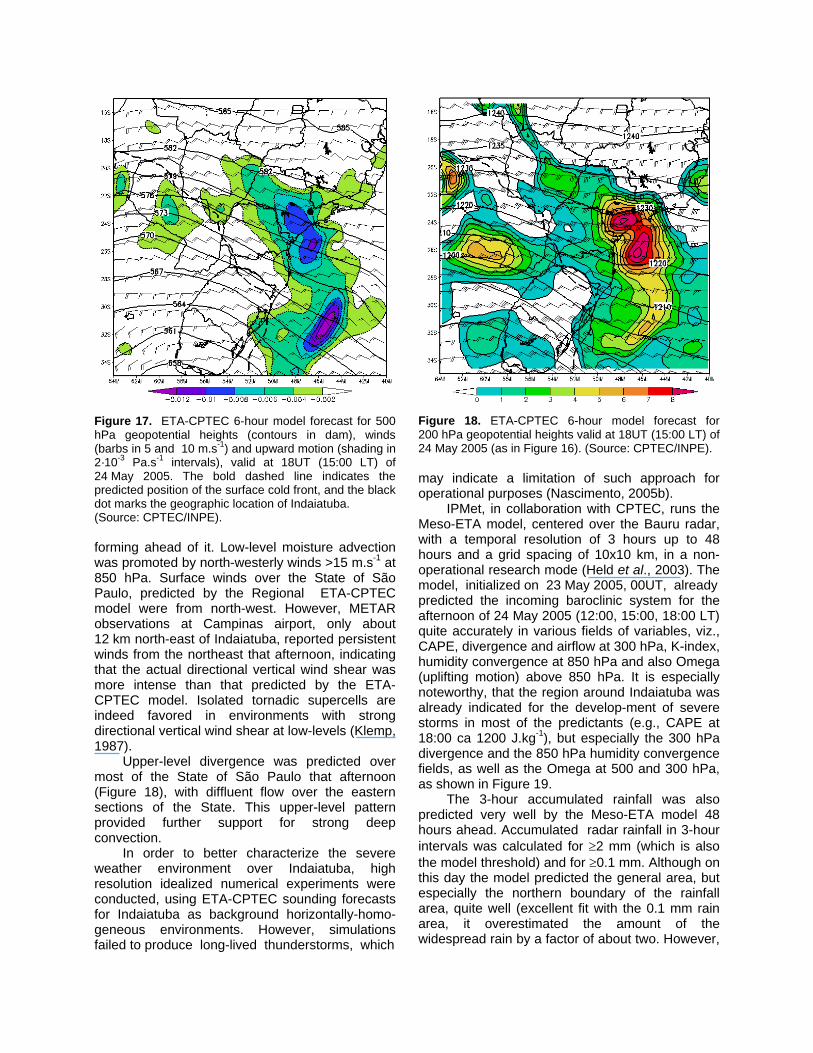
Figure 17. ETA-CPTEC 6-hour model forecast for 500 hPa geopotential heights (contours in dam), winds (barbs in 5 and 10 m.s-1) and upward motion (shading in 2·10
-3 Pa.s-1 intervals), valid at 18UT (15:00 LT) of
24 May 2005. The bold dashed line indicates the predicted position of the surface cold front, and the black dot marks the geographic location of Indaiatuba. (Source: CPTEC/INPE). forming ahead of it. Low-level moisture advection was promoted by north-westerly winds >15 m.s-1 at 850 hPa. Surface winds over the State of São Paulo, predicted by the Regional ETA-CPTEC model were from north-west. However, METAR observations at Campinas airport, only about 12 km north-east of Indaiatuba, reported persistent winds from the northeast that afternoon, indicating that the actual directional vertical wind shear was more intense than that predicted by the ETA-CPTEC model. Isolated tornadic supercells are indeed favored in environments with strong directional vertical wind shear at low-levels (Klemp, 1987). Upper-level divergence was predicted over most of the State of São Paulo that afternoon (Figure 18), with diffluent flow over the eastern sections of the State. This upper-level pattern provided further support for strong deep convection. In order to better characterize the severe weather environment over Indaiatuba, high resolution idealized numerical experiments were conducted, using ETA-CPTEC sounding forecasts for Indaiatuba as background horizontally-homo-geneous environments. However, simulations failed to produce long-lived thunderstorms, which
Figure 18. ETA-CPTEC 6-hour model forecast for 200 hPa geopotential heights valid at 18UT (15:00 LT) of 24 May 2005 (as in Figure 16). (Source: CPTEC/INPE). may indicate a limitation of such approach for operational purposes (Nascimento, 2005b). IPMet, in collaboration with CPTEC, runs the Meso-ETA model, centered over the Bauru radar, with a temporal resolution of 3 hours up to 48 hours and a grid spacing of 10x10 km, in a non-operational research mode (Held et al., 2003). The model, initialized on 23 May 2005, 00UT, already predicted the incoming baroclinic system for the afternoon of 24 May 2005 (12:00, 15:00, 18:00 LT) quite accurately in various fields of variables, viz., CAPE, divergence and airflow at 300 hPa, K-index, humidity convergence at 850 hPa and also Omega (uplifting motion) above 850 hPa. It is especially noteworthy, that the region around Indaiatuba was already indicated for the develop-ment of severe storms in most of the predictants (e.g., CAPE at 18:00 ca 1200 J.kg-1), but especially the 300 hPa divergence and the 850 hPa humidity convergence fields, as well as the Omega at 500 and 300 hPa, as shown in Figure 19. The 3-hour accumulated rainfall was also predicted very well by the Meso-ETA model 48 hours ahead. Accumulated radar rainfall in 3-hour intervals was calculated for ≥2 mm (which is also the model threshold) and for ≥0.1 mm. Although on this day the model predicted the general area, but especially the northern boundary of the rainfall area, quite well (excellent fit with the 0.1 mm rain area, it overestimated the amount of the widespread rain by a factor of about two. However,
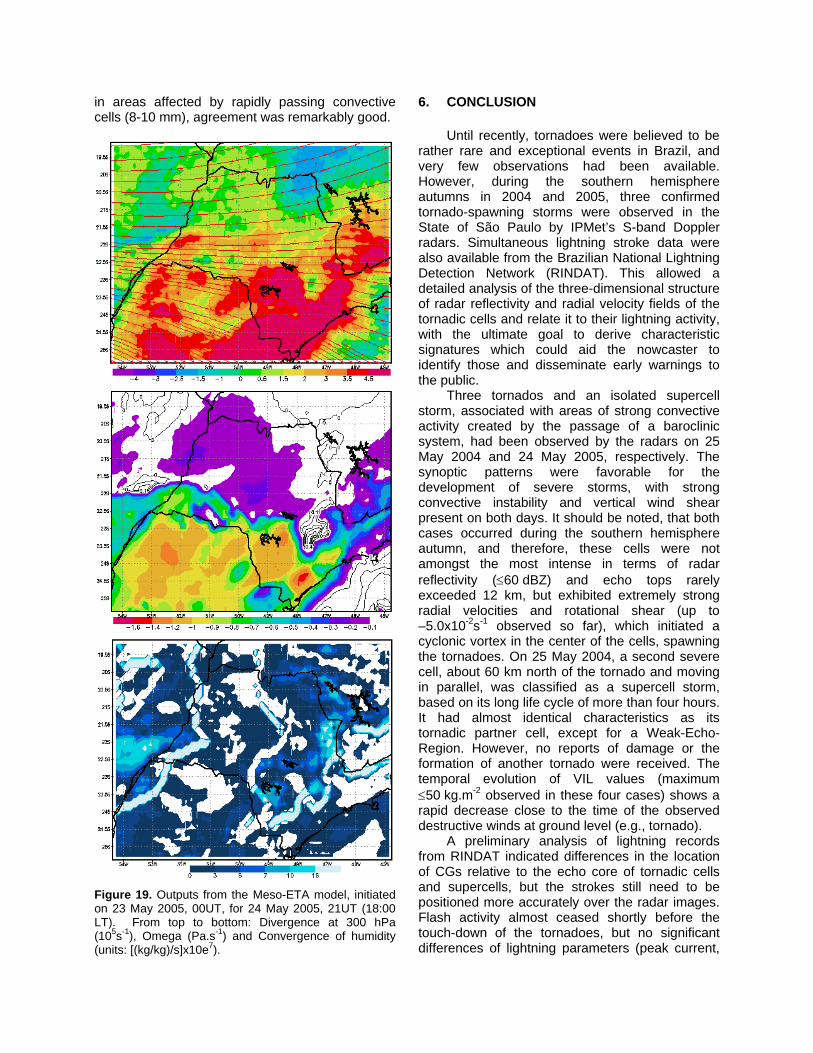
in areas affected by rapidly passing convective cells (8-10 mm), agreement was remarkably good.
Figure 19. Outputs from the Meso-ETA model, initiated on 23 May 2005, 00UT, for 24 May 2005, 21UT (18:00 LT). From top to bottom: Divergence at 300 hPa (105s-1), Omega (Pa.s-1) and Convergence of humidity (units: [(kg/kg)/s]x10e7).
6. CONCLUSION Until recently, tornadoes were believed to be rather rare and exceptional events in Brazil, and very few observations had been available. However, during the southern hemisphere autumns in 2004 and 2005, three confirmed tornado-spawning storms were observed in the State of São Paulo by IPMet’s S-band Doppler radars. Simultaneous lightning stroke data were also available from the Brazilian National Lightning Detection Network (RINDAT). This allowed a detailed analysis of the three-dimensional structure of radar reflectivity and radial velocity fields of the tornadic cells and relate it to their lightning activity, with the ultimate goal to derive characteristic signatures which could aid the nowcaster to identify those and disseminate early warnings to the public. Three tornados and an isolated supercell storm, associated with areas of strong convective activity created by the passage of a baroclinic system, had been observed by the radars on 25 May 2004 and 24 May 2005, respectively. The synoptic patterns were favorable for the development of severe storms, with strong convective instability and vertical wind shear present on both days. It should be noted, that both cases occurred during the southern hemisphere autumn, and therefore, these cells were not amongst the most intense in terms of radar reflectivity (≤60 dBZ) and echo tops rarely exceeded 12 km, but exhibited extremely strong radial velocities and rotational shear (up to –5.0x10⁻²s-1 observed so far), which initiated a cyclonic vortex in the center of the cells, spawning the tornadoes. On 25 May 2004, a second severe cell, about 60 km north of the tornado and moving in parallel, was classified as a supercell storm, based on its long life cycle of more than four hours. It had almost identical characteristics as its tornadic partner cell, except for a Weak-Echo-Region. However, no reports of damage or the formation of another tornado were received. The temporal evolution of VIL values (maximum ≤50 kg.m-2 observed in these four cases) shows a rapid decrease close to the time of the observed destructive winds at ground level (e.g., tornado).
A preliminary analysis of lightning records from RINDAT indicated differences in the location of CGs relative to the echo core of tornadic cells and supercells, but the strokes still need to be positioned more accurately over the radar images. Flash activity almost ceased shortly before the touch-down of the tornadoes, but no significant differences of lightning parameters (peak current,
multiplicity, polarity) were found for the tornadic and non-tornadic cells. Based on the operationally available Regional ETA-CPTEC model, the predicted severe weather parameters (6 hours) did display some skill in highlighting the existence of a pre-storm environment that was favorable for significant severe weather development in the Indaiatuba region for the afternoon of 24 May 2005. However, a very good indication for this region was provided by the Meso-ETA model (IPMet/CPTEC) at least 48 hours ahead of the severe event. This study highlights the importance of Doppler radar and real-time lightning observations, especially as a useful tool for nowcasting techniques, to predict the development of extremely severe rain, hail or wind storms in Southeast Brazil. However, the signatures obtained so far still need to be fine-tuned with more cases, in order to derive more precise algorithms to issue automatic warnings for the forecaster. Locally available forecast models need to be tested further and fine-tuned, in order to achieve an indicative alert system of up to 48 hours ahead of a severe event. 7. ACKNOWLEDGEMENTS This study is partially being conducted under the project “Monitoring, Quantification and Now-casting of Precipitation in the State of São Paulo” (FAPESP Processo No. 2001/14095-6). The authors thank Dr Sin Chan Chou and Diego Chagas of CPTEC/INPE for providing the output from the operational Regional Eta model and the Laboratory for Environmental Monitoring and Modeling Studies of the Federal University of Paraná and Instituto Tecnológico SIMEPAR for the computer support. Hermes A. G. França is acknowledged for assisting with the retrieval and pre-processing of the raw radar data. 8. REFERENCES Chisholm, A. J. and Renick, J.H., 1972: The
kinematics of multicell and supercell Alberta hailstorms. Research Council of Alberta Hail Studies, Report No.72-2, pp 24-31, Red Deer, Canada.
Gomes, A. M., Held, G, Lima, M. A. and Calheiros R.V., 2000: Estudo da Evolução de Tempestades Severas na Área Central do Estado de São Paulo por Radar Doppler. Proceedings, XI Congresso Bras. de Meteor., SBMET, Rio de Janeiro, 16-20 Outubro 2000, Paper MR00006, p 1921-1929.
Held, G., Gomes, A. M. and Nachtigall, L. F., 2001: Severe Storm Signatures Observed by Doppler Radar in the State of São Paulo, Brazil: From Synoptic Scale to Microburst. Preprints, 30th International Conference on Radar Meteorology, AMS, Munich, Germany, 19-24 July 2001, 248-250.
Held, G. and Gomes, J. L., 2003: The Bauru Flash Flood of 8 February 2001 and Options for Improved Warnings, Preprints, 31st Conference on Radar Meteorology, AMS, Seattle, E.U.A., 6-12 August 2003, 660-663.
Held, G., Gomes, A. M., Pinto Jr., O., Antonio, C. A. A. and Porto da Silva, A.B., 2004: The Palmital Tornado: Lightning and Radar Obser-vations. Proceedings, International Confe-rence on Grounding and Earthing (GROUND ’2004) & 1st International Conference on Lightning Physics and Effects, Belo Horizonte, Brazil, 7-11 November 2004, 23-28.
Held, G., Gomes, A. M., Nascimento, E., Pinto Jr., O, Naccarato, K. P., Antonio, C. A. and Porto Da Silva A. B., 2005: Tornado Signatures for Nowcasting Using Radar and Lightning Observations in Brazil. Geophysical Research Abstracts, Volume 7, CD ROM, EGU General Assembly 2005, Vienna, Austria, 24-29 April 2005, 6pp.
Klemp, J. B., 1987: Dynamics of tornadic thunderstorms. Ann. Rev. Fluid Mech., 19, 369-402.
Markowski, P. M., 2002: Hook echoes and rear-flank downdrafts: a review. Mon. Wea. Rev., 130, 852-876.
Nascimento, E. L., 2005a: Severe storms forecasting utilizing convective parameters and mesoscale models: an operational strategy adoptable in Brazil? Rev. Bras. Meteor., 20, 121-140. (In Portuguese)
Nascimento, E. L., 2005b: Very short range prediction of convective storm motion in Brazil utilizing mesoscale model output. Submitted to the WWRP International Symposium on Nowcasting and Very Short Range Forecasting, Toulose, France.
Nascimento, E. L. and Marcelino, I.P.V.O., 2005: A multiple-vortex tornado in Brazil. Submitted to Mon. Wea. Rev.
Pinto Jr., O., 2003: The Brazilian lightning detection network: a historical background and future perspectives. Proceedings, VII International Symposium on Lightning Protection, Curitiba, Brazil, 17-21 November 2003, p. 3-5.
Top Related
Copyright © 2022 FDOKUMEN

