


Bahasa
Halaman
Hukum


Mahmood et al. BMC Genomics 2014, 15:441http://www.biomedcentral.com/1471-2164/15/441
RESEARCH ARTICLE Open Access
Analysis of peptide PSY1 responding transcripts inthe two Arabidopsis plant lines: wild type and psy1rreceptor mutantKhalid Mahmood1,2, Rubini Kannangara1, Kirsten Jørgensen1 and Anja T Fuglsang1,2*
Abstract
Background: Small-secreted peptides are emerging as important components in cell-cell communication duringbasic developmental stages of plant cell growth and development. Plant peptide containing sulfated tyrosine 1(PSY1) has been reported to promote cell expansion and differentiation in the elongation zone of roots. PSY1 actionis dependent on a receptor PSY1R that triggers a signaling cascade leading to cell elongation. However little isknown about cellular functions and the components involved in PSY1-based signaling cascade.
Results: Differentially expressed genes were identified in a wild type plant line and in a psy1r receptor mutant lineof Arabidopsis thaliana after treatment with PSY1. Seventy-seven genes were found to be responsive to the PSY1peptide in wild type plants while 154 genes were responsive in the receptor mutant plants. PSY1 activates thetranscripts of genes involved in cell wall modification. Gene enrichment analysis revealed that PSY1-responsive genesare involved in responses to stimuli, metabolic processes and biosynthetic processes. The significant enrichment termsof PSY1-responsive genes were higher in psy1r mutant plants compared to in wild type plants. Two parallel responsesto PSY1 were identified, differing in their dependency on the PSY1R receptor. Promoter analysis of the differentiallyexpressed genes identified a light regulatory motif in some of these.
Conclusion: PSY1-responsive genes are involved in cellular functions and stimuli responses suggesting a crosstalkbetween developmental cues and environmental stimuli. Possibly, two parallel responses to PSY1 exist. A motifinvolved in light regulation was identified in the promoter region of the differentially expressed genes. Reducedhypocotyl growth was observed in etiolated receptor mutant seedlings.
Keywords: Cellular functions, Gene enrichment analysis, Microarray, Signaling cascade, Small signaling peptides
BackgroundIn the past few years, our understanding of signalsrequired for cell-to-cell communication during plantdevelopment has increased tremendously. Identifica-tion of components that mediate signaling serves as alandmark in understanding the mechanism of cell-to-cell communication in planta. Several componentssuch as phytohormones, mobile transcription factors,mobile small RNAs and peptides serve this purpose[1,2]. Phytohormones are lipophilic compounds which areactive at very low concentrations and involved in plant
* Correspondence: [email protected] of Plant and Environmental Sciences, University ofCopenhagen, Copenhagen, Denmark2PUMPKIN, Centre for membrane pumps in cells and disease, Copenhagen,Denmark
© 2014 Mahmood et al.; licensee BioMed CenCreative Commons Attribution License (http:/distribution, and reproduction in any mediumDomain Dedication waiver (http://creativecomarticle, unless otherwise stated.
growth ranging from embryogenesis to senescence [2].Similarly, small-secreted peptides are now emerging asgrowth regulators and many of them are involved in basicfunctions of cell growth and development. More than1000 genes are annotated as encoding putatively secretedpeptides in the Arabidopsis genome but very few areknown to be involved in specific cellular signaling [2,3].However, the precise role and mechanism proceededby secreted peptides is yet to be established. Secretedpeptides have now been recognized as a new class ofintracellular signal molecules, which coordinate andspecify cellular functions in plants. As a new class ofintracellular signal molecules, the role of these secretedpeptides could be explored further.
tral Ltd. This is an Open Access article distributed under the terms of the/creativecommons.org/licenses/by/2.0), which permits unrestricted use,, provided the original work is properly credited. The Creative Commons Publicmons.org/publicdomain/zero/1.0/) applies to the data made available in this

Mahmood et al. BMC Genomics 2014, 15:441 Page 2 of 12http://www.biomedcentral.com/1471-2164/15/441
Plant cells transduce signals utilizing surface receptorsbinding to ligands present in the apoplast [4]. The S-locusreceptor ZmPK1 from Maize was the first receptor kinaseidentified in plants [5], and many receptors have beenidentified in plants ever since [6,7]. Signaling moleculescan elicit different signaling pathways, and a singlereceptor can also respond to more than one signalmolecule [8]. Perception of signal molecules [9], andadjustability to different environmental conditions [10]are interesting characteristics of these signaling cas-cades. Plants demonstrate different growth patternsunder different environmental conditions owing toasymmetric elongation or cell division [11-14]. Theyalso exhibit flexibility in the size and numbers of pro-duced organs to ensure diversity and specificity inperception of external stimuli [1,2,10-15].Plant peptide containing sulfated tyrosine (PSY1) is a
tyrosine-sulfated peptide isolated from Arabidopsis cellsuspension medium [16]. It promotes cell expansionand differentiation in the elongation zone of roots atnanomolar concentration. This 18-amino acid glyco-peptide is derived from a 75-amino acid precursorpolypeptide containing an N-terminal signal peptide[16]. PSY1 is believed to bind the extracellular domainof Leucine rich Repeat Receptor Like Kinase (LRR-LK),which is named as a receptor of PSY1 (PSY1R). PSY1and its receptor PSY1R are expressed throughout thewhole plant with higher expression in shoot apicalmeristem and elongation zone of roots. PSY1 is knownto be highly up-regulated after wounding [16]. Exogen-ous application of purified PSY1 peptide to suspensioncell culture induces cellular proliferation, expansionand elongation while overexpression of ArabidopsisPSY1 causes longer roots with larger cotyledon ascompared to wild type [16]. Recently, receptor PSY1Rand peptide PSY1 were found to be involved in plantdefense [17,18]. The PSY1R might integrate growthpromotion and defense signals leading to modulationof cellular plasticity, and may allow the cells to adjusttowards environmental changes.In order to understand the role of PSY1 and its
receptor PSY1R, a full genome microarray study wasperformed. Identification of genes responding to PSY1is a bottleneck in explaining the specific signalingphenomenon. This is the first comprehensive study toelucidate components of the PSY1-based signalingcascade using full genome microarray in response toexogenously applied PSY1. We found that severalgenes, involved in plethora of physiological functions,are differentially expressed after PSY1 exposure. Ourstudy indicates that two PSY1 responses exist. Thepromoter analysis leads to identification of a lightregulatory motif in differentially expressed genes ofpsy1r mutant plants.
Results and discussionGenome wide analysis of two plant lines after PSY1treatment and validation of microarray dataIn order to understand the PSY1-based signaling cas-cade, we decided to identify genes affected by PSY1. Forthis purpose, transcriptome analyses were performed ontwo plant lines after PSY1 treatment. The two plant lines(wild type and psy1r) were germinated and grown hydro-ponically for one week under sterile conditions. Thenboth lines were treated with PSY1 peptide (10 nM) for4 hrs before mRNA isolation for microarray analysis(Figure 1). Three independent biological samples wereprepared and an Arabidopsis Gene Expression Micro-array (V4) of one color was used.In the transcriptome analysis, a number of genes were
identified using the criteria; P < 0.05 and fold change >2or < −2. Gene expression analysis after peptide treatment ofwild type plants revealed significant differential expressionof 77 genes. Among them 51 genes were up-regulated while26 genes were down-regulated (Additional file 1: Table S1).Mutation of the receptor resulted in 154 genes with alteredexpression levels as compared to wild type (Figure 2).Among them, 102 genes were down-regulated while 52genes were up-regulated in receptor knockout plantsindicating the lack of a downstream response to the treat-ment (Additional file 2: Table S2). Interestingly, thenumber of differentially expressed genes (261) washigher when comparison was made between PSY1-treatedwild type and PSY1-treated receptor knockout lines(psy1r) (Additional file 3: Table S3). Examination of GeneOntology (GO) terms in both plant lines after PSY1treatment demonstrated the specific contribution of dif-ferent classes of biological functions in each category(Figure 2, Additional file 4: Table S4). Individual genes ofeach category were assigned to six different classes ofrelevant putative biological functions that were derivedautomatically using AmiGO. Interestingly all three com-parisons showed the overall same distribution. Max-imum numbers of differentially expressed genes wereinvolved in cellular and biosynthetic processes while themajor part of the genes were also involved in regulationand metabolism (Figure 2). The category “reproduction”was not found after PSY1 treatment in wild type whilethis category was present in receptor knockout plants(Figure 2). Additionally, the number of differentiallyexpressed genes attributed as kinases or phosphataseswere higher in receptor mutant plants as compared toPSY1 responsive genes (Additional file 1: Table S1 andAdditional file 2: Table S2).The expression levels found in the microarray study
were confirmed by quantitative real time RT-PCR forselected genes (Figure 3). The genes were selected inview of their role in cell elongation with range of differen-tial expression to validate microarray data. The selected

Cellular andbiosynthetic processes
Regulation
Metabolism
Stress
Transport
Reproduction
psy1r vs WT(154)
WT+PSY1 vs WT(77)
WT+PSY1 vs psy1r+PSY1(261)
Figure 2 Gene Ontology (GO) terms depicting the distribution of expressed genes by Amigo GO (http://amigo.geneontology.org/cgi-bin/amigo/go.cgi). Venn diagram represents the percentage of each biological function obtained by genes involved in corresponding functionsdivided by all expressed genes. The category psy1r vs WT that represents the percentage of differentially expressed genes attributed to specificbiological functions in psy1r mutant plants compared to wild type (psy1r vs WT). The category “WT + PSY1 vs WT” represents the percentage ofdifferentially expressed genes after PSY1 treatment compared to untreated wild type. Other category “WT + PSY1 vs psy1r + PSY1” highlights thepercentage of differentially expressed genes in PSY1-treated receptor mutant plants compared to PSY1-treated wild type plants.
Microarray
Validation through RT-PCR
WT psy1r Plant lines
-PSY1 +PSY1 +PSY1 -PSY1
PSY1 peptide (10 nm)
Figure 1 Schematic presentation of experimental set-up. Two plant lines were grown hydroponically for one week and following treatedwith 10 nM PSY1 for 4 hr before RNA extraction. Three independent biological samples were prepared.
Mahmood et al. BMC Genomics 2014, 15:441 Page 3 of 12http://www.biomedcentral.com/1471-2164/15/441

** *
*
*
*
*
*
*
*
*
*
**
*
*
*
0
1
2
3
4
5
WVD2
5PTASE11
RALF35AM
L2CRL
AT1G10
585
SCRL3
AT1G29
450
AT3G03
850
ATMPK11
Rel
ativ
e ge
ne e
xpre
ssio
n to
non
-tre
ated
WT
WT WT+PSY1 psy1r psy1r+PSY1
PSY1R dependent genesPSY1R independent genes
Figure 3 Validation of microarray data through qRT-PCR of selected genes. The transcript levels in plants were assessed following 4 hexposure of 10 nM of PSY1 to one-week-old plants. Relative gene expression levels were compared with wild type control (defined value of 1).The relative transcript levels were calculated from three independent biological replicates. * Indicates significance calculated among treatmentsusing Tukey’s test (P < 0.05).
Mahmood et al. BMC Genomics 2014, 15:441 Page 4 of 12http://www.biomedcentral.com/1471-2164/15/441
genes included a novel protein WAVE-DAMPENED 2(WVD2, AT5G28646) involved in cell expansion androot waving. Another gene that encodes a phos-phatidylinositol polyphosphate 5-phosphatase (5PTase11,AT1G47510) also up-regulated after PSY1 treatment wasselected, and so was RALF35, which is not characterizedbut belongs to another family of signaling peptide. Othertested proteins included AML2 (AT2G42890), which isinvolved in embryo development, CRL (AT5G51020),which is implicated in pattern of cell division and MPK11(AT1G01560), which influences differentiation and plastiddivision. The specific primers used for each gene are listedin Additional file 5: Table S5. The qRT-PCR results gen-erally agreed with the microarray data, however quanti-tative differences in expression levels were observed. Inour experiments, the microarray was found to be moresensitive than the qRT-PCR data (Figure 3). Importantly,the qRT-PCR confirmed the presence of two groups ofPSY1 responsive genes, one group dependent on the pres-ence of PSY1R, the other group independent of PSY1R.
Identification of enriched GO terms of differentiallyexpressed genes in both plant linesIn order to identify enriched GO terms, an analysis ofover-representing GO categories using AgriGO (Fisher’sexact test < 0.05) was conducted [19]. Over-representingGO terms were divided into Biological Processes (BP),Cellular Component (CC) and Molecular Function (MF).According to BP, 32 categories were significantly enrichedin wild type after PSY1 treatment. To make it more simpleand visual, the over-representing GO categories were
drawn manually. These over-representing GO categoriesinclude response to hormone stimulus, regulation ofbiosynthetic processes and regulation of transcription(Figure 4A). When looking at cellular components (CC),four significant enriched categories were observed withmajority of genes localized to cell wall (Figure 4B). Cellwall loosening requires lowering of the apoplastic pHas well as structural changes such as breakage of load-bearing bonds through enzymes [20]. According tomolecular functions, two over-represented GO cat-egories were found namely transcription factor activityand carboxylesterase activity (Figure 4C). Esterases re-move methyl groups from polysaccharides and canthereby cause breakage of polysaccharides [21]. This issuggested to be one of the mechanisms required forcell elongation [22-24], and would support a mechan-ism of PSY1-induced cell growth.A functional enrichment study of differentially expressed
genes in the psy1rmutant plants revealed that 52 GO termswere significantly enriched. The most prominent enrichedfunctions in BP were response to stimuli, regulation oftranscription, metal ion transport, flower developmentand response to abscisic acid stimulus (ABA) (Figure 5A).Response to stimuli and regulation of transcription arebelieved to happen through perception of PSY1 peptideby the receptor PSY1R as extracellular signals mediatespecific cellular functions by triggering a signaling cascadethat result in modulation of transcription factor activity[25]. Other significant enriched terms are metal ion trans-port genes (AT5G26690, AT2G28160, AT3G46900, AT3G48970 and AT5G52710) mainly involved in copper and
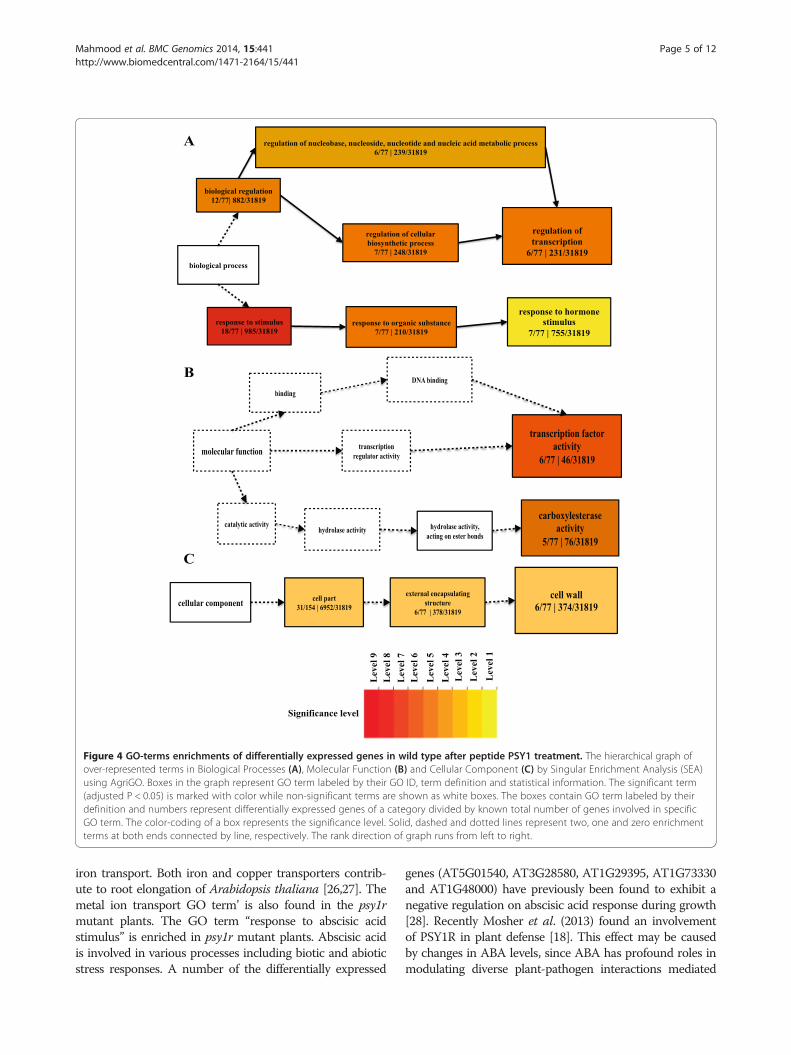
Figure 4 GO-terms enrichments of differentially expressed genes in wild type after peptide PSY1 treatment. The hierarchical graph ofover-represented terms in Biological Processes (A), Molecular Function (B) and Cellular Component (C) by Singular Enrichment Analysis (SEA)using AgriGO. Boxes in the graph represent GO term labeled by their GO ID, term definition and statistical information. The significant term(adjusted P < 0.05) is marked with color while non-significant terms are shown as white boxes. The boxes contain GO term labeled by theirdefinition and numbers represent differentially expressed genes of a category divided by known total number of genes involved in specificGO term. The color-coding of a box represents the significance level. Solid, dashed and dotted lines represent two, one and zero enrichmentterms at both ends connected by line, respectively. The rank direction of graph runs from left to right.
Mahmood et al. BMC Genomics 2014, 15:441 Page 5 of 12http://www.biomedcentral.com/1471-2164/15/441
iron transport. Both iron and copper transporters contrib-ute to root elongation of Arabidopsis thaliana [26,27]. Themetal ion transport GO term’ is also found in the psy1rmutant plants. The GO term “response to abscisic acidstimulus” is enriched in psy1r mutant plants. Abscisic acidis involved in various processes including biotic and abioticstress responses. A number of the differentially expressed
genes (AT5G01540, AT3G28580, AT1G29395, AT1G73330and AT1G48000) have previously been found to exhibit anegative regulation on abscisic acid response during growth[28]. Recently Mosher et al. (2013) found an involvementof PSY1R in plant defense [18]. This effect may be causedby changes in ABA levels, since ABA has profound roles inmodulating diverse plant-pathogen interactions mediated

Figure 5 GO-terms enrichments of differentially expressed genes in receptor knockout (psy1r) plants. The hierarchical graph ofover-represented terms in Biological Processes (A), Molecular Function (B) and Cellular Component (C) by Singular Enrichment Analysis(SEA) using AgriGO. Boxes in the graph represent GO term labeled by their GO ID, term definition and statistical information. The significantterm (adjusted P < 0.05) is marked with color while non-significant terms are shown as white boxes. The boxes contain GO term labeled bytheir definition and numbers represent differentially expressed genes of a category divided by known total number of genes involved inspecific GO term. The color-coding of a box represents the significance level. Solid, dashed and dotted lines represent two, one and zeroenrichment terms at both ends connected by line, respectively while color line represents negative correlation to the enrichment level ofterm. The rank direction of graph runs from left to right.
Mahmood et al. BMC Genomics 2014, 15:441 Page 6 of 12http://www.biomedcentral.com/1471-2164/15/441

Mahmood et al. BMC Genomics 2014, 15:441 Page 7 of 12http://www.biomedcentral.com/1471-2164/15/441
by cross talk with the jasmonic acid and salicylic acid signalpathways [29]. Genes found in the psy1r mutant plantsinvolved in GO term “flower development” (AT4G16280,AT5G67060, AT1G24260, AT4G01500 and AT3G50330)are mainly involved in promotion of transition of vegetativemeristem to reproductive development, carpel formationand ovule development [30-32]. According to cellularcomponent (CC), over-representing GO term found inthe psy1r mutant plant is nucleus (Figure 5B). This isnot surprising due to the increase in transcription factoractivity occurring in the nucleus. According to molecularfunctions (MF), 22 categories were significantly enriched.The most significant enriched functions were ion bindingfollowed by transcription factor activity, kinase activity andATP binding (Figure 5C). These molecular function GOterms make sense in psy1rmutant plants due to PSY1R rolein these functions and being a receptor of peptide PSY1.In the PSY1-treated psy1r mutant plants, 62 GO terms
were found according to biological component (BP) andthese numbers were higher in the PSY1-treated psy1rmutant plants than in untreated psy1r mutant plants. GOterms lacking in the untreated psy1r mutant is “responseto auxin stimulus” and “cellular amino acid metabolic pro-cesses”. No differences were observed according to cellularcomponent. When comparing molecular function GOterms of PSY1-treated and untreated psy1r plants, mostprominent difference is the carboxylesterase activity ob-served in peptide-treated plants. This enzyme activity iscompletely absent in the untreated mutant plant line.
9
18103
22
31
112
15
WT+PSY1 vs WT (77)
WT vs psy1r(154)
A
WT + PSY1 vs psy1r + PSY1
(261)Figure 6 Comparison among differentially expressed genes in both pcomparing differentially expressed genes in all three treatments. Genes matreatment, genes marked “gray” are differentially expressed in all three treapeptide-treated wild type and untreated psy1r mutant plants. Genes markeone treatment but absent in the other treatments. The 112 genes marked witplants. B) Venn diagram of PSY1-responsive genes. Grey: genes differentiarepresents genes induced in wild type and in psy1r mutant plants, respec
These differences encouraged a more comprehensiveanalysis of differentially expressed genes in the twoplant lines.
Receptor dependent and independent response topeptide PSY1In order to compare the affected genes Venn diagramswere drawn. The diagrams provide a comparison ofdifferentially expressed genes in all three treatments(Figure 6A). The diagrams illustrate that some differ-entially expressed genes are common among treat-ments and some solely expressed in one treatment butabsent in other treatments. Additionally a simplifiedcomparison is made between peptide-treated wild typeand peptide-treated psy1r mutant plants (Figure 6B). Itrevealed that PSY1 does trigger a response even in theabsence of PSY1R, suggesting the existence of two parallelresponses, named as a) PSY1R-independent response andb) PSY1R-dependent response. The genes that respondedto PSY1 in both plant lines belongs to the PSY1R-independent response, while the PSY1R dependentresponse consists of genes that are differentially expressedas response to PSY1 only in the presence of the receptorPSY1R. The PSY1R-receptor independent responseincludes 46 genes expressed in both plant lines afterPSY1 treatment (Figure 6B). There could be two possiblereasons for transcripts expression in psy1r-independentresponse. The first one might be due to absence of naturalreceptor PSY1R, PSY1 binds to a low affinity receptor that
31
46
215
WT+PSY1 vs WT (77)B
WT + PSY1 vs psy1r + PSY1 (261)
lant lines with and without peptide treatment. A) Venn diagramrked “Bright green” are common between both plant lines after PSY1tments. Genes marked with “violet color” are common betweend with “yellow”, “blue color” and “pink color” are solely expressed inh “orange” are common between treated and untreated psy1r mutantlly expressed in both plant lines after PSY1 treatment, blue and pinktively, after PSY1 exposure.

Mahmood et al. BMC Genomics 2014, 15:441 Page 8 of 12http://www.biomedcentral.com/1471-2164/15/441
capable of activating another signaling cascade resultsin transcripts expression. Alternatively, second one mayexplain that the addition of exogenous PSY1 peptide inthe presence of endogenous PSY1 may cause homeo-static disturbance and a parallel signaling cascade is ini-tiated. Nevertheless, a clear response is observed afterexogenous peptide treatment.Interestingly, when analyzing the over-represented
GO categories it is found that the PSY1R-independentpathway represents the cell wall modifications (hydrolaseactivity), while the PSY1R-dependent pathway representsthe response to stimuli, regulation of transcription, metalion transport, flower development and response to absci-sic acid stimulus.
Identification of light-responsive cis elements in promotersof differentially expressed genesA search for common elements (cis elements) in thePSY1 affected genes was carried out using the Promo-mer tools in the Botany Array Resource [33]. The Pro-momer tools use alignment of sequences of genes andenumerative method to find motifs. We searched forover-represented 6-bp motifs in the 1-kb upstream pro-moter region (Table 1). The data indicated that all putativemotifs are TA rich. It is known that TA rich sequences inthe core promoter region act in promoting or repressinggenes at the transcriptional level [34]. The highly signifi-cant motifs include TATATA and TGTATA (Table 1),which are a part of the light regulatory motif (TGTATA-TAT). The TGTATATAT motif was previously shown tobe involved in the network of light regulated genes [35].This motif is found in the promoter region of 14 genes ofpsy1r mutant plants and in only two PSY1-responsivegene promoters in wild type plants, accounting for 9% and2% of all differentially expressed genes, respectively(Table 1). The fourteen genes of psy1r mutant plants con-taining the light regulatory motif in the promoter regionare: Isochorismate synthase 2 (ICS2, AT1G18870), KnoxArabidopsis thaliana meinox (KNATM, AT1G14760),RXW8 (AT1G58520), AT1G23205, Ovate family protein16 (OFP16, AT2G32100), AT3G62990, Cytochrome P450(CYP82C2, AT4G31970), NGA4 (AT4G01500), Peroxid-ase 52 (PRX52, AT5G05340), Sweet 12 (AT5G23660),AT5G46080, NDR1-like 3 (AT5G06320), Longifolia 1(AT5G15580) and AT5G21910. The Longifolia 1 is knownto regulate longitudinal cell elongation in Arabidopsisthaliana [36]. The finding of TGTATATAT in differen-tially expressed genes of psy1r mutant plants may suggestan involvement of PSY1R in light response. A separateexperiment was conducted in order to test if psy1r knock-out plants react differently to the lack of light. Elongationof hypocotyls of etiolated psy1r plants was analyzed after5 days of growth. Comparison of hypocotyls of dark-grown plants revealed shorter hypocotyls in psy1r mutant
plants compared to wild type (Figure 7). These results alsosupport the view that PSY1R contributes to hypocotyl cellelongation in response to light.
ConclusionsSmall signaling peptides perceived by receptors are situ-ated in specific cells to control growth and developmentby eliciting a vast array of physiological responses. PSY1is a secreted peptide and its action is dependent on areceptor PSY1R that triggers a signaling cascade leadingto cell elongation. However, the targets of this signalingpathway are yet to be studied in detail. Our work re-vealed that addition of exogenous PSY1 leads to tran-scription of cell wall modifying enzymes, enzymes thatmight contribute to the loosening of the cell wall duringelongation. Two parallel responses to PSY1 were foundto exist (PSY1R-dependent and PSY1R-independent).This could suggest that other receptors for PSY1 pep-tides exist within the plant. PSY1-responsive genesencode several genes localized in cell wall that regulatecarboxylestrase activity, while differentially expressedgenes in psy1r mutant plants largely were localized tothe nucleus with molecular function of ion binding andtranscription factor activity. A major part of PSY1-responsive genes were involved in cell growth, celldifferentiation and catabolic processes. Genome widegene expression profiling based on GO revealed thatmost differentially expressed genes were involved incellular functions and response to stimuli. This suggests acrosstalk between developmental cues and environmentalstimuli. A promoter analysis revealed a specific cis-element present in 9% of the differentially expressedgenes of psy1r mutant plants. This element has previ-ously been found in genes regulated by light. Elong-ation growth of hypocotyls is closely linked to light andone can speculate that PSY1R is involved in the regula-tion of light response.
MethodsPlant material and growth conditionsExperiments with Arabidopsis thaliana were performedon ecotype Columbia-0. Twenty-five milligram (mg) ofseeds of two plant lines (wild type and psy1r knockout)were surface sterilized in a micro-centrifuge tube bytreating them with ethanol and subsequently Klorin con-taining 0.2% tween for 10 min. Seeds were then washedagain with ethanol for 10 min and rinsed with sterilewater twice before subjecting them to imbibition andstratification at 4°C for three days. After stratification,seeds of the two plant lines were grown hydroponically.Nutrient solution of hydroponic culture containing
half strength of Murashige and Skoog medium (MS)with 1% (w/v) sucrose was prepared (pH 5.7, KOH) andsterilized by autoclaving. The stratified seeds of the two

Table 1 Putative cis-regulatory motives statistically over-represented in the promoters of differentially expressed genes
Motif PSY1 responsive genesin wild type (77 genes)
Differentially expressed genes inpsy1r mutant plants (154 genes)
Differentially expressed genes in PSY1 treated wild type plantscompared to PSY treated psy1r mutant plants (261 genes)
Hits out of 77 genes % Z-score p-value Hits out of 154 genes % Z-score p-value Hits out of 261 genes % Z-score p-value
TATATA 58 75 2.1 0.05 141 92 5.7 0.001 221 85 3.6 0.001
AAAATA 75 97 2.0 0.05 149 97 3.6 0.001 256 98 3.5 0.001
AAAATT 74 96 2.0 0.05 148 96 1.4 ns 254 97 2.6 0.005
AATAAA 76 99 1.7 0.05 148 96 3.1 0.001 253 97 3.8 0.001
TGTATA 53 68 1.7 0.05 114 74 3.0 0.001 199 76 3.2 0.001
TGTATATAT 2 2 ns ns 14 9 ns ns 21 8 ns ns
These sequences have been obtained using the programs Promomer (http://bar.utoronto.ca/ntools/cgi-bin/BAR_Promomer.cgi) and Motif Analysis (TAIR). Z-scores and p-values are those calculated by the correspondingprogram (Promomer or Motif Analysis).
Mahm
oodet
al.BMCGenom
ics2014,15:441
Page9of
12http://w
ww.biom
edcentral.com/1471-2164/15/441

WT psy1r
WT psy1r
A B
Hyp
ocot
yl le
ngth
(mm
)Etiolated seedlings
Figure 7 Wild type (WT) and psy1r mutant seedlings grown for 5 days in the dark. A) Seeds of wild type and psy1r mutant plants weregrown ½ MS + 1% sucrose agar plates. Results are average ((±SE) of minimum of 92 hypocotyls (Wt n = 108, psy1r n = 92 analyzed per genotype(P < 0.001 ANOVA, Tukey test). B) Hypocotyl length (mm) of representative WT and psy1r mutant plant grown in dark.
Mahmood et al. BMC Genomics 2014, 15:441 Page 10 of 12http://www.biomedcentral.com/1471-2164/15/441
plant lines were grown in 500 mL-conical flasks contain-ing 250 mL nutrient solution. Flasks were placed in agrowth chamber on a shaker at 180 rpm under continu-ous light and sterilized conditions. The purified, naturalPSY1 was obtained from Yoshikatsu Matsubyashi Lab,National Institute for basic biology, Japan and PSY1applied to seedlings as described by Amano et al [16].After one week, plants were treated with the PSY1 peptideat 10 nM concentration for 4 hrs and then transferred intoliquid nitrogen and stored at −80°C until RNA extraction.
RNA extraction and microarrayTotal RNA was extracted from three biological replicatesof 25 mg seedlings grown in hydroponic culture in ster-ile conditions using the RNeasy Plant mini kit (Qiagen).RNA integrity was assessed using an Agilent 2100 Bioa-nalyser with RNA 6000 Nano Assay (Agilent Technolo-gies) and was processed for use on Arabidopsis (V4) GeneExpression Microarray (Agilent Technologies). Arabidop-sis (V4) Gene Expression Microarray was used for RNAanalysis according to manufacturer’s detail (Design ID:21169, G2519F; Agilent Technologies, Palo Alto, CA,USA). Briefly, 200 ng of total RNA containing RNAspiked in Mix was reverse transcribed in to cDNA thatwas then in vitro transcribed into cRNA, labeled withcyanine 3-CTP using Agilent Low RNA Input Linear AmpKit (Agilent Technologies). The Agilent RNA spike-incontrol targets are a set of 10 in vitro-synthesized poly-adenylated transcripts derived from the adenovirus E1Agene used to monitor the labeling reactions and themicroarray performance. For labeled cRNA purifica-tion, 84 μl sterile H2O, 350 μl RLT buffer from QiagenRNAeasy Mini Kit (Qiagen Technologies), and 250-μlEtOH were added. The purification steps followed theprotocol described by the manufacturer.After obtaining the required cRNA yield and incorpor-
ation rate of fluorescent dye cyanine 3-CTP, a hybridization
step was carried out simultaneously for all three biologicalrepeats. Hybridizations were carried out in Agilent’sSuperHyb Hybridization Chambers (Agilent Technolo-gies) containing 5 μg of cyanine 3-labeled linearly amp-lified cRNA. The hybridization reaction was performedat 65°C for 17 hours using the Agilent DNA microarrayhybridization oven (Agilent Technologies), following pro-cedures described in the Agilent One-Color Microarray-Based Gene Expression Analysis protocol. The hybridizedmicroarrays were disassembled in Agilent Gene Expres-sion Wash Buffer 1 (Agilent Technologies) and thenwashed with the same buffer for 1 min at room tem-perature, followed by washing with Gene ExpressionWash Buffer 2 for one min at 37°C. The microarrayswere then scanned immediately using the Agilent DNAMicroarray Scanner (Agilent Technologies). The im-ages generated were analyzed with Agilent FeatureExtraction Software. The raw data of hybridization wasimported into the microarray analysis software Gene-Spring 11.5 (Agilent Technologies). Normalization andbackground intensity determination for each featureperformed using the Robust Multiarray Average sum-marization algorithm, as described by Irizarry et al.[37]. Genes were considered differentially regulated iftheir normalized expression value was significantly dif-ferent from the control (P < 0.05). One-way ANOVAwith Benjamini Hochberg multiple testing corrections(false discovery rate of 0.05) was used to identify genesdifferentially regulated between treatment groups. Genesexhibiting more than a 2-fold enhanced or reduced tran-scription level in three independent experiments wereconsidered to show significant alterations in expression.
Real time PCRAliquots of RNA samples used for the microarray ana-lysis were also analyzed by real-time RT-PCR. Reversetranscription (RT) was performed with 2 μg of total

Mahmood et al. BMC Genomics 2014, 15:441 Page 11 of 12http://www.biomedcentral.com/1471-2164/15/441
RNA to obtain cDNA with SuperScript II and Oligo(dT)12-18 (Invitrogen) as the primer in a 20 μl reactionvolume. Each cDNA sample was diluted 1:4 in sterileddH2O, and 1 μl of this dilution was used as templatefor qPCR. Primers for the PCR reactions were designed byBeacon Designer™ to have a Tm of ~ 60°C and an optimalannealing temperature of 53–55°C with the length of theamplicons between 120 and 300 bp. Real-time PCR wasperformed with DyNAmo™ Flash SYBR® Green qPCR Kit(Qiagen) in 20 μL reactions according to manufacturer’sinstruction. Each PCR reaction contains 5 μl of dilutedcDNA (100 ng), 5 μl (0.5 μM) of both primers and 10 μlof DyNAmo™ Flash SYBR® Green master mix. The initialdenaturing time was 7 min at 95°C, followed by 45 cyclesconsisting of 95°C for 10 s, 57°C for 15 s, 68°C for 30 sand 75°C for 1 s with a single fluorescence measurement.Then it was held at 60°C for 60s. A melting curve analysisof the generated products (65°C–95°C with a heating rateof 1°C s−1 and a continuous fluorescence measurement)was performed after the PCR cycles.ACT2 (AT3G18780) was selected as a valid housekeep-
ing gene since the expression of ACT2 did not changesignificantly in plant lines treated with the PSY1 peptidecompared to untreated plant lines (Additional file 6:Figure S1). In addition to this, no significant changes inexpression of ACT2 could be observed in the microarraydata further demonstrating that the ACT2 expression isunaffected by the PSY1 peptide treatment. For relativequantification, amplification efficiencies (E) for primer settargeting each gene were determined in the following way:an aliquot of cDNA transcribed from 5 μg of total RNAwas diluted with sterile ddH2O to 10−1, 10−2 and 10−3.Standard curves for each gene were performed using theundiluted and diluted cDNA to cover the range of all tem-plate concentrations. The specific primers for each genewere used. Gene-specific PCR efficiency was used to calcu-late the expression of target genes relative to the expressionof ACT2 reference gene. The ΔCT value was calculatedas follows: ΔCT (target genes) = CT (target gene)- CT(Reference gene), where CT is the cycle number atwhich PCR product exceeded a set threshold. Relativetranscript level (RTL) was calculated through = 1× 2-ΔCT.
Gene ontologyGene ontologies were analyzed for term enrichment usingthe AgriGO Single Enrichment Analysis tool with TAIR10GO annotation (http://bioinfo.cau.edu.cn/agriGO/). GOenrichment was performed in AgriGO (FDR correctionand Fisher’s exact test < 0.05) using the whole Arabidopsisgenome as the background/reference.
Hypocotyl length measurements in dark grown plantsSeedlings of psy1r and wild type plants were grown on MSmedium (0.8% (w/v) agar and 1% (w/v) sucrose) at 22°C
for 5 days. Seedlings were transferred to transparencies,scanned and measured using the application ImageJ forhypocotyl length measurements.
Availability of supporting dataThe data sets supporting the results of this article are in-cluded within the article (and its additional files alongwith list of genes). Raw microarray data were depositedto GEO public database and available under the acces-sion number “GSE55684”. (http://www.ncbi.nlm.nih.gov/geo/query/acc.cgi?acc=GSE55684).
Additional files
Additional file 1: Table S1. List of genes that were differentiallyexpressed in wild type plants after PSY1 treatment. Genes were identifiedusing the criteria; P < 0.05 and fold change >2 or < −2 through One-wayANOVA (with Benjamini Hochberg multiple testing corrections andFDR < 0.05) between control and peptide PSY1 treated wild type plants.The up-regulated and down regulated genes were sorted from highestto lowest fold expression values.
Additional file 2: Table S2. List of all genes differentially expressed inpsy1r mutant plant compared to wild type plants. Genes were identifiedusing the criteria; P < 0.05 and fold change >2 or < −2 through One-wayANOVA (with Benjamini Hochberg multiple testing corrections andFDR < 0.05) between psy1r mutant plants and wild type plants. Theup-regulated and down regulated genes were sorted from highest tolowest fold expression values.
Additional file 3: Table S3. List of genes differentially expressed inPSY1-treated psy1r mutant plants compared to peptide treated wild typeplants. Genes were identified using the criteria; P < 0.05 and fold change >2or < −2 through One-way ANOVA (with Benjamini Hochberg multipletesting corrections and FDR < 0.05) between PSY1 treated psy1r mutantplants and PSY1 treated-wild type plants. The up-regulated and downregulated genes were sorted from highest to lowest fold expression values.
Additional file 4: Table S4. Functional grouping of genes showingdifferential transcript expression in different treatments. Gene ontology(GO) enrichment was performed in AgriGO (FDR correction and Fisher’sexact test < 0.05) using the whole Arabidopsis genome as thebackground/reference.
Additional file 5: Table S5. Primers used for RT-PCR validation ofselected genes identified by microarray after PSY1 treatment in wild typeplants.
Additional file 6: Figure S1. The ACT2 (At3g18780) gene expression.The expression of ACT2 was not significantly altered in both plant linestreated with the PSY1 peptide compared to the untreated plant lines.The significance level was tested among three independent biologicalreplicates (n = 3). The scale bars represent standard error (S.E) amongthree biological samples.
AbbreviationPSY1: Plant peptide containing sulfated tyrosine 1; PSY1R: Receptor of plantpeptide containing sulfated tyrosine 1; RNA: Ribonucleic acid; LRR-LK: Leucinerich repeat receptor like kinase; GO: Gene Ontology; RT-PCR: Real timepolymerase chain reaction; WVD2: Wave dampened2; BP: Biological processes;CC: Cellular component; MF: Molecular function; ABA: Abscisic acid;MS: Murashige and Skoog medium; RT: Reverse transcription; RTL: Relativetranscript level; SEA: Singular enrichment analysis; ANOVA: Analysis of variance.
Competing interestsThe authors declare they have no competing interests.

Mahmood et al. BMC Genomics 2014, 15:441 Page 12 of 12http://www.biomedcentral.com/1471-2164/15/441
Author’s contributionKM, KJ and ATF designed the study. KM prepared the material. KJ and RKhelped in conducting RT-PCR and microarray experiments. KM, KJ, and ATF,analyzed microarray data and identify common motif in promoter region ofdifferentially expressed regions. KM, KJ and ATF wrote the manuscript. ATF andKJ supervised the project. All authors read and approved the final manuscript.
AcknowledgementsThe projected was supported by a grant from the Danish Research Foundation,FNU, #272-08-0504 (to ATF) and by the PUMPkin Centre - a Centre of Excellencefunded by the Danish National Research Foundation.
Received: 20 December 2013 Accepted: 20 May 2014Published: 6 June 2014
References1. Sparks E, Wachsman G, Benfey PN: Spatiotemporal signalling in plant
development. Nat Rev Genet 2013, 14(9):631–644.2. Murphy E, Smith S, De Smet I: Small signaling peptides in Arabidopsis
development: how cells communicate over a short distance. Plant Cell2012, 24(8):3198–3217.
3. Wang YH, Irving HR: Developing a model of plant hormone interactions.Plant Signal Behav 2011, 6(4):494–500.
4. Zan Y, Ji Y, Zhang Y, Yang S, Song Y, Wang J: Genome-wide identification,characterization and expression analysis of populus leucine-rich repeatreceptor-like protein kinase genes. BMC Genomics 2013, 14:318.
5. Walker JC, Zhang R: Relationship of a putative receptor protein kinasefrom maize to the S-locus glycoproteins of Brassica. Nature 1990,345(6277):743–746.
6. Lee JS, Torii KU: A tale of two systems: peptide ligand-receptor pairs inplant development. Cold Spring Harb Symp Quant Biol 2012, 77:83–89.
7. Matsubayashi Y: Ligand-receptor pairs in plant peptide signaling. J Cell Sci2003, 116:3863–3870.
8. Kholodenko BN: Cell-signalling dynamics in time and space. Nat Rev MolCell Biol 2006, 7(3):165–176.
9. Xiong L, Schumaker KS, Zhu JK: Cell signaling during cold, drought, andsalt stress. Plant Cell 2002, 14(Suppl):S165–S183.
10. Chow B, McCourt P: Plant hormone receptors: perception is everything.Genes Dev 2006, 20(15):1998–2008.
11. Harashima H, Schnittger A: The integration of cell division, growth anddifferentiation. Curr Opin Plant Biol 2010, 13(1):66–74.
12. Gray WM: Hormonal regulation of plant growth and development. PLoSBiol 2004, 2(9):E311.
13. Mitchell CA, Myers PN: Mechanical stress regulation of plant growth anddevelopment. Hortic Rev 1995, 17:1–42.
14. Montgomery BL: Right place, right time: Spatiotemporal light regulation ofplant growth and development. Plant Signal Behav 2008, 3(12):1053–1060.
15. Czyzewicz N, Yue K, Beeckman T, Smet ID: Message in a bottle: smallsignalling peptide outputs during growth and development. J Exp Bot2013, 64(17):5281–5296.
16. Amano Y, Tsubouchi H, Shinohara H, Ogawa M, Matsubayashi Y:Tyrosine-sulfated glycopeptide involved in cellular proliferation andexpansion in Arabidopsis. Proc Natl Acad Sci U S A 2007,104(46):18333–18338.
17. Mosher S, Kemmerling B: PSKR1 and PSY1R-mediated regulation of plantdefense responses. Plant Signal Behav 2013, 8(5):e24119.
18. Mosher S, Seybold H, Rodriguez P, Stahl M, Davies KA, Dayaratne S, Morillo SA,Wierzba M, Favery B, Keller H, Tax FE, Kemmerling B: The tyrosine-sulfatedpeptide receptors PSKR1 and PSY1R modify the immunity of Arabidopsis tobiotrophic and necrotrophic pathogens in an antagonistic manner. Plant J2013, 73(3):469–482.
19. Du Z, Zhou X, Ling Y, Zhang Z, Su Z: agriGO: a GO analysis toolkit for theagricultural community. Nucleic Acids Res 2010, 38:64–70.
20. Muller K, Linkies A, Vreeburg RA, Fry SC, Krieger-Liszkay A, Leubner-Metzger G:In vivo cell wall loosening by hydroxyl radicals during cress seedgermination and elongation growth. Plant Physiol 2009, 150(4):1855–1865.
21. Willats WG, Orfila C, Limberg G, Buchholt HC, van Alebeek GJ, Voragen AG,Marcus SE, Christensen TM, Mikkelsen JD, Murray BS, Knox JP:Modulation ofthe degree and pattern of methyl-esterification of pectic homogalacturonanin plant cell walls. Implications for pectin methyl esterase action, matrixproperties, and cell adhesion. J Biol Chem 2001, 276(22):19404–19413.
22. Yu L, Sun J, Li L: PtrCel9A6, an Endo-1,4-beta-Glucanase, Is Required forCell Wall Formation during Xylem Differentiation in Populus. Mol Plant2013, 6(6):1904–1917.
23. Sato S, Kato T, Kakegawa K, Ishii T, Liu YG, Awano T, Takabe K, Nishiyama Y,Kuga S, Nakamura Y, Tabata S, Shibata D: Role of the putativemembrane-bound endo-1,4-beta-glucanase KORRIGAN in cellelongation and cellulose synthesis in Arabidopsis thaliana. Plant CellPhysiol 2001, 42(3):251–263.
24. Hayashi T: The primary wall controls plant cell growth. Tanpakushitsukakusan koso Protein, nucleic acid, enzyme 1992, 37(15):2968–2976.
25. Karin M: Signal transduction and gene control. Curr Opin Cell Biol 1991,3(3):467–473.
26. Giehl RF, Lima JE, von Wiren N: Localized iron supply triggers lateralroot elongation in Arabidopsis by altering the AUX1-mediated auxindistribution. Plant Cell 2012, 24(1):33–49.
27. Sancenon V, Puig S, Mateu-Andres I, Dorcey E, Thiele DJ, Penarrubia L:The Arabidopsis copper transporter COPT1 functions in root elongationand pollen development. J Biol Chem 2004, 279(15):15348–15355.
28. Xin Z, Wang A, Yang G, Gao P, Zheng ZL: The Arabidopsis A4 subfamily oflectin receptor kinases negatively regulates abscisic acid response inseed germination. Plant Physiol 2009, 149(1):434–444.
29. Fan J, Hill L, Crooks C, Doerner P, Lamb C: Abscisic Acid Has a Key Rolein Modulating Diverse Plant-Pathogen Interactions. Plant Physiol 2009,150(4):1750–1761.
30. Chandler J, Wilson A, Dean C: Arabidopsis mutants showing an alteredresponse to vernalization. Plant J 1996, 10(4):637–644.
31. Gremski K, Ditta G, Yanofsky MF: The HECATE genes regulate femalereproductive tract development in Arabidopsis thaliana. Development2007, 134(20):3593–3601.
32. Alvarez JP, Goldshmidt A, Efroni I, Bowman JL, Eshed Y: The NGATHA distalorgan development genes are essential for style specification in Arabidopsis.Plant Cell 2009, 21(5):1373–1393.
33. Toufighi K, Brady SM, Austin R, Ly E, Provart NJ: The Botany Array Resource:e-Northerns, Expression Angling, and promoter analyses. Plant J 2005,43(1):153–163.
34. Hobson GM, Mitchell MT, Molloy GR, Pearson ML, Benfield PA: Identificationof a novel TA-rich DNA binding protein that recognizes a TATA sequencewithin the brain creatine kinase promoter. Nucleic Acids Res 1988,16(18):8925–8944.
35. Hudson ME, Quail PH: Identification of promoter motifs involved in thenetwork of phytochrome A-regulated gene expression by combinedanalysis of genomic sequence and microarray data. Plant Physiol 2003,133(4):1605–1616.
36. Lee YK, Kim GT, Kim IJ, Park J, Kwak SS, Choi G, Chung WI: LONGIFOLIA1and LONGIFOLIA2, two homologous genes, regulate longitudinal cellelongation in Arabidopsis. Development 2006, 133(21):4305–4314.
37. Irizarry RA, Hobbs B, Collin F, Beazer-Barclay YD, Antonellis KJ, Scherf U,Speed TP: Exploration, normalization, and summaries of high densityoligonucleotide array probe level data. Biostatistics 2003, 4(2):249–264.
doi:10.1186/1471-2164-15-441Cite this article as: Mahmood et al.: Analysis of peptide PSY1 respondingtranscripts in the two Arabidopsis plant lines: wild type and psy1r receptormutant. BMC Genomics 2014 15:441.
Submit your next manuscript to BioMed Centraland take full advantage of:
• Convenient online submission
• Thorough peer review
• No space constraints or color figure charges
• Immediate publication on acceptance
• Inclusion in PubMed, CAS, Scopus and Google Scholar
• Research which is freely available for redistribution
Submit your manuscript at www.biomedcentral.com/submit
Top Related
Copyright © 2022 FDOKUMEN

