


Bahasa
Halaman
Hukum


LBNL-6560E
Analysis of Open Automated Demand Response Deployments in California and Guidelines to Transition to Industry Standards
Girish Ghatikar, David Riess, Mary Ann Piette
Lawrence Berkeley National Laboratory
January 2014

DISCLAIMER
This document was prepared as an account of work sponsored by the United States Government. While this document is believed to contain correct information, neither the United States Government nor any agency thereof, nor The Regents of the University of California, nor any of their employees, makes any warranty, express or implied, or assumes any legal responsibility for the accuracy, completeness, or usefulness of any information, apparatus, product, or process disclosed, or represents that its use would not infringe privately owned rights. Reference herein to any specific commercial product, process, or service by its trade name, trademark, manufacturer, or otherwise, does not necessarily constitute or imply its endorsement, recommendation, or favoring by the United States Government or any agency thereof, or The Regents of the University of California. The views and opinions of authors expressed herein do not necessarily state or reflect those of the United States Government or any agency thereof or The Regents of the University of California.

ACKNOWLEDGEMENTS
The work described in this report was coordinated by the Demand Response Research Center and funded by the California Energy Commission (Energy Commission), Public Interest Energy Research (PIER) Program, under Work for Others Contract No. 500-‐03-‐026, and by the U.S. Department of Energy under Contract No. DE-‐AC02-‐05CH11231. The authors would like to thank the reviewers and the OpenADR Alliance members, Rolf Bienert, Jim Zuber, and Ed Koch, and former Lawrence Berkeley National Laboratory staff, Venkata Ganti, for their contributions. The authors also want to acknowledge all others who assisted in review of this document, and for their ongoing support, including the California Energy Commission and PIER Program staff.


Abstract This report reviews the Open Automated Demand Response (OpenADR) deployments within the territories serviced by California’s investor-‐owned utilities (IOUs) and the transition from the OpenADR 1.0 specification to the formal standard—OpenADR 2.0. As demand response service providers and customers start adopting OpenADR 2.0, it is necessary to ensure that the existing Automated Demand Response (AutoDR) infrastructure investment continues to be useful and takes advantage of the formal standard and its many benefits. This study focused on OpenADR deployments and systems used by the California IOUs and included a summary of the OpenADR deployment from the U.S. Department of Energy-‐funded demonstration conducted by the Sacramento Municipal Utility District (SMUD). Lawrence Berkeley National Laboratory collected and analyzed data about OpenADR 1.0 deployments, categorized architectures, developed a data model mapping to understand the technical compatibility of each version, and compared the capabilities and features of the two specifications. The findings, for the first time, provided evidence of the total enabled load shed and average first cost for system enablement in the IOU and SMUD service territories. The OpenADR 2.0a profile specification semantically supports AutoDR system architectures and data propagation with a testing and certification program that promotes interoperability, scaled deployments by multiple vendors, and provides additional features that support future services.


Table of Contents Executive Summary ................................................................................................................. 1 Introduction and Background ............................................................................................. 1 Background ......................................................................................................................................... 2 Study Methodology ........................................................................................................................... 3 Report Organization ......................................................................................................................... 3
Existing OpenADR Deployments in California ............................................................... 4 OpenADR 1.0 in the Pacific Gas and Electric Company (PG&E) Territory ...................... 4 OpenADR 1.0 in the Southern California Edison (SCE) Territory ..................................... 7 OpenADR 1.0 in the San Diego Gas and Electric (SDG&E) Company Territory .......... 10 OpenADR 1.0 in the Sacramento Municipal Utility District (SMUD) Territory ......... 13 Summary of Existing OpenADR 1.0 Deployments in California ...................................... 13
OpenADR 1.0 System Architecture .................................................................................. 15 Key Characteristics of Enablement Architectures .............................................................. 15 DR Event Data Propagation ...................................................................................................................... 15 DR Event Data Client ................................................................................................................................... 16 DR Event Data Integration ........................................................................................................................ 17
Classification of Enablement Communication Architectures .......................................... 18 Direct-‐Enrollment Architecture ............................................................................................................. 18 Managed Services Architecture .............................................................................................................. 19 Aggregator Architecture ............................................................................................................................ 19
Summary of OpenADR 1.0 Systems Architecture ................................................................ 19 Findings, Transition Strategy, and Next Steps ............................................................ 21 Transition Plan and Strategy ...................................................................................................... 22 Next Steps .......................................................................................................................................... 22
Appendix: Compatibility Guide for OpenADR 1.0 and 2.0 ....................................... 23 DR Event Data Conveyance: OpenADR 1.0 versus OpenADR 2.0 .................................... 23 DR Event Data Model: Overview ............................................................................................................ 23 Mapping 1.0 eventState onto 2.0 eiEvent .......................................................................................... 24 OpenADR 1.0 DR Event Metadata .......................................................................................................... 24 OpenADR 1.0 Simple Event Data Constituents ................................................................................ 26 OpenADR 1.0 Smart Event Data Constituents .................................................................................. 27
Summary of OpenADR 1.0 to OpenADR 2.0 Event Data Mapping .................................. 29 Features: OpenADR 1.0 versus OpenADR 2.0 ....................................................................... 29 DR Program Configuration ....................................................................................................................... 29 Utility / DR Event Server Communication ......................................................................................... 30 Event Targeting ............................................................................................................................................. 30 Response Schedule ...................................................................................................................................... 30 Opt-‐Out Schedule .......................................................................................................................................... 31 Program Constraints ................................................................................................................................... 31 Feedback .......................................................................................................................................................... 31 Bidding .............................................................................................................................................................. 31
Summary of OpenADR 1.0 versus 2.0 Feature Compatibility .......................................... 32 Summary of Technical Compatibility between OpenADR 1.0 and OpenADR 2.0 ..... 32 Program Implementations: OpenADR 1.0 Program-‐Specific Payloads ....................... 35

References ............................................................................................................................... 39

1
Executive Summary The Demand Response Research Center (DRRC) at Lawrence Berkeley National Laboratory (LBNL) develops and evaluates technology to automate demand response to help develop low-‐cost demand-‐side management resources and enable their participation in electricity markets. The DRRC developed the first-‐generation communication specification—open automated demand response (OpenADR) version 1.0, which has been used in California for years. It also contributed to the development of the second-‐generation formal standard (OpenADR 2.0) that is beginning to be used. As the transition from the specification to the formal standard occurs, it is necessary to ensure that the existing AutoDR infrastructure investment continues to be useful and takes advantage of the new standard. To facilitate this evolution, the DRRC evaluated the transition of existing demand response automation systems in California from OpenADR 1.0 to OpenADR 2.0. The study focused on OpenADR deployments and systems used by the California investor-‐owned utilities (IOUs) and included a summary of the OpenADR deployment from the U.S. Department of Energy-‐funded demonstration conducted by the Sacramento Municipal Utility District (SMUD). The research team collected and analyzed data from the IOUs and vendors about OpenADR 1.0 deployments, categorized deployment architectures, developed a data model mapping to understand the technical compatibility of each version, and compared the capabilities and features of the two specifications. The study found the following:
• The total load shed that has been enabled within the service territories of the California IOUs using OpenADR 1.0 is approximately 250 megawatts (MW). Moving forward, utilities should track OpenADR client and server deployment architectures, customer-‐side load-‐shed strategies, and actual peak-‐load reductions for these systems. Tracking additional details about enabled systems will help determine AutoDR performance and upgrade plans, will help guide AutoDR building code adoption, and will help identify the potential for AutoDR resources to participate in wholesale DR markets.
• Within the California IOU service territories, the average first cost for system enablement using OpenADR 1.0 ranges from $170/kilowatt (kW) to $300/kW. In the recent SMUD pilot, the average first cost was less than $125/kW. To assess and to reduce the first costs of AutoDR systems, utilities must track these costs at a more granular level.
• AutoDR programs that make use of OpenADR 1.0 include both aggregator-‐managed programs and programs wherein customers enroll directly with their utility. The OpenADR 2.0a profile specification can semantically support current AutoDR system architectures and data propagation patterns.
• OpenADR 2.0 has a more focused scope relative to OpenADR 1.0. Both specifications define functionality related to the conveyance of DR event information between the server and the client, but OpenADR 1.0 also included

2
functionality related to configuration of DR programs and interactions between the AutoDR server and other utility-‐side systems.
• One vendor has provided OpenADR 1.0 DR automation server deployments in all IOU territories; however, OpenADR 2.0 will help promote competition to provide these systems. OpenADR 1.0 client compliance was not an issue, as the clients were validated to receive and respond to that server’s DR signals. OpenADR 2.0 includes formal testing and certification, which will be important and will help ensure interoperability between any clients and servers as more vendors begin producing OpenADR-‐certified products.
• OpenADR 1.0 users cannot evaluate a transition to OpenADR 2.0 until utilities begin offering AutoDR programs that OpenADR 2.0 is uniquely qualified to enable. Until then, IOUs should support both 1.0 and 2.0 infrastructures. Existing systems using OpenADR 1.0 should take a phased approach to transitioning to OpenADR 2.0 that accounts for a continued cost-‐benefit analysis of maintaining both OpenADR 1.0 and 2.0 servers, a business case for transitioning to 2.0, and an assessment of the features of OpenADR 2.0 that provide unique support for future applications of DR services.

1
Introduction and Background The Demand Response Research Center (DRRC) at Lawrence Berkeley National Laboratory (LBNL) has been developing and evaluating technology to automate demand response to help develop low-‐cost demand-‐side management resources for more than ten years. This project was initiated to evaluate and facilitate the transition of the existing demand response automation systems in California from the first-‐generation communication specification to the second-‐generation formal standard. The specification, known as open automated demand response (OpenADR) version 1.0, was originally conceived by LBNL in 2002. The term “OpenADR” was developed for this communication technology to distinguish it from proprietary DR technologies. After several years of field demonstrations, OpenADR 1.0 was commercialized in California in 2006, beginning with utility program incentives in northern California and followed by incentives from southern Californian utilities. The entire OpenADR specification was donated to the Organization for the Advancement of Structured Information Standards (OASIS) for further development in 2009. This donation was motivated by LBNL’s involvement in the National Smart Grid Standards process (described below). Since 2009, OASIS and the OpenADR Alliance have been developing the second-‐generation of the OpenADR specification, known as OpenADR 2.0. The underlying principles for both OpenADR 1.0 and 2.0 are the same; however, there are syntactical differences that prevent backwards compatibility. Therefore, to ensure that existing AutoDR infrastructure investment is not stranded as the industry moves to the 2.0 standard, it is necessary to evaluate the potential costs and challenges associated with upgrading or maintaining the existing systems. A key goal of this transition is to ensure that the automated DR infrastructure in California continues to be useful and take advantage of the new standard. This report focuses on automated DR programs that use OpenADR within the territories serviced by the California investor-‐owned utilities (IOUs). Also included is a summary of the OpenADR deployment from the U.S. Department of Energy-‐funded demonstration conducted by the Sacramento Municipal Utility District (SMUD). By analyzing data provided by the three California IOUs1 and interviewing vendors involved with AutoDR enablement, this study characterized both the scale of AutoDR deployments and the key characteristics of existing systems. This report provides a technical description of strategies and concepts to transition current customers from OpenADR 1.0 to 2.0 communication standards. It describes the key similarities and differences between OpenADR 1.0 and 2.0, and provides a framework that can be used to develop transition plans to the more updated specification. This report is intended to assist the OpenADR 1.0 stakeholders—in particular technology vendors, utilities, building engineers, facility managers, and electricity service providers—to identify deployment pathways for OpenADR 2.0. 1 The three IOUs in California are the Pacific Gas and Electric Company (PG&E), Southern California Edison (SCE), and San Diego Gas & Electric (SDG&E).

2
This project’s specific technical objectives are to:
1. Collect and organize information on the existing OpenADR 1.0 deployments within the territories serviced by the California IOUs.
2. Evaluate the capabilities of OpenADR 2.0 and its advantages to both the California IOUs and the AutoDR program participants.
3. Develop a mapping between key data models defined by the OpenADR 1.0 specification and the OpenADR 2.0 specification.
4. Identify and evaluate strategies that might be used to transition California's existing OpenADR 1.0 infrastructure to OpenADR 2.0.
Background California IOUs and many other utilities and electricity service providers in the United States (U.S.) and across the world have deployed DR automation and communication infrastructure using the OpenADR 1.0 specification (Piette et al. 2009a). Since 2007, the California IOUs have been deploying OpenADR under the direction of the California Public Utilities Commission (CPUC). The primary objectives of this effort have been to advance and improve the reliability, performance, and cost effectiveness of DR programs in California. Demand response is defined as a set of demand-‐side actions that reduce or shift electricity use to improve the reliability and economics of the electric grid in response to requests from the electric grid. It differs from energy efficiency in that it is a dynamic system that involves events or price responsiveness. Fully automated DR involves end-‐to-‐end automation of communication between electricity service providers and their customers (e.g., facilities, aggregators). OpenADR is an open and interoperable information exchange model that facilitates the automation of DR in between DR service providers and customers (Koch and Piette 2007). OpenADR-‐based systems allow customers to fully automate the invocation of pre-‐defined control strategies in response to DR events that their control systems receive through this automated communication channel (Piette et al. 2009b). OpenADR 2.0 is a result of the National Institute of Standards and Technology (NIST)-‐led activity in the U.S. to identify, develop, and implement Smart Grid interoperability standards (NIST 2012). OpenADR 2.0 is a set of profile specifications that were developed from OpenADR 1.0 within the standards development organization (SDO) called the Organization for Advancement of Structured Information Standards (OASIS) and supported by the OpenADR Alliance (OASIS 2012; OpenADR Alliance, no date; and OpenADR Alliance 2012 and 2013). Transitioning from OpenADR 1.0 systems to the formal OpenADR 2.0 standard offers many potential benefits for California users. Three key benefits are:
• A compliance and certification platform of OpenADR 2.0 that provides interoperability testing for the U.S. Smart Grid standards (Smart Grid Interoperability Panel 2012).

3
• Support for OpenADR 2.0 by a non-‐profit, member-‐based organization, the OpenADR Alliance, which provides market facilitation and supports large scale implementations (Ghatikar and Bienert 2011).
• Use of standardized data models that are supported by the North American Energy Standards Board, independent systems operators (ISO), and regional transmission operators (RTO), for use with DR programs in both retail and wholesale markets in the United States (Holmberg 2012; NIST, no date).
Study Methodology The following tasks were performed to meet the goals and objectives of this study:
1. Collect and analyze information: Data regarding the nature of existing OpenADR 1.0 deployments in California were collected from the California IOUs. Program implementers and vendors that were involved with OpenADR enablement were also contacted in order to obtain supplementary data.
2. Categorize customer deployments: The information that was obtained from vendors and IOUs was used to categorize existing OpenADR 1.0 deployments and to identify and generalize AutoDR system architectures.
3. Develop a data model mapping: The OpenADR 1.0 and 2.0 specifications were used to develop a mapping between the key data models defined by each specification, to understand the technical compatibility.
4. OpenADR 1.0 and 2.0 features: After reviewing OpenADR 1.0 and 2.0 data models, the study team conducted an evaluation comparing the capabilities and features of the two specifications and made recommendations.
Report Organization This report is organized in following sections:
1. Introduction and Background: Provides an introduction and background to the project, as well as the project’s study methodology.
2. Existing OpenADR Deployments in California: Provides a summary of OpenADR 1.0 deployments to identify the transition’s impact.
3. OpenADR 1.0 System Architecture: Outlines AutoDR system architectures for OpenADR 1.0, to look at the transition issues as an end-‐to-‐end system.
4. Findings, Transition Strategy, and Next Steps: Summarizes key findings and next steps for transition.
5. Appendices: Reviews OpenADR 1.0 and 2.0 specifications and provides a mapping among functions, features, and data model compatibility for IOU-‐supported AutoDR programs.

4
Existing OpenADR Deployments in California This section summarizes information related to the status of existing OpenADR 1.0 systems within each of the California IOU territories and SMUD. This summary includes information about the amount of peak-‐demand reduction that has been automated using OpenADR, the number of facilities that are currently using OpenADR, and the scale of the investment that has been made in the technology necessary to enable these systems. These data are important to help characterize the scale of the effort that could be required to transition from the legacy OpenADR 1.0 infrastructure to the new OpenADR 2.0 standard. Both OpenADR 1.0 and 2.0 use client-‐server architecture. Each of the utilities that offer OpenADR-‐enabled DR programs have procured an OpenADR server that sends DR signals and DR event messages to customers. Customers may either receive these DR signals directly from the utility, or they may receive them from a third-‐party aggregator. Table 1 shows the investment that has been made in the deployment of technology necessary to enable AutoDR using OpenADR. These technology incentives were offered by the IOUs to cover the cost of enabling facilities to use OpenADR 1.0 for DR automation. The total allowable incentive for each project was capped on a price-‐per-‐kilowatt basis. In cases where the cap was reached, data were not available regarding any additional costs that might have been borne by the customer. Because of this, it is possible that the first costs may be underrepresented by this figure. On the other hand, there is some evidence that some vendors organize the field installation designs to obtain the maximum DR automation incentive available from the utilities. The total cost of enablement was not available from San Diego Gas & Electric; the figure shown in Table 1 was calculated by multiplying the maximum incentive of $300 per kilowatt by the amount of enabled load shed. The following sections describe the analysis in greater detail for each of the IOUs.
Table 1. Summary of OpenADR 1.0 Deployment in California IOUs
Utility
Enabled Load Shed kilowatts (kW)a
Cost of Enablement
($M)
Enrolled Service Accounts
Enrolled Load Shed (kW)b
Pacific Gas and Electric Company 81,330 13.9 347 70,577 Southern California Edison 157,748 37.0 747 155,329 San Diego Gas & Electric 10,740 3.2c 126 8,130 TOTAL 249,818 54.1 1,220 234,036 a The total enabled DR load-‐shed capability as estimated by the IOUs. b The total DR load-‐shed capability that is currently enrolled in at least one AutoDR program. c The total cost of enablement for SDG&E was estimated by multiplying the maximum $300/kW technology incentive by the total enabled load shed.
OpenADR 1.0 in the Pacific Gas and Electric Company (PG&E) Territory The Pacific Gas and Electric Company (PG&E) has been offering OpenADR-‐based communication systems to provide automation for DR programs since 2007. PG&E currently offers OpenADR-‐based automation for the following four DR programs:

5
• Peak Day Pricing (PDP) (PG&E, no date): This is a dynamic pricing program for large commercial and industrial customers. Many of the participants in this program were originally on the Critical Peak Pricing program, which was defined by a six-‐hour high price event. The PDP events are shorter, at four hours in duration. In addition to time of use pricing, this program adds a surcharge for energy consumed during 9 to 15 annual Peak Day Pricing events. In exchange, customers receive a lower electricity rate during summer months.
• Demand Bidding Program (DBP) (PG&E, no date): This program incentivizes participants to submit day-‐ahead load-‐reduction bids, but it does not impose penalties on enrollees for opting to not participate.
• Capacity Bidding Program (CBP) (PG&E, no date): This is an aggregator-‐managed program with both day-‐of and day-‐ahead options. During CBP events, aggregators nominate customers under their management for participation and allocate incentives according the individual agreements that they maintain with each of their customers.
• Aggregator Managed Portfolio (AMP) (PG&E, no date): In this program, the responsibility of program design falls to the aggregator. Because of this, the participation requirements and incentives vary depending on the aggregator.
Data provided by PG&E indicate that, since 2007, a total of 81,330 kilowatts (kW) of AutoDR load-‐shed capability has been enabled2 at a cost of $13.9 million. These costs represent the technology incentive (TI) paid to customers to cover the first costs3 associated with OpenADR client enablement between 2007 and 2012. This cost was considered for the purposes of identifying the magnitude of the existing investment in OpenADR. Comparing the installed capacity of the AutoDR systems with the total incentive costs shows that the average installed cost within the PG&E territory has been $170.90 per kilowatt. Data provided by third-‐party contractors involved with PG&E’s AutoDR programs show that of this total enabled load-‐shed capability, 70,577 kW is currently enrolled4 in at least one AutoDR program (Table 2). This currently enrolled AutoDR capacity includes a total of 347 service accounts. Of these 347 currently enrolled service accounts, 37 percent are enrolled in one of the direct-‐enrollment5 programs (PDP or DBP), and 80 percent are enrolled in one of the aggregator-‐managed programs (CBP or AMP). These figures include service accounts that are enrolled in a single program, as well as those that have enrollments in multiple programs. Across the currently enrolled service accounts, a total of 17 percent are enrolled in both a direct-‐enrollment program and an aggregator-‐managed program. 2 Enabled load shed refers to estimated or tested load-‐shed capability. Actual performance varies from these numbers, and not all enabled load shed is actively enrolled in an AutoDR program. 3 The data for instances where customers may have exceeded the maximum TI payment is not available. 4 Enrolled load shed refers to load-‐shed capability that is actively enrolled in at least one demand response program. 5 Direct-‐enrollment refers to programs that are not serviced by an aggregator, but rather programs where the participant enrolls with and interacts directly with the utility.

6
Table 2. Breakdown of PG&E AutoDR Program Enrollment
Enrollment Type Enrolled Service Accounts
Enrolled kW
% Enrolled Service Accounts
% Enrolled kW
Direct-‐Enrollment Only 68 39,454 20 56 Aggregator-‐Managed Only 220 24,142 63 34 Both 59 6,981 17 10 Total 347 70,577 100 100
While a large percentage (80 percent) of service accounts are enrolled in one of the aggregator-‐managed programs, these enrollments only account for approximately 44 percent of the total AutoDR-‐enabled peak-‐demand reduction capability. By contrast, the 37 percent of service accounts that are enrolled in one of the direct-‐enrollment programs account for approximately 66 percent of total AutoDR-‐enabled load-‐shed capability (Figure 1). Among the direct enrollment participants, select large industrial customers provide a significantly higher peak-‐demand reduction capability (PG&E 2007). Figure 2 and Figure 3 provide a breakdown of PG&E AutoDR program enrollment on the basis of service accounts enrolled and kilowatts enrolled, respectively.
Figure 1. PG&E AutoDR Program Participation by Enrolled Service Accounts vs. Enrolled
Load Shed
0.00%
20.00%
40.00%
60.00%
80.00%
100.00%
Direct Enrollment Aggregator-‐Managed
PG&E AutoDR Program Participation by Enrolled Service Accounts vs. Enrolled Load Shed
% of Enrolled Service Accounts % of Enrolled Load Shed (kW)

7
Figure 2. Breakdown of PG&E AutoDR Program Participation
by Enrolled Service Accounts
Figure 3. Breakdown of PG&E AutoDR Program Participation
by Enrolled Load Shed (kW)
OpenADR 1.0 in the Southern California Edison (SCE) Territory The Southern California Edison Company (SCE) has been offering OpenADR-‐based communication systems to provide automation for DR programs since 2007. It currently offers OpenADR-‐based automation for the following five DR programs:
• Summer Advantage Incentive (SAI) (SCE, no date): This is one of SCE’s dynamic pricing programs for their business customers. This program, also known as Critical Peak Pricing (CPP), is event-‐based and rewards customers in exchange for reducing their load during 9 to 15 annual SAI events. Like with PG&E, customers receive a lower electricity rate on summer non-‐SAI event days.
• Real-‐Time Pricing (RTP) (SCE, no date): This program is non-‐event based where energy prices are determined based on the season, week day versus weekend/holidays, time of day, and the previous day’s high temperature as recorded in downtown Los Angeles. Electricity consumers can benefit from
PDP 4%
DBP 12%
CBP 25% AMP
28%
PDP + AMP 0%
DBP + CBP 10% DBP + AMP
4% De-‐Enrolled
17%
Breakdown of PG&E AutoDR Program Participation by Enrolled Service Accounts
PDP 6% DBP
44%
CBP 14%
AMP 17%
PDP + AMP 0%
DBP + CBP 6%
DBP + AMP 3%
De-‐Enrolled 10%
Breakdown of PG&E AutoDR Program Participation by Enrolled Load Shed (kW)

8
enrolling in this program if they are able to reduce their energy consumption when prices are elevated.
• Demand Bidding Program (DBP) (SCE, no date): This program is event-‐based and offers customer incentives to voluntarily reduce their consumption during DBP events that may occur on any weekday between noon and 8 p.m., excluding holidays. There are no penalties imposed on enrollees who do not submit bids or who fail to meet their bids.
• Capacity Bidding Program (CBP): This program is aggregator-‐based and allows aggregated customers to participate in demand response by making monthly nominations. Aggregators are rewarded for meeting their commitments as well as committing reductions on a monthly basis, even if no events are called during the month. Bill savings vary by month.
• Aggregator Managed Portfolio (AMP): This aggregator-‐managed program, also known as Demand Response Contract (DRC), is similar to CBP. Customers may choose to work with an aggregator with participation requirements and incentives that best meet their business needs.
Data provided by SCE was most comprehensive and indicate that a total of 157,748 kW of AutoDR load-‐shed capability has been enabled6 at a cost of $37.0 million. These program costs represent the technology incentive paid to customers to cover the first costs7 associated with OpenADR enablement between 2007 and 2012. Comparing the installed capacity of the AutoDR systems with the total incentive costs suggests that the average installed cost has been $234.5 per kilowatt. This comes in under the budgeted cap of $300 per kilowatt. As of May 2013, data from SCE shows that of this total enabled load-‐shed capability, 155,329 kW is currently enrolled8 in at least one AutoDR program (Table 3). This currently enrolled AutoDR capacity includes a total of 747 service accounts. The U.S Department of Energy’s $11.4 million American Recovery and Reinvestment Act grant influenced a larger load shed and enablement cost in the SCE territory. This project provided an additional enablement of up to 80 megawatts (MW) using OpenADR 1.0 (Honeywell 2009). Of the 747 enrolled service accounts, 33 percent are enrolled in one of the direct-‐enrollment programs9 (SAI, DBP, or RTP), and 73 percent are enrolled in one of the aggregator-‐managed programs (CBP or AMP). These numbers include service accounts 6 Enabled load shed refers to estimated or tested load-‐shed capability. Actual performance varies from these numbers, and not all enabled load shed is actively enrolled in an AutoDR program. 7 The data for instances where customer costs may have exceeded the technology incentive cap of $300/kW are not available. 8 Enrolled load shed refers to load-‐shed capability that is actively enrolled in at least one demand response program. 9 Direct-‐enrollment refers to programs that are not serviced by an aggregator, but rather programs where the participant enrolls with and interacts directly with the utility.

9
enrolled in a single program and those enrolled in multiple programs. Across the currently enrolled service accounts, a total of 6.2 percent are enrolled in both a direct-‐enrollment program and an aggregator-‐managed program.
Table 3. Breakdown of SCE AutoDR Program Enrollment Enrollment Type Enrolled
Service Accounts Enrolled kW
% Enrolled Service Accounts
% Enrolled kW
Direct-‐Enrollment Only 201 107,622 27 69 Aggregator-‐Managed Only 500 38,206 67 25 Both 46 9,501 6 6 Total 747 155,329 100 100
While a large number (73 percent) of service accounts are enrolled in one of the aggregator-‐managed programs, these account for approximately 31 percent of total AutoDR-‐enabled load-‐shed. By contrast, the 33 percent of service accounts enrolled in one of the direct-‐enrollment programs account for approximately 75 percent of total AutoDR-‐enabled load-‐shed capability (Figure 4).10 Among the direct-‐enrollment participants, select large industrial customers provide a significantly higher load shed. Figure 5 and Figure 6 show a breakdown of SCE AutoDR program enrollment on the basis of service accounts enrolled and kilowatts enrolled, respectively.
Figure 4: SCE AutoDR Program Participation by Enrolled Service
Accounts vs. Enrolled Load Shed
10 The sum of the percentage of service accounts enrolled in one of the aggregator-‐managed programs plus the percentage of service accounts enrolled in one of the direct-‐enrollment programs is greater than 100 percent because of service accounts that are enrolled in both types of programs.
0.00%
20.00%
40.00%
60.00%
80.00%
Direct Enrollment Aggregator-‐Managed
SCE AutoDR Program Participation by Enrolled Service Accounts vs. Enrolled Load Shed
% of Enrolled Service Accounts % of Enrolled Load Shed (kW)

10
Figure 5: Breakdown of SCE AutoDR Program Participation
by Enrolled Service Accounts
Figure 6: Breakdown of SCE AutoDR Program Participation
by Enrolled Load Shed (kW)
OpenADR 1.0 in the San Diego Gas and Electric (SDG&E) Company Territory The San Diego Gas & Electric Company (SDG&E) currently offers OpenADR-‐based communication systems to provide automation for demand reduction. It currently offers OpenADR-‐based automation for the following two DR programs:
• Critical Peak Pricing (CPP) (SDG&E 2013a): This is a dynamic pricing program for commercial and industrial customers that consume at least 20 kW. This program adds a surcharge for energy consumed during critical peak pricing events, but offers lower rates at all other times.
• Capacity Bidding Program (CBP) (SDG&E 2013b): In this program, customers set bids to reduce energy consumption during CBP events. Customers are rewarded for meeting their commitments and for committing capacity on a monthly basis, even if no events occur during the month.
SAI 6%
RTP 1% DBP
19% AMP 11%
CBP 19%
DBP + AMP 1%
AMP + SAI 1%
CBP + AMP 34%
DBP + CBP 2%
DBP + CBP + AMP 2% De-‐Enrolled
4%
Breakdown of SCE AutoDR Program Participation by Enrolled Service Accounts
SAI 9% RTP
12%
DBP 47%
AMP 9%
CBP 3% DBP + AMP
3% AMP + SAI
1% CBP + AMP
13%
DBP + CBP 0%
DBP + CBP + AMP 1% De-‐Enrolled
2%
Breakdown of SCE AutoDR Program Participation by Enrolled Load Shed (kW)

11
SDG&E data indicate that a total of 10,740 kW of AutoDR load-‐shed capability has been enabled11 within the service territory. The total cost of enablement was not available from SDG&E; however, given a maximum incentive of $300 per kilowatt, the total cost of enablement should not have exceeded $3.2 million. Data from SDG&E also indicate that of this total enabled load-‐shed capability, 8,130 kW is currently enrolled12 in at least one AutoDR program (Table 4). This currently enrolled AutoDR capacity includes approximately 126 service accounts. Of these 126 currently enrolled service accounts, 17 percent are enrolled in the direct-‐enrollment13 program (CPP), and 84 percent are enrolled in the aggregator-‐managed program (CBP). These figures include service accounts that are enrolled in a single program, as well as those that have enrollments in multiple programs. Across the currently enrolled service accounts, only one account is enrolled in both programs.
Table 4. Breakdown of SDG&E AutoDR Program Enrollment
Enrollment Type Enrolled Service Accounts
Enrolled kW
% Enrolled Service Accounts
% Enrolled kW
Direct-‐Enrollment Only 20 2,061 16 25 Aggregator-‐Managed Only 105 6,029 83 74 Both 1 40 1 0.5 Total 126 8,130 100 100
In contrast to the other California IOUs, a majority of SDG&E AutoDR program enrollment comes from aggregators, both on the basis of accounts enrolled and on the basis of kW load-‐shed enrolled (Figure 7). Figure 8 and Figure 9 show a breakdown of SDG&E AutoDR program enrollment on the basis of service accounts enrolled and kilowatts enrolled, respectively.
11 Enabled load shed refers to estimated or tested load-‐shed capability. Actual performance varies from these numbers, and not all enabled load shed is actively enrolled in an AutoDR program. 12 Enrolled load shed refers to load-‐shed capability that is actively enrolled in at least one demand response program. 13 Direct-‐enrollment refers to programs that are not serviced by an aggregator, but rather programs where the participant enrolls with and interacts directly with the utility.

12
Figure 7. SDG&E AutoDR Program Participation by Enrolled Service Accounts vs. Enrolled
Load Shed
Figure 8. Breakdown of SDG&E AutoDR Program Participation
by Enrolled Service Accounts
Figure 9. Breakdown of SDG&E AutoDR Program Participation
by Enrolled Load Shed (kW)
0.00% 20.00% 40.00% 60.00% 80.00% 100.00%
Direct Enrollment Aggregator-‐Managed
SDG&E AutoDR Program Participation by Enrolled Service Accounts vs. Enrolled Load Shed
% of Enrolled Service Accounts % of Enrolled Load Shed (kW)
CBP 58%
CBP + CPP 1%
CPP 11% De-‐Enrolled
30%
Breakdown of SDG&E AutoDR Program Participation by Enrolled Service Accounts
CBP 56%
CBP + CPP 1%
CPP 19%
De-‐Enrolled 24%
Breakdown of SDG&E AutoDR Program Participation by Enrolled Load Shed (kW)

13
OpenADR 1.0 in the Sacramento Municipal Utility District (SMUD) Territory The Sacramento Municipal Utility District (SMUD) is currently piloting an OpenADR-‐based communication system to provide automation for DR programs. It offers OpenADR-‐based automation for the following four DR programs:
• Firm Load Reduction: This program requires participants to reduce their energy consumption by a minimum of 50 kW, to a predetermined maximum level for at least two consecutive hours during peak usage hours (SMUD 2013).
• Minimum Dependable Load Reduction Program (minDLR): This program requires a one-‐year commitment to deliver between 50 and 150 percent of a predefined load reduction goal during each hour of “conservation day” events. This program offers compensation for committed capacity, as well as compensation for energy curtailment (SMUD 2013).
• Demand Response Peak Pricing: This program adds an energy surcharge of $0.50/kilowatt-‐hour (kWh) during specific conservation days, and rewards participants with an off-‐peak energy discount of $0.02/kWh during summer months (SMUD 2013).
• Voluntary Load Reduction Program: This program has no minimum capacity or energy reduction commitment and compensates for DR shed (SMUD 2013).
The SMUD AutoDR programs are being piloted with nine customers that have enrolled a total of 126 sites. These sites are enabled to provide 3.5 MW of peak load reduction. SMUD does not currently offer any aggregator-‐managed programs; the customers that are enrolled in the pilot programs have contracts with SMUD directly. In addition to technical assistance that is provided by SMUD at no cost to the customer, SMUD offers a technology incentive for AutoDR enablement that covers 100 percent of the enablement costs up to a maximum of $125/kW. To date, the actual costs of enablement within the SMUD territory have been less than this $125/kW maximum.
Summary of Existing OpenADR 1.0 Deployments in California Within the service territories of the California IOUs, over 1,200 separate service accounts, representing an estimated 234 MW of peak-‐demand reduction capabilities, are currently enrolled in AutoDR programs. The California IOUs offer AutoDR programs that are administered by third-‐party aggregators (aggregator-‐managed programs), as well as programs where customers enroll directly with the utility (direct-‐enrollment programs). Across all three IOU territories, the aggregator-‐managed programs account for a majority of enrollments. Within the PG&E and SCE territories, the direct-‐enrollment programs account for a majority of the peak-‐load reduction capability. This indicates that larger energy consumers tend to be enrolled directly with utilities rather than through aggregators. It should be noted that within the direct-‐enrollment programs in both the PG&E and SCE territories, several very large industrial customers serve to accentuate these findings.

14
At approximately $234/kW, the average cost of technology enablement within the SCE territory is somewhat higher than the $170/kW average cost of enablement within the PG&E territory. The cost of enablement within both SCE and PG&E was significantly higher than SMUD, which reported a cost of less than $125/kW.

15
OpenADR 1.0 System Architecture To identify strategies that can be used to transition existing AutoDR infrastructure from OpenADR 1.0 to 2.0, it is important to understand the various types of system architectures that have been used for AutoDR enablement, and the role that OpenADR plays within each one. This section describes the key characteristics of existing OpenADR 1.0-‐enabled systems, as well as the three most common system architectures that have been deployed for the purposes of AutoDR enablement.
Key Characteristics of Enablement Architectures The different architectures that are used for OpenADR 1.0-‐enabled AutoDR systems can be defined by three key characteristics:
• DR Event Propagation: This describes the route that DR Event data follows in order to ultimately affect the behavior of the load at the client site.
• DR Event Data Client Type: This describes how the customer’s client receives the DR event data.
• DR Event Data Integration: This describes how the customer’s loads are affected once DR event data has been received.
Each of these characteristics is described in detail in the following sections.
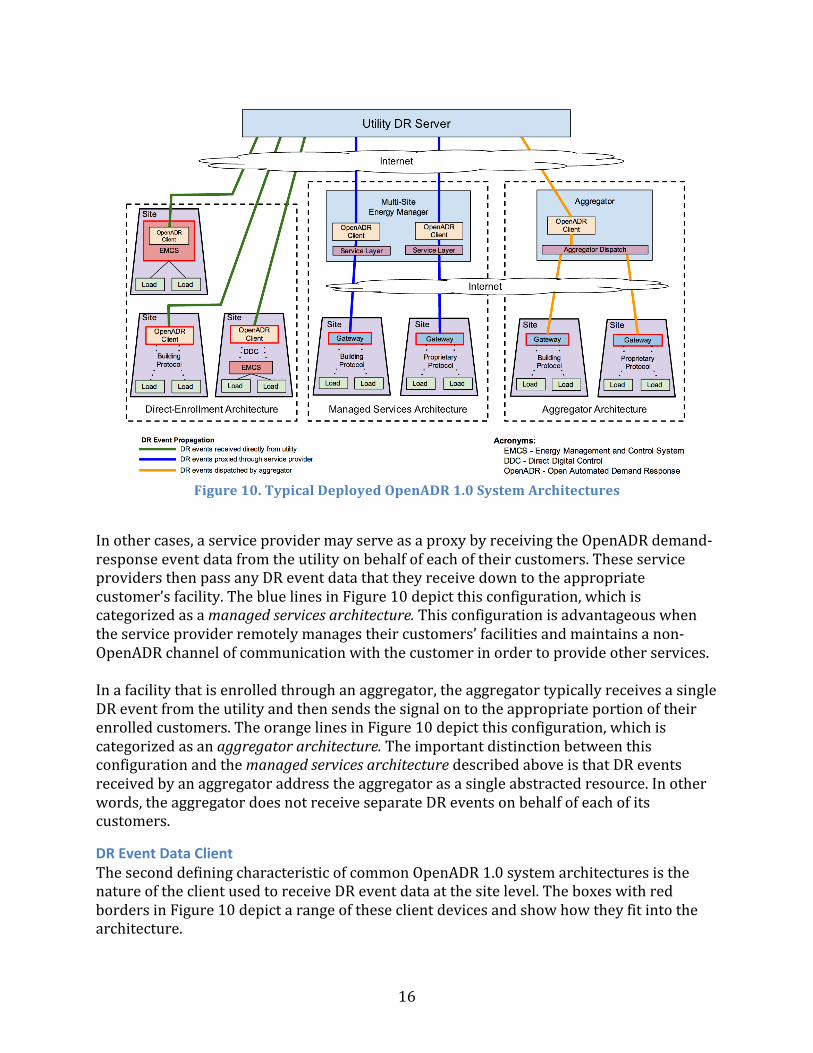
DR Event Data Propagation Sites enrolled in the AutoDR programs that are offered by the California IOUs all receive DR event data that originates from the utility as an OpenADR demand-‐response event. There are, however, various methods that may be used to route this OpenADR event data from the utility down to the customer’s facility. In the simplest case, the customer receives DR event data directly from the utility with no intermediary. These customers would have some type of OpenADR-‐enabled device at their facility, which would be configured to interact directly with the utility’s OpenADR server. The green lines in Figure 10 depict this configuration, which is categorized as a direct-‐enrollment architecture.
16
Figure 10. Typical Deployed OpenADR 1.0 System Architectures
In other cases, a service provider may serve as a proxy by receiving the OpenADR demand-‐response event data from the utility on behalf of each of their customers. These service providers then pass any DR event data that they receive down to the appropriate customer’s facility. The blue lines in Figure 10 depict this configuration, which is categorized as a managed services architecture. This configuration is advantageous when the service provider remotely manages their customers’ facilities and maintains a non-‐OpenADR channel of communication with the customer in order to provide other services. In a facility that is enrolled through an aggregator, the aggregator typically receives a single DR event from the utility and then sends the signal on to the appropriate portion of their enrolled customers. The orange lines in Figure 10 depict this configuration, which is categorized as an aggregator architecture. The important distinction between this configuration and the managed services architecture described above is that DR events received by an aggregator address the aggregator as a single abstracted resource. In other words, the aggregator does not receive separate DR events on behalf of each of its customers.
DR Event Data Client The second defining characteristic of common OpenADR 1.0 system architectures is the nature of the client used to receive DR event data at the site level. The boxes with red borders in Figure 10 depict a range of these client devices and show how they fit into the architecture.

17
Customers who receive DR event data from the utility must have an OpenADR-‐enabled client device in order to receive these signals. This OpenADR client may be a standalone device that interfaces with building systems either using direct digital control (DDC) or common building protocols such as Modbus or BACnet. This OpenADR client may also be a piece of software running on a PC or server. Customers who receive their DR event data through a service provider (energy management service or aggregator) will typically have some custom hardware and/or software installed at their facility that the service provider communicates with directly, using a non-‐OpenADR protocol. The protocols used for this type of communication between the service provider and the customers are typically proprietary, or specific to the service provider’s system.
DR Event Data Integration Once the DR event data have reached the customer’s facility, either from the utility directly or by way of a service provider or aggregator, some mechanism must interpret the DR event data and, if appropriate, automatically invoke the customer’s pre-‐defined load-‐shed strategies. This mechanism constitutes the final integration of the DR event data into the customer’s facility. There are various approaches to achieving this integration, some of which are depicted in Figure 10 by the dotted lines between the DR clients and other devices. One basic form of DR client integration in commercial buildings is achieved by integrating OpenADR with a building’s DDC system. These systems invoke load-‐shed strategies using DDC platforms that map specific DR Event thresholds to a binary signal (relays), which trigger a response from the heating, ventilation, or air-‐conditioning control strategies. The most common strategy is to increase the zone temperature set point, thereby reducing cooling loads and changing the building electric load shape. The commonly used CLIR14 (Ghatikar and Hennage, no date) and Java Application Control Engine (JACE™) (Tridium 2011) hardware clients can both be configured to perform this conversion of DR event data into binary signals. These examples of OpenADR clients can be thought of as gateway hardware platforms that support OpenADR software clients. In cases where a deeper integration of DR event data is necessary, more sophisticated OpenADR clients may communicate to other control systems (i.e., SCADA [supervisory control and data acquisition] or PLCs [programmable logic controllers] using either proprietary protocols or standard open building communication and control protocols such as Modbus15 or BACnet.16 These DR client integration models, which also include small commercial and residential systems such as communicating thermostats and plug-‐load controllers, can have the OpenADR client reside natively in the devices or hosted in the cloud network. These OpenADR clients are embedded software platforms and can often be implemented without hardware upgrades.
14 CLIR is the acronym for the Client and Logic with Integrated Relay OpenADR 1.0 gateway. 15 Modbus website: http://www.modbus.org/. 16 BACnet website: http://www.bacnet.org/.

18
Figure 11 is a functional diagram that highlights the relationship between DR Logic, pre-‐defined control strategies, and ultimately, the load. It is important to determine what portion of the OpenADR 1.0 message a particular system relies upon as input data for the control strategies. As described in greater detail later in this report, the OpenADR 1.0 event data include two components, which are referred to as simple client information and smart client information (Ghatikar and Koch 2012). The DR logic parses one or both of these components, and determines which control strategy should be invoked.
Figure 11: Functional Diagram of OpenADR System Integration
Classification of Enablement Communication Architectures The following sections describe some higher-‐level classifications of common AutoDR system architectures. While the previous section focused on functional characteristics of typical systems, the following sections classify common system architectures, or groupings of these functional characteristics.
Direct-‐Enrollment Architecture This architecture allows customers to receive signals directly from the utility’s OpenADR server. In many cases, these systems use a standalone DR event data client that either includes embedded control logic or is integrated with facility control systems.17 These DR client devices often integrate with existing building systems by using either DDC or by using common building protocols such as Modbus or BACnet. The commonly used CLIR and JACE box gateway devices are examples of stand-‐alone DR event data clients that may be used for this type of AutoDR enablement. Vendors who are involved in deploying systems of this type do not typically maintain an ongoing relationship with the customer following enablement. This is important to note when examining potential methods of transitioning these systems, because in many cases there may not be a service contract in place, leaving the customer responsible for system maintenance.
17 In cases where the OpenADR client includes control logic, the resulting system enables an outcome that is similar to device direct load control; however, the customer decides the response strategy.

19
Managed Services Architecture Multi-‐site energy managers that provide energy management services in addition to DR enablement typically implement managed services architecture (Kiliccote and Piette 2008). These systems often use proprietary hardware at the customer’s facility and use controls software that is either provided as a cloud service or implemented at the facility. Most often, entities who implement these systems operate a virtual OpenADR 1.0 client for their customer, and either relay the DR event data to the customer’s control systems using a proprietary communication channel or remotely configure the customers’ control systems to appropriately respond to events.
Aggregator Architecture Technology vendors that operate as DR resource aggregators typically employ systems that relay DR signals to customers through proprietary infrastructure. This aggregator architecture resembles the managed services architecture, as described above. The difference, however, is that instead of providing a separate virtual OpenADR 1.0 client for each of their customers, the aggregator uses one OpenADR 1.0 client. The DR messages that this client receives are then distributed to devices at their customers’ facilities using proprietary communications.
Summary of OpenADR 1.0 Systems Architecture From the customer enrollment by program type (Table 5), we identified the number of systems that follow the aggregator architecture, as well as the number of systems that collectively follow the direct-‐enrollment and managed services architectures. Distinguishing between the number of systems that follow the direct-‐enrollment versus managed services architectures is somewhat more challenging.
Table 5. Summary of AutoDR Enrollment by Program Type in California IOUs
Enrollment Type Enrolled Service Accounts
Enrolled kW
% Enrolled Service Accounts
% Enrolled kW
Direct-‐Enrollment Only 289 149,137 24 64 Aggregator-‐Managed Only 825 68,377 68 29 Both 106 16,522 8 7 Total 1,220 234,036 100 100
Data from PG&E do, however, provide helpful information in determining the systems used in a portion of deployments with direct-‐enrollment architecture. In particular, data indicate that at least 46 sites use CLIR boxes. These sites account for about 11 percent of all sites that were enabled within the PG&E territory. Additionally, these sites that are known to have been enabled using CLIR boxes account for over 33 percent of enabled capacity within the PG&E territory. Most of the CLIR boxes in all IOU territories have been in the field since 2007 and, common to such electronic equipment, they are approaching end-‐of-‐life, thus requiring replacement or major maintenance. These AutoDR deployment architectures that have evolved over years can be used to determine how and where OpenADR 2.0 client and server infrastructure require transition

20
and how the customer equipment and control can support AutoDR requirements for building codes such as California Title 24 code. OpenADR 2.0 data models and their compatibility with OpenADR 1.0 are described in the Appendix: Compatibility of OpenADR 1.0 and OpenADR 2.0.

21
Findings, Transition Strategy, and Next Steps One objective of this project was to better understand the nature of the OpenADR 1.0 installed base in California to evaluate how to transition the clients to support OpenADR 2.0. This section summarizes key issues regarding the use of OpenADR 1.0 in California and how we might transition to the OpenADR 2.0 standard.
1. OpenADR Client Install Data: Detailed information on the characteristics of the existing OpenADR deployments is limited. In the future, utilities should track features and characteristics of the existing client and server architectures, and should also maintain records of peak-‐load reduction level (kW) for enabled, enrolled, and actual performance. This information is critical to determine AutoDR performance and can help guide building code compliance for AutoDR, determine upgrade plans, and identify potential for AutoDR resources to participate in ISO markets.
2. OpenADR 1.0-‐Enabled Load Shed: Approximately 250 MW of load shed has been enabled using OpenADR 1.0 within the IOU service territories.18 There is, however, no immediate need to transition the existing OpenADR 1.0 infrastructure to the 2.0 standard, so long as the IOUs continue to support the existing OpenADR 1.0 server infrastructure and do not begin to offer AutoDR programs where features are unique to OpenADR 2.0.
3. Customer Technology Incentive Costs: The average first cost for system enablement using OpenADR 1.0 ranges from $170/kW to $300/kW within the IOU service territories. In the recent SMUD pilot, the average first cost was less than $125/kW. To assess and to reduce the first costs of AutoDR systems, utilities must track the constituent components of these costs.
4. AutoDR Programs Supporting OpenADR: The AutoDR programs that make use of OpenADR 1.0 include programs that are managed by third-‐party aggregators, as well as programs wherein customers enroll directly with their utility. The OpenADR 2.0a profile19 specification can support current system architectures and data propagation for current AutoDR-‐enabled programs. There are, however, some changes that were introduced with OpenADR 2.0. The most noticeable change can be characterized by the scope and functions of OpenADR 2.0 relative to the 1.0 standard. Where OpenADR 1.0 defines a broad set of interfaces between the AutoDR server and various systems, including the AutoDR client, OpenADR 2.0 focuses exclusively on the relationship between the server and the client. In the context of the OpenADR 2.0 specification, any interactions that are outside of the OpenADR client/server relationship are not defined.
5. Interoperability and Certification: Only one vendor provided OpenADR 1.0 server deployments; hence, OpenADR 1.0 client compliance was not an issue, as the clients were validated to receive and respond to that server’s DR signals. OpenADR 2.0 includes a formal testing and certification process that will help ensure
18 The total does not include SMUD enabled load shed of 3.5 MW. 19 See the OpenADR 2.0 specification (www.openadr.org/specification) for more detail on the 2.0a profile. Also refer to the Appendix for more information: “A Profile versus B Profile (OpenADR 2.0).”

22
interoperability between clients and servers as more vendors begin producing OpenADR-‐certified products.
Transition Plan and Strategy Existing systems using OpenADR 1.0 should take a phased approach to transitioning to OpenADR 2.0 that accounts for a continued cost-‐benefit analysis of maintaining both OpenADR 1.0 and 2.0 servers, a business case for transitioning to 2.0, and an assessment of the features of OpenADR 2.0 that provide unique support for future applications of DR services. At a minimum, the strategy for this transition plan must include the following elements:
• Identify the utility and customer benefits that consider transition costs, mapping of DR control strategies, and end-‐to-‐end communication testing.
• For any transition or upgrades, consider the trade-‐off between upgrading the client software in dedicated OpenADR devices and replacing them with new OpenADR 2.0 hardware that interoperates with existing DR strategies.
• While considering upgrades to client software, it is important to bear in mind where the hardware is in its lifecycle. Upgrading software on devices that are near their end-‐of-‐life is not likely to make long-‐term economic sense.
• The California IOUs can continue to support both OpenADR 1.0 and 2.0 servers without any client transition. The upgrades of 2.0 clients will enable IOUs to support and maintain one 2.0 server and provide customers with advanced features of 2.0. These features may be used with any future DR programs that require advanced locational-‐dispatch and telemetry to participate in ISO DR markets.
• Within California, the customers own the OpenADR client. However, the AutoDR program must include clear instructions on how customers can support the maintenance of the infrastructure for persistent AutoDR participation.
Next Steps This report provides insights into the extent of existing OpenADR-‐based AutoDR infrastructure within California, as well as the system architectures and the enablement costs. Understanding the nature of the existing systems is critical in order to ensure that the existing AutoDR infrastructure continues to be supported as California transitions to OpenADR 2.0. Understanding the nature of the existing infrastructure is also important, in order to determine what additional systems may be necessary to enable customer-‐side DR and distributed energy resources to participate in future price-‐responsive markets and ISO wholesale markets. New research and development initiatives should be developed to ensure that this existing AutoDR infrastructure is leveraged in ways that allow for better integration of supply-‐side and demand-‐side systems.

23
Appendix: Compatibility Guide for OpenADR 1.0 and 2.0 The following section outlines the similarities and differences between the OpenADR 1.0 and 2.0 specifications. The first section provides a detailed mapping that identifies where data that exists in the OpenADR 1.0 DR event data model may be found in the OpenADR 2.0 DR event data model. The second section provides a high-‐level description of the OpenADR 1.0 feature set and where it overlaps with the OpenADR 2.0 feature set. While both specifications define many different data models, the event data model is described in detail here because it is the primary means by which DR event data are conveyed between the DR server and its clients. Transitioning existing systems from OpenADR 1.0 to 2.0 requires an understanding of the similarities and differences between how these two models represent DR event data. See Figures A-‐3 through A-‐7 in this appendix for examples of how actual AutoDR programs within California make use of the OpenADR 1.0 event data conveyance.
DR Event Data Conveyance: OpenADR 1.0 versus OpenADR 2.0 The conveyance of DR event data comprises the core functionality of both the OpenADR 1.0 and the OpenADR 2.0 specifications. Semantically there is substantial overlap between the DR Event data models as defined by the 1.0 and 2.0 specifications; however, there are also substantial syntactical differences related to how the data are organized. The following section provides a comparison of the DR Event data models as defined by the 1.0 and 2.0 specifications. This comparison includes a granular description of where the constituent data within the 1.0 model can be found in the 2.0 model and a summary table providing an at-‐a-‐glance comparison.
DR Event Data Model: Overview Within the 1.0 specification, the data model that is responsible for conveying DR event information is called eventState. The corresponding model within the 2.0 specifications is called eiEvent, and is an extension of the Energy Interop standard. Both the 1.0 and 2.0 specifications make provisions for representing complete DR event data, as well as a simplified version of the same DR event. These simplified representations of DR events are useful in cases where the client system is computationally constrained and unable to process the complete DR event payload, or in cases where the complete DR event payload provides more information than is necessary or useful. Within the 1.0 specification, the eventState object contains both a “simple” representation of the DR event, as well as a “smart” representation of the DR event. These two representations of the same DR event exist side by side within the eventState object, allowing the client to consume either format. The OpenADR 2.0 specification is defined by two different profiles. The eiEvent model that is defined by the “a” profile conveys a simplified version of event data, while the eiEvent model that is defined by the “b” profile conveys a complete version of the same event. In contrast to OpenADR 1.0, clients that interact with servers using the “a” profile will only be

24
able to receive the simplified version of the event data, but under the “b” profile it is valid for DR events to be conveyed in a way that is compliant with either profile.
Simple versus Smart DR Event Data (OpenADR 1.0) The “smart” representation of a DR event, within the 1.0 standard, conveys the DR signal as a series of one or more decimal values that dictate the DR signal level for a particular time period during the event (Ghatikar et al. 2010). The identifier that accompanies these signals defines the meaning of the decimal value (e.g., price level, load shed). By translating the DR signal level into a finite set of values in OperationModeValues, the “simple” representation of a DR event may be generated. These four values are: (1) Normal, (2) Moderate, (3) High, and (4) Special. This is a logical translation process that is defined by the ResponseSchedule (Piette et al. 2009a, p. 78) and the OperationStateSpec (Piette et al. 2009a, p. 79, Table 3) entities. See Figure A-‐1 for an example of an OpenADR 1.0 event payload that includes both simple and smart data.
A Profile versus B Profile (OpenADR 2.0) The 2.0a and 2.0b profile’s representation of DR event data is similar to the 1.0 “smart” representation, in that it conveys the DR signal as a series of one or more decimal values. An identifier that defines the meaning of the decimal value accompanies these values. The 2.0a profile’s representation of DR event data is similar to the 1.0 “simple” representation, in that the signals that it transmits map to the same set of four operation modes. See Figure A-‐2 for an example of an OpenADR 2.0a event payload.
Mapping 1.0 eventState onto 2.0 eiEvent As discussed in the previous sections, the eventState object, defined in the 1.0 data model, and the eiEvent object, defined by the 2.0a and 2.0b profiles, have much in common. The following section outlines the constituents of the 1.0 eventState object and identifies where similar data can be found in the eiEvent object. See Figure A-‐1 for an example of an OpenADR 1.0 eventState object, and Figure A-‐2 for an example of an OpenADR 2.0a eiEvent object.
OpenADR 1.0 DR Event Metadata The following sections describe the attributes of the OpenADR 1.0 eventState object and where analogous data are located in the data models defined by the 2.0 profiles.
Program Name Description: This identifies the DR program to which this event belongs. If the EventStatus field is NONE, indicating that there is no pending or active DR event, then this field is not applicable.
1.0 model: eventState attribute: programName 2.0 mapping: eiEvent:eventDescriptor:marketContext
Notes: The marketContext defined within the OpenADR 2.0 specification is a Uniform Resource Identifier (URI) that is used to reference the DR program to which an event

25
relates, but the OpenADR 2.0 specification does not include provisions for describing the details of a DR program. See the section “DR Program Configuration” for more information.
Event Modification Number Description: Modification number of the DR event. Used to indicate if the issuer modified the DR Event. This is an integer value that is incremented each time the event is modified.
1.0 model: eventState attribute: eventModNumber 2.0 mapping: eiEvent:eventDescriptor:modificationNumber
Event ID Description: Unique identifier assigned to a DR Event when it is created. If the Event Status is none, this field is not applicable.
1.0 model: eventState attribute: eventIdentifier 2.0 mapping: eiEvent:eventDescriptor:eventID
Client ID Description: A unique identifier assigned to this client.
1.0 model: eventState attribute: drasClientID 2.0 mapping: eiEvent:eiTarget:venID
Event Data Instance ID Description: A unique transaction ID assigned to a particular payload. In the 1.0 protocol, the client uses this ID to confirm receipt of the eventState payload.
1.0 model: eventState attribute: eventStateID 2.0 mapping: oadrDistributeEvent:requestID
OpenADR Server ID Description: A unique identifier that is assigned to the OpenADR server.
1.0 model: eventState attribute: drasName 2.0 mapping: oadrDistributeEvent:vtnID
Test Flag Description: A Boolean flag used to identify whether or not the event should be treated as a real event or as a test event.
1.0 model: eventState attribute: testEvent 2.0 mapping: eiEvent:eventDescriptor:testEvent
Offline Flag Description: A Boolean flag that indicates whether or not the client is offline from the perspective of the OpenADR server.

26
1.0 model: eventState attribute: offLine 2.0 mapping: No analogous entity
OpenADR 1.0 Simple Event Data Constituents The following sections describe the elements of the eventState object that make up the “simple” portion of the 1.0 DR event data model, and where analogous data are located in the data models defined by the 2.0 profiles.
Event Status Description: The current state of a DR event. The status of the event must be one of the following values (Piette et al. 2009a, p. 78):
• NONE – no event pending • FAR – event pending far into the future • NEAR – event pending soon • ACTIVE – event currently in process20 • CANCELLED – event has been cancelled20
1.0 model: eventState:simpleDRModeData:EventStatus 2.0 model: eiEvent:eventDescriptor:eventStatus
Notes: The values for the eventStatus entity as defined by the 2.0 specification include the above statuses, as well as a “COMPLETED” status.
Operation Mode Description: The current “Operational State” at the time the event payload was sent. The operational state must be one of the following values:
• NORMAL – normal operation • MODERATE – moderate shift or shed • HIGH – high shift or shed • SPECIAL – special operation mode, reserved for custom use
1.0 model: eventState:simpleDRModeData:OperationModeValue 2.0 model: eiEvent:eiEventSignals:eiEventSignal:currentValue
Notes: A conformant 2.0a data structure may contain only a single eiEventSignal within the eiEventSignals with the signalName of “SIMPLE”. This signalName indicates that the value within the corresponding signal payload maps to discrete levels: • 0 = Normal • 1 = Moderate • 2 = High • 3 = Special
20 The Event Status values of ACTIVE and CANCELLED are not defined in the documented spec, but are defined in the XML schema definition (XSD) schema that defines the OpenADR 1.0 data model.

27
A signal structured in this way is 2.0b compliant as well.
Operation Mode Schedule Description: A list of one or more “modeSlots,” each defining an “Operational State” that the facility should take on during a particular period of time during the event.
1.0 model: eventState:simpleDRModeData:operationModeSchedule 2.0 model: eiEvent:eiEventSignals:eiEventSignal:intervals
OpenADR 1.0 Smart Event Data Constituents The following sections describe the elements of the eventState object that make up the “smart” portion of the 1.0 DR event data model, and where analogous data are located in the data models defined by the 2.0 profiles.
Notification Time Description: This is the time at which the participants should be notified of the DR event.
1.0 model: eventState:drEventData:notificationTime 2.0 model: eiEvent:eiActivePeriod:properties:x-‐eiNotification
Event Start Time / End Time Description: The beginning and end of the DR event.
1.0 model: eventState:drEventData:startTime / endTime 2.0 model: eiEvent:eiActivePeriod:properties:dtstart / duration
DR Event Data Container Description: This element contains the DR data for a single DR event.
1.0 model: eventState:drEventData:eventInfoInstances 2.0 model: eiEvent
Note: The 1.0 specification defines an EventInfoInstances object to define the data for a single DR event, despite the pluralization of the object name. A single DR eventState object may include zero or more EventInfoInstances objects.
DR Event Info Type Description: Defines the type of event data contained within a single EventInfoInstances object. The following list enumerates the valid event info types:
• PRICE_ABSOLUTE • PRICE_RELATIVE • PRICE_MULTIPLE • LOAD_LEVEL • LOAD_AMOUNT

28
• LOAD_PERCENTAGE • GRID_RELIABILITY 1.0 model: eventState:drEventData:eventInfoInstances:eventInfoTypeID 2.0 model: eiEvent:eiEventSignals:eiEventSignal:signalName
DR Event / DR Program Association Description: Defines the program for which this event was generated.
1.0 model: eventState:drEventData:eventInfoInstances:eventInfoName 2.0 model: eiEvent:eventDescriptor:marketContext
Note: The 1.0 eventInfoName corresponds to the name of the EventInfoType from which the event was generated, but since the EventInfoType object is never passed to the client, this value is better seen from the client’s perspective as the identifier for a particular DR program.
DR Event States Description: Defines the schedule of values for the DR event signal during the event’s active period. An event may contain one or more of these event states. In other words, the event signal may have one value for the duration of the event, or the signal value may change periodically throughout the course of the event.
1.0 model: eventState:drEventData:eventInfoInstances:eventInfoValues 2.0 model: eiEvent:eventSignals:eventSignal:intervals

29
Summary of OpenADR 1.0 to OpenADR 2.0 Event Data Mapping Table 6 provides a high-‐level overview of where the elements and attributes within the 1.0 DR event data model can be found in the equivalent 2.0 data model. For simplicity, some inconsequential attributes have been omitted.
Table 6. OpenADR 1.0 to OpenADR 2.0 DR Event Data Model Mapping
1.0 eventState attributes and elements 2.0 mapping
[attr] programName eiEvent:eventDescriptor:marketContext [attr] eventModNumber eiEvent:eventDescriptor:modificationNumber [attr] eventIdentifier eiEvent:eventDescriptor:eventID [attr] drasClientID eiEvent:eiTarget:venID [attr] eventStateID oadrDistributeEvent:requestID [attr] drasName oadrDistributeEvent:vtnID [attr] testEvent eiEvent:eventDescriptor:testEvent [attr] offLine No equivalent [simple] EventStatus eiEvent:eventDescriptor:eventStatus [simple] OperationModeValue eiEvent:eiEventSignals:eiEventSignal:currentValue [simple] operationModeSchedule eiEvent:eiEventSignals:eiEventSignal:intervals [smart] notificationTime eiEvent:eiActivePeriod:properties:x-‐eiNotification [smart] startTime eiEvent:eiActivePeriod:properties:dtstart [smart] endTime eiEvent:eiActivePeriod:properties:duration [smart] eventInfoInstances:eventInfoTypeID eiEvent:eiEventSignals:eiEventSignal:signalName [smart] eventInfoInstances:eventInfoName eiEvent:eventDescriptor:marketContext [smart] eventInfoInstances:eventInfoValues eiEvent:eventSignals:eventSignal:intervals
Features: OpenADR 1.0 versus OpenADR 2.0 While both OpenADR 1.0 and 2.0 are intended to standardize the conveyance of DR event data between a service provider and a customer, they are somewhat divergent in terms of the features that they include. Generally, OpenADR 1.0 is broader in scope and includes features that are not available in 2.0. For example, OpenADR 1.0 provided signaling systems between utility back-‐office systems and the automation server. OpenADR 2.0 is restricted to communications between the customer’s OpenADR client and the OpenADR server. The sections below compare key features between OpenADR 1.0 and OpenADR 2.0.
DR Program Configuration Description: The 1.0 specification provides a data model to define specific DR programs. This model (UtilityProgram) includes definitions for constraints on when events for the program can be issued, optional bidding configuration, and a listing of enrolled participants.

30
The program definition model also includes one or more event information type definitions (EventInfoType), which specify the structure of the actual DR event signals (EventInfoInstances) that will be distributed to clients. Compatibility: Beyond providing a means by which to associate events with a given DR program (marketContext), the OpenADR 2.0 specification does not prescribe21 how metadata related to DR programs should be represented within the OpenADR 2.0 server. A reasonable implementation of an OpenADR 2.0 server would constrain DR events to conform to the limitations of a specific program, but the 2.0 specification does not dictate exactly how this must be done.
Utility / DR Event Server Communication Description: The 1.0 specification defines data models, which should be used for transmitting DR program and DR event data between the utility or system operator and the demand response automation server. Compatibility: Any interaction between the demand response event server and an upstream system such as a Utility or System Operator is out of scope for OpenADR 2.0.
Event Targeting Description: In OpenADR 1.0, the UtilityDREvent entity defines how the utility or ISO should convey event data to the OpenADR server. Among the data within this entity is a destination element that describes a series of constraints that the OpenADR server should place on the propagation of the event. This destination entity allows for targeting clients on the basis of location (Piette et al. 2009a, p. 59), participant ID, group ID, or client ID. Compatibility: The OpenADR 2.0b specification also defines a mechanism for targeting DR events, though it diverges from the 1.0 specification in that the event targeting information exists within the context of the actual DR event data. As with OpenADR 1.0, an OpenADR 2.0 server is responsible for correctly distributing events to clients; however, within the OpenADR 2.0 specification, targeting data are passed down to the clients within the eiTarget element. This form of targeting can be used for the purposes of locational-‐based dispatch, or more generally, it allows the DR event server to invoke services from a subset of the resources that may be accessible through a particular client.
Response Schedule Description: The OpenADR 1.0 specification includes the concept of a response schedule, which dictates the conditions under which the Operation Mode variable for a particular participant should transition between its various states. The Response Schedule entity is made up of a series of OperationStateSpecs that contain the logic that specifies when these transitions should take place (Piette et al. 2009a, pp. 78–79).
21 OpenADR Alliance. 2012 and 2013. OpenADR 2.0 "a" and "b Profile Specifications. http://www.openadr.org/specification

31
Compatibility: The OpenADR 2.0 specification does not require analogous functionality to the Response Schedule, but the implementation of this feature is not precluded by the 2.0 specification.
Opt-‐Out Schedule Description: The OpenADR 1.0 specification affords participants the ability to convey a set of constraints to the OpenADR server that determine when the resource will be available for participation in DR events (Piette et al. 2009a, p. 93). The entity used to convey this information is named OptOutState. Compatibility: The OpenADR 2.0b profile specification includes an EiOpt entity that provides functionality that is analogous to the OptOutState entity that is specified by the 1.0 standard. This functionality is not included in the 2.0a profile specification.
Program Constraints Description: The OpenADR 1.0 specification defines the concept of a program constraint, which defines a set of time and date constraints to which events must conform (Piette et al. 2009a, p. 68). These program constraints may be placed on various entities, including programs, participants, accounts, or individual events. For example, a participant might use a program constraint to set blackout dates during which the facility may be unable or unwilling to respond to DR signals. Compatibility: Functionality related to constraining specific DR programs does not currently exist within the 2.0 specification but may be included in later revisions.
Feedback Description: The OpenADR 1.0 specification defines a mechanism that allows participants to provide feedback to the OpenADR server regarding the state of the DR resource. This mechanism is intended to provide the OpenADR server with visibility into how a particular participant site responded to a DR event, or with visibility into the status of the resource outside of an event (Piette et al. 2009a, p. 27). Compatibility: The eiReport service defined by the OpenADR 2.0b profile serves as a replacement for this feedback mechanism. This 2.0b reporting functionality is much more broad than the functionality described by the 1.0 specification, and includes provisions for the conveyance of telemetry.
Bidding Description: The OpenADR 1.0 specification defines a bidding scheme that is based on the concept of a standing bid (Piette et al. 2009a, p. 83). The specification describes a scheme that allows participants to dynamically modify their standing bids, but does not require that this functionality be implemented in order for entities to participate in bidding programs. OpenADR clients that are not able to dynamically submit bids may rely on their standing bid to participate. Compatibility: The OpenADR 2.0 specification does not currently make provisions for bidding. The Energy Interop models, on which the OpenADR 2.0 profiles are based,

32
describes functionality related to bidding, but this functionality is not explicitly included in the OpenADR 2.0 specification. This functionality may be included in later revisions of the specification.
Summary of OpenADR 1.0 versus 2.0 Feature Compatibility Table 7 provides a high-‐level overview of where the concepts addressed by OpenADR 1.0 overlap with those of the OpenADR 2.0 standard.
Table 7. OpenADR 1.0 to OpenADR 2.0 Feature Comparison
OpenADR 1.0 Concept 2.0a 2.0b DR Program Configuration no no Utility / DR Event Server Communication no no Event Targeting yes yes Response Schedule no no Opt-‐Out Schedule no yes Program Constraints no no Feedback no yes Bidding no no
Summary of Technical Compatibility between OpenADR 1.0 and OpenADR 2.0 Both the OpenADR 1.0 standard and the OpenADR 2.0 standard are designed specifically for the conveyance of DR event and price data, as well as the conveyance of data related to management and support of such programs. The two standards are similar, considering that OpenADR 1.0 was the basis for the newer OpenADR 2.0 standard. Both these standards have similar semantics but different syntaxes (Ghatikar and Koch 2012).

33
Figure A-‐1. OpenADR 1.0 DR Event Data Payload
<eventState programName= "xs:string" eventModNumber= "xs:unsignedInt" eventIdentifier= "xs:string" drasClientID= "xs:string" eventStateID= "xs:unsignedInt" schemaVersion= "20080509" drasName= "xs:string" testEvent= "xs:boolean" offLine= "xs:boolean">
<simpleDRModeData> <EventStatus>
['NONE'|'FAR'|'NEAR'|'ACTIVE'|'CANCELED'] </EventStatus> [1] <OperationModeValue>
['NORMAL'|'MODERATE'|'HIGH'|'SPECIAL'] </OperationModeValue> [1] <currentTime> xs:decimal </currentTime> [1] <operationModeSchedule> [0..1]
<modeSlot> <OperationModeValue>
['NORMAL'|'MODERATE'|'HIGH'|'SPECIAL'] </OperationModeValue> [1] <modeTimeSlot> xs:nonNegativeInteger </modeTimeSlot> [1]
</modeSlot> [1..*] </operationModeSchedule> </simpleDRModeData > [1]
<drEventData> <notificationTime> xs:dateTime </notificationTime> [1] <startTime> xs:dateTime </startTime> [1] <endTime> xs:dateTime </endTime> [1] <eventInfoInstances>
<eventInfoTypeID> ['PRICE_ABSOLUTE'|'PRICE_RELATIVE'|'PRICE_MULTIPLE'| 'LOAD_LEVEL'|'LOAD_AMOUNT'|'LOAD_PERCENTAGE'|'GRID_RELIABILITY']
</eventInfoTypeID> [1] <eventInfoName> xs:string </eventInfoName> [1] <eventInfoValues>
<value> xs:decimal </value> [1] <timeOffset> xs:unsignedInt </timeOffset> [1]
</eventInfoValues> [1..*] </eventInfoInstances> [0..*] </drEventData > [0..1]
</eventState>
Simple Data
Smart Data

34
Figure A-‐2. OpenADR 2.0a DR Event Data Payload
<ei:eiEvent>
<ei:eventDescriptor> <ei:eventID> xs:string </ei:eventID> [1] <ei:modificationNumber> xs:unsignedInt </ei:modificationNumber> [1] <ei:priority> xs:unsignedInt </ei:priority> [0..1] <ei:eiMarketContext>
<emix:marketContext> ... </emix:marketContext> [1] </ei:eiMarketContext> [1] <ei:createdDateTime> xcal:DateTimeType </ei:createdDateTime> [1] <ei:eventStatus>
['none'|'far'|'near'|'active'|'completed'|'cancelled'] </ei:eventStatus> [1] <ei:testEvent> xs:string </ei:testEvent> [0..1] <ei:vtnComment> xs:string </ei:vtnComment> [0..1] </ei:eventDescriptor > [1]
<ei:eiActivePeriod> <xcal:properties> ... </xcal:properties> [1] <xcal:components> ... </xcal:components> [1]
</ei:eiActivePeriod> [1]
<ei:eiEventSignals>
<ei:eventSignal> <strm:intervals>
<ei:interval> <xcal:duration> ... </xcal:duration> [1] <xcal:uid> ... </xcal:uid> [1] <strm:streamPayloadBase> ... </strm:streamPayloadBase> [1]
</ei:interval> [1..*] </strm:intervals> [1] <ei:signalName> xs:string </ei:signalName> [1] <ei:signalType>
['delta'|'level'|'multiplier'|'price'|'priceMultiplier'| 'priceRelative'|'product'|'setpoint']
</ei:signalType> [1] <ei:signalID> xs:string </ei:signalID> [1] <ei:currentValue> xs:float </ei:currentValue> [1]
</ei:eventSignal > [1..*]
</ei:eiEventSignals> [1]
<ei:eiTarget> <ei:groupID> xs:string </ei:groupID> [0..*] <ei:resourceID> xs:string </ei:resourceID> [0..*] <ei:venID> xs:string </ei:venID> [0..*] <ei:partyID> xs:string </ei:partyID> [0..*]
</ei:eiTarget> [1]
</ei:eiEvent>
eiTarget
eventSignal
eventDescriptor
eiActivePeriod

35
Program Implementations: OpenADR 1.0 Program-‐Specific Payloads The following section outlines some of the OpenADR 1.0 payloads used to convey DR event data for specific program types. These example payloads, coupled with the data mapping in the previous section, should provide an idea of how these 1.0 data structures may be transposed into the 2.0 structures.
Figure A-‐3. OpenADR 1.0 Critical Peak Pricing (CPP) / Peak Day Pricing (PDP) Example
Payload
<?xml version="1.0" encoding="UTF-8" standalone="yes"?> <p:listOfEventState> <p:eventStates ... programName="PDP"> <p:simpleDRModeData> <p:EventStatus>ACTIVE</p:EventStatus> <p:OperationModeValue>HIGH</p:OperationModeValue> <p:currentTime>8315.892</p:currentTime> <p:operationModeSchedule> <p:modeSlot> <p:OperationModeValue>HIGH</p:OperationModeValue> <p:modeTimeSlot>0</p:modeTimeSlot> </p:modeSlot> <p:modeSlot> <p:OperationModeValue>NORMAL</p:OperationModeValue> <p:modeTimeSlot>14399</p:modeTimeSlot> </p:modeSlot> </p:operationModeSchedule> </p:simpleDRModeData> <p:drEventData> <p:notificationTime>2013-09-19T15:26:32.000-07:00</p:notificationTime> <p:startTime>2013-09-20T14:00:00.000-07:00</p:startTime> <p:endTime>2013-09-20T18:00:00.000-07:00</p:endTime> <p:eventInfoInstances> <p:eventInfoTypeID>PRICE_RELATIVE</p:eventInfoTypeID> <p:eventInfoName>cpp_price</p:eventInfoName> <p:eventInfoValues> <p:value>1.2</p:value> <p:timeOffset>0</p:timeOffset> </p:eventInfoValues> </p:eventInfoInstances> </p:drEventData> <p:customData/> </p:eventStates> </p:listOfEventState>

36
Figure A-‐4. OpenADR 1.0 Demand Bidding Program (DBP) Example Payload
<?xml version="1.0" encoding="UTF-8" standalone="yes"?> <p:listOfEventState> <p:eventStates ... programName="DBP"> <p:simpleDRModeData> <p:EventStatus>FAR</p:EventStatus> <p:OperationModeValue>NORMAL</p:OperationModeValue> <p:currentTime>-240604.404</p:currentTime> <p:operationModeSchedule> <p:modeSlot> <p:OperationModeValue>HIGH</p:OperationModeValue> <p:modeTimeSlot>0</p:modeTimeSlot> </p:modeSlot> <p:modeSlot> <p:OperationModeValue>MODERATE</p:OperationModeValue> <p:modeTimeSlot>3600</p:modeTimeSlot> </p:modeSlot> <p:modeSlot> <p:OperationModeValue>HIGH</p:OperationModeValue> <p:modeTimeSlot>10800</p:modeTimeSlot> </p:modeSlot> <p:modeSlot> <p:OperationModeValue>MODERATE</p:OperationModeValue> <p:modeTimeSlot>21600</p:modeTimeSlot> </p:modeSlot> </p:operationModeSchedule> </p:simpleDRModeData> <p:drEventData> <p:notificationTime>2013-09-06T10:28:17.000-07:00</p:notificationTime> <p:startTime>2013-09-09T12:00:00.000-07:00</p:startTime> <p:endTime>2013-09-09T20:00:00.000-07:00</p:endTime> <p:eventInfoInstances> <p:eventInfoTypeID>LOAD_AMOUNT</p:eventInfoTypeID> <p:eventInfoName>bid</p:eventInfoName> </p:eventInfoInstances> </p:drEventData> <p:customData/> </p:eventStates> </p:listOfEventState>

37
Figure A-‐5. OpenADR 1.0 Aggregator-‐managed Portfolio (AMP) / Demand Response Contract
(DRC) Example Payload
Figure A-‐6. OpenADR 1.0 Capacity Bidding Program (CBP) Example Payload
<?xml version="1.0" encoding="UTF-8" standalone="yes"?> <p:listOfEventState> <p:eventStates ... programName="AMP"> <p:simpleDRModeData> <p:EventStatus>ACTIVE</p:EventStatus> <p:OperationModeValue>HIGH</p:OperationModeValue> <p:currentTime>15213.96</p:currentTime> <p:operationModeSchedule> <p:modeSlot> <p:OperationModeValue>HIGH</p:OperationModeValue> <p:modeTimeSlot>0</p:modeTimeSlot> </p:modeSlot> </p:operationModeSchedule> </p:simpleDRModeData> <p:drEventData> <p:notificationTime>2013-09-19T15:28:04.000-07:00</p:notificationTime> <p:startTime>2013-09-20T12:00:00.000-07:00</p:startTime> <p:endTime>2013-09-20T18:00:00.000-07:00</p:endTime> </p:drEventData> <p:customData/> </p:eventStates> </p:listOfEventState>
<?xml version="1.0" encoding="UTF-8" standalone="yes"?> <p:listOfEventState> <p:eventStates ... programName="CBP"> <p:simpleDRModeData> <p:EventStatus>ACTIVE</p:EventStatus> <p:OperationModeValue>HIGH</p:OperationModeValue> <p:currentTime>88.24</p:currentTime> <p:operationModeSchedule> <p:modeSlot> <p:OperationModeValue>HIGH</p:OperationModeValue> <p:modeTimeSlot>0</p:modeTimeSlot> </p:modeSlot> </p:operationModeSchedule> </p:simpleDRModeData> <p:drEventData> <p:notificationTime>2013-09-10T18:14:52.000-07:00</p:notificationTime> <p:startTime>2013-09-10T18:16:00.000-07:00</p:startTime> <p:endTime>2013-09-10T23:00:00.000-07:00</p:endTime> </p:drEventData> <p:customData/> </p:eventStates> </p:listOfEventState>

38
Figure A-‐7. OpenADR 1.0 Real Time Pricing (RTP) Example Payload
<?xml version="1.0" encoding="UTF-8" ?> <p:listOfEventState> <p:eventStates> <p:simpleDRModeData> <p:EventStatus>FAR</p:EventStatus> <p:OperationModeValue>NORMAL</p:OperationModeValue> <p:currentTime>-24285.56</p:currentTime> <p:operationModeSchedule> <p:modeSlot> <p:OperationModeValue>NORMAL</p:OperationModeValue> <p:modeTimeSlot>0</p:modeTimeSlot> </p:modeSlot> <p:modeSlot> <p:OperationModeValue>NORMAL</p:OperationModeValue> <p:modeTimeSlot>3600</p:modeTimeSlot> </p:modeSlot> <p:modeSlot> <p:OperationModeValue>NORMAL</p:OperationModeValue> <p:modeTimeSlot>7200</p:modeTimeSlot> </p:modeSlot> ... <p:modeSlot> <p:OperationModeValue>NORMAL</p:OperationModeValue> <p:modeTimeSlot>82800</p:modeTimeSlot> </p:modeSlot> </p:operationModeSchedule> </p:simpleDRModeData> <p:drEventData> <p:notificationTime>2009-06-02T17:15:00.0</p:notificationTime> <p:startTime>2009-06-03T00:00:00.0</p:startTime> <p:endTime>2009-06-03T23:59:00.0</p:endTime> <p:eventInfoInstances> <p:eventInfoTypeID>PRICE_ABSOLUTE</p:eventInfoTypeID> <p:eventInfoName>Price</p:eventInfoName> <p:eventInfoValues> <p:value>0.0</p:value> <p:timeOffset>0</p:timeOffset> </p:eventInfoValues> <p:eventInfoValues> <p:value>0.0</p:value> <p:timeOffset>3600</p:timeOffset> </p:eventInfoValues> ... <p:eventInfoValues> <p:value>0.0</p:value> <p:timeOffset>82800</p:timeOffset> </p:eventInfoValues> </p:eventInfoInstances> </p:drEventData> <p:customData/> </p:eventStates> </p:listOfEventState>

39
References Ghatikar, Girish, and Rolf Bienert. 2011. Smart Grid Standards and Systems Interoperability: A Precedent with OpenADR. Lawrence Berkeley National Laboratory and The OpenADR Alliance. Presented at Grid-‐Interop 2011, Phoenix, Arizona. December 5–8, 2011, and published in the Proceedings. http://drrc.lbl.gov/sites/drrc.lbl.gov/files/LBNL-‐5273E.pdf. Ghatikar, Girish, and Dan Hennage. No date. Client and Logic with Integrated Relay User Guide: Installation and Troubleshooting for Auto-‐DRInc. DRRC and Akuacom. http://drrc.lbl.gov/sites/drrc.lbl.gov/files/clir-‐userguide-‐6-‐r3.pdf. Ghatikar, Girish, and Ed Koch. 2012. Deploying Systems Interoperability and Customer Choice within Smart Grid. Lawrence Berkeley National Laboratory and Akuacom/Honeywell. Presented at Grid-‐Interop 2012, Irving, Texas, December 3–6, 2012 and published in the Proceedings. http://drrc.lbl.gov/sites/drrc.lbl.gov/files/LBNL-‐6016E.pdf. Ghatikar, Girish, Johanna L. Mathieu, Mary Ann Piette, Edward Koch, and Dan Hennage. 2010. Open Automated Demand Response Dynamic Pricing Technologies and Demonstration. Demand Response Research Center. http://drrc.lbl.gov/publications/open-‐automated-‐demand-‐response-‐dynamic-‐pricing-‐technologies-‐and-‐demonstration. Holmberg, David G., Girish Ghatikar, Edward L. Koch, and Jim Boch. 2012. OpenADR Advances. National Institute of Standards and Technology, Lawrence Berkeley National Laboratory, Akuacom/Honeywell, and IPKeys Technologies. Published in the Proceedings. http://drrc.lbl.gov/sites/drrc.lbl.gov/files/LBNL-‐6055E.pdf. Honeywell. 2009. Honeywell Awarded Smart Grid Grant from U.S. Department of Energy. Press release. http://www51.honeywell.com/honeywell/news-‐events/press-‐releases-‐details/11.17.09SmartGridGrand.html Kiliccote, S., M. A. Piette, J. Mathieu, and K. Parrish. 2010. Findings from Seven Years of Field Performance Data for Automated Demand Response in Commercial Buildings. Environmental Energy Technologies Division. Presented at the 2010 ACEEE Summer Study on Energy Efficiency in Buildings, Pacific Grove, California, August 15–20, 2010, and published in the Proceedings. http://drrc.lbl.gov/sites/drrc.lbl.gov/files/lbnl-‐3643e.pdf. Kiliccote, Sila, and Mary Ann Piette. 2008. Automation of Capacity Bidding with an Aggregator Using Open Automated Demand Response. Demand Response Research Center. CEC-‐500-‐2008-‐059. http://drrc.lbl.gov/publications/automation-‐capacity-‐bidding-‐aggregator-‐using-‐open-‐automated-‐demand-‐response. Koch, E., and M. A. Piette. 2007. Architecture Concepts and Technical Issues for an Open, Interoperable Automated Demand Response Infrastructure. Energy Environmental Technologies Division. Presented at the Grid Interop Forum, Albuquerque, New Mexico, November 7–9, 2007. http://drrc.lbl.gov/sites/drrc.lbl.gov/files/63664.pdf.

40
NIST. 2012. NIST Framework and Roadmap for Smart Grid Interoperability Standards, Release 2.0. 2012. Office of the National Coordinator for Smart Grid Interoperability, Engineering Laboratory in collaboration with Physical Measurement Laboratory and Information Technology Laboratory. U.S. Department of Commerce. http://www.nist.gov/smartgrid/upload/NIST_Framework_Release_2-‐0_corr.pdf. NIST (National Institute of Standards and Technology). No Date. PAP19: Wholesale Demand Response (DR) Communication Protocol. http://collaborate.nist.gov/twiki-‐sggrid/bin/view/SmartGrid/PAP19WholesaleDR. OASIS. 2012. Energy Interoperation Version 1.0. Committee Specification 02 [Committee Specification 01 with errata]. http://docs.oasis-‐open.org/energyinterop/ei/v1.0/energyinterop-‐v1.0.html. OpenADR Alliance. No date. The OpenADR Primer. An Introduction to Automated Demand Response and the OpenADR Standard. http://www.openadr.org/assets/docs/openadr_primer.pdf. OpenADR Alliance. 2012 and 2013. OpenADR 2.0 “a” and “b” Profile Specifications. http://www.openadr.org/specification. PG&E. No date. Peak Day Pricing. http://www.pge.com/pdp. PG&E. No date. Demand Bidding Program. http://www.pge.com/dbp. PG&E. No date. Capacity Bidding Program. http://www.pge.com/cbp. PG&E. No date. Aggregator Managed Portfolio. http://www.pge.com/amp. PG&E. 2007. Auto-‐DR Program: Task 13 Deliverable: Auto-‐DR Assessment Study http://drrc.lbl.gov/publications/pacific-‐gas-‐electric-‐company-‐2007-‐auto-‐dr-‐program-‐task-‐13-‐deliverable-‐auto-‐dr-‐assessmen. Piette, Mary Ann, Girish Ghatikar, Sila Kiliccote, Ed Koch, Dan Hennage, Peter Palensky, and Charles McParland. 2009a. Open Automated Demand Response Communications Specification (Version 1.0). California Energy Commission, PIER Program. CEC-‐500-‐2009-‐063. http://openadr.lbl.gov/pdf/cec-‐500-‐2009-‐063.pdf. Piette, M. A., G. Ghatikar, S. Kiliccote, D. Watson. E. Koch, and D. Hennage. 2009b. Design and Operation of an Open, Interoperable Automated Demand Response Infrastructure for Commercial Buildings. Lawrence Berkeley National Laboratory and Akuacom. Journal of Computing Science and Information Engineering, Vol. 9, Issue 2. http://drrc.lbl.gov/sites/drrc.lbl.gov/files/lbnl-‐2340e.pdf.

41
SCE (Southern California Edison). No date. Demand Response Programs. https://www.sce.com/wps/portal/home/business/savings-‐incentives/demand-‐response. SDG&E. 2013a. Critical Peak Pricing. https://www.sdge.com/sites/default/files/documents/1903202013/Critical%20Peak%20Pricing%20Fact%20Sheet.pdf?nid=1381. SDG&E. 2013b. Capacity Bidding Program. https://www.sdge.com/sites/default/files/documents/1599427071/Capacity%20Bidding%20Fact%20Sheet.pdf?nid=1371. SMUD. 2013. Program Details. PowerDirect® Automated Demand Response Program. https://www.smud.org/powerdirect/details.htm. Smart Grid Interoperability Panel. 2012. Interoperability Process Reference Panel (IPRM). Version 2.0. Smart Grid Testing & Certification Committee. https://collaborate.nist.gov/twiki-‐sggrid/pub/SmartGrid/SmartGridTestingAndCertificationCommittee/IPRM_final_-‐_011612.pdf. Tridium. 2011. OpenADR Simple Client Driver. http://www.tridium.com/galleries/datasheet_pdf/T-‐OADR-‐DS-‐FINAL.pdf.
Top Related
Copyright © 2022 FDOKUMEN

