


Bahasa
Halaman
Hukum


Dedicated to
My Parents
P a g e |
Analysis of Moving Average Convergence Divergence (MACD) in different economies
1
1
Abstract
The current dissertation is undertaken to analyze technical analysis, its indicators and
their profitability and feasibility. This dissertation gives the basics idea of technical
analysis and how it works and helps the investors in generating profits. It also shows
how to use charts for technical analysis. In the analysis part it focuses on one of the
most popular indicator called Moving Average Convergence Divergence (MACD)
and applies it in different stock exchanges to examine whether it works in all or not.
The objective of this dissertation is to provide investors with a clearer view of where
to use Moving Average Convergence Divergence (MACD).
This dissertation analyses performance of Moving Average Convergence Divergence
in five different stock markets. These stock markets include Bombay Stock Exchange,
Athens Stock Exchange, New York Stock Exchange, Dubai Financial Market, Abu
Dhabi Stock Exchange and Australian Stock Exchange.
The conclusion of this dissertation was that Moving Average Convergence
Divergence was able to work at its best where the economy was not going through
any kind of crisis. In other words efficient markets where as it was not able to
generate much profit in economy like Greece which is suffering from European Debt
Crisis. In Middle Eastern markets it was not able to perform well at all.
At the end of this paper investors can easily make out where they can use MACD and
where they need to use fundamental analysis or other technical indicators.
Analysis of Moving Average Convergence Divergence (MACD) in different economies
2
2
Declaration
I hereby declare that this submission is my own work and that, to the best of my
knowledge and belief, it contains no material previously published or written by
another person, nor material which to a substantial extend has been accepted for the
award of any other degree or diploma of a university or other institute of higher
learning, except where due acknowledgement is made in the text of the report.
Zayd Pandit

P a g e |
Analysis of Moving Average Convergence Divergence (MACD) in different economies
3
3
Acknowledgements
It is a great pleasure to thank everyone who assisted me in writing my dissertation
successfully. I offer my sincerest gratitude to my supervisor, Dr. Elango
Rangaswamy, who guided me through several parts of my dissertation. I am also
grateful to my classmates and colleagues at work who provided me with great
information resources and helped me during my dissertation. I offer my regards and blessings to my family and all of those who supported me in
any respect during the completion of my dissertation without them this dissertation
would not have been completed.
Sincerely,
Zayd Pandit
Analysis of Moving Average Convergence Divergence (MACD) in different economies
4
4
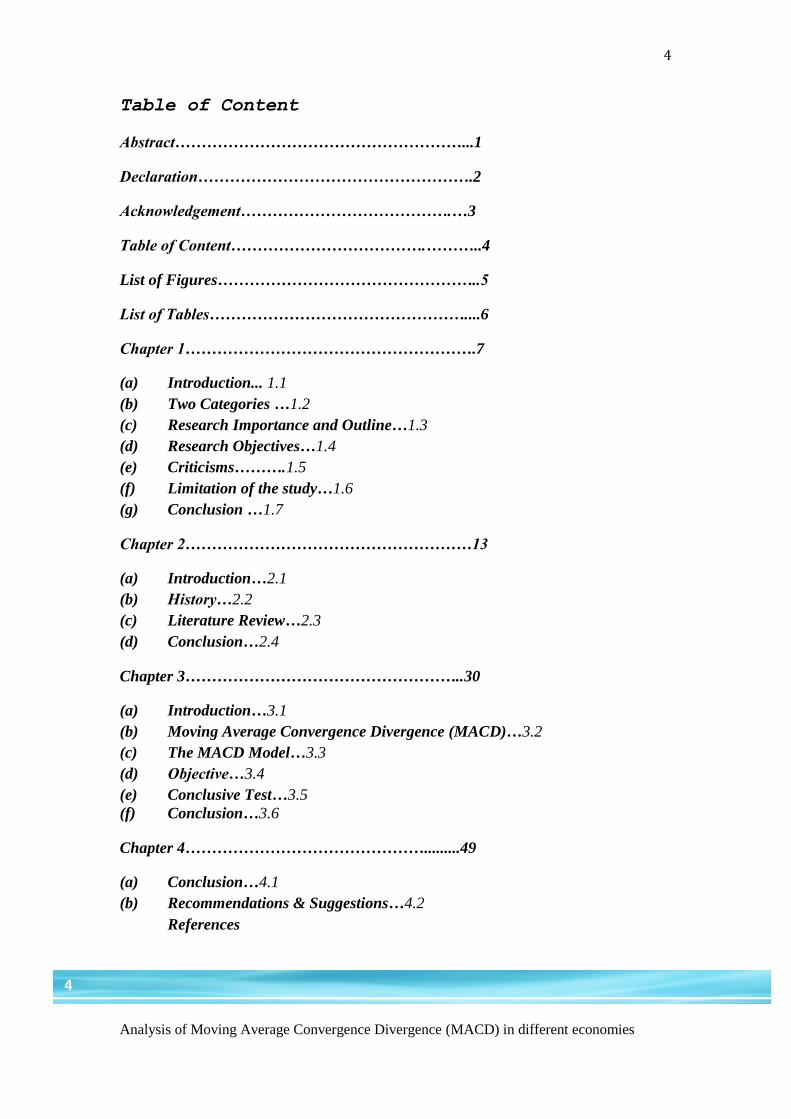
Table of Content
Abstract………………………………………………...1
Declaration…………………………………………….2
Acknowledgement………………………………….…3
Table of Content……………………………….………..4
List of Figures…………………………………………..5
List of Tables…………………………………………....6
Chapter 1……………………………………………….7
(a) Introduction... 1.1
(b) Two Categories …1.2
(c) Research Importance and Outline…1.3
(d) Research Objectives…1.4
(e) Criticisms……….1.5
(f) Limitation of the study…1.6
(g) Conclusion …1.7
Chapter 2………………………………………………13
(a) Introduction…2.1
(b) History…2.2
(c) Literature Review…2.3
(d) Conclusion…2.4
Chapter 3……………………………………………..30
(a) Introduction…3.1
(b) Moving Average Convergence Divergence (MACD)…3.2
(c) The MACD Model…3.3
(d) Objective…3.4
(e) Conclusive Test…3.5
(f) Conclusion…3.6
Chapter 4……………………………………….........49
(a) Conclusion…4.1
(b) Recommendations & Suggestions…4.2
References

P a g e |
Analysis of Moving Average Convergence Divergence (MACD) in different economies
5
5
List of Figures
Serial No. Fig. No. Page
1 3.1 30
2 3.2 31
3 3.3 32
4 3.4 34
5 3.5 36
6 3.6 37
7 3.7 38
8 3.8 40
9 3.9 41
10 3.10 43
11 3.11 44
12 3.12 46
13 3.13 47
Analysis of Moving Average Convergence Divergence (MACD) in different economies
6
6
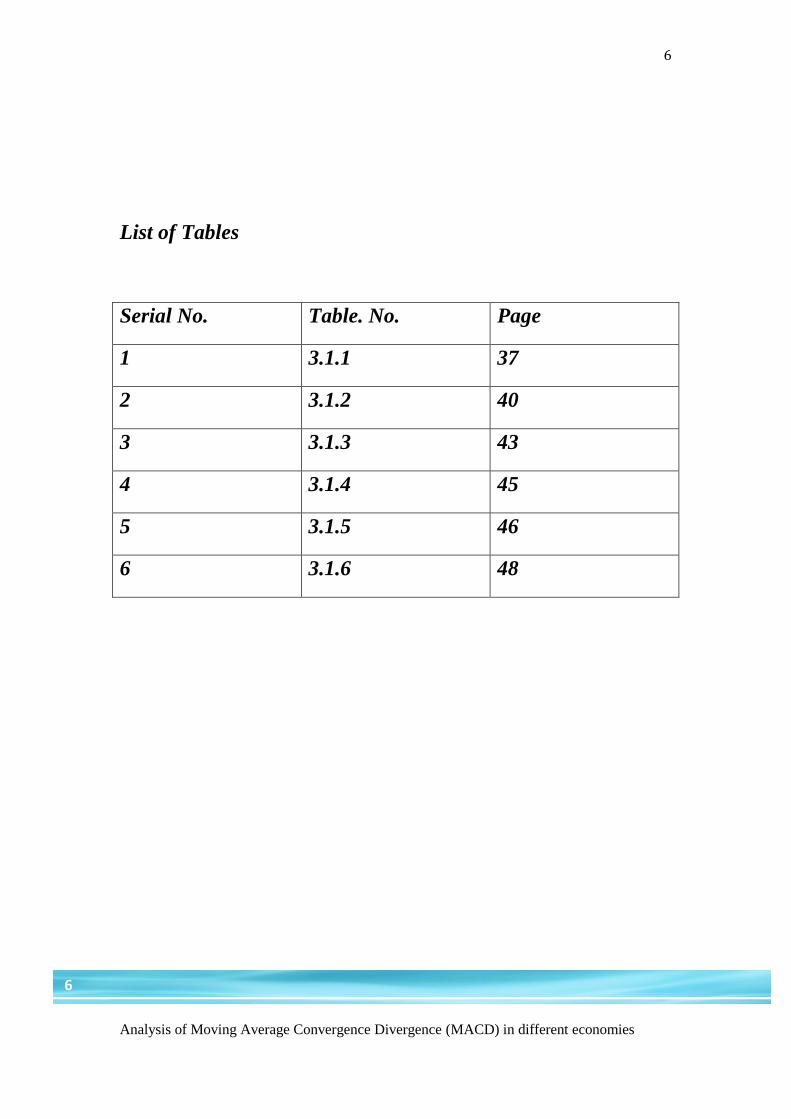
List of Tables
Serial No. Table. No. Page
1 3.1.1 37
2 3.1.2 40
3 3.1.3 43
4 3.1.4 45
5 3.1.5 46
6 3.1.6 48

P a g e |
Analysis of Moving Average Convergence Divergence (MACD) in different economies
7
7
Chapter One
This chapter includes introduction to research papers and providing a brief
background about technical analysis and its indicators. In addition to this the
dissertation also provides the rationale behind this research and whom it’s going to
benefit. In the end this chapter will clearly describe the objective and a short
conclusion.
(1.1) Introduction
These days investors and traders are using different technical indicators in the
financial markets to make money. Some combine two or more technical indicators
and some combine technical analysis and fundamental analysis. All this is done with a
sole purpose of making money and minimizing risk. Earlier investors used to rely on
fundamentals of the company and there decision was based on these fundamental.
Since the introduction of technical analysis many trader or investors have shifted from
fundamentals to technical analysis. Technical analysis has helped a lot of traders and
investors in making money. Technical Analysis can be defined as the practice of
studying the stock market`s past in an attempt to predict its future is known as
Technical Analysis. It helps in forecasting future financial prices movements.

Analysis of Moving Average Convergence Divergence (MACD) in different economies
8
8
Technical analysis is like weather forecasting, which does not result in absolute
prediction about the future trend. Anticipation of what will happen to prices in future
is where technical analysis comes handy.
Pring (2002) has given a definition for technical analysis:
“The technical approach to investment is essentially a reflection of the idea that prices
move in trends that are determined by the changing attitudes of investors towards a
variety of economic, monetary, political and psychological forces. The art of technical
analysis, for it is an art, is to identify a trend reversal at a relatively early stage and
ride on that trend until the weight of the evidence shows or proves that the trend has
reversed.”
(1.2) Two Categories
Technical Analysis vs. Fundamental Analysis
As discussed earlier there are two main categories or school of thoughts in the
financial markets. We already know that technical analysis focuses on movements of
prices of securities and predict future prices using this data. On the contrary economic
factors are used by fundamental analysts. These factors are called Fundamentals. Next
section highlights the differences between technical analysis and fundamental
analysis.
Technical Analysis - Charts vs. Fundamental Analysis- Financial Statements
Both of these schools of thoughts approach securities from two different perspectives.
First, the technical analysis uses charts and patterns to predict the future on the other
P a g e |
Analysis of Moving Average Convergence Divergence (MACD) in different economies
9
9
hand fundamental analysis depend on financial statements for predicting the direction
of future price movements.
Fundamental analysis relies on financial statements like balance sheet, income
statement and cash flow statement to determine the value of a company. It’s very
helpful for making investment decisions as in if the stock price is below the intrinsic
value it means it’s a good investment. But on the whole fundamental analysis goes
beyond only financial statements. On the other hand technical analysts believe stock
price contains all the information including the fundamentals of a company. And all
this information can be found in charts. Fundamental analysis approach has a long-
term analysis as compared to technical analysis. In case of technical analysis the
period of analysis can be from days to weeks and months in short the period is
relatively small. Fundamental analysis period is mostly over number of years.
Both of these schools of thoughts differ in terms of time periods because of their
different styles of investment for which they are made. In case of fundamental
analysis a company`s value takes times to get reflected in the market. If there is a rise
in the prices, the gain cannot be realized until the correct stock price is reflected in the
market. This type of investment is popularly known as value investment and it works
on the assumption that short-term market is incorrect. It believes that price of a stock
with the passage of time corrects itself. The passage of time in this case can represent
several numbers of years. Fundamentalists’ work on numbers and its analysis are
released after a long period of time. As we all know earning per share changes mostly
after financial statements are submitted which most of the times quarterly not on daily
basis like price and volume. It can also be said that fundamentals are general
Analysis of Moving Average Convergence Divergence (MACD) in different economies
10
10
characters of a business. As we know the data, which the fundamentalists use for
analysis takes a lot of time to generate as compared to price and volume, used by
technicians and because of this reason fundamental analysis has long time frame.
(1.3) Research Importance and Outline
Technical analysis portrays the real picture of the Stock Market with the help of
charts and graphs. It helps the investors in identifying the trends and patterns. It also
helps the investors in avoiding the bad investments. To be a successful trader one
needs to understand the trends and patterns. Technical analysis is a great tool for
forecasting future prices and short-term trends. The trader or the investor needs to do
a bit of research about the market and then apply technical analysis so that he can
make the most of it. One of the most important indicators of technical analysis is
Moving Average Convergence Divergence (MACD). This dissertation will help the
investors in selecting the right markets for applying (MACD) indicator.
The rationale behind this dissertation is to comprehend the previous studies and
researches that have been done by various scholars in the past on technical analysis
and its indicators. There are many studies done in the past on technical analysis and
its indicators. In the beginning I will be collecting different research papers on
technical analysis, its indicators and their profitability. I will be giving my own brief
conclusion for each of studies and in the end will provide a small summary of all the
conclusions. This paper will also apply Moving Average Convergence Divergence
indicator to various stock exchanges to check whether it works in each of them or not.
This dissertation uses excel and stock charts software to generate charts and analyze
the moment of the prices.
P a g e |
Analysis of Moving Average Convergence Divergence (MACD) in different economies
11
11
The purpose behind this is to verify whether MACD indicator works in different
market conditions or not. Many research papers have tried to check the feasibility of
indictors in a single financial market. This paper will try to check whether MACD
performs well in every condition or not. To check this MACD indicator will be tested
in stock markets with different economic conditions and the Macd model will be
calculating profits and will be reflecting on the charts as well.
(1.4) Research Objective
The main aim of this dissertation is to provide a clear perspective regarding the
MACD to the investors and traders who wants to use it in different markets with
totally different economical conditions. Apart from this, this dissertation will also
provide a test on various stock markets to check the profitability of Moving Averages
Convergence Divergence indicator. This will help the investors or traders in deciding
whether MACD is reliable or not. It will also highlight in which markets should
investors rely on Macd.
As this will include both emerging markets as well as developed one it will provide a
basis for the investor to select which type of market he wants to invest in. The
dissertation uses data from different stock markets so its going to benefit the investors
in selecting the markets around the globe and choose whether to use MADC as an
indicator or not depending on the current economic condition.
(1.5) Criticism
Critics have often described technical analysis as a form of black magic. Technical
analysis enjoyed mainstream credibility just few decades back. Before most of the
Analysis of Moving Average Convergence Divergence (MACD) in different economies
12
12
traders used to depend on fundamentals, but now they also have started using
technical analysis. Most of the criticism is because of academic theories. One of the
most important theories is Efficient Market Hypothesis. According to EMH the
market price is perfect and correct and all the past trading information is present in the
current price. Keeping this in mind, any kind of analyses for finding undervalued
securities is just waste of time.
There are three forms of Efficient Market Hypothesis. The first form of efficient
market hypothesis is the weak market hypothesis. This theory states that all the
information is present in the current market price. Any kind of analysis will not be
able to predict or forecast future movement of price.
Next is the second form of efficient market hypothesis known as the semi- strong
which states that even fundamental analysis cannot help in finding good investment
opportunities. The last and third form of efficient market hypothesis is the Strong
Market Hypothesis which claims that all information is already present in the current
price including past trading information and neither the technical analysis nor the
fundamental analysis can provide any extra information to traders or investors. There
are many academicians who believe in the weak form hypothesis; this means if
technical analysis really works according to them the market is not efficient.
The next question is whether they can coexist. Technical analysis and Fundamental
analysis are considered as north and south poles. Surprisingly many market
participants find success when they combine fundamental analysis and technical
analysis. Some analysts use technical analysis techniques for determining the best
time to enter into an undervalued security but they are also using fundamentals. When
P a g e |
Analysis of Moving Average Convergence Divergence (MACD) in different economies
13
13
security is oversold this can be done. Right timing can improve gains when the
security is oversold. Sometimes it’s the other way round, technical analysts’ looks for
support in fundamentals to strengthen their technical analysis. Technical traders to be
on the safer side reaffirm their decision by using key fundamental data. So we can say
the combination of both technical analysis and fundamental analysis can provide
fruitful results. Participants who are extremely devoted to one of the school of
thoughts don't agree with it. But there are advantages in understanding both schools of
thoughts.
(1.6) Scope of Work
The paper only uses one indicator, which is Moving Average Convergence
Divergence. Even if MACD works in every market it does not mean that other
indicators will also behave in the same way.
The paper will not help the investor or the trader in selecting a security. It will help in
only selecting the stock market where he wants to use MACD.
(1.7) Structure of Dissertation
The Conclusion of this part of the chapter is that technical analysis is used to predict
price movements and it consists of indicators and charts. This paper sheds more light
on indicators, as the main focus of this paper is an indicator. MACD is one of most
used and most relied on indicator is the world of technical analysis. In the proceeding
chapters this study will include past studies done by others followed by analysis to
test the performance of MACD in different stock markets
Analysis of Moving Average Convergence Divergence (MACD) in different economies
14
14
Chapter 2
Literature Review
(2.1) Introduction
Technical analysts claim that this technical approach helps them in generating profit
from changes in psychological factors in the market. It can be better understood in
this statement:
The technical approach to investment is essentially a reflection of the idea that prices
move in trends, which are determined by the changing attitudes of investors towards a
variety of economic, monetary, political and psychological forces. Since the technical
approach is based on the theory that the price is a reflection of mass psychology in
action, it attempts to forecast future price movements on the assumptions that crowd
psychology moves between panic, fear, and pessimism on one hand and confidence
excessive optimism, and greed on the other (Pring 1991, pp.2).
Technical Analysis can be divided into two parts charts and indicators. Indicators are
calculated using the price and the volume of that particular security. Indicators help in
predicting trends, volatile, momentum and flow of money. Technical indicators

P a g e |
Analysis of Moving Average Convergence Divergence (MACD) in different economies
15
15
provide more information regarding the supply and demand of securities. Indicators
like volume act as a confirmation of the price movements and also whether the given
trend will continue or not. Indicators not only help in acting as a confirmation tool but
also can general buy and sell signals.
Indicators can be further divided in to two main categories Lagging and Leading
indicators.
Lagging indicators are those indicators, which follow the price movements but have
less predictive qualities. Examples of lagging indicators are moving averages and
Bollinger bands. During the non-trending period these indicators don’t work to their
full potential. But during the trending periods the indicators work perfectly. The
reason behind this is that the indicators focus more on trends and give less buy and
sell signals. Leading indicators are stronger than lagging indicators during a sideways
range or non-trending periods. Leading indicators generate a lot of buy and sell signal
so it would be better to uses them in markets, which are non-trending. Traders should
use both the indicators while trading as leading indicators are too volatile and can
force the traders to take the wrong decision.
Indicators are used to generate buy and sell signals using crossovers and divergences.
Crossovers are when the indicators go through an important level or through its
moving average. The signals indicate that the trend is going to change and the price of
the security is also going to change. The other ways indicators are used is
divergences. This happens when the actual price direction and the direction of the
indicators are moving in opposite directions. Divergences can be positive or negative.

Analysis of Moving Average Convergence Divergence (MACD) in different economies
16
16
In short, technical indicators provide additional information regarding the future price
movements. These indicators help the traders in identifying trends, momentum, and
volatility and many other such elements. Based on these indications traders are able to
take decisions. Some traders use one indicator only for making decision for buying
and selling decisions whereas it might be better to use indicators with chart patterns,
price movements and other indicators.
(2.2) History
In this section we will discuss one of the oldest and the most popular form of
technical analysis named as Dow theory. Dow Theory was introduced by Charles H.
Dow in the late 1800s, everyone in financial industry from brokers, dealer, fund
managers, investors to speculators use technical analysis. It was found in a survey that
most of practitioners rely on technical analysis. (Billingsley and Chance 1996;
Brorsen and Irwin 1987; Irwin and Brorsen 1985) and nearly half of the foreign
exchange traders support the fact that technical analysis plays major factors in
determining exchange rates in the short run.
On the contrary to this most academics are doubtful about technical analysis as they
believe in fundamental analysis which states that markets are information efficient
P a g e |
Analysis of Moving Average Convergence Divergence (MACD) in different economies
17
17
and all the information is impounded in current prices.
In the last few decades many theoretical explanations for the widespread use of
technical analysis have been developed based on models.(Treynor and Ferguson
1985; Brown and Jennings 1989; Grundy and Mc Nichols 1989; Blume, Easley and O
Hara 1994), behavioral (or feedback) models (De Long et al. 1990a, 1991; Shleifer
and Summers 1990), disequilibrium models (Beja and Goldman 1980),herding
models (Froot, Scharfstein and Stein 1992), agent-based models (Schmidt 2002), and
chaos theory (Clyde and Osler 1997).
This paragraph gives a brief idea about the previous studies done on technical
analysis.(Donchian 1960), numerous empirical studies have tested the profitability of
technical trading rules in a variety of markets for the purpose of either in covering
profitable trading rules or testing market efficiency, or both. U.S and outside U.S
stock markets both have been used for testing technical analysis and foreign exchange
market also. Futures market is the only market where few studies have been analyzed.
Before 1980 technical trading studies were used on few trading systems. In these
studies net return was calculated after deducting the transactional cost of these
strategies, problems related to data snooping and statistical tests was disregarded, risk
was not handled adequately and test procedure was without sample verification along
with parameter optimization. Technical trading studies have improved significantly
after mid 1980`s.
Testing procedure now include some new few features:(1) increase in number of
trading systems;(2) transactional costs and risk are used to adjust returns; (3) Out of

Analysis of Moving Average Convergence Divergence (MACD) in different economies
18
18
sample verification and parameter optimization are conducted; and (4) both
conventional statistical tests as well as more sophisticated bootstrap methods were
applied.
(2.3) Literature Review
Since its origin, there has not been research on technical analysis on a consistent
basis. Alexander (1961 & 1964) and Fama and Blume(1966) suggested that filter
rules cannot be used for investment decision to generate excessive returns. However
the data used by Fama and Blume(1966) was later analyzed by Sweeney(1988) and
the result was that when filter rules are applied to fifteen stocks of Dow Jones, filter
rules generates excessive returns over buy and hold alternative. During 1990`s
research on technical analysis increased as well as the methods for testing trading
rules.
Technical Analysis is defined generally as ‘the use of past price behavior to guide
trading decisions in asset market’ (Neeley, 1997:23). If we talk about taking position
in foreign exchange market past exchange rates can act as a guide. Technical analysis
was initially looked upon with disbelief by the economists because of their support to
efficient market hypothesis (Taylor & Allen 1992). Focus of serious economic
research these days is technical analysis. The purpose of this literature review is to
collect evidence concerning the usage and feasibility of technical analysis. A lot of
research has been done to check whether technical analysis is profitable or not. In a
research work by Levich & Thomas (1993) and Neeley et al. (1997) the statistical
significance of profits generated by technical analysis are determined by the used of
P a g e |
Analysis of Moving Average Convergence Divergence (MACD) in different economies
19
19
bootstrap approach. The conclusion of this paper is that if you follow simple technical
trading rule it can help you in generating excess returns. it should be kept in mind that
the approach used in this paper differs from what is generally used by analysts. In
general the analysts use their own imagination, own judgment in bringing forth their
predictions without following technical trading rules (Taylor & Allen, 1990). Because
of this a precautionary note is seen in the conclusions of (Taylor & Allen, 1990). In
that paper the authors kept a note of six technicians and their exchange rates and
surveyed them. On the basis of root mean square, they found that one out of the total
number of technicians were not able to outstrip on a continuous basis the predictions
of an independent walk, for the exchange rate for a specific time frame. Still, the
paper of Osler & Chang (1995) supports that the use of “head and shoulder’’ rule can
be one of the approaches that may be profitable.
Technical analysis was previously used with fundamental analysis. The above
research work has only considered the profitability of technical analysis in isolation.
Now the question is whether profits will be generated if technical analysis is
combined with trading rules based on fundamental analysis. As it can be seen Taylor
and Allen (1992) in 1988 surveys were conducted amongst chief foreign exchange
dealers in the London market on the use of technical analysis. Moving average or
trend following systems is used by 64% of the dealers and other trading systems such
as oscillators or momentum indicators were used by 40% of the dealers. Around 90%
of dealers when forming their exchange rate targets for a short period used some sort
of technical analysis. In addition to this, 60% of dealers consider technical analysis as
important as fundamental analysis. From the above paragraph we can say many
Analysis of Moving Average Convergence Divergence (MACD) in different economies
20
20
traders and investors rely on technical analysis.
In a similar study by Menkhoff (1997) he analyzed the manner in which foreign
exchange professionals like fund managers worked in Germany. The result of that
analysis was that 87% of dealer gave more than 10% weightage to technical analysis
in case of decision-making. Technical analysis means value on the basis of
importance was 35% and similar responses from other professionals. Technical
analysis played a major factor in decision making for short periods such as intraday to
6 months. Present dealers’ preferred technical analysis, the way in which technical
analysis was used had no relation with institutional size and the last finding was that
academically chartists and fundamentalists were on the same level.
But this could be dangerous as the investors can select a wrong stock, which
fundamentally would be a poor decision and could result in loss. Another research by
Frankel and Froot (1990) showed that the demand for dollar can change if we switch
to forecasting method in foreign exchange market. This survey was done in euro
money magazine for forecasting firms. In 1978 fundamental analysis was used by
nineteen forecasting firms and technical analysis by only three firms. This pattern has
reversed after five years. In 1983 fundamental analysis was used by one firm and
technical analysis by eight firms. In 1988 fundamental analysis was used by seven
forecasting firms and technical analysis by eighteen forecasting firms.
From the above-mentioned studies we can conclude that technical analysis in last two
decades has become more popular among investors and traders then fundamental
analysis. Currently technical analysis is easier to use because of new software, which
P a g e |
Analysis of Moving Average Convergence Divergence (MACD) in different economies
21
21
are freely available.
Stressing on the profitability of technical analysis, Lento(2008) calculates returns of
fifteen largest global equity markets using nine technical trading rules and Hurts
statistics was used to determine whether the trading rules were profitable in markets
with long term dependencies. In this paper Pearson`s correlation and OLS regression
is used to check association between profitability of technical analysis with Hurts
statistics. Pearson and OLS regression shows an association of p = 26% between
profitability of technical trading rules and hurts statistics. Some of these markets were
having low H and the technical trading rules were profitable proving that these trading
use were able to use full information by processing historical prices into future
signals. Correlation, regression and tabulation in this paper show that there is some
association between profitability of technical trading rule and H.
Whereas Levy (1966; 1967) has tested a number of additional trading rules based on
technical analysis. In some cases results are inconsistent with the theory of random
walk. In particular Levy`s article, “Random Walks: Reality or Myth”(1967) he has
calculated returns earned by several mechanical stock market trading rules in a period
ranging from October 1960 to October 1965.
Levy uses different variations of trading rules to calculate returns earned and finds
these returns in excess of returns earned by random selection policy. In light of the
results Levy states: “The evidence above conclusively proves that technical stock
analysis could have produced greater-than-random profitability at less-than-random
risk for the 1960-1965 periods.” Keeping this in mind the theory of random walk is

Analysis of Moving Average Convergence Divergence (MACD) in different economies
22
22
proved wrong. In response to Levy`s work Jensen (1967) evaluated trading models
used by Levy. The results of Levy`s trading rules are somewhat over stated as a result
of his definition on returns on random selection policy, his assumption regarding the
identity of the decision and trading price, treatment to risk differentials and his
neglect of the cost of operating the rules. Levy has taken high risk portfolios during
that period.
Keeping all this in mind we cannot agree with Levy because his study does not
entirely explain all the results of Levy. It requires additional test to validate whether
Random walk is a myth or a reality.
Testing technical analysis in futures market Griffioen (2003) tests a large set of 5350
technical trading rules on the prices of cocoa future contracts traded at two different
stock exchanges CSCE and LIFFE and also on pound dollar exchange. The period
was from 1983 to 1997.These rules consists of three sub sets: 1990 moving average,
2760 trading break out and 600 filter strategy. In comparison to CSCE cocoa prices
these strategies perform much better for LIFFE cocoa prices. It performed much
better during the period from 1983 to 1987.The results during this period are
statistically significant for forecasting purpose and economically profitable. In case of
CSCE cocoa prices the results were not that significant for forecasting and hence not
profitable. These strategies were applied to pound/dollar exchange rate for same
period and the result was statistically significant but most of them were not profitable.
The reason for difference in performance of technical trading rules in LIFFE and
CSCE a cocoa future contract is the demand and supply mechanism and pound-dollar

P a g e |
Analysis of Moving Average Convergence Divergence (MACD) in different economies
23
23
exchange rates. Cocoa future and price level of pound dollar exchange rate were
coincidently highly correlated and this is the reason why trading rules perform better
in this period. This spurious correlation led to strengthening of price trend in LIFFE
cocoa future contracts in London and weakening the price trends of CSCE cocoa
futures contracts in New York. The trends on LIFFE are strong enough to be
identified by trading rules. In case of CSCE the trading rules are not able to identify
trends. Structural break in the trend can be identified by trading rules.
The finding of Griffioen`s paper is that technical analysis may identify strong trends
and even identify structural break in trends, but it cannot identify the forces behind
these trends. Technical analyst cannot rely on trading rules but also need to use
economic fundamentals to identify forces behind these trends. In case of LIFFE the
trends were caused because of demand and supply mechanism in cocoa market and
pound dollar exchange rate. These forces changed direction at the trend break point.
So the conclusion is that if technical analysis and fundamentals point out in the same
direction then in that case technical analysis can be successful.
The next research done by Eric,Andjelic and Redzepagic (2009) sheds light on two
most popular indicators of technical analysis Macd and relative volatility index (RVI).
These two indicators are popular for determining trends and forecasting future stock
prices. In this paper the MACD and RVI indicators are applied to stocks which are
continuously traded on the financial markets of Serbia. The rationale behind this study
is to find the most profitable parameters of MACD and RVI to optimize the
investment strategy in the financial market. The hypothesis of this research is that
MACD and RVI provides a sound basis for a sound investment strategy. In the

Analysis of Moving Average Convergence Divergence (MACD) in different economies
24
24
methodology part technical analysis is applied in financial markets. It will be using
two indicators MACD and RVI. The tools used in this research for analysis and
calculation part are Meta Stock and Microsoft Excel. The conclusion of this study was
that MACD and RVI play a major role in optimization of investment strategy. One of
the limitations of this research, which must have effected the calculation, is that the
turnover of stocks on the Belgrade stock exchange is low and very less number of
transactions takes place.
On the other hand Park & Irwin (2004) tests the evidence on the profitability of
technical analysis. In this paper surveys and theoretical and empirical studies have
been used to analyze and review technical analysis. First the paper analysis survey
carried on market participants who are practicing technical analysis. The first finding
of the survey is that technical analysis is widely used in future contracts and foreign
exchange markets. Nearly 40% of practitioners support the fact that technical analysis
plays an important part in predicting future prices in case of short periods. Theoretical
models are used to present significance of profitability of technical analysis. Models
like martingale model or random walk model proves that technical analysis is not
profitable in high risk markets. Other models like noisy rational expectation models
and behavioral models support the theory that trading strategies are profitable in a
noisy market. This paper includes two empirical studies earlier and modern empirical
study. Earlier studies show that technical analysis is successful in foreign exchange
markets and futures markets. In case of stock markets technical analyses was not
profitable before 1980.On the contrary modern studies show that till 1990 technical
trading rules were able to generate economic profits in stock markets. Most of modern

P a g e |
Analysis of Moving Average Convergence Divergence (MACD) in different economies
25
25
studies almost 70% of them showed positive results regarding profitability of
technical analysis. In spite of positive results technical analysis are subject to
problems during testing procedures like data snooping, search technologies and
difficulties in calculating risk and estimating transaction cost. In future, researchers
should try to highlight these problems so that the work can produce conclusive
evidence on profitability of technical analysis.
Similarly Kuan (2005) has used White`s reality check and Hansen`s SPA test to
reexamine profitability of technical analysis. These tests correct the preconceptions of
data snooping. In this paper studies technical trading rules in depth not only including
simple technical trading rules but also investors strategies. In this paper these
strategies and rules have been tested with four main indices. The first finding of these
tests was that significant profitable technical trading rules and strategies exist in
markets like NASDAQ composite and Russell 2000, but mature markets like DJIA
and S&P 500. The other finding of this paper is that investor strategies are able to
increase profits of simple rules and there is a chance that investor strategies can
generate profits from failed simple rules.
Rodrigues,Rivero,Felix(2000) tries to forecast from NN and SNN predictors and
transform the forecast into simple technical rules in which positive returns and
negative returns were executed for long and short positions respectively. The same
strategy is applied to nine currencies participating in ERM and exchange rates are
used with the Deutschemark for 1 January 1978-31December 1994. Technical trading
rules are derived from nearest neighbor nonlinear predictor. The profitability of these
rules are evaluated against the linear moving average trading rules, keeping in mind
Analysis of Moving Average Convergence Divergence (MACD) in different economies
26
26
both the interest rate and transaction cost. The mean annual total return is used to
measure the profitability and eight out of nine times the nonlinear approach out
performs the linear moving average approach. In these cases the mean annual total
return is different from zero. Trading rules based on nonlinear predictor generates the
highest returns in 8 out of 9 cases. Ideal profit and Sharpe ratio is used to assess the
economic value of predictors. Using nonlinear predictors as trading rules gives us the
highest value for both profitability measures.
In the next research Marshall ,Cahan, Cahan (2008) has selected 49 developed and
emerging market indices which are included in Morgan Stanley capital index (MSCI)
and investigates profitability of technical trading rules in them. Trading rules from
four rule families in excess of 5000 technical trading rules on each market have been
used. With the help of these results we can prove whether or not technical analysis
work around the globe or not. Emerging markets do not follow a random walk and
there is evidence about it and some authors in the past have documented profits with
the help of technical analysis. But these profits are inconsistent. This paper doesn't
focus on historical period for profitability but on recent times to ensure profitability.
In isolation many technical trading rules are profitable, however there is no proper
evidence that technical trading rules work successfully in emerging markets, these
markets are said to be information inefficient. But technical analysis can be used for
other investments. All the technical rules are not profitable. But the 5000 trading rules
are not successful except when used in isolation.
Again stressing on the profitability Lento (2009) checks the profitability of combine
P a g e |
Analysis of Moving Average Convergence Divergence (MACD) in different economies
27
27
single approach to technical analysis on S&P 500 data set which is information
efficient and robust. In addition, nine trading rules and their profitability was also
tested. Here profitability means returns in excess of buy and hold strategy. In case of
individual trading rules combine single approach on average improves profitability.
Combined single approach outperforms buy and hold strategy before taking the
transactional cost into account. In some cases because of transactional cost
profitability was eliminated. If there is no profit remaining after the transactional cost
still technical analysis information can be used by a statistical investor to reallocate
his assets using that information. Hence technical analysis can be of economic
significance.
This study supports the results of the previous research done by Lento & Gradojevic
(2007) and Lento (2008). In both the studies CSA was profitable. This study also
proves that when we combine different signals, more powerful and effective trading
technique is created. The result of this study gives a healthy support to CSA and its
profitability. It’s quite different than the original CSA because it uses the most
efficient market index for a period of 59 years with approximately more than 14000
daily observations. This is why the results of this paper are the most robust till now.
There is a need of more research work in the area of CSA like which trading rules are
more successful.
Similarly Rodriguez,Rivero,Felix(1999) investigates the forecasting power of
technical trading rules. For evaluating the forecasting power of technical rules this
Analysis of Moving Average Convergence Divergence (MACD) in different economies
28
28
paper uses General Index of Madrid stock Exchange daily data for the period of 31
years from 1966-1997. The findings of this paper are that technical analysis indicates
buy signals that generate higher return on a constant basis in comparison with the sell
signals. This supports the statement that technical analysis has forecasting power. One
more interesting thing is that returns generated with the help of buy signals are less
volatile than returns from sell signals. This means there are nonlinearities present in
the data of Madrid Stock Exchange. There are negative returns generated by sell
signals. Other models of finance like GAARCH and GAARCH-M are not able to
generate any of these signals. Their adequacy is checked by combining bootstrap
method and technical trading rules. These models fail to predict both returns as well
as volatility.
As its clear that period is too long so to just to verify the results the period is divided
into sub periods and the results for sub periods are no different. Thus it’s clear that
results of this paper support profitability of technical analysis. But still the returns are
not that high, so if we deduct transaction cost and brokerage fee that cannot be
considered as profit. Research on more sophisticated trading rules is needed and on
their profitability to verify good profits after transaction costs and brokerage fee.
On the other hand Park and Irwin (2005) selected the data used by Lukac, Brorsen,
and Irwin for investigating 12 future markets for the period of 1975-1984.But actually
they started from 1978 as the first 3 years were used for optimizing trading rules. Park
and Irwin have extended that data from 1975- 2003 for the same 12 future markets.
These markets include highly traded agricultural commodities, metals and financials.
Sample Performance of technical trading rules is measured by evaluating daily prices

P a g e |
Analysis of Moving Average Convergence Divergence (MACD) in different economies
29
29
for each future market from 1975 through 2003.The sample period is divided into two
sub periods 1975-1984 and 1985 to 2003. The main reason behind this is confirmation
and replication. First the original annual portfolios mean gross return calculated by
Lukac, Brorsen and Irwin is compared with Parks and Irwin trading models gross
return. Gross returns help us to measure better performances because transaction costs
don’t contaminate it. Annual net returns of both trading models are compared using
correlation coefficient and sign consistency comparison between trading models was
also checked. In the replication stage the trading model was applied to new set of data
starting from 1985-2003.Keeping all the parameters in mind the sample performance
was evaluated. Stationery bootstrap method was used to measure the statistical
significance of technical trading rules. This minimizes the harmful effects of data
snooping. Lukac, Brorsen, and Irwin had found technical trading rules to be
profitable. The first sub period of 1978-1984 had generated significant economic
profits in six out of 12 future markets. But in case of the latter period from 1985-2003
the same technical trading rules were not successful. The trading model was only able
to generate profits for some financials like the mark and T-bills. The portfolio annual
mean return of first sub period was 4.13% and it dropped to -5.82% for the second
sub period.
There are 3 major reasons for technical analysis not being successful for the period
from 1985-2003. The first is data snooping selection bias in previous studies the
second being the structural changes in the markets and last one as suggested by Kidd
and Brorsen that the use of technical analysis decreased after 1990 because the price
volatility decreased and Kurtosis increased for daily price returns when the markets
Analysis of Moving Average Convergence Divergence (MACD) in different economies
30
30
were closed.
Recently Hsu, Hsu,and Kaun (2009) has used a new step wise test ( the step SPA test)
for large scale multiple testing problems without data snooping bias. With the help of
step SPA test we can identify different trading rules, which are significant. To date
researchers were using step-RC test but step- SPA test is more powerful than the step-
RC test because it ignores conservative configuration. This paper tries to look for new
evidence for the predictive ability of technical trading rules in both growth and
emerging markets. The results of this paper are based on market indices as well as
exchange-traded fund, which can be traded as low cost. So these results have a lot of
information in them, which can be used. The first finding of this paper is that
technical rules are able to predict U.S indices before ETF period quite powerfully.
There are 269 significant rules in terms of mean return, 136 rules in terms of Sharpe
ratio and 220 rules in terms of x-statistics and 230 rules in terms of studentized mean
return. In some indices the evidence is weaker like the NASDAQ composite Index,
Significant rules in terms of mean return are 33 and 7 significant rules in terms of
Sharpe ration. There are more than hundred significant trading rules under Russell
2000 index. The presence of many significant trading rules provides a strong evidence
of the predictability of index returns. On the other hand the predictability of technical
trading rules is not the same for post-ETF period. The Step-SPA test obtains zero
significant rules for all three U.S ETF`s.
The step-SPA test can also be applied to similar, multiple testing problems.
According to the results of this paper it’s not necessary that predicting power of
P a g e |
Analysis of Moving Average Convergence Divergence (MACD) in different economies
31
31
technical rules will be a consequence of serial correlation in data.
Neely and Weller (2011) emphasize the importance of market efficiency in foreign
exchange markets. According to the literature simple trading rules on dollar exchange
rates provide risk adjusted returns for 15 years during 1970`s and 80`s.In the same
period complex rules which are not studied well have generated average returns.
Excess returns from technical trading rules cannot be justified by relying on adjusted
risk or central bank intervention. One of the reasons for profitability can be
psychological biases. For e.g. if the central bank adopts the policy of leaning against
the wind this gives rise to predictable trends. Research based evidence shows that
period of greatest profitably is before intervention of the central bank. Central bank
intervenes to stable the market from which TTR`s generate profit. Hence
interventions of Central banks are correlated with high profits for technical rules.
Using Moving Averages Han, Yang and Zhou (2011) generate investment-timing
portfolio with the help of standard moving average of technical analysis and applies it
to portfolios after sorting on the basis of volatility. The result of this paper performs
better than the buy and hold strategy with returns which have negative risk exposures
on the market factors and the Fama-French SMB and HML factors. In case of high
volatility portfolios the returns are higher than CAPM and Fama and French three
factor models and also higher than momentum strategy. Moving average is similar to
momentum strategy but it has less correlation with momentum strategy.
This study proposes that it will be productive to continue research about
profitability of technical analysis in other markets and asset markets using the cross-
Analysis of Moving Average Convergence Divergence (MACD) in different economies
32
32
sectional performance, keeping in mind the role of volatility. This model of moving
average can replace momentum strategy in investment related issues in future
research papers.
Again stressing on profitability Marshall, Young and Roze (2007), investigates the
U.S. equity market using quantitative techniques of candlestick to check profitability.
Candlestick is being used by many technicians but there is insufficient literature
present to provide evidence about its profitability. Candlestick generally uses one to
three days of previous data to generate a signal. It’s popular among short term
investors. Positions are taken up to ten days. Now candlestick technical analysis is
also available in software. In this paper, candlestick analysis is applied to DJIA
component stocks over a period from 1/1/1992 to 31/12/2002. Neither any unexpected
bullish nor bearish signal is generated by candlestick analysis. Relying entirely on
Candlestick analysis for decision making doesn’t make sense. But at the same time
investors should not forget that candlestick techniques compliment other market
timing techniques.
On the other hand Isakov and Marti (2011), provides evidence about profitability of
technical analysis. First it checks performance of complex trading rules which are
based on moving averages calculated for long periods. It finds that when a signal is
generated over a long period the trading rule is more profitable. It uses a test which
relies on simulation to find new trading strategy which follows long term trends. In
the end it uses financial leverage with trading strategies to generate signals in markets
following an upward trend as it’s difficult to outperform such markets only by long
positions. The test for the period of 1994-2008 generated profit ranging from 274% to
P a g e |
Analysis of Moving Average Convergence Divergence (MACD) in different economies
33
33
572%. This was much higher than the market yield.
This paper suggests that moving averages are able to generate profits by taking
advantage of long term market movements. This paper also attempts to prove efficient
market hypothesis could be wrong. Most of the investors or technicians are interested
in short term gains and are unaware of long term trends. Further research is still
required to confirm profitability of these rules in a longer period in other markets.
(2.4) Conclusion
From this literature review it can be said that technical analysis is profitable most of
the time. The tests conducted in these studies have mostly supported technical
analysis as a profitable tool. These tests include the Pearson and OLS regression,
Hurts statistics, Correlation, White Reality Check and Hansen`s SPA test The studies
also show the popularity of technical analysis, as it has become the first choice of
every trader. The next chapter will test the MACD`s performance in different stock
markets.
Chapter 3
Data Methodology
(3.1) Introduction
In this chapter this paper sheds light on the working of the most popular indicator of
technical analysis Moving Average Convergence Divergence (MACD). In the second
part it will apply macd in different stock markets using different indices. In the end a
short summary with a brief conclusion will follow.
(3.2) Moving Average Convergence Divergence (MACD)
Analysis of Moving Average Convergence Divergence (MACD) in different economies
34
34
This is one of the most popular and common indicators used in technical analysis.
MACD includes two exponential moving averages, which is used to measure
momentum. The difference between the two moving averages plotted against Centre
line is called MACD. The line at which both the moving averages are equal is known
as the centerline. There is an exponential moving average of the MACD automatically
drawn on the chart. This helps in measuring short-term momentum, which helps in
signaling current direction of momentum.
When the short term moving average is above the long term moving average, this
means there is an upward momentum and when the short term moving average is
below the long term moving average it indicates a downward momentum. 26-day and
12-day exponential moving averages are commonly used for calculations. Nine day
exponential moving average of MACD values is used to create the signal line. In case
of volatile securities short term averages are used and vice versa for less volatile
securities. Histogram is plotted against the centerline and represented by bars in
MACD. A bar represents the difference between the moving average and the signal
line. The higher the bars higher will be the momentum in either of the directions.
(3.3) The MACD Model
The model used in this paper is similar to how we generate MACD line and signal
line along with the actual price on the chart. It generates a buy or a sell signal in terms
of 1 and -1 respectively and calculates the profit wherever the signals change. These
signals are generated when the signal line and Macd intersect each other. Till the next
P a g e |
Analysis of Moving Average Convergence Divergence (MACD) in different economies
35
35
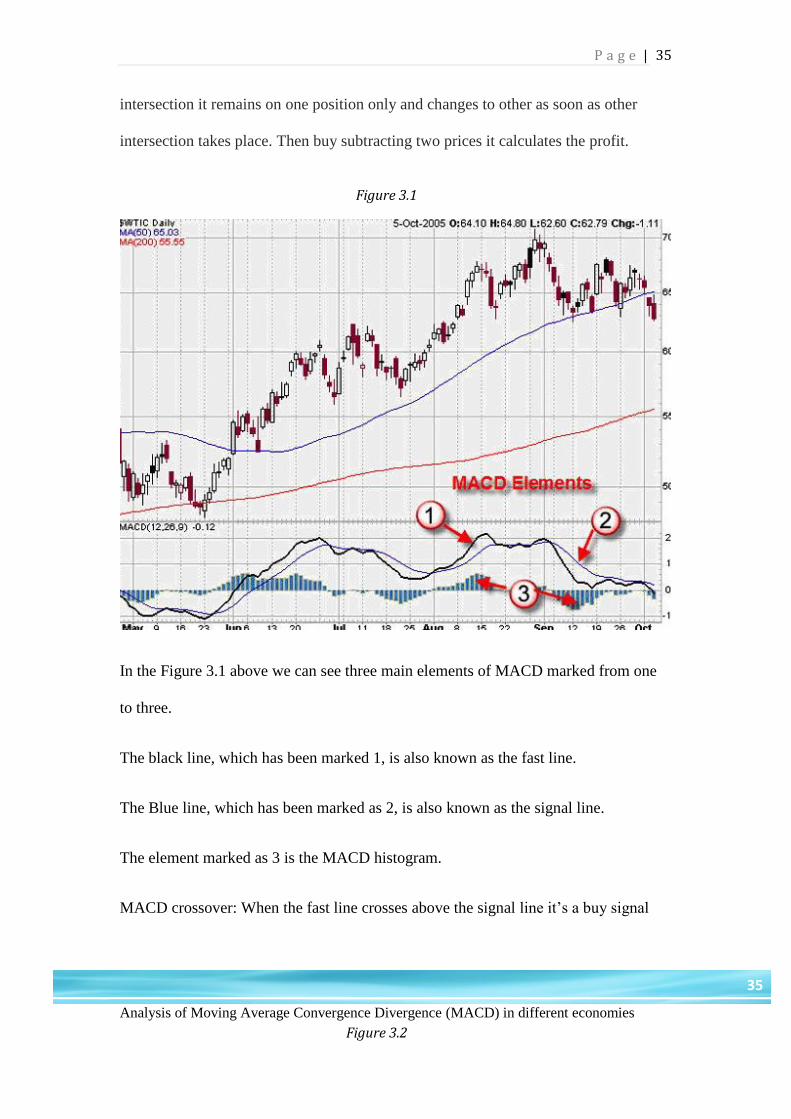
intersection it remains on one position only and changes to other as soon as other
intersection takes place. Then buy subtracting two prices it calculates the profit.
In the Figure 3.1 above we can see three main elements of MACD marked from one
to three.
The black line, which has been marked 1, is also known as the fast line.
The Blue line, which has been marked as 2, is also known as the signal line.
The element marked as 3 is the MACD histogram.
MACD crossover: When the fast line crosses above the signal line it’s a buy signal
Figure 3.1
Figure 3.2
Analysis of Moving Average Convergence Divergence (MACD) in different economies
36
36
and when fast line crosses below the signal line it’s a sell signal. This is the most
common way of using MACD.
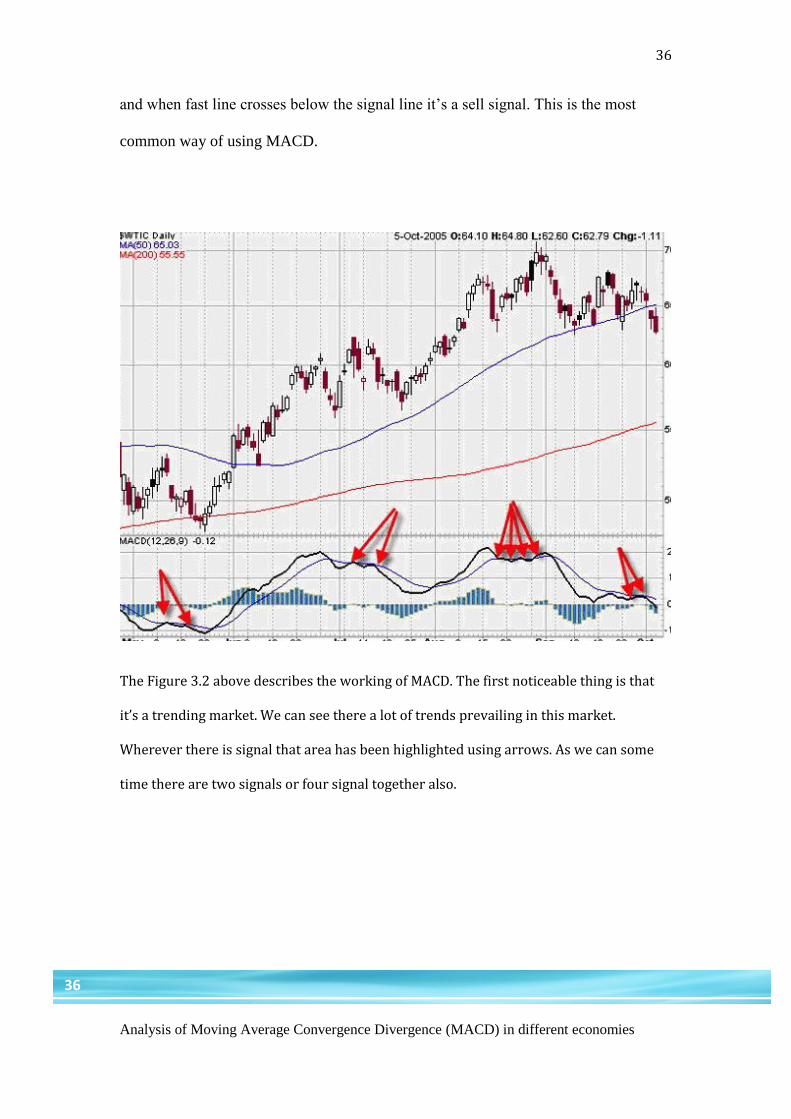
The Figure 3.2 above describes the working of MACD. The first noticeable thing is that
it’s a trending market. We can see there a lot of trends prevailing in this market.
Wherever there is signal that area has been highlighted using arrows. As we can some
time there are two signals or four signal together also.
P a g e |
Analysis of Moving Average Convergence Divergence (MACD) in different economies
37
37
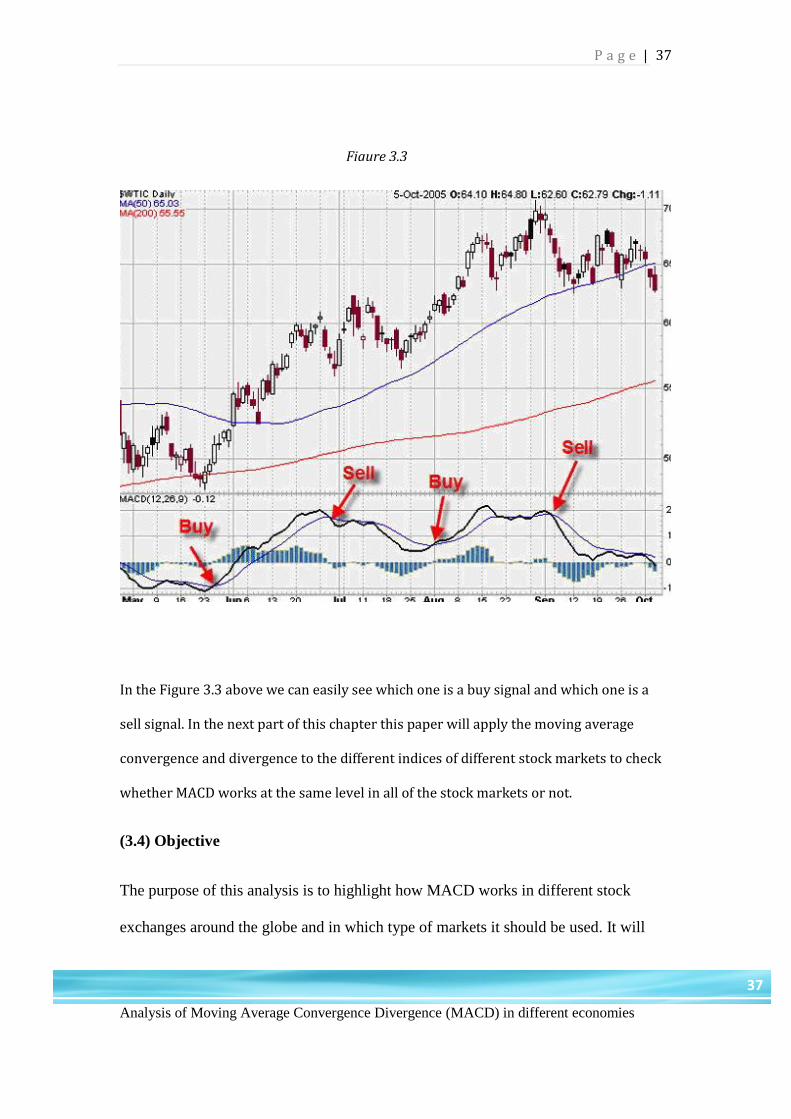
In the Figure 3.3 above we can easily see which one is a buy signal and which one is a
sell signal. In the next part of this chapter this paper will apply the moving average
convergence and divergence to the different indices of different stock markets to check
whether MACD works at the same level in all of the stock markets or not.
(3.4) Objective
The purpose of this analysis is to highlight how MACD works in different stock
exchanges around the globe and in which type of markets it should be used. It will
Figure 3.3
Analysis of Moving Average Convergence Divergence (MACD) in different economies
38
38
help the investors in selecting the markets in which MACD will be reliable or vice
versa.
(3.5) Conclusive Test
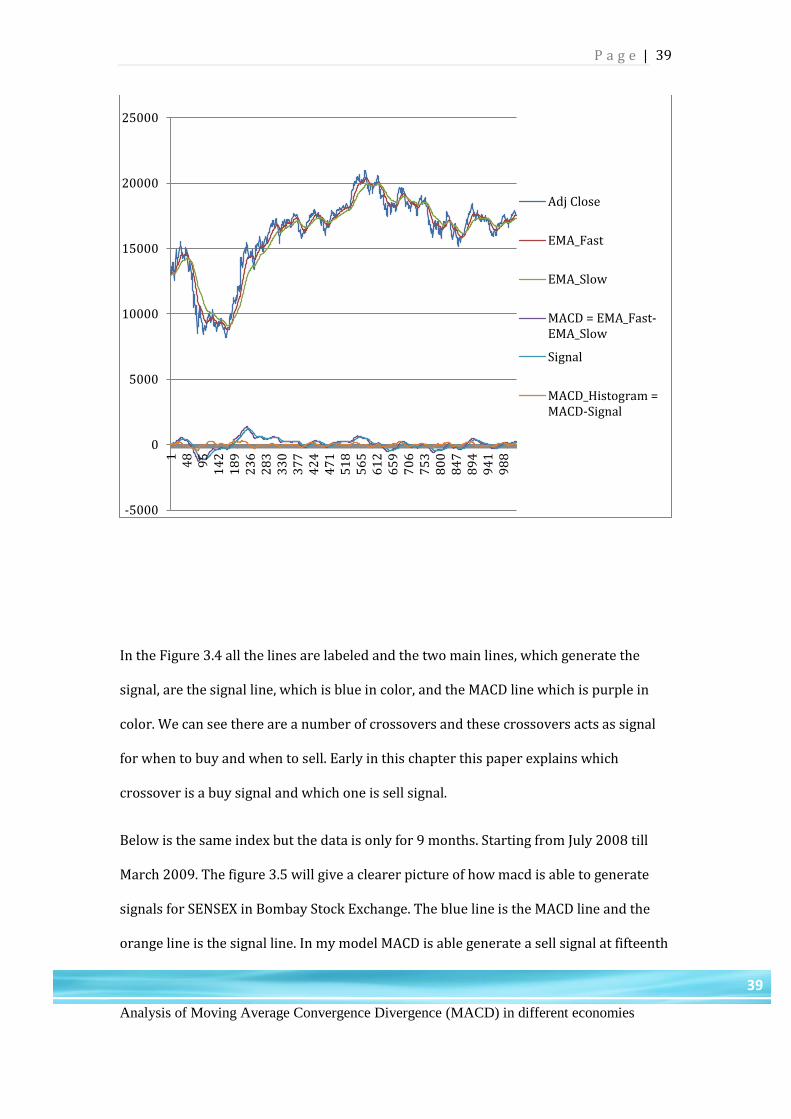
This paper applies MACD in Bombay Stock Exchange using past prices of BSE Sensex
from July 2008 to September 2012. The parameters used are exponential moving
average days fast, exponential moving average days slow and signal line. The data has
been taken from yahoo finance and applied on the model, which calculates the profit
made on each transaction. The model first calculates the exponential moving averages
12 days and 26 days. Then MACD line is calculated by subtracting 12 days from 26 days
EMA. Then the 9-day EMA of macd is calculated which is called the signal line. After this
it calculates the MACD histogram by subtracting MACD line and signal line. In the end it
also calculates the profit wherever it’s possible by checking the signals generated by
MACD. Figure 3.4 reflects the price moments for the Bombay stock exchange index
SENSEX. Figure 3.4
P a g e |
Analysis of Moving Average Convergence Divergence (MACD) in different economies
39
39
In the Figure 3.4 all the lines are labeled and the two main lines, which generate the
signal, are the signal line, which is blue in color, and the MACD line which is purple in
color. We can see there are a number of crossovers and these crossovers acts as signal
for when to buy and when to sell. Early in this chapter this paper explains which
crossover is a buy signal and which one is sell signal.
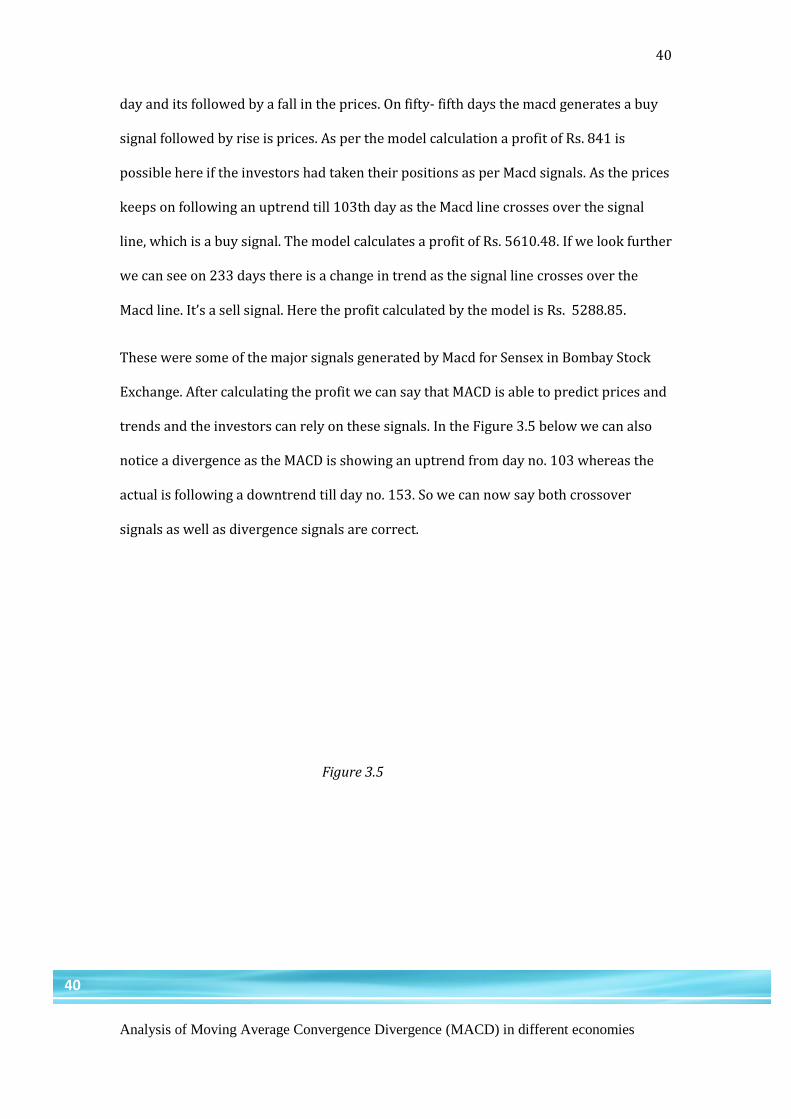
Below is the same index but the data is only for 9 months. Starting from July 2008 till
March 2009. The figure 3.5 will give a clearer picture of how macd is able to generate
signals for SENSEX in Bombay Stock Exchange. The blue line is the MACD line and the
orange line is the signal line. In my model MACD is able generate a sell signal at fifteenth
-5000
0
5000
10000
15000
20000
25000
14
89
51
42
18
92
36
28
33
30
37
74
24
47
15
18
56
56
12
65
97
06
75
38
00
84
78
94
94
19
88
Adj Close
EMA_Fast
EMA_Slow
MACD = EMA_Fast-EMA_Slow
Signal
MACD_Histogram =MACD-Signal
Analysis of Moving Average Convergence Divergence (MACD) in different economies
40
40
day and its followed by a fall in the prices. On fifty- fifth days the macd generates a buy
signal followed by rise is prices. As per the model calculation a profit of Rs. 841 is
possible here if the investors had taken their positions as per Macd signals. As the prices
keeps on following an uptrend till 103th day as the Macd line crosses over the signal
line, which is a buy signal. The model calculates a profit of Rs. 5610.48. If we look further
we can see on 233 days there is a change in trend as the signal line crosses over the
Macd line. It’s a sell signal. Here the profit calculated by the model is Rs. 5288.85.
These were some of the major signals generated by Macd for Sensex in Bombay Stock
Exchange. After calculating the profit we can say that MACD is able to predict prices and
trends and the investors can rely on these signals. In the Figure 3.5 below we can also
notice a divergence as the MACD is showing an uptrend from day no. 103 whereas the
actual is following a downtrend till day no. 153. So we can now say both crossover
signals as well as divergence signals are correct.
Figure 3.5
P a g e |
Analysis of Moving Average Convergence Divergence (MACD) in different economies
41
41
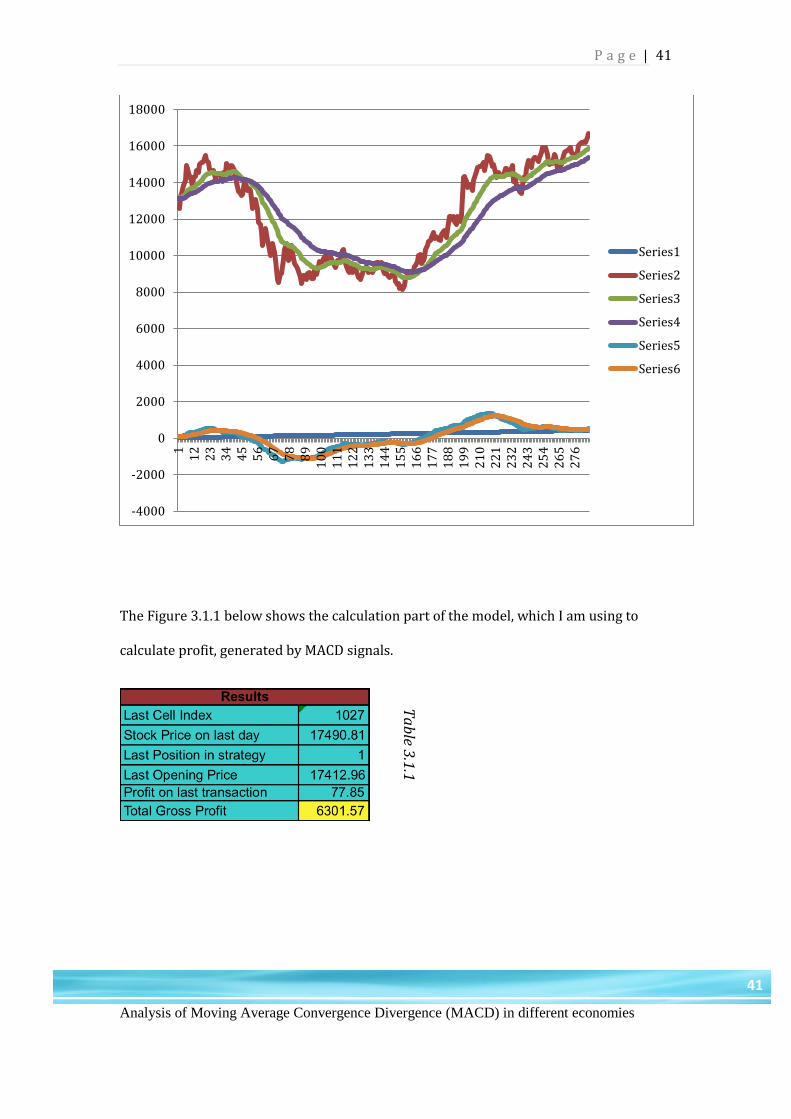
The Figure 3.1.1 below shows the calculation part of the model, which I am using to
calculate profit, generated by MACD signals.
-4000
-2000
0
2000
4000
6000
8000
10000
12000
14000
16000
18000
11
22
33
44
55
66
77
88
91
00
11
11
22
13
31
44
15
51
66
17
71
88
19
92
10
22
12
32
24
32
54
26
52
76
Series1
Series2
Series3
Series4
Series5
Series6T
ab
le 3.1
.1

Analysis of Moving Average Convergence Divergence (MACD) in different economies
42
42
Now we shift from the Bombay stock exchange to Athens stock exchange and we will be
applying MACD to Athens Index Compos. This paper will use the same model, which was
used for Sensex to check the profitability of Macd in Athens Stock Market. Data for
Athens Index Compos ranges from July 2008 to Sept 2012 and is reflecting in the figure
3.6.
Figure 3.6
In the Figure 3.6 we can see that first signal generated by the MACD is a buy signal and
it’s followed by fall in prices and on ninety seventh day MACD generates a sell signal as
the MACD blue line crosses above the signal orange line. As per model calculation the
profit equals to EUR 1338.09. For some time the macd line and the signal line move
close to each other till day no. 235. On day no. 235 the signal orange line crosses over
-1000
-500
0
500
1000
1500
2000
2500
3000
3500
4000
14
58
91
33
17
72
21
26
53
09
35
33
97
44
14
85
52
95
73
61
76
61
70
57
49
79
38
37
88
19
25
96
91
01
3
Time (days)
Adj Close
EMA_Fast
EMA_Slow
MACD = EMA_Fast-EMA_Slow
Signal
P a g e |
Analysis of Moving Average Convergence Divergence (MACD) in different economies
43
43
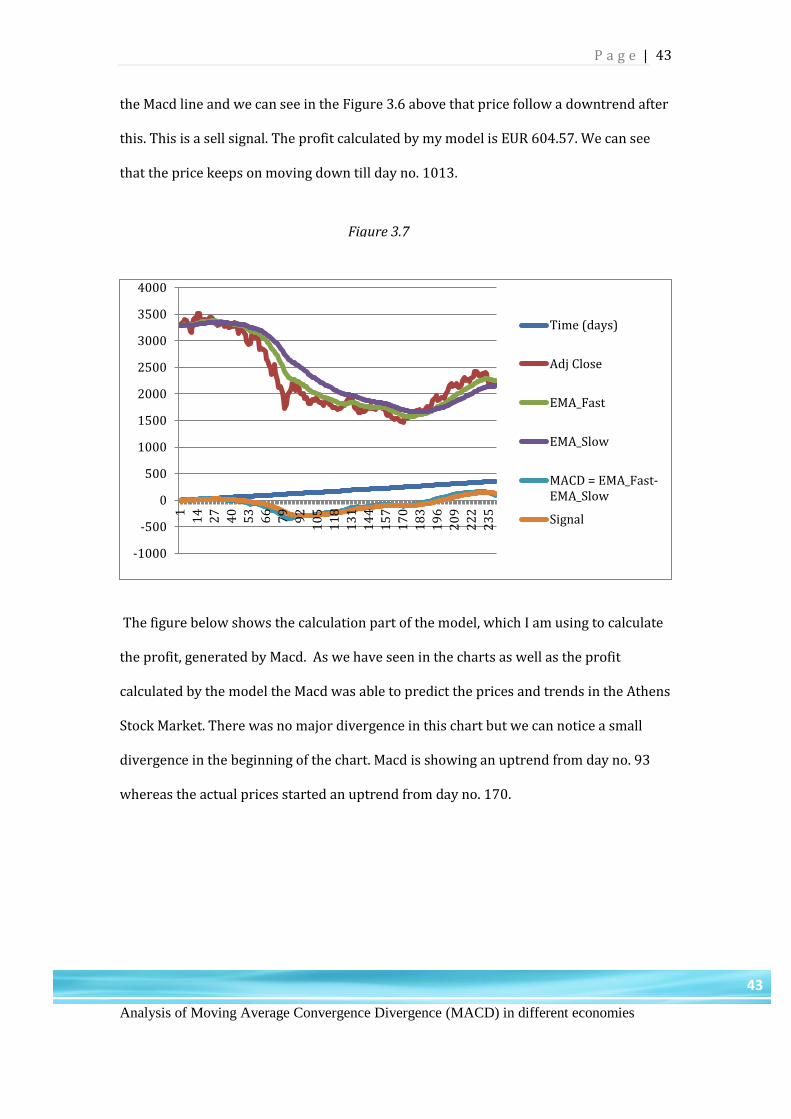
the Macd line and we can see in the Figure 3.6 above that price follow a downtrend after
this. This is a sell signal. The profit calculated by my model is EUR 604.57. We can see
that the price keeps on moving down till day no. 1013.
The figure below shows the calculation part of the model, which I am using to calculate
the profit, generated by Macd. As we have seen in the charts as well as the profit
calculated by the model the Macd was able to predict the prices and trends in the Athens
Stock Market. There was no major divergence in this chart but we can notice a small
divergence in the beginning of the chart. Macd is showing an uptrend from day no. 93
whereas the actual prices started an uptrend from day no. 170.
-1000
-500
0
500
1000
1500
2000
2500
3000
3500
4000
1
14
27
40
53
66
79
92
10
5
11
8
13
1
14
4
15
7
17
0
18
3
19
6
20
9
22
2
23
5
Time (days)
Adj Close
EMA_Fast
EMA_Slow
MACD = EMA_Fast-EMA_Slow
Signal
Figure 3.7
Analysis of Moving Average Convergence Divergence (MACD) in different economies
44
44
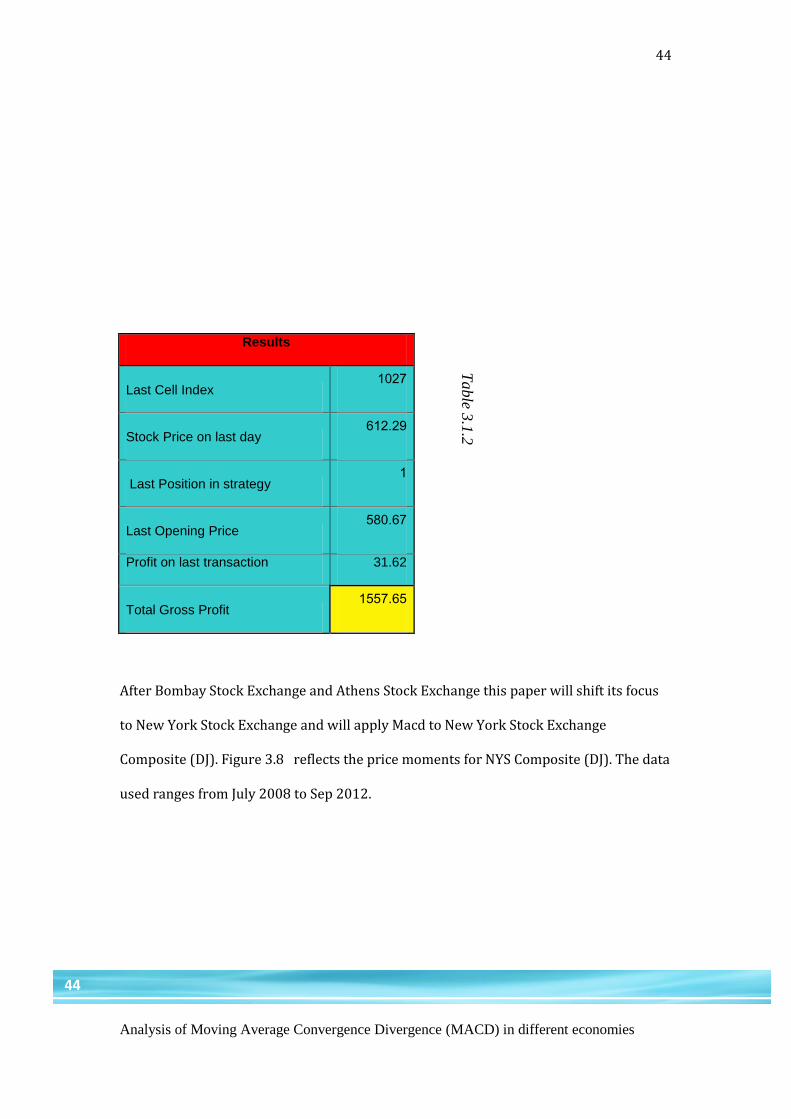
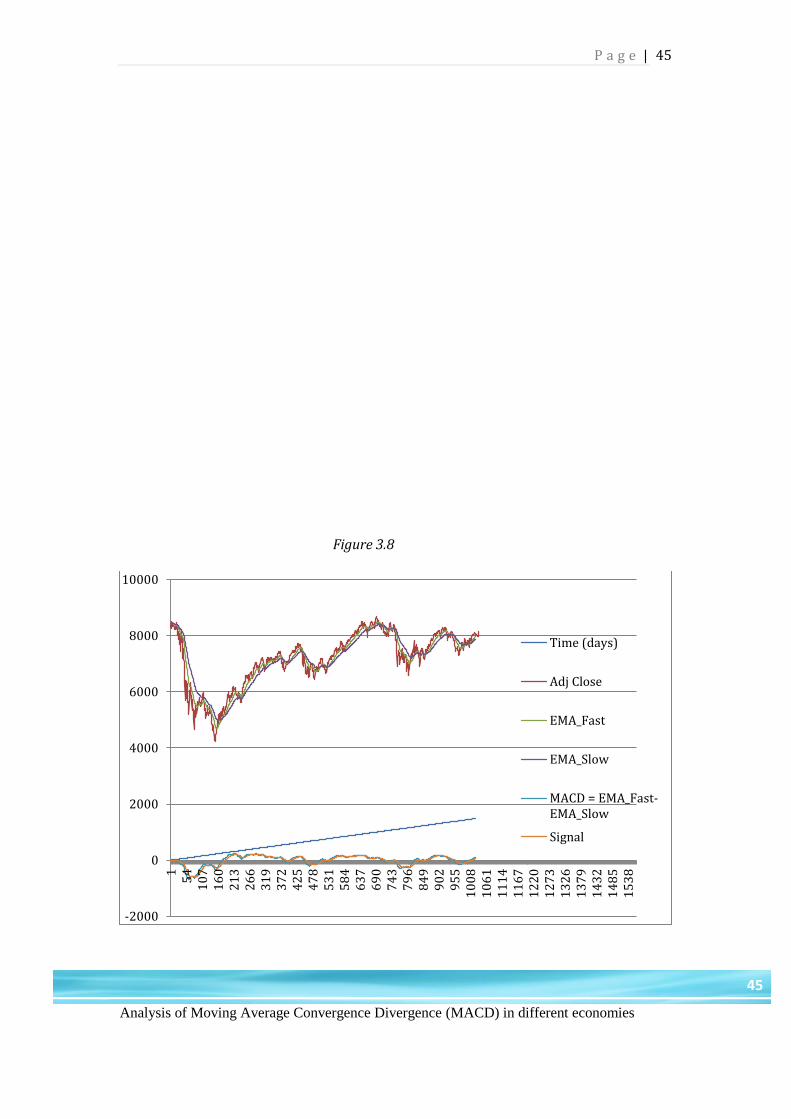
After Bombay Stock Exchange and Athens Stock Exchange this paper will shift its focus
to New York Stock Exchange and will apply Macd to New York Stock Exchange
Composite (DJ). Figure 3.8 reflects the price moments for NYS Composite (DJ). The data
used ranges from July 2008 to Sep 2012.
Results
Last Cell Index 1027
Stock Price on last day 612.29
Last Position in strategy 1
Last Opening Price 580.67
Profit on last transaction 31.62
Total Gross Profit 1557.65
Table 3
.1.2
P a g e |
Analysis of Moving Average Convergence Divergence (MACD) in different economies
45
45
-2000
0
2000
4000
6000
8000
10000
15
41
07
16
02
13
26
63
19
37
24
25
47
85
31
58
46
37
69
07
43
79
68
49
90
29
55
10
08
10
61
11
14
11
67
12
20
12
73
13
26
13
79
14
32
14
85
15
38
Time (days)
Adj Close
EMA_Fast
EMA_Slow
MACD = EMA_Fast-EMA_Slow
Signal
Figure 3.8
Analysis of Moving Average Convergence Divergence (MACD) in different economies
46
46
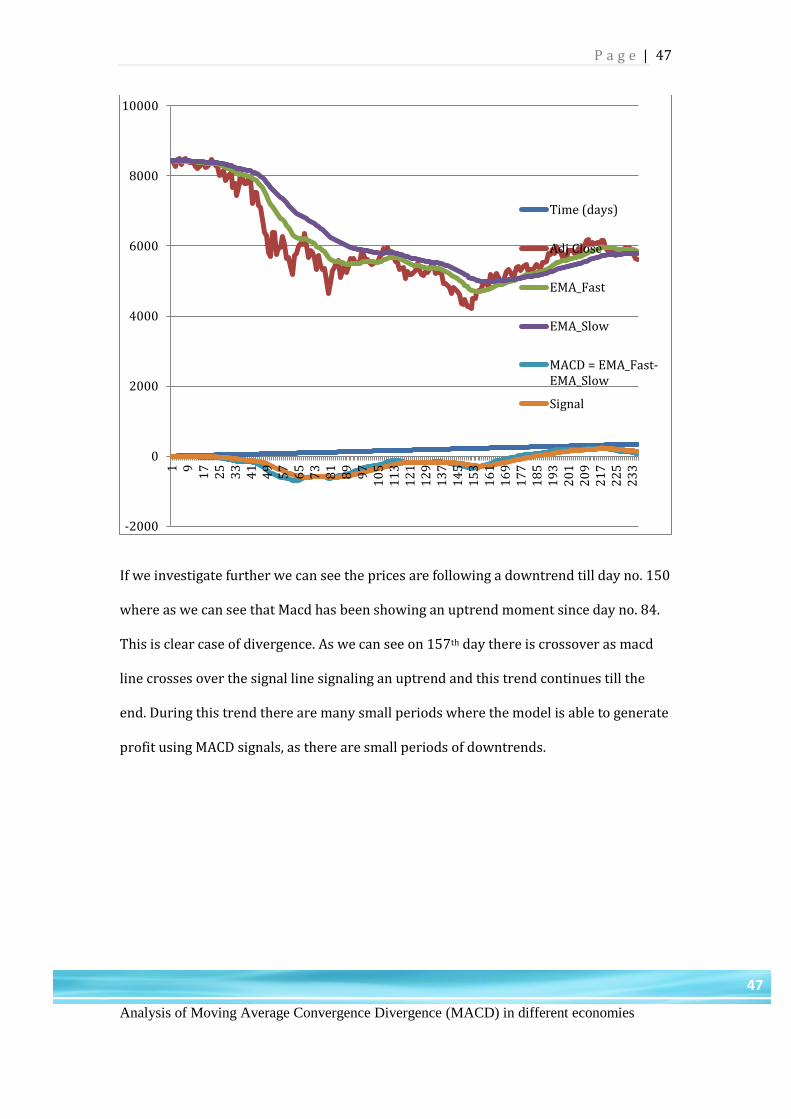
In the Figure 3.7 above we can see the price movement of NYSE Composite (DJ) and the
forecasted price movement created with the help of MACD. We can see MACD which
includes the Macd Line and signal line at the below of the chart. We can see there are
many crossovers, which act as signals. To give a clearer picture of whether the MACD is
able to forecast the future price movements I have added one more chart, which focuses
on first 200 days only.
As we can see in the Figure 3.9 that the price starts from $ 8438 and initially there was
no trend. On 12th day the prices start decreasing and MACD also signals that the price
will follow a downtrend as the signal line crosses above the Macd line and the gap
between these two lines keep on increasing till 90th day and than starts narrowing as
they cross each other on 99th day signaling a change in trend and generating a buy
signal. The profit here calculated by the model equals to $2526.73.
Figure 3.9
P a g e |
Analysis of Moving Average Convergence Divergence (MACD) in different economies
47
47
If we investigate further we can see the prices are following a downtrend till day no. 150
where as we can see that Macd has been showing an uptrend moment since day no. 84.
This is clear case of divergence. As we can see on 157th day there is crossover as macd
line crosses over the signal line signaling an uptrend and this trend continues till the
end. During this trend there are many small periods where the model is able to generate
profit using MACD signals, as there are small periods of downtrends.
-2000
0
2000
4000
6000
8000
10000
1 91
72
53
34
14
95
76
57
38
18
99
71
05
11
31
21
12
91
37
14
51
53
16
11
69
17
71
85
19
32
01
20
92
17
22
52
33
Time (days)
Adj Close
EMA_Fast
EMA_Slow
MACD = EMA_Fast-EMA_Slow
Signal
Analysis of Moving Average Convergence Divergence (MACD) in different economies
48
48
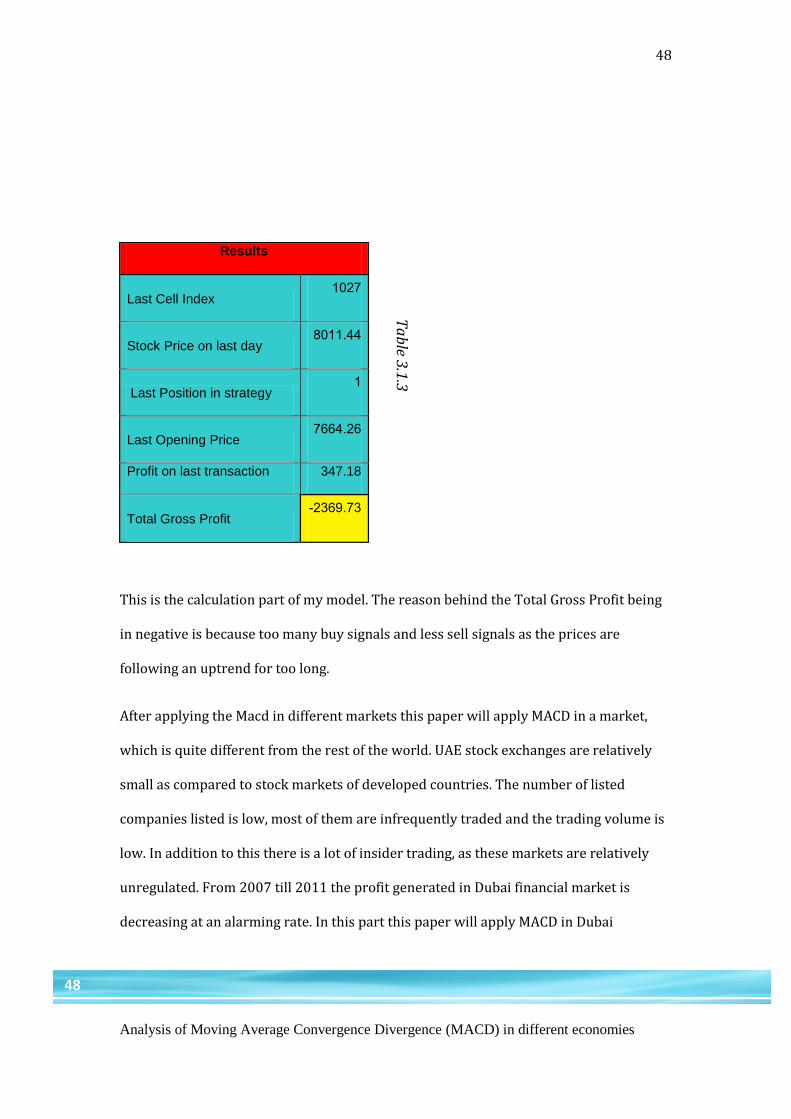
This is the calculation part of my model. The reason behind the Total Gross Profit being
in negative is because too many buy signals and less sell signals as the prices are
following an uptrend for too long.
After applying the Macd in different markets this paper will apply MACD in a market,
which is quite different from the rest of the world. UAE stock exchanges are relatively
small as compared to stock markets of developed countries. The number of listed
companies listed is low, most of them are infrequently traded and the trading volume is
low. In addition to this there is a lot of insider trading, as these markets are relatively
unregulated. From 2007 till 2011 the profit generated in Dubai financial market is
decreasing at an alarming rate. In this part this paper will apply MACD in Dubai
Results
Last Cell Index 1027
Stock Price on last day 8011.44
Last Position in strategy 1
Last Opening Price 7664.26
Profit on last transaction 347.18
Total Gross Profit -2369.73
Ta
ble 3
.1.3
P a g e |
Analysis of Moving Average Convergence Divergence (MACD) in different economies
49
49
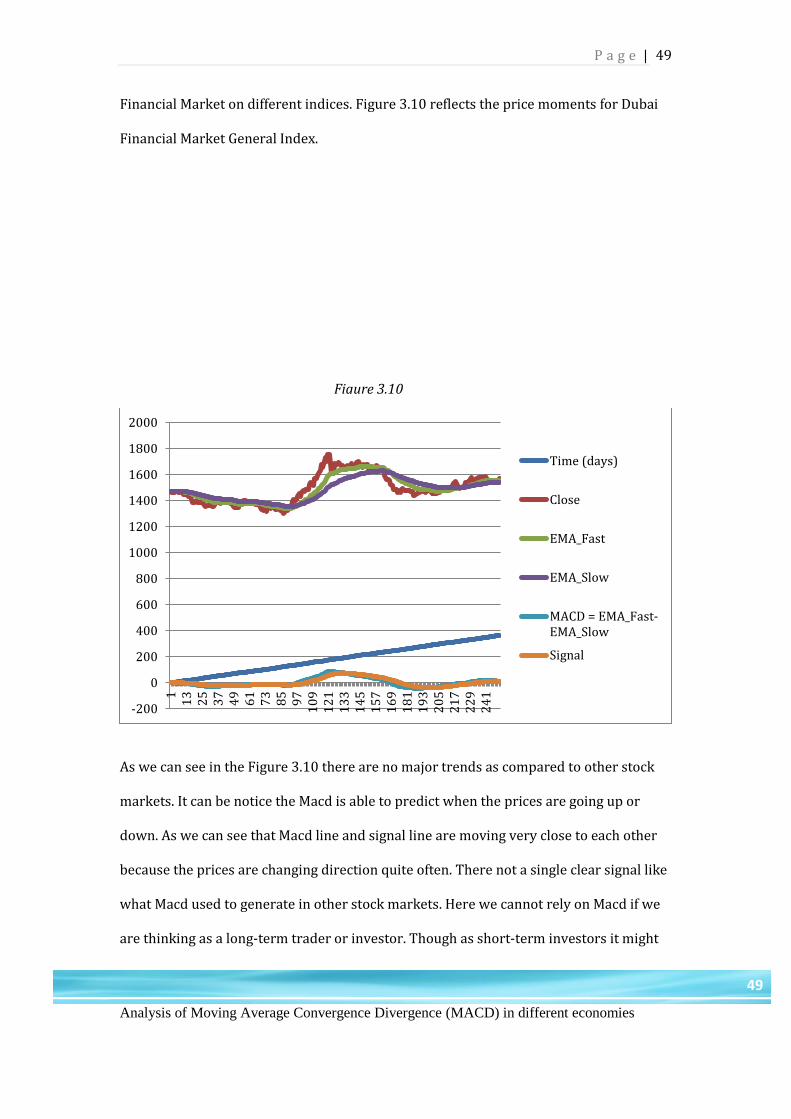
Financial Market on different indices. Figure 3.10 reflects the price moments for Dubai
Financial Market General Index.
As we can see in the Figure 3.10 there are no major trends as compared to other stock
markets. It can be notice the Macd is able to predict when the prices are going up or
down. As we can see that Macd line and signal line are moving very close to each other
because the prices are changing direction quite often. There not a single clear signal like
what Macd used to generate in other stock markets. Here we cannot rely on Macd if we
are thinking as a long-term trader or investor. Though as short-term investors it might
-200
0
200
400
600
800
1000
1200
1400
1600
1800
2000
11
32
53
74
96
17
38
59
71
09
12
11
33
14
51
57
16
91
81
19
32
05
21
72
29
24
1
Time (days)
Close
EMA_Fast
EMA_Slow
MACD = EMA_Fast-EMA_Slow
Signal
Figure 3.10
Analysis of Moving Average Convergence Divergence (MACD) in different economies
50
50
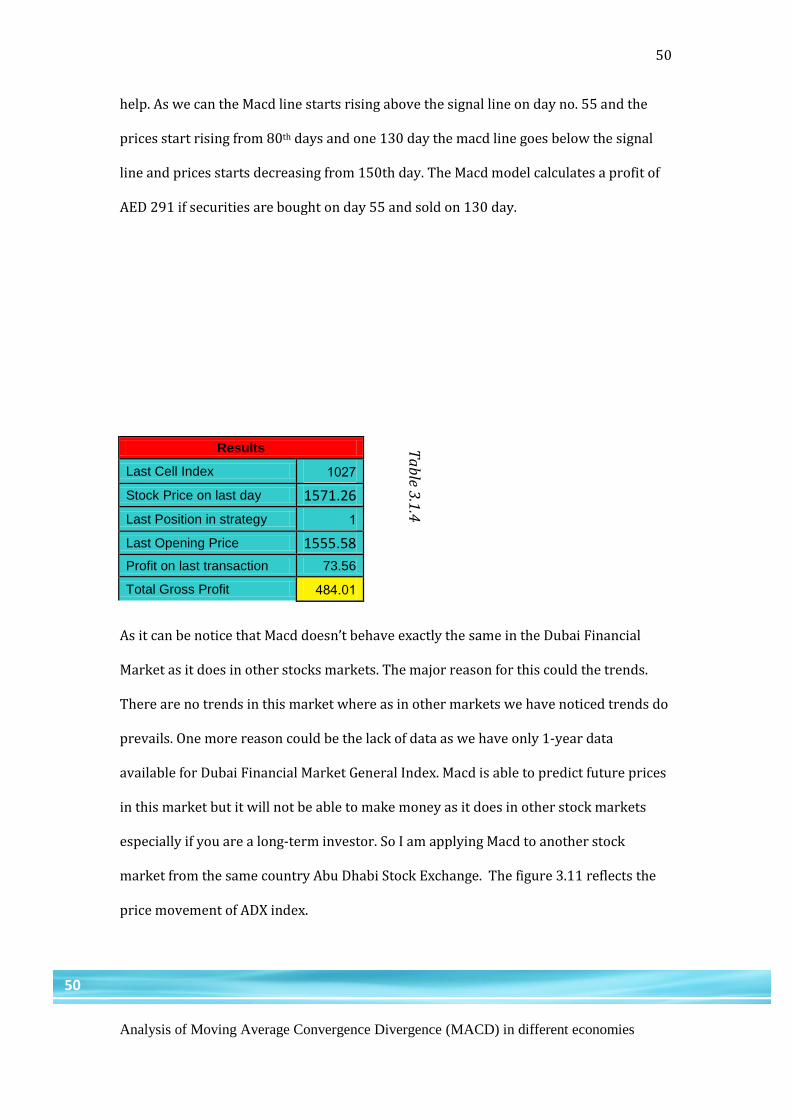
help. As we can the Macd line starts rising above the signal line on day no. 55 and the
prices start rising from 80th days and one 130 day the macd line goes below the signal
line and prices starts decreasing from 150th day. The Macd model calculates a profit of
AED 291 if securities are bought on day 55 and sold on 130 day.
As it can be notice that Macd doesn’t behave exactly the same in the Dubai Financial
Market as it does in other stocks markets. The major reason for this could the trends.
There are no trends in this market where as in other markets we have noticed trends do
prevails. One more reason could be the lack of data as we have only 1-year data
available for Dubai Financial Market General Index. Macd is able to predict future prices
in this market but it will not be able to make money as it does in other stock markets
especially if you are a long-term investor. So I am applying Macd to another stock
market from the same country Abu Dhabi Stock Exchange. The figure 3.11 reflects the
price movement of ADX index.
Results
Last Cell Index 1027
Stock Price on last day 1571.26
Last Position in strategy 1
Last Opening Price 1555.58
Profit on last transaction 73.56
Total Gross Profit 484.01
Ta
ble 3
.1.4

P a g e |
Analysis of Moving Average Convergence Divergence (MACD) in different economies
51
51
Figure 3.11
Analysis of Moving Average Convergence Divergence (MACD) in different economies
52
52
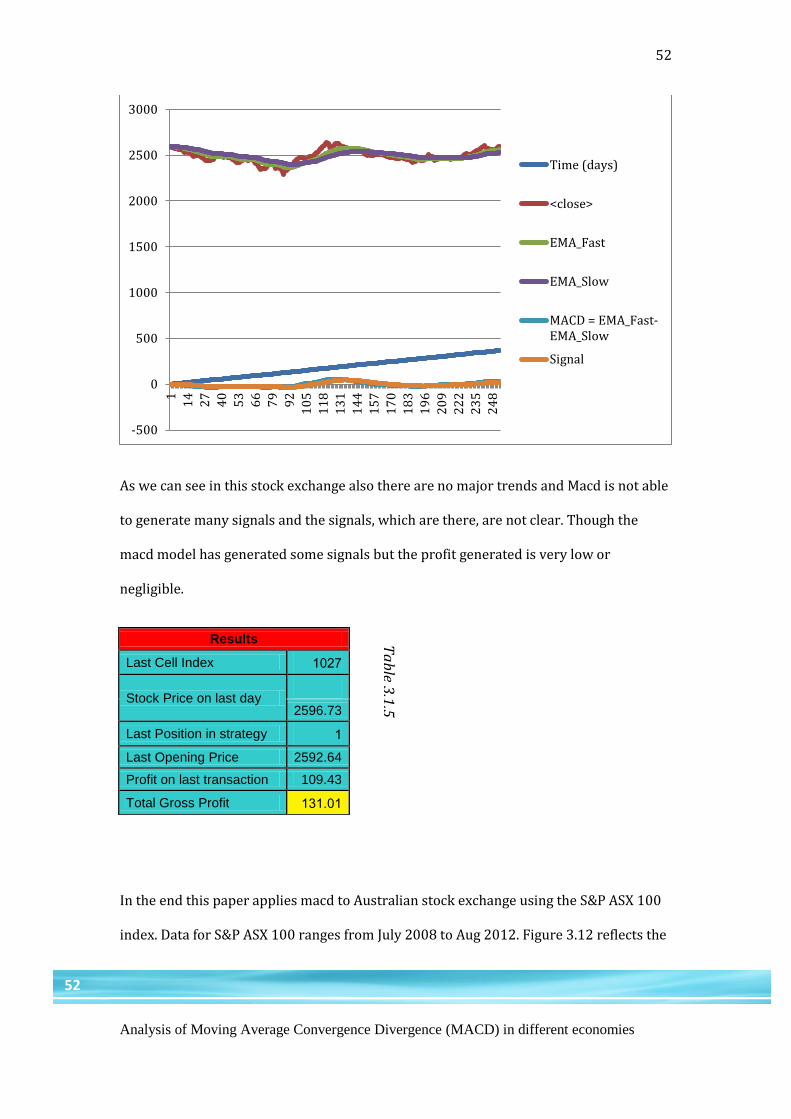
As we can see in this stock exchange also there are no major trends and Macd is not able
to generate many signals and the signals, which are there, are not clear. Though the
macd model has generated some signals but the profit generated is very low or
negligible.
In the end this paper applies macd to Australian stock exchange using the S&P ASX 100
index. Data for S&P ASX 100 ranges from July 2008 to Aug 2012. Figure 3.12 reflects the
-500
0
500
1000
1500
2000
2500
3000
1
14
27
40
53
66
79
92
10
5
11
8
13
1
14
4
15
7
17
0
18
3
19
6
20
9
22
2
23
5
24
8
Time (days)
<close>
EMA_Fast
EMA_Slow
MACD = EMA_Fast-EMA_Slow
Signal
Results
Last Cell Index 1027
Stock Price on last day
2596.73
Last Position in strategy 1
Last Opening Price 2592.64
Profit on last transaction 109.43
Total Gross Profit 131.01
Ta
ble 3
.1.5
P a g e |
Analysis of Moving Average Convergence Divergence (MACD) in different economies
53
53
price moment of S&P ASX 100.
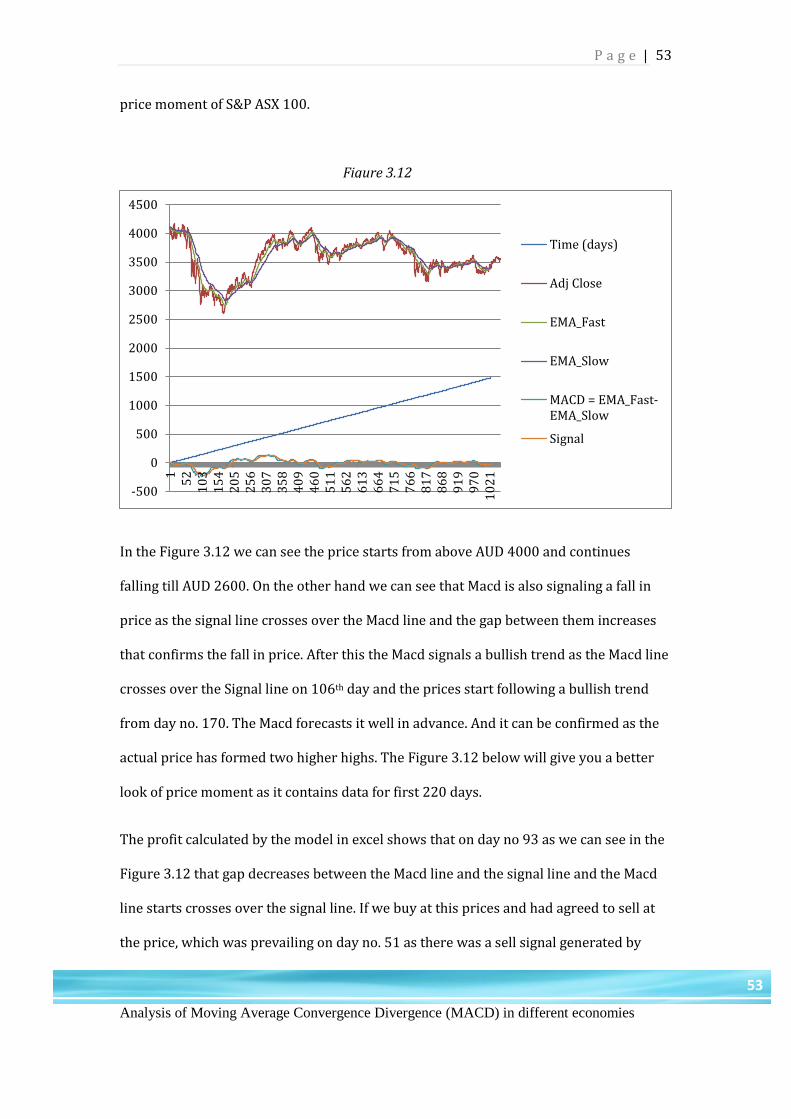
In the Figure 3.12 we can see the price starts from above AUD 4000 and continues
falling till AUD 2600. On the other hand we can see that Macd is also signaling a fall in
price as the signal line crosses over the Macd line and the gap between them increases
that confirms the fall in price. After this the Macd signals a bullish trend as the Macd line
crosses over the Signal line on 106th day and the prices start following a bullish trend
from day no. 170. The Macd forecasts it well in advance. And it can be confirmed as the
actual price has formed two higher highs. The Figure 3.12 below will give you a better
look of price moment as it contains data for first 220 days.
The profit calculated by the model in excel shows that on day no 93 as we can see in the
Figure 3.12 that gap decreases between the Macd line and the signal line and the Macd
line starts crosses over the signal line. If we buy at this prices and had agreed to sell at
the price, which was prevailing on day no. 51 as there was a sell signal generated by
-500
0
500
1000
1500
2000
2500
3000
3500
4000
4500
15
21
03
15
42
05
25
63
07
35
84
09
46
05
11
56
26
13
66
47
15
76
68
17
86
89
19
97
01
02
1
Time (days)
Adj Close
EMA_Fast
EMA_Slow
MACD = EMA_Fast-EMA_Slow
Signal
Figure 3.12
Analysis of Moving Average Convergence Divergence (MACD) in different economies
54
54
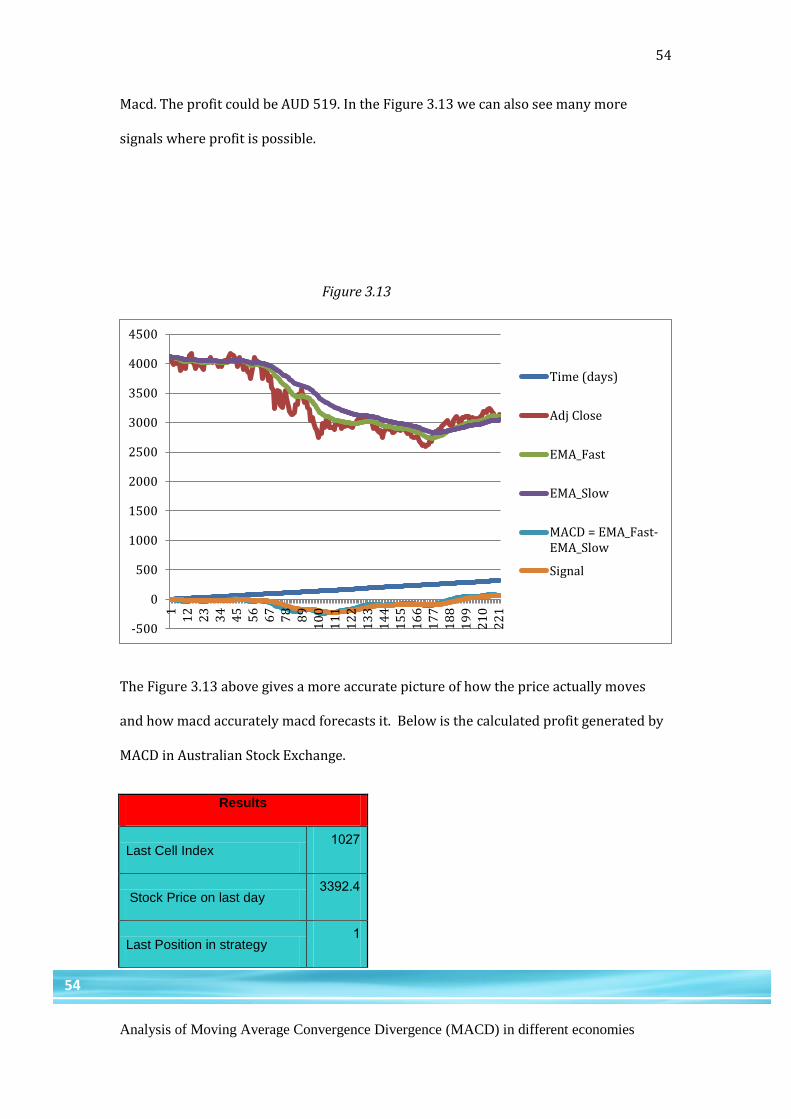
Macd. The profit could be AUD 519. In the Figure 3.13 we can also see many more
signals where profit is possible.
The Figure 3.13 above gives a more accurate picture of how the price actually moves
and how macd accurately macd forecasts it. Below is the calculated profit generated by
MACD in Australian Stock Exchange.
-500
0
500
1000
1500
2000
2500
3000
3500
4000
4500
11
22
33
44
55
66
77
88
91
00
11
11
22
13
31
44
15
51
66
17
71
88
19
92
10
22
1
Time (days)
Adj Close
EMA_Fast
EMA_Slow
MACD = EMA_Fast-EMA_Slow
Signal
Results
Last Cell Index 1027
Stock Price on last day 3392.4
Last Position in strategy 1
Figure 3.13
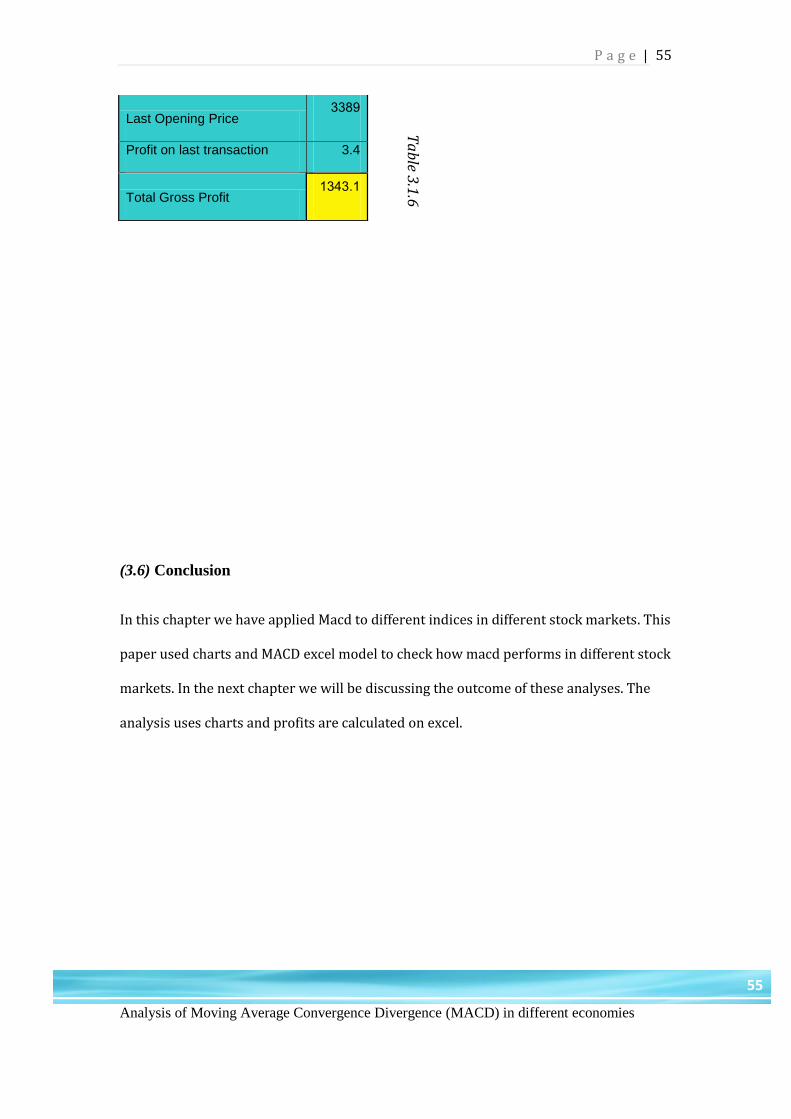
P a g e |
Analysis of Moving Average Convergence Divergence (MACD) in different economies
55
55
(3.6) Conclusion
In this chapter we have applied Macd to different indices in different stock markets. This
paper used charts and MACD excel model to check how macd performs in different stock
markets. In the next chapter we will be discussing the outcome of these analyses. The
analysis uses charts and profits are calculated on excel.
Last Opening Price 3389
Profit on last transaction 3.4
Total Gross Profit 1343.1
Ta
ble 3
.1.6
Analysis of Moving Average Convergence Divergence (MACD) in different economies
56
56
Chapter 4
(4.1) Conclusion
This chapter discusses the output of analysis done in the previous chapter. As we
know this paper has analyzed performance of Moving Average Divergence
Convergence (MACD) in different stock markets around the globe by apply MACD
to different indices.

P a g e |
Analysis of Moving Average Convergence Divergence (MACD) in different economies
57
57
For most of the markets this dissertation uses historical data of indices ranging from
2008 to 2012. The paper uses charts and Macd model created on excel to check
whether MACD is able to forecast future prices and calculates the profits also.
First the Macd is applied in Bombay Stock Exchange (BSE). The index used is
Sensex and the data ranges from July 2008 to Sep-2012. It can be noticed that MACD
is able to forecast prices and is able to predict changes in trends much before it
happens in reality. A successful divergence signal was also noticed. As we know
Indian economy is one of the emerging economies and many investors are aiming for
markets in India including Bombay Stock Exchange and National Stock Exchange.
Investors can depend on Macd signals, as the Macd model was able to generate
profits.
After this the Macd was applied in Athens Stock Exchange using the Athens Index
Compos. The historical prices for AIC range from July 2008 to Sep 2012. It can be
seen in the chart that Macd was able to predict the future prices as well as change in
trends but later on the price kept on following a downtrend and whenever MACD was
signaling an uptrend. It was just for few days. So the investors need to be more
cautious from such signals. One more thing to keep in mind is that in this period the
Euro debt crisis had started and this can be the reason why the prices kept on falling
and even though Macd was generating bullish signals but the MACD line was never
able to stay above the signal line. Investors should not rely only on Macd in such
markets where there is a crisis going on. It would be better to use more indicators like
Relative Strength Index and Stochastics. These indicators can help in confirming the

Analysis of Moving Average Convergence Divergence (MACD) in different economies
58
58
signals generated by Macd.
Next in line comes the New York Stock Exchange. The paper applies Macd to NYSE
using the New York Stock Exchange Composite (DJ) index. The data for NYSE
composite (DJ) ranges from July 2008 to Sept 2012. In this case Macd is able to
predict future prices and trends and the Macd model was able to generate profit by
relying on macd signals. In this period US economy was hit by recession but still
Macd works perfectly and the Macd model was able to capture profits by relying on
Macd signals.
After New York Stock Exchange this paper shifts its focus to markets in the Middle
East. It applies Macd to Dubai Financial Market and Abu Dhabi Stock Exchange.
Macd was not able to perform in both of these markets as these markets lack trends
and are more volatile than other stock markets. Investors should not rely on Macd
alone in such markets. Investors should use fundamental analysis as well as technical
analysis indicators so that they can minimize their losses.
Finally when applied in Australia Stock Market it was able to work perfectly as it was
able to predict prices as well as change in trends and the MACD model was able
capture profits by relying on signals generated by Macd. Australian economy is one
of the economies, which was not affected by recession as much as it had affected
other countries like USA and Russia. So we can say investors can rely on Macd when
investing in economies like Australia.
To conclude we can say that MACD performs well in economies like India and
Australia as the former is an emerging economy and the latter is developed economy
P a g e |
Analysis of Moving Average Convergence Divergence (MACD) in different economies
59
59
both the economies were not going through any kind of crisis. But as we move to
European economies specially the PIGS economies, which include countries like
Portugal, Italy, Greece and Spain, in this dissertation we have analyzed Athens stock
market, Greece`s economy is severely affected by European Debt Crisis. Investor
should not rely only on single indicators but use a couple of indicators and use
fundamental analysis in selecting which stock to invest in. In NYSE Macd was able to
forecast price movement but wasn’t able to generated huge profits as the U.S
economy was affected by recession during this period. In Dubai Financial Market and
Abu Dhabi Stock Exchange, MACD is not able to perform at all and it would be a
poor decision to use Macd in such non-trending markets.
Analysis of Moving Average Convergence Divergence (MACD) in different economies
60
60
(4.2) Suggestions and Recommendations
Technical analysis can be a great tool for making money in the stock market. But
ignoring the fundamental side of trading can result in loss as we can see in this
dissertation that it was not able to make money in some markets.
Keeping the above statement in mind the investors or traders should consider the
fundamental factors like current economic conditions for selecting a stock and then
apply technical analysis to determine the entry and exit points.
In addition to this to be a successful technical analyst one needs to gain a lot of
experience in the field of financial markets. Lot of training is required and one needs
to be updated regarding the recent developments in the financial markets.
To be on the safer side it would be better to use a couple of technical indicator during
technical analysis and Macd being a primary indicator. As we learned from this
dissertation that MACD can fail also in some markets.

P a g e |
Analysis of Moving Average Convergence Divergence (MACD) in different economies
61
61
As we know from our analysis Macd was not able to work in Dubai Financial Markets
and Abu Dhabi Stock Exchange as both are non-trending markets and the data
available for both of them was not more than a year.
On the other hand investors should be careful as sometime Macd generates a false
signal. To overcome such hurdles investors should wait for a confirmation signal from
the other indicators.
Further study is required in this matter as this paper only includes few stock markets
around the globe.
In normal conditions Macd can be used for long term trading also but its best suited
for short term trading.

Analysis of Moving Average Convergence Divergence (MACD) in different economies
62
62
Reference
Pring, M.J. (2002) Technical Analysis Explained. New York: McGraw-Hill.
Billingsley, R.S. and Chance,D.M. (1996) Benefits and limitations of diversification
among commodity trading advisors.
Brorsen,B.W. and Irwin, S.H. (1987) Futures funds and price volatility. Review of
Futures
Markets 6: 118–135.
Treynor, Jack L. and Robert Ferguson. "In Defense of Technical Analysis." Journal of
Finance,
40 (April 1985), 757-73.
Brown, D.P. and Jennings, R.H. (1989) On technical analysis. Review of Financial
Studies
P a g e |
Analysis of Moving Average Convergence Divergence (MACD) in different economies
63
63
2: 527–551.
Grundy, B.D. and McNichols, M. (1989) Trade and the revelation of information
through prices and direct disclosure. Review of Financial Studies 2: 495–526.
Blume, L., Easley, D. and O’Hara, M. (1994) Market statistics and technical analysis:
the
role of volume. Journal of Finance 49: 153–181
Shleifer, A. and Summers, L.H. (1990) The noise trader approach to finance. Journal
of
Economic Perspectives 4: 19–33.
Froot, K.A., Scharfstein, D.S. and Stein, J.C. (1992) Herd on the street: informational
inefficiencies in a market with short-term speculation. Journal of Finance 47: 1461–
1484.
Schmidt, A.B. (2002) Why technical trading may be successful? A lesson from the
agent-
based modeling. Physica A 303: 185–188.
Clyde, W.C. and Osler, C.L. (1997) Charting: chaos theory in disguise? Journal of
Futures
Markets 17: 489–514.
Donchian, R.D. (1960) High finance in copper. Financial Analysts Journal
November–
Analysis of Moving Average Convergence Divergence (MACD) in different economies
64
64
December, 133–142.
Alexander, S.S. (1961) Price movements in speculative markets: trends or random
walks. Industrial Management Review 2: 7–26.
Alexander, S.S. (1964) Price movements in speculative markets: trends or random
walks No. 2. Industrial Management Review 5: 25–46.
Fama, E.F. and Blume, M.E. (1966) Filter rules and stock market trading. Journal of
Business 39: 226–241.
Sweeny, R.J. (1988) Some new filter rule tests: methods and results. Journal of
Financial
and Quantitative Analysis 23: 285–300.
Neely, C.J. (1997) Technical analysis in the foreign exchange market: a layman’s
guide.
Federal Reserve Bank of St Louis September/October, 23–38.
Taylor, M.P. and Allen, H. (1992) The use of technical analysis in the foreign
exchange
market. Journal of International Money and Finance 11: 304–314.
Levich, R.M. and Thomas, L.R. III (1993) The significance of technical trading rule
profits in the foreign exchange market: a bootstrap approach. Journal of International
Money and Finance 12: 451–474.
Osler, Carol L. and Chang, P. H. Kevin, Head and Shoulders: Not Just a Flaky Pattern
P a g e |
Analysis of Moving Average Convergence Divergence (MACD) in different economies
65
65
(August 1995
Menkhoff, L. (1997) Examining the use of technical currency analysis. International
Journal of Finance and Economics 2: 307–318.
Frankel, Jeffrey A. and Kenneth Froot. (1990) "Using Survey Data to Test Standard
Propositions Regarding Exchange Rate Expectations."
Lento, C., 2008. “A combined signal approach to technical analysis on the S&P 500”,
The Journal of Business and Economics Research 6(8), pp. 11 - 22.
Levy, R.A. (1967a) Random walks: reality or myth. Financial Analysts Journal 23:
69–77.
Griffioen, G.A., 2003. Technical Analysis in Financial Markets.
Park, C. and Irwin, S.H. (2004) The Profitability of Technical Analysis: A Review.
Agmas Project Research Report No. 2004-04
Hsu, P.-H., Kuan, C.-M. (2005). Re-examing the profitability of technical analysis
with data snooping checks. Journal of Financial Econometrics 3, iss. 4, 606-628.
Fernández-Rodríguez, F., González-Martel, C. and S. Sosvilla-Rivero (2000): “On the
profitability of technical trading rules based on artificial neural networks: Evidence
from the Madrid stock market”
Marshall, B., Cahan, R.C., Cahan, J.M. (2010) Technical Analysis Around The
World, working paper, Massey University New Zealand.
Lento, C. 2009. Combined Signal Approach: “Further Evidence from the Asian-
Analysis of Moving Average Convergence Divergence (MACD) in different economies
66
66
Pacific Equity Markets.” Applied Economics Letters, 16(7), 749-753.
Fernández-Rodríguez, F., Sosvilla-Rivero, S. and M. D. García-Artiles (1997): "Using
nearest neighbour predictors to forecast the Spanish stock market"
Park, C.H., and S.H. Irwin. (2005) “The Profitability of Technical Trading Rules in US
Futures Markets: A Data Snooping Free Test.”
Neely, C.J., Weller, P.A., 2012. “Technical analysis in the foreign exchange market.”
Hsu, P.H., Hsu Y.-C., Kuan, C.H. (2010). “Testing the Predictive Ability of Technical
Analysis Using a New Stepwise Test without Data Snooping Bias.”
Han, Yufeng, Yang, Ke and Zhou, Guofu, A New Anomaly: “The Cross-Sectional
Profitability of Technical Analysis.”
Marshall, B.R., M.R. Young and L.C. Rose, 2006. Candlestick Technical Trading
Strategies:
Can They Create Value for Investors?
Isakov , Dušan and Marti, Didier, “Technical Analysis with a Long Term Perspective:
Trading Strategies and Market
Top Related
Copyright © 2022 FDOKUMEN

