


Bahasa
Halaman
Hukum


Air Force Institute of Technology Air Force Institute of Technology
AFIT Scholar AFIT Scholar
Theses and Dissertations Student Graduate Works
3-19-2007
Rapid Runway Repair (RRR): An Optimization for Minimum Rapid Runway Repair (RRR): An Optimization for Minimum
Operating Strip (MOS) Selection Operating Strip (MOS) Selection
David J. Duncan
Follow this and additional works at: https://scholar.afit.edu/etd
Part of the Construction Engineering and Management Commons, and the Transportation Engineering
Commons
Recommended Citation Recommended Citation Duncan, David J., "Rapid Runway Repair (RRR): An Optimization for Minimum Operating Strip (MOS) Selection" (2007). Theses and Dissertations. 3025. https://scholar.afit.edu/etd/3025
This Thesis is brought to you for free and open access by the Student Graduate Works at AFIT Scholar. It has been accepted for inclusion in Theses and Dissertations by an authorized administrator of AFIT Scholar. For more information, please contact [email protected].
RAPID RUNWAY REPAIR (RRR): AN OPTIMIZATION FOR MINIMUM OPERATING STRIP SELECTION
THESIS
David Duncan, Captain, USAF
AFIT/GEM/ENV/07-M4
DEPARTMENT OF THE AIR FORCE AIR UNIVERSITY
AIR FORCE INSTITUTE OF TECHNOLOGY
Wright-Patterson Air Force Base, Ohio
APPROVED FOR PUBLIC RELEASE; DISTRIBUTION UNLIMITED

The views expressed in this thesis are those of the author and do not reflect the official policy or position of the United States Air Force, Department of Defense, or the United States Government.

AFIT/GEM/ENV/07-M4
RAPID RUNWAY REPAIR (RRR): AN OPTIMIZATION
FOR MINIMUM OPERATING STRIP SELECTION
THESIS
Presented to the Faculty
Department of Systems and Engineering Management
Graduate School of Engineering and Management
Air Force Institute of Technology
Air University
Air Education and Training Command
In Partial Fulfillment of the Requirements for the
Degree of Master of Science in Engineering Management
David Duncan, BS
Captain, USAF
March 2007
APPROVED FOR PUBLIC RELEASE; DISTRIBUTION UNLIMITED.

AFIT/GEM/ENV/07-M4
RAPID RUNWAY REPAIR (RRR): AN OPTIMIZATION
FOR MINIMUM OPERATING STRIP SELECTION
David Duncan, BS Captain, USAF
Approved: -- signed-- 16 Mar 07 ____________________________________ Sonia E. Leach (Chairman) date -- signed -- 16 Mar 07 ____________________________________ Alfred E. Thal, Jr. (Member) date -- signed -- 19 Mar 07 ____________________________________ Jason J. Cook (Member) date
iv
AFIT/GEM/ENV/07-M4
Abstract Minimum Operating Strip (MOS) selection determines the exact placement of the
MOS on the damaged runway, and therefore, the amount of munitions that need to be
neutralized and the amount of damage that will need to be repaired. MOS selection, in
essence, is the key determinant of the time required to attain an operational takeoff and
recovery surface. Since the MOS selection stage determines the events and scope of
work for all of the Rapid Runway Repair (RRR) stages that follow, it could be argued
that this is the most important stage in the entire RRR process. The primary purpose of
this research was to evaluate the application of a decision analysis methodology for the
selection of a MOS during the RRR process. The secondary purpose was to determine
the effect of additional considerations on both the MOS selected and the repair time.
MOSs selected utilizing the outlined methodology were compared to a MOS selected
using the current USAF method. Results showed that additional considerations have an
impact on both MOS selection and time to repair. Results also showed that the outlined
methodology selected a MOS with a shorter repair time, despite additional damage, than
the MOS selected using the current USAF method.

v
Acknowledgments
I would like to express my sincere appreciation to Mrs. Diana Kremmel for her
technical support and assistance, and for the initial programming of the computer
program utilized in this research. Her efforts were crucial to the completion of this work.
Thank you.
David Duncan

vi
Table of Contents
Page Abstract ...................................................................................................................... iv Acknowledgements ......................................................................................................v Table of Contents ....................................................................................................... vi List of Figures ............................................................................................................. ix List of Tables ...............................................................................................................x I. Introduction ............................................................................................................1 1.1 Background.......................................................................................................1 1.2 Current and Investigated Selection Methods ....................................................2 1.3 Importance of Research ....................................................................................4 II. Literature Review...................................................................................................7 2.1 Areas of Past Rapid Runway Repair (RRR) Research ....................................7 2.1.1. Damage Assessment .............................................................................7 2.1.2. Minimum Operating Strip (MOS) Selection.........................................9 2.1.3. Explosive Ordinance Disposal............................................................11 2.1.4. Bomb Damage Repair.........................................................................12 2.1.5. Minimum Operating Strip (MOS) Set-Up ..........................................15 2.2 Techniques Utilized by Researchers..............................................................16 2.2.1. Monte Carlo Simulation and Expected Value ....................................16 2.2.2. Value Focused Thinking.....................................................................17 2.2.3. Field Tests and Experiments...............................................................21 2.2.4. Neural Networks .................................................................................28 III. Methodology........................................................................................................29 3.1 Methodology Overview .................................................................................29 3.2 Selecting the Variables Including the Additional Considerations .................29 3.3 Generic Network of Common Rapid Runway Repair (RRR) Activities.......33 3.4 Time Equations ..............................................................................................40 3.4.1. Activity A............................................................................................40 3.4.2. Activity B............................................................................................41 3.4.3. Activity C............................................................................................42 3.4.4. Activity D............................................................................................43 3.4.5. Activity E ............................................................................................43 3.4.6. Activity F ............................................................................................43
vii
Page 3.4.7. Activity G............................................................................................44 3.4.8. Activity H............................................................................................45 3.4.9. Activity I .............................................................................................45 3.4.10. Activity J...........................................................................................46 3.4.11. Activity K..........................................................................................47 3.4.12. Activity L ..........................................................................................47 3.4.13. Activity M.........................................................................................48 3.4.14. Activity N..........................................................................................48 3.4.15. Activity O..........................................................................................49 3.4.16. Activity P ..........................................................................................50 3.4.17. Activity Q..........................................................................................50 3.4.18. Activity R..........................................................................................51 3.4.19. Activity S ..........................................................................................52 3.4.20. Activity T ..........................................................................................53 3.4.21. Activity U..........................................................................................53 3.4.22. Activity V..........................................................................................55 3.4.23. Activity W.........................................................................................56 3.5 Efficiency Factors ..........................................................................................56 3.5.1. Human Efficiency ...............................................................................57 3.5.2. Equipment Efficiency .........................................................................60 3.5.3. Epoxy Curing Efficiency ....................................................................61 3.6 Model Constraints..........................................................................................62 3.7 Application of Model to Rapid Runway Recovery (RRR) Operations .........65 IV. Results and Analysis.............................................................................................68 4.1 Introduction....................................................................................................68 4.2 Scenario One: Summer Desert.......................................................................68 4.3 Scenario Two: Rain........................................................................................71 4.4 Scenario Three: Winter ..................................................................................74 4.5 Scenario Four: Cool, Windy ..........................................................................77 4.6 Scenario Five: Ideal Conditions.....................................................................79 4.7 General MOS Selection Characteristics.........................................................82 4.8 General Resource Characteristics ..................................................................84 4.8.1. Manpower ............................................................................................85 4.8.2. Equipment ............................................................................................86 4.8.3. Materials ..............................................................................................87 4.9 Influence of Weather......................................................................................87 4.10 Time Versus Value of Additional Considerations .......................................88 4.11 Current USAF Methodology Comparison ...................................................90

viii
Page V. Conclusion ...........................................................................................................98 5.1 Conclusion .....................................................................................................98 5.2 Areas for Additional Research.......................................................................99 Bibliography ..............................................................................................................105 Appendix A: Damage Assessment Data ....................................................................107 Appendix B: Airfield Damage Plot............................................................................108 Appendix C: Selected MOS for Scenarios One, Three, and Five..............................109 Appendix D: Selected MOS for Scenario Two..........................................................110 Appendix E: Selected MOS for Scenario Four..........................................................111 Appendix F: Expert Selected MOS............................................................................112
ix
List of Figures
Figure Page 1. Generic Activity Network.....................................................................................36

x
List of Tables
Table Page 1. Criteria Weights ....................................................................................................19 2. Actual Mix Design Summary ...............................................................................27 3. Methodology Variables.........................................................................................30 4. Network Activities ................................................................................................33 5. Temperature Effects on Human Efficiency ..........................................................58 6. Precipitation Effects on Human Efficiency ..........................................................59 7. Wind Speed Effects on Human Efficiency ...........................................................59 8. Slipperiness Effects on Human Efficiency ...........................................................60 9. Slipperiness Effects on Equipment .......................................................................61 10. Epoxy Curing Efficiency ......................................................................................62 11. Manpower .............................................................................................................63 12. Equipment .............................................................................................................64 13. Results – Scenario One: Summer Desert ..............................................................69 14. Scenario One – Top Three Potential MOSs..........................................................71 15. Results – Scenario Two: Rain...............................................................................73 16. Scenario Two – Top Three Potential MOSs.........................................................74 17. Results – Scenario Three: Winter .........................................................................76 18. Scenario Three – Top Three Potential MOSs ......................................................77 19. Results – Scenario Four: Cool, Windy .................................................................78 20. Scenario Four – Top Three Potential MOSs.........................................................79

xi
Table Page 21. Results – Scenario Five: Ideal Conditions ............................................................81 22. Scenario Five – Top Three Potential MOSs .........................................................82 23. RRR Personnel Requirements...............................................................................85 24. Current Methodology Selection............................................................................91

1
RAPID RUNWAY REPAIR (RRR): AN OPTIMIZATION
FOR MINIMUM OPERATING STRIP SELECTION
I. Introduction
1.1 Background
Since the inception of the military aircraft, the need to provide an adequate
takeoff and landing surface has been recognized. Around the time of World War II
(WWII), aircraft became larger and required stronger surfaces to carry their weight (TC
5-340, 1988). With the development of these more substantial airfields came the
realization that a dedicated workforce would be needed to repair and maintain the airfield
surfaces and that the airfield surfaces would be enemy targets that could cripple air
operations during war. This realization was the prime motivator in the development of
the first Aviation Engineers, whose primary task was to repair enemy airfields or
construct new airfields close to the front lines (AFPAM 10-219, 1997).
During and following WWII, early Aviation Engineers developed many runway
construction and repair materials which had varying degrees of success. However, it was
not until the Cold War that the repair materials and repair methods developed into what is
now known as Rapid Runway Repair (RRR). The meaning of the term expedient repair,
and the mission of the Rapid Runway Repair process, is to provide an accessible and
functional minimum operating strip with the added goal to provide it within 4 hours of
the enemy attack (UFC 3-270-07, 2002; AFPAM 10-219, 1997).

2
As the materials for the RRR process have developed through time, so too has the
RRR process methodology. The RRR process has developed into five stages: 1) damage
assessment, 2) Minimum Operating Strip (MOS) selection, 3) Explosive Ordinance
Disposal (EOD), 4) bomb damage repair, and 5) MOS set-up. The damage assessment
stage occurs after an enemy attack and involves damage assessment teams accomplishing
a quick survey of the damage incurred, to include the size and location of craters and
spall fields and the size, location, and type of unexploded ordinances (UXOs) and
bomblet fields. During, or directly following, the damage assessment stage comes the
MOS selection stage, which includes plotting the damage called in from the damage
assessment teams and then selecting a MOS to repair. The EOD stage consists of
neutralizing and clearing or in-place deflagration of UXOs and bomblet fields on and
around the selected MOS. The bomb damage repair stage encompasses all the
construction efforts to repair the MOS and taxiways to attain a usable launch and
recovery surface, to include surveying, filling and capping craters, and filling spalls. The
final stage, MOS set-up, is the physical layout and set-up of airfield lighting, airfield-
marking operations, and the arresting barrier.
1.2 Current and Investigated Selection Methods
Since the selected MOS will determine what type and how much work will be
required, and since little research has been done in the area, this research will explore the
selection method of the MOS. The current methodology taught to U.S. Air Force Civil
Engineers can be summed up as; select the MOS with the apparent shortest repair time
determined by the least amount of damage (AFPAM 10-219, 1997). This instruction is
supplemented by a series of “if possible” and “should consider” type statements, which

3
are intended to provide further guidance and clarity in selecting the most preferred MOS
when incorporated into the decision maker’s selection process (AFPAM 10-219, 1997).
There are a few major weaknesses in the current MOS selection technique. First,
selecting the least amount of apparent damage is a crude, or rough, estimation of the time
required to repair a MOS. Second, currently there is no set methodology for
incorporating the if possibles or should considers into the MOS selection process. It
seems the number of these types of considerations that get included in the MOS selection
decision is a function of the skill of the MOS selection team, the time in which the MOS
selection team has to generate a list of potential MOSs, and the amount of pressure felt by
the selection team to expedite the MOS selection process and present the list of potential
MOSs to the decision maker. Finally, the estimated times to complete each potential
MOS are provided by members of the repair crew (based on their opinion and
experience) and are determined by looking at a map of the plotted damage.
This thesis will utilize decision analysis methodologies to select the best MOS by
generating a list of potential MOSs with the shortest repair times. Optimization will be
used to minimize MOS repair time. This methodology and model will not only capture
the number of the different types of damage but also the actual time required to repair
them. The model will also capture resource requirements, repair techniques, and many of
the if possibles and should considers, collectively referred to as additional considerations
from here forward, outlined in many of the governing regulations.
Total repair time will be calculated from a series of RRR task equations derived
from Whitehead, Hoffman, Potter, Neuswanger, & Wilding (1983). Constraints will be
added to the model to capture MOS placement, manpower requirements, equipment
4
requirements, material requirements, and other additional considerations. A list will then
be generated of all the potential MOSs, which will be ranked by their calculated repair
time. The MOSs at the top of this list, the ones with the shortest calculated repair time,
can then be presented to the decision maker for MOS selection.
1.3 Importance of Research
The use, capabilities, and war-fighting dependency of aircraft have developed and
grown through history, from the observation planes of World War I, to the strategic
bombers of WWII, to the close air support of Korea and Vietnam, finally arriving at the
total air superiority of today as seen in Operations Desert Storm, Enduring Freedom, and
Iraqi Freedom. Today, the importance of airpower is clearer than ever. Images of
aircraft bombing buildings, runways, and other strategic targets dominated the media
coverage during the early stages of Operations Desert Storm and Enduring Freedom.
With the large role the U.S. Air Force (USAF) is playing in major conflicts and
peacekeeping operations throughout the world, it is critical that research continues to
examine all areas vital to aircraft operation.
The RRR process of today is very different from the pick-and-shovel maintenance
of the first military runways. Today’s military aircraft are high performing machines that
require high quality surfaces for takeoff and landing operations (Wang & Menegozzi,
1991). These surfaces need to be much smoother then ever before and have the
capability to bear the immense load of today’s heavy aircraft. The modern aircraft’s
dependency on these specific, engineered surfaces makes the runway an ideal target for
enemy attack (Wang & Menegozzi, 1991). For this reason, great interest has been shown
in the research and development of the RRR process.

5
The majority of this research and development has been in the damage
assessment, bomb damage repair, and MOS setup stages of the RRR process. Practically
no research has been done on the MOS selection stage of the RRR process. One reason
for this may be that the damage assessment, bomb damage repair, and MOS setup stages
are the stages of the RRR process that encompass the majority of the repair time.
Furthermore, at approximately 30 minutes, MOS selection is the one stage the takes the
least amount of time during the RRR process. Therefore, researchers have focused their
efforts in areas where the majority of the timesavings in the RRR process could be found.
The fact that the MOS selection stage takes the least amount of time during the
RRR process does not mean this stage is not worthy of research. In fact, the MOS
selection stage determines how much work will have to be completed to attain a usable
MOS. MOS selection determines the exact placement of the MOS on the damaged
runway, and therefore, the amount of munitions that will need to be neutralized (and
therefore the time required to make the area safe for the crater repair team to work) and
the amount of damage that will need to be repaired (and therefore the time required to
repair all the damage on approach to and within the MOS). MOS selection, in essence, is
the key determinant with regard to the time required to attain an operational takeoff and
recovery surface. Since the MOS selection stage determines the events and scope of
work for the all of the RRR stages that follow (constituting the majority of both the RRR
process and repair time), it could be argued that this is the most important stage in the
entire RRR process and the stage most worthy of research.
There are many advantages to utilizing the methodology presented in this paper
over the current selection method. First, this methodology provides a consistent and

6
repeatable technique for MOS selection. It does not feel the pressures of time or
leadership; every time the same data is inputted, the model will return the same optimized
answer. Second, it provides a more reliable time estimate derived from equations written
to capture actual RRR task times, as opposed to the old system of asking a member of the
repair team to provide their opinion, which will change every time a new team member is
asked to provide an estimate. Third, it consistently incorporates the additional
considerations, such as MOS placement and available resources, into the MOS selection
process for every potential MOS. Finally, this model recognizes the amount (or number)
of damage alone will not dictate the time required to repair the MOS; one must also
consider the types and size of the damage.
This thesis is organized as follows. Chapter 2 presents a literature review in the
areas of RRR and MOS selection. The optimization methodology utilized in this research
is presented in Chapter 3. Chapter 4 presents the results and findings of the application of
this selection methodology. Finally, Chapter 5 presents conclusions and
recommendations for further research.

7
II. Literature Review
2.1 Areas of Past Rapid Runway Repair (RRR) Research
The Rapid Runway Repair (RRR) process has been divided into five stages: 1)
damage assessment, 2) Minimum Operating Strip (MOS) selection, 3) explosive
ordinance disposal (EOD), 4) bomb damage repair, and 5) MOS set-up. Very little focus
has been placed on the MOS selection stage of the RRR process. The majority of
information on this stage is found in military affiliated publications and is typically a
brief mention, on the lines of the MOS should be selected, while describing steps to
improve another one of the stages in the RRR process (Whitehead, Hoffman, Potter,
Neuswanger, & Wilding, 1983). Instead, most researchers have focused their efforts on
the other four stages of the RRR process to improve efficiencies and reduce the time to
achieve an active runway. A discussion of the research of each stage of the RRR process
will be presented in the following sections.
2.1.1. Damage Assessment
Research conducted in the damage assessment stage has focused on decreasing
the time it takes to complete the RRR process by using computers to automate the
process. An early attempt at computer automation was made by D. E. Emerson with his
description of the Airbase Damage Assessment (AIDA) computer model. AIDA is a
computer simulation of the expected damage to targets, such as buildings and runways,
caused by conventional (non-nuclear, biological, or chemical) air attacks (Emerson,
1976). The primary purpose of AIDA is to assist in the planning of an air attack by
simulating the damage effects of different airframe and weapons packages (Emerson,

8
1976). AIDA also offers a function that will search a specified area (such as a runway)
for a smaller predetermined square footage (such as the area of a MOS, 50 feet by 1000
feet) within the larger specified area that is clear of any damage (Emerson, 1976). If no
such area exists, AIDA will place the smaller square footage area within the larger
specified area such that the number of craters within the smaller square footage area is
minimized (Emerson, 1976). This fits well with the current MOS selection practice of
choosing the area with the smallest number of repairs. A limitation of AIDA, from a
RRR damage assessment standpoint, is all the outputs are based on Monte Carlo
simulations of platform and weapon packages. That is, after an attack, one cannot enter
the actual runway damage experienced into AIDA for a damage assessment.
An attempt at creating true automated damage assessment was presented by Dr.
Paul Wang and Dr. Linel Menegozzi in their description of Automated Damage
Assessment (ADA). ADA uses ground sensors coupled with software that would provide
post attack information on size, type, and location of craters, spall fields, and Unexploded
Ordinances (UXOs) (Wang & Menegozzi, 1991). This information is used to choose the
best repair plan based on optimization of damage and repair time (Wang & Menegozzi,
1991). ADA requires the use of algorithmic processors and neural networks to keep all
RRR personnel in contact with each other and provide them access to the base repair plan
(Wang & Menegozzi, 1991). The drawback to ADA is that it considers technologies not
yet in existence, let alone in the current inventory of the USAF. This means that until
this technology is fully developed and accepted by the USAF, the efficiencies claimed
cannot be realized. Another drawback is the practicality of having to place ground
sensors and another communications networks on every airfield that the military is

9
currently using. The first prohibitive element is cost. After cost is an uneasy reliance on
a new sophisticated communications network and electronic sensors to perform the
damage assessment, when the typical simulation of a post attack environment is a
communications blackout with the minimal number of command centers on emergency
back-up power.
2.1.2. Minimum Operating Strip (MOS) Selection
It appears that very little research has been accomplished in the MOS selection
stage since all works found on this stage of the RRR process were found in U.S. Air
Force, Army, or Department of Defense (DoD) regulations. An Air Force pamphlet,
AFPAM 10-219 Vol.4, describes each stage of the RRR process in detail. Chapter three
of this pamphlet describes the MOS selection procedures. The predominate attitude
towards MOS selection is choosing a MOS that can be repaired in the least amount of
time (AFPAM 10-219 Vol.4, 1997). In fact, the MOS selection procedure is designed to
choose the MOS with the least amount of damage, which is thought to require the least
amount of repair time (AFPAM 10-219 Vol.4, 1997). With this goal in mind, two tasks
are outlined for the MOS selection team: (1) identify potential MOS locations and (2)
identify access routes (AFPAM 10-219 Vol.4, 1997). The previous statements are the
most direct and forceful statements in this chapter; the rest of the MOS selection
instruction is a series of “should consider” statements. The first set of should statements
outlines the initial considerations for a MOS candidate which include considering MOSs
that: have the same centerline as the original runway, are located at either end of the
original runway, maximize the use of existing NAVigational Aids (NAVAIDS),

10
minimize MOS painting/blackout, speed UXO clearance, and utilize the existing aircraft
arresting system (AFPAM 10-219 Vol.4, 1997).
The pamphlet goes on to outline “other consequential considerations” that may
influence MOS selection: resource limitations and sortie capability (comprised of launch
or recovery (LOR) status, MOS location, and low probable aircraft damage) (AFPAM
10-219 Vol.4, 1997). While this step-by-step instruction on the entire RRR process
provides detailed, absolute, firm, how to instruction on the other stages of the RRR
process (i.e. the step-by-step, how to detailing of the determination of upheaval in both
text and detailed pictures) (AFPAM 10-219 Vol.4, 1997), it provides little instruction on
the actual procedures of MOS selection; instead, this document provides a goal statement
and a series of should considerations.
Currently, there have been efforts to go to more joint publication of requirements
and regulations for all the Services. One of the products from this effort is the Unified
Facilities Criteria (UFC), UFC 3-270-7, entitled “O&M: Airfield Damage Repair.” This
document outlines the similarities and differences in the way each Service performs
airfield damage repair, in both expedient and sustainment situations. This UFC lists
criteria for selecting the best repair options as: Aircraft Type and Load, Available
Material, Available Equipment, Repair Quality Criteria (RQC), Existing Pavement
Structure, Time Criteria, and Repair Crew Capability (UFC 3-270-7, 2002). While the
previous list calls out definite criteria for repair selection, this document is a brief
description and comparison of each repair method and not very detailed. Therefore, it
does not describe how to consider these criteria and implement them to achieve an
efficient or optimum MOS selection.
11
An Army training circular entitled “Air Base Damage Repair (Pavement Repair)”
mainly describes the different airfield repair responsibilities of the Army and Air Force
after an attack. In the “Selection of the MOS” section, this training circular describes the
MOS selection process as, using the damage assessment to select a MOS that requires the
least amount of time and effort to repair (TC 5-340, 1988). While this description of the
MOS selection process is not very detailed, back in Appendix C, “Army and Air Force
Spall Repair,” there is a statement on how to select a repair technique when fixing a spall
which suggests that material availability, soldier expertise, repair time required, and
durability of repairs are factors that should be considered when selecting a repair
technique (TC 5-340, 1988). While this statement was made only in reference to spall
repair, similarities in the factors called out can be seen with the criteria for MOS selection
and repair selection listed in the previous two references.
2.1.3. Explosive Ordinance Disposal (EOD)
Due to the sensitive nature of Explosive Ordinance Disposal (EOD), little
research is available that outlines procedures or the work that has been done to improve
this stage of the RRR process. Research examining the effects of weather on the various
stages of the RRR process includes equations for determining the time for disarming a
bomb and removing bomblets; it also provides worker and equipment efficiency charts
for these procedures (Whitehead, Hoffman, Potter, Neuswanger & Wilding, 1983).
While the equations prove useful in determining the time for these activities, the
description of how these equations where developed for these particular tasks is brief.
AFPAM 10-219 Volume 4, which describes the RRR process, makes many
statements on how to call in UXOs and bomb damage during the damage assessment
12
stage to the team who will be selecting the MOS (AFPAM 10-219 Vol.4, 1997). This
document also describes the team composition for damage assessment and the procedure
for marking UXOs when found (AFPAM 10-219 Vol.4, 1997). AFPAM 10-219 provides
a short paragraph describing the EOD relationship to the RRR process. Included in this
paragraph are EOD activities that include: providing a time estimation for MOS
clearance, providing time estimates for neutralizing each UXO, and estimating time
needed for in-place UXO deflagration (AFPAM 10-219 Vol.4, 1997). This pamphlet
makes the point that choosing the MOS with the least amount of damage may not be the
best MOS to select due to the time required for EOD neutralizing and clearing
requirements for a MOS laden with UXOs (AFPAM 10-219 Vol.4, 1997). It is also
stated that UXOs within 300 feet of repairs should be identified, and EOD personnel will
clear UXOs from the MOS and the surrounding 100 feet and the first 1,500 feet of the
overruns (AFPAM 10-219 Vol.4, 1997). This Air Force pamphlet mainly describes how
other activities have to accommodate EOD activities and does not describe in detail, due
to its sensitive nature, the neutralizing of UXOs by EOD personnel. It also does not state
timelines for EOD work, but it does describe the expected cleared zones that RRR
personnel will have to work in and provides a general sense of how EOD operations will
flow through the MOS area.
2.1.4. Bomb Damage Repair
The central focus of the majority of research on the RRR process is on materials
and/or techniques used to repair the damaged runway. A study by Chang (1990)
analyzed nine RRR techniques for crater repair utilized by the United States Air Force,
Army, and Navy, and the Royal Engineers from the United Kingdom. The nine RRR

13
techniques compared by Chang are: fiberglass-reinforced plastic (FRP) mats, bolt-
together FRP panels, foldable FRP mats, precast concrete slabs, precast asphalt concrete
block, magnesium phosphate, crushed rock, polyurethane cap, and AM-2 aluminum
matting (Chang, 1990). A value focused thinking analysis was used in this study, which
resulted in the U.S. Air Force’s preferred method of crater repair, the fold fiberglass mat,
finishing in the top three RRR methods (Chang, 1990). While Chang’s study uses a solid
analytical methodology to determine the best technique to repair a crater, it does not
address the question of which crater or craters on which to focus one’s attention or
resources.
Another analysis of RRR techniques/materials was a field test documented by
Stroup, Reed, and Hammitt (1980). This field test studied the results of eleven crater
repair techniques: regulated-set concrete, BN (55, 25, 15) concretes, AM2 matting, XM-
19 matting, full depth crushed stone aggregate, aggregate repair cap, aggregate/cement
repair cap, asphalt, water-cement aggregate grout, reinforced earth, and SilikalR (Stroup,
Reed & Hammitt, 1980). The procedure and effectiveness results for each repair
technique are then discussed in detail. While advice on technique for the particular
peculiarities of each RRR method is helpful, most of the techniques examined are not in
use by the USAF for initial RRR for the establishment of a MOS.
A smaller study by Alford and Bush (1985) compared two RRR methods
employed by the USAF, precast slab and folded fiberglass mat. The precast slab method
was developed by Germany and was a technique utilized primarily in this region (Alford
& Bush, 1985). The folded fiberglass mat is a more mobile method (capable of being
airlifted) and is currently utilized throughout the entire U.S. Air Force (Alford & Bush,

14
1985). The findings of this study were that both methods had problems with settling and
the creation of foreign object debris (FOD) (Alford & Bush, 1985). This study was
another comparison of techniques with the purpose of evaluating the best standard
practice and its efforts did not address selecting the optimum location to perform either
method of repair to achieve a MOS.
Other research is devoted to finding new materials to more effectively accomplish
the RRR process. These new materials are typically capping materials to take the place
of the folded fiberglass mat. Soares (1990) describes a method developed in conjunction
with a private company that involves the mixing of concrete materials (fine aggregate,
coarse aggregate, cement, and water) in certain proportions. Anderson and Riley (2002)
describe a trademarked mix design, PaveMendTM, which contains no Portland Cement or
conventional aggregate. Instead, PaveMendTM is comprised of residual materials, like fly
ash and volcanic ash, and fine grains of metal oxides (Anderson & Riley, 2002). These
are just two examples of the many papers devoted to developing new crater capping
materials. Different mix designs of concrete and asphaltic concrete have also been
evaluated to be utilized as caps. The obstacle these capping materials have yet to
overcome, and an advantage to fiberglass mats, is cure time. In most cases, the procedure
for repairing the crater is the same for all capping techniques; in the case of the fiberglass
mat though, the repair can be used instantaneously because time is not required for the
capping material to harden to achieve the capacity to carry the load of an aircraft landing
or taking-off.

15
2.1.5. Minimum Operating Strip (MOS) Set-Up
Whitehead et al. (1983) did a study on the various components required to
perform MOS set-up. Their study was primarily focused on determining the effects of
weather conditions on the Rapid Runway Repair process. The two primary elements of
they were weather characterization and assessment of weather effects (Whitehead et al.,
1983) The weather conditions their study found that would affect the durations of
activities comprising the RRR process were: 1) Effective Temperature, 2) Precipitation,
3) Slippery Conditions, 4) Visibility, and 5) Wind (Whitehead et al., 1983). Their study
analyzed the effects of the five fore-mentioned weather conditions on the three
components of the RRR process: men, materials, and equipment (Whitehead et al., 1983).
The results of the study by Whitehead et al. (1983) included a list of activity
duration formulas and a series of efficiency charts. All of the activity duration equations
consist of some activity duration divided by an efficiency variable that can be looked up
in one of the corresponding efficiency charts; this will give the actual duration of the
activity after the effect of weather (Whitehead et al., 1983). The study is a useful look at
actual worker/machine efficiency and material usefulness under various weather
conditions. One shortfall of their study is that they considered each weather condition
separately. For example they only considered cold, but not cold combined with freezing
rain; or they considered rain, but not rain combined with low visibility. Therefore, one
must analyze all weather conditions separately and then use the results from the condition
that produces the longest duration. Not only does this cause additional calculation, but
also it may miss the possible compounding of simultaneous weather conditions.

16
2.2 Techniques Utilized by Researchers
Since the inception of the RRR process, the Services and researchers, whether in
conjunction or through independent efforts, have been trying to improve the process.
Over the years many methods of analysis have been employed to bring efficiencies and
improvement to the process. The following sections provide examples of such research
efforts.
2.2.1. Monte Carlo Simulation and Expected Value
Emerson (1976) utilized Monte Carlo simulations and Expected Value in a
computer modeling program he developed called AIDA (Airbase Damage Assessment) to
model bomb damage for utilization in damage assessment. AIDA is a program consisting
of 1950 card images and was written in FORTRAN IV (Emerson, 1976). There are
seven categories of input cards to program and describe the attack: control card, target
card, attack card, alternate attack card, effective miss distance card, redo card, and an end
card (Emerson, 1976). These cards are used to describe airframe and ordinance packages
used to attack an airbase. AIDA uses this information to compute the attack in one of
two ways, by using a Monte Carlo simulation or Expected Value.
The Monte Carlo simulation took into account the types of weapons (in two
categories, point impact and area weapons), weapon reliability of each type, effective
miss distance, and the target kill probability given the target is hit (Emerson, 1976). The
effective miss distance, or the distance which munitions can miss and still be effective
enough to be considered a hit, is used to calculate target coverage, which is the
proportion of the target area covered by the area created by the effective miss distance
(Emerson, 1976). All the target coverage areas for each target and point impact weapon

17
combination are then summed to get the cumulative coverage fraction (Emerson, 1976).
For area munitions, the total fractional coverage is the fractional area of a target covered
by bomblets’ rectangular pattern for the sum of all munitions (Emerson, 1976). The
target coverage and total fractional coverage from the previously mentioned calculations
are combined with the probability of a hit for each munitions type. The results of the
Monte Carlo simulation are the number of hits and the amount of damage inflicted
(Emerson, 1976).
Emerson (1976) also used Expected Value to estimate bomb damage. The same
inputs used in the Monte Carlo simulation are used in this calculation. Emerson (1976)
uses expected value to calculate the average value of the hit density for each target and
for each attack. He then uses this to find the total expected number of hits for all the
attacks.
2.2.2. Value Focused Thinking
Chang (1990) used a systems analysis technique, which mirrors what is now
known as Value Focused Thinking, to analysis different RRR techniques. Chang’s
objective was to determine the best RRR technique to use considering equipment and
manpower (Chang, 1990). Nine alternatives were considered; they were the culmination
of techniques used by the United States Air Force, Army, and Navy, and the Royal
Engineers from the United Kingdom (Chang, 1990). The alternatives considered in this
study were: fiberglass-reinforced plastic (FRP) mats, bolt-together FRP panels, foldable
FRP mats, precast concrete slabs, precast asphalt concrete block, magnesium phosphate,
crushed rock, polyurethane cap, and AM-2 aluminum matting (Chang, 1990). Fifteen
criteria (which were ranked and weighted using the Delphi technique) were used to

18
evaluate the alternatives: equipment intensiveness, dependency (technique’s dependency
on proper performance of tasks), need for dedicated equipment, operational (under wide
temperature range), labor intensiveness, complexity, peacetime usage, structural strength,
maintenance difficulty, shelf life, material cost, initial repair time, utility (application of
technique to other repair tasks), storage requirements, and operational (under wide range
of aircraft types) (Chang, 1990). The weights for the fifteen criteria are presented in
Table 1.
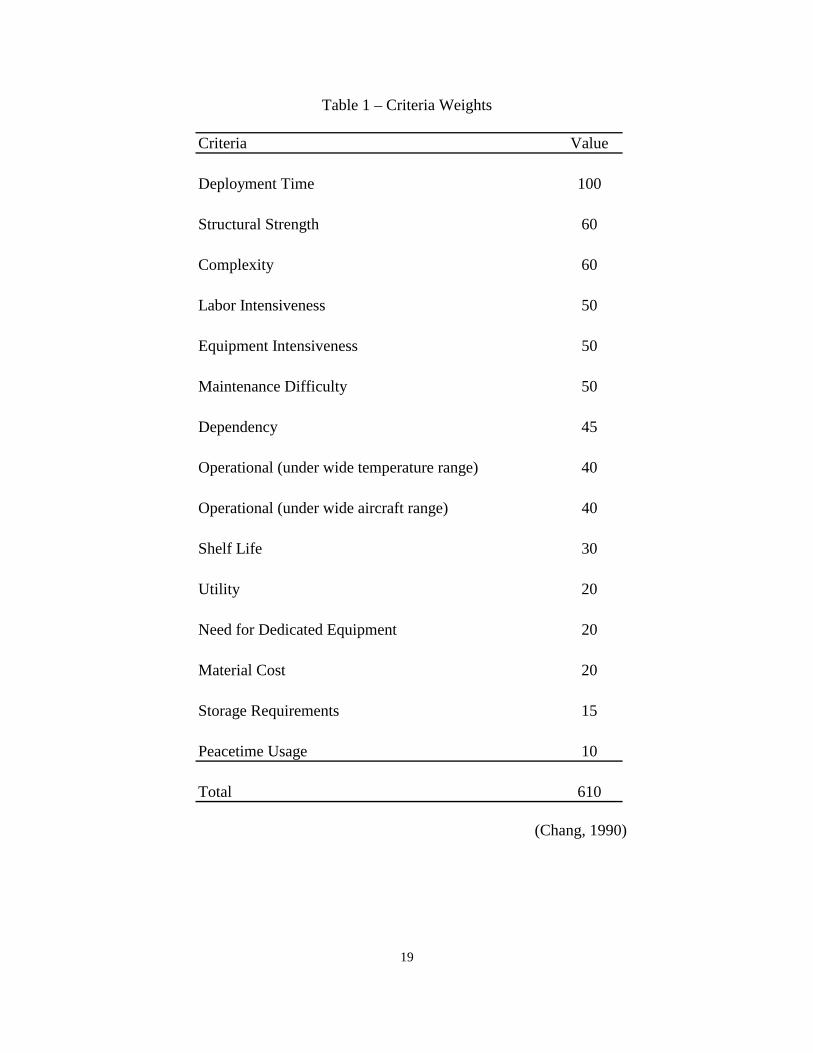
19
Table 1 – Criteria Weights
(Chang, 1990)
Criteria Value
Deployment Time 100
Structural Strength 60
Complexity 60
Labor Intensiveness 50
Equipment Intensiveness 50
Maintenance Difficulty 50
Dependency 45
Operational (under wide temperature range) 40
Operational (under wide aircraft range) 40
Shelf Life 30
Utility 20
Need for Dedicated Equipment 20
Material Cost 20
Storage Requirements 15
Peacetime Usage 10
Total 610
20
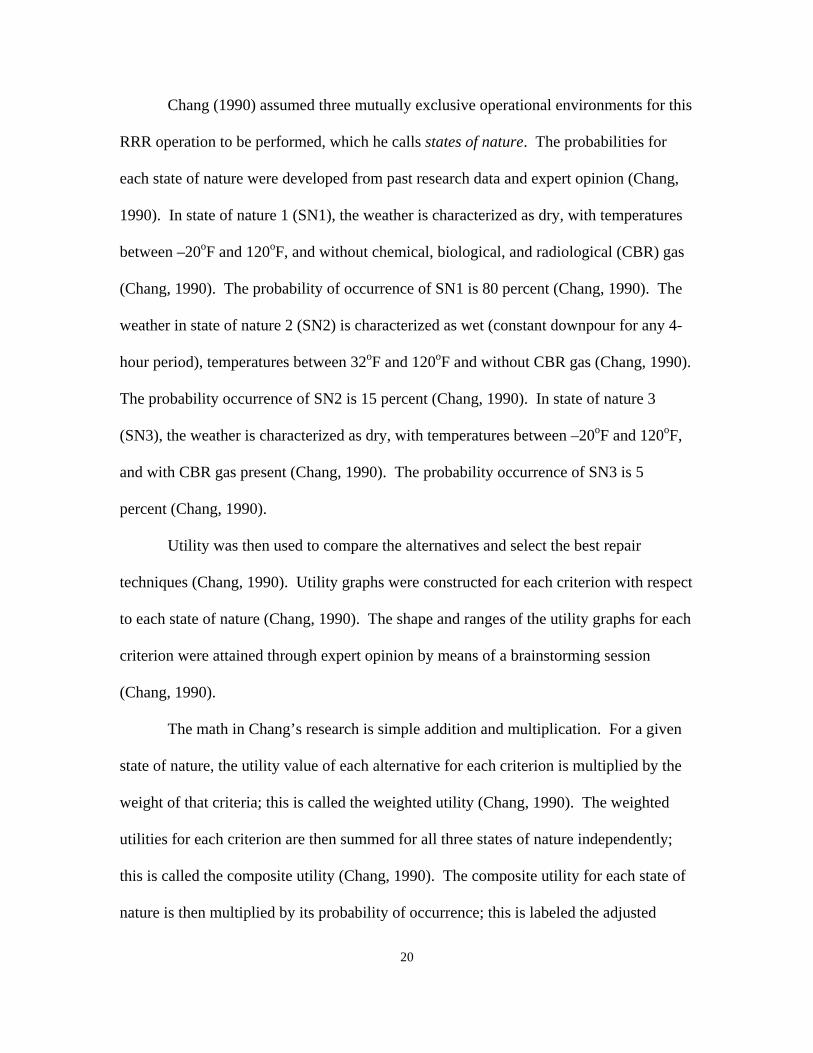
Chang (1990) assumed three mutually exclusive operational environments for this
RRR operation to be performed, which he calls states of nature. The probabilities for
each state of nature were developed from past research data and expert opinion (Chang,
1990). In state of nature 1 (SN1), the weather is characterized as dry, with temperatures
between –20oF and 120oF, and without chemical, biological, and radiological (CBR) gas
(Chang, 1990). The probability of occurrence of SN1 is 80 percent (Chang, 1990). The
weather in state of nature 2 (SN2) is characterized as wet (constant downpour for any 4-
hour period), temperatures between 32oF and 120oF and without CBR gas (Chang, 1990).
The probability occurrence of SN2 is 15 percent (Chang, 1990). In state of nature 3
(SN3), the weather is characterized as dry, with temperatures between –20oF and 120oF,
and with CBR gas present (Chang, 1990). The probability occurrence of SN3 is 5
percent (Chang, 1990).
Utility was then used to compare the alternatives and select the best repair
techniques (Chang, 1990). Utility graphs were constructed for each criterion with respect
to each state of nature (Chang, 1990). The shape and ranges of the utility graphs for each
criterion were attained through expert opinion by means of a brainstorming session
(Chang, 1990).
The math in Chang’s research is simple addition and multiplication. For a given
state of nature, the utility value of each alternative for each criterion is multiplied by the
weight of that criteria; this is called the weighted utility (Chang, 1990). The weighted
utilities for each criterion are then summed for all three states of nature independently;
this is called the composite utility (Chang, 1990). The composite utility for each state of
nature is then multiplied by its probability of occurrence; this is labeled the adjusted
21
composite utility (Chang, 1990). Finally, a final composite utility is calculated for each
alternative by adding the three adjusted composite utilities (Chang, 1990).
Chang performed a simple sensitivity analysis on the results. The composite
utility scores of states of nature 2 and 3 were divided by the composite utility score of
state of nature 1 to provide a sense of an alternative’s sensitivity to changes in the
environment (Chang, 1990). This same type of calculation was performed on the
weighted utility scores for each criterion of states of nature 2 and 3, which were divided
by the respective weighted utility score of that criterion in state of nature 1 (Chang,
1990).
2.2.3. Field Tests and Experiments
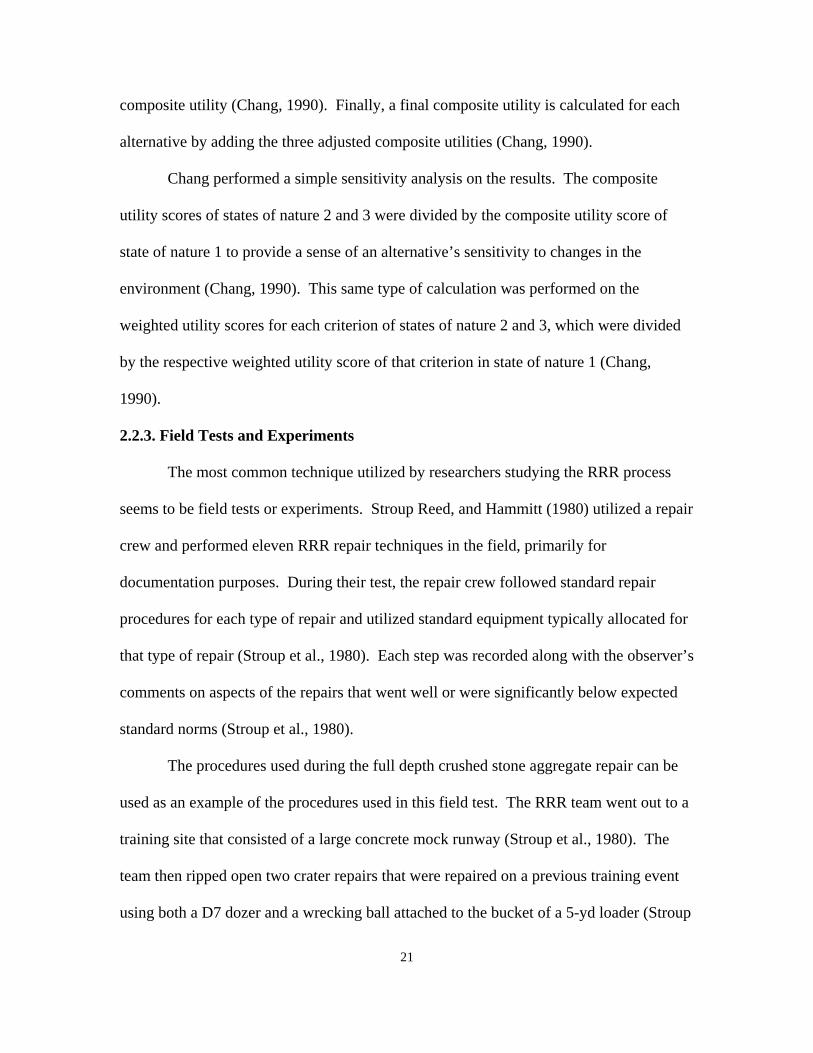
The most common technique utilized by researchers studying the RRR process
seems to be field tests or experiments. Stroup Reed, and Hammitt (1980) utilized a repair
crew and performed eleven RRR repair techniques in the field, primarily for
documentation purposes. During their test, the repair crew followed standard repair
procedures for each type of repair and utilized standard equipment typically allocated for
that type of repair (Stroup et al., 1980). Each step was recorded along with the observer’s
comments on aspects of the repairs that went well or were significantly below expected
standard norms (Stroup et al., 1980).
The procedures used during the full depth crushed stone aggregate repair can be
used as an example of the procedures used in this field test. The RRR team went out to a
training site that consisted of a large concrete mock runway (Stroup et al., 1980). The
team then ripped open two crater repairs that were repaired on a previous training event
using both a D7 dozer and a wrecking ball attached to the bucket of a 5-yd loader (Stroup

22
et al., 1980). Crater 1 was opened to the dimensions of 3 ft deep with an 18 ft diameter
(Stroup et al., 1980). Crater 2 was opened to the dimensions 5 ft deep with a 75 ft
diameter (Stroup et al., 1980).
For the large crater repair, the team then used a 5-yd loader to push ejecta, 12
inches or less, back into the crater (Stroup et al., 1980). A D7 dozer, in the crater, was
used to spread and compact the fill pushed into the crater by the loader (Stroup et al.,
1980). The loader also pushed unsuitable ejecta and upheaval off the runway (Stroup et
al., 1980). A 30-ton vibratory roller made two passes in the crater to compact the ejecta
in the crater (Stroup et al., 1980). Three 20-ton dump trucks were used to bring select,
graded material to the crater (Stroup et al., 1980). The dozer, loader, and dump trucks
placed the graded material into the crater in 12 in lifts (Stroup et al., 1980). The vibratory
roller then made 4 passes over the material (Stroup et al., 1980). A nuclear densimeter
was used to check the compaction of the lift (Stroup et al., 1980). Then the second 12 in
lift was placed into the crater and compacted using the same procedures as those used in
the first (Stroup et al., 1980). Then a road grader was used to establish the final grade of
the crater and the roller then made two more passes (Stroup et al., 1980). The nuclear
densimeter was used to check the final compaction (Stroup et al., 1980). A sand bolt,
liquid asphalt spray on the repair with sand applied on top as asphalt cures, was applied
to half of the large crater (Stroup et al., 1980). The large crater was repaired in 3 hours
25 minutes (Stroup et al., 1980).
The small crater repair started by removing the water in the bottom of the crater
by hand and bucket (Stroup et al., 1980). Since the repairs for both craters were
happening simultaneously, the grader was used on the small crater to push usable ejecta

23
into the hole and the unusable ejecta off the runway (Stroup et al., 1980). Hand labor was
used to spread the ejecta in the small crater and two small vibrating plate compactors
were used for compaction (Stroup et al., 1980). Dump trucks then placed the first lift of
graded fill into the crater; this was spread by the grater, and compacted by four passes of
the vibratory roller (Stroup et al., 1980). The nuclear densimeter was used to check
compaction (Stroup et al., 1980). Then, two additional lifts were place using the same
procedure to bring the crater to finish level (Stroup et al., 1980).
Stroup et al. (1980) then tested the crater repairs by running a load cart, set up to
simulate an F-4 aircraft, across the repairs. The small crater had 3 to 4 inches of
deflection after only 2 passes of the load cart (Stroup et al., 1980). Poor performance was
attributed to the water in the bottom of the crater (Stroup et al., 1980). The load cart
made 30 passes across the large crater to get deflections of 4 inches in the repair (Stroup
et al., 1980). The 30-ton vibratory roller then made 28 more passes across the large
crater and the load cart test was performed again (Stroup et al., 1980). After 30 passes of
the load cart a maximum deflection of 2 inches was recorded (Stroup et al., 1980). Poor
performance of the large crater was attributed to meeting minimum compaction
requirements (Stroup et al., 1980).
Similar procedures of execution and documentation were followed for all eleven
types of repairs analyzed by this study. The exception in execution is that all of the other
techniques in the study were capping type repairs, so in addition to placing and
compacting fill material in the crater, a cap was place on the repair to reduce foreign
object debris (FOD) (Stroup et al., 1980). The specific tools, equipment, materials, and

24
procedures for each technique were implemented as called out in regulations governing
the repairs and analyzed and documented in similar fashion (Stroup et al., 1980).
Alford and Bush (1985) performed a field experiment comparing the US Air
Force Europe (USAFE) precast slab technique and the fiberglass foreign object damage
(FOD) cover placed over a crushed stone repair. Their study spent a great deal of effort
recording every detail of the two repairs. They recorded: dimensions of the crater,
gradation and quantities of materials used in the repair, procedures utilized for placement
of materials, procedures for testing the repair, and repair durability results.
For the precast slab repair, a charge was placed and exploded under the 6 inch
thick concrete test runway creating a crater approximately 3.25 ft deep with a diameter of
15.5 ft (Alford & Bush, 1985). To account for upheaval and the dimensions of the
precast slabs (78.5 inches square by 6 in thick), an area of 26.5 by 33 ft was chosen to be
repaired (Alford & Bush, 1985). The debris around the crater was loaded into trucks with
a front-end loader and taken to a stockpile (Alford & Bush, 1985). The 26.5 by 33 ft
perimeter was saw cut and concrete was removed within this area with a backhoe and a
front-end loader (Alford & Bush, 1985). Silty sand and loose debris were removed from
the center of the crater to achieve a minimum depth of 24 in for the placement of ballast
rock (Alford & Bush, 1985). The moisture content and density of the subgrade material
between the crater hole and the saw cut was recorded (Alford & Bush, 1985).
Ballast rock was then dumped into the crater by dump trucks and spread by the
loader (Alford & Bush, 1985). Final placement and leveling of the ballast was performed
by hand tools to within 9 inches of the finished height (Alford & Bush, 1985). A finer
graded leveling coarse was then placed into the hole by dump truck and spread by the

25
loader (Alford & Bush, 1985). The leveling coarse was brought to final grade (a height
such that the precast slabs would be 0.5 inches above the existing runway pavement) by
hand using a screed (Alford & Bush, 1985). The precast slabs were then placed using a
forklift (Alford & Bush, 1985). A loaded dump truck was driven over the precast slabs to
seat them; this brought the height of the slabs to almost flush with the existing runway
(Alford & Bush, 1985). One slab was carefully removed to test compaction properties of
the subgrade and then the slab was replaced (Alford & Bush, 1985). Mason sand was
washed into the joint cracks using a fire truck (Alford & Bush, 1985).
The crater for the fiberglass FOD cover repair was in the same setting and created
utilizing the same technique as that used to create the crater for the precast slab repair
(Alford & Bush, 1985). This crater was approximately 4.5 ft deep and 15 ft wide (Alford
& Bush, 1985). After removing the debris and upheaval from around the crater, utilizing
the same techniques as on the previous repair, the area to be repaired had a diameter of 25
ft (Alford & Bush, 1985). The crater was filled utilizing similar techniques and materials
to a height 4 inches above the runway’s elevation (Alford & Bush, 1985). The fill was
then compacted with three passes of a double drum vibratory roller, cut to final elevation
with a grader, and compacted again with two more passes of the roller (Alford & Bush,
1985). The fiberglass FOD cover was then placed over the filled crater with an all-terrain
forklift, and anchored using 5 inch bolts space 3 ft on center (Alford & Bush, 1985).
A load cart was set up twice, once to simulate a F-2 aircraft and once to simulate a
F-15 aircraft (Alford & Bush, 1985). Aircraft operations simulated were: taxi runs,
touch-and-go operations, and braking runs (Alford & Bush, 1985). The load cart was run

26
across these repairs 50 times and the deflection was incrementally measured and recorded
along with other behavioral characteristics (Alford & Bush, 1985).
Field tests or experiments have also been utilized for the development of new
materials. Soares (1990) utilized a field test, along with some lab testing, in his joint
development of a new mix design intended for use as a capping material. Soares (1990)
wanted to develop a RRR capping material (mix design) that could be implemented
within current U.S. Air Force resources.
The following method was developed through his research effort. The crater hole
is to be filled to within 8 inches of the finished pavement (Soares, 1990). Adjacent to the
crater, an equivalent hole was marked-off using a string line (Soares, 1990). The coarse
materials were then placed into the marked equivalent area (Soares, 1990). The cement
layer was then added (Soares, 1990). On top of that, a thin layer of sand was placed to
keep the cement from blowing away (Soares, 1990). Finally, the fine aggregate layer was
added to the top (Soares, 1990). The dry materials were then mixed with a soil stabilizer
(Soares, 1990). A lip was formed around the materials so the water, when added, would
not run off (Soares, 1990). It was recommended after the test to cut groves into the
material pile, so when the water was added, it would reach the bottom materials in the
pile (Soares, 1990). Water was added using a water truck with a spray bar (Soares,
1990). It is recommended that the edges be windrowed toward the center using a grader
before final mixing (Soares, 1990). The wet mix was then blended with the soil stabilizer
(Soares, 1990). A grader was used to place the mix into the adjacent crater (Soares,
1990). The mix was compacted with a smooth drum vibratory roller for fifteen minutes

27
(Soares, 1990). Final elevation was attained by use of a grader (Soares, 1990). A final
pass of the roller (with no vibration) was used to provide a smooth finish (Soares, 1990).
The mix design utilized is that which is called out in the Maximum Density
Approach described in the American Concrete Institute (ACI) Code (Soares, 1990). The
mix design is described in the following table, Table 2, in units/cubic yard.
Table 2 Actual Mix Design Summary
(Soares, 1990) Test cylinders were made to determine the performance of the mix (Soares, 1990).
The first set of cylinders was made from concrete mixed in the laboratory in a drum
mixer and compacted in the laboratory with a compaction hammer (Soares, 1990). The
second set of cylinders was made from concrete mixed in the field by the soil stabilizer
and compacted in the laboratory with a small sledgehammer (Soares, 1990). The third set
Component Amount
Slump 0.0 in
Air Content 2%
Water 214.9 lb
Cement 389.0 lb
Coarse Aggregate 1,853 lb
Fine Aggregate 1,386 lb
Totals 3,843 lb
Unit Weight 142.3 pcf

28
of cylinders was made from concrete mixed in the field by the soil stabilizer and
compacted in the field by the vibratory roller (Soares, 1990). Test performed on the
various sets of cylinders were settlement test, compressive, flexural, and tensile strength
tests (Soares, 1990).
2.2.4. Neural Networks
Paul Wang and Lionel Menegozzi (1991) describe a MOS selection process in
development that involves automated ground sensors and advanced communications
networks (to detect post attack runway damage) linked to algorithmic processors and
neural networks (to evaluate and select an optimized MOS). Neural networks will be
utilized to perform the decision analysis functions of the MOS selection process (Wang
& Menegozzi, 1991). The neural network will analyze two types of data: 1) pre-
determined parameters (such as base layout, repair methods, and resources) and 2)
continuously updated information from the sensors (such as damage type, size, and
location) (Wang & Menegozzi, 1991). The networks will use this information to select
the MOS with the least repair time.
Two approaches to utilizing the neural network are to be evaluated: 1) Neural
Network Pattern Recognition Approach and 2) Neural Network Optimization Approach
(Wang & Menegozzi, 1991). The first approach would use predetermined patterns (MOS
and taxiway areas) as templates and selects the pattern and MOS with the least amount of
damage (Wang & Menegozzi, 1991). The second approach would use Symplex and/or
Metropolis algorithms to compute and select the best MOS in a method similar in
approach to the Traveling Salesman Problem in other operational research (Wang &
Menegozzi, 1991).

29
III. Methodology
3.1 Methodology Overview
The primary purpose of this thesis was to evaluate the application of a decision
analysis methodology for the selection of a Minimum Operating Strip (MOS) during the
Rapid Runway Repair (RRR) process. To achieve this, this thesis calculated the effect of
all the variables on the overall time to complete the repairs to the selected MOS. This
process started by selecting additional measurable considerations, which are believed to
have an impact on the overall time to complete repairs on the MOS, to incorporate.
Then, the most common RRR activities were combined to form a generic activity
network. Next, equations were developed to describe the duration of each of the
activities in the network and required resources were assigned to each activity. Finally,
the overall time required to complete the repairs to the MOS was calculated by adding the
activity times according to their flow in the network. The steps called out above, along
with any assumptions made, will be described in further detail in the sections below.
3.2 Selecting the Variables Including the Additional Considerations
The selection of the variables, to include the additional considerations, was
guided by the main overarching RRR publication, AFPAM 10-219 Vol. 4 (1997), and the
research done by Whitehead et al. (1983). The weather variables (Temperature,
Precipitation, Wind Speed, and Slipperiness), along with their units of measure, were
taken from the research by Whitehead et al. (1983). A list of the variables considered and
the units they were measured in can be seen in Table 3.
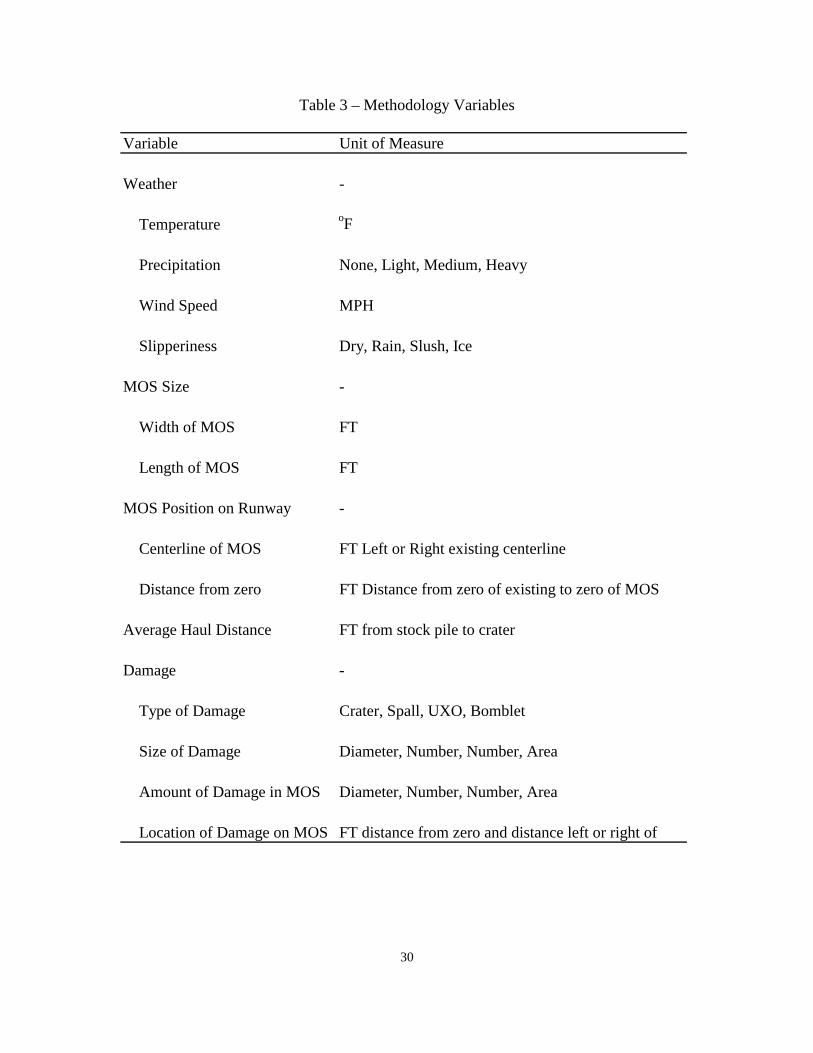
30
Table 3 – Methodology Variables
Variable Unit of Measure
Weather -
Temperature oF
Precipitation None, Light, Medium, Heavy
Wind Speed MPH
Slipperiness Dry, Rain, Slush, Ice
MOS Size -
Width of MOS FT
Length of MOS FT
MOS Position on Runway -
Centerline of MOS FT Left or Right existing centerline
Distance from zero FT Distance from zero of existing to zero of MOS
Average Haul Distance FT from stock pile to crater
Damage -
Type of Damage Crater, Spall, UXO, Bomblet
Size of Damage Diameter, Number, Number, Area
Amount of Damage in MOS Diameter, Number, Number, Area
Location of Damage on MOS FT distance from zero and distance left or right of
31
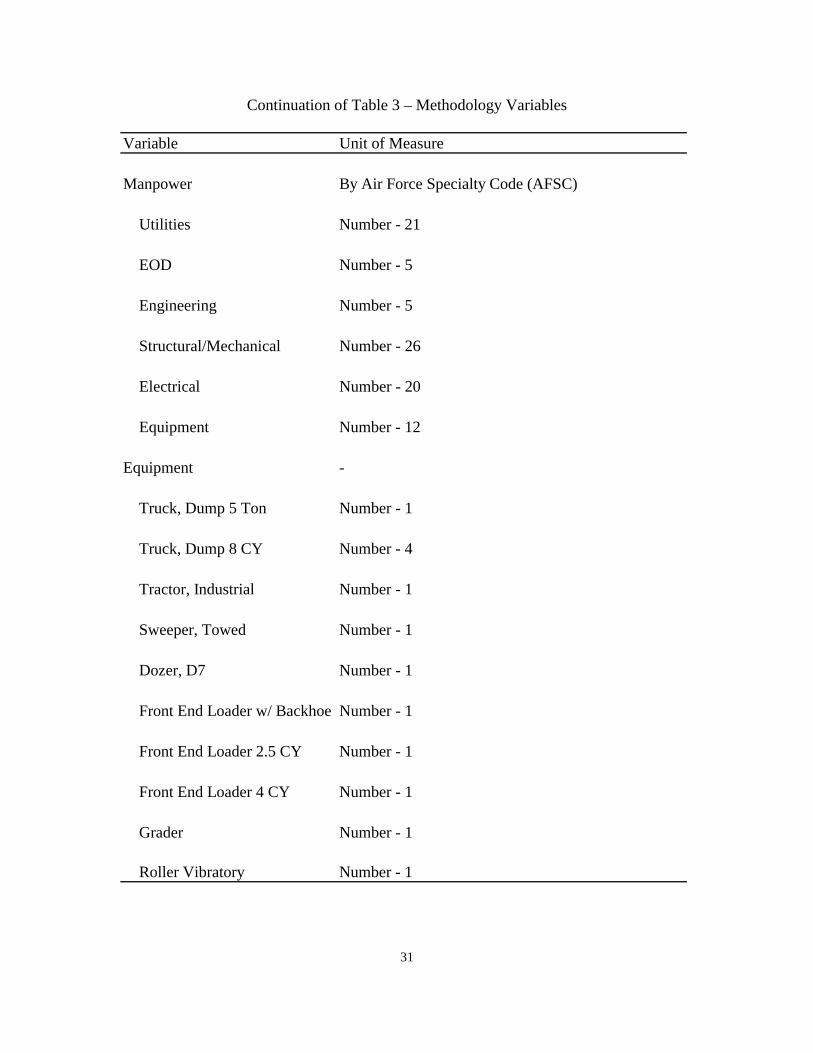
Continuation of Table 3 – Methodology Variables
Variable Unit of Measure
Manpower By Air Force Specialty Code (AFSC)
Utilities Number - 21
EOD Number - 5
Engineering Number - 5
Structural/Mechanical Number - 26
Electrical Number - 20
Equipment Number - 12
Equipment -
Truck, Dump 5 Ton Number - 1
Truck, Dump 8 CY Number - 4
Tractor, Industrial Number - 1
Sweeper, Towed Number - 1
Dozer, D7 Number - 1
Front End Loader w/ Backhoe Number - 1
Front End Loader 2.5 CY Number - 1
Front End Loader 4 CY Number - 1
Grader Number - 1
Roller Vibratory Number - 1
32
Continuation of Table 3 – Methodology Variables
A MOS size of 50 ft by 5,000 ft was assumed (being the most common size in
exercises). An average haul distance of 5,000 ft was assumed. The types and quantities
of manpower and equipment and FFM and AM2 were taken from AFH 10-222 Vols.1
and 2 (1996). Where discrepancies in quantities were found, the most conservative
number was chosen. The types and numbers of manpower and equipment to complete
Variable Unit of Measure
Forklift A/T 10K Number - 2
Forklift A/T 13K Number - 3
Tractor, Semi Number - 2
Trailer, Semi Number - 2
Paint Machine Number - 1
Excavator, Wheeled Number - 1
Other Resources -
Folded Fiberglass Mat (FFM) LFT
Aluminum Mat (AM2) SFT
Graded Fill Material CY
Paint Gal.
Spall Epoxy Bags

33
each RRR activity were taken from AFH 10-222 Vols.1 and 2 (1996) and from the
research by Whitehead et al. (1983); they will be discussed further in the sections below.
3.3 Generic Network of Common Rapid Runway Repair (RRR) Activities
A list of the most common activities was developed using guidance from AFPAM
10-219 Vol. 4 (1997), AFH 10-222 Vols.1 and 2 (1996), and from the research by
Whitehead et al. (1983). These publications provided many of the assumptions for the
manpower, equipment, and other resource requirements to perform each activity. The
activities included in this model are listed in Table 4, along with their assigned activity
I.D. used in the generic network, and a brief description of what each activity involves.
Table 4 – Network Activities
Activity I.D. Activity Name Description - Time to:
A UXO Removal Neutralize and remove a 750-pound bomb
B Bomblet Removal Clear area using a bulldozer
C Clear Debris Usable debris is pushed into crater, unusable debris is pushed off runway
D Install Mobile Aircraft Arresting System (MAAS)
Install and setup MAAS, anchoring into concrete, soil, or asphalt
E Install Emergency Airfield Lighting System (EALS)
Layout and connect EALS system
F Survey MOS/Centerline Survey and mark the centerline of the new MOS

34
Continuation of Table 4 – Network Activities
Activity I.D. Activity Name Description - Time to:
G Load/Deliver Graded Fill Load dump trucks with graded material utilizing a front end loader, deliver fill from stock pile to crater and return
H Loosen Crater Lip Remove upheaval from crater edge
I Sweep Spall Repair Areas Sweep the repaired spall areas utilizing a tractor and towed sweeper
J Compact Crater Debris Compact debris pushed into crater using a dozer or loader by driving over debris
K Sweep Rest of Runway Sweep entire runway except spall and crater repair areas with towed sweeper
L Dry Spall Dry spall using hand-held driers
M Distribute Graded Fill Push graded fill into crater and evenly distribute throughout
N Paint Rest of Centerline Paint rest of MOS new centerline except spall and crater repair areas
O Repair Spall Damage Clean spall, remove unsound pavement, blow out spall with compressed air, mix, place, finish epoxy (Silikal®)
P Compact Fill for FFM Repair Compact graded fill for FFM repair with vibratory roller
Q Compact Fill for AM2 Repair Compact graded fill for AM2 repair with vibratory roller
R Paint Centerline in Spall Repair Area
Paint MOS new centerline in repaired spall areas

35
Continuation of Table 4 – Network Activities
A generic network of the previously described RRR activities was created by
placing the activities in a sequence as close to those outlined in various RRR regulations,
the work by Whitehead et al. (1990), and common construction techniques. The activity
network was utilized to determine the total time required to repair the MOS; this is
detailed further in the following section. The generic activity network utilized is shown
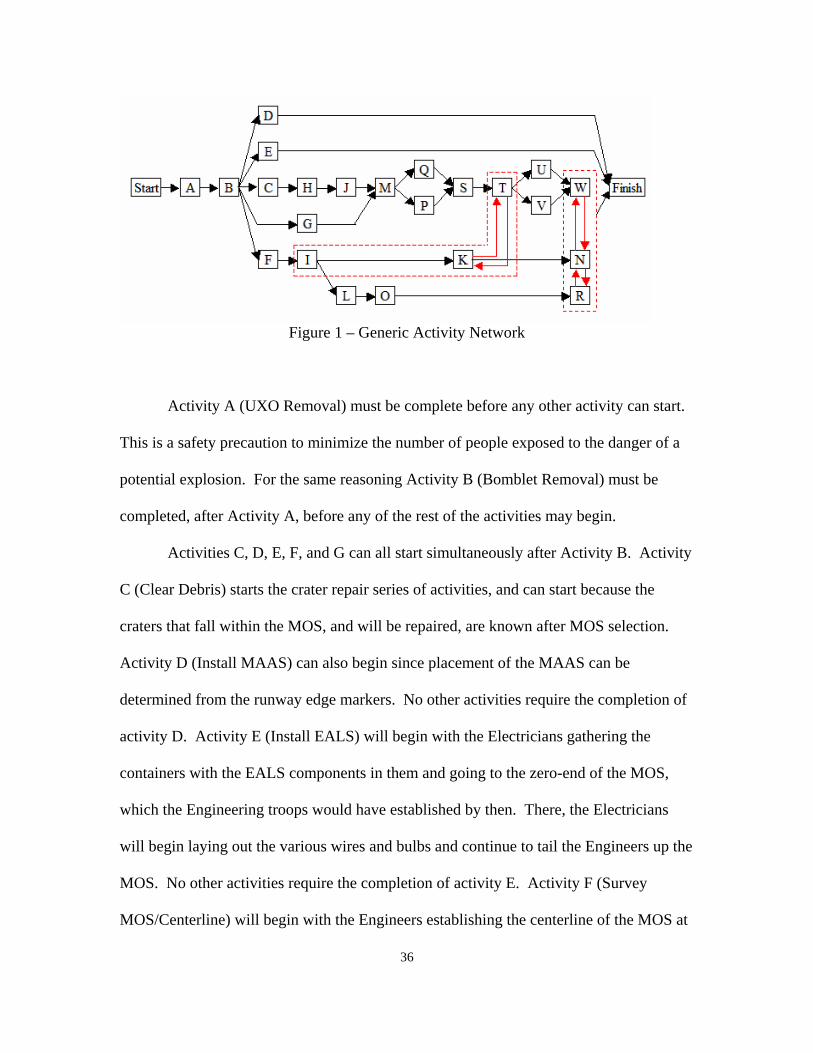
in Figure 1.
Activity I.D. Activity Name Description - Time to:
S Grade Crater Grade compacted graded fill with motorized grader achieving proper level
T Sweep Crater Area Sweep repaired crater areas utilizing a tractor and towed sweeper
U Place AM2 Load AM2 on semi trailer with forklift, deliver to crater, assemble, place, bolt in place
V Place FFM Load FFM on semi trailer with forklift, deliver to crater, assemble, place, bolt in place
W Paint Centerline in Crater Paint MOS centerline in repaired crater
36
Figure 1 – Generic Activity Network
Activity A (UXO Removal) must be complete before any other activity can start.
This is a safety precaution to minimize the number of people exposed to the danger of a
potential explosion. For the same reasoning Activity B (Bomblet Removal) must be
completed, after Activity A, before any of the rest of the activities may begin.
Activities C, D, E, F, and G can all start simultaneously after Activity B. Activity
C (Clear Debris) starts the crater repair series of activities, and can start because the
craters that fall within the MOS, and will be repaired, are known after MOS selection.
Activity D (Install MAAS) can also begin since placement of the MAAS can be
determined from the runway edge markers. No other activities require the completion of
activity D. Activity E (Install EALS) will begin with the Electricians gathering the
containers with the EALS components in them and going to the zero-end of the MOS,
which the Engineering troops would have established by then. There, the Electricians
will begin laying out the various wires and bulbs and continue to tail the Engineers up the
MOS. No other activities require the completion of activity E. Activity F (Survey
MOS/Centerline) will begin with the Engineers establishing the centerline of the MOS at

37
the zero-end of the MOS. They will continue up the MOS. Activity G (Load/Deliver
Graded Fill) can also begin; dump trucks can start to deliver graded fill to the craters to
be repaired since these craters will be known at MOS selection.
Activity H (Loosen Crater Lip) can begin after the debris surrounding the crater
has been cleared. After Activities C and H have been completed, Activity J (Compact
Debris) can start, compacting the debris that Activities C and H have pushed into the
crater. After Activities G and J have been completed, Activity M (Distribute Graded Fill)
will begin. In actual practice, Activity M may start before Activity J has been completed;
for simplification purposes though, it was assumed that Activity M would not start until
all graded fill was delivered.
After the graded fill has been distributed in the crater, Activity P (Compact Fill
for FFM) and Activity Q (Compact Fill for AM2) may begin. These activities have been
called out separately and placed in the network as activities that can be accomplished
simultaneously because, for the purposes of this research, the repair will be completed
with either FFM or AM2 (i.e., one would choose between the two activities and only
accomplish one). This thesis focused on FFM repairs and used this repair as the primary
repair method for crater repair, since this is the primary crater repair method endorsed by
current Air Force guidance. (AM2 has been demoted to taxiway and parking apron
repairs due to roughness criteria, with some specific exceptions.)
Activity S (Grade Crater) can begin after Activity P or Activity Q has been
completed and the fill has been compacted in the crater. The compaction activities, in
practice, actually would be split around the grading activity. To clarify, the crater would
be compacted with a certain number of passes and then this activity pauses. During this
38
pause, the grader would grade the fill material to the appropriate level. Then, compacting
the fill with a few more passes would complete the compaction activity. For ease of
calculation, the compacting activity is considered as one continuous process, followed by
the grading activity.
Activities I, K, and T have been shown with a dashed box surrounding them and
extra activity arrows connecting Activities K and T. This is to show that these activities
are all related. In fact, they are the parts of the same activity, sweeping. This activity
was broken out into three separate activities: Activity I (Sweep Spall Repair Area),
Activity K (Sweep Rest of Runway), and Activity T (Sweep Crater Repair Area).
Sweeping was broken out into three separate activities to better depict actual practice, as
it is not always done as a continuous process. For instance, if there were spalls, this
thesis assumed these areas would be swept first (if the early start time for Activity I is
less than the early start time of Activity T) to give repair crews a better idea of the scope
of the repairs and a cleaner starting point for when they have to clean the spalls for
adhesion purposes. However, if the early start time for Activity T were less than the
early start time for Activity I, then Activity T would be accomplished before Activity I.
In both of these scenarios, Activity K would start third, unless it could be completed
before the early start time of Activity T. Then Activity K would start second and activity
T would start third. The first reason behind the assumptions of order among these three
sweeping activities is if an activity can be completed before the early start time of any
other sweeping activity, then it has priority over the other because the first can be
completed without delaying the second. The second reason behind the assumptions of
order among the three sweeping activities is priority is given to the activity that can start

39
the earliest. The final reason for the assumption of order is none of these sweeping events
can happen simultaneously since there is only one sweeper.
Activity L (Dry Spall) occurs if the spall has moisture in it and can start after the
spall repair area has been swept. It was assumed Activity L would start after the spall
repair area has been swept for two reasons: 1) the area must be cleaned to ease the
inspection of the spall repair area to determine the extent of the damage by the spall
repair crew and 2) the spalls and surrounding area need to be cleaned for proper bonding
of the epoxy used in spall repair.
Activity O (Repair Spall Damage) can start after Activity L has been completed.
It was assumed that all the spalls would be dried before starting to repair any of the
spalls. Drying the spalls is required to proper epoxy curing.
Activities U (Place AM2) and V (Place FFM) can start after the completion of
Activity T. These activities are shown as simultaneous events in the network for the
same reasons given above for Activities P and Q. Activity V was also be the primary
technique utilized in this thesis for the same reasons stated above for activities P and Q.
Activities N (Paint Rest of Centerline), R (Paint Centerline in Spall Repair Area),
and W (Paint Centerline in Crater Repair Area) are shown in the network with a dashed
box around them and activity arrows going back and forth between them. This, again, is
to show that these activities are connected, or are actually one activity broken out into
three activities. The painting activity was broken out into three separate activities, for the
same reasons stated above for the sweeping activity, because the painting activity is not
always a continuous process. Priority was given to the paint activity that could be
accomplished before the early start of another paint activity, since this would not add

40
time to the overall network time. If this could not be accomplished, priority was given to
the activity that could be completed the earliest.
3.4 Time Equations
The overall time for the RRR process on the selected MOS was calculated using
the Critical Path Method (CPM). The CPM utilizes a network diagram of the project
activities (such as the one shown earlier in Figure 1). There can be many paths through a
network, a path being defined as a series of connected activities (Meredith and Mantel,
2006). The critical path is the path, from the project start to the project finish, with the
longest duration; a delay in the critical path would result in a delay of the entire project
(Meredith and Mantel, 2006). The durations of each activity were determined using the
equations below. The duration of each path in the network was calculated. The overall
time for the RRR project was the duration of the critical path in the network.
The time equations for each activity were adopted, or derived, from AFPAM 10-
219 Vol. 4 (1997), AFH 10-222 Vols.1 and 2 (1996), and from the research by
Whitehead et al. (1983). The time equations for each activity, along with any
assumptions (also from AFPAM 10-219 Vol. 4 (1997), AFH 10-222 Vols. 1 and 2
(1996), and from the research by Whitehead et al. (1983), which have not been stated
above), are described below.
3.4.1. Activity A
The time equation for Activity A (UXO Removal) is a function of the number of
UXOs on the MOS, the time required to neutralize a 750-pound bomb, load the bomb in a
dump truck and haul it off the runway, the number of 2-man teams, and the human
efficiency factor. The time equation for Activity A is described.

41
(# UXOs) * (20 min/UXO) time = (1)
(# Teams) * (Human Efficiency)
Equation 1 was adapted from the research by Whitehead et al. (1983). The time
equation for Activity A assumes the time required to neutralize a 750-pound bomb, load
it in the back of a dump truck, and haul it off the runway is 20 minutes. The second
assumption for this equation is that it requires two Explosive Ordinance Disposal (EOD)
personnel to disarm on bomb because they work in pairs. It also requires one dump truck
driver to haul the bomb away; an Equipment personnel was assigned to this task. The
maximum number of EOD teams is two based on the assumption of five EOD personnel
assigned to RRR team. It was also assumed that any UXO within 100 feet of the selected
MOS would be removed as a safety precaution.
3.4.2. Activity B
The time equation for Activity B (Bomblet Removal) is a function of area covered
by bomblets, size and performance characteristics of a bulldozer, and the dozer efficiency
factor. The equation for Activity B is described below.
(Number of Passes) * (Time per Pass)
time = (2a) (Number of Dozers) * (Dozer Efficiency)
or
Length of Bomblet Area Width of Bomblet Area
Blade Width Speed of Dozer time = (2b)
(Number of Dozers) * (Dozer Efficiency)
+ Maneuver Time*

42
Equations 2a and 2b were adapted from the research by Whitehead et al. (1983).
The time equations for Activity B assume maneuver time was 15 seconds per cycle.
Blade width was assumed to be 9 feet. Travel speed of the dozer was assumed to be 25
MPH or 444 ft/sec. One dozer was assumed for use to complete Activity B along with
one Equipment operator. Bomblets within 100 feet of the selected MOS were cleared as
a safety precaution. If any portion of a bomblet field was on or within 100 feet of the
MOS the entire bomblet field was cleared.
3.4.3. Activity C
The time equation for Activity C (Clear Debris) is a function of the number of
craters to be repaired, the area to be cleared around each crater, the rate at which the area
can be cleared, and the efficiency factor of the equipment used to do the clearing. The
time equation for Activity C is described below.
(# of Craters) * (Area to be Cleared)
time = (3) (Clearing Rate) * (# of Equipment) * (Equipment Efficiency)
Equation 3 was adapted from the research by Whitehead et al. (1983). The time
equation for Activity C assumes the area to be cleared at each crater was 75 feet by 500
feet. The clearing rate was assumed to be 2,286 sft/min. If any portion of an imaginary
box with dimensions of the crater diameter is on the MOS, the crater is counted as a
crater that requires repair. The number of crater repair crews designated for RRR
operations determines the number of equipment used, this thesis assumed two crews. It
was assumed that one Equipment operator would be required per crew.

43
3.4.4. Activity D
The time equation for Activity D (Install MAAS) is described below. Equation 4
was derived from AFH 10-222 Vol. 2 (1996). The time equation for Activity D assumes
a six-man team of Utilities personnel can install a MAAS on pavement, soil, or asphalt in
two hours.
(2 hours)
time = (4) (Human Efficiency)
3.4.5. Activity E
The time equation for Activity E (Install EALS) is described below. Equation 5
was adapted from AFH 10-222 Vol. 2 (1996). The time equation for Activity D assumes
a six-man team of Electrical personnel can layout and install an EALS for a 10,000-foot
runway in six hours.
(6 hours/10,000 ft) * (MOS Length)
time = (5) (Human Efficiency)
3.4.6. Activity F
The time equation for Activity F (Survey MOS/Centerline) is a function of MOS
length. The time equation for Activity F is described below. Equation 6 was adapted
from the research by Whitehead et al. (1983). The time equation for Activity F assumes a
3-man survey team can survey and mark 1,000 feet of MOS in 4 minutes.
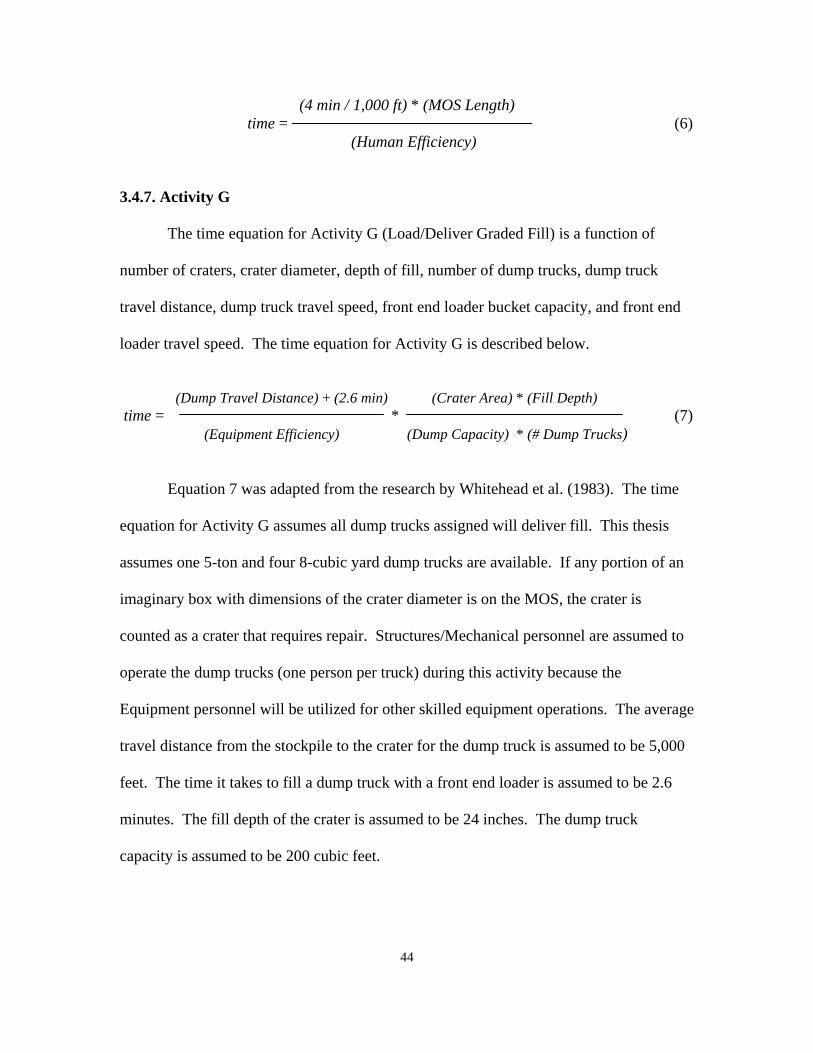
44
(4 min / 1,000 ft) * (MOS Length) time = (6)
(Human Efficiency)
3.4.7. Activity G
The time equation for Activity G (Load/Deliver Graded Fill) is a function of
number of craters, crater diameter, depth of fill, number of dump trucks, dump truck
travel distance, dump truck travel speed, front end loader bucket capacity, and front end
loader travel speed. The time equation for Activity G is described below.
(Dump Travel Distance) + (2.6 min) (Crater Area) * (Fill Depth)
time = * (7) (Equipment Efficiency) (Dump Capacity) * (# Dump Trucks)
Equation 7 was adapted from the research by Whitehead et al. (1983). The time
equation for Activity G assumes all dump trucks assigned will deliver fill. This thesis
assumes one 5-ton and four 8-cubic yard dump trucks are available. If any portion of an
imaginary box with dimensions of the crater diameter is on the MOS, the crater is
counted as a crater that requires repair. Structures/Mechanical personnel are assumed to
operate the dump trucks (one person per truck) during this activity because the
Equipment personnel will be utilized for other skilled equipment operations. The average
travel distance from the stockpile to the crater for the dump truck is assumed to be 5,000
feet. The time it takes to fill a dump truck with a front end loader is assumed to be 2.6
minutes. The fill depth of the crater is assumed to be 24 inches. The dump truck
capacity is assumed to be 200 cubic feet.

45
3.4.8. Activity H
The time equation for Activity H (Loosen Crater Lip) is a function of number of
craters, size of craters, length of upheaval removed per time, and number of crater repair
crews. The time equation for Activity H is described below.
(Crater Diameter) * (3.14)
time = (8) (7.5 ft/min) * (# Crater Crews) * (Equipment Efficiency)
Equation 8 was adapted from the research by Whitehead et al. (1983). The time
equation for Activity H assumes a bulldozer or front-end loader can remove 7.5 feet of
upheaval per minute. If any portion of an imaginary box with dimensions of the crater
diameter is on the MOS, the crater is counted as a crater that requires repair. Crater
diameter for small craters is actual repaired diameter, which is assumed to be twice the
apparent diameter. Crater diameter for large craters is actual repaired diameter plus
apparent diameter. One Equipment personnel is required per crater crew.
3.4.9. Activity I
The time equation for Activity I (Sweep Spall Repair Areas) is a function of spall
area to be repaired and sweeper speed. The time equation for Activity I is described
below.
(Spall Area)
time = (9) (1,320 sft/min) * (Equipment Efficiency)
Equation 9 was adapted from the research by Whitehead et al. (1983). The time
equation for Activity I assumes the towed sweeper can cover 1,320 sft/min. One tractor
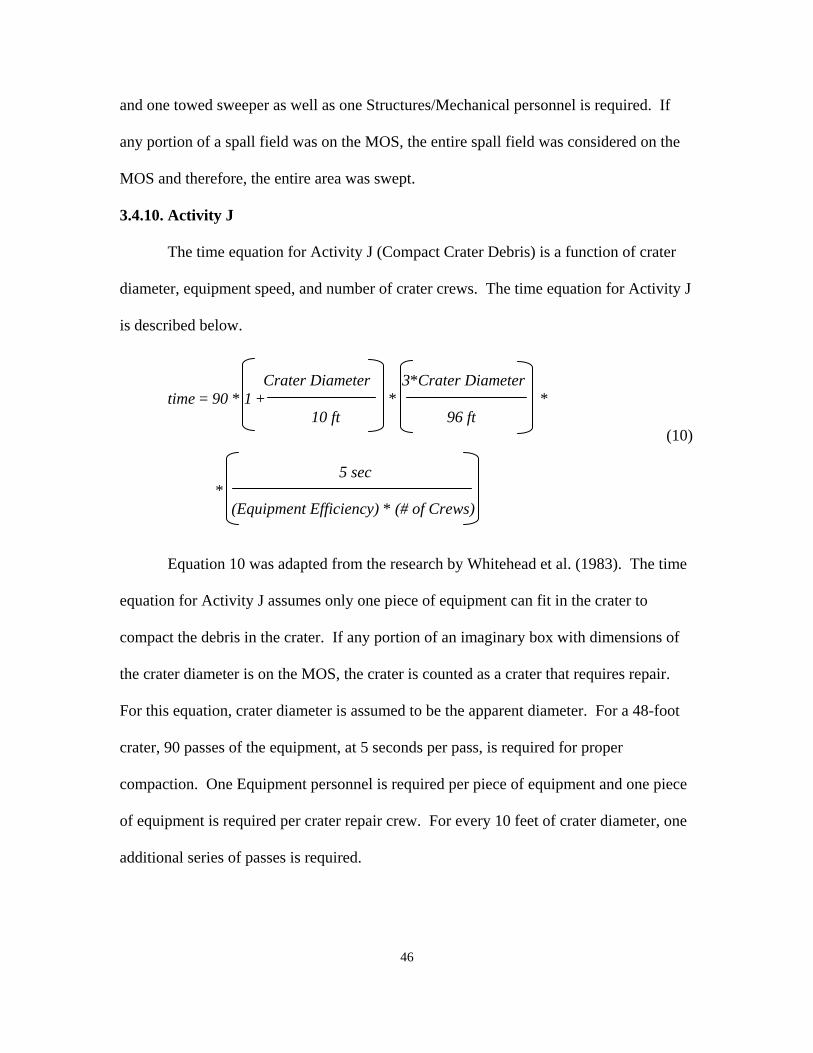
46
and one towed sweeper as well as one Structures/Mechanical personnel is required. If
any portion of a spall field was on the MOS, the entire spall field was considered on the
MOS and therefore, the entire area was swept.
3.4.10. Activity J
The time equation for Activity J (Compact Crater Debris) is a function of crater
diameter, equipment speed, and number of crater crews. The time equation for Activity J
is described below.
Crater Diameter 3*Crater Diameter time = 90 * 1 + * *
10 ft 96 ft (10)
5 sec *
(Equipment Efficiency) * (# of Crews)
Equation 10 was adapted from the research by Whitehead et al. (1983). The time
equation for Activity J assumes only one piece of equipment can fit in the crater to
compact the debris in the crater. If any portion of an imaginary box with dimensions of
the crater diameter is on the MOS, the crater is counted as a crater that requires repair.
For this equation, crater diameter is assumed to be the apparent diameter. For a 48-foot
crater, 90 passes of the equipment, at 5 seconds per pass, is required for proper
compaction. One Equipment personnel is required per piece of equipment and one piece
of equipment is required per crater repair crew. For every 10 feet of crater diameter, one
additional series of passes is required.

47
3.4.11. Activity K
The time equation for Activity K (Sweep Rest of Runway) is a function of area to
be swept and sweeper speed. The time equation for Activity K is described below.
(MOS Area)
time = - (times of Activities I and T) (11) (1,320 sft/min) * (Equipment Efficiency) Equation 11 was adapted from the research by Whitehead et al. (1983). The time
equation for Activity K assumes the towed sweeper can cover 1,320 sft/min. One tractor
and one towed sweeper as well as one Structures/Mechanical personnel is required.
3.4.12. Activity L
The time equation for Activity L (Dry Spall) is described below.
(2 min) * (# of Spalls) + (5 min)
time = (12) (# of Dryers) * (Dryer Efficiency)
Equation 12 was adapted from the research by Whitehead et al. (1983). The time
equation for Activity L assumes it takes two minutes to dry a spall and five minutes for
the spall to cool. However, you do not have to allow the first spall to cool before starting
to dry the next spall. The number of dryers is assumed to be the same as the number of
personnel assigned to the spall repair activity. This thesis assumes there are six spall
repair crews working in teams of two personnel. Structures/Mechanical personnel are
assigned to this activity. Human efficiency factors were used in place of dryer efficiency.
If any portion of a spall field was on the MOS the entire spall field was dried and
repaired.

48
3.4.13. Activity M
The time equation for Activity M (Distribute Graded Fill) is a function of cycle
time and quantity of fill placed during each cycle. The time equation for Activity M is
described below.
(Volume of Craters) * (30 sec)
time = (13) (25 cft) * (# of Equipment) * (Equipment Efficiency)
Equation 13 was adapted from the research by Whitehead et al. (1983). The time
equation for Activity M assumes the volume of craters is equal to the area of each crater
to be repaired multiplied by a depth of 24 inches. A 30 second cycle time is assumed;
one cycle is placing 25 cft of fill into the crater. If any portion of an imaginary box with
dimensions of the crater diameter is on the MOS, the crater is counted as a crater that
requires repair. The number of crater repair crews determines the number of pieces of
equipment. One front-end loader or other bucket type piece of equipment and one
Equipment personnel is required per crater repair crew.
3.4.14. Activity N
The time equation for Activity N (Paint Rest of Centerline) is a function of the
length of MOS, paint drying time, and paint machine speed. The time equation for
Activity N is described below.
(Length of MOS) * (3 ft)
time = + (Drying Time) (200 sft/min) * (Equipment Efficiency) (14)
- (time of Activities R and W)

49
Equation 14 was adapted from the research by Whitehead et al. (1983). The time
equation for Activity N assumes the paint machine can cover 200 sft/minute. The area
that requires paint is an area with a width of 3 feet and the length of the MOS selected.
Three equipment personnel are required to operate the paint machine and paint the
centerline. There is only one paint machine for all the RRR activities. A gallon of paint
was assumed to cover 250 square feet. Drying time was assumed to be 60 minutes in no
precipitation, 90 minutes in light precipitation, and painting was not deemed possible in
medium or heavy precipitation.
3.4.15. Activity O
The time equation for Activity O (Repair Spall Damage) is a function of number
of spalls, time to prepare each spall, time to mix and place epoxy for each spall, and
number of spall repair crews. The time equation for Activity O is described below.
(2 min) * (# of Spalls) (6.5 min) * (# of Spalls)
time = + (15) (# of Crews) * (Human Efficiency) 2*(# of Crews) * (Human Efficiency)
+ (Cure Time)
Equation 15 was adapted from the research by Whitehead et al. (1983). The time
equation for Activity O assumes that a two-man crew is required to prepare the spalls, but
only one man is required to repair the spalls by mixing and placing the epoxy. It was
assumed that six spall repair crews would be used. This activity will be accomplished by
Structures/Mechanical personnel. It was assumed that two minutes is required to prepare
one spall and 6.5 minutes is required to mix and place the epoxy into the spall. Cure time
was assumed to be 60 minutes in no precipitation, 90 minutes in light precipitation, and

50
this activity could not be accomplished in medium or heavy precipitation. If any portion
of a spall field was on the MOS, the entire spall field was repaired.
3.4.16. Activity P
The time equation for Activity P (Compact Fill for FFM Repair) is a function of
crater diameter, coverage of the vibratory roller, and number of crater crews. The time
equation for Activity P is described below.
(32 passes) * (Crater Diameter) Crater Diameter 14 seconds
time = * (16) 6.25 ft coverage 57 ft Crater # Crater Crews
Equation 16 was adapted from the research by Whitehead et al. (1983). The time
equation for Activity P assumes 32 passes of the vibratory roller are required for proper
compaction of a FFM repair. The roller coverage was assumed to be 6.25 feet, achieving
proper overlap of passes. The time to complete one pass on a 57-foot crater was assumed
to be 14 seconds. The time required per pass was assumed to scale linearly with respect
to crater diameter. If any portion of an imaginary box with dimensions of the crater
diameter is on the MOS, the crater is counted as a crater that requires repair. One
vibratory roller and one Equipment personnel is required to complete this activity.
3.4.17. Activity Q
The time equation for Activity Q (Compact Fill for AM2 Repair) is a function of
crater diameter and coverage of the vibratory roller. The time equation for Activity Q is
described below.
*

51
(24 passes)*(Crater Diameter) Crater Diameter 14 seconds time = * * (17) 6.25 ft coverage 57 ft Crater # Crater Crews Equation 17 was adapted from the research by Whitehead et al. (1983). The time
equation for Activity Q assumes 24 passes of the vibratory roller are required for proper
compaction of an AM2 repair. The roller coverage was assumed to be 6.25 feet,
achieving proper overlap of passes. The time to complete one pass on a 57-foot crater
was assumed to be 14 seconds. The time required per pass was assumed to scale linearly
with respect to crater diameter. If any portion of an imaginary box with dimensions of
the crater diameter is on the MOS, the crater is counted as a crater that requires repair.
One vibratory roller and one Equipment personnel is required to complete this activity.
3.4.18. Activity R
The time equation for Activity R (Paint Centerline in Spall Repair Area) is a
function of length of the spall area that requires painting and painter speed. The time
equation for Activity R is described below.
(Length of Spall Area) * (3 ft)
time = (18) (200 sft/min) * (Equipment Efficiency)
Equation 18 was adapted from the research by Whitehead et al. (1983). The time
equation for Activity R assumes the paint machine can cover 200 sft/minute. The area
that requires paint is an area with a width of 3 feet and the length of the spall area
repaired. Three equipment personnel are required to operate the paint machine and paint
the centerline. There is only one paint machine for all the RRR activities. A gallon of
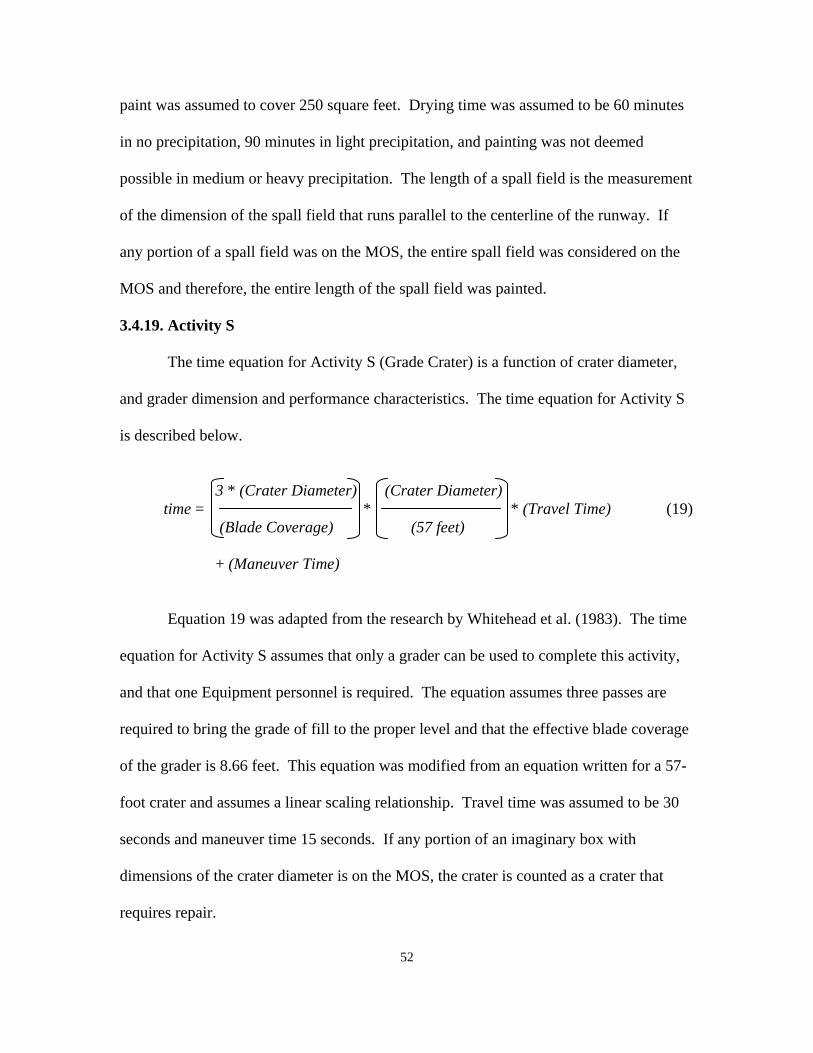
52
paint was assumed to cover 250 square feet. Drying time was assumed to be 60 minutes
in no precipitation, 90 minutes in light precipitation, and painting was not deemed
possible in medium or heavy precipitation. The length of a spall field is the measurement
of the dimension of the spall field that runs parallel to the centerline of the runway. If
any portion of a spall field was on the MOS, the entire spall field was considered on the
MOS and therefore, the entire length of the spall field was painted.
3.4.19. Activity S
The time equation for Activity S (Grade Crater) is a function of crater diameter,
and grader dimension and performance characteristics. The time equation for Activity S
is described below.
3 * (Crater Diameter) (Crater Diameter)
time = * * (Travel Time) (19) (Blade Coverage) (57 feet)
+ (Maneuver Time)
Equation 19 was adapted from the research by Whitehead et al. (1983). The time
equation for Activity S assumes that only a grader can be used to complete this activity,
and that one Equipment personnel is required. The equation assumes three passes are
required to bring the grade of fill to the proper level and that the effective blade coverage
of the grader is 8.66 feet. This equation was modified from an equation written for a 57-
foot crater and assumes a linear scaling relationship. Travel time was assumed to be 30
seconds and maneuver time 15 seconds. If any portion of an imaginary box with
dimensions of the crater diameter is on the MOS, the crater is counted as a crater that
requires repair.
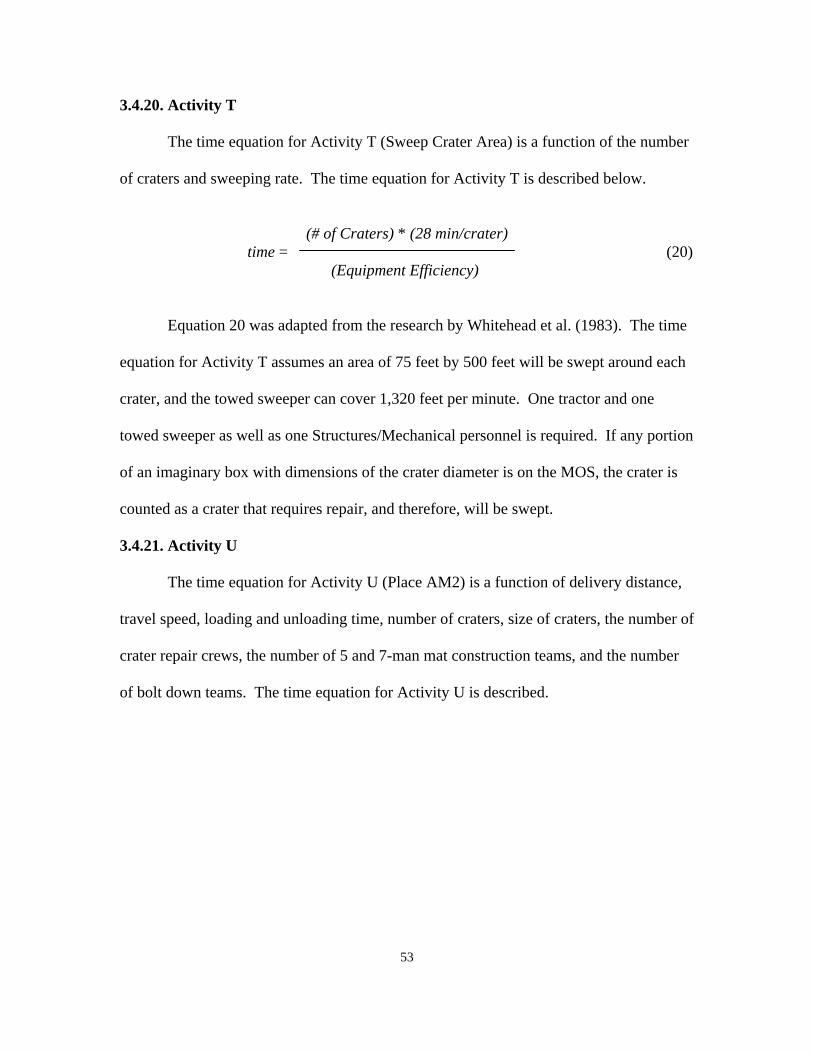
53
3.4.20. Activity T
The time equation for Activity T (Sweep Crater Area) is a function of the number
of craters and sweeping rate. The time equation for Activity T is described below.
(# of Craters) * (28 min/crater)
time = (20) (Equipment Efficiency)
Equation 20 was adapted from the research by Whitehead et al. (1983). The time
equation for Activity T assumes an area of 75 feet by 500 feet will be swept around each
crater, and the towed sweeper can cover 1,320 feet per minute. One tractor and one
towed sweeper as well as one Structures/Mechanical personnel is required. If any portion
of an imaginary box with dimensions of the crater diameter is on the MOS, the crater is
counted as a crater that requires repair, and therefore, will be swept.
3.4.21. Activity U
The time equation for Activity U (Place AM2) is a function of delivery distance,
travel speed, loading and unloading time, number of craters, size of craters, the number of
crater repair crews, the number of 5 and 7-man mat construction teams, and the number
of bolt down teams. The time equation for Activity U is described.
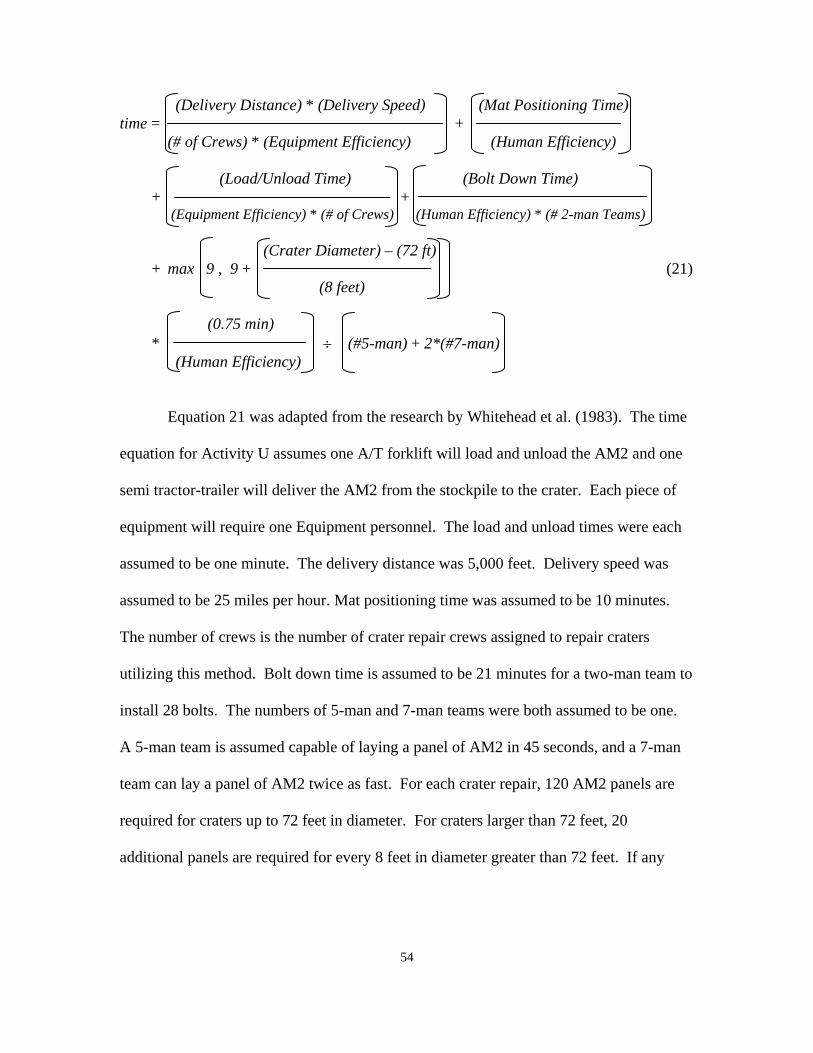
54
(Delivery Distance) * (Delivery Speed) (Mat Positioning Time) time = + (# of Crews) * (Equipment Efficiency) (Human Efficiency)
(Load/Unload Time) (Bolt Down Time) + (Equipment Efficiency) * (# of Crews) (Human Efficiency) * (# 2-man Teams) (Crater Diameter) – (72 ft) + max 9 , 9 + (21) (8 feet)
(0.75 min) * ÷ (#5-man) + 2*(#7-man) (Human Efficiency) Equation 21 was adapted from the research by Whitehead et al. (1983). The time
equation for Activity U assumes one A/T forklift will load and unload the AM2 and one
semi tractor-trailer will deliver the AM2 from the stockpile to the crater. Each piece of
equipment will require one Equipment personnel. The load and unload times were each
assumed to be one minute. The delivery distance was 5,000 feet. Delivery speed was
assumed to be 25 miles per hour. Mat positioning time was assumed to be 10 minutes.
The number of crews is the number of crater repair crews assigned to repair craters
utilizing this method. Bolt down time is assumed to be 21 minutes for a two-man team to
install 28 bolts. The numbers of 5-man and 7-man teams were both assumed to be one.
A 5-man team is assumed capable of laying a panel of AM2 in 45 seconds, and a 7-man
team can lay a panel of AM2 twice as fast. For each crater repair, 120 AM2 panels are
required for craters up to 72 feet in diameter. For craters larger than 72 feet, 20
additional panels are required for every 8 feet in diameter greater than 72 feet. If any
+

55
portion of an imaginary box with dimensions of the crater diameter is on the MOS, the
crater is counted as a crater that requires repair.
3.4.22. Activity V
The time equation for Activity V (Place FFM) is a function of delivery distance,
travel speed, loading and unloading time, number of craters, size of craters, and the
number of crater repair crews. The time equation for Activity U is described below.
(Delivery Distance) * (Delivery Speed)
time = (# of Crews) * (Equipment Efficiency)
(Load/Unload Time) + (22)
(Equipment Efficiency) * (# of Crews)
(# of Craters) * (Placement Time) +
(Human Efficiency) * (# of Crews)
Equation 22 was adapted from the research by Whitehead et al. (1983). The time
equation for Activity V assumes one A/T forklift will load and unload the FFM and one
semi tractor-trailer will deliver the FFM from the stockpile to the crater. Each piece of
equipment will require one Equipment personnel. The delivery distance was 5,000 feet.
The load and unload times were each one minute. Delivery speed was assumed to be 25
miles per hour. Placement time for small craters was assumed to be 21 minutes and 26
minutes for large craters. A small crater was assumed to have a diameter less than 26
feet. If any portion of an imaginary box with dimensions of the crater diameter is on the
MOS, the crater is counted as a crater that requires repair.
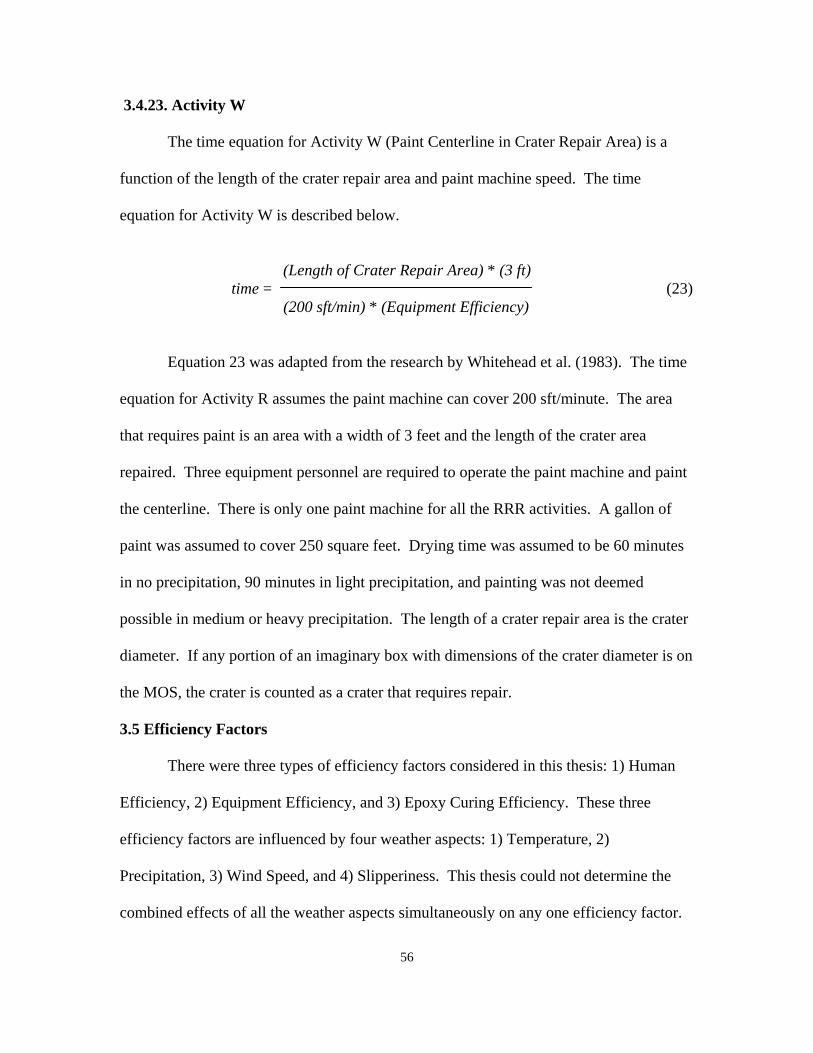
56
3.4.23. Activity W
The time equation for Activity W (Paint Centerline in Crater Repair Area) is a
function of the length of the crater repair area and paint machine speed. The time
equation for Activity W is described below.
(Length of Crater Repair Area) * (3 ft)
time = (23) (200 sft/min) * (Equipment Efficiency)
Equation 23 was adapted from the research by Whitehead et al. (1983). The time
equation for Activity R assumes the paint machine can cover 200 sft/minute. The area
that requires paint is an area with a width of 3 feet and the length of the crater area
repaired. Three equipment personnel are required to operate the paint machine and paint
the centerline. There is only one paint machine for all the RRR activities. A gallon of
paint was assumed to cover 250 square feet. Drying time was assumed to be 60 minutes
in no precipitation, 90 minutes in light precipitation, and painting was not deemed
possible in medium or heavy precipitation. The length of a crater repair area is the crater
diameter. If any portion of an imaginary box with dimensions of the crater diameter is on
the MOS, the crater is counted as a crater that requires repair.
3.5 Efficiency Factors
There were three types of efficiency factors considered in this thesis: 1) Human
Efficiency, 2) Equipment Efficiency, and 3) Epoxy Curing Efficiency. These three
efficiency factors are influenced by four weather aspects: 1) Temperature, 2)
Precipitation, 3) Wind Speed, and 4) Slipperiness. This thesis could not determine the
combined effects of all the weather aspects simultaneously on any one efficiency factor.

57
Therefore, the weather aspect that caused the greatest decrease in efficiency was used in
the time equations above. The assumptions made on how the weather aspects affect the
efficiency factors are described in the sections below.
3.5.1. Human Efficiency
With respect to temperature, human efficiency is categorized in three categories:
light, medium, and strenuous work. Light work was categorized as work that can be done
while sitting, such as equipment operating. Medium work was categorized as work
involving walking and lifting or moving of items of moderate weight, such as surveying
and spall repair. Strenuous work was categorized as work involving heavy lifting or
moving of items and other strenuous activities, such as installing the MAAS or AM2
matting system.
The effects of temperature on efficiency for the three types of labor are shown in
Table 5 below. Table 5 shows the temperature ranges and corresponding efficiency
ranges. The efficiency factor ranges have a linear relationship to the temperature ranges.

58
Table 5 – Temperature Effects on Human Efficiency
Work Type
Strenuous -50 -15 0.10 0.22
-15 -5 0.22 0.52
-5 35 0.52 1.00
35 80 1.00 1.00
80 120 1.00 0.00
Medium -50 0 0.05 0.20
0 20 0.20 0.42
20 45 0.42 1.00
45 85 1.00 1.00
85 100 1.00 0.65
100 120 0.65 0.15
Light -50 0 0.00 0.35
0 20 0.35 0.67
20 50 0.67 1.00
50 90 1.00 1.00
90 100 1.00 0.80
100 120 0.80 0.25
Temperature Efficiency

59
Precipitation was categorized as: None, Light, Medium, or Heavy. The effects of
precipitation on the human efficiency factor can be seen in Table 6.
Table 6 –Precipitation Effects on Human Efficiency
The effects of wind speed on the human efficiency factor were broken out into two types
of human labor, hand labor and equipment operation. The effects of wind speed on the
human efficiency factor in these two categories can be seen in Table 7.
Table 7 – Wind Speed Effects on Human Efficiency
Precipitation Efficiency
None 1
Light 0.95
Medium 0.9
Heavy 0.85
Work Type
Hand Labor 0 15 1 0.9
15 30 0.9 0.25
30 50 0.25 0.12
In Equipment 0 30 1 1
30 50 1 0.5
Miles/Hour Efficiency

60
Slipperiness was divided into four categories: 1) Ice, 2) Slush, 3) Rain, and 4) Dry. The
effects of the categories of slipperiness on the human efficiency factor can be seen in
Table 8.
Table 8 – Slipperiness Effects on Human Efficiency
3.5.2. Equipment Efficiency
The only weather aspect assumed to have a strong affect on the equipment
efficiency factor was slipperiness. Slipperiness was divided into the four categories
mentioned above: 1) Ice, 2) Slush, 3) Rain, and 4) Dry. The RRR equipment was also
divided into categories: strongly effected and moderately effected. Generally, tracked
equipment was considered strongly effected and wheeled equipment was considered
moderately effected. The effects of the categories of slipperiness on the human
efficiency factor can be seen in Table 9.
Slipperiness Efficiency
Ice 0.25
Slush 0.65
Rain 0.95
Dry 1

61
Table 9 – Slipperiness Effects on Equipment
Since temperature, precipitation, and wind speed had little effect on the
equipment’s performance, the effects of these weather aspects were applied to the human
equipment operators and the smallest efficiency factor was used as the equipment
efficiency factor in the time equations above.
3.5.3. Epoxy Curing Efficiency
The only weather aspect assumed to affect epoxy curing was precipitation.
Precipitation was categorized as: None, Light, Medium, or Heavy. The effect of
precipitation on the epoxy curing efficiency factor can be seen in Table 10.
Degree of Effect Slipperiness Efficiency
Strongly Affected Ice 0.25
Slush 0.45
Rain 0.8
Dry 1
Moderately Affected Ice 0.5
Slush 0.7
Rain 0.95
Dry 1
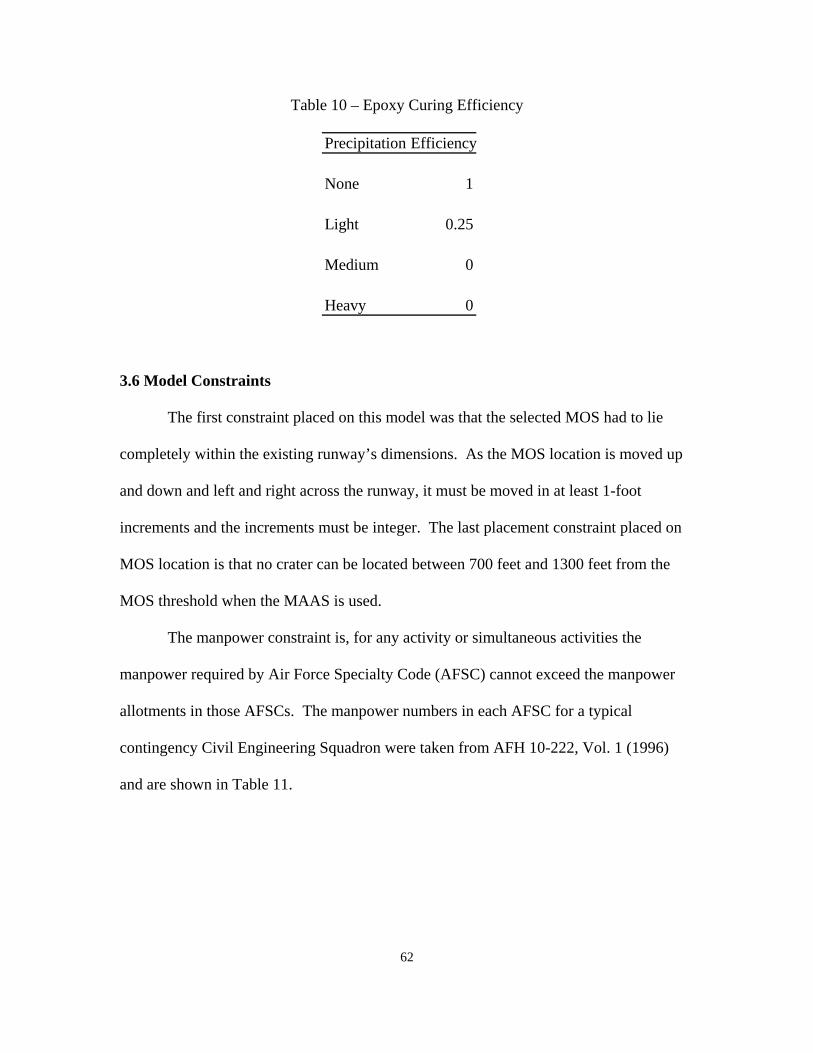
62
Table 10 – Epoxy Curing Efficiency
3.6 Model Constraints
The first constraint placed on this model was that the selected MOS had to lie
completely within the existing runway’s dimensions. As the MOS location is moved up
and down and left and right across the runway, it must be moved in at least 1-foot
increments and the increments must be integer. The last placement constraint placed on
MOS location is that no crater can be located between 700 feet and 1300 feet from the
MOS threshold when the MAAS is used.
The manpower constraint is, for any activity or simultaneous activities the
manpower required by Air Force Specialty Code (AFSC) cannot exceed the manpower
allotments in those AFSCs. The manpower numbers in each AFSC for a typical
contingency Civil Engineering Squadron were taken from AFH 10-222, Vol. 1 (1996)
and are shown in Table 11.
Precipitation Efficiency
None 1
Light 0.25
Medium 0
Heavy 0

63
Table 11 - Manpower
The equipment constraint for any activity (or simultaneous activities) is, the
number of each specific piece of equipment required cannot exceed the equipment
allotments for that type of equipment. The equipment numbers used were taken from
AFH 10-222 Vols. 1 and 2 (1996) and can be seen in Table 12.
AFSC No. People
Utilities 21
Engineering 5
EOD 5
Structural/Mechanical 26
Electrical 20
Equipment 12

64
Table 12 - Equipment
Material constraints placed on the model are as follows. It is assumed one MAAS
and one EALS (which can light a 150 foot by 10,000 foot runway) are available. There
Vehicle Type Qty
Truck, Dump 5 Ton 1
Truck, Dump 8 CY 4
Tractor, Industrial 1
Sweeper Towed 1
Dozer, D7 1
Front End Loader w/ Backhoe 1
Front End Loader 2.5 CY 1
Front End Loader 4 CY 1
Grader 1
Roller Vibratory 1
Forklift A/T 10K 2
Forklift A/T 13K 3
Tractor, Semi 2
Trailer Semi 2
Paint Machine 1
Excavator, Wheeled 1

65
are 15,390 square feet of AM2 (however, AM2 was not utilized as a repair method in this
research) and 378 linear feet of FFM (enough to repair seven 50-foot craters). There are
50 gallons of paint and 400 bags of epoxy (enough to fill 400 spalls) and 1,500 cubic
yards of graded fill material (enough for 24 inches in approximately seven 50-foot
craters). The amount of AM2, FFM, graded fill, and bags of epoxy were established by
AFPAM10-219, Vol.4 (1997). The amount of paint was assumed to be a quantity
sufficient to paint a 10,000-foot MOS.
3.7 Application of Model to Rapid Runway Recovery (RRR) Operations
One runway damage scenario, evaluated under five different weather conditions,
was evaluated in this model. The damage scenario used was a sample taken from actual
scenarios used to train MOS selection team members. The damage scenario and five
weather condition scenarios are described below.
The first weather condition scenario simulates summer time desert conditions.
The temperature is hot, 110 degrees Fahrenheit. The wind is average, 6 mph. There is no
precipitation (i.e. none) and slipperiness is dry.
The second weather condition scenario simulates a stormy, rainy day. The
temperature is 70 degrees Fahrenheit. The wind is higher, 10 mph. Precipitation is
classified as medium. Slipperiness is rain.
The third weather condition scenario simulates winter conditions. The
temperature is lower, 40 degrees Fahrenheit. Wind speed is 6 mph. Precipitation is
classified as none. Slipperiness is classified as ice.

66
The fourth weather condition scenario simulates a cool, windy day. The
temperature is 60 degrees Fahrenheit. The wind is high, 20 mph. There is no
precipitation (i.e. none). Slipperiness is classified as dry.
The fifth weather condition scenario depicts ideal weather conditions. The
temperature is 70 degrees Fahrenheit. There is no wind (i.e. wind speed is 0 mph). There
is no precipitation (i.e. none) and slipperiness is classified as dry.
The damage scenario involved a 200-foot wide, 7,000-foot long runway. The
damage was evenly distributed throughout the runway. There were 10 craters, 3 UXOs, 3
bomblet fields, and 2 spall fields. The craters were fairly evenly distributed down the
runway, spaced approximately 500 to 1,000-feet apart. The craters were also evenly
distributed across the runway from left to right with every third crater being on the
opposite side of the runway. The three UXOs were concentrated toward the middle of
the runway with one UXO on the left side of the runway and two UXOs on the right side
of the runway. Two of the bomblet fields were closer to the ends of the runway with the
spall fields closer to the center of the runway, but still outside (or further from the middle
of the runway) of the UXOs, and the third spall field was quite small in comparison to the
first two and more toward the center of the runway. Both larger bomblet fields were
skewed across the runway, they started on the left side of the runway and ended on the
right side. The small bomblet field was located only on the right side of the runway.
The spall field closest to the zero end of the runway started on the right side and ended on
the left side of the runway. The second spall field was only on the right side of the
runway. The damage assessment, or list of runway damage, can be seen in Appendix A.
A plot of the damage on the runway can be seen in Appendix B.

67
The total time for each potential MOS was calculated utilizing the equations
above by adding the activity time of the critical path of the activity network as described
earlier. This involved calculating the number of craters and size of each crater, area of
bomblet fields, number of spalls, and number of UXOs in each potential MOS. The
efficiency factor was determined based on the weather condition being analyzed. Any
potential MOS that did not meet constraints or resource requirements were discarded
from consideration. A potential MOS was calculated for every five feet across the
runway width ([200-25-25]/5+1=31 potential MOS positions) and for every 100 feet
down the runway length ([7,000-2000]/100+1=21 potential MOS positions). A total of
651 potential MOSs were evaluated in each scenario. The selected MOS was the
potential MOS with the shortest repair time.
The results of MOS selection utilizing the methodology outlined in this chapter
were compared to a MOS selected by a MOS selection expert. A plot of the runway
damage, a plastic, scale representation of the MOS, Repair Quality Criteria (RQC), and
operational inputs were provided to the MOS selection expert. The expert proceeded to
move the plastic MOS across the runway, visually evaluating and selecting the best
MOS.
68
IV. Results and Analysis
4.1 Introduction
This chapter will discuss the results of applying the outlined methodology to the
damaged runway under the five weather conditions described in Chapter 3. General
MOS characteristics that were seen across all scenarios are discussed, as well as resource
characteristics. Some general comments on the influence of weather on the MOS
selection in these scenarios are presented. This is followed by a discussion on time
versus additional considerations. The chapter finishes with a comparison of the current
selection methodology to the methodology presented in this thesis.
4.2 Scenario One: Summer Desert
As previously stated, the first weather condition scenario simulated summer time,
desert conditions. The temperature is 110 degrees Fahrenheit, with 6 mph wind, no
precipitation, and slipperiness is dry. The characteristics of the MOS with the least repair
time can be seen in Table 13.
The selected MOS had a critical path that involved crater repair activities (instead
of spall repair activities), despite the fact that the combined damage of all three craters
were among the smallest in size throughout the entire runway. This was made possible
because the selected MOS also had the minimum number of spalls needing repair. The
size of the craters were large enough to control the critical path, yet small enough to
overcome the added time of clearing the maximum number of UXOs and the largest
bomblet field. There were potential MOSs, with repair times greater than the selected
MOS, whose critical path was controlled by spall repair activities. This occurred when

69
the spall number was at the maximum and crater number and size was low. The
characteristics of the MOS selected can be seen in Table 13 below and in picture form in
Appendix C.
Table 13 – Results – Scenario One: Summer Desert
Table 13 displays the results of all the selected MOSs that have the minimum time
to repair. More accurately, it describes an area in which the MOS can be placed that will
result in the selected MOS having the minimum repair time. The first characteristic
described, MOS centerline (MOS C.L.), shows that the centerline of the 50-foot wide
Characteristic
MOS C.L. 30 to 75 ft Right of Existing C.L.
MOS Threshold 500 ft from Existing Threshold
Min Time 17.92 hours
Max Time 46.21 hours
Max Width 95 ft
Max Length 5,000 ft
Small Craters 1
Large Craters 2
Spalls 250
Bomblets 380
UXOs 3

70
MOS can be located anywhere from 30 feet to 75 feet left of the existing runway
centerline. MOS Threshold shows the start of the MOS is located 500 feet from the
threshold of the existing runway. Min Time is the time estimate to complete the selected
50-foot by 5,000-foot MOS; it is also the minimum time a MOS can be repaired in under
the given scenario. Max Time is the maximum time it would take to complete any one of
the potential MOSs considered on the runway. Max Width and Max Length describe the
dimensions of the area in which the selected MOS can be shifted and still contain the
same damage, and therefore, result in the same repair time. Max Width and Max Length
also describe the maximum width and length the MOS dimensions could be expanded to
without having to make any additional repairs. Time to repair the larger MOS may
increase, however, due to additional lighting, sweeping, and/or painting requirements.
Small Craters, Large Craters, Spalls, Bomblets, and UXOs all show the quantity of each
type of damage that must be repaired to complete the selected MOS. All tables for
subsequent scenarios are displayed in like manner.
One of the goals of this thesis was to provide a methodology that would produce a
list of potential MOSs ranked by repair time. The top three-ranked potential MOSs for
Scenario One can be seen in Table 14. The results displayed in Table 14 are shown in
similar manner to those displayed in Table 13. The first characteristic, MOS C.L., shows
the distance or a range of distances, either right or left of the existing runway centerline,
that the MOS centerline should be located. MOS Threshold shows the distance or range
of distances from the existing runway threshold that the MOS threshold should be
located. Min Time is the minimum time required to repair the selected MOS. Max
Width and Max Length are the maximum width and maximum length that the selected

71
MOS can be expanded to without having to repair any more damage. Small Craters,
Large Craters, Spalls, Bomblets, and UXOs all show the number of that specific type of
damage contained within the MOS. All further tables describing the top three-ranked
potential MOSs will be displayed in the same manner as Table 14.
Table 14 – Scenario One – Top Three Potential MOSs
4.3 Scenario Two: Rain
As mentioned earlier, the second weather condition scenario simulates a stormy,
rainy day. The temperature is 70 degrees Fahrenheit, a wind speed of 10 mph.
Characteristic
MOS C.L. 30 to 75 ft Right 65 to 75 ft Left 65 to 75 ft Left
MOS Threshold 500 ft 2,000 ft 1,600 to 1,900 ft
Min Time 17.92 hours 19.01 hours 20.05 hours
Max Width 95 ft 60 ft 60 ft
Max Length 5,000 ft 5,000 ft 5,500 ft
Small Craters 1 1 1
Large Craters 2 2 2
Spalls 250 250 250
Bomblets 380 205 555
UXOs 3 1 1
1 2 3

72
Precipitation is classified as medium. Slipperiness is rain. The results indicate that no
MOS could be repaired.
All potential MOSs had some level of spall repair. Since it is raining in this
scenario, the spall epoxy cannot cure. Therefore, the spall cure time went to infinity (or
1,000,000 for each spall), resulting in the very large minimum repair time as shown in
Table 14. The infinite epoxy curing time caused all potential MOS critical paths to be
controlled by the spall repair activities (rather than the crater repair activities). The
selected MOS was chosen because it had the minimum number of spalls to repair,
bomblets to clear, and UXOs to make safe. The characteristics of the MOS with the least
repair time for these weather conditions can be seen in Table 15 and in picture format in
Appendix D. The top three-ranked potential MOSs for Scenario Two can be seen in
Table 16.

73
Table 15 – Results – Scenario Two: Rain
Characteristic
MOS C.L. -75 to -30 ft Left of Existing C.L.
MOS Threshold 2,000 ft from Existing Threshold
Min Time 36,475,001.53 hours
Max Time 65,641,669.58 hours
Max Width 95 ft
Max Length 5,000 ft
Small Craters 2
Large Craters 2
Spalls 250
Bomblets 205
UXOs 2

74
Table 16 – Scenario Two – Top Three Potential MOSs
4.4 Scenario Three: Winter
As stated earlier, the third weather condition scenario simulates winter conditions. The
temperature is 40 degrees Fahrenheit. Wind speed is 6 mph. Precipitation is classified as
none. Slipperiness is classified as ice.
The selected MOS had a critical path that was controlled by the crater repair
activities. Again, the size of the crater repairs was among the smallest of all the crater
repairs throughout the runway. This particular MOS had a critical path controlled by the
crater repair activities because it also had the minimum number of spalls needing repair.
The size of the craters was large enough to control the critical path, yet small enough to
overcome the added time of clearing the largest bomblet field. There were potential
Characteristic
MOS C.L. 30 to 75 ft Left 30 to 75 ft Left 25 ft Left
MOS Threshold 2,000 ft 700 to 800 ft 2,000 ft
Min Time 36,475,001.53 hours 36,475,001.69 hours 36,475,001.71 hours
Max Width 95 ft 95 ft 50 ft
Max Length 5,000 ft 5,100 ft 5,000 ft
Small Craters 2 1 2
Large Craters 2 3 3
Spalls 250 250 250
Bomblets 205 380 205
UXOs 2 2 3
1 2 3

75
MOSs, with repair times greater than the selected MOS, whose critical path was
controlled by spall repair activities. This occurred when the spall number was at the
maximum and crater number and size was low.
There were a couple of cases where selecting a MOS with more damage than
another would actually save time. Both cases involved repairing one more crater, the
maximum number of spalls, the maximum number of bomblets, and the maximum
number of UXOs. In both cases, the MOSs that had greater repair times had one less
crater, the minimum number of spalls, and two bomblet fields, resulting in the medium
level of bomblet repair. One of the cases had two UXOs (one less than the MOS with the
better time) and the other had three UXOs. Both of these cases were instances where
doing more work, or repairing more damage, would result in a faster repair. The case
with the greatest timesavings had a timesaving of approximately 35 minutes (44.36 hours
versus 44.94 hours) over the MOS with the next closest time. The characteristics of the
MOS with the least repair time can be seen in Table 17 and in picture format in Appendix
C. The top three-ranked potential MOSs for Scenario Three can be seen in Table 18.

76
Table 17 – Results – Scenario Three: Winter
Characteristic
MOS C.L. 30 to 75 ft Right of Existing C.L.
MOS Threshold 500 ft from Existing Threshold
Min Time 27.58 hours
Max Time 67.92 hours
Max Width 95 ft
Max Length 5,000 ft
Small Craters 1
Large Craters 2
Spalls 250
Bomblets 380
UXOs 3

77
Table 18 – Scenario Three – Top Three Potential MOSs
4.5 Scenario Four: Cool, Windy
As mentioned in Chapter 3, the fourth weather conditions scenario simulates a cool,
windy day. The temperature is 60 degrees Fahrenheit. The wind speed is 20 mph. There
is no precipitation. Slipperiness is classified as dry.
The selected MOS had a critical path that was controlled by spall repair activities.
The selected MOS had the minimum amount of spall damage, bomblet damage, and
number of UXOs. There were some potential MOSs that had a critical path controlled by
crater repair activities. These MOSs had a large number, and large size, of crater repairs
(6 or more) with any amount of spall repair, or they had four or five craters to repair with
Characteristic
MOS C.L. 30 to 75 ft Right 65 to 75 ft Left 65 to 75 ft Left
MOS Threshold 500 ft 2,000 ft 1,600 to 1,900 ft
Min Time 27.58 hours 29.25 hours 30.34 hours
Max Width 95 ft 60 ft 60 ft
Max Length 5,000 ft 5,000 ft 5,500 ft
Small Craters 1 1 1
Large Craters 2 2 2
Spalls 250 250 250
Bomblets 380 205 555
UXOs 3 1 1
1 2 3

78
the minimum amount of spall repair. The characteristics of the MOS with the least repair
time can be seen in Table 16 below and in picture format in Appendix E. The top three-
ranked potential MOSs for Scenario Four can be seen in Table 19. The top three-ranked
potential MOSs for Scenario Four can be seen in Table 20.
Table 19 – Results – Scenario Four: Cool, Windy
Characteristic
MOS C.L. -75 to -65 ft Left of Existing C.L.
MOS Threshold 2,000 ft from Existing Threshold
Min Time 11.98 hours
Max Time 23.62 hours
Max Width 60 ft
Max Length 5,000 ft
Small Craters 1
Large Craters 2
Spalls 250
Bomblets 205
UXOs 1

79
Table 20 – Scenario Four – Top Three Potential MOSs
4.6 Scenario Five: Ideal Conditions
As previously stated, the fifth weather condition scenario depicts ideal weather
conditions. The temperature is 70 degrees Fahrenheit. There is no wind. There is no
precipitation and slipperiness is classified as dry.
The selected MOS had a critical path that was controlled by the crater repair
activities. Although, among the smallest of all the potential MOSs, the size of the craters
were large enough to control the critical path, yet small enough to overcome the added
time of clearing the maximum number of UXOs and the largest bomblet field. There
were potential MOSs, with repair times greater than the selected MOS, whose critical
Characteristic
MOS C.L. 65 to 75 ft Left 30 to 75 ft Right 65 to 75 ft Left
MOS Threshold 2,000 ft 500 ft 1,600 to 1,900 ft
Min Time 11.98 hours 12.49 hours 12.53 hours
Max Width 60 ft 95 ft 60 ft
Max Length 5,000 ft 5,000 ft 5,300 ft
Small Craters 1 1 1
Large Craters 2 2 2
Spalls 250 250 250
Bomblets 205 380 555
UXOs 1 3 1
1 2 3

80
path was controlled by spall repair activities. This occurred when the spall number was
at the maximum and crater number and size was low.
Again, there were instances where doing more work (i.e. repairing a higher
number of a specific type of damage) would result in a timesavings. One specific case in
the results from this weather scenario is a MOS with 6 craters and 2 spall fields (with 450
spalls) took less time to repair than a second MOS with 5 craters and 1 spall field (with
250 spalls). The time to complete the first MOS would have been 18.18 hours versus
19.09 hours to complete the second MOS, a timesaving of almost 1 hour. A second case
where it would save time to chose a MOS with more damage saved 1 hour and 34
minutes. The runway with more damage had 5 craters, 450 spalls (the maximum), 555
bomblets (the maximum), and 3 UXOs (the maximum) and could be repaired in 13.51
hours. The runway with less damage had 4 craters, 250 spalls (the minimum), 380
bomblets, and 2 UXOs and could be repaired in 15.08 hours. The characteristics of the
MOS with the least repair time can be seen in Table 21 below and in picture format in
Appendix C. The top three-ranked potential MOSs for Scenario Five can be seen in
Table 22.

81
Table 21 – Results – Scenario Five: Ideal Conditions
Characteristic
MOS C.L. 30 to 75 ft Right of Existing C.L.
MOS Threshold 500 ft from Existing Threshold
Min Time 9.06 hours
Max Time 23.05 hours
Max Width 95 ft
Max Length 5,000 ft
Small Craters 1
Large Craters 2
Spalls 250
Bomblets 380
UXOs 3

82
Table 22 – Scenario Five – Top Three Potential MOSs
4.7 General MOS Selection Characteristics
In all weather conditions, a combination of two damage characteristics was
present when a potential MOS had a critical path that was controlled by spall repair
activities. One characteristic was the number of spalls on the MOS was high. There
were MOSs with as many as five craters that required repair, but the critical path was still
controlled by spall repair activities when the spall number was at the scenario maximum
of 450 spalls. A second characteristic was the combined size of the crater repairs was
low. The selected MOS for the fourth scenario described above had a critical path
Characteristic
MOS C.L. 30 to 75 ft Right 65 to 75 ft Left 65 to 75 ft Left
MOS Threshold 500 ft 2,000 ft 1,600-1,900 ft
Min Time 9.06 hours 9.68 hours 10.23 hours
Max Width 95 ft 60 ft 60 ft
Max Length 5,000 ft 5,000 ft 5,500 ft
Small Craters 1 1 1
Large Craters 2 2 2
Spalls 250 250 250
Bomblets 380 205 555
UXOs 3 1 1
1 2 3

83
controlled by spall repair activities and the number of spalls was only 250. This was
because the combined size of three craters on the MOS was small.
Looking at the results of all the weather conditions, almost every possible
combination of having more or less damage in one, two, three, or all of the different
damage categories (craters, spalls, bomblets, or UXOs) was observed. For instance, there
were cases where one MOS would have one more UXO, but less bomblets than a second
MOS and have a shorter repair time. There were cases were one runway would have
more bomblets, but one less UXO than a second runway and have a shorter repair time.
There were cases when not having to paint, but having more damage had a shorter repair
time than having to paint with less damage. In almost every instance where this
reduction in repair time with an increase in number of damage, the combined size of the
crater repairs was less, thus saving more time than added by clearing an extra UXO or
extra bomblets.
In fact, combined size of crater repairs, more than number of damage, had a
bigger influence on total repair time. Yes, in most cases, reducing the number of craters
to repair, reduced repair time (mainly because fewer craters often meant less combined
repair size). However, there were a few cases where repairing a greater number of small
diameter craters had a faster total MOS repair time than repairing a fewer number of
larger diameter craters. There were numerous cases of two potential MOSs with almost
identical damage, but with one MOS having the same number but smaller sized craters
and having one more UXO or a greater number of bomblets and still having a shorter
total repair time. When all the potential MOSs were ranked by total repair time and a
group of MOSs with the same number of crater repairs was selected, many results

84
showed that one MOS with added spalls, bomblets, or UXOs did not have an increased
total repair time if its total crater repair size was smaller than the crater repair size of the
other MOS.
The biggest influence on total repair time was which path was the critical path in
the RRR process. If the crater repair path was the critical path, then (in this scenario) the
number of spall repairs had no influence on the total repair time. If the spall repair path
was the critical path, then the number of craters made no difference to the total repair
time (potential MOSs with a range of 2 to 5 crater repairs all had the same total repair
time in some cases of MOSs with spall controlled critical paths).
It is not true to say number of damage have complete influence on total repair
time, nor is true to say numbers have no influence on total repair time. It is more true to
say some numbers have an influence on total repair time. Which numbers have an effect
on repair time, and when, is determined by which activities are on the critical path. If
you have a crater controlled critical path, the number of spalls has no influence on total
repair time. If you have a spall controlled critical path, the number of craters has no
influence on total repair time.
4.8 General Resource Characteristics
In this analysis, resources (manpower, equipment, and materials), or rather the
lack of a resource, did not have a major influence on the outcome of the tested scenarios.
The combination of a scenario that required fewer resources then the recommended
generic quantities and the influence of the network on the timing and use of resources,
contributed to the lack of resource influence on the MOS selection. The impact of each
of the three types of resources is described in further detail in the following sections.

85
4.8.1. Manpower
All of the selected MOSs, despite weather condition scenario, had the same
manpower requirements (with the exception of one less equipment operator in the rain
scenario). The maximum number of personnel working on the networked RRR activities
was 33 for all weather conditions and all selected MOSs. The rest of the personnel
requirements can be seen in Table 23 below.
Table 23 – RRR Personnel Requirements
The required personnel were people required to perform various RRR activities to
complete the repairs to the selected MOS. The personnel available were the number of
people designated for airbase recovery as called out in AFH 10-222, Volume 1. This
paper recognizes that not all personnel assigned to airbase recovery are allocated to RRR,
but instead some are allocated to base infrastructure and facility recovery. However,
since the runway is normally designated as the facility with the top priority, it was
AFSC Qty Required Qty Available
EOD 4 5
Enginnering 3 8
Utilities 6 21
Equipment 4 12
Electrical 6 20
Structural/Mechanical 18 26

86
assumed that all personnel required for MOS completion would be assigned to the RRR
team. Before the breakout of the two teams (RRR and base recovery), there is only one
AFSC in which the required number of personnel approaches the number available, EOD.
Because of the lack of surplus in this AFSC and the fact that they work in pairs, this
AFSC has a greater potential of affecting the total repair time. There were no cases in the
tested scenarios where manpower became a critical resource, or was over taxed thereby
changing the completion time of a potential MOS or making a potential MOS impractical
to repair.
4.8.2. Equipment
Every piece of equipment designated for RRR activities is not necessarily
required for all possible MOSs. However, if a piece of equipment was required for RRR,
it was most likely a critical resource. For instance, there may be only one piece of
equipment, such as a tractor and sweeper or a paint machine, and if that piece of
equipment fails or is not available for use, a potential MOS requiring that piece of
equipment would have to be dropped from consideration. Although there may be more
than one piece of equipment, if used, it may still be considered critical. Dump trucks, for
instance, are a type of RRR equipment that there is usually more than one allocated to
RRR activities. However, dump trucks are the type of equipment that every one available
is utilized during the MOS repair (if you have four, you use four; if you have six, you use
six). Utilizing all the dump trucks saves time. If one were unavailable, it would increase
the time of certain activities. If an activity that is affected were on the critical path, the
total time to repair the MOS would be affected, thus making that piece of equipment
critical.
87
Equipment was not found to be a critical factor in the selection of a MOS in this
scenario. The first reason for this is that it was assumed that all equipment would be
available. Second, the activities in the network were primarily based on the equipment
required to complete the activity (i.e. grading the crater required a grater, compacting the
fill required a vibratory roller). These activities were placed in the network knowing that
one could not start before the previous activity was complete, thereby reducing the
potential over tasking of a specific piece of equipment. Third, the activities that required
the most equipment, the crater repair activities, were all in a single path. The other
activity paths in the network tended not to require much equipment.
4.8.3. Materials
Materials constraints did not influence any of the tested scenarios. The stockpile
of materials was more than required to repair any of the MOSs that were selected. There
was enough paint available to paint a 10,000-foot MOS and the selected MOS was only
5,000-foot long. There was enough FFM and select fill to repair seven 50-foot craters
and the maximum number of crater repairs on a selected MOS in any of the scenarios was
four. There was enough epoxy to fill 400 spalls; despite the fact that there were potential
MOSs with 450 spalls, in every weather condition the selected MOS had only 250 spalls.
Therefore, epoxy was not a critical resource.
4.9 Influence of Weather
The selected MOS for both Scenario One: Desert and Scenario Three: Winter was
the same MOS as the selected MOS of Scenario Five: Ideal Conditions. This MOS was
located 500 feet down the runway and the MOS centerline was 52.5 feet right of the
existing runway centerline. The MOS width is 95 feet and the length was 5,000 feet. Of

88
course, the repair times were different in each scenario. Scenario One took longer than
Scenario Five. This was attributed to the decrease in worker efficiency in the hotter
temperature. Scenario Three took longer than both Scenarios One and Five. This was
attributed to the decrease in worker efficiency in the colder temperatures and the decrease
in worker and equipment efficiencies due to the slippery pavement conditions. All three
weather conditions selected MOSs with critical paths that were controlled by crater repair
activities. The selected MOS can be seen in Appendix C.
Both Scenario Two: Rain and Scenario Four: Windy had selected MOSs in
locations similar to each other, both had critical paths that were controlled by spall repair
activities. This MOS was located 2,000 feet down the runway and the MOS centerline
was 52.5 feet left of the existing runway centerline for Scenario Two and 70 feet left of
the existing runway centerline for Scenario Four. Both were on the left edge and at the
very end of the existing runway. Both had a length of 5,000 feet. The width of the
selected MOS for Scenario Two was 95 feet and 60 feet for Scenario Four. The selected
MOSs can be seen in Appendix D and Appendix E, respectively.
It was interesting to find that the MOS with the second shortest repair time for
Scenarios One, Three, and Five were the exact same MOS (location and size) as that
selected for Scenario Four and similar to that of Scenario Two. If the effect of weather
were not considered on the total time to repair, this MOS may be the preferred MOS.
4.10 Time Versus Value of Additional Considerations
Some of the additional considerations were easy to incorporate and evaluate their
total effect on repair time of the various potential MOSs. Additional considerations like
manpower or weather conditions would be examples of this. These considerations would

89
influence any MOS in the same way, despite MOS location. However, this is not the
case for some additional considerations.
Some additional considerations have little or no effect on the repair time of the
MOS, such as MOS located left or right of the existing runway centerline. However,
these considerations do add value to a selected MOS that incorporates them. Some
additional considerations have an influence on time, such as MOS located on the existing
runway centerline (the influence being the time saved by not painting a new centerline),
but the influence on repair time does not capture their total value as a feature added to the
MOS. This value is not seen in the time required to complete repairs to the MOS, but is
captured by the people operating on the MOS.
Because these additional considerations did not affect repair time (or their total
effect cannot be measured in repair time alone), they did not influence the MOS selected.
However, some of these features can be evaluated in the results. For instance, locating
the MOS on the centerline did affect the repair time by saving the time needed to paint a
new centerline. Looking at the results of Scenario Five: Ideal Conditions, the MOS
selected with the minimum repair time had a repair time of 9.06 hours. The MOS with
the lowest repair time that was on the centerline of the existing runway had a repair time
of 15.03 hours. Currently, this methodology did not consider whether having a MOS on
the existing centerline is worth the additional 5.97 hours to repair. Again, the second
fastest repair time for Scenarios One, Three and Five was achieved in a MOS located at
the left corner on the departure end of the runway (2,000 feet from the existing threshold,
5,000 feet long and going to the end of the existing runway, 70 foot left of the existing
centerline, and 60 feet wide and sharing the left edge of the existing runway). This MOS
90
captures many additional considerations: is located at either the threshold or departure
end of existing runway; if not on centerline, shares edge of existing runway; can utilize
existing airfield lighting (if operational); and most likely would have access to the
taxiway that is located at the departure end of the existing runway. Again, the value of
these features was not considered, only the time to repair. A decision maker would have
to decide if these features are worth the 37 minutes to 1 hour and 40 minutes of added
repair time (varying depending of weather conditions in each scenario).
4.11 Current USAF Methodology Comparison
The MOS selected utilizing the current USAF MOS selection techniques was
selected based on the assumed 50-foot by 5,000-foot minimum MOS dimensions. It was
visually selected/located at the existing runway threshold and centered 75 feet to the left
of the existing centerline. When analyzing the selected MOS, it was determined that the
MOS dimensions could be increased without adding additional time. The characteristics
of the MOS selected utilizing the current USAF methodology are described in Table 24
below (along side the characteristics of the MOS selected in Scenario Five) and can be
seen in picture format in Appendix F.

91
Table 24 – Current Methodology Selection
The primary considerations of the MOS selector were quantity and location of
damage. A MOS with the near minimum number of craters was selected, the selected
MOS having three craters. The MOS only had one spall field. Even though two bomblet
fields would need to be cleared, only one of the bomblet fields was actually on the MOS,
the other was within 100 feet of the MOS and would be cleared for safety reasons. The
fact that only one of the bomblet fields was on the MOS was significant because although
this thesis assumes the bomblets have not exploded, are on the surface, and can be
cleared with a bulldozer, the MOS selector realized the potential that some of the
bomblets might have penetrated the pavement surface and would be more difficult to
Characteristic
MOS C.L. 75 to 50 ft Left of Existing C.L. 30 to 75 ft Right of Existing C.L.
MOS Threshold 0 ft from Existing Threshold 500 ft from Existing Threshold
Min Time 10.45 hours 9.06 hours
Max Time 23.05 hours 23.05 hours
Max Width 75 ft 95 ft
Max Length 5,400 ft 5,000 ft
Small Craters 0 1
Large Craters 3 2
Spalls 250 250
Bomblets 380 380
UXOs 1 3
Current Methodology Scenario Five: Ideal Conditions
92
remove. Also, a bomblet could have exploded under the surface causing a large, crater
size cavity under the pavement surface, and this could have gone undetected by initial
damage assessment.
The placement of the damage on the MOS played a significant role in the expert’s
selection of the MOS. The damage on this MOS was primarily concentrated in the
middle of the MOS. There was approximately 1,200 feet of runway from the threshold
before the first repaired damage (a large crater). The MOS selector assumed most of the
touchdowns on landings would be within the first 500 feet from the threshold, and any
repairs within the first 500 feet would require more reoccurring maintenance than repairs
outside this area. Also, on takeoff, the aircraft is the heaviest at the start of its takeoff, at
the threshold. As the aircraft moves down the runway, it builds lift reducing the force
applied to the runway surface. Reducing the weight on the repairs can increase the time
between repair maintenance.
An aspect of how the spall and bomblet fields were placed on the MOS, which the
MOS selector found appealing, is that they were skewed across the MOS. This resulted
in a smaller, triangular shaped portion of the spall and bomblet fields being placed on the
MOS and the majority of the damage off the MOS. This was desirable because the
aircraft would be passing over a smaller amount of the damage potentially making the
number of repairs that required maintenance less. The final damage placement
consideration of the MOS selected is that if the repair on the last crater, located 4895 feet
down the runway was repaired well enough, the leadership may consider using the MOS
as a bi-directional runway. However, it was noted that this would most likely increase
the frequency of maintenance on this repair.
93
There were two positive features of the selected MOS, which were a result of its
placement on the existing runway. The first was it shared the same threshold as the
existing runway. This is an operational feature that helps pilots landing on the MOS who
are used to touching down at a specific distance down the runway. The second feature,
which resulted from MOS placement, is the potential use of some of the existing
NAVAIDS and runway lighting. There is the potential to use some of the existing edge
lighting. Even more desirable, is the possibility of using existing approach lighting.
This would save time in the set up of lighting that is off the paved surface, and also
lighting that controls the decent and approach angle (lighting one would not want to make
a mistake in setting up despite all the stress and pressure to get an operational MOS after
an attack). Not only is there a possible timesaving, but there is also an operational benefit
to the pilots being able to use the lights they are used to landing with.
Comparing the MOS selected utilizing the current USAF methodology to a MOS
selected under similar conditions utilizing the methodology discussed in this thesis (the
MOS selected in Scenario Five: Ideal Conditions described above), the first thing one
may notice is that the time of the MOS selected using the method outlined in this thesis
requires less time (1 hour 24 minutes) to repair more damage (making safe and clearing
2 more UXOs). The two MOSs required the repair of the same spall field and the same
two bomblet fields. The number of craters was the same, but they were different craters.
The craters on the MOS selected in Scenario Five had smaller craters; this is where the
timesavings were achieved. The timesavings realized from the size of the crater repairs
more than made up for the time required to remove two more UXOs. Both MOSs had

94
one edge of the MOS which shared an edge with the existing runway, and therefore, both
had the potential to utilize some of the existing runway lighting.
Both selected MOSs have advantages with respect to different additional
considerations over each other. The biggest Civil Engineering, maintenance related
advantage the MOS selected by the expert over the MOS selected utilizing the outlined
methodology is the first crater is more than 1,200 feet down the MOS (compared to
within the first 500 feet in the Scenario Five MOS). This would imply there is a potential
maintenance savings since this crater is taking less abuse from the aircraft. The biggest
operational advantage is that the expert selected MOS starts at the existing runway
threshold providing the opportunity to utilize existing approach lighting. This MOS also
has the possibility of being expanded to a longer operational length without repairing any
additional damage. The final additional consideration that might be considered an
advantage is that there is only one UXO to clear on the expert selected MOS. This
minimizes the number of EOD teams and/or time the teams are exposed to the UXO
hazard.
The MOS selected utilizing the methodology presented in Chapter 3 had some
advantages in additional considerations over the expert selected MOS. The damage on
this selected MOS was more spread out giving the potential for looser tolerances on
repair quality (with the exception of the first crater which is within the first 500 feet).
The crater size is smaller; on a MOS with a critical path controlled by crater repair
activities, this will contribute to timesavings. This MOS is better suited to bi-directional
use since the nearest crater is over 1,500 feet from the departure end of the MOS. This
MOS also has the possibility of being expanded a wider operational width. The final

95
additional consideration that might be considered an advantage is that all UXOs are
cleared on the selected MOS. This would eliminate any potential future danger from
unexploded munitions left on the runway and can create a worry free environment (with
respect to UXOs) for personnel maintaining, working, and operating on the environment.
Again, the methodology presented in Chapter 3 does not evaluate the differences
between these types of additional considerations, except in the case of the time required
to repair a MOS with any particular set of additional considerations. This methodology
still requires a decision maker to determine the value of one set of additional
considerations on one MOS over another set additional considerations on another MOS;
and then determine if the additional time to repair one over the other is worth it.
The following are aspects that might have influenced MOS selection decision or
number of additional considerations that were included in the decision of the MOS
selected by the expert. There was a lack of pressure, which is normally found in training
and real world scenarios, on the expert selecting the MOS. There was no high-ranking
Airbase Commander demanding an answer, there were no time constraints, and the
control room was not the typical hectic (phones ringing, people shouting over each other,
Commander barking out orders) environment. The expert making the MOS selection was
at one time a trainer of MOS selection personnel; he truly was an expert. Since he was a
trainer, he was probably better trained himself and knew all of the additional
considerations outlined in the various controlling regulations and standard practices.
Finally, the expert knew the purpose of his participation was to use his MOS selection in
a comparison with the methods outlined in this work; and the expert knew the purpose of
this work was to evaluate the inclusion of additional consideration on MOS selection.
96
Although I compared the MOS selected by the expert to the MOS selected by the
methodology described in Chapter 3, and provided a time estimate for completing the
expert selected MOS using the time equations in Chapter 3, the computer program
evaluating potential MOSs utilizing these equations would never have selected the MOS
selected by the expert as a possible MOS to consider for repair. The reason for this is the
MOS did not meet a defined requirement based on Repair Quality Criteria (RQC). In all
scenarios, there was a requirement of a barrier landing. As such, RQC does not allow
repairs between 700 feet and 1,300 feet from the MOS threshold on a unidirectional MOS
(this is to prevent the tail hook of the aircraft from snagging the FOD cover of the repair
and ripping the cover off, ruining the repair). The MOS selected by the expert had a
crater located at 1,270 feet from the MOS threshold, violating the previously stated
guidance.
A potential reason for this expert oversight is in an attempt to reduce the effort
required by the expert assisting this work, the MOS damage was pre-plotted and a clear
plastic sheet the size of the requested MOS was provided. The expert had requested the
RQC book to use during his MOS selection with the intent on using it to get minimum
MOS length requirements based on aircraft type and operation. Once the expert was told
the scenario involved selecting a MOS that was 50 feet by 5,000 feet he did not need the
RQC book to evaluate repair length since 5,000 feet is longer than the minimum for the
specified aircraft and aircraft operations. Therefore, the expert did not look at the criteria
in the RQC book, which would have reminded him of the barrier space requirements. As
stated above, pre-knowledge of the reason for this exercise potentially caused greater

97
emphasis on the selection based on additional considerations, and this additional focus
may have caused the oversight in MOS requirements.

98
V. Conclusion
5.1 Conclusion
The amount of damage (or number of craters, spalls, bomblets, or UXOs) may not
always be the best evaluation method for Minimum Operating Strip (MOS) selection,
even if only trying to select a MOS with minimum repair time. This study showed that
not all damage need be considered (or counted) during the selection process. The critical
path in the activity network determined which types of damage influence the time
required to repair the MOS. The repair of damage within activities not on the critical
path had no influence on the time required to finish the MOS repairs. An understanding
of both the activities and how the activities network, and how the activities and their
networks change from one potential MOS to the next, is critical in the selection of the
best MOS.
Specifically, the number of craters was not always the best determination of
which MOS would be the fastest to repair, even on MOSs with critical paths controlled
by crater repair activities. A better determination of which MOS will take longer to
repair is the combined size of the craters. For example, there were cases analyzed where
MOSs with 4 or 5 smaller craters were faster to repair than runways with 3 larger craters.
The impact of additional considerations is greater on MOS repair time than
previously credited for in current MOS selection publications. For instance, as stated
above, the size of crater damage can potentially change a MOS selection decision. Some
additional considerations have an influence on repair time and operational ease, such as
being centered on the existing centerline. While they may save repair time within a

99
specific activity (such as not having to paint) and provide an operational benefit, the cost
in repair time of the total MOS may be higher due to other considerations; for instance, to
get a MOS centered on the existing runway centerline would take approximately an
additional six hours to repair in Scenario Five: Ideal Conditions. Only when all
considerations are considered concurrently can the best MOS be selected and the true
repair time be known.
Resources play a bigger part in MOS selection than perhaps shown in this paper.
As stated earlier, the lack of resource impact in this research is a result of not having a
resource shortage. However, it is easy to see that not having enough resources could
have an impact on MOS selection and the selected MOS. For instance, not having
enough manpower will most likely increase the repair time for all potential MOSs. Not
having enough equipment or materials may eliminate the consideration of some potential
MOSs or even have the potential to make MOS repair impossible altogether.
5.2 Areas for Additional Research
Finding little to no published research on the MOS selection process leaves room
for an abundance of additional research topics in this area. The first few suggestions for
further work is research that would directly benefit the model/methodology outlined in
this thesis. The other areas of additional research called out may or may not be capable
of being utilized directly in the methodology outlined in this work, but would further the
understanding of MOS selection and the impacts of MOS features on repair time,
maintenance time, and/or MOS operational usability.
This research only looked at damage on the runway; expanding the model to
incorporate damage to the entire airfield (i.e., including taxiways, parking apron, etc.)

100
would provide a more complete and realistic analysis. This work only considered the
effects of the efficiency factor that had the greatest negative impact on repair time under
conditions that produced multiple efficiency factors for each activity. Research could be
done to determine how to evaluate the effect of the combination conditions efficiency to
create a single efficiency factor that describes the effect of multiple conditions (i.e., cold
and windy versus the maximum of cold or wind).
The age of the research which provided the basis for the majority of the time
equations was quite old (1983), at least in the evolution of the Rapid Runway Repair
(RRR) process. If repair time estimation has any role in the MOS selection decision, it
would be beneficial to revalidate and possibly update research used to develop the time
estimation equations. There is room to take time estimation a step further. Research in
applying probability distributions to activity time and resource availability would prove
useful in providing a truer estimation of repair completion time. Probability distributions
could also be applied to the type of damage to determine the probabilities of the various
types of repair activities. This would provide insight to proper team composition and
equipment and material requirements.
It has recently been made known that there will be changes in the structuring,
manpower, and equipment utilized in the Civil Engineering career field in the near future.
These changes may have an effect on many of the assumptions used in this research.
Going through the new regulations and reevaluating the assumptions will be necessary.
If the new regulations are anything like the current documents that outline the RRR
requirements, a good area of research will be analyzing the different values given for the
same standard in the various publications and determining which values would be best to
101
adopt as the standard and subsequently update all discrepancies in the various
publications.
The activities and activity network play a major role in determining repair time
and the time required to incorporate any of the additional considerations. Research in
developing a generic network, or series of generic networks, would benefit the MOS
selection team by helping them evaluate which types of damage will influence their time
estimate. Research in this area will also help establish the most efficient arrangement of
activities (i.e., order of process) to both maximize use of resources and minimize repair
time.
Repeatedly, the measure of repairing a MOS in four hours kept appearing in
regulations guiding the RRR process (sometimes the measure referred to four hours to
repair a certain number of craters with a certain size crew, other times it referred to four
hours to repair the entire MOS to include UXO clearing and paint times, yet another
inconsistency in the guiding regulations). Even in the ideal scenario (with two crater
crews repairing three craters), this four-hour time requirement was not met; it took
approximately seven hours just for the crater repair activities (much more time was
required in conditions less than ideal). In addition to this was a little more than two hours
of other work that was required to complete the MOS. Even if, hypothetically, the crew
size and skill, equipment available, and materials on hand were adjusted to accomplish
crater and spall repair in only four hours, this measure would not tell the entire story.
The times for UXO and bomblet clearing and painting ranged from 45 minutes to over 7
hours (nearly twice the 4-hour crater repair requirement) in ideal conditions in the

102
runway damage scenario evaluated. This leads to the question of what is the appropriate
measurement or standard for evaluating the best MOS to select and repair.
Some of the many additional considerations were evaluated in chapters 3 and 4.
Some were directly or partially incorporated into MOS selection based on the time
required to incorporate the additional consideration into the MOS selection. The rest
could not easily be converted into a time measurement, and therefore, were evaluated by
looking at the results and determining the additional time required or time savings of
potential MOSs with these additional considerations. Still, there were many additional
considerations whose impact were not entirely captured or had to be left out of the
equations altogether. Incorporating a methodology that calculates the perceived value
(based on the opinions of Decision Maker(s), perhaps high ranking Civil Engineering and
Operational leadership) of all additional considerations (perhaps even including repair
and maintenance times) would further the methodology evaluated and increase the
likelihood of selecting the best MOS. It will take the contributions of area experts and
leadership to determine the value of incorporating additional considerations and
determine the tradeoff between the value added by incorporating any additional
considerations verses the time required to incorporate them.
Throughout this research, the definition of repair time was initial repair time, the
time required to repair the damage the first time and provide a usable MOS. However,
there are two types of repair time. The first, is the one just described, and is the most
common definition and the time most commonly considered in MOS selection. The
second type of repair time is maintenance time. It is a measure historically overlooked by
leadership, but is becoming more and more commonly considered at lower levels within
103
the MOS selection team because of the known difficulty to get approval to shut down an
operational runway to perform required maintenance. Maintenance time, or the
properties that positively or negatively influence the time required for future
maintenance, should be researched and evaluated for incorporation into MOS selection
(perhaps in the methodology suggested above, assigning and incorporating value of
additional considerations).
Maintenance time can be equated to repair time. Either the time can be spent up
front to repair a better MOS (one with less potential future maintenance problems or
potential longer periods of time between scheduled maintenance); or one can spend less
time on the initial repair, but add the additional time required to shut the MOS down for
more frequent repairs. Sometimes, it is critical to get the MOS up fast, to minimize
initial repair time, and future maintenance is less or of no concern at all, like in an
evacuation or emergency-landing scenario. Other times, it is less critical to focus on
initial repair time, such as after an attach when the enemy has been pushed back by other
friendly forces, and a little more time can be spent upfront selecting a more maintainable
MOS requiring less future maintenance (fewer number of times and/ or shorter durations
that air operations are interrupted as the MOS is shut down for maintenance). The
tradeoff between the two would provide a good research topic that would have the
potential to change MOS selection mentality.
MOS selection utilizing a methodology that evaluates potential MOSs
mathematically lends itself well to computer automation. The final suggestion for future
research was going to be incorporating a methodology for evaluation of repair and
maintenance times along with as many additional considerations as possible (perhaps

104
using a value method as described above) into an user-friendly computer program. This
would eliminate the oversight or omission of any requirements or additional
considerations as happened during the expert selected MOS selection described in
Chapter 4. It would also ensure that each MOS and each consideration was evaluated
consistently for each potential MOS. However, it has been made known that the USAF is
currently in development of a computer aided MOS selection program. Hopefully, many
of the considerations outlined in this chapter are found to be included in this software
program.

105
Bibliography
Air Force Engineering and Services Center. Program Management Plan (PMP) for Rapid Runway Repair (RRR). Tyndall Air Force Base FL: Air Force Engineering and Services Center, 1983.
Alford, Samuel J. and Albert J. Bush III. Crater Repair of North Auxiliary Airfield,
South Carolina: Final Report, August 1985. Vicksburg MS: Corps of Engineers, August 1985 (ADA160156).
Anderson, Mark and Mike Riley. “PaveMendTM as a Solution for Rapid Runway
Repair,” Proceedings of the 27th International Air Transportation Conference. 221-230. Reston, VA: American Society of Civil Engineers, 2002. Baker, Steven A. ”Innovative Engineers Pave New Paths in Afghanistan,” Engineer,
October-December: 20-22 (December 2003). Chang, Shujie. Rapid Runway Repair (RRR) Techniques: A Systems Analysis. Port
Hueneme CA: Naval Civil Engineering Laboratory, May 1990 (ADA225238). Department of the Air Force. Guide to Bare Base Development. AFH 10-222 Vol. 1.
Washington: HQ USAF, 1 July 1996. Department of the Air Force. Guide to Bare Base Development. AFH 10-222 Vol. 2.
Washington: HQ USAF, 1 December 1996. Department of the Air Force. Rapid Runway Repair Operations. AFPAM 10-219, Vol.
4. Washington: HQ USAF, 1 April 1997. Department of the Army. Air Base Repair (Pavement Repair). TC 5-340. Washington:
HQ US Army, 27 December 1988. Departments of the Army and Air Force. Troop Construction and Engineering Support
of the Air Force Overseas. JAR 415-30 and AFR 93-10. Washington: HQ Army and HQ USAF, 15 May 1979.
Department of Defense. Unified Facilities Criteria (UFC). UFC 3-270-07. Washington,
12 August 2002. Department of Defense. Unified Facilities Criteria (UFC) (Draft). UFC 3-270-07.
Washington, 30 June 2003.

106
Emerson, D.E. AIDA: An Airbase Damage Assessment Model. Contract F44620-73-C-0011. HQ USAF Washington: Director of Planning, Programming and Analysis, September, 1976 (ADA033102).
Meredith, Jack R. and Samuel J. Mantel, Jr. Project Management: A Managerial
Approach (6th Edition). Hoboken: John Wiley & Sons, Incorporated, 2006. Soares, Paul A. Development and Testing of Rapid Repair Methods for War Damage
Runways. Department of Civil Engineering, University of Florida and Naval Postgraduate School, Monterey CA, Spring 1990 (ADA223970).
Stroup, Theodore, David Reed, and George Hammitt. Airfield Damage Recovery
Techniques of 18th Engineer Brigade in Europe. HQ US Army Washington: Office, Chief of Engineers, December, 1980 (ADA094222).
Wang, Paul and Lionel Menegozzi. “A Neural Network Based Postattack Damage
Assessment System,” Proceedings of the 1991 IEEE National. 724-729. Dayton OH: IEEE, 1991.
Whitehead, J.M., M.D. Hoffman, P.E. Potter, C.P. Neuswanger, and M.M. Wilding. The
Effects of Weather on Rapid Runway Repair. Volume I: Final Report, 30 June 19822-5 November 1982. Contract F08635-80-0206. Tyndall Air Force Base FL: Air Force Engineering and Services Center, May 1983(ADA130409).
Whitehead, J.M., M.D. Hoffman, P.E. Potter, C.P. Neuswanger, and M.M. Wilding. The
Effects of Weather on Rapid Runway Repair. Volume II: Final Report, 30 June 19822-5 November 1982. Contract F08635-80-0206. Tyndall Air Force Base FL: Air Force Engineering and Services Center, May 1983(ADA130409).

107
Appendix A: Damage Assessment Data
Dam
age
Type
Dist
ance
from
Zer
oL
or R
of C
ente
rline
Dist
ance
L o
r RD
iam
eter
or W
idth
Size
of D
or W
Fiel
d Id
entif
ier
Dist
ance
Dow
n Pa
vem
ent
L or
R o
f Cen
terli
neD
istan
ce L
or R
Dia
met
er o
r Wid
thSi
ze o
f D o
r WN
umbe
r Ide
ntifi
erN
umbe
r of S
or B
1 C 440 R 20 D 40
2 C 1270 L 30 D 30
3 B 1560 L 60 W 80 F 300 R 40 W 160 N 350
4 C 2180 L 60 D 35
5 C 3100 R 50 D 20
6 X 3380 L 40
7 C 3960 R 25 D 30
8 X 4450 R 100
9 B 4550 R 100 W 10 F 30 R 70 W 50 N 30
10 C 4895 L 45 D 35
11 S 5530 R 30 W 50 F 300 R 180 W 200 N 200
12 C 5810 L 15 D 25
13 C 6670 R 65 D 25
14 C 875 R 60 D 35
15 S 2430 R 30 W 50 F 350 L 60 W 150 N 250
16 X 4000 R 80
17 C 5440 L 30 D 25
18 B 6240 L 20 W 40 F 200 R 40 W 120 N 175

108
Appendix B: Airfield Damage Plot
Station Damage Description
0+000
1+000
2+000
3+000
4+000
5+000
6+000
7+000
C440R20D40
C875R60D35
C1270L30D30
B1560L60W80F300R40W160N350
C2180L60D35 S2430R30W50F350L50W150N250
C3100R50D20
X3380L40
C3960R25D30 X4000R80
X4450R100 B4550R100W10F30R70W50N30
C4895L45D35
C5440L30D25 S5530R30W50F300R180W200N200 C5810L15D25
B6240L20W40F200R40W120N175
C6670R65D25
Legend Small Craters Large Craters Spall Fields Bomblet Fields UXOs

109
Appendix C: Selected MOS for Scenarios One, Three, and Five
Legend Small Craters Large Craters Spall Fields Bomblet Fields UXOs 50 x 5,000 MOS Expanded MOS
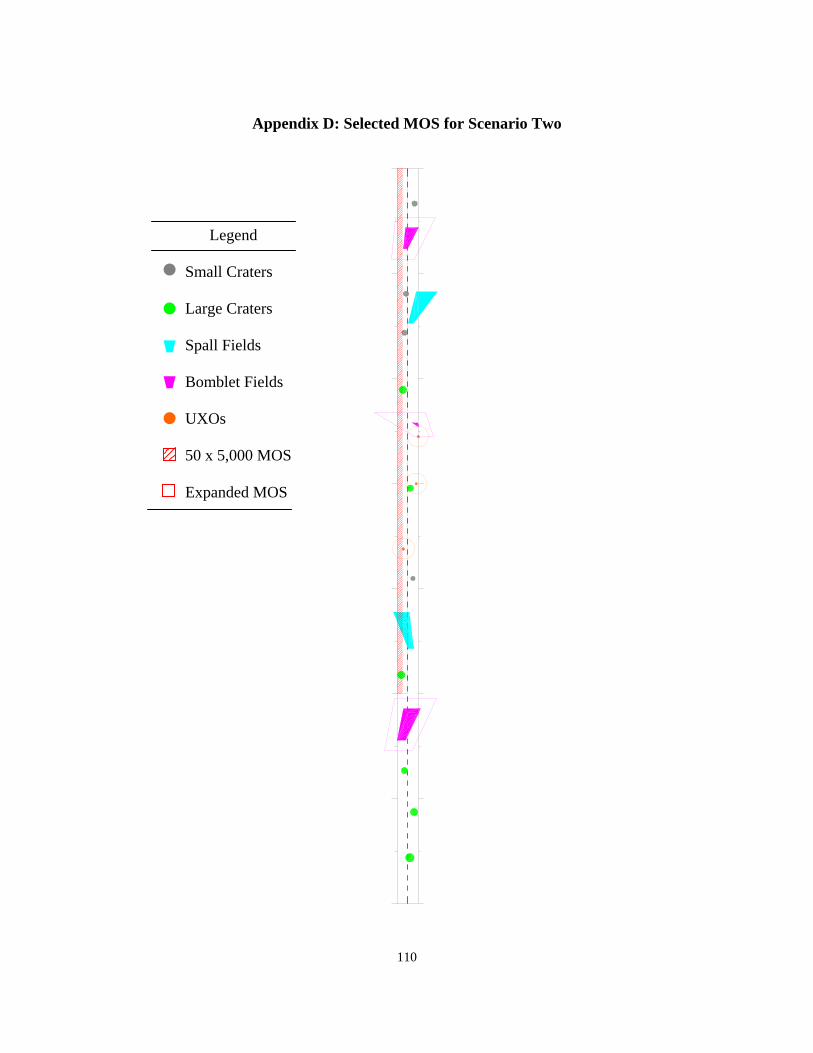
110
Appendix D: Selected MOS for Scenario Two
Legend Small Craters Large Craters Spall Fields Bomblet Fields UXOs 50 x 5,000 MOS Expanded MOS

111
Appendix E: Selected MOS for Scenario Four
Legend Small Craters Large Craters Spall Fields Bomblet Fields UXOs 50 x 5,000 MOS Expanded MOS

112
Appendix F: Expert Selected MOS
Legend Small Craters Large Craters Spall Fields Bomblet Fields UXOs 50 x 5,000 MOS Expanded MOS
REPORT DOCUMENTATION PAGE Form Approved OMB No. 074-0188
The public reporting burden for this collection of information is estimated to average 1 hour per response, including the time for reviewing instructions, searching existing data sources, gathering and maintaining the data needed, and completing and reviewing the collection of information. Send comments regarding this burden estimate or any other aspect of the collection of information, including suggestions for reducing this burden to Department of Defense, Washington Headquarters Services, Directorate for Information Operations and Reports (0704-0188), 1215 Jefferson Davis Highway, Suite 1204, Arlington, VA 22202-4302. Respondents should be aware that notwithstanding any other provision of law, no person shall be subject to an penalty for failing to comply with a collection of information if it does not display a currently valid OMB control number. PLEASE DO NOT RETURN YOUR FORM TO THE ABOVE ADDRESS. 1. REPORT DATE (DD-MM-YYYY) 22-03-2007
2. REPORT TYPE Master’s Thesis
3. DATES COVERED (From – To) Sep 2006 – Mar 2007
5a. CONTRACT NUMBER
5b. GRANT NUMBER
4. TITLE AND SUBTITLE Rapid Runway Repair (RRR): an Optimization for Minimum Operating Strip (MOS) Selection 5c. PROGRAM ELEMENT NUMBER
5d. PROJECT NUMBER 5e. TASK NUMBER
6. AUTHOR(S) Duncan, David J., Captain, USAF
5f. WORK UNIT NUMBER
7. PERFORMING ORGANIZATION NAMES(S) AND ADDRESS(S) Air Force Institute of Technology Graduate School of Engineering and Management (AFIT/EN) 2950 Hobson Way WPAFB OH 45433-7765
8. PERFORMING ORGANIZATION REPORT NUMBER AFIT/GEM/ENV/07-M4
10. SPONSOR/MONITOR’S ACRONYM(S)
9. SPONSORING/MONITORING AGENCY NAME(S) AND ADDRESS(ES) N/A
11. SPONSOR/MONITOR’S REPORT NUMBER(S)
12. DISTRIBUTION/AVAILABILITY STATEMENT APPROVED FOR PUBLIC RELEASE; DISTRIBUTION UNLIMITED.
13. SUPPLEMENTARY NOTES 14. ABSTRACT Minimum Operating Strip (MOS) selection determines the exact placement of the MOS on the damaged runway, and therefore, the amount of munitions that need to be neutralized and the amount of damage that will need to be repaired. MOS selection, in essence, is the key determinant of the time required to attain an operational takeoff and recovery surface. Since the MOS selection stage determines the events and scope of work for all of the Rapid Runway Repair (RRR) stages that follow, it could be argued that this is the most important stage in the entire RRR process. The primary purpose of this research was to evaluate the application of a decision analysis methodology for the selection of a MOS during the RRR process. The secondary purpose was to determine the effect of additional considerations on both the MOS selected and the repair time. MOSs selected utilizing the outlined methodology were compared to a MOS selected using the current USAF method. Results showed that additional considerations have an impact on both MOS selection and time to repair. Results also showed that the outlined methodology selected a MOS with a shorter repair time, despite additional damage, than the MOS selected using the current USAF method. 15. SUBJECT TERMS Minimum Operating Strip (MOS) Rapid Runway Repair (RRR) Optimization, Selection, Runway, Airfield, Repair 16. SECURITY CLASSIFICATION OF:
19a. NAME OF RESPONSIBLE PERSON Major Sonia Leach, AFIT/ENV
REPORT U
ABSTRACT U
c. THIS PAGE U
17. LIMITATION OF ABSTRACT UU
18. NUMBER OF PAGES 113 19b. TELEPHONE NUMBER (Include area code)
(937) 785-3636X7390
Standard Form 298 (Rev: 8-98) Prescribed by ANSI Std. Z39-18
Top Related
Copyright © 2022 FDOKUMEN

