An Intelligent Handover Mechanism Based on MOS ... - MDPI
35
Citation: Lee, T.-H.; Chang, L.-H.; Chan, Y.-S. An Intelligent Handover Mechanism Based on MOS Predictions for Real-Time Video Conference Services in Mobile Networks. Appl. Sci. 2022, 12, 4049. https://doi.org/10.3390/ app12084049 Academic Editors: Amy J. C. Trappey, John P. T. Mo and Ching-Hung Lee Received: 26 February 2022 Accepted: 11 April 2022 Published: 16 April 2022 Publisher’s Note: MDPI stays neutral with regard to jurisdictional claims in published maps and institutional affil- iations. Copyright: © 2022 by the authors. Licensee MDPI, Basel, Switzerland. This article is an open access article distributed under the terms and conditions of the Creative Commons Attribution (CC BY) license (https:// creativecommons.org/licenses/by/ 4.0/). applied sciences Article An Intelligent Handover Mechanism Based on MOS Predictions for Real-Time Video Conference Services in Mobile Networks Tsung-Han Lee *, Lin-Huang Chang and Ya-Shu Chan Department of Computer Science, National Taichung University of Education, No. 140, Minsheng Rd., West Dist., Taichung City 403454, Taiwan; [email protected] (L.-H.C.); [email protected] (Y.-S.C.) * Correspondence: [email protected] Abstract: In mobile networks, handover mechanisms provide fast and smooth access service for mobile users. However, one of the main challenges in mobile networks is the handover management with increased mobility and bandwidth demand of the required network services. Therefore, in this paper, we propose a MOS-aware (mean opinion score-aware) mobile network handover mechanism based on deep learning to determine the appropriate handover time for real-time video conference services in mobile networks. We construct a wireless network topology with LTE characteristics in a Mininet-WiFi simulation. User equipment (UE) can determine the service-required MOS (Mean Opinion Score) from the proposed deep-learning-based handover mechanism with appropriate handover time. Simulation results show that the proposed scheme provides higher performance than the original A3 handover mechanism. The contribution of this paper is to combine the real-time video conferencing services with a deep-learning-based handover mechanism by predicting MOS values to improve the quality of service for users in mobile networks. Keywords: handover; long term evolution; 5G; mean opinion score; deep learning 1. Introduction Long-term evolution (LTE) and 5G, which were recently launched and which officially triggered the new era of fifth generation telecommunication, [1] are high-speed wireless communication standards for mobile devices in the field of telecommunications that pro- vide high-speed mobile networks for people’s lives. LTE and 5G provide mobile users with the stability of data transmission through handover technology, allowing users to have enough bandwidth to meet the needs of quality of service (QoS) for various network applications. In order to meet the increasing demand for data traffic, the deployment of small base stations will play an important role in future network deployment. Network operators must not only meet the needs of mobile users for traditional signal coverage but must also meet the needs of users to provide a quality of experience (QoE) for different network services. When users are moving around the deployment environment of multi- ple base stations, the user equipment (UE) in general only decides the time to handover based on the signal strength. The most important issue in the handover mechanism is to find the appropriate moment to trigger the handover process. The original event A3 handover mechanism is usually used as a measurement for the required signal strength of handover in LTE, which detects the offset when the signal strength of the neighboring eNB is continuously greater than the signal strength from the serving eNB during the signaling period. However, the handover mechanism should be predicted and carried out before a user encounters QoE degradation. The QoE of network services will be degraded due to the low signal quality. Therefore, it is the motivation of this research to predict the optimal handover time for each UE based on the signal strength provided by neighboring base stations (BSs), and to maintain the required QoE during its continuous movement. In addition, real-time video streaming service is a crucial application, such as auto- mated guided vehicles (AGVs) and unmanned aerial vehicles (UAVs) in the smart machin- Appl. Sci. 2022, 12, 4049. https://doi.org/10.3390/app12084049 https://www.mdpi.com/journal/applsci
-
Upload
khangminh22 -
Category
Documents
-
view
4 -
download
0
Transcript of An Intelligent Handover Mechanism Based on MOS ... - MDPI

�����������������
Citation: Lee, T.-H.; Chang, L.-H.;
Chan, Y.-S. An Intelligent Handover
Mechanism Based on MOS
Predictions for Real-Time Video
Conference Services in Mobile
Networks. Appl. Sci. 2022, 12, 4049.
https://doi.org/10.3390/
app12084049
Academic Editors: Amy J. C. Trappey,
John P. T. Mo and Ching-Hung Lee
Received: 26 February 2022
Accepted: 11 April 2022
Published: 16 April 2022
Publisher’s Note: MDPI stays neutral
with regard to jurisdictional claims in
published maps and institutional affil-
iations.
Copyright: © 2022 by the authors.
Licensee MDPI, Basel, Switzerland.
This article is an open access article
distributed under the terms and
conditions of the Creative Commons
Attribution (CC BY) license (https://
creativecommons.org/licenses/by/
4.0/).
applied sciences
Article
An Intelligent Handover Mechanism Based on MOS Predictionsfor Real-Time Video Conference Services in Mobile NetworksTsung-Han Lee *, Lin-Huang Chang and Ya-Shu Chan
Department of Computer Science, National Taichung University of Education, No. 140, Minsheng Rd., West Dist.,Taichung City 403454, Taiwan; [email protected] (L.-H.C.); [email protected] (Y.-S.C.)* Correspondence: [email protected]
Abstract: In mobile networks, handover mechanisms provide fast and smooth access service formobile users. However, one of the main challenges in mobile networks is the handover managementwith increased mobility and bandwidth demand of the required network services. Therefore, in thispaper, we propose a MOS-aware (mean opinion score-aware) mobile network handover mechanismbased on deep learning to determine the appropriate handover time for real-time video conferenceservices in mobile networks. We construct a wireless network topology with LTE characteristics ina Mininet-WiFi simulation. User equipment (UE) can determine the service-required MOS (MeanOpinion Score) from the proposed deep-learning-based handover mechanism with appropriatehandover time. Simulation results show that the proposed scheme provides higher performancethan the original A3 handover mechanism. The contribution of this paper is to combine the real-timevideo conferencing services with a deep-learning-based handover mechanism by predicting MOSvalues to improve the quality of service for users in mobile networks.
Keywords: handover; long term evolution; 5G; mean opinion score; deep learning
1. Introduction
Long-term evolution (LTE) and 5G, which were recently launched and which officiallytriggered the new era of fifth generation telecommunication, [1] are high-speed wirelesscommunication standards for mobile devices in the field of telecommunications that pro-vide high-speed mobile networks for people’s lives. LTE and 5G provide mobile userswith the stability of data transmission through handover technology, allowing users tohave enough bandwidth to meet the needs of quality of service (QoS) for various networkapplications. In order to meet the increasing demand for data traffic, the deployment ofsmall base stations will play an important role in future network deployment. Networkoperators must not only meet the needs of mobile users for traditional signal coverage butmust also meet the needs of users to provide a quality of experience (QoE) for differentnetwork services. When users are moving around the deployment environment of multi-ple base stations, the user equipment (UE) in general only decides the time to handoverbased on the signal strength. The most important issue in the handover mechanism isto find the appropriate moment to trigger the handover process. The original event A3handover mechanism is usually used as a measurement for the required signal strength ofhandover in LTE, which detects the offset when the signal strength of the neighboring eNBis continuously greater than the signal strength from the serving eNB during the signalingperiod. However, the handover mechanism should be predicted and carried out before auser encounters QoE degradation. The QoE of network services will be degraded due tothe low signal quality. Therefore, it is the motivation of this research to predict the optimalhandover time for each UE based on the signal strength provided by neighboring basestations (BSs), and to maintain the required QoE during its continuous movement.
In addition, real-time video streaming service is a crucial application, such as auto-mated guided vehicles (AGVs) and unmanned aerial vehicles (UAVs) in the smart machin-
Appl. Sci. 2022, 12, 4049. https://doi.org/10.3390/app12084049 https://www.mdpi.com/journal/applsci

Appl. Sci. 2022, 12, 4049 2 of 35
ery. For instance, real-time video streaming services in UAVs are now widely used foraerial photography, surveillance, image recognition, object detection, and remote sensing.However, existing LTE handover solutions are unable to meet the quality requirements interms of quality of service for real-time video streaming while the UAV is moving in flight.
This research proposes a deep learning model on a mean opinion score (MOS) evalua-tion approach for a real-time video conference service for optimal handover time predictionto improve the user’s QoE. We will construct an experimental and simulation platformfor LTE/5G networks to analyze the signal strength (reference symbol received power,RSRP) of neighboring base stations reported by UE. Besides the fact that the experimentalresults show the proposed deep-learning-based MOS-aware handover mechanism, we willanalyze the QoE performance and compare the experimental results with the general LTEEvent A3 handover mechanism.
The rest of this paper is organized as follows. Section 2 introduces related researchstudies. In Section 3, MOS modeling for video conferences over mobile networks ispresented. Section 4 presents the handover dataset collection and deep-learning modelperformance analysis. Section 5 describes the proposed deep-learning-based handovermechanism. Section 6 provides experimental results and performance analysis. Finally, wedraw the conclusion and suggest future works in Section 7.
2. Related Works2.1. Event A3 Handover Mechanism
The handover method of evolved Node B (eNB) can be divided into X2-Handover andS1-Handover [2]. X2 handover occurs when there is an X2 interface connection betweeneNBs, and each eNB is controlled by the same mobility management entity (MME). S1handover is suitable for a non-X2 interface connection between eNBs or when eNBs arecontrolled by different MMEs. In this paper, we focus on the X2 handover. The X2handover process is shown in Figure 1 [3]. According to the roaming and measurementcontrol messages sent by the source eNB, the UE generates the required measurementreport and transmits the report to the serving eNB. The serving eNB decides whether tohand over based on the measurement report and radio resource management (RRM). Theserving eNB sends a request and necessary related information to the target eNB whenthe handover occurs. When the target eNB agrees to handover, it sends an ACK back tothe serving eNB. The serving eNB uses this information through a radio resource control(RRC) connection reconfiguration to deliver to the UE. Once the UE successfully accessesthe target eNB, the UE sends an RRC connection reconfiguration complete message tothe target eNB, indicating that the UE has successfully completed the handover to thetarget eNB. After the target eNB receives the message returned by the UE, it sends a pathswitch request message to the MME to notify the MME to switch the path of the resourcetransmission. After receiving the notification, the MME sends a request to the S-GW toupdate the user plane. when the path switch and user plane are updated, the target eNBreturns an ACK message to the serving eNB. After receiving the message, the serving eNBcan release the resources previously occupied by the UE.
The common activities for handover measurements in LTE include events A1 toA5. Event A3 [4] is usually used as a measurement for the required signal strength ofthe handover. Among the different events in LTE, event A3 uses an offset to reduce thepossibility of a ping-pong effect and does not require any adjustment of the signal thresholdfor different environments. The general process of event A3 is shown in Figure 2. When thesignal strength of the neighboring eNB is continuously greater than the offset of the signalstrength from the serving eNB during the measurement time, event A3 is triggered and theUE switches to the neighboring eNB. In this research, we refer to the previous research [5]and set the offset value as 3 dB.

Appl. Sci. 2022, 12, 4049 3 of 35Appl. Sci. 2022, 12, x FOR PEER REVIEW 3 of 36
Figure 1. The X2 handover process.
The common activities for handover measurements in LTE include events A1 to A5. Event A3 [4] is usually used as a measurement for the required signal strength of the handover. Among the different events in LTE, event A3 uses an offset to reduce the pos-sibility of a ping-pong effect and does not require any adjustment of the signal threshold for different environments. The general process of event A3 is shown in Figure 2. When the signal strength of the neighboring eNB is continuously greater than the offset of the signal strength from the serving eNB during the measurement time, event A3 is triggered and the UE switches to the neighboring eNB. In this research, we refer to the previous research [5] and set the offset value as 3 dB.
Figure 1. The X2 handover process.
Appl. Sci. 2022, 12, x FOR PEER REVIEW 4 of 36
Figure 2. The event A3 handover
2.2. Machine Learning Based Handover Management In [6], the authors present a machine-learning-based handover management scheme
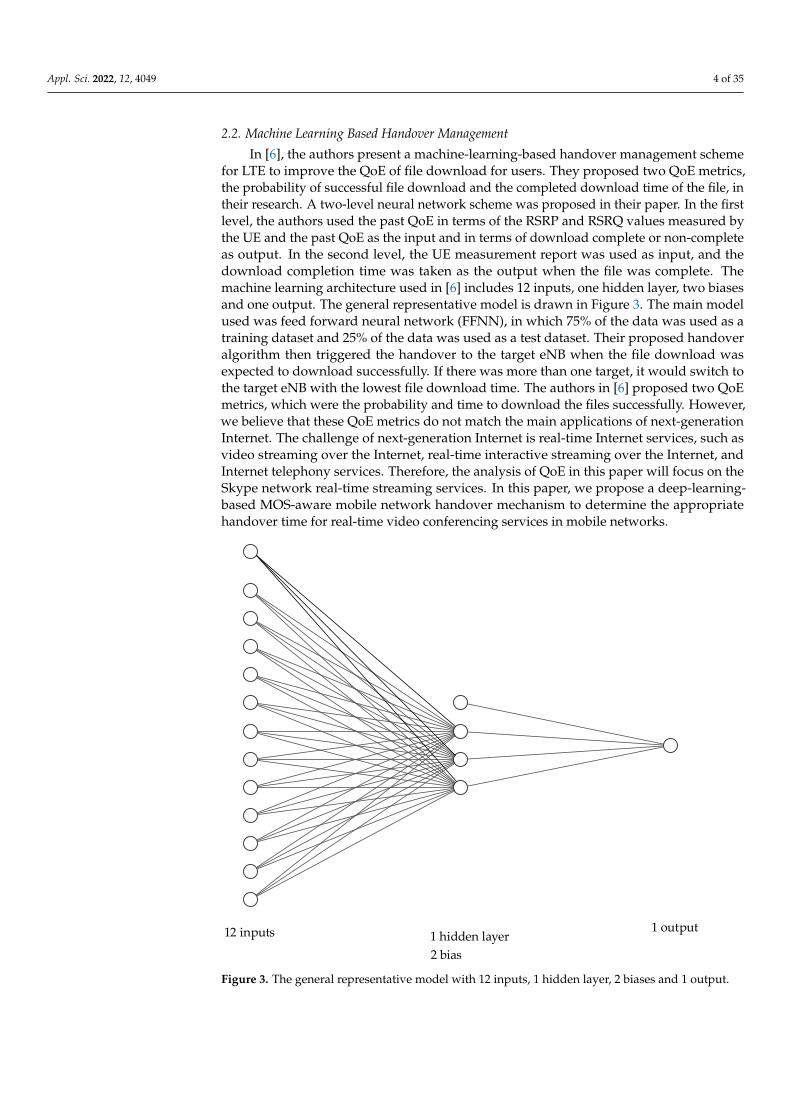
for LTE to improve the QoE of file download for users. They proposed two QoE metrics, the probability of successful file download and the completed download time of the file, in their research. A two-level neural network scheme was proposed in their paper. In the first level, the authors used the past QoE in terms of the RSRP and RSRQ values measured by the UE and the past QoE as the input and in terms of download complete or non-complete as output. In the second level, the UE measurement report was used as input, and the download completion time was taken as the output when the file was complete. The machine learning architecture used in [6] includes 12 inputs, one hidden layer, two biases and one output. The general representative model is drawn in Figure 3. The main model used was feed forward neural network (FFNN), in which 75% of the data was used as a training dataset and 25% of the data was used as a test dataset. Their proposed hand-over algorithm then triggered the handover to the target eNB when the file download was expected to download successfully. If there was more than one target, it would switch to the target eNB with the lowest file download time. The authors in [6] proposed two QoE metrics, which were the probability and time to download the files successfully. However, we believe that these QoE metrics do not match the main applications of next-generation Internet. The challenge of next-generation Internet is real-time Internet services, such as video streaming over the Internet, real-time interactive streaming over the Internet, and Internet telephony services. Therefore, the analysis of QoE in this paper will focus on the Skype network real-time streaming services. In this paper, we propose a deep-learning-based MOS-aware mobile network handover mechanism to determine the appropriate handover time for real-time video conferencing services in mobile networks.
RSRP(dBm)
TimeHandoverDecision
Time-to-Trigger(ms)A3 Offset
Event A3 triggered at UE
The signal strength of the serving eNB
The signal strength of the neighbor eNB
Figure 2. The event A3 handover.
Appl. Sci. 2022, 12, 4049 4 of 35
2.2. Machine Learning Based Handover Management
In [6], the authors present a machine-learning-based handover management schemefor LTE to improve the QoE of file download for users. They proposed two QoE metrics,the probability of successful file download and the completed download time of the file, intheir research. A two-level neural network scheme was proposed in their paper. In the firstlevel, the authors used the past QoE in terms of the RSRP and RSRQ values measured bythe UE and the past QoE as the input and in terms of download complete or non-completeas output. In the second level, the UE measurement report was used as input, and thedownload completion time was taken as the output when the file was complete. Themachine learning architecture used in [6] includes 12 inputs, one hidden layer, two biasesand one output. The general representative model is drawn in Figure 3. The main modelused was feed forward neural network (FFNN), in which 75% of the data was used as atraining dataset and 25% of the data was used as a test dataset. Their proposed handoveralgorithm then triggered the handover to the target eNB when the file download wasexpected to download successfully. If there was more than one target, it would switch tothe target eNB with the lowest file download time. The authors in [6] proposed two QoEmetrics, which were the probability and time to download the files successfully. However,we believe that these QoE metrics do not match the main applications of next-generationInternet. The challenge of next-generation Internet is real-time Internet services, such asvideo streaming over the Internet, real-time interactive streaming over the Internet, andInternet telephony services. Therefore, the analysis of QoE in this paper will focus on theSkype network real-time streaming services. In this paper, we propose a deep-learning-based MOS-aware mobile network handover mechanism to determine the appropriatehandover time for real-time video conferencing services in mobile networks.
Appl. Sci. 2022, 12, x FOR PEER REVIEW 5 of 36
Figure 3. The general representative model with 12 inputs, 1 hidden layer, 2 biases and 1 output.
In [7], the authors proposed a vertical handover prediction scheme based on the sig-nal-to-noise ratio (SNR) for LTE-WLAN heterogeneous networks. The minimum value of SNR allowed for each bandwidth was determined based on the specifications of the IEEE 802.11 standard. From the first scheme, their research required continuous reports of the strength of the nearby network signals scanned by the MS. Similarly, in the second scheme, the strength of the nearby network signals and the data rate of the MS and the available bandwidth of the neighboring sites were continuously reported. To perform the handover prediction, the authors used a threshold and handover zone (HOzone) for the computation. Their proposed prediction scheme used two independent thresholds. The first threshold was defined as the signal strength of the current service station. The second threshold was obtained from the signal strength of the candidate target station measured by the MS. HOzone represented the time interval between the selection of another base station (BS) and access point (AP) as candidate targets, such that the mobile station (MS) would possess enough time to perform the prediction. The proposed vertical handover prediction schemes achieved a prediction success with 99% percentage in the predefined surrounding areas using a random movement manner. However, the signal strength and available bandwidth were used to determine whether the handover was needed. The dif-ference in bandwidth and delay requirements between different network services, how-ever, was ignored. It may not be sufficient to meet the diverse needs of the Internet ser-vices if any handover mechanism only provides information of the signal strength and/or available bandwidth. Therefore, it is essential to provide the QoE-aware mechanism as the handover criteria for network services.
In [8], the authors presented a trajectory prediction algorithm of UE to plan for BS handover. The proposed CNN-LSTM model extracted features from historical trajectories to predict the direction of UE actions based on the historical trajectories of the UE. They selected a certain range of user trajectory data and set the time span of the data to no more than 5 s in order to better predict user trajectories for small coverage of 5G BS. For every 5 s, these data were recalculated as new path data. The simulation results showed that the proposed model could reduce the number of BS handovers by predicting the trajectory of
12 inputs 1 output1 hidden layer2 bias
Figure 3. The general representative model with 12 inputs, 1 hidden layer, 2 biases and 1 output.

Appl. Sci. 2022, 12, 4049 5 of 35
In [7], the authors proposed a vertical handover prediction scheme based on thesignal-to-noise ratio (SNR) for LTE-WLAN heterogeneous networks. The minimum valueof SNR allowed for each bandwidth was determined based on the specifications of the IEEE802.11 standard. From the first scheme, their research required continuous reports of thestrength of the nearby network signals scanned by the MS. Similarly, in the second scheme,the strength of the nearby network signals and the data rate of the MS and the availablebandwidth of the neighboring sites were continuously reported. To perform the handoverprediction, the authors used a threshold and handover zone (HOzone) for the computation.Their proposed prediction scheme used two independent thresholds. The first thresholdwas defined as the signal strength of the current service station. The second thresholdwas obtained from the signal strength of the candidate target station measured by the MS.HOzone represented the time interval between the selection of another base station (BS)and access point (AP) as candidate targets, such that the mobile station (MS) would possessenough time to perform the prediction. The proposed vertical handover prediction schemesachieved a prediction success with 99% percentage in the predefined surrounding areasusing a random movement manner. However, the signal strength and available bandwidthwere used to determine whether the handover was needed. The difference in bandwidthand delay requirements between different network services, however, was ignored. Itmay not be sufficient to meet the diverse needs of the Internet services if any handovermechanism only provides information of the signal strength and/or available bandwidth.Therefore, it is essential to provide the QoE-aware mechanism as the handover criteria fornetwork services.
In [8], the authors presented a trajectory prediction algorithm of UE to plan for BShandover. The proposed CNN-LSTM model extracted features from historical trajectoriesto predict the direction of UE actions based on the historical trajectories of the UE. Theyselected a certain range of user trajectory data and set the time span of the data to no morethan 5 s in order to better predict user trajectories for small coverage of 5G BS. For every5 s, these data were recalculated as new path data. The simulation results showed that theproposed model could reduce the number of BS handovers by predicting the trajectory ofthe user. The CNN-LSTM was a more effective and stable model in predicting the trajectoryof the user. However, we believe that the selected prediction time range cannot be basedmerely on a single prediction time range. It may not be sufficient to meet all demands of ahandover decision in a shorter prediction time when the UE is moving fast. Therefore, inour research, we conduct the different prediction times, 2, 4, 6, 8 and 10 s as the basis of theexperiments to meet the requirements of various UE moving speeds.
In [9], the authors proposed and evaluated the performance of a machine-learning-based approach to handover in scenarios with the presence of signal-blocking obstacles.The ns-3 simulator was used as the proof of concept. In the proposed mechanism, UEcould choose the eNB that would most likely offer users the highest long-term QoS afterthe handover procedure, even in severe propagation conditions. The proposed schemespresented higher performance as compared to the classical ones and substantially improvedusers’ QoS in challenging scenarios. In [10], an intelligent handover scheme based on theElman network in high-speed rail scenarios has been proposed. A neural network modelin different regions, as well as input parameters, was trained by the Elman network toobtain the good prediction capabilities in order to improve the effectiveness and reliabilityof handover.
A handover mechanism for cost assessment was proposed in [11] that integrated sig-naling overhead, delay, call drops, and radio resource. The mathematical model developedwas applicable to a variety of cellular architectures, but the focus of the paper was on thecontrol/data separation architecture (CDSA). In addition, the handover prediction wasproposed and evaluated as part of the overall cost through the stacked long and short-termmemory (LSTM) model. Their evaluation of the overall model across different prioritizationparameters such as user dissatisfaction, latency, signaling strength, and resources showedthe impact of prediction accuracy as part of the overall cost. They also showed that the de-

Appl. Sci. 2022, 12, 4049 6 of 35
veloped model coupled with a complementary data-driven deep-learning approach couldreduce user complaints, latency, signaling overhead and resource waste. They concludedthat the performance improvement could be attributed to the inherent recurrent natureof the LSTM model, which favors better model time series data. However, the priorityparameters proposed in their paper should be specific to the network services used by theuser, rather than fixed parameters, especially for the scenarios of users conducting servicessuch as real-time video stream services. In this case, the users are more sensitive to thenetwork quality requirements. Therefore, our research will provide a deep learning modelto provide a more efficient handoff mechanism for users when using Skype real-time videoconference services.
In [12], the authors proposed an offline scheme based on double deep reinforcementlearning to minimize the frequency of handover in mm-wave networks. The optimalbase station selection policy maximized the UE-BS connection time from the offline DDRLalgorithms. The authors in [13] employed the LSTM model to simulate a regression problemto estimate the expected time for different neighbors of the current service cell whiledownloading a file. The proposed approach was better than the traditional event-basedhandover scheme. The proposed QoE model was similar to the research in literature [7],which evaluated QoE based on the time required to download a file. However, they didnot consider the QoS or QoE issue for users being more sensitive with real-time streamservices. Therefore, the more complex QoE evaluation criteria for real-time video conferenceservices proposed in our research are applied to evaluate the proposed deep-learning-basedhandoff mechanism.
In [14], a multilayer neural network (MLNN) privacy and security preservation pro-tocol was presented. To facilitate target cell selection, parameters taking user satisfaction,network, UE and service requirements into consideration were deployed so as to enhanceboth QoS and QoE during and after handover. The authors in [15] presented a machinelearning scheme that not only facilitated optimal selection of target cells but also upheldboth security and privacy during handovers. The simulation results showed that theirproposed handover scheme provided a lower packet drop rate and ping-pong rate.
In summary, the research studies in [6,8–15] have shown the advantage of predictingoptimal handover timing with better results as compared to the original handover mech-anism by using the deep learning model. This observation is consistent with the resultsin this paper. However, this paper further considers the QoE required for the networkservice and then uses deep learning to predict the optimal handover timing. In addition,the authors also compared the performance results for different deep learning models, suchas MLP, CNN, GRU and RNN/LSTM. From the results of [8,11,13], the RNN/LSTM-baseddeep learning model showed much more effective and stable predictions of the handovertiming of UE. The above results are consistent with the experimental results in this paper.The experimental results in this paper show that RNN has the best performance among theMLP, CNN, RNN and LSTM models.
2.3. Quality of Experience
The standard P.10 [16] proposed by the ITU Telecommunication Standardization Sector(ITU-T) was first interpreted as QoE in Amendment 1 [17] in 2007. The QoE representsthe user’s subjective perception of the overall service acceptance of an application. TheEuropean Cooperation in Science and Technology (COST) proposed a more detailed whitepaper to explain QoE [18], which was included in ITU-T P.10 Amendment 5 in 2016 [19].
The QoE focuses more on users’ subjective experience than traditional QoS. Therefore,besides common network parameters such as throughput, delay or packet loss rate, users’expectation may also affect the QoE. However, users may have different requirements whenusing different network services in a mobile network. For example, authors A. Vizzarriand F. Davide proposed a QoE measurement based on page response time (PRT) and videoresponse time (VRT) [20] and summarized three key factors that affect PRT or VRT. These

Appl. Sci. 2022, 12, 4049 7 of 35
three factors were used to quantify whether the service is good or not to meet the requiredQoE from users.
The authors C. Lambrecht and O. Verscheure [21] used the Moving Picture QualityMetric (MPQM) model to evaluate the MOS of video quality, which is based on the humanspatio-temporal vision projection. The MPQM model is based on human spatio-temporalvision, and the process not only considers the effect of network parameters, but alsoincludes the degradation of image quality caused by the compression and decompressionof images.
In [22], the authors proposed a QoS-aware flexible mobility management scheme forsoftware-defined networking (SDN)-based mobile networks. The proposed QoS-baseddifferential handover procedure for each class can be provided by the interaction betweenthe forwarding plane nodes and SDN controller. The performance analysis showed thatthe proposed scheme could enhance flexible network resource utilization to meet theQoS requirements for each class. A handover management scheme for device-to-device(D2D) communication was proposed in [23]. The proposed approach predicted the destina-tion eNB of D2D users based on their movements and the received signal characteristics.Therefore, both UE in a D2D pair resided in the same cell to increase throughput andreduce latency.
3. MOS-Aware Measurement Scheme in Mobile Networks
The most commonly used QoE measurement is the mean opinion score (MOS). It isdefined by the ITU-T in standard P.800 [24]. MOS was first used as a measure of VoIPservice quality, as shown in Table 1. MOS of 1 means bad quality of experience, MOS of5 means excellent quality of experience. With the popularity of QoE-related research anddiscussion, MOS is gradually used in various services.
Table 1. The relationship between MOS and VoIP.
MOS Quality Impairment
5 Excellent Imperceptible4 Good Perceptible but not annoying3 Fair Slightly annoying2 Poor Annoying1 Bad Very Annoying
3.1. Video Conference MOS Measurement
The real-time video conferencing MOS values were calculated based on the experi-mental results in [25]. The tool used to test video conferencing was Skype. Since Skypesupports variable video bit rates, it is often used for real-time video processing by adjustingthe video resolution and FPS. Table 2 lists the video-related parameters used by Skype.Skype can support up to 640 × 480 resolution, 30 FPS and 950 Kbps bit rate, and it can bereduced to 160 × 120 resolution, 5 FPS and 5 Kbps bit rate when the network conditionsare not sufficient to support it.
Table 2. Skype video codec parameters.
Video resolution 640 × 480, 320 ×240, 160 × 120
Frame rate per second 5–30 fps
Video bitrate 5–950 Kbps
According to the test experiments in [26], video transmission in video conferencingrelies mainly on the UDP protocol. The factors affecting the quality of video conferenceare packet loss rate, video bitrate and frame rate. The video bitrate is calculated as shownin Equation (1), which represents the amount of data that can be received during a videoconference. When the packet loss rate is less than 10%, the amount of received data

Appl. Sci. 2022, 12, 4049 8 of 35
depends on the current available throughput, and when the available throughput is morethan 1 Mbps, the amount of received data is sufficient for the video conference. When thepacket loss rate is greater than 10%, due to the continuous loss of packets, it is difficult tomeet the requirement of video conference, and then the first priority will be to ensure thetransmission quality of sound, thus the BW value will be fixed at 21 Kbps.
Rv =
{(1− 0.15− 4.5PL)(0.77BW− 10.8)
(1− 0.15− 4.5PL)× 21PL < 10%PL ≥ 10%
(1)
Equation (2) represents the relationship between the amount of received data and theframe rate. The measurement results are shown in Figure 4, which illustrates that the fps(frame per second) can achieve 28 fps when the video bit rate is greater than 200 kbps andcan only maintain 5 fps when the bitrate is less than 20 kbps.
f (Rv) =
5101528
Rv ≤ 2020 < Rv ≤ 80
80 < Rv ≤ 200200 < Rv
(2)Appl. Sci. 2022, 12, x FOR PEER REVIEW 9 of 36
Figure 4. The relationship between the amount of data received and the frame rate.
The video bitrate and frame rate obtained from Equations (1) and (2) can be used to calculate the current MOS for the video conference service, defined in [21]. In Equation (3), where Icoding represents the video quality under the influence of video bitrate and frame rate and PL represents the packet loss rate, DPL indicates the extent to which the robustness of the video quality is affected by packet loss. MOS = 1 + I exp (− PLD ) (3)
The Icoding is shown in Equation (4), where Iofr represents the ideal video quality that can be achieved at the current video bitrate, f(Rv) represents the current fps, Ofr represents the ideal frame rate that can be achieved at the current video bitrate, and Dfr represents the extent to which the robustness of the video quality is affected by the frame rate. I = I × exp {− [ln f(R ) − ln(O )]2D } (4)
IOfr is calculated as shown in Equation (5) for video bitrate, and Ofr and Dfr are calcu-lated in the same way as Equation (6). I = a − a1 + Rb (5)
D =O =g + h × R (6)
The relevant constants, a, b, c, g, h, are defined in [19], with a = 3.759, b = 184.1, c = 1.161, g = 1.446, and h = 0.02228, resulting in the complete MOS calculation equation as shown in (7).
MOS = 1 + 3.759 − 3.7591 + R184.1 .× exp − (ln f(R ) − ln (1.431 + 0.02228R ))2(1.446 + 0.03881R )
(7)
0
5
10
15
20
25
30
0 50 100
150
200
250
300
350
400
Fram
e ra
te(fp
s)
Video bitrate(kbps)
Figure 4. The relationship between the amount of data received and the frame rate.
The video bitrate and frame rate obtained from Equations (1) and (2) can be used tocalculate the current MOS for the video conference service, defined in [21]. In Equation (3),where Icoding represents the video quality under the influence of video bitrate and framerate and PL represents the packet loss rate, DPL indicates the extent to which the robustnessof the video quality is affected by packet loss.
MOS = 1 + Icoding exp(− PL
DPL
)(3)
The Icoding is shown in Equation (4), where Iofr represents the ideal video quality thatcan be achieved at the current video bitrate, f(Rv) represents the current fps, Ofr representsthe ideal frame rate that can be achieved at the current video bitrate, and Dfr represents theextent to which the robustness of the video quality is affected by the frame rate.
Icoding = IOfr × exp {− [ln(f(Rv))− ln(Ofr)]2
2Dfr2 } (4)
Appl. Sci. 2022, 12, 4049 9 of 35
IOfr is calculated as shown in Equation (5) for video bitrate, and Ofr and Dfr arecalculated in the same way as Equation (6).
IOfr = a− a
1 +(
Rvb
)c (5)
Dfr = Ofr = g + h× Rv (6)
The relevant constants, a, b, c, g, h, are defined in [19], with a = 3.759, b = 184.1,c = 1.161, g = 1.446, and h = 0.02228, resulting in the complete MOS calculation equation asshown in (7).
MOS = 1 +(
3.759− 3.7591+( Rv
184.1 )1.161
)× exp
(− (ln(f(Rv))−ln(1.431+0.02228Rv))
2
2(1.446+0.03881Rv)2
) (7)
3.2. Video Conference MOS Testing and Analysis
In order to conduct a simulation environment for mobile networks, we refer to thepath loss model in 3GPP TR36.814 [27]. As shown in Equation (8), PL represents the pathloss in dB. R means the eNB’s signal covered radius in kilometers. The UE-measuredRSRP (reference symbol received power) is given by Equation (9). The transmissionpower for each resource element is Pt (dBm), and this model is imported into Mininet-WiFi [28] to ensure that the user’s performance during mobility has the characteristics ofan LTE network.
PL = 131.1 + 42.8 log10 R (dB) (8)
RSRP = Pt − PL (dBm) (9)
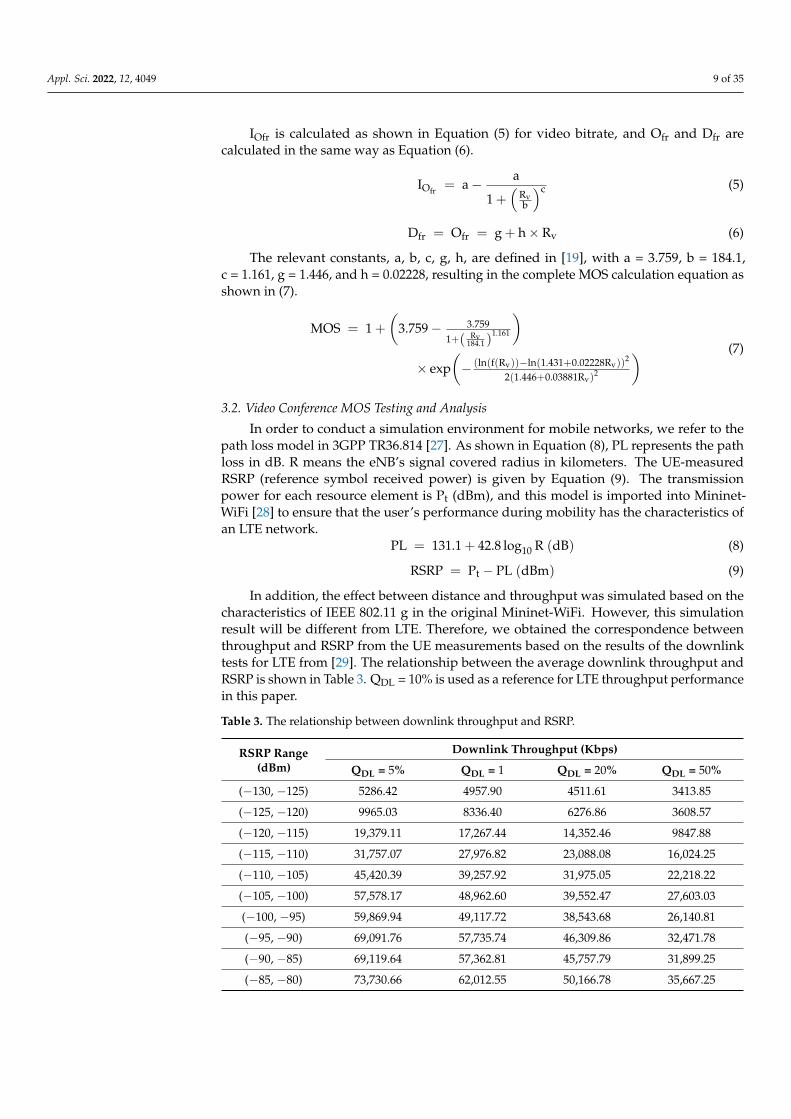
In addition, the effect between distance and throughput was simulated based on thecharacteristics of IEEE 802.11 g in the original Mininet-WiFi. However, this simulationresult will be different from LTE. Therefore, we obtained the correspondence betweenthroughput and RSRP from the UE measurements based on the results of the downlinktests for LTE from [29]. The relationship between the average downlink throughput andRSRP is shown in Table 3. QDL = 10% is used as a reference for LTE throughput performancein this paper.
Table 3. The relationship between downlink throughput and RSRP.
RSRP Range(dBm)
Downlink Throughput (Kbps)
QDL = 5% QDL = 1 QDL = 20% QDL = 50%
(−130, −125) 5286.42 4957.90 4511.61 3413.85
(−125, −120) 9965.03 8336.40 6276.86 3608.57
(−120, −115) 19,379.11 17,267.44 14,352.46 9847.88
(−115, −110) 31,757.07 27,976.82 23,088.08 16,024.25
(−110, −105) 45,420.39 39,257.92 31,975.05 22,218.22
(−105, −100) 57,578.17 48,962.60 39,552.47 27,603.03
(−100, −95) 59,869.94 49,117.72 38,543.68 26,140.81
(−95, −90) 69,091.76 57,735.74 46,309.86 32,471.78
(−90, −85) 69,119.64 57,362.81 45,757.79 31,899.25
(−85, −80) 73,730.66 62,012.55 50,166.78 35,667.25
Appl. Sci. 2022, 12, 4049 10 of 35
Table 3. Cont.
RSRP Range(dBm)
Downlink Throughput (Kbps)
QDL=5% QDL=1 QDL=20% QDL=50%
(−80, −75) 81,108.99 69,941.47 58,038.26 42,717.76
(−75, −70) 84,024.21 73,216.94 61,404.49 45,849.86
(−70, −65) 84,040.74 73,226.51 61,409.52 45,851.77
(−65, −60) 88,638.70 78,669.06 67,211.11 51,452.32
(−60, −55) 94,461.86 86,211.75 75,755.57 60,218.17
(−55, −50) 101,295.20 99,657.95 94,443.59 83,012.62
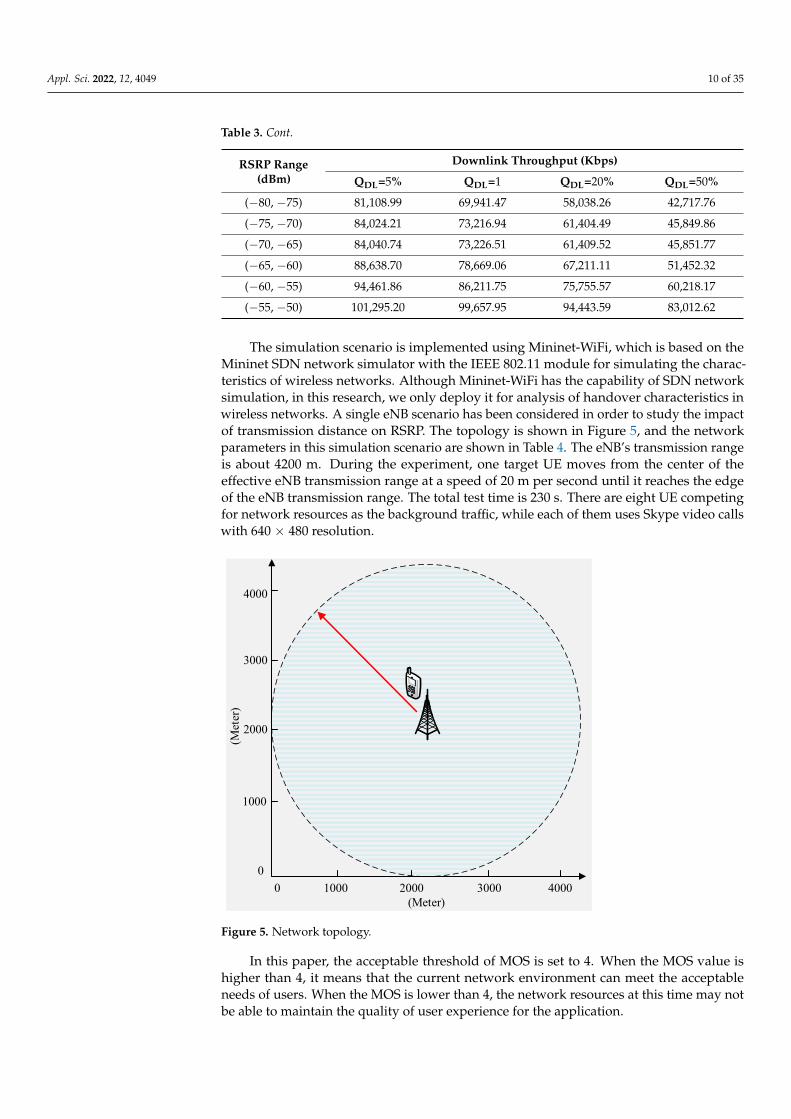
The simulation scenario is implemented using Mininet-WiFi, which is based on theMininet SDN network simulator with the IEEE 802.11 module for simulating the charac-teristics of wireless networks. Although Mininet-WiFi has the capability of SDN networksimulation, in this research, we only deploy it for analysis of handover characteristics inwireless networks. A single eNB scenario has been considered in order to study the impactof transmission distance on RSRP. The topology is shown in Figure 5, and the networkparameters in this simulation scenario are shown in Table 4. The eNB’s transmission rangeis about 4200 m. During the experiment, one target UE moves from the center of theeffective eNB transmission range at a speed of 20 m per second until it reaches the edgeof the eNB transmission range. The total test time is 230 s. There are eight UE competingfor network resources as the background traffic, while each of them uses Skype video callswith 640 × 480 resolution.
Appl. Sci. 2022, 12, x FOR PEER REVIEW 11 of 36
0 4000
4000
30001000 20000
3000
2000
1000
(Meter)
(Met
er)
Figure 5. Network topology.
Table 4. The network parameters used in the simulation.
Band 2.1 GHz Channel Bandwidth 15 MHz
Resource Block 75 eNB’s transport range 4200 M
eNB’s txpower 43 dBm eNB’s antenna gain 18 dB
UE’s txpower 18 dBm UE’s moving speed 20 m/s
In this paper, the acceptable threshold of MOS is set to 4. When the MOS value is higher than 4, it means that the current network environment can meet the acceptable needs of users. When the MOS is lower than 4, the network resources at this time may not be able to maintain the quality of user experience for the application.
Since this experiment is based on LTE telecom network architecture, assuming that the network throughput can meet the Skype video conferencing demand for users. The experiment aims at analyzing the impact caused by packet loss rate on MOS values of video conferencing. Since there are eight users using video conferencing services at the same time, they compete with each other for throughput, as shown in Figure 6. It can be found that when the RSRP is greater than −122.6 dBm, the packet loss rate is smaller than 10%. When the RSRP is lower than −122.6 dBm, the packet loss rate increases sharply due to the long distance from the eNB.
Figure 5. Network topology.
In this paper, the acceptable threshold of MOS is set to 4. When the MOS value ishigher than 4, it means that the current network environment can meet the acceptableneeds of users. When the MOS is lower than 4, the network resources at this time may notbe able to maintain the quality of user experience for the application.

Appl. Sci. 2022, 12, 4049 11 of 35
Table 4. The network parameters used in the simulation.
Band 2.1 GHz
Channel Bandwidth 15 MHz
Resource Block 75
eNB’s transport range 4200 M
eNB’s txpower 43 dBm
eNB’s antenna gain 18 dB
UE’s txpower 18 dBm
UE’s moving speed 20 m/s
Since this experiment is based on LTE telecom network architecture, assuming thatthe network throughput can meet the Skype video conferencing demand for users. Theexperiment aims at analyzing the impact caused by packet loss rate on MOS values ofvideo conferencing. Since there are eight users using video conferencing services at thesame time, they compete with each other for throughput, as shown in Figure 6. It can befound that when the RSRP is greater than −122.6 dBm, the packet loss rate is smaller than10%. When the RSRP is lower than −122.6 dBm, the packet loss rate increases sharply dueto the long distance from the eNB.
Appl. Sci. 2022, 12, x FOR PEER REVIEW 12 of 36
Figure 6. The relationship for packet loss rate and RSRP from UE.
Figure 7 shows the relationship between MOS and RSRP. The MOS value of the Skype video conference service is calculated according to Equation (7) based on the packet loss rate and the relative video bitrate. In Figure 7, when the RSRP is greater than −122.6 dBm, the MOS value is about 4.25. When RSRP is smaller than −122.6 dBm, the packet loss rate rises to more than 10%, and the MOS value drops below 4, lower than the MOS ac-ceptable threshold. Based on the explanations above, the eNB needs to determine whether the current eNB can satisfy the users’ demand for video conferencing services based on the received RSRP from UE.
Figure 7. The relationship between MOS and RSRP for video conference service for UE.
0
10
20
30
40
50
60
70
80
90
100
-41 -82 -96 -103 -108 -113 -116 -119 -121 -123 -125RSRP (dBm)
Pack
et lo
ssra
te (%
)
0
0.5
1
1.5
2
2.5
3
3.5
4
4.5
5
-41 -82 -96 -103 -108 -113 -116 -119 -121 -123 -125
MO
S
RSRP (dBm)
Figure 6. The relationship for packet loss rate and RSRP from UE.
Figure 7 shows the relationship between MOS and RSRP. The MOS value of the Skypevideo conference service is calculated according to Equation (7) based on the packet lossrate and the relative video bitrate. In Figure 7, when the RSRP is greater than −122.6 dBm,the MOS value is about 4.25. When RSRP is smaller than −122.6 dBm, the packet loss raterises to more than 10%, and the MOS value drops below 4, lower than the MOS acceptablethreshold. Based on the explanations above, the eNB needs to determine whether thecurrent eNB can satisfy the users’ demand for video conferencing services based on thereceived RSRP from UE.

Appl. Sci. 2022, 12, 4049 12 of 35
Appl. Sci. 2022, 12, x FOR PEER REVIEW 12 of 36
Figure 6. The relationship for packet loss rate and RSRP from UE.
Figure 7 shows the relationship between MOS and RSRP. The MOS value of the Skype video conference service is calculated according to Equation (7) based on the packet loss rate and the relative video bitrate. In Figure 7, when the RSRP is greater than −122.6 dBm, the MOS value is about 4.25. When RSRP is smaller than −122.6 dBm, the packet loss rate rises to more than 10%, and the MOS value drops below 4, lower than the MOS ac-ceptable threshold. Based on the explanations above, the eNB needs to determine whether the current eNB can satisfy the users’ demand for video conferencing services based on the received RSRP from UE.
Figure 7. The relationship between MOS and RSRP for video conference service for UE.
0
10
20
30
40
50
60
70
80
90
100
-41 -82 -96 -103 -108 -113 -116 -119 -121 -123 -125RSRP (dBm)
Pack
et lo
ssra
te (%
)
0
0.5
1
1.5
2
2.5
3
3.5
4
4.5
5
-41 -82 -96 -103 -108 -113 -116 -119 -121 -123 -125
MO
S
RSRP (dBm)
Figure 7. The relationship between MOS and RSRP for video conference service for UE.
4. Handover Dataset Collection and Deep Learning Model Performance Analysis
The most common mobile network handover method is based on RSRP measurements.Therefore, the main essence of the proposed handover mechanism is to predict the RSRPfrom neighboring eNBs using deep learning models. The implementation of the deep learn-ing models is achieved with Python, using Keras (version 2.2.2) and Tensorflow (version1.8.0), as a backend. We compare the performance of four deep learning models, includingMLP (multilayer perceptron), CNN (convolutional neural network), RNN (recurrent neuralnetwork), and LSTM (long short-term memory), and we apply the deep learning modelswith the best prediction accuracy.
4.1. Dataset Collection and Analysis
Figure 8 shows the scenario being implemented in Mininet-WiFi to collect the trainingdataset. During the dataset collection, the UE passes through the transmission range ofthe eNB at a speed of 20 m per second from different tangents and observes the variationof RSRP under different tangents. The collection method is to record the change of RSRPvalues of UE in every 1 s interval.
Table 5 shows the features for the training dataset. The training dataset will collect theRSRP values in every one-second interval from the eNB as the input to predict the RSRPvalues for the next 2, 4, 6, 8, and 10 s. RSRP_t represents the collected RSRP value at time t.The training label of RSRP value after 2 s, i.e., at time t + 2, is RSRP_t + 2. The training labelof RSRP value after 4 s is RSRP_t + 4, and so on. Lastly, the training label of RSRP valueafter 10 s is RSRP_t + 10.
In this paper, the performance of deep learning models such as MLP, CNN, RNN, andLSTM are compared and the relevant parameters of the models are listed in Table 6.
• In the MLP model, the numbers of neurons in the first and second layers are both 128,and the number of neurons in the third layer is reduced to 64.
• The CNN model includes a convolutional layer, a pooling layer, and a fully connectedlayer. The convolutional base layer uses 32 neurons and the fully connected layer uses16 neurons.

Appl. Sci. 2022, 12, 4049 13 of 35
• The RNN model uses two RNN layers, where the first layer uses 64 neurons and thesecond layer uses 32 neurons.
• The LSTM model uses two LSTM layers with the same number of neurons as the RNN.
Appl. Sci. 2022, 12, x FOR PEER REVIEW 13 of 36
4. Handover Dataset Collection and Deep Learning Model Performance Analysis The most common mobile network handover method is based on RSRP measure-
ments. Therefore, the main essence of the proposed handover mechanism is to predict the RSRP from neighboring eNBs using deep learning models. The implementation of the deep learning models is achieved with Python, using Keras (version 2.2.2) and Tensorflow (version 1.8.0), as a backend. We compare the performance of four deep learning models, including MLP (multilayer perceptron), CNN (convolutional neural network), RNN (re-current neural network), and LSTM (long short-term memory), and we apply the deep learning models with the best prediction accuracy.
4.1. Dataset Collection and Analysis Figure 8 shows the scenario being implemented in Mininet-WiFi to collect the train-
ing dataset. During the dataset collection, the UE passes through the transmission range of the eNB at a speed of 20 m per second from different tangents and observes the varia-tion of RSRP under different tangents. The collection method is to record the change of RSRP values of UE in every 1 s interval.
0 4000
4000
30001000 20000
3000
2000
1000
(Meter)
(Met
er)
Figure 8. The UE movement path and RSRP are collected as the training dataset.
Table 5 shows the features for the training dataset. The training dataset will collect the RSRP values in every one-second interval from the eNB as the input to predict the RSRP values for the next 2, 4, 6, 8, and 10 s. RSRP_t represents the collected RSRP value at time t. The training label of RSRP value after 2 s, i.e., at time t + 2, is RSRP_t + 2. The training label of RSRP value after 4 s is RSRP_t + 4, and so on. Lastly, the training label of RSRP value after 10 s is RSRP_t + 10.
Table 5. The features for the training dataset.
Prediction Time Dataset Features Label Prediction next 2 s of time t
RSRP_t, RSRP_t + 1, RSRP_t + 2, RSRP_t + 3, RSRP_t + 4, RSRP_t + 5, RSRP_t + 6, RSRP_t + 7, RSRP_t- + 8,
RSRP_t + 9, RSRP_t + 10
RSRP_t + 2 Prediction next 4 s of time t RSRP_t + 4 Prediction next 6 s of time t RSRP_t + 6 Prediction next 8 s of time t RSRP_t + 8 Prediction next 10 s of time t RSRP_t + 10
Figure 8. The UE movement path and RSRP are collected as the training dataset.
Table 5. The features for the training dataset.
Prediction Time Dataset Features Label
Prediction next 2 s of time t
RSRP_t, RSRP_t + 1, RSRP_t + 2,RSRP_t + 3, RSRP_t + 4, RSRP_t + 5,RSRP_t + 6, RSRP_t + 7, RSRP_t- + 8,
RSRP_t + 9, RSRP_t + 10
RSRP_t + 2
Prediction next 4 s of time t RSRP_t + 4
Prediction next 6 s of time t RSRP_t + 6
Prediction next 8 s of time t RSRP_t + 8
Prediction next 10 s of time t RSRP_t + 10
Table 6. Deep learning model parameters.
Model Hidden Layer Neurons
MLP 3 full connection layers 128, 128, 64
CNN 1 convolutional layer, 1 pooling layer, 1 fullconnection layers 32, 16
RNN 2 RNN layer 64, 32
LSTM 2 LSTM layer 64, 32
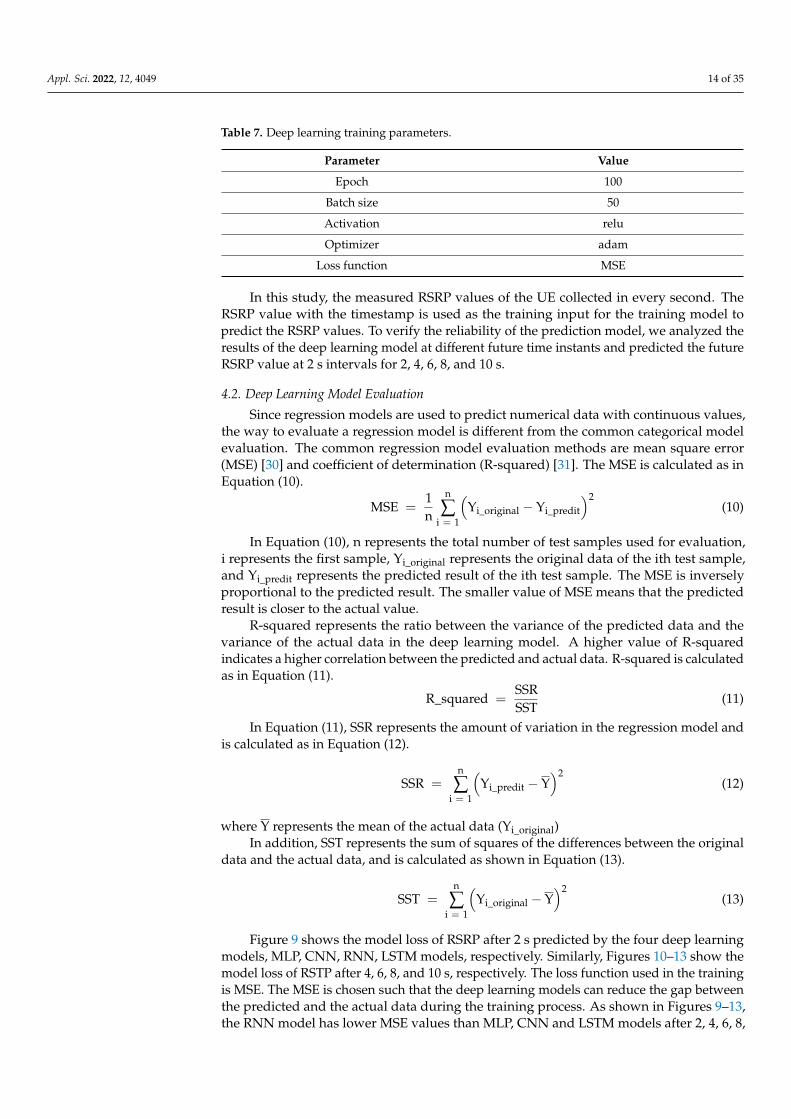
All the deep learning models are trained using a training dataset with 2840 in number.Each deep learning model is trained for a total of 100 epochs with 50 batch size in eachepoch. The performance of each deep learning model is evaluated after training witha testing dataset, which is 525 in number. Some other training parameters are shownin Table 7.
Appl. Sci. 2022, 12, 4049 14 of 35
Table 7. Deep learning training parameters.
Parameter Value
Epoch 100
Batch size 50
Activation relu
Optimizer adam
Loss function MSE
In this study, the measured RSRP values of the UE collected in every second. TheRSRP value with the timestamp is used as the training input for the training model topredict the RSRP values. To verify the reliability of the prediction model, we analyzed theresults of the deep learning model at different future time instants and predicted the futureRSRP value at 2 s intervals for 2, 4, 6, 8, and 10 s.
4.2. Deep Learning Model Evaluation
Since regression models are used to predict numerical data with continuous values,the way to evaluate a regression model is different from the common categorical modelevaluation. The common regression model evaluation methods are mean square error(MSE) [30] and coefficient of determination (R-squared) [31]. The MSE is calculated as inEquation (10).
MSE =1n
n
∑i = 1
(Yi_original − Yi_predit
)2(10)
In Equation (10), n represents the total number of test samples used for evaluation,i represents the first sample, Yi_original represents the original data of the ith test sample,and Yi_predit represents the predicted result of the ith test sample. The MSE is inverselyproportional to the predicted result. The smaller value of MSE means that the predictedresult is closer to the actual value.
R-squared represents the ratio between the variance of the predicted data and thevariance of the actual data in the deep learning model. A higher value of R-squaredindicates a higher correlation between the predicted and actual data. R-squared is calculatedas in Equation (11).
R_squared =SSRSST
(11)
In Equation (11), SSR represents the amount of variation in the regression model andis calculated as in Equation (12).
SSR =n
∑i = 1
(Yi_predit − Y
)2(12)
where Y represents the mean of the actual data (Yi_original)In addition, SST represents the sum of squares of the differences between the original
data and the actual data, and is calculated as shown in Equation (13).
SST =n
∑i = 1
(Yi_original − Y
)2(13)
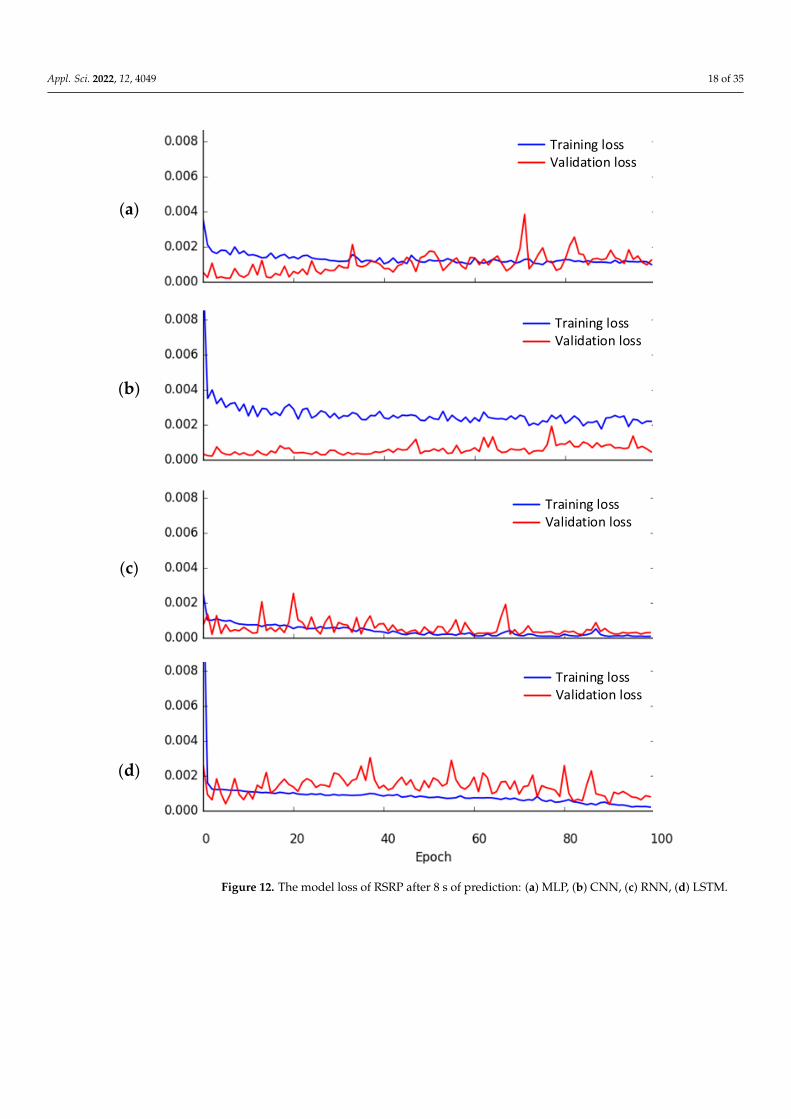
Figure 9 shows the model loss of RSRP after 2 s predicted by the four deep learningmodels, MLP, CNN, RNN, LSTM models, respectively. Similarly, Figures 10–13 show themodel loss of RSTP after 4, 6, 8, and 10 s, respectively. The loss function used in the trainingis MSE. The MSE is chosen such that the deep learning models can reduce the gap betweenthe predicted and the actual data during the training process. As shown in Figures 9–13,the RNN model has lower MSE values than MLP, CNN and LSTM models after 2, 4, 6, 8,

Appl. Sci. 2022, 12, 4049 15 of 35
and 10 s. That is, the RNN model has better prediction performance of RSRP than othermodels for all different predicting time intervals.
Appl. Sci. 2022, 12, x FOR PEER REVIEW 16 of 36
(a)
(b)
(c)
(d)
Figure 9. The model loss of RSRP after 2 s of prediction: (a) MLP, (b) CNN, (c) RNN, (d) LSTM.
Training lossValidation loss
Training lossValidation loss
Training lossValidation loss
Training lossValidation loss
Figure 9. The model loss of RSRP after 2 s of prediction: (a) MLP, (b) CNN, (c) RNN, (d) LSTM.

Appl. Sci. 2022, 12, 4049 16 of 35
Appl. Sci. 2022, 12, x FOR PEER REVIEW 17 of 36
(a)
(b)
(c)
(d)
Figure 10. The model loss of RSRP after 4 s of prediction: (a) MLP, (b) CNN, (c) RNN, (d) LSTM.
Training lossValidation loss
Training lossValidation loss
Training lossValidation loss
Training lossValidation loss
Figure 10. The model loss of RSRP after 4 s of prediction: (a) MLP, (b) CNN, (c) RNN, (d) LSTM.

Appl. Sci. 2022, 12, 4049 17 of 35
Appl. Sci. 2022, 12, x FOR PEER REVIEW 18 of 36
(a)
(b)
(c)
(d)
Figure 11. The model loss of RSRP after 6 s of prediction: (a) MLP, (b) CNN, (c) RNN, (d) LSTM.
Training lossValidation loss
Training lossValidation loss
Training lossValidation loss
Training lossValidation loss
Figure 11. The model loss of RSRP after 6 s of prediction: (a) MLP, (b) CNN, (c) RNN, (d) LSTM.
Appl. Sci. 2022, 12, 4049 18 of 35
Appl. Sci. 2022, 12, x FOR PEER REVIEW 19 of 36
(a)
(b)
(c)
(d)
Figure 12. The model loss of RSRP after 8 s of prediction: (a) MLP, (b) CNN, (c) RNN, (d) LSTM.
Training lossValidation loss
Training lossValidation loss
Training lossValidation loss
Training lossValidation loss
Figure 12. The model loss of RSRP after 8 s of prediction: (a) MLP, (b) CNN, (c) RNN, (d) LSTM.

Appl. Sci. 2022, 12, 4049 19 of 35
Appl. Sci. 2022, 12, x FOR PEER REVIEW 20 of 36
(a)
(b)
(c)
(d)
Figure 13. The model loss of RSRP after 10 s of prediction: (a) MLP, (b) CNN, (c) RNN, (d) LSTM.
5. The Proposed Deep-Learning-Based Handover Mechanism for Real-Time Video Conference Services
Figure 14 shows the mobile moving path for a deep learning model performance analysis. The purpose of designing this verification path is to observe whether the deep learning model can maintain a certain prediction accuracy for the RSRP after changing the movement direction. During the collection of the verification dataset, the UE starts mov-ing from a position close to the center of the eNB and changes its direction of movement when it reaches the edge of the effective transmission range of the eNB at 202 s. The change of RSRP is recorded once per second during the movement. The experiment collects a total of 525 s of verification dataset. The test results of the validation dataset are presented in this section. The prediction results of four deep learning models: MLP, CNN, RNN, and LSTM, are implemented to analyze the RSRP prediction function for LTE and to select the deep learning model with best prediction capability.
Training lossValidation loss
Training lossValidation loss
Training lossValidation loss
Training lossValidation loss
Figure 13. The model loss of RSRP after 10 s of prediction: (a) MLP, (b) CNN, (c) RNN, (d) LSTM.
5. The Proposed Deep-Learning-Based Handover Mechanism for Real-Time VideoConference Services
Figure 14 shows the mobile moving path for a deep learning model performanceanalysis. The purpose of designing this verification path is to observe whether the deeplearning model can maintain a certain prediction accuracy for the RSRP after changing themovement direction. During the collection of the verification dataset, the UE starts movingfrom a position close to the center of the eNB and changes its direction of movement whenit reaches the edge of the effective transmission range of the eNB at 202 s. The change of

Appl. Sci. 2022, 12, 4049 20 of 35
RSRP is recorded once per second during the movement. The experiment collects a total of525 s of verification dataset. The test results of the validation dataset are presented in thissection. The prediction results of four deep learning models: MLP, CNN, RNN, and LSTM,are implemented to analyze the RSRP prediction function for LTE and to select the deeplearning model with best prediction capability.
Appl. Sci. 2022, 12, x FOR PEER REVIEW 21 of 36
0 4000
4000
30001000 20000
3000
2000
1000
(Meter)
(Met
er)
Figure 14. Mobile moving path for deep learning model performance analysis.
In order to verify the reliability of the prediction models, we analyze the results of the deep learning models in predicting the RSRP values at different future time points: the 2nd, 4th, 6th, 8th and 10th seconds, with an interval of 2 s by using MLP, CNN, RNN and LSTM deep learning models. The 2 s period is chosen as the shortest prediction time. The main reason is that when the deep learning model predicts the future RSRP and pre-pares handover based on the prediction results, the process requires some processing and communication time. If the interval time is set to 1 s, it may result in a situation where the handover event has already occurred by the time the prediction result is returned. There-fore, using 2 s as the prediction time can provide the eNB with enough response time to analyze and process the prediction results. The purpose of selecting and predicting RSRP from eNBs with different time intervals is to observe whether the selected eNBs can con-tinue to satisfy the users’ demand, thus avoiding the ping-pong effect at the handover. In addition, by predicting the selection of eNBs that can maintain MOS greater than 4 for a longer period of time, frequent handover will be avoided. The speed of UE movement in the experiment is set at 90 km/h. The maximum prediction time is 10 s. In this case, the UE moves a distance of 250 m in 10 s. In addition, when the user wanders for a long time around the cell boundary, the proposed mechanism in this paper will predict and select the RSRP with different time intervals for eNBs to continually satisfy the user’s require-ments in order to avoid the ping-pong effect during handover.
Based on the prediction results of the four deep learning models shown in Tables 8–11, we can observe that the mean square error (MSE) of accuracy gradually increases and the R-square value of accuracy slightly decreases as the prediction interval increases. The results indicate that the models are less accurate in predicting longer intervals. Among the four deep learning models, the minimum MSE value of accuracy is the RNN model with 0.111 and the maximum R-square value of accuracy is the RNN with 0.999 compared with the other three models in the 2 s period. This indicates that RNN has better perfor-mance results than the other three models.
Figure 14. Mobile moving path for deep learning model performance analysis.
In order to verify the reliability of the prediction models, we analyze the results ofthe deep learning models in predicting the RSRP values at different future time points:the 2nd, 4th, 6th, 8th and 10th seconds, with an interval of 2 s by using MLP, CNN, RNNand LSTM deep learning models. The 2 s period is chosen as the shortest predictiontime. The main reason is that when the deep learning model predicts the future RSRP andprepares handover based on the prediction results, the process requires some processingand communication time. If the interval time is set to 1 s, it may result in a situation wherethe handover event has already occurred by the time the prediction result is returned.Therefore, using 2 s as the prediction time can provide the eNB with enough responsetime to analyze and process the prediction results. The purpose of selecting and predictingRSRP from eNBs with different time intervals is to observe whether the selected eNBs cancontinue to satisfy the users’ demand, thus avoiding the ping-pong effect at the handover.In addition, by predicting the selection of eNBs that can maintain MOS greater than 4 for alonger period of time, frequent handover will be avoided. The speed of UE movement inthe experiment is set at 90 km/h. The maximum prediction time is 10 s. In this case, theUE moves a distance of 250 m in 10 s. In addition, when the user wanders for a long timearound the cell boundary, the proposed mechanism in this paper will predict and select theRSRP with different time intervals for eNBs to continually satisfy the user’s requirementsin order to avoid the ping-pong effect during handover.
Based on the prediction results of the four deep learning models shown in Tables 8–11,we can observe that the mean square error (MSE) of accuracy gradually increases andthe R-square value of accuracy slightly decreases as the prediction interval increases. Theresults indicate that the models are less accurate in predicting longer intervals. Among thefour deep learning models, the minimum MSE value of accuracy is the RNN model with0.111 and the maximum R-square value of accuracy is the RNN with 0.999 compared with

Appl. Sci. 2022, 12, 4049 21 of 35
the other three models in the 2 s period. This indicates that RNN has better performanceresults than the other three models.
Table 8. RSRP prediction test results using MLP.
Interval MSE R-Squared
2 s 0.814 0.993
4 s 2.115 0.979
6 s 3.526 0.962
8 s 4.949 0.942
10 s 5.633 0.929
Table 9. RSRP prediction test results using CNN.
Interval MSE R-Squared
2 s 0.621 0.994
4 s 0.958 0.99
6 s 1.555 0.983
8 s 1.818 0.979
10 s 2.701 0.966
Table 10. RSRP prediction test results using RNN.
Interval MSE R-Squared
2 s 0.111 0.999
4 s 0.409 0.996
6 s 0.968 0.99
8 s 1.219 0.986
10 s 1.259 0.984
Table 11. RSRP prediction test results using LSTM.
Interval MSE R-Squared
2 s 0.715 0.993
4 s 1.896 0.981
6 s 2.902 0.969
8 s 3.203 0.963
10 s 4.254 0.946
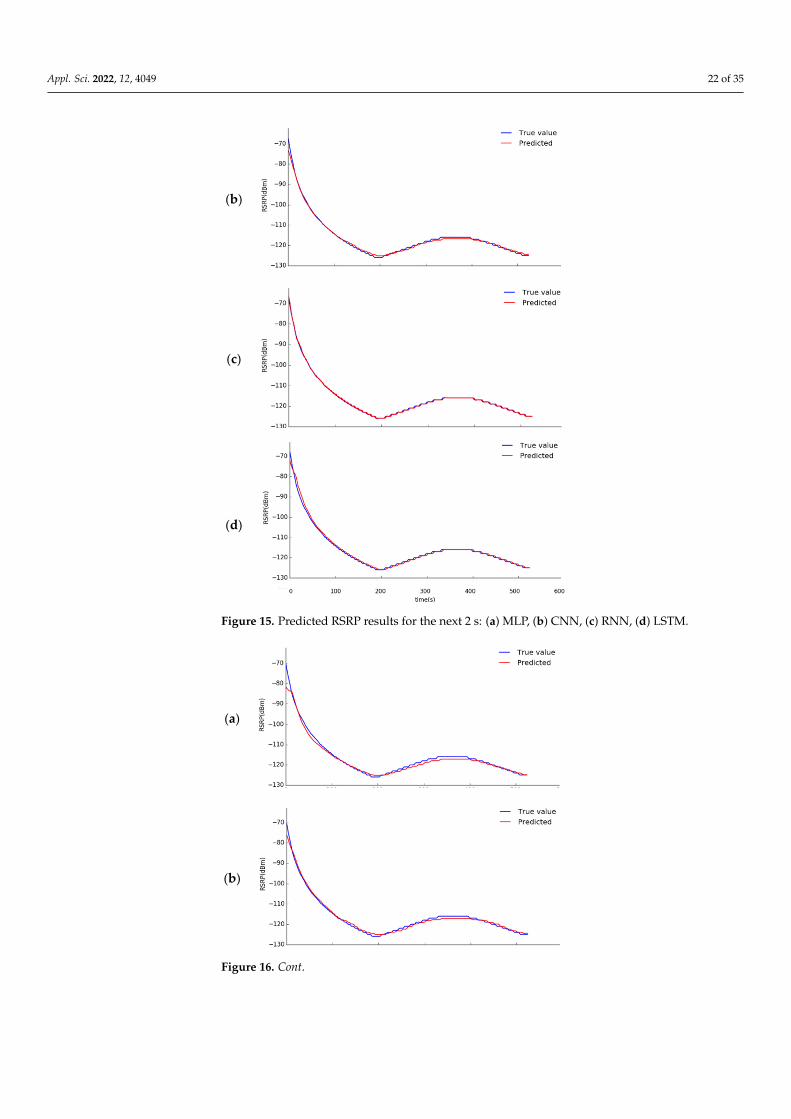
Figures 15–19 show the RSRP results predicted by the four deep learning models after2, 4, 6, 8, and 10 s. The X-axis shows the time in seconds when the UE moves, and theY-axis shows the change in RSRP in dBm. The blue line represents the actual RSRP, andthe red line is the predicted RSRP from the trained deep learning model. A higher overlapbetween the blue and red lines means that the prediction result of the deep learning modelis better.
Appl. Sci. 2022, 12, x FOR PEER REVIEW 22 of 36
Table 8. RSRP prediction test results using MLP.
Interval MSE R-Squared 2 s 0.814 0.993 4 s 2.115 0.979 6 s 3.526 0.962 8 s 4.949 0.942 10 s 5.633 0.929
Table 9. RSRP prediction test results using CNN.
Interval MSE R-Squared 2 s 0.621 0.994 4 s 0.958 0.99 6 s 1.555 0.983 8 s 1.818 0.979 10 s 2.701 0.966
Table 10. RSRP prediction test results using RNN.
Interval MSE R-Squared 2 s 0.111 0.999 4 s 0.409 0.996 6 s 0.968 0.99 8 s 1.219 0.986 10 s 1.259 0.984
Table 11. RSRP prediction test results using LSTM.
Interval MSE R-Squared 2 s 0.715 0.993 4 s 1.896 0.981 6 s 2.902 0.969 8 s 3.203 0.963 10 s 4.254 0.946
Figures 15–19 show the RSRP results predicted by the four deep learning models af-ter 2, 4, 6, 8, and 10 s. The X-axis shows the time in seconds when the UE moves, and the Y-axis shows the change in RSRP in dBm. The blue line represents the actual RSRP, and the red line is the predicted RSRP from the trained deep learning model. A higher overlap between the blue and red lines means that the prediction result of the deep learning model is better.
(a)
Figure 15. Cont.
Appl. Sci. 2022, 12, 4049 22 of 35Appl. Sci. 2022, 12, x FOR PEER REVIEW 23 of 36
(b)
(c)
(d)
Figure 15. Predicted RSRP results for the next 2 s: (a) MLP, (b) CNN, (c) RNN, (d) LSTM.
(a)
(b)
Figure 15. Predicted RSRP results for the next 2 s: (a) MLP, (b) CNN, (c) RNN, (d) LSTM.
Appl. Sci. 2022, 12, x FOR PEER REVIEW 23 of 36
(b)
(c)
(d)
Figure 15. Predicted RSRP results for the next 2 s: (a) MLP, (b) CNN, (c) RNN, (d) LSTM.
(a)
(b)
Figure 16. Cont.

Appl. Sci. 2022, 12, 4049 23 of 35Appl. Sci. 2022, 12, x FOR PEER REVIEW 24 of 36
(c)
(d)
Figure 16. Predicted RSRP results for the next 4 s: (a) MLP, (b) CNN, (c) RNN, (d) LSTM.
(a)
(b)
(c)
Figure 16. Predicted RSRP results for the next 4 s: (a) MLP, (b) CNN, (c) RNN, (d) LSTM.
Appl. Sci. 2022, 12, x FOR PEER REVIEW 24 of 36
(c)
(d)
Figure 16. Predicted RSRP results for the next 4 s: (a) MLP, (b) CNN, (c) RNN, (d) LSTM.
(a)
(b)
(c)
Figure 17. Cont.
Appl. Sci. 2022, 12, 4049 24 of 35Appl. Sci. 2022, 12, x FOR PEER REVIEW 25 of 36
(d)
Figure 17. Predicted RSRP results for the next 6 s: (a) MLP, (b) CNN, (c) RNN, (d) LSTM.
(a)
(b)
(c)
(d)
Figure 18. Predicted RSRP results for the next 8 s: (a) MLP, (b) CNN, (c) RNN, (d) LSTM.
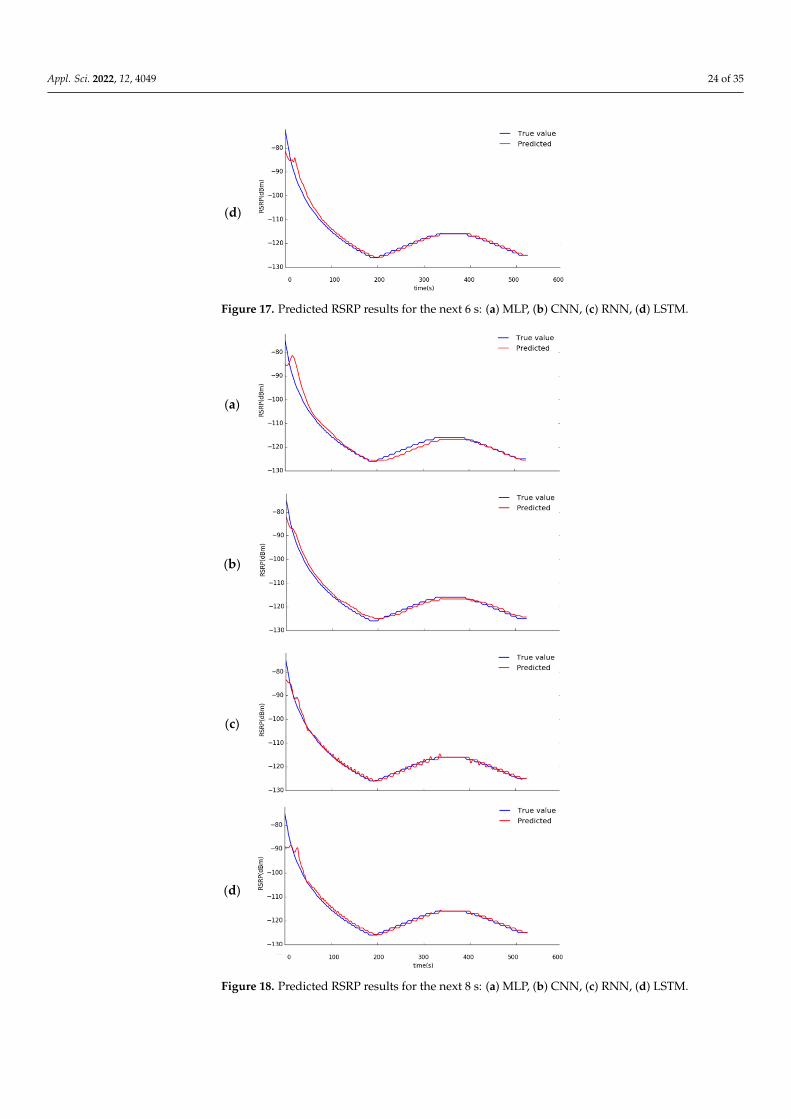
Figure 17. Predicted RSRP results for the next 6 s: (a) MLP, (b) CNN, (c) RNN, (d) LSTM.
Appl. Sci. 2022, 12, x FOR PEER REVIEW 25 of 36
(d)
Figure 17. Predicted RSRP results for the next 6 s: (a) MLP, (b) CNN, (c) RNN, (d) LSTM.
(a)
(b)
(c)
(d)
Figure 18. Predicted RSRP results for the next 8 s: (a) MLP, (b) CNN, (c) RNN, (d) LSTM. Figure 18. Predicted RSRP results for the next 8 s: (a) MLP, (b) CNN, (c) RNN, (d) LSTM.
Appl. Sci. 2022, 12, 4049 25 of 35Appl. Sci. 2022, 12, x FOR PEER REVIEW 26 of 36
(a)
(b)
(c)
(d)
Figure 19. Predicted RSRP results for the next 10 s: (a) MLP, (b) CNN, (c) RNN, (d) LSTM.
From Figures 15–19, the four deep learning models all show a significant or consid-erable gap between the real data and the predicted data as the prediction time increases. However, the predicted data of the RNN model stays relatively close to the real data in general. Conversely, the overall prediction result of the CNN model produces a relatively larger deviation from the real data.
The proposed deep-learning-based handover mechanism is implemented using the Mininet-WiFi for LTE network simulation. When the UE sends back the received RSRP value to the eNB in every second, the eNB will make RSRP predictions for the next 2, 4, 6, 8, and 10 s based on the RSRP values. Based on the predicted RSRP values, the corre-sponding MOS values are calculated according to Equation (7). According to the RSRP values received from the UE, the eNB needs to predict whether the eNB can meet the required MOS for video conferencing services in the next few seconds. If not, it activates
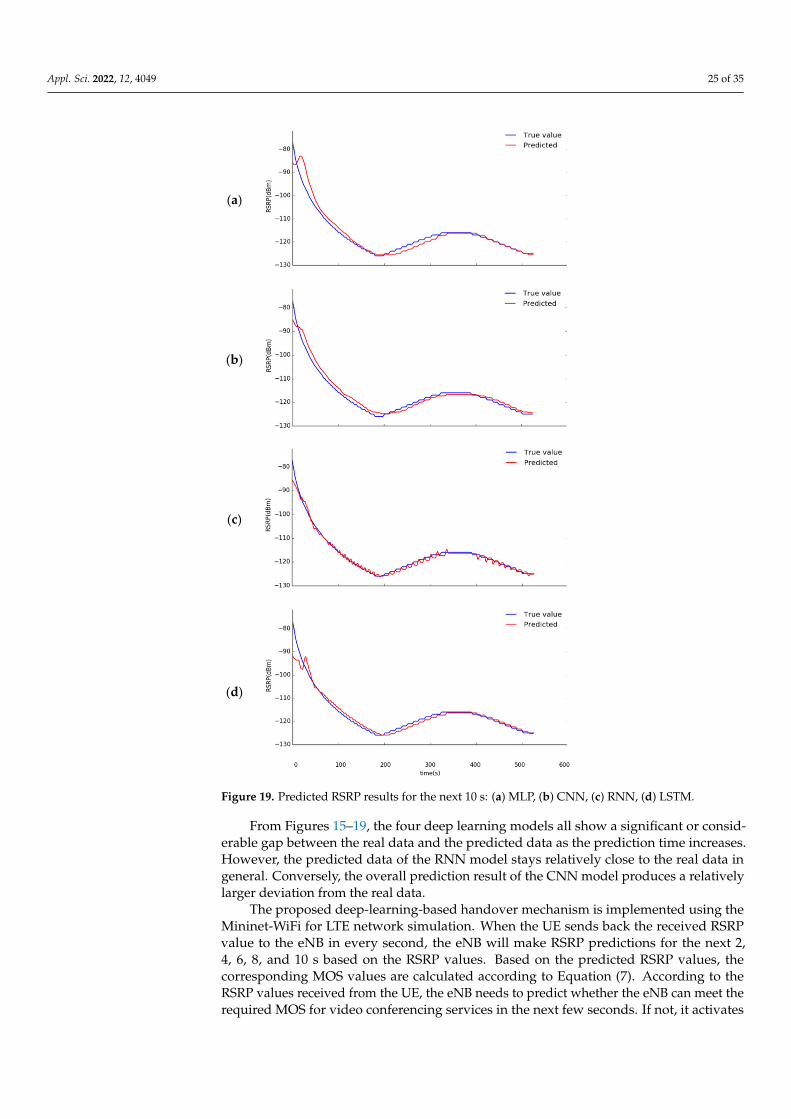
Figure 19. Predicted RSRP results for the next 10 s: (a) MLP, (b) CNN, (c) RNN, (d) LSTM.
From Figures 15–19, the four deep learning models all show a significant or consid-erable gap between the real data and the predicted data as the prediction time increases.However, the predicted data of the RNN model stays relatively close to the real data ingeneral. Conversely, the overall prediction result of the CNN model produces a relativelylarger deviation from the real data.
The proposed deep-learning-based handover mechanism is implemented using theMininet-WiFi for LTE network simulation. When the UE sends back the received RSRPvalue to the eNB in every second, the eNB will make RSRP predictions for the next 2,4, 6, 8, and 10 s based on the RSRP values. Based on the predicted RSRP values, thecorresponding MOS values are calculated according to Equation (7). According to theRSRP values received from the UE, the eNB needs to predict whether the eNB can meet therequired MOS for video conferencing services in the next few seconds. If not, it activates

Appl. Sci. 2022, 12, 4049 26 of 35
the handover mechanism before the signal quality is degraded to avoid the MOS valuegoing too low.
6. Experimental Results and Analysis
In this section, the proposed deep-learning-based handover mechanism is evaluatedto meet the MOS requirements of the real-time video conference service. We also comparethe original event A3 and the proposed deep-learning-based handover mechanism. Theexperiment topology and UE’s moving path are shown in Figure 20. The injection ofnetwork traffic from the iperf tool is used to simulate the transmission of a video call inSkype. The experiments were performed three times with fixed paths for the originalevent A3 and the proposed deep-learning-based handover mechanism individually. Themobile nodes were evaluated with the same moving speed. According to the previousexperimental results, the RNN model has the lowest MSE value and the highest R-squarevalue than the MLP, CNN and LSTM models. Thus, the RNN deep learning model isimplemented using the Mininet-WiFi for LTE network simulation. The acceptable thresholdof MOS is set to 4 since the speed of the mobile node in the experiment is 20 m per second.The eNB will make RSRP predictions for the next 2 s to confirm whether the eNB can meetthe required MOS for Skype video conferencing services. If not, eNB activates the handovermechanism before the signal quality is degraded to avoid an MOS value lower than 4.
Appl. Sci. 2022, 12, x FOR PEER REVIEW 27 of 36
the handover mechanism before the signal quality is degraded to avoid the MOS value going too low.
6. Experimental Results and Analysis In this section, the proposed deep-learning-based handover mechanism is evaluated
to meet the MOS requirements of the real-time video conference service. We also compare the original event A3 and the proposed deep-learning-based handover mechanism. The experiment topology and UE’s moving path are shown in Figure 20. The injection of net-work traffic from the iperf tool is used to simulate the transmission of a video call in Skype. The experiments were performed three times with fixed paths for the original event A3 and the proposed deep-learning-based handover mechanism individually. The mobile nodes were evaluated with the same moving speed. According to the previous experi-mental results, the RNN model has the lowest MSE value and the highest R-square value than the MLP, CNN and LSTM models. Thus, the RNN deep learning model is imple-mented using the Mininet-WiFi for LTE network simulation. The acceptable threshold of MOS is set to 4 since the speed of the mobile node in the experiment is 20 m per second. The eNB will make RSRP predictions for the next 2 s to confirm whether the eNB can meet the required MOS for Skype video conferencing services. If not, eNB activates the hando-ver mechanism before the signal quality is degraded to avoid an MOS value lower than 4.
Figure 20. UE’s moving path for handover mechanism testing.
Figures 21 and 22 show the packet loss rates of three experimental results of the pro-posed deep-learning-based handover mechanism and LTE event A3 handover mecha-nism, respectively. The LTE event A3 handover mechanism is based only on the signal strength difference between eNBs. It results in a higher packet loss rate under the required network traffic for the real-time video conference service due to the late triggering of the handover mechanism, as compared to the proposed deep-learning-based handover mech-anism. Therefore, the overall packet loss rate of the event A3 handover mechanism is rel-atively higher than that of the proposed deep-learning-based handover mechanism.
Figure 20. UE’s moving path for handover mechanism testing.
Figures 21 and 22 show the packet loss rates of three experimental results of theproposed deep-learning-based handover mechanism and LTE event A3 handover mech-anism, respectively. The LTE event A3 handover mechanism is based only on the signalstrength difference between eNBs. It results in a higher packet loss rate under the requirednetwork traffic for the real-time video conference service due to the late triggering ofthe handover mechanism, as compared to the proposed deep-learning-based handovermechanism. Therefore, the overall packet loss rate of the event A3 handover mechanism isrelatively higher than that of the proposed deep-learning-based handover mechanism.

Appl. Sci. 2022, 12, 4049 27 of 35Appl. Sci. 2022, 12, x FOR PEER REVIEW 28 of 36
Figure 21. The packet loss rates of three experimental results of the proposed deep-learning-based handover mechanism.
Figure 21. The packet loss rates of three experimental results of the proposed deep-learning-basedhandover mechanism.
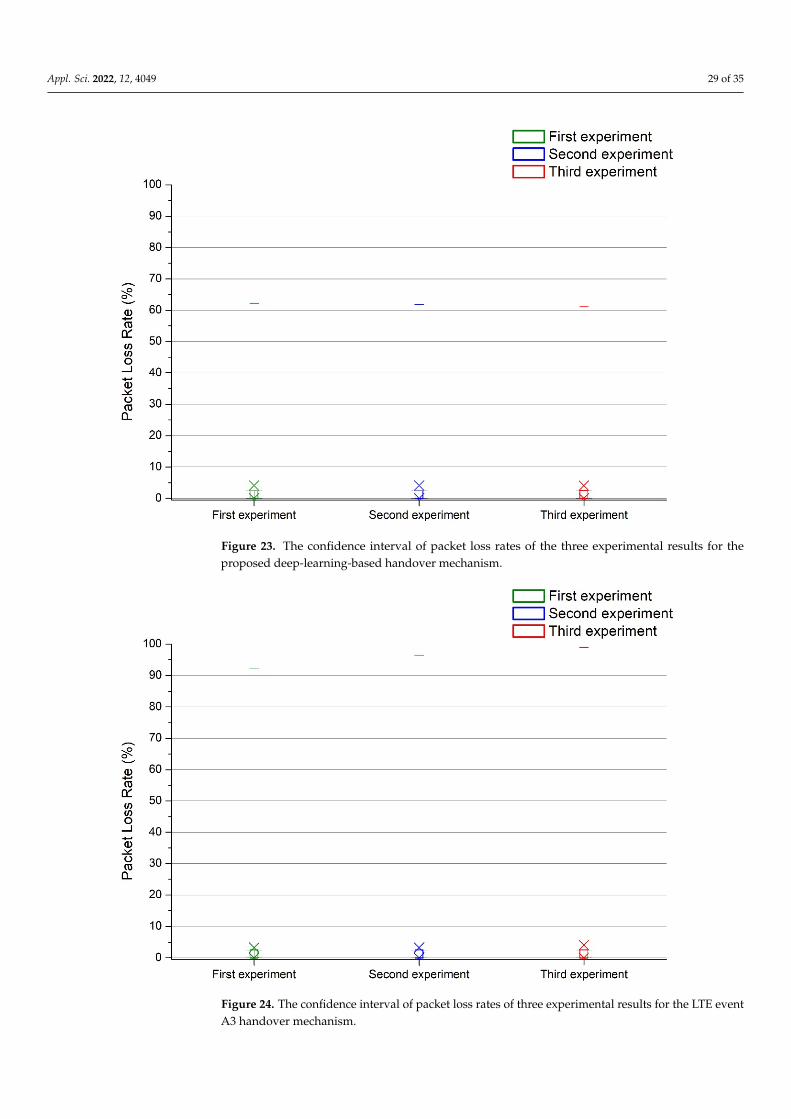
Figures 23 and 24 show the 95% confidence interval of three experimental results ofpacket loss rates for the proposed deep-learning-based handover mechanism and the LTEevent A3 handover mechanism, respectively. Within the 95% confidence interval, it can befound that both the event A3 handover mechanism and the proposed deep-learning-basedhandover mechanism can maintain their packet loss rates below 4%. The highest packetloss rates of the proposed deep-learning-based handover mechanism is from 61% to 62%;however, the highest packet loss rates of the LTE Event A3 handover mechanism is from92% to 97%.

Appl. Sci. 2022, 12, 4049 28 of 35
Appl. Sci. 2022, 12, x FOR PEER REVIEW 29 of 36
Figure 22. The packet loss rates of three experimental results of the LTE event A3 handover mecha-nism.
Figures 23 and 24 show the 95% confidence interval of three experimental results of packet loss rates for the proposed deep-learning-based handover mechanism and the LTE event A3 handover mechanism, respectively. Within the 95% confidence interval, it can be found that both the event A3 handover mechanism and the proposed deep-learning-based handover mechanism can maintain their packet loss rates below 4%. The highest packet loss rates of the proposed deep-learning-based handover mechanism is from 61% to 62%; however, the highest packet loss rates of the LTE Event A3 handover mechanism is from 92% to 97%.
Figure 22. The packet loss rates of three experimental results of the LTE event A3 handover mechanism.
Figures 25 and 26 show the MOS of three experimental results of the proposed deep-learning-based handover mechanism and LTE event A3 handover mechanism, respectively.We observe the experiments of the MOS values equal to or greater than 4 for both mecha-nisms. In the three experiments, the proposed deep-learning-based handover mechanismwith MOS values equal to or greater than 4 are maintained for 682, 683 and 682 s. However,the MOS values equal to or greater than 4 for the three experimental results of the LTEevent A3 handover mechanism are only 673, 674 and 673 s.
Appl. Sci. 2022, 12, 4049 29 of 35Appl. Sci. 2022, 12, x FOR PEER REVIEW 30 of 36
Figure 23. The confidence interval of packet loss rates of the three experimental results for the pro-posed deep-learning-based handover mechanism.
Figure 24. The confidence interval of packet loss rates of three experimental results for the LTE event A3 handover mechanism.
Figures 25 and 26 show the MOS of three experimental results of the proposed deep-learning-based handover mechanism and LTE event A3 handover mechanism, respec-tively. We observe the experiments of the MOS values equal to or greater than 4 for both mechanisms. In the three experiments, the proposed deep-learning-based handover
Figure 23. The confidence interval of packet loss rates of the three experimental results for theproposed deep-learning-based handover mechanism.
Appl. Sci. 2022, 12, x FOR PEER REVIEW 30 of 36
Figure 23. The confidence interval of packet loss rates of the three experimental results for the pro-posed deep-learning-based handover mechanism.
Figure 24. The confidence interval of packet loss rates of three experimental results for the LTE event A3 handover mechanism.
Figures 25 and 26 show the MOS of three experimental results of the proposed deep-learning-based handover mechanism and LTE event A3 handover mechanism, respec-tively. We observe the experiments of the MOS values equal to or greater than 4 for both mechanisms. In the three experiments, the proposed deep-learning-based handover
Figure 24. The confidence interval of packet loss rates of three experimental results for the LTE eventA3 handover mechanism.

Appl. Sci. 2022, 12, 4049 30 of 35
Appl. Sci. 2022, 12, x FOR PEER REVIEW 31 of 36
mechanism with MOS values equal to or greater than 4 are maintained for 682, 683 and 682 s. However, the MOS values equal to or greater than 4 for the three experimental re-sults of the LTE event A3 handover mechanism are only 673, 674 and 673 s.
Figure 25. The MOS of three experimental results of the proposed deep-learning-based handover mechanism.
Figure 25. The MOS of three experimental results of the proposed deep-learning-based handover mechanism.
Figures 27 and 28 show the 95% confidence intervals of the MOS values for thedeep-learning-based handover mechanism and the LTE event A3 handover mechanism,respectively. The MOS results of these two handover mechanisms are compared as below.Within the 95% confidence interval, it can be found that both the LTE event A3 handovermechanism and the proposed deep-learning-based handover mechanism are able to main-tain their MOS around 4.2. The minimum MOS for the proposed deep-learning-basedhandover mechanism is around 3.2 to 3.3; however, the minimum MOS for the LTE eventA3 handover mechanism is as low as 2.4.

Appl. Sci. 2022, 12, 4049 31 of 35
Appl. Sci. 2022, 12, x FOR PEER REVIEW 32 of 36
Figure 26. The MOS of three experimental results of the LTE event A3 handover mechanism.
Figures 27 and 28 show the 95% confidence intervals of the MOS values for the deep-learning-based handover mechanism and the LTE event A3 handover mechanism, respec-tively. The MOS results of these two handover mechanisms are compared as below. Within the 95% confidence interval, it can be found that both the LTE event A3 handover mechanism and the proposed deep-learning-based handover mechanism are able to main-tain their MOS around 4.2. The minimum MOS for the proposed deep-learning-based handover mechanism is around 3.2 to 3.3; however, the minimum MOS for the LTE event A3 handover mechanism is as low as 2.4.
Figure 26. The MOS of three experimental results of the LTE event A3 handover mechanism.
Based on the packet loss rate variation of the two handover mechanisms within 15 sbefore and after the handover time, in the first handover, the average packet loss rate ofthe proposed deep-learning-based handover mechanism is 6.30%, and the average packetloss rate of the LTE event A3 handover mechanism is 7.07%. In the second handover, theaverage packet loss rate of the proposed deep-learning-based handover mechanism is5.12%, and the average packet loss rate of the LTE event A3 handover mechanism is 7.06%;thus, the deep learning prediction video conference MOS-based hand change mechanismproposed in this study is better than the general one. Therefore, the above results showthat the proposed deep-learning-based handover mechanism is better than the LTE eventA3 handover mechanism.

Appl. Sci. 2022, 12, 4049 32 of 35Appl. Sci. 2022, 12, x FOR PEER REVIEW 33 of 36
Figure 27. The confidence interval of MOS of the three experimental results for the proposed deep-learning-based handover mechanism.
Figure 28. The confidence interval of MOS of the three experimental results for the LTE event A3 handover mechanism.
Based on the packet loss rate variation of the two handover mechanisms within 15 s before and after the handover time, in the first handover, the average packet loss rate of
Figure 27. The confidence interval of MOS of the three experimental results for the proposed deep-learning-based handover mechanism.
Appl. Sci. 2022, 12, x FOR PEER REVIEW 33 of 36
Figure 27. The confidence interval of MOS of the three experimental results for the proposed deep-learning-based handover mechanism.
Figure 28. The confidence interval of MOS of the three experimental results for the LTE event A3 handover mechanism.
Based on the packet loss rate variation of the two handover mechanisms within 15 s before and after the handover time, in the first handover, the average packet loss rate of
Figure 28. The confidence interval of MOS of the three experimental results for the LTE event A3handover mechanism.

Appl. Sci. 2022, 12, 4049 33 of 35
7. Conclusions
This paper is based on user experience for real-time video conference service andcombines deep learning to implement a handover mechanism by predicting MOS toenhance the quality of service for users in the LTE network. First, we summarize theMOS evaluation criteria of a real-time video conference service and establish a handovermechanism based on MOS.
In addition, we have proposed a deep learning model to predict the RSRP of LTE signalstrength, and we analyzed the prediction accuracy of four deep learning models, includingMLP, CNN, RNN and LSTM. From the evaluation experiments of the prediction resultsof the four deep learning models, it can be observed that all the deep learning modelslead to a decrease in accuracy when predicting longer time intervals. However, the RNNmodel has the lowest MSE when predicting after 2, 4, 6, 8 and 10 s, respectively. Moreover,the experimental results for model loss indicate that the RNN model has better predictionresults in both the short and long term than the other three deep learning models.
Based on the predicted RSRP values from the proposed RNN deep learning model,the corresponding MOS values are calculated according to Equation (7). The experimentalresults have also demonstrated that the proposed deep-learning-based handover mecha-nism can improve the quality of users’ real-time video conference service experience ascompared with the general LTE event A3 handover mechanism. The MOS values equalto or greater than 4 for the proposed deep-learning-based handover mechanism can ac-cumulate about 682 s; however, it can accumulate only about 673 s for the LTE event A3handoff mechanism.
Furthermore, this paper focuses on the proposed deep learning handover mechanismvia the Skype video conference services in LTE. However, the same approach could beextended to the main applications of online video conferencing services such as MS Teams,Zoom, Google Meet, etc., by adjusting the parameters.
In addition, AGVs and UAVs are two of the major applications of current mobilerobotics in the context of Industry 4.0. For example, mobile robots can implement ap-plications such as image recognition and object detection via real-time video streaming.However, the proposed deep-learning-based handover mechanism can provide a morestable real-time video streaming service while the robot is moving to meet the video qualityrequirements for image recognition and object recognition.
In the future, the proposed deep-learning-based handover mechanism can be ex-tended to different application services for MOS handover mechanism research and can beimplemented in the 5G next-generation network.
Author Contributions: Conceptualization, T.-H.L., L.-H.C. and Y.-S.C.; methodology, T.-H.L., L.-H.C. and Y.-S.C.; software, Y.-S.C.; validation, T.-H.L., L.-H.C. and Y.-S.C.; formal analysis, T.-H.L.,L.-H.C. and Y.-S.C.; investigation, T.-H.L. and L.-H.C.; resources, T.-H.L.; data curation, T.-H.L.,L.-H.C. and Y.-S.C.; writing—original draft preparation, T.-H.L., L.-H.C. and Y.-S.C.; writing—reviewand editing, T.-H.L. and L.-H.C.; visualization, Y.-S.C.; supervision, T.-H.L.; project administration,T.-H.L.; funding acquisition, T.-H.L. All authors have read and agreed to the published version ofthe manuscript.
Funding: This research was funded by the Ministry of Science and Technology, Taiwan, ROC, grantnumber MOST 109-2221-E-142-002 and MOST 110-2221-E-142-001.
Institutional Review Board Statement: Not applicable.
Informed Consent Statement: Not applicable.
Data Availability Statement: Not applicable.
Acknowledgments: The authors would like to acknowledge the support from the Ministry of Scienceand Technology of Taiwan, ROC (MOST 109-2221-E-142-002 and MOST 110-2221-E-142-001).
Conflicts of Interest: The authors declare no conflict of interest.

Appl. Sci. 2022, 12, 4049 34 of 35
References1. Yi, S.; Chun, S.; Lee, Y.; Park, S.; Jung, S. Radio Protocols for LTE and LTE-Advanced; Wiley Online Library: Hoboken, NJ, USA, 2012.
[CrossRef]2. 3GPP TS 36.423 Release 15.4.0; Evolved Universal Terrestrial Radio Access Network (E-UTRAN); X2 Application Protocol (X2AP).
ETSI: Sophia Antipolis, France, 2019. Available online: https://www.etsi.org/deliver/etsi_ts/136400_136499/136423/15.05.00_60/ts_136423v150500p.pdf (accessed on 18 February 2022).
3. Ahmad, R.; Sundararajan, E.A.; Othman, N.E.; Ismail, M. Handover in LTE-advanced wireless networks: State of art and surveyof decision algorithm. Telecommun. Syst. 2017, 66, 533–558. [CrossRef]
4. Davaasambuu, B.; Yu, K.; Sato, T. Self-Optimization of Handover Parameters for Long-Term Evolution with Dual Wireless MobileRelay Nodes. Future Internet 2015, 7, 196–213. [CrossRef]
5. Harja, S.L.; Hendrawan. Evaluation and Optimization Handover Parameter based X2 in LTE Network. In Proceedings of the 20173rd International Conference on Wireless and Telematics (ICWT), Palembang, Indonesia, 27–28 July 2017; pp. 175–180. [CrossRef]
6. Ali, Z.; Baldo, N.; Mangues-Bafalluy, J.; Giupponi, L. Machine Learning Based Handover Management for Improved QoE in LTE.In Proceedings of the NOMS 2016-2016 IEEE/IFIP Network Operations and Management Symposium, Istanbul, Turkey, 25–29April 2016; pp. 794–798. [CrossRef]
7. Hosny, K.M.; Khashaba, M.M.; Khedr, W.I.; Amer, F.A. New vertical handover prediction schemes for LTE-WLAN heterogeneousnetworks. PLoS ONE 2019, 14, e0215334. [CrossRef] [PubMed]
8. Ma, Y.; Chen, X.; Zhang, L. Base Station Handover Based on User Trajectory Prediction in 5G Networks. In Proceedings of the IEEEInternational Symposium on Parallel and Distributed Processing with Applications (ISPA), New York, NY, USA, 30 September–3October 2021; pp. 1476–1482.
9. Cabral de Brito Guerra, T.; Dantas, Y.R.; Sousa, V.A., Jr. A Machine Learning Approach for Handover in LTE Networks withSignal Obstructions. J. Commun. Inf. Syst. 2020, 35, 271–289. [CrossRef]
10. Li, D.; Li, D.; Xu, Y. Machine Learning Based Handover Performance Improvement for LTE-R. In Proceedings of the 2019 IEEEInternational Conference on Consumer Electronics—Taiwan (ICCE-TW), Yilan, Taiwan, 20–22 May 2019; pp. 1–2. [CrossRef]
11. Ozturk, M.; Gogate, M.; Onireti, O.; Adeel, A.; Hussain, A.; Imran, M.A. A novel deep learning driven, low-cost mobilityprediction approach for 5G cellular networks: The case of the Control/Data Separation Architecture (CDSA). Neurocomputing2019, 358, 479–489. [CrossRef]
12. Mollel, M.S.; Abubakar, A.I.; Ozturk, M.; Kaijage, S.; Kisangiri, M.; Zoha, A.; Imran, M.A.; Abbasi, Q.H. Intelligent handoverdecision scheme using double deep reinforcement learning. Phys. Commun. 2020, 42, 101133. [CrossRef]
13. Ali, Z.; Miozzo, M.; Giupponi, L.; Dini, P.; Denic, S.Z.; Vassaki, S. Recurrent Neural Networks for Handover Management inNext-Generation Self-Organized Networks. In Proceedings of the 2020 IEEE 31st Annual International Symposium on Personal,Indoor and Mobile Radio Communications, Virtual Conference, London, UK, 31 August–3 September 2020; pp. 1–6.
14. Nyangaresi, V.O.; Rodrigues, A.J. Efficient handover protocol for 5G and beyond networks. Comput. Secur. 2022, 113, 102546.[CrossRef]
15. Nyangaresi, V.O.; Rodrigues, A.J.; Abeka, S.O. Machine Learning Protocol for Secure 5G Handovers. Int. J. Wirel. Inf. Netw. 2022,29, 14–35. [CrossRef]
16. ITU-T Recommendation P.10/G.100; Vocabulary of Terms on Telephone Transmission Quality and Telephone Sets. December 1998.ITU: Geneva, Switzerland. Available online: https://www.itu.int/rec/T-REC-P.10-199812-S (accessed on 18 February 2022).
17. ITU-T Recommendation P.10/G.100 Amendment 1; New Appendix I—Definition of Quality of Experience (QoE). January 2007. ITU:Geneva, Switzerland. Available online: https://www.itu.int/rec/T-REC-P.10-200701-S!Amd1 (accessed on 18 February 2022).
18. Brunnström, K.; Beker, S.A.; Moor, K.D.; Dooms, A.; Egger, S.; Garcia, M.; Hossfeld, T.; Jumisko-Pyykkö, S.; Keimel, C.;Larabi, M.; et al. Qualinet White Paper on Definitions of Quality of Experience; HAL: Lyon, France, 2013.
19. ITU-T Rec. P.10/G.100; Vocabulary for Performance and Quality of Service. Amendment 5: New Definitions for Inclusion inRecommendation ITU-T P.10/G.100. July 2016. ITU: Geneva, Switzerland. Available online: https://www.itu.int/rec/T-REC-P.10-201607-S!Amd5 (accessed on 18 February 2022).
20. Vizzarri, A.; Davide, F. QoE QoS Mapping for YouTube services Over LTE Network. MobiWac ‘16. In Proceedings of the 14thACM International Symposium on Mobility Management and Wireless Access, Malta, 13–17 November 2016; pp. 107–114.[CrossRef]
21. Lambrecht, C.J.V.D.B.; Verscheure, O. Perceptual Quality Measure Using a Spatiotemporal Model of the Human Visual System. InDigital Video Compression: Algorithms and Technologies 1996; SPIE: San Jose, CA, USA, 1996; Volume 2668, pp. 450–461. [CrossRef]
22. Kyung, Y.; Kim, T. QoS-Aware Flexible Handover Management in Software-Defined Mobile Networks. Appl. Sci. 2020, 10, 4264.[CrossRef]
23. Lai, W.K.; Shieh, C.; Chou, F.; Hsu, C.; Shen, M. Handover Management for D2D Communication in 5G Networks. Appl. Sci.2020, 10, 4409. [CrossRef]
24. ITU-T Recommendation P.800; Methods for Objective and Subjective Assessment of Quality. August 1996. ITU: Geneva, Switzerland.Available online: https://www.itu.int/rec/T-REC-P.800-199608-I/en (accessed on 18 February 2022).
25. Zhang, X.; Xu, Y.; Hu, H.; Liu, Y.; Guo, Z.; Wang, Y. Modeling and Analysis of Skype Video Calls: Rate Control and Video Quality.In IEEE Transactions on Multimedia; IEEE: Manhattan, NY, USA, 2013; Volume 15, pp. 1446–1457. [CrossRef]
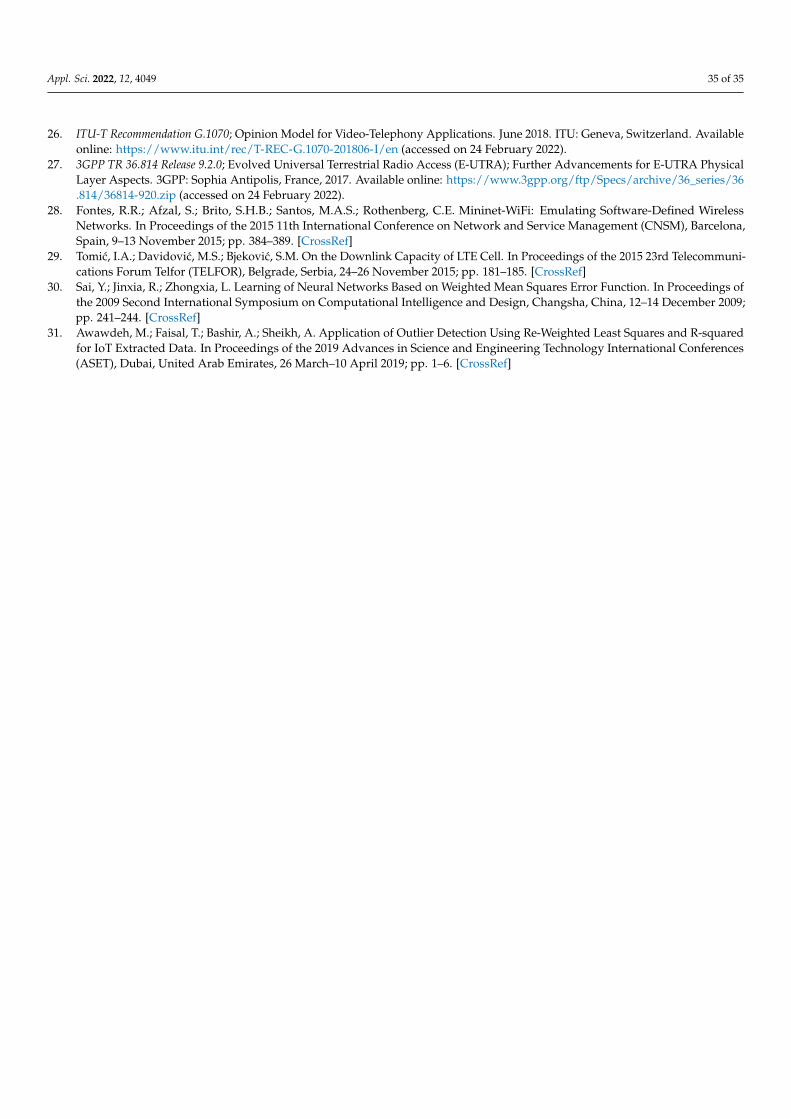
Appl. Sci. 2022, 12, 4049 35 of 35
26. ITU-T Recommendation G.1070; Opinion Model for Video-Telephony Applications. June 2018. ITU: Geneva, Switzerland. Availableonline: https://www.itu.int/rec/T-REC-G.1070-201806-I/en (accessed on 24 February 2022).
27. 3GPP TR 36.814 Release 9.2.0; Evolved Universal Terrestrial Radio Access (E-UTRA); Further Advancements for E-UTRA PhysicalLayer Aspects. 3GPP: Sophia Antipolis, France, 2017. Available online: https://www.3gpp.org/ftp/Specs/archive/36_series/36.814/36814-920.zip (accessed on 24 February 2022).
28. Fontes, R.R.; Afzal, S.; Brito, S.H.B.; Santos, M.A.S.; Rothenberg, C.E. Mininet-WiFi: Emulating Software-Defined WirelessNetworks. In Proceedings of the 2015 11th International Conference on Network and Service Management (CNSM), Barcelona,Spain, 9–13 November 2015; pp. 384–389. [CrossRef]
29. Tomic, I.A.; Davidovic, M.S.; Bjekovic, S.M. On the Downlink Capacity of LTE Cell. In Proceedings of the 2015 23rd Telecommuni-cations Forum Telfor (TELFOR), Belgrade, Serbia, 24–26 November 2015; pp. 181–185. [CrossRef]
30. Sai, Y.; Jinxia, R.; Zhongxia, L. Learning of Neural Networks Based on Weighted Mean Squares Error Function. In Proceedings ofthe 2009 Second International Symposium on Computational Intelligence and Design, Changsha, China, 12–14 December 2009;pp. 241–244. [CrossRef]
31. Awawdeh, M.; Faisal, T.; Bashir, A.; Sheikh, A. Application of Outlier Detection Using Re-Weighted Least Squares and R-squaredfor IoT Extracted Data. In Proceedings of the 2019 Advances in Science and Engineering Technology International Conferences(ASET), Dubai, United Arab Emirates, 26 March–10 April 2019; pp. 1–6. [CrossRef]