


Bahasa
Halaman
Hukum


An internship report on
A STUDY ON “WORKING CAPITAL MANAGEMENT “
AT DILIP MARETRIAL HANDLING EQUIPMENT
BY
SHARATH KUMAR CE
1NZ13MBA35
Submitted to
VISVESVARAYA TECHNOLOGICAL UNIVERSITY, BELAGAUM
In partial fulfillment of requirement for the award of degree of
MASTER OF BUSINESS ADMINISTRATION
Under the guidance of
INTERNAL GUIDE EXTERNAL GUIDE
Mrs.Sayantani banerjee Ms.Smitha
Asst.professor finance manger
DEPARTMENT OF MBA
NEW HORIZON COLLEGE OF ENGINEERING,
OUTER RING ROAD, MARATHALLI, BANGALORE-560103.
2014-2015


ACKNOWLEDGEMENT
I wish to place on record my deep sense of appreciation to all those who made this project
come into existence and guide me from the start to finish. I express my sincere gratitude to
institution of New Horizon College of Engineering, Bangalore.
I would like to thank Dr. Manjunath, principal of New Horizon College of Engineering,
Bangalore for giving me opportunity to prove my caliber by submitting this project report.
I am very grateful to Dr.sheelanmishra, Head of department of management studies, New
Horizon College of Engineering, and Bangalore for her support in to formatting and
completion of this project.
I am indebted to my sincere gratitude to Prof. Sayantani banerjee for his support from the
beginning till completion of this study.
I extend my sincere gratitude to Ms. SMITHA, finance manager of dilip material equipment,
Bommasandra industrial area, Bangalore for giving me the time and information needed for
making this assignment successful.
SHARATH KUMAR CE
1NZ13MBA35
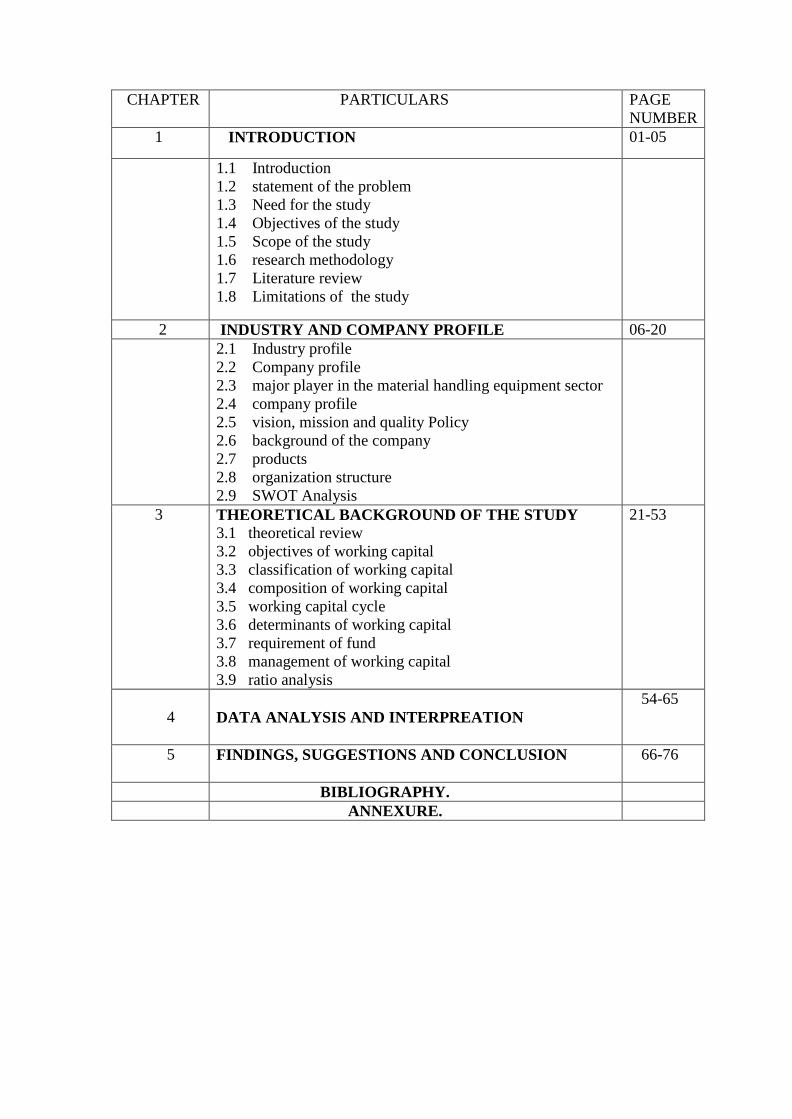
CHAPTER PARTICULARS PAGE
NUMBER
1 INTRODUCTION 01-05
1.1 Introduction
1.2 statement of the problem
1.3 Need for the study
1.4 Objectives of the study
1.5 Scope of the study
1.6 research methodology
1.7 Literature review
1.8 Limitations of the study
2 INDUSTRY AND COMPANY PROFILE 06-20
2.1 Industry profile
2.2 Company profile
2.3 major player in the material handling equipment sector
2.4 company profile
2.5 vision, mission and quality Policy
2.6 background of the company
2.7 products
2.8 organization structure
2.9 SWOT Analysis
3 THEORETICAL BACKGROUND OF THE STUDY
3.1 theoretical review
3.2 objectives of working capital
3.3 classification of working capital
3.4 composition of working capital
3.5 working capital cycle
3.6 determinants of working capital
3.7 requirement of fund
3.8 management of working capital
3.9 ratio analysis
21-53
4
DATA ANALYSIS AND INTERPREATION
54-65
5
FINDINGS, SUGGESTIONS AND CONCLUSION 66-76
BIBLIOGRAPHY.
ANNEXURE.
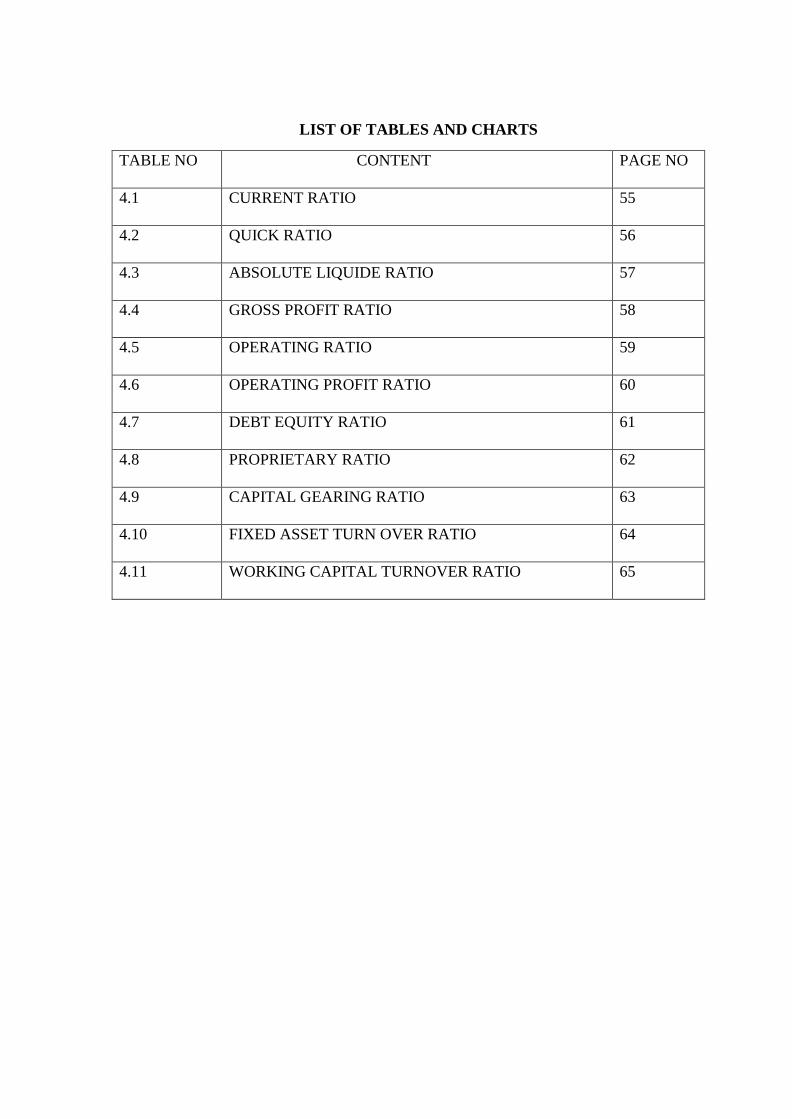
LIST OF TABLES AND CHARTS
TABLE NO CONTENT
PAGE NO
4.1 CURRENT RATIO
55
4.2 QUICK RATIO
56
4.3 ABSOLUTE LIQUIDE RATIO
57
4.4 GROSS PROFIT RATIO
58
4.5 OPERATING RATIO
59
4.6 OPERATING PROFIT RATIO
60
4.7 DEBT EQUITY RATIO
61
4.8 PROPRIETARY RATIO
62
4.9 CAPITAL GEARING RATIO
63
4.10 FIXED ASSET TURN OVER RATIO
64
4.11 WORKING CAPITAL TURNOVER RATIO
65
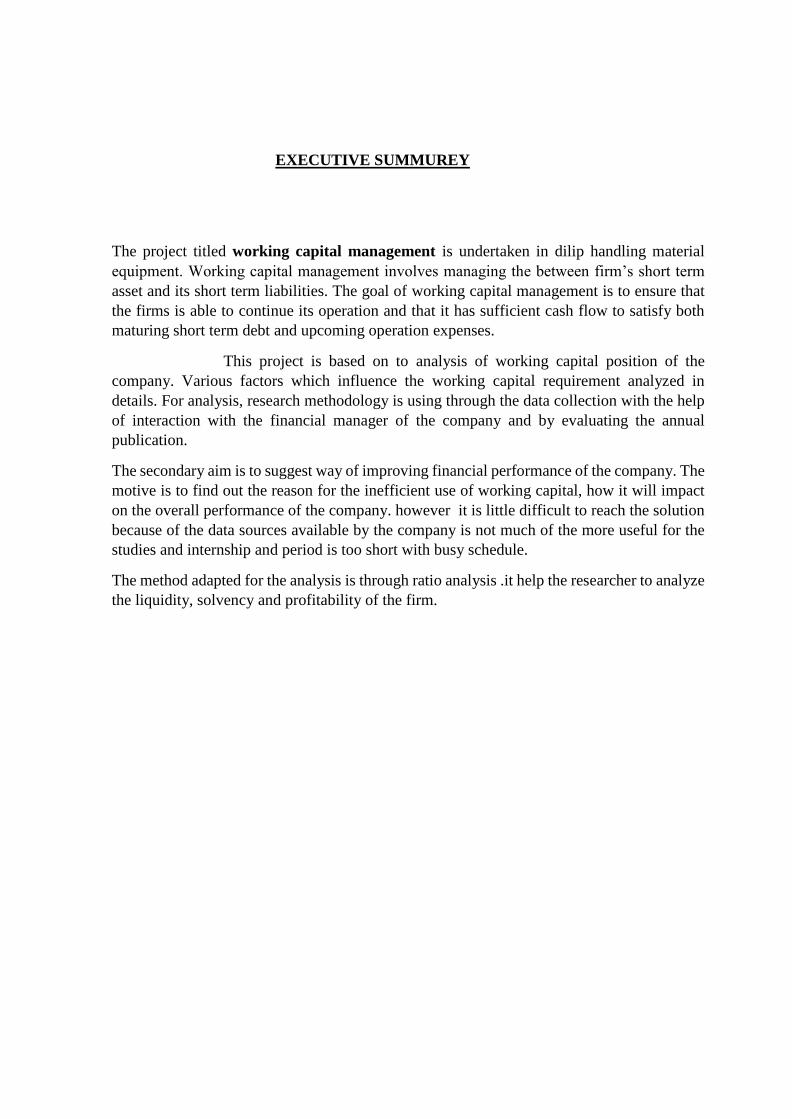
EXECUTIVE SUMMUREY
The project titled working capital management is undertaken in dilip handling material
equipment. Working capital management involves managing the between firm’s short term
asset and its short term liabilities. The goal of working capital management is to ensure that
the firms is able to continue its operation and that it has sufficient cash flow to satisfy both
maturing short term debt and upcoming operation expenses.
This project is based on to analysis of working capital position of the
company. Various factors which influence the working capital requirement analyzed in
details. For analysis, research methodology is using through the data collection with the help
of interaction with the financial manager of the company and by evaluating the annual
publication.
The secondary aim is to suggest way of improving financial performance of the company. The
motive is to find out the reason for the inefficient use of working capital, how it will impact
on the overall performance of the company. however it is little difficult to reach the solution
because of the data sources available by the company is not much of the more useful for the
studies and internship and period is too short with busy schedule.
The method adapted for the analysis is through ratio analysis .it help the researcher to analyze
the liquidity, solvency and profitability of the firm.
A STUDY ON WORKING CAPITAL MANAGEMENT
NEW HORIZON COLLEGE OF ENGINEERING Page | 1
CHAPTER 1
INTRODUCTION

A STUDY ON WORKING CAPITAL MANAGEMENT
NEW HORIZON COLLEGE OF ENGINEERING Page | 2
1.1 INTRODUCTION
Capital is what makes or breaks a business, and no business can run successfully without
enough capital to cover both short and long-term needs. Maintaining sufficient levels of short-
term capital is a constantly ongoing challenge, and in today’s turbulent financial markets and
uncertain business climate external financing has become both harder and more costly to
obtain. Companies are therefore increasingly shifting away from traditional sources of external
financing and turning their eyes towards their own organizations for ways of improving
liquidity. One efficient but often overlooked way of doing so is to reduce the amount of capital
tied-up in operations, that is, to improve the working capital management of the company.
Working capital is a financial metric of operating liquidity which describes the amount of cash
tied up in operations and defines the short term condition of a company. A positive working
capital position is required for the continuous running of a company’s operations, i.e. to pay
short term debt obligations and to cover operational expenses. A company with a negative
working capital balance is unable to cover its short-term liabilities with its current assets.
Working capital is calculated with the following formula:
Working Capital = Current Assets1 - Current Liabilities2
The above formula includes three important balance sheet accounts which all have a direct
impact on the business, namely accounts receivable (A/R), accounts payable (A/P) and
inventory. These accounts are often referred to as the three areas of working capital.
● Accounts Receivable – Money owed to the company for products/services that have been
delivered to customers but not yet paid for.
● Inventory – The raw materials, work-in-progress goods and finished goods that are ready or
will be ready for sale. Inventory represents a key asset to most businesses as the turnover of
inventory is a primary source of revenue generation and subsequently earnings for the
Shareholders/owners of the company.
● Accounts Payable – Money owed to suppliers for goods and services that the company has
purchased on credit.
Clearly, the importance of the above components differs between companies and industries,
and whereas for example retailers and manufacturers often have large inventories of finished
goods, work-in-progress (WIP) and raw materials, banks and insurance companies do not hold
any traditional inventory. However, regulation requires both banks and insurance companies
to maintain certain reserve levels. In addition to the required reserves, these types of businesses
typically hold major positions of liquid assets and large portfolios of interest-bearing
investments in which deposits and premiums received from customers are invested. The
uncertainty of cash
1. Current Assets = Cash, Accounts Receivable (A/R) and Inventory
2. Current Liabilities = Short term debt, Accounts Payable (A/P), Accrued Liabilities and Other
Debts flows also varies significantly between industries, and many retailers have little to worry
about when it comes to accounts receivables as the customer pays on site at the time of

A STUDY ON WORKING CAPITAL MANAGEMENT
NEW HORIZON COLLEGE OF ENGINEERING Page | 3
purchase. On the other hand, banks and insurance companies are privileged by the fact that
they receive deposits and premiums before having to make any payments, but are also subject
to unpredictable cash outflows when customers decide to withdraw their funds or when
insurance claims come in.
Why do companies need to Manage Working Capital?
Just as the importance of the working capital components depends on the nature of a company,
so does the optimal level of working capital. Even in a given industry, companies may have
very different working capital needs, and it is therefore impossible to determine an overall
optimal working capital level without considering a company’s specific situation.
“Just as the importance of the working capital components differ between companies and
industries, so does the optimal level of working capital.”
The appropriate level of working capital depends on both macro factors, such as the market
conditions in which a company operates, and micro factors, such as the set-up of the value
chain within the company. As working capital spans over a wide range of different business
activities, the parameters in the equation must be set in relation to the overall strategy and
business model to determine the optimal level of working capital. For example retailers with a
fast turnover of cash, or insurance companies that receive cash (premiums) before having to
settle possible claims, have much lower working capital requirements than manufacturing
companies that can experience substantial material and labor costs long before receiving
payment.
1.2 STATEMENT OF THE PROBLEM
The project titled WORKING CAPITAL MANAGEMENT OF DILIP MATERIAL
HANDLING EQUIPMENTS is mainly focused on evaluating the financial status of the
company and analyzing the working capital management of DILIP MATERIAL HANDLING
A STUDY ON WORKING CAPITAL MANAGEMENT
NEW HORIZON COLLEGE OF ENGINEERING Page | 4
EQUIPMENTS and also to make suggestion to different aspects of working capital
management my capabilities and from my knowledge
1.3 NEED FOR THE STUDY
Study of working capital helps to analyze the management of capital needed by the firm for
day to day activity. It analysis the concept of operating cycle and the factors affecting the
working capital of the company it helps to know why it is important to manage the efficiency
of the current assets and current liabilities. It is also help to find out the appropriate mix of
short term and long term financing used support this investment in current assets.
1.4 OBJECTIVES OF THE STUDY
Objective setting is the initial stage or starting point of any project undertaken.
The main objectives of the study are
To study the working capital management of dilip material handling equipment
Analysis of various component of the working capital.
To identify the factors, responsible for the changes in working Capital.
To assess the impact of working capital on profitability.
1.5 SCOPE OF THE STUDY
The scope of the study is to put into the theoretical aspects of the study into real life work
experience. The study of working capital is based on tool like ratio analysis,compounents like
inventories, receivables, cash and payables and term loan have give component wise
importance to the study. The main attempt is to know the firm ability to fulfill short term
obligation .further the study is based on last five years annual reports of dilip material
equipment
1.6 RESEARCH METHODOLOGY
PRIMARY DATA
Primary data is collected directly from the field of enquiry and thus original in nature. It was
collected through financial manager
SECONDARY DATA
Secondary data are that information which has been collected by the other for a specific
purpose.
Secondary data was collected from the audited balance sheet published report of the
Company and internal records like manual, brochure, sales records.
SOURECES OF DATA COLLECTION
A STUDY ON WORKING CAPITAL MANAGEMENT
NEW HORIZON COLLEGE OF ENGINEERING Page | 5
The data are collected mainly from the annual reports of the company. In addition to this,
different websites of the company, circulars, and company manuals has also been used together
for the information .and also used both secondary and primary data.
1.7 LITERATURE REVIW
MANAGEMENT OF WORKING CAPITAL
NANDINI SHARMA
Management of short term asset and short run sources of finance is described as working capital
management. Working capital management is concerned with all decision and acts that
influence the size and effectiveness of working capital. The goal of working capital
management is to manage is to manage each of firm current assets and current liabilities in
such a way that an acceptable level of working capital is maintained.it is concerned with the
determination of appropriate level of current assets and their efficient use as well as the choice
of financing mix for raising for the current resources. 'Proper management of working capital
is very important of success of the concern. It aims at protecting the purchase power of assets
and maximizing return of on investment. The manner of management of working capital to a
very large extent determination the success of operation of the concern. Failure of business is
undoubtedly due to poor management of working capital. Shortage of working capital is so
often advanced as the main cause of failure of an individual concern.
Mr.J. Aloy Niresh (2012)In his study reveals that ,there is a negative relationship between cash
conversion cycle and performance measuring among manufacturing firm in srilanka the study
recommends the manufacturing firms to manage the working capital efficiently to achieve
optimal profitability . By improving the inventory control process, collecting receivables in
line with the agreed credit terms and by delaying payments to suppliers. Manufacturing firm in
srilanka follow conservative policy. Which is contrary to the traditional belief, more investment
in current assets might also increase profitability
1.8 LIMITATION OF THE STUDY
The study only covers the accounting period of the last years and current year was
excluded on account of non-availability of data.so the current position of the firm was
not taken into consideration.
The study is mainly based on secondary data drawn from the secondary sources
connected to the topic. So errors are it may possible.
The main interaction with the management personnel was difficult in nature due to their
busy schedule.
A STUDY ON WORKING CAPITAL MANAGEMENT
NEW HORIZON COLLEGE OF ENGINEERING Page | 6
CHAPTER 2
INDUSTRY AND COMPANY PROFILE

A STUDY ON WORKING CAPITAL MANAGEMENT
NEW HORIZON COLLEGE OF ENGINEERING Page | 7
2.1 INDUSTRY PROFILE
Introduction
According to Construction World update, it has been projected that the present € 1.6 billion
construction equipment industry in India is expected to touch about € 10.3 billion. While the
current size is just a fraction of the world market, it has been growing between 10-15 %
compared to the global growth of around 5%. India is one among the top 10 markets for
construction equipment and is one of the key international markets. The prospects of the
construction equipment industry look attractive with a projected investment of € 212.5 billion
in the infrastructure sector over the next few years. The Indian market is catered by about 200
domestic manufacturers (small, medium & large).
Industrial goods
Machinery, manufacturing plants, materials, and other goods or component parts for use or
consumption by other industries or firms. Demand for industrial goods they help to produce
called derived demand
Material Handling Equipment’s Sector
Material handling equipment is equipment that relate to the movement, storage, control and
protection of materials, goods and products throughout the process of manufacturing,
distribution, consumption and disposal. Material handling equipment is the mechanical
equipment involved in the complete system.
The demand of construction and material equipment is correlated with the growth of
Infrastructure sector. India still needs to develop it in a big way. There is substantial scope for
the growth of the infrastructure sector viz., Roads, Steel, Coal, Cement, Power etc.
The continuing investments in these sectors will support demand of these products. Also, with
increased need of mechanization and shrinking timelines of infrastructures projects, the
demand for equipment’s should see a definitive upward trend. The demand is largely from
F&B, retail and automobile sectors. Palletisation and containerization are also expected to
increase demand. Although, it may be worthwhile to note that the global recession and
slowdown in India as well as the rise in input prices may act as major threat to this sector.
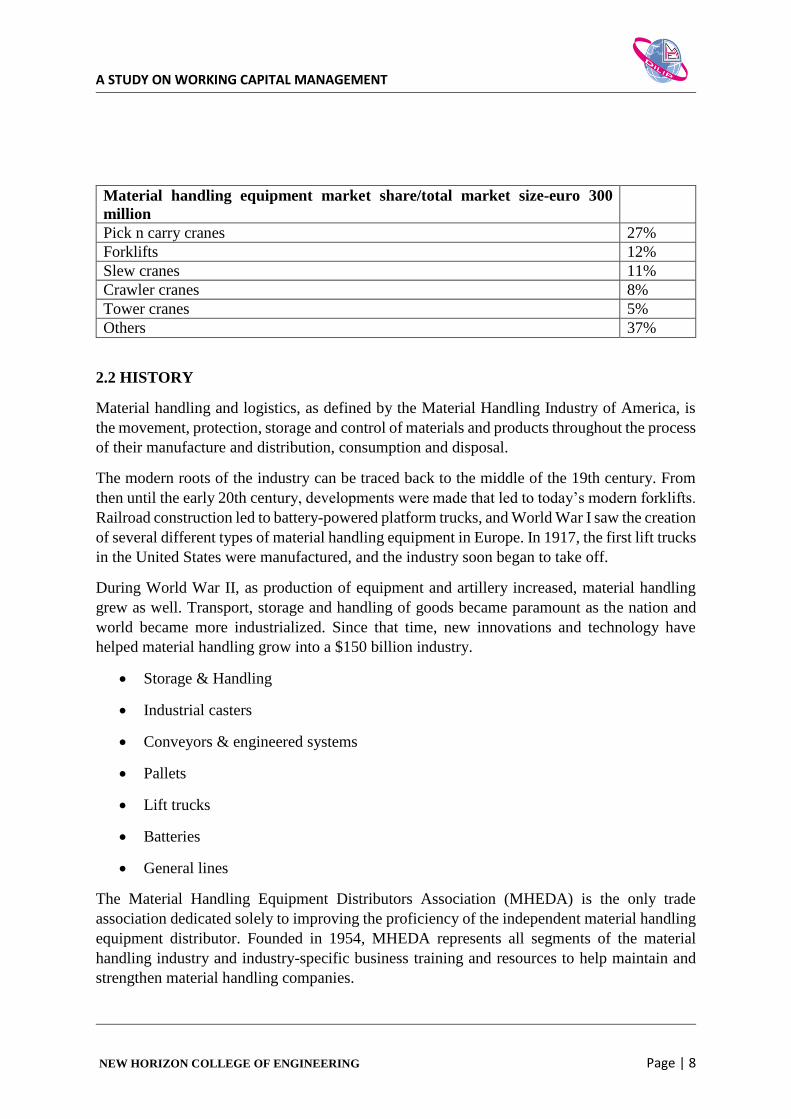
Market Size and Segmentation
The present market size is estimated to be around € 300 million. The table below explains the
different material handling equipment and their market share. The material handling equipment
is dominated by cranes and forklifts. Pick and carry cranes is the largest segment with 27 %
share of the material handling equipment market. Slew cranes, crawler cranes and tower cranes
together account for another 24 percent. Forklifts have 12 percent share.
A STUDY ON WORKING CAPITAL MANAGEMENT
NEW HORIZON COLLEGE OF ENGINEERING Page | 8
Material handling equipment market share/total market size-euro 300
million
Pick n carry cranes 27%
Forklifts 12%
Slew cranes 11%
Crawler cranes 8%
Tower cranes 5%
Others 37%
2.2 HISTORY
Material handling and logistics, as defined by the Material Handling Industry of America, is
the movement, protection, storage and control of materials and products throughout the process
of their manufacture and distribution, consumption and disposal.
The modern roots of the industry can be traced back to the middle of the 19th century. From
then until the early 20th century, developments were made that led to today’s modern forklifts.
Railroad construction led to battery-powered platform trucks, and World War I saw the creation
of several different types of material handling equipment in Europe. In 1917, the first lift trucks
in the United States were manufactured, and the industry soon began to take off.
During World War II, as production of equipment and artillery increased, material handling
grew as well. Transport, storage and handling of goods became paramount as the nation and
world became more industrialized. Since that time, new innovations and technology have
helped material handling grow into a $150 billion industry.
Storage & Handling
Industrial casters
Conveyors & engineered systems
Pallets
Lift trucks
Batteries
General lines
The Material Handling Equipment Distributors Association (MHEDA) is the only trade
association dedicated solely to improving the proficiency of the independent material handling
equipment distributor. Founded in 1954, MHEDA represents all segments of the material
handling industry and industry-specific business training and resources to help maintain and
strengthen material handling companies.
A STUDY ON WORKING CAPITAL MANAGEMENT
NEW HORIZON COLLEGE OF ENGINEERING Page | 9
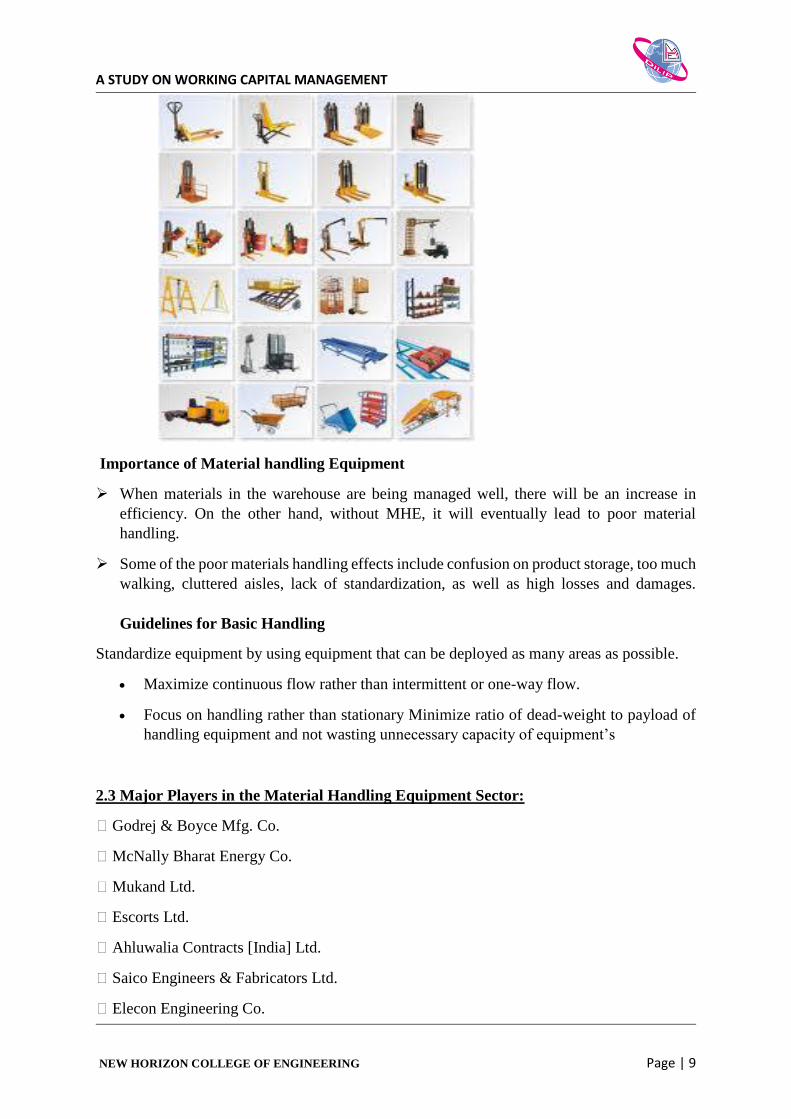
Importance of Material handling Equipment
When materials in the warehouse are being managed well, there will be an increase in
efficiency. On the other hand, without MHE, it will eventually lead to poor material
handling.
Some of the poor materials handling effects include confusion on product storage, too much
walking, cluttered aisles, lack of standardization, as well as high losses and damages.
Guidelines for Basic Handling
Standardize equipment by using equipment that can be deployed as many areas as possible.
Maximize continuous flow rather than intermittent or one-way flow.
Focus on handling rather than stationary Minimize ratio of dead-weight to payload of
handling equipment and not wasting unnecessary capacity of equipment’s
2.3 Major Players in the Material Handling Equipment Sector:
� Godrej & Boyce Mfg. Co.
� McNally Bharat Energy Co.
� Mukand Ltd.
� Escorts Ltd.
� Ahluwalia Contracts [India] Ltd.
� Saico Engineers & Fabricators Ltd.
� Elecon Engineering Co.
A STUDY ON WORKING CAPITAL MANAGEMENT
NEW HORIZON COLLEGE OF ENGINEERING Page | 10
� Electrometer
� ACE
� OMEGA
� Voltas
� TIL
� TELCON
Pick & Carry Cranes
Some of the typical uses include loading, unloading, moving, shifting and erecting material.
The pick-n-carry crane segment in India has an estimated market size of € 57.76 million (3698
units), and these cranes comprise 27 % of the overall material handling market and over 50 %
of the cranes market. The market has grown at a CAGR of 72 % in volume terms in the last 3
years. Going forward, the growth rate is expected to be in the range of 15-20 % over the next
few years. The key drivers are the construction and industrial sectors. Within the construction
sector the key demand driver is urban infrastructure (expected investment growth of 13 %
annually).
Within industrial applications, the key demand drivers are steel and power industries (growing
at around 9 % annually). The major players in this segment are ECEL and Actions Construction
Equipment (ACE). While ECEL has been the traditional leader in this segment, ACE has been
gaining share. A third player – Omega – has been able to capture 2.5 % of the market within
one year of commencing production. The barriers of entry in this segment are low. The first
movers have the added advantage of established sales, service and distribution network along
with an existing component supplier.
Other Cranes
Other cranes consist of slew cranes, crawler cranes and tower cranes. These are higher value,
more sophisticated cranes than pick-n-carry cranes and are typically used for heavier duty
work. The market for slew cranes is about € 23.24 million (300 numbers) with about € 8.6
million (180 numbers) of this being accounted for by imported used equipment.
Within slew cranes, yard cranes are the most prominent, comprising 65 % of all new slew
cranes. The crawler cranes market is about € 16.6 million (210 numbers) with imported used
cranes comprising about € 6.3 million (110 numbers). Tower cranes are about € 10.35 million
(175 numbers). In volume terms other cranes comprise about 16 % of the overall cranes
Market in India, but in value terms these cranes account for almost 47 % of the market. While
slew cranes have witnessed a CAGR of 34 % over the last 2 years, tower cranes have grown at
71 % CAGR in the same period. Industry sources indicate a growth rate of between 15-20 %
over the next few years.
Demand for other cranes is driven primarily by the construction and industrial sectors. Within
industrial applications, the key demand drivers going forward are likely to be the power,
refinery and mining sectors. With increasing average scale of infrastructure and construction
projects, the growth rate of slew (specifically yard/rough terrain) and tower cranes is likely to
A STUDY ON WORKING CAPITAL MANAGEMENT
NEW HORIZON COLLEGE OF ENGINEERING Page | 11
surpass the average growth rate of the overall cranes segment. With improved road networks
by 2010, demand for truck mounted cranes may also witness a spike. In the slew cranes
segment, used imports dominate the market, with Tractors India Limited (TIL) being the
market largest domestic player. TIL and ECEL have a market share of around 32 % and 6 %
in terms of volumes. Telco is the sole player in the crawler cranes segment with a share of
approximately 50 % by volume (balance is accounted for by used imports). Shrike Petain is the
market leader in the Tower crane category with 50 % market share followed by ACE at 25 %
market share.
ACE plans to widen its product portfolio in the cranes segment through manufacture of Truck
Mounted and Tower cranes. Electromech will ramp up the production of cranes at its Pune
plant in order to increase its market share from 10% to 25% in the next three years.
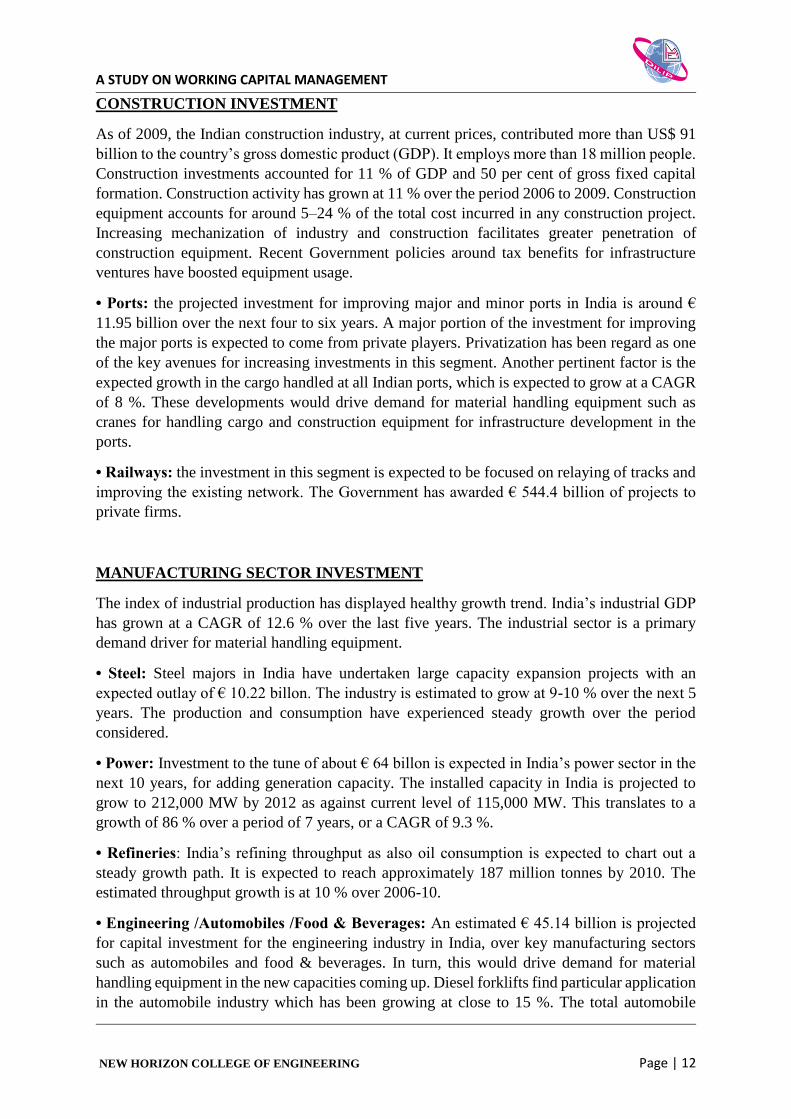
Forklifts
Forklifts are low tonnage vehicles used to transport materials stored in pallets, within limited
spaces. Most forklifts are in the 1 tons–5 tones range, though equipment up to 20 tones are
available. The flexibility and speed these equipment offer make them ideal for repetitive
material handling tasks especially in restricted areas like warehouses and yards .There are 3
types of forklifts based on fuel input - Diesel, Liquefied Petroleum Gas (LPG) and Battery.
Each variant finds application in different industries based on the load factor determined by the
power inputs pollution etc.
The current market is approximately of 2150 units per annum for forklifts with a market size
of approximately € 25.23 million. The segment has been on a 20 % growth trajectory year-on-
year and is estimated to grow at a CAGR between 10-20 %. Diesel powered forklifts comprise
a bulk of the market size at 83 % and are likely to drive growth going forward. Demand for
forklifts will be driven primarily by new capacity creation and increased automation in the
manufacturing and logistics (warehousing) sectors. Forklifts contribute to making the end user
industry organized and less labor intensive (in material handling). It has also increased the
levels of palletisation and containerization. Godrej and Voltas are the two major players having
around 80 % market share, with Godrej having 48 % share. The forklifts market is highly price
sensitive. Technology is presently not seen as a differentiator, but with the end user industries
becoming more organized and competitive, it would become increasingly important.
Opportunities in the Sector:
The construction equipment industry is primarily driven by two key sectors: Construction and
Manufacturing
A STUDY ON WORKING CAPITAL MANAGEMENT
NEW HORIZON COLLEGE OF ENGINEERING Page | 12
CONSTRUCTION INVESTMENT
As of 2009, the Indian construction industry, at current prices, contributed more than US$ 91
billion to the country’s gross domestic product (GDP). It employs more than 18 million people.
Construction investments accounted for 11 % of GDP and 50 per cent of gross fixed capital
formation. Construction activity has grown at 11 % over the period 2006 to 2009. Construction
equipment accounts for around 5–24 % of the total cost incurred in any construction project.
Increasing mechanization of industry and construction facilitates greater penetration of
construction equipment. Recent Government policies around tax benefits for infrastructure
ventures have boosted equipment usage.
• Ports: the projected investment for improving major and minor ports in India is around €
11.95 billion over the next four to six years. A major portion of the investment for improving
the major ports is expected to come from private players. Privatization has been regard as one
of the key avenues for increasing investments in this segment. Another pertinent factor is the
expected growth in the cargo handled at all Indian ports, which is expected to grow at a CAGR
of 8 %. These developments would drive demand for material handling equipment such as
cranes for handling cargo and construction equipment for infrastructure development in the
ports.
• Railways: the investment in this segment is expected to be focused on relaying of tracks and
improving the existing network. The Government has awarded € 544.4 billion of projects to
private firms.
MANUFACTURING SECTOR INVESTMENT
The index of industrial production has displayed healthy growth trend. India’s industrial GDP
has grown at a CAGR of 12.6 % over the last five years. The industrial sector is a primary
demand driver for material handling equipment.
• Steel: Steel majors in India have undertaken large capacity expansion projects with an
expected outlay of € 10.22 billon. The industry is estimated to grow at 9-10 % over the next 5
years. The production and consumption have experienced steady growth over the period
considered.
• Power: Investment to the tune of about € 64 billon is expected in India’s power sector in the
next 10 years, for adding generation capacity. The installed capacity in India is projected to
grow to 212,000 MW by 2012 as against current level of 115,000 MW. This translates to a
growth of 86 % over a period of 7 years, or a CAGR of 9.3 %.
• Refineries: India’s refining throughput as also oil consumption is expected to chart out a
steady growth path. It is expected to reach approximately 187 million tonnes by 2010. The
estimated throughput growth is at 10 % over 2006-10.
• Engineering /Automobiles /Food & Beverages: An estimated € 45.14 billion is projected
for capital investment for the engineering industry in India, over key manufacturing sectors
such as automobiles and food & beverages. In turn, this would drive demand for material
handling equipment in the new capacities coming up. Diesel forklifts find particular application
in the automobile industry which has been growing at close to 15 %. The total automobile

A STUDY ON WORKING CAPITAL MANAGEMENT
NEW HORIZON COLLEGE OF ENGINEERING Page | 13
production is set to cross 10 million units. Estimated CAGR for key segments is 15-18 % with
an overall outlook for the future pegged at 16 %. LPG forklifts find particular application in
food & beverages industry. Led by processed foods, wine, ice cream and edible oil, the € 53.12
billion food and beverages industry registered an 8.5 % growth during the 2005-06 fiscal.
• Retail: Exponential growth and emerging competition in organized retail in India is expected
to drive the organized logistics and warehousing industries. India’s organized chain store retail
is at the inflection point. The estimated potential market size is € 39.83 billion by 2015 implying
a CAGR of 32 % over next 10 years. This would drive the construction of new stores, in turn
leading to demand for construction equipment.
2.4 COMPANY PROFILE
Address of the company:
DILIP MATERIAL HANDLING EQUIPMENT
#83/A, 3rd cross, 8thmain,
Bommasandra industrial area,
Bangalore
Tele fax: +91 80 2783 9025
E-mail: [email protected]/[email protected]
Dilip material handling started in 1998 is the result of Mr. Chalapathy desire to provide
industry cost effective material handling solutions. Drawing on the hands-on experience he
gained working in the material handling equipment industry, he came up with a range of tough
but easy to operate equipment that even small industries could afford.
Today Dilip material handling equipment’s., unit at Bommasandra on the outskirts of
Bangalore, Dilip material handling equipment’s Is on ISO 9001:2000 certified company that
produces material handling products a range of Hydraulic Hand Pallet Trucks, High Lifting
Hand Pallet Trucks, Manual Trolleys, Hydraulic Floor Cranes, Hydraulic Hand Stackers, Semi-
Electric Stackers, Electric Stackers, Electric Platform Trucks, Manual Mobile Lift Platform,
Order picker, Hydraulic Lift Tables, Hydraulic Dock Leveler, Racking and storage solutions
with load capacities from 500KGS to 2500KGS. A well-equipped infrastructure and all India
sales and service network has helped us to be recognized as a mainstay in the India subcontinent
market. Dilip’s have always placed safety as top priority.
It also has the distinction of being the country’s only manufacturing of Hydraulic Hand Pallet
Trucks with Lift, neutral & lower. The superior
Performance of the equipment has seen dilip become a name that is gaining rapid popularity in
Karnataka and tamilnadu.
A STUDY ON WORKING CAPITAL MANAGEMENT
NEW HORIZON COLLEGE OF ENGINEERING Page | 14
The rust proof and scratch resistant equipment has been designed and built to offer long years
of trouble-free services, Manufacturing from high quality materials, they are light and
maneuverable besides being silent in operation. The Principle of ergonomics have been to
ensure ease of operation and low operation fatigue requiring minimal maintenance, the
equipment has proved its worth in a host of industries. Dilip’s now manufacturing more than
20 different products in India.
2.5VISION, MISSION AND QUALITY POLICY
VISION:
The Company wants to develop its products to global standards.
The Company also want to get quality standard certified to ensure its customers about the
quality of the product.
The Company wants to reduce the cost by introducing substitutes without comprising
on quality.
MISSION:
The Company is striving to develop new lift trucks with latest technologies.
The Company wants to improve the existing product in terms of quality.
ISO 9001: 2000
ISO Certificate Registration No. 44 100 114088-E3
QUALITY POLICY:
“Dilip material handling equipment's commits to design, produce and dispatch products of
consistent quality through continual improvements of process, products and satisfaction by
involving everyone in the organization
Range of Products:
Hydraulic Hand Pallet Trucks
Manual Stackers
Semi Electric Stackers
Electric Stackers
Electric Pallet Trucks
Mini Fork Lift
Tow Tractors
Electric Platform Trucks
Scissor Lift Tables
Dock Levelers
A STUDY ON WORKING CAPITAL MANAGEMENT
NEW HORIZON COLLEGE OF ENGINEERING Page | 15
Order Pickers
Goods Lift
Floor Cranes
Storage Systems
New Products:
Towing tractors
Counter Panel
Competitors in Dilip material handling equipment’s:
Maine Material Movement PVT. Ltd.
Marathi Handling
puma Material Handling Equipment
Elite Material Handling
Acer Engineers PVT Ltd
Dock Lift
Aditya material Handling
Josts
Nilkiamal
Patel Handling
Ferrow foundries
Marketing branches of Dilip:
Bangalore
Chennai
COMPANY OBJECTIVES:
Introduce 3 new products to the market.
Making 350 new customers.
Adopt A.C technology to the equipment.
Extend sales network to 3 states.
Major customers of Dilip’s material handling:
Amara raja Batteries, Tirupathi
Arriva T& D India Ltd. Bangalore/Chennai
Ashok Leyland Ltd. Bangalore
Biocon Limited, Bangalore
Coca-Cola India PVT Ltd, Pune
Dauber pharms
Mysore Paper Mills Ltd ,Bangalore
A STUDY ON WORKING CAPITAL MANAGEMENT
NEW HORIZON COLLEGE OF ENGINEERING Page | 16
Max India Ltd, Punjab
Eastern Groups of companies, Ernakulum
FDC limited, Mumbai
S.K.F India Ltd, Bangalore
TVS Ltd, Madurai
Kingfisher Ltd, Mumbai
Hindustan Lever Ltd, Pondicherry
M.T.R Foods limited, Bangalore
Mahindra & Mahindra company, Bangalore
2.6 BACK GROUND OF THE COMPANY
2.7 PRODUCTS
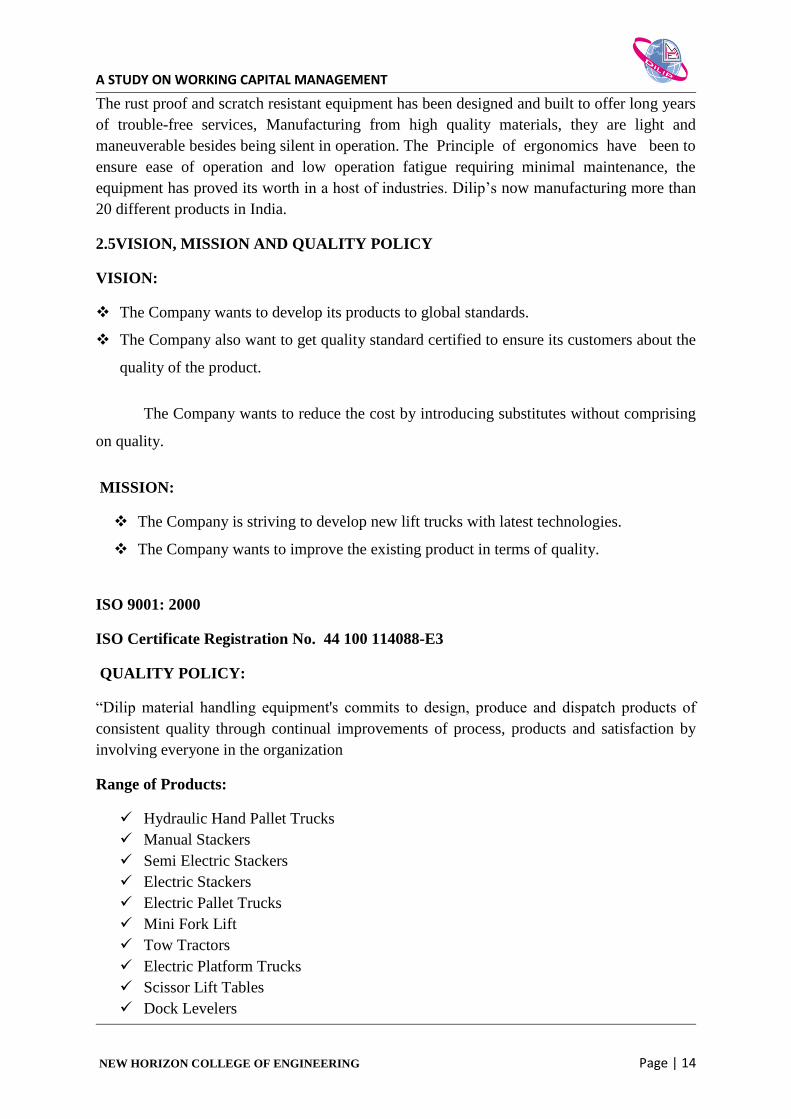
SEMI-ELECTRIC STACKER
MODEL; DES 5E/8E/10E CAPACITY: 800/1000kg
Ergonomically designed steering handle
For easy operation from all angle
1 Name of the company DILIP MATERIAL HANDLING
EQUIPMENT
2 Year of establishments 1998
3 Company registration No. U 29199KA2001PTC029595
4 Ownership Pattern PVT. LTD
5 Registered address NO 83/A, 4th phase, Bommasandra
industrial area, Bangalore.
Bangalore
6 Telephone No +91 80 2783 9026
7 Fax No. +91 80 2783 9025
8 Website Www. Dilip. [email protected]
www.diliplifttruck.com
9 Name of the directors and manager Mr. A V CHALAPATHY
Ms.SMITHA(manager)
10 Branch offices in India Chennai only

A STUDY ON WORKING CAPITAL MANAGEMENT
NEW HORIZON COLLEGE OF ENGINEERING Page | 17
Effortless operation
Robust stability
HYDRALIC DOCK LEVER SPECIFICATION
MODEL -30-90
Capacity: 3000-9000kg
Quality dock leveler
Easy to install
Long lasting
safe
HYDRALINC HAND PALLET TRUCK
MODEL: DP-25/30 Capacity: 2500/3000kg
No oil leakage
Minimum maintenances
Easy to operate
Requires minimum pulling power
HIGH LIFTING PALLET TRUCK
MODEL; DH-8/10 capacity: 800/100 kg
Versatile
A STUDY ON WORKING CAPITAL MANAGEMENT
NEW HORIZON COLLEGE OF ENGINEERING Page | 18
Compact
Economical
Light and maneuverable
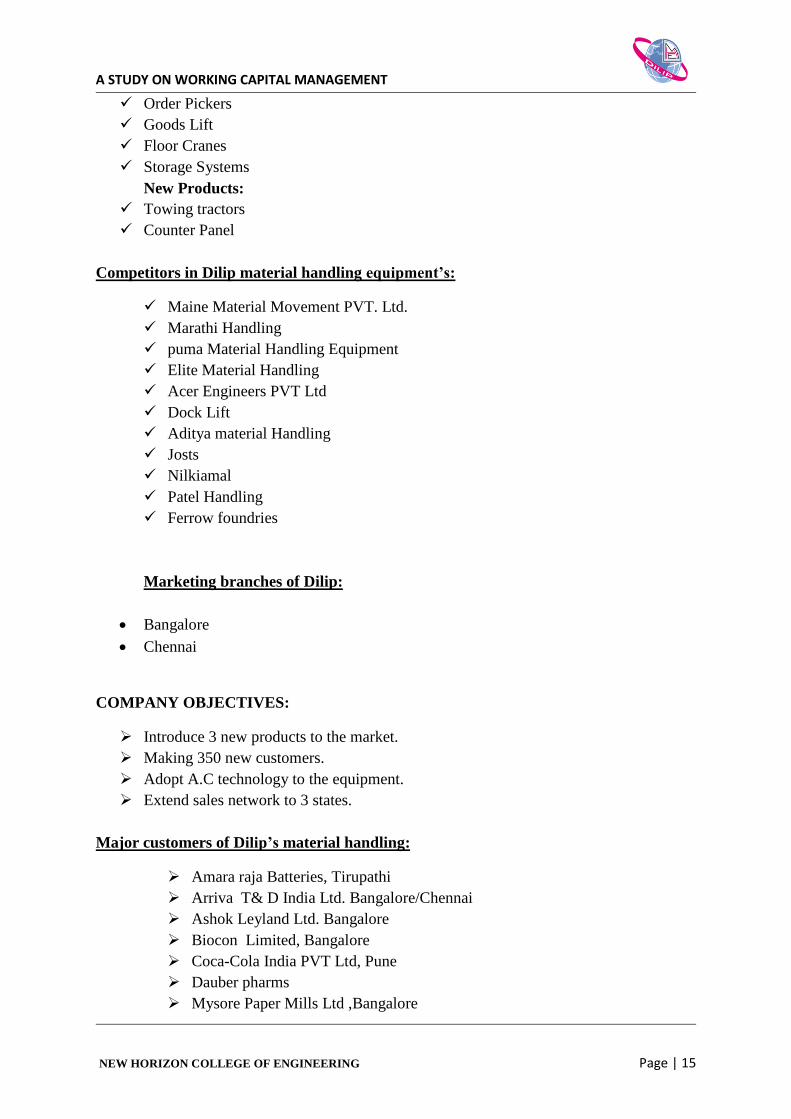
HAND OPERATED STACKER
MODEL: DS -5/8/15 capacity: 500/800/1500kg
To ensure the long life of the hydraulic system
Ergonomically designed steering handle
For easy operation from all angle
Light and compact construction
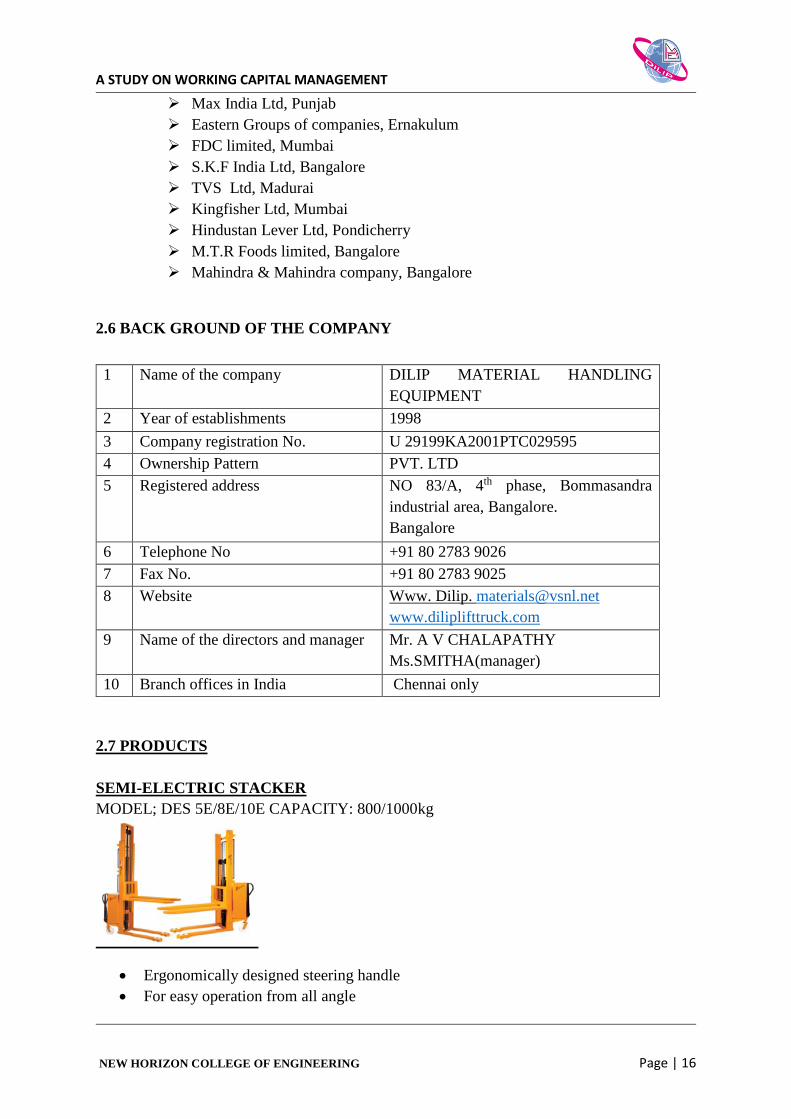
BATTERY OPERATED STACKER
MODEL; DPS-10/12/15 capacity; 1000/1200/1500kg
High quality ,imported drive motor for battery and constant road grip
Heavy duty structure robust , long lasting design
Electric break acting on drive motor is an added features
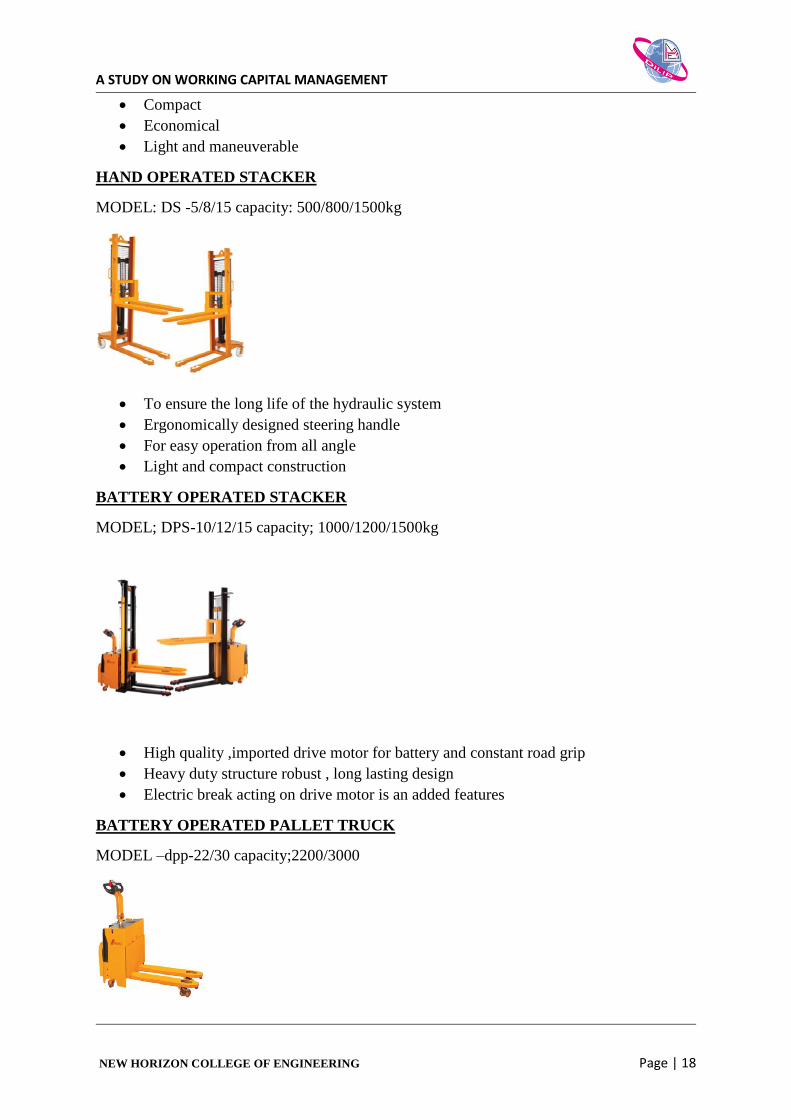
BATTERY OPERATED PALLET TRUCK
MODEL –dpp-22/30 capacity;2200/3000
A STUDY ON WORKING CAPITAL MANAGEMENT
NEW HORIZON COLLEGE OF ENGINEERING Page | 19
Total operator comfort
Operator-friendly
Easy maintenance
Maximum maneuverability
HYDRULIC SCISSOR LIFT TABLES
MODEL-DLT 5/10/20/30
Effortless operation
Robust stability
Firm anchoring
Compact design
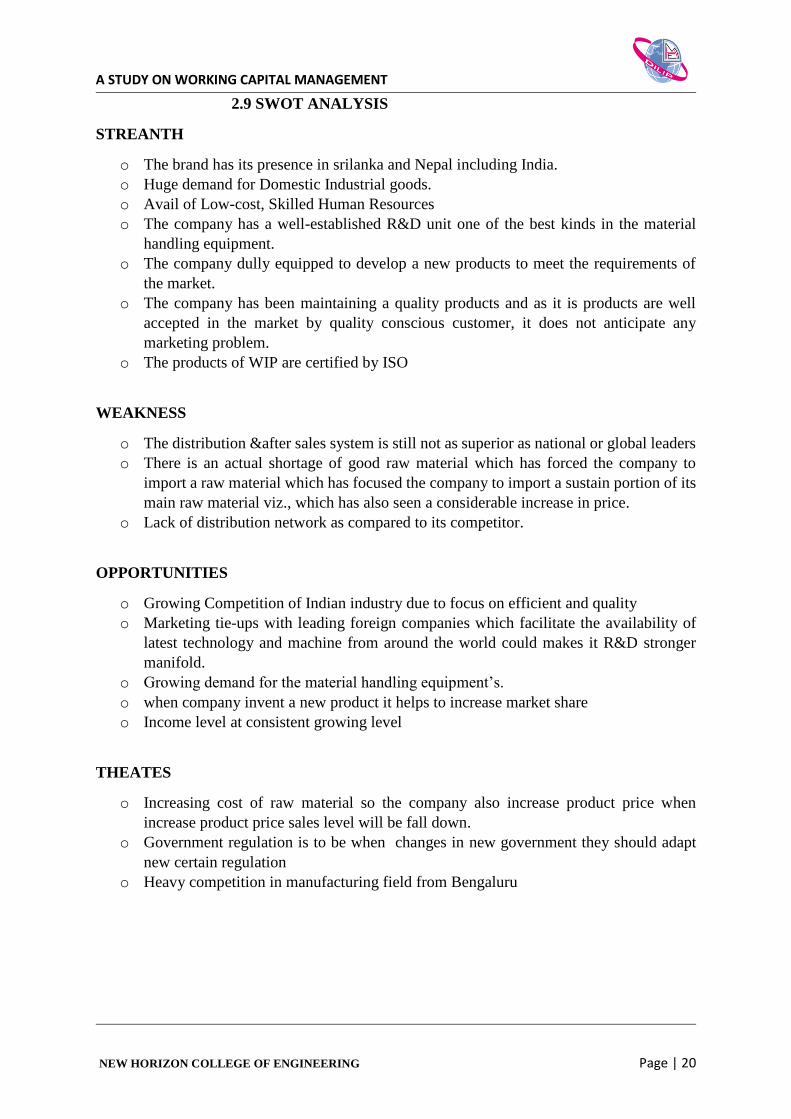
2.8 ORGANISATION STRUCTURE
CEO
MARKETING
MANGER
MANAGER
OPERATION
DESIGN
HEAD
PURCHASE
MANAGER
QUALITY
ASSURANCE
ACCOUNT
PROCESS
RECEPTION
AND EXE.hr
MARKETING
EXECUTIVE
SUPERVISOR
OPERATORS
& HELPERS
STORE
KEEPER QUALITY
INSPECTOR
A STUDY ON WORKING CAPITAL MANAGEMENT
NEW HORIZON COLLEGE OF ENGINEERING Page | 20
2.9 SWOT ANALYSIS
STREANTH
o The brand has its presence in srilanka and Nepal including India.
o Huge demand for Domestic Industrial goods.
o Avail of Low-cost, Skilled Human Resources
o The company has a well-established R&D unit one of the best kinds in the material
handling equipment.
o The company dully equipped to develop a new products to meet the requirements of
the market.
o The company has been maintaining a quality products and as it is products are well
accepted in the market by quality conscious customer, it does not anticipate any
marketing problem.
o The products of WIP are certified by ISO
WEAKNESS
o The distribution &after sales system is still not as superior as national or global leaders
o There is an actual shortage of good raw material which has forced the company to
import a raw material which has focused the company to import a sustain portion of its
main raw material viz., which has also seen a considerable increase in price.
o Lack of distribution network as compared to its competitor.
OPPORTUNITIES
o Growing Competition of Indian industry due to focus on efficient and quality
o Marketing tie-ups with leading foreign companies which facilitate the availability of
latest technology and machine from around the world could makes it R&D stronger
manifold.
o Growing demand for the material handling equipment’s.
o when company invent a new product it helps to increase market share
o Income level at consistent growing level
THEATES
o Increasing cost of raw material so the company also increase product price when
increase product price sales level will be fall down.
o Government regulation is to be when changes in new government they should adapt
new certain regulation
o Heavy competition in manufacturing field from Bengaluru

A STUDY ON WORKING CAPITAL MANAGEMENT
NEW HORIZON COLLEGE OF ENGINEERING Page | 21
CHAPTER 3
THEORATICAL REVIEW
A STUDY ON WORKING CAPITAL MANAGEMENT
NEW HORIZON COLLEGE OF ENGINEERING Page | 22
3.1 THEORETICAL REVIEW
Working capital is the key difference between the long term financial management and short
term financial management in tern of the timing of cash. Long term financial involves the cash
flow over the extended period of the time i.e. 5 to 15 years, while short term financial decision
cash with in a years or with in operating cycle. Working capital management is a short term
financial management.
Management of working capital is very much important for the success of the business. It has
been emphasized that a business should maintained should working capital position and also
that there should not be an excessive level of investment in the working capital component. As
pointed out of by rlph kenned and steavart MC Muller, “the inadequacy or miss-management
of working capital is one of a leading cause of business failure.
Working capital management concerned with the problem that arise in attempting to manage
the current asset, the current liabilities & in inter relationship that exits between them. The
current asset refers to those assets which can be easily converted in to cash in ordinary course
of business, without disturbing the operation of firm,
Current assets in fact, account for a very large portion of the total investment of the firm.
DEFINITION:
In accounting, “working capital is the difference between the inflow and outflow of funds. In
other words, it is the net cash inflow. It is defined as the excess of current assets over current
liabilities and provisions”.
3.2 Objectives of working capital
Explain how the definition of “working capital “differences between financial analysts and
accountants.
Understand the two fundamental decision issues in working capital management-and the
trade-offs involved in making these decisions.
Discuss the how to determine the optimal level of current assets.
Describe the relationship between profitability, liquidity, and risk in the management of
working capital.
Explain how to classify working capital according it its “components” and according to
“time” (i.e., either permanent or temporary).
Describe the hedging (maturity matching) approach to financing and the
advantages/disadvantages of short -term versus long-term financing.
Explain how the financial manager combines the current asset decision with the liability
structure decision.
Maintenance of working capital at appropriate level, and Availability of ample funds as
and when they are needed.
A STUDY ON WORKING CAPITAL MANAGEMENT
NEW HORIZON COLLEGE OF ENGINEERING Page | 23
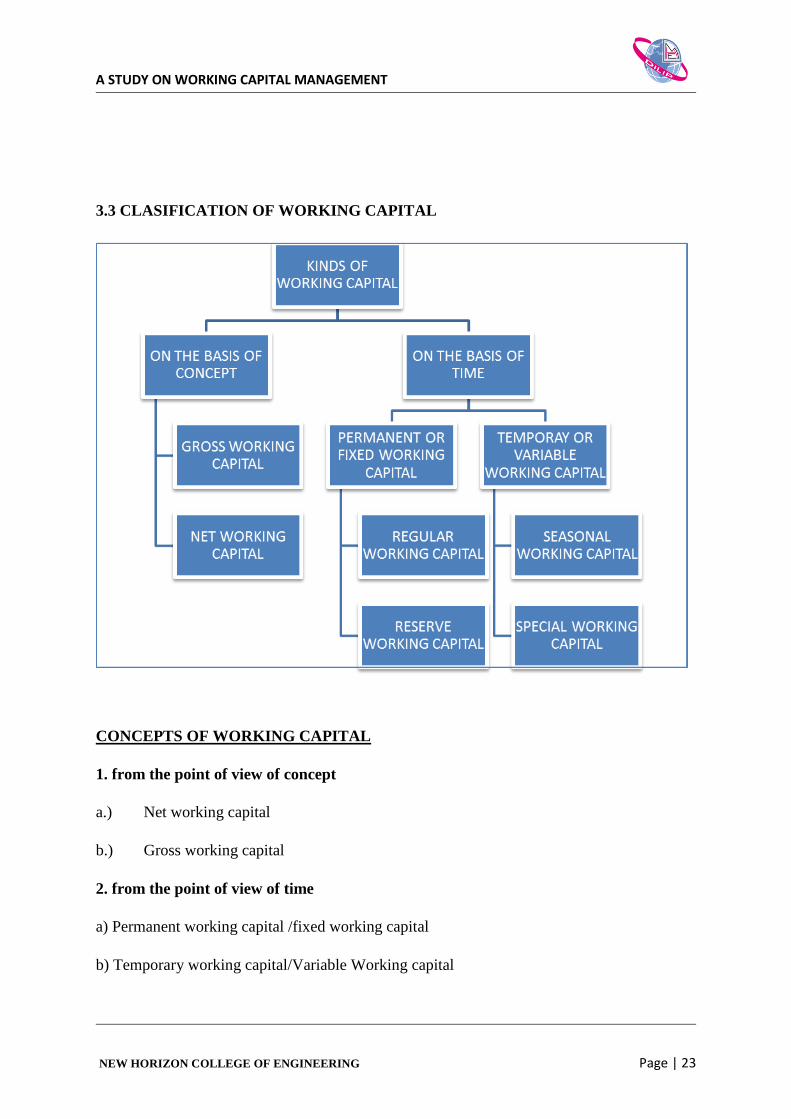
3.3 CLASIFICATION OF WORKING CAPITAL
CONCEPTS OF WORKING CAPITAL
1. from the point of view of concept
a.) Net working capital
b.) Gross working capital
2. from the point of view of time
a) Permanent working capital /fixed working capital
b) Temporary working capital/Variable Working capital
A STUDY ON WORKING CAPITAL MANAGEMENT
NEW HORIZON COLLEGE OF ENGINEERING Page | 24
1. ON THE BASIS CONCEPT
a.) NET WORKING CAPITAL
This is the difference between current assets and current liabilities . Current
liabilities are those that are expected to mature within on accounting year and include
creditors , bills payable and outstanding expenses.
Investments in current assets represents a very significant portion of the total
investment in assets .
The working capital needs increase as the firm’s grows as sales grow , the
firm needs to invest more in debtors and inventories .
B.)GROSS WORKING CAPITAL
Gross working capital refers to the firm’s investment in current assets . Current
assets are the assets which can be converted into cash within a short period say , an
accounting year . Current assets include cash , debtors , bills receivables , short term
securities etc. .
It is equal to the total sum of the current assets and may represent both
owned capital and loan capital .
2. ON THE BASIS OF TIME
a.) PERMANENT WORKING CAPITAL
Permanent working capital is permanently locked up in the circulations of current
assets . It covers the minimum amount requested for maintaining the circulation of
current assets .
1. INITIAL WORKING CAPITAL
At its inception and during the formative period of funds to meet its
obligations. The need for initial working capital is for every company to consolidate its
position
2. REGULAR WORKING CAPITAL
A STUDY ON WORKING CAPITAL MANAGEMENT
NEW HORIZON COLLEGE OF ENGINEERING Page | 25
It refers to the medium amount of liquid capital required to keep up the circulation
of the capital from the cash inventories to accounts receivable and from accounts
receivables to back again cash .
b)VARIABLE WORKING CAPITAL
It refers to the past of the working capital which changes with the volume of
business , it may be divided into two classes.
1. SEASONAL WORKING CAPITAL
There are many lines of business where the volume of operations is different and
hence the amount of working capital varies with the seasons . The capital required to meet
the seasonal working capital.
2. SPECIAL WORKING CAPITAL
The capital required to meet any special operations such as experiments with new
products or new technique of production and making interior advertising campaign etc
are also known as special working capital.
3.4 COMPOSITION OF WORKING CAPITAL
MAJOR CURRENT ASSET
Cash
Account receivable
Inventory
Marketable securities
MAJOUR CURRENT LIABILITIES
Bank over draft
Outstanding expenses
Accounts payable
Bill payable
Working capital refers to the cash a business requires for day to day operations or more
specifically, for financing conversion of raw material in to finished goods, which company
sells for payment. Among the most important item of the working capital are levels of
inventory, debtor ad creditor. These items are looked at for signs of a company efficiency and
financial strength.
A STUDY ON WORKING CAPITAL MANAGEMENT
NEW HORIZON COLLEGE OF ENGINEERING Page | 26
The better a company manager is working capital, the less the company needs to borrow. Even
companies with cash surpluses needs to manage working capital to ensure that those surpluses
are invested in ways that will generate suitable returns for investors.
Working capital management is very important to ensure that the company has enough fund to
carry on with its day to day operation smoothly. A business should not have a very long cash
conversion cycle. A cash conversion cycle measures the time period for which a firm will be
deprived of funds if its increase its investment as a part of its business growth strategies. For
this company has to take certain measures such as reduce the credit period of the customer,
negotiate with the supplier and increase its own credit period with them, maintaining the right
level of the inventory which reduce the raw material cost and proper cash management which
ensures that cash holding cost are reduced. If these measures are followed, the working capital
requirement automatically comes down.
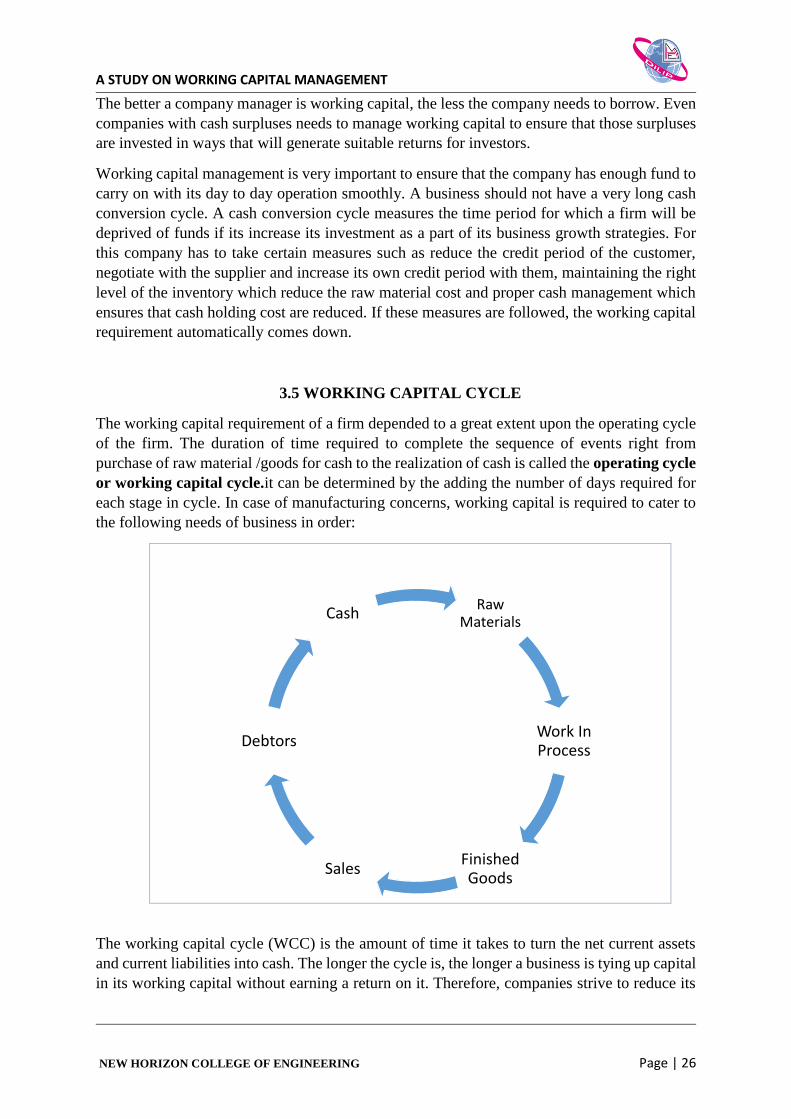
3.5 WORKING CAPITAL CYCLE
The working capital requirement of a firm depended to a great extent upon the operating cycle
of the firm. The duration of time required to complete the sequence of events right from
purchase of raw material /goods for cash to the realization of cash is called the operating cycle
or working capital cycle.it can be determined by the adding the number of days required for
each stage in cycle. In case of manufacturing concerns, working capital is required to cater to
the following needs of business in order:
The working capital cycle (WCC) is the amount of time it takes to turn the net current assets
and current liabilities into cash. The longer the cycle is, the longer a business is tying up capital
in its working capital without earning a return on it. Therefore, companies strive to reduce its
Raw Materials
Work In Process
Finished Goods
Sales
Debtors
Cash
A STUDY ON WORKING CAPITAL MANAGEMENT
NEW HORIZON COLLEGE OF ENGINEERING Page | 27
working capital cycle by collecting receivables quicker or sometimes stretching accounts
payable
Raw material are to be purchased for cash.
Production process converts raw material in to working process.
Work-in-process is converted into finished goods, during course of time through
production process.
Finished goods are converted into accounts receivable through sales.
Accounts receivable are realized into cash in due course of time.
3.6 DETERMINANTS OF WORKING CAPITAL
1. Small or Large Business
It is the first determinant of working capital that it is affected with the nature of business.
Business may be small or large. In small business, company need high working capital because,
small business is relating to trading of goods, for starting small business, you need very small
fixed capital but need high working capital for paying day to day expenses. But in large
business, we require more fixed capital than working capital for purchasing fixed asset.
2. Small or Large Demand
Nature of demand also absolutely affects the working capital need. Some product can be easily
sold by businessman, in that business; you need small amount of working capital because your
earned money from sale can easy fulfill the shortage of working capital. But, if demand is very
less, it is required that you have to invest large amount of working capital because your all
fixed expenses must be paid by you.
For paying fixed capital you need working capital.
3. Production Policy
Production policy is also main determinant of working capital requirement. Different company
may different production policy. Some companies stop or decrease the production level in off
seasons, in that time, company may also reduce the number of employees or decrease the
purchasing of new raw material, so, it will certainly decrease the amount of working capital
but on the side, some company may continue their productions in off season, in that case, they
need definitely large amount of working capital.
4. Credit Policy
Credit policy is relating to purchasing and selling of goods on credit basis. If company
purchases all goods on credit and sells on cash basis or advance basis, then it is certainly
company need very low amount of working capital. But if in company, goods are purchased
on cash basis, and sold on credit basis, it means, our earned money will receive after sometime
and we require large amount of working capital for continuing our business.
5. Dividend Policy
Dividend policy also effect working capital requirement. Company can distribute major part of
net profit. But, if there is no reserve, we have to invest large amount in working capital because,
A STUDY ON WORKING CAPITAL MANAGEMENT
NEW HORIZON COLLEGE OF ENGINEERING Page | 28
lacking of reserve will effect on adversely on fulfill our liabilities. In that case, we have to yield
working capital by taking short term loan for paying uncertain liability.
6. Working Capital Cycle
Working capital cycle shows all steps which starts from cash purchasing of raw material and
then this converted into finished product, after this it is converted into sale, if it is credit sale,
debtors will also the part of working capital cycle and when we gets money from our debtors,
it is the final part of working capital cycle. If we receive fastly from our debtors, we need small
amount working capital. Otherwise, for purchasing new raw material, we need more amount
of working capital.
7. Manufacturing Cycle
Manufacturing cycle means the process of converting raw material into finished product. Long
manufacturing cycle will create the situation in which we require large amount of working
capital. Suppose, we have to construct the building, for constructing colony of buildings, it may
consume the time more than 5 years, so according to this we need working capital.
8. Business Cycle
There are two main part of business cycle, one is boom and other is recession. In boom, we
need high money or working capital for development of business but in recession, we need
only low amount of working capital.
9. Price Level Changes
If there is increasing trend of products prices, we need to store high amount of working capital,
because next time, it is precisely that we have to pay more for purchasing raw material or other
service expenses. Inflation and deflation are two major factors which decide the next level of
working capital in business.
10. Effect of External Business Environmental Factors
There are many external business environmental factors which affect the need of working
capital like fiscal policy, monetary policy and bank policies and facilities

A STUDY ON WORKING CAPITAL MANAGEMENT
NEW HORIZON COLLEGE OF ENGINEERING Page | 29
3.7 REQUIREMENTS OF FUNDS
Fund requirements of company
FIXED CAPITAL WORKING CAPITAL
o Preliminary expenses Raw material
o Purchase of fixed assets Inventories
o Establishment work expenses Goods in progress
o Fixed working capital Others
Every company requires funds for investing into types of capital i.e. fixed capital, which
requires long term funds, and working capital, which requires short term funds.
Sources of working capital
Long term sources short term
sources
(Fixed working capital) (Temporary working
capital)
Loan from financial institution Factoring
Floating of debenture Invoice discounting
Accepting public depositing Bank over draft
Issue of shares Trade credit
Cash credit Instalment Credit
Income received
Commercial Papers
Trade finance
A STUDY ON WORKING CAPITAL MANAGEMENT
NEW HORIZON COLLEGE OF ENGINEERING Page | 30
Sources of additional working capital include the following:
Existing cash reserves
Profit (when you secure it as cash)
Payable (credit from supplier)
New equity or loans from shareholders
Bank overdraft or lines of credit
Term loans
If we have insufficient working capital and try to increase sales, you can easily over-stretch the
financial resource of the business. This is called overtrading. Early warning signs include:
Pressure on existing cash
Bank overdraft exceeds authorized limit
Seeking greater overdraft or lines or credit
Part-paying suppliers or other creditors
Management pre occupation with surviving rather than managing
Frequent short term emergency request to the bank.
Long term sources of working capital
Issue of shares
The number of authorized shares that is sold to and held by the shareholders of a company,
regardless of whether they are insiders, institutional investors or the general public.
Issued shares is a term of law and finance for the quantity of shares of a corporation, which
have been allocated (allotted) and are subsequently held by shareholders. The act of creating
new issued shares is called issuance, allocation or allotment. Allotment, in simplicity, is the
creation of shares and their transfer to a subscriber. After allotment, a subscriber becomes a
shareholder. The number of issued shares is a subset of the total authorized shares. It is that
amount which the board of directors and/or shareholders have agreed to allocate. Issued shares
are the sum of outstanding shares and treasury shares.
Debentures
A type of debt instrument that is not secured by physical assets or collateral. Debentures are
backed only by the general creditworthiness and reputation of the issuer. Both corporations and
governments frequently issue this type of bond in order to secure capital. Like other types of
bonds, debentures are documented in an indenture
Debentures have no collateral. Bond buyers generally purchase debentures based on the belief
that the bond issuer is unlikely to default on the repayment. An example of a government
debenture would be any government-issued Treasury bond (T-bond) or Treasury bill (T-bill).
T-bonds and T-bills are generally considered risk free because governments, at worst, can print
off more money or raise taxes to pay these type of debts.
Loan from financial institution
A STUDY ON WORKING CAPITAL MANAGEMENT
NEW HORIZON COLLEGE OF ENGINEERING Page | 31
The term debenture is a strictly legal term but there are other forms of loan or loan stock. A
loan is for a fixed amount with a fixed repayment schedule and mat appear on a balance sheet
with a specific name telling the reader exactly what the loan is and its main details.
Short Term Sources of Working Capital
Factoring
Factoring is a traditional source of short term funding. Factoring facility arrangements tend to
be restrictive and entering into a whole-turnover factoring facility can lead to aggressive
chasing of outstanding invoices from clients, and a loss of control of a company’s credit
function.
Instalment Credit
Instalment credit is a form of finance to pay for goods or services over a period through the
payment of principal and interest in regular payments.
Invoice Discounting
Invoice Discounting is a form of asset based finance which enables a business to release cash
tied up in an invoice and unlike factoring enables a client to retain control of the administration
of its debtors.
Income received in advance
Income received in advance is seen as a liability because it is money that does not correlate to
that specific accounting or business year but rather for one that is still to come. The income
account will then be credited to the income received in advance account and the income
received in advance will be debited to the income account such as rent.
Advances received from customers
A liability account used to record an amount received from a customer before a service has
been provided or before goods have been shipped.
Bank Overdraft
A bank overdraft is when someone is able to spend more than what is actually in their bank
account. The overdraft will be limited. A bank overdraft is also a type of loan as the money is
technically borrowed.
Commercial Papers
A commercial paper is an unsecured promissory note. Commercial paper is a money-market
security issued by large corporations to get money to meet short term debt obligations e.g.
Payroll, and is only backed by an issuing bank or corporation’s promise to pay the face amount
on the maturity date specified on the note. Since it is not backed by collateral, only firms with
excellent credit ratings will be able to sell their commercial paper at a reasonable price
Trade finance
A STUDY ON WORKING CAPITAL MANAGEMENT
NEW HORIZON COLLEGE OF ENGINEERING Page | 32
An exporter requires an importer to prepay for goods shipped. The importer naturally wants to
reduce risk by asking the exporter to document that the goods have been shipped. The
importer’s bank assists by providing a letter of credit to the exporter (or the exporter’s bank)
providing for payment upon presentation of certain documents, such as a bill of lading. The
exporter’s bank may make a loan to the exporter on the basis of the export contract.
Letter of Credit
A letter of credit is a document that a financial institution issues to a seller of goods or services
which says that the issuer will pay the seller for goods/services the seller delivers to a third-
party buyer. The issuer then seeks reimbursement from the buyer or from the buyer’s bank.
The document is essentially a guarantee to the seller that it will be paid by the issuer of the
letter of credit regardless of whether the buyer ultimately fails to pay. In this way, the risk that
the buyer will fail to pay is transferred from the seller to the letter of credit’s issuer.
3.8 Management of working capital
Guided by the above criteria, management will use a combination of policies and techniques
for the management of working capital. These policies aim at managing the current assets
(generally cash and cash equivalents, inventories and debtors) and the short term financing,
such that cash flows and returns are acceptable.
Cash management.
WHAT IS CASH?
The term cash with reference to cash management is used in two sense .in a narrow sense it
include ,coins, currency notes, cheque, bank draft held by a firm with it and the demand deposit
held by it in bank . in broader sense it also include near cash assets such as marketable securities
and time deposit with banks .such deposit can immediately be sold or converted into cash if
the circumstances so require .the term cash management is generally used for management of
both cash and near current assts.
FACTS OF CASH MANAGEMENT
Management of cash is concerned with the managing of
a. cash inflow and outflow of firm
b. cash flows within the firms and
Cash balances needed by the firm at a point of time by the financing of deficit or of investing
surplus cash. but it is difficult to predict cash flows accurately .hence ,in order to resolve the
uncertainty about cash flow prediction and lack of synchronization between cash receipts and
payments ,the firm should develop some strategies regarding the following four factor of cash
management.

A STUDY ON WORKING CAPITAL MANAGEMENT
NEW HORIZON COLLEGE OF ENGINEERING Page | 33
1. CASH PLANNING
It is a technique to plan and control the use of cash it protects the financial condition of
the firm by developing projected cash statement from forecasting of expected cash in flows
and out flows for a given period the forecasts may be used on the present operation or the
anticipated future operations .cash planning is very crucial in developing the overall operating
plans of the firm.
2. CONTROLLING THE LEVEL OF CASH BALANCES
As one of the basic objectives of cash management is to minimize the level of cash
balance, controlling the level of cash balance does not mean just minimizing the level of cash
balance within the firm .it means neither ensuring that the level of cash balance is neither
excessive nor inadequate .(i.e. .optimum).
3. OPTIMUM CASH LEVEL
Company must decide about the appropriation level of cash balances to be maintained. Both
the cost of excess cash and danger of cash deficiency have to be matched to arrive at optimum
level of cash balance.
4. INVESTMENT SURPLUS CASH
All surplus cash has been properly invested so as to earn profit .the company has to decide
about the division of such cash balance borrowed from bank deposit ,marketable securities on
inter corporate loan.
An idea cash management system depends on the company’s product, organization structure,
culture and option available
MANAGEMENT OF INVENTORY
In dictionary meaning of inventory is a “detailed list of goods, furniture etc.” Many
understand the word inventory, as a stock of goods, but the generally accepted meaning of the
word ‘goods’ in the accounting language, is the stock of finished goods only. In a
manufacturing organization, however, in addition to the stock of finished goods, there will be
stock of partly finished goods, raw materials and stores. The collective name of these entire
items is ‘inventory’.
The term ‘inventory’ refers to the stockpile of production a firm is offering for sale and the
components that make up the production.
Identify the level of inventory which allows for uninterrupted production but reduces the
investment in raw material – and minimizes recording costs - and hence increases cash flow.
Besides this, the lead times in production should be lowered to reduce work in progress (WIP)
and similarly, the Finished Goods should be kept on as low level as possible to avoid over

A STUDY ON WORKING CAPITAL MANAGEMENT
NEW HORIZON COLLEGE OF ENGINEERING Page | 34
production – see supply chain management ;Just in Time (JIT); Economic order quantity
(EOQ); Economic quantity.
Inventories occupy the most strategic position in the structure of working capital of most
business enterprises. It constitutes the largest component of current asset in most business
enterprises. In the sphere of working capital, the efficient control of inventory has passed the
most serious problem to the cement mills because about two-third of the current assets of mills
are blocked in inventories. The turnover of working capital is largely governed by the turnover
of inventory. It is therefore quite natural that inventory which helps in maximize profit occupies
the most significant place among current assets
Inventories consist of raw materials, stores, spares, packing materials, coal, petroleum
products, works-in-progress and finished products in stock either at the factory or deposits. It
is most important component of current assets in the cement industry and was 42 per cent of
total current assets for sample companies as on March 31, 2004. In other industries too it is
very important component of total investment.
The maintenance of inventory means blocking of funds and so it involves the interest and
opportunity cost to the firm. In many countries especially in Japan great emphasis is placed on
inventory management. Efforts are made to minimize the stock of inputs and outputs by proper
planning and forecasting of demand of various inputs and producing only that much quantity
which can be sold in the market.
The inventory cost is not only interest on stocks but also cost of store building for storage,
insurance and obsolesce and movement of inputs from place of storage to the factory where the
materials have to be finally used to convert them into finished goods. In japan industries have
adopted concept of JIT (Just in Time) and components, materials are received when required
for which detailed instructions are given to suppliers.
There are many engineering companies who receive components directly at assembly point and
that too only for 3-4 hours requirements at a time. Even in case of bulk materials like iron ore,
which is imported from abroad, the minimum possible inventory is kept.
As against this by and large in India the inventory of coal, raw materials and packing materials
is very high and many items become junk or obsolete causing heavy loss to the enterprise. Lack
of inventory planning in India has been pointed out by various committees but due to
uncertainties in supplies, problem of timely receipt of railway wagons, lack of planning and
unreliable suppliers the investment in inventories is quit high.
Objectives of Inventory Management
The primary objectives of inventory management are:
(i) To minimize the possibility of disruption in the production schedule of a firm for want of
raw material, stock and spares.
(ii)To keep down capital investment in inventories.
A STUDY ON WORKING CAPITAL MANAGEMENT
NEW HORIZON COLLEGE OF ENGINEERING Page | 35
So it is essential to have necessary inventories. Excessive inventory is an idle resource of a
concern. The concern should always avoid this situation. The investment in inventories should
be just sufficient in the optimum level. The major dangers of excessive inventories are:
(i) The unnecessary tie up of the firm’s funds and loss of profit.
(ii) Excessive carrying cost, and
(iii) The risk of liquidity.
The excessive level of inventories consumes the funds of business, which cannot be used for
any other purpose and thus involves an opportunity cost. The carrying cost, such as the cost of
shortage, handling insurance, recording and inspection, are also increased in proportion to the
volume of inventories. This cost will impair the concern profitability further.
On the other hand, a low level of inventories may result in frequent interruptions in the
production schedule resulting in under-utilization of capacity and lower sales. The aim of
inventory management thus should be to avoid excessive inventory and inadequate inventory
and to maintain adequate inventory for smooth running of the business operations. Efforts
should be made to place orders at the right time with the right source to purchase the right
quantity at the right price and quality. The effective inventory management should
(i) Maintain sufficient stock of raw material in the period of short supply and anticipate price
changes.
(ii) Ensure a continuous supply of material to production department facilitating uninterrupted
production.
(iii) Minimize the carrying cost and time.
(iv)Maintain sufficient stock of finished goods for smooth sales operations.
(v) Ensure that materials are available for use in production and production services as and
when required.
(vi) Ensure that finished goods are available for delivery to customers to fulfil orders, smooth
sales operation and efficient customer service.
(vii) Minimize investment in inventories and minimize the carrying cost and time.
MANAGEMENT OF RECEIVABLE
INTRODUCTION:
Management of trade credit is commonly known as Management of Receivables. Receivables
are one of the three primary components of working capital, the other being inventory and cash,
the other being inventory and cash. Receivables occupy second important place after
inventories and thereby constitute a substantial portion of current assets in several firms. The
capital invested in receivables is almost of the same amount as that invested in cash and
inventories. Receivables thus, form about one third of current assets in India. Trade credit is an
important market tool. As, it acts like a bridge for mobilization of goods from production to
distribution stages in the field of marketing. Receivables provide protection to sales from

A STUDY ON WORKING CAPITAL MANAGEMENT
NEW HORIZON COLLEGE OF ENGINEERING Page | 36
competitions. It acts no less than a magnet in attracting potential customers to buy the product
at terms and conditions favorable to them as well as to the firm. Receivables management
demands due consideration not financial executive not only because cost and risk are associated
with this investment but also for the reason that each rupee can contribute to firm's net worth.
MEANING AND DEFINITION:
When goods and services are sold under an agreement permitting the customer to pay for them
at a later date, the amount due from the customer is recorded as accounts receivables; So,
receivables are assets accounts representing amounts owed to the firm as a result of the credit
sale of goods and services in the ordinary course of business. The value of these claims is
carried on to the assets side of the balance sheet under titles such as accounts receivable, trade
receivables or customer receivables. This term can be defined as "debt owed to the firm by
customers arising from sale of goods or services in ordinary course of business." 1 According
to Robert N. Anthony, "Accounts receivables are amounts owed to the business enterprise,
usually by its customers. Sometimes it is broken down into trade accounts receivables; the
former refers to amounts owed by customers, and the latter refers to amounts owed by
employees and others".
Generally, when a concern does not receive cash payment in respect of ordinary sale of its
products or services immediately in order to allow them a reasonable period of time to pay for
the goods they have received. The firm is said to have granted trade credit. Trade credit thus,
gives rise to certain receivables or book debts expected to be collected by the firm in the near
future. In other words, sale of goods on credit converts finished goods of a selling firm into
receivables or book debts, on their maturity these receivables are realized and cash is generated.
According to prasanna Chandra, "The balance in the receivables accounts would be; average
daily credit sales x average collection period."
The book debts or receivable arising out of credit has three dimensions:
It involves an element of risk, which should be carefully assessed. Unlike cash sales credit
sales are not risk less as the cash payment remains undeceived.
It is based on economics value. The economic value in goods and services passes to the
buyer immediately when the sale is made in return for an equivalent economic value expected
by the seller from him to be received later on.
plies futurity, as the payment for the goods and services received by the buyer is made
by him to the firm on a future date.
The customer who represent the firm's claim or assets, from whom receivables or book-debts
are to be collected in the near future, are known as debtors or trade debtors. A receivable
originally comes into existence at the very instance when the sale is affected. But the funds
generated as a result of these ales can be of no use until the receivables are actually collected
in the normal course of the business. Receivables may be represented by acceptance; bills or
notes and the like due from others at an assignable date in the due course of the business. As
sale of goods is a contract, receivables too get affected in accordance with the law of contract
A STUDY ON WORKING CAPITAL MANAGEMENT
NEW HORIZON COLLEGE OF ENGINEERING Page | 37
e.g. Both the parties (buyer and seller) must have the capacity to contract, proper consideration
and mutual assent must be present to pass the title of goods and above all contract of sale to be
enforceable must be in writing. Moreover, extensive care is needed to be exercised for
differentiating true sales form what may appear to be as sales like bailment, sales contracts,
consignments etc. Receivables, as are forms of investment in any enterprise manufacturing and
selling goods on credit basis, large sums of funds are tied up in trade debtors. Hence, a great
deal of careful analysis and proper management is exercised for effective and efficient
management of Receivables to ensure a positive contribution towards increase in turnover and
profits.
When goods and services are sold under an agreement permitting the customer to pay for them
at a later date, the amount due from the customer is recorded as accounts receivables; so,
receivables are assets accounts representing amounts owed to the firm as a result of the credit
sale of goods and services in the ordinary course of business. The value of these claims is
carried on to the assets side of the balance sheet under titles such as accounts receivable, trade
receivables or customer receivables. This term can be defined as "debt owe to the firm by
customers arising from sale of goods or services in ordinary course of business." 1 According
to Robert N. Anthony, "Accounts receivables are amounts owed to the business enterprise,
usually by its customers. Sometimes it is broken down into trade accounts receivables; the
former refers to amounts owed by customers, and the latter refers to amounts owed by
employees and others".
2 Generally, when a concern does not receive cash payment in respect of ordinary sale of its
products or services immediately in order to allow them a reasonable period of time to pay for
the goods they have received. The firm is said to have granted trade credit. Trade credit thus,
gives rise to certain receivables or book debts expected to be collected by the firm in the near
future. In other words, sale of goods on credit converts finished goods of a selling firm into
receivables or book debts, on their maturity these receivables are realized and cash is generated.
According to prasanna Chandra, "The balance in the receivables accounts would be; average
daily credit sales x average collection period."
The book debts or receivable arising out of credit has three dimensions:
sales are not risk less as the cash payment remains unreceived.
buyer immediately when the sale is made in return for an equivalent economic value expected
by the seller from him to be received later.
Receivables play a very important role in accelerating the velocity of distributions. As a
middleman would act quickly enough in mobilizing his quota of goods from the productions
place for distribution without any hassle of immediate cash payment. As, he can pay the full
amount after affecting his sales. Similarly, the customers would hurry for purchasing their
needful even if they are not in a position to pay cash instantly. It is for these receivables are
regarded as a bridge for the movement of goods form production to distributions among the
ultimate consumer. ;
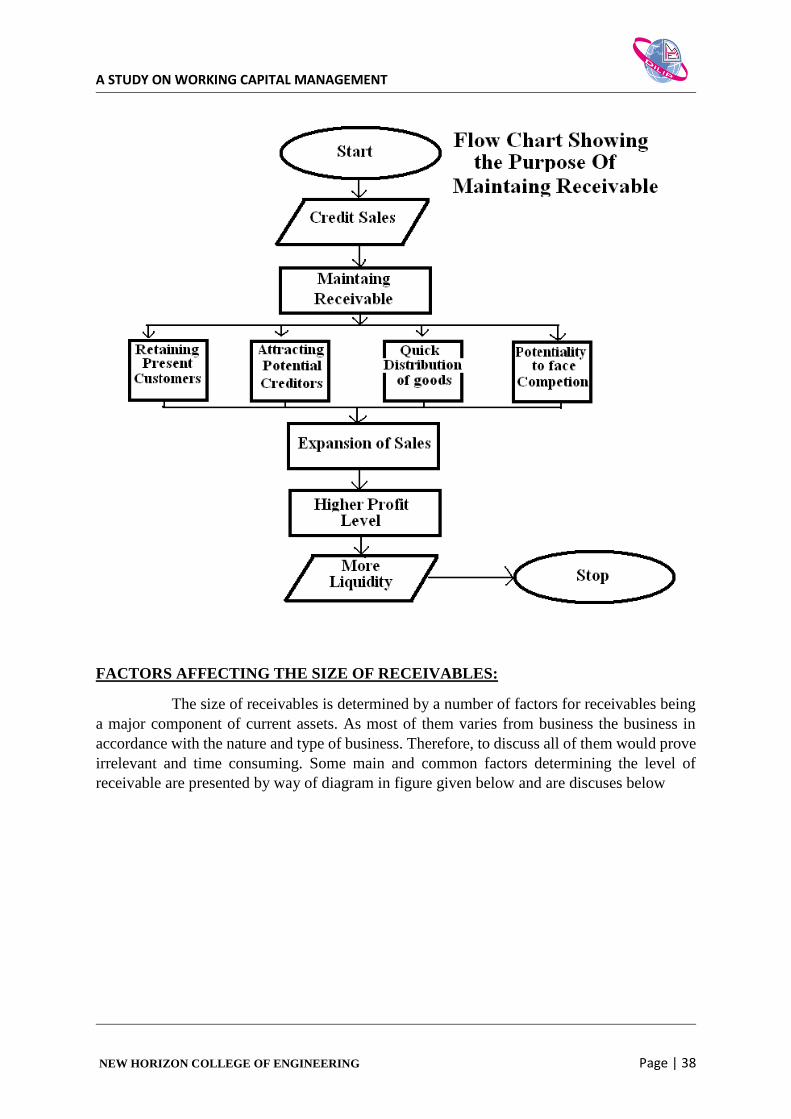
A STUDY ON WORKING CAPITAL MANAGEMENT
NEW HORIZON COLLEGE OF ENGINEERING Page | 38
FACTORS AFFECTING THE SIZE OF RECEIVABLES:
The size of receivables is determined by a number of factors for receivables being
a major component of current assets. As most of them varies from business the business in
accordance with the nature and type of business. Therefore, to discuss all of them would prove
irrelevant and time consuming. Some main and common factors determining the level of
receivable are presented by way of diagram in figure given below and are discuses below
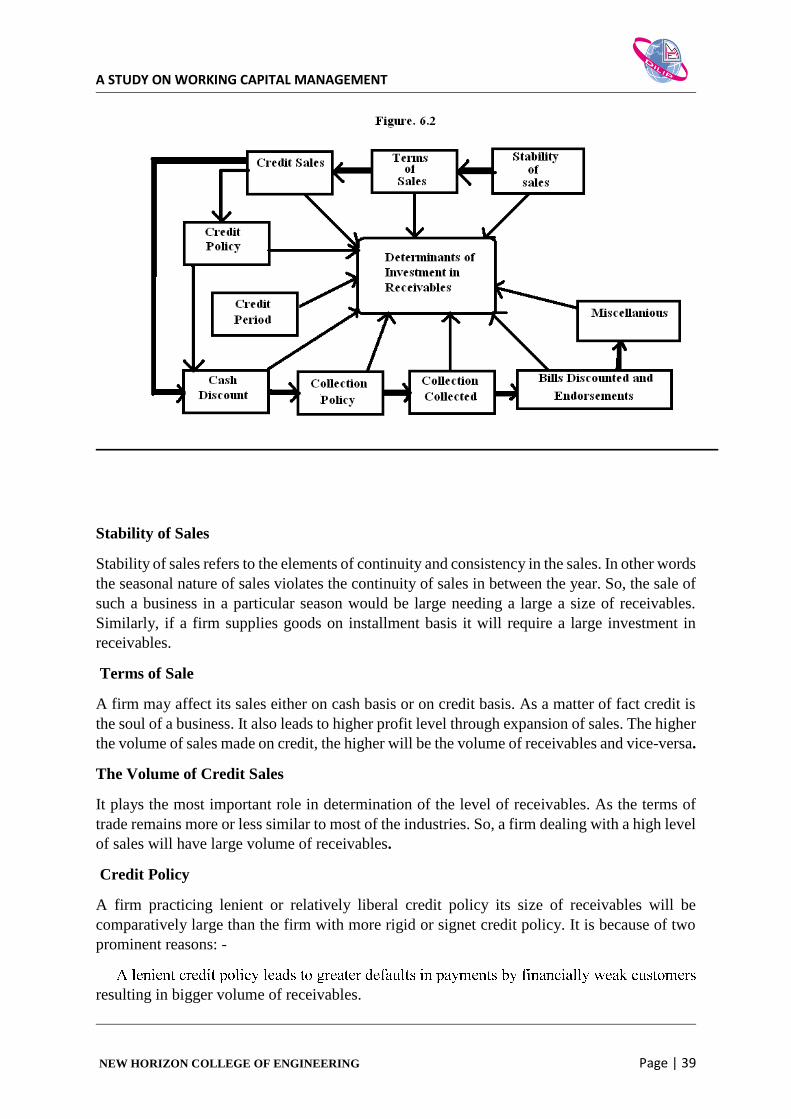
A STUDY ON WORKING CAPITAL MANAGEMENT
NEW HORIZON COLLEGE OF ENGINEERING Page | 39
Stability of Sales
Stability of sales refers to the elements of continuity and consistency in the sales. In other words
the seasonal nature of sales violates the continuity of sales in between the year. So, the sale of
such a business in a particular season would be large needing a large a size of receivables.
Similarly, if a firm supplies goods on installment basis it will require a large investment in
receivables.
Terms of Sale
A firm may affect its sales either on cash basis or on credit basis. As a matter of fact credit is
the soul of a business. It also leads to higher profit level through expansion of sales. The higher
the volume of sales made on credit, the higher will be the volume of receivables and vice-versa.
The Volume of Credit Sales
It plays the most important role in determination of the level of receivables. As the terms of
trade remains more or less similar to most of the industries. So, a firm dealing with a high level
of sales will have large volume of receivables.
Credit Policy
A firm practicing lenient or relatively liberal credit policy its size of receivables will be
comparatively large than the firm with more rigid or signet credit policy. It is because of two
prominent reasons: -
resulting in bigger volume of receivables.

A STUDY ON WORKING CAPITAL MANAGEMENT
NEW HORIZON COLLEGE OF ENGINEERING Page | 40
Terms of Sale The period for which credit is granted to a customer duly brings about increase
or decrease in receivables. The shorter the credit period, the lesser is the amount of receivables.
As short term credit ties the funds for a short period only. Therefore, a company does not
require holding unnecessary investment by way of receivables.
Cash Discount
Cash discount on one hand attracts the customers for payments before the lapse of credit
period. As a tempting offer of lesser payments is proposed to the customer in this system, if a
customer succeeds in paying within the stipulated period. On the other hand reduces the
working capital requirements of the concern. Thus, decreasing the receivables management.
Collection Policy
The policy, practice and procedure adopted by a business enterprise in granting credit, deciding
as to the amount of credit and the procedure selected for the collection of the same also greatly
influence the level of receivables of a concern. The more lenient or liberal to credit and
collection policies the more receivables are required for the purpose of investment.
Collection Collected
If an enterprise is efficient enough in encasing the payment attached to the receivables within
the stipulated period granted to the customer. Then, it will opt for keeping the level of
receivables low. Whereas, enterprise experiencing undue delay in collection of payments will
always have to maintain large receivables.
Bills Discounting and Endorsement
If the firm opts for discounting its bills, with the bank or endorsing the bills to the third party,
for meeting its obligations. In such circumstances, it would lower the level of receivables
required in conducting business.
Quality of Customer
If a company deals specifically with financially sound and credit worthy customers then it
would definitely receive all the payments in due time. As a result the firm can comfortably do
with a lesser amount of receivables than in case where a company deals with customers having
financially weaker position.
Miscellaneous
There are certain general factors such as price level variations, attitude of management type
and nature of business, availability of funds and the lies that play
MANAGEMENT OF PAYABLES
A substantial part of purchase of goods and services in business are on credit terms rather than
against cash payment. While the supplier of goods and services trend to perceive credit as lever
for enhancing sales or as a form non price instruments of credit is referred to as accounts
payable, trade credit, trade bill, trade acceptance, commercial draft of bill payable depending
on the nature of the credit. The extent which this buy-now pay later facility Is provide will
A STUDY ON WORKING CAPITAL MANAGEMENT
NEW HORIZON COLLEGE OF ENGINEERING Page | 41
depends upon the a variety of factors such as nature , quality and volume of the item to be
purchased, the prevalent in the trade ,the degree of completion and the financial status of parties
concerned.
Advantages of payable
1. Easy to obtain: payable or trade credit is reality obtainable, in most cases, without
extended procedural formalities, during the period of credit crunch of working capital.
Trade credit from the large supplier can be boon to small buyers.
2. Supplier assume the risk: where the supplier have the advantage of high gross margins
on their products, they would be able to assume greater risk and extent more liberal
credit.
3. Informality: in trade credit is no rigidity in the matter of repayment of schedule dates:
occasional delays are not frowned upon. Its serves as an extendible, convenient sources
of unsecured credit.
4. Continues financing; even as the current dues are paid, fresh credit flows in as further
purchase are made. Its continues sources of finance. With a steady credit terms and the
expectation of continues circulation of trade credit backing up repeat purchases, trade
credit does, in effect, operates as long term sources.
A STUDY ON WORKING CAPITAL MANAGEMENT
NEW HORIZON COLLEGE OF ENGINEERING Page | 42
3.9 RATIO ANALYSIS
INTRODUCTION
The analysis of the financial statements and interpretations of financial results of a particular
period of operations with the help of 'ratio' is termed as "ratio analysis." Ratio analysis used to
determine the financial soundness of a business concern. Alexander Wall designed a system of
ratio analysis and presented it in useful form in the year 1909.
Meaning and Definition
The term 'ratio' refers to the mathematical relationship between any two inter-related variables.
In other words, it establishes relationship between two items expressed in quantitative form.
According J. Batty, Ratio can be defined as "the term accounting ratio is used to describe
significant relationships which exist between figures shown in a balance sheet and profit and
loss account in a budgetary control system or any other part of the accounting management."
Advantages of Ratio Analysis
Ratio analysis is necessary to establish the relationship between two accounting figures to
highlight the significant information to the management or users who can analyze the business
situation and to monitor their performance in a meaningful way. The following are the
advantages of ratio analysis:
(1) It facilitates the accounting information to be summarized and simplified in a required form.
(2) It highlights the inter-relationship between the facts and figures of various segments of
Business.
(3) Ratio analysis helps to remove all type of wastages and inefficiencies.
(4) It provides necessary information to the management to take prompt decision relating to
Business.
(5) It helps to the management for effectively discharge its functions such as planning,
organizing, controlling, directing and forecasting.
(6) Ratio analysis reveals profitable and unprofitable activities. Thus, the management is able
to Concentrate on unprofitable activities and consider to improve the efficiency.
(7) Ratio analysis is used as a measuring rod for effective control of performance of business
activities.
(8) Ratios are an effective means of communication and informing about financial soundness
made by the business concern to the proprietors, investors, creditors and other parties.
(9) Ratio analysis is an effective tool which is used for measuring the operating results of the
enterprises.
(10) It facilitates control over the operation as well as resources of the business.
(11) Effective co-operation can be achieved through ratio analysis.
(12) Ratio analysis provides all assistance to the management to fix responsibilities.
A STUDY ON WORKING CAPITAL MANAGEMENT
NEW HORIZON COLLEGE OF ENGINEERING Page | 43
(13) Ratio analysis helps to determine the performance of liquidity, profitability and solvency
position of the business concern.
Limitations of Ratio Analysis
Ratio analysis is one of the important techniques of determining the performance of financial
strength and weakness of a firm. Though ratio analysis is relevant and useful technique for the
business concern, the analysis is based on the information available in the financial statements.
There are some situations, where ratios are misused, it may lead the management to wrong
direction. The ratio analysis suffers from the following limitations:
(1) Ratio analysis is used on the basis of financial statements. Number of limitations of financial
Statements may affect the accuracy or quality of ratio analysis.
(2) Ratio analysis heavily depends on quantitative facts and figures and it ignores qualitative
data. Therefore this may limit accuracy.
(3) Ratio analysis is a poor measure of a firm's performance due to lack of adequate standards
laid for ideal ratios.
(4) It is not a substitute for analysis of financial statements. It is merely used as a tool for
measuring the performance of business activities.
(5) Ratio analysis clearly has some latitude for window dressing.
(6) It makes comparison of ratios between companies which is questionable due to differences
in methods of accounting operation and financing.
(7)Ratio analysis does not consider the change in price level, as such, these ratio will not help
in drawing meaningful inferences.
CLASSIFICATION OF RATIOS
Accounting Ratios are classified on the basis of the different parties interested in making use
of the ratios. A very large number of accounting ratios are used for the purpose of determining
the financial position of a concern for different purposes. Ratios may be broadly classified in
to:
(1) Classification of Ratios on the basis of Balance Sheet.
(2) Classification of Ratios on the basis of Profit and Loss Account.
(3) Classification of Ratios on the basis of Mixed Statement (or) Balance Sheet and Profit and
Loss Account.
This classification further grouped in to:
I. Liquidity Ratios
II. Profitability Ratios
III. Turnover Ratios

A STUDY ON WORKING CAPITAL MANAGEMENT
NEW HORIZON COLLEGE OF ENGINEERING Page | 44
IV.Leverage ratios
These classifications are discussed hereunder:
1. Classification of Ratios on the basis of Balance Sheet: Balance sheet ratios which establish
the Relationship between two balance sheet items. For example, Current Ratio, Fixed Asset
Ratio, Capital Gearing Ratio and Liquidity Ratio etc.
2. Classification on the basis of Income Statements: These ratios deal with the relationship
between two items or two group of items of the income statement or profit and loss account.
For example, Gross Profit Ratio, Operating Ratio, Operating Profit Ratio, and Net Profit Ratio
etc.
3. Classification on the basis of Mixed Statements: These ratios also known as Composite
or Mixed Ratios or Inter Statement Ratios. The inter statement ratios which deal with
relationship between the item of profit and loss account and item of balance sheet. For example,
return on Investment Ratio, Net Profit to Total Asset Ratio, Creditor's Turnover Ratio, Earning
per Share Ratio and Price Earnings Ratio etc.
To analyze the financial performance, following accounting ratios are applied. The ratios are
grouped under the following four headings.
1. Liquidity ratios
2. Turnover ratios
3. Leverage ratios
4. Profitability ratios
(1) LIQUIDITY RATIOS
Liquidity Ratios are also termed as Short-Term Solvency Ratios. The term liquidity means the
extent of quick convertibility of assets in to money for paying obligation of short-term nature.
Accordingly, liquidity ratios are useful in obtaining an indication of a firm's ability to meet its
current liabilities, but it does not reveal h0w effectively the cash resources can be managed. To
measure the liquidity of a firm, the following ratios are commonly used:
(1) Current Ratio.
(2) Quick Ratio (or) Acid Test or Liquid Ratio.
(3) Absolute Liquid Ratio (or) Cash Position Ratio.
(1) Current Ratio
Current Ratio establishes the relationship between current Assets and current Liabilities. It
attempts to measure the ability of a firm to meet its current obligations. In order to compute
this ratio, the following formula is used:
Current Ratio =Current assets- Current Liabilities

A STUDY ON WORKING CAPITAL MANAGEMENT
NEW HORIZON COLLEGE OF ENGINEERING Page | 45
The two basic components of this ratio are current assets and current liabilities. Current asset
normally means assets which can be easily converted in to cash within a year's time. On the
other hand, current liabilities represent those liabilities which are payable within a year.
Advantages of Current Ratios:
(1) Current ratio helps to measure the liquidity of a firm.
(2) It represents general picture of the adequacy of the working capital position of a company.
(3) It indicates liquidity of a company.
(4) It represents a margin of safety, i.e., cushion of protection against current creditors.
(5) It helps to measure the short-term financial position of a company or short-term solvency
of a firm.
Disadvantages of Current Ratio:
(1) Current ratios cannot be appropriate to all business it depends on many other factors.
(2) Window' dressing is another problem of current ratio, for example, overvaluation of closing
stock.
(3) It is a crude measure of a firm's liquidity only on the basis Of quantity and not quality of
current
(2) Quick Ratio (or) Acid Test or Liquid Ratio
Quick Ratio also termed as Acid Test or Liquid Ratio. It is supplementary to
the current ratio. The acid test ratio is a more severe and stringent test of a firm's ability to pay
its short-term obligations 'as and when they become due. Quick Ratio establishes the
relationship between the quick assets and current liabilities. In order to compute this ratio, the
below presented formula is used:
Liquid Assets
(Current Assets - Stock and Prepaid Expenses)
Liquid Ratio = -------------------------------------------------------------
Current Liabilities
Quick Ratio can be calculated by two basic components of quick assets and current liabilities.
Quick Assets = Current Assets - (Inventories + Prepaid expenses)
Current liabilities represent those liabilities which are payable within a year.
Advantages

A STUDY ON WORKING CAPITAL MANAGEMENT
NEW HORIZON COLLEGE OF ENGINEERING Page | 46
(I) Quick Ratio helps to measure the liquidity position of a firm.
(2) It is used as a supplementary to the current ratio.
(3) It is used to remove inherent defects of current ratio.
(3) Absolute Liquid Ratio
Absolute Liquid Ratio is also called as Cash Position Ratio (or) Over Due Liability Ratio. This
ratio established the relationship between the absolute liquid assets and current ~iabilities.
Absolute Liquid Assets include cash in hand, cash at bank, and marketable securities or
temporary investments. The optimum value for this ratio should be one, i.e., 1: 2. It indicates
that 50% worth absolute liquid assets are considered adequate to pay the 100% worth current
liabilities in time. If the ratio is relatively lower than one, it represents that the company's day-
to-day cash management is poor. If the ratio is considerably more than one, the absolute liquid
ratio represents enough funds in the form of cash to meet its short-term obligations in time.
The Absolute Liquid ratio can be calculated by dividing the total of the Absolute
Liquid Assets by Total Current Liabilities. Thus,
Absolute Liquid Assets
Absolute Liquid Ratio =
Current Liabilities
(2) PROFITABILITY RATIOS
The term profitability means the profit earning capacity of any business activity. Thus, profit
earning may be judged on the volume of profit margin of any activity and is calculated by
subtracting costs from the total revenue accruing to a firm during a particular period.
Profitability Ratio is used to measure the overall efficiency or performance of a business.
Generally, a large number of ratios can also be used for determining the profitability as the
same is related to sales or investments.
The following important profitability ratios are discussed below:
1. Gross Profit Ratio.
2. Net Profit Ratio.
3. Return on Investment Ratio.
(1) Gross Profit Ratio
Gross Profit Ratio established the relationship between gross profit and net sales. This ratio is
calculated by dividing the Gross Profit by Sales. It is usually indicated as percentage.
Gross profit
Gross Profit Ratio = ---------------- *100
Net sale
A STUDY ON WORKING CAPITAL MANAGEMENT
NEW HORIZON COLLEGE OF ENGINEERING Page | 47
Gross Profit = Sales –cost of goods sold
Net Sales = Gross Sales - Sales Return (or) Return Inwards
Or GPR=GROSS PROFIT+NET SALES
Higher Gross Profit Ratio is an indication that the firm has higher profitability. It also reflects
the effective standard of performance of firm's business. Higher Gross Profit Ratio will be
result of the following factors.
(1) Increase in selling price, i.e., sales higher than cost of goods sold.
(2) Decrease in cost of goods sold with selling price remaining constant.
(3) Increase in selling price without any corresponding proportionate increase in cost.
(4) Increase in the sales mix.
A low gross profit ratio generally indicates the result of the following factors:
(l) Increase in cost of goods sold.
(2) Decrease in selling price.
(3) Decrease in sales volume.
(4) High competition.
(5) Decrease in sales mix.
Advantages
(1) It helps to measure the relationship between gross profit and net sales.
(2) It reflects the efficiency with which a firm produces its product.
(3) This ratio tells the management, that a low gross profit ratio may indicate un favorable
purchasing and mark-up policies.
(4) A low gross profit ratio also indicates the inability of the management to increase sales.
(2) Net profit ratio
Net Profit Ratio is also termed as Sales Margin Ratio (or) Profit Margin Ratio (or) Net Profit
to Sales Ratio. This ratio reveals the firm's overall efficiency in operating the business. Net
profit Ratio is used to measure the relationship between net profit (either before or after taxes)
and sales. This ratio can be
Calculated by the following formula:
Net Profit Ratio = Net Profit Ratio is also termed as Sales Margin Ratio (or) Profit Margin
Ratio (or) Net Profit to Sales
Ratio. This ratio reveals the firm's overall efficiency in operating the business. Net profit Ratio
is used to measure the relationship between net profit (either before or after taxes) and sales.
This ratio can be
A STUDY ON WORKING CAPITAL MANAGEMENT
NEW HORIZON COLLEGE OF ENGINEERING Page | 48
Calculated by the following formula:
Net Profit after Tax
Net Profit Ratio =------------------------- x 100
Net Sales
Or NPR=NET PROFIT+NET SALES
Net profit includes non-operating incomes and profits. Non-Operating Incomes such as
dividend received, interest on investment, profit on sales of fixed assets, commission received,
discount received etc. Profit or Sales Margin indicates margin available after deduction cost of
production, other operating expenses, and income tax from the sales revenue. Higher Net Profit
Ratio indicates the standard performance of the business concern.
Advantages
(1) This is the best measure of profitability and liquidity.
(2) It helps to measure overall operational efficiency of the business concern.
(3) It facilitates to make or buy decisions.
(4) It helps to determine the managerial efficiency to use a firm's resources to generate income
on its invested capital.
(5) Net profit Ratio is very much useful as a tool of investment evaluation.
(3)Return on investment
This ratio is also called as ROL This ratio measures a return on the owner's or shareholders'
investment. This ratio establishes the relationship between net profit after interest and taxes
and the owner's investment. Usually this is calculated in percentage. This ratio, thus. can be
calculated as :
investmentfundor rsshareholde
taxandinterst er profit(aftnet investmenton return
Shareholder's Investments = Equity Share Capital + Preference
Net Profit - Interest and Taxes
Net Profit = Net Profit - Interest and Taxes
Or ROI=EBIT+TOTAL ASSETS
Advantages
(1) This ratio highlights the success of the business from the owner's point of view.
(2) It helps to measure an income on the shareholders' or proprietor's investments.
A STUDY ON WORKING CAPITAL MANAGEMENT
NEW HORIZON COLLEGE OF ENGINEERING Page | 49
(3) This ratio helps to the management for important decisions making.
(4) It facilitates in determining efficiently handling of owner's investment
(3)TURNOVER RATIOS
Turnover Ratios may be also termed as Efficiency Ratios or Performance Ratios or Activity
Ratios. Turnover Ratios highlight the different aspect of financial statement to satisfy the
requirements of different parties interested in the business. It also indicates the effectiveness
with which different assets are vitalized in a business. Turnover means the number of times
assets are converted or turned over into sales. The activity ratios indicate the rate at which
different assets are turned over.
Stock turnover ratio
This ratio is also called as Inventory Ratio or Stock Velocity Ratio. Inventory means stock of
raw materials, working in progress and finished goods. This ratio is used to measure whether
the investment in stock in trade is effectively utilized or not. It reveals the relationship between
sales and cost of goods sold or average inventory at cost price or average inventory at selling
price. Stock Turnover Ratio indicates the number of times the stock has been turned over in
business during a particular period. While using this ratio, care must be taken regarding season
and condition. Price trend. Supply condition etc. In order to compute this ratio, the following
formulae are used
Inventory turnover ratio=inventory/working capital
Advantage
(1) This ratio indicates whether investment in stock in trade is efficiently used or not.
(2) This ratio is widely used as a measure of investment in stock is within proper limit or not.
(3) This ratio highlights the operational efficiency of the business concern.
(4) This ratio is helpful in evaluating the stock utilization
Debtor turnover ratio
Debtor's Turnover Ratio is also termed as Receivable Turnover Ratio or Debtor's Velocity.
Receivables and Debtors represent the uncollected portion of credit sales. Debtor's Velocity
indicates the number of times the receivables are turned over in business during a particular
period. In other words, it represents how quickly the debtors are converted into cash. It is used
to measure the liquidity position of a concern. This ratio establishes the relationship between
receivables and sales.
DTR=NET CREDIT SALE/AVERAGE TRADE DEBTOR
Fixed asset turnover ratio
This ratio indicates the efficiency of assets management. Fixed Assets Turnover Ratio is used
to measure the utilization of fixed assets. This ratio establishes the relationship between cost
A STUDY ON WORKING CAPITAL MANAGEMENT
NEW HORIZON COLLEGE OF ENGINEERING Page | 50
of goods sold and total fixed assets. Higher the ratio highlights a firm has successfully utilized
the fixed assets. If the ratio is depressed, it indicates the underutilization of fixed assets. The
ratio may also be calculated as:
Cost of Goods Sold
Fixed Assets Turnover Ratio = ---------------------------
Total Fixed Assets
(Or)
Sales
= ----------------
Net Fixed Assets
OR
FATR=COST OF SALE+NET FIXED ASSETS
Working capital turnover ratio
This ratio highlights the effective utilization of working capital with regard to sales. This ratio
represent the firm's liquidity position. It establishes relationship between cost of sales and
networking capital.
Significance: It is an index to know whether the working capital has been effectively utilized
or not in making sales. A higher working capital turnover ratio indicates efficient utilization of
working capital, i.e., a firm can repay its fixed liabilities out of its working capital. Also, a
lower working capital turnover ratio shows that the firm has to face the shortage of working
capital to meet its day-to-day business activities unsatisfactorily.
WORKING CAPITAL TURNOVER RATIO=COST OF SALES/NET WORKING CAPITAL
Capital turnover ratio
This ratio measures the efficiency of capital utilization in the business. This ratio establishes
the relationship between cost of sales or sales and capital employed or shareholders' fund. This
ratio may also be calculated as:
Cost of Sale
Capital Turnover Ratio = -------------------------------------
Capital Employed
A STUDY ON WORKING CAPITAL MANAGEMENT
NEW HORIZON COLLEGE OF ENGINEERING Page | 51
(4)PROFITABILITY RATIO
The term profitability means the profit earning capacity of any business activity. Thus, profit
earning may be judged on the volume of profit margin of any activity and is calculated by
subtracting costs from the total revenue accruing to a firm during a particular period.
Profitability Ratio is used to measure the overall efficiency or performance of a business.
Generally, a large number of ratios can also be used for determining the profitability as the
same is related to sales or investments.
Gross profit ratio
Gross Profit Ratio established the relationship between gross profit and net sales. This ratio is
calculated by dividing the Gross Profit by Sales. It is usually indicated as percentage.
Gross Profit
Gross Profit Ratio = ----------------------------*100
Net sale
Advantage
(1) It helps to measure the relationship between gross profit and net sales.
(2) It reflects the efficiency with which a firm produces its product.
(3) This ratio tells the management, that a low gross profit ratio may indicate unfavorable
purchasing and mark-up policies.
(4) A low gross profit ratio also indicates the inability of the management to increase sales
Operating ratio
Operating Ratio is calculated to measure the relationship between total operating expenses and
sales. The total operating expenses is the sum total of cost of goods sold, office and
administrative expenses and selling and distribution expenses. In other words, this ratio
indicates a firm's ability to cover total operating expenses. In order to compute this ratio, the
following formula is used:
Operating cost
Operating ratio = ---------------------------------*100
Net sale
Operating cost = Cost of goods sold + Administrative Expenses+ Selling and Distribution
Expenses
Net sale = Sales - Sales Return (or) Return Inwards.
Net profit ratio
Net Profit Ratio is also termed as Sales Margin Ratio (or) Profit Margin Ratio (or) Net Profit
to Sales Ratio. This ratio reveals the firm's overall efficiency in operating the business. Net
profit Ratio is used to measure the relationship between net profit (either before or after taxes)
and sales. This ratio can be calculated by the following formula:
A STUDY ON WORKING CAPITAL MANAGEMENT
NEW HORIZON COLLEGE OF ENGINEERING Page | 52
Net profit after tax
Net profit ratio = ----------------------------------*100
Net sale
Net profit includes non-operating incomes and profits. Non-Operating Incomes such as
dividend received, interest on investment, profit on sales of fixed assets, commission received,
discount received. Profit or Sales Margin indicates margin available after deduction cost of
production, other operating expenses, and income tax from the sales revenue. Higher Net Profit
Ratio indicates the standard performance of the business concern.
Advantages
(1) This is the best measure of profitability and liquidity.
(2) It helps to measure overall operational efficiency of the business concern.
(3) It facilitates to make or buy decisions.
(4) It helps to determine the managerial efficiency to use a firm's resources to generate income
on its invested capital.
(5) Net profit Ratio is very much useful as a tool of investment evaluation
Return on investment ratio
This ratio is also called as ROL This ratio measures a return on the owner's or shareholders'
investment. This ratio establishes the relationship between net profit after interest and taxes
and the owner's investment. Usually this is calculated in percentage. This ratio, thus. can be
calculated as :
Net Profit (after interest and tax)
Return on Investment Ratio = ------------------------------------------*100
Shareholders' Fund (or) Investments
Advantages
(1) This ratio highlights the success of the business from the owner's point of view.
(2) It helps to measure an income on the shareholders' or proprietor's investments.
(3) This ratio helps to the management for important decisions making.
(4) It facilitates in determining efficiently handling of owner's investment.
Dividend payout ratio
This ratio highlights the relationship between payment of dividend on equity share capital and
the profits available after meeting tax and preference dividend. This ratio indicates the dividend
A STUDY ON WORKING CAPITAL MANAGEMENT
NEW HORIZON COLLEGE OF ENGINEERING Page | 53
policy adopted by the top management about utilization of divisible profit to pay dividend or
to retain or both. The ratio, thus, can be calculated as :
Equity Dividend
Dividend Payout Ratio = -----------------------------------------------*100
Net Profit after Tax and Preference Dividend
A STUDY ON WORKING CAPITAL MANAGEMENT
NEW HORIZON COLLEGE OF ENGINEERING Page | 54
CHAPTER 4
DATA ANALYSIS AND INTERPRETATION
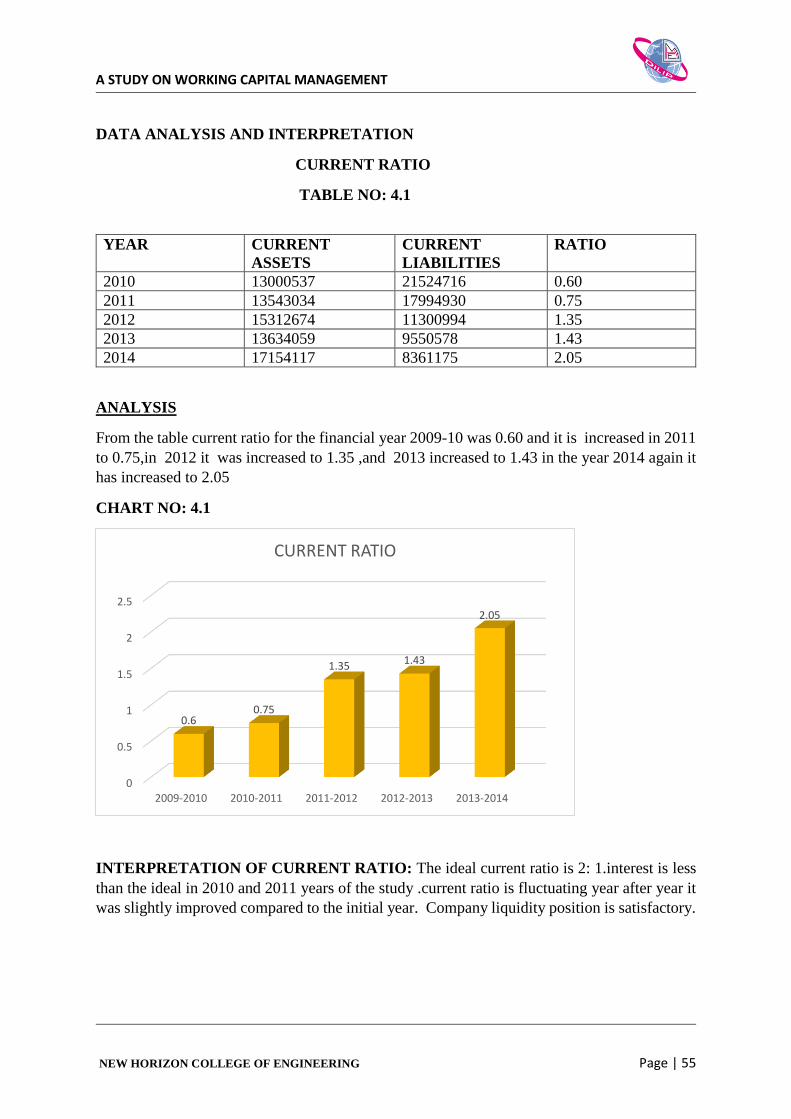
A STUDY ON WORKING CAPITAL MANAGEMENT
NEW HORIZON COLLEGE OF ENGINEERING Page | 55
DATA ANALYSIS AND INTERPRETATION
CURRENT RATIO
TABLE NO: 4.1
YEAR CURRENT
ASSETS
CURRENT
LIABILITIES
RATIO
2010 13000537 21524716 0.60
2011 13543034 17994930 0.75
2012 15312674 11300994 1.35
2013 13634059 9550578 1.43
2014 17154117 8361175 2.05
ANALYSIS
From the table current ratio for the financial year 2009-10 was 0.60 and it is increased in 2011
to 0.75,in 2012 it was increased to 1.35 ,and 2013 increased to 1.43 in the year 2014 again it
has increased to 2.05
CHART NO: 4.1
INTERPRETATION OF CURRENT RATIO: The ideal current ratio is 2: 1.interest is less
than the ideal in 2010 and 2011 years of the study .current ratio is fluctuating year after year it
was slightly improved compared to the initial year. Company liquidity position is satisfactory.
0
0.5
1
1.5
2
2.5
2009-2010 2010-2011 2011-2012 2012-2013 2013-2014
0.60.75
1.35 1.43
2.05
CURRENT RATIO
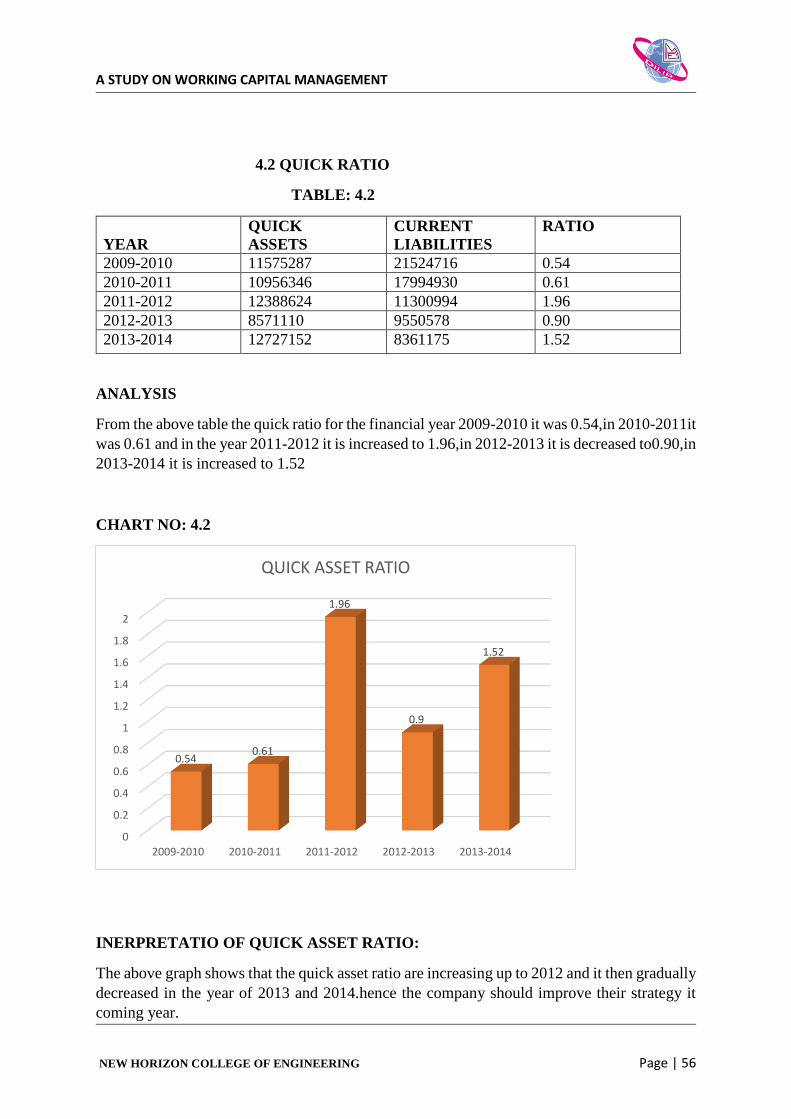
A STUDY ON WORKING CAPITAL MANAGEMENT
NEW HORIZON COLLEGE OF ENGINEERING Page | 56
4.2 QUICK RATIO
TABLE: 4.2
YEAR
QUICK
ASSETS
CURRENT
LIABILITIES
RATIO
2009-2010 11575287 21524716 0.54
2010-2011 10956346 17994930 0.61
2011-2012 12388624 11300994 1.96
2012-2013 8571110 9550578 0.90
2013-2014 12727152 8361175 1.52
ANALYSIS
From the above table the quick ratio for the financial year 2009-2010 it was 0.54,in 2010-2011it
was 0.61 and in the year 2011-2012 it is increased to 1.96,in 2012-2013 it is decreased to0.90,in
2013-2014 it is increased to 1.52
CHART NO: 4.2
INERPRETATIO OF QUICK ASSET RATIO:
The above graph shows that the quick asset ratio are increasing up to 2012 and it then gradually
decreased in the year of 2013 and 2014.hence the company should improve their strategy it
coming year.
0
0.2
0.4
0.6
0.8
1
1.2
1.4
1.6
1.8
2
2009-2010 2010-2011 2011-2012 2012-2013 2013-2014
0.540.61
1.96
0.9
1.52
QUICK ASSET RATIO
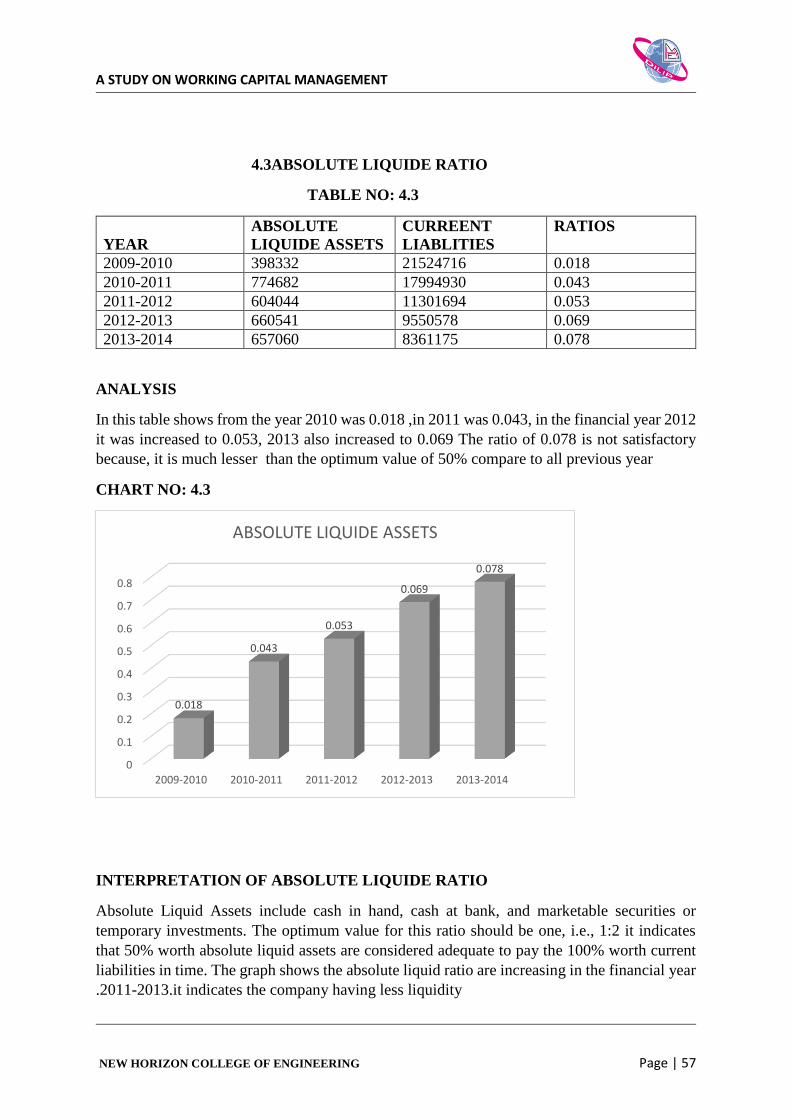
A STUDY ON WORKING CAPITAL MANAGEMENT
NEW HORIZON COLLEGE OF ENGINEERING Page | 57
4.3ABSOLUTE LIQUIDE RATIO
TABLE NO: 4.3
YEAR
ABSOLUTE
LIQUIDE ASSETS
CURREENT
LIABLITIES
RATIOS
2009-2010 398332 21524716 0.018
2010-2011 774682 17994930 0.043
2011-2012 604044 11301694 0.053
2012-2013 660541 9550578 0.069
2013-2014 657060 8361175 0.078
ANALYSIS
In this table shows from the year 2010 was 0.018 ,in 2011 was 0.043, in the financial year 2012
it was increased to 0.053, 2013 also increased to 0.069 The ratio of 0.078 is not satisfactory
because, it is much lesser than the optimum value of 50% compare to all previous year
CHART NO: 4.3
INTERPRETATION OF ABSOLUTE LIQUIDE RATIO
Absolute Liquid Assets include cash in hand, cash at bank, and marketable securities or
temporary investments. The optimum value for this ratio should be one, i.e., 1:2 it indicates
that 50% worth absolute liquid assets are considered adequate to pay the 100% worth current
liabilities in time. The graph shows the absolute liquid ratio are increasing in the financial year
.2011-2013.it indicates the company having less liquidity
0
0.1
0.2
0.3
0.4
0.5
0.6
0.7
0.8
2009-2010 2010-2011 2011-2012 2012-2013 2013-2014
0.018
0.043
0.053
0.069
0.078
ABSOLUTE LIQUIDE ASSETS
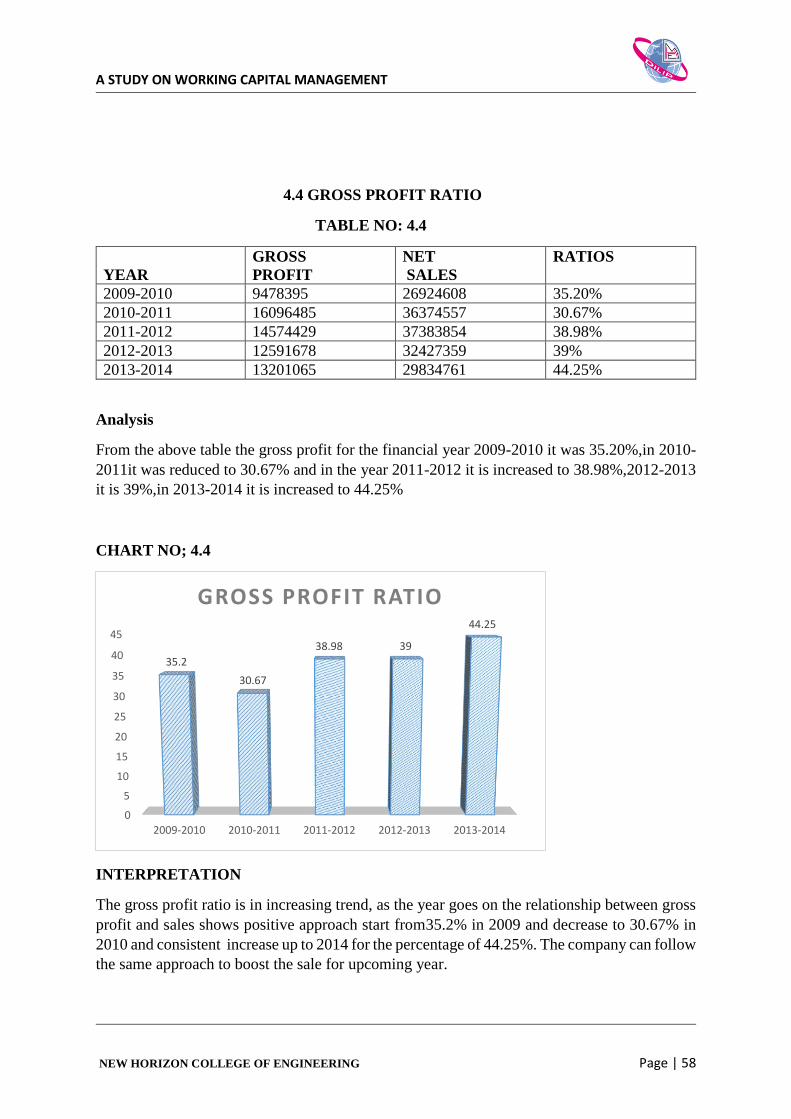
A STUDY ON WORKING CAPITAL MANAGEMENT
NEW HORIZON COLLEGE OF ENGINEERING Page | 58
4.4 GROSS PROFIT RATIO
TABLE NO: 4.4
YEAR
GROSS
PROFIT
NET
SALES
RATIOS
2009-2010 9478395 26924608 35.20%
2010-2011 16096485 36374557 30.67%
2011-2012 14574429 37383854 38.98%
2012-2013 12591678 32427359 39%
2013-2014 13201065 29834761 44.25%
Analysis
From the above table the gross profit for the financial year 2009-2010 it was 35.20%,in 2010-
2011it was reduced to 30.67% and in the year 2011-2012 it is increased to 38.98%,2012-2013
it is 39%,in 2013-2014 it is increased to 44.25%
CHART NO; 4.4
INTERPRETATION
The gross profit ratio is in increasing trend, as the year goes on the relationship between gross
profit and sales shows positive approach start from35.2% in 2009 and decrease to 30.67% in
2010 and consistent increase up to 2014 for the percentage of 44.25%. The company can follow
the same approach to boost the sale for upcoming year.
0
5
10
15
20
25
30
35
40
45
2009-2010 2010-2011 2011-2012 2012-2013 2013-2014
35.2
30.67
38.98 39
44.25
GROSS PROFIT RATIO
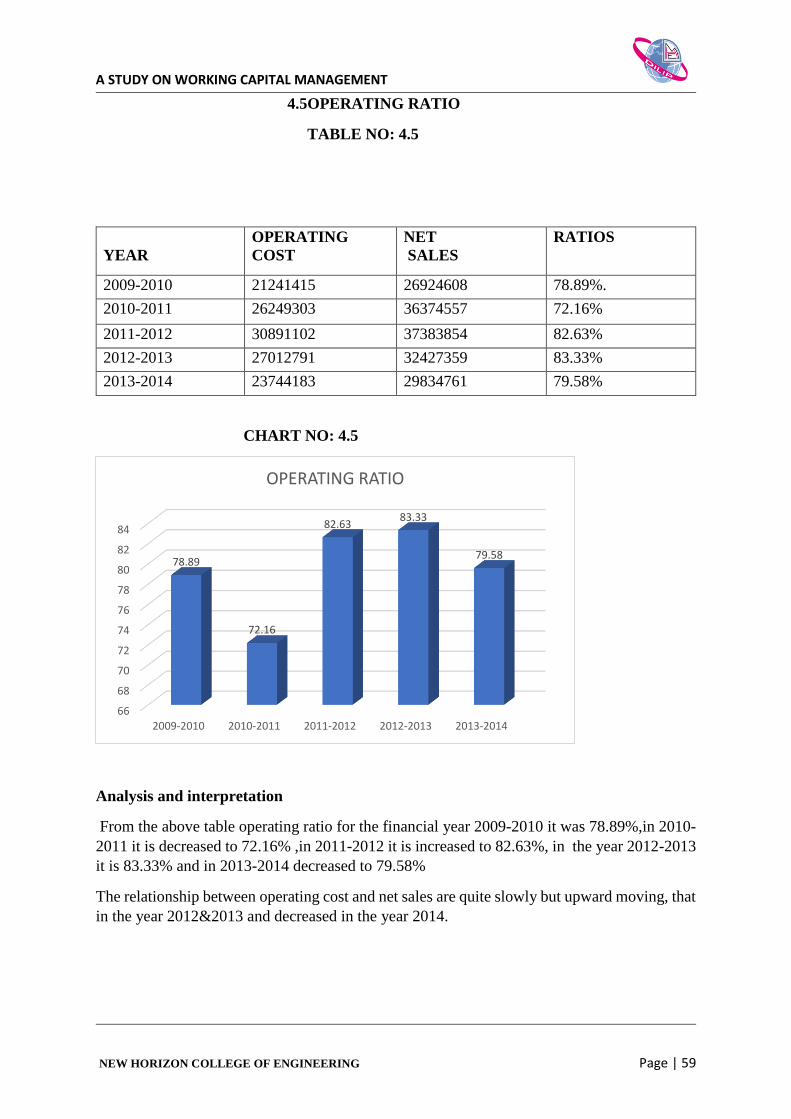
A STUDY ON WORKING CAPITAL MANAGEMENT
NEW HORIZON COLLEGE OF ENGINEERING Page | 59
4.5OPERATING RATIO
TABLE NO: 4.5
CHART NO: 4.5
Analysis and interpretation
From the above table operating ratio for the financial year 2009-2010 it was 78.89%,in 2010-
2011 it is decreased to 72.16% ,in 2011-2012 it is increased to 82.63%, in the year 2012-2013
it is 83.33% and in 2013-2014 decreased to 79.58%
The relationship between operating cost and net sales are quite slowly but upward moving, that
in the year 2012&2013 and decreased in the year 2014.
66
68
70
72
74
76
78
80
82
84
2009-2010 2010-2011 2011-2012 2012-2013 2013-2014
78.89
72.16
82.6383.33
79.58
OPERATING RATIO
YEAR
OPERATING
COST
NET
SALES
RATIOS
2009-2010 21241415 26924608 78.89%.
2010-2011 26249303 36374557 72.16%
2011-2012 30891102 37383854 82.63%
2012-2013 27012791 32427359 83.33%
2013-2014 23744183 29834761 79.58%
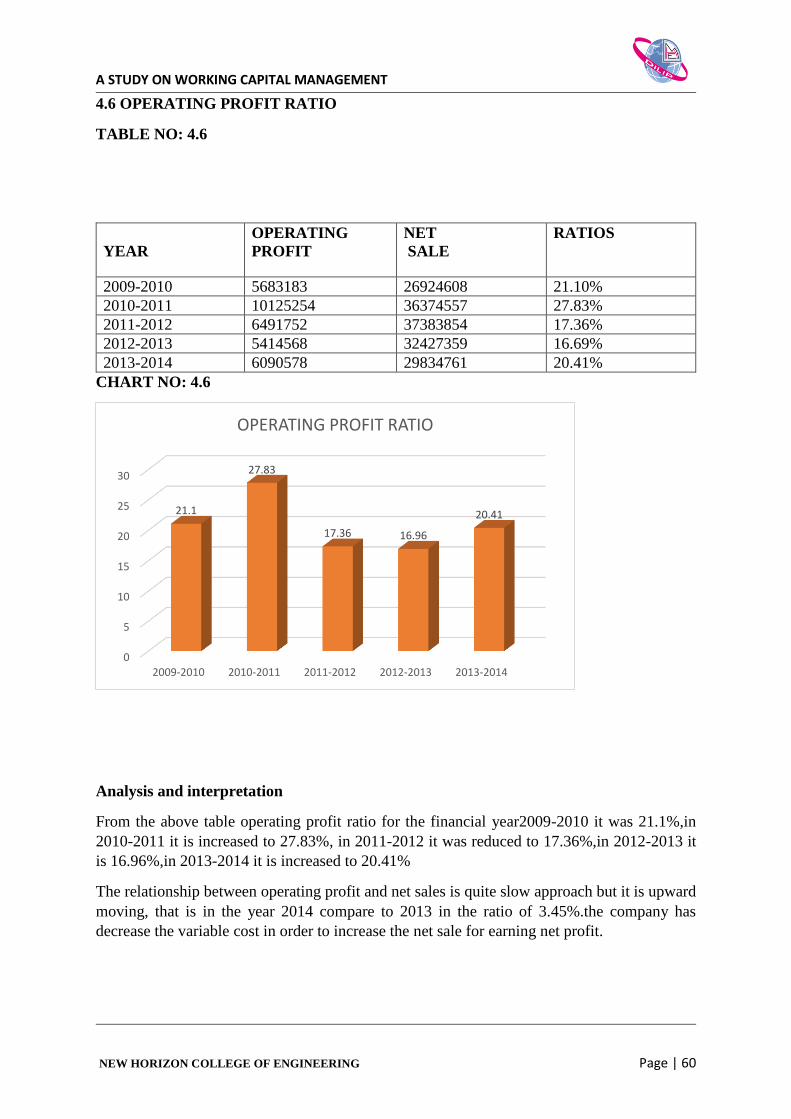
A STUDY ON WORKING CAPITAL MANAGEMENT
NEW HORIZON COLLEGE OF ENGINEERING Page | 60
4.6 OPERATING PROFIT RATIO
TABLE NO: 4.6
CHART NO: 4.6
Analysis and interpretation
From the above table operating profit ratio for the financial year2009-2010 it was 21.1%,in
2010-2011 it is increased to 27.83%, in 2011-2012 it was reduced to 17.36%,in 2012-2013 it
is 16.96%,in 2013-2014 it is increased to 20.41%
The relationship between operating profit and net sales is quite slow approach but it is upward
moving, that is in the year 2014 compare to 2013 in the ratio of 3.45%.the company has
decrease the variable cost in order to increase the net sale for earning net profit.
YEAR
OPERATING
PROFIT
NET
SALE
RATIOS
2009-2010 5683183 26924608 21.10%
2010-2011 10125254 36374557 27.83%
2011-2012 6491752 37383854 17.36%
2012-2013 5414568 32427359 16.69%
2013-2014 6090578 29834761 20.41%
0
5
10
15
20
25
30
2009-2010 2010-2011 2011-2012 2012-2013 2013-2014
21.1
27.83
17.36 16.96
20.41
OPERATING PROFIT RATIO
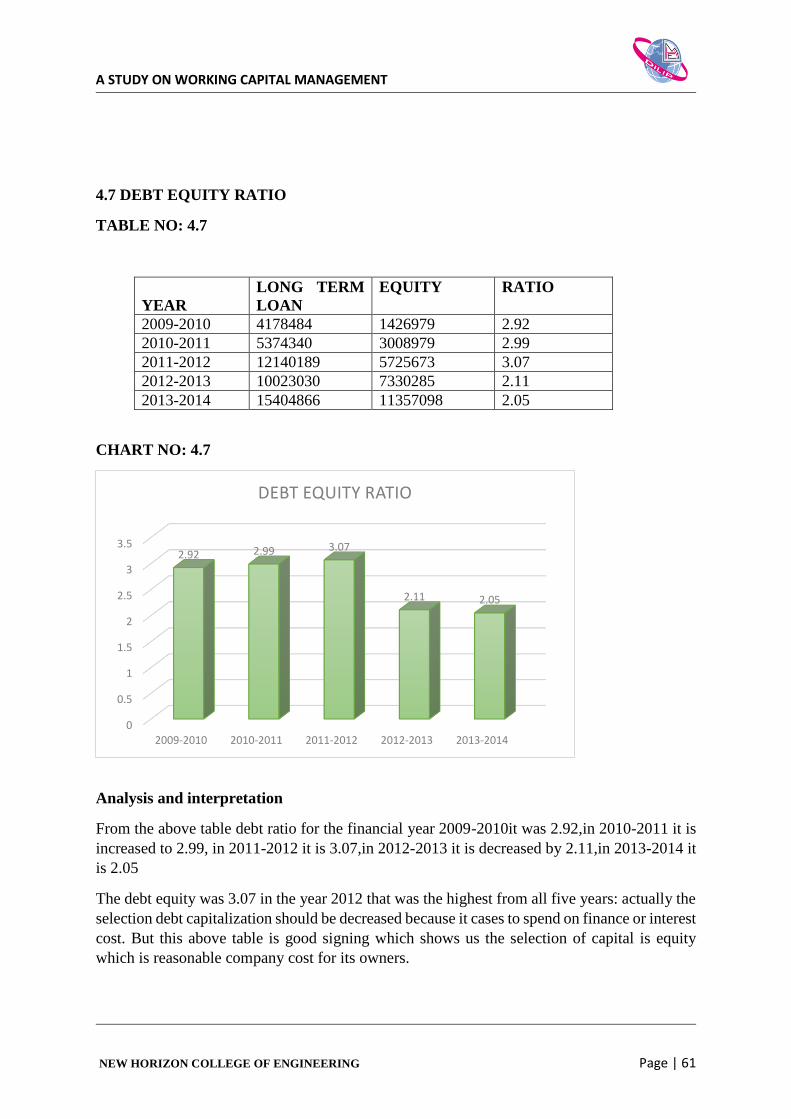
A STUDY ON WORKING CAPITAL MANAGEMENT
NEW HORIZON COLLEGE OF ENGINEERING Page | 61
4.7 DEBT EQUITY RATIO
TABLE NO: 4.7
YEAR
LONG TERM
LOAN
EQUITY RATIO
2009-2010 4178484 1426979 2.92
2010-2011 5374340 3008979 2.99
2011-2012 12140189 5725673 3.07
2012-2013 10023030 7330285 2.11
2013-2014 15404866 11357098 2.05
CHART NO: 4.7
Analysis and interpretation
From the above table debt ratio for the financial year 2009-2010it was 2.92,in 2010-2011 it is
increased to 2.99, in 2011-2012 it is 3.07,in 2012-2013 it is decreased by 2.11,in 2013-2014 it
is 2.05
The debt equity was 3.07 in the year 2012 that was the highest from all five years: actually the
selection debt capitalization should be decreased because it cases to spend on finance or interest
cost. But this above table is good signing which shows us the selection of capital is equity
which is reasonable company cost for its owners.
0
0.5
1
1.5
2
2.5
3
3.5
2009-2010 2010-2011 2011-2012 2012-2013 2013-2014
2.92 2.99 3.07
2.11 2.05
DEBT EQUITY RATIO
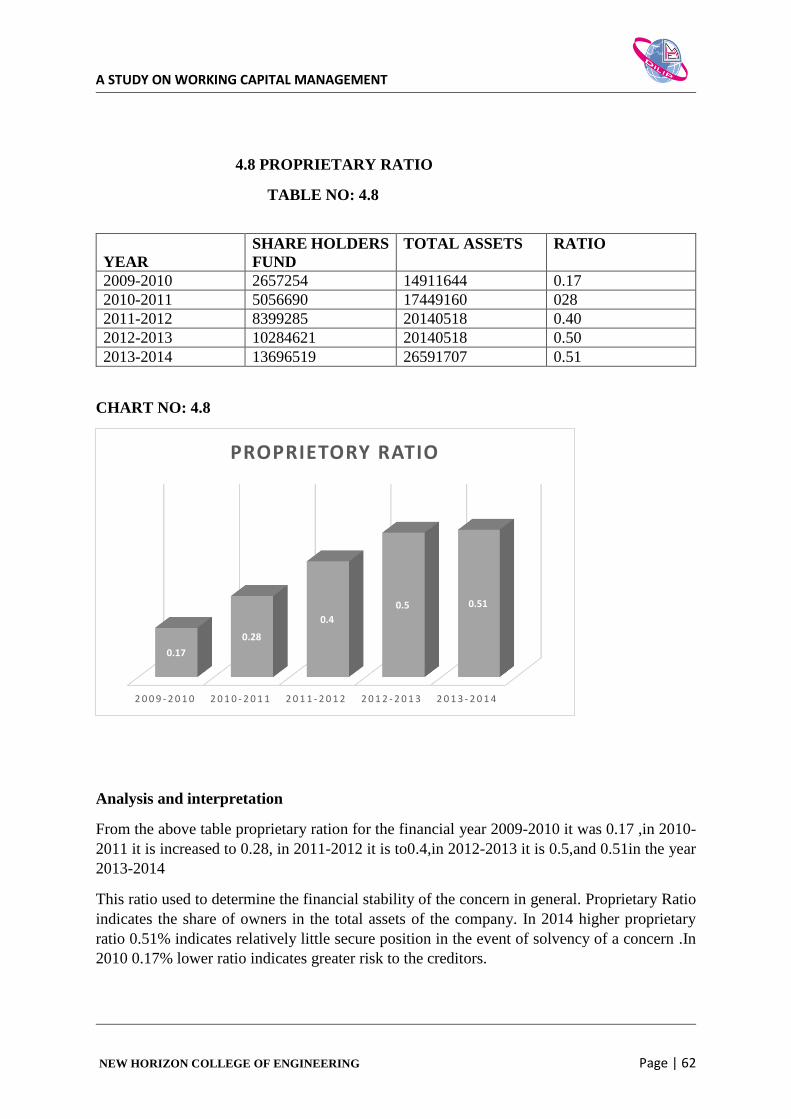
A STUDY ON WORKING CAPITAL MANAGEMENT
NEW HORIZON COLLEGE OF ENGINEERING Page | 62
4.8 PROPRIETARY RATIO
TABLE NO: 4.8
CHART NO: 4.8
Analysis and interpretation
From the above table proprietary ration for the financial year 2009-2010 it was 0.17 ,in 2010-
2011 it is increased to 0.28, in 2011-2012 it is to0.4,in 2012-2013 it is 0.5,and 0.51in the year
2013-2014
This ratio used to determine the financial stability of the concern in general. Proprietary Ratio
indicates the share of owners in the total assets of the company. In 2014 higher proprietary
ratio 0.51% indicates relatively little secure position in the event of solvency of a concern .In
2010 0.17% lower ratio indicates greater risk to the creditors.
2 0 0 9 - 2 0 1 0 2 0 1 0 - 2 0 1 1 2 0 1 1 - 2 0 1 2 2 0 1 2 - 2 0 1 3 2 0 1 3 - 2 0 1 4
0.17
0.28
0.4
0.5 0.51
PROPRIETORY RATIO
YEAR
SHARE HOLDERS
FUND
TOTAL ASSETS RATIO
2009-2010 2657254 14911644 0.17
2010-2011 5056690 17449160 028
2011-2012 8399285 20140518 0.40
2012-2013 10284621 20140518 0.50
2013-2014 13696519 26591707 0.51

A STUDY ON WORKING CAPITAL MANAGEMENT
NEW HORIZON COLLEGE OF ENGINEERING Page | 63
4.9CAPITAL GEARING RATIO
TABLE NO: 4.9
YEAR
EQUITY SHARE
CAPITAL
FIXED INTERST
BEARING FUNDS
RATIOS
2009-2010 2657254 4178484 0.64
2010-2011 5056690 8985090 0.56
2011-2012 8399285 17574451 0.48
2012-2013 10284621 15457292 0.67
2013-2014 13696519 23276628 0.59
CHART NO: 4.11
Analysis and interpretation
From the above table capital gearing ratio for the financial year 2009-2010 it was 0.64%,in
2010-2011 it is decreased by 0.56%, in 2011-2012 it was reduced to 0.48%,in 2012-2013 it is
increased to 0.67,in 2013-2014 it is 0.59%.
The above graph shows in the year 2013 high capital gearing ratio of 0.67 % indicates a
company is having large funds bearing fixed interest compare to 2011 &2012 and/or fixed
dividend as compared to equity share capital. A low capital gearing ratio of 2012&2013
represents equity share capital and other fixed interest bearing loans are less than equity share
capital. And 2014 decrease by 0.08%
0
0.1
0.2
0.3
0.4
0.5
0.6
0.7
2009-2010 2010-2011 2011-2012 2012-2013 2013-2014
0.64
0.56
0.48
0.67
0.59
CAPITAL GEARING RATIO
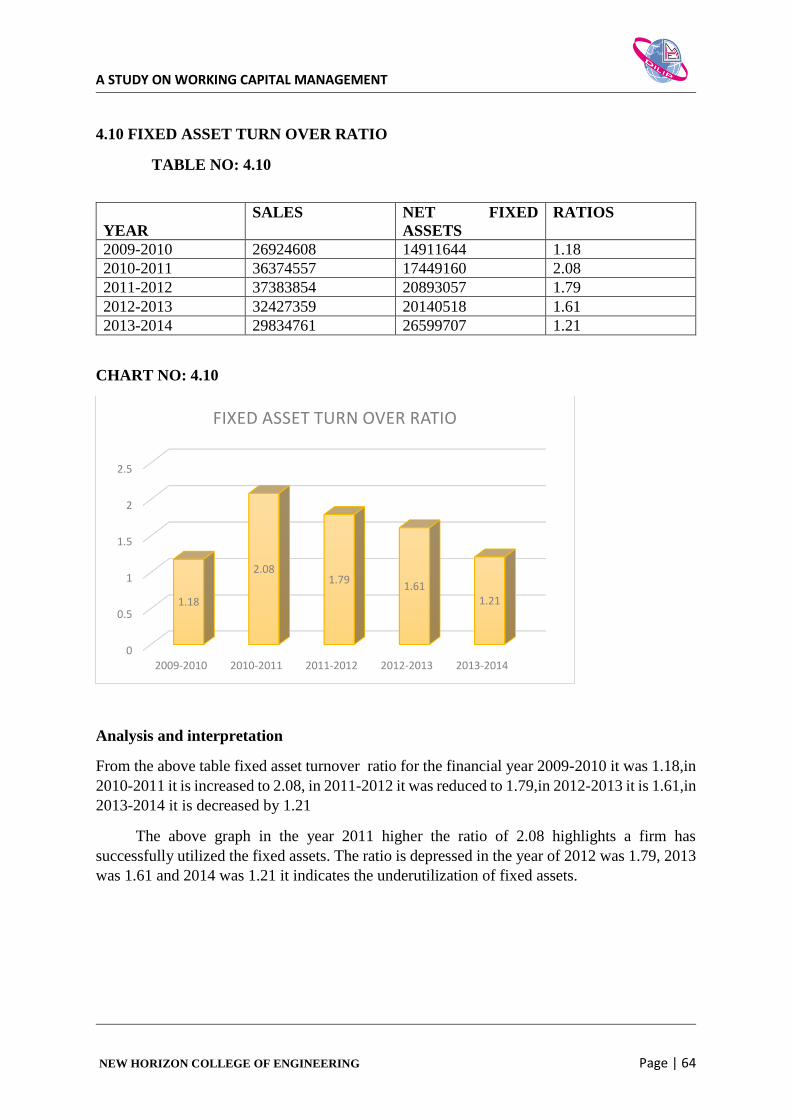
A STUDY ON WORKING CAPITAL MANAGEMENT
NEW HORIZON COLLEGE OF ENGINEERING Page | 64
4.10 FIXED ASSET TURN OVER RATIO
TABLE NO: 4.10
CHART NO: 4.10
Analysis and interpretation
From the above table fixed asset turnover ratio for the financial year 2009-2010 it was 1.18,in
2010-2011 it is increased to 2.08, in 2011-2012 it was reduced to 1.79,in 2012-2013 it is 1.61,in
2013-2014 it is decreased by 1.21
The above graph in the year 2011 higher the ratio of 2.08 highlights a firm has
successfully utilized the fixed assets. The ratio is depressed in the year of 2012 was 1.79, 2013
was 1.61 and 2014 was 1.21 it indicates the underutilization of fixed assets.
0
0.5
1
1.5
2
2.5
2009-2010 2010-2011 2011-2012 2012-2013 2013-2014
1.18
2.081.79
1.611.21
FIXED ASSET TURN OVER RATIO
YEAR
SALES NET FIXED
ASSETS
RATIOS
2009-2010 26924608 14911644 1.18
2010-2011 36374557 17449160 2.08
2011-2012 37383854 20893057 1.79
2012-2013 32427359 20140518 1.61
2013-2014 29834761 26599707 1.21
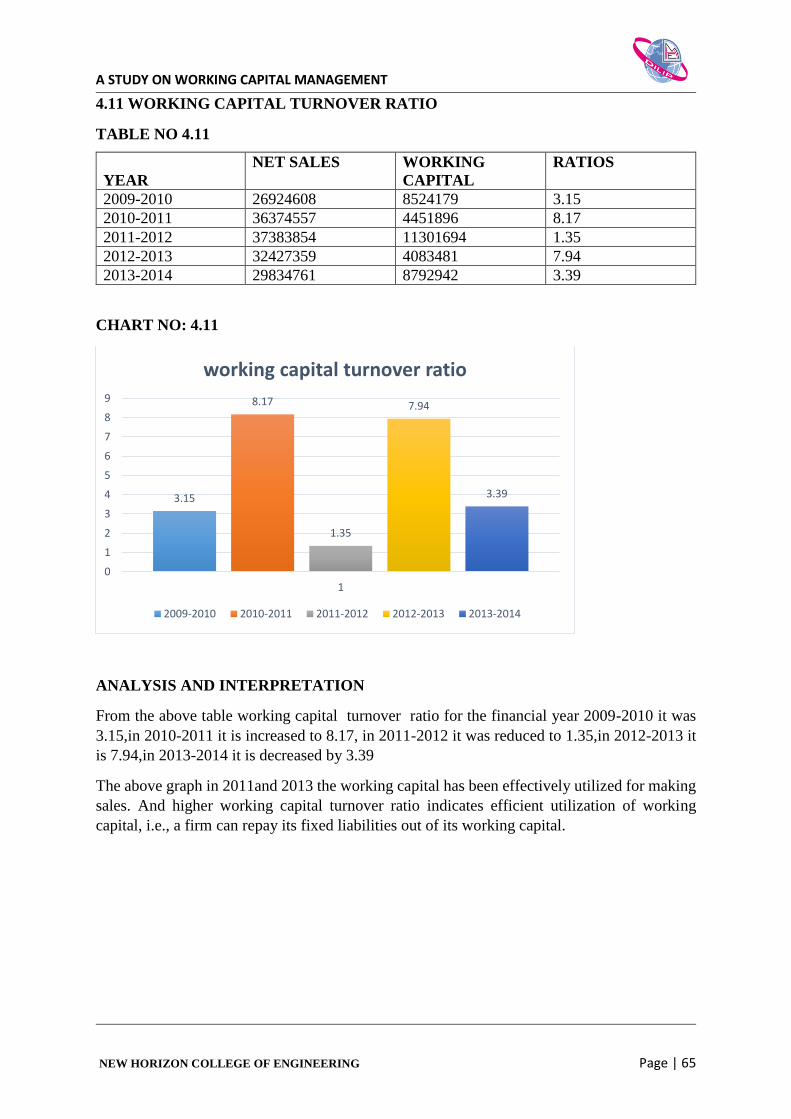
A STUDY ON WORKING CAPITAL MANAGEMENT
NEW HORIZON COLLEGE OF ENGINEERING Page | 65
4.11 WORKING CAPITAL TURNOVER RATIO
TABLE NO 4.11
CHART NO: 4.11
ANALYSIS AND INTERPRETATION
From the above table working capital turnover ratio for the financial year 2009-2010 it was
3.15,in 2010-2011 it is increased to 8.17, in 2011-2012 it was reduced to 1.35,in 2012-2013 it
is 7.94,in 2013-2014 it is decreased by 3.39
The above graph in 2011and 2013 the working capital has been effectively utilized for making
sales. And higher working capital turnover ratio indicates efficient utilization of working
capital, i.e., a firm can repay its fixed liabilities out of its working capital.
3.15
8.17
1.35
7.94
3.39
0
1
2
3
4
5
6
7
8
9
1
working capital turnover ratio
2009-2010 2010-2011 2011-2012 2012-2013 2013-2014
YEAR
NET SALES WORKING
CAPITAL
RATIOS
2009-2010 26924608 8524179 3.15
2010-2011 36374557 4451896 8.17
2011-2012 37383854 11301694 1.35
2012-2013 32427359 4083481 7.94
2013-2014 29834761 8792942 3.39

A STUDY ON WORKING CAPITAL MANAGEMENT
NEW HORIZON COLLEGE OF ENGINEERING Page | 66
CHAPTER 5
FINDINGS, SUGGESSTIONS AND CONCLUSIONS
A STUDY ON WORKING CAPITAL MANAGEMENT
NEW HORIZON COLLEGE OF ENGINEERING Page | 67
5.1FINDINGS
The current ratio of the company was 0.60:1 in the year of 2010 over a period of time
it has improved to 2.05:1that is a very good sign within 5 years come out and they have
reached the ideal ratio the company showing slowly the short term solvency position of
the company improved certain extent over a period of time the company recover it and
it has reached more than the ideal in fifth year 2014
Quick ratio shows that liquidity position of the organization is good it has improved
and over a period of time the company was able to recovered and now company
position is good
Absolute liquid ratio shows that optimum value for this ratio should be one, i.e., 1: 2. It
indicates that 50% worth absolute liquid assets are considered adequate to pay the 100%
worth current liabilities in time. But the organization ratio is relatively lower than one,
it represents that the company's day-to-day cash management is poor of cash to meet
its short-term obligations in time.
Gross profit ratio shows that increased except 2011 Higher Gross Profit Ratio of the
company I.e. 44.25%in 2014 is an indication that the firm has higher profitability. It
also reflects the effective standard of performance of firm's business.
Operating ratio shows it increased in all the year in 2014the ratio indicated that 79.58%
of the net sales have been consumed by cost of goods sold, administrative expenses,
selling and distribution expenses and other expenses. The remaining. 20.42% indicates
a firm's ability to cover the interest charges, income tax payable and dividend payable.
The debt equity ratio shows that the company is depending more on outsiders fund than
owners fund if the company not able to generate the revenue it will difficult for the
company to pay of interest on debt.
The company has to better its short term liquidity with in a period of 5 years, and has
landed the ideal policies.
Fixed assets turnover Ratio is used to measure the utilization of fixed assets.in 2010 it
was 1.18 times in 2014 it was 1.21times it indicates Higher the ratio highlights dilip
material handling equipment firm has successfully utilized the fixed assets.
Working capital turnover ratio shows that ratio highlights the effective utilization of
working capital with regard to sales. It shows the firm's liquidity position is good.
A STUDY ON WORKING CAPITAL MANAGEMENT
NEW HORIZON COLLEGE OF ENGINEERING Page | 68
5.2SUGGESTIONS
There are certain issues and flaws associated with Marketing Strategies, so in order to
implement it effectively and efficiently we would like to suggest certain recommendations to
the company.
Company should find some better distribution channels
The company should properly use their funds so that the working capital can be
improved
Innovate or perish is the slogan of every business, so the firm has to take innovative
steps to sustain in the market.
Marketing department should make efforts to make available all of the product varieties
in the depot norm wise
I recommend coordination between Production and Marketing department. By Market
research company should design products and services to suit the underlying
dimensions of quality service, So that a proper strategies forecast for each variety can
be maintained by the Marketing department
By giving advertisement it helps selling more products and maintain brand image of
the company.
A STUDY ON WORKING CAPITAL MANAGEMENT
NEW HORIZON COLLEGE OF ENGINEERING Page | 69
5.3CONCLUSIONS
Dilip material handling equipment’s largest handling equipment seller in Karnataka and
also tamilnadu. The high- end production technology of WIP is well acknowledge
among the handling equipment processing industries in Karnataka and tamilnadu.
The study was conducted to analyze the working capital management in dilip material
handling equipment’s. By using ratio analysis. The financial statement of the company
was analyzed and interrupted .by this study it is observed in that the liquidity position
of the company is satisfactory, as the company does not have standard working capital.
A major study of working capital management explains the
needs and scope of the same in the manufacturing industry. In effective provision can
do much to ensure the success of business while its sufficient management can leads to
loss or profits. A study of working capital is importance to external analysis of its close
relationship with the current day to day operation of the business. Thus it can be
conclude that all the precaution should be taken for effective management of working
capital.
Company is good in its products and follows strict quality maintenance. But company
is facing the problem of lack material and proper distribution network.
In overall company should take preventive measures to improve their working
capital for better growth company should rectify some issues.

A STUDY ON WORKING CAPITAL MANAGEMENT
NEW HORIZON COLLEGE OF ENGINEERING Page | 70
6.0BIBILIOGRAPHY
BOOKs
S.K Gupta and R.K Sharma, ‘financial management’, Kaylani publishers, New Delhi
I.M Pandey ‘financial management’, viksas publication, new Delhi
WEBSITES
Search engine WWW.GOOGLE .COM
www.diliplifttruck.com
www.investmentpedia.com
www.slideshare.com
www.wikipedia.com
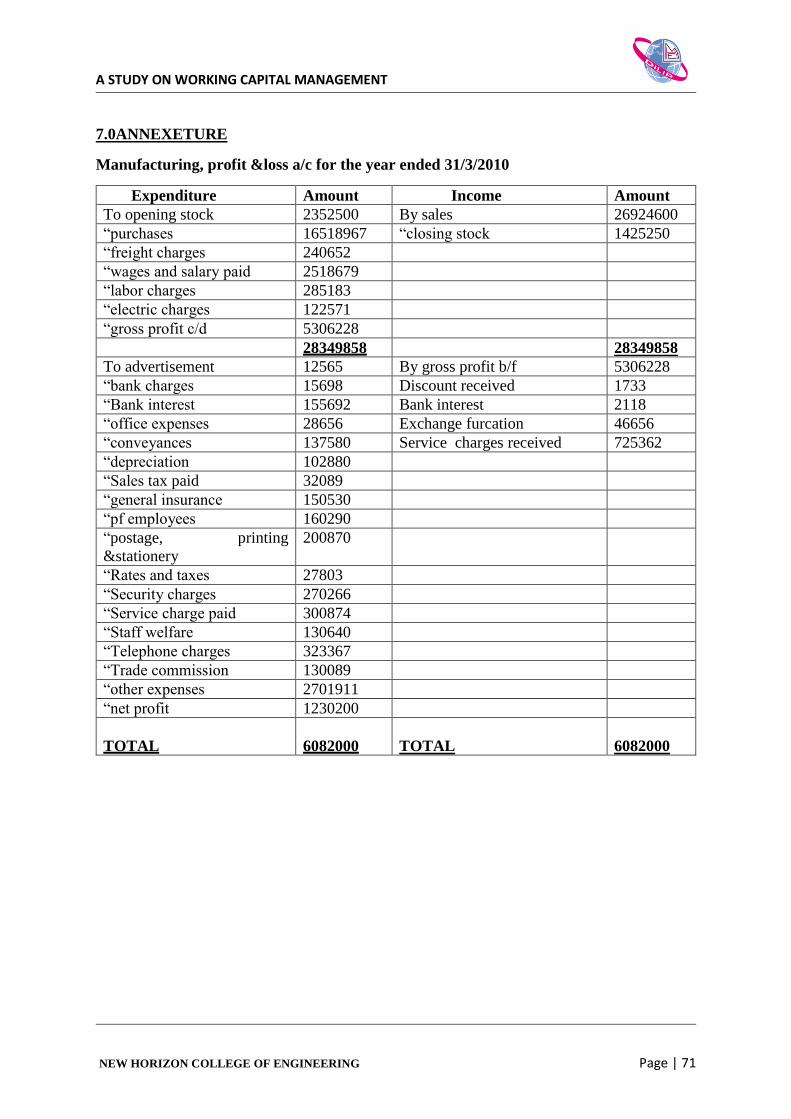
A STUDY ON WORKING CAPITAL MANAGEMENT
NEW HORIZON COLLEGE OF ENGINEERING Page | 71
7.0ANNEXETURE
Manufacturing, profit &loss a/c for the year ended 31/3/2010
Expenditure Amount Income Amount
To opening stock 2352500 By sales 26924600
“purchases 16518967 “closing stock 1425250
“freight charges 240652
“wages and salary paid 2518679
“labor charges 285183
“electric charges 122571
“gross profit c/d 5306228
28349858 28349858
To advertisement 12565 By gross profit b/f 5306228
“bank charges 15698 Discount received 1733
“Bank interest 155692 Bank interest 2118
“office expenses 28656 Exchange furcation 46656
“conveyances 137580 Service charges received 725362
“depreciation 102880
“Sales tax paid 32089
“general insurance 150530
“pf employees 160290
“postage, printing
&stationery
200870
“Rates and taxes 27803
“Security charges 270266
“Service charge paid 300874
“Staff welfare 130640
“Telephone charges 323367
“Trade commission 130089
“other expenses 2701911
“net profit 1230200
TOTAL
6082000
TOTAL
6082000

A STUDY ON WORKING CAPITAL MANAGEMENT
NEW HORIZON COLLEGE OF ENGINEERING Page | 72
Manufacturing, profit &loss a/c for the year ended 31/3/2011
Expenditure Amount Income Amount
To opening stock 1425250 By sales 36374557
“purchases 26378708 “closing stock 2586688
“freight charges 28974
“wages and salary paid 2354490
“labor charges 223281
“electric charges 179196
“gross profit c/d 9120780
38961245 38961246
To advertisement 189375 By gross profit b/f 9120780
“bank charges 135690 “Discount received 10282
“Bank interest 24985 “Bank interest received 10282
“office expenses 26940 “Exchange furcation 17862
“conveyances 13569 “Service charges received 722865
“depreciation 1085895 “Tender amount received 64400
“Sales tax paid 45569 “Subsidiary received 21442
“general insurance 165694
“pf employees 165560
“postage, printing
&stationery
185320
“Rates and taxes 33256
“Security charges 255620
“Service charge paid 318956
“Staff welfare 1455620
“Telephone charges 332565
“Trade commission 136897
“other expenses 3422764
“net profit 2047711
TOTAL
10040986
TOTAL
10040986
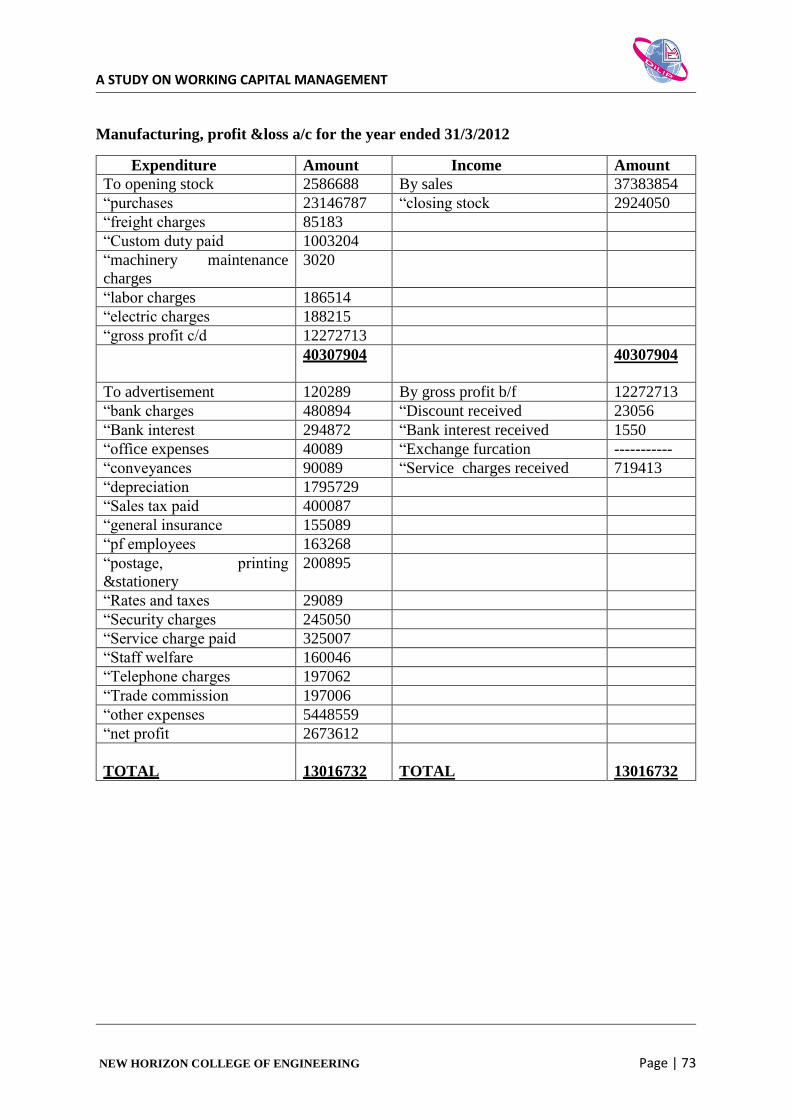
A STUDY ON WORKING CAPITAL MANAGEMENT
NEW HORIZON COLLEGE OF ENGINEERING Page | 73
Manufacturing, profit &loss a/c for the year ended 31/3/2012
Expenditure Amount Income Amount
To opening stock 2586688 By sales 37383854
“purchases 23146787 “closing stock 2924050
“freight charges 85183
“Custom duty paid 1003204
“machinery maintenance
charges
3020
“labor charges 186514
“electric charges 188215
“gross profit c/d 12272713
40307904 40307904
To advertisement 120289 By gross profit b/f 12272713
“bank charges 480894 “Discount received 23056
“Bank interest 294872 “Bank interest received 1550
“office expenses 40089 “Exchange furcation -----------
“conveyances 90089 “Service charges received 719413
“depreciation 1795729
“Sales tax paid 400087
“general insurance 155089
“pf employees 163268
“postage, printing
&stationery
200895
“Rates and taxes 29089
“Security charges 245050
“Service charge paid 325007
“Staff welfare 160046
“Telephone charges 197062
“Trade commission 197006
“other expenses 5448559
“net profit 2673612
TOTAL
13016732
TOTAL
13016732
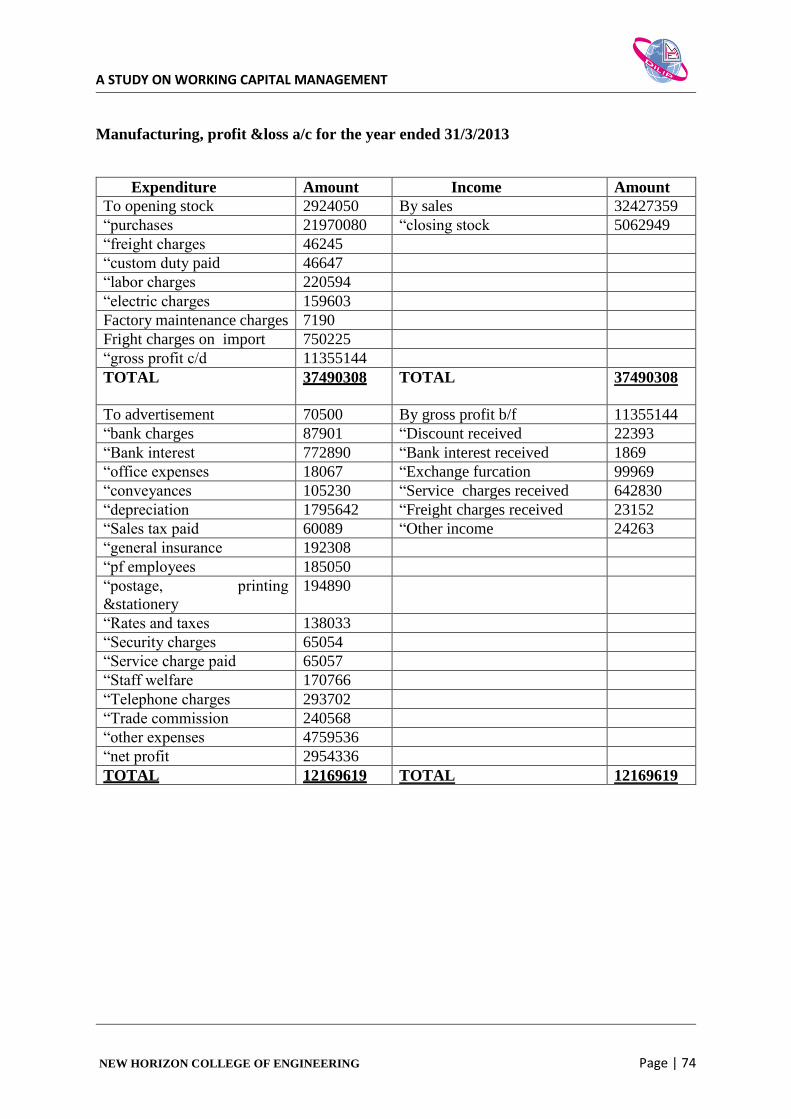
A STUDY ON WORKING CAPITAL MANAGEMENT
NEW HORIZON COLLEGE OF ENGINEERING Page | 74
Manufacturing, profit &loss a/c for the year ended 31/3/2013
Expenditure Amount Income Amount
To opening stock 2924050 By sales 32427359
“purchases 21970080 “closing stock 5062949
“freight charges 46245
“custom duty paid 46647
“labor charges 220594
“electric charges 159603
Factory maintenance charges 7190
Fright charges on import 750225
“gross profit c/d 11355144
TOTAL
37490308 TOTAL 37490308
To advertisement 70500 By gross profit b/f 11355144
“bank charges 87901 “Discount received 22393
“Bank interest 772890 “Bank interest received 1869
“office expenses 18067 “Exchange furcation 99969
“conveyances 105230 “Service charges received 642830
“depreciation 1795642 “Freight charges received 23152
“Sales tax paid 60089 “Other income 24263
“general insurance 192308
“pf employees 185050
“postage, printing
&stationery
194890
“Rates and taxes 138033
“Security charges 65054
“Service charge paid 65057
“Staff welfare 170766
“Telephone charges 293702
“Trade commission 240568
“other expenses 4759536
“net profit 2954336
TOTAL 12169619 TOTAL 12169619
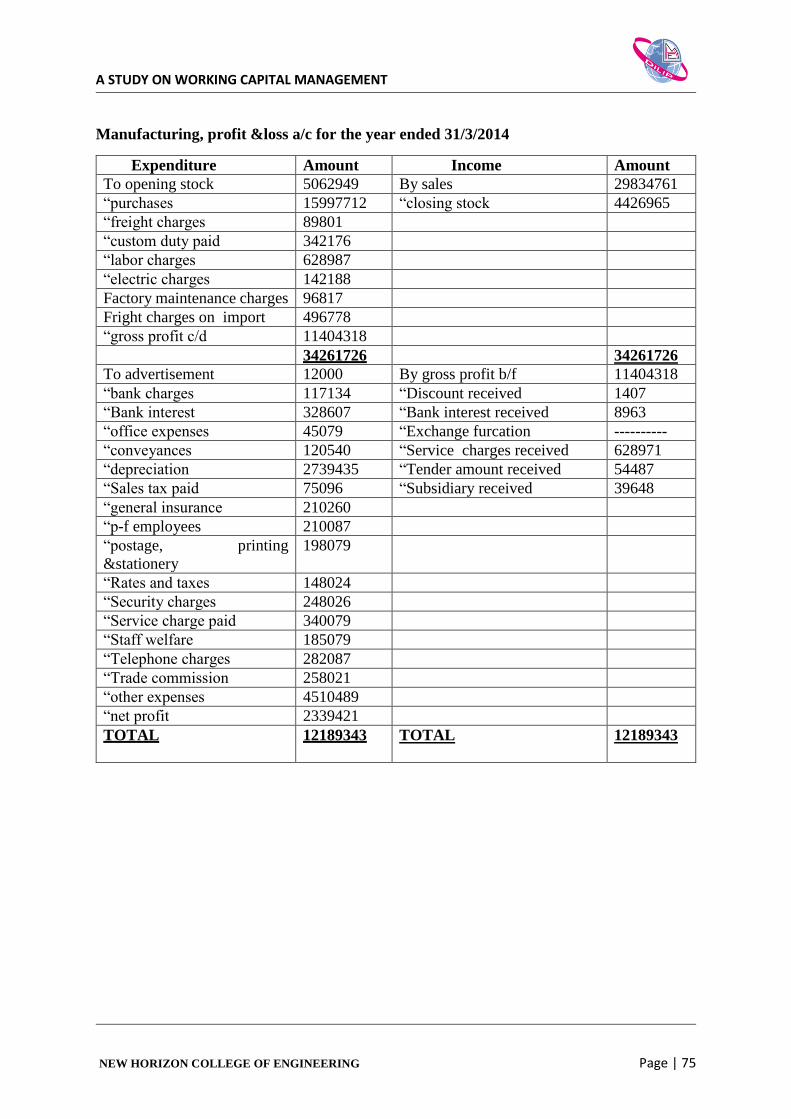
A STUDY ON WORKING CAPITAL MANAGEMENT
NEW HORIZON COLLEGE OF ENGINEERING Page | 75
Manufacturing, profit &loss a/c for the year ended 31/3/2014
Expenditure Amount Income Amount
To opening stock 5062949 By sales 29834761
“purchases 15997712 “closing stock 4426965
“freight charges 89801
“custom duty paid 342176
“labor charges 628987
“electric charges 142188
Factory maintenance charges 96817
Fright charges on import 496778
“gross profit c/d 11404318
34261726 34261726
To advertisement 12000 By gross profit b/f 11404318
“bank charges 117134 “Discount received 1407
“Bank interest 328607 “Bank interest received 8963
“office expenses 45079 “Exchange furcation ----------
“conveyances 120540 “Service charges received 628971
“depreciation 2739435 “Tender amount received 54487
“Sales tax paid 75096 “Subsidiary received 39648
“general insurance 210260
“p-f employees 210087
“postage, printing
&stationery
198079
“Rates and taxes 148024
“Security charges 248026
“Service charge paid 340079
“Staff welfare 185079
“Telephone charges 282087
“Trade commission 258021
“other expenses 4510489
“net profit 2339421
TOTAL
12189343 TOTAL 12189343
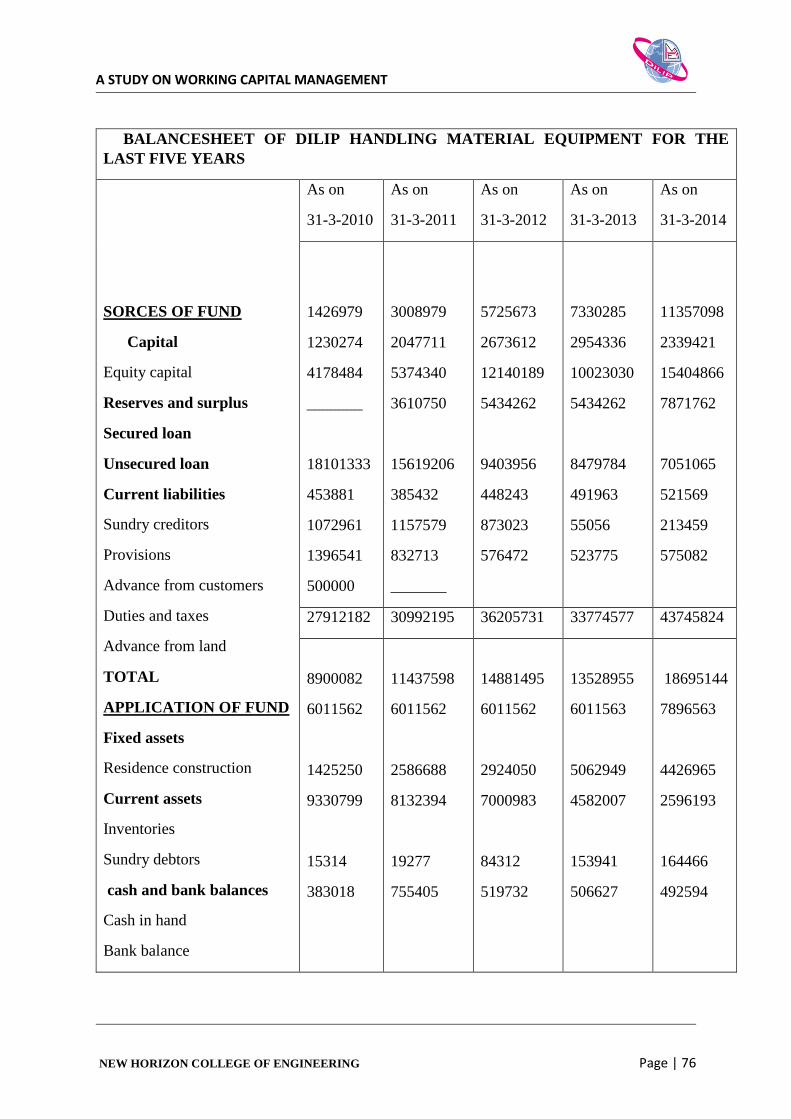
A STUDY ON WORKING CAPITAL MANAGEMENT
NEW HORIZON COLLEGE OF ENGINEERING Page | 76
BALANCESHEET OF DILIP HANDLING MATERIAL EQUIPMENT FOR THE
LAST FIVE YEARS
SORCES OF FUND
Capital
Equity capital
Reserves and surplus
Secured loan
Unsecured loan
Current liabilities
Sundry creditors
Provisions
Advance from customers
Duties and taxes
Advance from land
TOTAL
APPLICATION OF FUND
Fixed assets
Residence construction
Current assets
Inventories
Sundry debtors
cash and bank balances
Cash in hand
Bank balance
As on
31-3-2010
As on
31-3-2011
As on
31-3-2012
As on
31-3-2013
As on
31-3-2014
1426979
1230274
4178484
_______
18101333
453881
1072961
1396541
500000
3008979
2047711
5374340
3610750
15619206
385432
1157579
832713
_______
5725673
2673612
12140189
5434262
9403956
448243
873023
576472
7330285
2954336
10023030
5434262
8479784
491963
55056
523775
11357098
2339421
15404866
7871762
7051065
521569
213459
575082
27912182 30992195 36205731 33774577 43745824
8900082
6011562
1425250
9330799
15314
383018
11437598
6011562
2586688
8132394
19277
755405
14881495
6011562
2924050
7000983
84312
519732
13528955
6011563
5062949
4582007
153941
506627
18695144
7896563
4426965
2596193
164466
492594
Top Related
Copyright © 2022 FDOKUMEN

