


Bahasa
Halaman
Hukum

GREENARCS – GREEN ARCHITECTURE AND ARTS ONLINE MAGAZINE (ENGLISH). YEAR 1 2014
GREENARCS – Green Architecture and Arts Online Academy. http://greenarcs.com 1
Moossavi, Seyed Morteza. (2014). Adaptive Thermal Comfort Standard for Delhi. GREENARCS –
Green Architecture and Arts Online Magazine (English), Year 1, http://greenarcs.com/?p=1457
Adaptive Thermal Comfort Standard for Delhi
Seyed Morteza Moossavi
(Ph.D. Scholar of Architecture, M.D. Arch.)
Architecture and Ekistics Department
Jamia Millia Islamia, New Delhi
_________________________________________
Keywords: Architecture, Green Architecture, Human Thermal Comfort, Adaptive Thermal Comfort,
Adaptive Comfort Model, Delhi, New Delhi, Adaptive Thermal Comfort for Delhi.
Abstract
Metropolitan Delhi with a population of 16 million, and is rapidly urbanizing with a
3.85 percent annual growth rate over the 1990s is extreme in nature and Delhi
features an atypical version of the composite climate, between semi-arid and
subtropical. Aproximately 50% of Indian area has composite climate condition like as
Delhi. So if we can find a thermal comfort standard with a tolerance, it can be
useable for all of this area.
According to climate of India, Indian nature-oriented people tend to use natural
energies. Because of Indian culture and nature and energy problem of India, is
certain that adaptive thermal comfort model that allows control over natural
ventilation to inhabitants, is suitable and useful for India and Delhi. So this article
tries to achieve and present an adaptive thermal comfort standard for Delhi.
Introduction
Delhi, the capital of India, is the third largest city of India. As of July 2007, the
National Capital Territory of Delhi comprises nine districts, 27 tehsils, 59 census
towns, 300 villages and three statutory towns – the Municipal Corporation of Delhi
(MCD); the New Delhi Municipal Committee (NDMC); and the Delhi Cantonment
Board (DCB). Delhi is spread over an area of 1483 sq. kilometers with 216 meters
elevation at sea level.1
1 Delhicapital Website, 2012
GREENARCS – GREEN ARCHITECTURE AND ARTS ONLINE MAGAZINE (ENGLISH). YEAR 1 2014
GREENARCS – Green Architecture and Arts Online Academy. http://greenarcs.com 2
Metropolitan Delhi has a population of 16 million, and is rapidly urbanizing with a
3.85 percent annual growth rate over the 1990s amounting to half a million additional
inhabitants each year.2
Delhi is located at 23.38°N Latitude and 77.13°E longitude, with 216 meters
elevation at sea level and lies in northern India.
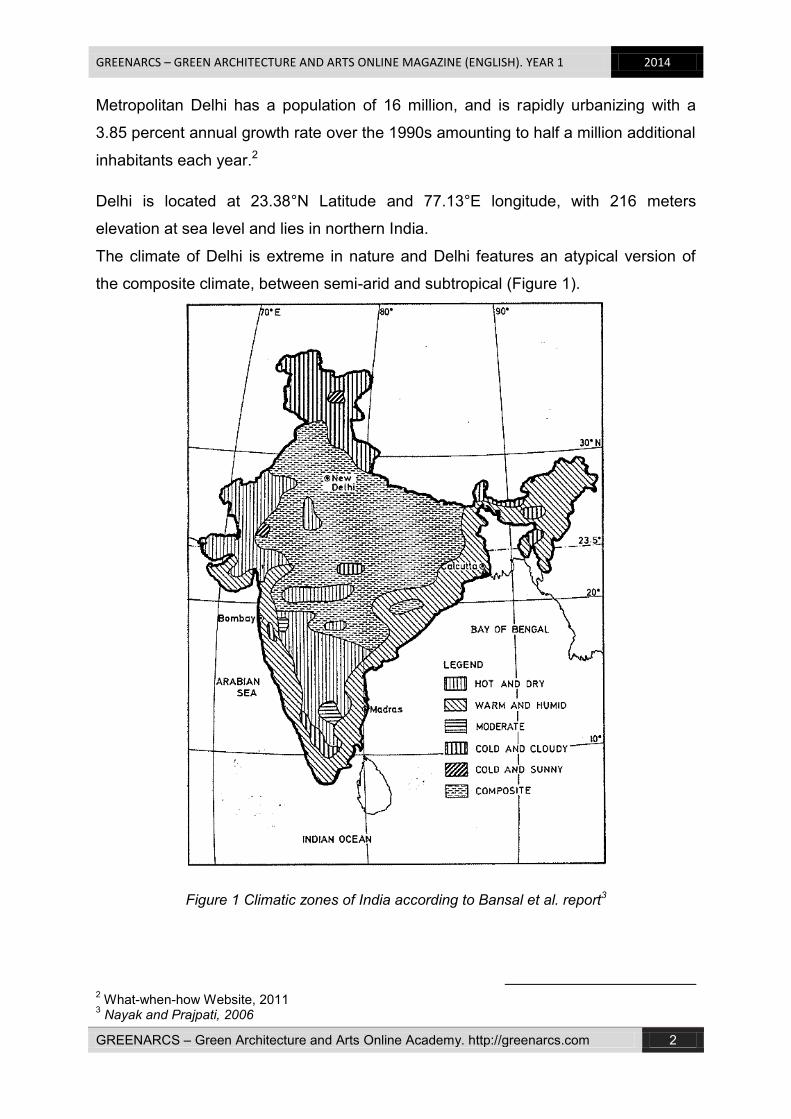
The climate of Delhi is extreme in nature and Delhi features an atypical version of
the composite climate, between semi-arid and subtropical (Figure 1).
Figure 1 Climatic zones of India according to Bansal et al. report3
2 What-when-how Website, 2011
3 Nayak and Prajpati, 2006
GREENARCS – GREEN ARCHITECTURE AND ARTS ONLINE MAGAZINE (ENGLISH). YEAR 1 2014
GREENARCS – Green Architecture and Arts Online Academy. http://greenarcs.com 3
Summers can be unbearable with temperatures hovering around 25°C to 46°C. Delhi
receives 75% of rainfall during these three months. October is somewhat tolerable
with temperatures averaging 33°C and minimal rainfall and humidity. Cottons are the
best bet to beat the Delhi heat. November to end of March is the best time in Delhi
with temperatures averaging around 21°C to 30°C during the day and can fall to 2°C
to 5°C minimums during the night.4
As it is observed in Figure 1, about 50% of Indian area has composite climate
condition like as Delhi. So if we can present a thermal comfort standard with a
tolerance, it can be useable for this area. This article tries to achieve this aim.
Literature Review
National Building Code of India (NBC) 2005 has determined range of human thermal
comfort between 25ºC to 30ºC with optimum condition at 27.5ºC.5 But in this code,
no information about the access method and the standard is not provided. Another
fundamental problem is that the standard range is very limited. This does not have in
consistent to principles of passive and natural ventilation that demand a wider range
of human thermal comfort point. This standard seems to be appropriate for active
building system.
The other hand research field of thermal comfort for India and especially the city of
Delhi is very limited. Mahadiv Indraganti and J. K. Nayak have done the most
important researches in this field.
Indraganti in his research, " Thermal comfort in naturally ventilated apartments in
summer: Findings from a field study in Hyderabad, India", has achieved results for
the entire range of India based on adoptive model and focus on Hyderabad city. His
used model in research is Fergus Nicol model. Due to deferent climatic condition of
Delhi, this study cannot be invoked. Thermal comfort range proposed in this study is
26ºC to 32ºC. So it is above the range of building code of India and it is clear that
more study in this field is necessary.
J. K. Nayak in his study, "Hand book on Energy Conscious Buildings", has provided
bioclimatic graphs in several cities of India including Delhi. According to provided
design techniques for micro-climates of India, this research is important. But it is very
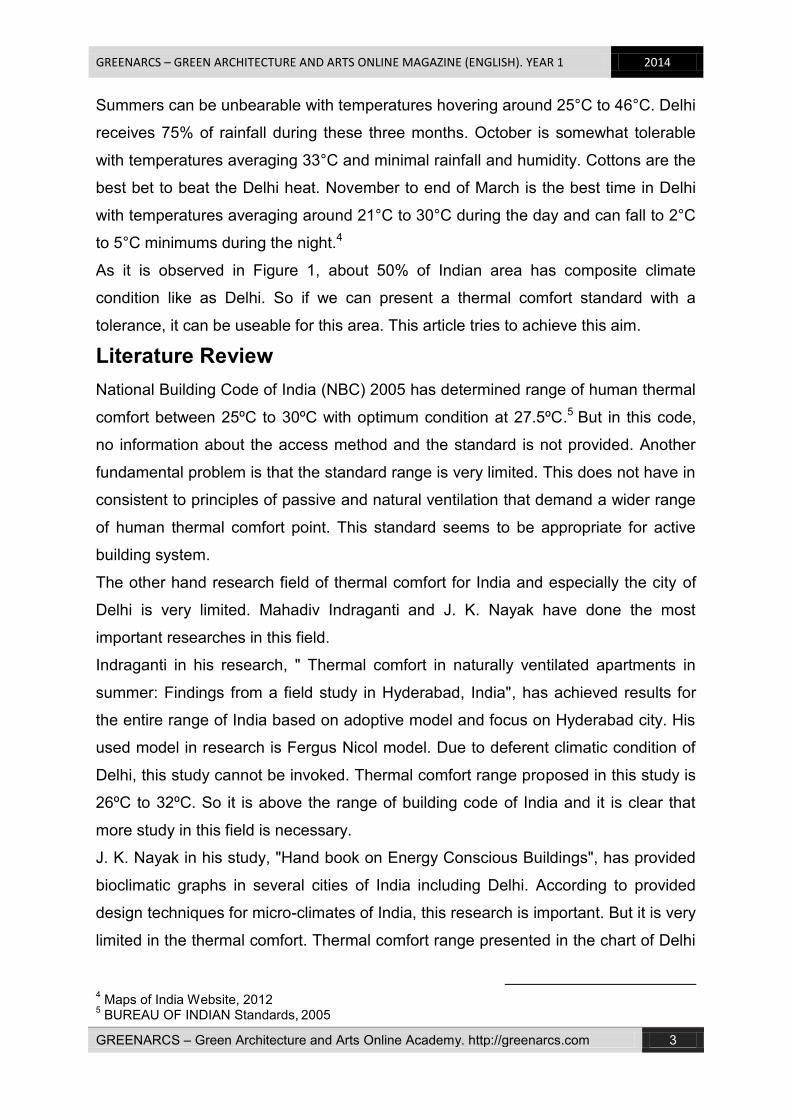
limited in the thermal comfort. Thermal comfort range presented in the chart of Delhi
4 Maps of India Website, 2012
5 BUREAU OF INDIAN Standards,
2005
GREENARCS – GREEN ARCHITECTURE AND ARTS ONLINE MAGAZINE (ENGLISH). YEAR 1 2014
GREENARCS – Green Architecture and Arts Online Academy. http://greenarcs.com 4
in this study is between 21.5ºC to 27ºC. As can be seen it is quite differently and
lower than other presented ranges in other studies (Figure 2).
74 J=January, F=February, MH=March, AL=April, My=May, JE=June, JY=July, AT=August,
S=September, O=October, N=November, D=December
Figure 2 Bioclimatic chart of New Delhi 6
Other studies have been done are very limited or related to buildings with central
ventilation systems and are not useful in this research.
Methods
Thermal Comfort: “that condition of mind that expresses satisfaction with the thermal
environment”.7
6 Nayak and Prajapati, 2006
7 Dunn, Brager, Brown et al., 2004
GREENARCS – GREEN ARCHITECTURE AND ARTS ONLINE MAGAZINE (ENGLISH). YEAR 1 2014
GREENARCS – Green Architecture and Arts Online Academy. http://greenarcs.com 5
Because there are large variations, both physiologically and psychologically, from
person to person, it is difficult to satisfy everyone in a space. The environmental
conditions required for comfort are not the same for everyone.
In general, people naturally adapt and may also make various adjustments to
themselves and their surroundings to reduce discomfort and physiological strain. It
has been observed that, through adaptive actions, an acceptable degree of comfort
in residences and offices is possible over a range of air temperatures from about 17
to 31°C.8
According to climate of India, Indian nature-oriented people tend to use natural
energies. So because of Indian culture and nature and energy problem of India, is
certain that adaptive thermal comfort model that allows control over natural
ventilation to inhabitants, is suitable for India and Delhi.
On the other hand according to study field of this research that is passive building
design, it was preferred to the use adoptive thermal comfort model. In this model, the
latest research presented by Fergus Nicol and J. S. Brager were considered. In the
last section about these thermal comfort models were discussed and the equations
were presented.
As J. S. Brager and R. De Dear study is based on studies from 160 buildings located
in most places in the world especially south-east Asia and ASHRAE has developed
this model, this model was preferred to use.
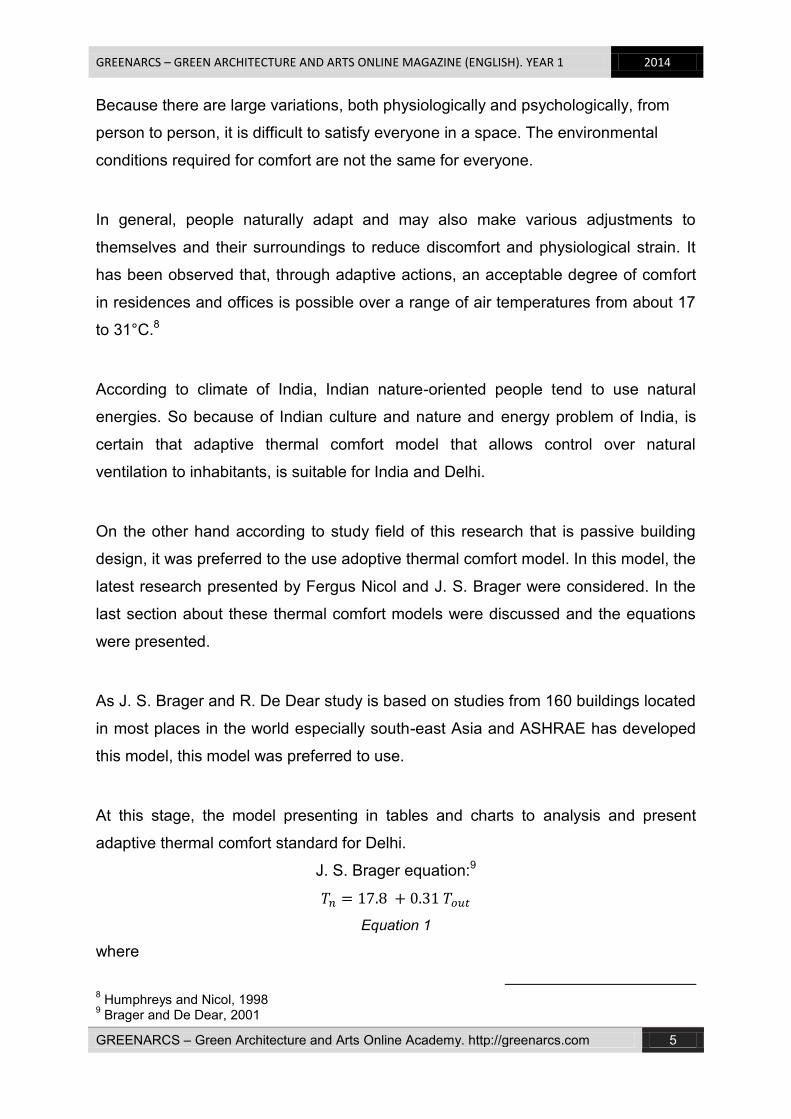
At this stage, the model presenting in tables and charts to analysis and present
adaptive thermal comfort standard for Delhi.
J. S. Brager equation:9
Equation 1
where
8 Humphreys and Nicol, 1998
9 Brager and De Dear, 2001
GREENARCS – GREEN ARCHITECTURE AND ARTS ONLINE MAGAZINE (ENGLISH). YEAR 1 2014
GREENARCS – Green Architecture and Arts Online Academy. http://greenarcs.com 6
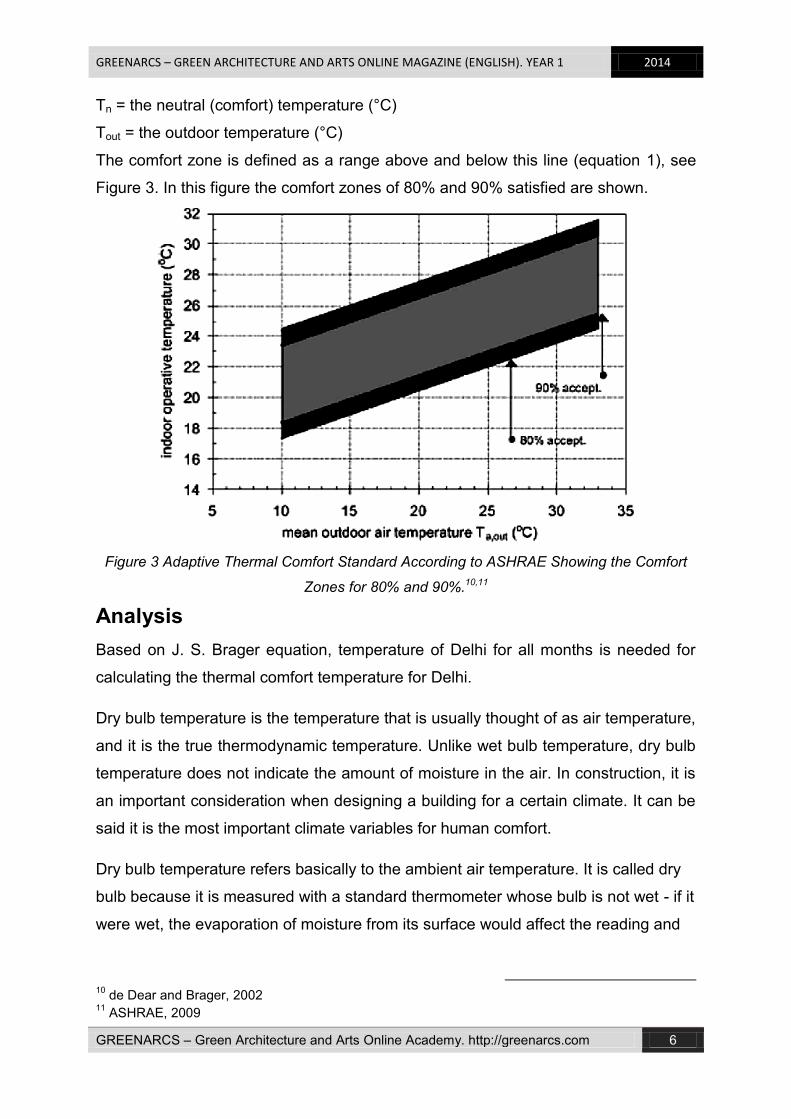
Tn = the neutral (comfort) temperature (°C)
Tout = the outdoor temperature (°C)
The comfort zone is defined as a range above and below this line (equation 1), see
Figure 3. In this figure the comfort zones of 80% and 90% satisfied are shown.
Figure 3 Adaptive Thermal Comfort Standard According to ASHRAE Showing the Comfort
Zones for 80% and 90%.10,11
Analysis
Based on J. S. Brager equation, temperature of Delhi for all months is needed for
calculating the thermal comfort temperature for Delhi.
Dry bulb temperature is the temperature that is usually thought of as air temperature,
and it is the true thermodynamic temperature. Unlike wet bulb temperature, dry bulb
temperature does not indicate the amount of moisture in the air. In construction, it is
an important consideration when designing a building for a certain climate. It can be
said it is the most important climate variables for human comfort.
Dry bulb temperature refers basically to the ambient air temperature. It is called dry
bulb because it is measured with a standard thermometer whose bulb is not wet - if it
were wet, the evaporation of moisture from its surface would affect the reading and
10
de Dear and Brager, 2002 11
ASHRAE, 2009
GREENARCS – GREEN ARCHITECTURE AND ARTS ONLINE MAGAZINE (ENGLISH). YEAR 1 2014
GREENARCS – Green Architecture and Arts Online Academy. http://greenarcs.com 7
give something closer to the wet bulb temperature. In weather data terms, dry bulb
temperature refers to the outdoor air temperature.
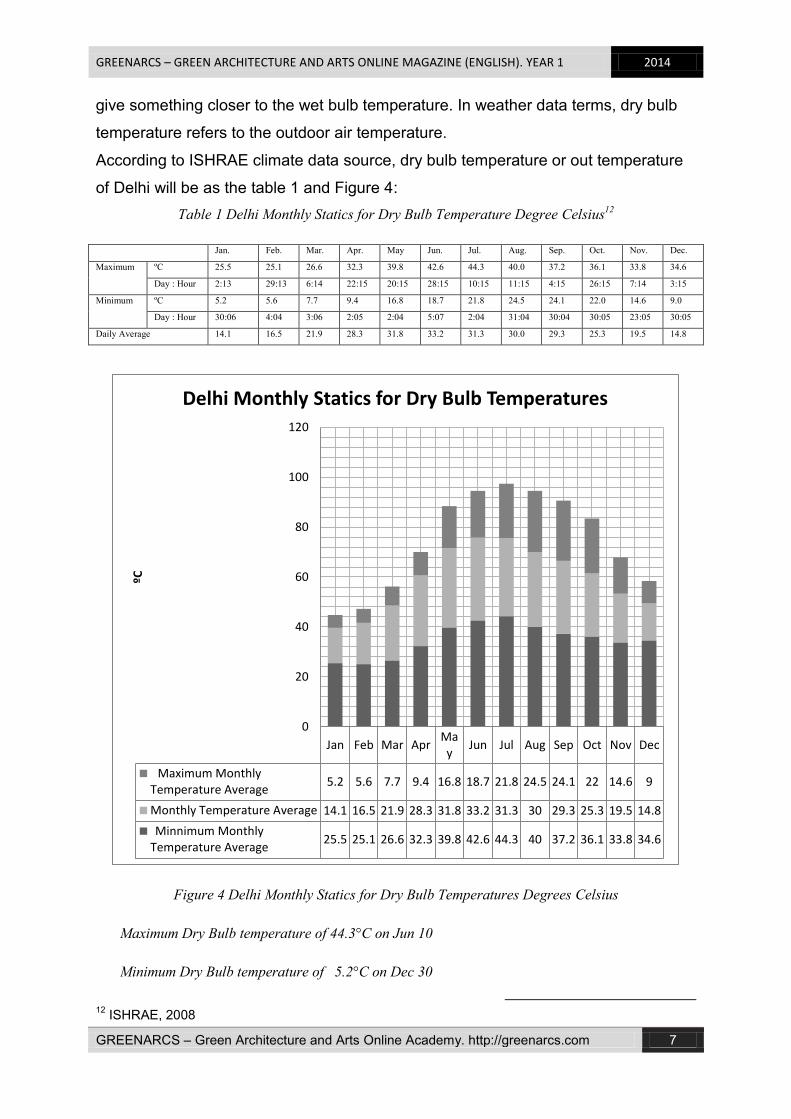
According to ISHRAE climate data source, dry bulb temperature or out temperature
of Delhi will be as the table 1 and Figure 4:
Table 1 Delhi Monthly Statics for Dry Bulb Temperature Degree Celsius12
Jan. Feb. Mar. Apr. May Jun. Jul. Aug. Sep. Oct. Nov. Dec.
Maximum ºC 25.5 25.1 26.6 32.3 39.8 42.6 44.3 40.0 37.2 36.1 33.8 34.6
Day : Hour 2:13 29:13 6:14 22:15 20:15 28:15 10:15 11:15 4:15 26:15 7:14 3:15
Minimum ºC 5.2 5.6 7.7 9.4 16.8 18.7 21.8 24.5 24.1 22.0 14.6 9.0
Day : Hour 30:06 4:04 3:06 2:05 2:04 5:07 2:04 31:04 30:04 30:05 23:05 30:05
Daily Average 14.1 16.5 21.9 28.3 31.8 33.2 31.3 30.0 29.3 25.3 19.5 14.8
Figure 4 Delhi Monthly Statics for Dry Bulb Temperatures Degrees Celsius
Maximum Dry Bulb temperature of 44.3°C on Jun 10
Minimum Dry Bulb temperature of 5.2°C on Dec 30
12
ISHRAE, 2008
Jan Feb Mar AprMay
Jun Jul Aug Sep Oct Nov Dec
Maximum MonthlyTemperature Average
5.2 5.6 7.7 9.4 16.8 18.7 21.8 24.5 24.1 22 14.6 9
Monthly Temperature Average 14.1 16.5 21.9 28.3 31.8 33.2 31.3 30 29.3 25.3 19.5 14.8
Minnimum MonthlyTemperature Average
25.5 25.1 26.6 32.3 39.8 42.6 44.3 40 37.2 36.1 33.8 34.6
0
20
40
60
80
100
120
ºC
Delhi Monthly Statics for Dry Bulb Temperatures
GREENARCS – GREEN ARCHITECTURE AND ARTS ONLINE MAGAZINE (ENGLISH). YEAR 1 2014
GREENARCS – Green Architecture and Arts Online Academy. http://greenarcs.com 8
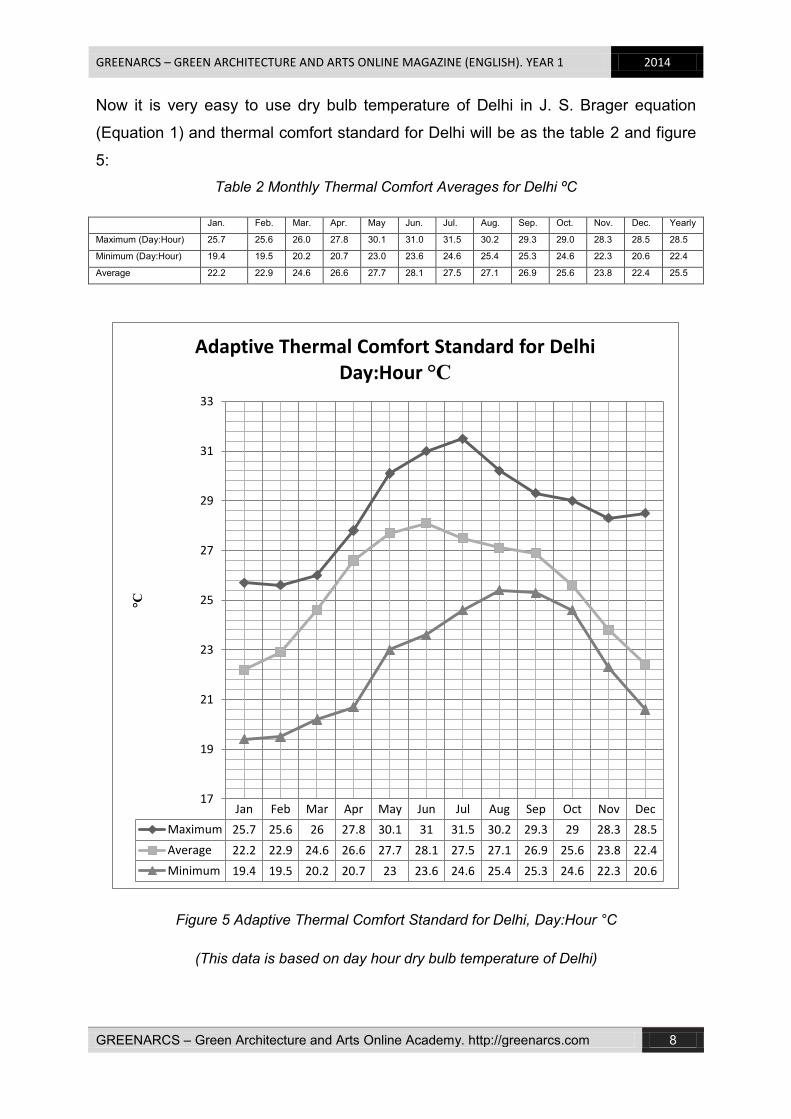
Now it is very easy to use dry bulb temperature of Delhi in J. S. Brager equation
(Equation 1) and thermal comfort standard for Delhi will be as the table 2 and figure
5:
Table 2 Monthly Thermal Comfort Averages for Delhi ºC
Jan. Feb. Mar. Apr. May Jun. Jul. Aug. Sep. Oct. Nov. Dec. Yearly
Maximum (Day:Hour) 25.7 25.6 26.0 27.8 30.1 31.0 31.5 30.2 29.3 29.0 28.3 28.5 28.5
Minimum (Day:Hour) 19.4 19.5 20.2 20.7 23.0 23.6 24.6 25.4 25.3 24.6 22.3 20.6 22.4
Average 22.2 22.9 24.6 26.6 27.7 28.1 27.5 27.1 26.9 25.6 23.8 22.4 25.5
Figure 5 Adaptive Thermal Comfort Standard for Delhi, Day:Hour °C
(This data is based on day hour dry bulb temperature of Delhi)
Jan Feb Mar Apr May Jun Jul Aug Sep Oct Nov Dec
Maximum 25.7 25.6 26 27.8 30.1 31 31.5 30.2 29.3 29 28.3 28.5
Average 22.2 22.9 24.6 26.6 27.7 28.1 27.5 27.1 26.9 25.6 23.8 22.4
Minimum 19.4 19.5 20.2 20.7 23 23.6 24.6 25.4 25.3 24.6 22.3 20.6
17
19
21
23
25
27
29
31
33
°C
Adaptive Thermal Comfort Standard for Delhi Day:Hour °C
GREENARCS – GREEN ARCHITECTURE AND ARTS ONLINE MAGAZINE (ENGLISH). YEAR 1 2014
GREENARCS – Green Architecture and Arts Online Academy. http://greenarcs.com 9
Conclusion
Delhi with a composite climate, very hot summer and cold winter and wet months in
monsoon season between summer and winter, is a very difficult case to achieve
thermal comfort standard. But according to Indian culture and its attitude to adapt
human life to natural environment, it is possible to use adaptive thermal comfort
model to make a thermal comfort standard for Delhi. So we can summarize all
results of this study as the following:
Extremely Minimum Thermal Comfort = 19.4 ºC January
Extremely Maximum Thermal Comfort = 31.5 ºC July
Minimum Average of Thermal Comfort = 22.2 ºC January
Maximum Average Thermal Comfort = 28.1 ºC June
Achieved range of thermal comfort standard according to ISHRAE weather data and
based on Brager and De Dear (ASHRAE) adaptive thermal comfort model will be
between 22 ºC to 28 ºC.
References
ASHRAE (American Society of Heating, R. and A.-C. E. (2009). Access to Additional
Content for ASHRAE 2009 Fundamentals Handbook ( SI Units ) (SI., p. 995).
Atlanta, GA, USA: ASHRAE.
Brager, G. S., & De Dear, R. (2001). Center for the Built Environment Climate ,
Comfort , & Natural Ventilation : A new adaptive comfort standard for (p. 18).
Berkeley: University of California, Berkeley. Retrieved from
http://repositories.cdlib.org/cedr/cbe/ieq/Brager2001
De Dear, R. J., & Brager, G. S. (2002). Thermal comfort in naturally ventilated
buildings: revisions to ASHRAE Standard 55. Energy and Buildings, 34(6), 549–
561. doi:10.1016/S0378-7788(02)00005-1
GREENARCS – GREEN ARCHITECTURE AND ARTS ONLINE MAGAZINE (ENGLISH). YEAR 1 2014
GREENARCS – Green Architecture and Arts Online Academy. http://greenarcs.com 10
Delhicapital Website. (2012). tourist destinations in Delhi Delhi News of the week.
www.Delhicapital.com. Retrieved February 8, 2012, from
http://www.delhicapital.com/about-delhi/
Dunn, W. A., Brager, G. S., Brown, K. A., Clark, D. R., Deringer, J. J., Hogeling, J. J.,
Int-hout, D., et al. (2004). ASHRAE STANDARD Thermal Environmental
Conditions for Human Occupancy (First., Vol. 2004, p. 34). Atlanta, GA, USA:
American Society of Heating, Refrigerating and Air-Conditioning Engineers
(ASHRAE).
Humphreys, M. A., & Nicol, J. F. (1998). Understanding the adaptive approach to
thermal comfort. ASHRAE Transactions, 104(1), 991–1004.
ISHRAE (Indian Society of Heating, R. and A.-C. E. (2008). Original Source of
Weather Data of Delhi. New Delhi, India. Retrieved from
http://apps1.eere.energy.gov/buildings/energyplus/weatherdata/2_asia_wmo_re
gion_2/IND_New.Delhi.421820_ISHRAE.zip
Nayak, J. K., & Prajapati, J. A. (2006). Handbook on Energy Conscious Buildings
(Second., Vol. 4, p. 396). Mumbai, India: Indian Institute of Technology, Bombay
& Solar Energy Centre, Ministry of Non-conventional Energy Sources (MNRE).
What-when-how Website. (2011). Climate risk assessment in selected case studies (
Cities , Disasters , and Climate risk ) Part 2. Retrieved August 12, 2011, from
41. http://what-when-how.com/climate-change/climate-risk-assessment-in-
selected-i-case-studies-cities-disasters-and-climate-risk-part-2/
Top Related
Copyright © 2022 FDOKUMEN

