


Bahasa
Halaman
Hukum

ACE VISION User Guide 1/110
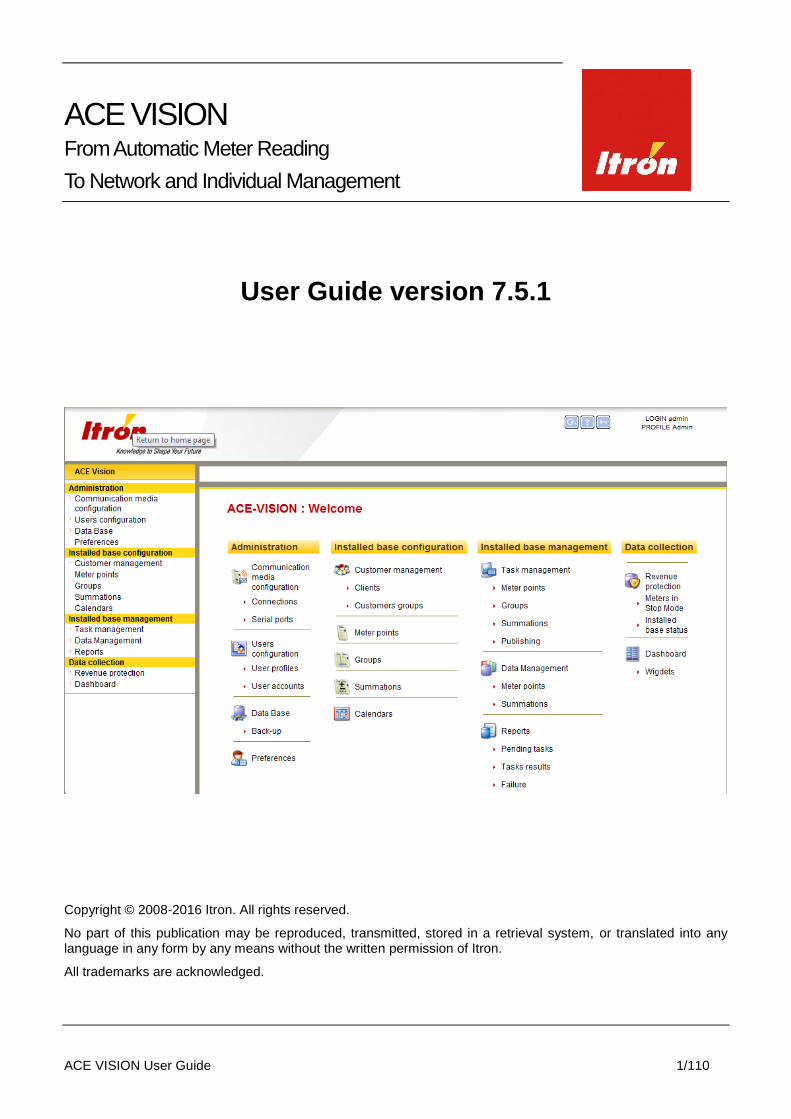
ACE VISION From Automatic Meter Reading
To Network and Individual Management
User Guide version 7.5.1
Copyright © 2008-2016 Itron. All rights reserved.
No part of this publication may be reproduced, transmitted, stored in a retrieval system, or translated into any language in any form by any means without the written permission of Itron.
All trademarks are acknowledged.

ACE VISION User Guide 2/110
1. INTRODUCTION: .............................................................................................................................................. 5
1.1. Requirements............................................................................................................................................ 5
1.1.1. System Compatibility ........................................................................................................................ 5
1.1.2. Meter Compatibility ........................................................................................................................... 5
1.1.3. Communication ................................................................................................................................. 5
1.2. System Architecture .................................................................................................................................. 6
1.3. ACE Vision Icons ...................................................................................................................................... 7
2. Software Administration..................................................................................................................................... 8
2.1. Login ......................................................................................................................................................... 8
2.2. Connections ............................................................................................................................................11
2.3. Serial Ports .............................................................................................................................................12
2.4. Mobile Terminals.....................................................................................................................................13
2.5. Clients .....................................................................................................................................................14
2.6. Customer Groups ...................................................................................................................................15
2.7. User Account Creation ............................................................................................................................16
2.8. User Profiles ...........................................................................................................................................17
2.9. Modification follow up .............................................................................................................................19
2.10. Data base of cities ..................................................................................................................................20
2.11. Back up / Restore ...................................................................................................................................21
3. Using ACE Vision ............................................................................................................................................23
3.1. Meter Points ............................................................................................................................................23
3.2. Communication Statistics .......................................................................................................................24
3.3. Creating Meter Points .............................................................................................................................25
3.3.1. Network topology ............................................................................................................................28
3.3.1.1. Definition of substation level .......................................................................................................28
3.3.1.2. Definition of substations ..............................................................................................................29
3.4. Meter Point Actions .................................................................................................................................30
3.4.1. Meter Characteristics ......................................................................................................................30
3.4.2. Meter Tasks ....................................................................................................................................31
3.4.2.1. Reading Tasks and Data Export .................................................................................................31
3.4.2.2. Configuration Programming ........................................................................................................32
3.4.2.3. Actions ........................................................................................................................................32
3.4.3. Load Profiles ...................................................................................................................................33
3.4.4. Logbook ..........................................................................................................................................36
3.4.5. Billing Data ......................................................................................................................................37
3.4.5.1. Customisation .............................................................................................................................37
3.4.5.2. Global Data .................................................................................................................................38
3.4.5.3. Total Energy ................................................................................................................................38
3.4.5.4. Energy Rate Registers ................................................................................................................39
3.4.5.5. Maximum Demands ....................................................................................................................39
3.4.5.6. RMS Max ....................................................................................................................................40
ACE VISION User Guide 3/110
3.4.5.7. Excess Demand ..........................................................................................................................40
3.4.6. Instantaneous Data .........................................................................................................................41
3.4.6.1. Customisation .............................................................................................................................42
3.4.6.2. Total Energy ................................................................................................................................43
3.4.6.3. Energy Rate Registers ................................................................................................................43
3.4.6.4. Instantaneous Power ..................................................................................................................44
3.4.6.5. Power Factor ...............................................................................................................................44
3.4.6.6. RMS Value ..................................................................................................................................45
3.4.6.7. Neutral ........................................................................................................................................45
3.4.6.8. Phase Angle ................................................................................................................................45
3.4.7. Diagnostics .....................................................................................................................................47
3.4.7.1. Field Information .........................................................................................................................48
3.4.8. Power Quality Data .........................................................................................................................48
3.4.8.1. Swells ..........................................................................................................................................48
3.4.8.2. Sags ............................................................................................................................................48
3.4.8.3. Cuts .............................................................................................................................................49
3.5. Meter Groups ..........................................................................................................................................50
3.5.1. Create a Meter Group .....................................................................................................................51
3.5.2. Add Tasks to a Group .....................................................................................................................53
3.6. Calendar .................................................................................................................................................54
3.6.1. Calendar Creation (Step 1) .............................................................................................................54
3.6.2. Create Rates (Step 2) .....................................................................................................................55
3.6.3. Create Day Profiles (Step 3) ...........................................................................................................55
3.6.4. Create Seasons (Step 4) ................................................................................................................57
3.6.5. Create Special Days (Step 5) .........................................................................................................58
3.6.6. Create Weeks (Step 6) ...................................................................................................................58
3.7. Summations ............................................................................................................................................60
3.7.1. Creating a Summation ....................................................................................................................61
3.7.2. Summation Characteristics .............................................................................................................62
3.7.3. Summation Tasks ...........................................................................................................................63
3.7.4. Summation Load Profile Calculation...............................................................................................64
3.7.4.1. View Summation Load Profile Graph..........................................................................................65
3.7.4.2. Measurements ............................................................................................................................66
3.7.4.3. Rates (Estimation of Energy Costs)............................................................................................67
3.7.4.4. Minimum and Maximum Values ..................................................................................................68
3.7.4.5. Export Summation Data ..............................................................................................................68
3.8. Dynamic summation ...............................................................................................................................69
3.9. Energy Monitoring ...................................................................................................................................71
3.10. Probability of Energy ...............................................................................................................................72
3.11. Publishing ...............................................................................................................................................73
3.12. Data Management ..................................................................................................................................74
3.12.1. Meters .............................................................................................................................................74
3.12.2. Summations ....................................................................................................................................74
3.13. Revenue Protection ................................................................................................................................74

ACE VISION User Guide 4/110
3.13.1. Meters in Stop Mode .......................................................................................................................74
3.13.2. Energy Monitoring ...........................................................................................................................76
3.13.3. Probability of Energy .......................................................................................................................76
3.13.4. Check Configuration .......................................................................................................................77
3.13.5. Installed Base Status ......................................................................................................................78
3.14. Synchronising ACE VISION to an HHU ..................................................................................................80
3.15. Reports ...................................................................................................................................................81
3.15.1. Pending Tasks ................................................................................................................................81
3.15.2. Task Results ...................................................................................................................................82
3.15.3. Failures ...........................................................................................................................................83
3.16. Preferences .............................................................................................................................................84
3.16.1. Configuration ...................................................................................................................................84
3.16.2. Your Account ..................................................................................................................................86
3.16.3. Customisation of Instantaneous Data .............................................................................................87
3.16.4. Customisation of EOB Data ............................................................................................................88
3.16.5. Widgets ...........................................................................................................................................89
3.17. Exploitation of Widgets ...........................................................................................................................96
3.17.1. Exports CSV et PDF .......................................................................................................................96
3.17.2. Full screen display ..........................................................................................................................96
3.18. WEB SERVICES.....................................................................................................................................98
3.18.1. Objectif ............................................................................................................................................98
3.18.2. Associated rules ..............................................................................................................................98
3.18.3. Architecture .....................................................................................................................................98
3.18.4. Methods ..........................................................................................................................................99
3.18.5. Structure of data used by web services ........................................................................................100
3.18.5.1. Meter .....................................................................................................................................100
3.18.5.2. Customer ..............................................................................................................................101
3.18.5.3. Load profile information ........................................................................................................102
3.18.5.4. Load profile Channel .............................................................................................................102
3.18.5.5. Data from a load profile channel ...........................................................................................102
3.18.5.6. Data from a PUSH load profile channel (estimated values for PUSH) .................................102
3.18.5.7. EOB.......................................................................................................................................102
3.18.6. ACE VISION REFLECT ................................................................................................................103
3.19. ACE VISION CONFIGURATION ..........................................................................................................105
3.19.1. LAUNCHING ACE VISION CONFIGURATION ............................................................................105
3.19.1.1. Preferences ...........................................................................................................................105
3.19.1.2. Back up .................................................................................................................................107
3.19.1.3. Database Restoration ...........................................................................................................107
3.19.1.4. Database Archiving ...............................................................................................................108
3.19.1.5. About .....................................................................................................................................109
3.20. Adaptation of communication TIME OUT .............................................................................................110

ACE VISION User Guide 5/110
1. INTRODUCTION:
ACE VISION is an automatic meter reading (AMR) software solution which has been developed by Itron to provide a competitive data collection solution that is particularly suited to management of medium sized (several thousand meter points) industrial meter parks. Its user interface is based on web publishing technology providing a simple user friendly interface.
This user guide covers use of ACE Vision in conjunction with ACE 6000, SL7000 (int’l and DTM) and ACE 8000 Meters. This guide does not include meter configuration guidance.
1.1. REQUIREMENTS
1.1.1. System Compatibility
Ace Vision is compatible with the following operating systems:
Windows XP Pro SP3
Windows Vista (32 and 64 bit)
Windows 7 (32 and 64 bit)
Windows 2008 (32 and 64 bit)
1.1.2. Meter Compatibility
Ace Vision supports the following Itron commercial and Industrial meters:
ACE6000 (All versions to v4.10)
SL7000 (All version from v2.x to v7.31)
IEC7 DTM (all versions to v9.23)
ACE8000 (All versions)
1.1.3. Communication
ACE Vision can be connected via local port or over a distribute architecture network using the following methods
PSTN modem
GSM
GPRS
Ethernet Network
Laptop ( using ACE-VISION Mobile LT1.1)
HHU ( using ACE-VISION Mobile 1.1 )

ACE VISION User Guide 6/110
1.2. SYSTEM ARCHITECTURE
Ace Vision software is composed of:
An IIS Web Server: ACE Vision application for editing and display of data.
Windows Service Scheduler: communications and data export sequencer (capable of managing up to 8 communication paths simultaneously).
MySQL database server (does not require a licence)
ACE Vision Configuration Tool: For the initialisation of the various servers.
ACE VISION User Guide 7/110
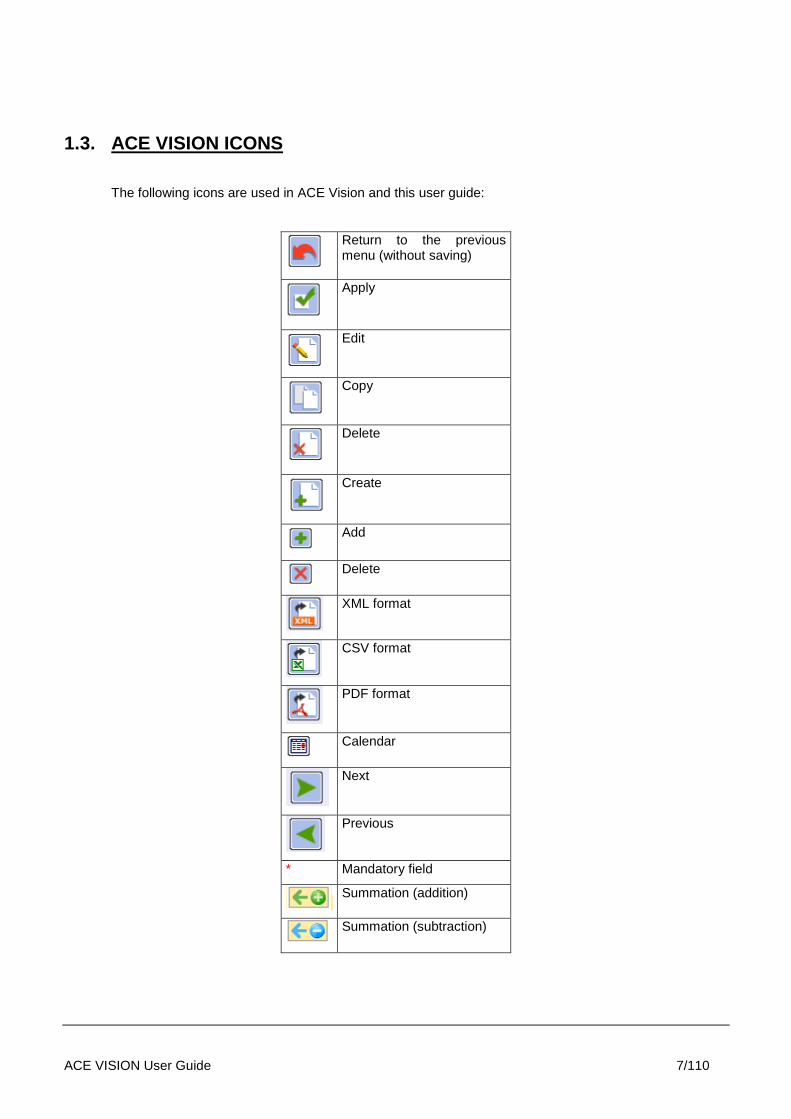
1.3. ACE VISION ICONS
The following icons are used in ACE Vision and this user guide:
Return to the previous menu (without saving)
Apply
Edit
Copy
Delete
Create
Add
Delete
XML format
CSV format
PDF format
Calendar
Next
Previous
* Mandatory field
Summation (addition)
Summation (subtraction)

ACE VISION User Guide 8/110
2. SOFTWARE ADMINISTRATION
This Section provides a detailed guide to all operations that can be performed by the administrator.
A default Administrator user account is automatically created on installation of ACE Vision. This account can be used to create and manage all other user accounts that may be required to operate the software.
2.1. LOGIN
Once the software is installed, an ACE Vision icon appears on the desktop. Click on the icon and the following screen appears:
To login remotely to a host server, open Internet Explorer and enter the IP address of the host in the URL:
ACE VISION User Guide 9/110
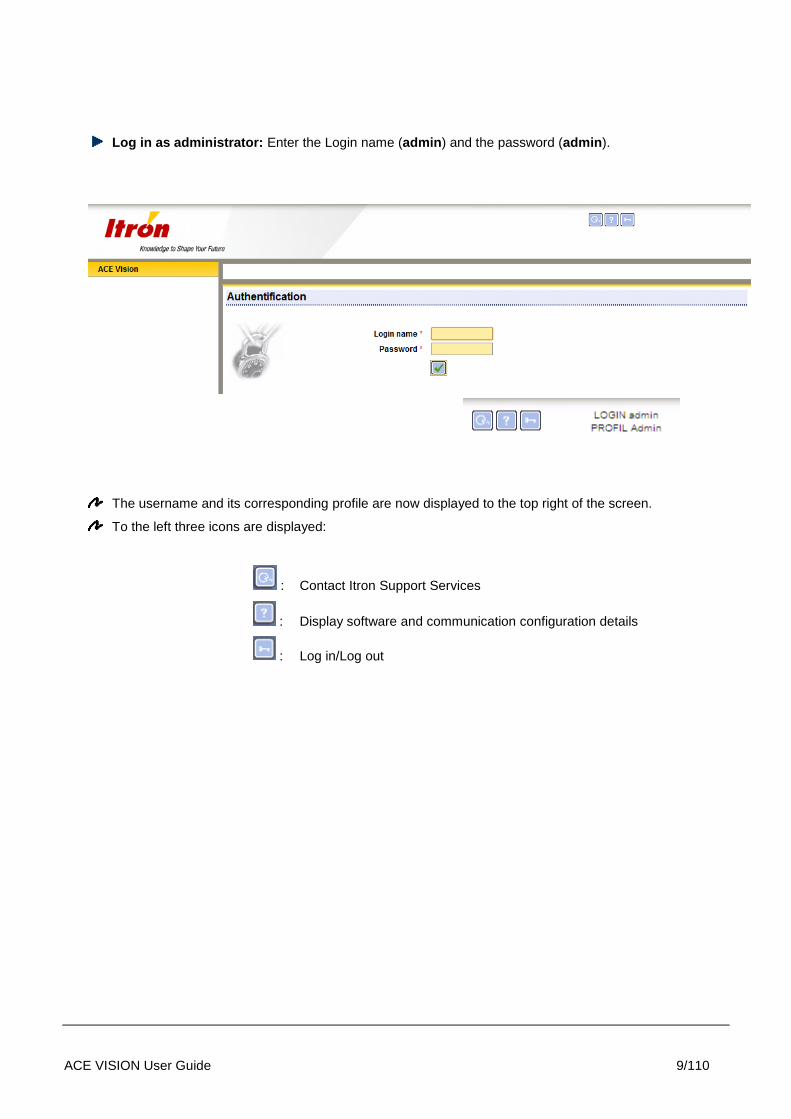
Log in as administrator: Enter the Login name (admin) and the password (admin).
The username and its corresponding profile are now displayed to the top right of the screen.
To the left three icons are displayed:
: Contact Itron Support Services
: Display software and communication configuration details
: Log in/Log out

ACE VISION User Guide 10/110
Once logged in as administrator, all features available to the administrator are displayed on the welcome screen.
From this welcome screen, actions available to the administrator can be accessed in two ways:
1) Using the sidebar – the sidebar is always displayed on the left of the screen.
2) Selecting the action directly from the welcome page (the main screen).
Note: To return to this welcome page at any time, click on the icon at the top left of the screen.
The actions available on the welcome page will differ according to the profile of the user. These functions can be added or removed by the administrator.

ACE VISION User Guide 11/110
2.2. CONNECTIONS
Select Communication media configuration - Connections to configure the method of communication between the remote reading station and the meter (modem, optical head or direct connection).
There are 4 communication types available:
Modem
Modem TAPI
Direct Connection (via RS232)
Optical Head
Select the desired connection type and click on the Edit button.
A window appears allowing the input of the relevant settings for the communication type selected. The edited connection type can then be associated to a serial port.
Note: Modem and Modem TAPI connections include a Modem SMS setting. Select this to enable the sending of SMS messages.
ACE VISION User Guide 12/110
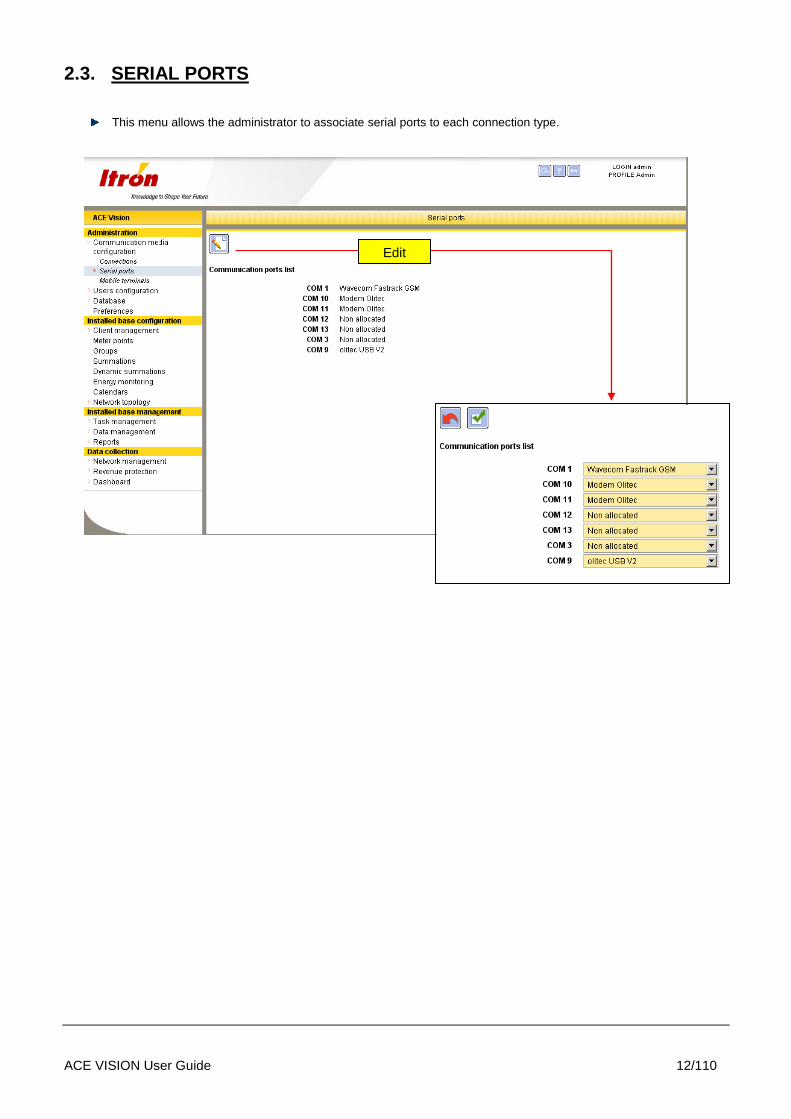
2.3. SERIAL PORTS
This menu allows the administrator to associate serial ports to each connection type.
Edit

ACE VISION User Guide 13/110
2.4. MOBILE TERMINALS
See Ace-VISION Mobile User guide

ACE VISION User Guide 14/110
2.5. CLIENTS
Select Customer management - Clients to create, copy, edit and remove clients.
Note: The administrator account has access to all clients by default.
The Client menu lists all client details (name, contract number, telephone number, address, Email and comments). A client can manage one or more meters. The client is billed for all meters attached to the client name. Un client peut gérer un ou plusieurs compteurs, c’est à lui que l’on facture. The client must have a unique name in the database
The Client menu lists all client details (name, contract number, telephone number, address, Email and comments). A client can manage one or more meters. The client is billed for all meters attached to the client name. The client must have a unique name in the database.
Add
Selection
Edit
ACE VISION User Guide 15/110
The Create a login name automatically setting can be selected to automatically create a new user that is associated to this client. When a user is created using this method, the Client name is used as the user name and also as the user password.
A customer who has access to the notification management menu can receive an SMS or Email message sent from ACE Vision.
The Alarm tab is used to define the manner of the notification (recipient, notification format: Email/SMS, Notification type: Alarm / Meter in stop / energy monitoring / probability of energy / check configuration.
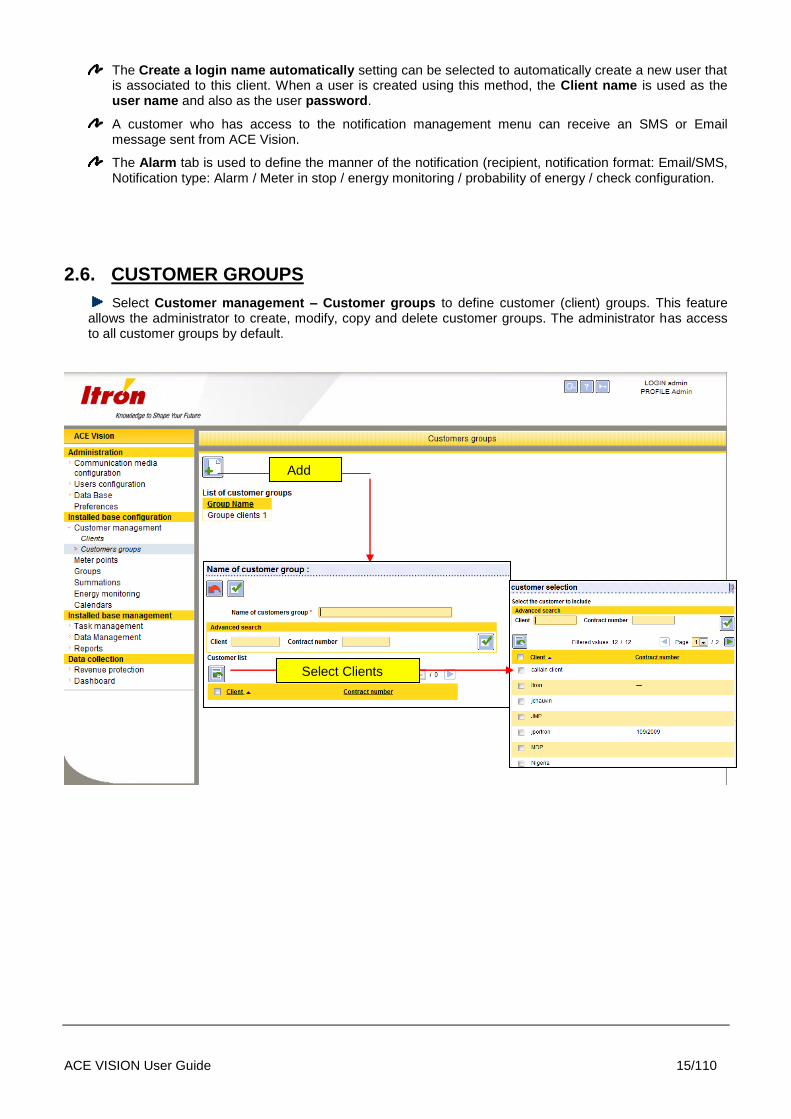
2.6. CUSTOMER GROUPS
Select Customer management – Customer groups to define customer (client) groups. This feature allows the administrator to create, modify, copy and delete customer groups. The administrator has access to all customer groups by default.
Add
Select Clients
ACE VISION User Guide 16/110
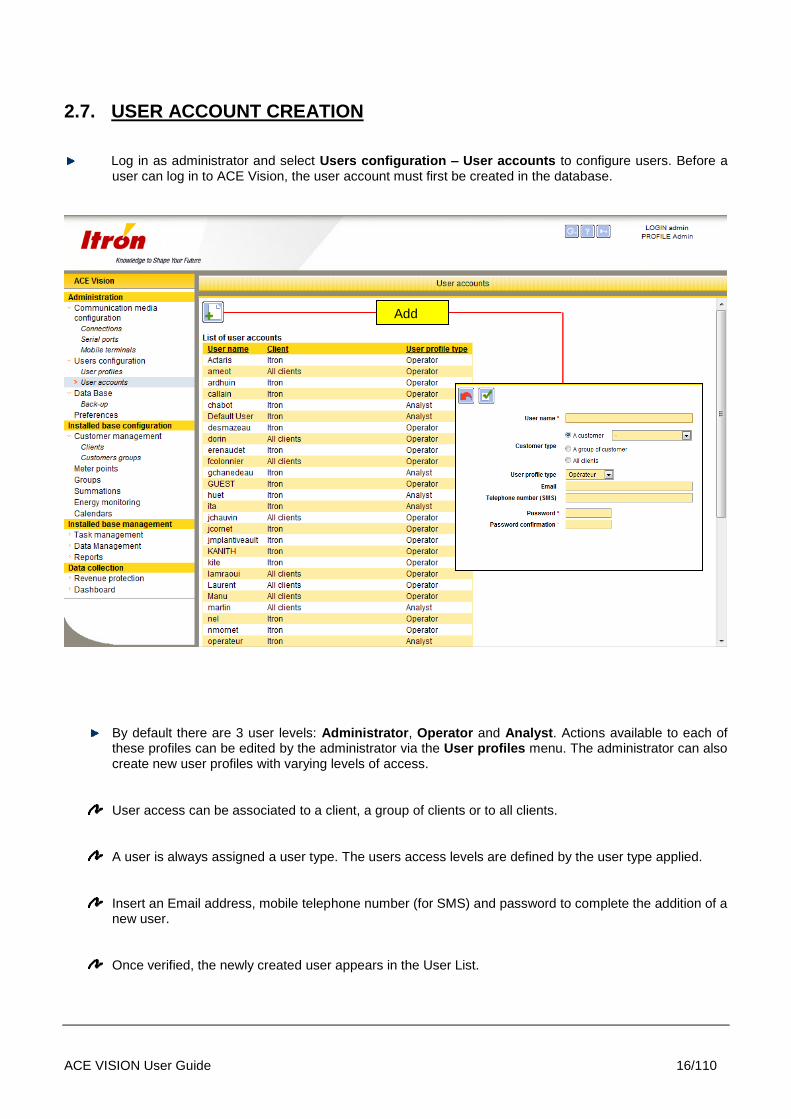
2.7. USER ACCOUNT CREATION
Log in as administrator and select Users configuration – User accounts to configure users. Before a user can log in to ACE Vision, the user account must first be created in the database.
By default there are 3 user levels: Administrator, Operator and Analyst. Actions available to each of these profiles can be edited by the administrator via the User profiles menu. The administrator can also create new user profiles with varying levels of access.
User access can be associated to a client, a group of clients or to all clients.
A user is always assigned a user type. The users access levels are defined by the user type applied.
Insert an Email address, mobile telephone number (for SMS) and password to complete the addition of a new user.
Once verified, the newly created user appears in the User List.
Add

ACE VISION User Guide 17/110
2.8. USER PROFILES
Select Users configuration – User profiles to define the actions available to each user type. There are 2 predefined user profiles: «Operator » and « Analyst ».
The names of the 2 predefined user profiles can be changed.
Extra user profiles can be created.
User profiles can be completely removed, as long as they are not associated with any user accounts.
Notification Management: Allows users to receive Email or SMS alarm messages sent from meters.
Meters and Groups Management: Allows users to create a meter or a meter group.
Summations Management: Allows users to create a virtual meter as an algebraic sum of several meters and view the resulting load profiles.
Calendars and rate management: Allows users to create a rate structure and add this into the load profile.
Add
Edit

ACE VISION User Guide 18/110
Data Customisation Management: Allows a user to customise instantaneous data (Instantaneous Power, Power factor, RMS Max, Neutral, Phase angle).
Reading Tasks Management: Allows reading tasks (e.g. read load profile, read billing data).
Clock Setting: Allows users to synchronise the meter time with PC time.
End of Billing: Allows users to generate an EOB (End of Billing).
Start management: Allows users start measurement in a meter.
Configuration management: Allows users to change meter configurations.
Probability of Energy: Allows users to verify the coherence of energies (Total Active Import) contained in an EOB.
Configuration Programming: Allows users to access the configuration comparison feature. A reference meter configuration exported from AIMS_PRO or ACE Pilot can be compared with the meter configuration read by ACE Vision.
Export tasks management: Users can create tasks to export remote reading data.
Access to immediate exports: Allows users to manually export meter data to file.
Access to scheduled exports: Allows users to view load profile data that has been previously exported.
Access to alarms as a whole: Allows users have access to all alarms.
Mobile Terminals: Allows the management of Hand Held Units.

ACE VISION User Guide 19/110
2.9. MODIFICATION FOLLOW UP
The modifications in the system are tracked into the data base : are concerned all the writing actions ( creation, modification, deletion). The reading actions are not stored.
The display of the modification follow up could be accessed through the menu Administration->DataBase->Modification follow up.
A modification is described with the following information
- User name ( login name)
- Date and time of modification
- Action ( creation / modification / deletion )
- Concerned object ( connection, serial port, meters, user profile, user account, preferences, customer, HHU/ laptop, summation, groups of meters, groups of customers, calendar, energy monitoring, tasks management, reset of meters statistics, widgets)
The display of the events of modification could be reduced to a certain period of time (default value 24 hours), and filtered on objects, action, and users.
All those modifications could be exported in CSV file.
An option of ‘settings.xml’ called NbLogUpdateResults allows to limit the number of events displayed in the web site. The default value is 1000.
This list of events could be backed up ( xml format), from the configuration tools, with the same process as for the meters .

ACE VISION User Guide 20/110
2.10. DATA BASE OF CITIES
In order to associate a meter to a city, a database of cities could be imported into ACE-VISION. The creation of the list or importation of the list should be done through the menu Administration->DataBase->Cities.
The default list is empty. The list could be edited (creation, modification, deletion of all or part of the list).
A city could be deleted only if not associated to any meters.
If the database is imported, the importation file should be in CSV format, according the following structure :
Column number Information
Column 1 City name
Column 2 Postcode
The separator should be the < ; > character ( semi-column) .
Name should be in capital letters, no dash ( but space )
Example :
CityName;Postcode;
L ABERGEMENT CLEMENCIAT;01400;
L ABERGEMENT DE VAREY;01640;
AMAREINS;01090;
AMBERIEU EN BUGEY;01500;
AMBERIEUX EN DOMBES1330;
ACE VISION User Guide 21/110
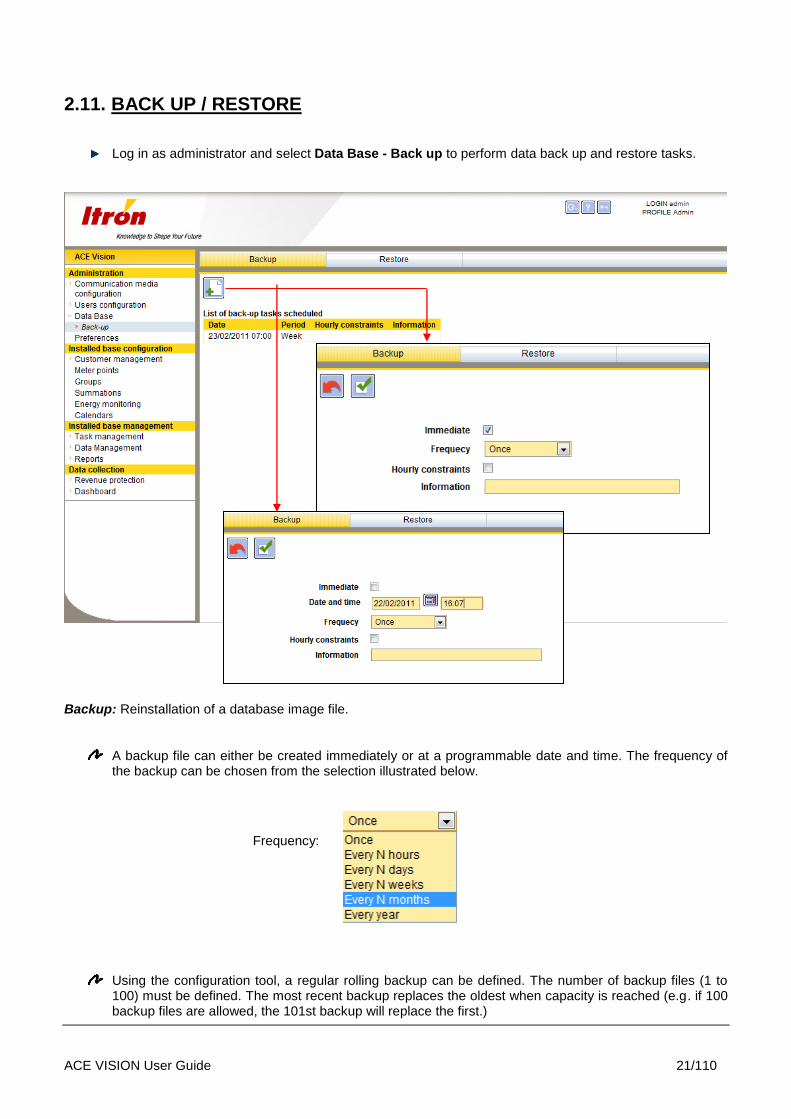
2.11. BACK UP / RESTORE
Log in as administrator and select Data Base - Back up to perform data back up and restore tasks.
Backup: Reinstallation of a database image file.
A backup file can either be created immediately or at a programmable date and time. The frequency of the backup can be chosen from the selection illustrated below.
Frequency:
Using the configuration tool, a regular rolling backup can be defined. The number of backup files (1 to 100) must be defined. The most recent backup replaces the oldest when capacity is reached (e.g. if 100 backup files are allowed, the 101st backup will replace the first.)

ACE VISION User Guide 22/110
Restore: The contents of the backup file are loaded into the database. Any data previously present in the database is erased and no longer available.
Data restore is carried out by selecting the required restore file from the displayed list :

ACE VISION User Guide 23/110
3. USING ACE VISION
3.1. METER POINTS
Note: meter points are often referred to simply as meters in ACE Vision and this user guide.
The Meter Points feature is one of the most important in ACE Vision. From this menu, the meter database and remote meter reading tasks associated to each meter are generated. This is also the menu to use to view the remote reading data. The diagram above illustrates the different options available from the Meter point menu.
Select the List tab to display a list of all meters that already exist in the database.
Select the Statistics tab to view a set of communications statistics of the meters in the database.
List
Statistics
Meters
Charcteristics
Diagnostics
Instantaneous
Event Log
Tasks
Load Profiles
Power Quality
Billing
Edit Meter
Copy Meter
Delete Meter
Edit Tâsks
Delete Tasks
Global Data
Total Energies
Energy Rates
Maximum Demand
RMS Values
Excess Demand
Delete
Delete
Display Graph
Display Events
Display Rates
Export to file
Display Measurements
METERS
TASKS
VIEW
DATA

ACE VISION User Guide 24/110
3.2. COMMUNICATION STATISTICS
Select Meter Points, the select the Statistics tab to view statistics of all meters. Click on a column title to sort the meters in rising order. The contents of the final column can be selected via a drop down list:

ACE VISION User Guide 25/110
3.3. CREATING METER POINTS
Select Task Management- Meter Points to create a new meter.
Note: The creation of meter points is only available to users if enabled in the user account by the administrator. If not enabled, the creation icon will not appear on the screen.

ACE VISION User Guide 26/110
The settings listed below are used to enter the characteristics of each meter.
Note: Fields mark with a * must be completed.
Meter Point
Client: Customer to which the meter belongs.
Localisation: Identify the placement of the meter.
Address: Physical location of meter point
Latitude (GPS):
Longitude (GPS):
PostCode : if the list of city is not empty, it is proposed to fill the postcode of the city Then the name of city is filled automacally.
Installation Date:
Comments: Any further information related to a meter can be added here
Technical Definition
Technical Aspects
Serial Number: ACE Vision systematically checks the serial number of a meter before commencing remote reading.
Meter Type: ACE6000, SL7000, ACE8000
Firmware Version: Meter firmware type
Electricity Reader Password:
Laboratory Password: This is only required if configuration task creation is enabled.
First initial LP data collection depth (in days): (31 by default)
Number of EOB data set to be read at first collection: (2 by default)
Attached File: Any data file can be associated to the meter (e.g. graphs and characteristics of meter installation)
Communication Setup
Connection Types: chosen from the following list:
1) Direct Connection or Optical Probe:
Connection Name: Chosen from the connection list previously created.
Physical Address: Physical address of meter (17 by default)
ACE VISION User Guide 27/110
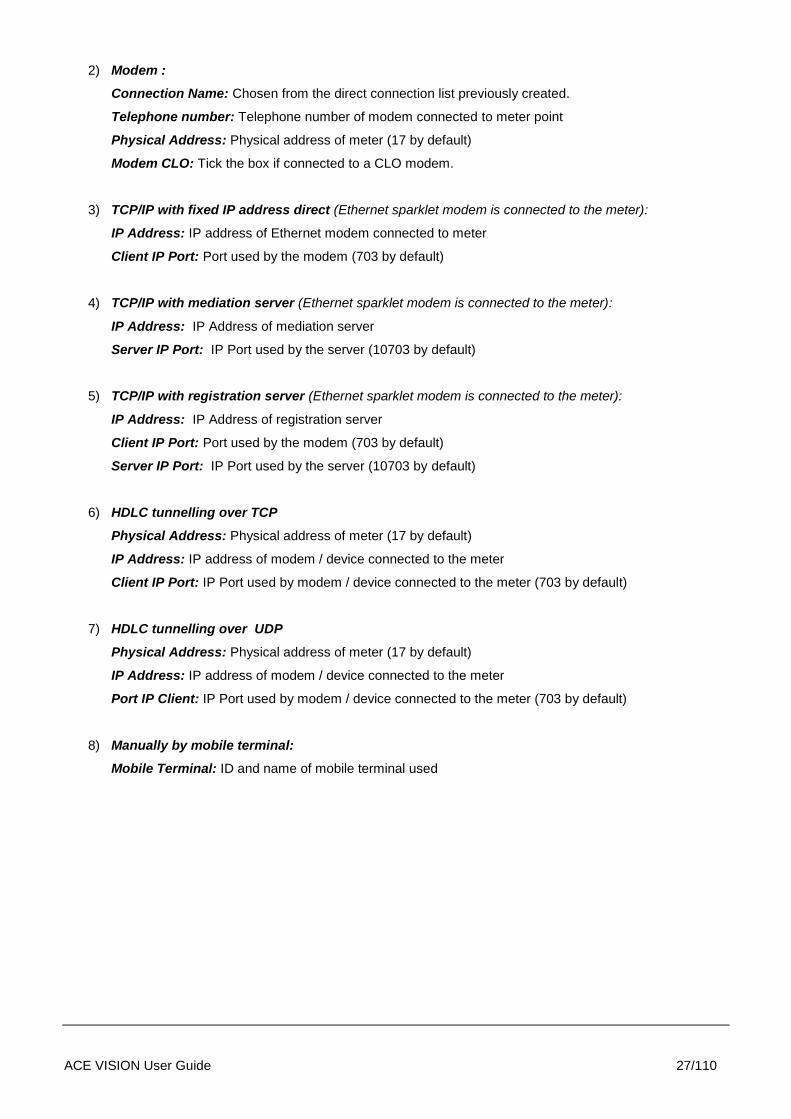
2) Modem :
Connection Name: Chosen from the direct connection list previously created.
Telephone number: Telephone number of modem connected to meter point
Physical Address: Physical address of meter (17 by default)
Modem CLO: Tick the box if connected to a CLO modem.
3) TCP/IP with fixed IP address direct (Ethernet sparklet modem is connected to the meter):
IP Address: IP address of Ethernet modem connected to meter
Client IP Port: Port used by the modem (703 by default)
4) TCP/IP with mediation server (Ethernet sparklet modem is connected to the meter):
IP Address: IP Address of mediation server
Server IP Port: IP Port used by the server (10703 by default)
5) TCP/IP with registration server (Ethernet sparklet modem is connected to the meter):
IP Address: IP Address of registration server
Client IP Port: Port used by the modem (703 by default)
Server IP Port: IP Port used by the server (10703 by default)
6) HDLC tunnelling over TCP
Physical Address: Physical address of meter (17 by default)
IP Address: IP address of modem / device connected to the meter
Client IP Port: IP Port used by modem / device connected to the meter (703 by default)
7) HDLC tunnelling over UDP
Physical Address: Physical address of meter (17 by default)
IP Address: IP address of modem / device connected to the meter
Port IP Client: IP Port used by modem / device connected to the meter (703 by default)
8) Manually by mobile terminal:
Mobile Terminal: ID and name of mobile terminal used

ACE VISION User Guide 28/110
Network topology
In the meter definition screen, a meter could be linked to a outgoing line of a substation (if some are defined). It should be defined :
Substation level
Substation name
Outgoing lines
Advanced Functions
Notification message: Message added to the start of an SMS or Email message
Energy Monitoring: Select the energy type to be monitored.
Note: Once created, the meter is added to the list of meter points in the database.
3.3.1. Network topology
3.3.1.1. Definition of substation level
The first step of the definition of network topology is the creation of the substation levels. In ACE-VISION, up to 6 levels could be created, the level 1 being the higher one.
This is accessible through menu Installed Base configuration->Network Topology->Substations levels. One level could be suppressed only if no meters are associated to him.
ACE VISION User Guide 29/110
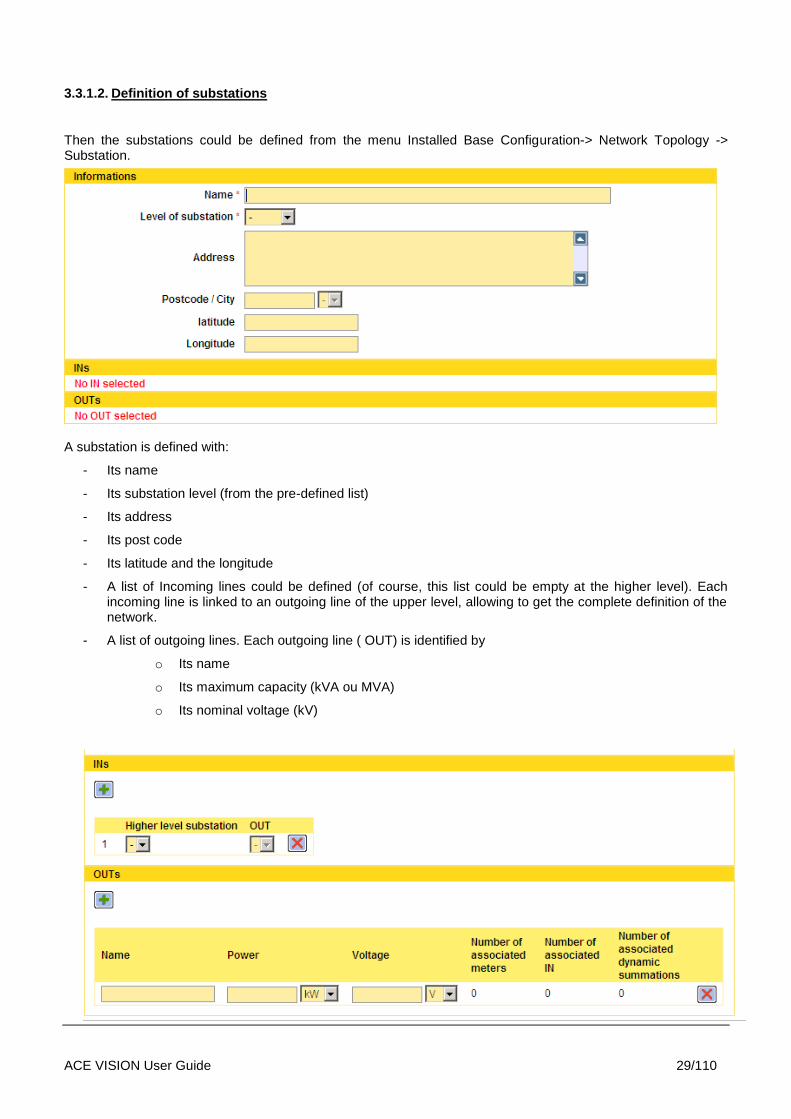
3.3.1.2. Definition of substations
Then the substations could be defined from the menu Installed Base Configuration-> Network Topology -> Substation.
A substation is defined with:
- Its name
- Its substation level (from the pre-defined list)
- Its address
- Its post code
- Its latitude and the longitude
- A list of Incoming lines could be defined (of course, this list could be empty at the higher level). Each incoming line is linked to an outgoing line of the upper level, allowing to get the complete definition of the network.
- A list of outgoing lines. Each outgoing line ( OUT) is identified by
o Its name
o Its maximum capacity (kVA ou MVA)
o Its nominal voltage (kV)
ACE VISION User Guide 30/110
Only the field with (*) are mandatory – the others are optional
The substation management is the same as the one for the meters. Creation, modification, duplication, deletion features are available.
Deletion of a substation is possible only if no other substation is linked to it.
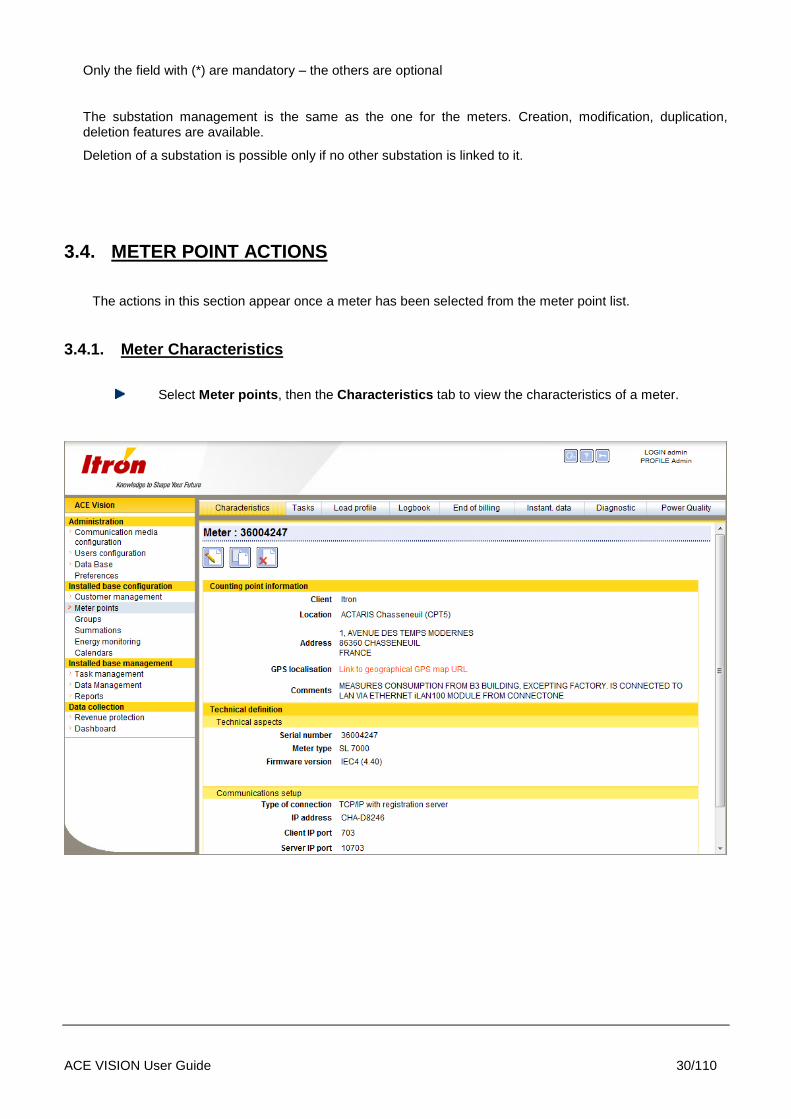
3.4. METER POINT ACTIONS
The actions in this section appear once a meter has been selected from the meter point list.
3.4.1. Meter Characteristics
Select Meter points, then the Characteristics tab to view the characteristics of a meter.

ACE VISION User Guide 31/110
3.4.2. Meter Tasks
Select the Tasks tab to view programming and/or remote reading operations. A task can be performed immediately or scheduled and activated once or at regular intervals, within or outside a specified time slot.
Tasks can be set to read and export data, to configure a meter point and perform meter actions.
Tasks can be executed immediately or at a fixed date. Tasks can be performed one time only or at regular intervals.
A time slot can be defined (hourly constraints), with tasks only being performed within this time slot.
3.4.2.1. Reading Tasks and Data Export
Reading tasks can be set to read the following meter data:
Load Profile Data
ACE VISION User Guide 32/110
Log Book Data
Billing (EOB) Data
Instantaneous Data
Meter Diagnostic Data
Power Quality Data
Reading Tasks can also be used to export data in XML, CSV or PDF format.
For load profile and logbook data export, the export period must be defined. The data exported is the last complete data set applicable to the defined period available (e.g. if the period selected is Day, the preceding day’s data is exported).
Data exported for billing (EOB), instantaneous, diagnostic and power quality data is the latest data available in the meter at the moment of task execution.
The exported data can be published to local file, Email or via FTP.
3.4.2.2. Configuration Programming
The configuration programming task can be used to load a pre-existing configuration (created in AIMS_PRO (v5.35.3 or higher) or ACE Pilot) in XML format (The file is digitally signed).
Note: In order to create a configuration programming task, the client COSEM password Laboratory must be defined in the meter characteristics.
3.4.2.3. Actions
The following actions can be created as tasks:
Check configuration: To compare a reference configuration with the configuration read by ACE Vision
Measurement check: To check if meter is in Start or Stop mode
Clock setting
Generation of billing data: To perform an EOB reset.
Start measurement: To leave Stop mode
If check configuration is selected, a reference configuration must be uploaded.
Note: If generation of billing data is selected, no other action or data reading operation can be selected in the task and the task may be performed once only.

ACE VISION User Guide 33/110
3.4.3. Load Profiles
Load profile data can be displayed in graphic form (in 2D or 3D). The viewing period can be altered, but must lie within the configuration period.
The Measurements tab displays load profile data in table form (date and time and aggregate power value for each selected channel).
ACE VISION User Guide 34/110
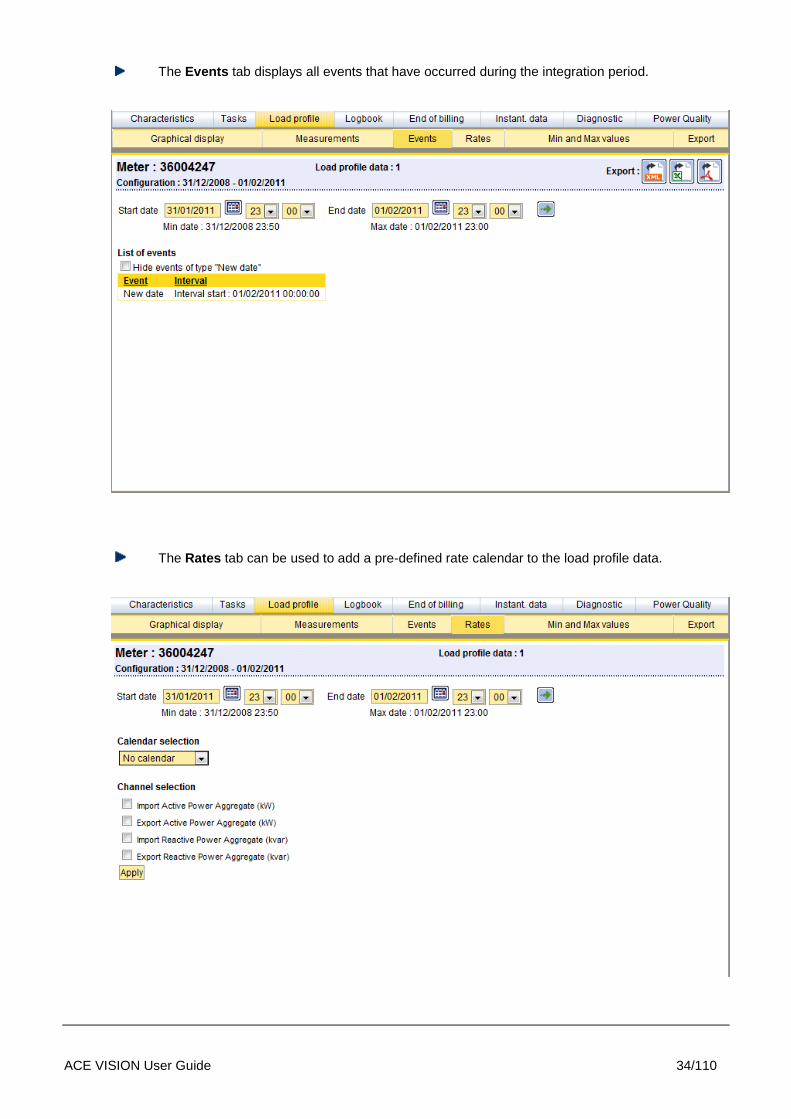
The Events tab displays all events that have occurred during the integration period.
The Rates tab can be used to add a pre-defined rate calendar to the load profile data.
ACE VISION User Guide 35/110
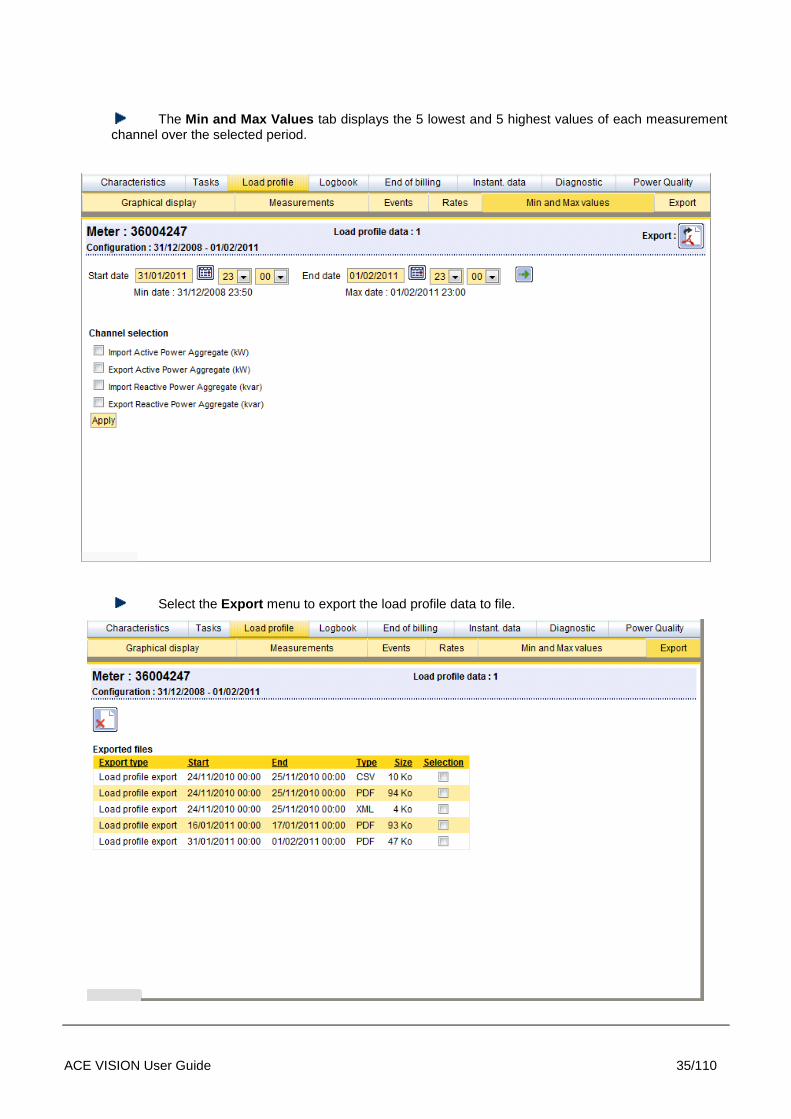
The Min and Max Values tab displays the 5 lowest and 5 highest values of each measurement channel over the selected period.
Select the Export menu to export the load profile data to file.
ACE VISION User Guide 36/110
3.4.4. Logbook
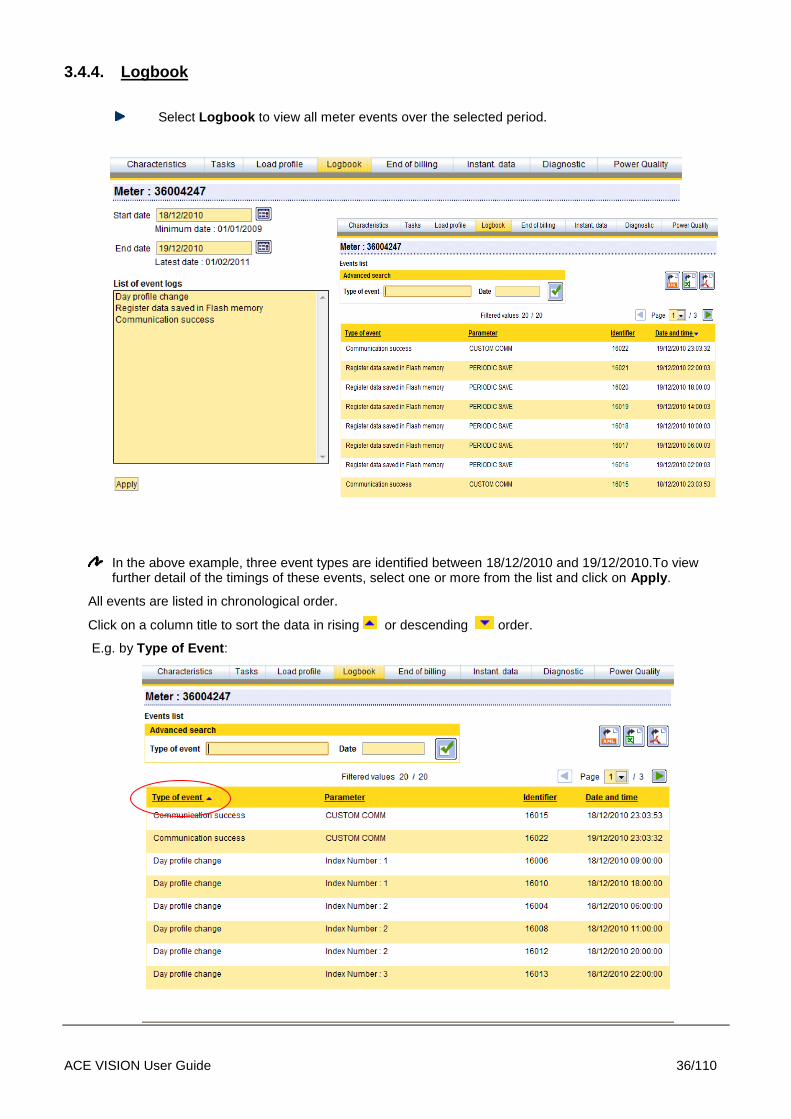
Select Logbook to view all meter events over the selected period.
In the above example, three event types are identified between 18/12/2010 and 19/12/2010.To view further detail of the timings of these events, select one or more from the list and click on Apply.
All events are listed in chronological order.
Click on a column title to sort the data in rising or descending order.
E.g. by Type of Event:
ACE VISION User Guide 37/110
3.4.5. Billing Data
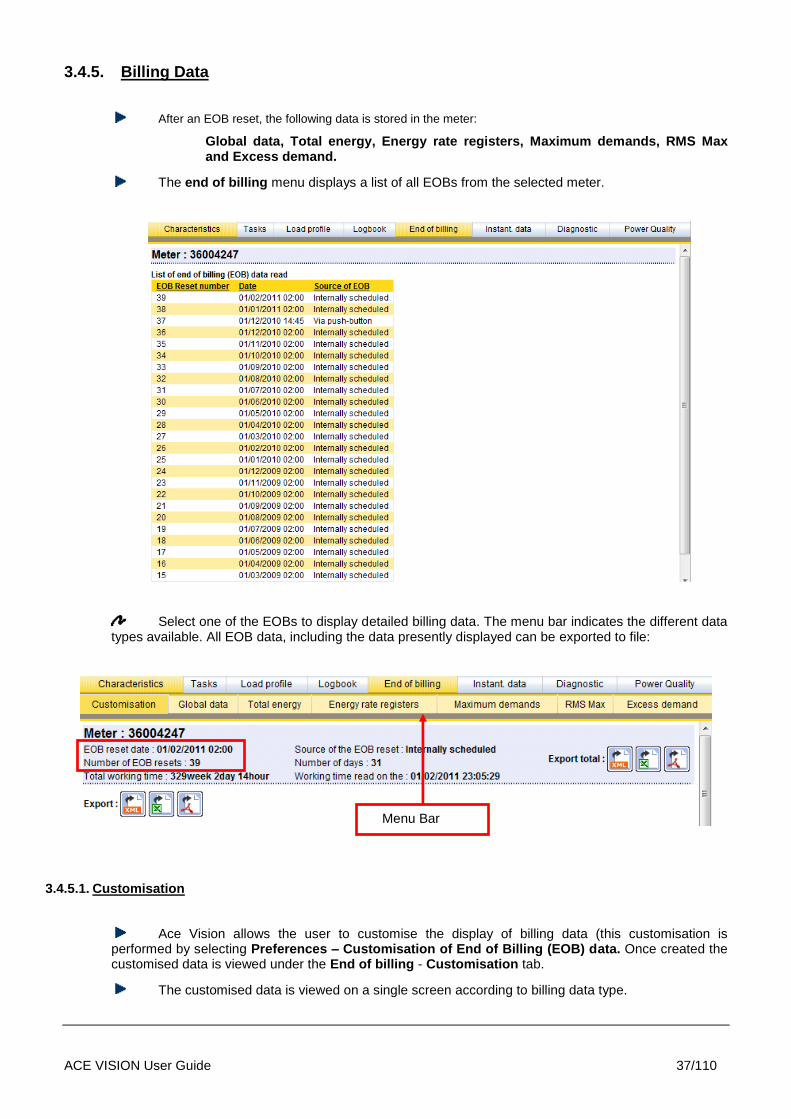
After an EOB reset, the following data is stored in the meter:
Global data, Total energy, Energy rate registers, Maximum demands, RMS Max and Excess demand.
The end of billing menu displays a list of all EOBs from the selected meter.
Select one of the EOBs to display detailed billing data. The menu bar indicates the different data types available. All EOB data, including the data presently displayed can be exported to file:
3.4.5.1. Customisation
Ace Vision allows the user to customise the display of billing data (this customisation is performed by selecting Preferences – Customisation of End of Billing (EOB) data. Once created the customised data is viewed under the End of billing - Customisation tab.
The customised data is viewed on a single screen according to billing data type.
Menu Bar
ACE VISION User Guide 38/110
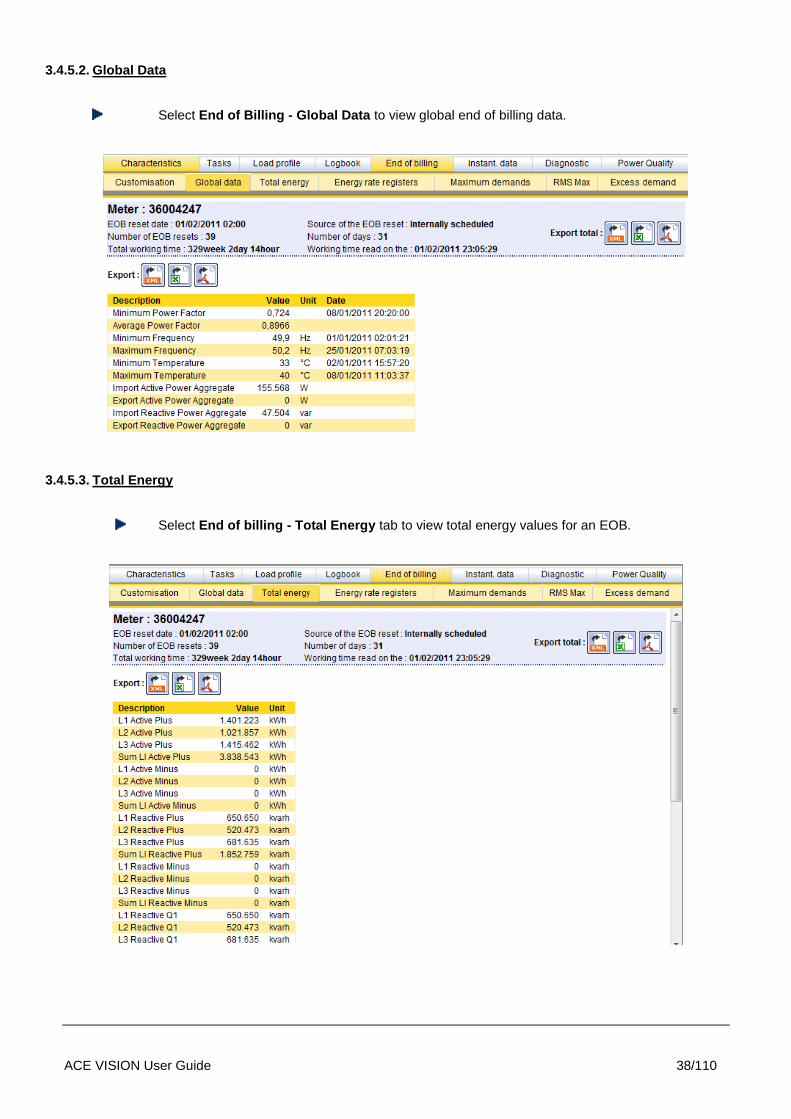
3.4.5.2. Global Data
Select End of Billing - Global Data to view global end of billing data.
3.4.5.3. Total Energy
Select End of billing - Total Energy tab to view total energy values for an EOB.

ACE VISION User Guide 39/110
3.4.5.4. Energy Rate Registers
Select End of Billing - Energy rate registers to view EOB energy rate registers values.
3.4.5.5. Maximum Demands
Select End of billing - Maximum demands to display maximum demand details.
ACE VISION User Guide 40/110
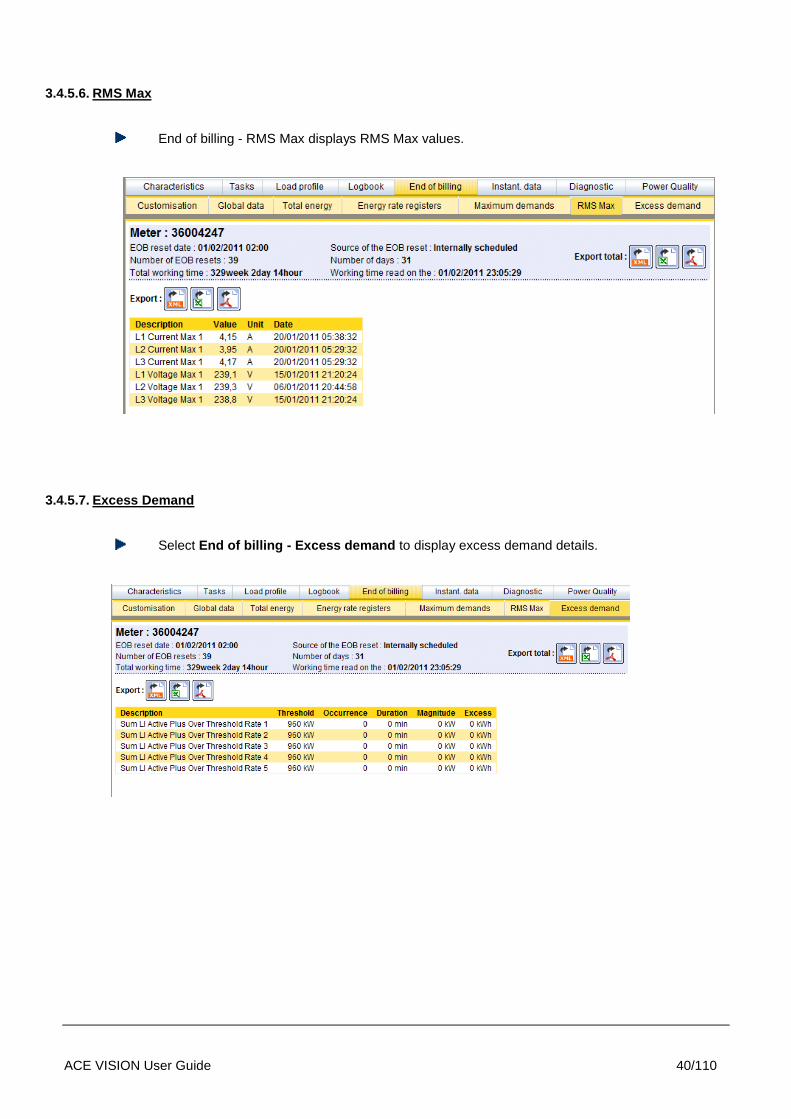
3.4.5.6. RMS Max
End of billing - RMS Max displays RMS Max values.
3.4.5.7. Excess Demand
Select End of billing - Excess demand to display excess demand details.

ACE VISION User Guide 41/110
3.4.6. Instantaneous Data
The Instant. data tab provides instant data to the last second. Instantaneous data consists of:
Instantaneous power, Power factor, RMS Value, Neutral and Phase angle.
Select Instant. Data to display a list of all instantaneous data available from the selected meter.
Select a time from the instantaneous data list to display detailed data for that given moment. A menu bar indicates the instantaneous data types available.
Menu Bar

ACE VISION User Guide 42/110
3.4.6.1. Customisation
Ace Vision allows the user (subject to administrative rights) to customise the display of instantaneous data (this customisation is performed by selecting Preferences - Customisation of Instantaneous data. Once created the customised data is viewed under the Instant Data. - Customisation tab.
Customised data is displayed on a single screen by instantaneous data type.

ACE VISION User Guide 43/110
3.4.6.2. Total Energy
Instantaneous total energy values can be displayed by selecting Instant data. - Total energy.
3.4.6.3. Energy Rate Registers
Select Instant data. - Energy rate registers to view instantaneous values

ACE VISION User Guide 44/110
3.4.6.4. Instantaneous Power
Select Instant data. - Instant. power to display instantaneous power details.
3.4.6.5. Power Factor
Instant data. – Power Factor displays power factor for each phase (phase1, 2 and 3) and average power factor.

ACE VISION User Guide 45/110
3.4.6.6. RMS Value
Select Instant data. - RMS Value to display instantaneous voltage and current per phase.
3.4.6.7. Neutral
Select Instant data. – Neutral to display instantaneous current and voltage of neutral
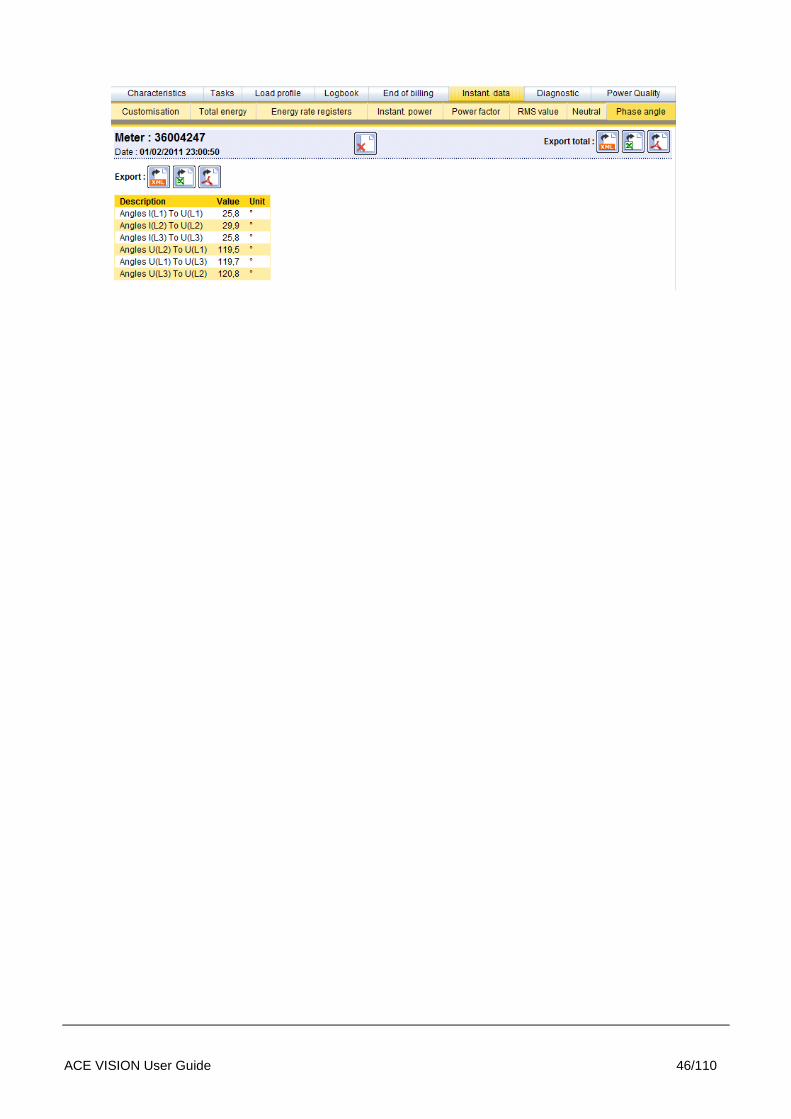
3.4.6.8. Phase Angle
Phase Angle voltage/voltage and voltage/ current
ACE VISION User Guide 46/110

ACE VISION User Guide 47/110
3.4.7. Diagnostics
Each meter reading provides time-stamped diagnostic records.
Select a date and time from the list to view if fatal and non fatal alarms were activated during the selected period.

ACE VISION User Guide 48/110
3.4.7.1. Field Information
The Diagnostics - Field Information tab provides information relative to HHU (mobile terminal connections).
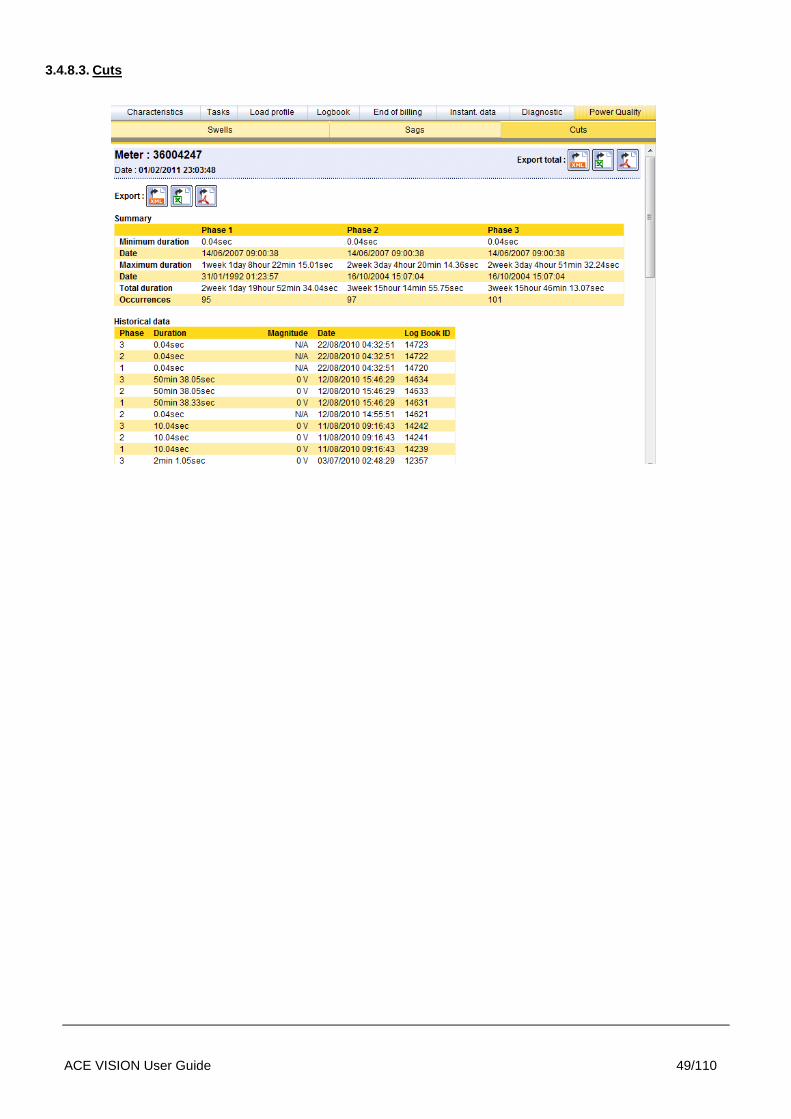
3.4.8. Power Quality Data
There are three types of power quality data: Swells, Sags and Cuts. Only data from the last remote reading are displayed. A menu bar related to the three power quality types is provided:
3.4.8.1. Swells
3.4.8.2. Sags
ACE VISION User Guide 49/110
3.4.8.3. Cuts

ACE VISION User Guide 50/110
3.5. METER GROUPS
ACE Vision allows the creation and definition of groups of meters. Each group must have a name and a group may contain meters of different types (e.g. ACE6000 and SL7000 etc)
Select Installed base management – Groups to display a list of already existing groups.
Meters in the group

ACE VISION User Guide 51/110
Once a group is selected, Characteristics and Tasks tabs are displayed. The characteristics tab displays group details (client name, meter type and meter list). The task tab displays all tasks associated to the selected group.
3.5.1. Create a Meter Group
Once a new group has been created, the following screen is displayed:
Enter a name for the group, along with the client and meter type(s).
Click on the button under Group meters list to display a list of meters available to the selected client:
ACE VISION User Guide 52/110
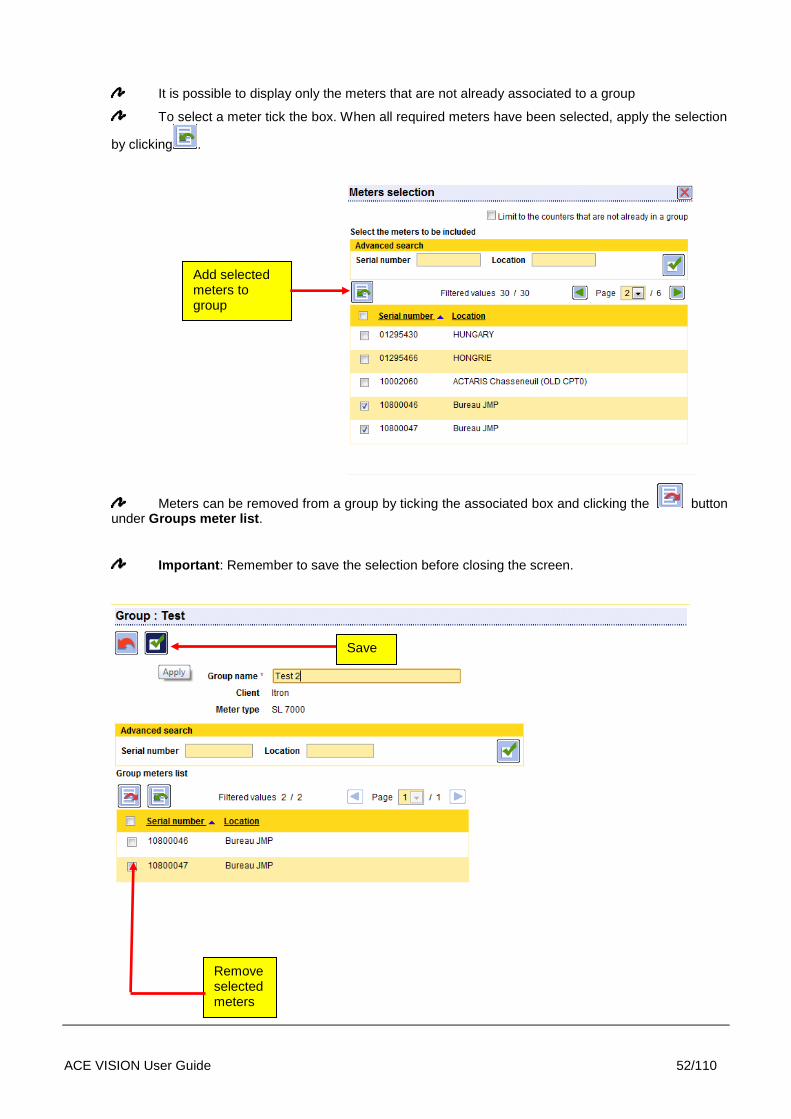
It is possible to display only the meters that are not already associated to a group
To select a meter tick the box. When all required meters have been selected, apply the selection
by clicking .
Meters can be removed from a group by ticking the associated box and clicking the button under Groups meter list.
Important: Remember to save the selection before closing the screen.
Add selected meters to group
Remove selected meters
Save

ACE VISION User Guide 53/110
3.5.2. Add Tasks to a Group
Just as tasks can be added to individual meters, they can also be assigned to a group of meters
List of tasks assigned to group Chasseneuil (CPT0-6):
As for a meter, to create group tasks, the user must:
Select the type of tasks to perform
Program the date and time of task execution
The settings are configured in the same way as for meter point tasks (see Meter Tasks)

ACE VISION User Guide 54/110
3.6. CALENDAR
This menu allows the user to create calendars containing tariffication (time of use) periods.
The first screen displays a list of existing calendars:
3.6.1. Calendar Creation (Step 1)
A wizard is provided to help define the different constituents of the calendar (Rates, Day Profiles, Seasons, Special days, Weeks).
Each calendar must be given a unique name. A calendar can be associated to all clients or a specific client chosen from the existing list. A comment field is available to describe the calendar (see example below):
Add

ACE VISION User Guide 55/110
Once the description field has been completed click on the Next button to move on to the next section of the wizard (Rates).
3.6.2. Create Rates (Step 2)
Define the rates to be added to the calendar by assigning names and colours. Click on the Add button, then Next to move to the next screen of the wizard.
3.6.3. Create Day Profiles (Step 3)
Day profiles are defined in 2 steps:
1. Create and name a new daily profile.
2. Define the period (cut off time of daily profile).
Next
Add
ACE VISION User Guide 56/110
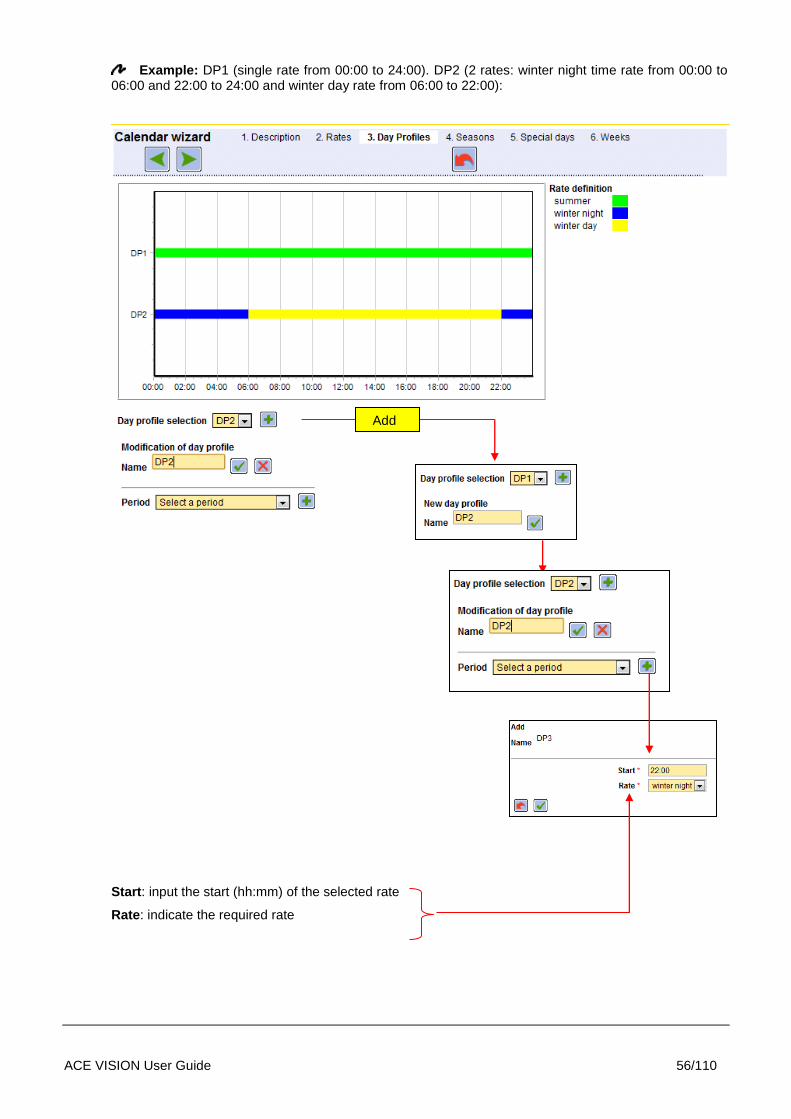
Example: DP1 (single rate from 00:00 to 24:00). DP2 (2 rates: winter night time rate from 00:00 to 06:00 and 22:00 to 24:00 and winter day rate from 06:00 to 22:00):
Start: input the start (hh:mm) of the selected rate
Rate: indicate the required rate
Add

ACE VISION User Guide 57/110
3.6.4. Create Seasons (Step 4)
To create a season, the season must have a label and a start date. A season is valid until the day and month of the start of the next season (if more than 1 season exists).
Example: 2 seasons are created (Summer from 01-04 to 31-10 and Winter from 01-11 to 31-03)
Add
Double-click to Edit

ACE VISION User Guide 58/110
3.6.5. Create Special Days (Step 5)
The calendar allows the creation of special days, to which day profiles can be associated.
Example: 01/01/11 is created as a special day with a DP1 day profile
3.6.6. Create Weeks (Step 6)
The final step of calendar creation is to add weekly profiles for the previously created seasons.
Add
Edit (by double click)
Save Calendar

ACE VISION User Guide 59/110
Once the final step is complete and the calendar has been applied, a summary calendar screen is displayed showing details of the calendar settings.
Note: An existing calendar can be edited, deleted or copied as required.

ACE VISION User Guide 60/110
3.7. SUMMATIONS
ACE Vision allows users to carry out arithmetic operations on data. Select Installed base management – Summations to access a list of existing summations.
Add

ACE VISION User Guide 61/110
3.7.1. Creating a Summation
A summation is defined by its name, for all clients, or for a specific client chosen from the list.
Meters can be further sorted according serial number and location.
Available meters are displayed by page. To add meters to a summation, tick the meter’s box
and apply the selection by clicking the addition button ( ) or the subtraction button ( ).
Note: All meters on a page can be selected or deselected at once by ticking the box to the left of the serial number column title.
Add Meters
ACE VISION User Guide 62/110
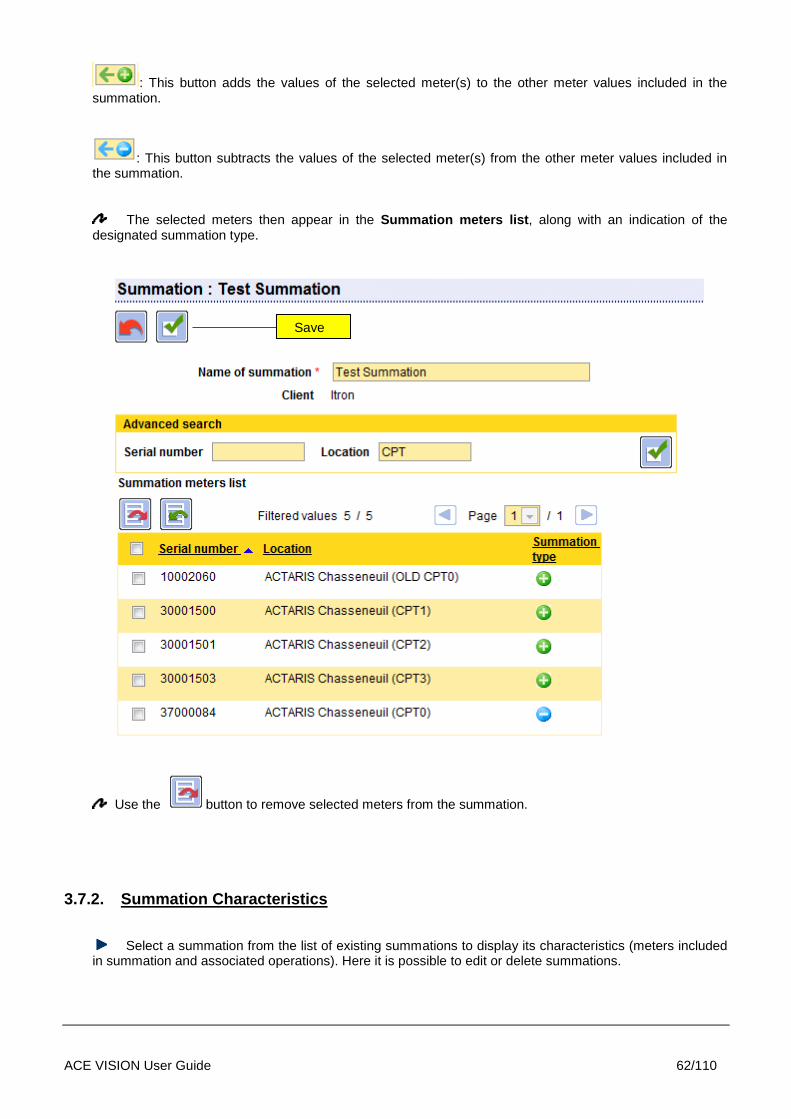
: This button adds the values of the selected meter(s) to the other meter values included in the summation.
: This button subtracts the values of the selected meter(s) from the other meter values included in the summation.
The selected meters then appear in the Summation meters list, along with an indication of the designated summation type.
Use the button to remove selected meters from the summation.
3.7.2. Summation Characteristics
Select a summation from the list of existing summations to display its characteristics (meters included in summation and associated operations). Here it is possible to edit or delete summations.
Save

ACE VISION User Guide 63/110
3.7.3. Summation Tasks
From the Summations - Tasks tab, a task can be created to produce an export file of the load profile resulting from a summation. The file can be exported in XML, CSV and PDF formats.
An export period corresponding to the data range to be exported must be selected. The data exported is the last complete data set applicable to the defined period available (e.g. if the period selected is Day, the preceding day’s data is exported).
The export file can be published by file (local), by FTP or by Email.

ACE VISION User Guide 64/110
Tasks can be executed immediately or at a fixed date. Tasks can be performed one time only or at regular intervals.
A time slot can be defined (hourly constraints), with tasks only being performed within this time slot.
3.7.4. Summation Load Profile Calculation
The Load profile tab displays the results of the summation on the load profile of the meters concerned.
For the summation to be valid, the concerned meters must respect the following rules:
The meters must have a common range of data
The meters must have a common recording interval period
The meters must have common channels
Apply and View Graph

ACE VISION User Guide 65/110
3.7.4.1. View Summation Load Profile Graph
This graph can be exported to file in PDF format and the associated data in XML or CSV format.
ACE VISION User Guide 66/110
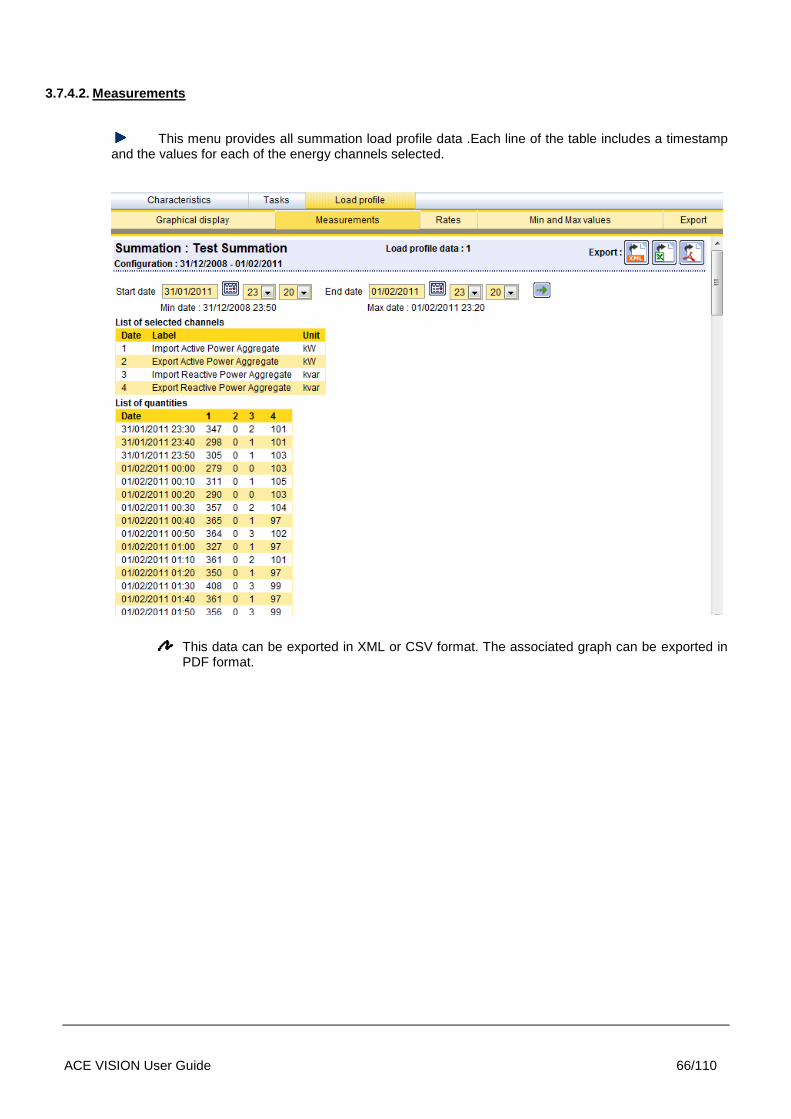
3.7.4.2. Measurements
This menu provides all summation load profile data .Each line of the table includes a timestamp and the values for each of the energy channels selected.
This data can be exported in XML or CSV format. The associated graph can be exported in
PDF format.
ACE VISION User Guide 67/110
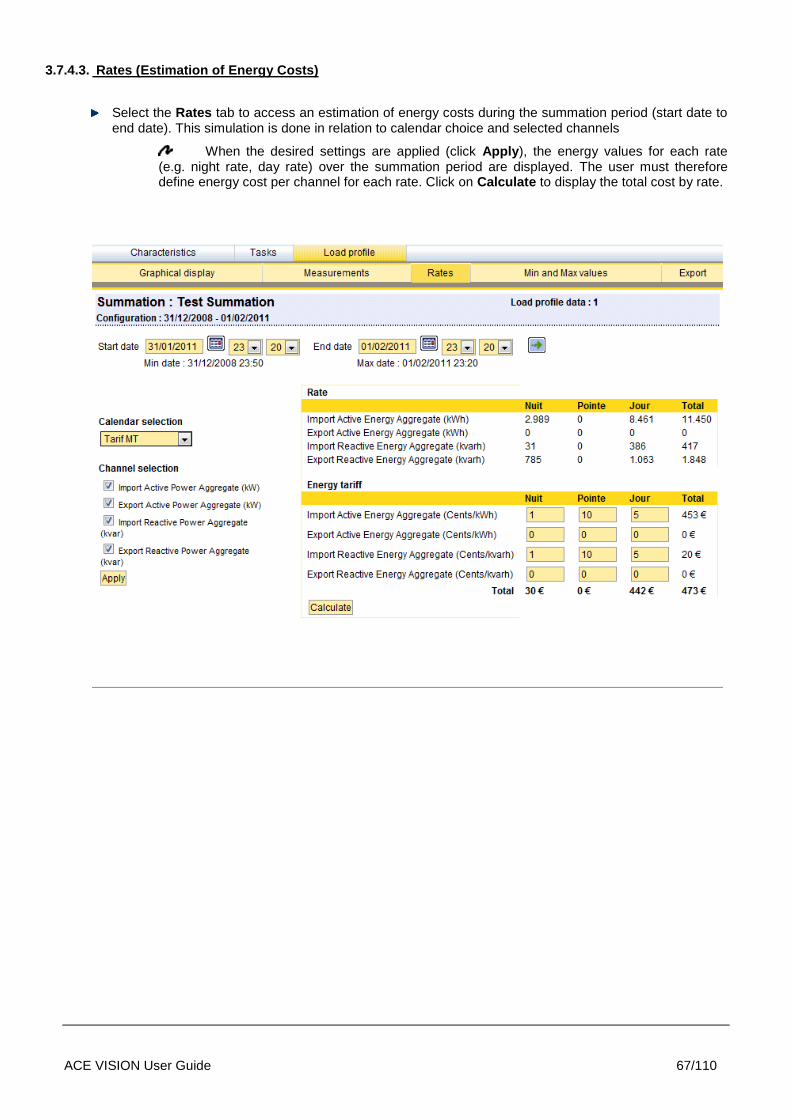
3.7.4.3. Rates (Estimation of Energy Costs)
Select the Rates tab to access an estimation of energy costs during the summation period (start date to end date). This simulation is done in relation to calendar choice and selected channels
When the desired settings are applied (click Apply), the energy values for each rate (e.g. night rate, day rate) over the summation period are displayed. The user must therefore define energy cost per channel for each rate. Click on Calculate to display the total cost by rate.
ACE VISION User Guide 68/110
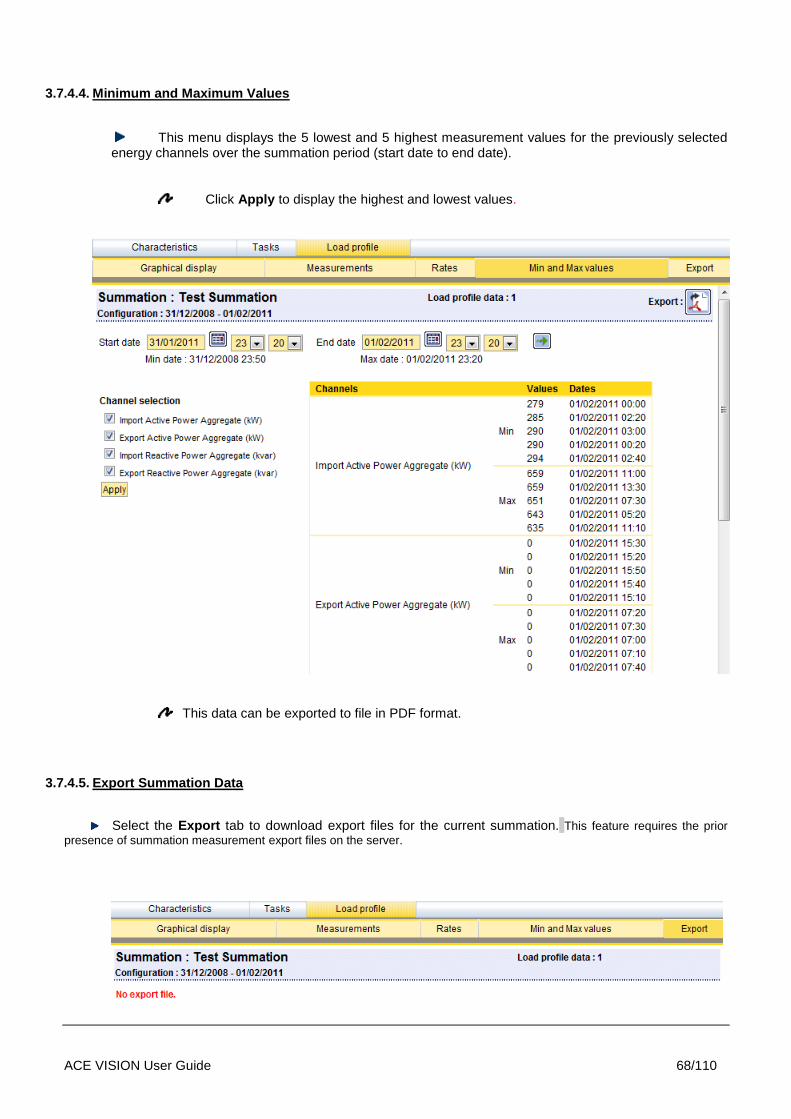
3.7.4.4. Minimum and Maximum Values
This menu displays the 5 lowest and 5 highest measurement values for the previously selected energy channels over the summation period (start date to end date).
Click Apply to display the highest and lowest values.
This data can be exported to file in PDF format.
3.7.4.5. Export Summation Data
Select the Export tab to download export files for the current summation. This feature requires the prior
presence of summation measurement export files on the server.

ACE VISION User Guide 69/110
3.8. DYNAMIC SUMMATION
This dynamic summation is defined according several criteria. The scope of this summation is evolving along the time, and so there is no need to modify the summation as soon as meters are added or modified in the data base of ACE-VISION.
A dynamic summation is created through the menu Installed Base configuration -> Dynamic Summation. The tasks relevant to the dynamic summation are created through the menu Installed Base Management - > Tasks Management -> Dynamic summation.
Once defined, the dynamic summation is identical to a static summation.
A dynamic summation is defined with
A name
N criteria ( AND condition )
o Customer ( all, one specific, or a group )
o Location
o Postcode ( city )
o Meter type Type
o Substation
o Substation outgoing lines
o Production type

ACE VISION User Guide 70/110
In a dynamic summation, all meters are added (no substraction possible )
Once the dynamic summation is defined, relevant load profile could be visualized, (tab Load Profile), meters that entered currently into the dynamic summation.
Dynamic summation data could be exported.

ACE VISION User Guide 71/110
3.9. ENERGY MONITORING
Select Energy Monitoring to view a list of existing monitoring tasks. Monitoring is used to perform checks
after load profiles have been read to detect any active energy anomalies.
To create a new monitoring task, the following details must be entered: name, energy to monitor, start and end time (if required as a time slot is only required for random production), a threshold along with an alarm trigger, the number of consecutive values and the meters to monitor.
Add

ACE VISION User Guide 72/110
An SMS or Email alert is automatically sent to specified users when an anomaly is detected. A regular report listing meters with anomalies is sent by Email to specified users.
3.10. PROBABILITY OF ENERGY
This feature allows users to check the coherence of Total Active Import energy values contained in an EOB. Each time a new EOB is read in the meter, the difference between the sum of the three active energy imports for the three phases and the aggregate active import energy is calculated. If the difference is beyond the configured threshold (threshold for energy probability check in ACE Vision configuration tool) an alarm is activated.
Add meters

ACE VISION User Guide 73/110
3.11. PUBLISHING
Use this feature to configure the sending of reports for Meters in stop mode, energy monitoring, probability of energy, configuration control and on some alarms checks (cover opening, magnet attack, voltage loss).
Select Publishing - Tasks.
The export file can be published by file (local), by FTP or by Email.
Tasks can be executed immediately or at a fixed date. Tasks can be performed one time only or at regular intervals.
A time slot can be defined (hourly constraints), with tasks only being performed within this time slot.
Add

ACE VISION User Guide 74/110
3.12. DATA MANAGEMENT
This module allows to visualize the data associated to meters, static and dynamic summations.
3.12.1. Meters
Allows you to view:
• The list of meters,
• General information on these meters (identity card)
• Tasks performed on the meters,
• All data can be viewed,
• It is possible to restart one or more tasks.
3.12.2. Summations
Allows you to view:
• The list of summations,
• The meters that are associated to these summations,
• The results of load profiles,
• It is possible to restart one or more tasks
3.13. REVENUE PROTECTION
This menu produces reports according to different controls and monitoring tasks put in place, it can also
provide a report on the state of a meter park.
Each report can be exported to PDF or XLS format (according to data type).
3.13.1. Meters in Stop Mode
Select Revenue Protection – Meters in stop:

ACE VISION User Guide 75/110
ACE VISION User Guide 76/110
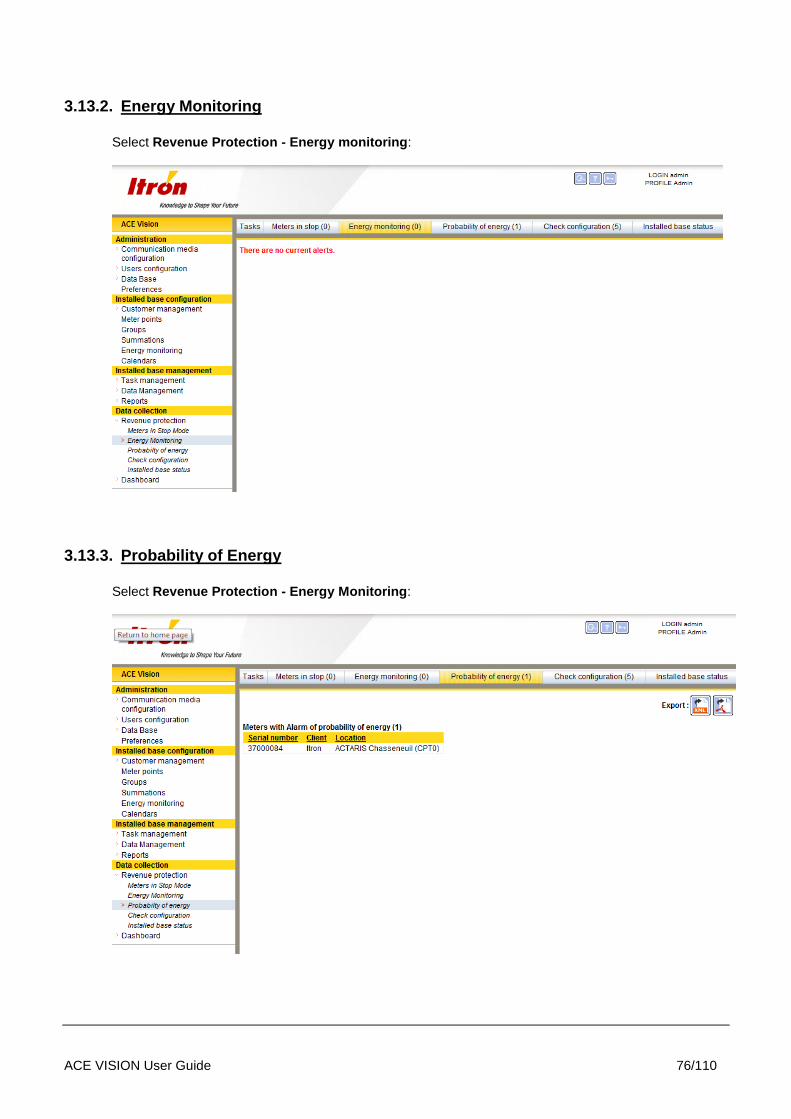
3.13.2. Energy Monitoring
Select Revenue Protection - Energy monitoring:
3.13.3. Probability of Energy
Select Revenue Protection - Energy Monitoring:
ACE VISION User Guide 77/110
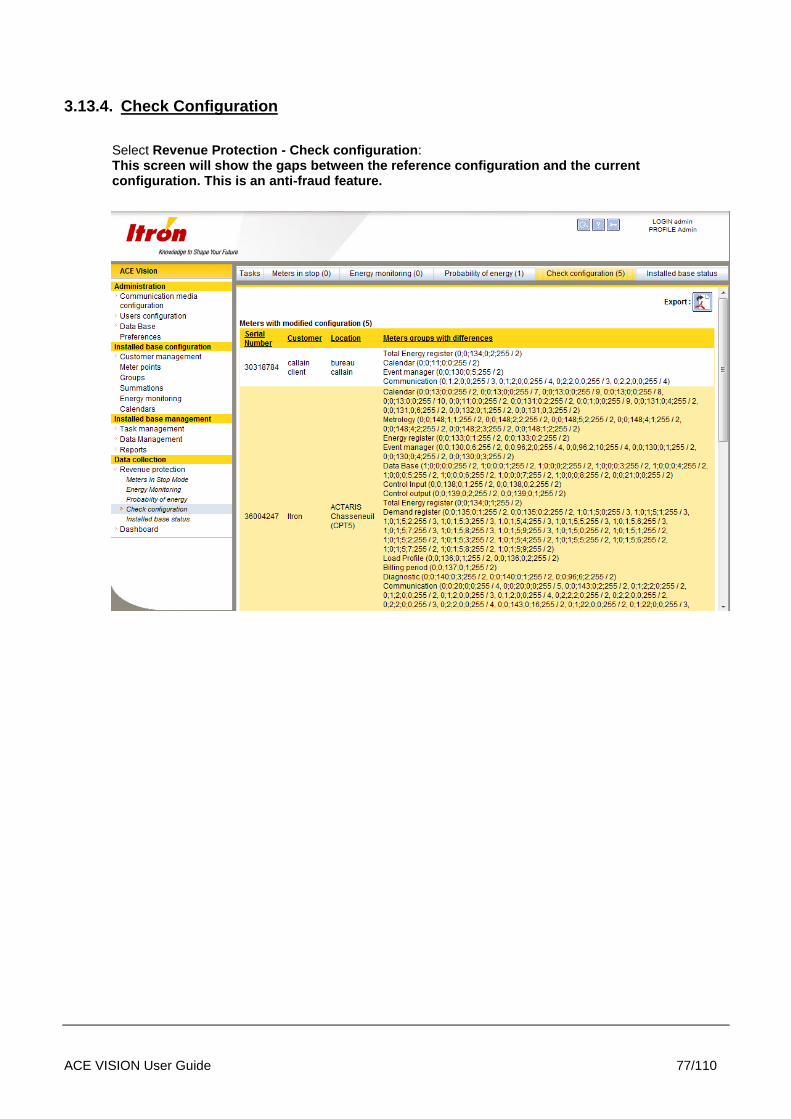
3.13.4. Check Configuration
Select Revenue Protection - Check configuration: This screen will show the gaps between the reference configuration and the current configuration. This is an anti-fraud feature.

ACE VISION User Guide 78/110
3.13.5. Installed Base Status
Failed tasks or meters can be selected over a period of between 1 and 31 days in
predefined steps.
a) List of tasks:
In certain cases further information about the type of action or messages are displayed when
the mouse is held over the icon:

ACE VISION User Guide 79/110
b) Failed Task Graphs:

ACE VISION User Guide 80/110
3.14. SYNCHRONISING ACE VISION TO AN HHU
See relevant user guide of ACE-VISION Mobile

ACE VISION User Guide 81/110
3.15. REPORTS
Select Installed base management - Reports to access a list of pending tasks, to follow tasks in progress and to view failed tasks.
3.15.1. Pending Tasks

ACE VISION User Guide 82/110
3.15.2. Task Results
Check that the scheduler is activated:
Scheduler activated :
Scheduler not activated :
To deactivate the scheduler click on the button, to restart, click on the button.
Check that automatic update is enabled to be follow task execution in real time.
Click the button to remove the results of completed tasks.

ACE VISION User Guide 83/110
3.15.3. Failures
See Installed Base Status
ACE VISION User Guide 84/110
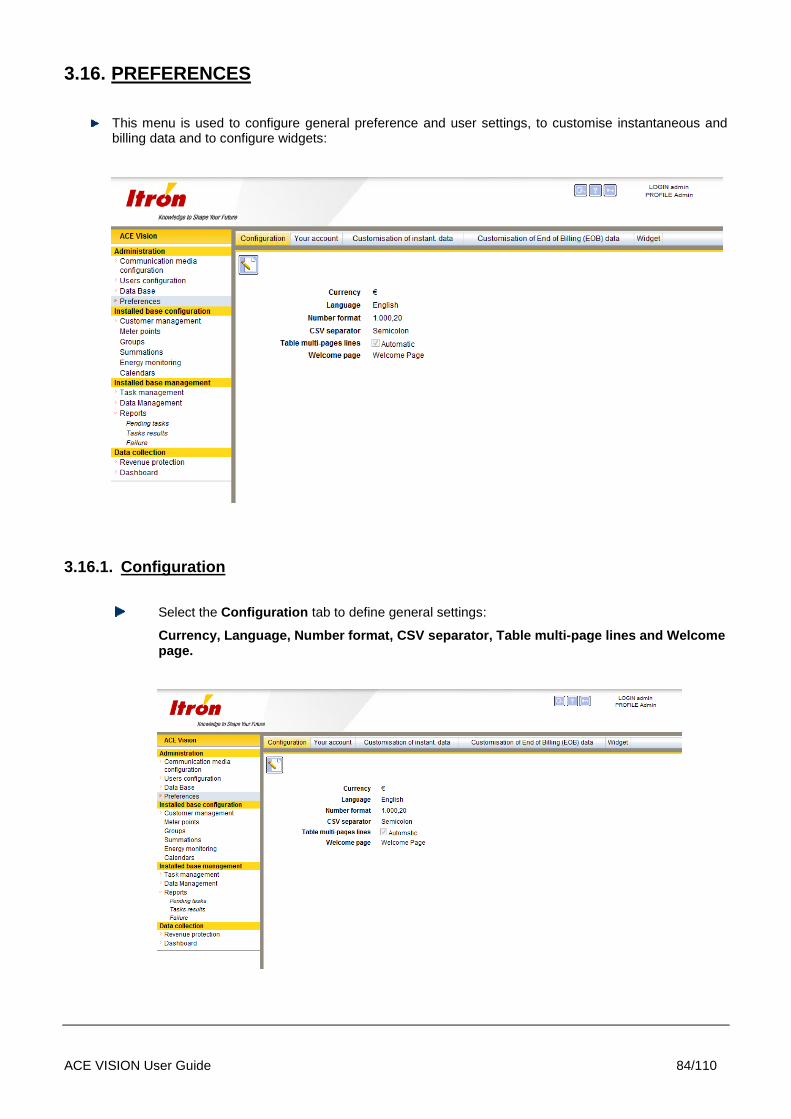
3.16. PREFERENCES
This menu is used to configure general preference and user settings, to customise instantaneous and billing data and to configure widgets:
3.16.1. Configuration
Select the Configuration tab to define general settings:
Currency, Language, Number format, CSV separator, Table multi-page lines and Welcome page.

ACE VISION User Guide 85/110
The welcome page can be a widget, which allows when when launching ACE Vision to have an immediate visualisation of the main indicators defined by the customer.
The function ‘save time interval’ has also been added, for some analysis on a specific time period. Value has to be put on ‘Yes’ to memorize the time interval. User can invalidate this function by reprogramming the value to ‘No’.
Without this feature, the user had to enter the time interval of the load profile a wanted to visualize, for each meter.

ACE VISION User Guide 86/110
3.16.2. Your Account
This tab allows the user to modify certain user specific data. The user account password can also be changed here.
Remark: After the first installation of the tool, the default login and password are admin / admin.

ACE VISION User Guide 87/110
3.16.3. Customisation of Instantaneous Data
The Customisation of Instant data menu is used to define in detail the data to be displayed in the customisation tab in the Meter points menu.
Instantaneous data is divided into several groups: Total energy, Energy rate registers, Instant. Power, Power factor, RMS Value, Neutral, Phase angle and THD (Total Harmonic Distortion.
Tick the box to add data to the customised data view.

ACE VISION User Guide 88/110
3.16.4. Customisation of EOB Data
The Customisation of End of Billing (EOB) Data is to be displayed in the Customisation section of Meter points.
Billing data is divided into several groups: Global data, Total energy, Energy rate registers, RMS Max, Maximum demands and Excess demand.
Tick the box to add data to the customised data view.

ACE VISION User Guide 89/110
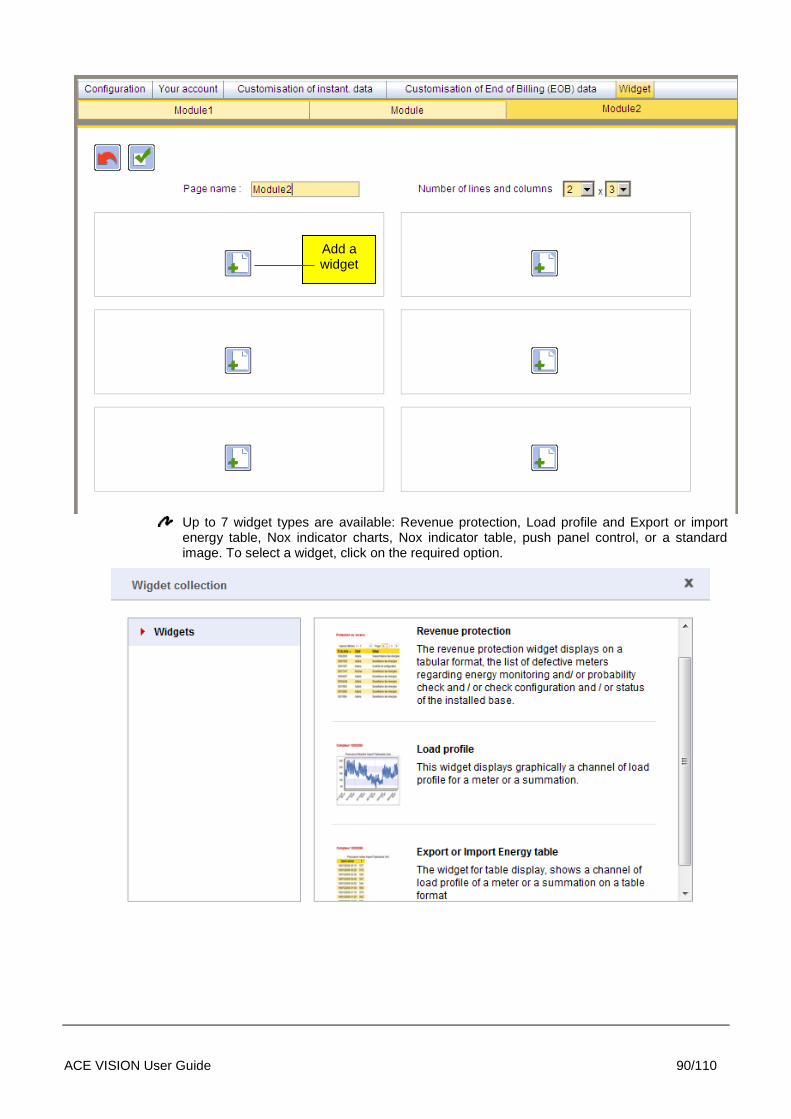
3.16.5. Widgets
Widgets can be selected and configured to allow the display of key information on a single screen. This menu is used to configure modules containing the widgets required.
To access widgets, Select Dashboard – Widgets:
A module can contain up to 10 lines and 5 columns ( default value 2x3)
The name of a module can be changed
Delete a module
Add a module
Edit a module
ACE VISION User Guide 90/110
Up to 7 widget types are available: Revenue protection, Load profile and Export or import energy table, Nox indicator charts, Nox indicator table, push panel control, or a standard image. To select a widget, click on the required option.
Add a widget

ACE VISION User Guide 91/110
Every widget must be given a name.
Revenue protection widgets can contain energy monitoring, probability of energy, check configuration and diagnostic information.
A load profile widget can contain information relating to a meter or a summation in the form of a graph or a histogram. A load profile widget requires prior configuration of various parameters:

ACE VISION User Guide 92/110
An export or import energy table widget contains information relevant to a meter or summation in table form. This widget requires prior configuration of various parameters:
A Nox indicator widget contains the Nox information of a meter ( not available for a summation ). This indicator allows to evaluate periods of time during which the production site has been really hazardous (energy produced in ‘basis’ period), compared to the period of time non hazardous (energy produced in mode ‘preset’).
This widget is determined by the values of load profiles, with interval of 10min, and this is by these values that we will know the periods of hazardous and non-hazardous productions.
This requires the definition of two thresholds:
coupling threshold: power in kW or MW
Threshold NOx: power in kW or MW
The mode "basis" corresponds to a higher power produced, compared to NOx threshold. This is the normal operating mode.
The mode "Preset" corresponds to a generated power between the coupling threshold and the NOx threshold. This is the mode of reduced operation, global energy demand is lower than the normal operating mode.
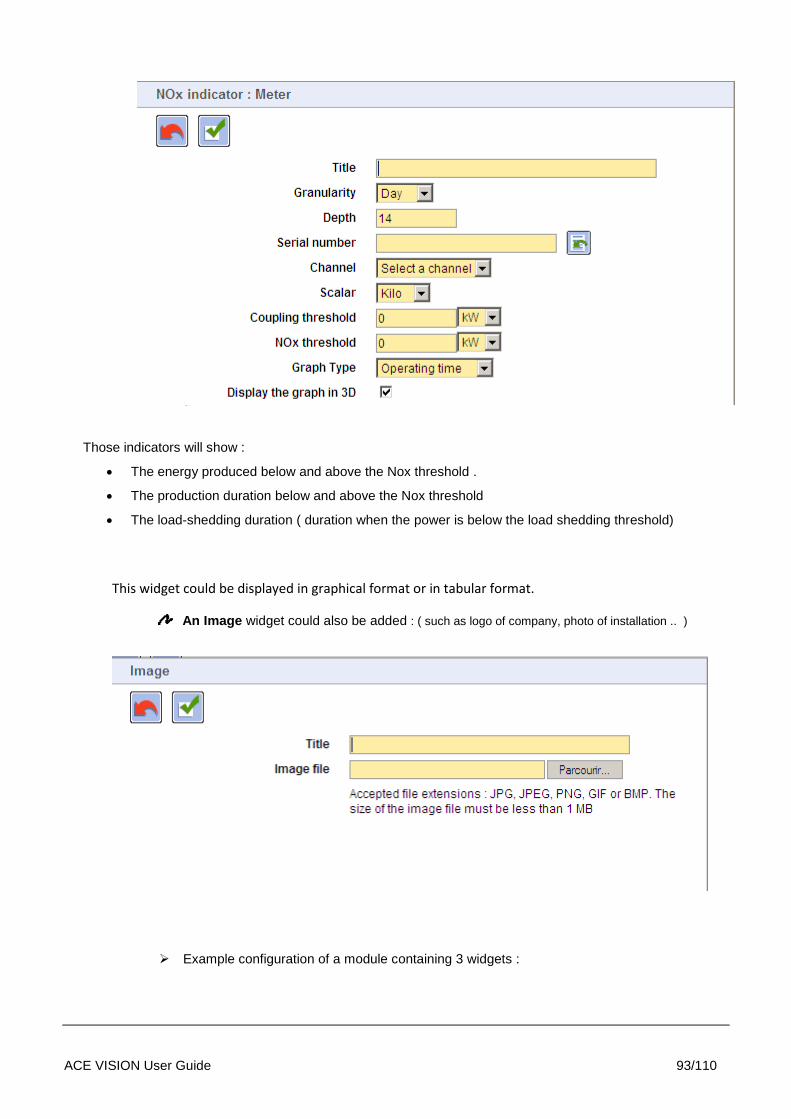
This widget requires prior configuration of various parameters:
ACE VISION User Guide 93/110
Example configu
Those indicators will show :
The energy produced below and above the Nox threshold .
The production duration below and above the Nox threshold
The load-shedding duration ( duration when the power is below the load shedding threshold)
This widget could be displayed in graphical format or in tabular format.
An Image widget could also be added : ( such as logo of company, photo of installation .. )
Example configuration of a module containing 3 widgets :

ACE VISION User Guide 94/110
ACE VISION User Guide 95/110
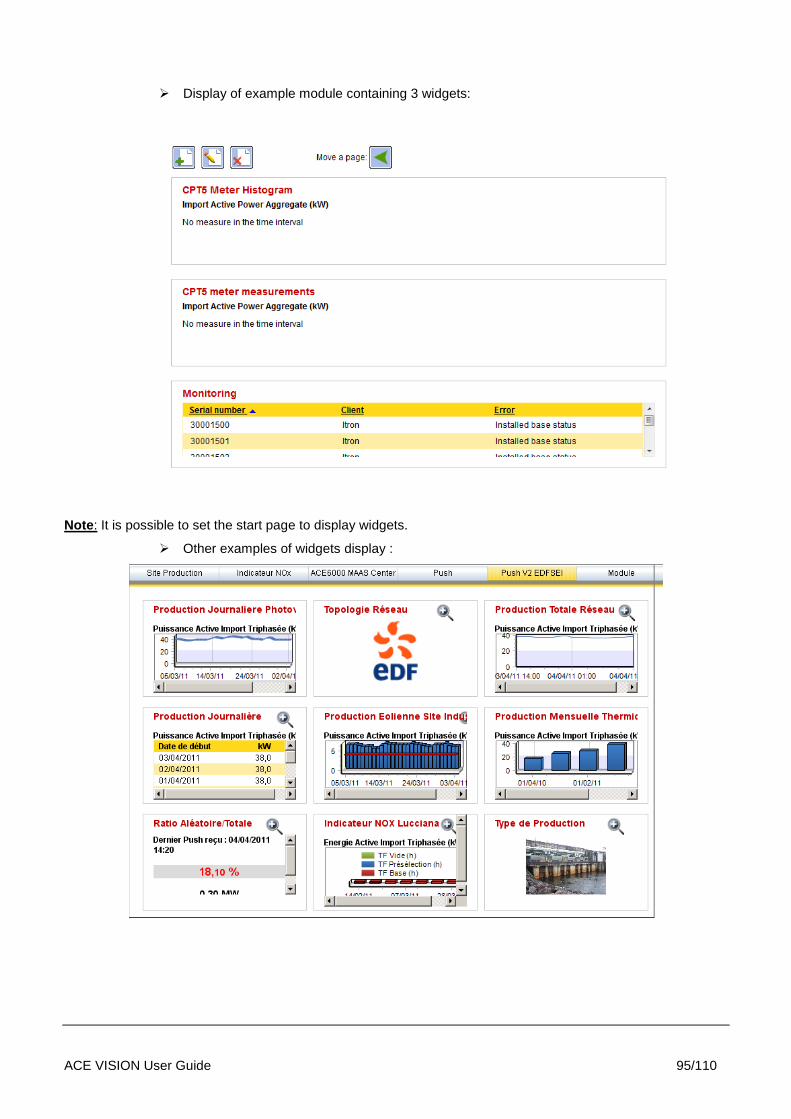
Display of example module containing 3 widgets:
Note: It is possible to set the start page to display widgets.
Other examples of widgets display :

ACE VISION User Guide 96/110
3.17. EXPLOITATION OF WIDGETS
3.17.1. Exports CSV et PDF
In full screen mode, there is a possibility to export the widgets in CSV or PDF format. In CSV, the export will be tabular, but in PDF the export will be tabular and graphical
For that, 2 buttons have been added
This feature is available only in case of relevant widget ( no need to export a image widget ! )
3.17.2. Full screen display
.
To better visualize one widget of a given page, a zoom – unzoom feature is added.
Mode widget standard with zoom button Mode widget « full screen » with unzoom button

ACE VISION User Guide 97/110
Then in the main menu, or the welcome page, a full screen feature is added. It allow to display one page in full screen ( removing the left hand menu ) . To come back to the standard page, the un-zoom menu should be used ( the one in the upper banner )
Un-zoom from full screen
Full screen mode

ACE VISION User Guide 98/110
3.18. WEB SERVICES
3.18.1. Objectif
ACE VISION Database (MySQL) is not accessible to the customers.
The webservices function allows customer to access the ACE VISION database in order to personalize the data. Customer will be able to:
- Read
- Modify
- Create
- Delete
datas inside the database
Big interest is that the customer can base the development of external tools based on these webservices, without any new adaptation of his tools when a new version of ACE VISION is available.
3.18.2. Associated rules
Implementation of the WEB SERVICE shall respect the following rules:
- The type of service WCF (Windows Communication Foundation) will be hosted as a Windows service on the same server than ACE Vision
- The WCF Web Service has to be "standard / basic" in order to comply with the W3C standard and be compatible with any development language.
- Authentication to the Web Service will be done with ACE Vision user account. It must have the necessary rights to access the Web Service. Multiple connections with the same user account must be carried out simultaneously.
- The only possible access right in this version in a user profile is:
o Read only
- Access to the Web Service functionality will be subject to a new license option.
- In order to avoid at the maximum to return labels, we use codes (enumerations for example) which will be described in the SDK (software development kit) and the Web Services User Guide. In the case of exceptions, messages will be by default in English or the language of the user connected to the Web service (if known).
- The data returned by the Web service must be pre-treated and not be raw data as in database. It must be possible to link data retrieved from a Web Service method to components (charts, graphs or other) without having to re-form data
3.18.3. Architecture

ACE VISION User Guide 99/110
3.18.4. Methods
A library with all the functions has been developed. It allows to access in ACE Vision database all data listed below:
Methods
Meter
Access to the list of meters
Access to the list of meters linked to a customer (name or ID)
Access to a meter, from its ID or serial number
Access to list of customer
Customer Access to a customer, from its ID or name
Access to load profile information (configuration of LP, configuration of channels)
Meter data Access to the description of a load profile channel, from its ID (ID retrieved from LP information above)
Access to a LP channel, for a specific ID : measurements and events (ID of the channel retrieved from the channel description above)

ACE VISION User Guide 100/110
Access to a load profile channel and values estimated for a Push meter for a specific channel ID : measurements and events (ID of the channel retrieved from the channel description above)
Access to a list of EOB (ID and date) from a date interval
Access to all the data of an EOB, from its ID or a specified date.
Access to datas of personalized EOB, from its ID or a fixed date
ADI
Access to Push ratio
Access to power margin
Access to the list of producer (ID and meter name) to disconnect
3.18.5. Structure of data used by web services
3.18.5.1.Meter
Field Type Comments
MeterID Int Identification of meter
ParentCustomerId Int ID number of customer
SerialNumber String Serial number of meter. Used for modem connection, mediation & registration server.
MeterType MeterType List of meter types
ConnectionId Int Identification number of the connection dedicated to the meter
MeterConnectionType ConnectionType List of connection type
PasswordReading String Password used for readings
PasswordWriting String Password used for configuration writing
Comments String Comments
PhoneNumber String Phone number for modem connection
Location String Localization (country, town, area, company, …)
Address String Address
PhysicalAddress Int Example : 17
IpAddress String IP@
IpClientPort Int Example : 703
IpServerPort Int Example : 10703
FirmwareVersion String Example : "4.55"
MeterDaysFirstLoadLP Int Number of days to read for the first reading of load profiles
MeterCountFirstLoadEOB Int Number of EOB to read for the first reading of EOB
CurrentType CurrentType List of connection type (CT, DC)

ACE VISION User Guide 101/110
GPSLatitude String Latitude GPS. Example : "46.66030"
GPSLongitude String Longitude GPS. Example : "0.37260"
StatBegin DateTime Starting date for statistical calculations
StatLastSuccess DateTime Date of last successful reading
StatLastError DateTime Date of last reading in error
StatLastErrorMessage String Error message of last reading in error.
StatCountTry1 Int Number of successful communications after 1st attempt
StatCountTry2 Int Number of successful communications after 2nd attempt
StatCountTry3 Int Number of successful communications after 3rd attempt
StatCountTry4 Int Number of successful communications after 4th attempt
VoltageQualityDate DateTime Date of last voltage quality reading
THDDefectNumberCurrent Int Number of THD Defect History Current
THDDefectNumberVoltage int Number of THD Defect History Voltage
IsMeterModemCLO Bool Indicate if this is a CLO modem
WaveformSamplingPeriod Float Sampling period of waveforms in secondes
NominalFrequency Int Nominal frequency of meter (50 or 60 Hz)
CurrentRatingIb Int Nominal current of meter (used for waveforms calculation)
DeviceAddress String Address de peripherical (used by Indigo+)
IsPushMeter Bool Indicate if meter used the PUSH function
ProviderType MeterProviderType List of types of producers (Wind, Sun, Main, etc)
PowerTheory Int Installed power available in kW (used for the PUSH)
PowerNextEstimated Int Power (in kW) to use for next estimated power (used for the PUSH)
PushInsert DateTime Date of setting queue (used for the PUSH)
CreationDate DateTime Date of meter commissioning
MeterMeasurementDate DateTime Date/hour of the last identification of the meter state (measurements started)
MeasurementStatus WorkingMode Indicate the last state known regarding meter measuremernts
Notification String Notification message
PortableTerminalID Int Identification of portable terminal associated to the meter
3.18.5.2.Customer
Field Type Comments
CustomerID Int ID of customer
Name String Name of customer
AccountNumber String Customer reference
PhoneNumber String Customer phone number
Address String Customer address
Email String Customer email
Comments String Comments
ACE VISION User Guide 102/110
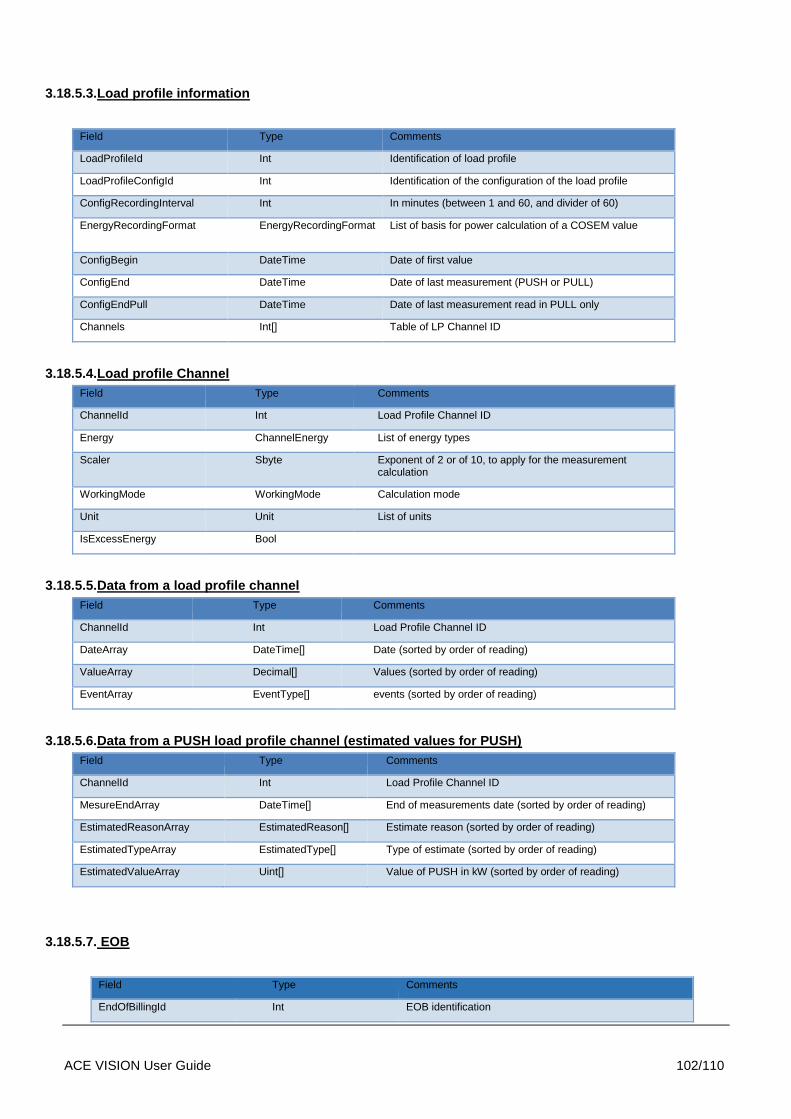
3.18.5.3.Load profile information
Field Type Comments
LoadProfileId Int Identification of load profile
LoadProfileConfigId Int Identification of the configuration of the load profile
ConfigRecordingInterval Int In minutes (between 1 and 60, and divider of 60)
EnergyRecordingFormat EnergyRecordingFormat List of basis for power calculation of a COSEM value
ConfigBegin DateTime Date of first value
ConfigEnd DateTime Date of last measurement (PUSH or PULL)
ConfigEndPull DateTime Date of last measurement read in PULL only
Channels Int[] Table of LP Channel ID
3.18.5.4.Load profile Channel
Field Type Comments
ChannelId Int Load Profile Channel ID
Energy ChannelEnergy List of energy types
Scaler Sbyte Exponent of 2 or of 10, to apply for the measurement calculation
WorkingMode WorkingMode Calculation mode
Unit Unit List of units
IsExcessEnergy Bool
3.18.5.5.Data from a load profile channel
Field Type Comments
ChannelId Int Load Profile Channel ID
DateArray DateTime[] Date (sorted by order of reading)
ValueArray Decimal[] Values (sorted by order of reading)
EventArray EventType[] events (sorted by order of reading)
3.18.5.6.Data from a PUSH load profile channel (estimated values for PUSH)
Field Type Comments
ChannelId Int Load Profile Channel ID
MesureEndArray DateTime[] End of measurements date (sorted by order of reading)
EstimatedReasonArray EstimatedReason[] Estimate reason (sorted by order of reading)
EstimatedTypeArray EstimatedType[] Type of estimate (sorted by order of reading)
EstimatedValueArray Uint[] Value of PUSH in kW (sorted by order of reading)
3.18.5.7. EOB
Field Type Comments
EndOfBillingId Int EOB identification

ACE VISION User Guide 103/110
MeterId Int ID of meter linked to this EOB
Date DateTime Date of EOB
Reason EndOfBillingReason Reason of EOB
DaysCount EndOfBillingDays Number of days for this EOB
ResetsCount EndOfBillingResets Number of EOB generated
IntegrationPeriod int Integration period in minutes
MaxMode EnfOfBillingMaxMode MaxDemandMode : 0: max request mode, 1: max excess mode
ExcessMode EndOfBillingExcessMode 0: no management, 1: end of integration period, 2: rising value, 3: projection
ReadDate DateTime Date/Hour of EOB reading
TotalOperatingTime Int Total operating time
GlobalValueArray CValue[] Global data
BillingTotalArray CValue[] Total energy
BillingRateArray CValue[] Energies per rate
BillingMaxArray CValue[] Max Power
BillingRMSMaxArray CValue[] RMS Max values
BillingExcessArray CEndOfBillingExcess[] Excess power
3.18.6. ACE VISION REFLECT
To use the web service offered by ACE VISION, an Ace Vision Reflect tool will be installed if you choose the complete installation.
- Documentation in English describing all methods exposed by the Web service with the format of the recovered data (CHM, and PDF)
- A web service usage example in .Net:
o The tool is as generic as possible and rely on the contract to recover automatically the name of the web methods and associated parameters.
o The addition of a new method of web service should not require recompilation of this tool.
o The test tool will authorize the data entry of all the fields (method parameters) of web services methods. An help may be considered depending on the parameter type
Example:
- Date & Time in a proposed calendar
- Boolean proposed a checkbox
- Character set ASCII standard proposed entry
- List proposed inside a combo
- Numerical value => a "ultranumericeditor"
- .......
The result will be visible in a table (that will allow to export automatically)
After entering the login information to the ACE VISION database, VISION REFLECT home page will offer the user the library of available functions.

ACE VISION User Guide 104/110

ACE VISION User Guide 105/110
3.19. ACE VISION CONFIGURATION
The purpose of this chapter is the use of ACE VISION configuration tool. The parameters to adjust or possible actions are:
- Preferences (all adjustable parameters belong to this option)
- Backup (database)
- Archiving Backups
- Archiving track changes
- Restoring the database
- About
3.19.1. LAUNCHING ACE VISION CONFIGURATION
This tool is available in the directory below:
C:\Program Files (x86)\Itron\ACE Vision\Tools\Configuration\
Click on ACE Vision Configuration
3.19.1.1.Preferences
This section allows to adjust some parameters. It is highly recommended to not modify parameters. Only the following parameters have to be updated:
- Push offset: it is advisable to put this offset at 180 s (instead of 30s which is the value per default inside the configuration) to be sure that data pushed by the meter is well arrived on the FTP site
- Push FTP:
o URL to indicate: localhost or IP of the server
o Login: Acevision
o Password: Acevision
o This is the FTP account dedicated to populate ACE Vision Database with the data pushed by meters
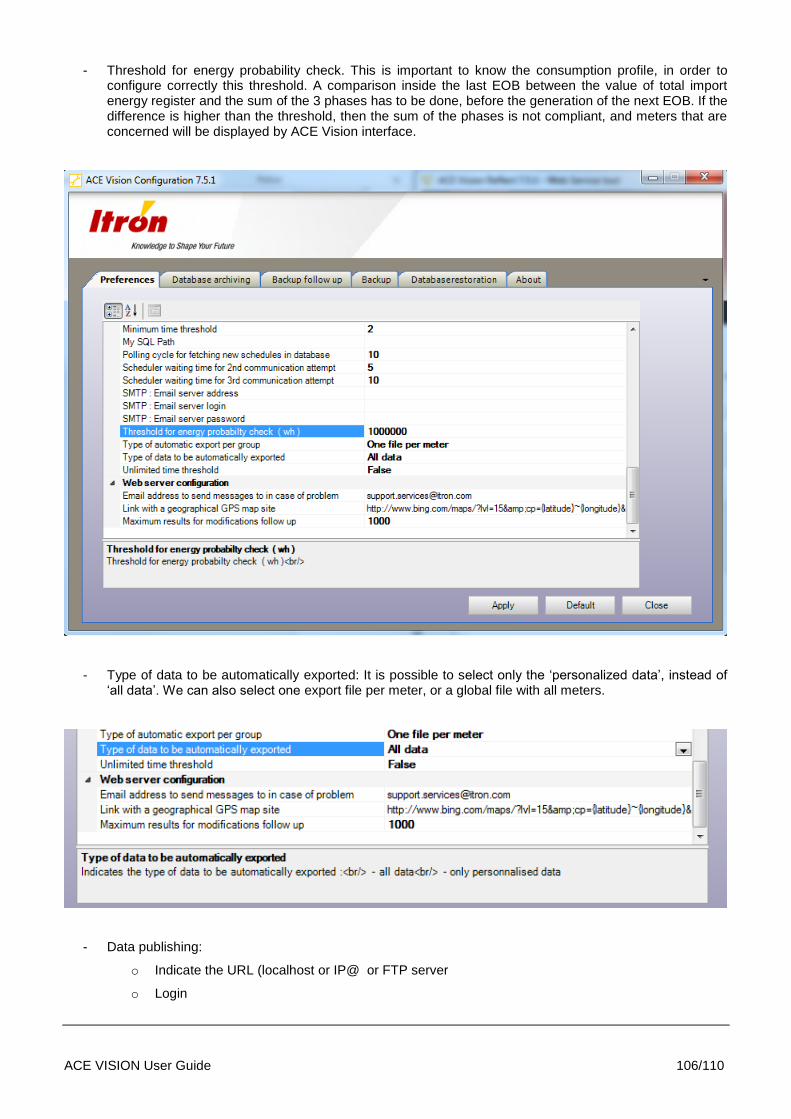
ACE VISION User Guide 106/110
- Threshold for energy probability check. This is important to know the consumption profile, in order to configure correctly this threshold. A comparison inside the last EOB between the value of total import energy register and the sum of the 3 phases has to be done, before the generation of the next EOB. If the difference is higher than the threshold, then the sum of the phases is not compliant, and meters that are concerned will be displayed by ACE Vision interface.
- Type of data to be automatically exported: It is possible to select only the ‘personalized data’, instead of ‘all data’. We can also select one export file per meter, or a global file with all meters.
- Data publishing:
o Indicate the URL (localhost or IP@ or FTP server
o Login
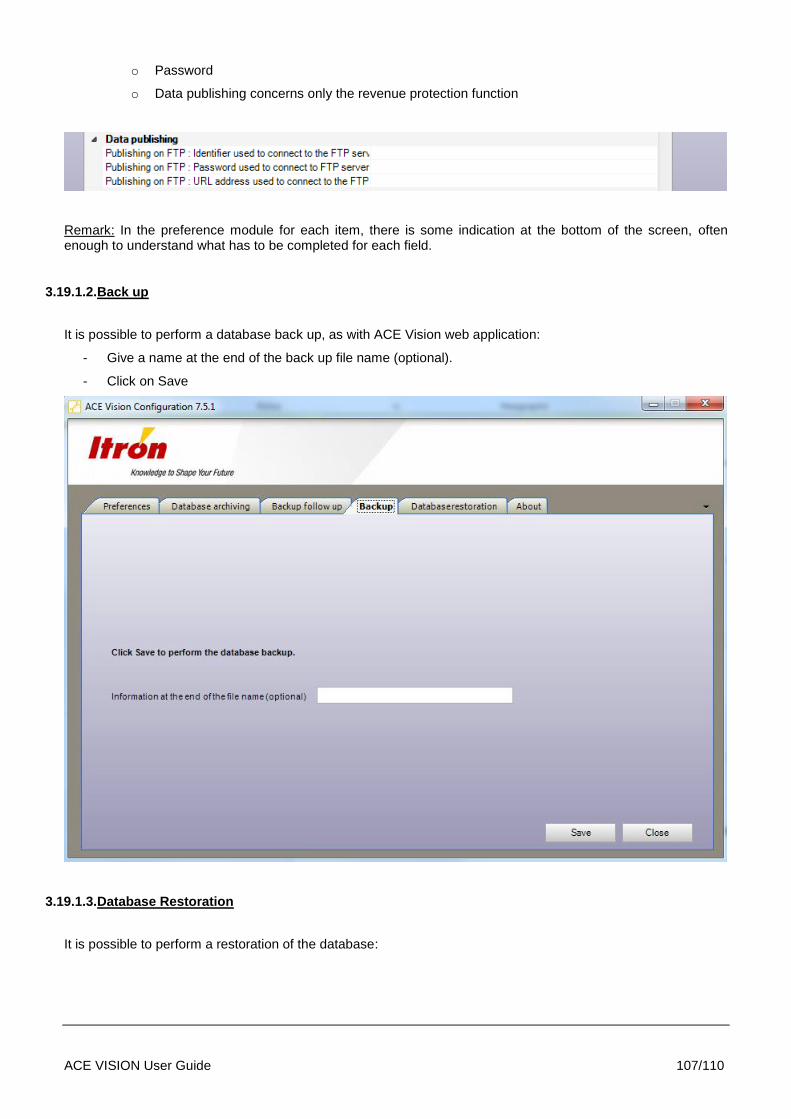
ACE VISION User Guide 107/110
o Password
o Data publishing concerns only the revenue protection function
Remark: In the preference module for each item, there is some indication at the bottom of the screen, often enough to understand what has to be completed for each field.
3.19.1.2.Back up
It is possible to perform a database back up, as with ACE Vision web application:
- Give a name at the end of the back up file name (optional).
- Click on Save
3.19.1.3.Database Restoration
It is possible to perform a restoration of the database:
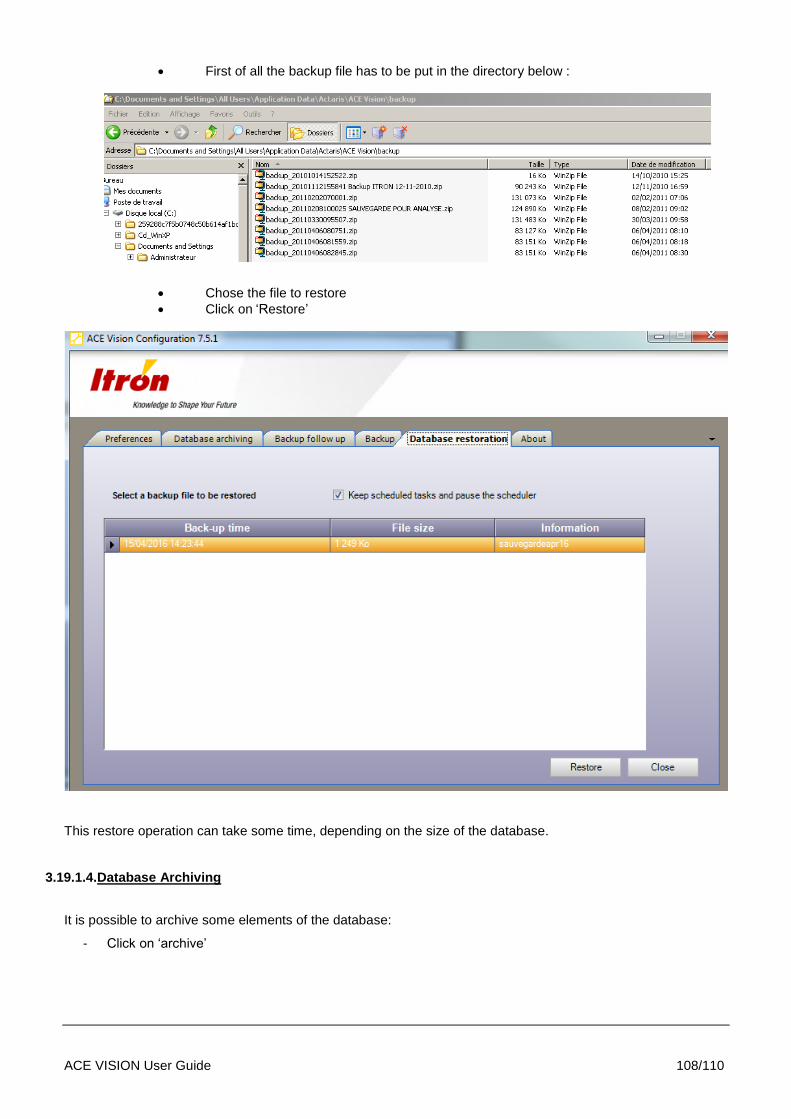
ACE VISION User Guide 108/110
First of all the backup file has to be put in the directory below :
Chose the file to restore
Click on ‘Restore’
This restore operation can take some time, depending on the size of the database.
3.19.1.4.Database Archiving
It is possible to archive some elements of the database:
- Click on ‘archive’

ACE VISION User Guide 109/110
It is possible to extract the archive , and chose the month to archive
3.19.1.5.About
This screen provides information about ACE Vision configuration version, and allows to choose the language.

ACE VISION User Guide 110/110
3.20. ADAPTATION OF COMMUNICATION TIME OUT
These time out can be modified only when some communication troubles are seen between ACE Vision and the meters.
Top Related
Copyright © 2022 FDOKUMEN

