


Bahasa
Halaman
Hukum


i
FACTORS INFLUENCING STUDENTS’ PERFORMANCE IN
MATHEMATICS AT PUNTLAND SECONDARY SCHOOL
CERTIFICATE EXAMINATION IN PUNTLAND STATE, SOMALIA
Abdullahi Nur Salad
A Research Project Report Submitted to the Department of Educational
Administration and Planning in Partial Fulfillment of the Requirements
for the Award of the Degree of Master of Education in Educational
Administration and Planning (Educational Planning)
University of Nairobi
2015

ii
DECLARATION
This research report is a result of my own independent effort and has never
been submitted to any other institution for any award
Abdullahi Nur Salad
E55/75705/2015
This research report is submitted for examination with our approval as
University Supervisors
Dr. Ursulla Okoth
Senior Lecturer
Department of Educational Administration and Planning
University of Nairobi
_______________________________________________________________
Dr. Ibrahim Khatete
Senior Lecturer
Department of Educational Administration and Planning
University of Nairobi

iii
DEDICATION
This work is dedicated to my brother Abdulkadir Nur Salad, who was behind
me all the way through my basic education.

iv
ACKNOWLEDGEMENT
I would like to offer my special thanks to University of Nairobi and Ministry
of Education and Higher Education Puntland State for the opportunity they
gave me to study.
It gives me great pleasure in acknowledging the advice, assistance and
encouragement of my research project supervisors, Dr. Ursulla Okoth and Dr.
Ibrahim Khatete whom without their professional guidance and valuable
support I would not have successfully completed this study.
I would like to express my deep gratitude to students, teachers, and head
teachers who took part in this study as respondents; you provided valuable
information without which the study would not have been a success. I would
like also to extend my gratitude to all my colleagues with whom we attended
this programme for the health class discussions. I acknowledge all my friends
who encouraged me throughout the course of the study whom I haven’t
mentioned their names in this writing.
Above all, I thank the Almighty God who helped me throughout this process.

v
TABLE OF CONTENTS Contents Page
DECLARATION............................................................................................... ii
DEDICATION ................................................................................................. iii
ACKNOWLEDGEMENT ............................................................................... iv
TABLE OF CONTENTS ...................................................................................v
LIST OF TABLES ......................................................................................... viii
LIST OF FIGURES ......................................................................................... ix
ACRONYMS ......................................................................................................x
ABSTRACT ..................................................................................................... xi
CHAPTER ONE
INTRODUCTION
1.1 Background to the study .............................................................................1
1.2 Statement of the problem ............................................................................6
1.3 Purpose of the study ....................................................................................7
1.4 Research objectives ....................................................................................7
1.5 Research questions .....................................................................................8
1.6. Significance of the study ............................................................................8
1.7 Limitations of the study ..............................................................................9
1.8 Delimitations of the study ......................................................................... 10
1.9 Assumptions of the study .......................................................................... 10
1.10 Definition of significant terms ................................................................ 10
1.11 Organization of the study ........................................................................ 11
CHAPTER TWO
REVIEW OF RELATED LITERATURE
2.1 Introduction .............................................................................................. 12
2.2 Influence of teacher’s qualifications on academic performance ................. 12
2.3 Teaching - learning resource materials on students’ performance .............. 13
2.4 Career development on students’ achievement in schools ......................... 14
vi
2.5 Students’ entry behavior on secondary school achievements ..................... 15
2.6 Summary of literature review .................................................................... 16
2.7 Theoretical framework .............................................................................. 16
2.8 Conceptual framework of the study ........................................................... 17
CHAPTER THREE
RESEARCH METHODOLOGY
3.1 Introduction .............................................................................................. 19
3.2 Research design ........................................................................................ 19
3.3 Target population ...................................................................................... 19
3.4 Sampling techniques and sample size ........................................................ 20
3.5 Research instruments ................................................................................ 20
3.6 Validity of the instrument ......................................................................... 21
3.7 Reliability of the instrument ...................................................................... 22
3.8 Data collection procedure ......................................................................... 23
3.9 Data analysis ............................................................................................ 23
CHAPTER FOUR
DATA ANALYSIS, PRESENTATION AND INTERPRETATION
4.1 Introduction .............................................................................................. 24
4.2 Questionnaire return rate ........................................................................... 24
4.3 Demographic information ......................................................................... 25
4.3.1 Gender of respondents ........................................................................ 25
4.3.2 Teacher professional qualifications ..................................................... 26
4.3.3 Teachers work experience .................................................................. 26
4.4 Data Analysis as per the Objectives .......................................................... 27
4.4.1 Teacher qualifications ........................................................................ 27
4.4.2 Teaching-learning resource material ................................................... 31
4.4.3 Students’ perception ........................................................................... 35
4.4.4 Mathematics foundation ..................................................................... 39

vii
CHAPTER FIVE
SUMMARY, CONCLUSIONS AND RECOMMENDATIONS
5.1 Introduction .............................................................................................. 42
5.2 Summary of the study ............................................................................... 42
5.3 Summary of study findings ....................................................................... 43
5.4 Conclusion................................................................................................ 44
5.5 Recommendations .................................................................................... 44
5.6 Suggestions for further research ................................................................ 45
REFERENCE ................................................................................................... 46
APPENDICES .................................................................................................. 48
APPENDIX I ..................................................................................................... 48
APPENDIX II .................................................................................................... 49
APPENDIX III ................................................................................................... 53
APPENDIX IV .................................................................................................. 56
APPENDIX V .................................................................................................... 58
APPENDIX VI .................................................................................................. 60

viii
LIST OF TABLES
Table 1.1 Performance in mathematics of Puntland secondary school graduates
2014, 2013 and 2012 ...................................................................................... 3
Table 1.2 Students’ performance in 2007–2010 form 4 in 4 public schools’ at
Puntland centralized examination ................................................................... 5
Table 1.3 Mean scores in mathematics, biology, physics and chemistry in
2012, 2013, 2014 in PNEB ............................................................................. 6
Table 3.1 Sampling techniques (Form 4 students) ........................................ 20
Table 4.1: Questionnaire return rate .......................................................... 25
Table 4.2 highest academic qualification ...................................................... 26
Table 4.3 Teachers work experience............................................................. 27
Table 4.4 Teaching Methods used ................................................................ 30

ix
LIST OF FIGURES
Figure 2.1. Relationship between factors influencing students’ achievement
and students’ performance in mathematics ................................................... 18
Figure 4.1: Gender of respondents ................................................................ 25
Figure 4.2 Teacher qualification ................................................................... 28
Figure 4.3 Adequacy of resource materials ................................................... 32
Figure 4.4: Students’ Perception in Mathematics .......................................... 36
Figure 4.5: Grade 8 results ........................................................................... 39
Figure 4.6 Students’ response on the foundation in mathematics .................. 40
x
ACRONYMS
KCSE Kenya Certificate of Secondary Education
KNEC Kenya National Examination Board
OECD Organization for Economic Co-operation
Development
PISA Programme for International Student
Assessment
PNEB Puntland National Education Board
PSC Puntland Secondary Certificate

xi
ABSTRACT
This research aimed to examine factors influencing students’ performance in mathematics at Puntland secondary school certificate examination in Puntland state, Somalia. The study was guided by four objectives: to assess how the teachers’ professional qualifications in Mathematics affected students’ performance in secondary schools in Puntland State, to establish how adequacy of teaching- learning resource materials in mathematics affected students’ performance at secondary school, to assess how students’ perceptions of their career development affected performance in Mathematics at secondary school and to establish how students’ previous primary school achievement influenced their performance in Mathematics at secondary school. The study adopted the Education Production Function Theory by Schulz (1961). The study adopted a descriptive survey design targeting 20 supervisors, 25 head teachers, 45 teachers and 1099 students. Data was analyzed and presented in percentages, frequencies, graphs and tables. The study revealed that most of the teachers have necessary qualifications for teaching mathematics at secondary school level, but the methodologies they used were mainly teacher-centered. The study also found out that there is insufficient mathematics resource materials; a textbook: student ratio is on average 1:10 which does not favour students to do individual assignments in class or at home. The students’ have high perception on the career development in mathematics; students perceived mathematics as important for their life. On the contrary, teachers, head teachers and most of the supervisors have the opinion that the students’ have poor attitude towards mathematics because of their dismal performance. They all felt that students have weak foundation in mathematics. Further study of other factors affecting the students’ performance and teaching methodologies is suggested.

1
CHAPTER ONE
INTRODUCTION
1.1 Background to the study
Mathematics is a discipline that deals with the logic of shapes, quantities and
arrangements. It helps us recognize patterns. It is a key to many subjects like
technology, physics, biology and it is tool for specializations like engineering,
and commerce. Mathematics produces solutions for complex real life
problems. For these reasons mathematics performance in all academic areas
should be considered vital to all learners. In order to improve the learners
performance in mathematics, OECD administers PISA (Program for
International Student Assessment) test, which is designed to measure whether
students can apply what they’ve learned in school to real-life problems, in
every 3 years to design appropriate strategies. The last programme survey was
conducted in 2012. It was done in 65 countries and economies. On top of the
result was Shanghai province while U.S. students lagged behind the average
mark. Out of this 65 countries and economies only one country was from
Africa, Tunisia which was ranked 59th of these 65 countries and economies.
Mwenda, Nyaga, Muthas and Reche (2013) in Kenya have mentioned that the
Kenyan secondary school students, particularly from those in Tharaka South
District perform poorly in mathematics in the KCSE compared to other
subjects. This was highlighted in their study “Factors contributing to students’

2
poor performance in mathematics in public secondary schools in Tharaka
South District in Kenya.” In this study, the significant factors that contribute to
students’ poor performance in mathematics include inadequate teaching and
learning resources such as textbooks, inadequate teaching force, low entry
marks at form one and students’ negative attitude towards mathematics.
Historically Somali students are poor in mathematics since pre-war era as
Mohamed (2006) mentioned in his research. Mohamed (2006) in his study on
factors influencing students’ performance in mathematics in Benadir region
found that there is a difference in performance before and after the civil war.
The performance was better before the war comparatively. In the study
Mohamed also found that only three schools scored the mean scores of 39.7,
46.3 and 37.7 in 2004, 2005 and 2006 respectively in the centralized
examination. Comparatively in Puntland the results for the last three years are
30.51, 23.44 and 22.09 showing a steady drop.
Education systems all over the world face challenges of secondary school
students’ poor performance in mathematics. Morris and Arora (1992) stated
that the problem of students’ poor performance in mathematics is not confined
to anyone country but universal. Many countries of the world generally and
particularly African countries are experiencing low level performances by
students in mathematics in their annual examinations from the annual
examination reports. In Kenya for example, the mean scores in KCSE
mathematics in 2012 and 2013 were 28.66 and 27.58 respectively as reported

3
by The Kenya National Examination Council in their 2013 KCSE
Examination Report. This problem is not limited to Kenya but Puntland is
much worse. In Puntland, the mean score of mathematics examinations in
2012 and 2013 are 30.51 and 23.44 of the possible 100% respectively as
Puntland national Examination Board reported in 2012 and 2013 in their
examination reports. The low performance in mathematics at secondary
schools in Puntland is a problem that needs to be addressed. From the report
the individual grades for the years 2012, 2013, 2014 were as shown in table
1.1
Table 1.1 Performance in mathematics of Puntland secondary school graduates 2014, 2013 and 2012
Year A B C D E Total
2014 82 157 269 530 1480 2518
2013 75 161 262 516 1302 2316
2012 70 196 219 574 516 1575
These numbers show how poor Puntland secondary school graduates are
performing in general secondary leaving examinations. In this table, grade E is
a fail mark. The percentage of students who failed was, 59%, 56% and 33% in
2014, 2013 and 2012 respectively.
4
The studies have shown that students’ performance in mathematics at
secondary schools is poor. There must be factors affecting the performance of
these students in mathematics. Olatunde (2010) cited in his study, in
agreement with Birgen (2005) who asserted that experience and qualification
of the teachers is a factor on students’ performance. Therefore lack of trained
teachers can be a problem.
Educational material resources influence students’ performance as reported in
the UNESCO report (2008). The report indicated that teaching/learning
materials such as textbooks, classrooms, teaching aids (chalk, board, ruler and
protractor), stationeries and laboratories affect academic performance of the
learners. Also Mutai (2006) asserted that learning is strengthened when there
were enough reference materials such as textbooks, exercise books, teaching
aids and classrooms. Mohamed (2006) stated that the use of teaching resources
in observed mathematics classes was very minimal.
In Puntland, the minister of education with support of Africa Educational
Trust (AET) tried to identify the causes of poor performance of students in
mathematics in 2011. A workshop was held in the ministry of education
premises for 17 mathematics teachers from selected secondary schools. One of
the objectives of this workshop was to identify the causes of low performance
in mathematics in Puntland secondary schools. The causes of low performance
in mathematics were identified as; poor foundation from primary schools,
students belief that mathematics is a difficult subject, inadequate textbooks,

5
poor mathematics teaching methodology and no adequate teaching resources
among others. In this workshop, it was noted that there was an alarming poor
performance in mathematics in the form four Puntland examination results
between 2007 and 2010. The data on the first four public schools’ mean scores
show these alarming results as can be seen in table 1.2.
Table 1.2 Students’ performance in 2007–2010 form 4 in 4 public schools’ at Puntland centralized examination
School 2007 2008 2009 2010
Omar Samatar 25.7 31.6 32 27.2
Gambol 11.7 16.4 16.3 27.2
Bosaso Public 14.2 20.6 21 14.4
Sh. Osman 11.4 9.6 12 16.4
These findings were revealed from the discussions of mathematics teachers in
that workshop, but there was no study done to find out what are the real causes
of these alarming figures.
As mentioned in this section many studies have been done on mathematics
generally in other parts of the world on factors influencing students’
performance in mathematics in secondary schools. Researchers in many
different countries, in the world and in the region, investigated the causes of
this problem. However, the studies have not examined performance in Somalia

6
and particularly in Puntland state. As there is no study about this topic done in
Puntland and studies done in Somalia are not completely addressing the
challenges in Puntland secondary school, there is then need to conduct this
study in Puntland State of Somalia.
1.2 Statement of the problem
The need of enhancing students’ performance in Mathematics is a priority for
Puntland Ministry of Education as this subject is a key to science and
technology and to development. Even though the performance in other science
subjects are low, mathematics is the poorest performed subject in Puntland
form four examinations from PNEB reports for the last 3 years as presented in
table 1.3.
Table 1.3 Mean scores in mathematics, biology, physics and chemistry in 2012, 2013, 2014 in PNEB
Year Mathematics Biology Physics Chemistry
2014 22.09 42.37 35.52 40.72
2013 23.44 38.60 34.99 37.72
2012 30.51 49.96 39.91 35.9
All these subjects mean score is below 50% but mathematics is the lowest at
all the times. This indeed shows that there is need of conducting study on this
issue to find out the root cause of this problem.

7
The factors that influence secondary school students’ performance in
mathematics in Banadir secondary schools as found out by Mohamed (2006)
were teacher characteristics, teaching methods, teaching resources, students’
attitudes and other factors. These factors may affect Puntland students in
different ways. The Banadir region students are evaluated in school based
examinations while Puntland students go through centralized examinations.
Puntland state conducted one workshop for mathematics teachers in 2011. One
of the aims of this workshop was to identify the causes of the problem,
however no other study has been conducted to verify this. Therefore there is
need of research to be done to find out the factors influencing students’
performance in mathematics at secondary school form four examination
certificate level in Puntland.
1.3 Purpose of the study
The purpose of this study was to examine factors influencing students’
Performance in Mathematics at Puntland secondary school certificate level in
Puntland State of Somalia.
1.4 Research Objectives
The objectives that guided the study are:
1. To assess how the teachers’ professional qualifications in Mathematics
affect students’ performance in secondary schools in Puntland State.
2. To establish how adequacy of teaching- learning resource materials in
mathematics affect students’ performance at secondary school.

8
3. To assess how students’ perceptions of their career development affect
performance in Mathematics at secondary school.
4. To establish how students’ previous primary school achievement affect
their performance in Mathematics at secondary school.
1.5 Research questions
In order to realize the objectives, the following research questions were
used:
1. How do the teachers’ professional qualifications in Mathematics affect
students’ performance in secondary schools in Puntland state?
2. How do adequacies of teaching- learning resource materials in
mathematics affect students’ performance at secondary schools in
Puntland?
3. How do students’ perceptions of their career development affect
performance in Mathematics at secondary school?
4. In what ways does the students’ primary school performance in
Mathematics affect their Mathematics achievement at secondary
school?
1.6. Significance of the study
There are no studies on this topic in Puntland according to the researchers’
knowledge, therefore the findings of this study may be of great significance
for Puntland ministry of education and secondary schools as it may them to
offer solutions on perennial problems existing in Puntland education system.

9
The recommendations of the study may be adopted by teachers, school
management and students to find strategies to improve the quality of education
in Puntland. These study findings may inform further researches on this topic
which may in turn help improve the school management and teaching/
learning processes in secondary schools.
The findings may also be useful to all Puntland secondary schools as the
concerns in the study of the selected secondary schools are similar or same in
all other secondary schools in Puntland. Educational planners may benefit
from the study findings in a way that they may use the findings to plan for
improved performance in mathematics.
1.7 Limitations of the study
This study focused on the factors influencing students’ performance in
mathematics in Puntland secondary schools with respect to teachers’
professional qualifications, adequacy of teaching-learning resource materials,
students’ perception of their career development and students’ primary school
performance. There was a challenge with respondents as Somalis are oral
society and were not comfortable to fill the questionnaires on time. To
minimize this challenge, the researcher personally visited all selected
secondary schools and pleaded with the respondents to complete filling the
questionnaires.

10
1.8 Delimitations of the study
This study focused on Ministry of Education Quality Assurance, secondary
school management, teachers and students in only four public secondary
schools in the big cities of Puntland.
1.9 Assumptions of the study
The following were the assumptions of the study:
i. Students’ performance in mathematics in secondary school certificate
level is influenced by teachers’ qualifications.
ii. Students’ performance in mathematics in secondary school certificate
level is influenced by adequacy of of teaching-learning resource
materials.
iii. Students’ performance in mathematics in secondary school certificate
level is influenced by students’ perception of their career development.
1.10 Definition of Significant Terms
The following are the significant terms that will be used in the study:
Career development is the process through which a person’s work identity is
formed. It is a major aspect of human development and it covers one’s entire
lifetime.
Mean score is the average mark of the students for that subject.
Performance refers to the grade that students achieve in examinations.
Professional qualification refers to a document which shows that someone
has successfully finished a course of study which allows him/her to work in
one of the professions.

11
1.11 Organization of the study
This project is organized into five chapters. Chapter one presents the
background to the study, statement of the problem, purpose of the study,
research objectives of the study, research questions of the study, significance
of the study, limitations of the study, delimitations of the study, assumptions
of the study, definition of the significant terms and the organization of the
study. Chapter two presents relative literature reviewed giving attention to
influence of teacher qualification, material resources, students’ perception and
students’ primary school mathematics achievement to students’ performance
in mathematics in Puntland secondary certificate level. The chapter also
encompasses theoretical framework and conceptual framework. Chapter three
presents the research methodology. It deals with the research design, the target
population, sampling techniques and sample size, research instruments,
validity of the instruments, reliability of the instruments, data collection
procedure and data analysis techniques. Chapter four presents the data
obtained from the field, its analysis and interpretations and chapter five deals
with the summary of the findings, conclusions and recommendations.

12
CHAPTER TWO REVIEW OF RELATED LITERATURE
2.1 Introduction
This chapter focuses on the literature review related to the study. The chapter
discusses the Influence of teachers’ qualifications on academic performance,
Teaching - learning resources materials on students’ performance, Students’
perception of their career development on their achievement and students’
primary school performance on secondary school achievements. It also covers
the theoretical and conceptual frameworks.
2.2 Influence of teacher’s qualifications on academic performance
The quality of implementing mathematics programmes is ultimately
determined by the teachers’ performance and effective work in the classroom
situation (Rukangu, 2000). Qualified teachers use different methods to
enhance students’ performance. Oseiwu (2013) cited in the study “Factors
Affecting Academic Performance in Mathematical Sciences” that in a study
conducted in Nairobi at the secondary schools by team of mathematics
teachers in 2013, the major findings indicated that variation in mathematics
performance was found to be significantly influenced by the type of teaching
method. Hassana stated in this study that some teachers lack the patience to
attend to students’ questions in the class, because most of them are untrained
teachers, they only know mathematics, but they lack methods of teaching and
psychological willpower to mentor their students through guidance and
counseling for better academic achievements. Teachers not only need

13
knowledge of a particular subject matter but also need to have pedagogical
knowledge and knowledge of their students (Bransford et al., 2000). Mohamed
(2006) in his study found out that 56.25% of Banadir region mathematics
teachers were professionally qualified to mathematics and yet the examination
results were poor, indicating that for an enhanced achievement in mathematics
teachers need more than just a qualification. Teacher background
characteristics and classroom instructional practices therefore do make a
difference in students’ academic achievement (Kimani, Kara, Njagi, 2013).
There is a need to find out the effect of educational resources to students’
performance.
2.3 Teaching - learning resource materials on students’ performance
Educational materials play important role in achieving students’ high
performance in mathematics. Utilization of these materials makes mathematics
easy to grasp and understand by learners. Generally, the use of teaching
resources in the observed mathematics classes was very minimal (Mohamed,
2006). Olatunde and Otieno (2010) cited in their study “Teaching/Learning
Resources and Academic Performance in Mathematics in Secondary Schools
in Bondo District of Kenya” that Mutai (2006) asserted that learning is
strengthened when there is enough reference materials such as textbooks,
exercise books, teaching aids and classrooms, but also further asserted that
academic achievement illustrates per excellence the correct use of these
materials. This is needed to evaluate the effect of educational resources to
students’ performance.

14
2.4 Career development on students’ achievement in schools
Students’ perception of the subject is very crucial. We should identify and
work on how their perceptions of what they learn and how they learn is set. If
the institutions do not consider the importance of hearing what students think
of their learning, the students’ performance of any subject would not enhance.
Therefore, this study will find out how the students’ career development
perception influences students’ performance in mathematics. Suan (2014) has
done study on “Factors Affecting Underachievement in Mathematics.” In this
study he revealed that there was a significant relationship between academic
performance in mathematics and students’ factors. In this study he cited the
study of Brown, Brown and Bibby (2008) who found out that low
participation of mathematics in UK was due to the perceived difficulties, lack
of confidence, dislike, boredom and lack of relevance on the subject.
Tshabalala and Ncube (2013) stated in their study “Causes of Poor
Performance of Ordinary Level Pupils in Mathematics in Rural secondary
Schools in Nkayi District: Learner’s Attributions” that 73% of their
respondents in this study believe that mathematics is naturally a difficult
subject. They cited in this study that Osafehinti (2009) posited, if a student has
a positive attitude towards mathematics he/she will not only enjoy studying it
but will also derive satisfaction from the knowledge of mathematical ideas
he/she gains. In this study, they stated that according to Umameh (2011) there
is need for genuine attitude change as it may bring about interest and positive
attitudes towards the subject. They also asserted that this negative attitude is

15
partially created by teachers citing the following statements. Most of
mathematics teachers do not make the teaching of mathematics practical and
exciting and this leads to negative attitudes to mathematics by students
(Salman, 2010). Some of the methods teachers used to teach mathematics did
not help students develop conceptual understanding of mathematics
(Nyaumwe et al, 2004). This study will find out the effect of students’
perception to their mathematics performance.
2.5 Students’ entry behavior on secondary school achievements
No one expects good performance in mathematics from students as long as
their mathematics base is poor. When teaching mathematics it builds with a
hierarchy of easy to hard to make the conceptual understanding easier. Any
learner who has not covered the basics of mathematics thoroughly would get
hard to grasp and understand the mathematical concepts. As reports from
Puntland National Examination Board (PNEB) shows, the mathematics results
are not as bad as those of form 4, but are below average in the recent years
except 2014. The mean score of standard eight mathematics examinations in
2012, 2013 and 2014 are 46.8, 38.23 and 55 respectively. This is low when
compared to science results of the same years which are 58.59, 63.30 and
56.76 in 2012, 2013 and 2014 respectively. Chege (2011), in Puntland
secondary schools mathematics teachers’ workshop report, one of the
identified mathematics problems in secondary schools was “poor foundation
from primary schools”. This study would like find out how this factor affects

16
the students’ performance of mathematics in Puntland secondary certificate
level.
2.6 Summary of literature review
The reviewed literature has shown positive influence of teachers’
qualifications on academic performance in mathematics. The reviewed
literature revealed that there is a positive relationship between usage of
teaching-learning resource materials and students’ performance. It also shows
students’ positive perception and previous mathematical performance enhance
students’ performance in mathematics. The gaps filled by this study is that
there are no enough studies about this topic done in Somalia and there is no
study done in Puntland, therefore there was need of finding out the factors
influencing students’ performance in mathematics in Puntland secondary
schools.
2.7 Theoretical framework
The study adopted the Education Production Function Theory by Schulz
(1960). The production function was used to find out the maximum product
from a combination of different inputs as a way of explaining the residual
factor in the American rate of economic growth in the 1950s.
Educational production function is defined as follows:
A = f(X1, … Xn)
A … Output

17
X1, … Xn …… Input
In this case the dependent variable being “A” the output and independent
variables being X1, X2, X3 and X4. The output, A, students’ performance in
mathematics is a function of X1, X2, X3 and X4, which are teachers’
qualification, resource materials, students’ perception and students’
mathematical background are the inputs that influence the output, students’
performance.
2.8 Conceptual framework of the study
Students’ achievement, as an output, is produced by inputs in the educational
process. The model of input-Process-Output is used in this conceptual
framework.

18
Figure 2.1. Relationship between factors influencing students’ achievement and students’ performance in mathematics
The study conceptual framework is based on the variables used in the study. In
this conceptual framework it is conceptualized that improvement of teachers’
professional qualifications, increasing provision of learning-teaching
materials, strengthening mathematics basis in primary schools, enhancing
students’ career development perception influences and improves students’
academic performance in mathematics. The focus was on the factors
influencing students’ mathematics performance which are the central
independent variables. These factors determined the end result of the study
which is enhancing students’ performance in mathematics.
Students’ performance
in mathematics (high
grades of F4 exam
results, positive
attitude toward
mathematics)
Factors influencing students’
performance:
• School Management commitment
• Teachers commitment
• Students commitment
Teaching -
Learning Process
Teachers’ professional
Qualifications (knowledge,
methodology)
Teaching/learning resources
(availability, adequacy,
usage)
Students’ perception of their
career development
(Attitude toward maths)
Primary school performance

19
CHAPTER THREE
RESEARCH METHODOLOGY
3.1 Introduction
This chapter presents the methodology that was used in the study. It includes
research design, target population, sample size and sampling procedures,
research instruments, validity, reliability and methods of data analysis.
3.2 Research Design
This study was carried out using descriptive survey design. This design
involved acquiring information about one or more groups by asking them
questions and tabulating their answers. Descriptive survey uses either
questionnaire or interviews to collect data. A survey study can be used to
assess personality variables such as attitudes and opinions about events,
individuals or procedures. This design allowed the researcher to obtain and
assess opinions, attitudes and practices. The goal of this design usually is to
learn about a large population by surveying a sample of that population.
3.3 Target Population
The target population of the research study was 25 public secondary schools in
Puntland. In this study, the target population was the 20 supervisors, 25 head
teachers, 45 mathematics teachers and 1,099 form four students. (Source:
Puntland EMIS records 2014)

20
3.4 Sampling Techniques and sample Size
The researcher selected 4 schools with largest populations and left out 4
schools with small populations from the 25 public secondary schools. The four
big secondary schools were mainly public secondary schools operating in
Puntland. The number of form four students in these 4 schools was 1,099
students, 390 students were randomly selected. Amin (2005) said that
randomization is effective in creating equivalent representative groups that are
essentially the same on all relevant variables thought of by researcher. Four
head teachers and 20 mathematics teachers from these 4 schools were
randomly selected whereas 6 supervisors were purposively selected from the
ministry.
Table 3.1 Sampling techniques (Form 4 students)
School Target
Population
Sample Size Sampling technique
A 174 100 Randomly selected
B 394 100 Randomly selected
C 365 100 Randomly selected
D 166 90 Randomly selected
Total 1099 390
Source: schools records & secondary unit data (2015)
3.5 Research instruments
Field data was collected by the help of questionnaires, especially for students
and teachers. The researcher personally conducted the data collection using

21
the questionnaires. The other instrument that was used for the data collection
was interview schedule. This was used on the national supervisors, head
teachers and one teacher from each school.
The questionnaires were found to be easily understood and filled with no
difficult as they were self-explanatory. The researcher chose questionnaires as
a data collection instrument because of their usefulness, reliable, and being
able to generate useful information in a short period of time. Usually,
questionnaires are used to obtain important information about a population;
they are cheap and easy to administer (Mugenda and Mugenda, 2003).
Questionnaires were explained, distributed and collected by the researcher.
The researcher interviewed selected supervisors, selected secondary school
head teachers and one teacher from each of these 4 schools. The researcher
chose the interview method in order to get thorough and complete information
about the study topic. The interview was done by the researcher himself in
order to show data validity and reliability.
3.6 Validity of the instrument
Validity is the degree to which the results obtained in a study represents the
phenomenon being investigated. Content validity was guaranteed by the
provision enough coverage of the topic under study. Content validity refers to
the degree to which the content of the items reflects the content domain of
interest (Miller, 2003). The researcher consulted with the supervisors of the

22
study to improve the validity of the instruments. The researcher also used
friends, who are experienced in research instruments development, to proof
read the instruments and advise on any changes that helped to increase the
validity of the instruments.
3.7 Reliability of the instrument
Reliability of the instruments is defined as the measure of the degree to which
a research instrument yields consistent results after repeated trials (Mugenda
and Mugenda, 2003). The researcher used the test and re-test method by
administering the same instruments twice to the same group with a time lapse
of two weeks between the first and second tests. This involved administering
the same instruments twice to the same group of respondents with a two week
interval between the two tests. The two scores were then correlated to
ascertain if the contents in the instruments are consistent in getting the same
responses every time they were administered. The researcher used Pearson
product moment correlation coefficient formula to measure the correlation.
This is a measure of the strength of a linear association between two variables.
It is denoted by r. The Pearson correlation coefficient, r, can take a range of
values from +1 to -1. A value of 0 indicates that there is association between
the variables. A value greater than 0 indicates positive associations while a
value less than 0 indicates a negative association. Here comes the formula:
23
Where:
r = Pearson’s correlation coefficient
X = first set of results
Y = second set of results
A reliability of 0.8 was obtained which shows high reliability of the data.
According to Mugenda and Mugenda (2003), a co-efficient reliability of 0.8 or
more shows high reliability of the data.
3.8 Data collection procedures
The researcher used both the qualitative and quantitative approach of data
collection. The researcher collected both qualitative and quantitative data from
ministry of education quality assurance and standards directorate staff, head
teachers, teachers and students of eight secondary schools in Puntland. Data
collection was done by the researcher personally. The researcher received
permission letters from ministry of education and the schools selected.
3.9 Data analysis
The researcher analyzed quantitative data from questionnaires by using simple
frequencies and percentages. The researcher chose frequencies and
percentages as they are easy to be compared, interpreted and understood.
Qualitative data was analyzed using content or thematic analysis after which it
is integrated in quantitative data.

24
CHAPTER FOUR
DATA ANALYSIS, PRESENTATION AND INTERPRETATION
4.1 Introduction
This research focuses on factors influencing students’ performance in
mathematics at Puntland secondary school certificate examination in Puntland
State, Somalia. In this chapter, the results of the study are presented, analyzed
and discussed in the context of research objectives of the study and the
research questions.
4.2 Questionnaire return rate
Questionnaires were given to 390 students and 20 teachers. The return rate of
the questionnaire is shown in table 4.1.
Table 4.1: Questionnaire return rate
Category of Sample Frequency Percentage response respondents numbers by category
Students 390 369 95%
Teachers 20 19 95%
Head teachers 8 8 100%
Supervisors 6 6 100%
Total 424 402 98%

25
Table 4.1 shows that 369 students out of 390 returned filled up questionnaires
which make the return rate as 95%. For the teachers’ questionnaires 19 out of
20 were filled and returned giving a return rate of 95%. The return rate of head
teachers and supervisors interviewed are 100% each. This shows that the
respondents’ participation was very high, giving a high level of confidence in
conclusions drawn.
4.3 Demographic information
4.3.1 Gender of respondents
In this study the students were asked to indicate their gender in the instruments
provided. The findings are shown in figure 4.1
Figure 4.1: Gender of respondents
Figure 4.1 shows that 69% of the students are boys, which is normally the
percentage distribution of students in Puntland secondary schools as the
ministry of education and higher education statistics book shows. There are no
female teachers, head teachers and supervisors that took part this study. The
69%
31%
Male
Female
26
reason being that there are no female form four math teachers, no female head
teachers and no female supervisors in this targeted population.
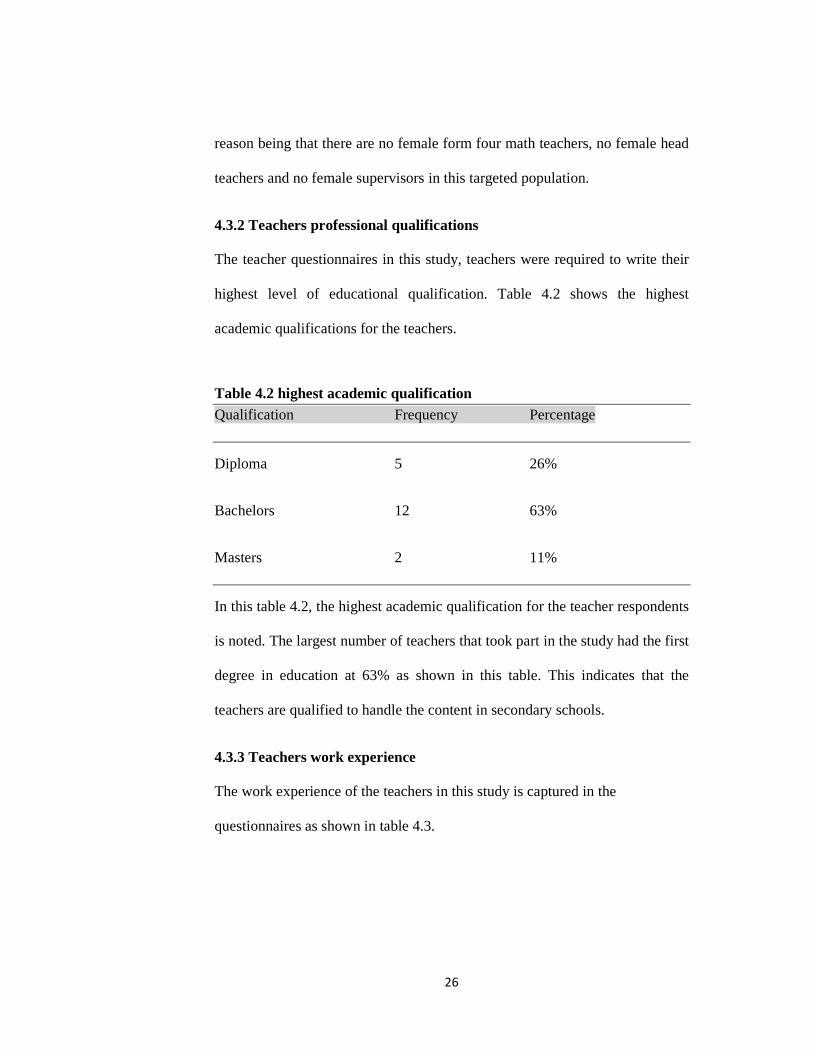
4.3.2 Teachers professional qualifications
The teacher questionnaires in this study, teachers were required to write their
highest level of educational qualification. Table 4.2 shows the highest
academic qualifications for the teachers.
Table 4.2 highest academic qualification Qualification Frequency Percentage
Diploma 5 26%
Bachelors 12 63%
Masters 2 11%
In this table 4.2, the highest academic qualification for the teacher respondents
is noted. The largest number of teachers that took part in the study had the first
degree in education at 63% as shown in this table. This indicates that the
teachers are qualified to handle the content in secondary schools.
4.3.3 Teachers work experience
The work experience of the teachers in this study is captured in the
questionnaires as shown in table 4.3.

27
Table 4.3 Teachers work experience Working Experience Frequency Percentage
Less than 2 years 3 16%
2- 5 years 5 26%
6 – 10 years 10 53%
Over 15 years 1 5%
Table 4.3 shows that the majority of the teachers, 53% have working
experience of 6 to 10 years which allow them to provide quality teaching and
learning instructions.
4.4 Data Analysis as per the Objectives
This section presents data analysis on factors influencing students’
performance in mathematics at Puntland secondary school certificate
examination in Puntland State, Somalia.
4.4.1 Teacher Qualifications
Research Question 1: How do the teachers’ professional qualifications in
Mathematics affect students’ performance in
secondary schools in Puntland state?
Students, teachers, head teachers and supervisors were asked how the
teachers’ professional qualifications in mathematics affect students’
performance in Puntland secondary schools. The students and teachers

28
provided their opinions through filled up questionnaires while head teachers
and supervisors gave their opinions through interviews. The results of the
findings are as follows:
4.4.1.1 Findings from the students
In figure 4.2 students are asked to clarify whether the teachers are using their
qualifications in teaching activities.
Figure 4.2 Teacher qualification
Figure 4.2 indicates how the mathematics teachers were scored using
“strongly agree”, “agree”, “don’t know”, “disagree” and “strongly disagree” as
tools on the following attributes:
• Explain the work well,
• repeat where it is not clear,
• answer questions thoroughly,
• respond rudely to students’ questions,
• give homework, mark and return,
17
1
10
7
10
9
68
13
8
12
9
12
8
10
5
10
7
12
6
71
99
10
1
10
4
6
28
13
26
16
20
22
39
63
65
79
52
45
38
27
41
30
10
2
37
36
36
Teacher Qualifications
SA Total A Total DK Total DA Total SD Total

29
• help students when they are stuck and
• use different teaching methods.
When the students were asked whether their mathematics teachers explain the
lessons well 171 out of 348 which is 49% of them strongly agreed that they
explain lessons well. Over 30% of them think the teachers answer students’
questions and make necessary clarifications when needed. They also believe
that teachers use different methods in teaching and provide homework to
students.
When asked if the teachers respond rudely to the students’ questions 40%
agreed or strongly agreed while 52% disagreed or strongly disagreed. The rest
of the students did not know the teacher’s behavior on these issues. When
compared the male students with female students on this issues the results are
almost the same regarding the percentage distribution of the two. As this
figure shows the majority of the students believe that the teachers are
relatively doing well in their teaching activities.
4.4.1.2 Findings from the teachers
In table 4.4 teachers were asked to evaluate the methods they applied in the
teaching activities by using the words always (A), often (O), sometimes (S)
and never (N). The percentages of their usage are as indicated in table 4.4.

30
Table 4.4 Teaching Methods used Use Always Often Sometimes Never
Lecturing method 3 5 4 0
Small group discussion 0 5 7 0
Questioning method 6 4 2 0
Demonstration method 4 3 4 1
Problem solving method 4 4 4 0
Table 4.4 shows that 25% of the teachers always use lecturing in their teaching
activities. The table shows that majority of the teachers work with individual
students, check students’ exercise books and allows students to think of
solutions to practical problems.
The teachers interviewed gave a lot of valuable information. One of the
teachers told the researcher that he should not bother to find out the teachers’
qualifications as they are badly trained. He said that most of the teachers use
lecturing method, thinking of only covering the syllabus without giving any
consideration to students’ performance. He said that he believes that the
students are doing their best to study mathematics but reason goes back to the
teachers who do not motivate students to perform well.
4.4.1.3 Findings from head teachers and supervisors
Most of the head teachers interviewed confirmed that the mathematics
teachers have the qualifications needed to teach this subject. They also

31
confirmed that the mathematics performance of students is bad as their
teachers are not using the appropriate methodologies in teaching mathematics;
methodologies that are applicable to the lesson that is to be delivered,
preferring use of lecturing method in most of their teaching times viewing it as
the easiest way to deliver their lessons. Although they blamed students’
mathematics foundation in early grades, the syllabus overload and students
whom they said are not giving enough time and energy in studying
mathematics; they also believe the ways of teaching mathematics in secondary
schools is a part of the existing problem.
Supervisors interviewed confirmed that teachers are not using different
methodologies of teaching and learning to enhance the performance of
students in mathematics. One well experienced supervisor told the researcher
that Puntland secondary mathematics teachers are using lecturing method over
80% of their teaching time. He said most of the students are not aware the
importance of student-centered approach, so they are happy to teacher-
centered approach being applied.
4.4.2 Teaching-learning Resource Material
Research Question 2: How do adequacies of teaching- learning resource
materials in mathematics affect students’ performance at secondary
schools in Puntland?
Students, teachers, head teachers and supervisors were asked how adequacies
of teaching-learning resource materials in mathematics affect students’
32
performance at secondary schools in Puntland. The students and teachers
provided their opinions through questionnaires while some teachers, head
teachers and supervisors gave their opinions through interviews. The results of
the findings are as follows:
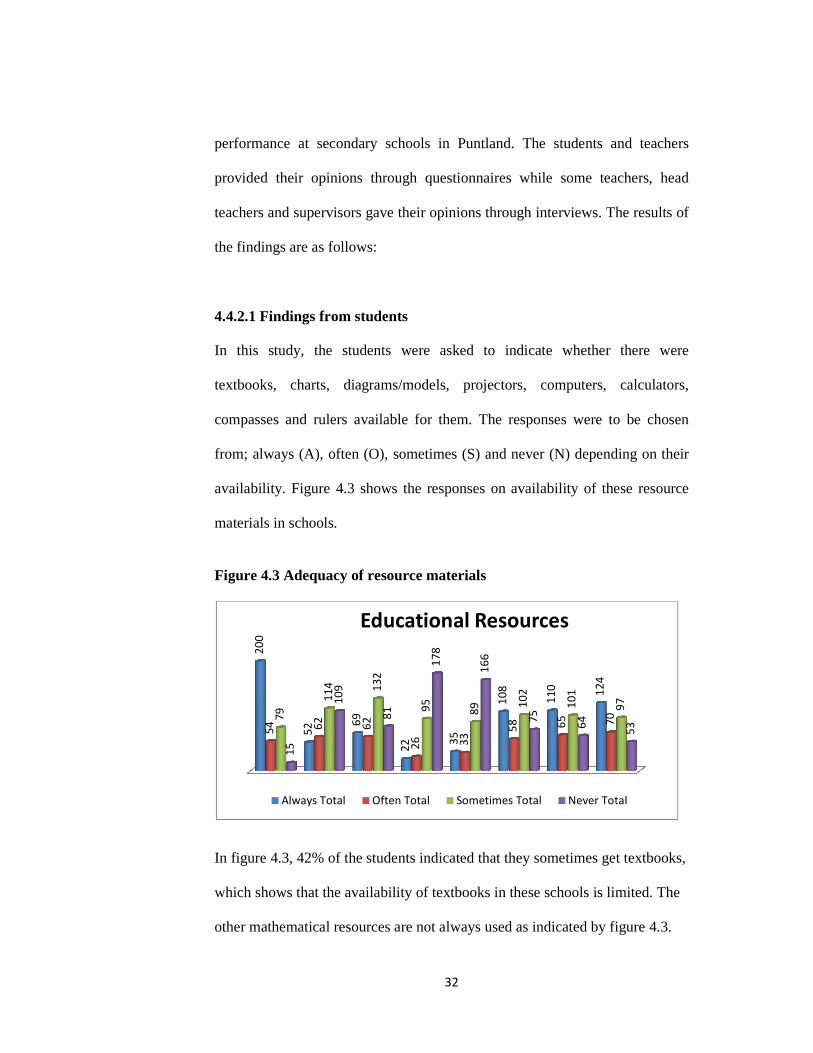
4.4.2.1 Findings from students
In this study, the students were asked to indicate whether there were
textbooks, charts, diagrams/models, projectors, computers, calculators,
compasses and rulers available for them. The responses were to be chosen
from; always (A), often (O), sometimes (S) and never (N) depending on their
availability. Figure 4.3 shows the responses on availability of these resource
materials in schools.
Figure 4.3 Adequacy of resource materials
In figure 4.3, 42% of the students indicated that they sometimes get textbooks,
which shows that the availability of textbooks in these schools is limited. The
other mathematical resources are not always used as indicated by figure 4.3.
20
0
52
69
22
35
10
8
11
0
12
4
54
62
62
26
33
58
65
70
79
11
4
13
2
95
89
10
2
10
1
97
15
10
9
81
17
8
16
6
75
64
53
Educational Resources
Always Total Often Total Sometimes Total Never Total

33
The only mathematical instrument that students use is ruler. The least
available items that are never or rarely used are computers and projectors as
indicated in this figure.
4.4.2.2 Findings from the teachers
Teachers’ questionnaire on resource materials used in mathematics class were
reported as shown in table 4.5.
Table 4.5 Resources materials - teachers
Item Always Often Sometimes Never
Textbooks 25% 33% 42% 0%
Charts 0% 33% 25% 42%
Diagrams 8% 42% 42% 8%
Projectors 0% 33% 33% 33%
Calculator 17% 50% 25% 8%
Computers 0% 8% 33% 58%
Compasses 8% 25% 67% 0%
Rulers 58% 25% 17% 0%
According to the teachers’ responses in this study, students use textbooks in
class always as 25% of their teaching and learning times. This again shows
from the teachers’ perspective that the availability of textbooks is very limited.

34
This table also shows that the teachers never use computers most of their
teaching times. Other mathematics resources like charts, models and diagrams
are rarely used by the teachers in their teaching times.
The teachers interviewed indicated that there are no enough mathematics
resource materials for the students. They particularly emphasized that there are
no sufficient textbooks for their respective schools, the average ration for the
school textbooks to students being 1:10 or over. The study showed that there
are insufficient resource materials in the sampled schools.
4.4.2.3 Findings from the head teachers and supervisors
The head teachers interviewed unanimously took the view that mathematics
resource materials are insufficient. They especially believed that textbooks are
inadequate, the ratio being one textbook for ten students. They also mentioned
that projectors and computers are not enough in the schools. Only one head
teacher indicated that the school had enough projectors to use for class
presentations. Another head teacher said that he organized students in groups
of between 15 and 20 due to inadequate number of computers and other
resource materials. He said that each group is provided one book for each
subject.
The supervisors interviewed confirmed that teaching-learning resource
materials are insufficient in schools. They said that textbooks are inadequate in
the schools. The sharing ratio is one book to over ten students. One supervisor
told the researcher that students do not have an opportunity to take with them

35
books home. He continued saying the limited textbooks that are available are
used only in classes.
4.4.3 Students’ Perception
Research Question 3: How do students’ perceptions of their career
development affect performance in Mathematics at secondary school?
In this study, the researcher prepared a questionnaire to capture students’
perception about mathematics as an important subject in their career
development. The students were asked to give their opinion on this aspect in
12 statements in order to identify their perception of the subject. The
statements were mainly how students’ viewed mathematics in terms of:
1. too easy
2. fairly easy
3. about right level
4. quite difficult
5. very difficult
6. hated subject
7. useful in life
8. important for career development
9. boring
10. liked subject
11. understandable subject
12. well performed subject

36
The responses are recorded in figure 4.4 in details.
Figure 4.4: Students’ Perception in Mathematics
This graph shows that 64% of students either strongly agreed or agree that
mathematics is too easy. This shows that the students have a positive
perception towards learning mathematics, so their low performance should not
be related to their perception in mathematics.
When it comes to their opinions on whether mathematics was about right
level, 68% either strongly agreed or agreed which again shows students’
positive perception in mathematics.
In addition to that the students’ views on how mathematics is difficult, 59%
either strongly disagreed or disagreed to the assertion that mathematics is
either quite difficult or very difficult. The findings indicate that students
perceive mathematics as being right level and not very hard when it comes to
difficultness. This also shows the positive attitude of students towards
0
50
100
150
200
250
1 2 3 4 5 6 7 8 9 10 11 12
SA
A
DK
DA
SDA

37
mathematics which is totally different from the views of teachers and head
teachers.
When students were asked whether mathematics is a hated subject, only 18%
strongly agree that view which still shows positive perception of the students
towards mathematics.
Students well noted that mathematics is useful in life and important for career
development. Over 85% of them strongly agree or agree that mathematics is
important for their career development. About that number also indicated that
mathematics is useful for life. Majority of the students declared that the
students’ perception in mathematics is highly important for their career
development and useful for their life.
Now let us see whether students perceive mathematics as boring subject, 59%
of the students either strong disagreed or disagreed that mathematics is a
boring subject. This shows that students perceive mathematics as a subject that
they enjoy learning. Sixty percent of the students strongly agreed or agreed
that mathematics is a subject they like doing more than any other subject.
In conclusion, the perception of the students towards mathematics whether it is
important for career development, useful for life, fair, not hated, showed that
there is positive perception of students towards the subject. Those students,
who indicated, that they do not know their perception of mathematics were
between 2% and 10% on all the items examined.

38
4.4.3.1 Findings from the teachers, head teachers and supervisors
In table 4.6 teachers’ views on students’ perception on mathematics is briefed.
Table 4.6: Teacher’s Opinion on students’ Math Perception
Word used Frequency Percent
Hard 3 50%
Difficult 4 38%
Normal 1 13%
Teachers interviewed unanimously perceived students’ as having negative
attitudes towards mathematics. The students’ perceive mathematics as hard,
boring and hated subject. To quote the exact words used by some of the
teachers, the responses in table 4.6 shows how the 8 teachers interviewed
expressed themselves towards students’ perception on mathematics. As
indicated in table 4.6 about 88% of the teachers interviewed think that students
perceive mathematics as a hard subject that they could not study. It seems that
teachers have the perception of mathematics is hard for the students which
could be a legend believed in the past.
The 8 head teachers interviewed think that students perceive mathematics as a
difficult subject and this is caused by students’ low level of mathematics
foundation in primary schools. Only two head teachers said that science
students are different from arts students and may perceive mathematics as not
hard subject.

39
Most of supervisors interviewed share the notion with the head teachers and
teachers. However, at least 2 supervisors told the researcher that students’
perception towards mathematics is positive and very high. These experienced
supervisors blamed the teachers and head teachers that they are not addressing
the issue by discussing it with their teachers and changing the teacher-centered
methodology with student-centered methodology.
4.4.4 Mathematics Foundation
Figure 4.5 shows the students’ responses on the question they were asked to
provide the information about their background in mathematics at primary
schools. The results in the last centralized examination are as reported in
figure 4.5.
Figure 4.5: Grade 8 results
In this figure 4.5, 66% of the students got over 50% marks at primary school
examination and 17% got between 41 and 50. Combined these 2 percentages
gives about 80% of the students got over 41% and above. The required pass
0-10 11-20 21-30 31-40 41-50 <50
6 4 15 27
43
160
0 6 5 20 19
64
6 10 20 47
62
224
Grade 8 results
Male Female Total
40
mark is 40% therefore it can be concluded that the mathematics foundation of
the students is not so bad. At the same time, students were asked to indicate
the results they got in the latest test in the school. It is observed that 64% of
them got 41% and over.
Apart from students’ claims, the teachers also gave their opinions on the mean
grade of students’ in the latest test in their respective schools. The teachers
indicated that the mean percentage mark in the latest mathematics test is 30%.
This percentage is not very different from that given by the students. In
general, students’ background in mathematics is good and is likely to give
them a head start.
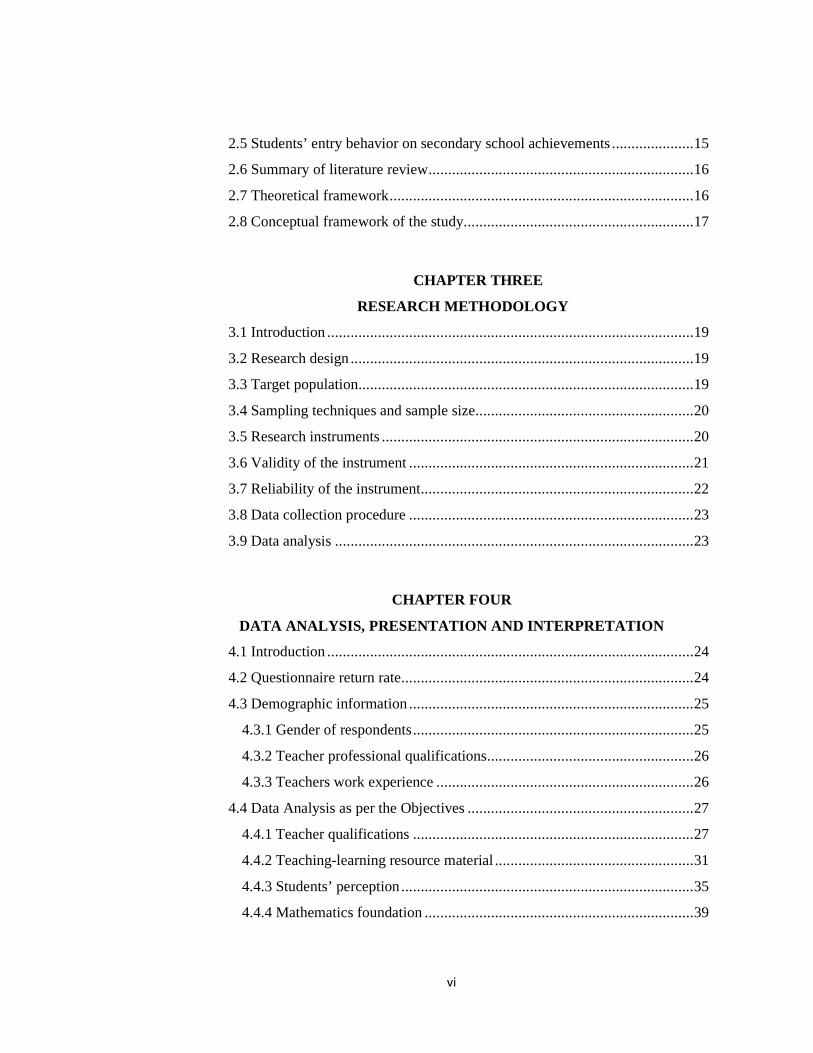
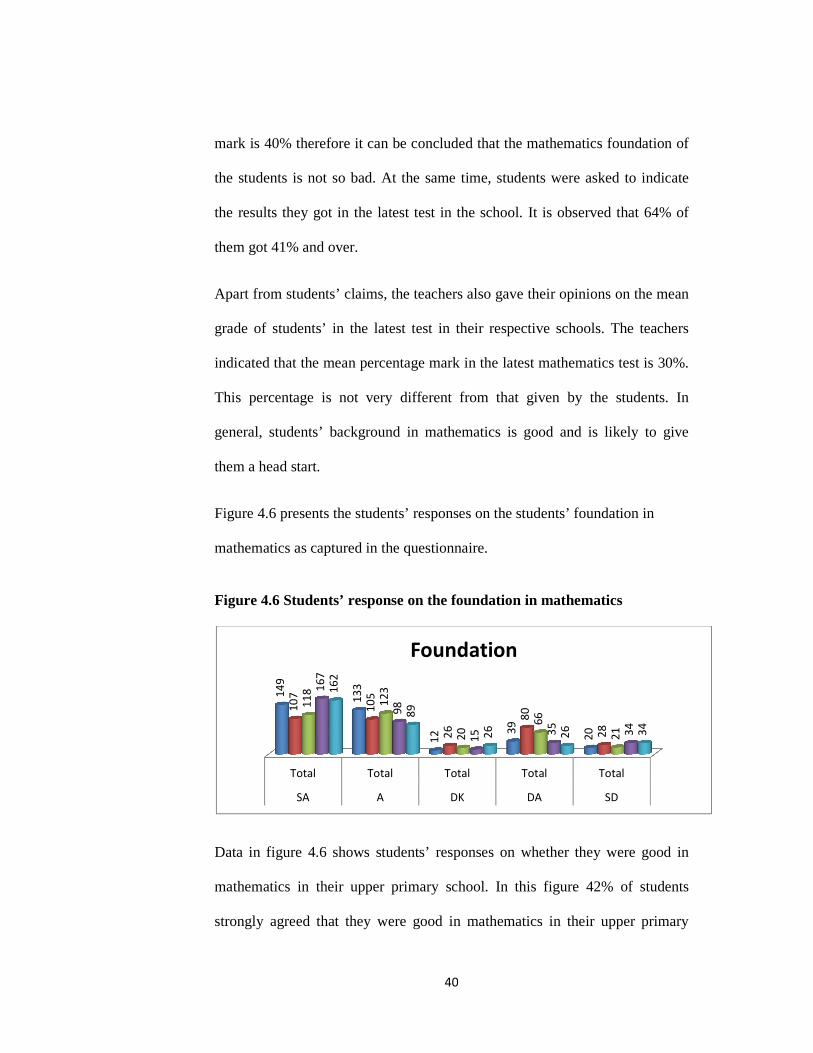
Figure 4.6 presents the students’ responses on the students’ foundation in
mathematics as captured in the questionnaire.
Figure 4.6 Students’ response on the foundation in mathematics
Data in figure 4.6 shows students’ responses on whether they were good in
mathematics in their upper primary school. In this figure 42% of students
strongly agreed that they were good in mathematics in their upper primary
Total Total Total Total Total
SA A DK DA SD
14
9
13
3
12
39
20
10
7
10
5
26
80
28
11
8
12
3
20
66
21
16
7
98
15
35
34
16
2
89
26
26
34
Foundation

41
school era. The majority of students indicated that they were good in
mathematics in their primary schools which differs with the opinions of the
teachers, head teachers and supervisors who believed that the students were
poor in mathematics in their primary schools. Most of the students also said
they liked mathematics, their teachers were qualified, and they liked their
teachers.
42
CHAPTER FIVE
SUMMARY, CONCLUSIONS AND RECOMMENDATIONS
5.1 Introduction
This section provides a summary, conclusions and recommendations of the
study and suggestions for areas of further study.
5.2 Summary of the Study
The main aim of the study was to investigate the factors influencing students’
performance in mathematics at Puntland secondary school certificate
examination in Puntland State, Somalia. The study was guided by four
objectives which were on; teachers’ professional qualifications in
Mathematics, adequacy of teaching- learning resource materials, students’
perceptions of their career development and students’ primary school and how
these objectives influence students’ mathematics performance.
The study adopted descriptive survey design with a sample of 390 students, 20
teachers, 8 head teachers and 6 supervisors. Data was collected using two
questionnaires, one for students and one for teachers. Interviews were also
used to capture information from 8 teachers, 8 head teachers and 6
supervisors.

43
5.3 Summary of study findings
The study found out that most of the teachers have qualifications needed for
teaching mathematics, but methodologies used by the teachers are mainly
teacher-centered as the head teachers and supervisors indicated.
The study also found out that resource materials needed for teaching
mathematics are insufficient in the schools. For example textbook: student
ratio was 1:10 and less. This showed that students do not take textbooks to do
assignments or homework at home.
The students’ perception on mathematics was positive. The students’
perceived mathematics as important in their life and in their career
development. They also indicated that the subject was neither difficult nor
boring. On the other hand, teachers, head teachers and most of the supervisors
were of the opinion that students’ perception on mathematics was negative.
They believe that students hate mathematics and that they found it as boring
and unimportant subject in their lives. However, from the students’
performance in the latest test it confirmed the position of students’ opinions.
Students’ mathematics foundation in early grades is low according to
secondary school head teachers, teachers and school supervisors. The reason
being teachers are not trained to enhance the performance of the young boys
and girls. Supervisors, head teachers and teachers all agreed that the biggest
problem lies in weak foundation of mathematics. But on the other hand,
majority of the students indicated in this study that performed well in their
primary schools.

44
5.4 Conclusion
The study tried to examine the four objectives which looked at factors
influencing students’ performance in mathematics at Puntland secondary
school certificate examination in Puntland State, Somalia. The factors were:
Teachers qualification, Mathematics resource materials, Students’ perception
of mathematics and students’ mathematics foundation.
From the findings of the study the researcher makes the following
conclusions;
a. The teachers have the necessary qualifications but don’t apply student-
centered methodology which is inevitable for enhancing the students’
mathematics performance.
b. The resource materials of mathematics are inadequate compelling
students to be confined to teachers’ notes.
c. Students’ perception in mathematics is very positive leading them to be
ready to study the subject, but teachers’ perception on students and
methodologies used made the students helpless.
d. The foundation of mathematics in early grades is weak due to
untrained or badly trained teachers.
5.5 Recommendations
The following recommendations are made based on the findings of the study:
1. The ministry of education and higher education should address issues
related to teaching and learning activities. They should train secondary

45
school mathematics teachers to change their attitude towards students
performance in mathematics.
2. Enhance the provision of educational resource materials for secondary
schools. Special intervention is to be organized to provide mathematics
textbooks for public secondary schools.
3. The ministry of education and higher education should plan on how to
strengthen the students’ background in mathematics.
5.6 Suggestions for Further Research
Based on the findings of the study the researcher suggests the following
studies to be carried out as a complementary to this study:
1. A study need to be done on the factors influencing students’
mathematics performance other than the factors in this study, because
there could be other factors influencing this problem.
2. This study was on secondary schools only, there is need to carry out a
similar study on the students’ mathematics performance in primary
schools to make the necessary early interventions.
3. There is also need to carry out a study on how the teaching
methodologies as a main factor influencing the students’ mathematics
performance at national examinations.

46
REFERENCE
Kimani, G. N., Kara, A. M. and Njagi, L. W. (2013), Teacher factors
influencing students academic achievement in secondary schools in
Nyandarua Count, Kenya In International Journal of Education and
Research
Mwenda, E. E., Nyaga G., Dr. Muthaa G. and Dr. Reche G. (2013), “Factors
Contributing to Students Poor Performance in Mathematics in Public
Secondary Schools in Tharaka South District, Kenya”, Chuka
University, Kenya
Ramiah, Nena (2010), A study of Students’ Perception of the Factors
Affecting their Academic Performance: A Case Study at Bangkok
University, Bangkok Research Center, Bangkok
Suan, Joefel S. (2014) “Factors Affecting Underachievement in Mathematics”,
Cebu City, Philippines. PISA 5th Survey Programme (2012),
www.oecd.org/pisa
Thembinkosi, Tshabalala and Ncube, A. C. (2013), “Causes of Poor
Performance of Ordinary Level Pupils in Mathematics in Rural
Secondary Schools inNkayi District: Learner’s Attributions”,
Zimbabwe Open University, Zimbabwe

47
KCSE Examination Report (2013), Kenya National Examination Council,
Nairobi, Kenya
PSC Examination Reports (2013, 2014), Puntland National Examination
Board, Garowe, Puntland Center for Public Education, Teacher
Quality and Student Achievement
Akala, Nyagah and Kalai, (2012) Research Methods in Education, University
of Nairobi, Kenya
Akala, Nyaga, Kalai and Khatete, Research Methods in Education, University
of Nairobi, Kenya
Chege, Paul (2011), Puntland Mathematics Teachers Workshop Report,
Garowe, Puntland

48
APPENDICES
APPENDIX I
LETTER OF INTRODUCTION
Educational Administration &
Planning
University of Nairobi
The head teacher
__________________________________________________ secondary school
Dear sir/madam
REF: INVITATION TO PARTICIPATE IN RESEARCH
I am a student at university of Nairobi currently pursuing a Masters’ degree in
Educational Planning. As part of my endeavor, I am required to carry out
research on “Factors influencing students’ performance in mathematics at
Puntland secondary certificate level in Puntland state, Somalia”. Your
school has been selected for the study. The purpose of this letter is to kindly
request you to allow me to carry out the study in your school. The information
you give will be only used for the purpose of this study and your identity will
be treated with confidentiality. Please be honest in your responses and ensure
that you do not give your identity. The information will be for the purpose of
the study only.
Sincerely yours
Abdullahi Nur Salad

49
APPENDIX II
Students Questionnaire
Puntland secondary school students are performing poor in mathematics as
form four leaving examination results are showing. This study intends to find
out the factors that influence student‘s performance in mathematics, so that
appropriate recommendations are done.
The information you provide will not be used in any way against you. The
results will be treated as highly confidential and are for research purposes
only. So you are kindly requested to answer the following questions as honest
as possible.
Section 1a: General Information
Instruction: Please tick the best answer
1. Gender: Male Female 2. My mean score in the last examination (test) this year is (Please tick
the appropriate box):
0 – 10 11 – 20 21 – 30 31 – 40 41 – 50 over 50
3. My mean score in Grade 8 examination (test) was (Please tick the appropriate box):
0 – 10 11 – 20 21 – 30 31 – 40 41 – 50 over 50

50
Section 1b: Teachers’ Professional Qualification Below are different themes in mathematics. Show how strongly you agree or disagree by making a tick in the appropriate box Table 1: Teachers’ Professional Qualification
Section 2: Teaching – learning material resources Below are different items, select their appropriate use one for each item. Table 2: Teaching-learning resources
I use: Always (A) Often (O) Sometimes (S) Never (N)
Text Books Charts
Diagrams/ Models
Projectors Computers Calculators
Compass
Ruler
Mathematics teacher: Strongly Agree
Agree Do not know
Disagree Strongly Disagree
explains the work well repeats where it is not clear
answers questions thoroughly
responds rudely to students‘ questions
gives homework, marks and returns the next day
helps students when they are stuck
uses different methods

51
Section 3: Students’ perception in mathematics Below are different themes in mathematics. Show how strongly you agree or disagree by making a tick in the appropriate box. Table 3: Students’ Perception
Mathematics is: Strongly
Agree
Agree Do not
know
Disagree Strongly
Disagree
too easy
fairly easy
about right level
quite difficult
very difficult
hated subject
useful in life
important for career
development
Boring.
a subject that I like
doing more than
any other subject
a subject that I
understand its
meaning of new
concepts, words and
formulae
a subject that I am
happy with its
examination results

52
Section 4: Primary School Performance
Below are different themes in mathematics. Show how strongly you agree or
disagree by making a tick in the appropriate box
Table 4: Primary School Performance
In my upper primary, Strongly
Agree Agree Do not
know Disagree Strongly
Disagree I was good in mathematics.
Mathematics was one of my favorite subjects
I used to get high marks in mathematics.
I liked my mathematics teachers.
Our mathematics teachers were qualified to teach mathematics.

53
APPENDIX III
Teacher Questionnaire:
Puntland secondary school students are performing poor in mathematics as
form four leaving examination results are showing. This study intends to find
out the factors that influence student‘s performance in mathematics, so that
appropriate recommendations are done.
The information you provide will not be used in any way against you. The
results will be treated as highly confidential and are for research purposes
only. So you are kindly requested to answer the following questions as honest
as possible.
Section 1a: General information
Region: ____________________________
a) What is your gender? Male Female
b) What is your Professional Status? Trained
Untrained
c) What is your Academic Qualification? Secondary
Bachelor Master Other Specify:
d) What is your Specialization: Major: Minor:
e) What is your Teaching Experience? less than 2 years
2 – 5 years
6 – 10 years 11 - 15 years Over 15 years

54
f) What is your students’ mean score of the last mathematics examination
(test)?
0 – 10 11 – 20 21 – 30 31 – 40 41 – 50 over 50
Section 1b: Teachers’ Professional Qualification
Please tick the appropriate place, one tick of rating for each method.
Table 5: Teaching-learning Material Resources
I use: Always
(A)
Often (O) Sometimes (S) Never (N)
Lecturing Method
Small Group Discussion
Questioning Method
Problem-solving Method
Demonstration Method
a strategy that students learn best by finding solutions to problems on their own
to work with individual students
to check my students’ exercise books
to allow students to think of solutions to practical problems themselves before the I show them how they are solved

55
Section 2: Teaching/learning resources
Please tick the appropriate place, one tick of rating for each method.
Table 6: Teaching resources
I use the following
items in class:
Always (A) Often (O) Sometimes (S) Never (N)
Text Books Charts
Diagrams/ Models
Projectors Calculators
Computers
Compass
rulers

56
APPENDIX IV
Head Teachers Interview
Instruction: Please tick the best answer
Gender: Male Female
Interview Questions
1. How do you perceive mathematics performance of your students?
_______________________________________________________________
_______________________________________________________________
_______________________________________________________________
2. Do you think the following factors influence students’ performance in
mathematics in Puntland? If yes, how?
a. The teachers’ professional qualifications:
______________________________________________________
______________________________________________________
b. Adequacies of teaching- learning resource materials:
______________________________________________________
______________________________________________________
c. Students’ perceptions of their career development: ___________
______________________________________________________
______________________________________________________

57
d. Students’ primary school performance: ____________________
______________________________________________________
______________________________________________________
3. Do you provide the following teaching materials to the mathematics
teachers and students?
a. Textbooks:__________________________________________
b. Mathematics
charts:_____________________________________
c. Campuses/rulers:_____________________________________
d. Calculators:_________________________________________
e. Projectors:__________________________________________
4. What is the ratio of mathematics textbooks to the students?
_______________________________________________________________
5. How did your students perform in mathematics in their standard 8
examinations?
_______________________________________________________________
_______________________________________________________________
_______________________________________________________________
6. How do your students perceive mathematics?
_______________________________________________________________
_______________________________________________________________
_______________________________________________________________

58
APPENDIX V
Teachers Interview
Instruction: Please tick the best answer
Gender: Male Female
Interview Questions
1. How do you perceive mathematics performance of your school?
_________________________________________________________
_________________________________________________________
_________________________________________________________
_________________________________________________________
_________________________________________________________
2. Do you think the following factors influence students’ performance in
mathematics in Puntland? If yes, how?
a. The teachers’ professional qualifications:
______________________________________________________
______________________________________________________
b. Adequacies of teaching- learning resource materials:
_____________________________________________________
______________________________________________________
______________________________________________________

59
c. Students’ perceptions of their career development:
______________________________________________________
______________________________________________________
d. Students’ primary school performance:
______________________________________________________
______________________________________________________
3. Does your school provide the following teaching materials to the
mathematics teachers and students?
a. Textbooks:
____________________________________________
b. Mathematics
charts:_____________________________________
___________________________________________________
c. Campuses/rulers:_____________________________________
d. Calculators:_________________________________________
e. Projectors:__________________________________________
4. What is the ratio of mathematics textbooks to the students?
_______________________________________________________________
_______________________________________________________________

60
5. How did your students perform in mathematics in their standard 8
examinations?
_______________________________________________________________
_______________________________________________________________
_______________________________________________________________
_______________________________________________________________
6. How do your students perceive mathematics?
____________________________________
_________________________________________________________
_________________________________________________________

61
APPENDIX VI
Quality Assurance and Standards Interview:
Instruction: Please tick the best answer
Gender: Male Female
Interview Questions
1. Do you think Puntland secondary school students are performing well
in mathematics?
_______________________________________________________________
_______________________________________________________________
_______________________________________________________________
2. Do you think the following factors influence students’ performance in
mathematics in Puntland? If yes, how?
a. The teachers’ professional qualifications:
____________________
___________________________________________________
___________________________________________________
___________________________________________________
62
b. Adequacies of teaching- learning resource materials:
___________________________________________________
___________________________________________________
___________________________________________________
c. Students’ perceptions of their career
development:___________
___________________________________________________
___________________________________________________
_________________.
d. Students’ primary school performance:
_____________________
___________________________________________________
___________________________________________________
___________________________________________________
3. How students in Puntland secondary schools perceive mathematics?
______________________________________________________
______________________________________________________
_____________________________________________________.
4. Do the schools have adequate material resources for mathematics for
both teachers and students?
_________________________________________
_________________________________________________________
_________________________________________________________
_________________________________________

63
5. Are these materials used properly?
_________________________________________________________
_________________________________________________________
_________________________________________________________
6. Do the teachers use appropriate teaching methods in schools?
_________________________________________________________
_________________________________________________________
_________________________________________________________
Top Related
Copyright © 2022 FDOKUMEN

