


Bahasa
Halaman
Hukum


Abby Ryan, Faith Garcia, Leila Carey Date Due: 4-9-19
Our Lady of Mount Carmel School GLOBE Report
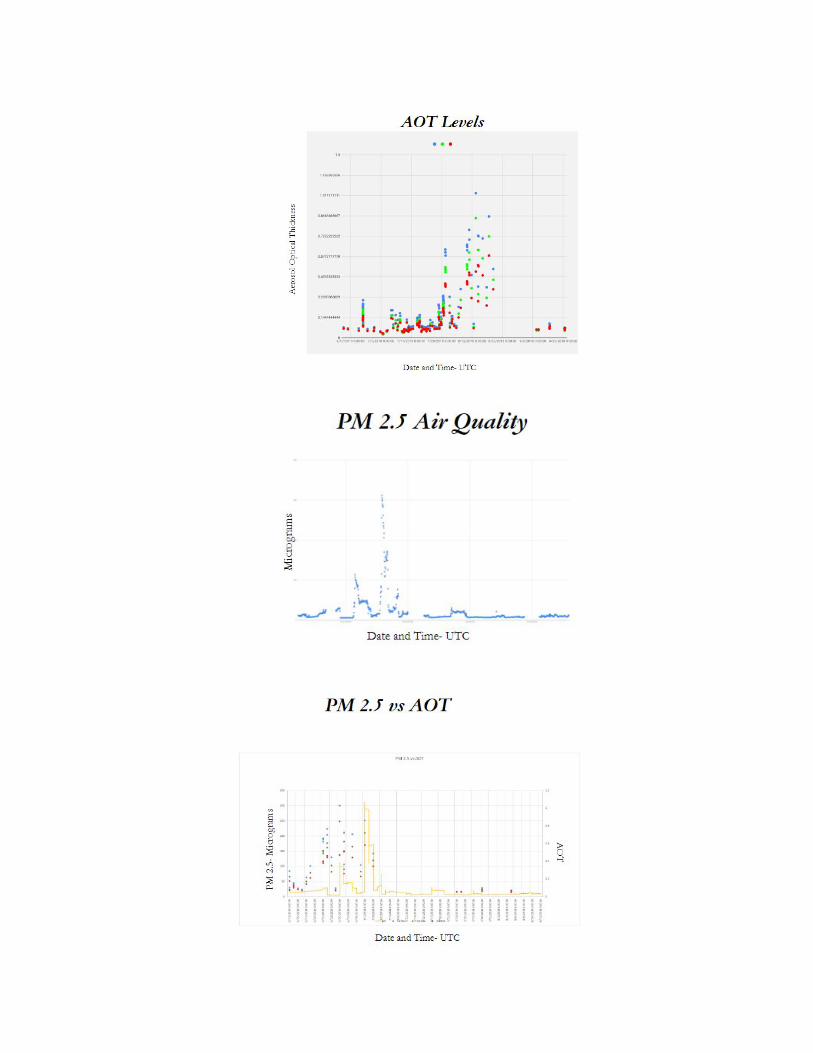
The Effects of Forest Fires on Air Quality
Abstract
The question we explored was “Do fires have a detrimental effect on air quality?”. Our
hypothesis was that they do have a detrimental effect on air quality. We decided this by creating
graphs that allowed us to analyze the data more clearly. We found that the spikes in the data
occurred during the high points of the fire. These spikes reached way past the accepted PM 2.5 and
AOT, meaning that the air quality was very dangerous for humans, animals, and plants in the area.
The PM 2.5 rose to over 300 micrograms, with the accepted amount being 35. These things led us
to believe that the effect of these fires and other fires are definitely detrimental and can even be life
threatening.
Research Question
“Do fires have a detrimental effect on air quality?” This is an important thing to know
because many people suffer from breathing problems, such as asthma, and it would be helpful for
them to know which areas have good air quality and which ones have bad air quality. Fires emit
harmful gases which can be damaging to lungs not affected by a respiratory disease. Smoke effects
PM 2.5. PM 2.5 consists of small particles that can go deep into the lungs and bloodstream. We
want to find out how much pm 2.5 fires emit and if it stays in the atmosphere long after the fires
have ended.

Introduction
In our project, we investigated if fires have a long term effect on air quality. Fires cause a
significant increase in aerosol concentrations. Forest fires send partially burned organic carbon
aloft (“ Aerosols: Tiny Particles, Big Impact). Due to the effects of forest fires, we wanted to find
out whether the excess amount of particles will stick around after a forest fire. This can be useful
to many scientists and civilians, because they will now know how safe it is outside after a large fire
has occurred. Some people have respiratory issues, such as asthma or COPD, which can make it
harder to breathe. The excess amount of aerosols in the atmosphere can contribute to the
worldwide concern of global warming. This excess amount of aerosols can even harm people who
are perfectly healthy. When pollution is abundant in the atmosphere, it can worsen air quality, and
may have harmful side-effects.
Aerosols are a gaseous suspension of fine solid or liquid particles. Many things can
affect the path, color, distance traveled and thickness of aerosols. Forest Fire smoke tends to be
gray because these lower-temperature blazes release lighter-colored organic matter and brown
carbon (wood and vegetation) (“ How the Smoke Rises”). Although most aerosols remain
suspended for short periods of time- periods typically between four days and a week- they can
travel vast distances (“ Aerosols: Tiny Particles, Big Impact”). Aerosols are the main source of the
pollutants in our air. The difference between the amount of incoming solar radiation and the
amount of outgoing terrestrial radiation is the radiation or energy budget. In other words, radiation
budget is the difference between the energy from the sun and the radiation leaving earth. There are

many types of aerosols. Some are volcanic aerosols, desert dust, human-made aerosols, fires, and
sea salt. Fires significantly contribute to aerosol concentration. Fires are the rapid oxidation of a
material in the exothermic chemical process of combustion. They release heat, light, and reaction
products. We will measure the Aerosol Optical Thickness (AOT), and the PM 2.5. AOT is the
“degree to which aerosols prevent the transmission of light in the atmosphere”. (“Exploring
Aerosol Optical Thickness”) PM 2.5 is an air pollutant that can be very dangerous if it gets into our
systems. (“Fine Particles”)
Research Methods
We used data from the California and Oregon fires this past summer and fall of 2018. The
data was from a teacher in Athena, Oregon. The PM 2.5 data was measured every day from August
8th until October 10th, 2018. The AOT data was measured from June 13, 2018 to September 23,
2018. The weather was generally very hot during that summer. Measurements were taken of the

PM 2.5 and the AOT in Athena, Oregon; at the teacher’s house. We received the data, then put it
into graphs, showing us more clearly when the high or low points occurred. We created our graphs
using Google Sheets and Excel. We analyzed our data by looking for things that especially stuck
out to us.
Results
Yes, Forest fires have a very large effect on air quality. Because the smoke gets thicker as
the fires build up, the amount of aerosols grows and spreads all over the world. We first looked at
the AOT and PM 2.5 and made charts using the data. We made a chart comparing the PM 2.5 and
AOT data. We found that in this chart, the spikes and low points matched pretty well, suggesting
that something significant was occuring during the fires at these specific points. Figure 3 is the
chart we used to compare AOT PM 2.5.

Discussion
The results acquired from this project were very significant. The data we collected showed
us that fires do have an effect on air quality. We discovered that fires have a lot to do with the air
quality around us. The results supported our hypothesis by proving that the amount of aerosols
from fires did have long term effects on the air quality. We found that the PM 2.5 and AOT both
went up during the middle of the fire. This must’ve been one of the most violent points of the fire.
Because of our discoveries, we would advise people with breathing problems to evacuate at the
first sign of fire. The accepted PM 2.5 is 35 micrograms per cubic meter of air, and our results
showed that at many times, the PM 2.5 was way above that, causing severe health threats. These
particles travel deep into our lungs, possibly causing respiratory and cardiovascular issues. (“Fine
Particles”) Our experiment could have been better if we had AOT data for the same days we had
PM 2.5 data. This would close up the gaps between the data we had for AOT and P.M 2.5 and we
would be able to point out more spikes and low points.

Conclusion
Our hypothesis was proved through our research. We predicted that the fires would
significantly damage the air quality at least for a short amount of time. Our question was “Do fire
have a detrimental effect on air quality?”. We came to our conclusion by analyzing our data,
looking for high and low areas. We found that the PM 2.5 and AOT both spiked at around the
middle of the data collection period, when the fires were at their worse. These high levels tell us
that the air quality was severely damaged during this time. Luckily, it went down quite a bit shortly
after the spike. Our experiment could've been better if we found data to fill in the gaps. Mrs. Rizzi
and Dr. Pippen significantly helped our experiment by helping us see important things in the data
and create graphs.
GLOBE Badges
Be a Collaborator
Leila Carey, Faith Garcia, and Abby Ryan all collaborated on this project. Faith Garcia collected most of our background research. Leila Carey was one of the writers and the editor. She also did graphing. Abby Ryan was one of the other writers who also did some of the graphing.
Be a Data Scientist We used and analyzed data from the California/Oregon fires during the summer of 2018. Although we didn’t make the measurements, we learned how to use a Calitoo and practiced with some. We compared the PM 2.5 and AOT data. We were looking for similarities and differences, and for the most part, they went up and down at the same times, hinting at high and low points during the fires.
Be a STEM Professional We received assistance from NASA scientist Margaret Pippen, who helped us to gather our information and showed us many important things about our data, such as strange high and low points.

Bibliography
● “Department of Health.” Fine Particles (PM 2.5) Questions and Answers,
www.health.ny.gov/environmental/indoors/air/pmq_a.htm.
● “Aerosols: Tiny Particles, Big Impact.” NASA, NASA,
earthobservatory.nasa.gov/features/Aerosols/page4.php.
● “How the Smoke Rises.” NASA, NASA,
earthobservatory.nasa.gov/images/144658/how-the-smoke-rises.
● “Exploring Aerosol Optical Thickness Using MODIS Satellite Imagery in NEO.”
Datasheets, 25 Sept. 2018, serc.carleton.edu/usingdata/datasheets/aerosolopticalthick.html.
Top Related
Copyright © 2022 FDOKUMEN

