


Bahasa
Halaman
Hukum


Published Ahead of Print 16 July 2014. 2014, 88(19):11327. DOI: 10.1128/JVI.01612-14. J. Virol.
Shilts, Santiago F. Elena and Svetlana Y. FolimonovaMaría Bergua, Mark P. Zwart, Choaa El-Mohtar, Turksen LevelIs Not Required for Exclusion at the CellularExclusion at the Whole-Organism Level but A Viral Protein Mediates Superinfection
http://jvi.asm.org/content/88/19/11327Updated information and services can be found at:
These include:
REFERENCEShttp://jvi.asm.org/content/88/19/11327#ref-list-1at:
This article cites 59 articles, 28 of which can be accessed free
CONTENT ALERTS more»articles cite this article),
Receive: RSS Feeds, eTOCs, free email alerts (when new
http://journals.asm.org/site/misc/reprints.xhtmlInformation about commercial reprint orders: http://journals.asm.org/site/subscriptions/To subscribe to to another ASM Journal go to:
on Septem
ber 8, 2014 by guesthttp://jvi.asm
.org/D
ownloaded from
on S
eptember 8, 2014 by guest
http://jvi.asm.org/
Dow
nloaded from

A Viral Protein Mediates Superinfection Exclusion at the Whole-Organism Level but Is Not Required for Exclusion at the CellularLevel
María Bergua,a Mark P. Zwart,b Choaa El-Mohtar,c Turksen Shilts,c Santiago F. Elena,b,d Svetlana Y. Folimonovaa
University of Florida, Department of Plant Pathology, Gainesville, Florida, USAa; Instituto de Biología Molecular y Celular de Plantas (CSIC-UPV), València, Spainb; Universityof Florida, Citrus Research and Education Center, Lake Alfred, Florida, USAc; The Santa Fe Institute, Santa Fe, New Mexico, USAd
ABSTRACT
Superinfection exclusion (SIE), the ability of an established virus infection to interfere with a secondary infection by the same ora closely related virus, has been described for different viruses, including important pathogens of humans, animals, and plants.Citrus tristeza virus (CTV), a positive-sense RNA virus, represents a valuable model system for studying SIE due to the existenceof several phylogenetically distinct strains. Furthermore, CTV allows SIE to be examined at the whole-organism level. Previ-ously, we demonstrated that SIE by CTV is a virus-controlled function that requires the viral protein p33. In this study, we showthat p33 mediates SIE at the whole-organism level, while it is not required for exclusion at the cellular level. Primary infection ofa host with a fluorescent protein-tagged CTV variant lacking p33 did not interfere with the establishment of a secondary infec-tion by the same virus labeled with a different fluorescent protein. However, cellular coinfection by both viruses was rare. Theobtained observations, along with estimates of the cellular multiplicity of infection (MOI) and MOI model selection, suggestedthat low levels of cellular coinfection appear to be best explained by exclusion at the cellular level. Based on these results, we pro-pose that SIE by CTV is operated at two levels—the cellular and the whole-organism levels— by two distinct mechanisms thatcould function independently. This novel aspect of viral SIE highlights the intriguing complexity of this phenomenon, furtherunderstanding of which may open up new avenues to manage virus diseases.
IMPORTANCE
Many viruses exhibit superinfection exclusion (SIE), the ability of an established virus infection to interfere with a secondaryinfection by related viruses. SIE plays an important role in the pathogenesis and evolution of virus populations. The observa-tions described here suggest that SIE could be controlled independently at different levels of the host: the whole-organism levelor the level of individual cells. The p33 protein of citrus tristeza virus (CTV), an RNA virus, was shown to mediate SIE at thewhole-organism level, while it appeared not to be required for exclusion at the cellular level. SIE by CTV is, therefore, highlycomplex and appears to use mechanisms different from those proposed for other viruses. A better understanding of this phe-nomenon may lead to the development of new strategies for controlling viral diseases in human populations and agroecosys-tems.
Superinfection exclusion (SIE), a phenomenon in which a pri-mary virus infection prevents a secondary infection by the
same or a closely related virus, has been reported in a broad rangeof bacterial, plant, and animal viruses (1–10). Among them areimportant pathogens of humans, such as human immunodefi-ciency virus (HIV) (11), hepatitis C virus (HCV) (12), West Nilevirus (13), and rubella virus (14). From the standpoint of virusevolution, SIE has been suggested to be a mechanism to reducecompetition for resources (15, 16) and to maintain the stability ofviral sequences due to the prevention of recombination eventsbetween related strains coinfecting the same cell (17, 18). Thelatter property of the exclusion phenomenon itself has clear im-plications for treating viral infections. If viruses could successfullysuperinfect cells, recombination would greatly increase virus vari-ability. This increased variability could, in turn, result in the en-hanced evolution of drug and vaccine resistance, thus compro-mising the development of antivirus treatments. The significanceof SIE for mitigation of the effects of virus infection has also beenshown for plant viruses. In what is referred to as cross-protection,crops are purposefully infected with a mild isolate as a protectivemeasure against other virus variants that cause severe disease (7,
10). This widely accepted practice in agriculture has been an effec-tive antiviral management procedure that has allowed the eco-nomical production of various crops.
In spite of the importance of SIE in viral pathogenesis, ourunderstanding of how virus variants exclude each other is largelyincomplete. With animal and human viruses, studies of SIE mech-anisms were carried out mostly in cell cultures, thus avoiding thepossibility of the exclusion effect being masked by an interferonresponse as well as other complications related to the nature ofthese pathosystems (9, 12, 14, 19). The research demonstrated thatexclusion could result from impairments of different steps of theviral life cycle during superinfection, including downregulation of
Received 4 June 2014 Accepted 14 July 2014
Published ahead of print 16 July 2014
Editor: A. Simon
Address correspondence to Svetlana Y. Folimonova. [email protected].
Copyright © 2014, American Society for Microbiology. All Rights Reserved.
doi:10.1128/JVI.01612-14
October 2014 Volume 88 Number 19 Journal of Virology p. 11327–11338 jvi.asm.org 11327
on Septem
ber 8, 2014 by guesthttp://jvi.asm
.org/D
ownloaded from
cell surface viral receptors after primary virus infection, whichaffects secondary virus attachment, or interference with incomingvirus penetration into the cell or with incoming virus replicationand/or translation (1–3, 5, 9, 12, 19). Such mechanisms appar-ently function at the level of cells that were preinfected with theprimary virus, and, thus, it is not clear how, if at all, they relate toSIE at the organism level. Interestingly, while many animal virusesshow SIE at the cellular level, the ability to exclude secondaryinfection by the same or a closely related virus at the whole-organ-ism level varies for different viruses. For instance, it was shownthat HIV exhibits SIE only at the cellular level, while it permitssuperinfection by different virus strains at the level of an organism(reviewed in reference 20). On the other hand, with Borna diseasevirus as well as HCV and hepatitis B virus, SIE has been observedat the cellular level and in intact host organisms as well: in exper-imentally infected animals or in highly susceptible individuals (8,12, 17, 19, 21–23). Collectively, these observations suggest thatwhen it is occurring at both levels, the exclusion could be con-trolled by different mechanisms.
Plant viruses have provided more opportunities to examine theSIE phenomenon at the whole-organism level (7, 10). Most casesof homologous interference have been attributed to the inductionof RNA silencing by the primary virus, an antiviral host defensemechanism that degrades the challenge virus RNA in a sequence-specific manner (7, 24, 25). RNA silencing can function systemi-cally in cells containing the primary virus as well as in uninfectedcells and, therefore, could explain SIE at both the cellular and theorganism levels, in contrast to the mechanisms proposed for ani-mal viruses (7, 24–27). However, mechanisms of SIE associatedwith both plant and animal viruses have not been elucidated.
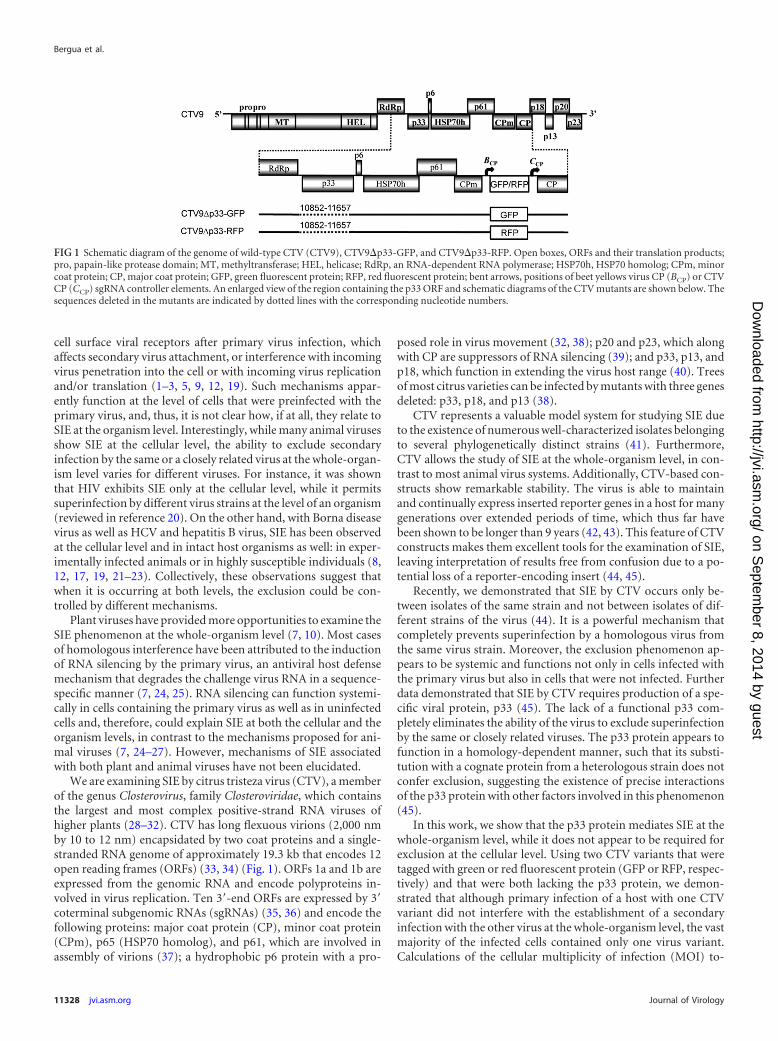
We are examining SIE by citrus tristeza virus (CTV), a memberof the genus Closterovirus, family Closteroviridae, which containsthe largest and most complex positive-strand RNA viruses ofhigher plants (28–32). CTV has long flexuous virions (2,000 nmby 10 to 12 nm) encapsidated by two coat proteins and a single-stranded RNA genome of approximately 19.3 kb that encodes 12open reading frames (ORFs) (33, 34) (Fig. 1). ORFs 1a and 1b areexpressed from the genomic RNA and encode polyproteins in-volved in virus replication. Ten 3=-end ORFs are expressed by 3=coterminal subgenomic RNAs (sgRNAs) (35, 36) and encode thefollowing proteins: major coat protein (CP), minor coat protein(CPm), p65 (HSP70 homolog), and p61, which are involved inassembly of virions (37); a hydrophobic p6 protein with a pro-
posed role in virus movement (32, 38); p20 and p23, which alongwith CP are suppressors of RNA silencing (39); and p33, p13, andp18, which function in extending the virus host range (40). Treesof most citrus varieties can be infected by mutants with three genesdeleted: p33, p18, and p13 (38).
CTV represents a valuable model system for studying SIE dueto the existence of numerous well-characterized isolates belongingto several phylogenetically distinct strains (41). Furthermore,CTV allows the study of SIE at the whole-organism level, in con-trast to most animal virus systems. Additionally, CTV-based con-structs show remarkable stability. The virus is able to maintainand continually express inserted reporter genes in a host for manygenerations over extended periods of time, which thus far havebeen shown to be longer than 9 years (42, 43). This feature of CTVconstructs makes them excellent tools for the examination of SIE,leaving interpretation of results free from confusion due to a po-tential loss of a reporter-encoding insert (44, 45).
Recently, we demonstrated that SIE by CTV occurs only be-tween isolates of the same strain and not between isolates of dif-ferent strains of the virus (44). It is a powerful mechanism thatcompletely prevents superinfection by a homologous virus fromthe same virus strain. Moreover, the exclusion phenomenon ap-pears to be systemic and functions not only in cells infected withthe primary virus but also in cells that were not infected. Furtherdata demonstrated that SIE by CTV requires production of a spe-cific viral protein, p33 (45). The lack of a functional p33 com-pletely eliminates the ability of the virus to exclude superinfectionby the same or closely related viruses. The p33 protein appears tofunction in a homology-dependent manner, such that its substi-tution with a cognate protein from a heterologous strain does notconfer exclusion, suggesting the existence of precise interactionsof the p33 protein with other factors involved in this phenomenon(45).
In this work, we show that the p33 protein mediates SIE at thewhole-organism level, while it does not appear to be required forexclusion at the cellular level. Using two CTV variants that weretagged with green or red fluorescent protein (GFP or RFP, respec-tively) and that were both lacking the p33 protein, we demon-strated that although primary infection of a host with one CTVvariant did not interfere with the establishment of a secondaryinfection with the other virus at the whole-organism level, the vastmajority of the infected cells contained only one virus variant.Calculations of the cellular multiplicity of infection (MOI) to-
FIG 1 Schematic diagram of the genome of wild-type CTV (CTV9), CTV9�p33-GFP, and CTV9�p33-RFP. Open boxes, ORFs and their translation products;pro, papain-like protease domain; MT, methyltransferase; HEL, helicase; RdRp, an RNA-dependent RNA polymerase; HSP70h, HSP70 homolog; CPm, minorcoat protein; CP, major coat protein; GFP, green fluorescent protein; RFP, red fluorescent protein; bent arrows, positions of beet yellows virus CP (BCP) or CTVCP (CCP) sgRNA controller elements. An enlarged view of the region containing the p33 ORF and schematic diagrams of the CTV mutants are shown below. Thesequences deleted in the mutants are indicated by dotted lines with the corresponding nucleotide numbers.
Bergua et al.
11328 jvi.asm.org Journal of Virology
on Septem
ber 8, 2014 by guesthttp://jvi.asm
.org/D
ownloaded from
gether with MOI model selection and an analysis of the spatialdistribution of cells infected by the two virus variants lacking thep33 protein suggested that exclusion at the cellular level was still inplace.
MATERIALS AND METHODSVirus isolates and inoculation of citrus trees. The GFP-tagged p33 dele-tion mutant CTV9�p33-GFP (38, 45) and the RFP-tagged p33 deletionmutant CTV9�p33-RFP, described below, have been maintained in citrusplants under greenhouse conditions. These plants were used as sources ofvirus for subsequent graft inoculations of young trees to assess SIE asdescribed previously (44, 45).
Generation of CTV9�p33-RFP. The full-length cDNA clone of CTVT36 pCAM:CTV947R (46) and the GFP-tagged cDNA clone CTV-BC5/GFP (42) were the basis for engineering the RFP-tagged p33 deletionmutant construct. The RFP (TagRFP) reporter gene mobilized in thepSITEII-C1 vector (47), kindly provided by M. M. Goodin (University ofKentucky, Lexington, KY), was amplified using primers designed to in-corporate PacI and XhoI restriction endonuclease sites at the 5= and 3=ends, respectively. The PCR-amplified RFP ORF digested with PacI andXhoI was introduced into the CTV-BC5/GFP vector digested with thesame enzymes. The resulting CTV-BC5/RFP construct was digested withPmeI and PstI endonucleases (nucleotide positions 11869 to 11876 and17208 to 17213 in the genome of T36, respectively). The fragment con-taining the RFP ORF was substituted for the corresponding fragment inpCAM�p33 9-47R modified from the original binary vector construct,pCAM:CTV947R (46), to create a deletion within the p33 gene, as de-scribed by Tatineni et al. (38), and to introduce the ORF of the p22 silenc-ing suppressor of tomato chlorosis virus (48) by replacing the hygromycingene in the pCAMBIA 1380 backbone at the XhoI site. The new constructwas named pCTV9�p33-RFP.
In order to accumulate CTV9�p33-RFP virions for inoculation ofcitrus plants, the respective construct was first transfected into Agrobacte-rium tumefaciens cells. The bacterial cultures carrying pCTV9�p33-RFPbinary plasmids were used for infiltration of Nicotiana benthamianaplants as described earlier (46, 49). One week after infiltration,CTV9�p33-RFP virions were extracted from the infiltrated leaves, con-centrated by centrifugation on a sucrose cushion, and used for inoculationof the bark flap of Citrus macrophylla seedlings according to the proceduredescribed earlier (50).
Serological assays. Double-antibody sandwich enzyme-linked im-munosorbent assay (ELISA) of tissue extracts was performed as describedpreviously using antibodies specific to CTV virions (44, 45, 51) to confirminfection in inoculated plants.
Examination of fluorescence in citrus plants infected with RFP- orGFP-tagged viruses. Bark tissues from trees inoculated with CTV9�p33-RFP and/or CTV9�p33-GFP were examined for RFP and GFP fluores-cence at different times beginning at 4 weeks after primary infection and at6 weeks after challenge using a Zeiss Stemi SV 11 UV fluorescence dissect-ing microscope (Carl Zeiss Jena).
Confocal laser scanning microscopy. Samples of bark tissue fromdifferent flushes of five individual C. macrophylla trees infected withCTV9�p33-RFP and/or CTV9�p33-GFP were collected at the time pointcorresponding to 12 weeks after challenge inoculation with the secondaryvirus. This time is enough for the second virus to get established in a treeunder the conditions in which no SIE at the host level occurs. Importantly,samples were taken from the newly developed systemic tissues, which canbe colonized by both viruses. The samples were observed using a confocallaser scanning fluorescence microscope (TCS SL; Leica, Heidelberg, Ger-many). GFP and RFP were excited by using 488- and 543-nm laser lines,respectively. When using multiple fluorophores simultaneously, imageswere acquired sequentially, line by line, in order to reduce excitation andemission cross talk. Exposure settings that minimized oversaturated pix-els in the final images were used. A Leica HC PL Fluotar �10.0/0.30objective was used. Image acquisition was conducted at a resolution of 512
by 512 pixels. A total of 10 z-stacks comprising 50 optical sections weretaken using samples of bark tissue for each treatment (z-step width, 2.5�m). The number of cells infected by CTV9�p33-RFP and/orCTV9�p33-GFP in each z-stack was determined by visual inspection ofCTV9�p33-RFP or CTV9�p33-GFP in the red or green channel, respec-tively, using ImageJ software (http://rsb.info.nih.gov/ij/). Five sequentialoptical sections at different depths within the z-stack (sections 8 to 12, 18to 22, 28 to 32, and 38 to 42) were merged separately in the green and redchannels to count the number of cells infected by each virus instead ofusing a whole z-stack projection of 50 sections. The total number of cellswas obtained by adding the number of cells found in each set of themerged sections. Caution was taken in order to avoid counting the samecell twice on the merged sections at different depths within the z-stack.Images obtained in the green and red channels were superimposed toreveal cells doubly infected with RFP- and GFP-tagged viruses (yellowcells). A cell was counted as coinfected with the two virus variants if thedistribution and intensity of GFP and RFP fluorescence throughout thecell observed in the green and red channels, respectively, were compara-ble. Cell coinfection was confirmed by colocalization analysis using Colo-calization ImageJ plug-in software.
MOI calculation. The MOI was calculated by fitting the observedcount data to the so-called model 1 described previously (52) and origi-nally proposed elsewhere (53). This model assumes that the number ofinfecting virions, considered only over the virus-infected cells, takes aconstant value of mI and that the proportion of cells infected only by theCTV9�p33-RFP variant is then given by the zero term of a binomialdistribution of the number of infecting virions of the CTV9�p33-GFPvariant:
Pr�GFP � g� � �mI
g �pGFPg �1 � pGFP�mI � g
where Pr is the expected probability, g is an observation of CTV9�p33-GFP-infected cells, and pGFP is the frequency of the CTV9�p33-GFP-infected cells, estimated from the data as
pGFP � 1 � pRFP � �f �GFP � RFP�� � f �GFP � RFP�� ⁄
�f �GFP � RFP�� � f �GFP�� RFP� � 2f �GFP � RFP��where pRFP is the frequency of the CTV9�p33-RFP-infected cells, and f(·)denotes the observed frequencies of each class of infected cells. Given thatmI is constant, the expected frequency of cells coinfected by both variantsin the fraction of infected cells is just given by 1 � pGFP
m1 � pRFPm1 . The
predicted frequency of singly and mixed-variant infected cells can then becompared to the observed frequency by means of a G likelihood ratio test(54).
MOI model selection. Model selection was first performed for a set offour models described previously (52) and afterwards for a set of twomodels (models 2 and 4). Model 2 is the null model and assumes that thedistribution of infecting viruses follows a Poisson distribution, such thatPr�K � k� � mT
k e�mT /k!, where mT is the number of infecting virions overall cells, K is a random variable denoting the number of viruses infecting acell, and k is a realization of this random variable (i.e., a particular valuetaken by K). It then follows that the expected frequency of cellular coin-fections in infected cells is (52)
f �GFP � RFP� � �1 � e�mT pGFP��1 � e�mT�1�pGFP��To predict f(GFP � RFP) from the data, we use the relationship be-
tween mT and the predicted fraction of uninfected cells:
mT � � ln�f �GFP�� RFP���We could not quantify the total number of susceptible cells, and,
moreover, not all phloem-associated cells appear to be susceptible to in-fection (55). We therefore took the highest number of infected cells ob-served for one sample (176 cells for CTV9�p33-GFP; see Table 1) to be themaximum number of susceptible cells, �. This number is an outlier, andthe actual number for each sample is therefore likely to be lower, but this
Viral Superinfection Exclusion at Whole-Organism Level
October 2014 Volume 88 Number 19 jvi.asm.org 11329
on Septem
ber 8, 2014 by guesthttp://jvi.asm
.org/D
ownloaded from

makes our analysis conservative with respect to whether SIE occurs (i.e., ifthe actual number of susceptible cells is slightly lower, we would expectmore cellular coinfection and the discrepancy between model 2 and thedata would become larger, more strongly favoring alternative models).Therefore, f (GFP � RFP) is approximately equal to (g � r)/�, where g andr are the numbers of CTV9�p33-GFP- and CTV9�p33-RFP-infected cellsobserved, respectively.
Model 3 assumes that the two virus variants become separated overtime as the virus expands throughout the host plant (52). This segregationof virus variants will not affect mT, but it will affect the frequency ofcellular coinfection, such that
f �GFP � RFP� � e��t�1 � e�mT pGFP��1 � e�mT�1�pGFP��where � is a constant that determines that rate at which tissues are infectedby only one genotype over time. Model 4 assumes that there is SIE. Sincewe are considering data from a single time point here, we simplify themodel described previously (52) (referred to as model 5 in the previousstudy), such that SIE has a constant magnitude and therefore
mT � �� · ln�f �GFP�� RFP���where � is a constant that determines the strength of SIE by lowering mT.Model 5 combines models 3 and 4.
We performed grid searches over progressively smaller large pa-rameter spaces to ensure global and accurate estimates of parameters.We calculated the binomial likelihood for model predictions for eachsample (L) as
L �f �GFP � RFP��x, y�
� �x
y �f �GFP � RFP�y �1 � f �GFP � RFP��x � y
where x is the total number of infected cells, and y is the number ofcoinfected cells. The sum of the negative log likelihood (NLL) values wasthen used for model selection by means of the Akaike information crite-rion (AIC).
Spatial segregation analysis. To test if there was spatial segregation ofthe two virus variants at the cellular level, we considered whether thespatial distribution of the two variants over infected cells appears to berandom. We first determined the Cartesian coordinates of the main areasof infection in each merged section separately for each virus variant usingImageJ (56), (i) generating an 8-bit monochrome image, (ii) reducing theimage to 50 by 5 pixels (width by height; each pixel then has the approx-imate dimensions of one infected cell), (iii) setting the threshold valuessuch that the background is lost (threshold value, 15), and (iv) using theImageJ tool to determine coordinates. A .csv file of coordinates was thenimported into R, version 3.0.2 (57). The arrays containing the coordinatedata for the two virus variants were combined, and any repetition of pairsof coordinates was removed. The data were then resampled 1,000 times:we randomly selected N coordinates of infected cells for each virus variant,where N is the number of infected points. We then determined the dis-tance to the nearest neighbor for each infected point (d), using the nndistprocedure in the Spatstat library (58), and used these measurements tocalculate R, the nearest-neighbor ratio (59):
R �� d ⁄ N
1 ⁄ 2N ⁄ A
where A is the total area analyzed (the area of one merged section in areduced resolution was equal to 250 pixels). The numerator is the meandistance to the nearest neighbor, whereas the denominator is the expectedmean distance to the nearest neighbor for a given density. A value of R of1 indicates overdispersion, whereas a value of R of 1 indicates aggre-gation. However, here we were not interested in the absolute values of R,which also depend on the spatial distribution of all infected cells, but,rather, were interested in the comparison of R values for observed andresampled data. We therefore considered whether values of R calculatedfor the observed data fell within the 95% confidence interval (CI) estab-
lished using the resampled data. However, our analysis is based on fourmerged sections per virus variant per flush. To take into account theeffects of multiple comparisons, we first considered which sections hadobserved values outside the predicted 95% CI. We then resampled thedata for these sections 10,000 times, determined Holm-Bonferroni-cor-rected CIs (i.e., 98.75%, 98.33%, 97.5%, and 95% CIs), and then sequen-tially checked whether the observed R values fell within these limits, start-ing with the most divergent sample. The Holm-Bonferroni correction wasused to account for the fact that multiple sections are tested per flush in abalanced manner.
RESULTSGeneration of CTV deletion mutants tagged with fluorescentproteins to study the distribution of virus populations in citrustrees. In our recent study, we demonstrated that modifications ofthe p33 gene, which restricted production of the functional pro-tein, prevented SIE (45). In contrast to the wild-type virus, mu-tants with a deletion or a frameshift mutation within the p33 ORFlost the ability to exclude superinfection by the same mutants orby the wild-type virus. The primary infection with these mutantshad no interference with a secondary infection, as was observedwhen a GFP-tagged virus was used as a challenge virus. The ex-pression of GFP fluorescence in trees preinfected with the p33mutants and then challenged with the GFP-marked virus wascomparable to that found upon inoculation of trees with no pri-mary infection.
Thus, the lack of production of the p33 protein resulted in theinability of the virus to exclude superinfection at the whole-plantlevel. Our next goal was to assess whether this observation at theplant level has a parallel at the cellular level. To examine the dis-tribution of both the primary and challenge viruses in plant tissuesupon their sequential inoculation and to be able to discriminatebetween them, we generated another CTV mutant, CTV9�p33-RFP, in addition to the CTV9�p33-GFP construct that was usedin our previous experiments (45). Similar to the latter virus,CTV9�p33-RFP contained a deletion within the p33 gene and hadthe ORF for a fluorescent protein, in this case, RFP, inserted be-
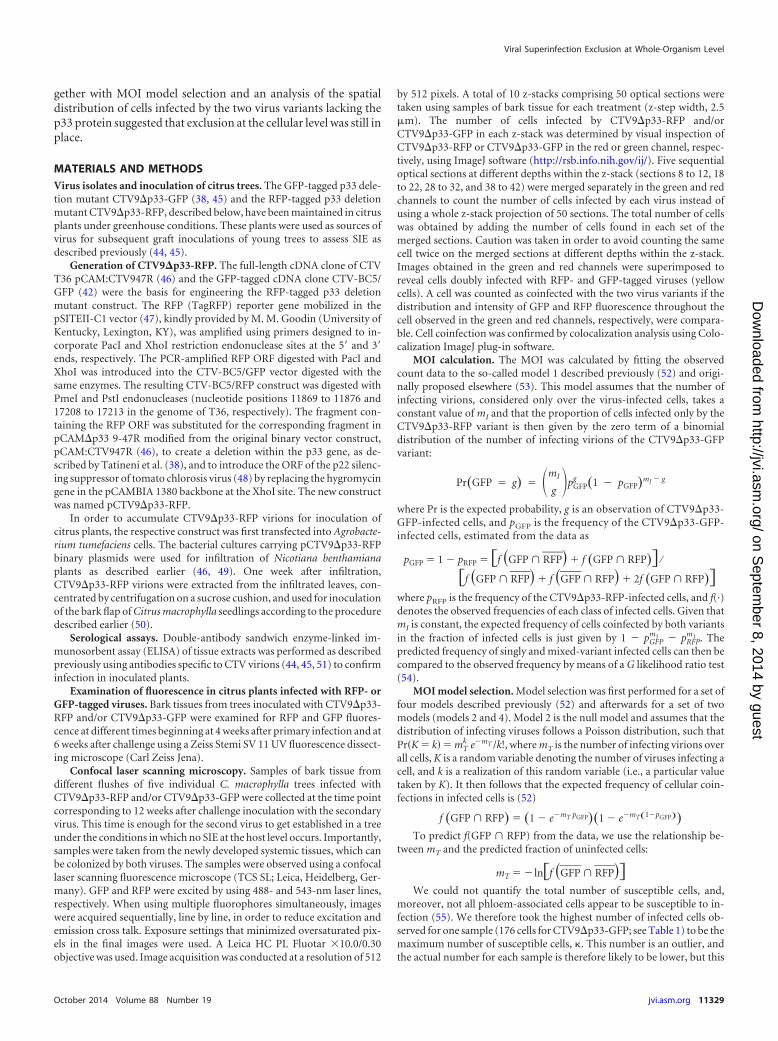
FIG 2 Examination of virus infection in C. macrophylla trees inoculated withCTV9-GFP, CTV9�p33GFP, or CTV9�p33RFP. (A) Observation of GFP orRFP fluorescence in phloem-associated cells of the inoculated trees. Observa-tions were done on the internal surface of bark at 2 months after inoculationusing a confocal laser scanning fluorescence microscope. Bars � 300 �m. (B)Analysis of viral titer by double-antibody sandwich ELISA. Trees were assayed6 weeks after initial inoculation. CTV titers (A405 values obtained by ELISA)are the averages of the results for 5 plants � 1 SD.
Bergua et al.
11330 jvi.asm.org Journal of Virology
on Septem
ber 8, 2014 by guesthttp://jvi.asm
.org/D
ownloaded from

tween the CPm and CP genes under the control of the beet yellowsvirus CP sgRNA promoter (Fig. 1). Both viruses had nearly iden-tical biological properties. The infection levels of the GFP- andRFP-tagged deletion mutants, their movement and distribution,as well as their stability within host plants were similar and werealso comparable to those of the wild-type virus. The CTV9�p33-RFP and CTV9�p33-GFP mutants established productive infec-tion in citrus plants at similar times, which was usually about 4 to5 weeks postinoculation, and at similar levels, as was demon-strated by the observation of GFP and RFP fluorescence in phloemtissue of the infected plants and by serological assays of the plantmaterial (ELISA) using CTV-specific antiserum (Fig. 2). The char-acteristics of CTV9�p33-RFP and CTV9�p33-GFP were compa-rable to those of the GFP-tagged wild-type CTV. All three virusesreached similar titers and had a similar distribution in citrus trees,as was shown by a similar distribution of infected cells (Fig. 2).These observations were in agreement with the earlier reports,which demonstrated that CTV mutants with a deletion within thep33 ORF retain the ability to infect, multiply, and spread through-out trees of most citrus varieties at the levels of the wild-type virus(38, 45). Importantly, the viruses continuously expressed brightred or green fluorescence in infected phloem cells, allowing theirvisualization over extended periods of many months. These re-sults were consistent with our previous observations of the re-markable stability of recombinant CTV vector constructs, which
have demonstrated the ability to maintain and express a foreigninsert in a host for more than 9 years thus far (42, 43).
Sequential inoculation of a host with viruses that lack p33protein results in superinfection at the whole-organism levelbut not at the cellular level. As we demonstrated previously (45),primary infection with a CTV variant that lacks the p33 proteindoes not exclude superinfection by the same virus at the plantlevel. To assess whether the absence of p33 leads to superinfectionat the cellular level, we examined the distribution of virus-infectedcells upon sequential inoculation of the host trees, with the maininterest being to see whether both viruses occupy the same cells orwhether they are mainly confined to separate cells. Young C. mac-rophylla trees were first inoculated with the CTV9�p33-RFP iso-late by grafting virus-infected tissue into the stems of receptortrees. At 6 weeks postinoculation, systemic infection of the newleaves was confirmed by observation of RFP fluorescence and byELISA (data not shown). The plants were challenged by placementof a second graft of tissue infected with CTV9�p33-GFP. As acontrol for this experiment, another set of plants was first inocu-lated with CTV9�p33-RFP but was not subjected to a secondaryinoculation. An additional set of control plants with no primaryinfection was challenge inoculated with CTV9�p33-GFP (Fig. 3; areciprocal experiment in which the GFP-tagged deletion mutantwas used for primary inoculation and the RFP-tagged virus wasused as the challenge led to results similar to those described be-
FIG 3 Observation of fluorescence in phloem-associated cells of C. macrophylla trees infected with CTV variants. (A) Trees were inoculated with CTV9�p33-RFP. (B) Trees were inoculated with CTV9�p33-GFP. (C) Trees were first inoculated with CTV9�p33-RFP and then challenged with CTV9�p33-GFP. Arrows,cells that are coinfected with the two virus mutants. Observations were done at 12 weeks after challenge inoculation on the internal surface of bark of the newlydeveloped flushes using a confocal laser scanning fluorescence microscope. Bars � 300 �m.
Viral Superinfection Exclusion at Whole-Organism Level
October 2014 Volume 88 Number 19 jvi.asm.org 11331
on Septem
ber 8, 2014 by guesthttp://jvi.asm
.org/D
ownloaded from

low). The distribution of the superinfecting GFP-tagged mutantvirus and the primary RFP-tagged virus in doubly infected treeswas examined by visual observation of GFP and RFP fluorescencein the bark tissue of the newly developed systemic tissue starting at
2 months postchallenge and compared to the distribution of vi-ruses in singly infected plants.
As we expected, superinfection by CTV9�p33-GFP was notexcluded in the plants preinfected with CTV9�p33-RFP. Both
FIG 4 Observation of fluorescence in phloem-associated cells of C. macrophylla trees upon sequential inoculation with CTV variants. Trees were first inoculatedwith CTV9�p33-RFP and then challenged with CTV9�p33-GFP. Observations were done at 12 weeks after challenge inoculation on the internal surface of barkof the newly developed flushes using a confocal laser scanning fluorescence microscope. Five sequential optical sections at different depths within the z-stack(sections 8 to 12 [A], 18 to 22 [B], 28 to 32 [C], and 38 to 42 [D]) were merged separately in the green and red channels to count the number of cells infected byeach virus. (E) z-projection of 50 sections. Bars � 300 �m.
Bergua et al.
11332 jvi.asm.org Journal of Virology
on Septem
ber 8, 2014 by guesthttp://jvi.asm
.org/D
ownloaded from
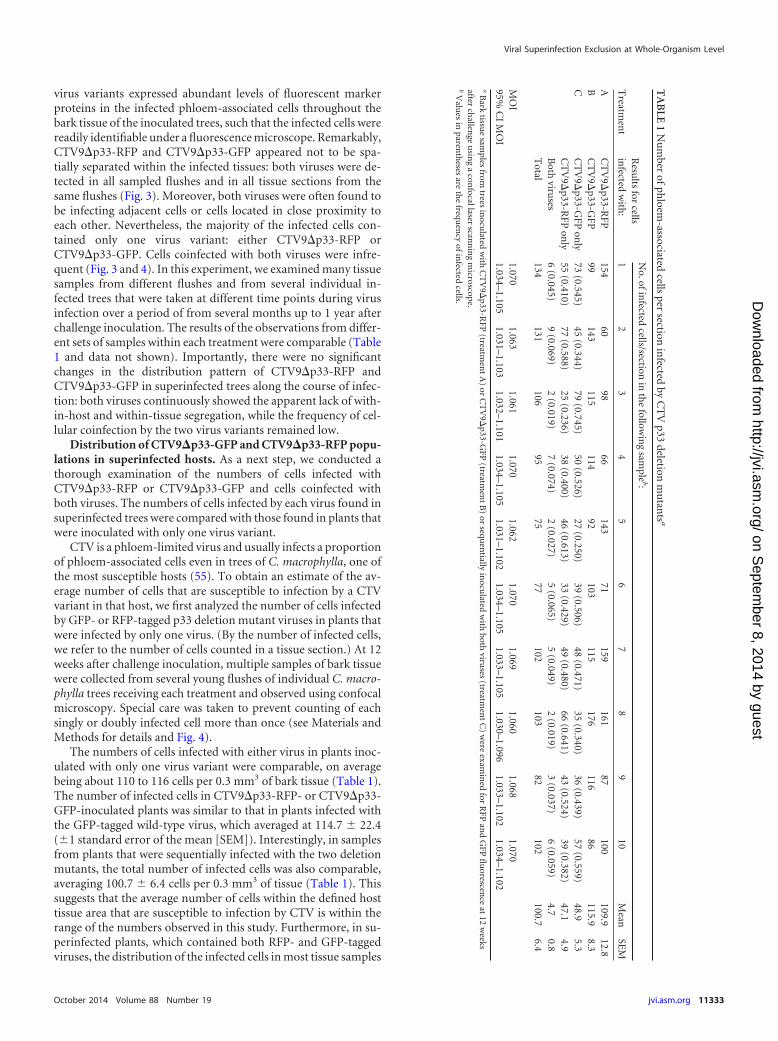
virus variants expressed abundant levels of fluorescent markerproteins in the infected phloem-associated cells throughout thebark tissue of the inoculated trees, such that the infected cells werereadily identifiable under a fluorescence microscope. Remarkably,CTV9�p33-RFP and CTV9�p33-GFP appeared not to be spa-tially separated within the infected tissues: both viruses were de-tected in all sampled flushes and in all tissue sections from thesame flushes (Fig. 3). Moreover, both viruses were often found tobe infecting adjacent cells or cells located in close proximity toeach other. Nevertheless, the majority of the infected cells con-tained only one virus variant: either CTV9�p33-RFP orCTV9�p33-GFP. Cells coinfected with both viruses were infre-quent (Fig. 3 and 4). In this experiment, we examined many tissuesamples from different flushes and from several individual in-fected trees that were taken at different time points during virusinfection over a period of from several months up to 1 year afterchallenge inoculation. The results of the observations from differ-ent sets of samples within each treatment were comparable (Table1 and data not shown). Importantly, there were no significantchanges in the distribution pattern of CTV9�p33-RFP andCTV9�p33-GFP in superinfected trees along the course of infec-tion: both viruses continuously showed the apparent lack of with-in-host and within-tissue segregation, while the frequency of cel-lular coinfection by the two virus variants remained low.
Distribution of CTV9�p33-GFP and CTV9�p33-RFP popu-lations in superinfected hosts. As a next step, we conducted athorough examination of the numbers of cells infected withCTV9�p33-RFP or CTV9�p33-GFP and cells coinfected withboth viruses. The numbers of cells infected by each virus found insuperinfected trees were compared with those found in plants thatwere inoculated with only one virus variant.
CTV is a phloem-limited virus and usually infects a proportionof phloem-associated cells even in trees of C. macrophylla, one ofthe most susceptible hosts (55). To obtain an estimate of the av-erage number of cells that are susceptible to infection by a CTVvariant in that host, we first analyzed the number of cells infectedby GFP- or RFP-tagged p33 deletion mutant viruses in plants thatwere infected by only one virus. (By the number of infected cells,we refer to the number of cells counted in a tissue section.) At 12weeks after challenge inoculation, multiple samples of bark tissuewere collected from several young flushes of individual C. macro-phylla trees receiving each treatment and observed using confocalmicroscopy. Special care was taken to prevent counting of eachsingly or doubly infected cell more than once (see Materials andMethods for details and Fig. 4).
The numbers of cells infected with either virus in plants inoc-ulated with only one virus variant were comparable, on averagebeing about 110 to 116 cells per 0.3 mm3 of bark tissue (Table 1).The number of infected cells in CTV9�p33-RFP- or CTV9�p33-GFP-inoculated plants was similar to that in plants infected withthe GFP-tagged wild-type virus, which averaged at 114.7 � 22.4(�1 standard error of the mean [SEM]). Interestingly, in samplesfrom plants that were sequentially infected with the two deletionmutants, the total number of infected cells was also comparable,averaging 100.7 � 6.4 cells per 0.3 mm3 of tissue (Table 1). Thissuggests that the average number of cells within the defined hosttissue area that are susceptible to infection by CTV is within therange of the numbers observed in this study. Furthermore, in su-perinfected plants, which contained both RFP- and GFP-taggedviruses, the distribution of the infected cells in most tissue samples
TA
BLE
1N
um
berof
phloem
-associatedcells
persection
infected
byC
TV
p33deletion
mu
tants
a
Treatm
ent
Resu
ltsfor
cellsin
fectedw
ith:
No.ofin
fectedcells/section
inth
efollow
ing
sample
b:
12
34
56
78
910
Mean
SEM
AC
TV
9�p33-R
FP154
6098
66143
71159
16187
100109.9
12.8B
CT
V9�
p33-GFP
99143
115114
92103
115176
11686
115.98.3
CC
TV
9�p33-G
FPon
ly73
(0.545)45
(0.344)79
(0.745)50
(0.526)27
(0.250)39
(0.506)48
(0.471)35
(0.340)36
(0.439)57
(0.559)48.9
5.3C
TV
9�p33-R
FPon
ly55
(0.410)77
(0.588)25
(0.236)38
(0.400)46
(0.613)33
(0.429)49
(0.480)66
(0.641)43
(0.524)39
(0.382)47.1
4.9B
othviru
ses6
(0.045)9
(0.069)2
(0.019)7
(0.074)2
(0.027)5
(0.065)5
(0.049)2
(0.019)3
(0.037)6
(0.059)4.7
0.8T
otal134
131106
9575
77102
10382
102100.7
6.4
MO
I1.070
1.0631.061
1.0701.062
1.0701.069
1.0601.068
1.07095%
CI
MO
I1.034–1.105
1.031–1.1031.032–1.101
1.034–1.1051.031–1.102
1.034–1.1051.033–1.105
1.030–1.0961.033–1.102
1.034–1.102a
Bark
tissue
samples
fromtrees
inocu
latedw
ithC
TV
9�p33-R
FP(treatm
ent
A)
orC
TV
9�p33-G
FP(treatm
ent
B)
orsequ
entially
inocu
latedw
ithboth
viruses
(treatmen
tC
)w
ereexam
ined
forR
FPan
dG
FPfl
uorescen
ceat
12w
eeksafter
challen
geu
sing
acon
focallaserscan
nin
gm
icroscope.b
Valu
esin
parenth
esesare
the
frequen
cyofin
fectedcells.
Viral Superinfection Exclusion at Whole-Organism Level
October 2014 Volume 88 Number 19 jvi.asm.org 11333
on Septem
ber 8, 2014 by guesthttp://jvi.asm
.org/D
ownloaded from

was such that, on average, half of the susceptible cells were infectedwith one virus variant, while the other half contained the secondvirus (Table 1). The percentage of cells coinfected with bothCTV9�p33-GFP and CTV9�p33-RFP was low: 4.7% � 0.8% ofall infected cells (Table 1; Fig. 4).
Model selection-based approach to explain the low level ofcellular coinfection in a superinfected host. Counts of singly in-fected and coinfected cells (Table 1) were used to calculate theCTV cellular MOI. To this end, we used the simplest statisticalmodel described previously (52), so-called model 1. An MOI valuewas calculated for each of the samples for which data are providedin Table 1. MOI values were all very low and ranged from 1.060 to1.070, with an average value of 1.066 � 0.001 (�1 SEM). Theselow MOI values could be caused by SIE at the cellular level, butthey could also result from low infection levels in the superin-fected host plants or from spatial segregation of the two virusgenotypes that lowers the frequency of cellular coinfection as thetwo virus variants become physically separated in different partsof the plant, due to genetic drift, and, therefore, do not have accessto the same cells. To determine which explanation best supportsthe data, we performed model selection on four Poisson-basedmodels of MOI: the null model (model 2), a model incorporatingspatial segregation of virus genotypes over time (model 3), amodel incorporating SIE (model 4), and a model combining spa-tial segregation and SIE (model 5). Other mechanisms affectingMOI (i.e., spatial aggregation of infected cells and differences inhost cell vulnerability) were not considered because they lead tohigh levels of cellular coinfection (52). Whereas Model 2 waspoorly supported by the data, support for all other models wassimilar (Table 2, analysis A). Therefore, MOI model selection initself could show only that there were significant deviations fromthe null model, but it could not identify what mechanisms mightbe responsible for these deviations.
Spatial segregation of the two virus variants would result inpatches of cells infected by only one virus variant. However, bothvirus variants were always observed in all bark tissue samples,suggesting that there was no tissue-level segregation. To testwhether there might be spatial segregation at the cellular level, weconsidered whether the spatial distribution of both virus variantsover infected regions appeared to be random, using a resamplingapproach. If there is spatial segregation, we would expect to seevariants distributed nonrandomly over infected regions, whichwas tested using the average-distance-to-nearest-neighbor ratio
(59). In the majority of tissue sections, we observed a randomdistribution of virus variants over infected regions (Table 3). Onlyin one case, however, was the distribution of virus variants overinfected regions nonrandom for all merged sections tested (sam-ple 8 in Table 3), although three sections showed aggregation andone showed overdispersion. Moreover, the frequency of coin-fected cells in samples in which all sections showed a randomdistribution of the two viruses was not significantly different fromthat in samples that contained occasional sections with a nonran-dom distribution of those virus variants (by the test of equal pro-portions with 1 degree of freedom, 2 � 0.004 and P � 0.949).Therefore, a quantitative analysis of the spatial distribution of thevirus variants provided results that largely concurred with the ini-tial observations, confirming that for most samples there was noevidence for nonrandom mixing of the genotypes, thus suggestingthat spatial segregation of virus variants may not contribute sub-stantially to the observed low levels of cellular coinfection in su-perinfected plants.
To test this idea, we repeated the model selection procedureusing only data from flushes where virus variants appeared to berandomly distributed in all merged sections. Models 3 and 5 couldthen be excluded a priori, given that the virus variants were wellmixed. Model 4, incorporating SIE, was much better supportedthan the null model 2 (Table 2, analysis B). Note that using onlypartial data for this second analysis is a conservative approach. Weexcluded those data for which we could not be absolutely sure thatthe two virus variants were spatially well mixed, to avoid errone-ously attributing any deviations from model 2, the null model, toSIE. We can therefore conclude that the data provide support forthe occurrence of SIE at the cellular level, given the low estimatesof cellular MOI and the fact that competing hypotheses explainingthe low levels of cellular coinfection can be discounted.
DISCUSSION
SIE has been studied for a number of different viruses. Most stud-ies with animal and human viruses examined the phenomenon atthe cellular level. Therefore, the described mechanisms appearedto be limited to those that modulate exclusion, as the secondaryvirus aims to infect a cell that has been already occupied. Suchmechanisms have been identified at various stages of the viral lifecycle, including receptor-mediated attachment, penetration, andsubsequent disassembly, translation, and replication steps (1–3, 9,12, 19, 60). Those, however, would apparently work only in cells
TABLE 2 Parameter estimates and model selection for cellular MOIa
Analysis Model Parameter estimates (95% CI) NLL AIC �AIC AW
A 2 94.728 189.456 140.309 03 � � 0.030 (0.020–0.038) 23.574 49.147 0.6604 � � 0.459 (0.370–0.604) 25.482 52.964 3.816 0.0985 � � 0.030 (0.021–0.038), � � 1 (*) 23.574 51.147 2.000 0.243
B 2 51.179 102.357 73.422 04 � � 0.451 (0.332–0.653) 13.468 28.935 1
a For model fitting and selection, analysis A included all Poisson-based models and all the data. Analysis B was performed only on replicate flushes in which the distribution of virusvariants over infected cells is random, and hence, models incorporating the spatial segregation of genotypes (models 3 and 5) can be excluded a priori. For analysis A there was verylittle support for the null model (model 2), while the level of support for all other models was similar. Note that for the parameter estimates, model 5 collapses to model 3,suggesting that this model can be ignored altogether. For analysis B, there was strong support for model 4, while the estimate of � was similar to that in analysis A. NLL, negative loglikelihood; �AIC, difference in the Akaike information criterion (AIC) between the best-fitting model and the model in question; AW, Akaike weight, which is the probability that amodel is the best-supported model out of the set of models; �, a parameter that determines how quickly the spatial segregation of virus genotypes occurs over time; �, a parameterthat determines the magnitude of superinfection exclusion (see Materials and Methods); *, the lower and upper values of the 95% CI coincide with the parameter estimate.
Bergua et al.
11334 jvi.asm.org Journal of Virology
on Septem
ber 8, 2014 by guesthttp://jvi.asm
.org/D
ownloaded from

preinfected with the primary virus, leaving uninfected cells sus-ceptible to the secondary virus. On the other hand, a model thatcould explain SIE at both the cellular and the systemic levels hasbeen proposed for a number of plant viruses. According to thismodel, upon infection the primary virus acts as an elicitor of RNAsilencing, a host defense mechanism which recognizes and de-stroys homologous sequences, such as those present in the ge-nomes of closely related viruses invading the same host, thus pre-venting the secondary infection by other viruses (7, 9, 24, 25).RNA silencing is initially triggered in cells that became infectedwith the primary virus, where viral double-stranded RNA, such asreplicative intermediates or structured regions in the virus ge-nome, is recognized by the host machinery and processed intosmall interfering RNAs (siRNAs) (61–63). The siRNAs then guidesequence-specific degradation of the viral RNA in these cells.Translocation of siRNAs into the neighboring or more distantnoninfected cells leads to protection of noninfected cells and,therefore, generates RNA-based immunity against a closely re-lated virus at the systemic level.
The data presented here provide new insights into the SIE phe-nomenon. Our results show that the viral p33 protein mediatesexclusion at the systemic (whole-organism) level, while exclusionat the cellular level still occurs in its absence. Examination of thedistribution of GFP- and RFP-tagged CTV variants, both lackingthe p33 protein, upon their sequential inoculation into citrus treesshowed that in superinfected plants only a small fraction (� 4.7%)of infected cells was coinfected with both virus variants. There areseveral plausible explanations for the scarcity of doubly infectedcells, among which is the action of mechanisms preventing super-infection of already infected cells. Additionally, other mechanismsdecreasing the likelihood of two different virus genomes replicat-ing in the same cell may be considered. Those include a low virustiter limiting the MOI, the spatial segregation of virus variants,and exclusion through competition upon simultaneous invasioninto a cell. However, the last three models do not seem to be wellsupported by our observations. As we showed previously, with thewild-type CTV used for primary infection, the exclusion of thesecondary infection by the homologous virus was absolute: notrace of the challenge virus was found in preinfected trees (44).Infection by the challenge virus appeared to be excluded both incells infected with the primary virus and in cells that were notinfected. According to the observations obtained from severalstudies, CTV9�p33-GFP, CTV9�p33-RFP, and the wild-type vi-rus exhibit a similar ability to infect, multiply, and spreadthroughout C. macrophylla plants (38, 45; results of this study). Allthree viruses accumulated at similar titers in the infected trees, andthe numbers of cells infected by the deletion mutants and thewild-type virus in singly inoculated plants were comparable.These data suggest that the loss of the ability of the deletion mu-tants to exclude each other at the whole-plant level cannot beexplained simply by a reduction in viral invasiveness, and neithercan the low incidence of cellular coinfection in the superinfectedplants be attributed to many more susceptible cells remaining un-occupied upon CTV9�p33 infection, since the number of thoseshould be similar to that upon infection with the wild-type virus.The latter conclusion is also supported by the observation that thenumber of susceptible cells in the host tissue could be limited: indoubly infected plants, the total number of infected cells was notgreater than that in singly infected plants; each of the two deletionmutants infected approximately half the number of cells in com-
TABLE 3 Resampling analysis of the distribution of virus variants overinfected cellsa
Sample Sections
R value
CTV9�p33-GFP CTV9�p33-RFP
Observed CI resampled Observed CI resampled
1 8–12 0.609 0.604–0.951A 0.768 0.768–0.887A
18–22 0.921 0.674–1.086 0.464 0.464–1.741B
28–32 0.490 0.490–1.654 0.506 0.253–2.85638–42 0.310 0.310–0.465 0.376 0.358–0.450
2 8–12 0.899 0.837–1.021 0.982 0.905–1.02918–22 0.960 0.795–1.040 0.532* 0.576–1.228C
28–32 1.637 0.501–1.803 0.566 0.537–1.61038–42 0.379 0.379–0.423 0.435 0.435–0.435
3 8–12 1.218 0.918–1.258 3.802 0.365–4.05018–22 1.112 1.070–1.179 0.851 0.837–1.27428–32 0.988 0.951–1.063 0.802 0.777–1.07938–42 0.785 0.725–0.955 0.721 0.696–0.963
4 8–12 0.787 0.769–0.825 0.633 0.598–0.86418–22 0.795 0.736–0.928 0.731 0.676–0.93428–32 0.741 0.719–0.946 0.786 0.734–0.93238–42 0.607 0.607–0.719 0.627 0.593–0.719
5 8–12 0.430 0.335–0.608 0.503 0.490–0.55018–22 0.283 0.283–2.573 1.949 0.379–1.98528–32 0.464 0.397–0.681 1.704* 0.379–1.680B
38–42 0.376* 0.487–1.575C 1.150* 0.998–1.102C
6 8–12 0.882 0.867–0.947 0.753 0.677–0.90018–22 1.284* 0.765–1.040C 0.910 0.693–0.98328–32 0.867* 0.872–1.088B 0.988 0.925–1.07338–42 0.866* 0.890–1.072A 0.897 0.869–1.051
7 8–12 0.888 0.847–0.935 0.716* 0.721–0.928C
18–22 0.718 0.560–1.197 1.075 0.538–1.21228–32 0.580 0.580–0.641 0.405 0.306–2.24438–42 0.438 0.438–0.475 0.438 0.219–0.693
8 8–12 0.537* 0.611–0.894 0.969 0.912–0.96518–22 0.639* 0.658–1.002B 0.969 0.911–0.99028–32 0.499* 0.547–1.057A 0.878 0.748–0.92738–42 1.400* 0.440–1.363C 0.909 0.711–0.953
9 8–12 0.799 0.686–0.859 0.773 0.765–0.88318–22 0.517 0.438–1.169 1.343 0.335–1.44528–32 1.632 0.395–1.898 0.849 0.849–0.89138–42 1.700 0.376–1.784 0.633 0.663–0.686
10 8–12 2.377 0.249–2.775 0.438 0.438–0.52018–22 0.497 0.374–1.645 0.632 0.632–0.66428–32 0.835 0.577–0.845 0.561 0.487–0.97938–42 0.580 0.580–0.743A 0.704 0.704–0.755
a For each merged section, we compared the observed value of the average nearest-neighbor ratio (R) to the CI for predicted R values obtained by resampling thedistribution of virus variants over all infected cells. A Holm-Bonferroni correction tothe CI was made. In most cases, the observed R values fell inside the corresponding CI,indicating random spatial distribution. For those cases in which the observed R valuefelt outside of the 95% CI (indicated with an asterisk), we sequentially considered the97.5% CI (A), 98.33% CI (B), and 98.75% CI (C). R values were either less than theexpected value, suggesting the clustering of virus variants and therefore spatialaggregation (eight cases), or greater than the expected value, suggesting spatialoverdispersion of infected cells (four cases).
Viral Superinfection Exclusion at Whole-Organism Level
October 2014 Volume 88 Number 19 jvi.asm.org 11335
on Septem
ber 8, 2014 by guesthttp://jvi.asm
.org/D
ownloaded from

parison with the number infected in singly inoculated plants(Table 1), yet the inoculum pressure for viruses upon generatingsingly and doubly infected plants was comparable.
Similarly, the exclusion through competition at the within-celllevel following simultaneous invasion did not appear to play adetermining role in the observed rareness of cellular coinfections.Each virus variant was as competitive as the other and wild-typeCTV. Moreover, the fluorescence levels in cells infected with ei-ther virus were similar. Additionally, when cells were coinfected,we typically observed reasonably high levels of expression of eachfluorescent protein, again suggesting that the two variants werenot displacing each other at the cellular level. Therefore, it wouldbe likely that upon simultaneous entry into a cell, both variantshave a nearly equal probability of establishing an infection thatwould result in cells replicating distinct virus genomes. This situ-ation appears to have occurred in a low percentage of cells foundto be coinfected with the GFP- and RFP-tagged mutants.
Both GFP- and RFP-tagged p33 deletion mutants were al-ways found in the same plant organs (flushes), appeared to bewell mixed within the same sections of tissue, and were oftenseen occupying neighboring cells. Moreover, multiple observa-tions taken as the infection of the host progressed over timeshowed the apparent lack of the within-host and within-tissuesegregation of the two virus variants, allowing us to concludethat spatial separation appeared not to be a factor that deter-mined low levels of cellular coinfection by the GFP- and RFP-tagged p33 deletion mutants. The lack of spatial structuring ofviral populations observed in plants superinfected by the twoCTV variants is an intriguing observation that raises a specialinterest per se. This situation greatly differs from what wasreported for other viruses of both animals and plants. For in-stance, it was demonstrated that subpopulations of HCV ap-pear to be unevenly distributed in tissues of the same host (64).For a number of plant viruses, analysis of plant host coloniza-tion with identical but differentially labeled virus variantsshowed that they establish infection in separate tissue clustersin the inoculated leaves and the segregation of the virus vari-ants increases as they move systemically (65, 66). Another re-markable example was presented in a study that involved plumpox virus in a Prunus tree, in which distinct virus populationswere found to be occupying different branches within this pe-rennial host plant (67). In contrast to these reports, we did notfind spatial segregation of the two CTV p33 deletion mutants inhost tissues in superinfected plants. A possible explanation forthis observation is that a lack of SIE at the systemic level in thecase of these mutant viruses could be a factor that explains theirunstructured distribution within a host. More studies, how-ever, will be required to elucidate the effect of SIE and otherdriving forces on the structure of virus populations at the in-trahost level.
The data presented here suggest that SIE by CTV operates attwo levels, the cellular and the whole-organism levels, likely bytwo distinct mechanisms that could function independently. Theviral p33 protein mediates the exclusion at the whole-organismlevel, while it does not appear to be required for exclusion at thecellular level. Thus, another mechanism must operate at the cel-lular level. Whether this mechanism shares similar features withone of the mechanisms described for other plant or animal virusesor is unique remains to be determined.
ACKNOWLEDGMENTS
This research was supported by the National Science Foundation undergrant number 1050883 (to S. Y. Folimonova). Work in Valencia, Spain,was supported by grant BFU2012-30805 (to S. F. Elena) and by a Juan dela Cierva postdoctoral fellowship (JCI-2011-10379, to M. P. Zwart), bothfrom the Spanish Ministerio de Economía y Competitividad.
Any opinions, findings, and conclusions or recommendations ex-pressed in this material are those of the authors and do not necessarilyreflect the views of the National Science Foundation.
REFERENCES1. Steck FT, Rubin H. 1966. The mechanism of interference between an
avian leukosis virus and Rous sarcoma virus. I. Establishment of interfer-ence. Virology 29:628 – 641.
2. Steck FT, Rubin H. 1966. The mechanism of interference between anavian leukosis virus and Rous sarcoma virus. II. Early steps of infection byRSV of cells under conditions of interference. Virology 29:642– 653.
3. Adams RH, Brown DT. 1985. BHK cells expressing Sindbis virus-inducedhomologous interference allow the translation of nonstructural genes ofsuperinfecting virus. J. Virol. 54:351–357.
4. Strauss JH, Strauss EG. 1994. The alphaviruses: gene expression, repli-cation, and evolution. Microbiol. Rev. 58:491–562.
5. Karpf AR, Lenches E, Strauss EG, Strauss JH, Brown DT. 1997. Super-infection exclusion of alphaviruses in three mosquito cell lines persistentlyinfected with Sindbis virus. J. Virol. 71:7119 –7123.
6. Singh IR, Suomalainen M, Varadarajan S, Garoff H, Helenius A. 1997.Multiple mechanisms for the inhibition of entry and uncoating of super-infecting Semliki Forest virus. Virology 231:59 –71. http://dx.doi.org/10.1006/viro.1997.8492.
7. Hull R. 2002. Matthews’ plant virology, 4th ed. Academic Press, NewYork, NY.
8. Geib T, Sauder C, Venturelli S, Hassler C, Staeheli P, Schewemmle M.2003. Selective virus resistance conferred by expression of Borna diseasevirus nucleocapsid components. J. Virol. 77:4283– 4290. http://dx.doi.org/10.1128/JVI.77.7.4283-4290.2003.
9. Lee YM, Tscherne DM, Yun SI, Frolov I, Rice CM. 2005. Dualmechanisms of pestiviral superinfection exclusion at entry and RNAreplication. J. Virol. 79:3231–3242. http://dx.doi.org/10.1128/JVI.79.6.3231-3242.2005.
10. Gal-On A, Shiboleth YM. 2006. Cross protection, p 261–288. In Loeben-stein G, Carr JP (ed), Natural resistance mechanisms of plants to viruses.Springer, Dordrecht, The Netherlands.
11. Michel N, Allespach I, Venzke S, Fackler OT, Keppler OT. 2005. TheNef protein of human immunodeficiency virus establishes superinfectionimmunity by a dual strategy to downregulate cell-surface CCR5 and CD4.Curr. Biol. 15:714 –723. http://dx.doi.org/10.1016/j.cub.2005.02.058.
12. Tscherne DM, Evans MJ, von Hahn T, Jones CT, Stamataki Z,McKeating JA, Lindenbach BD, Rice CM. 2007. Superinfection exclu-sion in cells infected with hepatitis C virus. J. Virol. 81:3693–3703. http://dx.doi.org/10.1128/JVI.01748-06.
13. Zou G, Zhang B, Lim PY, Yuan ZM, Bernard KA, Shi PY. 2009.Exclusion of West Nile virus superinfection through RNA replication. J.Virol. 83:11765–11776. http://dx.doi.org/10.1128/JVI.01205-09.
14. Claus C, Tzeng WP, Liebert UG, Frey TK. 2007. Rubella virus-inducedsuperinfection exclusion studied in cells with persisting replicons. J. Gen.Virol. 88:2769 –2773. http://dx.doi.org/10.1099/vir.0.83092-0.
15. Nowak MA, May RM. 1994. Superinfection and the evolution of parasiteevolution. Proc. Biol. Sci. 255:81– 89. http://dx.doi.org/10.1098/rspb.1994.0012.
16. Frank SA. 2001. Multiplicity of infection and the evolution of hybridincompatibility in segmented viruses. Heredity 87:522–529. http://dx.doi.org/10.1046/j.1365-2540.2001.00911.x.
17. Formella S, Jehle C, Sauder C, Staeheli P, Schewemmle M. 2000.Sequence variability of Borna disease virus: resistance to superinfec-tion may contribute to high genome stability in persistently infectedcells. J. Virol. 74:7878 –7883. http://dx.doi.org/10.1128/JVI.74.17.7878-7883.2000.
18. Huang IC, Li W, Sui J, Marasco W, Choe H, Farzan M. 2008. InfluenzaA virus neuraminidase limits viral superinfection. J. Virol. 82:4834 – 4843.http://dx.doi.org/10.1128/JVI.00079-08.
19. Schaller T, Appel N, Koutsoudakis G, Kallis S, Lohmann V, Piet-
Bergua et al.
11336 jvi.asm.org Journal of Virology
on Septem
ber 8, 2014 by guesthttp://jvi.asm
.org/D
ownloaded from

schmann T, Bartenschlager R. 2007. Analysis of hepatitis C virus super-infection exclusion by using novel fluorochrome gene-tagged viral ge-nomes. J. Virol. 81:4591– 4603. http://dx.doi.org/10.1128/JVI.02144-06.
20. Nethe M, Berkhout B, van der Kuyl AC. 2005. Retroviral superin-fection resistance. Retrovirology 2:52. http://dx.doi.org/10.1186/1742-4690-2-52.
21. Laskus T, Wang LF, Radkowski M, Vargas H, Nowicki M, Wilkinson J,Rakela J. 2001. Exposure of hepatitis C virus (HCV) RNA-positive recip-ients to HCV RNA-positive blood donors results in rapid predominanceof a single donor strain and exclusion and/or suppression of the recipientstrain. J. Virol. 75:2059 –2066. http://dx.doi.org/10.1128/JVI.75.5.2059-2066.2001.
22. Walters KA, Joyce MA, Addison WR, Fischer KP, Tyrrell DLJ. 2004.Superinfection exclusion in duck hepatitis B virus infection is mediated bythe large surface antigen. J. Virol. 78:7925–7937. http://dx.doi.org/10.1128/JVI.78.15.7925-7937.2004.
23. Ramírez S, Pérez-del-Pulgar S, Carrión JA, Coto-Llerena M, Mensa L,Dragun J, García-Valdecasas JC, Navasa M, Forns X. 2010. Hepatitis Cvirus superinfection of liver grafts: a detailed analysis of early exclusion ofnon-dominant virus strains. J. Gen. Virol. 91:1183–1188. http://dx.doi.org/10.1099/vir.0.018929-0.
24. Ratcliff F, Harrison BD, Baulcombe DC. 1997. A similarity between viraldefense and gene silencing in plants. Science 276:1558 –1560. http://dx.doi.org/10.1126/science.276.5318.1558.
25. Ratcliff F, MacFarlane SA, Baulcombe DC. 1999. Gene silencing withoutDNA: RNA-mediated cross-protection between viruses. Plant Cell 11:1207–1215.
26. Ding SW, Voinnet O. 2007. Antiviral immunity directed by small RNAs.Cell 30:413– 426. http://dx.doi.org/10.1016/j.cell.2007.07.039.
27. Voinnet O. 2005. Induction and suppression of RNA silencing: insightsfrom viral infections. Nat. Rev. Genet. 6:206 –220. http://dx.doi.org/10.1038/nrg1555.
28. Bar-Joseph M, Garnsey SM, Gonsalves D. 1979. The closteroviruses: adistinct group of elongated plant viruses. Adv. Virus Res. 25:93–168. http://dx.doi.org/10.1016/S0065-3527(08)60569-2.
29. Dolja VV, Karasev AV, Koonin EV. 1994. Molecular biology and evolu-tion of closteroviruses: sophisticated build-up of large RNA genomes.Annu. Rev. Phytopathol. 32:261–285. http://dx.doi.org/10.1146/annurev.py.32.090194.001401.
30. Agranovsky AA. 1996. Principles of molecular organization, expression,and evolution of closteroviruses: over the barriers. Adv. Virus Res. 47:119 –158. http://dx.doi.org/10.1016/S0065-3527(08)60735-6.
31. Karasev AV. 2000. Genetic diversity and evolution of closteroviruses.Annu. Rev. Phytopathol. 38:293–324. http://dx.doi.org/10.1146/annurev.phyto.38.1.293.
32. Dolja VV, Kreuze JF, Valkonen JPT. 2006. Comparative and functionalgenomics of closteroviruses. Virus Res. 117:38 –51. http://dx.doi.org/10.1016/j.virusres.2006.02.002.
33. Pappu HR, Karasev AV, Anderson EJ, Pappu SS, Hilf ME, Febres VJ,Eckloff RMG, McCaffery M, Boyko V, Gowda S, Dolja VV, Koonin EV,Gumpf DJ, Cline KC, Garnsey SM, Dawson WO, Lee RF, Niblett CL.1994. Nucleotide sequence and organization of eight open reading framesof the citrus tristeza closterovirus genome. Virology 199:35– 46. http://dx.doi.org/10.1006/viro.1994.1095.
34. Karasev AV, Boyko VP, Gowda S, Nikolaeva OV, Hilf ME, KooninEV, Niblett CL, Cline K, Gumpf DJ, Lee RF, Garnsey SM, Le-wandowski DJ, Dawson WO. 1995. Complete sequence of the Citrustristeza virus RNA genome. Virology 208:511–520. http://dx.doi.org/10.1006/viro.1995.1182.
35. Hilf ME, Karasev AV, Pappu HR, Gumpf DJ, Niblett CL, Garnsey SM.1995. Characterization of Citrus tristeza virus subgenomic RNAs in in-fected tissue. Virology 208:576 –582. http://dx.doi.org/10.1006/viro.1995.1188.
36. Karasev AV, Hilf ME, Garnsey SM, Dawson WO. 1997. Transcriptionalstrategy of closteroviruses: mapping the 5= termini of the Citrus tristezavirus subgenomic RNAs. J. Virol. 71:6233– 6236.
37. Satyanarayana T, Gowda S, Ayllón MA, Dawson WO. 2003. Frameshiftmutations in infectious cDNA clones of Citrus tristeza virus: a strategy tominimize the toxicity of viral sequences to Escherichia coli. Virology 313:481– 491. http://dx.doi.org/10.1016/S0042-6822(03)00387-8.
38. Tatineni S, Robertson CJ, Garnsey SM, Bar-Joseph M, Gowda S, Daw-son WO. 2008. Three genes of Citrus tristeza virus are dispensable for
infection and movement throughout some varieties of citrus trees. Virol-ogy 376:297–307. http://dx.doi.org/10.1016/j.virol.2007.12.038.
39. Lu R, Folimonov A, Shintaku M, Li WX, Falk BW, Dawson WO, DingSW. 2004. Three distinct suppressors of RNA silencing encoded by a 20-kbviral RNA genome. Proc. Natl. Acad. Sci. U. S. A. 101:15742–15747. http://dx.doi.org/10.1073/pnas.0404940101.
40. Tatineni S, Robertson CJ, Garnsey SM, Dawson WO. 2011. A plant virusevolved by acquiring multiple nonconserved genes to extend its hostrange. Proc. Natl. Acad. Sci. U. S. A. 108:17366 –17371. http://dx.doi.org/10.1073/pnas.1113227108.
41. Harper SJ. 2013. Citrus tristeza virus: evolution of complex and variedgenotypic groups. Front. Microbiol. 4:93. http://dx.doi.org/10.3389/fmicb.2013.00093.
42. Folimonov AS, Folimonova SY, Bar-Joseph M, Dawson WO. 2007. Astable RNA virus-based vector for citrus trees. Virology 368:205–216. http://dx.doi.org/10.1016/j.virol.2007.06.038.
43. Dawson WO, Folimonova SY. 2013. Virus-based transient expressionvectors for woody crops: a new frontier for vector design and use. Annu.Rev. Phytopathol. 51:321–337. http://dx.doi.org/10.1146/annurev-phyto-082712-102329.
44. Folimonova SY, Robertson CJ, Shilts T, Folimonov AS, Hilf ME,Garnsey SM, Dawson WO. 2010. Infection with strains of Citrus tristezavirus does not exclude superinfection by other strains of the virus. J. Virol.84:1314 –1325. http://dx.doi.org/10.1128/JVI.02075-09.
45. Folimonova SY. 2012. Superinfection exclusion is an active virus-controlled function that requires a specific protein. J. Virol. 86:5554 –5561. http://dx.doi.org/10.1128/JVI.00310-12.
46. Gowda S, Satyanarayana T, Robertson CJ, Garnsey SM, DawsonWO. 2005. Infection of citrus plants with virions generated in Nicoti-ana benthamiana plants agroinfiltrated with a binary vector based Cit-rus tristeza virus, p 23–33. In Hilf ME, Duran-Vila N, Rocha-Pena MA(ed), Proceedings of the 16th Conference of the International Organi-zation of Citrus Virologists. International Organization of Citrus Vi-rologists, Riverside, CA.
47. Martin K, Kopperud K, Chakrabarty R, Banerjee R, Brooks R, GoodinMM. 2009. Transient expression in Nicotiana benthamiana fluorescentmarker lines provides enhanced definition of protein localization, move-ment and interactions in planta. Plant J. 59:150 –162. http://dx.doi.org/10.1111/j.1365-313X.2009.03850.x.
48. Cañizares MC, Navas-Castillo J, Moriones E. 2008. Multiple suppressorsof RNA silencing encoded by both genomic RNAs of the crinivirus, To-mato chlorosis virus. Virology 379:168 –174. http://dx.doi.org/10.1016/j.virol.2008.06.020.
49. Ambrós S, El-Mohtar C, Ruiz-Ruiz S, Peña L, Guerri J, Dawson WO,Moreno P. 2011. Agroinoculation of Citrus tristeza virus causes systemicinfection and symptoms in the presumed nonhost Nicotiana benthami-ana. Mol. Plant Microbe Interact. 24:1119 –1131. http://dx.doi.org/10.1094/MPMI-05-11-0110.
50. Robertson CJ, Garnsey SM, Satyanarayana T, Folimonova S, DawsonWO. 2005. Efficient infection of citrus plants with different cloned con-structs of Citrus tristeza virus amplified in Nicotiana benthamiana proto-plasts, p 187–195. In Hilf ME, Duran-Vila N, Rocha-Pena MA (ed), Pro-ceedings of the 16th Conference of the International Organization ofCitrus Virologists. International Organization of Citrus Virologists, Riv-erside, CA.
51. Garnsey SM, Cambra M. 1991. Enzyme-linked immunosorbent assay(ELISA) for citrus pathogens, p 193–216. In Roistacher CN (ed), Graft-transmissible diseases of citrus. Handbook for detection and diagnosis.FAO, Rome, Italy.
52. Zwart MP, Tromas N, Elena SF. 2013. Model-selection-based approachfor calculating cellular multiplicity of infection during virus colonizationof multi-cellular hosts. PLoS One 8:e64657. http://dx.doi.org/10.1371/journal.pone.0064657.
53. González-Jara P, Fraile A, Canto T, García-Arenal F. 2009. The multi-plicity of infection of a plant virus varies during colonization of its eukary-otic host. J. Virol. 83:7487–7494. http://dx.doi.org/10.1128/JVI.00636-09.
54. Sokal RR, Rohlf FJ. 1995. Biometry, 3rd ed, p 686 – 697. WH Freeman &Co, New York, NY.
55. Folimonova SY, Folimonov AS, Tatineni S, Dawson WO. 2008. Citrustristeza virus: survival at the edge of the movement continuum. J. Virol.82:6546 – 6556. http://dx.doi.org/10.1128/JVI.00515-08.
56. Schneider CA, Rasband WS, Eliceiri KW. 2012. NIH Image to ImageJ: 25
Viral Superinfection Exclusion at Whole-Organism Level
October 2014 Volume 88 Number 19 jvi.asm.org 11337
on Septem
ber 8, 2014 by guesthttp://jvi.asm
.org/D
ownloaded from

years of image analysis. Nat. Methods 9:671– 675. http://dx.doi.org/10.1038/nmeth.2089.
57. Development Core Team R. 2013. R: a language and environment forstatistical computing. R Foundation for Statistical Computing, Vienna,Austria.
58. Baddeley A, Turner R. 2013. Spatstat: spatial point pattern analysis,model-fitting, simulation, tests. R Foundation for Statistical Computing,Vienna, Austria.
59. Clark PJ, Evans C. 1954. Distance to nearest neighbor as a measure ofspatial relationships in populations. Ecology 35:445– 453. http://dx.doi.org/10.2307/1931034.
60. Webster B, Ott M, Green WC. 2013. Evasion of superinfection exclusionand elimination of primary viral RNA by an adapted strain of hepatitis Cvirus. J. Virol. 87:13354 –13369. http://dx.doi.org/10.1128/JVI.02465-13.
61. Voinnet O. 2001. RNA silencing as a plant immune system againstviruses. Trends Genet. 17:449 – 459. http://dx.doi.org/10.1016/S0168-9525(01)02367-8.
62. Baulcombe D. 2004. RNA silencing in plants. Nature 431:356 –363. http://dx.doi.org/10.1038/nature02874.
63. Ding SW. 2010. RNA-based antiviral immunity. Nat. Rev. Immunol.10:623– 644. http://dx.doi.org/10.1038/nri2824.
64. Laskus T, Radkowski M, Wang LF, Nowicki M, Rakela J. 2000. Unevendistribution of hepatitis C virus quasispecies in tissues from subjects withend-stage liver disease: confounding effect of viral adsorption and mount-ing evidence for the presence of low-level extrahepatic replication. J. Virol.74:1014 –1017. http://dx.doi.org/10.1128/JVI.74.2.1014-1017.2000.
65. Dietrich C, Maiss E. 2003. Fluorescent labelling reveals spatial sepa-ration of potyvirus populations in mixed infected Nicotiana benthami-ana plants. J. Gen. Virol. 84:2871–2876. http://dx.doi.org/10.1099/vir.0.19245-0.
66. Takahashi T, Sugawara T, Yamatsuta T, Isogai M, Natsuaki T, Yo-shikawa N. 2007. Analysis of the spatial distribution of identical and twodistinct virus populations differently labeled with cyan and yellow fluo-rescent proteins in coinfected plants. Phytopathology 97:1200 –1206. http://dx.doi.org/10.1094/PHYTO-97-10-1200.
67. Jridi C, Martin JF, Marie-Jeanne V, Labonne G, Blanc S. 2006. Distinctviral populations differentiate and evolve independently in a single peren-nial host plant. J. Virol. 80:2349 –2357. http://dx.doi.org/10.1128/JVI.80.5.2349-2357.2006.
Bergua et al.
11338 jvi.asm.org Journal of Virology
on Septem
ber 8, 2014 by guesthttp://jvi.asm
.org/D
ownloaded from
Top Related
Copyright © 2022 FDOKUMEN

