


Bahasa
Halaman
Hukum

electronic reprint
Acta Crystallographica Section B
Structural Science,Crystal Engineeringand Materials
ISSN 2052-5206
A top–down approach to crystal engineering of a racemicΔ2-isoxazoline
Giuseppe M. Lombardo, Antonio Rescifina, Ugo Chiacchio, Alessia Bacchiand Francesco Punzo
Acta Cryst. (2014). B70, 172–180
Copyright c© International Union of Crystallography
Author(s) of this paper may load this reprint on their own web site or institutional repository provided thatthis cover page is retained. Republication of this article or its storage in electronic databases other than asspecified above is not permitted without prior permission in writing from the IUCr.
For further information see http://journals.iucr.org/services/authorrights.html
Acta Crystallographica Section B: Structural Science, Crystal Engineering and Materialspublishes scientific articles related to the structural science of compounds and materialsin the widest sense. Knowledge of the arrangements of atoms, including their temporalvariations and dependencies on temperature and pressure, is often the key to understand-ing physical and chemical phenomena and is crucial for the design of new materialsand supramolecular devices. Acta Crystallographica B is the forum for the publicationof such contributions. Scientific developments based on experimental studies as well asthose based on theoretical approaches, including crystal-structure prediction, structure–property relations and the use of databases of crystal structures, are published.
Crystallography Journals Online is available from journals.iucr.org
Acta Cryst. (2014). B70, 172–180 Giuseppe M. Lombardo et al. · Racemic Δ2-isoxazoline
crystal engineering
172 doi:10.1107/S2052520613030862 Acta Cryst. (2014). B70, 172–180
Acta Crystallographica Section B
Structural Science,Crystal Engineeringand Materials
ISSN 2052-5206
A top–down approach to crystal engineering of aracemic D2-isoxazoline
Giuseppe M. Lombardo,a
Antonio Rescifina,a Ugo
Chiacchio,a Alessia Bacchib* and
Francesco Punzoa*
aDipartimento di Scienze del Farmaco, Univer-
sita degli Studi di Catania, Viale Andrea Doria,
6, 95125 Catania, Italy, and bDipartimento di
Chimica, Universita degli Studi di Parma, Parco
Area delle Scienze 17/A, 43124 Parma, Italy
Correspondence e-mail:
[email protected], [email protected]
# 2014 International Union of Crystallography
The crystal structure of racemic dimethyl (4RS,5RS)-
3-(4-nitrophenyl)-4,5-dihydroisoxazole-4,5-dicarboxylate,
C13H12N2O7, has been determined by single-crystal X-ray
diffraction. By analysing the degree of growth of the
morphologically important crystal faces, a ranking of the most
relevant non-covalent interactions determining the crystal
structure can be inferred. The morphological information is
considered with an approach opposite to the conventional
one: instead of searching inside the structure for the potential
key interactions and using them to calculate the crystal habit,
the observed crystal morphology is used to define the
preferential lines of growth of the crystal, and then this
information is interpreted by means of density functional
theory (DFT) calculations. Comparison with the X-ray
structure confirms the validity of the strategy, thus suggesting
this top–down approach to be a useful tool for crystal
engineering.
Received 13 September 2013
Accepted 10 November 2013
1. Introduction
The common approach to crystal engineering is based on
structural analysis of crystal packing aimed at highlighting the
most relevant non-covalent interactions that could make it
possible to control and design the synthesis of the solid state
for compounds of interest. The information gained from the
solid-state arrangement of the building blocks of the crystal
allows a wide range of speculations on possible chemical and
physical ways to enhance or deplete some of these key inter-
actions. In this framework, insight into packing arrangements
provided by the increasingly powerful and easy-to-control X-
ray diffraction instruments makes this task easier to carry out.
However, it is often limited to inspection of the packing
geometry to identify the shortest intermolecular contacts from
which the main interactions responsible for the crystal cohe-
sion are inferred. Moreover, these are usually ascribed a priori
to well established categories such as various kinds of
hydrogen bonds, �–� interactions, and so on. The pitfalls of
this kind of approach have recently been discussed and might
present the risk of subjectivity when ranking structural motifs
only on the basis of geometrical evidence, without also
calculating the interaction energy (Gavezzotti, 2013).
In this paper we invert this conventional approach to crystal
engineering by looking at the crystal morphology, by recalling
that the outer shape of a crystal must contain valuable infor-
mation on the microscopic behaviour at the molecular level
(Weissbuch et al., 1991, 1995, 2003). According to previous
examples (Bacchi et al., 2011), we adopt a rational protocol
that starts by identifying the morphologically important (MI)
faces that are necessarily related to the main factors that build
up the crystal, then performing a geometrical analysis to find
electronic reprint
objectively the directions of the main interactions. We then
derive a quantitative ranking of the energies involved in the
process of the crystal building by means of DFT calculations.
We do not perform a crystal morphology prediction (Bacchi et
al., 2011; Lazo Fraga et al., 2013; Li Destri et al., 2011, 2013;
Punzo, 2011, 2013), but consider the real crystal morphology
that is experimentally measured and indexed on the diffract-
ometer. Possible inconsistencies between predicted and
experimental crystal morphologies could be interpreted on the
basis of molecular structures and bond anisotropies, as well as
on the fact that computational methods do not fully take into
account some relevant experimental factors such as
temperature, supersaturation and growth mechanism, or the
key role played by the solvent in solution crystallization.
We interpret the experimental morphology on the basis of
the periodic bond chain (PBC) theory (Hartman & Bennema,
1980; Bennema et al., 2004), thus assuming that the surface
area corresponding to the most prominent MI faces belongs to
those showing a slower growth rate, which is in turn propor-
tional to the attachment energy (Ea). Although the attach-
ment energy was originally defined as ‘the bond energy
released when a building unit is attached to the surface of the
crystal face concerned’ (Hartman & Perdok, 1955), accord-
ingly to current literature (Punzo, 2011) we define it as the
energy released by attaching a molecule, or a growth slice, to a
growing crystal surface. More specifically, for our purposes, we
consider the energy released as a consequence of the inter-
actions normal to the surface of the formula unit within an
underlying slice (Punzo, 2011). For this reason, instead of
limiting the structural analysis to the crystal packing we
consider the structural and energy landscape provided by each
MI face as resulting from cutting a slab parallel to that face,
thus corresponding to a picture of that particular crystal-
lographic environment. By attaching successive formula units
to the slab, we interpret in fine detail the overall process of
crystal growth, explained on the basis of the final crystal
morphology.
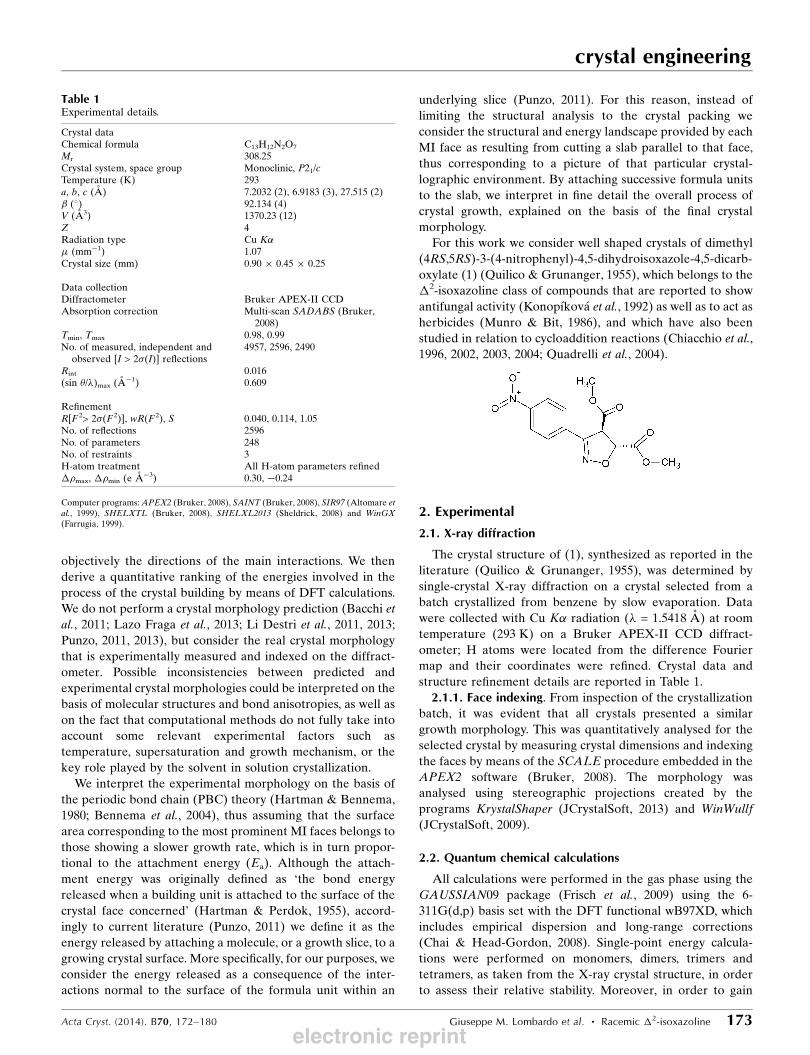
For this work we consider well shaped crystals of dimethyl
(4RS,5RS)-3-(4-nitrophenyl)-4,5-dihydroisoxazole-4,5-dicarb-
oxylate (1) (Quilico & Grunanger, 1955), which belongs to the
�2-isoxazoline class of compounds that are reported to show
antifungal activity (Konopıkova et al., 1992) as well as to act as
herbicides (Munro & Bit, 1986), and which have also been
studied in relation to cycloaddition reactions (Chiacchio et al.,
1996, 2002, 2003, 2004; Quadrelli et al., 2004).
2. Experimental
2.1. X-ray diffraction
The crystal structure of (1), synthesized as reported in the
literature (Quilico & Grunanger, 1955), was determined by
single-crystal X-ray diffraction on a crystal selected from a
batch crystallized from benzene by slow evaporation. Data
were collected with Cu K� radiation (� = 1.5418 A) at room
temperature (293 K) on a Bruker APEX-II CCD diffract-
ometer; H atoms were located from the difference Fourier
map and their coordinates were refined. Crystal data and
structure refinement details are reported in Table 1.
2.1.1. Face indexing. From inspection of the crystallization
batch, it was evident that all crystals presented a similar
growth morphology. This was quantitatively analysed for the
selected crystal by measuring crystal dimensions and indexing
the faces by means of the SCALE procedure embedded in the
APEX2 software (Bruker, 2008). The morphology was
analysed using stereographic projections created by the
programs KrystalShaper (JCrystalSoft, 2013) and WinWullf
(JCrystalSoft, 2009).
2.2. Quantum chemical calculations
All calculations were performed in the gas phase using the
GAUSSIAN09 package (Frisch et al., 2009) using the 6-
311G(d,p) basis set with the DFT functional wB97XD, which
includes empirical dispersion and long-range corrections
(Chai & Head-Gordon, 2008). Single-point energy calcula-
tions were performed on monomers, dimers, trimers and
tetramers, as taken from the X-ray crystal structure, in order
to assess their relative stability. Moreover, in order to gain
crystal engineering
Acta Cryst. (2014). B70, 172–180 Giuseppe M. Lombardo et al. � Racemic �2-isoxazoline 173
Table 1Experimental details.
Crystal dataChemical formula C13H12N2O7
Mr 308.25Crystal system, space group Monoclinic, P21/cTemperature (K) 293a, b, c (A) 7.2032 (2), 6.9183 (3), 27.515 (2)� (�) 92.134 (4)V (A3) 1370.23 (12)Z 4Radiation type Cu K�� (mm�1) 1.07Crystal size (mm) 0.90 � 0.45 � 0.25
Data collectionDiffractometer Bruker APEX-II CCDAbsorption correction Multi-scan SADABS (Bruker,
2008)Tmin, Tmax 0.98, 0.99No. of measured, independent and
observed [I > 2�(I)] reflections4957, 2596, 2490
Rint 0.016(sin �/�)max (A�1) 0.609
RefinementR[F 2> 2�(F 2)], wR(F 2), S 0.040, 0.114, 1.05No. of reflections 2596No. of parameters 248No. of restraints 3H-atom treatment All H-atom parameters refined�max, �min (e A�3) 0.30, �0.24
Computer programs: APEX2 (Bruker, 2008), SAINT (Bruker, 2008), SIR97 (Altomare etal., 1999), SHELXTL (Bruker, 2008), SHELXL2013 (Sheldrick, 2008) and WinGX(Farrugia, 1999).
electronic reprint
information on the interaction of a single molecule with the
(001), (010) and ð�1102Þ surfaces, models were built by consid-
ering a single molecule within the crystal with the 6 (or 7)
nearest molecules from the adjacent slab with the proper
Miller indices. For these latter models, the calculations were
performed on the 6 (or 7) slab molecules and on the nearest
interacting single molecule belonging to the adjacent slab.
2.3. Crystal morphology prediction
Prediction and study of the possible crystal morphologies
were performed using a preliminary equilibration protocol, by
means of the Discover module included in Materials Studio 4.4
(Accelrys, 2003), adopting the molecular mechanics approx-
imation and the COMPASS forcefield (Sun, 1998). The
established single-crystal structure was used as the input for
energy minimization. A distance cutoff was selected for
interactions between molecules, applied as 1.5 times the value
calculated in terms of the centroid-to-centroid distance along
each lattice vector. An energy cutoff of �2.49 kJ mol�1 was
also applied and only interactions with a more stabilizing
energy were considered. The morphology protocol itself is
based on the so-called GM method, based on the PBC theory.
For this purpose, the calculations were performed allowing a
minimum interplanar distance (dhkl) of 1.300 A and a
maximum value of 3 for each of the three Miller indices. The
overall number of growing faces was limited to 200. All of
these calculations correspond to 0 K and surface relaxation
was not applied. Furthermore, the surface is considered to be a
perfect termination of the bulk. A detailed description of the
calculation performed can be found in Punzo (2013).
3. Results and discussion
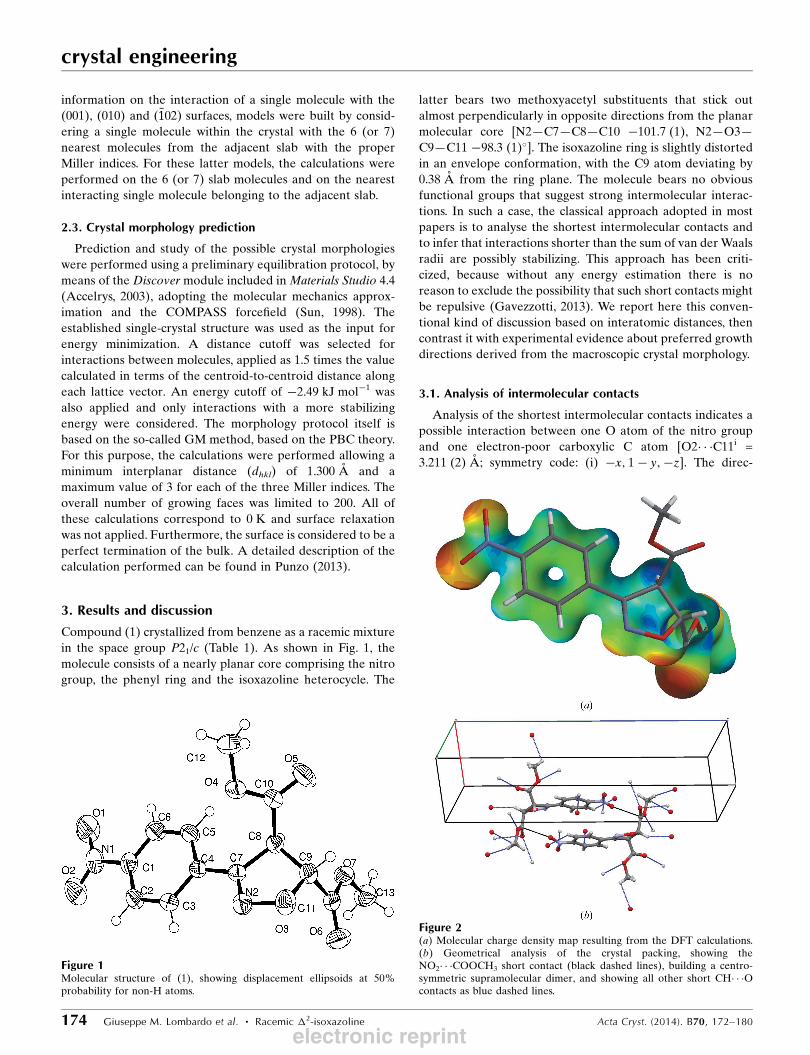
Compound (1) crystallized from benzene as a racemic mixture
in the space group P21/c (Table 1). As shown in Fig. 1, the
molecule consists of a nearly planar core comprising the nitro
group, the phenyl ring and the isoxazoline heterocycle. The
latter bears two methoxyacetyl substituents that stick out
almost perpendicularly in opposite directions from the planar
molecular core [N2—C7—C8—C10 �101.7 (1), N2—O3—
C9—C11 �98.3 (1)�]. The isoxazoline ring is slightly distorted
in an envelope conformation, with the C9 atom deviating by
0.38 A from the ring plane. The molecule bears no obvious
functional groups that suggest strong intermolecular interac-
tions. In such a case, the classical approach adopted in most
papers is to analyse the shortest intermolecular contacts and
to infer that interactions shorter than the sum of van der Waals
radii are possibly stabilizing. This approach has been criti-
cized, because without any energy estimation there is no
reason to exclude the possibility that such short contacts might
be repulsive (Gavezzotti, 2013). We report here this conven-
tional kind of discussion based on interatomic distances, then
contrast it with experimental evidence about preferred growth
directions derived from the macroscopic crystal morphology.
3.1. Analysis of intermolecular contacts
Analysis of the shortest intermolecular contacts indicates a
possible interaction between one O atom of the nitro group
and one electron-poor carboxylic C atom [O2� � �C11i =
3.211 (2) A; symmetry code: (i) �x; 1 � y;�z]. The direc-
crystal engineering
174 Giuseppe M. Lombardo et al. � Racemic �2-isoxazoline Acta Cryst. (2014). B70, 172–180
Figure 1Molecular structure of (1), showing displacement ellipsoids at 50%probability for non-H atoms.
Figure 2(a) Molecular charge density map resulting from the DFT calculations.(b) Geometrical analysis of the crystal packing, showing theNO2� � �COOCH3 short contact (black dashed lines), building a centro-symmetric supramolecular dimer, and showing all other short CH� � �Ocontacts as blue dashed lines.
electronic reprint
tionality of the contact suggests donation of electron density
from the O lone pair perpendicular to the plane of the sp2
carboxylate group. The charge density map calculated by DFT
methods (as specified in x2) on the isolated molecule supports
the possibility of this interaction (Fig. 2a). This interaction
defines a centrosymmetric supramolecular dimer (Fig. 2b). All
other short interactomic contacts would usually be interpreted
as weak CH� � �O interactions.
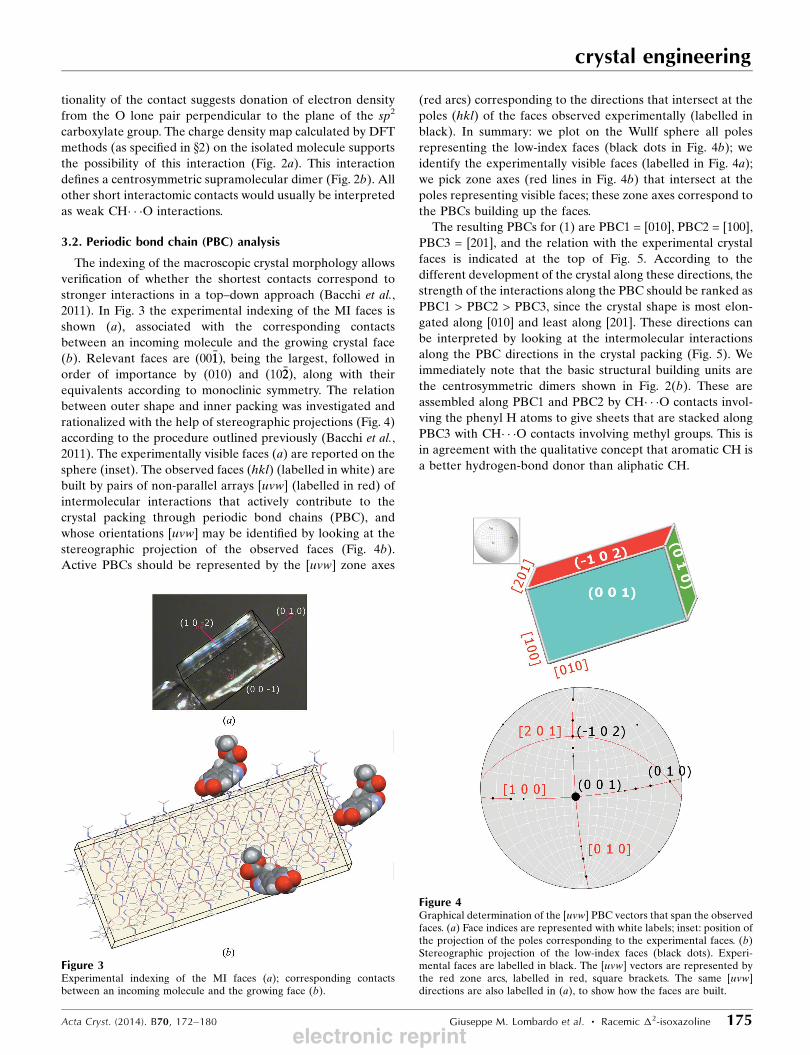
3.2. Periodic bond chain (PBC) analysis
The indexing of the macroscopic crystal morphology allows
verification of whether the shortest contacts correspond to
stronger interactions in a top–down approach (Bacchi et al.,
2011). In Fig. 3 the experimental indexing of the MI faces is
shown (a), associated with the corresponding contacts
between an incoming molecule and the growing crystal face
(b). Relevant faces are ð00�11Þ, being the largest, followed in
order of importance by (010) and ð10�22Þ, along with their
equivalents according to monoclinic symmetry. The relation
between outer shape and inner packing was investigated and
rationalized with the help of stereographic projections (Fig. 4)
according to the procedure outlined previously (Bacchi et al.,
2011). The experimentally visible faces (a) are reported on the
sphere (inset). The observed faces (hkl) (labelled in white) are
built by pairs of non-parallel arrays [uvw] (labelled in red) of
intermolecular interactions that actively contribute to the
crystal packing through periodic bond chains (PBC), and
whose orientations [uvw] may be identified by looking at the
stereographic projection of the observed faces (Fig. 4b).
Active PBCs should be represented by the [uvw] zone axes
(red arcs) corresponding to the directions that intersect at the
poles (hkl) of the faces observed experimentally (labelled in
black). In summary: we plot on the Wullf sphere all poles
representing the low-index faces (black dots in Fig. 4b); we
identify the experimentally visible faces (labelled in Fig. 4a);
we pick zone axes (red lines in Fig. 4b) that intersect at the
poles representing visible faces; these zone axes correspond to
the PBCs building up the faces.
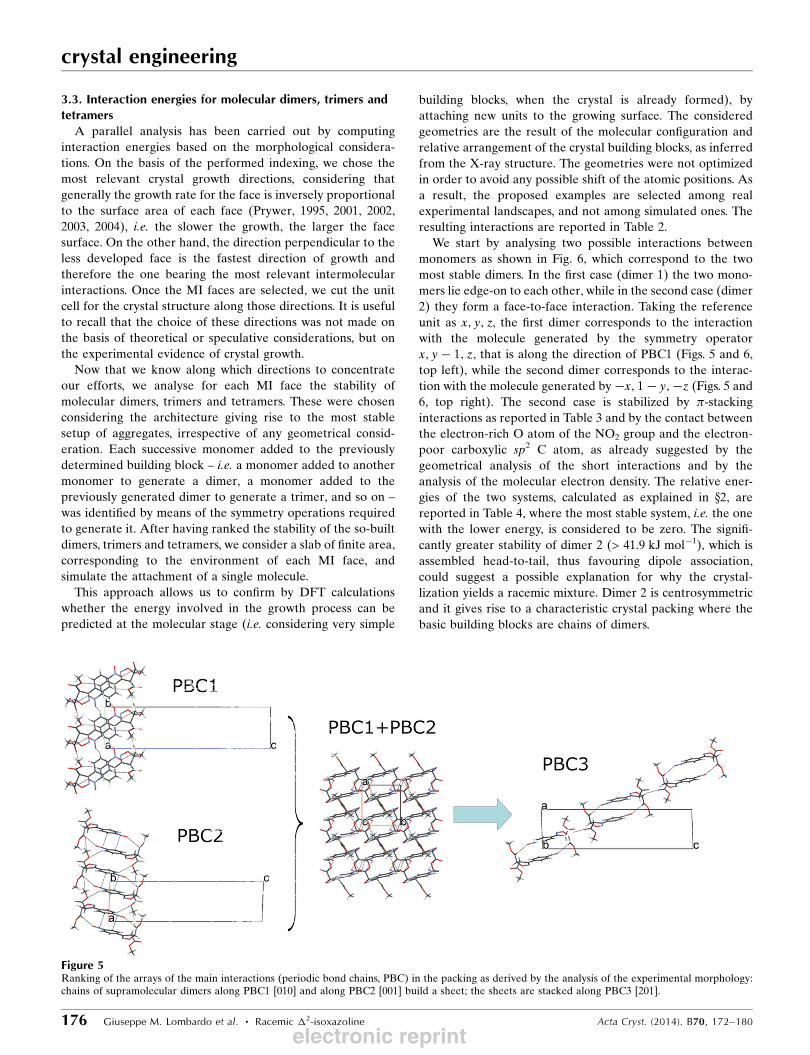
The resulting PBCs for (1) are PBC1 = [010], PBC2 = [100],
PBC3 = [201], and the relation with the experimental crystal
faces is indicated at the top of Fig. 5. According to the
different development of the crystal along these directions, the
strength of the interactions along the PBC should be ranked as
PBC1 > PBC2 > PBC3, since the crystal shape is most elon-
gated along [010] and least along [201]. These directions can
be interpreted by looking at the intermolecular interactions
along the PBC directions in the crystal packing (Fig. 5). We
immediately note that the basic structural building units are
the centrosymmetric dimers shown in Fig. 2(b). These are
assembled along PBC1 and PBC2 by CH� � �O contacts invol-
ving the phenyl H atoms to give sheets that are stacked along
PBC3 with CH� � �O contacts involving methyl groups. This is
in agreement with the qualitative concept that aromatic CH is
a better hydrogen-bond donor than aliphatic CH.
crystal engineering
Acta Cryst. (2014). B70, 172–180 Giuseppe M. Lombardo et al. � Racemic �2-isoxazoline 175
Figure 3Experimental indexing of the MI faces (a); corresponding contactsbetween an incoming molecule and the growing face (b).
Figure 4Graphical determination of the [uvw] PBC vectors that span the observedfaces. (a) Face indices are represented with white labels; inset: position ofthe projection of the poles corresponding to the experimental faces. (b)Stereographic projection of the low-index faces (black dots). Experi-mental faces are labelled in black. The [uvw] vectors are represented bythe red zone arcs, labelled in red, square brackets. The same [uvw]directions are also labelled in (a), to show how the faces are built.
electronic reprint
3.3. Interaction energies for molecular dimers, trimers andtetramers
A parallel analysis has been carried out by computing
interaction energies based on the morphological considera-
tions. On the basis of the performed indexing, we chose the
most relevant crystal growth directions, considering that
generally the growth rate for the face is inversely proportional
to the surface area of each face (Prywer, 1995, 2001, 2002,
2003, 2004), i.e. the slower the growth, the larger the face
surface. On the other hand, the direction perpendicular to the
less developed face is the fastest direction of growth and
therefore the one bearing the most relevant intermolecular
interactions. Once the MI faces are selected, we cut the unit
cell for the crystal structure along those directions. It is useful
to recall that the choice of these directions was not made on
the basis of theoretical or speculative considerations, but on
the experimental evidence of crystal growth.
Now that we know along which directions to concentrate
our efforts, we analyse for each MI face the stability of
molecular dimers, trimers and tetramers. These were chosen
considering the architecture giving rise to the most stable
setup of aggregates, irrespective of any geometrical consid-
eration. Each successive monomer added to the previously
determined building block – i.e. a monomer added to another
monomer to generate a dimer, a monomer added to the
previously generated dimer to generate a trimer, and so on –
was identified by means of the symmetry operations required
to generate it. After having ranked the stability of the so-built
dimers, trimers and tetramers, we consider a slab of finite area,
corresponding to the environment of each MI face, and
simulate the attachment of a single molecule.
This approach allows us to confirm by DFT calculations
whether the energy involved in the growth process can be
predicted at the molecular stage (i.e. considering very simple
building blocks, when the crystal is already formed), by
attaching new units to the growing surface. The considered
geometries are the result of the molecular configuration and
relative arrangement of the crystal building blocks, as inferred
from the X-ray structure. The geometries were not optimized
in order to avoid any possible shift of the atomic positions. As
a result, the proposed examples are selected among real
experimental landscapes, and not among simulated ones. The
resulting interactions are reported in Table 2.
We start by analysing two possible interactions between
monomers as shown in Fig. 6, which correspond to the two
most stable dimers. In the first case (dimer 1) the two mono-
mers lie edge-on to each other, while in the second case (dimer
2) they form a face-to-face interaction. Taking the reference
unit as x; y; z, the first dimer corresponds to the interaction
with the molecule generated by the symmetry operator
x; y� 1; z, that is along the direction of PBC1 (Figs. 5 and 6,
top left), while the second dimer corresponds to the interac-
tion with the molecule generated by �x; 1 � y;�z (Figs. 5 and
6, top right). The second case is stabilized by �-stacking
interactions as reported in Table 3 and by the contact between
the electron-rich O atom of the NO2 group and the electron-
poor carboxylic sp2 C atom, as already suggested by the
geometrical analysis of the short interactions and by the
analysis of the molecular electron density. The relative ener-
gies of the two systems, calculated as explained in x2, are
reported in Table 4, where the most stable system, i.e. the one
with the lower energy, is considered to be zero. The signifi-
cantly greater stability of dimer 2 (> 41.9 kJ mol�1), which is
assembled head-to-tail, thus favouring dipole association,
could suggest a possible explanation for why the crystal-
lization yields a racemic mixture. Dimer 2 is centrosymmetric
and it gives rise to a characteristic crystal packing where the
basic building blocks are chains of dimers.
crystal engineering
176 Giuseppe M. Lombardo et al. � Racemic �2-isoxazoline Acta Cryst. (2014). B70, 172–180
Figure 5Ranking of the arrays of the main interactions (periodic bond chains, PBC) in the packing as derived by the analysis of the experimental morphology:chains of supramolecular dimers along PBC1 [010] and along PBC2 [001] build a sheet; the sheets are stacked along PBC3 [201].
electronic reprint
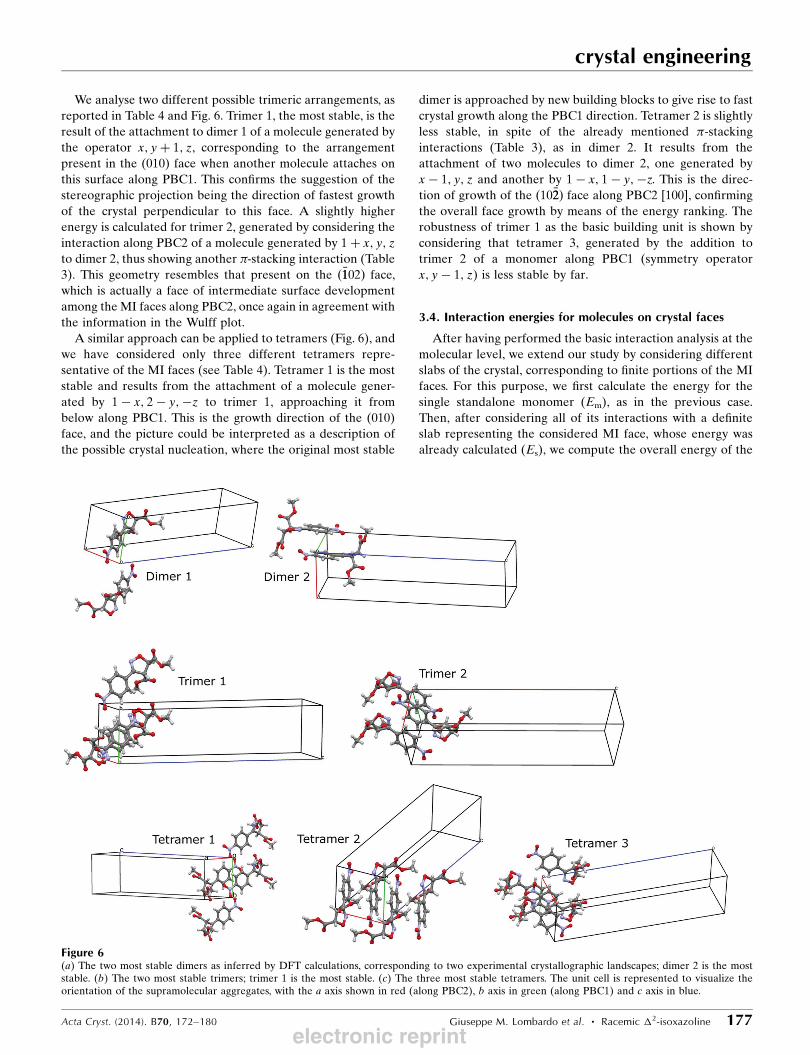
We analyse two different possible trimeric arrangements, as
reported in Table 4 and Fig. 6. Trimer 1, the most stable, is the
result of the attachment to dimer 1 of a molecule generated by
the operator x; yþ 1; z, corresponding to the arrangement
present in the (010) face when another molecule attaches on
this surface along PBC1. This confirms the suggestion of the
stereographic projection being the direction of fastest growth
of the crystal perpendicular to this face. A slightly higher
energy is calculated for trimer 2, generated by considering the
interaction along PBC2 of a molecule generated by 1 þ x; y; zto dimer 2, thus showing another �-stacking interaction (Table
3). This geometry resembles that present on the ð�1102Þ face,
which is actually a face of intermediate surface development
among the MI faces along PBC2, once again in agreement with
the information in the Wulff plot.
A similar approach can be applied to tetramers (Fig. 6), and
we have considered only three different tetramers repre-
sentative of the MI faces (see Table 4). Tetramer 1 is the most
stable and results from the attachment of a molecule gener-
ated by 1 � x; 2 � y;�z to trimer 1, approaching it from
below along PBC1. This is the growth direction of the (010)
face, and the picture could be interpreted as a description of
the possible crystal nucleation, where the original most stable
dimer is approached by new building blocks to give rise to fast
crystal growth along the PBC1 direction. Tetramer 2 is slightly
less stable, in spite of the already mentioned �-stacking
interactions (Table 3), as in dimer 2. It results from the
attachment of two molecules to dimer 2, one generated by
x� 1; y; z and another by 1 � x; 1 � y;�z. This is the direc-
tion of growth of the ð10�22Þ face along PBC2 [100], confirming
the overall face growth by means of the energy ranking. The
robustness of trimer 1 as the basic building unit is shown by
considering that tetramer 3, generated by the addition to
trimer 2 of a monomer along PBC1 (symmetry operator
x; y� 1; z) is less stable by far.
3.4. Interaction energies for molecules on crystal faces
After having performed the basic interaction analysis at the
molecular level, we extend our study by considering different
slabs of the crystal, corresponding to finite portions of the MI
faces. For this purpose, we first calculate the energy for the
single standalone monomer (Em), as in the previous case.
Then, after considering all of its interactions with a definite
slab representing the considered MI face, whose energy was
already calculated (Es), we compute the overall energy of the
crystal engineering
Acta Cryst. (2014). B70, 172–180 Giuseppe M. Lombardo et al. � Racemic �2-isoxazoline 177
Figure 6(a) The two most stable dimers as inferred by DFT calculations, corresponding to two experimental crystallographic landscapes; dimer 2 is the moststable. (b) The two most stable trimers; trimer 1 is the most stable. (c) The three most stable tetramers. The unit cell is represented to visualize theorientation of the supramolecular aggregates, with the a axis shown in red (along PBC2), b axis in green (along PBC1) and c axis in blue.
electronic reprint
system (Esm). We subtract Es from Esm in order to compare the
energy of the standalone monomer with the interacting one.
Furthermore, we compute the possible energy surplus by
defining �Em = Esm � Es � Em. In order to avoid any possible
inequality as a result of the different number of interactions
considered for a single monomer and, more critically, having
dealt with slabs containing different numbers of fragments, we
normalize these calculations for a single monomer (�Em/Ns).
The results obtained are reported in Table 5. They illustrate
the landscape more completely and clearly than in the
previous analysis which was confined to discrete numbers of
aggregates, and they confirm the results already obtained. In
summary: (010) has the greatest attachment energy Ea and this
is the smallest face but the fastest direction of growth; the
[010] direction, normal to this face, corresponds to PBC1
according to morphology considerations (see Fig. 4). The ð�1102Þface has the second largest Ea, and the morphological analysis
shown in Fig. 4 confirms that the growth direction [100]
normal to this face corresponds to PBC2. Finally, face (001)
has the smallest Ea, confirming that the direction normal to it,
[201], is the weakest periodic bond chain, i.e. PBC3.
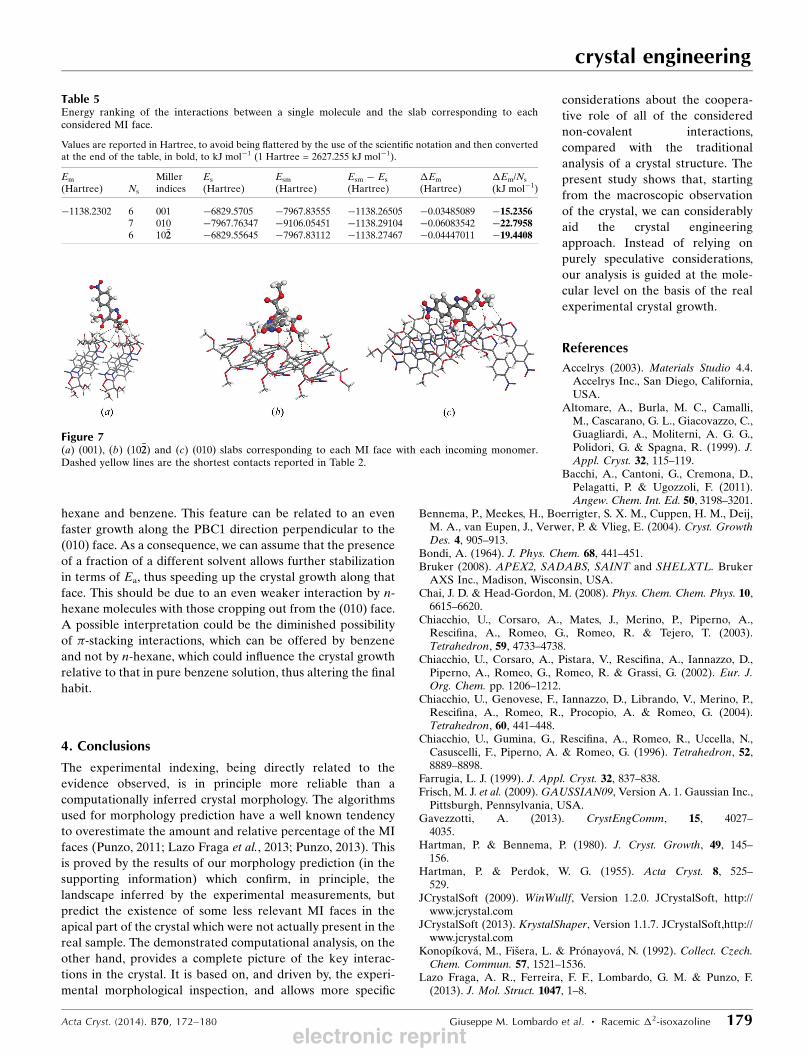
Fig. 7 shows each considered slab, corresponding to each MI
face, together with the interacting monomer, and dashed in
yellow the shortest contacts already reported in Table 2.
3.5. Morphology prediction
The results obtained were compared with those inferred by
a morphology prediction, performed as described in x2. The
obtained crystal habit is provided in the supporting informa-
tion,1 together with a table reporting the computed MI faces.
Although the overall crystal shape is roughly confirmed as
expected (Punzo, 2011), the specific list of the MI faces is only
partially reproduced by the prediction. In fact, only the (001)
face [reported as (002)] is present, while the other MI faces are
not even reported as less important ones. These results suggest
that the standard (Punzo, 2013) forcefield-based approach to
morphology prediction is not completely reliable. As always,
the pitfalls of the theoretical predictions are not only due to
the chosen algorithms and forcefields, but more often to the
role of solvent. The calculations are carried out in vacuo, but
no more realistic results are achieved whether the solvent is
considered explicitly or not. However, arguments about the
role of the solvent can be interpreted as a potential tool for
fine tuning of the crystal habit.
All experimental attempts to use other solvents gave rise to
thinner crystals, such as in the case of a 1:1 mixture of n-
crystal engineering
178 Giuseppe M. Lombardo et al. � Racemic �2-isoxazoline Acta Cryst. (2014). B70, 172–180
Table 2Summary of short intermolecular contacts.
The third column gives the difference (�) with respect to the sum of the vander Waals radii (Bondi, 1964). Interactions are reported up to a maximum limitof � = 0.2 A. These values refer to positions inferred from the Fourier map ofthe reported crystal structure, and not optimized by means of the DFTcalculations. Interactions involving H atoms refer to X-ray positions, which are0.1–0.2 A shorter than nuclear positions.
Contact Distance (A) � (A)
O1� � �H3i 2.76 (2) 0.04O1� � �H6ii 2.72 (2) 0.00O1� � �H121iii 2.79 (4) 0.07O2� � �O4iv 3.2254 (19) 0.19O2� � �O7v 3.2117 (18) 0.17O2� � �C7v 3.325 (2) 0.11O2� � �C11v 3.211 (2) �0.01O2� � �H131v 2.83 (3) 0.11O4� � �O2iv 3.2254 (19) 0.19O4� � �H2iv 2.68 (2) �0.04O5� � �C9vi 3.266 (2) 0.05O5� � �C13vii 3.310 (3) 0.09O5� � �H9vi 2.38 (2) �0.34O6� � �H5viii 2.84 (2) 0.12O6� � �H121ix 2.73 (4) 0.01O6� � �H133x 2.72 (3) 0.00O7� � �H132vii 2.61 (3) �0.11O7� � �O2v 3.2117 (18) 0.17N2� � �H6viii 2.91 (2) 0.16C13� � �O5xi 3.310 (3) 0.09H2� � �O4xii 2.68 (2) �0.04H3� � �O1viii 2.76 (2) 0.04H5� � �O6i 2.84 (2) 0.12H6� � �N2i 2.91 (2) 0.16H6� � �O1ii 2.72 (2) 0.00H9� � �O5xiii 2.38 (2) �0.34H121� � �O6xiv 2.73 (4) 0.01H121� � �O1iii 2.79 (4) 0.07H131� � �O2v 2.83 (3) 0.11H132� � �O7xi 2.61 (3) �0.11H133� � �O6vii 2.72 (3) 0.00
Symmetry codes: (i) x;�1 þ y; z; (ii) �x;�y;�z; (iii) 1 � x;�y;�z; (iv)1 � x; 1 � y;�z; (v) �x; 1 � y;�z; (vi) 1 � x;� 1
2 þ y; 12 � z; (vii) �x;� 1
2 þ y; 12 � z;
(viii) x; 1 þ y; z; (ix) �1 þ x; 1 þ y; z; (x) �x; 12 þ y; 1 � z; (xi) �x; 1
2 þ y; 12 � z; (xii)
1 � x; 1 � y; z; (xiii) 1 � x; 12 þ y; 1
2 � z; (xiv) 1 þ x;�1 þ y; z.
Table 3Selected �–� stacking interactions between aromatic rings (C1–C6) in(1).
Centroid� � �centroid Distance (A) Interplanar angle (�)
Cg� � �Cgi 3.8647 (9) 0Cg� � �Cgii 3.8863 (9) 0
Symmetry codes: (i) �x; 1 � y;�z; (ii) 1 � x; 1 � y;�z.
Table 4Energy ranking for dimers, trimers and tetramers.
In each case, the most stable aggregate is considered to be zero.
Supramolecular clusters and symmetrygenerators Energy (kJ mol�1)
Dimer 1 [(x; y; z); (x; y� 1; z)] 45.135Dimer 2 [(x; y; z); (�x; 1 � y;�z)] 0.000
Trimer 1 [(x; y; z); (�x; 1 � y;�z);(x; yþ 1; z)]
0.000
Trimer 2 [(x; y; z); (�x; 1 � y;�z);(1 � x; 1 � y;�z)]
4.961
Tetramer 1 [(x; y; z); (�x; 1 � y;�z);(x; y� 1; z); (1 � x; 2 � y;�z)]
0.000
Tetramer 2 [(x; y; z); (�x; 1 � y;�z);(1 � x; 1 � y;�z); (x� 1; y; z)]
12.142
Tetramer 3 [(x; y; z); (�x; 1 � y;�z);(1 � x; 1 � y;�z); (x; y� 1; z)]
27.059
1 Supporting information for this paper is available from the IUCr electronicarchives (Reference: BI5027).
electronic reprint
hexane and benzene. This feature can be related to an even
faster growth along the PBC1 direction perpendicular to the
(010) face. As a consequence, we can assume that the presence
of a fraction of a different solvent allows further stabilization
in terms of Ea, thus speeding up the crystal growth along that
face. This should be due to an even weaker interaction by n-
hexane molecules with those cropping out from the (010) face.
A possible interpretation could be the diminished possibility
of �-stacking interactions, which can be offered by benzene
and not by n-hexane, which could influence the crystal growth
relative to that in pure benzene solution, thus altering the final
habit.
4. Conclusions
The experimental indexing, being directly related to the
evidence observed, is in principle more reliable than a
computationally inferred crystal morphology. The algorithms
used for morphology prediction have a well known tendency
to overestimate the amount and relative percentage of the MI
faces (Punzo, 2011; Lazo Fraga et al., 2013; Punzo, 2013). This
is proved by the results of our morphology prediction (in the
supporting information) which confirm, in principle, the
landscape inferred by the experimental measurements, but
predict the existence of some less relevant MI faces in the
apical part of the crystal which were not actually present in the
real sample. The demonstrated computational analysis, on the
other hand, provides a complete picture of the key interac-
tions in the crystal. It is based on, and driven by, the experi-
mental morphological inspection, and allows more specific
considerations about the coopera-
tive role of all of the considered
non-covalent interactions,
compared with the traditional
analysis of a crystal structure. The
present study shows that, starting
from the macroscopic observation
of the crystal, we can considerably
aid the crystal engineering
approach. Instead of relying on
purely speculative considerations,
our analysis is guided at the mole-
cular level on the basis of the real
experimental crystal growth.
References
Accelrys (2003). Materials Studio 4.4.Accelrys Inc., San Diego, California,USA.
Altomare, A., Burla, M. C., Camalli,M., Cascarano, G. L., Giacovazzo, C.,Guagliardi, A., Moliterni, A. G. G.,Polidori, G. & Spagna, R. (1999). J.Appl. Cryst. 32, 115–119.
Bacchi, A., Cantoni, G., Cremona, D.,Pelagatti, P. & Ugozzoli, F. (2011).Angew. Chem. Int. Ed. 50, 3198–3201.
Bennema, P., Meekes, H., Boerrigter, S. X. M., Cuppen, H. M., Deij,M. A., van Eupen, J., Verwer, P. & Vlieg, E. (2004). Cryst. GrowthDes. 4, 905–913.
Bondi, A. (1964). J. Phys. Chem. 68, 441–451.Bruker (2008). APEX2, SADABS, SAINT and SHELXTL. Bruker
AXS Inc., Madison, Wisconsin, USA.Chai, J. D. & Head-Gordon, M. (2008). Phys. Chem. Chem. Phys. 10,
6615–6620.Chiacchio, U., Corsaro, A., Mates, J., Merino, P., Piperno, A.,
Rescifina, A., Romeo, G., Romeo, R. & Tejero, T. (2003).Tetrahedron, 59, 4733–4738.
Chiacchio, U., Corsaro, A., Pistara, V., Rescifina, A., Iannazzo, D.,Piperno, A., Romeo, G., Romeo, R. & Grassi, G. (2002). Eur. J.Org. Chem. pp. 1206–1212.
Chiacchio, U., Genovese, F., Iannazzo, D., Librando, V., Merino, P.,Rescifina, A., Romeo, R., Procopio, A. & Romeo, G. (2004).Tetrahedron, 60, 441–448.
Chiacchio, U., Gumina, G., Rescifina, A., Romeo, R., Uccella, N.,Casuscelli, F., Piperno, A. & Romeo, G. (1996). Tetrahedron, 52,8889–8898.
Farrugia, L. J. (1999). J. Appl. Cryst. 32, 837–838.Frisch, M. J. et al. (2009). GAUSSIAN09, Version A. 1. Gaussian Inc.,
Pittsburgh, Pennsylvania, USA.Gavezzotti, A. (2013). CrystEngComm, 15, 4027–
4035.Hartman, P. & Bennema, P. (1980). J. Cryst. Growth, 49, 145–
156.Hartman, P. & Perdok, W. G. (1955). Acta Cryst. 8, 525–
529.JCrystalSoft (2009). WinWullf, Version 1.2.0. JCrystalSoft, http://
www.jcrystal.comJCrystalSoft (2013). KrystalShaper, Version 1.1.7. JCrystalSoft,http://
www.jcrystal.comKonopıkova, M., Fisera, L. & Pronayova, N. (1992). Collect. Czech.Chem. Commun. 57, 1521–1536.
Lazo Fraga, A. R., Ferreira, F. F., Lombardo, G. M. & Punzo, F.(2013). J. Mol. Struct. 1047, 1–8.
crystal engineering
Acta Cryst. (2014). B70, 172–180 Giuseppe M. Lombardo et al. � Racemic �2-isoxazoline 179
Table 5Energy ranking of the interactions between a single molecule and the slab corresponding to eachconsidered MI face.
Values are reported in Hartree, to avoid being flattered by the use of the scientific notation and then convertedat the end of the table, in bold, to kJ mol�1 (1 Hartree = 2627.255 kJ mol�1).
Em
(Hartree) Ns
Millerindices
Es
(Hartree)Esm
(Hartree)Esm � Es
(Hartree)�Em
(Hartree)�Em/Ns
(kJ mol�1)
�1138.2302 6 001 �6829.5705 �7967.83555 �1138.26505 �0.03485089 �15.23567 010 �7967.76347 �9106.05451 �1138.29104 �0.06083542 �22.79586 10�22 �6829.55645 �7967.83112 �1138.27467 �0.04447011 �19.4408
Figure 7(a) ð001Þ, (b) ð10�22Þ and (c) ð010Þ slabs corresponding to each MI face with each incoming monomer.Dashed yellow lines are the shortest contacts reported in Table 2.
electronic reprint

Li Destri, G., Marrazzo, A., Rescifina, A. & Punzo, F. (2011). J.Pharm. Sci. 100, 4896–4906.
Li Destri, G., Marrazzo, A., Rescifina, A. & Punzo, F. (2013). J.Pharm. Sci. 102, 73–83.
Munro, D. & Bit, R. A. (1986). European Patent EP174685A2.Prywer, J. (1995). J. Cryst. Growth, 155, 254–259.Prywer, J. (2001). J. Cryst. Growth, 224, 134–144.Prywer, J. (2002). Cryst. Growth Des. 2, 281–286.Prywer, J. (2003). Cryst. Growth Des. 3, 593–598.Prywer, J. (2004). J. Cryst. Growth, 270, 699–710.Punzo, F. (2011). Cryst. Growth Des. 11, 3512–3521.Punzo, F. (2013). J. Mol. Struct. 1032, 147–154.
Quadrelli, P., Scrocchi, R., Caramella, P., Rescifina, A. & Piperno, A.(2004). Tetrahedron, 60, 3643–3651.
Quilico, A. & Grunanger, P. (1955). Gazz. Chim. Ital. 85, 1449–1467.
Sheldrick, G. M. (2008). Acta Cryst. A64, 112–122.Sun, H. (1998). J. Phys. Chem. B, 102, 7338–7364.Weissbuch, I., Addadi, L., Lahav, M. & Leiserowitz, L. (1991).Science, 253, 637–645.
Weissbuch, I., Lahav, M. & Leiserowitz, L. (2003). Cryst. Growth Des.3, 125–150.
Weissbuch, I., Popovitz-Biro, R., Lahav, M., Leiserowitz, L. &Rehovot (1995). Acta Cryst. B51, 115–148.
crystal engineering
180 Giuseppe M. Lombardo et al. � Racemic �2-isoxazoline Acta Cryst. (2014). B70, 172–180
electronic reprint
Top Related
Copyright © 2022 FDOKUMEN

