


Bahasa
Halaman
Hukum

Annals of Biomedical Engineering, Vol. 12, pp. 281-304, 1984 0090-6964/84/$3.00 + .00 Printed in the U.S.A. All rights reserved. Copyright �9 1984 Pergamon Press Ltd.
A SIMULATION METHOD FOR THE STUDY OF LASER TRANSILLUMINATION OF
BIOLOGICAL TISSUES
Jean-Michel Maarek, Gilbert Jarry
Laboratoire de Physiologie Facult6 de M6decine de Cr6teil
Cr6teil, France
Bertrand de Cosnac, Alain Lansiart
Service d 'Electronique Saclay Centre d 'Etudes Nucl6aires
Gif sur Yvette, France
Bui-Mong-Hung
INSERM U.138 Facult6 de M~decine de Cr6teil
Cr6teil, France
The Monte-Carlo method is employed to simulate the illumination o f a blood slab by a continuous laser. It is assumed that the geometry o f the medium is bi- dimensional and that scattering or absorption takes place only when a photon strikes a red blood cell. The parameters involved in the calculations concern the photons free path lengths between two collisions, the scattering angles and the absorption probability at collision. These parameters are assessed according to experimental or literature data. Fortran programs allow the computation o f diffuse and collimated transmittances (Ta and 7`., respectively), o f transmittance measured with an optic fiber Tf and o f reflectance R. The variations o f 7,, and Tf with blood thickness are in accordance with established laws. Moreover, measured and com- puted reflectances change with hematocrit ratio in a similar way.
This work demonstrates that the Monte-Carlo method is a simple reliable tool which can be used to provide a realistic model o f laser penetration in complex bio- logical structures. Moreover, this method will permit investigations in laser tomo- spectrometry by providing a useful simulation o f the interaction o f ultrashort light pulses with biological media.
K e y w o r d s - Transillumination, Laser, Monte-Carlo method, Light scattering, Transmittance, Reflectance.
Acknowledgements-This work has been supported by grants f rom DGRST (80 M 0732), INSERM and Universit6 Paris Val de Marne. The authors are grateful to Miss B. Besson and Miss E. Nguyen Van Long for their technical assistance.
Address correspondence to Dr. Jean-Michel Maarek, Laboratoire de Physiologie, Facult6 de M6decine, 8, rue du G6n6ral Sarrail, 94010 Cr6teil, C6dex, France
281
282 Jean-Michel Maarek et al.
INTRODUCTION
Biological tissues are transparent to visible and infrared light. The band of low absorption is limited in the short wavelengths (about 600 nm) by the presence of various pigments as hemoglobin and in the larger wavelengths (about 1300 nm) by the water constituent. Various studies of in vitro tissular spectrometry have shown that spectral analysis of some molecules (cyto- chromes) produces information concerning the redox state of tissues (3,4,9,21). Oxygen saturation of blood hemoglobin is an index of overall oxidative state of tissues (6,8,20). Due to the lack of precise determination of scattering and absorption in tissues, the studies concerning the tissular penetration of light have been mostly of a theoretical nature and limited to blood (11,15,18,22). Recently, J6bsis was able to study, by a noninvasive method, the light trans- mission and the oxidative state of brain through the heads of living animals and humans (10). Thus, it is possible to envisage the application of spectrom- etry to entire organs in situ. A spectrochemical measurement could be local- ized inside an organ and a "metabolic image" might be obtained in a definite plane. The major difficulty encountered in such a tomospectroscopic approach lies in the magnitude of tissular light scattering. Since the usual procedures of optical filtration are usually inadequate in such conditions of scattering, picosecond laser systems were used by Duguay and Mattick to obtain a tem- poral resolution, which could permit the focalization within a scattering medium (7). Such a system, combined with a shutter using an optical Kerr cell, furnished tomographic images in isolated hearts perfused with a hemo- globin free solution (16).
The purpose of this work is the development of a method for the analysis of scattering patterns in blood and tissues. The models which are based on either the Kubelka theory (13,14) or the photon diffusion theory (11,15,22) consider photons as particles moving in the medium according to the general laws of transport phenomena (2). Extension of these models to heterogeneous and geometrically complex media is difficult. Thus the Monte-Carlo method (5,12,17) has been used in the present work. Also described is an experimen- tal formula which takes into account the spatial dispersion of a light beam inside a biological sample.
PRINCIPLES FOR MODELLING OF STEADY STATE LIGHT ENERGY TRANSFER
The Monte-Carlo M e t h o d
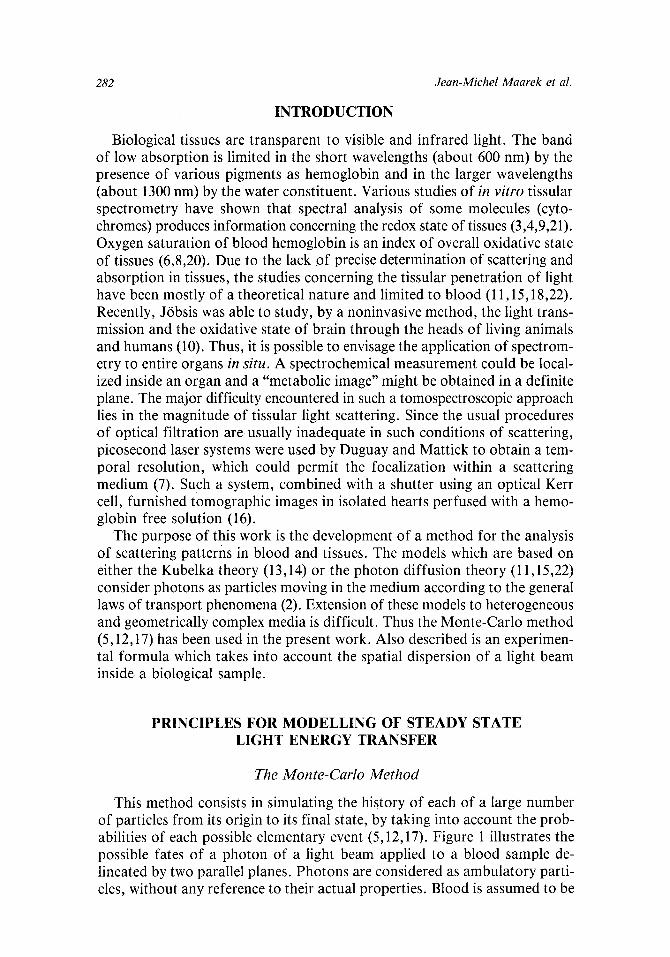
This method consists in simulating the history of each of a large number of particles from its origin to its final state, by taking into account the prob- abilities of each possible elementary event (5,12,17). Figure 1 illustrates the possible fates of a photon of a light beam applied to a blood sample de- lineated by two parallel planes. Photons are considered as ambulatory parti- cles, without any reference to their actual properties. Blood is assumed to be
Simulation of Tissue Transillumination 283
5
I J
~ L
J
F IGURE 1. Different possible fates of a photon in a blood sample: collimated transmission (1) , immedi- ate absorption (2), absorption following several scatterings (3), diffuse transmission (4), backscat- tering (5) ; �9 = Scattering and ~r = absorption.
a suspension of red cells in a perfectly transparent plasma. Thus, the as- sumption is made that scattering and absorption are possible only when a photon encounters a red cell. The medium is considered to be two-dimen- sional.
One of the main advantages of the Monte-Carlo method appears to be the ability to simulate on a computer the illumination of a sample of blood or tissue by a continuous laser and to obtain a mapping of the photons present in the medium.
Simulation of Photon Scattering
The basis of the simulation has been described by De Palma and Gasper (5). The main points are mentioned below.
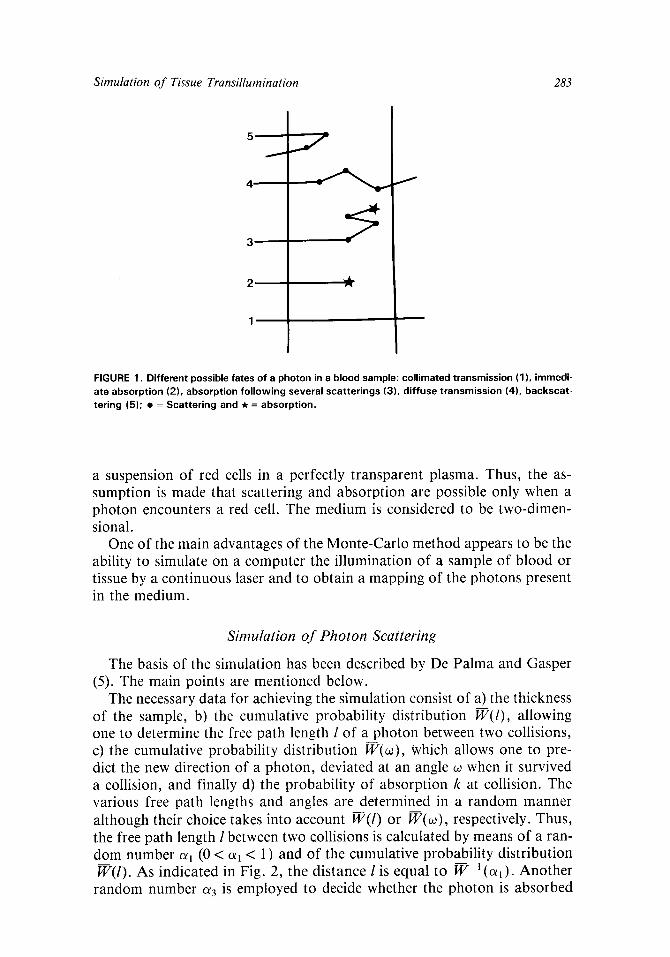
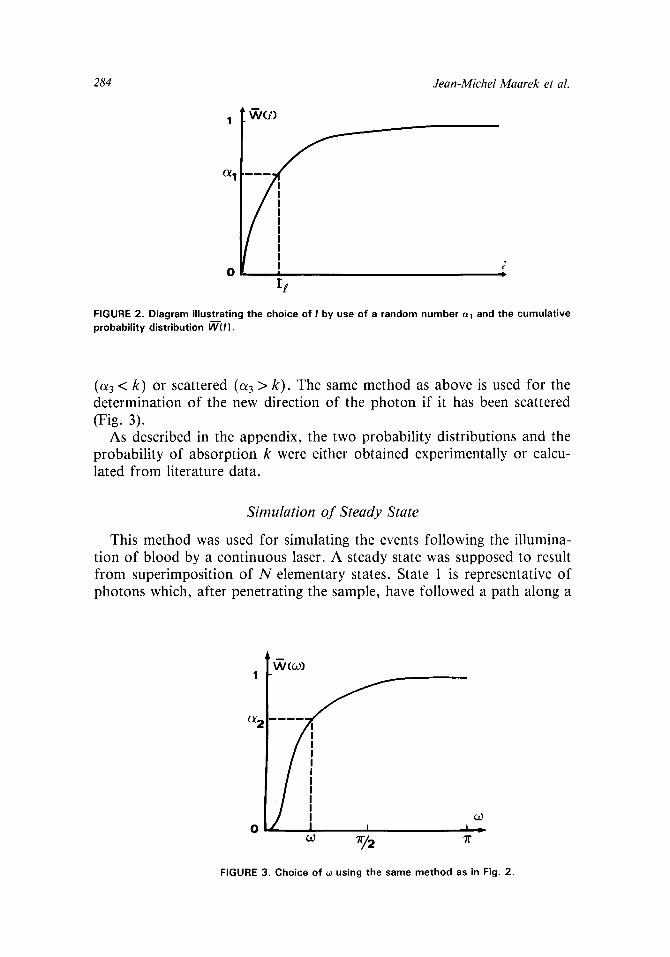
The necessary data for achieving the simulation consist of a) the thickness of the sample, b) the cumulative probability distribution W(l), allowing one to determine the free path length l of a photon between two collisions, c) the cumulative probability distribution W(~), Which allows one to pre- dict the new direction of a photon, deviated at an angle ~ when it survived a collision, and finally d) the probability of absorption k at collision. The various free path lengths and angles are determined in a random manner although their choice takes into account W(I) or W(~0), respectively. Thus, the free path length l between two collisions is calculated by means of a ran- dom number ~l (0 < oq < 1) and of the cumulative probability distribution W'(l). As indicated in Fig. 2, the distance I is equal to W "-1 (oq). Another
random number o~3 is employed to decide whether the photon is absorbed
284 Jean-Michel Maarek et al.
1 I ~/ (~)
OL 1 ------ I
I
0 I
I1
FIGURE 2. Diagram illustrating the choice of I by use of a random number oL 1 and the cumulative probability distribution IN(I).
(o~3 < k) or scattered (o~3 > k). The same method as above is used for the determination of the new direction of the photon if it has been scattered (Fig. 3).
As described in the appendix, the two probability distributions and the probability of absorption k were either obtained experimentally or calcu- lated from literature data.
Simulation of Steady State
This method was used for simulating the events following the illumina- tion of blood by a continuous laser. A steady state was supposed to result from superimposition of N elementary states. State 1 is representative of photons which, after penetrating the sample, have followed a path along a
1
~ 2
O
~/CO0)
. . . . I
C0
FIGURE 3. Choice of ~ using the same method as in Fig. 2.
Simulation of Tissue Transiltumination 285
distance given by W(/) and either have got out of the sample or have collided with a blood cell. State 2 is represented by photons which after being in state 1, have been either absorbed after the first collision or scattered with an angle depending on W(w) along a distance given by ~'( l) . Later, these pho- tons are either out of the sample or have struck a red cell for the second time. The same is true for states 3,4 . . . . N - 1. State N is the one for which the last photons after escaping from ( N - 1 )th state are either absorbed by the Nth collision or are gone out of the sample.
MATERIAL AND METHODS
Material
Measurements were performed on human citrated blood samples with various hematocrit ratios; biological tissues were sampled on dogs after acute experiments carried out for other purposes.
Measurement of Scattered Light Intensity as a Function of Angulation
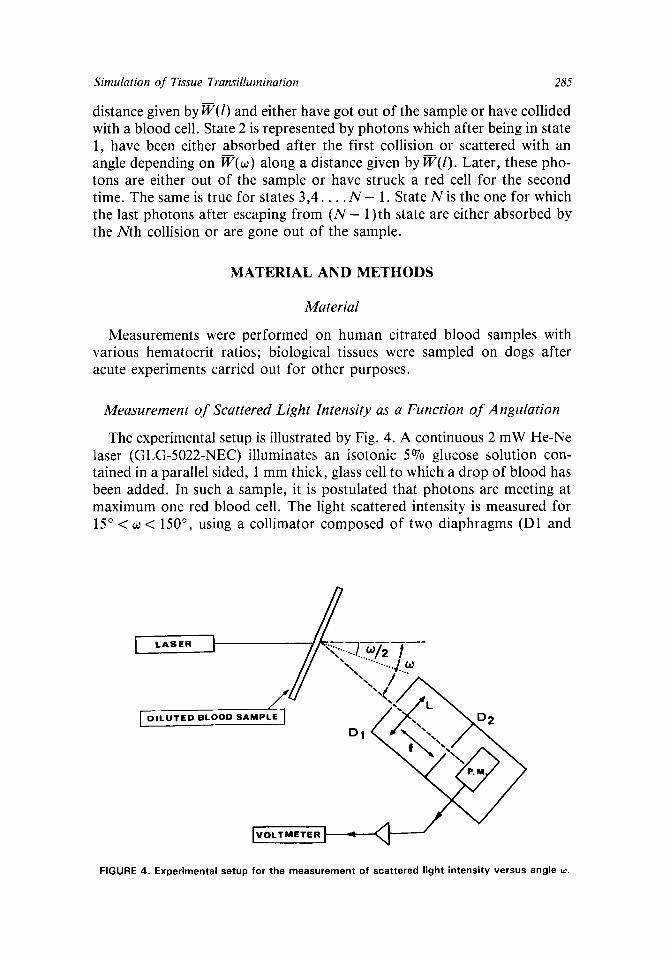
The experimental setup is illustrated by Fig. 4. A continuous 2 mW He-Ne laser (GLG-5022-NEC) illuminates an isotonic 5% glucose solution con- tained in a parallel sided, 1 mm thick, glass cell to which a drop of blood has been added. In such a sample, it is postulated that photons are meeting at maximum one red blood cell. The light scattered intensity is measured for 15 ~ < ~0 < 150 ~ using a collimator composed of two diaphragms (D1 and
l I I " .......... 7....
i / - %.~
FIGURE 4. Experimental setup for the measurement of scattered light intensity versus angle w.
286 Jean-Michel Maarek et al.
D2), a lens (L) and a photomultiplier (R 928 Hamamatsu). The position of L between D1 (entry window) and D2 (focus point of L) allows the selection of light beams coming from the sample at an angle o~, For each measure- ment, the collimator is rotated for o~ value and the sample for r The rota- tion of the sample avoids multiple scatterings encountered for oJ close to 7r/2 when the preparation remains in the same geometrical position. The output voltage V(0~) of the photomultiplier (P.M.) is read on a voltmeter (7500 Data Precision).
Experimental Evaluation o f Light Dispersion in Blood and Tissues
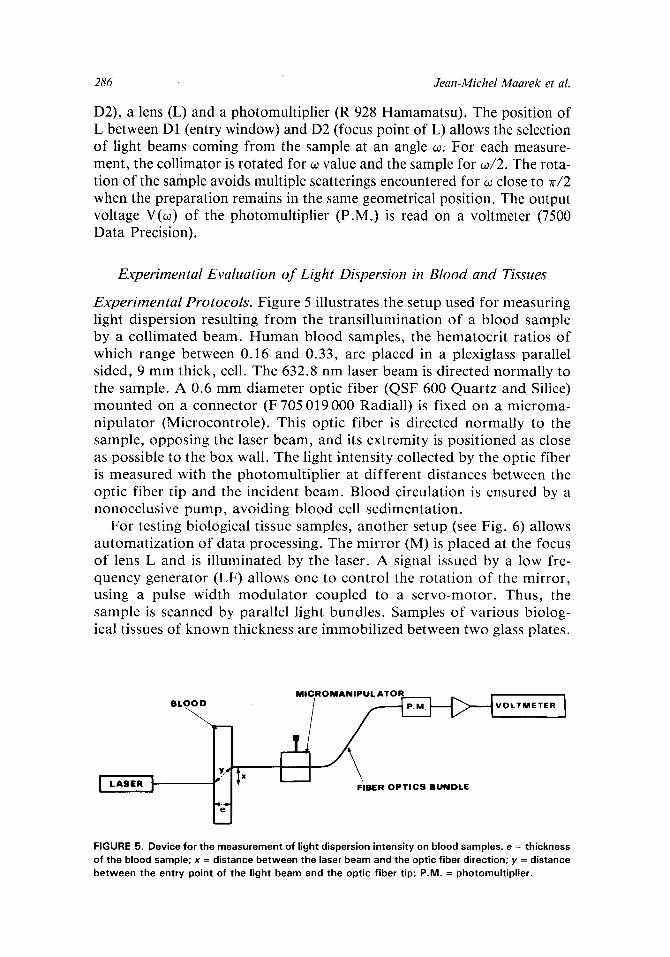
Experimental Protocols. Figure 5 illustrates the setup used for measuring light dispersion resulting f rom the trans.illumination of a blood sample by a coll imated beam. H u m a n blood samples, the hematocr i t ratios of which range between 0.16 and 0.33, are placed in a plexiglass parallel sided, 9 m m thick, cell. The 632.8 nm laser beam is directed normal ly to the sample. A 0.6 m m diameter optic fiber (QSF 600 Quar tz and Silice) m o u n t e d on a connector (F705019000 Radiall) is fixed on a microma- nipula tor (Microcontrole). This optic fiber is directed normal ly to the sample, opposing the laser beam, and its extremity is posi t ioned as close as possible to the box wall. The light intensity collected by the optic fiber is measured with the photomul t ip l ier at different distances between the optic fiber tip and the incident beam. Blood circulation is ensured by a nonocclusive pump, avoiding b lood cell sedimentat ion.
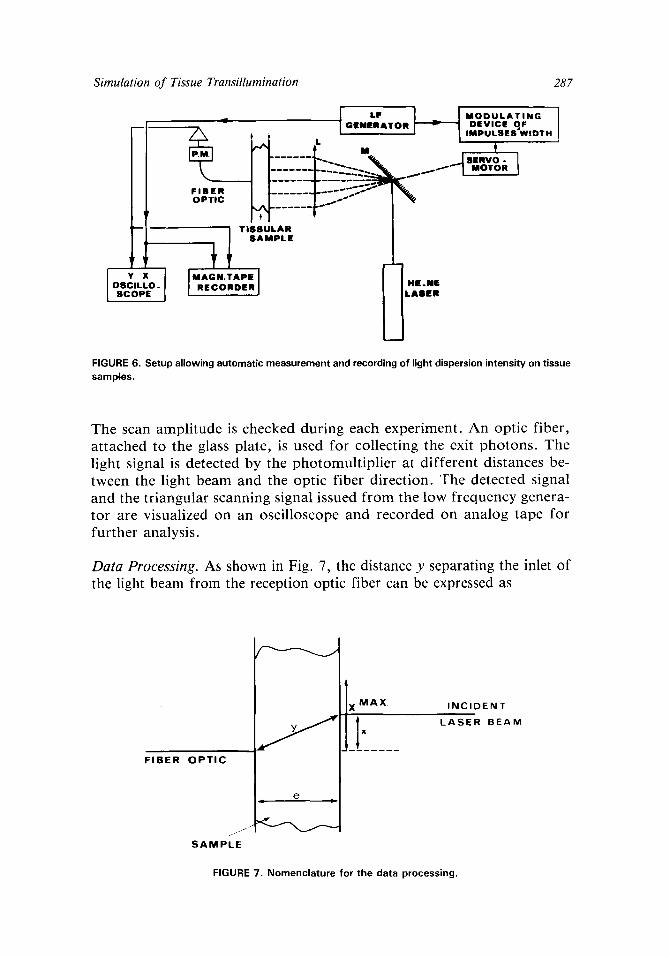
For testing biological tissue samples, another setup (see Fig. 6) allows au tomat iza t ion of data processing. The mir ror (M) is placed at the focus of lens L and is i l luminated by the laser. A signal issued by a low fre- quency generator (LF) allows one to control the rota t ion of the mirror , using a pulse width modu la to r coupled to a servo-motor . Thus, the sample is scanned by parallel light bundles. Samples o f various biolog- ical tissues of known thickness are immobil ized between two glass plates.
I L A S E R I
B L O O D M I C R O M A N I P U L A T O R
FIBER O P T I C S B U N D L E
F I G U R E 5. Device for the measurement of light dispersion intensity on blood samples, e = thickness of the blood sample; x = distance between the laser beam and the optic fiber direction; y = distance between the entry point of the light beam and the optic fiber tip; P . M . = photomultiplier.
Simulation of Tissue Transillumination 287
- F I
LF ~ MODULATING I - - ~ G E N E R A T O R D E V I C E 9 F
2 - - - . . . . . . . j .RVO. . . . . . . ~ . ~ . ~ F I MOTOR F I B E R . . . . . . . . . " 1 " OPTIC . . . . . ..~'~
~ I TiSSULAR S A M P L E
L'xd --o.,,-i OSCILLO_ RECORDER S C O P E L A i E R
FIGURE 6. Setup allowing automat ic measurement and recording of light dispersion intensity on tissue samples.
The scan amplitude is checked during each experiment. An optic fiber, attached to the glass plate, is used for collecting the exit photons. The light signal is detected by the photomultiplier at different distances be- tween the light beam and the optic fiber direction. The detected signal and the triangular scanning signal issued from the low frequency genera- tor are visualized on an oscilloscope and recorded on analog tape for further analysis.
Data Processing. As shown in Fig. 7, the distance y separating the inlet of the light beam from the reception optic fiber can be expressed as
J FIBER OPTIC ~ ~ i
SAMPLE
MAX.
I X
INCIDENT LASER BEAM
FIGURE 7. N o m e n c l a t u r e for t h e data processing.
288 Jean-Michel Maarek et al.
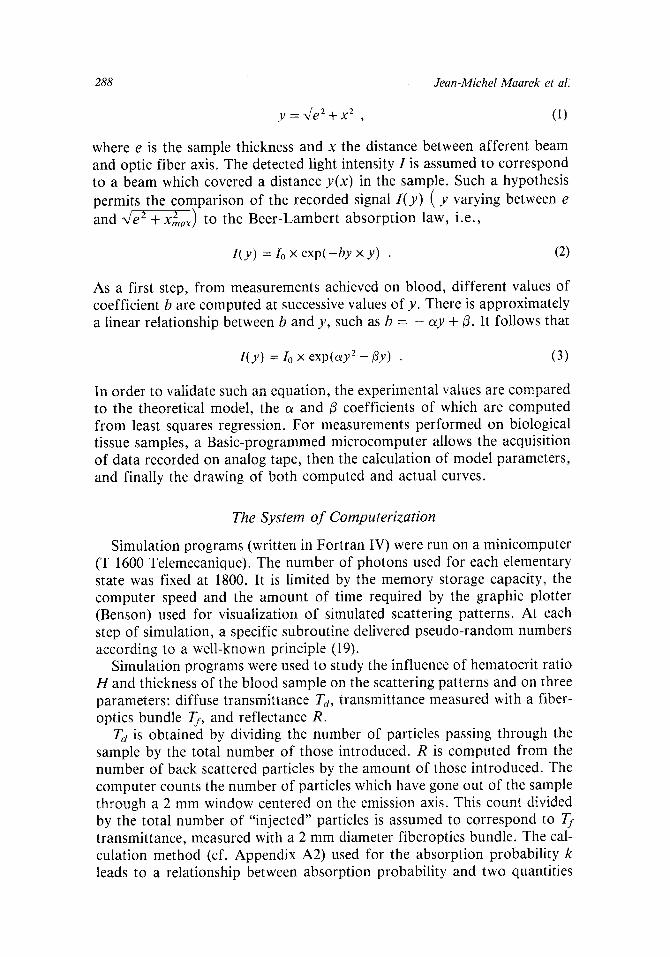
y = e 4 e ~ x 2 , (i)
where e is the sample thickness and x the distance between afferent beam and optic fiber axis. The detected light intensity I is assumed to correspond to a beam which covered a distance y(x) in the sample. Such a hypothesis permits the comparison of the recorded signal I (y) ( y varying between e and ~/e2-1 - xZax) to the Beer-Lambert absorpt ion law, i.e.,
I(y) = Io x exp(-by x y) . (2)
As a first step, from measurements achieved on blood, different values of coefficient b are computed at successive values of y. There is approximately a linear relationship between b and y, such as b = - ~y +/3. It follows that
I(y) = [o x exp(cxy 2 -/~y) . (3)
In order to validate such an equation, the experimental values are compared to the theoretical model, the o~ and [3 coefficients of which are computed from least squares regression. For measurements performed on biological tissue samples, a Basic-programmed microcomputer allows the acquisition of data recorded on analog tape, then the calculation of model parameters, and finally the drawing of both computed and actual curves.
The System o f Computerization
Simulation programs (written in Fortran IV) were run on a minicomputer (T 1600 Telemecanique). The number of photons used for each elementary state was fixed at 1800. It is limited by the memory storage capacity, the computer speed and the amount of time required by the graphic plotter (Benson) used for visualization of simulated scattering patterns. At each step of simulation, a specific subroutine delivered pseudo-random numbers according to a well-known principle (19).
Simulation programs were used to study the influence of hematocrit ratio H and thickness of the blood sample on the scattering patterns and on three parameters: diffuse transmittance Td, transmittance measured with a fiber- optics bundle T Z, and reflectance R.
Td is obtained by dividing the number of particles passing through the sample by the total number of those introduced. R is computed from the number of back scattered particles by the amount of those introduced. The computer counts the number of particles which have gone out of the sample through a 2 mm window centered on the emission axis. This count divided by the total number of "injected" particles is assumed to correspond to Tf transmittance, measured with a 2 mm diameter fiberoptics bundle. The cal- culation method (cf. Appendix A2) used for the absorption probability k leads to a relationship between absorption probability and two quantities
Simulation of Tissue Transillumination 289
which depend on hematocrit H, i.e., the mean free path before absorption and the mean free path before random scattering. The dependence of the absorption probability upon hematocrit may be considered as rather artifi- cial, since each event corresponding to the absorption of a photon by a red blood cell would not actually be bound to the environment of the cell. We compared the changes in Td, T I, and R according to the hypothesis of a hematocrit dependency of the absorption probability k and to the absence of such a dependency. In the last case, the value of k for H = 0.45 was used throughout the computation.
RESULTS
Experimental W(~o) Curve
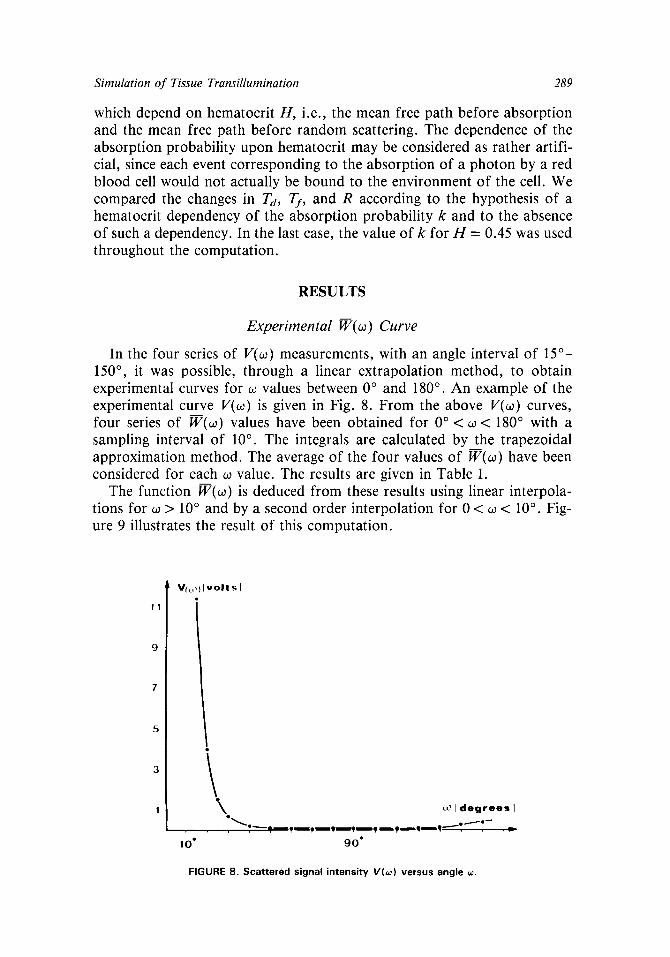
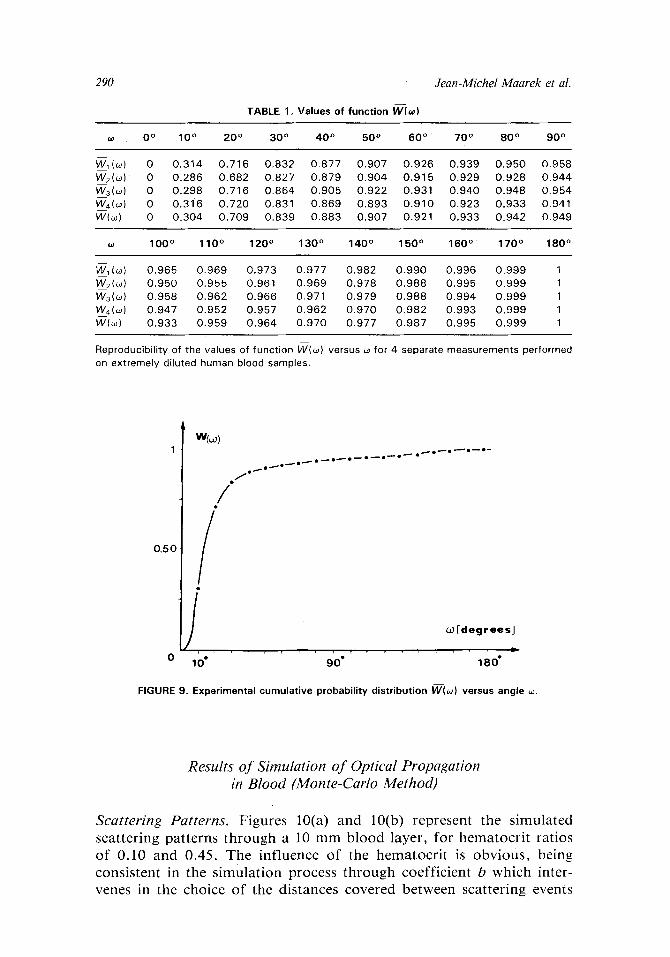
In the four series of V(~o) measurements, with an angle interval of 15 ~ 150 ~ it was possible, through a linear extrapolation method, to obtain experimental curves for o~ values between 0 ~ and 180 ~ An example of the experimental curve V(o~) is given in Fig. 8. From the above V(w) curves, four series of W(w) values have been obtained for 0 ~ < w < 180 ~ with a sampling interval of 10 ~ The integrals are calculated by the trapezoidal approximation method. The average of the four values of W(w) have been considered for each ~0 value. The results are given in Table I.
The function W(o~) is deduced from these results using linear interpola- tions for ~0 > 10 ~ and by a second order interpolation for 0 < co < 10 ~ Fig- ure 9 illustrates the result of this computat ion.
11
V(r v o l t .~ I
10"
"~ r I d e g r e e s I
�9 , ~ = , - - ? I 9 1 9 1 9 1 9 I ~ m m s q ~ �9 , , ~---
9 0 "
FIGURE 8. Scattered signal intensity V ( ~ ) versus angle ~.
290 Jean-Michel Maarek et al.
T A B L E 1, V a l u e s of func t ion W ( ~ )
0 ~ 1 0 ~ 2 0 ~ 3 0 ~ 4 0 ~ 5 0 ~ 6 0 ~ 7 0 ~ 8 0 ~ 9 0 ~
WI(~) 0 0.314 0.716 0,832 0,877 0,907 0,926 0.939 0,950 0.958 W2(~) 0 0.286 0.682 0,827 0.879 0,904 0.915 0.929 0,928 0,944 W3(co) 0 0.298 0.716 0.864 0.905 0.922 0.931 0.940 0.948 0.954 W4(~) 0 0.316 0.720 0.831 0.869 0.893 0.910 0.923 0.933 0.941 W(~) 0 0.304 0.709 0.839 0.883 0,907 0.921 0.933 0.942 0.949
1 0 0 ~ 1 1 0 ~ 1 2 0 ~ 1 3 0 ~ 1 4 0 ~ 1 5 0 ~ 1 6 0 ~ 1 7 0 ~ 1 8 0 ~
W1 (co) 0,965 0.969 0,973 0.977 0.982 0,990 0.996 0.999 1 1~2 (co) 0.950 0.955 0.961 0.969 0.978 0.988 0.995 0,999 1 1~3 (co) 0,958 0.962 0.966 0.971 0.979 0.988 0.994 0,999 1 W4(co) 0.947 0.952 0.957 0,962 0.970 0.982 0.993 0.999 1 W(w) 0.933 0.959 0.964 0.970 0.977 0.987 0.995 0.999 1
Reproducibility of the values of function IN(~o) versus co for 4 separate measurements performed on extremely diluted human blood samples,
0.50
0
/
/ c o [ d e g r e e s ]
10" 90" 180"
FIGURE 9. Exper imenta l c u m u l a t i v e probabi l i ty d istr ibut ion W(w) versus angle co.
Results of Simulation of Optical Propagation in Blood (Monte-Carlo Method)
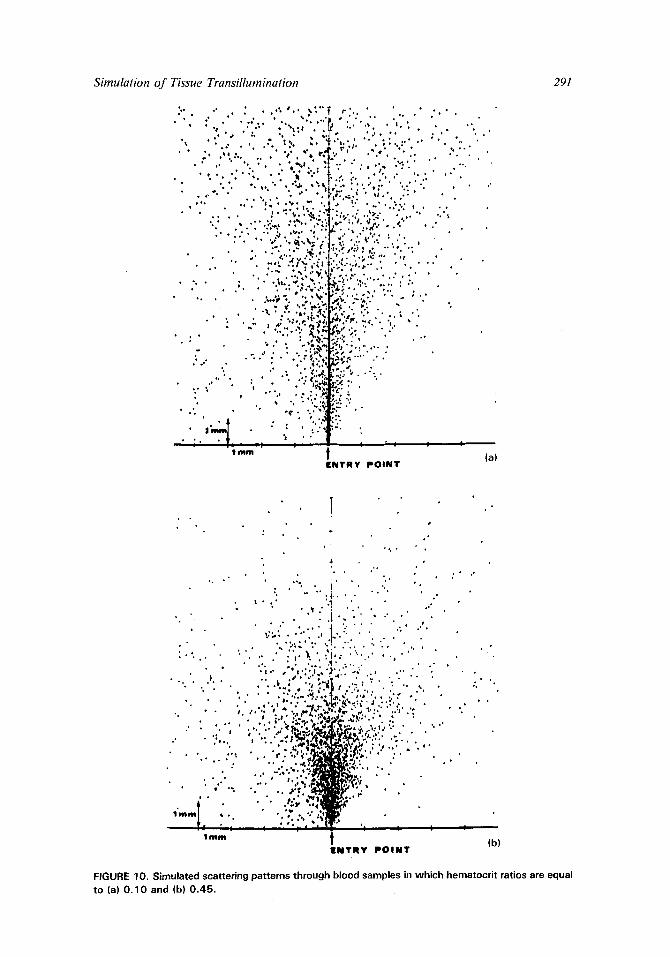
Scattering Patterns. Figures 10(a) and 10(b) represent the simulated scattering patterns through a 10 mm blood layer, for hematocrit ratios of 0.10 and 0.45. The influence of the hematocri t is obvious, being consistent in the simulation process through coefficient b which inter- venes in the choice of the distances covered between scattering events
S i m u l a t i o n o f T i s s u e T r a n s i l l u m i n a t i o n 2 9 1
"~ . . . . . . . . ' . . :.~.
�9 ,. ' , . . , . .. ',,':..,;. :
. . . . . �9 : ,,;: . . . . - . �9 �9 . t , � 9 '
�9 . , r
�9 " . �9 ; " " 3 , : . " . , .
�9 . �9 : . . . : ; , " . � 9 : . �9 ~ "; r o�9
: "" "" " "" "i'." �9 ..�9 .
�9 �9 ~149 �9 ~
�9 r �9
�9 . ' . t : . m m
'�9 '".'.i: : ":' ':' "," ""2. .�9 ,�9 �9 .~" . .. t ~ ' . � 9 �9 t t � 9 1 4 9
.~ ~ ;. �9 �9 ~ * � 9 1 4 9 �9 ' * � 9 1 4 9 1 7 6 t . ~ �9
" : . . . : .2)�9149 , � 9
r , ~ t � 9 �9 ~ r 1 4 9
l . ~ r~r176 * t " "" ~ ~ ? ~. ...~ :~'�9149149 . . , �9
�9 % r 1 4 9 �9 � 9 1 4 9 ~ ~ �9 � 9
r 1 4 9 �9 ~ * . . � 9 ~
~ ~ . �9 , . , �9 ": : : . , ~ . . = . ; . . . � 9 1 4 9 ~ : . .
d � 9 1 4 9 ' � 9 �9 o�9 h � 9 , % �9 :~' : ~ . . .
,~,~ , �9 v r .
,h I .~: ;..7': , ,
" ( a )
E N T R Y P O I N T
T ~
I �9
�9 ~ i / : §
0
�9 ~ ~
. , ~ �9 . ~
�9 . �9 �9 . 0~ �9 �9 . ~ ~176 ,~ � 9176
t 4
�9 ~ . �9 �9 �9 #
: . : . . ; . . ' . . . ' . - � 9 : ' . . . . . �9 . �9 �9 ~ %" ' - " . . . . ' ' � 9
�9 ~ . ~ , . . , ( ~ t �9 �9 . ~ � 9 . ~ �9 ~
. .= �9 ~ . . . ~ , ,~ . , . -
" . �9 ' �9 ' , � 9 1 4 9 " . " � 9 ~ X � 9 ' .t ." : " . . �9 . . . . �9 �9 �9 �9 . , ; . ' , _ " . , , ' b � 9 � 9 ~ : . . . . . . , � 9 .
�9 �9 �9149 , ; ' �9149 . , ' ~ ; , ~ ; , ; , . ' ; : ' ' . . . . .
�9 �9 �9 * ' : �9 �9 o , " � 9 r 149 . � 9 �9 . ~ �9 �9
�9 �9 �9 � 9176 ~ e t . " ' a , ~ ' , ' '
, . " �9 �9 �9 " ; : ; ' . , - , ~ W . . . ; " �9
, u l �9 �9
1 m m (b )
E N T R Y P O I N T
FIGURE 10, Simulated scattering patterns through blood samples in which hematocr i t ratios are equal
to (a) O. 10 and (b) 0 . 45 .
292 Jean-Michel Maarek et al.
(see Append ix A1). For the same blood volume, the higher the hemato- crit ratio, the higher the probabil i ty for the pho ton ic particles to meet a great number o f red cells, and thus, the higher the rate of absorpt ion events and changes o f direction. Statistically, for hematocr i t H -- 0.10, fewer absorpt ion events are likely to occur, and the paths between two collisions are longer. The scattering pat tern becomes more spread.
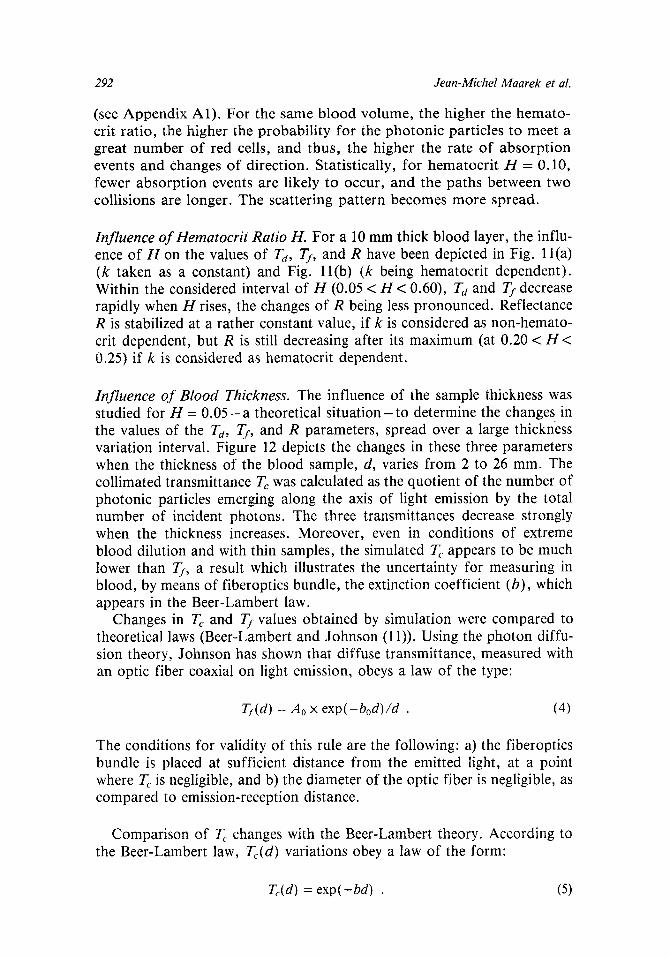
Influence o f Hematocrit Ratio H. For a 10 mm thick blood layer, the influ- ence of H on the values of Td, Tr and R have been depicted in Fig. 11 (a) (k taken as a constant) and Fig. l l (b) (k being hematocrit dependent). Within the considered interval of H (0.05 < H < 0.60), Ta and Tf decrease rapidly when H rises, the changes of R being less pronounced. Reflectance R is stabilized at a rather constant value, if k is considered as non-hemato- crit dependent, but R is still decreasing after its maximum (at 0.20 < H < 0.25) if k is considered as hematocrit dependent.
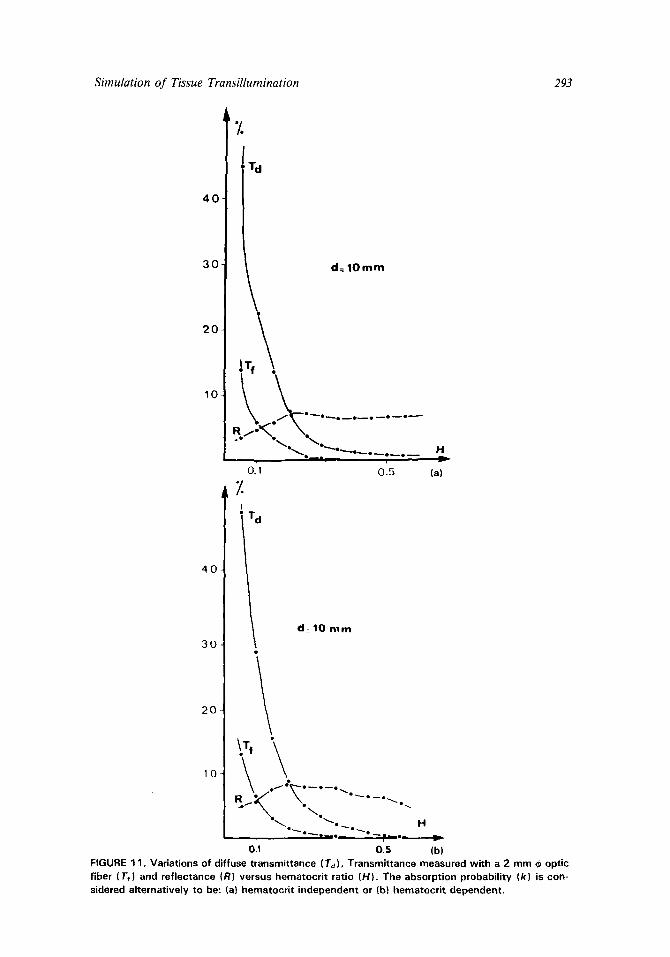
Influence o f Blood Thickness. The influence of the sample thickness was studied for H = 0 . 0 5 - a theoretical s i tua t ion- to determine the changes in the values of the Ta, Tr and R parameters, spread over a large thickness variation interval. Figure 12 depicts the changes in these three parameters when the thickness of the blood sample, d, varies from 2 to 26 mm. The collimated transmittance Tc was calculated as the quotient of the number of photonic particles emerging along the axis of light emission by the total number of incident photons. The three transmittances decrease strongly when the thickness increases. Moreover, even in conditions of extreme blood dilution and with thin samples, the simulated Tc appears to be much lower than Tr a result which illustrates the uncertainty for measuring in blood, by means of fiberoptics bundle, the extinction coefficient (b), which appears in the Beer-Lambert law.
Changes in Tc and T/values obtained by simulation were compared to theoretical laws (Beer-Lambert and Johnson (11)). Using the photon diffu- sion theory, Johnson has shown that diffuse transmittance, measured with an optic fiber coaxial on light emission, obeys a law of the type:
To(d) = Ao x exp(-bod)/d . (4)
The conditions for validity of this rule are the following: a) the fiberoptics bundle is placed at sufficient distance from the emitted light, at a point where Tc is negligible, and b) the diameter of the optic fiber is negligible, as compared to emission-reception distance.
Comparison of Tc changes with the Beer-Lambert theory. According to the Beer-Lambert law, To(d) variations obey a law of the form:
Tr = exp(-bd) . (5)
Simulation of Tissue Transillumination 293
4 0
3 0 .
20 -
4 0
10 -
3 0
./.
. d= l O m m
\ ~Tf ~ �9 �9 . . . . .
0.'1 0 .5
Z T d
H
(a)
d= 10 n l m
2o /
R ~ /, , .~-- ~ . . . . . ,~. . . . . . ~-0
0.1 0.5 (b) FIGURE 11. Variations of diffuse transmittance (Td), Transmittance measured with a 2 mm ~ optic f iber ('l f) and ref lectance (R) versus hematocri t ratio (H). The absorpt ion probabil i ty (k) is con- sidered alternatively to be" (a) hematocr i t independent or (b) hematocr i t dependent.
294 Jean-Michel Maarek et al.
1 0 0
5 0
",•.\ H = 0 , 0 5
. \ ~ o~, , , , ,~ ~ 1 7 6
2 1 0 2 '0
dCrnm) |
30
FIGURE 12. Variations of T d, TG, R and collimated transmittance (T~] as a function of blood sam- ple thickness (d).
By using a linear regression for Tc values obtained with 2 < d < 18 mm, the following equation was computed.
Log(Te) = -0.248 x d - 1.751 (r = -0.995 ; n = 9) (6)
The high value obtained for the r coefficient confirms that the simulated values of Tc fit the Beer-Lambert law. Moreover the slope of the linear semi-logarithmic relationship appears to be close to the theoretical values ( -0 .202 mm -1 ), calculated from the mean free path before absorption and the mean free path before random scattering (see Appendix A1).
Above d = 18 mm, Tc values are too low, and the method appears to be irrelevant, due to the very small number of photons.
Comparison of Tf changes with the Johnson rule. If T/(d) obeys a law of the form: Tr(d) = Ao x exp(-bod)/d (Eq. 4), it implies a linear rela- tionship between Log(d x Tf(d)) and d. The linear regression for d > 14 mm (distances for which the Johnson law is valid) leads to the following equation:
L o g ( d • = -0 .085• ( r = - 0 . 9 0 1 ; n = 7 ) . (7)
The value of the regression coefficient makes the hypothesis acceptable and the calculated slope is not too different from the theoretical value of bo (0.115 mm -]) calculated from the two mean free paths mentioned above.
Simulation of Tissue Transillumination 295
Experimental Assessment of Light Scattering
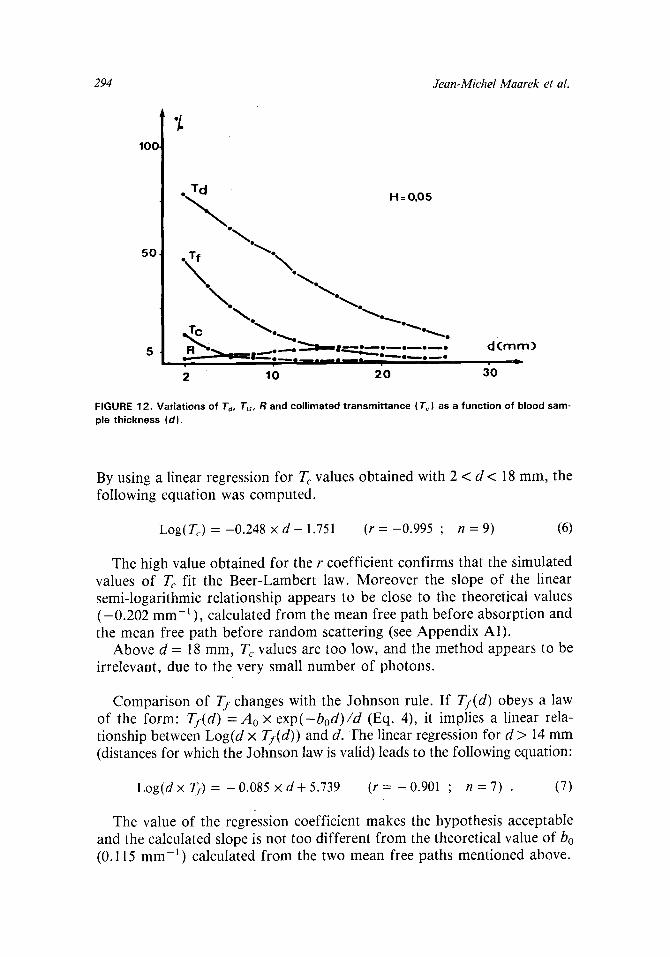
Blood Samples. For four samples of human blood, with different he- matocrit ratios, the results of measurements have been analysed by fitting the relat ionship I(y) = I0 • exp(o~ • y2 _ /3 X y ) (Eq. 3). For each hematocrit ratio, the least squares method allows the calculation of o~ and/3 coefficients. Figure 13 illustrates the experimental values of transmitted light and the calculated curve in an example corresponding to H = 0.24 for various values of distance between the two parallel emission and detection axes.
10 I V( v o l t s )
.~_
.\ .\
\ e~
H : 0 . 2 4
o%
\
%.
~~ ~
1 5
FIGURE 13. Experimental points and calculated curve of the transmitted signal (V ) versus the dis- tance (x) between the laser beam and the fiber optic direction in a 9 mm thick blood sample.
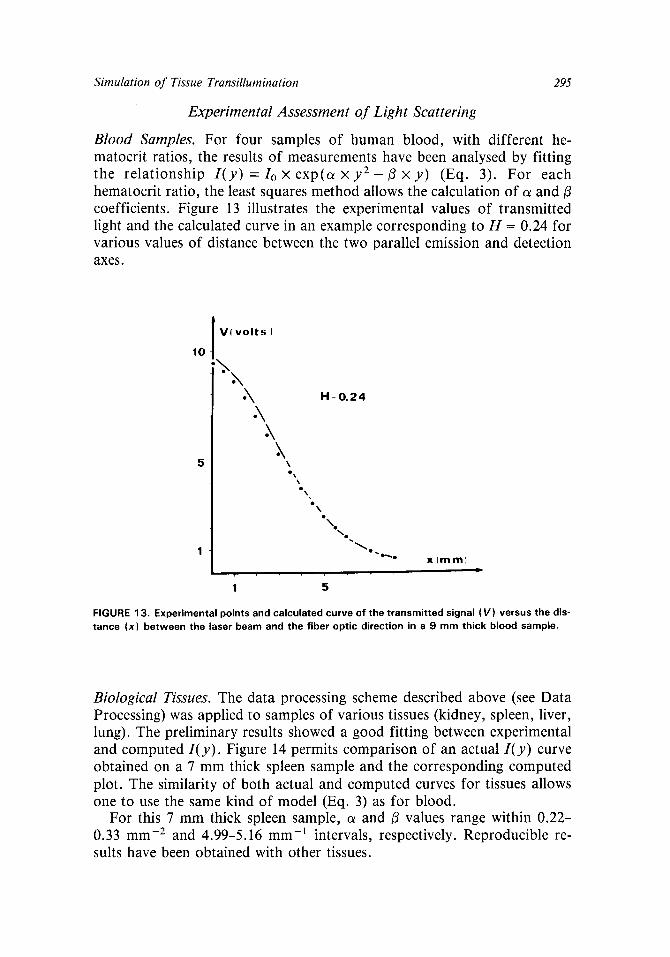
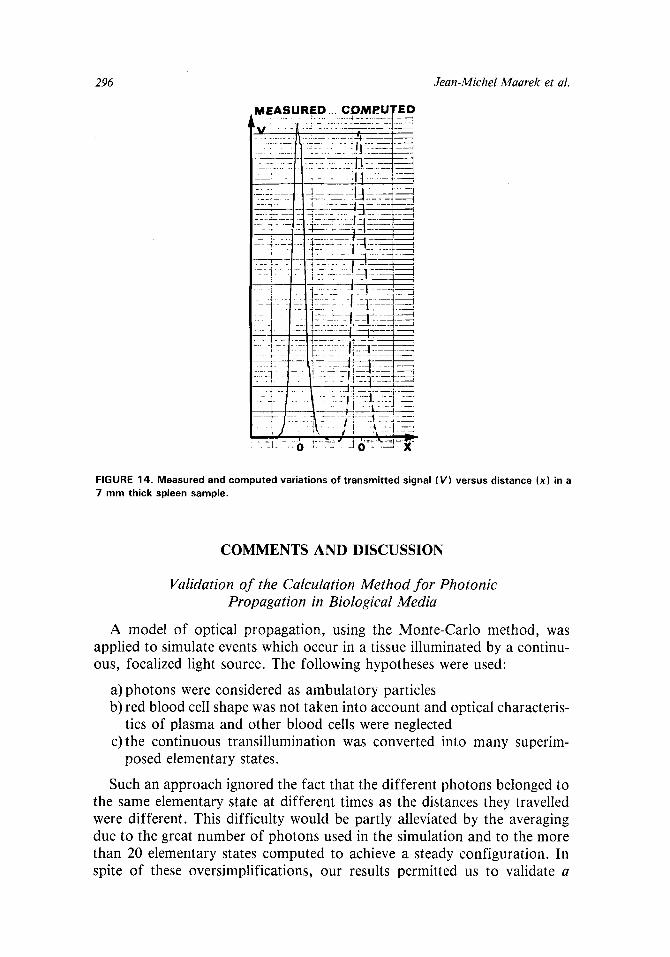
Biological Tissues. The data processing scheme described above (see Data Processing) was applied to samples of various tissues (kidney, spleen, liver, lung). The preliminary results showed a good fitting between experimental and computed I(y). Figure 14 permits comparison of an actual I(y) curve obtained on a 7 mm thick spleen sample and the corresponding computed plot. The similarity of both actual and computed curves for tissues allows one to use the same kind of model (Eq. 3) as for blood.
For this 7 mm thick spleen sample, o~ and/3 values range within 0.22- 0.33 mm -2 and 4.99-5.16 mm -] intervals, respectively. Reproducible re- sults have been obtained with other tissues.
296 Jean-Michel Maarek et al.
M E A S U R E D . . . czQ_jp_ u i~ E D
�9 ~_-.', _ 2_. :~ ~ 2 2 - 2 - . 5 IA---_-~s
i !i
' ~ -~ .._ -~ "-1 ---i
s ". 7.[s --. "X"
FIGURE 14. Measured and computed variations of transmitted signal (V) versus distance (x) in a 7 mm thick spleen sample.
C O M M E N T S A N D D I S C U S S I O N
Validation of the Calculation Method for Photonic Propagation in Biological Media
A model of optical propagation, using the Monte-Carlo method, was applied to simulate events which occur in a tissue illuminated by a continu- ous, focalized light source. The following hypotheses were used:
a) photons were considered as ambulatory particles b) red blood cell shape was not taken into account and optical characteris-
tics of plasma and other blood cells were neglected c)the continuous transillumination was converted into many superim-
posed elementary states.
Such an approach ignored the fact that the different photons belonged to the same elementary state at different times as the distances they travelled were different. This difficulty would be partly alleviated by the averaging due to the great number of photons used in the simulation and to the more than 20 elementary states computed to achieve a steady configuration. In spite of these oversimplifications, our results permitted us to validate a
Simulation of Tissue Transillumination 297
posteriori the method used for representing the light propagation. Simu- lated collimated transmittance values varied with blood thickness in confor- mity with the Beer-Lambert law. Nevertheless it should be pointed out that each photon emerging from the sample along the emission axis was counted as transmitted and collimated, whatever its past history. Since the simulation obeyed the Beer-Lambert law, it hardly seemed probable that a scattered photon has kept actually, when emerging from the sample, the properties of those which had not been submitted to any interaction. Moreover, the John- son law was confirmed, although less precisely than the Beer-Lambert law, probably because the criterion for the selection of photons penetrating the optic fiber was more difficult to define. Actually, a condition should be that the emerging photons were spread in a narrow cone, the axis of which coin- cided with the axis of the detecting fiberoptics bundle. It was mentioned above (see The System of Computerization) that the absorption probability may be dependent on the hematocrit ratio. Such a functional relationship, induced by the computational procedure, seemed to be validated by com- parison of Figs. 1 l(a) and 1 l(b). In Fig. 1 l(a) reflectance was rather steady for high hematocrit ratios, but in Fig. 1 l(b) it appeared to be decreasing. The latter fact is probably closer to reality, since reflectance ultimately will diminish to zero when hematocrit ratio becomes equal to unity, the blood being then the equivalent of a non-scattering hemoglobin solution.
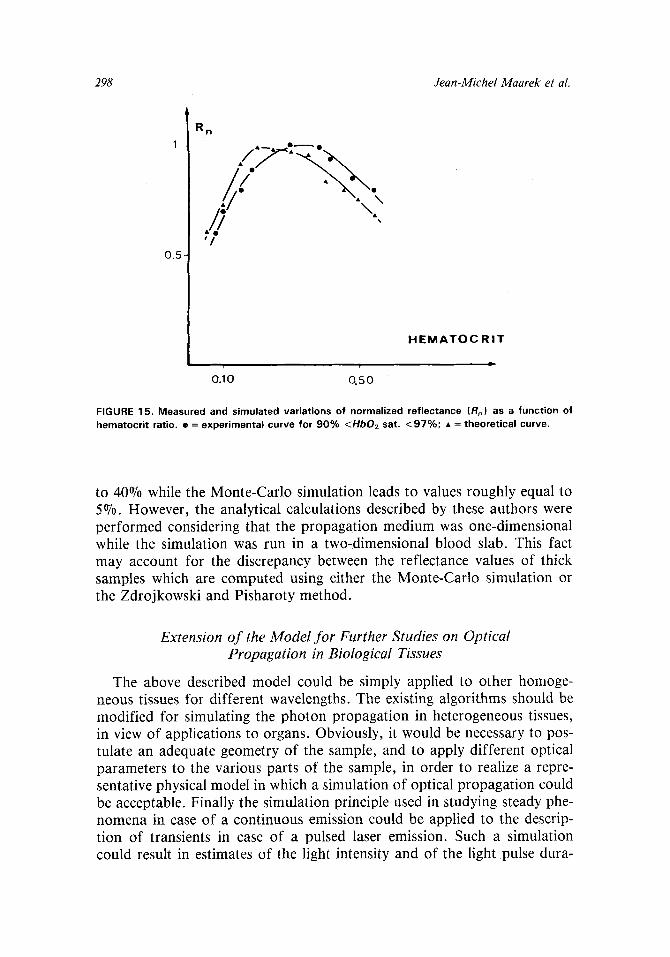
Measurements of reflectance variations as a function of hematocrit ratio were repeated on blood samples in which 02 saturation was above 90%. In these experiments, reflectance was measured by an optic fiber parallel to the one directing the laser beam into the blood sample, both fibers being im- mersed. Figure 15 shows the comparison between the experimental data and the simulated ones when absorption probability is changing with hemato- crit. Normalization of the two series of values were accomplished by divid- ing the actually measured values of reflectance by their maximal value, i.e.,
R(H) R,,(H) = (8)
emax
This comparison is imperfect because the simulated reflectance takes into account all the photons reflected by the sample while the measured reflec- tance considers only photons which entered into the optic fiber. Neverthe- less, the similarity of both simulated and measured curves shown in Fig. 15 might be considered as another argument for validating the proposed model and the relationship between the absorption probability k and the hemato- crit ratio H. Such a relationship needs further experimental confirmation; the setup described by Bickel (1) could be used for these experiments.
The reflectance values obtained by simulation for thick blood samples (see R values for d > 20 mm in Fig. 12) appeared to be much lower than the calculated reflectance of a semi-infinite layer of blood, computed according to Zdrojkowski and Pisharoty (22). Their reflectance value is almost equal
298 Jean-Michel Maarek et al.
0 . 5
R n
\ \ . -,,?
.,// ' /
0 . 10 0 . 5 0
H E M A T O C R I T
i ,
FIGURE 15. Measured and simulated variations of normalized reflectance (R. ) as a function of hematocrit ratio. �9 = experimental curve for 9 0 % <Hb02 sat. < 9 7 % ; �9 = theoretical curve.
to 40% while the Monte-Carlo simulation leads to values roughly equal to 5~ However, the analytical calculations described by these authors were performed considering that the propagation medium was one-dimensional while the simulation was run in a two-dimensional blood slab. This fact may account for the discrepancy between the reflectance values of thick samples which are computed using either the Monte-Carlo simulation or the Zdrojkowski and Pisharoty method.
Extension of the Model for Further Studies on Optical Propagation in Biological Tissues
The above described model could be simply applied to other homoge- neous tissues for different wavelengths. The existing algorithms should be modified for simulating the photon propagation in heterogeneous tissues, in view of applications to organs. Obviously, it would be necessary to pos- tulate an adequate geometry of the sample, and to apply different optical parameters to the various parts of the sample, in order to realize a repre- sentative physical model in which a simulation of optical propagation could be acceptable. Finally the simulation principle used in studying steady phe- nomena in case of a continuous emission could be applied to the descrip- tion of transients in case of a pulsed laser emission. Such a simulation could result in estimates of the light intensity and of the light pulse dura.
Simulation of Tissue Transillumination 299
tion required for a tomospectroscopic apparatus. It would permit predic- tion of the quality of imaging and the maximal depth for which such a tomospectroscopy would be possible.
Assessment o f Light Dispersion in Tissues by Utilization o f the I(y) = Io • exp(o~ • y2 _ 13 • y) Relationship
The reported experiments dealt only with organs which could be easily mounted in our present setup. In fact, the studied organs are relatively light absorbent, being highly vascularized and rich in pigments. The adaptation of the experimental setup should then concern tissues which are more trans- parent to visible and near infrared light than the organs studied above, such as skin, fatty deposits, intestine, brain and even bone. Although the above formula seems to describe, as a first approximate, the light dispersion, it seems necessary to check its validity for various tissues of different thick- nesses.
CONCLUSION
A simulation based on the Monte-Carlo method permitted the analysis of scattering patterns in a blood sample illuminated with a laser beam. It was established that basic parameters, such as transmittances and reflectance, computed through this simulation, behave according to well known laws. This simulation method can be applied to other tissues, provided that opti- cal parameters of these tissues are measured. Furthermore, the above proce- dure will be applicable to the simulation of tomospectroscopy in rough physical models of organs. Such a simulation may help to forecast the char- acteristics of the tomospectroscopic device.
A P P E N D I X
Determination o f the Cumulative Probability Distribution W(I) and W(~o) and o f the Probability o f Absorption k
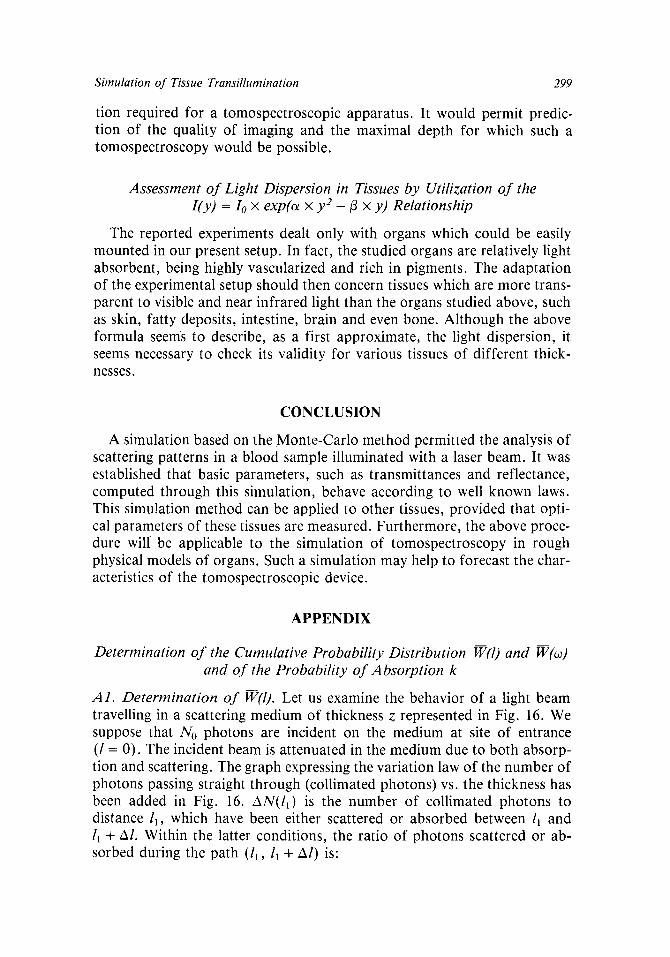
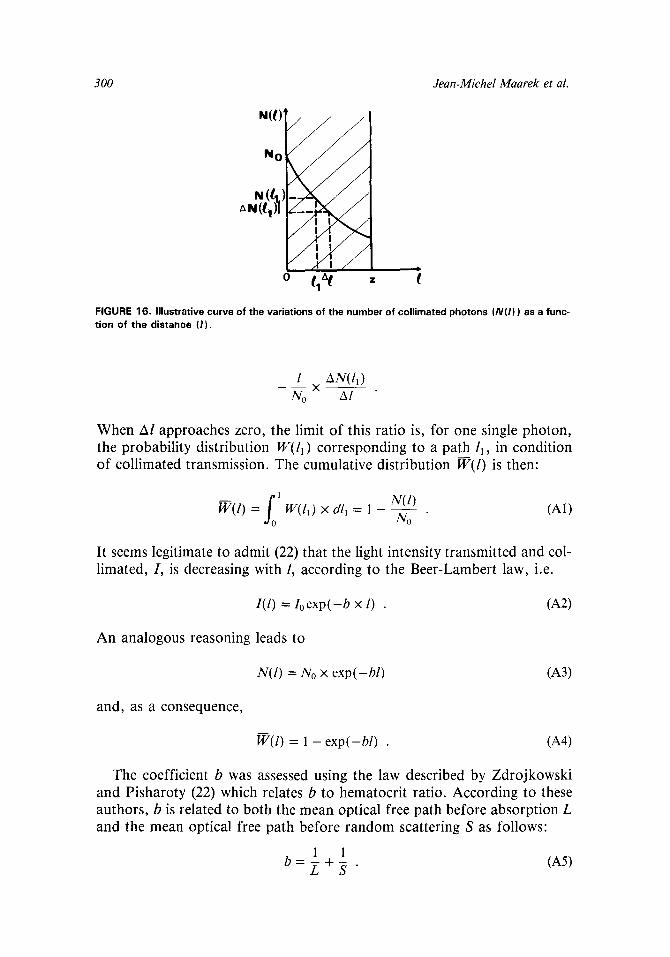
A1. Determination o f W(I). Let us examine the behavior of a light beam travelling in a scattering medium of thickness z represented in Fig. 16. We suppose that No photons are incident on the medium at site of entrance (l = 0). The incident beam is attenuated in the medium due to both absorp- tion and scattering. The graph expressing the variation law of the number of photons passing straight through (collimated photons) vs. the thickness has been added in Fig. t6. AN(/l) is the number of collimated photons to distance /1, which have been either scattered or absorbed between l~ and ll + Al. Within the latter conditions, the ratio of photons scattered or ab- sorbed during the path (l~, l~ + A/) is:
300 Jean-Michel Maarek et al.
o ilZXl
FIGURE 16. Il lustrative curve of the variations of the number of col l imated photons (N(I)) as a func- tion of the distance ( I ) ,
l AN(I l )
No ,5/
When Al approaches zero, the limit of this ratio is, for one single photon , the probabil i ty distribution W(ll) corresponding to a path ll, in condit ion of coll imated transmission. The cumulat ive distribution W(1) is then:
fo ~ N(1) (A1) W(t) = W(6) x d6 = ~ - W2-o
It seems legitimate to admit (22) that the light intensity t ransmit ted and col- l imated, I, is decreasing with l, according to the Beer-Lambert law, i.e.
I(l) = I0exp(-b x 1) .
An analogous reasoning leads to
and, as a consequence,
N(l) = No X exp(-b/)
W(I) = 1 - exp(-b/) .
(A2)
(A3)
1 1 b = ~ + ~ . (A5)
The coefficient b was assessed using the law described by Zdrojkowski and Pisharoty (22) which relates b to hematocr i t ratio. According to these authors , b is related to both the mean optical free path before absorpt ion L and the mean optical free path before r a n d o m scattering S as follows:
(A4)
Simulation of Tissue Transillumination 301
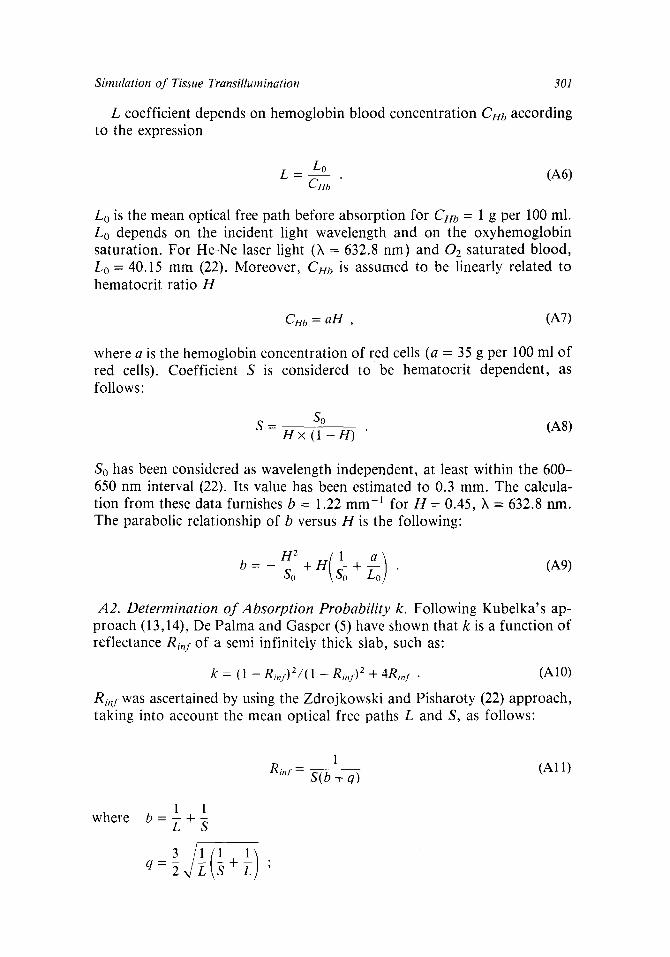
L coefficient depends on hemoglobin blood concentration CHb according to the expression
L - L0 (A6)
L0 is the mean optical free path before absorption for CHb = 1 g per 100 ml. Lo depends on the incident light wavelength and on the oxyhemoglobin saturation. For He-Ne laser light (k = 632.8 nm) and 02 saturated blood, Lo = 40.15 mm (22). Moreover, CHa is assumed to be linearly related to hematocrit ratio H
CHb = aH , (A7)
where a is the hemoglobin concentration of red cells (a = 35 g per 100 ml of red cells). Coefficient S is considered to be hematocrit dependent, as follows:
S - So (AS) H • (1 - H )
So has been considered as wavelength independent, at least within the 600- 650 nm interval (22). Its value has been estimated to 0.3 mm. The calcula- tion from these data furnishes b = 1.22 mm -1 for H = 0.45, X = 632.8 nm. The parabolic relationship of b versus H is the following:
H 2 H(1 a ) (A9) b - So + ~ + L o o "
A2. Determinat ion o f Absorp t ion Probabi l i ty k. Following Kubelka's ap- proach (13,14), De Palma and Gasper (5) have shown that k is a function of reflectance Ri,,i of a semi infinitely thick slab, such as:
k = (1 - Ri,,f)2/(1 - Ri,~t.) 2 + 4Rinf �9 (A10)
Riny was ascertained by using the Zdrojkowski and Pisharoty (22) approach, taking into account the mean optical free paths L and S, as follows:
1 1 where b = Z +
q = ~
1 Rinf - S(b + q) (A11)
302 Jean-Michel Maarek et al.
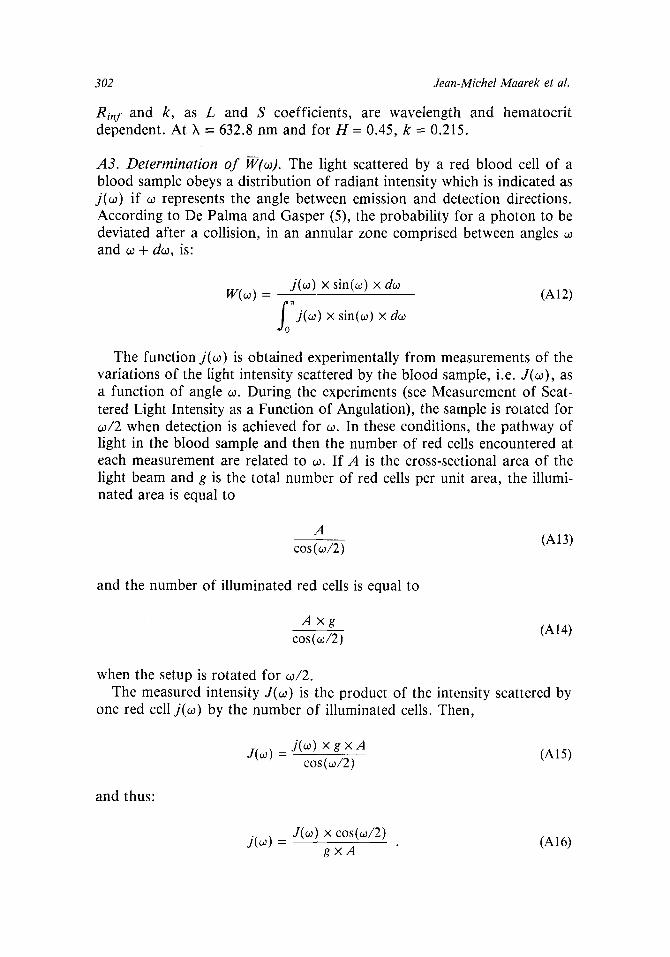
Rin f and k, as L and S coefficients, are wavelength and hematocrit dependent. At X = 632.8 nm and for H = 0.45, k = 0.215.
A3. Determination o f W(co). The light scattered by a red blood cell of a blood sample obeys a distribution of radiant intensity which is indicated as j(co) if co represents the angle between emission and detection directions. According to De Palma and Gasper (5), the probability for a photon to be deviated after a collision, in an annular zone comprised between angles co and co +dco, is:
j(w) X sin(w) x dw W(w) = (A12)
L ~j(w) x sin(w) x dw
The function j(co) is obtained experimentally from measurements of the variations of the light intensity scattered by the blood sampte, i.e. J(co), as a function of angle co. During the experiments (see Measurement of Scat- tered Light Intensity as a Function of Angulation), the sample is rotated for co/2 when detection is achieved for co. In these conditions, the pathway of light in the blood sample and then the number of red cells encountered at each measurement are related to co. If A is the cross-sectional area of the light beam and g is the total number of red cells per unit area, the illumi- nated area is equal to
A cos(w/2)
(A13)
and the number of illuminated red cells is equal to
A x g (A14) cos(w/2)
when the setup is rotated for co/2. The measured intensity J(co) is the product of the intensity scattered by
one red cell j(co) by the number of illuminated cells. Then,
j(w) x g x A J(w) - (A15)
cos(w/2)
and thus:
j(w) = J(w) x cos(w/2) (A16) g x A
Simulation o f Tissue Transillumination 303
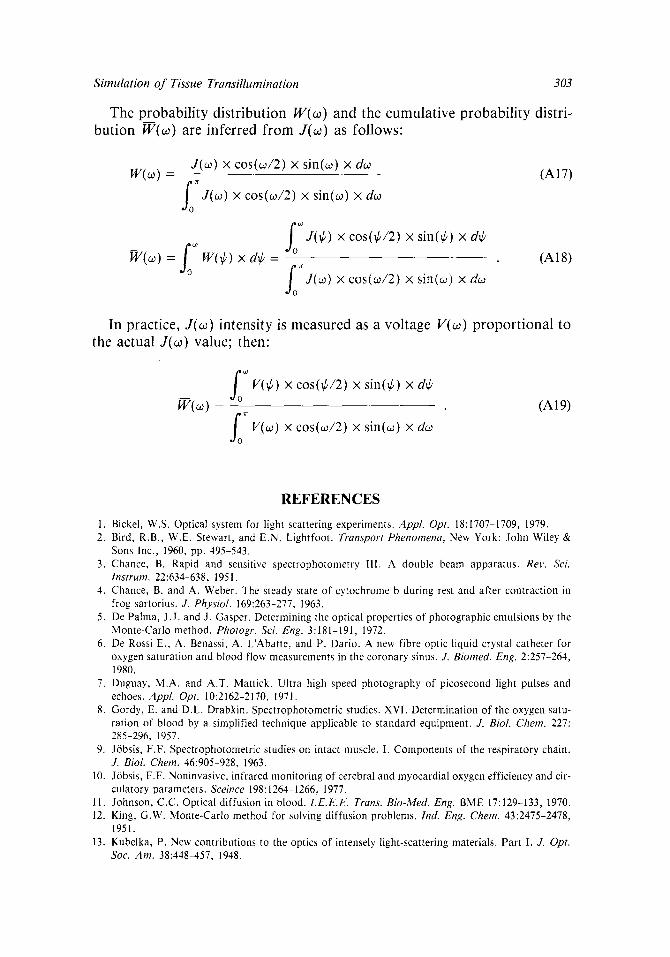
The probability distribution W(~o) and the cumulative probability distri- bution W(w) are inferred from J(c0) as follows:
J(co) • cos (co /2) • sin(co) • dw W(co) = (A17)
o~"J(co) • cos (co /2) • s in (w) •
g ~o J(C`) x cos(c`/2) x sin(C,) x dc` P
W(co) = ~ W(C`) • d~b = (A18) -to
fo J(co) x cos(co/2) x sin(o:) x rico 7r
In practice, J(c0) intensity is measured as a voltage V(c0) proport ional to the actual J(c0) value; then:
fo ~ V(C`) x cos(C`/2) x sin(c`) • W(co) -- (A19)
fo ~ V(co) x cos(co/2) x sin(c0) x dw
REFERENCES
1. Bickel, W.S. Optical system for light scattering experiments. Appl. Opt. 18:1707-1709, 1979. 2. Bird, R.B., W.E. Stewart, and E.N. Lightfoot. Transport Phenomena, New York: John Wiley &
Sons Inc., 1960, pp. 495-543. 3. Chance, B. Rapid and sensitive spectrophotometry Ill. A double beam apparatus. Rev. Sci.
Instrum. 22:634-638, 1951. 4. Chance, B. and A. Weber. The steady state of cytochrome b during rest and after contraction in
frog sartorius. J. Physiol. 169:263-277, 1963. 5. De Palma, J.J. and J. Gasper. Determining the optical properties of photographic emulsions by the
Monte-Carlo method. Photogr. Sci. Eng. 3:181-191, 1972. 6. De Rossi E., A. Benassi, A. L'Abatte, and P. Dario. A new fibre optic liquid crystal catheter for
oxygen saturation and blood flow measurements in the coronary sinus. J. Biomed. Eng. 2:257-264, 1980.
7. Duguay, M.A. and A.T. Mattick. Ultra high speed photography of picosecond light pulses and echoes. Appl. Opt. 10:2162-2170, 1971.
8. Gordy, E. and D.L. Drabkin. Spectrophotometric studies. XVI. Determination of the oxygen satu- ration of blood by a simplified technique applicable to standard equipment. J. Biol. Chem. 227: 285-296, 1957.
9. J6bsis, F.F. Spectrophotometric studies on intact muscle. I. Components of the respiratory chain. J. Biol. Chem. 46:905 928, 1963.
10. Jobsis, F.F. Noninvasive, infrared monitoring of cerebral and myocardial oxygen efficiency and cir- culatory parameters. Sceince 198:1264-1266, 1977.
11. Johnson, C.C. Optical diffusion in blood. LE.E.E. Trans. Bio-Med. Eng. BME 17:129-133, 1970. 12. King, G.W. Monte-Carlo method for solving diffusion problems. Ind. Eng. Chem. 43:2475-2478,
1951. 13. Kubelka, P. New contributions to the optics of intensely light-scattering materials. Part I. J. Opt.
Soc. Am. 38:448-457, 1948.
304 Jean-Michel Maarek et al.
14. Kubelka, P. New contributions to the optics of intensely light-scattering materials. Part II: Non- homogeneous layers. J, Opt, Soc. Am. 44:330-335, 1954.
15. Longini, R.L. and R. Zdrojkowski. A note on the theory of back-scattering of light by living tissue. I.E.E.E. Trans. Bio-Med. Eng. BME 15:4-10, 1968.
16. Martin, J.L., Y. Lecarpentier, A. Antonetti, and G. Grillon. Picosecond laser stereometry light scat- tering measurements on biological material. Med, Biol. Eng. Comput. 18:250-252, 1980.
17. McCracken, D.D. The Monte-Carlo method. Scientific American 192:90-96, 1955. 18. McRae, R.A., J.A. McClure, and P. Latimer. Spectral transmission and scattering properties of red
blood cells. J. Opt. Soc. Am. 51:1366-1372, 1961. 19. Pelletier, J.P. Techniques num6riques appliqu6es au calcul scientifique. Paris: Masson et cie, 1971,
pp. 290-296. 20. Polanyi, M.L. and R.M. Hehir. In vivo oximeter with fast dynamic response. Rev. Sci. Instrum.
33:1050-1054, 1962. 21. Ramirez, J. Oxidation-reduction changes of cytochromes following stimulation of amphibian
cardiac muscle. J. Physiol. 147:14-32, 1959. 22. Zdrojkowski, R.J. and N.R. Pisharoty. Optical transmission and reflection by blood. I.E.E.E.
Trans. Bio-Med. Eng. BME 17:122-128, 1970.
Top Related
Copyright © 2022 FDOKUMEN

