


Bahasa
Halaman
Hukum


Journal of Clinical Epidemiology - (2014) -
ORIGINAL ARTICLE
A new framework to enhance the interpretation of external validationstudies of clinical prediction models
Thomas P.A. Debraya,*, Yvonne Vergouweb, Hendrik Koffijberga, Daan Nieboerb,Ewout W. Steyerbergb,1, Karel G.M. Moonsa,1
aJulius Center for Health Sciences and Primary Care, University Medical Center Utrecht, Str. 6.131, PO Box 85500,
3508GA Utrecht, The NetherlandsbDepartment of Public Health, Erasmus Medical Center, Rotterdam, The Netherlands
Accepted 30 June 2014; Published online xxxx
Abstract
Objectives: It is widely acknowledged that the performance of diagnostic and prognostic prediction models should be assessed inexternal validation studies with independent data from ‘‘different but related’’ samples as compared with that of the development sample.We developed a framework of methodological steps and statistical methods for analyzing and enhancing the interpretation of results fromexternal validation studies of prediction models.
Study Design and Setting: We propose to quantify the degree of relatedness between development and validation samples on a scaleranging from reproducibility to transportability by evaluating their corresponding case-mix differences. We subsequently assess the models’performance in the validation sample and interpret the performance in view of the case-mix differences. Finally, we may adjust the model tothe validation setting.
Results: We illustrate this three-step framework with a prediction model for diagnosing deep venous thrombosis using three validationsamples with varying case mix. While one external validation sample merely assessed the model’s reproducibility, two other samples ratherassessed model transportability. The performance in all validation samples was adequate, and the model did not require extensive updatingto correct for miscalibration or poor fit to the validation settings.
Conclusion: The proposed framework enhances the interpretation of findings at external validation of prediction models. � 2014 TheAuthors. Published by Elsevier Inc. This is an open access article under the CC BY-NC-SA license (http://creativecommons.org/licenses/by-nc-sa/3.0/).
Keywords: Case mix; Reproducibility; Transportability; Generalizability; Prediction model; Validation
1. Introduction
Clinical prediction models are commonly developed tofacilitate diagnostic or prognostic probability estimationsin daily medical practice. Such models are typicallydeveloped by (statistically) associating multiple predic-tors with outcome data from a so-called derivation ordevelopment sample. Well-known examples are the Wellsmodels for diagnosing deep venous thrombosis, the Gailmodel for prediction of breast cancer incidence [1],
Funding: This work was supported by the Netherlands Organiza-
tion for Scientific Research (Grants 9120.8004, 918.10.615, 916.11.126,
and 917.11.383).
Conflict of interest: None.1 These authors contributed equally.
* Corresponding author. Tel.: þ31 (0)88 75 680 26; fax:þ31 (0)88 75
680 99.
E-mail address: [email protected] (T.P.A. Debray).
http://dx.doi.org/10.1016/j.jclinepi.2014.06.018
0895-4356/� 2014 The Authors. Published by Elsevier Inc. This is an open acc
licenses/by-nc-sa/3.0/).
and the Framingham risk scores for cardiovascular riskassessment [2].
As prediction models are developed to be applied in newindividuals, their value depends on their performanceoutside the development sample [3e7]. It is therefore rec-ommended to quantify the predictive accuracy of novel pre-diction models in different samples (as compared with thedevelopment sample) from the same or similar target pop-ulations or domains [3,4,6e12]. These so-called (external)validation studies may range from temporal (eg, samplefrom the same hospital or primary care practice only laterin time), to geographical (eg, sample from different hospi-tal, region, or even country), to validations across differentmedical settings (eg, from secondary to primary caresetting or vice versa) or different target populations or do-mains (eg, from adults to children) with increasinglydifferent study samples or case mix between developmentand validation samples [3,4,6,13].
ess article under the CC BY-NC-SA license (http://creativecommons.org/

2 T.P.A. Debray et al. / Journal of Clinical Epidemiology - (2014) -
What is new?
Key findings� The proposed methodological framework for pre-
diction model validation studies may enhance theinterpretation of results from validation studies.Important issues are judging to what extent thesubjects in the validation sample are truly differentfrom the development sample, how the case mix ofthe validation sample at hand can be placed in viewof other validation studies of the same model, andto what extent the (clinical) transportability orrather (statistical) reproducibility of the model isstudied.
What this adds to what was known?� The value of any developed (diagnostic or prog-
nostic) prediction model depends on its perfor-mance outside the development sample, andtherefore it is widely recommended to externallyvalidate its predictive accuracy in samples fromplausibly related source populations (as comparedwith the development sample). It is often unclearhow results from validation studies relate to theactual generalizability of the prediction modeland how researchers should interpret good or poormodel performance in the validation sample. Byquantifying the relatedness between the develop-ment and validation samples, it becomes possibleto interpret estimated model performance interms of (clinical) transportability or (statistical)reproducibility.
� Internal validation studies assess model repro-ducibility.
� External validation studies do not necessarilyassess model transportability (to a large extent).
What is the implication and what should changenow?� When externally validating a prediction model,
researchers should evaluate and quantify the relat-edness between the population of the developmentand validation samples; otherwise, inferences onthe actual clinical value or transportability of aprediction model may be misleading and causeprediction models to be implemented in incompat-ible populations.
Unfortunately, the concept of external validation re-mains rather abstract and loosely defined. It is often unclearto which extent individuals from the validation sample(meaningfully) differ or may differ from the development
sample. One often still has to speculate how an estimatedmodel performance (eg, discrimination or calibration) inan external validation study should be interpreted, that is,under which conditions the model can successfully be im-plemented across other plausibly related populations.
Justice et al. and others [6,7,14,15] attempted to refinethe interpretation of validation study results by distinguish-ing between model reproducibility and model transport-ability. Model reproducibility refers that a modelperforms sufficiently accurate across new samples fromthe same target population. This can also be approximatedwith resampling techniques using the development data setonly, such as bootstrapping or cross-validation techniques,commonly referred to as internal validation of a predictionmodel [11,12]. Transportability refers that a modelperforms well across samples from different but relatedsource populations and can only be assessed in externalvalidation studies. The degree of relatedness between thedevelopment and (external) validation samples is often un-clear and, thereby, obfuscates the extent of transportabilitythat is actually being tested. It may, for instance, bepossible that some external validation studies rather reflecta model’s reproducibility, for example, when thedevelopment and validation samples have a very similarcase mix.
We anticipate that a framework for quantifying differ-ences in case mix between the development and validationsample(s) would help to interpret the results of externalvalidation studies of prediction models. In particular, thesedifferences could indicate the extent to which an externalvalidation study assesses the model’s reproducibility or itstransportability. We hereto propose a framework of meth-odological steps and address statistical methods foranalyzing and interpreting the results of external validationstudies. We illustrate the use of our framework in an empir-ical example on validation of a developed prediction modelfor the presence of deep vein thrombosis (DVT) using alarge individual participant data set with different valida-tion samples, with varying case mix. We aim to improvethe inference making of studies aimed at testing of predic-tion models in new participant samples to better determinewhether a prediction model is clinically valuable or merelystatistically reproducible [6]. The framework thus facili-tates faster and wider implementation of genuinely usefulmodels and allows a speedier identification of models thatare of limited value [16].
2. Empirical example data
DVT is a blood clot that forms in a leg vein and maymigrate to the lungs leading to blockage of arterial flow,preventing oxygenation of the blood and potentiallycausing death. Multivariable diagnostic prediction modelshave been proposed during the past decades to safelyexclude DVT without having to refer for further burdening(reference standard) testing. Physicians may, however,
3T.P.A. Debray et al. / Journal of Clinical Epidemiology - (2014) -
doubt to use such a diagnostic prediction model if their pa-tient(s) represent a specific subgroup, such as elderly co-morbid patients [17], that was not well represented in thedevelopment sample. For this article, we hypothesize thatit is yet unclear to what extent the developed DVT diag-nostic prediction models are valid across samples of thesame or of different (but related) target populations becausethe performance of a prediction model may change accord-ing to the characteristics of the patients or clinical setting(eg, primary or secondary care).
To illustrate our framework, we used individual partici-pant data (IPD) from four different data sets with varyingcase mix (Table 1) to develop and test a multivariable diag-nostic model for predicting the presence or absence ofDVT. Specifically, we used one data set (n 5 1,295) todevelop a logistic regression model with seven predefined(based on previous developed prediction models) patientcharacteristics and the D-dimer test result (Table 2). Next,we assessed the model performance in the three remainingvalidation data sets (n1 5 791, n2 5 1,028, and n3 51,756), each with different case mix. We note that dataare used for illustration purposes of our framework onlyand not to present the optimal diagnostic strategy in thevalidated settings. For further details on these studies, werefer to the literature [18].
3. Methods
Fig. 1 describes the steps of our proposed methods andsteps for analysis and enhanced interpretation of the resultsof external validation studies. In the first step, we quantifyto what extent the (case mix of the) development and vali-dation samples are related. In the second step, we assess themodel’s predictive accuracy in the development and valida-tion samples to identify the extent to which its predictivemechanisms differ or remain accurate in the validation sam-ple as compared with the development sample. In the thirdstep, we combine the results from the preceding steps tojudge whether the model’s performance in the validationsample rather reflects a degree of reproducibility or trans-portability. In this step, we also indicate what type of revi-sions to the model, based on the validation sample at hand,
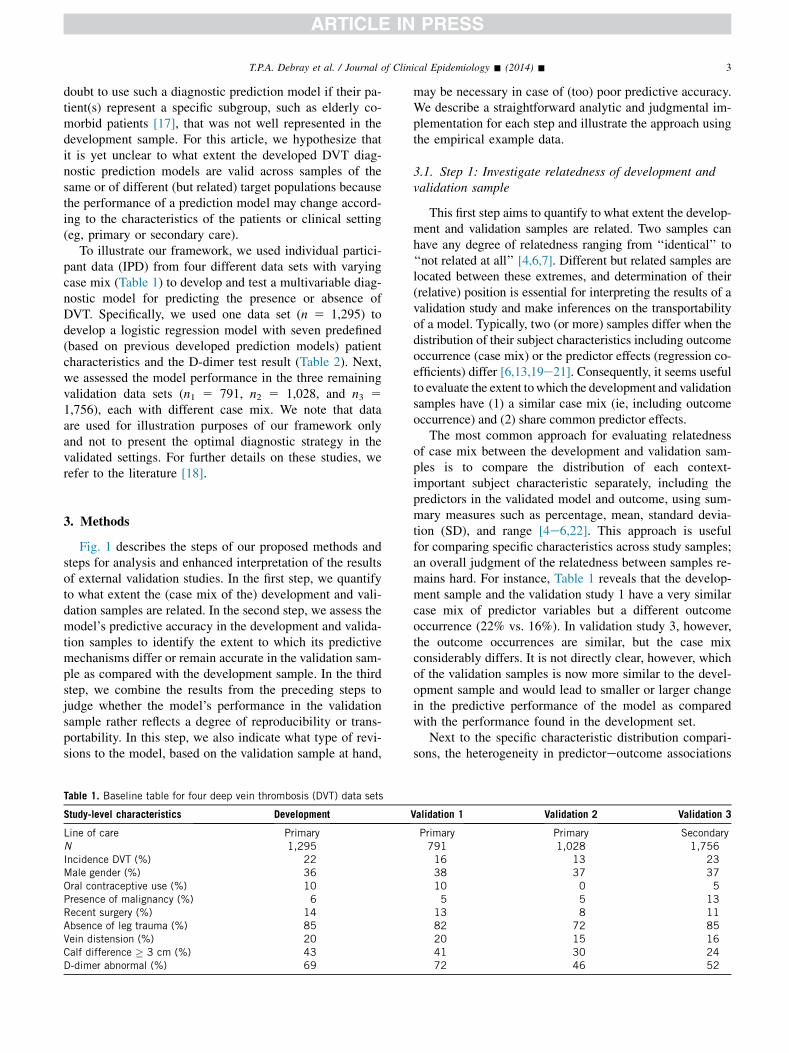
Table 1. Baseline table for four deep vein thrombosis (DVT) data sets
Study-level characteristics Development
Line of care PrimaryN 1,295Incidence DVT (%) 22Male gender (%) 36Oral contraceptive use (%) 10Presence of malignancy (%) 6Recent surgery (%) 14Absence of leg trauma (%) 85Vein distension (%) 20Calf difference � 3 cm (%) 43D-dimer abnormal (%) 69
may be necessary in case of (too) poor predictive accuracy.We describe a straightforward analytic and judgmental im-plementation for each step and illustrate the approach usingthe empirical example data.
3.1. Step 1: Investigate relatedness of development andvalidation sample
This first step aims to quantify to what extent the develop-ment and validation samples are related. Two samples canhave any degree of relatedness ranging from ‘‘identical’’ to‘‘not related at all’’ [4,6,7]. Different but related samples arelocated between these extremes, and determination of their(relative) position is essential for interpreting the results of avalidation study and make inferences on the transportabilityof a model. Typically, two (or more) samples differ when thedistribution of their subject characteristics including outcomeoccurrence (case mix) or the predictor effects (regression co-efficients) differ [6,13,19e21]. Consequently, it seems usefulto evaluate the extent towhich the development and validationsamples have (1) a similar case mix (ie, including outcomeoccurrence) and (2) share common predictor effects.
The most common approach for evaluating relatednessof case mix between the development and validation sam-ples is to compare the distribution of each context-important subject characteristic separately, including thepredictors in the validated model and outcome, using sum-mary measures such as percentage, mean, standard devia-tion (SD), and range [4e6,22]. This approach is usefulfor comparing specific characteristics across study samples;an overall judgment of the relatedness between samples re-mains hard. For instance, Table 1 reveals that the develop-ment sample and the validation study 1 have a very similarcase mix of predictor variables but a different outcomeoccurrence (22% vs. 16%). In validation study 3, however,the outcome occurrences are similar, but the case mixconsiderably differs. It is not directly clear, however, whichof the validation samples is now more similar to the devel-opment sample and would lead to smaller or larger changein the predictive performance of the model as comparedwith the performance found in the development set.
Next to the specific characteristic distribution compari-sons, the heterogeneity in predictoreoutcome associations
Validation 1 Validation 2 Validation 3
Primary Primary Secondary791 1,028 1,75616 13 2338 37 3710 0 55 5 13
13 8 1182 72 8520 15 1641 30 2472 46 52

Table 2. Estimated regression coefficients and corresponding standard errors (SE) for four primary care deep vein thrombosis (DVT) data sets
Development Validation 1 Validation 2 Validation 3
N 1,295 791 1,028 1,756Constant (model intercept) �5.02 (0.38) �6.71 (1.06) �4.67 (0.37) �4.46 (0.29)Male gender 0.71 (0.16) 0.40 (0.22) 0.60 (0.21) 0.49 (0.14)Oral contraceptive use 0.76 (0.27) 0.47 (0.35) �7.02 (58.62) 0.49 (0.32)Presence of malignancy 0.50 (0.26) �0.07 (0.43) 0.68 (0.36) 0.30 (0.18)Recent surgery 0.42 (0.20) 0.55 (0.28) �0.04 (0.38) 0.49 (0.19)Absence of leg trauma 0.67 (0.22) 0.81 (0.31) 0.55 (0.25) 0.25 (0.21)Vein distension 0.53 (0.17) 0.23 (0.25) 0.22 (0.26) 0.58 (0.18)Calf difference � 3 cm 1.15 (0.15) 0.87 (0.21) 0.87 (0.21) 1.42 (0.14)D-dimer abnormal 2.43 (0.30) 3.95 (1.01) 2.40 (0.30) 2.96 (0.22)
The linear predictor for a subject (given by the model from the development sample) is as follows: �5.02 þ (0.71 �male gender)þ (0.76 � OCuse) þ (0.50 � presence of malignancy) þ (0.42 � recent surgery) þ (0.67 � absence of leg trauma) þ (0.53 � vein distension) þ (1.15 � calfdifference � 3 cm) þ (2.43 � abnormal D-dimer). The probability (or risk) of DVT for the same subject is given by 1/[1 þ exp(�linear predictor)].
4 T.P.A. Debray et al. / Journal of Clinical Epidemiology - (2014) -
between the development and validation samples can alsobe evaluated by, for example, refitting the original modelin the validation sample (Table 2). Unfortunately, also forthis approach, it is not directly clear how to summarize dif-ferences in estimated regression coefficients (or corre-sponding adjusted odds ratios) as heterogeneity betweenthe underlying target populations and how to judge to whatextent a model’s performance in other validation studies isaffected.
We here propose two statistical approaches that use IPDfrom the development and validation samples to calculatean overall measure of their (dis)similarity. The firstapproach calculates a summary measure of relatednessbased on how well the study individuals from both samplescan be distinguished. The second approach assesses towhich extent the predicted risk distributions of the develop-ment and validation samples diverge.
3.1.1. Approach 1: Distinguishing between individualsof validation and development sets
The relatedness between two samples is typically testedby assuming an underlying (eg, multivariate normal)
Fig. 1. Proposed approach to external validation studies. Typical validat
distribution of subject characteristics. This strategy is, how-ever, often undesirable because it cannot adequately ac-count for dichotomous or nonlinear variables. Wetherefore relate to the principles of discriminant analysisand the Mahalanobis distance metric by considering ageneralization of Hotelling T2 [23]. In particular, we pro-pose to quantify to which extent individuals from the devel-opment and validation samples can be distinguished anduse this as a measure of nonrelatedness. We hereto estimatea binary logistic regression model, further referred to asmembership model, to predict the probability that an indi-vidual belongs to (is a member of) the development sampleas compared with the validation sample. Hence, the depen-dent variable of this model is ‘‘1’’ for participants of thedevelopment set and ‘‘0’’ for those of the validation set.This model should at least include as independent variablesthe predictors and outcome from the original predictionmodel to ensure that model performance can (at leastpartially) be interpreted in terms of its considered predic-tors and outcome. It may be clear that if the membershipmodel discriminates poorly (or well), both samples arestrongly (or not much) related in terms of the considered
ion studies are restricted to step 2: ‘‘Assess model performance’’.

5T.P.A. Debray et al. / Journal of Clinical Epidemiology - (2014) -
predictor variables and outcome status. The discriminativeability can be quantified using measures such as the concor-dance (c) statistic.
3.1.2. Approach 2: Comparing the predicted risks be-tween development and validation samples
It is also possible to use the IPD of both samples todirectly compare the distribution of the model’s predictedrisks in the development and validation samples [11,20].This can be achieved by calculating the spread, heredefined as the SD, and the mean of the linear predictor(LP) of the original model in the development and valida-tion samples. Because the LP is the logit transformation ofthe predicted risks in logistic regression, its interpretationis fairly straightforward. An increased (or decreased)variability of the LP indicates more (or less) heterogeneityof case mix between the development and validation sam-ples and thus of their overarching target populations. Asthe case-mix heterogeneity increases, individuals have alarger variety of patient characteristics, and the modeltends to discriminate better [20,24]. Specifically, thediscriminative ability may improve (or deteriorate) whenthe SD of the LP increases (or decreases) because individ-ual risk estimates become more (or less) separable betweenboth samples. Conversely, differences in mean of the LPbetween the development and validation samples reflectthe difference in overall (predicted) outcome frequencydthat is, in fact a reflection of case mix severitydandmay therefore reveal the model’s calibration-in-the-largein the validation sample [25].
3.1.3. Empirical exampleResults from the empirical example (Fig. 2) demonstrate
that approach 1 and the distribution of the LP (approach 2)
Fig. 2. Results from step 1 in the empirical example. Results of analyzing themodel. The y-axis reflects the extent to which the validation sample is differtistic of the membership model). In the left graph, the x-axis reflects the pstandard deviation (SD) of the linear predictor. In the right graph, the x-axCircle, validation study 1; square, validation study 2; triangle, validation st
generally lead to similar conclusions. Specifically, wefound that it was difficult to distinguish between individ-uals from the development sample and validation study 1.The concordance statistic of the membership model, cm,was 0.56 with 95% confidence interval of 0.54, 0.59 indi-cating that both samples are largely the same. Approach2 reveals that both samples also had a similar SD of theLP (1.45 vs. 1.47) and similar mean of the LP (�1.72 vs.�1.75). Hence, both approaches show that the developmentsample and validation study 1 had a similar distribution ofcase mix, and we can expect similar model performance inboth samples.
For validation studies 2 and 3, we found an increasedspread of the LP and a decreased average of the LP. Themembership models indicated that individuals from thedevelopment and validation samples could be distinguishedmore easily and that their case mix was indeed much lessrelated to the case mix of the development sample (cm 50.71 and cm 5 0.68 respectively).
3.2. Step 2: Assessment of the model’s performance inthe validation study
In this second step, we evaluate the originally developedmodel’s performance in the validation sample. This is typi-cally quantified in terms of calibration and discrimination[11,12,26]. Calibration reflects the extent to which the pre-dicted probabilities and actual probabilities agree, whereasdiscrimination is the ability to distinguish high-risk fromlow-risk individuals. Here, we focus on the calibration-in-the-large plus calibration slope and the c-statistic assummary measures of calibration and discrimination,respectively [11,27e30]. The calibration slope can be usedas a statistic for evaluating to which extent the model’s
validation sample (median with 95% CI) and validating the predictionent but related to the development sample (as indicated by the c-sta-otential for good performance indicated by the relative difference inis reflects the difference between the means of the linear predictors.udy 3.

6 T.P.A. Debray et al. / Journal of Clinical Epidemiology - (2014) -
predictive mechanisms remain valid in the validation sam-ple. Finally, we recommend visual inspection of the calibra-tion plot, in which groups of predicted probabilities areplotted against actually observed outcomes and perfect pre-dictions should be on the 45� line [27].
3.2.1. Calibration-in-the-largeThis statistic is given as the intercept term a from the
recalibration model logitðyÞ5aþ logitðbyÞ [11]. It quan-tifies whether the average of predictions corresponds withthe average outcome frequency and ideally equals 0.Values below (or above) this value indicate that the modeloverestimates (or respectively underestimates) theoutcome. By definition, the calibration-in-the-large is al-ways optimal (0) in the development sample of the predic-tion model [11,31]. Consequently, it is a useful statistic foridentifying whether unexplained differences exist in theoutcome frequency of the validation sample, for example,because of mechanisms not captured by the included pre-dictors [4,25,32].
3.2.2. Calibration slopeThe calibration slope, denoted as boverall, can be estimated
from the recalibration model logitðyÞ5aþ boverall logitðbyÞ. Itreflects whether predicted risks are appropriately scaled withrespect to each other over the entire range of predicted prob-abilities (boverall 5 1) [29,33]. Typically, boverall O 1 occurswhen predicted probabilities do not vary enough (eg, pre-dicted risks are systematically too low) and 0 ! boverall !1 occurs when they vary too much (eg, predicted risks aretoo low for low outcome risks and too high for high outcomerisks). A poor calibration slope (0! boverall ! 1) usually re-flects overfitting of the model in the development sample butmay also indicate inconsistency of predictor effects betweenthe development and validation samples [11,21,27,34e36].
3.2.3. Concordance statisticThe c-statistic represents the probability that individ-
uals with the outcome receive a higher predicted probabil-ity than those without. It corresponds to the area under thereceiver operating characteristic curve for binary out-comes and can range from 0.5 (no discrimination) to 1.0(perfect discrimination). Because the c-statistic revealsto what extent the prediction model can rank order the in-dividuals according to the outcome in the validation sam-ple, it is a useful tool for evaluating its discriminativevalue.
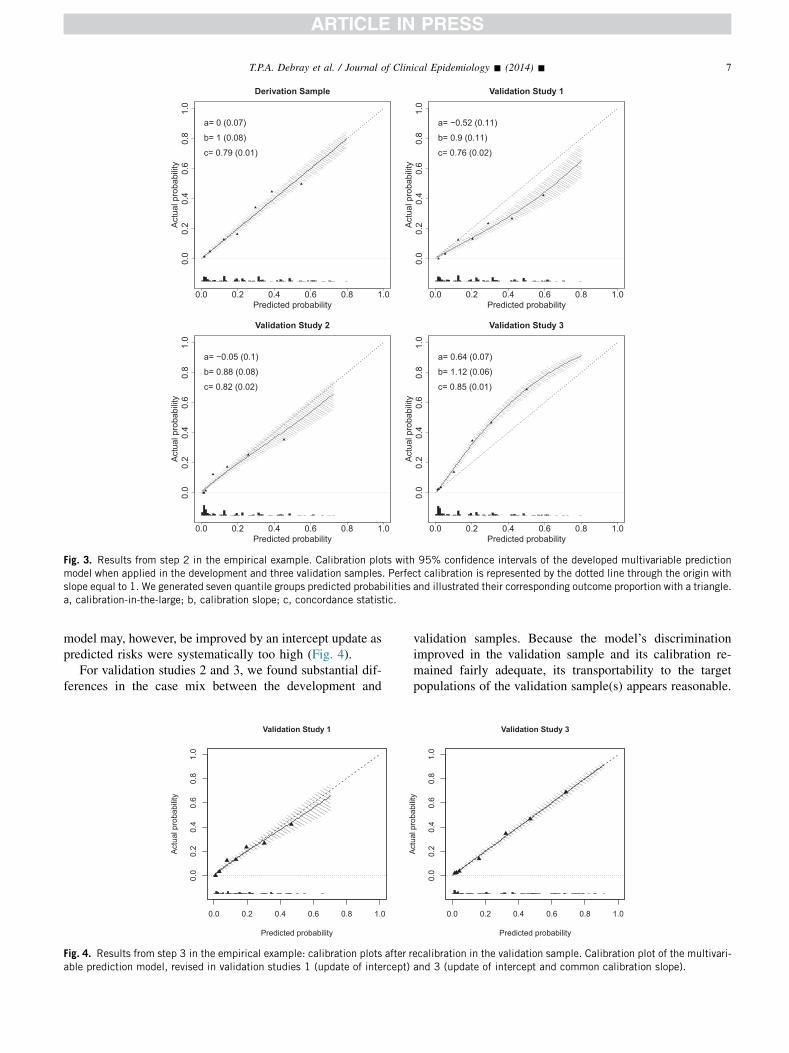
3.2.4. Empirical exampleIn validation study 1, we found that the discriminative
ability of the developed model slightly decreased(Fig. 3). Predicted risks were systematically too high (cali-bration-in-the-large 5 �0.52 with P ! 0.0001) but re-mained proportionally accurate (calibration slope 50.90). For validation studies 2 and 3, we found anincreased discriminative ability in the validation sample.
This increase was expected from step 1 because of anincreased spread of the LP. Although the achievedcalibration-in-the-large and calibration slope were reason-able for validation study 2, predicted risks were systemat-ically too low and did not vary enough in validation study 3(calibration slope: 1.12 with P ! 0.0001).
3.3. Step 3: Interpretation of model validation results
In this final step, we describe how the model’s predictiveaccuracy in the validation sample in step 2 can be inter-preted by combining the results from step 1. We also indi-cate what may be done to further improve the model’sperformance in the overarching target population of thevalidation sample in case of poor performance.
In step 1, we identified whether the reproducibility(similar case mix) or transportability (different case mix)of the prediction model is assessed when evaluated in thevalidation sample. Step 2 directly indicates whether differ-ences in case mix between the development and validationsample actually affect model performance in the latter. Step2 also indicates whether the discriminative ability of theprediction model differs because of differences in casemix heterogeneity (reflected by a different variability ofthe LP in step 1) and whether the calibration-in-the-largedeteriorates because of differences in overall (predicted)outcome frequency (reflected by a different mean of theLP in step 1).
In case of poor predictive performance in the validationset, several methods may improve the model’s accuracy inthe validation sample at hand. These updating methods mayrange from an intercept update to adjustment or even re-estimation of individual regression coefficients or addingpredictors [3,11,34,36,37]. Specifically, a poor calibration-in-the-large may be overcome by re-estimating its interceptor baseline hazard (if applicable) in the validation sample(intercept update) [3,11,34,36,37]. Similarly, a poor cali-bration slope (eg, due to overfitting) may be corrected byapplying an overall adjustment of the calibration slope (lo-gistic calibration). On the other hand, when predictor ef-fects are heterogeneous between the development andvalidation samples and calibration plots show inconsistentpredictions across the whole range of predicted probabili-ties, updating becomes more difficult and may require there-estimation of individual predictors or even inclusion ofadditional predictors. In those scenarios, the validationstudy indicates that the model’s predictive mechanismsmay no longer be valid in the validation set; the model thuspoorly transports, and a more substantial model revision orupdating is needed.
3.3.1. Empirical exampleIn validation study 1, we can conclude that rather the
model’s reproducibility than transportability was tested inthe external validation study and that model performancewas concordantly adequate in the validation sample. The
0.0 0.2 0.4 0.6 0.8 1.0
0.0
0.2
0.4
0.6
0.8
1.0
Derivation Sample
Predicted probability
Act
ual p
roba
bilit
y
a= 0 (0.07)
b= 1 (0.08)
c= 0.79 (0.01)
0.0 0.2 0.4 0.6 0.8 1.0
0.0
0.2
0.4
0.6
0.8
1.0
Validation Study 1
Predicted probability
Act
ual p
roba
bilit
y
a= −0.52 (0.11)
b= 0.9 (0.11)
c= 0.76 (0.02)
0.0 0.2 0.4 0.6 0.8 1.0
0.0
0.2
0.4
0.6
0.8
1.0
Validation Study 2
Predicted probability
Act
ual p
roba
bilit
y
a= −0.05 (0.1)
b= 0.88 (0.08)
c= 0.82 (0.02)
0.0 0.2 0.4 0.6 0.8 1.0
0.0
0.2
0.4
0.6
0.8
1.0
Validation Study 3
Predicted probability
Act
ual p
roba
bilit
y
a= 0.64 (0.07)
b= 1.12 (0.06)
c= 0.85 (0.01)
Fig. 3. Results from step 2 in the empirical example. Calibration plots with 95% confidence intervals of the developed multivariable predictionmodel when applied in the development and three validation samples. Perfect calibration is represented by the dotted line through the origin withslope equal to 1. We generated seven quantile groups predicted probabilities and illustrated their corresponding outcome proportion with a triangle.a, calibration-in-the-large; b, calibration slope; c, concordance statistic.
7T.P.A. Debray et al. / Journal of Clinical Epidemiology - (2014) -
model may, however, be improved by an intercept update aspredicted risks were systematically too high (Fig. 4).
For validation studies 2 and 3, we found substantial dif-ferences in the case mix between the development and
0.0 0.2 0.4 0.6 0.8 1.0
0.0
0.2
0.4
0.6
0.8
1.0
Validation Study 1
Predicted probability
Act
ual p
roba
bilit
y
Fig. 4. Results from step 3 in the empirical example: calibration plots after rable prediction model, revised in validation studies 1 (update of intercept)
validation samples. Because the model’s discriminationimproved in the validation sample and its calibration re-mained fairly adequate, its transportability to the targetpopulations of the validation sample(s) appears reasonable.
0.0 0.2 0.4 0.6 0.8 1.0
0.0
0.2
0.4
0.6
0.8
1.0
Validation Study 3
Predicted probability
Act
ual p
roba
bilit
y
ecalibration in the validation sample. Calibration plot of the multivari-and 3 (update of intercept and common calibration slope).

8 T.P.A. Debray et al. / Journal of Clinical Epidemiology - (2014) -
For validation study 3, however, some miscalibrationoccurred such that the prediction model should be revised,for example, by updating its intercept and common calibra-tion slope in the validation sample (Fig. 4).
4. Discussion
Studies to quantify the performance of developed exist-ing prediction models in other individuals (external valida-tion studies) are important to assess the model’sperformance outside the development setting and to eval-uate the models’ extent of generalizability [3,4,6e12,16].It is often unclear how such validation results relate togeneralizability of the prediction model and how re-searchers should interpret good or poor model performanceobserved in a validation sample. We presented a frameworkto better interpret the results from (external) validationstudies and to infer whether the external validation studyrather assesses a model’s reproducibility or transportability.This framework uses concepts that were previously pro-posed [6,7,14,15]. It hereto distinguishes between (statisti-cal) reproducibility that can be assessed in individuals whoare from an identical source population, and (clinical)transportability that can be assessed in individuals whoare from a different but related source population.
With our proposed framework, it becomes possible tocompare the results from different validation studies andto expose boundaries of model transportability or general-izability. The underlying rationale bears a strong resem-blance to John Locke’s doctrine of empiricism [38] andKarl Popper’s theory of refutability [39e41]. Predictionmodels that perform well in validation studies with morepronounced case mix differences as compared with thosein the development sample are likely to generalize betteracross different target populations and, ultimately, to bemore valuable in routine care. It is, however, possible thatsome well-developed models are not transportable and mayfirst require model updating before actual implementationin another source or target population. The validation re-sults can then guide the update strategy [35]. Our frame-work may also be used to expose inflated findings andspin [42,43]. This may, for instance, occur when re-searchers deduce optimistic model generalizability fromvalidation studies with similar case mix as compared withthe development sample. Finally, our framework may beused to verify whether reported model performance isreproducible in the original source population. Byrendering validation study results more transparent, it fol-lows recent recommendations by Ioannidis et al. [44].The relevance of case mix differences between differentsource populations has also been highlighted for studiesevaluating the performance of diagnostic tests [45]. Inparticular, it is well known that the accuracy of a diagnostictest may vary across different study populations, such thatreported estimates cannot directly be translated to popula-tions with a different case mix. This effect is also known as
spectrum bias [14,15]. Furthermore, this issue has alsobeen described for transporting prediction models acrossdifferent settings, such as from secondary to primary care[3,10,46].
To appreciate our framework and recommendations,some considerations have to be made. First, in ourframework comparing case mix between development andvalidation data sets, one needs the availability of theparticipant-level data from the development sample. Thismay not always be available to researchers (externally) vali-dating a previously published prediction model. This im-plies that accurate calculation of differences in case mix(step 1) may not directly be possible and makes the interpre-tation of validation study results in step 3 more difficult. Forthis reason, researchers should routinely report the meanand SD of the LP when developing a novel predictionmodel, as this enables comparison of case mix differenceswhen this model is validated by others with no access toparticipant-level data of the development set. The describedapproaches in this article could be extended to calculatecase mix differences when only aggregate data or summaryresults from the development study are at hand, plus ofcourse the participant data from the validation study. Inparticular, information on the means and covariance of thepredictor variables in the development sample is sufficientto estimate the membership model (approach 1) or tocompare predicted risks between the development and vali-dation samples (approach 2). When such information is notfully reported in the model development article or unavai-lable from the corresponding authors, it can be borrowedfrom the validation sample to reconstruct participant-leveldata from the development sample (Appendix Table A1 atwww.jclinepi.com). Finally, case mix differences betweensubject characteristics of development and validation sam-ples can also be evaluated on the average level, by relyingon published baseline tables. Unfortunately, aforementionedapproaches will inevitably mask subtle dissimilarities be-tween the development and validation samples, reducing po-tential case mix differences between these samples. Theinability to access IPD from the development study thusnot only complicates interpretation of external validationstudy results but may also limit the usefulness of futureexternal validation studies. Further research is needed toevaluate how much information about the development sam-ple is actually required to allow proper distinction betweentesting of model’s reproducibility and transportability.
Second, the approaches in this study rely on subject-level characteristics to evaluate differences in case mix be-tween the development and validation samples. Differencesin study-level characteristics (such as inclusion and exclu-sion criteria, details on subject recruitment, or study designchoices) may provide additional insights into achievedmodel performance and could therefore further improvethe interpretation of prediction model validation results(step 3) [47]. For this reason, researchers should clearlyreport details on the design of the validation study and

9T.P.A. Debray et al. / Journal of Clinical Epidemiology - (2014) -
describe how subjects were enrolled in the study. The rele-vance of study-level characteristics has previously beenhighlighted for therapeutic studies, as the generalizabilityof estimated treatment effects is often unclear because ofstrict inclusion and exclusion criteria [48]. This has leadto the CONsolidated Standards of Reporting Trials (CON-SORT) statement, enabling readers to understand a trial’sdesign, conduct, analysis, and interpretation and to assessthe validity of its results [49]. Similar guidelines on report-ing are currently being developed for studies developing orvalidating risk prediction models [43,50].
Third, we proposed using a membership model approach(based on a generalization of Hotelling T2) and the distribu-tion of the LP approach, to evaluate case-mix differencesbetween the development and validation samples in a singledimension. The membership model approach explicitly ac-counts for differences in subject characteristics, outcomeoccurrence, and their interrelation, whereas the distributionof the LP approach merely compares predicted risk distri-butions. However, both approaches tend to yield similarconclusions in our clinical examples. The LP may be lessuseful for evaluating case mix differences in survival dataas it does not account for baseline survival. Conversely,the usefulness of the comparative model strongly dependson its included variables and may be prone to overfitting.Other metrics for quantifying the relatedness betweensamplesdsuch as the overlap coefficient [51,52] or exten-sions of the Mahalanobis distance metric [53]dhave notbeen evaluated here but may lead to similar conclusions.
Fourth, we noted that differences between the develop-ment and validation samples beyond parameters (predictorsand outcome) of the prediction model, such as missedimportant predictors, may substantially influence a model’stransportability, as we found in validation study 3 [3,4,6].These missed predictors could for instance explain differ-ences in baseline risk or interact with included predictors[3,4,19,25,32]. Consequently, in such situations, the inter-pretation of differences in case mix is not always straight-forward, and clinical expertise remains paramount ininterpreting the results of a model validation study.
Fifth, we used the calibration-in-the-large, the calibrationslope, and the c-statistic as summary statistics for assessingmodel performance and interpreting generalizability of aprediction model. Other measures such as the case-mixecorrected c-statistic may provide additional insights intomodel performance [20]. Furthermore, by focusing on sum-mary statistics of model calibration (such as calibration-in-the-large or the calibration slope), precipitate conclusionsabout external validity may be reached. For instance, it ispossible that the prediction model shows good calibrationas a whole but yields inaccurate predictions in specific riskcategories. This, in turn, may affect the model’s generaliz-ability toward these risk categories. We therefore emphasizethe graphing of calibration plots of the model in the valida-tion sample and visual inspection of these plots in additionto calculation of the calibration slope [27].
Finally, it is important to recognize that good perfor-mance of a prediction model in another validation sampledoes not necessarily correlates with its clinical usefulness.External validity, as we studied here, relates to statistical val-idity that considers the whole range of predicted values [6].Clinical usefulness often implies a threshold value for thepredicted risk or probability above and below which patientsare classified and differently managed [3,4,6,10,27,54].
5. Conclusion
The proposed methodological framework for predictionmodel validation studies enhances the interpretation of re-sults from (external) validation studies. The most importantissue is judging to what extent the individuals in the valida-tion sample are different from the development sample,how the case mix can be placed in view of other validationstudies of the same model, and to what extent the transport-ability of the model is studied.
Acknowledgments
The authors would like to thank Stan Buckens for hisinput and comments during the preparation of the article.The authors also gratefully acknowledge the following au-thors for sharing of individual participant data from thedeep vein thrombosis studies: A.J. Ten Cate-Hoek, R. Ou-dega, K.G.M. Moons, R.A. Kraaijenhagen, and D.B. Toll.
Author contributions: T.P.A.D. worked out the statisticalmethods, undertook the statistical analyses, and producedthe initial draft of the article. E.W.S. and K.G.M.M.conceived the project and identified examples. H.K., Y.V.,D.N., E.W.S., and K.G.M.M. assisted in deriving analyticalmethods and interpreting case study results. All authorsrevised the article before submission.
Supplementary data
Supplementary data related to this article can be found athttp://dx.doi.org/10.1016/j.jclinepi.2014.06.018.
References
[1] Gail MH, Brinton LA, Byar DP, Corle DK, Green SB, Schairer C,
et al. Projecting individualized probabilities of developing breast
cancer for white females who are being examined annually. J Natl
Cancer Inst 1989;81:1879e86.
[2] Wilson PW, DAgostino RB, Levy D, Belanger AM, Silbershatz H,
Kannel WB. Prediction of coronary heart disease using risk factor
categories. Circulation 1998;97:1837e47.
[3] Moons KGM, Kengne AP, Grobbee DE, Royston P, Vergouwe Y,
Altman DG, et al. Risk prediction models: II. External validation,
model updating, and impact assessment. Heart 2012;98(9):691e8.
[4] Altman DG, Vergouwe Y, Royston P, Moons KGM. Prognosis and
prognostic research: validating a prognostic model. BMJ 2009;
338:b605.

10 T.P.A. Debray et al. / Journal of Clinical Epidemiology - (2014) -
[5] Reilly BM, Evans AT. Translating clinical research into clinical
practice: impact of using prediction rules to make decisions. Ann
Intern Med 2006;144:201209.
[6] Altman DG, Royston P. What do we mean by validating a prog-
nostic model? Stat Med 2000;19:453e73.[7] Justice AC, Covinsky KE, Berlin JA. Assessing the generalizability
of prognostic information. Ann Intern Med 1999;130:515e24.
[8] Steyerberg EW, Moons KGM, van der Windt DA, Hayden JA,
Perel P, Schroter S, et al. Prognosis research strategy (PROG-
RESS) 3: prognostic model research. PLoS Med 2012;10(2):
e1001381.
[9] Moons KGM, Royston P, Vergouwe Y, Grobbee DE, Altman DG.
Prognosis and prognostic research: what, why, and how? BMJ
2009;338:b375.
[10] Moons KGM, Altman DG, Vergouwe Y, Royston P. Prognosis and
prognostic research: application and impact of prognostic models
in clinical practice. BMJ 2009;338:b606.
[11] Steyerberg EW. Clinical prediction models: a practical approach to
development, validation, and updating. NewYork,NY: Springer; 2009.
[12] Harrell FE Jr. Regression modeling strategies with applications to
linear models, logistic regression and survival analysis. New York,
NY: Springer; 2001.
[13] Toll DB, Janssen KJM, Vergouwe Y, Moons KGM. Validation, up-
dating and impact of clinical prediction rules: a review. J Clin Epi-
demiol 2008;61:1085e94.
[14] Knottnerus JA. Prediction rules: statistical reproducibility and clin-
ical similarity. Med Decis Making 1992;12:286e7.
[15] Knottnerus JA. Diagnostic prediction rules: principles, requirements
and pitfalls. Prim Care 1995;22:341e63.
[16] Smith-Spangler CM. Transparency and reproducible research in
modeling. Med Decis Making 2012;32:663e6.[17] Toll DB, Oudega R, Vergouwe Y, Moons KGM, Hoes AW. A new
diagnostic rule for deep vein thrombosis: safety and efficiency in
clinically relevant subgroups. Fam Pract 2008;25(1):3e8.[18] Geersing GJ, Zuithoff NPA, Kearon C, Anderson DR, Ten Cate-
Hoek AJ, Elf JL, et al. Exclusion of deep vein thrombosis using
the Wells-rule in various clinically important subgroups; an individ-
ual patient data meta-analysis. BMJ 2014;348:g1340.
[19] Debray TPA, Moons KGM, Ahmed I, Koffijberg H, Riley RD. A
framework for developing, implementing, and evaluating clinical
prediction models in an individual participant data meta-analysis.
Stat Med 2013;32:3158e80.[20] Vergouwe Y, Moons KGM, Steyerberg EW. External validity of risk
models: use of benchmark values to disentangle a case-mix effect
from incorrect coefficients. Am J Epidemiol 2010;172:971e80.
[21] Vergouwe Y, Steyerberg EW, Eijkemans MJC, Habbema JDF. Val-
idity of prognostic models: when is a model clinically useful?
Semin Urol Oncol 2002;20(2):96e107.
[22] Collins GS, Altman DG. Identifying patients with undetected colo-
rectal cancer: an independent validation of QCancer (colorectal). Br
J Cancer 2012;107:260e5.
[23] OBrien PC. Comparing two samples: extensions of the t, rank-sum,
and log-rank tests. J Am Stat Assoc 1988;83:52e61.[24] Roozenbeek B, Lingsma HF, Lecky FE, Lu J, Weir J, Butcher I,
et al. Prediction of outcome after moderate and severe traumatic
brain injury: external validation of the International Mission on
Prognosis and Analysis of Clinical Trials (IMPACT) and Corticoid
Randomisation after Significant Head injury (CRASH) prognostic
models. Crit Care Med 2012;40:1609e17.
[25] HailpernSM,VisintainerPF.Odds ratios and logistic regression: further
examples of their use and interpretation. Stata J 2003;3(3):213e25.
[26] Gail MH, Pfeiffer RM. On criteria for evaluating models of absolute
risk. Biostatistics 2005;6(2):227e39.
[27] Steyerberg EW, Vickers AJ, Cook NR, Gerds T, Gonen M,
Obuchowski N, et al. Assessing the performance of prediction
models: a framework for traditional and novel measures. Epidemi-
ology 2010;21:128e38.
[28] Fawcett T. ROC graphs: notes and practical considerations for re-
searchers. The Netherlands: Kluwer Academic Publishers, HP Labs
Tech Report; 2004:HPL-2003-4.
[29] Miller ME, Langefeld CD, Tierney WM, Hui SL, McDonald CJ. Vali-
dation of probabilistic predictions.MedDecisMaking1993;13:49e58.[30] Hilden J. The area under the ROC curve and its competitors. Med
Decis Making 1991;11:95e101.
[31] Moons KGM, Kengne AP, Woodward M, Royston P, Vergouwe Y,
Altman DG, et al. Risk prediction models: I. Development, internal
validation, and assessing the incremental value of a new (bio)
marker. Heart 2012;98(9):683e90.
[32] Walter SD. Variation in baseline risk as an explanation of heteroge-
neity in meta-analysis. Stat Med 1997;16:2883e900.
[33] Cox DR. Two further applications of a model for binary regression.
Biometrika 1958;45(3):562e5.
[34] Janssen KJM, Moons KGM, Kalkman CJ, Grobbee DE, Vergouwe Y.
Updating methods improved the performance of a clinical prediction
model in new patients. J Clin Epidemiol 2008;61:76e86.
[35] Steyerberg EW, Borsboom GJJ, van Houwelingen HC,
Eijkemans MJC, Habbema JDF. Validation and updating of predic-
tive logistic regression models: a study on sample size and
shrinkage. Stat Med 2004;23:2567e86.
[36] van Houwelingen HC. Validation, calibration, revision and combi-
nation of prognostic survival models. Stat Med 2000;19:3401e15.
[37] Janssen KJM, Vergouwe Y, Kalkman CJ, Grobbee DE,
Moons KGM. A simple method to adjust clinical prediction models
to local circumstances. Can J Anesth 2009;56(3):194e201.[38] J. Locke. An essay concerning human understanding. 1689.
[39] Calder BJ, Phillips LW, Tybout AM. The concept of external valid-
ity. J Cons Res 1982;9(3):240e4.
[40] Maclure M. Popperian refutation in epidemiology. Am J Epidemiol
1985;121:343e50.
[41] Lucas JW. Theory-testing, generalization, and the problem of
external validity. Soc Theor 2003;21(3):236e53.[42] Ochodo EA, de Haan MC, Reitsma JB, Hooft L, Bossuyt PM,
Leeflang MMG. Overinterpretation and misreporting of diagnostic
accuracy studies: evidence of ‘‘spin’’. Radiology 2013;267:
581e8.
[43] Collins GS, de Groot JA, Dutton S, Omar O, Shanyinde M, Tajar A,
et al. External validation of multivariable prediction models: a sys-
tematic review of methodological conduct and reporting. BMC Med
Res Methodol 2014;14:40.
[44] Ioannidis JPA, Greenland S, Hlatky MA, Khoury MJ, Macleod MR,
Moher D, et al. Increasing value and reducing waste in research
design, conduct, and analysis. Lancet 2014;383:166e75.
[45] Willis BH. Spectrum biasdwhy clinicians need to be cautious when
applying diagnostic test studies. Fam Pract 2008;25:390e6.
[46] Oudega R, Hoes AW, Moons KGM. The Wells rule does not
adequately rule out deep venous thrombosis in primary care pa-
tients. Ann Intern Med 2005;143:100e7.
[47] Bouwmeester W, Zuithoff NPA, Mallett S, Geerlings MI,
Vergouwe Y, Steyerberg EW, et al. Reporting and methods in
clinical prediction research: a systematic review. PLoS Med
2012;9(5):1e12.
[48] Gross CP, Mallory R, Heiat A, Krumholz HM. Reporting the
recruitment process in clinical trials: who are these patients and
how did they get there? Ann Intern Med 2002;137:10e6.[49] Schulz KF, Altman DG, Moher D. CONSORT 2010 statement: up-
dated guidelines for reporting parallel group randomised trials. BMJ
2010;340:c332.
[50] Collins GS. Opening up multivariable prediction models:
consensus-based guidelines for transparent reporting. London,
UK: BMJ Blogs; 2011, Available at http://blogs.bmj.com/bmj/2011/
08/03/gary-collins-opening-up-multivariable-prediction-models/. Ac-
cessed April 4, 2013.
[51] Clemons TE, Bradley EL Jr. A nonparametric measure of the over-
lapping coefficient. Comput Stat Data 2000;34(1):51e61.

11T.P.A. Debray et al. / Journal of Clinical Epidemiology - (2014) -
[52] Mizuno S, Yamaguchi T, Fukushima A, Matsuyama Y, Ohashi Y.
Overlap coefficient for assessing the similarity of pharmacokinetic
data between ethnically different populations. Clin Trials 2005;2:
174e81.
[53] de Leon AR, Carriere KC. A generalized Mahalanobis distance for
mixed data. J Multivariate Anal 2005;92:174e85.
[54] Wyatt JC, Altman DG. Prognostic models: clinically useful or
quickly forgotten? BMJ 1995;311:1539.
Copyright © 2022 FDOKUMEN

