


Bahasa
Halaman
Hukum

i n t e r n a t i o n a l j o u r n a l o f h y d r o g e n en e r g y 3 6 ( 2 0 1 1 ) 3 4 8 3e3 4 9 5
Avai lab le a t www.sc iencedi rec t .com
journa l homepage : www.e lsev ier . com/ loca te /he
A comparison of two different flow types on performance ofa thermally coupled recuperative reactor containing naphthareforming process and hydrogenation of nitrobenzene
D. Iranshahi, E. Pourazadi, A.M. Bahmanpour, M.R. Rahimpour*
Department of Chemical Engineering, School of Chemical and Petroleum Engineering, Shiraz University, Shiraz 71345, Iran
a r t i c l e i n f o
Article history:
Received 20 August 2010
Received in revised form
20 November 2010
Accepted 8 December 2010
Available online 13 January 2011
Keywords:
Recuperative coupling
Catalytic naphtha reforming
Hydrogen production
Aromatic enhancement
Nitrobenzene hydrogenation
* Corresponding author. Tel.: þ98 711 230307E-mail address: [email protected] (
0360-3199/$ e see front matter Copyright ªdoi:10.1016/j.ijhydene.2010.12.033
a b s t r a c t
Refineries have been looking for proper ways of improving reformer performance by
enhancing the octane number of the product via increasing the aromatics’ compounds. To
reach this goal, the endothermic catalytic naphtha reforming is coupled with the
exothermic hydrogenation of nitrobenzene to aniline in a multifunctional heat exchanger
reactor through the process intensification concept. Considering the higher thermal effi-
ciency as well as the smaller size of the coupled reactor, utilizing this reactor is given
priority. In this novel configuration, the first and the second reactor of the conventional
naphtha reforming process are exchanged with the coupled reactors contain the endo-
thermic naphtha reforming in the shell side and the hydrogenation reaction in the tube
side. Both co-current and counter-current modes of flow are examined during the opera-
tion considering various studies in literature which show the superiority of co-current flow
compared with the counter-current flow. The result of current study is compared with the
corresponding results for conventional tubular reactor (CTR). The results show higher
aromatic production as much as 18.73% and 16.48% in the co-current and counter-current
mode, respectively. Hydrogen molar flow rate increases about 5 kmol/h by using counter-
current flow regime, compared with the CTR.
Copyright ª 2010, Hydrogen Energy Publications, LLC. Published by Elsevier Ltd. All rights
reserved.
1. Introduction catalytic reformer. The process licensors have responded to
1.1. Catalytic naphtha reforming process
Thecatalytic reformingunithasan important role in refineries.
This process includes the reconstruction of low-octane
hydrocarbons in the naphtha stream and production of more
valuable high-octane gasoline components without changing
the boiling point range. Over the past decade, refiners have
been forced to maximize their existing asset utilization. With
capital at apremium, refinersmustdelivermore fromtheunits
they already have. These double pressures from environ-
mental regulations and asset utilization have influenced the
1; fax: þ98 711 6287294.M.R. Rahimpour).2010, Hydrogen Energy P
these needs [1]. As a consequence, several research efforts
have been made and some modifications have been proposed
to enhance the production of the aromatic and hydrogen, as
well as the operating conditions of the process.
Studies which have been done on the catalytic naphtha
reforming process are categorized as bellow:
1.1.1. Studies on the kinetics of catalytic naphtha reformingprocessThe naphtha feed stream is composed of various hydrocarbons
and related isomers which are normally influenced by various
reactions. Thus a detailed kinetic model considering all the
ublications, LLC. Published by Elsevier Ltd. All rights reserved.
i n t e rn a t i o n a l j o u r n a l o f h y d r o g e n en e r g y 3 6 ( 2 0 1 1 ) 3 4 8 3e3 4 9 53484
components and reactions is too complex [2]. Accordingly,
various attempts have been made to find more acceptable
lumpedgroupsof reactions to represent the catalytic reforming
reactions. In this way, the first significant attempt to model
a reformingsystemwasmadebySmith [3]whoconsideredonly
threebasic components innaphthamainstructure:Thesewere
paraffins, naphthenes, and aromatics industrially known as
PNA.Weifeng et al. [4] developed anewkineticmodel including
20 lumped components and 31 reactions. The subdivision of
8-carbon aromatics and all the hydro cracking reactions of the
paraffin lumps were taken into consideration in their model.
Boyas and Froment [5] studied a very detailed model for the
catalytic reforming of naphtha based on its fundamentals.
The model provided a thorough insight into the process and
a wide predictive potential but contained a huge number of
parameters. The current model also imposed equilibrium for
thehydrogenationanddehydrogenationreactions. Stijepovic et
al. [6] postulated a semi-empirical kinetic model for catalytic
reforming. Their lumping strategy was based on paraffins,
olefins, naphthenes and aromatics (PONA) analysis.
1.1.2. Studies on the modeling and improvement of aromaticsand hydrogen yields of the CTRsLi et al. [7] and Taskar and Riggs [8] modeled and optimized
a semi-regenerative catalytic naphtha reformer by considering
most of its key constitutes. Juarez et al. [9] modeled and simu-
lated four catalytic reactors in series for naphtha reforming.The
process model used an extended version of the kinetic model
reported by Krane et al. Weifeng et al. [2] considered 18-lumped
kinetic models to simulate and optimize a whole industrial
catalytic naphtha reforming process by Aspen Plus platform.
Khosravanipour and Rahimpour [10] presented a membrane
catalytic bed concept fornaphtha reforming inorder to enhance
hydrogen and aromatic production yield. Rahimpour et al.
[11e14] have presented novel reactor configurations and modi-
fications which lead to higher production rate of the desired
products. In the previous studies [14], the concept of using
thermally coupled reactors containing naphtha reforming
process and hydrogenation of nitrobenzene has been investi-
gated. In the present research, utilizing co-current and counter-
current flow regimes has been discussed and the related results
have been compared.
1.1.3. Studies on the catalyst and catalyst regenerationMore studies have been done previously on the new catalyst
preparation and catalyst deactivation due to the coke deposi-
tion and sintering. In this way Benitez et al. [15] and Boutzeloit
et al. [16] examined the reforming efficiency and product
Table 1 e Rate constants and heat of reactions fornaphtha reforming.
k ¼ AexpðB� E=1:8 TÞ A B E DH298 K
kf1 9.87 23.21 36,350 71,038.06
kf2 9.87 35.98 58,550 �36,953.33
kf3 1 42.97 63,800 �51,939.31
kf4 1 42.97 63,800 �56,597.54
Ke1 1.04 � 10�3 46.15 46,045 e
Ke2 9.87 �7.12 8000 e
enhancement through the catalyst with different metal basis.
Considering the coke deposition phenomenon on the catalyst
surface and regeneration of catalyst some researches have
been made, Mazzieri et al. [17] and Sugimoto et al. [18] inves-
tigated the coke formation and regeneration of catalyst during
the catalytic naphtha reforming process.
1.2. Catalytic hydrogenation of nitrobenzene process
1.2.1. Literatures for coupled reactorsOne of the most important advantages of using thermally
coupled reactors is to save energywhich consequently reduces
the capital and operational costs [19]. Considering the lower
capital costs due to the elimination of the inter stage heaters
and related piping system and operational costs due to lower
fuel consumption, as well as higher thermal efficiency, inves-
tigation of the thermally coupled reactors has been the first
priority in this research.Oneshouldconsider the fact that using
the presented configuration leads to combination of two
separate plantswhich indeed reduces the capital costs. Process
intensification (PI), known as the strategy of miniaturizing
process plants, is a novel design approach which can reduce
equipment size by several orders of magnitude leading to
substantial saving in capital cost, improvement of the safety
of the system and reducing environment impact [20]. In recent
years, many researches have been made in order to apply
this strategy in the coupling process. Bhat and Sadhukhan
[21] reviewed the PI for methane steam reforming by coupling
and using themembrane separation technologies to overcome
the mass transfer, heat transfer and thermodynamic limita-
tions. Altimari and Bildea [22] discussed about the design and
control of plant wide systems of coupling exothermic and
endothermic reactions in a steady state behavior. Patel and
Sunol [23] developed a distributed mathematical model for
thermally coupled membrane reactor to couple the methane
steam reforming through the exothermic methane combus-
tion. Glockler et al. [24] presented a theory to analyze and
optimize the reactor design to couple the exothermic and
endothermic reactions in an adiabatic fixed-bed reactor with
reverse flow mode. AboeGhander et al. [25] investigated
coecurrent and counterecurrent operation modes for the
above configuration.
Based on the researches made in literature, most of the
implemented studies on the coupled reactors have presented
higher conversion in the coecurrent mode compared with the
counterecurrent one. On the other hand, the results of some
specific studies showed the superiority of the counterecurrent
modeofoperation [25]. Thesedifferent resultsmadeuscompare
the performance of two reactor configurations, simultaneously.
Table 2 e Rate constants and heat of reaction forhydrogenation of nitrobenzene.
k ¼ A0expðB0 � E0=1:8 TÞ A0 B0 E0 DH298 K
k0 0.186 0 10 �44,3000
KH2 4.427 � 10�3 0 0 e
KNB 1.51 � 10�5 0 0 e
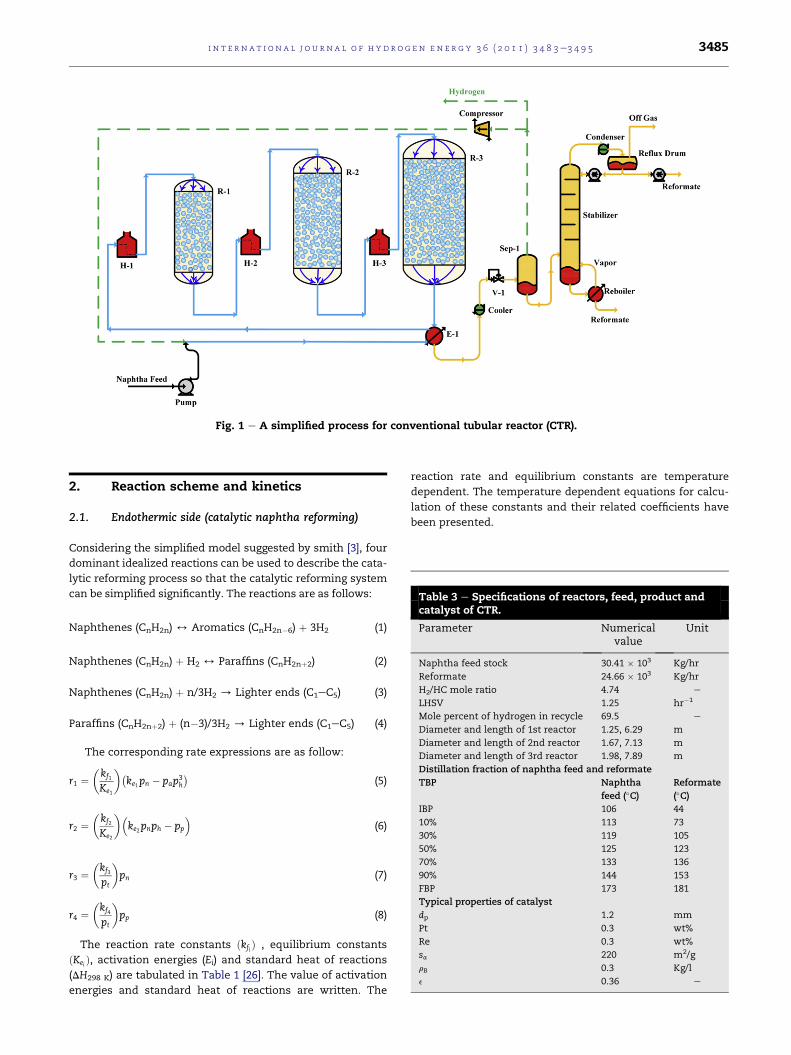
Table 3 e Specifications of reactors, feed, product andcatalyst of CTR.
Parameter Numericalvalue
Unit
Naphtha feed stock 30.41 � 103 Kg/hr
Reformate 24.66 � 103 Kg/hr
H2/HC mole ratio 4.74 e
LHSV 1.25 hr�1
Mole percent of hydrogen in recycle 69.5 e
Diameter and length of 1st reactor 1.25, 6.29 m
Diameter and length of 2nd reactor 1.67, 7.13 m
Diameter and length of 3rd reactor 1.98, 7.89 m
Distillation fraction of naphtha feed and reformate
TBP Naphtha
feed (�C)Reformate
(�C)IBP 106 44
10% 113 73
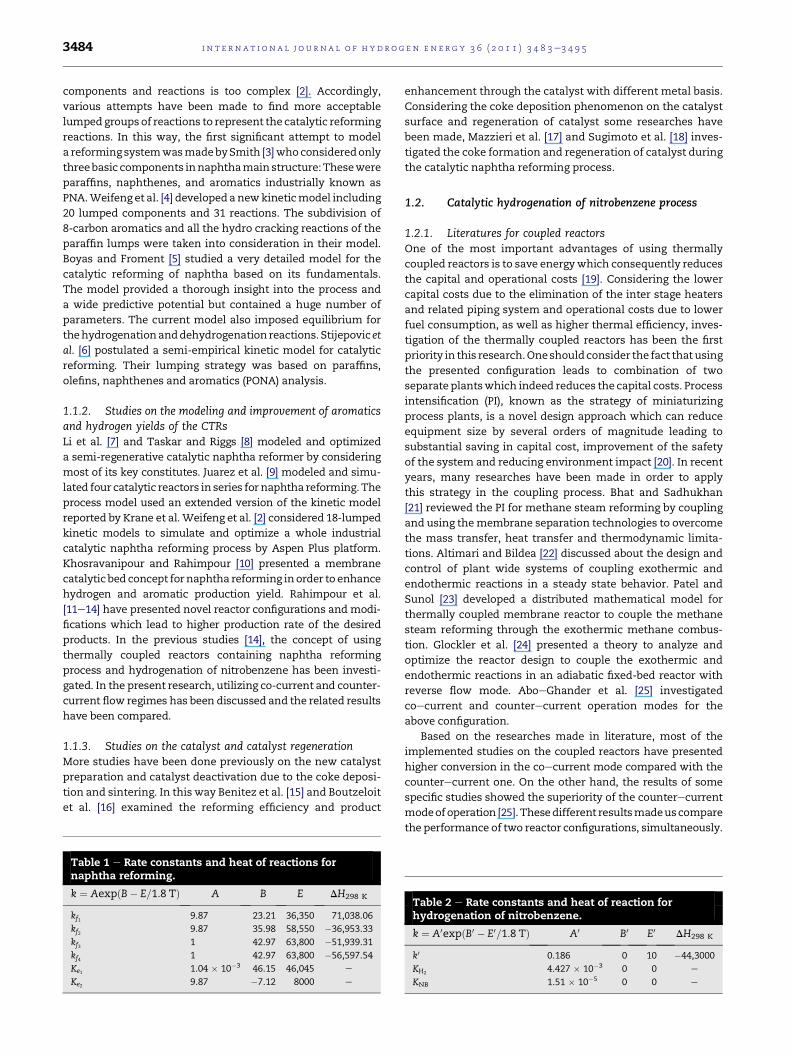
Fig. 1 e A simplified process for conventional tubular reactor (CTR).
i n t e r n a t i o n a l j o u r n a l o f h y d r o g e n en e r g y 3 6 ( 2 0 1 1 ) 3 4 8 3e3 4 9 5 3485
2. Reaction scheme and kinetics
2.1. Endothermic side (catalytic naphtha reforming)
Considering the simplified model suggested by smith [3], four
dominant idealized reactions can be used to describe the cata-
lytic reforming process so that the catalytic reforming system
can be simplified significantly. The reactions are as follows:
Naphthenes (CnH2n) 4 Aromatics (CnH2n�6) þ 3H2 (1)
Naphthenes (CnH2n) þ H2 4 Paraffins (CnH2nþ2) (2)
Naphthenes (CnH2n) þ n/3H2 / Lighter ends (C1eC5) (3)
Paraffins (CnH2nþ2) þ (n�3)/3H2 / Lighter ends (C1eC5) (4)
The corresponding rate expressions are as follow:
r1 ¼�kf1
Ke1
��ke1pn � pap
3h
�(5)
r2 ¼�kf2
K
��ke2pnph � pp
�(6)
30% 119 105
50% 125 123
70% 133 136
90% 144 153
FBP 173 181
Typical properties of catalyst
dp 1.2 mm
Pt 0.3 wt%
e2
r3 ¼�kf3
pt
�pn (7)
r4 ¼�kf4
pt
�pp (8)
Re 0.3 wt%
sa 220 m2/g
rB 0.3 Kg/l
e 0.36 e
The reaction rate constants ðkfi Þ , equilibrium constants
ðKei Þ, activation energies (Ei) and standard heat of reactions
(DH298 K) are tabulated in Table 1 [26]. The value of activation
energies and standard heat of reactions are written. The
reaction rate and equilibrium constants are temperature
dependent. The temperature dependent equations for calcu-
lation of these constants and their related coefficients have
been presented.
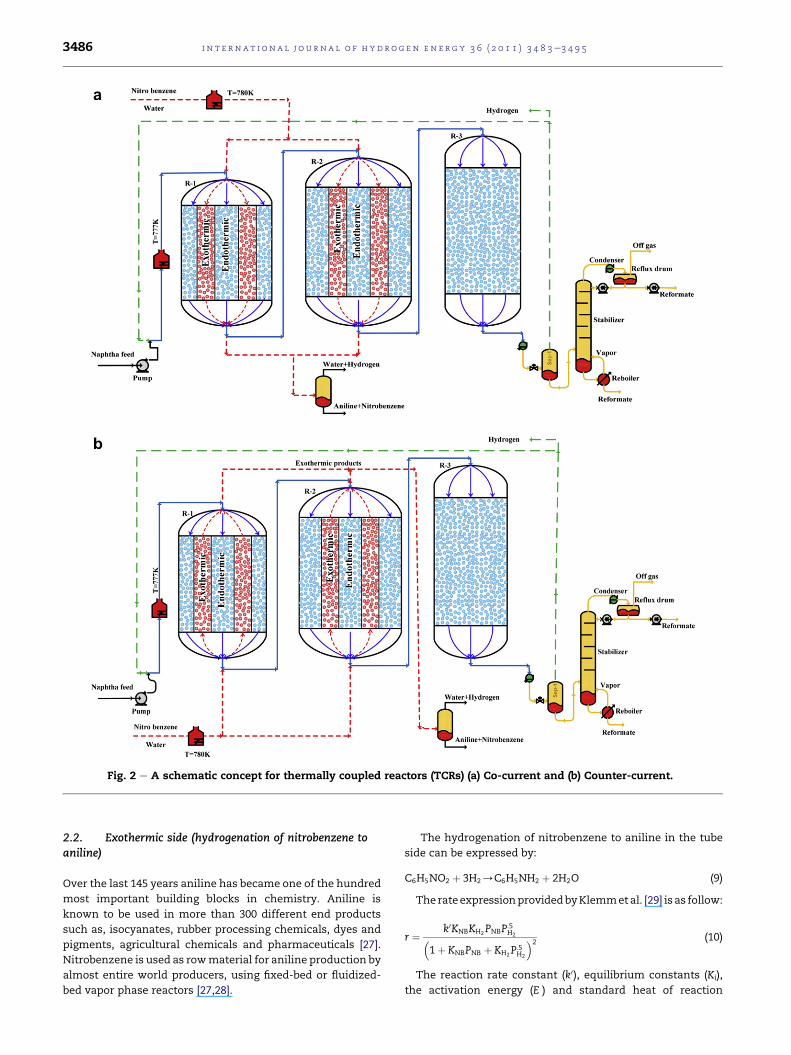
Fig. 2 e A schematic concept for thermally coupled reactors (TCRs) (a) Co-current and (b) Counter-current.
i n t e rn a t i o n a l j o u r n a l o f h y d r o g e n en e r g y 3 6 ( 2 0 1 1 ) 3 4 8 3e3 4 9 53486
2.2. Exothermic side (hydrogenation of nitrobenzene toaniline)
Over the last 145 years aniline has became one of the hundred
most important building blocks in chemistry. Aniline is
known to be used in more than 300 different end products
such as, isocyanates, rubber processing chemicals, dyes and
pigments, agricultural chemicals and pharmaceuticals [27].
Nitrobenzene is used as rowmaterial for aniline production by
almost entire world producers, using fixed-bed or fluidized-
bed vapor phase reactors [27,28].
The hydrogenation of nitrobenzene to aniline in the tube
side can be expressed by:
C6H5NO2 þ 3H2/C6H5NH2 þ 2H2O (9)
The rateexpressionprovidedbyKlemmetal. [29] is as follow:
r ¼ k0KNBKH2PNBP:5
H2�1þ KNBPNB þ KH2
P:5H2
�2 (10)
The reaction rate constant (k0), equilibrium constants (Ki),
the activation energy (E ) and standard heat of reaction
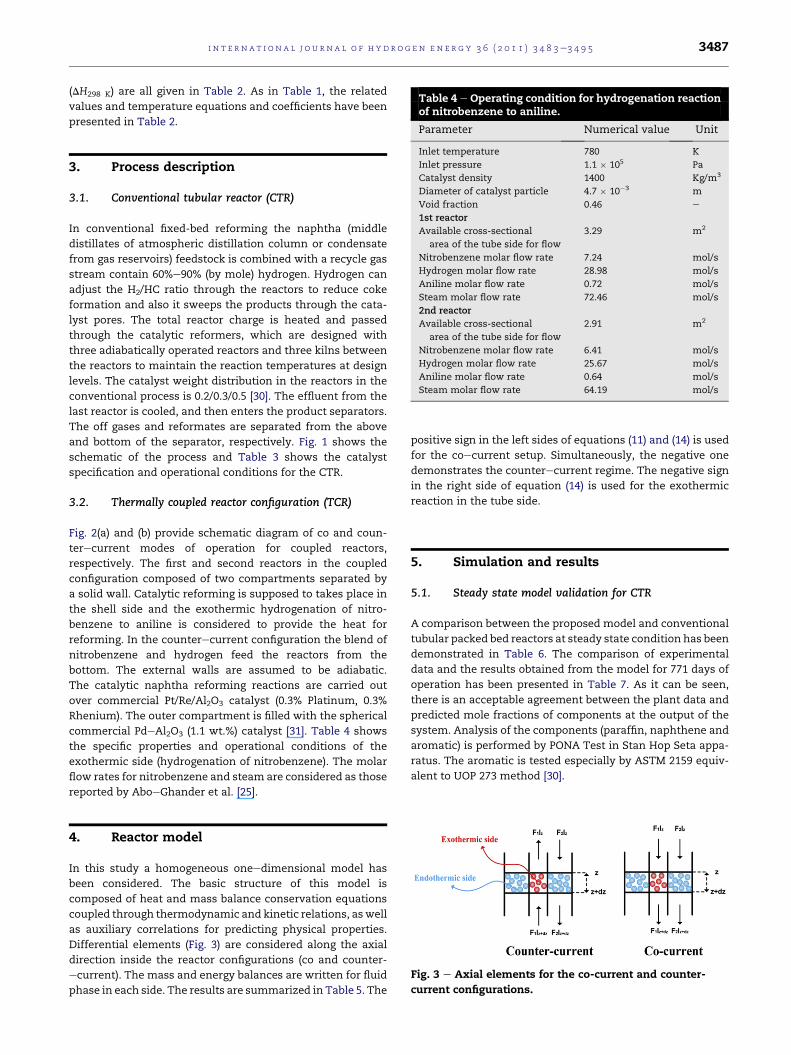
Table 4 e Operating condition for hydrogenation reactionof nitrobenzene to aniline.
i n t e r n a t i o n a l j o u r n a l o f h y d r o g e n en e r g y 3 6 ( 2 0 1 1 ) 3 4 8 3e3 4 9 5 3487
(DH298 K) are all given in Table 2. As in Table 1, the related
values and temperature equations and coefficients have been
presented in Table 2.
Parameter Numerical value UnitInlet temperature 780 K
Inlet pressure 1.1 � 105 Pa
Catalyst density 1400 Kg/m3
Diameter of catalyst particle 4.7 � 10�3 m
Void fraction 0.46 e
1st reactor
Available cross-sectional
area of the tube side for flow
3.29 m2
Nitrobenzene molar flow rate 7.24 mol/s
Hydrogen molar flow rate 28.98 mol/s
Aniline molar flow rate 0.72 mol/s
Steam molar flow rate 72.46 mol/s
2nd reactor
Available cross-sectional
area of the tube side for flow
2.91 m2
Nitrobenzene molar flow rate 6.41 mol/s
Hydrogen molar flow rate 25.67 mol/s
Aniline molar flow rate 0.64 mol/s
Steam molar flow rate 64.19 mol/s
3. Process description
3.1. Conventional tubular reactor (CTR)
In conventional fixed-bed reforming the naphtha (middle
distillates of atmospheric distillation column or condensate
from gas reservoirs) feedstock is combined with a recycle gas
stream contain 60%e90% (by mole) hydrogen. Hydrogen can
adjust the H2/HC ratio through the reactors to reduce coke
formation and also it sweeps the products through the cata-
lyst pores. The total reactor charge is heated and passed
through the catalytic reformers, which are designed with
three adiabatically operated reactors and three kilns between
the reactors to maintain the reaction temperatures at design
levels. The catalyst weight distribution in the reactors in the
conventional process is 0.2/0.3/0.5 [30]. The effluent from the
last reactor is cooled, and then enters the product separators.
The off gases and reformates are separated from the above
and bottom of the separator, respectively. Fig. 1 shows the
schematic of the process and Table 3 shows the catalyst
specification and operational conditions for the CTR.
3.2. Thermally coupled reactor configuration (TCR)
Fig. 2(a) and (b) provide schematic diagram of co and coun-
terecurrent modes of operation for coupled reactors,
respectively. The first and second reactors in the coupled
configuration composed of two compartments separated by
a solid wall. Catalytic reforming is supposed to takes place in
the shell side and the exothermic hydrogenation of nitro-
benzene to aniline is considered to provide the heat for
reforming. In the counterecurrent configuration the blend of
nitrobenzene and hydrogen feed the reactors from the
bottom. The external walls are assumed to be adiabatic.
The catalytic naphtha reforming reactions are carried out
over commercial Pt/Re/Al2O3 catalyst (0.3% Platinum, 0.3%
Rhenium). The outer compartment is filled with the spherical
commercial PdeAl2O3 (1.1 wt.%) catalyst [31]. Table 4 shows
the specific properties and operational conditions of the
exothermic side (hydrogenation of nitrobenzene). The molar
flow rates for nitrobenzene and steam are considered as those
reported by AboeGhander et al. [25].
Fig. 3 e Axial elements for the co-current and counter-
current configurations.
4. Reactor model
In this study a homogeneous oneedimensional model has
been considered. The basic structure of this model is
composed of heat and mass balance conservation equations
coupled through thermodynamic and kinetic relations, aswell
as auxiliary correlations for predicting physical properties.
Differential elements (Fig. 3) are considered along the axial
direction inside the reactor configurations (co and counter-
ecurrent). The mass and energy balances are written for fluid
phase in each side. The results are summarized in Table 5. The
positive sign in the left sides of equations (11) and (14) is used
for the coecurrent setup. Simultaneously, the negative one
demonstrates the counterecurrent regime. The negative sign
in the right side of equation (14) is used for the exothermic
reaction in the tube side.
5. Simulation and results
5.1. Steady state model validation for CTR
A comparison between the proposed model and conventional
tubular packed bed reactors at steady state condition has been
demonstrated in Table 6. The comparison of experimental
data and the results obtained from the model for 771 days of
operation has been presented in Table 7. As it can be seen,
there is an acceptable agreement between the plant data and
predicted mole fractions of components at the output of the
system. Analysis of the components (paraffin, naphthene and
aromatic) is performed by PONA Test in Stan Hop Seta appa-
ratus. The aromatic is tested especially by ASTM 2159 equiv-
alent to UOP 273 method [30].
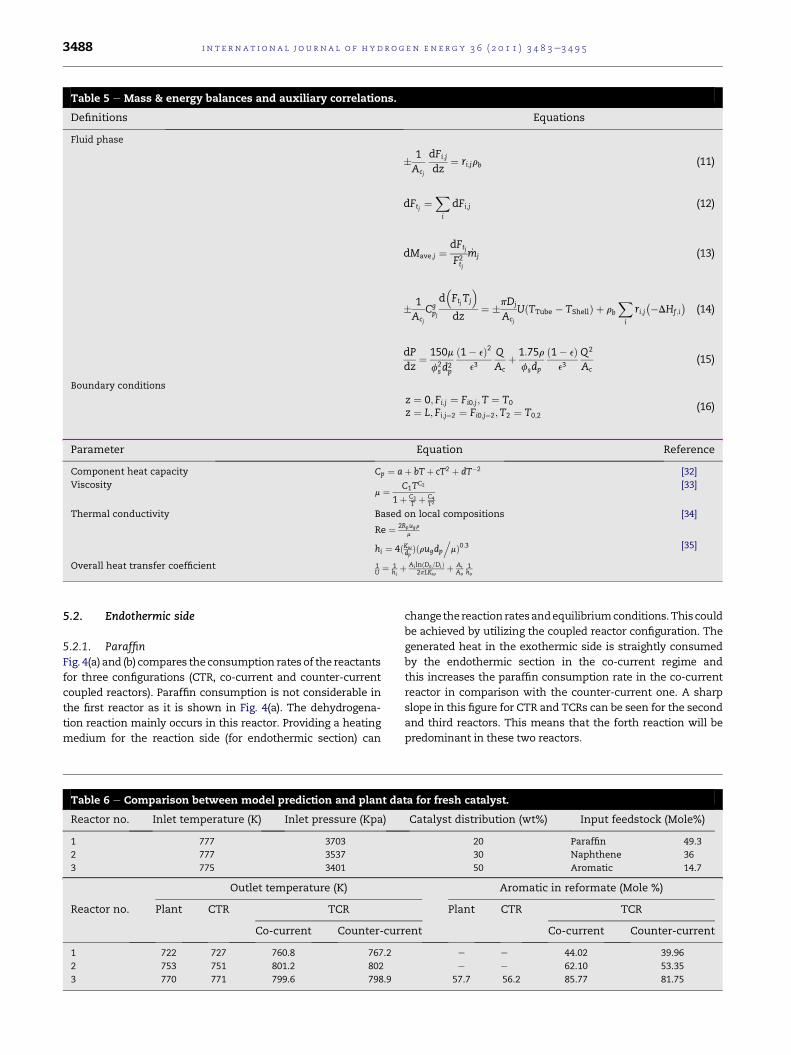
Table 5 e Mass & energy balances and auxiliary correlations.
Definitions Equations
Fluid phase
� 1Acj
dFi;j
dz¼ ri;jrb (11)
dFtj ¼Xi
dFi;j (12)
dMave;j ¼dFtj
F2tj
_mj (13)
� 1Acj
Cgpj
d�FtjTj
�dz
¼ �pDj
Acj
UðTTube � TShellÞ þ rb
Xi
ri;j��DHf ;i
�(14)
dPdz
¼ 150m
f2sd
2p
ð1� eÞ2e3
QAc
þ 1:75rfsdp
ð1� eÞe3
Q2
Ac(15)
Boundary conditions
z ¼ 0; Fi;j ¼ Fi0;j;T ¼ T0
z ¼ L; Fi;j¼2 ¼ Fi0;j¼2;T2 ¼ T0;2(16)
Parameter Equation Reference
Component heat capacity Cp ¼ aþ bTþ cT2 þ dT�2 [32]
Viscositym ¼ C1TC2
1þ C3T þ C4
T2
[33]
Thermal conductivity Based on local compositions [34]
Re ¼ 2Rpugr
m
hi ¼ 4ðKwdpÞðrugdp
.mÞ0:3 [35]
Overall heat transfer coefficient 1U ¼ 1
hiþ Ai lnðDo=DiÞ
2pLKwþ Ai
Ao
1ho
i n t e rn a t i o n a l j o u r n a l o f h y d r o g e n en e r g y 3 6 ( 2 0 1 1 ) 3 4 8 3e3 4 9 53488
5.2. Endothermic side
5.2.1. ParaffinFig. 4(a) and (b) compares theconsumption rates of the reactants
for three configurations (CTR, co-current and counter-current
coupled reactors). Paraffin consumption is not considerable in
the first reactor as it is shown in Fig. 4(a). The dehydrogena-
tion reaction mainly occurs in this reactor. Providing a heating
medium for the reaction side (for endothermic section) can
Table 6 e Comparison between model prediction and plant da
Reactor no. Inlet temperature (K) Inlet pressure (Kpa)
1 777 3703
2 777 3537
3 775 3401
Outlet temperature (K)
Reactor no. Plant CTR TCR
Co-current Counter-cur
1 722 727 760.8 767.2
2 753 751 801.2 802
3 770 771 799.6 798.9
changethereaction ratesandequilibriumconditions.Thiscould
be achieved by utilizing the coupled reactor configuration. The
generated heat in the exothermic side is straightly consumed
by the endothermic section in the co-current regime and
this increases the paraffin consumption rate in the co-current
reactor in comparison with the counter-current one. A sharp
slope in this figure for CTR and TCRs can be seen for the second
and third reactors. This means that the forth reaction will be
predominant in these two reactors.
ta for fresh catalyst.
Catalyst distribution (wt%) Input feedstock (Mole%)
20 Paraffin 49.3
30 Naphthene 36
50 Aromatic 14.7
Aromatic in reformate (Mole %)
Plant CTR TCR
rent Co-current Counter-current
e e 44.02 39.96
e e 62.10 53.35
57.7 56.2 85.77 81.75
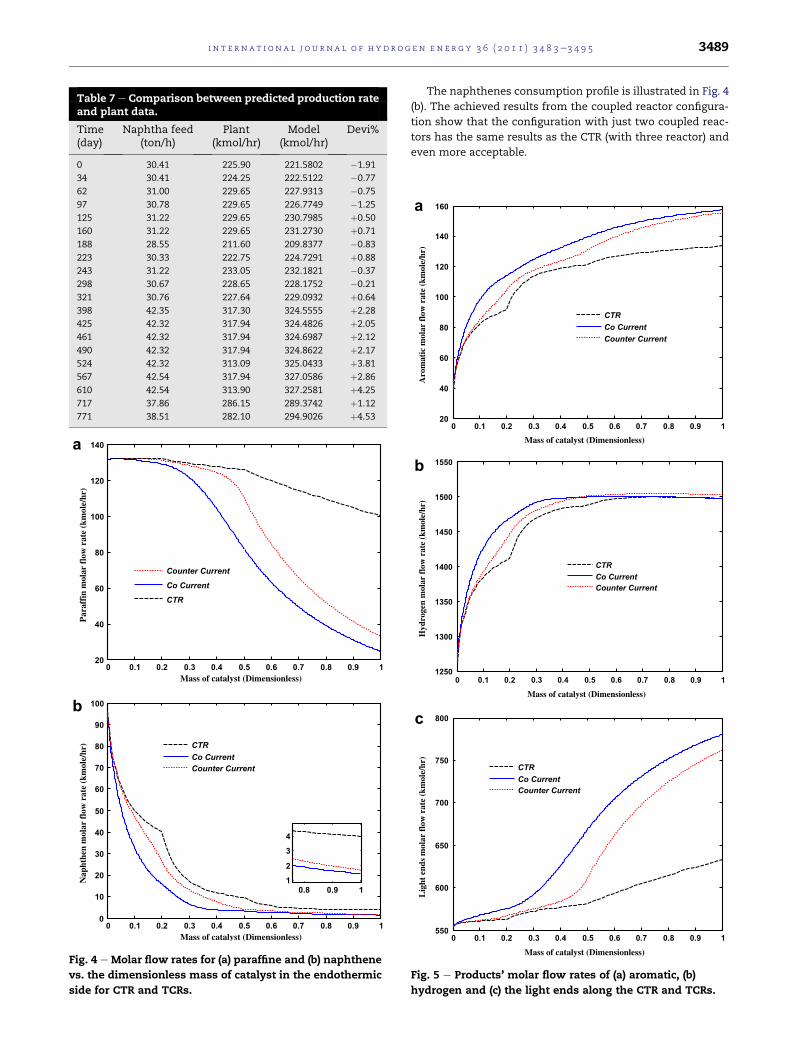
Table 7 e Comparison between predicted production rateand plant data.
Time(day)
Naphtha feed(ton/h)
Plant(kmol/hr)
Model(kmol/hr)
Devi%
0 30.41 225.90 221.5802 �1.91
34 30.41 224.25 222.5122 �0.77
62 31.00 229.65 227.9313 �0.75
97 30.78 229.65 226.7749 �1.25
125 31.22 229.65 230.7985 þ0.50
160 31.22 229.65 231.2730 þ0.71
188 28.55 211.60 209.8377 �0.83
223 30.33 222.75 224.7291 þ0.88
243 31.22 233.05 232.1821 �0.37
298 30.67 228.65 228.1752 �0.21
321 30.76 227.64 229.0932 þ0.64
398 42.35 317.30 324.5555 þ2.28
425 42.32 317.94 324.4826 þ2.05
461 42.32 317.94 324.6987 þ2.12
490 42.32 317.94 324.8622 þ2.17
524 42.32 313.09 325.0433 þ3.81
567 42.54 317.94 327.0586 þ2.86
610 42.54 313.90 327.2581 þ4.25
717 37.86 286.15 289.3742 þ1.12
771 38.51 282.10 294.9026 þ4.53
0 0.1 0.2 0.3 0.4 0.5 0.6 0.7 0.8 0.9 1
0
10
20
30
40
50
60
70
80
90
100
Mass of catalyst (Dimensionless)
Nap
hthe
n m
olar
flo
w r
ate
(km
ole/
hr)
0.8 0.9 1
1
2
3
4
CTR
Co Current
Counter Current
0 0.1 0.2 0.3 0.4 0.5 0.6 0.7 0.8 0.9 1
20
40
60
80
100
120
140a
b
Mass of catalyst (Dimensionless)
Par
affi
n m
olar
flo
w r
ate
(km
ole/
hr)
Counter Current
Co Current
CTR
Fig. 4 e Molar flow rates for (a) paraffine and (b) naphthene
vs. the dimensionless mass of catalyst in the endothermic
side for CTR and TCRs.
i n t e r n a t i o n a l j o u r n a l o f h y d r o g e n en e r g y 3 6 ( 2 0 1 1 ) 3 4 8 3e3 4 9 5 3489
The naphthenes consumption profile is illustrated in Fig. 4
(b). The achieved results from the coupled reactor configura-
tion show that the configuration with just two coupled reac-
tors has the same results as the CTR (with three reactor) and
even more acceptable.
0 0.1 0.2 0.3 0.4 0.5 0.6 0.7 0.8 0.9 1
20
40
60
80
100
120
140
160a
b
c
Mass of catalyst (Dimensionless)
Aro
mat
ic m
olar
flo
w r
ate
(km
ole/
hr)
CTR
Co Current
Counter Current
0 0.1 0.2 0.3 0.4 0.5 0.6 0.7 0.8 0.9 1
1250
1300
1350
1400
1450
1500
1550
Mass of catalyst (Dimensionless)
Hyd
roge
n m
olar
flo
w r
ate
(km
ole/
hr)
CTR
Co Current
Counter Current
0 0.1 0.2 0.3 0.4 0.5 0.6 0.7 0.8 0.9 1
550
600
650
700
750
800
Mass of catalyst (Dimensionless)
Lig
ht e
nds
mol
ar f
low
rat
e (k
mol
e/hr
)
CTR
Co Current
Counter Current
Fig. 5 e Products’ molar flow rates of (a) aromatic, (b)
hydrogen and (c) the light ends along the CTR and TCRs.
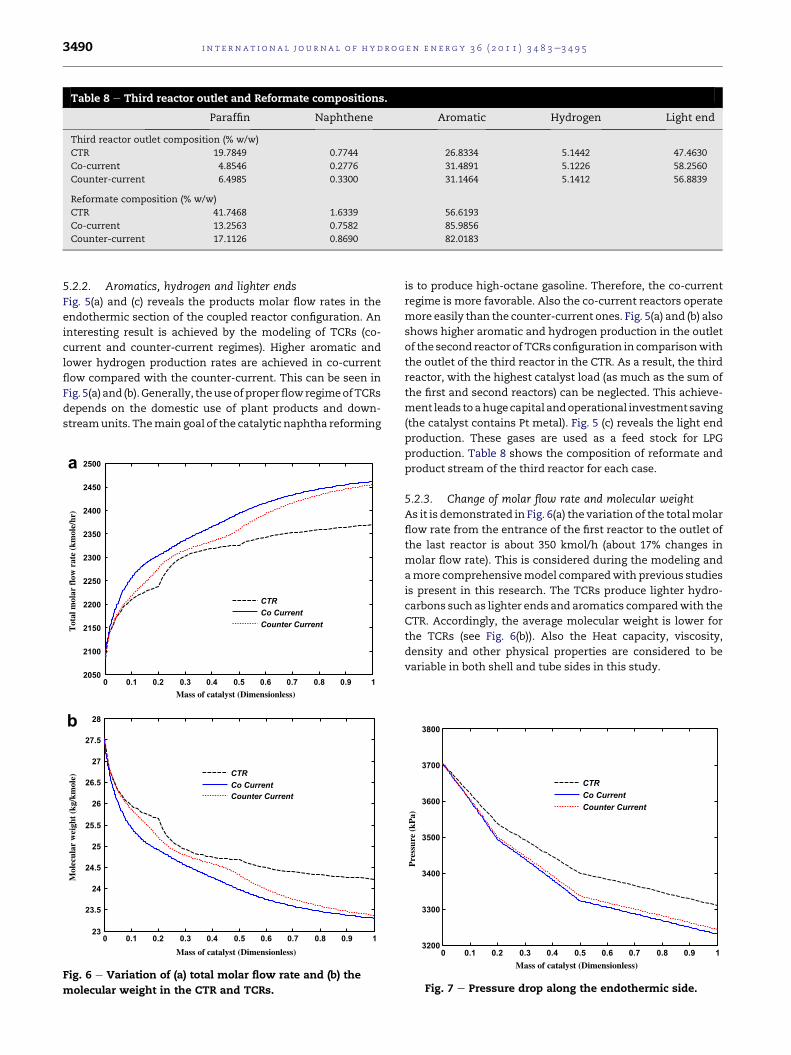
Table 8 e Third reactor outlet and Reformate compositions.
Paraffin Naphthene Aromatic Hydrogen Light end
Third reactor outlet composition (% w/w)
CTR 19.7849 0.7744 26.8334 5.1442 47.4630
Co-current 4.8546 0.2776 31.4891 5.1226 58.2560
Counter-current 6.4985 0.3300 31.1464 5.1412 56.8839
Reformate composition (% w/w)
CTR 41.7468 1.6339 56.6193
Co-current 13.2563 0.7582 85.9856
Counter-current 17.1126 0.8690 82.0183
i n t e rn a t i o n a l j o u r n a l o f h y d r o g e n en e r g y 3 6 ( 2 0 1 1 ) 3 4 8 3e3 4 9 53490
5.2.2. Aromatics, hydrogen and lighter endsFig. 5(a) and (c) reveals the products molar flow rates in the
endothermic section of the coupled reactor configuration. An
interesting result is achieved by the modeling of TCRs (co-
current and counter-current regimes). Higher aromatic and
lower hydrogen production rates are achieved in co-current
flow compared with the counter-current. This can be seen in
Fig. 5(a) and (b).Generally, theuseofproperflowregimeofTCRs
depends on the domestic use of plant products and down-
streamunits. Themain goal of the catalytic naphtha reforming
0 0.1 0.2 0.3 0.4 0.5 0.6 0.7 0.8 0.9 1
23
23.5
24
24.5
25
25.5
26
26.5
27
27.5
28
Mass of catalyst (Dimensionless)
Mol
ecul
ar w
eigh
t (k
g/km
ole) CTR
Co Current
Counter Current
0 0.1 0.2 0.3 0.4 0.5 0.6 0.7 0.8 0.9 1
2050
2100
2150
2200
2250
2300
2350
2400
2450
2500a
b
Mass of catalyst (Dimensionless)
Tot
al m
olar
flo
w r
ate
(km
ole/
hr)
CTR
Co Current
Counter Current
Fig. 6 e Variation of (a) total molar flow rate and (b) the
molecular weight in the CTR and TCRs.
is to produce high-octane gasoline. Therefore, the co-current
regime is more favorable. Also the co-current reactors operate
more easily than the counter-current ones. Fig. 5(a) and (b) also
shows higher aromatic and hydrogen production in the outlet
of the second reactor of TCRs configuration in comparisonwith
the outlet of the third reactor in the CTR. As a result, the third
reactor, with the highest catalyst load (as much as the sum of
the first and second reactors) can be neglected. This achieve-
ment leads to ahugecapital andoperational investment saving
(the catalyst contains Pt metal). Fig. 5 (c) reveals the light end
production. These gases are used as a feed stock for LPG
production. Table 8 shows the composition of reformate and
product stream of the third reactor for each case.
5.2.3. Change of molar flow rate and molecular weightAs it is demonstrated in Fig. 6(a) the variation of the totalmolar
flow rate from the entrance of the first reactor to the outlet of
the last reactor is about 350 kmol/h (about 17% changes in
molar flow rate). This is considered during the modeling and
amore comprehensivemodel comparedwith previous studies
is present in this research. The TCRs produce lighter hydro-
carbons such as lighter ends and aromatics comparedwith the
CTR. Accordingly, the average molecular weight is lower for
the TCRs (see Fig. 6(b)). Also the Heat capacity, viscosity,
density and other physical properties are considered to be
variable in both shell and tube sides in this study.
0 0.1 0.2 0.3 0.4 0.5 0.6 0.7 0.8 0.9 1
3200
3300
3400
3500
3600
3700
3800
Mass of catalyst (Dimensionless)
Pre
ssur
e (k
Pa)
CTR
Co Current
Counter Current
Fig. 7 e Pressure drop along the endothermic side.
0 0.1 0.2 0.3 0.4 0.5 0.6 0.7 0.8 0.9 1
4.5
5
5.5
6
6.5
7
7.5
8
8.5
Mass of catalyst (Dimensionless)
H2/H
C m
olar
rat
io
CTR
Co Current
Counter Current
Fig. 8 e H2/HC ratio through the reactor for CTR and TCRs.
0 0.05 0.1 0.15 0.2 0.25 0.3 0.35 0.4 0.45 0.5
0
5
10
15
20
24.84
26.06
30a
b
Mass of catalyst (Dimensionless)
Ani
lin m
olar
flo
w r
ate
(km
ole/
hr)
Co Current
Counter Current
0 0.05 0.1 0.15 0.2 0.25 0.3 0.35 0.4 0.45 0.5
265
270
275
280
285
290
295
300
305
312.5
310
314.8
320
Mass of catalyst (Dimensionless)
H2O
mol
ar f
low
rat
e (k
mol
e/hr
)
Co Current
Counter Current
Fig. 9 e Changes of (a) aniline and (b) water in the
exothermic side for TCRs (co-current and counter-current).
0 0.1 0.2 0.3 0.4 0.5 0.6 0.7 0.8 0.9 1
720
730
740
750
760
770
780
790
800
810a
b
c
Mass of catalyst (Dimensionless)
Tem
pera
ture
of
shel
l sid
e (K
)
Co Current
Counter Current
CTR
0 0.05 0.1 0.15 0.2 0.25 0.3 0.35 0.4 0.45 0.5
0
0.5
1
1.5
2
2.5
x 10
4
Mass of catalyst (Dimensionless)
Hea
t (k
J/kg
cat.hr
)
0.19 0.195 0.2
1000
1200
1400
Endothermic Heat of Reaction
Transfered Heat
0 0.05 0.1 0.15 0.2 0.25 0.3 0.35 0.4 0.45 0.5
0
0.5
1
1.5
2
2.5
x 10
4
Mass of catalyst (Dimensionless)
Hea
t (k
J/kg
cat.hr
)
0.02 0.04
0
500
1000
1500Enothermic Heat of Reaction
Transfered Heat
Fig. 10 e (a) Thermal profiles of CTR and TCRs, and the
consumed heat of endothermic side and transfer heat
through the solid walls of (b) co-current and (c) counter-
current.
i n t e r n a t i o n a l j o u r n a l o f h y d r o g e n en e r g y 3 6 ( 2 0 1 1 ) 3 4 8 3e3 4 9 5 3491
i n t e rn a t i o n a l j o u r n a l o f h y d r o g e n en e r g y 3 6 ( 2 0 1 1 ) 3 4 8 3e3 4 9 53492
5.2.4. Pressure dropSince the total molar flow rate increases, the velocity and
related viscose losses as well as the pressure drop increase.
Fig. 7 depicts the pressure profile along the CTR and TCRs. The
related equation (Ergun equation) was shown in Table 5.
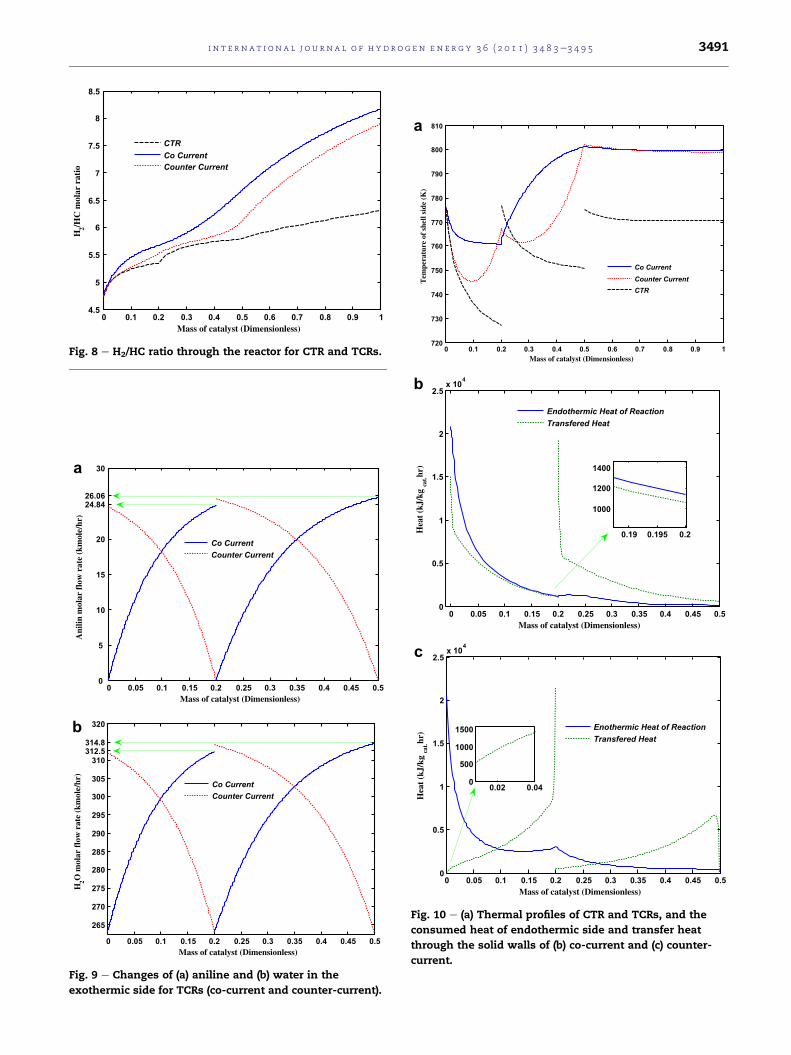
5.2.5. H2/HC ratioClearly theH2/HC ratio increases along the reactor according to
thehydrogenproduction. Increasing this ratio is a guarantee to
enhance the catalyst life time and also reduces load on the
catalyst. On the other hand, it is a constraint and can shift the
dehydrogenation reaction in the reverse direction to reduce
thehydrogenandaromaticproductions.Higher temperature in
the TCRs can aid to reduce the undesirable effect of increasing
in the H2/HC. Fig. 8 shows this ratio in the CTR and TCRs.
5.3. Exothermic side
5.3.1. Molar behaviorFig. 9(a) and (b) presents themolar flow rate of the exothermic
side of the reactor for both coecurrent and counterecurrent
mode of operation. The same value for the space velocity
0 0.025 0.05 0.075 0.1 0.125 0.15 0.175 0.2
750
800
850
900
950
1000
1050
1100a
b
Mass of catalyst (Dimensionless)
Tem
pera
ture
of
exot
herm
ic s
ide
(K)
N=1
N=10
N=100
N=750
Counter CurrentCo Current
0.2 0.25 0.3 0.35 0.4 0.45 0.5
650
700
750
800
850
900
950
1000
Mass of catalyst (Dimensionless)
Tem
pera
ture
of
exot
herm
ic s
ide
(K)
N=1
N=10
N=100
N=750
Co CurrentCounter Current
Fig. 11 e Effect of tube’s number on the developed hot spot
in the exothermic sides of co and counter-current reactors
for (a) first reactor and (b) second reactor.
which was considered by AboeGhander et al. [25] has been
applied in our study. The molar flow rates of the exothermic
components are basedon stoichiometric values. Adding steam
to the feed lineprevents the coke formationon the catalyst and
reduces the temperature along the hydrogenation side and
maintains it low by diluting the reacting mixture on the
hydrogenation side [25,36]. The hydrogenation of nitroben-
zene is an irreversible reaction and it is not limited due to the
thermodynamic equilibrium and it continues to the end. Fuel
depletion will impress the reaction rate and will stop it. The
concentrated feed generates high heat and consequently
a considerable peak in the temperature. Sowe divided the feed
stream into two parallel lines to avoid this phenomenon. The
conversions for nitrobenzene in the first and the second reac-
tors are 86.40e86.38% and 90.60e90.59% respectively for co-
current and counter-current regimes.
5.4. Thermall behavior
5.4.1. Endothermic sideFig. 10(a) presents the temperature profile in the endothermic
side of the CTR and TCRs simultaneously. The temperature in
0 0.02 0.04 0.06 0.08 0.1 0.12 0.14 0.16 0.18 0.2
0
200
400
600
800
1000
1200
1400
1600
a
b
Mass of catalyst (Dimensionless)
Hea
t (k
j/kg
cat.hr
)
Exothermic Heat of Reaction
Transfered Heat
Counter Current
Co Current
N=750
0.2 0.25 0.3 0.35 0.4 0.45 0.5
-200
0
200
400
600
800
1000
1200
1400
1600
1792
Mass of catalyst (Dimensionless)
Hea
t (k
j/kg
cat.hr
)
Exothermic Heat of Reaction
Transfered Heat
Counter Current
Co Current
N=750
Fig. 12 e Exothermic heat of reaction and the transferred
heat in the TCRs for (a) first reactor and (b) second reactor.
i n t e r n a t i o n a l j o u r n a l o f h y d r o g e n en e r g y 3 6 ( 2 0 1 1 ) 3 4 8 3e3 4 9 5 3493
the CTR falls in each reactor due to the predominant endo-
thermic reaction. The temperature reduction of the first reactor
in TCR configuration for co-current flow pattern is lower
compared with the CTR because of the heat source (exothermic
reaction inthe tubeside).Considering thecaseof co-currentflow
in the thermally coupled reactor configuration (Fig. 10b), the
consumption heat in the endothermic side is higher compared
with the transferred heat through the tube wall in the first
reactor.Thiscan justify the temperature reductionalong thefirst
reactor. In the second reactor, the amount of transferred heat is
higher comparedwith theheat consumption in theendothermic
side which raises the temperature of the system. The heat
transfer for the counter-current flow regime has been shown in
Fig. 10(c).As it canbeseen, at theentranceof thereactor, theheat
consumption rate is higher compared with the transferred heat
through the tubewall. Therefore, the temperature of the system
reduces. In a certain axial position in Fig. 10(c), (dimensionless
mass of catalyst ¼ 0.1) the amount of transferred heat exceeds
the amount of consumed heat in the endothermic side which
justifies the temperature increase in Fig. 10(a). The same trend
can be seen in the second reactor and a minimum in tempera-
ture profile of the endothermic side occurs for the counter-
current flow regime of the TCR in this reactor.
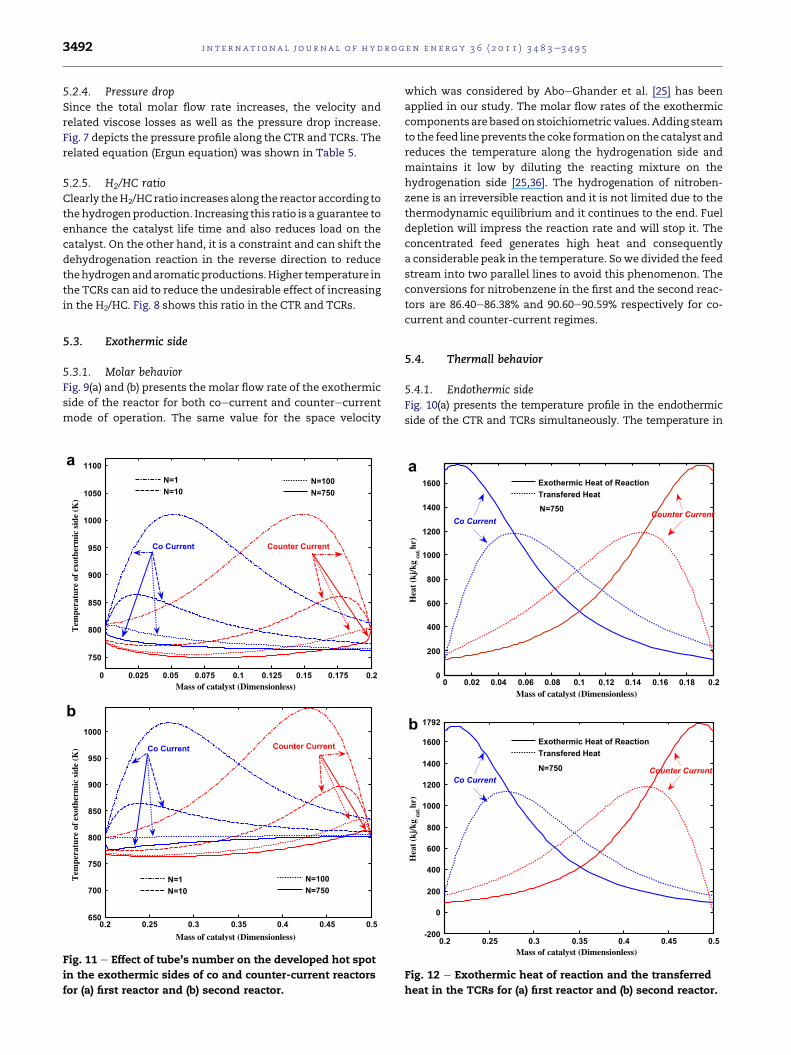
5.4.2. Exothermic sideFig. 11(a) and (b) shows the exothermic temperature profiles in
the first and second reactors for both co and counter-current
flows.As thenumber of tubes increases, thehot spot decreases
and the thermal behavior improves.
Fig. 12 demonstrates the heat generation in the exothermic
sides for co-current and counter-current flows. The generated
heat in the exothermic side is higher for the co-current config-
uration in the first reactor (also the transferred heat through
the solid wall). Accordingly, the temperature of the exothermic
side remains higher (higher maximum temperature for co-
current). Fig. 12(b) demonstrates a reverse phenomenon for the
exothermic side of the second reactor (higher maximum
temperature for counter-current).
6. Conclusion
Inorder tosaveenergyandminimize thecapitalandoperational
costs, a novel reactor configuration has been proposed for the
catalytic naphtha reforming process in previous studies. In this
research, two different modes of operation have
been investigated in order to determine their advantages and
disadvantages. Considering aromatics and hydrogen as the
main products of the naphtha reforming process, the variation
of the production rate of these two componentsmay clarify the
situation. According to the calculations made by this research
group, higher aromatics production rate can be achieved by
utilizing the co-current mode of operation. On the other hand,
by utilizing the counter-current flow regime, the hydrogen
production rate increasedbyabout 5 kmol/h comparedwith the
co-current flow. The pressure and temperature profile also has
been presented in this study. Generally, according to all the
calculations made in this research, utilizing the co-current
mode of operation is given priority. These results suggest that
the counter-current configuration can be a compelling way
to boost hydrogen production and the co-current mode of
operation enhances the aromatic production rate and ensure
the other desired results, as well. However, an investigation in
relation to the environmental aspects, commercial viability and
economic feasibility of the proposed configuration is necessary
in order to consider commercialization of the process.
Nomenclature
a catalyst activity
A moles of aromatic formed, kmol h�1
Ac cross-section area of reactor, m2
cp specific heat capacity, kJ kmol�1 K�1
dp particle diameter, m
Ed activation energy of catalyst, J mol�1
Ei activation energy for ith reaction, kJ kmol�1
Fi molar flow rate of component i
hf heat transfer coefficient, W m�2 K�1
H2 hydrogen, kmol h�1
keff effective thermal conductivity, W m�1 s�1
kf1 forward rate constant for reaction (1),
kmol h�1 kg cat�1 MPa�1
kf2 forward rate constant for reaction (2),
kmol h�1 kg cat�1 MPa�2
kf3 forward rate constant for reactions (3),
kmol h�1 kg cat�1 MPa�2
kf4 forward rate constant for reactions (4),
kmol h�1 kg cat�1 MPa�2
Ke1 equilibrium constant, MPa3
Ke2 equilibrium constant, M Pa�1
L length of reactor, m
Mi molecular weight of component i, kg kmol�1
Mw average molecular weight of the feedstock,
kg kmol�1
n average carbon number for naphtha
NA molar flow rate of aromatic, kmol h�1
Ni molar flow rate of component i, kmol h�1
p moles of paraffin formed, kmol h�1
Pi partial pressure of ith component, kPa
P total pressure, kPa
Q volumetric flow rate, m3 s�1
ri rate of reaction for ith reaction, kmol kg cat�1 h�1
R gas constant, kJ kmol�1 K�1
sa specific surface area of catalyst pellet, m2 kg�1
T temperature of gas phase, K
yi mole fraction for ith component in gas phase
e void fraction of catalyst bed
m viscosity of gas phase, kg m�1 s�1
r density of gas phase, kg m�3
rb reactor bulk density, kg m�3
fs sphericity
DH heat of reaction, kJ kmol�1
a aromatic
cal calculated
h hydrogen
i number of components
j number of reaction sides (1: Endothermic, 2:
Exothermic)
n naphthene
i n t e rn a t i o n a l j o u r n a l o f h y d r o g e n en e r g y 3 6 ( 2 0 1 1 ) 3 4 8 3e3 4 9 53494
out outlet
p paraffin
CTR conventional tubular reactor
FBP final boiling pint, �CHC Hydrocarbon, kmol h�1
IBP initial boiling pint, �CLHSV liquid hourly space velocity, hr�1
Pt platinum
Re rhenium
RON research octane number
TBP true boiling point, �KTCR thermally coupled reactor
WHSV weight hourly space velocity, hr�1
r e f e r e n c e s
[1] Aitani AM. Catalytic naphtha reforming, encyclopedia ofchemical processing; 2005; doi:10.1081/E-ECHP-120039766.
[2] Weifeng H, Hongye S, Yongyou H, Jian C. Modeling,simulation and optimization of a whole industrial catalyticnaphtha reforming process on aspen plus platform. ChinJ Chem Eng 2006;14(5):584e91.
[3] Smith RB. Kinetic analysis of naphtha reforming withplatinum catalyst. Chem Eng Prog 1959;55(6):76e80.
[4] Weifeng H, Hongye S, Yongyou H, Jian C. Lumpedkinetics model and its on-line application to commercialcatalytic naphtha reforming process. J Chem Ind Eng2006;57(7).
[5] Boyas RS, Froment GF. Fundamental kinetic modeling ofcatalytic reformer. Ind Eng Chem Res 2009;48:1107e19.
[6] Stijepovic MZ, Ostojic AV, Milenkovic I, Linke P. developmentof a kinetic model for catalytic reforming of naphtha andparameter estimation using industrial plant data. Energy &Fuels 2009;23:979e83.
[7] Li J, Tan Y, Liao L. Modeling and optimization of a semi-regenerative catalytic naphtha reformer. In: Conference oncontrol application; 2005.
[8] Taskar U, Riggs JB. Modeling and optimization ofa semiregenerative catalytic naphtha reformer. AIChE J 1997;43(3):740e53.
[9] Juarez JA, Macias EV, Garcia LD, Arredondo EG. Modeling andsimulation of four catalytic reactors in series for naphthareforming. Energy & Fuels 2001;15:887e93.
[10] Khosravanipour Mostafazadeh A, Rahimpour MR. Amembrane catalytic bed concept for naphtha reforming inthe presence of catalyst deactivation. Chem Eng Process2009;48:683e94.
[11] Rahimpour MR, Iranshahi D, Bahmanpour AM. Dynamicoptimization of a multi-stage spherical, radial flowreactor for the naphtha reforming process in thepresence of catalyst deactivation using differentialevolution (DE) method. Int J Hydrogen Energy 2010;35(14):7498e511.
[12] Iranshahi D, Pourazadi E, Paymooni K, Am Bahmanpour,Rahimpour MR, Shariati A. Modeling of an axial flow,spherical packed-bed reactor for naphtha reforming processin the presence of the catalyst deactivation. Int J HydrogenEnreg 2010;35(23):12784e99.
[13] Rahimpour MR, Iranshahi D, Pourazadi E, Bahmanpour AM.A comparative study on a novel combination of spherical andmembrane tubular reactorsof thecatalyticnaphtha reformingprocess. Int J Hydrogen Enreg; 2010; doi:10.1016/j.ijhydene.2010.09.043.
[14] Iranshahi D, Bahmanpour AM, Pourazadi E, Rahimpour MR.Mathematical modeling of a multi-stage naphtha reformingprocess using novel thermally coupled recuperative reactorsto enhance aromatic production. Int J Hydrogen Enreg 2010;35(20):10984e93.
[15] Benitez V, Boutzeloit M, Mazzieri VA, Especel C, Epron F,Vera CR, et al. Preparation of trimetallic PteReeGe/Al2O3 andPteIreGe/Al2O3 naphtha reforming catalysts by surfaceredox reaction. Appl Catal A Gen 2007;319:210e7.
[16] Boutzeloit M, Benitez VM, Mazzieri VA, Especel C, Epron F,Vera CR, et al. Effect of the method of addition of Ge on thecatalytic properties of PteRe/Al2O3 and PteIr/Al2O3
naphtha reforming catalysts. Catal Commun 2006;7:627e32.
[17] Mazzieri VA, Pieck CL, Vera CR, Yori JC, Grau JM. Analysis ofcoke deposition and study of the variables of regenerationand rejuvenation of naphtha reforming trimetallic catalysts.Catal Today 2008;135:870e8.
[18] Sugimoto M, Murakawa T, Hirano T, Ohashi H. Novelregeneration method of Pt/KL zeolite catalyst for lightnaphtha reforming. Appl Catal A Gen 1993;95:257e68.
[19] Dautzenberg FM, Mukherjee M. Process intensification usingmulti- functional reactors. Chem Eng Sci 2001;56:251.
[20] Zanfir M, Gavriilidis A. Modelling of a catalytic plate reactorfor dehydrogenation-combustion coupling. Chem Eng Sci2001;56:2671e83.
[21] BhatSA, Sadhukhan J. Process intensificationaspects forsteammethane reforming: an overview. AIChE J 2009;55:408e22.
[22] Altimari P, Bildea CS. Integrated design and control of plantwidesystemscouplingexothermicandendothermic reactions.Comp Chem Eng 2009;33:911e23.
[23] Patel KS, Sunol AK. Modeling and simulation of methanesteam reforming in a thermally couples membrane reactor.Int J Hydrogen Energy 2007;32:2344e58.
[24] Glockler B, Kolios G, Tellaeche C, Nieken U. A heat-integratedreverse-flow reactor concept for endothermic high-temperaturesyntheses,part i: fundamentalse short-cut theoryand experimental verification of a traveling endothermicreaction zone. Chem Eng Technol 2009;32:1339e47.
[25] Abo-Ghander NS, Grace JR, Elnashaie SSEH, Lim CJ. Modelingof a novel membrane reactor to integrate dehydrogenation ofethyl benzene to styrene with hydrogenation ofnitrobenzene to aniline. Chem Eng Sci 2008;63:1817e26.
[26] Rase RF. Chemical reactor design for process plants, vol. 2.John Wiley & Sons, Inc.; 1977.
[27] Ullmann’s encyclopedia of industrial chemistry. 6th ed.,vol. 3. Germany: WILEY-VCH; 2003. 161e175.
[28] Diao S, Qian W, Luo G, Wei F, Wang Y. Gaseous catalytichydrogenation of nitrobenzene to aniline in a two-stagefluidized bed reactor. Appl Catal A Gen 2005;286:30e5.
[29] Klemm E, Amon B, Redlingsho fer H, Dieterich E, Emig G.Deactivation kinetics in the hydrogenation of nitrobenzene toaniline on thebasis of a coke formationkinetics investigationsin an isothermal catalytic wall reactor. Chem Eng Sci 2001;56:1347e53.
[30] Operating Data of Catalytic ReformerUnit, Domestic Refinery;2005.
[31] AmonB,RedlingshoferH,KlemmE,DieterichE,EmigG.Kineticinvestigations of the deactivation by coking of a noble metalcatalyst in the catalytic hydrogenation of nitrobenzene usinga catalytic wall reactor. Chem Eng Process 1999;38:395e404.
[32] Smith JM, Van ness HC, Abbot MM. Introduction to chemicalengineering thermodynamic. 6th ed.NewYork:McGraweHill;2001.
[33] Perry RH, Green DW, Maloney JO. Perry’s chemical engineers’handbook. 7th ed. McGraw-Hill; 1997.
[34] Reid RC, Sherwood TK, Prausnitz J. The properties of gasesand liquids. 3rd ed. New York: McGraweHill; 1977.

i n t e r n a t i o n a l j o u r n a l o f h y d r o g e n en e r g y 3 6 ( 2 0 1 1 ) 3 4 8 3e3 4 9 5 3495
[35] Wen D, Ding Y. Heat transfer of gas flowthrough a packedbed. Chem Eng Sci 2006;61:3532e42.
[36] Abo-Ghander NS, Logist F, Grace JR, VanImpe JFM,Elnashaie SSEH, Lim CJ. Optimal design of an auto
thermal membrane reactor coupling thedehydrogenation of ethylbenzene to styrene with thehydrogenation of nitrobenzene to aniline. Chem Eng Sci2010;65:3113e27.
Top Related

Copyright © 2022 FDOKUMEN

