ZTE CORPORATION 中興通訊股份有限公司 - HKEXnews
79
Hong Kong Exchanges and Clearing Limited and The Stock Exchange of Hong Kong Limited take no responsibility for the contents of this announcement, make no representation as to its accuracy or completeness and expressly disclaim any liability whatsoever for any loss howsoever arising from or in reliance upon the whole or any part of the contents of this announcement. ZTE CORPORATION 中 興 通 訊 股 份 有 限 公 司 (a joint stock limited company incorporated in the People’s Republic of China with limited liability) (Stock Code: 763) 2009 ANNUAL REPORT SUMMARY AND RESULTS ANNOUNCEMENT 1 IMPORTANT 1.1 The Board of Directors, Supervisory Committee and the Directors, Supervisors and senior management of ZTE Corporation (the ‘‘Company’’) confirm that the annual report summary and results announcement does not contain any false information, misleading statements or material omissions, and collectively and individually accept responsibility for the truthfulness, accuracy and completeness of the contents of this annual report. An annual report containing all information required to be presented in annual reports in accordance with Appendix 16 of the Rules Governing the Listing of Securities on the Stock Exchange of Hong Kong Limited will be posted on the website of the Hong Kong Stock Exchange (http://www.hkexnews.com.hk) in due course. 1.2 There are no Directors, Supervisors or senior management who do not warrant or who dispute the truthfulness, accuracy and completeness of the contents of this annual report. 1.3 This annual report has been considered and approved at the second meeting of the Fifth Session of the Board of Directors of the Company. Mr. Zhang Junchao, Director, was unable to attend the meeting due to work reasons and authorised in writing Mr. Hou Weigui, Chairman, to vote on his behalf. Mr. Li Jin, Independent Director, was unable to attend the meeting due to work reasons and authorised in writing Mr. Chen Naiwei, Independent Director, to vote on his behalf. Mr. Tan Zhenhui, Independent Director, was unable to attend the meeting due to work reasons and authorised in writing Mr. Chen Naiwei, Independent Director, to vote on his behalf. 1.4 The respective financial statements of ZTE Corporation and its subsidiaries (the ‘‘Group’’) for the year ended 31 December 2009 were prepared in accordance with PRC Accounting Standards for Business Enterprises (‘‘PRC ASBEs’’) and with Hong Kong Financial Reporting Standards (‘‘HKFRSs’’) respectively, and had been audited by Ernst & Young Hua Ming and Ernst & Young, and an unqualified auditors’ report has been issued by each of them. –1–
-
Upload
khangminh22 -
Category
Documents
-
view
0 -
download
0
Transcript of ZTE CORPORATION 中興通訊股份有限公司 - HKEXnews

Hong Kong Exchanges and Clearing Limited and The Stock Exchange of Hong Kong Limited
take no responsibility for the contents of this announcement, make no representation as to its
accuracy or completeness and expressly disclaim any liability whatsoever for any loss howsoever
arising from or in reliance upon the whole or any part of the contents of this announcement.
ZTE CORPORATION
中 興 通 訊 股 份 有 限 公 司(a joint stock limited company incorporated in the People’s Republic of China with limited liability)
(Stock Code: 763)
2009 ANNUAL REPORT SUMMARY AND RESULTS
ANNOUNCEMENT
1 IMPORTANT
1.1 The Board of Directors, Supervisory Committee and the Directors, Supervisors and senior
management of ZTE Corporation (the ‘‘Company’’) confirm that the annual report
summary and results announcement does not contain any false information, misleading
statements or material omissions, and collectively and individually accept responsibility
for the truthfulness, accuracy and completeness of the contents of this annual report. An
annual report containing all information required to be presented in annual reports in
accordance with Appendix 16 of the Rules Governing the Listing of Securities on the
Stock Exchange of Hong Kong Limited will be posted on the website of the Hong Kong
Stock Exchange (http://www.hkexnews.com.hk) in due course.
1.2 There are no Directors, Supervisors or senior management who do not warrant or who
dispute the truthfulness, accuracy and completeness of the contents of this annual report.
1.3 This annual report has been considered and approved at the second meeting of the Fifth
Session of the Board of Directors of the Company. Mr. Zhang Junchao, Director, was
unable to attend the meeting due to work reasons and authorised in writing Mr. Hou
Weigui, Chairman, to vote on his behalf. Mr. Li Jin, Independent Director, was unable to
attend the meeting due to work reasons and authorised in writing Mr. Chen Naiwei,
Independent Director, to vote on his behalf. Mr. Tan Zhenhui, Independent Director, was
unable to attend the meeting due to work reasons and authorised in writing Mr. Chen
Naiwei, Independent Director, to vote on his behalf.
1.4 The respective financial statements of ZTE Corporation and its subsidiaries (the
‘‘Group’’) for the year ended 31 December 2009 were prepared in accordance with PRC
Accounting Standards for Business Enterprises (‘‘PRC ASBEs’’) and with Hong Kong
Financial Reporting Standards (‘‘HKFRSs’’) respectively, and had been audited by Ernst
& Young Hua Ming and Ernst & Young, and an unqualified auditors’ report has been
issued by each of them.
– 1 –

1.5 Mr. Hou Weigui, Chairman of the Company, Mr. Wei Zaisheng, Chief Financial Officer
of the Company and Mr. Shi Chunmao, Head of Finance Division of the Company,
hereby declare that they warrant the truthfulness and completeness of the financial
reports contained in the 2009 annual report.
2 CORPORATE PROFILE
2.1 Corporate information
Abbreviated Name of Stock ZTE
Stock code 000063 (A shares) 763 (H shares)
Bond code 中興債1(115003) —
Place of listing The Shenzhen Stock Exchange The Stock Exchange
of Hong Kong
Limited
Registered and office address ZTE Plaza, Keji Road South, Hi-Tech Industrial Park,
Nanshan District, Shenzhen, Guangdong Province,
People’s Republic of China
Postal code 518057
Principal place of business
in Hong Kong
8/F Gloucester Tower, The Landmark, 15 Queen’s
Road Central, Central, Hong Kong
Website http://www.zte.com.cn
E-mail [email protected]
2.2 Contact Persons and Correspondence
Authorised representatives
Secretary to the
Board of Directors
Securities affairs
representative
Name Yin Yimin, Feng Jianxiong Feng Jianxiong Xu Yulong, Li Fei
Address ZTE Plaza, Keji Road South, Hi-Tech Industrial Park, Nanshan District,
Shenzhen, Guangdong Province, People’s Republic of China
Tel +86 755 26770282
Fax +86 755 26770286
E-mail [email protected]
– 2 –

3 ACCOUNTING AND BUSINESS DATA HIGHLIGHTS
3.1 Major financial data of the Group prepared in accordance with PRC ASBEs
Unit: RMB in millions
For the
year ended
31 December
2009
For the
year ended
31 December
2008
Year-on-year
change (%)
For the
year ended
31 December
2007
Total operating revenue 60,272.6 44,293.4 36.08% 34,777.2
Total profit 3,324.7 2,262.5 46.95% 1,727.7
Net profit attributable to shareholders
of the listed company 2,458.1 1,660.2 48.06% 1,252.2
Net profit after extraordinary items
attributable to shareholders of the listed
company 2,338.5 1,548.1 51.06% 1,245.8
Net cash flow from operating activities 3,729.3 3,647.9 2.23% 88.4
As at
31 December
2009
As at
31 December
2008
Year-on-year
change
As at
31 December
2007
Total assets 68,342.3 50,865.9 34.36% 39,229.6
Owners’ equity attributable to
shareholders of the listed company 16,825.3 14,249.5 18.08% 12,137.2
Share capital 1,831.3 1,343.3 36.33% 959.5
3.2 Major financial indicators of the Group prepared in accordance with PRC ASBEs
Item
For the
year ended
31 December
2009
For the
year ended
31 December
2008
Year-on-year
change (%)
For the
year ended
31 December
2007
Basic earnings per share (RMB/share) 1.40 Note1 0.95 Note2 47.37% 0.72 Note2
Diluted earnings per share
(RMB/share) 1.35 Note1 0.93 Note2 45.16% 0.71 Note2
Basic earnings per share after
extraordinary items (RMB) 1.33 Note1 0.89 Note2 49.44% 0.71 Note2
Fully diluted return on net assets
(%) 14.61 11.65
Increase by 2.96
percentage points 10.32
Weighted average return on net assets
(%) 15.83 12.36
Increase by 3.47
percentage points 10.94
Fully diluted return on net assets after
extraordinary items (%) 13.90 10.86
Increase by 3.04
percentage points 10.26
Weighted average return on net assets
after extraordinary items (%) 15.06 11.52
Increase by 3.54
percentage points 10.88
Net cash flow from operating activities
per share (RMB) 2.12 Note3 2.09 Note4 1.44% 0.05 Note4
– 3 –

Item
As at
31 December
2009
As at
31 December
2008
Year-on-year
change (%)
As at
31 December
2007
Net asset per share attributable to
shareholders of the listed company
(RMB) 9.55 Note3 8.16 Note4 17.03% 6.95 Note4
Note 1 : Following the implementation of profit distribution and capitalisation of capital reserve for 2008
and the Phase I Share Incentive Scheme during 2009, the total share capital of the Company was
increased from 1,343,330,310 shares to 1,831,336,215 shares, including 69,737,523 restricted
shares remaining in lock-up. Basic earnings per share for 2009 in the above table is calculated on
the basis of 1,752,691,606 shares, namely the weighted average number of ordinary share capital
after deducting restricted shares remaining in lock-up. Diluted earnings per share for 2009 is
calculated on the basis of the weighted average potentially dilutive ordinary share capital of
1,822,429,129 shares, being the sum of 1,752,691,606 shares and 69,737,523 restricted shares
under the Phase I Share Incentive Scheme remaining in lock-up. Following the completion of H
share placing under the general mandate on 21 January 2010, the total share capital of the
Company was increased from 1,831,336,215 shares to 1,889,631,015 shares. Following the expiry
of the Company’s ‘‘ZXC1’’ Warrants on 12 February 2010 and the exercise of 23,348,590 ‘‘ZXC1’’
Warrants, the total share capital of the Company was increased from 1,889,631,015 shares before
the exercise to 1,911,154,456 shares. Basic earnings per share of 2009 was RMB1.33 per share,
calculated on the basis of the total shares capital of 1,911,154,456 shares as at the date of this
report after the deduction of 69,737,523 restricted shares remaining in lock-up.
Note 2 : Basic earnings per share of 2008 and 2007 as set out in the above table is based on a total share
capital of 1,746,329,402 shares after the implementation of the Company’s profit distribution and
capitalisation from capital reserve for 2008. Diluted earnings per share for 2008 is calculated on
the basis of the weighted average ordinary share capital of 1,793,083,149 shares, being the sum of
1,746,329,402 shares and 46,753,747 potentially dilutive ordinary shares arising from restricted
shares under the Phase I Share Incentive Scheme in 2008. Diluted earnings per share for 2007 is
calculated on the basis of the weighted average ordinary share capital of 1,763,330,765 shares,
being the sum of 1,746,329,402 shares and 17,001,363 potentially dilutive ordinary shares arising
from restricted shares under the Phase I Share Incentive Scheme in 2007.
Note 3 : Net cash flow per share from operating activities and net assets per share attributable to
shareholders of the listed company for 2009 set out in the above table are calculated on the basis
of 1,761,598,692 shares, namely share capital of 1,831,336,215 shares as at the end of 2009 less
69,737,523 restricted shares remaining in lock-up.
Note 4 : Net cash flow per share from operating activities and net assets per share attributable to
shareholders of the listed company for 2008 and 2007 set out in the above table are calculated on
the basis of 1,746,329,402 shares, namely total share capital after the implementation of the 2008
profit distribution plan.
– 4 –

Extraordinary items
H Applicable & N/A
Unit: RMB in millions
Extraordinary items Amount
Government grant recognised in current profit and lossNote 168.6Other non-operating income 102.9Less: Gains/losses arising from the disposal of non-current assets 26.7
Other non-operating expenses 104.1Effect of income tax 21.1
Total 119.6
Note: With the exception of government grants which were closely related to the ordinary business
operations of the Company and received in fixed amounts on a continuous basis in accordance with
national policies and designated standards.
3.3 Major accounting information prepared in accordance with HKFRs
3.3.1 Major financial information of the Group prepared in accordance with HKFRSs
Unit: RMB in millions
For the year ended 31 December
Results 2009 2008 2007 2006 2005
Revenue 60,272.6 44,293.4 34,777.2 23,214.6 21,740.7
Cost of sales (41,667.8) (29,911.5) (23,415.0) (15,365.9) (14,101.7)
Gross profit 18,604.8 14,381.9 11,362.2 7,848.7 7,639.0
Other income and revenue 1,723.5 1,295.7 1,028.0 724.7 516.9
Research and development (5,781.6) (3,994.1) (3,210.4) (2,832.7) (1,959.5)
Selling and distribution costs (7,157.8) (5,401.0) (4,531.5) (3,274.7) (3,186.4)
Administrative expenses (2,735.2) (2,190.0) (1,718.2) (1,097.6) (1,095.4)
Other expenses (603.2) (1,159.7) (898.2) (191.5) (128.6)
Profit from operating
activities 4,050.5 2,932.8 2,031.9 1,176.9 1,786.0
Finance costs (751.7) (690.2) (328.3) (153.7) (175.9)
Share of profit and loss of
jointly controlled entities
and associates 26.0 19.9 24.1 7.5 (4.2)
Profit before tax 3,324.8 2,262.5 1,727.7 1,030.7 1,605.9
Tax (629.1) (350.6) (276.2) (127.1) (179.9)
Profit for the year 2,695.7 1,911.9 1,451.5 903.6 1,426.0
Attributable to:
Minority interests (237.6) (251.7) (199.3) (136.6) (138.3)
Attributable to:
Shareholders of parent
company 2,458.1 1,660.2 1,252.2 767.0 1,287.7
– 5 –

Unit: RMB in millions
As at 31 December
Assets and liabilities 2009 2008 2007 2006 2005
Total assets 69,464.9 52,228.8 41,034.4 26,787.2 22,464.0
Total liabilities 51,516.0 37,045.3 28,146.0 15,461.4 11,742.8
Minority interests 1,123.6 934.0 751.2 561.9 470.7
Shareholders’ equity
attributable to the
parent company 16,825.3 14,249.5 12,137.2 10,763.9 10,250.5
3.3.2 Major financial indicators of the Group prepared in accordance with HKFRSs
Items 2009 2008 2007 2006 2005
Basic earnings per share
(RMB/share) 1.40Note1 0.95 Note2 0.72 Note2 0.44 Note2 0.74 Note2
Net asset per shareNote3
(RMB/share) 9.55Note1 8.16 Note2 6.95 Note2 6.16 Note2 5.87 Note2
Return on net
assetsNote3 14.61% 11.65% 10.32% 7.13% 12.56%
Note 1 : Following the implementation of profit distribution and capitalisation of capital reserve for 2008
and the Phase I Share Incentive Scheme during 2009, the total share capital of the Company was
increased from 1,343,330,310 shares to 1,831,336,215 shares, including 69,737,523 restricted
shares remaining in lock-up. Basic earnings per share for 2009 in the above table is calculated on
the basis of 1,752,691,606 shares, namely the weighted average number of ordinary share capital
after deducting restricted shares remaining in lock-up. Net asset per share for 2009 in the above
table is calculated on the basis of 1,761,598,692 shares, namely the share capital after deducting
restricted shares remaining in lock-up.
Note 2 : The figures set out above have been re-stated to reflect the increase of the Company’s total share
capital from 1,343,330,310 shares to 1,746,329,402 shares as a result of the implementation of the
2008 profit distribution plan.
Note 3 : The above financial indicators represent figures excluding minority interests.
3.4 Differences between PRC ASBEs and HKFRSs
& Applicable H N/A
The amounts of net profit and net asset of the Group for the year ended and as at 31
December 2009 calculated in accordance with PRC ASBEs are entirely consistent with
those calculated under HKFRSs.
– 6 –

4 CHANGES IN SHARE CAPITAL AND SHAREHOLDERS
4.1 Changes in share capital during the year (unit: shares)
Prior to the change Increase/decrease as a result of the change (+, –) After the change
Number of
shares
Percentage
(%)
New
issue
Bonus
issue
Transfer
from capital
reserveNote 1
OthersNote 2,
Note 3 Sub-total
Number of
share
Percentage
(%)
I. Shares subject to lock-up 1,693,914 0.13 — — 486,271 70,279,273 70,765,544 72,459,458 3.96
1. State-owned shares — — — — — — — — —
2. State-owned corporate shares — — — — — — — — —
3. Other domestic shares — — — — — 66,899,197 66,899,197 66,899,197 3.65
Comprising:
Domestic non-state-owned
corporate shares — — — — — — — — —
Domestic natural person
shares — — — — — 66,899,197 66,899,197 66,899,197 3.65
4. Foreign shares — — — — — — — — —
Comprising:
Foreign corporate shares — — — — — — — — —
Foreign natural person shares — — — — — — — — —
5. Senior management shares 1,693,914 0.13 — — 486,271 3,380,076 3,866,347 5,560,261 0.31
II. Shares not subject to lock-up 1,341,636,396 99.87 — — 402,512,821 14,727,540 417,240,361 1,758,876,757 96.04
1. RMB ordinary shares 1,117,424,940 83.18 — — 335,249,385 14,727,540 349,976,925 1,467,401,865 80.12
2. Domestic-listed foreign shares — — — — — — — — —
3. Overseas-listed foreign shares
(H shares) 224,211,456 16.69 — — 67,263,436 — 67,263,436 291,474,892 15.92
4. Others — — — — — — — — —
III. Total number of shares 1,343,330,310 100 — — 402,999,092 85,006,813 488,005,905 1,831,336,215 100
Note 1 : On 5 June 2009, the Company increased its share capital by way of capitalisation of the capital
reserve (creation of 3 shares for every 10 shares based on a total share capital of 1,343,330,310
shares as at 31 December 2008). For details of changes in the Company’s share capital following
the capitalisation, please refer to the announcement of the Company ‘‘Profit Distribution and
Capitalisation of Capital Reserve for 2008’’ dated 27 May 2009.
Note 2 : Implementation of the Phase I Share Incentive Scheme (Revised Version dated 5 February 2007)
commenced upon consideration and approval at the first extraordinary general meeting of the
Company for 2007 convened on 13 March 2007, after the receipt of a no-comment letter from the
CSRC. Registration of 85,050,238 Subject Share quotas granted to 4,022 Scheme Participants
under the Phase I Share Incentive Scheme of the Company with China Securities Depository and
Clearing Company Limited, Shenzhen Branch has been completed. The first unlocking of Subject
Shares under the Phase I Share Incentive Scheme was completed on 22 July 2009. After deduction
of 43,425 Subject Share quotas which had not been unlocked and which had lapsed, the total share
capital of the Company had increased by 85,006,813 shares. For details, please refer to the
‘‘Announcement on the Completion of Unlocking of Subject Shares under the First Unlocking of
the Phase I Share Incentive Scheme’’ published by the Company on 22 July 2009.
Note 3 : The number of senior management shares unlocked during the year was 167,832 A shares. (1) In
accordance with relevant domestic regulations, 163,048 A shares held by former senior
management personnel of the Company who had departed were unlocked in accordance with
relevant laws and regulations after a period of 6 months had expired since their resignations; (2)
In 2008, Executive Vice President Mr. Tian Wenguo disposed of the shares that had been
unlocked during the same year. In accordance with relevant provisions, 25% of his shareholdings
(4,784 A shares) were unlocked at the beginning of 2009.
– 7 –

4.2 Changes in shares subject to lock-up
4.2.1 Table of changes in shares subject to lock-up
Unit: shares
Name of
shareholders
Number of
shares subject
to lock-up at
the beginning
of the year
Number of
shares
unlocked
during the
year
Increase in
number of
shares subject
to lock-up
during the
year
Number of
shares
subject to
lock-up at
the end of
the year Reasons for lock-up
Date of
unlocking
Hou Weigui 380,600 — 114,179 494,779 Restricted senior
management shares
Note 1
Zhao Xianming 11,250 — 330,975 342,225 Restricted senior
management shares and
restricted shares under
share incentive scheme
Note 1,
Note 2
Xu Huijun 11,250 — 330,975 342,225 Restricted senior
management shares and
restricted shares under
share incentive scheme
Note 1,
Note 2
Chen Jie 106,725 — 214,017 320,742 Restricted senior
management shares and
restricted shares under
share incentive scheme
Note 1,
Note 2
Ni Qin 97,782 — 211,335 309,117 Restricted senior
management shares and
restricted shares under
share incentive scheme
Note 1,
Note 2
Zeng Xuezhong 22,500 — 279,750 302,250 Restricted senior
management shares and
restricted shares under
share incentive scheme
Note 1,
Note 2
Fan Qingfeng 15,000 — 277,500 292,500 Restricted senior
management shares and
restricted shares under
share incentive scheme
Note 1,
Note 2
Wu Zengqi 15,000 — 277,500 292,500 Restricted senior
management shares and
restricted shares under
share incentive scheme
Note 1,
Note 2
Pang Shengqing 11,475 — 276,443 287,918 Restricted senior
management shares and
restricted shares under
share incentive scheme
Note 1,
Note 2
– 8 –

Name of
shareholders
Number of
shares subject
to lock-up at
the beginning
of the year
Number of
shares
unlocked
during the
year
Increase in
number of
shares subject
to lock-up
during the
year
Number of
shares
subject to
lock-up at
the end of
the year Reasons for lock-up
Date of
unlocking
Yin Yimin 202,832 — 60,848 263,680 Restricted senior
management shares
Note 1
Others 819,500 167,832 68,559,854 69,211,522 Restricted senior
management shares and
restricted shares under
share incentive scheme
Note 1,
Note 2
Total 1,693,914 167,832 70,933,376 72,459,458 — —
Note 1 : In accordance with relevant domestic regulations, up to 25% of the shares held may be disposed of
through the stock exchange each year.
Note 2 : Unlocked in accordance with the Phase I Share Incentive Scheme (Revised Version dated 5
February 2007) of ZTE Corporation.
4.3 Shareholders of the Company
4.3.1 Top ten shareholders of the Company and top ten holders of shares not subject to lock-up asat 31 December 2009
Total number of
shareholders
Total number of shareholders: 32,761 shareholders (of which32,435 were holders of A shares and 326 were holders of H shares)
Shareholdings of top ten shareholders
Name of shareholders
Nature of
shareholders
Percentage of
shareholding
(%)
Total number
of shares
held (shares)
Number of
shares held
subject to
lock-up
(shares)
Number of
pledged or
frozen
1. Shenzhen Zhongxingxin
Telecommunications Equipment
Company Limited (‘‘Zhongxingxin’’)
State-owned
shareholder
33.87% 620,214,413 0 Nil
2. HKSCC Nominees Limited Foreign
shareholder
15.89% 290,954,719 0 Unknown
3. Guangfa Jufeng Stock Fund Others 1.80% 33,000,000 0 Unknown
4. China Life Insurance Company
Limited — Dividend — Individual
Dividend — 005L- FH002 Shen
Others 1.73% 31,599,426 0 Unknown
5. Hunan Nantian (Group) Co., Ltd Others 1.14% 20,805,894 0 Unknown
6. Xingye Trend Investment Hybrid Fund Others 1.12% 20,526,341 0 Unknown
7. BoCom-Schroders Blue-chip Stock
Fund
Others 0.77% 14,044,500 0 Unknown
8. Changsheng Tongqing Tradable
Separated Stock Fund
Others 0.70% 12,907,585 0 Unknown
9. Xingye Global Vision Stock Fund Others 0.60% 10,992,514 0 Unknown
10. Rongtong SZSE 100 Index Stock Fund Others 0.57% 10,509,088 0 Unknown
– 9 –

Shareholdings of top ten holders of shares not subject to lock-up
Name of shareholders
Number of
shares held
not subject to
lock-up
Class of
shares
1. Zhongxingxin 620,214,413 A shares
2. HKSCC Nominees Limited 290,954,719 H shares
3. Guangfa Jufeng Stock Fund 33,000,000 A shares
4. China Life Insurance Company Limited — Dividend
— Individual Dividend — 005L — FH002 Shen
31,599,426 A shares
5. Hunan Nantian (Group) Co., Ltd 20,805,894 A shares
6. Xingye Trend Investment Hybrid Fund 20,526,341 A shares
7. BoCom-Schroders Blue-chip Stock Fund 14,044,500 A shares
8. Changsheng Tongqing Separate Trading Stock Fund 12,907,585 A shares
9. Xingye Global Vision Stock Fund 10,992,514 A shares
10. Rongtong SZSE 100 Index Stock Fund 10,509,088 A shares
Descriptions of any connected party
relationships or concerted party
relationships among the above
shareholders
1. Among the Company’s top ten shareholders,
Xingye Trend Investment Hybrid Fund (6th)
and Xingye Global Vision Stock Fund (9th)
were managed by the same fund manager,
Xingye Global Fund Management Limited.
2. There were no connected party relationships
or concerted party relationships between
Zhongxingxin and other shareholders listed
above.
3. Save for the above, the Company is not aware
of any connected party relationships or
concerted party relationships among the rest
of the top ten shareholders and the rest of the
top ten holders of shares that are not subject
to lock-up.
Name of
shareholder
Agreed period
of shareholding
Agreed period of shareholding for strategic investors or
legal persons participating in the placing of new shares None None
– 10 –

4.3.2 Number of circulating shares not subject to lock-up held by original holders of non-
circulating shares interested in 5% or above of the shares at the end of the reporting period
Name of shareholder
Circulating
shares not subject
to lock-up held at
the beginning of
the year (shares)
Increase/
decrease
during the
year (shares)
Reasons
for change
Circulating
shares not subject
to lock-up held at
the end of the
year (shares)
Zhongxingxin 477,088,010 143,126,403 Note 620,214,413
Note: The change in the number of circulating shares not subject to lock-up held by Zhongxingxin during
the reporting period is attributable to the implementation of the proposals of profit distribution and
capitalisation from capital reserves of the Company for 2008. For details, please refer to the
announcements headed ‘‘Announcement on Profit Distribution and Capitalisation from Capital
Reserves for 2008’’ announced on 27 May 2009.
4.4 Controlling shareholder and de facto controller
4.4.1 Changes in controlling shareholder and de facto controller
& Applicable H N/A
4.4.2 Details of controlling shareholder and de facto controller
4.4.2.1 Name of controlling shareholder of the Company: Shenzhen Zhongxing Xin
Telecommunications Equipment Company, Limited (‘‘Zhongxingxin’’)
Legal representative: Xie Weiliang
Date of incorporation: 29 April 1993
Registered capital: RMB100 million
Scope of business: Production of programmed switchboard cabinets, telephones
and related components, electronic products; import and
export operations; treatment of waste water, toxic fumes and
noise and related technical services, research and technical
development of environmental protection equipment;
production of continuous monitoring smoke systems.
– 11 –
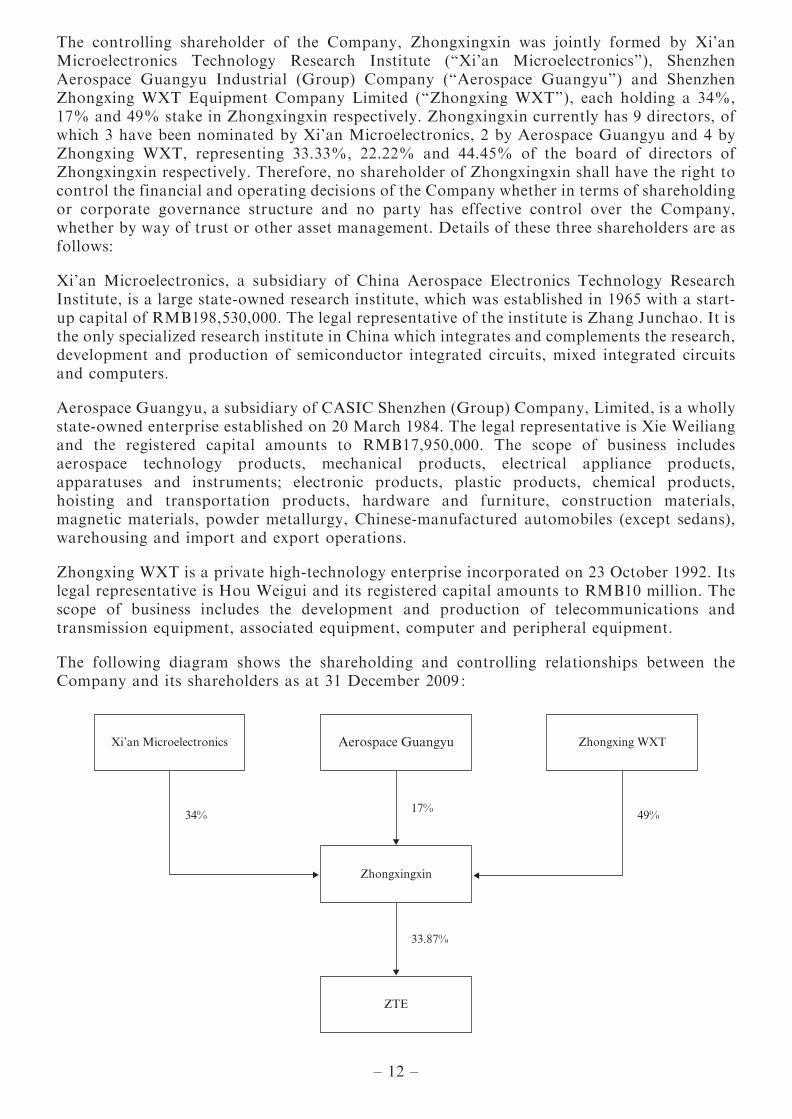
The controlling shareholder of the Company, Zhongxingxin was jointly formed by Xi’anMicroelectronics Technology Research Institute (‘‘Xi’an Microelectronics’’), ShenzhenAerospace Guangyu Industrial (Group) Company (‘‘Aerospace Guangyu’’) and ShenzhenZhongxing WXT Equipment Company Limited (‘‘Zhongxing WXT’’), each holding a 34%,17% and 49% stake in Zhongxingxin respectively. Zhongxingxin currently has 9 directors, ofwhich 3 have been nominated by Xi’an Microelectronics, 2 by Aerospace Guangyu and 4 byZhongxing WXT, representing 33.33%, 22.22% and 44.45% of the board of directors ofZhongxingxin respectively. Therefore, no shareholder of Zhongxingxin shall have the right tocontrol the financial and operating decisions of the Company whether in terms of shareholdingor corporate governance structure and no party has effective control over the Company,whether by way of trust or other asset management. Details of these three shareholders are asfollows:
Xi’an Microelectronics, a subsidiary of China Aerospace Electronics Technology ResearchInstitute, is a large state-owned research institute, which was established in 1965 with a start-up capital of RMB198,530,000. The legal representative of the institute is Zhang Junchao. It isthe only specialized research institute in China which integrates and complements the research,development and production of semiconductor integrated circuits, mixed integrated circuitsand computers.
Aerospace Guangyu, a subsidiary of CASIC Shenzhen (Group) Company, Limited, is a whollystate-owned enterprise established on 20 March 1984. The legal representative is Xie Weiliangand the registered capital amounts to RMB17,950,000. The scope of business includesaerospace technology products, mechanical products, electrical appliance products,apparatuses and instruments; electronic products, plastic products, chemical products,hoisting and transportation products, hardware and furniture, construction materials,magnetic materials, powder metallurgy, Chinese-manufactured automobiles (except sedans),warehousing and import and export operations.
Zhongxing WXT is a private high-technology enterprise incorporated on 23 October 1992. Itslegal representative is Hou Weigui and its registered capital amounts to RMB10 million. Thescope of business includes the development and production of telecommunications andtransmission equipment, associated equipment, computer and peripheral equipment.
The following diagram shows the shareholding and controlling relationships between theCompany and its shareholders as at 31 December 2009 :
– 12 –

5 DIRECTORS, SUPERVISORS AND SENIOR MANAGEMENT
5.1 Changes in the shareholdings and annual remuneration of and share incentives granted to
directors, supervisors and senior management during the reporting period
Shares granted under the Share Incentive Schemeduring the reporting period
(restricted A shares)
Name Title Gender Age
Term ofoffice
commencingon
Note 7
Term ofofficeending
onNote 7
Number ofshares held
at thebeginning of
the year
Number ofshares held atthe end of theyear (including
shares underthe ShareIncentiveScheme)
Reasonfor change
Total pre-taxremunerationreceived fromthe Company
during thereporting
period(RMB10,000)
Number ofrestricted
sharesgranted(share)
Number ofrestricted
sharesgranted
during theperiod
(shares)Note 5
Grantprice of
restrictedshares
(cum-rightbasis)
(RMB)
Number ofrestricted
shares heldat the end
of thereporting
period
Whetherremuneration isreceived fromshareholderentities orother connectedentities
Hou Weigui Chairman Male 68 3/2007 3/2010 507,466 659,706 Note 1 147.0 0 0 30.05 0 No
Wang Zongyin Vice Chairman Male 65 3/2007 3/2010 0 18,200 Note 2 10 18,200 0 30.05 18,200 Yes
Xie Weiliang Vice Chairman Male 54 3/2007 3/2010 0 18,200 Note 2 10 18,200 0 30.05 18,200 Yes
Zhang Junchao Director Male 56 3/2007 3/2010 0 18,200 Note 2 10 18,200 0 30.05 18,200 Yes
Li Juping Director Male 54 3/2007 3/2010 0 18,200 Note 2 10 18,200 0 30.05 18,200 Yes
Dong Lianbo Director Male 53 3/2007 3/2010 0 18,200 Note 2 10 18,200 0 30.05 18,200 Yes
Shi Lirong Director and President Male 46 3/2007 3/2010 154,064 200,283 Note 1 166.0 0 0 30.05 0 No
Yin Yimin Executive Director Male 46 3/2007 3/2010 270,442 351,574 Note 1 603.0 0 0 30.05 0 No
He Shiyou Director and ExecutiveVice President
Male 43 3/2007 3/2010 147,410 191,633 Note 1 169.7 0 0 30.05 0 No
Zhu WuxiangNote 4
Independent Director Male 44 3/2007 7/2009 0 0 — 5.8 0 0 30.05 0 No
Chen ShaohuaNote 4
Independent Director Male 48 3/2007 7/2009 0 0 — 5.8 0 0 30.05 0 No
Qiao WenjunNote 4
Independent Director Male 39 3/2007 7/2009 0 0 — 5.8 0 0 30.05 0 No
Mi Zhengkun Independent Director Male 64 3/2007 3/2010 0 0 — 10 0 0 30.05 0 No
Li Jin Independent Director Male 42 3/2007 3/2010 0 0 — 10 0 0 30.05 0 No
Qu XiaohuiNote 5
Independent Director Female 55 7/2009 3/2010 0 0 — 4.5 0 0 30.05 0 No
Wei WeiNote 5
Independent Director Male 44 7/2009 3/2010 0 0 — 4.5 0 0 30.05 0 No
Chen NaiweiNote 5
Independent Director Male 52 7/2009 3/2010 0 0 — 4.5 0 0 30.05 0 No
Zhang Taifeng Chairman of SupervisoryCommittee
Male 68 3/2007 3/2010 170,352 221,458 Note 1 147.0 0 0 30.05 0 No
Wang Wangxi Supervisor Male 43 3/2007 3/2010 0 0 — 66.9 0 0 30.05 0 No
He Xuemei Supervisor Female 39 3/2007 3/2010 0 0 — 35.6 0 0 30.05 0 No
Qu Deqian Supervisor Male 48 3/2007 3/2010 14,028 18,236 Note 1 0 0 0 30.05 0 Yes
Wang Yan Supervisor Female 45 3/2007 3/2010 0 0 — 0 0 0 30.05 0 Yes
Wei Zaisheng Executive Vice Presidentand Chief FinancialOfficer
Male 47 3/2007 3/2010 165,564 215,233 Note 1 156.0 0 0 30.05 0 No
Xie Daxiong Executive Vice President Male 46 3/2007 3/2010 82,775 289,607 Notes 1 and 2 150.6 182,000 0 30.05 182,000 No
Tian Wenguo Executive Vice President Male 41 3/2007 3/2010 19,136 206,877 Notes 1 and 2 171.0 182,000 0 30.05 182,000 No
Qiu Weizhao Executive Vice President Male 46 3/2007 3/2010 0 182,000 Note 2 144.7 182,000 0 30.05 182,000 No
Fan Qingfeng Executive Vice President Male 41 3/2007 3/2010 20,000 292,500 Notes 1 and 2and 3
148.5 273,000 0 30.05 273,000 No
Chen Jie Senior Vice President Female 51 3/2007 3/2010 142,300 366,990 Notes 1 and 2 142.5 182,000 0 30.05 182,000 No
Zhao Xianming Senior Vice President Male 43 3/2007 3/2010 15,000 347,100 Notes 1 and 2 138.4 327,600 0 30.05 327,600 No
Pang Shengqing Senior Vice President Male 41 3/2007 3/2010 15,300 292,891 Notes 1 and 2 128.4 273,000 0 30.05 273,000 No
Zeng Xuezhong Senior Vice President Male 36 3/2007 3/2010 30,000 312,000 Notes 1 and 2 130.5 273,000 0 30.05 273,000 No
Xu Huijun Senior Vice President Male 36 3/2007 3/2010 15,000 347,100 Notes 1 and 2 126.6 327,600 0 30.05 327,600 No
Ye Weimin Senior Vice President Male 43 3/2007 3/2010 57,326 256,524 Notes 1 and 2 114.9 182,000 0 30.05 182,000 No
Ni Qin Senior Vice President Male 50 3/2007 3/2010 130,376 351,489 Notes 1 and 2 119.6 182,000 0 30.05 182,000 No
Wu Zengqi Senior Vice President Male 45 3/2007 3/2010 20,000 299,000 Notes 1 and 2 117.3 273,000 0 30.05 273,000 No
Zhu Jinyun Senior Vice President Male 39 3/2009 3/2010 0 253,708 Note 2 113.5 253,708 0 30.05 253,708 No
Zhang Renjun Senior Vice President Male 42 3/2009 3/2010 0 0 — 113.6 0 0 30.05 0 No
Feng Jianxiong Secretary to the Board Male 36 3/2007 3/2010 10,000 195,000 Notes 1 and 2 66.8 182,000 0 30.05 182,000 No
Total — — — — — 1,986,539 5,941,909 — 3,519.0 3,365,908 0 — 3,365,908 —
– 13 –

Note 1 : The profit distribution and capitalisation from capital reserves for 2008 (creation of 3 shares forevery 10 shares and RMB3 for every 10 shares (including tax) in cash) were implemented on 5June 2009. The shareholdings of Directors, supervisors and senior management have beenadjusted accordingly.
Note 2 : Registration of the A Shares granted to Scheme Participants under the Phase I Share IncentiveScheme of the Company with China Securities Depository and Clearing Company Limited,Shenzhen Branch was completed in July 2009.
Note 3 : Shareholdings were reduced in accordance with the provisions of ‘‘Administrative Rules forCompany Shareholdings by Directors, Supervisors and Senior Management of Listed Companiesand Their Changes’’.
Note 4 : The three Independent Directors aforesaid departed in July 2009 upon the conclusion of their termof office.
Note 5 : The term of the three Independent Directors aforesaid was effective from July 2009.
Note 6 : The first unlocking of shares granted to the Directors and senior management of the Companyunder the Share Incentive Scheme was completed on 26 February 2010. For details, please refer tothe Announcement of the Company on the First Unlocking of Shares Granted to the Directorsand Senior Management of the Company under the Share Incentive Scheme dated 27 February2010.
Note 7 : The term of offices set out above represents the term of office for the Fourth Session of the Boardof Directors and the Fourth Session of the Supervisory Committee. For information on there-appointments and new appointments of the Fifth Session of the Board of Directors and seniormanagement and the Fifth Session of the Supervisory Committee, please refer to the sectionheaded “Change in the Directors, supervisors and senior management after the end of the year” inthe Annual Report.
– 14 –

5.2 Directors’ attendance at the Board meetings
Name of Directors Position
Attendance
required
Attendance
in person
(including
attendance
via video
conference)
Attendance via
communications
means
Attendance
by proxy Absence
Two
consecutive
absences in
person
Hou Weigui Chairman and
Non-executive Director
10 5 4 1 0 Nil
Wang Zongyin Vice Chairman and
Non-executive Director
10 2 4 4 0 YesNote 1
Xie Weiliang Vice Chairman and
Non-executive Director
10 5 4 1 0 Nil
Zhang Junchao Non-executive Director 10 4 4 2 0 Nil
Li Juping Non-executive Director 10 4 4 2 0 Nil
Dong Lianbo Non-executive Director 10 5 4 1 0 Nil
Yin Yimin Executive Director 10 6 4 0 0 Nil
Shi Lirong Executive Director 10 5 4 1 0 Nil
He Shiyou Executive Director 10 4 4 2 0 Nil
Zhu Wuxiang Independent Non-executive
Director
5 3 1 1 0 Nil
Chen Shaohua Independent Non-executive
Director
5 4 1 0 0 Nil
Qiao Wenjun Independent Non-executive
Director
5 3 1 1 0 Nil
Mi Zhengkun Independent Non-executive
Director
10 4 4 2 0 Nil
Li Jin Independent Non-executive
Director
10 5 4 1 0 Nil
Qu Xiaohui Independent Non-executive
Director
5 2 3 0 0 Nil
Wei Wei Independent Non-executive
Director
5 2 3 0 0 Nil
Chen Naiwei Independent Non-executive
Director
5 2 3 0 0 Nil
Board meetings held during the year 10
Including: On-site meetings 2
Meetings via communications means 4
On-site meetings assisted by communications means 4
Notes 1 : Deputy Chairman Wang Zongyin did not attend the twenty-third and twenty-fourth meetings of
the Fourth Session of the Board of Directors owing to work reasons and appointed Chairman
Mr. Hou Weigui to vote on his behalf.
5.3 Directors’, Supervisors’ and President’s interests in shares or debentures
The interests in shares of the Company held by Directors, Supervisors and the President
of the Company as at 31 December 2009 are set out in Section 5.1 of this report headed
‘‘(2) changes in the shareholdings and annual remuneration of directors, supervisors and
senior management’’ in the 2008 annual report of the Company.
Save as disclosed above, as at 31 December 2009, none of the Directors, Supervisors and
the President had any interest or short position in the shares, underlying shares and
debentures of the Company and its associated corporations (within the meaning of Part
XV of the Securities and Futures Ordinance) that is required to be recorded in the register
– 15 –

to be kept by the Company under Section 352 of the Securities and Futures Ordinance, or
otherwise notified to the Company and The Stock Exchange of Hong Kong Limited
(‘‘Hong Kong Stock Exchange’’) pursuant to the Model Code for Securities Transactions
by Directors of Listed Companies (‘‘Model Code’’) as set out in Appendix 10 to the Rules
Governing the Listing of Securities on The Stock Exchange of Hong Kong Limited
(‘‘Hong Kong Stock Exchange Listing Rules’’).
As at 31 December 2009, none of the Directors, Supervisors or the President of the
Company, or their respective spouses or children under the age of 18 had been granted or
had exercised any rights to subscribe for the share capital or debentures of the Company
or its associated corporations.
6 REPORT OF THE BOARD OF DIRECTORS
6.1 Discussion and Analysis of overall operations during the reporting period
6.1.1 Business Review for 2009
Business Review
Overview of the PRC telecommunications industry in 2009
China’s telecommunications industry sustained stable development in 2009, as domestic
carriers were engaged in vigorous 3G network building to take advantage of favourable
government policies. According to statistics published by the Ministry of Industry and
Information Technology (‘‘MIIT’’), revenue for the domestic telecommunications sector
grew by 3.9% to RMB842.43 billion for 2009, as compared to the same period last year.
New fixed asset investments grew 26.1% to RMB372.49 billion. In overview, the process
of the industrialisation and commercialisation of 3G networks in China was gaining pace,
with the three leading carriers having made direct investments of RMB160.90 billion in
aggregate in 3G network construction.
Overview of the global telecommunications industry in 2009
The global 3G business moved into the stage of rapid development in 2009 having
undergone a prolonged induction period. Despite a slowdown in growth, revenue from
global mobile voice businesses continued to account for a dominant share of carriers’
income. The data business became the fastest-growing segment thanks to the fast
penetration of 3G and the development of mobile Internet connections, while the business
of fixed-line broadband sustained growth as usage was driven by multi-media applications
on the Internet. Region-wise, the Asia Pacific has surpassed North America and Western
Europe to claim the world’s largest share of telecommunications investments, with
growing investments in segments such as mobile communication, broadband access,
optical transmission and data communication.
For carriers in developed markets, mobile broadband services and value-added customer
services represented the major growth drivers in 2009. Carriers were more focused on cost
efficiency and users’ experience, seeking to lower overall network ownership costs and
operating costs in particular, while network quality, environment-friendliness, smooth
upgrades and resource recycling, etc were also top on the agenda. In emerging markets,
the development of carriers’ mobile business was driven by the ability in cost-effective and
– 16 –

efficient network building and the massive demand for terminal products, while the
efficient utilization of frequency resources was also a concern of carriers given their
relative scarcity and the fast pace of user growth.
A new scenario in competition was emerging in the equipment manufacturing industry, as
certain players were gaining control with increasing market shares and influence, while
others were seeking to diversify their products or moving to exit the mainstream market.
Operating results of the Group for 2009
The Group performed strongly amid adverse market conditions in 2009, capitalising rare
market opportunities to report growth in scale and profit. Operating revenue of the
Group based on financial statements prepared in accordance with PRC ASBEs and
HKFRSs amounted to RMB60.273 billion, representing a year-on-year growth of
36.08%. Net profit grew 48.06% to RMB2,458 million.
By market
The domestic market:
The Group reported operating revenue of RMB30.404 billion in the domestic market
during 2009, representing a year on-year growth of 74.07%. The construction of 3G
networks was strongly supported by the government as a new driver of economic growth.
Leveraging the opportunity of full-scale 3G construction in the nation, we emerged
become China’s largest supplier of 3G network equipment as we dominated in the
network construction tenders of the three leading carriers and developed positive and
balanced strategic partnerships with the big three. Meanwhile, strong sales were reported
for our TD-SCDMA, CDMA and XPON products.
The international market
During reporting period, the Group’s revenue from its international operations grew
11.34% to RMB29.869 billion and accounted for 49.56% of its total operating revenue.
We overcame the impact of the financial crisis and sustained growth in a lacklustre
international telecom market on the back of its cost-competitiveness, technological edge
and financial strengths. We made successive breakthroughs in the high-end markets
around the world, as our principal products (with the exception of terminals), such as
carrying networks, access networks and service networks, were gaining footholds in
important markets in Europe and America, which are set to become significant growth
spots for the Company.
By products
Carriers’ network
In 2009, the Group attained significant breakthroughs and growth in the mainstream
product of carriers’ network. In wireless products, the ability of the WCDMA and LTE
products to deliver was gaining recognition among top-rate customers, while the Group’s
GSM and WCDMA products sustained rapid year-on-year growth with steady increase in
global market shares. Our CDMA, TD-SCDMA, WiMAX and core network service
products continued to lead the market, while our carriage products received a significant
boost in overall competitiveness with breakthroughs in key technologies. Our continuous
innovation in wireline fixed network products also enabled us to maintain a leading edge
– 17 –

in the FTTx market. In terms of new products, the Group orchestrated a strategic
transformation in product development through technological upgrades and operational
innovations in service software products, capitalising on new opportunities presented by
the Mobile Internet and the Internet of Things.
While breaking into new markets, the Group was also aware of the importance of
constantly improving its ability in full network delivery, key network indicator protection,
engineering quality management and work progress control. Engineering service centres
were set up to provide tailor-made services to customers that would meet the diversified
needs of carriers, so that the Company could readily compete on its project delivery
capabilities and premium service quality.
In the mainstream market, the Group topped the overall ranking for the PRC 3G market
during the reporting period, while revenue from Europe and America was growing fast as
a percentage of the Group’s sales revenue from international markets. We succeeded in
making major breakthroughs in the mainstream market on the back of our strengths in
research and development as well as our ability in swift network delivery, winning
contracts to build commercial networks in major cities around the world for mainstream
carriers such as CSL, KPN and Telenor.
Terminals
The Group’s terminal business sustained rapid growth throughout 2009, as its global
ranking in terms of handset delivery continued to rise. In the domestic market, we
reported stable growth in our terminal products throughout the year thanks to the
thriving 3G market. On the international front, we continued to make breakthroughs in
important country markets and mainstream carriers, resulting in a more balanced global
presence. Sales of our terminal products were on the rise in Europe and the United States,
auguring well for the realization of our development and business objectives for 2010.
Telecommunication software systems, services and other products
Growth for the segment in 2009 was driven by stronger sales of fixed terminals in the
domestic market and elsewhere in Asia, as well as strong growth in service income in the
home market.
– 18 –

6.2 Breakdown of principal operations by industry and product segments (under PRC ASBEs)
Revenue mix
Operating
revenue
(RMB in
millions)
Operating
costs
(RMB in
millions)
Gross
profit
margin
Year-on-year
increase/
decrease in
operating
revenue
Year-on-year
increase/
decrease in
operating
costs
Year-on-year
increase/
decrease in
gross profit
margin
(percentage
points)
I. By industry
Manufacturing of
communication
equipment 60,272.6 40,623.3 32.60% 36.08% 37.74% (0.82)
Total 60,272.6 40,623.3 32.60% 36.08% 37.74% (0.82)
II. By product
Carriers’ networks 39,982.3 26,035.4 34.88% 38.04% 42.15% (1.88)
Terminal 13,071.5 9,654.7 26.14% 34.86% 30.59% 2.41
Telecommunication
software systems, services
and other products 7,218.8 4,933.2 31.66% 28.06% 30.36% (1.21)
Total 60,272.6 40,623.3 32.60% 36.08% 37.74% (0.82)
6.3 Breakdown of principal operations by geographic region (under PRC ASBEs)
Revenue mix
Operating
revenue
(RMB in
millions)
Year-on-year
increase/decrease
in operating
revenue (%)
III.By region
The PRC 30,404.3 74.07%
Asia (excluding the PRC) 13,198.6 26.51%
Africa 6,860.6 (26.32%)
Others 9,809.1 38.49%
Total 60,272.6 36.08%
– 19 –

6.4 Items relating to fair value measurement
(1) Items relating to fair value measurement
Unit: RMB in thousands
Item
Opening
balance
Gains/losses
arising from
fair value
change for
the period
Accumulated
fair value
change dealt
with in equity
Impairment
charge for
the period
Closing
balance
Financial assets
Including: 1. Financial assets at fair value
through profit or loss — — — — —
Including: derivative financial
assets — — — — —
2. Available-for-sale financial assets — — — — —
Sub-total of financial assets — — — — —
Financial liabilitiesNote 1 12,560 (12,560) — — —
Investment properties — — — — —
Productive living assets — — — — —
Others — — — — —
Total 12,560 (12,560) — — —
Note 1 : Financial liabilities comprised derivative financial liabilities.
6.5 Financial assets and financial liabilities held in foreign currencies
Unit: RMB in thousands
Item
Opening
balance
Gains/losses
arising from fair
value change for
the period
Accumulated
fair value
change dealt
with in equity
Impairment
charge for
the period
Closing
balance
Financial assets
Including: 1. Financial assets at fair value
through profit or loss — — — — —
Including: derivative
financial assets — — — — —
2. Loans and receivables 7,570,941 — — (203,103) 16,929,417
3. Available-for-sale financial
assets — — — — 7,112
4. Held-to-maturity investments — — — — —
Sub-total of financial assets 7,570,941 — — (203,103) 16,936,529
Financial liabilities 12,560 12,560 — — 5,657,676
– 20 –

6.6 Management Discussion and Analysis (under HKFRSs)
The financial data below are extracted from the Group’s audited financial statements
prepared in accordance with HKFRSs. The following discussion and analysis should be
read in conjunction with the Group’s financial statements audited by Ernst & Young and
the accompanying notes as set out in this annual report.
Unit: RMB in millions
Comprehensive Income Statement 2009 2008
Operating revenue:Carriers’ networks 39,982.3 28,963.8Terminals 13,071.5 9,692.6Telecommunication software systems, services and other
products 7,218.8 5,637.0
Total revenue 60,272.6 44,293.4Cost of sales (41,667.8) (29,911.5)
Gross profit 18,604.8 14,381.9Other income and gains 1,723.5 1,295.7Research and development costs (5,781.6) (3,994.1)Selling and distribution costs (7,157.8) (5,401.0)Administrative expenses (2,735.2) (2,190.0)Other expenses (603.2) (1,159.7)
Profit from operating activities 4,050.5 2,932.8Finance costs (751.7) (690.2)Share of profit and loss of associates 26.0 19.9
Profit before tax 3,324.8 2,262.5Tax (629.1) (350.6)
Profit for the year 2,695.7 1,911.9Attributable to:Minority interests (237.6) (251.7)
Attributable to:Shareholders of parent company 2,458.1 1,660.2
Other comprehensive income 8.6 (181.5)
Comprehensive income 2,704.3 1,730.4
Dividend 552.4 403.0
Earnings per share — Basic RMB1.40 RMB0.95
— Diluted RMB1.35 RMB0.93
– 21 –

Revenue analysed by product and geographic region
The following table sets out the revenue and the corresponding percentage of the total
revenue attributable to the major product segments of the Group for the periods
indicated:
Unit: RMB in millions
Product segment 2009 2008
Revenue
As a
percentage of
operating
revenue Revenue
As a
percentage of
operating
revenue
Carrier’s networks 39,982.3 66.3% 28,963.8 65.4%
Terminal 13,071.5 21.7% 9,692.6 21.9%
Telecommunication software
systems, services and other
products 7,218.8 12.0% 5,637.0 12.7%
Total 60,272.6 100.0% 44,293.4 100.0%
The following table sets out the operating revenue of the Group and the corresponding
percentage of the total operating revenue attributable to the PRC, Asia (excluding the
PRC), Africa and other regions for the periods indicated:
Unit: RMB in millions
Region 2009 2008
Revenue
As a
percentage of
operating
revenue Revenue
As a
percentage of
operating
revenue
The PRC 30,404.3 50.4% 17,466.4 39.4%
Asia (excluding the PRC) 13,198.6 21.9% 10,432.9 23.6%
Africa 6,860.6 11.4% 9,311.1 21.0%
Other regions 9,809.1 16.3% 7,083.0 16.0%
Total 60,272.6 100.0% 44,293.4 100.0%
The Group reported RMB60,272.6 million in operating revenue for 2009, a 36.1% growth
as compared to last year. Our domestic business sustained stable growth, with operating
revenue growing 74.1% to RMB30,404.3 million. Analysed by product, revenue growth in
varying degrees was reported in all product segments, namely carriers’ networks,
terminals and telecommunications software systems, services and other products,
combining into substantial growth for the Group’s total operating revenue for 2009.
The growth in operating revenue from the Group’s carriers’ networks segment was
attributable mainly to the growth in domestic sales, CDMA, TD-SCDMA and WCDMA
system equipment accounting for significant contributions.
– 22 –

The increase in operating revenue from the Group’s terminal product segment was driven
mainly by sales growth for CDMA terminals in the domestic market and for 3G terminals
in both the domestic and the European markets.
The increase in operating revenue from the Group’s telecommunications software
systems, services and other products was mainly driven by growth in service income in
the domestic market and sales of fixed terminals in both the domestic market and
elsewhere in Asia.
Cost of sales and gross profit
The following tables set out (1) the cost of sales of the Group and cost of sales as a
percentage of total operating revenue and (2) the Group’s gross profit and gross profit
margin for the periods indicated:
Unit: RMB in millions
Product segment 2009 2008
Cost of
sales
As a
percentage
of segment
revenue
Cost of
sales
As a
percentage
of segment
revenue
Carrier’s networks 26,725.2 66.8% 18,589.2 64.2%
Terminal 9,770.9 74.7% 7,394.1 76.3%
Telecommunication software systems,
services and other products 5,171.7 71.6% 3,928.2 69.7%
Total 41,667.8 69.1% 29,911.5 67.5%
Unit: RMB in millions
Product segment 2009 2008
Gross
profit
Gross
profit
margin
Gross
profit
Gross
profit
margin
Carrier’s networks 13,257.1 33.2% 10,374.6 35.8%
Terminal 3,300.6 25.3% 2,298.5 23.7%
Telecommunication software systems,
services and other products 2,047.1 28.4% 1,708.8 30.3%
Total 18,604.8 30.9% 14,381.9 32.5%
Cost of sales of the Group for 2009 increased 39.3% as compared to last year to
RMB41,667.8 million. The Group’s overall gross profit margin of 30.9% was 1.6
percentage points lower as compared to last year, reflecting mainly the decline in the gross
profit margin of carriers’ networks.
– 23 –

Cost of sales for the Group’s carriers’ networks amounted to RMB26,725.2 million, a
43.8% increase as compared to last year. The gross profit margin for carriers’ networks
was 33.2% versus 35.8% for last year, reflecting lower gross profit margins for GSM
system equipment and CDMA system equipment.
Cost of sales for the Group’s terminal products amounted to RMB9,770.9 million,
increasing by 32.1% as compared to last year. Gross profit margin for the Group’s
terminal segment was 25.3%, versus 23.7% for last year. The higher gross profit margin
for terminal was attributable mainly to the substantial increase in the weighting of 3G
terminals (including TD and WCDMA) as a percentage of the overall sales of the terminal
segment.
Cost of sales for the Group’s telecommunications software systems, services and other
products amounted to RMB5,171.7 million, increasing by 31.7% compared to last year.
The relevant gross profit margin was lower at 28.4%, compared to 30.3% for last year,
reflecting primarily the decline in the gross profit margin of fixed terminal products.
Other income and gains
Other income and gains of the Group for 2009 amounted to RMB1,723.5 million,
representing a 33.0% growth compared to RMB1,295.7 million for 2008. The increase was
attributable mainly to exchange gains and the increase in value-added tax rebates for
software products in 2009.
Research and development costs
The Group’s research and development costs for 2009 increased by 44.8% to RMB5,781.6
million from RMB3,994.1 million for 2008, and grew slightly from 9.0% in 2008 to 9.6%
as a percentage of operating revenue.
Selling and distribution costs
The Group’s selling and distribution costs for 2009 increased by 32.5% to RMB7,157.8
million from RMB5,401.0 million for 2008, but decreased from 12.2% to 11.9% as a
percentage of operating revenue. The decrease of selling and distribution costs as a
percentage of operating revenue despite the increase in total amount mainly reflected
economies of scale.
Administrative expenses
Administrative expenses of the Group for 2009 increased by 24.9% to RMB2,735.2
million, as compared to RMB2,190.0 million for 2008, but decreased from 4.9% to 4.5%
as a percentage of operating revenue mainly as a result of economies of scale.
Other expenses
Other expenses of the Group for 2009 decreased by 48.0% to RMB 603.2 million, as
compared to RMB1,159.7 million for 2008. The decrease was mainly due to a change in
accounting presentation, whereby exchange losses recorded in 2008 were accounted for as
‘‘Other expenses,’’ while exchange gains for 2009 were presented under ‘‘Other income and
gains.’’
– 24 –

Profit from operating activities
The Group’s profit from operating activities for 2009 increased by 38.1% to RMB4,050.5
million, as compared to RMB2,932.8 million for 2008, while the operating profit margin
grew from 6.6% for 2008 to 6.7% for 2009, primarily as a result of expanded business
scale.
Finance costs
Finance costs of the Group for 2009 increased by 8.9% to RMB751.7 million, as
compared to RMB690.2 million for 2008, reflecting primarily the increase in interest
payments relating to factoring and interest bearing bank borrowings.
Tax
The Group’s income tax expense for 2009 was RMB629.1 million, which was 79.4%
higher as compared to RMB350.6 million for 2008, reflecting mainly the 47.0% growth in
pre-tax profit for 2009 over 2008 coupled with a higher effective tax rate of 18.9% for
2009, as compared to 15.5% for 2008, as a result of rapid profit growth of certain
subsidiaries which were subject to higher tax rates.
Profit attributable to minority interests
The Group’s minority interests for 2009 amounted to RMB237.6 million, which was 5.6%
lower as compared to RMB251.7 million for 2008. Minority interests decreased from
13.2% for 2008 to 8.8% for 2009 as a percentage of net profit before minority interests,
reflecting mainly reduced profit for subsidiaries with a higher level of minority interests.
Other comprehensive income
Other comprehensive income of the Group for 2009 increased by 104.7% to RMB8.6
million, compared to RMB-181.5 million for 2008. The increase was mainly attributable
to gains arising from the translation of financial statements denominated in foreign
currencies.
Debt-equity ratio and the basis of calculation
Debt-equity ratio is calculated by dividing interest-bearing liabilities by the sum of
interest-bearing liabilities and equity (including minority interests).
The Group’s debt-equity ratio for 2009 was 41.8%, increasing by 1.0 percentage points as
compared to 40.8% for 2008. The increase was mainly attributable to the relatively
substantial increase in interest-bearing bank loans.
Liquidity and capital resources
In 2009, the Group’s development funds were financed mainly by cash generated from its
operations and bank loans. The Group’s cash requirements related primarily to
production and operating activities, repayment of due liabilities, capital expenditure,
interest and dividend payments and other unforeseeable cash requirements.
Cash and cash equivalents of the Group as of 31 December 2009 amounted to
RMB14,075.8 million.
– 25 –

Cash flow data
Unit: RMB in millions
2009 2008
Net cash inflow from operating activities 3,381.8 2,686.6
Net cash outflow from investing activities (2,998.6) (1,856.9)
Net cash inflow from financing activities 2,332.2 4,473.2
Net increase in cash and cash equivalents 2,715.4 5,302.9
Cash and cash equivalents at year-end 14,075.8 11,344.2
Operating activities
The Group had a net cash inflow from operating activities of RMB3,381.8 million for
2009 compared to RMB2,686.6 million for 2008, reflecting year-on-year increase of cash
outflow for purchases and the provision of services by RMB7,821.4 million mainly as a
result of expanded sales, increase of cash outflow for payments made to employees by
RMB1,738.7 million, increase of tax payment by RMB772.3 million, coupled with
increase of cash inflow for sales and the provision of services by approximately
RMB13,128.5 million and the decrease of cash inflow from tax rebates by
approximately RMB767.7 million.
Investing activities
The net cash outflow from the Group’s investment activities for 2009 was RMB2,998.6
million compared to a net cash outflow of RMB1,856.9 million for 2008. Cash outflow
was mainly applied in the purchase of property, plant and equipment with a cash payment
of RMB1,592.1 million.
Financing activities
The Group’s net cash flow from financing activities for 2009 was RMB2,332.2 million,
compared to RMB4,473.2 million for 2008, reflecting mainly proceeds from the issue of
Bonds cum Warrants in the previous year.
Capital expenditure
The following table sets out the Group’s capital expenditure for the periods indicated. The
following capital expenditure was funded by long-term bank loans, cash generated from
operating activities and government grants.
Unit: RMB in millions
Capital expenditure 2009 2008
Purchases of fixed assets and construction
in progress payments 1,592.1 1,229.6
The Group’s capital expenditure in 2009 amounting to RMB1,592.1 million was mainly
used for the completion of construction work at ZTE Industrial Park, equipment
installation and the purchase of machinery and equipment.
– 26 –

Indebtedness
Unit: RMB in millions
31 December
Item 2009 2008
Secured bank loans 2,431.4 2,658.5
Unsecured bank loan 6,811.5 4,298.5
Unit: RMB in millions
31 December
Item 2009 2008
Short-term bank loans 6,846.5 5,664.5
Long-term bank loans 2,396.4 1,292.5
Credit facilities available to the Group included long-term and short-term bank loans,
which were mainly used as working capital. Of the Group’s long-term loans, RMB loans
were subject to fixed interest rates while USD loans were subject to floating interest rates.
To control the risk associated with RMB appreciation, the Group’s borrowings were
mainly denominated in US dollars, apart from certain RMB loans.
The Group’s bank loans in 2009 increased mainly as a result of the borrowing of bank
loans to provide additional working capital.
Contractual obligations
Unit: RMB in millions
31 December 2009
Item Total
Less than
one year
Two to
five years
More than
five years
Bank loans 9,242.9 6,846.5 2,038.3 358.1
Operating lease obligations 425.7 196.7 197.5 31.5
Contingent liabilities
Unit: RMB in millions
31 December
Item 2009 2008
Guarantees given to banks in connection with
borrowing to customers 66.8 77.2
Guarantees given to banks in respect of performance bonds 7,721.6 8,245.9
Total 7,788.4 8,323.1
– 27 –

Capital commitments
The Group had the following capital commitments as of the dates indicated:
Unit: RMB in millions
31 December
Item 2009 2008
Land and buildings:
Contracted, but not provided for 1,240.4 301.4
Investment in associates:
Contracted, but not provided for 18.9 265.7
Land and buildings:
Authorised, but not contracted 5,834.0 5,875.9
Details of the Subsidiaries, Jointly-controlled Entities and Associates of the Group
Details of the subsidiaries, jointly-controlled entities and associates of the Group as at 31
December 2009 are set out in notes 18, 19 and 20 to the financial statements prepared in
accordance with HKFRSs in the 2009 annual report of the Company.
Prospects for New Business
Details of the prospects for new business of the Group are set out in the ‘‘Chairman’s
Statement’’ in the 2009 Annual Report of the Group.
Employees
Details of the number of employees, remuneration, remuneration policy, bonus and
training programs of the Group as at 31 December 2009 are set out in the sections headed
‘‘Directors, Supervisors, Senior Management and Employees’’ and ‘‘Corporate
Governance Structure’’ in the 2009 Annual Report of the Group.
Charges on Assets
Details of charges on the Group’s assets as at 31 December 2009 are set out in note 31 to
the financial statements prepared under HKFRSs.
Plans for Material Investments or Acquisition of Capital Assets
Details of the Group’s material investments and their performance and prospects as at 31
December 2009 are set out section headed ‘‘Report of the Board of Directors’’ in the 2009
Annual Report of the Group.
Details of future plans for material investments or acquisition of capital assets are set out
section headed ‘‘Report of the Board of Directors’’ in the 2009 Annual Report of the
Group.
Market Risks
For details of the Group’s exposure to interest rate risks and foreign exchange risks,
please refer to the section 6.13.2 hereof.
– 28 –

6.7 Use of Proceeds
H Applicable & N/A
6.7.1 Use of issue proceeds from the Bonds cum Warrants of the Group
The Company issued 40 million bonds cum warrants with a value of RMB4 billion
(‘‘Bonds cum Warrants’’) on 30 January 2008. The net proceeds of RMB3,961,443,520
raised from the issue of the Bonds cum Warrants after deduction of the underwriting
commission, sponsorship fees and registration fees were deposited into the designated
account of the Company opened with China Development Bank, Shenzhen Branch
(account number: 44 301560040310230000) on 5 February 2008. A capital verification
report in respect thereof was issued by Shenzhen Nanfang-Minhe CPA on 5 February
2008. The Company utilised RMB81,443,500 of the issue proceeds in the reporting year
and proceeds from the issue of Bonds Warrants had been fully utilized, with a total
utilization of of RMB3,961,143,500 on an accumulative basis. A verification report on the
deposit and application in 2008 of proceeds from the issue of bonds cum warrants of the
Company has been furnished by 廣東立信大華會計師事務所 (Guangdong Lixin Dahua
Certified Public Accountants). An examination opinion has been furnished by Guotai
Jun’an Securities Co., Ltd., the sponsor of the Company’s bonds cum warrants. For
details please refer to the full text of the report ‘‘Verification Report on the Deposit and
Application in 2009 of proceeds from the issue of bonds cum warrants of ZTE
Corporation’’ simultaneously published with this report.
As at the end of the reporting period, the said issue proceeds of the Company were applied
as follows:
Unit: RMB in ten thousands
Gross amount of issue proceeds 396,144.35 Gross amount of issue proceeds
utilised during the reporting
period 8,144.35
Gross amount of issue proceeds
for which use has been
changed 0
Gross amount of issue proceeds
utilised to-date 396,144.35
Proportion of gross amount of
issue proceeds for which use
has been changed 0
– 29 –

Projects committed
Any change
in project
(including
projects with
changes)
Total
amount of
issue
proceeds
committed
to
investment
Investment
amount
planned as
at the end
of the
period (1)
Amount
invested
during the
year
Accumulated
investment as
at the end of
the period (2)
Difference
between
accumulated
investment and
investment
amount
planned as at
the end of the
period (2)–(1)
Progress of
investment as
at the end of
the period
(2)/(1)
Period for
return of
capital
(year) Earnings
Anticipated
benefits
achieved
Whether there
has been
significant
change to
project
feasibility
The building-up of theresearch and developmentand productionenvironment and scaleproduction capacity ofTD-SCDMA HSDPAsystem equipment
No 18,782 N/A — 18,782 N/A N/A 3.03 See below Yes No
The building-up of thedevelopment environmentand scale productioncapacity of TD-SCDMAterminal products
No 11,776 N/A — 11,776 N/A N/A 4.12 See below Yes No
Industrialisation of TDupgrade technology
No 67,326 N/A 26,114.49 67,326 N/A N/A 5.70 See below Yes No
Construction of innovativehandset platform
No 174,915 N/A 38,032.91 174,915 N/A N/A 5.29 See below Yes No
Construction of nextgeneration broadbandwireless mobile SDRplatform
No 53,358 N/A 15,851.03 53,358 N/A N/A 5.93 See below Yes No
Industralisation of nextgeneration IP-basedamalgamation network forfull multi-media services
No 39,727 N/A — 39,727 N/A N/A 5.49 See below Yes No
Research, development andproduction of integratednetwork managementsystem
No 56,635 N/A 26,147.29 56,635 N/A N/A 5.31 See below Yes No
Industrialisation of xPONoptical access
No 49,371 N/A 16,641.98 49,371 N/A N/A 5.42 See below Yes No
Industrialisation of nextgeneration optical networktransmission equipment
No 64,108 N/A 24,168.53 64,108 N/A N/A 5.05 See below Yes No
Construction of ICTintegrated businessplatform
No 99,647 N/A 44,730.41 99,647 N/A N/A 3.94 See below Yes No
Industrialisation of RFIDsystems integration
No 19,394 N/A 9,522.11 19,394 N/A N/A 5.02 See below Yes No
Total — 655,039 — 201,208.75 655,039 — — — — — —
– 30 –

Non-fulfillment of scheduled progress or
anticipate earnings and reasons
The scheduled progress of projects utilising proceeds from the
issue of Bonds cum Warrants of the Company was fulfilled.
Significant change to project feasibility No
Change to implementation location of
investment projects using issue proceeds
No
Change in the manner in which investment
projects using issue proceeds were
implemented
No
Initial investments and fund replacements in
investment projects using issue proceeds
1. In order to expedite the construction of issue proceeds
investment projects, the Company had used internal funds
for initial investments in issue proceed investment
projects prior to the receipt of the issue proceeds. As at
31 December 2007, the actual amount invested using
internal funds was RMB1,576,936,600. In order to
increase capital efficiency and to reduce financial
expenses, the Company subsequently replaced the
initially invested internal funds with issue proceeds. For
details of the replacement, please refer to the
‘‘Announcement on the Replacement of Internal Funds
Previously Invested in Issue Proceed Investment Projects
with Proceeds from the Issue of Bonds cum Warrants’’ of
the Company dated 14 March 2008.
2. As at 31 December 2009, the amount invested by the
Company in projects utilizing issue proceeds had met the
agreed investment amount set out in issue prospectuses
(RMB6,550.39 million) and the portion in excess had been
funded by the Company’s internal resources. Such portion
would be replaced if the warrants are exercised upon
maturity. The exercise period for the ‘‘ZXC1’’ Warrants
expired on 12 February 2010. A total of 23,348,590 ‘‘
ZXC1’’ Warrants had been exercised, generating total
issue proceeds of RMB912,464,758.64. In order to
enhance the efficiency of fund application and reduce
finance costs, the Company replaced internal funds that
had previously been invested in the issue proceed projects
with proceeds from the exercise of the warrants. For
details, please refer to the ‘‘Announcement of the
Company on the replacement of internal funds that had
previously been invested in the issue proceed projects with
proceeds from the exercise of the warrants’’ dated 25
March 2010.
Application of idle funds as additional
working capital
There was no application of idle funds as additional working
capital.
Amount of issue proceeds in surplus of
requirements for project implementation
and reasons
There was no Company issue proceeds in surplus of
requirements for project implementation.
Use and status of unutilised issue proceeds Proceeds from the issue of Bonds cum Warrants of the
Company had been fully utilised.
Problems and other information in the use of
issue proceeds and related disclosure
No
Note 1 : There was no adjustment to the total amount of issue proceeds committed to investment.
– 31 –

The progress of the projects and the earnings generated are discussed as follows:
The building-up of the R&D and production environment and scale production capacity
of TD-SCDMA HSDPA system equipment
With the completion of ancillary facilities for production environments such as the
assembly environment, adjustment and testing environment and high-temperature aging
environment, the project was ready for large-scale production and commercial supply. TD
system equipment supplied under the Phase I, Phase II and Phase III tenders of China
Mobile reported stable application in operating networks, while TD system equipment
required by the Phase IV tenders of China Mobile was under production.
The building-up of the development environment and scale production capacity of TD-
SCDMA terminal products
The building of the development environment and large-scale production capacity for TD-
SCDMA terminals has been completed, pending project inspection and acceptance by the
National Development and Reform Commission. With such completion, ZTE’s delivery
of TD-SCDMA terminal products, such as handsets, data cards, modules and wireless
terminals, increased significantly both in terms of volume and value in 2009, and were
firmly established in a forefront position in terms of market share. The project has
contributed strongly in terms of social as well as economic benefits.
Industrialisation of TD upgrade technology
In line with increased government efforts to advance TD-LTE, ZTE was also gaining
rapid progress in the industrialisation of TD-LTE as it stepped up with LTE research and
development, passing the indoor and outdoor stages of the PoC test organised by the
MIIT TD-LTE Task Force in association with China Mobile in April and August,
respectively, in 2009. In September 2009, we were appointed as one of the contract-
suppliers of TD-LTE demo networks at the Shanghai World Expo after completing
relevant tests at the invitation of China Mobile. This was followed by a demo of the first
TD-LTE service between different supplier systems and terminals at the Telecom World
2009 held in Geneva in October, in a joint effort by ZTE and Hong Kong-based ASTRI.
In November, ZTE’s system realised the theoretical download speed of 130Mbps at the
TD-LTE demo for Guangdong Mobile. In December 2009, ZTE became one of the first
manufacturers to commence technical tests (outdoor testing) after the first batch of its
TD-LTE passed the technical tests (laboratory testing) organised by the MIIT TD-LTE
Task Force. The first stage of outdoor testing was completed in January 2010.
Construction of innovative handset platform
Handset TVs: The handset service was put to large-scale commercial application
following completion of research and development and coordinated on-site fine-tuning
for a majority of the world’s markets and TV standards. The project mainly comprised the
research and development, coordinated on-site fine-tuning and large-scale commercial
application of proprietary TV data cards for international markets and the research and
development and large-scale commercial application of TD TVs for the domestic market.
Next we will be looking at the integration and system optimisation of various service
standards, markets and product requirements.
– 32 –

Smart handsets: The EVDO smart handsets operating on the Qualcomm platform were
launched in the overseas market, while at home they were supplied to China Telecom. The
year under review also saw our global launch of Windows Mobile 6.5 smart handsets in
association with Microsoft. Meanwhile, we have joined the Google OHA Alliance and
overseas delivery of the Android handset has been scheduled for the first quarter.
GoTa handsets: GoTa terminals G880, G660, G79 and S580 were commercially launched
during the year. In addition, a new model G380 has been developed in 2010 to further
enrich the product line of GoTa terminals.
IMS customer-end software platform: The commercial version of the IMS customer-end
software was launched on a number of TD-SCDMA and EVDO handsets, featuring IMS-
based software such as real-time communication, video-phone and video-conference.
Construction of next-generation broadband wireless mobile SDR platform
Our SDR-based wireless products delivered solid performance in the market, as we
captured the largest overall market share for 3G in China during the reporting period,
Internationally, the Company’s CDMA products continued to rank top in market shares,
while our G/U dual-mode products were ascending fast in ranking. As new products in the
market, our WIMAX/LTE products enjoyed a leading edge at the outset. At present, we
are looking to extend the scope of our SDR products and add more depth to their
functional aspects. Study is currently underway on multi-mode SDR products featuring
closer coupling and more extensive coverage, with preliminary research and development
completed on multi-modes with base-band sharing and RF sharing features.
Industralisation of next generation IP-based amalgamation network for full multi-media
services
The next-generation IP-based IMS amalgamation network of ZTE was developed in close
tandem with carriers’ shift of focus to all-rounded service offerings, with the aim of
providing comprehensive support to different applications in the context of all-rounded
services. ICT amalgamated solutions were provided to corporate customers to meet their
needs to reduce operating costs, enhance administrative efficiency, improve business
process flows and increase revenue. For home users, the amalgamated video solution
featuring 3-way communications, IPTV and video monitoring promised to satisfy
household requirements for entertainment, communication and safety. On a personal
note, a rich variety of exclusive and personalised features were provided in multi-media
services such as video phones, multi-media colour ringtones, colour vibration alerts and
video-sharing. Fast service deployment and provision was also supported. These cutting-
edge solutions have lent powerful support for ZTE’s solid results, such as in the case of
China Mobile, who became the first carrier in the industry to offer an IMS-based HD
video conference system with the assistance of ZTE, giving the mobile telecommunications
carrier a significant edge in expanding its customer bases in the government and corporate
sectors for its all-rounded service. On the back of its technical strengths, ZTE secured a
lion’s share in China Telecom’s IMS trial projects, while in the overseas market, ZTE was
picked as IMS partner by mainstream carriers in the high-end market of Europe and
America, such as Telenor.
– 33 –

Research, development and production of integrated network management system
As at the end of 2009, our integrated network management system completed equipment
management over 13 types of specialised networks developed by ZTE, as well as systems
integration with centralised security, centralised storage, malfunctioning electronic
workflow processing, smart resource management and GIS mapping. In addition,
further sophisticated functions were developed in 2009, such as end-to-end performance
monitoring and trend analysis, and warning relevances/root problem analysis. In 2009,
commercial applications of our products under research and development were launched
in Ethiopia, India and Hong Kong, while a high-end market project in Canada was
acquired.
Industrialisation of xPON optical access
The domestic xPON market grew significantly during 2009 as China Telecom and China
Unicom continued to expand their EPON networks while China Mobile was also starting
large-scale E/GPON construction. ZTE consolidated its position as the leading brand
name for xPON as it continued to distinguished itself from competition in the domestic
xPON market on the back of its solid research and development capabilities and
comprehensive range of sophisticated products. With the global debut and commercial
application of 10GEPON featuring smooth upgrades of FTTx products, ZTE has been
firmly established as the global forerunner in next-generation PON technologies.
Our EPON and GPON products continued to penetrate high-end markets such as Europe,
North America and the Asia Pacific leveraging its strengths in research and development
and the range and sophistication of its products, following successful applications in
numerous countries and regions, including Italy, Indonesia, Russia, Ukraine, Lithuania,
Argentina, Brazil, Chile, Holland, Algeria, Hong Kong, Saudi Arabia and Ethiopia, etc.
Industrialisation of next generation optical network transmission equipment
Branding itself as the ‘‘carrier of dreams and values,’’ this project strives to meet the needs
of carriers in network upgrades by providing all-rounded transmission solutions such as
MSTP/PTN, WDM/OTN and NMS, with special emphasis on matching the business
requirements of 3G Backhaul carriage under the IP trend. In 2009, the project reported
sound progress with the launch of the ZXCTN series of PTN products, Mx20 series of
wave division products, as well as the large-capacity ASON and ZXONE 5800, which
were widely recognized in the global market. At home, ZTE received three major awards
at the ‘‘Optical Communications and Carrying Network Construction Forum 2009’’: the
‘‘Optical Communications Industry Driver Award 2009,’’ the ‘‘Best Optical
Communications Transmission System Supplier Award 2009’’ and the ‘‘Most
Competitive Supplier of PTN Solution 2009.’’ Internationally, our IxWDM solution
was honoured with the (BBWF Europe) InfoVision Award 2009.
As the ZTE project of ‘‘Industrialisation of next generation optical network transmission
equipment’’ continues to advance, the Company’s market position in the optical network
industry will be further consolidated. According to the report on market shares in 3Q09
issued by OVUM, a leading consultant, ZTE outpaced competitors in the optical network
market during the past year, leapfrogging from 11th to 4th in global market share ranking
to become a leading player. In line with project progress, further new products will be
industrialised and marketed in 2010, which are expected to be well received by the market.
– 34 –

Construction of ICT integrated business platform
The primary purpose of the ICT integrated business platform project is to enhance the
core competitiveness of ZTE’s business software products (especially the VAS products)
by building an ICT business platform that addresses the general trend of ICT integration
in the communications industry. The incorporation of success features of the Internet into
business network planning has become a dominant trend among telecommunications
carriers since 2009, in tandem with the ongoing fusion and cross-penetration between the
telecommunications sector and the Internet. In view of this development, ZTE’s ICT
integrated business platform was built upon the core concept of cluster service network
(CSN), with the aim of helping carriers to provide cluster services based on unified and
open standards in a fast and economical manner, as well as to deploy resources on a
consolidated basis. The competitiveness of various service software products, such as
service provision platforms, service management platforms, service access switches,
software shops and support platforms for the Internet of Things, has been effectively
enhanced as a result. On the solid foundation provided by this project, ZTE’s SIDE
(service integration and deployment environment) project proposal was admitted by
ITU-T in a further boost to the standing of PRC companies in the international
communications industry.
Industrialisation of RFID systems integration
After three years of solid work in product research development as well as marketing, our
RFID products and solutions were growing towards maturity and widely recognised in the
market, while initial capabilities in RFID systems integration were also formed.
In 2009, the Group’s RFID 433MHz product achieved breakthrough in highway multi-
path identification and became the established prime domestic brand name in this area
with overwhelming market shares. The performance of our commercially launched ultra-
high frequency products was further improved, ranking among the top band and
outperforming domestic peers in various indicators in product tests. Performance
consistency of the commercially launched label products was also improved with the
full process from label design to commercial production in operation. Marketing options
were broadened with our strengths in proprietary research, development and production,
as well as OEM and ODM capabilities. New versions of software standard network units
showing improved stability were launched in the latter half of 2009 after incorporating
features to address new market requirements.
The Company also made significant progress in industry solutions as it concluded the first
deal in electronic car plate in China’s transportation industry, paving the way for further
development in this area and striking another note in terms of brand building. Currently
we are involved in the tenders for multi-provincial electronic car plates, ETC free flow,
multi-path identification and anti-fraud inspection for national-class items. We expect our
status as the prime brand in China in this sector to be further reinforced in 2010, as we
strive to grow into a large-scale supplier of RFID integrated systems.
6.8 Investments using funds other than issue proceeds
& Applicable H N/A
– 35 –

6.9 Explanatory statement by the Board of Directors on the Company’s accounting policies and
the reasons and impact of changes to accounting estimates and significant accounting errors
and corrections
& Applicable H N/A
6.10Explanatory statement by the Board of Directors in respect of qualified auditors’ report
from accountants
& Applicable H N/A
6.11Board of Directors’ proposal for profit distribution or capitalisation from capital reserves for
the current year
H Applicable & N/A
(1) Proposal for profit distribution or capitalisation from capital reserve for 2009
Net profit of the Company for the year 2009 calculated in accordance with PRC ASBEsamounted to RMB733,826,000. Together with undistributed profit of RMB1,992,735,000carried forward at the beginning of the year, profit available for distribution amounted toRMB2,726,561,000. After deducting statutory surplus reserves of RMB73,383,000 profitavailable for distribution to shareholders amounted to RMB2,653,178,000. Profit of theCompany for the year 2009 calculated in accordance with HKFRSs amounted toRMB721,736,000. Together with undistributed profit of RMB1,996,413,000 carriedforward at the beginning of the year, profit available for distribution amounted toRMB2,718,149,000. After deducting statutory surplus reserves of RMB73,383,000, profitavailable for distribution to shareholders amounted to RMB2,644,766,000.
In accordance with the requirements of the Ministry of Finance of the People’s Republicof China and the Articles of Association, profit available for distribution shall be thelower of profit available for distribution as calculated in accordance with PRC ASBEsand that calculated in accordance with HKFRSs. Therefore the amount of profit availablefor distribution is RMB2,644,766,000. The Board of Directors of the Company hasrecommended as follows:
Proposed profit distribution for 2009 : A cash dividend of RMB3 (before tax) for every 10shares held will be paid on the basis of the total share capital of the Company as at 8 April2010 less the number of Subject Shares remaining in lock-up under the Share IncentiveScheme and the number of restricted shares that may be repurchased and cancelled duringthis period in accordance with the implementation of the Phase I Share Incentive Scheme(the ‘‘Share Incentive Scheme’’) as at the A share record date for the purpose of the 2009profit distribution (the ‘‘Record Date’’). As at 8 April 2010, 69,737,523 registered SubjectShares under the Share Incentive Scheme remained in lock-up. In accordance withrelevant provisions of the Share Incentive Scheme, restricted shares remaining in lock-upshall not be entitled to the cash dividend. The number of shares entitled to the cashdividend under the 2009 profit distribution proposal will be 1,841,416,933 shares in casethe second unlocking of registered Subject Shares granted under the first award of theShare Incentive Scheme (the ‘‘Second Unlocking’’) is not completed by the Record Date,on which basis the 2009 profit distribution plan will be implemented. In case the secondunlocking is completed by the Record Date, the maximum of shares to be unlocked inaccordance with the Share Incentive Scheme will be 35% of the Subject Shares under thefirst award, namely 26,797,252 shares, which will be entitled to the cash dividend.
– 36 –

Proposed capitalisation from capital reserve for 2009 : The issue of 5 bonus shares forevery 10 shares by way of capitalization of capital reserves. In case the aforesaid secondunlocking is not completed by the Record Date, the capitalization will be based on thetotal share capital of the Company of 1,911,154,456 shares as at 8 April 2010 and theshare capital will be increased by a total of 955,577,228 shares. In case the aforesaidsecond unlocking is completed by the Record Date, the capitalization will be based on thetotal share capital of the Company as at 8 April 2010 less the number of Subject Shareswhich are not unlocked owing to the failure of Scheme Participants to meet theperformance appraisal requirements or their resignations and which may be required to berepurchased and cancelled prior to the Record Date for the purpose of the 2009 profitdistribution.
In order to qualify for the final dividend and the bonus shares created from thecapitalisation of capital reserves, H shareholders should lodge their transfer documentstogether with relevant share certificates with Computershare Hong Kong InvestorServices Limited at Shops 1712-16, 17th Floor, Hopewell Centre, 183 Queen’s Road East,Wanchai, Hong Kong no later than 4 : 30 p.m. on 3 May 2010.
According to the Enterprise Income Tax Law of the People’s Republic of China and theImplementation Regulations for Enterprise Income Tax of the People’s Republic of Chinawhich took effect on 1 January 2008, enterprise income tax is payable by non-residententerprises in respect of income derived from the PRC at an applicable tax rate of 10%,which shall be withheld and paid by listed issuers on behalf of the non-residententerprises. Cash dividend payable to H-share non-resident enterprises after the deductionof the said enterprise income tax is RMB2.7 per 10 shares.
(2) Implementation of the cash bonus distribution policy during the reporting period
The Company’s profit distribution and capitalisation from capital reserves for 2008, wasimplemented on 5 June 2009. For further details, please refer to the ‘‘Announcement onProfit Distribution and Capitalisation from Capital Reserves for 2008 of ZTECorporation’’ dated 27 May 2009 and published in China Securities Journal, SecuritiesTimes and Shanghai Securities News.
– 37 –

(3) Cash distribution of the Company for the past three years
Year
Cash
distribution
amount (before
tax) (RMB ten
thousands)
Net profit in the
consolidated statements
attributable to
shareholders of the listed
company (RMB ten
thousands)
Cash distribution as a
percentage of net profit
in the consolidated
statements attributable
to shareholders of the
listed company (%)
Net profit of
the year
available for
distribution
(RMB ten
thousands)
2008 40,299.9 166,019.9 24.27 239,573.4
2007 23,988.0 125,215.8 19.16 165,775.2
2006 14,392.8 76,697.2 18.77 178,651.2
Accumulated cash distribution in the past three
years as a percentage of average annual profit
available for distribution (%) 40.42
Note: Profit available for distribution in 2006 amounted to RMB3,766,426,000 under PRC ASBEs and
RMB1,786,512,000 under HKFRSs. In accordance with the requirements of the Ministry of Finance
of the People’s Republic of China and the Articles of Association, profit available for distribution
shall be the lower of profit available for distribution as calculated in accordance with PRC ASBEs
and that calculated in accordance with HKFRSs. Therefore profit available for distribution in 2006
was RMB1,786,512,000.
The Company recorded profit for the reporting period but did not put forth any proposal
of cash distribution of profit
& Applicable H N/A
6.12Purchase, sale or redemption of shares
Neither the Company nor any of its subsidiaries has purchased, sold or redeemed any
listed securities of the Company during the year.
6.13Business outlook and risk exposures for 2010
6.13.1Business outlook for 2010
2010 will be a year of opportunities as well as challenges, as the demand for
telecommunication services is expected to grow in tandem with the general economic
recovery, while we should continue to expect changing scenes in the competition among
global suppliers of telecommunications equipment. In the domestic market, the Group’s
business should be well supported as carriers continue to invest in 3G networks, optical
communications products and terminals. Elsewhere, the telecommunications industry is
expected to embrace stable growth amid global economic recovery, with 3G network
construction driving investment growth especially in the Asia Pacific. Our efforts to grow
partnerships with high-end carriers in Europe and America over the past years are
expected to pay off as businesses with these companies materialize, and these regions are
expected to form a new growth spot for the Company.
In 2010, the Group will focus on improving its capabilities in integrate solutions and strive
to constantly improve the quality of networks provided to customers by enhancing its
competition strategy, product planning, product delivery and market behaviour, etc.
– 38 –

Meanwhile, we will further increase our efficiency and pursue internationalization in
greater depth, laying solid foundations for our growth into a top-rate world-class
enterprise as we take advantage of the opportunities at hand.
6.13.2Risk exposure
(1) Interest rate risk
As the size of the Group’s outstanding loans continued to grow, the total amount of
interest payments owed by the Group will vary in line with any fluctuations in the loan
interest rates determined by the State and the profitability of the Group will be affected as
a result.
(2) Foreign exchange risk
The foreign exchange risk of the Group arose mainly from exchange differences in the
conversion to RMB (the functional currency of the Group) of sales and purchases settled
in currencies other than RMB. The impact of RMB exchange rate movements is a subject
of exchange rate management. The Group adopted an open-ended principle in exchange
rate management, with flexible application of a combination of approaches, such as the
business planning method, financial management method and financial instrument
method. The Group endeavoured to include terms relating to exchange risk aversion or
sharing when entering into purchase and sales contracts and sought to enhance its internal
management standards by actively managing its foreign exchange position and matching
currencies and amounts received or incurred. Where matching was not practicable,
derivative products such as foreign exchange forward contracts were employed to lock up
exchange rates in varying proportions based on the maturity profile of the outstanding
foreign exchange positions, so as to minimise the impact of exchange rate fluctuations on
the principal business of the Group. With a strong emphasis on the research of exchange
risk management policies, models and strategies, the Group has formulated a foreign
exchange risk management policy that takes into account the actual conditions of the
Company’s operations and international standards in risk management with ongoing
improvements and has gained considerable experience in the conduct of exchange rate risk
management through the use of derivative financial instruments in foreign exchange.
(3) Credit risk
The Group encounters differing customer groups with the swift expansion of its one-stop
communications solution services, and its business will be affected by the varied credit
profiles of these customers.
(4) Country risk
Under the new global economic and financial order, the Group will continue to be
exposed to debtors’ risks, political risks or even warfare or the succession of political
regimes in countries where the Group’s projects are operated. As such, a very high level of
operational and risk control capabilities is required.
– 39 –

7 MATERIAL MATTERS
7.1 Acquisition of assets
& Applicable H N/A
7.2 Disposal of assets
& Applicable H N/A
7.3 Material guarantees
H Applicable & N/A
Third party guarantees provided by the Company (excluding guarantees on behalf of
subsidiaries)
Guaranteed party
Date of incurrence
(date of execution of
relevant agreements) Amounts guaranteed
Type of
guarantee Term
Whether
fully
performed
Whether
provided in
favour of
connected
parties
(Yes/No)
Djibouti Telecom S.A 8 September 2006 RMB50 million Joint liability 12 years No NoUnited Telecoms
Limited (Note 1)11 December 2006 INR73,923,700
(approximatelyRMB10,760,300)
Assurance 3 years Yes No
Benin Telecoms S.A.(Note 2)
28 June 2007 USD3 million(approximately
RMB20,484,600)
Assurance 6.5 years No No
Total amount guaranteed during the year 0
Total balance of amount guaranteed at the end of the year (A) RMB70,484,600
Guarantees provided in favour of subsidiaries
Total amount guaranteed in favour of subsidiaries during the year
(Note 3)
USD55,146,300
Total balance of amount guaranteed in favour of subsidiaries at
the end of the year (B)
USD86,551,300
Total amount guaranteed by the Company
(including guarantees in favour of subsidiaries)
Total guaranteed amount (A+B) RMB640,989,600
Total guaranteed amount as a percentage of net assets of the
Company at the end of the year
3.81%
of which:
Amounts of guarantees provided in favour of shareholders,
effective controllers and their connected parties(C)
0
Amount of debt guarantee provided directly or indirectly in
favour of parties with a gearing ratio exceeding 70% (Note 4)
(D)
USD86,551,300
Amount of total guarantee exceeding 50% of net assets (E) 0
Aggregate amount of the three guarantee amounts stated above *
(C+D+E)
USD 86,551,300
– 40 –

Note 1 : Guarantee in favour of United Telecoms Limited of India provided by ZTE HK, a wholly-owned
subsidiary of the Company, in the form of a bank-issued irrevocable standby letter of credit.
Performance of the guarantee has been completed as of now.
Note 2 : Guarantee provided by ZTE HK, a wholly-owned subsidiary of the Company, in the form of a
standby letter of credit backed by its bank credit facility, while the bank credit facility of ZTE HK
is guaranteed by the Company. In effect of the aforesaid two guarantees, ZTE is the ultimate
guarantor and Benin Telecoms is the ultimate party being guaranteed, for an amount of USD3
million. As the gearing ratio of Benin Telecoms was in excess of 70%, the aforesaid guarantee was
subject to consideration and approval by the Board of Directors and the general meeting of the
Company in accordance with requirements of relevant laws and regulations.
Note 3 : It was respectively approved at the Twenty-fourth and Twenty-fifth Meetings of the Fourth
Session of the Board of Directors that the 51% equity interests in Closed Joint-Stock Company
CJSC TK Mobile (‘‘CJSC TK Mobile’’) held by the Company be applied as a security against a
bank loan extended to CJSC TK Mobile; a performance guarantee of US$40 million be provided
by the Company for PT. ZTE Indonesia (‘‘ZTE Indonesia’’), a wholly-owned subsidiary and
application be made by the Company to the relevant bank for the issuance of a letter of
performance guarantee with an amount of US$5 million. Since the gearing ratio of both CJSC TK
Mobile and ZTE Indonesia was above 70%, the aforesaid guarantees were approved at the first
extraordinary general meeting of 2009 in accordance with relevant laws and regulations. As at the
date of this report, a US$5 million guarantee for ZTE Indonesia provided by way of standby
letter of credit backed by the Company’s banking credit facilities has been executed and the
US$40 million performance guarantee agreement has been signed. The guarantee to provided in
respect of CJSC TK Mobile’s bank loans by way of pledge of equity has yet to be performed as
the relevant agreement has yet to be signed.
It was approved at the Thirty-first Meeting of the Fourth Session of the Board of Directors that a
performance guarantee of not more than US$30 million be provided by the Company for ZTE
Telecom India Private Limited (‘‘ZTE India’’), a wholly-owned subsidiary million and application
be made by the Company to the relevant bank for the issuance of an assurance letter in respect of
contract performance to provide guarantee with an amount not exceeding US$3 million for ZTE
India. Since the gearing ratio of ZTE India was above 70%, the aforesaid guarantees were
approved at the second extraordinary general meeting of 2009 in accordance with relevant laws
and regulations. As at the date of this report, an agreement in respect of the US$30 million
performance guarantee provided by the Company has been signed and US$146,300 out of the
US$3 million guarantee provided to ZTE India by way of bank assurance letter has been drawn
upon.
During the Reporting Period, a USD20 million guarantee provided by the Company for ZTE HK
in 2008 was released upon expiry.
Note 4 : In addition to guarantees described in Note 2 and Note 3, the Company provide a guarantee in
respect of a bank loan extended to subsidiary Congo-Chine Telecom S.A.R.L. by pledging its 51%
equity interests in Congo-Chine Telecom S.A.R.L. As the gearing ratio of Congo-Chine exceeded
70%, the said guarantee was subject to consideration and approval by the Board of Directors and
the general meeting of the Company in accordance with requirements of relevant laws and
regulations.
Note 5 : Guaranteed amounts denominated in Indian Rupee are translated at the exchange rate of 1 Indian
Rupee to RMB0.14561 (being the book exchange rate of the Company on 31 December 2009).
Guaranteed amounts denominated in US dollars are translated at the exchange rate of USD1 to
RMB6.8282 (being the book exchange of the Company on 31 December 2009).
Note 6 : All third party guarantees of the Company shall be submitted to the Board of Directors for its
review and shall require the approval of two-thirds of the members of the Board. If such third
party guarantees are otherwise subject to review and approval at the general meeting, then they
shall be tabled at the general meeting following approval by the Board of Directors.
– 41 –

7.4 Significant connected transactions
7.4.1 Connected transactions in the ordinary course of business (in accordance with PRC laws and
regulations)
H Applicable & N/A
Classification
Member of the Group
(party to connected
transaction)
Connected person
(counterparty to
connected transaction) Subject matter Pricing basis Transaction price
Amounts of
connected
transactions
for January to
December
2008
(Excluding
VAT)
(RMB10,000)
As a
percentage of
transactions in
the same
classification Settlement
Whether
different
from
estimated
Purchase of raw
materials
ZTE Kangxun
Telecom Company,
Limited
Shenzhen
Zhongxingxin
Telecommunications
Equipment Company,
Limited and
subsidiaries Shenzhen
Zhongxing Xindi
Telecommunications
Equipment Company,
Limited, Shenzhen
Zhongxing Xinyu
FPC Company,
Limited, Zhongxing
Xinzhou Complete
Equipment Co., Ltd.
Various products
such as cabinets,
cases, distribution
frames, soft circuit
boards and shelters
Consistent with
market prices
(as per contract)
Cabinets: RMB1–RMB31,000 per unit;
Cases: RMB1–RMB17,000 per unit
depending on level of sophistication;
Distribution frames: RMB2–
RMB300,000 per unit depending on
level of sophistication and functional
features; Soft circuit boards: RMB2–
RMB50 per unit depending on
measurement, technical parameters and
functional features; Shelter:
RMB20,000–RMB100,000 per unit,
depending on measurement, materials
used and configuration.
69,843.9 2.04% Banker’s
acceptance
bill
No
Mobi Antenna
Technologies
(Shenzhen) Co., Ltd.
Various products
such as
communications
antennas
Consistent with
market prices
(as per contract)
Communication antenna: RMB320–
RMB2,500 per piece, RF parts and
components RMB350–4,100 per unit,
depending on technical parameters and
functional features.
33,163.2 0.97% Banker’s
acceptance
bill
No
Property leasing ZTE Corporation
and majority-owned
subsidiary Chengdu
Zhongxing Software
Company, Limited
Zhongxingxin (lessor) Property located at
No. 800 Tianfu
Avenue Central,
Chengdu, Sichuan
with a leased area of
19,000 sq.m.
Consistent with
market prices
(as per contract)
Monthly rent of RMB40/sq.m.
(property management undertaken by
ZTE and no management fees are
payable)
870.07 2.68% Banker’s
acceptance
bill
No
ZTE Corporation Zhongxingxin (lessor) Property located at
Jinye Road,
Electronics City,
Xi’an, Shaanxi with a
leased area of 44,000
sq.m.
Consistent with
market prices
(as per contract)
Monthly rent of RMB42.5/sq.m.
(inclusive of RMB2.5/sq. m. as monthly
management fees for landscape area)
2,126.07 6.55% Banker’s
acceptance
bill
No
Shenzhen Zhongxing
Development
Company Limited
(lessor)
Property located at
19 Huayuan East
Road, Haidian
District, Beijing with
a leased area of
25,000 sq.m.;
additional space with
area of 6,000 sq.m.
was leased with effect
from 18 April 2009
and leased area was
increased from 25,000
sq.m. to 31,000 sq.m.
Consistent with
market prices
(as per contract)
Monthly rent of RMB115/sq.m.
(property management undertaken by
ZTE and no management fees are
payable)
3,559.56 10.97% Banker’s
acceptance
bill
No
Chongqing
Zhongxing
Development
Company Limited
(lessor)
Property located at
No.3 Xing Guang
Wu Road, North
New District,
Chongqing with an
intended leased area
of 20,000 sq.m.
Consistent with
market prices
(as per contract)
Monthly rent of RMB30/sq.m.
(property management undertaken by
the Company and no management fees
are payable)
463.06 1.43% Banker’s
acceptance
bill
No
Connected transactions involving sales of products or provision of labour services to the
Zhongxingxin and its subsidiaries by the Company during the year amounted to
RMB3,302,310.
– 42 –

7.4.2 Current connected creditor’s rights and debts
& Applicable H N/A
7.4.3 Fund appropriations in 2008 and progress of repayment as at year-end
& Applicable H N/A
7.5 Entrusted fund management
& Applicable H N/A
7.6 Performance of Undertakings
H Applicable & N/A
Undertakings Given by: Details Performance
Other undertakings Zhongxingxin On 10 October 2008, Zhongxingxin, the
controlling shareholder of the Company,
acquired additional A shares in the
Company through the trading system of
Shenzhen Stock Exchange. Zhongxingxin
undertook that it would not sell down its
holdings of shares in the Company
during the period of additional
acquisition and the statutory period. As
at 9 October 2009, the additional share
acquisition by Zhongxingxin, controlling
shareholder of the Company, was
completed and a total of 7,649,116 A
shares in the Company had been
additional acquired on a cumulative
basis. The additional acquisition was in
compliance with relevant provisions of
the Securities Law and other relevant
laws and regulations, departmental rules
and the business rules of Shenzhen Stock
Exchange. For details please refer to the
Announcement of the Completion of the
Controlling Shareholders’ Acquisition of
Additional Shares in the Company
published by the Company in China
Securities Journal, Securities Times and
Shanghai Securities News and on
www.cninfo.com on 10 October 2009.
In compliance with its
undertaking,
Zhongxingxin did not
sell down its holdings
of shares in the
Company during the
period of additional
acquisition and the
statutory period.
7.7 Material litigation or arbitration
& Applicable H N/A
During the year, the Group had no material litigation or arbitration. Please refer to
Section headed ‘‘Material Matters’’ set out in 2009 annual report of the Company for
details of the progress during the year of non-material litigation and arbitration occurring
prior to the year and non-material litigation and arbitration occurring during the year.
– 43 –

7.8 Other significant events and analysis of their impact of and solutions
7.8.1 Investment in securities
& Applicable H N/A
7.8.2 Equity interests in other listed companies
& Applicable H N/A
7.8.3 Equity interests in companies proposed for listing and non-listed financial enterprises
H Applicable & N/A
The application for initial public offering by Nationz Technologies Inc. (‘‘Nationz
Technologies’’), an associate of the Company, was approved by the GEM Board Issue
Approval Committee under the China Securities Regulatory Commission (‘‘CSRC’’) at
the 13th working meeting of 2010 of the Committee on 26 March 2010.
As at 31 December 2009, the Company owned 21.76 million shares of Nationz
Technologies, representing 26.67% equity interest of Nationz Technologies before the
offering.
7.8.4 Dealings in shares of other listed companies
& Applicable H N/A
7.8.5 Other comprehensive income
2009 2008
Difference arising from foreign currency translation 8,644 (181,500)
Total 8,644 (181,500)
8 REPORT OF THE SUPERVISORY COMMITTEE
8.1 Supervisory committee meetings
The Supervisory Committee held five meetings in 2009, the details of which are as follows:
1. The fourteenth meeting of the fourth session of the Supervisory Committee of the
Company was held on 19 March 2009, at which the ‘‘2008 report on the work of the
Supervisory Committee’’, ‘‘Full Text of the 2008 Annual Report of the Company’’,
‘‘Summary of the 2008 Annual Report and Results Announcement of the Company’’,
‘‘the 2008 Financial Report of the Company as Audited by the PRC and Hong Kong
Auditors’’, ‘‘the 2008 Final Financial Accounts of the Company’’, ‘‘Resolution on
Significant Asset Impairment Provision for 2008 by the Company’’, ‘‘the 2008 Self-
assessment Report on Internal Control of the Company’’, ‘‘Report of the Company
on the Application of Proceeds from the Issue of Bonds cum Warrants’’, ‘‘Report of
the Audit Committee on the 2008 Audit of the Company Performed by the PRC and
Hong Kong Auditors’’, ‘‘Resolution of the Company on Determining the Audit Fees
of the PRC Auditors and the Hong Kong Auditors of the Company for 2008’’,
‘‘Report on the Proposed Profit Distribution and Capitalisation from Capital Reserve
– 44 –

of the Company for 2008’’, ‘‘Resolution of the Company on the Proposed Ongoing
Connected Transaction Framework Agreement for 2009’’, ‘‘Resolution with respect
to the Proposed Application by the Company for Composite Credit Facilities for the
Six Months ended 30 June 2009’’, ‘‘Resolution with respect to the Proposed
Application by the Company to China Development Bank for US$2.5 billion
Composite Credit Facilities’’ and the ‘‘Resolution on the Appointment of the PRC
Auditors and the Hong Kong Auditors of the Company for 2009’’ were considered
and approved.
2. The fifteenth meeting of the fourth session of the Supervisory Committee of the
Company was held on 23 April 2009, at which the ‘‘2009 First Quarterly Report of the
Company’’ and ‘‘Resolutions of the Company on Connected Transactions regarding
the Lease of Property’’ were considered and approved.
3. The sixteenth meeting of the fourth session of the Supervisory Committee of the
Company was held on 6 July 2009, at which the ‘‘Resolution on Matters pertaining to
the Implementation of the ‘Phase I Share Incentive Scheme’’’, ‘‘Resolution of the
Company on the Verification of the List of Scheme Participants in respect of the
‘Phase I Share Incentive Scheme’’’ and ‘‘Resolution of the Company on the
Verification of the List of Scheme Participants in respect of the First Unlocking
under the ‘Phase I Share Incentive Scheme’’’ were considered and approved.
4. The seventeenth meeting of the fourth session of the Supervisory Committee of the
Company was held on 19 August 2009, at which the ‘‘Full Text and Summary of the
2009 Interim Report and the Results Announcement of the Company’’, ‘‘2009 Interim
Final Financial Accounts’’ and ‘‘Resolution of the Company on the Continued
Purchase of ‘Liability Insurance for Directors, Supervisors and Senior Management’’’
and ‘‘Resolution on the ‘Specific System for the Selection and Appointment of
Accountants’ Firm’’’ were considered and approved.
5. The eighteenth meeting of the fourth session of the Supervisory Committee of the
Company was held on 27 October 2009, at which the ‘‘2009 Third Quarterly Report of
the Company’’ and ‘‘Resolutions of the Company on Continuous Connected
Transactions’’ were considered and approved.
8.2 The Supervisory Committee has furnished its opinion on the Company’s conditions in 2009 as
follows:
1. The Company has established a proper internal control system with proper
documentation such as the Articles of Association, the Rules of Procedure for
General Meetings, the Rules of Procedure for Board of Directors’ Meetings and the
Rules of Procedure for Supervisory Committee Meetings and the Company’s
management systems have been in good order. The decision-making process of the
Company has been in compliance with the relevant requirements of the Company
Law of the People’s Republic of China and the Articles of Association of the
Company. The procedures, proposed resolutions and implementation of resolutions
of the general meetings and meetings of the Board of Directors have also been in
compliance with relevant provisions of the laws, regulations and the Articles of
Association. Obligations of information disclosure have been duly performed.
– 45 –

2. The Directors and the management have diligently performed their duties in
compliance with the laws and conscientiously implemented the resolutions of the
general meetings and meetings of the Board of Directors. They have not violated any
laws, regulations and the Articles of Association in the performance of their duties,
nor have they acted against the Company and its shareholders’ interests.
3. The preparation and review processes for the full text and summary of the 2009
annual report of the Company have been in compliance with provisions of the laws
and regulations and the Articles of Association. The contents and format of the full
text and summary of the 2009 annual report of the Company are in compliance with
various requirements of regulatory authorities including the CSRC, Shenzhen Stock
Exchange and the Stock Exchange of Hong Kong Limited. The 2009 financial report
of the Company gives a true and accurate view of the financial position, and
operating results of the Company for the year 2009.
4. The Supervisory Committee has confirmed following due inspection that the latest
application of issue proceeds by the Company has been in compliance with provisions
of relevant laws and regulations.
5. All connected party transactions between the Company and its connected parties
have been conducted on an arm’s length basis without compromising the interests of
the Company and its shareholders.
9 CORPORATION GOVERNANCE REPORT
The Group complied with all the code provisions of the Code on Corporate Governance
Practices set out in Appendix 14 to the Hong Kong Stock Exchange Listing Rules
throughout 2009.
The Directors of the Company confirm that the Company has adopted code provisions
relating to the dealing in the Company’s shares by Directors contained in the Model Code
for Securities Transactions by Directors of Listed Issuers (‘‘Model Code’’) set out in
Appendix 10 to the Listing Rules. After making specific enquiry with the Directors and
Supervisors, the Company was not aware of any information that reasonably suggested
that the Directors and Supervisors had not complied with provisions of the Model Code
during 2009.
– 46 –

10 FINANCIAL REPORTS
10.1The Audit Committee of the Company has reviewed, in association with the management,
the accounting principles and standards adopted by the Group, and has investigated
issues relating to auditing, internal control and financial reporting, including the review of
the consolidated and company balance sheets at 31 December 2009 and the consolidated
and company income statement and cash flow statements for the year ended 31 December
2009 prepared by the Group in accordance with PRC ASBEs and the consolidated
statement of financial position at 31 December 2009 and the consolidated statement of
comprehensive income, consolidated statement of changes in equity and consolidated cash
flow statement for the year ended 31 December 2009 prepared in accordance with
HKFRSs.
10.2Audit Opinion
The consolidated and company balance sheets as at 31 December 2009, the consolidated
and company income statements, statement of changes in equity and cash flow statements
for the year ended 31 December 2009 prepared by the Group in accordance with PRC
ASBEs have been audited by Ernst & Young Hua Ming, who has issued a standard
auditors’ report with unqualified opinion (Ernst & Young Hua Ming (2010) SHENZI NO.
60438556_H01).
Ernst & Young issued an unqualified auditors’ report following auditing in connection
with the consolidated and company statements of financial position as at 31 December
2009, the consolidated statement of comprehensive income, the consolidated statement of
changes in equity and the consolidated cash flow statement for the year ended 31
December 2009 prepared by the Group in accordance with HKFRSs.
10.3 Comparative balance sheets, income statements, cash flow statements and statement of
change in owner’s equity (consolidated and parent)
10.3.1 Accounting statements prepared in accordance with PRC ASBEs and notes thereto (Please
see Appendix I)
10.3.2 Accounting statements prepared in accordance with HKFRSs (Please see Appendix II)
10.4 Changes in accounting policies, accounting estimates and auditing methods compared to the
2008 annual report
& Applicable H N/A
10.5 Details, corrected amounts, reasons and effect of significant accounting errors
& Applicable H N/A
– 47 –

10.6 Changes in the scope of consolidation compared to the 2008 annual report are set out in the
following
During 2009, the Group deregistered subsidiary ZIMAX (Cayman) Holding Limited and
established the following new subsidiaries: tier-one subsidiaries including 中興國通通訊裝
備技術(北京)有限公司, Shenzhen Zhongxing ICT Co., Ltd. (深圳中興網信科技有限公
司), 中興通訊(杭州)有限責任公司 and 深圳市中興和泰酒店投資管理有限公司; and tier-
two subsidiaries including 南京中興力維軟件有限公司, 南京中興特種系統有限責任公司,
南京中興新軟件有限責任公司, 三亞中興軟件有限責任公司, 重慶中興軟件有限責任公司,
北京市中興百納有限責任公司, 濟南中興通訊技術有限責任公司 and 深圳市中興九歌信息
技術有限公司.
Other than the newly established subsidiaries and the deregistered subsidiary, the scope of
consolidation was consistent with that of the previous year.
By order of the Board
Hou Weigui
Chairman
Shenzhen, PRC
8 April 2010
As at the date of this announcement, the Board of Directors of the Company comprises three
executive directors, Shi Lirong, Yin Yimin and He Shiyou; six non-executive directors, Hou
Weigui, Lei Fanpei, Xie Weiliang, Zhang Junchao, Wang Zhanchen and Dong Lianbo; and five
independent non-executive directors, Li Jin, Qu Xiaohui, Wei Wei, Chen Naiwei and Tan
Zhenhui.
– 48 –

APPENDIX I: FINANCIAL STATEMENTS PREPARED WITH PRC ASBES
ZTE Corporation
Balance Sheet
Currency: RMB’000
2009.12.31 2008.12.31
Assets Consolidated Company Consolidated Company
(Audited) (Audited) (Audited) (Audited)
Current assets
Cash on hand and at bank 14,496,808 10,096,875 11,480,406 8,331,272
Bills receivable 779,112 672,374 1,578,473 1,513,358
Trade receivables 15,319,215 19,557,131 9,972,495 13,186,642
Factored trade receivables 2,870,221 2,727,445 1,658,941 1,783,941
Prepayments 355,422 173,408 355,887 18,546
Dividend receivable — 1,017,020 — 23,848
Other receivables 1,059,829 3,240,367 757,847 1,442,177
Inventories 9,324,800 4,747,278 8,978,036 5,211,017
Amount due from customers for contract
work 11,388,496 10,829,088 7,894,010 8,038,449
Total current assets 55,593,903 53,060,986 42,676,095 39,549,250
Non-current assets
Available-for-sale financial assets 253,760 244,448 251,148 243,198
Long-term trade receivables 383,749 1,347,932 612,008 1,214,038
Factored long-term trade receivables 2,968,629 3,093,629 753,568 753,568
Long-term equity investments 440,282 2,196,637 168,433 1,747,760
Fixed assets 4,714,533 3,195,746 4,103,076 2,608,957
Construction in progress 1,332,735 790,491 817,086 402,290
Intangible assets 613,773 481,171 589,084 479,947
Development costs 778,375 151,564 476,020 137,915
Deferred tax assets 643,918 382,537 400,265 231,182
Long-term deferred assets 10,306 — 19,138 —
Other non-current assets 608,359 608,359 — —
Total non-current assets 12,748,419 12,492,514 8,189,826 7,818,855
TOTAL ASSETS 68,342,322 65,553,500 50,865,921 47,368,105
Legal representative: Chief Financial Officer: Head of Finance Division:
Hou Weigui Wei Zaisheng Shi Chun Mao
– 49 –

ZTE Corporation
Balance Sheet (Audited) (Continued)
Currency: RMB’000
2009.12.31 2008.12.31
Liabilities and shareholders’ equity Consolidated Company Consolidated Company
(Audited) (Audited) (Audited) (Audited)
Current liabilities
Short-term loans 4,906,503 3,388,734 3,882,479 1,273,828
Bank advances on factored trade
receivables 2,870,221 2,727,445 1,658,941 1,783,941
Derivative financial liabilities — — 12,560 12,560
Bills payable 8,484,861 9,473,080 6,318,059 6,901,568
Trade payables 13,046,804 17,834,626 9,495,946 12,582,726
Amount due to customers for contract
work 2,519,706 2,153,082 2,965,582 2,408,455
Advances from customers 2,337,628 2,039,175 1,392,862 1,640,192
Salary and welfare payables 2,398,720 878,705 1,443,017 596,515
Taxes payable 77,715 (307,988) (765,040) (993,777)
Dividend payable 16,966 75 22,750 10
Other payables 2,213,477 5,662,122 1,553,011 4,188,152
Deferred income 92,830 33,237 64,281 31,263
Provision 189,664 88,298 170,382 100,724
Long-term loans due within one year 1,939,965 1,204,846 1,782,006 673,384
Total current liabilities 41,095,060 45,175,437 29,996,836 31,199,541
Non-current liabilities
Long-term loans 2,396,393 1,742,512 1,292,547 1,005,039
Bank advances on factored long-term
trade receivables 2,968,629 3,093,629 753,568 753,568
Bonds payable 3,632,681 3,632,681 3,514,652 3,514,652
Specific payables — — 80,000 80,000
Deferred tax liabilities 3,924 1,143 5,019 7,242
Other non-current liabilities 296,769 296,769 39,752 39,752
Total non-current liabilities 9,298,396 8,766,734 5,685,538 5,400,253
Total liabilities 50,393,456 53,942,171 35,682,374 36,599,794
– 50 –

ZTE Corporation
Balance Sheet (Audited) (Continued)
Currency: RMB’000
2009.12.31 2008.12.31
Liabilities and shareholders’ equity Consolidated Company Consolidated Company
(Audited) (Audited) (Audited) (Audited)
Shareholders’ equity
Share capital 1,831,336 1,831,336 1,343,330 1,343,330
Capital reserves 6,749,899 6,745,877 6,298,172 6,271,137
Less: Restricted shares remaining in
lock-up 447,235 447,235 — —
Surplus reserves 1,505,203 842,986 1,431,820 769,603
Retained profits 6,853,682 2,100,753 5,021,369 1,992,735
Proposed final dividend 552,425 552,425 402,999 402,999
Foreign currency translation
differences (220,043) (14,813) (248,146) (11,493)
Total equity attributable to equity
holders of the parent 16,825,267 11,611,329 14,249,544 10,768,311
Minority interests 1,123,599 — 934,003 —
Total shareholders’ equity 17,948,866 11,611,329 15,183,547 10,768,311
TOTAL LIABILITIES AND
SHAREHOLDERS’ EQUITY 68,342,322 65,553,500 50,865,921 47,368,105
Legal representative: Chief Financial Officer: Head of Finance Division:
Hou Weigui Wei Zaisheng Shi Chun Mao
– 51 –

ZTE Corporation
Income Statement
Currency: RMB’000
Item 2009 2008
Consolidated Company Consolidated Company
(Audited) (Audited) (Audited) (Audited)
I. Operating revenue 60,272,563 55,057,688 44,293,427 40,745,196
Less: Operating costs 40,623,339 45,634,129 29,492,530 33,455,197
Taxes and surcharges 692,933 80,016 415,854 89,472
Selling and distribution costs 7,044,382 5,247,526 5,312,516 4,076,649
Administrative expenses 2,567,928 1,517,716 2,099,715 1,131,736
Research and development costs 5,781,583 1,619,869 3,994,145 885,718
Finance expenses 784,726 810,802 1,308,254 1,013,256
Impairment losses 737,940 492,847 419,358 164,869
Add: Gains/(losses) from changes in
fair values 12,560 12,560 (128,328) (136,203)
Investment income 11,871 1,051,371 122,666 1,268,859
Including:Share of profits of
associates and Jointly-
controlled entities 26,002 12,089 19,877 1,867
II. Operating profit 2,064,163 718,714 1,245,393 1,060,955
Add: Non-operating income 1,391,420 268,136 1,098,296 127,061
Less: Non-operating expenses 130,841 47,713 81,146 46,571
Including: Gains and loss on
disposal of non-current assets 26,744 10,455 37,154 17,879
III. Total profit 3,324,742 939,137 2,262,543 1,141,445
Less: Income tax 629,081 205,311 350,608 163,583
IV. Net profit 2,695,661 733,826 1,911,935 977,862
Net profit attributable to equity
holders of the parent 2,458,121 733,826 1,660,199 977,862
Minority interests 237,540 — 251,736 —
V. Earnings per share
(1) Basic earnings per share* RMB1.40 RMB0.42 RMB0.95 RMB0.56
(2) Diluted earnings per share** RMB1.35 RMB0.40 RMB0.93 RMB0.55
VI. Other comprehensive income 8,644 (3,320) (181,500) (7,842)
VII. Comprehensive income 2,704,305 730,506 1,730,435 970,020
Including:
Comprehensive income attributable
to equity holders of the parent 2,486,224 730,506 1,477,615 970,020
Comprehensive income attributable
to minority interests 218,081 — 252,820 —
Legal representative: Chief Financial Officer: Head of Finance Division:
Hou Weigui Wei Zaisheng Shi Chun Mao
– 52 –

* As a result of the implementation of the 2008 profit distribution plan, the total share capital was increased
from 1,343,330,310 shares to 1,746,329,402 shares, and the basic earnings per share for 2008 was restated
accordingly. Basic earnings per share for the period under review was calculated on the basis of the weighted
average number of ordinary share capital, namely the total share capital at the end of the period after
deduction of 69,737,523 restricted shares remaining in lock-up.
** As certain Subject Share quotas under the Phase I Share Incentive Scheme of the Company have given rise
to 69,737,523 and 46,753,747 potentially dilutive ordinary shares, respectively, for the reporting period and
2008, respectively, therefore diluted earnings per share has been calculated on the basis of basic earnings per
share taking into account the said factors, and the diluted earnings per share for 2008 has been restated.
*** Restricted items have been excluded from the opening and closing balances of cash and cash equivalents.
– 53 –

ZTE Corporation
Cash Flow Statement
Currency: RMB’000
Item 2009 2008
Consolidated Company Consolidated Company
(Audited) (Audited) (Audited) (Audited)
I. Cash flows from operating activities
Cash received from sale of goods or
rendering services 58,137,378 51,366,991 45,008,874 39,233,345
Cash received from taxes returned 3,204,945 2,099,164 3,972,631 3,088,258
Cash received relating to other operating activities 442,533 317,223 325,759 213,248
Sub-total of cash inflow 61,784,856 53,783,378 49,307,264 42,534,851
Cash paid for goods and services 38,252,058 44,383,735 30,430,667 31,511,180
Cash paid to and on behalf of employees 7,899,513 2,126,248 6,160,806 1,523,431
Payments of taxes and levies 3,287,551 168,456 2,515,238 149,482
Cash paid relating to other operating activities 8,616,462 6,113,866 6,552,640 4,734,886
Sub-total of cash outflow 58,055,584 52,792,305 45,659,351 37,918,979
Net cash flows from operating activities 3,729,272 991,073 3,647,913 4,615,872
II. Cash flows from investing activities
Cash received from sale of investments 12,933 5,572 15,392 —
Cash received from gains of investment 5,210 53,217 89,862 97,900
Net cash received form disposal of fixed assets,
intangible assets and other long-terms assets 1,011 — 52,554 —
Sub-total of cash inflow 19,154 58,789 157,808 97,900
Cash paid to acquire fixed asset, intangible assets
and other long term assets 2,053,824 1,601,175 1,911,923 1,302,964
Cash paid for investment 266,425 410,925 233,536 805,114
Sub-total of cash outflow 2,320,249 2,012,100 2,145,459 2,108,078
Net cash flow from investing activities (2,301,095) (1,953,311) (1,987,651) (2,010,178)
– 54 –

Item 2009 2008
Consolidated Company Consolidated Company
(Audited) (Audited) (Audited) (Audited)
III. Cash flows from financing activities
Cash received from investment 46,371 29,771 43,342 43,342
Including: Capital injected the subsidiaries by
minority interests 22,070 — — —
Cash received from borrowings 9,721,064 7,544,169 9,365,004 6,372,399
Cash received from the issue of Bonds cum
Warrants — — 3,961,444 3,961,444
Sub-total of cash inflow 9,767,435 7,573,940 13,369,790 10,377,185
Cash paid for debt repayments 7,435,235 4,160,328 8,896,625 8,376,712
Cash payments for distribution of dividends and
interest expenses 1,045,009 945,760 830,481 668,330
Including: Dividends and profit paid by
subsidiaries to minority interests 44,227 — 68,510 —
Sub-total of cash outflow 8,480,244 5,106,088 9,727,106 9,045,042
Net cash flow from financing activities 1,287,191 2,467,852 3,642,684 1,332,143
IV. Effect of changes in foreign exchange rate on cash
and cash equivalents 16,294 (21,136) (268,535) (218,452)
V. Net increase in cash and cash equivalents 2,731,662 1,484,478 5,034,411 3,719,385
Add: cash and cash equivalents at beginning of
year 11,344,160 8,323,750 6,309,749 4,604,365
VI. Net balance of cash and cash equivalents 14,075,822 9,808,228 11,344,160 8,323,750
Legal representative: Chief Financial Officer: Head of Finance Division:
Hou Weigui Wei Zaisheng Shi Chun Mao
– 55 –

ZTE
Corporation
ConsolidatedStatementofChangesin
Equity(A
udited)
Currency
:RM
B’000
2009
2008
Equ
ity
attributab
leto
equity
holdersof
thepa
rent
Equ
ityattributab
leto
equity
holdersof
thepa
rent
Shareca
pitalCap
ital
reserve
Restricted
shares
remaining
in
lock
-up
Surplus
reserve
Retaine
d
profit
Propo
sed
fina
l
divide
nd
Foreign
curren
cy
tran
slation
differen
ceSu
b-total
Minority
interests
Total
shareh
olde
rs’
equity
Shareca
pital
Cap
ital
reserve
Surp
lus
reserve
Retaine
d
profit
Prop
osed
final
divide
nd
For
eign
curren
cy
tran
slation
differen
ceSu
b-total
Minor
ity
interests
Total
shareh
olde
rs’
equity
I.Cur
rent
year’s
open
ing
balanc
e1,34
3,33
06,29
8,17
2—
1,43
1,82
05,02
1,36
940
2,99
9(248
,146
)14
,249
,544
934,00
315
,183
,547
959,52
25,80
7,33
21,36
4,75
83,83
1,23
123
9,88
0(65,56
2)12
,137
,161
751,24
712
,888
,408
II.Cha
ngedu
ring
theye
ar
(1)Net
profit
——
——
2,45
8,12
1—
—2,45
8,12
123
7,54
02,69
5,66
1—
——
1,66
0,19
9—
—1,66
0,19
925
1,73
61,91
1,93
5
(2)Other
compr
ehen
sive
inco
me
——
——
——
28,103
28,103
(19,45
9)8,64
4—
——
——
(182
,584
)(182
,584
)1,08
4(181
,500
)
Total
compr
ehen
sive
inco
me
——
——
2,45
8,12
1—
28,103
2,48
6,22
421
8,08
12,70
4,30
5—
——
1,66
0,19
9—
(182
,584
)1,47
7,61
525
2,82
01,73
0,43
5
(3)Sh
areh
olde
r’sinjection
and
capital
redu
ction
1.Cap
italinjection
from
shareh
olde
rs(N
ote1)
85,007
474,03
7(447
,235
)—
——
—11
1,80
922
,070
133,87
9—
——
——
——
——
2.Equ
itysettled
shareex
pens
e
charge
dto
equity
(Note1)
—29
9,59
4—
——
——
299,59
4—
299,59
4—
299,55
1—
——
—29
9,55
1—
299,55
1
3.Others
—80
,000
——
——
—80
,000
(12,17
6)67
,824
—(9,876
)—
——
—(9,876
)(19,98
4)(29,86
0)
(4)Pr
ofit
appr
opriation
1.App
ropr
iation
tosu
rplusreserves
——
—73
,383
(73,38
3)—
——
——
——
67,062
(67,06
2)—
——
——
2.Distribution
tosh
areh
olde
rs—
——
——
(402
,999
)—
(402
,999
)(38,37
9)(441
,378
)—
——
—(239
,880
)—
(239
,880
)(50,08
0)(289
,960
)
3.Pr
opos
edfin
aldivide
nd—
——
—(552
,425
)55
2,42
5—
——
——
——
(402
,999
)40
2,99
9—
——
—
4.Others
——
——
——
——
——
——
——
——
——
—
(5)Trans
ferof
shareh
olde
rs’eq
uity
1.Trans
ferof
capitalreserveto
shareca
pital
402,99
9(402
,999
)—
——
——
——
—38
3,80
8(383
,808
)—
——
——
——
2.Trans
ferof
surp
lusreserves
to
shareca
pital
——
——
——
——
——
——
——
——
——
—
3.Su
rplusreserves
mak
ing
upof
losses
——
——
——
——
——
——
——
——
——
—
4.Others
——
——
——
——
——
——
——
——
——
—
(6)Directly
charge
dto
gainsan
dlosses
insh
areh
olde
rs’eq
uity
1.Effectof
chan
gesof
othe
req
uity
holders’
interest
ininve
sted
entit
iesby
equity
metho
d—
1,09
5—
——
——
1,09
5—
1,09
5—
4,76
3—
——
—4,76
3—
4,76
3
2.Issu
eof
Bon
dscu
mW
arrants
—58
0,21
0—
——
—58
0,21
0—
580,21
0
III.
Cur
rent
year’s
clos
ing
balanc
e1,83
1,33
66,74
9,89
9(447
,235
)1,50
5,20
36,85
3,68
255
2,42
5(220
,043
)16
,825
,267
1,12
3,59
917
,948
,866
1,34
3,33
06,29
8,17
21,43
1,82
05,02
1,36
940
2,99
9(248
,146
)14
,249
,544
934,00
315
,183
,547
Legalrepresentative:
HouW
eigui
ChiefFinancialOfficer:W
eiZaishen
gHeadofFinance
Division:ShiChunM
ao
– 56 –

ZTE
Corporation
StatementofChangesin
Equity(A
udited)
Currency:RM
B’000
2009
2008
Sha
reca
pital
Cap
ital
reserve
Restricted
shares
remaining
in
lock
-up
Surplus
reserve
Retaine
d
profit
Propo
sed
fina
ldivide
nd
Foreign
curren
cy
tran
slation
differen
ce
Total
shareh
olde
rs’
equity
Shareca
pital
Cap
ital
reserve
Surp
lus
reserve
Retaine
dpr
ofit
Prop
osed
fina
ldivide
nd
For
eign
curren
cytran
slation
differen
ce
Total
shareh
olde
rs’
equity
I.Cur
rent
year’s
open
ing
balanc
e1,34
3,33
06,27
1,13
7—
769,60
31,99
2,73
540
2,99
9(11,49
3)10
,768
,311
959,52
25,77
2,06
176
9,60
31,41
7,87
223
9,88
0(3,651
)9,15
5,28
7II.Cha
ngedu
ring
theye
ar(1)Net
profit
——
——
733,82
6—
—73
3,82
6—
——
977,86
2—
—97
7,86
2(2)Other
compr
ehen
sive
inco
me
——
——
——
(3,320
)(3,320
)—
——
——
(7,842
)(7,842
)
Total
compr
ehen
sive
inco
me
——
——
733,82
6—
(3,320
)73
0,50
6—
——
977,86
2—
(7,842
)97
0,02
0
(3)Sh
areh
olde
r’sinjection
and
capitalredu
ction
1.Cap
ital
injection
from
shareh
olde
rs(N
ote1)
85,007
474,03
7(447
,235
)—
——
—11
1,80
9—
——
——
——
2.Equ
ity
settled
shareex
pens
ech
arge
dto
equity
(Note1)
—29
9,59
4—
——
——
299,59
4—
299,55
1—
——
—29
9,55
13.
Others
—80
,000
——
——
—80
,000
——
——
——
—(4)Pr
ofit
appr
opriation
1.App
ropr
iation
tosu
rplusreserves
——
—73
,383
(73,38
3)—
——
——
——
——
—2.
Distribution
tosh
areh
olde
rs—
——
——
(402
,999
)—
(402
,999
)—
——
—(239
,880
)—
(239
,880
)3.
Prop
osed
fina
ldivide
nd—
——
—(552
,425
)55
2,42
5—
——
——
(402
,999
)40
2,99
9—
—4.
Others
——
——
——
——
——
——
——
—(5)Trans
ferof
shareh
olde
rs’eq
uity
1.Trans
ferof
capitalreserveto
shareca
pital
402,99
9(402
,999
)—
——
——
—38
3,80
8(383
,808
)—
——
——
2.Trans
ferof
surp
lusreserves
tosh
areca
pital
——
——
——
——
——
——
——
—3.
Surp
lusreserves
mak
ing
upof
losses
——
——
——
——
——
——
——
—4.
Others
——
——
——
——
——
——
——
—(6)Others
1.Effectof
chan
gesof
othe
req
uity
holders’
interest
ininve
sted
entities
byeq
uity
metho
d—
24,108
——
——
—24
,108
—3,12
3—
——
—3,12
32.
Issu
eof
Bon
dscu
mW
arrants
—58
0,21
0—
——
—58
0,21
0
III.
Cur
rent
year’s
clos
ing
balanc
e1,83
1,33
66,74
5,87
7(447
,235
)84
2,98
62,10
0,75
355
2,42
5(14,81
3)11
,611
,329
1,34
3,33
06,27
1,13
776
9,60
31,99
2,73
540
2,99
9(11,49
3)10
,768
,311
Legalrepresentative:
HouW
eigui
ChiefFinancialOfficer:W
eiZaishen
gHeadofFinance
Division:ShiChunM
ao
– 57 –

APPENDIX II FINANCIAL STATEMENTS PREPARED UNDER HKFRSs AND NOTES
HERETO
Consolidated Statement of Comprehensive Income
(Prepared under Hong Kong Financial Reporting Standards)
Year ended 31 December 2009
2009 2008Note RMB’000 RMB’000
REVENUE 5 60,272,563 44,293,427Cost of sales (41,667,788) (29,911,471)
Gross profit 18,604,775 14,381,956Other income and gains 1,723,498 1,295,715Research and development costs (5,781,583) (3,994,145)Selling and distribution costs (7,157,844) (5,400,967)Administrative expenses (2,735,186) (2,190,037)Other expenses (603,176) (1,159,682)Finance costs 7 (751,744) (690,174)Share of profits and losses of associates 26,002 19,877
PROFIT BEFORE TAX 6 3,324,742 2,262,543Income tax expense 8 (629,081) (350,608)
PROFIT FOR THE YEAR 2,695,661 1,911,935
OTHER COMPREHENSIVE INCOMEExchange differences on translation of foreignoperations 8,644 (181,500)
OTHER COMPREHENSIVE INCOME FORTHE YEAR, NET OF TAX 8,644 (181,500)
TOTAL COMPREHENSIVE INCOME FORTHE YEAR 2,704,305 1,730,435
Profit attributable to:Owners of the Company 2,458,121 1,660,199Minority interests 237,540 251,736
2,695,661 1,911,935
Total comprehensive income attributable to:Owners of the Company 2,486,224 1,477,615Minority interests 218,081 252,820
2,704,305 1,730,435
EARNINGS PER SHARE ATTRIBUTABLE TOORDINARY EQUITY HOLDERS OF THEPARENT
Basic RMB1.40 RMB0.95
Diluted RMB1.35 RMB0.93
Details of dividend payable and proposed for the year are set out in Note 9 to the financialstatements
– 58 –

Consolidated Statement of Financial Position
(Prepared under Hong Kong Financial Reporting Standards)
31 December 2009
2009 2008
Note RMB’000 RMB’000
NON-CURRENT ASSETS
Property, plant and equipment 6,057,574 4,892,515
Prepaid land lease payments 503,771 508,389
Intangible assets 877,397 592,974
Investments in a jointly-controlled entity 2,255 2,255
Investments in associates 438,027 166,178
Available-for-sale investments 253,760 251,148
Long-term trade receivables 11 383,749 612,008
Factored long-term trade receivables 2,968,629 753,568
Deferred tax assets 643,918 400,265
Pledged deposits 608,359 —
Total non-current assets 12,737,439 8,179,300
CURRENT ASSETS
Prepaid land lease payments 10,980 10,527
Inventories 9,324,800 8,978,036
Amount due from customers for contract works 11,388,496 7,894,010
Trade and bills receivables 11 16,098,327 11,550,968
Factored trade receivables 2,870,221 1,658,941
Prepayments, deposits and other receivables 2,537,793 2,476,642
Pledged deposits 420,986 136,246
Cash and cash equivalents 14,075,822 11,344,160
Total current assets 56,727,425 44,049,530
CURRENT LIABILITIES
Trade and bills payables 12 21,531,665 15,814,005
Amount due to customers for contract works 2,519,706 2,965,582
Other payables and accruals 7,285,229 4,661,469
Derivative financial instruments — 12,560
Interest-bearing bank borrowings 6,846,468 5,664,485
Bank advances on factored trade receivables 2,870,221 1,658,941
Tax payable 1,147,347 559,953
Dividends payable 16,966 22,750
Total current liabilities 42,217,602 31,359,745
NET CURRENT ASSETS 14,509,823 12,689,785
TOTAL ASSETS LESS CURRENT
LIABILITIES 27,247,262 20,869,085
– 59 –

2009 2008
Note RMB’000 RMB’000
TOTAL ASSETS LESS CURRENT
LIABILITIES 27,247,262 20,869,085
NON-CURRENT LIABILITIES
Bonds cum warrants 3,632,681 3,514,652
Interest-bearing bank borrowings 2,396,393 1,292,547
Deferred tax liabilities 3,924 5,019
Bank advances on factored long-term trade
receivables 2,968,629 753,568
Financial guarantee contract 3,689 3,689
Provision for retirement benefits 38,028 36,063
Other long-term payables 255,052 80,000
Total non-current liabilities 9,298,396 5,685,538
Net assets 17,948,866 15,183,547
EQUITY
Equity attributable to owners of the Company
Issued capital 1,831,336 1,343,330
Restricted shares subject to lock-up (447,235) —
Equity component of bonds cum warrants 580,210 580,210
Reserves 14,308,531 11,923,005
Proposed final dividends 552,425 402,999
16,825,267 14,249,544
Minority interests 1,123,599 934,003
Total equity 17,948,866 15,183,547
Hou Weigui Shi Lirong
Director Director
– 60 –

1. BASIS OF PREPARATION
These financial statements have been prepared in accordance with Hong Kong Financial Reporting
Standards (‘‘HKFRSs’’) (which include all Hong Kong Financial Reporting Standards, Hong Kong
Accounting Standards (‘‘HKASs’’) and Interpretations) issued by the Hong Kong Institute of Certified
Public Accountants, accounting principles generally accepted in Hong Kong and the disclosure
requirements of the Hong Kong Companies Ordinance. They have been prepared under the historical
cost convention, except for derivative financial instruments, which have been measured at fair value. These
financial statements are presented in Renminbi (‘‘RMB’’) and all values are rounded to the nearest thousand
except when otherwise indicated.
Basis of consolidation
The consolidated financial statements include the financial statements of the Company and its subsidiaries
for the year ended 31 December 2009. The results of subsidiaries are consolidated from the date of
acquisition, being the date on which the Group obtains control, and continue to be consolidated until the
date that such control ceases. All income, expenses and unrealised gains and losses resulting from
intercompany transactions and intercompany balances within the Group are eliminated on consolidation in
full.
Minority interests represent the interests of outside shareholders not held by the Group in the results and
net assets of the Company’s subsidiaries. An acquisition of minority interests is accounted for using the
parent entity extension method whereby the difference between the consideration and the book value of the
share of the net assets acquired is recognised as goodwill.
2. CHANGES IN ACCOUNTING POLICY AND DISCLOSURES
The Group has adopted the following new and revised HKFRSs for the first time for the current year’s
financial statements. Except for in certain cases, giving rise to new and revised accounting policies and
additional disclosures, the adoption of these new and revised HKFRSs has had no significant effect on these
financial statements.
HKFRS 1 and HKAS 27 Amendments Amendments to HKFRS 1
First-time Adoption of HKFRSs and HKAS 27
Consolidated and Separate Financial Statements —
Cost of an Investment in a Subsidiary, Jointly
Controlled Entity or Associate
HKFRS 2 Amendments Amendments to HKFRS 2 Share-based Payment —
Vesting Conditions and Cancellations
HKFRS 7 Amendments Amendments to HKFRS 7 Financial Instruments:
Disclosures — Improving Disclosures about Financial
Instruments
HKFRS 8 Operating Segments
HKAS 1(Revised) Presentation of Financial Statements
HKAS 18 Amendment* Amendment to Appendix to HKAS 18 Revenue —
Determining whether an entity is acting as a principal
or as an agent
HKAS 23 (Revised) Borrowing Costs
HKAS 32 and HKAS 1 Amendments Amendments to HKAS 32 Financial Instruments:
Presentation and HKAS 1 Presentation of Financial
Statements — Puttable Financial Instruments and
Obligations Arising On Liquidation
HK(IFRIC) — Int 9 and HKAS 39
Amendments
Amendments to HK(IFRIC) — Int 9 Reassessment of
Embedded Derivatives and HKAS 39 Financial
Instruments: Recognition and Measurement —
Embedded Derivatives
HK(IFRIC) — Int 13 Customer Loyalty Programmes
HK(IFRIC) — Int 15 Agreements for the Construction of Real Estate
HK(IFRIC) — Int 16 Hedges of a Net Investment in a Foreign Operation
– 61 –

HK(IFRIC) — Int 18 Transfers of Assets from Customers
(adopted from 1 July 2009)
Improvements to HKFRSs (October 2008) Amendments to a number of HKFRSs
* Included in Improvements to HKFRSs 2009 (as issued in May 2009).
The principal effects of adopting these new and revised HKFRSs are as follows:
(a) Amendments to HKFRS 1 First-time Adoption of HKFRSs and HKAS 27 Consolidated and Separate
Financial Statements — Cost of an Investment in a Subsidiary, Jointly Controlled Entity or Associate
The HKAS 27 Amendment requires all dividends from subsidiaries, associates or jointly-controlled
entities to be recognised in the statement of comprehensive income in the parent’s separate financial
statements. The distinction between pre and post acquisition profits is no longer required. However,
the payment of such dividends requires the Company to consider whether there is an indicator of
impairment. The amendment is applied prospectively, the amendments have had no impact on the
financial position or results of operations of the Group.
(b) Amendments to HKFRS 2 Share-based Payment — Vesting Conditions and Cancellations
The HKFRS 2 Amendments clarify that vesting conditions are service conditions and performance
conditions only. Any other conditions are non-vesting conditions. Where an award does not vest as a
result of a failure to meet a non-vesting condition that is within the control of either the entity or the
counterparty, this is accounted for as a cancellation. As the Group has not entered into share-based
payment schemes with non-vesting conditions attached, the amendments have had no impact on the
financial position or results of operations of the Group.
(c) Amendments to HKFRS 7 Financial Instruments: Disclosures — Improving Disclosures about Financial
Instruments
The HKFRS 7 Amendments require additional disclosures about fair value measurement and liquidity
risk. Fair value measurements related to items recorded at fair value are to be disclosed by sources of
inputs using a three-level fair value hierarchy, by class, for all financial instruments recognised at fair
value. In addition, a reconciliation between the beginning and ending balances is now required for
level 3 fair value measurements, as well as significant transfers between levels in the fair value
hierarchy. The amendments also clarify the requirements for liquidity risk disclosures with respect to
derivative transactions and assets used for liquidity management. During the year ended 31 December
2009, there were no transfer of fair value measurements between Level 1 and Level 2 and no transfer
into or out of Level 3.
(d) HKFRS 8 Operating Segments
HKFRS 8, which replaces HKAS 14 Segment Reporting, specifies how an entity should report
information about its operating segments, based on information about the components of the entity
that is available to the chief operating decision maker for the purposes of allocating resources to the
segments and assessing their performance. The standard also requires the disclosure of information
about the products and services provided by the segments, the geographical areas in which the Group
operates, and revenue from the Group’s major customers. The Group concluded that the operating
segments determined in accordance with HKFRS 8 are the same as the business segments previously
identified under HKAS 14. These revised disclosures, including the related revised comparative
information, are shown in note 4 to the financial statements.
(e) HKAS 1 (Revised) Presentation of Financial Statements
HKAS 1 (Revised) introduces changes in the presentation and disclosures of financial statements. The
revised standard separates owner and non-owner changes in equity. The statement of changes in equity
includes only details of transactions with owners, with all non-owner changes in equity presented as a
single line. In addition, this standard introduces the statement of comprehensive income, with all items
– 62 –

of income and expense recognised in profit or loss, together with all other items of recognised income
and expense recognised directly in equity, either in one single statement, or in two linked statements.
The Group has elected to present one single statement.
(f) Amendment to Appendix to HKAS 18 Revenue — Determining whether an entity is acting as a principal
or as an agent
Guidance has been added to the appendix (which accompanies the standard) to determine whether the
Group is acting as a principal or as an agent. The features to consider are whether the Group (i) has
the primary responsibility for providing the goods or services, (ii) has inventory risk, (iii) has the
discretion to establish prices and (iv) bears credit risk. The Group has assessed its revenue
arrangements against these criteria and concluded that it is acting as a principal in all arrangements.
The amendment has had no impact on the financial position or results of operations of the Group.
(g) HKAS 23 (Revised) Borrowing Costs
HKAS 23 has been revised to require capitalisation of borrowing costs when such costs are directly
attributable to the acquisition, construction or production of a qualifying asset. As the Group’s
current policy for borrowing costs aligns with the requirements of the revised standard, the revised
standard has had no impact on the financial position or results of operations of the Group.
(h) Amendments to HKAS 32 Financial Instruments: Presentation and HKAS 1 Presentation of Financial
Statements — Puttable Financial Instruments and Obligations Arising on Liquidation
The HKAS 32 Amendments provide a limited scope exception for puttable financial instruments and
instruments that impose specified obligations arising on liquidation to be classified as equity if they
fulfil a number of specified features. The HKAS 1 Amendments require disclosure of certain
information relating to these puttable financial instruments and obligations classified as equity. As the
Group currently has no such financial instruments or obligations, the amendments have had no impact
on the financial position or results of operations of the Group.
(i) Amendments to HK(IFRIC) — Int 9 Reassessment of Embedded Derivatives and HKAS 39 Financial
Instruments: Recognition and Measurement — Embedded Derivatives
The amendment to HK(IFRIC) — Int 9 requires an entity to assess whether an embedded derivative
must be separated from a host contract when the entity reclassifies a hybrid financial asset out of the
fair value through profit or loss category. This assessment is to be made based on circumstances that
existed on the later of the date the entity first became a party to the contract and the date of any
contract amendments that significantly change the cash flows of the contract. HKAS 39 has been
revised to state that if an embedded derivative cannot be separately measured, the entire hybrid
instrument must remain classified as fair value through profit or loss in its entirety. The adoption of
the amendments has had no impact on the financial position or results of operations of the Group.
(j) HK(IFRIC) — Int 13 Customer Loyalty Programmes
HK(IFRIC) — Int 13 requires customer loyalty award credits to be accounted for as a separate
component of the sales transaction in which they are granted. The consideration received in the sales
transaction is allocated between the loyalty award credits and the other components of the sale. The
amount allocated to the loyalty award credits is determined by reference to their fair value and is
deferred until the awards are redeemed or the liability is otherwise extinguished. As the Group
currently has no customer loyalty award scheme, the interpretation has had no impact on the financial
position or results of operations of the Group.
(k) HK(IFRIC) — Int 15 Agreements for the Construction of Real Estate
HK(IFRIC) — Int 15 replaces HK Interpretation 3 Revenue — Pre-completion Contracts for the Sale
of Development Properties. It clarifies when and how an agreement for the construction of real estate
should be accounted for as a construction contract in accordance with HKAS 11 Construction
Contracts or an agreement for the sale of goods or services in accordance with HKAS 18 Revenue. The
– 63 –

interpretation has had no impact on the accounting for the Group’s construction activities. As the
Group currently is not involved in any construction of real estate, the interpretation has had no impact
on the financial position or results of operations of the Group.
(l) HK(IFRIC) — Int 16 Hedges of a Net Investment in a Foreign Operation
HK(IFRIC) — Int 16 provides guidance on the accounting for a hedge of a net investment in a foreign
operation. This includes clarification that (i) hedge accounting may be applied only to the foreign
exchange differences arising between the functional currencies of the foreign operation and the parent
entity; (ii) a hedging instrument may be held by any entities within a group; and (iii) on disposal of a
foreign operation, the cumulative gain or loss relating to both the net investment and the hedging
instrument that was determined to be an effective hedge should be reclassified to profit or loss as a
reclassification adjustment. As the Group currently has no hedge of a net investment in a foreign
operation, the interpretation has had no impact on the financial position or results of operations of the
Group.
(m) HK(IFRIC) — Int 18 Transfers of Assets from Customers (adopted from 1 July 2009)
HK(IFRIC) — Int 18 provides guidance on accounting by recipients that receive from customers items
of property, plant and equipment or cash for the acquisition or construction of such items, provided
that these assets must then be used to connect customers to networks or to provide ongoing access to a
supply of goods or services, or both. As the Group currently has no such transactions, the
interpretation has had no impact on the financial position or results of operations of the Group.
(n) In October 2008, the HKICPA issued its first Improvements to HKFRSs which sets out amendments
to a number of HKFRSs. Except for the amendments to HKFRS 5 Non-current Assets Held for Sale
and Discontinued Operations — Plan to sell the controlling interest in a subsidiary which are effective
for annual periods beginning on or after 1 July 2009, the Group adopted all the amendments from 1
January 2009. While the adoption of some of the amendments results in changes in accounting policies,
none of these amendments has had a significant financial impact on the Group. Details of the key
amendments most applicable to the Group are as follows:
. HKFRS 7 Financial Instruments: Disclosures: Removes the reference to ‘‘total interest income’’
as a component of finance costs.
. HKAS 1 Presentation of Financial Statements: Clarifies that assets and liabilities which are
classified as held for trading in accordance with HKAS 39 are not automatically classified as
current in the statement of financial position.
. HKAS 16 Property, Plant and Equipment: Replaces the term ‘‘net selling price’’ with ‘‘fair value
less costs to sell’’ and the recoverable amount of property, plant and equipment is the higher of an
asset’s fair value less costs to sell and its value in use.
In addition, items of property, plant and equipment held for rental that are routinely sold in the
ordinary course of business after rental are transferred to inventories when rental ceases and they
are held for sale.
. HKAS 20 Accounting for Government Grants and Disclosure of Government Assistance:
Requires government loans granted in the future with no or at a below-market rate of interest to
be recognised and measured in accordance with HKAS 39 and the benefit of the reduced interest
to be accounted for as a government grant.
. HKAS 36 Impairment of Assets: When discounted cash flows are used to estimate ‘‘fair value less
costs to sell’’, additional disclosures (e.g., discount rate and growth rate used) are required which
are consistent with the disclosures required when the discounted cash flows are used to estimate
‘‘value in use’’.
. HKAS 38 Intangible Assets: Expenditure on advertising and promotional activities is recognised
as an expense when the Group either has the right to access the goods or has received the service.
– 64 –

The reference to there being rarely, if ever, persuasive evidence to support an amortisation
method for intangible assets other than the straight-line method has been removed. The Group
has reassessed the useful lives of its intangible assets and concluded that the straight-line method
is still appropriate.
3 ISSUED BUT NOT YET EFFECTIVE HONG KONG FINANCIAL REPORTING STANDARDS
The Group has not applied the following new and revised HKFRSs, that have been issued but are not yet
effective, in these financial statements.
HKFRS 1 (Revised) First-time Adoption of Hong Kong Financial Reporting
Standards1
HKFRS 1 Amendments Amendments to HKFRS 1 First-time Adoption of
Hong Kong Financial Reporting Standards —
Additional Exemptions for First-time Adopters2
HKFRS 1 Amendments Limited Exception from Comparative HKFRS 7
Disclosures for First-time Adopters4
HKFRS 2 Amendments Amendments to HKFRS 2 Share-based Payment —
Group Cash-settled Share-based Payment Transactions2
HKFRS 3 (Revised) Business Combinations1
HKFRS 9 Financial Instruments6
HKAS 24 (Revised) Related Party Disclosures5
HKAS 27 (Revised) Consolidated and Separate Financial Statements1
HKAS 32 Amendment Amendment to HKAS 32 Financial Instruments:
Presentation — Classification of Rights Issues3
HKAS 39 Amendment Amendment to HKAS 39 Financial Instruments:
Recognition and Measurement — Eligible Hedged
Items1
HK(IFRIC) — Int 14 Amendments Prepayments of a Minimum Funding Requirement5
HK(IFRIC) — Int 17 Distributions of Non-cash Assets to Owners1
HK(IFRIC) — Int 19 Extinguishing Financial Liabilities with Equity
Instruments4
HKFRS 5 included in Improvements to
HKFRSs issued in October 2008
Amendments to HKFRS 5 Non-current Assets Held for
Sale and Discontinued Operations — Plan to sell the
controlling interest in a subsidiary1
HK Interpretation 4
(Revised in December 2009)
Leases — Determination of the Length of Lease Term in
respect of Hong Kong Land Leases2
Apart from the above, the HKICPA has issued Improvements to HKFRSs 2009 which sets out amendments
to a number of HKFRSs primarily with a view to removing inconsistencies and clarifying wording. The
amendments to HKFRS 2, HKAS 38, HK(IFRIC) — Int 9 and HK(IFRIC) — Int 16 are effective for
annual periods beginning on or after 1 July 2009 while the amendments to HKFRS 5, HKFRS 8, HKAS 1,
HKAS 7, HKAS 17, HKAS 36 and HKAS 39 are effective for annual periods beginning on or after 1
January 2010 although there are separate transitional provisions for each standard or interpretation.
1 Effective for annual periods beginning on or after 1 July 2009
2 Effective for annual periods beginning on or after 1 January 2010
3 Effective for annual periods beginning on or after 1 February 2010
4 Effective for annual periods beginning on or after 1 July 2010
5 Effective for annual periods beginning on or after 1 January 2011
6 Effective for annual periods beginning on or after 1 January 2013
– 65 –

HKFRS 1 (Revised) was issued with an aim to improve the structure of the standard. The revised version of
the standard does not make any changes to the substance of accounting by first-time adopters. As the
Group is not a first-time adopter of HKFRSs, the amendments will not have any financial impact on the
Group.
The HKFRS 1 Amendments provide relief from the full retrospective application of HKFRSs for the
measurement of oil and gas assets and leases. As a result of extending the options for determining deemed
cost to oil and gas assets, the existing exemption relating to decommissioning liabilities has also been
revised. As the Group is not a first-time adopter of HKFRSs, the amendments will not have any financial
impact on the Group.
HKFRS 1 has been amended to allow first-time adopters to utilise the transitional provisions in HKFRS 7
as they relate to the March 2009 amendments. In addition, the transitional provisions in IFRS 7 are
amended to clarify that the disclosures required by the March 2009 amendments need not be provided for:
1) Annual or interim periods, including any statement of financial position, presented within an annual
comparative period ending before 31 December 2009. 2) Any statement of financial position as at the
beginning of the earliest comparative period as at a date before 31 December 2009. As the Group is not a
first-time adopter of HKFRSs, the amendments are not applicable to the Group.
The HKFRS 2 Amendments provide guidance on how to account for cash-settled share-based payment
transactions in the separate financial statements of the entity receiving the goods and services when the
entity has no obligation to settle the share-based payment transactions. The amendments also incorporate
guidance that was previously included in HK(IFRIC) — Int 8 Scope of HKFRS 2 and HK(IFRIC) — Int 11
HKFRS 2 — Group and Treasury Share Transactions. The Group expects to adopt the HKFRS 2
Amendments from 1 January 2010.
HKFRS 3 (Revised) introduces a number of changes in the accounting for business combinations that will
impact the amount of goodwill recognised, the reported results in the period that an acquisition occurs, and
future reported results.
HKAS 27 (Revised) requires that a change in the ownership interest of a subsidiary without loss of control
is accounted for as an equity transaction. Therefore, such a change will have no impact on goodwill, nor will
it give rise to a gain or loss. Furthermore, the revised standard changes the accounting for losses incurred by
the subsidiary as well as the loss of control of a subsidiary. Other consequential amendments were made to
HKAS 7 Statement of Cash Flows, HKAS 12 Income Taxes, HKAS 21 The Effects of Changes in Foreign
Exchange Rates, HKAS 28 Investments in Associates and HKAS 31 Interests in Joint Ventures.
The Group expects to adopt HKFRS 3 (Revised) and HKAS 27 (Revised) from 1 January 2010. The changes
introduced by these revised standards must be applied prospectively and will affect the accounting of future
acquisitions, loss of control and transactions with minority interests.
HKFRS 9 issued in November 2009 is the first part of phase 1 of a comprehensive project to entirely replace
HKAS 39 Financial Instruments: Recognition and Measurement. This phase focuses on the classification
and measurement of financial assets. Instead of classifying financial assets into four categories, an entity
shall classify financial assets as subsequently measured at either amortised cost or fair value, on the basis of
both the entity’s business model for managing the financial assets and the contractual cash flow
characteristics of the financial assets. This aims to improve and simplify the approach for the classification
and measurement of financial assets compared with the requirements of HKAS 39.
HKAS 39 is aimed to be replaced by HKFRS 9 in its entirety by the end of 2010. The Group expects to
adopt HKFRS 9 from 1 January 2013.
HKAS 24 (Revised) clarifies and simplifies the definition of related parties. It also provides for a partial
exemption of related party disclosure to government-related entities for transactions with the same
government or entities that are controlled, jointly controlled or significantly influenced by the same
government. The Group expects to adopt HKAS 24 (Revised) from 1 January 2011 and the comparative
related party disclosures will be amended accordingly.
– 66 –

The HKAS 32 Amendment revises the definition of financial liabilities such that rights, options or warrants
issued to acquire a fixed number of the entity’s own equity instruments for a fixed amount of any currency
are equity instruments, provided that the entity offers the rights, options or warrants pro rata to all of its
existing owners of the same class of its own non-derivative equity instruments. The Group expects to adopt
the HKAS 32 Amendment from 1 January 2011. The amendment will not have any material financial impact
on the Group.
The HKAS 39 Amendment addresses the designation of a one-sided risk in a hedged item, and the
designation of inflation as a hedged risk or portion in particular situations. It clarifies that an entity is
permitted to designate a portion of the fair value changes or cash flow variability of a financial instrument
as a hedged item. As the Group has not entered into any such hedges, the amendment is unlikely to have any
financial impact on the Group.
The HK(IFRIC) — Int 14 Amendments remove an unintended consequence arising from the treatment of
prepayments of future contributions in certain circumstances when there is a minimum funding
requirement. The amendments require an entity to treat the benefit of an early payment as a pension
asset. The economic benefit available as a reduction in future contributions is thus equal to the sum of (i)
the prepayment for future services and (ii) the estimated future services costs less the estimated minimum
funding requirement contributions that would be required as if there were no prepayments. The Group
expects to adopt the HK(IFRIC) — Int 14 Amendments from 1 January 2011. The amendments will not
have any material financial impact on the Group.
HK(IFRIC) — Int 17 standardises practice in the accounting for non-reciprocal distributions of non-cash
assets to owners. The Group expects to apply the interpretation from 1 January 2010 prospectively. The
interpretation clarifies that (i) a dividend payable should be recognised when the dividend is appropriately
authorised and is no longer at the discretion of the entity; (ii) an entity should measure the dividend payable
at the fair value of the net assets to be distributed; and (iii) an entity should recognise the difference between
the dividend paid and the carrying amount of the net assets distributed in profit or loss. Other consequential
amendments were made to HKAS 10 Events after the Reporting Period and HKFRS 5 Non-current Assets
Held for Sale and Discontinued Operations. While the adoption of the interpretation may result in changes
in certain accounting policies, the interpretation is unlikely to have any material financial impact on the
Group.
HK(IFRIC) — Int 19 addresses the accounting by an entity when the terms of a financial liability are
renegotiated and result in the entity issuing equity instruments to a creditor of the entity to extinguish all or
part of the financial liability. The Group expects to adopt the interpretation from 1 January 2011. The
interpretation clarifies that equity instruments issued to a creditor to extinguish a financial liability are
consideration paid in accordance with HKAS 39 Financial Instruments: Recognition and Measurement and
the difference between the carrying amount of the financial liability extinguished, and the consideration
paid, shall be recognised in profit or loss. The consideration paid should be measured based on the fair
value of the equity instrument issued or, if the fair value of the equity instrument cannot be reliably
measured, the fair value of the financial liability extinguished. As the Group has not undertaken such
transactions, the interpretation is unlikely to have any material financial impact on the Group.
The amendments to HKFRS 5 clarify that all assets and liabilities of a subsidiary shall be classified as held
for sale if an entity has a sale plan involving loss of control of the subsidiary, regardless of whether the
entity will retain a non-controlling interest. The Group expects to adopt the amendments from 1 January
2010. The changes must be applied prospectively and will affect future sale transactions or plans involving
loss of control of a subsidiary.
– 67 –

Improvements to HKFRSs 2009 issued in May 2009 sets out amendments to a number of HKFRSs. Except
for the amendment to HKAS 18, the Group expects to adopt the amendments from 1 January 2010. There
are separate transitional provisions for each standard. While the adoption of some of the amendments may
result in changes in accounting policies, none of these amendments are expected to have a significant
financial impact on the Group. Those amendments that are expected to have a significant impact on the
Group are as follows:
(a) HKFRS 2 Share-based Payment: Clarifies that a contribution of a business on the formation of a joint
venture and combination of entities or businesses under common control is not within the scope of
HKFRS 2 even though it is outside the scope of HKFRS 3.
(b) HKFRS 5 Non-current Assets Held for Sale and Discontinued Operations: Clarifies that (i) the
disclosures required in respect of non-current assets classified as held for sale or a discontinued
operation are those set out in HKFRS 5; (ii) the general requirements of HKAS 1 still apply (e.g.,
source of estimation uncertainty); and (iii) the disclosures in other HKFRSs are not required unless:
(i) those HKFRSs specifically require disclosures in respect of non-current assets classified as held
for sale or discontinued operations; or
(ii) the disclosures relate to the measurement of assets or liabilities within a disposal group that are
outside the scope of measurement requirements of HKFRS 5 and disclosures are not disclosed
elsewhere in the financial statements.
(c) HKFRS 8 Operating Segments: Clarifies that segment assets and liabilities need only to be reported
when those assets and liabilities are included in measures that are used by the chief operating decision
maker.
(d) HKAS 1 Presentation of Financial Statements: States that the terms of a liability that could result, at
anytime, in its settlement by the issuance of equity instruments at the option of the counterparty do
not affect its classification.
(e) HKAS 7 Statement of Cash Flows: Requires that only expenditures that result in a recognised asset in
the statement of financial position can be classified as a cash flow from investing activities.
(f) HKAS 17 Leases: Removes the specific guidance on classifying land as a lease. As a result, leases of
land should be classified as either operating or finance leases in accordance with the general guidance
in HKAS 17.
HK Interpretation 4 Leases — Determination of the Length of Lease Term in respect of Hong Kong
Land Leases is revised as a consequence of the amendment to HKAS 17 Leases included in
Improvements to HKFRSs 2009. Following this amendment, the scope of HK Interpretation 4 has
been expanded to cover all land leases, including those classified as finance leases. As a result, this
Interpretation is applicable to all leases of property accounted for in accordance with HKAS 16,
HKAS 17 and HKAS 40.
(g) HKAS 36 Impairment of Assets: Clarifies that the largest unit permitted for allocating goodwill
acquired in a business combination is the operating segment as defined in HKFRS 8 Operating
Segments before aggregation for financial reporting purposes.
(h) HKAS 38 Intangible Assets: Clarifies that (i) if an intangible asset acquired in a business combination
is identifiable only with another intangible asset, the acquirer may recognise the group of assets as a
single asset provided that the individual assets have similar useful lives; and (ii) the valuation
techniques presented for determining the fair value of intangible assets acquired in a business
combination that are not traded in active markets are only examples and are not restrictive on the
methods that can be used.
– 68 –

(i) HKAS 39 Financial Instruments: Recognition and Measurement: Clarifies that (i) a prepayment
option is considered closely related to the host contract when the exercise price of a prepayment option
reimburses the lender up to the approximate present value of lost interest for the remaining term of the
host contract; (ii) the scope exemption for contracts between an acquirer and a vendor in a business
combination to buy or sell an acquiree at a future date, applies only to binding forward contracts, and
not derivative contracts where further actions by either party are still to be taken; and (iii) gains or
losses on cash flow hedges of a forecast transaction that subsequently results in the recognition of a
financial instrument or on cash flow hedges of recognised financial instruments should be reclassified
in the period that the hedged forecast cash flows affect profit or loss.
(j) HK(IFRIC) — Int 9 Reassessment of Embedded Derivatives: Clarifies that it does not apply to
possible reassessment, at the date of acquisition, to embedded derivatives in contracts acquired in a
combination between entities or businesses under common control or the formation of a joint venture.
(k) HK(IFRIC) — Int 16 Hedges of a Net Investment in a Foreign Operation: Removes the restriction of
where the hedging instrument may be held in a hedge of a net investment in a foreign operation,
qualifying hedging instruments may be held by any entity or entities within the Group, including the
foreign operation itself, as long as the designation, documentation and effectiveness requirements of
HKAS 39 that relate to a net investment hedge are satisfied.
– 69 –

4. SEGMENT INFORMATION
(1) Business segments
The following tables present revenue, profit and certain asset, liability and expenditure information for
the Group’s business segments for the years ended 31 December 2009 and 2008.
Year ended 31 December 2009
Networks Terminals
Telecommunications
software systems,
services and other
products Total
RMB’000 RMB’000 RMB’000 RMB’000
Segment revenue:
Telecommunications system
contracts 39,982,316 — 4,314,626 44,296,942
Sale of goods and services — 13,071,519 2,904,102 15,975,621
39,982,316 13,071,519 7,218,728 60,272,563
Segment results 8,814,294 1,738,784 1,358,831 11,911,909
Bank and other interest income 110,715
Dividend income and unallocated
gains 1,612,783
Other unallocated expenses (9,584,923)
Finance costs (751,744)
Share of profits and losses of
associates 26,002
Profit before tax 3,324,742
Segment assets 31,782,376 5,513,601 5,738,245 43,034,222
Investments in associates 438,027
Investments in a jointly-controlled
entity 2,255
Other unallocated assets 25,990,360
Total Assets 69,464,864
Segment liabilities 8,630,920 506,969 1,558,295 10,696,184
Unallocated liabilities 40,819,814
Total liabilities 51,515,998
Other segment information:
Impairment losses recognised
in profit or loss 489,518 160,040 88,382 737,940
Depreciation and amortisation 632,195 206,685 114,141 953,021
Capital expenditure 1,650,277 539,529 297,954 2,487,760
– 70 –

Year ended 31 December 2008
Networks Terminals
Telecommunications
software systems,
services and other
products Total
RMB’000 RMB’000 RMB’000 RMB’000
Segment revenue
Telecommunications system
contracts 28,963,799 — 3,127,846 32,091,645
Sale of goods and services — 9,692,563 2,509,219 12,201,782
28,963,799 9,692,563 5,637,065 44,293,427
Segment results 6,888,262 1,087,853 1,004,874 8,980,989
Bank and other interest income 112,786
Dividend income and unallocated
gains 1,182,929
Other unallocated expenses (7,343,864)
Finance costs (690,174)
Share of profits and losses of
associates 19,877
Profit before tax 2,262,543
Segment assets 22,811,960 5,011,544 4,432,469 32,255,973
Investments in associates 166,178
Investments in a jointly-controlled
entity 2,255
Other unallocated assets 19,804,424
Total assets 52,228,830
Segment liabilities 3,399,777 149,854 808,813 4,358,444
Unallocated liabilities 32,686,839
Total liabilities 37,045,283
Other segment information:
Impairment losses recognised in
profit or loss 274,221 91,767 53,370 419,358
Depreciation and amortisation 491,251 114,127 97,247 702,625
Capital expenditure 1,353,308 314,210 267,601 1,935,119
– 71 –

(2) Geographical information
(a) Revenue from external customers
2009 2008
RMB’000 RMB’000
The PRC (place of domicile) 30,404,275 17,466,429
Asia (excluding the PRC) 13,198,605 10,432,933
Africa 6,860,602 9,311,123
Other countries 9,809,081 7,082,942
60,272,563 44,293,427
The revenue information above is based on the location of the customers.
(b) Non-current assets
2009 2008
RMB’000 RMB’000
The PRC(place of domicile) 5,352,373 4,274,923
Asia (excluding the PRC) 633,843 513,702
Africa 1,436,800 1,192,552
Other countries 15,726 12,701
7,438,742 5,993,878
5. REVENUE
2009 2008
RMB’000 RMB’000
Revenue
Telecommunications system contracts 44,296,942 32,091,645
Sale of goods 13,073,619 10,425,761
Sale of services 2,902,002 1,776,021
60,272,563 44,293,427
– 72 –

6. PROFIT BEFORE TAX
The Group’s profit before tax is arrived at after charging/(crediting):
2009 2008
RMB’000 RMB’000
Cost of goods and services 38,285,841 25,305,556
Depreciation 771,671 587,640
Amortisation of intangible assets other than
deferred development costs 42,422 53,584
Research and development costs:
Deferred development costs amortised** 100,418 61,401
Current year expenditure 5,781,583 3,994,145
Less: Government grants released (167,034) (131,037)
5,714,967 3,924,509
Loss on financial derivative instruments 10,162 128,328
Impairment of trade receivables* 456,105 472,954
Provision for warranties** 72,896 135,045
Write-down/(reversal) of inventories to net realisable value** 281,835 (53,596)
Minimum lease payments under operating leases on land and buildings 359,287 325,356
Contingent rent receivable in respect of an operating lease (43,587) (27,569)
Auditors’ remuneration 6,741 6,933
Staff costs (including directors’ and supervisors’
remuneration in note 8):
Wages, salaries, bonuses, allowances and welfare 8,202,158 5,521,487
Equity-settled share expense 299,594 299,551
Retirement benefit scheme contributions:
Defined benefit pension scheme 2,788 2,356
Defined contribution pension scheme 404,608 380,136
8,909,148 6,203,530
Foreign exchange differences, net* — 495,710
Loss on disposal of items of property, plant and equipment* 26,692 36,918
Loss on disposal of subsidiaries* 6,069 —
Loss on retirement and disposal of intangible assets* 52 236
* The impairment of trade receivables, foreign exchange differences, loss on disposal of items of
property, plant and equipment, loss on disposal of subsidiaries and loss on retirement and disposal of
intangible assets are included in ‘‘Other expenses’’ on the face of the consolidated statement of
comprehensive income.
** The provision for warranties, amortisation of deferred development costs and write-down/(reversal of
write-down) of inventories to net realisable value are included in ‘‘Cost of sales’’ on the face of the
consolidated statement of comprehensive income.
– 73 –

7. FINANCE COSTS
An analysis of finance costs is as follows:
Group
2009 2008
RMB’000 RMB’000
Interest on bank loans wholly repayable within five years 255,710 308,578
Interest on bonds cum warrants 150,029 133,418
Interest expense on financial liabilities not at fair values through profit
or loss 405,739 441,996
Other finance costs:
Finance costs on trade receivables and bills discounted 346,005 248,178
751,744 690,174
8. TAX
2009 2008
RMB’000 RMB’000
Group:
Current — Hong Kong 4,689 698
Current — Mainland China 611,029 317,723
Current — Overseas 258,111 131,683
Deferred (note 36) (244,748) (99,496)
Total tax charge for the year 629,081 350,608
Hong Kong profits tax has been provided at the rate of 16.5% (2008 : 16.5%) on the estimated assessable
profits arising in Hong Kong during the year. Taxes on profits assessable elsewhere have been calculated at
the rates of tax prevailing in the jurisdictions in which the Group operates, based on existing legislation,
interpretations and practices in respect thereof.
Under the new enterprise income tax law of the PRC effective from 1 January 2008, the tax rate applicable
to domestic-invested enterprises and foreign-invested enterprises has been standardised at 25%. As a
national-grade hi-tech enterprise in Shenzhen, the Company enjoys an enterprise income tax rate of 15% for
the years from 2008 to 2010.
9. DIVIDENDS
2009 2008
RMB’000 RMB’000
Proposed dividends — RMB0.3 (2008 : RMB0.3) per ordinary share 552,425 402,999
Please refer to Note 13(d) for details of the proposed final dividend for the year. The profit distribution
proposal is subject to the approval of the Company’s shareholders at the forthcoming annual general
meeting.
10. EARNINGS PER SHARE
Basic earnings per share amount is computed by dividing the net profit for the year attributable to ordinary
equity holders of the parent by the weighted average number of ordinary shares of 1,752,691,606 (2008 :
1,746,329,402) in issue, as adjusted to reflect the capitalisation issue during the year.
– 74 –

The calculation of diluted earnings per share amounts is based on the profit for the year attributable to
ordinary equity holders of the parent. The weighted average number of ordinary shares used in the
calculation is the number of ordinary shares in issue during the year, as used in the basic earnings per share
calculation, and the weighted average number of ordinary shares assumed to have been issued at no
consideration on the deemed exercise of all dilutive potential ordinary shares into ordinary shares.
Calculations of basic and diluted earnings per share are as follows:
2009 2008
RMB’000 RMB’000
Earnings
Net profit for the year attributable to ordinary equity holders
of the Company 2,458,121 1,660,199
Number of shares
2009 2008
’000 ’000
Shares
Weighted average number of ordinary shares in issue during the year
as used in the basic earnings per share calculation# 1,752,692 1,746,329*
Shares subject to lock-up under the Share Incentive Scheme# 69,738 46,754*
Warrants attached to bonds## — —
Adjusted weighted average number of ordinary shares in issue 1,822,430 1,793,083*
# In July 2009, all of the 85,006,813 Subject Shares under the Share Incentive Scheme of the Company
were registered as share capital on a one-off basis, whereby the total share capital was increased from
1,746,329,402 shares to 1,831,336,215 shares. Among the total subject shares, 69,737,523 shares are
subject to lock-up under the share incentive scheme and they are excluded from the calculation of basic
earnings per shares.
## The average market price of the ordinary shares during the year is less than the exercise price of the
warrants, therefore, they are not considered in the calculation of diluted earnings per share for the
years ended 31 December 2009 and 2008.
* The number of ordinary shares in issue during 2008 had been adjusted to take into account the bonus
issue during the year ended 31 December 2009.
– 75 –

11. TRADE AND BILLS RECEIVABLES/LONG-TERM TRADE RECEIVABLES
Group Company
2009 2008 2009 2008
RMB’000 RMB’000 RMB’000 RMB’000
Trade and bills receivables 18,337,023 13,865,230 22,025,346 16,630,122
Impairment (1,854,947) (1,702,254) (1,459,189) (1,370,103)
16,482,076 12,162,976 20,566,157 15,260,019
Current portion (16,098,327) (11,550,968) (20,229,505) (14,700,000)
Long-term portion 383,749 612,008 336,652 560,019
Progress payment for telecommunications system contracts is normally made in accordance with the agreed
payment schedule. The Group’s trading terms with its major customers are mainly on credit, except for new
customers, where payment in advance is normally required. The credit period is generally 90 days and is
extendable up to one year depending on customers’ credit worthiness except for certain oversea customers.
The credit terms for major customers are reviewed regularly by senior management. The Group seeks to
maintain strict control over its outstanding receivables and has a credit control department to minimise
credit risk. Overdue balances are reviewed regularly by senior management. In view of the aforementioned,
there is no significant concentration of credit risk.
An aged analysis of the trade and bills receivables as at the balance sheet date, based on the invoice date and
net of provision, is as follows:
Group Company
2009 2008 2009 2008
RMB’000 RMB’000 RMB’000 RMB’000
Within 6 months 13,957,684 10,216,760 12,805,496 10,686,644
7 to 12 months 2,096,148 1,495,092 3,103,233 2,323,405
1 to 2 years 413,242 444,240 2,995,713 1,460,119
2 to 3 years 15,002 6,884 968,709 549,041
Over 3 years — — 693,006 240,810
16,482,076 12,162,976 20,566,157 15,260,019
Current portion of trade and
bills receivables (16,098,327) (11,550,968) (20,229,505) (14,700,000)
Long-term portion 383,749 612,008 336,652 560,019
– 76 –

The movements in the provision for impairment of trade and bills receivables are as follows:
Group Company
2009 2008 2009 2008
RMB’000 RMB’000 RMB’000 RMB’000
At 1 January 1,702,254 1,236,853 1,370,103 1,069,236
Impairment losses recognised (note 6) 519,459 478,818 395,054 315,829
Amount write off as uncollectible (303,412) (7,553) (242,851) (14,962)
Impairment losses reversed (note 6) (63,354) (5,864) (63,117) —
At 31 December 1,854,947 1,702,254 1,459,189 1,370,103
Included in the above provision for impairment of trade and bills receivables is a provision for individually
impaired trade receivables of RMB582,272,000 (2008 : RMB808,889,000) with a carrying amount before
provision of RMB582,272,000 (2008 : RMB879,925,000). The individually impaired trade receivables relate
to customers that were in financial difficulties and are not expected to be recovered. The Group does not
hold any collateral or other credit enhancements over these balances.
An aged analysis of the trade and bills receivables that are not considered to be impaired is as follows:
Group Company
2009 2008 2009 2008
RMB’000 RMB’000 RMB’000 RMB’000
Neither past due nor impaired 4,583,346 4,816,412 3,938,943 5,114,829
Less than one year past due 10,823,345 5,866,359 11,541,159 6,864,336
15,406,691 10,682,771 15,480,102 11,979,165
Receivables that were neither past due nor impaired relate to a large number of diversified customers for
whom there was no recent history of default.
Receivables that were past due but not impaired relate to a number of independent customers that have a
good track record with the Group. Based on past experience, the directors of the Company are of the
opinion that no provision for impairment is necessary in respect of these balances as there has not been a
significant change in credit quality and the balances are still considered fully recoverable. The Group does
not hold any collateral or other credit enhancements over these balances.
The balances due from subsidiaries, the controlling shareholder, associates and related companies included
in the above are as follows:
Group Company
2009 2008 2009 2008
RMB’000 RMB’000 RMB’000 RMB’000
Subsidiaries — — 8,515,630 6,183,968
The controlling shareholder — 943 — —
Associates 12,459 19,414 11,609 19,354
Related companies — 54 889 5,488
12,459 20,411 8,528,128 6,208,810
The balances are unsecured, interest-free, and on credit terms similar to those offered to the major
customers of the Group.
– 77 –

12. TRADE AND BILLS PAYABLES
An aged analysis of the trade and bills payables as at the balance sheet date, based on the invoice date, is as
follows:
Group Company
2009 2008 2009 2008
RMB’000 RMB’000 RMB’000 RMB’000
Within 6 months 21,161,940 15,682,255 27,278,626 19,435,358
7 to 12 months 41,328 76,570 3,123 20,361
1 to 2 years 276,089 22,529 529 545
2 to 3 years 24,525 8,062 288 620
Over 3 years 27,783 24,589 25,140 27,409
21,531,665 15,814,005 27,307,706 19,484,293
The balances due to subsidiaries, the controlling shareholder, related companies and associates included in
the above are as follows:
Group Company
2009 2008 2009 2008
RMB’000 RMB’000 RMB’000 RMB’000
Subsidiaries — — 17,585,804 12,503,470
The controlling shareholder 85,566 129,468 — —
Related companies 54,601 87,226 152 152
Associates 75,796 43,785 — —
215,963 260,479 17,585,956 12,503,622
The balances are unsecured, interest-free and are repayable on demand.
The trade payables are non-interest-bearing and are normally settled on 90-day terms.
– 78 –

13. POST BALANCE SHEET EVENTS
(a) On 21 January 2010, an aggregate of 58,294,800 H shares were allotted and issued by the Company at
the placing price of HK$45.0 per share to no less than six placees, who and whose ultimate beneficial
owners are independent third parties. The net proceeds raised from the placing amounted to
approximately HK$2,596 million. Following the completion of the placing, the total number of issued
shares of the Company has increased from 1,831,336,215 to 1,889,631,015, while the total number of H
shares held by the public has increased from 291,474,892 to 349,769,692.
(b) The exercise period of warrants attached to bonds of the Company has expired. As at the close of
trading on 12 February 2010, a total of 23,348,590 warrants had been exercised, accounting for
35.81% of the total number of warrants prior to the current exercise. A total of 41,851,410 warrants
had not been exercised and had lapsed. Following the exercise of the warrants, the Company’s total
number of issued share capital has increased from 1,889,631,015 prior to the exercise to 1,911,154,456
after the exercise.
(c) The application for initial public offering by Nationz Technologies, an associate of the Company, was
approved by the GEM Board Issue Approval Committee under the China Securities Regulatory
Commission (‘‘CSRC’’) at the 13th working meeting of 2010 of the Committee on 26 March 2010.
As at 31 December 2009, the Company owned 21.76 million shares of Nationz Technologies,
representing 26.67% equity interest of Nationz Technologies before the offering.
(d) Pursuant to the profit distribution proposal recommended by the Board, the Company will pay a cash
dividend of RMB3 (before tax) for every 10 shares held on the basis of the total share capital of the
Company as at 8 April 2010 less the number of restricted shares remaining in lock-up under the Share
Incentive Scheme and the number of restricted shares that may be repurchased and cancelled in
accordance with the implementation of the Share Incentive Scheme as at the A share record date for
the purpose of the 2009 profit distribution (the ‘‘Record Date’’), and will also issue 5 bonus shares for
every 10 shares held to shareholders whose name appear in the register as at the Record Date through
an increase in registered capital by way of capitalisation of capital reserves. In accordance with
relevant provisions of the Share Incentive Scheme, application will be made in 2010 for the second
unlocking of 35% of the Subject Shares granted, and restricted shares remaining in lock-up shall not
be entitled to the cash dividend. As at 8 April 2010, 69,737,523 restricted shares remained in lock-up.
The number of shares entitled to the cash dividend under the 2009 profit distribution proposal will be
1,841,416,933 shares in case the second unlocking is not completed by the Record Date, or a maximum
of 1,868,214,185 shares in case the second unlocking is completed by the Record Date. The said profit
distribution proposal is subject to approval by the general meeting of the Company.
– 79 –