Young Talent - State Bank of Pakistan
228
artworks of the next generation of painters in Pakistan Young Talent:
-
Upload
khangminh22 -
Category
Documents
-
view
3 -
download
0
Transcript of Young Talent - State Bank of Pakistan
artworks of the next generation of painters
in Pakistan
Young Talent:Young

COVER STORYWitnessing talent from an imaginative perspective is a refreshing experience, especially when it comes from young visionaries who are eager to tell a story of brilliance and wonder. This year, Askari Bank celebrates on its cover the creative and fresh vision of young painters across Pakistan, highlighting their novel works that mirror Askari Bank’s passion to provide a whole new experience of creativity and excellence in banking
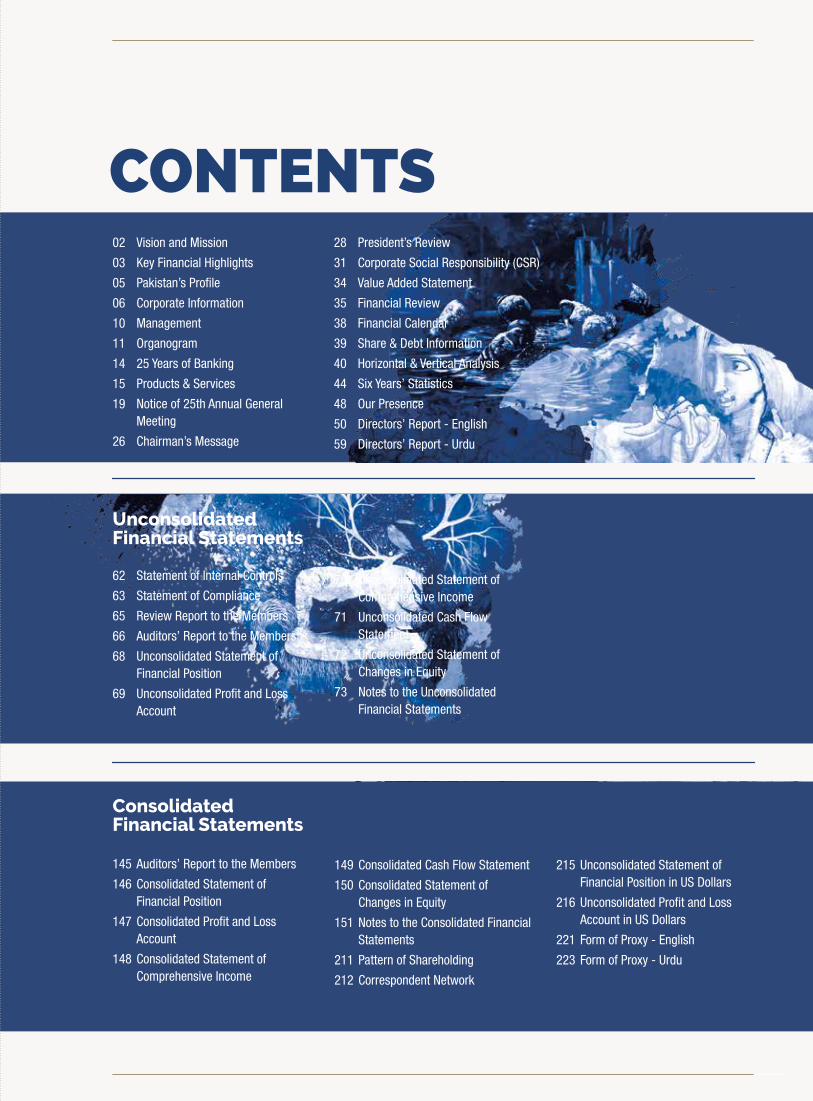
CONTENTS02 Vision and Mission
03 Key Financial Highlights
05 Pakistan’s Profile
06 Corporate Information
10 Management
11 Organogram
14 25 Years of Banking
15 Products & Services
19 Notice of 25th Annual General Meeting
26 Chairman’s Message
28 President’s Review
31 Corporate Social Responsibility (CSR)
34 Value Added Statement
35 Financial Review
38 Financial Calendar
39 Share & Debt Information
40 Horizontal & Vertical Analysis
44 Six Years’ Statistics
48 Our Presence
50 Directors’ Report - English
59 Directors’ Report - Urdu
Unconsolidated Financial Statements
62 Statement of Internal Controls
63 Statement of Compliance
65 Review Report to the Members
66 Auditors’ Report to the Members
68 Unconsolidated Statement of Financial Position
69 Unconsolidated Profit and Loss Account
70 Unconsolidated Statement of Comprehensive Income
71 Unconsolidated Cash Flow Statement
72 Unconsolidated Statement of Changes in Equity
73 Notes to the Unconsolidated Financial Statements
Consolidated Financial Statements
145 Auditors’ Report to the Members
146 Consolidated Statement of Financial Position
147 Consolidated Profit and Loss Account
148 Consolidated Statement of Comprehensive Income
149 Consolidated Cash Flow Statement
150 Consolidated Statement of Changes in Equity
151 Notes to the Consolidated Financial Statements
211 Pattern of Shareholding
212 Correspondent Network
215 Unconsolidated Statement of Financial Position in US Dollars
216 Unconsolidated Profit and Loss Account in US Dollars
221 Form of Proxy - English
223 Form of Proxy - Urdu

VISIONTo be the bank of first choice in the region
MISSIONTo be the leading private sector bank in Pakistan with an international presence, delivering quality service through
innovative technology and effective human resource management in a modern and progressive organizational
culture of meritocracy, maintaining high ethical and professional standards, while providing enhanced value to
all our stakeholders, and contributing to society
02Ce
lebrat
ing Y
oung T
alent
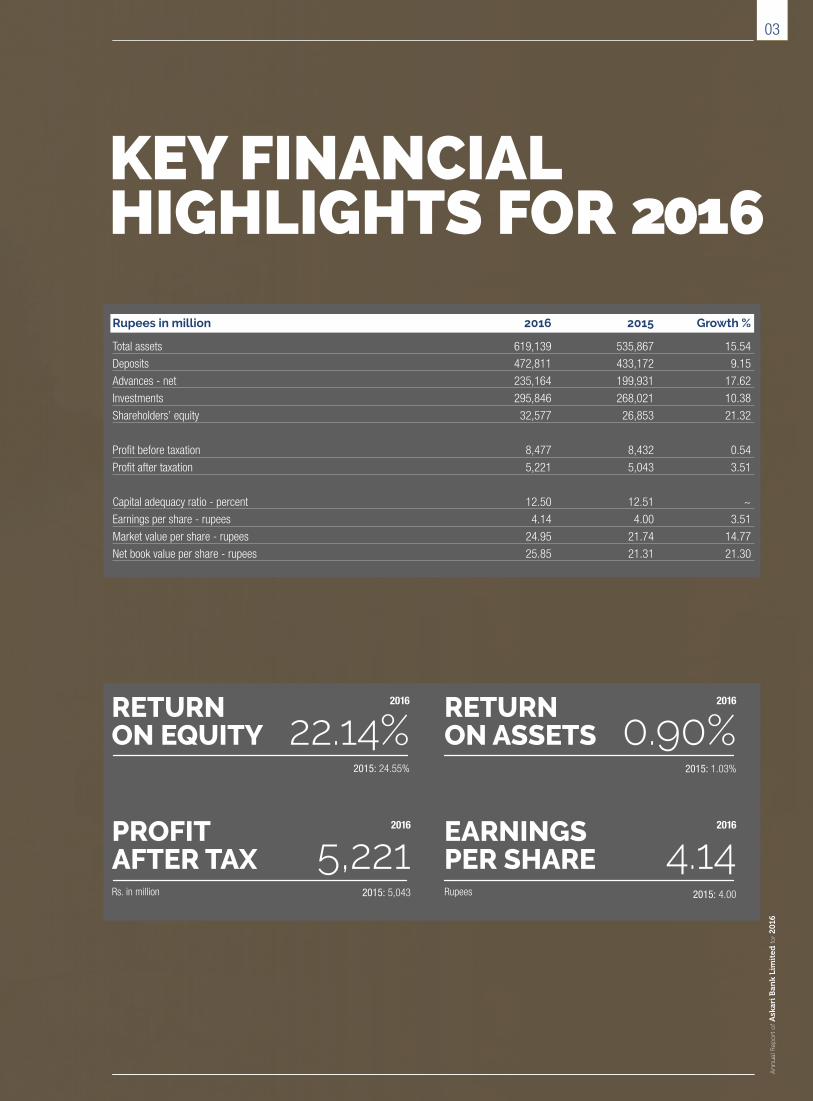
KEY FINANCIAL HIGHLIGHTS FOR 2016
Rupees in million 2016 2015 Growth %
Total assets 619,139 535,867 15.54
Deposits 472,811 433,172 9.15
Advances - net 235,164 199,931 17.62
Investments 295,846 268,021 10.38
Shareholders’ equity 32,577 26,853 21.32
Profit before taxation 8,477 8,432 0.54
Profit after taxation 5,221 5,043 3.51
Capital adequacy ratio - percent 12.50 12.51 ~
Earnings per share - rupees 4.14 4.00 3.51
Market value per share - rupees 24.95 21.74 14.77
Net book value per share - rupees 25.85 21.31 21.30
5,2212015: 5,043Rs. in million Rupees
0.90%2015: 1.03%
22.14%RETURNON EQUITY
PROFITAFTER TAX
RETURNON ASSETS
EARNINGSPER SHARE
2015: 24.55%
2016
2016
2016
2016
4.142015: 4.00
03
An
nu
al R
epo
rt o
f Ask
ari B
ank
Lim
ited
for 2
016
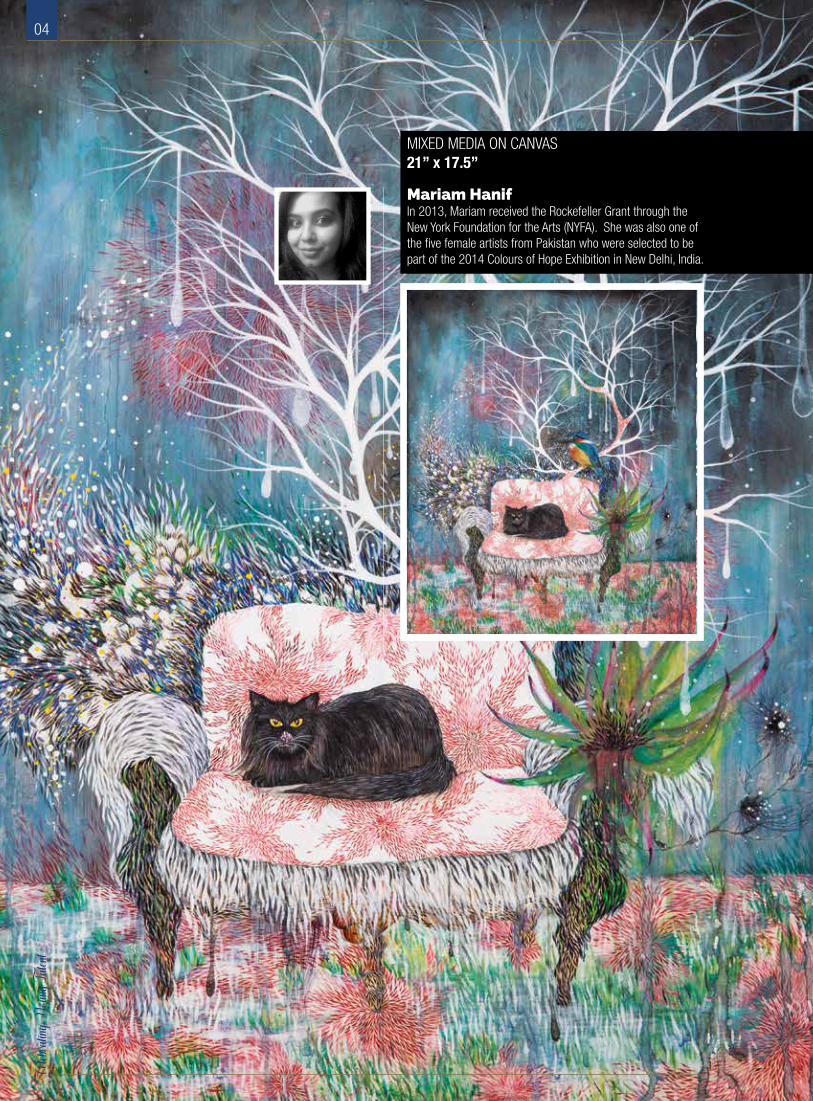
Mariam Hanif In 2013, Mariam received the Rockefeller Grant through the New York Foundation for the Arts (NYFA). She was also one of the five female artists from Pakistan who were selected to be part of the 2014 Colours of Hope Exhibition in New Delhi, India.
MIXED MEDIA ON CANVAS21” x 17.5”
04Ce
lebrat
ing Y
oung T
alent
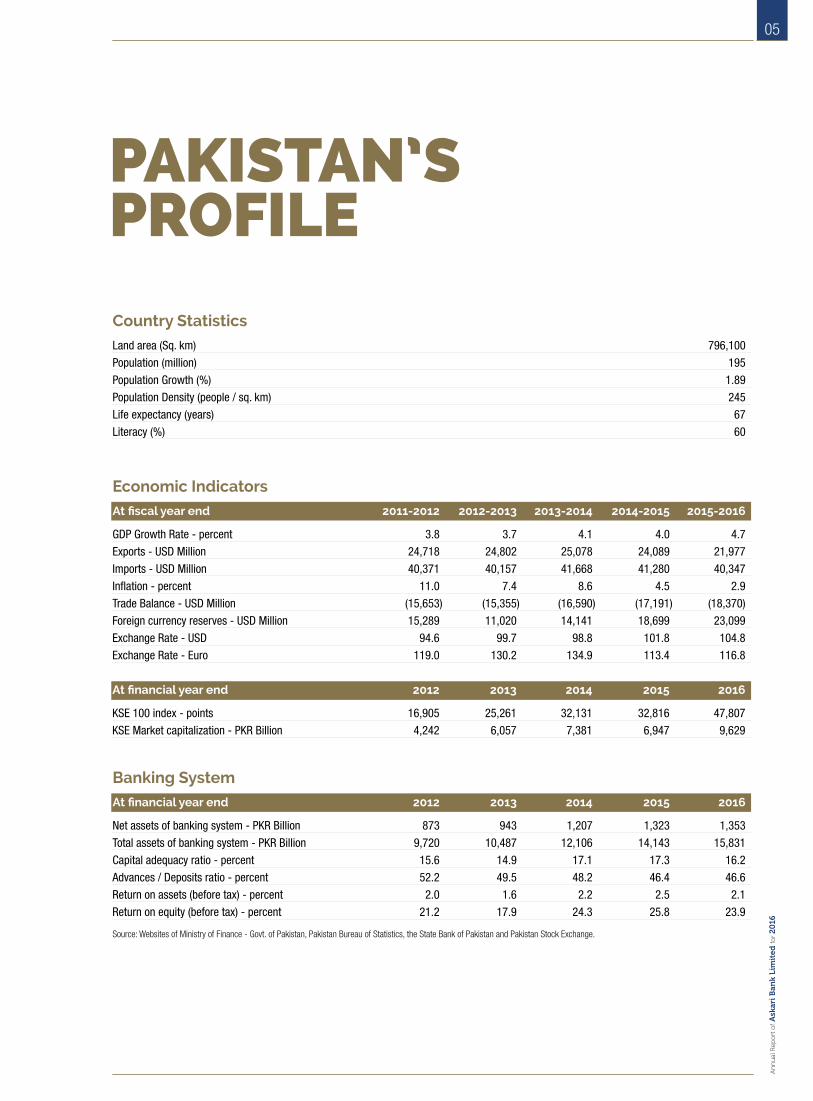
PAKISTAN’S PROFILE
Country Statistics
Land area (Sq. km) 796,100
Population (million) 195
Population Growth (%) 1.89
Population Density (people / sq. km) 245
Life expectancy (years) 67
Literacy (%) 60
Economic Indicators
At fiscal year end 2011-2012 2012-2013 2013-2014 2014-2015 2015-2016
GDP Growth Rate - percent 3.8 3.7 4.1 4.0 4.7
Exports - USD Million 24,718 24,802 25,078 24,089 21,977
Imports - USD Million 40,371 40,157 41,668 41,280 40,347
Inflation - percent 11.0 7.4 8.6 4.5 2.9
Trade Balance - USD Million (15,653) (15,355) (16,590) (17,191) (18,370)
Foreign currency reserves - USD Million 15,289 11,020 14,141 18,699 23,099
Exchange Rate - USD 94.6 99.7 98.8 101.8 104.8
Exchange Rate - Euro 119.0 130.2 134.9 113.4 116.8
At financial year end 2012 2013 2014 2015 2016
KSE 100 index - points 16,905 25,261 32,131 32,816 47,807
KSE Market capitalization - PKR Billion 4,242 6,057 7,381 6,947 9,629
Banking System
At financial year end 2012 2013 2014 2015 2016
Net assets of banking system - PKR Billion 873 943 1,207 1,323 1,353
Total assets of banking system - PKR Billion 9,720 10,487 12,106 14,143 15,831
Capital adequacy ratio - percent 15.6 14.9 17.1 17.3 16.2
Advances / Deposits ratio - percent 52.2 49.5 48.2 46.4 46.6
Return on assets (before tax) - percent 2.0 1.6 2.2 2.5 2.1
Return on equity (before tax) - percent 21.2 17.9 24.3 25.8 23.9
Source: Websites of Ministry of Finance - Govt. of Pakistan, Pakistan Bureau of Statistics, the State Bank of Pakistan and Pakistan Stock Exchange.
05
An
nu
al R
epo
rt o
f Ask
ari B
ank
Lim
ited
for 2
016

CORPORATE INFORMATIONBOARD OF DIRECTORS
Lt Gen Khalid Nawaz Khan, HI (M), Sitara-i-Esar (Retd)Chairman - Non-Executive Director
Lt Gen Shafqaat Ahmed, HI (M) (Retd)Non-Executive Director
Lt Gen Javed Iqbal, HI (M) (Retd)*Non-Executive Director
Mr. Qaiser JavedNon-Executive Director
Dr. Nadeem InayatNon-Executive Director
Mr. Manzoor AhmedNon-Executive Director - NIT Nominee
Mr. Asif Reza SanaIndependent Director
Mr. Zaffar Ahmad Khan Independent Director
Mr. Tariq Hafeez Malik Independent Director
Mr. Muhammad GhousIndependent Director
Syed M. HusainiPresident & Chief Executive - Executive Director
* Appointed to fill the casual vacancy upon resignation of Lt Gen Muhammad Haroon Aslam HI (M), S Bt (Retd), subject to approval of the State Bank of Pakistan.
BOARD COMMITTEESAUDIT & COMPLIANCE
Mr. Asif Reza SanaChairman
Mr. Qaiser Javed
Dr. Nadeem Inayat
Mr. Manzoor Ahmed
Mr. Muhammad Ghous
HUMAN RESOURCE & REMUNERATION
Mr. Zaffar Ahmad KhanChairman
Dr. Nadeem Inayat
Mr. Muhammad Ghous
RISK MANAGEMENT
Mr. Manzoor AhmedChairman
Mr. Qaiser Javed
Mr. Asif Reza Sana
Syed M. Husaini
INFORMATION TECHNOLOGY
Mr. Tariq Hafeez MalikChairman
Mr. Zaffar Ahmad Khan
Syed M. Husaini
06Ce
lebrat
ing Y
oung T
alent
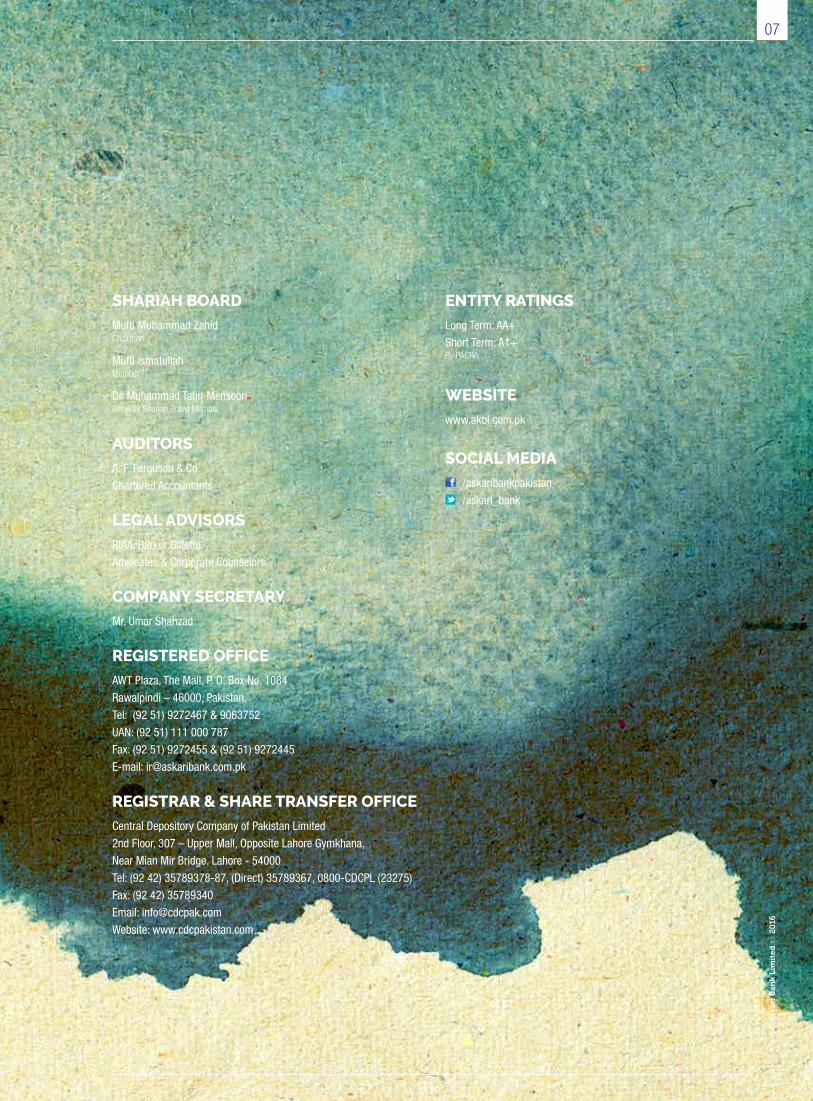
SHARIAH BOARD
Mufti Muhammad ZahidChairman
Mufti Ismatullah Member
Dr. Muhammad Tahir MansooriResident Shariah Board Member
AUDITORS
A. F. Ferguson & Co.
Chartered Accountants
LEGAL ADVISORS
RIAA, Barker Gillette
Advocates & Corporate Counselors
COMPANY SECRETARY
Mr. Umar Shahzad
REGISTERED OFFICE
AWT Plaza, The Mall, P. O. Box No. 1084
Rawalpindi – 46000, Pakistan.
Tel: (92 51) 9272467 & 9063752
UAN: (92 51) 111 000 787
Fax: (92 51) 9272455 & (92 51) 9272445
E-mail: [email protected]
REGISTRAR & SHARE TRANSFER OFFICE
Central Depository Company of Pakistan Limited
2nd Floor, 307 – Upper Mall, Opposite Lahore Gymkhana,
Near Mian Mir Bridge, Lahore - 54000
Tel: (92 42) 35789378-87, (Direct) 35789367, 0800-CDCPL (23275)
Fax: (92 42) 35789340
Email: [email protected]
Website: www.cdcpakistan.com
ENTITY RATINGS
Long Term: AA+
Short Term: A1+By PACRA
WEBSITE
www.akbl.com.pk
SOCIAL MEDIA
/askaribankpakistan
/askari_bank
07
An
nu
al R
epo
rt o
f Ask
ari B
ank
Lim
ited
for 2
016

08Ce
lebrat
ing Y
oung T
alent

Maham Gull With Masters in Fine Arts from the University of the Punjab, Maham has showcased her work through multiple group shows. She has a flair for stylistic calligraphy and has an avid interest in music too.
OIL ON CANVAS24” x 30”
09
An
nu
al R
epo
rt o
f Ask
ari B
ank
Lim
ited
for 2
016

MANAGEMENT
Syed M. HusainiPresident & Chief Executive
Rehan MirGlobal Treasurer
Saleem AnwarChief Financial Officer
Farrukh Iqbal KhanGroup Head - Operations
Khurshid ZafarGroup Head - Corporate & Investment Banking
Rashid Nawaz TipuGroup Head - Branch Banking
Abdus Samad KhanCountry Head - Agriculture & Rural Business
Abdul WaseemCountry Head - Credit Administration
Zain ul AbidinCountry Head - Compliance & Data
Shahid Alam SiddiquiCountry Head - Consumer Banking
Malik Suleman HasanExecutive Incharge - China Desk
Shahid AbbasiChief Internal Auditor
Rashid Zaman KhanChief Information Officer
Muhammad NadeemCountry Head - Risk Management
Asim BashirCountry Head - Branchless Banking
Zahid Hassan QureshiCountry Head - Special Asset Management
Syed Adil Abbas ZaidiCountry Head - International Banking
Ali Akbar HemaniCountry Head - Marketing & Product Development
Waseem Ijaz MianCountry Head - SME Banking
Zahid AfzalCountry Head - Systems & Operations
Mr. Ali Muhammad KhanCountry Head - Credit
Tariq MehmoodCountry Head - General Services
Bakar AhmedCountry Head - Human Resource
Khurram TariqCountry Head - Commercial Banking
Umar ShahzadCompany Secretary
NORTH REGION
Sher Afgan KhanzadaRegional General Manager - North I
Sheikh Muhammad Abrar AliRegional General Manager - North II
CENTRAL REGION
Saulat HameedRegional General Manager - Central I
Ejaz Musarrat SiddiquiRegional General Manager - Central II
SOUTH REGION
Ahmed Fawad HashmiHead Branch Banking & Special Asset Management
Rashid Iqbal ShaikhRegional General Manager - South I
Asim AsifRegional General Manager - South II
ISLAMIC BANKING
Fahd Sardar KhanCountry Head - Islamic Banking Services
WHOLESALE BANK BRANCH, BAHRAINAdnan AltafBranch Manager
CHINA REPRESENTATIVE OFFICEHasib Ur RahmanChief Representative Officer
10Ce
lebrat
ing Y
oung T
alent
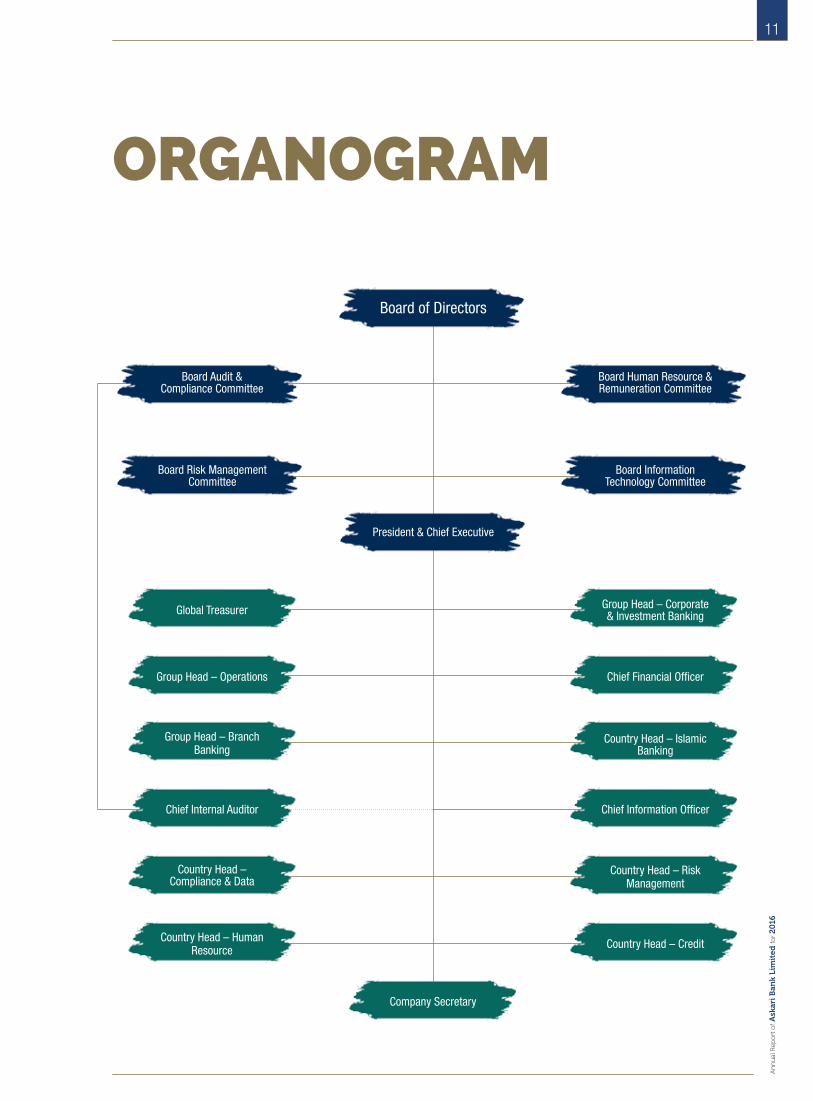
Board of Directors
President & Chief Executive
Board Human Resource & Remuneration Committee
Board Information Technology Committee
Board Risk Management Committee
ORGANOGRAM
Board Audit & Compliance Committee
Group Head – Corporate & Investment BankingGlobal Treasurer
Chief Financial OfficerGroup Head – Operations
Country Head – Islamic Banking
Group Head – Branch Banking
Chief Information OfficerChief Internal Auditor
Country Head – Risk Management
Country Head – Compliance & Data
Country Head – CreditCountry Head – Human Resource
Company Secretary
11
An
nu
al R
epo
rt o
f Ask
ari B
ank
Lim
ited
for 2
016

12Ce
lebrat
ing Y
oung T
alent
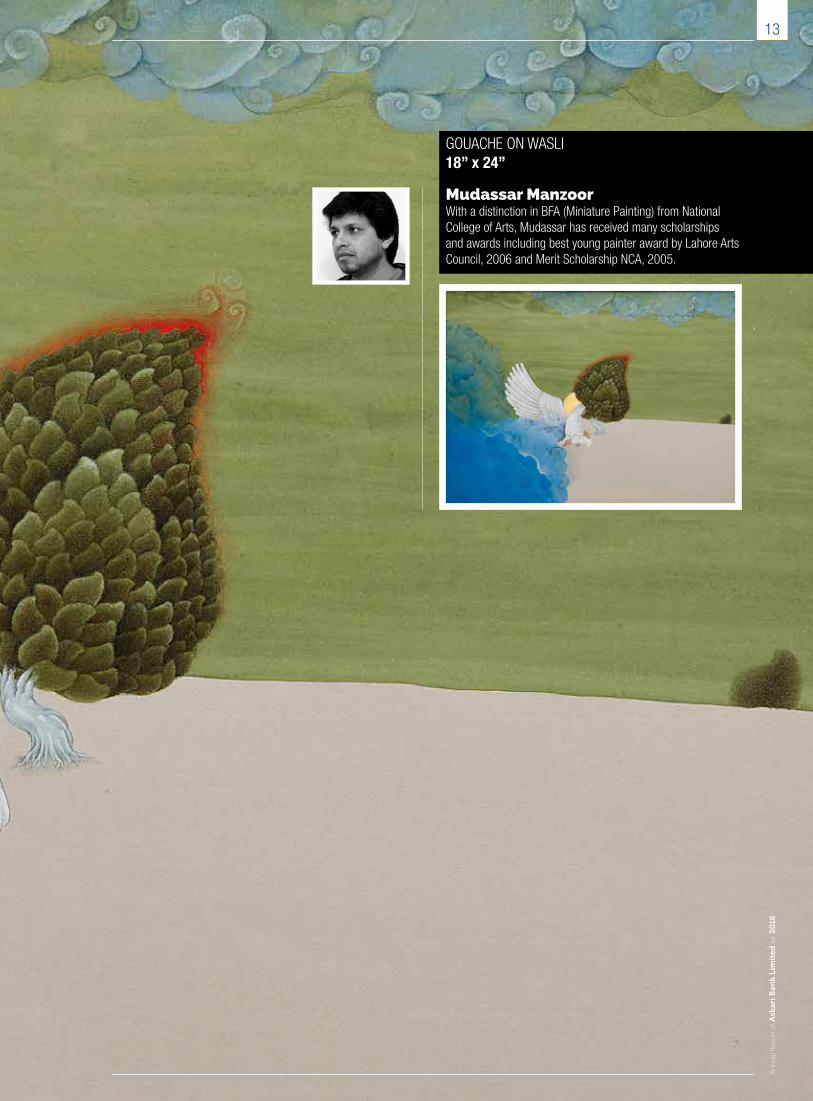
Mudassar Manzoor With a distinction in BFA (Miniature Painting) from National College of Arts, Mudassar has received many scholarships and awards including best young painter award by Lahore Arts Council, 2006 and Merit Scholarship NCA, 2005.
GOUACHE ON WASLI18” x 24”
13
An
nu
al R
epo
rt o
f Ask
ari B
ank
Lim
ited
for 2
016
25 YEARS OF BANKINGAskari Bank was incorporated in Pakistan on October 9, 1991, as a public limited company. It commenced operations on April 1, 1992, and is principally engaged in the business of banking, as defined in the Banking Companies Ordinance, 1962. The Bank is listed on the Pakistan Stock Exchange (formerly the Karachi, Lahore and Islamabad Stock Exchanges).
Askari Bank has since expanded into a network of 501 branches / sub-branches, including 94 dedicated Islamic banking branches / sub-branches, and a wholesale bank branch in Bahrain. In addition, the Bank has a representative office in Beijing, China.
A shared network of over 11,000 online ATMs covering all major cities in Pakistan supports the delivery channels for customer service. As at December 31, 2016, the Bank had equity of Rs. 32.6 billion and total assets of Rs. 619 billion, with 1,315,783 banking customers, serviced by 7,252 employees.
14Ce
lebrat
ing Y
oung T
alent
PRODUCTS & SERVICESBRANCH BANKINGAskari Bank aims to provide its customers with a wide array of financial solutions catering to diverse banking needs. We offer Conventional, Corporate, Consumer, Islamic, and Agriculture Banking services through a network of 500 branches / sub-branches in major cities, towns and cantonments. ASKARI BACHAT ACCOUNT
Askari Mahana Bachat Account is a term deposit product for individual and corporate customers with a medium term investment appetite. It offers individual customers the option of investing for one and two years tenures, while corporate customers can invest for two years. It is designed to cater to the saving needs of customers who want profit on a monthly basis with the option of availing financing facility of upto 90% of the principal amount. VALUE PLUS CURRENT ACCOUNT
Askari Value Plus Current Account offers financial freedom and security with unmatched flexibility. Customers (individuals) can open this account to avail the benefits of free life insurance coverage of upto Rs. 2 Million, debit card with two supplementary cards, I-Net facility, SMS alerts, issuance of cheque books and bankers’ cheques – all with no minimum balance requirements. Value Plus Current (Business Account) is specially designed to cater to the diversified needs of business community.
CURRENT ACCOUNT
Current Accounts cater to a variety of financial needs of our diverse customer base with added benefits of free cheque books, issuance of bankers’ cheques and much more.
SAVINGS ACCOUNT
Savings accounts offered by the Bank to both individual and institutional customers include Askari Special Deposit and normal savings account based on profit and loss sharing. Askari savings deposit offer attractive features and competitive returns.
ASKARI ASAAN ACCOUNT
Askari Bank offers Asaan Account to unbanked / under-banked individuals. The facility is available in current and savings account categories. As per the name of this product, its hassle-free account opening and operating procedure helps the lower income groups to fulfill their banking requirements with ease and comfort.
ASKARI LITTLE CHAMPS ACCOUNT
Askari Little Champs Account is designed specifically for minors (individuals below the age of 18 years). It introduces the concept of saving to the children and helps them understand the value of money at an early age. The account offers two variants i.e. current and savings accounts.
Little Champs Account comes with a money box as a welcome gift, along with a Visa Debit Card and cheque book. It offers high returns, free education insurance plan and surprise gifts on birthday.
ASKARI WAQAAR ACCOUNT
Askari Waqaar Account caters to the banking needs of senior citizens (55 years and above) looking for monthly profits, high returns and short term investment opportunities. Askari Waqaar Account offers two variants; Term deposit (one year) and Savings account. The customer has the option to choose any or both of these variants.
RUPEE TRAVELER CHEQUES
Askari Bank offers its customers the widely accepted Rupee Traveler Cheque, which eliminates all financial risks while travelling. It is a safe and secure way to make payments. BANCASSURANCE
The Bank offers innovative insurance solutions by fusing together banking, wealth management and insurance products. In partnership with EFU Life Assurance Limited and Jubilee Life Insurance Company Limited (JLI), the Bank offers its customers with value-added life insurance and wealth management products tailored to suit their long term financial requirements and protection plans.
ASK SONA CARD
Ask Sona Card is a joint venture of Askari Bank Limited & Fauji Fertilizer Company Limited (FFC). It is especially designed to create convenience and cater to the business needs of FFC and its dealers. It is an innovative, electronic cash management solution that replaces the existing conventional collections system. It is a transaction-specific debit card with plastic money features which has replaced the conventional transfer of funds.
INTERNATIONAL BANKINGWe have correspondent banking relationships with 473 banks in 85 countries around the world. The business in Asian region in particular continues to grow and delivers excellent results in terms of balance sheet growth and bottom line contribution. Concentrated efforts are being made to promote business from China, leveraging on
15
An
nu
al R
epo
rt o
f Ask
ari B
ank
Lim
ited
for 2
016
positive spill-over of the Chinese investment in Pakistan, especially under CPEC. We carry out regular due diligence exercises to ensure that we deal with only those financial institutions which are able to meet the prescribed standards and criteria.
ASKARI AASAAN MONEY TRANSFER
Role of Home Remittance segment is pivotal in promoting remittances through its state-of-the-art web based portal “Askari Aasaan Money Transfer”. This service is completely free of cost and is available for all citizens across the country. The remittances are received through our arrangements with correspondent banks and exchange companies globally. We have a dedicated team of customer service officers who are available to respond to the queries of remitters and beneficiaries of the remittances.
CORPORATE & INVESTMENT BANKINGAt Askari Bank, we understand the unique business requirements of our corporate and institutional clients, and accordingly strive to meet their expectations by providing a customized and relationship-based banking approach.
CORPORATE BANKING
Corporate banking works on a long-term relationship-based business model to provide a single point within the Bank which meets all business requirements of its corporate and institutional customers, including public sector enterprises. Its primary objective is to enhance customer service, which remains our top priority. Dedicated relationship managers ensure customer satisfaction for all our corporate clients. Our relationship-oriented outlook focuses on providing a complete array of tailored financing solutions that are practical and cost effective, some of which include:• Working Capital Facilities• Term Loans for Corporate and Project
Finance• Structured Trade Finance Facilities• Letters of Guarantee • Letters of Credit• Cash Management Solutions
• Bill Discounting• Export Financing• Receivable Discounting
INVESTMENT BANKING
Investment banking focuses on the origination and execution of a range of financial advisory and capital raising services to corporate and institutional clients. It also manages the Bank’s proprietary investments in local equity and debt markets. Investment banking offers various tailored financial solutions including debt syndications, project finance and advisory services, debt placements through capital markets as well as structured trade finance facilities. Whether a company is seeking to access the local or cross border syndications and debt capital markets, project financing needs, advisory services related to Mergers and Acquisitions and or local equity capital markets for raising capital, our Investment Banking is well positioned to provide due assistance. We tailor the right structured solutions to meet our customers’ needs in order to enhance business wealth and market competitiveness.
COMMERCIAL & SME BANKINGWe offer a diverse range of financial solutions designed to suit the unique needs of our commercial and SME customer base.
COMMERCIAL BANKING
Commercial Banking serves the middle tier segment by providing both general and tailored solutions encompassing all financial needs of the borrower ranging from project financing to working capital requirements / payroll management. Dedicated relationship managers at our credit hubs provide personalized solutions to our customers.
SMALL AND MEDIUM ENTERPRISES (SME) BANKING
Askari Bank has been playing a significant role in the development of the SME sector by providing customers with the opportunity to access credit through strategically located Regional Credit Hubs as well as our branches across the country. The Bank also offers trade expertise and awareness on trade related activity through these access
points, where specialized credit resources and empowered relationship management teams dedicatedly serve SMEs at the grass-root level.
In order to cater to the financial needs of SME segment, Askari Bank offers “Askari Smart Pack”, which includes the following products:• Askari Quick Finance• Askari Vendor’s Finance• Askari Business Solution• Askari Loan for Business Premises• Askari Lease Finance• Askari Loan for Fertilizer Dealers• Ask Fund Facility
CONSUMER BANKINGConsumer banking provides financing facilities to individuals through prudent, customer-centric policies and quality services that aim to make our customers’ experiences more interactive and intuitive. We are focused on broadening our outreach and expanding our presence in accordance with the needs of our customers across the country through direct sales as well as through our wide branch network. Special attention is given to business opportunities involving strategic alliances, with greater emphasis on a secured form of consumer lending; so as to increase product offerings and improve the quality of our asset portfolio. We are committed to providing financial solutions and services that meet our customers’ needs at every stage of life. ASK4CAR
Askari Ask4Car is an auto financing product for new, used and imported vehicles. It offers competitive mark-up, flexible repayment plan and quick processing without any hidden costs. The product is offered to the customers for a maximum tenure of 7 years. PERSONAL FINANCE
With unmatched financing features in terms of loan amount, payback period and easy monthly installments, Askari Bank’s Personal Finance makes sure that our customers get the most out of their loans. The product tenure ranges from 1 – 5 years and is designed primarily for salaried individuals.
PRODUCTS & SERVICES
16Ce
lebrat
ing Y
oung T
alent
MORTGAGE FINANCE
Whether our customers plan to construct a house, buy a constructed house, or renovate a house, Askari Mortgage Finance enables them to pursue their goals without any hassle. Askari Mortgage Finance is a premium house financing product offered to customers for a period up to 20 years. MASTER CREDIT CARD
Askari Bank offers a competitive suite of Classic, Gold, Corporate and Platinum Master Credit Cards that provide superior services, travel privileges, exciting discounts, online payment facility along with reward points and transactional alerts through SMS as an enhanced security feature. The option for Flexible Credit Plans (FCP), Extended Payment Plan (EPP) and Balance Transfer is also available to customers at discounted mark-up rates. ASKARI WORLD MASTER CARD
Askari Bank pioneered Pakistan’s first ever “World MasterCard” in collaboration with MasterCard International. This credit card is specifically designed for customers seeking high-class service standards and travel privileges worldwide.
ASKARI BRANCHLESS BANKINGAskari Bank launched branchless banking jointly with China Mobile Pakistan under the brand name of “Timepey” in 2012. With this initiative, banking has become even more convenient and efficient as customers can safely send and receive funds anytime, anywhere across the country. A wide network of Timepey shops across Pakistan are fully equipped to handle the day-to-day needs of the customers. The following transactions are currently being handled under this program: GOVERNMENT TO PERSON (G2P) DISBURSEMENT
Timepey has disbursed over Rs. 10 Billion cash assistance & return transport allowance from the Federal Disaster Management Authority (FDMA) Government of Pakistan to the temporarily displaced people of North Waziristan & Khyber Agency during the year 2016.
TIMEPEY MONEY TRANSFER
Customers can send and receive money from any Timepey outlet in the most efficient, secure and convenient manner. The facilities include person-to-person, Government-to-person, person-to-account, account-to-person and account-to-account funds transfers. TIMEPEY UTILITY BILL PAYMENT
Timepey account and non-account holders can pay all their utility bills through Timepey instantly and without any charges. Simply dial *888# from your mobile phone or visit any Timepey agent for cash payment. TIMEPEY MOBILE TOP-UP
Customers can purchase prepaid airtime and pay postpaid bills anytime, anywhere from their own mobile phone. This service is available to Zong customers who have a Timepey account.
AGRICULTURE BANKINGAgriculture banking products and services are offered to Pakistan’s farming and rural business community. This function of the Bank aims to extend credits on softer terms to farmers, both on revolving as well as term basis. Special emphasis is given to cattle farming and dairy products financing. Recently the mark-up rate was brought down to make agri-related financing available at grass-root levels so as to enhance not only the agricultural output, but to also become a source of better living standards for farmers who do not have access to low cost funding. A new segment of financing was added by channeling resources through supply chain of corporate entities, whose dependency of raw material is from the farm sector. This has boosted and expanded financing opportunity through more reliable and easy mode. Agriculture banking products and services are offered across the country through efficient delivery channels under a control mechanism with minimum turnaround time for loan application approvals. The Bank is practicing a vibrant program for fresh lending under revised parameters, with affordable terms and conditions.
Following are the financing products being offered to Farm and Non-Farm sector across Pakistan: • Kissan Ever Green Finance• Kissan Tractor Finance• Kissan Livestock Development Finance• Kissan Farm Mechanization Finance• Kissan Aabpashi Finance• Kissan White Pearl Finance• Kissan Gold Fish Finance
ISLAMIC BANKINGUnder the guidance of its Shariah Board and professional bankers, Askari Islamic banking offers a diversified range of Shariah compliant products and services to its valued customers to fulfill their banking needs. Presently working with 94 dedicated Islamic banking branches (including 3 sub-branches) in 36 cities spread across the country Askari Islamic has managed to increase its share in the banking Industry. ISLAMIC DEPOSIT PRODUCTS
Our customers enjoy the freedom to choose from a wide array of deposit products that offer flexible term deposit schemes, current accounts and savings accounts. Our Ahsan Munafa / Ahsan Munafa Corporate product is a chequing account that offers higher yields, calculated on a daily product basis. Askari Halal Savings Account is tailored to meet all business requirements of our customers and offers a host of value-added services. Askari Islamic Investment Certificate is a Mudarabah-based term deposit product that allows customers to invest their savings for different tenors ranging from 3 months to 5 years, and earn Halal returns on a periodic basis. ISLAMIC CONSUMER BANKING PRODUCTS
On the consumer banking front, Askari Ijarah Bis Sayyarah allows customers to get the car of their choice, while Askari Home Musharakah allows customers to purchase, build or renovate a house. We also provide Islamic solutions to the customers availing house finance facilities from conventional financial institutions, by transferring their facilities to Askari Islamic banking under Askari Home Musharakah.
17
An
nu
al R
epo
rt o
f Ask
ari B
ank
Lim
ited
for 2
016
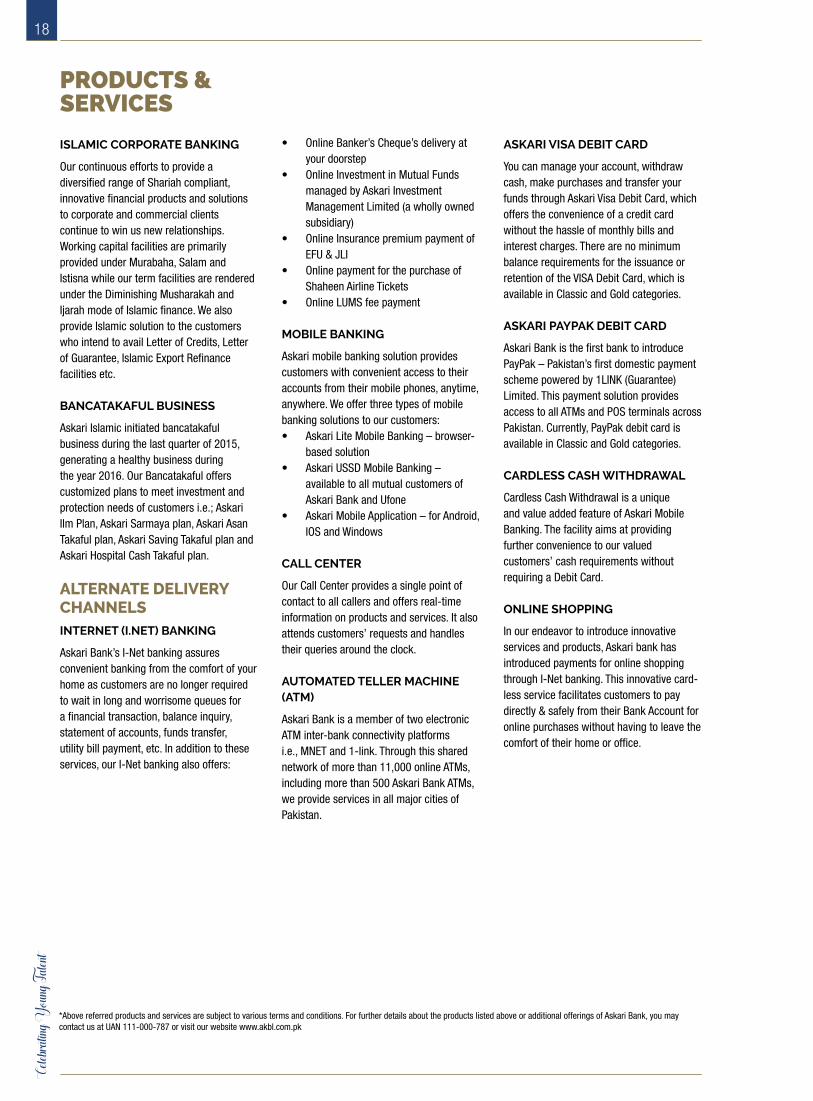
ISLAMIC CORPORATE BANKING
Our continuous efforts to provide a diversified range of Shariah compliant, innovative financial products and solutions to corporate and commercial clients continue to win us new relationships. Working capital facilities are primarily provided under Murabaha, Salam and Istisna while our term facilities are rendered under the Diminishing Musharakah and Ijarah mode of Islamic finance. We also provide Islamic solution to the customers who intend to avail Letter of Credits, Letter of Guarantee, Islamic Export Refinance facilities etc.
BANCATAKAFUL BUSINESS
Askari Islamic initiated bancatakaful business during the last quarter of 2015, generating a healthy business during the year 2016. Our Bancatakaful offers customized plans to meet investment and protection needs of customers i.e.; Askari Ilm Plan, Askari Sarmaya plan, Askari Asan Takaful plan, Askari Saving Takaful plan and Askari Hospital Cash Takaful plan.
ALTERNATE DELIVERY CHANNELSINTERNET (I.NET) BANKING
Askari Bank’s I-Net banking assures convenient banking from the comfort of your home as customers are no longer required to wait in long and worrisome queues for a financial transaction, balance inquiry, statement of accounts, funds transfer, utility bill payment, etc. In addition to these services, our I-Net banking also offers:
• Online Banker’s Cheque’s delivery at your doorstep
• Online Investment in Mutual Funds managed by Askari Investment Management Limited (a wholly owned subsidiary)
• Online Insurance premium payment of EFU & JLI
• Online payment for the purchase of Shaheen Airline Tickets
• Online LUMS fee payment MOBILE BANKING
Askari mobile banking solution provides customers with convenient access to their accounts from their mobile phones, anytime, anywhere. We offer three types of mobile banking solutions to our customers:• Askari Lite Mobile Banking – browser-
based solution• Askari USSD Mobile Banking –
available to all mutual customers of Askari Bank and Ufone
• Askari Mobile Application – for Android, IOS and Windows
CALL CENTER
Our Call Center provides a single point of contact to all callers and offers real-time information on products and services. It also attends customers’ requests and handles their queries around the clock. AUTOMATED TELLER MACHINE (ATM)
Askari Bank is a member of two electronic ATM inter-bank connectivity platforms i.e., MNET and 1-link. Through this shared network of more than 11,000 online ATMs, including more than 500 Askari Bank ATMs, we provide services in all major cities of Pakistan.
ASKARI VISA DEBIT CARD
You can manage your account, withdraw cash, make purchases and transfer your funds through Askari Visa Debit Card, which offers the convenience of a credit card without the hassle of monthly bills and interest charges. There are no minimum balance requirements for the issuance or retention of the VISA Debit Card, which is available in Classic and Gold categories.
ASKARI PAYPAK DEBIT CARD
Askari Bank is the first bank to introduce PayPak – Pakistan’s first domestic payment scheme powered by 1LINK (Guarantee) Limited. This payment solution provides access to all ATMs and POS terminals across Pakistan. Currently, PayPak debit card is available in Classic and Gold categories. CARDLESS CASH WITHDRAWAL
Cardless Cash Withdrawal is a unique and value added feature of Askari Mobile Banking. The facility aims at providing further convenience to our valued customers’ cash requirements without requiring a Debit Card. ONLINE SHOPPING
In our endeavor to introduce innovative services and products, Askari bank has introduced payments for online shopping through I-Net banking. This innovative card-less service facilitates customers to pay directly & safely from their Bank Account for online purchases without having to leave the comfort of their home or office.
*Above referred products and services are subject to various terms and conditions. For further details about the products listed above or additional offerings of Askari Bank, you may contact us at UAN 111-000-787 or visit our website www.akbl.com.pk
PRODUCTS & SERVICES
18Ce
lebrat
ing Y
oung T
alent
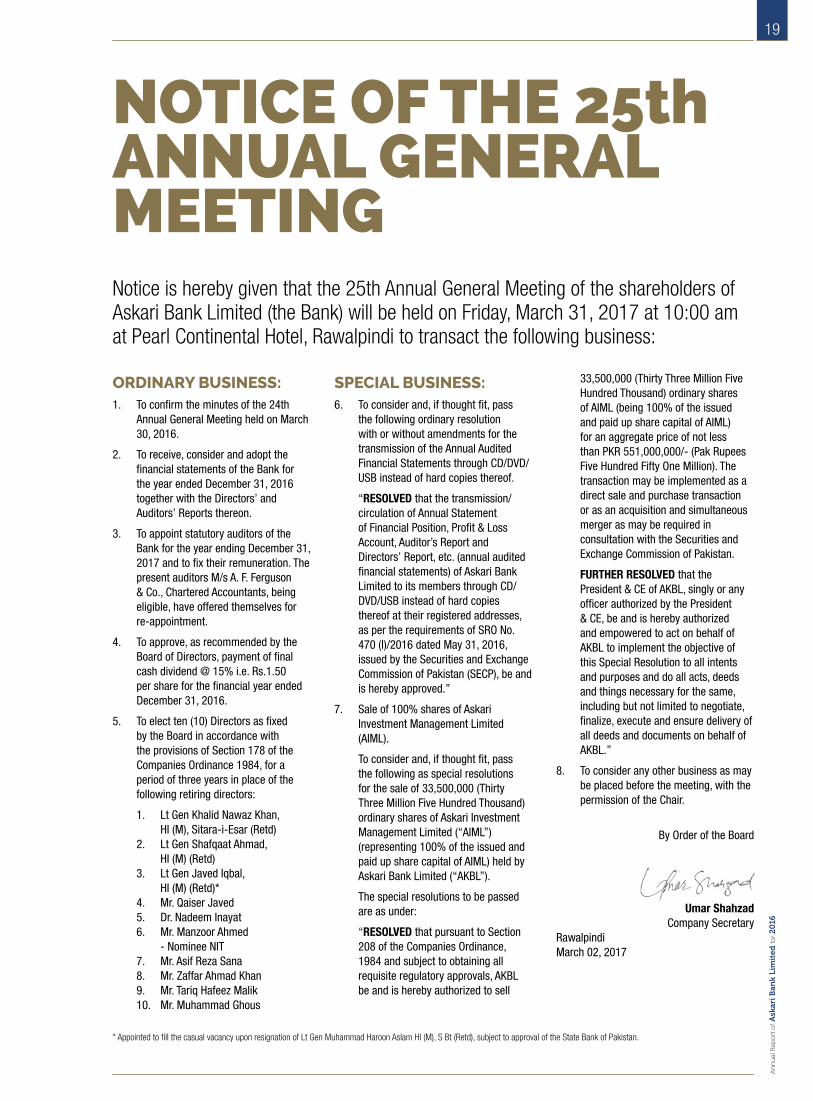
NOTICE OF THE 25thANNUAL GENERAL MEETINGNotice is hereby given that the 25th Annual General Meeting of the shareholders of Askari Bank Limited (the Bank) will be held on Friday, March 31, 2017 at 10:00 am at Pearl Continental Hotel, Rawalpindi to transact the following business:
ORDINARY BUSINESS:1. To confirm the minutes of the 24th
Annual General Meeting held on March 30, 2016.
2. To receive, consider and adopt the financial statements of the Bank for the year ended December 31, 2016 together with the Directors’ and Auditors’ Reports thereon.
3. To appoint statutory auditors of the Bank for the year ending December 31, 2017 and to fix their remuneration. The present auditors M/s A. F. Ferguson & Co., Chartered Accountants, being eligible, have offered themselves for re-appointment.
4. To approve, as recommended by the Board of Directors, payment of final cash dividend @ 15% i.e. Rs.1.50 per share for the financial year ended December 31, 2016.
5. To elect ten (10) Directors as fixed by the Board in accordance with the provisions of Section 178 of the Companies Ordinance 1984, for a period of three years in place of the following retiring directors:
1. Lt Gen Khalid Nawaz Khan, HI (M), Sitara-i-Esar (Retd)2. Lt Gen Shafqaat Ahmad, HI (M) (Retd)3. Lt Gen Javed Iqbal, HI (M) (Retd)*4. Mr. Qaiser Javed5. Dr. Nadeem Inayat6. Mr. Manzoor Ahmed - Nominee NIT7. Mr. Asif Reza Sana8. Mr. Zaffar Ahmad Khan9. Mr. Tariq Hafeez Malik10. Mr. Muhammad Ghous
SPECIAL BUSINESS:6. To consider and, if thought fit, pass
the following ordinary resolution with or without amendments for the transmission of the Annual Audited Financial Statements through CD/DVD/USB instead of hard copies thereof.
“RESOLVED that the transmission/circulation of Annual Statement of Financial Position, Profit & Loss Account, Auditor’s Report and Directors’ Report, etc. (annual audited financial statements) of Askari Bank Limited to its members through CD/DVD/USB instead of hard copies thereof at their registered addresses, as per the requirements of SRO No. 470 (I)/2016 dated May 31, 2016, issued by the Securities and Exchange Commission of Pakistan (SECP), be and is hereby approved.”
7. Sale of 100% shares of Askari Investment Management Limited (AIML).
To consider and, if thought fit, pass the following as special resolutions for the sale of 33,500,000 (Thirty Three Million Five Hundred Thousand) ordinary shares of Askari Investment Management Limited (“AIML”) (representing 100% of the issued and paid up share capital of AIML) held by Askari Bank Limited (“AKBL”).
The special resolutions to be passed are as under:
“RESOLVED that pursuant to Section 208 of the Companies Ordinance, 1984 and subject to obtaining all requisite regulatory approvals, AKBL be and is hereby authorized to sell
33,500,000 (Thirty Three Million Five Hundred Thousand) ordinary shares of AIML (being 100% of the issued and paid up share capital of AIML) for an aggregate price of not less than PKR 551,000,000/- (Pak Rupees Five Hundred Fifty One Million). The transaction may be implemented as a direct sale and purchase transaction or as an acquisition and simultaneous merger as may be required in consultation with the Securities and Exchange Commission of Pakistan.
FURTHER RESOLVED that the President & CE of AKBL, singly or any officer authorized by the President & CE, be and is hereby authorized and empowered to act on behalf of AKBL to implement the objective of this Special Resolution to all intents and purposes and do all acts, deeds and things necessary for the same, including but not limited to negotiate, finalize, execute and ensure delivery of all deeds and documents on behalf of AKBL.”
8. To consider any other business as may be placed before the meeting, with the permission of the Chair.
By Order of the Board
Umar ShahzadCompany Secretary
Rawalpindi March 02, 2017
* Appointed to fill the casual vacancy upon resignation of Lt Gen Muhammad Haroon Aslam HI (M), S Bt (Retd), subject to approval of the State Bank of Pakistan.
19
An
nu
al R
epo
rt o
f Ask
ari B
ank
Lim
ited
for 2
016
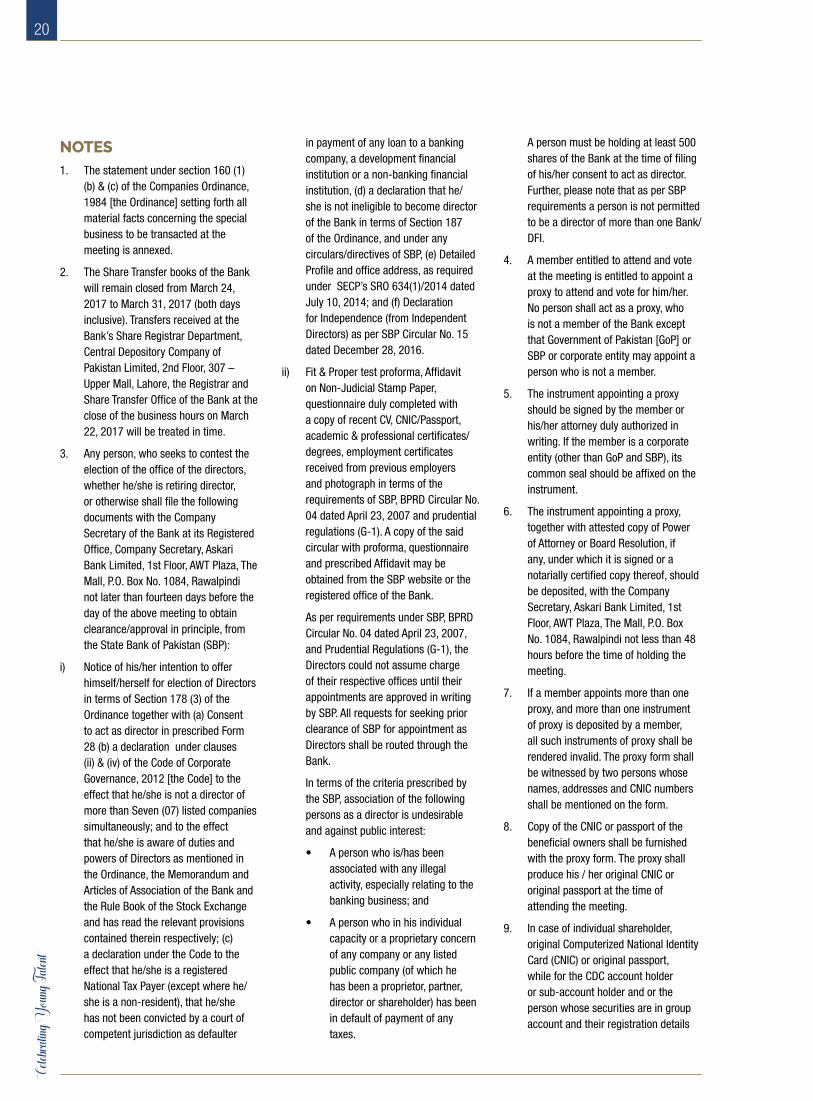
NOTES1. The statement under section 160 (1)
(b) & (c) of the Companies Ordinance, 1984 [the Ordinance] setting forth all material facts concerning the special business to be transacted at the meeting is annexed.
2. The Share Transfer books of the Bank will remain closed from March 24, 2017 to March 31, 2017 (both days inclusive). Transfers received at the Bank’s Share Registrar Department, Central Depository Company of Pakistan Limited, 2nd Floor, 307 – Upper Mall, Lahore, the Registrar and Share Transfer Office of the Bank at the close of the business hours on March 22, 2017 will be treated in time.
3. Any person, who seeks to contest the election of the office of the directors, whether he/she is retiring director, or otherwise shall file the following documents with the Company Secretary of the Bank at its Registered Office, Company Secretary, Askari Bank Limited, 1st Floor, AWT Plaza, The Mall, P.O. Box No. 1084, Rawalpindi not later than fourteen days before the day of the above meeting to obtain clearance/approval in principle, from the State Bank of Pakistan (SBP):
i) Notice of his/her intention to offer himself/herself for election of Directors in terms of Section 178 (3) of the Ordinance together with (a) Consent to act as director in prescribed Form 28 (b) a declaration under clauses (ii) & (iv) of the Code of Corporate Governance, 2012 [the Code] to the effect that he/she is not a director of more than Seven (07) listed companies simultaneously; and to the effect that he/she is aware of duties and powers of Directors as mentioned in the Ordinance, the Memorandum and Articles of Association of the Bank and the Rule Book of the Stock Exchange and has read the relevant provisions contained therein respectively; (c) a declaration under the Code to the effect that he/she is a registered National Tax Payer (except where he/she is a non-resident), that he/she has not been convicted by a court of competent jurisdiction as defaulter
in payment of any loan to a banking company, a development financial institution or a non-banking financial institution, (d) a declaration that he/she is not ineligible to become director of the Bank in terms of Section 187 of the Ordinance, and under any circulars/directives of SBP, (e) Detailed Profile and office address, as required under SECP’s SRO 634(1)/2014 dated July 10, 2014; and (f) Declaration for Independence (from Independent Directors) as per SBP Circular No. 15 dated December 28, 2016.
ii) Fit & Proper test proforma, Affidavit on Non-Judicial Stamp Paper, questionnaire duly completed with a copy of recent CV, CNIC/Passport, academic & professional certificates/degrees, employment certificates received from previous employers and photograph in terms of the requirements of SBP, BPRD Circular No. 04 dated April 23, 2007 and prudential regulations (G-1). A copy of the said circular with proforma, questionnaire and prescribed Affidavit may be obtained from the SBP website or the registered office of the Bank.
As per requirements under SBP, BPRD Circular No. 04 dated April 23, 2007, and Prudential Regulations (G-1), the Directors could not assume charge of their respective offices until their appointments are approved in writing by SBP. All requests for seeking prior clearance of SBP for appointment as Directors shall be routed through the Bank.
In terms of the criteria prescribed by the SBP, association of the following persons as a director is undesirable and against public interest:
• A person who is/has been associated with any illegal activity, especially relating to the banking business; and
• A person who in his individual capacity or a proprietary concern of any company or any listed public company (of which he has been a proprietor, partner, director or shareholder) has been in default of payment of any taxes.
A person must be holding at least 500 shares of the Bank at the time of filing of his/her consent to act as director. Further, please note that as per SBP requirements a person is not permitted to be a director of more than one Bank/DFI.
4. A member entitled to attend and vote at the meeting is entitled to appoint a proxy to attend and vote for him/her. No person shall act as a proxy, who is not a member of the Bank except that Government of Pakistan [GoP] or SBP or corporate entity may appoint a person who is not a member.
5. The instrument appointing a proxy should be signed by the member or his/her attorney duly authorized in writing. If the member is a corporate entity (other than GoP and SBP), its common seal should be affixed on the instrument.
6. The instrument appointing a proxy, together with attested copy of Power of Attorney or Board Resolution, if any, under which it is signed or a notarially certified copy thereof, should be deposited, with the Company Secretary, Askari Bank Limited, 1st Floor, AWT Plaza, The Mall, P.O. Box No. 1084, Rawalpindi not less than 48 hours before the time of holding the meeting.
7. If a member appoints more than one proxy, and more than one instrument of proxy is deposited by a member, all such instruments of proxy shall be rendered invalid. The proxy form shall be witnessed by two persons whose names, addresses and CNIC numbers shall be mentioned on the form.
8. Copy of the CNIC or passport of the beneficial owners shall be furnished with the proxy form. The proxy shall produce his / her original CNIC or original passport at the time of attending the meeting.
9. In case of individual shareholder, original Computerized National Identity Card (CNIC) or original passport, while for the CDC account holder or sub-account holder and or the person whose securities are in group account and their registration details
20Ce
lebrat
ing Y
oung T
alent

are uploaded as per the regulations, his / her authentication would be made by showing his / her original CNIC or original passport along with participant(s) ID Number and their account numbers. In case of GoP / SBP / corporate entity, the Board of Directors’ resolution / power of attorney with specimen signature shall be submitted along with proxy form to the Bank.
10. The Government of Pakistan through the Finance Act, 2016 has made certain amendments in terms of Section 150 of the Income Tax Ordinance, 2001 whereby the rates are enhanced for deduction of withholding tax on the amount of dividend paid by the companies/banks. These rates are as follows:
a) For filers of income tax returns 12.50%
b) For non-filers of income tax returns 20.00%
And to enable the Bank to make tax deductions on the amount of cash dividend @ 12.50% instead of 20.00% to all shareholders, whose names are not entered into the Active Tax payers List (ATL) provided on the website of Federal Board of Revenue (FBR), despite the fact that they are filers, are advised to make sure that their names are entered into ATL before the date of payment of the cash dividend, otherwise tax on their cash dividend (as and when declared) will be deducted @ 20.00% instead of 12.50%.
According to FBR, withholding tax will be determined separately on Filer/Non-Filer status of principal shareholder as well as Joint-shareholder(s) based on their shareholding proportions, in case of joint accounts, shareholders, who hold shares jointly, are requested to provide shareholding proportions of principal shareholder and joint holder(s) in respect of shares held by them to our Share Registrar M/s. Central Depository Company of Pakistan Limited, Lahore, in writing as follows:
Name of Principal
Shareholder/Joint Holders
Shareholding (%age)
CNIC No. (copy
attached)
Signature
The required information must reach our Share Registrar by March 22, 2017 otherwise it will be assumed that the shares are equally held.
SPECIAL NOTES TO THE SHAREHOLDERS:11. Submission of Copies of CNIC
(Mandatory):
In compliance of instructions issued by the Securities & Exchange Commission of Pakistan (SECP) vide its SRO 779 (I)/2011 dated August 18, 2011, SRO 831(I)/2012 dated July 5, 2012 and SRO 19 (I)/2014 dated January 10, 2014 which has made it mandatory that the dividend warrants should bear the Computerized National Identity Card Number (CNIC) of the registered member or authorized person, except in the case of minor(s) and corporate members. Therefore individual members or their authorized representatives holding shares in physical or through CDC Accounts, who have not yet provided an attested copy of their valid CNICs to the Shares Registrar / CDC participant respectively, are requested to provide the same at their earliest. The corporate entities holding shares in physical or through CDC account are requested to provide their National Tax Number (NTN) / NTN Certificates to Shares Registrar / CDC Participants respectively. Members while sending copies of CNICs /NTN / NTN Certificates must quote their respective folio numbers and / company name.
Please note that in case of non-availability of valid copy of CNIC of members, their dividend warrant(s) will be with-held. In this regard, a list of shareholders without CNIC in our record has been made available on the website of the Bank.
12. Payment of Cash Dividend Electronically (e-Dividend):
According to the SECP’s circular No. 8(4) SM/CDC 2008 of April 05, 2013, shareholders are entitled to receive their cash dividend directly in their bank accounts instead of receiving the dividend warrants physically. The shareholders may, therefore, authorize the Bank to credit the dividend directly to their bank accounts for all future dividends declared by the Bank. To facilitate the shareholders, a Form for Dividend Mandate has been made available on website of the Bank. Accordingly, shareholders having physical holding and desiring to avail this option may submit the prescribed Dividend Mandate Form, duly filled in and signed, to the Bank’s Share Registrar. Shareholders who hold shares with Participant/Central Depository Company of Pakistan Limited (CDC) may approach to submit the detail in prescribed Dividend Mandate Form, duly filled in and signed, to the concerned Stock Broker / CDC. The Bank encourages the shareholders to take dividend mandate option for instant credit of dividends eliminating the chances of dividend warrants getting lost in the post, remain undelivered or delivered at the wrong address, etc.
13. Transmission of Audited Financial Statements & Notices to Members through email (Optional):
In compliance of S.R.O. 787(I)/2014 of SECP dated September 8, 2014, which has allowed the circulation of soft copies of Audited Financial Statements along with Notice of Annual General Meeting through e-mail instead of sending the same through post to those members who desire to avail this facility. The members who wish to receive soft copies of Audited Financial Statements along with Notice of AGM through email are requested to provide their written consent on the Standard Request Form available on the Bank’s website (www.akbl.com.pk) to Bank’s Share Registrar.
21
An
nu
al R
epo
rt o
f Ask
ari B
ank
Lim
ited
for 2
016

The Bank has placed the audited financial statements for the year ended December 31, 2016 along with Auditors and Directors’ reports thereon on its website; www.akbl.com.pk.
14. Consent for Video Conference Facility:
In compliance of Circular No. 10 dated May 21, 2014 of SECP, shareholders of the Bank are informed that they can avail video conference facility in Karachi and Lahore. In this regard please fill the following form and submit the same with the Company Secretary, Askari Bank Limited, 1st Floor, AWT Plaza, The Mall, P.O. Box No. 1084, Rawalpindi at least ten (10) days before holding of general meeting. If the Bank receives consent from members holding in aggregate ten percent (10%) or more shareholding residing at a geographical location, to participate in the meeting through video conference at least ten (10) days prior to the date of meeting, the Bank will arrange video conference facility in that city subject to availability of such facility in that city. The Bank will intimate members regarding venue of Video Conference Facility at least five (5) days before the date of general meeting along with complete information necessary to enable them to access such facility.
I/We, ---------------- of -------------------- being a Member of Askari Bank Limited, holder of --------- Ordinary Share(s) as per Registered Folio No/CDC Sub-Account No.----------- hereby opt for video conference facility at ------------------.
______________
Signature of Member
15. Change of Address / particulars:
Members are requested to immediately notify any change in their addresses to the Bank’s Shares Registrar, M/s Central Depository Company of Pakistan Limited, 2nd Floor, 307-Upper Mall, Lahore. To facilitate the shareholders, a Form for Change of Particulars of Shareholders has been made available on the website of the Bank.
16. Zakat Declaration (CZ-50):
Zakat will be deducted from the dividends at source at the rate of 2.5% of the paid-up value of the share (Rs. 10/- each) and will be deposited within the prescribed period with the relevant authority. In case of claiming exemption, please submit your Zakat Declarations under Zakat and Ushr Ordinance, 1980 and Rule 4 of Zakat (Deduction and Refund) Rules, 1981 CZ-50 Form with our Share Registrar. Physical shareholders are requested to submit the said declaration to our Share Registrar in the proper manner. The shareholders must write Askari Bank’s name and their respective CDC Account number or folio numbers on Zakat Declarations at relevant place.
STATEMENT UNDER SECTION 160 (1) (b) & (c) OF THE COMPANIES ORDINANCE, 1984This statement sets out the material facts pertaining to the special business to be transacted at the 25th Annual General Meeting of the Bank to be held on Friday, March 31, 2017.
ITEM NO. 5 OF THE NOTICE – ELECTION OF DIRECTORS
Term of office of the present Directors of the Bank will expire on March 31, 2017. The Board of Directors of the Bank will be re-constituted for a fresh term of three years by electing ten (10) Directors.
ITEM NO. 6 OF THE NOTICE – CIRCULATION OF AUDITED FINANCIAL STATEMENTS THROUGH CD/DVD/USB
The Securities and Exchange Commission of Pakistan (SECP) has allowed companies to transmit / circulate the Annual Statement of Financial Position, Profit & Loss Account, Auditors’ Report and Directors’ Report etc. (Annual Audited Financial Statements) to its members through CD/DVD/USB at their registered addresses instead of transmitting the said accounts in hard copies. In this regard, a standard request form will be placed on the website of the Bank.
A shareholder may request to the Company Secretary to provide hard copy of Annual Audited Financial Statements and the same will be provided at the shareholder’s registered address, within one week of the demand.
None of the Directors of Askari Bank Limited has any personal interest in the aforesaid Special Business except in their capacity as shareholders or Directors of the Bank.
ITEM NO. 7 OF THE NOTICE - SALE OF SHARES OF ASKARI INVESTMENT MANAGEMENT LIMITED (AIML) HELD BY ASKARI BANK LIMITED (AKBL)
Askari Investment Management Limited (“AIML”) is a company incorporated under the laws of Pakistan and carrying on the business of asset management under license from the Securities and Exchange Commission of Pakistan. AIML’s issued and paid up share capital is currently PKR 335,000,000/- (Three Hundred Thirty Five Million), divided into 33,500,000 (Thirty Three Million Five Hundred Thousand) ordinary shares of PKR 10/- (Pak Rupees Ten) each, all of which are held by AKBL (directly and through its nominees).
AKBL is desirous of selling 33,500,000 (Thirty Three Million Five Hundred Thousand) ordinary shares of AIML (being 100% of the issued and paid up share capital of AIML) for an aggregate price of not less than PKR 551,000,000/- (Pak Rupees Five Hundred Fifty One Million).
The above sale / divestment has been approved by the Board of Directors of AKBL in their meeting held on January 05, 2017 at Rawalpindi, and is subject to obtaining all requisite regulatory approvals.
Since AIML is an associated company / undertaking of AKBL, the approval of the shareholders of AKBL is required under section 208 of the Companies Ordinance, 1984.
The information required to be annexed to the Notice by Notification No. SRO 27(I)/2012 dated 16 January 2012 is set out below:
22Ce
lebrat
ing Y
oung T
alent
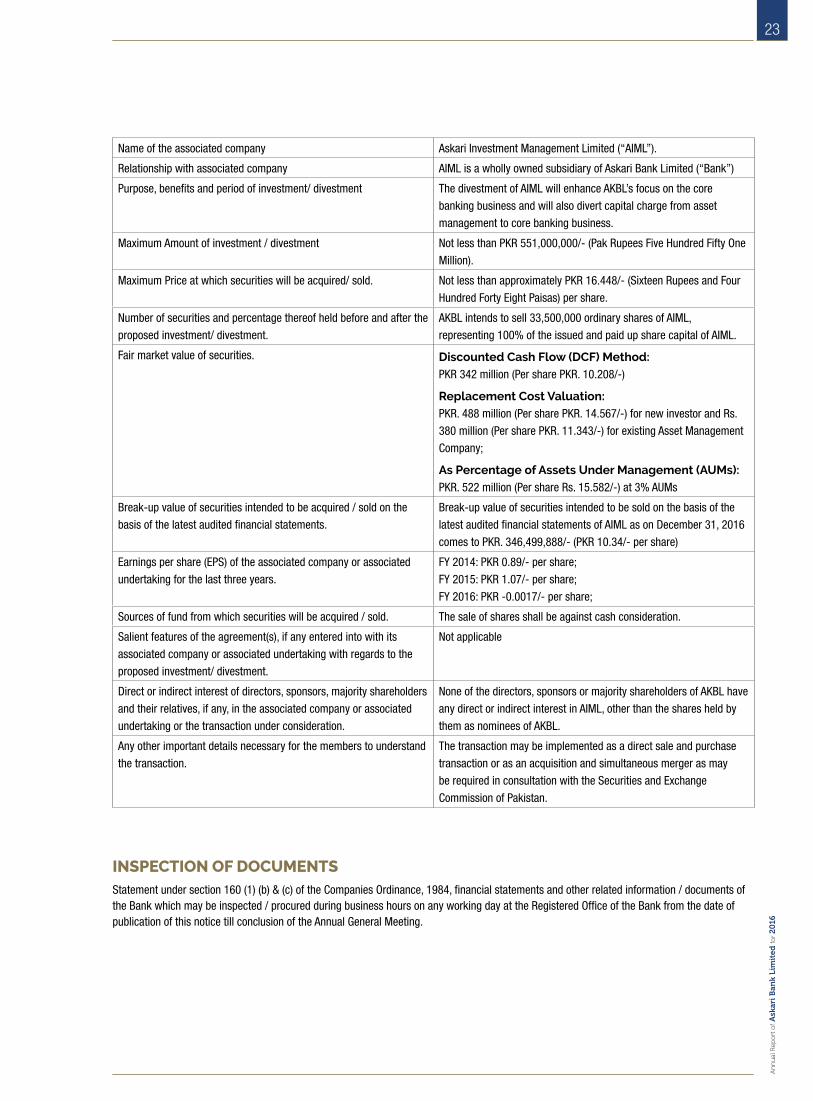
INSPECTION OF DOCUMENTSStatement under section 160 (1) (b) & (c) of the Companies Ordinance, 1984, financial statements and other related information / documents of the Bank which may be inspected / procured during business hours on any working day at the Registered Office of the Bank from the date of publication of this notice till conclusion of the Annual General Meeting.
Name of the associated company Askari Investment Management Limited (“AIML”).
Relationship with associated company AIML is a wholly owned subsidiary of Askari Bank Limited (“Bank”)
Purpose, benefits and period of investment/ divestment The divestment of AIML will enhance AKBL’s focus on the core
banking business and will also divert capital charge from asset
management to core banking business.
Maximum Amount of investment / divestment Not less than PKR 551,000,000/- (Pak Rupees Five Hundred Fifty One
Million).
Maximum Price at which securities will be acquired/ sold. Not less than approximately PKR 16.448/- (Sixteen Rupees and Four
Hundred Forty Eight Paisas) per share.
Number of securities and percentage thereof held before and after the
proposed investment/ divestment.
AKBL intends to sell 33,500,000 ordinary shares of AIML,
representing 100% of the issued and paid up share capital of AIML.
Fair market value of securities. Discounted Cash Flow (DCF) Method:
PKR 342 million (Per share PKR. 10.208/-)
Replacement Cost Valuation:
PKR. 488 million (Per share PKR. 14.567/-) for new investor and Rs.
380 million (Per share PKR. 11.343/-) for existing Asset Management
Company;
As Percentage of Assets Under Management (AUMs):
PKR. 522 million (Per share Rs. 15.582/-) at 3% AUMs
Break-up value of securities intended to be acquired / sold on the
basis of the latest audited financial statements.
Break-up value of securities intended to be sold on the basis of the
latest audited financial statements of AIML as on December 31, 2016
comes to PKR. 346,499,888/- (PKR 10.34/- per share)
Earnings per share (EPS) of the associated company or associated
undertaking for the last three years.
FY 2014: PKR 0.89/- per share;
FY 2015: PKR 1.07/- per share;
FY 2016: PKR -0.0017/- per share;
Sources of fund from which securities will be acquired / sold. The sale of shares shall be against cash consideration.
Salient features of the agreement(s), if any entered into with its
associated company or associated undertaking with regards to the
proposed investment/ divestment.
Not applicable
Direct or indirect interest of directors, sponsors, majority shareholders
and their relatives, if any, in the associated company or associated
undertaking or the transaction under consideration.
None of the directors, sponsors or majority shareholders of AKBL have
any direct or indirect interest in AIML, other than the shares held by
them as nominees of AKBL.
Any other important details necessary for the members to understand
the transaction.
The transaction may be implemented as a direct sale and purchase
transaction or as an acquisition and simultaneous merger as may
be required in consultation with the Securities and Exchange
Commission of Pakistan.
23
An
nu
al R
epo
rt o
f Ask
ari B
ank
Lim
ited
for 2
016

24Ce
lebrat
ing Y
oung T
alent

Dua Abbas After graduating with distinction from the National College of Arts, Dua went on to display her artwork on various galleries in Lahore. She currently works as a freelance contributor to a few distinct art exhibitions.
OIL ON CANVAS36” x 24”
25
An
nu
al R
epo
rt o
f Ask
ari B
ank
Lim
ited
for 2
016
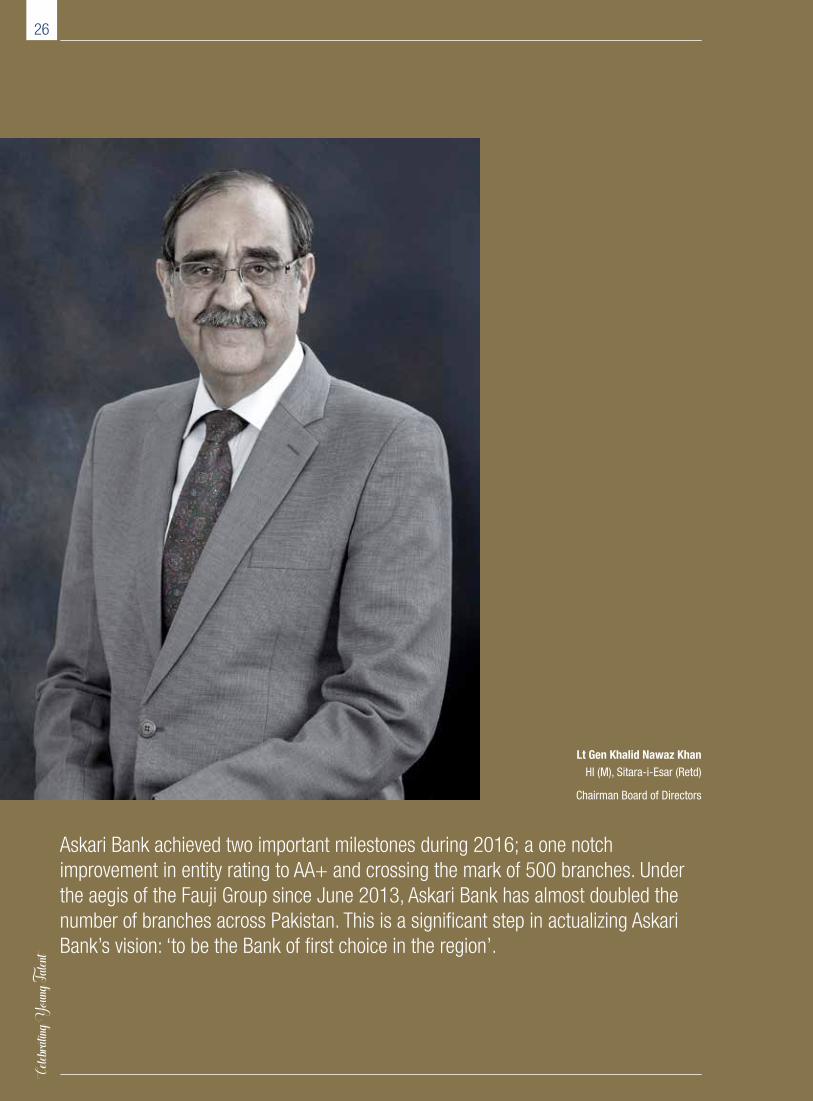
Askari Bank achieved two important milestones during 2016; a one notch improvement in entity rating to AA+ and crossing the mark of 500 branches. Under the aegis of the Fauji Group since June 2013, Askari Bank has almost doubled the number of branches across Pakistan. This is a significant step in actualizing Askari Bank’s vision: ‘to be the Bank of first choice in the region’.
Lt Gen Khalid Nawaz KhanHI (M), Sitara-i-Esar (Retd)
Chairman Board of Directors
26Ce
lebrat
ing Y
oung T
alent

CHAIRMAN’S MESSAGE The Bank posted consistent performance
during 2016 despite low interest margins
that impacted the banking industry. Askari
Bank is making good progress on the key
drivers of strong growth; extended footprint,
improved customer services, enhanced
efficiencies and quality assets, that will
positively impact long-term shareholder
value. The financial results for 2016
annexed with this report reflect another year
of steady growth enabled by a 16 percent
increase in the asset-base and a 4 percent
increase in profits. Based on these financial
results, the Board is pleased to announce a
final cash dividend of Rs.1.50 per share (i.e.
15 percent) for the year ended December
31, 2016.
Economic growth accelerated in Pakistan
during fiscal year 2016 on the cumulative
impact of the government’s macroeconomic
and structural reform program, lower oil
prices, and improved security situation,
outpacing growth forecasts. Inflation and
the current account deficit were lower than
expected, while foreign exchange reserves
strengthened and the budget deficit shrank.
However, looking ahead the forecast
for inflation and current account see an
edge-up on the expectation of higher global
oil prices. The China-Pakistan-Economic-
Corridor (CPEC) is now a reality and is
expected to bring significant investment
for infrastructure projects, especially road
network and energy projects, which in turn
will spurn other services and industries.
The recent trend of external ratings will also
play a key role in attracting investment and
opportunities in Pakistan.
With expanding presence, the Bank
increased its focus on the credo that
business is built on relationships. As a
customer-centric organization, Askari Bank
will continue to explore opportunities with a
clear direction; understanding and gaining
insight to the customer needs, delivering
customized solutions in a committed
and friendly manner by our inspired and
empowered people. The Bank assigns
high priority to sourcing and retaining the
right talent with emphasis on leadership,
while being at the forefront of innovative
technology in the industry.
I take this opportunity to convey my sincere
gratitude to all our customers across the
country who we consider our most valuable
asset. I am also thankful to the State Bank
of Pakistan for their continued support,
to my colleagues on the Board for their
valuable guidance, and to the entire team
of employees led by the President, whose
talents, unreserved effort and commitment
propels the Bank to greater heights.
Lt Gen Khalid Nawaz KhanHI (M), Sitara-i-Esar (Retd)
Chairman Board of Directors
Askari Bank Limited
February 14, 2017
27
An
nu
al R
epo
rt o
f Ask
ari B
ank
Lim
ited
for 2
016
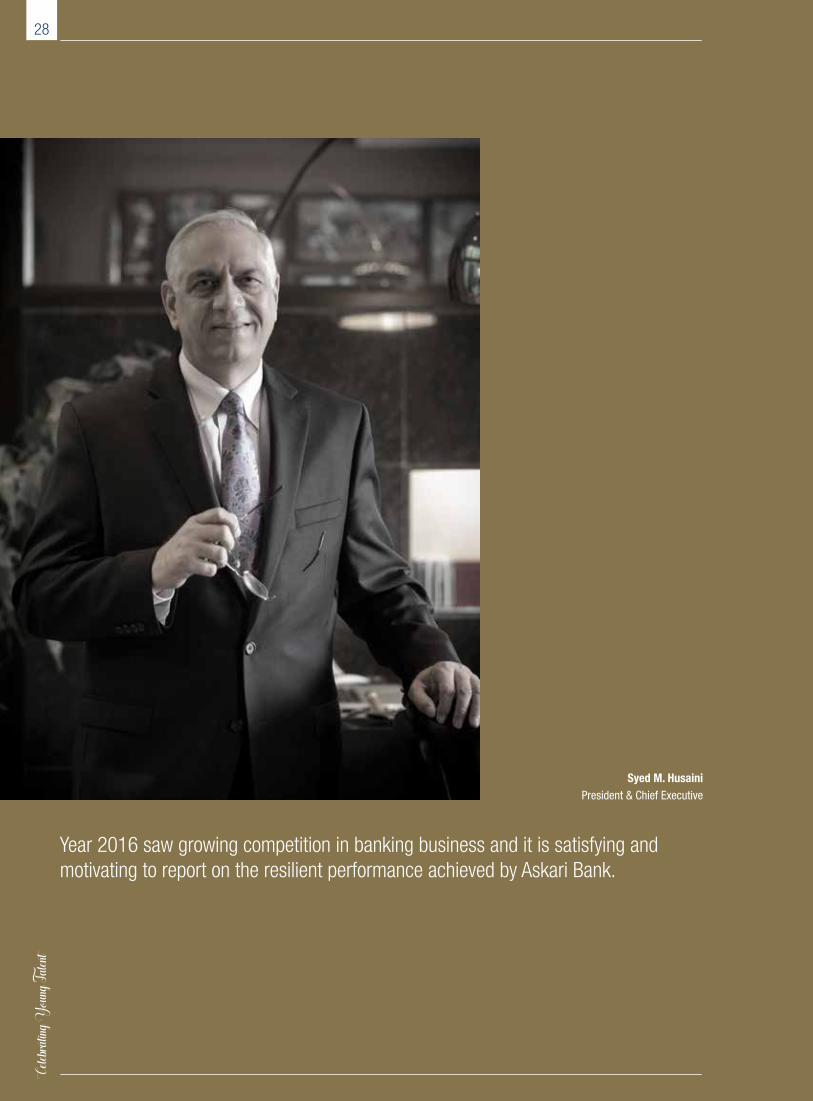
Syed M. HusainiPresident & Chief Executive
Year 2016 saw growing competition in banking business and it is satisfying and motivating to report on the resilient performance achieved by Askari Bank.
28Ce
lebrat
ing Y
oung T
alent
PRESIDENT’S REVIEW Over the last few years, Askari Bank has substantially expanded its network presence and has calibrated growth and reoriented the strategy in line with the changing environment. We have set out a growth path based on a well-defined risk management framework that focuses on maintaining a healthy asset quality, addresses stress to the asset portfolios while maintaining a strong balance sheet.
The comfort on macroeconomic front; mainly low inflation and overall external surplus enabled the continuation of staggered monetary easing and a cut of 25 basis points announced during 2016 reduced the policy rate to the lowest level since the early 70s. The overall economic growth was driven mainly by the industrial and services sectors as agriculture suffered due to decline in cotton production. External sector remained stable on account of growth in remittances; continued flows from IFIs; and a decline in global oil prices during fiscal 2016. Pakistan’s economy is poised to build on the progress made in recent years on the back of focused Government initiatives to drive sustainable growth, improved security conditions and China-Pakistan-Economic-Corridor (CPEC) related projects. Alongside, the historic low interest rates will help in further boosting up private credits in coming periods.
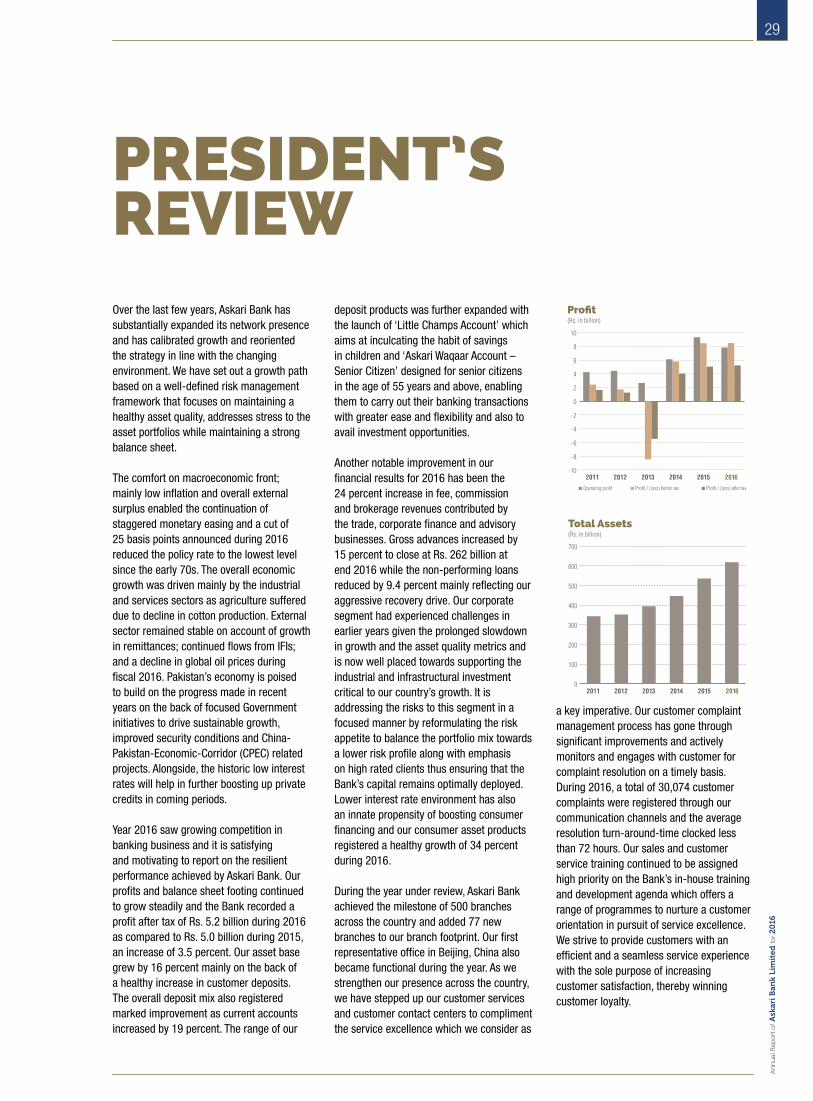
Year 2016 saw growing competition in banking business and it is satisfying and motivating to report on the resilient performance achieved by Askari Bank. Our profits and balance sheet footing continued to grow steadily and the Bank recorded a profit after tax of Rs. 5.2 billion during 2016 as compared to Rs. 5.0 billion during 2015, an increase of 3.5 percent. Our asset base grew by 16 percent mainly on the back of a healthy increase in customer deposits. The overall deposit mix also registered marked improvement as current accounts increased by 19 percent. The range of our
deposit products was further expanded with the launch of ‘Little Champs Account’ which aims at inculcating the habit of savings in children and ‘Askari Waqaar Account – Senior Citizen’ designed for senior citizens in the age of 55 years and above, enabling them to carry out their banking transactions with greater ease and flexibility and also to avail investment opportunities.
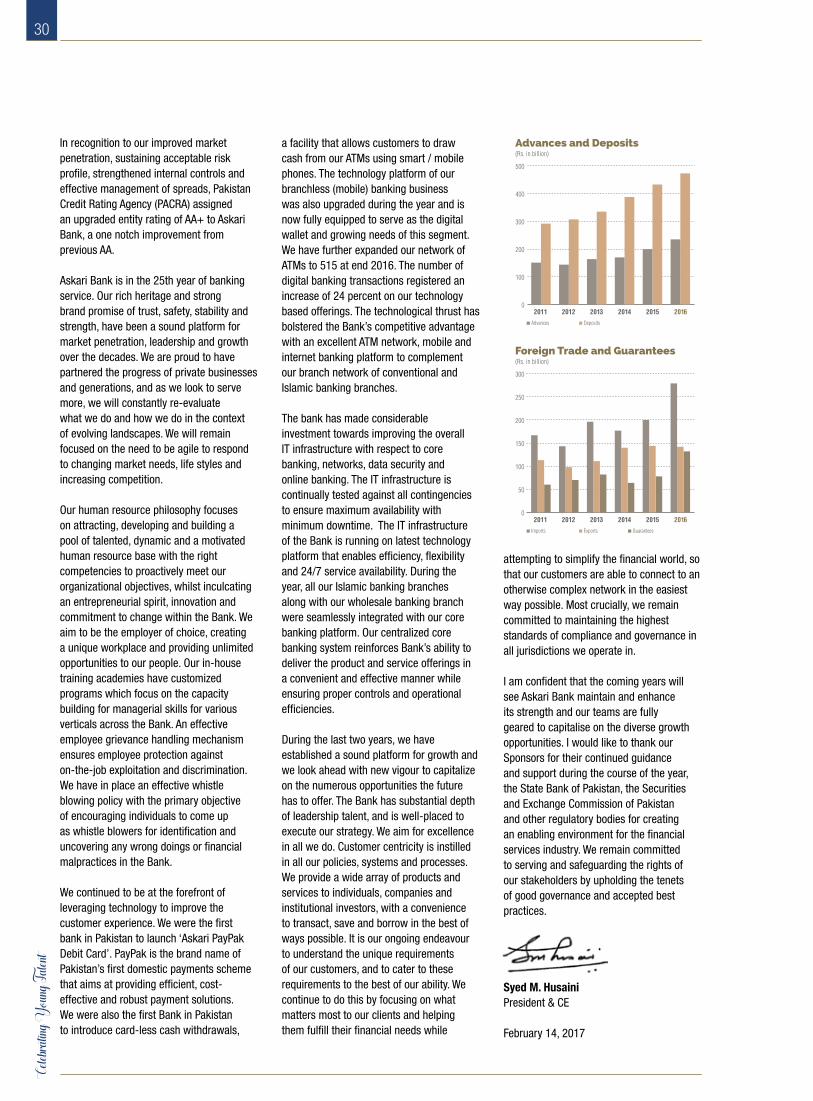
Another notable improvement in our financial results for 2016 has been the 24 percent increase in fee, commission and brokerage revenues contributed by the trade, corporate finance and advisory businesses. Gross advances increased by 15 percent to close at Rs. 262 billion at end 2016 while the non-performing loans reduced by 9.4 percent mainly reflecting our aggressive recovery drive. Our corporate segment had experienced challenges in earlier years given the prolonged slowdown in growth and the asset quality metrics and is now well placed towards supporting the industrial and infrastructural investment critical to our country’s growth. It is addressing the risks to this segment in a focused manner by reformulating the risk appetite to balance the portfolio mix towards a lower risk profile along with emphasis on high rated clients thus ensuring that the Bank’s capital remains optimally deployed. Lower interest rate environment has also an innate propensity of boosting consumer financing and our consumer asset products registered a healthy growth of 34 percent during 2016.
During the year under review, Askari Bank achieved the milestone of 500 branches across the country and added 77 new branches to our branch footprint. Our first representative office in Beijing, China also became functional during the year. As we strengthen our presence across the country, we have stepped up our customer services and customer contact centers to compliment the service excellence which we consider as
a key imperative. Our customer complaint management process has gone through significant improvements and actively monitors and engages with customer for complaint resolution on a timely basis. During 2016, a total of 30,074 customer complaints were registered through our communication channels and the average resolution turn-around-time clocked less than 72 hours. Our sales and customer service training continued to be assigned high priority on the Bank’s in-house training and development agenda which offers a range of programmes to nurture a customer orientation in pursuit of service excellence. We strive to provide customers with an efficient and a seamless service experience with the sole purpose of increasing customer satisfaction, thereby winning customer loyalty.
Profit / (loss) after taxProfit / (loss) before taxOperating profit
Pro�t(Rs. in billion)
201620152014201320122011-10
-8
-6
-4
-2
0
2
4
6
8
10
Total Assets(Rs. in billion)
2016201520142013201220110
100
200
300
400
500
600
700
29
An
nu
al R
epo
rt o
f Ask
ari B
ank
Lim
ited
for 2
016
In recognition to our improved market penetration, sustaining acceptable risk profile, strengthened internal controls and effective management of spreads, Pakistan Credit Rating Agency (PACRA) assigned an upgraded entity rating of AA+ to Askari Bank, a one notch improvement from previous AA.
Askari Bank is in the 25th year of banking service. Our rich heritage and strong brand promise of trust, safety, stability and strength, have been a sound platform for market penetration, leadership and growth over the decades. We are proud to have partnered the progress of private businesses and generations, and as we look to serve more, we will constantly re-evaluate what we do and how we do in the context of evolving landscapes. We will remain focused on the need to be agile to respond to changing market needs, life styles and increasing competition. Our human resource philosophy focuses on attracting, developing and building a pool of talented, dynamic and a motivated human resource base with the right competencies to proactively meet our organizational objectives, whilst inculcating an entrepreneurial spirit, innovation and commitment to change within the Bank. We aim to be the employer of choice, creating a unique workplace and providing unlimited opportunities to our people. Our in-house training academies have customized programs which focus on the capacity building for managerial skills for various verticals across the Bank. An effective employee grievance handling mechanism ensures employee protection against on-the-job exploitation and discrimination. We have in place an effective whistle blowing policy with the primary objective of encouraging individuals to come up as whistle blowers for identification and uncovering any wrong doings or financial malpractices in the Bank.
We continued to be at the forefront of leveraging technology to improve the customer experience. We were the first bank in Pakistan to launch ‘Askari PayPak Debit Card’. PayPak is the brand name of Pakistan’s first domestic payments scheme that aims at providing efficient, cost-effective and robust payment solutions. We were also the first Bank in Pakistan to introduce card-less cash withdrawals,
a facility that allows customers to draw cash from our ATMs using smart / mobile phones. The technology platform of our branchless (mobile) banking business was also upgraded during the year and is now fully equipped to serve as the digital wallet and growing needs of this segment. We have further expanded our network of ATMs to 515 at end 2016. The number of digital banking transactions registered an increase of 24 percent on our technology based offerings. The technological thrust has bolstered the Bank’s competitive advantage with an excellent ATM network, mobile and internet banking platform to complement our branch network of conventional and Islamic banking branches.
The bank has made considerable investment towards improving the overall IT infrastructure with respect to core banking, networks, data security and online banking. The IT infrastructure is continually tested against all contingencies to ensure maximum availability with minimum downtime. The IT infrastructure of the Bank is running on latest technology platform that enables efficiency, flexibility and 24/7 service availability. During the year, all our Islamic banking branches along with our wholesale banking branch were seamlessly integrated with our core banking platform. Our centralized core banking system reinforces Bank’s ability to deliver the product and service offerings in a convenient and effective manner while ensuring proper controls and operational efficiencies.
During the last two years, we have established a sound platform for growth and we look ahead with new vigour to capitalize on the numerous opportunities the future has to offer. The Bank has substantial depth of leadership talent, and is well-placed to execute our strategy. We aim for excellence in all we do. Customer centricity is instilled in all our policies, systems and processes. We provide a wide array of products and services to individuals, companies and institutional investors, with a convenience to transact, save and borrow in the best of ways possible. It is our ongoing endeavour to understand the unique requirements of our customers, and to cater to these requirements to the best of our ability. We continue to do this by focusing on what matters most to our clients and helping them fulfill their financial needs while
attempting to simplify the financial world, so that our customers are able to connect to an otherwise complex network in the easiest way possible. Most crucially, we remain committed to maintaining the highest standards of compliance and governance in all jurisdictions we operate in. I am confident that the coming years will see Askari Bank maintain and enhance its strength and our teams are fully geared to capitalise on the diverse growth opportunities. I would like to thank our Sponsors for their continued guidance and support during the course of the year, the State Bank of Pakistan, the Securities and Exchange Commission of Pakistan and other regulatory bodies for creating an enabling environment for the financial services industry. We remain committed to serving and safeguarding the rights of our stakeholders by upholding the tenets of good governance and accepted best practices.
Syed M. HusainiPresident & CE
February 14, 2017
DepositsAdvances
Advances and Deposits(Rs. in billion)
2016201520142013201220110
100
200
300
400
500
Exports GuaranteesImports
Foreign Trade and Guarantees(Rs. in billion)
2016201520142013201220110
50
100
150
200
250
300
30Ce
lebrat
ing Y
oung T
alent

CORPORATE SOCIAL RESPONSIBILITY (CSR)Askari Bank recognizes its obligation to society as a strategic imperative as reflected in its mission statement. As a socially responsible corporate entity, the Bank believes in taking initiatives which add value to peoples’ lives and the environment around them.
During 2016, the Bank continued to support various initiatives and projects in the areas of education, sports, health and social development as a means of bringing about a positive change in the lives of people around us. In addition to social sector development, certain initiatives were implemented through the involvement of stakeholders within the Bank. To this end, Askari Bank’s program of providing banking training to the children of employees in low income group is running successfully for the second year. Under this program, family members of such employees are given free banking training, thereby enabling them to become gainfully employed and pursue a career in banking.
Some of the other initiatives / events supported by Askari Bank during 2016 are as under:
EDUCATIONInvesting in education is investing in the future of our nation. The Bank contributes for the education sector by supporting educational programs aimed at providing learning opportunities to the youth. Following are some of the educational events supported by the bank during the year:
• Junior Model United Nations at Roots Ivy School, Islamabad
• Film and Drama Festival at NUML, Islamabad
• Outloud Pakistan Business Week Extravaganza at FAST University, Islamabad
President AKBL Syed M. Husaini and General Qamar Javed Bajwa at COAS Polo Cup, Show Jumping & Dressage Championships
SPORTSThe significance of sports is vital for physical and mental well-being and it also inculcates discipline and perseverance. Some of sporting events sponsored by Askari Bank were:
• COAS Polo Cup, Show Jumping and Dressage, Rawalpindi
• 5th All Pakistan Golf Championship, Mangla
• 6th Chief of Naval Staff Golf Championship, Lahore
• Cricket match between Pakistan Army and Australian Army, Rawalpindi
• Inspector General Frontier Corps Polo Cup, Peshawar
• Heavy Industries Taxila Olympiad 2016, Taxila
• Gwadar Coastal Highway Cycle Rally 2016
• Asian Tennis Tour by Islamabad Tennis Association
HEALTHAskari Bank has always contributed generously for health related projects and initiatives with the objective of promoting a healthier Pakistan. Some of the notable contributions were made to:
• Patients Aid Foundation, Karachi• Pakistan Red Crescent, Islamabad• Fatimid Foundation, Multan
• Pakistan Thalassaemia Welfare Society• Hamza Foundation Welfare Hospital• The Kidney Center, Post Graduate
Training Institute, Karachi
CULTURAL AND SOCIAL DEVELOPMENTTo uphold our traditions and participate in the social development of our community Askari Bank plays an active role in various initiatives aimed at promoting our culture and investing in societal causes. Some of these are listed below:
• Eid Milan Party at GE (Army), Tarbela• 14th August ceremony - PAF Academy,
Risalpur• Food and Shopping Festival - DeSom,
Lahore• Floral demonstration - Floral Art
Society of Pakistan, Karachi• Diwali Show 2016, Karachi• Monument construction at Shuhada-e-
Warsak Park and Chowk, AJK• 5th Islamic Finance Expo and
Conference, Karachi• SBP SME Mela (Lahore, Multan,
Gujranwala, Sargodha, Quetta, Hyderabad)
• CPEC Summit and Expo, Islamabad• 2nd Pakistan Edible Oil Conference
(PEOC) 2017, Karachi
31
An
nu
al R
epo
rt o
f Ask
ari B
ank
Lim
ited
for 2
016

32Ce
lebrat
ing Y
oung T
alent
Ali Saad As a young emerging Artist who graduated from the National College of Arts in 2016, Ali has displayed his work nationally and internationally. He has also been involved in conducting art workshops in Pakistan and UAE.
OIL ON CANVAS24” x 30”
33
An
nu
al R
epo
rt o
f Ask
ari B
ank
Lim
ited
for 2
016

VALUE ADDED STATEMENT FOR THE YEAR ENDED DECEMBER 31, 2016
Rs. in ‘000 % age
Value Added
Income from banking services 38,849,985
Cost of services (5,366,176)
Provision against non-performing assets 658,824
Valued added by banking services 34,142,633 99.7
Non-banking services income 104,816 0.3
Total value added 34,247,449 100.0
Value Allocated
to employees
Salaries, allowances and other benefits 7,924,064 23.1
to government
Income tax 3,256,313 9.5
to providers of capital
Cash dividend 1,890,390 5.5
to providers of finance
as financial charges 16,832,890 49.2
to expansion and growth
Depreciation 1,013,547 3.0
Retained in business 3,330,245 9.7
4,343,792 12.7
Total value allocated 34,247,449 100.0
Value Added(Percentage)
Income from non-banking services
Income from banking services
99.7
0.3
Value Allocated(Percentage)
To Governement
To Providers of Capital
To Providers of Finance
To Employees
To Expansion and Growth
12.7
23.1
9.5
5.5
49.2
34Ce
lebrat
ing Y
oung T
alent
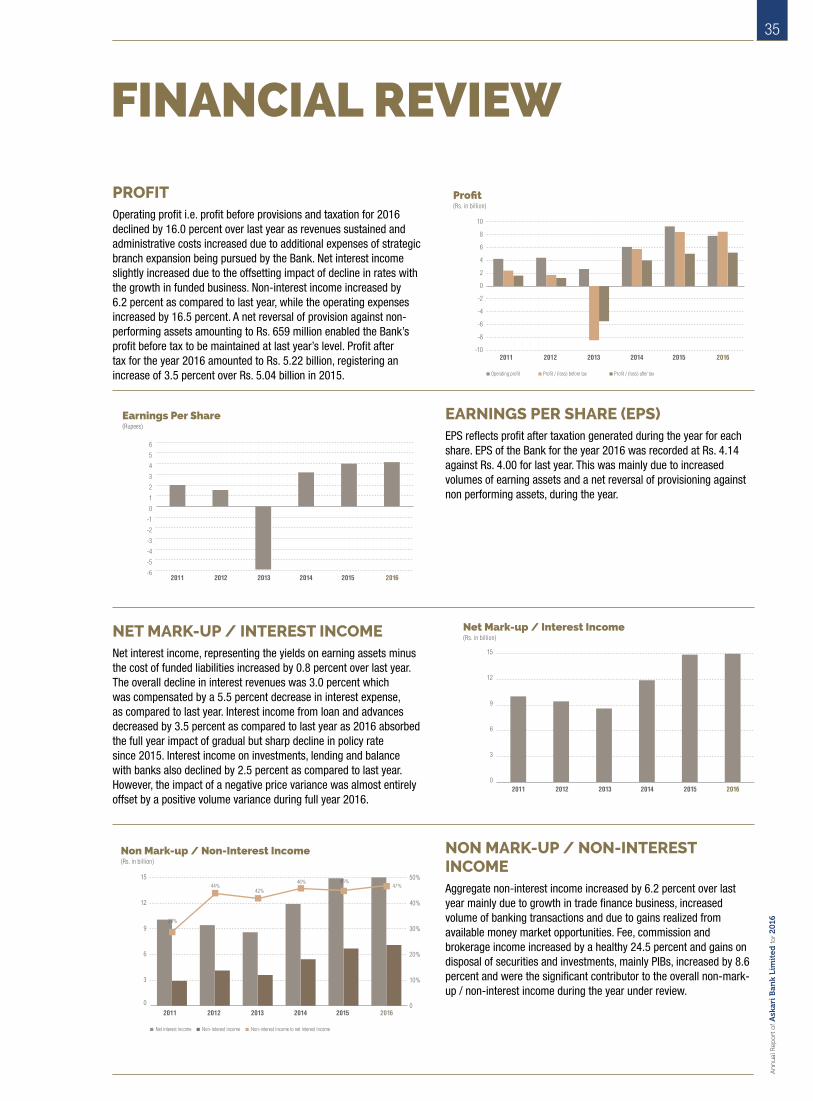
PROFITOperating profit i.e. profit before provisions and taxation for 2016 declined by 16.0 percent over last year as revenues sustained and administrative costs increased due to additional expenses of strategic branch expansion being pursued by the Bank. Net interest income slightly increased due to the offsetting impact of decline in rates with the growth in funded business. Non-interest income increased by 6.2 percent as compared to last year, while the operating expenses increased by 16.5 percent. A net reversal of provision against non-performing assets amounting to Rs. 659 million enabled the Bank’s profit before tax to be maintained at last year’s level. Profit after tax for the year 2016 amounted to Rs. 5.22 billion, registering an increase of 3.5 percent over Rs. 5.04 billion in 2015. Profit / (loss) after taxProfit / (loss) before taxOperating profit
Pro�t(Rs. in billion)
201620152014201320122011-10
-8
-6
-4
-2
0
2
4
6
8
10
EARNINGS PER SHARE (EPS) EPS reflects profit after taxation generated during the year for each share. EPS of the Bank for the year 2016 was recorded at Rs. 4.14 against Rs. 4.00 for last year. This was mainly due to increased volumes of earning assets and a net reversal of provisioning against non performing assets, during the year.
NET MARK-UP / INTEREST INCOME Net interest income, representing the yields on earning assets minus the cost of funded liabilities increased by 0.8 percent over last year. The overall decline in interest revenues was 3.0 percent which was compensated by a 5.5 percent decrease in interest expense, as compared to last year. Interest income from loan and advances decreased by 3.5 percent as compared to last year as 2016 absorbed the full year impact of gradual but sharp decline in policy rate since 2015. Interest income on investments, lending and balance with banks also declined by 2.5 percent as compared to last year. However, the impact of a negative price variance was almost entirely offset by a positive volume variance during full year 2016.
NON MARK-UP / NON-INTEREST INCOME Aggregate non-interest income increased by 6.2 percent over last year mainly due to growth in trade finance business, increased volume of banking transactions and due to gains realized from available money market opportunities. Fee, commission and brokerage income increased by a healthy 24.5 percent and gains on disposal of securities and investments, mainly PIBs, increased by 8.6 percent and were the significant contributor to the overall non-mark-up / non-interest income during the year under review.
FINANCIAL REVIEW
(Rs. in billion)
2016201520142013201220110
3
6
9
12
15
Net interest income Non-interest income Non-interest income to net interest income
0
10%
20%
30%
40%
50%
29%
44%46%
42%
45%47%
Non Mark-up / Non-Interest Income
Net Mark-up / Interest Income(Rs. in billion)
20162014 20152013201220110
3
6
9
12
15
Earnings Per Share(Rupees)
20162014 2015201320122011-6
-5
-4
-3
-2
-1
0
1
2
3
4
5
6
35
An
nu
al R
epo
rt o
f Ask
ari B
ank
Lim
ited
for 2
016
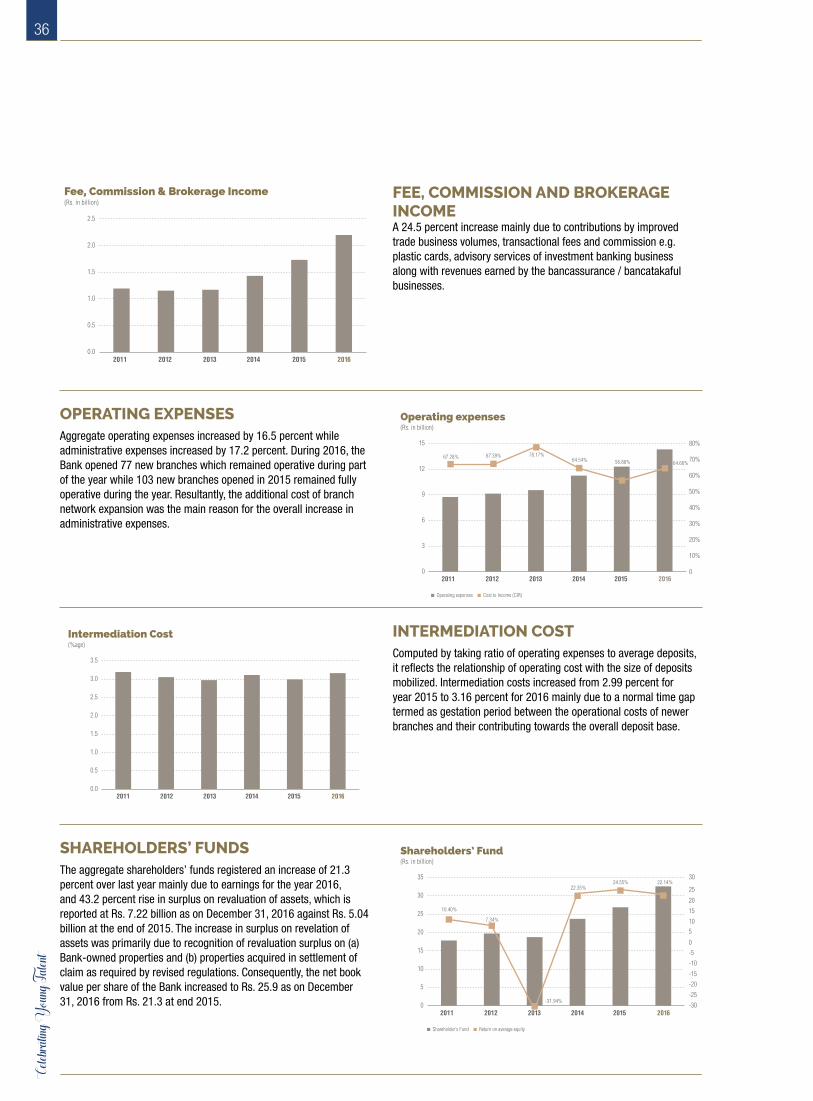
Fee, Commission & Brokerage Income(Rs. in billion)
20162014 20152013201220110.0
0.5
1.0
1.5
2.0
2.5
FEE, COMMISSION AND BROKERAGE INCOME A 24.5 percent increase mainly due to contributions by improved trade business volumes, transactional fees and commission e.g. plastic cards, advisory services of investment banking business along with revenues earned by the bancassurance / bancatakaful businesses.
OPERATING EXPENSES Aggregate operating expenses increased by 16.5 percent while administrative expenses increased by 17.2 percent. During 2016, the Bank opened 77 new branches which remained operative during part of the year while 103 new branches opened in 2015 remained fully operative during the year. Resultantly, the additional cost of branch network expansion was the main reason for the overall increase in administrative expenses.
INTERMEDIATION COST Computed by taking ratio of operating expenses to average deposits, it reflects the relationship of operating cost with the size of deposits mobilized. Intermediation costs increased from 2.99 percent for year 2015 to 3.16 percent for 2016 mainly due to a normal time gap termed as gestation period between the operational costs of newer branches and their contributing towards the overall deposit base.
SHAREHOLDERS’ FUNDS The aggregate shareholders’ funds registered an increase of 21.3 percent over last year mainly due to earnings for the year 2016, and 43.2 percent rise in surplus on revaluation of assets, which is reported at Rs. 7.22 billion as on December 31, 2016 against Rs. 5.04 billion at the end of 2015. The increase in surplus on revelation of assets was primarily due to recognition of revaluation surplus on (a) Bank-owned properties and (b) properties acquired in settlement of claim as required by revised regulations. Consequently, the net book value per share of the Bank increased to Rs. 25.9 as on December 31, 2016 from Rs. 21.3 at end 2015.
(Rs. in billion)
2016201520142013201220110
3
6
9
12
15
Operating expenses Cost to Income (CIR)
67.28% 67.39%64.54%
78.17%56.88% 64.66%
Operating expenses
0
10%
20%
30%
40%
50%
60%
70%
80%
(Rs. in billion)
2016201520142013201220110
5
10
15
20
25
30
35
Shareholder's Fund Return on average equity
22.14%24.55%
7.34%
10.40%
-31.94%
Shareholders’ Fund
-30
-25
-20
-15
-10
-50
510
15
20
25
30
22.35%
Intermediation Cost(%age)
20162014 20152013201220110.0
0.5
1.0
1.5
2.0
2.5
3.0
3.5
36Ce
lebrat
ing Y
oung T
alent
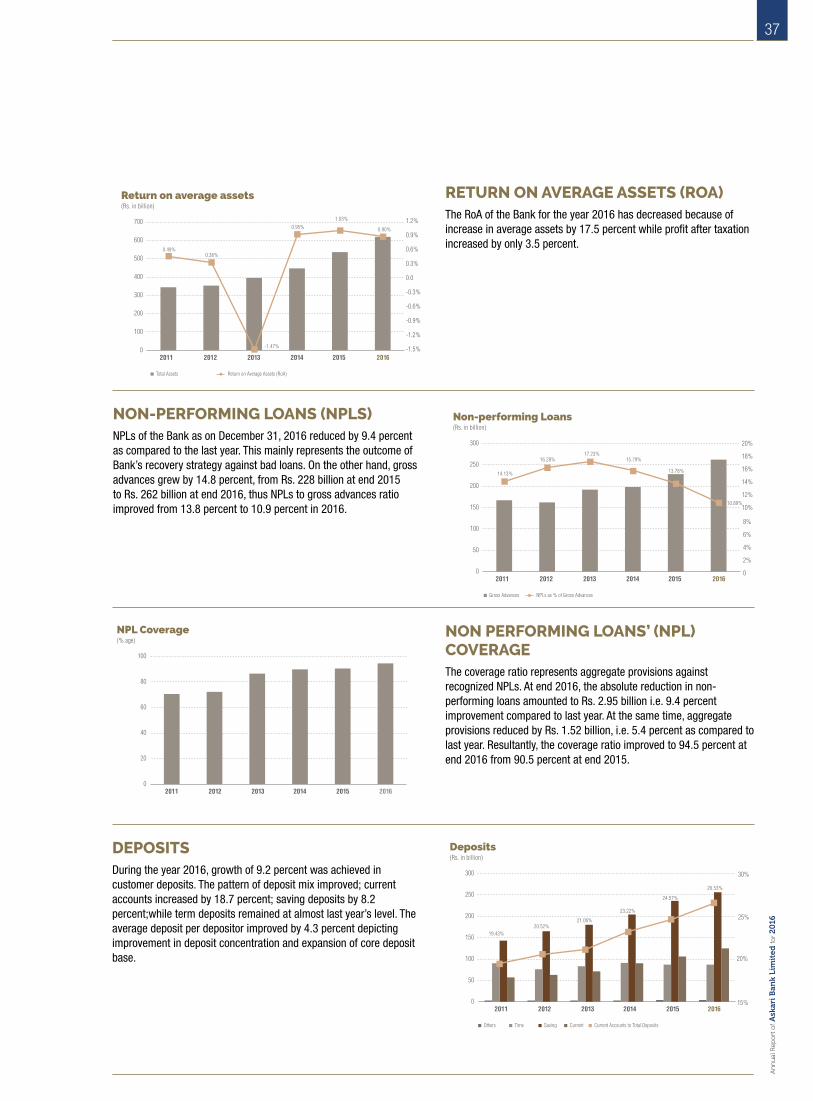
Deposits(Rs. in billion)
20162014 20152013201220110
50
100
150
200
250
300
Time Saving Current Current Accounts to Total DepositsOthers
15%
20%
25%
30%
19.43%20.52%
23.22%
21.06%
26.53%
24.57%
RETURN ON AVERAGE ASSETS (ROA) The RoA of the Bank for the year 2016 has decreased because of increase in average assets by 17.5 percent while profit after taxation increased by only 3.5 percent.
NON-PERFORMING LOANS (NPLS) NPLs of the Bank as on December 31, 2016 reduced by 9.4 percent as compared to the last year. This mainly represents the outcome of Bank’s recovery strategy against bad loans. On the other hand, gross advances grew by 14.8 percent, from Rs. 228 billion at end 2015 to Rs. 262 billion at end 2016, thus NPLs to gross advances ratio improved from 13.8 percent to 10.9 percent in 2016.
NON PERFORMING LOANS’ (NPL) COVERAGEThe coverage ratio represents aggregate provisions against recognized NPLs. At end 2016, the absolute reduction in non-performing loans amounted to Rs. 2.95 billion i.e. 9.4 percent improvement compared to last year. At the same time, aggregate provisions reduced by Rs. 1.52 billion, i.e. 5.4 percent as compared to last year. Resultantly, the coverage ratio improved to 94.5 percent at end 2016 from 90.5 percent at end 2015.
DEPOSITS During the year 2016, growth of 9.2 percent was achieved in customer deposits. The pattern of deposit mix improved; current accounts increased by 18.7 percent; saving deposits by 8.2 percent;while term deposits remained at almost last year’s level. The average deposit per depositor improved by 4.3 percent depicting improvement in deposit concentration and expansion of core deposit base.
Return on average assets(Rs. in billion)
2016201520142013201220110
100
200
300
400
500
600
700
Total Assets Return on Average Assets (RoA)
-1.5%
-1.2%
-0.9%
-0.6%
-0.3%
0.0
0.3%
0.6%
0.9%
1.2%
0.49%0.36%
0.95%
-1.47%
0.90%
1.03%
(Rs. in billion)
2016201520142013201220110
50
100
150
200
250
300
Gross Advances NPLs as % of Gross Advances
0
2%
4%
6%
8%
10%
12%
14%
16%
18%
20%
14.13%
16.28% 15.79%17.23%
10.89%
13.78%
Non-performing Loans
NPL Coverage(% age)
20162014 20152013201220110
20
40
60
80
100
37
An
nu
al R
epo
rt o
f Ask
ari B
ank
Lim
ited
for 2
016
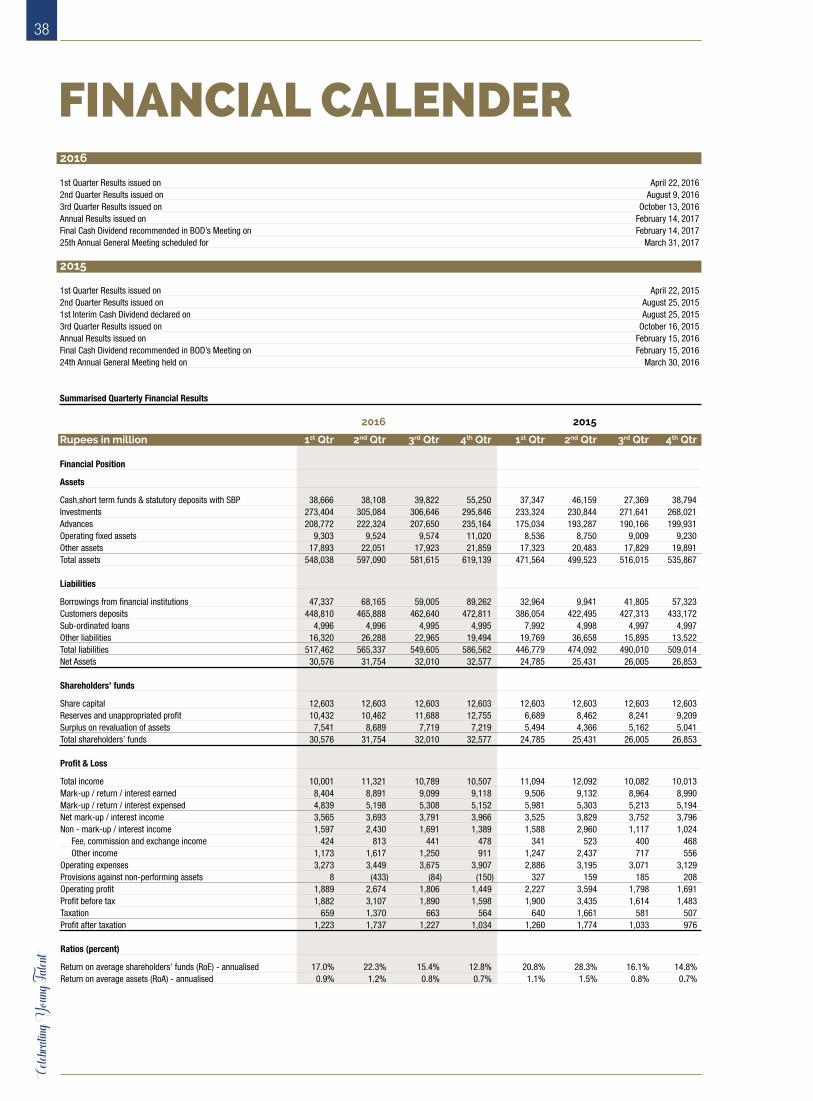
2016
1st Quarter Results issued on April 22, 20162nd Quarter Results issued on August 9, 20163rd Quarter Results issued on October 13, 2016Annual Results issued on February 14, 2017Final Cash Dividend recommended in BOD’s Meeting on February 14, 201725th Annual General Meeting scheduled for March 31, 2017 2015
1st Quarter Results issued on April 22, 20152nd Quarter Results issued on August 25, 20151st Interim Cash Dividend declared on August 25, 20153rd Quarter Results issued on October 16, 2015Annual Results issued on February 15, 2016Final Cash Dividend recommended in BOD’s Meeting on February 15, 201624th Annual General Meeting held on March 30, 2016
Summarised Quarterly Financial Results
2016 2015
Rupees in million 1st Qtr 2nd Qtr 3rd Qtr 4th Qtr 1st Qtr 2nd Qtr 3rd Qtr 4th Qtr
Financial Position
Assets
Cash,short term funds & statutory deposits with SBP 38,666 38,108 39,822 55,250 37,347 46,159 27,369 38,794 Investments 273,404 305,084 306,646 295,846 233,324 230,844 271,641 268,021 Advances 208,772 222,324 207,650 235,164 175,034 193,287 190,166 199,931 Operating fixed assets 9,303 9,524 9,574 11,020 8,536 8,750 9,009 9,230 Other assets 17,893 22,051 17,923 21,859 17,323 20,483 17,829 19,891 Total assets 548,038 597,090 581,615 619,139 471,564 499,523 516,015 535,867 Liabilities
Borrowings from financial institutions 47,337 68,165 59,005 89,262 32,964 9,941 41,805 57,323 Customers deposits 448,810 465,888 462,640 472,811 386,054 422,495 427,313 433,172 Sub-ordinated loans 4,996 4,996 4,995 4,995 7,992 4,998 4,997 4,997 Other liabilities 16,320 26,288 22,965 19,494 19,769 36,658 15,895 13,522 Total liabilities 517,462 565,337 549,605 586,562 446,779 474,092 490,010 509,014 Net Assets 30,576 31,754 32,010 32,577 24,785 25,431 26,005 26,853 Shareholders’ funds
Share capital 12,603 12,603 12,603 12,603 12,603 12,603 12,603 12,603 Reserves and unappropriated profit 10,432 10,462 11,688 12,755 6,689 8,462 8,241 9,209 Surplus on revaluation of assets 7,541 8,689 7,719 7,219 5,494 4,366 5,162 5,041 Total shareholders’ funds 30,576 31,754 32,010 32,577 24,785 25,431 26,005 26,853
Profit & Loss
Total income 10,001 11,321 10,789 10,507 11,094 12,092 10,082 10,013 Mark-up / return / interest earned 8,404 8,891 9,099 9,118 9,506 9,132 8,964 8,990 Mark-up / return / interest expensed 4,839 5,198 5,308 5,152 5,981 5,303 5,213 5,194 Net mark-up / interest income 3,565 3,693 3,791 3,966 3,525 3,829 3,752 3,796 Non - mark-up / interest income 1,597 2,430 1,691 1,389 1,588 2,960 1,117 1,024 Fee, commission and exchange income 424 813 441 478 341 523 400 468 Other income 1,173 1,617 1,250 911 1,247 2,437 717 556 Operating expenses 3,273 3,449 3,675 3,907 2,886 3,195 3,071 3,129 Provisions against non-performing assets 8 (433) (84) (150) 327 159 185 208 Operating profit 1,889 2,674 1,806 1,449 2,227 3,594 1,798 1,691 Profit before tax 1,882 3,107 1,890 1,598 1,900 3,435 1,614 1,483 Taxation 659 1,370 663 564 640 1,661 581 507 Profit after taxation 1,223 1,737 1,227 1,034 1,260 1,774 1,033 976 Ratios (percent)
Return on average shareholders’ funds (RoE) - annualised 17.0% 22.3% 15.4% 12.8% 20.8% 28.3% 16.1% 14.8%Return on average assets (RoA) - annualised 0.9% 1.2% 0.8% 0.7% 1.1% 1.5% 0.8% 0.7%
FINANCIAL CALENDER
38Ce
lebrat
ing Y
oung T
alent
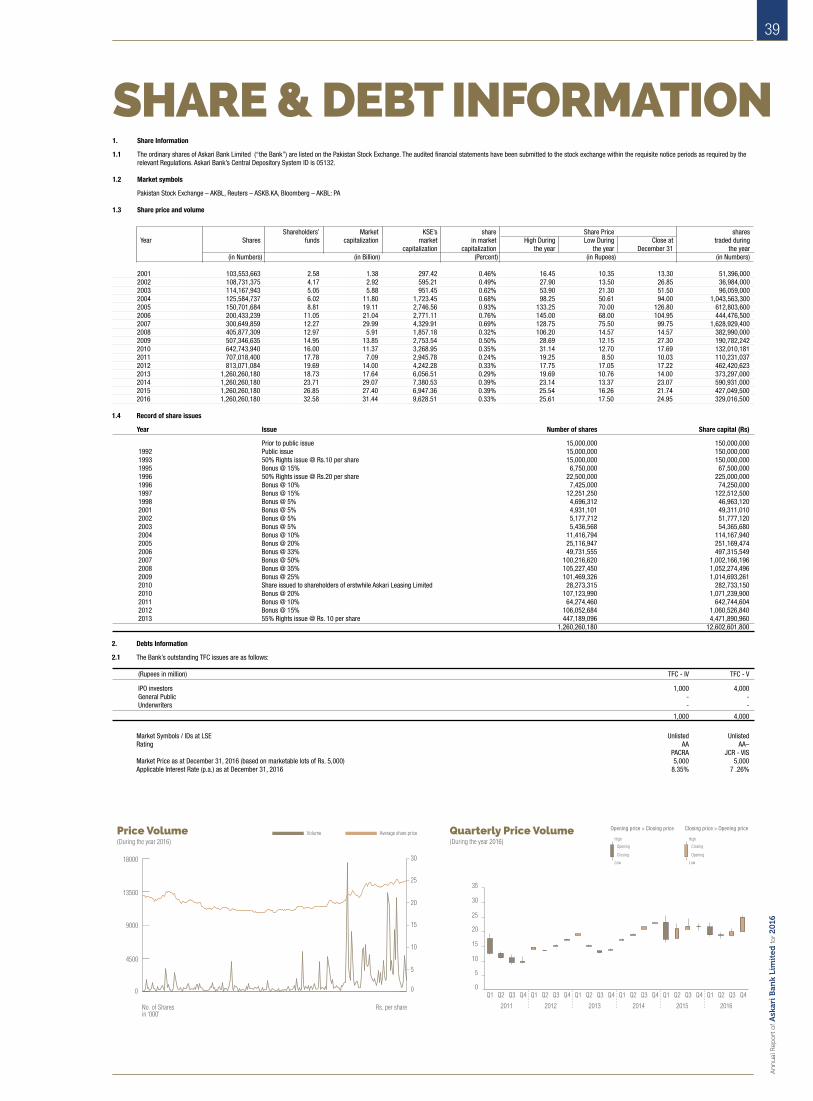
1. Share Information
1.1 The ordinary shares of Askari Bank Limited (“the Bank”) are listed on the Pakistan Stock Exchange. The audited financial statements have been submitted to the stock exchange within the requisite notice periods as required by the relevant Regulations. Askari Bank’s Central Depository System ID is 05132.
1.2 Market symbols
Pakistan Stock Exchange – AKBL, Reuters – ASKB.KA, Bloomberg – AKBL: PA 1.3 Share price and volume
Shareholders’ Market KSE’s share Share Price shares Year Shares funds capitalization market in market High During Low During Close at traded during capitalization capitalization the year the year December 31 the year (in Numbers) (in Billion) (Percent) (in Rupees) (in Numbers)
2001 103,553,663 2.58 1.38 297.42 0.46% 16.45 10.35 13.30 51,396,000 2002 108,731,375 4.17 2.92 595.21 0.49% 27.90 13.50 26.85 36,984,000 2003 114,167,943 5.05 5.88 951.45 0.62% 53.90 21.30 51.50 96,059,000 2004 125,584,737 6.02 11.80 1,723.45 0.68% 98.25 50.61 94.00 1,043,563,300 2005 150,701,684 8.81 19.11 2,746.56 0.93% 133.25 70.00 126.80 612,803,600 2006 200,433,239 11.05 21.04 2,771.11 0.76% 145.00 68.00 104.95 444,476,500 2007 300,649,859 12.27 29.99 4,329.91 0.69% 128.75 75.50 99.75 1,628,929,400 2008 405,877,309 12.97 5.91 1,857.18 0.32% 106.20 14.57 14.57 382,990,000 2009 507,346,635 14.95 13.85 2,753.54 0.50% 28.69 12.15 27.30 190,782,242 2010 642,743,940 16.00 11.37 3,268.95 0.35% 31.14 12.70 17.69 132,010,181 2011 707,018,400 17.78 7.09 2,945.78 0.24% 19.25 8.50 10.03 110,231,037 2012 813,071,084 19.69 14.00 4,242.28 0.33% 17.75 17.05 17.22 462,420,623 2013 1,260,260,180 18.73 17.64 6,056.51 0.29% 19.69 10.76 14.00 373,297,000 2014 1,260,260,180 23.71 29.07 7,380.53 0.39% 23.14 13.37 23.07 590,931,000 2015 1,260,260,180 26.85 27.40 6,947.36 0.39% 25.54 16.26 21.74 427,049,500 2016 1,260,260,180 32.58 31.44 9,628.51 0.33% 25.61 17.50 24.95 329,016,500
1.4 Record of share issues
Year Issue Number of shares Share capital (Rs)
Prior to public issue 15,000,000 150,000,000 1992 Public issue 15,000,000 150,000,000 1993 50% Rights issue @ Rs.10 per share 15,000,000 150,000,000 1995 Bonus @ 15% 6,750,000 67,500,000 1996 50% Rights issue @ Rs.20 per share 22,500,000 225,000,000 1996 Bonus @ 10% 7,425,000 74,250,000 1997 Bonus @ 15% 12,251,250 122,512,500 1998 Bonus @ 5% 4,696,312 46,963,120 2001 Bonus @ 5% 4,931,101 49,311,010 2002 Bonus @ 5% 5,177,712 51,777,120 2003 Bonus @ 5% 5,436,568 54,365,680 2004 Bonus @ 10% 11,416,794 114,167,940 2005 Bonus @ 20% 25,116,947 251,169,474 2006 Bonus @ 33% 49,731,555 497,315,549 2007 Bonus @ 50% 100,216,620 1,002,166,196 2008 Bonus @ 35% 105,227,450 1,052,274,496 2009 Bonus @ 25% 101,469,326 1,014,693,261 2010 Share issued to shareholders of erstwhile Askari Leasing Limited 28,273,315 282,733,150 2010 Bonus @ 20% 107,123,990 1,071,239,900 2011 Bonus @ 10% 64,274,460 642,744,604 2012 Bonus @ 15% 106,052,684 1,060,526,840 2013 55% Rights issue @ Rs. 10 per share 447,189,096 4,471,890,960 1,260,260,180 12,602,601,800 2. Debts Information
2.1 The Bank’s outstanding TFC issues are as follows: (Rupees in million) TFC - IV TFC - V
IPO investors 1,000 4,000 General Public - - Underwriters - -
1,000 4,000
Market Symbols / IDs at LSE Unlisted Unlisted Rating AA AA– PACRA JCR - VIS Market Price as at December 31, 2016 (based on marketable lots of Rs. 5,000) 5,000 5,000 Applicable Interest Rate (p.a.) as at December 31, 2016 8.35% 7 .26%
Price Volume(During the year 2016)
No. of Sharesin ‘000’
Rs. per share
Average share priceVolume
0
4500
9000
13500
18000
0
5
10
15
20
25
30
Quarterly Price Volume(During the year 2016)
0
5
10
15
20
30
25
35
Q1
2011
Q2
Q3
Q4
Q1
2012
Q2
Q3
Q4
Q1
2013
Q2
Q3
Q4
Q1
2014
Q2
Q3
Q4
Q1
2015
Q2
Q3
Q4
Q1
2016
Q2
Q3
Q4
Opening price > Closing price
High
Opening
Closing
Low
Closing price > Opening price
High
Closing
Opening
Low
SHARE & DEBT INFORMATION
39
An
nu
al R
epo
rt o
f Ask
ari B
ank
Lim
ited
for 2
016

HORIZONTAL ANDVERTICAL ANALYSIS Horizontal Analysis
2016 2015 2014 2013 2012 2011 Vs Vs Vs Vs Vs Vs 2016 2015 2014 2013 2012 2011 2015 2014 2013 2012 2011 2010
Rupees in million Variance Statement of Financial Position
AssetsCash and balances with treasury banks 42,568 29,685 19,130 26,105 24,435 26,168 43% 55% -27% 7% -7% 16%Balances with other banks 5,846 8,296 7,068 9,058 8,864 6,235 -30% 17% -22% 2% 42% 65%Lendings to financial institutions 6,837 813 3,428 2,503 6,319 1,592 741% -76% 37% -60% 297% -83%Investments 295,846 268,021 217,214 165,863 145,378 133,757 10% 23% 31% 14% 9% 31%Advances 235,164 199,931 170,496 163,557 143,727 150,711 18% 17% 4% 14% -5% -1%Operating fixed assets 11,020 9,230 8,299 8,567 8,841 9,349 19% 11% -3% -3% -5% -6%Assets held for sale 262 - 54 - - - 0% 0% 0% 0% 0% 0%Deferred tax assets - - 875 2,977 - - 0% -100% -71% 0% 0% 0%Other assets 21,597 19,891 20,517 16,197 15,491 15,945 9% -3% 27% 5% -3% 12% 619,139 535,867 447,083 394,827 353,056 343,756 16% 20% 13% 12% 3% 9% Liabilities Bills payable 8,580 6,095 6,855 5,688 3,700 2,756 41% -11% 21% 54% 34% -11%Borrowings 89,262 57,323 13,742 24,546 8,373 17,273 56% 317% -44% 193% -52% -32%Deposits and other accounts 472,811 433,172 387,587 335,241 306,937 291,503 9% 12% 16% 9% 5% 14%Sub-ordinated loans 4,995 4,997 7,993 3,994 6,987 6,990 0% -37% 100% -43% 0% 17%Deferred tax liabilities 526 96 - - 118 83 446% 0% 0% -100% 42% -3%Other liabilities 10,388 7,330 7,199 6,630 7,252 7,374 42% 2% 9% -9% -2% -9% 586,562 509,014 423,375 376,099 333,367 325,980 15% 20% 13% 13% 2% 9%Net Assets 32,577 26,853 23,707 18,729 19,688 17,776 21% 13% 27% -5% 11% 11% Represented by Share capital 12,603 12,603 12,603 12,603 8,131 7,070 0% 0% 0% 55% 15% 10%Reserves 8,671 6,446 4,824 5,613 8,542 8,136 35% 34% -14% -34% 5% 6%Unappropriated profit / (loss) 4,084 2,763 1,862 (1,583) 1,004 1,302 48% 48% -218% -258% -23% 86% 25,358 21,812 19,289 16,633 17,677 16,509 16% 13% 16% -6% 7% 11%Surplus on revaluation of assets - net of tax 7,219 5,041 4,418 2,096 2,011 1,267 43% 14% 111% 4% 59% 7% 32,577 26,853 23,707 18,729 19,688 17,776 21% 13% 27% -5% 11% 11%
Profit and Loss
Mark-up / return / interest earned 35,512 36,592 34,604 27,961 32,402 32,766 -3% 6% 24% -14% -1% 20%Mark-up / return / interest expensed 20,497 21,690 22,711 19,363 22,974 22,700 -6% -4% 17% -16% 1% 27% Net mark-up / interest income 15,016 14,902 11,893 8,597 9,428 10,067 1% 25% 38% -9% -6% 7% (Reversal) / provision against non-performing loans and advances - net (729) 316 (83) 9,854 2,342 1,630 331% 480% -101% 321% 44% -30% Impairment loss on available for sale investment 23 217 208 151 143 122 -90% 5% 37% 6% 17% -68% Provision for diminution in the value of investments 48 346 198 933 201 44 -86% 75% -79% 364% 362% -85% Provision against reverse repo - - - - - 35 0% 0% 0% 0% -100% -47% Reversal of provision against purchase under resale agreement - - - (35) - - 0% 0% 0% 0% 0% 0% Impairment loss on immovable assets - - - 200 - - 0% 0% 0% 0% 0% 0% Bad debts written off directly - - - - 1 - 0% 0% 0% -100% 0% 0% (659) 879 322 11,103 2,688 1,831 -175% 173% -97% 313% 47% -40%Net mark-up / interest income after provisions 15,674 14,023 11,571 (2,506) 6,741 8,236 12% 21% -562% -137% -18% 30%
Non mark-up/interest income Fee, commission and brokerage income 2,156 1,732 1,435 1,169 1,153 1,194 24% 21% 23% 1% -3% -6% Dividend income 305 303 349 509 1,036 289 1% -13% -31% -51% 258% 38% Income from dealing in foreign currencies 640 835 985 559 885 772 -23% -15% 76% -37% 15% 6% Gain on sale of investments - net 3,527 3,246 1,804 820 682 307 9% 80% 120% 20% 122% 45% Unrealised gain on revaluation of investments classified as held for trading - net - - - - 0 - 0% 0% 0% -100% 100% 0% Other income 479 573 744 540 361 340 -16% -23% 38% 50% 6% -10% Total non-markup / interest income 7,106 6,690 5,317 3,598 4,117 2,903 6% 26% 48% -13% 42% 4% 22,781 20,712 16,889 1,092 10,858 11,139 10% 23% 1446% -90% -3% 22%Non mark-up/interest expenses Administrative expenses 14,079 12,014 10,934 9,397 9,039 8,639 17% 10% 16% 4% 5% 11% Other provisions / write offs 3 50 47 114 9 - -93% 6% -59% 1215% 0% 0% Other charges 222 217 126 23 80 87 2% 72% 457% -72% -7% 104% Total non-markup / interest expenses 14,304 12,281 11,107 9,533 9,128 8,726 16% 11% 17% 4% 5% 11%Profit / (loss) before taxation 8,477 8,432 5,781 (8,441) 1,730 2,413 1% 46% -168% -588% -28% 90% Taxation – current (2,129) (2,330) (1,014) (94) (839) (833) -9% 130% 981% -89% 1% 153% – prior years’ (266) (416) - - - - 0% 0% 0% 0% 0% 0% – deferred (861) (642) (753) 3,054 364 48 34% -15% -125% 739% 664% 0% (3,256) (3,388) (1,766) 2,961 (475) (785) -4% 92% -160% -723% -39% 138%Profit / (loss) after taxation 5,221 5,043 4,015 (5,480) 1,255 1,628 4% 26% -173% -537% -23% 72%
Basic earnings per share - Rupees 4.14 4.00 3.19 (5.90) 1.54 2.30
40Ce
lebrat
ing Y
oung T
alent
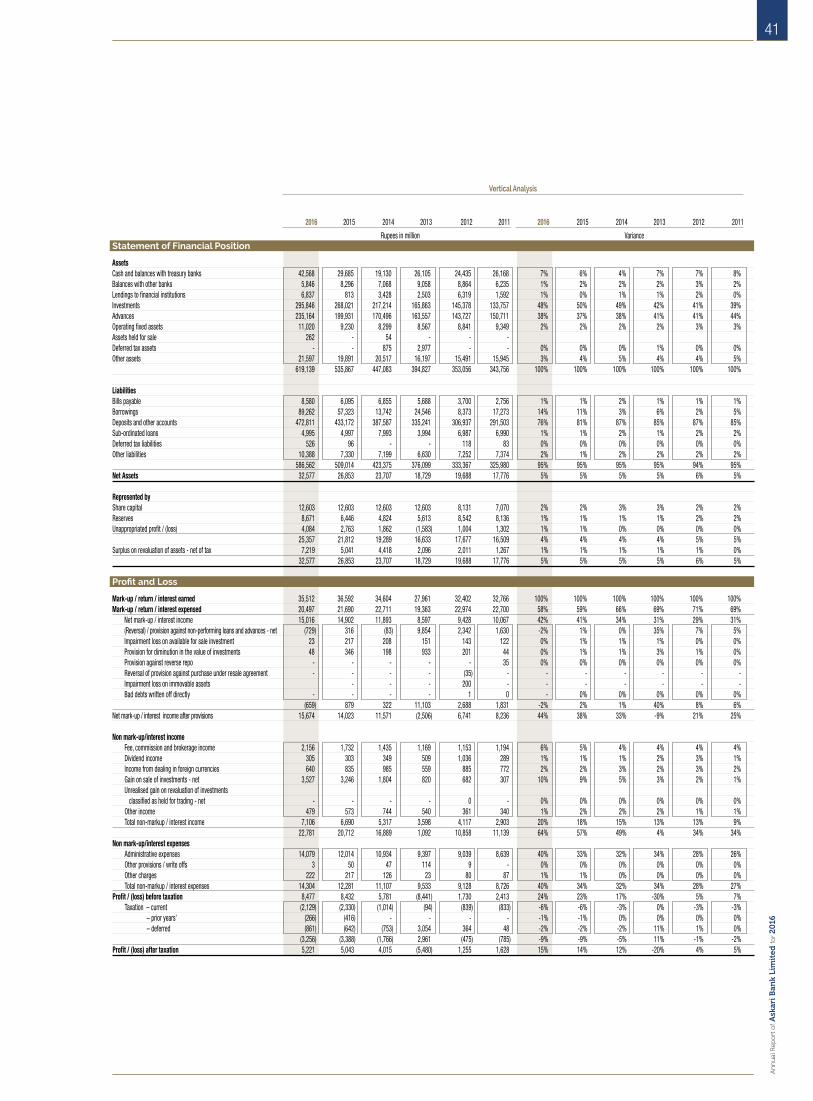
Vertical Analysis
2016 2015 2014 2013 2012 2011 2016 2015 2014 2013 2012 2011
Rupees in million Variance Statement of Financial Position
AssetsCash and balances with treasury banks 42,568 29,685 19,130 26,105 24,435 26,168 7% 6% 4% 7% 7% 8%Balances with other banks 5,846 8,296 7,068 9,058 8,864 6,235 1% 2% 2% 2% 3% 2%Lendings to financial institutions 6,837 813 3,428 2,503 6,319 1,592 1% 0% 1% 1% 2% 0%Investments 295,846 268,021 217,214 165,863 145,378 133,757 48% 50% 49% 42% 41% 39%Advances 235,164 199,931 170,496 163,557 143,727 150,711 38% 37% 38% 41% 41% 44%Operating fixed assets 11,020 9,230 8,299 8,567 8,841 9,349 2% 2% 2% 2% 3% 3%Assets held for sale 262 - 54 - - - Deferred tax assets - - 875 2,977 - - 0% 0% 0% 1% 0% 0%Other assets 21,597 19,891 20,517 16,197 15,491 15,945 3% 4% 5% 4% 4% 5% 619,139 535,867 447,083 394,827 353,056 343,756 100% 100% 100% 100% 100% 100% Liabilities Bills payable 8,580 6,095 6,855 5,688 3,700 2,756 1% 1% 2% 1% 1% 1%Borrowings 89,262 57,323 13,742 24,546 8,373 17,273 14% 11% 3% 6% 2% 5%Deposits and other accounts 472,811 433,172 387,587 335,241 306,937 291,503 76% 81% 87% 85% 87% 85%Sub-ordinated loans 4,995 4,997 7,993 3,994 6,987 6,990 1% 1% 2% 1% 2% 2%Deferred tax liabilities 526 96 - - 118 83 0% 0% 0% 0% 0% 0%Other liabilities 10,388 7,330 7,199 6,630 7,252 7,374 2% 1% 2% 2% 2% 2% 586,562 509,014 423,375 376,099 333,367 325,980 95% 95% 95% 95% 94% 95%Net Assets 32,577 26,853 23,707 18,729 19,688 17,776 5% 5% 5% 5% 6% 5% Represented by Share capital 12,603 12,603 12,603 12,603 8,131 7,070 2% 2% 3% 3% 2% 2%Reserves 8,671 6,446 4,824 5,613 8,542 8,136 1% 1% 1% 1% 2% 2%Unappropriated profit / (loss) 4,084 2,763 1,862 (1,583) 1,004 1,302 1% 1% 0% 0% 0% 0% 25,357 21,812 19,289 16,633 17,677 16,509 4% 4% 4% 4% 5% 5% Surplus on revaluation of assets - net of tax 7,219 5,041 4,418 2,096 2,011 1,267 1% 1% 1% 1% 1% 0% 32,577 26,853 23,707 18,729 19,688 17,776 5% 5% 5% 5% 6% 5%
Profit and Loss
Mark-up / return / interest earned 35,512 36,592 34,604 27,961 32,402 32,766 100% 100% 100% 100% 100% 100%Mark-up / return / interest expensed 20,497 21,690 22,711 19,363 22,974 22,700 58% 59% 66% 69% 71% 69% Net mark-up / interest income 15,016 14,902 11,893 8,597 9,428 10,067 42% 41% 34% 31% 29% 31% (Reversal) / provision against non-performing loans and advances - net (729) 316 (83) 9,854 2,342 1,630 -2% 1% 0% 35% 7% 5% Impairment loss on available for sale investment 23 217 208 151 143 122 0% 1% 1% 1% 0% 0% Provision for diminution in the value of investments 48 346 198 933 201 44 0% 1% 1% 3% 1% 0% Provision against reverse repo - - - - - 35 0% 0% 0% 0% 0% 0% Reversal of provision against purchase under resale agreement - - - - (35) - - - - - - - Impairment loss on immovable assets - - - 200 - - - - - - - Bad debts written off directly - - - - 1 0 - 0% 0% 0% 0% 0% (659) 879 322 11,103 2,688 1,831 -2% 2% 1% 40% 8% 6%Net mark-up / interest income after provisions 15,674 14,023 11,571 (2,506) 6,741 8,236 44% 38% 33% -9% 21% 25% Non mark-up/interest income Fee, commission and brokerage income 2,156 1,732 1,435 1,169 1,153 1,194 6% 5% 4% 4% 4% 4% Dividend income 305 303 349 509 1,036 289 1% 1% 1% 2% 3% 1% Income from dealing in foreign currencies 640 835 985 559 885 772 2% 2% 3% 2% 3% 2% Gain on sale of investments - net 3,527 3,246 1,804 820 682 307 10% 9% 5% 3% 2% 1% Unrealised gain on revaluation of investments classified as held for trading - net - - - - 0 - 0% 0% 0% 0% 0% 0% Other income 479 573 744 540 361 340 1% 2% 2% 2% 1% 1% Total non-markup / interest income 7,106 6,690 5,317 3,598 4,117 2,903 20% 18% 15% 13% 13% 9% 22,781 20,712 16,889 1,092 10,858 11,139 64% 57% 49% 4% 34% 34%Non mark-up/interest expenses Administrative expenses 14,079 12,014 10,934 9,397 9,039 8,639 40% 33% 32% 34% 28% 26% Other provisions / write offs 3 50 47 114 9 - 0% 0% 0% 0% 0% 0% Other charges 222 217 126 23 80 87 1% 1% 0% 0% 0% 0% Total non-markup / interest expenses 14,304 12,281 11,107 9,533 9,128 8,726 40% 34% 32% 34% 28% 27%Profit / (loss) before taxation 8,477 8,432 5,781 (8,441) 1,730 2,413 24% 23% 17% -30% 5% 7% Taxation – current (2,129) (2,330) (1,014) (94) (839) (833) -6% -6% -3% 0% -3% -3% – prior years’ (266) (416) - - - - -1% -1% 0% 0% 0% 0% – deferred (861) (642) (753) 3,054 364 48 -2% -2% -2% 11% 1% 0% (3,256) (3,388) (1,766) 2,961 (475) (785) -9% -9% -5% 11% -1% -2%Profit / (loss) after taxation 5,221 5,043 4,015 (5,480) 1,255 1,628 15% 14% 12% -20% 4% 5%
41
An
nu
al R
epo
rt o
f Ask
ari B
ank
Lim
ited
for 2
016
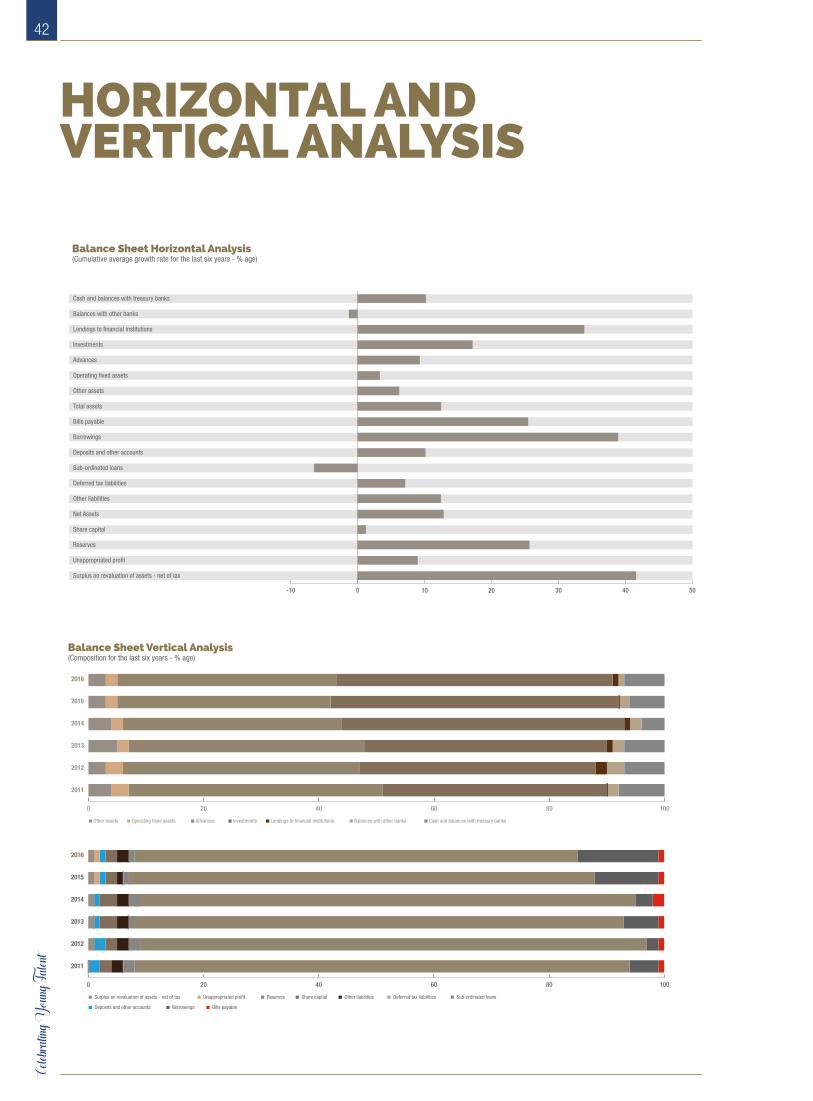
Balance Sheet Vertical Analysis(Composition for the last six years - % age)
Other assets Operating �xed assets Advances Investments Lendings to �nancial institutions Balances with other banks Cash and balances with treasury banks
0 20 40 60 80 100
2016
2015
2014
2013
2012
2011
Balance Sheet Vertical Analysis(Composition for the last six years)
Surplus on revaluation of assets - net of tax Unappropriated pro�t Reserves Share capital Other liabilities Deferred tax liabilities Sub-ordinated loans
Deposits and other accounts Borrowings Bills payable
0 20 40 60 80 100
2016
2015
2014
2013
2012
2011
Balance Sheet Horizontal Analysis(Cumulative average growth rate for the last six years - % age)
Cash and balances with treasury banks
Balances with other banks
Lendings to �nancial institutions
Investments
Advances
Operating �xed assets
Other assets
Total assets
Bills payable
Borrowings
Deposits and other accounts
Sub-ordinated loans
Deferred tax liabilities
Other liabilities
Net Assets
Share capital
Reserves
Unappropriated pro�t
Surplus on revaluation of assets - net of tax
-10 0 10 20 30 40 50
HORIZONTAL ANDVERTICAL ANALYSIS
42Ce
lebrat
ing Y
oung T
alent

Muhammad Arshad Masters in Fine Arts from the University of the Punjab, Muhammad Arshad has held several successful exhibitions in Pakistan and abroad. His achievements include the Excellence Award in 2013 from the Punjab Art Council.
OIL ON CANVAS24” x 30”
43
An
nu
al R
epo
rt o
f Ask
ari B
ank
Lim
ited
for 2
016
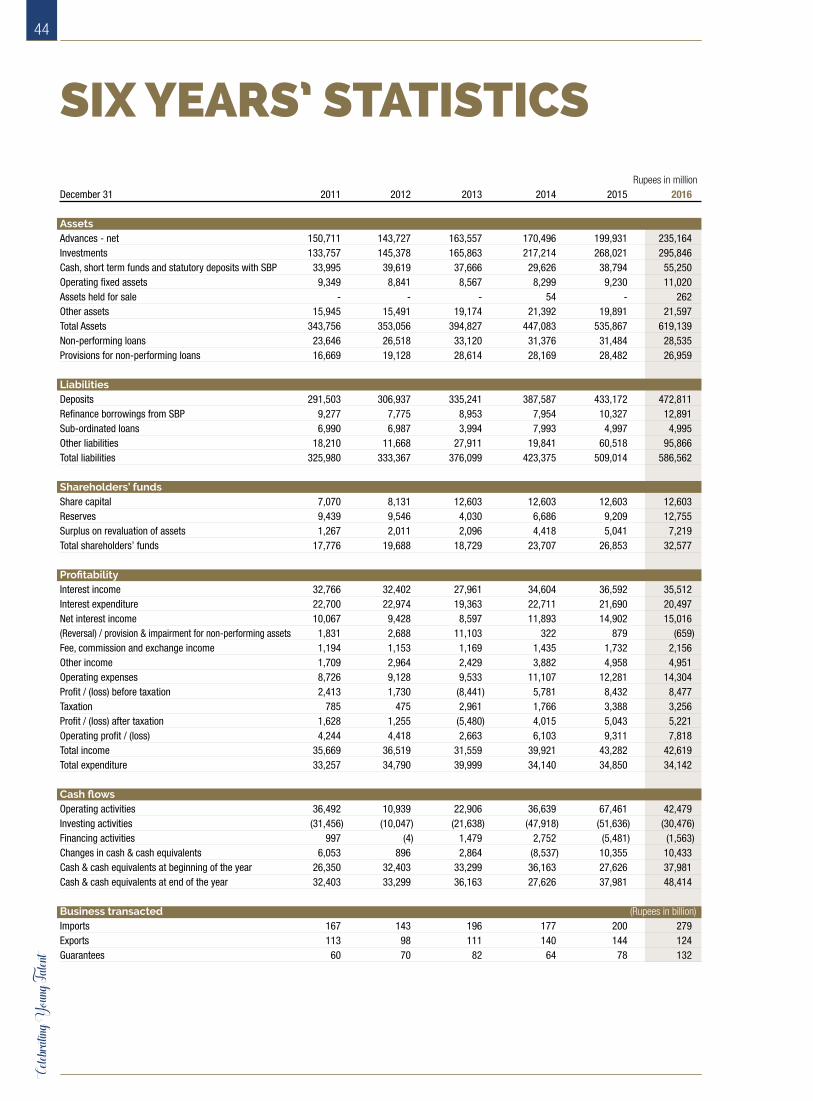
Rupees in millionDecember 31 2011 2012 2013 2014 2015 2016
Assets Advances - net 150,711 143,727 163,557 170,496 199,931 235,164 Investments 133,757 145,378 165,863 217,214 268,021 295,846 Cash, short term funds and statutory deposits with SBP 33,995 39,619 37,666 29,626 38,794 55,250 Operating fixed assets 9,349 8,841 8,567 8,299 9,230 11,020 Assets held for sale - - - 54 - 262 Other assets 15,945 15,491 19,174 21,392 19,891 21,597 Total Assets 343,756 353,056 394,827 447,083 535,867 619,139 Non-performing loans 23,646 26,518 33,120 31,376 31,484 28,535 Provisions for non-performing loans 16,669 19,128 28,614 28,169 28,482 26,959
Liabilities Deposits 291,503 306,937 335,241 387,587 433,172 472,811 Refinance borrowings from SBP 9,277 7,775 8,953 7,954 10,327 12,891 Sub-ordinated loans 6,990 6,987 3,994 7,993 4,997 4,995 Other liabilities 18,210 11,668 27,911 19,841 60,518 95,866 Total liabilities 325,980 333,367 376,099 423,375 509,014 586,562
Shareholders’ funds Share capital 7,070 8,131 12,603 12,603 12,603 12,603 Reserves 9,439 9,546 4,030 6,686 9,209 12,755 Surplus on revaluation of assets 1,267 2,011 2,096 4,418 5,041 7,219 Total shareholders’ funds 17,776 19,688 18,729 23,707 26,853 32,577
Profitability Interest income 32,766 32,402 27,961 34,604 36,592 35,512 Interest expenditure 22,700 22,974 19,363 22,711 21,690 20,497 Net interest income 10,067 9,428 8,597 11,893 14,902 15,016 (Reversal) / provision & impairment for non-performing assets 1,831 2,688 11,103 322 879 (659)Fee, commission and exchange income 1,194 1,153 1,169 1,435 1,732 2,156 Other income 1,709 2,964 2,429 3,882 4,958 4,951 Operating expenses 8,726 9,128 9,533 11,107 12,281 14,304 Profit / (loss) before taxation 2,413 1,730 (8,441) 5,781 8,432 8,477 Taxation 785 475 2,961 1,766 3,388 3,256 Profit / (loss) after taxation 1,628 1,255 (5,480) 4,015 5,043 5,221 Operating profit / (loss) 4,244 4,418 2,663 6,103 9,311 7,818 Total income 35,669 36,519 31,559 39,921 43,282 42,619 Total expenditure 33,257 34,790 39,999 34,140 34,850 34,142
Cash flows Operating activities 36,492 10,939 22,906 36,639 67,461 42,479 Investing activities (31,456) (10,047) (21,638) (47,918) (51,636) (30,476)Financing activities 997 (4) 1,479 2,752 (5,481) (1,563)Changes in cash & cash equivalents 6,053 896 2,864 (8,537) 10,355 10,433 Cash & cash equivalents at beginning of the year 26,350 32,403 33,299 36,163 27,626 37,981 Cash & cash equivalents at end of the year 32,403 33,299 36,163 27,626 37,981 48,414 Business transacted (Rupees in billion)Imports 167 143 196 177 200 279 Exports 113 98 111 140 144 124 Guarantees 60 70 82 64 78 132
SIX YEARS’ STATISTICS
44Ce
lebrat
ing Y
oung T
alent
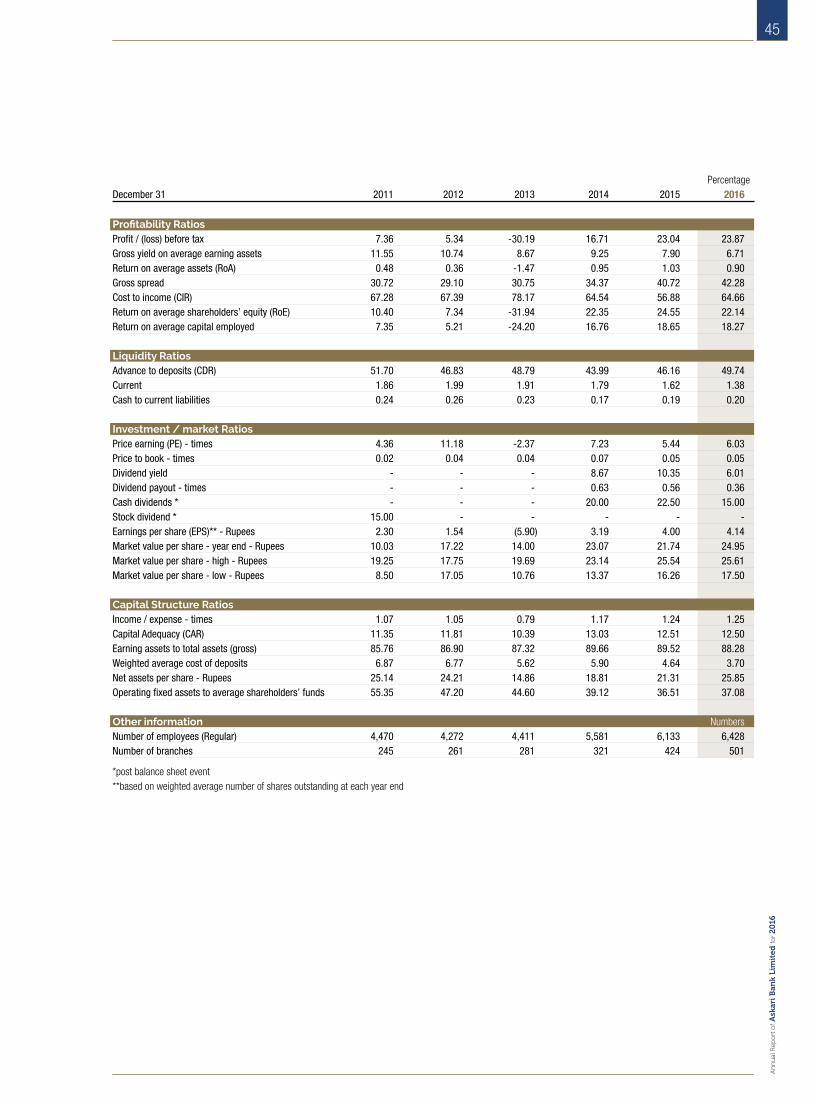
PercentageDecember 31 2011 2012 2013 2014 2015 2016
Profitability Ratios Profit / (loss) before tax 7.36 5.34 -30.19 16.71 23.04 23.87Gross yield on average earning assets 11.55 10.74 8.67 9.25 7.90 6.71Return on average assets (RoA) 0.48 0.36 -1.47 0.95 1.03 0.90Gross spread 30.72 29.10 30.75 34.37 40.72 42.28Cost to income (CIR) 67.28 67.39 78.17 64.54 56.88 64.66Return on average shareholders’ equity (RoE) 10.40 7.34 -31.94 22.35 24.55 22.14Return on average capital employed 7.35 5.21 -24.20 16.76 18.65 18.27 Liquidity Ratios Advance to deposits (CDR) 51.70 46.83 48.79 43.99 46.16 49.74Current 1.86 1.99 1.91 1.79 1.62 1.38Cash to current liabilities 0.24 0.26 0.23 0.17 0.19 0.20 Investment / market Ratios Price earning (PE) - times 4.36 11.18 -2.37 7.23 5.44 6.03Price to book - times 0.02 0.04 0.04 0.07 0.05 0.05Dividend yield - - - 8.67 10.35 6.01 Dividend payout - times - - - 0.63 0.56 0.36 Cash dividends * - - - 20.00 22.50 15.00 Stock dividend * 15.00 - - - - - Earnings per share (EPS)** - Rupees 2.30 1.54 (5.90) 3.19 4.00 4.14 Market value per share - year end - Rupees 10.03 17.22 14.00 23.07 21.74 24.95Market value per share - high - Rupees 19.25 17.75 19.69 23.14 25.54 25.61Market value per share - low - Rupees 8.50 17.05 10.76 13.37 16.26 17.50 Capital Structure Ratios Income / expense - times 1.07 1.05 0.79 1.17 1.24 1.25Capital Adequacy (CAR) 11.35 11.81 10.39 13.03 12.51 12.50Earning assets to total assets (gross) 85.76 86.90 87.32 89.66 89.52 88.28Weighted average cost of deposits 6.87 6.77 5.62 5.90 4.64 3.70Net assets per share - Rupees 25.14 24.21 14.86 18.81 21.31 25.85Operating fixed assets to average shareholders’ funds 55.35 47.20 44.60 39.12 36.51 37.08
Other information NumbersNumber of employees (Regular) 4,470 4,272 4,411 5,581 6,133 6,428 Number of branches 245 261 281 321 424 501
*post balance sheet event**based on weighted average number of shares outstanding at each year end
45
An
nu
al R
epo
rt o
f Ask
ari B
ank
Lim
ited
for 2
016

46Ce
lebrat
ing Y
oung T
alent
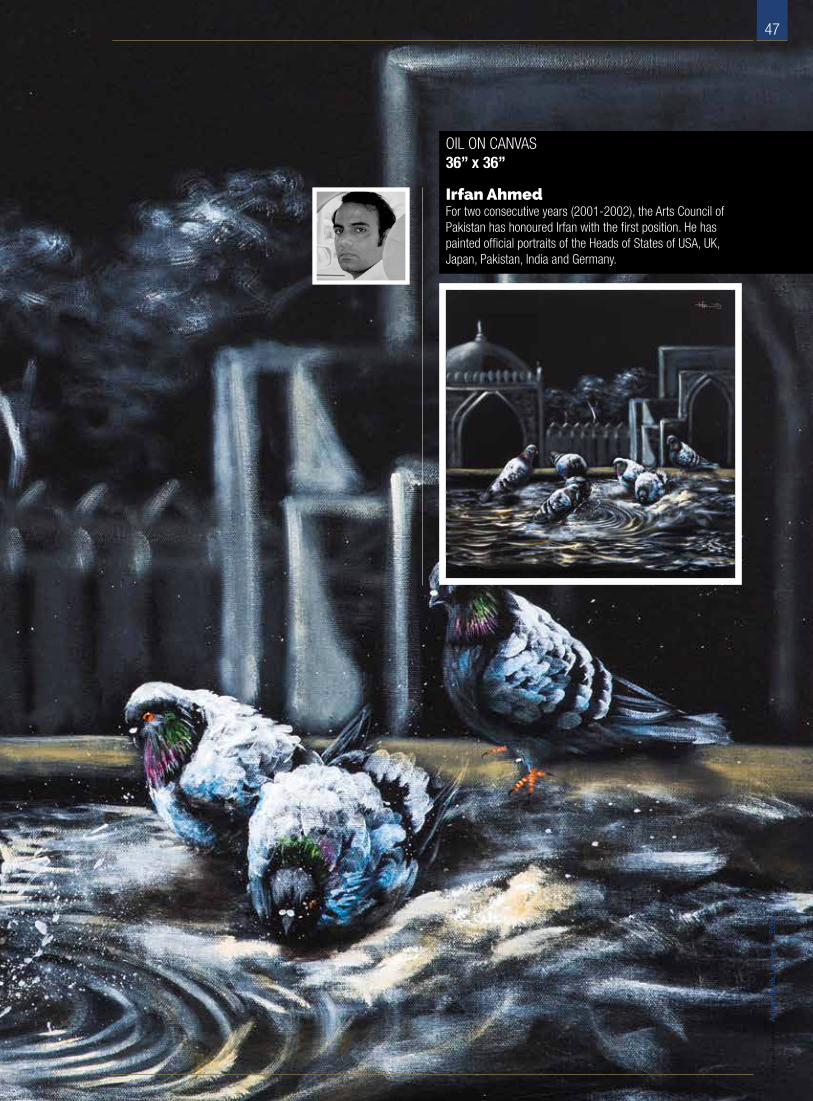
Irfan Ahmed For two consecutive years (2001-2002), the Arts Council of Pakistan has honoured Irfan with the first position. He has painted official portraits of the Heads of States of USA, UK, Japan, Pakistan, India and Germany.
OIL ON CANVAS36” x 36”
47
An
nu
al R
epo
rt o
f Ask
ari B
ank
Lim
ited
for 2
016
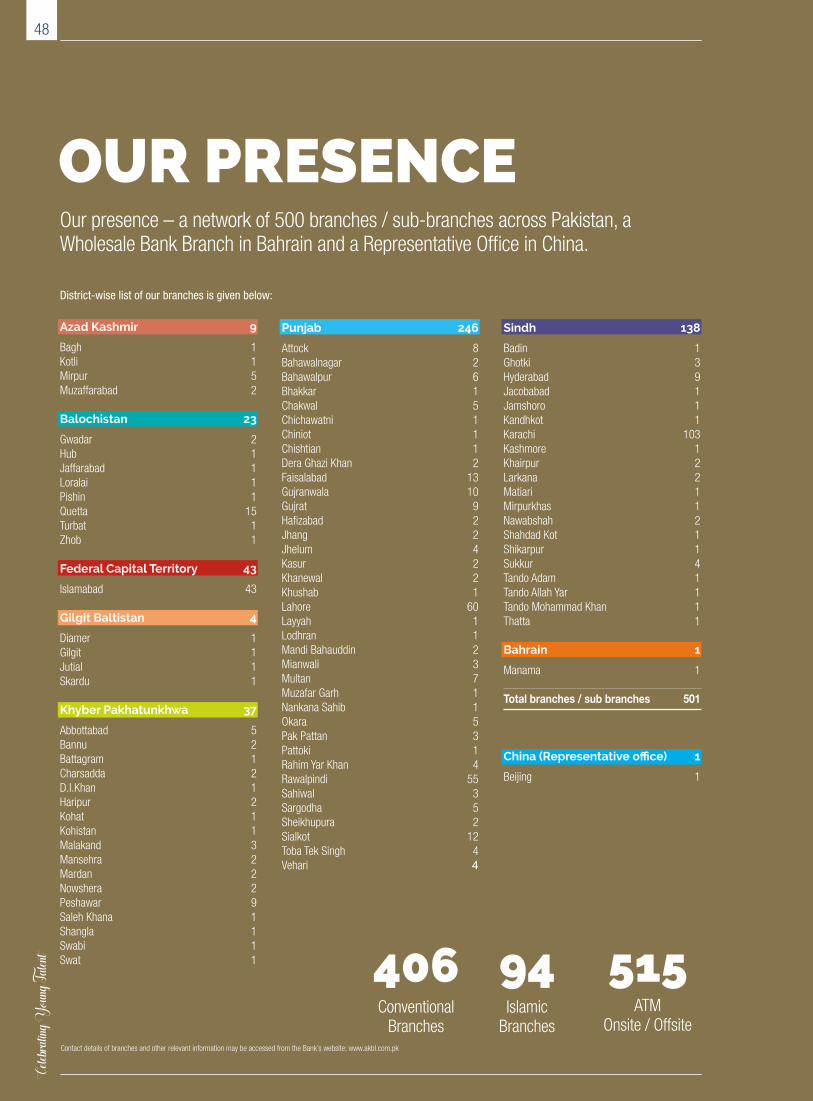
OUR PRESENCEOur presence – a network of 500 branches / sub-branches across Pakistan, a Wholesale Bank Branch in Bahrain and a Representative Office in China.
Contact details of branches and other relevant information may be accessed from the Bank’s website: www.akbl.com.pk
406 94 515Conventional
BranchesIslamic
BranchesATM
Onsite / Offsite
Azad Kashmir 9
Bagh 1Kotli 1Mirpur 5Muzaffarabad 2
Balochistan 23
Gwadar 2Hub 1Jaffarabad 1Loralai 1Pishin 1Quetta 15Turbat 1Zhob 1
Federal Capital Territory 43
Islamabad 43
Gilgit Baltistan 4
Diamer 1Gilgit 1Jutial 1Skardu 1
Khyber Pakhatunkhwa 37
Abbottabad 5Bannu 2Battagram 1Charsadda 2D.I.Khan 1Haripur 2Kohat 1Kohistan 1Malakand 3Mansehra 2Mardan 2Nowshera 2Peshawar 9Saleh Khana 1Shangla 1Swabi 1Swat 1
Punjab 246
Attock 8Bahawalnagar 2Bahawalpur 6Bhakkar 1Chakwal 5Chichawatni 1Chiniot 1Chishtian 1Dera Ghazi Khan 2Faisalabad 13Gujranwala 10Gujrat 9Hafizabad 2Jhang 2Jhelum 4Kasur 2Khanewal 2Khushab 1Lahore 60Layyah 1Lodhran 1Mandi Bahauddin 2Mianwali 3Multan 7Muzafar Garh 1Nankana Sahib 1Okara 5Pak Pattan 3Pattoki 1Rahim Yar Khan 4Rawalpindi 55Sahiwal 3Sargodha 5Sheikhupura 2Sialkot 12Toba Tek Singh 4Vehari 4
Sindh 138
Badin 1Ghotki 3Hyderabad 9Jacobabad 1Jamshoro 1Kandhkot 1Karachi 103Kashmore 1Khairpur 2Larkana 2Matiari 1Mirpurkhas 1Nawabshah 2Shahdad Kot 1Shikarpur 1Sukkur 4Tando Adam 1Tando Allah Yar 1Tando Mohammad Khan 1Thatta 1 Bahrain 1
Manama 1
Total branches / sub branches 501
China (Representative office) 1
Beijing 1
District-wise list of our branches is given below:
48Ce
lebrat
ing Y
oung T
alent
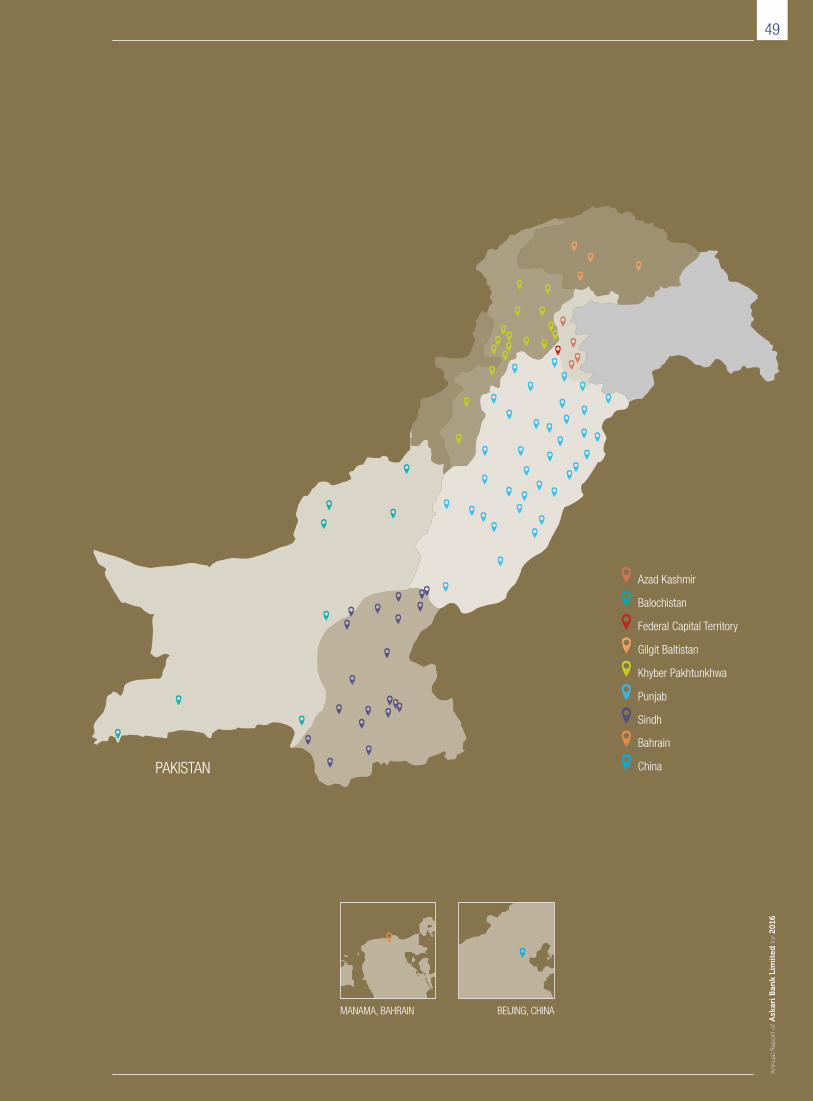
MANAMA, BAHRAIN BEIJING, CHINA
PAKISTAN
Azad Kashmir
Balochistan
Federal Capital Territory
Gilgit Baltistan
Khyber Pakhtunkhwa
Punjab
Bahrain
Sindh
China
49
An
nu
al R
epo
rt o
f Ask
ari B
ank
Lim
ited
for 2
016
The Directors present the 25th Annual Report of Askari Bank Limited along with the audited financial statements and Auditors’ reports thereon, for the year ended December 31, 2016.
ECONOMYPakistan’s economy maintained its momentum and grew by 4.7 percent during fiscal 2016. Government spending on infrastructure projects and low interest rates provided a respite to domestic demand while industrial performance was helped by easing energy supply situation. The improvement in macro numbers was also supported by successful completion of the IMF program, years low inflation; supported by subdued commodity prices, stable exchange rate, and greater investors’ confidence as observed through Pakistan’s improved ratings and carriage of China-Pakistan-Economic-Corridor (CPEC). Evident improvement in the security situation augmented these policy measures.
The stable exchange rate, along with the decline in oil prices, helped drag CPI inflation down to 2.9 percent in fiscal 2016. These growth-prone developments enabled largely sustained policy rate at 5.75 percent, lowest since early 70s. The sharp reduction in the cost of borrowing in recent years and favorable business environment created demand for bank credit. In absolute terms, credit to private sector expanded by Rs. 461 billion during the year – more than double the level of expansion seen since last fiscal year. Encouragingly, the expansion was fairly broad-based, as all the major sectors; textile, power, fertilizer, construction and transport resorted to bank borrowing. In addition, consumer financing also gained traction, with strong demand for auto loans.
Looking ahead, the recent gradual rise in oil prices is a concern given that the non-oil imports are expected to remain high while exports are yet to show any recognizable recovery; the exchange rate will be tested as the repayment phase approaches and any currency depreciation will further burden the balance of payments with higher external debt service payments. However, higher foreign investments including those associated with CPEC related projects are likely to offset the rise in import bill. The economy is expected to perform better on back of higher public spending and service sector growth and we are optimistic on the domestic demand owing to higher expected public sector spending; pre-election year, and greater pace of development projects particularly those related to CPEC.
OPERATING RESULTSAskari Bank’s results for 2016 reflect another year of sound performance that was enabled by a growth strategy well executed by our management team in an environment where the banking industry continued to be challenged by low interest margins.
Your Bank’s profit after taxation grew by 3.5 percent during full year 2016 to reach Rs. 5,221 million while the profit before taxation amounted to Rs. 8,477 million, almost unchanged from last year. Aggregate revenues increased by 2.5 percent mainly contributed by a 6.2 percent increase in non-markup income. Net markup income increased by 0.8 percent as the low interest rate environment of 2015 continued
throughout 2016; however with more clarity on policy direction and increasing economic activity, the period witnessed a moderate transition where credit growth outpaced investments; investment growth slowed down particularly during the second half of 2016. Though this transition had minimal impact on the revenue streams during the current period as investment revenues, particularly from the stock of fixed income Government bonds, continue as the major contributor for the second consecutive year. The aggregate cost of funds declined by 5.5 percent in line with the trend of interest rates and a major 10.6 percent reduction in cost deposits equipoise the slide in top line revenues and was the main reason for the rise in net interest margins along with a 13 percent growth in earning asset base.
With banking margins under further pressure during the year under review, your Bank expanded the trade and transactional business and aggressively ventured out as a strong financial services provider in the local market to secure structured deals. The growth of trade and financial services resulted in business related fee, commission and brokerage revenues to post a healthy increase of 24.5 percent during the year under review. The declining interest rate environment also enabled opportunities for capital gains by leveraging on the portfolio of fixed income bonds. As the growing market reviews sense that the interest rates have bottomed out and the expectation for further capital appreciation fades, the portfolio of fixed income bonds
DIRECTORS’ REPORT TO THE SHAREHOLDERS
50Ce
lebrat
ing Y
oung T
alent

is likely to lose its position on the list of preferred asset class, going forward. During 2016, aggregate capital gains from fixed income bonds and securities along with stock market investments posted a modest increase of 8.6 percent.
Administrative and other operating expenses increased to Rs. 14,079 million from Rs. 12,014 million, a rise of 17.2 percent. The rise in expenses is primarily due to the impact of Bank’s investment in network expansion; attributable to increase in human resource expenses, premises rent and other associated costs over the previous year. The investment in recent branch expansion has started reaping fruits for the Bank as is evident from strong growth in current and saving deposits.
The deposit base of the Bank grew to Rs. 473 billion at December 31, 2016 from Rs. 433 billion at the close of previous year, an increase of 9.2 percent. Deposit mix showed an impressive improvement as non-remunerative current accounts registered a notable 18.7 percent growth during the year and fixed deposits were contained at last year’s level. Aggregate saving deposits increased by 8.2 percent during the year ended December 31, 2016.
Gross advances registered a growth of 14.8 percent to close at Rs. 262 billion at end 2016 as the lending strategy remained focused on building a portfolio of quality advances. Aggregate non-performing loans (NPLs) declined by a notable 9.4 percent from Rs. 31.5 billion at end 2015 to Rs. 28.5 billion by end 2016. The Bank continues to maintain a very comfortable level of provisions against NPLs with a provision coverage ratio of 94.5 percent at December 31, 2016, a marked improvement from 90.5 percent at the close of 2015. The reduction in NPLs has resulted in an aggregate net reversal of Rs. 729 million of provision during 2016 as compared to charge of provision of Rs. 316 million during 2015. The Bank remains adequately capitalised with a capital adequacy ratio reported at 12.5 percent at December 31, 2016. During the year under review, various improvements were made to the CAR reporting systems to facilitate the Basel-III reporting framework requirements.
APPROPRIATIONSThe Board of Directors recommends the following appropriations for the year ended December 31, 2016:
(Rs. in ‘000) 2016 2015
Year ended December 31,Appropriations: Profit after taxation 5,220,635 5,043,419 Effect of recognition of actuarial losses (92,302) (11,161)
Profit available for appropriation 5,128,333 5,032,258 Interim cash dividend - 10 percent - (1,260,260)Transfer to statutory reserve (1,044,127) (1,008,684)Transfer to general reserve - -
Accumulated profit carried forward 4,084,206 2,763,314
Earnings per share - Rupees 4.14 4.00
DIVIDENDIn addition to the above, the Board has recommended a final cash dividend of 15 percent for the year ended December 31, 2016.
RATINGSPakistan Credit Rating Agency Limited (PACRA) has assigned entity ratings of ‘AA+’ to the Bank, a one notch improvement from ‘AA’ assigned by JCR-VIS. In their report, PACRA has recognized improved market penetration while sustaining an acceptable risk profile through strengthened systems and internal controls and effective management of spreads, as key rating drivers. The short term ratings have been maintained at ‘A1+’.
BRANCH NETWORKAskari Bank achieved the milestone of 500 branches with the addition of 77 new branches opened during 2016. The branch network reached 501 including 94 Islamic branches and a Wholesale Bank branch in Bahrain. The Bank has almost doubled its presence through branch network since it was acquired by the Fauji Group in mid-2013. Aggressive branch expansion across the country has been a focal point of Bank’s strategy aimed at enhanced customer access and convenience, backed by improved technology and service quality, and most importantly contributing towards
the financial inclusion in the country. We are confident that our new branches opened in recent years will soon be at par with those which have been patronized by our valued customers for decades and have yielded lasting relationships for sustained growth.
CHINA REP. OFFICEAskari Bank representative office in Beijing, China, is fully functional and this strategic initiative is perfectly aligned with the launch of the CPEC. A dedicated China-desk in Islamabad serves as a one-window for facilitation of existing and future trade flows between the two countries. The Bank is strongly positioned to capitalize on the CPEC related business opportunities which are considered as catalyst in boosting Pakistan’s economic growth in years to come.
A SKARI BANKAchieves another milestone
Entity Rating Upgrade
AA
AA+ (assigned byPACRA)
51
An
nu
al R
epo
rt o
f Ask
ari B
ank
Lim
ited
for 2
016
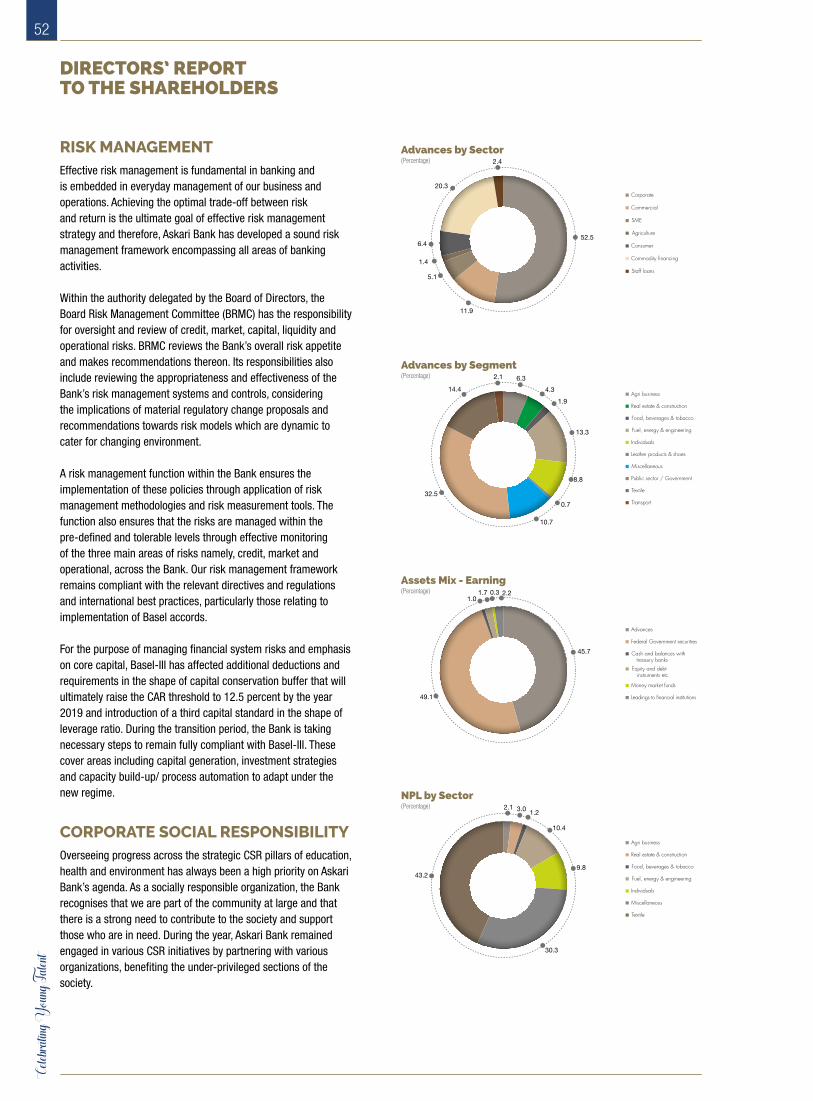
RISK MANAGEMENTEffective risk management is fundamental in banking and is embedded in everyday management of our business and operations. Achieving the optimal trade-off between risk and return is the ultimate goal of effective risk management strategy and therefore, Askari Bank has developed a sound risk management framework encompassing all areas of banking activities.
Within the authority delegated by the Board of Directors, the Board Risk Management Committee (BRMC) has the responsibility for oversight and review of credit, market, capital, liquidity and operational risks. BRMC reviews the Bank’s overall risk appetite and makes recommendations thereon. Its responsibilities also include reviewing the appropriateness and effectiveness of the Bank’s risk management systems and controls, considering the implications of material regulatory change proposals and recommendations towards risk models which are dynamic to cater for changing environment.
A risk management function within the Bank ensures the implementation of these policies through application of risk management methodologies and risk measurement tools. The function also ensures that the risks are managed within the pre-defined and tolerable levels through effective monitoring of the three main areas of risks namely, credit, market and operational, across the Bank. Our risk management framework remains compliant with the relevant directives and regulations and international best practices, particularly those relating to implementation of Basel accords.
For the purpose of managing financial system risks and emphasis on core capital, Basel-III has affected additional deductions and requirements in the shape of capital conservation buffer that will ultimately raise the CAR threshold to 12.5 percent by the year 2019 and introduction of a third capital standard in the shape of leverage ratio. During the transition period, the Bank is taking necessary steps to remain fully compliant with Basel-III. These cover areas including capital generation, investment strategies and capacity build-up/ process automation to adapt under the new regime.
CORPORATE SOCIAL RESPONSIBILITYOverseeing progress across the strategic CSR pillars of education, health and environment has always been a high priority on Askari Bank’s agenda. As a socially responsible organization, the Bank recognises that we are part of the community at large and that there is a strong need to contribute to the society and support those who are in need. During the year, Askari Bank remained engaged in various CSR initiatives by partnering with various organizations, benefiting the under-privileged sections of the society.
Advances by Sector(Percentage)
Commercial
SME
Agriculture
Corporate
Commodity financing
Staff loans
Consumer
11.9
5.1
1.4
6.4
20.3
2.4
52.5
Advances by Segment(Percentage)
Real estate & construction
Food, beverages & tobacco
Fuel, energy & engineering
Agri business
Leather products & shoes
Miscellaneous
Public sector / Government
Textile
Transport
Individuals
14.4
2.1
8.8
0.7
10.7
32.5
6.3
4.3
1.9
13.3
Assets Mix - Earning(Percentage)
Federal Government securities
Cash and balances with treasury banks
Equity and debt instruments etc.
Advances
Leadings to financial institutions
Money market funds
45.7
49.1
1.01.7 0.3 2.2
NPL by Sector(Percentage)
Real estate & construction
Food, beverages & tobacco
Fuel, energy & engineering
Agri business
Miscellaneous
Textile
Individuals
43.2
2.1 3.0 1.2
10.4
9.8
30.3
DIRECTORS’ REPORT TO THE SHAREHOLDERS
52Ce
lebrat
ing Y
oung T
alent
SUBSIDIARY COMPANIESThe Bank’s wholly owned subsidiary, Askari Investment Management Limited (AIML) manages mutual funds and is also engaged in advisory services for institutional clients. Askari Bank also holds controlling interest of 74 percent in Askari Securities Limited (ASL) which offers share brokerage, investment advisory and consultancy services.
During the year, on October 13, 2016, the Board of Directors approved the divestment of both companies. Pursuant to this decision, the disposal process has been initiated and is expected to be completed in 2017.
Accordingly, 100 percent of Bank’s investment in Askari Investment Management Limited representing 33,500,000 ordinary shares of Rs. 10 each and 74 percent of Bank’s investment in Askari Securities Limited representing 17,020,000 ordinary shares of Rs. 10 each, have been classified as held for sale.
Consolidated financial statements of the Bank, AIML and ASL for the year ended December 31, 2016 are included in this annual report.
HUMAN RESOURCEOne of the key strategic priorities for Askari Bank is to maintain focus on the indelible value of its human capital and their knowledge base, in achieving the goals set for them and for the Bank. The talents, passion and commitment of our people, The Askari Family, have been the cornerstone of our sustained success in recent years. Human resource management during the year focused on optimal deployment of staff based on an analysis of skills and competencies by redeploying employees to more value creating activities across many organizational verticals and geographies of the Bank. A Board’s Human Resource & Remuneration Committee periodically reviews and monitors the Bank’s human resource strategy, aligning policies and overcoming challenges of strategic importance that directly affect AKBL’s ability to hire, develop and retain the talent needed for it, to achieve its goals.
Our training and development programs focused to enhance the functional and managerial skills and capabilities of the employees for sustainable growth in various fields of the Bank. 5,842 employees were given an opportunity to attend training in 412 courses in our three training academies located in Rawalpindi, Lahore and Karachi. We provide career growth opportunities to all cadres of employees by building an enabling environment, which leads to consistent employee motivation objectives. Our effective grievance handling mechanism ensures maximum protection for all, in the best interest of the organization. The Bank pays special attention to less earning employees of lower cadre by providing special incentives for their dependents through free banking training opportunities thus leading to gainful employment within and outside, enhanced medical treatment and special allowance to fulfill their dreams of excelling in competitive sports, during the year 2016.
CUSTOMER COMPLAINT MANAGEMENTAskari Bank promotes a culture that values customer experience and customer satisfaction remains primary and focal in every relationship. Effective management of customer complaints and queries is an important element in this chain and is therefore assigned high priority and are handled promptly and fairly. A dedicated complaint management unit ensures timely resolution of complaints in order to foster customer confidence and also continually engages with internal customers for process reviews and enhancements of efficiencies based on customer feedback.
CORPORATE GOVERNANCEThe requirements of Code of Corporate Governance as set out in the Pakistan Stock Exchange Limited Regulations in the rule book for the year ended December 31, 2016 have been fully adopted by Askari Bank and have been duly complied with. A statement to this effect is annexed in this annual report.
CORPORATE AND FINANCIAL REPORTING FRAMEWORK• The financial statements, prepared by
the management of the Bank present fairly its state of affairs, the results of its operations, and changes in equity and cash flows.
• Proper books of accounts of the Bank have been maintained.
• Accounting policies have been consistently applied in preparation of these financial statements except as stated in the notes to the financial statements and accounting estimates are based on reasonable and prudent judgment.
• International Accounting, Islamic and Shariah Standards, as applicable to banking companies in Pakistan, have been followed in preparation of these financial statements.
• The system of internal control, which is in place, is being continuously reviewed by the internal audit department as are other such procedures. Such review processes will continue with a view to removing any weakness and mitigating risk.
• The Board of Directors is satisfied with the Bank’s ability to continue as a going concern.
• There has been no material deviation from the best practices of corporate governance as detailed in the Regulation 5.19 of the Pakistan Stock Exchange Limited Regulations.
• Key operating data and financial data for the last six years, in a summarized form, is included in this report.
• There are no statutory payments on account of taxes, duties, levies and charges which are outstanding as of December 31, 2016, except as disclosed in annexed financial statements.
53
An
nu
al R
epo
rt o
f Ask
ari B
ank
Lim
ited
for 2
016
• The following is the fair value of investments as at December 31, 2016:
– Provident Fund Rs. 3,805 million, based on un-audited financial statements (December 31, 2015: Rs. 3,298 million)
– Gratuity Fund Rs. 1,761 million, based on un-audited financial statements (December 31, 2015: Rs. 1,558 million)
• During 2016, five meetings of the Board of Directors were held. Attendance by each Director was as follows:
1. Lt Gen Khalid Nawaz Khan, HI (M), Sitara-i-Esar (Retd) - (Chairman) 5
2. Lt Gen Muhammad Haroon Aslam, HI (M), S Bt, (Retd) - Resigned on February 7, 2017 5
3. Lt Gen Shafqaat Ahmed, HI (M) (Retd) 4
4. Mr. Qaiser Javed 4
5. Dr. Nadeem Inayat 5
6. Mr. Manzoor Ahmed 5
7. Mr. Asif Reza Sana 5
8. Mr. Zaffar Ahmed Khan 4
9. Mr. Tariq Hafeez Malik 4
10. Mr. Muhammad Ghous 5
11. Syed M. Husaini - (President & CE) 5
DIRECTORS’ TRAINING PROGRAM
During the year, one of our Director
completed the Directors’ Training Programme.
Out of ten Directors, nine have now
completed the prescribed Directors’ training
Programme.
BOARD EVALUATION
The Board’s role of oversight and its
effectiveness is evaluated by the Board itself
through a formal process using quantitative
scaled techniques. The annual evaluation
process gauges the extent of individual
and collective efforts / contributions of the
directors in terms of strategic decisions taken
and measuring impacts against expected
benefits and outcome, devising monitoring
mechanisms and their implementation,
formation of board subcommittees for
important areas i.e. audit, risk, technology
and human resource, and devising their
terms of reference and reviewing compliance
there against. In view of the ‘Guidelines on Performance Evaluation of Board of Directors’
as introduced by the SBP through BPRD
Circular No 11 of August 22, 2016, Askari
Bank has initiated the process of aligning
its evaluation process with the guidance
provided by the regulator.
PATTERN OF SHAREHOLDING
The pattern of shareholding at the close of
December 31, 2016 is included in this annual
report.
TRADING IN SHARES
No trades in the shares of the Bank were
carried out by the President & CE, CFO,
Company Secretary, their spouses and minor
children during the year 2016.
STATEMENT ON INTERNAL CONTROLS
The management of the Bank assumes
responsibility of establishing and maintaining
effective internal controls throughout
the Bank and has made a statement on
DIRECTORS’ REPORT TO THE SHAREHOLDERS
internal control in this annual report. The
management’s statement on internal control
has been endorsed by the Board of Directors.
AUDITORS
The present auditors, M/s A. F. Ferguson &
Co., Chartered Accountants have completed
their assignment for the year ended
December 31, 2016 and shall retire at
the conclusion of the 25th Annual General
Meeting. Being eligible, they have offered
themselves for reappointment. As advised by
the Board’s Audit & Compliance Committee,
the Board recommends appointment of M/s
A. F. Ferguson & Co., Chartered Accountants,
as auditors for the year 2017.
EVENTS AFTER THE DATE OF STATEMENT OF FINANCIAL POSITION
There have not been any material events
that occurred subsequent to the date of
the Statement of Financial Position that
require adjustments to the attached financial
statements.
54Ce
lebrat
ing Y
oung T
alent
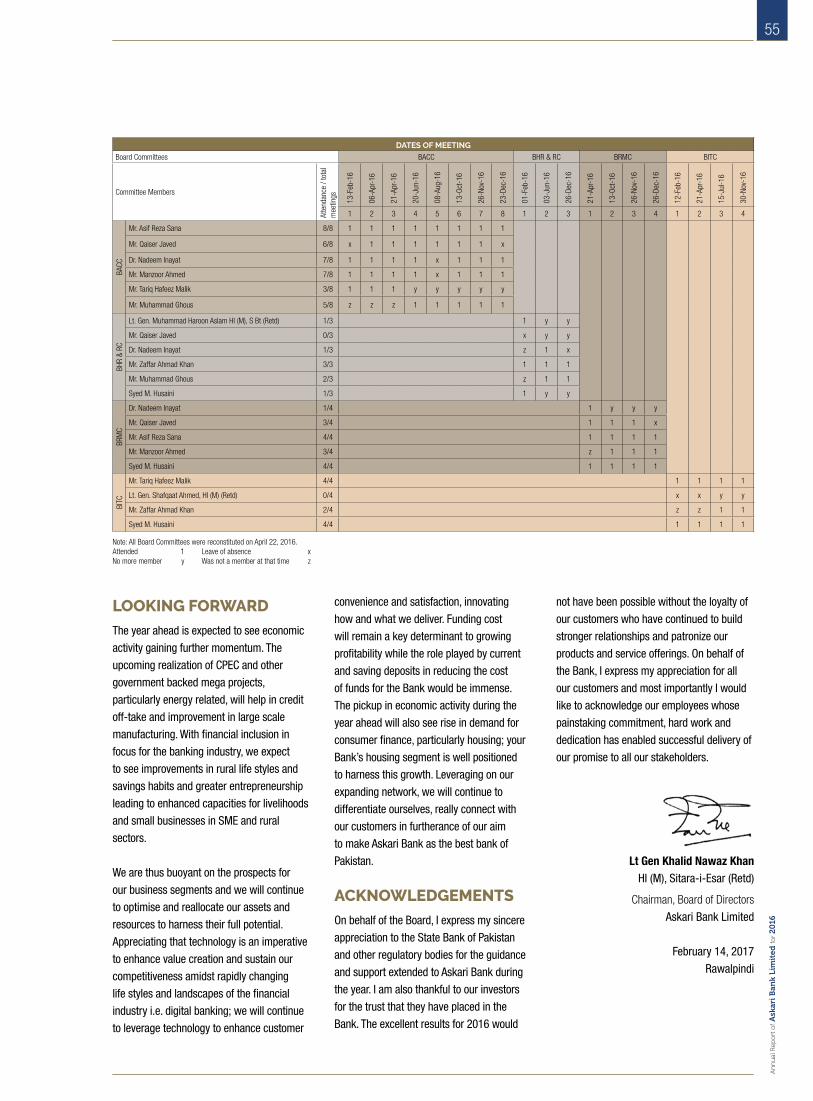
LOOKING FORWARD
The year ahead is expected to see economic
activity gaining further momentum. The
upcoming realization of CPEC and other
government backed mega projects,
particularly energy related, will help in credit
off-take and improvement in large scale
manufacturing. With financial inclusion in
focus for the banking industry, we expect
to see improvements in rural life styles and
savings habits and greater entrepreneurship
leading to enhanced capacities for livelihoods
and small businesses in SME and rural
sectors.
We are thus buoyant on the prospects for
our business segments and we will continue
to optimise and reallocate our assets and
resources to harness their full potential.
Appreciating that technology is an imperative
to enhance value creation and sustain our
competitiveness amidst rapidly changing
life styles and landscapes of the financial
industry i.e. digital banking; we will continue
to leverage technology to enhance customer
DATES OF MEETING
Board Committees BACC BHR & RC BRMC BITC
Committee Members
Atte
ndan
ce /
tota
l m
eetin
gs
13-F
eb-1
6
06-A
pr-1
6
21-A
pr-1
6
20-J
un-1
6
08-A
ug-1
6
13-O
ct-1
6
26-N
ov-1
6
23-D
ec-1
6
01-F
eb-1
6
03-J
un-1
6
26-D
ec-1
6
21-A
pr-1
6
13-O
ct-1
6
26-N
ov-1
6
26-D
ec-1
6
12-F
eb-1
6
21-A
pr-1
6
15-J
ul-1
6
30-N
ov-1
6
1 2 3 4 5 6 7 8 1 2 3 1 2 3 4 1 2 3 4
BACC
Mr. Asif Reza Sana 8/8 1 1 1 1 1 1 1 1
Mr. Qaiser Javed 6/8 x 1 1 1 1 1 1 x
Dr. Nadeem Inayat 7/8 1 1 1 1 x 1 1 1
Mr. Manzoor Ahmed 7/8 1 1 1 1 x 1 1 1
Mr. Tariq Hafeez Malik 3/8 1 1 1 y y y y y
Mr. Muhammad Ghous 5/8 z z z 1 1 1 1 1
BHR
& RC
Lt. Gen. Muhammad Haroon Aslam HI (M), S Bt (Retd) 1/3 1 y y
Mr. Qaiser Javed 0/3 x y y
Dr. Nadeem Inayat 1/3 z 1 x
Mr. Zaffar Ahmad Khan 3/3 1 1 1
Mr. Muhammad Ghous 2/3 z 1 1
Syed M. Husaini 1/3 1 y y
BRM
C
Dr. Nadeem Inayat 1/4 1 y y y
Mr. Qaiser Javed 3/4 1 1 1 x
Mr. Asif Reza Sana 4/4 1 1 1 1
Mr. Manzoor Ahmed 3/4 z 1 1 1
Syed M. Husaini 4/4 1 1 1 1
BITC
Mr. Tariq Hafeez Malik 4/4 1 1 1 1
Lt. Gen. Shafqaat Ahmed, HI (M) (Retd) 0/4 x x y y
Mr. Zaffar Ahmad Khan 2/4 z z 1 1
Syed M. Husaini 4/4 1 1 1 1
convenience and satisfaction, innovating
how and what we deliver. Funding cost
will remain a key determinant to growing
profitability while the role played by current
and saving deposits in reducing the cost
of funds for the Bank would be immense.
The pickup in economic activity during the
year ahead will also see rise in demand for
consumer finance, particularly housing; your
Bank’s housing segment is well positioned
to harness this growth. Leveraging on our
expanding network, we will continue to
differentiate ourselves, really connect with
our customers in furtherance of our aim
to make Askari Bank as the best bank of
Pakistan.
ACKNOWLEDGEMENTS
On behalf of the Board, I express my sincere
appreciation to the State Bank of Pakistan
and other regulatory bodies for the guidance
and support extended to Askari Bank during
the year. I am also thankful to our investors
for the trust that they have placed in the
Bank. The excellent results for 2016 would
not have been possible without the loyalty of
our customers who have continued to build
stronger relationships and patronize our
products and service offerings. On behalf of
the Bank, I express my appreciation for all
our customers and most importantly I would
like to acknowledge our employees whose
painstaking commitment, hard work and
dedication has enabled successful delivery of
our promise to all our stakeholders.
Lt Gen Khalid Nawaz KhanHI (M), Sitara-i-Esar (Retd)
Chairman, Board of Directors
Askari Bank Limited
February 14, 2017
Rawalpindi
Note: All Board Committees were reconstituted on April 22, 2016. Attended 1 Leave of absence x No more member y Was not a member at that time z
55
An
nu
al R
epo
rt o
f Ask
ari B
ank
Lim
ited
for 2
016
56Ce
lebrat
ing Y
oung T
alent

57
An
nu
al R
epo
rt o
f Ask
ari B
ank
Lim
ited
for 2
016
58Ce
lebrat
ing Y
oung T
alent
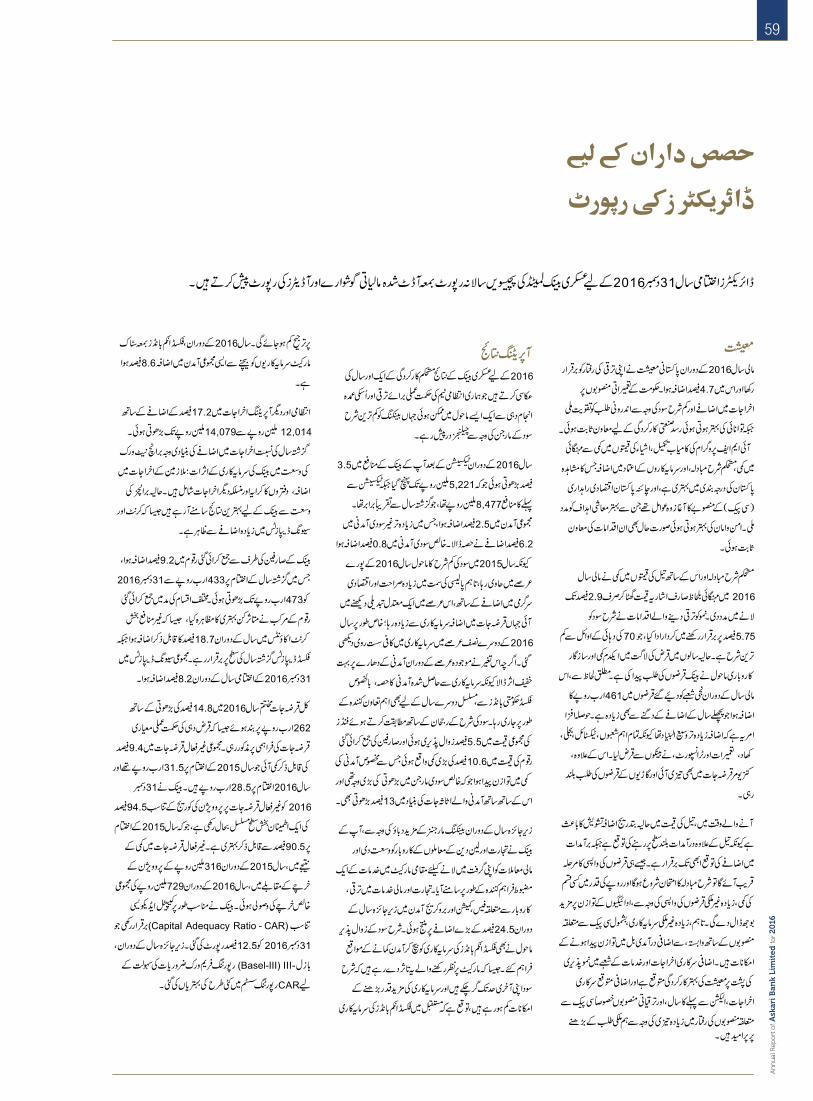
59
An
nu
al R
epo
rt o
f Ask
ari B
ank
Lim
ited
for 2
016

S.A. NooryAlthough Noory was trained in Fine Arts, he worked diligently to master the art of miniature painting. Over the years he has developed his own oeuvre, which encompasses a wide range of subjects rendered in the miniature tradition.
WATERCOLOR ON PAPER13.5” x 10.5”
60Ce
lebrat
ing Y
oung T
alent

An
nu
al R
epo
rt o
f Ask
ari B
ank
Lim
ited
for 2
016
61
UNCONSOLIDATED FINANCIAL STATEMENTS OF
FOR THE YEAR ENDED DECEMBER 31, 2016
ASKARI BANK LIMITED

Celeb
rating
Youn
g Tale
nt62
STATEMENT OF INTERNAL CONTROLS
The Management of Askari Bank Limited (the Bank) assumes full responsibility for establishing and maintaining effective system of internal
controls throughout the Bank to ensure reliable, accurate and fair financial reporting, effectiveness of operations and compliance with the
applicable laws and regulations. Management understands that the effective maintenance of the internal controls system is an ongoing
process under the ownership of the management. All significant policies and procedural manuals are in place; and the review, revision and
improvement to keep them updated to cope with latest challenges is actively pursued by the management.
Architecture of the Bank’s internal control system involves different levels of monitoring activities .i.e. line management, Compliance & Data
Division (CDD) and Audit & Inspection Division (AID). The Bank’s AID is independent from the line management and reviews the adequacy
and implementation of control activities across the Bank as well as implementation of and compliance with all the prescribed policies and
procedures.
All significant and material findings pointed out by the internal, external auditors and regulators are addressed on priority basis by CDD.
The function also actively monitors implementation of the corrective / remedial measure to ensure that identified risks are mitigated to
safeguarding the interest of the Bank.
In compliance with the SBP’s directives, the Bank had completed the implementation of road map regarding Internal Controls over Financial
Reporting (ICFR) on September 30, 2012. This included detailed documentation of the existing processes, comprehensive evaluation of
controls both at entity as well as activity level, development of detailed remedial action plans for the gaps identified as a result of such
evaluation and devising comprehensive testing plans of the controls of all processes. Consequent to grant of exemption by the State Bank
of Pakistan (SBP) from the requirement of submission of Long Form Report (LFR), the documentation including the testing results have been
reviewed by the internal auditors of the Bank, on the basis of which Annual Assessment Report duly approved by the Audit Committee was
submitted to the SBP. Annual Assessment Report for the year 2016 is due for submission by March 31, 2017.
During the year under review, we have endeavored to follow the guidelines issued by SBP on internal controls for evaluation and management
of significant risks and we will continue to endeavor for further improvements in the Internal Controls System.
While an internal controls system is effectively implemented and monitored; however, due to inherent limitations, internal controls system
is designed to manage rather than eliminate the risk of failure to achieve the desired objectives and can only provide reasonable and not
absolute assurance against material misstatement or loss.
Saleem Anwar Syed M. Husaini Chief Financial Officer President & Chief Executive
February 14, 2017
An
nu
al R
epo
rt o
f Ask
ari B
ank
Lim
ited
for 2
016
63
This statement is being presented to comply with the Code of Corporate Governance (the CCG) contained in Regulation 5.19 of Pakistan Stock Exchange Limited Regulations, for the purpose of establishing a framework of good governance, whereby a listed company is managed in compliance with the best practices of corporate governance.
Askari Bank Limited (the Bank) has applied the principles contained in the CCG in the following manner:
1. The Bank encourages representation of independent, non-executive directors and directors representing minority interests on its board of directors. At present the Board includes:
Category Name
Independent Directors Mr. Asif Reza Sana
Mr. Zaffar Ahmad Khan
Mr. Tariq Hafeez Malik
Mr. Muhammad Ghous
Executive Director Syed M. Husaini, President & CE
Non-Executive Directors Lt Gen Khalid Nawaz Khan, HI (M) (Retd) - Chairman
Lt Gen Muhammad Haroon Aslam, HI (M) (Retd)
Lt Gen Shafqaat Ahmed, HI (M) (Retd)
Mr. QaiserJaved
Dr. Nadeem Inayat
Mr. Manzoor Ahmed - Nominee NIT
The independent directors meet the criteria of independence under clause 5.19.1(b) of the CCG.
2. The directors have confirmed that none of them is serving as a director on more than seven listed companies, including Askari Bank Limited.
3. All the resident directors of the Bank are registered as taxpayers and none of them has defaulted in payment of any loan to a banking company, a DFI or an NBFI or, being a member of a stock exchange, has been declared as a defaulter by that stock exchange.
4. No casual vacancy occurred on the Board during the year; however, the President & CE of the Bank was re-appointed for another term of three (3) years i.e. from June 03, 2016 to June 02, 2019.
5. The Bank has prepared a statement of “Code of Conduct”, and has ensured that appropriate steps have been taken to disseminate it throughout the Bank along with its supporting policies and procedures.
6. The Board has developed a vision / mission statement, overall corporate strategy and has approved significant policies of the Bank. A complete record of particulars of significant policies along with the dates on which they were approved or amended has been maintained.
7. All the powers of the Board have been duly exercised and decisions on material transactions, including appointment and determination of remuneration and terms and conditions of employment of the President & Chief Executive, and non-executive directors, have been taken by the Board / shareholders.
8. The meetings of the Board were presided over by the Chairman and the Board met at least once in every quarter. Written notices of the Board meetings, along with agenda and working papers, were circulated at least seven days before the meetings. The minutes of the meetings were appropriately recorded and circulated.
9. The Board arranged appropriate training programs for its directors during the year. More than half of the directors have certification under Directors’ Training Program offered by institutions that meet the criteria specified by the SECP.
10. The Board has approved the appointments of Chief Financial Officer (CFO), Company Secretary and Head of Internal Audit, including their remuneration and terms and conditions of employment.
11. The Directors’ Report for this year has been prepared in compliance with the requirements of the CCG and fully describes the salient matters required to be disclosed.
STATEMENT OF COMPLIANCEWITH THE CODE OF CORPORATE GOVERNANCE FOR THE YEAR ENDED DECEMBER 31, 2016
Celeb
rating
Youn
g Tale
nt64
12. The financial statements of the Bank were duly endorsed by the President & Chief Executive and the Chief Financial Officer before approval of the Board.
13. The directors, President & Chief Executive and executives do not hold any interest in the shares of the Bank other than that disclosed in the pattern of shareholding.
14. The Bank has complied with all the corporate and financial reporting requirements of the CCG.
15. The Board has formed a Board Audit & Compliance Committee (BACC). It comprises of 5 members, of whom 3 members are non-executive directors and 2 members are independent directors, including the Chairman of the Committee.
16. The meetings of the Board Audit & Compliance Committee (BACC) were held at least once in every quarter prior to approval of interim and final results of the Bank as required by the CCG. The Terms of Reference of the Committee have been formed and advised to the Committee for compliance.
17. The Board has formed a Board Human Resource & Remuneration Committee (BHR&RC). It comprises of 3 members, of whom 1 member is non-executive director, 2 members are independent directors including the Chairman of the Committee.
18. The Board has set-up an effective internal audit function which is considered suitably qualified and experienced for the purpose and is conversant with the policies and procedures of the Bank.
19. The statutory auditors of the Bank have confirmed that they have been given a satisfactory rating under the quality control review program of the Institute of Chartered Accountants of Pakistan (ICAP), that they or any of the partners of the firm, their spouses and minor children do not hold shares of the Bank and that the firm and all its partners are in compliance with International Federation of Accountants (IFAC) guidelines on Code of Ethics, as adopted by the ICAP.
20. The statutory auditors or the persons associated with them have not been appointed to provide other services except in accordance with the PSX Regulations and the auditors have confirmed that they have observed IFAC guidelines in this regard.
21. The ‘closed period’, prior to the announcement of interim / final results, and business decisions, which may materially affect the market price of Bank’s shares, was determined and intimated to directors, employees and the stock exchange.
22. Material / price sensitive information has been disseminated among all market participants at once through the stock exchange.
23. The Bank has complied with the requirements relating to maintenance of register of persons having access to inside information by designated senior management officer in a timely manner and maintained proper record including basis for inclusion or exclusion of names of persons from the said list.
24. We confirm that all other material principles enshrined in the CCG have been complied with.
For and on behalf of the Board
Rawalpindi Lt Gen Khalid Nawaz Khan February 14, 2017 HI(M), Sitara-i-Esar (Retd) Chairman
STATEMENT OF COMPLIANCEWITH THE CODE OF CORPORATE GOVERNANCE FOR THE YEAR ENDED DECEMBER 31, 2016

An
nu
al R
epo
rt o
f Ask
ari B
ank
Lim
ited
for 2
016
65
AUDITORS’ REVIEW REPORT TO THE MEMBERSON STATEMENT OF COMPLIANCE WITH THE CODE OF CORPORATE GOVERNANCE
We have reviewed the enclosed Statement of Compliance with the best practices (the Statement) contained in the Code of Corporate Governance (the Code) prepared by the Board of Directors (the Board) of Askari Bank Limited (the Bank) for the year ended December 31, 2016 to comply with the requirements of Regulation 5.19 of Pakistan Stock Exchange Limited Regulations issued by Pakistan Stock Exchange Limited where the Bank is listed.
The responsibility for compliance with the Code is that of the Board of the Bank. Our responsibility is to review, to the extent where such compliance can be objectively verified, whether the Statement reflects the status of the Bank’s compliance with the provisions of the Code and report if it does not and to highlight any non-compliance with the requirements of the Code. A review is limited primarily to inquiries of the Bank’s personnel and review of various documents prepared by the Bank to comply with the Code.
As a part of our audit of the financial statements we are required to obtain an understanding of the accounting and internal control systems sufficient to plan the audit and develop an effective audit approach. We are not required to consider whether the Board’s statement on internal control covers all risks and controls, or to form an opinion on the effectiveness of such internal controls, the Bank’s corporate governance procedures and risks.
The Code requires the Bank to place before the Audit Committee, and upon recommendation of the Audit Committee, place before the Board for their review and approval its related party transactions distinguishing between transactions carried out on terms equivalent to those that prevail in arm’s length transactions and transactions which are not executed at arm’s length price and recording proper justification for using such alternative pricing mechanism. We are only required and have ensured compliance of this requirement to the extent of the approval of the related party transactions by the Board upon recommendation of the Audit Committee. We have not carried out any procedures to determine whether the related party transactions were undertaken at arm’s length price or not.
Based on our review, nothing has come to our attention which causes us to believe that the Statement does not appropriately reflect the Bank’s compliance, in all material respects, with the best practices contained in the Code as applicable to the Bank for the year ended December 31, 2016.
Chartered AccountantsIslamabadEngagement partner: S. Haider Abbas
Date: February 28, 2017
A.F. FERGUSON & CO., Chartered Accountants, a member firm of the PWC networkPIA Building. 3rd Floor, 49 Blue Area, Fazl-ul-Haq Road, P.O. Box 3021, Islamabad-44000, PakistanTel: +92 (51) 2273457-60 / 2604934-37; Fax: +92 (51) 2277924; <www.pwc.com/pk>
KARACHI LAHORE ISLAMABAD
Celeb
rating
Youn
g Tale
nt66
We have audited the annexed unconsolidated statement of financial position of Askari Bank Limited (the Bank) as at December 31, 2016
and the related unconsolidated profit and loss account, unconsolidated statement of comprehensive income, unconsolidated cash flow
statement and unconsolidated statement of changes in equity together with the notes forming part thereof (here in after referred to as
the ‘financial statements’) for the year then ended, in which are incorporated the unaudited certified returns from the branches except for
twenty six branches which have been audited by us and one branch audited by auditors abroad and we state that we have obtained all the
information and explanations which, to the best of our knowledge and belief, were necessary for the purposes of our audit.
It is the responsibility of the Bank’s Board of Directors to establish and maintain a system of internal control, and prepare and present the
financial statements in conformity with approved accounting standards and the requirements of the Banking Companies Ordinance, 1962
(LVI I of 1962), and the Companies Ordinance, 1984 (XL VI I of 1984). Our responsibility is to express an opinion on these statements based
on our audit.
We conducted our audit in accordance with the International Standards on Auditing as applicable in Pakistan. These standards require
that we plan and perform the audit to obtain reasonable assurance about whether the financial statements are free of any material
misstatement. An audit includes examining, on a test basis, evidence supporting amounts and disclosures in the financial statements.
An audit also includes assessing accounting policies and significant estimates made by management, as well as, evaluating the overall
presentation of the financial statements. We believe that our audit provides a reasonable basis for our opinion and after due verification,
which in case of loans and advances covered more than sixty per cent of the total loans and advances of the Bank, we report that:
(a) in our opinion, proper books of accounts have been kept by the Bank as required by the Companies Ordinance, 1984 (XLVII of 1984),
and the returns referred to above received from the branches have been found adequate for the purposes of our audit;
(b) in our opinion:
(i) the unconsolidated statement of financial position and unconsolidated profit and loss account together with the notes
thereon have been drawn up in conformity with the Banking Companies Ordinance, 1962 (LVII of 1962), and the Companies
Ordinance, 1984 (XLVII of 1984), and are in agreement with the books of account and are further in accordance with
accounting policies consistently applied except for the changes as stated in note 5.11 to the financial statements with which
we concur;
(ii) the expenditure incurred during the year was for the purpose of the Bank’s business; and
AUDITORS’ REPORT TO THE MEMBERS
A.F. FERGUSON & CO., Chartered Accountants, a member firm of the PWC networkPIA Building. 3rd Floor, 49 Blue Area, Fazl-ul-Haq Road, P.O. Box 3021, Islamabad-44000, PakistanTel: +92 (51) 2273457-60 / 2604934-37; Fax: +92 (51) 2277924; <www.pwc.com/pk>
KARACHI LAHORE ISLAMABAD
An
nu
al R
epo
rt o
f Ask
ari B
ank
Lim
ited
for 2
016
67
(iii) the business conducted, investments made and the expenditure incurred during the year were in accordance with the
objects of the Bank and the transactions of the Bank which have come to our notice have been within the powers of the
Bank;
(c) in our opinion and to the best of our information and according to the explanations given to us, the unconsolidated statement of
financial position, unconsolidated profit and loss account, unconsolidated statement of comprehensive income, unconsolidated
cash flow statement and unconsolidated statement of changes in equity together with the notes forming part thereof conform with
approved accounting standards as applicable in Pakistan, and give the information required by the Banking Companies Ordinance,
1962 (LVII of 1962), and the Companies Ordinance, 1984 (XLVII of 1984), in the manner so required and give a true and fair view of
the state of the Bank’s affairs as at December 31, 2016 and its true balance of the profit, its comprehensive income, its cash flows
and changes in equity for the year then ended; and
(d) in our opinion Zakat deductible at source under the Zakat and Ushr Ordinance, 1980 (XVIII of 1980), was deducted by the Bank and
deposited in the Central Zakat Fund established under section 7 of that Ordinance.
Chartered AccountantsIslamabadEngagement partner: S. Haider Abbas
Date: February 28, 2017
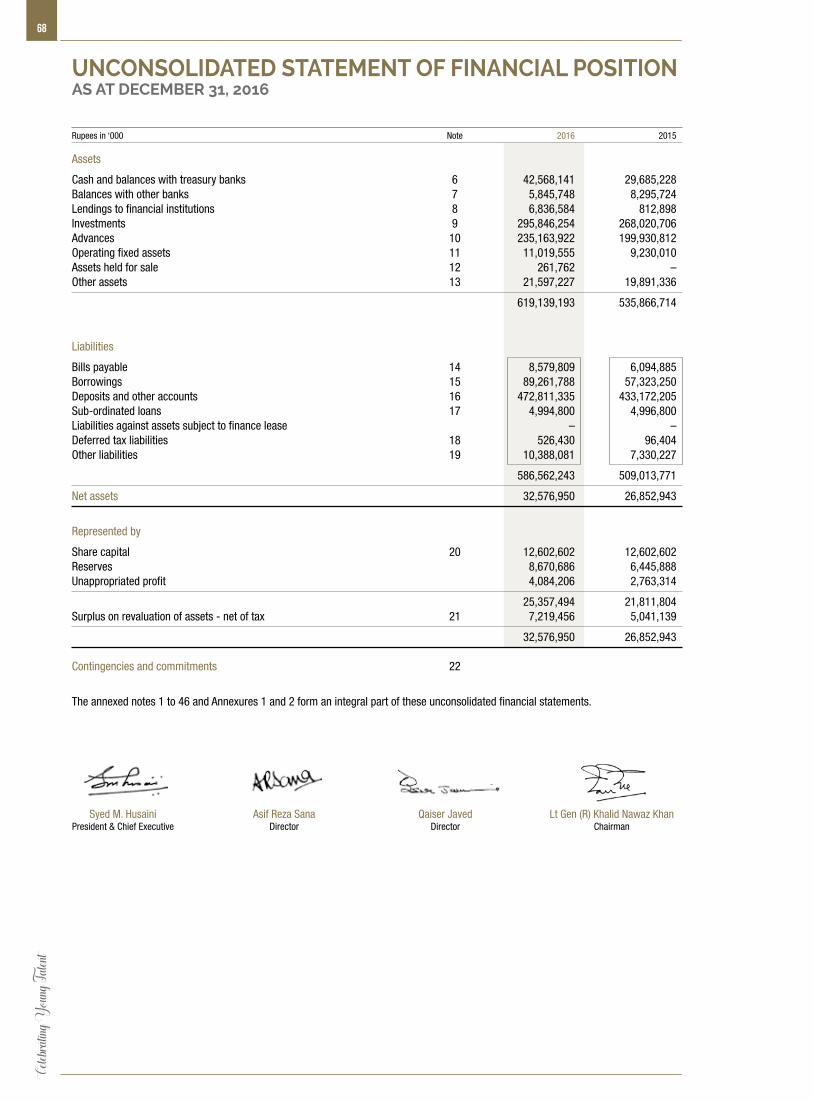
Celeb
rating
Youn
g Tale
nt68
Syed M. HusainiPresident & Chief Executive
Asif Reza SanaDirector
Qaiser JavedDirector
Lt Gen (R) Khalid Nawaz KhanChairman
UNCONSOLIDATED STATEMENT OF FINANCIAL POSITIONAS AT DECEMBER 31, 2016
Rupees in ‘000 Note 2016 2015
Assets
Cash and balances with treasury banks 6 42,568,141 29,685,228 Balances with other banks 7 5,845,748 8,295,724 Lendings to financial institutions 8 6,836,584 812,898 Investments 9 295,846,254 268,020,706 Advances 10 235,163,922 199,930,812 Operating fixed assets 11 11,019,555 9,230,010 Assets held for sale 12 261,762 – Other assets 13 21,597,227 19,891,336
619,139,193 535,866,714
Liabilities
Bills payable 14 8,579,809 6,094,885 Borrowings 15 89,261,788 57,323,250 Deposits and other accounts 16 472,811,335 433,172,205 Sub-ordinated loans 17 4,994,800 4,996,800 Liabilities against assets subject to finance lease – – Deferred tax liabilities 18 526,430 96,404 Other liabilities 19 10,388,081 7,330,227
586,562,243 509,013,771
Net assets 32,576,950 26,852,943
Represented by
Share capital 20 12,602,602 12,602,602 Reserves 8,670,686 6,445,888 Unappropriated profit 4,084,206 2,763,314
25,357,494 21,811,804 Surplus on revaluation of assets - net of tax 21 7,219,456 5,041,139
32,576,950 26,852,943 Contingencies and commitments 22
The annexed notes 1 to 46 and Annexures 1 and 2 form an integral part of these unconsolidated financial statements.
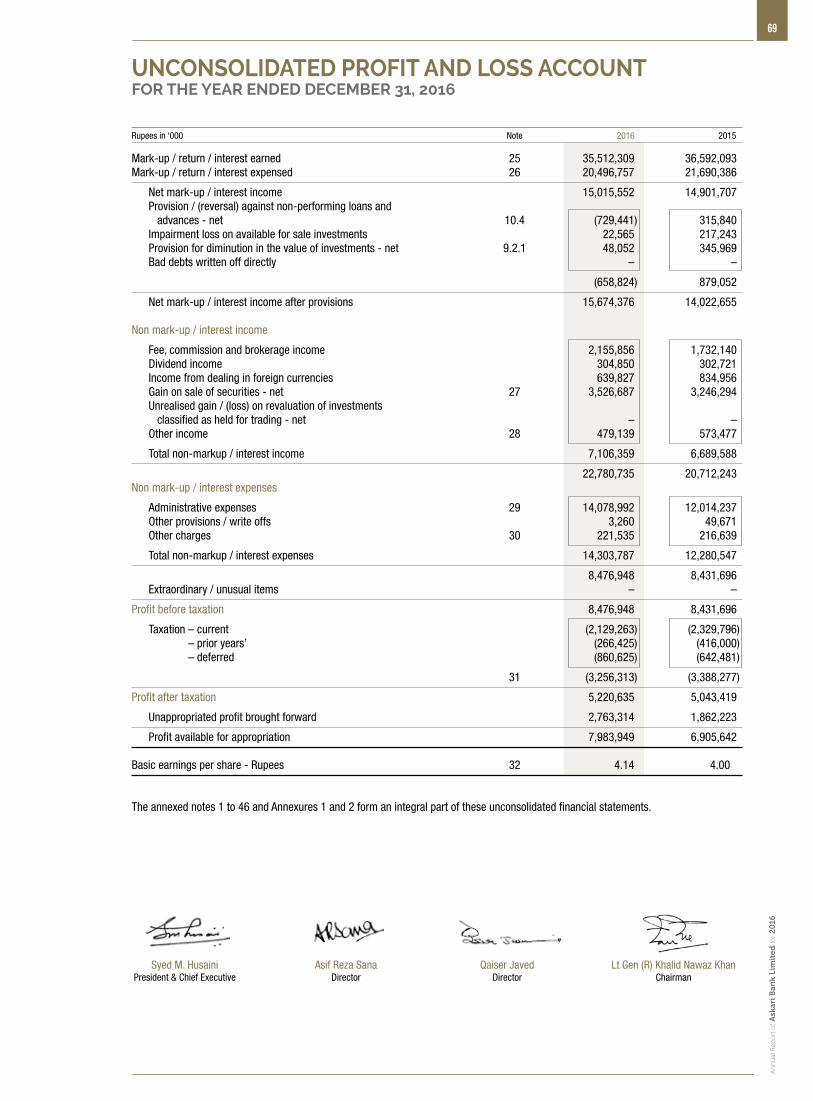
An
nu
al R
epo
rt o
f Ask
ari B
ank
Lim
ited
for 2
016
69
Syed M. HusainiPresident & Chief Executive
Asif Reza SanaDirector
Qaiser JavedDirector
Lt Gen (R) Khalid Nawaz KhanChairman
UNCONSOLIDATED PROFIT AND LOSS ACCOUNTFOR THE YEAR ENDED DECEMBER 31, 2016
Rupees in ‘000 Note 2016 2015
Mark-up / return / interest earned 25 35,512,309 36,592,093 Mark-up / return / interest expensed 26 20,496,757 21,690,386
Net mark-up / interest income 15,015,552 14,901,707 Provision / (reversal) against non-performing loans and advances - net 10.4 (729,441) 315,840 Impairment loss on available for sale investments 22,565 217,243 Provision for diminution in the value of investments - net 9.2.1 48,052 345,969 Bad debts written off directly – –
(658,824) 879,052
Net mark-up / interest income after provisions 15,674,376 14,022,655 Non mark-up / interest income
Fee, commission and brokerage income 2,155,856 1,732,140 Dividend income 304,850 302,721 Income from dealing in foreign currencies 639,827 834,956 Gain on sale of securities - net 27 3,526,687 3,246,294 Unrealised gain / (loss) on revaluation of investments classified as held for trading - net – – Other income 28 479,139 573,477
Total non-markup / interest income 7,106,359 6,689,588
22,780,735 20,712,243 Non mark-up / interest expenses
Administrative expenses 29 14,078,992 12,014,237 Other provisions / write offs 3,260 49,671 Other charges 30 221,535 216,639
Total non-markup / interest expenses 14,303,787 12,280,547
8,476,948 8,431,696 Extraordinary / unusual items – –
Profit before taxation 8,476,948 8,431,696
Taxation – current (2,129,263) (2,329,796) Taxation – prior years’ (266,425) (416,000) Taxation – deferred (860,625) (642,481)
31 (3,256,313) (3,388,277)
Profit after taxation 5,220,635 5,043,419
Unappropriated profit brought forward 2,763,314 1,862,223
Profit available for appropriation 7,983,949 6,905,642 Basic earnings per share - Rupees 32 4.14 4.00 The annexed notes 1 to 46 and Annexures 1 and 2 form an integral part of these unconsolidated financial statements.
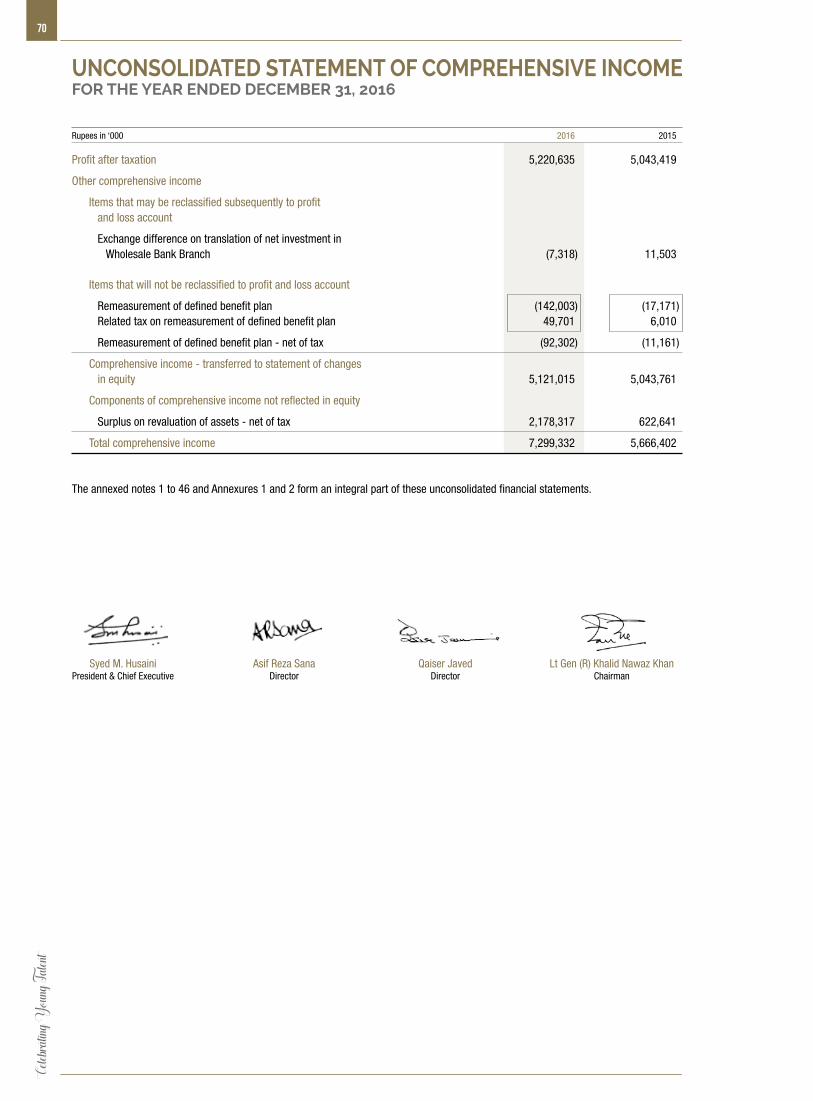
Celeb
rating
Youn
g Tale
nt70
UNCONSOLIDATED STATEMENT OF COMPREHENSIVE INCOMEFOR THE YEAR ENDED DECEMBER 31, 2016
Rupees in ‘000 2016 2015
Profit after taxation 5,220,635 5,043,419
Other comprehensive income
Items that may be reclassified subsequently to profit and loss account
Exchange difference on translation of net investment in Wholesale Bank Branch (7,318) 11,503 Items that will not be reclassified to profit and loss account
Remeasurement of defined benefit plan (142,003) (17,171) Related tax on remeasurement of defined benefit plan 49,701 6,010
Remeasurement of defined benefit plan - net of tax (92,302) (11,161)
Comprehensive income - transferred to statement of changes in equity 5,121,015 5,043,761
Components of comprehensive income not reflected in equity
Surplus on revaluation of assets - net of tax 2,178,317 622,641
Total comprehensive income 7,299,332 5,666,402 The annexed notes 1 to 46 and Annexures 1 and 2 form an integral part of these unconsolidated financial statements.
Syed M. HusainiPresident & Chief Executive
Asif Reza SanaDirector
Qaiser JavedDirector
Lt Gen (R) Khalid Nawaz KhanChairman

An
nu
al R
epo
rt o
f Ask
ari B
ank
Lim
ited
for 2
016
71
Rupees in ‘000 Note 2016 2015
Cash flow from operating activities
Profit before taxation 8,476,948 8,431,696 Less: dividend income (304,850) (302,721)
8,172,098 8,128,975 Adjustments: Depreciation / amortization 1,013,547 864,179 (Reversal of) / provision against non-performing loans and advances - net (729,441) 315,840 Impairment loss on available for sale investments 22,565 217,243 Provision for diminution in the value of investments - net 48,052 345,969 Gain on sale of asset held for sale – (215,466) Reversal of provision against operating fixed assets (9,842) (238) Provision against other assets 12,306 51,905 Charge for defined benefit plan 326,801 301,525 Gain on sale of operating fixed assets (6,484) (7,841)
677,504 1,873,116
8,849,602 10,002,091 (Increase) / decrease in operating assets Lendings to financial institutions (6,023,686) 1,187,102 Advances (34,399,975) (29,310,152) Other assets (excluding advance taxation) 371,124 (219,093)
(40,052,537) (28,342,143)Increase / (decrease) in operating liabilities Bills payable 2,484,924 (760,135) Borrowings 31,938,538 43,581,220 Deposits 39,639,130 45,585,585 Other liabilities 2,574,849 (22,430)
76,637,441 88,384,240
Cash generated from operations 45,434,506 70,044,188
Payment made to defined benefit plan – (200,294)
Income tax paid (2,955,266) (2,382,892)
Net cash flow from operating activities 42,479,240 67,461,002 Cash flow from investing activities
Net investments in available for sale securities (33,400,663) (44,088,780)Net investments in held to maturity securities 4,154,456 (6,322,982)Sale proceeds of assets held for sale – 269,169 Dividend income 289,272 292,964 Investments in operating fixed assets - net of adjustment (1,541,470) (1,804,812)Sale proceeds of operating fixed assets disposed off 22,543 18,190
Net cash used in investing activities (30,475,862) (51,636,251) Cash flow from financing activities
Payments of sub-ordinated loans - net (2,000) (2,996,000)Dividend paid (1,561,123) (2,485,279)
Net cash used in financing activities (1,563,123) (5,481,279) Exchange difference on translation of net investment in Wholesale Bank Branch (7,318) 11,503
Increase in cash and cash equivalents 10,432,937 10,354,975 Cash and cash equivalents at beginning of the year 37,980,952 27,625,977
Cash and cash equivalents at end of the year 33 48,413,889 37,980,952 The annexed notes 1 to 46 and Annexures 1 and 2 form an integral part of these unconsolidated financial statements.
UNCONSOLIDATED CASH FLOW STATEMENTFOR THE YEAR ENDED DECEMBER 31, 2016
Syed M. HusainiPresident & Chief Executive
Asif Reza SanaDirector
Qaiser JavedDirector
Lt Gen (R) Khalid Nawaz KhanChairman
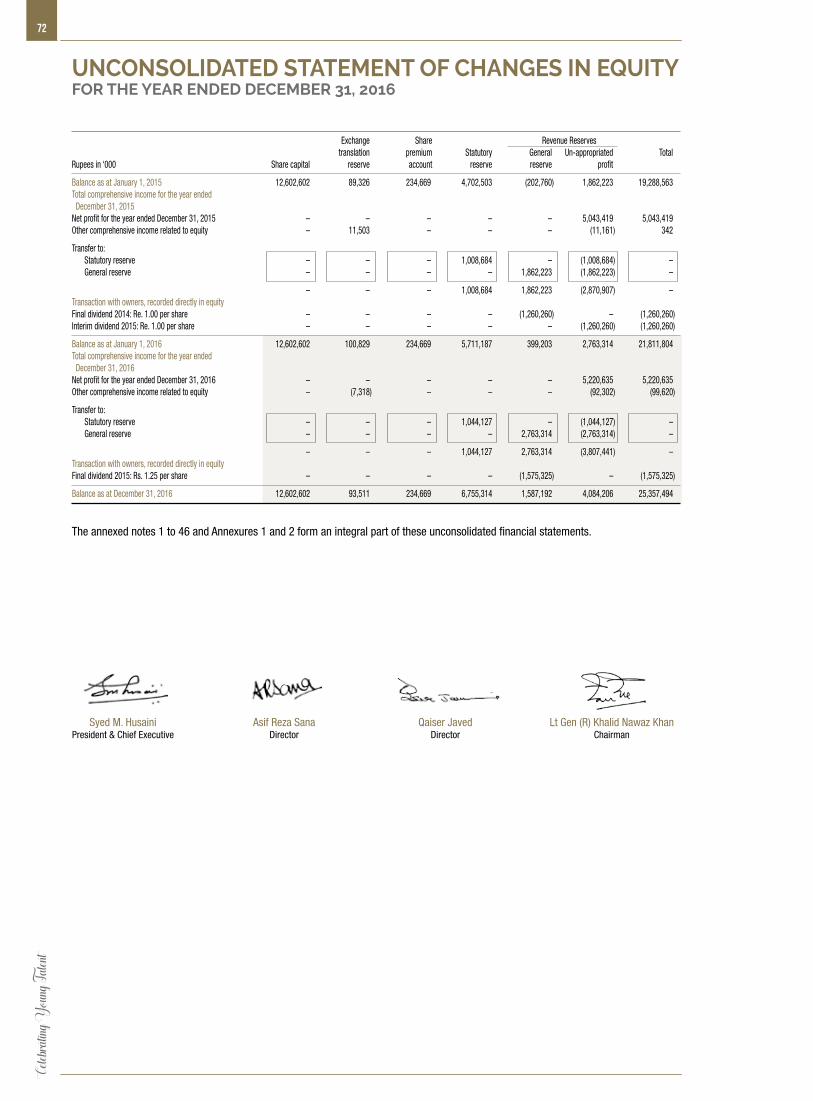
Celeb
rating
Youn
g Tale
nt72
Exchange Share Revenue Reserves translation premium Statutory General Un-appropriated TotalRupees in ‘000 Share capital reserve account reserve reserve profit
Balance as at January 1, 2015 12,602,602 89,326 234,669 4,702,503 (202,760) 1,862,223 19,288,563 Total comprehensive income for the year ended December 31, 2015Net profit for the year ended December 31, 2015 – – – – – 5,043,419 5,043,419 Other comprehensive income related to equity – 11,503 – – – (11,161) 342
Transfer to: Statutory reserve – – – 1,008,684 – (1,008,684) – General reserve – – – – 1,862,223 (1,862,223) –
– – – 1,008,684 1,862,223 (2,870,907) – Transaction with owners, recorded directly in equity Final dividend 2014: Re. 1.00 per share – – – – (1,260,260) – (1,260,260)Interim dividend 2015: Re. 1.00 per share – – – – – (1,260,260) (1,260,260)
Balance as at January 1, 2016 12,602,602 100,829 234,669 5,711,187 399,203 2,763,314 21,811,804 Total comprehensive income for the year ended December 31, 2016Net profit for the year ended December 31, 2016 – – – – – 5,220,635 5,220,635 Other comprehensive income related to equity – (7,318) – – – (92,302) (99,620)
Transfer to: Statutory reserve – – – 1,044,127 – (1,044,127) – General reserve – – – – 2,763,314 (2,763,314) –
– – – 1,044,127 2,763,314 (3,807,441) –Transaction with owners, recorded directly in equity Final dividend 2015: Rs. 1.25 per share – – – – (1,575,325) – (1,575,325)
Balance as at December 31, 2016 12,602,602 93,511 234,669 6,755,314 1,587,192 4,084,206 25,357,494
The annexed notes 1 to 46 and Annexures 1 and 2 form an integral part of these unconsolidated financial statements.
UNCONSOLIDATED STATEMENT OF CHANGES IN EQUITYFOR THE YEAR ENDED DECEMBER 31, 2016
Syed M. HusainiPresident & Chief Executive
Asif Reza SanaDirector
Qaiser JavedDirector
Lt Gen (R) Khalid Nawaz KhanChairman

An
nu
al R
epo
rt o
f Ask
ari B
ank
Lim
ited
for 2
016
73
1. STATUS AND NATURE OF BUSINESS
1.1 Askari Bank Limited (the Bank) was incorporated in Pakistan on October 9, 1991 as a Public Limited Company and is listed on the Pakistan Stock Exchange. The registered office of the Bank is situated at AWT Plaza, The Mall, Rawalpindi. The Bank is a scheduled commercial bank and is principally engaged in the business of banking as defined in the Banking Companies Ordinance, 1962. The Fauji Consortium: comprising of Fauji Foundation (FF), Fauji Fertilizer Company Limited (FFCL) and Fauji Fertilizer Bin Qasim Limited (FFBL) collectively owned 71.91 percent shares of the Bank as on December 31, 2016. The ultimate parent of the Bank is Fauji Foundation. The Bank has 501 branches (2015: 424 branches); 500 in Pakistan and Azad Jammu and Kashmir, including 91 (2015: 75) Islamic Banking branches, 36 (2015: 32) sub-branches and a Wholesale Bank Branch in the Kingdom of Bahrain.
2. BASIS OF PRESENTATION
2.1 These unconsolidated financial statements have been presented in accordance with the requirements of format prescribed by the State Bank of Pakistan’s BSD Circular No. 4 dated February 17, 2006.
2.2 These unconsolidated financial statements are separate financial statements of the Bank in which the investments in subsidiaries and associates are stated at cost and have not been accounted for on the basis of reported results and net assets of the investees which is done in consolidated financial statements.
2.3 In accordance with the directives of the Federal Government regarding shifting of the banking system to Islamic modes, the SBP has issued various circulars from time to time. One permissible form of trade related mode of financing comprises of purchase of goods by the Bank from its customers and resale to them at appropriate mark-up in price on a deferred payment basis. The purchases and sales arising under these arrangements are not reflected in these unconsolidated financial statements as such but are restricted to the amount of facilities actually utilized and the appropriate portion of mark-up thereon.
2.4 The financial results of the Islamic banking branches have been consolidated in these unconsolidated financial statements for reporting purposes, after eliminating material inter-branch transactions / balances. Key figures of the Islamic banking branches are disclosed in Annexure - 2 to these unconsolidated financial statements.
2.5 Items included in the unconsolidated financial statements are measured using the currency of the primary economic environment in which the Bank operates. The unconsolidated financial statements are presented in Pak. Rupee, which is the Bank’s functional and presentation currency. Figures have been rounded off to the nearest thousand of rupees unless otherwise stated.
3. STATEMENT OF COMPLIANCE
These unconsolidated financial statements have been prepared in accordance with the approved accounting standards as applicable in Pakistan and the requirements of the Companies Ordinance, 1984 and the Banking Companies Ordinance, 1962. Approved accounting standards comprise of such International Financial Reporting Standards (IFRS) issued by the International Accounting Standard Board (IASB) and Islamic Financial Accounting Standards (IFAS) issued by the Institute of Chartered Accountants of Pakistan (ICAP) as are notified under the Companies Ordinance, 1984, provisions of and directives issued under the Companies Ordinance, 1984 and the Banking Companies Ordinance, 1962 or directives issued by the Securities and Exchange Commission of Pakistan and the State Bank of Pakistan (SBP). In case the requirements differ, the provisions of and directives issued under the Companies Ordinance, 1984 and the Banking Companies Ordinance, 1962 and the directives issued by SBP shall prevail.
International Accounting Standard 39, “Financial Instruments: Recognition and Measurement”, International Accounting Standard 40, “Investment Property” and International Financial Reporting Standard 7,”Financial Instruments: Disclosure” are not applicable to banking companies in Pakistan. Accordingly, the requirements of these Standards have not been considered in the preparation of these unconsolidated financial statements. Accordingly, investments have been classified and valued in accordance with the requirements prescribed by SBP through various circulars.
3.1 Standards and amendments to approved accounting standards that are not yet effective
a) The following amendments to published accounting standards were effective during the year and have been adopted by the Bank:
Effective date (annual periods beginning on or after)
IFRS 5 Non-current Assets Held for Sale and Discontinued Operations (Amendments) January 1, 2016 IFRS 11 Joint Arrangements (Amendments) January 1, 2016 IAS 1 Presentation of financial statements (Amendments) January 1, 2016 IAS 16 Property, plant and equipment (Amendments) January 1, 2016 IAS 19 Employee Benefits (Amendments) January 1, 2016 IAS 27 Separate financial statements (Amendments) January 1, 2016 IAS 38 Intangible assets (Amendments) January 1, 2016
NOTES TO THE UNCONSOLIDATED FINANCIAL STATEMENTSFOR THE YEAR ENDED DECEMBER 31, 2016
Celeb
rating
Youn
g Tale
nt74
b) Following standards has been issued by the International Accounting Standards Board (IASB), which are yet to be notified by the Securities and Exchange Commission of Pakistan (SECP) for the purpose of its applicability in Pakistan:
effective date (Annual periods beginning On or after)
IFRS 1 First-time Adoption of International Financial Reporting Standards (Amendments) July 1, 2009 IFRS 14 Regulatory Deferral Accounts January 1, 2016
c) Following standards and amendments to published accounting standards will be effective in future periods and have not
been early adopted by the Bank: effective date (Annual periods beginning On or after)
IFRS 1 First-time Adoption of International Financial Reporting Standards (Amendments) January 1, 2018 IFRS 2 Share-based payment (Amendments) January 1, 2018 IFRS 4 Insurance Contracts January 1, 2018 IFRS 7 Financial Instruments (Amendments) January 1, 2018 IFRS 12 Disclosure of Interests in Other Entities (Amendments) January 1, 2017 IFRS 15 Revenue from Contracts with Customers January 1, 2018 IFRS 16 Leases January 1, 2019 IAS 12 Income taxes (Amendments) January 1, 2017 IAS 39 Financial Instruments: Recognition and Measurement (Amendments) January 1, 2018 IAS 40 Investment property (Amendments) July 1, 2018
The management anticipates that adoption of above standards and amendments in future periods will have no material
impact on the Bank’s financial statements other than in presentation / disclosure. 4. BASIS OF MEASUREMENT
These unconsolidated financial statements have been prepared under the historical cost convention as modified for certain investments which are carried at fair value, non-banking assets acquired in satisfaction of claims, freehold and leasehold land which are shown at revalued amounts and staff retirement gratuity and compensated absences which are carried at present value of defined benefit obligations net of fair value of plan assets.
Use of critical accounting estimates and judgments
The preparation of unconsolidated financial statements in conformity with approved accounting standards as applicable in Pakistan requires the use of certain accounting estimates. It also requires management to exercise its judgement in the process of applying the Bank’s accounting policies. The Bank uses estimates and assumptions concerning the future. The resulting accounting estimate will, by definition, seldom equal the related actual results. Estimates and judgments are continually evaluated and are based on historical experience and other factors, including expectations of future events that are believed to be reasonable under the circumstances. The areas involving a higher degree of judgment or complexity, or areas where assumptions and estimates are significant to the financial statements are as follow:
i) classification of investments (note 5.5) ii) provision against investments (note 5.5), advances (note 5.6), operating fixed assets (note 5.7) and other assets (note 5.8) iii) valuation and impairment of available for sale securities (note 5.5) iv) useful life of property and equipments, intangible assets and revaluation of land (note 5.7) v) taxation (note 5.10) vi) staff retirement benefits (note 5.12)
5. SUMMARY OF SIGNIFICANT ACCOUNTING POLICIES
The accounting policies set out below have been applied consistently to all periods presented in these financial statements.
NOTES TO THE UNCONSOLIDATED FINANCIAL STATEMENTSFOR THE YEAR ENDED DECEMBER 31, 2016
An
nu
al R
epo
rt o
f Ask
ari B
ank
Lim
ited
for 2
016
75
5.1 Assets held for sale
Non-current assets and associated liabilities are classified as held for sale when their carrying amount will be recovered principally through a sale transaction rather than continuing use and a sale is highly probable. Assets designated as held for sale are carried at the lower of carrying amount at designation and fair value less costs to sell, if fair value can reasonably be determined.
5.2 Cash and cash equivalents
Cash and cash equivalents comprise of cash and balances with treasury banks, balances with other banks and call money lendings.
5.3 Sale and repurchase agreements
Securities sold under repurchase agreement (repo) are retained in the unconsolidated financial statements as investments and a liability for consideration received is included in borrowings. Conversely, consideration for securities purchased under resale agreement (reverse repo) are included in lendings to financial institutions. The difference between sale and repurchase / purchase and resale price is recognized as mark-up / return expensed and earned on a time proportion basis as the case may be. Repo and reverse repo balances are reflected under borrowings from and lendings to financial institutions respectively.
5.4 Bai Muajjal receivable from other financial institutions
In Bai Muajjal, the Bank sells sukuk on deferred payment basis to other financial institutions. The deferred price is agreed at the time of sale and such proceeds are received at the end of the credit period.
5.5 Investments
Investments are classified as follows:
Held for trading
These represent securities acquired with the intention to trade by taking advantage of short-term market / interest rate movements. These are marked to market and surplus / deficit arising on revaluation of ‘held for trading’ investments is taken to profit and loss account in accordance with the requirements prescribed by the SBP through various circulars.
Available for sale
These represent securities which do not fall under ‘held for trading’ or ‘held to maturity’ categories. In accordance with the requirements of the SBP’s BSD Circular No. 20 dated August 04, 2000 and BPRD Circular 06 dated June 26, 2014, available for sale securities for which ready quotations are available on Reuters Page (PKRV) or Stock Exchanges are valued at market value and the resulting surplus / deficit is taken through “Statement of Comprehensive Income” and is shown below the shareholders’ equity in the unconsolidated statement of financial position.
Unquoted equity securities are valued at the lower of cost and break-up value. Break-up value of equity securities is calculated with reference to the net assets of the investee as per the latest audited financial statements. If the break-up value is less than cost the difference is included in profit and loss account. Unquoted debt securities are valued using the market value of secondary market where available.
Where the decline in prices of available for sale equity securities is significant and prolonged, it is considered impaired and included in profit and loss account. Impairment loss on available for sale debt securities is determined in accordance with the requirements of Prudential Regulations issued by the SBP.
Investments in other unquoted securities are valued at cost less impairment losses.
Held to maturity
These represent securities acquired with the intention and ability to hold them upto maturity. These are carried at amortized cost less impairment, determined in accordance with the requirements of Prudential Regulations issued by the SBP.
Investment in subsidiaries and associate
Investments in subsidiaries and associate are carried at cost less impairment, if any.
All purchases and sale of investment that require delivery within the time frame established by regulations or market convention are recognized at the trade date, which is the date the Bank commits to purchase or sell the investments.
5.6 Advances
Advances are stated net of provisions for non-performing advances. Provision for advances is determined in accordance with the requirements of the Prudential Regulations issued by the SBP from time to time. In addition, a general provision is maintained for advances other than consumer and small entities advances as per details given in note 10.4.3. General and specific provisions pertaining to overseas advances are made in accordance with the requirements of the regulatory authorities of the respective countries.
The provisions against non-performing advances are charged to the profit and loss account. Advances are written off when there is no realistic prospect of recovery.
Celeb
rating
Youn
g Tale
nt76
Ijarahs booked under IFAS - 2 are stated at cost less accumulated depreciation and impairment if any, and are shown under advances.
Depreciation on Ijarah assets is charged to profit and loss account by applying the straight line method whereby the depreciable value of Ijarah assets is written off over the Ijarah period. The Bank charges depreciation from the date of delivery of respective assets to Mustajir upto the date of maturity / termination of Ijarah agreement.
Leases where the Bank transfers substantially all the risks and rewards incidental to ownership of an asset to the lessee are classified as finance leases. A receivable is recognized at an amount equal to the present value of the lease payments including any guaranteed residual value. Finance lease receivables are included in advances to the customers.
Murabaha transactions are reflected as receivable at the invoiced amount. Actual sale and purchase are not reflected as the goods are purchased by the customer as agent of the Bank and all documents relating to purchase are in customers’ name.
In Salam, the seller undertakes to supply specific goods to the Bank at a future date in consideration of a price fully paid in advance at the time the contract of sale is made.
In Musharaka a relationship is established under a contract by the mutual consent of the Bank and the cutomer for sharing of profits and losses arising from a joint enterprise or venture.
Diminishing Musharaka (DM) is a form of co-ownership in which Bank and the customer share the ownership of a tangible asset in an agreed proportion and customer undertakes to buy in periodic installments the proportionate share of the Bank until the title to such tangible asset is completely transferred to the customer.
In Istisna, a contract of sale is made whereby the Bank places an order, to manufacture, assemble or construct, specific commodity to be delivered at a future date.
5.7 Capital work-in-progress, operating fixed assets and depreciation
Capital work-in-progress
Capital work-in-progress is stated at cost less impairment losses, if any.
Tangible assets
Fixed assets are stated at cost less impairment losses and accumulated depreciation except for freehold / leasehold land. Land is carried at revalued amounts which is not depreciated.
Land is revalued by professionally qualified valuers with sufficient regularity to ensure that the net carrying amount does not differ materially from their fair value. Surplus / (deficit) arising on revaluation of fixed assets is credited / (debited) to the surplus on revaluation of assets account and is shown below the shareholders’ equity in the unconsolidated statement of financial position. Except to the extent actually realized on disposal of land which are revalued, the surplus on revaluation of land shall not be applied to set-off or reduce any deficit or loss, whether past, current or future, or in any manner applied, adjusted or treated so as to add to the income, profit or surplus of the Bank or utilized directly or indirectly by way of dividend or bonus.
Intangible assets
Intangible assets are carried at cost less accumulated amortization and impairment losses, if any.
Depreciation / amortization
Depreciation / amortization is computed on monthly basis over the estimated useful lives of the related assets at the rates set out in notes 11.2 and 11.3 respectively on a monthly basis. The cost of assets is depreciated / amortized on the diminishing balance method, except for vehicles, carpets, renovations, other assets and intangibles which are depreciated / amortized on a straight line basis. Depreciation / amortization is charged for the full month of purchase / acquisition / availability for use of an asset while no depreciation / amortization is charged in the month of disposal of an asset. Maintenance and normal repairs are charged to profit and loss account as and when incurred. Major renewals and improvements are capitalized. Gains and losses on disposal of operating fixed assets are taken to the profit and loss account.
In making estimates of the depreciation / amortization, the management uses useful life and residual value which reflects the pattern in which economic benefits are expected to be consumed by the Bank. The useful life and the residual value are reviewed at each financial year end and any change in these estimates in future years might effect the carrying amounts of the respective item of operating fixed assets with the corresponding effect on depreciation / amortization charge.
5.8 Impairment
The carrying amount of the Bank’s assets are reviewed at the reporting date to determine whether there is any indication of impairment. If such indications exist, the asset’s recoverable amount is estimated in order to determine the extent of the impairment loss, if any. Impairment loss is recognized as expense in the unconsolidated profit and loss account. An impairment loss is reversed only to the extent that the asset’s carrying amount does not exceed the carrying amount that would have been determined, net of depreciation or amortization, if no impairment loss had been recognized.
NOTES TO THE UNCONSOLIDATED FINANCIAL STATEMENTSFOR THE YEAR ENDED DECEMBER 31, 2016
An
nu
al R
epo
rt o
f Ask
ari B
ank
Lim
ited
for 2
016
77
5.9 Deposits
Deposits are recorded at the fair value of proceeds received. Markup accrued on deposits is recognized separately as part of other liabilities and is charged to profit and loss account on a time proportion basis.
The Bank generates deposits in two modes i.e. “Qard” and “Modaraba” under Islamic Banking Operations. Deposits taken on Qard basis are classified as ‘Current Accounts’ and deposits generated on Modaraba basis are classified as ‘Saving Accounts’ and ‘Fixed Deposit Accounts’.
5.10 Taxation
Income tax on the profit or loss for the year comprises current and deferred tax. Income tax is recognized in the unconsolidated profit and loss account, except to the extent that it relates to items recognized directly in other comprehensive income or below equity, in which case it is recognized in other comprehensive income or below equity.
Current
Provision for current tax is the expected tax payable on the taxable profit for the year using tax rates applicable at the date of unconsolidated statement of financial position and any adjustment to tax payable for previous years.
Deferred
Deferred tax is provided for by using the balance sheet liability method, providing for temporary differences between the carrying amounts of assets and liabilities for financial reporting purposes and the amount used for taxation purposes. The amount of deferred tax provided is based on the expected manner of realization or settlement of the carrying amount of assets and liabilities using tax rates enacted or substantively enacted at the date of unconsolidated statement of financial position. A deferred tax asset is recognized only to the extent that it is probable that the future taxable profit will be available and credits can be utilized. Deferred tax assets are reduced to the extent it is no longer probable that the related tax benefit will be realized.
Deferred tax, on revaluation of investments, if any, is recognized as an adjustment to surplus / (deficit) arising on such revaluation.
5.11 Non-banking assets acquired in satisfaction of claims
To comply with the requirements of the ‘Regulations for Debt Property Swap’ (the Regulations) issued by SBP vide BPRD Circular No. 1 of 2016 dated January 1, 2016, the Bank has changed its accounting policy effective January 1, 2016 for recording of non-banking assets acquired in satisfaction of claims. In accordance with the Regulations, the non-banking assets acquired in satisfaction of claims are now being carried at revalued amounts. These assets are revalued by professionally qualified valuers with sufficient regularity to ensure that their net carrying value does not differ materially from their fair value. Surplus arising on revaluation of such properties is credited to the ‘surplus on revaluation of non banking assets’ account and any deficit arising on revaluation is taken to profit and loss account directly. Legal fees, transfer costs and direct costs of acquiring title to property is charged to profit and loss account and are not capitalised. Previously, non-banking assets acquired in satisfaction of claims were carried at cost including attached costs less impairment, if any. Had the accounting policy not been changed, non banking assets acquired in satisfaction of claims (included in other assets in the statement of financial position) and surplus on revaluation of these assets would have been lower by Rs 1,617,860 thousand.
5.12 Staff retirement benefits
Defined benefit plan
The Bank operates an approved funded gratuity scheme for all its regular employees. Contributions are made in accordance with the actuarial recommendation. The actuarial valuation is carried out periodically using “Projected Unit Credit Method”.
Defined contribution plan
The Bank operates a recognized provident fund scheme for all its regular employees for which equal monthly contributions are made both by the Bank and by the employees at the rate of 8.33% of the basic salary of the employee.
Compensated absences
The Bank provides compensated absences to all its regular employees. Liability for unfunded scheme is recognized on the basis of actuarial valuation using the “Projected Unit Credit Method”. Provision for the year is charged to unconsolidated profit and loss account. The amount recognized in the unconsolidated statement of financial position represents the present value of defined benefit obligations.
5.13 Revenue recognition
Mark-up / interest on advances and return on investments is recognized on accrual basis except on classified advances and investments which is recognized on receipt basis. Mark-up / interest on rescheduled / restructured advances and investments is recognized as permitted by the regulations of the SBP or overseas regulatory authority of the country where branch operates, except where in the opinion of the management it would not be prudent to do so.
Celeb
rating
Youn
g Tale
nt78
Fees, commission and brokerage income is recognized at the time of performance of service.
Dividend income is recognized when Bank’s right to receive the income is established.
Gains and losses on sale of investments are included in income currently.
Financing method is used in accounting for income from lease financing. Under this method, the unearned lease income (excess of the sum of the total lease rentals and estimated residual value over the cost of leased assets) is deferred and taken to income over the term of the lease period so as to produce a constant periodic rate of return on the outstanding net investment in lease. Repossessed vehicles on account of loan default are recorded in memorandum account.
Unrealized lease income is suspended on classified leases, in accordance with the requirements of the Prudential Regulations issued by the SBP. Gains / losses on termination of lease contracts, documentation charges, front-end fees and other lease income are recognized as income on receipt basis.
Profit on Murabaha sale transaction not due for the payment is deferred by recording a credit to the “Deferred Murabaha Income” account.
Profits on Musharaka and Diminishing Musharaka financings are recognized on accrual basis. Profit required to be suspended in compliance with the Prudential Regulations issued by SBP is recorded on receipt basis.
Revenue on Salam finance is recognized at the time of sale of Al-Muslam Fihi (Salam Goods).
The rentals received / receivable on Ijarahs under IFAS-2 are recorded as income / revenue.
The Bank recognizes revenue on Istisna finance at the time of sale of Al-Masnoo (Istisna Goods).
5.14 Foreign currencies
Foreign currency transactions
Foreign currency transactions are translated into Pak. Rupee at the exchange rates prevailing on the date of transaction. Monetary assets and liabilities in foreign currencies are translated to Pak. Rupee at the exchange rates prevailing at the reporting date. Outstanding foreign bills purchased are valued at the rates applicable to the remaining maturities. Exchange gains and losses are included in unconsolidated profit and loss account currently.
Foreign operation
The assets and liabilities of Wholesale Bank Branch are translated to Pak. Rupee at exchange rates prevailing at the date of unconsolidated statement of financial position. The results of foreign operations are translated at the average rate of exchange for the year.
Translation gains and losses
Translation gains and losses arising on revaluation of net investment in foreign operations are taken to equity under “Exchange Translation Reserve” through other comprehensive income and on disposal are recognized in unconsolidated profit and loss account.
Commitments
Commitments for outstanding forward foreign exchange contracts are valued at the rates applicable to the remaining maturities.
5.15 Provisions
Provisions are recognized when there are present, legal or constructive obligations as a result of past events, it is probable that an outflow of resources embodying economic benefits will be required to settle the obligation and a reliable estimate of the amounts can be made. Provision for guarantee claims and other off balance sheet obligations is recognized when intimated and reasonable certainty exists to settle the obligations. Expected recoveries are recognized by debiting customer accounts. Charge to unconsolidated profit and loss account is stated net off expected recoveries.
5.16 Off-setting
Financial assets and financial liabilities are only set-off and the net amount is reported in the unconsolidated financial statements when there is a legally enforceable right to set-off the recognized amount and the Bank intends either to settle on a net basis, or to realize the assets and to settle the liabilities simultaneously.
5.17 Financial assets and liabilities
Financial assets and financial liabilities are recognized at the time when the Bank becomes a party to the contractual provision of the instrument. Financial assets are de-recognized when the contractual right to future cash flows from the asset expires or is transferred along with the risk and reward of the asset. Financial liabilities are de-recognized when obligation specific in the contract is discharged, cancelled or expired. Any gain or loss on de-recognition of the financial asset and liability is recognized in the profit and loss account of the current period. The particular recognition and subsequent measurement methods adopted for significant financial assets and financial liabilities are disclosed in the individual policy statements associated with them.
NOTES TO THE UNCONSOLIDATED FINANCIAL STATEMENTSFOR THE YEAR ENDED DECEMBER 31, 2016
An
nu
al R
epo
rt o
f Ask
ari B
ank
Lim
ited
for 2
016
79
5.18 Derivative financial instruments
Derivative financial instruments are initially recognized at fair value on the date on which the derivative contract is entered into and are subsequently remeasured at fair value using appropriate valuation techniques. All derivative financial instruments are carried as assets when fair value is positive and liabilities when fair value is negative. Any change in the fair value of derivative financial instruments is taken to the profit and loss account.
5.19 Appropriations subsequent to date of unconsolidated statement of financial position
Appropriations subsequent to year end are recognized during the year in which those appropriations are made.
5.20 Segment reporting
A segment is a distinguishable component of the Bank that is engaged in providing products or services (business segment) or in providing product or services within a particular economic environment (geographical segment), which is subject to risks and rewards that are different from those of other segments. The Bank’s primary format of reporting is based on business segments.
5.20.1 Business segment
Corporate finance
Corporate financing includes corporate and investment banking activities such as mergers and acquisition, underwriting, privatization, securitization, IPO’s related activities and secondary private placements.
Trading and Sales
Trading and sales includes the Bank’s treasury and money market activities.
Retail Banking
Retail banking segment provides services to small borrowers and include loans, deposits and other transactions with retail customers and credit card business.
Commercial Banking
Commercial banking segment provides services related to project finance, export finance, trade finance, leasing, lending, guarantees, bills of exchange and deposits from corporate customers.
Payment and settlement
Payment and settlement includes income from payments and collections, funds transfer, clearing and settlement.
Agency services
Agency services include income from rent of lockers provided to customers.
5.20.2 Geographical segments
The Bank operates in two geographic regions; Pakistan and the Middle East.
Celeb
rating
Youn
g Tale
nt80
Rupees in ‘000 Note 2016 2015
6. CASH AND BALANCES WITH TREASURY BANKS
In Hand:
Local currency 7,070,754 6,336,493 Foreign currencies 731,479 1,423,204
7,802,233 7,759,697 National Prize Bonds 14,463 4,344
With the State Bank of Pakistan in:
Local currency current accounts 6.1 25,219,764 12,622,867 Foreign currency current account 6.1 2,246,172 2,271,811 Foreign currency deposit account 6.2 5,735,677 5,660,221
33,201,613 20,554,899 With National Bank of Pakistan in:
Local currency current accounts 1,549,832 1,366,288
42,568,141 29,685,228 6.1 These represent current accounts maintained with the SBP to comply with the statutory cash reserve requirements. 6.2 This represents special cash reserve maintained with the SBP and carries mark-up at the rate of 0.00% (2015: 0.00%) per annum. Rupees in ‘000 Note 2016 2015
7. BALANCES WITH OTHER BANKS
In Pakistan
On current accounts 165,727 131,004 On deposit accounts 7.1 2,293,217 2,235,207
2,458,944 2,366,211 Outside Pakistan
On current accounts 1,586,734 1,277,860 On deposit accounts 7.2 1,800,070 4,651,653
3,386,804 5,929,513
5,845,748 8,295,724 7.1 These represent placements with local banks, carrying interest rates ranging from 0.10% to 5.80% (2015: 0.25% to 6.15% ) per
annum. 7.2 These represent placements with international correspondent banks, carrying interest rates upto 0.66% (2015: upto 0.36%) per
annum.
NOTES TO THE UNCONSOLIDATED FINANCIAL STATEMENTSFOR THE YEAR ENDED DECEMBER 31, 2016
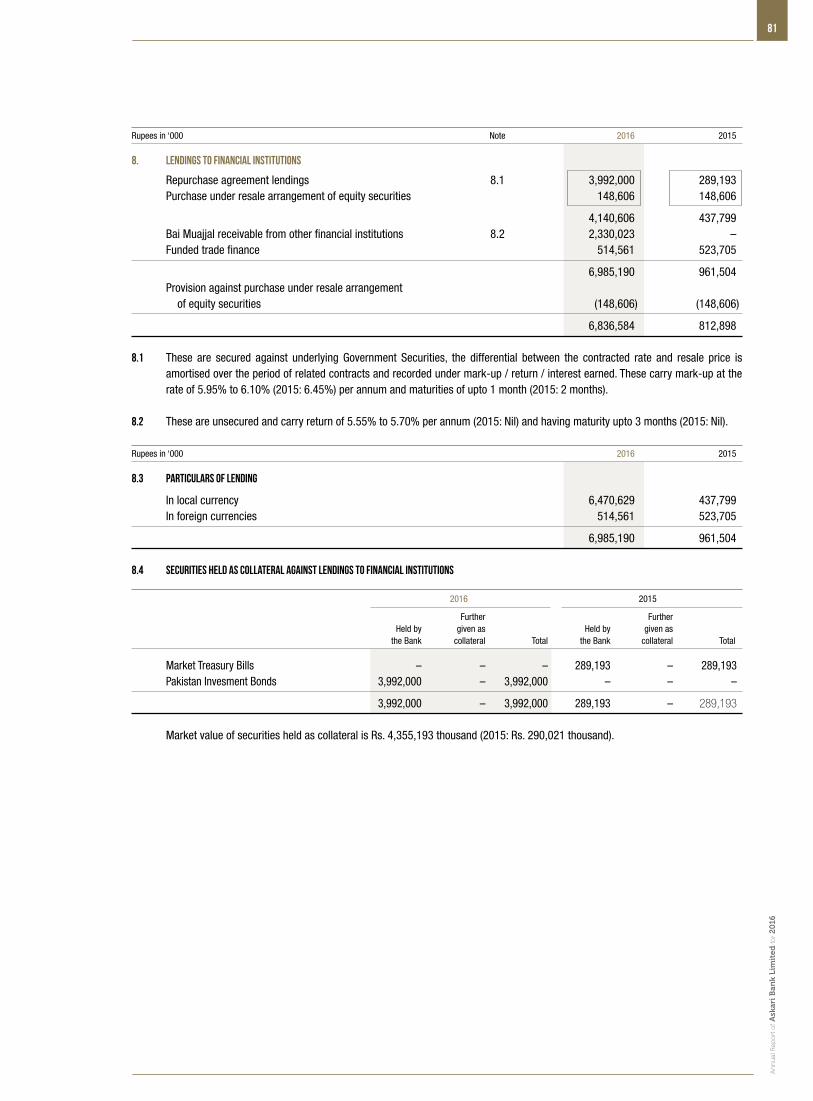
An
nu
al R
epo
rt o
f Ask
ari B
ank
Lim
ited
for 2
016
81
Rupees in ‘000 Note 2016 2015
8. LENDINGS TO FINANCIAL INSTITUTIONS
Repurchase agreement lendings 8.1 3,992,000 289,193 Purchase under resale arrangement of equity securities 148,606 148,606
4,140,606 437,799 Bai Muajjal receivable from other financial institutions 8.2 2,330,023 – Funded trade finance 514,561 523,705
6,985,190 961,504 Provision against purchase under resale arrangement of equity securities (148,606) (148,606)
6,836,584 812,898 8.1 These are secured against underlying Government Securities, the differential between the contracted rate and resale price is
amortised over the period of related contracts and recorded under mark-up / return / interest earned. These carry mark-up at the rate of 5.95% to 6.10% (2015: 6.45%) per annum and maturities of upto 1 month (2015: 2 months).
8.2 These are unsecured and carry return of 5.55% to 5.70% per annum (2015: Nil) and having maturity upto 3 months (2015: Nil). Rupees in ‘000 2016 2015
8.3 Particulars of lending
In local currency 6,470,629 437,799 In foreign currencies 514,561 523,705
6,985,190 961,504 8.4 Securities held as collateral against lendings to financial institutions 2016 2015
Further Further Held by given as Held by given as the Bank collateral Total the Bank collateral Total
Market Treasury Bills – – – 289,193 – 289,193 Pakistan Invesment Bonds 3,992,000 – 3,992,000 – – –
3,992,000 – 3,992,000 289,193 – 289,193
Market value of securities held as collateral is Rs. 4,355,193 thousand (2015: Rs. 290,021 thousand).
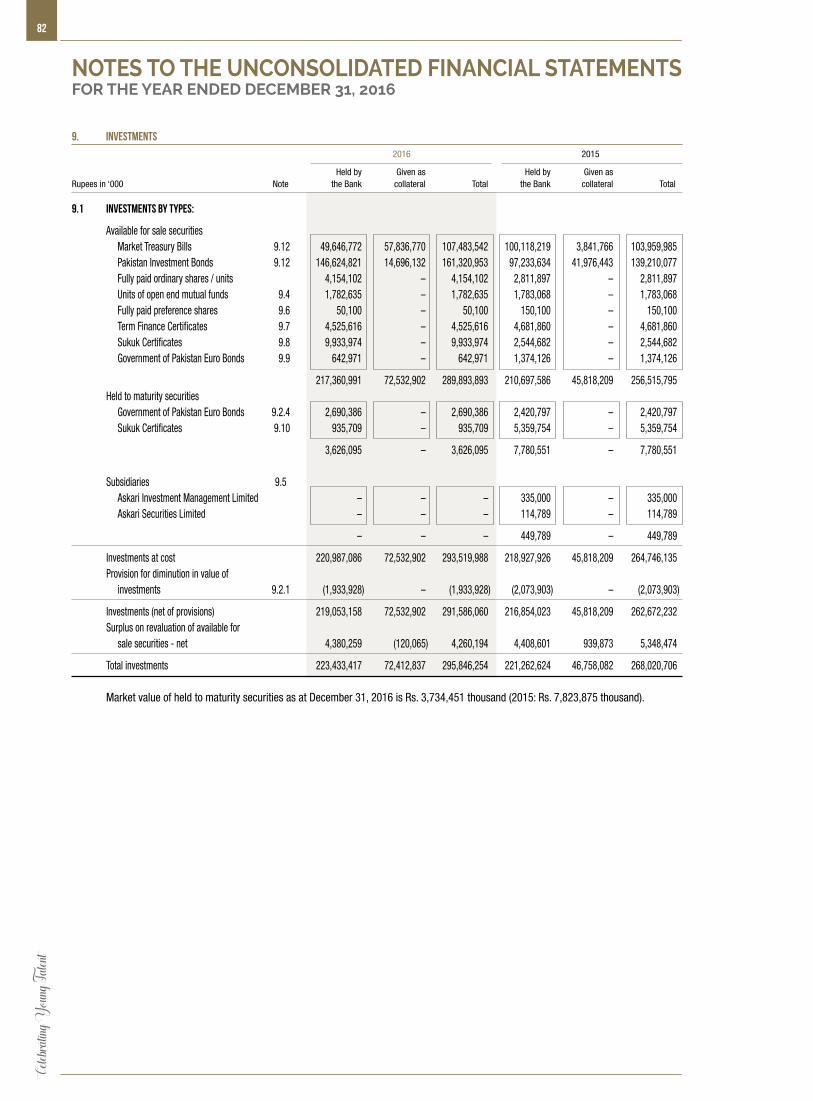
Celeb
rating
Youn
g Tale
nt82
9. INVESTMENTS
2016 2015
Held by Given as Held by Given asRupees in ‘000 Note the Bank collateral Total the Bank collateral Total
9.1 Investments by types:
Available for sale securities Market Treasury Bills 9.12 49,646,772 57,836,770 107,483,542 100,118,219 3,841,766 103,959,985 Pakistan Investment Bonds 9.12 146,624,821 14,696,132 161,320,953 97,233,634 41,976,443 139,210,077 Fully paid ordinary shares / units 4,154,102 – 4,154,102 2,811,897 – 2,811,897 Units of open end mutual funds 9.4 1,782,635 – 1,782,635 1,783,068 – 1,783,068 Fully paid preference shares 9.6 50,100 – 50,100 150,100 – 150,100 Term Finance Certificates 9.7 4,525,616 – 4,525,616 4,681,860 – 4,681,860 Sukuk Certificates 9.8 9,933,974 – 9,933,974 2,544,682 – 2,544,682 Government of Pakistan Euro Bonds 9.9 642,971 – 642,971 1,374,126 – 1,374,126
217,360,991 72,532,902 289,893,893 210,697,586 45,818,209 256,515,795 Held to maturity securities Government of Pakistan Euro Bonds 9.2.4 2,690,386 – 2,690,386 2,420,797 – 2,420,797 Sukuk Certificates 9.10 935,709 – 935,709 5,359,754 – 5,359,754
3,626,095 – 3,626,095 7,780,551 – 7,780,551 Subsidiaries 9.5 Askari Investment Management Limited – – – 335,000 – 335,000 Askari Securities Limited – – – 114,789 – 114,789
– – – 449,789 – 449,789
Investments at cost 220,987,086 72,532,902 293,519,988 218,927,926 45,818,209 264,746,135 Provision for diminution in value of investments 9.2.1 (1,933,928) – (1,933,928) (2,073,903) – (2,073,903)
Investments (net of provisions) 219,053,158 72,532,902 291,586,060 216,854,023 45,818,209 262,672,232 Surplus on revaluation of available for sale securities - net 4,380,259 (120,065) 4,260,194 4,408,601 939,873 5,348,474
Total investments 223,433,417 72,412,837 295,846,254 221,262,624 46,758,082 268,020,706 Market value of held to maturity securities as at December 31, 2016 is Rs. 3,734,451 thousand (2015: Rs. 7,823,875 thousand).
NOTES TO THE UNCONSOLIDATED FINANCIAL STATEMENTSFOR THE YEAR ENDED DECEMBER 31, 2016
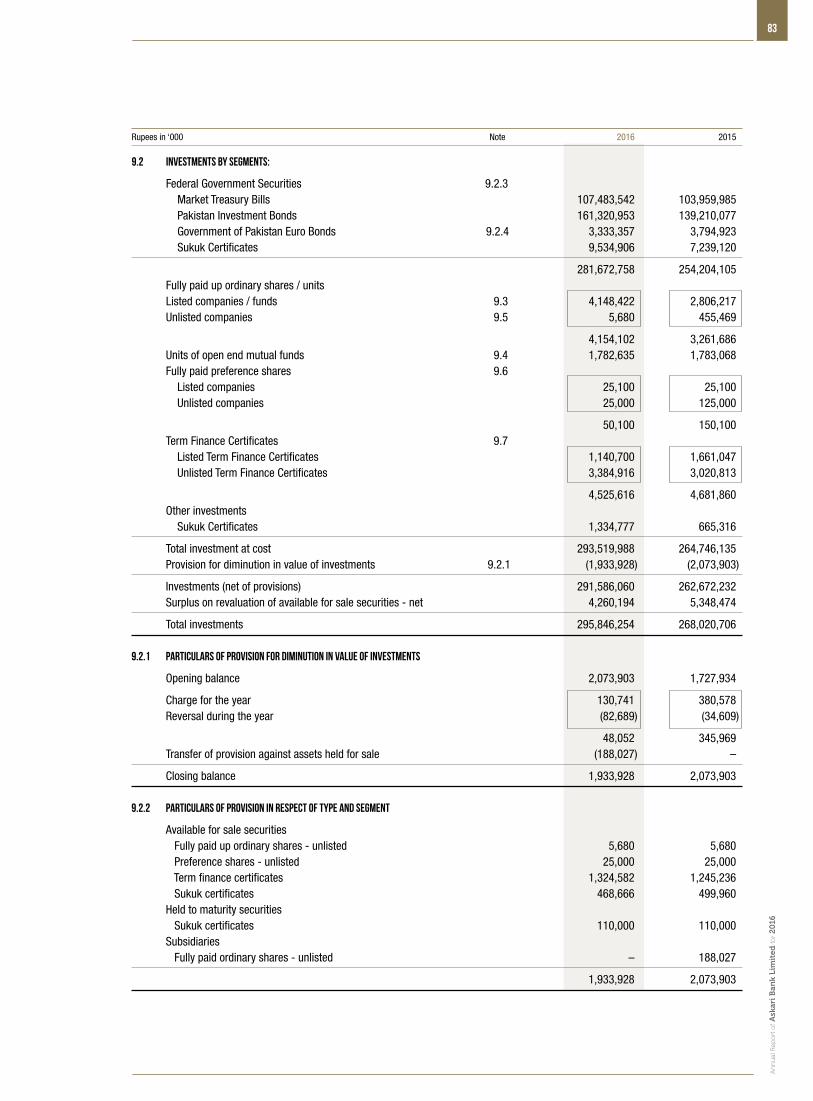
An
nu
al R
epo
rt o
f Ask
ari B
ank
Lim
ited
for 2
016
83
Rupees in ‘000 Note 2016 2015
9.2 Investments by segments:
Federal Government Securities 9.2.3 Market Treasury Bills 107,483,542 103,959,985 Pakistan Investment Bonds 161,320,953 139,210,077 Government of Pakistan Euro Bonds 9.2.4 3,333,357 3,794,923 Sukuk Certificates 9,534,906 7,239,120
281,672,758 254,204,105 Fully paid up ordinary shares / units Listed companies / funds 9.3 4,148,422 2,806,217 Unlisted companies 9.5 5,680 455,469
4,154,102 3,261,686 Units of open end mutual funds 9.4 1,782,635 1,783,068 Fully paid preference shares 9.6 Listed companies 25,100 25,100 Unlisted companies 25,000 125,000
50,100 150,100 Term Finance Certificates 9.7 Listed Term Finance Certificates 1,140,700 1,661,047 Unlisted Term Finance Certificates 3,384,916 3,020,813
4,525,616 4,681,860 Other investments Sukuk Certificates 1,334,777 665,316
Total investment at cost 293,519,988 264,746,135 Provision for diminution in value of investments 9.2.1 (1,933,928) (2,073,903)
Investments (net of provisions) 291,586,060 262,672,232 Surplus on revaluation of available for sale securities - net 4,260,194 5,348,474
Total investments 295,846,254 268,020,706 9.2.1 Particulars of provision for diminution in value of investments
Opening balance 2,073,903 1,727,934
Charge for the year 130,741 380,578 Reversal during the year (82,689) (34,609)
48,052 345,969 Transfer of provision against assets held for sale (188,027) –
Closing balance 1,933,928 2,073,903 9.2.2 Particulars of provision in respect of type and segment
Available for sale securities Fully paid up ordinary shares - unlisted 5,680 5,680 Preference shares - unlisted 25,000 25,000 Term finance certificates 1,324,582 1,245,236 Sukuk certificates 468,666 499,960 Held to maturity securities Sukuk certificates 110,000 110,000 Subsidiaries Fully paid ordinary shares - unlisted – 188,027
1,933,928 2,073,903
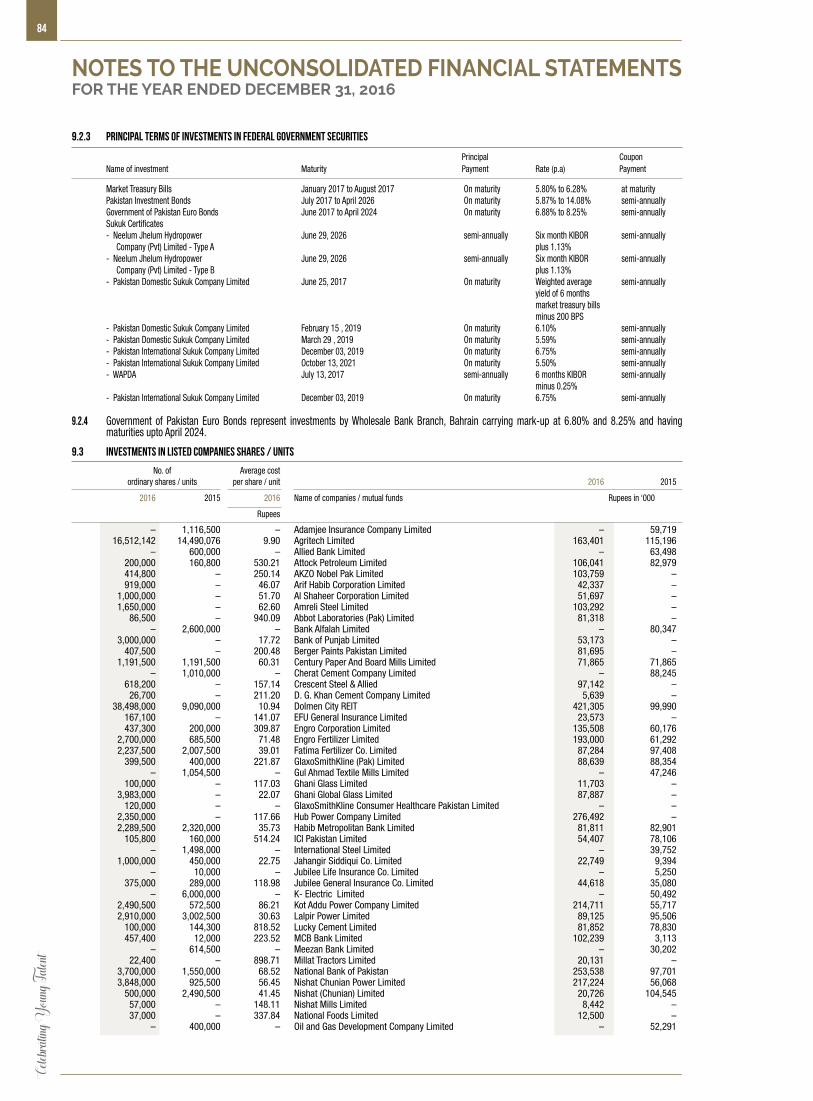
Celeb
rating
Youn
g Tale
nt84
9.2.3 Principal terms of investments in Federal Government Securities
Principal Coupon Name of investment Maturity Payment Rate (p.a) Payment
Market Treasury Bills January 2017 to August 2017 On maturity 5.80% to 6.28% at maturity Pakistan Investment Bonds July 2017 to April 2026 On maturity 5.87% to 14.08% semi-annually Government of Pakistan Euro Bonds June 2017 to April 2024 On maturity 6.88% to 8.25% semi-annually Sukuk Certificates - Neelum Jhelum Hydropower June 29, 2026 semi-annually Six month KIBOR semi-annually Company (Pvt) Limited - Type A plus 1.13% - Neelum Jhelum Hydropower June 29, 2026 semi-annually Six month KIBOR semi-annually Company (Pvt) Limited - Type B plus 1.13% - Pakistan Domestic Sukuk Company Limited June 25, 2017 On maturity Weighted average semi-annually yield of 6 months market treasury bills minus 200 BPS - Pakistan Domestic Sukuk Company Limited February 15 , 2019 On maturity 6.10% semi-annually - Pakistan Domestic Sukuk Company Limited March 29 , 2019 On maturity 5.59% semi-annually - Pakistan International Sukuk Company Limited December 03, 2019 On maturity 6.75% semi-annually - Pakistan International Sukuk Company Limited October 13, 2021 On maturity 5.50% semi-annually - WAPDA July 13, 2017 semi-annually 6 months KIBOR semi-annually minus 0.25% - Pakistan International Sukuk Company Limited December 03, 2019 On maturity 6.75% semi-annually 9.2.4 Government of Pakistan Euro Bonds represent investments by Wholesale Bank Branch, Bahrain carrying mark-up at 6.80% and 8.25% and having
maturities upto April 2024.
9.3 Investments in listed companies shares / units
No. of Average cost ordinary shares / units per share / unit 2016 2015
2016 2015 2016 Name of companies / mutual funds Rupees in ‘000
Rupees
– 1,116,500 – Adamjee Insurance Company Limited – 59,719 16,512,142 14,490,076 9.90 Agritech Limited 163,401 115,196 – 600,000 – Allied Bank Limited – 63,498 200,000 160,800 530.21 Attock Petroleum Limited 106,041 82,979 414,800 – 250.14 AKZO Nobel Pak Limited 103,759 – 919,000 – 46.07 Arif Habib Corporation Limited 42,337 – 1,000,000 – 51.70 Al Shaheer Corporation Limited 51,697 – 1,650,000 – 62.60 Amreli Steel Limited 103,292 – 86,500 – 940.09 Abbot Laboratories (Pak) Limited 81,318 – – 2,600,000 – Bank Alfalah Limited – 80,347 3,000,000 – 17.72 Bank of Punjab Limited 53,173 – 407,500 – 200.48 Berger Paints Pakistan Limited 81,695 – 1,191,500 1,191,500 60.31 Century Paper And Board Mills Limited 71,865 71,865 – 1,010,000 – Cherat Cement Company Limited – 88,245 618,200 – 157.14 Crescent Steel & Allied 97,142 – 26,700 – 211.20 D. G. Khan Cement Company Limited 5,639 – 38,498,000 9,090,000 10.94 Dolmen City REIT 421,305 99,990 167,100 – 141.07 EFU General Insurance Limited 23,573 – 437,300 200,000 309.87 Engro Corporation Limited 135,508 60,176 2,700,000 685,500 71.48 Engro Fertilizer Limited 193,000 61,292 2,237,500 2,007,500 39.01 Fatima Fertilizer Co. Limited 87,284 97,408 399,500 400,000 221.87 GlaxoSmithKline (Pak) Limited 88,639 88,354 – 1,054,500 – Gul Ahmad Textile Mills Limited – 47,246 100,000 – 117.03 Ghani Glass Limited 11,703 – 3,983,000 – 22.07 Ghani Global Glass Limited 87,887 – 120,000 – – GlaxoSmithKline Consumer Healthcare Pakistan Limited – – 2,350,000 – 117.66 Hub Power Company Limited 276,492 – 2,289,500 2,320,000 35.73 Habib Metropolitan Bank Limited 81,811 82,901 105,800 160,000 514.24 ICI Pakistan Limited 54,407 78,106 – 1,498,000 – International Steel Limited – 39,752 1,000,000 450,000 22.75 Jahangir Siddiqui Co. Limited 22,749 9,394 – 10,000 – Jubilee Life Insurance Co. Limited – 5,250 375,000 289,000 118.98 Jubilee General Insurance Co. Limited 44,618 35,080 – 6,000,000 – K- Electric Limited – 50,492 2,490,500 572,500 86.21 Kot Addu Power Company Limited 214,711 55,717 2,910,000 3,002,500 30.63 Lalpir Power Limited 89,125 95,506 100,000 144,300 818.52 Lucky Cement Limited 81,852 78,830 457,400 12,000 223.52 MCB Bank Limited 102,239 3,113 – 614,500 – Meezan Bank Limited – 30,202 22,400 – 898.71 Millat Tractors Limited 20,131 – 3,700,000 1,550,000 68.52 National Bank of Pakistan 253,538 97,701 3,848,000 925,500 56.45 Nishat Chunian Power Limited 217,224 56,068 500,000 2,490,500 41.45 Nishat (Chunian) Limited 20,726 104,545 57,000 – 148.11 Nishat Mills Limited 8,442 – 37,000 – 337.84 National Foods Limited 12,500 – – 400,000 – Oil and Gas Development Company Limited – 52,291
NOTES TO THE UNCONSOLIDATED FINANCIAL STATEMENTSFOR THE YEAR ENDED DECEMBER 31, 2016
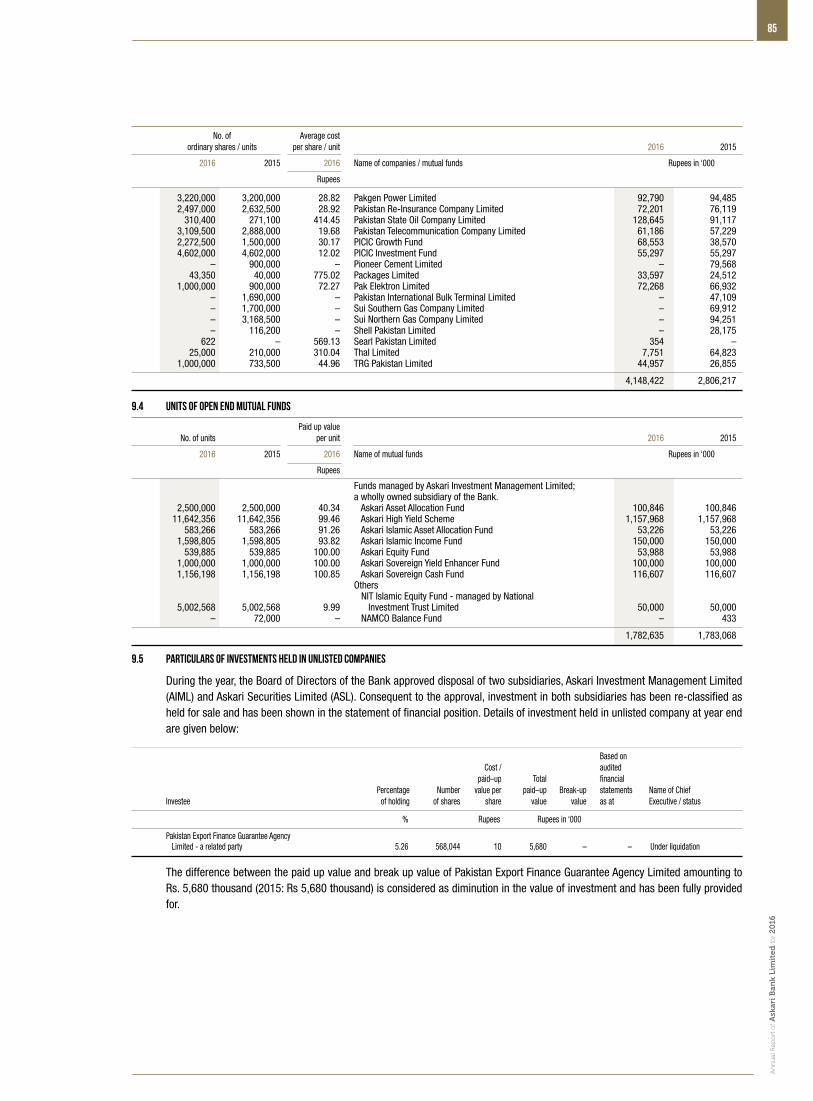
An
nu
al R
epo
rt o
f Ask
ari B
ank
Lim
ited
for 2
016
85
No. of Average cost ordinary shares / units per share / unit 2016 2015
2016 2015 2016 Name of companies / mutual funds Rupees in ‘000
Rupees
3,220,000 3,200,000 28.82 Pakgen Power Limited 92,790 94,485 2,497,000 2,632,500 28.92 Pakistan Re-Insurance Company Limited 72,201 76,119 310,400 271,100 414.45 Pakistan State Oil Company Limited 128,645 91,117 3,109,500 2,888,000 19.68 Pakistan Telecommunication Company Limited 61,186 57,229 2,272,500 1,500,000 30.17 PICIC Growth Fund 68,553 38,570 4,602,000 4,602,000 12.02 PICIC Investment Fund 55,297 55,297 – 900,000 – Pioneer Cement Limited – 79,568 43,350 40,000 775.02 Packages Limited 33,597 24,512 1,000,000 900,000 72.27 Pak Elektron Limited 72,268 66,932 – 1,690,000 – Pakistan International Bulk Terminal Limited – 47,109 – 1,700,000 – Sui Southern Gas Company Limited – 69,912 – 3,168,500 – Sui Northern Gas Company Limited – 94,251 – 116,200 – Shell Pakistan Limited – 28,175 622 – 569.13 Searl Pakistan Limited 354 – 25,000 210,000 310.04 Thal Limited 7,751 64,823 1,000,000 733,500 44.96 TRG Pakistan Limited 44,957 26,855
4,148,422 2,806,217
9.4 Units of open end mutual funds
Paid up value No. of units per unit 2016 2015
2016 2015 2016 Name of mutual funds Rupees in ‘000
Rupees
Funds managed by Askari Investment Management Limited; a wholly owned subsidiary of the Bank. 2,500,000 2,500,000 40.34 Askari Asset Allocation Fund 100,846 100,846 11,642,356 11,642,356 99.46 Askari High Yield Scheme 1,157,968 1,157,968 583,266 583,266 91.26 Askari Islamic Asset Allocation Fund 53,226 53,226 1,598,805 1,598,805 93.82 Askari Islamic Income Fund 150,000 150,000 539,885 539,885 100.00 Askari Equity Fund 53,988 53,988 1,000,000 1,000,000 100.00 Askari Sovereign Yield Enhancer Fund 100,000 100,000 1,156,198 1,156,198 100.85 Askari Sovereign Cash Fund 116,607 116,607 Others NIT Islamic Equity Fund - managed by National 5,002,568 5,002,568 9.99 Investment Trust Limited 50,000 50,000 – 72,000 – NAMCO Balance Fund – 433
1,782,635 1,783,068
9.5 Particulars of investments held in unlisted companies
During the year, the Board of Directors of the Bank approved disposal of two subsidiaries, Askari Investment Management Limited (AIML) and Askari Securities Limited (ASL). Consequent to the approval, investment in both subsidiaries has been re-classified as held for sale and has been shown in the statement of financial position. Details of investment held in unlisted company at year end are given below:
Based on Cost / audited paid–up Total financial Percentage Number value per paid–up Break-up statements Name of Chief Investee of holding of shares share value value as at Executive / status
% Rupees Rupees in ‘000
Pakistan Export Finance Guarantee Agency Limited - a related party 5.26 568,044 10 5,680 – – Under liquidation
The difference between the paid up value and break up value of Pakistan Export Finance Guarantee Agency Limited amounting to Rs. 5,680 thousand (2015: Rs 5,680 thousand) is considered as diminution in the value of investment and has been fully provided for.
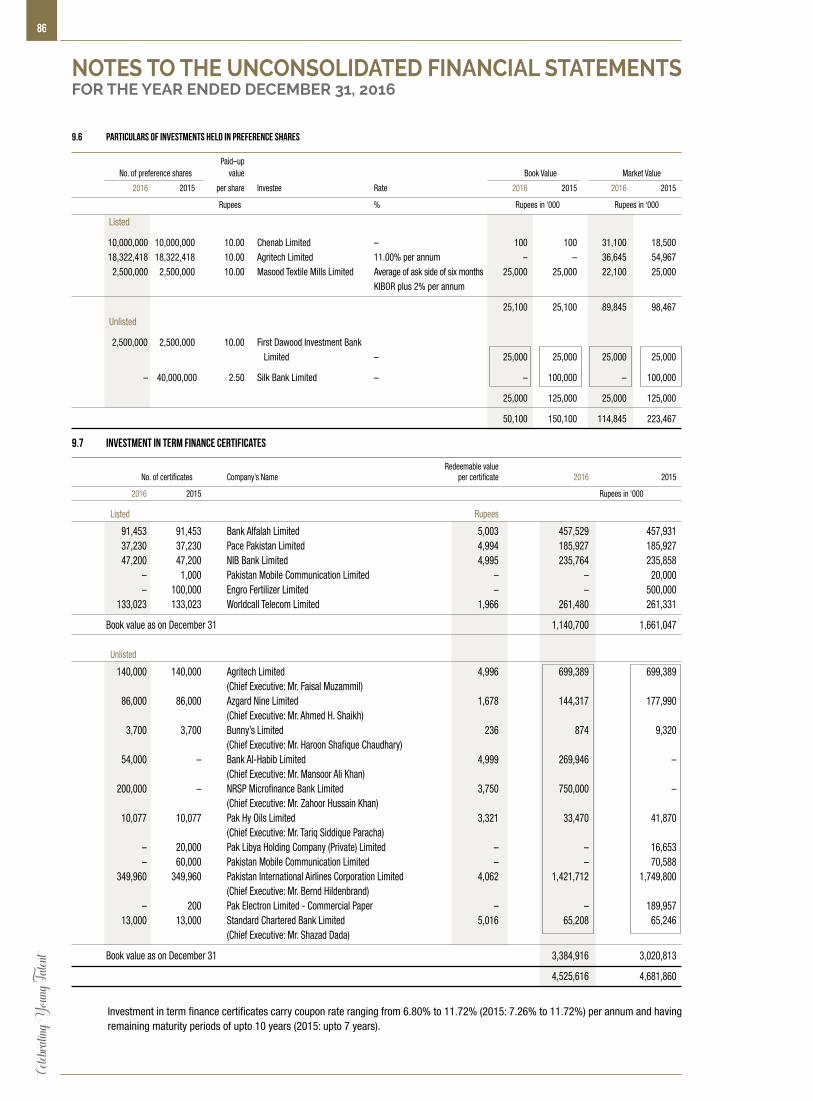
Celeb
rating
Youn
g Tale
nt86
9.6 Particulars of investments held in preference shares
Paid–up No. of preference shares value Book Value Market Value
2016 2015 per share Investee Rate 2016 2015 2016 2015
Rupees % Rupees in ‘000 Rupees in ‘000
Listed
10,000,000 10,000,000 10.00 Chenab Limited – 100 100 31,100 18,500 18,322,418 18,322,418 10.00 Agritech Limited 11.00% per annum – – 36,645 54,967 2,500,000 2,500,000 10.00 Masood Textile Mills Limited Average of ask side of six months 25,000 25,000 22,100 25,000 KIBOR plus 2% per annum
25,100 25,100 89,845 98,467 Unlisted
2,500,000 2,500,000 10.00 First Dawood Investment Bank Limited – 25,000 25,000 25,000 25,000
– 40,000,000 2.50 Silk Bank Limited – – 100,000 – 100,000
25,000 125,000 25,000 125,000
50,100 150,100 114,845 223,467
9.7 Investment in Term Finance Certificates
Redeemable value No. of certificates Company’s Name per certificate 2016 2015
2016 2015 Rupees in ‘000
Listed Rupees
91,453 91,453 Bank Alfalah Limited 5,003 457,529 457,931 37,230 37,230 Pace Pakistan Limited 4,994 185,927 185,927 47,200 47,200 NIB Bank Limited 4,995 235,764 235,858 – 1,000 Pakistan Mobile Communication Limited – – 20,000 – 100,000 Engro Fertilizer Limited – – 500,000 133,023 133,023 Worldcall Telecom Limited 1,966 261,480 261,331
Book value as on December 31 1,140,700 1,661,047 Unlisted
140,000 140,000 Agritech Limited 4,996 699,389 699,389 (Chief Executive: Mr. Faisal Muzammil) 86,000 86,000 Azgard Nine Limited 1,678 144,317 177,990 (Chief Executive: Mr. Ahmed H. Shaikh) 3,700 3,700 Bunny’s Limited 236 874 9,320 (Chief Executive: Mr. Haroon Shafique Chaudhary) 54,000 – Bank Al-Habib Limited 4,999 269,946 – (Chief Executive: Mr. Mansoor Ali Khan) 200,000 – NRSP Microfinance Bank Limited 3,750 750,000 – (Chief Executive: Mr. Zahoor Hussain Khan) 10,077 10,077 Pak Hy Oils Limited 3,321 33,470 41,870 (Chief Executive: Mr. Tariq Siddique Paracha) – 20,000 Pak Libya Holding Company (Private) Limited – – 16,653 – 60,000 Pakistan Mobile Communication Limited – – 70,588 349,960 349,960 Pakistan International Airlines Corporation Limited 4,062 1,421,712 1,749,800 (Chief Executive: Mr. Bernd Hildenbrand) – 200 Pak Electron Limited - Commercial Paper – – 189,957 13,000 13,000 Standard Chartered Bank Limited 5,016 65,208 65,246 (Chief Executive: Mr. Shazad Dada)
Book value as on December 31 3,384,916 3,020,813
4,525,616 4,681,860
Investment in term finance certificates carry coupon rate ranging from 6.80% to 11.72% (2015: 7.26% to 11.72%) per annum and having
remaining maturity periods of upto 10 years (2015: upto 7 years).
NOTES TO THE UNCONSOLIDATED FINANCIAL STATEMENTSFOR THE YEAR ENDED DECEMBER 31, 2016
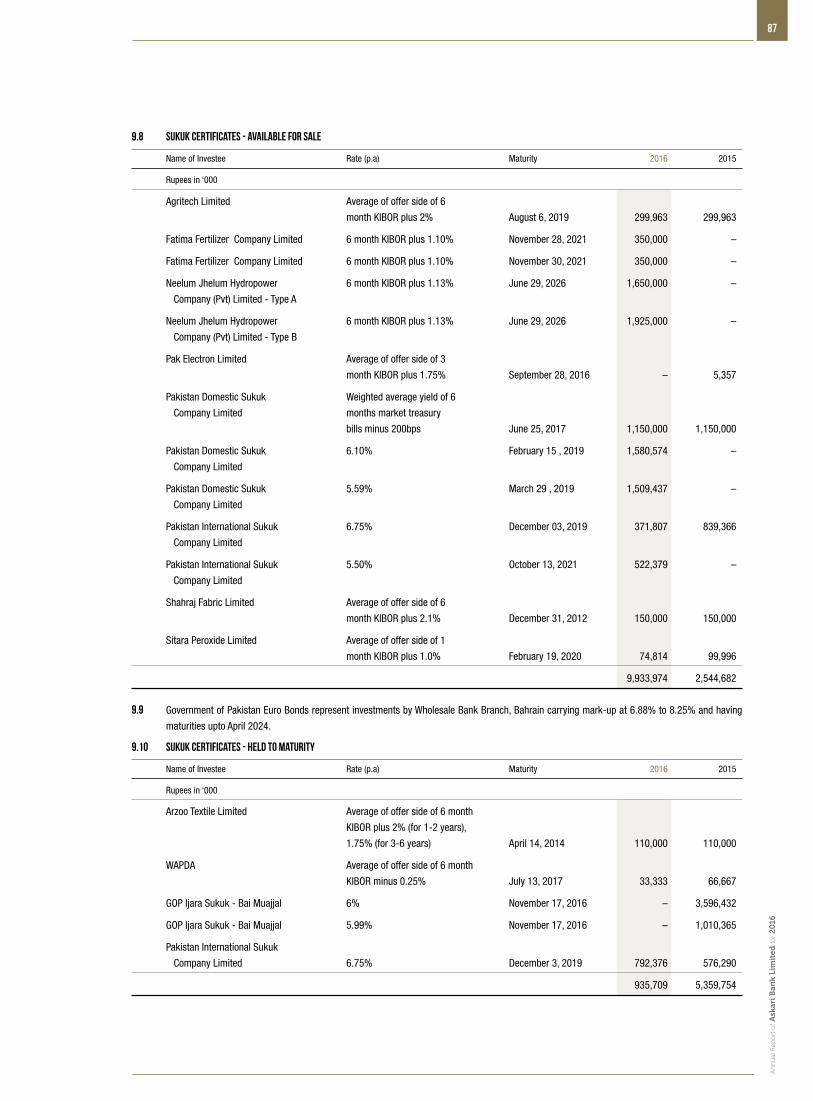
An
nu
al R
epo
rt o
f Ask
ari B
ank
Lim
ited
for 2
016
87
9.8 Sukuk Certificates - Available for sale
Name of Investee Rate (p.a) Maturity 2016 2015
Rupees in ‘000
Agritech Limited Average of offer side of 6
month KIBOR plus 2% August 6, 2019 299,963 299,963
Fatima Fertilizer Company Limited 6 month KIBOR plus 1.10% November 28, 2021 350,000 –
Fatima Fertilizer Company Limited 6 month KIBOR plus 1.10% November 30, 2021 350,000 –
Neelum Jhelum Hydropower 6 month KIBOR plus 1.13% June 29, 2026 1,650,000 –
Company (Pvt) Limited - Type A
Neelum Jhelum Hydropower 6 month KIBOR plus 1.13% June 29, 2026 1,925,000 –
Company (Pvt) Limited - Type B
Pak Electron Limited Average of offer side of 3
month KIBOR plus 1.75% September 28, 2016 – 5,357
Pakistan Domestic Sukuk Weighted average yield of 6
Company Limited months market treasury
bills minus 200bps June 25, 2017 1,150,000 1,150,000
Pakistan Domestic Sukuk 6.10% February 15 , 2019 1,580,574 –
Company Limited
Pakistan Domestic Sukuk 5.59% March 29 , 2019 1,509,437 –
Company Limited
Pakistan International Sukuk 6.75% December 03, 2019 371,807 839,366
Company Limited
Pakistan International Sukuk 5.50% October 13, 2021 522,379 –
Company Limited
Shahraj Fabric Limited Average of offer side of 6
month KIBOR plus 2.1% December 31, 2012 150,000 150,000
Sitara Peroxide Limited Average of offer side of 1
month KIBOR plus 1.0% February 19, 2020 74,814 99,996
9,933,974 2,544,682
9.9 Government of Pakistan Euro Bonds represent investments by Wholesale Bank Branch, Bahrain carrying mark-up at 6.88% to 8.25% and having
maturities upto April 2024.
Arzoo Textile Limited Average of offer side of 6 month
KIBOR plus 2% (for 1-2 years),
1.75% (for 3-6 years) April 14, 2014 110,000 110,000
WAPDA Average of offer side of 6 month
KIBOR minus 0.25% July 13, 2017 33,333 66,667
GOP Ijara Sukuk - Bai Muajjal 6% November 17, 2016 – 3,596,432
GOP Ijara Sukuk - Bai Muajjal 5.99% November 17, 2016 – 1,010,365
Pakistan International Sukuk
Company Limited 6.75% December 3, 2019 792,376 576,290
935,709 5,359,754
9.10 Sukuk Certificates - Held to maturity
Name of Investee Rate (p.a) Maturity 2016 2015
Rupees in ‘000
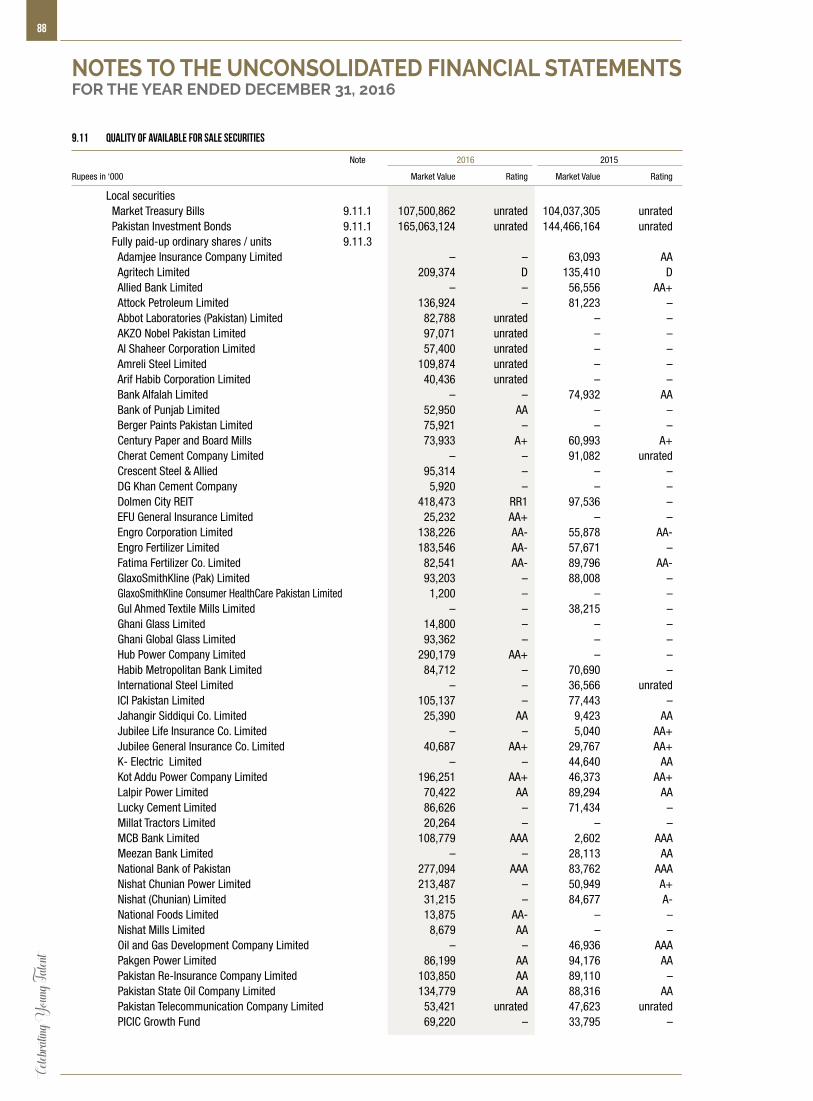
Celeb
rating
Youn
g Tale
nt88
9.11 Quality of available for sale securities
Note 2016 2015
Rupees in ‘000 Market Value Rating Market Value Rating
Local securities Market Treasury Bills 9.11.1 107,500,862 unrated 104,037,305 unrated Pakistan Investment Bonds 9.11.1 165,063,124 unrated 144,466,164 unrated Fully paid-up ordinary shares / units 9.11.3 Adamjee Insurance Company Limited – – 63,093 AA Agritech Limited 209,374 D 135,410 D Allied Bank Limited – – 56,556 AA+ Attock Petroleum Limited 136,924 – 81,223 – Abbot Laboratories (Pakistan) Limited 82,788 unrated – – AKZO Nobel Pakistan Limited 97,071 unrated – – Al Shaheer Corporation Limited 57,400 unrated – – Amreli Steel Limited 109,874 unrated – – Arif Habib Corporation Limited 40,436 unrated – – Bank Alfalah Limited – – 74,932 AA Bank of Punjab Limited 52,950 AA – – Berger Paints Pakistan Limited 75,921 – – – Century Paper and Board Mills 73,933 A+ 60,993 A+ Cherat Cement Company Limited – – 91,082 unrated Crescent Steel & Allied 95,314 – – – DG Khan Cement Company 5,920 – – – Dolmen City REIT 418,473 RR1 97,536 – EFU General Insurance Limited 25,232 AA+ – – Engro Corporation Limited 138,226 AA- 55,878 AA- Engro Fertilizer Limited 183,546 AA- 57,671 – Fatima Fertilizer Co. Limited 82,541 AA- 89,796 AA- GlaxoSmithKline (Pak) Limited 93,203 – 88,008 – GlaxoSmithKline Consumer HealthCare Pakistan Limited 1,200 – – – Gul Ahmed Textile Mills Limited – – 38,215 – Ghani Glass Limited 14,800 – – – Ghani Global Glass Limited 93,362 – – – Hub Power Company Limited 290,179 AA+ – – Habib Metropolitan Bank Limited 84,712 – 70,690 – International Steel Limited – – 36,566 unrated ICI Pakistan Limited 105,137 – 77,443 – Jahangir Siddiqui Co. Limited 25,390 AA 9,423 AA Jubilee Life Insurance Co. Limited – – 5,040 AA+ Jubilee General Insurance Co. Limited 40,687 AA+ 29,767 AA+ K- Electric Limited – – 44,640 AA Kot Addu Power Company Limited 196,251 AA+ 46,373 AA+ Lalpir Power Limited 70,422 AA 89,294 AA Lucky Cement Limited 86,626 – 71,434 – Millat Tractors Limited 20,264 – – – MCB Bank Limited 108,779 AAA 2,602 AAA Meezan Bank Limited – – 28,113 AA National Bank of Pakistan 277,094 AAA 83,762 AAA Nishat Chunian Power Limited 213,487 – 50,949 A+ Nishat (Chunian) Limited 31,215 – 84,677 A- National Foods Limited 13,875 AA- – – Nishat Mills Limited 8,679 AA – – Oil and Gas Development Company Limited – – 46,936 AAA Pakgen Power Limited 86,199 AA 94,176 AA Pakistan Re-Insurance Company Limited 103,850 AA 89,110 – Pakistan State Oil Company Limited 134,779 AA 88,316 AA Pakistan Telecommunication Company Limited 53,421 unrated 47,623 unrated PICIC Growth Fund 69,220 – 33,795 –
NOTES TO THE UNCONSOLIDATED FINANCIAL STATEMENTSFOR THE YEAR ENDED DECEMBER 31, 2016

An
nu
al R
epo
rt o
f Ask
ari B
ank
Lim
ited
for 2
016
89
Note 2016 2015
Rupees in ‘000 Market Value Rating Market Value Rating
PICIC Investment Fund 63,968 unrated 52,601 unrated Pioneer Cement Limited – – 81,774 – Packages Limited 36,850 AA 23,284 AA Pakistan International Bulk Terminal Limited – – 47,269 – Pak Electron Limited 71,280 A+ 56,286 A Sui Northern Gas Company Limited – – 76,171 AA- Sui Southern Gas Company Limited – – 63,495 AA- Shell Pakistan Limited – – 26,521 – Searl Pakistan Limited 407 – – – TRG Pakistan Limited 44,260 – 25,416 – Thal Limited 12,713 – 53,199 –
Fully paid preference shares Agritech Limited 36,645 unrated 54,967 unrated Chenab Limited 31,100 unrated 15,300 unrated Masood Textile Mills Limited 22,100 unrated 25,000 unrated First Dawood Investment Bank Limited 25,000 – 25,000 – Silk Bank Limited – – 100,000 A- Units of open end mutual funds Askari High Yield Scheme 1,214,244 A 1,243,778 A Askari Asset Allocation Fund 135,996 2-Star 119,526 3-Star Askari Islamic Asset Allocation Fund 70,654 1-Star 58,038 2-Star Askari Islamic Income Fund 164,749 A+ 165,465 AA- Askari Sovereign Yield Enhancer Fund 102,864 A+ 106,717 AA- Askari Equity Fund 70,367 3-Star 55,560 unrated Askari Sovereign Cash Fund 119,004 AA+ 120,004 AAA NAMCO Balance Fund – – 941 unrated NIT Islamic Equity Fund 64,183 – 49,325 – Term Finance Certificates Agritech Limited 699,389 D 699,389 D Azgard Nine Limited 144,317 D 177,990 D Bank Alfalah Limited 468,629 AA- 465,144 AA- Bunny’s Limited 874 unrated 9,320 unrated Bank Al Habib Limited 273,162 AA – – Engro Fertilizer Limited – – 457,795 AA- NIB Bank Limited 238,441 A+ 233,500 A+ NRSP Microfinance Bank (Pvt) Limited 752,478 A – – Pace Pakistan Limited 185,927 D 185,927 D Pak Hy Oils Limited 33,470 D 41,870 unrated Pak Libya Holding Company (Private) Limited – – 16,617 AA Pakistan International Airlines Corporation Limited 9.11.1 1,421,712 unrated 1,749,800 unrated Pakistan Mobile Communication Limited – – 90,985 AA- Pak Electron Limited – – 189,957 A- Standard Chartered Bank 65,260 AAA 65,100 AAA World Call Telecom Limited 261,481 D 261,481 D Sukuk Certificates 9.11.2 9,979,524 unrated 2,555,467 unrated Foreign securities Government of Pakistan Euro Bonds 9.11.1 664,619 unrated 1,388,019 unrated
294,148,407 261,858,589
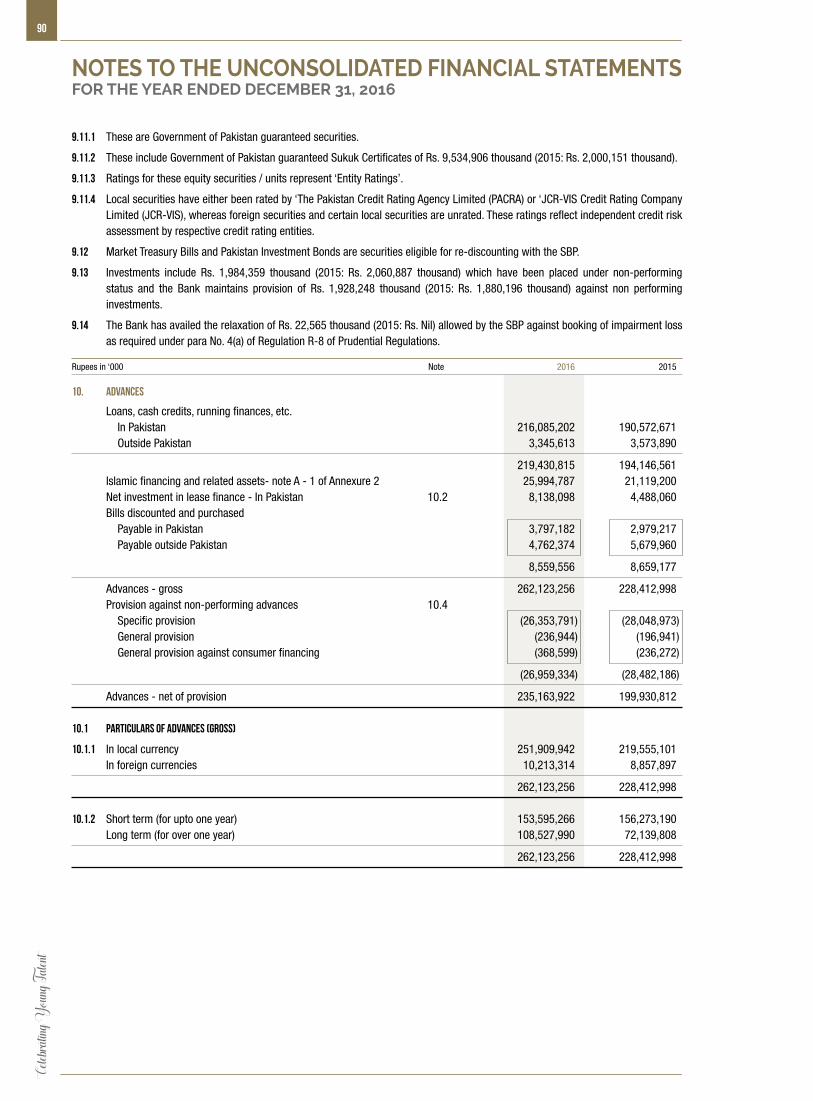
Celeb
rating
Youn
g Tale
nt90
9.11.1 These are Government of Pakistan guaranteed securities.
9.11.2 These include Government of Pakistan guaranteed Sukuk Certificates of Rs. 9,534,906 thousand (2015: Rs. 2,000,151 thousand).
9.11.3 Ratings for these equity securities / units represent ‘Entity Ratings’.
9.11.4 Local securities have either been rated by ‘The Pakistan Credit Rating Agency Limited (PACRA) or ‘JCR-VIS Credit Rating Company Limited (JCR-VIS), whereas foreign securities and certain local securities are unrated. These ratings reflect independent credit risk assessment by respective credit rating entities.
9.12 Market Treasury Bills and Pakistan Investment Bonds are securities eligible for re-discounting with the SBP.
9.13 Investments include Rs. 1,984,359 thousand (2015: Rs. 2,060,887 thousand) which have been placed under non-performing status and the Bank maintains provision of Rs. 1,928,248 thousand (2015: Rs. 1,880,196 thousand) against non performing investments.
9.14 The Bank has availed the relaxation of Rs. 22,565 thousand (2015: Rs. Nil) allowed by the SBP against booking of impairment loss as required under para No. 4(a) of Regulation R-8 of Prudential Regulations.
Rupees in ‘000 Note 2016 2015
10. ADVANCES
Loans, cash credits, running finances, etc. In Pakistan 216,085,202 190,572,671 Outside Pakistan 3,345,613 3,573,890
219,430,815 194,146,561 Islamic financing and related assets- note A - 1 of Annexure 2 25,994,787 21,119,200 Net investment in lease finance - In Pakistan 10.2 8,138,098 4,488,060 Bills discounted and purchased Payable in Pakistan 3,797,182 2,979,217 Payable outside Pakistan 4,762,374 5,679,960
8,559,556 8,659,177
Advances - gross 262,123,256 228,412,998 Provision against non-performing advances 10.4 Specific provision (26,353,791) (28,048,973) General provision (236,944) (196,941) General provision against consumer financing (368,599) (236,272)
(26,959,334) (28,482,186)
Advances - net of provision 235,163,922 199,930,812 10.1 Particulars of advances (Gross)
10.1.1 In local currency 251,909,942 219,555,101 In foreign currencies 10,213,314 8,857,897
262,123,256 228,412,998
10.1.2 Short term (for upto one year) 153,595,266 156,273,190 Long term (for over one year) 108,527,990 72,139,808
262,123,256 228,412,998
NOTES TO THE UNCONSOLIDATED FINANCIAL STATEMENTSFOR THE YEAR ENDED DECEMBER 31, 2016
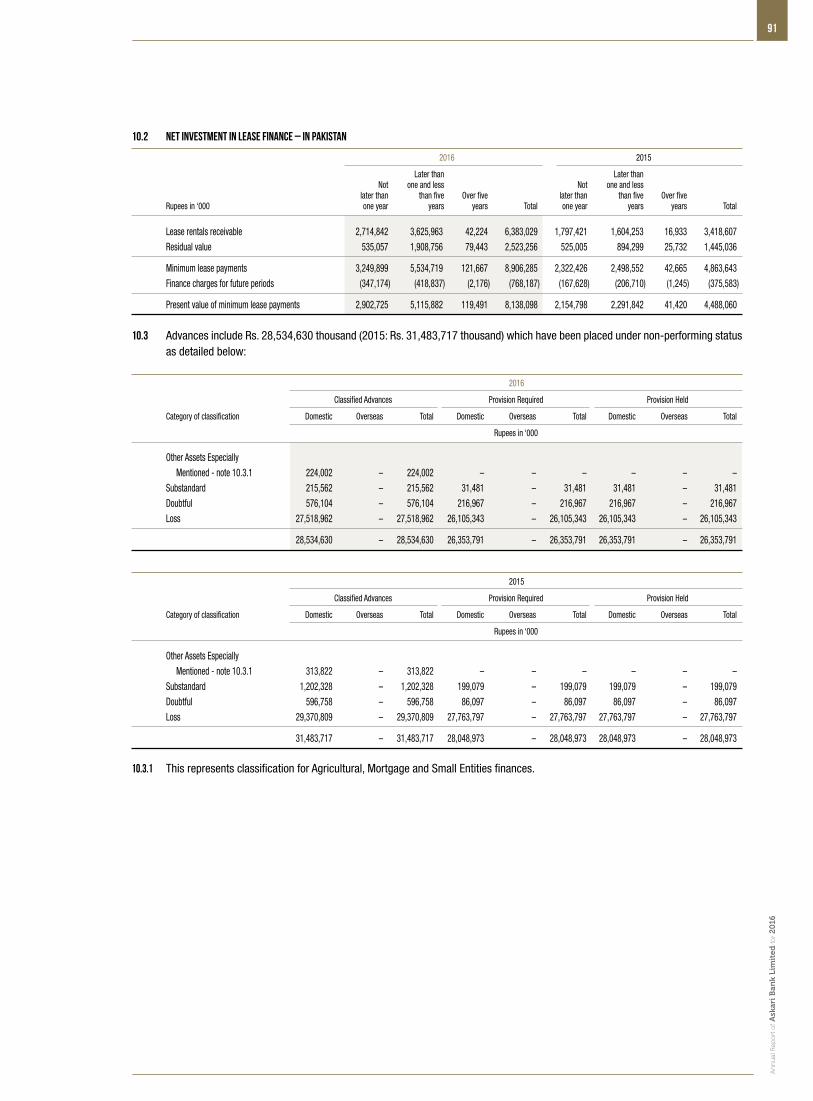
An
nu
al R
epo
rt o
f Ask
ari B
ank
Lim
ited
for 2
016
91
10.2 Net investment in lease finance – In Pakistan
2016 2015
Later than Later than Not one and less Not one and less later than than five Over five later than than five Over five Rupees in ‘000 one year years years Total one year years years Total
Lease rentals receivable 2,714,842 3,625,963 42,224 6,383,029 1,797,421 1,604,253 16,933 3,418,607
Residual value 535,057 1,908,756 79,443 2,523,256 525,005 894,299 25,732 1,445,036
Minimum lease payments 3,249,899 5,534,719 121,667 8,906,285 2,322,426 2,498,552 42,665 4,863,643
Finance charges for future periods (347,174) (418,837) (2,176) (768,187) (167,628) (206,710) (1,245) (375,583)
Present value of minimum lease payments 2,902,725 5,115,882 119,491 8,138,098 2,154,798 2,291,842 41,420 4,488,060
10.3 Advances include Rs. 28,534,630 thousand (2015: Rs. 31,483,717 thousand) which have been placed under non-performing status as detailed below:
2016
Classified Advances Provision Required Provision Held
Category of classification Domestic Overseas Total Domestic Overseas Total Domestic Overseas Total
Rupees in ‘000
Other Assets Especially
Mentioned - note 10.3.1 224,002 – 224,002 – – – – – –
Substandard 215,562 – 215,562 31,481 – 31,481 31,481 – 31,481
Doubtful 576,104 – 576,104 216,967 – 216,967 216,967 – 216,967
Loss 27,518,962 – 27,518,962 26,105,343 – 26,105,343 26,105,343 – 26,105,343
28,534,630 – 28,534,630 26,353,791 – 26,353,791 26,353,791 – 26,353,791
2015
Classified Advances Provision Required Provision Held
Category of classification Domestic Overseas Total Domestic Overseas Total Domestic Overseas Total
Rupees in ‘000
Other Assets Especially
Mentioned - note 10.3.1 313,822 – 313,822 – – – – – –
Substandard 1,202,328 – 1,202,328 199,079 – 199,079 199,079 – 199,079
Doubtful 596,758 – 596,758 86,097 – 86,097 86,097 – 86,097
Loss 29,370,809 – 29,370,809 27,763,797 – 27,763,797 27,763,797 – 27,763,797
31,483,717 – 31,483,717 28,048,973 – 28,048,973 28,048,973 – 28,048,973
10.3.1 This represents classification for Agricultural, Mortgage and Small Entities finances.
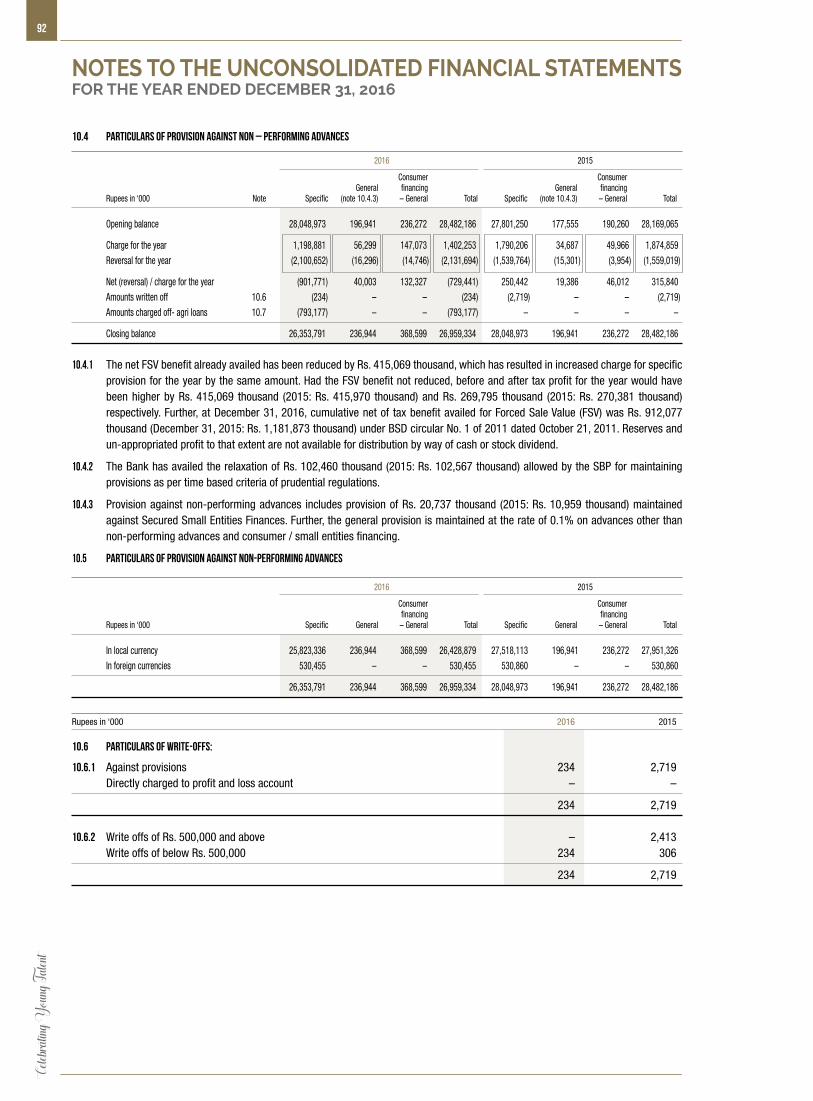
Celeb
rating
Youn
g Tale
nt92
10.4.1 The net FSV benefit already availed has been reduced by Rs. 415,069 thousand, which has resulted in increased charge for specific provision for the year by the same amount. Had the FSV benefit not reduced, before and after tax profit for the year would have been higher by Rs. 415,069 thousand (2015: Rs. 415,970 thousand) and Rs. 269,795 thousand (2015: Rs. 270,381 thousand) respectively. Further, at December 31, 2016, cumulative net of tax benefit availed for Forced Sale Value (FSV) was Rs. 912,077 thousand (December 31, 2015: Rs. 1,181,873 thousand) under BSD circular No. 1 of 2011 dated October 21, 2011. Reserves and un-appropriated profit to that extent are not available for distribution by way of cash or stock dividend.
10.4.2 The Bank has availed the relaxation of Rs. 102,460 thousand (2015: Rs. 102,567 thousand) allowed by the SBP for maintaining provisions as per time based criteria of prudential regulations.
10.4.3 Provision against non-performing advances includes provision of Rs. 20,737 thousand (2015: Rs. 10,959 thousand) maintained against Secured Small Entities Finances. Further, the general provision is maintained at the rate of 0.1% on advances other than non-performing advances and consumer / small entities financing.
10.5 Particulars of provision against non-performing advances
2016 2015
Consumer Consumer financing financing Rupees in ‘000 Specific General – General Total Specific General – General Total
In local currency 25,823,336 236,944 368,599 26,428,879 27,518,113 196,941 236,272 27,951,326
In foreign currencies 530,455 – – 530,455 530,860 – – 530,860
26,353,791 236,944 368,599 26,959,334 28,048,973 196,941 236,272 28,482,186
Rupees in ‘000 2016 2015
10.6 Particulars of write-offs:
10.6.1 Against provisions 234 2,719 Directly charged to profit and loss account – –
234 2,719 10.6.2 Write offs of Rs. 500,000 and above – 2,413 Write offs of below Rs. 500,000 234 306
234 2,719
10.4 Particulars of provision against non – performing advances
2016 2015
Consumer Consumer General financing General financing Rupees in ‘000 Note Specific (note 10.4.3) – General Total Specific (note 10.4.3) – General Total
Opening balance 28,048,973 196,941 236,272 28,482,186 27,801,250 177,555 190,260 28,169,065
Charge for the year 1,198,881 56,299 147,073 1,402,253 1,790,206 34,687 49,966 1,874,859
Reversal for the year (2,100,652) (16,296) (14,746) (2,131,694) (1,539,764) (15,301) (3,954) (1,559,019)
Net (reversal) / charge for the year (901,771) 40,003 132,327 (729,441) 250,442 19,386 46,012 315,840
Amounts written off 10.6 (234) – – (234) (2,719) – – (2,719)
Amounts charged off- agri loans 10.7 (793,177) – – (793,177) – – – –
Closing balance 26,353,791 236,944 368,599 26,959,334 28,048,973 196,941 236,272 28,482,186
NOTES TO THE UNCONSOLIDATED FINANCIAL STATEMENTSFOR THE YEAR ENDED DECEMBER 31, 2016
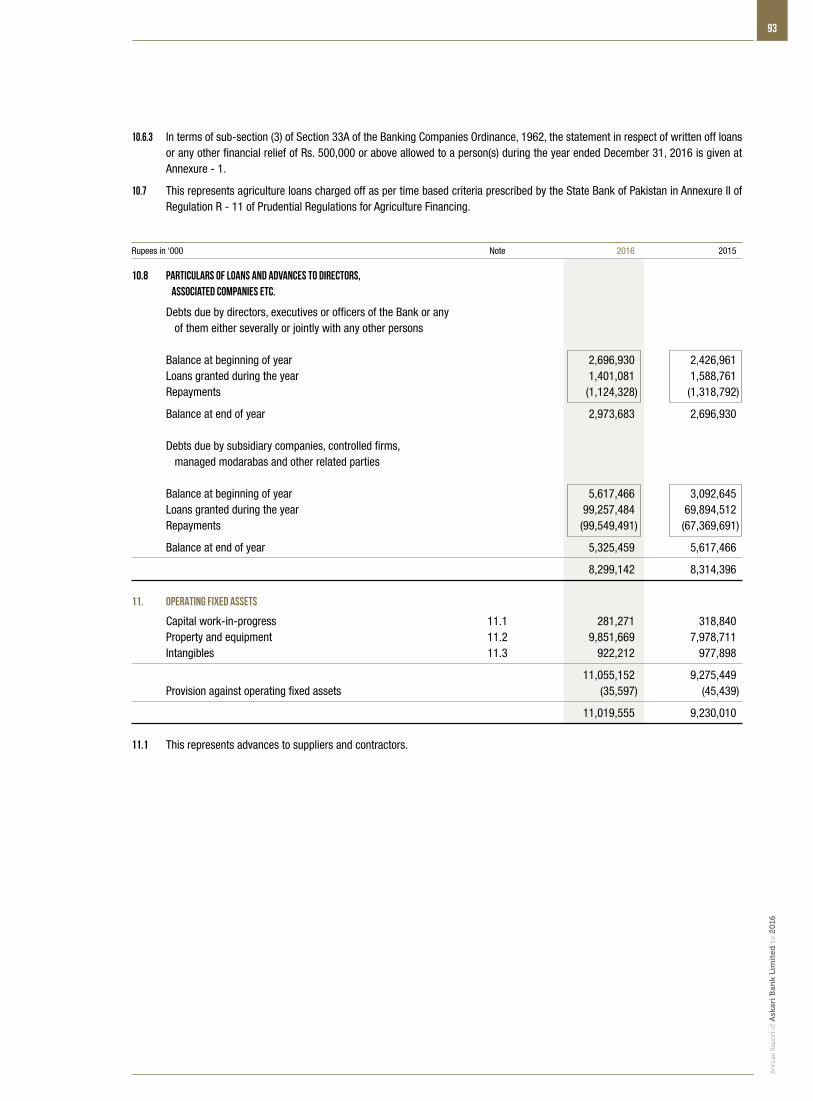
An
nu
al R
epo
rt o
f Ask
ari B
ank
Lim
ited
for 2
016
93
10.6.3 In terms of sub-section (3) of Section 33A of the Banking Companies Ordinance, 1962, the statement in respect of written off loans or any other financial relief of Rs. 500,000 or above allowed to a person(s) during the year ended December 31, 2016 is given at Annexure - 1.
10.7 This represents agriculture loans charged off as per time based criteria prescribed by the State Bank of Pakistan in Annexure II of Regulation R - 11 of Prudential Regulations for Agriculture Financing.
Rupees in ‘000 Note 2016 2015
10.8 Particulars of loans and advances to directors, associated companies etc.
Debts due by directors, executives or officers of the Bank or any of them either severally or jointly with any other persons Balance at beginning of year 2,696,930 2,426,961 Loans granted during the year 1,401,081 1,588,761 Repayments (1,124,328) (1,318,792)
Balance at end of year 2,973,683 2,696,930 Debts due by subsidiary companies, controlled firms, managed modarabas and other related parties Balance at beginning of year 5,617,466 3,092,645 Loans granted during the year 99,257,484 69,894,512 Repayments (99,549,491) (67,369,691)
Balance at end of year 5,325,459 5,617,466
8,299,142 8,314,396 11. OPERATING FIXED ASSETS
Capital work-in-progress 11.1 281,271 318,840 Property and equipment 11.2 9,851,669 7,978,711 Intangibles 11.3 922,212 977,898
11,055,152 9,275,449 Provision against operating fixed assets (35,597) (45,439)
11,019,555 9,230,010 11.1 This represents advances to suppliers and contractors.
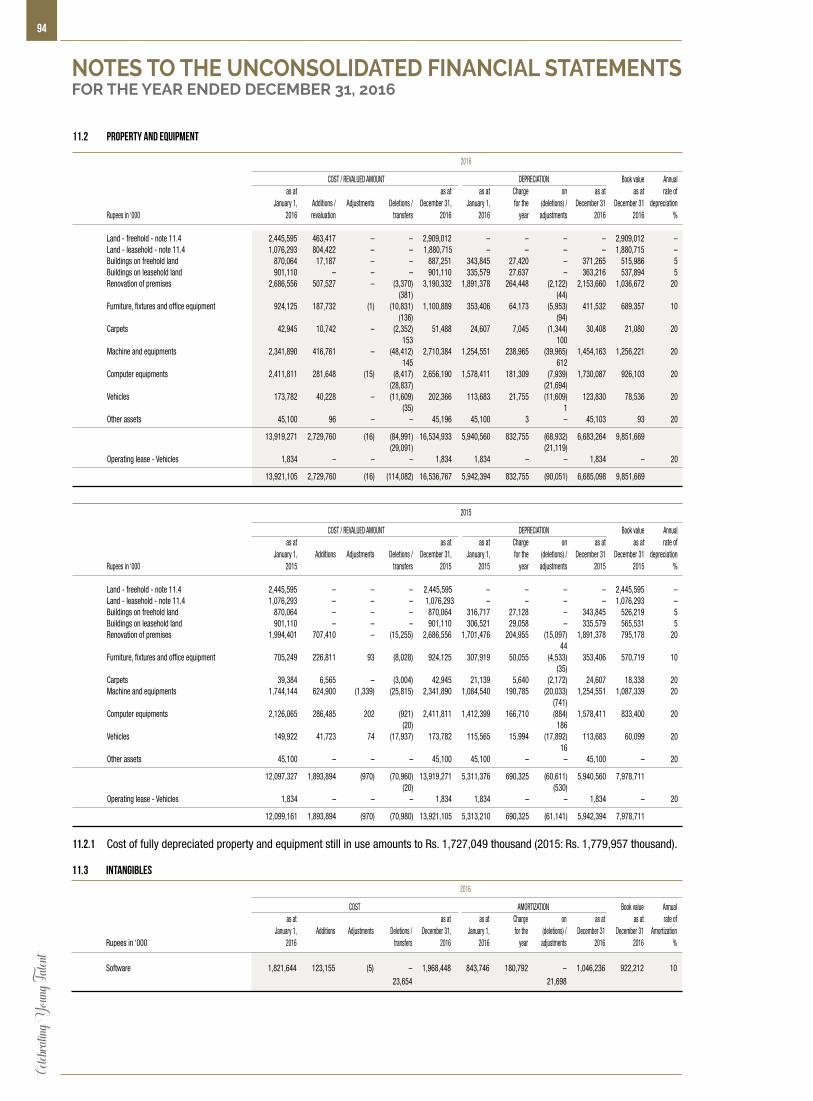
Celeb
rating
Youn
g Tale
nt94
11.2 Property and equipment
2016
COST / REVALUED AMOUNT DEPRECIATION Book value Annual as at as at as at Charge on as at as at rate of January 1, Additions / Adjustments Deletions / December 31, January 1, for the (deletions) / December 31 December 31 depreciation Rupees in ‘000 2016 revaluation transfers 2016 2016 year adjustments 2016 2016 %
Land - freehold - note 11.4 2,445,595 463,417 – – 2,909,012 – – – – 2,909,012 – Land - leasehold - note 11.4 1,076,293 804,422 – – 1,880,715 – – – – 1,880,715 – Buildings on freehold land 870,064 17,187 – – 887,251 343,845 27,420 – 371,265 515,986 5 Buildings on leasehold land 901,110 – – – 901,110 335,579 27,637 – 363,216 537,894 5 Renovation of premises 2,686,556 507,527 – (3,370) 3,190,332 1,891,378 264,448 (2,122) 2,153,660 1,036,672 20 (381) (44) Furniture, fixtures and office equipment 924,125 187,732 (1) (10,831) 1,100,889 353,406 64,173 (5,953) 411,532 689,357 10 (136) (94) Carpets 42,945 10,742 – (2,352) 51,488 24,607 7,045 (1,344) 30,408 21,080 20 153 100 Machine and equipments 2,341,890 416,761 – (48,412) 2,710,384 1,254,551 238,965 (39,965) 1,454,163 1,256,221 20 145 612 Computer equipments 2,411,811 281,648 (15) (8,417) 2,656,190 1,578,411 181,309 (7,939) 1,730,087 926,103 20 (28,837) (21,694) Vehicles 173,782 40,228 – (11,609) 202,366 113,683 21,755 (11,609) 123,830 78,536 20 (35) 1 Other assets 45,100 96 – – 45,196 45,100 3 – 45,103 93 20
13,919,271 2,729,760 (16) (84,991) 16,534,933 5,940,560 832,755 (68,932) 6,683,264 9,851,669 (29,091) (21,119) Operating lease - Vehicles 1,834 – – – 1,834 1,834 – – 1,834 – 20
13,921,105 2,729,760 (16) (114,082) 16,536,767 5,942,394 832,755 (90,051) 6,685,098 9,851,669
2015
COST / REVALUED AMOUNT DEPRECIATION Book value Annual as at as at as at Charge on as at as at rate of January 1, Additions Adjustments Deletions / December 31, January 1, for the (deletions) / December 31 December 31 depreciation Rupees in ‘000 2015 transfers 2015 2015 year adjustments 2015 2015 %
Land - freehold - note 11.4 2,445,595 – – – 2,445,595 – – – – 2,445,595 – Land - leasehold - note 11.4 1,076,293 – – – 1,076,293 – – – – 1,076,293 – Buildings on freehold land 870,064 – – – 870,064 316,717 27,128 – 343,845 526,219 5 Buildings on leasehold land 901,110 – – – 901,110 306,521 29,058 – 335,579 565,531 5 Renovation of premises 1,994,401 707,410 – (15,255) 2,686,556 1,701,476 204,955 (15,097) 1,891,378 795,178 20 44 Furniture, fixtures and office equipment 705,249 226,811 93 (8,028) 924,125 307,919 50,055 (4,533) 353,406 570,719 10 (35) Carpets 39,384 6,565 – (3,004) 42,945 21,139 5,640 (2,172) 24,607 18,338 20 Machine and equipments 1,744,144 624,900 (1,339) (25,815) 2,341,890 1,084,540 190,785 (20,033) 1,254,551 1,087,339 20 (741) Computer equipments 2,126,065 286,485 202 (921) 2,411,811 1,412,399 166,710 (884) 1,578,411 833,400 20 (20) 186 Vehicles 149,922 41,723 74 (17,937) 173,782 115,565 15,994 (17,892) 113,683 60,099 20 16 Other assets 45,100 – – – 45,100 45,100 – – 45,100 – 20
12,097,327 1,893,894 (970) (70,960) 13,919,271 5,311,376 690,325 (60,611) 5,940,560 7,978,711 (20) (530) Operating lease - Vehicles 1,834 – – – 1,834 1,834 – – 1,834 – 20
12,099,161 1,893,894 (970) (70,980) 13,921,105 5,313,210 690,325 (61,141) 5,942,394 7,978,711
11.2.1 Cost of fully depreciated property and equipment still in use amounts to Rs. 1,727,049 thousand (2015: Rs. 1,779,957 thousand).
11.3 Intangibles
2016
COST AMORTIZATION Book value Annual as at as at as at Charge on as at as at rate of January 1, Additions Adjustments Deletions / December 31, January 1, for the (deletions) / December 31 December 31 Amortization Rupees in ‘000 2016 transfers 2016 2016 year adjustments 2016 2016 %
Software 1,821,644 123,155 (5) – 1,968,448 843,746 180,792 – 1,046,236 922,212 10 23,654 21,698
NOTES TO THE UNCONSOLIDATED FINANCIAL STATEMENTSFOR THE YEAR ENDED DECEMBER 31, 2016
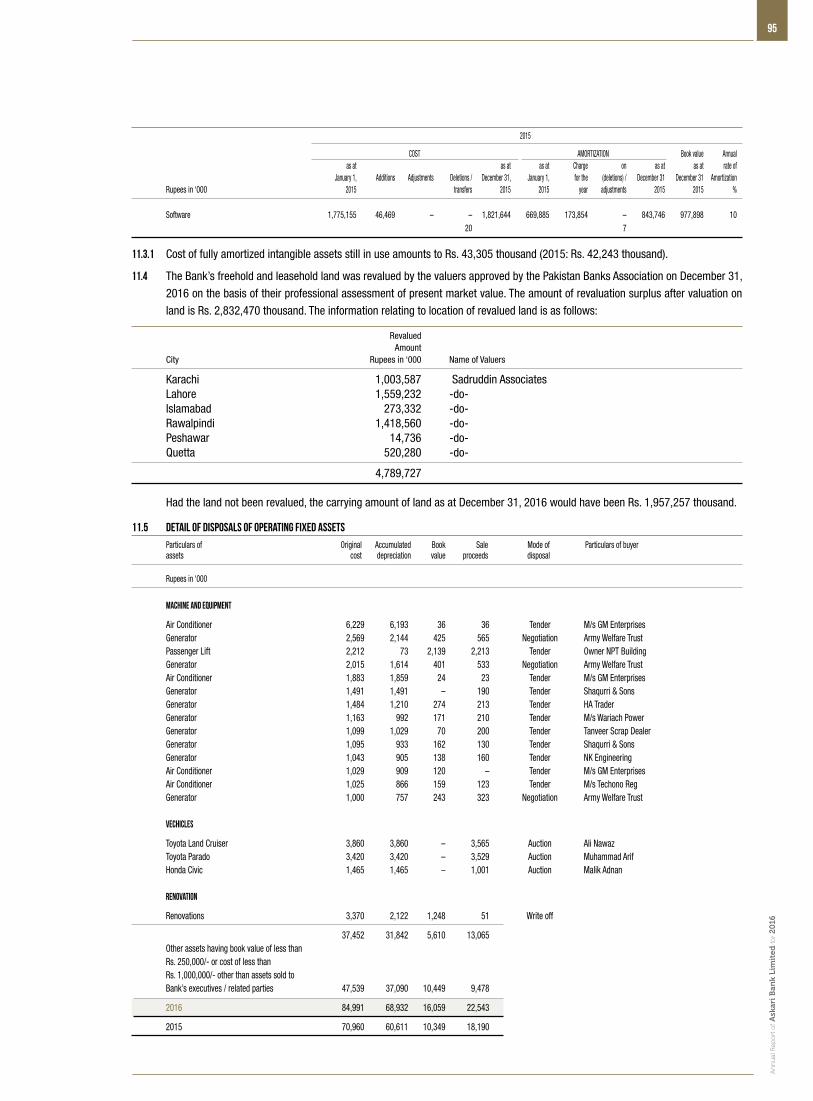
An
nu
al R
epo
rt o
f Ask
ari B
ank
Lim
ited
for 2
016
95
2015
COST AMORTIZATION Book value Annual as at as at as at Charge on as at as at rate of January 1, Additions Adjustments Deletions / December 31, January 1, for the (deletions) / December 31 December 31 Amortization Rupees in ‘000 2015 transfers 2015 2015 year adjustments 2015 2015 %
Software 1,775,155 46,469 – – 1,821,644 669,885 173,854 – 843,746 977,898 10 20 7
11.3.1 Cost of fully amortized intangible assets still in use amounts to Rs. 43,305 thousand (2015: Rs. 42,243 thousand).
11.4 The Bank’s freehold and leasehold land was revalued by the valuers approved by the Pakistan Banks Association on December 31,
2016 on the basis of their professional assessment of present market value. The amount of revaluation surplus after valuation on
land is Rs. 2,832,470 thousand. The information relating to location of revalued land is as follows:
Revalued Amount City Rupees in ‘000 Name of Valuers
Karachi 1,003,587 Sadruddin Associates Lahore 1,559,232 -do- Islamabad 273,332 -do- Rawalpindi 1,418,560 -do- Peshawar 14,736 -do- Quetta 520,280 -do-
4,789,727
Had the land not been revalued, the carrying amount of land as at December 31, 2016 would have been Rs. 1,957,257 thousand.
11.5 Detail of disposals of operating fixed assets
Particulars of Original Accumulated Book Sale Mode of Particulars of buyer assets cost depreciation value proceeds disposal
Rupees in ‘000
Machine and Equipment
Air Conditioner 6,229 6,193 36 36 Tender M/s GM Enterprises Generator 2,569 2,144 425 565 Negotiation Army Welfare Trust Passenger Lift 2,212 73 2,139 2,213 Tender Owner NPT Building Generator 2,015 1,614 401 533 Negotiation Army Welfare Trust Air Conditioner 1,883 1,859 24 23 Tender M/s GM Enterprises Generator 1,491 1,491 – 190 Tender Shaqurri & Sons Generator 1,484 1,210 274 213 Tender HA Trader Generator 1,163 992 171 210 Tender M/s Wariach Power Generator 1,099 1,029 70 200 Tender Tanveer Scrap Dealer Generator 1,095 933 162 130 Tender Shaqurri & Sons Generator 1,043 905 138 160 Tender NK Engineering Air Conditioner 1,029 909 120 – Tender M/s GM Enterprises Air Conditioner 1,025 866 159 123 Tender M/s Techono Reg Generator 1,000 757 243 323 Negotiation Army Welfare Trust Vechicles
Toyota Land Cruiser 3,860 3,860 – 3,565 Auction Ali Nawaz Toyota Parado 3,420 3,420 – 3,529 Auction Muhammad Arif Honda Civic 1,465 1,465 – 1,001 Auction Malik Adnan Renovation
Renovations 3,370 2,122 1,248 51 Write off
37,452 31,842 5,610 13,065 Other assets having book value of less than Rs. 250,000/- or cost of less than Rs. 1,000,000/- other than assets sold to Bank’s executives / related parties 47,539 37,090 10,449 9,478
2016 84,991 68,932 16,059 22,543
2015 70,960 60,611 10,349 18,190
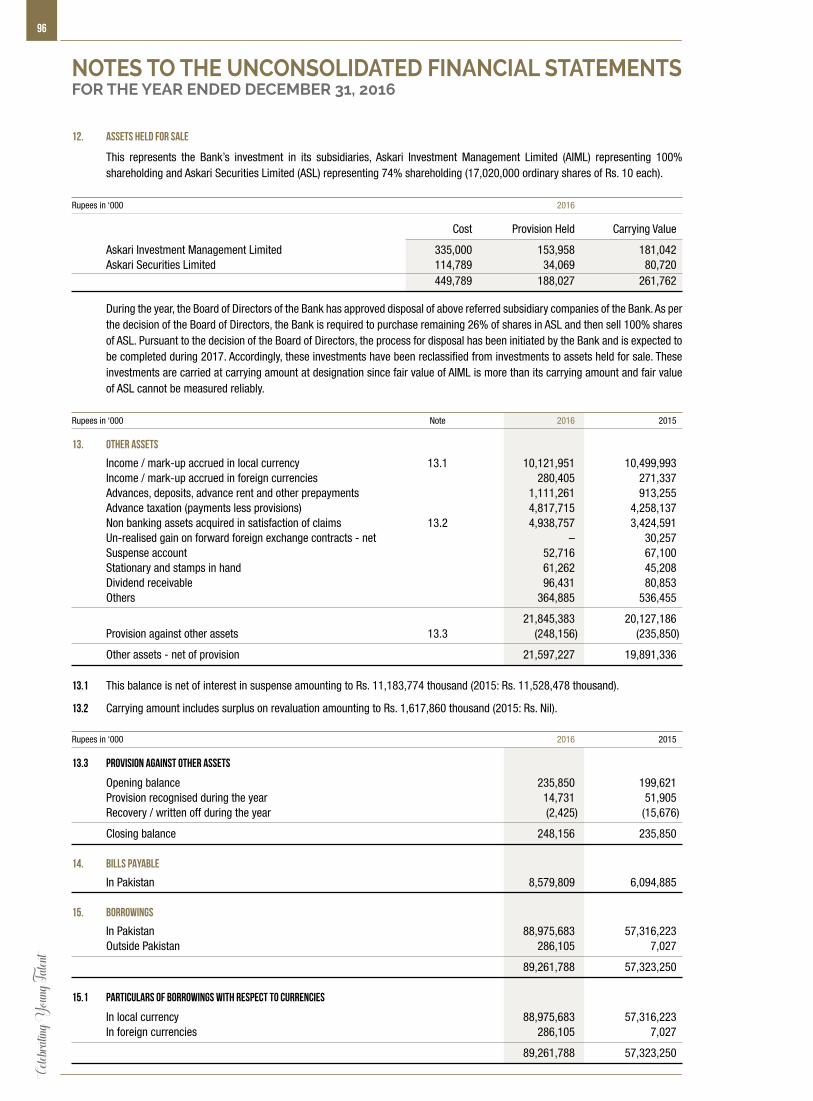
Celeb
rating
Youn
g Tale
nt96
12. Assets held for sale
This represents the Bank’s investment in its subsidiaries, Askari Investment Management Limited (AIML) representing 100% shareholding and Askari Securities Limited (ASL) representing 74% shareholding (17,020,000 ordinary shares of Rs. 10 each).
Rupees in ‘000 2016
Cost Provision Held Carrying Value
Askari Investment Management Limited 335,000 153,958 181,042 Askari Securities Limited 114,789 34,069 80,720 449,789 188,027 261,762
During the year, the Board of Directors of the Bank has approved disposal of above referred subsidiary companies of the Bank. As per the decision of the Board of Directors, the Bank is required to purchase remaining 26% of shares in ASL and then sell 100% shares of ASL. Pursuant to the decision of the Board of Directors, the process for disposal has been initiated by the Bank and is expected to be completed during 2017. Accordingly, these investments have been reclassified from investments to assets held for sale. These investments are carried at carrying amount at designation since fair value of AIML is more than its carrying amount and fair value of ASL cannot be measured reliably.
Rupees in ‘000 Note 2016 2015
13. OTHER ASSETS
Income / mark-up accrued in local currency 13.1 10,121,951 10,499,993 Income / mark-up accrued in foreign currencies 280,405 271,337 Advances, deposits, advance rent and other prepayments 1,111,261 913,255 Advance taxation (payments less provisions) 4,817,715 4,258,137 Non banking assets acquired in satisfaction of claims 13.2 4,938,757 3,424,591 Un-realised gain on forward foreign exchange contracts - net – 30,257 Suspense account 52,716 67,100 Stationary and stamps in hand 61,262 45,208 Dividend receivable 96,431 80,853 Others 364,885 536,455
21,845,383 20,127,186 Provision against other assets 13.3 (248,156) (235,850)
Other assets - net of provision 21,597,227 19,891,336 13.1 This balance is net of interest in suspense amounting to Rs. 11,183,774 thousand (2015: Rs. 11,528,478 thousand).
13.2 Carrying amount includes surplus on revaluation amounting to Rs. 1,617,860 thousand (2015: Rs. Nil).
Rupees in ‘000 2016 2015
13.3 Provision against other assets
Opening balance 235,850 199,621 Provision recognised during the year 14,731 51,905 Recovery / written off during the year (2,425) (15,676)
Closing balance 248,156 235,850 14. BILLS PAYABLE
In Pakistan 8,579,809 6,094,885 15. BORROWINGS
In Pakistan 88,975,683 57,316,223 Outside Pakistan 286,105 7,027
89,261,788 57,323,250 15.1 Particulars of borrowings with respect to currencies
In local currency 88,975,683 57,316,223 In foreign currencies 286,105 7,027
89,261,788 57,323,250
NOTES TO THE UNCONSOLIDATED FINANCIAL STATEMENTSFOR THE YEAR ENDED DECEMBER 31, 2016

An
nu
al R
epo
rt o
f Ask
ari B
ank
Lim
ited
for 2
016
97
Rupees in ‘000 Note 2016 2015
15.2 Details of borrowings - secured / unsecured
In Pakistan - local currency Secured Borrowings from the State Bank of Pakistan: Export refinance scheme 15.2.1 9,712,571 9,314,529 Long term financing of export oriented projects – 7,386 Long term financing facility 15.2.2 3,165,516 1,005,047 Financing facility for storage of agricultural produce 15.2.3 12,500 –
12,890,587 10,326,962 Repo borrowings State Bank of Pakistan 15.2.4 67,078,365 42,646,764 Financial institutions 15.2.5 6,211,169 3,842,399
73,289,534 46,489,163 Unsecured Call borrowings 15.2.6 2,795,562 500,000 Overdrawn balance with other banks – 98
2,795,562 500,098
88,975,683 57,316,223 Outside Pakistan - foreign currencies Overdrawn nostro accounts - unsecured 286,105 7,027
89,261,788 57,323,250 15.2.1 This facility is secured against demand promissory note executed in favour of the SBP. The effective mark-up rate is 2.5% to 3%
(2015: 2.5% to 4.5%) per annum payable on a quarterly basis.
15.2.2 This facility is secured against demand promissory note executed in favour of the SBP. The effective mark-up rate is 2.0% to 6.0% (2015: 3.0% to 6.0%) per annum payable on a quarterly basis.
15.2.3 These are secured against pledge of Government Securities and carry markup of 3.25% per annum and have maturities upto October 2020.
15.2.4 These are secured against pledge of Government Securities and carry markup of 5.87% (2015: 6.16%) per annum and have maturities upto 1 month (2015: 1 month).
15.2.5 These are secured against pledge of Government Securities and carry markup of 5.50% to 5.84% (2015: 6.0% to 6.35%) per annum and have maturities upto 3 months (2015: 1 month).
15.2.6 These carry mark-up rate of 5.00% to 5.60% (2015: 6.05%) per annum and having maturity upto 3 months (2015:1 month).
Rupees in ‘000 2016 2015
16. DEPOSITS AND OTHER ACCOUNTS
Customers Fixed deposits 87,044,527 87,271,214 Savings deposits 249,395,839 230,891,271 Current accounts - remunerative 753,080 735,829 Current accounts - non-remunerative 125,245,992 105,536,733 Special exporters’ account 31,934 59,733 Margin accounts 3,080,895 2,724,193 Others 1,205,111 824,850 Financial institutions Remunerative deposits 5,860,112 4,959,028 Non-remunerative deposits 193,845 169,354
472,811,335 433,172,205 16.1 Particulars of deposits
In local currency 433,188,494 395,239,968 In foreign currencies 39,622,841 37,932,237
472,811,335 433,172,205 Deposits include Rs. 14,035,655 thousand (2015: Rs. 12,335,964 thousand) due to related parties.

Celeb
rating
Youn
g Tale
nt98
Rupees in ‘000 2016 2015
17. SUB-ORDINATED LOANS
Term Finance Certificates - IV 998,000 998,400 Term Finance Certificates - V 3,996,800 3,998,400
4,994,800 4,996,800 17.1 The Bank had raised unsecured sub-ordinated loans through issuance of five separate Term Finance Certificates to improve the
Bank’s capital adequacy. The first two issues were fully redeemed in 2013 while the third issue was fully redeemed in 2015. Liability to the TFC holders is subordinated to and rank inferior to all other indebtedness of the Bank including deposits and is not redeemable before maturity without prior approval of the SBP. The salient features of outstanding issues are as follows:
Term Finance Certificates - IV Term Finance Certificates - V
Outstanding amount - Rupees in ‘000 998,000 3,996,800
Issue date December 23, 2011 September 30, 2014 Total issue Rupees 1,000 million Rupees 4,000 million Rating AA AA- Listing Unlisted Unlisted Rate Payable six monthly - Base Payable six monthly - Base Rate plus 1.75% Rate plus 1.20% (after 5 years: 2.20%) Base Rate is the simple average of the ask Base Rate is the simple average of the ask rate rate of six month KIBOR prevailing on the of six month KIBOR prevailing on the base rate base rate setting date. setting date. Repayment 10 Years 10 Years Call option Exercisable after 60 months from the date of issue Exercisable after 60 months from the date of issue subject to approval by the SBP. subject to approval by the SBP. Redemption 6-96th month: 0.32% 6-108th month: 0.36% 97-120th month: 99.68% 108-120th month: 99.64%
Rupees in ‘000 Note 2016 2015
18. DEFERRED TAX LIABILITIES
Deferred (debits) / credits arising due to: Accelerated tax depreciation and amortization 537,926 531,201 Provision against non-performing advances - excess of 1% of total advances (1,327,402) (2,181,302) - classified in sub-standard category (71,278) (71,278)
(860,754) (1,721,379) Surplus on revaluation of available for sale securities 1,491,068 1,871,966 Actuarial loss (103,884) (54,183)
526,430 96,404
19. OTHER LIABILITIES
Mark-up / return / interest payable in local currency 2,569,950 1,628,889 Mark-up / return / interest payable in foreign currencies 100,216 79,794 Unearned income / commission 292,344 305,368 Accrued expenses 1,358,471 1,324,779 Advance payments 245,651 164,333 Security deposit against lease / Ijarah financing 3,444,309 2,032,455 Unclaimed dividends 101,392 87,190 Branch adjustment account 121,306 251,574 Payable to defined benefit plan 384,364 – Payable against purchase of listed shares 10,252 28,811 Un-realised loss on forward foreign exchange contracts - net 82,664 – Withholding taxes payable 90,815 151,679 Federal excise duty payable 41,404 47,168 Workers’ Welfare Fund 19.1 500,766 331,227 Switch fee payable 431,432 343,634 Others 612,745 553,326
10,388,081 7,330,227
NOTES TO THE UNCONSOLIDATED FINANCIAL STATEMENTSFOR THE YEAR ENDED DECEMBER 31, 2016
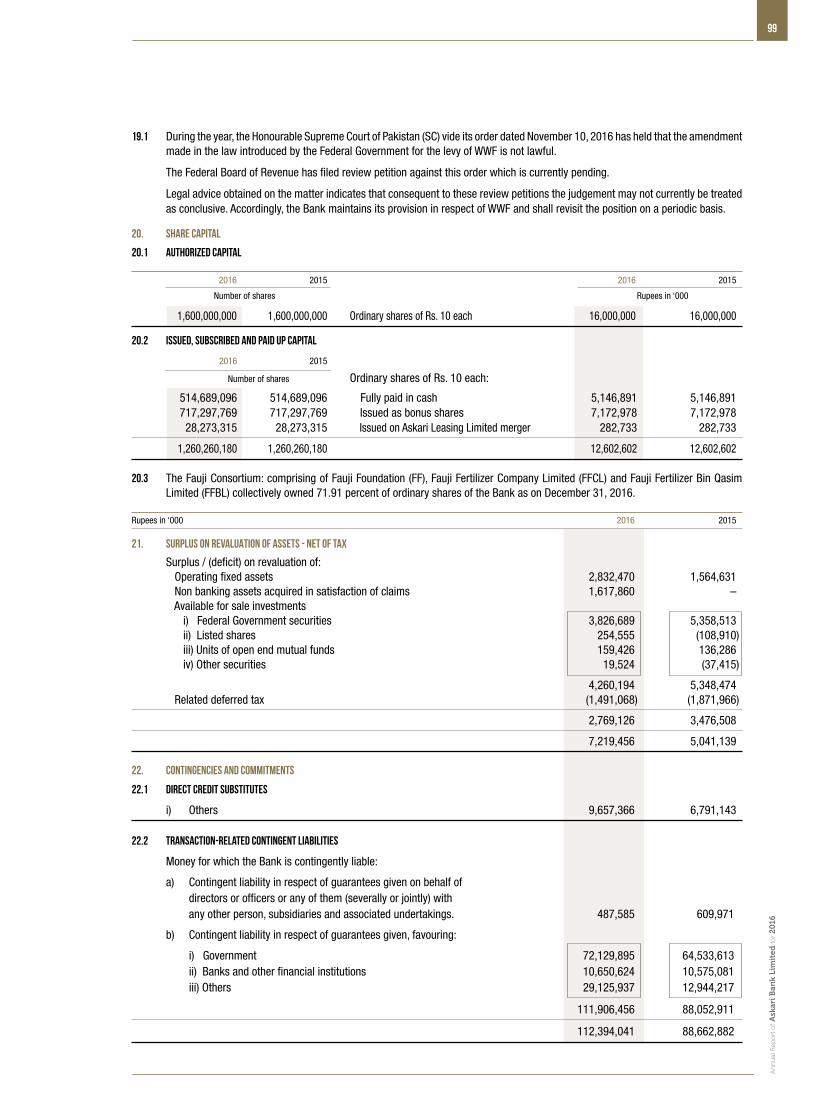
An
nu
al R
epo
rt o
f Ask
ari B
ank
Lim
ited
for 2
016
99
19.1 During the year, the Honourable Supreme Court of Pakistan (SC) vide its order dated November 10, 2016 has held that the amendment made in the law introduced by the Federal Government for the levy of WWF is not lawful.
The Federal Board of Revenue has filed review petition against this order which is currently pending.
Legal advice obtained on the matter indicates that consequent to these review petitions the judgement may not currently be treated as conclusive. Accordingly, the Bank maintains its provision in respect of WWF and shall revisit the position on a periodic basis.
20. share capital
20.1 Authorized capital
2016 2015 2016 2015
Number of shares Rupees in ‘000
1,600,000,000 1,600,000,000 Ordinary shares of Rs. 10 each 16,000,000 16,000,000
20.2 Issued, subscribed and paid up capital
2016 2015
Number of shares Ordinary shares of Rs. 10 each:
514,689,096 514,689,096 Fully paid in cash 5,146,891 5,146,891 717,297,769 717,297,769 Issued as bonus shares 7,172,978 7,172,978 28,273,315 28,273,315 Issued on Askari Leasing Limited merger 282,733 282,733
1,260,260,180 1,260,260,180 12,602,602 12,602,602
20.3 The Fauji Consortium: comprising of Fauji Foundation (FF), Fauji Fertilizer Company Limited (FFCL) and Fauji Fertilizer Bin Qasim Limited (FFBL) collectively owned 71.91 percent of ordinary shares of the Bank as on December 31, 2016.
Rupees in ‘000 2016 2015
21. SURPLUS ON REVALUATION OF ASSETS - NET OF TAX
Surplus / (deficit) on revaluation of: Operating fixed assets 2,832,470 1,564,631 Non banking assets acquired in satisfaction of claims 1,617,860 – Available for sale investments i) Federal Government securities 3,826,689 5,358,513 ii) Listed shares 254,555 (108,910) iii) Units of open end mutual funds 159,426 136,286 iv) Other securities 19,524 (37,415)
4,260,194 5,348,474 Related deferred tax (1,491,068) (1,871,966)
2,769,126 3,476,508
7,219,456 5,041,139
22. CONTINGENCIES AND COMMITMENTS
22.1 Direct credit substitutes
i) Others 9,657,366 6,791,143 22.2 Transaction-related contingent liabilities
Money for which the Bank is contingently liable:
a) Contingent liability in respect of guarantees given on behalf of directors or officers or any of them (severally or jointly) with any other person, subsidiaries and associated undertakings. 487,585 609,971
b) Contingent liability in respect of guarantees given, favouring:
i) Government 72,129,895 64,533,613 ii) Banks and other financial institutions 10,650,624 10,575,081 iii) Others 29,125,937 12,944,217
111,906,456 88,052,911
112,394,041 88,662,882
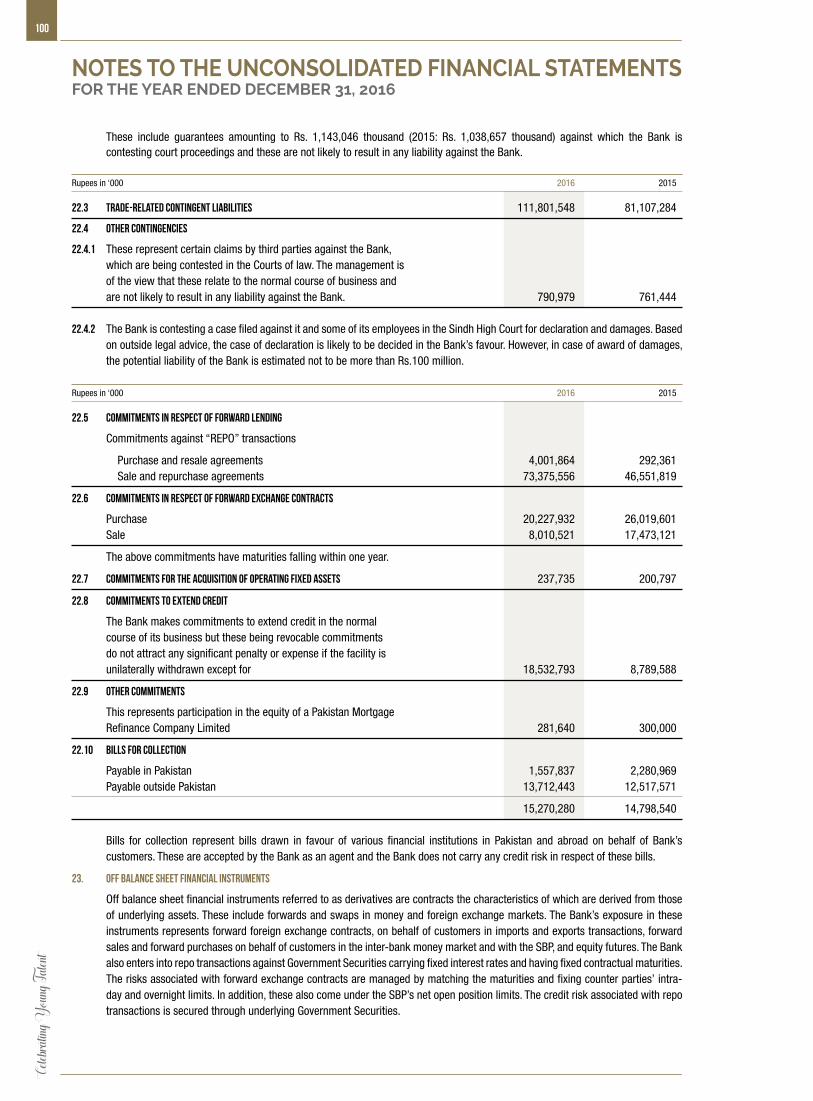
Celeb
rating
Youn
g Tale
nt100
These include guarantees amounting to Rs. 1,143,046 thousand (2015: Rs. 1,038,657 thousand) against which the Bank is contesting court proceedings and these are not likely to result in any liability against the Bank.
Rupees in ‘000 2016 2015
22.3 Trade-related contingent liabilities 111,801,548 81,107,284
22.4 Other contingencies
22.4.1 These represent certain claims by third parties against the Bank, which are being contested in the Courts of law. The management is of the view that these relate to the normal course of business and are not likely to result in any liability against the Bank. 790,979 761,444 22.4.2 The Bank is contesting a case filed against it and some of its employees in the Sindh High Court for declaration and damages. Based
on outside legal advice, the case of declaration is likely to be decided in the Bank’s favour. However, in case of award of damages, the potential liability of the Bank is estimated not to be more than Rs.100 million.
Rupees in ‘000 2016 2015
22.5 Commitments in respect of forward lending
Commitments against “REPO” transactions
Purchase and resale agreements 4,001,864 292,361 Sale and repurchase agreements 73,375,556 46,551,819
22.6 Commitments in respect of forward exchange contracts
Purchase 20,227,932 26,019,601 Sale 8,010,521 17,473,121
The above commitments have maturities falling within one year.
22.7 Commitments for the acquisition of operating fixed assets 237,735 200,797
22.8 Commitments to extend credit
The Bank makes commitments to extend credit in the normal course of its business but these being revocable commitments do not attract any significant penalty or expense if the facility is unilaterally withdrawn except for 18,532,793 8,789,588
22.9 Other commitments
This represents participation in the equity of a Pakistan Mortgage Refinance Company Limited 281,640 300,000
22.10 Bills for collection
Payable in Pakistan 1,557,837 2,280,969 Payable outside Pakistan 13,712,443 12,517,571
15,270,280 14,798,540
Bills for collection represent bills drawn in favour of various financial institutions in Pakistan and abroad on behalf of Bank’s customers. These are accepted by the Bank as an agent and the Bank does not carry any credit risk in respect of these bills.
23. OFF BALANCE SHEET FINANCIAL INSTRUMENTS
Off balance sheet financial instruments referred to as derivatives are contracts the characteristics of which are derived from those of underlying assets. These include forwards and swaps in money and foreign exchange markets. The Bank’s exposure in these instruments represents forward foreign exchange contracts, on behalf of customers in imports and exports transactions, forward sales and forward purchases on behalf of customers in the inter-bank money market and with the SBP, and equity futures. The Bank also enters into repo transactions against Government Securities carrying fixed interest rates and having fixed contractual maturities. The risks associated with forward exchange contracts are managed by matching the maturities and fixing counter parties’ intra-day and overnight limits. In addition, these also come under the SBP’s net open position limits. The credit risk associated with repo transactions is secured through underlying Government Securities.
NOTES TO THE UNCONSOLIDATED FINANCIAL STATEMENTSFOR THE YEAR ENDED DECEMBER 31, 2016

An
nu
al R
epo
rt o
f Ask
ari B
ank
Lim
ited
for 2
016
101
24. DERIVATIVE INSTRUMENTS
The Bank at present does not offer structured derivative products such as Interest Rate Swaps, Forward Rate Swap, Forward Rate Agreements or Foreign Exchange Options. The Bank’s Treasury and Investments Banking Group buy and sell derivative instruments such as forward exchange contracts and equity futures, however, does not deal in market making and foreign exchange hedging.
24.1 Forward exchange contracts
Forward Exchange Contract (FEC) is a product which is offered to the obligor who transacts internationally. The traders use this product to hedge themselves from unfavourable movements in a foreign currency, however, by agreeing to fix the exchange rate, they do not benefit from favourable movements in that currency.
FEC is a contract between the obligor and the Bank in which both agree to exchange an amount of one currency for another currency at an agreed forward exchange rate for settlement over more than two business days after the FEC is entered into (the day on which settlement occurs is called the value date). FEC is entered with those obligors whose credit worthiness has already been assessed, and they have underlined trade transactions.
If the relevant exchange rate moves un-favourably, the Bank will loose money, and obligor will benefit from that movement because the Bank must exchange currencies at the FEC rate. In order to mitigate this risk of adverse exchange rate movement, the Bank manages its exposure by taking forward position in inter-bank foreign exchange.
24.2 Equity futures
An equity futures contract is a standardized contract, traded on a futures counter of the stock exchange, to buy or sell a certain underlying scrip at a certain date in the future, at a specified price.
The Bank uses equity futures as a hedging instrument to hedge its equity portfolio against equity price risk. Only selected shares are allowed to be traded on futures exchange. Equity futures give flexibility to the Bank either to take delivery on the future settlement date or to settle it by adjusting the notional value of the contract based on the current market rates. Maximum exposure limit to the equity futures is 10% of Tier I Capital of the Bank, based on prevailing SBP regulations.
The accounting policies used to recognize and disclose derivatives are given in note 5.18.
Rupees in ‘000 Note 2016 2015
25. MARK-UP / RETURN / INTEREST EARNED
On loans and advances to: i) Customers 25.1 15,091,639 15,755,271 ii) Financial institutions 219,989 118,835
15,311,628 15,874,106 On investments in: i) Available for sale securities 19,370,206 19,709,523 ii) Held to maturity securities 473,055 283,433
19,843,261 19,992,956 On deposits with financial institutions 179,208 326,966 On securities purchased under resale agreements 111,889 245,231 On lendings to financial institutions 66,323 152,834
35,512,309 36,592,093
25.1 This includes an amount of Rs. 406,579 thousand (2015: Rs. 390,212 thousand) on account of income received from related parties.
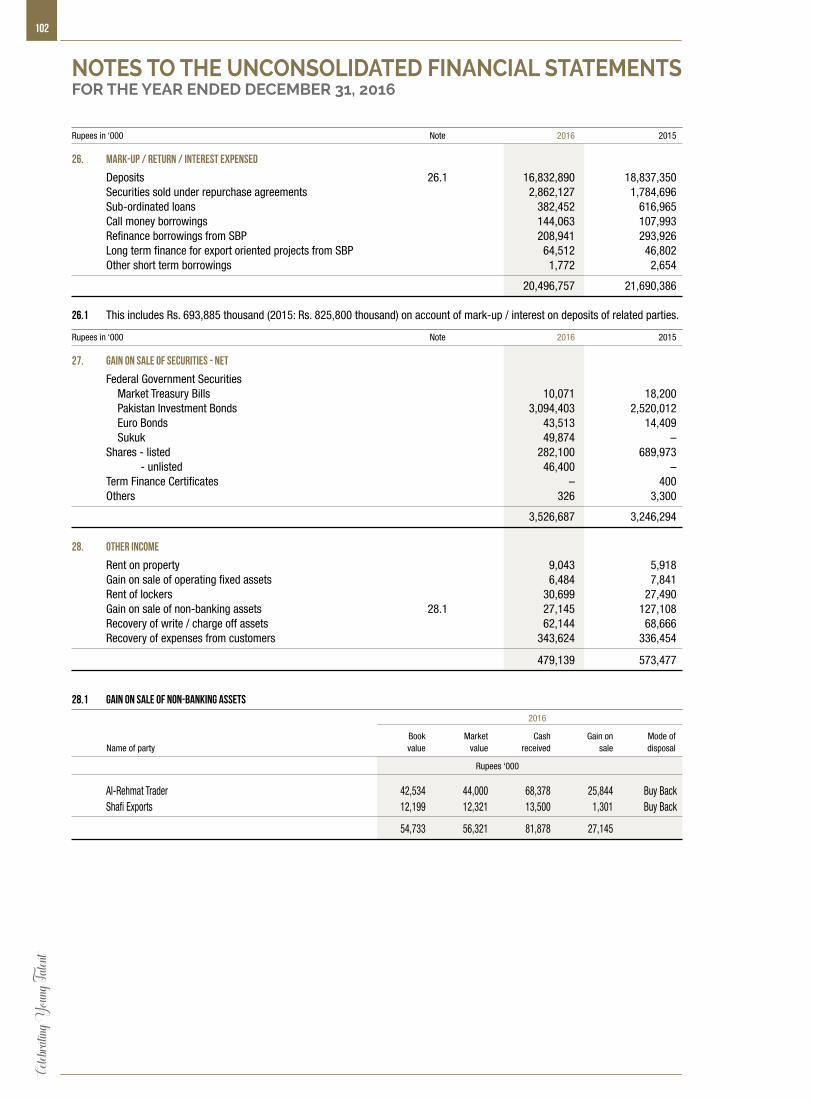
Celeb
rating
Youn
g Tale
nt102
Rupees in ‘000 Note 2016 2015
26. MARK-UP / RETURN / INTEREST EXPENSED
Deposits 26.1 16,832,890 18,837,350 Securities sold under repurchase agreements 2,862,127 1,784,696 Sub-ordinated loans 382,452 616,965 Call money borrowings 144,063 107,993 Refinance borrowings from SBP 208,941 293,926 Long term finance for export oriented projects from SBP 64,512 46,802 Other short term borrowings 1,772 2,654
20,496,757 21,690,386 26.1 This includes Rs. 693,885 thousand (2015: Rs. 825,800 thousand) on account of mark-up / interest on deposits of related parties.
Rupees in ‘000 Note 2016 2015
27. GAIN ON SALE OF SECURITIES - NET
Federal Government Securities Market Treasury Bills 10,071 18,200 Pakistan Investment Bonds 3,094,403 2,520,012 Euro Bonds 43,513 14,409 Sukuk 49,874 – Shares - listed 282,100 689,973 - unlisted 46,400 – Term Finance Certificates – 400 Others 326 3,300
3,526,687 3,246,294
28. OTHER INCOME
Rent on property 9,043 5,918 Gain on sale of operating fixed assets 6,484 7,841 Rent of lockers 30,699 27,490 Gain on sale of non-banking assets 28.1 27,145 127,108 Recovery of write / charge off assets 62,144 68,666 Recovery of expenses from customers 343,624 336,454
479,139 573,477
28.1 Gain on sale of non-banking assets
2016
Book Market Cash Gain on Mode of Name of party value value received sale disposal
Rupees ‘000
Al-Rehmat Trader 42,534 44,000 68,378 25,844 Buy Back Shafi Exports 12,199 12,321 13,500 1,301 Buy Back
54,733 56,321 81,878 27,145
NOTES TO THE UNCONSOLIDATED FINANCIAL STATEMENTSFOR THE YEAR ENDED DECEMBER 31, 2016
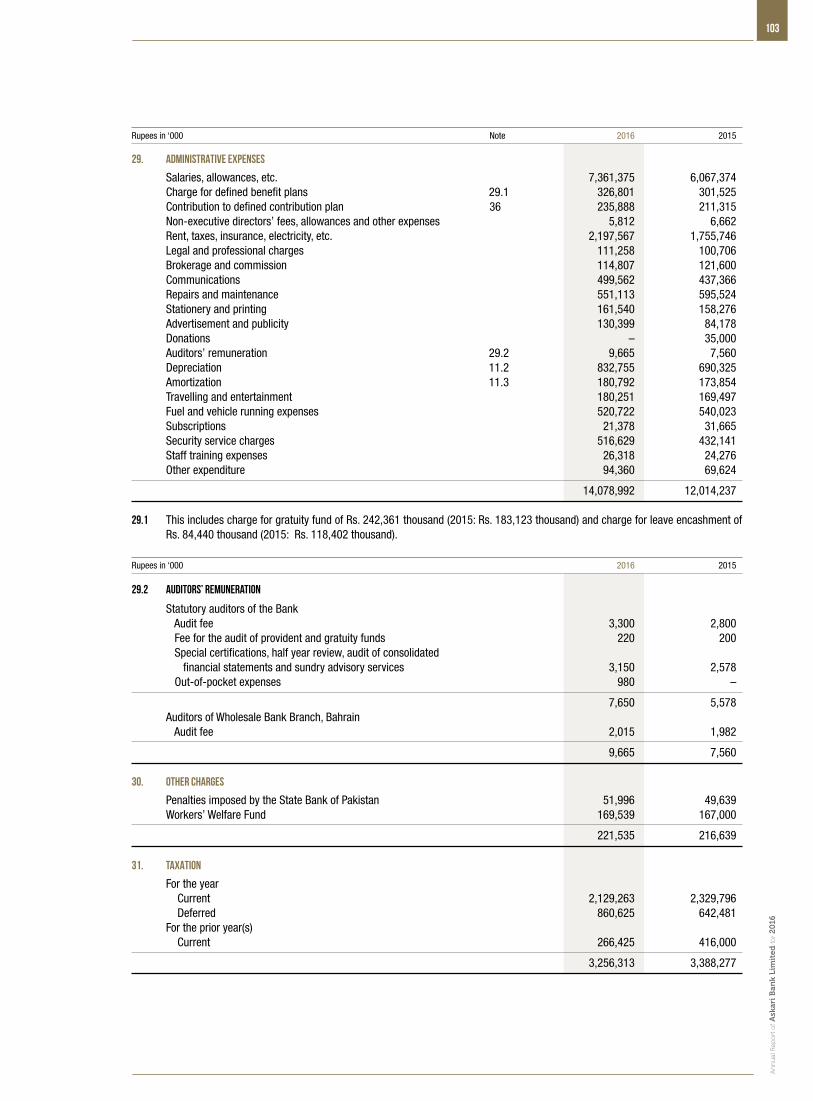
An
nu
al R
epo
rt o
f Ask
ari B
ank
Lim
ited
for 2
016
103
Rupees in ‘000 Note 2016 2015
29. ADMINISTRATIVE EXPENSES
Salaries, allowances, etc. 7,361,375 6,067,374 Charge for defined benefit plans 29.1 326,801 301,525 Contribution to defined contribution plan 36 235,888 211,315 Non-executive directors’ fees, allowances and other expenses 5,812 6,662 Rent, taxes, insurance, electricity, etc. 2,197,567 1,755,746 Legal and professional charges 111,258 100,706 Brokerage and commission 114,807 121,600 Communications 499,562 437,366 Repairs and maintenance 551,113 595,524 Stationery and printing 161,540 158,276 Advertisement and publicity 130,399 84,178 Donations – 35,000 Auditors’ remuneration 29.2 9,665 7,560 Depreciation 11.2 832,755 690,325 Amortization 11.3 180,792 173,854 Travelling and entertainment 180,251 169,497 Fuel and vehicle running expenses 520,722 540,023 Subscriptions 21,378 31,665 Security service charges 516,629 432,141 Staff training expenses 26,318 24,276 Other expenditure 94,360 69,624
14,078,992 12,014,237 29.1 This includes charge for gratuity fund of Rs. 242,361 thousand (2015: Rs. 183,123 thousand) and charge for leave encashment of
Rs. 84,440 thousand (2015: Rs. 118,402 thousand). Rupees in ‘000 2016 2015
29.2 Auditors’ remuneration
Statutory auditors of the Bank Audit fee 3,300 2,800 Fee for the audit of provident and gratuity funds 220 200 Special certifications, half year review, audit of consolidated financial statements and sundry advisory services 3,150 2,578 Out-of-pocket expenses 980 –
7,650 5,578 Auditors of Wholesale Bank Branch, Bahrain Audit fee 2,015 1,982
9,665 7,560
30. OTHER CHARGES
Penalties imposed by the State Bank of Pakistan 51,996 49,639 Workers’ Welfare Fund 169,539 167,000
221,535 216,639 31. TAXATION
For the year Current 2,129,263 2,329,796 Deferred 860,625 642,481 For the prior year(s) Current 266,425 416,000
3,256,313 3,388,277
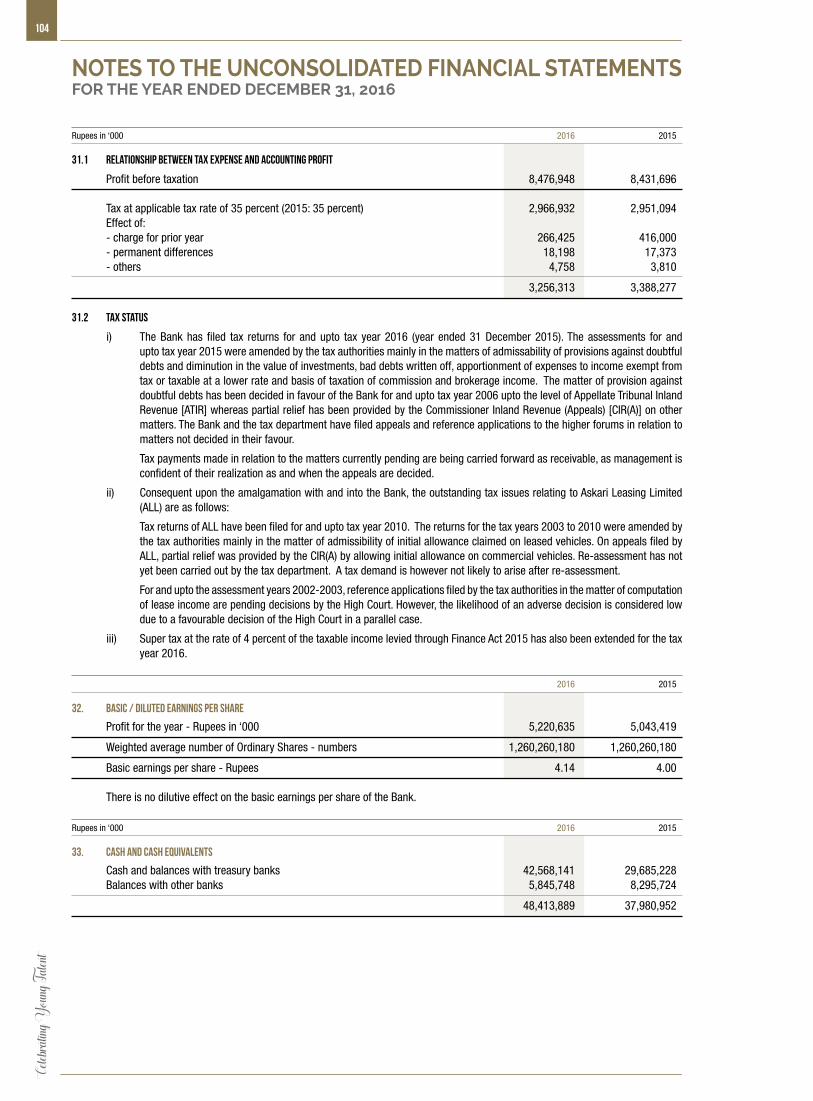
Celeb
rating
Youn
g Tale
nt104
Rupees in ‘000 2016 2015
31.1 Relationship between tax expense and accounting profit
Profit before taxation 8,476,948 8,431,696 Tax at applicable tax rate of 35 percent (2015: 35 percent) 2,966,932 2,951,094 Effect of: - charge for prior year 266,425 416,000 - permanent differences 18,198 17,373 - others 4,758 3,810
3,256,313 3,388,277 31.2 Tax status
i) The Bank has filed tax returns for and upto tax year 2016 (year ended 31 December 2015). The assessments for and upto tax year 2015 were amended by the tax authorities mainly in the matters of admissability of provisions against doubtful debts and diminution in the value of investments, bad debts written off, apportionment of expenses to income exempt from tax or taxable at a lower rate and basis of taxation of commission and brokerage income. The matter of provision against doubtful debts has been decided in favour of the Bank for and upto tax year 2006 upto the level of Appellate Tribunal Inland Revenue [ATIR] whereas partial relief has been provided by the Commissioner Inland Revenue (Appeals) [CIR(A)] on other matters. The Bank and the tax department have filed appeals and reference applications to the higher forums in relation to matters not decided in their favour.
Tax payments made in relation to the matters currently pending are being carried forward as receivable, as management is confident of their realization as and when the appeals are decided.
ii) Consequent upon the amalgamation with and into the Bank, the outstanding tax issues relating to Askari Leasing Limited (ALL) are as follows:
Tax returns of ALL have been filed for and upto tax year 2010. The returns for the tax years 2003 to 2010 were amended by the tax authorities mainly in the matter of admissibility of initial allowance claimed on leased vehicles. On appeals filed by ALL, partial relief was provided by the CIR(A) by allowing initial allowance on commercial vehicles. Re-assessment has not yet been carried out by the tax department. A tax demand is however not likely to arise after re-assessment.
For and upto the assessment years 2002-2003, reference applications filed by the tax authorities in the matter of computation of lease income are pending decisions by the High Court. However, the likelihood of an adverse decision is considered low due to a favourable decision of the High Court in a parallel case.
iii) Super tax at the rate of 4 percent of the taxable income levied through Finance Act 2015 has also been extended for the tax year 2016.
2016 2015
32. BASIC / DILUTED EARNINGS PER SHARE
Profit for the year - Rupees in ‘000 5,220,635 5,043,419
Weighted average number of Ordinary Shares - numbers 1,260,260,180 1,260,260,180
Basic earnings per share - Rupees 4.14 4.00 There is no dilutive effect on the basic earnings per share of the Bank. Rupees in ‘000 2016 2015
33. CASH AND CASH EQUIVALENTS
Cash and balances with treasury banks 42,568,141 29,685,228 Balances with other banks 5,845,748 8,295,724
48,413,889 37,980,952
NOTES TO THE UNCONSOLIDATED FINANCIAL STATEMENTSFOR THE YEAR ENDED DECEMBER 31, 2016
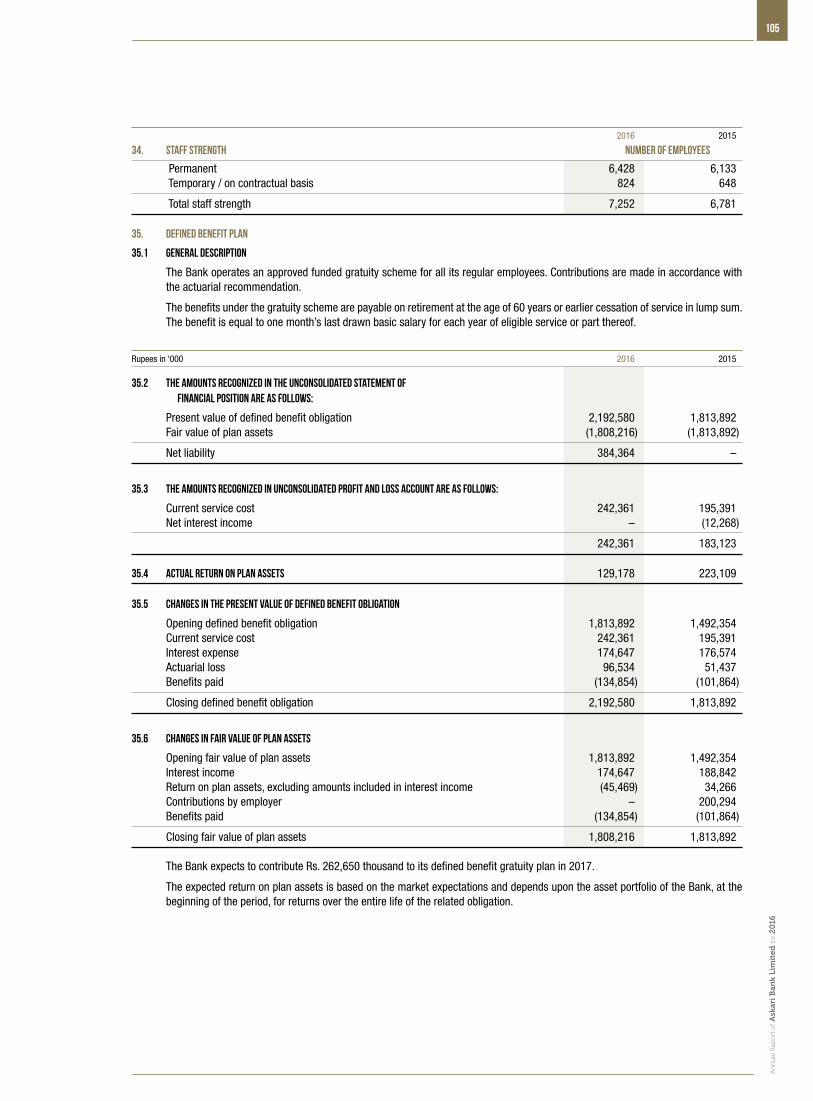
An
nu
al R
epo
rt o
f Ask
ari B
ank
Lim
ited
for 2
016
105
2016 2015
34. STAFF STRENGTH Number of employees
Permanent 6,428 6,133 Temporary / on contractual basis 824 648
Total staff strength 7,252 6,781
35. DEFINED BENEFIT PLAN
35.1 General description
The Bank operates an approved funded gratuity scheme for all its regular employees. Contributions are made in accordance with the actuarial recommendation.
The benefits under the gratuity scheme are payable on retirement at the age of 60 years or earlier cessation of service in lump sum. The benefit is equal to one month’s last drawn basic salary for each year of eligible service or part thereof.
Rupees in ‘000 2016 2015
35.2 The amounts recognized in the unconsolidated statement of financial position are as follows:
Present value of defined benefit obligation 2,192,580 1,813,892 Fair value of plan assets (1,808,216) (1,813,892)
Net liability 384,364 –
35.3 The amounts recognized in unconsolidated profit and loss account are as follows:
Current service cost 242,361 195,391 Net interest income – (12,268)
242,361 183,123 35.4 Actual return on plan assets 129,178 223,109
35.5 Changes in the present value of defined benefit obligation
Opening defined benefit obligation 1,813,892 1,492,354 Current service cost 242,361 195,391 Interest expense 174,647 176,574 Actuarial loss 96,534 51,437 Benefits paid (134,854) (101,864)
Closing defined benefit obligation 2,192,580 1,813,892
35.6 Changes in fair value of plan assets
Opening fair value of plan assets 1,813,892 1,492,354 Interest income 174,647 188,842 Return on plan assets, excluding amounts included in interest income (45,469) 34,266 Contributions by employer – 200,294 Benefits paid (134,854) (101,864)
Closing fair value of plan assets 1,808,216 1,813,892 The Bank expects to contribute Rs. 262,650 thousand to its defined benefit gratuity plan in 2017.
The expected return on plan assets is based on the market expectations and depends upon the asset portfolio of the Bank, at the beginning of the period, for returns over the entire life of the related obligation.
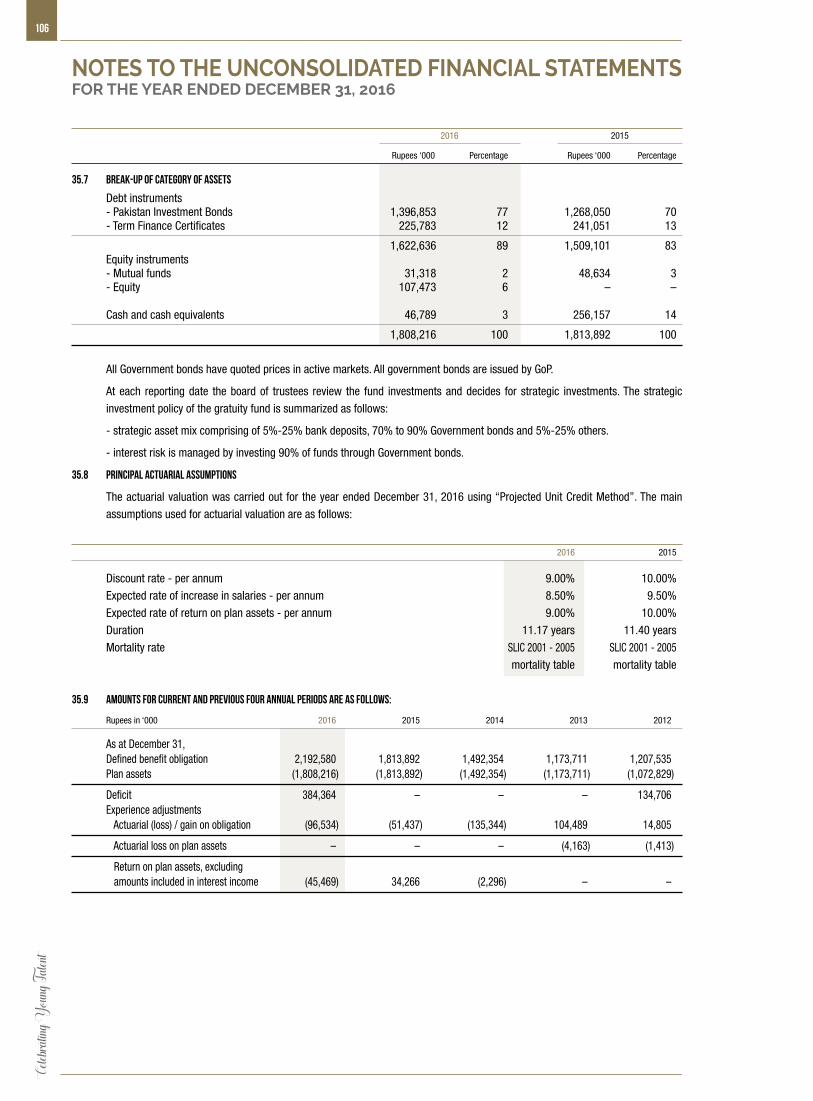
Celeb
rating
Youn
g Tale
nt106
2016 2015
Rupees ‘000 Percentage Rupees ‘000 Percentage
35.7 Break-up of category of assets
Debt instruments - Pakistan Investment Bonds 1,396,853 77 1,268,050 70 - Term Finance Certificates 225,783 12 241,051 13
1,622,636 89 1,509,101 83 Equity instruments - Mutual funds 31,318 2 48,634 3 - Equity 107,473 6 – –
Cash and cash equivalents 46,789 3 256,157 14
1,808,216 100 1,813,892 100
All Government bonds have quoted prices in active markets. All government bonds are issued by GoP.
At each reporting date the board of trustees review the fund investments and decides for strategic investments. The strategic
investment policy of the gratuity fund is summarized as follows:
- strategic asset mix comprising of 5%-25% bank deposits, 70% to 90% Government bonds and 5%-25% others.
- interest risk is managed by investing 90% of funds through Government bonds.
35.8 Principal actuarial assumptions
The actuarial valuation was carried out for the year ended December 31, 2016 using “Projected Unit Credit Method”. The main
assumptions used for actuarial valuation are as follows:
2016 2015
Discount rate - per annum 9.00% 10.00%
Expected rate of increase in salaries - per annum 8.50% 9.50%
Expected rate of return on plan assets - per annum 9.00% 10.00%
Duration 11.17 years 11.40 years
Mortality rate SLIC 2001 - 2005 SLIC 2001 - 2005
mortality table mortality table
35.9 Amounts for current and previous four annual periods are as follows:
Rupees in ‘000 2016 2015 2014 2013 2012
As at December 31, Defined benefit obligation 2,192,580 1,813,892 1,492,354 1,173,711 1,207,535 Plan assets (1,808,216) (1,813,892) (1,492,354) (1,173,711) (1,072,829)
Deficit 384,364 – – – 134,706 Experience adjustments Actuarial (loss) / gain on obligation (96,534) (51,437) (135,344) 104,489 14,805
Actuarial loss on plan assets – – – (4,163) (1,413)
Return on plan assets, excluding amounts included in interest income (45,469) 34,266 (2,296) – –
NOTES TO THE UNCONSOLIDATED FINANCIAL STATEMENTSFOR THE YEAR ENDED DECEMBER 31, 2016

An
nu
al R
epo
rt o
f Ask
ari B
ank
Lim
ited
for 2
016
107
35.10 Sensitivity analysis
Sensitivity analysis is performed by changing only one assumption at a time while keeping the other assumptions constant. Sensitivity analysis of key assumptions is given below:
Impact on Defined Benefit Obligation
Change in Increase in Decrease in Assumptions assumption assumption assumption
Rupees in ‘000
Discount rate 1.00% (225,081) 265,493 Salary increase 1.00% 264,176 (227,971) Mortality rate change 1 year (465) 463 36. DEFINED CONTRIBUTION PLAN
The Bank operates a recognized provident fund scheme for all its regular employees for which equal monthly contributions are made both by the Bank and by the employees to the fund at the rate of 8.33% of basic salary of the employee. Payments are made to the employees as specified in the rules of the fund. The total assets of the fund as at December 31, 2015 were Rs. 3,270,502 thousand (December 31, 2014: Rs. 2,776,823 thousand) as per latest available audited financial statements of the fund.
36.1 The details of size and investment of the provident fund is as follows:
2016 2015
Rupees in ‘000 Un-audited Audited
Size of the Fund 3,767,730 3,270,502 Cost of investments 3,544,211 3,094,751 Fair value of investments 3,805,396 3,298,414 Percentage of investments 94.07% 94.63% 36.2 Breakup of provident fund investments
2016 2015
Rupees in ‘000 Percentage Rupees in ‘000 Percentage
Pakistan Investment Bonds 2,529,242 71.36 2,484,018 80.26 Government Sukuks – – 99,275 3.21 Mutual Funds 765,338 21.60 321,396 10.39 Shares 249,631 7.04 190,062 6.14
3,544,211 100.00 3,094,751 100.00 All the investments out of provident fund trust have been made in accordance with the provisions of Section 227 of the Companies Ordinance, 1984
and the rules formulated for this purpose.
37. COMPENSATED ABSENCES
37.1 General description
The Bank grants compensated absences to all its regular employees as per effective Service Rules. Provisions are recorded in accordance with the actuarial recommendation.
Under this unfunded scheme, regular employees are entitled to 30 days privilege leave for each completed year of service. Unutilized privilege leaves are accumulated upto a maximum of 120 days out of which 60 days are encashable at the time of separation from service on the basis of last drawn gross salary.
37.2 Principal actuarial assumptions
The actuarial valuation was carried out for the year ended December 31, 2016 using “Projected Unit Credit Method”. Present value of obligation as at December 31, 2016 was Rs. 314,797 thousand (2015: Rs. 280,352 thousand). Expense for the year of Rs. 84,440 thousand (2015: Rs 118,402 thousand) has been included in administrative expenses. The main assumptions used for actuarial valuation are as follows:
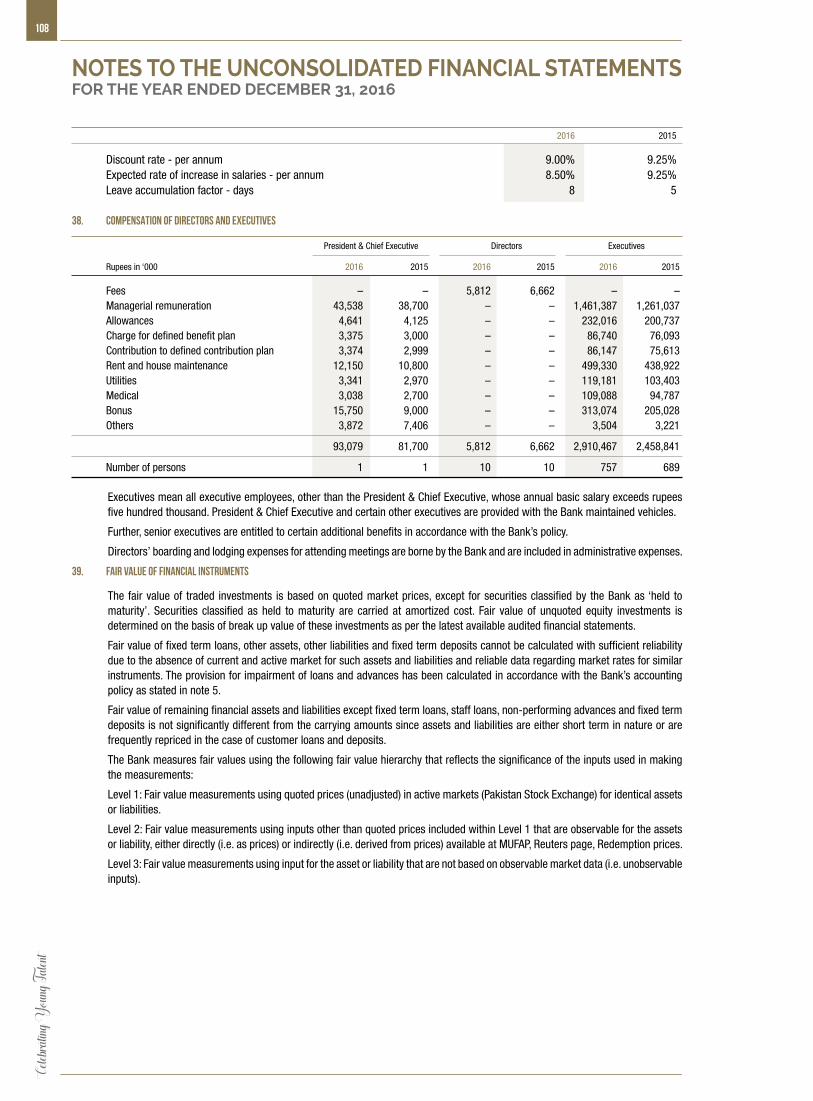
Celeb
rating
Youn
g Tale
nt108
2016 2015
Discount rate - per annum 9.00% 9.25% Expected rate of increase in salaries - per annum 8.50% 9.25% Leave accumulation factor - days 8 5
38. COMPENSATION OF DIRECTORS AND EXECUTIVES
President & Chief Executive Directors Executives
Rupees in ‘000 2016 2015 2016 2015 2016 2015
Fees – – 5,812 6,662 – – Managerial remuneration 43,538 38,700 – – 1,461,387 1,261,037 Allowances 4,641 4,125 – – 232,016 200,737 Charge for defined benefit plan 3,375 3,000 – – 86,740 76,093 Contribution to defined contribution plan 3,374 2,999 – – 86,147 75,613 Rent and house maintenance 12,150 10,800 – – 499,330 438,922 Utilities 3,341 2,970 – – 119,181 103,403 Medical 3,038 2,700 – – 109,088 94,787 Bonus 15,750 9,000 – – 313,074 205,028 Others 3,872 7,406 – – 3,504 3,221
93,079 81,700 5,812 6,662 2,910,467 2,458,841
Number of persons 1 1 10 10 757 689
Executives mean all executive employees, other than the President & Chief Executive, whose annual basic salary exceeds rupees five hundred thousand. President & Chief Executive and certain other executives are provided with the Bank maintained vehicles.
Further, senior executives are entitled to certain additional benefits in accordance with the Bank’s policy.
Directors’ boarding and lodging expenses for attending meetings are borne by the Bank and are included in administrative expenses.
39. FAIR VALUE OF FINANCIAL INSTRUMENTS
The fair value of traded investments is based on quoted market prices, except for securities classified by the Bank as ‘held to maturity’. Securities classified as held to maturity are carried at amortized cost. Fair value of unquoted equity investments is determined on the basis of break up value of these investments as per the latest available audited financial statements.
Fair value of fixed term loans, other assets, other liabilities and fixed term deposits cannot be calculated with sufficient reliability due to the absence of current and active market for such assets and liabilities and reliable data regarding market rates for similar instruments. The provision for impairment of loans and advances has been calculated in accordance with the Bank’s accounting policy as stated in note 5.
Fair value of remaining financial assets and liabilities except fixed term loans, staff loans, non-performing advances and fixed term deposits is not significantly different from the carrying amounts since assets and liabilities are either short term in nature or are frequently repriced in the case of customer loans and deposits.
The Bank measures fair values using the following fair value hierarchy that reflects the significance of the inputs used in making the measurements:
Level 1: Fair value measurements using quoted prices (unadjusted) in active markets (Pakistan Stock Exchange) for identical assets or liabilities.
Level 2: Fair value measurements using inputs other than quoted prices included within Level 1 that are observable for the assets or liability, either directly (i.e. as prices) or indirectly (i.e. derived from prices) available at MUFAP, Reuters page, Redemption prices.
Level 3: Fair value measurements using input for the asset or liability that are not based on observable market data (i.e. unobservable inputs).
NOTES TO THE UNCONSOLIDATED FINANCIAL STATEMENTSFOR THE YEAR ENDED DECEMBER 31, 2016
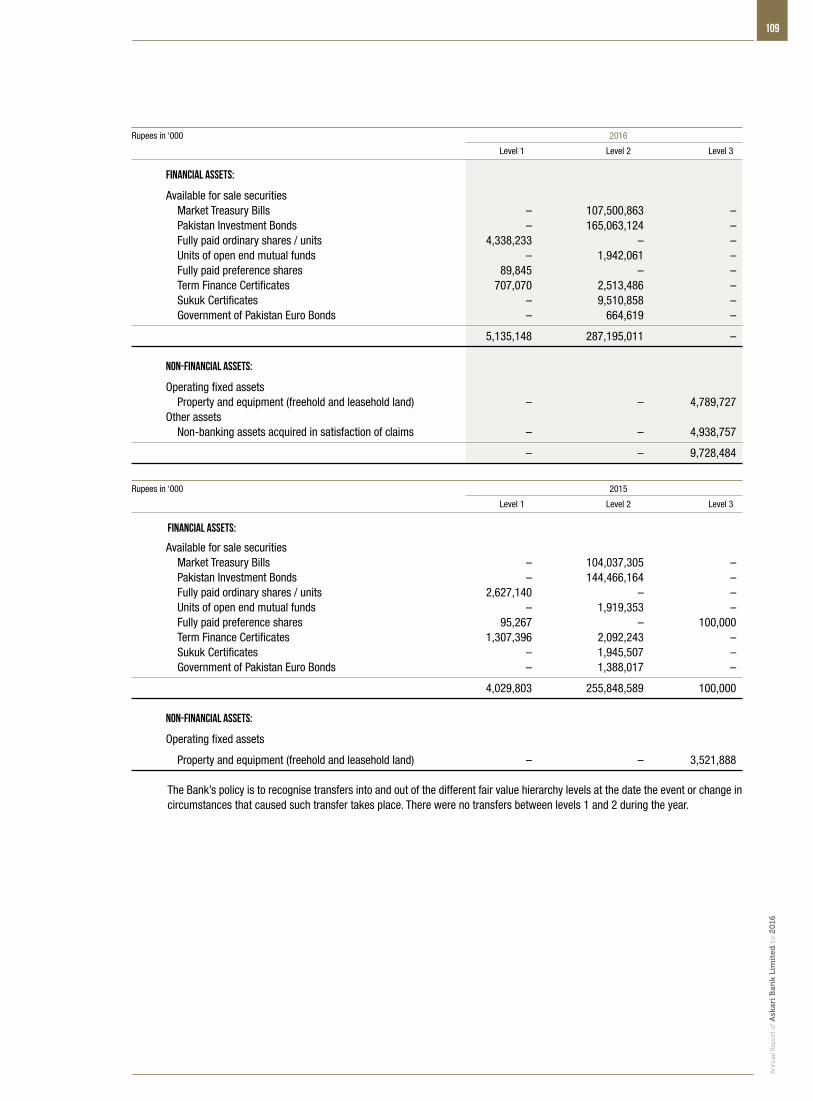
An
nu
al R
epo
rt o
f Ask
ari B
ank
Lim
ited
for 2
016
109
Rupees in ‘000 2016
Level 1 Level 2 Level 3
Financial assets:
Available for sale securities Market Treasury Bills – 107,500,863 – Pakistan Investment Bonds – 165,063,124 – Fully paid ordinary shares / units 4,338,233 – – Units of open end mutual funds – 1,942,061 – Fully paid preference shares 89,845 – – Term Finance Certificates 707,070 2,513,486 – Sukuk Certificates – 9,510,858 – Government of Pakistan Euro Bonds – 664,619 –
5,135,148 287,195,011 – Non-financial assets:
Operating fixed assets Property and equipment (freehold and leasehold land) – – 4,789,727 Other assets Non-banking assets acquired in satisfaction of claims – – 4,938,757
– – 9,728,484
Rupees in ‘000 2015
Level 1 Level 2 Level 3
Financial assets:
Available for sale securities Market Treasury Bills – 104,037,305 – Pakistan Investment Bonds – 144,466,164 – Fully paid ordinary shares / units 2,627,140 – – Units of open end mutual funds – 1,919,353 – Fully paid preference shares 95,267 – 100,000 Term Finance Certificates 1,307,396 2,092,243 – Sukuk Certificates – 1,945,507 – Government of Pakistan Euro Bonds – 1,388,017 –
4,029,803 255,848,589 100,000 Non-financial assets:
Operating fixed assets
Property and equipment (freehold and leasehold land) – – 3,521,888 The Bank’s policy is to recognise transfers into and out of the different fair value hierarchy levels at the date the event or change in
circumstances that caused such transfer takes place. There were no transfers between levels 1 and 2 during the year.
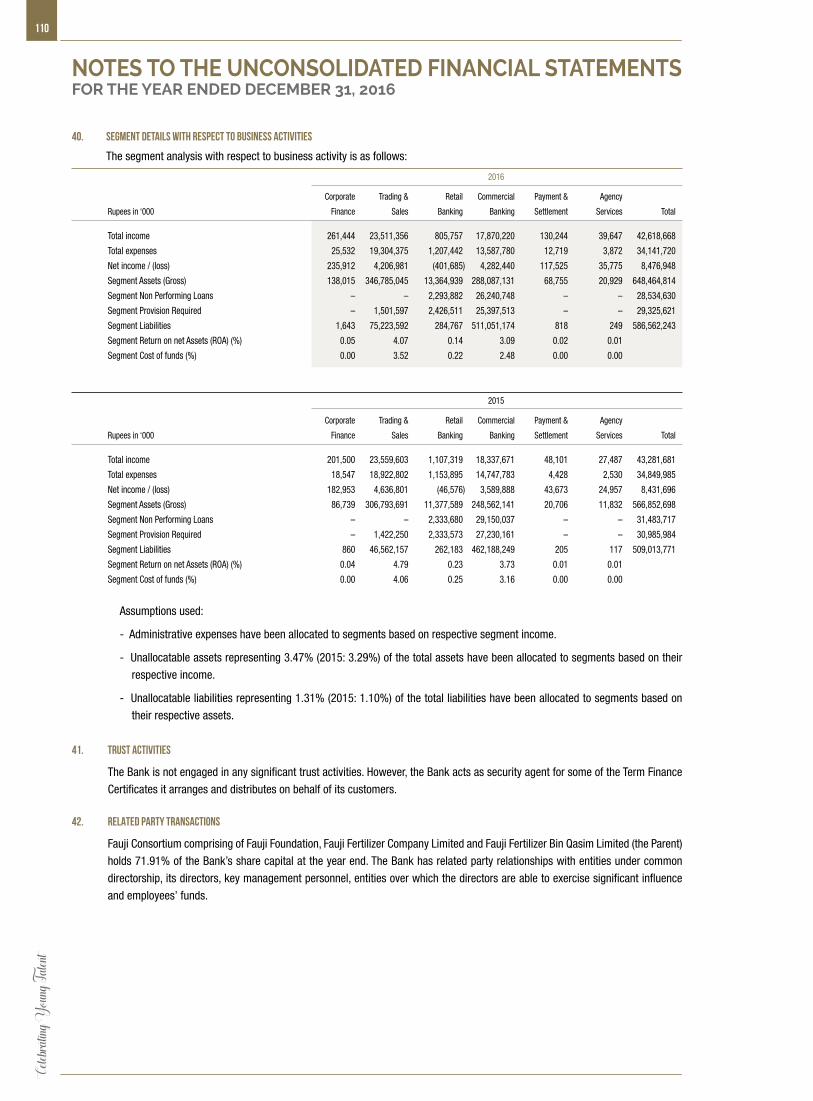
Celeb
rating
Youn
g Tale
nt110
40. SEGMENT DETAILS WITH RESPECT TO BUSINESS ACTIVITIES
The segment analysis with respect to business activity is as follows:
2016
Corporate Trading & Retail Commercial Payment & Agency
Rupees in ‘000 Finance Sales Banking Banking Settlement Services Total
Total income 261,444 23,511,356 805,757 17,870,220 130,244 39,647 42,618,668
Total expenses 25,532 19,304,375 1,207,442 13,587,780 12,719 3,872 34,141,720
Net income / (loss) 235,912 4,206,981 (401,685) 4,282,440 117,525 35,775 8,476,948
Segment Assets (Gross) 138,015 346,785,045 13,364,939 288,087,131 68,755 20,929 648,464,814
Segment Non Performing Loans – – 2,293,882 26,240,748 – – 28,534,630
Segment Provision Required – 1,501,597 2,426,511 25,397,513 – – 29,325,621
Segment Liabilities 1,643 75,223,592 284,767 511,051,174 818 249 586,562,243
Segment Return on net Assets (ROA) (%) 0.05 4.07 0.14 3.09 0.02 0.01
Segment Cost of funds (%) 0.00 3.52 0.22 2.48 0.00 0.00
2015
Corporate Trading & Retail Commercial Payment & Agency
Rupees in ‘000 Finance Sales Banking Banking Settlement Services Total
Total income 201,500 23,559,603 1,107,319 18,337,671 48,101 27,487 43,281,681
Total expenses 18,547 18,922,802 1,153,895 14,747,783 4,428 2,530 34,849,985
Net income / (loss) 182,953 4,636,801 (46,576) 3,589,888 43,673 24,957 8,431,696
Segment Assets (Gross) 86,739 306,793,691 11,377,589 248,562,141 20,706 11,832 566,852,698
Segment Non Performing Loans – – 2,333,680 29,150,037 – – 31,483,717
Segment Provision Required – 1,422,250 2,333,573 27,230,161 – – 30,985,984
Segment Liabilities 860 46,562,157 262,183 462,188,249 205 117 509,013,771
Segment Return on net Assets (ROA) (%) 0.04 4.79 0.23 3.73 0.01 0.01
Segment Cost of funds (%) 0.00 4.06 0.25 3.16 0.00 0.00
Assumptions used:
- Administrative expenses have been allocated to segments based on respective segment income.
- Unallocatable assets representing 3.47% (2015: 3.29%) of the total assets have been allocated to segments based on their
respective income.
- Unallocatable liabilities representing 1.31% (2015: 1.10%) of the total liabilities have been allocated to segments based on
their respective assets.
41. TRUST ACTIVITIES
The Bank is not engaged in any significant trust activities. However, the Bank acts as security agent for some of the Term Finance
Certificates it arranges and distributes on behalf of its customers.
42. RELATED PARTY TRANSACTIONS
Fauji Consortium comprising of Fauji Foundation, Fauji Fertilizer Company Limited and Fauji Fertilizer Bin Qasim Limited (the Parent)
holds 71.91% of the Bank’s share capital at the year end. The Bank has related party relationships with entities under common
directorship, its directors, key management personnel, entities over which the directors are able to exercise significant influence
and employees’ funds.
NOTES TO THE UNCONSOLIDATED FINANCIAL STATEMENTSFOR THE YEAR ENDED DECEMBER 31, 2016
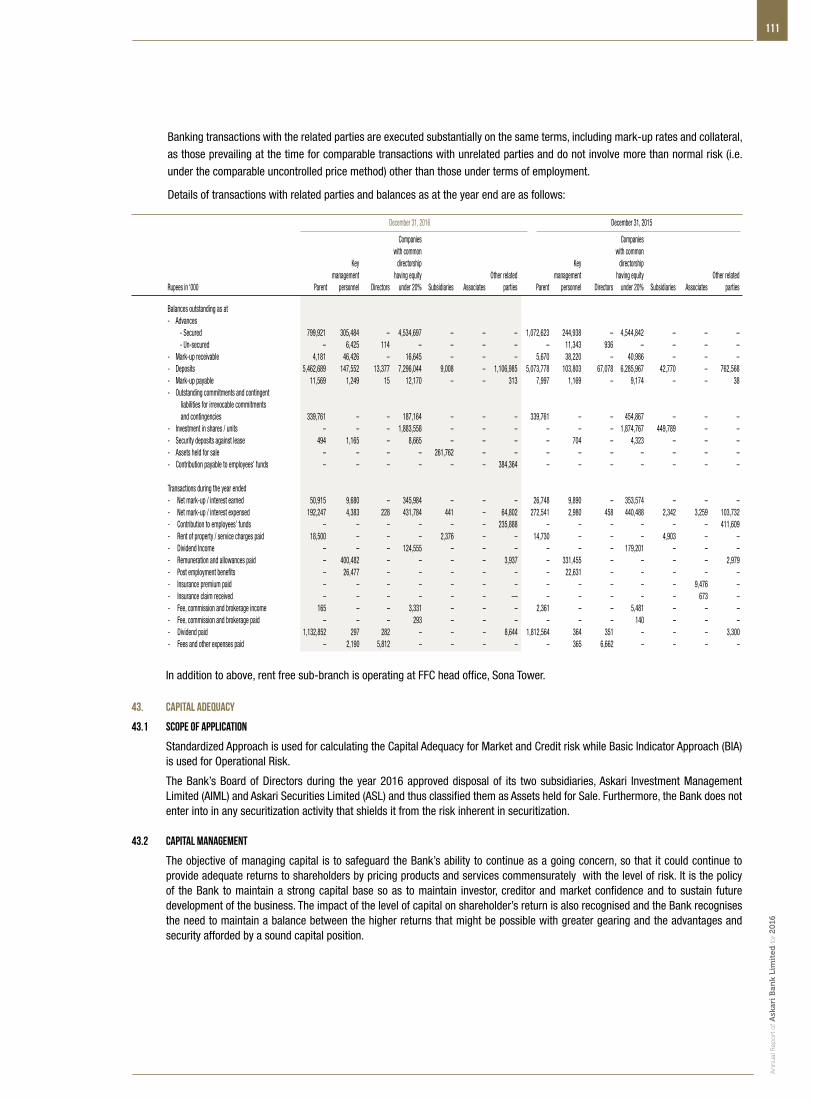
An
nu
al R
epo
rt o
f Ask
ari B
ank
Lim
ited
for 2
016
111
Banking transactions with the related parties are executed substantially on the same terms, including mark-up rates and collateral,
as those prevailing at the time for comparable transactions with unrelated parties and do not involve more than normal risk (i.e.
under the comparable uncontrolled price method) other than those under terms of employment.
Details of transactions with related parties and balances as at the year end are as follows:
December 31, 2016 December 31, 2015
Companies Companies with common with common Key directorship Key directorship management having equity Other related management having equity Other related Rupees in ‘000 Parent personnel Directors under 20% Subsidiaries Associates parties Parent personnel Directors under 20% Subsidiaries Associates parties
Balances outstanding as at - Advances - Secured 799,921 305,484 – 4,534,697 – – – 1,072,623 244,938 – 4,544,842 – – – - Un-secured – 6,425 114 – – – – – 11,343 936 – – – – - Mark-up receivable 4,181 46,426 – 16,645 – – – 5,670 38,220 – 40,986 – – – - Deposits 5,462,689 147,552 13,377 7,296,044 9,008 – 1,106,985 5,073,778 103,803 67,078 6,285,967 42,770 – 762,568 - Mark-up payable 11,569 1,249 15 12,170 – – 313 7,997 1,169 – 9,174 – – 38 - Outstanding commitments and contingent liabilities for irrevocable commitments and contingencies 339,761 – – 187,164 – – – 339,761 – – 454,867 – – – - Investment in shares / units – – – 1,883,558 – – – – – – 1,874,767 449,789 – – - Security deposits against lease 494 1,165 – 8,665 – – – – 704 – 4,323 – – – - Assets held for sale – – – – 261,762 – – – – – – – – – - Contribution payable to employees’ funds – – – – – – 384,364 – – – – – – – Transactions during the year ended - Net mark-up / interest earned 50,915 9,680 – 345,984 – – – 26,748 9,890 – 353,574 – – – - Net mark-up / interest expensed 192,247 4,383 228 431,784 441 – 64,802 272,541 2,980 458 440,488 2,342 3,259 103,732 - Contribution to employees’ funds – – – – – – 235,888 – – – – – – 411,609 - Rent of property / service charges paid 18,500 – – – 2,376 – – 14,730 – – – 4,903 – – - Dividend Income – – – 124,555 – – – – – – 179,201 – – – - Remuneration and allowances paid – 400,482 – – – – 3,937 – 331,455 – – – – 2,979 - Post employment benefits – 26,477 – – – – – – 22,631 – – – – – - Insurance premium paid – – – – – – – – – – – – 9,476 – - Insurance claim received – – – – – – –– – – – – – 673 – - Fee, commission and brokerage income 165 – – 3,331 – – – 2,361 – – 5,481 – – – - Fee, commission and brokerage paid – – – 293 – – – – – – 140 – – – - Dividend paid 1,132,852 297 282 – – – 8,644 1,812,564 364 351 – – – 3,300 - Fees and other expenses paid – 2,190 5,812 – – – – – 365 6,662 – – – –
In addition to above, rent free sub-branch is operating at FFC head office, Sona Tower.
43. CAPITAL ADEQUACY
43.1 Scope of Application
Standardized Approach is used for calculating the Capital Adequacy for Market and Credit risk while Basic Indicator Approach (BIA) is used for Operational Risk.
The Bank’s Board of Directors during the year 2016 approved disposal of its two subsidiaries, Askari Investment Management Limited (AIML) and Askari Securities Limited (ASL) and thus classified them as Assets held for Sale. Furthermore, the Bank does not enter into in any securitization activity that shields it from the risk inherent in securitization.
43.2 Capital Management
The objective of managing capital is to safeguard the Bank’s ability to continue as a going concern, so that it could continue to provide adequate returns to shareholders by pricing products and services commensurately with the level of risk. It is the policy of the Bank to maintain a strong capital base so as to maintain investor, creditor and market confidence and to sustain future development of the business. The impact of the level of capital on shareholder’s return is also recognised and the Bank recognises the need to maintain a balance between the higher returns that might be possible with greater gearing and the advantages and security afforded by a sound capital position.
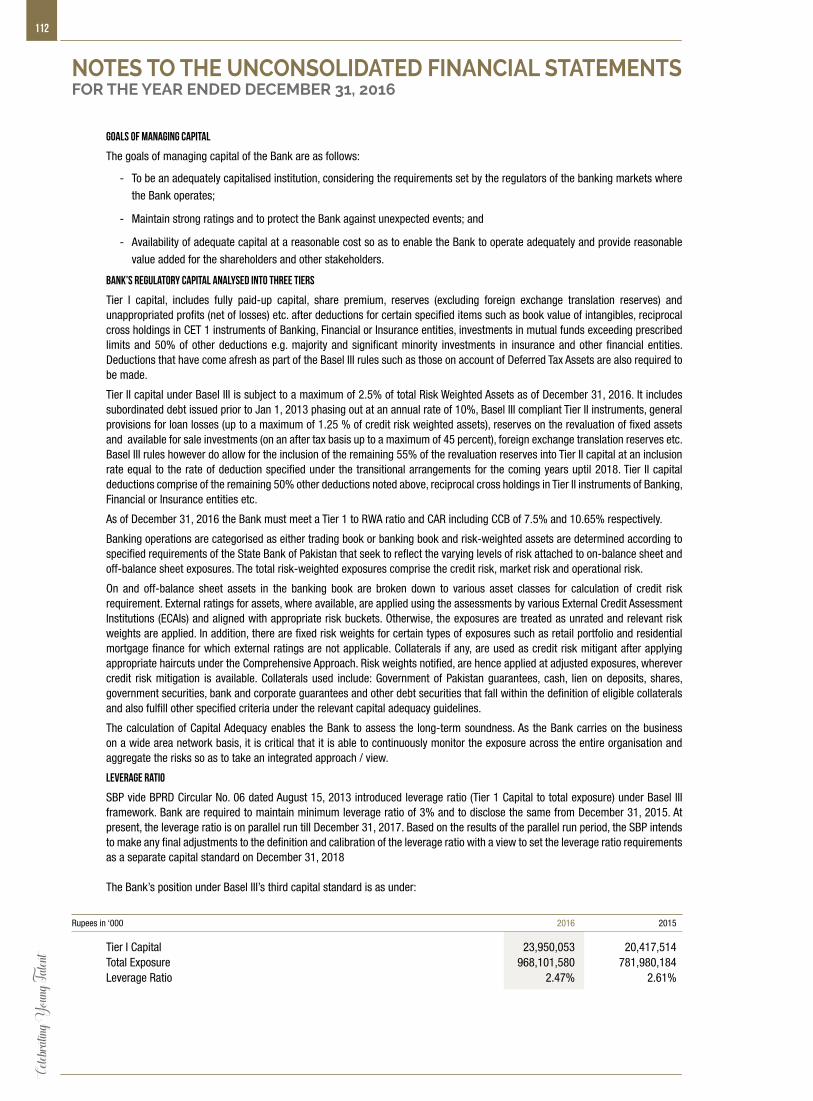
Celeb
rating
Youn
g Tale
nt112
Goals of managing capital
The goals of managing capital of the Bank are as follows:
- To be an adequately capitalised institution, considering the requirements set by the regulators of the banking markets where
the Bank operates;
- Maintain strong ratings and to protect the Bank against unexpected events; and
- Availability of adequate capital at a reasonable cost so as to enable the Bank to operate adequately and provide reasonable
value added for the shareholders and other stakeholders.
Bank’s regulatory capital analysed into three tiers
Tier I capital, includes fully paid-up capital, share premium, reserves (excluding foreign exchange translation reserves) and unappropriated profits (net of losses) etc. after deductions for certain specified items such as book value of intangibles, reciprocal cross holdings in CET 1 instruments of Banking, Financial or Insurance entities, investments in mutual funds exceeding prescribed limits and 50% of other deductions e.g. majority and significant minority investments in insurance and other financial entities. Deductions that have come afresh as part of the Basel III rules such as those on account of Deferred Tax Assets are also required to be made.
Tier II capital under Basel III is subject to a maximum of 2.5% of total Risk Weighted Assets as of December 31, 2016. It includes subordinated debt issued prior to Jan 1, 2013 phasing out at an annual rate of 10%, Basel III compliant Tier II instruments, general provisions for loan losses (up to a maximum of 1.25 % of credit risk weighted assets), reserves on the revaluation of fixed assets and available for sale investments (on an after tax basis up to a maximum of 45 percent), foreign exchange translation reserves etc. Basel III rules however do allow for the inclusion of the remaining 55% of the revaluation reserves into Tier II capital at an inclusion rate equal to the rate of deduction specified under the transitional arrangements for the coming years uptil 2018. Tier II capital deductions comprise of the remaining 50% other deductions noted above, reciprocal cross holdings in Tier II instruments of Banking, Financial or Insurance entities etc.
As of December 31, 2016 the Bank must meet a Tier 1 to RWA ratio and CAR including CCB of 7.5% and 10.65% respectively.
Banking operations are categorised as either trading book or banking book and risk-weighted assets are determined according to specified requirements of the State Bank of Pakistan that seek to reflect the varying levels of risk attached to on-balance sheet and off-balance sheet exposures. The total risk-weighted exposures comprise the credit risk, market risk and operational risk.
On and off-balance sheet assets in the banking book are broken down to various asset classes for calculation of credit risk requirement. External ratings for assets, where available, are applied using the assessments by various External Credit Assessment Institutions (ECAIs) and aligned with appropriate risk buckets. Otherwise, the exposures are treated as unrated and relevant risk weights are applied. In addition, there are fixed risk weights for certain types of exposures such as retail portfolio and residential mortgage finance for which external ratings are not applicable. Collaterals if any, are used as credit risk mitigant after applying appropriate haircuts under the Comprehensive Approach. Risk weights notified, are hence applied at adjusted exposures, wherever credit risk mitigation is available. Collaterals used include: Government of Pakistan guarantees, cash, lien on deposits, shares, government securities, bank and corporate guarantees and other debt securities that fall within the definition of eligible collaterals and also fulfill other specified criteria under the relevant capital adequacy guidelines.
The calculation of Capital Adequacy enables the Bank to assess the long-term soundness. As the Bank carries on the business on a wide area network basis, it is critical that it is able to continuously monitor the exposure across the entire organisation and aggregate the risks so as to take an integrated approach / view.
Leverage Ratio
SBP vide BPRD Circular No. 06 dated August 15, 2013 introduced leverage ratio (Tier 1 Capital to total exposure) under Basel III framework. Bank are required to maintain minimum leverage ratio of 3% and to disclose the same from December 31, 2015. At present, the leverage ratio is on parallel run till December 31, 2017. Based on the results of the parallel run period, the SBP intends to make any final adjustments to the definition and calibration of the leverage ratio with a view to set the leverage ratio requirements as a separate capital standard on December 31, 2018
The Bank’s position under Basel III’s third capital standard is as under:
Rupees in ‘000 2016 2015
Tier I Capital 23,950,053 20,417,514 Total Exposure 968,101,580 781,980,184 Leverage Ratio 2.47% 2.61%
NOTES TO THE UNCONSOLIDATED FINANCIAL STATEMENTSFOR THE YEAR ENDED DECEMBER 31, 2016

An
nu
al R
epo
rt o
f Ask
ari B
ank
Lim
ited
for 2
016
113
Rupees in ‘000 Note 2016 2015
43.3 Capital Adequacy Ratio (CAR)
Common Equity Tier 1 capital (CET1): Instruments and reserves Fully Paid-up Capital/ Capital deposited with SBP 12,602,602 12,602,602 Balance in Share Premium Account 234,669 234,669 Reserve for issue of Bonus Shares – – General/ Statutory Reserves 8,342,506 6,110,390 Gain/(Losses) on derivatives held as Cash Flow Hedge – – Unappropriated/unremitted profit 4,084,206 2,763,314 Minority Interests arising from CET1 capital instruments issued to third parties by consolidated bank subsidiaries (amount allowed in CET1 capital of the consolidation group) – –
CET 1 before Regulatory Adjustments 25,263,983 21,710,975 Total regulatory adjustments applied to CET1 43.3.1 1,313,930 1,293,461
Common Equity Tier 1 23,950,053 20,417,514 Additional Tier 1 (AT 1) Capital Qualifying Additional Tier-1 instruments plus any related share premium of which: Classified as equity – – of which: Classified as liabilities – – Additional Tier-1 capital instruments issued by consolidated subsidiaries and held by third parties (amount allowed in group AT 1) of which: instrument issued by subsidiaries subject to phase out – –
AT1 before regulatory adjustments – –
Total regulatory adjustment applied to AT1 capital 43.3.2 – – Additional Tier 1 capital after regulatory adjustments – –
Additional Tier 1 capital recognized for capital adequacy – –
Tier 1 Capital (CET1 + admissible AT1) 23,950,053 20,417,514 Tier 2 Capital Qualifying Tier 2 capital instruments under Basel III plus any related share premium 3,992,000 3,993,600 Tier 2 capital instruments subject to phaseout arrangement issued under pre-Basel III rules 418,800 628,320 Tier 2 capital instruments issued to third parties by consolidated subsidiaries (amount allowed in group tier 2) – – of which: instruments issued by subsidiaries subject to phase out – – General provisions or general reserves for loan losses-up to maximum of 1.25% of Credit Risk Weighted Assets 605,543 433,213 Revaluation Reserves of which: Revaluation reserves on Property 2,209,327 1,048,303 of which: Unrealized Gains / Losses on AFS 2,159,919 2,329,260
4,369,246 3,377,563 Foreign Exchange Translation Reserves 93,511 100,829 Undisclosed / Other Reserves (if any) – –
T2 before regulatory adjustments 9,479,100 8,533,525 Total regulatory adjustment applied to T2 capital 43.3.3 380,247 178,269
Tier 2 capital (T2) after regulatory adjustments 9,098,853 8,355,256
Tier 2 capital recognized for capital adequacy 9,098,853 8,268,453 Portion of Additional Tier 1 capital recognized in Tier 2 capital – –
Total Tier 2 capital admissible for capital adequacy 9,098,853 8,268,453 TOTAL CAPITAL (T1 + admissible T2) 33,048,906 28,685,967
Total Risk Weighted Assets (RWA) 43.6 264,431,082 229,290,400
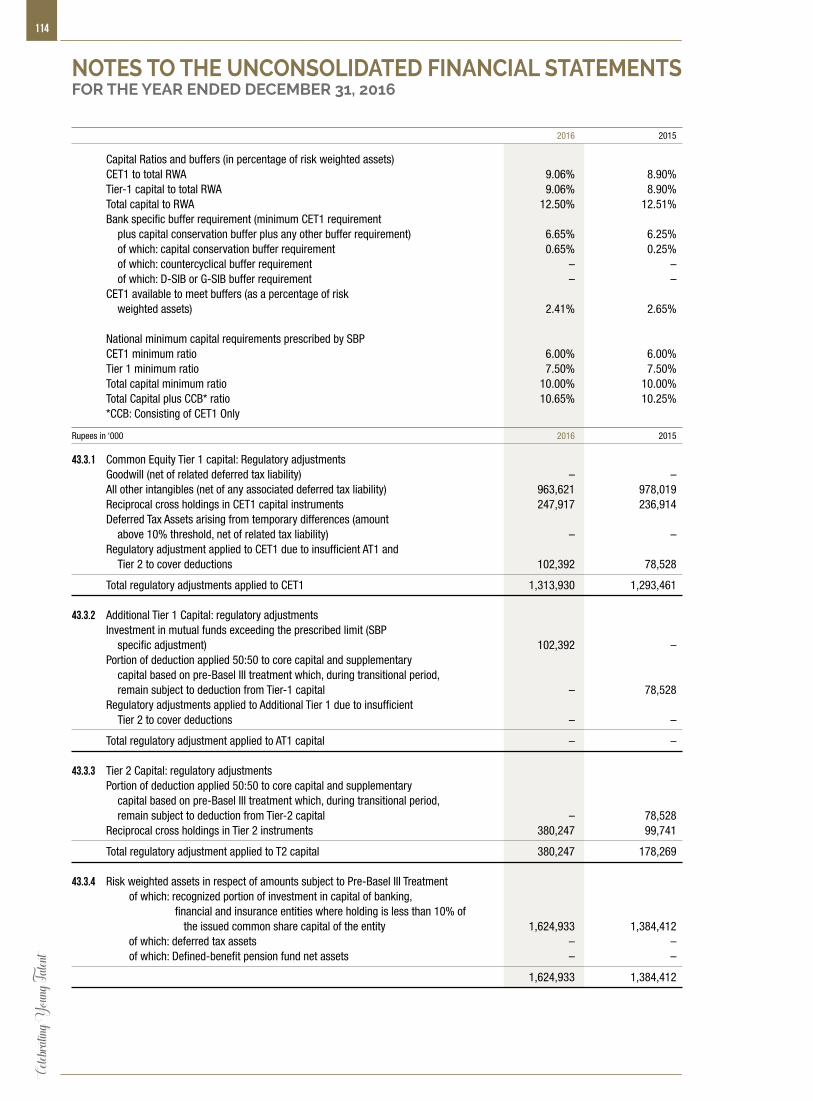
Celeb
rating
Youn
g Tale
nt114
2016 2015
Capital Ratios and buffers (in percentage of risk weighted assets) CET1 to total RWA 9.06% 8.90% Tier-1 capital to total RWA 9.06% 8.90% Total capital to RWA 12.50% 12.51% Bank specific buffer requirement (minimum CET1 requirement plus capital conservation buffer plus any other buffer requirement) 6.65% 6.25% of which: capital conservation buffer requirement 0.65% 0.25% of which: countercyclical buffer requirement – – of which: D-SIB or G-SIB buffer requirement – – CET1 available to meet buffers (as a percentage of risk weighted assets) 2.41% 2.65%
National minimum capital requirements prescribed by SBP CET1 minimum ratio 6.00% 6.00% Tier 1 minimum ratio 7.50% 7.50% Total capital minimum ratio 10.00% 10.00% Total Capital plus CCB* ratio 10.65% 10.25% *CCB: Consisting of CET1 Only
Rupees in ‘000 2016 2015
43.3.1 Common Equity Tier 1 capital: Regulatory adjustments Goodwill (net of related deferred tax liability) – – All other intangibles (net of any associated deferred tax liability) 963,621 978,019 Reciprocal cross holdings in CET1 capital instruments 247,917 236,914 Deferred Tax Assets arising from temporary differences (amount above 10% threshold, net of related tax liability) – – Regulatory adjustment applied to CET1 due to insufficient AT1 and Tier 2 to cover deductions 102,392 78,528
Total regulatory adjustments applied to CET1 1,313,930 1,293,461 43.3.2 Additional Tier 1 Capital: regulatory adjustments Investment in mutual funds exceeding the prescribed limit (SBP specific adjustment) 102,392 – Portion of deduction applied 50:50 to core capital and supplementary capital based on pre-Basel III treatment which, during transitional period, remain subject to deduction from Tier-1 capital – 78,528 Regulatory adjustments applied to Additional Tier 1 due to insufficient Tier 2 to cover deductions – –
Total regulatory adjustment applied to AT1 capital – – 43.3.3 Tier 2 Capital: regulatory adjustments Portion of deduction applied 50:50 to core capital and supplementary capital based on pre-Basel III treatment which, during transitional period, remain subject to deduction from Tier-2 capital – 78,528 Reciprocal cross holdings in Tier 2 instruments 380,247 99,741
Total regulatory adjustment applied to T2 capital 380,247 178,269 43.3.4 Risk weighted assets in respect of amounts subject to Pre-Basel III Treatment of which: recognized portion of investment in capital of banking, financial and insurance entities where holding is less than 10% of the issued common share capital of the entity 1,624,933 1,384,412 of which: deferred tax assets – – of which: Defined-benefit pension fund net assets – –
1,624,933 1,384,412
NOTES TO THE UNCONSOLIDATED FINANCIAL STATEMENTSFOR THE YEAR ENDED DECEMBER 31, 2016
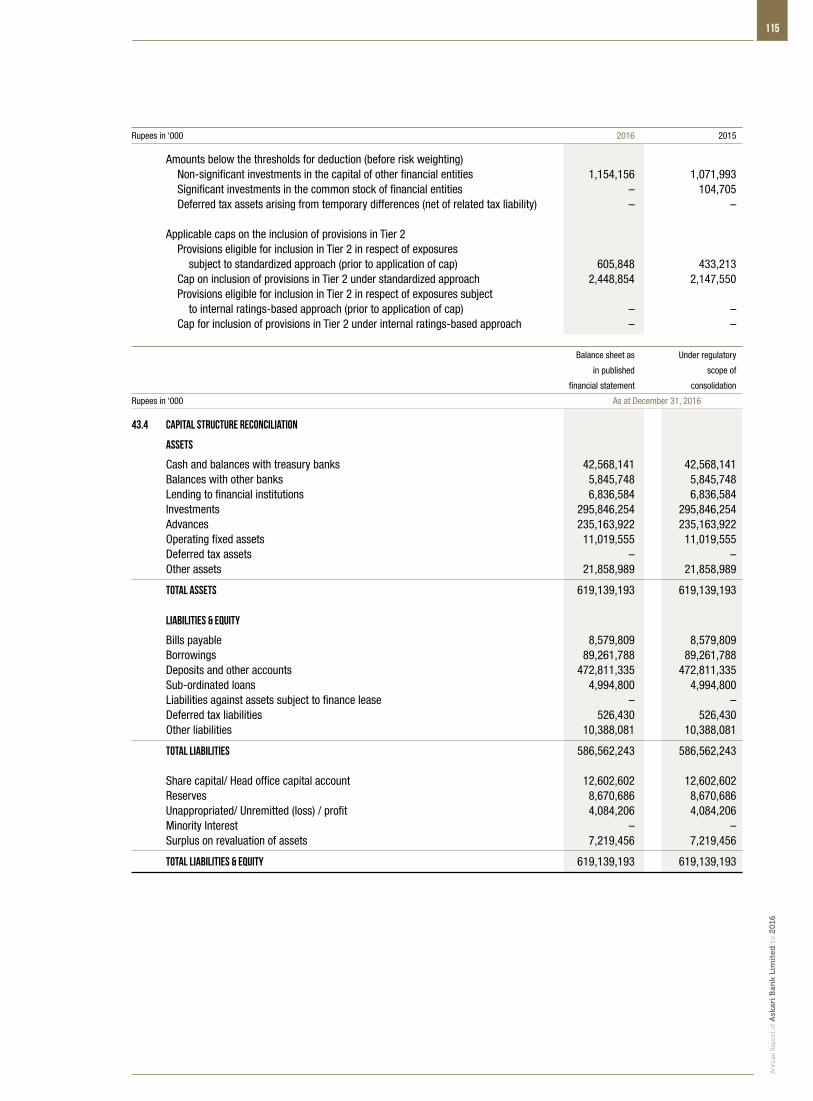
An
nu
al R
epo
rt o
f Ask
ari B
ank
Lim
ited
for 2
016
115
Rupees in ‘000 2016 2015
Amounts below the thresholds for deduction (before risk weighting) Non-significant investments in the capital of other financial entities 1,154,156 1,071,993 Significant investments in the common stock of financial entities – 104,705 Deferred tax assets arising from temporary differences (net of related tax liability) – – Applicable caps on the inclusion of provisions in Tier 2 Provisions eligible for inclusion in Tier 2 in respect of exposures subject to standardized approach (prior to application of cap) 605,848 433,213 Cap on inclusion of provisions in Tier 2 under standardized approach 2,448,854 2,147,550 Provisions eligible for inclusion in Tier 2 in respect of exposures subject to internal ratings-based approach (prior to application of cap) – – Cap for inclusion of provisions in Tier 2 under internal ratings-based approach – –
Balance sheet as Under regulatory
in published scope of
financial statement consolidation
Rupees in ‘000 As at December 31, 2016
43.4 Capital Structure Reconciliation
Assets
Cash and balances with treasury banks 42,568,141 42,568,141 Balances with other banks 5,845,748 5,845,748 Lending to financial institutions 6,836,584 6,836,584 Investments 295,846,254 295,846,254 Advances 235,163,922 235,163,922 Operating fixed assets 11,019,555 11,019,555 Deferred tax assets – – Other assets 21,858,989 21,858,989
Total assets 619,139,193 619,139,193 Liabilities & Equity
Bills payable 8,579,809 8,579,809 Borrowings 89,261,788 89,261,788 Deposits and other accounts 472,811,335 472,811,335 Sub-ordinated loans 4,994,800 4,994,800 Liabilities against assets subject to finance lease – – Deferred tax liabilities 526,430 526,430 Other liabilities 10,388,081 10,388,081
Total liabilities 586,562,243 586,562,243 Share capital/ Head office capital account 12,602,602 12,602,602 Reserves 8,670,686 8,670,686 Unappropriated/ Unremitted (loss) / profit 4,084,206 4,084,206 Minority Interest – – Surplus on revaluation of assets 7,219,456 7,219,456
Total liabilities & equity 619,139,193 619,139,193
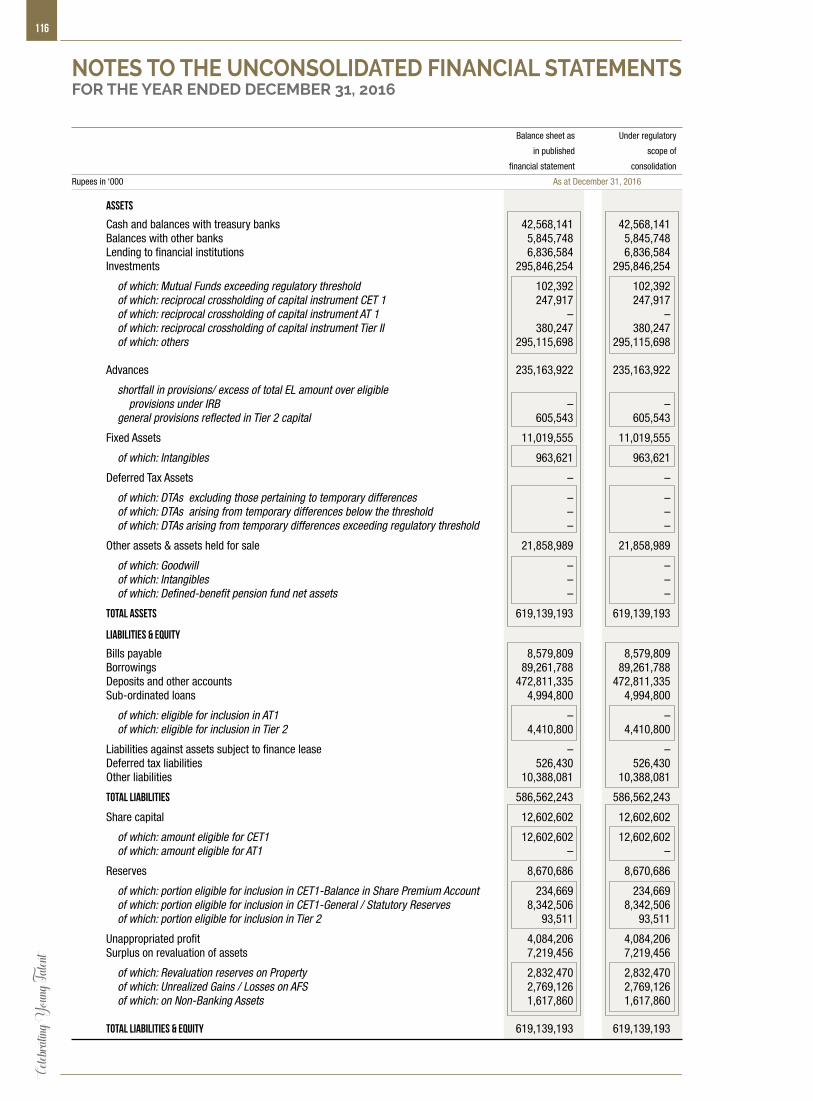
Celeb
rating
Youn
g Tale
nt116
Balance sheet as Under regulatory
in published scope of
financial statement consolidation
Rupees in ‘000 As at December 31, 2016
Assets
Cash and balances with treasury banks 42,568,141 42,568,141 Balances with other banks 5,845,748 5,845,748 Lending to financial institutions 6,836,584 6,836,584 Investments 295,846,254 295,846,254
of which: Mutual Funds exceeding regulatory threshold 102,392 102,392 of which: reciprocal crossholding of capital instrument CET 1 247,917 247,917 of which: reciprocal crossholding of capital instrument AT 1 – – of which: reciprocal crossholding of capital instrument Tier II 380,247 380,247 of which: others 295,115,698 295,115,698 Advances 235,163,922 235,163,922
shortfall in provisions/ excess of total EL amount over eligible provisions under IRB – – general provisions reflected in Tier 2 capital 605,543 605,543
Fixed Assets 11,019,555 11,019,555
of which: Intangibles 963,621 963,621
Deferred Tax Assets – –
of which: DTAs excluding those pertaining to temporary differences – – of which: DTAs arising from temporary differences below the threshold – – of which: DTAs arising from temporary differences exceeding regulatory threshold – –
Other assets & assets held for sale 21,858,989 21,858,989
of which: Goodwill – – of which: Intangibles – –
of which: Defined-benefit pension fund net assets – –
Total assets 619,139,193 619,139,193
Liabilities & Equity
Bills payable 8,579,809 8,579,809 Borrowings 89,261,788 89,261,788 Deposits and other accounts 472,811,335 472,811,335 Sub-ordinated loans 4,994,800 4,994,800
of which: eligible for inclusion in AT1 – – of which: eligible for inclusion in Tier 2 4,410,800 4,410,800
Liabilities against assets subject to finance lease – – Deferred tax liabilities 526,430 526,430 Other liabilities 10,388,081 10,388,081
Total liabilities 586,562,243 586,562,243
Share capital 12,602,602 12,602,602
of which: amount eligible for CET1 12,602,602 12,602,602 of which: amount eligible for AT1 – –
Reserves 8,670,686 8,670,686
of which: portion eligible for inclusion in CET1-Balance in Share Premium Account 234,669 234,669 of which: portion eligible for inclusion in CET1-General / Statutory Reserves 8,342,506 8,342,506 of which: portion eligible for inclusion in Tier 2 93,511 93,511
Unappropriated profit 4,084,206 4,084,206 Surplus on revaluation of assets 7,219,456 7,219,456
of which: Revaluation reserves on Property 2,832,470 2,832,470 of which: Unrealized Gains / Losses on AFS 2,769,126 2,769,126 of which: on Non-Banking Assets 1,617,860 1,617,860
Total liabilities & Equity 619,139,193 619,139,193
NOTES TO THE UNCONSOLIDATED FINANCIAL STATEMENTSFOR THE YEAR ENDED DECEMBER 31, 2016

An
nu
al R
epo
rt o
f Ask
ari B
ank
Lim
ited
for 2
016
117
Balance sheet as in published financial statements
Rupees in ‘000 As at December 31, 2016
43.5 Basel III Disclosure
Common Equity Tier 1 capital (CET1): Instruments and reserves
Fully Paid-up Capital / Capital deposited with SBP 12,602,602 Balance in Share Premium Account 234,669 General / Statutory Reserves 8,342,506 Unappropriated profit 4,084,206
CET 1 before Regulatory Adjustments 25,263,983
Common Equity Tier 1 capital: Regulatory adjustments
All other intangibles (net of any associated deferred tax liability) 963,621 Reciprocal cross holdings in CET1 capital instruments 247,917 Deferred Tax Assets arising from temporary differences (amount above 10% threshold, net of related tax liability) – Regulatory adjustment applied to CET1 due to insufficient AT1 and Tier 2 to cover deductions 102,392
Total regulatory adjustments applied to CET1 1,313,930
Common Equity Tier 1 23,950,053 Additional Tier 1 (AT1) Capital
Qualifying Additional Tier-1 instruments plus any related share premium – of which: Classified as equity – of which: Classified as liabilities – Additional Tier-1 capital instruments issued by consolidated subsidiaries and held by third parties (amount allowed in group AT 1) – of which: instrument issued by subsidiaries subject to phase out –
AT1 before regulatory adjustments –
Additional Tier 1 Capital: regulatory adjustments
Investment in mutual funds exceeding the prescribed limit (SBP specific adjustment) 102,392 Portion of deduction applied 50:50 to core capital and supplementary capital based on pre-Basel III treatment which, during transitional period, remain subject to deduction from Tier-1 capital –
Total of Regulatory Adjustment applied to AT1 capital 102,392
Additional Tier 1 capital –
Additional Tier 1 capital recognized for capital adequacy –
Tier 1 Capital (CET1 + admissible AT1) 23,950,053 Tier 2 Capital
Qualifying Tier 2 capital instruments under Basel III 3,992,000 Capital instruments subject to phase out arrangement from Tier 2 (Pre-Basel III instruments) 418,800 General Provisions or general reserves for loan losses-up to maximum of 1.25% of Credit Risk Weighted Assets 605,543 Revaluation Reserves eligible for Tier 2 4,369,246
of which: portion pertaining to Property 2,209,327 of which: portion pertaining to AFS securities 2,159,919
Foreign Exchange Translation Reserves 93,511 Undisclosed / Other Reserves –
T2 before regulatory adjustments 9,479,100
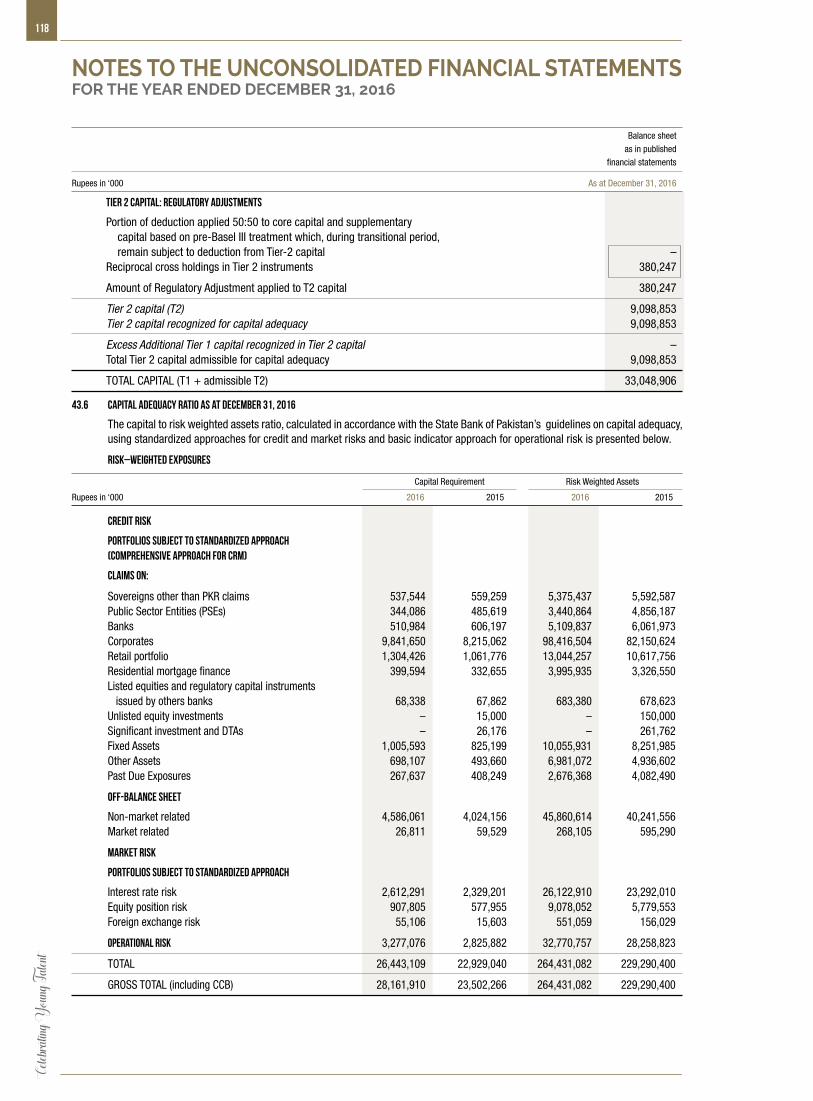
Celeb
rating
Youn
g Tale
nt118
Balance sheet as in published financial statements
Rupees in ‘000 As at December 31, 2016
Tier 2 Capital: regulatory adjustments
Portion of deduction applied 50:50 to core capital and supplementary capital based on pre-Basel III treatment which, during transitional period, remain subject to deduction from Tier-2 capital – Reciprocal cross holdings in Tier 2 instruments 380,247
Amount of Regulatory Adjustment applied to T2 capital 380,247
Tier 2 capital (T2) 9,098,853 Tier 2 capital recognized for capital adequacy 9,098,853
Excess Additional Tier 1 capital recognized in Tier 2 capital – Total Tier 2 capital admissible for capital adequacy 9,098,853
TOTAL CAPITAL (T1 + admissible T2) 33,048,906
43.6 Capital adequacy ratio as at December 31, 2016
The capital to risk weighted assets ratio, calculated in accordance with the State Bank of Pakistan’s guidelines on capital adequacy, using standardized approaches for credit and market risks and basic indicator approach for operational risk is presented below.
Risk–weighted exposures
Capital Requirement Risk Weighted Assets
Rupees in ‘000 2016 2015 2016 2015
credit risk
Portfolios subject to standardized approach (comprehensive approach for CRM)
Claims on:
Sovereigns other than PKR claims 537,544 559,259 5,375,437 5,592,587 Public Sector Entities (PSEs) 344,086 485,619 3,440,864 4,856,187 Banks 510,984 606,197 5,109,837 6,061,973 Corporates 9,841,650 8,215,062 98,416,504 82,150,624 Retail portfolio 1,304,426 1,061,776 13,044,257 10,617,756 Residential mortgage finance 399,594 332,655 3,995,935 3,326,550 Listed equities and regulatory capital instruments issued by others banks 68,338 67,862 683,380 678,623 Unlisted equity investments – 15,000 – 150,000 Significant investment and DTAs – 26,176 – 261,762 Fixed Assets 1,005,593 825,199 10,055,931 8,251,985 Other Assets 698,107 493,660 6,981,072 4,936,602 Past Due Exposures 267,637 408,249 2,676,368 4,082,490
Off-Balance Sheet
Non-market related 4,586,061 4,024,156 45,860,614 40,241,556 Market related 26,811 59,529 268,105 595,290
Market risk
Portfolios subject to standardized approach
Interest rate risk 2,612,291 2,329,201 26,122,910 23,292,010 Equity position risk 907,805 577,955 9,078,052 5,779,553 Foreign exchange risk 55,106 15,603 551,059 156,029
Operational risk 3,277,076 2,825,882 32,770,757 28,258,823
TOTAL 26,443,109 22,929,040 264,431,082 229,290,400
GROSS TOTAL (including CCB) 28,161,910 23,502,266 264,431,082 229,290,400
NOTES TO THE UNCONSOLIDATED FINANCIAL STATEMENTSFOR THE YEAR ENDED DECEMBER 31, 2016

An
nu
al R
epo
rt o
f Ask
ari B
ank
Lim
ited
for 2
016
119
43.7 Main features of regulatory capital instruments
Main Features Common Shares Instrument- 3 (PPTFC TFC IV) Instrument- 4 (PPTFC TFC V)
Issuer Askari Bank - Public Limited Company
Unique identifier AKBL NA NA
Governing law(s) of the instrument The Companies Ordinance 1984 & The Companies Ordinance, 1984 The Companies Ordinance, 1984
Stock Exchanges Regulations
Regulatory treatment
Transitional Basel III rules NA Tier 2 NA
Post-transitional Basel III rules NA Ineligible NA
Eligible at solo / group / group & solo Solo and Group Solo and Group Solo and Group
Instrument type Ordinary shares Subordinated Debt Instrument Subordinated Debt Instrument
Amount recognized in regulatory capital (Currency in 12,602,602 418,800 3,992,000
PKR thousands, as of reporting date)
Par value of instrument Rs. 10 per Share Rs. 1,000,000 per Insrument Rs. 1,000,000 per Insrument
Accounting classification Shareholder’s equity Liability - amortized cost Liability - amortized cost
Original date of issuance Year 1992 December 23, 2011 September 30, 2014
Perpetual or dated Perpetual/ no Maturity Dated Dated
Original maturity date NA December 23, 2021 September 30, 2024
Issuer call subject to prior supervisory approval NA Yes Yes
Optional call date, contingent call dates and NA December 23, 2016 September 30, 2019,Call would be subject
redemption amount to SBP approval and not less than 30
days notice to investors and security trustee.
Tax: as per prevailing structure.
Subsequent call dates, if applicable NA Yes Yes
Coupons / dividends
Fixed or floating dividend/ coupon NA Floating Floating
coupon rate and any related index/ benchmark NA Average Ask 6 month KIBOR + 1.75% Average Ask 6 month KIBOR + 1.20%
(1 to 5 Years) & Average Ask 6 month
KIBOR + 2.20% (6 to 10 Years)
Existence of a dividend stopper No No No
Fully discretionary, partially discretionary or mandatory NA Mandatory Mandatory
Existence of step up or other incentive to redeem No No No
Noncumulative or cumulative Non cumulative Cumulative Cumulative
Convertible or non-convertible NA Non-convertible Convertible
If convertible, conversion trigger(s) NA NA As deemed to be triggered by SBP
If convertible, fully or partially NA NA Fully or as deemed appropriate by SBP
If convertible, conversion rate NA NA Dependent on target market value of
equity per share on or before the date of
converison
If convertible, mandatory or optional conversion NA NA Mandatory
If convertible, specify instrument type convertible into NA NA Common Equity Tier 1
If convertible, specify issuer of instrument it converts into NA NA Askari Bank Limited
Write-down feature NA NA Yes
If write-down, write-down trigger(s) NA NA As deemed to be triggered by SBP.
Legal basis is provided to authorities to
set trigger as part of the terms of contract.
If write-down, full or partial NA NA As deemed to be appropriate by SBP.
If write-down, permanent or temporary NA NA Legal basis is provided to authorities to
If temporary write-down, description of write-up mechanism NA NA decide as part of the terms of contract.
Position in subordination hierarchy in liquidation (specify 3rd, Subordinated Debt being senior 2nd, Lenders and Depositors 2nd, Lenders and Depositors being senior
instrument type immediately senior to instrument) being senior
Non-compliant transitioned features No Yes No
If yes, specify non-compliant features NA Does not meet loss absorbency NA
requirements including conversion
Capital adequacy ratio
Required Actual 2016 2015 2016 2015
CET1 to total RWA 6.00% 6.00% 9.06% 8.90%
Tier-1 capital to total RWA 7.50% 7.50% 9.06% 8.90%
Total capital to total RWA 10.00% 10.00% 12.50% 12.51%
Gross Total Capital to total RWA (including CCB) 10.65% 10.25% 12.50% 12.51%
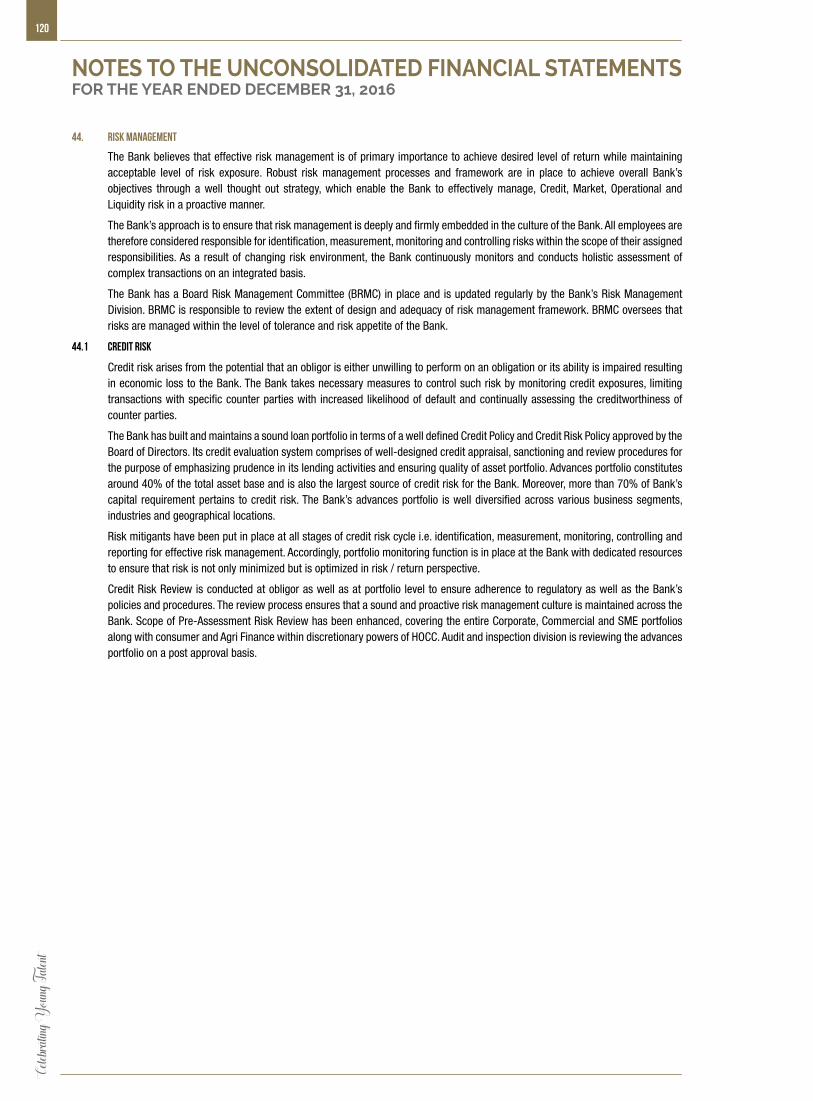
Celeb
rating
Youn
g Tale
nt120
44. RISK MANAGEMENT
The Bank believes that effective risk management is of primary importance to achieve desired level of return while maintaining acceptable level of risk exposure. Robust risk management processes and framework are in place to achieve overall Bank’s objectives through a well thought out strategy, which enable the Bank to effectively manage, Credit, Market, Operational and Liquidity risk in a proactive manner.
The Bank’s approach is to ensure that risk management is deeply and firmly embedded in the culture of the Bank. All employees are therefore considered responsible for identification, measurement, monitoring and controlling risks within the scope of their assigned responsibilities. As a result of changing risk environment, the Bank continuously monitors and conducts holistic assessment of complex transactions on an integrated basis.
The Bank has a Board Risk Management Committee (BRMC) in place and is updated regularly by the Bank’s Risk Management Division. BRMC is responsible to review the extent of design and adequacy of risk management framework. BRMC oversees that risks are managed within the level of tolerance and risk appetite of the Bank.
44.1 Credit Risk
Credit risk arises from the potential that an obligor is either unwilling to perform on an obligation or its ability is impaired resulting in economic loss to the Bank. The Bank takes necessary measures to control such risk by monitoring credit exposures, limiting transactions with specific counter parties with increased likelihood of default and continually assessing the creditworthiness of counter parties.
The Bank has built and maintains a sound loan portfolio in terms of a well defined Credit Policy and Credit Risk Policy approved by the Board of Directors. Its credit evaluation system comprises of well-designed credit appraisal, sanctioning and review procedures for the purpose of emphasizing prudence in its lending activities and ensuring quality of asset portfolio. Advances portfolio constitutes around 40% of the total asset base and is also the largest source of credit risk for the Bank. Moreover, more than 70% of Bank’s capital requirement pertains to credit risk. The Bank’s advances portfolio is well diversified across various business segments, industries and geographical locations.
Risk mitigants have been put in place at all stages of credit risk cycle i.e. identification, measurement, monitoring, controlling and reporting for effective risk management. Accordingly, portfolio monitoring function is in place at the Bank with dedicated resources to ensure that risk is not only minimized but is optimized in risk / return perspective.
Credit Risk Review is conducted at obligor as well as at portfolio level to ensure adherence to regulatory as well as the Bank’s policies and procedures. The review process ensures that a sound and proactive risk management culture is maintained across the Bank. Scope of Pre-Assessment Risk Review has been enhanced, covering the entire Corporate, Commercial and SME portfolios along with consumer and Agri Finance within discretionary powers of HOCC. Audit and inspection division is reviewing the advances portfolio on a post approval basis.
NOTES TO THE UNCONSOLIDATED FINANCIAL STATEMENTSFOR THE YEAR ENDED DECEMBER 31, 2016

An
nu
al R
epo
rt o
f Ask
ari B
ank
Lim
ited
for 2
016
121
44.1.1 SEGMENT INFORMATION
Segmental Information is presented in respect of the class of business and geographical distribution of advances, deposits, contingencies and commitments.
44.1.1.1 Segment by class of business
2016 2015
Contingencies and Contingencies and
Advances Deposits Commitments - note 44.1.1.6 Advances Deposits Commitments - note 44.1.1.6
Rupees in ‘000 Percent Rupees in ‘000 Percent Rupees in ‘000 Percent Rupees in ‘000 Percent Rupees in ‘000 Percent Rupees in ‘000 Percent
Agriculture finances 3,576,371 1.36 3,842,218 0.81 1,551,558 0.43 3,878,666 1.70 3,425,016 0.79 654,654 0.24 Automobiles and Allied 773,519 0.30 2,013,449 0.43 252,617 0.07 1,044,527 0.46 1,107,919 0.26 280,101 0.10 Cables / Electronics 2,701,249 1.03 2,822,440 0.60 1,738,981 0.48 3,006,374 1.32 4,774,760 1.10 1,540,915 0.56 Carpets 80,398 0.03 352,934 0.07 8,250 0.00 78,080 0.03 128,971 0.03 8,250 0.00 Cement 2,994,025 1.14 479,227 0.10 1,674,275 0.47 2,334,179 1.02 464,520 0.11 1,788,668 0.65 Chemicals / Pharmaceuticals 5,044,205 1.92 1,193,756 0.25 4,689,262 1.30 4,148,075 1.82 2,788,100 0.64 3,093,205 1.12 Engineering 740,025 0.28 403,155 0.09 4,334,405 1.21 45,454 0.02 448,138 0.10 13,877,480 5.01 Fertilizers 2,022,455 0.77 2,897,960 0.61 5,247,773 1.46 2,931,671 1.28 4,286,310 0.99 2,668,838 0.96 Food and Allied 8,092,397 3.09 1,225,539 0.26 948,822 0.26 3,691,952 1.62 748,138 0.17 1,077,265 0.39 Fuel / Energy 17,630,179 6.73 2,739,153 0.58 35,551,970 9.89 21,725,867 9.51 962,695 0.22 19,202,001 6.93 Ghee and Edible Oil 2,225,561 0.85 777,626 0.16 2,464,737 0.69 2,513,308 1.10 532,983 0.12 1,885,242 0.68 Glass and Ceramics 1,805,348 0.69 32,224 0.01 621,221 0.17 2,056,181 0.90 54,052 0.01 693,816 0.25 Hotels and Restaurants 2,862,339 1.09 496,497 0.11 491 0.00 2,523,884 1.10 796,438 0.18 239,196 0.09 Individuals 23,086,530 8.81 190,397,975 40.27 2,932,627 0.82 17,884,178 7.83 165,874,917 38.30 439,527 0.16 Insurance 74,949 0.03 1,021,956 0.22 – – 21,896 0.01 1,767,497 0.41 – – Financial institutions / Investment companies 3,626,132 1.38 183,393 0.04 34,537,594 9.61 1,026,667 0.45 6,291 0.00 48,343,439 17.45 Leasing 640,000 0.24 6,947 0.00 150,000 0.04 615,000 0.27 13,657 0.00 – – Leather Products and Shoes 1,747,738 0.67 873,093 0.18 1,294,398 0.36 1,603,964 0.70 757,571 0.17 1,015,003 0.37 Modarabas – – 12 0.00 – – – – 12 0.00 518,346 0.19 Paper and Board 427,044 0.16 130,715 0.03 557,209 0.16 291,017 0.13 132,290 0.03 339,570 0.12 Plastic products 1,174,196 0.45 161,791 0.03 648,322 0.18 415,137 0.18 206,032 0.05 290,702 0.10 Ready made garments 2,432,235 0.93 884,083 0.19 675,739 0.19 1,037,571 0.45 359,715 0.08 257,765 0.09 Real Estate / Construction 6,553,193 2.50 18,656,191 3.95 17,880,697 4.97 4,002,861 1.75 15,413,359 3.56 45,643,775 16.47 Rice Processing and trading 6,128,491 2.34 1,127,937 0.24 258,136 0.07 5,404,329 2.37 929,808 0.21 201,688 0.07 Rubber Products 745,080 0.28 108,992 0.02 1,180,916 0.33 205,968 0.09 219,664 0.05 69,058 0.02 Services (Other than Financial, Hotelling and Travelling) 5,137,514 1.96 7,706,778 1.63 55,699,083 15.50 2,945,291 1.29 6,526,484 1.51 687,539 0.25 Sports goods 371,496 0.14 152,154 0.03 168,466 0.05 299,794 0.13 112,572 0.03 160,232 0.06 Sugar 4,850,866 1.85 238,376 0.05 167,856 0.05 5,756,270 2.52 69,869 0.02 1,777 0.01 Surgical equipment / Metal Products 10,269,940 3.92 2,208,867 0.47 1,530,107 0.43 7,658,364 3.35 2,109,448 0.49 820,337 0.30 Synthetic and Rayon 878,930 0.34 169,617 0.04 444,236 0.12 1,275,791 0.56 92,524 0.02 248,338 0.09 Textile 33,857,964 12.92 4,766,839 1.01 9,071,708 2.52 31,374,438 13.74 4,239,102 0.98 8,379,726 3.02 Tobacco / Cigarette manufacturing 4,462 0.00 8 0.00 1,000 0.00 4,462 0.00 – – – – Transport and communication 5,129,771 1.96 2,672,122 0.57 3,869,062 1.08 3,804,627 1.67 3,895,240 0.90 4,460,220 1.61 Travel Agencies 251,055 0.10 355,695 0.08 490,331 0.14 106,492 0.05 149,849 0.03 393,396 0.14 Woolen 394,778 0.15 951,015 0.20 31,960 0.01 371,502 0.16 558,325 0.13 4,050 0.00 Public sector / Government 85,244,751 32.51 168,256,224 35.59 157,411,108 43.80 72,753,491 31.85 165,798,351 38.28 106,367,819 38.39 Others 18,548,070 7.08 52,504,377 11.10 11,327,058 3.15 19,575,670 8.57 43,421,588 10.03 11,398,102 4.11
262,123,256 100.00 472,811,335 100.00 359,411,975 100.00 228,412,998 100.00 433,172,205 100.00 277,050,040 100.00
44.1.1.2 Segment by sector
2016 2015
Contingencies and Contingencies and
Advances Deposits Commitments - note 44.1.1.6 Advances Deposits Commitments - note 44.1.1.6
Rupees in ‘000 Percent Rupees in ‘000 Percent Rupees in ‘000 Percent Rupees in ‘000 Percent Rupees in ‘000 Percent Rupees in ‘000 Percent
Public sector / Government 85,244,751 32.51 168,256,224 35.59 157,411,108 43.80 72,753,491 31.85 165,798,351 38.28 106,367,819 38.39 Private 176,878,505 67.49 304,555,111 64.41 202,000,867 56.20 155,659,507 68.15 267,373,854 61.72 170,682,221 61.61
262,123,256 100.00 472,811,335 100.00 359,411,975 100.00 228,412,998 100.00 433,172,205 100.00 277,050,040 100.00 0
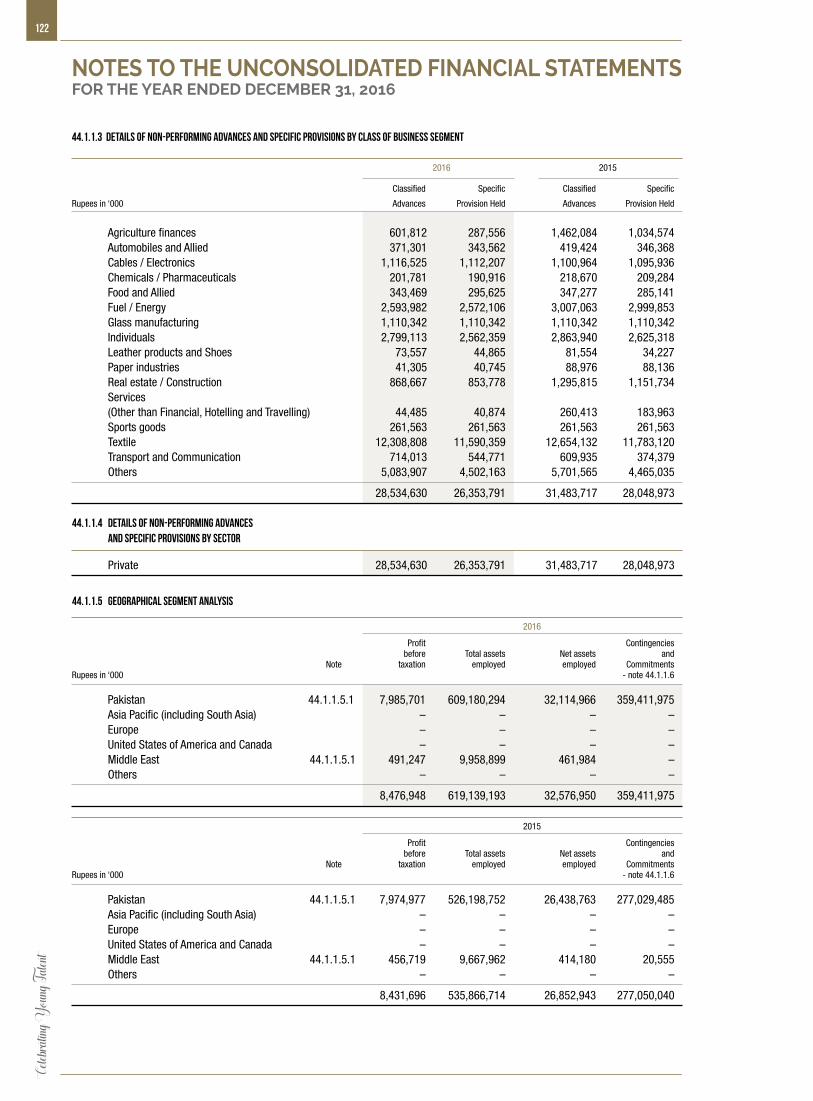
Celeb
rating
Youn
g Tale
nt122
44.1.1.3 Details of non-performing advances and specific provisions by class of business segment
2016 2015
Classified Specific Classified Specific
Rupees in ‘000 Advances Provision Held Advances Provision Held
Agriculture finances 601,812 287,556 1,462,084 1,034,574 Automobiles and Allied 371,301 343,562 419,424 346,368 Cables / Electronics 1,116,525 1,112,207 1,100,964 1,095,936 Chemicals / Pharmaceuticals 201,781 190,916 218,670 209,284 Food and Allied 343,469 295,625 347,277 285,141 Fuel / Energy 2,593,982 2,572,106 3,007,063 2,999,853 Glass manufacturing 1,110,342 1,110,342 1,110,342 1,110,342 Individuals 2,799,113 2,562,359 2,863,940 2,625,318 Leather products and Shoes 73,557 44,865 81,554 34,227 Paper industries 41,305 40,745 88,976 88,136 Real estate / Construction 868,667 853,778 1,295,815 1,151,734 Services (Other than Financial, Hotelling and Travelling) 44,485 40,874 260,413 183,963 Sports goods 261,563 261,563 261,563 261,563 Textile 12,308,808 11,590,359 12,654,132 11,783,120 Transport and Communication 714,013 544,771 609,935 374,379 Others 5,083,907 4,502,163 5,701,565 4,465,035
28,534,630 26,353,791 31,483,717 28,048,973 44.1.1.4 Details of non-performing advances and specific provisions by sector
Private 28,534,630 26,353,791 31,483,717 28,048,973
44.1.1.5 Geographical segment analysis
2016
Profit Contingencies before Total assets Net assets and Note taxation employed employed CommitmentsRupees in ‘000 - note 44.1.1.6
Pakistan 44.1.1.5.1 7,985,701 609,180,294 32,114,966 359,411,975 Asia Pacific (including South Asia) – – – – Europe – – – – United States of America and Canada – – – – Middle East 44.1.1.5.1 491,247 9,958,899 461,984 – Others – – – –
8,476,948 619,139,193 32,576,950 359,411,975
2015
Profit Contingencies before Total assets Net assets and Note taxation employed employed CommitmentsRupees in ‘000 - note 44.1.1.6
Pakistan 44.1.1.5.1 7,974,977 526,198,752 26,438,763 277,029,485 Asia Pacific (including South Asia) – – – – Europe – – – – United States of America and Canada – – – – Middle East 44.1.1.5.1 456,719 9,667,962 414,180 20,555 Others – – – –
8,431,696 535,866,714 26,852,943 277,050,040
NOTES TO THE UNCONSOLIDATED FINANCIAL STATEMENTSFOR THE YEAR ENDED DECEMBER 31, 2016
An
nu
al R
epo
rt o
f Ask
ari B
ank
Lim
ited
for 2
016
123
44.1.1.5.1 These do not include intra bank items of Rs. 9,328,052 thousand (2015: Rs. 9,081,656 thousand) eliminated upon consolidation of wholesale bank branch.
44.1.1.6 Contingencies and commitments include amounts given in note 22 except bills for collection.
44.1.1.7 Collateral
Following is the list of main types of collateral taken by the Bank.
- Government and trustee securities
- Defence saving certificates
- Fixed deposits (TDR)
- Lien on deposits
- Cash margin
- Shares listed on main index
- Shares listed on non main index
- Government guarantees
44.2 Market Risk
Market risk is the risk that the value of on and off-balance sheet positions of a financial institution will be adversely affected by movements in market rates or prices such as interest rates, foreign exchange rates, equity prices and credit spreads resulting in a loss to earnings and capital.
The Bank’s Risk Management Process seeks to identify, measure, monitor, and control market risks in order to shield against adverse movements in market factors and to attain an efficient risk/return profile of its open positions. The Risk Management Division has developed and implemented market risk policy and risk measurement /monitoring methodology for review and reporting of market risk. The Bank makes use of the globally established Value-at-Risk (VaR) methodology to measure traded market risk.
In addition, sensitivity analysis is carried out to gauge the impact of extreme market movements on traded exposures. Meanwhile, stress testing is used to analyze the impact of both the abnormal market movements across different markets as well as to assess non-traded market risk, in particular interest rate risk in the banking book. The performance of the Bank’s traded portfolios is evaluated through the use of risk / return analysis. Risk is kept under check through the revaluation of all traded market risk exposed positions on a daily basis, and controlled by ensuring that these positions do not breach regulatory limits and the Bank’s own internally-established risk tolerance limits.
44.2.1 Market risk - General disclosures Basel III specific
Basel III Standardized Approach is used for calculating the Capital Adequacy for Market Risk.
44.2.2 Foreign Exchange Risk
Foreign exchange risk, or the risk that the Bank’s earnings and / or capital can fluctuate due to changes in foreign exchange
rates, arises out from the Bank’s foreign exchange exposure which consists of foreign currency cash in hand, nostro / vostro
accounts, forward contracts, forward bookings with exporters, foreign bills purchased, foreign currency placements with SBP
and the Bank’s Wholesale Bank Branch, foreign currency lendings / deposits and capital investments in offshore operations.
The Bank’s treasury manages consolidated foreign exchange exposure by matching foreign currency assets and liabilities
in spot and forward. The foreign exchange exposure and nostro balances are maintained within regulatory limits and VaR is
calculated for consolidated foreign exchange exposure on a daily basis. The impact of a change in USD / PKR parity on the net
open position is also determined through daily sensitivity analysis.
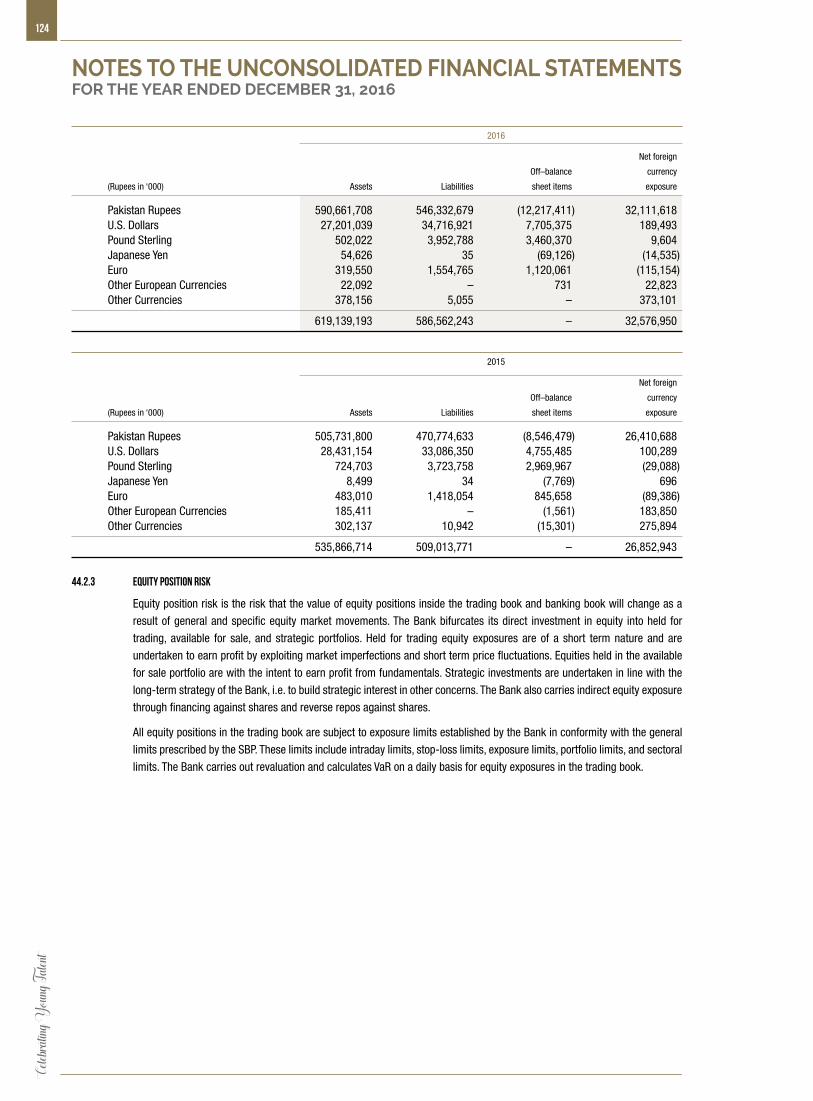
Celeb
rating
Youn
g Tale
nt124
2016
Net foreign
Off–balance currency
(Rupees in ‘000) Assets Liabilities sheet items exposure
Pakistan Rupees 590,661,708 546,332,679 (12,217,411) 32,111,618 U.S. Dollars 27,201,039 34,716,921 7,705,375 189,493 Pound Sterling 502,022 3,952,788 3,460,370 9,604 Japanese Yen 54,626 35 (69,126) (14,535) Euro 319,550 1,554,765 1,120,061 (115,154) Other European Currencies 22,092 – 731 22,823 Other Currencies 378,156 5,055 – 373,101
619,139,193 586,562,243 – 32,576,950
2015
Net foreign
Off–balance currency
(Rupees in ‘000) Assets Liabilities sheet items exposure
Pakistan Rupees 505,731,800 470,774,633 (8,546,479) 26,410,688 U.S. Dollars 28,431,154 33,086,350 4,755,485 100,289 Pound Sterling 724,703 3,723,758 2,969,967 (29,088) Japanese Yen 8,499 34 (7,769) 696 Euro 483,010 1,418,054 845,658 (89,386) Other European Currencies 185,411 – (1,561) 183,850 Other Currencies 302,137 10,942 (15,301) 275,894
535,866,714 509,013,771 – 26,852,943
44.2.3 Equity position risk
Equity position risk is the risk that the value of equity positions inside the trading book and banking book will change as a
result of general and specific equity market movements. The Bank bifurcates its direct investment in equity into held for
trading, available for sale, and strategic portfolios. Held for trading equity exposures are of a short term nature and are
undertaken to earn profit by exploiting market imperfections and short term price fluctuations. Equities held in the available
for sale portfolio are with the intent to earn profit from fundamentals. Strategic investments are undertaken in line with the
long-term strategy of the Bank, i.e. to build strategic interest in other concerns. The Bank also carries indirect equity exposure
through financing against shares and reverse repos against shares.
All equity positions in the trading book are subject to exposure limits established by the Bank in conformity with the general
limits prescribed by the SBP. These limits include intraday limits, stop-loss limits, exposure limits, portfolio limits, and sectoral
limits. The Bank carries out revaluation and calculates VaR on a daily basis for equity exposures in the trading book.
NOTES TO THE UNCONSOLIDATED FINANCIAL STATEMENTSFOR THE YEAR ENDED DECEMBER 31, 2016
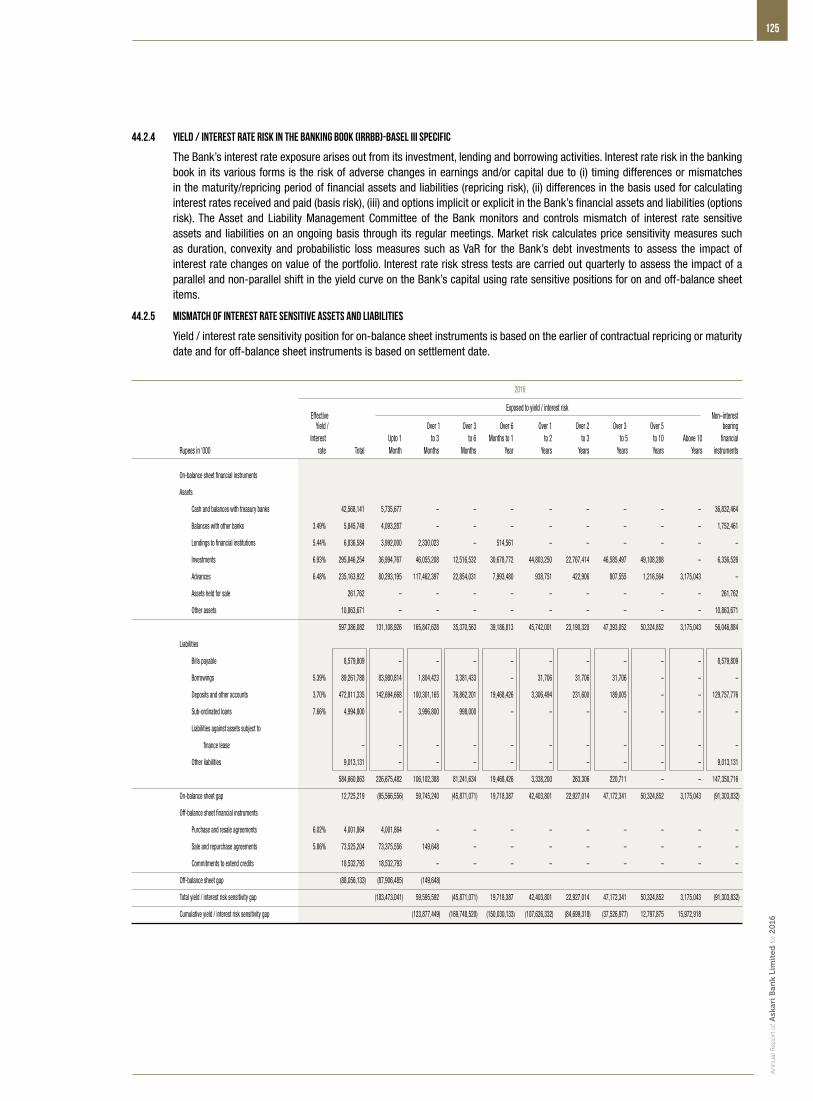
An
nu
al R
epo
rt o
f Ask
ari B
ank
Lim
ited
for 2
016
125
44.2.4 Yield / Interest Rate Risk in the Banking Book (IRRBB)-Basel III Specific
The Bank’s interest rate exposure arises out from its investment, lending and borrowing activities. Interest rate risk in the banking book in its various forms is the risk of adverse changes in earnings and/or capital due to (i) timing differences or mismatches in the maturity/repricing period of financial assets and liabilities (repricing risk), (ii) differences in the basis used for calculating interest rates received and paid (basis risk), (iii) and options implicit or explicit in the Bank’s financial assets and liabilities (options risk). The Asset and Liability Management Committee of the Bank monitors and controls mismatch of interest rate sensitive assets and liabilities on an ongoing basis through its regular meetings. Market risk calculates price sensitivity measures such as duration, convexity and probabilistic loss measures such as VaR for the Bank’s debt investments to assess the impact of interest rate changes on value of the portfolio. Interest rate risk stress tests are carried out quarterly to assess the impact of a parallel and non-parallel shift in the yield curve on the Bank’s capital using rate sensitive positions for on and off-balance sheet items.
44.2.5 Mismatch of interest rate sensitive assets and liabilities
Yield / interest rate sensitivity position for on-balance sheet instruments is based on the earlier of contractual repricing or maturity date and for off-balance sheet instruments is based on settlement date.
2016
Effective
Exposed to yield / interest risk Non–interest
Yield / Over 1 Over 3 Over 6 Over 1 Over 2 Over 3 Over 5 bearing Interest Upto 1 to 3 to 6 Months to 1 to 2 to 3 to 5 to 10 Above 10 financial Rupees in ‘000 rate Total Month Months Months Year Years Years Years Years Years instruments
On-balance sheet financial instruments
Assets
Cash and balances with treasury banks 42,568,141 5,735,677 – – – – – – – – 36,832,464
Balances with other banks 3.49% 5,845,748 4,093,287 – – – – – – – – 1,752,461
Lendings to financial institutions 5.44% 6,836,584 3,992,000 2,330,023 – 514,561 – – – – – –
Investments 6.93% 295,846,254 36,994,767 46,055,208 12,516,532 30,678,772 44,803,250 22,767,414 46,585,497 49,108,288 – 6,336,526
Advances 6.48% 235,163,922 80,293,195 117,462,397 22,854,031 7,993,480 938,751 422,906 807,555 1,216,564 3,175,043 –
Assets held for sale 261,762 – – – – – – – – – 261,762
Other assets 10,863,671 – – – – – – – – – 10,863,671
597,386,082 131,108,926 165,847,628 35,370,563 39,186,813 45,742,001 23,190,320 47,393,052 50,324,852 3,175,043 56,046,884
Liabilities
Bills payable 8,579,809 – – – – – – – – – 8,579,809
Borrowings 5.39% 89,261,788 83,980,814 1,804,423 3,381,433 – 31,706 31,706 31,706 – – –
Deposits and other accounts 3.70% 472,811,335 142,694,668 100,301,165 76,862,201 19,468,426 3,306,494 231,600 189,005 – – 129,757,776
Sub-ordinated loans 7.66% 4,994,800 – 3,996,800 998,000 – – – – – – –
Liabilities against assets subject to
finance lease – – – – – – – – – – –
Other liabilities 9,013,131 – – – – – – – – – 9,013,131
584,660,863 226,675,482 106,102,388 81,241,634 19,468,426 3,338,200 263,306 220,711 – – 147,350,716
On-balance sheet gap 12,725,219 (95,566,556) 59,745,240 (45,871,071) 19,718,387 42,403,801 22,927,014 47,172,341 50,324,852 3,175,043 (91,303,832)
Off-balance sheet financial instruments
Purchase and resale agreements 6.02% 4,001,864 4,001,864 – – – – – – – – –
Sale and repurchase agreements 5.86% 73,525,204 73,375,556 149,648 – – – – – – – –
Commitments to extend credits 18,532,793 18,532,793 – – – – – – – – –
Off-balance sheet gap (88,056,133) (87,906,485) (149,648)
Total yield / interest risk sensitivity gap (183,473,041) 59,595,592 (45,871,071) 19,718,387 42,403,801 22,927,014 47,172,341 50,324,852 3,175,043 (91,303,832)
Cumulative yield / interest risk sensitivity gap (123,877,449) (169,748,520) (150,030,133) (107,626,332) (84,699,318) (37,526,977) 12,797,875 15,972,918
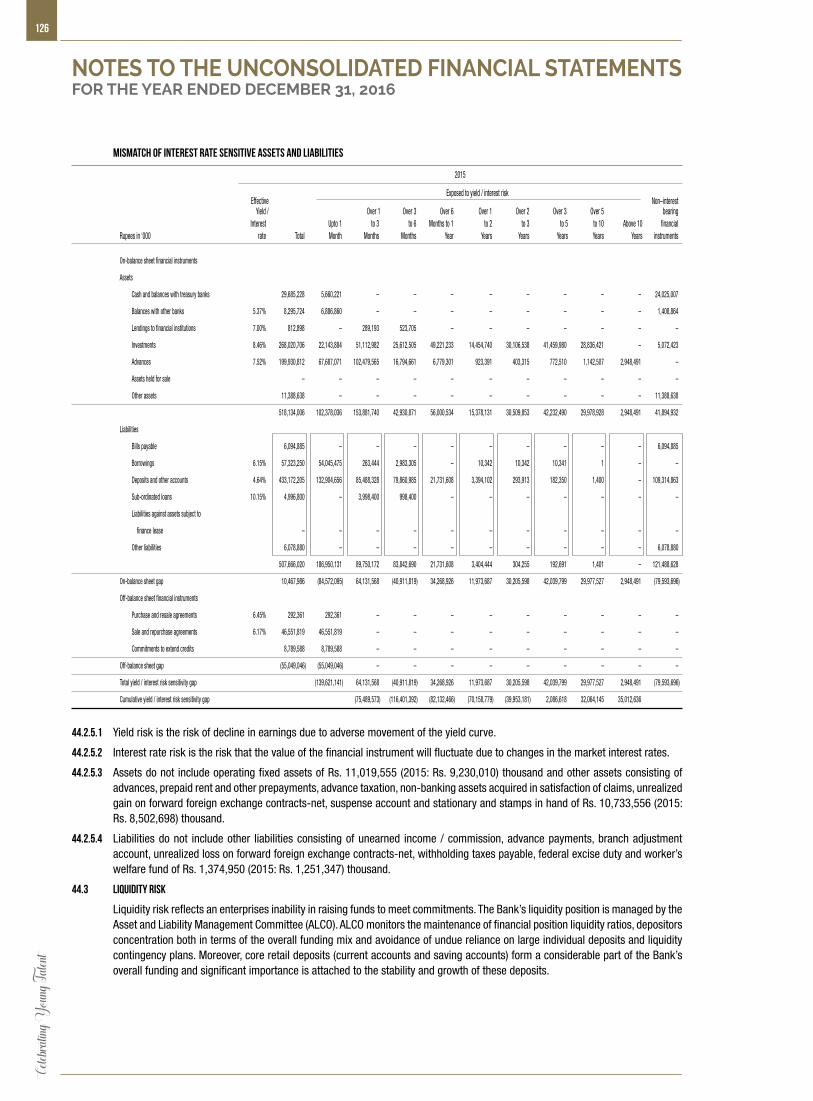
Celeb
rating
Youn
g Tale
nt126
Mismatch of interest rate sensitive assets and liabilities
2015
Effective
Exposed to yield / interest risk Non–interest
Yield / Over 1 Over 3 Over 6 Over 1 Over 2 Over 3 Over 5 bearing Interest Upto 1 to 3 to 6 Months to 1 to 2 to 3 to 5 to 10 Above 10 financial Rupees in ‘000 rate Total Month Months Months Year Years Years Years Years Years instruments
On-balance sheet financial instruments
Assets
Cash and balances with treasury banks 29,685,228 5,660,221 – – – – – – – – 24,025,007
Balances with other banks 5.37% 8,295,724 6,886,860 – – – – – – – – 1,408,864
Lendings to financial institutions 7.00% 812,898 – 289,193 523,705 – – – – – – –
Investments 8.46% 268,020,706 22,143,884 51,112,982 25,612,505 49,221,233 14,454,740 30,106,538 41,459,980 28,836,421 – 5,072,423
Advances 7.52% 199,930,812 67,687,071 102,479,565 16,794,661 6,779,301 923,391 403,315 772,510 1,142,507 2,948,491 –
Assets held for sale – – – – – – – – – – –
Other assets 11,388,638 – – – – – – – – – 11,388,638
518,134,006 102,378,036 153,881,740 42,930,871 56,000,534 15,378,131 30,509,853 42,232,490 29,978,928 2,948,491 41,894,932
Liabilities
Bills payable 6,094,885 – – – – – – – – – 6,094,885
Borrowings 6.15% 57,323,250 54,045,475 263,444 2,983,305 – 10,342 10,342 10,341 1 – –
Deposits and other accounts 4.64% 433,172,205 132,904,656 85,488,328 79,860,985 21,731,608 3,394,102 293,913 182,350 1,400 – 109,314,863
Sub-ordinated loans 10.15% 4,996,800 – 3,998,400 998,400 – – – – – – –
Liabilities against assets subject to
finance lease – – – – – – – – – – –
Other liabilities 6,078,880 – – – – – – – – – 6,078,880
507,666,020 186,950,131 89,750,172 83,842,690 21,731,608 3,404,444 304,255 192,691 1,401 – 121,488,628
On-balance sheet gap 10,467,986 (84,572,095) 64,131,568 (40,911,819) 34,268,926 11,973,687 30,205,598 42,039,799 29,977,527 2,948,491 (79,593,696)
Off-balance sheet financial instruments
Purchase and resale agreements 6.45% 292,361 292,361 – – – – – – – – –
Sale and repurchase agreements 6.17% 46,551,819 46,551,819 – – – – – – – – –
Commitments to extend credits 8,789,588 8,789,588 – – – – – – – – –
Off-balance sheet gap (55,049,046) (55,049,046) – – – – – – – – –
Total yield / interest risk sensitivity gap (139,621,141) 64,131,568 (40,911,819) 34,268,926 11,973,687 30,205,598 42,039,799 29,977,527 2,948,491 (79,593,696)
Cumulative yield / interest risk sensitivity gap (75,489,573) (116,401,392) (82,132,466) (70,158,779) (39,953,181) 2,086,618 32,064,145 35,012,636
44.2.5.1 Yield risk is the risk of decline in earnings due to adverse movement of the yield curve.
44.2.5.2 Interest rate risk is the risk that the value of the financial instrument will fluctuate due to changes in the market interest rates.
44.2.5.3 Assets do not include operating fixed assets of Rs. 11,019,555 (2015: Rs. 9,230,010) thousand and other assets consisting of advances, prepaid rent and other prepayments, advance taxation, non-banking assets acquired in satisfaction of claims, unrealized gain on forward foreign exchange contracts-net, suspense account and stationary and stamps in hand of Rs. 10,733,556 (2015: Rs. 8,502,698) thousand.
44.2.5.4 Liabilities do not include other liabilities consisting of unearned income / commission, advance payments, branch adjustment account, unrealized loss on forward foreign exchange contracts-net, withholding taxes payable, federal excise duty and worker’s welfare fund of Rs. 1,374,950 (2015: Rs. 1,251,347) thousand.
44.3 Liquidity Risk
Liquidity risk reflects an enterprises inability in raising funds to meet commitments. The Bank’s liquidity position is managed by the Asset and Liability Management Committee (ALCO). ALCO monitors the maintenance of financial position liquidity ratios, depositors concentration both in terms of the overall funding mix and avoidance of undue reliance on large individual deposits and liquidity contingency plans. Moreover, core retail deposits (current accounts and saving accounts) form a considerable part of the Bank’s overall funding and significant importance is attached to the stability and growth of these deposits.
NOTES TO THE UNCONSOLIDATED FINANCIAL STATEMENTSFOR THE YEAR ENDED DECEMBER 31, 2016
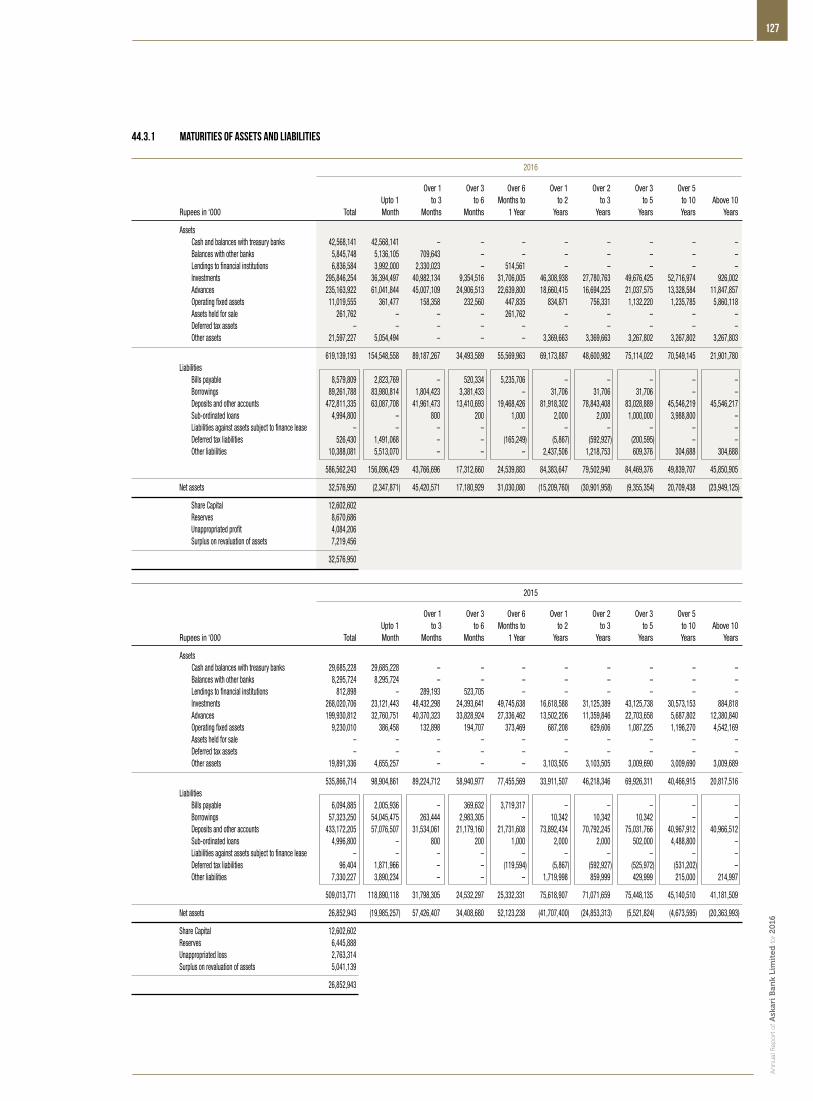
An
nu
al R
epo
rt o
f Ask
ari B
ank
Lim
ited
for 2
016
127
44.3.1 Maturities of Assets and Liabilities
2016
Over 1 Over 3 Over 6 Over 1 Over 2 Over 3 Over 5 Upto 1 to 3 to 6 Months to to 2 to 3 to 5 to 10 Above 10 Rupees in ‘000 Total Month Months Months 1 Year Years Years Years Years Years
Assets Cash and balances with treasury banks 42,568,141 42,568,141 – – – – – – – – Balances with other banks 5,845,748 5,136,105 709,643 – – – – – – – Lendings to financial institutions 6,836,584 3,992,000 2,330,023 – 514,561 – – – – – Investments 295,846,254 36,394,497 40,982,134 9,354,516 31,706,005 46,308,938 27,780,763 49,676,425 52,716,974 926,002 Advances 235,163,922 61,041,844 45,007,109 24,906,513 22,639,800 18,660,415 16,694,225 21,037,575 13,328,584 11,847,857 Operating fixed assets 11,019,555 361,477 158,358 232,560 447,835 834,871 756,331 1,132,220 1,235,785 5,860,118 Assets held for sale 261,762 – – – 261,762 – – – – – Deferred tax assets – – – – – – – – – – Other assets 21,597,227 5,054,494 – – – 3,369,663 3,369,663 3,267,802 3,267,802 3,267,803
619,139,193 154,548,558 89,187,267 34,493,589 55,569,963 69,173,887 48,600,982 75,114,022 70,549,145 21,901,780 Liabilities Bills payable 8,579,809 2,823,769 – 520,334 5,235,706 – – – – – Borrowings 89,261,788 83,980,814 1,804,423 3,381,433 – 31,706 31,706 31,706 – – Deposits and other accounts 472,811,335 63,087,708 41,961,473 13,410,693 19,468,426 81,918,302 78,843,408 83,028,889 45,546,219 45,546,217 Sub-ordinated loans 4,994,800 – 800 200 1,000 2,000 2,000 1,000,000 3,988,800 – Liabilities against assets subject to finance lease – – – – – – – – – – Deferred tax liabilities 526,430 1,491,068 – – (165,249) (5,867) (592,927) (200,595) – – Other liabilities 10,388,081 5,513,070 – – – 2,437,506 1,218,753 609,376 304,688 304,688
586,562,243 156,896,429 43,766,696 17,312,660 24,539,883 84,383,647 79,502,940 84,469,376 49,839,707 45,850,905
Net assets 32,576,950 (2,347,871) 45,420,571 17,180,929 31,030,080 (15,209,760) (30,901,958) (9,355,354) 20,709,438 (23,949,125)
Share Capital 12,602,602 Reserves 8,670,686 Unappropriated profit 4,084,206 Surplus on revaluation of assets 7,219,456
32,576,950
2015
Over 1 Over 3 Over 6 Over 1 Over 2 Over 3 Over 5 Upto 1 to 3 to 6 Months to to 2 to 3 to 5 to 10 Above 10 Rupees in ‘000 Total Month Months Months 1 Year Years Years Years Years Years
Assets Cash and balances with treasury banks 29,685,228 29,685,228 – – – – – – – – Balances with other banks 8,295,724 8,295,724 – – – – – – – – Lendings to financial institutions 812,898 – 289,193 523,705 – – – – – – Investments 268,020,706 23,121,443 48,432,298 24,393,641 49,745,638 16,618,588 31,125,389 43,125,738 30,573,153 884,818 Advances 199,930,812 32,760,751 40,370,323 33,828,924 27,336,462 13,502,206 11,359,846 22,703,658 5,687,802 12,380,840 Operating fixed assets 9,230,010 386,458 132,898 194,707 373,469 687,208 629,606 1,087,225 1,196,270 4,542,169 Assets held for sale – – – – – – – – – – Deferred tax assets – – – – – – – – – – Other assets 19,891,336 4,655,257 – – – 3,103,505 3,103,505 3,009,690 3,009,690 3,009,689
535,866,714 98,904,861 89,224,712 58,940,977 77,455,569 33,911,507 46,218,346 69,926,311 40,466,915 20,817,516 Liabilities Bills payable 6,094,885 2,005,936 – 369,632 3,719,317 – – – – – Borrowings 57,323,250 54,045,475 263,444 2,983,305 – 10,342 10,342 10,342 – – Deposits and other accounts 433,172,205 57,076,507 31,534,061 21,179,160 21,731,608 73,892,434 70,792,245 75,031,766 40,967,912 40,966,512 Sub-ordinated loans 4,996,800 – 800 200 1,000 2,000 2,000 502,000 4,488,800 – Liabilities against assets subject to finance lease – – – – – – – – – – Deferred tax liabilities 96,404 1,871,966 – – (119,594) (5,867) (592,927) (525,972) (531,202) – Other liabilities 7,330,227 3,890,234 – – – 1,719,998 859,999 429,999 215,000 214,997
509,013,771 118,890,118 31,798,305 24,532,297 25,332,331 75,618,907 71,071,659 75,448,135 45,140,510 41,181,509
Net assets 26,852,943 (19,985,257) 57,426,407 34,408,680 52,123,238 (41,707,400) (24,853,313) (5,521,824) (4,673,595) (20,363,993)
Share Capital 12,602,602 Reserves 6,445,888 Unappropriated loss 2,763,314 Surplus on revaluation of assets 5,041,139
26,852,943
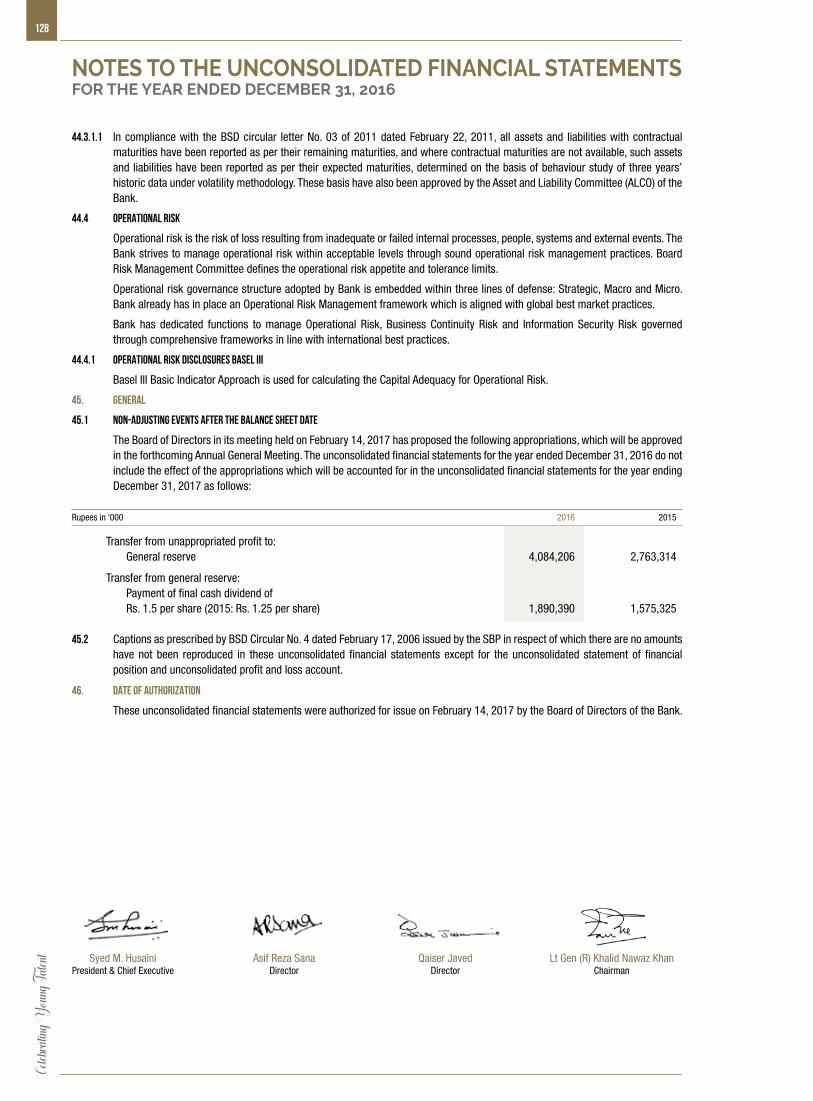
Celeb
rating
Youn
g Tale
nt128
44.3.1.1 In compliance with the BSD circular letter No. 03 of 2011 dated February 22, 2011, all assets and liabilities with contractual maturities have been reported as per their remaining maturities, and where contractual maturities are not available, such assets and liabilities have been reported as per their expected maturities, determined on the basis of behaviour study of three years’ historic data under volatility methodology. These basis have also been approved by the Asset and Liability Committee (ALCO) of the Bank.
44.4 OPERATIONAL RISK
Operational risk is the risk of loss resulting from inadequate or failed internal processes, people, systems and external events. The Bank strives to manage operational risk within acceptable levels through sound operational risk management practices. Board Risk Management Committee defines the operational risk appetite and tolerance limits.
Operational risk governance structure adopted by Bank is embedded within three lines of defense: Strategic, Macro and Micro. Bank already has in place an Operational Risk Management framework which is aligned with global best market practices.
Bank has dedicated functions to manage Operational Risk, Business Continuity Risk and Information Security Risk governed through comprehensive frameworks in line with international best practices.
44.4.1 OPERATIONAL RISK DISCLOSURES BASEL III
Basel III Basic Indicator Approach is used for calculating the Capital Adequacy for Operational Risk.
45. GENERAL
45.1 Non-adjusting events after the balance sheet date
The Board of Directors in its meeting held on February 14, 2017 has proposed the following appropriations, which will be approved in the forthcoming Annual General Meeting. The unconsolidated financial statements for the year ended December 31, 2016 do not include the effect of the appropriations which will be accounted for in the unconsolidated financial statements for the year ending December 31, 2017 as follows:
Rupees in ‘000 2016 2015
Transfer from unappropriated profit to: General reserve 4,084,206 2,763,314
Transfer from general reserve: Payment of final cash dividend of Rs. 1.5 per share (2015: Rs. 1.25 per share) 1,890,390 1,575,325 45.2 Captions as prescribed by BSD Circular No. 4 dated February 17, 2006 issued by the SBP in respect of which there are no amounts
have not been reproduced in these unconsolidated financial statements except for the unconsolidated statement of financial position and unconsolidated profit and loss account.
46. DATE OF AUTHORIZATION
These unconsolidated financial statements were authorized for issue on February 14, 2017 by the Board of Directors of the Bank.
Syed M. HusainiPresident & Chief Executive
Asif Reza SanaDirector
Qaiser JavedDirector
Lt Gen (R) Khalid Nawaz KhanChairman
NOTES TO THE UNCONSOLIDATED FINANCIAL STATEMENTSFOR THE YEAR ENDED DECEMBER 31, 2016
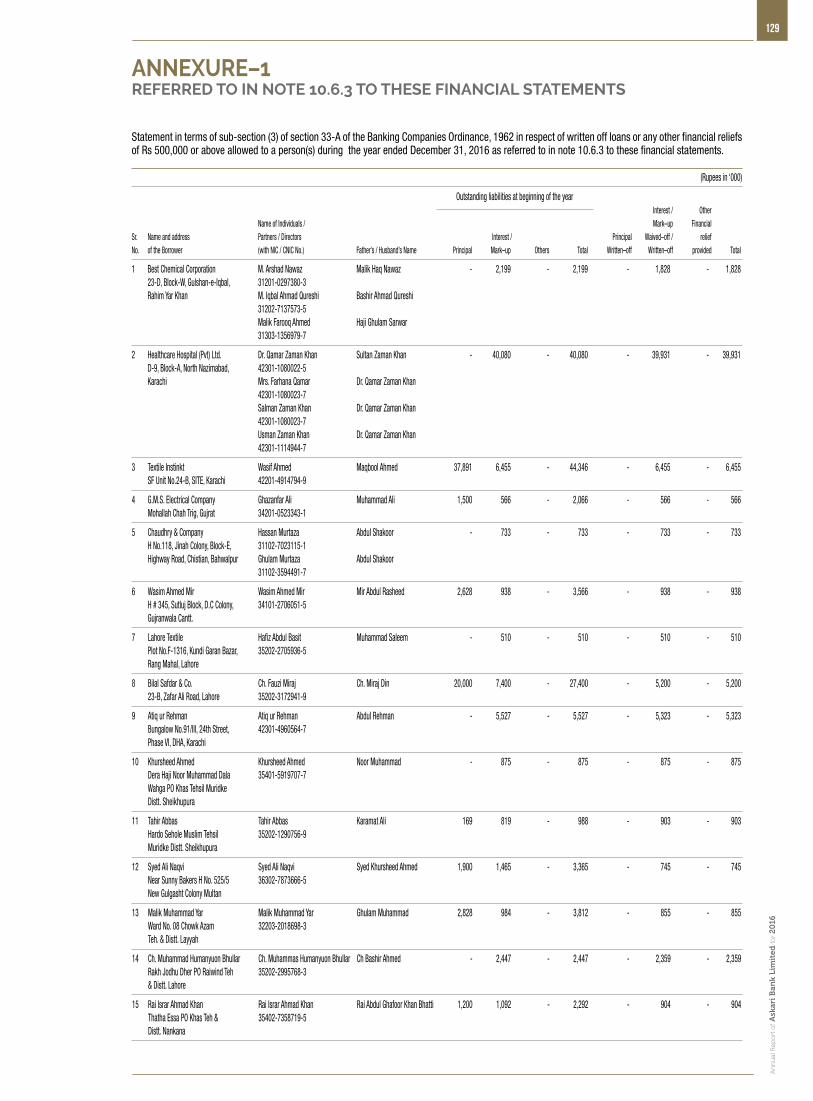
An
nu
al R
epo
rt o
f Ask
ari B
ank
Lim
ited
for 2
016
129
ANNEXURE–1REFERRED TO IN NOTE 10.6.3 TO THESE FINANCIAL STATEMENTS
Statement in terms of sub-section (3) of section 33-A of the Banking Companies Ordinance, 1962 in respect of written off loans or any other financial reliefs of Rs 500,000 or above allowed to a person(s) during the year ended December 31, 2016 as referred to in note 10.6.3 to these financial statements. (Rupees in ‘000)
Outstanding liabilities at beginning of the year Interest / Other Name of Individuals / Mark–up FinancialSr. Name and address Partners / Directors Interest / Principal Waived–off / reliefNo. of the Borrower (with NIC / CNIC No.) Father’s / Husband’s Name Principal Mark–up Others Total Written–off Written–off provided Total
1 Best Chemical Corporation M. Arshad Nawaz Malik Haq Nawaz - 2,199 - 2,199 - 1,828 - 1,828 23-D, Block-W, Gulshan-e-Iqbal, 31201-0297380-3 Rahim Yar Khan M. Iqbal Ahmad Qureshi Bashir Ahmad Qureshi 31202-7137573-5 Malik Farooq Ahmed Haji Ghulam Sarwar 31303-1356979-7
2 Healthcare Hospital (Pvt) Ltd. Dr. Qamar Zaman Khan Sultan Zaman Khan - 40,080 - 40,080 - 39,931 - 39,931 D-9, Block-A, North Nazimabad, 42301-1080022-5 Karachi Mrs. Farhana Qamar Dr. Qamar Zaman Khan 42301-1080023-7 Salman Zaman Khan Dr. Qamar Zaman Khan 42301-1080023-7 Usman Zaman Khan Dr. Qamar Zaman Khan 42301-1114944-7
3 Textile Instinkt Wasif Ahmed Maqbool Ahmed 37,891 6,455 - 44,346 - 6,455 - 6,455 SF Unit No.24-B, SITE, Karachi 42201-4914794-9
4 G.M.S. Electrical Company Ghazanfar Ali Muhammad Ali 1,500 566 - 2,066 - 566 - 566 Mohallah Chah Trig, Gujrat 34201-0523343-1
5 Chaudhry & Company Hassan Murtaza Abdul Shakoor - 733 - 733 - 733 - 733 H No.118, Jinah Colony, Block-E, 31102-7023115-1 Highway Road, Chistian, Bahwalpur Ghulam Murtaza Abdul Shakoor 31102-3594491-7
6 Wasim Ahmed Mir Wasim Ahmed Mir Mir Abdul Rasheed 2,628 938 - 3,566 - 938 - 938 H # 345, Sutluj Block, D.C Colony, 34101-2706051-5 Gujranwala Cantt.
7 Lahore Textile Hafiz Abdul Basit Muhammad Saleem - 510 - 510 - 510 - 510 Plot No.F-1316, Kundi Garan Bazar, 35202-2705936-5 Rang Mahal, Lahore
8 Bilal Safdar & Co. Ch. Fauzi Miraj Ch. Miraj Din 20,000 7,400 - 27,400 - 5,200 - 5,200 23-B, Zafar Ali Road, Lahore 35202-3172941-9
9 Atiq ur Rehman Atiq ur Rehman Abdul Rehman - 5,527 - 5,527 - 5,323 - 5,323 Bungalow No.91/III, 24th Street, 42301-4960564-7 Phase VI, DHA, Karachi
10 Khursheed Ahmed Khursheed Ahmed Noor Muhammad - 875 - 875 - 875 - 875 Dera Haji Noor Muhammad Dala 35401-5919707-7 Wahga PO Khas Tehsil Muridke Distt. Sheikhupura
11 Tahir Abbas Tahir Abbas Karamat Ali 169 819 - 988 - 903 - 903 Hardo Sehole Muslim Tehsil 35202-1290756-9 Muridke Distt. Sheikhupura
12 Syed Ali Naqvi Syed Ali Naqvi Syed Khursheed Ahmed 1,900 1,465 - 3,365 - 745 - 745 Near Sunny Bakers H No. 525/5 36302-7873666-5 New Gulgasht Colony Multan
13 Malik Muhammad Yar Malik Muhammad Yar Ghulam Muhammad 2,828 984 - 3,812 - 855 - 855 Ward No. 08 Chowk Azam 32203-2018698-3 Teh. & Distt. Layyah
14 Ch. Muhammad Humanyuon Bhullar Ch. Muhammas Humanyuon Bhullar Ch Bashir Ahmed - 2,447 - 2,447 - 2,359 - 2,359 Rakh Jodhu Dher PO Raiwind Teh 35202-2995768-3 & Distt. Lahore
15 Rai Israr Ahmad Khan Rai Israr Ahmad Khan Rai Abdul Ghafoor Khan Bhatti 1,200 1,092 - 2,292 - 904 - 904 Thatha Essa PO Khas Teh & 35402-7358719-5 Distt. Nankana
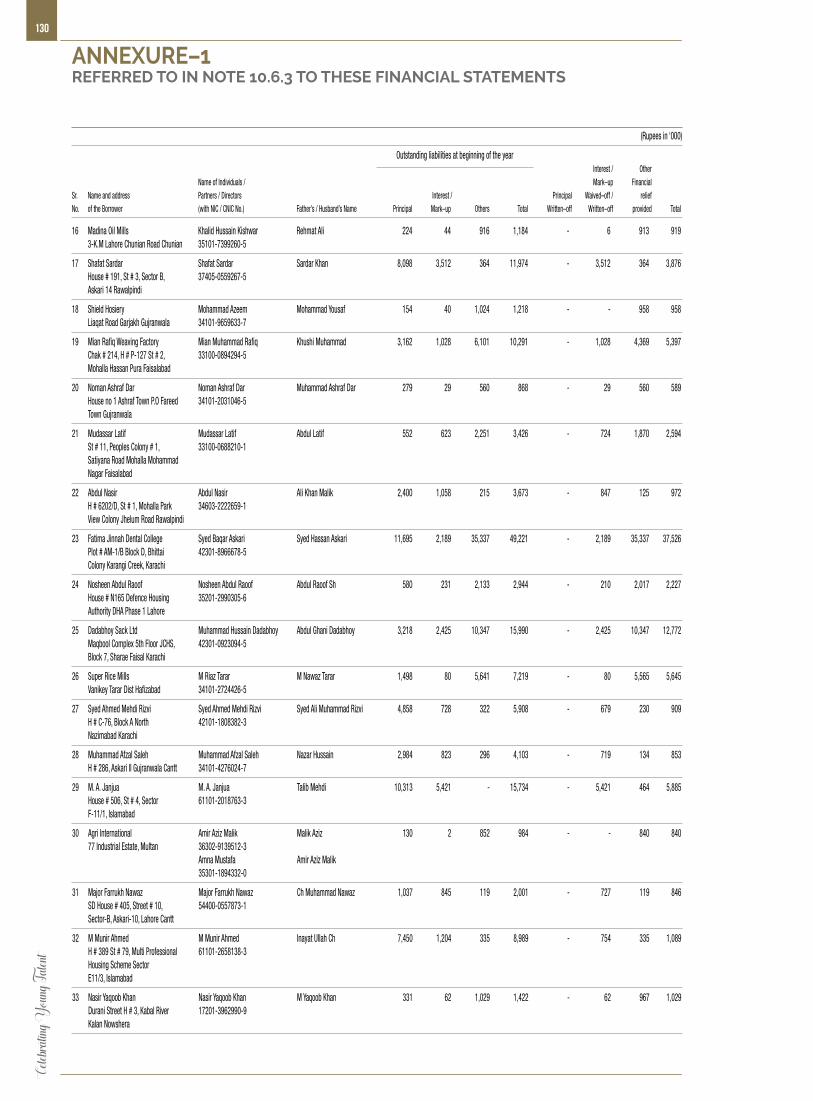
Celeb
rating
Youn
g Tale
nt130
(Rupees in ‘000)
Outstanding liabilities at beginning of the year Interest / Other Name of Individuals / Mark–up FinancialSr. Name and address Partners / Directors Interest / Principal Waived–off / reliefNo. of the Borrower (with NIC / CNIC No.) Father’s / Husband’s Name Principal Mark–up Others Total Written–off Written–off provided Total
16 Madina Oil Mills Khalid Hussain Kishwar Rehmat Ali 224 44 916 1,184 - 6 913 919 3-K.M Lahore Chunian Road Chunian 35101-7399260-5
17 Shafat Sardar Shafat Sardar Sardar Khan 8,098 3,512 364 11,974 - 3,512 364 3,876 House # 191, St # 3, Sector B, 37405-0559267-5 Askari 14 Rawalpindi
18 Shield Hosiery Mohammad Azeem Mohammad Yousaf 154 40 1,024 1,218 - - 958 958 Liaqat Road Garjakh Gujranwala 34101-9659633-7
19 Mian Rafiq Weaving Factory Mian Muhammad Rafiq Khushi Muhammad 3,162 1,028 6,101 10,291 - 1,028 4,369 5,397 Chak # 214, H # P-127 St # 2, 33100-0894294-5 Mohalla Hassan Pura Faisalabad
20 Noman Ashraf Dar Noman Ashraf Dar Muhammad Ashraf Dar 279 29 560 868 - 29 560 589 House no 1 Ashraf Town P.O Fareed 34101-2031046-5 Town Gujranwala
21 Mudassar Latif Mudassar Latif Abdul Latif 552 623 2,251 3,426 - 724 1,870 2,594 St # 11, Peoples Colony # 1, 33100-0688210-1 Satiyana Road Mohalla Mohammad Nagar Faisalabad
22 Abdul Nasir Abdul Nasir Ali Khan Malik 2,400 1,058 215 3,673 - 847 125 972 H # 6202/D, St # 1, Mohalla Park 34603-2222659-1 View Colony Jhelum Road Rawalpindi
23 Fatima Jinnah Dental College Syed Baqar Askari Syed Hassan Askari 11,695 2,189 35,337 49,221 - 2,189 35,337 37,526 Plot # AM-1/B Block D, Bhittai 42301-8966678-5 Colony Karangi Creek, Karachi
24 Nosheen Abdul Raoof Nosheen Abdul Raoof Abdul Raoof Sh 580 231 2,133 2,944 - 210 2,017 2,227 House # N165 Defence Housing 35201-2990305-6 Authority DHA Phase 1 Lahore
25 Dadabhoy Sack Ltd Muhammad Hussain Dadabhoy Abdul Ghani Dadabhoy 3,218 2,425 10,347 15,990 - 2,425 10,347 12,772 Maqbool Complex 5th Floor JCHS, 42301-0923094-5 Block 7, Sharae Faisal Karachi
26 Super Rice Mills M Riaz Tarar M Nawaz Tarar 1,498 80 5,641 7,219 - 80 5,565 5,645 Vanikey Tarar Dist Hafizabad 34101-2724426-5
27 Syed Ahmed Mehdi Rizvi Syed Ahmed Mehdi Rizvi Syed Ali Muhammad Rizvi 4,858 728 322 5,908 - 679 230 909 H # C-76, Block A North 42101-1808382-3 Nazimabad Karachi
28 Muhammad Afzal Saleh Muhammad Afzal Saleh Nazar Hussain 2,984 823 296 4,103 - 719 134 853 H # 286, Askari II Gujranwala Cantt 34101-4276024-7
29 M. A. Janjua M. A. Janjua Talib Mehdi 10,313 5,421 - 15,734 - 5,421 464 5,885 House # 506, St # 4, Sector 61101-2018763-3 F-11/1, Islamabad
30 Agri International Amir Aziz Malik Malik Aziz 130 2 852 984 - - 840 840 77 Industrial Estate, Multan 36302-9139512-3 Amna Mustafa Amir Aziz Malik 35301-1894332-0
31 Major Farrukh Nawaz Major Farrukh Nawaz Ch Muhammad Nawaz 1,037 845 119 2,001 - 727 119 846 SD House # 405, Street # 10, 54400-0557873-1 Sector-B, Askari-10, Lahore Cantt
32 M Munir Ahmed M Munir Ahmed Inayat Ullah Ch 7,450 1,204 335 8,989 - 754 335 1,089 H # 389 St # 79, Multi Professional 61101-2658138-3 Housing Scheme Sector E11/3, Islamabad
33 Nasir Yaqoob Khan Nasir Yaqoob Khan M Yaqoob Khan 331 62 1,029 1,422 - 62 967 1,029 Durani Street H # 3, Kabal River 17201-3962990-9 Kalan Nowshera
ANNEXURE–1REFERRED TO IN NOTE 10.6.3 TO THESE FINANCIAL STATEMENTS
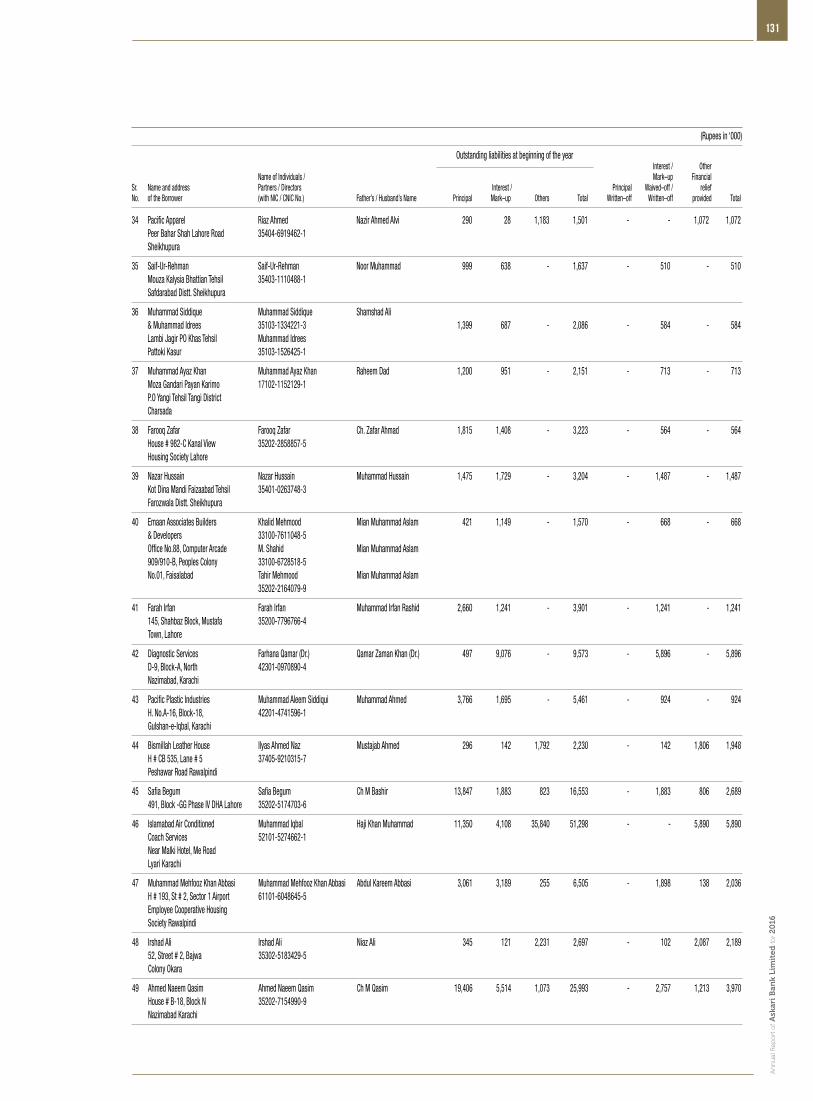
An
nu
al R
epo
rt o
f Ask
ari B
ank
Lim
ited
for 2
016
131
(Rupees in ‘000)
Outstanding liabilities at beginning of the year Interest / Other Name of Individuals / Mark–up FinancialSr. Name and address Partners / Directors Interest / Principal Waived–off / reliefNo. of the Borrower (with NIC / CNIC No.) Father’s / Husband’s Name Principal Mark–up Others Total Written–off Written–off provided Total
34 Pacific Apparel Riaz Ahmed Nazir Ahmed Alvi 290 28 1,183 1,501 - - 1,072 1,072 Peer Bahar Shah Lahore Road 35404-6919462-1 Sheikhupura
35 Saif-Ur-Rehman Saif-Ur-Rehman Noor Muhammad 999 638 - 1,637 - 510 - 510 Mouza Kalysia Bhattian Tehsil 35403-1110488-1 Safdarabad Distt. Sheikhupura
36 Muhammad Siddique Muhammad Siddique Shamshad Ali & Muhammad Idrees 35103-1334221-3 1,399 687 - 2,086 - 584 - 584 Lambi Jagir PO Khas Tehsil Muhammad Idrees Pattoki Kasur 35103-1526425-1
37 Muhammad Ayaz Khan Muhammad Ayaz Khan Raheem Dad 1,200 951 - 2,151 - 713 - 713 Moza Gandari Payan Karimo 17102-1152129-1 P.O Yangi Tehsil Tangi District Charsada
38 Farooq Zafar Farooq Zafar Ch. Zafar Ahmad 1,815 1,408 - 3,223 - 564 - 564 House # 982-C Kanal View 35202-2858857-5 Housing Society Lahore
39 Nazar Hussain Nazar Hussain Muhammad Hussain 1,475 1,729 - 3,204 - 1,487 - 1,487 Kot Dina Mandi Faizaabad Tehsil 35401-0263748-3 Farozwala Distt. Sheikhupura
40 Emaan Associates Builders Khalid Mehmood Mian Muhammad Aslam 421 1,149 - 1,570 - 668 - 668 & Developers 33100-7611048-5 Office No.88, Computer Arcade M. Shahid Mian Muhammad Aslam 909/910-B, Peoples Colony 33100-6728518-5 No.01, Faisalabad Tahir Mehmood Mian Muhammad Aslam 35202-2164079-9
41 Farah Irfan Farah Irfan Muhammad Irfan Rashid 2,660 1,241 - 3,901 - 1,241 - 1,241 145, Shahbaz Block, Mustafa 35200-7796766-4 Town, Lahore
42 Diagnostic Services Farhana Qamar (Dr.) Qamar Zaman Khan (Dr.) 497 9,076 - 9,573 - 5,896 - 5,896 D-9, Block-A, North 42301-0970890-4 Nazimabad, Karachi
43 Pacific Plastic Industries Muhammad Aleem Siddiqui Muhammad Ahmed 3,766 1,695 - 5,461 - 924 - 924 H. No.A-16, Block-18, 42201-4741596-1 Gulshan-e-Iqbal, Karachi
44 Bismillah Leather House Ilyas Ahmed Naz Mustajab Ahmed 296 142 1,792 2,230 - 142 1,806 1,948 H # CB 535, Lane # 5 37405-9210315-7 Peshawar Road Rawalpindi
45 Safia Begum Safia Begum Ch M Bashir 13,847 1,883 823 16,553 - 1,883 806 2,689 491, Block -GG Phase IV DHA Lahore 35202-5174703-6
46 Islamabad Air Conditioned Muhammad Iqbal Haji Khan Muhammad 11,350 4,108 35,840 51,298 - - 5,890 5,890 Coach Services 52101-5274662-1 Near Malki Hotel, Me Road Lyari Karachi
47 Muhammad Mehfooz Khan Abbasi Muhammad Mehfooz Khan Abbasi Abdul Kareem Abbasi 3,061 3,189 255 6,505 - 1,898 138 2,036 H # 193, St # 2, Sector 1 Airport 61101-6048645-5 Employee Cooperative Housing Society Rawalpindi
48 Irshad Ali Irshad Ali Niaz Ali 345 121 2,231 2,697 - 102 2,087 2,189 52, Street # 2, Bajwa 35302-5183429-5 Colony Okara
49 Ahmed Naeem Qasim Ahmed Naeem Qasim Ch M Qasim 19,406 5,514 1,073 25,993 - 2,757 1,213 3,970 House # B-18, Block N 35202-7154990-9 Nazimabad Karachi
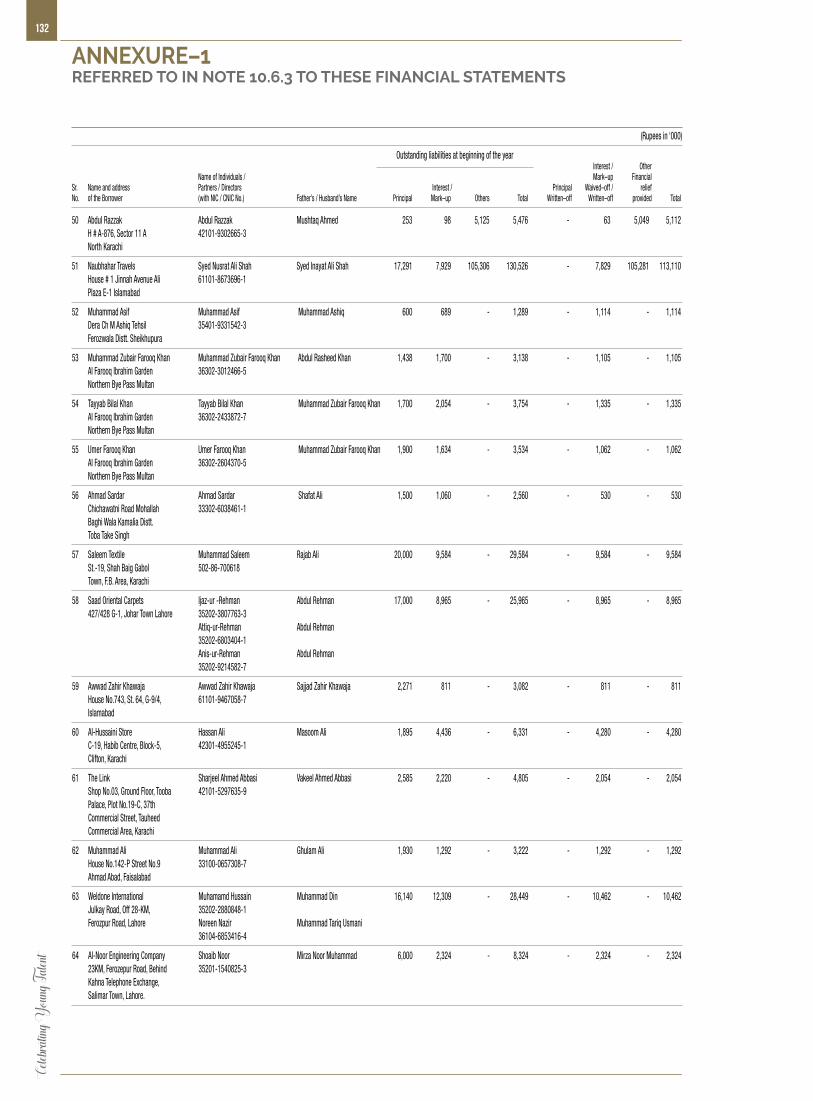
Celeb
rating
Youn
g Tale
nt132
50 Abdul Razzak Abdul Razzak Mushtaq Ahmed 253 98 5,125 5,476 - 63 5,049 5,112 H # A-876, Sector 11 A 42101-9302665-3 North Karachi
51 Naubhahar Travels Syed Nusrat Ali Shah Syed Inayat Ali Shah 17,291 7,929 105,306 130,526 - 7,829 105,281 113,110 House # 1 Jinnah Avenue Ali 61101-8673696-1 Plaza E-1 Islamabad
52 Muhammad Asif Muhammad Asif Muhammad Ashiq 600 689 - 1,289 - 1,114 - 1,114 Dera Ch M Ashiq Tehsil 35401-9331542-3 Ferozwala Distt. Sheikhupura
53 Muhammad Zubair Farooq Khan Muhammad Zubair Farooq Khan Abdul Rasheed Khan 1,438 1,700 - 3,138 - 1,105 - 1,105 Al Farooq Ibrahim Garden 36302-3012466-5 Northern Bye Pass Multan
54 Tayyab Bilal Khan Tayyab Bilal Khan Muhammad Zubair Farooq Khan 1,700 2,054 - 3,754 - 1,335 - 1,335 Al Farooq Ibrahim Garden 36302-2433872-7 Northern Bye Pass Multan
55 Umer Farooq Khan Umer Farooq Khan Muhammad Zubair Farooq Khan 1,900 1,634 - 3,534 - 1,062 - 1,062 Al Farooq Ibrahim Garden 36302-2604370-5 Northern Bye Pass Multan
56 Ahmad Sardar Ahmad Sardar Shafat Ali 1,500 1,060 - 2,560 - 530 - 530 Chichawatni Road Mohallah 33302-6038461-1 Baghi Wala Kamalia Distt. Toba Take Singh
57 Saleem Textile Muhammad Saleem Rajab Ali 20,000 9,584 - 29,584 - 9,584 - 9,584 St.-19, Shah Baig Gabol 502-86-700618 Town, F.B. Area, Karachi
58 Saad Oriental Carpets Ijaz-ur -Rehman Abdul Rehman 17,000 8,965 - 25,965 - 8,965 - 8,965 427/428 G-1, Johar Town Lahore 35202-3807763-3 Attiq-ur-Rehman Abdul Rehman 35202-6803404-1 Anis-ur-Rehman Abdul Rehman 35202-9214582-7
59 Awwad Zahir Khawaja Awwad Zahir Khawaja Sajjad Zahir Khawaja 2,271 811 - 3,082 - 811 - 811 House No.743, St. 64, G-9/4, 61101-9467058-7 Islamabad
60 Al-Hussaini Store Hassan Ali Masoom Ali 1,895 4,436 - 6,331 - 4,280 - 4,280 C-19, Habib Centre, Block-5, 42301-4955245-1 Clifton, Karachi
61 The Link Sharjeel Ahmed Abbasi Vakeel Ahmed Abbasi 2,585 2,220 - 4,805 - 2,054 - 2,054 Shop No.03, Ground Floor, Tooba 42101-5297635-9 Palace, Plot No.19-C, 37th Commercial Street, Tauheed Commercial Area, Karachi
62 Muhammad Ali Muhammad Ali Ghulam Ali 1,930 1,292 - 3,222 - 1,292 - 1,292 House No.142-P Street No.9 33100-0657308-7 Ahmad Abad, Faisalabad
63 Weldone International Muhamamd Hussain Muhammad Din 16,140 12,309 - 28,449 - 10,462 - 10,462 Julkay Road, Off 28-KM, 35202-2880848-1 Ferozpur Road, Lahore Noreen Nazir Muhammad Tariq Usmani 36104-6853416-4
64 Al-Noor Engineering Company Shoaib Noor Mirza Noor Muhammad 6,000 2,324 - 8,324 - 2,324 - 2,324 23KM, Ferozepur Road, Behind 35201-1540825-3 Kahna Telephone Exchange, Salimar Town, Lahore.
(Rupees in ‘000)
Outstanding liabilities at beginning of the year Interest / Other Name of Individuals / Mark–up FinancialSr. Name and address Partners / Directors Interest / Principal Waived–off / reliefNo. of the Borrower (with NIC / CNIC No.) Father’s / Husband’s Name Principal Mark–up Others Total Written–off Written–off provided Total
ANNEXURE–1REFERRED TO IN NOTE 10.6.3 TO THESE FINANCIAL STATEMENTS

An
nu
al R
epo
rt o
f Ask
ari B
ank
Lim
ited
for 2
016
133
65 Qamar Tanning Company Sheikh Aftab Ahmed Sheikh Abdul Latif 7,997 759 - 8,756 - 568 - 568 135/9-L, Arifwala, Shaiwal 36502-3738269-5 Sheikh Iftikhar Ahmed Sheikh Abdul Latif 36502-9512028-5 Qamar Aftab Sheikh Aftab Ahmed 36502-0698257-7 Muhammad Bashir Sheikh Abdul Latif 36502-0973309-1 Mst. Kaneez Fatima Sheikh Aftab Ahmed 36502-1896222-4 Sheikh Muhammad Waheed Sheikh Muhammad Saeed 36502-8472318-3 Mst. Balqees Iftikhar Sheikh Iftikhar Ahmed 36502-1555534-2 Mst. Robeena Shaheen Muhammad Bashir 36502-0696137-6 Mubashar Hassan Farooq Ahmed 36502-5858415-9 Sheikh Abdul Latif Sheikh Muhammad Siddique 36502-7410207-7
66 Sheikh Javed Ahmed Sheikh Javaid Ahmed Sheikh Abdul Latif 30,801 30,158 - 60,959 - 19,158 - 19,158 Engineers & Contractors 35202-2223703-5 338-E, Gulshan-e-Ravi, Lahore Sheikh Muhammad Nassar Javaid Sheikh Javaid Ahmed 35202-8380672-9 Muhammad Saqib Javaid Sheikh Javaid Ahmed 35202-2714201-9 Shaikh Marieje Javaid Sheikh Javaid Ahmed 35202-2232253-5 Anwari Begum Shaikh Javaid Ahmed 35202-7692903-8 Shazia Zaffer Shaikh Zaffer Iqbal N.A.
67 New Mehran Gasoline (CNG) Station Abdul Qayyum Qureshi Muhammad Mehfooz Qureshi 8,248 10,497 - 18,745 - 9,076 - 9,076 Gulf Homes, D-1597, Shaheed 45504-1145105-9 Mohtarama Benazir Bhutto Road, Sukkur
68 Ali Javed Khan Ali Javed Khan Javed Ahmed Khan 98 1 632 731 - - 630 630 Askari Homes 1 Gujranwala Cantt 34101-8074291-7
69 Riaz Ahmad Riaz Ahmad Al Bodad Urf Dad Muhammad 188 41 1,546 1,775 - 41 1,475 1,516 6-B, Satellite Town Sadiqabad 53403-3135040-1
70 Johar Asma Johar Asma Mushtaq Hussain 298 24 526 848 - - 523 523 P.O Karim Pura H # 2969-T Peshawar 17301-1215651-0
71 Asad Ullah Khan Asad Ullah Khan Nawab Dawood Khan 244 34 1,275 1,553 - - 1,259 1,259 Flat # 14-A, Askari Appartment 42301-9375686-9 School Road Cantt Karachi
72 Yasir Mehmood Yasir Mehmood Muhammad Qayyum 767 348 2,336 3,451 - 290 2,297 2,587 756 Zeeshan Colony Dhoke 37405-2514726-1 Chaudharian Rwp
73 Fateh Mubeen Fateh Mubeen Fateh Alim 48 519 - 567 - 519 - 519 H # 73/B3 Gulberg III Liberty 35202-2428484-1 Market Lahore
TOTAL 331,098 225,479 227,785 784,362 - 189,368 195,040 384,408
(Rupees in ‘000)
Outstanding liabilities at beginning of the year Interest / Other Name of Individuals / Mark–up FinancialSr. Name and address Partners / Directors Interest / Principal Waived–off / reliefNo. of the Borrower (with NIC / CNIC No.) Father’s / Husband’s Name Principal Mark–up Others Total Written–off Written–off provided Total
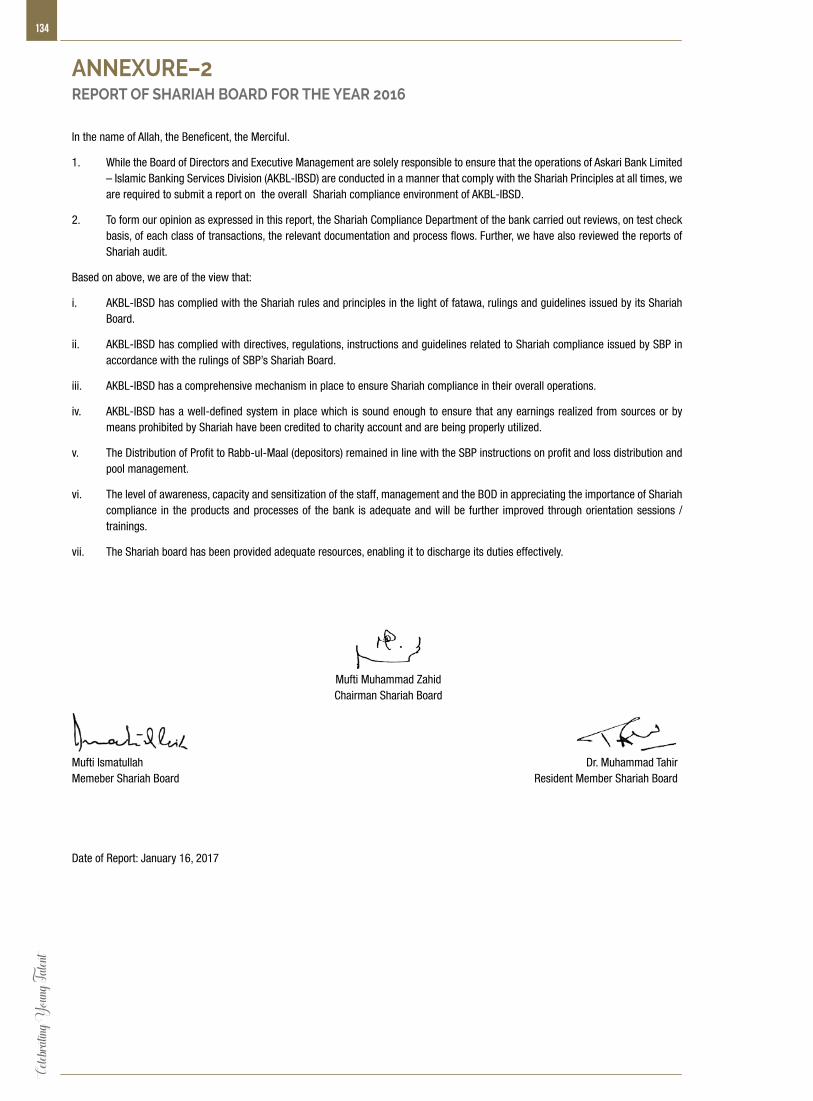
Celeb
rating
Youn
g Tale
nt134
In the name of Allah, the Beneficent, the Merciful.
1. While the Board of Directors and Executive Management are solely responsible to ensure that the operations of Askari Bank Limited – Islamic Banking Services Division (AKBL-IBSD) are conducted in a manner that comply with the Shariah Principles at all times, we are required to submit a report on the overall Shariah compliance environment of AKBL-IBSD.
2. To form our opinion as expressed in this report, the Shariah Compliance Department of the bank carried out reviews, on test check basis, of each class of transactions, the relevant documentation and process flows. Further, we have also reviewed the reports of Shariah audit.
Based on above, we are of the view that:
i. AKBL-IBSD has complied with the Shariah rules and principles in the light of fatawa, rulings and guidelines issued by its Shariah Board.
ii. AKBL-IBSD has complied with directives, regulations, instructions and guidelines related to Shariah compliance issued by SBP in accordance with the rulings of SBP’s Shariah Board.
iii. AKBL-IBSD has a comprehensive mechanism in place to ensure Shariah compliance in their overall operations.
iv. AKBL-IBSD has a well-defined system in place which is sound enough to ensure that any earnings realized from sources or by means prohibited by Shariah have been credited to charity account and are being properly utilized.
v. The Distribution of Profit to Rabb-ul-Maal (depositors) remained in line with the SBP instructions on profit and loss distribution and pool management.
vi. The level of awareness, capacity and sensitization of the staff, management and the BOD in appreciating the importance of Shariah compliance in the products and processes of the bank is adequate and will be further improved through orientation sessions / trainings.
vii. The Shariah board has been provided adequate resources, enabling it to discharge its duties effectively.
Mufti Muhammad Zahid Chairman Shariah Board
Mufti Ismatullah Dr. Muhammad TahirMemeber Shariah Board Resident Member Shariah Board
Date of Report: January 16, 2017
ANNEXURE–2REPORT OF SHARIAH BOARD FOR THE YEAR 2016
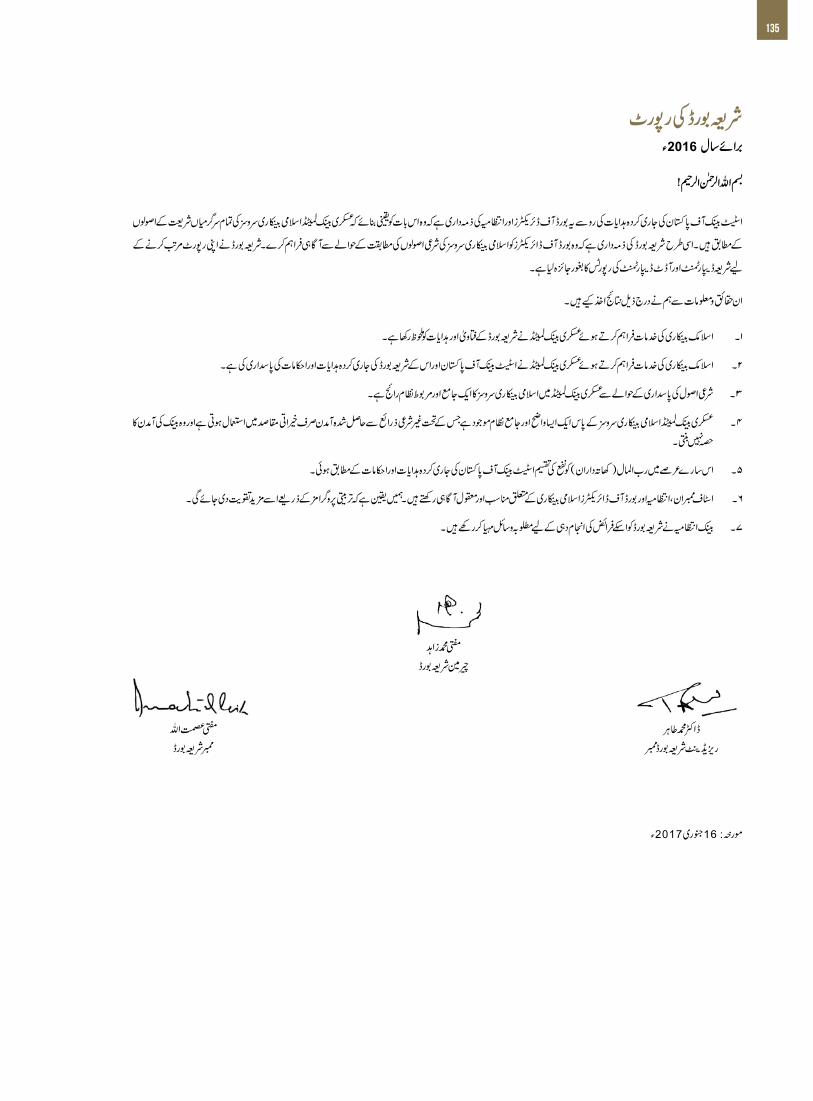
An
nu
al R
epo
rt o
f Ask
ari B
ank
Lim
ited
for 2
016
135
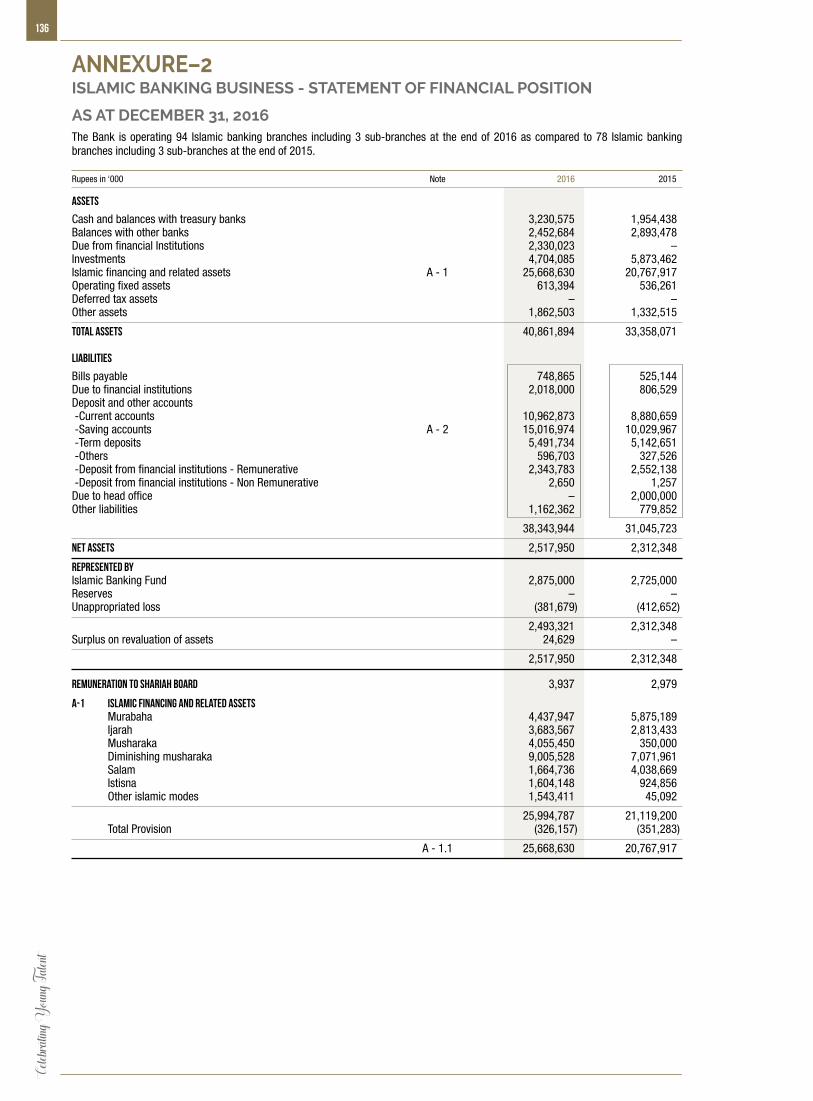
Celeb
rating
Youn
g Tale
nt136
ANNEXURE–2ISLAMIC BANKING BUSINESS - STATEMENT OF FINANCIAL POSITION
AS AT DECEMBER 31, 2016The Bank is operating 94 Islamic banking branches including 3 sub-branches at the end of 2016 as compared to 78 Islamic banking branches including 3 sub-branches at the end of 2015.
Rupees in ‘000 Note 2016 2015
ASSETS
Cash and balances with treasury banks 3,230,575 1,954,438 Balances with other banks 2,452,684 2,893,478 Due from financial Institutions 2,330,023 –Investments 4,704,085 5,873,462 Islamic financing and related assets A - 1 25,668,630 20,767,917 Operating fixed assets 613,394 536,261 Deferred tax assets – – Other assets 1,862,503 1,332,515
Total Assets 40,861,894 33,358,071 LIABILITIES
Bills payable 748,865 525,144 Due to financial institutions 2,018,000 806,529 Deposit and other accounts -Current accounts 10,962,873 8,880,659 -Saving accounts A - 2 15,016,974 10,029,967 -Term deposits 5,491,734 5,142,651 -Others 596,703 327,526 -Deposit from financial institutions - Remunerative 2,343,783 2,552,138 -Deposit from financial institutions - Non Remunerative 2,650 1,257 Due to head office – 2,000,000 Other liabilities 1,162,362 779,852
38,343,944 31,045,723
NET ASSETS 2,517,950 2,312,348
REPRESENTED BY Islamic Banking Fund 2,875,000 2,725,000 Reserves – –Unappropriated loss (381,679) (412,652)
2,493,321 2,312,348 Surplus on revaluation of assets 24,629 –
2,517,950 2,312,348
Remuneration to Shariah Board 3,937 2,979
A-1 Islamic Financing and Related Assets Murabaha 4,437,947 5,875,189 Ijarah 3,683,567 2,813,433 Musharaka 4,055,450 350,000 Diminishing musharaka 9,005,528 7,071,961 Salam 1,664,736 4,038,669 Istisna 1,604,148 924,856 Other islamic modes 1,543,411 45,092
25,994,787 21,119,200 Total Provision (326,157) (351,283)
A - 1.1 25,668,630 20,767,917
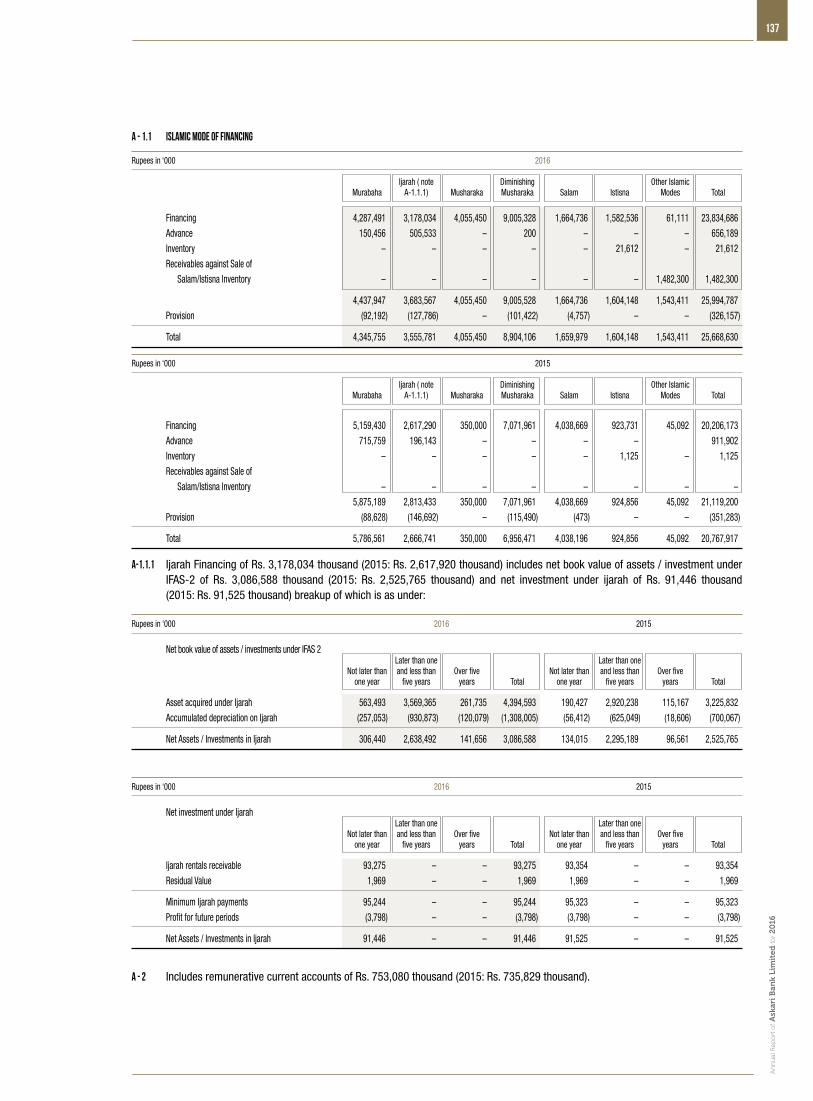
An
nu
al R
epo
rt o
f Ask
ari B
ank
Lim
ited
for 2
016
137
A - 1.1 Islamic Mode of Financing
Rupees in ‘000 2016
Ijarah ( note Diminishing Other Islamic Murabaha A-1.1.1) Musharaka Musharaka Salam Istisna Modes Total
Financing 4,287,491 3,178,034 4,055,450 9,005,328 1,664,736 1,582,536 61,111 23,834,686
Advance 150,456 505,533 – 200 – – – 656,189
Inventory – – – – – 21,612 – 21,612
Receivables against Sale of
Salam/Istisna Inventory – – – – – – 1,482,300 1,482,300
4,437,947 3,683,567 4,055,450 9,005,528 1,664,736 1,604,148 1,543,411 25,994,787
Provision (92,192) (127,786) – (101,422) (4,757) – – (326,157)
Total 4,345,755 3,555,781 4,055,450 8,904,106 1,659,979 1,604,148 1,543,411 25,668,630
Rupees in ‘000 2015
Ijarah ( note Diminishing Other Islamic Murabaha A-1.1.1) Musharaka Musharaka Salam Istisna Modes Total
Financing 5,159,430 2,617,290 350,000 7,071,961 4,038,669 923,731 45,092 20,206,173
Advance 715,759 196,143 – – – – 911,902
Inventory – – – – – 1,125 – 1,125
Receivables against Sale of
Salam/Istisna Inventory – – – – – – – –
5,875,189 2,813,433 350,000 7,071,961 4,038,669 924,856 45,092 21,119,200
Provision (88,628) (146,692) – (115,490) (473) – – (351,283)
Total 5,786,561 2,666,741 350,000 6,956,471 4,038,196 924,856 45,092 20,767,917
A-1.1.1 Ijarah Financing of Rs. 3,178,034 thousand (2015: Rs. 2,617,920 thousand) includes net book value of assets / investment under IFAS-2 of Rs. 3,086,588 thousand (2015: Rs. 2,525,765 thousand) and net investment under ijarah of Rs. 91,446 thousand (2015: Rs. 91,525 thousand) breakup of which is as under:
Rupees in ‘000 2016 2015
Net book value of assets / investments under IFAS 2 Later than one Later than one Not later than and less than Over five Not later than and less than Over five one year five years years Total one year five years years Total
Asset acquired under Ijarah 563,493 3,569,365 261,735 4,394,593 190,427 2,920,238 115,167 3,225,832
Accumulated depreciation on Ijarah (257,053) (930,873) (120,079) (1,308,005) (56,412) (625,049) (18,606) (700,067)
Net Assets / Investments in Ijarah 306,440 2,638,492 141,656 3,086,588 134,015 2,295,189 96,561 2,525,765
Rupees in ‘000 2016 2015
Net investment under Ijarah Later than one Later than one Not later than and less than Over five Not later than and less than Over five one year five years years Total one year five years years Total
Ijarah rentals receivable 93,275 – – 93,275 93,354 – – 93,354
Residual Value 1,969 – – 1,969 1,969 – – 1,969
Minimum Ijarah payments 95,244 – – 95,244 95,323 – – 95,323
Profit for future periods (3,798) – – (3,798) (3,798) – – (3,798)
Net Assets / Investments in Ijarah 91,446 – – 91,446 91,525 – – 91,525
A - 2 Includes remunerative current accounts of Rs. 753,080 thousand (2015: Rs. 735,829 thousand).
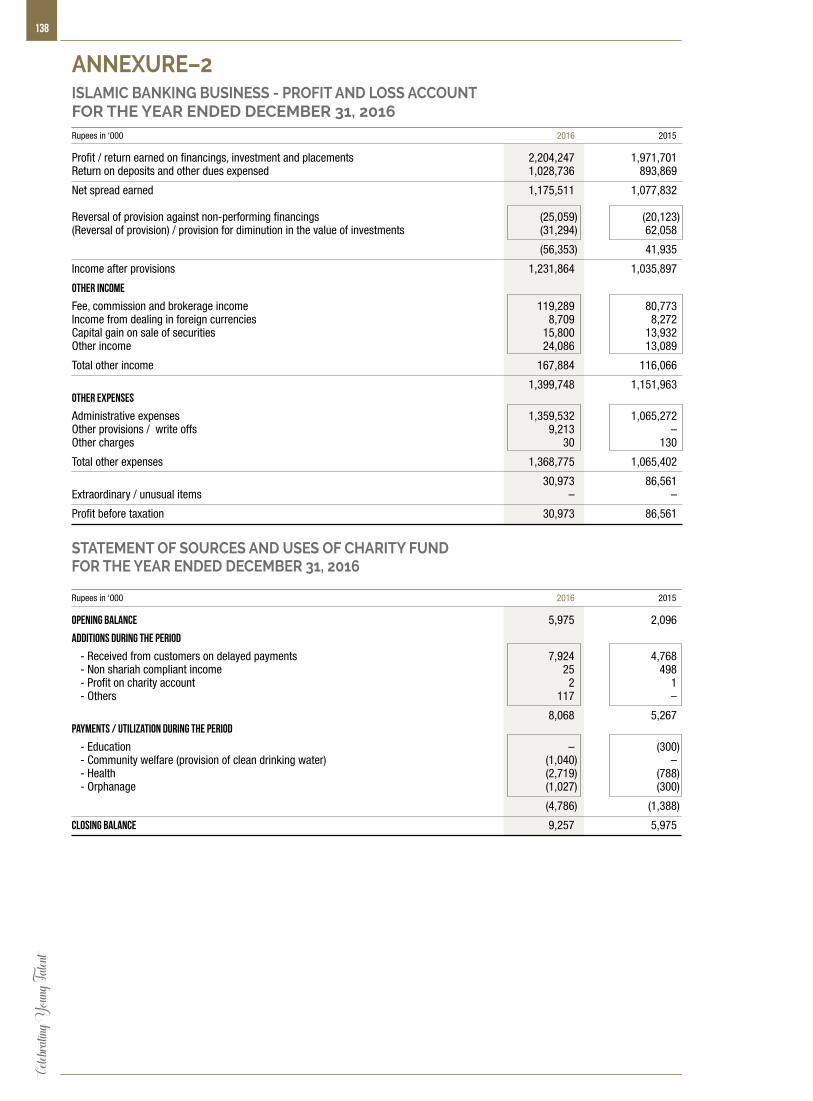
Celeb
rating
Youn
g Tale
nt138
STATEMENT OF SOURCES AND USES OF CHARITY FUND FOR THE YEAR ENDED DECEMBER 31, 2016
Rupees in ‘000 2016 2015
Opening balance 5,975 2,096
Additions during the period
- Received from customers on delayed payments 7,924 4,768 - Non shariah compliant income 25 498 - Profit on charity account 2 1 - Others 117 –
8,068 5,267 Payments / Utilization during the period
- Education – (300) - Community welfare (provision of clean drinking water) (1,040) – - Health (2,719) (788) - Orphanage (1,027) (300)
(4,786) (1,388)
Closing Balance 9,257 5,975
Rupees in ‘000 2016 2015
Profit / return earned on financings, investment and placements 2,204,247 1,971,701 Return on deposits and other dues expensed 1,028,736 893,869
Net spread earned 1,175,511 1,077,832 Reversal of provision against non-performing financings (25,059) (20,123)(Reversal of provision) / provision for diminution in the value of investments (31,294) 62,058
(56,353) 41,935
Income after provisions 1,231,864 1,035,897
Other Income
Fee, commission and brokerage income 119,289 80,773 Income from dealing in foreign currencies 8,709 8,272 Capital gain on sale of securities 15,800 13,932 Other income 24,086 13,089
Total other income 167,884 116,066
1,399,748 1,151,963 Other expenses
Administrative expenses 1,359,532 1,065,272 Other provisions / write offs 9,213 – Other charges 30 130
Total other expenses 1,368,775 1,065,402
30,973 86,561 Extraordinary / unusual items – –
Profit before taxation 30,973 86,561
ANNEXURE–2ISLAMIC BANKING BUSINESS - PROFIT AND LOSS ACCOUNTFOR THE YEAR ENDED DECEMBER 31, 2016
An
nu
al R
epo
rt o
f Ask
ari B
ank
Lim
ited
for 2
016
139
ANNEXURE–2ISLAMIC BANKING BUSINESS - NOTES TO THE ACCOUNTSFOR THE YEAR ENDED DECEMBER 31, 2016
Disclosure for profit and loss distribution and pool management
1.1 Bank generates deposit on the basis of following two modes:
1. Qard
2. Mudaraba
Deposits taken on Qard Basis are classified as ‘Current Account’ and deposits generated on Mudaraba basis are classified as ‘Savings Account’ and ‘Fixed Deposit Accounts’.
The Bank also accepted / acquired inter-bank funds, for short term liquidity requirement under Musharaka mode. Profits realized in Musharaka pools are distributed in pre agreed profit sharing ratio. Besides above, the bank also accept funds from State Bank of Pakistan in Islamic Export Refinance pool under Musharaka mode. The features, risk and reward of this Musharaka pool are in accordance with the SBP IERS scheme and circulars issued from time to time.
Asset pools are created at the Bank’s discretion and the Bank can add, amend, and transfer an asset to any other pool in the interest of deposit holders. During the year following three Mudaraba based pools were maintained by the Bank having below mentioned key features:
a. General Pool
The objective of the pool is to invest funds on a Shariah Compliant basis and maximize profits for the Rabb-ul-Mal on a Gross Mudarabah Basis. In this pool, portfolio diversification strategy has been used to mitigate the risk of loss. Diversification may marginally reduce returns but it also spreads risk by reducing chances of loss.
b. Foreign Currency Pool
The objective of the pool is to invest funds on a Shariah Compliant basis and maximize profits for the Rabb-ul-Mal i.e. depositors in foreign currency: US dollars on a Gross Mudaraba Basis. Due to dearth and limitations of foreign denominated investment opportunities available to Islamic Banks operating in Pakistan, the returns would be linked with an earning assets pool comprising of Shariah compliant assets, with reliance mainly on placement(s) with other known Islamic Financial Institutions.
c. Financial Institutions (FI) Pool
The objective of the pool is to obtain and invest funds primarily from conventional side of the Bank, on a Shariah Compliant Gross Mudaraba basis, mainly to meet liquidity needs in line with business requirements and banking norms. The FI pool is linked with an earning assets pool comprising mainly of investments in sovereign risk, i.e. GOP guaranteed SLR eligible Sukuk.
Under the above Mudaraba based pools, the Bank accepted funds on Mudaraba basis from depositors (Rabb-ul-Mal) where the Bank acted as Manager (Mudarib) and invested the funds in Shariah Compliant modes of financings, investments and placements. Also, as allowed, the Bank at its discretion commingled its own funds including current accounts as equity with the depositor’s funds in all the pools. However, for investment purposes, Rabb-ul-Mal’s funds were given priority over own funds (equity). Unutilized portion of equity after commingling with the deposit in a pool is mainly invested in Sukuk.
The net profit of each deposit pool is calculated on all the remunerative assets booked by utilizing the funds from the pool after deduction of direct expenses as approved by Shariah Board, if any. The directly related costs comprise of depreciation on Ijarah assets, Wakalah tul Istismar fee, Brokerage fee paid for placement of funds under Islamic modes, Takaful / Insurance expense, Registration expense and Commission to car ijarah dealers, staff & others. The general and specific provisions created against non-performing financings and diminution in the value of investments shall be borne by the Bank as Mudarib. However, write-offs of financings and loss on sale of investments shall be charged to respective pool(s) along with other direct expenses. Provisions/write offs shall revert to Mudarib / pool(s) to which it was originally charged. From the net return, profit is paid to the Mudarib in the ratio of Mudarib’s equity in the pool to the total pool. The Mudarib’s share is deducted from this profit to calculate distributable profit. Rabb-ul-Mal’s share is distributed among depositors according to weightages assigned at the inception of profit calculation period.
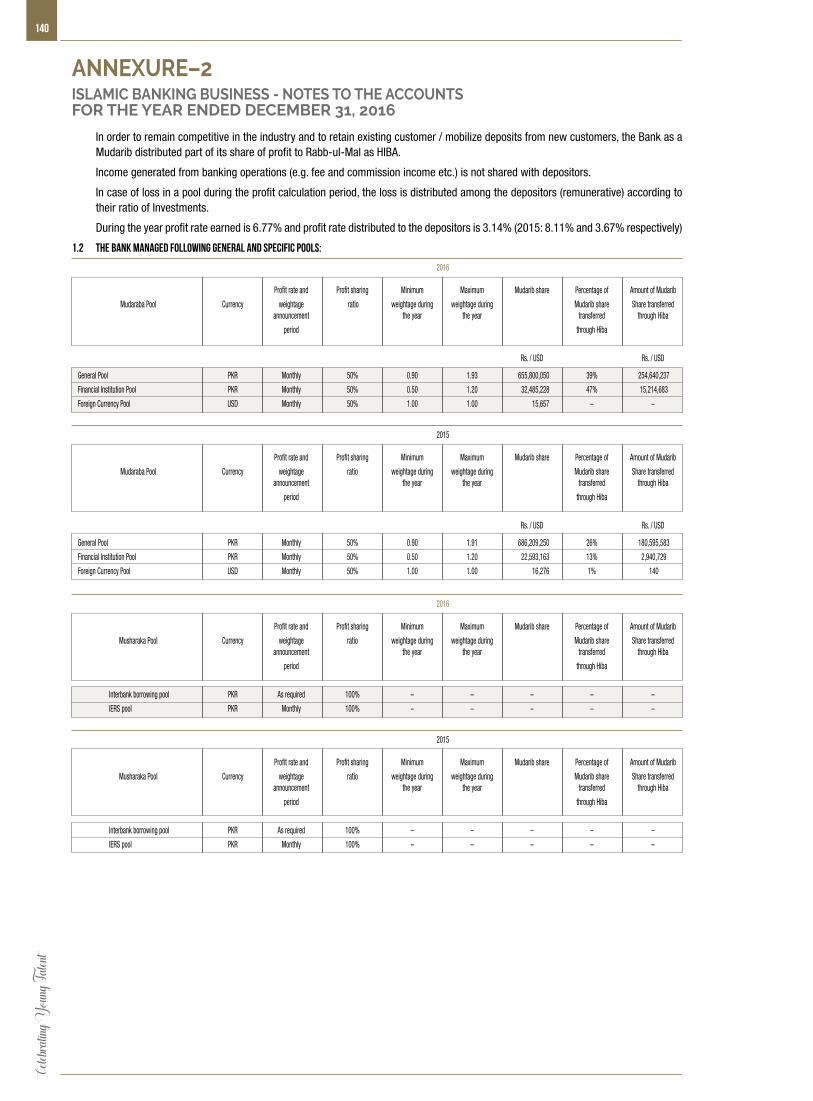
Celeb
rating
Youn
g Tale
nt140
In order to remain competitive in the industry and to retain existing customer / mobilize deposits from new customers, the Bank as a Mudarib distributed part of its share of profit to Rabb-ul-Mal as HIBA.
Income generated from banking operations (e.g. fee and commission income etc.) is not shared with depositors.
In case of loss in a pool during the profit calculation period, the loss is distributed among the depositors (remunerative) according to their ratio of Investments.
During the year profit rate earned is 6.77% and profit rate distributed to the depositors is 3.14% (2015: 8.11% and 3.67% respectively)
1.2 The Bank managed following General and Specific Pools:
2016 Profit rate and Profit sharing Minimum Maximum Mudarib share Percentage of Amount of Mudarib
Mudaraba Pool Currency weightage ratio weightage during weightage during Mudarib share Share transferred announcement the year the year transferred through Hiba
period through Hiba
Rs. / USD Rs. / USD
General Pool PKR Monthly 50% 0.90 1.93 655,800,050 39% 254,640,237
Financial Institution Pool PKR Monthly 50% 0.50 1.20 32,485,228 47% 15,214,683
Foreign Currency Pool USD Monthly 50% 1.00 1.00 15,657 – –
2015 Profit rate and Profit sharing Minimum Maximum Mudarib share Percentage of Amount of Mudarib
Mudaraba Pool Currency weightage ratio weightage during weightage during Mudarib share Share transferred announcement the year the year transferred through Hiba
period through Hiba
Rs. / USD Rs. / USD
General Pool PKR Monthly 50% 0.90 1.91 686,209,250 26% 180,595,583
Financial Institution Pool PKR Monthly 50% 0.50 1.20 22,593,163 13% 2,940,729
Foreign Currency Pool USD Monthly 50% 1.00 1.00 16,276 1% 140
2016 Profit rate and Profit sharing Minimum Maximum Mudarib share Percentage of Amount of Mudarib
Musharaka Pool Currency weightage ratio weightage during weightage during Mudarib share Share transferred announcement the year the year transferred through Hiba
period through Hiba
Interbank borrowing pool PKR As required 100% – – – – –
IERS pool PKR Monthly 100% – – – – –
2015 Profit rate and Profit sharing Minimum Maximum Mudarib share Percentage of Amount of Mudarib
Musharaka Pool Currency weightage ratio weightage during weightage during Mudarib share Share transferred announcement the year the year transferred through Hiba
period through Hiba
Interbank borrowing pool PKR As required 100% – – – – –
IERS pool PKR Monthly 100% – – – – –
ANNEXURE–2ISLAMIC BANKING BUSINESS - NOTES TO THE ACCOUNTSFOR THE YEAR ENDED DECEMBER 31, 2016
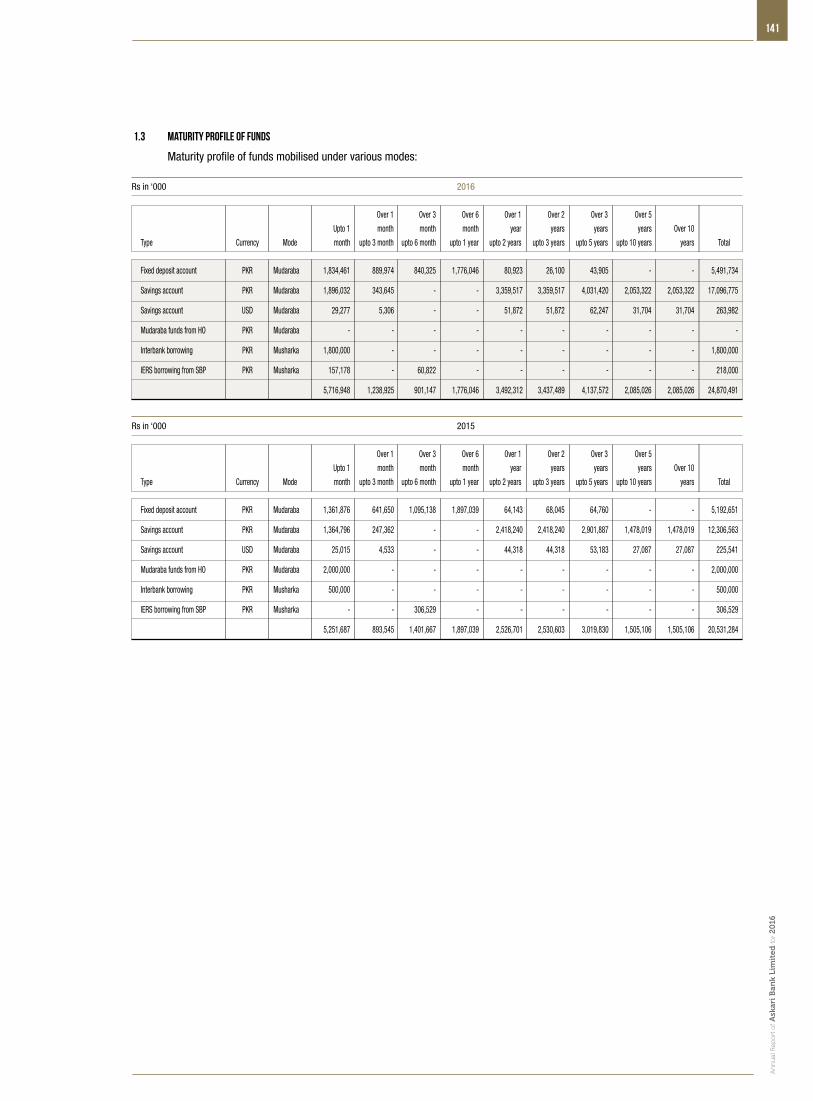
An
nu
al R
epo
rt o
f Ask
ari B
ank
Lim
ited
for 2
016
141
1.3 Maturity profile of funds
Maturity profile of funds mobilised under various modes:
Rs in ‘000 2016
Over 1 Over 3 Over 6 Over 1 Over 2 Over 3 Over 5
Upto 1 month month month year years years years Over 10
Type Currency Mode month upto 3 month upto 6 month upto 1 year upto 2 years upto 3 years upto 5 years upto 10 years years Total
Fixed deposit account PKR Mudaraba 1,834,461 889,974 840,325 1,776,046 80,923 26,100 43,905 - - 5,491,734
Savings account PKR Mudaraba 1,896,032 343,645 - - 3,359,517 3,359,517 4,031,420 2,053,322 2,053,322 17,096,775
Savings account USD Mudaraba 29,277 5,306 - - 51,872 51,872 62,247 31,704 31,704 263,982
Mudaraba funds from HO PKR Mudaraba - - - - - - - - - -
Interbank borrowing PKR Musharka 1,800,000 - - - - - - - - 1,800,000
IERS borrowing from SBP PKR Musharka 157,178 - 60,822 - - - - - - 218,000
5,716,948 1,238,925 901,147 1,776,046 3,492,312 3,437,489 4,137,572 2,085,026 2,085,026 24,870,491
Rs in ‘000 2015
Over 1 Over 3 Over 6 Over 1 Over 2 Over 3 Over 5
Upto 1 month month month year years years years Over 10
Type Currency Mode month upto 3 month upto 6 month upto 1 year upto 2 years upto 3 years upto 5 years upto 10 years years Total
Fixed deposit account PKR Mudaraba 1,361,876 641,650 1,095,138 1,897,039 64,143 68,045 64,760 - - 5,192,651
Savings account PKR Mudaraba 1,364,796 247,362 - - 2,418,240 2,418,240 2,901,887 1,478,019 1,478,019 12,306,563
Savings account USD Mudaraba 25,015 4,533 - - 44,318 44,318 53,183 27,087 27,087 225,541
Mudaraba funds from HO PKR Mudaraba 2,000,000 - - - - - - - - 2,000,000
Interbank borrowing PKR Musharka 500,000 - - - - - - - - 500,000
IERS borrowing from SBP PKR Musharka - - 306,529 - - - - - - 306,529
5,251,687 893,545 1,401,667 1,897,039 2,526,701 2,530,603 3,019,830 1,505,106 1,505,106 20,531,284
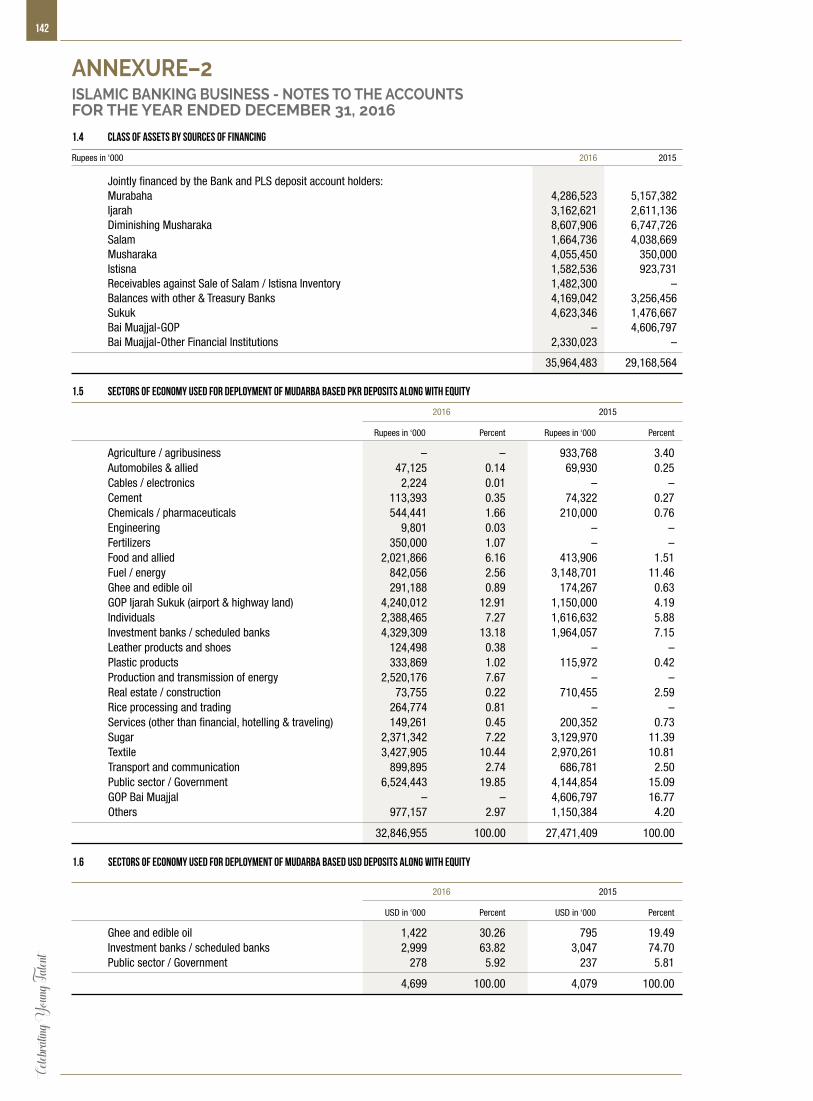
Celeb
rating
Youn
g Tale
nt142
1.4 Class of assets by sources of financing
Rupees in ‘000 2016 2015
Jointly financed by the Bank and PLS deposit account holders: Murabaha 4,286,523 5,157,382 Ijarah 3,162,621 2,611,136 Diminishing Musharaka 8,607,906 6,747,726 Salam 1,664,736 4,038,669 Musharaka 4,055,450 350,000 Istisna 1,582,536 923,731 Receivables against Sale of Salam / Istisna Inventory 1,482,300 – Balances with other & Treasury Banks 4,169,042 3,256,456 Sukuk 4,623,346 1,476,667 Bai Muajjal-GOP – 4,606,797 Bai Muajjal-Other Financial Institutions 2,330,023 –
35,964,483 29,168,564 1.5 Sectors of Economy used for deployment of Mudarba Based PKR Deposits along with Equity
2016 2015
Rupees in ‘000 Percent Rupees in ‘000 Percent
Agriculture / agribusiness – – 933,768 3.40 Automobiles & allied 47,125 0.14 69,930 0.25 Cables / electronics 2,224 0.01 – – Cement 113,393 0.35 74,322 0.27 Chemicals / pharmaceuticals 544,441 1.66 210,000 0.76 Engineering 9,801 0.03 – – Fertilizers 350,000 1.07 – –
Food and allied 2,021,866 6.16 413,906 1.51 Fuel / energy 842,056 2.56 3,148,701 11.46 Ghee and edible oil 291,188 0.89 174,267 0.63 GOP Ijarah Sukuk (airport & highway land) 4,240,012 12.91 1,150,000 4.19 Individuals 2,388,465 7.27 1,616,632 5.88 Investment banks / scheduled banks 4,329,309 13.18 1,964,057 7.15 Leather products and shoes 124,498 0.38 – – Plastic products 333,869 1.02 115,972 0.42 Production and transmission of energy 2,520,176 7.67 – – Real estate / construction 73,755 0.22 710,455 2.59 Rice processing and trading 264,774 0.81 – – Services (other than financial, hotelling & traveling) 149,261 0.45 200,352 0.73 Sugar 2,371,342 7.22 3,129,970 11.39 Textile 3,427,905 10.44 2,970,261 10.81 Transport and communication 899,895 2.74 686,781 2.50 Public sector / Government 6,524,443 19.85 4,144,854 15.09 GOP Bai Muajjal – – 4,606,797 16.77 Others 977,157 2.97 1,150,384 4.20
32,846,955 100.00 27,471,409 100.00 1.6 Sectors of Economy used for deployment of Mudarba Based USD Deposits along with Equity
2016 2015
USD in ‘000 Percent USD in ‘000 Percent
Ghee and edible oil 1,422 30.26 795 19.49 Investment banks / scheduled banks 2,999 63.82 3,047 74.70 Public sector / Government 278 5.92 237 5.81
4,699 100.00 4,079 100.00
ANNEXURE–2ISLAMIC BANKING BUSINESS - NOTES TO THE ACCOUNTSFOR THE YEAR ENDED DECEMBER 31, 2016

143
An
nu
al R
epo
rt o
f Ask
ari B
ank
Lim
ited
for 2
016
CONSOLIDATED FINANCIAL STATEMENTS OF
FOR THE YEAR ENDED DECEMBER 31, 2016
ASKARI BANK LIMITED

144Ce
lebrat
ing Y
oung T
alent
145
An
nu
al R
epo
rt o
f Ask
ari B
ank
Lim
ited
for 2
016
We have audited the annexed consolidated financial statements comprising consolidated statement of financial position of Askari Bank Limited (the Bank) and its subsidiary companies as at December 31, 2016 and the related consolidated profit and loss account, consolidated statement of comprehensive income, consolidated cash flow statement and consolidated statement of changes in equity, together with the notes forming part thereof (hereinafter referred to as the ‘consolidated financial statements’) for the year then ended. These financial statements include unaudited certified returns from the branches, except for twenty six branches which have been audited by us and one branch audited by auditors abroad. We have also expressed separate opinions on the financial statements of Askari Bank Limited and its subsidiary companies Askari Investment Management Limited and Askari Securities (Pvt) Limited.
These consolidated financial statements are the responsibility of Bank’s management. Our responsibility is to express an opinion on these consolidated financial statements based on our audit.
Our audit was conducted in accordance with the International Standards on Auditing and accordingly included such tests of accounting records and such other auditing procedures as we considered necessary in the circumstances.
In our opinion, the consolidated financial statements present fairly the financial position of the Bank and its subsidiary companies as at December 31, 2016 and the results of their operations for the year then ended.
Chartered AccountantsIslamabadEngagement partner: S. Haider Abbas
Date: February 28, 2017
A.F. FERGUSON & CO., Chartered Accountants, a member firm of the PWC networkPIA Building. 3rd Floor, 49 Blue Area, Fazl-ul-Haq Road, P.O. Box 3021, Islamabad-44000, PakistanTel: +92 (51) 2273457-60 / 2604934-37; Fax: +92 (51) 2277924; <www.pwc.com/pk>
KARACHI LAHORE ISLAMABAD
AUDITORS’ REPORT TO THE MEMBERS
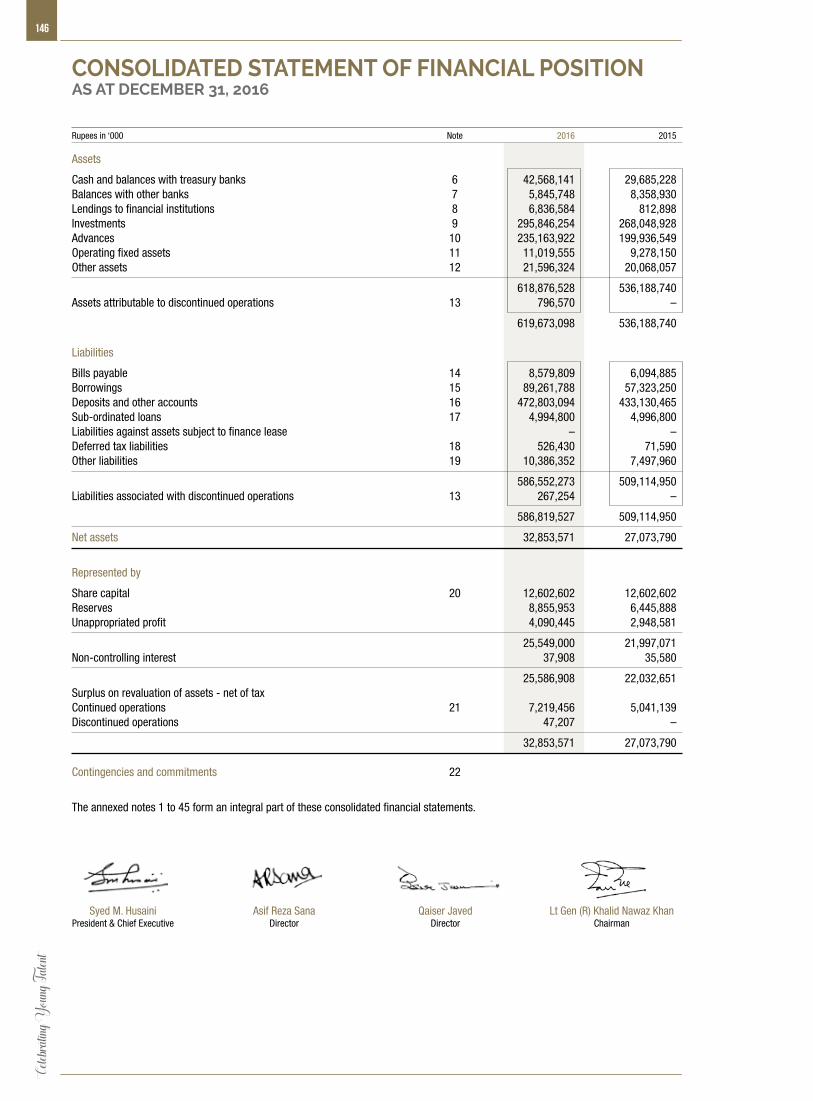
146Ce
lebrat
ing Y
oung T
alent
Rupees in ‘000 Note 2016 2015
Assets
Cash and balances with treasury banks 6 42,568,141 29,685,228 Balances with other banks 7 5,845,748 8,358,930 Lendings to financial institutions 8 6,836,584 812,898 Investments 9 295,846,254 268,048,928 Advances 10 235,163,922 199,936,549 Operating fixed assets 11 11,019,555 9,278,150 Other assets 12 21,596,324 20,068,057
618,876,528 536,188,740 Assets attributable to discontinued operations 13 796,570 –
619,673,098 536,188,740 Liabilities
Bills payable 14 8,579,809 6,094,885 Borrowings 15 89,261,788 57,323,250 Deposits and other accounts 16 472,803,094 433,130,465 Sub-ordinated loans 17 4,994,800 4,996,800 Liabilities against assets subject to finance lease – –Deferred tax liabilities 18 526,430 71,590 Other liabilities 19 10,386,352 7,497,960
586,552,273 509,114,950 Liabilities associated with discontinued operations 13 267,254 –
586,819,527 509,114,950
Net assets 32,853,571 27,073,790
Represented by
Share capital 20 12,602,602 12,602,602 Reserves 8,855,953 6,445,888 Unappropriated profit 4,090,445 2,948,581
25,549,000 21,997,071 Non-controlling interest 37,908 35,580
25,586,908 22,032,651 Surplus on revaluation of assets - net of tax Continued operations 21 7,219,456 5,041,139Discontinued operations 47,207 –
32,853,571 27,073,790 Contingencies and commitments 22
The annexed notes 1 to 45 form an integral part of these consolidated financial statements.
CONSOLIDATED STATEMENT OF FINANCIAL POSITIONAS AT DECEMBER 31, 2016
Syed M. HusainiPresident & Chief Executive
Asif Reza SanaDirector
Qaiser JavedDirector
Lt Gen (R) Khalid Nawaz KhanChairman
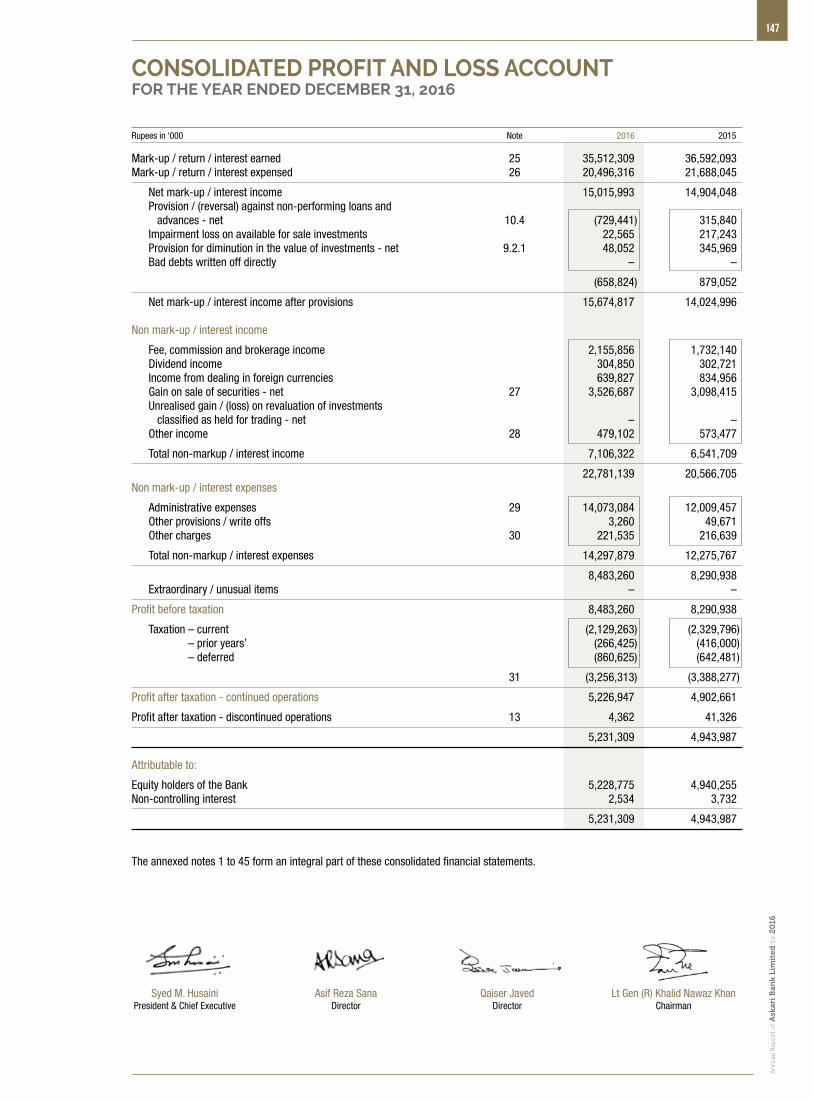
147
An
nu
al R
epo
rt o
f Ask
ari B
ank
Lim
ited
for 2
016
Rupees in ‘000 Note 2016 2015
Mark-up / return / interest earned 25 35,512,309 36,592,093 Mark-up / return / interest expensed 26 20,496,316 21,688,045
Net mark-up / interest income 15,015,993 14,904,048 Provision / (reversal) against non-performing loans and advances - net 10.4 (729,441) 315,840 Impairment loss on available for sale investments 22,565 217,243 Provision for diminution in the value of investments - net 9.2.1 48,052 345,969 Bad debts written off directly – –
(658,824) 879,052
Net mark-up / interest income after provisions 15,674,817 14,024,996 Non mark-up / interest income
Fee, commission and brokerage income 2,155,856 1,732,140 Dividend income 304,850 302,721 Income from dealing in foreign currencies 639,827 834,956 Gain on sale of securities - net 27 3,526,687 3,098,415 Unrealised gain / (loss) on revaluation of investments classified as held for trading - net – – Other income 28 479,102 573,477
Total non-markup / interest income 7,106,322 6,541,709
22,781,139 20,566,705 Non mark-up / interest expenses
Administrative expenses 29 14,073,084 12,009,457 Other provisions / write offs 3,260 49,671 Other charges 30 221,535 216,639
Total non-markup / interest expenses 14,297,879 12,275,767
8,483,260 8,290,938 Extraordinary / unusual items – –
Profit before taxation 8,483,260 8,290,938
Taxation – current (2,129,263) (2,329,796) Taxation – prior years’ (266,425) (416,000) Taxation – deferred (860,625) (642,481)
31 (3,256,313) (3,388,277)
Profit after taxation - continued operations 5,226,947 4,902,661
Profit after taxation - discontinued operations 13 4,362 41,326
5,231,309 4,943,987
Attributable to:
Equity holders of the Bank 5,228,775 4,940,255 Non-controlling interest 2,534 3,732
5,231,309 4,943,987 The annexed notes 1 to 45 form an integral part of these consolidated financial statements.
CONSOLIDATED PROFIT AND LOSS ACCOUNTFOR THE YEAR ENDED DECEMBER 31, 2016
Syed M. HusainiPresident & Chief Executive
Asif Reza SanaDirector
Qaiser JavedDirector
Lt Gen (R) Khalid Nawaz KhanChairman
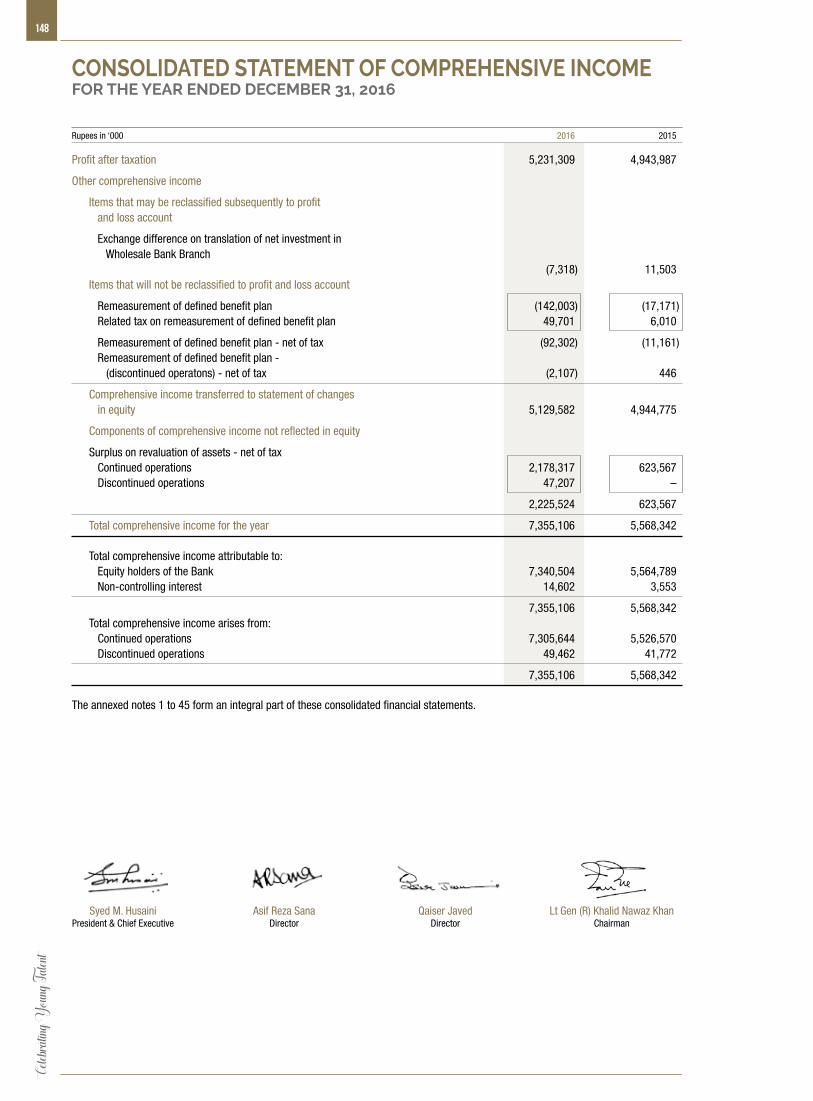
148Ce
lebrat
ing Y
oung T
alent
Rupees in ‘000 2016 2015
Profit after taxation 5,231,309 4,943,987
Other comprehensive income
Items that may be reclassified subsequently to profit and loss account
Exchange difference on translation of net investment in Wholesale Bank Branch (7,318) 11,503 Items that will not be reclassified to profit and loss account
Remeasurement of defined benefit plan (142,003) (17,171) Related tax on remeasurement of defined benefit plan 49,701 6,010
Remeasurement of defined benefit plan - net of tax (92,302) (11,161) Remeasurement of defined benefit plan - (discontinued operatons) - net of tax (2,107) 446
Comprehensive income transferred to statement of changes in equity 5,129,582 4,944,775
Components of comprehensive income not reflected in equity
Surplus on revaluation of assets - net of tax Continued operations 2,178,317 623,567 Discontinued operations 47,207 –
2,225,524 623,567
Total comprehensive income for the year 7,355,106 5,568,342 Total comprehensive income attributable to: Equity holders of the Bank 7,340,504 5,564,789 Non-controlling interest 14,602 3,553
7,355,106 5,568,342 Total comprehensive income arises from: Continued operations 7,305,644 5,526,570 Discontinued operations 49,462 41,772
7,355,106 5,568,342 The annexed notes 1 to 45 form an integral part of these consolidated financial statements.
CONSOLIDATED STATEMENT OF COMPREHENSIVE INCOMEFOR THE YEAR ENDED DECEMBER 31, 2016
Syed M. HusainiPresident & Chief Executive
Asif Reza SanaDirector
Qaiser JavedDirector
Lt Gen (R) Khalid Nawaz KhanChairman

149
An
nu
al R
epo
rt o
f Ask
ari B
ank
Lim
ited
for 2
016
Rupees in ‘000 Note 2016 2015
Cash flow from operating activities
Profit before taxation 8,483,260 8,290,938 Less: dividend income (304,850) (302,721)
8,178,410 7,988,217 Adjustments: Depreciation / amortization 1,013,547 864,179 (Reversal of provision) / provision against non-performing loans and advances - net (729,441) 315,840 Impairment loss on available for sale investments 22,565 217,243 Provision for diminution in the value of investments - net 48,052 345,969 Gain on sale of asset held for sale – (67,587) Reversal of provision against operating fixed assets (9,842) (238) Provision against other assets 12,306 51,905 Unrealised loss on revaluation of investments classified as held for trading - net – – Charge for defined benefit plan 326,801 307,334 Gain on sale of operating fixed assets (6,484) (7,841)
677,504 2,026,804
8,855,914 10,015,021 (Increase) / decrease in operating assets Lendings to financial institutions (6,023,686) 1,187,102 Held for trading securities 245,405 (41,235) Advances (34,394,238) (29,305,283) Other assets (excluding advance taxation) 527,382 36,388
(39,645,137) (28,123,028)Increase / (decrease) in operating liabilities Bills payable 2,484,924 (760,135) Borrowings 31,938,538 43,581,220 Deposits 39,672,629 45,595,592 Other liabilities 2,405,386 (291,251)
76,501,477 88,125,426 Discontinued operations (87,999) 22,446
Cash generated from operations 45,624,255 70,039,865
Payment made to defined benefit plan – (203,541)
Income tax paid (2,931,144) (2,382,892)
Net cash flow from operating activities 42,693,111 67,453,432 Cash flow from investing activities
Net investments in available for sale securities (33,356,084) (44,074,172)Net investments in held to maturity securities 4,154,456 (6,322,982)Sale proceeds of asset held for sale – 269,169 Dividend income 289,272 292,964 Investments in operating fixed assets - net of adjustment (1,493,330) (1,765,809)Sale proceeds of operating fixed assets disposed off 22,543 18,190 Discontinued operations (369,796) (35,852)
Net cash used in investing activities (30,752,939) (51,618,492) Cash flow from financing activities
Payments of sub-ordinated loans - net (2,000) (2,996,000)Dividend paid (1,561,123) (2,485,279)
Net cash used in financing activities (1,563,123) (5,481,279) Exchange difference on translation of net investment in Wholesale Bank Branch (7,318) 11,503
Increase in cash and cash equivalents 10,369,731 10,365,164 Cash and cash equivalents at beginning of the year 38,044,158 27,678,994
Cash and cash equivalents at end of the year 32 48,413,889 38,044,158 The annexed notes 1 to 45 form an integral part of these consolidated financial statements.
CONSOLIDATED CASH FLOW STATEMENTFOR THE YEAR ENDED DECEMBER 31, 2016
Syed M. HusainiPresident & Chief Executive
Asif Reza SanaDirector
Qaiser JavedDirector
Lt Gen (R) Khalid Nawaz KhanChairman
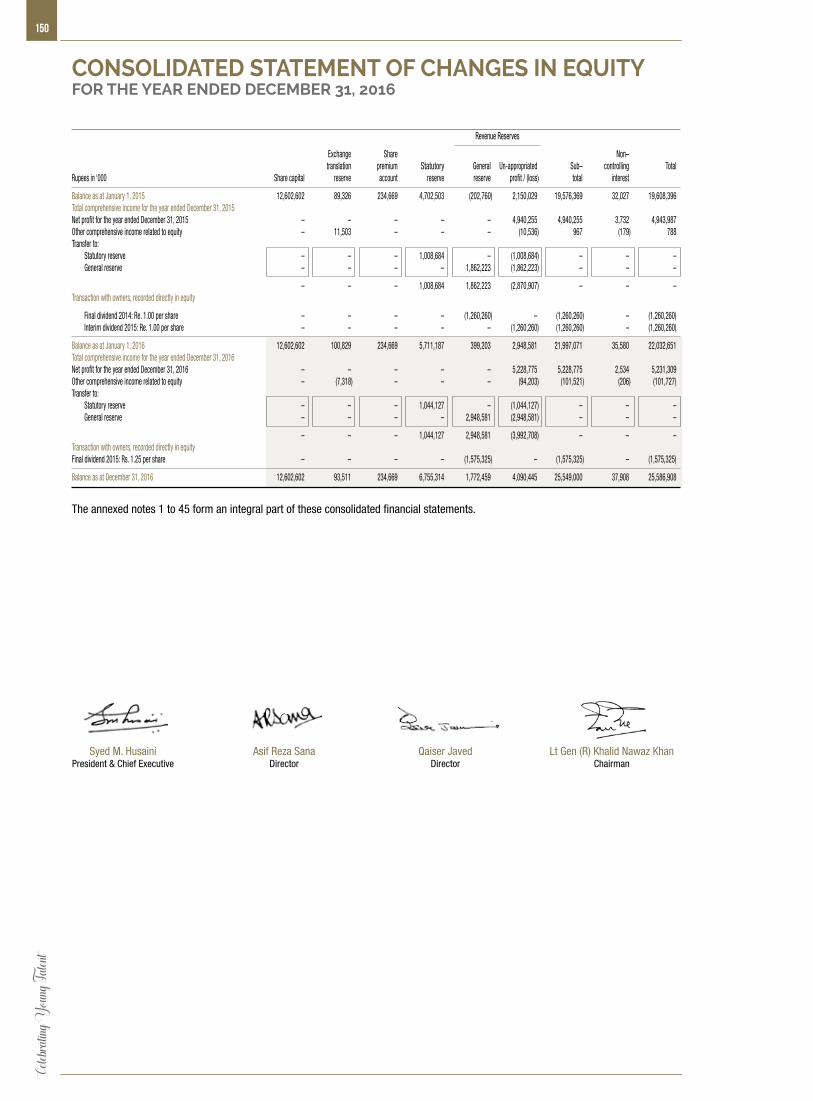
150Ce
lebrat
ing Y
oung T
alent
Revenue Reserves
Exchange Share Non– translation premium Statutory General Un-appropriated Sub– controlling TotalRupees in ‘000 Share capital reserve account reserve reserve profit / (loss) total interest
Balance as at January 1, 2015 12,602,602 89,326 234,669 4,702,503 (202,760) 2,150,029 19,576,369 32,027 19,608,396 Total comprehensive income for the year ended December 31, 2015 Net profit for the year ended December 31, 2015 – – – – – 4,940,255 4,940,255 3,732 4,943,987 Other comprehensive income related to equity – 11,503 – – – (10,536) 967 (179) 788 Transfer to: Statutory reserve – – – 1,008,684 – (1,008,684) – – – General reserve – – – – 1,862,223 (1,862,223) – – –
– – – 1,008,684 1,862,223 (2,870,907) – – – Transaction with owners, recorded directly in equity
Final dividend 2014: Re. 1.00 per share – – – – (1,260,260) – (1,260,260) – (1,260,260) Interim dividend 2015: Re. 1.00 per share – – – – – (1,260,260) (1,260,260) – (1,260,260)
Balance as at January 1, 2016 12,602,602 100,829 234,669 5,711,187 399,203 2,948,581 21,997,071 35,580 22,032,651 Total comprehensive income for the year ended December 31, 2016 Net profit for the year ended December 31, 2016 – – – – – 5,228,775 5,228,775 2,534 5,231,309 Other comprehensive income related to equity – (7,318) – – – (94,203) (101,521) (206) (101,727)Transfer to: Statutory reserve – – – 1,044,127 – (1,044,127) – – – General reserve – – – – 2,948,581 (2,948,581) – – –
– – – 1,044,127 2,948,581 (3,992,708) – – – Transaction with owners, recorded directly in equity Final dividend 2015: Rs. 1.25 per share – – – – (1,575,325) – (1,575,325) – (1,575,325)
Balance as at December 31, 2016 12,602,602 93,511 234,669 6,755,314 1,772,459 4,090,445 25,549,000 37,908 25,586,908
The annexed notes 1 to 45 form an integral part of these consolidated financial statements.
CONSOLIDATED STATEMENT OF CHANGES IN EQUITYFOR THE YEAR ENDED DECEMBER 31, 2016
Syed M. HusainiPresident & Chief Executive
Asif Reza SanaDirector
Qaiser JavedDirector
Lt Gen (R) Khalid Nawaz KhanChairman
151
An
nu
al R
epo
rt o
f Ask
ari B
ank
Lim
ited
for 2
016
1. STATUS AND NATURE OF BUSINESS
1.1 The Group consists of Askari Bank Limited, the holding company, Askari Investment Management Limited (AIML), a wholly owned subsidiary company and Askari Securities Limited (ASL), a partly owned subsidiary company. The financial statements of AIML and ASL have been consolidated based on their audited financial statements for the year ended December 31, 2016.
1.2 Askari Bank Limited (the Bank) was incorporated in Pakistan on October 9, 1991 as a Public Limited Company and is listed on the Pakistan Stock Exchange. The registered office of the Bank is situated at AWT Plaza, The Mall, Rawalpindi. The Bank is a scheduled commercial bank and is principally engaged in the business of banking as defined in the Banking Companies Ordinance, 1962. The Fauji Consortium: comprising of Fauji Foundation (FF), Fauji Fertilizer Company Limited (FFCL) and Fauji Fertilizer Bin Qasim Limited (FFBL) collectively owned 71.91 percent shares of the Bank as on December 31, 2016. The ultimate parent of the Bank is Fauji Foundation. The Bank has 501 branches (2015: 424 branches); 500 in Pakistan and Azad Jammu and Kashmir, including 91 (2015: 75) Islamic Banking branches, 35 (2015: 32) sub-branches and a Wholesale Bank Branch in the Kingdom of Bahrain.
1.3 AIML was incorporated in Pakistan on May 30, 2005 as a public limited company. AIML is a Non Banking Finance Company (NBFC), under license by the Securities and Exchange Commission of Pakistan (SECP) to undertake asset management and investment advisory services under the Non-Banking Finance Companies and Notified Entities Regulations, 2007 (NBFC & NE Regulations). The license was obtained on September 21, 2005. AIML is a wholly owned subsidiary of the Bank with its registered office in Karachi. AIML obtained its certificate of commencement of business on September 22, 2005.
1.4 ASL was incorporated in Pakistan on October 1, 1999 under the Companies Ordinance, 1984 as a public limited company. The Bank holds 74% Ordinary Shares of ASL. The principal activity includes share brokerage, investment advisory and consultancy services. The registered office of ASL is situated in Islamabad.
2. BASIS OF PRESENTATION
2.1 These consolidated financial statements have been presented in accordance with the requirements of format prescribed by the State Bank of Pakistan’s BSD Circular No. 4 dated February 17, 2006.
2.2 In accordance with the directives of the Federal Government regarding shifting of the banking system to Islamic modes, the SBP has issued various circulars from time to time. One permissible form of trade related mode of financing comprises of purchase of goods by the Group from its customers and resale to them at appropriate mark-up in price on a deferred payment basis. The purchases and sales arising under these arrangements are not reflected in these consolidated financial statements as such but are restricted to the amount of facilities actually utilized and the appropriate portion of mark-up thereon.
2.3 The financial results of the Islamic banking branches have been consolidated in these consolidated financial statements for reporting purposes, after eliminating material inter-branch transactions / balances. Key figures of the Islamic banking branches are disclosed in Annexure - 2 to unconsolidated financial statements.
2.4 Items included in the consolidated financial statements are measured using the currency of the primary economic environment in which the Group operates. The consolidated financial statements are presented in Pak. Rupee, which is the Group’s functional and presentation currency. Figures have been rounded off to the nearest thousand of rupees unless otherwise stated.
3. STATEMENT OF COMPLIANCE
3.1 These consolidated financial statements have been prepared in accordance with the approved accounting standards as applicable in Pakistan, the requirements of the Companies Ordinance, 1984 and the Banking Companies Ordinance, 1962. Approved accounting standards comprise of such International Financial Reporting Standards (IFRS) issued by the International Accounting Standard Board (IASB) and Islamic Financial Accounting Standards (IFAS) issued by the Institute of Chartered Accountants of Pakistan (ICAP) as are notified under the Companies Ordinance, 1984, provisions of and directives issued under the Companies Ordinance, 1984 and the Banking Companies Ordinance, 1962 and directives issued by the SBP. In case requirements differ, the provisions of and directives issued under the Companies Ordinance, 1984 and the Banking Companies Ordinance, 1962 and the directives issued by the SBP shall prevail.
International Accounting Standard 39, “Financial Instruments: Recognition and Measurement”, International Accounting Standard 40, “Investment Property” and International Financial Reporting Standard 7,”Financial Instruments: Disclosure” are not applicable to banking companies in Pakistan. Accordingly, the requirements of these Standards have not been considered in the preparation of these consolidated financial statements. Accordingly, investments have been classified and valued in accordance with the requirements prescribed by the SBP through various circulars.
The Securities and Exchange Commission of Pakistan vide SRO 56(1)/2016 dated January 28, 2016 has relaxed the requirement of consolidation under IFRS 10, “Consolidated Financial Statements” for companies having investment in mutual funds established under trust structure.
NOTES TO THE CONSOLIDATED FINANCIAL STATEMENTSFOR THE YEAR ENDED DECEMBER 31, 2016
152Ce
lebrat
ing Y
oung T
alent
3.2 Standards and amendments to approved accounting standards that are not yet effective
a) The following amendments to published accounting standards were effective during the year and have been adopted by the Group:
Effective date (annual periods beginning on or after)
IFRS 5 Non-current Assets Held for Sale and Discontinued Operations (Amendments) January 1, 2016 IFRS 11 Joint Arrangements (Amendments) January 1, 2016 IAS 1 Presentation of financial statements (Amendments) January 1, 2016 IAS 16 Property, plant and equipment (Amendments) January 1, 2016 IAS 19 Employee Benefits (Amendments) January 1, 2016 IAS 27 Separate financial statements (Amendments) January 1, 2016 IAS 38 Intangible assets (Amendments) January 1, 2016 b) Following standards has been issued by the International Accounting Standards Board (IASB), which are yet to be notified
by the Securities and Exchange Commission of Pakistan (SECP) for the purpose of its applicability in Pakistan: Effective date (annual periods beginning on or after)
IFRS 1 First-time Adoption of International Financial Reporting Standards July 1, 2009 IFRS 14 Regulatory Deferral Accounts January 1, 2016
c) Following standards and amendments to published accounting standards will be effective in future periods and have not been early adopted by the Group.
Effective date (annual periods beginning on or after)
IFRS 1 First-time Adoption of International Financial Reporting Standards (Amendments) January 1, 2018 IFRS 2 Share-based payment (Amendments) January 1, 2018 IFRS 4 Insurance Contracts January 1, 2018 IFRS 7 Financial Instruments (Amendments) January 1, 2018 IFRS 12 Disclosure of Interests in Other Entities (Amendments) January 1, 2017 IFRS 15 Revenue from Contracts with Customers January 1, 2018 IFRS 16 Leases (Amendments) January 1, 2019 IAS 12 Income taxes (Amendments) January 1, 2017 IAS 39 Financial Instruments: Recognition and Measurement (Amendments) January 1, 2018 IAS 40 Investment property (Amendments) July 1, 2018
The management anticipates that adoption of above standards and amendments in future periods will have no material impact on
the Group’s financial statements other than in presentation / disclosure.
4. BASIS OF MEASUREMENT
These consolidated financial statements have been prepared under the historical cost convention as modified for certain investments which are carried at fair value, non-banking assets acquired in satisfaction of claims, freehold and leasehold land which are shown at revalued amounts and staff retirement gratuity and compensated absences which are carried at present value of defined benefit obligations net of fair value of plan assets.
Use of critical accounting estimates and judgments
The preparation of consolidated financial statements in conformity with approved accounting standards as applicable in Pakistan requires the use of certain accounting estimates. It also requires management to exercise its judgment in the process of applying the Group’s accounting policies. The Group uses estimates and assumptions concerning the future. The resulting accounting estimate will, by definition, seldom equal the related actual results. Estimates and judgments are continually evaluated and are based on historical experience and other factors, including expectations of future events that are believed to be reasonable under the circumstances. The areas involving a higher degree of judgment or complexity, or areas where assumptions and estimates are
NOTES TO THE CONSOLIDATED FINANCIAL STATEMENTSFOR THE YEAR ENDED DECEMBER 31, 2016

153
An
nu
al R
epo
rt o
f Ask
ari B
ank
Lim
ited
for 2
016
significant to the financial statements are as follows:
i) classification of investments (note 5.6) ii) provision against investments (note 5.6), advances (note 5.7), operating fixed assets (note 5.8) and other assets (note 5.9) iii) valuation and impairment of available for sale securities (note 5.6) iv) useful life of property and equipments, intangible assets and revaluation of land (note 5.8) v) taxation (note 5.11) vi) staff retirement benefits (note 5.13)
5. SUMMARY OF SIGNIFICANT ACCOUNTING POLICIES
The accounting policies set out below have been applied consistently to all periods presented in these financial statements.
5.1 Assets held for sale
Non-current assets and associated liabilities are classified as held for sale when their carrying amount will be recovered principally through a sale transaction rather than continuing use and a sale is highly probable. Assets designated as held for sale are carried at the lower of carrying amount at designation and fair value less costs to sell, if fair value can reasonably be determined.
5.2 Basis of consolidation
The consolidated financial statements include the financial statements of the Bank and its subsidiary companies, AIML with 100% holding (2015: 100%) and ASL with 74% holding (2015: 74%) collectively referred to as “the Group”.
During the year, the Board of Directors of the Bank has approved disposal of above referred subsidiary companies of the Bank. As per the decision of the Board of Directors, the Bank is required to purchase remaining 26% of shares in ASL and then sell 100% shares of ASL. Pursuant to the decision of the Board of Directors, the process for disposal has been initiated by the Bank and is expected to be completed during 2017. Accordingly, carrying amount of this investment has been reclassified from investments to assets held for sale.
Subsidiaries are those enterprises in which the holding company directly or indirectly controls, beneficially owns or holds more than 50% of the voting securities or otherwise has the power to elect and appoint more than 50% of its directors. The financial statements of the subsidiaries are included in the consolidated financial statements from the date control commences until the date that control ceases.
The assets and liabilities of subsidiary companies have been accounted for as per the requirements of International Financial Reporting Standard 5 “Non-current assets held for sale and discontinued operations” and hence not been consolidated on a line by line basis. The carrying value of investment held by the holding company is eliminated against holding company’s share in paid up capital of the subsidiaries.
Material intra-group balances and transactions have been eliminated.
Non-controlling interests are that part of net results of the operations and of net assets of the subsidiary attributable to interests which are not owned by the Bank. Non-controlling interests are presented as separate item in the consolidated financial statements.
5.3 Cash and cash equivalents
Cash and cash equivalents comprise of cash and balances with treasury banks, balances with other banks and call money lendings.
5.4 Sale and repurchase agreements
Securities sold under repurchase agreement (repo) are retained in the consolidated financial statements as investments and a liability for consideration received is included in borrowings. Conversely, consideration for securities purchased under resale agreement (reverse repo) are included in lendings to financial institutions. The difference between sale and repurchase / purchase and resale price is recognised as mark-up / return expensed and earned on a time proportion basis as the case may be. Repo and reverse repo balances are reflected under borrowings from and lendings to financial institutions respectively.
5.5 Bai Muajjal receivable from other financial institutions
In Bai Muajjal, the Bank sells sukuk on deferred payment basis to other financial institutions. The deferred price is agreed at the time of sale and such proceeds are received at the end of the credit period.
5.6 Investments
Investments are classified as follows:
Held for trading
These represent securities acquired with the intention to trade by taking advantage of short-term market / interest rate movements. These are marked to market and surplus / deficit arising on revaluation of ‘held for trading’ investments is taken to profit and loss
154Ce
lebrat
ing Y
oung T
alent
account in accordance with the requirements prescribed by the SBP through various circulars.
Available for sale
These represent securities which do not fall under ‘held for trading’ or ‘held to maturity’ categories. In accordance with the requirements of the SBP’s BSD Circular No. 20 dated August 04, 2000 and BPRD Circular 06 dated June 26, 2014, available for sale securities for which ready quotations are available on Reuters Page (PKRV) or Stock Exchanges are valued at market value and the resulting surplus / deficit is taken through “Statement of Comprehensive Income” and is shown below the shareholders’ equity in the consolidated statement of financial position.
Unquoted equity securities are valued at the lower of cost and break-up value. Break-up value of equity securities is calculated with reference to the net assets of the investee as per the latest audited financial statements. If the break-up value is less than cost the difference is included in profit and loss account. Unquoted debt securities are valued using the market value of secondary market where available.
Where the decline in prices of available for sale equity securities is significant and prolonged, it is considered impaired and included in profit and loss account. Impairment loss on available for sale debt securities is determined in accordance with the requirements of Prudential Regulations issued by the SBP.
Investments in other unquoted securities are valued at cost less impairment losses.
Held to maturity
These represent securities acquired with the intention and ability to hold them upto maturity. These are carried at amortized cost less impairment, determined in accordance with the requirements of Prudential Regulations issued by the SBP.
All purchases and sale of investment that require delivery within the time frame established by regulations or market convention are recognized at the trade date, which is the date the Group commits to purchase or sell the investments.
5.7 Advances
Advances are stated net of provisions for non-performing advances. Provision for advances is determined in accordance with the requirements of the Prudential Regulations issued by the SBP from time to time. In addition, a general provision is maintained for advances other than consumer and small entities advances as per details given in note 10.4.3. General and specific provisions pertaining to overseas advances are made in accordance with the requirements of the regulatory authorities of the respective countries.
The provisions against non-performing advances are charged to the consolidated profit and loss account. Advances are written off when there is no realistic prospect of recovery.
Ijarahs booked under IFAS - 2 are stated at cost less accumulated depreciation and impairment if any, and are shown under advances.
Depreciation on Ijarah assets is charged to the consolidated profit and loss account by applying the straight line method whereby the depreciable value of Ijarah assets is written off over the Ijarah period. The Group charges depreciation from the date of delivery of respective assets to Mustajir upto the date of maturity / termination of Ijarah agreement.
Leases where the Group transfers substantially all the risks and rewards incidental to ownership of an asset to the lessee are classified as finance leases. A receivable is recognised at an amount equal to the present value of the lease payments including any guaranteed residual value. Finance lease receivables are included in advances to the customers.
Murabaha transactions are reflected as receivable at the invoiced amount. Actual sale and purchase are not reflected as the goods are purchased by the customer as agent of the Group and all documents relating to purchase are in customers’ name.
In Salam, the seller undertakes to supply specific goods to the Group at a future date in consideration of a price fully paid in advance at the time the contract of sale is made.
In Musharaka a relationship is established under a contract by the mutual consent of the Group and the cutomer for sharing of profits and losses arising from a joint enterprise or venture.
Diminishing Musharaka (DM) is a form of co-ownership in which Group and the customer share the ownership of a tangible asset in an agreed proportion and customer undertakes to buy in periodic installments the proportionate share of the Group until the title to such tangible asset is completely transferred to the customer.
In Istisna, a contract of sale is made whereby the Group places an order, to manufacture, assemble or construct, specific commodity to be delivered at a future date.
NOTES TO THE CONSOLIDATED FINANCIAL STATEMENTSFOR THE YEAR ENDED DECEMBER 31, 2016
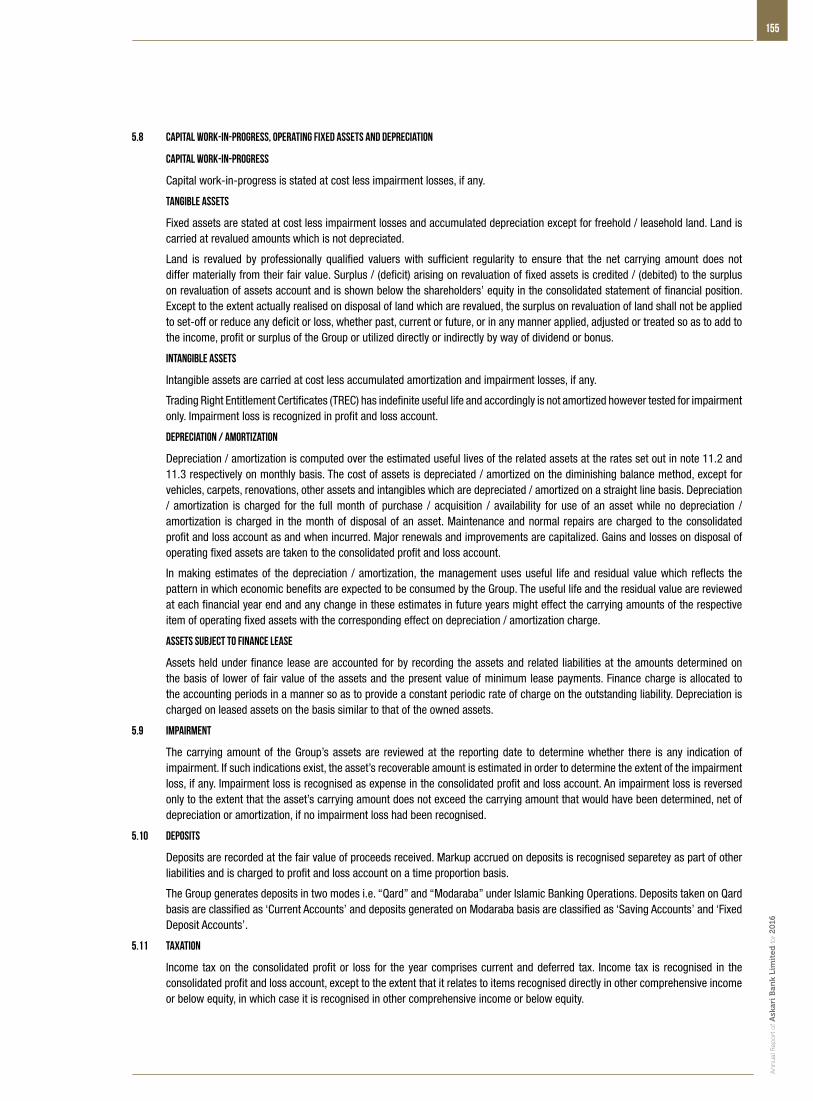
155
An
nu
al R
epo
rt o
f Ask
ari B
ank
Lim
ited
for 2
016
5.8 Capital work-in-progress, operating fixed assets and depreciation
Capital work-in-progress
Capital work-in-progress is stated at cost less impairment losses, if any.
Tangible assets
Fixed assets are stated at cost less impairment losses and accumulated depreciation except for freehold / leasehold land. Land is carried at revalued amounts which is not depreciated.
Land is revalued by professionally qualified valuers with sufficient regularity to ensure that the net carrying amount does not differ materially from their fair value. Surplus / (deficit) arising on revaluation of fixed assets is credited / (debited) to the surplus on revaluation of assets account and is shown below the shareholders’ equity in the consolidated statement of financial position. Except to the extent actually realised on disposal of land which are revalued, the surplus on revaluation of land shall not be applied to set-off or reduce any deficit or loss, whether past, current or future, or in any manner applied, adjusted or treated so as to add to the income, profit or surplus of the Group or utilized directly or indirectly by way of dividend or bonus.
Intangible assets
Intangible assets are carried at cost less accumulated amortization and impairment losses, if any.
Trading Right Entitlement Certificates (TREC) has indefinite useful life and accordingly is not amortized however tested for impairment only. Impairment loss is recognized in profit and loss account.
Depreciation / amortization
Depreciation / amortization is computed over the estimated useful lives of the related assets at the rates set out in note 11.2 and 11.3 respectively on monthly basis. The cost of assets is depreciated / amortized on the diminishing balance method, except for vehicles, carpets, renovations, other assets and intangibles which are depreciated / amortized on a straight line basis. Depreciation / amortization is charged for the full month of purchase / acquisition / availability for use of an asset while no depreciation / amortization is charged in the month of disposal of an asset. Maintenance and normal repairs are charged to the consolidated profit and loss account as and when incurred. Major renewals and improvements are capitalized. Gains and losses on disposal of operating fixed assets are taken to the consolidated profit and loss account.
In making estimates of the depreciation / amortization, the management uses useful life and residual value which reflects the pattern in which economic benefits are expected to be consumed by the Group. The useful life and the residual value are reviewed at each financial year end and any change in these estimates in future years might effect the carrying amounts of the respective item of operating fixed assets with the corresponding effect on depreciation / amortization charge.
Assets subject to finance lease
Assets held under finance lease are accounted for by recording the assets and related liabilities at the amounts determined on the basis of lower of fair value of the assets and the present value of minimum lease payments. Finance charge is allocated to the accounting periods in a manner so as to provide a constant periodic rate of charge on the outstanding liability. Depreciation is charged on leased assets on the basis similar to that of the owned assets.
5.9 Impairment
The carrying amount of the Group’s assets are reviewed at the reporting date to determine whether there is any indication of impairment. If such indications exist, the asset’s recoverable amount is estimated in order to determine the extent of the impairment loss, if any. Impairment loss is recognised as expense in the consolidated profit and loss account. An impairment loss is reversed only to the extent that the asset’s carrying amount does not exceed the carrying amount that would have been determined, net of depreciation or amortization, if no impairment loss had been recognised.
5.10 Deposits
Deposits are recorded at the fair value of proceeds received. Markup accrued on deposits is recognised separetey as part of other liabilities and is charged to profit and loss account on a time proportion basis.
The Group generates deposits in two modes i.e. “Qard” and “Modaraba” under Islamic Banking Operations. Deposits taken on Qard basis are classified as ‘Current Accounts’ and deposits generated on Modaraba basis are classified as ‘Saving Accounts’ and ‘Fixed Deposit Accounts’.
5.11 Taxation
Income tax on the consolidated profit or loss for the year comprises current and deferred tax. Income tax is recognised in the consolidated profit and loss account, except to the extent that it relates to items recognised directly in other comprehensive income or below equity, in which case it is recognised in other comprehensive income or below equity.
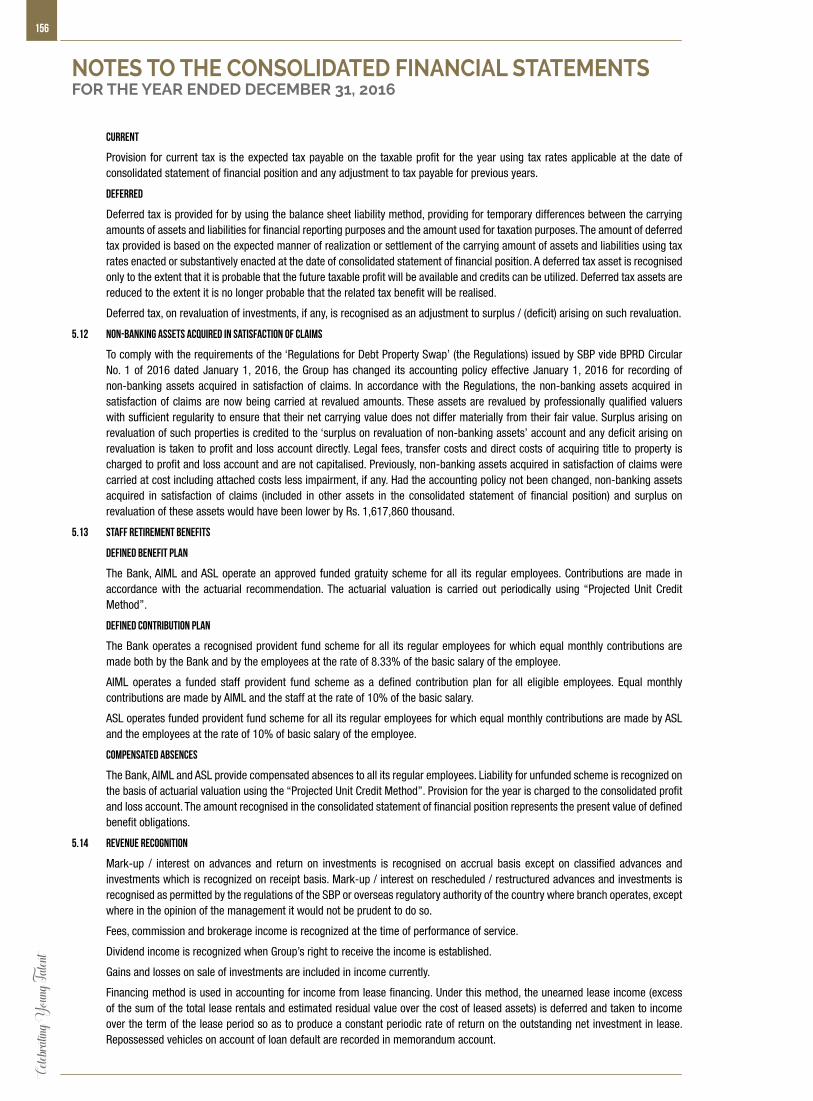
156Ce
lebrat
ing Y
oung T
alent
Current
Provision for current tax is the expected tax payable on the taxable profit for the year using tax rates applicable at the date of consolidated statement of financial position and any adjustment to tax payable for previous years.
Deferred
Deferred tax is provided for by using the balance sheet liability method, providing for temporary differences between the carrying amounts of assets and liabilities for financial reporting purposes and the amount used for taxation purposes. The amount of deferred tax provided is based on the expected manner of realization or settlement of the carrying amount of assets and liabilities using tax rates enacted or substantively enacted at the date of consolidated statement of financial position. A deferred tax asset is recognised only to the extent that it is probable that the future taxable profit will be available and credits can be utilized. Deferred tax assets are reduced to the extent it is no longer probable that the related tax benefit will be realised.
Deferred tax, on revaluation of investments, if any, is recognised as an adjustment to surplus / (deficit) arising on such revaluation.
5.12 Non-banking assets acquired in satisfaction of claims
To comply with the requirements of the ‘Regulations for Debt Property Swap’ (the Regulations) issued by SBP vide BPRD Circular No. 1 of 2016 dated January 1, 2016, the Group has changed its accounting policy effective January 1, 2016 for recording of non-banking assets acquired in satisfaction of claims. In accordance with the Regulations, the non-banking assets acquired in satisfaction of claims are now being carried at revalued amounts. These assets are revalued by professionally qualified valuers with sufficient regularity to ensure that their net carrying value does not differ materially from their fair value. Surplus arising on revaluation of such properties is credited to the ‘surplus on revaluation of non-banking assets’ account and any deficit arising on revaluation is taken to profit and loss account directly. Legal fees, transfer costs and direct costs of acquiring title to property is charged to profit and loss account and are not capitalised. Previously, non-banking assets acquired in satisfaction of claims were carried at cost including attached costs less impairment, if any. Had the accounting policy not been changed, non-banking assets acquired in satisfaction of claims (included in other assets in the consolidated statement of financial position) and surplus on revaluation of these assets would have been lower by Rs. 1,617,860 thousand.
5.13 Staff retirement benefits
Defined benefit plan
The Bank, AIML and ASL operate an approved funded gratuity scheme for all its regular employees. Contributions are made in accordance with the actuarial recommendation. The actuarial valuation is carried out periodically using “Projected Unit Credit Method”.
Defined contribution plan
The Bank operates a recognised provident fund scheme for all its regular employees for which equal monthly contributions are made both by the Bank and by the employees at the rate of 8.33% of the basic salary of the employee.
AIML operates a funded staff provident fund scheme as a defined contribution plan for all eligible employees. Equal monthly contributions are made by AIML and the staff at the rate of 10% of the basic salary.
ASL operates funded provident fund scheme for all its regular employees for which equal monthly contributions are made by ASL and the employees at the rate of 10% of basic salary of the employee.
Compensated absences
The Bank, AIML and ASL provide compensated absences to all its regular employees. Liability for unfunded scheme is recognized on the basis of actuarial valuation using the “Projected Unit Credit Method”. Provision for the year is charged to the consolidated profit and loss account. The amount recognised in the consolidated statement of financial position represents the present value of defined benefit obligations.
5.14 Revenue recognition
Mark-up / interest on advances and return on investments is recognised on accrual basis except on classified advances and investments which is recognized on receipt basis. Mark-up / interest on rescheduled / restructured advances and investments is recognised as permitted by the regulations of the SBP or overseas regulatory authority of the country where branch operates, except where in the opinion of the management it would not be prudent to do so.
Fees, commission and brokerage income is recognized at the time of performance of service.
Dividend income is recognized when Group’s right to receive the income is established.
Gains and losses on sale of investments are included in income currently.
Financing method is used in accounting for income from lease financing. Under this method, the unearned lease income (excess of the sum of the total lease rentals and estimated residual value over the cost of leased assets) is deferred and taken to income over the term of the lease period so as to produce a constant periodic rate of return on the outstanding net investment in lease. Repossessed vehicles on account of loan default are recorded in memorandum account.
NOTES TO THE CONSOLIDATED FINANCIAL STATEMENTSFOR THE YEAR ENDED DECEMBER 31, 2016

157
An
nu
al R
epo
rt o
f Ask
ari B
ank
Lim
ited
for 2
016
Unrealised lease income is suspended on classified leases, in accordance with the requirements of the Prudential Regulations issued by the SBP. Gains / losses on termination of lease contracts, documentation charges, front-end fees and other lease income are recognised as income on receipt basis.
Profit on Murabaha sale transaction not due for the payment is deferred by recording a credit to the “Deferred Murabaha Income” account.
Profits on Musharaka and Diminishing Musharaka financings are recognized on accrual basis. Profit required to be suspended in compliance with the Prudential Regulations issued by SBP is recorded on receipt basis.
Revenue on Salam finance is recognized at the time of sale of Al-Muslam Fihi (Salam Goods).
The rentals received / receivable on Ijarahs under IFAS-2 are recorded as income / revenue.
The Group recognizes revenue on Istisna finance at the time of sale of Al-Masnoo (Istisna Goods).
5.15 Foreign currencies
Foreign currency transactions
Foreign currency transactions are translated into Pak. Rupee at the exchange rates prevailing on the date of transaction. Monetary assets and liabilities in foreign currencies are translated to Pak. Rupee at the exchange rates prevailing at the reporting date. Outstanding foreign bills purchased are valued at the rates applicable to the remaining maturities. Exchange gains and losses are included in consolidated profit and loss account currently.
Foreign operation
The assets and liabilities of Wholesale Bank Branch are translated to Pak. Rupee at exchange rates prevailing at the date of consolidated statement of financial position. The results of foreign operations are translated at the average rate of exchange for the year.
Translation gains and losses
Translation gains and losses arising on revaluation of net investment in foreign operations are taken to equity under “Exchange Translation Reserve” through other comprehensive income and on disposal are recognised in consolidated profit and loss account.
Commitments
Commitments for outstanding forward foreign exchange contracts are valued at the rates applicable to the remaining maturities.
5.16 Provisions
Provisions are recognised when there are present, legal or constructive obligations as a result of past events, it is probable that an out flow of resources embodying economic benefits will be required to settle the obligation and a reliable estimate of the amounts can be made. Provision for guarantee claims and other off balance sheet obligations is recognized when intimated and reasonable certainty exists to settle the obligations. Expected recoveries are recognized by debiting customer accounts. Charge to consolidated profit and loss account is stated net off expected recoveries.
5.17 Off-setting
Financial assets and financial liabilities are only set-off and the net amount is reported in the consolidated financial statements when there is a legally enforceable right to set-off the recognised amount and the Group intends either to settle on a net basis, or to realise the assets and to settle the liabilities simultaneously.
5.18 Financial assets and liabilities
Financial assets and financial liabilities are recognised at the time when the Group becomes a party to the contractual provision of the instrument. Financial assets are de-recognised when the contractual right to future cash flows from the asset expires or is transferred along with the risk and reward of the asset. Financial liabilities are de-recognised when obligation specific in the contract is discharged, cancelled or expired. Any gain or loss on de-recognition of the financial asset and liability is recognised in the profit and loss account of the current period. The particular recognition and subsequent measurement methods adopted for significant financial assets and financial liabilities are disclosed in the individual policy statements associated with them.
5.19 Derivative financial instruments
Derivative financial instruments are initially recognized at fair value on the date on which the derivative contract is entered into and are subsequently re–measured at fair value using appropriate valuation techniques. All derivative financial instruments are carried as assets when fair value is positive and liabilities when fair value is negative. Any change in the fair value of derivative financial instruments is taken to the profit and loss account.
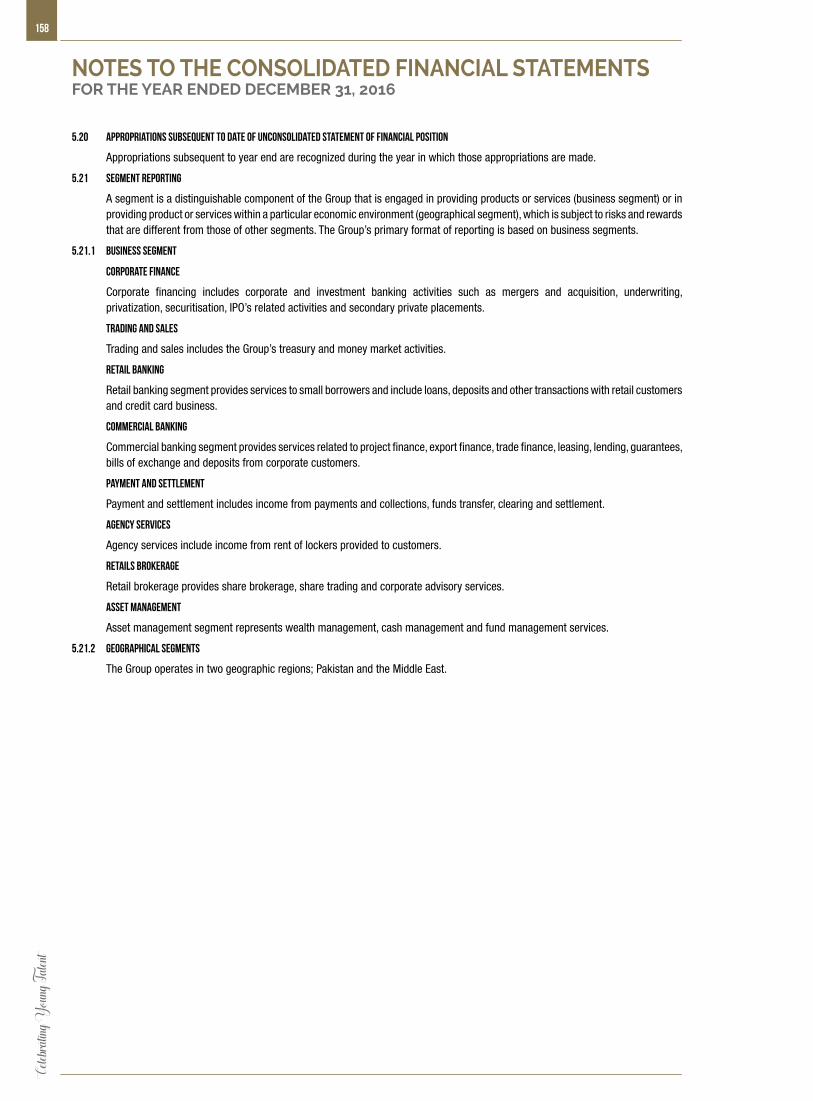
158Ce
lebrat
ing Y
oung T
alent
5.20 Appropriations subsequent to date of unconsolidated statement of financial position
Appropriations subsequent to year end are recognized during the year in which those appropriations are made.
5.21 Segment reporting
A segment is a distinguishable component of the Group that is engaged in providing products or services (business segment) or in providing product or services within a particular economic environment (geographical segment), which is subject to risks and rewards that are different from those of other segments. The Group’s primary format of reporting is based on business segments.
5.21.1 Business segment
Corporate finance
Corporate financing includes corporate and investment banking activities such as mergers and acquisition, underwriting, privatization, securitisation, IPO’s related activities and secondary private placements.
Trading and Sales
Trading and sales includes the Group’s treasury and money market activities.
Retail Banking
Retail banking segment provides services to small borrowers and include loans, deposits and other transactions with retail customers and credit card business.
Commercial Banking
Commercial banking segment provides services related to project finance, export finance, trade finance, leasing, lending, guarantees, bills of exchange and deposits from corporate customers.
Payment and settlement
Payment and settlement includes income from payments and collections, funds transfer, clearing and settlement.
Agency services
Agency services include income from rent of lockers provided to customers.
Retails brokerage
Retail brokerage provides share brokerage, share trading and corporate advisory services.
Asset management
Asset management segment represents wealth management, cash management and fund management services.
5.21.2 Geographical segments
The Group operates in two geographic regions; Pakistan and the Middle East.
NOTES TO THE CONSOLIDATED FINANCIAL STATEMENTSFOR THE YEAR ENDED DECEMBER 31, 2016

159
An
nu
al R
epo
rt o
f Ask
ari B
ank
Lim
ited
for 2
016
Rupees in ‘000 Note 2016 2015
6. CASH AND BALANCES WITH TREASURY BANKS
In hand:
Local currency 7,070,754 6,336,493 Foreign currencies 731,479 1,423,204
7,802,233 7,759,697 National Prize Bonds 14,463 4,344
With the State Bank of Pakistan in:
Local currency current accounts 6.1 25,219,764 12,622,867 Foreign currency current account 6.1 2,246,172 2,271,811 Foreign currency deposit account 6.2 5,735,677 5,660,221
33,201,613 20,554,899 With National Bank of Pakistan in:
Local currency current accounts 1,549,832 1,366,288
42,568,141 29,685,228 6.1 These represent current accounts maintained with the SBP to comply with the statutory cash reserve requirements. 6.2 This represents special cash reserve maintained with the SBP and carries mark-up at the rate of 0.00% (2015: 0.00%) per annum. Rupees in ‘000 Note 2016 2015
7. BALANCES WITH OTHER BANKS
In Pakistan
On current accounts 165,727 193,887 On deposit accounts 7.1 2,293,217 2,235,530
2,458,944 2,429,417 Outside Pakistan
On current accounts 1,586,734 1,277,860 On deposit accounts 7.2 1,800,070 4,651,653
3,386,804 5,929,513
5,845,748 8,358,930 7.1 These represent placements with local banks, carrying interest rates ranging from 0.10% to 5.80% (2015: 0.25% to 6.15% ) per
annum. 7.2 These represent placements with international correspondent banks, carrying interest rates upto 0.66% (2015: upto 0.36%) per
annum.

160Ce
lebrat
ing Y
oung T
alent
Rupees in ‘000 Note 2016 2015
8. LENDINGS TO FINANCIAL INSTITUTIONS
Repurchase agreement lendings 8.1 3,992,000 289,193 Purchase under resale arrangement of equity securities 148,606 148,606
4,140,606 437,799 Bai Muajjal receivable from other financial institutions 8.2 2,330,023 – Funded trade finance 514,561 523,705
6,985,190 961,504 Provision against purchase under resale arrangement of equity securities (148,606) (148,606)
6,836,584 812,898 8.1 These are secured against underlying Government Securities, the differential between the contracted rate and resale price is
amortised over the period of related contracts and recorded under mark-up / return / interest earned. These carry mark-up at the rate of 5.95% to 6.10% (2015: 6.45%) per annum and maturities of upto 1 month (2015: 2 months).
8.2 These are unsecured and carry return of 5.55% to 5.70% per annum (2015: Nil) and having maturity upto 3 months (2015: Nil). Rupees in ‘000 Note 2016 2015
8.3 Particulars of lending
In local currency 6,470,629 437,799 In foreign currencies 514,561 523,705
6,985,190 961,504 8.4 Securities held as collateral against lendings to financial institutions 2016 2015
Further Further Held by given as Held by given as the Group collateral Total the Group collateral Total
Market Treasury Bills – – – 289,193 – 289,193 Pakistan Invesment Bonds 3,992,000 – 3,992,000 – – –
3,992,000 – 3,992,000 289,193 – 289,193
Market value of securities held as collateral is Rs. 4,355,193 thousand (2015: Rs. 290,021 thousand).
NOTES TO THE CONSOLIDATED FINANCIAL STATEMENTSFOR THE YEAR ENDED DECEMBER 31, 2016
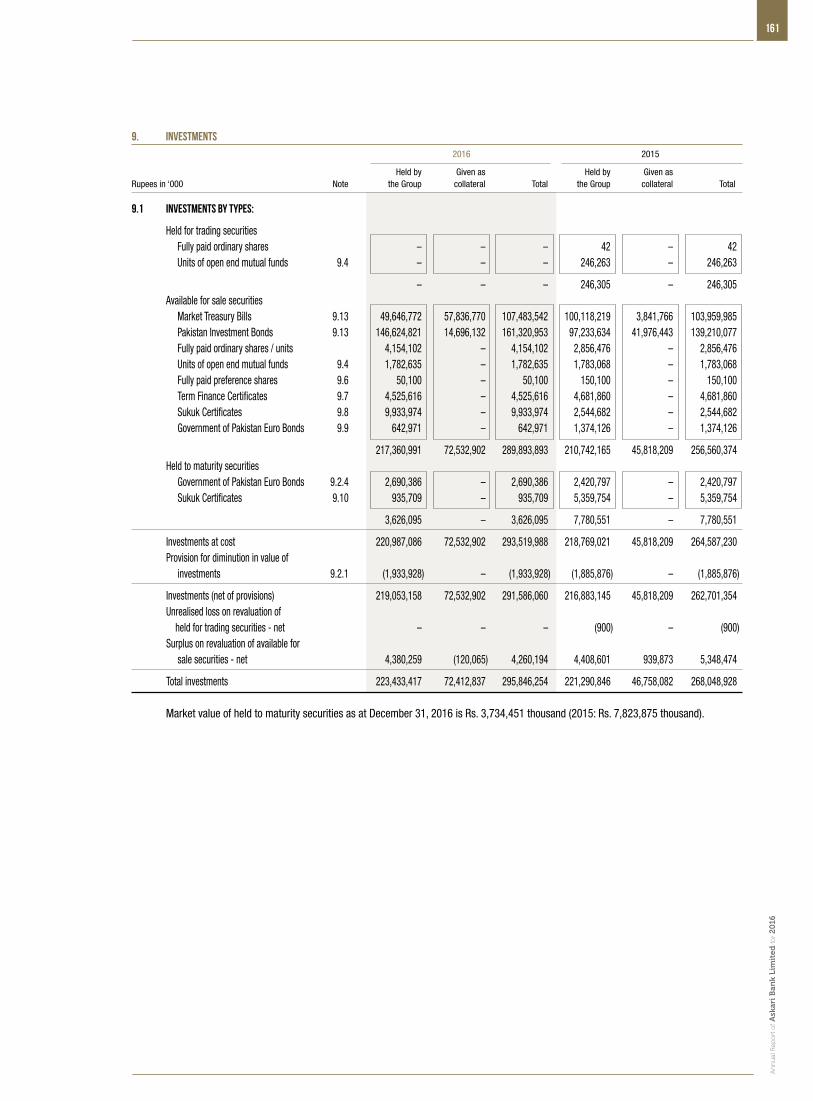
161
An
nu
al R
epo
rt o
f Ask
ari B
ank
Lim
ited
for 2
016
9. INVESTMENTS
2016 2015
Held by Given as Held by Given asRupees in ‘000 Note the Group collateral Total the Group collateral Total
9.1 Investments by types:
Held for trading securities Fully paid ordinary shares – – – 42 – 42 Units of open end mutual funds 9.4 – – – 246,263 – 246,263
– – – 246,305 – 246,305 Available for sale securities Market Treasury Bills 9.13 49,646,772 57,836,770 107,483,542 100,118,219 3,841,766 103,959,985 Pakistan Investment Bonds 9.13 146,624,821 14,696,132 161,320,953 97,233,634 41,976,443 139,210,077 Fully paid ordinary shares / units 4,154,102 – 4,154,102 2,856,476 – 2,856,476 Units of open end mutual funds 9.4 1,782,635 – 1,782,635 1,783,068 – 1,783,068 Fully paid preference shares 9.6 50,100 – 50,100 150,100 – 150,100 Term Finance Certificates 9.7 4,525,616 – 4,525,616 4,681,860 – 4,681,860 Sukuk Certificates 9.8 9,933,974 – 9,933,974 2,544,682 – 2,544,682 Government of Pakistan Euro Bonds 9.9 642,971 – 642,971 1,374,126 – 1,374,126
217,360,991 72,532,902 289,893,893 210,742,165 45,818,209 256,560,374 Held to maturity securities Government of Pakistan Euro Bonds 9.2.4 2,690,386 – 2,690,386 2,420,797 – 2,420,797 Sukuk Certificates 9.10 935,709 – 935,709 5,359,754 – 5,359,754
3,626,095 – 3,626,095 7,780,551 – 7,780,551
Investments at cost 220,987,086 72,532,902 293,519,988 218,769,021 45,818,209 264,587,230 Provision for diminution in value of investments 9.2.1 (1,933,928) – (1,933,928) (1,885,876) – (1,885,876)
Investments (net of provisions) 219,053,158 72,532,902 291,586,060 216,883,145 45,818,209 262,701,354 Unrealised loss on revaluation of held for trading securities - net – – – (900) – (900) Surplus on revaluation of available for sale securities - net 4,380,259 (120,065) 4,260,194 4,408,601 939,873 5,348,474
Total investments 223,433,417 72,412,837 295,846,254 221,290,846 46,758,082 268,048,928 Market value of held to maturity securities as at December 31, 2016 is Rs. 3,734,451 thousand (2015: Rs. 7,823,875 thousand).

162Ce
lebrat
ing Y
oung T
alent
Rupees in ‘000 Note 2016 2015
9.2 Investments by segments:
Federal Government Securities 9.2.3 Market Treasury Bills 107,483,542 103,959,985 Pakistan Investment Bonds 161,320,953 139,210,077 Government of Pakistan Euro Bonds 9.2.4 3,333,357 3,794,923 Sukuk Certificates 9,534,906 7,239,120
281,672,758 254,204,105 Fully paid up ordinary shares / units Listed companies / funds 9.3 4,148,422 2,850,838 Unlisted companies 9.5 5,680 5,680
4,154,102 2,856,518 Units of open end mutual funds 9.4 1,782,635 2,029,331 Fully paid preference shares 9.6 Listed companies 25,100 25,100 Unlisted companies 25,000 125,000
50,100 150,100 Term Finance Certificates 9.7 Listed Term Finance Certificates 1,140,700 1,661,047 Unlisted Term Finance Certificates 3,384,916 3,020,813
4,525,616 4,681,860 Other investments Sukuk Certificates 1,334,777 665,316
Total investment at cost 293,519,988 264,587,230 Provision for diminution in value of investments 9.2.1 (1,933,928) (1,885,876)
Investments (net of provisions) 291,586,060 262,701,354 Less: Unrealised loss on revaluation of held for trading securities - net 9.12 – (900) Surplus on revaluation of available for sale securities - net 4,260,194 5,348,474
Total investments 295,846,254 268,048,928 9.2.1 Particulars of provision for diminution in value of investments
Opening balance 1,885,876 1,539,907
Charge for the year 130,741 380,578 Reversal during the year (82,689) (34,609)
48,052 345,969
Closing balance 1,933,928 1,885,876 9.2.2 Particulars of provision in respect of type and segment
Available for sale securities Fully paid up ordinary shares - unlisted 5,680 5,680 Preference shares - unlisted 25,000 25,000 Term finance certificates 1,324,582 1,245,236 Sukuk certificates 468,666 499,960 Held to maturity securities Sukuk certificates 110,000 110,000
1,933,928 1,885,876
NOTES TO THE CONSOLIDATED FINANCIAL STATEMENTSFOR THE YEAR ENDED DECEMBER 31, 2016

163
An
nu
al R
epo
rt o
f Ask
ari B
ank
Lim
ited
for 2
016
9.2.3 Principal terms of investments in Federal Government Securities
Principal Coupon Name of investment Maturity Payment Rate (p.a) Payment
Market Treasury Bills January 2017 to August 2017 On maturity 5.80% to 6.28% at maturity Pakistan Investment Bonds July 2017 to April 2026 On maturity 5.87% to 14.08% semi-annually Government of Pakistan Euro Bonds June 2017 to April 2024 On maturity 6.88% to 8.25% semi-annually Sukuk Certificates - Neelum Jhelum Hydropower June 29, 2026 semi-annually Six month KIBOR semi-annually Company (Pvt) Limited - Type A plus 1.13% - Neelum Jhelum Hydropower June 29, 2026 semi-annually Six month KIBOR semi-annually Company (Pvt) Limited - Type B plus 1.13% - Pakistan Domestic Sukuk Company Limited June 25, 2017 On maturity Weighted average semi-annually yield of 6 months market treasury bills minus 200 BPS - Pakistan Domestic Sukuk Company Limited February 15 , 2019 On maturity 6.10% semi-annually - Pakistan Domestic Sukuk Company Limited March 29 , 2019 On maturity 5.59% semi-annually - Pakistan International Sukuk Company Limited December 03, 2019 On maturity 6.75% semi-annually - Pakistan International Sukuk Company Limited October 13, 2021 On maturity 5.50% semi-annually - WAPDA July 13, 2017 semi-annually 6 months KIBOR semi-annually minus 0.25% - Pakistan International Sukuk Company Limited December 03, 2019 On maturity 6.75% semi-annually 9.2.4 Government of Pakistan Euro Bonds represent investments by Wholesale Bank Branch, Bahrain carrying mark-up at 6.80% and 8.25% and having
maturities upto April 2024.
9.3 Investments in listed companies shares / units
No. of Average cost ordinary shares / units per share / unit 2016 2015
2016 2015 2016 Name of companies / mutual funds Rupees in ‘000
Rupees
– 1,116,500 – Adamjee Insurance Company Limited – 59,719 16,512,142 14,490,076 9.90 Agritech Limited 163,401 115,196 - 600,000 – Allied Bank Limited – 63,498 200,000 160,800 530.21 Attock Petroleum Limited 106,041 82,979 – 200 – Attock Refinery Limited – 42 414,800 – 250.14 AKZO Nobel Pak Limited 103,759 – 919,000 – 46.07 Arif Habib Corporation Limited 42,337 – 1,000,000 – 51.70 Al Shaheer Corporation Limited 51,697 – 1,650,000 – 62.60 Amreli Steel Limited 103,292 – 86,500 – 940.09 Abbot Laboratories (Pak) Limited 81,318 – – 2,600,000 – Bank Alfalah Limited – 80,347 3,000,000 – 17.72 Bank of Punjab Limited 53,173 – 407,500 – 200.48 Berger Paints Pakistan Limited 81,695 – 1,191,500 1,191,500 60.31 Century Paper And Board Mills Limited 71,865 71,865 – 1,010,000 – Cherat Cement Company Limited – 88,245 618,200 – 157.14 Crescent Steel & Allied 97,142 – 26,700 – 211.20 D. G. Khan Cement Company Limited 5,639 – 38,498,000 9,090,000 10.94 Dolmen City REIT 421,305 99,990 167,100 – 141.07 EFU General Insurance Limited 23,573 – 437,300 200,000 309.87 Engro Corporation Limited 135,508 60,176 2,700,000 685,500 71.48 Engro Fertilizer Limited 193,000 61,292 2,237,500 2,007,500 39.01 Fatima Fertilizer Co. Limited 87,284 97,408 399,500 400,000 221.88 GlaxoSmithKline (Pak) Limited 88,639 88,354 – 1,054,500 – Gul Ahmad Textile Mills Limited – 47,246 100,000 – 117.03 Ghani Glass Limited 11,703 – 3,983,000 – 22.07 Ghani Global Glass Limited 87,887 – 120,000 – – GlaxoSmithKline Consumer Healthcare Pakistan Limited – – 2,350,000 – 117.66 Hub Power Company Limited 276,492 – 2,289,500 2,320,000 35.73 Habib Metropolitan Bank Limited 81,811 82,901 105,800 160,000 514.24 ICI Pakistan Limited 54,407 78,106 – 1,498,000 – International Steel Limited – 39,752 – 3,034,603 – Islamabad Stock Exchange (ISE) – 4,505 – 4,007,383 – Karachi Stock Exchange (KSE) – 40,074 1,000,000 450,000 22.75 Jahangir Siddiqui Co. Limited 22,749 9,394 – 10,000 – Jubilee Life Insurance Co. Limited – 5,250 375,000 289,000 118.98 Jubilee General Insurance Co. Limited 44,618 35,080 – 6,000,000 – K- Electric Limited – 50,492 2,490,500 572,500 86.21 Kot Addu Power Company Limited 214,711 55,717 2,910,000 3,002,500 30.63 Lalpir Power Limited 89,125 95,506 100,000 144,300 818.52 Lucky Cement Limited 81,852 78,830 457,400 12,000 223.52 MCB Bank Limited 102,239 3,113 – 614,500 – Meezan Bank Limited – 30,202 22,400 – 898.68 Millat Tractors Limited 20,131 – 3,700,000 1,550,000 68.52 National Bank of Pakistan 253,538 97,701 3,848,000 925,500 56.45 Nishat Chunian Power Limited 217,224 56,068 500,000 2,490,500 41.45 Nishat (Chunian) Limited 20,726 104,545
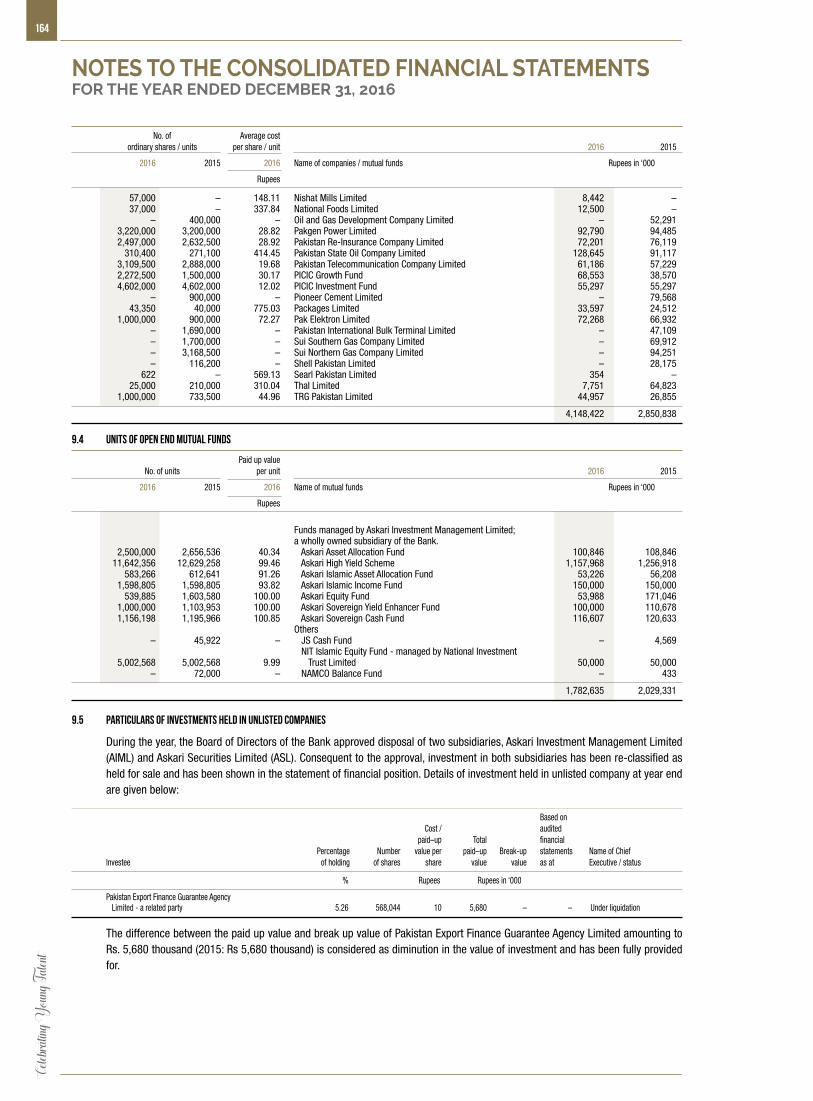
164Ce
lebrat
ing Y
oung T
alent
No. of Average cost ordinary shares / units per share / unit 2016 2015
2016 2015 2016 Name of companies / mutual funds Rupees in ‘000
Rupees
57,000 – 148.11 Nishat Mills Limited 8,442 – 37,000 – 337.84 National Foods Limited 12,500 – – 400,000 – Oil and Gas Development Company Limited – 52,291 3,220,000 3,200,000 28.82 Pakgen Power Limited 92,790 94,485 2,497,000 2,632,500 28.92 Pakistan Re-Insurance Company Limited 72,201 76,119 310,400 271,100 414.45 Pakistan State Oil Company Limited 128,645 91,117 3,109,500 2,888,000 19.68 Pakistan Telecommunication Company Limited 61,186 57,229 2,272,500 1,500,000 30.17 PICIC Growth Fund 68,553 38,570 4,602,000 4,602,000 12.02 PICIC Investment Fund 55,297 55,297 – 900,000 – Pioneer Cement Limited – 79,568 43,350 40,000 775.03 Packages Limited 33,597 24,512 1,000,000 900,000 72.27 Pak Elektron Limited 72,268 66,932 – 1,690,000 – Pakistan International Bulk Terminal Limited – 47,109 – 1,700,000 – Sui Southern Gas Company Limited – 69,912 – 3,168,500 – Sui Northern Gas Company Limited – 94,251 – 116,200 – Shell Pakistan Limited – 28,175 622 – 569.13 Searl Pakistan Limited 354 – 25,000 210,000 310.04 Thal Limited 7,751 64,823 1,000,000 733,500 44.96 TRG Pakistan Limited 44,957 26,855
4,148,422 2,850,838
9.4 Units of open end mutual funds
Paid up value No. of units per unit 2016 2015
2016 2015 2016 Name of mutual funds Rupees in ‘000
Rupees
Funds managed by Askari Investment Management Limited; a wholly owned subsidiary of the Bank. 2,500,000 2,656,536 40.34 Askari Asset Allocation Fund 100,846 108,846 11,642,356 12,629,258 99.46 Askari High Yield Scheme 1,157,968 1,256,918 583,266 612,641 91.26 Askari Islamic Asset Allocation Fund 53,226 56,208 1,598,805 1,598,805 93.82 Askari Islamic Income Fund 150,000 150,000 539,885 1,603,580 100.00 Askari Equity Fund 53,988 171,046 1,000,000 1,103,953 100.00 Askari Sovereign Yield Enhancer Fund 100,000 110,678 1,156,198 1,195,966 100.85 Askari Sovereign Cash Fund 116,607 120,633 Others – 45,922 – JS Cash Fund – 4,569 NIT Islamic Equity Fund - managed by National Investment 5,002,568 5,002,568 9.99 Trust Limited 50,000 50,000 – 72,000 – NAMCO Balance Fund – 433
1,782,635 2,029,331
NOTES TO THE CONSOLIDATED FINANCIAL STATEMENTSFOR THE YEAR ENDED DECEMBER 31, 2016
9.5 Particulars of investments held in unlisted companies
During the year, the Board of Directors of the Bank approved disposal of two subsidiaries, Askari Investment Management Limited (AIML) and Askari Securities Limited (ASL). Consequent to the approval, investment in both subsidiaries has been re-classified as held for sale and has been shown in the statement of financial position. Details of investment held in unlisted company at year end are given below:
Based on Cost / audited paid–up Total financial Percentage Number value per paid–up Break-up statements Name of Chief Investee of holding of shares share value value as at Executive / status
% Rupees Rupees in ‘000
Pakistan Export Finance Guarantee Agency Limited - a related party 5.26 568,044 10 5,680 – – Under liquidation
The difference between the paid up value and break up value of Pakistan Export Finance Guarantee Agency Limited amounting to Rs. 5,680 thousand (2015: Rs 5,680 thousand) is considered as diminution in the value of investment and has been fully provided for.
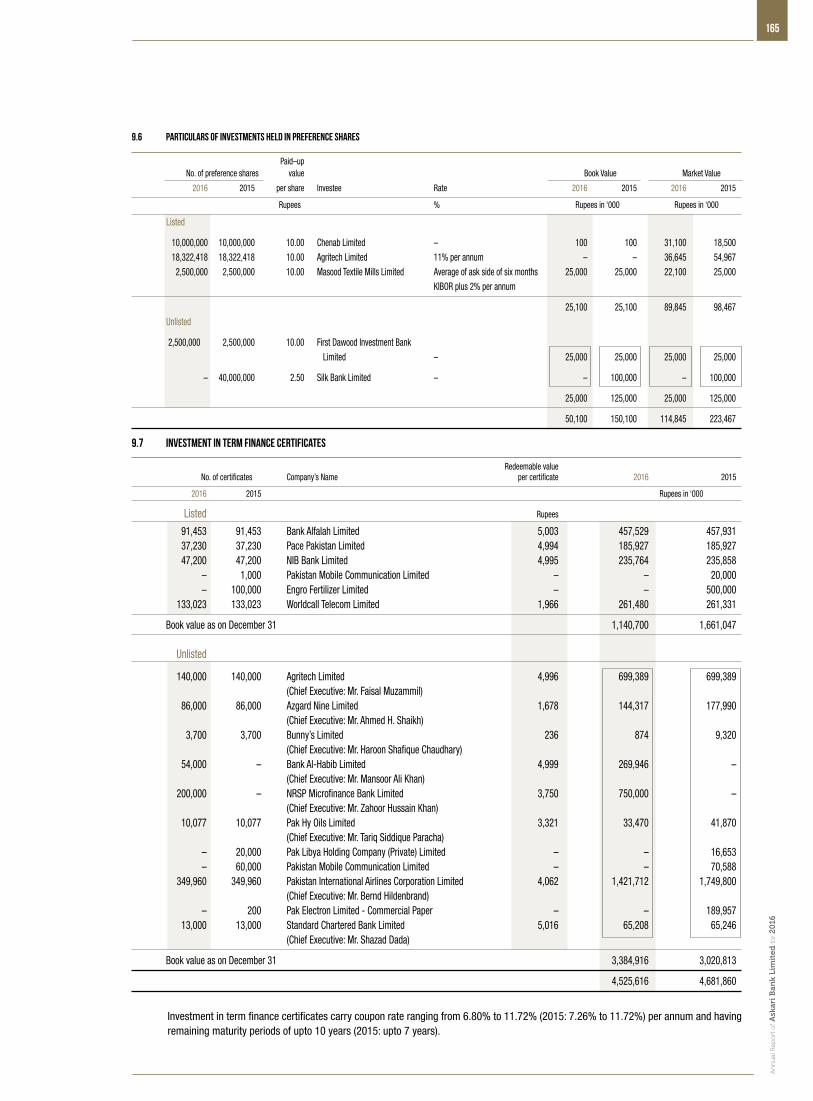
165
An
nu
al R
epo
rt o
f Ask
ari B
ank
Lim
ited
for 2
016
9.6 Particulars of investments held in preference shares
Paid–up No. of preference shares value Book Value Market Value
2016 2015 per share Investee Rate 2016 2015 2016 2015
Rupees % Rupees in ‘000 Rupees in ‘000
Listed
10,000,000 10,000,000 10.00 Chenab Limited – 100 100 31,100 18,500 18,322,418 18,322,418 10.00 Agritech Limited 11% per annum – – 36,645 54,967 2,500,000 2,500,000 10.00 Masood Textile Mills Limited Average of ask side of six months 25,000 25,000 22,100 25,000 KIBOR plus 2% per annum
25,100 25,100 89,845 98,467 Unlisted
2,500,000 2,500,000 10.00 First Dawood Investment Bank Limited – 25,000 25,000 25,000 25,000
– 40,000,000 2.50 Silk Bank Limited – – 100,000 – 100,000
25,000 125,000 25,000 125,000
50,100 150,100 114,845 223,467
9.7 Investment in Term Finance Certificates
Redeemable value No. of certificates Company’s Name per certificate 2016 2015
2016 2015 Rupees in ‘000
Listed Rupees
91,453 91,453 Bank Alfalah Limited 5,003 457,529 457,931 37,230 37,230 Pace Pakistan Limited 4,994 185,927 185,927 47,200 47,200 NIB Bank Limited 4,995 235,764 235,858 – 1,000 Pakistan Mobile Communication Limited – – 20,000 – 100,000 Engro Fertilizer Limited – – 500,000 133,023 133,023 Worldcall Telecom Limited 1,966 261,480 261,331
Book value as on December 31 1,140,700 1,661,047 Unlisted
140,000 140,000 Agritech Limited 4,996 699,389 699,389 (Chief Executive: Mr. Faisal Muzammil) 86,000 86,000 Azgard Nine Limited 1,678 144,317 177,990 (Chief Executive: Mr. Ahmed H. Shaikh) 3,700 3,700 Bunny’s Limited 236 874 9,320 (Chief Executive: Mr. Haroon Shafique Chaudhary) 54,000 – Bank Al-Habib Limited 4,999 269,946 – (Chief Executive: Mr. Mansoor Ali Khan) 200,000 – NRSP Microfinance Bank Limited 3,750 750,000 – (Chief Executive: Mr. Zahoor Hussain Khan) 10,077 10,077 Pak Hy Oils Limited 3,321 33,470 41,870 (Chief Executive: Mr. Tariq Siddique Paracha) – 20,000 Pak Libya Holding Company (Private) Limited – – 16,653 – 60,000 Pakistan Mobile Communication Limited – – 70,588 349,960 349,960 Pakistan International Airlines Corporation Limited 4,062 1,421,712 1,749,800 (Chief Executive: Mr. Bernd Hildenbrand) – 200 Pak Electron Limited - Commercial Paper – – 189,957 13,000 13,000 Standard Chartered Bank Limited 5,016 65,208 65,246 (Chief Executive: Mr. Shazad Dada)
Book value as on December 31 3,384,916 3,020,813
4,525,616 4,681,860
Investment in term finance certificates carry coupon rate ranging from 6.80% to 11.72% (2015: 7.26% to 11.72%) per annum and having
remaining maturity periods of upto 10 years (2015: upto 7 years).
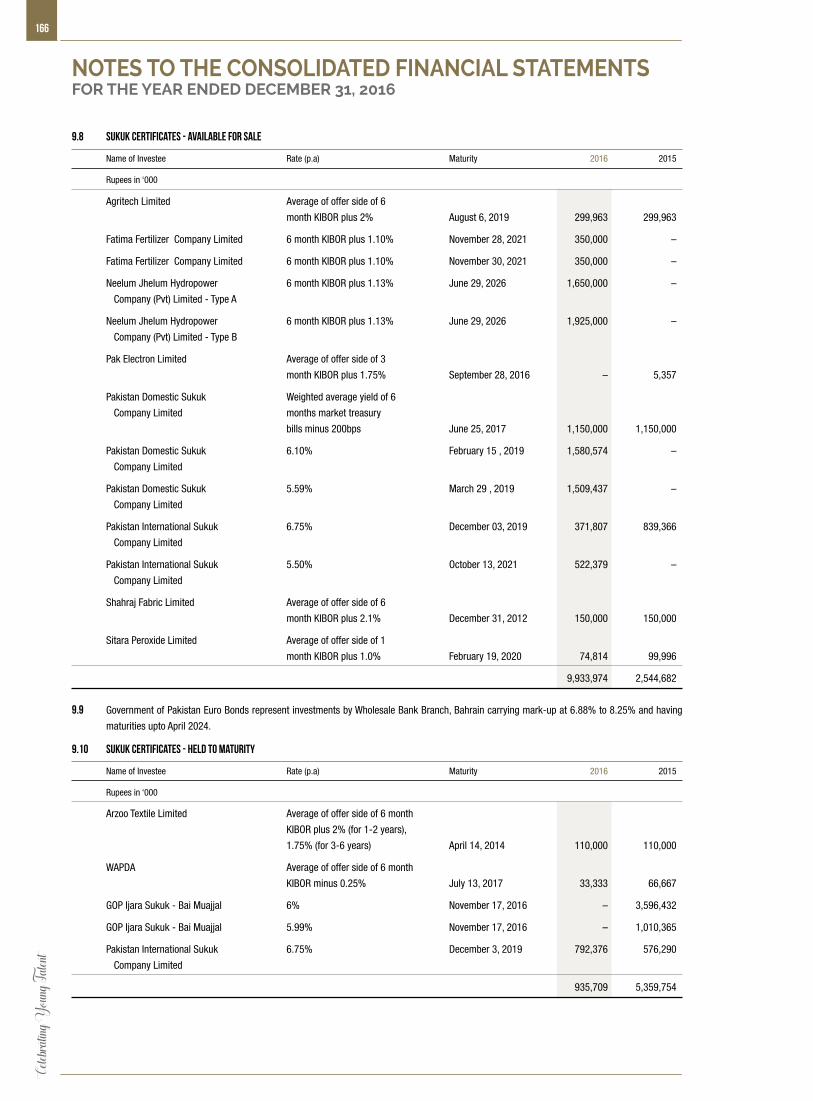
166Ce
lebrat
ing Y
oung T
alent
9.8 Sukuk Certificates - Available for sale
Name of Investee Rate (p.a) Maturity 2016 2015
Rupees in ‘000
Agritech Limited Average of offer side of 6
month KIBOR plus 2% August 6, 2019 299,963 299,963
Fatima Fertilizer Company Limited 6 month KIBOR plus 1.10% November 28, 2021 350,000 –
Fatima Fertilizer Company Limited 6 month KIBOR plus 1.10% November 30, 2021 350,000 –
Neelum Jhelum Hydropower 6 month KIBOR plus 1.13% June 29, 2026 1,650,000 –
Company (Pvt) Limited - Type A
Neelum Jhelum Hydropower 6 month KIBOR plus 1.13% June 29, 2026 1,925,000 –
Company (Pvt) Limited - Type B
Pak Electron Limited Average of offer side of 3
month KIBOR plus 1.75% September 28, 2016 – 5,357
Pakistan Domestic Sukuk Weighted average yield of 6
Company Limited months market treasury
bills minus 200bps June 25, 2017 1,150,000 1,150,000
Pakistan Domestic Sukuk 6.10% February 15 , 2019 1,580,574 –
Company Limited
Pakistan Domestic Sukuk 5.59% March 29 , 2019 1,509,437 –
Company Limited
Pakistan International Sukuk 6.75% December 03, 2019 371,807 839,366
Company Limited
Pakistan International Sukuk 5.50% October 13, 2021 522,379 –
Company Limited
Shahraj Fabric Limited Average of offer side of 6
month KIBOR plus 2.1% December 31, 2012 150,000 150,000
Sitara Peroxide Limited Average of offer side of 1
month KIBOR plus 1.0% February 19, 2020 74,814 99,996
9,933,974 2,544,682
9.9 Government of Pakistan Euro Bonds represent investments by Wholesale Bank Branch, Bahrain carrying mark-up at 6.88% to 8.25% and having
maturities upto April 2024.
Arzoo Textile Limited Average of offer side of 6 month
KIBOR plus 2% (for 1-2 years),
1.75% (for 3-6 years) April 14, 2014 110,000 110,000
WAPDA Average of offer side of 6 month
KIBOR minus 0.25% July 13, 2017 33,333 66,667
GOP Ijara Sukuk - Bai Muajjal 6% November 17, 2016 – 3,596,432
GOP Ijara Sukuk - Bai Muajjal 5.99% November 17, 2016 – 1,010,365
Pakistan International Sukuk 6.75% December 3, 2019 792,376 576,290
Company Limited
935,709 5,359,754
9.10 Sukuk Certificates - Held to maturity
Name of Investee Rate (p.a) Maturity 2016 2015
Rupees in ‘000
NOTES TO THE CONSOLIDATED FINANCIAL STATEMENTSFOR THE YEAR ENDED DECEMBER 31, 2016
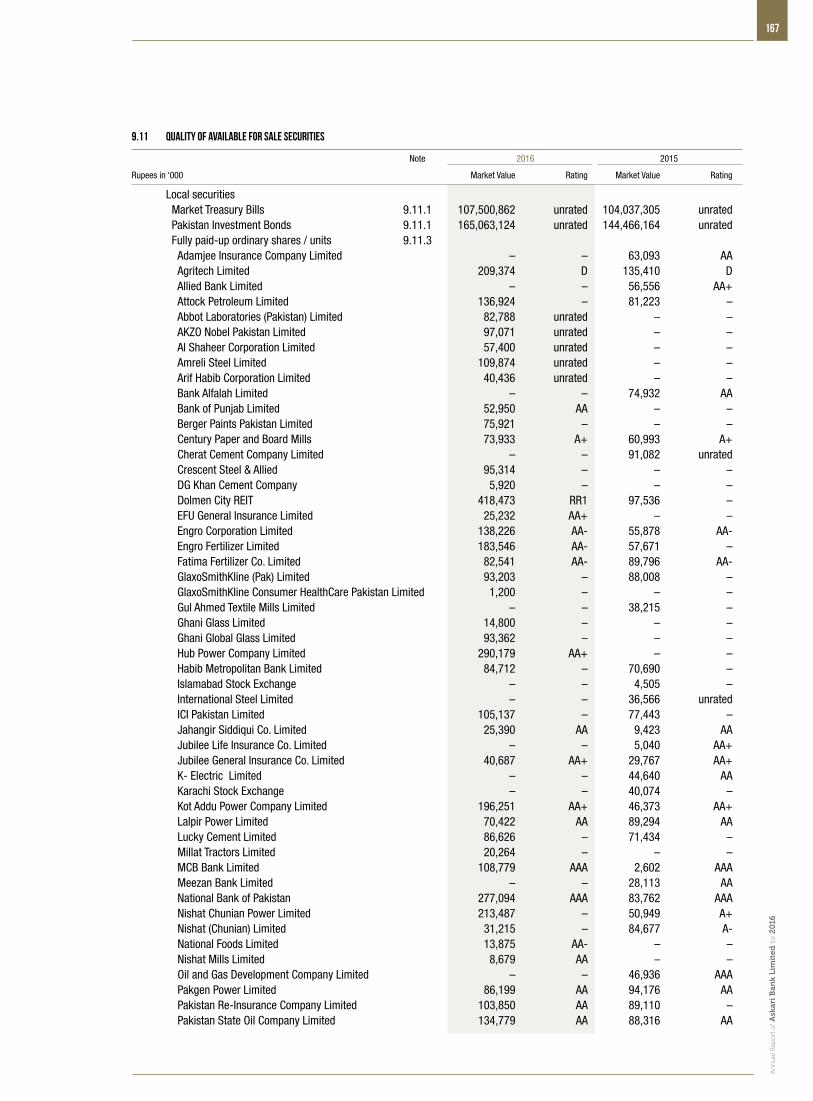
167
An
nu
al R
epo
rt o
f Ask
ari B
ank
Lim
ited
for 2
016
9.11 Quality of available for sale securities
Note 2016 2015
Rupees in ‘000 Market Value Rating Market Value Rating
Local securities Market Treasury Bills 9.11.1 107,500,862 unrated 104,037,305 unrated Pakistan Investment Bonds 9.11.1 165,063,124 unrated 144,466,164 unrated Fully paid-up ordinary shares / units 9.11.3 Adamjee Insurance Company Limited – – 63,093 AA Agritech Limited 209,374 D 135,410 D Allied Bank Limited – – 56,556 AA+ Attock Petroleum Limited 136,924 – 81,223 – Abbot Laboratories (Pakistan) Limited 82,788 unrated – – AKZO Nobel Pakistan Limited 97,071 unrated – – Al Shaheer Corporation Limited 57,400 unrated – – Amreli Steel Limited 109,874 unrated – –
Arif Habib Corporation Limited 40,436 unrated – – Bank Alfalah Limited – – 74,932 AA Bank of Punjab Limited 52,950 AA – – Berger Paints Pakistan Limited 75,921 – – – Century Paper and Board Mills 73,933 A+ 60,993 A+ Cherat Cement Company Limited – – 91,082 unrated Crescent Steel & Allied 95,314 – – – DG Khan Cement Company 5,920 – – – Dolmen City REIT 418,473 RR1 97,536 – EFU General Insurance Limited 25,232 AA+ – – Engro Corporation Limited 138,226 AA- 55,878 AA- Engro Fertilizer Limited 183,546 AA- 57,671 – Fatima Fertilizer Co. Limited 82,541 AA- 89,796 AA- GlaxoSmithKline (Pak) Limited 93,203 – 88,008 – GlaxoSmithKline Consumer HealthCare Pakistan Limited 1,200 – – – Gul Ahmed Textile Mills Limited – – 38,215 – Ghani Glass Limited 14,800 – – – Ghani Global Glass Limited 93,362 – – – Hub Power Company Limited 290,179 AA+ – – Habib Metropolitan Bank Limited 84,712 – 70,690 – Islamabad Stock Exchange – – 4,505 – International Steel Limited – – 36,566 unrated ICI Pakistan Limited 105,137 – 77,443 – Jahangir Siddiqui Co. Limited 25,390 AA 9,423 AA Jubilee Life Insurance Co. Limited – – 5,040 AA+ Jubilee General Insurance Co. Limited 40,687 AA+ 29,767 AA+ K- Electric Limited – – 44,640 AA Karachi Stock Exchange – – 40,074 – Kot Addu Power Company Limited 196,251 AA+ 46,373 AA+ Lalpir Power Limited 70,422 AA 89,294 AA Lucky Cement Limited 86,626 – 71,434 – Millat Tractors Limited 20,264 – – – MCB Bank Limited 108,779 AAA 2,602 AAA Meezan Bank Limited – – 28,113 AA National Bank of Pakistan 277,094 AAA 83,762 AAA Nishat Chunian Power Limited 213,487 – 50,949 A+ Nishat (Chunian) Limited 31,215 – 84,677 A- National Foods Limited 13,875 AA- – – Nishat Mills Limited 8,679 AA – – Oil and Gas Development Company Limited – – 46,936 AAA Pakgen Power Limited 86,199 AA 94,176 AA Pakistan Re-Insurance Company Limited 103,850 AA 89,110 – Pakistan State Oil Company Limited 134,779 AA 88,316 AA

168Ce
lebrat
ing Y
oung T
alent
Note 2016 2015
Rupees in ‘000 Market Value Rating Market Value Rating
Pakistan Telecommunication Company Limited 53,421 – 47,623 unrated PICIC Growth Fund 69,220 – 33,795 – PICIC Investment Fund 63,968 – 52,601 unrated Pioneer Cement Limited – – 81,774 – Packages Limited 36,850 AA 23,284 AA Pakistan International Bulk Terminal Limited – – 47,269 – Pak Electron Limited 71,280 A+ 56,286 A Sui Northern Gas Company Limited – – 76,171 AA- Sui Southern Gas Company Limited – – 63,495 AA- Shell Pakistan Limited – – 26,521 – Searl Pakistan Limited 407 – – – TRG Pakistan Limited 44,260 – 25,416 – Thal Limited 12,713 – 53,199 –
Fully paid preference shares Agritech Limited 36,645 unrated 54,967 unrated Chenab Limited 31,100 unrated 15,300 unrated Masood Textile Mills Limited 22,100 unrated 25,000 unrated First Dawood Investment Bank Limited 25,000 – 25,000 – Silk Bank Limited – – 100,000 A- Units of open end mutual funds Askari High Yield Scheme 1,214,244 A 1,243,778 A Askari Asset Allocation Fund 135,996 2-Star 119,526 3-Star Askari Islamic Asset Allocation Fund 70,654 1-Star 58,038 2-Star Askari Islamic Income Fund 164,749 A+ 165,465 AA- Askari Sovereign Yield Enhancer Fund 102,864 A+ 106,717 AA- Askari Equity Fund 70,367 3-Star 55,560 unrated Askari Sovereign Cash Fund 119,004 AA+ 120,004 AAA NAMCO Balance Fund – – 941 unrated NIT Islamic Equity Fund 64,183 – 49,325 – Term Finance Certificates Agritech Limited 699,389 D 699,389 D Azgard Nine Limited 144,317 D 177,990 D Bank Alfalah Limited 468,629 AA- 465,144 AA- Bunny’s Limited 874 unrated 9,320 unrated Bank Al Habib Limited 273,162 AA – – Engro Fertilizer Limited – – 457,795 AA- NIB Bank Limited 238,441 A+ 233,500 A+ NRSP Microfinance Bank (Pvt) Limited 752,478 A – – Pace Pakistan Limited 185,927 D 185,927 D Pak Hy Oils Limited 33,470 D 41,870 unrated Pak Libya Holding Company (Private) Limited – – 16,617 AA Pakistan International Airlines Corporation Limited 9.11.1 1,421,712 unrated 1,749,800 unrated Pakistan Mobile Communication Limited – – 90,985 AA- Pak Electron Limited – – 189,957 A- Standard Chartered Bank 65,260 AAA 65,100 AAA World Call Telecom Limited 261,481 D 261,481 D Sukuk Certificates 9.11.2 9,979,524 unrated 2,555,467 unrated Foreign securities Government of Pakistan Euro Bonds 9.11.1 664,619 unrated 1,388,019 unrated
294,148,407 261,903,168
NOTES TO THE CONSOLIDATED FINANCIAL STATEMENTSFOR THE YEAR ENDED DECEMBER 31, 2016
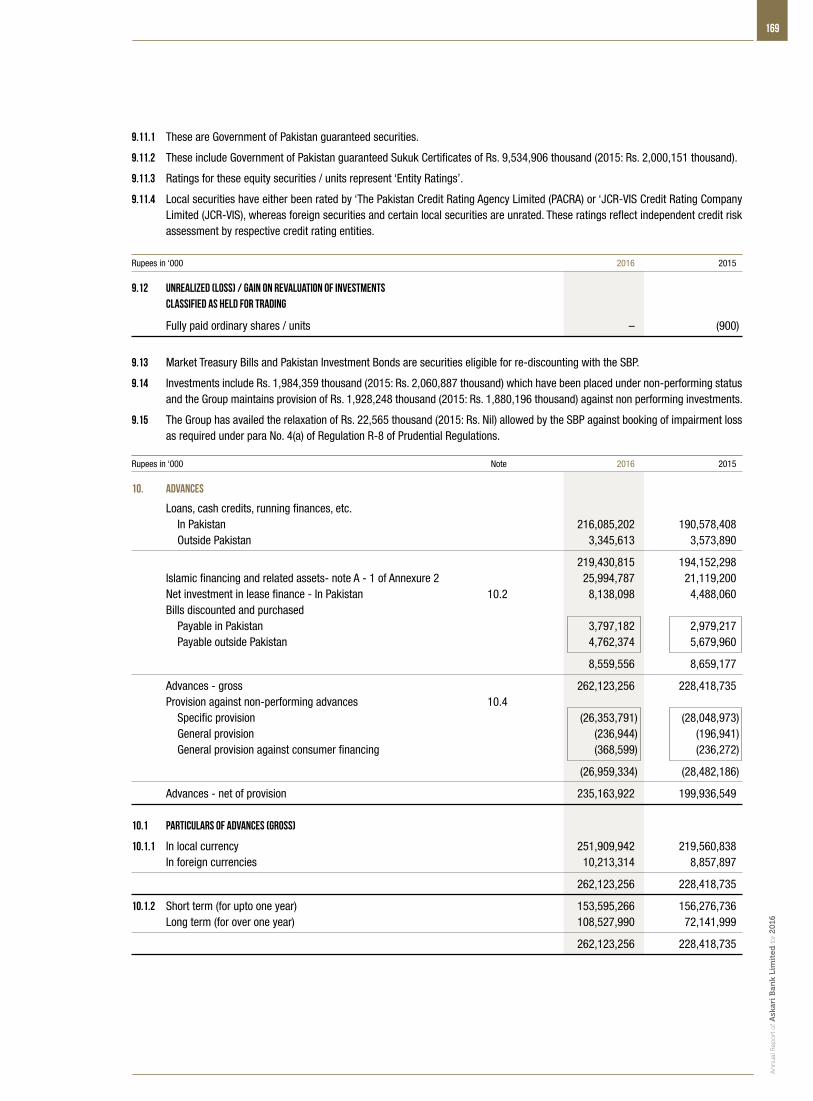
169
An
nu
al R
epo
rt o
f Ask
ari B
ank
Lim
ited
for 2
016
Rupees in ‘000 Note 2016 2015
10. ADVANCES
Loans, cash credits, running finances, etc. In Pakistan 216,085,202 190,578,408 Outside Pakistan 3,345,613 3,573,890
219,430,815 194,152,298 Islamic financing and related assets- note A - 1 of Annexure 2 25,994,787 21,119,200 Net investment in lease finance - In Pakistan 10.2 8,138,098 4,488,060 Bills discounted and purchased Payable in Pakistan 3,797,182 2,979,217 Payable outside Pakistan 4,762,374 5,679,960
8,559,556 8,659,177
Advances - gross 262,123,256 228,418,735 Provision against non-performing advances 10.4 Specific provision (26,353,791) (28,048,973) General provision (236,944) (196,941) General provision against consumer financing (368,599) (236,272)
(26,959,334) (28,482,186)
Advances - net of provision 235,163,922 199,936,549 10.1 Particulars of advances (Gross)
10.1.1 In local currency 251,909,942 219,560,838 In foreign currencies 10,213,314 8,857,897
262,123,256 228,418,735
10.1.2 Short term (for upto one year) 153,595,266 156,276,736 Long term (for over one year) 108,527,990 72,141,999
262,123,256 228,418,735
9.11.1 These are Government of Pakistan guaranteed securities.
9.11.2 These include Government of Pakistan guaranteed Sukuk Certificates of Rs. 9,534,906 thousand (2015: Rs. 2,000,151 thousand).
9.11.3 Ratings for these equity securities / units represent ‘Entity Ratings’.
9.11.4 Local securities have either been rated by ‘The Pakistan Credit Rating Agency Limited (PACRA) or ‘JCR-VIS Credit Rating Company Limited (JCR-VIS), whereas foreign securities and certain local securities are unrated. These ratings reflect independent credit risk assessment by respective credit rating entities.
Rupees in ‘000 2016 2015
9.12 Unrealized (loss) / gain on revaluation of investments classified as held for trading
Fully paid ordinary shares / units – (900)
9.13 Market Treasury Bills and Pakistan Investment Bonds are securities eligible for re-discounting with the SBP.
9.14 Investments include Rs. 1,984,359 thousand (2015: Rs. 2,060,887 thousand) which have been placed under non-performing status and the Group maintains provision of Rs. 1,928,248 thousand (2015: Rs. 1,880,196 thousand) against non performing investments.
9.15 The Group has availed the relaxation of Rs. 22,565 thousand (2015: Rs. Nil) allowed by the SBP against booking of impairment loss as required under para No. 4(a) of Regulation R-8 of Prudential Regulations.
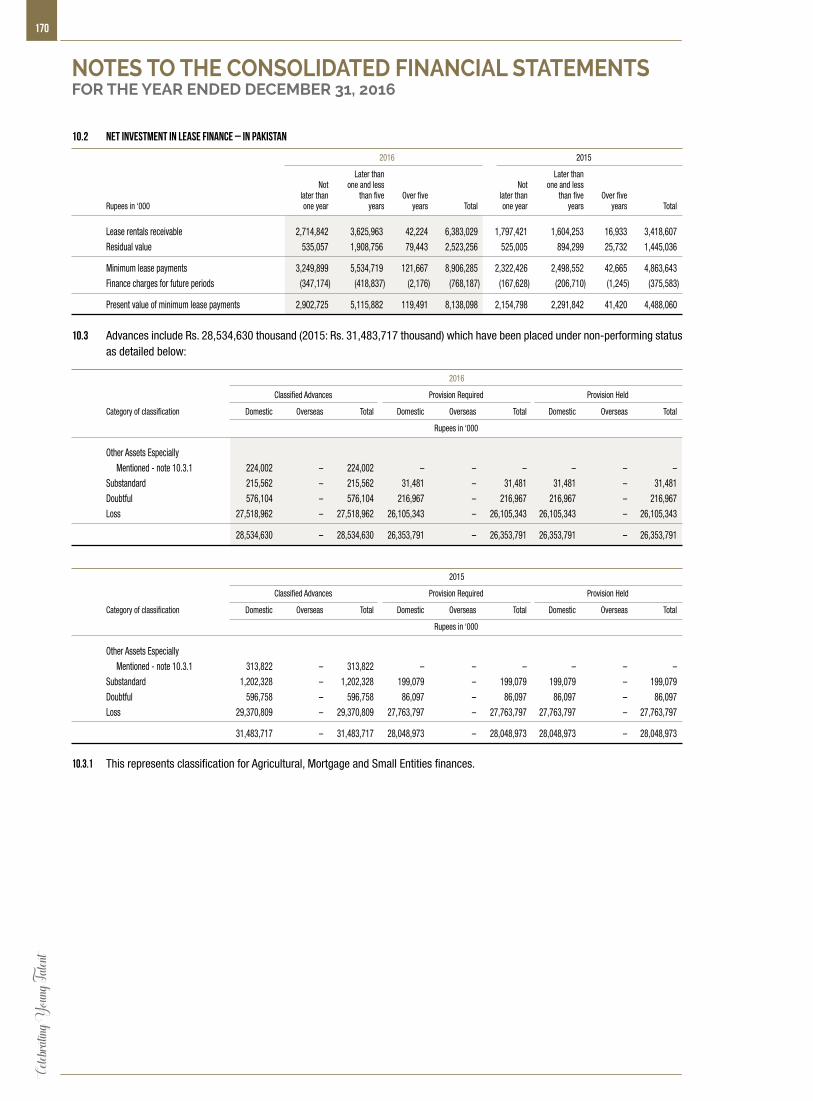
170Ce
lebrat
ing Y
oung T
alent
10.2 Net investment in lease finance – In Pakistan
2016 2015
Later than Later than Not one and less Not one and less later than than five Over five later than than five Over five Rupees in ‘000 one year years years Total one year years years Total
Lease rentals receivable 2,714,842 3,625,963 42,224 6,383,029 1,797,421 1,604,253 16,933 3,418,607
Residual value 535,057 1,908,756 79,443 2,523,256 525,005 894,299 25,732 1,445,036
Minimum lease payments 3,249,899 5,534,719 121,667 8,906,285 2,322,426 2,498,552 42,665 4,863,643
Finance charges for future periods (347,174) (418,837) (2,176) (768,187) (167,628) (206,710) (1,245) (375,583)
Present value of minimum lease payments 2,902,725 5,115,882 119,491 8,138,098 2,154,798 2,291,842 41,420 4,488,060
10.3 Advances include Rs. 28,534,630 thousand (2015: Rs. 31,483,717 thousand) which have been placed under non-performing status as detailed below:
2016
Classified Advances Provision Required Provision Held
Category of classification Domestic Overseas Total Domestic Overseas Total Domestic Overseas Total
Rupees in ‘000
Other Assets Especially
Mentioned - note 10.3.1 224,002 – 224,002 – – – – – –
Substandard 215,562 – 215,562 31,481 – 31,481 31,481 – 31,481
Doubtful 576,104 – 576,104 216,967 – 216,967 216,967 – 216,967
Loss 27,518,962 – 27,518,962 26,105,343 – 26,105,343 26,105,343 – 26,105,343
28,534,630 – 28,534,630 26,353,791 – 26,353,791 26,353,791 – 26,353,791
2015
Classified Advances Provision Required Provision Held
Category of classification Domestic Overseas Total Domestic Overseas Total Domestic Overseas Total
Rupees in ‘000
Other Assets Especially
Mentioned - note 10.3.1 313,822 – 313,822 – – – – – –
Substandard 1,202,328 – 1,202,328 199,079 – 199,079 199,079 – 199,079
Doubtful 596,758 – 596,758 86,097 – 86,097 86,097 – 86,097
Loss 29,370,809 – 29,370,809 27,763,797 – 27,763,797 27,763,797 – 27,763,797
31,483,717 – 31,483,717 28,048,973 – 28,048,973 28,048,973 – 28,048,973
10.3.1 This represents classification for Agricultural, Mortgage and Small Entities finances.
NOTES TO THE CONSOLIDATED FINANCIAL STATEMENTSFOR THE YEAR ENDED DECEMBER 31, 2016

171
An
nu
al R
epo
rt o
f Ask
ari B
ank
Lim
ited
for 2
016
10.4.1 The net FSV benefit already availed has been reduced by Rs. 415,069 thousand, which has resulted in increased charge for specific provision for the year by the same amount. Had the FSV benefit not reduced, before and after tax profit for the year would have been higher by Rs. 415,069 thousand (2015: Rs. 415,970 thousand) and Rs. 269,795 thousand (2015: Rs. 270,381 thousand) respectively. Further, at December 31, 2016, cumulative net of tax benefit availed for Forced Sale Value (FSV) was Rs. 912,077 thousand (December 31, 2015: Rs. 1,181,873 thousand) under BSD circular No. 1 of 2011 dated October 21, 2011. Reserves and un-appropriated profit to that extent are not available for distribution by way of cash or stock dividend.
10.4.2 The Group has availed the relaxation of Rs. 102,460 thousand (2015: Rs. 102,567 thousand) allowed by the SBP for maintaining provisions as per time based criteria of prudential regulations.
10.4.3 Provision against non-performing advances includes provision of Rs. 20,737 thousand (2015: Rs. 10,959 thousand) maintained against Secured Small Entities Finances. Further, the general provision is maintained at the rate of 0.1% on advances other than non-performing advances and consumer / small entities financing.
10.5 Particulars of provision against non-performing advances
2016 2015
Consumer Consumer financing financing Rupees in ‘000 Specific General – General Total Specific General – General Total
In local currency 25,823,336 236,944 368,599 26,428,879 27,518,113 196,941 236,272 27,951,326
In foreign currencies 530,455 – – 530,455 530,860 – – 530,860
26,353,791 236,944 368,599 26,959,334 28,048,973 196,941 236,272 28,482,186
Rupees in ‘000 2016 2015
10.6 Particulars of write-offs:
10.6.1 Against provisions 234 2,719 Directly charged to profit and loss account – –
234 2,719 10.6.2 Write offs of Rs. 500,000 and above – 2,413 Write offs of below Rs. 500,000 234 306
234 2,719
10.4 Particulars of provision against non–performing advances
2016 2015
Consumer Consumer General financing General financing Rupees in ‘000 Note Specific (note 10.4.3) – General Total Specific (note 10.4.3) – General Total
Opening balance 28,048,973 196,941 236,272 28,482,186 27,801,250 177,555 190,260 28,169,065
Charge for the year 1,198,881 56,299 147,073 1,402,253 1,790,206 34,687 49,966 1,874,859
Reversal for the year (2,100,652) (16,296) (14,746) (2,131,694) (1,539,764) (15,301) (3,954) (1,559,019)
Net (reversal) / charge for the year (901,771) 40,003 132,327 (729,441) 250,442 19,386 46,012 315,840
Amounts written off 10.6 (234) – – (234) (2,719) – – (2,719)
Amounts charged off- agri loans 10.7 (793,177) – – (793,177) – – – –
Closing balance 26,353,791 236,944 368,599 26,959,334 28,048,973 196,941 236,272 28,482,186
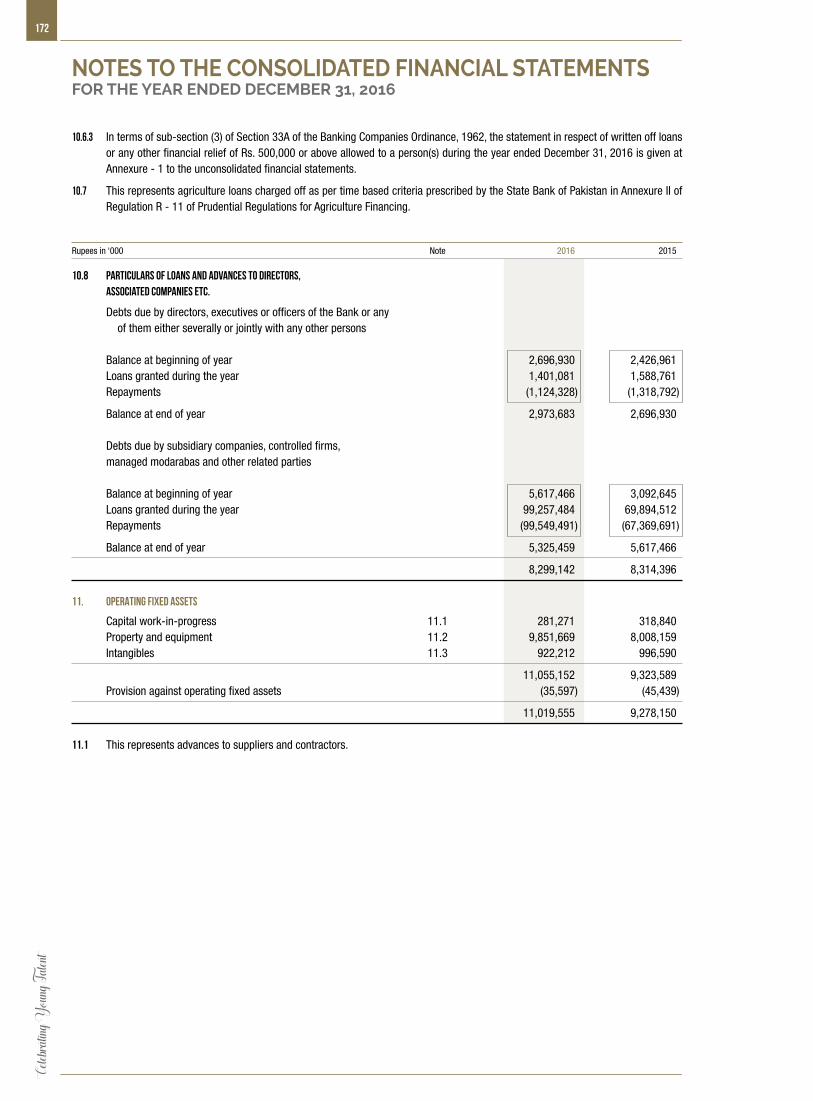
172Ce
lebrat
ing Y
oung T
alent
10.6.3 In terms of sub-section (3) of Section 33A of the Banking Companies Ordinance, 1962, the statement in respect of written off loans or any other financial relief of Rs. 500,000 or above allowed to a person(s) during the year ended December 31, 2016 is given at Annexure - 1 to the unconsolidated financial statements.
10.7 This represents agriculture loans charged off as per time based criteria prescribed by the State Bank of Pakistan in Annexure II of Regulation R - 11 of Prudential Regulations for Agriculture Financing.
Rupees in ‘000 Note 2016 2015
10.8 Particulars of loans and advances to directors, associated companies etc.
Debts due by directors, executives or officers of the Bank or any of them either severally or jointly with any other persons Balance at beginning of year 2,696,930 2,426,961 Loans granted during the year 1,401,081 1,588,761 Repayments (1,124,328) (1,318,792)
Balance at end of year 2,973,683 2,696,930 Debts due by subsidiary companies, controlled firms, managed modarabas and other related parties Balance at beginning of year 5,617,466 3,092,645 Loans granted during the year 99,257,484 69,894,512 Repayments (99,549,491) (67,369,691)
Balance at end of year 5,325,459 5,617,466
8,299,142 8,314,396 11. OPERATING FIXED ASSETS
Capital work-in-progress 11.1 281,271 318,840 Property and equipment 11.2 9,851,669 8,008,159 Intangibles 11.3 922,212 996,590
11,055,152 9,323,589 Provision against operating fixed assets (35,597) (45,439)
11,019,555 9,278,150 11.1 This represents advances to suppliers and contractors.
NOTES TO THE CONSOLIDATED FINANCIAL STATEMENTSFOR THE YEAR ENDED DECEMBER 31, 2016
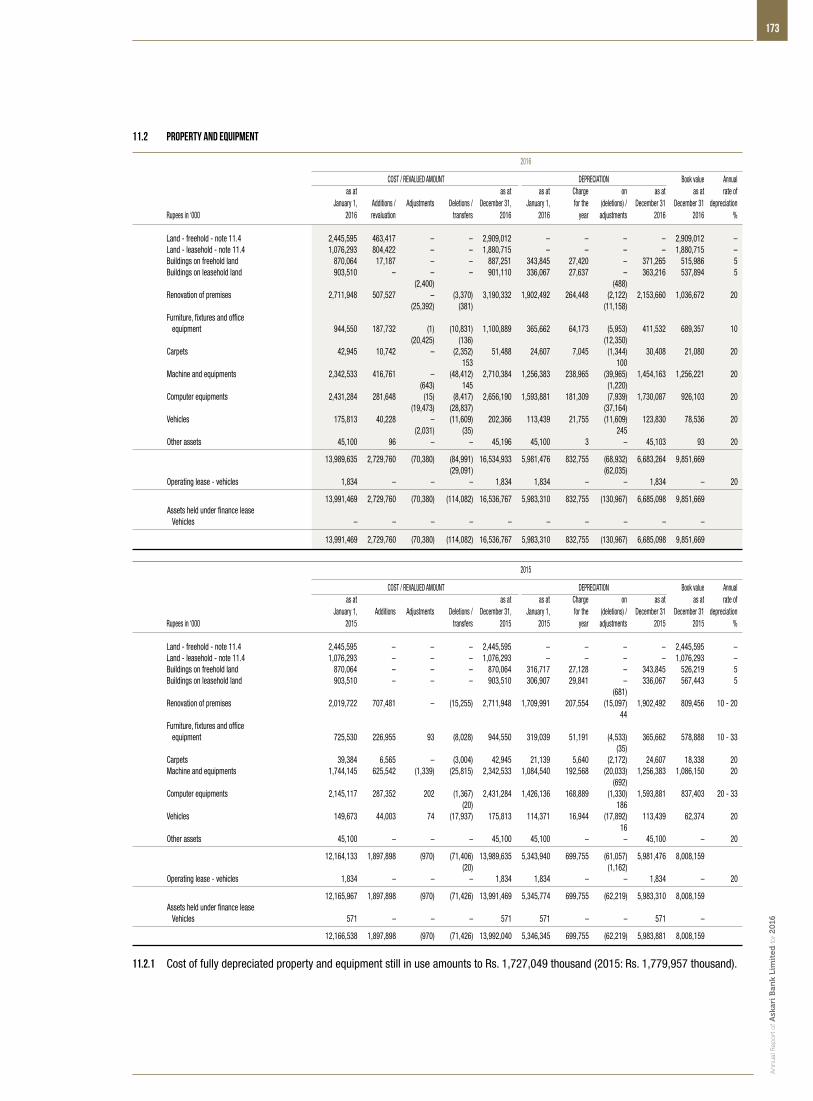
173
An
nu
al R
epo
rt o
f Ask
ari B
ank
Lim
ited
for 2
016
11.2 Property and equipment
2016
COST / REVALUED AMOUNT DEPRECIATION Book value Annual as at as at as at Charge on as at as at rate of January 1, Additions / Adjustments Deletions / December 31, January 1, for the (deletions) / December 31 December 31 depreciation Rupees in ‘000 2016 revaluation transfers 2016 2016 year adjustments 2016 2016 %
Land - freehold - note 11.4 2,445,595 463,417 – – 2,909,012 – – – – 2,909,012 – Land - leasehold - note 11.4 1,076,293 804,422 – – 1,880,715 – – – – 1,880,715 – Buildings on freehold land 870,064 17,187 – – 887,251 343,845 27,420 – 371,265 515,986 5 Buildings on leasehold land 903,510 – – – 901,110 336,067 27,637 – 363,216 537,894 5 (2,400) (488) Renovation of premises 2,711,948 507,527 – (3,370) 3,190,332 1,902,492 264,448 (2,122) 2,153,660 1,036,672 20 (25,392) (381) (11,158) Furniture, fixtures and office equipment 944,550 187,732 (1) (10,831) 1,100,889 365,662 64,173 (5,953) 411,532 689,357 10 (20,425) (136) (12,350) Carpets 42,945 10,742 – (2,352) 51,488 24,607 7,045 (1,344) 30,408 21,080 20 153 100 Machine and equipments 2,342,533 416,761 – (48,412) 2,710,384 1,256,383 238,965 (39,965) 1,454,163 1,256,221 20 (643) 145 (1,220) Computer equipments 2,431,284 281,648 (15) (8,417) 2,656,190 1,593,881 181,309 (7,939) 1,730,087 926,103 20 (19,473) (28,837) (37,164) Vehicles 175,813 40,228 – (11,609) 202,366 113,439 21,755 (11,609) 123,830 78,536 20 (2,031) (35) 245 Other assets 45,100 96 – – 45,196 45,100 3 – 45,103 93 20
13,989,635 2,729,760 (70,380) (84,991) 16,534,933 5,981,476 832,755 (68,932) 6,683,264 9,851,669 (29,091) (62,035) Operating lease - vehicles 1,834 – – – 1,834 1,834 – – 1,834 – 20
13,991,469 2,729,760 (70,380) (114,082) 16,536,767 5,983,310 832,755 (130,967) 6,685,098 9,851,669 Assets held under finance lease Vehicles – – – – – – – – – –
13,991,469 2,729,760 (70,380) (114,082) 16,536,767 5,983,310 832,755 (130,967) 6,685,098 9,851,669
2015
COST / REVALUED AMOUNT DEPRECIATION Book value Annual as at as at as at Charge on as at as at rate of January 1, Additions Adjustments Deletions / December 31, January 1, for the (deletions) / December 31 December 31 depreciation Rupees in ‘000 2015 transfers 2015 2015 year adjustments 2015 2015 %
Land - freehold - note 11.4 2,445,595 – – – 2,445,595 – – – – 2,445,595 – Land - leasehold - note 11.4 1,076,293 – – – 1,076,293 – – – – 1,076,293 – Buildings on freehold land 870,064 – – – 870,064 316,717 27,128 – 343,845 526,219 5 Buildings on leasehold land 903,510 – – – 903,510 306,907 29,841 – 336,067 567,443 5 (681) Renovation of premises 2,019,722 707,481 – (15,255) 2,711,948 1,709,991 207,554 (15,097) 1,902,492 809,456 10 - 20 44 Furniture, fixtures and office equipment 725,530 226,955 93 (8,028) 944,550 319,039 51,191 (4,533) 365,662 578,888 10 - 33 (35) Carpets 39,384 6,565 – (3,004) 42,945 21,139 5,640 (2,172) 24,607 18,338 20 Machine and equipments 1,744,145 625,542 (1,339) (25,815) 2,342,533 1,084,540 192,568 (20,033) 1,256,383 1,086,150 20 (692) Computer equipments 2,145,117 287,352 202 (1,367) 2,431,284 1,426,136 168,889 (1,330) 1,593,881 837,403 20 - 33 (20) 186 Vehicles 149,673 44,003 74 (17,937) 175,813 114,371 16,944 (17,892) 113,439 62,374 20 16 Other assets 45,100 – – – 45,100 45,100 – – 45,100 – 20
12,164,133 1,897,898 (970) (71,406) 13,989,635 5,343,940 699,755 (61,057) 5,981,476 8,008,159 (20) (1,162) Operating lease - vehicles 1,834 – – – 1,834 1,834 – – 1,834 – 20
12,165,967 1,897,898 (970) (71,426) 13,991,469 5,345,774 699,755 (62,219) 5,983,310 8,008,159 Assets held under finance lease Vehicles 571 – – – 571 571 – – 571 –
12,166,538 1,897,898 (970) (71,426) 13,992,040 5,346,345 699,755 (62,219) 5,983,881 8,008,159
11.2.1 Cost of fully depreciated property and equipment still in use amounts to Rs. 1,727,049 thousand (2015: Rs. 1,779,957 thousand).

174Ce
lebrat
ing Y
oung T
alent
11.3 Intangibles
2016
COST AMORTIZATION Book value Annual as at as at as at Charge on as at as at rate of January 1, Additions Adjustments Deletions / December 31, January 1, for the (deletions) / December 31 December 31 Amortization Rupees in ‘000 2016 transfers 2016 2016 year adjustments 2016 2016 %
Software 1,839,064 123,155 (5) – 1,968,448 857,400 180,792 – 1,046,236 922,212 10 (17,420) 23,654 8,044 Trading Right Entitlement Certificates 12,426 – (12,426) – – – – – – – Exchanges membership cards 2,500 – (2,500) – – – – – – –
1,853,990 123,155 (32,351) – 1,968,448 857,400 180,792 – 1,046,236 922,212 23,654 8,044
2015
COST AMORTIZATION Book value Annual as at as at as at Charge on as at as at rate of January 1, Additions Adjustments Deletions / December 31, January 1, for the (deletions) / December 31 December 31 Amortization Rupees in ‘000 2015 transfers 2015 2015 year adjustments 2015 2015 %
Software 1,789,044 50,000 – – 1,839,064 681,581 175,812 – 857,400 981,664 10 - 25 – 20 7 Trading Right Entitlement Certificates 12,426 – – – 12,426 – – – – 12,426 Exchanges membership cards 2,500 – – – 2,500 – – – – 2,500
1,803,970 50,000 – – 1,853,990 681,581 175,812 – 857,400 996,590 20 7
11.3.1 Cost of fully amortized intangible assets still in use amounts to Rs. 43,305 thousand (2015: Rs. 42,243 thousand).
11.4 The Group’s freehold and leasehold land was revalued by the valuers approved by the Pakistan Banks Association on December 31, 2016 on the basis of their professional assessment of present market value. The amount of revaluation surplus after valuation on land is Rs. 2,832,470 thousand. The information relating to location of revalued land is as follows:
Revalued Amount City Rupees in ‘000 Name of Valuers
Karachi 1,003,587 Sadruddin Associates Lahore 1,559,232 -do- Islamabad 273,332 -do- Rawalpindi 1,418,560 -do- Peshawar 14,736 -do- Quetta 520,280 -do-
4,789,727 Had the land not been revalued, the carrying amount of land as at December 31, 2016 would have been Rs. 1,957,257 thousand.
NOTES TO THE CONSOLIDATED FINANCIAL STATEMENTSFOR THE YEAR ENDED DECEMBER 31, 2016
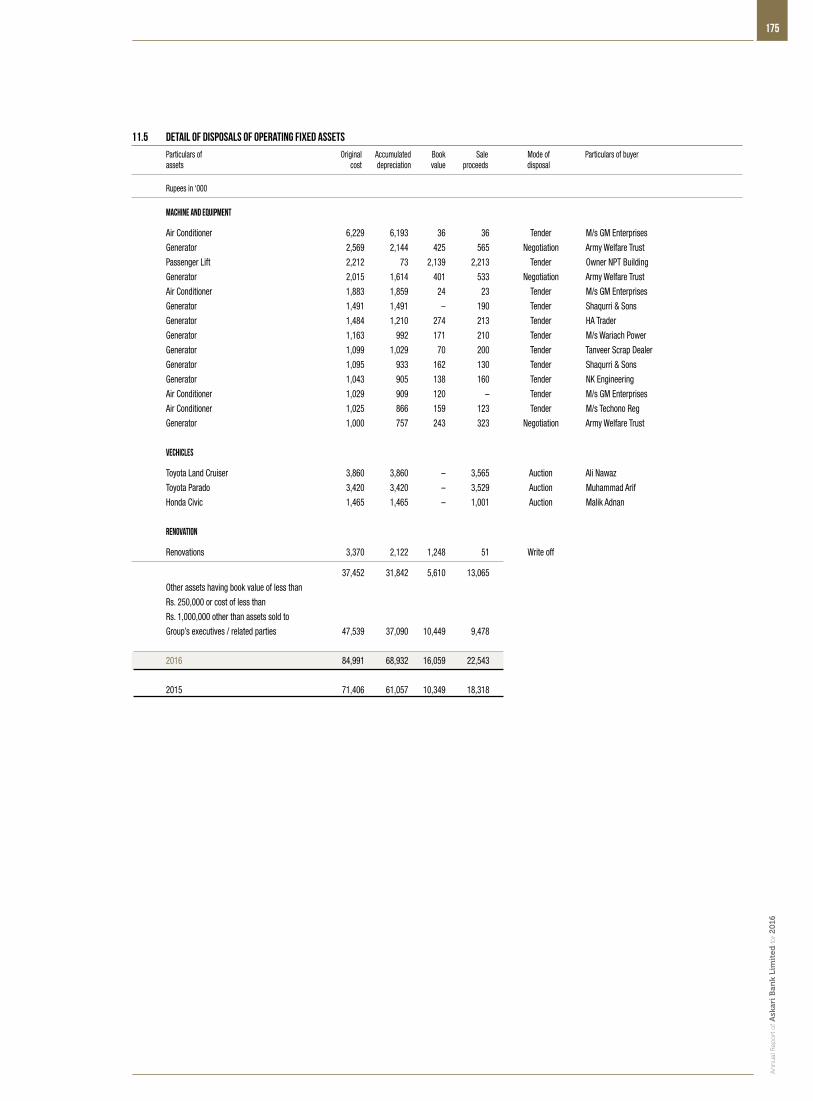
175
An
nu
al R
epo
rt o
f Ask
ari B
ank
Lim
ited
for 2
016
11.5 Detail of disposals of operating fixed assets
Particulars of Original Accumulated Book Sale Mode of Particulars of buyer assets cost depreciation value proceeds disposal
Rupees in ‘000
Machine and Equipment
Air Conditioner 6,229 6,193 36 36 Tender M/s GM Enterprises
Generator 2,569 2,144 425 565 Negotiation Army Welfare Trust
Passenger Lift 2,212 73 2,139 2,213 Tender Owner NPT Building
Generator 2,015 1,614 401 533 Negotiation Army Welfare Trust
Air Conditioner 1,883 1,859 24 23 Tender M/s GM Enterprises
Generator 1,491 1,491 – 190 Tender Shaqurri & Sons
Generator 1,484 1,210 274 213 Tender HA Trader
Generator 1,163 992 171 210 Tender M/s Wariach Power
Generator 1,099 1,029 70 200 Tender Tanveer Scrap Dealer
Generator 1,095 933 162 130 Tender Shaqurri & Sons
Generator 1,043 905 138 160 Tender NK Engineering
Air Conditioner 1,029 909 120 – Tender M/s GM Enterprises
Air Conditioner 1,025 866 159 123 Tender M/s Techono Reg
Generator 1,000 757 243 323 Negotiation Army Welfare Trust
Vechicles
Toyota Land Cruiser 3,860 3,860 – 3,565 Auction Ali Nawaz
Toyota Parado 3,420 3,420 – 3,529 Auction Muhammad Arif
Honda Civic 1,465 1,465 – 1,001 Auction Malik Adnan
Renovation
Renovations 3,370 2,122 1,248 51 Write off
37,452 31,842 5,610 13,065
Other assets having book value of less than
Rs. 250,000 or cost of less than
Rs. 1,000,000 other than assets sold to
Group’s executives / related parties 47,539 37,090 10,449 9,478
2016 84,991 68,932 16,059 22,543
2015 71,406 61,057 10,349 18,318
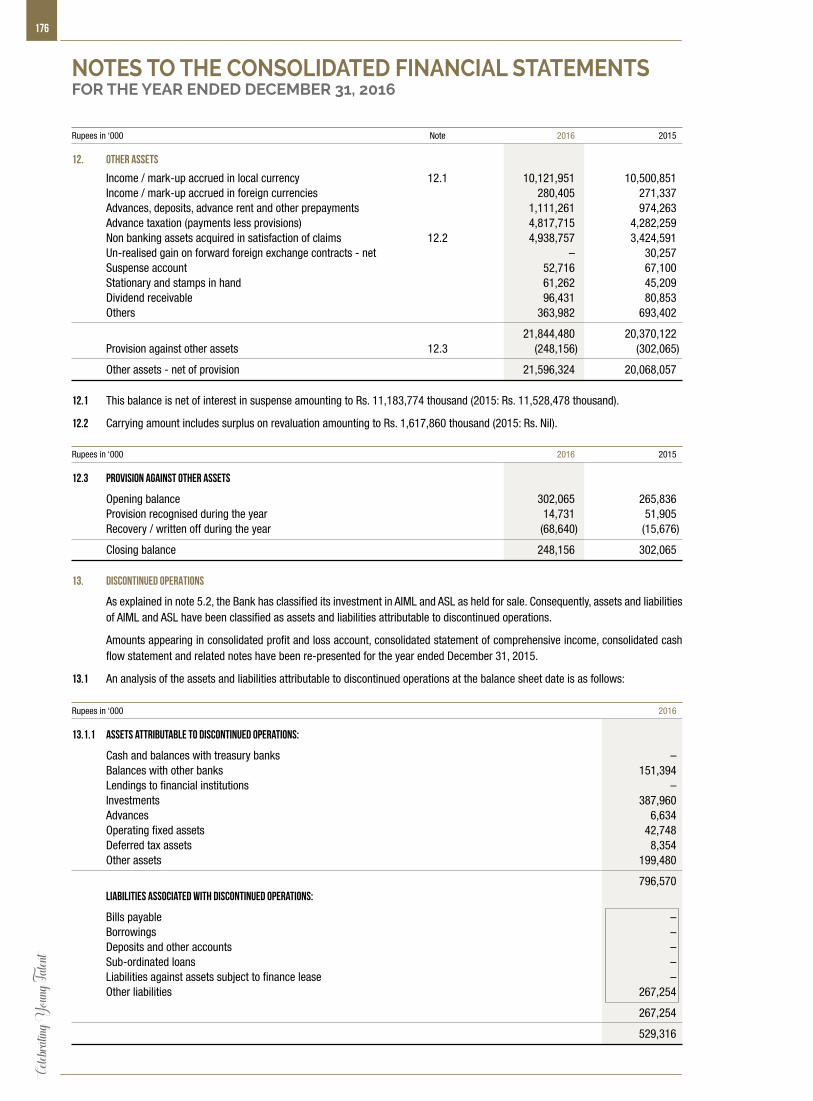
176Ce
lebrat
ing Y
oung T
alent
Rupees in ‘000 Note 2016 2015
12. OTHER ASSETS
Income / mark-up accrued in local currency 12.1 10,121,951 10,500,851 Income / mark-up accrued in foreign currencies 280,405 271,337 Advances, deposits, advance rent and other prepayments 1,111,261 974,263 Advance taxation (payments less provisions) 4,817,715 4,282,259 Non banking assets acquired in satisfaction of claims 12.2 4,938,757 3,424,591 Un-realised gain on forward foreign exchange contracts - net – 30,257 Suspense account 52,716 67,100 Stationary and stamps in hand 61,262 45,209 Dividend receivable 96,431 80,853 Others 363,982 693,402
21,844,480 20,370,122 Provision against other assets 12.3 (248,156) (302,065)
Other assets - net of provision 21,596,324 20,068,057 12.1 This balance is net of interest in suspense amounting to Rs. 11,183,774 thousand (2015: Rs. 11,528,478 thousand).
12.2 Carrying amount includes surplus on revaluation amounting to Rs. 1,617,860 thousand (2015: Rs. Nil). Rupees in ‘000 2016 2015
12.3 Provision against other assets
Opening balance 302,065 265,836 Provision recognised during the year 14,731 51,905 Recovery / written off during the year (68,640) (15,676)
Closing balance 248,156 302,065
13. DISCONTINUED OPERATIONS
As explained in note 5.2, the Bank has classified its investment in AIML and ASL as held for sale. Consequently, assets and liabilities of AIML and ASL have been classified as assets and liabilities attributable to discontinued operations.
Amounts appearing in consolidated profit and loss account, consolidated statement of comprehensive income, consolidated cash flow statement and related notes have been re-presented for the year ended December 31, 2015.
13.1 An analysis of the assets and liabilities attributable to discontinued operations at the balance sheet date is as follows:
Rupees in ‘000 2016
13.1.1 Assets attributable to discontinued operations:
Cash and balances with treasury banks – Balances with other banks 151,394 Lendings to financial institutions – Investments 387,960 Advances 6,634 Operating fixed assets 42,748 Deferred tax assets 8,354 Other assets 199,480
796,570 Liabilities associated with discontinued operations:
Bills payable – Borrowings – Deposits and other accounts – Sub-ordinated loans – Liabilities against assets subject to finance lease – Other liabilities 267,254
267,254
529,316
NOTES TO THE CONSOLIDATED FINANCIAL STATEMENTSFOR THE YEAR ENDED DECEMBER 31, 2016
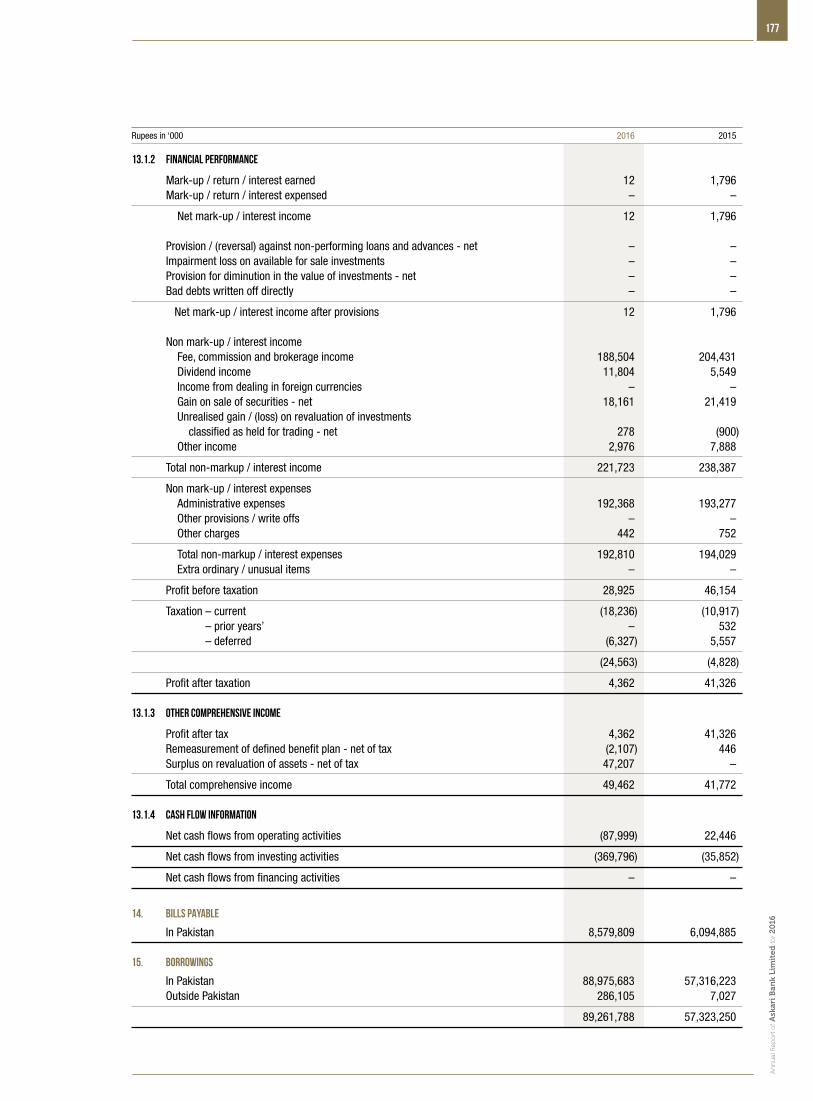
177
An
nu
al R
epo
rt o
f Ask
ari B
ank
Lim
ited
for 2
016
Rupees in ‘000 2016 2015
13.1.2 Financial performance
Mark-up / return / interest earned 12 1,796 Mark-up / return / interest expensed – –
Net mark-up / interest income 12 1,796 Provision / (reversal) against non-performing loans and advances - net – – Impairment loss on available for sale investments – – Provision for diminution in the value of investments - net – – Bad debts written off directly – –
Net mark-up / interest income after provisions 12 1,796 Non mark-up / interest income Fee, commission and brokerage income 188,504 204,431 Dividend income 11,804 5,549 Income from dealing in foreign currencies – – Gain on sale of securities - net 18,161 21,419 Unrealised gain / (loss) on revaluation of investments classified as held for trading - net 278 (900) Other income 2,976 7,888
Total non-markup / interest income 221,723 238,387
Non mark-up / interest expenses Administrative expenses 192,368 193,277 Other provisions / write offs – – Other charges 442 752
Total non-markup / interest expenses 192,810 194,029 Extra ordinary / unusual items – –
Profit before taxation 28,925 46,154
Taxation – current (18,236) (10,917) Taxation – prior years’ – 532 Taxation – deferred (6,327) 5,557
(24,563) (4,828)
Profit after taxation 4,362 41,326 13.1.3 Other comprehensive income
Profit after tax 4,362 41,326 Remeasurement of defined benefit plan - net of tax (2,107) 446 Surplus on revaluation of assets - net of tax 47,207 –
Total comprehensive income 49,462 41,772 13.1.4 Cash flow information
Net cash flows from operating activities (87,999) 22,446
Net cash flows from investing activities (369,796) (35,852)
Net cash flows from financing activities – –
14. BILLS PAYABLE
In Pakistan 8,579,809 6,094,885
15. BORROWINGS
In Pakistan 88,975,683 57,316,223 Outside Pakistan 286,105 7,027
89,261,788 57,323,250
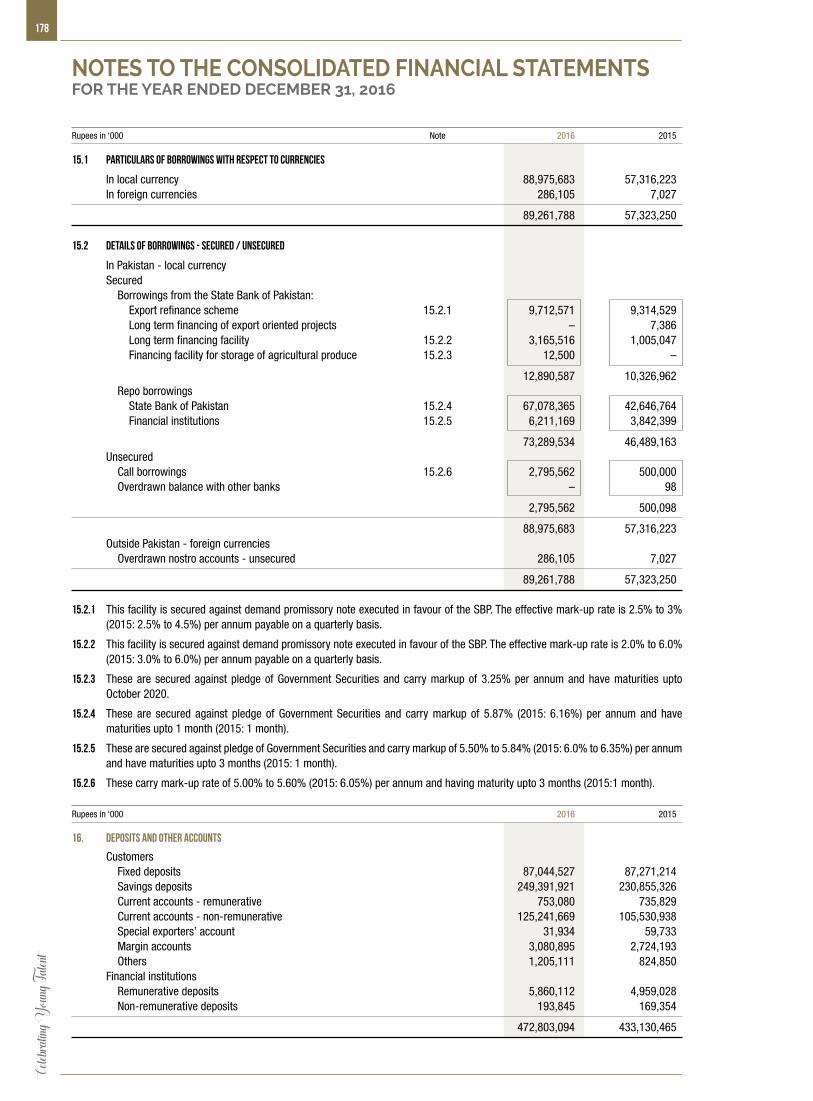
178Ce
lebrat
ing Y
oung T
alent
Rupees in ‘000 Note 2016 2015
15.1 Particulars of borrowings with respect to currencies
In local currency 88,975,683 57,316,223 In foreign currencies 286,105 7,027
89,261,788 57,323,250 15.2 Details of borrowings - secured / unsecured
In Pakistan - local currency Secured Borrowings from the State Bank of Pakistan: Export refinance scheme 15.2.1 9,712,571 9,314,529 Long term financing of export oriented projects – 7,386 Long term financing facility 15.2.2 3,165,516 1,005,047 Financing facility for storage of agricultural produce 15.2.3 12,500 –
12,890,587 10,326,962 Repo borrowings State Bank of Pakistan 15.2.4 67,078,365 42,646,764 Financial institutions 15.2.5 6,211,169 3,842,399
73,289,534 46,489,163 Unsecured Call borrowings 15.2.6 2,795,562 500,000 Overdrawn balance with other banks – 98
2,795,562 500,098
88,975,683 57,316,223 Outside Pakistan - foreign currencies Overdrawn nostro accounts - unsecured 286,105 7,027
89,261,788 57,323,250 15.2.1 This facility is secured against demand promissory note executed in favour of the SBP. The effective mark-up rate is 2.5% to 3%
(2015: 2.5% to 4.5%) per annum payable on a quarterly basis.
15.2.2 This facility is secured against demand promissory note executed in favour of the SBP. The effective mark-up rate is 2.0% to 6.0% (2015: 3.0% to 6.0%) per annum payable on a quarterly basis.
15.2.3 These are secured against pledge of Government Securities and carry markup of 3.25% per annum and have maturities upto October 2020.
15.2.4 These are secured against pledge of Government Securities and carry markup of 5.87% (2015: 6.16%) per annum and have maturities upto 1 month (2015: 1 month).
15.2.5 These are secured against pledge of Government Securities and carry markup of 5.50% to 5.84% (2015: 6.0% to 6.35%) per annum and have maturities upto 3 months (2015: 1 month).
15.2.6 These carry mark-up rate of 5.00% to 5.60% (2015: 6.05%) per annum and having maturity upto 3 months (2015:1 month).
Rupees in ‘000 2016 2015
16. DEPOSITS AND OTHER ACCOUNTS
Customers Fixed deposits 87,044,527 87,271,214 Savings deposits 249,391,921 230,855,326 Current accounts - remunerative 753,080 735,829 Current accounts - non-remunerative 125,241,669 105,530,938 Special exporters’ account 31,934 59,733 Margin accounts 3,080,895 2,724,193 Others 1,205,111 824,850 Financial institutions Remunerative deposits 5,860,112 4,959,028 Non-remunerative deposits 193,845 169,354
472,803,094 433,130,465
NOTES TO THE CONSOLIDATED FINANCIAL STATEMENTSFOR THE YEAR ENDED DECEMBER 31, 2016
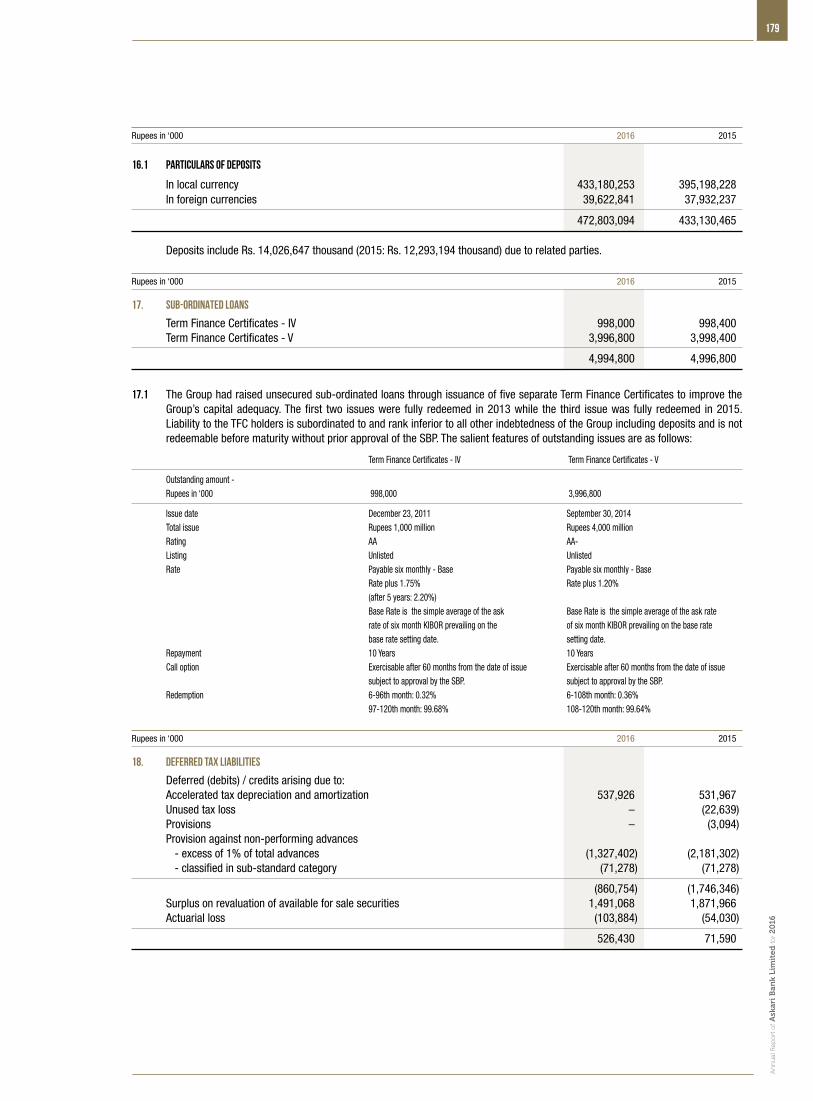
179
An
nu
al R
epo
rt o
f Ask
ari B
ank
Lim
ited
for 2
016
Rupees in ‘000 2016 2015
16.1 Particulars of deposits
In local currency 433,180,253 395,198,228 In foreign currencies 39,622,841 37,932,237
472,803,094 433,130,465 Deposits include Rs. 14,026,647 thousand (2015: Rs. 12,293,194 thousand) due to related parties.
Rupees in ‘000 2016 2015
17. SUB-ORDINATED LOANS
Term Finance Certificates - IV 998,000 998,400 Term Finance Certificates - V 3,996,800 3,998,400
4,994,800 4,996,800
17.1 The Group had raised unsecured sub-ordinated loans through issuance of five separate Term Finance Certificates to improve the Group’s capital adequacy. The first two issues were fully redeemed in 2013 while the third issue was fully redeemed in 2015. Liability to the TFC holders is subordinated to and rank inferior to all other indebtedness of the Group including deposits and is not redeemable before maturity without prior approval of the SBP. The salient features of outstanding issues are as follows:
Term Finance Certificates - IV Term Finance Certificates - V
Outstanding amount - Rupees in ‘000 998,000 3,996,800
Issue date December 23, 2011 September 30, 2014 Total issue Rupees 1,000 million Rupees 4,000 million Rating AA AA- Listing Unlisted Unlisted Rate Payable six monthly - Base Payable six monthly - Base Rate plus 1.75% Rate plus 1.20% (after 5 years: 2.20%) Base Rate is the simple average of the ask Base Rate is the simple average of the ask rate rate of six month KIBOR prevailing on the of six month KIBOR prevailing on the base rate base rate setting date. setting date. Repayment 10 Years 10 Years Call option Exercisable after 60 months from the date of issue Exercisable after 60 months from the date of issue subject to approval by the SBP. subject to approval by the SBP. Redemption 6-96th month: 0.32% 6-108th month: 0.36% 97-120th month: 99.68% 108-120th month: 99.64%
Rupees in ‘000 2016 2015
18. DEFERRED TAX LIABILITIES
Deferred (debits) / credits arising due to: Accelerated tax depreciation and amortization 537,926 531,967 Unused tax loss – (22,639) Provisions – (3,094) Provision against non-performing advances - excess of 1% of total advances (1,327,402) (2,181,302) - classified in sub-standard category (71,278) (71,278)
(860,754) (1,746,346) Surplus on revaluation of available for sale securities 1,491,068 1,871,966 Actuarial loss (103,884) (54,030)
526,430 71,590
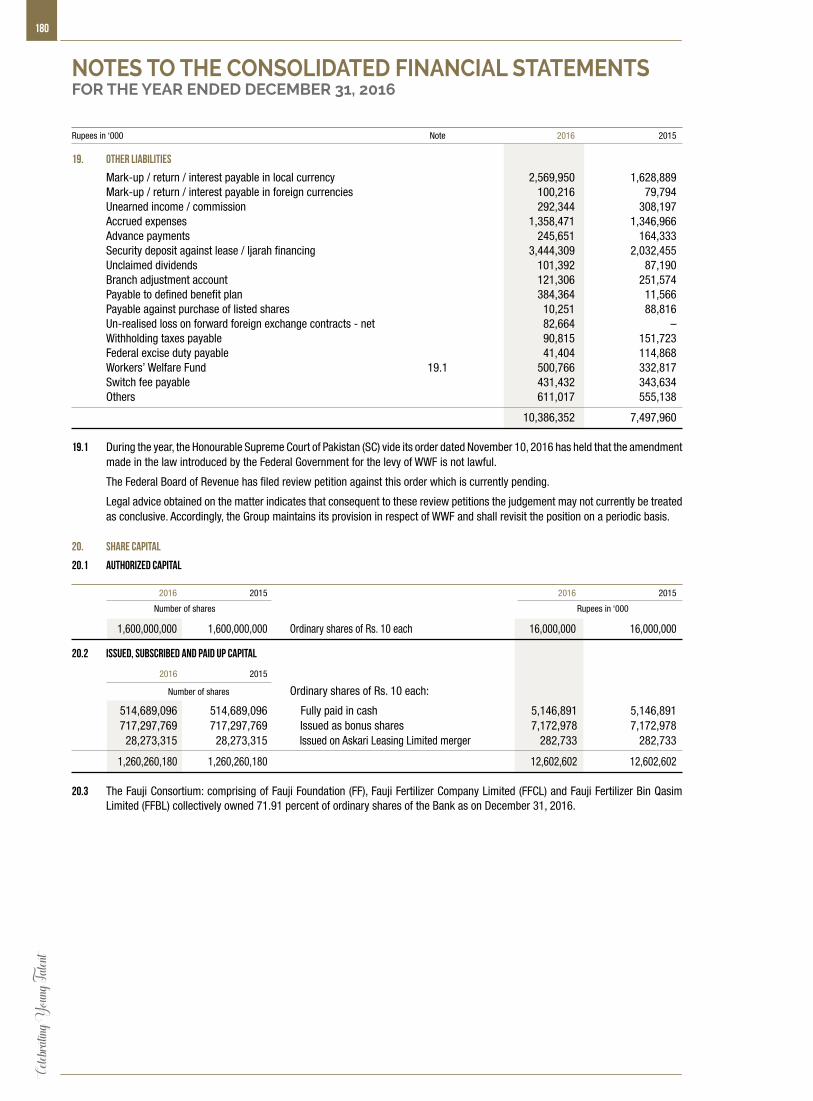
180Ce
lebrat
ing Y
oung T
alent
Rupees in ‘000 Note 2016 2015
19. OTHER LIABILITIES
Mark-up / return / interest payable in local currency 2,569,950 1,628,889 Mark-up / return / interest payable in foreign currencies 100,216 79,794 Unearned income / commission 292,344 308,197 Accrued expenses 1,358,471 1,346,966 Advance payments 245,651 164,333 Security deposit against lease / Ijarah financing 3,444,309 2,032,455 Unclaimed dividends 101,392 87,190 Branch adjustment account 121,306 251,574 Payable to defined benefit plan 384,364 11,566 Payable against purchase of listed shares 10,251 88,816 Un-realised loss on forward foreign exchange contracts - net 82,664 – Withholding taxes payable 90,815 151,723 Federal excise duty payable 41,404 114,868 Workers’ Welfare Fund 19.1 500,766 332,817 Switch fee payable 431,432 343,634 Others 611,017 555,138
10,386,352 7,497,960 19.1 During the year, the Honourable Supreme Court of Pakistan (SC) vide its order dated November 10, 2016 has held that the amendment
made in the law introduced by the Federal Government for the levy of WWF is not lawful.
The Federal Board of Revenue has filed review petition against this order which is currently pending.
Legal advice obtained on the matter indicates that consequent to these review petitions the judgement may not currently be treated as conclusive. Accordingly, the Group maintains its provision in respect of WWF and shall revisit the position on a periodic basis.
20. share capital
20.1 Authorized capital
2016 2015 2016 2015
Number of shares Rupees in ‘000
1,600,000,000 1,600,000,000 Ordinary shares of Rs. 10 each 16,000,000 16,000,000
20.2 Issued, subscribed and paid up capital
2016 2015
Number of shares Ordinary shares of Rs. 10 each:
514,689,096 514,689,096 Fully paid in cash 5,146,891 5,146,891 717,297,769 717,297,769 Issued as bonus shares 7,172,978 7,172,978 28,273,315 28,273,315 Issued on Askari Leasing Limited merger 282,733 282,733
1,260,260,180 1,260,260,180 12,602,602 12,602,602
20.3 The Fauji Consortium: comprising of Fauji Foundation (FF), Fauji Fertilizer Company Limited (FFCL) and Fauji Fertilizer Bin Qasim Limited (FFBL) collectively owned 71.91 percent of ordinary shares of the Bank as on December 31, 2016.
NOTES TO THE CONSOLIDATED FINANCIAL STATEMENTSFOR THE YEAR ENDED DECEMBER 31, 2016
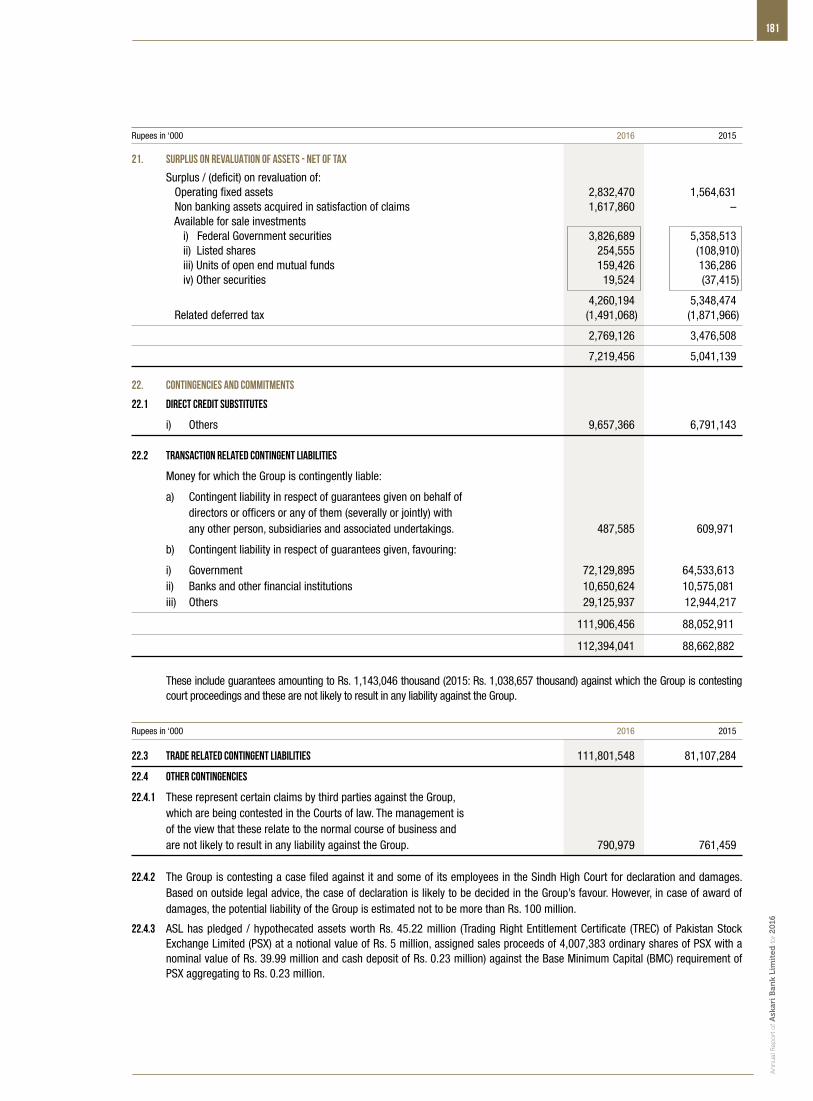
181
An
nu
al R
epo
rt o
f Ask
ari B
ank
Lim
ited
for 2
016
Rupees in ‘000 2016 2015
21. SURPLUS ON REVALUATION OF ASSETS - NET OF TAX
Surplus / (deficit) on revaluation of: Operating fixed assets 2,832,470 1,564,631 Non banking assets acquired in satisfaction of claims 1,617,860 – Available for sale investments i) Federal Government securities 3,826,689 5,358,513 ii) Listed shares 254,555 (108,910) iii) Units of open end mutual funds 159,426 136,286 iv) Other securities 19,524 (37,415)
4,260,194 5,348,474 Related deferred tax (1,491,068) (1,871,966)
2,769,126 3,476,508
7,219,456 5,041,139
22. CONTINGENCIES AND COMMITMENTS
22.1 Direct credit substitutes
i) Others 9,657,366 6,791,143 22.2 Transaction related contingent liabilities
Money for which the Group is contingently liable:
a) Contingent liability in respect of guarantees given on behalf of directors or officers or any of them (severally or jointly) with any other person, subsidiaries and associated undertakings. 487,585 609,971
b) Contingent liability in respect of guarantees given, favouring:
i) Government 72,129,895 64,533,613 ii) Banks and other financial institutions 10,650,624 10,575,081 iii) Others 29,125,937 12,944,217
111,906,456 88,052,911
112,394,041 88,662,882
These include guarantees amounting to Rs. 1,143,046 thousand (2015: Rs. 1,038,657 thousand) against which the Group is contesting court proceedings and these are not likely to result in any liability against the Group.
Rupees in ‘000 2016 2015
22.3 Trade related contingent liabilities 111,801,548 81,107,284
22.4 Other contingencies
22.4.1 These represent certain claims by third parties against the Group, which are being contested in the Courts of law. The management is of the view that these relate to the normal course of business and are not likely to result in any liability against the Group. 790,979 761,459 22.4.2 The Group is contesting a case filed against it and some of its employees in the Sindh High Court for declaration and damages.
Based on outside legal advice, the case of declaration is likely to be decided in the Group’s favour. However, in case of award of damages, the potential liability of the Group is estimated not to be more than Rs. 100 million.
22.4.3 ASL has pledged / hypothecated assets worth Rs. 45.22 million (Trading Right Entitlement Certificate (TREC) of Pakistan Stock Exchange Limited (PSX) at a notional value of Rs. 5 million, assigned sales proceeds of 4,007,383 ordinary shares of PSX with a nominal value of Rs. 39.99 million and cash deposit of Rs. 0.23 million) against the Base Minimum Capital (BMC) requirement of PSX aggregating to Rs. 0.23 million.
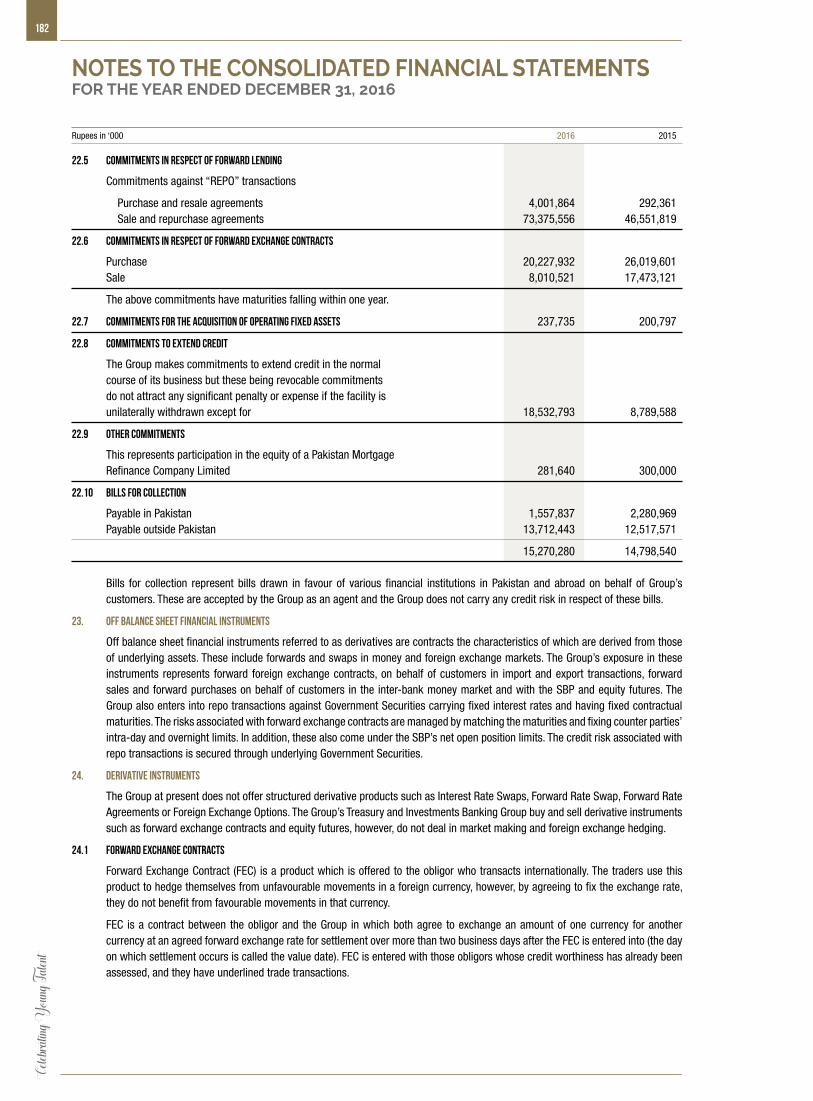
182Ce
lebrat
ing Y
oung T
alent
Rupees in ‘000 2016 2015
22.5 Commitments in respect of forward lending
Commitments against “REPO” transactions
Purchase and resale agreements 4,001,864 292,361 Sale and repurchase agreements 73,375,556 46,551,819
22.6 Commitments in respect of forward exchange contracts
Purchase 20,227,932 26,019,601 Sale 8,010,521 17,473,121
The above commitments have maturities falling within one year.
22.7 Commitments for the acquisition of operating fixed assets 237,735 200,797
22.8 Commitments to extend credit
The Group makes commitments to extend credit in the normal course of its business but these being revocable commitments do not attract any significant penalty or expense if the facility is unilaterally withdrawn except for 18,532,793 8,789,588
22.9 Other commitments
This represents participation in the equity of a Pakistan Mortgage Refinance Company Limited 281,640 300,000
22.10 Bills for collection
Payable in Pakistan 1,557,837 2,280,969 Payable outside Pakistan 13,712,443 12,517,571
15,270,280 14,798,540
Bills for collection represent bills drawn in favour of various financial institutions in Pakistan and abroad on behalf of Group’s customers. These are accepted by the Group as an agent and the Group does not carry any credit risk in respect of these bills.
23. OFF BALANCE SHEET FINANCIAL INSTRUMENTS
Off balance sheet financial instruments referred to as derivatives are contracts the characteristics of which are derived from those of underlying assets. These include forwards and swaps in money and foreign exchange markets. The Group’s exposure in these instruments represents forward foreign exchange contracts, on behalf of customers in import and export transactions, forward sales and forward purchases on behalf of customers in the inter-bank money market and with the SBP and equity futures. The Group also enters into repo transactions against Government Securities carrying fixed interest rates and having fixed contractual maturities. The risks associated with forward exchange contracts are managed by matching the maturities and fixing counter parties’ intra-day and overnight limits. In addition, these also come under the SBP’s net open position limits. The credit risk associated with repo transactions is secured through underlying Government Securities.
24. DERIVATIVE INSTRUMENTS
The Group at present does not offer structured derivative products such as Interest Rate Swaps, Forward Rate Swap, Forward Rate Agreements or Foreign Exchange Options. The Group’s Treasury and Investments Banking Group buy and sell derivative instruments such as forward exchange contracts and equity futures, however, do not deal in market making and foreign exchange hedging.
24.1 Forward exchange contracts
Forward Exchange Contract (FEC) is a product which is offered to the obligor who transacts internationally. The traders use this product to hedge themselves from unfavourable movements in a foreign currency, however, by agreeing to fix the exchange rate, they do not benefit from favourable movements in that currency.
FEC is a contract between the obligor and the Group in which both agree to exchange an amount of one currency for another currency at an agreed forward exchange rate for settlement over more than two business days after the FEC is entered into (the day on which settlement occurs is called the value date). FEC is entered with those obligors whose credit worthiness has already been assessed, and they have underlined trade transactions.
NOTES TO THE CONSOLIDATED FINANCIAL STATEMENTSFOR THE YEAR ENDED DECEMBER 31, 2016

183
An
nu
al R
epo
rt o
f Ask
ari B
ank
Lim
ited
for 2
016
If the relevant exchange rate moves un-favourably, the Group will loose money, and obligor will benefit from that movement because the Group must exchange currencies at the FEC rate. In order to mitigate this risk of adverse exchange rate movement, the Group manages its exposure by taking forward position in inter-bank foreign exchange.
24.2 Equity futures
An equity futures contract is a standardized contract, traded on a futures counter of the stock exchange, to buy or sell a certain underlying scrip at a certain date in the future, at a specified price.
The Group uses equity futures as a hedging instrument to hedge its equity portfolio against equity price risk. Only selected shares are allowed to be traded on futures exchange. Equity futures give flexibility to the Group either to take delivery on the future settlement date or to settle it by adjusting the notional value of the contract based on the current market rates. Maximum exposure limit to the equity futures is 10% of Tier I Capital of the Group based on prevailing SBP regulations.
The accounting policies used to recognize and disclose derivatives are given in note 5.19.
Rupees in ‘000 Note 2016 2015
25. MARK-UP / RETURN / INTEREST EARNED
On loans and advances to: i) Customers 25.1 15,091,639 15,755,271 ii) Financial institutions 219,989 118,835
15,311,628 15,874,106 On investments in: i) Available for sale securities 19,370,206 19,709,523 ii) Held to maturity securities 473,055 283,433
19,843,261 19,992,956 On deposits with financial institutions 179,208 326,966 On securities purchased under resale agreements 111,889 245,231 On lendings to financial institutions 66,323 152,834
35,512,309 36,592,093
25.1 This includes an amount of Rs. 406,579 thousand (2015: Rs. 390,212 thousand) on account of income received from related parties.
Rupees in ‘000 Note 2016 2015
26. MARK-UP / RETURN / INTEREST EXPENSED
Deposits 26.1 16,832,449 18,835,009 Securities sold under repurchase agreements 2,862,127 1,784,696 Sub-ordinated loans 382,452 616,965 Call money borrowings 144,063 107,993 Refinance borrowings from SBP 208,941 293,926 Long term finance for export oriented projects from SBP 64,512 46,802 Other short term borrowings 1,772 2,654
20,496,316 21,688,045
26.1 This includes Rs. 693,444 thousand (2015: Rs. 823,458 thousand) on account of mark-up / interest on deposits of related parties.
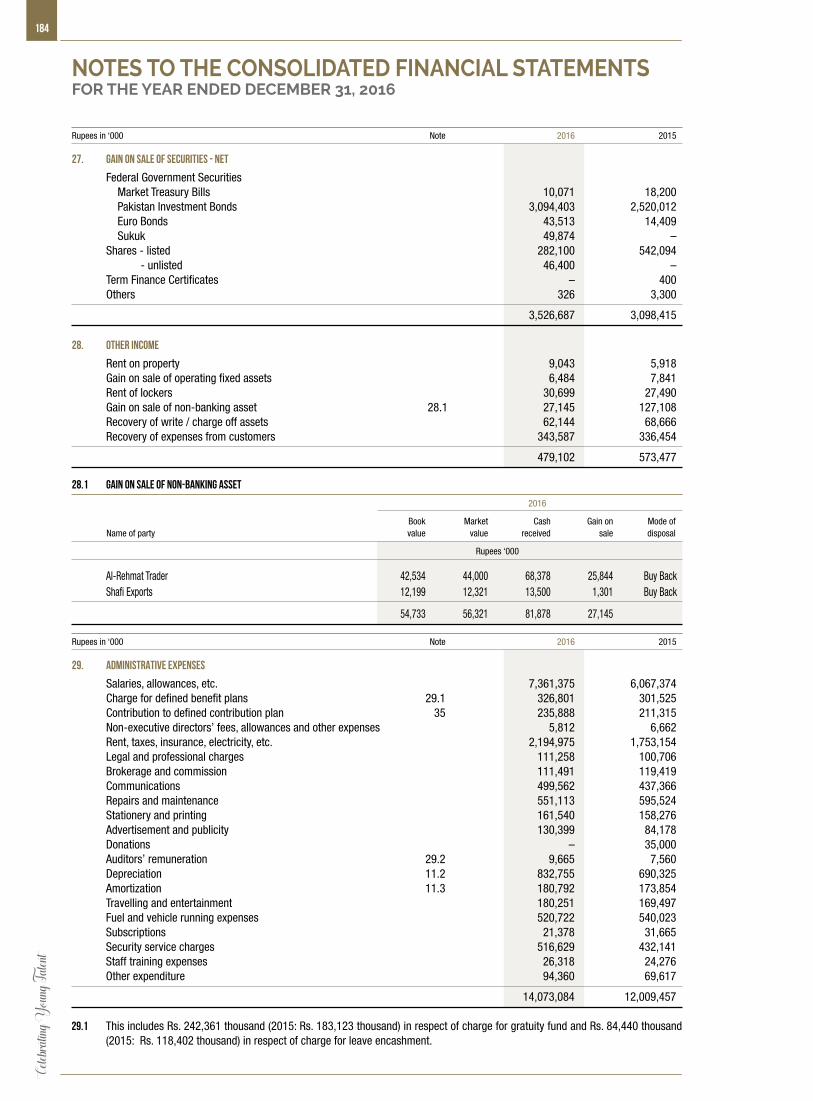
184Ce
lebrat
ing Y
oung T
alent
Rupees in ‘000 Note 2016 2015
27. GAIN ON SALE OF SECURITIES - NET
Federal Government Securities Market Treasury Bills 10,071 18,200 Pakistan Investment Bonds 3,094,403 2,520,012 Euro Bonds 43,513 14,409 Sukuk 49,874 – Shares - listed 282,100 542,094 - unlisted 46,400 – Term Finance Certificates – 400 Others 326 3,300
3,526,687 3,098,415 28. OTHER INCOME
Rent on property 9,043 5,918 Gain on sale of operating fixed assets 6,484 7,841 Rent of lockers 30,699 27,490 Gain on sale of non-banking asset 28.1 27,145 127,108 Recovery of write / charge off assets 62,144 68,666 Recovery of expenses from customers 343,587 336,454
479,102 573,477
Rupees in ‘000 Note 2016 2015
29. ADMINISTRATIVE EXPENSES
Salaries, allowances, etc. 7,361,375 6,067,374 Charge for defined benefit plans 29.1 326,801 301,525 Contribution to defined contribution plan 35 235,888 211,315 Non-executive directors’ fees, allowances and other expenses 5,812 6,662 Rent, taxes, insurance, electricity, etc. 2,194,975 1,753,154 Legal and professional charges 111,258 100,706 Brokerage and commission 111,491 119,419 Communications 499,562 437,366 Repairs and maintenance 551,113 595,524 Stationery and printing 161,540 158,276 Advertisement and publicity 130,399 84,178 Donations – 35,000 Auditors’ remuneration 29.2 9,665 7,560 Depreciation 11.2 832,755 690,325 Amortization 11.3 180,792 173,854 Travelling and entertainment 180,251 169,497 Fuel and vehicle running expenses 520,722 540,023 Subscriptions 21,378 31,665 Security service charges 516,629 432,141 Staff training expenses 26,318 24,276 Other expenditure 94,360 69,617
14,073,084 12,009,457 29.1 This includes Rs. 242,361 thousand (2015: Rs. 183,123 thousand) in respect of charge for gratuity fund and Rs. 84,440 thousand
(2015: Rs. 118,402 thousand) in respect of charge for leave encashment.
28.1 Gain on sale of non-banking asset
2016
Book Market Cash Gain on Mode of Name of party value value received sale disposal
Rupees ‘000
Al-Rehmat Trader 42,534 44,000 68,378 25,844 Buy Back Shafi Exports 12,199 12,321 13,500 1,301 Buy Back
54,733 56,321 81,878 27,145
NOTES TO THE CONSOLIDATED FINANCIAL STATEMENTSFOR THE YEAR ENDED DECEMBER 31, 2016
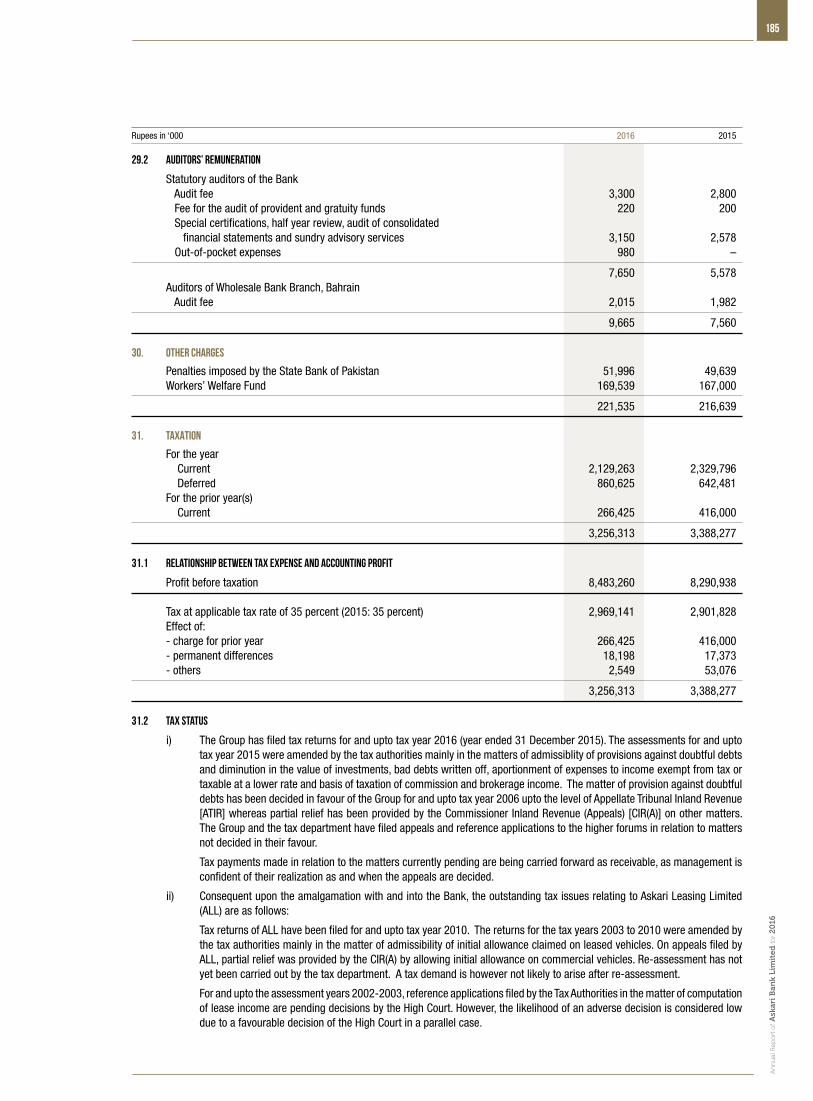
185
An
nu
al R
epo
rt o
f Ask
ari B
ank
Lim
ited
for 2
016
Rupees in ‘000 2016 2015
29.2 Auditors’ remuneration
Statutory auditors of the Bank Audit fee 3,300 2,800 Fee for the audit of provident and gratuity funds 220 200 Special certifications, half year review, audit of consolidated financial statements and sundry advisory services 3,150 2,578 Out-of-pocket expenses 980 –
7,650 5,578 Auditors of Wholesale Bank Branch, Bahrain Audit fee 2,015 1,982
9,665 7,560 30. OTHER CHARGES
Penalties imposed by the State Bank of Pakistan 51,996 49,639 Workers’ Welfare Fund 169,539 167,000
221,535 216,639
31. TAXATION
For the year Current 2,129,263 2,329,796 Deferred 860,625 642,481 For the prior year(s) Current 266,425 416,000
3,256,313 3,388,277 31.1 Relationship between tax expense and accounting profit
Profit before taxation 8,483,260 8,290,938 Tax at applicable tax rate of 35 percent (2015: 35 percent) 2,969,141 2,901,828 Effect of: - charge for prior year 266,425 416,000 - permanent differences 18,198 17,373 - others 2,549 53,076
3,256,313 3,388,277 31.2 Tax status
i) The Group has filed tax returns for and upto tax year 2016 (year ended 31 December 2015). The assessments for and upto tax year 2015 were amended by the tax authorities mainly in the matters of admissiblity of provisions against doubtful debts and diminution in the value of investments, bad debts written off, aportionment of expenses to income exempt from tax or taxable at a lower rate and basis of taxation of commission and brokerage income. The matter of provision against doubtful debts has been decided in favour of the Group for and upto tax year 2006 upto the level of Appellate Tribunal Inland Revenue [ATIR] whereas partial relief has been provided by the Commissioner Inland Revenue (Appeals) [CIR(A)] on other matters. The Group and the tax department have filed appeals and reference applications to the higher forums in relation to matters not decided in their favour.
Tax payments made in relation to the matters currently pending are being carried forward as receivable, as management is confident of their realization as and when the appeals are decided.
ii) Consequent upon the amalgamation with and into the Bank, the outstanding tax issues relating to Askari Leasing Limited (ALL) are as follows:
Tax returns of ALL have been filed for and upto tax year 2010. The returns for the tax years 2003 to 2010 were amended by the tax authorities mainly in the matter of admissibility of initial allowance claimed on leased vehicles. On appeals filed by ALL, partial relief was provided by the CIR(A) by allowing initial allowance on commercial vehicles. Re-assessment has not yet been carried out by the tax department. A tax demand is however not likely to arise after re-assessment.
For and upto the assessment years 2002-2003, reference applications filed by the Tax Authorities in the matter of computation of lease income are pending decisions by the High Court. However, the likelihood of an adverse decision is considered low due to a favourable decision of the High Court in a parallel case.
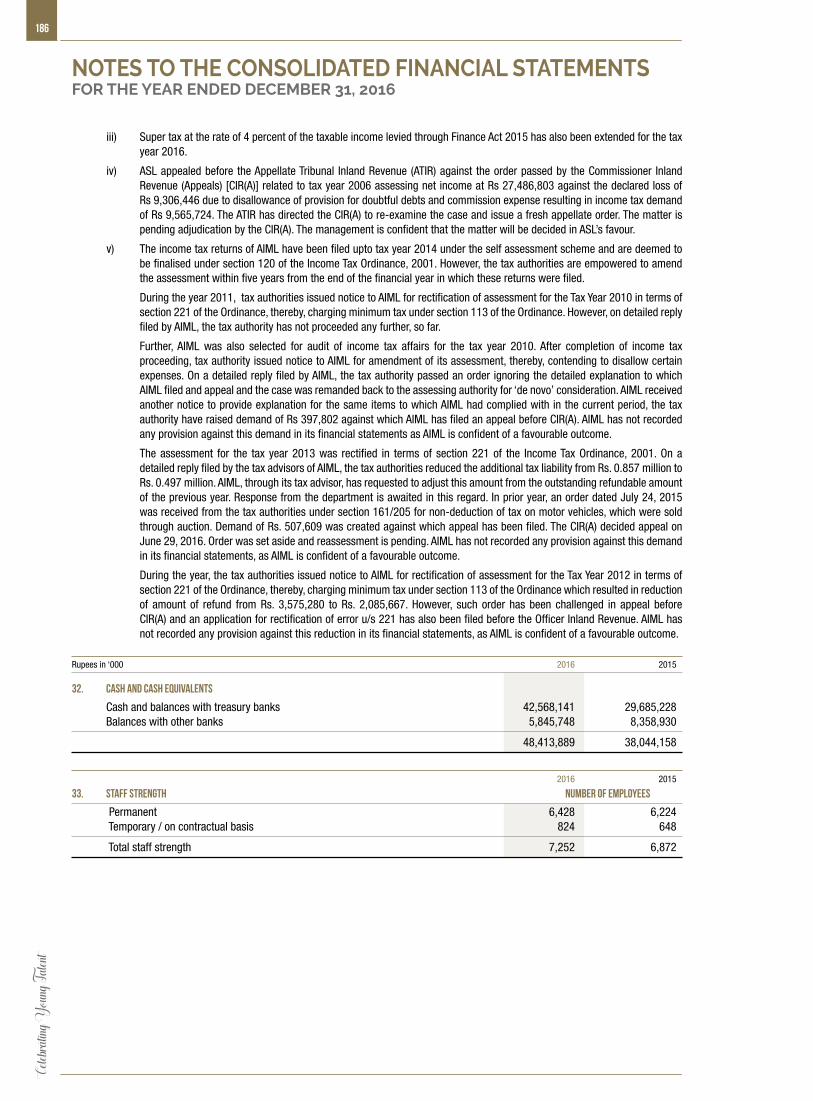
186Ce
lebrat
ing Y
oung T
alent
iii) Super tax at the rate of 4 percent of the taxable income levied through Finance Act 2015 has also been extended for the tax year 2016.
iv) ASL appealed before the Appellate Tribunal Inland Revenue (ATIR) against the order passed by the Commissioner Inland Revenue (Appeals) [CIR(A)] related to tax year 2006 assessing net income at Rs 27,486,803 against the declared loss of Rs 9,306,446 due to disallowance of provision for doubtful debts and commission expense resulting in income tax demand of Rs 9,565,724. The ATIR has directed the CIR(A) to re-examine the case and issue a fresh appellate order. The matter is pending adjudication by the CIR(A). The management is confident that the matter will be decided in ASL’s favour.
v) The income tax returns of AIML have been filed upto tax year 2014 under the self assessment scheme and are deemed to be finalised under section 120 of the Income Tax Ordinance, 2001. However, the tax authorities are empowered to amend the assessment within five years from the end of the financial year in which these returns were filed.
During the year 2011, tax authorities issued notice to AIML for rectification of assessment for the Tax Year 2010 in terms of section 221 of the Ordinance, thereby, charging minimum tax under section 113 of the Ordinance. However, on detailed reply filed by AIML, the tax authority has not proceeded any further, so far.
Further, AIML was also selected for audit of income tax affairs for the tax year 2010. After completion of income tax proceeding, tax authority issued notice to AIML for amendment of its assessment, thereby, contending to disallow certain expenses. On a detailed reply filed by AIML, the tax authority passed an order ignoring the detailed explanation to which AIML filed and appeal and the case was remanded back to the assessing authority for ‘de novo’ consideration. AIML received another notice to provide explanation for the same items to which AIML had complied with in the current period, the tax authority have raised demand of Rs 397,802 against which AIML has filed an appeal before CIR(A). AIML has not recorded any provision against this demand in its financial statements as AIML is confident of a favourable outcome.
The assessment for the tax year 2013 was rectified in terms of section 221 of the Income Tax Ordinance, 2001. On a detailed reply filed by the tax advisors of AIML, the tax authorities reduced the additional tax liability from Rs. 0.857 million to Rs. 0.497 million. AIML, through its tax advisor, has requested to adjust this amount from the outstanding refundable amount of the previous year. Response from the department is awaited in this regard. In prior year, an order dated July 24, 2015 was received from the tax authorities under section 161/205 for non-deduction of tax on motor vehicles, which were sold through auction. Demand of Rs. 507,609 was created against which appeal has been filed. The CIR(A) decided appeal on June 29, 2016. Order was set aside and reassessment is pending. AIML has not recorded any provision against this demand in its financial statements, as AIML is confident of a favourable outcome.
During the year, the tax authorities issued notice to AIML for rectification of assessment for the Tax Year 2012 in terms of section 221 of the Ordinance, thereby, charging minimum tax under section 113 of the Ordinance which resulted in reduction of amount of refund from Rs. 3,575,280 to Rs. 2,085,667. However, such order has been challenged in appeal before CIR(A) and an application for rectification of error u/s 221 has also been filed before the Officer Inland Revenue. AIML has not recorded any provision against this reduction in its financial statements, as AIML is confident of a favourable outcome.
Rupees in ‘000 2016 2015
32. CASH AND CASH EQUIVALENTS
Cash and balances with treasury banks 42,568,141 29,685,228 Balances with other banks 5,845,748 8,358,930
48,413,889 38,044,158
2016 2015
33. STAFF STRENGTH Number of employees
Permanent 6,428 6,224 Temporary / on contractual basis 824 648
Total staff strength 7,252 6,872
NOTES TO THE CONSOLIDATED FINANCIAL STATEMENTSFOR THE YEAR ENDED DECEMBER 31, 2016
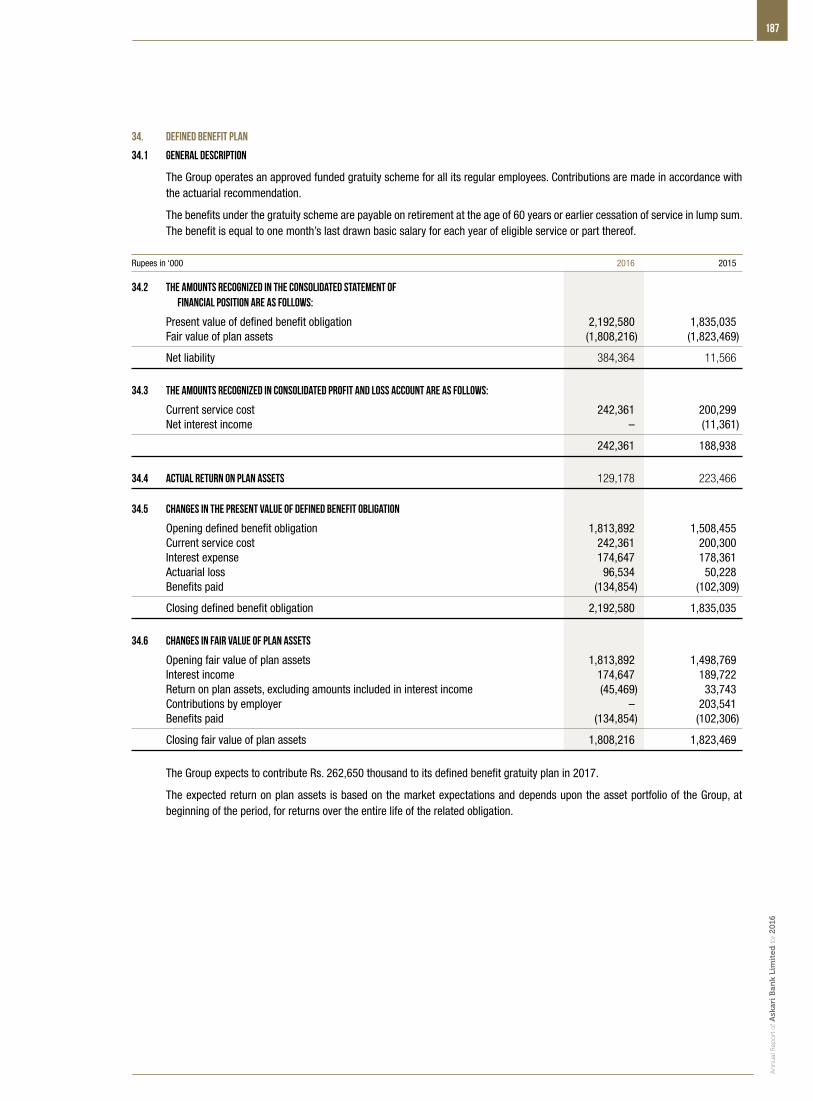
187
An
nu
al R
epo
rt o
f Ask
ari B
ank
Lim
ited
for 2
016
34. DEFINED BENEFIT PLAN
34.1 General description
The Group operates an approved funded gratuity scheme for all its regular employees. Contributions are made in accordance with the actuarial recommendation.
The benefits under the gratuity scheme are payable on retirement at the age of 60 years or earlier cessation of service in lump sum. The benefit is equal to one month’s last drawn basic salary for each year of eligible service or part thereof.
Rupees in ‘000 2016 2015
34.2 The amounts recognized in the consolidated statement of financial position are as follows:
Present value of defined benefit obligation 2,192,580 1,835,035 Fair value of plan assets (1,808,216) (1,823,469)
Net liability 384,364 11,566
34.3 The amounts recognized in consolidated profit and loss account are as follows:
Current service cost 242,361 200,299 Net interest income – (11,361)
242,361 188,938
34.4 Actual return on plan assets 129,178 223,466 34.5 Changes in the present value of defined benefit obligation
Opening defined benefit obligation 1,813,892 1,508,455 Current service cost 242,361 200,300 Interest expense 174,647 178,361 Actuarial loss 96,534 50,228 Benefits paid (134,854) (102,309)
Closing defined benefit obligation 2,192,580 1,835,035
34.6 Changes in fair value of plan assets
Opening fair value of plan assets 1,813,892 1,498,769 Interest income 174,647 189,722 Return on plan assets, excluding amounts included in interest income (45,469) 33,743 Contributions by employer – 203,541 Benefits paid (134,854) (102,306)
Closing fair value of plan assets 1,808,216 1,823,469
The Group expects to contribute Rs. 262,650 thousand to its defined benefit gratuity plan in 2017.
The expected return on plan assets is based on the market expectations and depends upon the asset portfolio of the Group, at beginning of the period, for returns over the entire life of the related obligation.
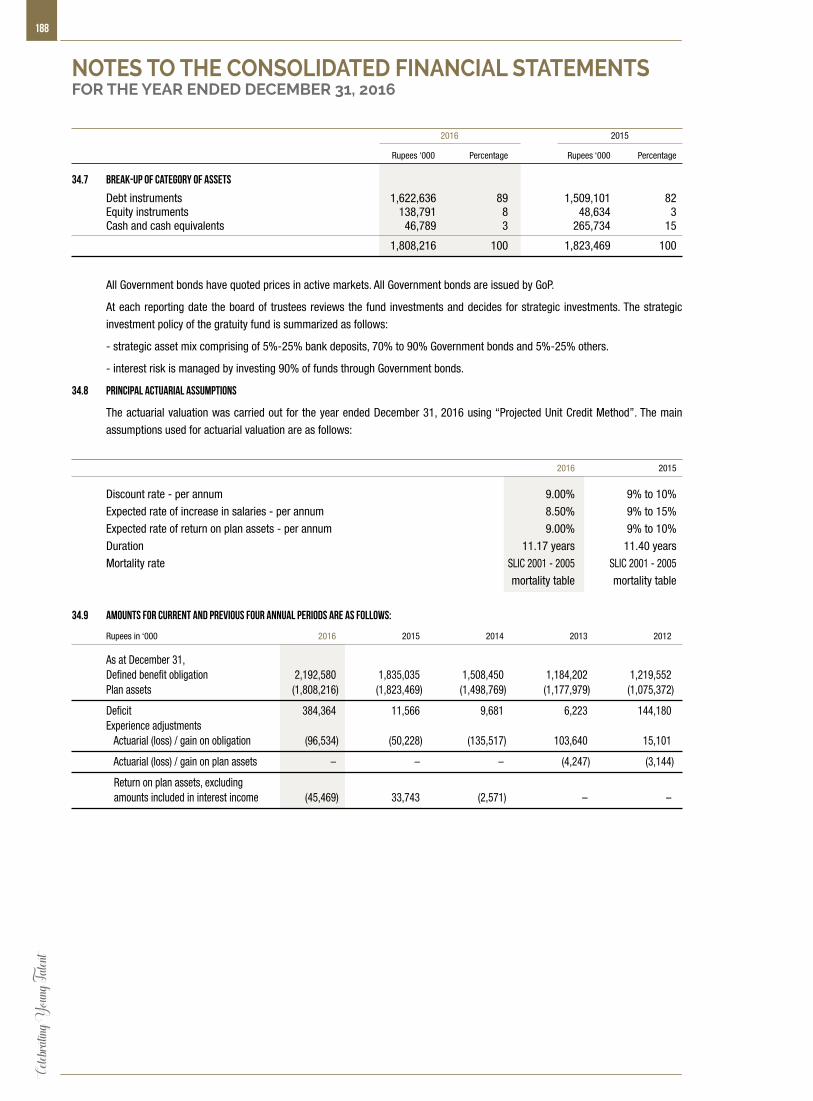
188Ce
lebrat
ing Y
oung T
alent
2016 2015
Rupees ‘000 Percentage Rupees ‘000 Percentage
34.7 Break-up of category of assets
Debt instruments 1,622,636 89 1,509,101 82 Equity instruments 138,791 8 48,634 3 Cash and cash equivalents 46,789 3 265,734 15
1,808,216 100 1,823,469 100
All Government bonds have quoted prices in active markets. All Government bonds are issued by GoP.
At each reporting date the board of trustees reviews the fund investments and decides for strategic investments. The strategic
investment policy of the gratuity fund is summarized as follows:
- strategic asset mix comprising of 5%-25% bank deposits, 70% to 90% Government bonds and 5%-25% others.
- interest risk is managed by investing 90% of funds through Government bonds.
34.8 Principal actuarial assumptions
The actuarial valuation was carried out for the year ended December 31, 2016 using “Projected Unit Credit Method”. The main
assumptions used for actuarial valuation are as follows:
2016 2015
Discount rate - per annum 9.00% 9% to 10%
Expected rate of increase in salaries - per annum 8.50% 9% to 15%
Expected rate of return on plan assets - per annum 9.00% 9% to 10%
Duration 11.17 years 11.40 years
Mortality rate SLIC 2001 - 2005 SLIC 2001 - 2005
mortality table mortality table
34.9 Amounts for current and previous four annual periods are as follows:
Rupees in ‘000 2016 2015 2014 2013 2012
As at December 31, Defined benefit obligation 2,192,580 1,835,035 1,508,450 1,184,202 1,219,552 Plan assets (1,808,216) (1,823,469) (1,498,769) (1,177,979) (1,075,372)
Deficit 384,364 11,566 9,681 6,223 144,180 Experience adjustments Actuarial (loss) / gain on obligation (96,534) (50,228) (135,517) 103,640 15,101
Actuarial (loss) / gain on plan assets – – – (4,247) (3,144)
Return on plan assets, excluding amounts included in interest income (45,469) 33,743 (2,571) – –
NOTES TO THE CONSOLIDATED FINANCIAL STATEMENTSFOR THE YEAR ENDED DECEMBER 31, 2016
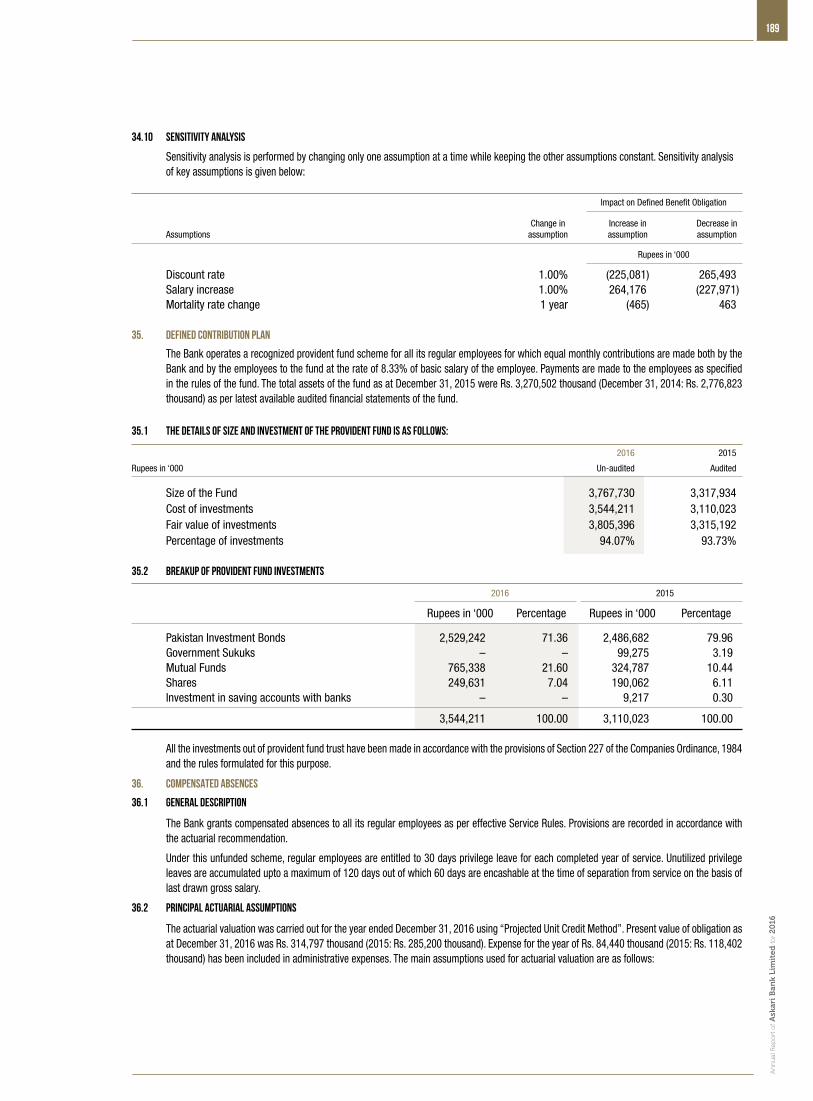
189
An
nu
al R
epo
rt o
f Ask
ari B
ank
Lim
ited
for 2
016
34.10 Sensitivity analysis
Sensitivity analysis is performed by changing only one assumption at a time while keeping the other assumptions constant. Sensitivity analysis of key assumptions is given below:
Impact on Defined Benefit Obligation
Change in Increase in Decrease in Assumptions assumption assumption assumption
Rupees in ‘000
Discount rate 1.00% (225,081) 265,493 Salary increase 1.00% 264,176 (227,971) Mortality rate change 1 year (465) 463 35. DEFINED CONTRIBUTION PLAN
The Bank operates a recognized provident fund scheme for all its regular employees for which equal monthly contributions are made both by the Bank and by the employees to the fund at the rate of 8.33% of basic salary of the employee. Payments are made to the employees as specified in the rules of the fund. The total assets of the fund as at December 31, 2015 were Rs. 3,270,502 thousand (December 31, 2014: Rs. 2,776,823 thousand) as per latest available audited financial statements of the fund.
35.1 The details of size and investment of the provident fund is as follows:
2016 2015
Rupees in ‘000 Un-audited Audited
Size of the Fund 3,767,730 3,317,934 Cost of investments 3,544,211 3,110,023 Fair value of investments 3,805,396 3,315,192 Percentage of investments 94.07% 93.73% 35.2 Breakup of provident fund investments
2016 2015
Rupees in ‘000 Percentage Rupees in ‘000 Percentage
Pakistan Investment Bonds 2,529,242 71.36 2,486,682 79.96 Government Sukuks – – 99,275 3.19 Mutual Funds 765,338 21.60 324,787 10.44 Shares 249,631 7.04 190,062 6.11 Investment in saving accounts with banks – – 9,217 0.30
3,544,211 100.00 3,110,023 100.00 All the investments out of provident fund trust have been made in accordance with the provisions of Section 227 of the Companies Ordinance, 1984
and the rules formulated for this purpose.
36. COMPENSATED ABSENCES
36.1 General description
The Bank grants compensated absences to all its regular employees as per effective Service Rules. Provisions are recorded in accordance with the actuarial recommendation.
Under this unfunded scheme, regular employees are entitled to 30 days privilege leave for each completed year of service. Unutilized privilege leaves are accumulated upto a maximum of 120 days out of which 60 days are encashable at the time of separation from service on the basis of last drawn gross salary.
36.2 Principal actuarial assumptions
The actuarial valuation was carried out for the year ended December 31, 2016 using “Projected Unit Credit Method”. Present value of obligation as at December 31, 2016 was Rs. 314,797 thousand (2015: Rs. 285,200 thousand). Expense for the year of Rs. 84,440 thousand (2015: Rs. 118,402 thousand) has been included in administrative expenses. The main assumptions used for actuarial valuation are as follows:
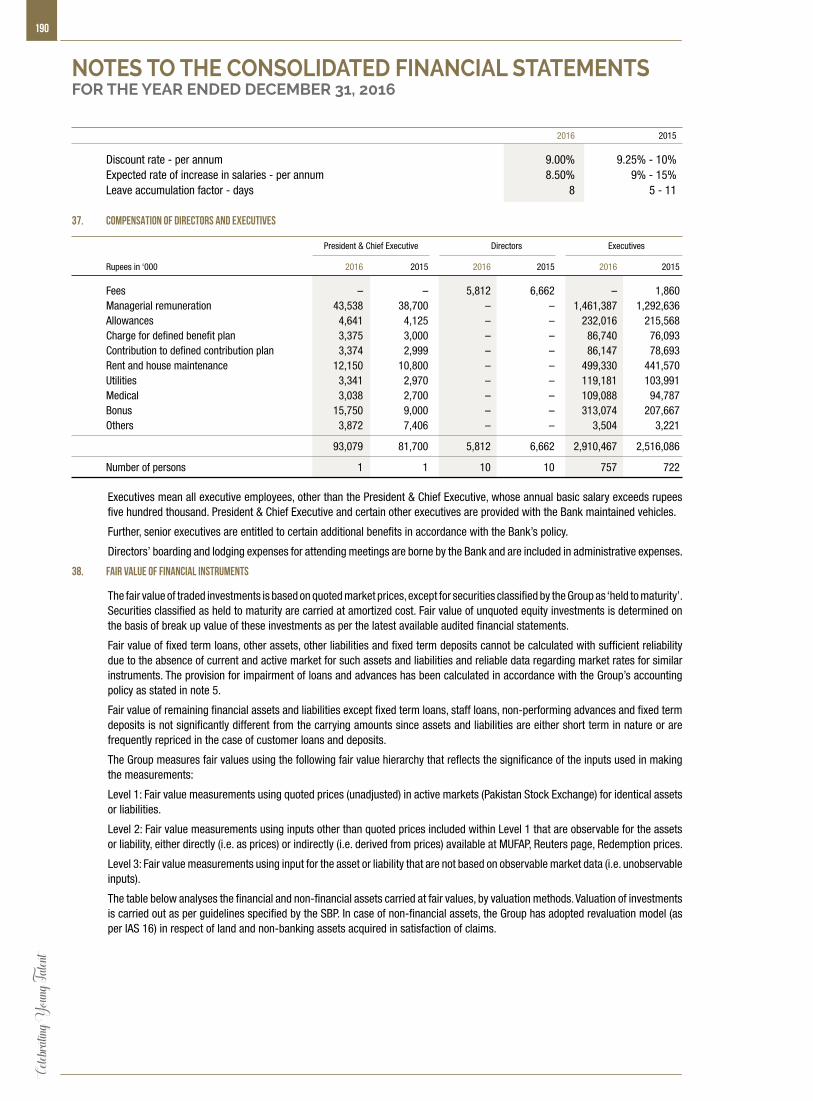
190Ce
lebrat
ing Y
oung T
alent
2016 2015
Discount rate - per annum 9.00% 9.25% - 10% Expected rate of increase in salaries - per annum 8.50% 9% - 15% Leave accumulation factor - days 8 5 - 11
37. COMPENSATION OF DIRECTORS AND EXECUTIVES
President & Chief Executive Directors Executives
Rupees in ‘000 2016 2015 2016 2015 2016 2015
Fees – – 5,812 6,662 – 1,860 Managerial remuneration 43,538 38,700 – – 1,461,387 1,292,636 Allowances 4,641 4,125 – – 232,016 215,568 Charge for defined benefit plan 3,375 3,000 – – 86,740 76,093 Contribution to defined contribution plan 3,374 2,999 – – 86,147 78,693 Rent and house maintenance 12,150 10,800 – – 499,330 441,570 Utilities 3,341 2,970 – – 119,181 103,991 Medical 3,038 2,700 – – 109,088 94,787 Bonus 15,750 9,000 – – 313,074 207,667 Others 3,872 7,406 – – 3,504 3,221
93,079 81,700 5,812 6,662 2,910,467 2,516,086
Number of persons 1 1 10 10 757 722
Executives mean all executive employees, other than the President & Chief Executive, whose annual basic salary exceeds rupees five hundred thousand. President & Chief Executive and certain other executives are provided with the Bank maintained vehicles.
Further, senior executives are entitled to certain additional benefits in accordance with the Bank’s policy.
Directors’ boarding and lodging expenses for attending meetings are borne by the Bank and are included in administrative expenses.
38. FAIR VALUE OF FINANCIAL INSTRUMENTS
The fair value of traded investments is based on quoted market prices, except for securities classified by the Group as ‘held to maturity’. Securities classified as held to maturity are carried at amortized cost. Fair value of unquoted equity investments is determined on the basis of break up value of these investments as per the latest available audited financial statements.
Fair value of fixed term loans, other assets, other liabilities and fixed term deposits cannot be calculated with sufficient reliability due to the absence of current and active market for such assets and liabilities and reliable data regarding market rates for similar instruments. The provision for impairment of loans and advances has been calculated in accordance with the Group’s accounting policy as stated in note 5.
Fair value of remaining financial assets and liabilities except fixed term loans, staff loans, non-performing advances and fixed term deposits is not significantly different from the carrying amounts since assets and liabilities are either short term in nature or are frequently repriced in the case of customer loans and deposits.
The Group measures fair values using the following fair value hierarchy that reflects the significance of the inputs used in making the measurements:
Level 1: Fair value measurements using quoted prices (unadjusted) in active markets (Pakistan Stock Exchange) for identical assets or liabilities.
Level 2: Fair value measurements using inputs other than quoted prices included within Level 1 that are observable for the assets or liability, either directly (i.e. as prices) or indirectly (i.e. derived from prices) available at MUFAP, Reuters page, Redemption prices.
Level 3: Fair value measurements using input for the asset or liability that are not based on observable market data (i.e. unobservable inputs).
The table below analyses the financial and non-financial assets carried at fair values, by valuation methods. Valuation of investments is carried out as per guidelines specified by the SBP. In case of non-financial assets, the Group has adopted revaluation model (as per IAS 16) in respect of land and non-banking assets acquired in satisfaction of claims.
NOTES TO THE CONSOLIDATED FINANCIAL STATEMENTSFOR THE YEAR ENDED DECEMBER 31, 2016
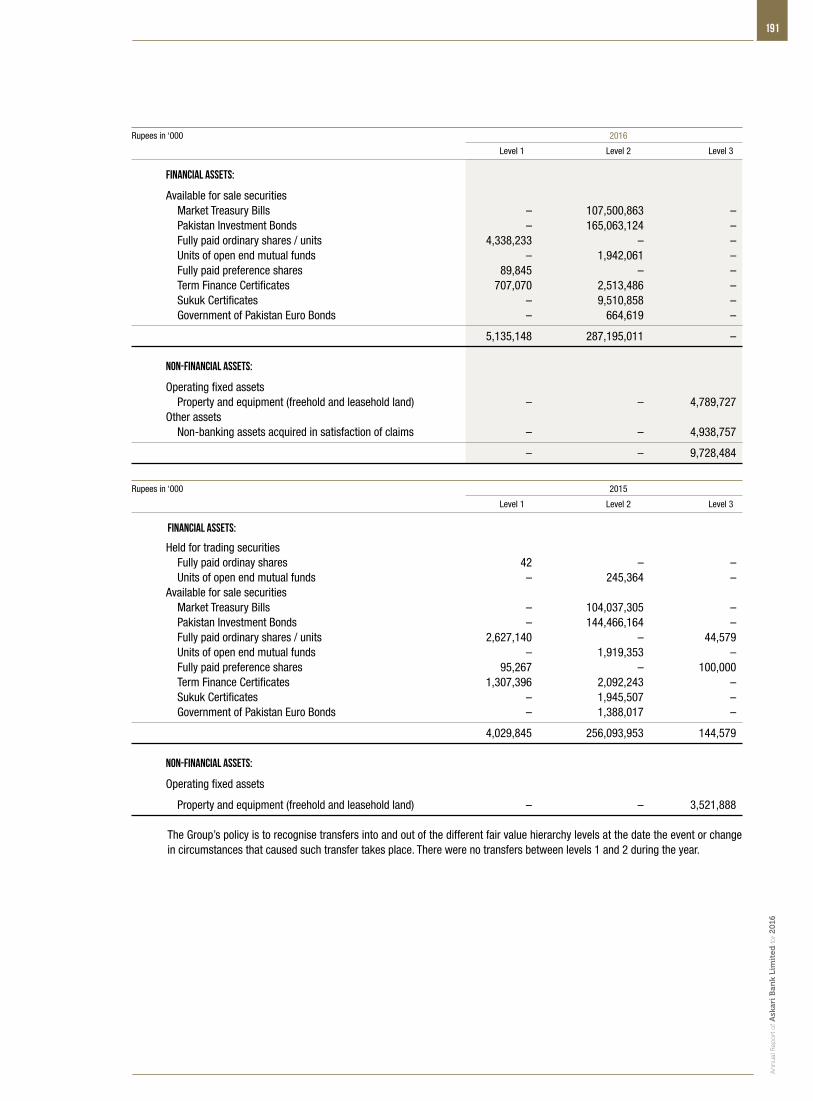
191
An
nu
al R
epo
rt o
f Ask
ari B
ank
Lim
ited
for 2
016
Rupees in ‘000 2016
Level 1 Level 2 Level 3
Financial assets:
Available for sale securities Market Treasury Bills – 107,500,863 – Pakistan Investment Bonds – 165,063,124 – Fully paid ordinary shares / units 4,338,233 – – Units of open end mutual funds – 1,942,061 – Fully paid preference shares 89,845 – – Term Finance Certificates 707,070 2,513,486 – Sukuk Certificates – 9,510,858 – Government of Pakistan Euro Bonds – 664,619 –
5,135,148 287,195,011 – Non-financial assets:
Operating fixed assets Property and equipment (freehold and leasehold land) – – 4,789,727 Other assets Non-banking assets acquired in satisfaction of claims – – 4,938,757
– – 9,728,484
Rupees in ‘000 2015
Level 1 Level 2 Level 3
Financial assets:
Held for trading securities Fully paid ordinay shares 42 – – Units of open end mutual funds – 245,364 – Available for sale securities Market Treasury Bills – 104,037,305 – Pakistan Investment Bonds – 144,466,164 – Fully paid ordinary shares / units 2,627,140 – 44,579 Units of open end mutual funds – 1,919,353 – Fully paid preference shares 95,267 – 100,000 Term Finance Certificates 1,307,396 2,092,243 – Sukuk Certificates – 1,945,507 – Government of Pakistan Euro Bonds – 1,388,017 –
4,029,845 256,093,953 144,579 Non-financial assets:
Operating fixed assets
Property and equipment (freehold and leasehold land) – – 3,521,888 The Group’s policy is to recognise transfers into and out of the different fair value hierarchy levels at the date the event or change
in circumstances that caused such transfer takes place. There were no transfers between levels 1 and 2 during the year.
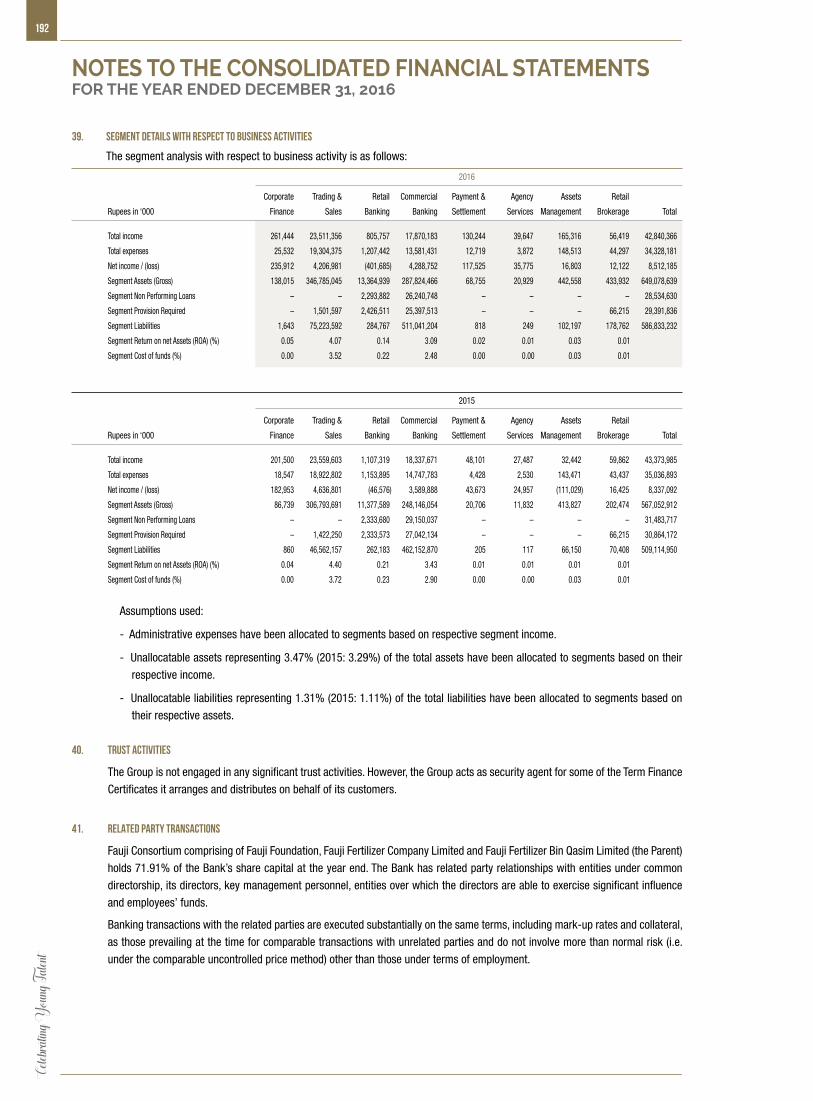
192Ce
lebrat
ing Y
oung T
alent
39. SEGMENT DETAILS WITH RESPECT TO BUSINESS ACTIVITIES
The segment analysis with respect to business activity is as follows:
2016
Corporate Trading & Retail Commercial Payment & Agency Assets Retail
Rupees in ‘000 Finance Sales Banking Banking Settlement Services Management Brokerage Total
Total income 261,444 23,511,356 805,757 17,870,183 130,244 39,647 165,316 56,419 42,840,366
Total expenses 25,532 19,304,375 1,207,442 13,581,431 12,719 3,872 148,513 44,297 34,328,181
Net income / (loss) 235,912 4,206,981 (401,685) 4,288,752 117,525 35,775 16,803 12,122 8,512,185
Segment Assets (Gross) 138,015 346,785,045 13,364,939 287,824,466 68,755 20,929 442,558 433,932 649,078,639
Segment Non Performing Loans – – 2,293,882 26,240,748 – – – – 28,534,630
Segment Provision Required – 1,501,597 2,426,511 25,397,513 – – – 66,215 29,391,836
Segment Liabilities 1,643 75,223,592 284,767 511,041,204 818 249 102,197 178,762 586,833,232
Segment Return on net Assets (ROA) (%) 0.05 4.07 0.14 3.09 0.02 0.01 0.03 0.01
Segment Cost of funds (%) 0.00 3.52 0.22 2.48 0.00 0.00 0.03 0.01
2015
Corporate Trading & Retail Commercial Payment & Agency Assets Retail
Rupees in ‘000 Finance Sales Banking Banking Settlement Services Management Brokerage Total
Total income 201,500 23,559,603 1,107,319 18,337,671 48,101 27,487 32,442 59,862 43,373,985
Total expenses 18,547 18,922,802 1,153,895 14,747,783 4,428 2,530 143,471 43,437 35,036,893
Net income / (loss) 182,953 4,636,801 (46,576) 3,589,888 43,673 24,957 (111,029) 16,425 8,337,092
Segment Assets (Gross) 86,739 306,793,691 11,377,589 248,146,054 20,706 11,832 413,827 202,474 567,052,912
Segment Non Performing Loans – – 2,333,680 29,150,037 – – – – 31,483,717
Segment Provision Required – 1,422,250 2,333,573 27,042,134 – – – 66,215 30,864,172
Segment Liabilities 860 46,562,157 262,183 462,152,870 205 117 66,150 70,408 509,114,950
Segment Return on net Assets (ROA) (%) 0.04 4.40 0.21 3.43 0.01 0.01 0.01 0.01
Segment Cost of funds (%) 0.00 3.72 0.23 2.90 0.00 0.00 0.03 0.01
Assumptions used:
- Administrative expenses have been allocated to segments based on respective segment income.
- Unallocatable assets representing 3.47% (2015: 3.29%) of the total assets have been allocated to segments based on their
respective income.
- Unallocatable liabilities representing 1.31% (2015: 1.11%) of the total liabilities have been allocated to segments based on
their respective assets.
40. TRUST ACTIVITIES
The Group is not engaged in any significant trust activities. However, the Group acts as security agent for some of the Term Finance
Certificates it arranges and distributes on behalf of its customers.
41. RELATED PARTY TRANSACTIONS
Fauji Consortium comprising of Fauji Foundation, Fauji Fertilizer Company Limited and Fauji Fertilizer Bin Qasim Limited (the Parent)
holds 71.91% of the Bank’s share capital at the year end. The Bank has related party relationships with entities under common
directorship, its directors, key management personnel, entities over which the directors are able to exercise significant influence
and employees’ funds.
Banking transactions with the related parties are executed substantially on the same terms, including mark-up rates and collateral,
as those prevailing at the time for comparable transactions with unrelated parties and do not involve more than normal risk (i.e.
under the comparable uncontrolled price method) other than those under terms of employment.
NOTES TO THE CONSOLIDATED FINANCIAL STATEMENTSFOR THE YEAR ENDED DECEMBER 31, 2016
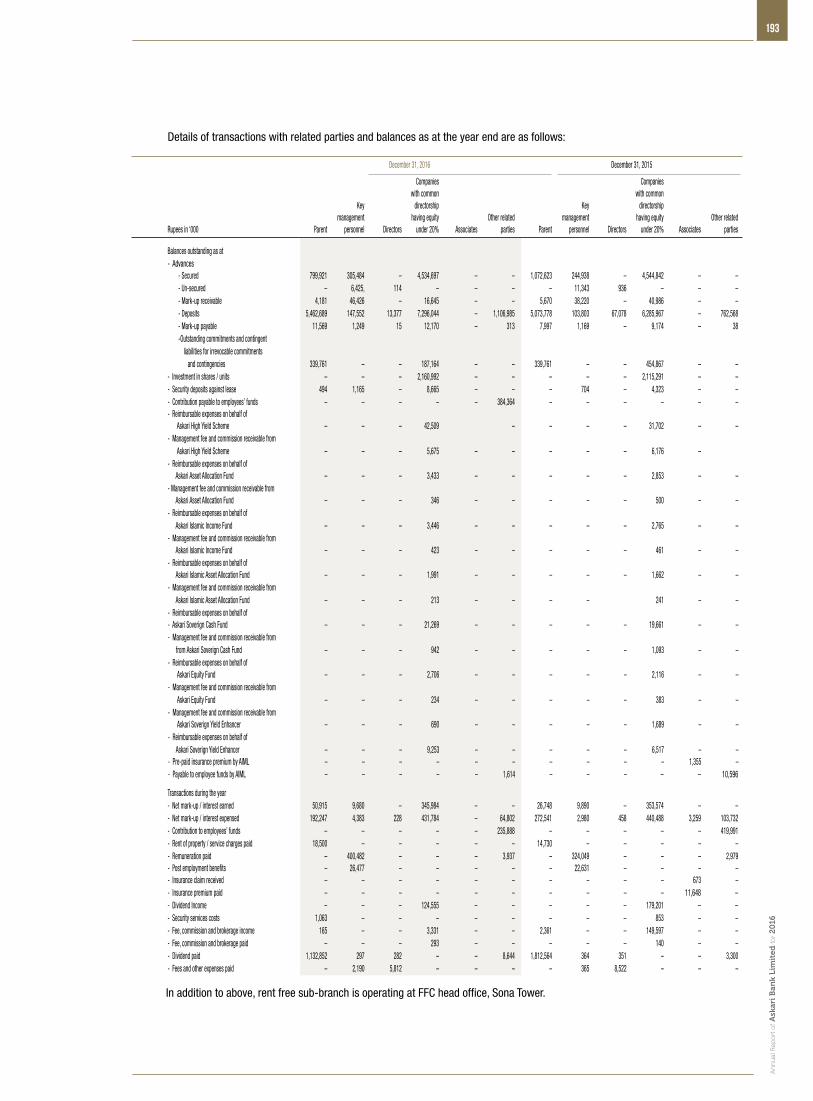
193
An
nu
al R
epo
rt o
f Ask
ari B
ank
Lim
ited
for 2
016
Details of transactions with related parties and balances as at the year end are as follows:
December 31, 2016 December 31, 2015
Companies Companies with common with common Key directorship Key directorship management having equity Other related management having equity Other related Rupees in ‘000 Parent personnel Directors under 20% Associates parties Parent personnel Directors under 20% Associates parties
Balances outstanding as at - Advances - Secured 799,921 305,484 – 4,534,697 – – 1,072,623 244,938 – 4,544,842 – – - Un-secured – 6,425, 114 – – – – 11,343 936 – – – - Mark-up receivable 4,181 46,426 – 16,645 – – 5,670 38,220 – 40,986 – – - Deposits 5,462,689 147,552 13,377 7,296,044 – 1,106,985 5,073,778 103,803 67,078 6,285,967 – 762,568 - Mark-up payable 11,569 1,249 15 12,170 – 313 7,997 1,169 – 9,174 – 38 -Outstanding commitments and contingent liabilities for irrevocable commitments and contingencies 339,761 – – 187,164 – – 339,761 – – 454,867 – – - Investment in shares / units – – – 2,160,992 – – – – – 2,115,291 – – - Security deposits against lease 494 1,165 – 8,665 – – – 704 – 4,323 – – - Contribution payable to employees’ funds – – – – – 384,364 – – – – – – - Reimbursable expenses on behalf of Askari High Yield Scheme – – – 42,509 – – – – 31,702 – – - Management fee and commission receivable from Askari High Yield Scheme – – – 5,675 – – – – – 6,176 – - Reimbursable expenses on behalf of Askari Asset Allocation Fund – – – 3,433 – – – – – 2,853 – –
- Management fee and commission receivable from Askari Asset Allocation Fund – – – 346 – – – – – 500 – –
- Reimbursable expenses on behalf of Askari Islamic Income Fund – – – 3,446 – – – – – 2,765 – – - Management fee and commission receivable from Askari Islamic Income Fund – – – 423 – – – – – 461 – –
- Reimbursable expenses on behalf of Askari Islamic Asset Allocation Fund – – – 1,991 – – – – – 1,662 – –
- Management fee and commission receivable from Askari Islamic Asset Allocation Fund – – – 213 – – – – 241 – – - Reimbursable expenses on behalf of - Askari Soverign Cash Fund – – – 21,269 – – – – – 19,661 – –
- Management fee and commission receivable from from Askari Soverign Cash Fund – – – 942 – – – – – 1,093 – – - Reimbursable expenses on behalf of Askari Equity Fund – – – 2,706 – – – – – 2,116 – –
- Management fee and commission receivable from Askari Equity Fund – – – 234 – – – – – 383 – – - Management fee and commission receivable from Askari Soverign Yield Enhancer – – – 690 – – – – – 1,689 – –
- Reimbursable expenses on behalf of Askari Soverign Yield Enhancer – – – 9,253 – – – – – 6,517 – – - Pre-paid insurance premium by AIML – – – – – – – – – – 1,355 – - Payable to employee funds by AIML – – – – – 1,614 – – – – – 10,596
Transactions during the year - Net mark-up / interest earned 50,915 9,680 – 345,984 – – 26,748 9,890 – 353,574 – – - Net mark-up / interest expensed 192,247 4,383 228 431,784 – 64,802 272,541 2,980 458 440,488 3,259 103,732 - Contribution to employees’ funds – – – – – 235,888 – – – – – 419,991 - Rent of property / service charges paid 18,500 – – – – – 14,730 – – – – – - Remuneration paid – 400,482 – – – 3,937 – 324,049 – – – 2,979 - Post employment benefits – 26,477 – – – – – 22,631 – – – –
- Insurance claim received – – – – – – – – – – 673 – - Insurance premium paid – – – – – – – – – – 11,648 – - Dividend Income – – – 124,555 – – – – – 179,201 – –
- Security services costs 1,063 – – – – – – – – 853 – – - Fee, commission and brokerage income 165 – – 3,331 – – 2,361 – – 149,597 – – - Fee, commission and brokerage paid – – – 293 – – – – – 140 – – - Dividend paid 1,132,852 297 282 – – 8,644 1,812,564 364 351 – – 3,300 - Fees and other expenses paid – 2,190 5,812 – – – – 365 8,522 – – – In addition to above, rent free sub-branch is operating at FFC head office, Sona Tower.

194Ce
lebrat
ing Y
oung T
alent
42. CAPITAL ADEQUACY
42.1 Scope of Application
Standardized Approach is used for calculating the Capital Adequacy for Market and Credit risk while Basic Indicator Approach (BIA) is used for Operational Risk.
The Bank’s Board of Directors during the year 2016 approved disposal of its two subsidiaries, Askari Investment Management Limited (AIML) and Askari Securities Limited (ASL) and thus classified them as Assets attributable to Discontinued Operations. Furthermore, the Bank does not enter into in any securitization activity that shields it from the risk inherent in securitization.
42.2 Capital Management
The objective of managing capital is to safeguard the Group’s ability to continue as a going concern, so that it could continue to provide adequate returns to shareholders by pricing products and services commensurately with the level of risk. It is the policy of the Group to maintain a strong capital base so as to maintain investor, creditor and market confidence and to sustain future development of the business. The impact of the level of capital on shareholder’s return is also recognised and the Group recognises the need to maintain a balance between the higher returns that might be possible with greater gearing and the advantages and security afforded by a sound capital position.
Goals of managing capital
The goals of managing capital of the Bank are as follows:
- To be an adequately capitalised institution, considering the requirements set by the regulators of the banking markets where
the Group operates;
- Maintain strong ratings and to protect the Group against unexpected events; and
- Availability of adequate capital at a reasonable cost so as to enable the Group to operate adequately and provide reasonable
value added for the shareholders and other stakeholders.
Group’s regulatory capital analysed in two tiers
Tier I capital, includes fully paid-up capital, share premium, reserves (excluding foreign exchange translation reserves) and unappropriated profits (net of losses) etc. after deductions for certain specified items such as book value of intangibles, reciprocal cross holdings in CET 1 instruments of Banking, Financial or Insurance entities, investments in mutual funds exceeding prescribed limits and 50% of other deductions e.g. majority and significant minority investments in insurance and other financial entities. Deductions that have come afresh as part of the Basel III rules such as those on account of Deferred Tax Assets are also required to be made.
Tier II capital under Basel III is subject to a maximum of 2.5% of total Risk Weighted Assets as of December 31, 2016. It includes subordinated debt issued prior to January 1, 2013 phasing out at an annual rate of 10%, Basel III compliant Tier II instruments, general provisions for loan losses (up to a maximum of 1.25% of credit risk weighted assets), reserves on the revaluation of fixed assets and available for sale investments (on an after tax basis up to a maximum of 45 percent), foreign exchange translation reserves etc. Basel III rules however do allow for the inclusion of the remaining 55% of the revaluation reserves into Tier II capital at an inclusion rate equal to the rate of deduction specified under the transitional arrangements for the coming years uptil 2018. Tier II capital deductions comprise of the remaining 50% other deductions noted above, reciprocal cross holdings in Tier II instruments of Banking, Financial or Insurance entities etc.
As of December 31, 2016 the Group must meet a Tier 1 to RWA ratio and CAR including CCB of 7.5% and 10.65% respectively.
Banking operations are categorised as either trading book or banking book and risk-weighted assets are determined according to specified requirements of the State Bank of Pakistan that seek to reflect the varying levels of risk attached to on-balance sheet and off-balance sheet exposures. The total risk-weighted exposures comprise the credit risk, market risk and operational risk.
On and off-balance sheet assets in the banking book are broken down to various asset classes for calculation of credit risk requirement. External ratings for assets, where available, are applied using the assessments by various External Credit Assessment Institutions (ECAIs) and aligned with appropriate risk buckets. Otherwise, the exposures are treated as unrated and relevant risk weights are applied. In addition, there are fixed risk weights for certain types of exposures such as retail portfolio and residential mortgage finance for which external ratings are not applicable. Collaterals if any, are used as credit risk mitigant after applying appropriate haircuts under the Comprehensive Approach. Risk weights notified, are hence applied at adjusted exposures, wherever credit risk mitigation is available. Collaterals used include: Government of Pakistan guarantees, cash, lien on deposits, shares, government securities, bank and corporate guarantees and other debt securities that fall within the definition of eligible collaterals and also fulfill other specified criteria under the relevant capital adequacy guidelines.
The calculation of Capital Adequacy enables the Group to assess the long-term soundness. As the Group carries on the business on a wide area network basis, it is critical that it is able to continuously monitor the exposure across the entire organisation and aggregate the risks so as to take an integrated approach / view.
NOTES TO THE CONSOLIDATED FINANCIAL STATEMENTSFOR THE YEAR ENDED DECEMBER 31, 2016
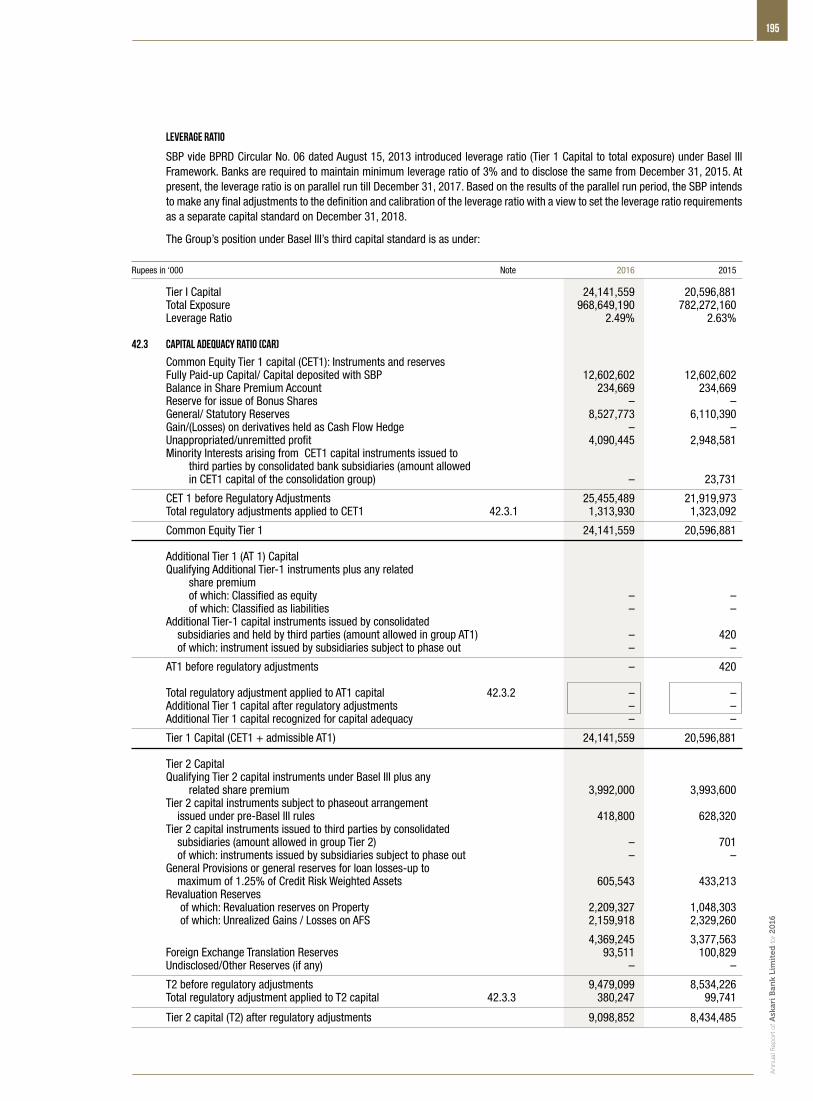
195
An
nu
al R
epo
rt o
f Ask
ari B
ank
Lim
ited
for 2
016
Leverage ratio
SBP vide BPRD Circular No. 06 dated August 15, 2013 introduced leverage ratio (Tier 1 Capital to total exposure) under Basel III Framework. Banks are required to maintain minimum leverage ratio of 3% and to disclose the same from December 31, 2015. At present, the leverage ratio is on parallel run till December 31, 2017. Based on the results of the parallel run period, the SBP intends to make any final adjustments to the definition and calibration of the leverage ratio with a view to set the leverage ratio requirements as a separate capital standard on December 31, 2018.
The Group’s position under Basel III’s third capital standard is as under: Rupees in ‘000 Note 2016 2015
Tier I Capital 24,141,559 20,596,881 Total Exposure 968,649,190 782,272,160 Leverage Ratio 2.49% 2.63%
42.3 Capital Adequacy Ratio (CAR)
Common Equity Tier 1 capital (CET1): Instruments and reserves Fully Paid-up Capital/ Capital deposited with SBP 12,602,602 12,602,602 Balance in Share Premium Account 234,669 234,669 Reserve for issue of Bonus Shares – – General/ Statutory Reserves 8,527,773 6,110,390 Gain/(Losses) on derivatives held as Cash Flow Hedge – – Unappropriated/unremitted profit 4,090,445 2,948,581 Minority Interests arising from CET1 capital instruments issued to third parties by consolidated bank subsidiaries (amount allowed in CET1 capital of the consolidation group) – 23,731
CET 1 before Regulatory Adjustments 25,455,489 21,919,973 Total regulatory adjustments applied to CET1 42.3.1 1,313,930 1,323,092
Common Equity Tier 1 24,141,559 20,596,881 Additional Tier 1 (AT 1) Capital Qualifying Additional Tier-1 instruments plus any related share premium of which: Classified as equity – – of which: Classified as liabilities – –
Additional Tier-1 capital instruments issued by consolidated subsidiaries and held by third parties (amount allowed in group AT1) – 420 of which: instrument issued by subsidiaries subject to phase out – –
AT1 before regulatory adjustments – 420 Total regulatory adjustment applied to AT1 capital 42.3.2 – –
Additional Tier 1 capital after regulatory adjustments – – Additional Tier 1 capital recognized for capital adequacy – –
Tier 1 Capital (CET1 + admissible AT1) 24,141,559 20,596,881
Tier 2 Capital Qualifying Tier 2 capital instruments under Basel III plus any related share premium 3,992,000 3,993,600 Tier 2 capital instruments subject to phaseout arrangement issued under pre-Basel III rules 418,800 628,320 Tier 2 capital instruments issued to third parties by consolidated subsidiaries (amount allowed in group Tier 2) – 701 of which: instruments issued by subsidiaries subject to phase out – – General Provisions or general reserves for loan losses-up to maximum of 1.25% of Credit Risk Weighted Assets 605,543 433,213 Revaluation Reserves of which: Revaluation reserves on Property 2,209,327 1,048,303 of which: Unrealized Gains / Losses on AFS 2,159,918 2,329,260
4,369,245 3,377,563 Foreign Exchange Translation Reserves 93,511 100,829 Undisclosed/Other Reserves (if any) – –
T2 before regulatory adjustments 9,479,099 8,534,226 Total regulatory adjustment applied to T2 capital 42.3.3 380,247 99,741
Tier 2 capital (T2) after regulatory adjustments 9,098,852 8,434,485
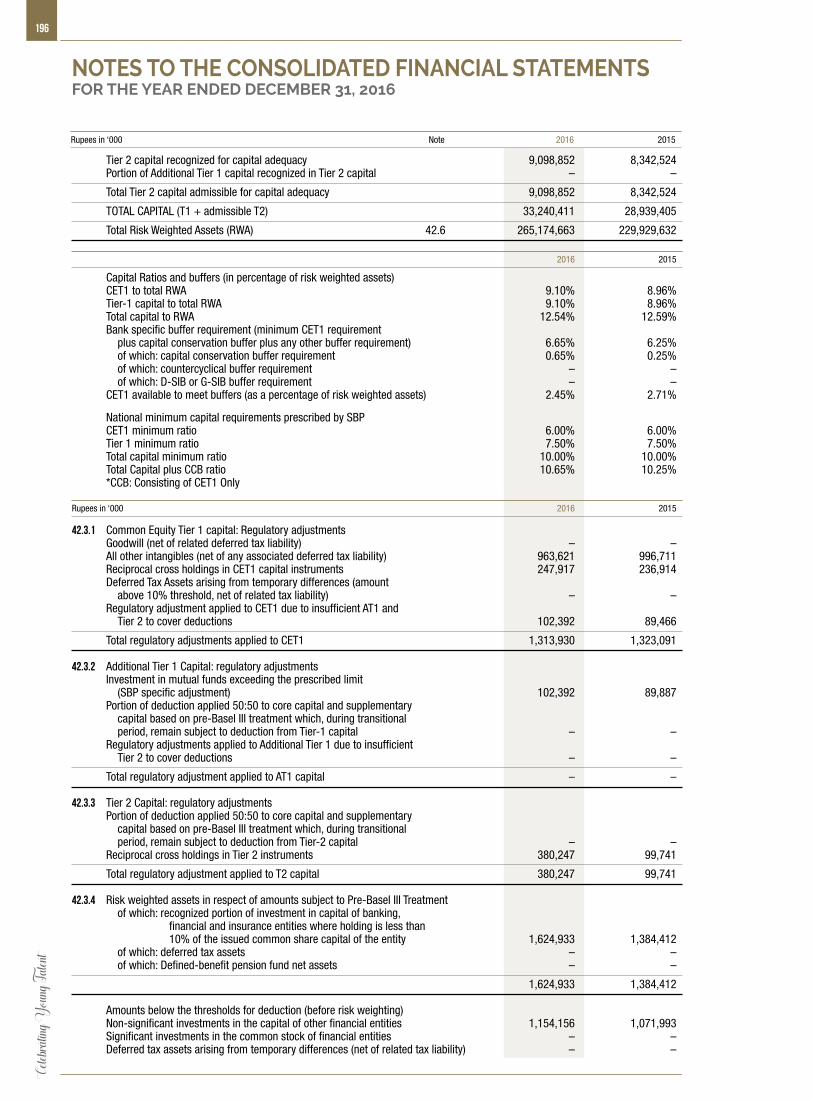
196Ce
lebrat
ing Y
oung T
alent
Tier 2 capital recognized for capital adequacy 9,098,852 8,342,524 Portion of Additional Tier 1 capital recognized in Tier 2 capital – –
Total Tier 2 capital admissible for capital adequacy 9,098,852 8,342,524
TOTAL CAPITAL (T1 + admissible T2) 33,240,411 28,939,405
Total Risk Weighted Assets (RWA) 42.6 265,174,663 229,929,632 2016 2015
Capital Ratios and buffers (in percentage of risk weighted assets) CET1 to total RWA 9.10% 8.96% Tier-1 capital to total RWA 9.10% 8.96% Total capital to RWA 12.54% 12.59% Bank specific buffer requirement (minimum CET1 requirement plus capital conservation buffer plus any other buffer requirement) 6.65% 6.25% of which: capital conservation buffer requirement 0.65% 0.25% of which: countercyclical buffer requirement – – of which: D-SIB or G-SIB buffer requirement – – CET1 available to meet buffers (as a percentage of risk weighted assets) 2.45% 2.71%
National minimum capital requirements prescribed by SBP CET1 minimum ratio 6.00% 6.00% Tier 1 minimum ratio 7.50% 7.50% Total capital minimum ratio 10.00% 10.00% Total Capital plus CCB ratio 10.65% 10.25% *CCB: Consisting of CET1 Only
Rupees in ‘000 2016 2015
42.3.1 Common Equity Tier 1 capital: Regulatory adjustments Goodwill (net of related deferred tax liability) – – All other intangibles (net of any associated deferred tax liability) 963,621 996,711 Reciprocal cross holdings in CET1 capital instruments 247,917 236,914 Deferred Tax Assets arising from temporary differences (amount above 10% threshold, net of related tax liability) – – Regulatory adjustment applied to CET1 due to insufficient AT1 and Tier 2 to cover deductions 102,392 89,466
Total regulatory adjustments applied to CET1 1,313,930 1,323,091
42.3.2 Additional Tier 1 Capital: regulatory adjustments Investment in mutual funds exceeding the prescribed limit (SBP specific adjustment) 102,392 89,887 Portion of deduction applied 50:50 to core capital and supplementary capital based on pre-Basel III treatment which, during transitional period, remain subject to deduction from Tier-1 capital – – Regulatory adjustments applied to Additional Tier 1 due to insufficient Tier 2 to cover deductions – –
Total regulatory adjustment applied to AT1 capital – –
42.3.3 Tier 2 Capital: regulatory adjustments Portion of deduction applied 50:50 to core capital and supplementary capital based on pre-Basel III treatment which, during transitional period, remain subject to deduction from Tier-2 capital – – Reciprocal cross holdings in Tier 2 instruments 380,247 99,741
Total regulatory adjustment applied to T2 capital 380,247 99,741 42.3.4 Risk weighted assets in respect of amounts subject to Pre-Basel III Treatment of which: recognized portion of investment in capital of banking, financial and insurance entities where holding is less than 10% of the issued common share capital of the entity 1,624,933 1,384,412 of which: deferred tax assets – – of which: Defined-benefit pension fund net assets – –
1,624,933 1,384,412 Amounts below the thresholds for deduction (before risk weighting) Non-significant investments in the capital of other financial entities 1,154,156 1,071,993 Significant investments in the common stock of financial entities – – Deferred tax assets arising from temporary differences (net of related tax liability) – –
NOTES TO THE CONSOLIDATED FINANCIAL STATEMENTSFOR THE YEAR ENDED DECEMBER 31, 2016
Rupees in ‘000 Note 2016 2015
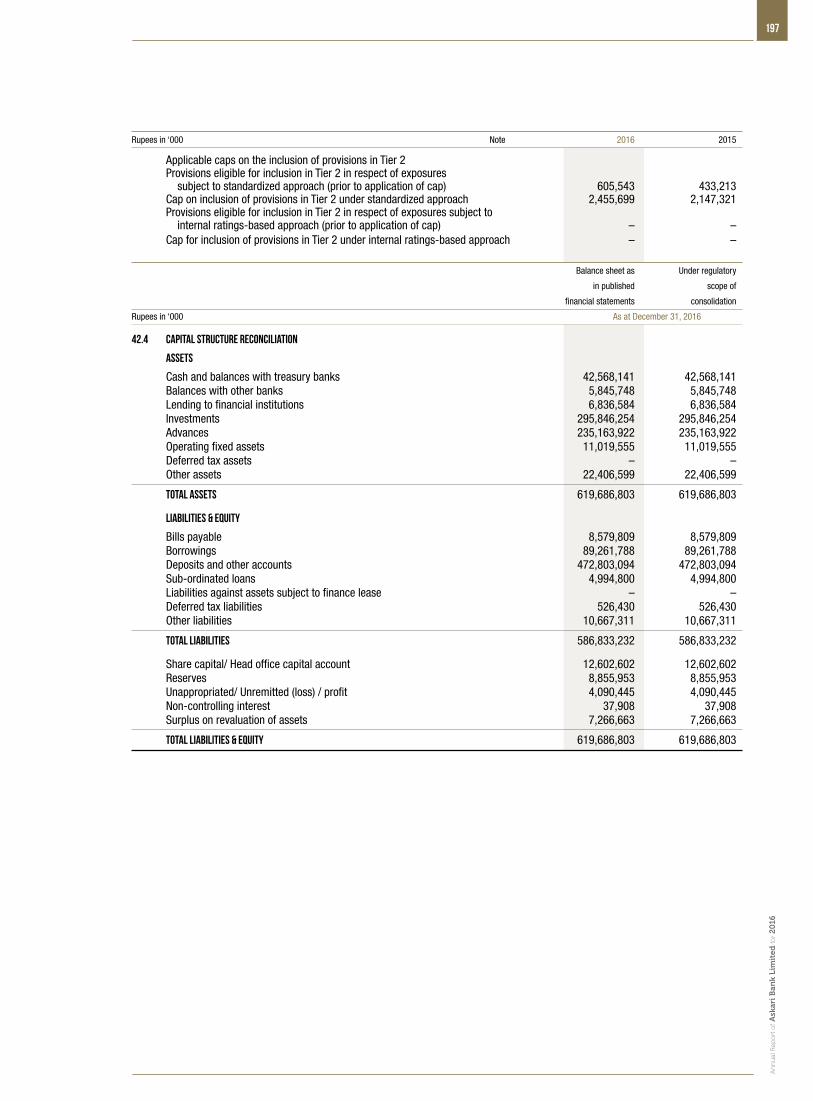
197
An
nu
al R
epo
rt o
f Ask
ari B
ank
Lim
ited
for 2
016
Applicable caps on the inclusion of provisions in Tier 2 Provisions eligible for inclusion in Tier 2 in respect of exposures subject to standardized approach (prior to application of cap) 605,543 433,213 Cap on inclusion of provisions in Tier 2 under standardized approach 2,455,699 2,147,321 Provisions eligible for inclusion in Tier 2 in respect of exposures subject to internal ratings-based approach (prior to application of cap) – – Cap for inclusion of provisions in Tier 2 under internal ratings-based approach – –
Balance sheet as Under regulatory
in published scope of
financial statements consolidation
Rupees in ‘000 As at December 31, 2016
42.4 Capital Structure Reconciliation
Assets
Cash and balances with treasury banks 42,568,141 42,568,141 Balances with other banks 5,845,748 5,845,748 Lending to financial institutions 6,836,584 6,836,584 Investments 295,846,254 295,846,254 Advances 235,163,922 235,163,922 Operating fixed assets 11,019,555 11,019,555 Deferred tax assets – – Other assets 22,406,599 22,406,599
Total assets 619,686,803 619,686,803
Liabilities & Equity
Bills payable 8,579,809 8,579,809 Borrowings 89,261,788 89,261,788 Deposits and other accounts 472,803,094 472,803,094 Sub-ordinated loans 4,994,800 4,994,800 Liabilities against assets subject to finance lease – – Deferred tax liabilities 526,430 526,430 Other liabilities 10,667,311 10,667,311
Total liabilities 586,833,232 586,833,232
Share capital/ Head office capital account 12,602,602 12,602,602 Reserves 8,855,953 8,855,953 Unappropriated/ Unremitted (loss) / profit 4,090,445 4,090,445 Non-controlling interest 37,908 37,908 Surplus on revaluation of assets 7,266,663 7,266,663
Total liabilities & equity 619,686,803 619,686,803
Rupees in ‘000 Note 2016 2015
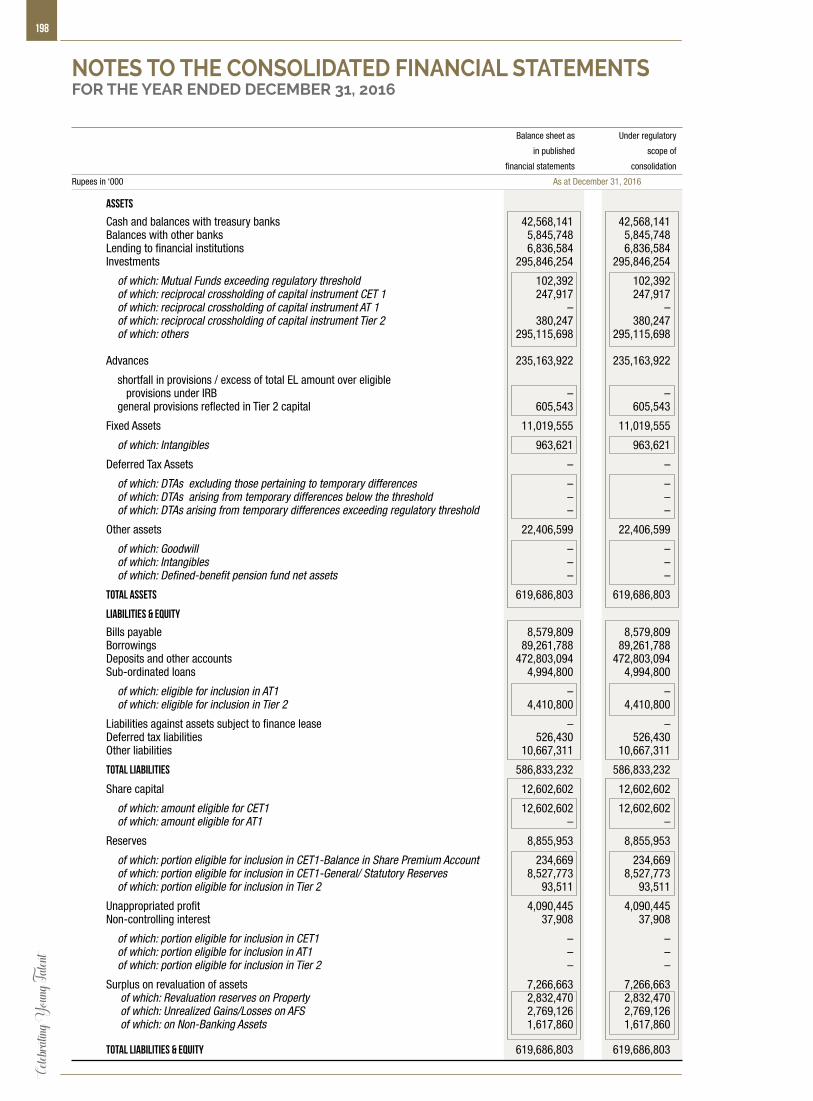
198Ce
lebrat
ing Y
oung T
alent
Balance sheet as Under regulatory
in published scope of
financial statements consolidation
Rupees in ‘000 As at December 31, 2016
Assets
Cash and balances with treasury banks 42,568,141 42,568,141 Balances with other banks 5,845,748 5,845,748 Lending to financial institutions 6,836,584 6,836,584 Investments 295,846,254 295,846,254
of which: Mutual Funds exceeding regulatory threshold 102,392 102,392 of which: reciprocal crossholding of capital instrument CET 1 247,917 247,917 of which: reciprocal crossholding of capital instrument AT 1 – – of which: reciprocal crossholding of capital instrument Tier 2 380,247 380,247 of which: others 295,115,698 295,115,698 Advances 235,163,922 235,163,922
shortfall in provisions / excess of total EL amount over eligible provisions under IRB – – general provisions reflected in Tier 2 capital 605,543 605,543
Fixed Assets 11,019,555 11,019,555
of which: Intangibles 963,621 963,621
Deferred Tax Assets – –
of which: DTAs excluding those pertaining to temporary differences – – of which: DTAs arising from temporary differences below the threshold – – of which: DTAs arising from temporary differences exceeding regulatory threshold – –
Other assets 22,406,599 22,406,599
of which: Goodwill – – of which: Intangibles – – of which: Defined-benefit pension fund net assets – –
Total assets 619,686,803 619,686,803
Liabilities & Equity
Bills payable 8,579,809 8,579,809 Borrowings 89,261,788 89,261,788 Deposits and other accounts 472,803,094 472,803,094 Sub-ordinated loans 4,994,800 4,994,800
of which: eligible for inclusion in AT1 – – of which: eligible for inclusion in Tier 2 4,410,800 4,410,800
Liabilities against assets subject to finance lease – – Deferred tax liabilities 526,430 526,430 Other liabilities 10,667,311 10,667,311
Total liabilities 586,833,232 586,833,232
Share capital 12,602,602 12,602,602
of which: amount eligible for CET1 12,602,602 12,602,602 of which: amount eligible for AT1 – –
Reserves 8,855,953 8,855,953
of which: portion eligible for inclusion in CET1-Balance in Share Premium Account 234,669 234,669 of which: portion eligible for inclusion in CET1-General/ Statutory Reserves 8,527,773 8,527,773 of which: portion eligible for inclusion in Tier 2 93,511 93,511
Unappropriated profit 4,090,445 4,090,445 Non-controlling interest 37,908 37,908
of which: portion eligible for inclusion in CET1 – – of which: portion eligible for inclusion in AT1 – – of which: portion eligible for inclusion in Tier 2 – –
Surplus on revaluation of assets 7,266,663 7,266,663 of which: Revaluation reserves on Property 2,832,470 2,832,470 of which: Unrealized Gains/Losses on AFS 2,769,126 2,769,126 of which: on Non-Banking Assets 1,617,860 1,617,860
Total liabilities & Equity 619,686,803 619,686,803
NOTES TO THE CONSOLIDATED FINANCIAL STATEMENTSFOR THE YEAR ENDED DECEMBER 31, 2016
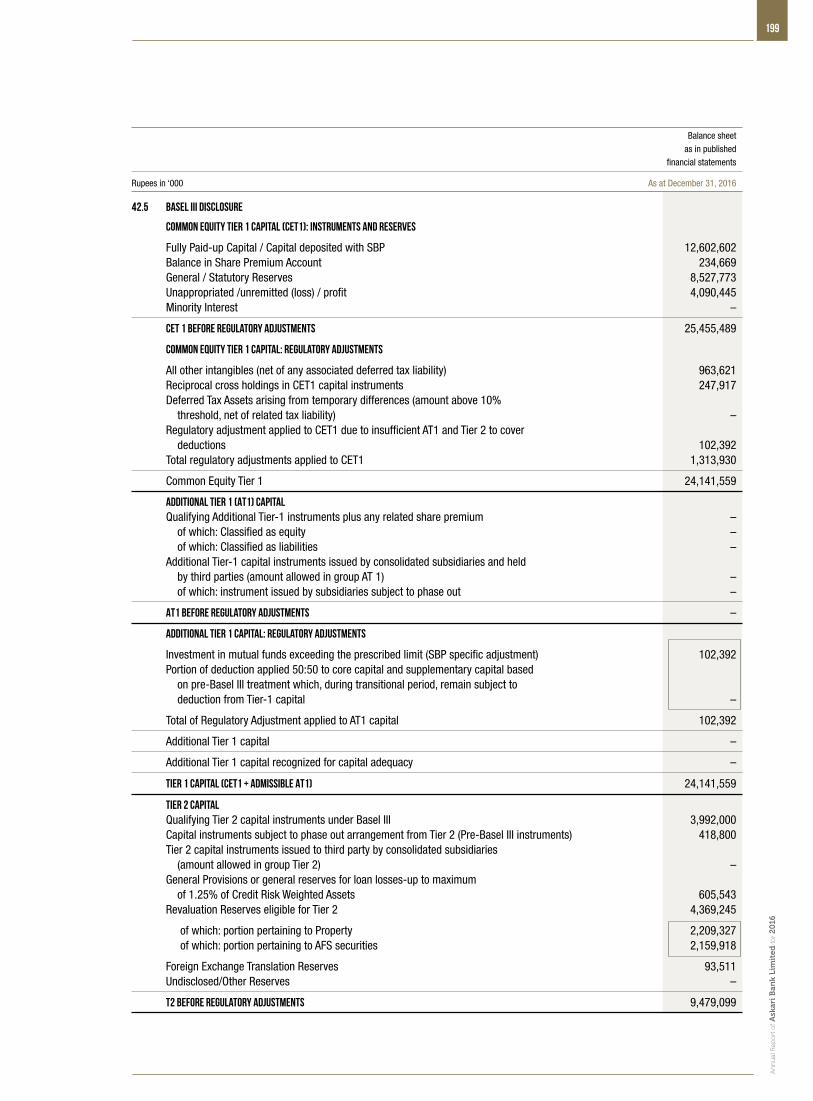
199
An
nu
al R
epo
rt o
f Ask
ari B
ank
Lim
ited
for 2
016
Balance sheet as in published financial statements
Rupees in ‘000 As at December 31, 2016
42.5 Basel III Disclosure
Common Equity Tier 1 capital (CET1): Instruments and reserves
Fully Paid-up Capital / Capital deposited with SBP 12,602,602 Balance in Share Premium Account 234,669 General / Statutory Reserves 8,527,773 Unappropriated /unremitted (loss) / profit 4,090,445 Minority Interest –
CET 1 before Regulatory Adjustments 25,455,489
Common Equity Tier 1 capital: Regulatory adjustments
All other intangibles (net of any associated deferred tax liability) 963,621 Reciprocal cross holdings in CET1 capital instruments 247,917 Deferred Tax Assets arising from temporary differences (amount above 10% threshold, net of related tax liability) – Regulatory adjustment applied to CET1 due to insufficient AT1 and Tier 2 to cover deductions 102,392 Total regulatory adjustments applied to CET1 1,313,930
Common Equity Tier 1 24,141,559
Additional Tier 1 (AT1) Capital Qualifying Additional Tier-1 instruments plus any related share premium – of which: Classified as equity – of which: Classified as liabilities – Additional Tier-1 capital instruments issued by consolidated subsidiaries and held by third parties (amount allowed in group AT 1) – of which: instrument issued by subsidiaries subject to phase out –
AT1 before regulatory adjustments –
Additional Tier 1 Capital: regulatory adjustments
Investment in mutual funds exceeding the prescribed limit (SBP specific adjustment) 102,392 Portion of deduction applied 50:50 to core capital and supplementary capital based on pre-Basel III treatment which, during transitional period, remain subject to deduction from Tier-1 capital –
Total of Regulatory Adjustment applied to AT1 capital 102,392
Additional Tier 1 capital –
Additional Tier 1 capital recognized for capital adequacy –
Tier 1 Capital (CET1 + admissible AT1) 24,141,559
Tier 2 Capital Qualifying Tier 2 capital instruments under Basel III 3,992,000 Capital instruments subject to phase out arrangement from Tier 2 (Pre-Basel III instruments) 418,800 Tier 2 capital instruments issued to third party by consolidated subsidiaries (amount allowed in group Tier 2) – General Provisions or general reserves for loan losses-up to maximum of 1.25% of Credit Risk Weighted Assets 605,543 Revaluation Reserves eligible for Tier 2 4,369,245
of which: portion pertaining to Property 2,209,327 of which: portion pertaining to AFS securities 2,159,918
Foreign Exchange Translation Reserves 93,511 Undisclosed/Other Reserves –
T2 before regulatory adjustments 9,479,099
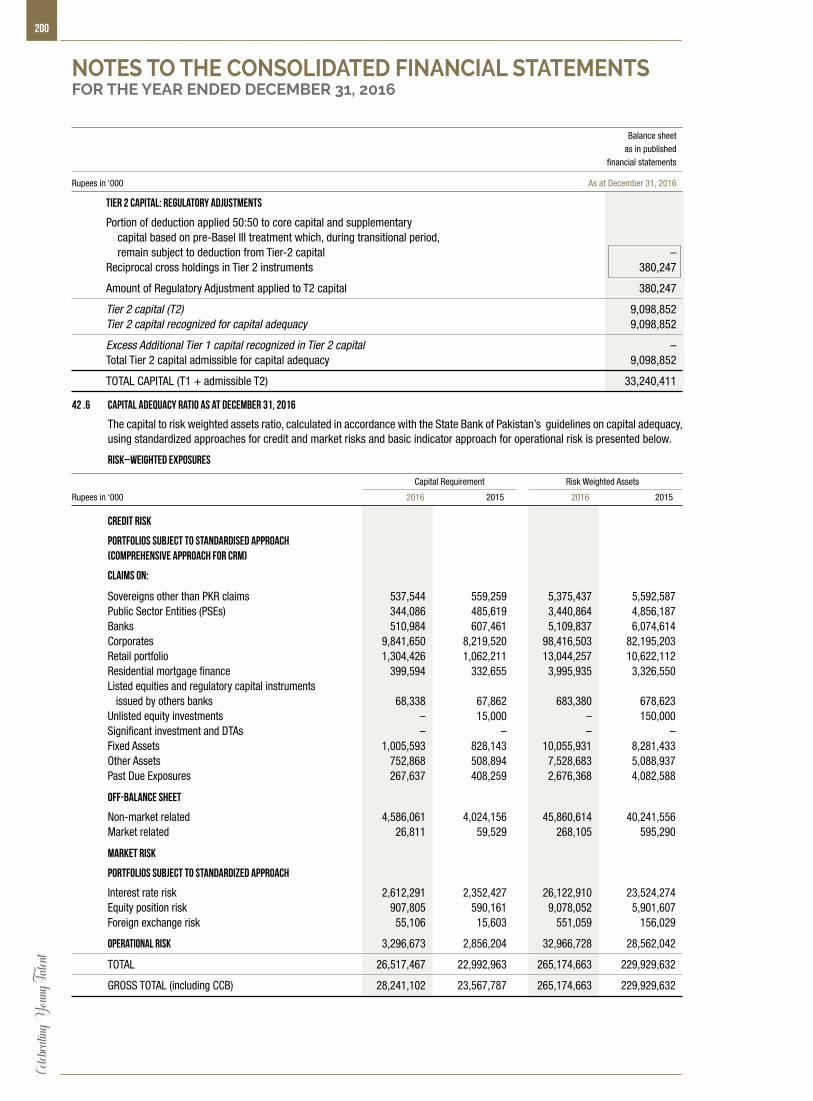
200Ce
lebrat
ing Y
oung T
alent
Balance sheet as in published financial statements
Rupees in ‘000 As at December 31, 2016
42 .6 Capital adequacy ratio as at December 31, 2016
The capital to risk weighted assets ratio, calculated in accordance with the State Bank of Pakistan’s guidelines on capital adequacy, using standardized approaches for credit and market risks and basic indicator approach for operational risk is presented below.
Risk–weighted exposures
Capital Requirement Risk Weighted Assets
Rupees in ‘000 2016 2015 2016 2015
credit risk
Portfolios subject to standardised approach (comprehensive approach for CRM)
Claims on:
Sovereigns other than PKR claims 537,544 559,259 5,375,437 5,592,587 Public Sector Entities (PSEs) 344,086 485,619 3,440,864 4,856,187 Banks 510,984 607,461 5,109,837 6,074,614 Corporates 9,841,650 8,219,520 98,416,503 82,195,203 Retail portfolio 1,304,426 1,062,211 13,044,257 10,622,112 Residential mortgage finance 399,594 332,655 3,995,935 3,326,550 Listed equities and regulatory capital instruments issued by others banks 68,338 67,862 683,380 678,623 Unlisted equity investments – 15,000 – 150,000 Significant investment and DTAs – – – – Fixed Assets 1,005,593 828,143 10,055,931 8,281,433 Other Assets 752,868 508,894 7,528,683 5,088,937 Past Due Exposures 267,637 408,259 2,676,368 4,082,588
Off-Balance Sheet
Non-market related 4,586,061 4,024,156 45,860,614 40,241,556 Market related 26,811 59,529 268,105 595,290
Market risk
Portfolios subject to standardized approach
Interest rate risk 2,612,291 2,352,427 26,122,910 23,524,274 Equity position risk 907,805 590,161 9,078,052 5,901,607 Foreign exchange risk 55,106 15,603 551,059 156,029
Operational risk 3,296,673 2,856,204 32,966,728 28,562,042
TOTAL 26,517,467 22,992,963 265,174,663 229,929,632
GROSS TOTAL (including CCB) 28,241,102 23,567,787 265,174,663 229,929,632
Tier 2 Capital: regulatory adjustments
Portion of deduction applied 50:50 to core capital and supplementary capital based on pre-Basel III treatment which, during transitional period, remain subject to deduction from Tier-2 capital – Reciprocal cross holdings in Tier 2 instruments 380,247
Amount of Regulatory Adjustment applied to T2 capital 380,247
Tier 2 capital (T2) 9,098,852 Tier 2 capital recognized for capital adequacy 9,098,852
Excess Additional Tier 1 capital recognized in Tier 2 capital – Total Tier 2 capital admissible for capital adequacy 9,098,852
TOTAL CAPITAL (T1 + admissible T2) 33,240,411
NOTES TO THE CONSOLIDATED FINANCIAL STATEMENTSFOR THE YEAR ENDED DECEMBER 31, 2016

201
An
nu
al R
epo
rt o
f Ask
ari B
ank
Lim
ited
for 2
016
42.7 Main features of regulatory capital instruments
Main Features Common Shares Instrument- 3 (PPTFC TFC IV) Instrument- 4 (PPTFC TFC V)
Issuer Askari Bank - Public Limited Company
Unique identifier AKBL NA NA
Governing law(s) of the instrument The Companies Ordinance 1984 & The Companies Ordinance, 1984 The Companies Ordinance, 1984
Stock Exchanges Regulations
Regulatory treatment
Transitional Basel III rules NA Tier 2 NA
Post-transitional Basel III rules NA Ineligible NA
Eligible at solo / group / group & solo Solo and Group Solo and Group Solo and Group
Instrument type Ordinary shares Subordinated Debt Instrument Subordinated Debt Instrument
Amount recognized in regulatory capital (Currency in 12,602,602 418,800 3,992,000
PKR thousands, as of reporting date)
Par value of instrument Rs. 10 per Share Rs. 1,000,000 per Insrument Rs. 1,000,000 per Insrument
Accounting classification Shareholder’s equity Liability - amortized cost Liability - amortized cost
Original date of issuance Year 1992 December 23, 2011 September 30, 2014
Perpetual or dated Perpetual/ no Maturity Dated Dated
Original maturity date NA December 23, 2021 September 30, 2024
Issuer call subject to prior supervisory approval NA Yes Yes
Optional call date, contingent call dates and NA December 23, 2016 September 30, 2019,Call would be subject
redemption amount to SBP approval and not less than 30
days notice to investors and security trustee.
Tax: as per prevailing structure.
Subsequent call dates, if applicable NA Yes Yes
Coupons / dividends
Fixed or floating dividend/ coupon NA Floating Floating
coupon rate and any related index/ benchmark NA Average Ask 6 month KIBOR + 1.75% Average Ask 6 month KIBOR + 1.20%
(1 to 5 Years) & Average Ask 6 month
KIBOR + 2.20% (6 to 10 Years)
Existence of a dividend stopper No No No
Fully discretionary, partially discretionary or mandatory NA Mandatory Mandatory
Existence of step up or other incentive to redeem No No No
Noncumulative or cumulative Non cumulative Cumulative Cumulative
Convertible or non-convertible NA Non-convertible Convertible
If convertible, conversion trigger(s) NA NA As deemed to be triggered by SBP
If convertible, fully or partially NA NA Fully or as deemed appropriate by SBP
If convertible, conversion rate NA NA Dependent on target market value of
equity per share on or before the date of
conversion
If convertible, mandatory or optional conversion NA NA Mandatory
If convertible, specify instrument type convertible into NA NA Common Equity Tier 1
If convertible, specify issuer of instrument it converts into NA NA Askari Bank Limited
Write-down feature NA NA Yes
If write-down, write-down trigger(s) NA NA As deemed to be triggered by SBP.
Legal basis is provided to authorities to
set trigger as part of the terms of contract.
If write-down, full or partial NA NA As deemed to be appropriate by SBP.
If write-down, permanent or temporary NA NA Legal basis is provided to authorities to
If temporary write-down, description of write-up mechanism NA NA decide as part of the terms of contract.
Position in subordination hierarchy in liquidation (specify
instrument type immediately senior to instrument) 3rd, Subordinated Debt being senior 2nd, Lenders and Depositors 2nd, Lenders and Depositors being senior
being senior
Non-compliant transitioned features No Yes No
If yes, specify non-compliant features NA Does not meet loss absorbency NA
requirements including conversion
Capital adequacy ratio
Required Actual 2016 2015 2016 2015
CET1 to total RWA 6.00% 6.00% 9.10% 8.96%
Tier-1 capital to total RWA 7.50% 7.50% 9.10% 8.96%
Total capital to total RWA 10.00% 10.00% 12.54% 12.59%
Gross Total Capital to total RWA (including CCB) 10.65% 10.25% 12.54% 12.59%

202Ce
lebrat
ing Y
oung T
alent
43. RISK MANAGEMENT
The Group believes that effective risk management is of primary importance to achieve desired level of return while maintaining acceptable level of risk exposure. Robust risk management processes and framework are in place to achieve overall Group’s objectives through a well thought out strategy, which enable the Group to effectively manage, Credit, Market, Operational and Liquidity risk in a proactive manner.
The Group’s approach is to ensure that risk management is deeply and firmly embedded in the culture of the Group. All employees are therefore considered responsible for identification, measurement, monitoring and controlling risks within the scope of their assigned responsibilities. As a result of changing risk environment, the Group continuously monitors and conducts holistic assessment of complex transactions on an integrated basis.
The Group has a Board Risk Management Committee (BRMC) in place and is updated regularly by the Bank’s Risk Management Division. BRMC is responsible to review the extent of design and adequacy of risk management framework. BRMC oversees that risks are managed within the level of tolerance and risk appetite of the Group.
43.1 Credit Risk
Credit risk arises from the potential that an obligor is either unwilling to perform on an obligation or its ability is impaired resulting in economic loss to the Group. The Group takes necessary measures to control such risk by monitoring credit exposures, limiting transactions with specific counter parties with increased likelihood of default and continually assessing the creditworthiness of counter parties.
The Group has built and maintains a sound loan portfolio in terms of a well defined Credit Policy and Credit Risk Policy approved by the Board of Directors. Its credit evaluation system comprises of well-designed credit appraisal, sanctioning and review procedures for the purpose of emphasizing prudence in its lending activities and ensuring quality of asset portfolio. Advances portfolio constitutes around 40% of the total asset base and is also the largest source of credit risk for the Group. Moreover, more than 70% of Group’s capital requirement pertains to credit risk. The Group’s advances portfolio is well diversified across various business segments, industries and geographical locations.
Risk mitigants have been put in place at all stages of credit risk cycle i.e. identification, measurement, monitoring, controlling and reporting for effective risk management. Accordingly, portfolio monitoring function is in place at the Group with dedicated resources to ensure that risk is not only minimized but is optimized in risk / return perspective.
Credit Risk Review is conducted at obligor as well as at portfolio level to ensure adherence to regulatory as well as the Group’s policies and procedures. The review process ensures that a sound and proactive risk management culture is maintained across the Group. Scope of Pre-Assessment Risk Review has been enhanced, covering the entire Corporate, Commercial and SME portfolios along with consumer and Agri Finance within discretionary powers of HOCC. Audit and inspection division is reviewing the advances portfolio on a post approval basis.
NOTES TO THE CONSOLIDATED FINANCIAL STATEMENTSFOR THE YEAR ENDED DECEMBER 31, 2016
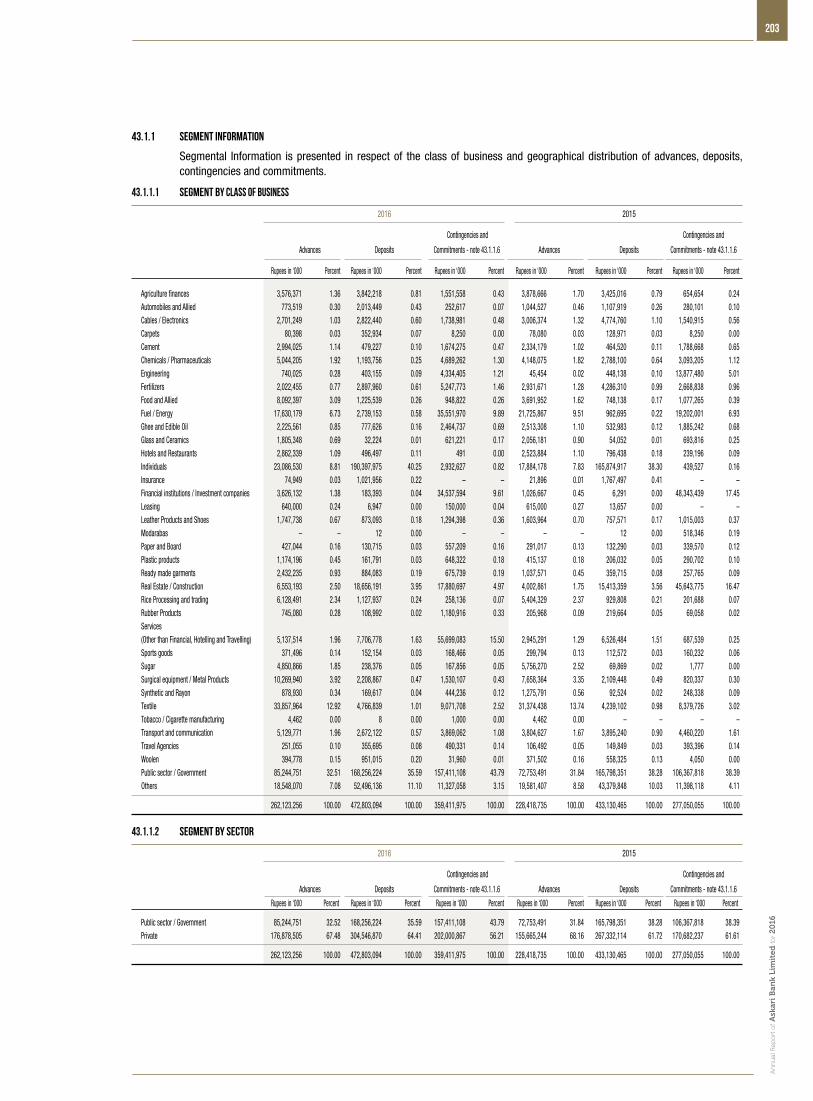
203
An
nu
al R
epo
rt o
f Ask
ari B
ank
Lim
ited
for 2
016
43.1.1 SEGMENT INFORMATION
Segmental Information is presented in respect of the class of business and geographical distribution of advances, deposits, contingencies and commitments.
43.1.1.1 Segment by class of business
2016 2015
Contingencies and Contingencies and
Advances Deposits Commitments - note 43.1.1.6 Advances Deposits Commitments - note 43.1.1.6
Rupees in ‘000 Percent Rupees in ‘000 Percent Rupees in ‘000 Percent Rupees in ‘000 Percent Rupees in ‘000 Percent Rupees in ‘000 Percent
Agriculture finances 3,576,371 1.36 3,842,218 0.81 1,551,558 0.43 3,878,666 1.70 3,425,016 0.79 654,654 0.24 Automobiles and Allied 773,519 0.30 2,013,449 0.43 252,617 0.07 1,044,527 0.46 1,107,919 0.26 280,101 0.10 Cables / Electronics 2,701,249 1.03 2,822,440 0.60 1,738,981 0.48 3,006,374 1.32 4,774,760 1.10 1,540,915 0.56 Carpets 80,398 0.03 352,934 0.07 8,250 0.00 78,080 0.03 128,971 0.03 8,250 0.00 Cement 2,994,025 1.14 479,227 0.10 1,674,275 0.47 2,334,179 1.02 464,520 0.11 1,788,668 0.65 Chemicals / Pharmaceuticals 5,044,205 1.92 1,193,756 0.25 4,689,262 1.30 4,148,075 1.82 2,788,100 0.64 3,093,205 1.12 Engineering 740,025 0.28 403,155 0.09 4,334,405 1.21 45,454 0.02 448,138 0.10 13,877,480 5.01 Fertilizers 2,022,455 0.77 2,897,960 0.61 5,247,773 1.46 2,931,671 1.28 4,286,310 0.99 2,668,838 0.96 Food and Allied 8,092,397 3.09 1,225,539 0.26 948,822 0.26 3,691,952 1.62 748,138 0.17 1,077,265 0.39 Fuel / Energy 17,630,179 6.73 2,739,153 0.58 35,551,970 9.89 21,725,867 9.51 962,695 0.22 19,202,001 6.93 Ghee and Edible Oil 2,225,561 0.85 777,626 0.16 2,464,737 0.69 2,513,308 1.10 532,983 0.12 1,885,242 0.68 Glass and Ceramics 1,805,348 0.69 32,224 0.01 621,221 0.17 2,056,181 0.90 54,052 0.01 693,816 0.25 Hotels and Restaurants 2,862,339 1.09 496,497 0.11 491 0.00 2,523,884 1.10 796,438 0.18 239,196 0.09 Individuals 23,086,530 8.81 190,397,975 40.25 2,932,627 0.82 17,884,178 7.83 165,874,917 38.30 439,527 0.16 Insurance 74,949 0.03 1,021,956 0.22 – – 21,896 0.01 1,767,497 0.41 – – Financial institutions / Investment companies 3,626,132 1.38 183,393 0.04 34,537,594 9.61 1,026,667 0.45 6,291 0.00 48,343,439 17.45 Leasing 640,000 0.24 6,947 0.00 150,000 0.04 615,000 0.27 13,657 0.00 – – Leather Products and Shoes 1,747,738 0.67 873,093 0.18 1,294,398 0.36 1,603,964 0.70 757,571 0.17 1,015,003 0.37 Modarabas – – 12 0.00 – – – – 12 0.00 518,346 0.19 Paper and Board 427,044 0.16 130,715 0.03 557,209 0.16 291,017 0.13 132,290 0.03 339,570 0.12 Plastic products 1,174,196 0.45 161,791 0.03 648,322 0.18 415,137 0.18 206,032 0.05 290,702 0.10 Ready made garments 2,432,235 0.93 884,083 0.19 675,739 0.19 1,037,571 0.45 359,715 0.08 257,765 0.09 Real Estate / Construction 6,553,193 2.50 18,656,191 3.95 17,880,697 4.97 4,002,861 1.75 15,413,359 3.56 45,643,775 16.47 Rice Processing and trading 6,128,491 2.34 1,127,937 0.24 258,136 0.07 5,404,329 2.37 929,808 0.21 201,688 0.07 Rubber Products 745,080 0.28 108,992 0.02 1,180,916 0.33 205,968 0.09 219,664 0.05 69,058 0.02 Services (Other than Financial, Hotelling and Travelling) 5,137,514 1.96 7,706,778 1.63 55,699,083 15.50 2,945,291 1.29 6,526,484 1.51 687,539 0.25 Sports goods 371,496 0.14 152,154 0.03 168,466 0.05 299,794 0.13 112,572 0.03 160,232 0.06 Sugar 4,850,866 1.85 238,376 0.05 167,856 0.05 5,756,270 2.52 69,869 0.02 1,777 0.00 Surgical equipment / Metal Products 10,269,940 3.92 2,208,867 0.47 1,530,107 0.43 7,658,364 3.35 2,109,448 0.49 820,337 0.30 Synthetic and Rayon 878,930 0.34 169,617 0.04 444,236 0.12 1,275,791 0.56 92,524 0.02 248,338 0.09 Textile 33,857,964 12.92 4,766,839 1.01 9,071,708 2.52 31,374,438 13.74 4,239,102 0.98 8,379,726 3.02 Tobacco / Cigarette manufacturing 4,462 0.00 8 0.00 1,000 0.00 4,462 0.00 – – – – Transport and communication 5,129,771 1.96 2,672,122 0.57 3,869,062 1.08 3,804,627 1.67 3,895,240 0.90 4,460,220 1.61 Travel Agencies 251,055 0.10 355,695 0.08 490,331 0.14 106,492 0.05 149,849 0.03 393,396 0.14 Woolen 394,778 0.15 951,015 0.20 31,960 0.01 371,502 0.16 558,325 0.13 4,050 0.00 Public sector / Government 85,244,751 32.51 168,256,224 35.59 157,411,108 43.79 72,753,491 31.84 165,798,351 38.28 106,367,818 38.39 Others 18,548,070 7.08 52,496,136 11.10 11,327,058 3.15 19,581,407 8.58 43,379,848 10.03 11,398,118 4.11
262,123,256 100.00 472,803,094 100.00 359,411,975 100.00 228,418,735 100.00 433,130,465 100.00 277,050,055 100.00
43.1.1.2 Segment by sector
2016 2015
Contingencies and Contingencies and
Advances Deposits Commitments - note 43.1.1.6 Advances Deposits Commitments - note 43.1.1.6
Rupees in ‘000 Percent Rupees in ‘000 Percent Rupees in ‘000 Percent Rupees in ‘000 Percent Rupees in ‘000 Percent Rupees in ‘000 Percent
Public sector / Government 85,244,751 32.52 168,256,224 35.59 157,411,108 43.79 72,753,491 31.84 165,798,351 38.28 106,367,818 38.39 Private 176,878,505 67.48 304,546,870 64.41 202,000,867 56.21 155,665,244 68.16 267,332,114 61.72 170,682,237 61.61
262,123,256 100.00 472,803,094 100.00 359,411,975 100.00 228,418,735 100.00 433,130,465 100.00 277,050,055 100.00
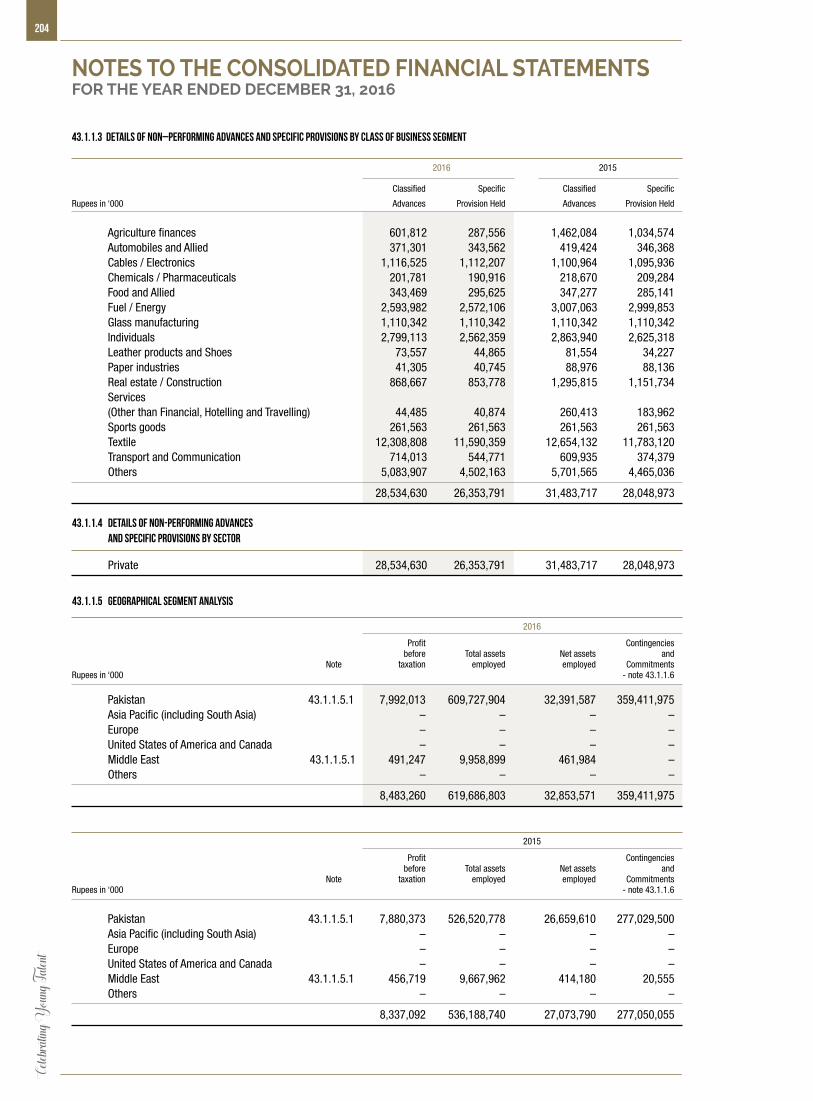
204Ce
lebrat
ing Y
oung T
alent
43.1.1.3 Details of non–performing advances and specific provisions by class of business segment
2016 2015
Classified Specific Classified Specific
Rupees in ‘000 Advances Provision Held Advances Provision Held
Agriculture finances 601,812 287,556 1,462,084 1,034,574 Automobiles and Allied 371,301 343,562 419,424 346,368 Cables / Electronics 1,116,525 1,112,207 1,100,964 1,095,936 Chemicals / Pharmaceuticals 201,781 190,916 218,670 209,284 Food and Allied 343,469 295,625 347,277 285,141 Fuel / Energy 2,593,982 2,572,106 3,007,063 2,999,853 Glass manufacturing 1,110,342 1,110,342 1,110,342 1,110,342 Individuals 2,799,113 2,562,359 2,863,940 2,625,318 Leather products and Shoes 73,557 44,865 81,554 34,227 Paper industries 41,305 40,745 88,976 88,136 Real estate / Construction 868,667 853,778 1,295,815 1,151,734 Services (Other than Financial, Hotelling and Travelling) 44,485 40,874 260,413 183,962 Sports goods 261,563 261,563 261,563 261,563 Textile 12,308,808 11,590,359 12,654,132 11,783,120 Transport and Communication 714,013 544,771 609,935 374,379 Others 5,083,907 4,502,163 5,701,565 4,465,036
28,534,630 26,353,791 31,483,717 28,048,973 43.1.1.4 Details of non-performing advances and specific provisions by sector
Private 28,534,630 26,353,791 31,483,717 28,048,973
43.1.1.5 Geographical segment analysis
2016
Profit Contingencies before Total assets Net assets and Note taxation employed employed CommitmentsRupees in ‘000 - note 43.1.1.6
Pakistan 43.1.1.5.1 7,992,013 609,727,904 32,391,587 359,411,975 Asia Pacific (including South Asia) – – – – Europe – – – –
United States of America and Canada – – – – Middle East 43.1.1.5.1 491,247 9,958,899 461,984 – Others – – – –
8,483,260 619,686,803 32,853,571 359,411,975
2015
Profit Contingencies before Total assets Net assets and Note taxation employed employed CommitmentsRupees in ‘000 - note 43.1.1.6
Pakistan 43.1.1.5.1 7,880,373 526,520,778 26,659,610 277,029,500
Asia Pacific (including South Asia) – – – – Europe – – – –
United States of America and Canada – – – – Middle East 43.1.1.5.1 456,719 9,667,962 414,180 20,555 Others – – – –
8,337,092 536,188,740 27,073,790 277,050,055
NOTES TO THE CONSOLIDATED FINANCIAL STATEMENTSFOR THE YEAR ENDED DECEMBER 31, 2016
205
An
nu
al R
epo
rt o
f Ask
ari B
ank
Lim
ited
for 2
016
43.1.1.5.1 These do not include intra bank items of Rs. 9,328,052 thousand (2015: Rs. 9,081,656 thousand) eliminated upon consolidation of wholesale bank branch.
43.1.1.6 Contingencies and commitments include amounts given in note 22 except bills for collection.
43.1.1.7 Collateral
Following is the list of main types of collateral taken by the Group.
- Government and trustee securities
- Defence saving certificates
- Fixed deposits (TDR)
- Lien on deposits
- Cash margin
- Shares listed on main index
- Shares listed on non main index
- Government guarantees
43.2 Market Risk:
Market risk is the risk that the value of on and off-balance sheet positions of a financial institution will be adversely affected by movements in market rates or prices such as interest rates, foreign exchange rates, equity prices and credit spreads resulting in a loss to earnings and capital.
The Group’s Risk Management Process seeks to identify, measure, monitor, and control market risks in order to shield against adverse movements in market factors and to attain an efficient risk/return profile of its open positions. The Risk Management Division has developed and implemented market risk policy and risk measurement /monitoring methodology for review and reporting of market risk. The Group makes use of the globally established Value-at-Risk (VaR) methodology to measure traded market risk.
In addition, sensitivity analysis is carried out to gauge the impact of extreme market movements on traded exposures. Meanwhile, stress testing is used to analyze the impact of both the abnormal market movements across different markets as well as to assess non-traded market risk, in particular interest rate risk in the banking book. The performance of the Group’s traded portfolios is evaluated through the use of risk / return analysis. Risk is kept under check through the revaluation of all traded market risk exposed positions on a daily basis, and controlled by ensuring that these positions do not breach regulatory limits and the Group’s own internally-established risk tolerance limits.
43.2.1 Market risk - General disclosures Basel III specific
Basel III Standardized Approach is used for calculating the Capital Adequacy for Market Risk.
43.2.2 Foreign Exchange Risk
Foreign exchange risk, or the risk that the Group’s earnings and / or capital can fluctuate due to changes in foreign exchange
rates, arises out from the Group’s foreign exchange exposure which consists of foreign currency cash in hand, nostro / vostro
accounts, forward contracts, forward bookings with exporters, foreign bills purchased, foreign currency placements with SBP
and the Group’s Wholesale Group Branch, foreign currency lendings / deposits and capital investments in offshore operations.
The Group’s treasury manages consolidated foreign exchange exposure by matching foreign currency assets and liabilities
in spot and forward. The foreign exchange exposure and nostro balances are maintained within regulatory limits and VaR is
calculated for consolidated foreign exchange exposure on a daily basis. The impact of a change in USD / PKR parity on the net
open position is also determined through daily sensitivity analysis.
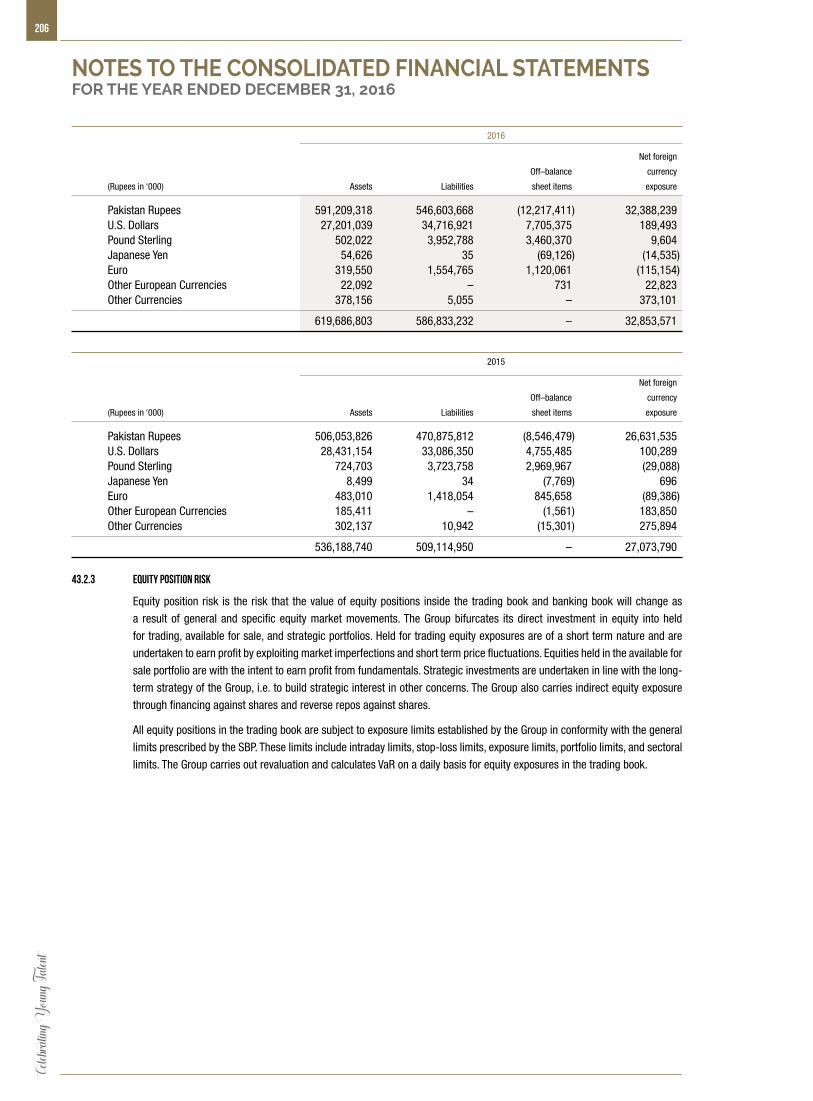
206Ce
lebrat
ing Y
oung T
alent
2016
Net foreign
Off–balance currency
(Rupees in ‘000) Assets Liabilities sheet items exposure
Pakistan Rupees 591,209,318 546,603,668 (12,217,411) 32,388,239 U.S. Dollars 27,201,039 34,716,921 7,705,375 189,493 Pound Sterling 502,022 3,952,788 3,460,370 9,604 Japanese Yen 54,626 35 (69,126) (14,535) Euro 319,550 1,554,765 1,120,061 (115,154) Other European Currencies 22,092 – 731 22,823 Other Currencies 378,156 5,055 – 373,101
619,686,803 586,833,232 – 32,853,571
2015
Net foreign
Off–balance currency
(Rupees in ‘000) Assets Liabilities sheet items exposure
Pakistan Rupees 506,053,826 470,875,812 (8,546,479) 26,631,535 U.S. Dollars 28,431,154 33,086,350 4,755,485 100,289 Pound Sterling 724,703 3,723,758 2,969,967 (29,088) Japanese Yen 8,499 34 (7,769) 696 Euro 483,010 1,418,054 845,658 (89,386) Other European Currencies 185,411 – (1,561) 183,850 Other Currencies 302,137 10,942 (15,301) 275,894
536,188,740 509,114,950 – 27,073,790
43.2.3 Equity position risk
Equity position risk is the risk that the value of equity positions inside the trading book and banking book will change as
a result of general and specific equity market movements. The Group bifurcates its direct investment in equity into held
for trading, available for sale, and strategic portfolios. Held for trading equity exposures are of a short term nature and are
undertaken to earn profit by exploiting market imperfections and short term price fluctuations. Equities held in the available for
sale portfolio are with the intent to earn profit from fundamentals. Strategic investments are undertaken in line with the long-
term strategy of the Group, i.e. to build strategic interest in other concerns. The Group also carries indirect equity exposure
through financing against shares and reverse repos against shares.
All equity positions in the trading book are subject to exposure limits established by the Group in conformity with the general
limits prescribed by the SBP. These limits include intraday limits, stop-loss limits, exposure limits, portfolio limits, and sectoral
limits. The Group carries out revaluation and calculates VaR on a daily basis for equity exposures in the trading book.
NOTES TO THE CONSOLIDATED FINANCIAL STATEMENTSFOR THE YEAR ENDED DECEMBER 31, 2016
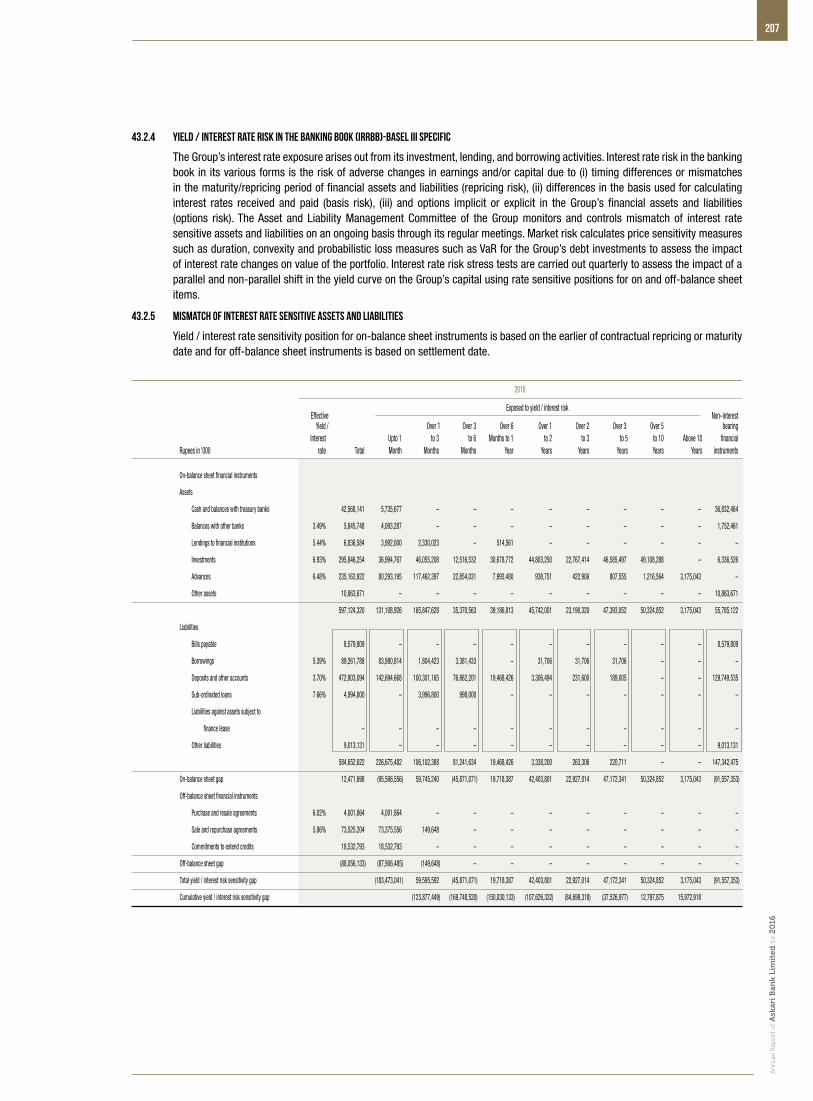
207
An
nu
al R
epo
rt o
f Ask
ari B
ank
Lim
ited
for 2
016
43.2.4 Yield / Interest Rate Risk in the Banking Book (IRRBB)-Basel III Specific
The Group’s interest rate exposure arises out from its investment, lending, and borrowing activities. Interest rate risk in the banking book in its various forms is the risk of adverse changes in earnings and/or capital due to (i) timing differences or mismatches in the maturity/repricing period of financial assets and liabilities (repricing risk), (ii) differences in the basis used for calculating interest rates received and paid (basis risk), (iii) and options implicit or explicit in the Group’s financial assets and liabilities (options risk). The Asset and Liability Management Committee of the Group monitors and controls mismatch of interest rate sensitive assets and liabilities on an ongoing basis through its regular meetings. Market risk calculates price sensitivity measures such as duration, convexity and probabilistic loss measures such as VaR for the Group’s debt investments to assess the impact of interest rate changes on value of the portfolio. Interest rate risk stress tests are carried out quarterly to assess the impact of a parallel and non-parallel shift in the yield curve on the Group’s capital using rate sensitive positions for on and off-balance sheet items.
43.2.5 Mismatch of interest rate sensitive assets and liabilities
Yield / interest rate sensitivity position for on-balance sheet instruments is based on the earlier of contractual repricing or maturity date and for off-balance sheet instruments is based on settlement date.
2016
Effective
Exposed to yield / interest risk Non–interest
Yield / Over 1 Over 3 Over 6 Over 1 Over 2 Over 3 Over 5 bearing Interest Upto 1 to 3 to 6 Months to 1 to 2 to 3 to 5 to 10 Above 10 financial Rupees in ‘000 rate Total Month Months Months Year Years Years Years Years Years instruments
On-balance sheet financial instruments
Assets
Cash and balances with treasury banks 42,568,141 5,735,677 – – – – – – – – 36,832,464
Balances with other banks 3.49% 5,845,748 4,093,287 – – – – – – – – 1,752,461
Lendings to financial institutions 5.44% 6,836,584 3,992,000 2,330,023 – 514,561 – – – – – –
Investments 6.93% 295,846,254 36,994,767 46,055,208 12,516,532 30,678,772 44,803,250 22,767,414 46,585,497 49,108,288 – 6,336,526
Advances 6.48% 235,163,922 80,293,195 117,462,397 22,854,031 7,993,480 938,751 422,906 807,555 1,216,564 3,175,043 –
Other assets 10,863,671 – – – – – – – – – 10,863,671
597,124,320 131,108,926 165,847,628 35,370,563 39,186,813 45,742,001 23,190,320 47,393,052 50,324,852 3,175,043 55,785,122
Liabilities
Bills payable 8,579,809 – – – – – – – – – 8,579,809
Borrowings 5.39% 89,261,788 83,980,814 1,804,423 3,381,433 – 31,706 31,706 31,706 – – –
Deposits and other accounts 3.70% 472,803,094 142,694,668 100,301,165 76,862,201 19,468,426 3,306,494 231,600 189,005 – – 129,749,535
Sub-ordinated loans 7.66% 4,994,800 – 3,996,800 998,000 – – – – – – –
Liabilities against assets subject to
finance lease – – – – – – – – – – –
Other liabilities 9,013,131 – – – – – – – – – 9,013,131
584,652,622 226,675,482 106,102,388 81,241,634 19,468,426 3,338,200 263,306 220,711 – – 147,342,475
On-balance sheet gap 12,471,698 (95,566,556) 59,745,240 (45,871,071) 19,718,387 42,403,801 22,927,014 47,172,341 50,324,852 3,175,043 (91,557,353)
Off-balance sheet financial instruments
Purchase and resale agreements 6.02% 4,001,864 4,001,864 – – – – – – – – –
Sale and repurchase agreements 5.86% 73,525,204 73,375,556 149,648 – – – – – – – –
Commitments to extend credits 18,532,793 18,532,793 – – – – – – – – –
Off-balance sheet gap (88,056,133) (87,906,485) (149,648) – – – – – – – –
Total yield / interest risk sensitivity gap (183,473,041) 59,595,592 (45,871,071) 19,718,387 42,403,801 22,927,014 47,172,341 50,324,852 3,175,043 (91,557,353)
Cumulative yield / interest risk sensitivity gap (123,877,449) (169,748,520) (150,030,133) (107,626,332) (84,699,318) (37,526,977) 12,797,875 15,972,918
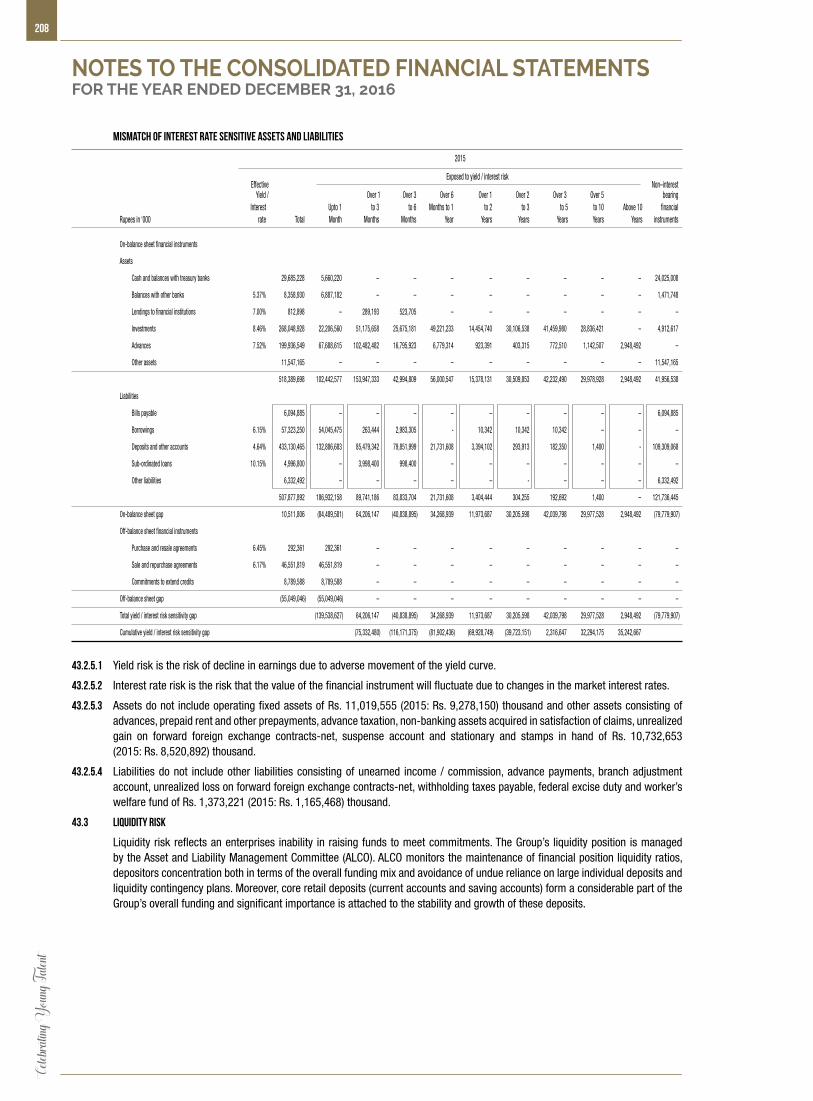
208Ce
lebrat
ing Y
oung T
alent
Mismatch of interest rate sensitive assets and liabilities
2015
Effective
Exposed to yield / interest risk Non–interest
Yield / Over 1 Over 3 Over 6 Over 1 Over 2 Over 3 Over 5 bearing Interest Upto 1 to 3 to 6 Months to 1 to 2 to 3 to 5 to 10 Above 10 financial Rupees in ‘000 rate Total Month Months Months Year Years Years Years Years Years instruments
On-balance sheet financial instruments
Assets
Cash and balances with treasury banks 29,685,228 5,660,220 – – – – – – – – 24,025,008
Balances with other banks 5.37% 8,358,930 6,887,182 – – – – – – – – 1,471,748
Lendings to financial institutions 7.00% 812,898 – 289,193 523,705 – – – – – – –
Investments 8.46% 268,048,928 22,206,560 51,175,658 25,675,181 49,221,233 14,454,740 30,106,538 41,459,980 28,836,421 – 4,912,617
Advances 7.52% 199,936,549 67,688,615 102,482,482 16,795,923 6,779,314 923,391 403,315 772,510 1,142,507 2,948,492 –
Other assets 11,547,165 – – – – – – – – – 11,547,165
518,389,698 102,442,577 153,947,333 42,994,809 56,000,547 15,378,131 30,509,853 42,232,490 29,978,928 2,948,492 41,956,538
Liabilities
Bills payable 6,094,885 – – – – – – – – – 6,094,885
Borrowings 6.15% 57,323,250 54,045,475 263,444 2,983,305 - 10,342 10,342 10,342 – – –
Deposits and other accounts 4.64% 433,130,465 132,886,683 85,479,342 79,851,999 21,731,608 3,394,102 293,913 182,350 1,400 - 109,309,068
Sub-ordinated loans 10.15% 4,996,800 – 3,998,400 998,400 – – – – – – –
Other liabilities 6,332,492 – – – – – - – – – 6,332,492
507,877,892 186,932,158 89,741,186 83,833,704 21,731,608 3,404,444 304,255 192,692 1,400 – 121,736,445
On-balance sheet gap 10,511,806 (84,489,581) 64,206,147 (40,838,895) 34,268,939 11,973,687 30,205,598 42,039,798 29,977,528 2,948,492 (79,779,907)
Off-balance sheet financial instruments
Purchase and resale agreements 6.45% 292,361 292,361 – – – – – – – – –
Sale and repurchase agreements 6.17% 46,551,819 46,551,819 – – – – – – – – –
Commitments to extend credits 8,789,588 8,789,588 – – – – – – – – –
Off-balance sheet gap (55,049,046) (55,049,046) – – – – – – – – –
Total yield / interest risk sensitivity gap (139,538,627) 64,206,147 (40,838,895) 34,268,939 11,973,687 30,205,598 42,039,798 29,977,528 2,948,492 (79,779,907)
Cumulative yield / interest risk sensitivity gap (75,332,480) (116,171,375) (81,902,436) (69,928,749) (39,723,151) 2,316,647 32,294,175 35,242,667
43.2.5.1 Yield risk is the risk of decline in earnings due to adverse movement of the yield curve.
43.2.5.2 Interest rate risk is the risk that the value of the financial instrument will fluctuate due to changes in the market interest rates.
43.2.5.3 Assets do not include operating fixed assets of Rs. 11,019,555 (2015: Rs. 9,278,150) thousand and other assets consisting of advances, prepaid rent and other prepayments, advance taxation, non-banking assets acquired in satisfaction of claims, unrealized gain on forward foreign exchange contracts-net, suspense account and stationary and stamps in hand of Rs. 10,732,653 (2015: Rs. 8,520,892) thousand.
43.2.5.4 Liabilities do not include other liabilities consisting of unearned income / commission, advance payments, branch adjustment account, unrealized loss on forward foreign exchange contracts-net, withholding taxes payable, federal excise duty and worker’s welfare fund of Rs. 1,373,221 (2015: Rs. 1,165,468) thousand.
43.3 Liquidity Risk
Liquidity risk reflects an enterprises inability in raising funds to meet commitments. The Group’s liquidity position is managed by the Asset and Liability Management Committee (ALCO). ALCO monitors the maintenance of financial position liquidity ratios, depositors concentration both in terms of the overall funding mix and avoidance of undue reliance on large individual deposits and liquidity contingency plans. Moreover, core retail deposits (current accounts and saving accounts) form a considerable part of the Group’s overall funding and significant importance is attached to the stability and growth of these deposits.
NOTES TO THE CONSOLIDATED FINANCIAL STATEMENTSFOR THE YEAR ENDED DECEMBER 31, 2016

209
An
nu
al R
epo
rt o
f Ask
ari B
ank
Lim
ited
for 2
016
43.3.1 Maturities of Assets and Liabilities
2016
Over 1 Over 3 Over 6 Over 1 Over 2 Over 3 Over 5 Upto 1 to 3 to 6 Months to to 2 to 3 to 5 to 10 Above 10 Rupees in ‘000 Total Month Months Months 1 Year Years Years Years Years Years
Assets Cash and balances with treasury banks 42,568,141 42,568,141 – – – – – – – – Balances with other banks 5,845,748 5,136,105 709,643 – – – – – – – Lendings to financial institutions 6,836,584 3,992,000 2,330,023 – 514,561 – – – – – Investments 295,846,254 36,394,497 40,982,134 9,354,516 31,706,005 46,308,938 27,780,763 49,676,425 52,716,974 926,002 Advances 235,163,922 61,041,844 45,007,109 24,906,513 22,639,800 18,660,415 16,694,225 21,037,575 13,328,584 11,847,857 Operating fixed assets 11,019,555 361,477 158,358 232,560 447,835 834,871 756,331 1,132,220 1,235,785 5,860,118 Deferred tax assets – – – – – – – – – – Other assets 21,596,324 5,054,494 – – – 3,369,663 3,369,663 3,267,802 3,267,802 3,266,900 Assets attributable to discontinued operations 810,275 – – – 810,275 – – – – –
619,686,803 154,548,558 89,187,267 34,493,589 56,118,476 69,173,887 48,600,982 75,114,022 70,549,145 21,900,877 Liabilities Bills payable 8,579,809 2,823,769 – 520,334 5,235,706 – – – – –
Borrowings 89,261,788 83,980,814 1,804,423 3,381,433 – 31,706 31,706 31,706 – – Deposits and other accounts 472,803,094 63,087,708 41,961,473 13,410,693 19,468,426 81,918,302 78,843,408 83,028,889 45,546,219 45,537,976 Sub-ordinated loans 4,994,800 – 800 200 1,000 2,000 2,000 1,000,000 3,988,800 –
Liabilities against assets subject to finance lease – – – – – – – – – – Deferred tax liabilities 526,430 1,491,068 – – (165,249) (5,867) (592,927) (200,595) – – Other liabilities 10,386,352 5,513,070 – – – 2,435,777 1,218,753 609,376 304,688 304,688
Liabilities associated with discontinued operations 280,959 – – – 280,959 – – – – –
586,833,232 156,896,429 43,766,696 17,312,660 24,820,842 84,381,918 79,502,940 84,469,376 49,839,707 45,842,664
Net assets 32,853,571 (2,347,871) 45,420,571 17,180,929 31,297,634 (15,208,031) (30,901,958) (9,355,354) 20,709,438 (23,941,787)
Share Capital 12,602,602 Reserves 8,855,953 Unappropriated profit 4,090,445 Non-controlling interest 37,908 Surplus on revaluation of assets - net of tax Continued operations 7,219,456 Discontinued operations 47,207
32,853,571
2015
Over 1 Over 3 Over 6 Over 1 Over 2 Over 3 Over 5 Upto 1 to 3 to 6 Months to to 2 to 3 to 5 to 10 Above 10 Rupees in ‘000 Total Month Months Months 1 Year Years Years Years Years Years
Assets Cash and balances with treasury banks 29,685,228 29,685,228 – – – – – – – – Balances with other banks 8,358,930 8,358,930 – – – – – – – –
Lendings to financial institutions 812,898 – 289,193 523,705 – – – – – – Investments 268,048,928 23,433,775 48,502,951 24,456,317 49,748,173 16,622,279 31,129,080 43,043,162 30,445,598 667,593 Advances 199,936,549 32,760,770 40,370,362 33,828,981 27,336,577 13,502,435 11,360,076 22,704,117 5,688,949 12,384,282 Operating fixed assets 9,278,150 434,598 132,898 194,707 373,469 687,208 629,606 1,087,225 1,196,270 4,542,169 Deferred tax assets – – – – – – – – – – Other assets 20,068,057 4,696,617 – – – 3,131,078 3,131,078 3,036,429 3,036,429 3,036,426
536,188,740 99,369,918 89,295,404 59,003,710 77,458,219 33,943,000 46,249,840 69,870,933 40,367,246 20,630,470 Liabilities Bills payable 6,094,885 2,005,936 – 369,632 3,719,317 – – – – – Borrowings 57,323,250 54,045,475 263,444 2,983,305 – 10,342 10,342 10,342 – – Deposits and other accounts 433,130,465 57,071,666 31,533,337 21,179,160 21,731,608 73,884,087 70,783,898 75,022,263 40,962,923 40,961,523 Sub-ordinated loans 4,996,800 – 800 200 1,000 2,000 2,000 502,000 4,488,800 – Liabilities against assets subject to finance lease – – – – – – – – – – Deferred tax liabilities 71,590 1,871,966 – – (119,441) (5,867) (617,894) (525,972) (531,202) – Other liabilities 7,497,960 3,979,253 – – – 1,759,356 879,678 439,839 219,919 219,915
509,114,950 118,974,296 31,797,581 24,532,297 25,332,484 75,649,918 71,058,024 75,448,472 45,140,440 41,181,438
Net assets 27,073,790 (19,604,378) 57,497,823 34,471,413 52,125,735 (41,706,918) (24,808,184) (5,577,539) (4,773,194) (20,550,968)
Share Capital 12,602,602 Reserves 6,445,888 Unappropriated profit 2,948,581 Non-controlling interest 35,580 Surplus on revaluation of assets 5,041,139
27,073,790
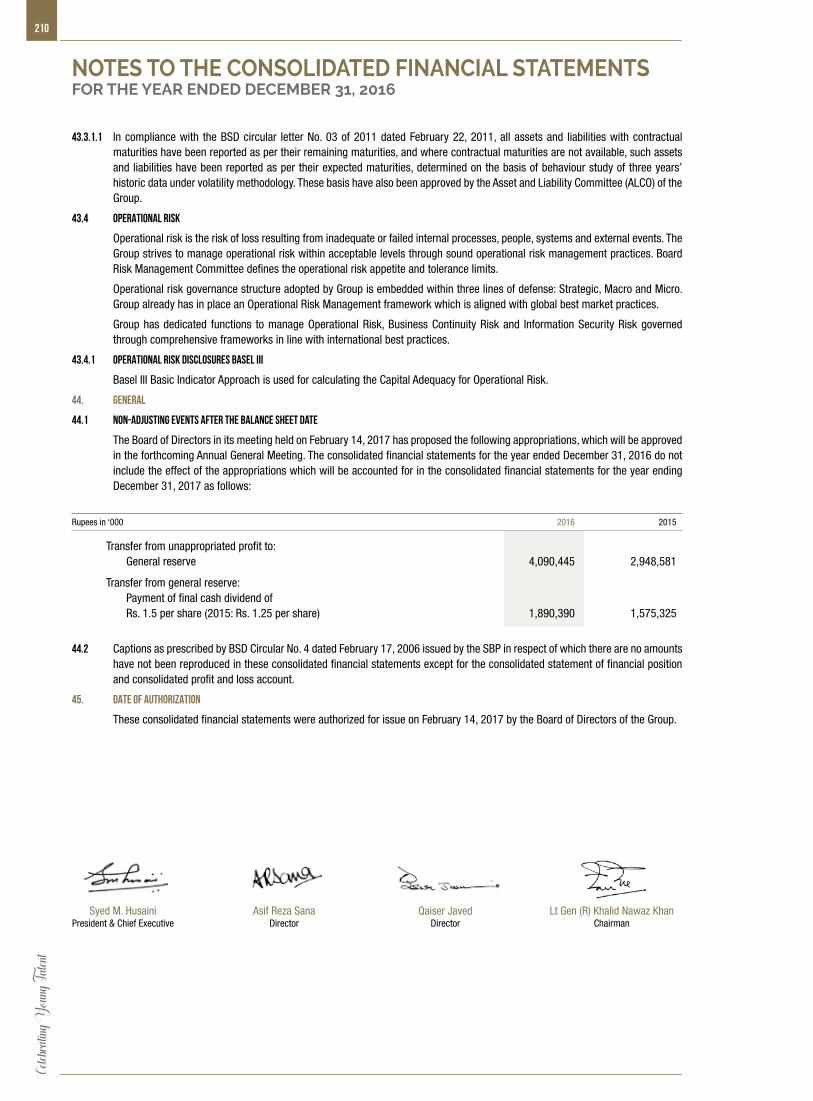
210Ce
lebrat
ing Y
oung T
alent
43.3.1.1 In compliance with the BSD circular letter No. 03 of 2011 dated February 22, 2011, all assets and liabilities with contractual maturities have been reported as per their remaining maturities, and where contractual maturities are not available, such assets and liabilities have been reported as per their expected maturities, determined on the basis of behaviour study of three years’ historic data under volatility methodology. These basis have also been approved by the Asset and Liability Committee (ALCO) of the Group.
43.4 OPERATIONAL RISK
Operational risk is the risk of loss resulting from inadequate or failed internal processes, people, systems and external events. The Group strives to manage operational risk within acceptable levels through sound operational risk management practices. Board Risk Management Committee defines the operational risk appetite and tolerance limits.
Operational risk governance structure adopted by Group is embedded within three lines of defense: Strategic, Macro and Micro. Group already has in place an Operational Risk Management framework which is aligned with global best market practices.
Group has dedicated functions to manage Operational Risk, Business Continuity Risk and Information Security Risk governed through comprehensive frameworks in line with international best practices.
43.4.1 OPERATIONAL RISK DISCLOSURES BASEL III
Basel III Basic Indicator Approach is used for calculating the Capital Adequacy for Operational Risk.
44. GENERAL
44.1 Non-adjusting events after the balance sheet date
The Board of Directors in its meeting held on February 14, 2017 has proposed the following appropriations, which will be approved in the forthcoming Annual General Meeting. The consolidated financial statements for the year ended December 31, 2016 do not include the effect of the appropriations which will be accounted for in the consolidated financial statements for the year ending December 31, 2017 as follows:
Rupees in ‘000 2016 2015
Transfer from unappropriated profit to: General reserve 4,090,445 2,948,581
Transfer from general reserve: Payment of final cash dividend of Rs. 1.5 per share (2015: Rs. 1.25 per share) 1,890,390 1,575,325
44.2 Captions as prescribed by BSD Circular No. 4 dated February 17, 2006 issued by the SBP in respect of which there are no amounts have not been reproduced in these consolidated financial statements except for the consolidated statement of financial position and consolidated profit and loss account.
45. DATE OF AUTHORIZATION
These consolidated financial statements were authorized for issue on February 14, 2017 by the Board of Directors of the Group.
NOTES TO THE CONSOLIDATED FINANCIAL STATEMENTSFOR THE YEAR ENDED DECEMBER 31, 2016
Syed M. HusainiPresident & Chief Executive
Asif Reza SanaDirector
Qaiser JavedDirector
Lt Gen (R) Khalid Nawaz KhanChairman
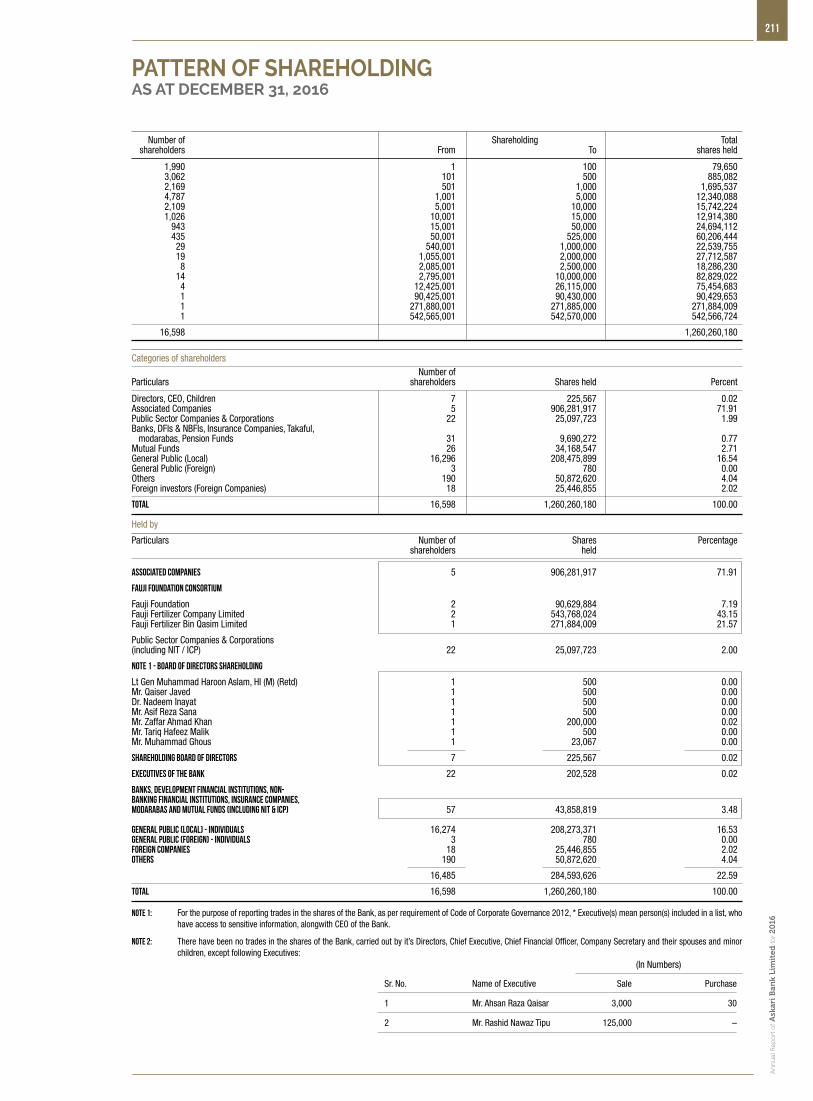
211
An
nu
al R
epo
rt o
f Ask
ari B
ank
Lim
ited
for 2
016
PATTERN OF SHAREHOLDINGAS AT DECEMBER 31, 2016
Number of Shareholding Total shareholders From To shares held
1,990 1 100 79,650 3,062 101 500 885,082 2,169 501 1,000 1,695,537 4,787 1,001 5,000 12,340,088 2,109 5,001 10,000 15,742,224 1,026 10,001 15,000 12,914,380 943 15,001 50,000 24,694,112 435 50,001 525,000 60,206,444 29 540,001 1,000,000 22,539,755 19 1,055,001 2,000,000 27,712,587 8 2,085,001 2,500,000 18,286,230 14 2,795,001 10,000,000 82,829,022 4 12,425,001 26,115,000 75,454,683 1 90,425,001 90,430,000 90,429,653 1 271,880,001 271,885,000 271,884,009 1 542,565,001 542,570,000 542,566,724
16,598 1,260,260,180
Categories of shareholders Number of Particulars shareholders Shares held Percent
Directors, CEO, Children 7 225,567 0.02 Associated Companies 5 906,281,917 71.91 Public Sector Companies & Corporations 22 25,097,723 1.99 Banks, DFIs & NBFIs, Insurance Companies, Takaful, modarabas, Pension Funds 31 9,690,272 0.77 Mutual Funds 26 34,168,547 2.71 General Public (Local) 16,296 208,475,899 16.54 General Public (Foreign) 3 780 0.00 Others 190 50,872,620 4.04 Foreign investors (Foreign Companies) 18 25,446,855 2.02
Total 16,598 1,260,260,180 100.00
Held by
Particulars Number of Shares Percentage shareholders held
Associated companies 5 906,281,917 71.91
Fauji Foundation Consortium
Fauji Foundation 2 90,629,884 7.19 Fauji Fertilizer Company Limited 2 543,768,024 43.15 Fauji Fertilizer Bin Qasim Limited 1 271,884,009 21.57
Public Sector Companies & Corporations (including NIT / ICP) 22 25,097,723 2.00
Note 1 - Board of Directors Shareholding
Lt Gen Muhammad Haroon Aslam, HI (M) (Retd) 1 500 0.00Mr. Qaiser Javed 1 500 0.00Dr. Nadeem Inayat 1 500 0.00Mr. Asif Reza Sana 1 500 0.00Mr. Zaffar Ahmad Khan 1 200,000 0.02Mr. Tariq Hafeez Malik 1 500 0.00Mr. Muhammad Ghous 1 23,067 0.00
Shareholding Board of Directors 7 225,567 0.02
Executives of the Bank 22 202,528 0.02
Banks, Development Financial Institutions, Non- Banking Financial Institutions, Insurance Companies, Modarabas and Mutual Funds (including NIT & ICP) 57 43,858,819 3.48 General Public (Local) - Individuals 16,274 208,273,371 16.53General Public (Foreign) - Individuals 3 780 0.00Foreign Companies 18 25,446,855 2.02Others 190 50,872,620 4.04
16,485 284,593,626 22.59
Total 16,598 1,260,260,180 100.00
Note 1: For the purpose of reporting trades in the shares of the Bank, as per requirement of Code of Corporate Governance 2012, * Executive(s) mean person(s) included in a list, who have access to sensitive information, alongwith CEO of the Bank.
Note 2: There have been no trades in the shares of the Bank, carried out by it’s Directors, Chief Executive, Chief Financial Officer, Company Secretary and their spouses and minor children, except following Executives:
Sr. No. Name of Executive Sale Purchase
1 Mr. Ahsan Raza Qaisar 3,000 30
2 Mr. Rashid Nawaz Tipu 125,000 –
(In Numbers)
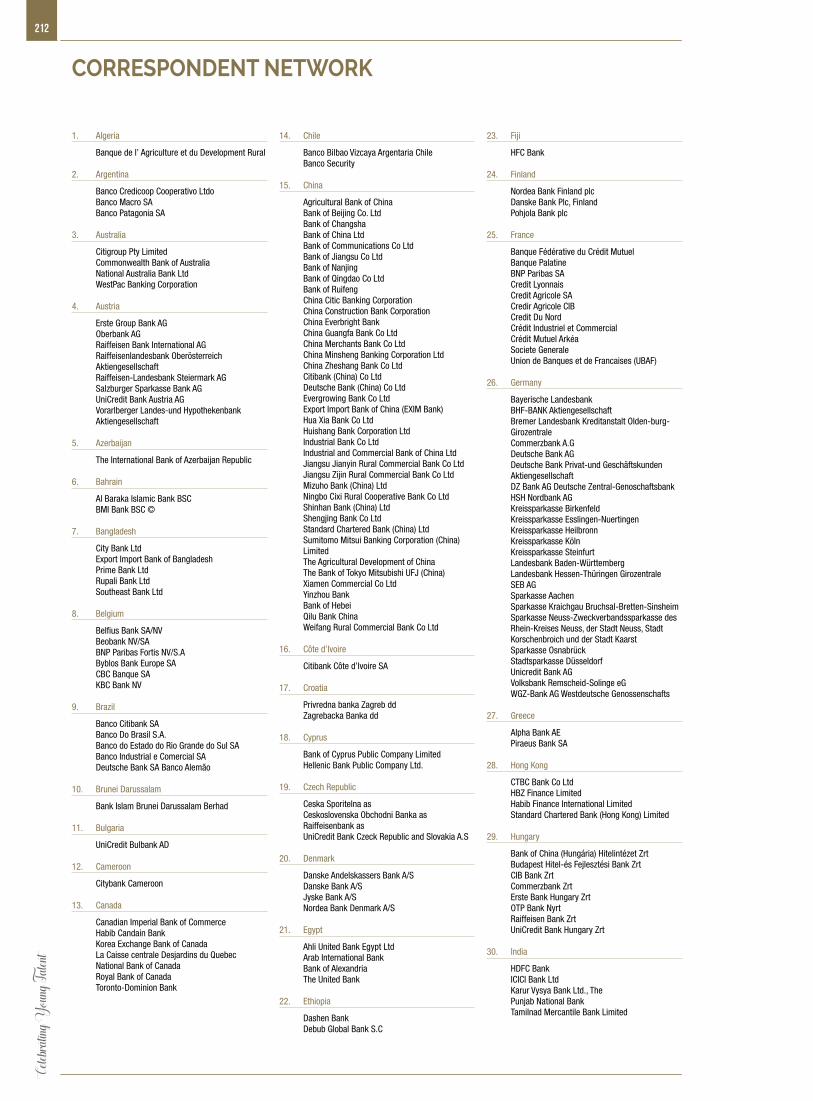
212Ce
lebrat
ing Y
oung T
alent
CORRESPONDENT NETWORK
1. Algeria
Banque de l’ Agriculture et du Development Rural 2. Argentina
Banco Credicoop Cooperativo Ltdo Banco Macro SA Banco Patagonia SA 3. Australia
Citigroup Pty Limited Commonwealth Bank of Australia National Australia Bank Ltd WestPac Banking Corporation
4. Austria
Erste Group Bank AG Oberbank AG Raiffeisen Bank International AG Raiffeisenlandesbank Oberösterreich
Aktiengesellschaft Raiffeisen-Landesbank Steiermark AG Salzburger Sparkasse Bank AG UniCredit Bank Austria AG Vorarlberger Landes-und Hypothekenbank
Aktiengesellschaft
5. Azerbaijan
The International Bank of Azerbaijan Republic
6. Bahrain
Al Baraka Islamic Bank BSC BMI Bank BSC ©
7. Bangladesh
City Bank Ltd Export Import Bank of Bangladesh Prime Bank Ltd Rupali Bank Ltd Southeast Bank Ltd 8. Belgium
Belfius Bank SA/NV Beobank NV/SA BNP Paribas Fortis NV/S.A Byblos Bank Europe SA CBC Banque SA KBC Bank NV
9. Brazil
Banco Citibank SA Banco Do Brasil S.A. Banco do Estado do Rio Grande do Sul SA Banco Industrial e Comercial SA Deutsche Bank SA Banco Alemão 10. Brunei Darussalam
Bank Islam Brunei Darussalam Berhad
11. Bulgaria
UniCredit Bulbank AD
12. Cameroon
Citybank Cameroon
13. Canada
Canadian Imperial Bank of Commerce Habib Candain Bank Korea Exchange Bank of Canada La Caisse centrale Desjardins du Quebec National Bank of Canada Royal Bank of Canada Toronto-Dominion Bank
14. Chile
Banco Bilbao Vizcaya Argentaria Chile Banco Security
15. China
Agricultural Bank of China Bank of Beijing Co. Ltd Bank of Changsha Bank of China Ltd Bank of Communications Co Ltd Bank of Jiangsu Co Ltd Bank of Nanjing Bank of Qingdao Co Ltd Bank of Ruifeng China Citic Banking Corporation China Construction Bank Corporation China Everbright Bank China Guangfa Bank Co Ltd China Merchants Bank Co Ltd China Minsheng Banking Corporation Ltd China Zheshang Bank Co Ltd Citibank (China) Co Ltd Deutsche Bank (China) Co Ltd Evergrowing Bank Co Ltd Export Import Bank of China (EXIM Bank) Hua Xia Bank Co Ltd Huishang Bank Corporation Ltd Industrial Bank Co Ltd Industrial and Commercial Bank of China Ltd Jiangsu Jianyin Rural Commercial Bank Co Ltd Jiangsu Zijin Rural Commercial Bank Co Ltd Mizuho Bank (China) Ltd Ningbo Cixi Rural Cooperative Bank Co Ltd Shinhan Bank (China) Ltd Shengjing Bank Co Ltd Standard Chartered Bank (China) Ltd Sumitomo Mitsui Banking Corporation (China)
Limited The Agricultural Development of China The Bank of Tokyo Mitsubishi UFJ (China) Xiamen Commercial Co Ltd Yinzhou Bank Bank of Hebei Qilu Bank China Weifang Rural Commercial Bank Co Ltd
16. Côte d’Ivoire
Citibank Côte d’Ivoire SA
17. Croatia
Privredna banka Zagreb dd Zagrebacka Banka dd
18. Cyprus
Bank of Cyprus Public Company Limited Hellenic Bank Public Company Ltd.
19. Czech Republic
Ceska Sporitelna as Ceskoslovenska Obchodni Banka as Raiffeisenbank as UniCredit Bank Czeck Republic and Slovakia A.S
20. Denmark
Danske Andelskassers Bank A/S Danske Bank A/S Jyske Bank A/S Nordea Bank Denmark A/S 21. Egypt
Ahli United Bank Egypt Ltd Arab International Bank Bank of Alexandria The United Bank
22. Ethiopia
Dashen Bank Debub Global Bank S.C
23. Fiji
HFC Bank
24. Finland
Nordea Bank Finland plc Danske Bank Plc, Finland Pohjola Bank plc
25. France
Banque Fédérative du Crédit Mutuel Banque Palatine BNP Paribas SA Credit Lyonnais Credit Agricole SA Credir Agricole CIB Credit Du Nord Crédit Industriel et Commercial Crédit Mutuel Arkéa Societe Generale Union de Banques et de Francaises (UBAF)
26. Germany
Bayerische Landesbank BHF-BANK Aktiengesellschaft Bremer Landesbank Kreditanstalt Olden-burg-
Girozentrale Commerzbank A.G Deutsche Bank AG Deutsche Bank Privat-und Geschäftskunden
Aktiengesellschaft DZ Bank AG Deutsche Zentral-Genoschaftsbank HSH Nordbank AG Kreissparkasse Birkenfeld Kreissparkasse Esslingen-Nuertingen Kreissparkasse Heilbronn Kreissparkasse Köln Kreissparkasse Steinfurt Landesbank Baden-Württemberg Landesbank Hessen-Thüringen Girozentrale SEB AG Sparkasse Aachen Sparkasse Kraichgau Bruchsal-Bretten-Sinsheim Sparkasse Neuss-Zweckverbandssparkasse des
Rhein-Kreises Neuss, der Stadt Neuss, Stadt Korschenbroich und der Stadt Kaarst
Sparkasse Osnabrück Stadtsparkasse Düsseldorf Unicredit Bank AG Volksbank Remscheid-Solinge eG WGZ-Bank AG Westdeutsche Genossenschafts
27. Greece
Alpha Bank AE Piraeus Bank SA
28. Hong Kong
CTBC Bank Co Ltd HBZ Finance Limited Habib Finance International Limited Standard Chartered Bank (Hong Kong) Limited
29. Hungary
Bank of China (Hungária) Hitelintézet Zrt Budapest Hitel-és Fejlesztési Bank Zrt CIB Bank Zrt Commerzbank Zrt Erste Bank Hungary Zrt OTP Bank Nyrt Raiffeisen Bank Zrt UniCredit Bank Hungary Zrt
30. India
HDFC Bank ICICI Bank Ltd Karur Vysya Bank Ltd., The Punjab National Bank Tamilnad Mercantile Bank Limited
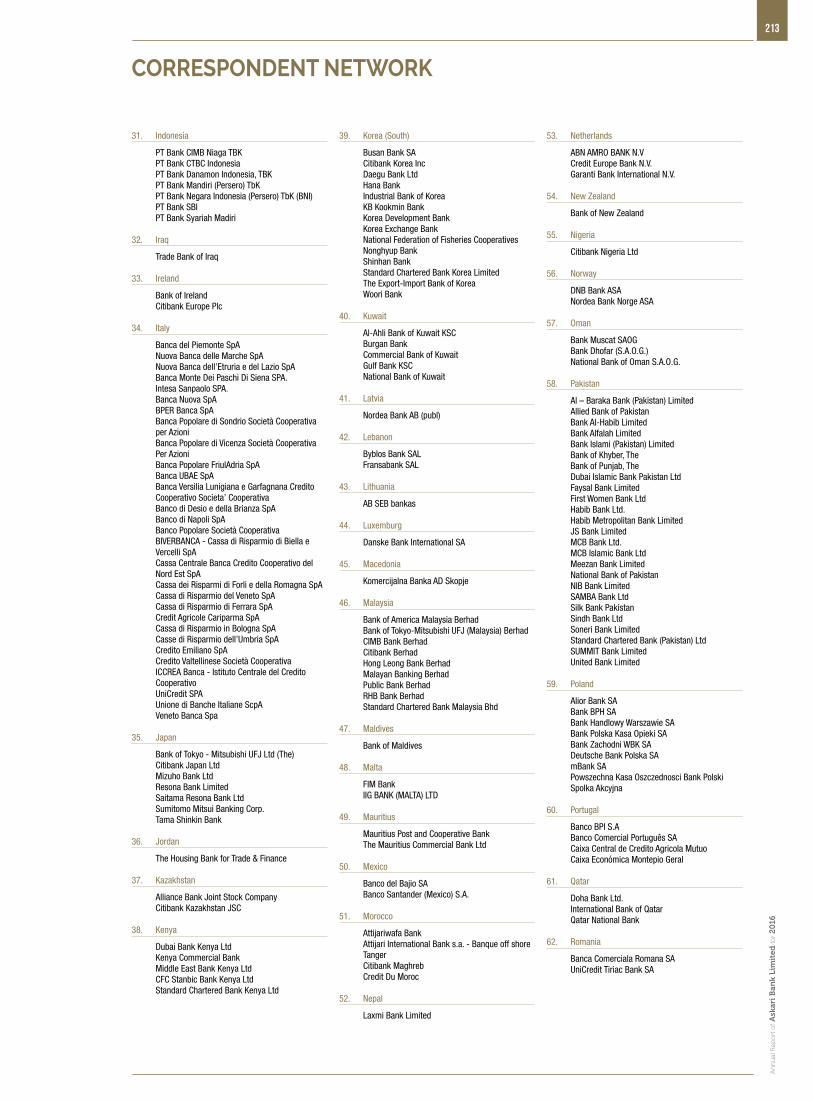
213
An
nu
al R
epo
rt o
f Ask
ari B
ank
Lim
ited
for 2
016
31. Indonesia
PT Bank CIMB Niaga TBK PT Bank CTBC Indonesia PT Bank Danamon Indonesia, TBK PT Bank Mandiri (Persero) TbK PT Bank Negara Indonesia (Persero) TbK (BNI) PT Bank SBI PT Bank Syariah Madiri
32. Iraq
Trade Bank of Iraq
33. Ireland
Bank of Ireland Citibank Europe Plc
34. Italy
Banca del Piemonte SpA Nuova Banca delle Marche SpA Nuova Banca dell’Etruria e del Lazio SpA Banca Monte Dei Paschi Di Siena SPA. Intesa Sanpaolo SPA. Banca Nuova SpA BPER Banca SpA Banca Popolare di Sondrio Società Cooperativa
per Azioni Banca Popolare di Vicenza Società Cooperativa
Per Azioni Banca Popolare FriulAdria SpA Banca UBAE SpA Banca Versilia Lunigiana e Garfagnana Credito
Cooperativo Societa’ Cooperativa Banco di Desio e della Brianza SpA Banco di Napoli SpA Banco Popolare Società Cooperativa BIVERBANCA - Cassa di Risparmio di Biella e
Vercelli SpA Cassa Centrale Banca Credito Cooperativo del
Nord Est SpA Cassa dei Risparmi di Forli e della Romagna SpA Cassa di Risparmio del Veneto SpA Cassa di Risparmio di Ferrara SpA Credit Agricole Cariparma SpA Cassa di Risparmio in Bologna SpA Casse di Risparmio dell’Umbria SpA Credito Emiliano SpA Credito Valtellinese Società Cooperativa ICCREA Banca - Istituto Centrale del Credito
Cooperativo UniCredit SPA Unione di Banche Italiane ScpA Veneto Banca Spa 35. Japan
Bank of Tokyo - Mitsubishi UFJ Ltd (The) Citibank Japan Ltd Mizuho Bank Ltd Resona Bank Limited Saitama Resona Bank Ltd Sumitomo Mitsui Banking Corp. Tama Shinkin Bank 36. Jordan
The Housing Bank for Trade & Finance
37. Kazakhstan
Alliance Bank Joint Stock Company Citibank Kazakhstan JSC 38. Kenya
Dubai Bank Kenya Ltd Kenya Commercial Bank Middle East Bank Kenya Ltd CFC Stanbic Bank Kenya Ltd Standard Chartered Bank Kenya Ltd
39. Korea (South)
Busan Bank SA Citibank Korea Inc Daegu Bank Ltd Hana Bank Industrial Bank of Korea KB Kookmin Bank Korea Development Bank Korea Exchange Bank National Federation of Fisheries Cooperatives Nonghyup Bank Shinhan Bank Standard Chartered Bank Korea Limited The Export-Import Bank of Korea Woori Bank
40. Kuwait
Al-Ahli Bank of Kuwait KSC Burgan Bank Commercial Bank of Kuwait Gulf Bank KSC National Bank of Kuwait
41. Latvia
Nordea Bank AB (publ)
42. Lebanon
Byblos Bank SAL Fransabank SAL 43. Lithuania
AB SEB bankas
44. Luxemburg
Danske Bank International SA
45. Macedonia
Komercijalna Banka AD Skopje
46. Malaysia
Bank of America Malaysia Berhad Bank of Tokyo-Mitsubishi UFJ (Malaysia) Berhad CIMB Bank Berhad Citibank Berhad Hong Leong Bank Berhad Malayan Banking Berhad Public Bank Berhad RHB Bank Berhad Standard Chartered Bank Malaysia Bhd
47. Maldives
Bank of Maldives
48. Malta
FIM Bank IIG BANK (MALTA) LTD
49. Mauritius
Mauritius Post and Cooperative Bank The Mauritius Commercial Bank Ltd
50. Mexico
Banco del Bajio SA Banco Santander (Mexico) S.A.
51. Morocco
Attijariwafa Bank Attijari International Bank s.a. - Banque off shore
Tanger Citibank Maghreb Credit Du Moroc
52. Nepal
Laxmi Bank Limited
53. Netherlands
ABN AMRO BANK N.V Credit Europe Bank N.V. Garanti Bank International N.V.
54. New Zealand
Bank of New Zealand 55. Nigeria
Citibank Nigeria Ltd
56. Norway
DNB Bank ASA Nordea Bank Norge ASA 57. Oman
Bank Muscat SAOG Bank Dhofar (S.A.O.G.) National Bank of Oman S.A.O.G. 58. Pakistan
Al – Baraka Bank (Pakistan) Limited Allied Bank of Pakistan Bank Al-Habib Limited Bank Alfalah Limited Bank Islami (Pakistan) Limited Bank of Khyber, The Bank of Punjab, The Dubai Islamic Bank Pakistan Ltd Faysal Bank Limited First Women Bank Ltd Habib Bank Ltd. Habib Metropolitan Bank Limited JS Bank Limited MCB Bank Ltd. MCB Islamic Bank Ltd Meezan Bank Limited National Bank of Pakistan NIB Bank Limited SAMBA Bank Ltd Silk Bank Pakistan Sindh Bank Ltd Soneri Bank Limited Standard Chartered Bank (Pakistan) Ltd SUMMIT Bank Limited United Bank Limited
59. Poland
Alior Bank SA Bank BPH SA Bank Handlowy Warszawie SA Bank Polska Kasa Opieki SA Bank Zachodni WBK SA Deutsche Bank Polska SA mBank SA Powszechna Kasa Oszczednosci Bank Polski
Spolka Akcyjna 60. Portugal
Banco BPI S.A Banco Comercial Português SA Caixa Central de Credito Agricola Mutuo Caixa Económica Montepio Geral 61. Qatar
Doha Bank Ltd. International Bank of Qatar Qatar National Bank
62. Romania
Banca Comerciala Romana SA UniCredit Tiriac Bank SA
CORRESPONDENT NETWORK
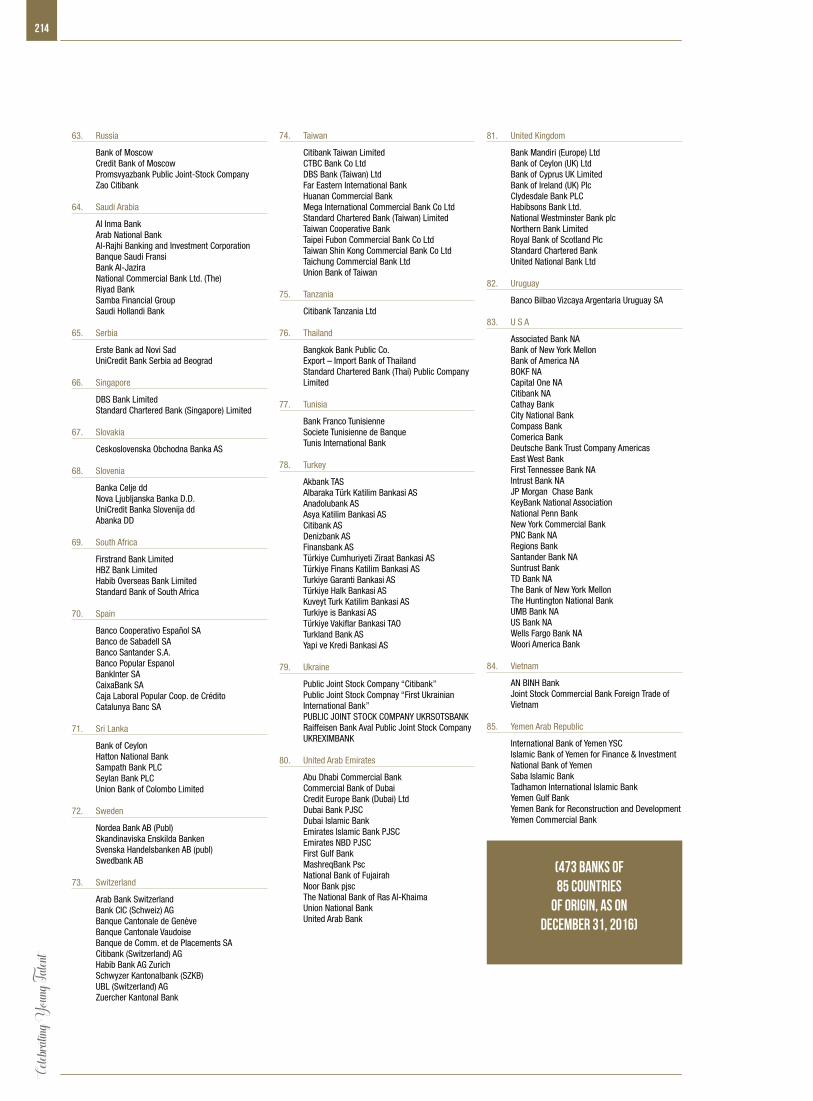
214Ce
lebrat
ing Y
oung T
alent
63. Russia
Bank of Moscow Credit Bank of Moscow Promsvyazbank Public Joint-Stock Company Zao Citibank
64. Saudi Arabia
Al Inma Bank Arab National Bank Al-Rajhi Banking and Investment Corporation Banque Saudi Fransi Bank Al-Jazira National Commercial Bank Ltd. (The) Riyad Bank Samba Financial Group Saudi Hollandi Bank
65. Serbia
Erste Bank ad Novi Sad UniCredit Bank Serbia ad Beograd
66. Singapore
DBS Bank Limited Standard Chartered Bank (Singapore) Limited 67. Slovakia
Ceskoslovenska Obchodna Banka AS 68. Slovenia
Banka Celje dd Nova Ljubljanska Banka D.D. UniCredit Banka Slovenija dd Abanka DD
69. South Africa
Firstrand Bank Limited HBZ Bank Limited Habib Overseas Bank Limited Standard Bank of South Africa
70. Spain
Banco Cooperativo Español SA Banco de Sabadell SA Banco Santander S.A. Banco Popular Espanol BankInter SA CaixaBank SA Caja Laboral Popular Coop. de Crédito Catalunya Banc SA 71. Sri Lanka
Bank of Ceylon Hatton National Bank Sampath Bank PLC Seylan Bank PLC Union Bank of Colombo Limited
72. Sweden
Nordea Bank AB (Publ) Skandinaviska Enskilda Banken Svenska Handelsbanken AB (publ) Swedbank AB
73. Switzerland
Arab Bank Switzerland Bank CIC (Schweiz) AG Banque Cantonale de Genève Banque Cantonale Vaudoise Banque de Comm. et de Placements SA Citibank (Switzerland) AG Habib Bank AG Zurich Schwyzer Kantonalbank (SZKB) UBL (Switzerland) AG Zuercher Kantonal Bank
74. Taiwan
Citibank Taiwan Limited CTBC Bank Co Ltd DBS Bank (Taiwan) Ltd Far Eastern International Bank Huanan Commercial Bank Mega International Commercial Bank Co Ltd Standard Chartered Bank (Taiwan) Limited Taiwan Cooperative Bank Taipei Fubon Commercial Bank Co Ltd Taiwan Shin Kong Commercial Bank Co Ltd Taichung Commercial Bank Ltd Union Bank of Taiwan
75. Tanzania
Citibank Tanzania Ltd 76. Thailand
Bangkok Bank Public Co. Export – Import Bank of Thailand Standard Chartered Bank (Thai) Public Company
Limited 77. Tunisia
Bank Franco Tunisienne Societe Tunisienne de Banque Tunis International Bank 78. Turkey
Akbank TAS Albaraka Türk Katilim Bankasi AS Anadolubank AS Asya Katilim Bankasi AS Citibank AS Denizbank AS Finansbank AS Türkiye Cumhuriyeti Ziraat Bankasi AS Türkiye Finans Katilim Bankasi AS Turkiye Garanti Bankasi AS Türkiye Halk Bankasi AS Kuveyt Turk Katilim Bankasi AS Turkiye is Bankasi AS Türkiye Vakiflar Bankasi TAO Turkland Bank AS Yapi ve Kredi Bankasi AS
79. Ukraine
Public Joint Stock Company “Citibank” Public Joint Stock Compnay “First Ukrainian
International Bank” PUBLIC JOINT STOCK COMPANY UKRSOTSBANK Raiffeisen Bank Aval Public Joint Stock Company UKREXIMBANK
80. United Arab Emirates
Abu Dhabi Commercial Bank Commercial Bank of Dubai Credit Europe Bank (Dubai) Ltd Dubai Bank PJSC Dubai Islamic Bank Emirates Islamic Bank PJSC Emirates NBD PJSC First Gulf Bank MashreqBank Psc National Bank of Fujairah Noor Bank pjsc The National Bank of Ras Al-Khaima Union National Bank United Arab Bank
81. United Kingdom
Bank Mandiri (Europe) Ltd Bank of Ceylon (UK) Ltd Bank of Cyprus UK Limited Bank of Ireland (UK) Plc Clydesdale Bank PLC Habibsons Bank Ltd. National Westminster Bank plc Northern Bank Limited Royal Bank of Scotland Plc Standard Chartered Bank United National Bank Ltd
82. Uruguay
Banco Bilbao Vizcaya Argentaria Uruguay SA
83. U S A
Associated Bank NA Bank of New York Mellon Bank of America NA BOKF NA Capital One NA Citibank NA Cathay Bank City National Bank Compass Bank Comerica Bank Deutsche Bank Trust Company Americas East West Bank First Tennessee Bank NA Intrust Bank NA JP Morgan Chase Bank KeyBank National Association National Penn Bank New York Commercial Bank PNC Bank NA Regions Bank Santander Bank NA Suntrust Bank TD Bank NA The Bank of New York Mellon The Huntington National Bank UMB Bank NA US Bank NA Wells Fargo Bank NA Woori America Bank 84. Vietnam
AN BINH Bank Joint Stock Commercial Bank Foreign Trade of
Vietnam
85. Yemen Arab Republic
International Bank of Yemen YSC Islamic Bank of Yemen for Finance & Investment National Bank of Yemen Saba Islamic Bank Tadhamon International Islamic Bank Yemen Gulf Bank Yemen Bank for Reconstruction and Development Yemen Commercial Bank
(473 Banks of 85 Countries
of Origin, as on December 31, 2016)
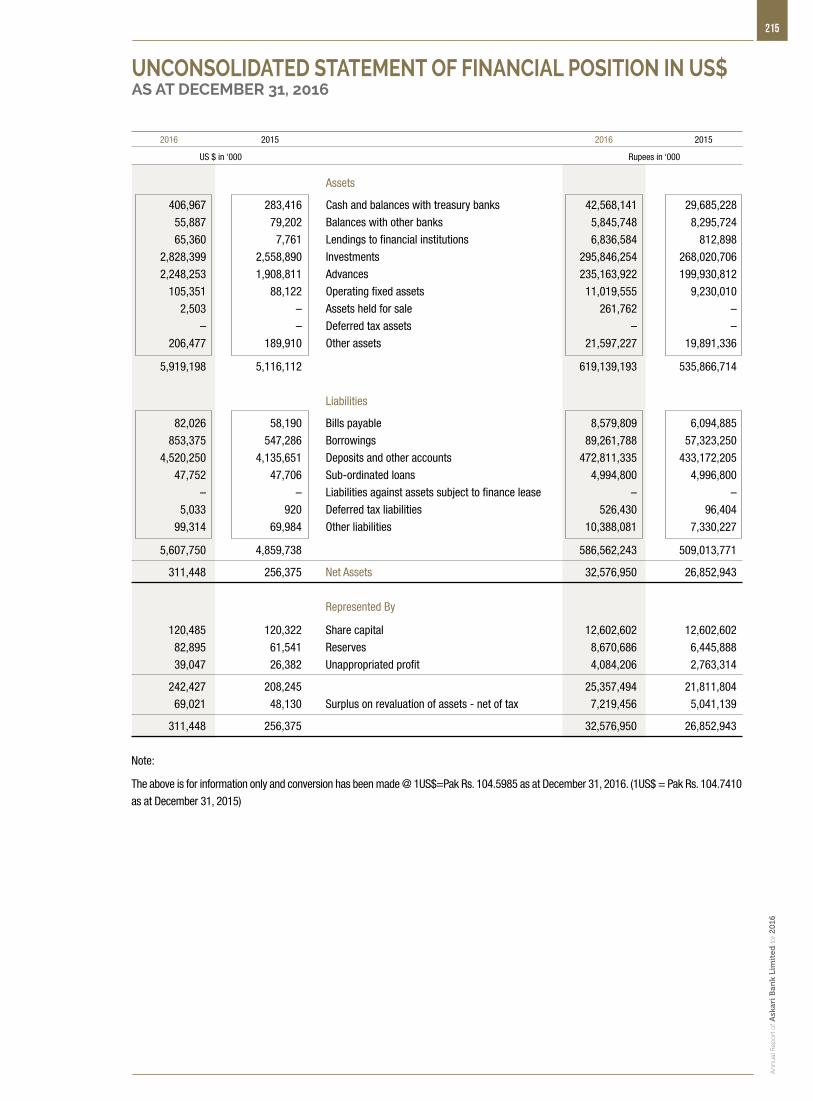
215
An
nu
al R
epo
rt o
f Ask
ari B
ank
Lim
ited
for 2
016
2016 2015 2016 2015
US $ in ‘000 Rupees in ‘000
Assets
406,967 283,416 Cash and balances with treasury banks 42,568,141 29,685,228
55,887 79,202 Balances with other banks 5,845,748 8,295,724
65,360 7,761 Lendings to financial institutions 6,836,584 812,898
2,828,399 2,558,890 Investments 295,846,254 268,020,706
2,248,253 1,908,811 Advances 235,163,922 199,930,812
105,351 88,122 Operating fixed assets 11,019,555 9,230,010
2,503 – Assets held for sale 261,762 –
– – Deferred tax assets – –
206,477 189,910 Other assets 21,597,227 19,891,336
5,919,198 5,116,112 619,139,193 535,866,714
Liabilities
82,026 58,190 Bills payable 8,579,809 6,094,885
853,375 547,286 Borrowings 89,261,788 57,323,250
4,520,250 4,135,651 Deposits and other accounts 472,811,335 433,172,205
47,752 47,706 Sub-ordinated loans 4,994,800 4,996,800
– – Liabilities against assets subject to finance lease – –
5,033 920 Deferred tax liabilities 526,430 96,404
99,314 69,984 Other liabilities 10,388,081 7,330,227
5,607,750 4,859,738 586,562,243 509,013,771
311,448 256,375 Net Assets 32,576,950 26,852,943
Represented By
120,485 120,322 Share capital 12,602,602 12,602,602
82,895 61,541 Reserves 8,670,686 6,445,888
39,047 26,382 Unappropriated profit 4,084,206 2,763,314
242,427 208,245 25,357,494 21,811,804
69,021 48,130 Surplus on revaluation of assets - net of tax 7,219,456 5,041,139
311,448 256,375 32,576,950 26,852,943
Note:
The above is for information only and conversion has been made @ 1US$=Pak Rs. 104.5985 as at December 31, 2016. (1US$ = Pak Rs. 104.7410
as at December 31, 2015)
UNCONSOLIDATED STATEMENT OF FINANCIAL POSITION IN US$AS AT DECEMBER 31, 2016
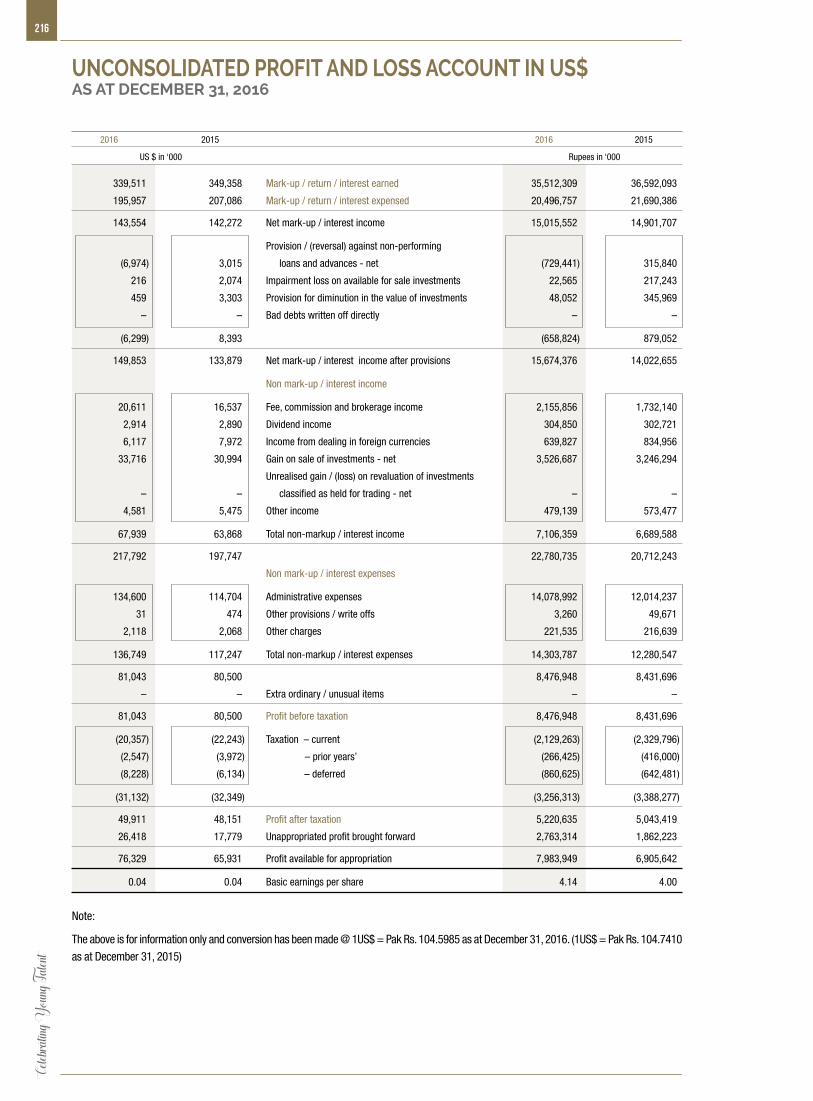
216Ce
lebrat
ing Y
oung T
alent
UNCONSOLIDATED PROFIT AND LOSS ACCOUNT IN US$ AS AT DECEMBER 31, 2016
2016 2015 2016 2015
US $ in ‘000 Rupees in ‘000
339,511 349,358 Mark-up / return / interest earned 35,512,309 36,592,093
195,957 207,086 Mark-up / return / interest expensed 20,496,757 21,690,386
143,554 142,272 Net mark-up / interest income 15,015,552 14,901,707
Provision / (reversal) against non-performing
(6,974) 3,015 loans and advances - net (729,441) 315,840
216 2,074 Impairment loss on available for sale investments 22,565 217,243
459 3,303 Provision for diminution in the value of investments 48,052 345,969
– – Bad debts written off directly – –
(6,299) 8,393 (658,824) 879,052
149,853 133,879 Net mark-up / interest income after provisions 15,674,376 14,022,655
Non mark-up / interest income
20,611 16,537 Fee, commission and brokerage income 2,155,856 1,732,140
2,914 2,890 Dividend income 304,850 302,721
6,117 7,972 Income from dealing in foreign currencies 639,827 834,956
33,716 30,994 Gain on sale of investments - net 3,526,687 3,246,294
Unrealised gain / (loss) on revaluation of investments
– – classified as held for trading - net – –
4,581 5,475 Other income 479,139 573,477
67,939 63,868 Total non-markup / interest income 7,106,359 6,689,588
217,792 197,747 22,780,735 20,712,243
Non mark-up / interest expenses
134,600 114,704 Administrative expenses 14,078,992 12,014,237
31 474 Other provisions / write offs 3,260 49,671
2,118 2,068 Other charges 221,535 216,639
136,749 117,247 Total non-markup / interest expenses 14,303,787 12,280,547
81,043 80,500 8,476,948 8,431,696
– – Extra ordinary / unusual items – –
81,043 80,500 Profit before taxation 8,476,948 8,431,696
(20,357) (22,243) Taxation – current (2,129,263) (2,329,796)
(2,547) (3,972) – prior years’ (266,425) (416,000)
(8,228) (6,134) – deferred (860,625) (642,481)
(31,132) (32,349) (3,256,313) (3,388,277)
49,911 48,151 Profit after taxation 5,220,635 5,043,419
26,418 17,779 Unappropriated profit brought forward 2,763,314 1,862,223
76,329 65,931 Profit available for appropriation 7,983,949 6,905,642
0.04 0.04 Basic earnings per share 4.14 4.00
Note:
The above is for information only and conversion has been made @ 1US$ = Pak Rs. 104.5985 as at December 31, 2016. (1US$ = Pak Rs. 104.7410
as at December 31, 2015)
217
An
nu
al R
epo
rt o
f Ask
ari B
ank
Lim
ited
for 2
016
NOTES
AGMFriday, March 31, 2017 at 10:00 am
at Pearl Continental Hotel, Rawalpindi

218Ce
lebrat
ing Y
oung T
alent
NOTES

219
An
nu
al R
epo
rt o
f Ask
ari B
ank
Lim
ited
for 2
016
NOTES

220Ce
lebrat
ing Y
oung T
alent
NOTES
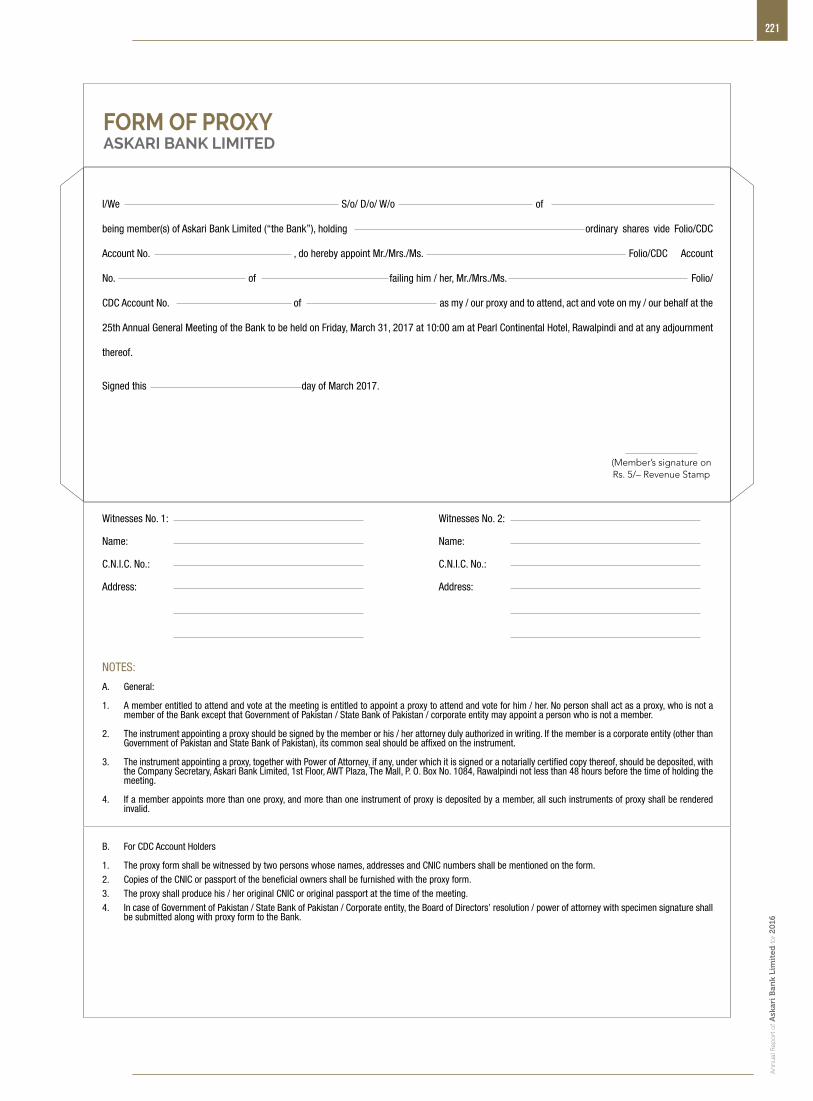
221
An
nu
al R
epo
rt o
f Ask
ari B
ank
Lim
ited
for 2
016
FORM OF PROXYASKARI BANK LIMITED
I/We S/o/ D/o/ W/o of
being member(s) of Askari Bank Limited (“the Bank”), holding ordinary shares vide Folio/CDC
Account No. , do hereby appoint Mr./Mrs./Ms. Folio/CDC Account
No. of failing him / her, Mr./Mrs./Ms. Folio/
CDC Account No. of as my / our proxy and to attend, act and vote on my / our behalf at the
25th Annual General Meeting of the Bank to be held on Friday, March 31, 2017 at 10:00 am at Pearl Continental Hotel, Rawalpindi and at any adjournment
thereof.
Signed this day of March 2017.
Witnesses No. 1: Witnesses No. 2:
Name: Name:
C.N.I.C. No.: C.N.I.C. No.:
Address: Address:
NOTES:
A. General:
1. A member entitled to attend and vote at the meeting is entitled to appoint a proxy to attend and vote for him / her. No person shall act as a proxy, who is not a member of the Bank except that Government of Pakistan / State Bank of Pakistan / corporate entity may appoint a person who is not a member.
2. The instrument appointing a proxy should be signed by the member or his / her attorney duly authorized in writing. If the member is a corporate entity (other than Government of Pakistan and State Bank of Pakistan), its common seal should be affixed on the instrument.
3. The instrument appointing a proxy, together with Power of Attorney, if any, under which it is signed or a notarially certified copy thereof, should be deposited, with the Company Secretary, Askari Bank Limited, 1st Floor, AWT Plaza, The Mall, P. O. Box No. 1084, Rawalpindi not less than 48 hours before the time of holding the meeting.
4. If a member appoints more than one proxy, and more than one instrument of proxy is deposited by a member, all such instruments of proxy shall be rendered invalid.
B. For CDC Account Holders
1. The proxy form shall be witnessed by two persons whose names, addresses and CNIC numbers shall be mentioned on the form.2. Copies of the CNIC or passport of the beneficial owners shall be furnished with the proxy form.3. The proxy shall produce his / her original CNIC or original passport at the time of the meeting.4. In case of Government of Pakistan / State Bank of Pakistan / Corporate entity, the Board of Directors’ resolution / power of attorney with specimen signature shall
be submitted along with proxy form to the Bank.
(Member’s signature onRs. 5/– Revenue Stamp

222Ce
lebrat
ing Y
oung T
alent
The Company Secretary:
ASKARI BANK LIMITEDAWT Plaza, The Mall, P.O. Box No. 1084,
Rawalpindi – Pakistan.
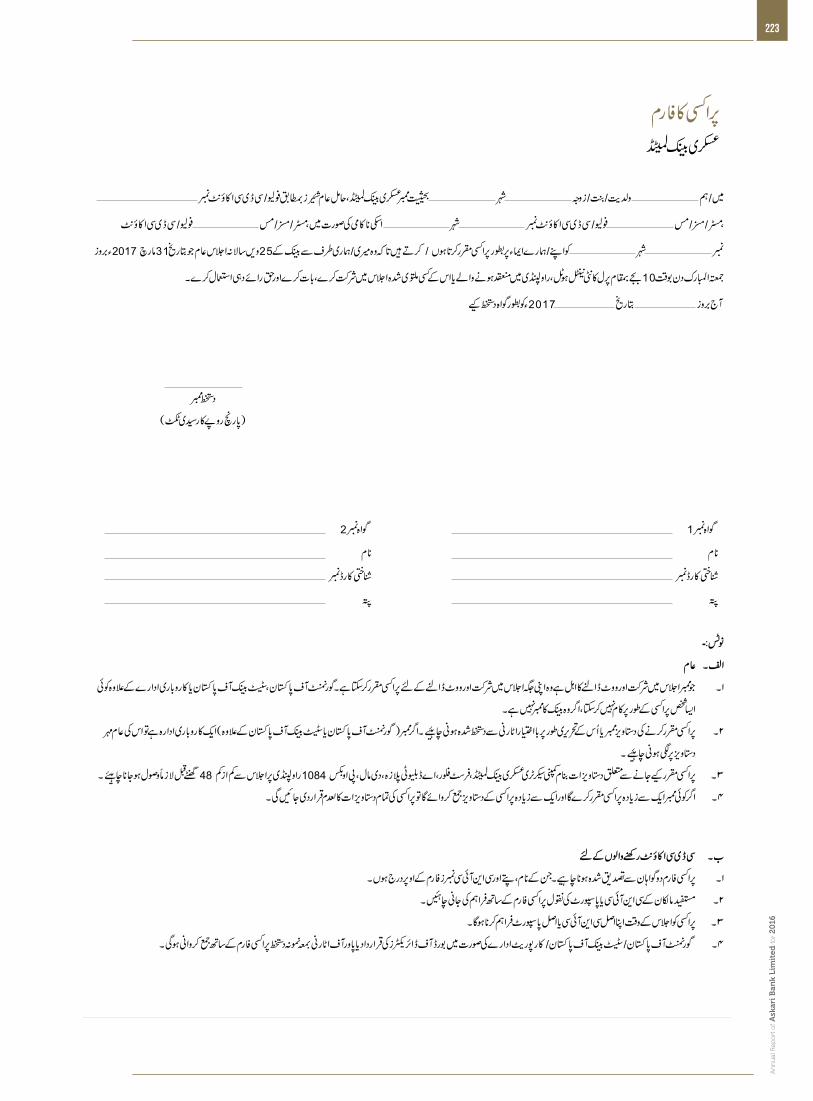
223
An
nu
al R
epo
rt o
f Ask
ari B
ank
Lim
ited
for 2
016
224Ce
lebrat
ing Y
oung T
alent
The Company Secretary:
ASKARI BANK LIMITEDAWT Plaza, The Mall, P.O. Box No. 1084,
Rawalpindi – Pakistan.
AKBL.COM.PK