
Xu, Y. and Prom-on, S. (2014). Toward invariant functional representations of variable surface...
43
1 Toward invariant functional representations of variable surface fundamental frequency contours: Synthesizing speech melody via model- based stochastic learning Yi Xu a E-mail: [email protected] Santitham Prom-on a,b,* E-mail: [email protected] a Department of Speech, Hearing and Phonetic Sciences, University College London, London WC1N 1PF, United Kingdom b Department of Computer Engineering, King Mongkut’s University of Technology Thonburi, Bangkok 10140, Thailand. * Corresponding author. Address: Department of Computer Engineering, King Mongkut’s University of Technology Thonburi, 126 Prachauthit Road, Bangmod, Thungkhru, Bangkok 10140, Thailand. Tel: +66 (0) 2470 9081; Fax: +66 (0) 2872 5050
Transcript of Xu, Y. and Prom-on, S. (2014). Toward invariant functional representations of variable surface...
1
Toward invariant functional representations of variable surface fundamental frequency contours: Synthesizing speech melody via model-based stochastic learning Yi Xu a E-mail: [email protected] Santitham Prom-on a,b,* E-mail: [email protected] a Department of Speech, Hearing and Phonetic Sciences, University College London, London WC1N 1PF, United Kingdom b Department of Computer Engineering, King Mongkut’s University of Technology Thonburi, Bangkok 10140, Thailand. * Corresponding author. Address: Department of Computer Engineering, King Mongkut’s University of Technology Thonburi, 126 Prachauthit Road, Bangmod, Thungkhru, Bangkok 10140, Thailand. Tel: +66 (0) 2470 9081; Fax: +66 (0) 2872 5050
2
Abstract Variability has been one of the major challenges for both theoretical understanding and computer synthesis of speech prosody. In this paper we show that economical representation of variability is the key to effective modeling of prosody. Specifically, we report the development of PENTAtrainer — A trainable yet deterministic prosody synthesizer based on an articulatory-functional view of speech. We show with testing results on Thai, Mandarin and English that it is possible to achieve high-accuracy predictive synthesis of fundamental frequency contours with very small sets of parameters obtained through stochastic learning from real speech data. The first key component of this system is syllable-synchronized sequential target approximation — implemented as the qTA model, which is designed to simulate, for each tonal unit, a wide range of contextual variability with a single invariant target. The second key component is the automatic learning of function-specific targets through stochastic global optimization, guided by a layered pseudo-hierarchical functional annotation scheme, which requires the manual labeling of only the temporal domains of the functional units. The results in terms of synthesis accuracy demonstrate that effective modeling of the contextual variability is the key also to effective modeling of function-related variability. Additionally, we show that, being both theory-based and trainable (hence data-driven), computational systems like PENTAtrainer can serve as an effective modeling tool in basic research, with which the level of falsifiability in theory testing can be raised, and also a closer link between basic and applied research in speech science can be developed.
3
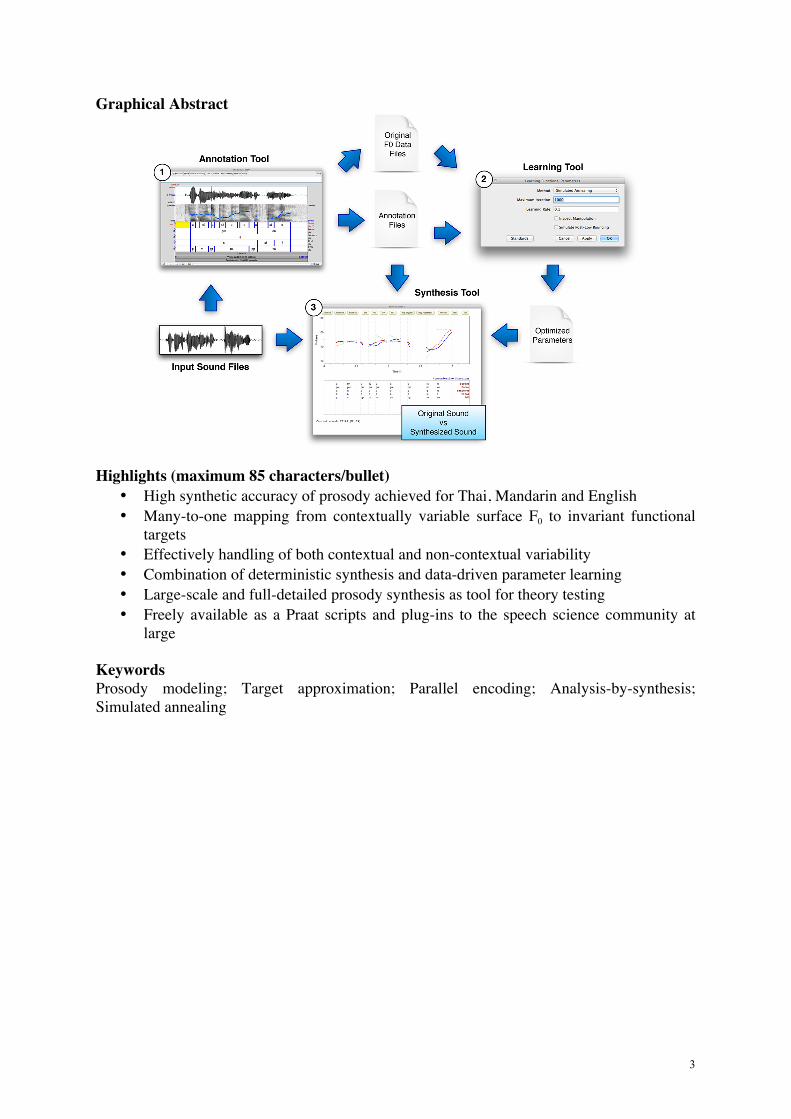
Graphical Abstract
Highlights (maximum 85 characters/bullet)
• High synthetic accuracy of prosody achieved for Thai, Mandarin and English • Many-to-one mapping from contextually variable surface F0 to invariant functional
targets • Effectively handling of both contextual and non-contextual variability • Combination of deterministic synthesis and data-driven parameter learning • Large-scale and full-detailed prosody synthesis as tool for theory testing • Freely available as a Praat scripts and plug-ins to the speech science community at
large Keywords Prosody modeling; Target approximation; Parallel encoding; Analysis-by-synthesis; Simulated annealing
4
1. Introduction Like the segmental aspects of speech (Perkell and Klatt, 1986), and perhaps to an even greater extent, speech prosody exhibits extensive variability and uncertainty, which makes its computational modeling extremely difficult. Among the various aspects of prosody, fundamental frequency (F0) is by far the most challenging, and has attracted most of the research effort. Many theories and computational models of F0 patterns have been proposed over the years (Anderson et al., 1984; Bailly and Holm, 2005; Black and Hunt, 1996; Fujisaki et al., 2005; Grabe et al., 2007; Hirst, 2005, 2011; Jilka et al., 1999; Kochanski and Shih, 2003; Mixdorff et al., 2003; Pierrehumbert, 1980, 1981; Prom-on et al., 2009; Taylor, 2000; van Santen and Möbius, 2000; Xu and Wang, 2001; Xu, 2005), and a large number of empirical studies have been conducted (as reviewed by Wagner and Watson, 2010; Shattuck-Hufnagel and Turk, 1996; Xu, 2011). Despite the extensive effort, however, most of the critical issues still remain unresolved and some are still under heated debate (Arvaniti and Ladd, 2009; Ladd, 2008; Wagner and Watson, 2010; Wightman, 2002; Xu, 2011). This lack of consensus has been an obstacle to linking basic prosody research to applied areas, resulting in slow advances in developing applications with capabilities for processing prosody.
One way to foster significant advances in prosody research is to develop computational models that can be used for theory testing. Such models would allow the translation of theories and empirical findings into algorithms that can predict fully continuous prosodic patterns, which can be directly compared to real speech data. Furthermore, and perhaps more importantly, such computational models would enable theories to predict phonetic details beyond the specific phenomena for which they were originally proposed. Testing such predictive powers would not only help demonstrate theories’ generalizability, but also make them readily applicable to speech technology once the test results are positive. The present study is part of our continued effort in this direction, with a significant extension from our previous work (Prom-on et al., 2009), and with particular focus on the problem of variability. Before describing our current work, however, we will first discuss the main sources of prosodic variability and review how they have been addressed so far.
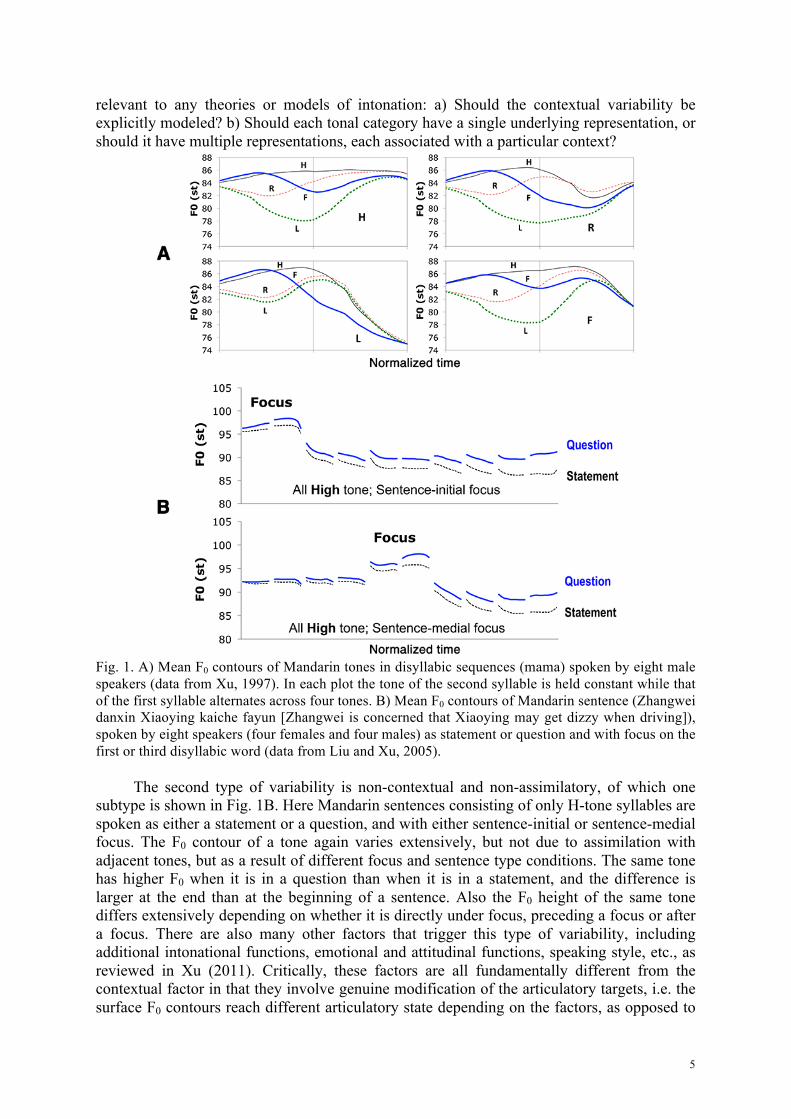
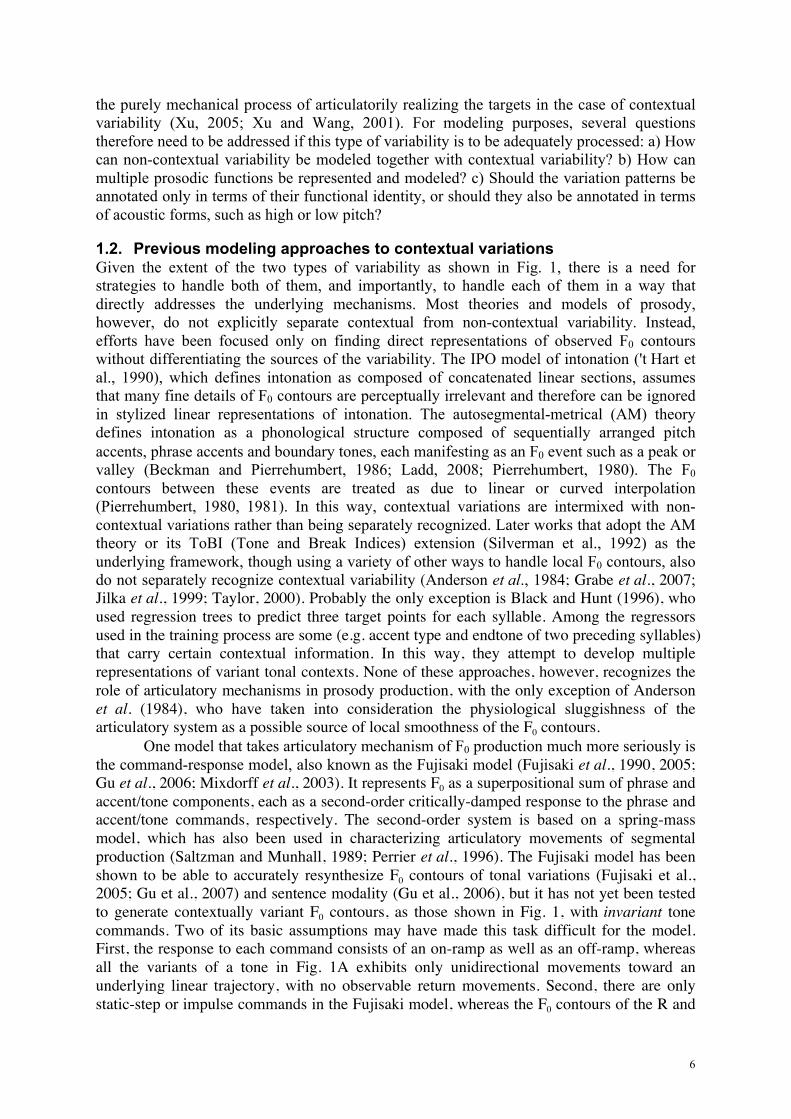
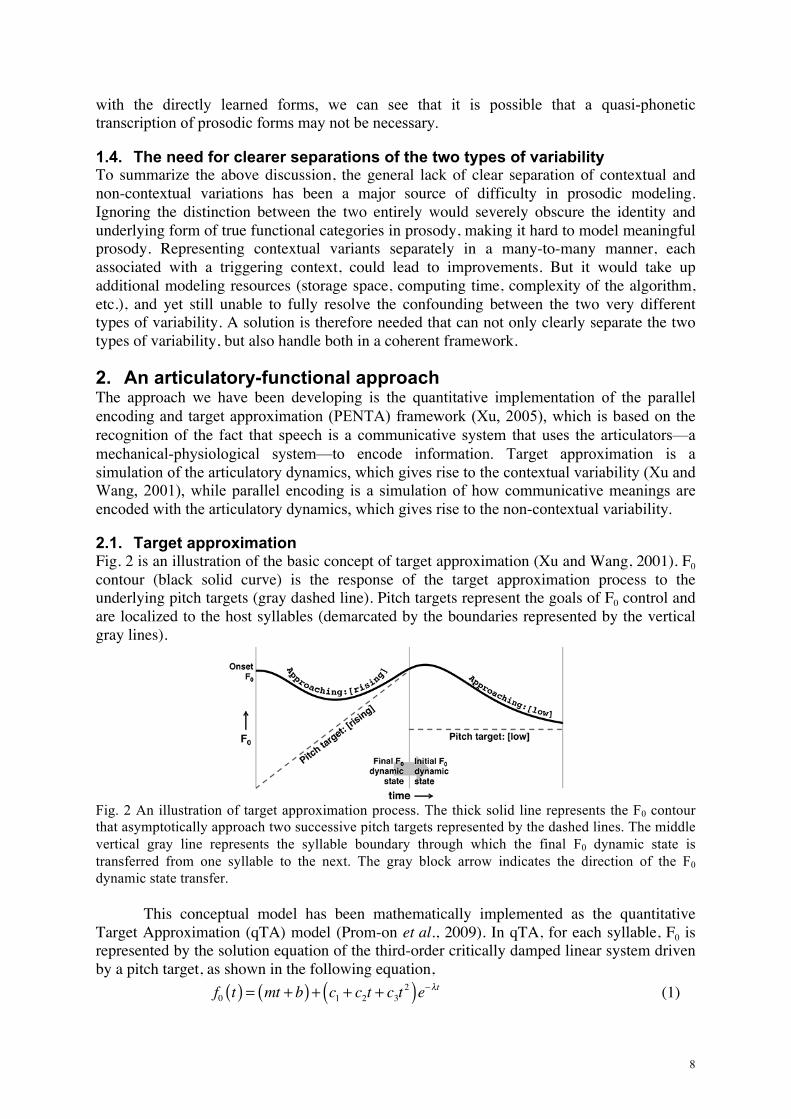
1.1. Two types of prosodic variability Like in the case of segmental aspect of speech (Ladefoged, 1967; Peterson and Barney, 1952), the nature of prosodic variability is best highlighted by controlled comparisons. Fig. 1 displays two very different types of F0 variability with previously reported empirical data (Liu and Xu, 2005; Xu, 1997). The first type is contextual variability, defined as the varying F0 manifestation of a tonal category as a function of its adjacent tones. As shown in Fig. 1A, contextual variability is mostly assimilatory: when the same tone in the second syllable of each graph is preceded by four different tones in the first syllable, its F0 contour varies extensively, especially in the early portion. Despite the extensive variability, however, all the contours gradually converge over time to a trajectory that is appropriate for the underlying tone: high-level for the High (H) tone, rising for the Rising (R) tone, low-level for the Low (L) tone and falling for the Falling (F) tone. As shown in Xu and Sun (2002), such carryover contextual variation is articulatorily inevitable given the physiological limit on the maximum speed of pitch change that applies to both Mandarin and English speakers and across genders. Fig. 1A also demonstrates that contextual variability is anything but trivial. In fact, much effort has been devoted to the understanding and modeling of this variability in terms of tonal coarticulation (Gu et al., 2007; Kochanski and Shih, 2003; Ni et al., 2006; Prom-on et al., 2009; Shen, 1990; Shih, 1987; Wu, 1984). However, theories and models of intonation rarely address the issue of contextual tonal variations explicitly in their original frameworks (Beckman and Pierrehumbert, 1986; Ladd, 2008; Pierrehumbert, 1980; Taylor, 2000; 't Hart et al., 1990). But given its extent as evident from an example in Fig. 1A, two questions are
5
relevant to any theories or models of intonation: a) Should the contextual variability be explicitly modeled? b) Should each tonal category have a single underlying representation, or should it have multiple representations, each associated with a particular context?
Fig. 1. A) Mean F0 contours of Mandarin tones in disyllabic sequences (mama) spoken by eight male speakers (data from Xu, 1997). In each plot the tone of the second syllable is held constant while that of the first syllable alternates across four tones. B) Mean F0 contours of Mandarin sentence (Zhangwei danxin Xiaoying kaiche fayun [Zhangwei is concerned that Xiaoying may get dizzy when driving]), spoken by eight speakers (four females and four males) as statement or question and with focus on the first or third disyllabic word (data from Liu and Xu, 2005).
The second type of variability is non-contextual and non-assimilatory, of which one
subtype is shown in Fig. 1B. Here Mandarin sentences consisting of only H-tone syllables are spoken as either a statement or a question, and with either sentence-initial or sentence-medial focus. The F0 contour of a tone again varies extensively, but not due to assimilation with adjacent tones, but as a result of different focus and sentence type conditions. The same tone has higher F0 when it is in a question than when it is in a statement, and the difference is larger at the end than at the beginning of a sentence. Also the F0 height of the same tone differs extensively depending on whether it is directly under focus, preceding a focus or after a focus. There are also many other factors that trigger this type of variability, including additional intonational functions, emotional and attitudinal functions, speaking style, etc., as reviewed in Xu (2011). Critically, these factors are all fundamentally different from the contextual factor in that they involve genuine modification of the articulatory targets, i.e. the surface F0 contours reach different articulatory state depending on the factors, as opposed to
6
the purely mechanical process of articulatorily realizing the targets in the case of contextual variability (Xu, 2005; Xu and Wang, 2001). For modeling purposes, several questions therefore need to be addressed if this type of variability is to be adequately processed: a) How can non-contextual variability be modeled together with contextual variability? b) How can multiple prosodic functions be represented and modeled? c) Should the variation patterns be annotated only in terms of their functional identity, or should they also be annotated in terms of acoustic forms, such as high or low pitch?
1.2. Previous modeling approaches to contextual variations Given the extent of the two types of variability as shown in Fig. 1, there is a need for strategies to handle both of them, and importantly, to handle each of them in a way that directly addresses the underlying mechanisms. Most theories and models of prosody, however, do not explicitly separate contextual from non-contextual variability. Instead, efforts have been focused only on finding direct representations of observed F0 contours without differentiating the sources of the variability. The IPO model of intonation ('t Hart et al., 1990), which defines intonation as composed of concatenated linear sections, assumes that many fine details of F0 contours are perceptually irrelevant and therefore can be ignored in stylized linear representations of intonation. The autosegmental-metrical (AM) theory defines intonation as a phonological structure composed of sequentially arranged pitch accents, phrase accents and boundary tones, each manifesting as an F0 event such as a peak or valley (Beckman and Pierrehumbert, 1986; Ladd, 2008; Pierrehumbert, 1980). The F0 contours between these events are treated as due to linear or curved interpolation (Pierrehumbert, 1980, 1981). In this way, contextual variations are intermixed with non-contextual variations rather than being separately recognized. Later works that adopt the AM theory or its ToBI (Tone and Break Indices) extension (Silverman et al., 1992) as the underlying framework, though using a variety of other ways to handle local F0 contours, also do not separately recognize contextual variability (Anderson et al., 1984; Grabe et al., 2007; Jilka et al., 1999; Taylor, 2000). Probably the only exception is Black and Hunt (1996), who used regression trees to predict three target points for each syllable. Among the regressors used in the training process are some (e.g. accent type and endtone of two preceding syllables) that carry certain contextual information. In this way, they attempt to develop multiple representations of variant tonal contexts. None of these approaches, however, recognizes the role of articulatory mechanisms in prosody production, with the only exception of Anderson et al. (1984), who have taken into consideration the physiological sluggishness of the articulatory system as a possible source of local smoothness of the F0 contours.
One model that takes articulatory mechanism of F0 production much more seriously is the command-response model, also known as the Fujisaki model (Fujisaki et al., 1990, 2005; Gu et al., 2006; Mixdorff et al., 2003). It represents F0 as a superpositional sum of phrase and accent/tone components, each as a second-order critically-damped response to the phrase and accent/tone commands, respectively. The second-order system is based on a spring-mass model, which has also been used in characterizing articulatory movements of segmental production (Saltzman and Munhall, 1989; Perrier et al., 1996). The Fujisaki model has been shown to be able to accurately resynthesize F0 contours of tonal variations (Fujisaki et al., 2005; Gu et al., 2007) and sentence modality (Gu et al., 2006), but it has not yet been tested to generate contextually variant F0 contours, as those shown in Fig. 1, with invariant tone commands. Two of its basic assumptions may have made this task difficult for the model. First, the response to each command consists of an on-ramp as well as an off-ramp, whereas all the variants of a tone in Fig. 1A exhibits only unidirectional movements toward an underlying linear trajectory, with no observable return movements. Second, there are only static-step or impulse commands in the Fujisaki model, whereas the F0 contours of the R and
7
F tones in the right two plots of Fig. 1A evidently converge to a dynamic rising or falling trajectory, respectively. This suggests that the underlying targets of these tones could be dynamic rather than static. The issue of dynamic targets has been addressed in Fujisaki et al. (2005) by adding to the model negative commands. But this creates a need to optimize for the amplitudes and timings of the additional commands. Third, unlike the syllable-synchronized tonal variation shown in Fig. 1, the timings of all commands, in terms of both onset and offset, are free parameters that need to be estimated during modeling, which also increases of the difficulty of establishing invariant tonal commands.
Thus to the questions of whether contextual variability should be explicitly modeled, the answer by most of the above-mentioned models is negative, because they have either ignored it or handled it indirectly. As for whether each tone should have a single or multiple underlying representations, the answer by those models that do address contextual variability in some way is that there need to be multiple representations, each corresponding to a particular tonal context (Black and Hunt, 1996; Fujisaki et al., 2005; Gu and Lee, 2007). Hence the best conceivable mapping so far between surface tonal realizations and the underlying representations is many-to-many.
1.3. Previous modeling approaches to non-contextual variations Probably because non-contextual variations often involve larger temporal domains than contextual variations, they have been the main focus of most of the theories and models. The strategies for handling non-contextual variability differ extensively, however. Many models do not explicitly separate the non-contextual from the contextual variability, as mentioned earlier. So, of how to model non-contextual variability together with contextual variability is irrelevant to them. A number of models, known as superpositional models, envision surface F0 as composed of different layers of prosodic elements added on top of each other. Among them, the command-response model, also known as the Fujisaki model, distinguishes two such layers: accent commands that correspond to local patterns, and phrase commands that correspond to global patterns (Fujisaki et al., 2005), with the accent commands having smaller time constant (hence faster changes) than the phrase commands. The accent and phrase commands generate two sequences of F0 contours, which are then summed up on a logarithmic scale. The allowance of only two explicit levels is an apparent limit of this model, as it makes it difficult to model more than one non-contextual functions (Gu et al., 2006), which is needed even for the F0 contours in Fig. 1B. The Superposition of Functional Contours (SFC) model alleviates this difficulty by allowing any arbitrary number of layers, referred to as metalinguistic functions (Bailly and Holm, 2005). On the other hand, the fact that SFC represents prototypical contours summarized from training data means that it avoids direct modeling of any articulatory constraints. This limits its ability to efficiently model contextual variability. So, with regard to the question of how multiple prosodic functions can be represented and modeled, the most explicit answer so far is superposition.
Finally, regarding the question as to how variable prosodic patterns should be annotated, the AM/ToBI answer is to use a representation that is at once phonological and quasi-phonetic, because it directly represents the relative pitch of the tone types, i.e., H for high pitch and L for low pitch. Similar quasi-phonetic is also used in INTSINT (Hirst, 2005, 2011) and RaP (Breen et al., 2012). Note that such annotations are even “narrower” than a narrow transcription of the segments by the International Phonetic Alphabet (IPA), because in IPA, symbols like [a], [i] and [u] do not directly represent acoustic or articulatory features such as formant frequency or tongue position. In contrast to these modeling-by-transcription approaches are a number of models that allow the learning of functional forms directly from data (Bailly and Holm, 2005; Black and Hunt, 1996; Fujisaki et al., 2005; Kochanski and Shih, 2003; Vainio et al., 2009). To the extent that they are able to achieve prosody synthesis
8
with the directly learned forms, we can see that it is possible that a quasi-phonetic transcription of prosodic forms may not be necessary.
1.4. The need for clearer separations of the two types of variability To summarize the above discussion, the general lack of clear separation of contextual and non-contextual variations has been a major source of difficulty in prosodic modeling. Ignoring the distinction between the two entirely would severely obscure the identity and underlying form of true functional categories in prosody, making it hard to model meaningful prosody. Representing contextual variants separately in a many-to-many manner, each associated with a triggering context, could lead to improvements. But it would take up additional modeling resources (storage space, computing time, complexity of the algorithm, etc.), and yet still unable to fully resolve the confounding between the two very different types of variability. A solution is therefore needed that can not only clearly separate the two types of variability, but also handle both in a coherent framework.
2. An articulatory-functional approach The approach we have been developing is the quantitative implementation of the parallel encoding and target approximation (PENTA) framework (Xu, 2005), which is based on the recognition of the fact that speech is a communicative system that uses the articulators—a mechanical-physiological system—to encode information. Target approximation is a simulation of the articulatory dynamics, which gives rise to the contextual variability (Xu and Wang, 2001), while parallel encoding is a simulation of how communicative meanings are encoded with the articulatory dynamics, which gives rise to the non-contextual variability.
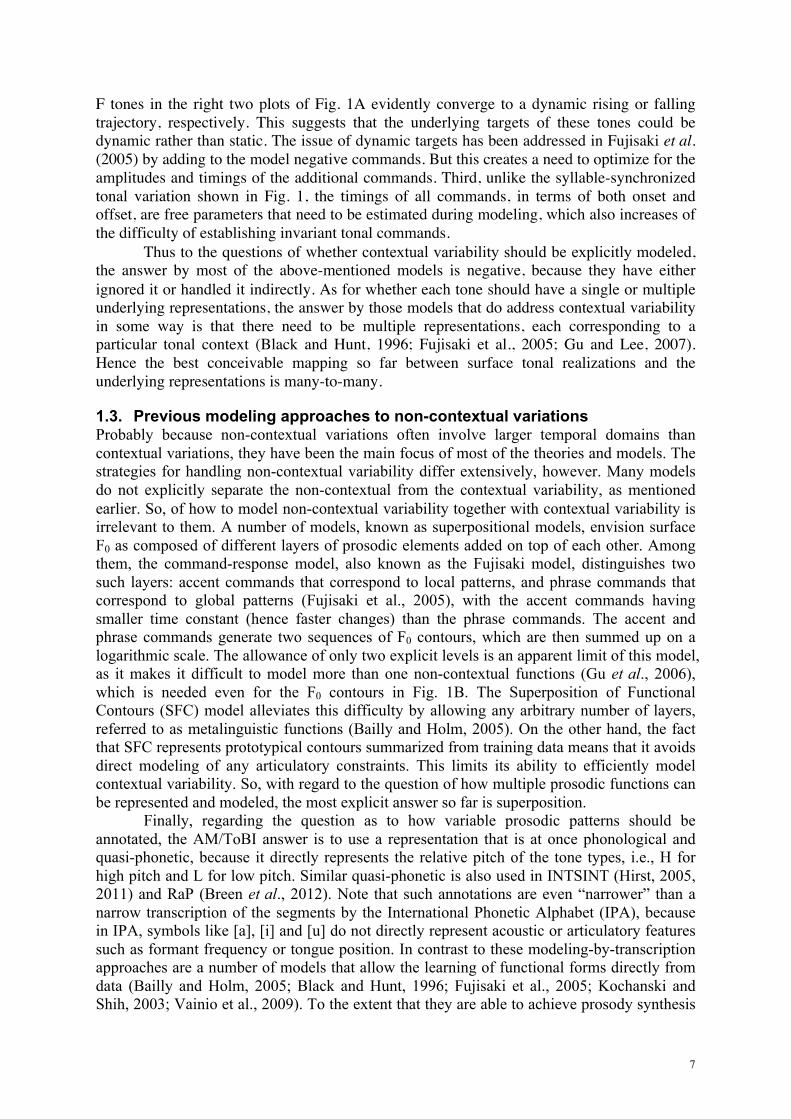
2.1. Target approximation Fig. 2 is an illustration of the basic concept of target approximation (Xu and Wang, 2001). F0 contour (black solid curve) is the response of the target approximation process to the underlying pitch targets (gray dashed line). Pitch targets represent the goals of F0 control and are localized to the host syllables (demarcated by the boundaries represented by the vertical gray lines).
Fig. 2 An illustration of target approximation process. The thick solid line represents the F0 contour that asymptotically approach two successive pitch targets represented by the dashed lines. The middle vertical gray line represents the syllable boundary through which the final F0 dynamic state is transferred from one syllable to the next. The gray block arrow indicates the direction of the F0 dynamic state transfer.
This conceptual model has been mathematically implemented as the quantitative Target Approximation (qTA) model (Prom-on et al., 2009). In qTA, for each syllable, F0 is represented by the solution equation of the third-order critically damped linear system driven by a pitch target, as shown in the following equation, f0 t( ) = mt + b( ) + c1 + c2t + c3t
2( )e−λt (1)
9
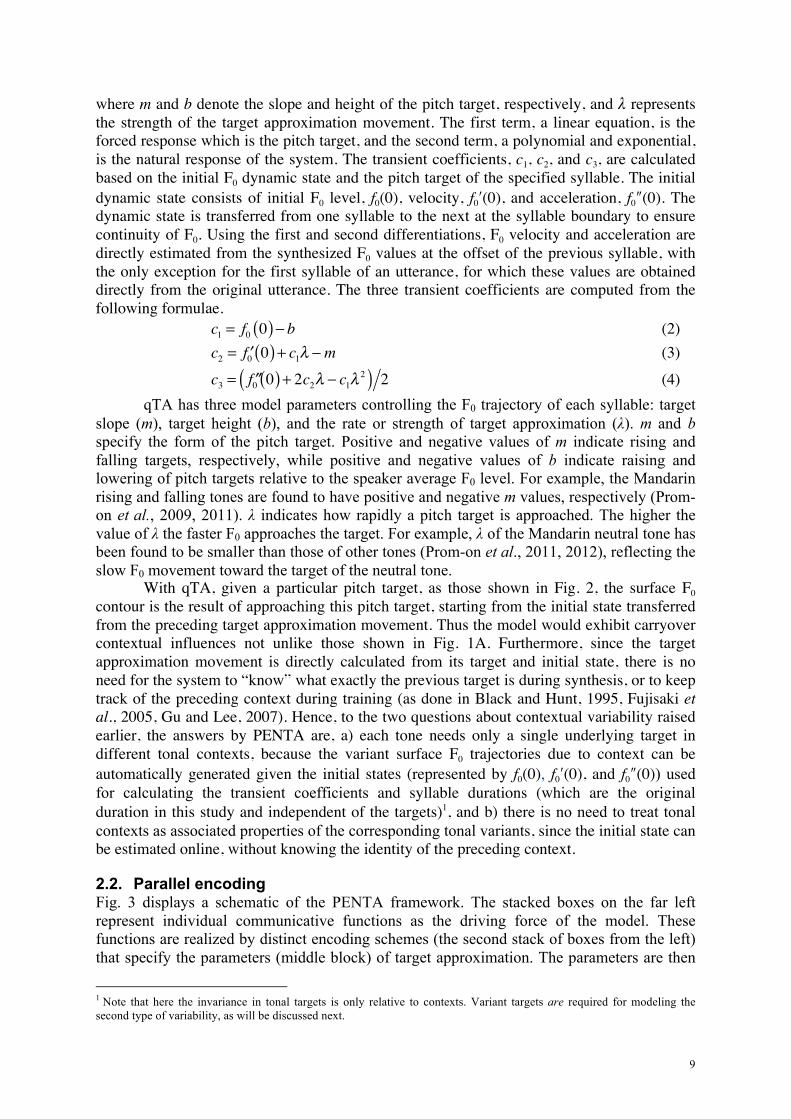
where m and b denote the slope and height of the pitch target, respectively, and λ represents the strength of the target approximation movement. The first term, a linear equation, is the forced response which is the pitch target, and the second term, a polynomial and exponential, is the natural response of the system. The transient coefficients, c1, c2, and c3, are calculated based on the initial F0 dynamic state and the pitch target of the specified syllable. The initial dynamic state consists of initial F0 level, f0(0), velocity, f0ʹ′(0), and acceleration, f0ʺ″(0). The dynamic state is transferred from one syllable to the next at the syllable boundary to ensure continuity of F0. Using the first and second differentiations, F0 velocity and acceleration are directly estimated from the synthesized F0 values at the offset of the previous syllable, with the only exception for the first syllable of an utterance, for which these values are obtained directly from the original utterance. The three transient coefficients are computed from the following formulae. c1 = f0 0( )− b (2) c2 = ′f0 0( ) + c1λ −m (3) c3 = ′′f0 0( ) + 2c2λ − c1λ
2( ) 2 (4) qTA has three model parameters controlling the F0 trajectory of each syllable: target
slope (m), target height (b), and the rate or strength of target approximation (λ). m and b specify the form of the pitch target. Positive and negative values of m indicate rising and falling targets, respectively, while positive and negative values of b indicate raising and lowering of pitch targets relative to the speaker average F0 level. For example, the Mandarin rising and falling tones are found to have positive and negative m values, respectively (Prom-on et al., 2009, 2011). λ indicates how rapidly a pitch target is approached. The higher the value of λ the faster F0 approaches the target. For example, λ of the Mandarin neutral tone has been found to be smaller than those of other tones (Prom-on et al., 2011, 2012), reflecting the slow F0 movement toward the target of the neutral tone.
With qTA, given a particular pitch target, as those shown in Fig. 2, the surface F0 contour is the result of approaching this pitch target, starting from the initial state transferred from the preceding target approximation movement. Thus the model would exhibit carryover contextual influences not unlike those shown in Fig. 1A. Furthermore, since the target approximation movement is directly calculated from its target and initial state, there is no need for the system to “know” what exactly the previous target is during synthesis, or to keep track of the preceding context during training (as done in Black and Hunt, 1995, Fujisaki et al., 2005, Gu and Lee, 2007). Hence, to the two questions about contextual variability raised earlier, the answers by PENTA are, a) each tone needs only a single underlying target in different tonal contexts, because the variant surface F0 trajectories due to context can be automatically generated given the initial states (represented by f0(0), f0ʹ′(0), and f0ʺ″(0)) used for calculating the transient coefficients and syllable durations (which are the original duration in this study and independent of the targets)1, and b) there is no need to treat tonal contexts as associated properties of the corresponding tonal variants, since the initial state can be estimated online, without knowing the identity of the preceding context.
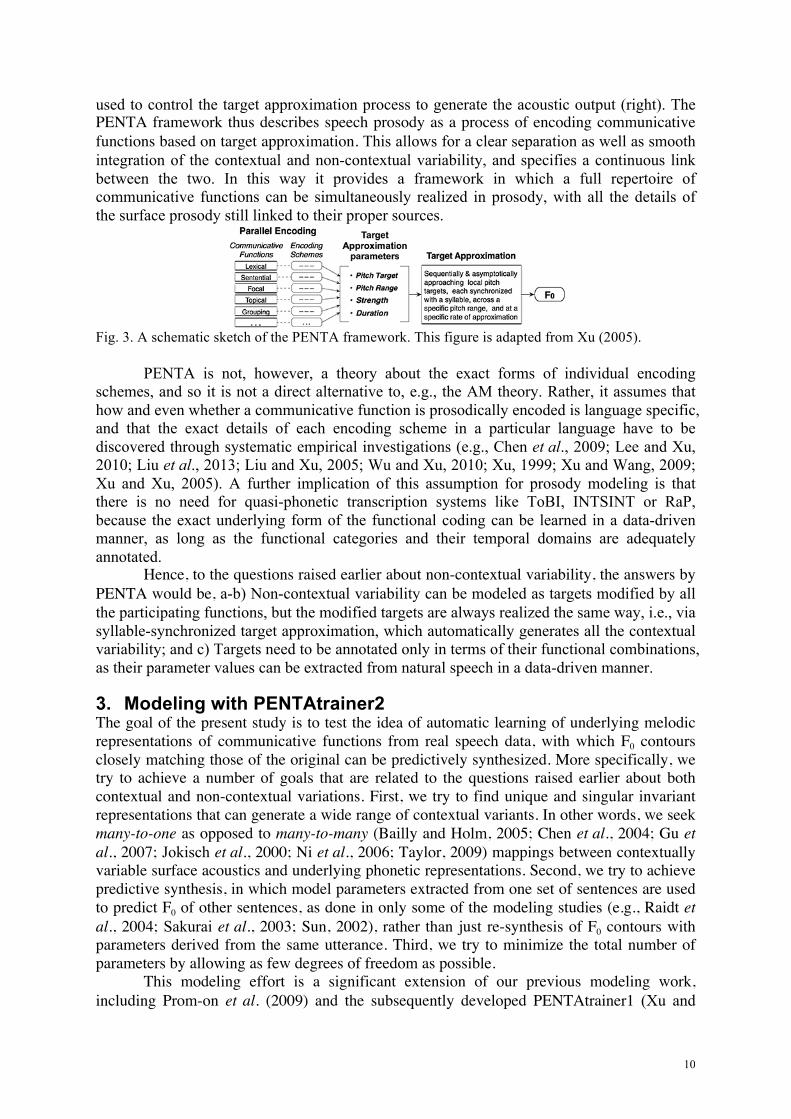
2.2. Parallel encoding Fig. 3 displays a schematic of the PENTA framework. The stacked boxes on the far left represent individual communicative functions as the driving force of the model. These functions are realized by distinct encoding schemes (the second stack of boxes from the left) that specify the parameters (middle block) of target approximation. The parameters are then
1 Note that here the invariance in tonal targets is only relative to contexts. Variant targets are required for modeling the second type of variability, as will be discussed next.
10
used to control the target approximation process to generate the acoustic output (right). The PENTA framework thus describes speech prosody as a process of encoding communicative functions based on target approximation. This allows for a clear separation as well as smooth integration of the contextual and non-contextual variability, and specifies a continuous link between the two. In this way it provides a framework in which a full repertoire of communicative functions can be simultaneously realized in prosody, with all the details of the surface prosody still linked to their proper sources.
Fig. 3. A schematic sketch of the PENTA framework. This figure is adapted from Xu (2005).
PENTA is not, however, a theory about the exact forms of individual encoding schemes, and so it is not a direct alternative to, e.g., the AM theory. Rather, it assumes that how and even whether a communicative function is prosodically encoded is language specific, and that the exact details of each encoding scheme in a particular language have to be discovered through systematic empirical investigations (e.g., Chen et al., 2009; Lee and Xu, 2010; Liu et al., 2013; Liu and Xu, 2005; Wu and Xu, 2010; Xu, 1999; Xu and Wang, 2009; Xu and Xu, 2005). A further implication of this assumption for prosody modeling is that there is no need for quasi-phonetic transcription systems like ToBI, INTSINT or RaP, because the exact underlying form of the functional coding can be learned in a data-driven manner, as long as the functional categories and their temporal domains are adequately annotated.
Hence, to the questions raised earlier about non-contextual variability, the answers by PENTA would be, a-b) Non-contextual variability can be modeled as targets modified by all the participating functions, but the modified targets are always realized the same way, i.e., via syllable-synchronized target approximation, which automatically generates all the contextual variability; and c) Targets need to be annotated only in terms of their functional combinations, as their parameter values can be extracted from natural speech in a data-driven manner.
3. Modeling with PENTAtrainer2 The goal of the present study is to test the idea of automatic learning of underlying melodic representations of communicative functions from real speech data, with which F0 contours closely matching those of the original can be predictively synthesized. More specifically, we try to achieve a number of goals that are related to the questions raised earlier about both contextual and non-contextual variations. First, we try to find unique and singular invariant representations that can generate a wide range of contextual variants. In other words, we seek many-to-one as opposed to many-to-many (Bailly and Holm, 2005; Chen et al., 2004; Gu et al., 2007; Jokisch et al., 2000; Ni et al., 2006; Taylor, 2009) mappings between contextually variable surface acoustics and underlying phonetic representations. Second, we try to achieve predictive synthesis, in which model parameters extracted from one set of sentences are used to predict F0 of other sentences, as done in only some of the modeling studies (e.g., Raidt et al., 2004; Sakurai et al., 2003; Sun, 2002), rather than just re-synthesis of F0 contours with parameters derived from the same utterance. Third, we try to minimize the total number of parameters by allowing as few degrees of freedom as possible.
This modeling effort is a significant extension of our previous modeling work, including Prom-on et al. (2009) and the subsequently developed PENTAtrainer1 (Xu and
11
Prom-on, 2010-2013). In the following two subsections we will describe the new components added to the previous system. In Section 4, we will explain how the newly developed PENTAtrainer2 is tested and report the results of modeling experiments on Thai, Mandarin and English. In Section 5 we will demonstrate the capability of PENTAtrainer2 to be used as a tool for theoretical hypothesis testing.
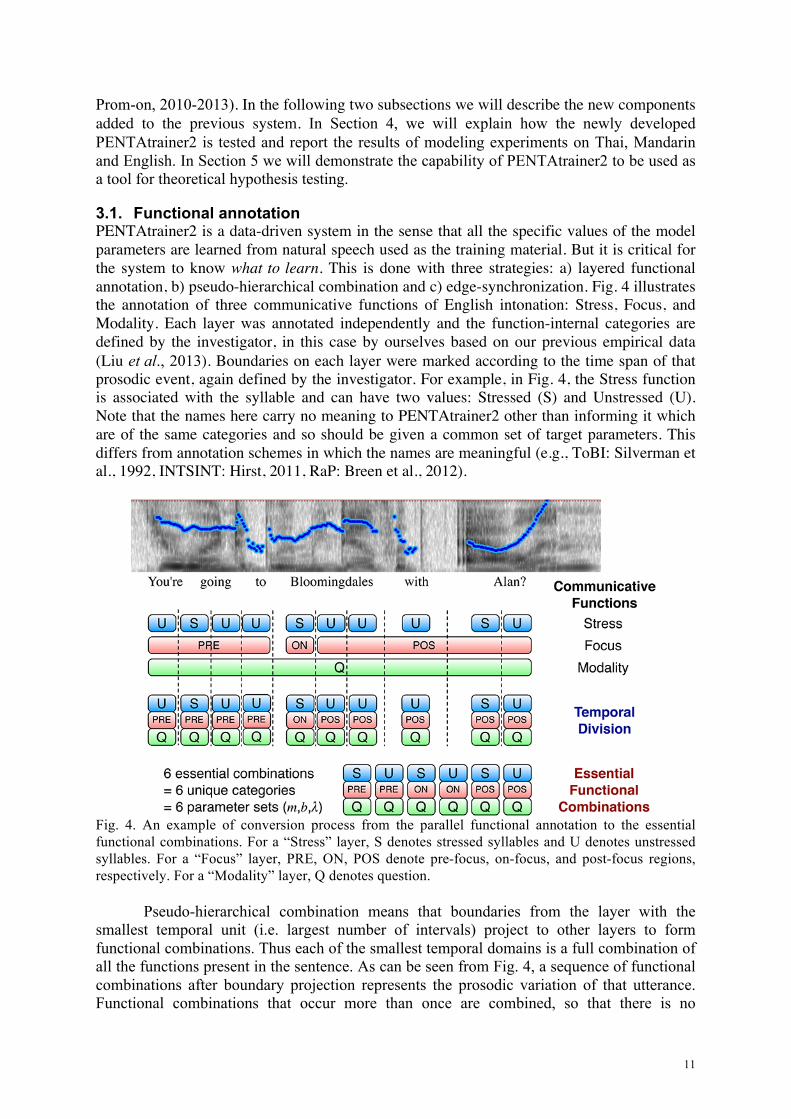
3.1. Functional annotation PENTAtrainer2 is a data-driven system in the sense that all the specific values of the model parameters are learned from natural speech used as the training material. But it is critical for the system to know what to learn. This is done with three strategies: a) layered functional annotation, b) pseudo-hierarchical combination and c) edge-synchronization. Fig. 4 illustrates the annotation of three communicative functions of English intonation: Stress, Focus, and Modality. Each layer was annotated independently and the function-internal categories are defined by the investigator, in this case by ourselves based on our previous empirical data (Liu et al., 2013). Boundaries on each layer were marked according to the time span of that prosodic event, again defined by the investigator. For example, in Fig. 4, the Stress function is associated with the syllable and can have two values: Stressed (S) and Unstressed (U). Note that the names here carry no meaning to PENTAtrainer2 other than informing it which are of the same categories and so should be given a common set of target parameters. This differs from annotation schemes in which the names are meaningful (e.g., ToBI: Silverman et al., 1992, INTSINT: Hirst, 2011, RaP: Breen et al., 2012).
Fig. 4. An example of conversion process from the parallel functional annotation to the essential functional combinations. For a “Stress” layer, S denotes stressed syllables and U denotes unstressed syllables. For a “Focus” layer, PRE, ON, POS denote pre-focus, on-focus, and post-focus regions, respectively. For a “Modality” layer, Q denotes question.
Pseudo-hierarchical combination means that boundaries from the layer with the smallest temporal unit (i.e. largest number of intervals) project to other layers to form functional combinations. Thus each of the smallest temporal domains is a full combination of all the functions present in the sentence. As can be seen from Fig. 4, a sequence of functional combinations after boundary projection represents the prosodic variation of that utterance. Functional combinations that occur more than once are combined, so that there is no
12
redundancy of functional representation. Note that such functional combination and boundary projection is an alternative to the superposition approach which requires F0-contour decomposition before parameter extraction, extracting two separate sets of parameters during trainings, and algorithmic summation during synthesis (Bailly and Holm, 2005; Fujisaki et al., 2005; Mixdorff et al., 2003). Here for each functional combination at the smallest temporal unit, only a single set of parameters need to be learned directly from the original (i.e., non-decomposed) F0 contours during training and used during synthesis. Finally, edge-synchronization means that all the layers, regardless of their own temporal scope, have fully synchronized edges with the smallest units. This is similar to the approaches of Bailly and Holm (2005) and Black and Hunt (1996), but differs from the Fujisaki model for which phrase commands and accent commands each have their own free onsets and offsets, and so both have to be learned separately (thus with additional degrees of freedom).
The functional annotation concept implemented in PENTAtrainer2 requires the annotation of only the temporal intervals of components of hypothetical prosodic functions, while the discovery of the function-specific parameters is left to the training process. Compared to annotation systems like ToBI, this frees the investigator of the responsibility to make detailed and quasi-phonetic transcriptions based on careful F0 inspection and listening. It also potentially enhances annotation consistency, as true communicative functions, by definition, are commonly shared by native speakers, thus alleviating the well-known problem of low cross-labeler consistency in ToBI type annotations (Breen et al., 2012; Syrdal and McGory, 2000; Wightman and Rose, 1999).
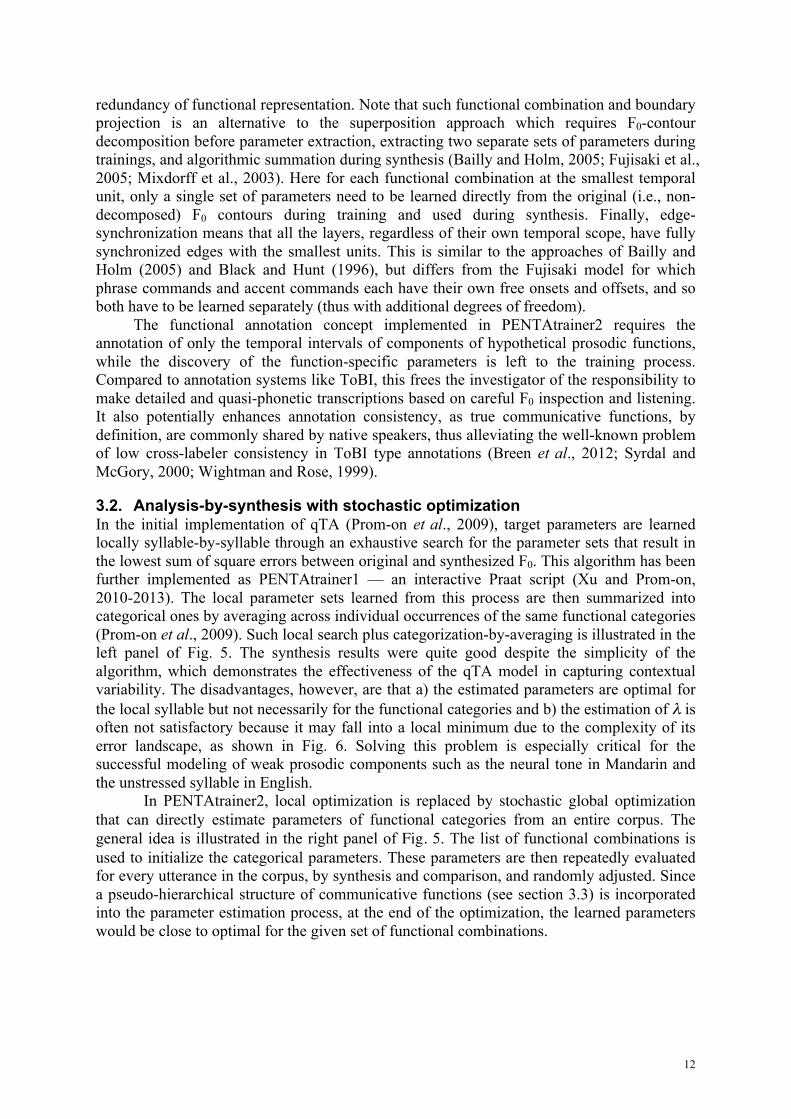
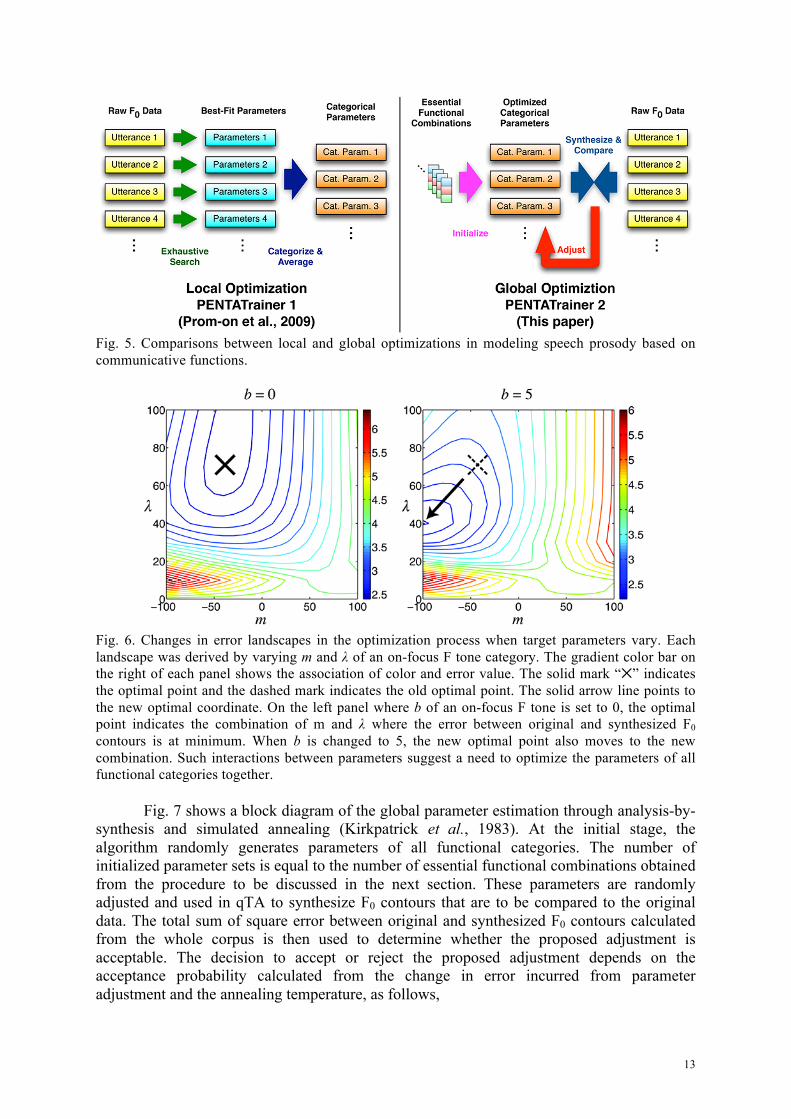
3.2. Analysis-by-synthesis with stochastic optimization In the initial implementation of qTA (Prom-on et al., 2009), target parameters are learned locally syllable-by-syllable through an exhaustive search for the parameter sets that result in the lowest sum of square errors between original and synthesized F0. This algorithm has been further implemented as PENTAtrainer1 — an interactive Praat script (Xu and Prom-on, 2010-2013). The local parameter sets learned from this process are then summarized into categorical ones by averaging across individual occurrences of the same functional categories (Prom-on et al., 2009). Such local search plus categorization-by-averaging is illustrated in the left panel of Fig. 5. The synthesis results were quite good despite the simplicity of the algorithm, which demonstrates the effectiveness of the qTA model in capturing contextual variability. The disadvantages, however, are that a) the estimated parameters are optimal for the local syllable but not necessarily for the functional categories and b) the estimation of λ is often not satisfactory because it may fall into a local minimum due to the complexity of its error landscape, as shown in Fig. 6. Solving this problem is especially critical for the successful modeling of weak prosodic components such as the neural tone in Mandarin and the unstressed syllable in English.
In PENTAtrainer2, local optimization is replaced by stochastic global optimization that can directly estimate parameters of functional categories from an entire corpus. The general idea is illustrated in the right panel of Fig. 5. The list of functional combinations is used to initialize the categorical parameters. These parameters are then repeatedly evaluated for every utterance in the corpus, by synthesis and comparison, and randomly adjusted. Since a pseudo-hierarchical structure of communicative functions (see section 3.3) is incorporated into the parameter estimation process, at the end of the optimization, the learned parameters would be close to optimal for the given set of functional combinations.
13
Fig. 5. Comparisons between local and global optimizations in modeling speech prosody based on communicative functions.
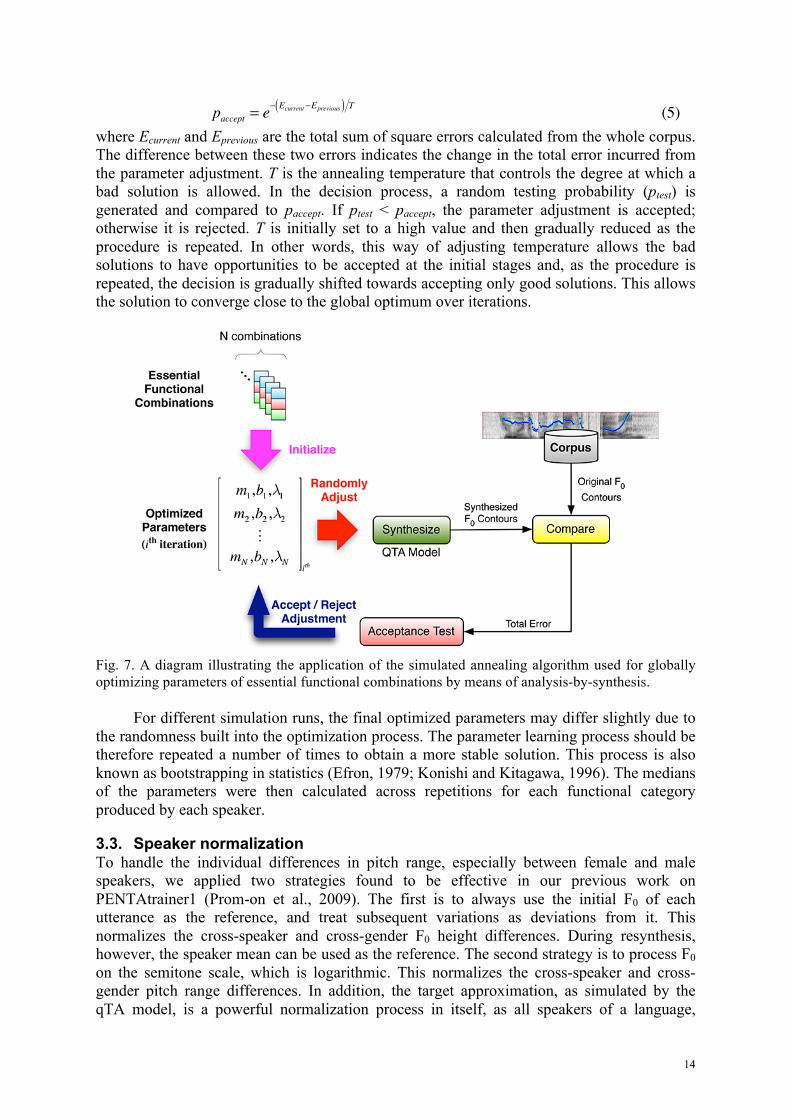
Fig. 6. Changes in error landscapes in the optimization process when target parameters vary. Each landscape was derived by varying m and λ of an on-focus F tone category. The gradient color bar on the right of each panel shows the association of color and error value. The solid mark “✕” indicates the optimal point and the dashed mark indicates the old optimal point. The solid arrow line points to the new optimal coordinate. On the left panel where b of an on-focus F tone is set to 0, the optimal point indicates the combination of m and λ where the error between original and synthesized F0 contours is at minimum. When b is changed to 5, the new optimal point also moves to the new combination. Such interactions between parameters suggest a need to optimize the parameters of all functional categories together.
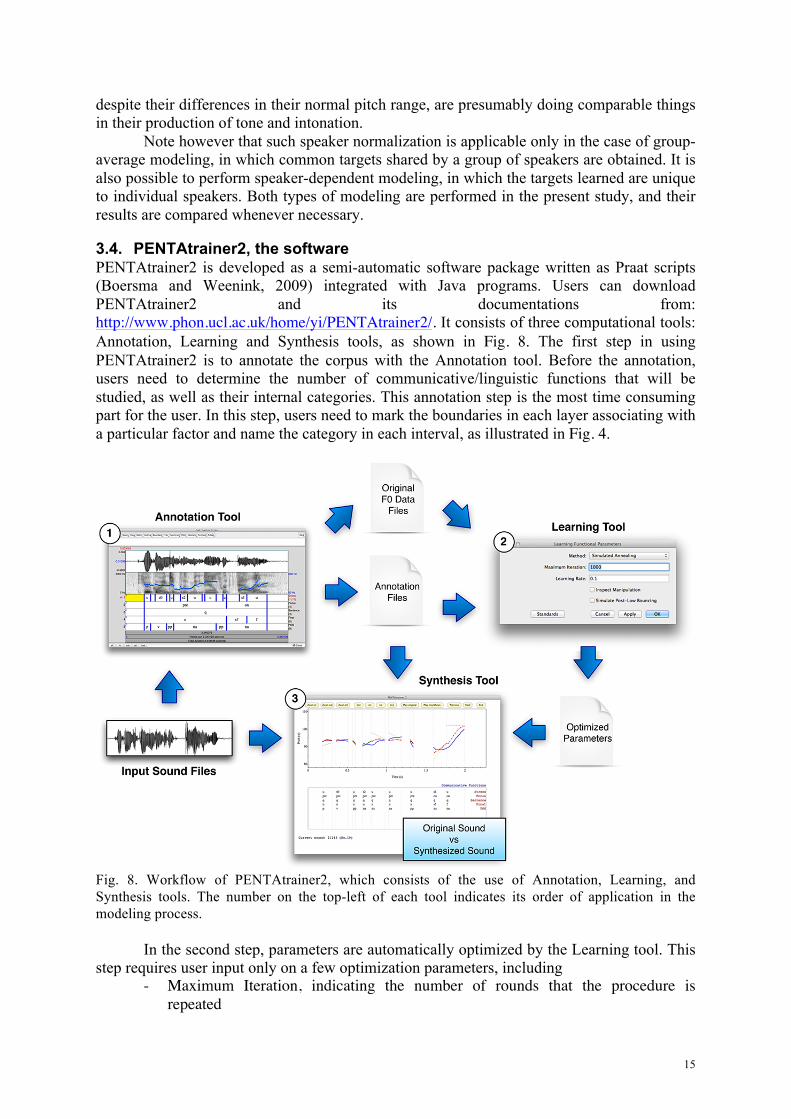
Fig. 7 shows a block diagram of the global parameter estimation through analysis-by-synthesis and simulated annealing (Kirkpatrick et al., 1983). At the initial stage, the algorithm randomly generates parameters of all functional categories. The number of initialized parameter sets is equal to the number of essential functional combinations obtained from the procedure to be discussed in the next section. These parameters are randomly adjusted and used in qTA to synthesize F0 contours that are to be compared to the original data. The total sum of square error between original and synthesized F0 contours calculated from the whole corpus is then used to determine whether the proposed adjustment is acceptable. The decision to accept or reject the proposed adjustment depends on the acceptance probability calculated from the change in error incurred from parameter adjustment and the annealing temperature, as follows,
14
paccept = e− Ecurrent−Eprevious( ) T
(5) where Ecurrent and Eprevious are the total sum of square errors calculated from the whole corpus. The difference between these two errors indicates the change in the total error incurred from the parameter adjustment. T is the annealing temperature that controls the degree at which a bad solution is allowed. In the decision process, a random testing probability (ptest) is generated and compared to paccept. If ptest < paccept, the parameter adjustment is accepted; otherwise it is rejected. T is initially set to a high value and then gradually reduced as the procedure is repeated. In other words, this way of adjusting temperature allows the bad solutions to have opportunities to be accepted at the initial stages and, as the procedure is repeated, the decision is gradually shifted towards accepting only good solutions. This allows the solution to converge close to the global optimum over iterations.
Fig. 7. A diagram illustrating the application of the simulated annealing algorithm used for globally optimizing parameters of essential functional combinations by means of analysis-by-synthesis.
For different simulation runs, the final optimized parameters may differ slightly due to the randomness built into the optimization process. The parameter learning process should be therefore repeated a number of times to obtain a more stable solution. This process is also known as bootstrapping in statistics (Efron, 1979; Konishi and Kitagawa, 1996). The medians of the parameters were then calculated across repetitions for each functional category produced by each speaker.
3.3. Speaker normalization To handle the individual differences in pitch range, especially between female and male speakers, we applied two strategies found to be effective in our previous work on PENTAtrainer1 (Prom-on et al., 2009). The first is to always use the initial F0 of each utterance as the reference, and treat subsequent variations as deviations from it. This normalizes the cross-speaker and cross-gender F0 height differences. During resynthesis, however, the speaker mean can be used as the reference. The second strategy is to process F0 on the semitone scale, which is logarithmic. This normalizes the cross-speaker and cross-gender pitch range differences. In addition, the target approximation, as simulated by the qTA model, is a powerful normalization process in itself, as all speakers of a language,
15
despite their differences in their normal pitch range, are presumably doing comparable things in their production of tone and intonation.
Note however that such speaker normalization is applicable only in the case of group-average modeling, in which common targets shared by a group of speakers are obtained. It is also possible to perform speaker-dependent modeling, in which the targets learned are unique to individual speakers. Both types of modeling are performed in the present study, and their results are compared whenever necessary.
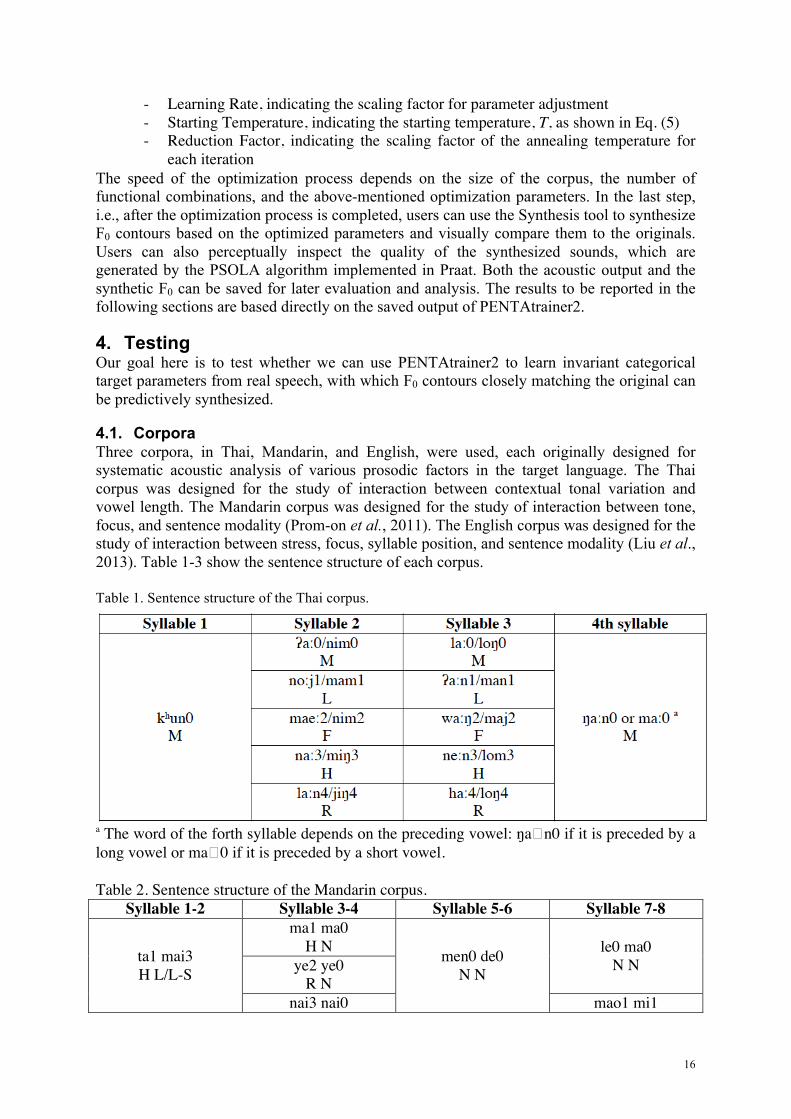
3.4. PENTAtrainer2, the software PENTAtrainer2 is developed as a semi-automatic software package written as Praat scripts (Boersma and Weenink, 2009) integrated with Java programs. Users can download PENTAtrainer2 and its documentations from: http://www.phon.ucl.ac.uk/home/yi/PENTAtrainer2/. It consists of three computational tools: Annotation, Learning and Synthesis tools, as shown in Fig. 8. The first step in using PENTAtrainer2 is to annotate the corpus with the Annotation tool. Before the annotation, users need to determine the number of communicative/linguistic functions that will be studied, as well as their internal categories. This annotation step is the most time consuming part for the user. In this step, users need to mark the boundaries in each layer associating with a particular factor and name the category in each interval, as illustrated in Fig. 4.
Fig. 8. Workflow of PENTAtrainer2, which consists of the use of Annotation, Learning, and Synthesis tools. The number on the top-left of each tool indicates its order of application in the modeling process.
In the second step, parameters are automatically optimized by the Learning tool. This step requires user input only on a few optimization parameters, including
- Maximum Iteration, indicating the number of rounds that the procedure is repeated
16
- Learning Rate, indicating the scaling factor for parameter adjustment - Starting Temperature, indicating the starting temperature, T, as shown in Eq. (5) - Reduction Factor, indicating the scaling factor of the annealing temperature for
each iteration The speed of the optimization process depends on the size of the corpus, the number of functional combinations, and the above-mentioned optimization parameters. In the last step, i.e., after the optimization process is completed, users can use the Synthesis tool to synthesize F0 contours based on the optimized parameters and visually compare them to the originals. Users can also perceptually inspect the quality of the synthesized sounds, which are generated by the PSOLA algorithm implemented in Praat. Both the acoustic output and the synthetic F0 can be saved for later evaluation and analysis. The results to be reported in the following sections are based directly on the saved output of PENTAtrainer2.
4. Testing Our goal here is to test whether we can use PENTAtrainer2 to learn invariant categorical target parameters from real speech, with which F0 contours closely matching the original can be predictively synthesized.
4.1. Corpora Three corpora, in Thai, Mandarin, and English, were used, each originally designed for systematic acoustic analysis of various prosodic factors in the target language. The Thai corpus was designed for the study of interaction between contextual tonal variation and vowel length. The Mandarin corpus was designed for the study of interaction between tone, focus, and sentence modality (Prom-on et al., 2011). The English corpus was designed for the study of interaction between stress, focus, syllable position, and sentence modality (Liu et al., 2013). Table 1-3 show the sentence structure of each corpus. Table 1. Sentence structure of the Thai corpus.
a The word of the forth syllable depends on the preceding vowel: ŋa�n0 if it is preceded by a long vowel or ma�0 if it is preceded by a short vowel. Table 2. Sentence structure of the Mandarin corpus.
Syllable 1-2 Syllable 3-4 Syllable 5-6 Syllable 7-8
ta1 mai3 H L/L-S
ma1 ma0 H N men0 de0
N N
le0 ma0 N N ye2 ye0
R N nai3 nai0 mao1 mi1
17
L N H H-F mei4 mei0
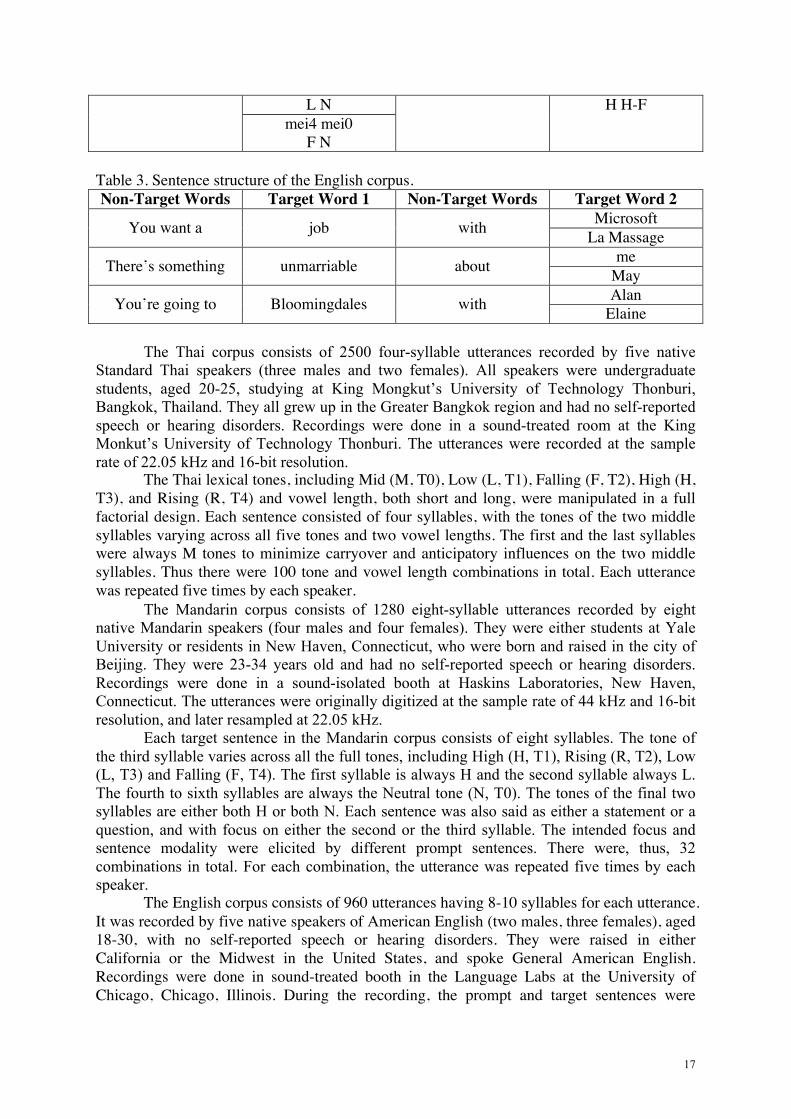
F N Table 3. Sentence structure of the English corpus. Non-Target Words Target Word 1 Non-Target Words Target Word 2
You want a job with Microsoft La Massage
There’s something unmarriable about me May
You’re going to Bloomingdales with Alan Elaine
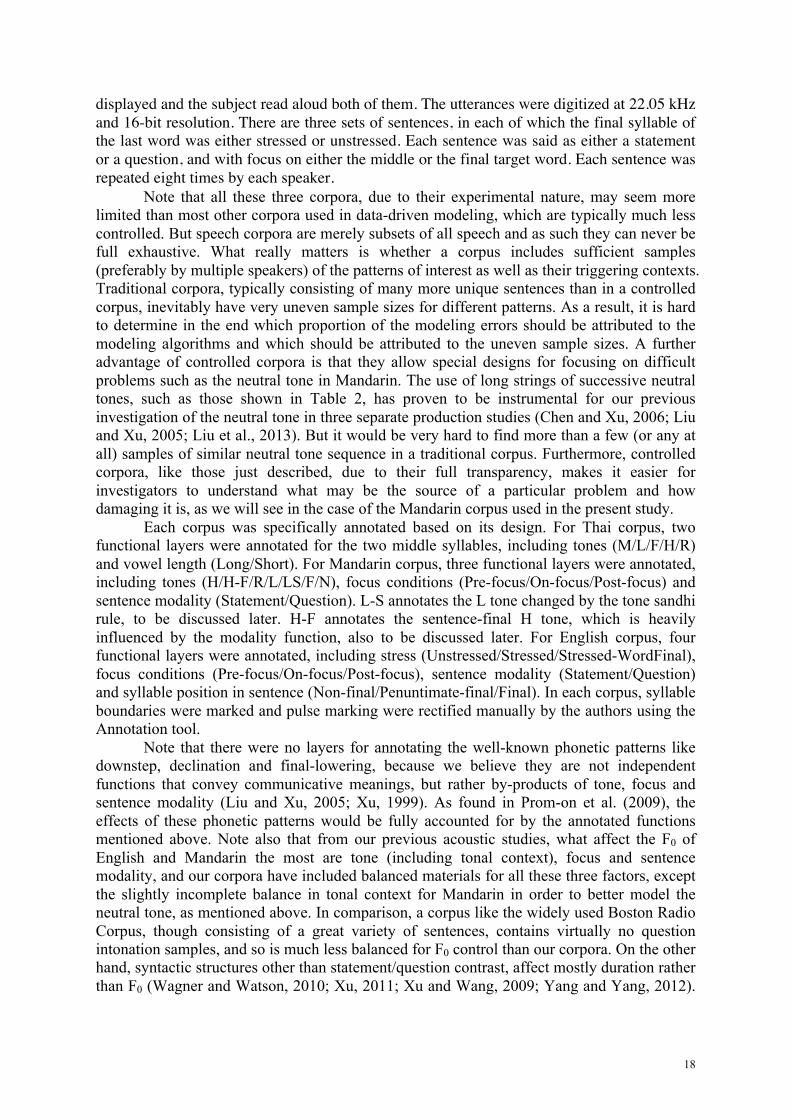
The Thai corpus consists of 2500 four-syllable utterances recorded by five native
Standard Thai speakers (three males and two females). All speakers were undergraduate students, aged 20-25, studying at King Mongkut’s University of Technology Thonburi, Bangkok, Thailand. They all grew up in the Greater Bangkok region and had no self-reported speech or hearing disorders. Recordings were done in a sound-treated room at the King Monkut’s University of Technology Thonburi. The utterances were recorded at the sample rate of 22.05 kHz and 16-bit resolution.
The Thai lexical tones, including Mid (M, T0), Low (L, T1), Falling (F, T2), High (H, T3), and Rising (R, T4) and vowel length, both short and long, were manipulated in a full factorial design. Each sentence consisted of four syllables, with the tones of the two middle syllables varying across all five tones and two vowel lengths. The first and the last syllables were always M tones to minimize carryover and anticipatory influences on the two middle syllables. Thus there were 100 tone and vowel length combinations in total. Each utterance was repeated five times by each speaker.
The Mandarin corpus consists of 1280 eight-syllable utterances recorded by eight native Mandarin speakers (four males and four females). They were either students at Yale University or residents in New Haven, Connecticut, who were born and raised in the city of Beijing. They were 23-34 years old and had no self-reported speech or hearing disorders. Recordings were done in a sound-isolated booth at Haskins Laboratories, New Haven, Connecticut. The utterances were originally digitized at the sample rate of 44 kHz and 16-bit resolution, and later resampled at 22.05 kHz.
Each target sentence in the Mandarin corpus consists of eight syllables. The tone of the third syllable varies across all the full tones, including High (H, T1), Rising (R, T2), Low (L, T3) and Falling (F, T4). The first syllable is always H and the second syllable always L. The fourth to sixth syllables are always the Neutral tone (N, T0). The tones of the final two syllables are either both H or both N. Each sentence was also said as either a statement or a question, and with focus on either the second or the third syllable. The intended focus and sentence modality were elicited by different prompt sentences. There were, thus, 32 combinations in total. For each combination, the utterance was repeated five times by each speaker.
The English corpus consists of 960 utterances having 8-10 syllables for each utterance. It was recorded by five native speakers of American English (two males, three females), aged 18-30, with no self-reported speech or hearing disorders. They were raised in either California or the Midwest in the United States, and spoke General American English. Recordings were done in sound-treated booth in the Language Labs at the University of Chicago, Chicago, Illinois. During the recording, the prompt and target sentences were
18
displayed and the subject read aloud both of them. The utterances were digitized at 22.05 kHz and 16-bit resolution. There are three sets of sentences, in each of which the final syllable of the last word was either stressed or unstressed. Each sentence was said as either a statement or a question, and with focus on either the middle or the final target word. Each sentence was repeated eight times by each speaker.
Note that all these three corpora, due to their experimental nature, may seem more limited than most other corpora used in data-driven modeling, which are typically much less controlled. But speech corpora are merely subsets of all speech and as such they can never be full exhaustive. What really matters is whether a corpus includes sufficient samples (preferably by multiple speakers) of the patterns of interest as well as their triggering contexts. Traditional corpora, typically consisting of many more unique sentences than in a controlled corpus, inevitably have very uneven sample sizes for different patterns. As a result, it is hard to determine in the end which proportion of the modeling errors should be attributed to the modeling algorithms and which should be attributed to the uneven sample sizes. A further advantage of controlled corpora is that they allow special designs for focusing on difficult problems such as the neutral tone in Mandarin. The use of long strings of successive neutral tones, such as those shown in Table 2, has proven to be instrumental for our previous investigation of the neutral tone in three separate production studies (Chen and Xu, 2006; Liu and Xu, 2005; Liu et al., 2013). But it would be very hard to find more than a few (or any at all) samples of similar neutral tone sequence in a traditional corpus. Furthermore, controlled corpora, like those just described, due to their full transparency, makes it easier for investigators to understand what may be the source of a particular problem and how damaging it is, as we will see in the case of the Mandarin corpus used in the present study.
Each corpus was specifically annotated based on its design. For Thai corpus, two functional layers were annotated for the two middle syllables, including tones (M/L/F/H/R) and vowel length (Long/Short). For Mandarin corpus, three functional layers were annotated, including tones (H/H-F/R/L/LS/F/N), focus conditions (Pre-focus/On-focus/Post-focus) and sentence modality (Statement/Question). L-S annotates the L tone changed by the tone sandhi rule, to be discussed later. H-F annotates the sentence-final H tone, which is heavily influenced by the modality function, also to be discussed later. For English corpus, four functional layers were annotated, including stress (Unstressed/Stressed/Stressed-WordFinal), focus conditions (Pre-focus/On-focus/Post-focus), sentence modality (Statement/Question) and syllable position in sentence (Non-final/Penuntimate-final/Final). In each corpus, syllable boundaries were marked and pulse marking were rectified manually by the authors using the Annotation tool.
Note that there were no layers for annotating the well-known phonetic patterns like downstep, declination and final-lowering, because we believe they are not independent functions that convey communicative meanings, but rather by-products of tone, focus and sentence modality (Liu and Xu, 2005; Xu, 1999). As found in Prom-on et al. (2009), the effects of these phonetic patterns would be fully accounted for by the annotated functions mentioned above. Note also that from our previous acoustic studies, what affect the F0 of English and Mandarin the most are tone (including tonal context), focus and sentence modality, and our corpora have included balanced materials for all these three factors, except the slightly incomplete balance in tonal context for Mandarin in order to better model the neutral tone, as mentioned above. In comparison, a corpus like the widely used Boston Radio Corpus, though consisting of a great variety of sentences, contains virtually no question intonation samples, and so is much less balanced for F0 control than our corpora. On the other hand, syntactic structures other than statement/question contrast, affect mostly duration rather than F0 (Wagner and Watson, 2010; Xu, 2011; Xu and Wang, 2009; Yang and Yang, 2012).
19
And duration modeling, as explained in the discussion, is what we will investigate in future studies.
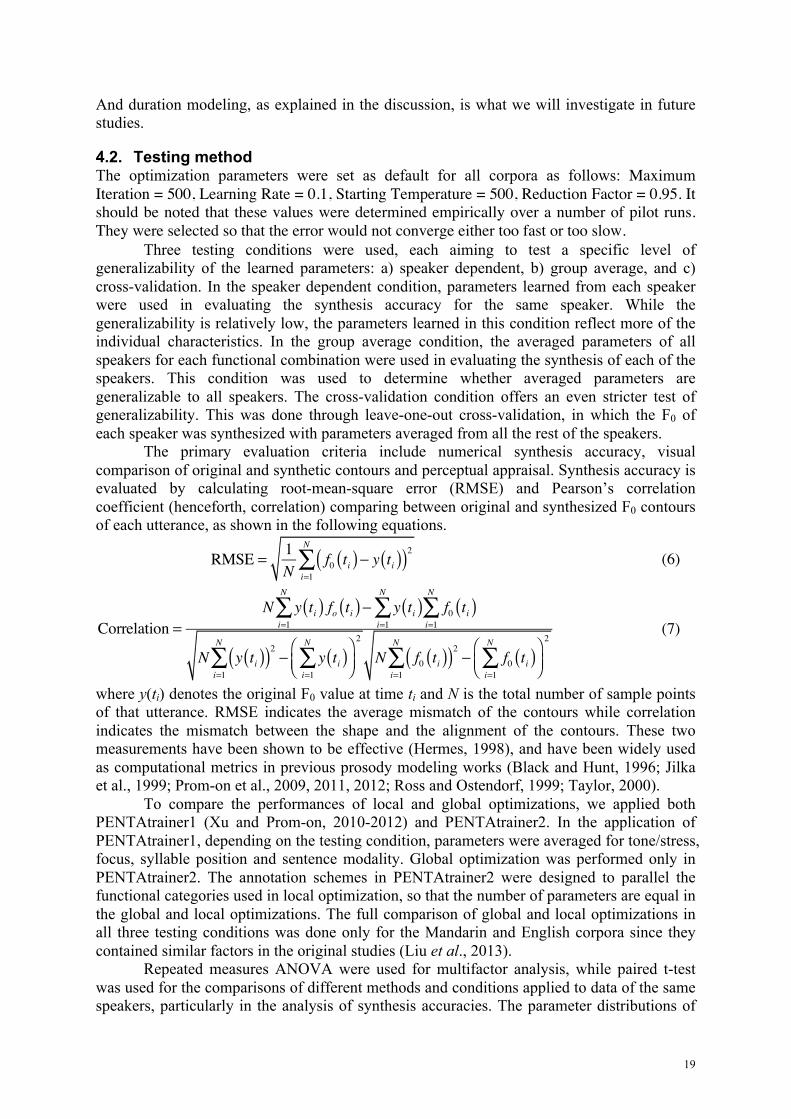
4.2. Testing method The optimization parameters were set as default for all corpora as follows: Maximum Iteration = 500, Learning Rate = 0.1, Starting Temperature = 500, Reduction Factor = 0.95. It should be noted that these values were determined empirically over a number of pilot runs. They were selected so that the error would not converge either too fast or too slow.
Three testing conditions were used, each aiming to test a specific level of generalizability of the learned parameters: a) speaker dependent, b) group average, and c) cross-validation. In the speaker dependent condition, parameters learned from each speaker were used in evaluating the synthesis accuracy for the same speaker. While the generalizability is relatively low, the parameters learned in this condition reflect more of the individual characteristics. In the group average condition, the averaged parameters of all speakers for each functional combination were used in evaluating the synthesis of each of the speakers. This condition was used to determine whether averaged parameters are generalizable to all speakers. The cross-validation condition offers an even stricter test of generalizability. This was done through leave-one-out cross-validation, in which the F0 of each speaker was synthesized with parameters averaged from all the rest of the speakers.
The primary evaluation criteria include numerical synthesis accuracy, visual comparison of original and synthetic contours and perceptual appraisal. Synthesis accuracy is evaluated by calculating root-mean-square error (RMSE) and Pearson’s correlation coefficient (henceforth, correlation) comparing between original and synthesized F0 contours of each utterance, as shown in the following equations.
RMSE = 1N
f0 ti( )− y ti( )( )2i=1
N
∑ (6)
Correlation =N y ti( ) fo ti( )
i=1
N
∑ − y ti( )i=1
N
∑ f0 ti( )i=1
N
∑
N y ti( )( )2i=1
N
∑ − y ti( )i=1
N
∑⎛⎝⎜⎞⎠⎟
2
N f0 ti( )( )2i=1
N
∑ − f0 ti( )i=1
N
∑⎛⎝⎜⎞⎠⎟
2 (7)
where y(ti) denotes the original F0 value at time ti and N is the total number of sample points of that utterance. RMSE indicates the average mismatch of the contours while correlation indicates the mismatch between the shape and the alignment of the contours. These two measurements have been shown to be effective (Hermes, 1998), and have been widely used as computational metrics in previous prosody modeling works (Black and Hunt, 1996; Jilka et al., 1999; Prom-on et al., 2009, 2011, 2012; Ross and Ostendorf, 1999; Taylor, 2000).
To compare the performances of local and global optimizations, we applied both PENTAtrainer1 (Xu and Prom-on, 2010-2012) and PENTAtrainer2. In the application of PENTAtrainer1, depending on the testing condition, parameters were averaged for tone/stress, focus, syllable position and sentence modality. Global optimization was performed only in PENTAtrainer2. The annotation schemes in PENTAtrainer2 were designed to parallel the functional categories used in local optimization, so that the number of parameters are equal in the global and local optimizations. The full comparison of global and local optimizations in all three testing conditions was done only for the Mandarin and English corpora since they contained similar factors in the original studies (Liu et al., 2013).
Repeated measures ANOVA were used for multifactor analysis, while paired t-test was used for the comparisons of different methods and conditions applied to data of the same speakers, particularly in the analysis of synthesis accuracies. The parameter distributions of
20
functional categories were analyzed using Student’s t-test. For the nature of the contrastive characteristics of underlying representations between functional categories, post-hoc analysis was performed only on the Thai corpus using Scheffé’s post-hoc test. This is because the Thai corpus was designed for primarily studying one main contributing prosodic factor while the English and Mandarin corpora were designed for studying interactions between various factors, none of which could be considered separately without others.
Perceptual appraisal was conducted on native Thai participants to test the effectiveness of Thai tone simulation and the naturalness of synthetic F0 contours. This was done only on Thai because perceptual evaluations done on English and Mandarin with an equivalent of PENTAtrainer1 already achieved satisfactory results. Pitch target parameters of tone functions estimated earlier were used to synthesize F0 contours which were imposed onto four utterance in the form of “�a�n1 wa�2 X krab3”, which translates to “(This) reads X”. Here X is the target word with five alternate tones on two CV and two CVC syllables: “ka�”, “lo�”, “lon”, and “yang”. For creating synthetic stimuli, the four utterances were recorded by a native Thai speaker, with the mid-tone on the target syllable. Using the Synthesis tool, F0 contours of all five tones were synthesized from the learned parameters and imposed onto the target syllable, thus creating 20 synthetic stimulus utterances. Pitch modification was done using the PSOLA algorithm in Praat (Boersma and Weenink, 2012). As controls, the natural stimuli of the same utterances of all tonal combinations were recorded by the same speaker. There are thus 40 stimulus utterances in total.
Thirteen native Thai listeners participated in the experiment, which was conducted through the ExperimentMFC of Praat. The stimulus utterances were randomly presented to the listeners. For each stimulus, listeners had to select, on the computer screen, the Thai word they just heard and select a naturalness score on a 5-level scale from terrible (1) to excellent (5). They were told that all stimuli were synthetic and did not know that natural stimuli were also included. Listeners were allowed to listen to the stimuli as many times as they preferred.
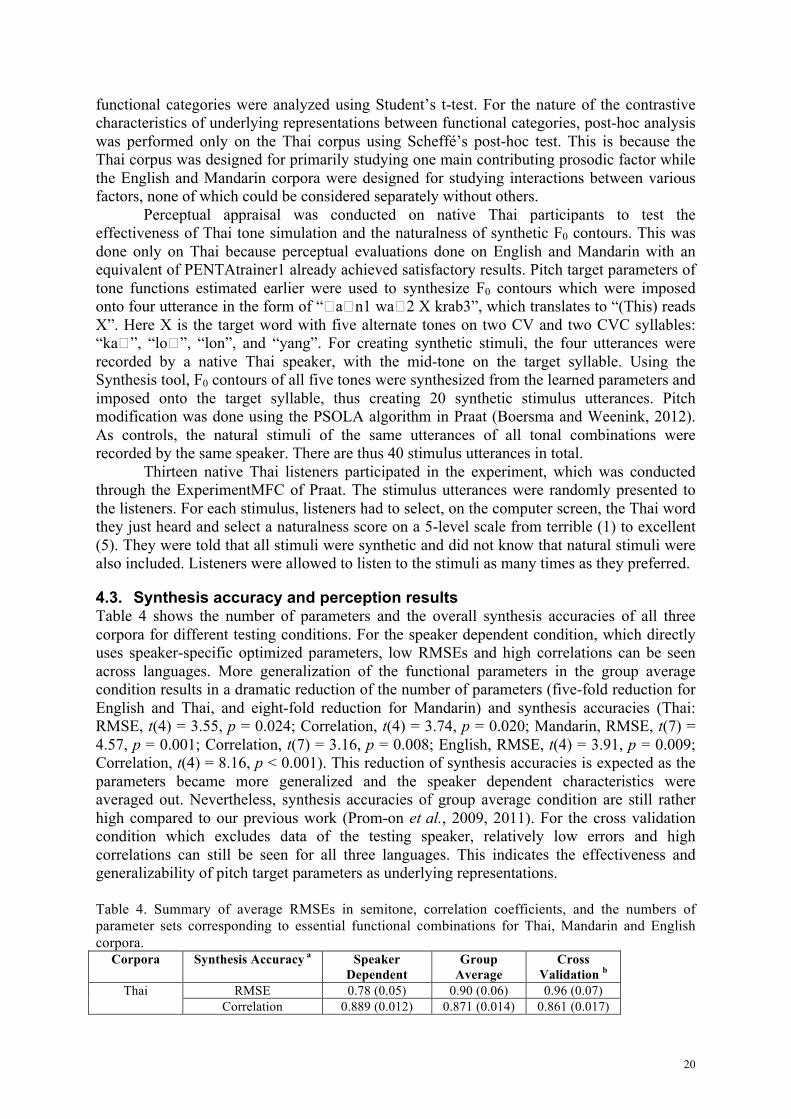
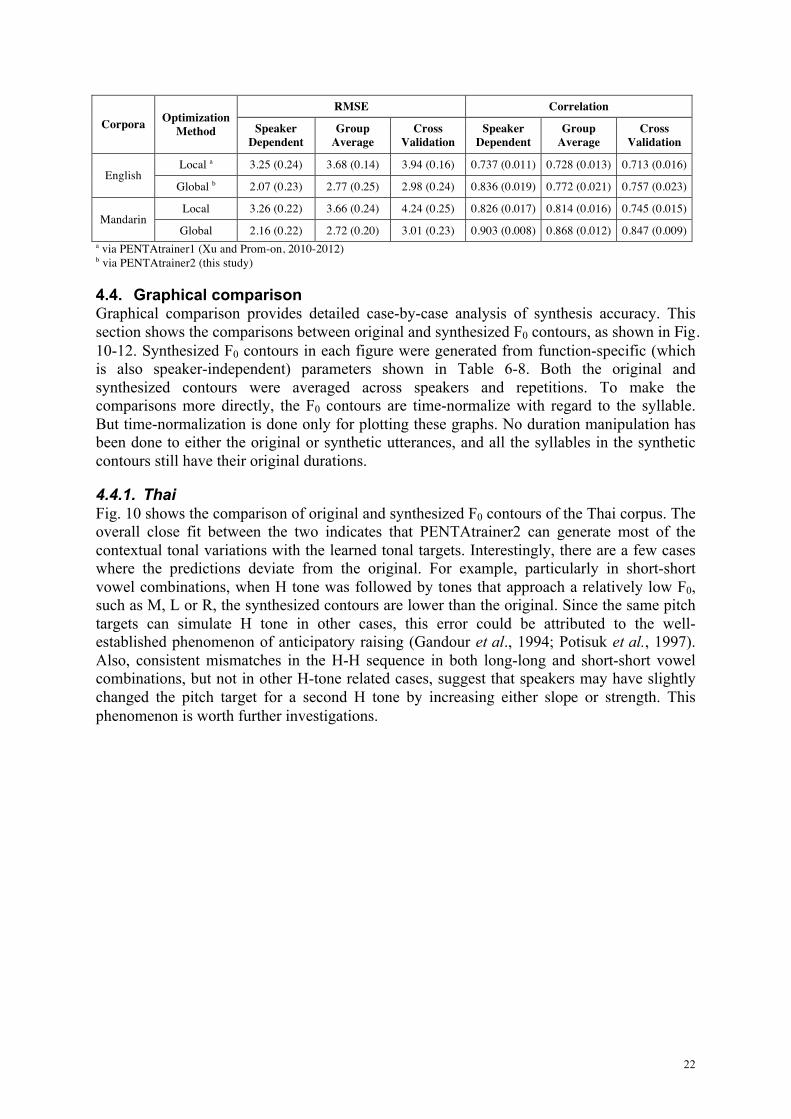
4.3. Synthesis accuracy and perception results Table 4 shows the number of parameters and the overall synthesis accuracies of all three corpora for different testing conditions. For the speaker dependent condition, which directly uses speaker-specific optimized parameters, low RMSEs and high correlations can be seen across languages. More generalization of the functional parameters in the group average condition results in a dramatic reduction of the number of parameters (five-fold reduction for English and Thai, and eight-fold reduction for Mandarin) and synthesis accuracies (Thai: RMSE, t(4) = 3.55, p = 0.024; Correlation, t(4) = 3.74, p = 0.020; Mandarin, RMSE, t(7) = 4.57, p = 0.001; Correlation, t(7) = 3.16, p = 0.008; English, RMSE, t(4) = 3.91, p = 0.009; Correlation, t(4) = 8.16, p < 0.001). This reduction of synthesis accuracies is expected as the parameters became more generalized and the speaker dependent characteristics were averaged out. Nevertheless, synthesis accuracies of group average condition are still rather high compared to our previous work (Prom-on et al., 2009, 2011). For the cross validation condition which excludes data of the testing speaker, relatively low errors and high correlations can still be seen for all three languages. This indicates the effectiveness and generalizability of pitch target parameters as underlying representations. Table 4. Summary of average RMSEs in semitone, correlation coefficients, and the numbers of parameter sets corresponding to essential functional combinations for Thai, Mandarin and English corpora.
Corpora Synthesis Accuracy a Speaker Dependent
Group Average
Cross Validation b
Thai RMSE 0.78 (0.05) 0.90 (0.06) 0.96 (0.07) Correlation 0.889 (0.012) 0.871 (0.014) 0.861 (0.017)
21
Number of Parameters 50 10 50 Mandarin RMSE 2.16 (0.22) 2.72 (0.20) 3.01 (0.23)
Correlation 0.903 (0.008) 0.868 (0.012) 0.847 (0.009) Number of Parameters 224 28 244
English RMSE 2.07 (0.23) 2.77 (0.25) 2.98 (0.24) Correlation 0.836 (0.019) 0.772 (0.021) 0.757 (0.023)
Number of Parameters 130 26 130 a The RMSE are calculated in semitones in order to make the results comparable across speakers, especially between males and females (Xu, 2011). To compare with studies that report Hz values, the conversion can be done with the equation: Hz ≈ fref × exp(st × ln(2) / 12) – fref, where fref is the reference F0 in Hz, and st is RMSE in semitones. Note that the conversion can only be an approximation because RMSE calculation in Hz has to be done on variable reference F0 (i.e., that of the original) rather than speaker average F0. b the numbers of parameter sets for cross validation equal those of speaker dependent, but they were derived from speakers other than the testing speaker.
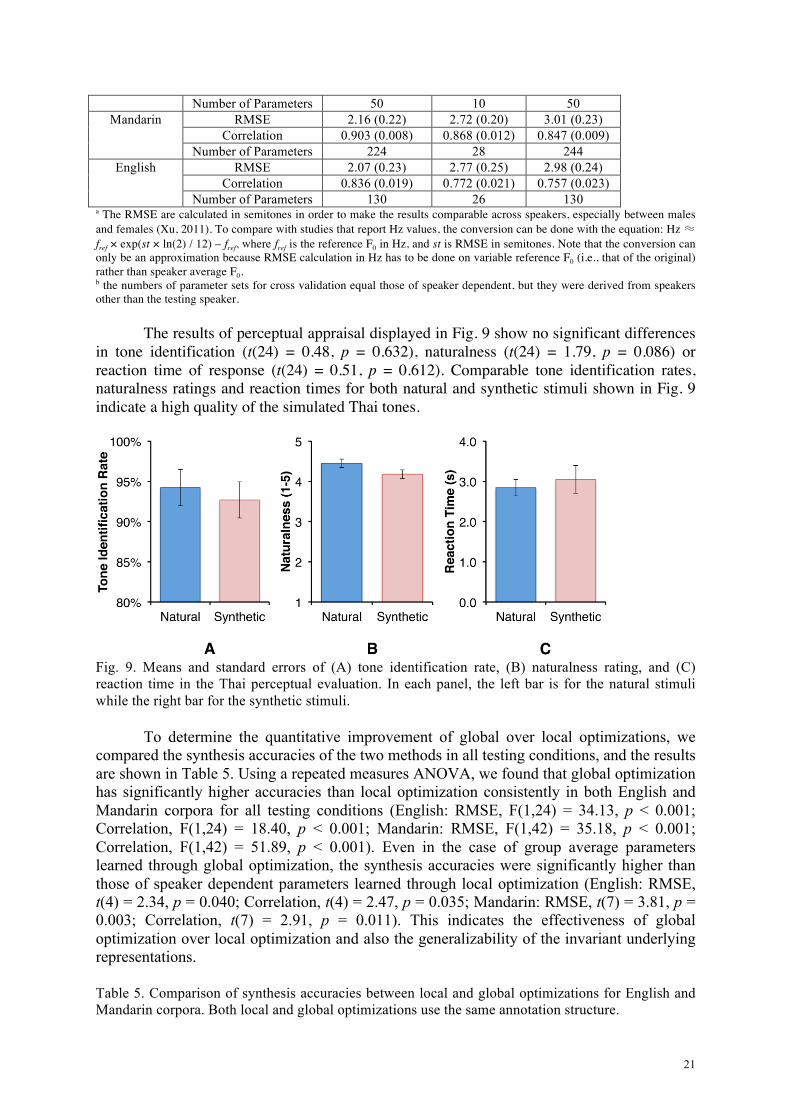
The results of perceptual appraisal displayed in Fig. 9 show no significant differences in tone identification (t(24) = 0.48, p = 0.632), naturalness (t(24) = 1.79, p = 0.086) or reaction time of response (t(24) = 0.51, p = 0.612). Comparable tone identification rates, naturalness ratings and reaction times for both natural and synthetic stimuli shown in Fig. 9 indicate a high quality of the simulated Thai tones.
Fig. 9. Means and standard errors of (A) tone identification rate, (B) naturalness rating, and (C) reaction time in the Thai perceptual evaluation. In each panel, the left bar is for the natural stimuli while the right bar for the synthetic stimuli.
To determine the quantitative improvement of global over local optimizations, we compared the synthesis accuracies of the two methods in all testing conditions, and the results are shown in Table 5. Using a repeated measures ANOVA, we found that global optimization has significantly higher accuracies than local optimization consistently in both English and Mandarin corpora for all testing conditions (English: RMSE, F(1,24) = 34.13, p < 0.001; Correlation, F(1,24) = 18.40, p < 0.001; Mandarin: RMSE, F(1,42) = 35.18, p < 0.001; Correlation, F(1,42) = 51.89, p < 0.001). Even in the case of group average parameters learned through global optimization, the synthesis accuracies were significantly higher than those of speaker dependent parameters learned through local optimization (English: RMSE, t(4) = 2.34, p = 0.040; Correlation, t(4) = 2.47, p = 0.035; Mandarin: RMSE, t(7) = 3.81, p = 0.003; Correlation, t(7) = 2.91, p = 0.011). This indicates the effectiveness of global optimization over local optimization and also the generalizability of the invariant underlying representations.
Table 5. Comparison of synthesis accuracies between local and global optimizations for English and Mandarin corpora. Both local and global optimizations use the same annotation structure.
22
Corpora Optimization Method
RMSE Correlation
Speaker Dependent
Group Average
Cross Validation
Speaker Dependent
Group Average
Cross Validation
English Local a 3.25 (0.24) 3.68 (0.14) 3.94 (0.16) 0.737 (0.011) 0.728 (0.013) 0.713 (0.016)
Global b 2.07 (0.23) 2.77 (0.25) 2.98 (0.24) 0.836 (0.019) 0.772 (0.021) 0.757 (0.023)
Mandarin Local 3.26 (0.22) 3.66 (0.24) 4.24 (0.25) 0.826 (0.017) 0.814 (0.016) 0.745 (0.015)
Global 2.16 (0.22) 2.72 (0.20) 3.01 (0.23) 0.903 (0.008) 0.868 (0.012) 0.847 (0.009) a via PENTAtrainer1 (Xu and Prom-on, 2010-2012) b via PENTAtrainer2 (this study)
4.4. Graphical comparison Graphical comparison provides detailed case-by-case analysis of synthesis accuracy. This section shows the comparisons between original and synthesized F0 contours, as shown in Fig. 10-12. Synthesized F0 contours in each figure were generated from function-specific (which is also speaker-independent) parameters shown in Table 6-8. Both the original and synthesized contours were averaged across speakers and repetitions. To make the comparisons more directly, the F0 contours are time-normalize with regard to the syllable. But time-normalization is done only for plotting these graphs. No duration manipulation has been done to either the original or synthetic utterances, and all the syllables in the synthetic contours still have their original durations.
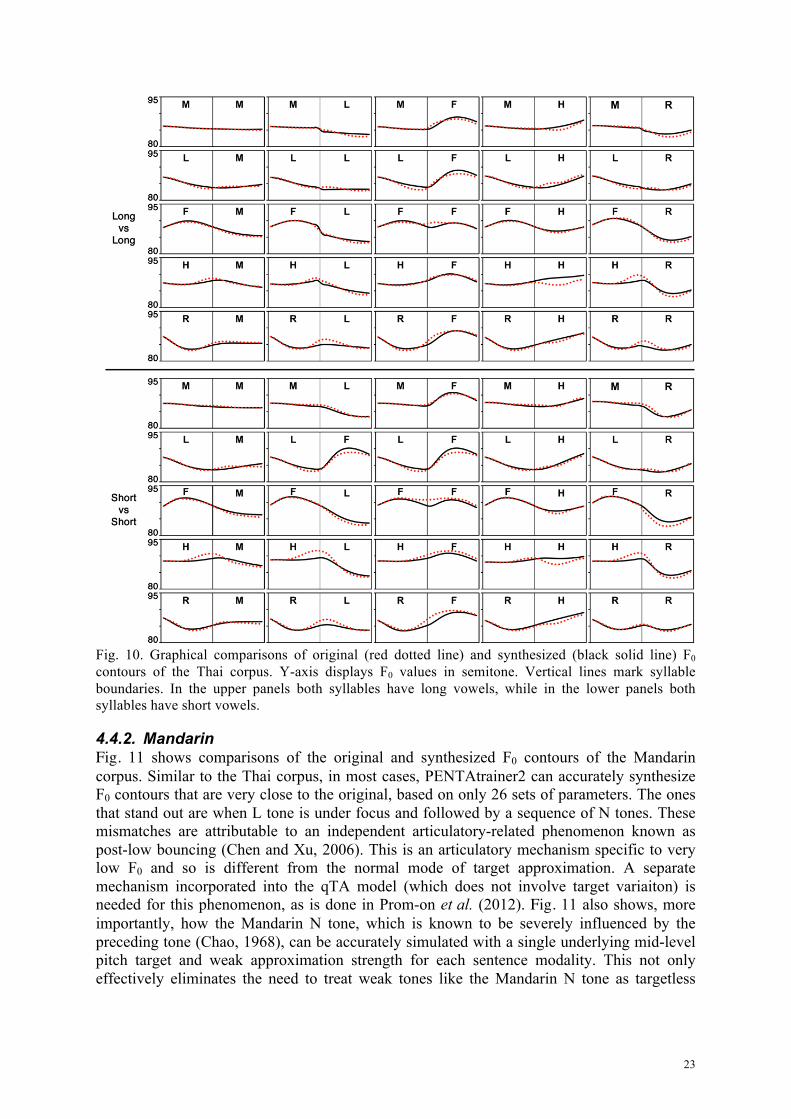
4.4.1. Thai Fig. 10 shows the comparison of original and synthesized F0 contours of the Thai corpus. The overall close fit between the two indicates that PENTAtrainer2 can generate most of the contextual tonal variations with the learned tonal targets. Interestingly, there are a few cases where the predictions deviate from the original. For example, particularly in short-short vowel combinations, when H tone was followed by tones that approach a relatively low F0, such as M, L or R, the synthesized contours are lower than the original. Since the same pitch targets can simulate H tone in other cases, this error could be attributed to the well-established phenomenon of anticipatory raising (Gandour et al., 1994; Potisuk et al., 1997). Also, consistent mismatches in the H-H sequence in both long-long and short-short vowel combinations, but not in other H-tone related cases, suggest that speakers may have slightly changed the pitch target for a second H tone by increasing either slope or strength. This phenomenon is worth further investigations.
23
Fig. 10. Graphical comparisons of original (red dotted line) and synthesized (black solid line) F0 contours of the Thai corpus. Y-axis displays F0 values in semitone. Vertical lines mark syllable boundaries. In the upper panels both syllables have long vowels, while in the lower panels both syllables have short vowels.
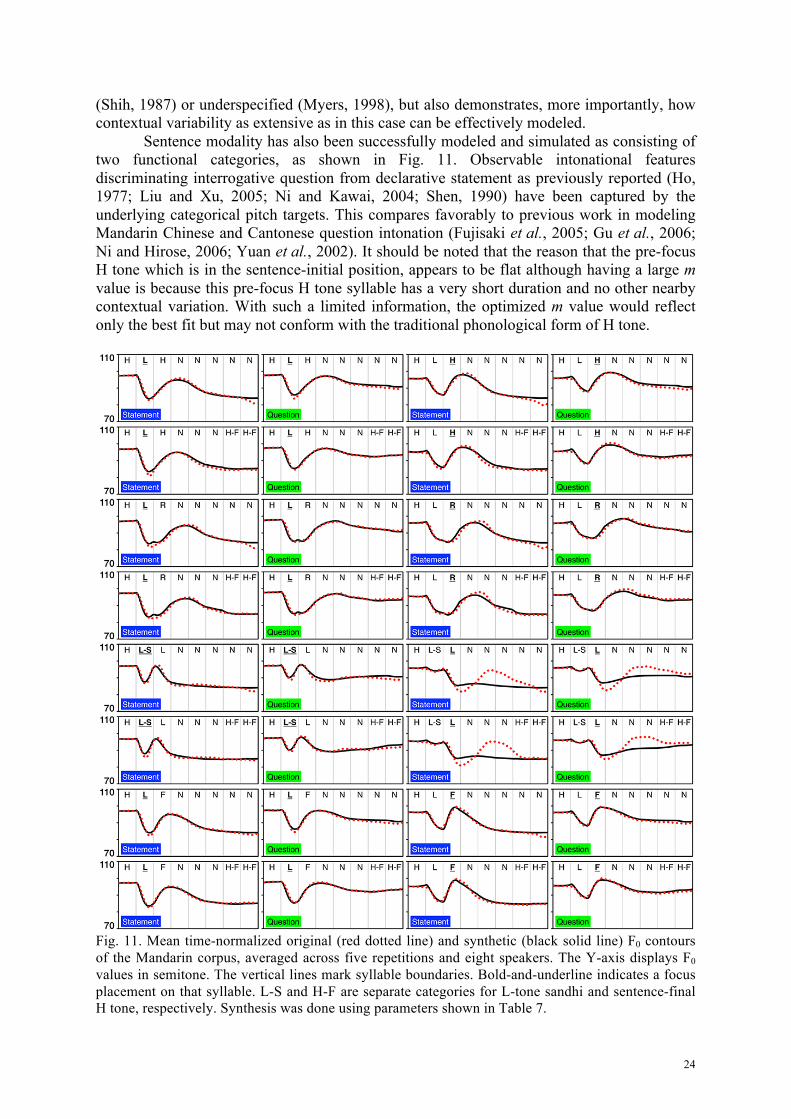
4.4.2. Mandarin Fig. 11 shows comparisons of the original and synthesized F0 contours of the Mandarin corpus. Similar to the Thai corpus, in most cases, PENTAtrainer2 can accurately synthesize F0 contours that are very close to the original, based on only 26 sets of parameters. The ones that stand out are when L tone is under focus and followed by a sequence of N tones. These mismatches are attributable to an independent articulatory-related phenomenon known as post-low bouncing (Chen and Xu, 2006). This is an articulatory mechanism specific to very low F0 and so is different from the normal mode of target approximation. A separate mechanism incorporated into the qTA model (which does not involve target variaiton) is needed for this phenomenon, as is done in Prom-on et al. (2012). Fig. 11 also shows, more importantly, how the Mandarin N tone, which is known to be severely influenced by the preceding tone (Chao, 1968), can be accurately simulated with a single underlying mid-level pitch target and weak approximation strength for each sentence modality. This not only effectively eliminates the need to treat weak tones like the Mandarin N tone as targetless
24
(Shih, 1987) or underspecified (Myers, 1998), but also demonstrates, more importantly, how contextual variability as extensive as in this case can be effectively modeled.
Sentence modality has also been successfully modeled and simulated as consisting of two functional categories, as shown in Fig. 11. Observable intonational features discriminating interrogative question from declarative statement as previously reported (Ho, 1977; Liu and Xu, 2005; Ni and Kawai, 2004; Shen, 1990) have been captured by the underlying categorical pitch targets. This compares favorably to previous work in modeling Mandarin Chinese and Cantonese question intonation (Fujisaki et al., 2005; Gu et al., 2006; Ni and Hirose, 2006; Yuan et al., 2002). It should be noted that the reason that the pre-focus H tone which is in the sentence-initial position, appears to be flat although having a large m value is because this pre-focus H tone syllable has a very short duration and no other nearby contextual variation. With such a limited information, the optimized m value would reflect only the best fit but may not conform with the traditional phonological form of H tone.
Fig. 11. Mean time-normalized original (red dotted line) and synthetic (black solid line) F0 contours of the Mandarin corpus, averaged across five repetitions and eight speakers. The Y-axis displays F0 values in semitone. The vertical lines mark syllable boundaries. Bold-and-underline indicates a focus placement on that syllable. L-S and H-F are separate categories for L-tone sandhi and sentence-final H tone, respectively. Synthesis was done using parameters shown in Table 7.
25
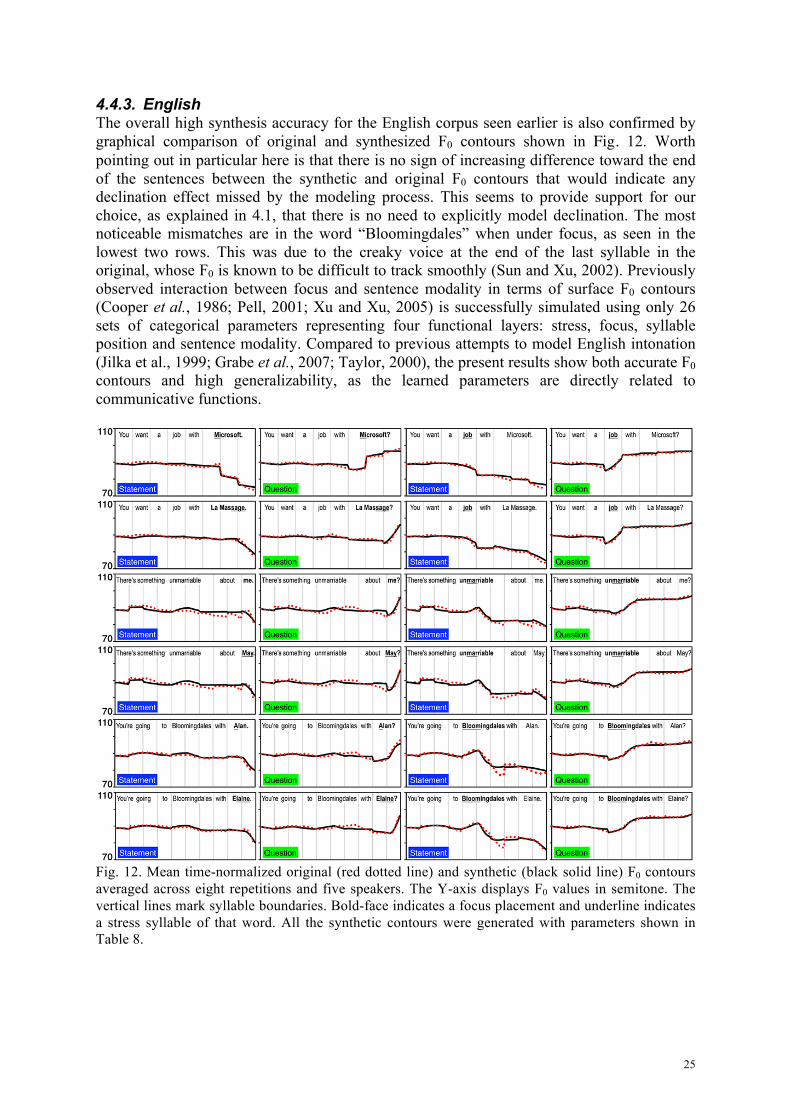
4.4.3. English The overall high synthesis accuracy for the English corpus seen earlier is also confirmed by graphical comparison of original and synthesized F0 contours shown in Fig. 12. Worth pointing out in particular here is that there is no sign of increasing difference toward the end of the sentences between the synthetic and original F0 contours that would indicate any declination effect missed by the modeling process. This seems to provide support for our choice, as explained in 4.1, that there is no need to explicitly model declination. The most noticeable mismatches are in the word “Bloomingdales” when under focus, as seen in the lowest two rows. This was due to the creaky voice at the end of the last syllable in the original, whose F0 is known to be difficult to track smoothly (Sun and Xu, 2002). Previously observed interaction between focus and sentence modality in terms of surface F0 contours (Cooper et al., 1986; Pell, 2001; Xu and Xu, 2005) is successfully simulated using only 26 sets of categorical parameters representing four functional layers: stress, focus, syllable position and sentence modality. Compared to previous attempts to model English intonation (Jilka et al., 1999; Grabe et al., 2007; Taylor, 2000), the present results show both accurate F0 contours and high generalizability, as the learned parameters are directly related to communicative functions.
Fig. 12. Mean time-normalized original (red dotted line) and synthetic (black solid line) F0 contours averaged across eight repetitions and five speakers. The Y-axis displays F0 values in semitone. The vertical lines mark syllable boundaries. Bold-face indicates a focus placement and underline indicates a stress syllable of that word. All the synthetic contours were generated with parameters shown in Table 8.
26
4.5. Parameter analysis Given that the qTA parameters all have articulatory meanings, detailed analysis of the parameters learned by PENTAtrainer2 can reveal various information of both modeling and theoretical interests.
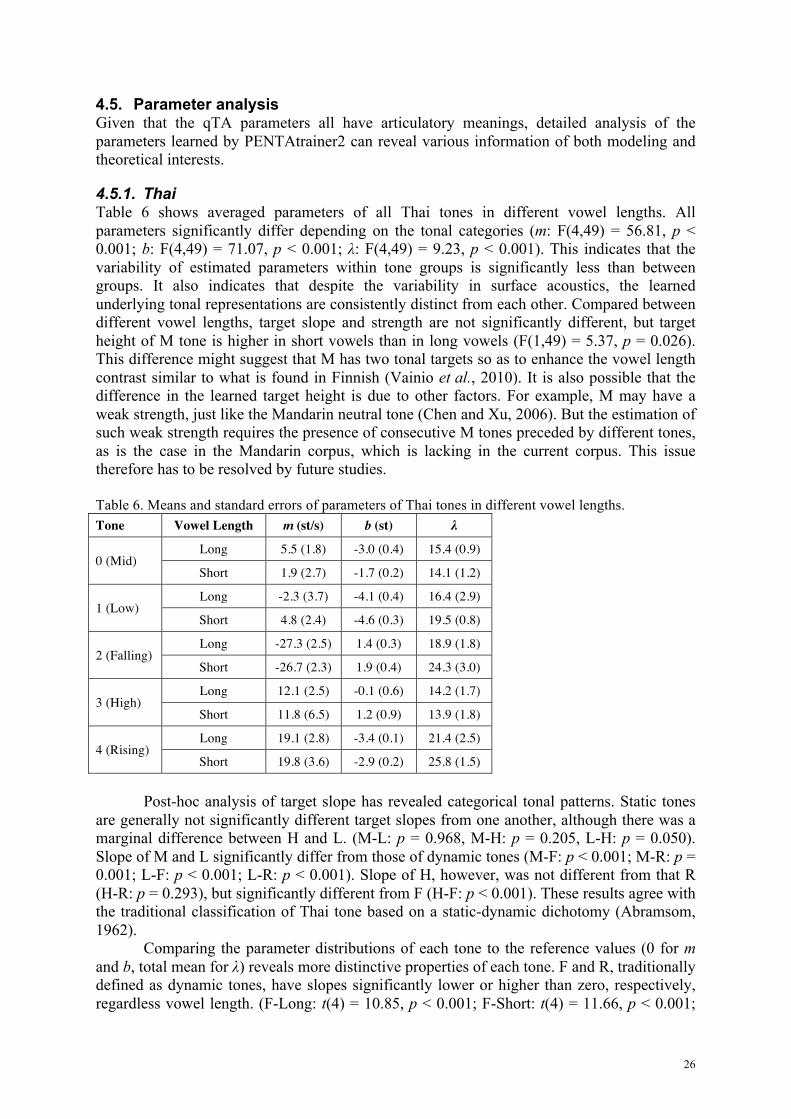
4.5.1. Thai Table 6 shows averaged parameters of all Thai tones in different vowel lengths. All parameters significantly differ depending on the tonal categories (m: F(4,49) = 56.81, p < 0.001; b: F(4,49) = 71.07, p < 0.001; λ: F(4,49) = 9.23, p < 0.001). This indicates that the variability of estimated parameters within tone groups is significantly less than between groups. It also indicates that despite the variability in surface acoustics, the learned underlying tonal representations are consistently distinct from each other. Compared between different vowel lengths, target slope and strength are not significantly different, but target height of M tone is higher in short vowels than in long vowels (F(1,49) = 5.37, p = 0.026). This difference might suggest that M has two tonal targets so as to enhance the vowel length contrast similar to what is found in Finnish (Vainio et al., 2010). It is also possible that the difference in the learned target height is due to other factors. For example, M may have a weak strength, just like the Mandarin neutral tone (Chen and Xu, 2006). But the estimation of such weak strength requires the presence of consecutive M tones preceded by different tones, as is the case in the Mandarin corpus, which is lacking in the current corpus. This issue therefore has to be resolved by future studies. Table 6. Means and standard errors of parameters of Thai tones in different vowel lengths. Tone Vowel Length m (st/s) b (st) λ
0 (Mid) Long 5.5 (1.8) -3.0 (0.4) 15.4 (0.9)
Short 1.9 (2.7) -1.7 (0.2) 14.1 (1.2)
1 (Low) Long -2.3 (3.7) -4.1 (0.4) 16.4 (2.9)
Short 4.8 (2.4) -4.6 (0.3) 19.5 (0.8)
2 (Falling) Long -27.3 (2.5) 1.4 (0.3) 18.9 (1.8)
Short -26.7 (2.3) 1.9 (0.4) 24.3 (3.0)
3 (High) Long 12.1 (2.5) -0.1 (0.6) 14.2 (1.7)
Short 11.8 (6.5) 1.2 (0.9) 13.9 (1.8)
4 (Rising) Long 19.1 (2.8) -3.4 (0.1) 21.4 (2.5)
Short 19.8 (3.6) -2.9 (0.2) 25.8 (1.5)
Post-hoc analysis of target slope has revealed categorical tonal patterns. Static tones are generally not significantly different target slopes from one another, although there was a marginal difference between H and L. (M-L: p = 0.968, M-H: p = 0.205, L-H: p = 0.050). Slope of M and L significantly differ from those of dynamic tones (M-F: p < 0.001; M-R: p = 0.001; L-F: p < 0.001; L-R: p < 0.001). Slope of H, however, was not different from that R (H-R: p = 0.293), but significantly different from F (H-F: p < 0.001). These results agree with the traditional classification of Thai tone based on a static-dynamic dichotomy (Abramsom, 1962).
Comparing the parameter distributions of each tone to the reference values (0 for m and b, total mean for λ) reveals more distinctive properties of each tone. F and R, traditionally defined as dynamic tones, have slopes significantly lower or higher than zero, respectively, regardless vowel length. (F-Long: t(4) = 10.85, p < 0.001; F-Short: t(4) = 11.66, p < 0.001;
27
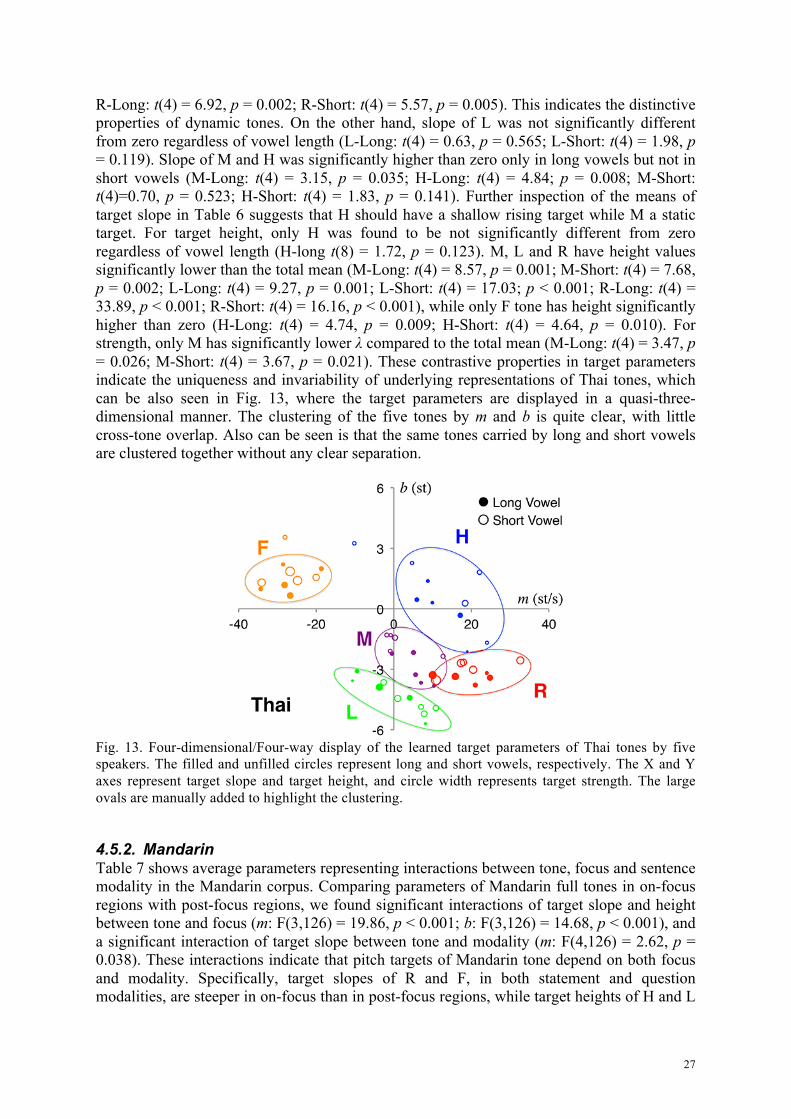
R-Long: t(4) = 6.92, p = 0.002; R-Short: t(4) = 5.57, p = 0.005). This indicates the distinctive properties of dynamic tones. On the other hand, slope of L was not significantly different from zero regardless of vowel length (L-Long: t(4) = 0.63, p = 0.565; L-Short: t(4) = 1.98, p = 0.119). Slope of M and H was significantly higher than zero only in long vowels but not in short vowels (M-Long: t(4) = 3.15, p = 0.035; H-Long: t(4) = 4.84; p = 0.008; M-Short: t(4)=0.70, p = 0.523; H-Short: t(4) = 1.83, p = 0.141). Further inspection of the means of target slope in Table 6 suggests that H should have a shallow rising target while M a static target. For target height, only H was found to be not significantly different from zero regardless of vowel length (H-long t(8) = 1.72, p = 0.123). M, L and R have height values significantly lower than the total mean (M-Long: t(4) = 8.57, p = 0.001; M-Short: t(4) = 7.68, p = 0.002; L-Long: t(4) = 9.27, p = 0.001; L-Short: t(4) = 17.03; p < 0.001; R-Long: t(4) = 33.89, p < 0.001; R-Short: t(4) = 16.16, p < 0.001), while only F tone has height significantly higher than zero (H-Long: t(4) = 4.74, p = 0.009; H-Short: t(4) = 4.64, p = 0.010). For strength, only M has significantly lower λ compared to the total mean (M-Long: t(4) = 3.47, p = 0.026; M-Short: t(4) = 3.67, p = 0.021). These contrastive properties in target parameters indicate the uniqueness and invariability of underlying representations of Thai tones, which can be also seen in Fig. 13, where the target parameters are displayed in a quasi-three-dimensional manner. The clustering of the five tones by m and b is quite clear, with little cross-tone overlap. Also can be seen is that the same tones carried by long and short vowels are clustered together without any clear separation.
Fig. 13. Four-dimensional/Four-way display of the learned target parameters of Thai tones by five speakers. The filled and unfilled circles represent long and short vowels, respectively. The X and Y axes represent target slope and target height, and circle width represents target strength. The large ovals are manually added to highlight the clustering.
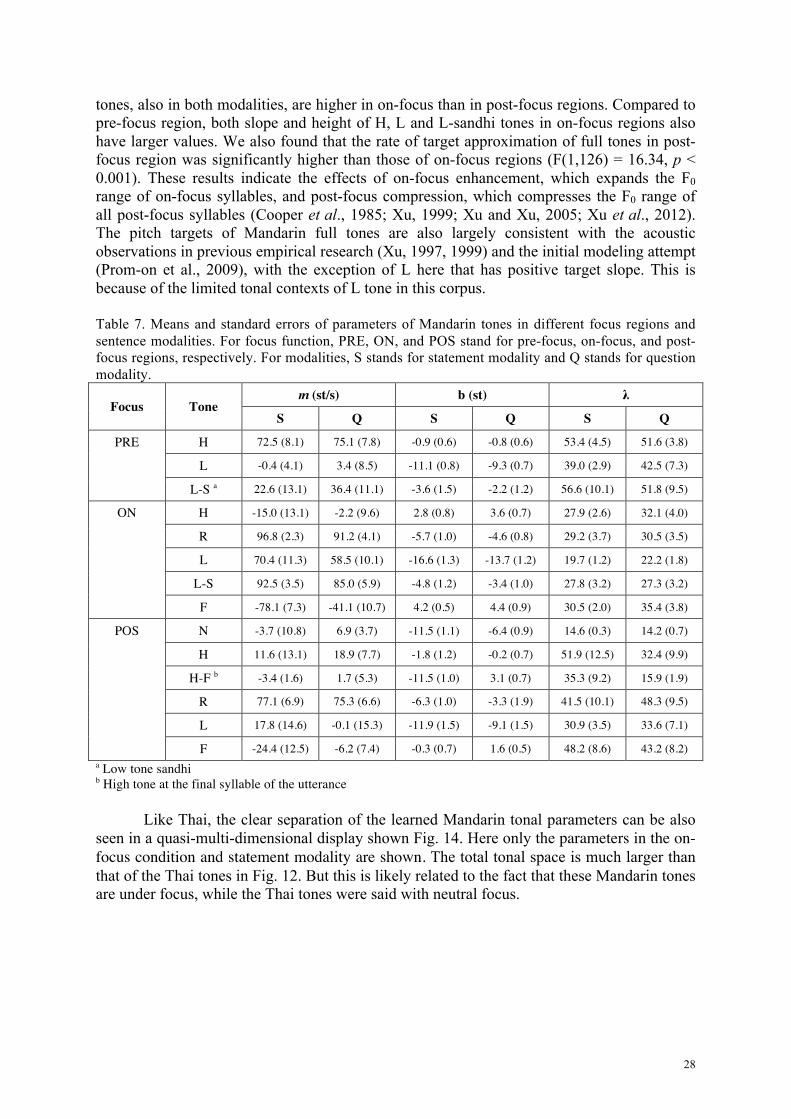
4.5.2. Mandarin Table 7 shows average parameters representing interactions between tone, focus and sentence modality in the Mandarin corpus. Comparing parameters of Mandarin full tones in on-focus regions with post-focus regions, we found significant interactions of target slope and height between tone and focus (m: F(3,126) = 19.86, p < 0.001; b: F(3,126) = 14.68, p < 0.001), and a significant interaction of target slope between tone and modality (m: F(4,126) = 2.62, p = 0.038). These interactions indicate that pitch targets of Mandarin tone depend on both focus and modality. Specifically, target slopes of R and F, in both statement and question modalities, are steeper in on-focus than in post-focus regions, while target heights of H and L
28
tones, also in both modalities, are higher in on-focus than in post-focus regions. Compared to pre-focus region, both slope and height of H, L and L-sandhi tones in on-focus regions also have larger values. We also found that the rate of target approximation of full tones in post-focus region was significantly higher than those of on-focus regions (F(1,126) = 16.34, p < 0.001). These results indicate the effects of on-focus enhancement, which expands the F0 range of on-focus syllables, and post-focus compression, which compresses the F0 range of all post-focus syllables (Cooper et al., 1985; Xu, 1999; Xu and Xu, 2005; Xu et al., 2012). The pitch targets of Mandarin full tones are also largely consistent with the acoustic observations in previous empirical research (Xu, 1997, 1999) and the initial modeling attempt (Prom-on et al., 2009), with the exception of L here that has positive target slope. This is because of the limited tonal contexts of L tone in this corpus. Table 7. Means and standard errors of parameters of Mandarin tones in different focus regions and sentence modalities. For focus function, PRE, ON, and POS stand for pre-focus, on-focus, and post-focus regions, respectively. For modalities, S stands for statement modality and Q stands for question modality.
Focus Tone m (st/s) b (st) λ
S Q S Q S Q
PRE H 72.5 (8.1) 75.1 (7.8) -0.9 (0.6) -0.8 (0.6) 53.4 (4.5) 51.6 (3.8)
L -0.4 (4.1) 3.4 (8.5) -11.1 (0.8) -9.3 (0.7) 39.0 (2.9) 42.5 (7.3)
L-S a 22.6 (13.1) 36.4 (11.1) -3.6 (1.5) -2.2 (1.2) 56.6 (10.1) 51.8 (9.5)
ON H -15.0 (13.1) -2.2 (9.6) 2.8 (0.8) 3.6 (0.7) 27.9 (2.6) 32.1 (4.0)
R 96.8 (2.3) 91.2 (4.1) -5.7 (1.0) -4.6 (0.8) 29.2 (3.7) 30.5 (3.5)
L 70.4 (11.3) 58.5 (10.1) -16.6 (1.3) -13.7 (1.2) 19.7 (1.2) 22.2 (1.8)
L-S 92.5 (3.5) 85.0 (5.9) -4.8 (1.2) -3.4 (1.0) 27.8 (3.2) 27.3 (3.2)
F -78.1 (7.3) -41.1 (10.7) 4.2 (0.5) 4.4 (0.9) 30.5 (2.0) 35.4 (3.8)
POS N -3.7 (10.8) 6.9 (3.7) -11.5 (1.1) -6.4 (0.9) 14.6 (0.3) 14.2 (0.7)
H 11.6 (13.1) 18.9 (7.7) -1.8 (1.2) -0.2 (0.7) 51.9 (12.5) 32.4 (9.9)
H-F b -3.4 (1.6) 1.7 (5.3) -11.5 (1.0) 3.1 (0.7) 35.3 (9.2) 15.9 (1.9)
R 77.1 (6.9) 75.3 (6.6) -6.3 (1.0) -3.3 (1.9) 41.5 (10.1) 48.3 (9.5)
L 17.8 (14.6) -0.1 (15.3) -11.9 (1.5) -9.1 (1.5) 30.9 (3.5) 33.6 (7.1)
F -24.4 (12.5) -6.2 (7.4) -0.3 (0.7) 1.6 (0.5) 48.2 (8.6) 43.2 (8.2) a Low tone sandhi b High tone at the final syllable of the utterance
Like Thai, the clear separation of the learned Mandarin tonal parameters can be also seen in a quasi-multi-dimensional display shown Fig. 14. Here only the parameters in the on-focus condition and statement modality are shown. The total tonal space is much larger than that of the Thai tones in Fig. 12. But this is likely related to the fact that these Mandarin tones are under focus, while the Thai tones were said with neutral focus.
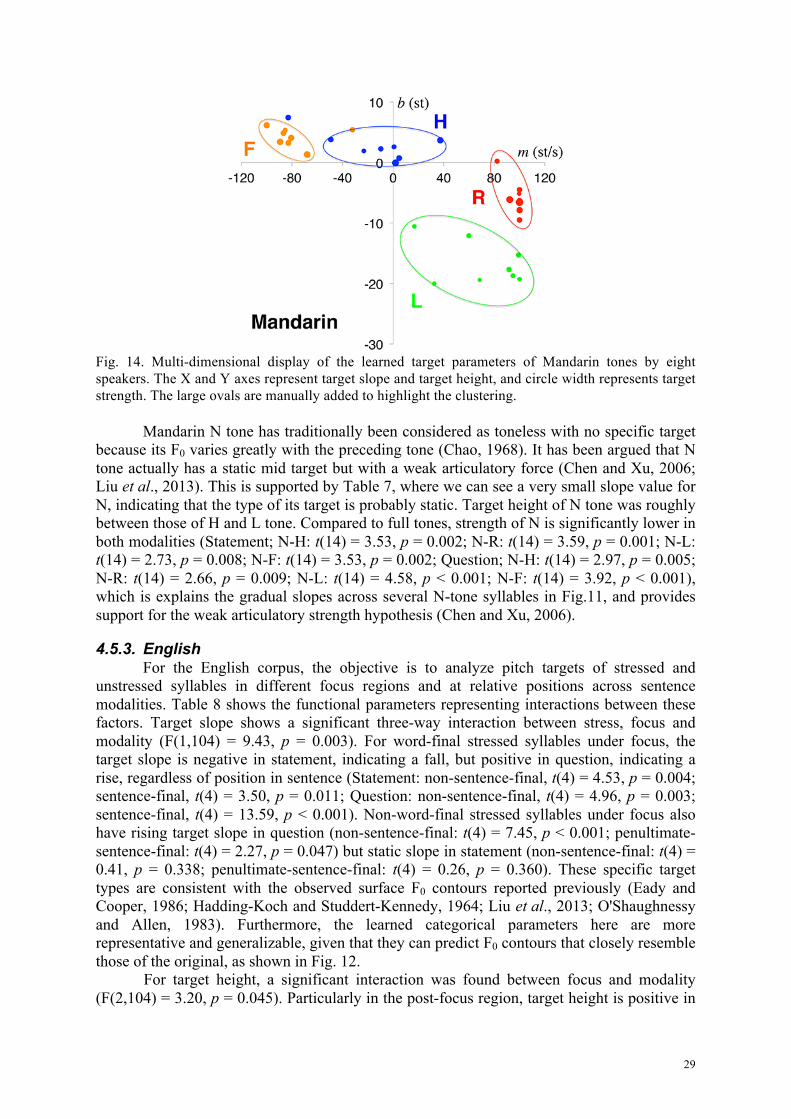
29
Fig. 14. Multi-dimensional display of the learned target parameters of Mandarin tones by eight speakers. The X and Y axes represent target slope and target height, and circle width represents target strength. The large ovals are manually added to highlight the clustering.
Mandarin N tone has traditionally been considered as toneless with no specific target because its F0 varies greatly with the preceding tone (Chao, 1968). It has been argued that N tone actually has a static mid target but with a weak articulatory force (Chen and Xu, 2006; Liu et al., 2013). This is supported by Table 7, where we can see a very small slope value for N, indicating that the type of its target is probably static. Target height of N tone was roughly between those of H and L tone. Compared to full tones, strength of N is significantly lower in both modalities (Statement; N-H: t(14) = 3.53, p = 0.002; N-R: t(14) = 3.59, p = 0.001; N-L: t(14) = 2.73, p = 0.008; N-F: t(14) = 3.53, p = 0.002; Question; N-H: t(14) = 2.97, p = 0.005; N-R: t(14) = 2.66, p = 0.009; N-L: t(14) = 4.58, p < 0.001; N-F: t(14) = 3.92, p < 0.001), which is explains the gradual slopes across several N-tone syllables in Fig.11, and provides support for the weak articulatory strength hypothesis (Chen and Xu, 2006).
4.5.3. English For the English corpus, the objective is to analyze pitch targets of stressed and
unstressed syllables in different focus regions and at relative positions across sentence modalities. Table 8 shows the functional parameters representing interactions between these factors. Target slope shows a significant three-way interaction between stress, focus and modality (F(1,104) = 9.43, p = 0.003). For word-final stressed syllables under focus, the target slope is negative in statement, indicating a fall, but positive in question, indicating a rise, regardless of position in sentence (Statement: non-sentence-final, t(4) = 4.53, p = 0.004; sentence-final, t(4) = 3.50, p = 0.011; Question: non-sentence-final, t(4) = 4.96, p = 0.003; sentence-final, t(4) = 13.59, p < 0.001). Non-word-final stressed syllables under focus also have rising target slope in question (non-sentence-final: t(4) = 7.45, p < 0.001; penultimate-sentence-final: t(4) = 2.27, p = 0.047) but static slope in statement (non-sentence-final: t(4) = 0.41, p = 0.338; penultimate-sentence-final: t(4) = 0.26, p = 0.360). These specific target types are consistent with the observed surface F0 contours reported previously (Eady and Cooper, 1986; Hadding-Koch and Studdert-Kennedy, 1964; Liu et al., 2013; O'Shaughnessy and Allen, 1983). Furthermore, the learned categorical parameters here are more representative and generalizable, given that they can predict F0 contours that closely resemble those of the original, as shown in Fig. 12.
For target height, a significant interaction was found between focus and modality (F(2,104) = 3.20, p = 0.045). Particularly in the post-focus region, target height is positive in
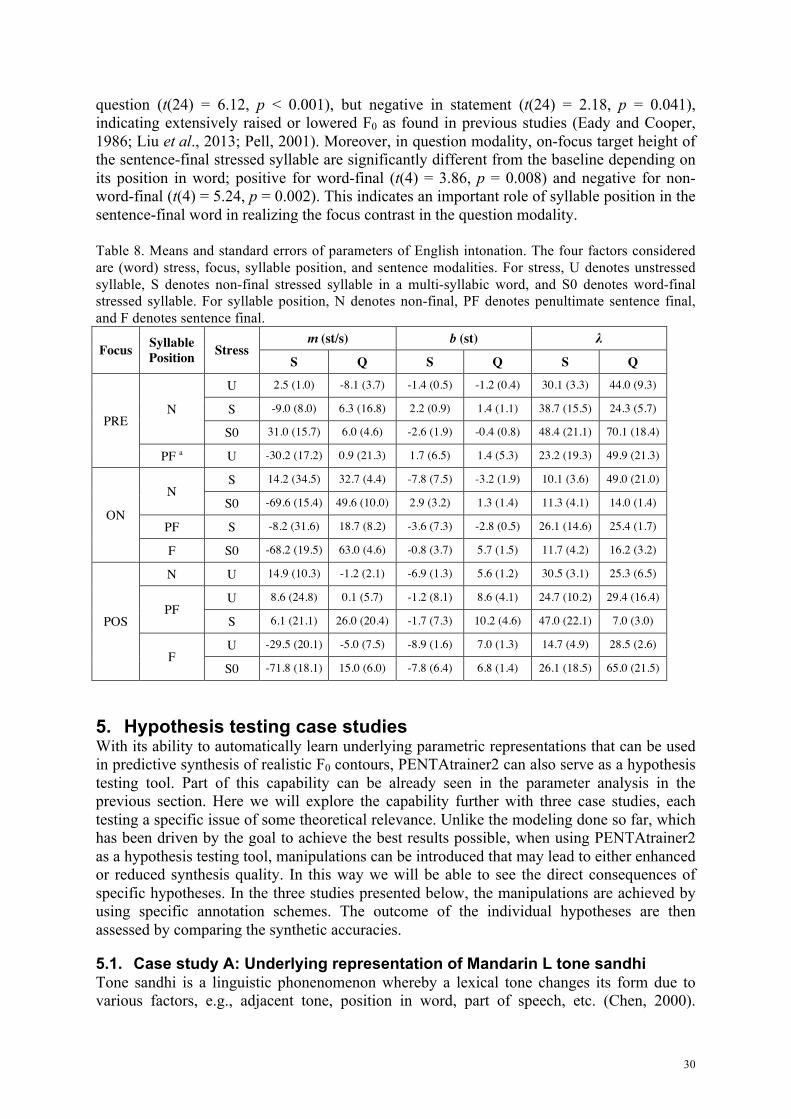
30
question (t(24) = 6.12, p < 0.001), but negative in statement (t(24) = 2.18, p = 0.041), indicating extensively raised or lowered F0 as found in previous studies (Eady and Cooper, 1986; Liu et al., 2013; Pell, 2001). Moreover, in question modality, on-focus target height of the sentence-final stressed syllable are significantly different from the baseline depending on its position in word; positive for word-final (t(4) = 3.86, p = 0.008) and negative for non-word-final (t(4) = 5.24, p = 0.002). This indicates an important role of syllable position in the sentence-final word in realizing the focus contrast in the question modality. Table 8. Means and standard errors of parameters of English intonation. The four factors considered are (word) stress, focus, syllable position, and sentence modalities. For stress, U denotes unstressed syllable, S denotes non-final stressed syllable in a multi-syllabic word, and S0 denotes word-final stressed syllable. For syllable position, N denotes non-final, PF denotes penultimate sentence final, and F denotes sentence final.
Focus Syllable Position Stress
m (st/s) b (st) λ
S Q S Q S Q
PRE N
U 2.5 (1.0) -8.1 (3.7) -1.4 (0.5) -1.2 (0.4) 30.1 (3.3) 44.0 (9.3)
S -9.0 (8.0) 6.3 (16.8) 2.2 (0.9) 1.4 (1.1) 38.7 (15.5) 24.3 (5.7)
S0 31.0 (15.7) 6.0 (4.6) -2.6 (1.9) -0.4 (0.8) 48.4 (21.1) 70.1 (18.4)
PF a U -30.2 (17.2) 0.9 (21.3) 1.7 (6.5) 1.4 (5.3) 23.2 (19.3) 49.9 (21.3)
ON
N S 14.2 (34.5) 32.7 (4.4) -7.8 (7.5) -3.2 (1.9) 10.1 (3.6) 49.0 (21.0)
S0 -69.6 (15.4) 49.6 (10.0) 2.9 (3.2) 1.3 (1.4) 11.3 (4.1) 14.0 (1.4)
PF S -8.2 (31.6) 18.7 (8.2) -3.6 (7.3) -2.8 (0.5) 26.1 (14.6) 25.4 (1.7)
F S0 -68.2 (19.5) 63.0 (4.6) -0.8 (3.7) 5.7 (1.5) 11.7 (4.2) 16.2 (3.2)
POS
N U 14.9 (10.3) -1.2 (2.1) -6.9 (1.3) 5.6 (1.2) 30.5 (3.1) 25.3 (6.5)
PF U 8.6 (24.8) 0.1 (5.7) -1.2 (8.1) 8.6 (4.1) 24.7 (10.2) 29.4 (16.4)
S 6.1 (21.1) 26.0 (20.4) -1.7 (7.3) 10.2 (4.6) 47.0 (22.1) 7.0 (3.0)
F U -29.5 (20.1) -5.0 (7.5) -8.9 (1.6) 7.0 (1.3) 14.7 (4.9) 28.5 (2.6)
S0 -71.8 (18.1) 15.0 (6.0) -7.8 (6.4) 6.8 (1.4) 26.1 (18.5) 65.0 (21.5)
5. Hypothesis testing case studies With its ability to automatically learn underlying parametric representations that can be used in predictive synthesis of realistic F0 contours, PENTAtrainer2 can also serve as a hypothesis testing tool. Part of this capability can be already seen in the parameter analysis in the previous section. Here we will explore the capability further with three case studies, each testing a specific issue of some theoretical relevance. Unlike the modeling done so far, which has been driven by the goal to achieve the best results possible, when using PENTAtrainer2 as a hypothesis testing tool, manipulations can be introduced that may lead to either enhanced or reduced synthesis quality. In this way we will be able to see the direct consequences of specific hypotheses. In the three studies presented below, the manipulations are achieved by using specific annotation schemes. The outcome of the individual hypotheses are then assessed by comparing the synthetic accuracies.
5.1. Case study A: Underlying representation of Mandarin L tone sandhi Tone sandhi is a linguistic phonenomenon whereby a lexical tone changes its form due to various factors, e.g., adjacent tone, position in word, part of speech, etc. (Chen, 2000).
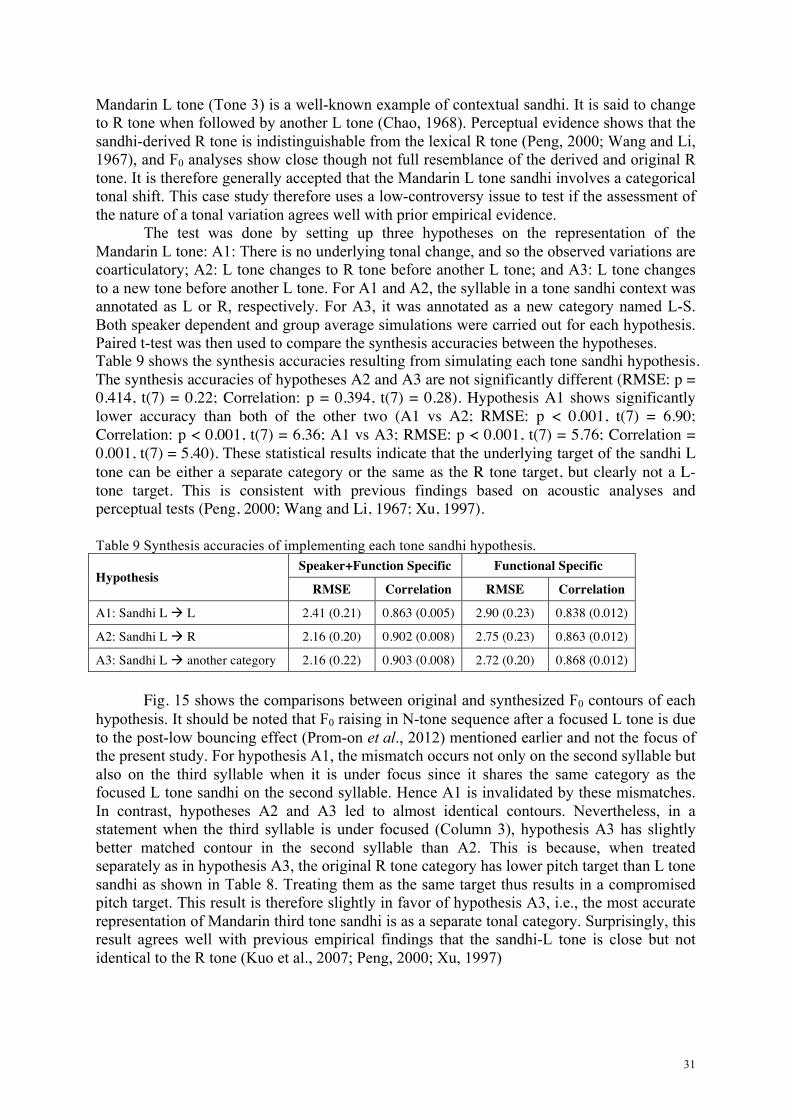
31
Mandarin L tone (Tone 3) is a well-known example of contextual sandhi. It is said to change to R tone when followed by another L tone (Chao, 1968). Perceptual evidence shows that the sandhi-derived R tone is indistinguishable from the lexical R tone (Peng, 2000; Wang and Li, 1967), and F0 analyses show close though not full resemblance of the derived and original R tone. It is therefore generally accepted that the Mandarin L tone sandhi involves a categorical tonal shift. This case study therefore uses a low-controversy issue to test if the assessment of the nature of a tonal variation agrees well with prior empirical evidence.
The test was done by setting up three hypotheses on the representation of the Mandarin L tone: A1: There is no underlying tonal change, and so the observed variations are coarticulatory; A2: L tone changes to R tone before another L tone; and A3: L tone changes to a new tone before another L tone. For A1 and A2, the syllable in a tone sandhi context was annotated as L or R, respectively. For A3, it was annotated as a new category named L-S. Both speaker dependent and group average simulations were carried out for each hypothesis. Paired t-test was then used to compare the synthesis accuracies between the hypotheses. Table 9 shows the synthesis accuracies resulting from simulating each tone sandhi hypothesis. The synthesis accuracies of hypotheses A2 and A3 are not significantly different (RMSE: p = 0.414, t(7) = 0.22; Correlation: p = 0.394, t(7) = 0.28). Hypothesis A1 shows significantly lower accuracy than both of the other two (A1 vs A2; RMSE: p < 0.001, t(7) = 6.90; Correlation: p < 0.001, t(7) = 6.36; A1 vs A3; RMSE: p < 0.001, t(7) = 5.76; Correlation = 0.001, t(7) = 5.40). These statistical results indicate that the underlying target of the sandhi L tone can be either a separate category or the same as the R tone target, but clearly not a L-tone target. This is consistent with previous findings based on acoustic analyses and perceptual tests (Peng, 2000; Wang and Li, 1967; Xu, 1997). Table 9 Synthesis accuracies of implementing each tone sandhi hypothesis.
Hypothesis Speaker+Function Specific Functional Specific
RMSE Correlation RMSE Correlation
A1: Sandhi L L 2.41 (0.21) 0.863 (0.005) 2.90 (0.23) 0.838 (0.012)
A2: Sandhi L R 2.16 (0.20) 0.902 (0.008) 2.75 (0.23) 0.863 (0.012)
A3: Sandhi L another category 2.16 (0.22) 0.903 (0.008) 2.72 (0.20) 0.868 (0.012)
Fig. 15 shows the comparisons between original and synthesized F0 contours of each hypothesis. It should be noted that F0 raising in N-tone sequence after a focused L tone is due to the post-low bouncing effect (Prom-on et al., 2012) mentioned earlier and not the focus of the present study. For hypothesis A1, the mismatch occurs not only on the second syllable but also on the third syllable when it is under focus since it shares the same category as the focused L tone sandhi on the second syllable. Hence A1 is invalidated by these mismatches. In contrast, hypotheses A2 and A3 led to almost identical contours. Nevertheless, in a statement when the third syllable is under focused (Column 3), hypothesis A3 has slightly better matched contour in the second syllable than A2. This is because, when treated separately as in hypothesis A3, the original R tone category has lower pitch target than L tone sandhi as shown in Table 8. Treating them as the same target thus results in a compromised pitch target. This result is therefore slightly in favor of hypothesis A3, i.e., the most accurate representation of Mandarin third tone sandhi is as a separate tonal category. Surprisingly, this result agrees well with previous empirical findings that the sandhi-L tone is close but not identical to the R tone (Kuo et al., 2007; Peng, 2000; Xu, 1997)
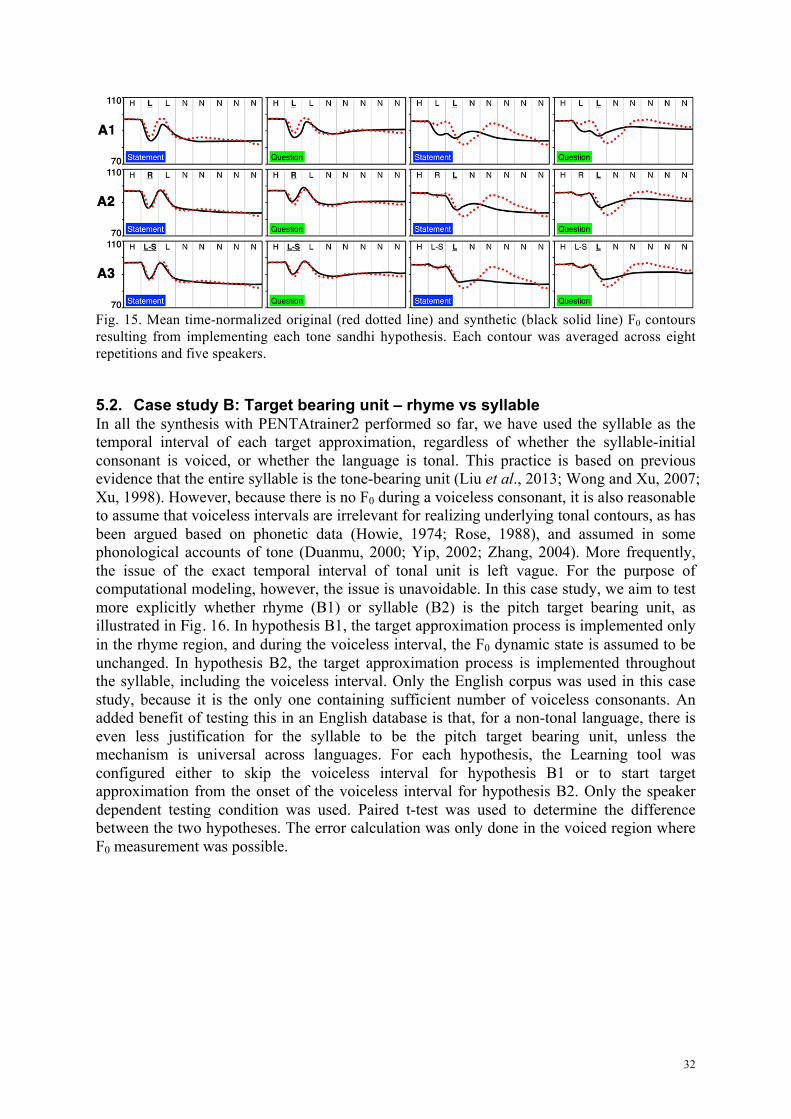
32
Fig. 15. Mean time-normalized original (red dotted line) and synthetic (black solid line) F0 contours resulting from implementing each tone sandhi hypothesis. Each contour was averaged across eight repetitions and five speakers.
5.2. Case study B: Target bearing unit – rhyme vs syllable In all the synthesis with PENTAtrainer2 performed so far, we have used the syllable as the temporal interval of each target approximation, regardless of whether the syllable-initial consonant is voiced, or whether the language is tonal. This practice is based on previous evidence that the entire syllable is the tone-bearing unit (Liu et al., 2013; Wong and Xu, 2007; Xu, 1998). However, because there is no F0 during a voiceless consonant, it is also reasonable to assume that voiceless intervals are irrelevant for realizing underlying tonal contours, as has been argued based on phonetic data (Howie, 1974; Rose, 1988), and assumed in some phonological accounts of tone (Duanmu, 2000; Yip, 2002; Zhang, 2004). More frequently, the issue of the exact temporal interval of tonal unit is left vague. For the purpose of computational modeling, however, the issue is unavoidable. In this case study, we aim to test more explicitly whether rhyme (B1) or syllable (B2) is the pitch target bearing unit, as illustrated in Fig. 16. In hypothesis B1, the target approximation process is implemented only in the rhyme region, and during the voiceless interval, the F0 dynamic state is assumed to be unchanged. In hypothesis B2, the target approximation process is implemented throughout the syllable, including the voiceless interval. Only the English corpus was used in this case study, because it is the only one containing sufficient number of voiceless consonants. An added benefit of testing this in an English database is that, for a non-tonal language, there is even less justification for the syllable to be the pitch target bearing unit, unless the mechanism is universal across languages. For each hypothesis, the Learning tool was configured either to skip the voiceless interval for hypothesis B1 or to start target approximation from the onset of the voiceless interval for hypothesis B2. Only the speaker dependent testing condition was used. Paired t-test was used to determine the difference between the two hypotheses. The error calculation was only done in the voiced region where F0 measurement was possible.
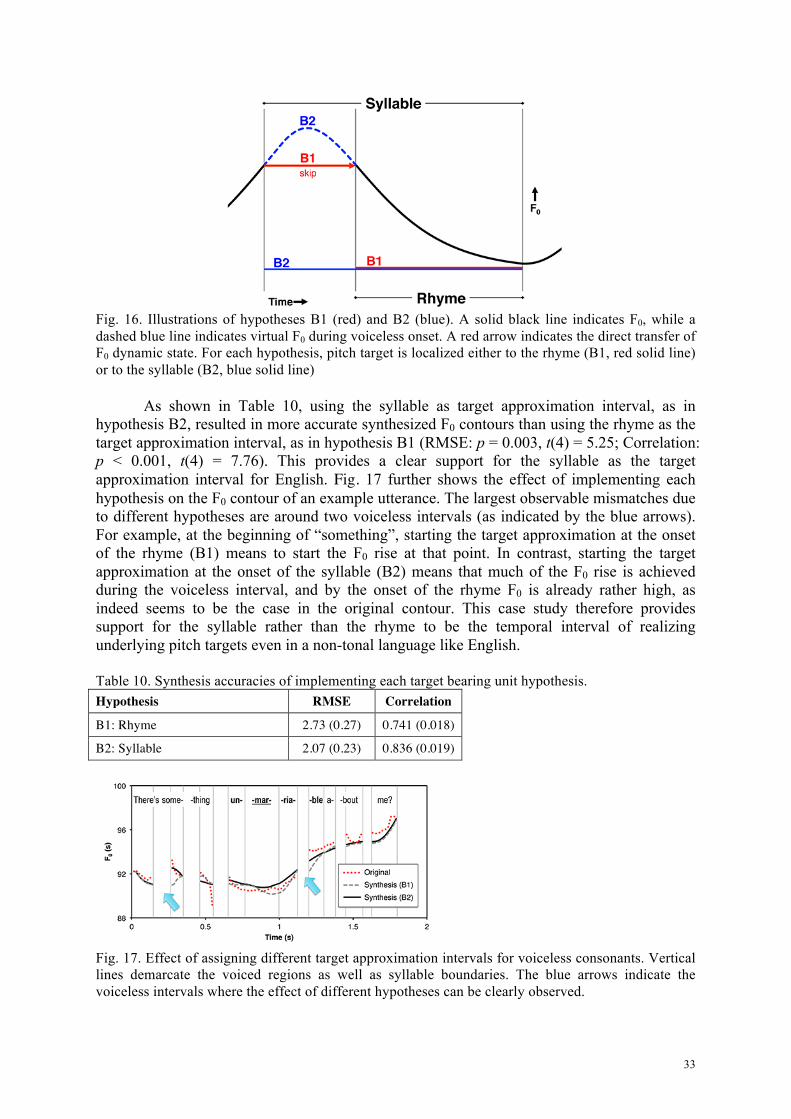
33
Fig. 16. Illustrations of hypotheses B1 (red) and B2 (blue). A solid black line indicates F0, while a dashed blue line indicates virtual F0 during voiceless onset. A red arrow indicates the direct transfer of F0 dynamic state. For each hypothesis, pitch target is localized either to the rhyme (B1, red solid line) or to the syllable (B2, blue solid line)
As shown in Table 10, using the syllable as target approximation interval, as in hypothesis B2, resulted in more accurate synthesized F0 contours than using the rhyme as the target approximation interval, as in hypothesis B1 (RMSE: p = 0.003, t(4) = 5.25; Correlation: p < 0.001, t(4) = 7.76). This provides a clear support for the syllable as the target approximation interval for English. Fig. 17 further shows the effect of implementing each hypothesis on the F0 contour of an example utterance. The largest observable mismatches due to different hypotheses are around two voiceless intervals (as indicated by the blue arrows). For example, at the beginning of “something”, starting the target approximation at the onset of the rhyme (B1) means to start the F0 rise at that point. In contrast, starting the target approximation at the onset of the syllable (B2) means that much of the F0 rise is achieved during the voiceless interval, and by the onset of the rhyme F0 is already rather high, as indeed seems to be the case in the original contour. This case study therefore provides support for the syllable rather than the rhyme to be the temporal interval of realizing underlying pitch targets even in a non-tonal language like English. Table 10. Synthesis accuracies of implementing each target bearing unit hypothesis. Hypothesis RMSE Correlation
B1: Rhyme 2.73 (0.27) 0.741 (0.018)
B2: Syllable 2.07 (0.23) 0.836 (0.019)
Fig. 17. Effect of assigning different target approximation intervals for voiceless consonants. Vertical lines demarcate the voiced regions as well as syllable boundaries. The blue arrows indicate the voiceless intervals where the effect of different hypotheses can be clearly observed.
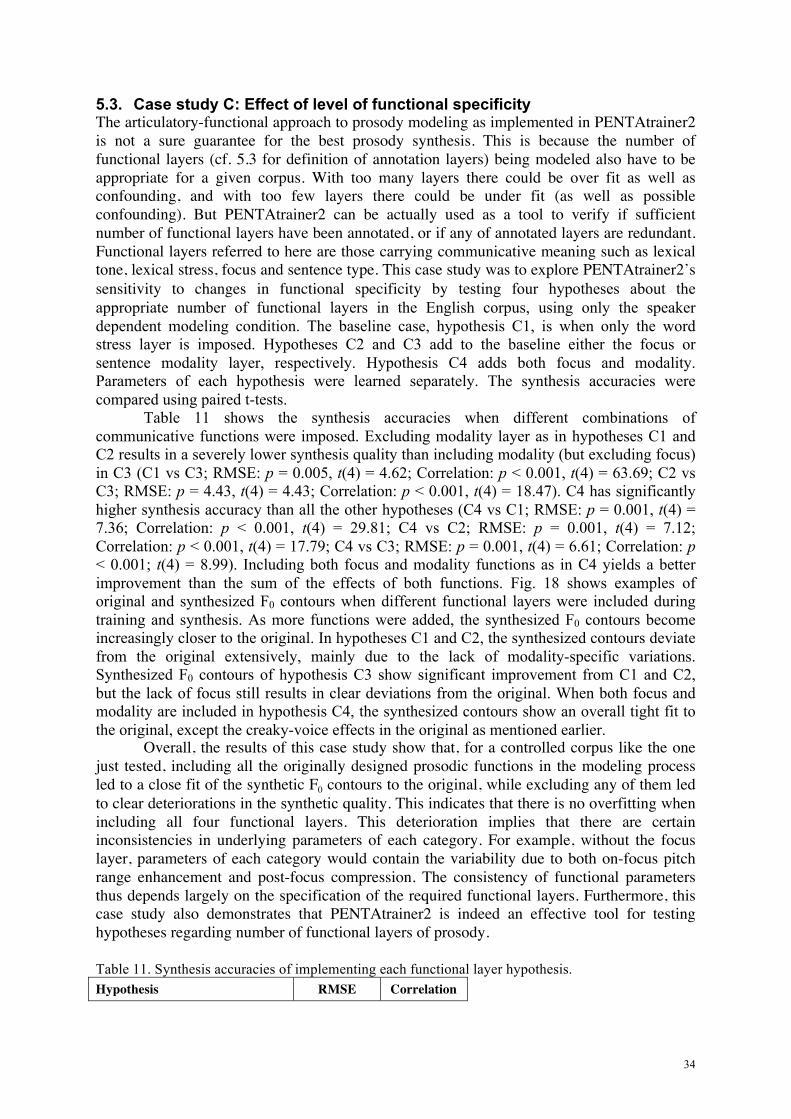
34
5.3. Case study C: Effect of level of functional specificity The articulatory-functional approach to prosody modeling as implemented in PENTAtrainer2 is not a sure guarantee for the best prosody synthesis. This is because the number of functional layers (cf. 5.3 for definition of annotation layers) being modeled also have to be appropriate for a given corpus. With too many layers there could be over fit as well as confounding, and with too few layers there could be under fit (as well as possible confounding). But PENTAtrainer2 can be actually used as a tool to verify if sufficient number of functional layers have been annotated, or if any of annotated layers are redundant. Functional layers referred to here are those carrying communicative meaning such as lexical tone, lexical stress, focus and sentence type. This case study was to explore PENTAtrainer2’s sensitivity to changes in functional specificity by testing four hypotheses about the appropriate number of functional layers in the English corpus, using only the speaker dependent modeling condition. The baseline case, hypothesis C1, is when only the word stress layer is imposed. Hypotheses C2 and C3 add to the baseline either the focus or sentence modality layer, respectively. Hypothesis C4 adds both focus and modality. Parameters of each hypothesis were learned separately. The synthesis accuracies were compared using paired t-tests.
Table 11 shows the synthesis accuracies when different combinations of communicative functions were imposed. Excluding modality layer as in hypotheses C1 and C2 results in a severely lower synthesis quality than including modality (but excluding focus) in C3 (C1 vs C3; RMSE: p = 0.005, t(4) = 4.62; Correlation: p < 0.001, t(4) = 63.69; C2 vs C3; RMSE: p = 4.43, t(4) = 4.43; Correlation: p < 0.001, t(4) = 18.47). C4 has significantly higher synthesis accuracy than all the other hypotheses (C4 vs C1; RMSE: p = 0.001, t(4) = 7.36; Correlation: p < 0.001, t(4) = 29.81; C4 vs C2; RMSE: p = 0.001, t(4) = 7.12; Correlation: p < 0.001, t(4) = 17.79; C4 vs C3; RMSE: p = 0.001, t(4) = 6.61; Correlation: p < 0.001; t(4) = 8.99). Including both focus and modality functions as in C4 yields a better improvement than the sum of the effects of both functions. Fig. 18 shows examples of original and synthesized F0 contours when different functional layers were included during training and synthesis. As more functions were added, the synthesized F0 contours become increasingly closer to the original. In hypotheses C1 and C2, the synthesized contours deviate from the original extensively, mainly due to the lack of modality-specific variations. Synthesized F0 contours of hypothesis C3 show significant improvement from C1 and C2, but the lack of focus still results in clear deviations from the original. When both focus and modality are included in hypothesis C4, the synthesized contours show an overall tight fit to the original, except the creaky-voice effects in the original as mentioned earlier.
Overall, the results of this case study show that, for a controlled corpus like the one just tested, including all the originally designed prosodic functions in the modeling process led to a close fit of the synthetic F0 contours to the original, while excluding any of them led to clear deteriorations in the synthetic quality. This indicates that there is no overfitting when including all four functional layers. This deterioration implies that there are certain inconsistencies in underlying parameters of each category. For example, without the focus layer, parameters of each category would contain the variability due to both on-focus pitch range enhancement and post-focus compression. The consistency of functional parameters thus depends largely on the specification of the required functional layers. Furthermore, this case study also demonstrates that PENTAtrainer2 is indeed an effective tool for testing hypotheses regarding number of functional layers of prosody. Table 11. Synthesis accuracies of implementing each functional layer hypothesis. Hypothesis RMSE Correlation
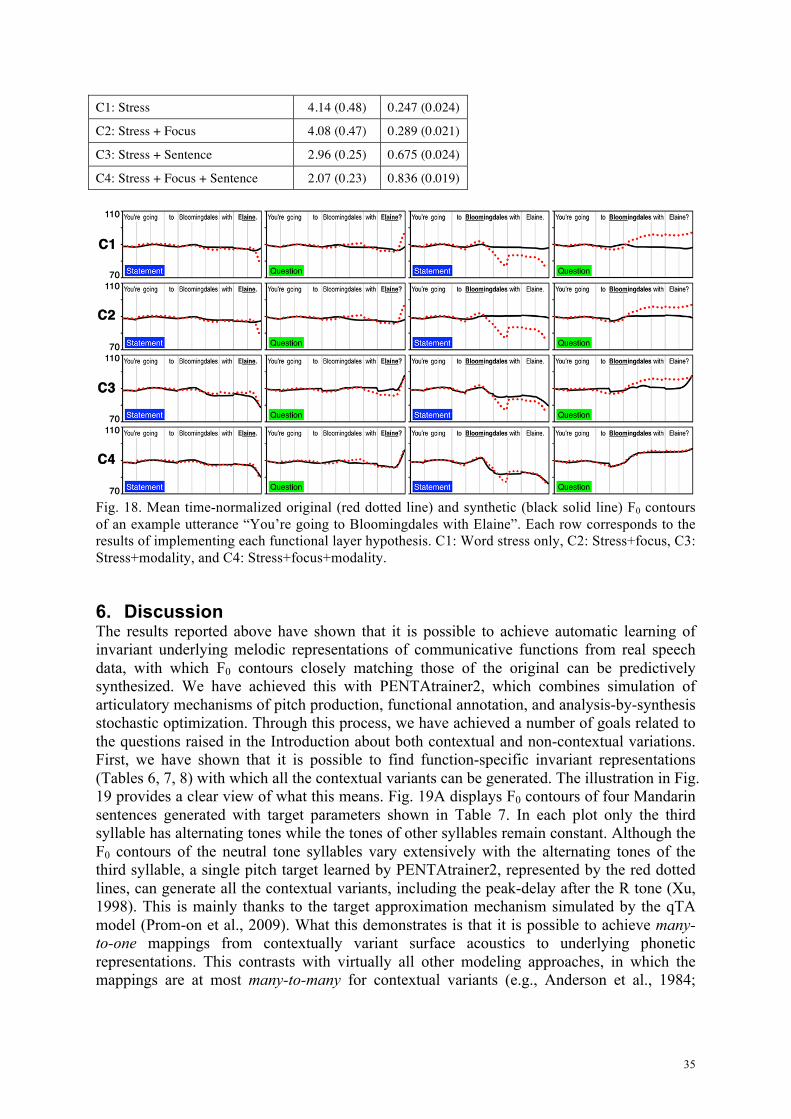
35
C1: Stress 4.14 (0.48) 0.247 (0.024)
C2: Stress + Focus 4.08 (0.47) 0.289 (0.021)
C3: Stress + Sentence 2.96 (0.25) 0.675 (0.024)
C4: Stress + Focus + Sentence 2.07 (0.23) 0.836 (0.019)
Fig. 18. Mean time-normalized original (red dotted line) and synthetic (black solid line) F0 contours of an example utterance “You’re going to Bloomingdales with Elaine”. Each row corresponds to the results of implementing each functional layer hypothesis. C1: Word stress only, C2: Stress+focus, C3: Stress+modality, and C4: Stress+focus+modality.
6. Discussion The results reported above have shown that it is possible to achieve automatic learning of invariant underlying melodic representations of communicative functions from real speech data, with which F0 contours closely matching those of the original can be predictively synthesized. We have achieved this with PENTAtrainer2, which combines simulation of articulatory mechanisms of pitch production, functional annotation, and analysis-by-synthesis stochastic optimization. Through this process, we have achieved a number of goals related to the questions raised in the Introduction about both contextual and non-contextual variations. First, we have shown that it is possible to find function-specific invariant representations (Tables 6, 7, 8) with which all the contextual variants can be generated. The illustration in Fig. 19 provides a clear view of what this means. Fig. 19A displays F0 contours of four Mandarin sentences generated with target parameters shown in Table 7. In each plot only the third syllable has alternating tones while the tones of other syllables remain constant. Although the F0 contours of the neutral tone syllables vary extensively with the alternating tones of the third syllable, a single pitch target learned by PENTAtrainer2, represented by the red dotted lines, can generate all the contextual variants, including the peak-delay after the R tone (Xu, 1998). This is mainly thanks to the target approximation mechanism simulated by the qTA model (Prom-on et al., 2009). What this demonstrates is that it is possible to achieve many-to-one mappings from contextually variant surface acoustics to underlying phonetic representations. This contrasts with virtually all other modeling approaches, in which the mappings are at most many-to-many for contextual variants (e.g., Anderson et al., 1984;
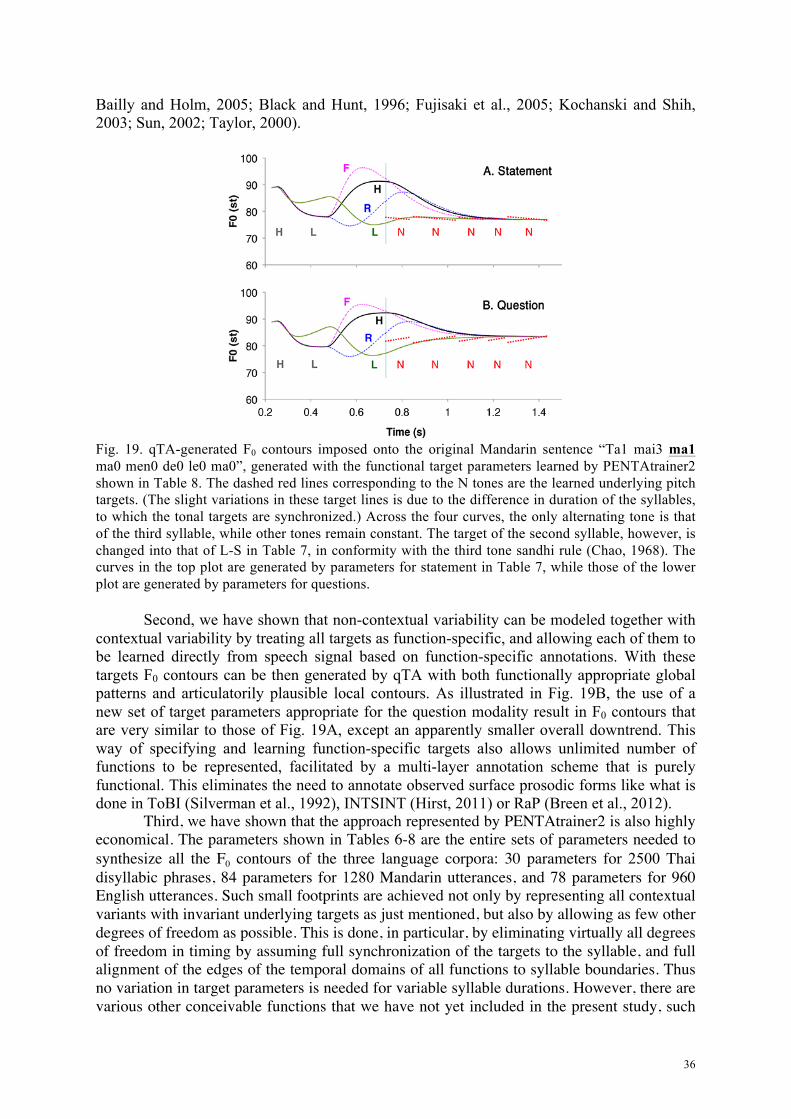
36
Bailly and Holm, 2005; Black and Hunt, 1996; Fujisaki et al., 2005; Kochanski and Shih, 2003; Sun, 2002; Taylor, 2000).
Fig. 19. qTA-generated F0 contours imposed onto the original Mandarin sentence “Ta1 mai3 ma1 ma0 men0 de0 le0 ma0”, generated with the functional target parameters learned by PENTAtrainer2 shown in Table 8. The dashed red lines corresponding to the N tones are the learned underlying pitch targets. (The slight variations in these target lines is due to the difference in duration of the syllables, to which the tonal targets are synchronized.) Across the four curves, the only alternating tone is that of the third syllable, while other tones remain constant. The target of the second syllable, however, is changed into that of L-S in Table 7, in conformity with the third tone sandhi rule (Chao, 1968). The curves in the top plot are generated by parameters for statement in Table 7, while those of the lower plot are generated by parameters for questions.
Second, we have shown that non-contextual variability can be modeled together with
contextual variability by treating all targets as function-specific, and allowing each of them to be learned directly from speech signal based on function-specific annotations. With these targets F0 contours can be then generated by qTA with both functionally appropriate global patterns and articulatorily plausible local contours. As illustrated in Fig. 19B, the use of a new set of target parameters appropriate for the question modality result in F0 contours that are very similar to those of Fig. 19A, except an apparently smaller overall downtrend. This way of specifying and learning function-specific targets also allows unlimited number of functions to be represented, facilitated by a multi-layer annotation scheme that is purely functional. This eliminates the need to annotate observed surface prosodic forms like what is done in ToBI (Silverman et al., 1992), INTSINT (Hirst, 2011) or RaP (Breen et al., 2012).
Third, we have shown that the approach represented by PENTAtrainer2 is also highly economical. The parameters shown in Tables 6-8 are the entire sets of parameters needed to synthesize all the F0 contours of the three language corpora: 30 parameters for 2500 Thai disyllabic phrases, 84 parameters for 1280 Mandarin utterances, and 78 parameters for 960 English utterances. Such small footprints are achieved not only by representing all contextual variants with invariant underlying targets as just mentioned, but also by allowing as few other degrees of freedom as possible. This is done, in particular, by eliminating virtually all degrees of freedom in timing by assuming full synchronization of the targets to the syllable, and full alignment of the edges of the temporal domains of all functions to syllable boundaries. Thus no variation in target parameters is needed for variable syllable durations. However, there are various other conceivable functions that we have not yet included in the present study, such
37
as topic shift, turn taking, emotion, attitude and speaking style. When they are included, the number of parameters will eventually increase. Some of these factors, as found in recent studies (Xu, Kelly and Smillie, 2013; Xu et al., 2013), could be implemented as global changes that alter all the target values in the same way, which would then result in an increase in the number of parameters. It should also be noted that the synthesis result in this study is still limited to only controlled corpora with fixed varying experimental factors. More work is still needed to test PENTAtrainer2’s ability to work with non-controlled corpora.
Fourth, we have shown that with the small sets of learned targets, predictive synthesis at high-accuracies (Tables 4, 5) can be achieved, both in a speaker-dependent manner, which captures individuality, and in a speaker-independent manner, which captures language/dialect characteristics. In the latter case, high synthetic accuracies can be achieved either when group averages are applied to each of the individuals in the group, regardless of gender, or through cross-validation, in which F0 contours of an individual speaker are predicted by parameters summarized from all other members of the group, also regardless of gender. The illustrations in Fig. 19 are in fact examples of group average synthesis, in which the F0 contours are generated with mean parameters from eight speakers, four females and four males.
Finally, we have shown the plausibility of using full-fledged prosody synthesis as a means of hypothesis testing for basic research. Computational modeling has often been used in basic research, but typically they are used to test a specific hypothesis on materials that are directly related to the hypothesis. The idea tested in the present project is rather different. That is, it is possible for a theory to demonstrate both validity and generalizability by showing its ability to predict full phonetic details that can be directly compared to real speech data, and especially details that are beyond the specific phenomena for which it was originally proposed. The appeal of this approach is that any phenomenon-specific hypothesis may have inadvertent consequences when used to make predictions on other aspects of the speech, but such consequences often remain hidden unless full-detailed synthesis has to be performed. Thus theory testing by full-scaled synthesis will help accelerate rather than harm theoretical development. For example, while the overall results of the present project have demonstrated the strengths of the target approximation hypothesis, the inability of PENTAtrainer2 in its present form to predict post-low bouncing as seen in rows 5-6 in Fig. 11 shows that additional articulatory mechanisms still need to be considered, as has been done in Prom-on et al. (2012). The case studies reported in section 5 further show that a theory-based synthesis system can be used to test various specific hypotheses by manipulating various aspects of the learning-synthesis process. The confirmation of target shift in Mandarin L-tone sandhi in case study A in 5.1 shows the effectiveness of PENTAtrainer2 for separating phonological changes of underlying targets from phonetic variations due to articulatory mechanism. The results of case study B in 5.2 offer direct evidence that the temporal domain of target approximation is more likely to be the syllable rather than the rhyme. Case study C in 5.3 shows the high sensitivity of PENTAtrainer2 to the number of layers of functional annotation provided by the investigator.
Beside what has been achieved, a number of caveats need to be mentioned. The first is that, although the derived underlying targets may be good enough for predictive synthesis, they may not be fully consistent with traditional phonetic descriptions. This is because the data-driven approach adopted here is fundamentally different from the classical rule-based approach to speech synthesis (Klatt, 1987) where a heavy reliance is on the theoretical knowledge of the researcher, which may or may not be accurate. On the other hand, targets derived from a data-driven approach may not be “accurate” either if the input data are not fully balanced. For example, in the Mandarin corpus used in the present study, the L tone is preceded only by H and L-S, which is probably why its learned m is highly positive (Table 7). A more balanced tonal context may lead to an m value much closer to zero, which would be
38
more consistent with the theoretical description of the Mandarin tones. Second, the current version of PENTAtrainer2 simulates only F0 variations due to the normal target approximation process. It has not incorporated algorithms for simulating additional articulatory mechanisms, including, in particular, anticipatory raising (Gandour et al., 1994; Potisuk et al., 1997; Xu, 1999), post-low bouncing (Chen and Xu, 2006), consonantal perturbation (Silverman, 1986) and vowel intrinsic pitch (Whalen and Levitt, 1995). Of these, post-low bouncing has already been simulated in a separate study by adding an extra component added to qTA (Prom-on et al., 2012). Third, we did not do any duration modeling for this paper, and no duration values of synthetic sentences were changed from the original. Duration modeling will be performed in subsequent studies. Fourth, perceptual evaluation of the synthetic prosody was conducted only for Thai in this study as this has never been done before. For English and Mandarin, since Prom-on et al. (2009) tested the both the intelligibility and naturalness of the synthetic tone and focus and show very close performance between the two. Given the significant improvement of the global optimization method in the present study over the method used in Prom-on et al. (2009) in terms of numerical evaluation results as shown in Table 5, it is reasonable to expect no deterioration of perceptual quality from that study. Finally, there were no detailed numerical comparisons with other models performed in the present study. This is because, for such comparisons to be meaningful, three basic requirements had to be met: a) the availability of common speech corpora with annotations suitable for all models under comparison, b) the design of common tasks that all models are able to perform, and c) the actual implementation of the other models either by us or by the original authors. These requirements can be met only in future studies designed for the purpose of direct model comparisons.
7. Conclusions The findings of the present study have demonstrated not only the ability of PENTAtrainer2 as a tool of prosody modeling and synthesis, but also the importance of directly addressing variability for the successful modeling of speech prosody in general. We have shown that the modeling of local contextual variability is not a dispensable burden, but a vital step toward effective modeling of non-contextual, i.e., function-driven variability. With the qTA model as the core of PENTAtrainer, we have achieved many-to-one mappings between surface prosody and underlying representations. This in turn allows targets to be directly associated with functional categories, and thus remain unique and invariant across local tonal contexts. When this intrinsic ability to handle variability is combined by the multi-layer functional annotation scheme and global stochastic optimization developed in this study, automatic learning of the target parameters and predictive synthesis of close-to-natural F0 contours of full phrases or sentences in three languages were achieved. Given the effectiveness of the current approach, it is potentially applicable to the segmental aspect of speech as well. Being both theory-based and trainable, PENTAtrainer can serve as a new type of tool for basic research. See supplementary materials for online address of PENTATrainer2 and its user manual, together with PENTAtrainer1, which is useful for sentence-by-sentence target estimation in small-scale studies and demonstrations.
Acknowledgements We would like to thank for the financial supports the Royal Society and the Royal Academy of Engineering through the Newton International Fellowship Scheme (to SP), the Thai Research Fund through the Research Grant for New Researcher (Grant Number TRG5680096 to SP), and the National Science Foundation (to YX). We thank Fang Liu for providing the English and Mandarin Chinese corpora used in this work. We would further
39
like to thank the Organizers of Speech Prosody 2012 for inviting us to give the tutorial about this work at the conference. References Abramson, A. S., 1962. The vowels and tones of Standard Thai: acoustical measurements and
experiments. Int. J. Am. Linguist. 28(2), pt. 3. Anderson, M. D., Pierrehumbert, J. B., Liberman, M. Y., 1984. Synthesis by rule of English
intonation patterns. In: Proc. ICASSP 1984, San Diego, pp. 77-80. Arvaniti, A., Ladd, D. R., 2009. Greek wh-questions and the phonology of intonation.
Phonology 26, 43-74. Bailly, G., Holm, B., 2005. SFC: A trainable prosodic model. Speech Commun. 46, 348-364. Beckman, M. E., Pierrehumbert, J. B., 1986. Intonational structure in Japanese and English.
Phonology Yearbook 3, 255-309. Black, A. W., Hunt, A. J., 1996. Generating F0 contours from ToBI labels using linear
regression. In: Proc. ICSLP 96, Philadelphia, pp. 1385-1388. Boersma, P., Weenink, D., 2012. Praat: doing phonetics by computer (version 5.3.35).
Available from http://www.praat.org/ (last visited 12 December 2012). Breen, M., Dilley, L. C., Kraemer, J. and Gibson, E., 2012. Inter-transcriber reliability for
two systems of prosodic annotation: ToBI (Tones and Break Indices) and RaP (Rhythm and Pitch). Corpus Linguist. Ling. 8, 277-312.
Chao, Y. R., 1968. A Grammar of Spoken Chinese. University of California Press, Berkeley, CA.
Chen, G.-P., Bailly, G., Liu, Q.-F., Wang, R.-H., 2004. A superposed prosodic model for Chinese text-to-speech synthesis. In: Proc. International Conference of Chinese Spoken Language Processing, Hong Kong, pp. 177-180.
Chen, M. Y., 2000. Tone Sandhi: Patterns Across Chinese Dialects. Cambridge University Press, Cambridge, UK.
Chen, Y., Xu, Y., 2006. Production of weak elements in speech – Evidence from f0 patterns of neutral tone in standard Chinese. Phonetica 63, 47-75.
Cho, H., Rauzy, S., 2008. Phonetic pitch movements of accentual phrases in Korean read speech. In: Proc. Speech Prosody 2008, Campinas, pp. 123-126.
Cooper, W. E., Eady, S. J., Mueller, P. R., 1985. Acoustical aspects of contrastive stress in question-answer contexts. J. Acoust. Soc. Am. 77, 2142-2156.
Duanmu, S., 2000. The phonology of Standard Chinese. Oxford University Press, Oxford. Eady, S. J., Cooper, W. E., 1986. Speech intonation and focus location in matched statements
and questions. J. Acoust. Soc. Am. 80, 402-416. Efron, B., 1979. Bootstrap methods: another look at the jackknife. Ann. Statist. 7, 1-26. Fujisaki, H., Hirose, K., Halle, P., Lei, H., 1990. Analysis and modeling of tonal features in
polysyllabic words and sentences of the standard Chinese. In: Proc. ICSLP 1990, Kobe, pp. 841-844.
Fujisaki, H., Wang, C., Ohno, S., Gu, W., 2005. Analysis and synthesis of fundamental frequency contours of Standard Chinese using the command-response model. Speech Commun. 47, 59-70.
Gandour, J., Potisuk, S., Dechonkit, S. 1994. Tonal coarticulations in Thai. J. Phonetics 22, 477-492.
Grabe, E., Kochanski, G., Coleman, J., 2007. Connecting intonation labels to mathematical descriptions of fundamental frequency. Lang. Speech 50, 281-310.
Gu, W., Hirose, K., Fujisaki, H., 2006. Modeling the effects of emphasis and question on fundamental frequency contours of Cantonese utterances. IEEE T. Audio Speech 14, 1155-1170.
40
Gu, W., Hirose, K., Fujisaki, H., 2007. Analysis of Tones in Cantonese Speech Based on the Command-Response Model. Phonetica 64, 29-62.
Hadding-Koch, K., Studdert-Kennedy, M., 1964. An experimental study of some intonation contours. Phonetica 11, 175-185.
Hermes, D. J., 1998. Measuring the Perceptual Similarity of Pitch Contours. J. Speech Lang. Hear. Res. 41(1), 73-82.
Hirst, D. J., 2005. Form and function in the representation of speech prosody. Speech Commun. 46, 334-347.
Hirst, D. J., 2011. The analysis by synthesis of speech melody: From data to models. J. Speech Science 1, 55-83.
Ho, A. T., 1977. Intonation variation in a Mandarin sentence for three expressions: interrogative, exclamatory and declarative. Phonetica 34, 446-457.
Howie, J. M., 1974. On the domain of tone in Mandarin. Phonetica 30, 129-148. Jilka, M., Möhler, G., Dogil, G., 1999. Rules for the generation of ToBI-based American
English intonation. Speech Commun. 28, 83-108. Jokisch, O., Mixdorff, H., Kruschke, H., Kordon, U., 2000. Learning the parameters of
quantitative prosody models. In: Proc. ICSLP 2000, Beijing, pp. 645-648. Kirkpatrick, S., Gelatt, C. D., Vecchi, M. P., 1983. Optimization by simulated annealing.
Science 220(4598), 671-680. Klatt, D. H., 1987. Review of text-to-speech conversion for English. Journal of the
Acoustical Society of America 82, 737-793. Kochanski, G., Shih, C., 2003. Prosody modeling with soft templates. Speech Commun. 39,
311-352. Konishi, S., Kitagawa, G., 1996. Generalised information criteria in model selection.
Biometrika 83, 875-890. Kuo, Y.-C., Xu, Y., Yip, M., 2007. The phonetics and phonology of apparent cases of
iterative tonal change in Standard Chinese, in: C. Gussenhoven and T. Riad (Eds.), Tones and Tunes Vol 2: Experimental Studies in Word and Sentence Prosody. Mouton de Gruyter, Berlin, pp. 211-237.
Ladd, D. R., 2008. Intonational phonology. Cambridge University Press, Cambridge. Ladefoged, P., 1967. Three areas of experimental phonetics. Oxford University Press. Lee, Y.-C., Xu, Y., 2010. Phonetic realization of contrastive focus in Korean. In: Proc.
Speech Prosody 2010, Chicago, pp. 100033:1-4. Liu, F., Xu, Y., 2005. Parallel encoding of focus and interrogative meaning in Mandarin
intonation, Phonetica 62, 70-87. Liu, F., Xu, Y., Prom-on, S. and Yu, A. C. L., 2013. Morpheme-like prosodic functions:
Evidence from acoustic analysis and computational modeling. Journal of Speech Sciences 3(1): 85-140.
Mixdorff, H., Fujisaki, H., Chen, G. P., Hu, Y., 2003. Towards the automatic extraction of Fujisaki model parameters for Mandarin. In: Proc. Eurospeech 2003, Geneva, pp. 873-876.
Myers, S., 1998. Surface underspecification of tone in Chichewa. Phonology 15, 367-392. Ni, J., Kawai, H., Hirose, K., 2006. Constrained tone transformation technique for separation
and combination of Mandarin tone and intonation. J. Acoust. Soc. Am. 119, 1764-1782. Ni, J., Kawai, H., Pitch targets anchor Chinese tone and intonation patterns. In: Proc. Speech
Prosody 2004, Nara, pp. 95-98 Ni, J., Hirose, K., 2006. Quantitative and structural modeling of voice fundamental frequency
contours of speech in Mandarin. Speech Commun. 48, 989-1008. O'Shaughnessy, D., Allen, J., 1983. Linguistic modality effects on fundamental frequency in
speech. J. Acoust. Soc. Am. 74, 1155-1171.
41
Pell, M. D., 2001. Influence of emotion and focus on prosody in matched statements and questions. J. Acoust. Soc. Am. 74, 1155-1171.
Peng, S.-H., 2000. Lexical versus ‘phonological’ representations of Mandarin Sandhi tones, in: M. B. Broe and J. B. Pierrehumbert (Eds.), Papers in Laboratory Phonology V: Acquisition and the Lexicon. Cambridge University Press, Cambridge, pp. 152-167.
Perkell, J. S., Klatt, D. H., (eds.) 1986. Invariance and variability of speech processes, Lawrence Erlbaum Associates, Hillsdale, NJ.
Perrier, P., Ostry, D. J., Laboissière, R., 1996. The Equilibrium-Point Hypothesis and its Application to Speech Motor Control. J. Speech Hear. Res. 39, 365-377.
Peterson, G. E., Barney, H. L., 1952. Control methods used in a study of the vowels. J. Acoust. Soc. Am. 24, 175-184.
Pierrehumbert, J., 1980. The phonology and phonetics of English intonation. Ph.D. thesis, MIT, Cambridge, MA.
Pierrehumbert, J., 1981. Synthesizing intonation. J. Acoust. Soc. Am. 70, 985-995. Potisuk, S., Gandour, J., Harper, M. P., 1997. Contextual variations in trisyllabic sequences
of Thai tones. Phonetica 42, 22-42. Prom-on, S., Liu, F., Xu, Y., 2011. Functional modeling of tone, focus and sentence type in
Mandarin Chinese. In: Proc. ICPhS XVII, Hong Kong, pp. 1638-1641. Prom-on, S., Liu, F., Xu, Y., 2012. Post-low bouncing in Mandarin Chinese: Acoustic
analysis and computational modeling. J. Acoust. Soc. Am. 132, 421-432. Prom-on, S., Xu, Y., Thipakorn, B., 2009. Modeling tone and intonation in Mandarin and
English as a process of target approximation. J. Acoust. Soc. Am. 125, 405-424. Raidt, S., Bailly, G., Holm, B., Mixdorff, H., 2004. Automatic generation of prosody:
Comparing two superpositional systems. In: Proc. Speech Prosody 2004, Nara, pp. 417-420.
Rose, P. J., 1988. On the non-equivalence of fundamental frequency and pitch in tonal description. In: Bradley, D., Henderson, E.J.A., Mazaudon, M. (Eds.), Prosodic Analysis and Asian Linguistics: To Honour R.K. Sprigg. Pacific Linguistics, Canberra, pp. 55-82.
Ross, K. N., Ostendorf, M., 1999. A dynamical system model for generating fundamental frequency for speech synthesis. IEEE T. Speech Audi. P. 7, 295-309.
Sakurai, A., Hirose, K., Minematsu, N., 2003. Data-driven generation of F0 contours using a superpositional model. Speech Commun. 40, 535-549.
Saltzman, E. L., Munhall, K. G., 1989. A dynamical approach to gestural patterning in speech production. Ecol. Psychol. 1, 333-382.
Shattuck-Hufnagel, S., Turk, A. E., 1996. A Prosody Tutorial for Investigators of Auditory Sentence Processing. J. Psycholinguist. Res. 25, 193-247.
Shen, X.-N. S., 1990. The prosody of Mandarin Chinese. University of California Press, Berkeley, CA.
Shih, C., 1987. The phonetics of the Chinese tonal system, AT&T Bell Labs technical memo. Silverman, K., Beckman, M., Pitrelli, J., Ostendorf, M., Wightman, C., Price, P.,
Pierrehumbert, J., Hirschberg, J., 1992. ToBI: A standard for labeling English prosody. In: Proc. ICSLP 1992, Banff, pp. 867-870.
Sun, X., 2002. The determination, analysis, and synthesis of fundamental frequency. Ph.D. dissertation, Northwestern University, 2002.
Sun, X., Xu, Y., 2002. Perceived pitch of synthesized voice with alternate cycles. J. Voice 16(4), 443-459.
Syrdal, A. K., McGory, J., 2000. Inter-transcriber reliability of ToBI prosodic labeling. In: Proc. ICSLP 2000, Beijing, pp. 235-238.
42
't Hart, J., Collier, R., Cohen, A., 1990. A perceptual Study of Intonation — An experimental-phonetic approach to speech melody. Cambridge University Press, Cambridge.
Taylor, P., 2000. Analysis and synthesis of intonation using the Tilt model. J. Acoust. Soc. Am. 107, 1697-1714.
Taylor, P., 2009. Text-to-Speech Synthesis. Cambridge University Press, Cambridge, UK. Vainio, M., Hirst, D. J., Suni, A., De Looze, C., 2009. Using functional prosodic annotation
for high quality multilingual, multidialectal and multistyle speech synthesis. In: Proc. SPECOM'2009, St. Petersburg, pp. 164-169.
Vainio, M., Järvikivi, J., Aalto, D., Suni, A., 2010. Phonetic tone signals phonological quantity and word structure. J. Acoust. Soc. Am. 128, 1313-1321.
van Santen, J., Möbius, B. 2000. A quantitative model of F0 generation and alignment. In: A. Botinis (ed.), Intonation – Analysis, Modeling and Technology, Kluwer, Dordrecht, pp. 269-288.
Wang, W. S.-Y., Li, K.-P., 1967. Tone 3 in Pekinese. J. Speech Hear. Res. 10, 629-636. Wagner, M., Watson, D. G., 2010. Experimental and theoretical advances in prosody: A
review. Lang. Cognitive Proc. 25, 905-945. Whalen, D. H., Levitt, A. G., 1995. The universality of intrinsic F0 of vowels. J. Phonetics 23,
349-366. Wightman, C., 2002. ToBI or not ToBI. In: Proc. Speech Prosody 2002, Aix-en-Provence, pp.
25-29. Wightman, C., Rose, R. C., 1999. Evaluation of an efficient prosody labeling system for
spontaneous speech utterances. In: Proc. IEEE ASRU 1999, Keystone, pp. 333-336. Wong, Y. W., Xu, Y., 2007. Consonantal perturbation of f0 contours of Cantonese tones. In:
Proc. ICPhS XVI, Saarbrucken, pp. 1293-1296. Wu, W. L., Xu., Y., 2010. Prosodic focus in Hong Kong Cantonese without post-focus
compression. In: Proc. Speech Prosody 2010, Chicago, pp. 100040:1-4. Wu, Z., 1984. Putonghua sanzizu biandiao guilü [Rules of tone sandhi in trisyllabic words in
Standard Chinese]. Zhongguo Yuyan Xuebao [Bulletin of Chinese Linguistics] 2, 70-92. Xu, Y., 1997. Contextual tonal variations in Mandarin. J. Phonetics 25, 61-83. Xu, Y., 1998. Consistency of tone-syllable alignment across different syllable structures and
speaking rates. Phonetica 55, 179-203. Xu, Y., 1999. Effects of tone and focus on the formation and alignment of F0 contours, J.
Phonetics 27, 55–105. Xu, Y., 2005. Speech melody as articulatorily implemented communicative functions. Speech
Commun. 46, 220-251. Xu, Y., 2011. Speech prosody: A methodological review. J. Speech Science 1., 85-115. Xu, Y., Chen, S.-W., Wang, B., 2012. Prosodic focus with and without post-focus
compression (PFC): A typological divide within the same language family? Linguist. Rev. 29, 131-147.
Xu, Y., Kelly, A. and Smillie, C., 2013. Emotional expressions as communicative signals, in: S. Hancil and D. Hirst (Eds.), Prosody and Iconicity. John Benjamins Publishing Co.: 33-60.
Xu, Y., Lee, A., Wu, W.-L., Liu, X. and Birkholz, P., 2013. Human vocal attractiveness as signaled by body size projection. PLoS ONE 8(4), e62397.
Xu, Y., Prom-on, S., 2010-2013. PENTAtrainer1. Available from: http://www.phon.ucl.ac.uk/home/yi/PENTAtrainer1/ (12 December 2012)
Xu, Y., Sun, X., 2002. Maximum speed of pitch change and how it may relate to speech. J. Acoust. Soc. Am. 111, 1399-1413.
43
Xu, Y., Wang, M., 2009. Organizing syllables into groups – Evidence from F0 and duration patterns in Mandarin. J. Phonetics 37, 507-520.
Xu, Y., Wang, Q. E., 2001. Pitch targets and their realization: Evidence from Mandarin Chinese. Speech Commun. 33, 319-337.
Xu, Y., Xu, C. X., 2005. Phonetic realization of focus in English declarative intonation. J. Phonetics 33, 159–197.
Yip, M., 2002. Tone. Cambridge University Press, Cambridge. Yang, X., Yang, Y. 2012. Effects of topic structure and syntax on boundary pitch variations
in Standard Chinese. In: Proc. Speech Prosody 2012, Shanghai, pp. 543-546. Yuan, J., Shih, C., Kochanski, G. P., 2002. Comparison of declarative and interrogative
intonation in Chinese. In: Proc. Speech Prosody 2002, Aix-en-Provence, pp. 711-714. Zhang, J., 2004. The role of contrast specific and language specific phonetics in contour tone
distribution, in: B. Hayes, R. Kirchner and D. Steriade (Eds.), Phonetically Based Phonology. Cambridge University Press.