Xtrackers II - Singapore Exchange
403
Xtrackers II Société d’investissement à capital variable R.C.S. Luxembourg N° B-124.284 Annual Report and Audited Financial Statements For the year ended 31 December 2020 No subscription can be accepted on the basis of the financial reports. Subscriptions are only valid if they are made on the basis of the latest published prospectus of Xtrackers II accompanied by the latest annual report and the most recent semi-annual report, if published thereafter.
-
Upload
khangminh22 -
Category
Documents
-
view
4 -
download
0
Transcript of Xtrackers II - Singapore Exchange

Xtrackers IISociété d’investissement à capital variable
R.C.S. Luxembourg N° B-124.284
Annual Report and Audited Financial StatementsFor the year ended 31 December 2020
No subscription can be accepted on the basis of the financial reports. Subscriptions are only valid if they are made on thebasis of the latest published prospectus of Xtrackers II accompanied by the latest annual report and the most recentsemi-annual report, if published thereafter.

Page
Organisation 3Directors’ Report 5Ind Auditors Report 13Statistics 17Statement of Net Assets as at 31 December 2020 27Statement of Operations and Changes in Net Assets for the year ended 31 December 2020 37Statement of Changes in Shares Issued for the year ended 31 December 2020 47Statement of Investments as at 31 December 2020 50Xtrackers II EUROZONE GOVERNMENT BOND UCITS ETF 50Xtrackers II EUROZONE GOVERNMENT BOND 1-3 UCITS ETF 61Xtrackers II EUROZONE GOVERNMENT BOND 3-5 UCITS ETF 63Xtrackers II EUROZONE GOVERNMENT BOND 5-7 UCITS ETF 64Xtrackers II EUROZONE GOVERNMENT BOND 7-10 UCITS ETF 65Xtrackers II EUROZONE GOVERNMENT BOND 15-30 UCITS ETF 67Xtrackers II EUROZONE GOVERNMENT BOND 25+ UCITS ETF 69Xtrackers II GLOBAL INFLATION-LINKED BOND UCITS ETF 70Xtrackers II EUROZONE INFLATION-LINKED BOND UCITS ETF 76Xtrackers II EUR OVERNIGHT RATE SWAP UCITS ETF 78Xtrackers II ITRAXX EUROPE SWAP UCITS ETF 81Xtrackers II ITRAXX CROSSOVER SWAP UCITS ETF 83Xtrackers II ITRAXX CROSSOVER SHORT DAILY SWAP UCITS ETF 85Xtrackers II USD EMERGING MARKETS BOND UCITS ETF 87Xtrackers II EUROZONE GOVERNMENT BOND SHORT DAILY SWAP UCITS ETF 102Xtrackers II IBOXX GERMANY COVERED BOND SWAP UCITS ETF 104Xtrackers II USD OVERNIGHT RATE SWAP UCITS ETF 106Xtrackers II GBP OVERNIGHT RATE SWAP UCITS ETF 109Xtrackers II GLOBAL GOVERNMENT BOND UCITS ETF 111Xtrackers II SINGAPORE GOVERNMENT BOND UCITS ETF 138Xtrackers II US TREASURIES UCITS ETF 139Xtrackers II US TREASURIES 1-3 UCITS ETF 145Xtrackers II EUR CORPORATE BOND UCITS ETF 148Xtrackers II GERMANY GOVERNMENT BOND UCITS ETF 231Xtrackers II GERMANY GOVERNMENT BOND 1-3 UCITS ETF 233Xtrackers II ESG EUR CORPORATE BOND UCITS ETF 234Xtrackers II EUROZONE AAA GOVERNMENT BOND SWAP UCITS ETF 292Xtrackers II IBOXX EUROZONE GOVERNMENT BOND YIELD PLUS UCITS ETF 293Xtrackers II AUSTRALIA GOVERNMENT BOND UCITS ETF 298Xtrackers II ITALY GOVERNMENT BOND 0-1 SWAP UCITS ETF 299Xtrackers II EUR COVERED BOND SWAP UCITS ETF 301Xtrackers II IBOXX EUROZONE GOVERNMENT BOND YIELD PLUS 1-3 UCITS ETF 303Xtrackers II JAPAN GOVERNMENT BOND UCITS ETF 305Xtrackers II GLOBAL AGGREGATE BOND SWAP UCITS ETF 315Xtrackers II EUR HIGH YIELD CORPORATE BOND UCITS ETF 325Xtrackers II EUR HIGH YIELD CORPORATE BOND 1-3 SWAP UCITS ETF 342Xtrackers II HARVEST CHINA GOVERNMENT BOND UCITS ETF 347Xtrackers II USD ASIA EX JAPAN CORPORATE BOND UCITS ETF 348Xtrackers II ESG EUR CORPORATE BOND SHORT DURATION UCITS ETF 352Notes to the Financial Statements 367Information for Shareholders - unaudited 392
Xtrackers II
Table of contents
2

Registered OfficeXtrackers II49, avenue J.F. KennedyL-1855 LuxembourgGrand Duchy of Luxembourg
Board of Directors
- Thilo Wendenburg(1)
Independent director, c/o DWS Investment S.A., 2, boulevard Konrad Adenauer, L-1115 Luxembourg, Grand Duchy of Luxembourg.
- Manooj Mistry(2)
DWS Global Head of Index Investing, DWS Investments UK Limited,Winchester House, 1 Great Winchester St, London EC2N 2DB, UnitedKingdom.
- Philippe Ah-SunChief Operating Officer of Index Investing, DWS Investments UK Limited, Winchester House, 1 Great Winchester Street, London EC2N 2DB,United Kingdom.
- Alex McKennaHead of Product Platform Engineering at DWS Investments UK Limited, Winchester House, 1 Great Winchester St, London EC2N 2DB, UnitedKingdom.
- Freddy BrauschMember of the Luxembourg Bar, independent director, 35, avenue J. F. Kennedy, L-1855 Luxembourg, Grand Duchy of Luxembourg.
DepositaryState Street Bank International GmbH, Luxembourg Branch49, avenue J.F. KennedyL-1855 LuxembourgGrand Duchy of Luxembourg
Management CompanyDWS Investment S.A.2, boulevard Konrad AdenauerL-1115 LuxembourgGrand Duchy of Luxembourg
Administrative Agent, Paying Agent, Domiciliary Agent and Listing AgentState Street Bank International GmbH, Luxembourg Branch49, avenue J.F. KennedyL-1855 LuxembourgGrand Duchy of Luxembourg
Registrar and Transfer AgentState Street Bank International GmbH, Luxembourg Branch49, avenue J.F. KennedyL-1855 LuxembourgGrand Duchy of Luxembourg
Xtrackers II
Organisation
(1) Thilo Wendenburg was appointed to the Board of Directors as at the General Meeting dated 26 June 2020.(2) Manooj Mistry submitted a letter of resignation dated 30 June 2020 to the Board of Directors. As a result, Manooj Mistry is no longer a member of the Board ofDirectors as of the aforementioned date.
3
Investment Managers / Sub-Portfolio Managers to certain Sub-Funds (see note 14)DWS Investments UK LimitedWinchester House1 Great Winchester StreetLondon EC2N 2DBUnited Kingdom
DWS Investment GmbHMainzer Landstrasse 11-1760329 Frankfurt am MainGermany
DWS Investments Hong Kong Limited (1)
Level 60, International Commerce Centre1 Austin Road West,Kowloon, Hong Kong
Harvest Global Investments Limited31/F One Exchange Square8 Connaught Place, CentralHong Kong
Securities Lending Agent to certain Sub-Funds (see note 8)Deutsche Bank AG, Frankfurt am Main head officeTaunusanlage 1260325 Frankfurt am MainGermany
Deutsche Bank AG, London branchWinchester House1 Great Winchester StreetLondon EC2N 2DBUnited Kingdom
Deutsche Bank AG, New York branch60 Wall StreetNew York NY 10005United States of America
Auditor of the CompanyErnst & Young S.A.35E, avenue J.F. KennedyL-1855 LuxembourgGrand Duchy of Luxembourg
Legal Advisers to the CompanyElvinger Hoss Prussensociété anonyme2, place Winston ChurchillL-1340 LuxembourgGrand Duchy of Luxembourg
Capitalised terms used herein shall have the same meaning as in the prospectus of Xtrackers II applicable as at 31 December 2020 (the �Prospectus�) unlessthe context requires otherwise.
Xtrackers II
Organisation (continued)
(1)As of 12 February 2020.
4
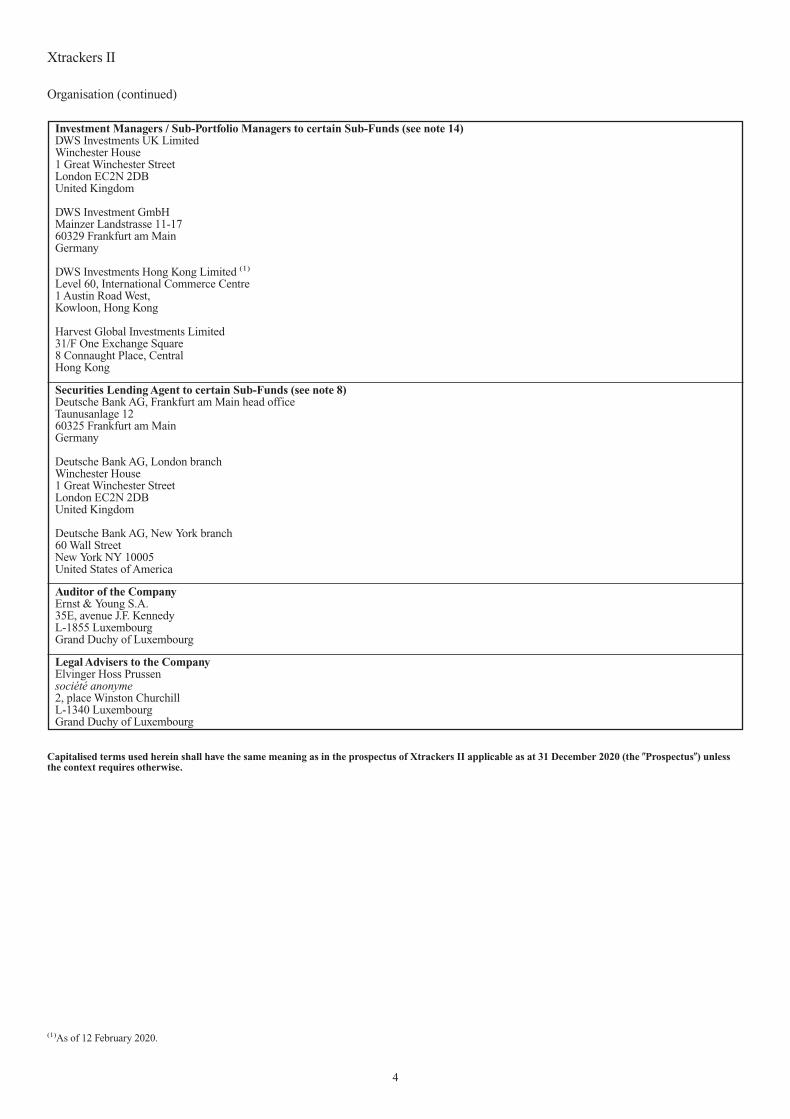
Full year 2020 performance figures for Share Classes
The performance figures in the Directors’ report are calculated based on the last official NAV published for 2020, which is in some casesdifferent than the NAV used for the purpose of the annual report. NAVs used for the annual report are all dated 31/12/2020 (except forliquidated Sub-Funds or Share Classes) and have been specially calculated for the purpose of the annual report; for the avoidance ofdoubt, the NAVs as published in the annual report are not NAVs on which any Shareholder could have traded. Computing performancefigures with the NAV included in the annual report will lead to different results than the table.
ISIN Sub-Fund NameShareClass
Sub-FundCurrency/
Share ClassCurrency
MaxAll-In
Fee
IndexPerformance
2020
Share ClassPerformance
2020
PerformanceDifference/Tracking
DifferenceCash strategies
LU0290358497Xtrackers II EUROVERNIGHT RATESWAP UCITS ETF
1C EUR/EUR 0.10% -0.47% -0.57% -0.10%/
-0.10%
LU0335044896Xtrackers II EUROVERNIGHT RATESWAP UCITS ETF
1D EUR/EUR 0.10% -0.47% -0.57% -0.10%/
-0.10%
LU0321465469Xtrackers II USDOVERNIGHT RATESWAP UCITS ETF
1C USD/USD 0.15% 0.38% 0.23% -0.15%/
-0.15%
LU0321464652Xtrackers II GBPOVERNIGHT RATESWAP UCITS ETF
1D GBP/GBP 0.15% 0.19% 0.04% -0.15%/
-0.15%
Sovereign and covered bonds strategies
LU0290355717
Xtrackers IIEUROZONEGOVERNMENT BONDUCITS ETF
1C EUR/EUR 0.15% 5.01% 4.86% -0.15%/
-0.15%
LU0643975591
Xtrackers IIEUROZONEGOVERNMENT BONDUCITS ETF
1D EUR/EUR 0.09% 5.01% 4.92% -0.09%/
-0.09%
LU2009147591
Xtrackers IIEUROZONEGOVERNMENT BONDUCITS ETF
2C - USD Hedged(1),(2) EUR/USD 0.20% 1.32% 2.10% 0.78%/
-0.15%
LU0290356871
Xtrackers IIEUROZONEGOVERNMENT BOND1-3 UCITS ETF
1C EUR/EUR 0.15% 0.04% -0.09% -0.13%/
-0.13%
LU0614173549
Xtrackers IIEUROZONEGOVERNMENT BOND1-3 UCITS ETF
1D EUR/EUR 0.15% 0.04% -0.09% -0.13%/
-0.13%
LU0290356954
Xtrackers IIEUROZONEGOVERNMENT BOND3-5 UCITS ETF
1C EUR/EUR 0.15% 1.66% 1.53% -0.13%/
-0.13%
LU0614173895
Xtrackers IIEUROZONEGOVERNMENT BOND3-5 UCITS ETF
1D EUR/EUR 0.15% 1.66% 1.53% -0.13%/
-0.13%
LU0290357176
Xtrackers IIEUROZONEGOVERNMENT BOND5-7 UCITS ETF
1C EUR/EUR 0.15% 3.00% 2.88% -0.12%/
-0.12%
LU0290357259
Xtrackers IIEUROZONEGOVERNMENT BOND7-10 UCITS ETF
1C EUR/EUR 0.15% 4.56% 4.41% -0.15%/
-0.15%
(1) Direct Replication FX hedged share classes:“Tracking Error is defined as the difference between the volatility of the unhedged share class of this Sub-Fund and the unhedged benchmark index”.(2) The share class was launched on 11 March 2020. Please see point 1 in the other significant events of the year section of the Information for Shareholders of thisannual report for further information.
Xtrackers II
Directors’ Report
5

ISIN Sub-Fund NameShareClass
Sub-FundCurrency/
Share ClassCurrency
MaxAll-In
Fee
IndexPerformance
2020
Share ClassPerformance
2020
PerformanceDifference/Tracking
DifferenceSovereign and covered bonds strategies (continued)
LU0290357507
Xtrackers IIEUROZONEGOVERNMENT BOND15-30 UCITS ETF
1C EUR/EUR 0.15% 12.20% 12.05% -0.15%/
-0.15%
LU0290357846
Xtrackers IIEUROZONEGOVERNMENT BOND25+ UCITS ETF
1C EUR/EUR 0.15% 17.13% 16.97% -0.16%/
-0.16%
LU0321462953
Xtrackers II USDEMERGINGMARKETS BONDUCITS ETF
1C - EUR Hedged(1) USD/EUR 0.40% 3.54% 1.44% -2.10%/
-0.29%
LU1920015440
Xtrackers II USDEMERGINGMARKETS BONDUCITS ETF
2C(2) USD/USD 0.25% 10.26% 9.79% -0.47%/
-0.47%
LU0677077884
Xtrackers II USDEMERGINGMARKETS BONDUCITS ETF
2D USD/USD 0.25% 3.54% 3.25% -0.29%/
-0.29%
LU0321463258
Xtrackers IIEUROZONEGOVERNMENT BONDSHORT DAILY SWAPUCITS ETF
1C EUR/EUR 0.15% -6.28% -6.42% -0.14%/
-0.14%
LU0321463506
Xtrackers II IBOXXGERMANY COVEREDBOND SWAP UCITSETF
1C EUR/EUR 0.15% 1.78% 1.63% -0.15%/
-0.15%
LU0962081203
Xtrackers II IBOXXGERMANY COVEREDBOND SWAP UCITSETF
1D EUR/EUR 0.15% 1.78% 1.63% -0.15%/
-0.15%
LU0378818131Xtrackers II GLOBALGOVERNMENT BONDUCITS ETF
1C - EUR Hedged(1) EUR/EUR 0.25% 1.20% 4.55% 3.35%/
-0.21%
LU0690964092Xtrackers II GLOBALGOVERNMENT BONDUCITS ETF
1D - EUR Hedged(1) EUR/EUR 0.25% 1.20% 4.54% 3.34%/
-0.21%
LU0641006290Xtrackers II GLOBALGOVERNMENT BONDUCITS ETF
2D - GBP Hedged(1) EUR/GBP 0.25% 1.20% 5.31% 4.11%/
-0.21%
LU0641006456Xtrackers II GLOBALGOVERNMENT BONDUCITS ETF
3C - USD Hedged(1) EUR/USD 0.25% 1.20% 5.94% 4.74%/
-0.21%
LU0641006613Xtrackers II GLOBALGOVERNMENT BONDUCITS ETF
4C - CHF Hedged(1) EUR/CHF 0.25% 1.20% 4.19% 2.99%/
-0.21%
LU0908508731Xtrackers II GLOBALGOVERNMENT BONDUCITS ETF
5C EUR/EUR 0.20% 1.20% 0.99% -0.21%/
-0.21%
LU0378818560
Xtrackers IISINGAPOREGOVERNMENT BONDUCITS ETF
1C SGD/SGD 0.20% 7.86% 7.57% -0.29%/
-0.29%
LU0429459356Xtrackers II USTREASURIES UCITSETF
1D USD/USD 0.07% 8.33% 8.24% -0.09%/
-0.09%
LU1399300455Xtrackers II USTREASURIES UCITSETF
2D - EUR Hedged(1) USD/EUR 0.10% 8.33% 6.79% -1.54%/
-0.09%
(1) Direct Replication FX hedged share classes:“Tracking Error is defined as the difference between the volatility of the unhedged share class of this Sub-Fund and the unhedged benchmark index”.(2) The share class was launched on 11 March 2020. Please see point 1 in the other significant events of the year section of the Information for Shareholders of thisannual report for further information.
Xtrackers II
Directors’ Report (continued)
6

ISIN Sub-Fund NameShareClass
Sub-FundCurrency/
Share ClassCurrency
MaxAll-In
Fee
IndexPerformance
2020
Share ClassPerformance
2020
PerformanceDifference/Tracking
DifferenceSovereign and covered bonds strategies (continued)
LU0429458895Xtrackers II USTREASURIES1-3 UCITS ETF
1D USD/USD 0.07% 3.12% 3.05% -0.07%/
-0.07%
LU0643975161Xtrackers II GERMANYGOVERNMENT BONDUCITS ETF
1C EUR/EUR 0.15% 2.99% 2.85% -0.14%/
-0.14%
LU0468896575Xtrackers II GERMANYGOVERNMENT BONDUCITS ETF
1D EUR/EUR 0.15% 2.99% 2.85% -0.14%/
-0.14%
LU0468897110Xtrackers II GERMANYGOVERNMENT BOND1-3 UCITS ETF
1D EUR/EUR 0.15% -0.59% -0.72% -0.13%/
-0.13%
LU0484969463
Xtrackers IIEUROZONE AAAGOVERNMENT BONDSWAP UCITS ETF
1C EUR/EUR 0.15% 3.14% 2.99% -0.15%/
-0.15%
LU0975326215
Xtrackers IIEUROZONE AAAGOVERNMENT BONDSWAP UCITS ETF
1D EUR/EUR 0.15% 3.14% 2.98% -0.16%/
-0.16%
LU0524480265
Xtrackers II IBOXXEUROZONEGOVERNMENT BONDYIELD PLUS UCITSETF
1C EUR/EUR 0.15% 6.32% 6.17% -0.15%/
-0.15%
LU0962071741
Xtrackers II IBOXXEUROZONEGOVERNMENT BONDYIELD PLUS UCITSETF
1D EUR/EUR 0.15% 6.32% 6.17% -0.15%/
-0.15%
LU0494592974
Xtrackers IIAUSTRALIAGOVERNMENT BONDUCITS ETF
1C AUD/AUD 0.25% 4.43% 4.15% -0.28%/
-0.28%
LU0613540268Xtrackers II ITALYGOVERNMENT BOND0-1 SWAP UCITS ETF
1C EUR/EUR 0.15% -0.06% -0.21% -0.15%/
-0.15%
LU0820950128Xtrackers II EURCOVERED BONDSWAP UCITS ETF
1C EUR/EUR 0.20% 3.08% 2.87% -0.21%/
-0.21%
LU0925589839
Xtrackers II IBOXXEUROZONEGOVERNMENT BONDYIELD PLUS1-3 UCITS ETF
1C EUR/EUR 0.15% 0.75% 0.59% -0.16%/
-0.16%
LU0975334821
Xtrackers II IBOXXEUROZONEGOVERNMENT BONDYIELD PLUS1-3 UCITS ETF
1D EUR/EUR 0.15% 0.75% 0.59% -0.16%/
-0.16%
LU0952581584Xtrackers II JAPANGOVERNMENT BONDUCITS ETF
1C JPY/JPY 0.15% -1.09% -1.24% -0.15%/
-0.15%
LU0942970103Xtrackers II GLOBALAGGREGATE BONDSWAP UCITS ETF
1D USD/USD 0.15% 9.20% 9.03% -0.17%/
-0.17%
LU0942970285Xtrackers II GLOBALAGGREGATE BONDSWAP UCITS ETF
2C - USD Hedged(1) USD/USD 0.20% 5.58% 5.37% -0.21%/
-0.16%
LU0942970368Xtrackers II GLOBALAGGREGATE BONDSWAP UCITS ETF
3D - GBP Hedged(1) USD/GBP 0.20% 4.96% 4.75% -0.21%/
-0.16%
(1) Direct Replication FX hedged share classes:“Tracking Error is defined as the difference between the volatility of the unhedged share class of this Sub-Fund and the unhedged benchmark index”.
Xtrackers II
Directors’ Report (continued)
7

ISIN Sub-Fund NameShareClass
Sub-FundCurrency/
Share ClassCurrency
MaxAll-In
Fee
IndexPerformance
2020
Share ClassPerformance
2020
PerformanceDifference/Tracking
DifferenceSovereign and covered bonds strategies (continued)
LU0942970442Xtrackers II GLOBALAGGREGATE BONDSWAP UCITS ETF
4C - CHF Hedged(1) USD/CHF 0.20% 3.88% 3.67% -0.21%/
-0.16%
LU0942970798Xtrackers II GLOBALAGGREGATE BONDSWAP UCITS ETF
5C - EUR Hedged(1) USD/EUR 0.20% 4.24% 4.02% -0.22%/
-0.16%
LU1094612022
Xtrackers II HARVESTCHINAGOVERNMENT BONDUCITS ETF
1D USD/USD 0.40% 9.65% 9.25% -0.40%/
-0.40%
Inflation Linked Strategies
LU0290357929Xtrackers II GLOBALINFLATION-LINKEDBOND UCITS ETF
1C - EUR Hedged(1) EUR/EUR 0.25% 3.25% 8.10% 4.85%/
-0.20%
LU0962078753Xtrackers II GLOBALINFLATION-LINKEDBOND UCITS ETF
1D - EUR Hedged(1) EUR/EUR 0.25% 3.25% 8.10% 4.85%/
-0.20%
LU0641007009Xtrackers II GLOBALINFLATION-LINKEDBOND UCITS ETF
2C - USD Hedged(1) EUR/USD 0.25% 3.25% 9.55% 6.30%/
-0.20%
LU0641007264Xtrackers II GLOBALINFLATION-LINKEDBOND UCITS ETF
3D - GBP Hedged(1) EUR/GBP 0.25% 3.25% 8.83% 5.58%/
-0.20%
LU0641007421Xtrackers II GLOBALINFLATION-LINKEDBOND UCITS ETF
4D - CHF Hedged(1) EUR/CHF 0.25% 3.25% 7.78% 4.53%/
-0.20%
LU0908508814Xtrackers II GLOBALINFLATION-LINKEDBOND UCITS ETF
5C EUR/EUR 0.20% 3.25% 3.04% -0.21%/
-0.21%
LU0290358224
Xtrackers IIEUROZONEINFLATION-LINKEDBOND UCITS ETF
1C EUR/EUR 0.20% 3.13% 2.93% -0.20%/
-0.20%
LU2178481649
Xtrackers II ESG EURCORPORATE BONDSHORT DURATIONUCITS ETF(5)
1C EUR/EUR 0.16% 1.21% 1.00% -0.21%/
-0.21%
Corporate bond strategies
LU0478205379Xtrackers II EURCORPORATE BONDUCITS ETF
1C EUR/EUR 0.12%(3) 2.77% 2.47% -0.30%/
-0.30%
LU0484968812Xtrackers II ESG EURCORPORATE BONDUCITS ETF
1D EUR/EUR 0.16% 2.62% 2.37% -0.25%/
-0.25%
LU1109943388Xtrackers II EUR HIGHYIELD CORPORATEBOND UCITS ETF
1C EUR/EUR 0.20% 1.65% 1.53% -0.12%/
-0.12%
LU1109942653Xtrackers II EUR HIGHYIELD CORPORATEBOND UCITS ETF
1D EUR/EUR 0.20% 1.65% 1.53% -0.12%/
-0.12%
LU1109939865
Xtrackers II EUR HIGHYIELD CORPORATEBOND 1-3 SWAPUCITS ETF
1D EUR/EUR 0.25%(4) 1.71% 0.77% -0.94%/
-0.94%
(1) Direct Replication FX hedged share classes:“Tracking Error is defined as the difference between the volatility of the unhedged share class of this Sub-Fund and the unhedged benchmark index”.(3) Permanent reduction from 0.16% to 0.12% with effect from 1 September 2020.(4) From 1 August 2020 until 31 July 2021 inclusive, the All-In fee of this Sub-Fund is reduced from 0.35% to 0.25%.(5) The Sub-Fund was launched on 23 July 2020. Please see point 1 in the significant events of the year section of the Notes to the Financial Statements of this annualreport for further information.
Xtrackers II
Directors’ Report (continued)
8

ISIN Sub-Fund NameShareClass
Sub-FundCurrency/
Share ClassCurrency
MaxAll-In
Fee
IndexPerformance
2020
Share ClassPerformance
2020
PerformanceDifference/Tracking
DifferenceCorporate bond strategies (continued)
LU1409136006
Xtrackers II USD ASIAEX JAPANCORPORATE BONDUCITS ETF
1D USD/USD 0.30% 7.16% 6.56% -0.60%/
-0.60%
Credit Strategies
LU0290358653Xtrackers II ITRAXXEUROPE SWAP UCITSETF
1C EUR/EUR 0.18% 0.00% -0.18% -0.18%/
-0.18%
LU0290359032Xtrackers II ITRAXXCROSSOVER SWAPUCITS ETF
1C EUR/EUR 0.24% 0.15% -0.09% -0.24%/
-0.24%
LU0321462870
Xtrackers II ITRAXXCROSSOVER SHORTDAILY SWAP UCITSETF
1C EUR/EUR 0.24% -4.56% -4.79% -0.23%/
-0.23%
The performance differences of the respective Share Class arose from various reasons such as, index replication via optimization asopposed to full replication, various fee components like Management Company Fee, Fixed Fee and Transaction Costs, specific taxesrespectively tax advantages, as well as positive or negative swap adjustments as disclosed in the Information for Shareholders section ofthis annual report.
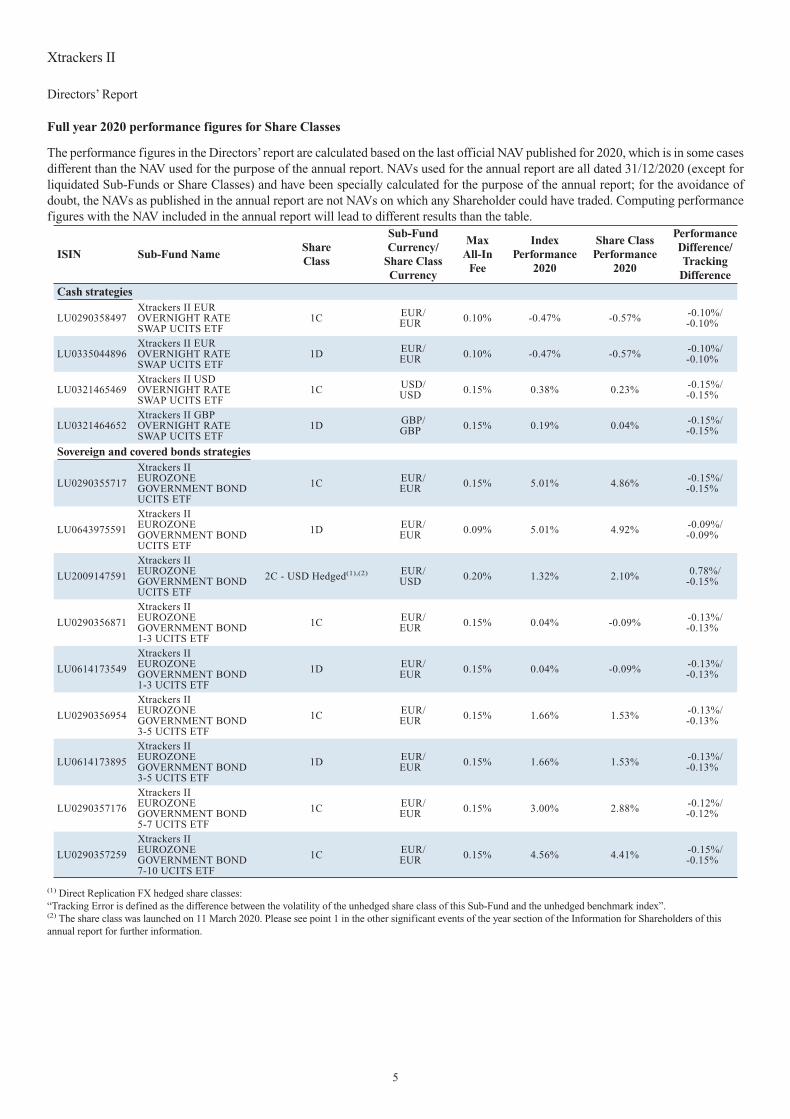
Anticipated and Realised Tracking Error
As per the following table, for each of the Sub-Funds and/or Share Classes launched before the beginning of the financial year ending31 December 2020, the level of realised tracking error was within the expected range, due to the effectiveness of replication techniquesutilised over the 2020 period.
ISIN Sub-Fund NameShareClass
AnticipatedTracking
Error
RealisedTracking Error
2020
Cash strategies
LU0290358497Xtrackers II EUR OVERNIGHT RATE SWAP UCITSETF
1C Up to 1% 0.00%
LU0335044896Xtrackers II EUR OVERNIGHT RATE SWAP UCITSETF
1D Up to 1% 0.00%
LU0321465469Xtrackers II USD OVERNIGHT RATE SWAP UCITSETF
1C Up to 1% 0.01%
LU0321464652Xtrackers II GBP OVERNIGHT RATE SWAP UCITSETF
1D Up to 1% 0.01%
Sovereign and covered bonds strategies
LU0290355717Xtrackers II EUROZONE GOVERNMENT BONDUCITS ETF
1C Up to 1% 0.01%
LU0643975591Xtrackers II EUROZONE GOVERNMENT BONDUCITS ETF
1D Up to 1% 0.01%
LU2009147591Xtrackers II EUROZONE GOVERNMENT BONDUCITS ETF
2C - USD Hedged(1),(2) Up to 1% 0.01%
LU0290356871Xtrackers II EUROZONE GOVERNMENT BOND1-3 UCITS ETF
1C Up to 1% 0.01%
LU0614173549Xtrackers II EUROZONE GOVERNMENT BOND1-3 UCITS ETF
1D Up to 1% 0.01%
(1) Direct Replication FX hedged share classes:“Tracking Error is defined as the difference between the volatility of the unhedged share class of this Sub-Fund and the unhedged benchmark index”.(2) The share class was launched on 11 March 2020. Please see point 1 in the other significant events of the year section of the Information for Shareholders of thisannual report for further information.
Xtrackers II
Directors’ Report (continued)
9
ISIN Sub-Fund NameShareClass
AnticipatedTracking
Error
RealisedTracking Error
2020
Sovereign and covered bonds strategies (continued)
LU0290356954Xtrackers II EUROZONE GOVERNMENT BOND3-5 UCITS ETF
1C Up to 1% 0.01%
LU0614173895Xtrackers II EUROZONE GOVERNMENT BOND3-5 UCITS ETF
1D Up to 1% 0.01%
LU0290357176Xtrackers II EUROZONE GOVERNMENT BOND5-7 UCITS ETF
1C Up to 1% 0.01%
LU0290357259Xtrackers II EUROZONE GOVERNMENT BOND7-10 UCITS ETF
1C Up to 1% 0.01%
LU0290357507Xtrackers II EUROZONE GOVERNMENT BOND15-30 UCITS ETF
1C Up to 1% 0.02%
LU0290357846Xtrackers II EUROZONE GOVERNMENT BOND 25+UCITS ETF
1C Up to 1% 0.03%
LU0321462953Xtrackers II USD EMERGING MARKETS BONDUCITS ETF
1C - EUR Hedged(1) Up to 2% 0.58%
LU1920015440Xtrackers II USD EMERGING MARKETS BONDUCITS ETF
2C(2) Up to 2% 0.62%
LU0677077884Xtrackers II USD EMERGING MARKETS BONDUCITS ETF
2D Up to 2% 0.58%
LU0321463258Xtrackers II EUROZONE GOVERNMENT BONDSHORT DAILY SWAP UCITS ETF
1C Up to 1% 0.01%
LU0321463506Xtrackers II IBOXX GERMANY COVERED BONDSWAP UCITS ETF
1C Up to 1% 0.01%
LU0962081203Xtrackers II IBOXX GERMANY COVERED BONDSWAP UCITS ETF
1D Up to 1% 0.01%
LU0378818131Xtrackers II GLOBAL GOVERNMENT BOND UCITSETF
1C - EUR Hedged(1) Up to 1% 0.02%
LU0690964092Xtrackers II GLOBAL GOVERNMENT BOND UCITSETF
1D - EUR Hedged(1) Up to 1% 0.02%
LU0641006290Xtrackers II GLOBAL GOVERNMENT BOND UCITSETF
2D - GBP Hedged(1) Up to 1% 0.02%
LU0641006456Xtrackers II GLOBAL GOVERNMENT BOND UCITSETF
3C - USD Hedged(1) Up to 1% 0.02%
LU0641006613Xtrackers II GLOBAL GOVERNMENT BOND UCITSETF
4C - CHF Hedged(1) Up to 1% 0.02%
LU0908508731Xtrackers II GLOBAL GOVERNMENT BOND UCITSETF
5C Up to 1% 0.02%
LU0378818560Xtrackers II SINGAPORE GOVERNMENT BONDUCITS ETF
1C Up to 1% 0.04%
LU0429459356 Xtrackers II US TREASURIES UCITS ETF 1D Up to 1% 0.03%LU1399300455 Xtrackers II US TREASURIES UCITS ETF 2D - EUR Hedged(1) Up to 1% 0.03%LU0429458895 Xtrackers II US TREASURIES 1-3 UCITS ETF 1D Up to 1% 0.01%
LU0643975161Xtrackers II GERMANY GOVERNMENT BONDUCITS ETF
1C Up to 1% 0.01%
LU0468896575Xtrackers II GERMANY GOVERNMENT BONDUCITS ETF
1D Up to 1% 0.01%
LU0468897110Xtrackers II GERMANY GOVERNMENT BOND1-3 UCITS ETF
1D Up to 1% 0.01%
LU0484969463Xtrackers II EUROZONE AAA GOVERNMENTBOND SWAP UCITS ETF
1C Up to 1% 0.01%
LU0975326215Xtrackers II EUROZONE AAA GOVERNMENTBOND SWAP UCITS ETF
1D Up to 1% 0.01%
(1) Direct Replication FX hedged share classes:“Tracking Error is defined as the difference between the volatility of the unhedged share class of this Sub-Fund and the unhedged benchmark index”.(2) The share class was launched on 11 March 2020. Please see point 1 in the other significant events of the year section of the Information for Shareholders of thisannual report for further information.
Xtrackers II
Directors’ Report (continued)
10

ISIN Sub-Fund NameShareClass
AnticipatedTracking
Error
RealisedTracking Error
2020
Sovereign and covered bonds strategies (continued)
LU0524480265Xtrackers II IBOXX EUROZONE GOVERNMENTBOND YIELD PLUS UCITS ETF
1C Up to 1% 0.65%
LU0962071741Xtrackers II IBOXX EUROZONE GOVERNMENTBOND YIELD PLUS UCITS ETF
1D Up to 1% 0.65%
LU0494592974Xtrackers II AUSTRALIA GOVERNMENT BONDUCITS ETF
1C Up to 1% 0.03%
LU0613540268Xtrackers II ITALY GOVERNMENT BOND 0-1 SWAPUCITS ETF
1C Up to 1% 0.03%
LU0820950128Xtrackers II EUR COVERED BOND SWAP UCITSETF
1C Up to 1% 0.01%
LU0925589839Xtrackers II IBOXX EUROZONE GOVERNMENTBOND YIELD PLUS 1-3 UCITS ETF
1C Up to 1% 0.02%
LU0975334821Xtrackers II IBOXX EUROZONE GOVERNMENTBOND YIELD PLUS 1-3 UCITS ETF
1D Up to 1% 0.02%
LU0952581584Xtrackers II JAPAN GOVERNMENT BOND UCITSETF
1C Up to 1% 0.01%
LU0942970103Xtrackers II GLOBAL AGGREGATE BOND SWAPUCITS ETF
1D Up to 1% 0.01%
LU0942970285Xtrackers II GLOBAL AGGREGATE BOND SWAPUCITS ETF
2C - USD Hedged(1) Up to 1% 0.01%
LU0942970368Xtrackers II GLOBAL AGGREGATE BOND SWAPUCITS ETF
3D - GBP Hedged(1) Up to 1% 0.01%
LU0942970442Xtrackers II GLOBAL AGGREGATE BOND SWAPUCITS ETF
4C - CHF Hedged(1) Up to 1% 0.01%
LU0942970798Xtrackers II GLOBAL AGGREGATE BOND SWAPUCITS ETF
5C - EUR Hedged(1) Up to 1% 0.01%
LU1094612022Xtrackers II HARVEST CHINA GOVERNMENTBOND UCITS ETF
1D Up to 2% 0.73%
Inflation Linked Strategies
LU0290357929Xtrackers II GLOBAL INFLATION-LINKED BONDUCITS ETF
1C - EUR Hedged(1) Up to 1% 0.16%
LU0962078753Xtrackers II GLOBAL INFLATION-LINKED BONDUCITS ETF
1D - EUR Hedged(1) Up to 1% 0.16%
LU0641007009Xtrackers II GLOBAL INFLATION-LINKED BONDUCITS ETF
2C - USD Hedged(1) Up to 1% 0.16%
LU0641007264Xtrackers II GLOBAL INFLATION-LINKED BONDUCITS ETF
3D - GBP Hedged(1) Up to 1% 0.16%
LU0641007421Xtrackers II GLOBAL INFLATION-LINKED BONDUCITS ETF
4D - CHF Hedged(1) Up to 1% 0.16%
LU0908508814Xtrackers II GLOBAL INFLATION-LINKED BONDUCITS ETF
5C Up to 1% 0.16%
LU0290358224Xtrackers II EUROZONE INFLATION-LINKEDBOND UCITS ETF
1C Up to 1% 0.28%
LU2178481649Xtrackers II ESG EUR CORPORATE BOND SHORTDURATION UCITS ETF(3) 1C Up to 1% 0.07%
Corporate bond strategies
LU0478205379 Xtrackers II EUR CORPORATE BOND UCITS ETF 1C Up to 1% 0.05%
LU0484968812Xtrackers II ESG EUR CORPORATE BOND UCITSETF
1D Up to 1% 0.05%
LU1109943388Xtrackers II EUR HIGH YIELD CORPORATE BONDUCITS ETF
1C Up to 1% 0.53%
(1) Direct Replication FX hedged share classes:“Tracking Error is defined as the difference between the volatility of the unhedged share class of this Sub-Fund and the unhedged benchmark index”.(3) The Sub-Fund was launched on 23 July 2020. Please see point 1 in the significant events of the year section of the Notes to the Financial Statements of this annualreport for further information.
Xtrackers II
Directors’ Report (continued)
11

ISIN Sub-Fund NameShareClass
AnticipatedTracking
Error
RealisedTracking Error
2020
Corporate bond strategies (continued)
LU1109942653Xtrackers II EUR HIGH YIELD CORPORATE BONDUCITS ETF
1D Up to 1% 0.53%
LU1109939865Xtrackers II EUR HIGH YIELD CORPORATE BOND1-3 SWAP UCITS ETF
1D Up to 1% 0.06%
LU1409136006Xtrackers II USD ASIA EX JAPAN CORPORATEBOND UCITS ETF
1D Up to 2% 0.90%
Credit Strategies
LU0290358653 Xtrackers II ITRAXX EUROPE SWAP UCITS ETF 1C Up to 1% 0.01%
LU0290359032Xtrackers II ITRAXX CROSSOVER SWAP UCITSETF
1C Up to 1% 0.01%
LU0321462870Xtrackers II ITRAXX CROSSOVER SHORT DAILYSWAP UCITS ETF
1C Up to 1% 0.01%
Luxembourg, 26 March 2021
While every effort is made to ensure the accuracy of this report, should there be any material differences with the data expressed in the Prospectus and/or Product Annexes, the latter shall prevail.
Capitalised terms used herein shall have the meaning ascribed to them in the current Prospectus unless the context otherwise requires.
Past performance is no indication for future returns.
Philippe Ah-Sun, Director Alex McKenna, Director
Xtrackers II
Directors’ Report (continued)
12

EY Ernst & Young Société anonyme
35E. Avenue John F. Kennedy L-1855 Luxembourg
B.P. 780 L-2017 Luxembourg
Building a better working world
Tel: +352 42 124 1
www.ey.com/en_lu
R.c.s. Luxembourg B 47 771 TVA LU 16063074
Independent auditor's report
To the Shareholders of Xtrackers II 49, Avenue J.F. Kennedy L-1855 Luxembourg
Opinion
We have audited the financial statements of Xtrackers II (the "Fund") and of each of its sub-funds, which comprise the statement of net assets and the statement of investments as at 31 December 2020 and the statement of operations and changes in net Assets for the year then ended, and the notes to the financial statements, including a summary of significant accounting policies.
In our opinion, the accompanying financial statements give a true and fair view of the financial position of the Fund and of each of its sub-funds as at 31 December 2020, and of the results of their operations and changes in their net assets for the year then ended in accordance with Luxembourg legal and regulatory requirements relating to the preparation and presentation of the financial statements.
Basis for opinion
We conducted our audit in accordance with EU Regulation N° 537/2014, the Law of 23 July 2016 on the audit profession (the "Law of 23 July 2016") and with International Standards on Auditing ("lSAs") as adopted for Luxembourg by the "Commission de Surveillance du Sector Financier" ("CSSF"). Our responsibilities under the EU Regulation N° 537/2014, the Law of 23 July 2016 and ISAs as adopted for Luxembourg by the CSSF are further described in the "Responsibilities of the "réviseur d'entreprises agréé" for the audit of the financial statements" section of our report. We are also independent of the Fund in accordance with the International Code of Ethics for Professional Accountants, including International Independence Standards, issued by the International Ethics Standards Board for Accountants ("lESBA Code") as adopted for Luxembourg by the CSSF together with the ethical requirements that are relevant to our audit of the financial statements, and have fulfilled our other ethical responsibilities under those ethical requirements. We believe that the audit evidence we have obtained is sufficient and appropriate to provide a basis for our opinion.
Key audit matters
Key audit matters are those matters that, in our professional judgment, were of most significance in our audit of the financial statements of the current period. We have determined that there are no key audit matters to communicate in our report.
13 A member firm of Ernst & Young Global Limited

EY Buildinq a better working world
Other information
The Board of Directors of the Fund is responsible for the other information. The other information comprises the information included in the annual report but does not include the financial statements and our report of "réviseur d'entreprises agra" thereon.
Our opinion on the financial statements does not cover the other information and we do not express any form of assurance conclusion thereon.
In connection with our audit of the financial statements, our responsibility is to read the other information and, in doing so, consider whether the other information is materially inconsistent with the financial statements or our knowledge obtained in the audit or otherwise appears to be materially misstated. If, based on the work we have performed, we conclude that there is a material misstatement of this other information, we are required to report this fact. We have nothing to report in this regard.
Responsibilities of the Board of Directors of the Fund and of those charged with governance for the financial statements
The Board of Directors of the Fund is responsible for the preparation and fair presentation of the financial statements in accordance with Luxembourg legal and regulatory requirements relating to the preparation and presentation of the financial statements, and for such internal control as the Board of Directors of the Fund determines is necessary to enable the preparation of financial statements that are hee from material misstatement, whether due to fraud or error.
In preparing the financial statements, the Board of Directors of the Fund is responsible for assessing the Fund's and of each of its sub-funds' ability to continue as a going concern, disclosing, as applicable, matters related to going concern and using the going concern basis of accounting unless the Board of Directors either intends to liquidate the Fund or to cease operations, or has no realistic alternative but to do so.
Responsibilities of the "réviseur d'entreprises agréé" for the audit of the financial statements
The objectives of our audit are to obtain reasonable assurance about whether the financial statements as a whole are free from material misstatement, whether due to fraud or error, and to issue a report of the "réviseur d'entreprises agréé" that includes our opinion. Reasonable assurance is a high level of assurance, but is not a guarantee that an audit conducted in accordance with EU Regulation N° 537/'2014, the Law of 23 July 2016 and with the ISAs as adopted for Luxembourg by the CSSF will always detect a material misstatement when it exists. Misstatements can arise from fraud or error and are considered material if, individually or in the aggregate, they could reasonably be expected to influence the economic decisions of users taken on the basis of these financial statements.
14 A member firm of Ernst & Young Global Limited

EY Building a better working world
As part of an audit in accordance with EU Regulation N° 537/2014, the Law of 23 July 2016 and with ISAs as adopted for Luxembourg by the CSSF, we exercise professional judgment and maintain professional skepticism throughout the audit. We also;
Identify and assess the risks of material misstatement of the financial statements, whether due to fraud or error, design and perform audit procedures responsive to those risks, and obtain audit evidence that is sufficient and appropriate to provide a basis for our opinion. The risk of not detecting a material misstatement resulting from fraud is higher than for one resulting from error, as fraud may involve collusion, forgery, intentional omissions, misrepresentations, or the override of internal control.
Obtain an understanding of internal control relevant to the audit in order to design audit procedures that are appropriate in the circumstances, but not for the purpose of expressing an opinion on the effectiveness of the Fund's internal control.
Evaluate the appropriateness of accounting policies used and the reasonableness of accounting estimates and related disclosures made by the Board of Directors of the Fund.
Conclude on the appropriateness of the Board of Directors of the Fund use of the going concern basis of accounting and, based on the audit evidence obtained, whether a material uncertainty exists related to events or conditions that may cast significant doubt on the Fund's ability to continue as a going concern. If we conclude that a material uncertainty exists, we are required to draw attention in our report of the "réviseur d'entreprises agra" to the related disclosures in the financial statements or, if such disclosures are inadequate, to modify our opinion. Our conclusions are based on the audit evidence obtained up to the date of our report of the "reviseur d'entreprises agréé". However, future events or conditions may cause the Fund or any of its sub-funds (except for the sub-fund where a decision to close exists) to cease to continue as a going concern.
Evaluate the overall presentation, structure and content of the financial statements, including the disclosures, and whether the financial statements represent the underlying transactions and events in a manner that achieves fair presentation.
We communicate with those charged with governance regarding, among other matters, the planned scope and timing of the audit and significant audit findings, including any significant deficiencies in internal control that we identify during our audit.
We also provide those charged with governance with a statement that we have complied with relevant ethical requirements regarding independence, and to communicate with them all relationships and other matters that may reasonably be thought to bear on our independence, and where applicable, related safeguards.
From the matters communicated with those charged with governance, we determine those matters that were of most significance in the audit of the financial statements of the current period and are therefore the key audit matters. We describe these matters in our report unless law or regulation precludes public disclosure about the matter.
15 - A member firm of Ernst & Young Global Limited

EY Buildinq a better working world
Report on other legal and regulatory requirements
We have been appointed as "réviseur d'entreprises agréé" by the General Meeting of the Shareholders on 17 April 2020 and the duration of our uninterrupted engagement, including previous renewals and reappointments, is fourteen years.
We confirm that the prohibited non-audit services referred to in EU Regulation No 537/2014 were not provided and that we remained independent of the Fund in conducting the audit.
We provided the following permitted services in addition to the statutory audit:
issuance of a long form report in the context of CSSF Circular 02/81 ,
issuance of redemption in kind reports;
issuance of contribution in kind reports.
Ernst & Young Société anonyme
Cabinet de révision agréé
ii0k$
Luxembourg, 26 March 2021
16 A member firm of Ernst & Young Global Limited

Xtrackers IIEUROZONE
GOVERNMENTBOND UCITS
ETF
Xtrackers IIEUROZONE
GOVERNMENTBOND 1-3 UCITS
ETF
Xtrackers IIEUROZONE
GOVERNMENTBOND 3-5 UCITS
ETF
Xtrackers IIEUROZONE
GOVERNMENTBOND 5-7 UCITS
ETF
EUR EUR EUR EUR
Total NetAssetValue
31 December 20201C 3,358,087,606 443,894,326 271,799,254 390,046,7211D 562,142,011 17,486,694 21,105,640 –
2C - USD Hedged 606,128(1),(2) – – –
31 December 20191C 2,714,147,518 463,634,156 264,669,043 379,134,4881D 324,771,964 19,442,646 23,949,341 –
2C - USD Hedged – – – –
31 December 20181C 2,467,381,772 407,740,724 263,234,803 296,709,0971D 124,369,302 32,125,922 51,866,314 –
2C - USD Hedged – – – –
NetAssetValue per Share
31 December 20201C 258.16 168.63 210.55 251.761D 221.93 159.56 198.81 –
2C - USD Hedged 74.86(1),(2) – – –
31 December 20191C 246.21 168.78 207.37 244.721D 212.17 159.71 196.58 –
2C - USD Hedged – – – –
31 December 20181C 231.05 168.52 202.10 234.871D 199.76 159.46 191.58 –
2C - USD Hedged – – – –(1)The share class was launched on 11 March 2020. Please see point 1 in the other significant events of the year section of the Information for Shareholders of thisannual report for further information.(2)Share class expressed in USD.
Xtrackers II
Statistics
17

Xtrackers IIEUROZONE
GOVERNMENTBOND 7-10
UCITS ETF
Xtrackers IIEUROZONE
GOVERNMENTBOND 15-30UCITS ETF
Xtrackers IIEUROZONE
GOVERNMENTBOND 25+ UCITS
ETF
Xtrackers IIGLOBAL
INFLATION-LINKED BOND
UCITS ETF
EUR EUR EUR EUR
Total NetAssetValue
31 December 20201C 136,578,837 30,463,439 149,846,370 –
1C - EUR Hedged – – – 1,123,361,2141D - EUR Hedged – – – 176,706,9692C - USD Hedged – – – 90,406,023(2)
3D - GBP Hedged – – – 200,092,542(3)
4D - CHF Hedged – – – 90,889,534(4)
5C – – – 148,339,074
31 December 20191C 70,599,162 37,897,495 29,032,952 –
1C - EUR Hedged – – – 659,998,7151D - EUR Hedged – – – 148,345,3012C - USD Hedged – – – 46,278,180(2)
3D - GBP Hedged – – – 128,613,959(3)
4D - CHF Hedged – – – 65,493,527(4)
5C – – – 126,988,605
31 December 20181C 84,966,530 23,502,619 24,036,185 –
1C - EUR Hedged(5) – – – 502,494,1261D - EUR Hedged(5) – – – 158,176,9562C - USD Hedged – – – 46,837,090(2)
3D - GBP Hedged(5) – – – 95,939,316(3)
4D - CHF Hedged(5) – – – 61,700,410(4)
5C – – – 194,504,989
NetAssetValue per Share
31 December 20201C 291.04 428.56 486.91 –
1C - EUR Hedged – – – 252.601D - EUR Hedged – – – 230.262C - USD Hedged – – – 29.15(2)
3D - GBP Hedged – – – 28.01(3)
4D - CHF Hedged – – – 115.59(4)
5C – – – 23.71
31 December 20191C 278.74 382.48 416.26 –
1C - EUR Hedged – – – 233.661D - EUR Hedged – – – 216.162C - USD Hedged – – – 26.61(2)
3D - GBP Hedged – – – 26.01(3)
4D - CHF Hedged – – – 108.86(4)
5C – – – 23.01
31 December 20181C 261.21 330.63 344.62 –
1C - EUR Hedged(5) – – – 222.261D - EUR Hedged(5) – – – 207.522C - USD Hedged – – – 24.60(2)
3D - GBP Hedged(5) – – – 24.59(3)
4D - CHF Hedged(5) – – – 104.90(4)
5C – – – 20.92(2)Share class expressed in USD.(3)Share class expressed in GBP.(4)Share class expressed in CHF.(5)During the year ending 31 December 2018 this share class changed its name.
Xtrackers II
Statistics (continued)
18

Xtrackers IIEUROZONEINFLATION-
LINKED BONDUCITS ETF
Xtrackers IIEUR
OVERNIGHTRATE SWAPUCITS ETF
Xtrackers IIITRAXX
EUROPE SWAPUCITS ETF
Xtrackers IIITRAXX
CROSSOVERSWAP UCITS ETF
EUR EUR EUR EUR
Total NetAssetValue
31 December 20201C 551,881,378 422,243,462 10,516,500 107,760,8271D – 6,909,403 – –
31 December 20191C 341,488,512 383,534,850 23,637,411 142,822,1411D – 5,564,125 – –
31 December 20181C 391,703,164 655,434,550 26,998,673 163,308,0411D – 15,958,620 – –
NetAssetValue per Share
31 December 20201C 234.35 135.94 120.86 200.041D – 127.25 – –
31 December 20191C 227.67 136.72 121.08 200.231D – 127.97 – –
31 December 20181C 214.06 137.40 117.91 188.281D – 128.61 – –
Xtrackers II
Statistics (continued)
19
Xtrackers IIITRAXX
CROSSOVERSHORT DAILY
SWAP UCITS ETF
Xtrackers IIUSD EMERGING
MARKETSBOND UCITS
ETF
Xtrackers IIEUROZONE
GOVERNMENTBOND SHORT
DAILY SWAPUCITS ETF
Xtrackers IIIBOXX
GERMANYCOVERED BONDSWAP UCITS ETF
EUR USD EUR EUR
Total NetAssetValue
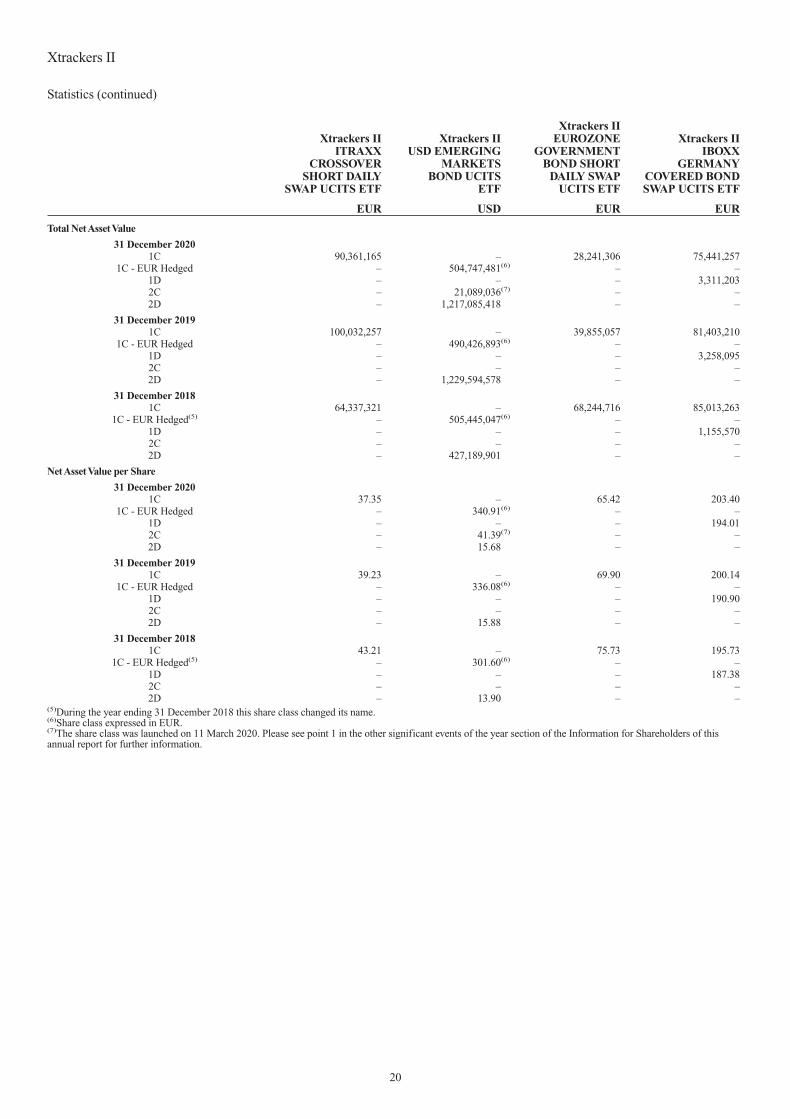
31 December 20201C 90,361,165 – 28,241,306 75,441,257
1C - EUR Hedged – 504,747,481(6) – –1D – – – 3,311,2032C – 21,089,036(7) – –2D – 1,217,085,418 – –
31 December 20191C 100,032,257 – 39,855,057 81,403,210
1C - EUR Hedged – 490,426,893(6) – –1D – – – 3,258,0952C – – – –2D – 1,229,594,578 – –
31 December 20181C 64,337,321 – 68,244,716 85,013,263
1C - EUR Hedged(5) – 505,445,047(6) – –1D – – – 1,155,5702C – – – –2D – 427,189,901 – –
NetAssetValue per Share
31 December 20201C 37.35 – 65.42 203.40
1C - EUR Hedged – 340.91(6) – –1D – – – 194.012C – 41.39(7) – –2D – 15.68 – –
31 December 20191C 39.23 – 69.90 200.14
1C - EUR Hedged – 336.08(6) – –1D – – – 190.902C – – – –2D – 15.88 – –
31 December 20181C 43.21 – 75.73 195.73
1C - EUR Hedged(5) – 301.60(6) – –1D – – – 187.382C – – – –2D – 13.90 – –
(5)During the year ending 31 December 2018 this share class changed its name.(6)Share class expressed in EUR.(7)The share class was launched on 11 March 2020. Please see point 1 in the other significant events of the year section of the Information for Shareholders of thisannual report for further information.
Xtrackers II
Statistics (continued)
20

Xtrackers IIUSD
OVERNIGHTRATE SWAPUCITS ETF
Xtrackers IIGBP
OVERNIGHTRATE SWAPUCITS ETF
Xtrackers IIGLOBAL
GOVERNMENTBOND UCITS
ETF
Xtrackers IISINGAPORE
GOVERNMENTBOND UCITS ETF
USD GBP EUR SGD
Total NetAssetValue
31 December 20201C 205,431,398 – – 137,804,122
1C - EUR Hedged – – 1,058,969,031 –1D – 80,327,960 – –
1D - EUR Hedged – – 213,319,073 –2D - GBP Hedged – – 131,970,724(3) –3C - USD Hedged – – 114,029,997(2) –4C - CHF Hedged – – 118,339,365(4) –
5C – – 594,657,326 –
31 December 20191C 162,275,601 – – 132,431,034
1C - EUR Hedged – – 681,241,972 –1D – 99,561,933 – –
1D - EUR Hedged – – 238,381,795 –2D - GBP Hedged – – 131,580,173(3) –3C - USD Hedged – – 57,280,356(2) –4C - CHF Hedged – – 66,842,868(4) –
5C – – 853,616,230 –
31 December 20181C 329,356,755 – – 143,525,612
1C - EUR Hedged – – 453,553,476 –1D – 103,732,822 – –
1D - EUR Hedged – – 217,841,943 –2D - GBP Hedged(5) – – 160,157,138(3) –3C - USD Hedged(5) – – 12,287,427(2) –4C - CHF Hedged(5) – – 46,296,925(4) –
5C – – 599,690,786 –
NetAssetValue per Share
31 December 20201C 179.39 – – 160.33
1C - EUR Hedged – – 244.92 –1D – 181.41 – –
1D - EUR Hedged – – 226.90 –2D - GBP Hedged – – 29.20(3) –3C - USD Hedged – – 14.17(2) –4C - CHF Hedged – – 187.81(4) –
5C – – 254.57 –
31 December 20191C 178.98 – – 149.05
1C - EUR Hedged – – 234.27 –1D – 182.36 – –
1D - EUR Hedged – – 219.23 –2D - GBP Hedged – – 28.00(3) –3C - USD Hedged – – 13.37(2) –4C - CHF Hedged – – 180.26(4) –
5C – – 252.07 –
31 December 20181C 175.36 – – 142.88
1C - EUR Hedged – – 224.69 –1D – 183.10 – –
1D - EUR Hedged – – 212.18 –2D - GBP Hedged(5) – – 26.70(3) –3C - USD Hedged(5) – – 12.46(2) –4C - CHF Hedged(5) – – 173.80(4) –
5C – – 234.54 –(2)Share class expressed in USD.(3)Share class expressed in GBP.(4)Share class expressed in CHF.(5)During the year ending 31 December 2018 this share class changed its name.
Xtrackers II
Statistics (continued)
21

Xtrackers IIUS TREASURIES
UCITS ETF
Xtrackers IIUS
TREASURIES1-3 UCITS
ETF
Xtrackers IIEUR
CORPORATEBOND UCITS
ETF
Xtrackers IIGERMANY
GOVERNMENTBOND UCITS ETF
USD USD EUR EUR
Total NetAssetValue
31 December 20201C – – 2,191,179,440 164,146,6831D 622,852,667 81,903,942 – 74,697,665
2D - EUR Hedged 829,514,941(6) – – –
31 December 20191C – – 1,565,592,724 177,090,3761D 599,020,318 115,472,636 – 60,693,056
2D - EUR Hedged 401,113,192(6) – – –
31 December 20181C – – 716,617,540 102,846,4151D 416,482,419 134,191,037 – 99,121,181
2D - EUR Hedged(5) 313,730,697(6) – – –
NetAssetValue per Share
31 December 20201C – – 163.43 210.451D 239.90 173.08 – 214.95
2D - EUR Hedged 123.33(6) – – –
31 December 20191C – – 159.49 204.631D 224.01 172.03 – 209.00
2D - EUR Hedged 117.63(6) – – –
31 December 20181C – – 150.31 198.941D 212.94 168.32 – 203.19
2D - EUR Hedged(5) 114.91(6) – – –(5)During the year ending 31 December 2018 this share class changed its name.(6)Share class expressed in EUR.
Xtrackers II
Statistics (continued)
22
Xtrackers IIGERMANY
GOVERNMENTBOND 1-3 UCITS
ETF
Xtrackers IIESG EUR
CORPORATEBOND UCITS
ETF
Xtrackers IIEUROZONE AAA
GOVERNMENTBOND SWAP
UCITS ETF
Xtrackers IIIBOXX
EUROZONEGOVERNMENT
BOND YIELDPLUS UCITS ETF
EUR EUR EUR EUR
Total NetAssetValue
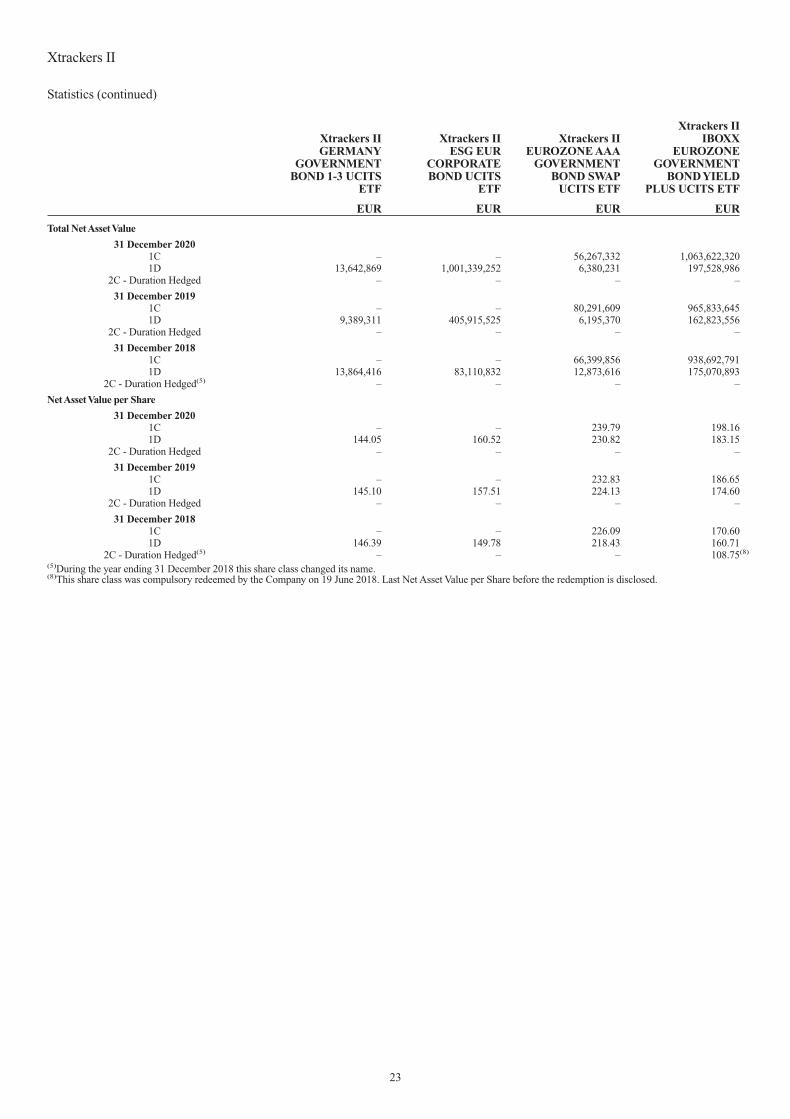
31 December 20201C – – 56,267,332 1,063,622,3201D 13,642,869 1,001,339,252 6,380,231 197,528,986
2C - Duration Hedged – – – –
31 December 20191C – – 80,291,609 965,833,6451D 9,389,311 405,915,525 6,195,370 162,823,556
2C - Duration Hedged – – – –
31 December 20181C – – 66,399,856 938,692,7911D 13,864,416 83,110,832 12,873,616 175,070,893
2C - Duration Hedged(5) – – – –
NetAssetValue per Share
31 December 20201C – – 239.79 198.161D 144.05 160.52 230.82 183.15
2C - Duration Hedged – – – –
31 December 20191C – – 232.83 186.651D 145.10 157.51 224.13 174.60
2C - Duration Hedged – – – –
31 December 20181C – – 226.09 170.601D 146.39 149.78 218.43 160.71
2C - Duration Hedged(5) – – – 108.75(8)
(5)During the year ending 31 December 2018 this share class changed its name.(8)This share class was compulsory redeemed by the Company on 19 June 2018. Last Net Asset Value per Share before the redemption is disclosed.
Xtrackers II
Statistics (continued)
23

Xtrackers IIAUSTRALIA
GOVERNMENTBOND UCITS ETF
Xtrackers IIITALY
GOVERNMENTBOND 0-1 SWAP
UCITS ETF
Xtrackers IIEUR
COVERED BONDSWAP UCITS ETF
Xtrackers IIIBOXX
EUROZONEGOVERNMENT
BOND YIELDPLUS 1-3 UCITS
ETF
AUD EUR EUR EUR
Total NetAssetValue
31 December 20201C 48,641,007 85,313,722 7,165,678 485,918,3331D – – – 9,604,292
31 December 20191C 36,371,509 175,535,410 39,851,421 591,424,6441D – – – 8,968,089
31 December 20181C 29,513,035 77,180,351 36,695,427 531,882,0391D – – – 23,499,013
NetAssetValue per Share
31 December 20201C 262.47 31.42 167.84 144.461D – – – 139.58
31 December 20191C 252.02 31.49 163.16 143.611D – – – 139.41
31 December 20181C 233.64 31.49 155.88 141.891D – – – 137.74
Xtrackers II
Statistics (continued)
24
Xtrackers IIJAPAN
GOVERNMENTBOND UCITS ETF
Xtrackers IIGLOBAL
AGGREGATEBOND SWAP
UCITS ETF
Xtrackers IIEUR HIGH YIELD
CORPORATE BONDUCITS ETF
Xtrackers IIEUR HIGH YIELD
CORPORATE BOND1-3 SWAP
UCITS ETF
JPY USD EUR EUR
Total NetAssetValue
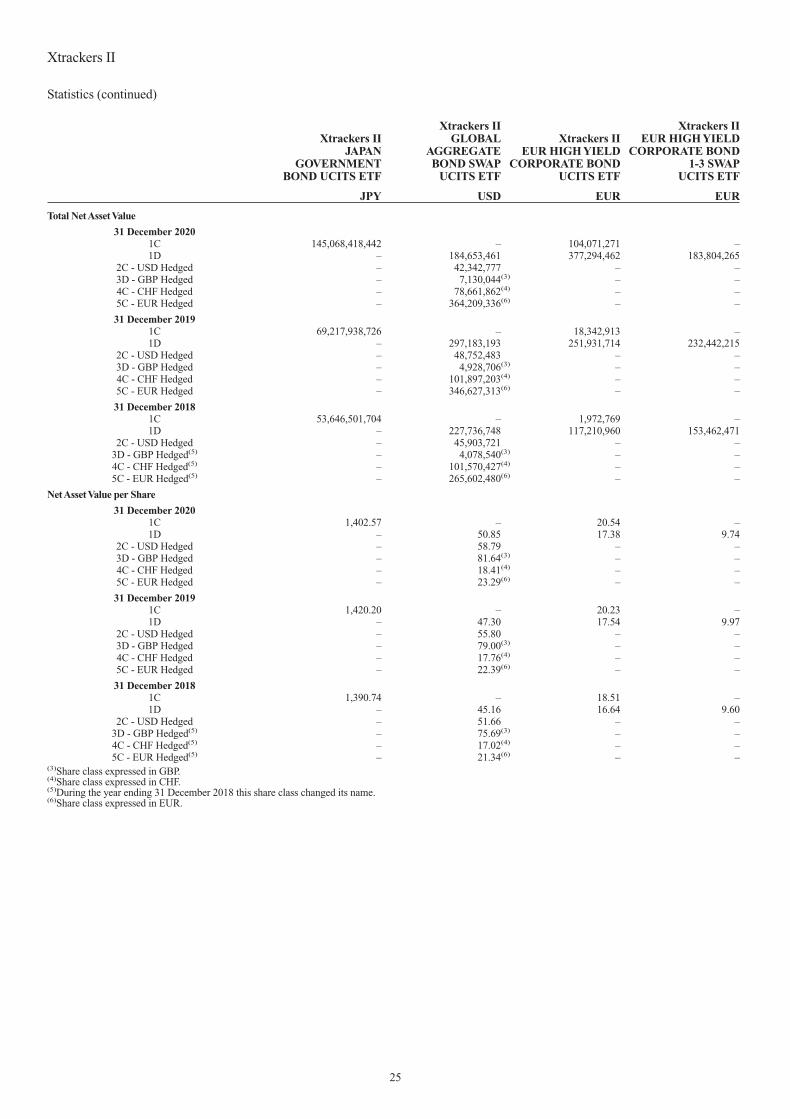
31 December 20201C 145,068,418,442 – 104,071,271 –1D – 184,653,461 377,294,462 183,804,265
2C - USD Hedged – 42,342,777 – –3D - GBP Hedged – 7,130,044(3) – –4C - CHF Hedged – 78,661,862(4) – –5C - EUR Hedged – 364,209,336(6) – –
31 December 20191C 69,217,938,726 – 18,342,913 –1D – 297,183,193 251,931,714 232,442,215
2C - USD Hedged – 48,752,483 – –3D - GBP Hedged – 4,928,706(3) – –4C - CHF Hedged – 101,897,203(4) – –5C - EUR Hedged – 346,627,313(6) – –
31 December 20181C 53,646,501,704 – 1,972,769 –1D – 227,736,748 117,210,960 153,462,471
2C - USD Hedged – 45,903,721 – –3D - GBP Hedged(5) – 4,078,540(3) – –4C - CHF Hedged(5) – 101,570,427(4) – –5C - EUR Hedged(5) – 265,602,480(6) – –
NetAssetValue per Share
31 December 20201C 1,402.57 – 20.54 –1D – 50.85 17.38 9.74
2C - USD Hedged – 58.79 – –3D - GBP Hedged – 81.64(3) – –4C - CHF Hedged – 18.41(4) – –5C - EUR Hedged – 23.29(6) – –
31 December 20191C 1,420.20 – 20.23 –1D – 47.30 17.54 9.97
2C - USD Hedged – 55.80 – –3D - GBP Hedged – 79.00(3) – –4C - CHF Hedged – 17.76(4) – –5C - EUR Hedged – 22.39(6) – –
31 December 20181C 1,390.74 – 18.51 –1D – 45.16 16.64 9.60
2C - USD Hedged – 51.66 – –3D - GBP Hedged(5) – 75.69(3) – –4C - CHF Hedged(5) – 17.02(4) – –5C - EUR Hedged(5) – 21.34(6) – –
(3)Share class expressed in GBP.(4)Share class expressed in CHF.(5)During the year ending 31 December 2018 this share class changed its name.(6)Share class expressed in EUR.
Xtrackers II
Statistics (continued)
25

Xtrackers IIHARVEST CHINA
GOVERNMENTBOND
UCITS ETF
Xtrackers IIUSD ASIAEX JAPAN
CORPORATE BONDUCITS ETF
Xtrackers IIESG EUR CORPO-
RATE BONDSHORT DURATION
UCITS ETF(9)
USD USD EUR
Total NetAssetValue
31 December 20201C – – 53,444,9371D 122,884,823 19,896,055 –
31 December 20191C – – –1D 49,173,949 23,070,782 –
31 December 20181C – – –1D 37,792,000 16,639,249 –
NetAssetValue per Share
31 December 20201C – – 45.181D 22.98 126.18 –
31 December 20191C – – –1D 21.49 121.80 –
31 December 20181C – – –1D 21.60 114.72 –
(9)The Sub-Fund was launched on 23 July 2020. Please see point 1 in the significant events of the year section of the Notes to the Financial Statements of this annualreport for further information.
Xtrackers II
Statistics (continued)
26
Xtrackers IIEUROZONE
GOVERNMENTBOND UCITS
ETF
Xtrackers IIEUROZONE
GOVERNMENTBOND 1-3 UCITS
ETF
Xtrackers IIEUROZONE
GOVERNMENTBOND 3-5 UCITS
ETF
Xtrackers IIEUROZONE
GOVERNMENTBOND 5-7 UCITS
ETF
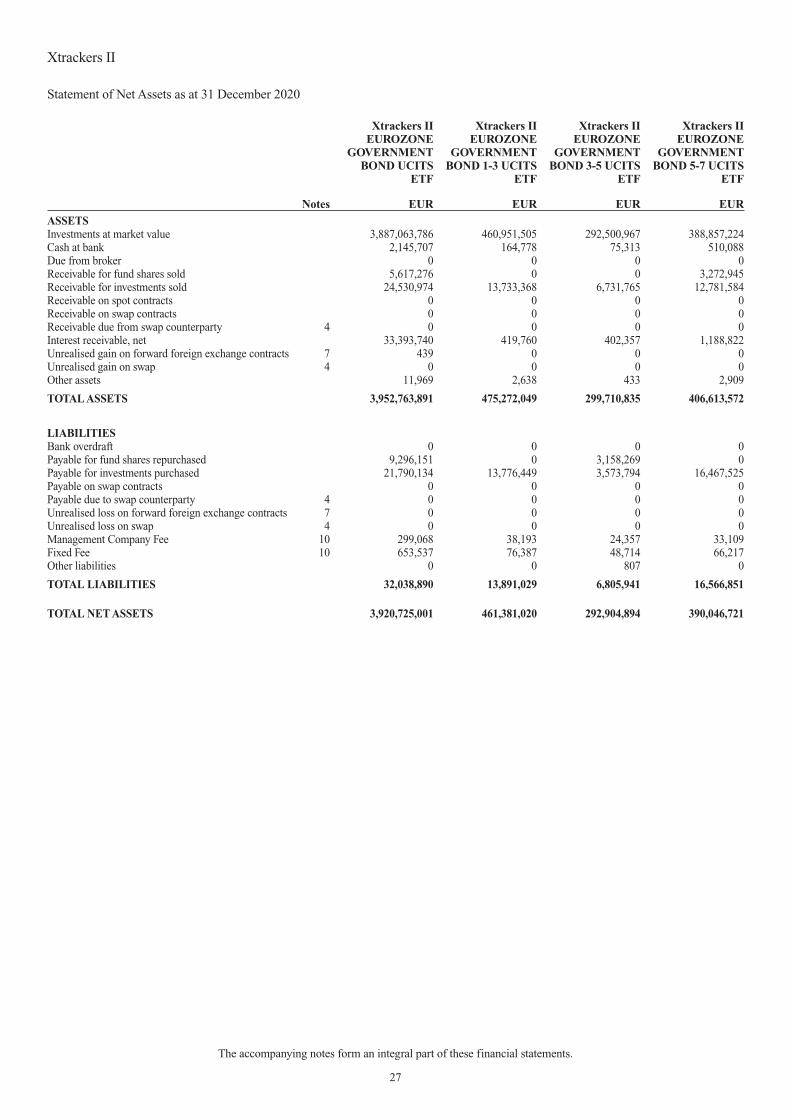
Notes EUR EUR EUR EURASSETSInvestments at market value 3,887,063,786 460,951,505 292,500,967 388,857,224Cash at bank 2,145,707 164,778 75,313 510,088Due from broker 0 0 0 0Receivable for fund shares sold 5,617,276 0 0 3,272,945Receivable for investments sold 24,530,974 13,733,368 6,731,765 12,781,584Receivable on spot contracts 0 0 0 0Receivable on swap contracts 0 0 0 0Receivable due from swap counterparty 4 0 0 0 0Interest receivable, net 33,393,740 419,760 402,357 1,188,822Unrealised gain on forward foreign exchange contracts 7 439 0 0 0Unrealised gain on swap 4 0 0 0 0Other assets 11,969 2,638 433 2,909
TOTAL ASSETS 3,952,763,891 475,272,049 299,710,835 406,613,572
LIABILITIESBank overdraft 0 0 0 0Payable for fund shares repurchased 9,296,151 0 3,158,269 0Payable for investments purchased 21,790,134 13,776,449 3,573,794 16,467,525Payable on swap contracts 0 0 0 0Payable due to swap counterparty 4 0 0 0 0Unrealised loss on forward foreign exchange contracts 7 0 0 0 0Unrealised loss on swap 4 0 0 0 0Management Company Fee 10 299,068 38,193 24,357 33,109Fixed Fee 10 653,537 76,387 48,714 66,217Other liabilities 0 0 807 0
TOTAL LIABILITIES 32,038,890 13,891,029 6,805,941 16,566,851
TOTAL NET ASSETS 3,920,725,001 461,381,020 292,904,894 390,046,721
Xtrackers II
Statement of Net Assets as at 31 December 2020
The accompanying notes form an integral part of these financial statements.
27

Xtrackers IIEUROZONE
GOVERNMENTBOND 7-10
UCITS ETF
Xtrackers IIEUROZONE
GOVERNMENTBOND 15-30UCITS ETF
Xtrackers IIEUROZONE
GOVERNMENTBOND 25+ UCITS
ETF
Xtrackers IIGLOBAL
INFLATION-LINKED BOND
UCITS ETF
Notes EUR EUR EUR EURASSETSInvestments at market value 136,196,298 30,170,930 148,777,502 1,829,233,638Cash at bank 93,181 9,151 43,565 22,130,001Due from broker 0 0 0 0Receivable for fund shares sold 3,493,248 0 0 16,682,227Receivable for investments sold 4,870,122 184,683 4,271,219 150,561Receivable on spot contracts 0 0 0 160,688Receivable on swap contracts 0 0 0 0Receivable due from swap counterparty 4 0 0 0 0Interest receivable, net 374,360 293,182 1,053,063 3,930,470Unrealised gain on forward foreign exchange contracts 7 0 0 0 0Unrealised gain on swap 4 0 0 0 0Other assets 902 23 367 27
TOTAL ASSETS 145,028,111 30,657,969 154,145,716 1,872,287,612
LIABILITIESBank overdraft 0 0 0 0Payable for fund shares repurchased 0 0 3,408,424 7,601,361Payable for investments purchased 8,417,211 186,138 857,802 29,120,898Payable on swap contracts 0 0 0 0Payable due to swap counterparty 4 0 0 0 0Unrealised loss on forward foreign exchange contracts 7 0 0 0 4,976,294Unrealised loss on swap 4 0 0 0 0Management Company Fee 10 10,688 2,797 10,101 423,752Fixed Fee 10 21,375 5,595 20,201 289,981Other liabilities 0 0 2,818 653
TOTAL LIABILITIES 8,449,274 194,530 4,299,346 42,412,939
TOTAL NET ASSETS 136,578,837 30,463,439 149,846,370 1,829,874,673
Xtrackers II
Statement of Net Assets as at 31 December 2020 (continued)
The accompanying notes form an integral part of these financial statements.
28

Xtrackers IIEUROZONEINFLATION-
LINKED BONDUCITS ETF
Xtrackers IIEUR
OVERNIGHTRATE SWAPUCITS ETF
Xtrackers IIITRAXX
EUROPE SWAPUCITS ETF
Xtrackers IIITRAXX
CROSSOVERSWAP UCITS
ETF
Notes EUR EUR EUR EURASSETSInvestments at market value 549,949,447 422,956,366 10,489,359 106,361,697Cash at bank 182,638 75,548 2,648 46,420Due from broker 0 0 0 0Receivable for fund shares sold 3,515,313 14,274,498 0 0Receivable for investments sold 591,028 0 0 0Receivable on spot contracts 0 0 0 0Receivable on swap contracts 0 18,581 0 1,127,170Receivable due from swap counterparty 4 0 29,815,929 0 1,383,154Interest receivable, net 1,900,079 343,376 1,465 75,103Unrealised gain on forward foreign exchange contracts 7 0 0 0 0Unrealised gain on swap 4 0 0 41,412 0Other assets 0 0 0 0
TOTAL ASSETS 556,138,505 467,484,298 10,534,884 108,993,544
LIABILITIESBank overdraft 0 0 0 0Payable for fund shares repurchased 0 0 0 0Payable for investments purchased 4,080,635 0 0 1,127,181Payable on swap contracts 0 14,275,521 0 0Payable due to swap counterparty 4 0 0 14,331 0Unrealised loss on forward foreign exchange contracts 7 0 0 0 0Unrealised loss on swap 4 0 23,952,683 0 52,124Management Company Fee 10 87,550 13,729 1,801 31,157Fixed Fee 10 87,550 54,872 2,252 22,255Other liabilities 1,392 34,628 0 0
TOTAL LIABILITIES 4,257,127 38,331,433 18,384 1,232,717
TOTAL NET ASSETS 551,881,378 429,152,865 10,516,500 107,760,827
Xtrackers II
Statement of Net Assets as at 31 December 2020 (continued)
The accompanying notes form an integral part of these financial statements.
29

Xtrackers IIITRAXX
CROSSOVERSHORT DAILY
SWAP UCITSETF
Xtrackers IIUSD EMERGING
MARKETSBOND UCITS
ETF
Xtrackers IIEUROZONE
GOVERNMENTBOND SHORT
DAILY SWAPUCITS ETF
Xtrackers IIIBOXX
GERMANYCOVERED BOND
SWAP UCITSETF
Notes EUR USD EUR EURASSETSInvestments at market value 88,751,125 1,829,694,605 27,796,909 78,287,622Cash at bank 30,421 31,752,471 3,608 3,536Due from broker 0 0 0 0Receivable for fund shares sold 0 0 0 0Receivable for investments sold 1,398,600 37,706,649 0 0Receivable on spot contracts 0 0 0 0Receivable on swap contracts 14,094 0 0 3,652Receivable due from swap counterparty 4 9,293,975 0 5,829,615 0Interest receivable, net 678 24,145,183 19,978 114,389Unrealised gain on forward foreign exchange contracts 7 0 0 0 0Unrealised gain on swap 4 0 0 0 8,379,930Other assets 0 969 0 0
TOTAL ASSETS 99,488,893 1,923,299,877 33,650,110 86,789,129
LIABILITIESBank overdraft 0 0 0 0Payable for fund shares repurchased 0 0 0 0Payable for investments purchased 0 65,994,695 0 0Payable on swap contracts 1,398,600 0 519 0Payable due to swap counterparty 4 0 0 0 8,016,936Unrealised loss on forward foreign exchange contracts 7 0 572,852 0 0Unrealised loss on swap 4 7,678,627 0 5,400,744 0Management Company Fee 10 29,459 654,584 2,514 6,578Fixed Fee 10 21,042 319,558 5,027 13,155Other liabilities 0 0 0 0
TOTAL LIABILITIES 9,127,728 67,541,689 5,408,804 8,036,669
TOTAL NET ASSETS 90,361,165 1,855,758,188 28,241,306 78,752,460
Xtrackers II
Statement of Net Assets as at 31 December 2020 (continued)
The accompanying notes form an integral part of these financial statements.
30

Xtrackers IIUSD
OVERNIGHTRATE SWAPUCITS ETF
Xtrackers IIGBP
OVERNIGHTRATE SWAPUCITS ETF
Xtrackers IIGLOBAL
GOVERNMENTBOND UCITS
ETF
Xtrackers IISINGAPORE
GOVERNMENTBOND UCITS
ETF
Notes USD GBP EUR SGDASSETSInvestments at market value 203,988,630 78,506,749 2,202,305,680 136,762,343Cash at bank 38,197 13,743 21,936,536 37,958Due from broker 0 0 0 0Receivable for fund shares sold 7,534,464 0 8,216,511 0Receivable for investments sold 0 0 25,241,575 0Receivable on spot contracts 0 0 79,315 0Receivable on swap contracts 5,456 1,190 0 0Receivable due from swap counterparty 4 29,990,006 6,574,020 0 0Interest receivable, net 131,929 39,964 11,660,344 1,049,716Unrealised gain on forward foreign exchange contracts 7 0 0 0 0Unrealised gain on swap 4 0 0 0 0Other assets 0 0 5,154 0
TOTAL ASSETS 241,688,682 85,135,666 2,269,445,115 137,850,017
LIABILITIESBank overdraft 0 0 0 0Payable for fund shares repurchased 0 0 0 0Payable for investments purchased 0 0 50,040,198 0Payable on swap contracts 7,534,914 0 0 0Payable due to swap counterparty 4 0 0 0 0Unrealised loss on forward foreign exchange contracts 7 0 0 1,529,418 0Unrealised loss on swap 4 28,672,078 4,787,472 0 0Management Company Fee 10 16,764 6,745 507,861 22,947Fixed Fee 10 33,528 13,489 372,787 22,948Other liabilities 0 0 11 0
TOTAL LIABILITIES 36,257,284 4,807,706 52,450,275 45,895
TOTAL NET ASSETS 205,431,398 80,327,960 2,216,994,840 137,804,122
Xtrackers II
Statement of Net Assets as at 31 December 2020 (continued)
The accompanying notes form an integral part of these financial statements.
31

Xtrackers IIUS TREASURIES
UCITS ETF
Xtrackers IIUS
TREASURIES1-3 UCITS
ETF
Xtrackers IIEUR
CORPORATEBOND UCITS
ETF
Xtrackers IIGERMANY
GOVERNMENTBOND UCITS
ETF
Notes USD USD EUR EURASSETSInvestments at market value 1,631,209,847 81,596,331 2,170,275,554 236,915,881Cash at bank 26,412,508 103,766 10,260,516 70,360Due from broker 0 0 0 0Receivable for fund shares sold 3,921,132 0 0 0Receivable for investments sold 17,518,961 3,976,699 10,935,545 2,678,430Receivable on spot contracts 1,455 0 0 0Receivable on swap contracts 0 0 0 0Receivable due from swap counterparty 4 0 0 0 0Interest receivable, net 7,219,770 295,158 17,708,601 1,885,921Unrealised gain on forward foreign exchange contracts 7 0 0 0 0Unrealised gain on swap 4 0 0 0 0Other assets 134 0 1,147 1,820
TOTAL ASSETS 1,686,283,807 85,971,954 2,209,181,363 241,552,412
LIABILITIESBank overdraft 0 0 0 0Payable for fund shares repurchased 0 0 4,413,798 0Payable for investments purchased 47,310,368 4,058,463 13,139,755 2,647,003Payable on swap contracts 0 0 0 0Payable due to swap counterparty 4 0 0 0 0Unrealised loss on forward foreign exchange contracts 7 901,921 0 0 0Unrealised loss on swap 4 0 0 0 0Management Company Fee 10 28,745 1,364 74,562 20,349Fixed Fee 10 236,337 8,185 372,721 40,712Other liabilities 838 0 1,087 0
TOTAL LIABILITIES 48,478,209 4,068,012 18,001,923 2,708,064
TOTAL NET ASSETS 1,637,805,598 81,903,942 2,191,179,440 238,844,348
Xtrackers II
Statement of Net Assets as at 31 December 2020 (continued)
The accompanying notes form an integral part of these financial statements.
32

Xtrackers IIGERMANY
GOVERNMENTBOND 1-3 UCITS
ETF
Xtrackers IIESG EUR
CORPORATEBOND UCITS
ETF
Xtrackers IIEUROZONE AAA
GOVERNMENTBOND SWAP
UCITS ETF
Xtrackers IIIBOXX
EUROZONEGOVERNMENT
BOND YIELDPLUS UCITS ETF
Notes EUR EUR EUR EURASSETSInvestments at market value 13,570,034 991,728,524 62,343,755 1,249,948,849Cash at bank 3,423 4,610,763 7,011 1,274,693Due from broker 0 0 0 0Receivable for fund shares sold 0 8,669,163 0 0Receivable for investments sold 739,814 15,157,056 0 10,005,148Receivable on spot contracts 0 0 0 0Receivable on swap contracts 0 0 0 0Receivable due from swap counterparty 4 0 0 0 0Interest receivable, net 70,534 7,849,130 0 11,069,878Unrealised gain on forward foreign exchange contracts 7 0 0 0 0Unrealised gain on swap 4 0 0 2,238,308 0Other assets 0 2,117 0 0
TOTAL ASSETS 14,383,805 1,028,016,753 64,589,074 1,272,298,568
LIABILITIESBank overdraft 0 0 0 0Payable for fund shares repurchased 0 0 0 3,566,981Payable for investments purchased 737,521 26,437,540 0 7,307,506Payable on swap contracts 0 0 0 0Payable due to swap counterparty 4 0 0 1,925,670 0Unrealised loss on forward foreign exchange contracts 7 0 0 0 0Unrealised loss on swap 4 0 0 0 0Management Company Fee 10 1,138 89,970 5,280 89,990Fixed Fee 10 2,277 149,991 10,561 179,987Other liabilities 0 0 0 2,797
TOTAL LIABILITIES 740,936 26,677,501 1,941,511 11,147,261
TOTAL NET ASSETS 13,642,869 1,001,339,252 62,647,563 1,261,151,307
Xtrackers II
Statement of Net Assets as at 31 December 2020 (continued)
The accompanying notes form an integral part of these financial statements.
33

Xtrackers IIAUSTRALIA
GOVERNMENTBOND UCITS
ETF
Xtrackers IIITALY
GOVERNMENTBOND 0-1 SWAP
UCITS ETF
Xtrackers IIEUR
COVERED BONDSWAP UCITS
ETF
Xtrackers IIIBOXX
EUROZONEGOVERNMENT
BOND YIELDPLUS 1-3 UCITS
ETF
Notes AUD EUR EUR EURASSETSInvestments at market value 48,373,212 84,346,534 7,075,963 490,962,759Cash at bank 78,658 0 0 317,882Due from broker 0 0 0 0Receivable for fund shares sold 0 0 0 0Receivable for investments sold 0 0 0 14,441,680Receivable on spot contracts 0 0 0 0Receivable on swap contracts 0 0 1,952 0Receivable due from swap counterparty 4 0 1,343,790 0 0Interest receivable, net 210,858 0 27,516 4,582,632Unrealised gain on forward foreign exchange contracts 7 0 0 0 0Unrealised gain on swap 4 0 0 86,033 0Other assets 0 0 0 1,447
TOTAL ASSETS 48,662,728 85,690,324 7,191,464 510,306,400
LIABILITIESBank overdraft 0 1,905 143 0Payable for fund shares repurchased 0 0 0 0Payable for investments purchased 0 0 0 14,632,039Payable on swap contracts 0 774 0 0Payable due to swap counterparty 4 0 0 23,561 0Unrealised loss on forward foreign exchange contracts 7 0 0 0 0Unrealised loss on swap 4 0 352,584 0 0Management Company Fee 10 13,033 7,113 1,041 64,008Fixed Fee 10 8,688 14,226 1,041 87,729Other liabilities 0 0 0 0
TOTAL LIABILITIES 21,721 376,602 25,786 14,783,776
TOTAL NET ASSETS 48,641,007 85,313,722 7,165,678 495,522,624
Xtrackers II
Statement of Net Assets as at 31 December 2020 (continued)
The accompanying notes form an integral part of these financial statements.
34

Xtrackers IIJAPAN
GOVERNMENTBOND UCITS
ETF
Xtrackers IIGLOBAL
AGGREGATEBOND SWAP
UCITS ETF
Xtrackers IIEUR HIGH
YIELDCORPORATE
BONDUCITS ETF
Xtrackers IIEUR HIGH
YIELDCORPORATE
BOND 1-3 SWAPUCITS ETF
Notes JPY USD EUR EURASSETSInvestments at market value 144,804,010,912 755,113,136 470,233,429 177,962,355Cash at bank 332,358,178 146,917 9,153,055 38,459Due from broker 0 0 0 0Receivable for fund shares sold 0 0 0 0Receivable for investments sold 3,649,462,980 0 2,814,204 0Receivable on spot contracts 0 0 0 0Receivable on swap contracts 0 75,627 0 0Receivable due from swap counterparty 4 0 594,980,449 0 44,308,155Interest receivable, net 263,781,074 7,296,275 5,590,484 1,635,045Unrealised gain on forward foreign exchange contracts 7 0 0 0 0Unrealised gain on swap 4 0 0 0 0Other assets 0 0 3,598 0
TOTAL ASSETS 149,049,613,144 1,357,612,404 487,794,770 223,944,014
LIABILITIESBank overdraft 0 0 0 0Payable for fund shares repurchased 0 0 0 0Payable for investments purchased 3,941,782,720 0 6,288,902 0Payable on swap contracts 0 0 0 0Payable due to swap counterparty 4 0 0 0 0Unrealised loss on forward foreign exchange contracts 7 0 0 0 0Unrealised loss on swap 4 0 585,933,122 0 40,064,116Management Company Fee 10 13,137,327 149,753 69,986 45,380Fixed Fee 10 26,274,655 169,541 69,986 30,253Other liabilities 0 0 163 0
TOTAL LIABILITIES 3,981,194,702 586,252,416 6,429,037 40,139,749
TOTAL NET ASSETS 145,068,418,442 771,359,988 481,365,733 183,804,265
Xtrackers II
Statement of Net Assets as at 31 December 2020 (continued)
The accompanying notes form an integral part of these financial statements.
35

Xtrackers IIHARVEST
CHINAGOVERNMENT
BONDUCITS ETF
Xtrackers IIUSD ASIAEX JAPAN
CORPORATEBOND UCITS
ETF
Xtrackers IIESG EUR
CORPORATEBOND
SHORT DURA-TION UCITS
ETF(1) COMBINED
Notes USD USD EUR EURASSETSInvestments at market value 119,202,276 19,715,602 52,874,792 21,810,613,896Cash at bank 2,470,581 40,238 369,698 126,104,445Due from broker 0 0 0 0Receivable for fund shares sold 0 0 4,111,999 77,215,770Receivable for investments sold 0 217,459 722,724 229,432,649Receivable on spot contracts 0 0 0 241,192Receivable on swap contracts 0 0 0 1,233,047Receivable due from swap counterparty 4 0 0 0 610,103,716Interest receivable, net 1,311,914 158,983 401,407 142,055,967Unrealised gain on forward foreign exchange contracts 7 0 0 0 439Unrealised gain on swap 4 0 0 0 10,745,683Other assets 0 0 923 36,375
TOTAL ASSETS 122,984,771 20,132,282 58,481,543 23,007,783,179
LIABILITIESBank overdraft 0 0 0 2,048Payable for fund shares repurchased 0 0 0 31,444,984Payable for investments purchased 0 225,116 5,026,744 352,962,619Payable on swap contracts 0 0 0 21,833,654Payable due to swap counterparty 4 0 0 0 9,980,498Unrealised loss on forward foreign exchange contracts 7 0 0 0 7,711,035Unrealised loss on swap 4 0 0 0 585,162,584Management Company Fee 10 62,467 7,407 3,698 2,881,966Fixed Fee 10 37,481 3,704 6,164 3,629,972Other liabilities 0 0 0 45,041
TOTAL LIABILITIES 99,948 236,227 5,036,606 1,015,654,401
TOTAL NET ASSETS 122,884,823 19,896,055 53,444,937 21,992,128,778
(1)The Sub-Fund was launched on 23 July 2020. Please see point 1 in the significant events of the year section of the Notes to the Financial Statements of this annualreport for further information.
Xtrackers II
Statement of Net Assets as at 31 December 2020 (continued)
The accompanying notes form an integral part of these financial statements.
36

Xtrackers IIEUROZONE
GOVERNMENTBOND UCITS
ETF
Xtrackers IIEUROZONE
GOVERNMENTBOND 1-3 UCITS
ETF
Xtrackers IIEUROZONE
GOVERNMENTBOND 3-5 UCITS
ETF
Xtrackers IIEUROZONE
GOVERNMENTBOND 5-7 UCITS
ETF
Notes EUR EUR EUR EUR
NETASSETSAT THE BEGINNING OF THEYEAR 3,038,919,483 483,076,802 288,618,383 379,134,488
INCOMEInterest on bonds, net 70,052,984 1,263,062 1,402,458 3,342,029Accretion of discount 0 0 0 0Income on securities lending, net 88,323 24,140 8,354 13,154TOTAL INCOME 70,141,307 1,287,202 1,410,812 3,355,183
EXPENSESAmortization of premium 56,624,566 2,578,197 1,240,674 2,956,289Management Company Fee 10 1,654,707 229,699 136,516 180,618Fixed Fee 10 3,575,822 459,398 273,032 361,236TOTAL EXPENSES 61,855,095 3,267,294 1,650,222 3,498,143NET INCOME / (LOSS) FROMINVESTMENTS 8,286,212 (1,980,092) (239,410) (142,960)
Net realised gain / (loss) on investments 42,602,035 1,072,243 3,692,100 9,532,109Net realised gain / (loss) on swap 0 0 0 0Net realised gain / (loss) on foreign exchange (132,965) 0 0 0Net realised gain / (loss) on futures 0 0 0 0
NET REALISED GAIN / (LOSS) 42,469,070 1,072,243 3,692,100 9,532,109
Change in net unrealised gain / (loss) oninvestments 103,547,354 371,053 513,435 2,309,295Change in net unrealised gain / (loss) on swap 0 0 0 0Change in net unrealised gain / (loss) onforward foreign exchange 439 0 0 0Change in net unrealised gain / (loss) onfutures 0 0 0 0CHANGE IN NET UNREALISED GAIN /(LOSS) 103,547,793 371,053 513,435 2,309,295
NET INCREASE / (DECREASE) IN NETASSETS AS A RESULT OF OPERATIONS 154,303,075 (536,796) 3,966,125 11,698,444
Dividends distributed 15 (1,371,236) 0 (75,676) 0
EVOLUTION OF THE CAPITAL
Subscriptions of Shares 1,984,998,565 361,636,056 96,805,315 177,098,702Redemptions of Shares (1,256,124,886) (382,795,042) (96,409,253) (177,884,913)Currency adjustment 0 0 0 0
NETASSETSAT THE END OF THEYEAR 3,920,725,001 461,381,020 292,904,894 390,046,721
Xtrackers II
Statement of Operations and Changes in Net Assets
for the year ended 31 December 2020
The accompanying notes form an integral part of these financial statements.
37
Xtrackers IIEUROZONE
GOVERNMENTBOND 7-10
UCITS ETF
Xtrackers IIEUROZONE
GOVERNMENTBOND 15-30UCITS ETF
Xtrackers IIEUROZONE
GOVERNMENTBOND 25+ UCITS
ETF
Xtrackers IIGLOBAL
INFLATION-LINKED BOND
UCITS ETF
Notes EUR EUR EUR EUR
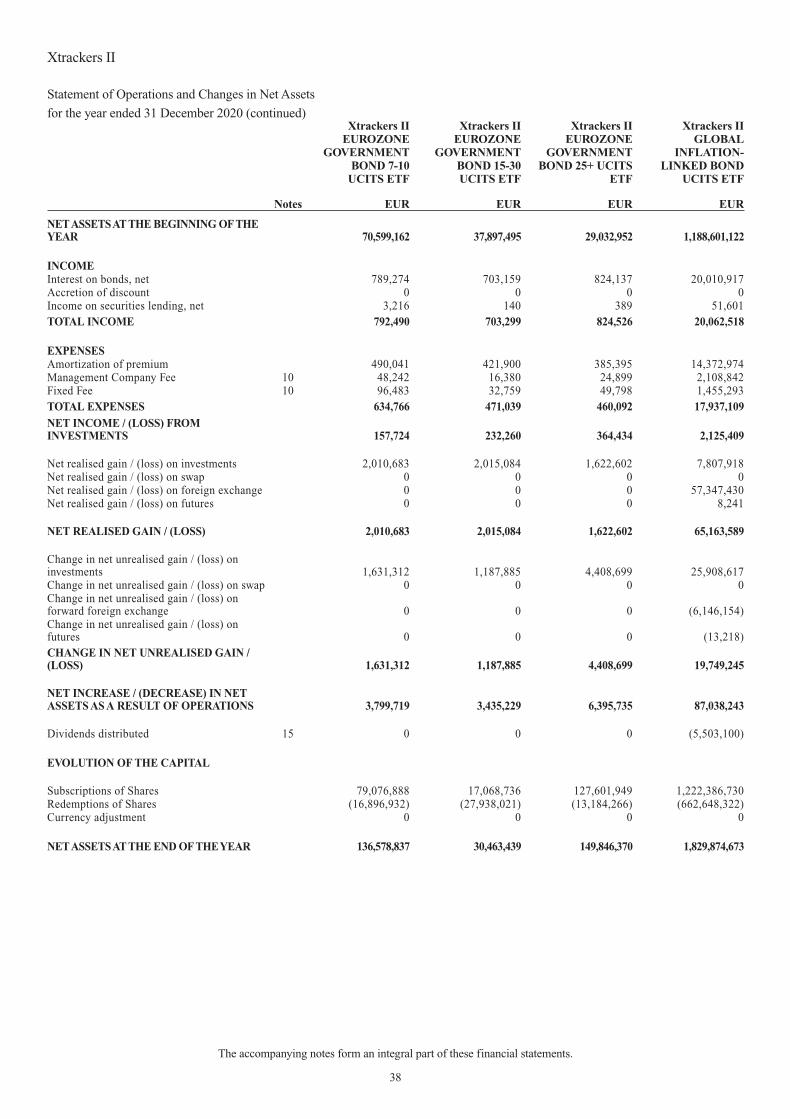
NETASSETSAT THE BEGINNING OF THEYEAR 70,599,162 37,897,495 29,032,952 1,188,601,122
INCOMEInterest on bonds, net 789,274 703,159 824,137 20,010,917Accretion of discount 0 0 0 0Income on securities lending, net 3,216 140 389 51,601TOTAL INCOME 792,490 703,299 824,526 20,062,518
EXPENSESAmortization of premium 490,041 421,900 385,395 14,372,974Management Company Fee 10 48,242 16,380 24,899 2,108,842Fixed Fee 10 96,483 32,759 49,798 1,455,293TOTAL EXPENSES 634,766 471,039 460,092 17,937,109NET INCOME / (LOSS) FROMINVESTMENTS 157,724 232,260 364,434 2,125,409
Net realised gain / (loss) on investments 2,010,683 2,015,084 1,622,602 7,807,918Net realised gain / (loss) on swap 0 0 0 0Net realised gain / (loss) on foreign exchange 0 0 0 57,347,430Net realised gain / (loss) on futures 0 0 0 8,241
NET REALISED GAIN / (LOSS) 2,010,683 2,015,084 1,622,602 65,163,589
Change in net unrealised gain / (loss) oninvestments 1,631,312 1,187,885 4,408,699 25,908,617Change in net unrealised gain / (loss) on swap 0 0 0 0Change in net unrealised gain / (loss) onforward foreign exchange 0 0 0 (6,146,154)Change in net unrealised gain / (loss) onfutures 0 0 0 (13,218)CHANGE IN NET UNREALISED GAIN /(LOSS) 1,631,312 1,187,885 4,408,699 19,749,245
NET INCREASE / (DECREASE) IN NETASSETS AS A RESULT OF OPERATIONS 3,799,719 3,435,229 6,395,735 87,038,243
Dividends distributed 15 0 0 0 (5,503,100)
EVOLUTION OF THE CAPITAL
Subscriptions of Shares 79,076,888 17,068,736 127,601,949 1,222,386,730Redemptions of Shares (16,896,932) (27,938,021) (13,184,266) (662,648,322)Currency adjustment 0 0 0 0
NETASSETSAT THE END OF THEYEAR 136,578,837 30,463,439 149,846,370 1,829,874,673
Xtrackers II
Statement of Operations and Changes in Net Assets
for the year ended 31 December 2020 (continued)
The accompanying notes form an integral part of these financial statements.
38

Xtrackers IIEUROZONEINFLATION-
LINKED BONDUCITS ETF
Xtrackers IIEUR
OVERNIGHTRATE SWAPUCITS ETF
Xtrackers IIITRAXX
EUROPE SWAPUCITS ETF
Xtrackers IIITRAXX
CROSSOVERSWAP UCITS ETF
Notes EUR EUR EUR EUR
NETASSETSAT THE BEGINNING OF THEYEAR 341,488,512 389,098,974 23,637,411 142,822,141
INCOMEInterest on bonds, net 3,071,556 4,430,937 60,088 928,428Accretion of discount 0 0 26,138 0Income on securities lending, net 1,715 0 0 0TOTAL INCOME 3,073,271 4,430,937 86,226 928,428
EXPENSESAmortization of premium 5,991,039 361,994 0 140,844Management Company Fee 10 416,693 97,232 13,698 178,419Fixed Fee 10 416,694 388,929 17,123 127,443TOTAL EXPENSES 6,824,426 848,155 30,821 446,706NET INCOME / (LOSS) FROMINVESTMENTS (3,751,155) 3,582,782 55,405 481,722
Net realised gain / (loss) on investments 866,400 35,560,226 1,179,035 8,981,219Net realised gain / (loss) on swap 0 (33,081,945) (371,866) (8,881,052)Net realised gain / (loss) on foreign exchange 0 707,051 (91,201) (1,705)Net realised gain / (loss) on futures 0 0 0 0
NET REALISED GAIN / (LOSS) 866,400 3,185,332 715,968 98,462
Change in net unrealised gain / (loss) oninvestments 16,521,265 7,060,005 (379,846) 3,696,499Change in net unrealised gain / (loss) on swap 0 (16,580,275) (574,052) (6,173,976)Change in net unrealised gain / (loss) onforward foreign exchange 0 0 0 0Change in net unrealised gain / (loss) onfutures 0 0 0 0CHANGE IN NET UNREALISED GAIN /(LOSS) 16,521,265 (9,520,270) (953,898) (2,477,477)
NET INCREASE / (DECREASE) IN NETASSETS AS A RESULT OF OPERATIONS 13,636,510 (2,752,156) (182,525) (1,897,293)
Dividends distributed 15 0 0 0 0
EVOLUTION OF THE CAPITAL
Subscriptions of Shares 270,136,932 822,422,549 2,211,005 61,271,093Redemptions of Shares (73,380,576) (779,616,502) (15,149,391) (94,435,114)Currency adjustment 0 0 0 0
NETASSETSAT THE END OF THEYEAR 551,881,378 429,152,865 10,516,500 107,760,827
Xtrackers II
Statement of Operations and Changes in Net Assets
for the year ended 31 December 2020 (continued)
The accompanying notes form an integral part of these financial statements.
39

Xtrackers IIITRAXX
CROSSOVERSHORT DAILY
SWAP UCITS ETF
Xtrackers IIUSD EMERGING
MARKETSBOND UCITS
ETF
Xtrackers IIEUROZONE
GOVERNMENTBOND SHORT
DAILY SWAPUCITS ETF
Xtrackers IIIBOXX
GERMANYCOVERED BONDSWAP UCITS ETF
Notes EUR USD EUR EUR
NETASSETSAT THE BEGINNING OF THEYEAR 100,032,257 1,780,098,517 39,855,057 84,661,305
INCOMEInterest on bonds, net 660,963 80,983,171 74,126 625,155Accretion of discount 0 0 37,655 0Income on securities lending, net 0 1,486 0 0TOTAL INCOME 660,963 80,984,657 111,781 625,155
EXPENSESAmortization of premium 225,154 6,995,119 0 249,721Management Company Fee 10 140,828 3,298,360 19,430 41,489Fixed Fee 10 100,592 1,655,812 38,859 82,979TOTAL EXPENSES 466,574 11,949,291 58,289 374,189NET INCOME / (LOSS) FROMINVESTMENTS 194,389 69,035,366 53,492 250,966
Net realised gain / (loss) on investments 495,287 (72,843,902) 1,116,350 755,443Net realised gain / (loss) on swap 5,632,254 0 (1,121,355) 941,167Net realised gain / (loss) on foreign exchange 0 39,818,700 (28) 0Net realised gain / (loss) on futures 0 401,740 0 0
NET REALISED GAIN / (LOSS) 6,127,541 (32,623,462) (5,033) 1,696,610
Change in net unrealised gain / (loss) oninvestments 2,873,173 28,766,874 1,043,174 1,185,738Change in net unrealised gain / (loss) on swap (7,501,508) 0 (3,625,811) (1,819,373)Change in net unrealised gain / (loss) onforward foreign exchange 0 (3,385,634) 0 0Change in net unrealised gain / (loss) onfutures 0 0 0 0CHANGE IN NET UNREALISED GAIN /(LOSS) (4,628,335) 25,381,240 (2,582,637) (633,635)
NET INCREASE / (DECREASE) IN NETASSETS AS A RESULT OF OPERATIONS 1,693,595 61,793,144 (2,534,178) 1,313,941
Dividends distributed 15 0 (45,007,326) 0 0
EVOLUTION OF THE CAPITAL
Subscriptions of Shares 376,077,660 1,195,288,111 4,144,620 3,063,962Redemptions of Shares (387,442,347) (1,136,414,258) (13,224,193) (10,286,748)Currency adjustment 0 0 0 0
NETASSETSAT THE END OF THEYEAR 90,361,165 1,855,758,188 28,241,306 78,752,460
Xtrackers II
Statement of Operations and Changes in Net Assets
for the year ended 31 December 2020 (continued)
The accompanying notes form an integral part of these financial statements.
40

Xtrackers IIUSD
OVERNIGHTRATE SWAPUCITS ETF
Xtrackers IIGBP
OVERNIGHTRATE SWAPUCITS ETF
Xtrackers IIGLOBAL
GOVERNMENTBOND UCITS
ETF
Xtrackers IISINGAPORE
GOVERNMENTBOND UCITS ETF
Notes USD GBP EUR SGD
NETASSETSAT THE BEGINNING OF THEYEAR 162,275,601 99,561,933 2,041,052,034 132,431,034
INCOMEInterest on bonds, net 1,976,500 970,043 42,823,590 3,086,294Accretion of discount 66,077 74,952 0 0Income on securities lending, net 0 0 24,679 0TOTAL INCOME 2,042,577 1,044,995 42,848,269 3,086,294
EXPENSESAmortization of premium 0 0 21,090,132 549,024Management Company Fee 10 97,975 46,557 3,220,231 135,644Fixed Fee 10 195,949 93,113 2,408,574 135,644TOTAL EXPENSES 293,924 139,670 26,718,937 820,312NET INCOME / (LOSS) FROMINVESTMENTS 1,748,653 905,325 16,129,332 2,265,982
Net realised gain / (loss) on investments 19,998,929 6,856,357 66,150,633 2,380,755Net realised gain / (loss) on swap (9,097,167) (3,641,815) 0 0Net realised gain / (loss) on foreign exchange 13,020,301 4,231,488 45,050,735 0Net realised gain / (loss) on futures 0 0 6,215 0
NET REALISED GAIN / (LOSS) 23,922,063 7,446,030 111,207,583 2,380,755
Change in net unrealised gain / (loss) oninvestments 6,700,996 4,328,017 (59,055,666) 5,074,860Change in net unrealised gain / (loss) on swap (32,043,111) (12,631,001) 0 0Change in net unrealised gain / (loss) onforward foreign exchange 0 0 (3,672,724) 0Change in net unrealised gain / (loss) onfutures 0 0 6,054 0CHANGE IN NET UNREALISED GAIN /(LOSS) (25,342,115) (8,302,984) (62,722,336) 5,074,860
NET INCREASE / (DECREASE) IN NETASSETS AS A RESULT OF OPERATIONS 328,601 48,371 64,614,579 9,721,597
Dividends distributed 15 0 (557,243) (3,960,053) 0
EVOLUTION OF THE CAPITAL
Subscriptions of Shares 172,923,528 47,605,547 2,024,464,839 0Redemptions of Shares (130,096,332) (66,330,648) (1,909,176,559) (4,348,509)Currency adjustment 0 0 0 0
NETASSETSAT THE END OF THEYEAR 205,431,398 80,327,960 2,216,994,840 137,804,122
Xtrackers II
Statement of Operations and Changes in Net Assets
for the year ended 31 December 2020 (continued)
The accompanying notes form an integral part of these financial statements.
41

Xtrackers IIUS TREASURIES
UCITS ETF
Xtrackers IIUS
TREASURIES1-3 UCITS
ETF
Xtrackers IIEUR
CORPORATEBOND UCITS
ETF
Xtrackers IIGERMANY
GOVERNMENTBOND UCITS ETF
Notes USD USD EUR EUR
NETASSETSAT THE BEGINNING OF THEYEAR 1,049,269,673 115,472,636 1,565,592,724 237,783,432
INCOMEInterest on bonds, net 27,231,812 1,796,385 31,755,317 3,403,916Accretion of discount 0 0 0 0Income on securities lending, net 11,931 0 2,101 11,834TOTAL INCOME 27,243,743 1,796,385 31,757,418 3,415,750
EXPENSESAmortization of premium 7,836,517 375,029 13,020,028 4,168,584Management Company Fee 10 138,545 9,632 418,130 134,717Fixed Fee 10 1,075,231 57,790 2,090,650 269,434TOTAL EXPENSES 9,050,293 442,451 15,528,808 4,572,735NET INCOME / (LOSS) FROMINVESTMENTS 18,193,450 1,353,934 16,228,610 (1,156,985)
Net realised gain / (loss) on investments 50,353,179 1,982,539 (6,090,026) 6,196,759Net realised gain / (loss) on swap 0 0 0 0Net realised gain / (loss) on foreign exchange 75,540,922 0 0 0Net realised gain / (loss) on futures 4,363 0 (749,051) 0
NET REALISED GAIN / (LOSS) 125,898,464 1,982,539 (6,839,077) 6,196,759
Change in net unrealised gain / (loss) oninvestments 27,163,201 50,239 48,099,951 1,692,589Change in net unrealised gain / (loss) on swap 0 0 0 0Change in net unrealised gain / (loss) onforward foreign exchange (3,224,565) 0 0 0Change in net unrealised gain / (loss) onfutures 0 0 0 0CHANGE IN NET UNREALISED GAIN /(LOSS) 23,938,636 50,239 48,099,951 1,692,589
NET INCREASE / (DECREASE) IN NETASSETS AS A RESULT OF OPERATIONS 168,030,550 3,386,712 57,489,484 6,732,363
Dividends distributed 15 (18,971,306) (2,216,827) 0 0
EVOLUTION OF THE CAPITAL
Subscriptions of Shares 1,551,134,560 15,681,691 1,526,565,521 209,923,642Redemptions of Shares (1,111,657,879) (50,420,270) (958,468,289) (215,595,089)Currency adjustment 0 0 0 0
NETASSETSAT THE END OF THEYEAR 1,637,805,598 81,903,942 2,191,179,440 238,844,348
Xtrackers II
Statement of Operations and Changes in Net Assets
for the year ended 31 December 2020 (continued)
The accompanying notes form an integral part of these financial statements.
42

Xtrackers IIGERMANY
GOVERNMENTBOND 1-3 UCITS
ETF
Xtrackers IIESG EUR
CORPORATEBOND UCITS
ETF
Xtrackers IIEUROZONE AAA
GOVERNMENTBOND SWAP
UCITS ETF
Xtrackers IIIBOXX
EUROZONEGOVERNMENT
BOND YIELDPLUS UCITS ETF
Notes EUR EUR EUR EUR
NETASSETSAT THE BEGINNING OF THEYEAR 9,389,311 405,915,525 86,486,980 1,128,657,201
INCOMEInterest on bonds, net 98,532 9,050,496 235,970 24,424,341Accretion of discount 0 0 0 0Income on securities lending, net 0 0 0 0TOTAL INCOME 98,532 9,050,496 235,970 24,424,341
EXPENSESAmortization of premium 176,832 4,135,393 233,051 12,311,548Management Company Fee 10 5,562 367,176 43,648 503,864Fixed Fee 10 11,124 611,959 87,297 1,007,727TOTAL EXPENSES 193,518 5,114,528 363,996 13,823,139NET INCOME / (LOSS) FROMINVESTMENTS (94,986) 3,935,968 (128,026) 10,601,202
Net realised gain / (loss) on investments (44) (1,202,953) 1,892,861 17,736,879Net realised gain / (loss) on swap 0 0 1,762,283 0Net realised gain / (loss) on foreign exchange 0 0 (26) 0Net realised gain / (loss) on futures 0 (115,012) 0 0
NET REALISED GAIN / (LOSS) (44) (1,317,965) 3,655,118 17,736,879
Change in net unrealised gain / (loss) oninvestments 3,188 15,973,537 777,602 20,746,741Change in net unrealised gain / (loss) on swap 0 0 (1,623,559) 0Change in net unrealised gain / (loss) onforward foreign exchange 0 0 0 0Change in net unrealised gain / (loss) onfutures 0 0 0 0CHANGE IN NET UNREALISED GAIN /(LOSS) 3,188 15,973,537 (845,957) 20,746,741
NET INCREASE / (DECREASE) IN NETASSETS AS A RESULT OF OPERATIONS (91,842) 18,591,540 2,681,135 49,084,822
Dividends distributed 15 0 (2,515,400) 0 (2,038,219)
EVOLUTION OF THE CAPITAL
Subscriptions of Shares 8,692,013 673,560,153 20,622,931 485,415,891Redemptions of Shares (4,346,613) (94,212,566) (47,143,483) (399,968,388)Currency adjustment 0 0 0 0
NETASSETSAT THE END OF THEYEAR 13,642,869 1,001,339,252 62,647,563 1,261,151,307
Xtrackers II
Statement of Operations and Changes in Net Assets
for the year ended 31 December 2020 (continued)
The accompanying notes form an integral part of these financial statements.
43

Xtrackers IIAUSTRALIA
GOVERNMENTBOND UCITS ETF
Xtrackers IIITALY
GOVERNMENTBOND 0-1 SWAP
UCITS ETF
Xtrackers IIEUR
COVERED BONDSWAP UCITS ETF
Xtrackers IIIBOXX
EUROZONEGOVERNMENT
BOND YIELDPLUS 1-3 UCITS
ETF
Notes AUD EUR EUR EUR
NETASSETSAT THE BEGINNING OF THEYEAR 36,371,509 175,535,410 39,851,421 600,392,732
INCOMEInterest on bonds, net 1,190,638 105,859 255,234 12,230,203Accretion of discount 0 907,747 5,640 0Income on securities lending, net 0 0 0 8,432TOTAL INCOME 1,190,638 1,013,606 260,874 12,238,635
EXPENSESAmortization of premium 613,780 0 0 11,088,221Management Company Fee 10 67,132 67,117 22,708 280,707Fixed Fee 10 44,754 134,234 22,708 561,414TOTAL EXPENSES 725,666 201,351 45,416 11,930,342NET INCOME / (LOSS) FROMINVESTMENTS 464,972 812,255 215,458 308,293
Net realised gain / (loss) on investments 955,696 776,181 721,484 4,337,698Net realised gain / (loss) on swap 0 5,400,240 (157,718) 0Net realised gain / (loss) on foreign exchange 0 (300) (64,154) 0Net realised gain / (loss) on futures 0 0 0 0
NET REALISED GAIN / (LOSS) 955,696 6,176,121 499,612 4,337,698
Change in net unrealised gain / (loss) oninvestments 117,390 3,495,754 (288,379) (1,657,195)Change in net unrealised gain / (loss) on swap 0 (10,786,926) 128 0Change in net unrealised gain / (loss) onforward foreign exchange 0 0 0 0Change in net unrealised gain / (loss) onfutures 0 0 0 0CHANGE IN NET UNREALISED GAIN /(LOSS) 117,390 (7,291,172) (288,251) (1,657,195)
NET INCREASE / (DECREASE) IN NETASSETS AS A RESULT OF OPERATIONS 1,538,058 (302,796) 426,819 2,988,796
Dividends distributed 15 0 0 0 (41,672)
EVOLUTION OF THE CAPITAL
Subscriptions of Shares 24,943,312 19,192,751 11,692,127 301,815,116Redemptions of Shares (14,211,872) (109,111,643) (44,804,689) (409,632,348)Currency adjustment 0 0 0 0
NETASSETSAT THE END OF THEYEAR 48,641,007 85,313,722 7,165,678 495,522,624
Xtrackers II
Statement of Operations and Changes in Net Assets
for the year ended 31 December 2020 (continued)
The accompanying notes form an integral part of these financial statements.
44
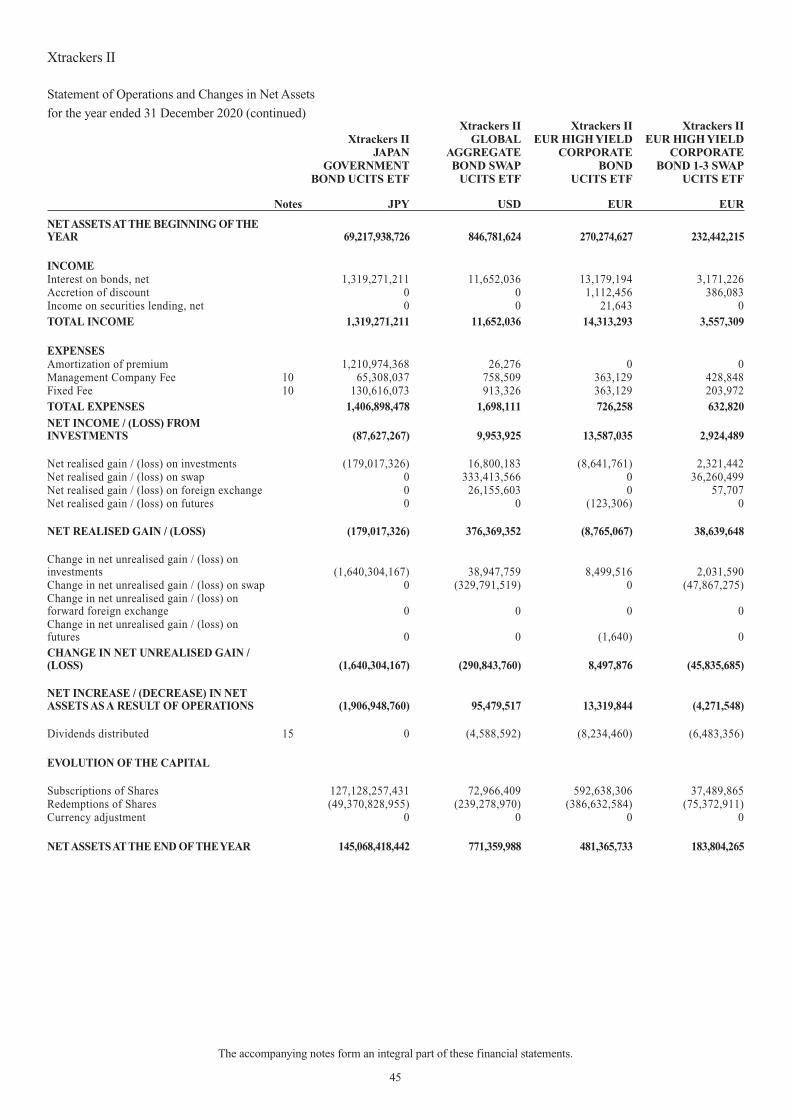
Xtrackers IIJAPAN
GOVERNMENTBOND UCITS ETF
Xtrackers IIGLOBAL
AGGREGATEBOND SWAP
UCITS ETF
Xtrackers IIEUR HIGH YIELD
CORPORATEBOND
UCITS ETF
Xtrackers IIEUR HIGH YIELD
CORPORATEBOND 1-3 SWAP
UCITS ETF
Notes JPY USD EUR EUR
NETASSETSAT THE BEGINNING OF THEYEAR 69,217,938,726 846,781,624 270,274,627 232,442,215
INCOMEInterest on bonds, net 1,319,271,211 11,652,036 13,179,194 3,171,226Accretion of discount 0 0 1,112,456 386,083Income on securities lending, net 0 0 21,643 0TOTAL INCOME 1,319,271,211 11,652,036 14,313,293 3,557,309
EXPENSESAmortization of premium 1,210,974,368 26,276 0 0Management Company Fee 10 65,308,037 758,509 363,129 428,848Fixed Fee 10 130,616,073 913,326 363,129 203,972TOTAL EXPENSES 1,406,898,478 1,698,111 726,258 632,820NET INCOME / (LOSS) FROMINVESTMENTS (87,627,267) 9,953,925 13,587,035 2,924,489
Net realised gain / (loss) on investments (179,017,326) 16,800,183 (8,641,761) 2,321,442Net realised gain / (loss) on swap 0 333,413,566 0 36,260,499Net realised gain / (loss) on foreign exchange 0 26,155,603 0 57,707Net realised gain / (loss) on futures 0 0 (123,306) 0
NET REALISED GAIN / (LOSS) (179,017,326) 376,369,352 (8,765,067) 38,639,648
Change in net unrealised gain / (loss) oninvestments (1,640,304,167) 38,947,759 8,499,516 2,031,590Change in net unrealised gain / (loss) on swap 0 (329,791,519) 0 (47,867,275)Change in net unrealised gain / (loss) onforward foreign exchange 0 0 0 0Change in net unrealised gain / (loss) onfutures 0 0 (1,640) 0CHANGE IN NET UNREALISED GAIN /(LOSS) (1,640,304,167) (290,843,760) 8,497,876 (45,835,685)
NET INCREASE / (DECREASE) IN NETASSETS AS A RESULT OF OPERATIONS (1,906,948,760) 95,479,517 13,319,844 (4,271,548)
Dividends distributed 15 0 (4,588,592) (8,234,460) (6,483,356)
EVOLUTION OF THE CAPITAL
Subscriptions of Shares 127,128,257,431 72,966,409 592,638,306 37,489,865Redemptions of Shares (49,370,828,955) (239,278,970) (386,632,584) (75,372,911)Currency adjustment 0 0 0 0
NETASSETSAT THE END OF THEYEAR 145,068,418,442 771,359,988 481,365,733 183,804,265
Xtrackers II
Statement of Operations and Changes in Net Assets
for the year ended 31 December 2020 (continued)
The accompanying notes form an integral part of these financial statements.
45

Xtrackers IIHARVEST CHINA
GOVERNMENTBOND
UCITS ETF
Xtrackers IIUSD ASIAEX JAPAN
CORPORATEBOND UCITS ETF
Xtrackers IIESG EUR CORPO-
RATE BONDSHORT DURA-
TION UCITSETF(1) COMBINED
Notes USD USD EUR EUR
NETASSETSAT THE BEGINNING OF THEYEAR 49,173,949 23,070,782 0 17,813,081,064
INCOMEInterest on bonds, net 2,100,399 803,898 200,113 366,783,587Accretion of discount 0 0 0 2,613,460Income on securities lending, net 0 0 0 270,687TOTAL INCOME 2,100,399 803,898 200,113 369,667,734
EXPENSESAmortization of premium 0 98,732 0 175,105,734Management Company Fee 10 176,092 43,695 8,360 15,563,563Fixed Fee 10 105,655 21,847 13,934 19,802,791TOTAL EXPENSES 281,747 164,274 22,294 210,472,088NET INCOME / (LOSS) FROMINVESTMENTS 1,818,652 639,624 177,819 159,195,646
Net realised gain / (loss) on investments 773,480 517,385 97,620 226,292,779Net realised gain / (loss) on swap 0 0 0 267,375,718Net realised gain / (loss) on foreign exchange (385,774) 0 0 233,585,630Net realised gain / (loss) on futures 0 (8) 0 (641,014)
NET REALISED GAIN / (LOSS) 387,706 517,377 97,620 726,613,113
Change in net unrealised gain / (loss) oninvestments 5,122,061 319,255 35,244 294,802,997Change in net unrealised gain / (loss) on swap 0 0 0 (406,389,253)Change in net unrealised gain / (loss) onforward foreign exchange 0 0 0 (15,220,915)Change in net unrealised gain / (loss) onfutures 0 0 0 (8,804)CHANGE IN NET UNREALISED GAIN /(LOSS) 5,122,061 319,255 35,244 (126,815,975)
NET INCREASE / (DECREASE) IN NETASSETS AS A RESULT OF OPERATIONS 7,328,419 1,476,256 310,683 758,992,784
Dividends distributed 15 (1,399,905) (546,360) 0 (90,287,775)
EVOLUTION OF THE CAPITAL
Subscriptions of Shares 78,760,610 7,187,684 77,774,470 15,199,772,181Redemptions of Shares (10,978,250) (11,292,307) (24,640,216) (11,361,731,830)Currency adjustment 0 0 0 (327,697,646)
NETASSETSAT THE END OF THEYEAR 122,884,823 19,896,055 53,444,937 21,992,128,778
(1)The Sub-Fund was launched on 23 July 2020. Please see point 1 in the significant events of the year section of the Notes to the Financial Statements of this annualreport for further information.
Xtrackers II
Statement of Operations and Changes in Net Assets
for the year ended 31 December 2020 (continued)
The accompanying notes form an integral part of these financial statements.
46

Sub-FundShareClass
Number ofShares as at
31 December2019
Number ofShares issued
Number ofShares
redeemed
Number ofShares as at
31 December2020
Xtrackers II EUROZONE GOVERNMENT BOND UCITSETF
1C 11,023,916 6,526,824 (4,543,146) 13,007,594
Xtrackers II EUROZONE GOVERNMENT BOND UCITSETF
1D 1,530,700 1,511,552 (509,254) 2,532,998
Xtrackers II EUROZONE GOVERNMENT BOND UCITSETF
2C - USDHedged(1)
0 67,208 (59,111) 8,097
Xtrackers II EUROZONE GOVERNMENT BOND1-3 UCITS ETF
1C 2,746,953 2,123,440 (2,237,969) 2,632,424
Xtrackers II EUROZONE GOVERNMENT BOND1-3 UCITS ETF
1D 121,738 25,308 (37,454) 109,592
Xtrackers II EUROZONE GOVERNMENT BOND3-5 UCITS ETF
1C 1,276,287 442,109 (427,500) 1,290,896
Xtrackers II EUROZONE GOVERNMENT BOND3-5 UCITS ETF
1D 121,832 23,829 (39,500) 106,161
Xtrackers II EUROZONE GOVERNMENT BOND5-7 UCITS ETF
1C 1,549,269 715,000 (715,000) 1,549,269
Xtrackers II EUROZONE GOVERNMENT BOND7-10 UCITS ETF
1C 253,283 276,000 (60,000) 469,283
Xtrackers II EUROZONE GOVERNMENT BOND15-30 UCITS ETF
1C 99,084 42,000 (70,000) 71,084
Xtrackers II EUROZONE GOVERNMENT BOND 25+UCITS ETF
1C 69,747 266,000 (28,000) 307,747
Xtrackers II GLOBAL INFLATION-LINKED BONDUCITS ETF
1C - EURHedged
2,824,582 2,377,617 (754,975) 4,447,224
Xtrackers II GLOBAL INFLATION-LINKED BONDUCITS ETF
1D - EURHedged
686,282 199,995 (118,847) 767,430
Xtrackers II GLOBAL INFLATION-LINKED BONDUCITS ETF
2C - USDHedged
1,739,352 4,160,410 (2,798,016) 3,101,746
Xtrackers II GLOBAL INFLATION-LINKED BONDUCITS ETF
3D - GBPHedged
4,944,839 6,327,867 (4,129,158) 7,143,548
Xtrackers II GLOBAL INFLATION-LINKED BONDUCITS ETF
4D - CHFHedged
601,651 795,704 (611,016) 786,339
Xtrackers II GLOBAL INFLATION-LINKED BONDUCITS ETF
5C 5,518,158 8,901,030 (8,163,566) 6,255,622
Xtrackers II EUROZONE INFLATION-LINKED BONDUCITS ETF
1C 1,499,907 1,185,000 (330,000) 2,354,907
Xtrackers II EUR OVERNIGHT RATE SWAP UCITS ETF 1C 2,805,333 5,984,578 (5,683,889) 3,106,022Xtrackers II EUR OVERNIGHT RATE SWAP UCITS ETF 1D 43,480 48,820 (38,000) 54,300Xtrackers II ITRAXX EUROPE SWAP UCITS ETF 1C 195,221 18,302 (126,507) 87,016Xtrackers II ITRAXX CROSSOVER SWAP UCITS ETF 1C 713,291 323,331 (497,926) 538,696Xtrackers II ITRAXX CROSSOVER SHORT DAILYSWAP UCITS ETF
1C 2,549,840 9,415,200 (9,545,947) 2,419,093
Xtrackers II USD EMERGING MARKETS BOND UCITSETF
1C - EURHedged
1,459,244 1,169,681 (1,148,351) 1,480,574
Xtrackers II USD EMERGING MARKETS BOND UCITSETF
2C(1) 0 1,169,488 (660,000) 509,488
Xtrackers II USD EMERGING MARKETS BOND UCITSETF
2D 77,451,223 43,594,515 (43,405,716) 77,640,022
Xtrackers II EUROZONE GOVERNMENT BONDSHORT DAILY SWAP UCITS ETF
1C 570,138 60,000 (198,429) 431,709
Xtrackers II IBOXX GERMANY COVERED BONDSWAP UCITS ETF
1C 406,738 15,165 (51,000) 370,903
Xtrackers II IBOXX GERMANY COVERED BONDSWAP UCITS ETF
1D 17,067 0 0 17,067
Xtrackers II USD OVERNIGHT RATE SWAP UCITS ETF 1C 906,694 963,570 (725,111) 1,145,153Xtrackers II GBP OVERNIGHT RATE SWAP UCITS ETF 1D 545,970 261,648 (364,826) 442,792Xtrackers II GLOBAL GOVERNMENT BOND UCITSETF
1C - EURHedged
2,907,893 4,103,779 (2,687,994) 4,323,678
Xtrackers II GLOBAL GOVERNMENT BOND UCITSETF
1D - EURHedged
1,087,335 782,917 (930,086) 940,166
(1)The share class was launched on 11 March 2020. Please see point 1 in the other significant events of the year section of the Information for Shareholders of thisannual report for further information.
Xtrackers II
Statement of Changes in Shares Issued
for the year ended 31 December 2020
The accompanying notes form an integral part of these financial statements.
47

Sub-FundShareClass
Number ofShares as at
31 December2019
Number ofShares issued
Number ofShares
redeemed
Number ofShares as at
31 December2020
Xtrackers II GLOBAL GOVERNMENT BOND UCITSETF
2D - GBPHedged
4,699,148 3,622,693 (3,803,025) 4,518,816
Xtrackers II GLOBAL GOVERNMENT BOND UCITSETF
3C - USDHedged
4,283,699 12,854,500 (9,088,743) 8,049,456
Xtrackers II GLOBAL GOVERNMENT BOND UCITSETF
4C - CHFHedged
370,808 729,790 (470,509) 630,089
Xtrackers II GLOBAL GOVERNMENT BOND UCITSETF
5C 3,386,449 1,732,445 (2,782,947) 2,335,947
Xtrackers II SINGAPORE GOVERNMENT BOND UCITSETF
1C 888,495 0 (29,000) 859,495
Xtrackers II US TREASURIES UCITS ETF 1D 2,674,025 2,411,341 (2,489,025) 2,596,341Xtrackers II US TREASURIES UCITS ETF 2D - EUR
Hedged3,409,835 6,764,248 (3,448,212) 6,725,871
Xtrackers II US TREASURIES 1-3 UCITS ETF 1D 671,226 90,000 (288,000) 473,226Xtrackers II EUR CORPORATE BOND UCITS ETF 1C 9,816,458 9,666,000 (6,075,000) 13,407,458Xtrackers II GERMANY GOVERNMENT BOND UCITSETF
1C 865,424 625,470 (710,924) 779,970
Xtrackers II GERMANY GOVERNMENT BOND UCITSETF
1D 290,401 365,800 (308,683) 347,518
Xtrackers II GERMANY GOVERNMENT BOND1-3 UCITS ETF
1D 64,708 60,000 (30,000) 94,708
Xtrackers II ESG EUR CORPORATE BOND UCITS ETF 1D 2,577,153 4,282,127 (621,000) 6,238,280Xtrackers II EUROZONE AAA GOVERNMENT BONDSWAP UCITS ETF
1C 344,857 87,361 (197,562) 234,656
Xtrackers II EUROZONE AAA GOVERNMENT BONDSWAP UCITS ETF
1D 27,642 0 0 27,642
Xtrackers II IBOXX EUROZONE GOVERNMENT BONDYIELD PLUS UCITS ETF
1C 5,174,541 2,167,395 (1,974,567) 5,367,369
Xtrackers II IBOXX EUROZONE GOVERNMENT BONDYIELD PLUS UCITS ETF
1D 932,535 341,153 (195,197) 1,078,491
Xtrackers II AUSTRALIA GOVERNMENT BOND UCITSETF
1C 144,319 95,000 (54,000) 185,319
Xtrackers II ITALY GOVERNMENT BOND 0-1 SWAPUCITS ETF
1C 5,574,554 610,136 (3,469,570) 2,715,120
Xtrackers II EUR COVERED BOND SWAP UCITS ETF 1C 244,248 70,302 (271,857) 42,693Xtrackers II IBOXX EUROZONE GOVERNMENT BONDYIELD PLUS 1-3 UCITS ETF
1C 4,118,331 2,025,445 (2,780,000) 3,363,776
Xtrackers II IBOXX EUROZONE GOVERNMENT BONDYIELD PLUS 1-3 UCITS ETF
1D 64,329 74,279 (69,800) 68,808
Xtrackers II JAPAN GOVERNMENT BOND UCITS ETF 1C 48,738,190 89,782,000 (35,090,000) 103,430,190Xtrackers II GLOBAL AGGREGATE BOND SWAPUCITS ETF
1D 6,282,659 791,000 (3,442,283) 3,631,376
Xtrackers II GLOBAL AGGREGATE BOND SWAPUCITS ETF
2C - USDHedged
873,760 87,384 (240,952) 720,192
Xtrackers II GLOBAL AGGREGATE BOND SWAPUCITS ETF
3D - GBPHedged
62,387 24,953 0 87,340
Xtrackers II GLOBAL AGGREGATE BOND SWAPUCITS ETF
4C - CHFHedged
5,736,863 219,971 (1,685,000) 4,271,834
Xtrackers II GLOBAL AGGREGATE BOND SWAPUCITS ETF
5C - EURHedged
15,482,004 922,157 (765,679) 15,638,482
Xtrackers II EUR HIGH YIELD CORPORATE BONDUCITS ETF
1C 906,718 7,788,891 (3,628,744) 5,066,865
Xtrackers II EUR HIGH YIELD CORPORATE BONDUCITS ETF
1D 14,366,530 26,125,822 (18,783,406) 21,708,946
Xtrackers II EUR HIGH YIELD CORPORATE BOND1-3 SWAP UCITS ETF
1D 23,320,908 3,932,219 (8,380,514) 18,872,613
Xtrackers II HARVEST CHINA GOVERNMENT BONDUCITS ETF
1D 2,288,454 3,557,996 (500,000) 5,346,450
Xtrackers II USD ASIA EX JAPAN CORPORATE BONDUCITS ETF
1D 189,414 58,261 (90,000) 157,675
Xtrackers II
Statement of Changes in Shares Issued
for the year ended 31 December 2020 (continued)
The accompanying notes form an integral part of these financial statements.
48

Sub-FundShareClass
Number ofShares as at
31 December2019
Number ofShares issued
Number ofShares
redeemed
Number ofShares as at
31 December2020
Xtrackers II ESG EUR CORPORATE BOND SHORTDURATION UCITS ETF(2)
1C 0 1,729,000 (546,000) 1,183,000
(2)The Sub-Fund was launched on 23 July 2020. Please see point 1 in the significant events of the year section of the Notes to the Financial Statements of this annualreport for further information.
Xtrackers II
Statement of Changes in Shares Issued
for the year ended 31 December 2020 (continued)
The accompanying notes form an integral part of these financial statements.
49

DescriptionNominal
ValueCurrency
(local) Cost Market Value
% ofNet
Assets
Transferable securities and money market instruments admitted to an official stock exchange listing(A)
Bonds
AustriaAustria Zero Coupon 16 - 15.07.23 3,419,000 EUR 3,449,458 3,478,935 0.09Austria Zero Coupon 16 - 15.07.23 1,530,000 EUR 1,553,850 1,556,821 0.04Austria Zero Coupon 17 - 20.09.22 3,580,000 EUR 3,614,895 3,622,539 0.09Austria Zero Coupon 19 - 15.07.24 4,515,000 EUR 4,611,552 4,625,132 0.12Austria Zero Coupon 20 - 20.02.30 4,813,000 EUR 4,940,943 5,006,138 0.13Austria Zero Coupon 20 - 20.04.23 3,018,000 EUR 3,058,560 3,065,303 0.08Austria Zero Coupon 20 - 20.10.40 1,777,000 EUR 1,793,498 1,786,003 0.04Austria 0.50% 17 - 20.04.27 5,331,000 EUR 5,554,009 5,716,618 0.15Austria 0.50% 19 - 20.02.29 5,850,000 EUR 6,144,839 6,338,733 0.16Austria 0.75% 16 - 20.10.26 7,086,000 EUR 7,447,183 7,667,474 0.19Austria 0.75% 18 - 20.02.28 5,298,000 EUR 5,570,820 5,805,639 0.15Austria 0.75% 20 - 20.03.51 1,932,000 EUR 2,187,760 2,306,956 0.06Austria 0.85% 20 - 30.06.20 1,441,000 EUR 1,679,575 1,899,283 0.05Austria 1.20% 15 - 20.10.25 5,729,000 EUR 6,145,176 6,256,705 0.16Austria 1.50% 16 - 20.02.47 3,804,000 EUR 4,542,843 5,251,132 0.13Austria 1.50% 16 - 02.11.86 1,287,000 EUR 1,652,513 2,179,456 0.06Austria 1.65% 14 - 21.10.24 5,298,000 EUR 5,689,541 5,779,780 0.15Austria 1.75% 13 - 20.10.23 6,127,000 EUR 6,492,846 6,549,579 0.17Austria 2.10% 17 - 20.09.17 3,088,000 EUR 5,064,034 6,963,219 0.18Austria 2.40% 13 - 23.05.34 4,433,000 EUR 5,637,240 6,031,434 0.15Austria 3.15% 12 - 20.06.44 3,631,000 EUR 5,676,926 6,350,679 0.16Austria 3.40% 12 - 22.11.22 5,391,000 EUR 5,790,498 5,809,679 0.15Austria 3.65% 11 - 20.04.22 2,950,000 EUR 3,113,908 3,115,296 0.08Austria 3.65% 11 - 20.04.22 1,390,000 EUR 1,462,677 1,467,885 0.04Austria 3.80% 12 - 26.01.62 1,945,000 EUR 3,970,213 4,746,956 0.12Austria 4.15% 07 - 15.03.37 7,149,000 EUR 11,286,796 12,223,680 0.31Austria 4.85% 09 - 15.03.26 4,604,000 EUR 5,838,694 5,958,861 0.15Austria 6.25% 97 - 15.07.27 4,891,000 EUR 6,937,520 7,131,561 0.18
130,908,367 138,691,476 3.54BelgiumBelgium Zero Coupon 20 - 22.10.27 4,113,000 EUR 4,173,306 4,272,558 0.11Belgium 0.10% 20 - 22.06.30 6,614,000 EUR 6,778,092 6,927,847 0.18Belgium 0.20% 16 - 22.10.23 2,117,000 EUR 2,153,560 2,171,100 0.06Belgium 0.20% 16 - 22.10.23 2,669,000 EUR 2,721,694 2,737,206 0.07Belgium 0.50% 17 - 22.10.24 6,657,000 EUR 6,859,323 6,961,889 0.18Belgium 0.80% 15 - 22.06.25 5,786,000 EUR 6,079,369 6,173,196 0.16Belgium 0.80% 15 - 22.06.25 3,942,000 EUR 4,134,454 4,205,796 0.11Belgium 0.80% 17 - 22.06.27 7,069,000 EUR 7,421,831 7,718,482 0.20Belgium 0.80% 18 - 22.06.28 6,813,000 EUR 7,114,668 7,503,804 0.19Belgium 0.80% 18 - 22.06.28 895,000 EUR 954,937 985,749 0.03Belgium 0.90% 19 - 22.06.29 8,678,000 EUR 9,367,515 9,688,032 0.25Belgium 1.00% 15 - 22.06.31 7,668,000 EUR 8,195,433 8,739,841 0.22Belgium 1.00% 16 - 22.06.26 7,975,000 EUR 8,424,952 8,695,736 0.22Belgium 1.45% 17 - 22.06.37 2,916,000 EUR 3,358,265 3,617,664 0.09Belgium 1.70% 19 - 22.06.50 3,730,000 EUR 4,425,668 5,170,601 0.13Belgium 1.90% 15 - 22.06.38 4,428,100 EUR 5,357,283 5,886,716 0.15Belgium 2.15% 16 - 22.06.66 2,594,600 EUR 3,684,019 4,376,127 0.11Belgium 2.25% 13 - 22.06.23 6,716,000 EUR 7,161,305 7,211,238 0.18
Xtrackers II
Xtrackers II EUROZONE GOVERNMENT BOND UCITS ETF
Statement of Investmentsas at 31 December 2020(expressed in EUR)
The accompanying notes form an integral part of these financial statements.
50

DescriptionNominal
ValueCurrency
(local) Cost Market Value
% ofNet
Assets
Transferable securities and money market instruments admitted to an official stock exchange listing(A)
Bonds (continued)
Belgium (continued)Belgium 2.25% 17 - 22.06.57 3,187,700 EUR 4,393,148 5,183,306 0.13Belgium 2.60% 14 - 22.06.24 4,664,000 EUR 5,130,274 5,204,732 0.13Belgium 2.60% 14 - 22.06.24 2,941,000 EUR 3,254,560 3,281,972 0.08Belgium 3.00% 14 - 22.06.34 1,912,000 EUR 2,574,066 2,734,603 0.07Belgium 3.00% 14 - 22.06.34 2,025,000 EUR 2,582,882 2,896,220 0.07Belgium 4.00% 06 - 28.03.22 7,159,000 EUR 7,564,475 7,576,083 0.19Belgium 4.25% 10 - 28.03.41 8,916,700 EUR 14,729,315 16,239,215 0.42Belgium 4.25% 12 - 28.09.22 3,196,000 EUR 3,461,658 3,473,605 0.09Belgium 4.25% 12 - 28.09.22 5,165,200 EUR 5,592,370 5,613,849 0.14Belgium 4.50% 11 - 28.03.26 5,732,000 EUR 7,138,126 7,300,194 0.19Belgium 5.00% 04 - 28.03.35 10,241,000 EUR 16,555,436 17,842,660 0.46Belgium 5.50% 98 - 28.03.28 9,840,072 EUR 13,640,500 14,237,179 0.36Kingdom of Belgium 0.40% 20 - 22.06.40 2,515,000 EUR 2,580,446 2,660,249 0.07Kingdom of Belgium 1.25% 18 - 22.04.33 4,393,000 EUR 4,884,832 5,206,196 0.13Kingdom of Belgium 1.60% 16 - 22.06.47 5,780,000 EUR 6,702,984 7,703,934 0.20Kingdom of Belgium 2.15% 16 - 22.06.66 923,000 EUR 1,308,655 1,556,758 0.04Kingdom of Belgium 3.75% 13 - 22.06.45 3,053,000 EUR 5,126,537 5,606,898 0.14Kingdom of Belgium 3.75% 13 - 22.06.45 2,002,000 EUR 3,138,733 3,676,714 0.09Kingdom of Belgium 4.00% 12 - 28.03.32 4,275,000 EUR 6,062,076 6,369,434 0.16
214,786,747 227,407,383 5.80EstoniaEstonia 0.125% 20 - 10.06.30 742,000 EUR 744,995 763,133 0.02
744,995 763,133 0.02FinlandFinland Zero Coupon 16 - 15.09.23 2,986,000 EUR 3,003,669 3,045,241 0.08Finland Zero Coupon 17 - 15.04.22 2,954,000 EUR 2,976,495 2,980,911 0.08Finland Zero Coupon 19 - 15.09.24 1,970,000 EUR 2,011,075 2,023,825 0.05Finland Zero Coupon 20 - 15.09.30 1,879,000 EUR 1,943,541 1,956,603 0.05Finland 0.125% 20 - 15.04.36 2,136,000 EUR 2,217,571 2,231,799 0.06Finland 0.25% 20 - 15.09.40 1,534,000 EUR 1,575,142 1,628,847 0.04Finland 0.50% 16 - 15.04.26 3,364,000 EUR 3,497,795 3,579,532 0.09Finland 0.50% 17 - 15.09.27 3,520,000 EUR 3,653,046 3,789,550 0.10Finland 0.50% 18 - 15.09.28 2,077,000 EUR 2,165,151 2,248,877 0.06Finland 0.50% 19 - 15.09.29 3,298,000 EUR 3,453,677 3,589,158 0.09Finland 0.75% 15 - 15.04.31 2,402,000 EUR 2,517,931 2,697,282 0.07Finland 0.875% 15 - 15.09.25 2,532,000 EUR 2,663,567 2,724,825 0.07Finland 1.125% 18 - 15.04.34 2,303,000 EUR 2,542,136 2,724,687 0.07Finland 1.375% 17 - 15.04.47 1,919,000 EUR 2,252,280 2,623,065 0.07Finland 1.50% 13 - 15.04.23 2,414,000 EUR 2,525,991 2,538,275 0.06Finland 1.625% 12 - 15.09.22 2,528,000 EUR 2,613,640 2,630,762 0.07Finland 2.00% 14 - 15.04.24 2,703,000 EUR 2,911,701 2,948,332 0.07Finland 2.625% 12 - 04.07.42 2,345,000 EUR 3,390,677 3,728,945 0.09Finland 2.75% 12 - 04.07.28 2,920,000 EUR 3,538,878 3,666,923 0.09Finland 4.00% 09 - 04.07.25 3,120,000 EUR 3,718,414 3,795,498 0.10
55,172,377 57,152,937 1.46FranceFrance OAT Zero Coupon 16 - 25.05.22 15,862,000 EUR 15,973,901 16,017,289 0.41France OAT Zero Coupon 17 - 25.03.23 20,504,000 EUR 20,721,591 20,834,180 0.53
Xtrackers II
Xtrackers II EUROZONE GOVERNMENT BOND UCITS ETF (continued)
Statement of Investmentsas at 31 December 2020(expressed in EUR)
The accompanying notes form an integral part of these financial statements.
51

DescriptionNominal
ValueCurrency
(local) Cost Market Value
% ofNet
Assets
Transferable securities and money market instruments admitted to an official stock exchange listing(A)
Bonds (continued)
France (continued)France OAT Zero Coupon 18 - 25.03.24 20,389,000 EUR 20,647,828 20,858,966 0.53France OAT Zero Coupon 19 - 25.02.22 14,701,000 EUR 14,805,782 14,819,196 0.38France OAT Zero Coupon 19 - 25.03.25 22,998,000 EUR 23,484,210 23,656,203 0.60France OAT Zero Coupon 19 - 25.11.29 20,839,000 EUR 21,152,816 21,611,919 0.55France OAT Zero Coupon 20 - 25.02.23 8,276,000 EUR 8,391,160 8,404,413 0.21France OAT Zero Coupon 20 - 25.02.26 14,280,000 EUR 14,650,717 14,730,820 0.38France OAT Zero Coupon 20 - 25.11.30 14,109,000 EUR 14,468,488 14,596,466 0.37France OAT 0.25% 16 - 25.11.26 18,904,000 EUR 19,319,932 19,870,873 0.51France OAT 0.50% 15 - 25.05.25 20,543,000 EUR 21,248,305 21,605,484 0.55France OAT 0.50% 16 - 25.05.26 20,786,000 EUR 21,596,284 22,065,794 0.56France OAT 0.50% 19 - 25.05.29 18,827,000 EUR 19,859,950 20,370,515 0.52France OAT 0.50% 20 - 25.05.40 5,185,000 EUR 5,438,254 5,592,634 0.14France OAT 0.75% 17 - 25.05.28 19,334,000 EUR 20,249,546 21,187,164 0.54France OAT 0.75% 17 - 25.05.28 4,220,000 EUR 4,530,550 4,624,487 0.12France OAT 0.75% 18 - 25.11.28 18,091,000 EUR 18,949,900 19,903,176 0.51France OAT 0.75% 18 - 25.11.28 2,649,000 EUR 2,873,332 2,914,350 0.07France OAT 0.75% 20 - 25.05.52 9,657,000 EUR 10,388,490 10,767,652 0.28France OAT 1.00% 15 - 25.11.25 14,163,040 EUR 15,022,507 15,331,066 0.39France OAT 1.00% 15 - 25.11.25 3,988,000 EUR 4,222,759 4,316,890 0.11France OAT 1.00% 17 - 25.05.27 18,600,857 EUR 19,880,779 20,517,071 0.52France OAT 1.25% 16 - 25.05.36 9,498,000 EUR 10,750,266 11,428,374 0.29France OAT 1.25% 16 - 25.05.36 9,857,000 EUR 11,082,005 11,860,337 0.30France OAT 1.25% 18 - 25.05.34 18,857,000 EUR 21,393,014 22,463,590 0.57France OAT 1.50% 15 - 25.05.31 25,283,000 EUR 28,511,767 30,179,811 0.77France OAT 1.50% 19 - 25.05.50 16,112,000 EUR 19,716,493 21,458,729 0.55France OAT 1.75% 13 - 25.05.23 19,897,000 EUR 20,956,337 21,077,887 0.54France OAT 1.75% 13 - 25.05.23 4,235,000 EUR 4,470,065 4,486,347 0.11France OAT 1.75% 14 - 25.11.24 19,873,000 EUR 21,452,190 21,800,133 0.56France OAT 1.75% 16 - 25.05.66 6,693,000 EUR 8,297,222 10,202,006 0.26France OAT 1.75% 17 - 25.06.39 14,073,500 EUR 17,181,217 18,603,337 0.48France OAT 2.00% 17 - 25.05.48 14,803,000 EUR 19,139,974 21,582,774 0.55France OAT 2.25% 12 - 25.10.22 18,815,100 EUR 19,760,262 19,838,453 0.51France OAT 2.25% 13 - 25.05.24 17,871,509 EUR 19,470,512 19,691,722 0.50France OAT 2.50% 14 - 25.05.30 25,338,000 EUR 30,856,210 32,365,988 0.83France OAT 2.75% 12 - 25.10.27 25,448,600 EUR 30,344,509 31,317,047 0.80France OAT 3.00% 12 - 25.04.22 23,582,000 EUR 24,675,734 24,726,670 0.63France OAT 3.25% 13 - 25.05.45 13,292,000 EUR 20,319,786 22,976,551 0.59France OAT 3.50% 10 - 25.04.26 16,733,000 EUR 20,043,408 20,484,664 0.52France OAT 3.50% 10 - 25.04.26 6,030,000 EUR 7,223,670 7,381,971 0.19France OAT 4.00% 05 - 25.04.55 9,280,000 EUR 17,723,093 20,119,040 0.51France OAT 4.00% 06 - 25.10.38 13,631,000 EUR 21,464,652 23,475,990 0.60France OAT 4.00% 10 - 25.04.60 8,585,400 EUR 17,081,717 19,692,134 0.50France OAT 4.25% 07 - 25.10.23 20,481,000 EUR 23,044,336 23,378,037 0.60France OAT 4.25% 07 - 25.10.23 2,733,000 EUR 3,116,174 3,119,583 0.08France OAT 4.50% 09 - 25.04.41 19,333,000 EUR 33,429,429 36,638,355 0.93France OAT 4.75% 04 - 25.04.35 14,922,000 EUR 23,805,521 25,593,170 0.65France OAT 5.50% 98 - 25.04.29 20,421,002 EUR 29,559,190 30,849,599 0.79France OAT 5.75% 01 - 25.10.32 17,532,000 EUR 28,618,363 30,230,252 0.77
Xtrackers II
Xtrackers II EUROZONE GOVERNMENT BOND UCITS ETF (continued)
Statement of Investmentsas at 31 December 2020(expressed in EUR)
The accompanying notes form an integral part of these financial statements.
52

DescriptionNominal
ValueCurrency
(local) Cost Market Value
% ofNet
Assets
Transferable securities and money market instruments admitted to an official stock exchange listing(A)
Bonds (continued)
France (continued)France OAT 6.00% 94 - 25.10.25 15,918,000 EUR 20,718,724 21,121,594 0.54France OAT 8.25% 92 - 25.04.22 639,000 EUR 714,114 713,766 0.02France OAT 8.50% 92 - 25.04.23 5,224,000 EUR 6,321,517 6,343,660 0.16
919,118,552 959,798,179 24.48GermanyBundesobligation Zero Coupon 17 - 08.04.22 10,384,000 EUR 10,464,442 10,479,429 0.27Bundesobligation Zero Coupon 17 - 07.10.22 10,091,570 EUR 10,207,392 10,219,329 0.26Bundesobligation Zero Coupon 18 - 14.04.23 9,643,000 EUR 9,777,757 9,810,306 0.25Bundesobligation Zero Coupon 18 - 13.10.23 9,976,000 EUR 10,141,013 10,191,083 0.26Bundesobligation Zero Coupon 19 - 05.04.24 12,060,000 EUR 12,317,409 12,365,600 0.32Bundesobligation Zero Coupon 19 - 18.10.24 11,321,000 EUR 11,643,024 11,650,554 0.30Bundesobligation Zero Coupon 20 - 11.04.25 10,053,000 EUR 10,364,619 10,379,663 0.26Bundesobligation Zero Coupon 20 - 10.10.25 12,868,000 EUR 13,327,377 13,329,005 0.34Bundesobligation Zero Coupon 20 - 10.10.25 2,694,000 EUR 2,793,183 2,792,184 0.07Bundesrepublik Deutschland Zero Coupon 16 -15.08.26 15,043,000 EUR 15,418,051 15,679,018 0.40Bundesrepublik Deutschland Zero Coupon 19 -15.08.29 13,873,000 EUR 14,530,382 14,640,732 0.37Bundesrepublik Deutschland Zero Coupon 19 -15.08.50 9,003,000 EUR 9,167,094 9,464,134 0.24Bundesrepublik Deutschland Zero Coupon 20 -15.02.30 12,708,000 EUR 13,340,681 13,422,141 0.34Bundesrepublik Deutschland Zero Coupon 20 -15.05.35 11,643,000 EUR 12,133,529 12,305,115 0.31Bundesrepublik Deutschland Zero Coupon 20 -15.11.27 11,157,000 EUR 11,647,808 11,696,331 0.30Bundesrepublik Deutschland Zero Coupon 20 -15.08.30 15,831,000 EUR 16,650,087 16,724,977 0.43Bundesrepublik Deutschland Zero Coupon 20 -15.08.30 3,292,000 EUR 3,471,036 3,490,738 0.09Bundesrepublik Deutschland 0.25% 17 - 15.02.27 15,678,000 EUR 16,248,410 16,639,532 0.42Bundesrepublik Deutschland 0.25% 18 - 15.08.28 13,108,000 EUR 13,683,713 14,059,641 0.36Bundesrepublik Deutschland 0.25% 19 - 15.02.29 13,313,000 EUR 14,010,453 14,316,401 0.36Bundesrepublik Deutschland 0.50% 15 - 15.02.25 14,061,000 EUR 14,657,023 14,803,280 0.38Bundesrepublik Deutschland 0.50% 16 - 15.02.26 15,860,000 EUR 16,613,928 16,890,107 0.43Bundesrepublik Deutschland 0.50% 17 - 15.08.27 15,224,000 EUR 15,993,125 16,476,935 0.42Bundesrepublik Deutschland 0.50% 18 - 15.02.28 13,108,000 EUR 13,880,142 14,253,246 0.36Bundesrepublik Deutschland 1.00% 14 - 15.08.24 11,521,000 EUR 12,173,760 12,267,676 0.31Bundesrepublik Deutschland 1.00% 15 - 15.08.25 14,396,000 EUR 15,419,065 15,580,766 0.40Bundesrepublik Deutschland 1.25% 17 - 15.08.48 13,090,600 EUR 16,923,955 18,432,489 0.47Bundesrepublik Deutschland 1.50% 12 - 04.09.22 10,717,000 EUR 11,098,201 11,123,817 0.28Bundesrepublik Deutschland 1.50% 13 - 15.02.23 10,336,000 EUR 10,806,053 10,833,678 0.28Bundesrepublik Deutschland 1.50% 13 - 15.05.23 11,347,000 EUR 11,907,885 11,959,057 0.30Bundesrepublik Deutschland 1.50% 14 - 15.05.24 12,088,000 EUR 12,908,429 13,022,644 0.33Bundesrepublik Deutschland 1.75% 12 - 04.07.22 13,443,000 EUR 13,925,068 13,944,021 0.36Bundesrepublik Deutschland 1.75% 14 - 15.02.24 11,779,035 EUR 12,655,383 12,714,762 0.32Bundesrepublik Deutschland 2.00% 11 - 04.01.22 11,268,000 EUR 11,575,795 11,582,377 0.30Bundesrepublik Deutschland 2.00% 13 - 15.08.23 11,342,800 EUR 12,129,433 12,172,639 0.31
Xtrackers II
Xtrackers II EUROZONE GOVERNMENT BOND UCITS ETF (continued)
Statement of Investmentsas at 31 December 2020(expressed in EUR)
The accompanying notes form an integral part of these financial statements.
53

DescriptionNominal
ValueCurrency
(local) Cost Market Value
% ofNet
Assets
Transferable securities and money market instruments admitted to an official stock exchange listing(A)
Bonds (continued)
Germany (continued)Bundesrepublik Deutschland 2.50% 12 - 04.07.44 14,649,586 EUR 22,329,398 24,596,508 0.63Bundesrepublik Deutschland 2.50% 14 - 15.08.46 15,766,800 EUR 24,472,273 27,210,974 0.69Bundesrepublik Deutschland 3.25% 10 - 04.07.42 10,024,000 EUR 16,719,024 18,051,219 0.46Bundesrepublik Deutschland 4.00% 05 - 04.01.37 14,175,000 EUR 23,265,100 24,544,607 0.63Bundesrepublik Deutschland 4.25% 07 - 04.07.39 9,510,000 EUR 16,978,078 17,942,567 0.46Bundesrepublik Deutschland 4.75% 98 - 04.07.28 7,074,133 EUR 9,817,386 10,058,356 0.26Bundesrepublik Deutschland 4.75% 03 - 04.07.34 12,593,100 EUR 20,847,475 21,836,367 0.56Bundesrepublik Deutschland 4.75% 08 - 04.07.40 7,028,000 EUR 13,632,252 14,304,385 0.36Bundesrepublik Deutschland 4.75% 08 - 04.07.40 3,603,500 EUR 6,608,872 7,334,356 0.19Bundesrepublik Deutschland 5.50% 00 - 04.01.31 11,062,000 EUR 17,516,716 18,044,556 0.46Bundesrepublik Deutschland 5.625% 98 - 04.01.28 8,754,007 EUR 12,480,033 12,767,719 0.33Bundesrepublik Deutschland 6.25% 94 - 04.01.24 6,213,000 EUR 7,502,394 7,545,875 0.19Bundesrepublik Deutschland 6.25% 00 - 04.01.30 6,032,000 EUR 9,623,100 9,901,392 0.25Bundesrepublik Deutschland 6.50% 97 - 04.07.27 7,081,000 EUR 10,325,826 10,499,507 0.27Bundesschatzanweisungen Zero Coupon 20 - 11.03.22 7,428,000 EUR 7,494,520 7,489,578 0.19Bundesschatzanweisungen Zero Coupon 20 - 10.06.22 7,995,000 EUR 8,076,249 8,074,957 0.21Bundesschatzanweisungen Zero Coupon 20 - 16.09.22 7,710,000 EUR 7,805,767 7,803,831 0.20Bundesschatzanweisungen Zero Coupon 20 - 15.12.22 4,118,000 EUR 4,177,809 4,175,652 0.11
673,676,977 691,895,813 17.65IrelandIreland Zero Coupon 17 - 18.10.22 2,708,000 EUR 2,730,005 2,741,545 0.07Ireland 0.20% 20 - 15.05.27 3,625,000 EUR 3,702,039 3,782,057 0.10Ireland 0.20% 20 - 18.10.30 3,857,000 EUR 3,961,641 4,052,936 0.10Ireland 0.40% 20 - 15.05.35 2,572,000 EUR 2,641,759 2,762,225 0.07Ireland 0.80% 15 - 15.03.22 3,371,000 EUR 3,418,749 3,432,487 0.09Ireland 0.90% 18 - 15.05.28 4,173,000 EUR 4,363,568 4,605,156 0.12Ireland 1.00% 16 - 15.05.26 5,803,000 EUR 6,083,697 6,306,816 0.16Ireland 1.10% 19 - 15.05.29 4,890,000 EUR 5,279,809 5,523,744 0.14Ireland 1.30% 18 - 15.05.33 2,315,000 EUR 2,497,808 2,753,276 0.07Ireland 1.35% 18 - 18.03.31 3,252,000 EUR 3,570,032 3,803,906 0.10Ireland 1.50% 19 - 15.05.50 2,988,600 EUR 3,485,763 4,013,002 0.10Ireland 1.70% 17 - 15.05.37 2,945,000 EUR 3,339,925 3,773,142 0.10Ireland 2.00% 15 - 18.02.45 4,430,000 EUR 5,374,711 6,350,624 0.16Ireland 2.40% 14 - 15.05.30 5,016,100 EUR 5,896,143 6,341,654 0.16Ireland 3.40% 14 - 18.03.24 4,203,000 EUR 4,689,434 4,757,712 0.12Ireland 3.90% 13 - 20.03.23 3,611,400 EUR 3,947,138 3,981,135 0.10Ireland 5.40% 09 - 13.03.25 6,015,000 EUR 7,396,104 7,557,908 0.19
72,378,325 76,539,325 1.95ItalyItaly 5.125% 04 - 31.07.24 1,684,000 EUR 1,914,322 1,991,275 0.05Italy 5.20% 04 - 31.07.34 1,077,000 EUR 1,291,884 1,634,893 0.04Italy Buoni Poliennali Del Tesoro Zero Coupon 20 -15.01.24 5,709,000 EUR 5,738,829 5,757,221 0.15Italy Buoni Poliennali Del Tesoro 0.05% 19 - 15.01.23 7,723,000 EUR 7,707,490 7,795,751 0.20Italy Buoni Poliennali Del Tesoro 0.05% 19 - 15.01.23 240,000 EUR 241,073 242,261 0.01Italy Buoni Poliennali Del Tesoro 0.30% 20 - 15.08.23 8,912,000 EUR 8,960,181 9,062,345 0.23Italy Buoni Poliennali Del Tesoro 0.35% 19 - 01.02.25 9,837,000 EUR 9,737,342 10,052,922 0.26Italy Buoni Poliennali Del Tesoro 0.35% 19 - 01.02.25 355,000 EUR 357,255 362,792 0.01
Xtrackers II
Xtrackers II EUROZONE GOVERNMENT BOND UCITS ETF (continued)
Statement of Investmentsas at 31 December 2020(expressed in EUR)
The accompanying notes form an integral part of these financial statements.
54

DescriptionNominal
ValueCurrency
(local) Cost Market Value
% ofNet
Assets
Transferable securities and money market instruments admitted to an official stock exchange listing(A)
Bonds (continued)
Italy (continued)Italy Buoni Poliennali Del Tesoro 0.50% 20 - 01.02.26 7,578,000 EUR 7,697,799 7,771,163 0.20Italy Buoni Poliennali Del Tesoro 0.60% 20 - 15.06.23 7,657,000 EUR 7,659,358 7,845,898 0.20Italy Buoni Poliennali Del Tesoro 0.65% 16 - 15.10.23 8,653,000 EUR 8,640,785 8,893,747 0.23Italy Buoni Poliennali Del Tesoro 0.85% 19 - 15.01.27 9,821,000 EUR 9,775,286 10,258,722 0.26Italy Buoni Poliennali Del Tesoro 0.90% 17 - 01.08.22 9,087,000 EUR 9,145,448 9,280,300 0.24Italy Buoni Poliennali Del Tesoro 0.90% 20 - 01.04.31 5,984,000 EUR 6,130,572 6,190,059 0.16Italy Buoni Poliennali Del Tesoro 0.95% 16 - 15.03.23 8,031,000 EUR 8,066,707 8,269,971 0.21Italy Buoni Poliennali Del Tesoro 0.95% 18 - 01.03.23 8,688,000 EUR 8,704,578 8,942,066 0.23Italy Buoni Poliennali Del Tesoro 0.95% 20 - 01.08.30 8,711,000 EUR 8,347,870 9,102,408 0.23Italy Buoni Poliennali Del Tesoro 0.95% 20 - 15.09.27 10,046,000 EUR 10,333,214 10,541,226 0.27Italy Buoni Poliennali Del Tesoro 1.00% 19 - 15.07.22 5,442,000 EUR 5,488,971 5,563,764 0.14Italy Buoni Poliennali Del Tesoro 1.00% 19 - 15.07.22 1,685,000 EUR 1,704,945 1,722,702 0.04Italy Buoni Poliennali Del Tesoro 1.20% 17 - 01.04.22 8,571,000 EUR 8,643,246 8,750,048 0.22Italy Buoni Poliennali Del Tesoro 1.25% 16 - 01.12.26 9,590,000 EUR 9,548,455 10,260,305 0.26Italy Buoni Poliennali Del Tesoro 1.35% 15 - 15.04.22 9,151,000 EUR 9,245,669 9,361,748 0.24Italy Buoni Poliennali Del Tesoro 1.35% 19 - 01.04.30 11,274,000 EUR 11,495,875 12,199,370 0.31Italy Buoni Poliennali Del Tesoro 1.45% 15 - 15.09.22 8,090,000 EUR 8,231,426 8,351,926 0.21Italy Buoni Poliennali Del Tesoro 1.45% 17 - 15.11.24 8,307,000 EUR 8,427,909 8,841,268 0.23Italy Buoni Poliennali Del Tesoro 1.45% 18 - 15.05.25 7,311,000 EUR 7,286,940 7,815,020 0.20Italy Buoni Poliennali Del Tesoro 1.45% 18 - 15.05.25 475,000 EUR 491,751 507,746 0.01Italy Buoni Poliennali Del Tesoro 1.45% 20 - 01.03.36 7,438,000 EUR 7,373,666 7,985,396 0.20Italy Buoni Poliennali Del Tesoro 1.50% 15 - 01.06.25 7,311,000 EUR 7,376,217 7,834,029 0.20Italy Buoni Poliennali Del Tesoro 1.50% 15 - 01.06.25 2,749,000 EUR 2,825,634 2,945,663 0.08Italy Buoni Poliennali Del Tesoro 1.60% 16 - 01.06.26 10,090,000 EUR 10,337,961 10,957,465 0.28Italy Buoni Poliennali Del Tesoro 1.65% 15 - 01.03.32 12,787,000 EUR 12,717,090 14,190,501 0.36Italy Buoni Poliennali Del Tesoro 1.65% 20 - 01.12.30 11,880,000 EUR 12,439,850 13,178,246 0.34Italy Buoni Poliennali Del Tesoro 1.70% 20 - 01.09.51 4,124,000 EUR 4,223,868 4,386,245 0.11Italy Buoni Poliennali Del Tesoro 1.75% 19 - 01.07.24 7,511,000 EUR 7,741,577 8,029,184 0.20Italy Buoni Poliennali Del Tesoro 1.75% 19 - 01.07.24 1,410,000 EUR 1,487,567 1,507,276 0.04Italy Buoni Poliennali Del Tesoro 1.80% 20 - 01.03.41 5,185,000 EUR 5,453,590 5,732,899 0.15Italy Buoni Poliennali Del Tesoro 1.85% 17 - 15.05.24 7,696,000 EUR 7,879,699 8,242,858 0.21Italy Buoni Poliennali Del Tesoro 1.85% 20 - 01.07.25 9,499,000 EUR 9,931,019 10,336,859 0.26Italy Buoni Poliennali Del Tesoro 2.00% 15 - 01.12.25 10,057,000 EUR 10,343,031 11,079,870 0.28Italy Buoni Poliennali Del Tesoro 2.00% 18 - 01.02.28 11,826,000 EUR 12,151,852 13,295,854 0.34Italy Buoni Poliennali Del Tesoro 2.05% 17 - 01.08.27 9,864,000 EUR 10,301,997 11,079,837 0.28Italy Buoni Poliennali Del Tesoro 2.10% 19 - 15.07.26 8,718,000 EUR 9,273,889 9,709,881 0.25Italy Buoni Poliennali Del Tesoro 2.20% 17 - 01.06.27 8,930,000 EUR 9,328,639 10,101,780 0.26Italy Buoni Poliennali Del Tesoro 2.25% 16 - 01.09.36 7,920,000 EUR 8,057,062 9,426,384 0.24Italy Buoni Poliennali Del Tesoro 2.45% 17 - 01.09.33 9,612,000 EUR 10,302,664 11,574,194 0.30Italy Buoni Poliennali Del Tesoro 2.45% 18 - 01.10.23 7,587,000 EUR 7,866,295 8,173,337 0.21Italy Buoni Poliennali Del Tesoro 2.45% 20 - 01.09.50 8,138,000 EUR 8,787,498 10,174,168 0.26Italy Buoni Poliennali Del Tesoro 2.50% 14 - 01.12.24 10,572,000 EUR 11,099,810 11,679,761 0.30Italy Buoni Poliennali Del Tesoro 2.50% 18 - 15.11.25 8,653,000 EUR 9,034,821 9,739,126 0.25Italy Buoni Poliennali Del Tesoro 2.70% 16 - 01.03.47 8,898,000 EUR 9,302,201 11,535,658 0.29Italy Buoni Poliennali Del Tesoro 2.80% 16 - 01.03.67 4,958,000 EUR 5,116,413 6,653,785 0.17Italy Buoni Poliennali Del Tesoro 2.80% 18 - 01.12.28 10,198,000 EUR 10,837,835 12,178,350 0.31Italy Buoni Poliennali Del Tesoro 2.95% 18 - 01.09.38 7,627,000 EUR 8,369,151 9,947,991 0.25Italy Buoni Poliennali Del Tesoro 3.00% 19 - 01.08.29 10,335,000 EUR 11,593,101 12,615,728 0.32
Xtrackers II
Xtrackers II EUROZONE GOVERNMENT BOND UCITS ETF (continued)
Statement of Investmentsas at 31 December 2020(expressed in EUR)
The accompanying notes form an integral part of these financial statements.
55

DescriptionNominal
ValueCurrency
(local) Cost Market Value
% ofNet
Assets
Transferable securities and money market instruments admitted to an official stock exchange listing(A)
Bonds (continued)
Italy (continued)Italy Buoni Poliennali Del Tesoro 3.10% 19 - 01.03.40 6,897,000 EUR 8,017,187 9,212,668 0.23Italy Buoni Poliennali Del Tesoro 3.25% 15 - 01.09.46 8,508,000 EUR 9,762,938 12,051,327 0.31Italy Buoni Poliennali Del Tesoro 3.35% 19 - 01.03.35 7,748,000 EUR 8,925,961 10,320,413 0.26Italy Buoni Poliennali Del Tesoro 3.45% 17 - 01.03.48 8,300,000 EUR 9,502,235 12,220,505 0.31Italy Buoni Poliennali Del Tesoro 3.45% 17 - 01.03.48 136,000 EUR 186,143 200,240 0.01Italy Buoni Poliennali Del Tesoro 3.50% 14 - 01.03.30 13,169,000 EUR 15,128,406 16,791,397 0.43Italy Buoni Poliennali Del Tesoro 3.75% 14 - 01.09.24 10,205,000 EUR 11,243,627 11,684,575 0.30Italy Buoni Poliennali Del Tesoro 3.85% 19 - 01.09.49 6,798,000 EUR 8,499,668 10,731,425 0.27Italy Buoni Poliennali Del Tesoro 4.00% 05 - 01.02.37 14,373,000 EUR 17,957,907 20,765,823 0.53Italy Buoni Poliennali Del Tesoro 4.50% 10 - 01.03.26 11,451,000 EUR 13,290,025 14,119,285 0.36Italy Buoni Poliennali Del Tesoro 4.50% 13 - 01.05.23 2,131,000 EUR 2,336,255 2,375,111 0.06Italy Buoni Poliennali Del Tesoro 4.50% 13 - 01.05.23 6,786,000 EUR 7,290,042 7,563,353 0.19Italy Buoni Poliennali Del Tesoro 4.50% 13 - 01.03.24 11,955,000 EUR 13,249,716 13,765,475 0.35Italy Buoni Poliennali Del Tesoro 4.75% 08 - 01.08.23 11,383,000 EUR 12,461,867 12,905,114 0.33Italy Buoni Poliennali Del Tesoro 4.75% 13 - 01.09.28 12,404,000 EUR 15,201,339 16,569,866 0.42Italy Buoni Poliennali Del Tesoro 4.75% 13 - 01.09.44 9,278,000 EUR 12,892,101 15,846,085 0.40Italy Buoni Poliennali Del Tesoro 5.00% 03 - 01.08.34 12,867,000 EUR 17,139,500 19,803,600 0.51Italy Buoni Poliennali Del Tesoro 5.00% 07 - 01.08.39 11,730,000 EUR 16,203,954 19,474,381 0.50Italy Buoni Poliennali Del Tesoro 5.00% 09 - 01.03.25 12,626,000 EUR 14,567,317 15,351,196 0.39Italy Buoni Poliennali Del Tesoro 5.00% 09 - 01.09.40 11,348,000 EUR 15,949,061 19,032,979 0.49Italy Buoni Poliennali Del Tesoro 5.00% 11 - 01.03.22 10,543,000 EUR 11,091,323 11,214,630 0.29Italy Buoni Poliennali Del Tesoro 5.25% 98 - 01.11.29 14,832,000 EUR 19,101,928 21,084,726 0.54Italy Buoni Poliennali Del Tesoro 5.50% 12 - 01.09.22 10,433,000 EUR 11,243,509 11,459,378 0.29Italy Buoni Poliennali Del Tesoro 5.50% 12 - 01.11.22 11,063,000 EUR 12,059,018 12,258,005 0.31Italy Buoni Poliennali Del Tesoro 5.75% 02 - 01.02.33 10,681,000 EUR 15,146,013 16,910,536 0.43Italy Buoni Poliennali Del Tesoro 6.00% 00 - 01.05.31 15,255,000 EUR 21,133,717 23,557,767 0.60Italy Buoni Poliennali Del Tesoro 6.50% 97 - 01.11.27 13,884,000 EUR 18,122,320 19,786,916 0.50Italy Buoni Poliennali Del Tesoro 7.25% 97 - 01.11.26 6,443,000 EUR 8,519,260 9,140,426 0.23Italy Buoni Poliennali Del Tesoro 9.00% 93 - 01.11.23 7,822,000 EUR 9,619,905 9,904,295 0.25Italy Certificati di Credito Del Tesoro Zero Coupon20 - 30.05.22 8,128,000 EUR 8,119,619 8,175,929 0.21Italy Certificati di Credito Del Tesoro Zero Coupon20 - 28.09.22 4,486,000 EUR 4,503,650 4,515,764 0.12
801,034,688 870,454,432 22.20LatviaLatvia 0.125% 20 - 14.04.23 853,000 EUR 863,882 862,507 0.02Latvia 0.375% 16 - 07.10.26 300,000 EUR 312,511 312,212 0.01Latvia 1.875% 19 - 19.02.49 1,160,000 EUR 1,274,613 1,595,041 0.04Latvia 2.875% 14 - 30.04.24 300,000 EUR 323,691 334,048 0.01
2,774,697 3,103,808 0.08LithuaniaLithuania 0.50% 20 - 28.07.50 986,000 EUR 955,551 997,327 0.02Lithuania 0.75% 20 - 06.05.30 621,000 EUR 650,997 674,155 0.02Lithuania 0.95% 17 - 26.05.27 565,000 EUR 602,185 611,096 0.02Lithuania 2.125% 14 - 29.10.26 450,000 EUR 496,517 518,907 0.01Lithuania 2.125% 15 - 22.10.35 584,000 EUR 630,941 758,943 0.02
3,336,191 3,560,428 0.09
Xtrackers II
Xtrackers II EUROZONE GOVERNMENT BOND UCITS ETF (continued)
Statement of Investmentsas at 31 December 2020(expressed in EUR)
The accompanying notes form an integral part of these financial statements.
56

DescriptionNominal
ValueCurrency
(local) Cost Market Value
% ofNet
Assets
Transferable securities and money market instruments admitted to an official stock exchange listing(A)
Bonds (continued)
LuxembourgLuxembourg Zero Coupon 19 - 13.11.26 1,109,000 EUR 1,127,932 1,146,586 0.03Luxembourg Zero Coupon 20 - 28.04.25 740,000 EUR 752,852 759,935 0.02Luxembourg Zero Coupon 20 - 28.04.30 700,000 EUR 714,669 726,278 0.02Luxembourg 0.625% 17 - 01.02.27 839,000 EUR 864,631 898,319 0.02Luxembourg 2.125% 13 - 10.07.23 805,000 EUR 854,885 862,459 0.02Luxembourg 2.25% 12 - 21.03.22 168,000 EUR 173,991 174,000 0.01State of the Grand-Duchy of Luxembourg ZeroCoupon 20 - 14.09.32 775,000 EUR 797,371 799,304 0.02
5,286,331 5,366,881 0.14NetherlandsNetherlands Zero Coupon 16 - 15.01.22 7,906,000 EUR 7,952,081 7,963,477 0.20Netherlands Zero Coupon 17 - 15.01.24 7,840,000 EUR 7,930,986 8,012,794 0.20Netherlands Zero Coupon 20 - 15.07.30 7,214,000 EUR 7,438,449 7,558,613 0.19Netherlands Zero Coupon 20 - 15.01.27 6,899,000 EUR 7,131,495 7,168,894 0.18Netherlands Zero Coupon 20 - 15.01.52 3,040,000 EUR 3,059,517 3,128,600 0.08Netherlands 0.25% 15 - 15.07.25 7,594,000 EUR 7,785,111 7,928,711 0.20Netherlands 0.25% 15 - 15.07.25 328,000 EUR 337,724 342,457 0.01Netherlands 0.25% 19 - 15.07.29 1,188,000 EUR 1,260,110 1,271,008 0.03Netherlands 0.25% 19 - 15.07.29 4,934,000 EUR 5,095,847 5,278,749 0.14Netherlands 0.50% 16 - 15.07.26 6,079,000 EUR 6,378,146 6,479,946 0.17Netherlands 0.50% 16 - 15.07.26 2,567,000 EUR 2,676,355 2,736,309 0.07Netherlands 0.50% 19 - 15.01.40 4,658,000 EUR 5,062,039 5,356,979 0.14Netherlands 0.75% 17 - 15.07.27 7,908,000 EUR 8,382,106 8,640,029 0.22Netherlands 0.75% 18 - 15.07.28 7,657,000 EUR 8,208,416 8,450,491 0.22Netherlands 1.75% 13 - 15.07.23 1,148,000 EUR 1,220,303 1,220,703 0.03Netherlands 1.75% 13 - 15.07.23 7,988,000 EUR 8,414,408 8,493,880 0.22Netherlands 2.00% 14 - 15.07.24 7,880,008 EUR 8,575,338 8,648,309 0.22Netherlands 2.25% 12 - 15.07.22 7,847,590 EUR 8,193,332 8,205,989 0.21Netherlands 2.50% 12 - 15.01.33 6,974,000 EUR 9,018,381 9,495,310 0.24Netherlands 2.75% 14 - 15.01.47 8,497,400 EUR 13,510,121 15,201,509 0.39Netherlands 3.75% 06 - 15.01.23 2,181,000 EUR 2,374,924 2,380,518 0.06Netherlands 3.75% 10 - 15.01.42 8,254,300 EUR 14,095,485 15,432,074 0.39Netherlands 4.00% 05 - 15.01.37 8,085,000 EUR 12,889,173 13,880,570 0.35Netherlands 5.50% 98 - 15.01.28 6,640,474 EUR 9,280,001 9,561,086 0.24Netherlands 7.50% 93 - 15.01.23 4,243,886 EUR 4,947,841 4,960,381 0.13
171,217,689 177,797,386 4.53PortugalPortugal Obrigacoes do Tesouro OT 0.475% 20 -18.10.30 4,288,000 EUR 4,325,575 4,473,500 0.11Portugal Obrigacoes do Tesouro OT 0.70% 20 -15.10.27 2,792,000 EUR 2,835,886 2,971,888 0.08Portugal Obrigacoes do Tesouro OT 0.90% 20 -12.10.35 2,062,000 EUR 2,140,161 2,210,996 0.06Portugal Obrigacoes do Tesouro OT 1.95% 19 -15.06.29 3,754,000 EUR 4,193,152 4,403,949 0.11Portugal Obrigacoes do Tesouro OT 1.95% 19 -15.06.29 2,366,000 EUR 2,673,005 2,775,638 0.07
Xtrackers II
Xtrackers II EUROZONE GOVERNMENT BOND UCITS ETF (continued)
Statement of Investmentsas at 31 December 2020(expressed in EUR)
The accompanying notes form an integral part of these financial statements.
57

DescriptionNominal
ValueCurrency
(local) Cost Market Value
% ofNet
Assets
Transferable securities and money market instruments admitted to an official stock exchange listing(A)
Bonds (continued)
Portugal (continued)Portugal Obrigacoes do Tesouro OT 2.125% 18 -17.10.28 6,445,600 EUR 7,020,898 7,597,967 0.19Portugal Obrigacoes do Tesouro OT 2.20% 15 -17.10.22 5,217,000 EUR 5,437,649 5,491,936 0.14Portugal Obrigacoes do Tesouro OT 2.25% 18 -18.04.34 3,568,000 EUR 4,116,408 4,494,825 0.11Portugal Obrigacoes do Tesouro OT 2.875% 15 -15.10.25 7,185,000 EUR 8,000,423 8,336,468 0.21Portugal Obrigacoes do Tesouro OT 2.875% 16 -21.07.26 5,960,000 EUR 6,737,659 7,041,084 0.18Portugal Obrigacoes do Tesouro OT 3.875% 14 -15.02.30 1,956,000 EUR 2,527,762 2,651,671 0.07Portugal Obrigacoes do Tesouro OT 3.875% 14 -15.02.30 1,645,000 EUR 2,025,923 2,230,061 0.06Portugal Obrigacoes do Tesouro OT 4.10% 06 -15.04.37 4,836,000 EUR 6,586,734 7,644,100 0.19Portugal Obrigacoes do Tesouro OT 4.10% 15 -15.02.45 2,165,000 EUR 3,064,433 3,771,993 0.10Portugal Obrigacoes do Tesouro OT 4.125% 17 -14.04.27 5,105,000 EUR 6,146,327 6,535,344 0.17Portugal Obrigacoes do Tesouro OT 4.95% 08 -25.10.23 6,295,000 EUR 7,147,018 7,286,903 0.19Portugal Obrigacoes do Tesouro OT 5.65% 13 -15.02.24 5,615,000 EUR 6,518,204 6,710,206 0.17Portugal Obrigacoes do Tesouro OT 5.65% 13 -15.02.24 1,039,000 EUR 1,229,663 1,241,657 0.03
82,726,880 87,870,186 2.24SlovakiaSlovakia Zero Coupon 16 - 13.11.23 901,000 EUR 891,955 915,333 0.02Slovakia 0.25% 20 - 14.05.25 1,199,000 EUR 1,225,713 1,242,574 0.03Slovakia 0.625% 16 - 22.05.26 1,320,000 EUR 1,354,743 1,402,805 0.03Slovakia 0.75% 19 - 09.04.30 1,401,000 EUR 1,502,253 1,562,594 0.04Slovakia 1.00% 18 - 12.06.28 1,263,000 EUR 1,330,215 1,406,981 0.03Slovakia 1.00% 20 - 09.10.30 1,043,000 EUR 1,108,625 1,193,073 0.03Slovakia 1.00% 20 - 14.05.32 1,089,000 EUR 1,183,561 1,260,649 0.03Slovakia 1.375% 15 - 21.01.27 1,366,000 EUR 1,453,402 1,524,686 0.04Slovakia 1.625% 16 - 21.01.31 1,570,000 EUR 1,680,695 1,914,378 0.05Slovakia 1.875% 17 - 09.03.37 1,516,000 EUR 1,705,570 1,995,207 0.05Slovakia 2.00% 17 - 17.10.47 979,000 EUR 1,198,785 1,426,390 0.04Slovakia 3.00% 13 - 28.02.23 1,362,600 EUR 1,460,408 1,467,891 0.04Slovakia 3.375% 12 - 15.11.24 1,643,000 EUR 1,864,170 1,899,308 0.05Slovakia 3.625% 14 - 16.01.29 1,458,000 EUR 1,798,439 1,955,603 0.05Slovakia 3.875% 13 - 08.02.33 795,000 EUR 1,075,968 1,198,931 0.03Slovakia 4.35% 10 - 14.10.25 1,499,000 EUR 1,822,295 1,859,178 0.05Slovakia 4.50% 06 - 10.05.26 219,080 EUR 282,303 278,049 0.01
22,939,100 24,503,630 0.62SloveniaSlovenia 0.20% 20 - 31.03.23 987,000 EUR 991,065 1,001,515 0.03
Xtrackers II
Xtrackers II EUROZONE GOVERNMENT BOND UCITS ETF (continued)
Statement of Investmentsas at 31 December 2020(expressed in EUR)
The accompanying notes form an integral part of these financial statements.
58

DescriptionNominal
ValueCurrency
(local) Cost Market Value
% ofNet
Assets
Transferable securities and money market instruments admitted to an official stock exchange listing(A)
Bonds (continued)
Slovenia (continued)Slovenia 0.275% 20 - 14.01.30 794,000 EUR 810,449 826,010 0.02Slovenia 0.488% 20 - 20.10.50 534,000 EUR 546,147 558,658 0.01Slovenia 0.875% 20 - 15.07.30 500,000 EUR 525,139 549,474 0.01Slovenia 1.00% 18 - 06.03.28 1,230,000 EUR 1,259,695 1,343,252 0.03Slovenia 1.188% 19 - 14.03.29 1,212,000 EUR 1,301,245 1,354,402 0.04Slovenia 1.25% 17 - 22.03.27 1,519,000 EUR 1,604,578 1,669,115 0.04Slovenia 1.50% 15 - 25.03.35 1,184,000 EUR 1,221,142 1,429,568 0.04Slovenia 1.75% 16 - 03.11.40 1,472,000 EUR 1,604,804 1,908,589 0.05Slovenia 2.125% 15 - 28.07.25 981,000 EUR 1,062,057 1,096,906 0.03Slovenia 2.25% 14 - 25.03.22 493,000 EUR 509,085 509,669 0.01Slovenia 2.25% 16 - 03.03.32 1,101,000 EUR 1,275,096 1,390,295 0.04Slovenia 3.125% 15 - 07.08.45 690,000 EUR 908,164 1,153,338 0.03Slovenia 4.625% 09 - 09.09.24 806,000 EUR 940,109 959,621 0.02Slovenia 5.125% 11 - 30.03.26 809,000 EUR 1,013,347 1,048,685 0.03
15,572,122 16,799,097 0.43SpainSpain Zero Coupon 20 - 30.04.23 11,182,000 EUR 11,253,854 11,331,839 0.29Spain Zero Coupon 20 - 31.01.25 10,967,000 EUR 11,028,090 11,184,476 0.28Spain Zero Coupon 20 - 31.01.26 2,010,000 EUR 2,046,097 2,050,549 0.05Spain 0.25% 19 - 30.07.24 8,430,000 EUR 8,564,767 8,665,554 0.22Spain 0.35% 18 - 30.07.23 10,993,000 EUR 11,112,657 11,250,120 0.29Spain 0.40% 17 - 30.04.22 6,317,000 EUR 6,365,324 6,403,353 0.16Spain 0.40% 17 - 30.04.22 4,462,000 EUR 4,509,805 4,522,995 0.12Spain 0.45% 17 - 31.10.22 9,577,000 EUR 9,683,967 9,758,963 0.25Spain 0.50% 20 - 30.04.30 11,025,000 EUR 11,178,019 11,562,579 0.29Spain 0.60% 19 - 31.10.29 11,053,000 EUR 11,356,351 11,695,639 0.30Spain 0.80% 20 - 30.07.27 9,308,000 EUR 9,640,319 9,966,262 0.25Spain 1.00% 20 - 31.10.50 6,587,000 EUR 6,134,673 6,808,708 0.17Spain 1.20% 20 - 31.10.40 6,792,000 EUR 7,061,227 7,511,896 0.19Spain 1.25% 20 - 31.10.30 12,932,000 EUR 13,771,314 14,452,351 0.37Spain 1.25% 20 - 31.10.30 100,000 EUR 109,406 111,756 0.00Spain 1.30% 16 - 31.10.26 12,797,000 EUR 13,417,926 14,061,599 0.36Spain 1.40% 18 - 30.04.28 11,311,000 EUR 11,936,520 12,649,770 0.32Spain 1.40% 18 - 30.07.28 10,699,000 EUR 11,277,847 11,982,485 0.31Spain 1.45% 17 - 31.10.27 11,377,000 EUR 12,037,818 12,696,343 0.32Spain 1.45% 19 - 30.04.29 8,392,000 EUR 8,938,999 9,475,245 0.24Spain 1.45% 19 - 30.04.29 2,584,000 EUR 2,841,287 2,917,544 0.07Spain 1.50% 17 - 30.04.27 10,477,000 EUR 11,143,932 11,690,889 0.30Spain 1.60% 15 - 30.04.25 11,178,000 EUR 11,807,748 12,190,882 0.31Spain 1.85% 19 - 30.07.35 9,888,000 EUR 11,260,173 11,966,073 0.30Spain 1.95% 15 - 30.07.30 11,798,000 EUR 13,098,619 13,987,616 0.36Spain 1.95% 16 - 30.04.26 11,076,000 EUR 12,025,552 12,479,551 0.32Spain 2.15% 15 - 31.10.25 5,875,000 EUR 6,426,308 6,618,129 0.17Spain 2.15% 15 - 31.10.25 6,209,000 EUR 6,672,294 6,994,376 0.18Spain 2.35% 17 - 30.07.33 9,805,000 EUR 11,158,541 12,366,429 0.32Spain 2.70% 18 - 31.10.48 7,438,000 EUR 9,487,197 10,908,078 0.28Spain 2.75% 14 - 31.10.24 12,470,000 EUR 13,702,574 14,042,841 0.36Spain 2.90% 16 - 31.10.46 8,902,000 EUR 11,324,319 13,323,897 0.34
Xtrackers II
Xtrackers II EUROZONE GOVERNMENT BOND UCITS ETF (continued)
Statement of Investmentsas at 31 December 2020(expressed in EUR)
The accompanying notes form an integral part of these financial statements.
59

DescriptionNominal
ValueCurrency
(local) Cost Market Value
% ofNet
Assets
Transferable securities and money market instruments admitted to an official stock exchange listing(A)
Bonds (continued)
Spain (continued)Spain 3.45% 16 - 30.07.66 7,676,000 EUR 11,811,237 13,906,888 0.35Spain 3.80% 14 - 30.04.24 10,816,000 EUR 12,071,046 12,394,379 0.32Spain 4.00% 14 - 31.10.64 511,000 EUR 676,320 1,004,726 0.03Spain 4.20% 05 - 31.01.37 10,491,000 EUR 14,930,414 16,690,813 0.43Spain 4.40% 13 - 31.10.23 10,832,000 EUR 12,134,412 12,366,569 0.32Spain 4.65% 10 - 30.07.25 11,784,000 EUR 14,127,392 14,565,405 0.37Spain 4.70% 09 - 30.07.41 11,093,000 EUR 17,758,375 19,839,427 0.51Spain 4.80% 08 - 31.01.24 9,028,000 EUR 10,359,829 10,531,072 0.27Spain 4.90% 07 - 30.07.40 9,692,000 EUR 15,612,880 17,508,830 0.45Spain 5.15% 13 - 31.10.28 3,873,000 EUR 5,119,992 5,487,082 0.14Spain 5.15% 13 - 31.10.28 5,867,000 EUR 7,840,182 8,312,087 0.21Spain 5.15% 13 - 31.10.44 7,327,000 EUR 12,429,879 14,463,680 0.37Spain 5.40% 13 - 31.01.23 11,153,000 EUR 12,410,226 12,547,460 0.32Spain 5.75% 01 - 30.07.32 11,728,000 EUR 17,961,378 19,264,265 0.49Spain 5.85% 11 - 31.01.22 11,768,000 EUR 12,537,666 12,587,070 0.32Spain 5.90% 11 - 30.07.26 12,152,000 EUR 15,794,377 16,456,360 0.42Spain 6.00% 98 - 31.01.29 13,228,000 EUR 18,685,244 19,804,792 0.50
514,634,373 545,359,692 13.91
Total - Bonds 3,686,308,411 3,887,063,786 99.14
Total Transferable securities and money market instruments admitted to an officialstock exchange listing 3,686,308,411 3,887,063,786 99.14
TOTAL INVESTMENT PORTFOLIO 3,686,308,411 3,887,063,786 99.14
TOTAL INVESTMENT PORTFOLIO INCLUDING ACCRUED INTEREST 3,920,457,526 99.99(A) Any duplicate securities appearing herein with the same name are either quoted on different stock exchanges or have different ISINs.
Xtrackers II
Xtrackers II EUROZONE GOVERNMENT BOND UCITS ETF (continued)
Statement of Investmentsas at 31 December 2020(expressed in EUR)
The accompanying notes form an integral part of these financial statements.
60

DescriptionNominal
ValueCurrency
(local) Cost Market Value
% ofNet
Assets
Transferable securities and money market instruments admitted to an official stock exchange listing(A)
Bonds
FranceFrance OAT Zero Coupon 16 - 25.05.22 28,319,000 EUR 28,572,432 28,596,243 6.20France OAT Zero Coupon 17 - 25.03.23 36,588,000 EUR 37,072,793 37,177,184 8.06France OAT Zero Coupon 19 - 25.02.22 26,237,000 EUR 26,421,966 26,447,945 5.73France OAT Zero Coupon 20 - 25.02.23 14,768,000 EUR 14,972,433 14,997,145 3.25
107,039,624 107,218,517 23.24GermanyBundesobligation Zero Coupon 17 - 08.04.22 18,852,000 EUR 19,020,532 19,025,250 4.12Bundesobligation Zero Coupon 17 - 07.10.22 17,920,000 EUR 18,151,379 18,146,867 3.93Bundesobligation Zero Coupon 18 - 14.04.23 17,001,000 EUR 17,307,932 17,295,967 3.75Bundesobligation Zero Coupon 18 - 13.10.23 17,001,000 EUR 17,403,820 17,367,542 3.77Bundesschatzanweisungen Zero Coupon 20 - 11.03.22 12,714,000 EUR 12,829,178 12,819,399 2.78Bundesschatzanweisungen Zero Coupon 20 - 10.06.22 13,792,000 EUR 13,932,274 13,929,932 3.02Bundesschatzanweisungen Zero Coupon 20 - 16.09.22 13,826,000 EUR 13,997,121 13,994,263 3.03Bundesschatzanweisungen Zero Coupon 20 - 15.12.22 7,416,000 EUR 7,523,320 7,519,824 1.63
120,165,556 120,099,044 26.03ItalyItaly Buoni Poliennali Del Tesoro 0.05% 19 - 15.01.23 14,162,000 EUR 14,165,071 14,295,406 3.10Italy Buoni Poliennali Del Tesoro 0.30% 20 - 15.08.23 15,031,000 EUR 15,142,500 15,284,573 3.31Italy Buoni Poliennali Del Tesoro 0.60% 20 - 15.06.23 13,154,000 EUR 13,311,401 13,478,509 2.92Italy Buoni Poliennali Del Tesoro 0.90% 17 - 01.08.22 16,691,000 EUR 16,906,681 17,046,055 3.69Italy Buoni Poliennali Del Tesoro 0.95% 18 - 01.03.23 15,343,000 EUR 15,551,549 15,791,680 3.42Italy Buoni Poliennali Del Tesoro 1.00% 19 - 15.07.22 11,105,000 EUR 11,255,112 11,353,473 2.46Italy Buoni Poliennali Del Tesoro 1.00% 19 - 15.07.22 1,233,000 EUR 1,250,075 1,260,588 0.27Italy Buoni Poliennali Del Tesoro 1.20% 17 - 01.04.22 15,301,000 EUR 15,470,936 15,620,638 3.39Italy Buoni Poliennali Del Tesoro 2.45% 18 - 01.10.23 14,270,000 EUR 15,323,382 15,372,811 3.33Italy Certificati di Credito Del Tesoro Zero Coupon20 - 30.05.22 15,025,000 EUR 15,015,972 15,113,600 3.28Italy Certificati di Credito Del Tesoro Zero Coupon20 - 28.09.22 7,590,000 EUR 7,621,487 7,640,358 1.66
141,014,166 142,257,691 30.83NetherlandsNetherlands Zero Coupon 16 - 15.01.22 14,115,600 EUR 14,207,927 14,218,220 3.08
14,207,927 14,218,220 3.08SpainSpain Zero Coupon 20 - 30.04.23 20,031,000 EUR 20,189,319 20,299,415 4.40Spain 0.35% 18 - 30.07.23 19,468,000 EUR 19,844,553 19,923,345 4.32Spain 0.40% 17 - 30.04.22 18,390,000 EUR 18,582,195 18,641,391 4.04
Xtrackers II
Xtrackers II EUROZONE GOVERNMENT BOND 1-3 UCITS ETF
Statement of Investmentsas at 31 December 2020(expressed in EUR)
The accompanying notes form an integral part of these financial statements.
61

DescriptionNominal
ValueCurrency
(local) Cost Market Value
% ofNet
Assets
Transferable securities and money market instruments admitted to an official stock exchange listing(A)
Bonds (continued)
Spain (continued)Spain 0.40% 17 - 30.04.22 807,000 EUR 816,916 818,032 0.18Spain 0.45% 17 - 31.10.22 17,150,000 EUR 17,406,072 17,475,850 3.79
76,839,055 77,158,033 16.73
Total - Bonds 459,266,328 460,951,505 99.91
Total Transferable securities and money market instruments admitted to an officialstock exchange listing 459,266,328 460,951,505 99.91
TOTAL INVESTMENT PORTFOLIO 459,266,328 460,951,505 99.91
TOTAL INVESTMENT PORTFOLIO INCLUDING ACCRUED INTEREST 461,371,265 100.00(A) Any duplicate securities appearing herein with the same name are either quoted on different stock exchanges or have different ISINs.
Xtrackers II
Xtrackers II EUROZONE GOVERNMENT BOND 1-3 UCITS ETF (continued)
Statement of Investmentsas at 31 December 2020(expressed in EUR)
The accompanying notes form an integral part of these financial statements.
62

DescriptionNominal
ValueCurrency
(local) Cost Market Value
% ofNet
Assets
Transferable securities and money market instruments admitted to an official stock exchange listing(A)
Bonds
FranceFrance OAT Zero Coupon 18 - 25.03.24 30,723,000 EUR 31,200,019 31,431,165 10.73France OAT Zero Coupon 19 - 25.03.25 34,551,000 EUR 35,215,087 35,539,850 12.13
66,415,106 66,971,015 22.86GermanyBundesobligation Zero Coupon 19 - 05.04.24 17,997,000 EUR 18,375,777 18,453,044 6.30Bundesobligation Zero Coupon 19 - 18.10.24 17,519,000 EUR 17,969,471 18,028,978 6.16Bundesobligation Zero Coupon 20 - 11.04.25 15,435,900 EUR 15,935,622 15,937,476 5.44Bundesobligation Zero Coupon 20 - 10.10.25 19,327,000 EUR 20,086,399 20,019,403 6.83Bundesobligation Zero Coupon 20 - 10.10.25 3,918,000 EUR 4,062,247 4,060,794 1.39
76,429,516 76,499,695 26.12ItalyItaly Buoni Poliennali Del Tesoro Zero Coupon 20 -15.01.24 8,646,000 EUR 8,700,822 8,719,028 2.98Italy Buoni Poliennali Del Tesoro 0.35% 19 - 01.02.25 14,921,000 EUR 14,821,772 15,248,516 5.20Italy Buoni Poliennali Del Tesoro 1.45% 17 - 15.11.24 12,735,000 EUR 13,192,822 13,554,057 4.63Italy Buoni Poliennali Del Tesoro 1.45% 18 - 15.05.25 12,049,000 EUR 12,387,263 12,879,658 4.40Italy Buoni Poliennali Del Tesoro 1.75% 19 - 01.07.24 12,089,000 EUR 12,596,226 12,923,020 4.41Italy Buoni Poliennali Del Tesoro 1.75% 19 - 01.07.24 1,178,000 EUR 1,244,446 1,259,270 0.43Italy Buoni Poliennali Del Tesoro 1.85% 17 - 15.05.24 11,700,000 EUR 12,057,506 12,531,373 4.28Italy Buoni Poliennali Del Tesoro 1.85% 20 - 01.07.25 14,208,000 EUR 15,125,334 15,461,217 5.28Italy Buoni Poliennali Del Tesoro 2.50% 18 - 15.11.25 12,918,000 EUR 14,504,497 14,539,470 4.96
104,630,688 107,115,609 36.57NetherlandsNetherlands Zero Coupon 17 - 15.01.24 11,886,000 EUR 12,069,511 12,147,967 4.15
12,069,511 12,147,967 4.15SpainSpain Zero Coupon 20 - 31.01.25 16,531,000 EUR 16,653,424 16,858,810 5.75Spain 0.25% 19 - 30.07.24 12,557,000 EUR 12,777,709 12,907,871 4.41
29,431,133 29,766,681 10.16
Total - Bonds 288,975,954 292,500,967 99.86
Total Transferable securities and money market instruments admitted to an officialstock exchange listing 288,975,954 292,500,967 99.86
TOTAL INVESTMENT PORTFOLIO 288,975,954 292,500,967 99.86
TOTAL INVESTMENT PORTFOLIO INCLUDING ACCRUED INTEREST 292,903,324 100.00(A) Any duplicate securities appearing herein with the same name are either quoted on different stock exchanges or have different ISINs.
Xtrackers II
Xtrackers II EUROZONE GOVERNMENT BOND 3-5 UCITS ETF
Statement of Investmentsas at 31 December 2020(expressed in EUR)
The accompanying notes form an integral part of these financial statements.
63

DescriptionNominal
ValueCurrency
(local) Cost Market Value
% ofNet
Assets
Transferable securities and money market instruments admitted to an official stock exchange listing(A)
Bonds
FranceFrance OAT Zero Coupon 20 - 25.02.26 16,900,000 EUR 17,345,541 17,433,533 4.47France OAT 0.25% 16 - 25.11.26 22,856,000 EUR 23,687,739 24,025,004 6.16France OAT 0.50% 16 - 25.05.26 25,023,000 EUR 26,197,963 26,563,666 6.81France OAT 1.00% 17 - 25.05.27 22,602,000 EUR 24,540,845 24,930,402 6.39
91,772,088 92,952,605 23.83GermanyBundesrepublik Deutschland Zero Coupon 16 -15.08.26 18,282,000 EUR 19,076,528 19,054,963 4.89Bundesrepublik Deutschland Zero Coupon 20 -15.11.27 13,748,000 EUR 14,419,531 14,412,580 3.70Bundesrepublik Deutschland 0.25% 17 - 15.02.27 18,904,000 EUR 20,054,411 20,063,382 5.14Bundesrepublik Deutschland 0.50% 16 - 15.02.26 18,777,000 EUR 19,775,978 19,996,566 5.13Bundesrepublik Deutschland 0.50% 17 - 15.08.27 18,285,000 EUR 19,651,858 19,789,856 5.07
92,978,306 93,317,347 23.93ItalyItaly Buoni Poliennali Del Tesoro 0.50% 20 - 01.02.26 8,791,000 EUR 8,934,011 9,015,083 2.31Italy Buoni Poliennali Del Tesoro 0.85% 19 - 15.01.27 11,915,000 EUR 11,934,017 12,446,051 3.19Italy Buoni Poliennali Del Tesoro 0.95% 20 - 15.09.27 11,963,000 EUR 12,370,022 12,552,726 3.22Italy Buoni Poliennali Del Tesoro 1.25% 16 - 01.12.26 11,818,000 EUR 12,132,293 12,644,033 3.24Italy Buoni Poliennali Del Tesoro 1.60% 16 - 01.06.26 12,133,000 EUR 12,525,629 13,176,107 3.38Italy Buoni Poliennali Del Tesoro 2.05% 17 - 01.08.27 12,002,000 EUR 13,031,225 13,481,366 3.46Italy Buoni Poliennali Del Tesoro 2.10% 19 - 15.07.26 10,296,000 EUR 11,007,662 11,467,416 2.94Italy Buoni Poliennali Del Tesoro 2.20% 17 - 01.06.27 10,649,000 EUR 11,567,961 12,046,345 3.09
93,502,820 96,829,127 24.83NetherlandsNetherlands Zero Coupon 20 - 15.01.27 8,110,000 EUR 8,384,997 8,427,270 2.16Netherlands 0.50% 16 - 15.07.26 9,837,000 EUR 10,417,244 10,485,808 2.69Netherlands 0.50% 16 - 15.07.26 461,000 EUR 490,516 491,406 0.13Netherlands 0.75% 17 - 15.07.27 9,517,000 EUR 10,350,797 10,397,971 2.66
29,643,554 29,802,455 7.64SpainSpain Zero Coupon 20 - 31.01.26 2,228,000 EUR 2,268,092 2,272,947 0.58Spain 0.80% 20 - 30.07.27 11,223,000 EUR 11,821,840 12,016,691 3.08Spain 1.30% 16 - 31.10.26 15,566,000 EUR 16,676,993 17,104,232 4.38Spain 1.45% 17 - 31.10.27 13,860,000 EUR 15,448,426 15,467,286 3.97Spain 1.50% 17 - 30.04.27 12,626,000 EUR 13,746,429 14,088,877 3.61Spain 1.95% 16 - 30.04.26 13,318,000 EUR 14,655,678 15,005,657 3.85
74,617,458 75,955,690 19.47
Total - Bonds 382,514,226 388,857,224 99.70
Total Transferable securities and money market instruments admitted to an officialstock exchange listing 382,514,226 388,857,224 99.70
TOTAL INVESTMENT PORTFOLIO 382,514,226 388,857,224 99.70
TOTAL INVESTMENT PORTFOLIO INCLUDING ACCRUED INTEREST 390,046,046 100.00(A) Any duplicate securities appearing herein with the same name are either quoted on different stock exchanges or have different ISINs.
Xtrackers II
Xtrackers II EUROZONE GOVERNMENT BOND 5-7 UCITS ETF
Statement of Investmentsas at 31 December 2020(expressed in EUR)
The accompanying notes form an integral part of these financial statements.
64

DescriptionNominal
ValueCurrency
(local) Cost Market Value
% ofNet
Assets
Transferable securities and money market instruments admitted to an official stock exchange listing(A)
Bonds
FranceFrance OAT Zero Coupon 19 - 25.11.29 7,729,000 EUR 7,872,172 8,015,669 5.87France OAT Zero Coupon 20 - 25.11.30 5,321,000 EUR 5,496,475 5,504,841 4.03France OAT 0.50% 19 - 25.05.29 7,025,000 EUR 7,437,169 7,600,938 5.56France OAT 0.75% 17 - 25.05.28 6,808,000 EUR 7,203,116 7,460,547 5.46France OAT 0.75% 17 - 25.05.28 1,902,000 EUR 2,068,001 2,084,307 1.53France OAT 0.75% 18 - 25.11.28 5,662,000 EUR 5,973,389 6,229,162 4.56France OAT 0.75% 18 - 25.11.28 2,007,000 EUR 2,171,111 2,208,041 1.62
38,221,433 39,103,505 28.63GermanyBundesrepublik Deutschland Zero Coupon 19 -15.08.29 5,061,000 EUR 5,308,172 5,341,076 3.91Bundesrepublik Deutschland Zero Coupon 20 -15.02.30 4,775,000 EUR 5,021,797 5,043,337 3.69Bundesrepublik Deutschland Zero Coupon 20 -15.08.30 5,830,000 EUR 6,118,617 6,159,220 4.51Bundesrepublik Deutschland Zero Coupon 20 -15.08.30 1,249,000 EUR 1,317,881 1,324,402 0.97Bundesrepublik Deutschland 0.25% 18 - 15.08.28 4,870,000 EUR 5,094,806 5,223,562 3.82Bundesrepublik Deutschland 0.25% 19 - 15.02.29 5,061,000 EUR 5,339,933 5,442,448 3.99Bundesrepublik Deutschland 0.50% 18 - 15.02.28 4,849,780 EUR 5,140,977 5,273,505 3.86
33,342,183 33,807,550 24.75ItalyItaly Buoni Poliennali Del Tesoro 0.95% 20 - 01.08.30 3,265,000 EUR 3,258,753 3,411,705 2.50Italy Buoni Poliennali Del Tesoro 1.35% 19 - 01.04.30 4,254,000 EUR 4,257,682 4,603,168 3.37Italy Buoni Poliennali Del Tesoro 1.65% 20 - 01.12.30 4,440,000 EUR 4,926,180 4,925,203 3.61Italy Buoni Poliennali Del Tesoro 2.00% 18 - 01.02.28 4,400,000 EUR 4,608,147 4,946,876 3.62Italy Buoni Poliennali Del Tesoro 2.80% 18 - 01.12.28 3,773,000 EUR 4,146,611 4,505,679 3.30Italy Buoni Poliennali Del Tesoro 3.00% 19 - 01.08.29 3,870,000 EUR 4,522,736 4,724,032 3.46
25,720,109 27,116,663 19.86NetherlandsNetherlands Zero Coupon 20 - 15.07.30 2,706,000 EUR 2,815,765 2,835,266 2.08Netherlands 0.25% 19 - 15.07.29 488,000 EUR 519,649 522,097 0.38Netherlands 0.25% 19 - 15.07.29 1,845,000 EUR 1,943,108 1,973,914 1.44Netherlands 0.75% 18 - 15.07.28 2,771,000 EUR 2,976,017 3,058,157 2.24
8,254,539 8,389,434 6.14SpainSpain 0.50% 20 - 30.04.30 4,052,000 EUR 4,106,433 4,249,576 3.11Spain 0.60% 19 - 31.10.29 4,142,000 EUR 4,253,159 4,382,822 3.21Spain 1.25% 20 - 31.10.30 4,797,000 EUR 5,347,884 5,360,959 3.93Spain 1.40% 18 - 30.04.28 4,189,000 EUR 4,459,628 4,684,810 3.43Spain 1.40% 18 - 30.07.28 4,022,000 EUR 4,286,517 4,504,492 3.30
Xtrackers II
Xtrackers II EUROZONE GOVERNMENT BOND 7-10 UCITS ETF
Statement of Investmentsas at 31 December 2020(expressed in EUR)
The accompanying notes form an integral part of these financial statements.
65

DescriptionNominal
ValueCurrency
(local) Cost Market Value
% ofNet
Assets
Transferable securities and money market instruments admitted to an official stock exchange listing(A)
Bonds (continued)
Spain (continued)Spain 1.45% 19 - 30.04.29 3,186,000 EUR 3,445,880 3,597,251 2.63Spain 1.45% 19 - 30.04.29 885,000 EUR 987,769 999,236 0.73
26,887,270 27,779,146 20.34
Total - Bonds 132,425,534 136,196,298 99.72
Total Transferable securities and money market instruments admitted to an officialstock exchange listing 132,425,534 136,196,298 99.72
TOTAL INVESTMENT PORTFOLIO 132,425,534 136,196,298 99.72
TOTAL INVESTMENT PORTFOLIO INCLUDING ACCRUED INTEREST 136,570,658 99.99(A) Any duplicate securities appearing herein with the same name are either quoted on different stock exchanges or have different ISINs.
Xtrackers II
Xtrackers II EUROZONE GOVERNMENT BOND 7-10 UCITS ETF (continued)
Statement of Investmentsas at 31 December 2020(expressed in EUR)
The accompanying notes form an integral part of these financial statements.
66

DescriptionNominal
ValueCurrency
(local) Cost Market Value
% ofNet
Assets
Transferable securities and money market instruments admitted to an official stock exchange listing(A)
Bonds
FranceFrance OAT 0.50% 20 - 25.05.40 232,000 EUR 243,654 250,239 0.82France OAT 1.25% 16 - 25.05.36 662,000 EUR 721,713 796,545 2.61France OAT 1.25% 16 - 25.05.36 210,000 EUR 245,957 252,680 0.83France OAT 1.50% 19 - 25.05.50 732,000 EUR 915,988 974,913 3.20France OAT 1.75% 17 - 25.06.39 635,000 EUR 779,300 839,388 2.76France OAT 2.00% 17 - 25.05.48 670,300 EUR 871,897 977,297 3.21France OAT 3.25% 13 - 25.05.45 602,000 EUR 937,041 1,040,617 3.42France OAT 4.00% 06 - 25.10.38 616,500 EUR 981,128 1,061,767 3.48France OAT 4.50% 09 - 25.04.41 875,000 EUR 1,527,538 1,658,230 5.44
7,224,216 7,851,676 25.77GermanyBundesrepublik Deutschland Zero Coupon 19 -15.08.50 408,000 EUR 409,451 428,898 1.41Bundesrepublik Deutschland 1.25% 17 - 15.08.48 594,000 EUR 778,023 836,394 2.75Bundesrepublik Deutschland 2.50% 12 - 04.07.44 661,000 EUR 1,018,176 1,109,812 3.64Bundesrepublik Deutschland 2.50% 14 - 15.08.46 710,500 EUR 1,125,650 1,226,209 4.03Bundesrepublik Deutschland 3.25% 10 - 04.07.42 457,000 EUR 773,523 822,966 2.70Bundesrepublik Deutschland 4.00% 05 - 04.01.37 643,000 EUR 1,065,825 1,113,382 3.65Bundesrepublik Deutschland 4.25% 07 - 04.07.39 432,000 EUR 777,132 815,057 2.68Bundesrepublik Deutschland 4.75% 08 - 04.07.40 343,000 EUR 652,610 698,122 2.29Bundesrepublik Deutschland 4.75% 08 - 04.07.40 132,000 EUR 262,040 268,665 0.88
6,862,430 7,319,505 24.03ItalyItaly Buoni Poliennali Del Tesoro 1.45% 20 - 01.03.36 334,000 EUR 331,363 358,581 1.18Italy Buoni Poliennali Del Tesoro 1.80% 20 - 01.03.41 235,000 EUR 247,113 259,832 0.85Italy Buoni Poliennali Del Tesoro 2.25% 16 - 01.09.36 361,000 EUR 376,283 429,662 1.41Italy Buoni Poliennali Del Tesoro 2.45% 20 - 01.09.50 366,000 EUR 428,892 457,575 1.50Italy Buoni Poliennali Del Tesoro 2.70% 16 - 01.03.47 406,000 EUR 438,014 526,352 1.73Italy Buoni Poliennali Del Tesoro 2.95% 18 - 01.09.38 351,000 EUR 390,789 457,814 1.50Italy Buoni Poliennali Del Tesoro 3.10% 19 - 01.03.40 312,000 EUR 368,276 416,754 1.37Italy Buoni Poliennali Del Tesoro 3.25% 15 - 01.09.46 379,000 EUR 443,027 536,842 1.76Italy Buoni Poliennali Del Tesoro 3.45% 17 - 01.03.48 281,000 EUR 311,762 413,730 1.36Italy Buoni Poliennali Del Tesoro 3.45% 17 - 01.03.48 103,000 EUR 140,322 151,652 0.50Italy Buoni Poliennali Del Tesoro 3.85% 19 - 01.09.49 313,000 EUR 445,212 494,107 1.62Italy Buoni Poliennali Del Tesoro 4.00% 05 - 01.02.37 648,000 EUR 817,572 936,217 3.07Italy Buoni Poliennali Del Tesoro 4.75% 13 - 01.09.44 417,000 EUR 591,287 712,203 2.34Italy Buoni Poliennali Del Tesoro 5.00% 07 - 01.08.39 529,000 EUR 750,944 878,256 2.88Italy Buoni Poliennali Del Tesoro 5.00% 09 - 01.09.40 515,000 EUR 731,732 863,763 2.84
6,812,588 7,893,340 25.91NetherlandsNetherlands 0.50% 19 - 15.01.40 211,000 EUR 227,777 242,663 0.80Netherlands 2.75% 14 - 15.01.47 388,000 EUR 632,182 694,116 2.28Netherlands 3.75% 10 - 15.01.42 372,000 EUR 642,611 695,484 2.28Netherlands 4.00% 05 - 15.01.37 364,000 EUR 588,575 624,926 2.05
2,091,145 2,257,189 7.41SpainSpain 1.00% 20 - 31.10.50 302,000 EUR 310,966 312,165 1.02Spain 1.20% 20 - 31.10.40 313,000 EUR 326,394 346,175 1.14
Xtrackers II
Xtrackers II EUROZONE GOVERNMENT BOND 15-30 UCITS ETF
Statement of Investmentsas at 31 December 2020(expressed in EUR)
The accompanying notes form an integral part of these financial statements.
67

DescriptionNominal
ValueCurrency
(local) Cost Market Value
% ofNet
Assets
Transferable securities and money market instruments admitted to an official stock exchange listing(A)
Bonds (continued)
Spain (continued)Spain 2.70% 18 - 31.10.48 340,000 EUR 440,122 498,622 1.64Spain 2.90% 16 - 31.10.46 400,000 EUR 524,666 598,692 1.96Spain 4.20% 05 - 31.01.37 474,000 EUR 691,656 754,117 2.48Spain 4.70% 09 - 30.07.41 497,000 EUR 805,249 888,867 2.92Spain 4.90% 07 - 30.07.40 438,000 EUR 717,326 791,258 2.60Spain 5.15% 13 - 31.10.44 334,000 EUR 586,930 659,324 2.16
4,403,309 4,849,220 15.92
Total - Bonds 27,393,688 30,170,930 99.04
Total Transferable securities and money market instruments admitted to an officialstock exchange listing 27,393,688 30,170,930 99.04
TOTAL INVESTMENT PORTFOLIO 27,393,688 30,170,930 99.04
TOTAL INVESTMENT PORTFOLIO INCLUDING ACCRUED INTEREST 30,464,112 100.00(A) Any duplicate securities appearing herein with the same name are either quoted on different stock exchanges or have different ISINs.
Xtrackers II
Xtrackers II EUROZONE GOVERNMENT BOND 15-30 UCITS ETF (continued)
Statement of Investmentsas at 31 December 2020(expressed in EUR)
The accompanying notes form an integral part of these financial statements.
68

DescriptionNominal
ValueCurrency
(local) Cost Market Value
% ofNet
Assets
Transferable securities and money market instruments admitted to an official stock exchange listing(A)
Bonds
FranceFrance OAT 0.75% 20 - 25.05.52 4,927,000 EUR 5,420,537 5,493,654 3.67France OAT 1.50% 19 - 25.05.50 8,225,000 EUR 10,657,356 10,954,447 7.31France OAT 1.75% 16 - 25.05.66 3,427,400 EUR 4,984,354 5,224,317 3.49France OAT 2.00% 17 - 25.05.48 7,548,500 EUR 10,587,624 11,005,713 7.34France OAT 4.00% 05 - 25.04.55 4,749,300 EUR 9,920,265 10,296,482 6.87France OAT 4.00% 10 - 25.04.60 4,391,200 EUR 9,699,175 10,071,994 6.72
51,269,311 53,046,607 35.40GermanyBundesrepublik Deutschland Zero Coupon 19 -15.08.50 4,631,000 EUR 4,779,730 4,868,200 3.25Bundesrepublik Deutschland 1.25% 17 - 15.08.48 6,705,900 EUR 9,140,625 9,442,381 6.30Bundesrepublik Deutschland 2.50% 14 - 15.08.46 7,997,300 EUR 13,294,459 13,802,060 9.21
27,214,814 28,112,641 18.76ItalyItaly Buoni Poliennali Del Tesoro 1.70% 20 - 01.09.51 2,104,000 EUR 2,178,025 2,237,793 1.49Italy Buoni Poliennali Del Tesoro 2.45% 20 - 01.09.50 4,164,000 EUR 4,931,915 5,205,854 3.48Italy Buoni Poliennali Del Tesoro 2.70% 16 - 01.03.47 4,553,000 EUR 5,545,145 5,902,658 3.94Italy Buoni Poliennali Del Tesoro 2.80% 16 - 01.03.67 2,545,000 EUR 3,164,509 3,415,466 2.28Italy Buoni Poliennali Del Tesoro 3.25% 15 - 01.09.46 4,296,000 EUR 5,718,727 6,085,155 4.06Italy Buoni Poliennali Del Tesoro 3.45% 17 - 01.03.48 1,495,000 EUR 1,906,296 2,201,163 1.47Italy Buoni Poliennali Del Tesoro 3.45% 17 - 01.03.48 2,813,000 EUR 4,044,211 4,141,721 2.76Italy Buoni Poliennali Del Tesoro 3.85% 19 - 01.09.49 3,509,000 EUR 5,176,015 5,539,361 3.70
32,664,843 34,729,171 23.18NetherlandsNetherlands Zero Coupon 20 - 15.01.52 1,568,000 EUR 1,588,416 1,613,699 1.08Netherlands 2.75% 14 - 15.01.47 4,349,855 EUR 7,481,115 7,781,716 5.19
9,069,531 9,395,415 6.27SpainSpain 1.00% 20 - 31.10.50 3,386,000 EUR 3,378,479 3,499,967 2.34Spain 2.70% 18 - 31.10.48 3,811,000 EUR 5,348,628 5,588,960 3.73Spain 2.90% 16 - 31.10.46 4,552,000 EUR 6,484,978 6,813,118 4.55Spain 3.45% 16 - 30.07.66 4,098,000 EUR 7,085,621 7,424,496 4.95Spain 4.00% 14 - 31.10.64 53,000 EUR 64,125 104,209 0.07Spain 4.00% 14 - 31.10.64 32,000 EUR 49,689 62,918 0.04
22,411,520 23,493,668 15.68
Total - Bonds 142,630,019 148,777,502 99.29
Total Transferable securities and money market instruments admitted to an officialstock exchange listing 142,630,019 148,777,502 99.29
TOTAL INVESTMENT PORTFOLIO 142,630,019 148,777,502 99.29
TOTAL INVESTMENT PORTFOLIO INCLUDING ACCRUED INTEREST 149,830,565 99.99(A) Any duplicate securities appearing herein with the same name are either quoted on different stock exchanges or have different ISINs.
Xtrackers II
Xtrackers II EUROZONE GOVERNMENT BOND 25+ UCITS ETF
Statement of Investmentsas at 31 December 2020(expressed in EUR)
The accompanying notes form an integral part of these financial statements.
69

DescriptionNominal
ValueCurrency
(local) Cost Market Value
% ofNet
Assets
Transferable securities and money market instruments admitted to an official stock exchange listing
Bonds
AustraliaAustralia 0.75% 17 - 21.11.27 3,304,000 AUD 2,243,815 2,466,955 0.13Australia 1.00% 18 - 21.02.50 2,326,000 AUD 1,641,018 1,991,515 0.11Australia 1.25% 12 - 21.02.22 3,890,000 AUD 2,921,206 2,931,089 0.16Australia 1.25% 15 - 21.08.40 2,184,000 AUD 1,682,715 1,950,993 0.11Australia 2.00% 13 - 21.08.35 2,529,000 AUD 2,221,417 2,496,307 0.13Australia 2.50% 10 - 20.09.30 3,353,000 AUD 3,181,131 3,437,421 0.19Australia 3.00% 09 - 20.09.25 4,619,000 AUD 4,282,000 4,394,469 0.24
18,173,302 19,668,749 1.07CanadaCanada 1.25% 13 - 01.12.47 5,196,402 CAD 4,313,834 4,782,429 0.26Canada 4.00% 99 - 01.12.31 5,178,317 CAD 4,859,806 5,096,853 0.28Canada 4.25% 95 - 01.12.26 4,644,482 CAD 3,855,464 3,940,474 0.22
13,029,104 13,819,756 0.76DenmarkDenmark Inflation Linked Bond 0.10% 12 - 15.11.23 15,790,726 DKK 2,200,903 2,215,400 0.12Denmark Inflation Linked Bond 0.10% 18 - 15.11.30 9,275,102 DKK 1,382,475 1,448,672 0.08
3,583,378 3,664,072 0.20FranceFrance OAT 0.10% 15 - 01.03.25 7,082,231 EUR 7,380,873 7,460,847 0.41France OAT 0.10% 16 - 25.07.47 6,468,597 EUR 7,509,525 8,924,658 0.49France OAT 0.10% 17 - 01.03.28 7,865,505 EUR 8,416,000 8,611,863 0.47France OAT 0.10% 18 - 25.07.36 4,578,971 EUR 5,203,162 5,629,249 0.31France OAT 0.10% 19 - 01.03.29 5,534,957 EUR 6,078,532 6,255,221 0.34France OAT 0.10% 20 - 01.03.26 3,077,076 EUR 3,268,325 3,323,335 0.18France OAT 0.10% 20 - 01.03.36 2,385,312 EUR 2,757,478 2,862,494 0.16France OAT 0.25% 13 - 25.07.24 11,333,106 EUR 11,918,945 12,082,678 0.66France OAT 0.70% 14 - 25.07.30 10,057,549 EUR 11,520,311 12,219,821 0.67France OAT 1.10% 10 - 25.07.22 13,304,538 EUR 13,816,990 13,911,890 0.76France OAT 1.80% 07 - 25.07.40 8,574,622 EUR 12,650,351 14,252,995 0.78France OAT 1.85% 11 - 25.07.27 14,133,523 EUR 16,781,186 17,368,121 0.95France OAT 2.10% 08 - 25.07.23 12,406,903 EUR 13,418,834 13,447,470 0.73France OAT 3.15% 02 - 25.07.32 8,430,329 EUR 12,454,397 13,237,386 0.72France OAT 3.40% 99 - 25.07.29 7,065,105 EUR 9,678,791 10,114,617 0.55
142,853,700 149,702,645 8.18GermanyBundesrepublik Deutschland Inflation Linked Bond0.10% 12 - 15.04.23 10,570,625 EUR 10,868,732 10,877,913 0.59Bundesrepublik Deutschland Inflation Linked Bond0.10% 15 - 15.04.26 10,557,196 EUR 11,301,055 11,470,605 0.63Bundesrepublik Deutschland Inflation Linked Bond0.10% 15 - 15.04.46 6,249,811 EUR 8,091,198 9,333,468 0.51Bundesrepublik Deutschland Inflation Linked Bond0.50% 14 - 15.04.30 12,145,572 EUR 14,062,261 14,600,435 0.80
44,323,246 46,282,421 2.53ItalyItaly Buoni Poliennali Del Tesoro 0.10% 16 - 15.05.22 6,292,517 EUR 6,297,033 6,377,655 0.35Italy Buoni Poliennali Del Tesoro 0.10% 18 - 15.05.23 6,125,382 EUR 6,135,672 6,259,712 0.34Italy Buoni Poliennali Del Tesoro 0.40% 19 - 15.05.30 5,398,802 EUR 5,291,463 5,730,019 0.31
Xtrackers II
Xtrackers II GLOBAL INFLATION-LINKED BOND UCITS ETF
Statement of Investmentsas at 31 December 2020(expressed in EUR)
The accompanying notes form an integral part of these financial statements.
70

DescriptionNominal
ValueCurrency
(local) Cost Market Value
% ofNet
Assets
Transferable securities and money market instruments admitted to an official stock exchange listing
Bonds (continued)
Italy (continued)Italy Buoni Poliennali Del Tesoro 0.65% 20 - 15.05.26 2,048,746 EUR 2,092,667 2,180,480 0.12Italy Buoni Poliennali Del Tesoro 1.25% 15 - 15.09.32 9,226,559 EUR 9,508,141 10,752,724 0.59Italy Buoni Poliennali Del Tesoro 1.30% 17 - 15.05.28 9,934,090 EUR 10,230,744 11,150,718 0.61Italy Buoni Poliennali Del Tesoro 2.35% 04 - 15.09.35 9,772,309 EUR 11,603,337 13,444,254 0.74Italy Buoni Poliennali Del Tesoro 2.35% 14 - 15.09.24 8,336,983 EUR 8,947,980 9,328,584 0.51Italy Buoni Poliennali Del Tesoro 2.55% 09 - 15.09.41 8,194,610 EUR 10,031,485 12,342,149 0.67Italy Buoni Poliennali Del Tesoro 2.60% 07 - 15.09.23 12,674,048 EUR 13,550,253 13,940,438 0.76Italy Buoni Poliennali Del Tesoro 3.10% 11 - 15.09.26 8,280,196 EUR 9,420,842 10,084,782 0.55
93,109,617 101,591,515 5.55New ZealandNew Zealand Government Inflation Linked Bond2.00% 12 - 20.09.25 3,268,000 NZD 2,245,008 2,390,960 0.13New Zealand Government Inflation Linked Bond2.50% 14 - 20.09.35 2,714,000 NZD 2,150,291 2,402,645 0.13New Zealand Government Inflation Linked Bond FRN13 - 20.09.30 2,721,000 NZD 2,109,821 2,350,672 0.13
6,505,120 7,144,277 0.39SpainSpain Inflation Linked Bond 0.15% 18 - 30.11.23 3,357,474 EUR 3,463,420 3,505,908 0.19Spain Inflation Linked Bond 0.65% 17 - 30.11.27 7,387,957 EUR 7,940,926 8,346,248 0.46Spain Inflation Linked Bond 0.70% 18 - 30.11.33 5,154,818 EUR 5,726,542 6,209,236 0.34Spain Inflation Linked Bond 1.00% 15 - 30.11.30 7,809,412 EUR 8,703,403 9,384,571 0.51Spain Inflation Linked Bond 1.80% 14 - 30.11.24 8,224,377 EUR 8,978,473 9,282,855 0.51
34,812,764 36,728,818 2.01SwedenSweden Inflation Linked Bond 0.125% 15 - 01.06.32 12,435,000 SEK 1,508,671 1,604,620 0.09Sweden Inflation Linked Bond 0.125% 16 - 01.06.26 14,900,000 SEK 1,728,924 1,745,183 0.09Sweden Inflation Linked Bond 0.125% 17 - 01.12.27 11,735,000 SEK 1,352,988 1,390,092 0.08Sweden Inflation Linked Bond 0.125% 20 - 01.06.30 6,170,000 SEK 692,372 718,783 0.04Sweden Inflation Linked Bond 0.25% 11 - 01.06.22 15,740,000 SEK 1,749,485 1,725,853 0.09Sweden Inflation Linked Bond 1.00% 14 - 01.06.25 17,770,000 SEK 2,150,779 2,117,393 0.12Sweden Inflation Linked Bond 3.50% 99 - 01.12.28 15,910,000 SEK 3,064,598 2,971,254 0.16
12,247,817 12,273,178 0.67United KingdomUnited Kingdom Gilt Inflation Linked 0.125% 11 -22.03.29 11,488,467 GBP 15,867,669 16,479,896 0.90United Kingdom Gilt Inflation Linked 0.125% 12 -22.03.44 11,446,325 GBP 20,724,098 22,901,338 1.25United Kingdom Gilt Inflation Linked 0.125% 12 -22.03.24 11,040,521 GBP 13,584,643 13,574,202 0.74United Kingdom Gilt Inflation Linked 0.125% 13 -22.03.68 8,912,389 GBP 25,281,977 29,346,118 1.60United Kingdom Gilt Inflation Linked 0.125% 14 -22.03.58 7,560,800 GBP 17,569,917 19,628,451 1.07United Kingdom Gilt Inflation Linked 0.125% 15 -22.03.46 9,230,732 GBP 17,264,839 19,187,772 1.05United Kingdom Gilt Inflation Linked 0.125% 15 -22.03.26 9,147,232 GBP 11,792,329 11,978,737 0.66
Xtrackers II
Xtrackers II GLOBAL INFLATION-LINKED BOND UCITS ETF (continued)
Statement of Investmentsas at 31 December 2020(expressed in EUR)
The accompanying notes form an integral part of these financial statements.
71

DescriptionNominal
ValueCurrency
(local) Cost Market Value
% ofNet
Assets
Transferable securities and money market instruments admitted to an official stock exchange listing
Bonds (continued)
United Kingdom (continued)United Kingdom Gilt Inflation Linked 0.125% 16 -22.11.65 4,911,883 GBP 13,146,555 15,028,048 0.82United Kingdom Gilt Inflation Linked 0.125% 16 -22.11.36 9,439,255 GBP 15,443,112 16,461,364 0.90United Kingdom Gilt Inflation Linked 0.125% 16 -22.11.56 4,277,303 GBP 9,639,750 10,866,061 0.59United Kingdom Gilt Inflation Linked 0.125% 17 -10.08.48 7,527,472 GBP 14,895,873 16,461,291 0.90United Kingdom Gilt Inflation Linked 0.125% 18 -10.08.28 11,277,824 GBP 15,763,490 15,922,845 0.87United Kingdom Gilt Inflation Linked 0.125% 18 -10.08.41 7,791,280 GBP 14,026,062 14,914,491 0.82United Kingdom Gilt Inflation Linked 0.25% 12 -22.03.52 9,014,456 GBP 19,386,374 21,624,435 1.18United Kingdom Gilt Inflation Linked 0.375% 11 -22.03.62 9,337,283 GBP 24,676,227 27,891,198 1.52United Kingdom Gilt Inflation Linked 0.50% 09 -22.03.50 10,132,217 GBP 21,904,813 24,624,778 1.35United Kingdom Gilt Inflation Linked 0.625% 09 -22.11.42 10,454,545 GBP 20,305,955 22,249,692 1.22United Kingdom Gilt Inflation Linked 0.625% 10 -22.03.40 11,574,173 GBP 21,296,078 23,204,588 1.27United Kingdom Gilt Inflation Linked 0.75% 07 -22.11.47 9,937,515 GBP 21,699,563 24,135,821 1.32United Kingdom Gilt Inflation Linked 0.75% 11 -22.03.34 11,120,236 GBP 18,349,797 19,475,734 1.07United Kingdom Gilt Inflation Linked 1.125% 07 -22.11.37 11,337,900 GBP 21,280,969 23,106,586 1.26United Kingdom Gilt Inflation Linked 1.25% 05 -22.11.55 9,336,103 GBP 26,472,450 29,526,795 1.61United Kingdom Gilt Inflation Linked 1.25% 06 -22.11.27 12,884,306 GBP 18,617,471 19,085,744 1.04United Kingdom Gilt Inflation Linked 1.25% 08 -22.11.32 11,807,745 GBP 19,824,282 20,952,624 1.15United Kingdom Gilt Inflation Linked 1.875% 07 -22.11.22 13,223,777 GBP 16,272,360 16,178,270 0.88United Kingdom Gilt Inflation Linked 2.00% 02 -26.01.35 5,479,443 GBP 17,771,369 18,643,550 1.02United Kingdom Gilt Inflation Linked 2.50% 86 -17.07.24 4,135,708 GBP 17,203,202 16,495,699 0.90United Kingdom Gilt Inflation Linked 4.125% 92 -22.07.30 2,902,367 GBP 12,465,938 12,351,191 0.68
502,527,162 542,297,319 29.64United StatesUnited States Treasury Inflation Indexed Bond 0.125%12 - 15.01.22 27,993,426 USD 24,791,837 23,299,423 1.27United States Treasury Inflation Indexed Bond 0.125%12 - 15.07.22 27,965,508 USD 24,664,335 23,580,296 1.29
Xtrackers II
Xtrackers II GLOBAL INFLATION-LINKED BOND UCITS ETF (continued)
Statement of Investmentsas at 31 December 2020(expressed in EUR)
The accompanying notes form an integral part of these financial statements.
72

DescriptionNominal
ValueCurrency
(local) Cost Market Value
% ofNet
Assets
Transferable securities and money market instruments admitted to an official stock exchange listing
Bonds (continued)
United States (continued)United States Treasury Inflation Indexed Bond 0.125%13 - 15.01.23 27,385,591 USD 24,252,624 23,264,887 1.27United States Treasury Inflation Indexed Bond 0.125%14 - 15.07.24 26,906,204 USD 23,903,562 23,564,446 1.29United States Treasury Inflation Indexed Bond 0.125%16 - 15.07.26 23,878,284 USD 21,319,752 21,478,057 1.17United States Treasury Inflation Indexed Bond 0.125%17 - 15.04.22 28,525,350 USD 24,864,143 23,810,085 1.30United States Treasury Inflation Indexed Bond 0.125%19 - 15.10.24 21,353,286 USD 19,197,604 18,722,075 1.02United States Treasury Inflation Indexed Bond 0.125%20 - 15.01.30 24,913,617 USD 23,345,915 22,729,916 1.24United States Treasury Inflation Indexed Bond 0.125%20 - 15.04.25 21,427,536 USD 19,747,701 18,846,768 1.03United States Treasury Inflation Indexed Bond 0.125%20 - 15.07.30 26,187,469 USD 24,500,985 24,031,318 1.31United States Treasury Inflation Indexed Bond 0.125%20 - 15.10.25 20,727,063 USD 18,608,235 18,429,703 1.01United States Treasury Inflation Indexed Bond 0.25%15 - 15.01.25 27,431,477 USD 24,515,318 24,207,348 1.32United States Treasury Inflation Indexed Bond 0.25%19 - 15.07.29 24,488,790 USD 22,645,956 22,677,173 1.24United States Treasury Inflation Indexed Bond 0.25%20 - 15.02.50 9,477,684 USD 9,297,814 9,242,658 0.51United States Treasury Inflation Indexed Bond 0.375%13 - 15.07.23 27,629,822 USD 24,489,468 23,940,721 1.31United States Treasury Inflation Indexed Bond 0.375%15 - 15.07.25 26,925,705 USD 24,154,832 24,187,313 1.32United States Treasury Inflation Indexed Bond 0.375%17 - 15.01.27 24,744,400 USD 22,217,744 22,580,951 1.23United States Treasury Inflation Indexed Bond 0.375%17 - 15.07.27 23,560,837 USD 20,965,986 21,676,383 1.19United States Treasury Inflation Indexed Bond 0.50%18 - 15.01.28 24,569,113 USD 21,714,887 22,775,097 1.25United States Treasury Inflation Indexed Bond 0.625%13 - 15.02.43 15,629,845 USD 14,313,534 15,940,350 0.87United States Treasury Inflation Indexed Bond 0.625%14 - 15.01.24 27,282,945 USD 24,490,673 23,946,193 1.31United States Treasury Inflation Indexed Bond 0.625%16 - 15.01.26 27,870,591 USD 25,242,675 25,446,535 1.39United States Treasury Inflation Indexed Bond 0.625%18 - 15.04.23 29,659,063 USD 26,070,580 25,538,591 1.40United States Treasury Inflation Indexed Bond 0.75%12 - 15.02.42 16,068,442 USD 15,033,912 16,738,856 0.92United States Treasury Inflation Indexed Bond 0.75%15 - 15.02.45 15,222,522 USD 14,272,528 16,071,917 0.88United States Treasury Inflation Indexed Bond 0.75%18 - 15.07.28 22,884,189 USD 20,966,188 21,772,525 1.19
Xtrackers II
Xtrackers II GLOBAL INFLATION-LINKED BOND UCITS ETF (continued)
Statement of Investmentsas at 31 December 2020(expressed in EUR)
The accompanying notes form an integral part of these financial statements.
73

DescriptionNominal
ValueCurrency
(local) Cost Market Value
% ofNet
Assets
Transferable securities and money market instruments admitted to an official stock exchange listing
Bonds (continued)
United States (continued)United States Treasury Inflation Indexed Bond 0.875%17 - 15.02.47 12,045,620 USD 11,677,615 13,249,727 0.72United States Treasury Inflation Indexed Bond 1.00%16 - 15.02.46 13,469,565 USD 13,491,224 15,032,923 0.82United States Treasury Inflation Indexed Bond 1.00%18 - 15.02.48 11,909,806 USD 11,712,188 13,566,717 0.74United States Treasury Inflation Indexed Bond 1.375%14 - 15.02.44 15,417,590 USD 16,418,999 18,165,499 0.99United States Treasury Inflation Indexed Bond 1.75%08 - 15.01.28 11,714,675 USD 11,514,596 11,754,890 0.64United States Treasury Inflation Indexed Bond 2.00%06 - 15.01.26 15,838,407 USD 15,361,201 15,398,804 0.84United States Treasury Inflation Indexed Bond 2.125%10 - 15.02.40 10,999,593 USD 12,694,142 13,941,703 0.76United States Treasury Inflation Indexed Bond 2.125%11 - 15.02.41 17,014,153 USD 20,096,103 21,836,166 1.19United States Treasury Inflation Indexed Bond 2.375%04 - 15.01.25 22,760,005 USD 21,948,774 21,744,039 1.19United States Treasury Inflation Indexed Bond 2.375%07 - 15.01.27 12,889,333 USD 12,873,388 13,109,796 0.72United States Treasury Inflation Indexed Bond 2.50%09 - 15.01.29 10,463,502 USD 11,030,552 11,243,625 0.61United States Treasury Inflation Indexed Bond 3.375%01 - 15.04.32 4,406,014 USD 5,229,687 5,491,908 0.30United States Treasury Inflation Indexed Bond 3.625%98 - 15.04.28 16,080,803 USD 17,729,135 18,092,606 0.99United States Treasury Inflation Indexed Bond 3.875%99 - 15.04.29 18,358,467 USD 20,978,761 21,637,081 1.18United States Treasury Inflation Indexed Bonds 0.50%19 - 15.04.24 20,142,995 USD 18,112,612 17,655,958 0.97United States Treasury Inflation Indexed Bonds0.875% 19 - 15.01.29 22,242,356 USD 20,976,500 21,378,822 1.17United States Treasury Inflation Indexed Bonds 1.00%19 - 15.02.49 9,487,806 USD 9,892,337 10,932,041 0.60
811,326,568 822,731,890 44.96
Total - Bonds 1,682,491,778 1,755,904,640 95.96
Total Transferable securities and money market instruments admitted to an officialstock exchange listing 1,682,491,778 1,755,904,640 95.96
Xtrackers II
Xtrackers II GLOBAL INFLATION-LINKED BOND UCITS ETF (continued)
Statement of Investmentsas at 31 December 2020(expressed in EUR)
The accompanying notes form an integral part of these financial statements.
74

DescriptionNominal
ValueCurrency
(local) Cost Market Value
% ofNet
Assets
Other transferable securities and money market instruments
Bonds
CanadaCanada 0.50% 17 - 01.12.50 4,606,849 CAD 3,309,261 3,701,432 0.20Canada 1.50% 10 - 01.12.44 5,570,627 CAD 4,703,529 5,140,814 0.28Canada 2.00% 07 - 01.12.41 4,848,102 CAD 4,314,469 4,691,311 0.26Canada 3.00% 03 - 01.12.36 4,654,692 CAD 4,399,828 4,715,540 0.26
16,727,087 18,249,097 1.00JapanJapanese Government CPI Linked Bond 0.10% 13 -10.09.23 351,642,500 JPY 2,872,978 2,793,896 0.15Japanese Government CPI Linked Bond 0.10% 14 -10.03.24 463,497,899 JPY 3,811,799 3,678,875 0.20Japanese Government CPI Linked Bond 0.10% 14 -10.09.24 609,734,100 JPY 4,996,715 4,840,933 0.26Japanese Government CPI Linked Bond 0.10% 15 -10.03.25 1,191,490,605 JPY 9,815,287 9,464,267 0.52Japanese Government CPI Linked Bond 0.10% 16 -10.03.26 913,503,408 JPY 7,565,466 7,261,434 0.40Japanese Government CPI Linked Bond 0.10% 17 -10.03.27 932,203,553 JPY 7,599,374 7,421,076 0.41Japanese Government CPI Linked Bond 0.10% 18 -10.03.28 907,074,132 JPY 7,440,236 7,210,399 0.39Japanese Government CPI Linked Bond 0.10% 19 -10.03.29 919,089,200 JPY 7,792,463 7,319,440 0.40Japanese Government CPI Linked Bond 0.20% 20 -10.03.30 324,416,487 JPY 2,659,703 2,626,963 0.14
54,554,021 52,617,283 2.87New ZealandNew Zealand Government Inflation Linked Bond2.50% 17 - 20.09.40 2,669,000 NZD 2,120,042 2,462,618 0.13
2,120,042 2,462,618 0.13
Total - Bonds 73,401,150 73,328,998 4.00
Total Other transferable securities and money market instruments 73,401,150 73,328,998 4.00
TOTAL INVESTMENT PORTFOLIO 1,755,892,928 1,829,233,638 99.96
TOTAL INVESTMENT PORTFOLIO INCLUDING ACCRUED INTEREST 1,833,164,108 100.18
Xtrackers II
Xtrackers II GLOBAL INFLATION-LINKED BOND UCITS ETF (continued)
Statement of Investmentsas at 31 December 2020(expressed in EUR)
The accompanying notes form an integral part of these financial statements.
75

DescriptionNominal
ValueCurrency
(local) Cost Market Value
% ofNet
Assets
Transferable securities and money market instruments admitted to an official stock exchange listing(A)
Bonds
FranceFrance OAT 0.10% 15 - 01.03.25 10,747,226 EUR 11,218,627 11,321,773 2.05France OAT 0.10% 15 - 01.03.25 869,501 EUR 907,452 915,984 0.17France OAT 0.10% 16 - 25.07.47 9,853,168 EUR 11,424,874 13,594,318 2.46France OAT 0.10% 16 - 25.07.47 764,702 EUR 989,807 1,055,052 0.19France OAT 0.10% 17 - 01.03.28 12,824,683 EUR 13,726,295 14,041,618 2.54France OAT 0.10% 18 - 25.07.36 7,484,192 EUR 8,585,743 9,200,841 1.67France OAT 0.10% 19 - 01.03.29 9,006,980 EUR 9,915,767 10,179,059 1.85France OAT 0.10% 20 - 01.03.26 5,055,386 EUR 5,378,024 5,459,968 0.99France OAT 0.10% 20 - 01.03.36 3,957,634 EUR 4,581,591 4,749,359 0.86France OAT 0.25% 13 - 25.07.24 18,744,238 EUR 19,716,468 19,983,982 3.62France OAT 0.70% 14 - 25.07.30 15,036,291 EUR 17,273,850 18,268,943 3.31France OAT 0.70% 14 - 25.07.30 1,489,434 EUR 1,758,638 1,809,647 0.33France OAT 1.10% 10 - 25.07.22 22,116,264 EUR 22,970,860 23,125,871 4.19France OAT 1.80% 07 - 25.07.40 14,089,629 EUR 20,979,430 23,420,205 4.24France OAT 1.85% 11 - 25.07.27 23,292,903 EUR 27,759,306 28,623,717 5.19France OAT 2.10% 08 - 25.07.23 20,266,843 EUR 21,930,806 21,966,623 3.98France OAT 3.15% 02 - 25.07.32 13,769,809 EUR 20,316,343 21,621,492 3.92France OAT 3.40% 99 - 25.07.29 11,731,928 EUR 16,157,921 16,795,780 3.04
235,591,802 246,134,232 44.60GermanyBundesrepublik Deutschland Inflation Linked Bond0.10% 12 - 15.04.23 17,548,632 EUR 18,057,973 18,058,771 3.27Bundesrepublik Deutschland Inflation Linked Bond0.10% 15 - 15.04.26 17,434,861 EUR 18,680,954 18,943,325 3.43Bundesrepublik Deutschland Inflation Linked Bond0.10% 15 - 15.04.46 10,246,569 EUR 13,453,734 15,302,226 2.78Bundesrepublik Deutschland Inflation Linked Bond0.50% 14 - 15.04.30 19,873,848 EUR 23,107,665 23,890,751 4.33
73,300,326 76,195,073 13.81ItalyItaly Buoni Poliennali Del Tesoro 0.10% 16 - 15.05.22 10,475,587 EUR 10,508,907 10,617,322 1.92Italy Buoni Poliennali Del Tesoro 0.10% 18 - 15.05.23 10,184,223 EUR 10,233,040 10,407,563 1.89Italy Buoni Poliennali Del Tesoro 0.40% 19 - 15.05.30 8,941,312 EUR 8,866,904 9,489,862 1.72Italy Buoni Poliennali Del Tesoro 0.65% 20 - 15.05.26 3,282,058 EUR 3,349,672 3,493,094 0.63Italy Buoni Poliennali Del Tesoro 1.25% 15 - 15.09.32 15,024,399 EUR 15,713,517 17,509,585 3.17Italy Buoni Poliennali Del Tesoro 1.30% 17 - 15.05.28 16,323,378 EUR 17,014,104 18,322,502 3.32Italy Buoni Poliennali Del Tesoro 2.35% 04 - 15.09.35 16,097,274 EUR 19,478,769 22,145,824 4.01Italy Buoni Poliennali Del Tesoro 2.35% 14 - 15.09.24 13,699,251 EUR 14,778,249 15,328,640 2.78Italy Buoni Poliennali Del Tesoro 2.55% 09 - 15.09.41 13,462,745 EUR 16,923,959 20,276,645 3.67Italy Buoni Poliennali Del Tesoro 2.60% 07 - 15.09.23 20,745,648 EUR 22,238,050 22,818,554 4.14Italy Buoni Poliennali Del Tesoro 3.10% 11 - 15.09.26 13,736,017 EUR 15,779,541 16,729,645 3.03
154,884,712 167,139,236 30.28SpainSpain Inflation Linked Bond 0.15% 18 - 30.11.23 5,493,527 EUR 5,671,390 5,736,396 1.04Spain Inflation Linked Bond 0.65% 17 - 30.11.27 12,139,278 EUR 13,100,818 13,713,864 2.49Spain Inflation Linked Bond 0.70% 18 - 30.11.33 8,486,663 EUR 9,465,540 10,222,611 1.85
Xtrackers II
Xtrackers II EUROZONE INFLATION-LINKED BOND UCITS ETF
Statement of Investmentsas at 31 December 2020(expressed in EUR)
The accompanying notes form an integral part of these financial statements.
76

DescriptionNominal
ValueCurrency
(local) Cost Market Value
% ofNet
Assets
Transferable securities and money market instruments admitted to an official stock exchange listing(A)
Bonds (continued)
Spain (continued)Spain Inflation Linked Bond 1.00% 15 - 30.11.30 12,881,014 EUR 14,503,627 15,479,114 2.80Spain Inflation Linked Bond 1.80% 14 - 30.11.24 13,581,041 EUR 14,907,191 15,328,921 2.78
57,648,566 60,480,906 10.96
Total - Bonds 521,425,406 549,949,447 99.65
Total Transferable securities and money market instruments admitted to an officialstock exchange listing 521,425,406 549,949,447 99.65
TOTAL INVESTMENT PORTFOLIO 521,425,406 549,949,447 99.65
TOTAL INVESTMENT PORTFOLIO INCLUDING ACCRUED INTEREST 551,849,526 99.99(A) Any duplicate securities appearing herein with the same name are either quoted on different stock exchanges or have different ISINs.
Xtrackers II
Xtrackers II EUROZONE INFLATION-LINKED BOND UCITS ETF (continued)
Statement of Investmentsas at 31 December 2020(expressed in EUR)
The accompanying notes form an integral part of these financial statements.
77

DescriptionNominal
ValueCurrency
(local) Cost Market Value
% ofNet
Assets
Transferable securities and money market instruments admitted to an official stock exchange listing
Bonds
AustraliaAustralia 3.00% 16 - 21.03.47 1,436,000 AUD 959,646 1,114,239 0.26New South Wales Treasury Corp. 4.00% 14 - 20.05.26 11,000,000 AUD 7,656,435 8,218,777 1.92Queensland Treasury Corp. 3.50% 17 - 21.08.30 25,000,000 AUD 16,180,010 19,191,296 4.47
24,796,091 28,524,312 6.65FinlandOP Corporate Bank PLC 0.375% 19 - 19.06.24 100,000 EUR 100,205 101,171 0.02Sampo OYJ 1.50% 14 - 16.09.21 550,000 EUR 556,124 557,579 0.13
656,329 658,750 0.15FranceBPCE SA 0.875% 18 - 31.01.24 100,000 EUR 101,802 102,724 0.02BPCE SA 1.00% 19 - 01.04.25 200,000 EUR 205,006 207,821 0.05BPCE SA FRN 14 - 08.07.26 500,000 EUR 519,630 506,940 0.12Credit Agricole SA 2.625% 15 - 17.03.27 334,000 EUR 375,630 374,565 0.09France OAT Zero Coupon 09 - 25.04.27 27,300,000 EUR 28,225,039 28,217,280 6.58France OAT Zero Coupon 09 - 25.04.28 26,600,000 EUR 27,525,087 27,547,758 6.42France OAT Zero Coupon 09 - 25.04.30 11,200,000 EUR 11,541,096 11,558,064 2.69France OAT Zero Coupon 09 - 25.04.32 3,000,000 EUR 3,091,245 3,071,220 0.72France OAT Zero Coupon 09 - 25.10.32 65,600,000 EUR 67,253,820 66,830,000 15.57France OAT Zero Coupon 09 - 25.04.34 6,000,000 EUR 6,116,628 6,087,180 1.42France OAT Zero Coupon 09 - 25.04.40 35,300,000 EUR 34,321,284 34,353,607 8.00France OAT Zero Coupon 09 - 25.04.45 14,000,000 EUR 12,902,804 12,900,160 3.01France OAT Zero Coupon 09 - 25.04.48 53,600,000 EUR 48,092,985 48,230,888 11.24Veolia Environnement SA 0.314% 16 - 04.10.23 900,000 EUR 908,068 910,923 0.21Vinci SA 1.625% 19 - 18.01.29 500,000 EUR 562,950 563,834 0.13Vivendi SA 0.75% 16 - 26.05.21 400,000 EUR 401,259 401,324 0.09
242,144,333 241,864,288 56.36GermanyKreditanstalt fuer Wiederaufbau 1.125% 18 - 09.05.33 6,000,000 EUR 6,753,780 7,013,010 1.63
6,753,780 7,013,010 1.63ItalyItaly Buoni Poliennali del Tesoro Coupon Strip ZeroCoupon 98 - 01.05.21 7,400,000 EUR 7,409,998 7,410,212 1.72Italy Buoni Poliennali Del Tesoro Hybrid Strip ZeroCoupon 98 - 01.11.29 8,500,000 EUR 8,070,956 8,106,790 1.89
15,480,954 15,517,002 3.61JapanJapan Government Twenty Year Bond 0.60% 17 -20.12.37 330,200,000 JPY 3,030,619 2,735,456 0.64
3,030,619 2,735,456 0.64JerseyGlencore Finance Europe Ltd. 1.875% 16 - 13.09.23 450,000 EUR 473,422 469,704 0.11Heathrow Funding Ltd. 1.875% 19 - 14.03.34 600,000 EUR 645,408 650,711 0.15
1,118,830 1,120,415 0.26NetherlandsKoninklijke DSM NV 0.75% 16 - 28.09.26 300,000 EUR 315,188 315,930 0.07NN Group NV 1.625% 17 - 01.06.27 100,000 EUR 107,402 109,503 0.03
422,590 425,433 0.10
Xtrackers II
Xtrackers II EUR OVERNIGHT RATE SWAP UCITS ETF
Statement of Investmentsas at 31 December 2020(expressed in EUR)
The accompanying notes form an integral part of these financial statements.
78

DescriptionNominal
ValueCurrency
(local) Cost Market Value
% ofNet
Assets
Transferable securities and money market instruments admitted to an official stock exchange listing
Bonds (continued)
NorwayTelenor ASA 2.50% 13 - 22.05.25 500,000 EUR 551,154 558,148 0.13
551,154 558,148 0.13SpainSpain Coupon Strip Zero Coupon 98 - 31.01.21 10,400,000 EUR 10,402,954 10,401,664 2.42Spain Coupon Strip Zero Coupon 98 - 31.01.22 19,300,000 EUR 19,406,766 19,401,904 4.52Spain Coupon Strip Zero Coupon 01 - 30.07.21 11,700,000 EUR 11,732,195 11,730,186 2.73Spain Coupon Strip Zero Coupon 01 - 30.07.24 8,400,000 EUR 8,534,652 8,533,476 1.99Spain Coupon Strip Zero Coupon 13 - 31.10.24 20,800,000 EUR 21,135,429 21,132,800 4.93Spain Coupon Strip Zero Coupon 14 - 31.10.29 200,000 EUR 196,291 199,390 0.05
71,408,287 71,399,420 16.64SupranationalsInter-American Development Bank 4.25% 14 -11.06.26 5,000,000 AUD 3,517,329 3,758,448 0.88
3,517,329 3,758,448 0.88United StatesCitigroup Inc. 1.25% 19 - 10.04.29 265,000 EUR 277,270 284,706 0.07
277,270 284,706 0.07
Total - Bonds 370,157,566 373,859,388 87.12
Total Transferable securities and money market instruments admitted to an officialstock exchange listing 370,157,566 373,859,388 87.12
Transferable securities and money market instruments dealt in on another regulated market
Bonds
ItalyItaly Buoni Poliennali del Tesoro Coupon Strip ZeroCoupon 98 - 01.05.26 200,000 EUR 194,093 198,688 0.05
194,093 198,688 0.05
Total - Bonds 194,093 198,688 0.05
Total Transferable securities and money market instruments dealt in on anotherregulated market 194,093 198,688 0.05
Other transferable securities and money market instruments
Bonds
ItalyItaly Buoni Poliennali del Tesoro Coupon Strip ZeroCoupon 02 - 01.08.29 3,200,000 EUR 3,021,308 3,049,376 0.71Italy Buoni Poliennali Del Tesoro Hybrid Strip ZeroCoupon 02 - 01.02.33 9,800,000 EUR 8,811,111 8,869,098 2.06
Xtrackers II
Xtrackers II EUR OVERNIGHT RATE SWAP UCITS ETF (continued)
Statement of Investmentsas at 31 December 2020(expressed in EUR)
The accompanying notes form an integral part of these financial statements.
79

DescriptionNominal
ValueCurrency
(local) Cost Market Value
% ofNet
Assets
Other transferable securities and money market instruments
Bonds (continued)
Italy (continued)Italy Buoni Poliennali Del Tesoro Hybrid Strip ZeroCoupon 03 - 01.08.34 24,800,000 EUR 21,564,806 21,759,768 5.07Italy Buoni Poliennali Del Tesoro Hybrid Strip ZeroCoupon 05 - 01.02.37 17,800,000 EUR 14,814,904 14,920,672 3.48Italy Buoni Poliennali Del Tesoro Hybrid Strip ZeroCoupon 15 - 01.06.25 300,000 EUR 289,382 299,376 0.07
48,501,511 48,898,290 11.39
Total - Bonds 48,501,511 48,898,290 11.39
Total Other transferable securities and money market instruments 48,501,511 48,898,290 11.39
TOTAL INVESTMENT PORTFOLIO 418,853,170 422,956,366 98.56
TOTAL INVESTMENT PORTFOLIO INCLUDING ACCRUED INTEREST 423,299,742 98.64
Xtrackers II
Xtrackers II EUR OVERNIGHT RATE SWAP UCITS ETF (continued)
Statement of Investmentsas at 31 December 2020(expressed in EUR)
The accompanying notes form an integral part of these financial statements.
80

DescriptionNominal
ValueCurrency
(local) Cost Market Value
% ofNet
Assets
Transferable securities and money market instruments admitted to an official stock exchange listing
Bonds
FranceFrance OAT Zero Coupon 09 - 25.10.28 500,000 EUR 472,242 518,760 4.93France OAT Zero Coupon 09 - 25.04.31 350,000 EUR 315,754 360,293 3.43France OAT Zero Coupon 09 - 25.04.32 600,000 EUR 617,342 614,244 5.84France OAT Zero Coupon 09 - 25.10.32 300,000 EUR 262,706 305,625 2.91France OAT Zero Coupon 09 - 25.04.37 510,000 EUR 509,497 507,414 4.82
2,177,541 2,306,336 21.93GermanyDeutsche Bundesrepublik Coupon Strips Zero Coupon97 - 04.01.23 1,100,000 EUR 1,106,986 1,114,718 10.60Deutsche Bundesrepublik Coupon Strips Zero Coupon98 - 04.07.28 1,000,000 EUR 1,028,549 1,047,690 9.96Deutsche Bundesrepublik Coupon Strips Zero Coupon05 - 04.01.34 1,200,000 EUR 1,243,154 1,269,168 12.07Deutsche Bundesrepublik Coupon Strips Zero Coupon14 - 15.08.40 800,000 EUR 820,461 846,472 8.05
4,199,150 4,278,048 40.68ItalyItaly Buoni Poliennali Del Tesoro Hybrid Strip ZeroCoupon 98 - 01.11.29 300,000 EUR 253,702 286,122 2.72
253,702 286,122 2.72SpainSpain 3.45% 16 - 30.07.66 100,000 EUR 174,407 181,174 1.72Spain Coupon Strip Zero Coupon 13 - 31.01.22 1,400,000 EUR 1,405,337 1,408,106 13.39Spain Coupon Strip Zero Coupon 13 - 31.10.24 200,000 EUR 199,579 203,200 1.93Spain Coupon Strip Zero Coupon 13 - 31.10.25 900,000 EUR 905,729 915,444 8.71Spain Coupon Strip Zero Coupon 13 - 31.10.26 600,000 EUR 600,937 609,366 5.79
3,285,989 3,317,290 31.54
Total - Bonds 9,916,382 10,187,796 96.87
Total Transferable securities and money market instruments admitted to an officialstock exchange listing 9,916,382 10,187,796 96.87
Xtrackers II
Xtrackers II ITRAXX EUROPE SWAP UCITS ETF
Statement of Investmentsas at 31 December 2020(expressed in EUR)
The accompanying notes form an integral part of these financial statements.
81

DescriptionNominal
ValueCurrency
(local) Cost Market Value
% ofNet
Assets
Transferable securities and money market instruments dealt in on another regulated market
Bonds
ItalyItaly Buoni Poliennali Del Tesoro Hybrid Strip ZeroCoupon 10 - 01.03.25 300,000 EUR 288,175 301,563 2.87
288,175 301,563 2.87
Total - Bonds 288,175 301,563 2.87
Total Transferable securities and money market instruments dealt in on anotherregulated market 288,175 301,563 2.87
TOTAL INVESTMENT PORTFOLIO 10,204,557 10,489,359 99.74
TOTAL INVESTMENT PORTFOLIO INCLUDING ACCRUED INTEREST 10,490,824 99.76
Xtrackers II
Xtrackers II ITRAXX EUROPE SWAP UCITS ETF (continued)
Statement of Investmentsas at 31 December 2020(expressed in EUR)
The accompanying notes form an integral part of these financial statements.
82

DescriptionNominal
ValueCurrency
(local) Cost Market Value
% ofNet
Assets
Transferable securities and money market instruments admitted to an official stock exchange listing
Bonds
CanadaCanadian Government Bond 5.75% 98 - 01.06.29 3,600,000 CAD 3,267,150 3,285,653 3.05National Bank of Canada 1.50% 14 - 25.03.21 100,000 EUR 102,086 100,431 0.09
3,369,236 3,386,084 3.14FranceFrance OAT Zero Coupon 09 - 25.04.25 25,600,000 EUR 26,304,024 26,283,520 24.39France OAT Zero Coupon 09 - 25.10.28 9,600,000 EUR 9,953,380 9,960,192 9.24France OAT Zero Coupon 09 - 25.04.30 1,600,000 EUR 1,649,827 1,651,152 1.53France OAT Zero Coupon 09 - 25.04.31 1,000,000 EUR 1,033,245 1,029,410 0.96France OAT Zero Coupon 09 - 25.04.32 1,100,000 EUR 1,127,181 1,126,114 1.05France OAT Zero Coupon 09 - 25.04.34 100,000 EUR 101,944 101,453 0.09France OAT Zero Coupon 09 - 25.04.40 1,500,000 EUR 1,458,411 1,459,785 1.35Total Capital International SA 1.375% 14 - 19.03.25 300,000 EUR 323,115 320,854 0.30
41,951,127 41,932,480 38.91GermanyDeutsche Bundesrepublik Coupon Strips Zero Coupon97 - 04.01.22 1,700,000 EUR 1,711,896 1,710,744 1.59Deutsche Bundesrepublik Coupon Strips Zero Coupon07 - 04.07.35 2,400,000 EUR 2,411,349 2,527,872 2.35Deutsche Bundesrepublik Coupon Strips Zero Coupon10 - 04.07.42 300,000 EUR 299,747 315,705 0.29Deutsche Bundesrepublik Coupon Strips Zero Coupon12 - 04.07.44 1,000,000 EUR 943,024 1,059,980 0.98
5,366,016 5,614,301 5.21SpainSpain 3.45% 16 - 30.07.66 3,000,000 EUR 5,006,550 5,435,209 5.04Spain Coupon Strip Zero Coupon 98 - 31.01.21 2,600,000 EUR 2,600,946 2,600,416 2.41Spain Coupon Strip Zero Coupon 98 - 31.01.23 2,100,000 EUR 2,107,722 2,122,365 1.97Spain Coupon Strip Zero Coupon 98 - 31.01.28 1,800,000 EUR 1,735,111 1,818,846 1.69Spain Coupon Strip Zero Coupon 01 - 30.07.24 2,000,000 EUR 2,032,410 2,031,780 1.89Spain Coupon Strip Zero Coupon 07 - 30.07.38 150,000 EUR 127,939 133,978 0.13Spain Coupon Strip Zero Coupon 11 - 30.04.21 1,500,000 EUR 1,501,648 1,502,220 1.39Spain Coupon Strip Zero Coupon 13 - 31.10.24 2,100,000 EUR 2,117,904 2,133,600 1.98
17,230,230 17,778,414 16.50SupranationalsEuropean Investment Bank 1.00% 16 - 14.04.32 1,500,000 EUR 1,690,238 1,727,740 1.60European Union 0.30% 20 - 04.11.50 7,200,000 EUR 7,624,649 7,784,838 7.23
9,314,887 9,512,578 8.83United KingdomSky Ltd. 1.50% 14 - 15.09.21 450,000 EUR 455,351 455,724 0.42
455,351 455,724 0.42
Total - Bonds 77,686,847 78,679,581 73.01
Total Transferable securities and money market instruments admitted to an officialstock exchange listing 77,686,847 78,679,581 73.01
Xtrackers II
Xtrackers II ITRAXX CROSSOVER SWAP UCITS ETF
Statement of Investmentsas at 31 December 2020(expressed in EUR)
The accompanying notes form an integral part of these financial statements.
83

DescriptionNominal
ValueCurrency
(local) Cost Market Value
% ofNet
Assets
Transferable securities and money market instruments dealt in on another regulated market
Bonds
ItalyItaly Buoni Poliennali del Tesoro Coupon Strip ZeroCoupon 13 - 01.03.22 1,600,000 EUR 1,606,356 1,606,768 1.49
1,606,356 1,606,768 1.49
Total - Bonds 1,606,356 1,606,768 1.49
Total Transferable securities and money market instruments dealt in on anotherregulated market 1,606,356 1,606,768 1.49
Other transferable securities and money market instruments
Bonds
ItalyItaly Buoni Poliennali del Tesoro Coupon Strip ZeroCoupon 98 - 01.05.23 9,000,000 EUR 8,954,980 9,061,020 8.41Italy Buoni Poliennali del Tesoro Coupon Strip ZeroCoupon 00 - 01.11.30 1,350,000 EUR 1,178,501 1,271,268 1.18Italy Buoni Poliennali del Tesoro Coupon Strip ZeroCoupon 02 - 01.08.26 2,300,000 EUR 2,206,726 2,282,589 2.12Italy Buoni Poliennali del Tesoro Coupon Strip ZeroCoupon 02 - 01.08.29 7,900,000 EUR 7,270,071 7,528,147 6.99Italy Buoni Poliennali Del Tesoro Hybrid Strip ZeroCoupon 03 - 01.08.34 3,900,000 EUR 3,369,172 3,421,899 3.17Italy Buoni Poliennali Del Tesoro Hybrid Strip ZeroCoupon 14 - 15.12.21 2,500,000 EUR 2,489,643 2,510,425 2.33
25,469,093 26,075,348 24.20
Total - Bonds 25,469,093 26,075,348 24.20
Total Other transferable securities and money market instruments 25,469,093 26,075,348 24.20
TOTAL INVESTMENT PORTFOLIO 104,762,296 106,361,697 98.70
TOTAL INVESTMENT PORTFOLIO INCLUDING ACCRUED INTEREST 106,436,800 98.77
Xtrackers II
Xtrackers II ITRAXX CROSSOVER SWAP UCITS ETF (continued)
Statement of Investmentsas at 31 December 2020(expressed in EUR)
The accompanying notes form an integral part of these financial statements.
84

DescriptionNominal
ValueCurrency
(local) Cost Market Value
% ofNet
Assets
Transferable securities and money market instruments admitted to an official stock exchange listing
Bonds
FranceFrance OAT Zero Coupon 09 - 25.04.31 1,100,000 EUR 1,136,569 1,132,351 1.25France OAT Zero Coupon 09 - 25.04.32 9,000,000 EUR 9,264,052 9,213,660 10.20
10,400,621 10,346,011 11.45GermanyDeutsche Bundesrepublik Coupon Strips Zero Coupon98 - 04.01.26 11,600,000 EUR 11,989,979 11,964,588 13.24
11,989,979 11,964,588 13.24ItalyItaly Buoni Poliennali Del Tesoro Hybrid Strip ZeroCoupon 98 - 01.11.29 600,000 EUR 534,638 572,244 0.63
534,638 572,244 0.63SpainSpain Coupon Strip Zero Coupon 05 - 31.01.30 600,000 EUR 577,137 598,038 0.66
577,137 598,038 0.66United StatesBorgWarner Inc. 1.80% 15 - 07.11.22 250,000 EUR 257,333 256,474 0.29
257,333 256,474 0.29
Total - Bonds 23,759,708 23,737,355 26.27
Total Transferable securities and money market instruments admitted to an officialstock exchange listing 23,759,708 23,737,355 26.27
Transferable securities and money market instruments dealt in on another regulated market
Bonds
ItalyItaly Buoni Poliennali del Tesoro Coupon Strip ZeroCoupon 98 - 01.05.26 16,200,000 EUR 16,018,118 16,093,728 17.81Italy Buoni Poliennali del Tesoro Coupon Strip ZeroCoupon 13 - 01.03.22 2,300,000 EUR 2,306,391 2,309,729 2.56
18,324,509 18,403,457 20.37
Total - Bonds 18,324,509 18,403,457 20.37
Total Transferable securities and money market instruments dealt in on anotherregulated market 18,324,509 18,403,457 20.37
Other transferable securities and money market instruments
Bonds
ItalyItaly Buoni Poliennali del Tesoro Coupon Strip ZeroCoupon 02 - 01.08.26 10,000,000 EUR 9,775,539 9,924,300 10.98
Xtrackers II
Xtrackers II ITRAXX CROSSOVER SHORT DAILY SWAP UCITS ETF
Statement of Investmentsas at 31 December 2020(expressed in EUR)
The accompanying notes form an integral part of these financial statements.
85

DescriptionNominal
ValueCurrency
(local) Cost Market Value
% ofNet
Assets
Other transferable securities and money market instruments
Bonds (continued)
Italy (continued)Italy Buoni Poliennali del Tesoro Coupon Strip ZeroCoupon 02 - 01.02.27 7,500,000 EUR 7,275,734 7,396,575 8.19Italy Buoni Poliennali del Tesoro Coupon Strip ZeroCoupon 02 - 01.08.29 9,600,000 EUR 8,943,739 9,148,128 10.12Italy Buoni Poliennali del Tesoro Coupon Strip ZeroCoupon 13 - 01.03.29 21,000,000 EUR 19,805,127 20,141,310 22.29
45,800,139 46,610,313 51.58
Total - Bonds 45,800,139 46,610,313 51.58
Total Other transferable securities and money market instruments 45,800,139 46,610,313 51.58
TOTAL INVESTMENT PORTFOLIO 87,884,356 88,751,125 98.22
TOTAL INVESTMENT PORTFOLIO INCLUDING ACCRUED INTEREST 88,751,803 98.22
Xtrackers II
Xtrackers II ITRAXX CROSSOVER SHORT DAILY SWAP UCITS ETF (continued)
Statement of Investmentsas at 31 December 2020(expressed in EUR)
The accompanying notes form an integral part of these financial statements.
86

DescriptionNominal
ValueCurrency
(local) Cost Market Value
% ofNet
Assets
Transferable securities and money market instruments admitted to an official stock exchange listing(A)
Bonds
AngolaAngola 8.00% 19 - 26.11.29 5,500,000 USD 4,980,556 5,156,250 0.28Angola 8.25% 18 - 09.05.28 4,900,000 USD 4,494,405 4,697,973 0.25Angola 8.25% 18 - 09.05.28 500,000 USD 459,675 479,385 0.03Angola 9.125% 19 - 26.11.49 3,900,000 USD 3,461,053 3,597,750 0.20Angola 9.375% 18 - 08.05.48 4,800,000 USD 4,523,884 4,521,600 0.24Angola 9.375% 18 - 08.05.48 600,000 USD 571,700 565,200 0.03Angola 9.50% 15 - 12.11.25 4,700,000 USD 4,686,765 4,882,360 0.26
23,178,038 23,900,518 1.29ArgentinaArgentina 0.125% 20 - 09.07.30 9,400,000 USD 3,567,363 3,807,000 0.20Argentina 0.125% 20 - 09.07.30 7,700,000 USD 2,899,678 3,070,452 0.17Argentina FRN 20 - 09.07.35 12,000,000 USD 4,018,814 4,380,000 0.24Argentina 0.125% 20 - 09.07.35 11,000,000 USD 3,769,172 3,932,610 0.21Argentina 0.125% 20 - 09.01.38 6,700,000 USD 2,535,274 2,738,625 0.15Argentina 0.125% 20 - 09.01.38 4,200,000 USD 1,542,964 1,585,542 0.08Argentina 0.125% 20 - 09.07.41 6,100,000 USD 2,096,370 2,302,750 0.12Argentina 0.125% 20 - 09.07.41 900,000 USD 298,138 311,634 0.02Argentina 0.125% 20 - 09.07.46 1,300,000 USD 428,020 476,450 0.03Argentina 1.00% 20 - 09.07.29 1,500,000 USD 618,750 648,750 0.03Argentina 1.00% 20 - 09.07.29 1,300,000 USD 522,266 533,013 0.03
22,296,809 23,786,826 1.28AzerbaijanAzerbaijan 3.50% 17 - 01.09.32 3,400,000 USD 3,308,948 3,592,440 0.19Azerbaijan 4.75% 14 - 18.03.24 3,400,000 USD 3,504,590 3,720,552 0.20Azerbaijan 4.75% 14 - 18.03.24 500,000 USD 509,805 547,140 0.03Southern Gas Corridor CJSC 6.875% 16 - 24.03.26 4,380,000 USD 4,859,742 5,290,602 0.29Southern Gas Corridor CJSC 6.875% 16 - 24.03.26 1,820,000 USD 2,005,215 2,198,378 0.12
14,188,300 15,349,112 0.83BahrainBahrain 5.45% 20 - 16.09.32 2,900,000 USD 2,794,936 3,047,262 0.16Bahrain 5.625% 19 - 30.09.31 3,100,000 USD 3,175,001 3,282,784 0.18Bahrain 6.00% 14 - 19.09.44 3,700,000 USD 3,429,722 3,826,393 0.21Bahrain 6.00% 14 - 19.09.44 200,000 USD 178,586 206,832 0.01Bahrain 6.125% 13 - 01.08.23 4,300,000 USD 4,420,915 4,624,048 0.25Bahrain 6.125% 13 - 01.08.23 400,000 USD 424,316 430,144 0.02Bahrain 6.75% 17 - 20.09.29 3,900,000 USD 4,125,066 4,476,696 0.24Bahrain 7.00% 15 - 26.01.26 3,500,000 USD 3,733,156 4,067,902 0.22Bahrain 7.00% 16 - 12.10.28 4,200,000 USD 4,418,565 4,861,253 0.26Bahrain 7.00% 16 - 12.10.28 800,000 USD 855,892 925,953 0.05Bahrain 7.375% 20 - 14.05.30 3,100,000 USD 3,343,633 3,681,107 0.20CBB International Sukuk Co. SPC 5.624% 16 -12.02.24 3,100,000 USD 3,155,513 3,322,270 0.18CBB International Sukuk Co. SPC 6.875% 18 -05.10.25 3,300,000 USD 3,533,458 3,826,944 0.21
37,588,759 40,579,588 2.19BoliviaBolivia 4.50% 17 - 20.03.28 3,100,000 USD 2,757,450 2,902,406 0.16
2,757,450 2,902,406 0.16
Xtrackers II
Xtrackers II USD EMERGING MARKETS BOND UCITS ETF
Statement of Investmentsas at 31 December 2020(expressed in USD)
The accompanying notes form an integral part of these financial statements.
87

DescriptionNominal
ValueCurrency
(local) Cost Market Value
% ofNet
Assets
Transferable securities and money market instruments admitted to an official stock exchange listing(A)
Bonds (continued)
BrazilBanco Nacional de Desenvolvimento Economico eSocial 5.75% 13 - 26.09.23 1,300,000 USD 1,358,198 1,452,750 0.08Brazil 2.625% 12 - 05.01.23 2,600,000 USD 2,574,948 2,696,200 0.15Brazil 2.875% 20 - 06.06.25 2,100,000 USD 2,109,761 2,185,071 0.12Brazil 3.875% 20 - 12.06.30 4,300,000 USD 4,321,380 4,536,500 0.25Brazil 4.25% 13 - 07.01.25 5,200,000 USD 5,335,993 5,701,852 0.31Brazil 4.50% 19 - 30.05.29 2,400,000 USD 2,452,101 2,669,976 0.14Brazil 4.625% 17 - 13.01.28 3,700,000 USD 3,795,505 4,140,300 0.22Brazil 4.75% 19 - 14.01.50 4,000,000 USD 3,949,729 4,256,000 0.23Brazil 5.00% 14 - 27.01.45 4,000,000 USD 3,826,574 4,440,000 0.24Brazil 5.625% 09 - 07.01.41 2,700,000 USD 2,803,036 3,179,250 0.17Brazil 5.625% 16 - 21.02.47 3,400,000 USD 3,504,593 4,054,500 0.22Brazil 6.00% 16 - 07.04.26 2,800,000 USD 3,117,089 3,362,800 0.18Brazil 7.125% 06 - 20.01.37 2,100,000 USD 2,509,114 2,848,146 0.15Brazil 8.25% 04 - 20.01.34 1,700,000 USD 2,191,771 2,475,642 0.13Brazil 8.875% 01 - 15.04.24 1,250,000 USD 1,477,261 1,553,125 0.08
45,327,053 49,552,112 2.67Cayman IslandsKSA Sukuk Ltd. 2.969% 19 - 29.10.29 1,800,000 USD 1,925,064 1,940,886 0.10KSA Sukuk Ltd. 3.628% 17 - 20.04.27 3,100,000 USD 3,440,620 3,479,180 0.19KSA Sukuk Ltd. 4.303% 18 - 19.01.29 1,500,000 USD 1,749,885 1,766,216 0.10Saudi Electricity Global Sukuk Co. 2 5.06% 13 -08.04.43 800,000 USD 975,084 1,016,800 0.06Saudi Electricity Global Sukuk Co. 3 4.00% 14 -08.04.24 1,100,000 USD 1,186,798 1,194,760 0.06Saudi Electricity Global Sukuk Co. 3 5.50% 14 -08.04.44 700,000 USD 892,244 931,738 0.05Saudi Electricity Global Sukuk Co. 4 4.723% 18 -27.09.28 800,000 USD 941,509 956,353 0.05
11,111,204 11,285,933 0.61ChileChile 2.45% 20 - 31.01.31 4,700,000 USD 4,844,309 5,031,397 0.27Chile 3.24% 18 - 06.02.28 6,000,000 USD 6,193,158 6,795,060 0.37Chile 3.50% 19 - 25.01.50 7,200,000 USD 7,679,167 8,253,072 0.44Chile 3.86% 17 - 21.06.47 4,000,000 USD 4,279,456 4,870,000 0.26Corp Nacional del Cobre de Chile 3.00% 19 -30.09.29 3,400,000 USD 3,449,353 3,675,028 0.20Corp Nacional del Cobre de Chile 3.15% 20 -14.01.30 3,100,000 USD 3,135,767 3,380,612 0.18Corp Nacional del Cobre de Chile 3.70% 19 -30.01.50 5,900,000 USD 6,032,731 6,483,106 0.35Corp Nacional del Cobre de Chile 4.375% 19 -05.02.49 4,000,000 USD 4,166,211 4,872,678 0.26Corp. Nacional del Cobre de Chile 3.625% 17 -01.08.27 4,000,000 USD 4,484,000 4,463,809 0.24
Xtrackers II
Xtrackers II USD EMERGING MARKETS BOND UCITS ETF (continued)
Statement of Investmentsas at 31 December 2020(expressed in USD)
The accompanying notes form an integral part of these financial statements.
88

DescriptionNominal
ValueCurrency
(local) Cost Market Value
% ofNet
Assets
Transferable securities and money market instruments admitted to an official stock exchange listing(A)
Bonds (continued)
Chile (continued)Corp. Nacional del Cobre de Chile 4.50% 17 -01.08.47 3,900,000 USD 4,126,501 4,782,882 0.26Empresa de Transporte de Pasajeros Metro SA 4.70%20 - 07.05.50 3,100,000 USD 3,592,489 3,900,203 0.21
51,983,142 56,507,847 3.04ChinaChina 0.55% 20 - 21.10.25 7,000,000 USD 6,973,318 6,990,410 0.38China 1.20% 20 - 21.10.30 6,200,000 USD 6,148,154 6,192,622 0.33China 1.95% 19 - 03.12.24 6,200,000 USD 6,308,848 6,545,774 0.35China 2.125% 19 - 03.12.29 6,200,000 USD 6,301,253 6,622,097 0.36China 2.625% 17 - 02.11.27 3,100,000 USD 3,151,549 3,385,583 0.18China 3.25% 18 - 19.10.23 4,700,000 USD 4,829,730 5,074,771 0.27China 3.50% 18 - 19.10.28 3,100,000 USD 3,339,917 3,612,928 0.20China Development Bank 1.00% 20 - 27.10.25 3,100,000 USD 3,083,053 3,103,534 0.17Export-Import Bank of China 2.875% 16 - 26.04.26 2,900,000 USD 2,914,314 3,167,815 0.17Export-Import Bank of China 2.875% 16 - 26.04.26 400,000 USD 425,641 436,940 0.02Export-Import Bank of China 3.625% 14 - 31.07.24 4,500,000 USD 4,642,709 4,926,600 0.27
48,118,486 50,059,074 2.70ColombiaColombia 2.625% 13 - 15.03.23 2,200,000 USD 2,192,211 2,271,522 0.12Colombia 3.00% 20 - 30.01.30 3,400,000 USD 3,422,006 3,563,234 0.19Colombia 3.875% 17 - 25.04.27 5,300,000 USD 5,414,494 5,898,900 0.32Colombia 4.00% 13 - 26.02.24 4,400,000 USD 4,510,505 4,757,544 0.26Colombia 4.50% 15 - 28.01.26 3,300,000 USD 3,479,615 3,737,283 0.20Colombia 4.50% 18 - 15.03.29 4,400,000 USD 4,625,156 5,087,544 0.27Colombia 5.00% 15 - 15.06.45 9,900,000 USD 10,561,551 12,078,000 0.65Colombia 5.20% 19 - 15.05.49 4,000,000 USD 4,480,467 5,072,880 0.27Colombia 5.625% 14 - 26.02.44 5,500,000 USD 6,311,671 7,122,500 0.38Colombia 6.125% 09 - 18.01.41 5,500,000 USD 6,551,618 7,361,750 0.40Colombia 7.375% 06 - 18.09.37 4,000,000 USD 5,242,022 5,835,040 0.32Colombia 8.125% 04 - 21.05.24 2,420,000 USD 2,755,814 2,964,500 0.16Colombia Government International Bond 3.125%20 - 15.04.31 2,200,000 USD 2,200,242 2,337,500 0.13Colombia Government International Bond 4.125%20 - 15.05.51 3,300,000 USD 3,357,895 3,663,000 0.20
65,105,267 71,751,197 3.87Costa RicaCosta Rica 4.25% 12 - 26.01.23 2,900,000 USD 2,810,713 2,780,404 0.15Costa Rica 6.125% 19 - 19.02.31 3,700,000 USD 3,120,950 3,445,662 0.19Costa Rica 7.00% 14 - 04.04.44 3,100,000 USD 2,822,786 2,840,406 0.15Costa Rica 7.158% 15 - 12.03.45 4,100,000 USD 3,833,287 3,787,416 0.20
12,587,736 12,853,888 0.69CroatiaCroatia 5.50% 13 - 04.04.23 4,500,000 USD 4,758,201 4,955,355 0.27Croatia 6.00% 13 - 26.01.24 3,240,000 USD 3,512,207 3,723,473 0.20Croatia 6.00% 13 - 26.01.24 1,500,000 USD 1,606,167 1,723,830 0.09Croatia 6.00% 13 - 26.01.24 660,000 USD 731,446 758,485 0.04
10,608,021 11,161,143 0.60
Xtrackers II
Xtrackers II USD EMERGING MARKETS BOND UCITS ETF (continued)
Statement of Investmentsas at 31 December 2020(expressed in USD)
The accompanying notes form an integral part of these financial statements.
89

DescriptionNominal
ValueCurrency
(local) Cost Market Value
% ofNet
Assets
Transferable securities and money market instruments admitted to an official stock exchange listing(A)
Bonds (continued)
Dominican RepublicDominican Republic 4.50% 20 - 30.01.30 3,100,000 USD 3,010,411 3,363,531 0.18Dominican Republic 4.875% 20 - 23.09.32 9,400,000 USD 9,856,119 10,434,094 0.56Dominican Republic 5.50% 15 - 27.01.25 4,000,000 USD 4,480,767 4,500,040 0.24Dominican Republic 5.875% 20 - 30.01.60 10,000,000 USD 9,576,029 10,975,100 0.59Dominican Republic 5.95% 17 - 25.01.27 5,300,000 USD 5,470,665 6,207,678 0.33Dominican Republic 6.00% 18 - 19.07.28 4,000,000 USD 4,103,172 4,775,040 0.26Dominican Republic 6.40% 19 - 05.06.49 4,700,000 USD 4,843,379 5,487,297 0.30Dominican Republic 6.50% 18 - 15.02.48 3,050,000 USD 3,033,334 3,587,593 0.19Dominican Republic 6.85% 15 - 27.01.45 6,200,000 USD 6,374,550 7,540,812 0.41Dominican Republic 6.875% 16 - 29.01.26 4,700,000 USD 5,038,450 5,663,547 0.31Dominican Republic 7.45% 14 - 30.04.44 4,700,000 USD 5,100,055 6,051,297 0.33
60,886,931 68,586,029 3.70EcuadorEcuador 0.50% 14 - 31.07.40 6,561,360 USD 5,770,704 2,673,820 0.14Ecuador 0.50% 16 - 31.07.40 6,196,840 USD 5,058,279 2,525,274 0.14Ecuador 0.50% 16 - 31.07.40 1,731,470 USD 1,433,550 705,591 0.04Ecuador 0.50% 17 - 31.07.40 6,196,840 USD 5,421,675 2,525,274 0.14Ecuador 0.50% 17 - 31.07.40 1,640,340 USD 1,128,437 668,455 0.04Ecuador 0.50% 17 - 31.07.40 3,645,200 USD 3,188,352 1,485,456 0.08Ecuador 0.50% 18 - 31.07.40 8,201,700 USD 6,888,394 3,342,275 0.18Ecuador 0.50% 19 - 31.07.40 1,549,210 USD 714,485 631,319 0.03Ecuador 0.50% 19 - 31.07.40 5,558,930 USD 6,669,479 2,265,320 0.12Ecuador 0.50% 19 - 31.07.40 4,264,884 USD 3,677,886 1,737,983 0.09Ecuador 7.95% 14 - 31.07.40 91,130 USD 90,500 37,136 0.00Ecuador 9.625% 17 - 31.07.40 1,731,470 USD 1,820,975 705,591 0.04
41,862,716 19,303,494 1.04EgyptEgypt 5.577% 18 - 21.02.23 3,900,000 USD 3,917,665 4,114,266 0.22Egypt 5.75% 20 - 29.05.24 3,900,000 USD 3,920,975 4,174,334 0.23Egypt 5.875% 15 - 11.06.25 709,000 USD 710,067 769,177 0.04Egypt 5.875% 15 - 11.06.25 3,700,000 USD 3,673,670 4,014,041 0.22Egypt 5.875% 15 - 11.06.25 91,000 USD 91,783 98,724 0.01Egypt 6.588% 18 - 21.02.28 3,500,000 USD 3,432,168 3,841,250 0.21Egypt 6.588% 18 - 21.02.28 400,000 USD 403,197 439,000 0.02Egypt 7.053% 19 - 15.01.32 3,100,000 USD 3,071,006 3,368,274 0.18Egypt 7.50% 17 - 31.01.27 5,850,000 USD 6,029,529 6,756,633 0.37Egypt 7.50% 17 - 31.01.27 350,000 USD 355,822 404,243 0.02Egypt 7.60% 19 - 01.03.29 5,400,000 USD 5,592,710 6,198,876 0.33Egypt 7.625% 20 - 29.05.32 5,400,000 USD 5,351,893 6,106,428 0.33Egypt 7.903% 18 - 21.02.48 3,106,000 USD 3,006,993 3,370,010 0.18Egypt 7.903% 18 - 21.02.48 1,594,000 USD 1,501,352 1,729,490 0.09Egypt 8.50% 17 - 31.01.47 5,250,000 USD 5,339,216 5,943,000 0.32Egypt 8.50% 17 - 31.01.47 210,000 USD 191,746 237,720 0.01Egypt 8.50% 17 - 31.01.47 2,340,000 USD 2,288,633 2,648,880 0.14Egypt 8.70% 19 - 01.03.49 4,400,000 USD 4,534,382 5,082,000 0.27Egypt 8.70% 19 - 01.03.49 300,000 USD 315,659 346,500 0.02Egypt 8.875% 20 - 29.05.50 6,200,000 USD 6,166,474 7,263,052 0.39
59,894,940 66,905,898 3.60
Xtrackers II
Xtrackers II USD EMERGING MARKETS BOND UCITS ETF (continued)
Statement of Investmentsas at 31 December 2020(expressed in USD)
The accompanying notes form an integral part of these financial statements.
90

DescriptionNominal
ValueCurrency
(local) Cost Market Value
% ofNet
Assets
Transferable securities and money market instruments admitted to an official stock exchange listing(A)
Bonds (continued)
El SalvadorEl Salvador 7.125% 19 - 20.01.50 3,400,000 USD 3,271,337 3,034,500 0.16El Salvador 7.65% 05 - 15.06.35 3,100,000 USD 3,009,612 2,921,781 0.16El Salvador 9.50% 20 - 15.07.52 3,100,000 USD 3,090,514 3,127,156 0.17
9,371,463 9,083,437 0.49EthiopiaEthiopia 6.625% 14 - 11.12.24 1,832,000 USD 1,797,972 1,863,510 0.10Ethiopia 6.625% 14 - 11.12.24 1,268,000 USD 1,248,615 1,289,810 0.07
3,046,587 3,153,320 0.17GabonGabon 6.625% 20 - 06.02.31 3,100,000 USD 2,786,900 3,204,685 0.17
2,786,900 3,204,685 0.17GhanaGhana 6.375% 20 - 11.02.27 3,900,000 USD 3,678,050 4,045,033 0.22Ghana 7.625% 18 - 16.05.29 3,100,000 USD 2,894,625 3,288,245 0.18Ghana 7.875% 20 - 11.02.35 3,100,000 USD 2,778,375 3,177,500 0.17Ghana 8.125% 14 - 18.01.26 3,100,000 USD 3,141,303 3,469,768 0.19Ghana 8.125% 19 - 26.03.32 3,900,000 USD 3,607,500 4,120,350 0.22Ghana 8.627% 18 - 16.06.49 3,100,000 USD 2,743,500 3,172,230 0.17Ghana 8.95% 19 - 26.03.51 3,100,000 USD 2,805,500 3,231,130 0.17Ghana 10.75% 15 - 14.10.30 3,100,000 USD 3,827,149 4,142,468 0.22
25,476,002 28,646,724 1.54GuatemalaGuatemala 6.125% 19 - 01.06.50 4,400,000 USD 5,504,400 5,802,544 0.31
5,504,400 5,802,544 0.31HungaryHungary 5.375% 13 - 21.02.23 5,500,000 USD 5,809,609 6,036,250 0.32Hungary 5.375% 14 - 25.03.24 5,800,000 USD 6,271,676 6,612,000 0.36Hungary 5.75% 13 - 22.11.23 5,400,000 USD 5,851,085 6,155,946 0.33Hungary 7.625% 11 - 29.03.41 3,900,000 USD 5,994,278 6,907,204 0.37
23,926,648 25,711,400 1.38IndiaExport-Import Bank of India 3.25% 20 - 15.01.30 3,100,000 USD 3,110,355 3,314,124 0.18Export-Import Bank of India 3.375% 16 - 05.08.26 3,100,000 USD 3,063,154 3,351,255 0.18Export-Import Bank of India 3.875% 18 - 01.02.28 3,100,000 USD 3,105,392 3,413,472 0.18
9,278,901 10,078,851 0.54IndonesiaIndonesia 2.85% 20 - 14.02.30 1,300,000 USD 1,311,634 1,401,361 0.08Indonesia 2.95% 17 - 11.01.23 900,000 USD 897,188 938,602 0.05Indonesia 3.375% 13 - 15.04.23 1,600,000 USD 1,611,093 1,695,196 0.09Indonesia 3.50% 17 - 11.01.28 1,200,000 USD 1,219,943 1,343,149 0.07Indonesia 3.70% 19 - 30.10.49 1,100,000 USD 1,127,538 1,202,784 0.07Indonesia 3.75% 18 - 01.03.23 1,200,000 USD 1,218,306 1,278,384 0.07Indonesia 3.85% 17 - 18.07.27 1,100,000 USD 1,134,827 1,255,056 0.07Indonesia 3.85% 20 - 15.10.30 1,600,000 USD 1,706,392 1,859,293 0.10Indonesia 4.10% 18 - 24.04.28 1,100,000 USD 1,179,210 1,277,518 0.07Indonesia 4.125% 15 - 15.01.25 2,200,000 USD 2,307,124 2,457,807 0.13Indonesia 4.15% 17 - 29.03.27 2,000,000 USD 2,079,710 2,291,020 0.12Indonesia 4.20% 20 - 15.10.50 1,600,000 USD 1,669,063 1,905,424 0.10
Xtrackers II
Xtrackers II USD EMERGING MARKETS BOND UCITS ETF (continued)
Statement of Investmentsas at 31 December 2020(expressed in USD)
The accompanying notes form an integral part of these financial statements.
91
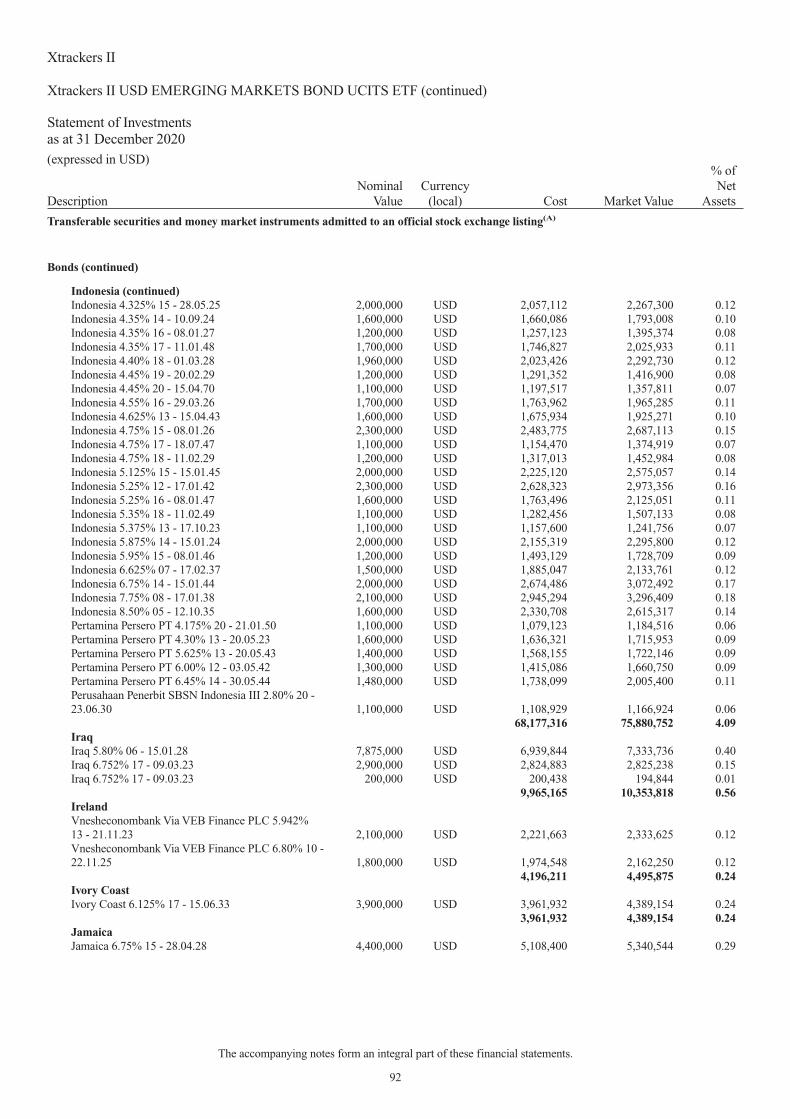
DescriptionNominal
ValueCurrency
(local) Cost Market Value
% ofNet
Assets
Transferable securities and money market instruments admitted to an official stock exchange listing(A)
Bonds (continued)
Indonesia (continued)Indonesia 4.325% 15 - 28.05.25 2,000,000 USD 2,057,112 2,267,300 0.12Indonesia 4.35% 14 - 10.09.24 1,600,000 USD 1,660,086 1,793,008 0.10Indonesia 4.35% 16 - 08.01.27 1,200,000 USD 1,257,123 1,395,374 0.08Indonesia 4.35% 17 - 11.01.48 1,700,000 USD 1,746,827 2,025,933 0.11Indonesia 4.40% 18 - 01.03.28 1,960,000 USD 2,023,426 2,292,730 0.12Indonesia 4.45% 19 - 20.02.29 1,200,000 USD 1,291,352 1,416,900 0.08Indonesia 4.45% 20 - 15.04.70 1,100,000 USD 1,197,517 1,357,811 0.07Indonesia 4.55% 16 - 29.03.26 1,700,000 USD 1,763,962 1,965,285 0.11Indonesia 4.625% 13 - 15.04.43 1,600,000 USD 1,675,934 1,925,271 0.10Indonesia 4.75% 15 - 08.01.26 2,300,000 USD 2,483,775 2,687,113 0.15Indonesia 4.75% 17 - 18.07.47 1,100,000 USD 1,154,470 1,374,919 0.07Indonesia 4.75% 18 - 11.02.29 1,200,000 USD 1,317,013 1,452,984 0.08Indonesia 5.125% 15 - 15.01.45 2,000,000 USD 2,225,120 2,575,057 0.14Indonesia 5.25% 12 - 17.01.42 2,300,000 USD 2,628,323 2,973,356 0.16Indonesia 5.25% 16 - 08.01.47 1,600,000 USD 1,763,496 2,125,051 0.11Indonesia 5.35% 18 - 11.02.49 1,100,000 USD 1,282,456 1,507,133 0.08Indonesia 5.375% 13 - 17.10.23 1,100,000 USD 1,157,600 1,241,756 0.07Indonesia 5.875% 14 - 15.01.24 2,000,000 USD 2,155,319 2,295,800 0.12Indonesia 5.95% 15 - 08.01.46 1,200,000 USD 1,493,129 1,728,709 0.09Indonesia 6.625% 07 - 17.02.37 1,500,000 USD 1,885,047 2,133,761 0.12Indonesia 6.75% 14 - 15.01.44 2,000,000 USD 2,674,486 3,072,492 0.17Indonesia 7.75% 08 - 17.01.38 2,100,000 USD 2,945,294 3,296,409 0.18Indonesia 8.50% 05 - 12.10.35 1,600,000 USD 2,330,708 2,615,317 0.14Pertamina Persero PT 4.175% 20 - 21.01.50 1,100,000 USD 1,079,123 1,184,516 0.06Pertamina Persero PT 4.30% 13 - 20.05.23 1,600,000 USD 1,636,321 1,715,953 0.09Pertamina Persero PT 5.625% 13 - 20.05.43 1,400,000 USD 1,568,155 1,722,146 0.09Pertamina Persero PT 6.00% 12 - 03.05.42 1,300,000 USD 1,415,086 1,660,750 0.09Pertamina Persero PT 6.45% 14 - 30.05.44 1,480,000 USD 1,738,099 2,005,400 0.11Perusahaan Penerbit SBSN Indonesia III 2.80% 20 -23.06.30 1,100,000 USD 1,108,929 1,166,924 0.06
68,177,316 75,880,752 4.09IraqIraq 5.80% 06 - 15.01.28 7,875,000 USD 6,939,844 7,333,736 0.40Iraq 6.752% 17 - 09.03.23 2,900,000 USD 2,824,883 2,825,238 0.15Iraq 6.752% 17 - 09.03.23 200,000 USD 200,438 194,844 0.01
9,965,165 10,353,818 0.56IrelandVnesheconombank Via VEB Finance PLC 5.942%13 - 21.11.23 2,100,000 USD 2,221,663 2,333,625 0.12Vnesheconombank Via VEB Finance PLC 6.80% 10 -22.11.25 1,800,000 USD 1,974,548 2,162,250 0.12
4,196,211 4,495,875 0.24Ivory CoastIvory Coast 6.125% 17 - 15.06.33 3,900,000 USD 3,961,932 4,389,154 0.24
3,961,932 4,389,154 0.24JamaicaJamaica 6.75% 15 - 28.04.28 4,400,000 USD 5,108,400 5,340,544 0.29
Xtrackers II
Xtrackers II USD EMERGING MARKETS BOND UCITS ETF (continued)
Statement of Investmentsas at 31 December 2020(expressed in USD)
The accompanying notes form an integral part of these financial statements.
92

DescriptionNominal
ValueCurrency
(local) Cost Market Value
% ofNet
Assets
Transferable securities and money market instruments admitted to an official stock exchange listing(A)
Bonds (continued)
Jamaica (continued)Jamaica 7.875% 15 - 28.07.45 5,600,000 USD 6,878,417 7,980,056 0.43Jamaica 8.00% 07 - 15.03.39 3,900,000 USD 5,239,650 5,674,539 0.30
17,226,467 18,995,139 1.02JordanJordan 5.75% 16 - 31.01.27 2,620,000 USD 2,575,917 2,885,748 0.16Jordan 5.75% 16 - 31.01.27 480,000 USD 486,331 528,687 0.03Jordan 5.85% 20 - 07.07.30 3,900,000 USD 3,906,349 4,296,630 0.23Jordan 6.125% 15 - 29.01.26 2,360,000 USD 2,416,179 2,622,566 0.14Jordan 6.125% 15 - 29.01.26 740,000 USD 755,810 822,330 0.04Jordan 7.375% 17 - 10.10.47 2,710,000 USD 2,663,974 3,161,695 0.17Jordan 7.375% 17 - 10.10.47 390,000 USD 373,262 455,004 0.03
13,177,822 14,772,660 0.80KazakhstanKazakhstan 3.875% 14 - 14.10.24 4,507,000 USD 4,683,293 5,004,537 0.27Kazakhstan 3.875% 14 - 14.10.24 193,000 USD 202,683 214,305 0.01Kazakhstan 4.875% 14 - 14.10.44 2,700,000 USD 3,075,479 3,661,092 0.20Kazakhstan 4.875% 14 - 14.10.44 400,000 USD 487,714 542,384 0.03Kazakhstan 5.125% 15 - 21.07.25 7,200,000 USD 7,878,974 8,505,000 0.46Kazakhstan 5.125% 15 - 21.07.25 400,000 USD 429,406 472,500 0.02Kazakhstan 6.50% 15 - 21.07.45 4,600,000 USD 6,245,671 7,423,664 0.40Kazakhstan 6.50% 15 - 21.07.45 100,000 USD 129,043 161,384 0.01
23,132,263 25,984,866 1.40KenyaKenya 6.875% 14 - 24.06.24 6,200,000 USD 6,226,356 6,779,700 0.37Kenya 6.875% 14 - 24.06.24 200,000 USD 217,547 218,700 0.01Kenya 7.25% 18 - 28.02.28 2,600,000 USD 2,599,633 2,912,000 0.16Kenya 7.25% 18 - 28.02.28 500,000 USD 526,448 560,000 0.03Kenya 8.00% 19 - 22.05.32 3,700,000 USD 3,904,684 4,309,701 0.23Kenya 8.25% 18 - 28.02.48 3,100,000 USD 3,031,268 3,557,306 0.19
16,505,936 18,337,407 0.99KuwaitKuwait 3.50% 17 - 20.03.27 13,800,000 USD 15,623,201 15,698,052 0.85
15,623,201 15,698,052 0.85MalaysiaMalaysia Sovereign Sukuk Bhd 3.043% 15 - 22.04.25 3,200,000 USD 3,234,496 3,515,190 0.19Malaysia Sukuk Global Bhd 3.179% 16 - 27.04.26 3,100,000 USD 3,182,598 3,463,855 0.19
6,417,094 6,979,045 0.38MexicoComision Federal de Electricidad 4.75% 16 - 23.02.27 600,000 USD 620,624 681,000 0.04Comision Federal de Electricidad 4.875% 13 -15.01.24 600,000 USD 624,081 664,506 0.04Mexico 2.659% 20 - 24.05.31 1,800,000 USD 1,804,465 1,842,930 0.10Mexico 3.25% 20 - 16.04.30 1,100,000 USD 1,124,080 1,187,901 0.06Mexico 3.60% 14 - 30.01.25 1,000,000 USD 1,021,398 1,113,740 0.06Mexico 3.75% 18 - 11.01.28 1,100,000 USD 1,096,127 1,235,465 0.07Mexico 3.771% 20 - 24.05.61 1,800,000 USD 1,800,000 1,872,000 0.10Mexico 4.00% 13 - 02.10.23 1,600,000 USD 1,646,607 1,752,000 0.09Mexico 4.125% 16 - 21.01.26 1,200,000 USD 1,242,556 1,378,500 0.07
Xtrackers II
Xtrackers II USD EMERGING MARKETS BOND UCITS ETF (continued)
Statement of Investmentsas at 31 December 2020(expressed in USD)
The accompanying notes form an integral part of these financial statements.
93

DescriptionNominal
ValueCurrency
(local) Cost Market Value
% ofNet
Assets
Transferable securities and money market instruments admitted to an official stock exchange listing(A)
Bonds (continued)
Mexico (continued)Mexico 4.15% 17 - 28.03.27 1,500,000 USD 1,589,080 1,730,640 0.09Mexico 4.35% 16 - 15.01.47 800,000 USD 801,367 913,000 0.05Mexico 4.50% 19 - 22.04.29 1,900,000 USD 2,025,362 2,225,375 0.12Mexico 4.50% 19 - 31.01.50 1,400,000 USD 1,436,352 1,639,750 0.09Mexico 4.60% 15 - 23.01.46 1,400,000 USD 1,367,293 1,634,514 0.09Mexico 4.60% 17 - 10.02.48 1,300,000 USD 1,306,930 1,522,300 0.08Mexico 4.75% 12 - 08.03.44 2,300,000 USD 2,377,206 2,731,273 0.15Mexico 4.75% 20 - 27.04.32 1,400,000 USD 1,524,956 1,684,900 0.09Mexico 5.00% 20 - 27.04.51 1,400,000 USD 1,520,471 1,743,000 0.09Mexico 5.55% 14 - 21.01.45 1,700,000 USD 1,860,481 2,227,017 0.12Mexico 5.75% 10 - 12.10.10 1,500,000 USD 1,555,453 1,989,390 0.11Mexico 6.05% 08 - 11.01.40 1,700,000 USD 1,983,177 2,276,657 0.12Mexico 6.75% 04 - 27.09.34 1,100,000 USD 1,391,011 1,546,886 0.08Mexico 8.30% 01 - 15.08.31 740,000 USD 977,342 1,123,875 0.06Petroleos Mexicanos 3.50% 13 - 30.01.23 500,000 USD 493,388 509,900 0.03Petroleos Mexicanos 4.50% 16 - 23.01.26 800,000 USD 737,830 797,256 0.04Petroleos Mexicanos 4.875% 13 - 18.01.24 600,000 USD 586,855 626,700 0.03Petroleos Mexicanos 5.35% 18 - 12.02.28 1,400,000 USD 1,257,615 1,376,998 0.07Petroleos Mexicanos 5.95% 20 - 28.01.31 2,100,000 USD 1,955,120 2,094,750 0.11Petroleos Mexicanos 6.35% 18 - 12.02.48 1,600,000 USD 1,360,055 1,441,200 0.08Petroleos Mexicanos 6.375% 14 - 23.01.45 900,000 USD 772,824 824,850 0.04Petroleos Mexicanos 6.49% 20 - 23.01.27 1,400,000 USD 1,360,100 1,472,800 0.08Petroleos Mexicanos 6.50% 11 - 02.06.41 900,000 USD 797,030 840,375 0.05Petroleos Mexicanos 6.50% 18 - 13.03.27 3,000,000 USD 2,928,857 3,159,570 0.17Petroleos Mexicanos 6.50% 18 - 23.01.29 1,100,000 USD 1,058,503 1,137,136 0.06Petroleos Mexicanos 6.625% 06 - 15.06.35 1,600,000 USD 1,472,161 1,584,000 0.09Petroleos Mexicanos 6.75% 17 - 21.09.47 3,400,000 USD 2,963,758 3,174,750 0.17Petroleos Mexicanos 6.84% 20 - 23.01.30 2,500,000 USD 2,392,202 2,600,600 0.14Petroleos Mexicanos 6.875% 17 - 04.08.26 1,700,000 USD 1,762,271 1,857,250 0.10Petroleos Mexicanos 6.875% 20 - 16.10.25 800,000 USD 791,100 875,920 0.05Petroleos Mexicanos 6.95% 20 - 28.01.60 2,100,000 USD 1,888,589 1,966,650 0.11Petroleos Mexicanos 7.69% 20 - 23.01.50 4,500,000 USD 4,491,650 4,537,125 0.25
61,766,327 67,594,449 3.64MoroccoMorocco 3.00% 20 - 15.12.32 3,100,000 USD 3,165,100 3,150,437 0.17Morocco 4.00% 20 - 15.12.50 3,900,000 USD 4,057,950 4,018,950 0.22
7,223,050 7,169,387 0.39NetherlandsPetrobras Global Finance BV 5.093% 20 - 15.01.30 4,900,000 USD 5,016,780 5,475,750 0.30Petrobras Global Finance BV 5.299% 18 - 27.01.25 1,300,000 USD 1,453,128 1,469,013 0.08Petrobras Global Finance BV 5.75% 18 - 01.02.29 1,500,000 USD 1,539,706 1,749,000 0.09Petrobras Global Finance BV 5.999% 18 - 27.01.28 2,700,000 USD 2,766,435 3,160,377 0.17Petrobras Global Finance BV 6.90% 19 - 19.03.49 2,800,000 USD 2,963,994 3,549,000 0.19Petrobras Global Finance BV 7.375% 17 - 17.01.27 2,200,000 USD 2,411,712 2,722,478 0.15Petrobras Global Finance BV 8.75% 16 - 23.05.26 1,700,000 USD 2,169,643 2,208,300 0.12
18,321,398 20,333,918 1.10NigeriaNigeria 6.50% 17 - 28.11.27 4,600,000 USD 4,390,862 4,956,500 0.27
Xtrackers II
Xtrackers II USD EMERGING MARKETS BOND UCITS ETF (continued)
Statement of Investmentsas at 31 December 2020(expressed in USD)
The accompanying notes form an integral part of these financial statements.
94

DescriptionNominal
ValueCurrency
(local) Cost Market Value
% ofNet
Assets
Transferable securities and money market instruments admitted to an official stock exchange listing(A)
Bonds (continued)
Nigeria (continued)Nigeria 7.143% 18 - 23.02.30 3,900,000 USD 3,758,265 4,202,250 0.23Nigeria 7.625% 17 - 28.11.47 4,700,000 USD 4,389,652 4,946,750 0.27Nigeria 7.625% 18 - 21.11.25 3,300,000 USD 3,379,638 3,790,070 0.20Nigeria 7.696% 18 - 23.02.38 3,100,000 USD 2,954,657 3,305,840 0.18Nigeria 7.696% 18 - 23.02.38 800,000 USD 719,553 853,120 0.04Nigeria 7.875% 17 - 16.02.32 4,500,000 USD 4,383,529 4,945,320 0.27Nigeria 7.875% 17 - 16.02.32 200,000 USD 221,900 219,792 0.01Nigeria 8.747% 18 - 21.01.31 3,100,000 USD 3,145,736 3,593,693 0.19
27,343,792 30,813,335 1.66OmanOman 4.125% 18 - 17.01.23 3,700,000 USD 3,613,765 3,730,044 0.20Oman 4.75% 16 - 15.06.26 7,300,000 USD 6,870,591 7,285,736 0.39Oman 5.375% 17 - 08.03.27 5,549,000 USD 5,275,568 5,650,325 0.30Oman 5.375% 17 - 08.03.27 251,000 USD 240,311 255,583 0.01Oman 5.625% 18 - 17.01.28 6,939,000 USD 6,553,645 7,063,347 0.38Oman 5.625% 18 - 17.01.28 361,000 USD 319,450 367,469 0.02Oman 6.00% 19 - 01.08.29 6,600,000 USD 6,411,359 6,804,864 0.37Oman 6.50% 17 - 08.03.47 5,830,000 USD 5,161,955 5,707,803 0.31Oman 6.50% 17 - 08.03.47 70,000 USD 63,885 68,533 0.00Oman 6.75% 18 - 17.01.48 7,900,000 USD 7,108,635 7,815,944 0.42Oman 6.75% 18 - 17.01.48 100,000 USD 83,166 98,936 0.01Oman 6.75% 20 - 28.10.27 4,200,000 USD 4,163,926 4,549,188 0.25Oman 7.375% 20 - 28.10.32 3,100,000 USD 3,442,550 3,424,111 0.19Oman Sovereign Sukuk SAOC 4.397% 17 - 01.06.24 5,800,000 USD 5,661,641 5,960,080 0.32Oman Sovereign Sukuk SAOC 5.932% 18 - 31.10.25 4,400,000 USD 4,444,257 4,818,733 0.26
59,414,704 63,600,696 3.43PakistanPakistan 6.875% 17 - 05.12.27 4,700,000 USD 4,604,834 4,896,225 0.27Pakistan 8.25% 14 - 15.04.24 3,100,000 USD 3,205,508 3,374,474 0.18
7,810,342 8,270,699 0.45PanamaBanco Nacional de Panama 2.50% 20 - 11.08.30 3,100,000 USD 3,131,445 3,100,000 0.17Panama 2.252% 20 - 29.09.32 3,900,000 USD 3,961,104 4,017,000 0.22Panama 3.16% 19 - 23.01.30 4,700,000 USD 4,852,776 5,205,297 0.28Panama 3.75% 15 - 16.03.25 3,900,000 USD 4,035,775 4,314,414 0.23Panama 3.87% 19 - 23.07.60 5,500,000 USD 6,254,270 6,476,305 0.35Panama 3.875% 16 - 17.03.28 3,900,000 USD 4,141,717 4,475,289 0.24Panama 4.00% 14 - 22.09.24 3,800,000 USD 3,959,953 4,203,788 0.23Panama 4.30% 13 - 29.04.53 5,400,000 USD 6,572,178 6,831,054 0.37Panama 4.50% 17 - 15.05.47 3,800,000 USD 4,713,754 4,878,288 0.26Panama 4.50% 18 - 16.04.50 5,300,000 USD 6,544,970 6,797,303 0.37Panama 4.50% 20 - 01.04.56 7,800,000 USD 9,702,498 10,042,500 0.54Panama 6.70% 06 - 26.01.36 6,300,000 USD 9,144,072 9,347,688 0.50Panama Notas del Tesoro 3.75% 19 - 17.04.26 3,100,000 USD 3,403,800 3,389,540 0.18
70,418,312 73,078,466 3.94
Xtrackers II
Xtrackers II USD EMERGING MARKETS BOND UCITS ETF (continued)
Statement of Investmentsas at 31 December 2020(expressed in USD)
The accompanying notes form an integral part of these financial statements.
95

DescriptionNominal
ValueCurrency
(local) Cost Market Value
% ofNet
Assets
Transferable securities and money market instruments admitted to an official stock exchange listing(A)
Bonds (continued)
ParaguayParaguay 4.95% 20 - 28.04.31 3,100,000 USD 3,642,066 3,747,156 0.20Paraguay 6.10% 14 - 11.08.44 3,100,000 USD 3,584,051 4,138,500 0.22
7,226,117 7,885,656 0.42PeruPeru 1.862% 20 - 01.12.32 3,100,000 USD 3,137,200 3,124,800 0.17Peru 2.392% 20 - 23.01.26 3,100,000 USD 3,182,005 3,306,181 0.18Peru 2.78% 20 - 01.12.60 6,200,000 USD 6,262,000 6,255,800 0.34Peru 2.783% 20 - 23.01.31 6,200,000 USD 6,465,560 6,798,362 0.37Peru 3.23% 20 - 28.07.21 3,100,000 USD 3,123,250 3,092,250 0.17Peru 4.125% 15 - 25.08.27 3,200,000 USD 3,483,211 3,756,032 0.20Peru 5.625% 10 - 18.11.50 7,900,000 USD 10,791,655 12,422,750 0.67Peru 7.35% 05 - 21.07.25 4,600,000 USD 5,492,774 5,888,046 0.32Peru 8.75% 03 - 21.11.33 6,700,000 USD 10,292,198 11,431,942 0.61Peruvian Government International Bond 6.55% 07 -14.03.37 3,500,000 USD 5,326,370 5,311,285 0.28Petroleos del Peru SA 4.75% 17 - 19.06.32 3,100,000 USD 3,228,601 3,574,300 0.19Petroleos del Peru SA 5.625% 17 - 19.06.47 3,100,000 USD 3,357,299 3,793,656 0.20
64,142,123 68,755,404 3.70PhilippinesPhilippine 1.648% 20 - 10.06.31 2,800,000 USD 2,843,400 2,835,006 0.15Philippine 2.457% 20 - 05.05.30 2,100,000 USD 2,204,529 2,267,326 0.12Philippine 2.65% 20 - 10.12.45 3,300,000 USD 3,357,750 3,341,555 0.18Philippine 2.95% 20 - 05.05.45 3,000,000 USD 3,147,184 3,163,443 0.17Philippine 3.00% 18 - 01.02.28 4,500,000 USD 4,590,016 4,975,020 0.27Philippine 3.70% 16 - 01.03.41 4,500,000 USD 4,707,262 5,200,139 0.28Philippine 3.70% 17 - 02.02.42 4,500,000 USD 4,728,558 5,217,930 0.28Philippine 3.75% 19 - 14.01.29 3,400,000 USD 3,683,887 3,966,100 0.21Philippine 3.95% 15 - 20.01.40 4,500,000 USD 4,892,482 5,342,490 0.29Philippine 4.20% 14 - 21.01.24 3,400,000 USD 3,583,150 3,772,776 0.20Philippine 5.00% 12 - 13.01.37 3,000,000 USD 3,619,912 3,958,609 0.21Philippine 5.50% 11 - 30.03.26 2,300,000 USD 2,644,649 2,859,054 0.16Philippine 6.375% 07 - 15.01.32 2,300,000 USD 2,953,800 3,285,230 0.18Philippine 6.375% 09 - 23.10.34 4,200,000 USD 5,611,543 6,165,004 0.33Philippine 7.75% 06 - 14.01.31 3,900,000 USD 5,370,549 6,014,424 0.33Philippine 9.50% 05 - 02.02.30 4,500,000 USD 6,654,771 7,419,022 0.40Philippine 10.625% 00 - 16.03.25 3,300,000 USD 4,301,241 4,678,443 0.25Power Sector Assets & Liabilities Management Corp.7.39% 09 - 02.12.24 2,600,000 USD 3,025,894 3,252,210 0.18
71,920,577 77,713,781 4.19PolandPoland 3.00% 12 - 17.03.23 6,000,000 USD 6,111,346 6,340,020 0.34Poland 3.25% 16 - 06.04.26 5,500,000 USD 5,745,410 6,202,592 0.34Poland 4.00% 14 - 22.01.24 6,200,000 USD 6,521,637 6,865,727 0.37
18,378,393 19,408,339 1.05QatarQatar 3.25% 16 - 02.06.26 5,500,000 USD 6,078,372 6,115,450 0.33Qatar 3.375% 19 - 14.03.24 3,100,000 USD 3,346,211 3,355,006 0.18Qatar 3.40% 20 - 16.04.25 3,100,000 USD 3,401,140 3,417,750 0.18
Xtrackers II
Xtrackers II USD EMERGING MARKETS BOND UCITS ETF (continued)
Statement of Investmentsas at 31 December 2020(expressed in USD)
The accompanying notes form an integral part of these financial statements.
96

DescriptionNominal
ValueCurrency
(local) Cost Market Value
% ofNet
Assets
Transferable securities and money market instruments admitted to an official stock exchange listing(A)
Bonds (continued)
Qatar (continued)Qatar 3.75% 20 - 16.04.30 4,700,000 USD 5,475,420 5,529,550 0.30Qatar 4.00% 19 - 14.03.29 6,200,000 USD 7,276,965 7,347,124 0.40Qatar 4.40% 20 - 16.04.50 7,800,000 USD 10,148,515 10,160,124 0.55Qatar 4.50% 18 - 23.04.28 4,700,000 USD 5,642,581 5,691,841 0.31Qatar 4.625% 16 - 02.06.46 3,100,000 USD 4,117,253 4,115,250 0.22Qatar 4.817% 19 - 14.03.49 9,300,000 USD 12,649,453 12,676,830 0.68Qatar 5.103% 18 - 23.04.48 9,400,000 USD 13,206,157 13,213,279 0.71Qatar 5.75% 11 - 20.01.42 1,400,000 USD 2,083,617 2,093,000 0.11Qatar 6.40% 09 - 20.01.40 1,600,000 USD 2,497,858 2,520,000 0.14Qatar 9.75% 00 - 15.06.30 2,200,000 USD 3,702,909 3,750,164 0.20
79,626,451 79,985,368 4.31RomaniaRomania 3.00% 20 - 14.02.31 3,800,000 USD 3,874,135 4,078,175 0.22Romania 4.00% 20 - 14.02.51 6,200,000 USD 6,507,314 6,733,857 0.36Romania 4.375% 13 - 22.08.23 4,700,000 USD 4,874,436 5,123,000 0.28Romania 4.875% 14 - 22.01.24 3,100,000 USD 3,257,976 3,459,755 0.19Romania 5.125% 18 - 15.06.48 3,800,000 USD 4,076,103 4,854,500 0.26Romania 6.125% 14 - 22.01.44 3,100,000 USD 3,711,587 4,374,472 0.23
26,301,551 28,623,759 1.54RussiaRussian Foreign Bond - Eurobond 4.25% 17 -23.06.27 4,400,000 USD 4,536,556 5,021,500 0.27Russian Foreign Bond - Eurobond 4.375% 18 -21.03.29 1,800,000 USD 1,947,803 2,099,250 0.11Russian Foreign Bond - Eurobond 4.375% 18 -21.03.29 3,600,000 USD 3,829,005 4,198,500 0.23Russian Foreign Bond - Eurobond 4.75% 16 -27.05.26 5,400,000 USD 5,675,061 6,237,000 0.34Russian Foreign Bond - Eurobond 4.875% 13 -16.09.23 3,600,000 USD 3,733,028 3,954,694 0.21Russian Foreign Bond - Eurobond 4.875% 13 -16.09.23 2,000,000 USD 2,179,818 2,197,052 0.12Russian Foreign Bond - Eurobond 5.10% 19 -28.03.35 200,000 USD 228,843 252,916 0.01Russian Foreign Bond - Eurobond 5.10% 19 -28.03.35 7,000,000 USD 7,115,493 8,852,060 0.48Russian Foreign Bond - Eurobond 5.10% 19 -28.03.35 200,000 USD 245,920 252,916 0.01Russian Foreign Bond - Eurobond 5.25% 17 -23.06.47 11,600,000 USD 12,980,868 16,049,760 0.86Russian Foreign Bond - Eurobond 5.25% 17 -23.06.47 1,200,000 USD 1,448,402 1,660,320 0.09Russian Foreign Bond - Eurobond 5.625% 12 -04.04.42 5,400,000 USD 6,394,287 7,506,734 0.40Russian Foreign Bond - Eurobond 5.625% 12 -04.04.42 200,000 USD 279,600 278,027 0.02Russian Foreign Bond - Eurobond 5.875% 13 -16.09.43 2,400,000 USD 2,923,834 3,462,240 0.19
Xtrackers II
Xtrackers II USD EMERGING MARKETS BOND UCITS ETF (continued)
Statement of Investmentsas at 31 December 2020(expressed in USD)
The accompanying notes form an integral part of these financial statements.
97

DescriptionNominal
ValueCurrency
(local) Cost Market Value
% ofNet
Assets
Transferable securities and money market instruments admitted to an official stock exchange listing(A)
Bonds (continued)
Russia (continued)Russian Foreign Bond - Eurobond 5.875% 13 -16.09.43 400,000 USD 545,492 577,040 0.03Russian Foreign Bond - Eurobond FRN 00 - 31.03.30 4,131,000 USD 4,769,158 4,792,373 0.26Russian Foreign Bond - Eurobond 12.75% 98 -24.06.28 4,378,000 USD 6,890,445 7,488,306 0.40Russian Foreign Bond - Eurobond 12.75% 98 -24.06.28 222,000 USD 361,730 379,718 0.02
66,085,343 75,260,406 4.05Saudi ArabiaRiyad Bank FRN 20 - 25.02.30 1,100,000 USD 1,119,079 1,121,428 0.06Saudi Arabia 2.50% 20 - 03.02.27 900,000 USD 944,154 949,930 0.05Saudi Arabia 2.75% 20 - 03.02.32 700,000 USD 735,788 738,675 0.04Saudi Arabia 2.90% 20 - 22.10.25 1,800,000 USD 1,926,997 1,938,150 0.10Saudi Arabia 3.25% 16 - 26.10.26 4,000,000 USD 4,375,966 4,429,800 0.24Saudi Arabia 3.25% 20 - 22.10.30 1,100,000 USD 1,202,504 1,212,750 0.06Saudi Arabia 3.625% 17 - 04.03.28 3,600,000 USD 4,002,156 4,036,500 0.22Saudi Arabia 3.75% 20 - 21.01.55 2,000,000 USD 2,185,041 2,184,200 0.12Saudi Arabia 4.00% 18 - 17.04.25 3,300,000 USD 3,666,613 3,686,087 0.20Saudi Arabia 4.375% 19 - 16.04.29 2,900,000 USD 3,408,082 3,443,402 0.19Saudi Arabia 4.50% 16 - 26.10.46 4,700,000 USD 5,675,832 5,696,400 0.31Saudi Arabia 4.50% 18 - 17.04.30 2,200,000 USD 2,636,204 2,655,972 0.14Saudi Arabia 4.50% 20 - 22.04.60 2,200,000 USD 2,749,392 2,760,120 0.15Saudi Arabia 4.625% 17 - 04.10.47 3,300,000 USD 4,067,004 4,076,259 0.22Saudi Arabia 5.00% 18 - 17.04.49 2,500,000 USD 3,256,470 3,274,650 0.18Saudi Arabia 5.25% 19 - 16.01.50 2,500,000 USD 3,376,012 3,406,550 0.18Saudi Arabian Oil Co. 1.625% 20 - 24.11.25 700,000 USD 711,187 717,361 0.04Saudi Arabian Oil Co. 2.25% 20 - 24.11.30 1,500,000 USD 1,516,736 1,527,077 0.08Saudi Arabian Oil Co. 2.875% 19 - 16.04.24 1,400,000 USD 1,468,023 1,485,616 0.08Saudi Arabian Oil Co. 3.25% 20 - 24.11.50 1,600,000 USD 1,605,984 1,620,801 0.09Saudi Arabian Oil Co. 3.50% 19 - 16.04.29 2,200,000 USD 2,425,987 2,444,744 0.13Saudi Arabian Oil Co. 3.50% 20 - 24.11.70 1,600,000 USD 1,611,980 1,616,908 0.09Saudi Arabian Oil Co. 4.25% 19 - 16.04.39 2,200,000 USD 2,541,603 2,568,645 0.14Saudi Arabian Oil Co. 4.375% 19 - 16.04.49 2,200,000 USD 2,640,691 2,655,267 0.14
59,849,485 60,247,292 3.25SenegalSenegal 6.25% 17 - 23.05.33 3,400,000 USD 3,484,898 3,810,720 0.21Senegal 6.75% 18 - 13.03.48 3,100,000 USD 3,054,151 3,410,570 0.18
6,539,049 7,221,290 0.39SerbiaSerbia 2.125% 20 - 01.12.30 3,700,000 USD 3,677,800 3,656,710 0.20
3,677,800 3,656,710 0.20South AfricaEskom Holdings SOC Ltd. 6.35% 18 - 10.08.28 2,900,000 USD 2,946,023 3,197,540 0.17Eskom Holdings SOC Ltd. 6.75% 13 - 06.08.23 2,900,000 USD 2,836,386 2,950,750 0.16Eskom Holdings SOC Ltd. 6.75% 13 - 06.08.23 200,000 USD 197,694 203,500 0.01Eskom Holdings SOC Ltd. 7.125% 15 - 11.02.25 3,200,000 USD 3,092,282 3,268,800 0.17Eskom Holdings SOC Ltd. 7.125% 15 - 11.02.25 500,000 USD 474,451 510,750 0.03South Africa 4.30% 16 - 12.10.28 6,000,000 USD 5,683,578 6,248,040 0.34
Xtrackers II
Xtrackers II USD EMERGING MARKETS BOND UCITS ETF (continued)
Statement of Investmentsas at 31 December 2020(expressed in USD)
The accompanying notes form an integral part of these financial statements.
98

DescriptionNominal
ValueCurrency
(local) Cost Market Value
% ofNet
Assets
Transferable securities and money market instruments admitted to an official stock exchange listing(A)
Bonds (continued)
South Africa (continued)South Africa 4.665% 12 - 17.01.24 4,300,000 USD 4,336,848 4,622,706 0.25South Africa 4.85% 17 - 27.09.27 2,900,000 USD 2,834,508 3,132,464 0.17South Africa 4.85% 19 - 30.09.29 6,000,000 USD 5,849,326 6,367,320 0.34South Africa 4.875% 16 - 14.04.26 3,700,000 USD 3,686,238 4,041,954 0.22South Africa 5.00% 16 - 12.10.46 2,900,000 USD 2,515,808 2,719,156 0.15South Africa 5.375% 14 - 24.07.44 2,900,000 USD 2,634,000 2,841,420 0.15South Africa 5.65% 17 - 27.09.47 4,500,000 USD 4,157,250 4,485,330 0.24South Africa 5.75% 19 - 30.09.49 8,900,000 USD 8,459,595 8,918,014 0.48South Africa 5.875% 13 - 16.09.25 6,000,000 USD 6,251,181 6,861,948 0.37South Africa 5.875% 18 - 22.06.30 4,300,000 USD 4,369,260 4,870,378 0.26
60,324,428 65,240,070 3.51Sri LankaSri Lanka 5.75% 18 - 18.04.23 3,900,000 USD 3,471,411 2,476,500 0.13Sri Lanka 6.20% 17 - 11.05.27 4,700,000 USD 4,093,644 2,650,659 0.14Sri Lanka 6.75% 18 - 18.04.28 3,900,000 USD 3,200,409 2,209,623 0.12Sri Lanka 6.825% 16 - 18.07.26 3,100,000 USD 2,700,384 1,766,690 0.10Sri Lanka 6.85% 15 - 03.11.25 4,600,000 USD 4,078,804 2,726,880 0.15Sri Lanka 6.85% 19 - 14.03.24 3,100,000 USD 2,905,045 1,860,000 0.10Sri Lanka 7.55% 19 - 28.03.30 4,700,000 USD 4,288,638 2,663,913 0.14Sri Lanka 7.85% 19 - 14.03.29 4,300,000 USD 3,976,028 2,453,150 0.13
28,714,363 18,807,415 1.01Trinidad And TobagoTrinidad and Tobago 4.50% 16 - 04.08.26 3,100,000 USD 3,059,364 3,402,281 0.18
3,059,364 3,402,281 0.18TunisiaTunisia 5.75% 15 - 30.01.25 3,100,000 USD 2,836,273 2,830,013 0.15
2,836,273 2,830,013 0.15TurkeyHazine Mustesarligi Varlik Kiralama AS 4.489% 14 -25.11.24 1,100,000 USD 1,046,716 1,098,064 0.06Hazine Mustesarligi Varlik Kiralama AS 5.004% 17 -06.04.23 1,200,000 USD 1,176,232 1,217,916 0.07Turkey 3.25% 13 - 23.03.23 1,500,000 USD 1,427,049 1,493,700 0.08Turkey 4.25% 15 - 14.04.26 1,500,000 USD 1,365,912 1,485,753 0.08Turkey 4.25% 20 - 13.03.25 1,900,000 USD 1,805,457 1,901,771 0.10Turkey 4.875% 13 - 16.04.43 3,000,000 USD 2,316,331 2,625,780 0.14Turkey 4.875% 16 - 09.10.26 2,900,000 USD 2,657,213 2,929,963 0.16Turkey 5.125% 18 - 17.02.28 1,900,000 USD 1,726,747 1,921,850 0.10Turkey 5.25% 20 - 13.03.30 1,900,000 USD 1,736,733 1,904,845 0.10Turkey 5.60% 19 - 14.11.24 2,500,000 USD 2,490,777 2,616,250 0.14Turkey 5.75% 14 - 22.03.24 2,600,000 USD 2,569,743 2,734,420 0.15Turkey 5.75% 17 - 11.05.47 3,500,000 USD 2,904,818 3,322,550 0.18Turkey 5.95% 20 - 15.01.31 2,300,000 USD 2,413,850 2,397,750 0.13Turkey 6.00% 11 - 14.01.41 3,200,000 USD 2,782,736 3,152,320 0.17Turkey 6.00% 17 - 25.03.27 3,400,000 USD 3,291,581 3,601,940 0.19Turkey 6.125% 18 - 24.10.28 2,100,000 USD 1,997,302 2,237,025 0.12Turkey 6.35% 19 - 10.08.24 2,200,000 USD 2,215,989 2,357,920 0.13Turkey 6.375% 20 - 14.10.25 2,500,000 USD 2,454,650 2,696,990 0.15
Xtrackers II
Xtrackers II USD EMERGING MARKETS BOND UCITS ETF (continued)
Statement of Investmentsas at 31 December 2020(expressed in USD)
The accompanying notes form an integral part of these financial statements.
99

DescriptionNominal
ValueCurrency
(local) Cost Market Value
% ofNet
Assets
Transferable securities and money market instruments admitted to an official stock exchange listing(A)
Bonds (continued)
Turkey (continued)Turkey 6.625% 14 - 17.02.45 3,100,000 USD 2,827,549 3,238,260 0.17Turkey 6.75% 10 - 30.05.40 2,100,000 USD 1,989,711 2,236,395 0.12Turkey 6.875% 06 - 17.03.36 2,800,000 USD 2,699,620 3,047,520 0.16Turkey 7.25% 08 - 05.03.38 1,000,000 USD 979,978 1,125,350 0.06Turkey 7.25% 18 - 23.12.23 2,100,000 USD 2,142,067 2,292,570 0.12Turkey 7.375% 05 - 05.02.25 3,300,000 USD 3,393,582 3,678,140 0.20Turkey 7.625% 19 - 26.04.29 3,200,000 USD 3,358,110 3,688,800 0.20Turkey 8.00% 04 - 14.02.34 1,500,000 USD 1,593,359 1,791,900 0.10Turkey 11.875% 00 - 15.01.30 1,600,000 USD 2,068,319 2,332,000 0.13
59,432,131 65,127,742 3.51UkraineUkraine 7.253% 20 - 15.03.33 6,200,000 USD 6,070,172 6,758,000 0.36Ukraine 7.375% 17 - 25.09.32 9,300,000 USD 9,000,040 10,216,515 0.55Ukraine 7.75% 15 - 01.09.25 200,000 USD 201,111 223,824 0.01Ukraine 7.75% 15 - 01.09.26 3,124,000 USD 3,076,319 3,521,060 0.19Ukraine 7.75% 15 - 01.09.27 2,791,000 USD 2,728,124 3,163,319 0.17Ukraine 7.75% 15 - 01.09.23 2,600,000 USD 2,652,502 2,856,859 0.15Ukraine 7.75% 15 - 01.09.23 1,600,000 USD 1,560,322 1,758,067 0.10Ukraine 7.75% 15 - 01.09.24 4,200,000 USD 4,189,071 4,665,948 0.25Ukraine 7.75% 15 - 01.09.25 3,900,000 USD 3,890,624 4,364,568 0.24Ukraine 7.75% 15 - 01.09.26 730,000 USD 745,243 822,783 0.04Ukraine 7.75% 15 - 01.09.26 246,000 USD 249,703 277,267 0.02Ukraine 7.75% 15 - 01.09.27 100,000 USD 93,185 113,340 0.01Ukraine 7.75% 15 - 01.09.27 1,209,000 USD 1,217,324 1,370,281 0.07Ukraine 9.75% 18 - 01.11.28 5,000,000 USD 5,425,933 6,149,200 0.33
41,099,673 46,261,031 2.49United Arab EmiratesAbu Dhabi 1.70% 20 - 02.03.31 2,800,000 USD 2,790,450 2,798,264 0.15Abu Dhabi 2.125% 19 - 30.09.24 5,600,000 USD 5,862,724 5,880,896 0.32Abu Dhabi 2.50% 19 - 30.09.29 5,600,000 USD 6,001,193 6,041,000 0.32Abu Dhabi 2.50% 20 - 16.04.25 5,600,000 USD 5,957,281 5,980,464 0.32Abu Dhabi 2.70% 20 - 02.09.70 2,800,000 USD 2,673,172 2,611,896 0.14Abu Dhabi 3.125% 16 - 03.05.26 4,600,000 USD 5,069,102 5,105,540 0.27Abu Dhabi 3.125% 17 - 11.10.27 7,400,000 USD 8,250,295 8,291,700 0.45Abu Dhabi 3.125% 19 - 30.09.49 7,400,000 USD 7,974,757 7,918,000 0.43Abu Dhabi 3.125% 20 - 16.04.30 5,500,000 USD 6,175,437 6,210,050 0.33Abu Dhabi 3.875% 20 - 16.04.50 7,400,000 USD 9,053,691 9,018,380 0.49Abu Dhabi 4.125% 17 - 11.10.47 5,600,000 USD 7,047,175 7,033,264 0.38Finance Department Government of Sharjah 4.00%20 - 28.07.50 1,800,000 USD 1,851,106 1,827,000 0.10
68,706,383 68,716,454 3.70UruguayUruguay 4.375% 15 - 27.10.27 4,800,000 USD 5,625,552 5,676,048 0.30Uruguay 4.375% 19 - 23.01.31 5,800,000 USD 7,009,300 7,105,058 0.38Uruguay 4.975% 18 - 20.04.55 8,000,000 USD 10,654,240 11,100,000 0.60Uruguay 5.10% 14 - 18.06.50 12,300,000 USD 16,558,238 17,189,373 0.93Uruguay 7.625% 06 - 21.03.36 3,300,000 USD 5,153,112 5,341,908 0.29
45,000,442 46,412,387 2.50
Xtrackers II
Xtrackers II USD EMERGING MARKETS BOND UCITS ETF (continued)
Statement of Investmentsas at 31 December 2020(expressed in USD)
The accompanying notes form an integral part of these financial statements.
100

DescriptionNominal
ValueCurrency
(local) Cost Market Value
% ofNet
Assets
Transferable securities and money market instruments admitted to an official stock exchange listing(A)
Bonds (continued)
VietnamVietnam 4.80% 14 - 19.11.24 3,100,000 USD 3,244,491 3,472,090 0.19
3,244,491 3,472,090 0.19
Total - Bonds 1,733,731,522 1,825,941,232 98.39
Total Transferable securities and money market instruments admitted to an officialstock exchange listing 1,733,731,522 1,825,941,232 98.39
Transferable securities and money market instruments dealt in on another regulated market(A)
Bonds
ColombiaEmpresas Publicas de Medellin ESP 4.25% 19 -18.07.29 2,200,000 USD 2,246,444 2,364,560 0.13
2,246,444 2,364,560 0.13
Total - Bonds 2,246,444 2,364,560 0.13
Total Transferable securities and money market instruments dealt in on anotherregulated market 2,246,444 2,364,560 0.13
Other transferable securities and money market instruments(A)
Bonds
Cayman IslandsBrazil Minas SPE via State of Minas Gerais 5.333%13 - 15.02.28 1,280,000 USD 1,359,389 1,388,813 0.08
1,359,389 1,388,813 0.08
Total - Bonds 1,359,389 1,388,813 0.08
Total Other transferable securities and money market instruments 1,359,389 1,388,813 0.08
TOTAL INVESTMENT PORTFOLIO 1,737,337,355 1,829,694,605 98.60
TOTAL INVESTMENT PORTFOLIO INCLUDING ACCRUED INTEREST 1,853,839,788 99.90(A) Any duplicate securities appearing herein with the same name are either quoted on different stock exchanges or have different ISINs.
Xtrackers II
Xtrackers II USD EMERGING MARKETS BOND UCITS ETF (continued)
Statement of Investmentsas at 31 December 2020(expressed in USD)
The accompanying notes form an integral part of these financial statements.
101

DescriptionNominal
ValueCurrency
(local) Cost Market Value
% ofNet
Assets
Transferable securities and money market instruments admitted to an official stock exchange listing
Bonds
CanadaCanada 5.00% 04 - 01.06.37 100,000 CAD 93,616 103,650 0.37
93,616 103,650 0.37FranceFrance OAT Zero Coupon 09 - 25.10.24 1,300,000 EUR 1,300,088 1,334,593 4.72France OAT Zero Coupon 09 - 25.04.45 2,100,000 EUR 1,418,671 1,935,024 6.85France OAT Zero Coupon 13 - 25.05.41 2,501,000 EUR 1,847,978 2,388,580 8.46
4,566,737 5,658,197 20.03GermanyBundesrepublik Deutschland Principal Strips ZeroCoupon 00 - 04.01.31 1,900,000 EUR 1,976,545 2,017,344 7.14Bundesrepublik Deutschland Principal Strips ZeroCoupon 08 - 04.07.40 750,000 EUR 783,966 795,630 2.82Deutsche Bundesrepublik Coupon Strips Zero Coupon07 - 04.07.38 1,800,000 EUR 1,878,595 1,902,024 6.74
4,639,106 4,714,998 16.70SpainSpain 3.45% 16 - 30.07.66 1,100,000 EUR 1,920,401 1,992,910 7.06Spain Coupon Strip Zero Coupon 98 - 31.01.27 220,000 EUR 219,704 223,975 0.79Spain Coupon Strip Zero Coupon 98 - 31.01.28 500,000 EUR 494,023 505,235 1.79Spain Coupon Strip Zero Coupon 01 - 30.07.25 500,000 EUR 505,509 508,575 1.80Spain Coupon Strip Zero Coupon 01 - 30.07.26 1,200,000 EUR 1,209,113 1,221,732 4.33Spain Coupon Strip Zero Coupon 15 - 30.07.22 2,300,000 EUR 2,305,458 2,317,273 8.20
6,654,208 6,769,700 23.97SupranationalsEuropean Investment Bank 1.00% 16 - 14.04.32 500,000 EUR 563,413 575,914 2.04
563,413 575,914 2.04
Total - Bonds 16,517,080 17,822,459 63.11
Total Transferable securities and money market instruments admitted to an officialstock exchange listing 16,517,080 17,822,459 63.11
Transferable securities and money market instruments dealt in on another regulated market
Bonds
ItalyItaly Buoni Poliennali del Tesoro Coupon Strip ZeroCoupon 98 - 01.05.26 3,800,000 EUR 3,717,915 3,775,072 13.37
3,717,915 3,775,072 13.37
Total - Bonds 3,717,915 3,775,072 13.37
Total Transferable securities and money market instruments dealt in on anotherregulated market 3,717,915 3,775,072 13.37
Xtrackers II
Xtrackers II EUROZONE GOVERNMENT BOND SHORT DAILY SWAP UCITS ETF
Statement of Investmentsas at 31 December 2020(expressed in EUR)
The accompanying notes form an integral part of these financial statements.
102

DescriptionNominal
ValueCurrency
(local) Cost Market Value
% ofNet
Assets
Other transferable securities and money market instruments
Bonds
ItalyItaly Buoni Poliennali del Tesoro Coupon Strip ZeroCoupon 98 - 01.05.27 5,300,000 EUR 5,181,243 5,206,296 18.43Italy Buoni Poliennali del Tesoro Coupon Strip ZeroCoupon 02 - 01.08.26 600,000 EUR 574,290 595,458 2.11Italy Buoni Poliennali del Tesoro Coupon Strip ZeroCoupon 13 - 01.03.26 400,000 EUR 391,316 397,624 1.41
6,146,849 6,199,378 21.95
Total - Bonds 6,146,849 6,199,378 21.95
Total Other transferable securities and money market instruments 6,146,849 6,199,378 21.95
TOTAL INVESTMENT PORTFOLIO 26,381,844 27,796,909 98.43
TOTAL INVESTMENT PORTFOLIO INCLUDING ACCRUED INTEREST 27,816,887 98.50
Xtrackers II
Xtrackers II EUROZONE GOVERNMENT BOND SHORT DAILY SWAP UCITS ETF (continued)
Statement of Investmentsas at 31 December 2020(expressed in EUR)
The accompanying notes form an integral part of these financial statements.
103

DescriptionNominal
ValueCurrency
(local) Cost Market Value
% ofNet
Assets
Transferable securities and money market instruments admitted to an official stock exchange listing
Bonds
FranceFrance OAT Zero Coupon 09 - 25.10.32 4,100,000 EUR 4,157,027 4,176,875 5.30
4,157,027 4,176,875 5.30GermanyBayerische Landesbank 1.75% 14 - 08.04.24 500,000 EUR 524,692 536,923 0.68Bayerische Landesbank 2.00% 12 - 11.07.22 1,500,000 EUR 1,603,305 1,557,715 1.98Bundesrepublik Deutschland Coupon Strips ZeroCoupon 03 - 04.07.32 200,000 EUR 205,814 211,486 0.27Deutsche Bundesrepublik Coupon Strips Zero Coupon97 - 04.07.21 10,500,000 EUR 10,529,527 10,529,715 13.37Deutsche Bundesrepublik Coupon Strips Zero Coupon97 - 04.07.22 3,800,000 EUR 3,830,744 3,835,796 4.87Deutsche Bundesrepublik Coupon Strips Zero Coupon97 - 04.07.25 2,000,000 EUR 2,028,153 2,058,800 2.61Deutsche Bundesrepublik Coupon Strips Zero Coupon97 - 04.07.26 1,800,000 EUR 1,833,961 1,862,064 2.36Deutsche Bundesrepublik Coupon Strips Zero Coupon03 - 04.07.29 3,200,000 EUR 3,272,891 3,359,840 4.27Deutsche Bundesrepublik Coupon Strips Zero Coupon03 - 04.07.34 1,600,000 EUR 1,641,074 1,697,824 2.16Deutsche Bundesrepublik Coupon Strips Zero Coupon07 - 04.07.35 1,600,000 EUR 1,501,099 1,685,248 2.14Deutsche Bundesrepublik Coupon Strips Zero Coupon10 - 04.07.42 11,900,000 EUR 12,375,026 12,522,965 15.90Deutsche Bundesrepublik Coupon Strips Zero Coupon13 - 15.08.23 7,500,000 EUR 7,610,198 7,628,175 9.69Deutsche Bundesrepublik Principal Strips ZeroCoupon 05 - 04.01.37 13,000,000 EUR 13,831,845 13,833,690 17.57Deutsche Kreditbank AG 1.375% 14 - 25.02.21 1,300,000 EUR 1,340,755 1,303,523 1.66Deutsche Pfandbriefbank AG 1.875% 14 - 21.01.22 1,500,000 EUR 1,530,313 1,537,196 1.95Deutsche Pfandbriefbank AG 2.375% 13 - 29.05.28 1,200,000 EUR 1,368,708 1,442,045 1.83Hamburg Commercial Bank AG 0.75% 14 - 07.10.21 750,000 EUR 753,862 757,035 0.96Muenchener Hypothekenbank eG 1.50% 14 - 25.06.24 600,000 EUR 629,037 641,814 0.81Muenchener Hypothekenbank eG 1.75% 12 - 03.06.22 1,000,000 EUR 1,059,350 1,032,409 1.31Norddeutsche Landesbank Girozentrale 3.25% 11 -18.01.21 532,000 EUR 532,840 532,718 0.68UniCredit Bank AG 1.875% 12 - 12.09.22 400,000 EUR 412,449 416,220 0.53
68,415,643 68,983,201 87.60SpainSpain Coupon Strip Zero Coupon 98 - 31.01.22 800,000 EUR 803,699 804,224 1.02Spain Coupon Strip Zero Coupon 13 - 31.01.21 900,000 EUR 900,242 900,270 1.14
1,703,941 1,704,494 2.16
Total - Bonds 74,276,611 74,864,570 95.06
Total Transferable securities and money market instruments admitted to an officialstock exchange listing 74,276,611 74,864,570 95.06
Xtrackers II
Xtrackers II IBOXX GERMANY COVERED BOND SWAP UCITS ETF
Statement of Investmentsas at 31 December 2020(expressed in EUR)
The accompanying notes form an integral part of these financial statements.
104

DescriptionNominal
ValueCurrency
(local) Cost Market Value
% ofNet
Assets
Other transferable securities and money market instruments
Bonds
ItalyItaly Buoni Poliennali del Tesoro Coupon Strip ZeroCoupon 98 - 01.05.23 3,400,000 EUR 3,396,200 3,423,052 4.35
3,396,200 3,423,052 4.35
Total - Bonds 3,396,200 3,423,052 4.35
Total Other transferable securities and money market instruments 3,396,200 3,423,052 4.35
TOTAL INVESTMENT PORTFOLIO 77,672,811 78,287,622 99.41
TOTAL INVESTMENT PORTFOLIO INCLUDING ACCRUED INTEREST 78,402,011 99.55
Xtrackers II
Xtrackers II IBOXX GERMANY COVERED BOND SWAP UCITS ETF (continued)
Statement of Investmentsas at 31 December 2020(expressed in EUR)
The accompanying notes form an integral part of these financial statements.
105

DescriptionNominal
ValueCurrency
(local) Cost Market Value
% ofNet
Assets
Transferable securities and money market instruments admitted to an official stock exchange listing
Bonds
BelgiumKingdom of Belgium Government Bond Coupon StripZero Coupon 98 - 28.03.27 1,100,000 EUR 1,237,121 1,392,796 0.68
1,237,121 1,392,796 0.68CanadaCanada 1.50% 12 - 01.06.23 1,886,000 CAD 1,392,578 1,525,691 0.74Canadian Government Bond 5.75% 98 - 01.06.29 2,750,000 CAD 2,803,826 3,070,956 1.49Province of Manitoba Canada 1.25% 20 - 25.06.49 1,200,000 EUR 1,435,144 1,698,145 0.83
5,631,548 6,294,792 3.06FranceFrance OAT Zero Coupon 09 - 25.04.31 3,600,000 EUR 4,524,521 4,534,324 2.21France OAT Zero Coupon 09 - 25.10.33 6,200,000 EUR 7,768,511 7,726,275 3.76France OAT Zero Coupon 09 - 25.04.39 39,200,000 EUR 46,672,315 46,964,563 22.86
58,965,347 59,225,162 28.83GermanyDeutsche Bundesrepublik Coupon Strips Zero Coupon05 - 04.01.34 2,000,000 EUR 2,453,251 2,588,151 1.26EnBW Energie Baden-Wuerttemberg AG FRN 19 -05.11.79 1,500,000 EUR 1,667,452 1,837,778 0.90
4,120,703 4,425,929 2.16ItalyAssicurazioni Generali SpA FRN 12 - 12.12.42 800,000 EUR 1,047,604 1,121,496 0.54Italy Buoni Poliennali del Tesoro Coupon Strip ZeroCoupon 98 - 01.05.21 20,200,000 EUR 24,502,292 24,749,816 12.05Italy Buoni Poliennali Del Tesoro Hybrid Strip ZeroCoupon 98 - 01.11.29 2,000,000 EUR 2,294,343 2,333,897 1.14
27,844,239 28,205,209 13.73JapanMitsubishi UFJ Financial Group Inc. FRN 17 -25.07.22 858,000 USD 863,432 864,983 0.42Mitsubishi UFJ Financial Group Inc. FRN 16 -13.09.21 800,000 USD 804,409 805,306 0.39
1,667,841 1,670,289 0.81NetherlandsING Groep NV 0.75% 17 - 09.03.22 1,000,000 EUR 1,137,374 1,237,619 0.60
1,137,374 1,237,619 0.60SpainSpain Coupon Strip Zero Coupon 98 - 31.01.23 2,700,000 EUR 3,099,080 3,338,768 1.63Spain Coupon Strip Zero Coupon 01 - 30.07.21 1,100,000 EUR 1,303,814 1,349,377 0.66Spain Coupon Strip Zero Coupon 01 - 30.07.25 2,300,000 EUR 2,431,063 2,862,428 1.39Spain Coupon Strip Zero Coupon 13 - 31.10.24 2,800,000 EUR 3,325,773 3,480,755 1.69
10,159,730 11,031,328 5.37SupranationalsEuropean Investment Bank 1.00% 16 - 14.04.32 4,700,000 EUR 5,920,901 6,623,793 3.22
5,920,901 6,623,793 3.22United StatesBank of America Corp. FRN 17 - 24.04.23 116,000 USD 116,888 117,203 0.06Bank of America Corp. FRN 17 - 20.01.23 128,000 USD 129,170 129,317 0.06Bank of America Corp. 2.503% 16 - 21.10.22 125,000 USD 125,663 127,238 0.06
Xtrackers II
Xtrackers II USD OVERNIGHT RATE SWAP UCITS ETF
Statement of Investmentsas at 31 December 2020(expressed in USD)
The accompanying notes form an integral part of these financial statements.
106
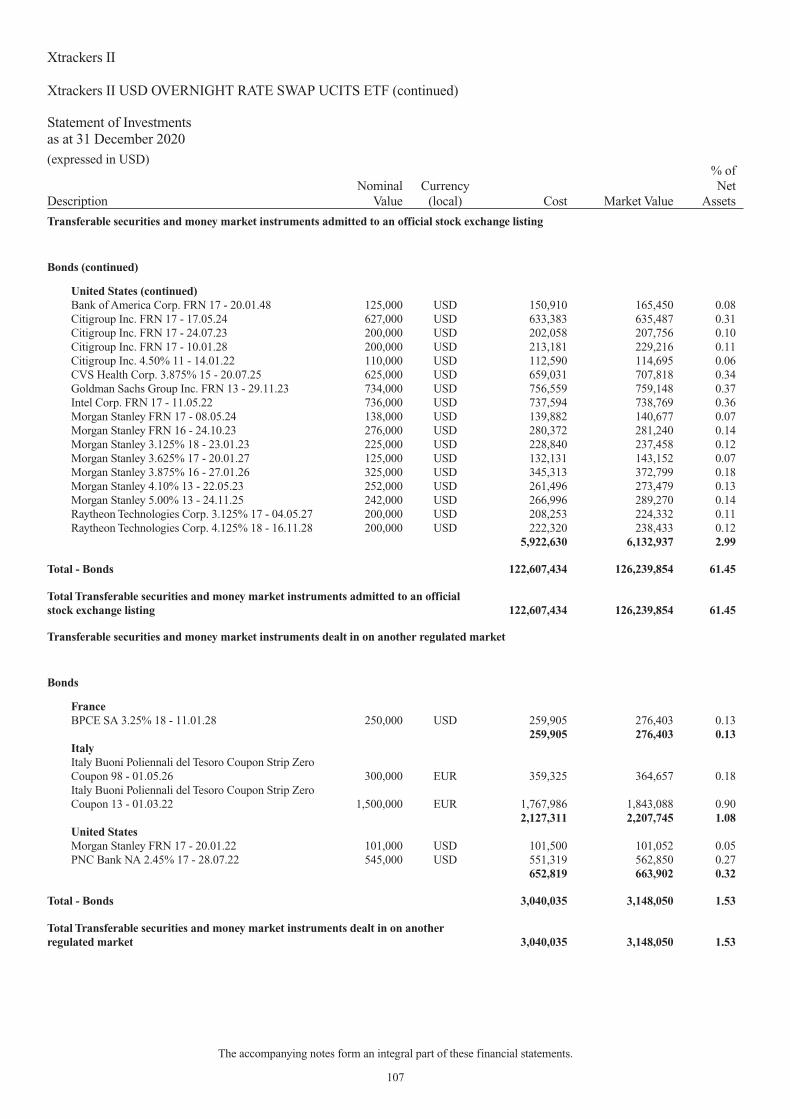
DescriptionNominal
ValueCurrency
(local) Cost Market Value
% ofNet
Assets
Transferable securities and money market instruments admitted to an official stock exchange listing
Bonds (continued)
United States (continued)Bank of America Corp. FRN 17 - 20.01.48 125,000 USD 150,910 165,450 0.08Citigroup Inc. FRN 17 - 17.05.24 627,000 USD 633,383 635,487 0.31Citigroup Inc. FRN 17 - 24.07.23 200,000 USD 202,058 207,756 0.10Citigroup Inc. FRN 17 - 10.01.28 200,000 USD 213,181 229,216 0.11Citigroup Inc. 4.50% 11 - 14.01.22 110,000 USD 112,590 114,695 0.06CVS Health Corp. 3.875% 15 - 20.07.25 625,000 USD 659,031 707,818 0.34Goldman Sachs Group Inc. FRN 13 - 29.11.23 734,000 USD 756,559 759,148 0.37Intel Corp. FRN 17 - 11.05.22 736,000 USD 737,594 738,769 0.36Morgan Stanley FRN 17 - 08.05.24 138,000 USD 139,882 140,677 0.07Morgan Stanley FRN 16 - 24.10.23 276,000 USD 280,372 281,240 0.14Morgan Stanley 3.125% 18 - 23.01.23 225,000 USD 228,840 237,458 0.12Morgan Stanley 3.625% 17 - 20.01.27 125,000 USD 132,131 143,152 0.07Morgan Stanley 3.875% 16 - 27.01.26 325,000 USD 345,313 372,799 0.18Morgan Stanley 4.10% 13 - 22.05.23 252,000 USD 261,496 273,479 0.13Morgan Stanley 5.00% 13 - 24.11.25 242,000 USD 266,996 289,270 0.14Raytheon Technologies Corp. 3.125% 17 - 04.05.27 200,000 USD 208,253 224,332 0.11Raytheon Technologies Corp. 4.125% 18 - 16.11.28 200,000 USD 222,320 238,433 0.12
5,922,630 6,132,937 2.99
Total - Bonds 122,607,434 126,239,854 61.45
Total Transferable securities and money market instruments admitted to an officialstock exchange listing 122,607,434 126,239,854 61.45
Transferable securities and money market instruments dealt in on another regulated market
Bonds
FranceBPCE SA 3.25% 18 - 11.01.28 250,000 USD 259,905 276,403 0.13
259,905 276,403 0.13ItalyItaly Buoni Poliennali del Tesoro Coupon Strip ZeroCoupon 98 - 01.05.26 300,000 EUR 359,325 364,657 0.18Italy Buoni Poliennali del Tesoro Coupon Strip ZeroCoupon 13 - 01.03.22 1,500,000 EUR 1,767,986 1,843,088 0.90
2,127,311 2,207,745 1.08United StatesMorgan Stanley FRN 17 - 20.01.22 101,000 USD 101,500 101,052 0.05PNC Bank NA 2.45% 17 - 28.07.22 545,000 USD 551,319 562,850 0.27
652,819 663,902 0.32
Total - Bonds 3,040,035 3,148,050 1.53
Total Transferable securities and money market instruments dealt in on anotherregulated market 3,040,035 3,148,050 1.53
Xtrackers II
Xtrackers II USD OVERNIGHT RATE SWAP UCITS ETF (continued)
Statement of Investmentsas at 31 December 2020(expressed in USD)
The accompanying notes form an integral part of these financial statements.
107

DescriptionNominal
ValueCurrency
(local) Cost Market Value
% ofNet
Assets
Other transferable securities and money market instruments
Bonds
ItalyItaly Buoni Poliennali del Tesoro Coupon Strip ZeroCoupon 98 - 01.11.24 600,000 EUR 648,244 737,162 0.36Italy Buoni Poliennali del Tesoro Coupon Strip ZeroCoupon 02 - 01.08.29 24,400,000 EUR 28,035,778 28,449,361 13.85Italy Buoni Poliennali Del Tesoro Hybrid Strip ZeroCoupon 03 - 01.08.34 34,000,000 EUR 34,818,870 36,500,867 17.77Italy Buoni Poliennali Del Tesoro Hybrid Strip ZeroCoupon 15 - 01.06.25 7,300,000 EUR 8,594,642 8,913,336 4.34
72,097,534 74,600,726 36.32
Total - Bonds 72,097,534 74,600,726 36.32
Total Other transferable securities and money market instruments 72,097,534 74,600,726 36.32
TOTAL INVESTMENT PORTFOLIO 197,745,003 203,988,630 99.30
TOTAL INVESTMENT PORTFOLIO INCLUDING ACCRUED INTEREST 204,120,559 99.36
Xtrackers II
Xtrackers II USD OVERNIGHT RATE SWAP UCITS ETF (continued)
Statement of Investmentsas at 31 December 2020(expressed in USD)
The accompanying notes form an integral part of these financial statements.
108
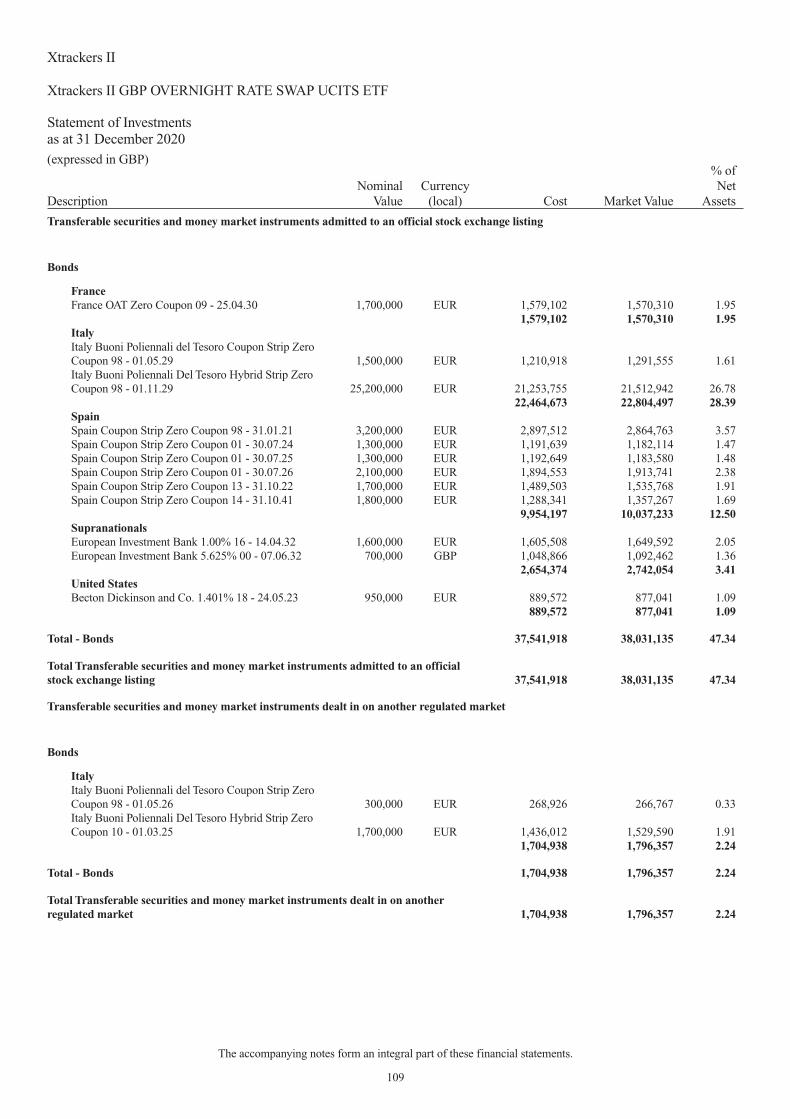
DescriptionNominal
ValueCurrency
(local) Cost Market Value
% ofNet
Assets
Transferable securities and money market instruments admitted to an official stock exchange listing
Bonds
FranceFrance OAT Zero Coupon 09 - 25.04.30 1,700,000 EUR 1,579,102 1,570,310 1.95
1,579,102 1,570,310 1.95ItalyItaly Buoni Poliennali del Tesoro Coupon Strip ZeroCoupon 98 - 01.05.29 1,500,000 EUR 1,210,918 1,291,555 1.61Italy Buoni Poliennali Del Tesoro Hybrid Strip ZeroCoupon 98 - 01.11.29 25,200,000 EUR 21,253,755 21,512,942 26.78
22,464,673 22,804,497 28.39SpainSpain Coupon Strip Zero Coupon 98 - 31.01.21 3,200,000 EUR 2,897,512 2,864,763 3.57Spain Coupon Strip Zero Coupon 01 - 30.07.24 1,300,000 EUR 1,191,639 1,182,114 1.47Spain Coupon Strip Zero Coupon 01 - 30.07.25 1,300,000 EUR 1,192,649 1,183,580 1.48Spain Coupon Strip Zero Coupon 01 - 30.07.26 2,100,000 EUR 1,894,553 1,913,741 2.38Spain Coupon Strip Zero Coupon 13 - 31.10.22 1,700,000 EUR 1,489,503 1,535,768 1.91Spain Coupon Strip Zero Coupon 14 - 31.10.41 1,800,000 EUR 1,288,341 1,357,267 1.69
9,954,197 10,037,233 12.50SupranationalsEuropean Investment Bank 1.00% 16 - 14.04.32 1,600,000 EUR 1,605,508 1,649,592 2.05European Investment Bank 5.625% 00 - 07.06.32 700,000 GBP 1,048,866 1,092,462 1.36
2,654,374 2,742,054 3.41United StatesBecton Dickinson and Co. 1.401% 18 - 24.05.23 950,000 EUR 889,572 877,041 1.09
889,572 877,041 1.09
Total - Bonds 37,541,918 38,031,135 47.34
Total Transferable securities and money market instruments admitted to an officialstock exchange listing 37,541,918 38,031,135 47.34
Transferable securities and money market instruments dealt in on another regulated market
Bonds
ItalyItaly Buoni Poliennali del Tesoro Coupon Strip ZeroCoupon 98 - 01.05.26 300,000 EUR 268,926 266,767 0.33Italy Buoni Poliennali Del Tesoro Hybrid Strip ZeroCoupon 10 - 01.03.25 1,700,000 EUR 1,436,012 1,529,590 1.91
1,704,938 1,796,357 2.24
Total - Bonds 1,704,938 1,796,357 2.24
Total Transferable securities and money market instruments dealt in on anotherregulated market 1,704,938 1,796,357 2.24
Xtrackers II
Xtrackers II GBP OVERNIGHT RATE SWAP UCITS ETF
Statement of Investmentsas at 31 December 2020(expressed in GBP)
The accompanying notes form an integral part of these financial statements.
109

DescriptionNominal
ValueCurrency
(local) Cost Market Value
% ofNet
Assets
Other transferable securities and money market instruments
Bonds
ItalyItaly Buoni Poliennali del Tesoro Coupon Strip ZeroCoupon 98 - 01.11.21 1,200,000 EUR 1,050,942 1,078,207 1.34Italy Buoni Poliennali del Tesoro Coupon Strip ZeroCoupon 98 - 01.05.22 22,700,000 EUR 20,661,100 20,406,846 25.40Italy Buoni Poliennali del Tesoro Coupon Strip ZeroCoupon 02 - 01.08.26 1,300,000 EUR 1,122,807 1,154,815 1.44Italy Buoni Poliennali Del Tesoro Hybrid Strip ZeroCoupon 02 - 01.02.33 19,800,000 EUR 16,056,452 16,039,389 19.97
38,891,301 38,679,257 48.15
Total - Bonds 38,891,301 38,679,257 48.15
Total Other transferable securities and money market instruments 38,891,301 38,679,257 48.15
TOTAL INVESTMENT PORTFOLIO 78,138,157 78,506,749 97.73
TOTAL INVESTMENT PORTFOLIO INCLUDING ACCRUED INTEREST 78,546,713 97.78
Xtrackers II
Xtrackers II GBP OVERNIGHT RATE SWAP UCITS ETF (continued)
Statement of Investmentsas at 31 December 2020(expressed in GBP)
The accompanying notes form an integral part of these financial statements.
110

DescriptionNominal
ValueCurrency
(local) Cost Market Value
% ofNet
Assets
Transferable securities and money market instruments admitted to an official stock exchange listing(A)
Bonds
AustraliaAustralia 0.25% 20 - 21.11.24 3,190,000 AUD 1,925,928 2,016,690 0.09Australia 0.25% 20 - 21.11.25 2,780,000 AUD 1,675,659 1,745,763 0.08Australia 0.50% 20 - 21.09.26 2,980,000 AUD 1,827,643 1,883,272 0.08Australia 1.00% 20 - 21.12.30 3,530,000 AUD 2,147,191 2,231,769 0.10Australia 1.00% 20 - 21.11.31 2,860,000 AUD 1,763,536 1,793,006 0.08Australia 1.25% 20 - 21.05.32 2,204,000 AUD 1,366,885 1,412,754 0.06Australia 1.50% 19 - 21.06.31 2,960,000 AUD 1,891,992 1,956,486 0.09Australia 1.75% 20 - 21.06.51 1,570,000 AUD 933,797 941,528 0.04Australia 2.25% 16 - 21.05.28 3,023,000 AUD 1,988,133 2,121,802 0.10Australia 2.25% 17 - 21.11.22 2,896,000 AUD 1,815,124 1,900,649 0.09Australia 2.50% 18 - 21.05.30 3,742,000 AUD 2,518,078 2,695,415 0.12Australia 2.75% 12 - 21.04.24 3,276,000 AUD 2,175,766 2,245,723 0.10Australia 2.75% 15 - 21.06.35 888,000 AUD 591,840 664,359 0.03Australia 2.75% 16 - 21.11.27 2,883,000 AUD 1,905,934 2,079,811 0.09Australia 2.75% 17 - 21.11.28 3,369,000 AUD 2,283,852 2,450,365 0.11Australia 2.75% 18 - 21.11.29 3,524,000 AUD 2,409,902 2,579,636 0.12Australia 2.75% 18 - 21.05.41 1,364,000 AUD 990,876 1,012,677 0.05Australia 3.00% 16 - 21.03.47 1,462,000 AUD 1,056,182 1,135,510 0.05Australia 3.25% 12 - 21.04.29 3,470,000 AUD 2,410,976 2,618,649 0.12Australia 3.25% 13 - 21.04.25 3,467,000 AUD 2,337,252 2,466,193 0.11Australia 3.25% 15 - 21.06.39 1,074,000 AUD 771,774 854,599 0.04Australia 3.75% 14 - 21.04.37 1,230,000 AUD 966,427 1,034,412 0.05Australia 4.25% 14 - 21.04.26 3,444,000 AUD 2,456,819 2,611,604 0.12Australia 4.50% 13 - 21.04.33 1,551,000 AUD 1,226,458 1,357,414 0.06Australia 4.75% 11 - 21.04.27 3,272,000 AUD 2,423,798 2,602,738 0.12Australia 5.50% 11 - 21.04.23 3,522,000 AUD 2,371,753 2,495,388 0.11Australia 5.75% 10 - 15.07.22 2,730,000 AUD 1,879,735 1,871,453 0.08
48,113,310 50,779,665 2.29AustriaAustria Zero Coupon 16 - 15.07.23 1,052,000 EUR 1,064,379 1,069,884 0.05Austria Zero Coupon 17 - 20.09.22 762,000 EUR 767,376 770,992 0.03Austria Zero Coupon 19 - 15.07.24 970,000 EUR 989,614 993,105 0.04Austria Zero Coupon 20 - 20.02.30 1,011,000 EUR 1,038,048 1,051,642 0.05Austria Zero Coupon 20 - 20.04.23 621,000 EUR 629,558 630,626 0.03Austria Zero Coupon 20 - 20.10.40 350,000 EUR 352,937 351,015 0.02Austria 0.50% 17 - 20.04.27 992,000 EUR 1,031,266 1,063,622 0.05Austria 0.50% 19 - 20.02.29 1,309,000 EUR 1,372,179 1,418,825 0.06Austria 0.75% 16 - 20.10.26 1,370,000 EUR 1,423,680 1,482,765 0.07Austria 0.75% 18 - 20.02.28 1,100,000 EUR 1,147,416 1,204,500 0.05Austria 0.75% 20 - 20.03.51 420,000 EUR 473,464 501,312 0.02Austria 0.85% 20 - 30.06.20 310,000 EUR 411,680 406,891 0.02Austria 1.20% 15 - 20.10.25 1,240,000 EUR 1,330,942 1,354,204 0.06Austria 1.50% 16 - 20.02.47 751,000 EUR 876,035 1,038,791 0.05Austria 1.50% 16 - 02.11.86 268,000 EUR 340,390 448,498 0.02Austria 1.65% 14 - 21.10.24 1,019,000 EUR 1,090,848 1,110,506 0.05Austria 1.75% 13 - 20.10.23 1,202,000 EUR 1,266,133 1,284,217 0.06Austria 2.10% 17 - 20.09.17 622,000 EUR 989,358 1,381,213 0.06Austria 2.40% 13 - 23.05.34 912,000 EUR 1,133,661 1,241,779 0.06
Xtrackers II
Xtrackers II GLOBAL GOVERNMENT BOND UCITS ETF
Statement of Investmentsas at 31 December 2020(expressed in EUR)
The accompanying notes form an integral part of these financial statements.
111

DescriptionNominal
ValueCurrency
(local) Cost Market Value
% ofNet
Assets
Transferable securities and money market instruments admitted to an official stock exchange listing(A)
Bonds (continued)
Austria (continued)Austria 3.15% 12 - 20.06.44 751,000 EUR 1,194,341 1,314,025 0.06Austria 3.40% 12 - 22.11.22 1,060,000 EUR 1,136,994 1,142,044 0.05Austria 3.65% 11 - 20.04.22 898,000 EUR 946,942 948,198 0.04Austria 3.80% 12 - 26.01.62 402,000 EUR 829,705 975,252 0.04Austria 4.15% 07 - 15.03.37 1,510,000 EUR 2,339,110 2,582,931 0.12Austria 4.85% 09 - 15.03.26 1,011,000 EUR 1,264,434 1,307,931 0.06Austria 6.25% 97 - 15.07.27 1,041,000 EUR 1,458,233 1,517,153 0.07
26,898,723 28,591,921 1.29BelgiumBelgium Zero Coupon 20 - 22.10.27 840,000 EUR 852,865 872,508 0.04Belgium 0.10% 20 - 22.06.30 1,409,000 EUR 1,438,153 1,475,082 0.07Belgium 0.20% 16 - 22.10.23 1,075,000 EUR 1,087,808 1,102,305 0.05Belgium 0.50% 17 - 22.10.24 1,534,237 EUR 1,578,009 1,604,352 0.07Belgium 0.80% 15 - 22.06.25 1,925,000 EUR 2,011,174 2,053,782 0.09Belgium 0.80% 17 - 22.06.27 1,405,000 EUR 1,485,975 1,534,119 0.07Belgium 0.80% 18 - 22.06.28 1,514,000 EUR 1,546,484 1,667,232 0.08Belgium 0.90% 19 - 22.06.29 1,700,000 EUR 1,809,506 1,898,730 0.09Belgium 1.00% 15 - 22.06.31 1,581,000 EUR 1,696,980 1,804,870 0.08Belgium 1.00% 16 - 22.06.26 1,603,000 EUR 1,681,249 1,748,392 0.08Belgium 1.45% 17 - 22.06.37 628,000 EUR 732,580 779,348 0.04Belgium 1.70% 19 - 22.06.50 820,000 EUR 964,779 1,135,782 0.05Belgium 1.90% 15 - 22.06.38 894,000 EUR 1,057,189 1,186,249 0.05Belgium 2.15% 16 - 22.06.66 720,000 EUR 1,057,608 1,213,704 0.05Belgium 2.25% 13 - 22.06.23 1,342,000 EUR 1,427,800 1,440,771 0.06Belgium 2.25% 17 - 22.06.57 670,000 EUR 881,399 1,088,817 0.05Belgium 2.60% 14 - 22.06.24 1,431,000 EUR 1,574,924 1,596,567 0.07Belgium 3.00% 14 - 22.06.34 854,000 EUR 1,088,959 1,222,586 0.06Belgium 4.00% 06 - 28.03.22 1,484,000 EUR 1,566,811 1,570,710 0.07Belgium 4.25% 10 - 28.03.41 1,828,000 EUR 2,931,962 3,327,326 0.15Belgium 4.25% 12 - 28.09.22 1,650,000 EUR 1,783,979 1,792,872 0.08Belgium 4.50% 11 - 28.03.26 1,229,000 EUR 1,523,696 1,565,500 0.07Belgium 5.00% 04 - 28.03.35 2,054,000 EUR 3,244,147 3,581,354 0.16Belgium 5.50% 98 - 28.03.28 2,055,000 EUR 2,883,442 2,972,393 0.13Kingdom of Belgium 0.40% 20 - 22.06.40 553,000 EUR 555,635 583,028 0.03Kingdom of Belgium 1.25% 18 - 22.04.33 1,030,000 EUR 1,178,591 1,221,477 0.05Kingdom of Belgium 1.60% 16 - 22.06.47 1,158,000 EUR 1,295,097 1,544,656 0.07Kingdom of Belgium 3.75% 13 - 22.06.45 1,059,000 EUR 1,706,758 1,945,383 0.09Kingdom of Belgium 4.00% 12 - 28.03.32 861,000 EUR 1,192,842 1,284,440 0.06
43,836,401 46,814,335 2.11CanadaCanada 0.50% 16 - 01.03.22 1,362,000 CAD 906,985 877,190 0.04Canada 1.00% 16 - 01.06.27 1,205,000 CAD 770,926 799,954 0.04Canada 1.00% 17 - 01.09.22 2,438,000 CAD 1,611,004 1,585,573 0.07Canada 1.50% 12 - 01.06.23 1,569,000 CAD 1,066,990 1,037,594 0.05Canada 1.50% 19 - 01.02.22 200,000 CAD 136,059 130,151 0.01Canada 1.50% 20 - 01.05.22 995,000 CAD 661,235 649,219 0.03Canada 1.75% 17 - 01.03.23 2,330,000 CAD 1,552,248 1,543,346 0.07Canada 2.00% 17 - 01.06.28 1,010,000 CAD 707,841 718,247 0.03
Xtrackers II
Xtrackers II GLOBAL GOVERNMENT BOND UCITS ETF (continued)
Statement of Investmentsas at 31 December 2020(expressed in EUR)
The accompanying notes form an integral part of these financial statements.
112

DescriptionNominal
ValueCurrency
(local) Cost Market Value
% ofNet
Assets
Transferable securities and money market instruments admitted to an official stock exchange listing(A)
Bonds (continued)
Canada (continued)Canada 2.00% 17 - 01.12.51 3,055,000 CAD 2,344,500 2,356,901 0.11Canada 2.00% 18 - 01.09.23 2,734,000 CAD 1,814,405 1,834,695 0.08Canada 2.25% 14 - 01.06.25 1,400,000 CAD 981,678 973,900 0.04Canada 2.25% 18 - 01.06.29 920,000 CAD 644,204 670,900 0.03Canada 2.25% 18 - 01.03.24 581,000 CAD 394,619 395,659 0.02Canada 2.75% 11 - 01.06.22 1,218,000 CAD 834,567 809,826 0.04Canada 2.75% 14 - 01.12.48 1,210,000 CAD 963,479 1,064,842 0.05Canada 3.50% 11 - 01.12.45 1,348,000 CAD 1,202,089 1,306,082 0.06Canada 4.00% 08 - 01.06.41 1,055,000 CAD 972,138 1,043,026 0.05Canada 5.00% 04 - 01.06.37 844,000 CAD 809,536 875,976 0.04Canadian Government Bond 0.25% 20 - 01.04.24 1,100,000 CAD 706,530 704,146 0.03Canadian Government Bond 0.25% 20 - 01.02.23 1,190,000 CAD 765,093 763,773 0.03Canadian Government Bond 2.50% 13 - 01.06.24 1,360,000 CAD 945,333 938,161 0.04Canadian Government Bond 2.75% 14 - 01.12.64 493,000 CAD 445,274 484,318 0.02Canadian Government Bond 5.75% 98 - 01.06.29 840,000 CAD 750,603 766,227 0.03Canadian Government Bond 5.75% 01 - 01.06.33 1,183,000 CAD 1,167,613 1,199,512 0.05Canadian Government Bond 8.00% 96 - 01.06.27 191,000 CAD 183,575 180,738 0.01
23,338,524 23,709,956 1.07DenmarkDenmark 0.25% 19 - 15.11.22 5,841,000 DKK 795,596 797,184 0.04Denmark 0.25% 20 - 15.11.52 3,190,000 DKK 463,339 469,577 0.02Denmark 0.50% 17 - 15.11.27 7,969,000 DKK 1,106,277 1,148,329 0.05Denmark 0.50% 19 - 15.11.29 11,822,000 DKK 1,708,104 1,726,987 0.08Denmark 1.50% 12 - 15.11.23 6,488,000 DKK 916,537 925,156 0.04Denmark 1.75% 14 - 15.11.25 6,470,000 DKK 951,834 969,266 0.04Denmark 4.50% 08 - 15.11.39 12,972,000 DKK 3,024,971 3,334,901 0.15
8,966,658 9,371,400 0.42FinlandFinland Zero Coupon 16 - 15.09.23 680,000 EUR 687,214 693,294 0.03Finland Zero Coupon 17 - 15.04.22 360,000 EUR 363,039 363,323 0.02Finland Zero Coupon 19 - 15.09.24 420,000 EUR 428,929 431,134 0.02Finland Zero Coupon 20 - 15.09.30 410,000 EUR 424,896 427,052 0.02Finland 0.125% 20 - 15.04.36 384,000 EUR 393,768 400,504 0.02Finland 0.25% 20 - 15.09.40 360,000 EUR 372,189 381,470 0.02Finland 0.50% 16 - 15.04.26 625,000 EUR 643,131 665,144 0.03Finland 0.50% 17 - 15.09.27 690,000 EUR 712,441 742,516 0.03Finland 0.50% 18 - 15.09.28 350,000 EUR 351,118 378,970 0.02Finland 0.50% 19 - 15.09.29 680,000 EUR 709,157 739,854 0.03Finland 0.75% 15 - 15.04.31 460,000 EUR 476,562 517,592 0.02Finland 0.875% 15 - 15.09.25 519,000 EUR 548,138 558,491 0.02Finland 1.125% 18 - 15.04.34 560,000 EUR 605,909 663,477 0.03Finland 1.375% 17 - 15.04.47 410,000 EUR 493,379 561,753 0.03Finland 1.50% 13 - 15.04.23 500,000 EUR 522,463 525,295 0.02Finland 1.625% 12 - 15.09.22 626,000 EUR 649,190 651,153 0.03Finland 2.00% 14 - 15.04.24 612,000 EUR 658,926 667,600 0.03Finland 2.625% 12 - 04.07.42 500,000 EUR 719,837 794,815 0.04
Xtrackers II
Xtrackers II GLOBAL GOVERNMENT BOND UCITS ETF (continued)
Statement of Investmentsas at 31 December 2020(expressed in EUR)
The accompanying notes form an integral part of these financial statements.
113
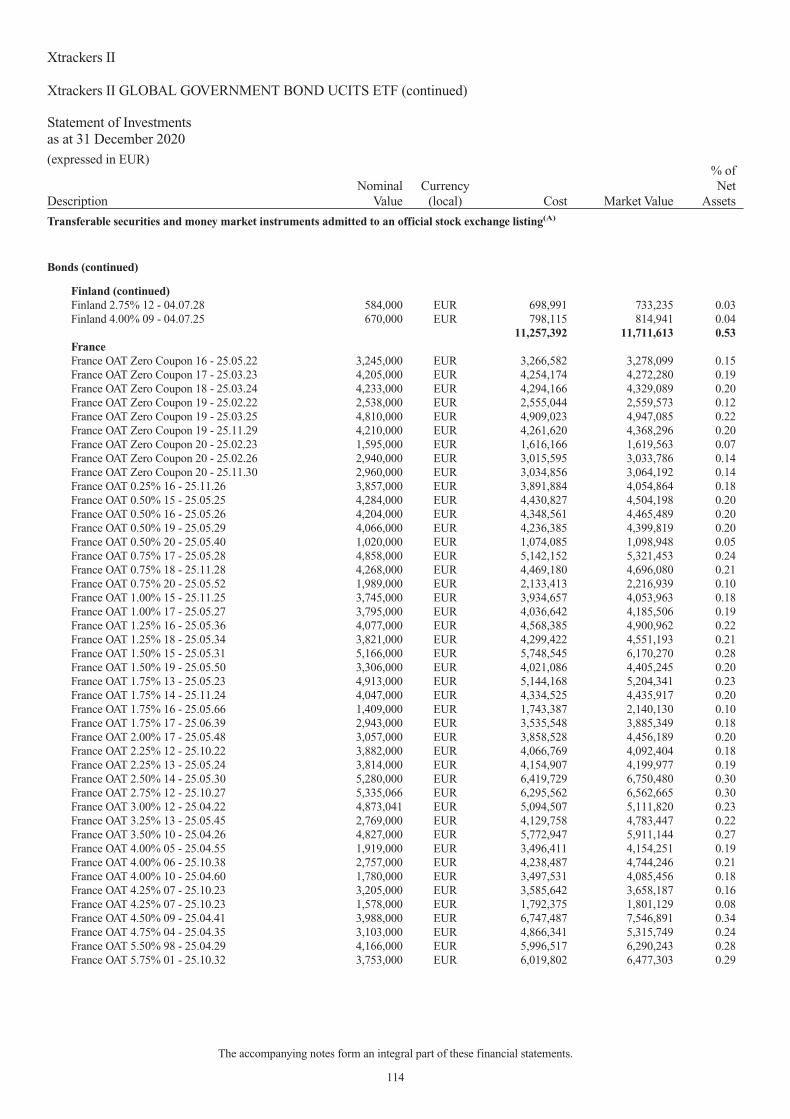
DescriptionNominal
ValueCurrency
(local) Cost Market Value
% ofNet
Assets
Transferable securities and money market instruments admitted to an official stock exchange listing(A)
Bonds (continued)
Finland (continued)Finland 2.75% 12 - 04.07.28 584,000 EUR 698,991 733,235 0.03Finland 4.00% 09 - 04.07.25 670,000 EUR 798,115 814,941 0.04
11,257,392 11,711,613 0.53FranceFrance OAT Zero Coupon 16 - 25.05.22 3,245,000 EUR 3,266,582 3,278,099 0.15France OAT Zero Coupon 17 - 25.03.23 4,205,000 EUR 4,254,174 4,272,280 0.19France OAT Zero Coupon 18 - 25.03.24 4,233,000 EUR 4,294,166 4,329,089 0.20France OAT Zero Coupon 19 - 25.02.22 2,538,000 EUR 2,555,044 2,559,573 0.12France OAT Zero Coupon 19 - 25.03.25 4,810,000 EUR 4,909,023 4,947,085 0.22France OAT Zero Coupon 19 - 25.11.29 4,210,000 EUR 4,261,620 4,368,296 0.20France OAT Zero Coupon 20 - 25.02.23 1,595,000 EUR 1,616,166 1,619,563 0.07France OAT Zero Coupon 20 - 25.02.26 2,940,000 EUR 3,015,595 3,033,786 0.14France OAT Zero Coupon 20 - 25.11.30 2,960,000 EUR 3,034,856 3,064,192 0.14France OAT 0.25% 16 - 25.11.26 3,857,000 EUR 3,891,884 4,054,864 0.18France OAT 0.50% 15 - 25.05.25 4,284,000 EUR 4,430,827 4,504,198 0.20France OAT 0.50% 16 - 25.05.26 4,204,000 EUR 4,348,561 4,465,489 0.20France OAT 0.50% 19 - 25.05.29 4,066,000 EUR 4,236,385 4,399,819 0.20France OAT 0.50% 20 - 25.05.40 1,020,000 EUR 1,074,085 1,098,948 0.05France OAT 0.75% 17 - 25.05.28 4,858,000 EUR 5,142,152 5,321,453 0.24France OAT 0.75% 18 - 25.11.28 4,268,000 EUR 4,469,180 4,696,080 0.21France OAT 0.75% 20 - 25.05.52 1,989,000 EUR 2,133,413 2,216,939 0.10France OAT 1.00% 15 - 25.11.25 3,745,000 EUR 3,934,657 4,053,963 0.18France OAT 1.00% 17 - 25.05.27 3,795,000 EUR 4,036,642 4,185,506 0.19France OAT 1.25% 16 - 25.05.36 4,077,000 EUR 4,568,385 4,900,962 0.22France OAT 1.25% 18 - 25.05.34 3,821,000 EUR 4,299,422 4,551,193 0.21France OAT 1.50% 15 - 25.05.31 5,166,000 EUR 5,748,545 6,170,270 0.28France OAT 1.50% 19 - 25.05.50 3,306,000 EUR 4,021,086 4,405,245 0.20France OAT 1.75% 13 - 25.05.23 4,913,000 EUR 5,144,168 5,204,341 0.23France OAT 1.75% 14 - 25.11.24 4,047,000 EUR 4,334,525 4,435,917 0.20France OAT 1.75% 16 - 25.05.66 1,409,000 EUR 1,743,387 2,140,130 0.10France OAT 1.75% 17 - 25.06.39 2,943,000 EUR 3,535,548 3,885,349 0.18France OAT 2.00% 17 - 25.05.48 3,057,000 EUR 3,858,528 4,456,189 0.20France OAT 2.25% 12 - 25.10.22 3,882,000 EUR 4,066,769 4,092,404 0.18France OAT 2.25% 13 - 25.05.24 3,814,000 EUR 4,154,907 4,199,977 0.19France OAT 2.50% 14 - 25.05.30 5,280,000 EUR 6,419,729 6,750,480 0.30France OAT 2.75% 12 - 25.10.27 5,335,066 EUR 6,295,562 6,562,665 0.30France OAT 3.00% 12 - 25.04.22 4,873,041 EUR 5,094,507 5,111,820 0.23France OAT 3.25% 13 - 25.05.45 2,769,000 EUR 4,129,758 4,783,447 0.22France OAT 3.50% 10 - 25.04.26 4,827,000 EUR 5,772,947 5,911,144 0.27France OAT 4.00% 05 - 25.04.55 1,919,000 EUR 3,496,411 4,154,251 0.19France OAT 4.00% 06 - 25.10.38 2,757,000 EUR 4,238,487 4,744,246 0.21France OAT 4.00% 10 - 25.04.60 1,780,000 EUR 3,497,531 4,085,456 0.18France OAT 4.25% 07 - 25.10.23 3,205,000 EUR 3,585,642 3,658,187 0.16France OAT 4.25% 07 - 25.10.23 1,578,000 EUR 1,792,375 1,801,129 0.08France OAT 4.50% 09 - 25.04.41 3,988,000 EUR 6,747,487 7,546,891 0.34France OAT 4.75% 04 - 25.04.35 3,103,000 EUR 4,866,341 5,315,749 0.24France OAT 5.50% 98 - 25.04.29 4,166,000 EUR 5,996,517 6,290,243 0.28France OAT 5.75% 01 - 25.10.32 3,753,000 EUR 6,019,802 6,477,303 0.29
Xtrackers II
Xtrackers II GLOBAL GOVERNMENT BOND UCITS ETF (continued)
Statement of Investmentsas at 31 December 2020(expressed in EUR)
The accompanying notes form an integral part of these financial statements.
114

DescriptionNominal
ValueCurrency
(local) Cost Market Value
% ofNet
Assets
Transferable securities and money market instruments admitted to an official stock exchange listing(A)
Bonds (continued)
France (continued)France OAT 6.00% 94 - 25.10.25 3,261,000 EUR 4,221,859 4,326,695 0.20France OAT 8.50% 92 - 25.04.23 1,230,000 EUR 1,486,856 1,493,097 0.07
188,042,093 197,924,002 8.93GermanyBundesobligation Zero Coupon 17 - 08.04.22 2,170,000 EUR 2,189,354 2,190,680 0.10Bundesobligation Zero Coupon 17 - 07.10.22 1,981,000 EUR 2,002,352 2,006,079 0.09Bundesobligation Zero Coupon 18 - 14.04.23 1,983,000 EUR 2,009,808 2,016,889 0.09Bundesobligation Zero Coupon 18 - 13.10.23 2,035,000 EUR 2,059,398 2,078,223 0.09Bundesobligation Zero Coupon 19 - 05.04.24 2,532,000 EUR 2,580,693 2,595,579 0.12Bundesobligation Zero Coupon 19 - 18.10.24 2,479,000 EUR 2,545,145 2,549,577 0.11Bundesobligation Zero Coupon 20 - 11.04.25 2,150,000 EUR 2,220,467 2,218,865 0.10Bundesobligation Zero Coupon 20 - 10.10.25 2,690,000 EUR 2,787,217 2,787,082 0.13Bundesobligation Zero Coupon 20 - 10.10.25 520,000 EUR 539,144 538,918 0.02Bundesrepublik Deutschland Zero Coupon 16 -15.08.26 3,299,000 EUR 3,357,515 3,439,537 0.16Bundesrepublik Deutschland Zero Coupon 19 -15.08.29 2,828,000 EUR 2,938,707 2,986,481 0.13Bundesrepublik Deutschland Zero Coupon 19 -15.08.50 1,880,000 EUR 1,900,875 1,974,376 0.09Bundesrepublik Deutschland Zero Coupon 20 -15.02.30 2,601,000 EUR 2,726,801 2,749,205 0.12Bundesrepublik Deutschland Zero Coupon 20 -15.05.35 2,310,000 EUR 2,402,528 2,440,931 0.11Bundesrepublik Deutschland Zero Coupon 20 -15.11.27 2,270,000 EUR 2,368,142 2,378,892 0.11Bundesrepublik Deutschland Zero Coupon 20 -15.08.30 3,250,000 EUR 3,416,044 3,436,485 0.16Bundesrepublik Deutschland Zero Coupon 20 -15.08.30 720,000 EUR 758,887 763,229 0.03Bundesrepublik Deutschland 0.25% 17 - 15.02.27 3,410,000 EUR 3,560,745 3,619,510 0.16Bundesrepublik Deutschland 0.25% 18 - 15.08.28 2,693,000 EUR 2,819,856 2,887,704 0.13Bundesrepublik Deutschland 0.25% 19 - 15.02.29 2,763,000 EUR 2,900,436 2,972,353 0.13Bundesrepublik Deutschland 0.50% 15 - 15.02.25 2,879,000 EUR 2,993,005 3,028,766 0.14Bundesrepublik Deutschland 0.50% 16 - 15.02.26 3,175,000 EUR 3,317,301 3,383,026 0.15Bundesrepublik Deutschland 0.50% 17 - 15.08.27 3,143,000 EUR 3,284,394 3,400,663 0.15Bundesrepublik Deutschland 0.50% 18 - 15.02.28 2,660,000 EUR 2,791,332 2,891,154 0.13Bundesrepublik Deutschland 1.00% 14 - 15.08.24 2,327,000 EUR 2,461,425 2,476,580 0.11Bundesrepublik Deutschland 1.00% 15 - 15.08.25 2,875,000 EUR 3,080,222 3,111,469 0.14Bundesrepublik Deutschland 1.25% 17 - 15.08.48 2,690,000 EUR 3,454,154 3,790,936 0.17Bundesrepublik Deutschland 1.50% 12 - 04.09.22 2,130,000 EUR 2,201,402 2,211,174 0.10Bundesrepublik Deutschland 1.50% 13 - 15.02.23 2,254,000 EUR 2,350,421 2,361,606 0.11Bundesrepublik Deutschland 1.50% 13 - 15.05.23 2,481,000 EUR 2,611,523 2,614,056 0.12Bundesrepublik Deutschland 1.50% 14 - 15.05.24 2,423,000 EUR 2,580,004 2,609,086 0.12Bundesrepublik Deutschland 1.75% 12 - 04.07.22 2,770,000 EUR 2,870,926 2,873,737 0.13Bundesrepublik Deutschland 1.75% 14 - 15.02.24 2,347,000 EUR 2,515,681 2,532,436 0.11Bundesrepublik Deutschland 2.00% 11 - 04.01.22 2,370,000 EUR 2,433,606 2,437,000 0.11Bundesrepublik Deutschland 2.00% 13 - 15.08.23 2,176,000 EUR 2,331,304 2,334,717 0.11Bundesrepublik Deutschland 2.50% 12 - 04.07.44 2,977,000 EUR 4,477,579 4,997,341 0.23
Xtrackers II
Xtrackers II GLOBAL GOVERNMENT BOND UCITS ETF (continued)
Statement of Investmentsas at 31 December 2020(expressed in EUR)
The accompanying notes form an integral part of these financial statements.
115

DescriptionNominal
ValueCurrency
(local) Cost Market Value
% ofNet
Assets
Transferable securities and money market instruments admitted to an official stock exchange listing(A)
Bonds (continued)
Germany (continued)Bundesrepublik Deutschland 2.50% 14 - 15.08.46 3,271,000 EUR 5,057,924 5,641,199 0.25Bundesrepublik Deutschland 3.25% 10 - 04.07.42 2,139,000 EUR 3,556,623 3,845,430 0.17Bundesrepublik Deutschland 4.00% 05 - 04.01.37 2,984,000 EUR 4,886,209 5,166,766 0.23Bundesrepublik Deutschland 4.25% 07 - 04.07.39 1,924,000 EUR 3,375,363 3,628,414 0.16Bundesrepublik Deutschland 4.75% 98 - 04.07.28 1,513,000 EUR 2,072,333 2,150,245 0.10Bundesrepublik Deutschland 4.75% 03 - 04.07.34 2,637,000 EUR 4,325,165 4,574,404 0.21Bundesrepublik Deutschland 4.75% 08 - 04.07.40 2,155,000 EUR 4,108,502 4,383,248 0.20Bundesrepublik Deutschland 5.50% 00 - 04.01.31 2,340,000 EUR 3,717,232 3,815,581 0.17Bundesrepublik Deutschland 5.625% 98 - 04.01.28 1,925,000 EUR 2,706,948 2,803,070 0.13Bundesrepublik Deutschland 6.25% 94 - 04.01.24 1,340,000 EUR 1,622,792 1,625,996 0.07Bundesrepublik Deutschland 6.25% 00 - 04.01.30 1,290,000 EUR 2,016,401 2,118,735 0.10Bundesrepublik Deutschland 6.50% 97 - 04.07.27 1,430,000 EUR 2,109,363 2,119,489 0.10Bundesschatzanweisungen Zero Coupon 20 - 11.03.22 1,438,000 EUR 1,451,232 1,450,554 0.07Bundesschatzanweisungen Zero Coupon 20 - 10.06.22 1,570,000 EUR 1,586,213 1,586,344 0.07Bundesschatzanweisungen Zero Coupon 20 - 16.09.22 1,770,000 EUR 1,792,270 1,791,842 0.08Bundesschatzanweisungen Zero Coupon 20 - 15.12.22 630,000 EUR 639,087 638,700 0.03
138,862,050 143,024,359 6.45IrelandIreland Zero Coupon 17 - 18.10.22 610,000 EUR 615,556 617,210 0.03Ireland 0.20% 20 - 15.05.27 754,000 EUR 766,557 787,402 0.03Ireland 0.20% 20 - 18.10.30 840,000 EUR 858,539 882,084 0.04Ireland 0.40% 20 - 15.05.35 490,000 EUR 503,781 523,859 0.02Ireland 0.80% 15 - 15.03.22 512,000 EUR 519,719 521,011 0.02Ireland 0.90% 18 - 15.05.28 846,000 EUR 881,363 930,938 0.04Ireland 1.00% 16 - 15.05.26 1,231,000 EUR 1,288,480 1,335,758 0.06Ireland 1.10% 19 - 15.05.29 1,096,000 EUR 1,175,049 1,235,521 0.06Ireland 1.30% 18 - 15.05.33 564,000 EUR 609,300 669,412 0.03Ireland 1.35% 18 - 18.03.31 550,000 EUR 621,434 644,380 0.03Ireland 1.50% 19 - 15.05.50 590,000 EUR 658,981 789,420 0.04Ireland 1.70% 17 - 15.05.37 702,000 EUR 807,272 899,683 0.04Ireland 2.00% 15 - 18.02.45 899,000 EUR 1,019,584 1,290,245 0.06Ireland 2.40% 14 - 15.05.30 980,000 EUR 1,138,769 1,236,662 0.06Ireland 3.40% 14 - 18.03.24 908,000 EUR 1,009,792 1,026,403 0.05Ireland 3.90% 13 - 20.03.23 700,000 EUR 762,184 770,840 0.03Ireland 5.40% 09 - 13.03.25 1,266,000 EUR 1,544,634 1,587,058 0.07
14,780,994 15,747,886 0.71IsraelIsrael 0.15% 20 - 31.07.23 810,000 ILS 204,066 206,134 0.01Israel 0.50% 20 - 30.04.25 1,400,000 ILS 363,035 359,836 0.02Israel 0.75% 19 - 31.07.22 1,900,000 ILS 491,616 489,080 0.02Israel 1.00% 19 - 31.03.30 1,882,000 ILS 490,971 488,810 0.02Israel 1.25% 17 - 30.11.22 500,000 ILS 132,208 130,205 0.01Israel 1.50% 18 - 30.11.23 1,800,000 ILS 471,595 475,925 0.02Israel 1.50% 20 - 31.05.37 1,000,000 ILS 262,904 257,143 0.01Israel 1.75% 15 - 31.08.25 1,950,000 ILS 549,326 529,943 0.02Israel 2.00% 16 - 31.03.27 1,950,000 ILS 547,693 545,072 0.02Israel 2.25% 18 - 28.09.28 2,036,000 ILS 605,219 584,036 0.03Israel 3.75% 14 - 31.03.24 2,846,000 ILS 835,082 807,925 0.04
Xtrackers II
Xtrackers II GLOBAL GOVERNMENT BOND UCITS ETF (continued)
Statement of Investmentsas at 31 December 2020(expressed in EUR)
The accompanying notes form an integral part of these financial statements.
116

DescriptionNominal
ValueCurrency
(local) Cost Market Value
% ofNet
Assets
Transferable securities and money market instruments admitted to an official stock exchange listing(A)
Bonds (continued)
Israel (continued)Israel 3.75% 17 - 31.03.47 2,258,000 ILS 844,204 802,914 0.04Israel 4.25% 12 - 31.03.23 1,998,000 ILS 575,140 555,869 0.02Israel 5.50% 11 - 31.01.22 1,689,000 ILS 472,537 455,387 0.02Israel 5.50% 12 - 31.01.42 2,013,000 ILS 915,365 877,700 0.04Israel 6.25% 06 - 30.10.26 1,809,000 ILS 646,000 616,933 0.03
8,406,961 8,182,912 0.37ItalyItaly Buoni Poliennali Del Tesoro Zero Coupon 20 -15.01.24 1,050,000 EUR 1,057,828 1,059,149 0.05Italy Buoni Poliennali Del Tesoro 0.05% 19 - 15.01.23 1,541,000 EUR 1,530,822 1,555,427 0.07Italy Buoni Poliennali Del Tesoro 0.30% 20 - 15.08.23 1,680,000 EUR 1,690,578 1,708,583 0.08Italy Buoni Poliennali Del Tesoro 0.35% 19 - 01.02.25 2,171,000 EUR 2,144,558 2,217,390 0.10Italy Buoni Poliennali Del Tesoro 0.50% 20 - 01.02.26 1,240,000 EUR 1,259,497 1,272,484 0.06Italy Buoni Poliennali Del Tesoro 0.60% 20 - 15.06.23 1,565,000 EUR 1,562,010 1,603,835 0.07Italy Buoni Poliennali Del Tesoro 0.65% 16 - 15.10.23 1,580,000 EUR 1,559,320 1,623,874 0.07Italy Buoni Poliennali Del Tesoro 0.85% 19 - 15.01.27 1,910,000 EUR 1,887,762 1,996,498 0.09Italy Buoni Poliennali Del Tesoro 0.90% 17 - 01.08.22 1,865,000 EUR 1,873,249 1,905,318 0.09Italy Buoni Poliennali Del Tesoro 0.90% 20 - 01.04.31 1,240,000 EUR 1,271,500 1,284,618 0.06Italy Buoni Poliennali Del Tesoro 0.95% 16 - 15.03.23 1,580,000 EUR 1,585,960 1,626,735 0.07Italy Buoni Poliennali Del Tesoro 0.95% 18 - 01.03.23 1,721,000 EUR 1,725,020 1,771,110 0.08Italy Buoni Poliennali Del Tesoro 0.95% 20 - 01.08.30 1,733,000 EUR 1,663,434 1,812,319 0.08Italy Buoni Poliennali Del Tesoro 0.95% 20 - 15.09.27 2,160,000 EUR 2,222,265 2,267,899 0.10Italy Buoni Poliennali Del Tesoro 1.00% 19 - 15.07.22 1,418,000 EUR 1,425,123 1,450,182 0.07Italy Buoni Poliennali Del Tesoro 1.20% 17 - 01.04.22 1,769,000 EUR 1,787,388 1,805,714 0.08Italy Buoni Poliennali Del Tesoro 1.25% 16 - 01.12.26 2,078,000 EUR 2,065,920 2,224,439 0.10Italy Buoni Poliennali Del Tesoro 1.35% 15 - 15.04.22 1,871,000 EUR 1,882,366 1,915,149 0.09Italy Buoni Poliennali Del Tesoro 1.35% 19 - 01.04.30 2,551,000 EUR 2,576,228 2,762,695 0.13Italy Buoni Poliennali Del Tesoro 1.45% 15 - 15.09.22 1,873,000 EUR 1,888,667 1,934,047 0.09Italy Buoni Poliennali Del Tesoro 1.45% 17 - 15.11.24 1,655,000 EUR 1,664,904 1,760,756 0.08Italy Buoni Poliennali Del Tesoro 1.45% 18 - 15.05.25 1,676,000 EUR 1,695,210 1,790,880 0.08Italy Buoni Poliennali Del Tesoro 1.45% 20 - 01.03.36 1,497,000 EUR 1,444,658 1,608,366 0.07Italy Buoni Poliennali Del Tesoro 1.50% 15 - 01.06.25 1,980,000 EUR 1,990,414 2,121,889 0.10Italy Buoni Poliennali Del Tesoro 1.60% 16 - 01.06.26 2,286,000 EUR 2,301,690 2,483,905 0.11Italy Buoni Poliennali Del Tesoro 1.65% 15 - 01.03.32 2,618,000 EUR 2,596,002 2,908,274 0.13Italy Buoni Poliennali Del Tesoro 1.65% 20 - 01.12.30 2,440,000 EUR 2,561,525 2,709,407 0.12Italy Buoni Poliennali Del Tesoro 1.70% 20 - 01.09.51 890,000 EUR 913,079 945,179 0.04Italy Buoni Poliennali Del Tesoro 1.75% 19 - 01.07.24 1,908,000 EUR 1,966,998 2,039,312 0.09Italy Buoni Poliennali Del Tesoro 1.80% 20 - 01.03.41 1,090,000 EUR 1,151,164 1,204,384 0.06Italy Buoni Poliennali Del Tesoro 1.85% 17 - 15.05.24 1,515,000 EUR 1,539,271 1,622,429 0.07Italy Buoni Poliennali Del Tesoro 1.85% 20 - 01.07.25 1,908,000 EUR 1,984,174 2,076,001 0.09Italy Buoni Poliennali Del Tesoro 2.00% 15 - 01.12.25 2,043,000 EUR 2,106,399 2,251,883 0.10Italy Buoni Poliennali Del Tesoro 2.00% 18 - 01.02.28 2,441,000 EUR 2,538,750 2,743,863 0.12Italy Buoni Poliennali Del Tesoro 2.05% 17 - 01.08.27 2,117,000 EUR 2,158,734 2,377,710 0.11Italy Buoni Poliennali Del Tesoro 2.10% 19 - 15.07.26 1,850,000 EUR 1,926,466 2,061,895 0.09Italy Buoni Poliennali Del Tesoro 2.20% 17 - 01.06.27 1,730,000 EUR 1,762,115 1,957,582 0.09Italy Buoni Poliennali Del Tesoro 2.25% 16 - 01.09.36 1,646,000 EUR 1,709,199 1,959,089 0.09Italy Buoni Poliennali Del Tesoro 2.45% 17 - 01.09.33 2,014,000 EUR 2,145,345 2,425,537 0.11Italy Buoni Poliennali Del Tesoro 2.45% 18 - 01.10.23 1,707,000 EUR 1,767,856 1,838,710 0.08
Xtrackers II
Xtrackers II GLOBAL GOVERNMENT BOND UCITS ETF (continued)
Statement of Investmentsas at 31 December 2020(expressed in EUR)
The accompanying notes form an integral part of these financial statements.
117

DescriptionNominal
ValueCurrency
(local) Cost Market Value
% ofNet
Assets
Transferable securities and money market instruments admitted to an official stock exchange listing(A)
Bonds (continued)
Italy (continued)Italy Buoni Poliennali Del Tesoro 2.45% 20 - 01.09.50 1,654,000 EUR 1,783,930 2,066,091 0.09Italy Buoni Poliennali Del Tesoro 2.50% 14 - 01.12.24 2,094,000 EUR 2,191,958 2,312,234 0.10Italy Buoni Poliennali Del Tesoro 2.50% 18 - 15.11.25 1,819,000 EUR 1,898,328 2,048,226 0.09Italy Buoni Poliennali Del Tesoro 2.70% 16 - 01.03.47 1,875,000 EUR 1,962,978 2,434,091 0.11Italy Buoni Poliennali Del Tesoro 2.80% 16 - 01.03.67 991,000 EUR 995,952 1,326,929 0.06Italy Buoni Poliennali Del Tesoro 2.80% 18 - 01.12.28 2,283,000 EUR 2,422,546 2,727,562 0.12Italy Buoni Poliennali Del Tesoro 2.95% 18 - 01.09.38 1,565,000 EUR 1,606,127 2,041,012 0.09Italy Buoni Poliennali Del Tesoro 3.00% 19 - 01.08.29 2,158,000 EUR 2,404,906 2,636,125 0.12Italy Buoni Poliennali Del Tesoro 3.10% 19 - 01.03.40 1,421,000 EUR 1,686,371 1,897,190 0.09Italy Buoni Poliennali Del Tesoro 3.25% 15 - 01.09.46 1,728,000 EUR 1,905,504 2,447,471 0.11Italy Buoni Poliennali Del Tesoro 3.35% 19 - 01.03.35 1,555,000 EUR 1,725,465 2,071,369 0.09Italy Buoni Poliennali Del Tesoro 3.45% 17 - 01.03.48 1,711,000 EUR 1,886,293 2,519,908 0.11Italy Buoni Poliennali Del Tesoro 3.50% 14 - 01.03.30 2,621,000 EUR 3,004,511 3,343,776 0.15Italy Buoni Poliennali Del Tesoro 3.75% 14 - 01.09.24 2,183,000 EUR 2,381,325 2,498,785 0.11Italy Buoni Poliennali Del Tesoro 3.85% 19 - 01.09.49 1,473,000 EUR 1,898,600 2,328,091 0.11Italy Buoni Poliennali Del Tesoro 4.00% 05 - 01.02.37 2,923,000 EUR 3,506,177 4,222,773 0.19Italy Buoni Poliennali Del Tesoro 4.50% 10 - 01.03.26 2,473,000 EUR 2,882,320 3,050,625 0.14Italy Buoni Poliennali Del Tesoro 4.50% 13 - 01.05.23 1,854,000 EUR 2,018,285 2,066,422 0.09Italy Buoni Poliennali Del Tesoro 4.50% 13 - 01.03.24 2,566,000 EUR 2,870,226 2,954,379 0.13Italy Buoni Poliennali Del Tesoro 4.75% 08 - 01.08.23 2,506,000 EUR 2,721,084 2,840,899 0.13Italy Buoni Poliennali Del Tesoro 4.75% 13 - 01.09.28 2,566,000 EUR 3,062,194 3,429,136 0.16Italy Buoni Poliennali Del Tesoro 4.75% 13 - 01.09.44 1,919,000 EUR 2,639,092 3,278,320 0.15Italy Buoni Poliennali Del Tesoro 5.00% 03 - 01.08.34 2,717,000 EUR 3,550,424 4,182,889 0.19Italy Buoni Poliennali Del Tesoro 5.00% 07 - 01.08.39 2,462,000 EUR 3,459,605 4,086,662 0.19Italy Buoni Poliennali Del Tesoro 5.00% 09 - 01.03.25 2,673,000 EUR 3,082,929 3,248,818 0.15Italy Buoni Poliennali Del Tesoro 5.00% 09 - 01.09.40 2,319,000 EUR 3,101,671 3,886,353 0.18Italy Buoni Poliennali Del Tesoro 5.00% 11 - 01.03.22 2,147,000 EUR 2,256,704 2,285,016 0.10Italy Buoni Poliennali Del Tesoro 5.25% 98 - 01.11.29 3,087,000 EUR 3,872,708 4,391,051 0.20Italy Buoni Poliennali Del Tesoro 5.50% 12 - 01.09.22 2,047,000 EUR 2,210,749 2,249,052 0.10Italy Buoni Poliennali Del Tesoro 5.50% 12 - 01.11.22 2,457,000 EUR 2,689,291 2,722,556 0.12Italy Buoni Poliennali Del Tesoro 5.75% 02 - 01.02.33 2,154,000 EUR 2,960,219 3,413,350 0.15Italy Buoni Poliennali Del Tesoro 6.00% 00 - 01.05.31 3,130,000 EUR 4,168,050 4,839,717 0.22Italy Buoni Poliennali Del Tesoro 6.50% 97 - 01.11.27 2,901,000 EUR 3,840,369 4,134,979 0.19Italy Buoni Poliennali Del Tesoro 7.25% 97 - 01.11.26 1,220,000 EUR 1,593,486 1,731,166 0.08Italy Buoni Poliennali Del Tesoro 9.00% 93 - 01.11.23 1,426,000 EUR 1,745,353 1,805,350 0.08
160,569,178 176,202,889 7.95JapanJapan Government Five Year Bond 0.10% 17 -20.03.22 91,300,000 JPY 744,850 724,601 0.03Japan Government Five Year Bond 0.10% 17 -20.06.22 137,350,000 JPY 1,094,267 1,090,816 0.05Japan Government Five Year Bond 0.10% 17 -20.09.22 180,150,000 JPY 1,464,030 1,431,769 0.06Japan Government Five Year Bond 0.10% 17 -20.12.22 139,750,000 JPY 1,110,403 1,111,303 0.05Japan Government Five Year Bond 0.10% 18 -20.03.23 182,650,000 JPY 1,457,849 1,453,330 0.07
Xtrackers II
Xtrackers II GLOBAL GOVERNMENT BOND UCITS ETF (continued)
Statement of Investmentsas at 31 December 2020(expressed in EUR)
The accompanying notes form an integral part of these financial statements.
118

DescriptionNominal
ValueCurrency
(local) Cost Market Value
% ofNet
Assets
Transferable securities and money market instruments admitted to an official stock exchange listing(A)
Bonds (continued)
Japan (continued)Japan Government Five Year Bond 0.10% 18 -20.06.23 79,700,000 JPY 648,120 634,563 0.03Japan Government Five Year Bond 0.10% 18 -20.09.23 110,150,000 JPY 922,974 877,570 0.04Japan Government Five Year Bond 0.10% 19 -20.12.23 180,450,000 JPY 1,461,799 1,438,581 0.06Japan Government Five Year Bond 0.10% 19 -20.03.24 166,450,000 JPY 1,382,696 1,327,709 0.06Japan Government Five Year Bond 0.10% 19 -20.06.24 242,950,000 JPY 2,070,586 1,938,305 0.09Japan Government Five Year Bond 0.10% 19 -20.09.24 283,600,000 JPY 2,374,263 2,263,786 0.10Japan Government Five Year Bond 0.10% 20 -20.12.24 216,500,000 JPY 1,833,058 1,729,047 0.08Japan Government Five Year Bond 0.10% 20 -20.03.25 262,200,000 JPY 2,236,462 2,095,767 0.09Japan Government Five Year Bond 0.10% 20 -20.06.25 411,850,000 JPY 3,302,346 3,293,257 0.15Japan Government Five Year Bond 0.10% 20 -20.09.25 537,000,000 JPY 4,367,702 4,293,648 0.19Japan Government Forty Year Bond 0.40% 16 -20.03.56 233,800,000 JPY 1,776,828 1,699,012 0.08Japan Government Forty Year Bond 0.50% 19 -20.03.59 291,100,000 JPY 2,499,205 2,170,045 0.10Japan Government Forty Year Bond 0.50% 20 -20.03.60 236,000,000 JPY 1,805,325 1,760,041 0.08Japan Government Forty Year Bond 0.80% 18 -20.03.58 235,100,000 JPY 2,061,877 1,939,790 0.09Japan Government Forty Year Bond 0.90% 17 -20.03.57 235,350,000 JPY 2,097,923 2,003,109 0.09Japan Government Forty Year Bond 1.40% 15 -20.03.55 113,950,000 JPY 1,168,415 1,106,843 0.05Japan Government Forty Year Bond 1.70% 14 -20.03.54 117,050,000 JPY 1,237,983 1,215,361 0.05Japan Government Forty Year Bond 1.90% 13 -20.03.53 110,600,000 JPY 1,233,553 1,192,060 0.05Japan Government Forty Year Bond 2.00% 12 -20.03.52 192,100,000 JPY 2,177,433 2,098,761 0.09Japan Government Forty Year Bond 2.20% 09 -20.03.49 131,100,000 JPY 1,549,275 1,467,672 0.07Japan Government Forty Year Bond 2.20% 10 -20.03.50 121,300,000 JPY 1,424,687 1,363,472 0.06Japan Government Forty Year Bond 2.20% 11 -20.03.51 187,600,000 JPY 2,206,659 2,115,949 0.10Japan Government Forty Year Bond 2.40% 07 -20.03.48 75,000,000 JPY 955,964 865,348 0.04Japan Government Ten Year Bond 0.10% 16 - 20.03.26 102,400,000 JPY 849,973 819,343 0.04Japan Government Ten Year Bond 0.10% 16 - 20.06.26 96,950,000 JPY 842,839 776,043 0.03
Xtrackers II
Xtrackers II GLOBAL GOVERNMENT BOND UCITS ETF (continued)
Statement of Investmentsas at 31 December 2020(expressed in EUR)
The accompanying notes form an integral part of these financial statements.
119
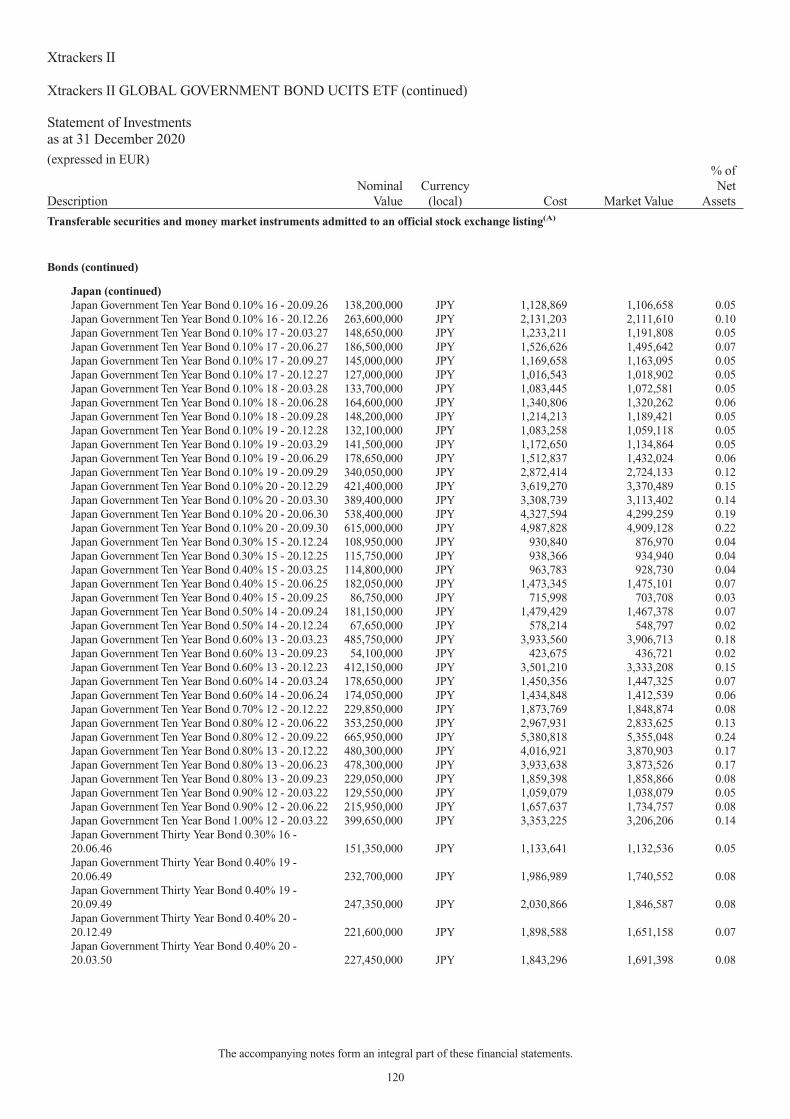
DescriptionNominal
ValueCurrency
(local) Cost Market Value
% ofNet
Assets
Transferable securities and money market instruments admitted to an official stock exchange listing(A)
Bonds (continued)
Japan (continued)Japan Government Ten Year Bond 0.10% 16 - 20.09.26 138,200,000 JPY 1,128,869 1,106,658 0.05Japan Government Ten Year Bond 0.10% 16 - 20.12.26 263,600,000 JPY 2,131,203 2,111,610 0.10Japan Government Ten Year Bond 0.10% 17 - 20.03.27 148,650,000 JPY 1,233,211 1,191,808 0.05Japan Government Ten Year Bond 0.10% 17 - 20.06.27 186,500,000 JPY 1,526,626 1,495,642 0.07Japan Government Ten Year Bond 0.10% 17 - 20.09.27 145,000,000 JPY 1,169,658 1,163,095 0.05Japan Government Ten Year Bond 0.10% 17 - 20.12.27 127,000,000 JPY 1,016,543 1,018,902 0.05Japan Government Ten Year Bond 0.10% 18 - 20.03.28 133,700,000 JPY 1,083,445 1,072,581 0.05Japan Government Ten Year Bond 0.10% 18 - 20.06.28 164,600,000 JPY 1,340,806 1,320,262 0.06Japan Government Ten Year Bond 0.10% 18 - 20.09.28 148,200,000 JPY 1,214,213 1,189,421 0.05Japan Government Ten Year Bond 0.10% 19 - 20.12.28 132,100,000 JPY 1,083,258 1,059,118 0.05Japan Government Ten Year Bond 0.10% 19 - 20.03.29 141,500,000 JPY 1,172,650 1,134,864 0.05Japan Government Ten Year Bond 0.10% 19 - 20.06.29 178,650,000 JPY 1,512,837 1,432,024 0.06Japan Government Ten Year Bond 0.10% 19 - 20.09.29 340,050,000 JPY 2,872,414 2,724,133 0.12Japan Government Ten Year Bond 0.10% 20 - 20.12.29 421,400,000 JPY 3,619,270 3,370,489 0.15Japan Government Ten Year Bond 0.10% 20 - 20.03.30 389,400,000 JPY 3,308,739 3,113,402 0.14Japan Government Ten Year Bond 0.10% 20 - 20.06.30 538,400,000 JPY 4,327,594 4,299,259 0.19Japan Government Ten Year Bond 0.10% 20 - 20.09.30 615,000,000 JPY 4,987,828 4,909,128 0.22Japan Government Ten Year Bond 0.30% 15 - 20.12.24 108,950,000 JPY 930,840 876,970 0.04Japan Government Ten Year Bond 0.30% 15 - 20.12.25 115,750,000 JPY 938,366 934,940 0.04Japan Government Ten Year Bond 0.40% 15 - 20.03.25 114,800,000 JPY 963,783 928,730 0.04Japan Government Ten Year Bond 0.40% 15 - 20.06.25 182,050,000 JPY 1,473,345 1,475,101 0.07Japan Government Ten Year Bond 0.40% 15 - 20.09.25 86,750,000 JPY 715,998 703,708 0.03Japan Government Ten Year Bond 0.50% 14 - 20.09.24 181,150,000 JPY 1,479,429 1,467,378 0.07Japan Government Ten Year Bond 0.50% 14 - 20.12.24 67,650,000 JPY 578,214 548,797 0.02Japan Government Ten Year Bond 0.60% 13 - 20.03.23 485,750,000 JPY 3,933,560 3,906,713 0.18Japan Government Ten Year Bond 0.60% 13 - 20.09.23 54,100,000 JPY 423,675 436,721 0.02Japan Government Ten Year Bond 0.60% 13 - 20.12.23 412,150,000 JPY 3,501,210 3,333,208 0.15Japan Government Ten Year Bond 0.60% 14 - 20.03.24 178,650,000 JPY 1,450,356 1,447,325 0.07Japan Government Ten Year Bond 0.60% 14 - 20.06.24 174,050,000 JPY 1,434,848 1,412,539 0.06Japan Government Ten Year Bond 0.70% 12 - 20.12.22 229,850,000 JPY 1,873,769 1,848,874 0.08Japan Government Ten Year Bond 0.80% 12 - 20.06.22 353,250,000 JPY 2,967,931 2,833,625 0.13Japan Government Ten Year Bond 0.80% 12 - 20.09.22 665,950,000 JPY 5,380,818 5,355,048 0.24Japan Government Ten Year Bond 0.80% 13 - 20.12.22 480,300,000 JPY 4,016,921 3,870,903 0.17Japan Government Ten Year Bond 0.80% 13 - 20.06.23 478,300,000 JPY 3,933,638 3,873,526 0.17Japan Government Ten Year Bond 0.80% 13 - 20.09.23 229,050,000 JPY 1,859,398 1,858,866 0.08Japan Government Ten Year Bond 0.90% 12 - 20.03.22 129,550,000 JPY 1,059,079 1,038,079 0.05Japan Government Ten Year Bond 0.90% 12 - 20.06.22 215,950,000 JPY 1,657,637 1,734,757 0.08Japan Government Ten Year Bond 1.00% 12 - 20.03.22 399,650,000 JPY 3,353,225 3,206,206 0.14Japan Government Thirty Year Bond 0.30% 16 -20.06.46 151,350,000 JPY 1,133,641 1,132,536 0.05Japan Government Thirty Year Bond 0.40% 19 -20.06.49 232,700,000 JPY 1,986,989 1,740,552 0.08Japan Government Thirty Year Bond 0.40% 19 -20.09.49 247,350,000 JPY 2,030,866 1,846,587 0.08Japan Government Thirty Year Bond 0.40% 20 -20.12.49 221,600,000 JPY 1,898,588 1,651,158 0.07Japan Government Thirty Year Bond 0.40% 20 -20.03.50 227,450,000 JPY 1,843,296 1,691,398 0.08
Xtrackers II
Xtrackers II GLOBAL GOVERNMENT BOND UCITS ETF (continued)
Statement of Investmentsas at 31 December 2020(expressed in EUR)
The accompanying notes form an integral part of these financial statements.
120

DescriptionNominal
ValueCurrency
(local) Cost Market Value
% ofNet
Assets
Transferable securities and money market instruments admitted to an official stock exchange listing(A)
Bonds (continued)
Japan (continued)Japan Government Thirty Year Bond 0.50% 16 -20.09.46 203,450,000 JPY 1,635,260 1,595,690 0.07Japan Government Thirty Year Bond 0.50% 19 -20.03.49 227,400,000 JPY 1,935,350 1,751,546 0.08Japan Government Thirty Year Bond 0.60% 16 -20.12.46 140,550,000 JPY 1,132,033 1,127,289 0.05Japan Government Thirty Year Bond 0.60% 20 -20.06.50 304,800,000 JPY 2,454,847 2,393,200 0.11Japan Government Thirty Year Bond 0.60% 20 -20.09.50 325,000,000 JPY 2,576,960 2,547,791 0.11Japan Government Thirty Year Bond 0.70% 18 -20.06.48 242,000,000 JPY 1,962,349 1,973,005 0.09Japan Government Thirty Year Bond 0.70% 19 -20.12.48 208,500,000 JPY 1,779,940 1,693,643 0.08Japan Government Thirty Year Bond 0.80% 16 -20.03.46 153,650,000 JPY 1,351,528 1,295,485 0.06Japan Government Thirty Year Bond 0.80% 17 -20.03.47 133,450,000 JPY 1,189,737 1,119,952 0.05Japan Government Thirty Year Bond 0.80% 17 -20.06.47 148,600,000 JPY 1,263,272 1,247,354 0.06Japan Government Thirty Year Bond 0.80% 17 -20.09.47 157,750,000 JPY 1,301,880 1,322,910 0.06Japan Government Thirty Year Bond 0.80% 17 -20.12.47 193,750,000 JPY 1,624,472 1,621,298 0.07Japan Government Thirty Year Bond 0.80% 18 -20.03.48 213,550,000 JPY 1,837,971 1,785,091 0.08Japan Government Thirty Year Bond 0.90% 18 -20.09.48 166,800,000 JPY 1,458,630 1,424,671 0.06Japan Government Thirty Year Bond 1.10% 03 -20.03.33 66,100,000 JPY 635,955 584,959 0.03Japan Government Thirty Year Bond 1.40% 15 -20.09.45 73,600,000 JPY 752,163 701,600 0.03Japan Government Thirty Year Bond 1.40% 15 -20.12.45 99,300,000 JPY 929,428 948,844 0.04Japan Government Thirty Year Bond 1.50% 14 -20.12.44 104,500,000 JPY 1,110,823 1,015,522 0.05Japan Government Thirty Year Bond 1.50% 15 -20.03.45 165,050,000 JPY 1,651,167 1,604,556 0.07Japan Government Thirty Year Bond 1.60% 15 -20.06.45 80,000,000 JPY 847,255 791,961 0.04Japan Government Thirty Year Bond 1.70% 03 -20.06.33 68,700,000 JPY 705,519 649,250 0.03Japan Government Thirty Year Bond 1.70% 13 -20.12.43 143,300,000 JPY 1,443,096 1,437,351 0.06Japan Government Thirty Year Bond 1.70% 14 -20.03.44 198,000,000 JPY 2,094,427 1,987,517 0.09Japan Government Thirty Year Bond 1.70% 14 -20.06.44 116,000,000 JPY 1,244,506 1,165,341 0.05
Xtrackers II
Xtrackers II GLOBAL GOVERNMENT BOND UCITS ETF (continued)
Statement of Investmentsas at 31 December 2020(expressed in EUR)
The accompanying notes form an integral part of these financial statements.
121

DescriptionNominal
ValueCurrency
(local) Cost Market Value
% ofNet
Assets
Transferable securities and money market instruments admitted to an official stock exchange listing(A)
Bonds (continued)
Japan (continued)Japan Government Thirty Year Bond 1.70% 14 -20.09.44 139,550,000 JPY 1,417,959 1,402,985 0.06Japan Government Thirty Year Bond 1.80% 02 -22.11.32 64,400,000 JPY 647,888 611,937 0.03Japan Government Thirty Year Bond 1.80% 13 -20.03.43 218,850,000 JPY 2,225,590 2,224,770 0.10Japan Government Thirty Year Bond 1.80% 13 -20.09.43 151,350,000 JPY 1,575,711 1,541,698 0.07Japan Government Thirty Year Bond 1.90% 12 -20.09.42 403,700,000 JPY 4,166,120 4,159,095 0.19Japan Government Thirty Year Bond 1.90% 13 -20.06.43 185,900,000 JPY 1,982,381 1,921,964 0.09Japan Government Thirty Year Bond 2.00% 04 -20.12.33 83,000,000 JPY 855,408 812,277 0.04Japan Government Thirty Year Bond 2.00% 10 -20.09.40 326,550,000 JPY 3,443,388 3,370,311 0.15Japan Government Thirty Year Bond 2.00% 11 -20.09.41 326,000,000 JPY 3,500,483 3,384,376 0.15Japan Government Thirty Year Bond 2.00% 12 -20.03.42 313,600,000 JPY 3,416,426 3,271,285 0.15Japan Government Thirty Year Bond 2.10% 03 -20.09.33 68,500,000 JPY 714,690 675,666 0.03Japan Government Thirty Year Bond 2.20% 09 -20.09.39 230,450,000 JPY 2,578,852 2,420,971 0.11Japan Government Thirty Year Bond 2.20% 11 -20.03.41 304,400,000 JPY 3,314,238 3,247,148 0.15Japan Government Thirty Year Bond 2.30% 02 -20.05.32 67,000,000 JPY 719,133 662,907 0.03Japan Government Thirty Year Bond 2.30% 05 -20.03.35 129,050,000 JPY 1,361,942 1,321,807 0.06Japan Government Thirty Year Bond 2.30% 05 -20.06.35 79,150,000 JPY 842,213 812,600 0.04Japan Government Thirty Year Bond 2.30% 06 -20.12.35 95,050,000 JPY 1,026,989 980,195 0.04Japan Government Thirty Year Bond 2.30% 07 -20.12.36 96,900,000 JPY 1,028,846 1,010,833 0.05Japan Government Thirty Year Bond 2.30% 09 -20.03.39 276,450,000 JPY 2,920,640 2,931,378 0.13Japan Government Thirty Year Bond 2.30% 10 -20.03.40 285,100,000 JPY 3,123,323 3,056,456 0.14Japan Government Thirty Year Bond 2.40% 01 -20.11.31 55,100,000 JPY 558,294 546,471 0.02Japan Government Thirty Year Bond 2.40% 04 -20.03.34 115,050,000 JPY 1,192,120 1,176,990 0.05Japan Government Thirty Year Bond 2.40% 05 -20.12.34 90,250,000 JPY 1,000,768 931,974 0.04Japan Government Thirty Year Bond 2.40% 07 -20.03.37 183,150,000 JPY 1,990,187 1,934,664 0.09
Xtrackers II
Xtrackers II GLOBAL GOVERNMENT BOND UCITS ETF (continued)
Statement of Investmentsas at 31 December 2020(expressed in EUR)
The accompanying notes form an integral part of these financial statements.
122

DescriptionNominal
ValueCurrency
(local) Cost Market Value
% ofNet
Assets
Transferable securities and money market instruments admitted to an official stock exchange listing(A)
Bonds (continued)
Japan (continued)Japan Government Thirty Year Bond 2.40% 08 -20.09.38 245,300,000 JPY 2,642,619 2,627,949 0.12Japan Government Thirty Year Bond 2.50% 04 -20.06.34 137,400,000 JPY 1,453,751 1,423,854 0.06Japan Government Thirty Year Bond 2.50% 04 -20.09.34 87,000,000 JPY 963,648 904,129 0.04Japan Government Thirty Year Bond 2.50% 05 -20.09.35 84,150,000 JPY 940,217 884,949 0.04Japan Government Thirty Year Bond 2.50% 06 -20.03.36 116,550,000 JPY 1,285,385 1,233,834 0.06Japan Government Thirty Year Bond 2.50% 06 -20.06.36 113,150,000 JPY 1,278,065 1,201,281 0.05Japan Government Thirty Year Bond 2.50% 06 -20.09.36 80,750,000 JPY 922,827 859,690 0.04Japan Government Thirty Year Bond 2.50% 07 -20.09.37 179,500,000 JPY 1,976,798 1,931,276 0.09Japan Government Thirty Year Bond 2.50% 08 -20.03.38 231,900,000 JPY 2,551,137 2,503,264 0.11Japan Government Twenty Year Bond 0.20% 16 -20.06.36 197,500,000 JPY 1,528,870 1,552,166 0.07Japan Government Twenty Year Bond 0.30% 19 -20.06.39 296,450,000 JPY 2,506,305 2,317,289 0.10Japan Government Twenty Year Bond 0.30% 19 -20.09.39 321,300,000 JPY 2,675,760 2,507,722 0.11Japan Government Twenty Year Bond 0.30% 20 -20.12.39 335,700,000 JPY 2,839,101 2,615,993 0.12Japan Government Twenty Year Bond 0.40% 16 -20.03.36 145,150,000 JPY 1,190,836 1,175,892 0.05Japan Government Twenty Year Bond 0.40% 19 -20.03.39 277,100,000 JPY 2,348,828 2,206,703 0.10Japan Government Twenty Year Bond 0.40% 20 -20.03.40 302,200,000 JPY 2,519,880 2,398,143 0.11Japan Government Twenty Year Bond 0.40% 20 -20.06.40 406,500,000 JPY 3,280,523 3,221,387 0.15Japan Government Twenty Year Bond 0.40% 20 -20.09.40 420,000,000 JPY 3,367,150 3,323,683 0.15Japan Government Twenty Year Bond 0.50% 16 -20.09.36 165,400,000 JPY 1,387,788 1,357,474 0.06Japan Government Twenty Year Bond 0.50% 18 -20.03.38 232,600,000 JPY 1,846,967 1,897,343 0.09Japan Government Twenty Year Bond 0.50% 18 -20.06.38 298,150,000 JPY 2,477,595 2,425,882 0.11Japan Government Twenty Year Bond 0.50% 19 -20.12.38 289,750,000 JPY 2,474,560 2,353,040 0.11Japan Government Twenty Year Bond 0.60% 16 -20.12.36 229,650,000 JPY 1,892,355 1,911,384 0.09Japan Government Twenty Year Bond 0.60% 17 -20.06.37 181,450,000 JPY 1,523,623 1,508,691 0.07
Xtrackers II
Xtrackers II GLOBAL GOVERNMENT BOND UCITS ETF (continued)
Statement of Investmentsas at 31 December 2020(expressed in EUR)
The accompanying notes form an integral part of these financial statements.
123

DescriptionNominal
ValueCurrency
(local) Cost Market Value
% ofNet
Assets
Transferable securities and money market instruments admitted to an official stock exchange listing(A)
Bonds (continued)
Japan (continued)Japan Government Twenty Year Bond 0.60% 17 -20.09.37 228,950,000 JPY 1,944,465 1,902,549 0.09Japan Government Twenty Year Bond 0.60% 17 -20.12.37 204,850,000 JPY 1,672,836 1,698,583 0.08Japan Government Twenty Year Bond 0.70% 17 -20.03.37 225,900,000 JPY 1,913,542 1,906,996 0.09Japan Government Twenty Year Bond 0.70% 18 -20.09.38 255,200,000 JPY 2,190,046 2,145,572 0.10Japan Government Twenty Year Bond 0.80% 03 -20.06.23 73,200,000 JPY 610,430 592,812 0.03Japan Government Twenty Year Bond 1.00% 03 -20.03.23 74,200,000 JPY 627,016 601,962 0.03Japan Government Twenty Year Bond 1.00% 15 -20.12.35 237,200,000 JPY 2,079,894 2,089,156 0.09Japan Government Twenty Year Bond 1.20% 14 -20.12.34 236,450,000 JPY 2,232,844 2,132,432 0.10Japan Government Twenty Year Bond 1.20% 15 -20.03.35 236,150,000 JPY 2,213,142 2,130,961 0.10Japan Government Twenty Year Bond 1.20% 15 -20.09.35 214,700,000 JPY 1,887,654 1,939,423 0.09Japan Government Twenty Year Bond 1.30% 15 -20.06.35 185,600,000 JPY 1,760,216 1,696,348 0.08Japan Government Twenty Year Bond 1.40% 03 -20.12.22 57,150,000 JPY 498,570 465,921 0.02Japan Government Twenty Year Bond 1.40% 14 -20.09.34 318,450,000 JPY 2,959,051 2,933,814 0.13Japan Government Twenty Year Bond 1.50% 12 -20.06.32 112,550,000 JPY 1,022,416 1,033,871 0.05Japan Government Twenty Year Bond 1.50% 13 -20.03.33 117,050,000 JPY 1,047,551 1,081,740 0.05Japan Government Twenty Year Bond 1.50% 14 -20.03.34 193,200,000 JPY 1,863,933 1,795,772 0.08Japan Government Twenty Year Bond 1.50% 14 -20.06.34 208,650,000 JPY 1,995,614 1,941,921 0.09Japan Government Twenty Year Bond 1.60% 10 -20.06.30 137,100,000 JPY 1,263,879 1,248,640 0.06Japan Government Twenty Year Bond 1.60% 12 -20.03.32 132,150,000 JPY 1,236,175 1,223,371 0.06Japan Government Twenty Year Bond 1.60% 12 -20.06.32 103,050,000 JPY 1,043,151 955,856 0.04Japan Government Twenty Year Bond 1.60% 13 -20.03.33 187,300,000 JPY 1,783,356 1,748,820 0.08Japan Government Twenty Year Bond 1.60% 13 -20.12.33 220,800,000 JPY 2,137,726 2,071,904 0.09Japan Government Twenty Year Bond 1.70% 02 -20.12.22 76,300,000 JPY 657,074 625,601 0.03Japan Government Twenty Year Bond 1.70% 11 -20.09.31 116,450,000 JPY 1,132,943 1,083,532 0.05
Xtrackers II
Xtrackers II GLOBAL GOVERNMENT BOND UCITS ETF (continued)
Statement of Investmentsas at 31 December 2020(expressed in EUR)
The accompanying notes form an integral part of these financial statements.
124

DescriptionNominal
ValueCurrency
(local) Cost Market Value
% ofNet
Assets
Transferable securities and money market instruments admitted to an official stock exchange listing(A)
Bonds (continued)
Japan (continued)Japan Government Twenty Year Bond 1.70% 11 -20.12.31 158,000,000 JPY 1,444,893 1,473,420 0.07Japan Government Twenty Year Bond 1.70% 12 -20.03.32 94,700,000 JPY 939,799 885,016 0.04Japan Government Twenty Year Bond 1.70% 12 -20.06.32 97,650,000 JPY 987,282 914,541 0.04Japan Government Twenty Year Bond 1.70% 12 -20.09.32 292,500,000 JPY 2,722,635 2,748,229 0.12Japan Government Twenty Year Bond 1.70% 12 -20.12.32 227,550,000 JPY 2,135,819 2,142,304 0.10Japan Government Twenty Year Bond 1.70% 13 -20.06.33 252,100,000 JPY 2,307,060 2,382,474 0.11Japan Government Twenty Year Bond 1.70% 13 -20.09.33 224,800,000 JPY 2,065,528 2,128,390 0.10Japan Government Twenty Year Bond 1.80% 03 -20.06.23 77,400,000 JPY 675,496 641,935 0.03Japan Government Twenty Year Bond 1.80% 10 -20.06.30 112,000,000 JPY 1,075,670 1,036,798 0.05Japan Government Twenty Year Bond 1.80% 10 -20.09.30 124,050,000 JPY 1,200,571 1,152,078 0.05Japan Government Twenty Year Bond 1.80% 11 -20.06.31 99,250,000 JPY 1,006,407 929,533 0.04Japan Government Twenty Year Bond 1.80% 11 -20.09.31 209,400,000 JPY 1,938,937 1,966,058 0.09Japan Government Twenty Year Bond 1.80% 12 -20.12.31 180,200,000 JPY 1,678,216 1,695,964 0.08Japan Government Twenty Year Bond 1.80% 12 -20.03.32 173,500,000 JPY 1,704,984 1,636,697 0.07Japan Government Twenty Year Bond 1.80% 13 -20.12.32 132,450,000 JPY 1,245,768 1,259,364 0.06Japan Government Twenty Year Bond 1.90% 02 -20.06.22 71,200,000 JPY 631,976 580,189 0.03Japan Government Twenty Year Bond 1.90% 02 -20.09.22 61,950,000 JPY 551,221 507,393 0.02Japan Government Twenty Year Bond 1.90% 03 -20.09.23 70,050,000 JPY 581,249 585,080 0.03Japan Government Twenty Year Bond 1.90% 03 -20.12.23 81,750,000 JPY 711,897 686,128 0.03Japan Government Twenty Year Bond 1.90% 04 -20.03.24 59,850,000 JPY 536,212 504,695 0.02Japan Government Twenty Year Bond 1.90% 05 -20.03.25 51,150,000 JPY 437,113 439,474 0.02Japan Government Twenty Year Bond 1.90% 05 -20.06.25 81,950,000 JPY 742,195 707,320 0.03Japan Government Twenty Year Bond 1.90% 09 -20.12.28 153,450,000 JPY 1,422,510 1,405,164 0.06Japan Government Twenty Year Bond 1.90% 09 -20.03.29 120,550,000 JPY 1,153,060 1,108,474 0.05
Xtrackers II
Xtrackers II GLOBAL GOVERNMENT BOND UCITS ETF (continued)
Statement of Investmentsas at 31 December 2020(expressed in EUR)
The accompanying notes form an integral part of these financial statements.
125

DescriptionNominal
ValueCurrency
(local) Cost Market Value
% ofNet
Assets
Transferable securities and money market instruments admitted to an official stock exchange listing(A)
Bonds (continued)
Japan (continued)Japan Government Twenty Year Bond 1.90% 10 -20.09.30 151,300,000 JPY 1,435,633 1,416,772 0.06Japan Government Twenty Year Bond 1.90% 11 -20.03.31 122,050,000 JPY 1,208,092 1,149,957 0.05Japan Government Twenty Year Bond 1.90% 11 -20.06.31 206,300,000 JPY 1,995,841 1,949,118 0.09Japan Government Twenty Year Bond 2.00% 02 -21.03.22 51,650,000 JPY 450,678 419,323 0.02Japan Government Twenty Year Bond 2.00% 02 -20.06.22 68,800,000 JPY 611,167 561,427 0.03Japan Government Twenty Year Bond 2.00% 04 -20.12.24 117,700,000 JPY 976,868 1,010,414 0.05Japan Government Twenty Year Bond 2.00% 05 -20.09.25 75,950,000 JPY 716,475 661,666 0.03Japan Government Twenty Year Bond 2.00% 06 -20.12.25 122,350,000 JPY 1,062,513 1,070,342 0.05Japan Government Twenty Year Bond 2.00% 07 -20.03.27 82,550,000 JPY 778,959 738,945 0.03Japan Government Twenty Year Bond 2.00% 10 -20.06.30 127,050,000 JPY 1,228,612 1,195,126 0.05Japan Government Twenty Year Bond 2.00% 11 -20.12.30 133,400,000 JPY 1,319,882 1,263,824 0.06Japan Government Twenty Year Bond 2.00% 11 -20.03.31 129,800,000 JPY 1,300,013 1,233,427 0.06Japan Government Twenty Year Bond 2.10% 04 -20.03.24 83,900,000 JPY 688,377 711,778 0.03Japan Government Twenty Year Bond 2.10% 04 -20.09.24 155,500,000 JPY 1,387,209 1,333,006 0.06Japan Government Twenty Year Bond 2.10% 05 -20.03.25 59,850,000 JPY 552,753 518,226 0.02Japan Government Twenty Year Bond 2.10% 05 -20.09.25 78,700,000 JPY 705,012 688,571 0.03Japan Government Twenty Year Bond 2.10% 05 -20.12.25 32,750,000 JPY 300,630 287,797 0.01Japan Government Twenty Year Bond 2.10% 06 -20.03.26 105,350,000 JPY 978,576 930,254 0.04Japan Government Twenty Year Bond 2.10% 06 -20.12.26 212,300,000 JPY 1,943,555 1,902,131 0.09Japan Government Twenty Year Bond 2.10% 07 -20.03.27 145,250,000 JPY 1,354,031 1,307,378 0.06Japan Government Twenty Year Bond 2.10% 07 -20.06.27 53,300,000 JPY 502,723 482,291 0.02Japan Government Twenty Year Bond 2.10% 07 -20.09.27 65,700,000 JPY 623,878 597,250 0.03Japan Government Twenty Year Bond 2.10% 07 -20.12.27 210,100,000 JPY 1,916,887 1,918,594 0.09Japan Government Twenty Year Bond 2.10% 08 -20.06.28 80,850,000 JPY 766,444 744,509 0.03
Xtrackers II
Xtrackers II GLOBAL GOVERNMENT BOND UCITS ETF (continued)
Statement of Investmentsas at 31 December 2020(expressed in EUR)
The accompanying notes form an integral part of these financial statements.
126

DescriptionNominal
ValueCurrency
(local) Cost Market Value
% ofNet
Assets
Transferable securities and money market instruments admitted to an official stock exchange listing(A)
Bonds (continued)
Japan (continued)Japan Government Twenty Year Bond 2.10% 08 -20.09.28 134,200,000 JPY 1,203,522 1,240,893 0.06Japan Government Twenty Year Bond 2.10% 08 -20.12.28 80,900,000 JPY 801,354 751,053 0.03Japan Government Twenty Year Bond 2.10% 09 -20.03.29 159,300,000 JPY 1,431,058 1,485,580 0.07Japan Government Twenty Year Bond 2.10% 09 -20.06.29 177,600,000 JPY 1,744,709 1,662,384 0.07Japan Government Twenty Year Bond 2.10% 09 -20.09.29 171,400,000 JPY 1,614,106 1,610,198 0.07Japan Government Twenty Year Bond 2.10% 09 -20.12.29 168,400,000 JPY 1,646,226 1,586,121 0.07Japan Government Twenty Year Bond 2.10% 10 -20.03.30 218,150,000 JPY 2,132,718 2,062,389 0.09Japan Government Twenty Year Bond 2.10% 10 -20.12.30 235,650,000 JPY 2,276,417 2,251,077 0.10Japan Government Twenty Year Bond 2.20% 04 -20.03.24 57,700,000 JPY 514,358 490,977 0.02Japan Government Twenty Year Bond 2.20% 06 -20.03.26 74,850,000 JPY 681,370 664,034 0.03Japan Government Twenty Year Bond 2.20% 06 -20.06.26 71,750,000 JPY 679,494 639,793 0.03Japan Government Twenty Year Bond 2.20% 06 -20.09.26 130,350,000 JPY 1,247,996 1,168,240 0.05Japan Government Twenty Year Bond 2.20% 07 -20.09.27 99,950,000 JPY 944,406 913,943 0.04Japan Government Twenty Year Bond 2.20% 08 -20.03.28 176,600,000 JPY 1,631,487 1,629,580 0.07Japan Government Twenty Year Bond 2.20% 08 -20.09.28 87,950,000 JPY 870,135 818,641 0.04Japan Government Twenty Year Bond 2.20% 09 -20.06.29 93,650,000 JPY 947,509 882,891 0.04Japan Government Twenty Year Bond 2.20% 10 -20.12.29 101,700,000 JPY 993,028 965,110 0.04Japan Government Twenty Year Bond 2.20% 10 -20.03.30 125,000,000 JPY 1,202,730 1,190,863 0.05Japan Government Twenty Year Bond 2.20% 11 -20.03.31 140,000,000 JPY 1,396,712 1,352,906 0.06Japan Government Twenty Year Bond 2.30% 06 -20.03.26 70,250,000 JPY 634,973 626,139 0.03Japan Government Twenty Year Bond 2.30% 06 -20.06.26 123,300,000 JPY 1,096,904 1,104,821 0.05Japan Government Twenty Year Bond 2.30% 07 -20.06.27 101,650,000 JPY 983,115 930,252 0.04Japan Government Twenty Year Bond 2.30% 08 -20.06.28 73,150,000 JPY 634,442 682,295 0.03Japan Government Twenty Year Bond 2.40% 04 -20.06.24 114,450,000 JPY 969,391 985,467 0.04
Xtrackers II
Xtrackers II GLOBAL GOVERNMENT BOND UCITS ETF (continued)
Statement of Investmentsas at 31 December 2020(expressed in EUR)
The accompanying notes form an integral part of these financial statements.
127

DescriptionNominal
ValueCurrency
(local) Cost Market Value
% ofNet
Assets
Transferable securities and money market instruments admitted to an official stock exchange listing(A)
Bonds (continued)
Japan (continued)Japan Government Twenty Year Bond 2.40% 08 -20.03.28 71,150,000 JPY 701,756 664,705 0.03Japan Government Twenty Year Bond 2.40% 08 -20.06.28 118,050,000 JPY 1,173,547 1,108,101 0.05Japan Government Two Year Bond 0.10% 20 -01.01.22 95,300,000 JPY 798,472 756,083 0.03Japan Government Two Year Bond 0.10% 20 -01.02.22 54,500,000 JPY 448,320 432,470 0.02Japan Government Two Year Bond 0.10% 20 -01.03.22 166,350,000 JPY 1,404,078 1,320,248 0.06Japan Government Two Year Bond 0.10% 20 -01.04.22 74,100,000 JPY 635,026 588,211 0.03Japan Government Two Year Bond 0.10% 20 -01.05.22 128,550,000 JPY 1,078,720 1,020,622 0.05Japan Government Two Year Bond 0.10% 20 -01.06.22 84,050,000 JPY 687,486 667,534 0.03Japan Government Two Year Bond 0.10% 20 -01.07.22 190,000,000 JPY 1,525,381 1,509,512 0.07Japan Government Two Year Bond 0.10% 20 -01.08.22 207,950,000 JPY 1,652,348 1,652,714 0.07Japan Government Two Year Bond 0.10% 20 -01.09.22 105,000,000 JPY 856,840 834,536 0.04Japan Government Two Year Bond 0.10% 20 -01.10.22 220,000,000 JPY 1,807,333 1,748,587 0.08Japan Government Two Year Bond 0.10% 20 -01.11.22 180,000,000 JPY 1,446,445 1,431,204 0.06Japan Government Two Year Bond 0.10% 20 -01.12.22 200,000,000 JPY 1,585,315 1,590,052 0.07
402,858,730 391,379,771 17.65NetherlandsNetherlands Zero Coupon 16 - 15.01.22 1,424,000 EUR 1,431,695 1,434,680 0.06Netherlands Zero Coupon 17 - 15.01.24 1,482,000 EUR 1,498,893 1,513,863 0.07Netherlands Zero Coupon 20 - 15.07.30 1,479,000 EUR 1,523,849 1,549,400 0.07Netherlands Zero Coupon 20 - 15.01.27 1,450,000 EUR 1,501,151 1,507,420 0.07Netherlands Zero Coupon 20 - 15.01.52 620,000 EUR 623,415 638,972 0.03Netherlands 0.25% 15 - 15.07.25 1,569,000 EUR 1,599,163 1,637,565 0.07Netherlands 0.25% 19 - 15.07.29 1,352,000 EUR 1,388,506 1,446,775 0.07Netherlands 0.50% 16 - 15.07.26 1,785,000 EUR 1,869,727 1,902,810 0.09Netherlands 0.50% 19 - 15.01.40 973,000 EUR 1,065,859 1,115,253 0.05Netherlands 0.75% 17 - 15.07.27 1,554,000 EUR 1,643,974 1,697,123 0.08Netherlands 0.75% 18 - 15.07.28 1,550,000 EUR 1,653,943 1,709,805 0.08Netherlands 1.75% 13 - 15.07.23 1,892,000 EUR 1,995,708 2,011,385 0.09Netherlands 2.00% 14 - 15.07.24 1,709,000 EUR 1,836,240 1,874,602 0.08Netherlands 2.25% 12 - 15.07.22 1,700,000 EUR 1,773,097 1,777,690 0.08Netherlands 2.50% 12 - 15.01.33 1,473,000 EUR 1,894,602 2,003,133 0.09Netherlands 2.75% 14 - 15.01.47 1,789,000 EUR 2,799,664 3,195,691 0.14Netherlands 3.75% 06 - 15.01.23 530,000 EUR 572,985 578,283 0.03Netherlands 3.75% 10 - 15.01.42 1,674,000 EUR 2,782,649 3,121,341 0.14
Xtrackers II
Xtrackers II GLOBAL GOVERNMENT BOND UCITS ETF (continued)
Statement of Investmentsas at 31 December 2020(expressed in EUR)
The accompanying notes form an integral part of these financial statements.
128

DescriptionNominal
ValueCurrency
(local) Cost Market Value
% ofNet
Assets
Transferable securities and money market instruments admitted to an official stock exchange listing(A)
Bonds (continued)
Netherlands (continued)Netherlands 4.00% 05 - 15.01.37 1,721,000 EUR 2,699,807 2,950,138 0.13Netherlands 5.50% 98 - 15.01.28 1,431,000 EUR 1,979,939 2,059,209 0.09Netherlands 7.50% 93 - 15.01.23 701,000 EUR 819,752 818,978 0.04
34,954,618 36,544,116 1.65NorwayNorway 1.375% 20 - 19.08.30 4,768,000 NOK 466,774 472,855 0.02Norway 1.50% 16 - 19.02.26 3,440,000 NOK 353,549 341,972 0.02Norway 1.75% 15 - 13.03.25 4,654,000 NOK 451,584 465,623 0.02Norway 1.75% 17 - 17.02.27 4,860,000 NOK 507,108 491,383 0.02Norway 1.75% 19 - 06.09.29 3,970,000 NOK 405,917 405,035 0.02Norway 2.00% 12 - 24.05.23 7,800,000 NOK 800,994 773,971 0.03Norway 2.00% 18 - 26.04.28 4,870,000 NOK 510,225 502,853 0.02Norway 3.00% 14 - 14.03.24 5,906,000 NOK 620,216 609,206 0.03
4,116,367 4,062,898 0.18SingaporeSingapore 0.50% 20 - 01.11.25 200,000 SGD 123,500 123,900 0.01Singapore 1.75% 17 - 01.04.22 410,000 SGD 266,209 258,281 0.01Singapore 1.75% 18 - 01.02.23 762,000 SGD 492,595 484,972 0.02Singapore 1.875% 20 - 01.03.50 434,000 SGD 325,017 316,448 0.01Singapore 2.00% 19 - 01.02.24 250,000 SGD 162,259 162,435 0.01Singapore 2.125% 16 - 01.06.26 637,000 SGD 438,852 426,254 0.02Singapore 2.25% 16 - 01.08.36 700,000 SGD 484,038 503,041 0.02Singapore 2.375% 15 - 01.06.25 560,000 SGD 358,399 376,218 0.02Singapore 2.375% 19 - 01.07.39 290,000 SGD 210,859 213,962 0.01Singapore 2.625% 18 - 01.05.28 550,000 SGD 381,864 384,567 0.02Singapore 2.75% 12 - 01.04.42 540,000 SGD 388,308 426,663 0.02Singapore 2.75% 13 - 01.07.23 860,000 SGD 555,217 563,511 0.03Singapore 2.75% 16 - 01.03.46 745,000 SGD 521,452 612,132 0.03Singapore 2.875% 10 - 01.09.30 570,000 SGD 412,866 418,784 0.02Singapore 2.875% 14 - 01.07.29 766,000 SGD 559,191 553,644 0.02Singapore 3.00% 09 - 01.09.24 910,000 SGD 627,945 617,094 0.03Singapore 3.125% 07 - 01.09.22 850,000 SGD 555,633 550,335 0.02Singapore 3.375% 13 - 01.09.33 700,000 SGD 487,799 551,653 0.02Singapore 3.50% 07 - 01.03.27 780,000 SGD 560,156 563,908 0.03
7,912,159 8,107,802 0.37SpainSpain Zero Coupon 20 - 30.04.23 2,290,000 EUR 2,307,261 2,320,297 0.10Spain Zero Coupon 20 - 31.01.25 2,244,000 EUR 2,245,168 2,287,556 0.10Spain Zero Coupon 20 - 31.01.26 390,000 EUR 397,572 398,139 0.02Spain 0.25% 19 - 30.07.24 1,748,000 EUR 1,775,338 1,796,160 0.08Spain 0.35% 18 - 30.07.23 2,394,000 EUR 2,407,415 2,449,553 0.11Spain 0.40% 17 - 30.04.22 2,186,000 EUR 2,205,508 2,216,570 0.10Spain 0.45% 17 - 31.10.22 1,867,000 EUR 1,879,596 1,902,322 0.09Spain 0.50% 20 - 30.04.30 2,164,000 EUR 2,187,779 2,266,833 0.10Spain 0.60% 19 - 31.10.29 2,240,000 EUR 2,281,631 2,371,264 0.11Spain 0.80% 20 - 30.07.27 1,803,000 EUR 1,864,145 1,928,795 0.09Spain 1.00% 20 - 31.10.50 1,422,000 EUR 1,324,173 1,470,618 0.07Spain 1.20% 20 - 31.10.40 1,390,000 EUR 1,450,011 1,536,562 0.07
Xtrackers II
Xtrackers II GLOBAL GOVERNMENT BOND UCITS ETF (continued)
Statement of Investmentsas at 31 December 2020(expressed in EUR)
The accompanying notes form an integral part of these financial statements.
129

DescriptionNominal
ValueCurrency
(local) Cost Market Value
% ofNet
Assets
Transferable securities and money market instruments admitted to an official stock exchange listing(A)
Bonds (continued)
Spain (continued)Spain 1.25% 20 - 31.10.30 2,683,000 EUR 2,858,154 2,999,218 0.14Spain 1.30% 16 - 31.10.26 2,715,000 EUR 2,801,467 2,982,119 0.13Spain 1.40% 18 - 30.04.28 2,260,000 EUR 2,398,426 2,525,027 0.11Spain 1.40% 18 - 30.07.28 2,276,000 EUR 2,378,036 2,549,085 0.12Spain 1.45% 17 - 31.10.27 2,453,000 EUR 2,554,108 2,736,606 0.12Spain 1.45% 19 - 30.04.29 2,293,000 EUR 2,434,520 2,589,905 0.12Spain 1.50% 17 - 30.04.27 2,124,000 EUR 2,230,167 2,370,520 0.11Spain 1.60% 15 - 30.04.25 2,241,000 EUR 2,337,401 2,443,280 0.11Spain 1.85% 19 - 30.07.35 1,985,000 EUR 2,237,232 2,402,207 0.11Spain 1.95% 15 - 30.07.30 2,453,000 EUR 2,685,516 2,909,614 0.13Spain 1.95% 16 - 30.04.26 2,288,000 EUR 2,476,985 2,577,909 0.12Spain 2.15% 15 - 31.10.25 2,587,000 EUR 2,803,735 2,913,670 0.13Spain 2.35% 17 - 30.07.33 2,132,000 EUR 2,440,185 2,689,627 0.12Spain 2.70% 18 - 31.10.48 1,539,000 EUR 1,890,270 2,258,154 0.10Spain 2.75% 14 - 31.10.24 2,485,000 EUR 2,715,187 2,795,742 0.13Spain 2.90% 16 - 31.10.46 1,808,000 EUR 2,315,701 2,706,264 0.12Spain 3.45% 16 - 30.07.66 1,612,000 EUR 2,458,149 2,898,461 0.13Spain 3.80% 14 - 30.04.24 2,304,000 EUR 2,553,617 2,638,703 0.12Spain 4.20% 05 - 31.01.37 2,194,000 EUR 3,150,247 3,489,218 0.16Spain 4.40% 13 - 31.10.23 2,160,000 EUR 2,405,624 2,465,082 0.11Spain 4.65% 10 - 30.07.25 2,415,000 EUR 2,893,508 2,984,823 0.13Spain 4.70% 09 - 30.07.41 2,361,000 EUR 3,685,611 4,223,316 0.19Spain 4.80% 08 - 31.01.24 1,886,000 EUR 2,166,723 2,198,683 0.10Spain 4.90% 07 - 30.07.40 2,004,000 EUR 3,104,358 3,616,225 0.16Spain 5.15% 13 - 31.10.28 1,970,000 EUR 2,627,466 2,791,881 0.13Spain 5.15% 13 - 31.10.44 1,516,000 EUR 2,453,179 2,991,940 0.13Spain 5.40% 13 - 31.01.23 2,365,000 EUR 2,627,007 2,659,610 0.12Spain 5.75% 01 - 30.07.32 2,420,000 EUR 3,620,059 3,976,910 0.18Spain 5.85% 11 - 31.01.22 2,441,000 EUR 2,601,195 2,612,702 0.12Spain 5.90% 11 - 30.07.26 2,485,000 EUR 3,241,254 3,364,108 0.15Spain 6.00% 98 - 31.01.29 2,706,000 EUR 3,802,478 4,052,401 0.18
105,273,162 112,357,679 5.07SwedenSweden 0.125% 20 - 12.05.31 3,050,000 SEK 295,530 306,610 0.01Sweden 0.75% 17 - 12.05.28 5,070,000 SEK 511,332 537,684 0.02Sweden 0.75% 18 - 12.11.29 6,525,000 SEK 648,807 696,522 0.03Sweden 1.00% 15 - 12.11.26 7,430,000 SEK 760,396 792,277 0.04Sweden 1.50% 12 - 13.11.23 10,160,000 SEK 1,054,104 1,065,851 0.05Sweden 2.50% 14 - 12.05.25 7,930,000 SEK 849,895 886,157 0.04Sweden 3.50% 09 - 30.03.39 5,040,000 SEK 705,009 780,772 0.04Sweden 3.50% 11 - 01.06.22 11,080,000 SEK 1,108,826 1,162,795 0.05
5,933,899 6,228,668 0.28United KingdomUnited Kingdom Gilt 0.125% 20 - 31.01.23 3,577,000 GBP 4,010,776 4,012,208 0.18United Kingdom Gilt 0.125% 20 - 30.01.26 2,500,000 GBP 2,776,885 2,813,667 0.13United Kingdom Gilt 0.125% 20 - 31.01.28 2,060,000 GBP 2,288,268 2,309,716 0.10United Kingdom Gilt 0.125% 20 - 31.01.24 1,350,000 GBP 1,505,026 1,516,213 0.07United Kingdom Gilt 0.25% 20 - 31.07.31 650,000 GBP 714,321 723,638 0.03
Xtrackers II
Xtrackers II GLOBAL GOVERNMENT BOND UCITS ETF (continued)
Statement of Investmentsas at 31 December 2020(expressed in EUR)
The accompanying notes form an integral part of these financial statements.
130
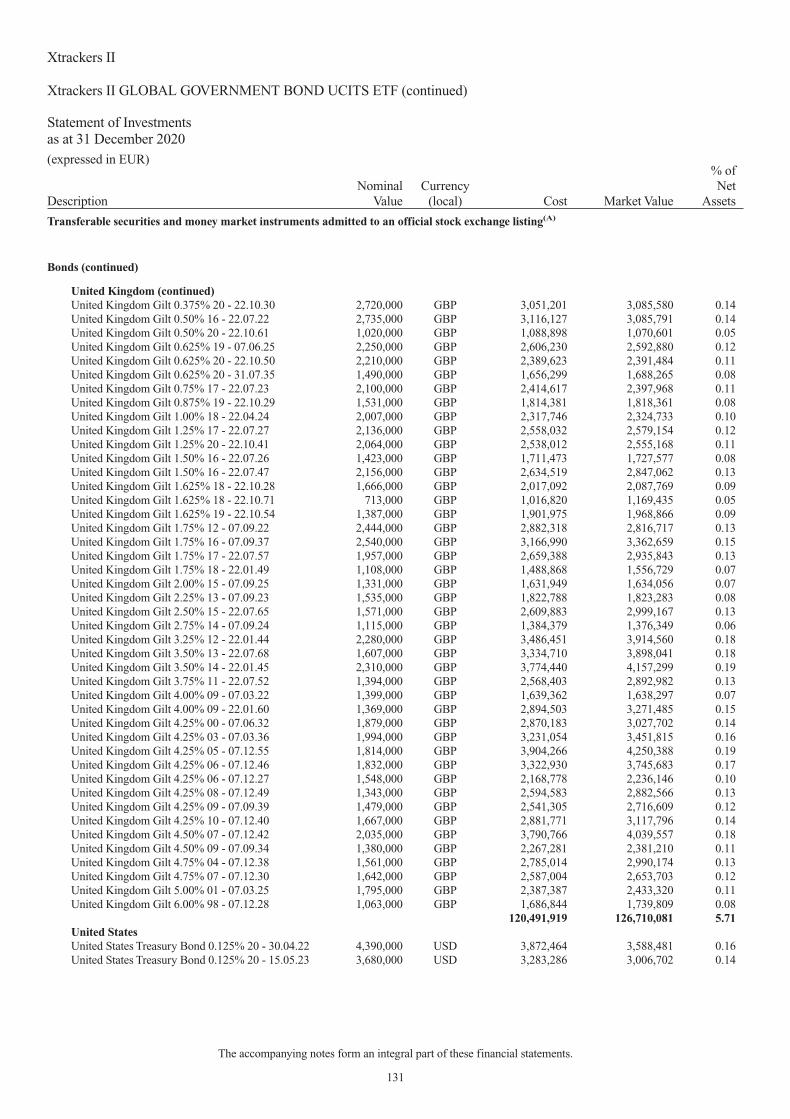
DescriptionNominal
ValueCurrency
(local) Cost Market Value
% ofNet
Assets
Transferable securities and money market instruments admitted to an official stock exchange listing(A)
Bonds (continued)
United Kingdom (continued)United Kingdom Gilt 0.375% 20 - 22.10.30 2,720,000 GBP 3,051,201 3,085,580 0.14United Kingdom Gilt 0.50% 16 - 22.07.22 2,735,000 GBP 3,116,127 3,085,791 0.14United Kingdom Gilt 0.50% 20 - 22.10.61 1,020,000 GBP 1,088,898 1,070,601 0.05United Kingdom Gilt 0.625% 19 - 07.06.25 2,250,000 GBP 2,606,230 2,592,880 0.12United Kingdom Gilt 0.625% 20 - 22.10.50 2,210,000 GBP 2,389,623 2,391,484 0.11United Kingdom Gilt 0.625% 20 - 31.07.35 1,490,000 GBP 1,656,299 1,688,265 0.08United Kingdom Gilt 0.75% 17 - 22.07.23 2,100,000 GBP 2,414,617 2,397,968 0.11United Kingdom Gilt 0.875% 19 - 22.10.29 1,531,000 GBP 1,814,381 1,818,361 0.08United Kingdom Gilt 1.00% 18 - 22.04.24 2,007,000 GBP 2,317,746 2,324,733 0.10United Kingdom Gilt 1.25% 17 - 22.07.27 2,136,000 GBP 2,558,032 2,579,154 0.12United Kingdom Gilt 1.25% 20 - 22.10.41 2,064,000 GBP 2,538,012 2,555,168 0.11United Kingdom Gilt 1.50% 16 - 22.07.26 1,423,000 GBP 1,711,473 1,727,577 0.08United Kingdom Gilt 1.50% 16 - 22.07.47 2,156,000 GBP 2,634,519 2,847,062 0.13United Kingdom Gilt 1.625% 18 - 22.10.28 1,666,000 GBP 2,017,092 2,087,769 0.09United Kingdom Gilt 1.625% 18 - 22.10.71 713,000 GBP 1,016,820 1,169,435 0.05United Kingdom Gilt 1.625% 19 - 22.10.54 1,387,000 GBP 1,901,975 1,968,866 0.09United Kingdom Gilt 1.75% 12 - 07.09.22 2,444,000 GBP 2,882,318 2,816,717 0.13United Kingdom Gilt 1.75% 16 - 07.09.37 2,540,000 GBP 3,166,990 3,362,659 0.15United Kingdom Gilt 1.75% 17 - 22.07.57 1,957,000 GBP 2,659,388 2,935,843 0.13United Kingdom Gilt 1.75% 18 - 22.01.49 1,108,000 GBP 1,488,868 1,556,729 0.07United Kingdom Gilt 2.00% 15 - 07.09.25 1,331,000 GBP 1,631,949 1,634,056 0.07United Kingdom Gilt 2.25% 13 - 07.09.23 1,535,000 GBP 1,822,788 1,823,283 0.08United Kingdom Gilt 2.50% 15 - 22.07.65 1,571,000 GBP 2,609,883 2,999,167 0.13United Kingdom Gilt 2.75% 14 - 07.09.24 1,115,000 GBP 1,384,379 1,376,349 0.06United Kingdom Gilt 3.25% 12 - 22.01.44 2,280,000 GBP 3,486,451 3,914,560 0.18United Kingdom Gilt 3.50% 13 - 22.07.68 1,607,000 GBP 3,334,710 3,898,041 0.18United Kingdom Gilt 3.50% 14 - 22.01.45 2,310,000 GBP 3,774,440 4,157,299 0.19United Kingdom Gilt 3.75% 11 - 22.07.52 1,394,000 GBP 2,568,403 2,892,982 0.13United Kingdom Gilt 4.00% 09 - 07.03.22 1,399,000 GBP 1,639,362 1,638,297 0.07United Kingdom Gilt 4.00% 09 - 22.01.60 1,369,000 GBP 2,894,503 3,271,485 0.15United Kingdom Gilt 4.25% 00 - 07.06.32 1,879,000 GBP 2,870,183 3,027,702 0.14United Kingdom Gilt 4.25% 03 - 07.03.36 1,994,000 GBP 3,231,054 3,451,815 0.16United Kingdom Gilt 4.25% 05 - 07.12.55 1,814,000 GBP 3,904,266 4,250,388 0.19United Kingdom Gilt 4.25% 06 - 07.12.46 1,832,000 GBP 3,322,930 3,745,683 0.17United Kingdom Gilt 4.25% 06 - 07.12.27 1,548,000 GBP 2,168,778 2,236,146 0.10United Kingdom Gilt 4.25% 08 - 07.12.49 1,343,000 GBP 2,594,583 2,882,566 0.13United Kingdom Gilt 4.25% 09 - 07.09.39 1,479,000 GBP 2,541,305 2,716,609 0.12United Kingdom Gilt 4.25% 10 - 07.12.40 1,667,000 GBP 2,881,771 3,117,796 0.14United Kingdom Gilt 4.50% 07 - 07.12.42 2,035,000 GBP 3,790,766 4,039,557 0.18United Kingdom Gilt 4.50% 09 - 07.09.34 1,380,000 GBP 2,267,281 2,381,210 0.11United Kingdom Gilt 4.75% 04 - 07.12.38 1,561,000 GBP 2,785,014 2,990,174 0.13United Kingdom Gilt 4.75% 07 - 07.12.30 1,642,000 GBP 2,587,004 2,653,703 0.12United Kingdom Gilt 5.00% 01 - 07.03.25 1,795,000 GBP 2,387,387 2,433,320 0.11United Kingdom Gilt 6.00% 98 - 07.12.28 1,063,000 GBP 1,686,844 1,739,809 0.08
120,491,919 126,710,081 5.71United StatesUnited States Treasury Bond 0.125% 20 - 30.04.22 4,390,000 USD 3,872,464 3,588,481 0.16United States Treasury Bond 0.125% 20 - 15.05.23 3,680,000 USD 3,283,286 3,006,702 0.14
Xtrackers II
Xtrackers II GLOBAL GOVERNMENT BOND UCITS ETF (continued)
Statement of Investmentsas at 31 December 2020(expressed in EUR)
The accompanying notes form an integral part of these financial statements.
131

DescriptionNominal
ValueCurrency
(local) Cost Market Value
% ofNet
Assets
Transferable securities and money market instruments admitted to an official stock exchange listing(A)
Bonds (continued)
United States (continued)United States Treasury Bond 0.125% 20 - 31.05.22 3,900,000 USD 3,437,606 3,187,945 0.14United States Treasury Bond 0.125% 20 - 30.06.22 4,590,000 USD 4,085,030 3,751,965 0.17United States Treasury Bond 0.125% 20 - 15.07.23 4,260,000 USD 3,603,153 3,479,496 0.16United States Treasury Bond 0.125% 20 - 31.07.22 4,590,000 USD 3,882,460 3,751,965 0.17United States Treasury Bond 0.125% 20 - 15.08.23 4,300,000 USD 3,597,536 3,512,168 0.16United States Treasury Bond 0.125% 20 - 31.08.22 4,900,000 USD 4,178,438 4,004,741 0.18United States Treasury Bond 0.125% 20 - 15.09.23 4,570,000 USD 3,894,095 3,732,116 0.17United States Treasury Bond 0.125% 20 - 30.09.22 5,130,000 USD 4,374,718 4,192,718 0.19United States Treasury Bond 0.125% 20 - 15.10.23 5,000,000 USD 4,284,317 4,083,278 0.18United States Treasury Bond 0.125% 20 - 31.10.22 5,680,000 USD 4,736,195 4,642,230 0.21United States Treasury Bond 0.125% 20 - 30.11.22 5,830,000 USD 4,871,776 4,764,824 0.21United States Treasury Bond 0.125% 20 - 15.12.23 5,550,000 USD 4,506,382 4,530,666 0.20United States Treasury Bond 0.25% 20 - 15.04.23 4,274,000 USD 3,896,848 3,501,847 0.16United States Treasury Bond 0.25% 20 - 31.05.25 4,700,000 USD 4,170,592 3,833,479 0.17United States Treasury Bond 0.25% 20 - 15.06.23 3,960,000 USD 3,513,844 3,244,575 0.15United States Treasury Bond 0.25% 20 - 30.06.25 4,625,000 USD 4,085,241 3,769,944 0.17United States Treasury Bond 0.25% 20 - 31.07.25 5,150,000 USD 4,361,899 4,196,568 0.19United States Treasury Bond 0.25% 20 - 31.08.25 5,400,000 USD 4,600,695 4,398,217 0.20United States Treasury Bond 0.25% 20 - 30.09.25 5,530,000 USD 4,706,907 4,501,981 0.20United States Treasury Bond 0.25% 20 - 31.10.25 6,000,000 USD 4,976,614 4,882,310 0.22United States Treasury Bond 0.25% 20 - 15.11.23 5,340,000 USD 4,467,575 4,376,625 0.20United States Treasury Bond 0.375% 20 - 31.03.22 4,064,000 USD 3,668,539 3,331,862 0.15United States Treasury Bond 0.375% 20 - 30.04.25 4,550,000 USD 4,061,644 3,732,052 0.17United States Treasury Bond 0.375% 20 - 31.07.27 4,550,000 USD 3,780,758 3,669,299 0.17United States Treasury Bond 0.375% 20 - 30.09.27 5,100,000 USD 4,310,837 4,103,722 0.19United States Treasury Bond 0.375% 20 - 30.11.25 6,270,000 USD 5,239,294 5,131,639 0.23United States Treasury Bond 0.50% 20 - 15.03.23 3,306,000 USD 3,036,239 2,723,928 0.12United States Treasury Bond 0.50% 20 - 31.03.25 4,250,000 USD 3,899,284 3,504,978 0.16United States Treasury Bond 0.50% 20 - 30.04.27 3,430,000 USD 3,064,713 2,795,872 0.13United States Treasury Bond 0.50% 20 - 31.05.27 3,590,000 USD 3,156,031 2,923,541 0.13United States Treasury Bond 0.50% 20 - 30.06.27 4,160,000 USD 3,539,930 3,385,068 0.15United States Treasury Bond 0.50% 20 - 31.08.27 4,530,000 USD 3,868,779 3,679,202 0.17United States Treasury Bond 0.50% 20 - 31.10.27 5,500,000 USD 4,557,156 4,458,594 0.20United States Treasury Bond 0.625% 20 - 31.03.27 2,449,000 USD 2,226,883 2,013,437 0.09United States Treasury Bond 0.625% 20 - 15.05.30 9,250,000 USD 8,061,448 7,392,233 0.33United States Treasury Bond 0.625% 20 - 15.08.30 11,300,000 USD 9,477,890 9,005,979 0.41United States Treasury Bond 0.625% 20 - 30.11.27 6,200,000 USD 5,034,952 5,066,432 0.23United States Treasury Bond 0.875% 20 - 15.11.30 8,650,000 USD 7,124,889 7,045,291 0.32United States Treasury Bond 1.125% 20 - 28.02.22 3,589,000 USD 3,292,389 2,967,643 0.13United States Treasury Bond 1.125% 20 - 28.02.25 4,450,000 USD 4,177,453 3,764,820 0.17United States Treasury Bond 1.125% 20 - 28.02.27 1,396,000 USD 1,321,804 1,183,015 0.05United States Treasury Bond 1.125% 20 - 15.05.40 5,600,000 USD 4,913,695 4,345,144 0.20United States Treasury Bond 1.125% 20 - 15.08.40 7,220,000 USD 5,901,076 5,587,379 0.25United States Treasury Bond 1.25% 16 - 31.07.23 2,522,000 USD 2,143,340 2,119,831 0.10United States Treasury Bond 1.25% 19 - 31.08.24 3,599,000 USD 3,268,368 3,050,826 0.14United States Treasury Bond 1.25% 20 - 15.05.50 6,230,000 USD 5,334,022 4,621,551 0.21United States Treasury Bond 1.375% 16 - 30.06.23 2,797,000 USD 2,443,547 2,355,979 0.11United States Treasury Bond 1.375% 16 - 31.08.23 2,770,000 USD 2,342,368 2,337,481 0.11
Xtrackers II
Xtrackers II GLOBAL GOVERNMENT BOND UCITS ETF (continued)
Statement of Investmentsas at 31 December 2020(expressed in EUR)
The accompanying notes form an integral part of these financial statements.
132

DescriptionNominal
ValueCurrency
(local) Cost Market Value
% ofNet
Assets
Transferable securities and money market instruments admitted to an official stock exchange listing(A)
Bonds (continued)
United States (continued)United States Treasury Bond 1.375% 16 - 30.09.23 2,980,000 USD 2,592,729 2,516,974 0.11United States Treasury Bond 1.375% 19 - 31.08.26 2,790,000 USD 2,520,959 2,398,182 0.11United States Treasury Bond 1.375% 19 - 15.10.22 2,977,000 USD 2,683,920 2,487,068 0.11United States Treasury Bond 1.375% 20 - 31.01.22 2,816,000 USD 2,563,445 2,332,426 0.11United States Treasury Bond 1.375% 20 - 31.01.25 3,451,000 USD 3,154,879 2,947,403 0.13United States Treasury Bond 1.375% 20 - 15.02.23 2,626,000 USD 2,417,501 2,202,552 0.10United States Treasury Bond 1.375% 20 - 15.08.50 7,520,000 USD 6,177,027 5,755,200 0.26United States Treasury Bond 1.375% 20 - 15.11.40 5,000,000 USD 4,112,022 4,042,413 0.18United States Treasury Bond 1.50% 15 - 31.01.22 2,846,000 USD 2,504,884 2,360,546 0.11United States Treasury Bond 1.50% 16 - 28.02.23 2,574,000 USD 2,329,038 2,165,511 0.10United States Treasury Bond 1.50% 16 - 31.03.23 2,899,000 USD 2,510,836 2,441,526 0.11United States Treasury Bond 1.50% 16 - 15.08.26 6,124,000 USD 5,463,607 5,298,377 0.24United States Treasury Bond 1.50% 19 - 15.08.22 3,573,000 USD 3,221,815 2,984,983 0.13United States Treasury Bond 1.50% 19 - 15.09.22 3,684,000 USD 3,354,460 3,081,009 0.14United States Treasury Bond 1.50% 19 - 30.09.24 3,663,000 USD 3,335,354 3,135,015 0.14United States Treasury Bond 1.50% 19 - 31.10.24 3,619,000 USD 3,258,333 3,100,131 0.14United States Treasury Bond 1.50% 19 - 30.11.24 4,015,000 USD 3,581,476 3,440,893 0.16United States Treasury Bond 1.50% 20 - 15.01.23 2,550,000 USD 2,332,224 2,142,064 0.10United States Treasury Bond 1.50% 20 - 31.01.27 2,388,000 USD 2,233,943 2,068,190 0.09United States Treasury Bond 1.50% 20 - 15.02.30 6,496,000 USD 6,300,334 5,617,736 0.25United States Treasury Bond 1.625% 12 - 15.08.22 2,162,000 USD 1,960,565 1,809,784 0.08United States Treasury Bond 1.625% 12 - 15.11.22 6,143,000 USD 5,502,671 5,160,274 0.23United States Treasury Bond 1.625% 16 - 15.02.26 5,811,000 USD 5,253,414 5,050,579 0.23United States Treasury Bond 1.625% 16 - 30.04.23 2,602,000 USD 2,310,972 2,199,701 0.10United States Treasury Bond 1.625% 16 - 15.05.26 5,920,000 USD 5,086,324 5,150,607 0.23United States Treasury Bond 1.625% 16 - 31.05.23 2,622,200 USD 2,346,222 2,219,457 0.10United States Treasury Bond 1.625% 16 - 31.10.23 2,683,000 USD 2,277,940 2,284,281 0.10United States Treasury Bond 1.625% 17 - 31.08.22 3,281,000 USD 2,888,656 2,747,742 0.12United States Treasury Bond 1.625% 19 - 15.08.29 4,967,000 USD 4,551,889 4,342,396 0.20United States Treasury Bond 1.625% 19 - 30.09.26 2,152,000 USD 1,950,704 1,874,789 0.08United States Treasury Bond 1.625% 19 - 31.10.26 2,341,000 USD 2,169,990 2,040,339 0.09United States Treasury Bond 1.625% 19 - 30.11.26 2,389,000 USD 2,188,630 2,082,480 0.09United States Treasury Bond 1.625% 19 - 15.12.22 3,196,000 USD 2,877,962 2,688,393 0.12United States Treasury Bond 1.625% 19 - 31.12.21 3,076,000 USD 2,793,764 2,551,706 0.12United States Treasury Bond 1.625% 20 - 15.11.50 5,420,000 USD 4,475,137 4,411,738 0.20United States Treasury Bond 1.75% 12 - 15.05.22 2,440,000 USD 2,116,356 2,038,444 0.09United States Treasury Bond 1.75% 13 - 15.05.23 4,879,000 USD 4,279,551 4,138,981 0.19United States Treasury Bond 1.75% 15 - 28.02.22 2,912,000 USD 2,559,180 2,424,584 0.11United States Treasury Bond 1.75% 15 - 31.03.22 3,050,000 USD 2,656,056 2,542,991 0.11United States Treasury Bond 1.75% 15 - 30.04.22 3,012,000 USD 2,728,330 2,514,770 0.11United States Treasury Bond 1.75% 15 - 30.09.22 2,959,000 USD 2,630,850 2,486,390 0.11United States Treasury Bond 1.75% 16 - 31.01.23 2,653,000 USD 2,381,747 2,240,783 0.10United States Treasury Bond 1.75% 17 - 31.05.22 3,372,100 USD 3,003,206 2,818,868 0.13United States Treasury Bond 1.75% 17 - 30.06.22 2,772,000 USD 2,428,469 2,320,408 0.10United States Treasury Bond 1.75% 19 - 15.06.22 2,300,000 USD 2,061,997 1,923,833 0.09United States Treasury Bond 1.75% 19 - 30.06.24 3,471,000 USD 3,172,925 2,988,864 0.13United States Treasury Bond 1.75% 19 - 15.07.22 2,626,000 USD 2,332,330 2,199,534 0.10United States Treasury Bond 1.75% 19 - 31.07.24 3,576,000 USD 3,243,177 3,082,475 0.14
Xtrackers II
Xtrackers II GLOBAL GOVERNMENT BOND UCITS ETF (continued)
Statement of Investmentsas at 31 December 2020(expressed in EUR)
The accompanying notes form an integral part of these financial statements.
133

DescriptionNominal
ValueCurrency
(local) Cost Market Value
% ofNet
Assets
Transferable securities and money market instruments admitted to an official stock exchange listing(A)
Bonds (continued)
United States (continued)United States Treasury Bond 1.75% 19 - 15.11.29 3,592,000 USD 3,353,505 3,172,413 0.14United States Treasury Bond 1.75% 19 - 31.12.24 3,469,000 USD 3,230,222 3,002,646 0.14United States Treasury Bond 1.75% 19 - 31.12.26 2,405,000 USD 2,240,538 2,112,090 0.10United States Treasury Bond 1.875% 15 - 31.05.22 2,748,000 USD 2,466,796 2,301,370 0.10United States Treasury Bond 1.875% 15 - 31.08.22 2,648,000 USD 2,333,947 2,226,753 0.10United States Treasury Bond 1.875% 15 - 31.10.22 2,900,000 USD 2,557,226 2,445,331 0.11United States Treasury Bond 1.875% 17 - 31.01.22 2,676,000 USD 2,348,988 2,228,428 0.10United States Treasury Bond 1.875% 17 - 28.02.22 2,738,000 USD 2,530,448 2,283,205 0.10United States Treasury Bond 1.875% 17 - 31.03.22 2,608,000 USD 2,346,966 2,177,796 0.10United States Treasury Bond 1.875% 17 - 30.04.22 3,018,000 USD 2,655,230 2,523,633 0.11United States Treasury Bond 1.875% 17 - 31.07.22 2,791,000 USD 2,491,660 2,343,797 0.11United States Treasury Bond 1.875% 17 - 31.08.24 2,932,000 USD 2,535,961 2,540,459 0.11United States Treasury Bond 1.875% 17 - 30.09.22 2,390,000 USD 2,093,165 2,012,543 0.09United States Treasury Bond 1.875% 19 - 30.06.26 2,650,000 USD 2,422,802 2,336,388 0.11United States Treasury Bond 1.875% 19 - 31.07.26 2,747,000 USD 2,507,950 2,423,312 0.11United States Treasury Bond 2.00% 12 - 15.02.22 3,322,000 USD 2,910,172 2,771,897 0.12United States Treasury Bond 2.00% 13 - 15.02.23 4,997,000 USD 4,380,937 4,244,826 0.19United States Treasury Bond 2.00% 15 - 15.02.25 6,106,000 USD 5,560,438 5,342,844 0.24United States Treasury Bond 2.00% 15 - 31.07.22 3,035,000 USD 2,694,464 2,553,352 0.12United States Treasury Bond 2.00% 15 - 15.08.25 5,900,000 USD 5,295,675 5,194,235 0.23United States Treasury Bond 2.00% 15 - 30.11.22 5,755,000 USD 5,022,353 4,871,090 0.22United States Treasury Bond 2.00% 16 - 15.11.26 5,800,000 USD 5,147,099 5,158,045 0.23United States Treasury Bond 2.00% 17 - 31.12.21 3,015,000 USD 2,629,227 2,509,959 0.11United States Treasury Bond 2.00% 17 - 30.04.24 2,547,000 USD 2,270,062 2,206,222 0.10United States Treasury Bond 2.00% 17 - 31.05.24 4,864,000 USD 4,365,110 4,218,185 0.19United States Treasury Bond 2.00% 17 - 30.06.24 2,550,000 USD 2,254,925 2,213,705 0.10United States Treasury Bond 2.00% 17 - 31.10.22 2,867,000 USD 2,481,837 2,422,997 0.11United States Treasury Bond 2.00% 20 - 15.02.50 5,462,000 USD 5,624,724 4,849,782 0.22United States Treasury Bond 2.125% 14 - 31.12.21 2,830,000 USD 2,497,891 2,358,840 0.11United States Treasury Bond 2.125% 15 - 15.05.25 5,591,000 USD 5,086,033 4,931,480 0.22United States Treasury Bond 2.125% 15 - 30.06.22 2,693,000 USD 2,426,119 2,266,658 0.10United States Treasury Bond 2.125% 15 - 31.12.22 5,562,000 USD 5,010,385 4,726,200 0.21United States Treasury Bond 2.125% 16 - 30.11.23 2,829,000 USD 2,481,223 2,444,349 0.11United States Treasury Bond 2.125% 17 - 29.02.24 2,502,000 USD 2,256,828 2,169,798 0.10United States Treasury Bond 2.125% 17 - 31.03.24 6,030,000 USD 5,420,485 5,236,301 0.24United States Treasury Bond 2.125% 17 - 31.07.24 2,452,000 USD 2,166,106 2,140,528 0.10United States Treasury Bond 2.125% 17 - 30.09.24 2,583,000 USD 2,326,275 2,259,505 0.10United States Treasury Bond 2.125% 17 - 30.11.24 2,513,000 USD 2,308,135 2,203,407 0.10United States Treasury Bond 2.125% 19 - 15.05.22 3,199,000 USD 2,937,925 2,685,606 0.12United States Treasury Bond 2.125% 19 - 31.05.26 2,787,000 USD 2,559,061 2,486,359 0.11United States Treasury Bond 2.25% 14 - 15.11.24 6,239,000 USD 5,578,403 5,492,684 0.25United States Treasury Bond 2.25% 15 - 15.11.25 6,210,000 USD 5,509,949 5,543,284 0.25United States Treasury Bond 2.25% 16 - 15.08.46 3,608,000 USD 3,153,810 3,367,618 0.15United States Treasury Bond 2.25% 17 - 31.12.23 2,685,000 USD 2,361,170 2,330,901 0.11United States Treasury Bond 2.25% 17 - 31.01.24 2,770,000 USD 2,569,751 2,408,228 0.11United States Treasury Bond 2.25% 17 - 15.02.27 5,053,000 USD 4,697,291 4,564,705 0.21United States Treasury Bond 2.25% 17 - 15.08.27 5,925,000 USD 5,319,529 5,369,085 0.24United States Treasury Bond 2.25% 17 - 31.10.24 2,725,000 USD 2,480,669 2,397,641 0.11
Xtrackers II
Xtrackers II GLOBAL GOVERNMENT BOND UCITS ETF (continued)
Statement of Investmentsas at 31 December 2020(expressed in EUR)
The accompanying notes form an integral part of these financial statements.
134

DescriptionNominal
ValueCurrency
(local) Cost Market Value
% ofNet
Assets
Transferable securities and money market instruments admitted to an official stock exchange listing(A)
Bonds (continued)
United States (continued)United States Treasury Bond 2.25% 17 - 15.11.27 5,597,000 USD 4,957,008 5,079,007 0.23United States Treasury Bond 2.25% 18 - 31.12.24 2,926,000 USD 2,648,683 2,580,473 0.12United States Treasury Bond 2.25% 19 - 31.03.26 3,116,000 USD 2,836,448 2,792,205 0.13United States Treasury Bond 2.25% 19 - 15.04.22 3,061,000 USD 2,758,644 2,570,144 0.12United States Treasury Bond 2.25% 19 - 30.04.24 4,320,000 USD 3,964,994 3,771,240 0.17United States Treasury Bond 2.25% 19 - 15.08.49 5,228,000 USD 5,054,293 4,892,371 0.22United States Treasury Bond 2.375% 14 - 15.08.24 6,599,000 USD 6,043,943 5,811,306 0.26United States Treasury Bond 2.375% 17 - 15.05.27 6,405,000 USD 5,829,259 5,838,402 0.26United States Treasury Bond 2.375% 18 - 31.01.23 2,902,000 USD 2,613,052 2,481,853 0.11United States Treasury Bond 2.375% 19 - 29.02.24 2,653,000 USD 2,450,955 2,317,689 0.10United States Treasury Bond 2.375% 19 - 15.03.22 2,706,000 USD 2,412,416 2,271,034 0.10United States Treasury Bond 2.375% 19 - 30.04.26 2,536,000 USD 2,343,384 2,288,667 0.10United States Treasury Bond 2.375% 19 - 15.05.29 5,566,000 USD 5,225,629 5,141,147 0.23United States Treasury Bond 2.375% 19 - 15.11.49 4,597,000 USD 4,595,947 4,415,767 0.20United States Treasury Bond 2.50% 13 - 15.08.23 4,452,000 USD 4,130,115 3,862,594 0.17United States Treasury Bond 2.50% 14 - 15.05.24 6,230,000 USD 5,672,287 5,485,556 0.25United States Treasury Bond 2.50% 15 - 15.02.45 3,633,000 USD 3,310,595 3,541,734 0.16United States Treasury Bond 2.50% 16 - 15.02.46 3,307,000 USD 3,031,303 3,228,991 0.15United States Treasury Bond 2.50% 16 - 15.05.46 3,321,000 USD 3,035,866 3,243,933 0.15United States Treasury Bond 2.50% 18 - 31.01.25 2,749,000 USD 2,522,659 2,450,352 0.11United States Treasury Bond 2.50% 18 - 31.03.23 2,802,000 USD 2,500,430 2,411,002 0.11United States Treasury Bond 2.50% 19 - 15.01.22 3,332,000 USD 2,969,281 2,790,028 0.13United States Treasury Bond 2.50% 19 - 31.01.24 3,301,000 USD 2,994,549 2,890,112 0.13United States Treasury Bond 2.50% 19 - 15.02.22 3,155,000 USD 2,792,503 2,647,056 0.12United States Treasury Bond 2.50% 19 - 28.02.26 2,915,000 USD 2,677,092 2,640,382 0.12United States Treasury Bond 2.625% 18 - 28.02.23 2,538,000 USD 2,296,765 2,185,137 0.10United States Treasury Bond 2.625% 18 - 31.03.25 1,969,000 USD 1,842,607 1,767,914 0.08United States Treasury Bond 2.625% 18 - 30.06.23 2,644,000 USD 2,386,826 2,293,957 0.10United States Treasury Bond 2.625% 18 - 31.12.23 3,282,000 USD 3,019,872 2,878,925 0.13United States Treasury Bond 2.625% 18 - 31.12.25 2,664,000 USD 2,466,493 2,421,194 0.11United States Treasury Bond 2.625% 19 - 31.01.26 2,831,000 USD 2,638,729 2,576,588 0.12United States Treasury Bond 2.625% 19 - 15.02.29 6,608,000 USD 6,259,054 6,199,811 0.28United States Treasury Bond 2.75% 12 - 15.08.42 1,821,000 USD 1,702,047 1,844,552 0.08United States Treasury Bond 2.75% 12 - 15.11.42 2,510,000 USD 2,373,645 2,540,220 0.11United States Treasury Bond 2.75% 13 - 15.11.23 5,804,000 USD 5,275,941 5,096,378 0.23United States Treasury Bond 2.75% 14 - 15.02.24 4,963,000 USD 4,541,834 4,381,362 0.20United States Treasury Bond 2.75% 17 - 15.08.47 3,438,000 USD 3,181,434 3,524,614 0.16United States Treasury Bond 2.75% 17 - 15.11.47 3,637,000 USD 3,520,286 3,731,879 0.17United States Treasury Bond 2.75% 18 - 15.02.28 6,788,000 USD 6,371,876 6,360,890 0.29United States Treasury Bond 2.75% 18 - 28.02.25 3,110,000 USD 2,803,625 2,801,523 0.13United States Treasury Bond 2.75% 18 - 30.04.23 3,013,000 USD 2,696,956 2,611,412 0.12United States Treasury Bond 2.75% 18 - 31.05.23 2,420,000 USD 2,162,642 2,101,467 0.09United States Treasury Bond 2.75% 18 - 30.06.25 2,080,000 USD 1,826,838 1,885,109 0.08United States Treasury Bond 2.75% 18 - 31.07.23 2,728,000 USD 2,508,778 2,378,681 0.11United States Treasury Bond 2.75% 18 - 31.08.23 2,314,000 USD 2,160,496 2,021,535 0.09United States Treasury Bond 2.75% 18 - 31.08.25 2,770,000 USD 2,611,264 2,517,179 0.11United States Treasury Bond 2.875% 13 - 15.05.43 3,512,000 USD 3,333,013 3,629,182 0.16United States Treasury Bond 2.875% 15 - 15.08.45 3,028,000 USD 3,087,788 3,148,754 0.14
Xtrackers II
Xtrackers II GLOBAL GOVERNMENT BOND UCITS ETF (continued)
Statement of Investmentsas at 31 December 2020(expressed in EUR)
The accompanying notes form an integral part of these financial statements.
135
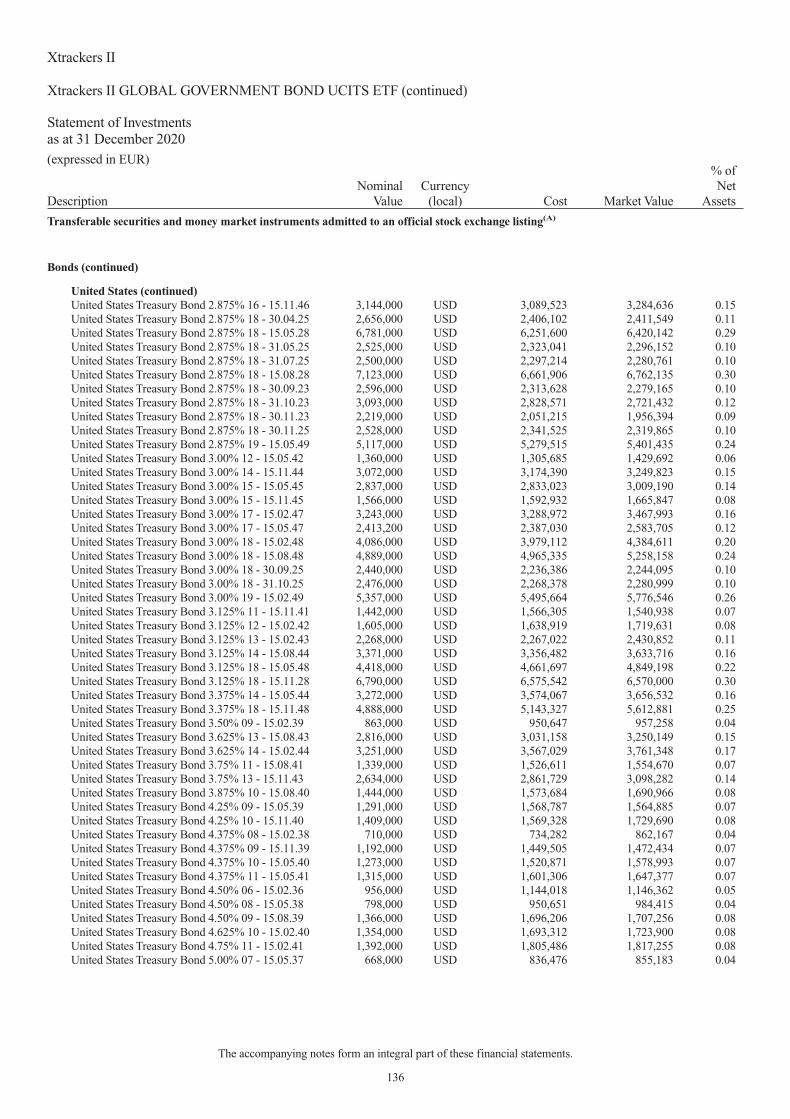
DescriptionNominal
ValueCurrency
(local) Cost Market Value
% ofNet
Assets
Transferable securities and money market instruments admitted to an official stock exchange listing(A)
Bonds (continued)
United States (continued)United States Treasury Bond 2.875% 16 - 15.11.46 3,144,000 USD 3,089,523 3,284,636 0.15United States Treasury Bond 2.875% 18 - 30.04.25 2,656,000 USD 2,406,102 2,411,549 0.11United States Treasury Bond 2.875% 18 - 15.05.28 6,781,000 USD 6,251,600 6,420,142 0.29United States Treasury Bond 2.875% 18 - 31.05.25 2,525,000 USD 2,323,041 2,296,152 0.10United States Treasury Bond 2.875% 18 - 31.07.25 2,500,000 USD 2,297,214 2,280,761 0.10United States Treasury Bond 2.875% 18 - 15.08.28 7,123,000 USD 6,661,906 6,762,135 0.30United States Treasury Bond 2.875% 18 - 30.09.23 2,596,000 USD 2,313,628 2,279,165 0.10United States Treasury Bond 2.875% 18 - 31.10.23 3,093,000 USD 2,828,571 2,721,432 0.12United States Treasury Bond 2.875% 18 - 30.11.23 2,219,000 USD 2,051,215 1,956,394 0.09United States Treasury Bond 2.875% 18 - 30.11.25 2,528,000 USD 2,341,525 2,319,865 0.10United States Treasury Bond 2.875% 19 - 15.05.49 5,117,000 USD 5,279,515 5,401,435 0.24United States Treasury Bond 3.00% 12 - 15.05.42 1,360,000 USD 1,305,685 1,429,692 0.06United States Treasury Bond 3.00% 14 - 15.11.44 3,072,000 USD 3,174,390 3,249,823 0.15United States Treasury Bond 3.00% 15 - 15.05.45 2,837,000 USD 2,833,023 3,009,190 0.14United States Treasury Bond 3.00% 15 - 15.11.45 1,566,000 USD 1,592,932 1,665,847 0.08United States Treasury Bond 3.00% 17 - 15.02.47 3,243,000 USD 3,288,972 3,467,993 0.16United States Treasury Bond 3.00% 17 - 15.05.47 2,413,200 USD 2,387,030 2,583,705 0.12United States Treasury Bond 3.00% 18 - 15.02.48 4,086,000 USD 3,979,112 4,384,611 0.20United States Treasury Bond 3.00% 18 - 15.08.48 4,889,000 USD 4,965,335 5,258,158 0.24United States Treasury Bond 3.00% 18 - 30.09.25 2,440,000 USD 2,236,386 2,244,095 0.10United States Treasury Bond 3.00% 18 - 31.10.25 2,476,000 USD 2,268,378 2,280,999 0.10United States Treasury Bond 3.00% 19 - 15.02.49 5,357,000 USD 5,495,664 5,776,546 0.26United States Treasury Bond 3.125% 11 - 15.11.41 1,442,000 USD 1,566,305 1,540,938 0.07United States Treasury Bond 3.125% 12 - 15.02.42 1,605,000 USD 1,638,919 1,719,631 0.08United States Treasury Bond 3.125% 13 - 15.02.43 2,268,000 USD 2,267,022 2,430,852 0.11United States Treasury Bond 3.125% 14 - 15.08.44 3,371,000 USD 3,356,482 3,633,716 0.16United States Treasury Bond 3.125% 18 - 15.05.48 4,418,000 USD 4,661,697 4,849,198 0.22United States Treasury Bond 3.125% 18 - 15.11.28 6,790,000 USD 6,575,542 6,570,000 0.30United States Treasury Bond 3.375% 14 - 15.05.44 3,272,000 USD 3,574,067 3,656,532 0.16United States Treasury Bond 3.375% 18 - 15.11.48 4,888,000 USD 5,143,327 5,612,881 0.25United States Treasury Bond 3.50% 09 - 15.02.39 863,000 USD 950,647 957,258 0.04United States Treasury Bond 3.625% 13 - 15.08.43 2,816,000 USD 3,031,158 3,250,149 0.15United States Treasury Bond 3.625% 14 - 15.02.44 3,251,000 USD 3,567,029 3,761,348 0.17United States Treasury Bond 3.75% 11 - 15.08.41 1,339,000 USD 1,526,611 1,554,670 0.07United States Treasury Bond 3.75% 13 - 15.11.43 2,634,000 USD 2,861,729 3,098,282 0.14United States Treasury Bond 3.875% 10 - 15.08.40 1,444,000 USD 1,573,684 1,690,966 0.08United States Treasury Bond 4.25% 09 - 15.05.39 1,291,000 USD 1,568,787 1,564,885 0.07United States Treasury Bond 4.25% 10 - 15.11.40 1,409,000 USD 1,569,328 1,729,690 0.08United States Treasury Bond 4.375% 08 - 15.02.38 710,000 USD 734,282 862,167 0.04United States Treasury Bond 4.375% 09 - 15.11.39 1,192,000 USD 1,449,505 1,472,434 0.07United States Treasury Bond 4.375% 10 - 15.05.40 1,273,000 USD 1,520,871 1,578,993 0.07United States Treasury Bond 4.375% 11 - 15.05.41 1,315,000 USD 1,601,306 1,647,377 0.07United States Treasury Bond 4.50% 06 - 15.02.36 956,000 USD 1,144,018 1,146,362 0.05United States Treasury Bond 4.50% 08 - 15.05.38 798,000 USD 950,651 984,415 0.04United States Treasury Bond 4.50% 09 - 15.08.39 1,366,000 USD 1,696,206 1,707,256 0.08United States Treasury Bond 4.625% 10 - 15.02.40 1,354,000 USD 1,693,312 1,723,900 0.08United States Treasury Bond 4.75% 11 - 15.02.41 1,392,000 USD 1,805,486 1,817,255 0.08United States Treasury Bond 5.00% 07 - 15.05.37 668,000 USD 836,476 855,183 0.04
Xtrackers II
Xtrackers II GLOBAL GOVERNMENT BOND UCITS ETF (continued)
Statement of Investmentsas at 31 December 2020(expressed in EUR)
The accompanying notes form an integral part of these financial statements.
136

DescriptionNominal
ValueCurrency
(local) Cost Market Value
% ofNet
Assets
Transferable securities and money market instruments admitted to an official stock exchange listing(A)
Bonds (continued)
United States (continued)United States Treasury Bond 5.25% 98 - 15.11.28 908,000 USD 956,159 999,520 0.05United States Treasury Bond 5.25% 99 - 15.02.29 520,000 USD 597,796 575,533 0.03United States Treasury Bond 5.375% 01 - 15.02.31 877,000 USD 1,053,445 1,028,448 0.05United States Treasury Bond 5.50% 98 - 15.08.28 558,000 USD 616,566 618,518 0.03United States Treasury Bond 6.00% 96 - 15.02.26 630,000 USD 645,700 660,836 0.03United States Treasury Bond 6.125% 97 - 15.11.27 1,037,000 USD 1,198,344 1,162,843 0.05United States Treasury Bond 6.25% 93 - 15.08.23 712,000 USD 685,265 674,292 0.03United States Treasury Bond 6.25% 00 - 15.05.30 783,000 USD 947,574 953,012 0.04
814,788,451 792,070,482 35.73
Total - Bonds 2,169,401,589 2,189,522,435 98.76
Total Transferable securities and money market instruments admitted to an officialstock exchange listing 2,169,401,589 2,189,522,435 98.76
Other transferable securities and money market instruments(A)
Bonds
CanadaCanada 0.25% 20 - 01.08.22 1,940,000 CAD 1,245,880 1,245,951 0.06Canada 0.25% 20 - 01.11.22 3,240,000 CAD 2,074,620 2,080,285 0.09Canada 0.25% 20 - 01.03.26 1,430,000 CAD 909,519 908,904 0.04Canada 0.50% 20 - 01.09.25 3,772,000 CAD 2,446,012 2,431,929 0.11Canada 0.50% 20 - 01.12.30 1,850,000 CAD 1,159,216 1,167,879 0.05Canada 1.25% 19 - 01.03.25 1,018,000 CAD 693,668 678,130 0.03Canada 1.50% 15 - 01.06.26 1,132,000 CAD 760,498 768,492 0.04Canada 1.50% 19 - 01.09.24 1,080,000 CAD 732,181 723,089 0.03Canada 1.50% 19 - 01.06.30 4,116,000 CAD 2,818,614 2,778,586 0.13
12,840,208 12,783,245 0.58
Total - Bonds 12,840,208 12,783,245 0.58
Total Other transferable securities and money market instruments 12,840,208 12,783,245 0.58
TOTAL INVESTMENT PORTFOLIO 2,182,241,797 2,202,305,680 99.34
TOTAL INVESTMENT PORTFOLIO INCLUDING ACCRUED INTEREST 2,213,966,024 99.86(A) Any duplicate securities appearing herein with the same name are either quoted on different stock exchanges or have different ISINs.
Xtrackers II
Xtrackers II GLOBAL GOVERNMENT BOND UCITS ETF (continued)
Statement of Investmentsas at 31 December 2020(expressed in EUR)
The accompanying notes form an integral part of these financial statements.
137

DescriptionNominal
ValueCurrency
(local) Cost Market Value
% ofNet
Assets
Transferable securities and money market instruments admitted to an official stock exchange listing
Bonds
SingaporeSingapore 0.50% 20 - 01.11.25 2,981,000 SGD 2,983,491 2,986,366 2.17Singapore 1.75% 17 - 01.04.22 5,711,000 SGD 5,741,242 5,817,796 4.22Singapore 1.75% 18 - 01.02.23 7,395,000 SGD 7,454,952 7,610,934 5.52Singapore 1.875% 20 - 01.03.50 4,306,000 SGD 5,060,350 5,077,205 3.68Singapore 2.00% 19 - 01.02.24 2,979,000 SGD 2,992,100 3,130,035 2.27Singapore 2.125% 16 - 01.06.26 5,741,000 SGD 5,782,648 6,212,336 4.51Singapore 2.25% 16 - 01.08.36 6,734,000 SGD 6,945,416 7,825,581 5.68Singapore 2.375% 15 - 01.06.25 6,513,000 SGD 6,762,441 7,075,723 5.14Singapore 2.375% 19 - 01.07.39 3,643,000 SGD 4,091,872 4,346,463 3.15Singapore 2.625% 18 - 01.05.28 5,409,000 SGD 5,581,053 6,115,956 4.44Singapore 2.75% 12 - 01.04.42 5,081,000 SGD 5,219,797 6,491,994 4.71Singapore 2.75% 13 - 01.07.23 8,608,000 SGD 8,768,371 9,121,037 6.62Singapore 2.75% 16 - 01.03.46 7,503,000 SGD 7,796,573 9,969,236 7.23Singapore 2.875% 10 - 01.09.30 7,065,000 SGD 7,726,843 8,393,926 6.09Singapore 2.875% 14 - 01.07.29 7,617,000 SGD 8,311,310 8,902,750 6.46Singapore 3.00% 09 - 01.09.24 8,721,000 SGD 9,053,680 9,563,449 6.94Singapore 3.125% 07 - 01.09.22 9,148,000 SGD 9,414,043 9,577,956 6.95Singapore 3.375% 13 - 01.09.33 6,955,000 SGD 7,661,200 8,863,452 6.43Singapore 3.50% 07 - 01.03.27 8,280,000 SGD 8,903,533 9,680,148 7.03
126,250,915 136,762,343 99.24
Total - Bonds 126,250,915 136,762,343 99.24
Total Transferable securities and money market instruments admitted to an officialstock exchange listing 126,250,915 136,762,343 99.24
TOTAL INVESTMENT PORTFOLIO 126,250,915 136,762,343 99.24
TOTAL INVESTMENT PORTFOLIO INCLUDING ACCRUED INTEREST 137,812,059 100.01
Xtrackers II
Xtrackers II SINGAPORE GOVERNMENT BOND UCITS ETF
Statement of Investmentsas at 31 December 2020(expressed in SGD)
The accompanying notes form an integral part of these financial statements.
138

DescriptionNominal
ValueCurrency
(local) Cost Market Value
% ofNet
Assets
Transferable securities and money market instruments admitted to an official stock exchange listing
Bonds
United StatesUnited States Treasury Bond 0.125% 20 - 30.04.22 5,566,000 USD 5,562,758 5,567,305 0.34United States Treasury Bond 0.125% 20 - 15.05.23 5,525,000 USD 5,517,639 5,524,569 0.34United States Treasury Bond 0.125% 20 - 31.05.22 5,878,000 USD 5,875,651 5,879,378 0.36United States Treasury Bond 0.125% 20 - 30.06.22 6,005,000 USD 6,002,664 6,005,939 0.37United States Treasury Bond 0.125% 20 - 15.07.23 6,471,000 USD 6,469,247 6,468,472 0.39United States Treasury Bond 0.125% 20 - 31.07.22 6,369,000 USD 6,369,519 6,370,493 0.39United States Treasury Bond 0.125% 20 - 15.08.23 6,390,000 USD 6,385,096 6,387,504 0.39United States Treasury Bond 0.125% 20 - 31.08.22 7,005,000 USD 7,003,818 7,005,547 0.43United States Treasury Bond 0.125% 20 - 15.09.23 6,815,000 USD 6,807,681 6,810,741 0.42United States Treasury Bond 0.125% 20 - 30.09.22 6,970,000 USD 6,969,447 6,970,000 0.43United States Treasury Bond 0.125% 20 - 15.10.23 6,796,000 USD 6,783,183 6,791,753 0.41United States Treasury Bond 0.125% 20 - 31.10.22 7,160,000 USD 7,157,079 7,161,119 0.44United States Treasury Bond 0.125% 20 - 30.11.22 7,828,000 USD 7,825,045 7,829,224 0.48United States Treasury Bond 0.125% 20 - 15.12.23 7,700,000 USD 7,690,100 7,689,774 0.47United States Treasury Bond 0.125% 20 - 31.12.22 7,824,000 USD 7,823,721 7,824,611 0.48United States Treasury Bond 0.25% 20 - 15.04.23 5,305,000 USD 5,310,854 5,319,920 0.32United States Treasury Bond 0.25% 20 - 31.05.25 6,087,000 USD 6,078,368 6,075,587 0.37United States Treasury Bond 0.25% 20 - 15.06.23 5,709,000 USD 5,719,377 5,724,611 0.35United States Treasury Bond 0.25% 20 - 30.06.25 6,563,000 USD 6,548,613 6,546,080 0.40United States Treasury Bond 0.25% 20 - 31.07.25 6,529,000 USD 6,530,294 6,510,127 0.40United States Treasury Bond 0.25% 20 - 31.08.25 6,760,000 USD 6,749,071 6,738,875 0.41United States Treasury Bond 0.25% 20 - 30.09.25 7,247,000 USD 7,232,535 7,220,390 0.44United States Treasury Bond 0.25% 20 - 31.10.25 7,340,000 USD 7,303,374 7,309,608 0.45United States Treasury Bond 0.25% 20 - 15.11.23 7,539,000 USD 7,553,877 7,560,792 0.46United States Treasury Bond 0.375% 20 - 31.03.22 5,668,400 USD 5,683,332 5,686,999 0.35United States Treasury Bond 0.375% 20 - 30.04.25 5,699,000 USD 5,710,518 5,720,371 0.35United States Treasury Bond 0.375% 20 - 31.07.27 5,844,000 USD 5,824,012 5,765,471 0.35United States Treasury Bond 0.375% 20 - 30.09.27 7,011,000 USD 6,953,555 6,902,001 0.42United States Treasury Bond 0.375% 20 - 30.11.25 7,829,000 USD 7,834,605 7,840,010 0.48United States Treasury Bond 0.375% 20 - 31.12.25 8,050,000 USD 8,051,285 8,055,031 0.49United States Treasury Bond 0.50% 20 - 15.03.23 5,398,000 USD 5,431,567 5,442,280 0.33United States Treasury Bond 0.50% 20 - 31.03.25 5,514,000 USD 5,553,932 5,565,263 0.34United States Treasury Bond 0.50% 20 - 30.04.27 4,473,000 USD 4,467,824 4,461,119 0.27United States Treasury Bond 0.50% 20 - 31.05.27 4,995,000 USD 4,996,005 4,977,049 0.30United States Treasury Bond 0.50% 20 - 30.06.27 5,512,000 USD 5,510,674 5,488,315 0.33United States Treasury Bond 0.50% 20 - 31.08.27 6,485,000 USD 6,482,615 6,443,962 0.39United States Treasury Bond 0.50% 20 - 31.10.27 6,964,000 USD 6,913,494 6,907,961 0.42United States Treasury Bond 0.625% 20 - 31.03.27 4,156,000 USD 4,183,355 4,180,352 0.26United States Treasury Bond 0.625% 20 - 15.05.30 12,306,000 USD 12,260,501 12,029,115 0.73United States Treasury Bond 0.625% 20 - 15.08.30 14,248,000 USD 14,069,148 13,887,348 0.85United States Treasury Bond 0.625% 20 - 30.11.27 7,528,000 USD 7,533,055 7,525,060 0.46United States Treasury Bond 0.875% 20 - 15.11.30 10,953,000 USD 10,940,438 10,907,648 0.67United States Treasury Bond 1.125% 20 - 28.02.22 5,451,000 USD 5,511,523 5,515,305 0.34United States Treasury Bond 1.125% 20 - 28.02.25 5,549,000 USD 5,734,335 5,745,382 0.35United States Treasury Bond 1.125% 20 - 28.02.27 4,245,000 USD 4,402,805 4,401,534 0.27United States Treasury Bond 1.125% 20 - 15.05.40 7,336,000 USD 7,305,393 6,956,592 0.42United States Treasury Bond 1.125% 20 - 15.08.40 9,357,000 USD 9,055,092 8,848,213 0.54United States Treasury Bond 1.25% 16 - 31.07.23 3,624,000 USD 3,652,941 3,727,624 0.23
Xtrackers II
Xtrackers II US TREASURIES UCITS ETF
Statement of Investmentsas at 31 December 2020(expressed in USD)
The accompanying notes form an integral part of these financial statements.
139

DescriptionNominal
ValueCurrency
(local) Cost Market Value
% ofNet
Assets
Transferable securities and money market instruments admitted to an official stock exchange listing
Bonds (continued)
United States (continued)United States Treasury Bond 1.25% 19 - 31.08.24 5,284,000 USD 5,325,691 5,480,911 0.33United States Treasury Bond 1.25% 20 - 15.05.50 5,617,000 USD 5,402,381 5,090,845 0.31United States Treasury Bond 1.375% 16 - 30.06.23 3,828,000 USD 3,830,960 3,945,831 0.24United States Treasury Bond 1.375% 16 - 31.08.23 4,053,000 USD 4,112,155 4,185,673 0.26United States Treasury Bond 1.375% 16 - 30.09.23 3,638,000 USD 3,672,500 3,760,783 0.23United States Treasury Bond 1.375% 19 - 31.08.26 4,331,000 USD 4,438,444 4,555,671 0.28United States Treasury Bond 1.375% 19 - 15.10.22 4,883,000 USD 4,922,167 4,992,105 0.30United States Treasury Bond 1.375% 20 - 31.01.22 5,315,000 USD 5,352,818 5,387,251 0.33United States Treasury Bond 1.375% 20 - 31.01.25 5,436,800 USD 5,547,606 5,682,306 0.35United States Treasury Bond 1.375% 20 - 15.02.23 5,237,000 USD 5,334,028 5,374,880 0.33United States Treasury Bond 1.375% 20 - 15.08.50 9,530,000 USD 9,178,376 8,911,294 0.54United States Treasury Bond 1.375% 20 - 15.11.40 7,076,000 USD 7,028,962 6,989,209 0.43United States Treasury Bond 1.50% 15 - 31.01.22 3,816,000 USD 3,835,583 3,872,942 0.24United States Treasury Bond 1.50% 16 - 28.02.23 3,752,400 USD 3,772,152 3,862,627 0.24United States Treasury Bond 1.50% 16 - 31.03.23 4,008,500 USD 4,061,944 4,130,947 0.25United States Treasury Bond 1.50% 16 - 15.08.26 8,626,600 USD 8,766,554 9,133,413 0.56United States Treasury Bond 1.50% 19 - 15.08.22 5,075,000 USD 5,118,668 5,188,791 0.32United States Treasury Bond 1.50% 19 - 15.09.22 5,332,000 USD 5,390,299 5,456,552 0.33United States Treasury Bond 1.50% 19 - 30.09.24 5,722,000 USD 5,870,710 5,993,348 0.37United States Treasury Bond 1.50% 19 - 31.10.24 5,634,000 USD 5,774,803 5,906,017 0.36United States Treasury Bond 1.50% 19 - 30.11.24 5,723,000 USD 5,838,930 6,002,443 0.37United States Treasury Bond 1.50% 20 - 15.01.23 5,093,000 USD 5,172,782 5,235,445 0.32United States Treasury Bond 1.50% 20 - 31.01.27 4,379,000 USD 4,521,528 4,640,714 0.28United States Treasury Bond 1.50% 20 - 15.02.30 10,161,000 USD 10,816,215 10,745,258 0.66United States Treasury Bond 1.625% 12 - 15.08.22 8,870,000 USD 8,951,206 9,086,206 0.55United States Treasury Bond 1.625% 12 - 15.11.22 14,216,000 USD 14,381,654 14,614,715 0.89United States Treasury Bond 1.625% 16 - 15.02.26 8,523,800 USD 8,661,840 9,067,192 0.55United States Treasury Bond 1.625% 16 - 30.04.23 3,639,000 USD 3,671,981 3,764,944 0.23United States Treasury Bond 1.625% 16 - 15.05.26 8,443,000 USD 8,594,011 8,988,497 0.55United States Treasury Bond 1.625% 16 - 31.05.23 3,866,000 USD 3,923,029 4,004,331 0.24United States Treasury Bond 1.625% 16 - 31.10.23 3,809,000 USD 3,859,502 3,968,502 0.24United States Treasury Bond 1.625% 17 - 31.08.22 4,401,000 USD 4,450,593 4,510,681 0.28United States Treasury Bond 1.625% 19 - 15.08.29 10,282,000 USD 10,690,558 10,996,117 0.67United States Treasury Bond 1.625% 19 - 30.09.26 4,247,000 USD 4,380,612 4,527,700 0.28United States Treasury Bond 1.625% 19 - 31.10.26 4,302,000 USD 4,430,086 4,587,343 0.28United States Treasury Bond 1.625% 19 - 30.11.26 4,205,000 USD 4,333,427 4,484,895 0.27United States Treasury Bond 1.625% 19 - 15.12.22 4,966,000 USD 5,047,304 5,111,876 0.31United States Treasury Bond 1.625% 19 - 31.12.21 5,355,000 USD 5,393,892 5,435,325 0.33United States Treasury Bond 1.625% 20 - 15.11.50 7,138,000 USD 7,143,642 7,097,291 0.43United States Treasury Bond 1.75% 12 - 15.05.22 9,137,000 USD 9,235,623 9,341,155 0.57United States Treasury Bond 1.75% 13 - 15.05.23 8,624,200 USD 8,749,452 8,954,346 0.55United States Treasury Bond 1.75% 15 - 28.02.22 4,051,500 USD 4,090,667 4,128,098 0.25United States Treasury Bond 1.75% 15 - 31.03.22 3,948,000 USD 3,970,214 4,028,194 0.25United States Treasury Bond 1.75% 15 - 30.04.22 3,870,000 USD 3,905,481 3,954,052 0.24United States Treasury Bond 1.75% 15 - 30.09.22 3,881,900 USD 3,910,193 3,991,685 0.24United States Treasury Bond 1.75% 16 - 31.01.23 3,888,000 USD 3,942,371 4,019,524 0.25United States Treasury Bond 1.75% 17 - 31.05.22 4,387,000 USD 4,442,608 4,488,107 0.27United States Treasury Bond 1.75% 17 - 30.06.22 4,595,000 USD 4,619,191 4,707,003 0.29
Xtrackers II
Xtrackers II US TREASURIES UCITS ETF (continued)
Statement of Investmentsas at 31 December 2020(expressed in USD)
The accompanying notes form an integral part of these financial statements.
140

DescriptionNominal
ValueCurrency
(local) Cost Market Value
% ofNet
Assets
Transferable securities and money market instruments admitted to an official stock exchange listing
Bonds (continued)
United States (continued)United States Treasury Bond 1.75% 19 - 15.06.22 5,397,000 USD 5,467,672 5,523,914 0.34United States Treasury Bond 1.75% 19 - 30.06.24 5,396,000 USD 5,538,890 5,686,878 0.35United States Treasury Bond 1.75% 19 - 15.07.22 5,331,000 USD 5,416,787 5,464,691 0.33United States Treasury Bond 1.75% 19 - 31.07.24 5,307,000 USD 5,452,248 5,598,885 0.34United States Treasury Bond 1.75% 19 - 15.11.29 10,191,000 USD 10,695,599 11,011,853 0.67United States Treasury Bond 1.75% 19 - 31.12.24 5,438,000 USD 5,620,113 5,761,306 0.35United States Treasury Bond 1.75% 19 - 31.12.26 4,390,000 USD 4,549,454 4,717,535 0.29United States Treasury Bond 1.875% 15 - 31.05.22 3,922,000 USD 3,962,547 4,019,131 0.25United States Treasury Bond 1.875% 15 - 31.08.22 3,906,000 USD 3,964,800 4,019,213 0.25United States Treasury Bond 1.875% 15 - 31.10.22 3,770,000 USD 3,835,343 3,890,758 0.24United States Treasury Bond 1.875% 17 - 31.01.22 4,613,400 USD 4,659,199 4,700,983 0.29United States Treasury Bond 1.875% 17 - 28.02.22 4,468,000 USD 4,500,289 4,558,756 0.28United States Treasury Bond 1.875% 17 - 31.03.22 4,713,000 USD 4,782,080 4,816,097 0.29United States Treasury Bond 1.875% 17 - 30.04.22 4,427,000 USD 4,471,787 4,530,066 0.28United States Treasury Bond 1.875% 17 - 31.07.22 4,607,000 USD 4,667,126 4,734,413 0.29United States Treasury Bond 1.875% 17 - 31.08.24 3,807,000 USD 3,905,501 4,036,907 0.25United States Treasury Bond 1.875% 17 - 30.09.22 4,856,000 USD 4,939,495 5,003,198 0.31United States Treasury Bond 1.875% 19 - 30.06.26 4,544,000 USD 4,761,307 4,902,905 0.30United States Treasury Bond 1.875% 19 - 31.07.26 4,165,000 USD 4,314,667 4,496,248 0.27United States Treasury Bond 2.00% 12 - 15.02.22 8,980,000 USD 9,064,257 9,168,720 0.56United States Treasury Bond 2.00% 13 - 15.02.23 8,910,800 USD 9,067,200 9,263,056 0.57United States Treasury Bond 2.00% 15 - 15.02.25 8,818,300 USD 9,116,773 9,444,537 0.58United States Treasury Bond 2.00% 15 - 31.07.22 3,755,000 USD 3,799,144 3,865,596 0.24United States Treasury Bond 2.00% 15 - 15.08.25 8,972,200 USD 9,322,290 9,667,546 0.59United States Treasury Bond 2.00% 15 - 30.11.22 8,634,300 USD 8,818,228 8,943,921 0.55United States Treasury Bond 2.00% 16 - 15.11.26 8,620,000 USD 8,990,458 9,381,658 0.57United States Treasury Bond 2.00% 17 - 31.12.21 4,607,000 USD 4,652,011 4,693,021 0.29United States Treasury Bond 2.00% 17 - 30.04.24 3,639,000 USD 3,742,583 3,857,908 0.24United States Treasury Bond 2.00% 17 - 31.05.24 9,884,000 USD 10,177,074 10,490,167 0.64United States Treasury Bond 2.00% 17 - 30.06.24 4,043,000 USD 4,179,246 4,296,319 0.26United States Treasury Bond 2.00% 17 - 31.10.22 4,568,000 USD 4,643,472 4,724,668 0.29United States Treasury Bond 2.00% 20 - 15.02.50 7,100,000 USD 8,024,073 7,705,164 0.47United States Treasury Bond 2.125% 14 - 31.12.21 3,912,400 USD 3,948,539 3,990,342 0.24United States Treasury Bond 2.125% 15 - 15.05.25 8,591,200 USD 8,898,462 9,275,140 0.57United States Treasury Bond 2.125% 15 - 30.06.22 3,902,600 USD 3,977,057 4,019,373 0.25United States Treasury Bond 2.125% 15 - 31.12.22 8,575,000 USD 8,748,167 8,916,661 0.54United States Treasury Bond 2.125% 16 - 30.11.23 4,001,000 USD 4,129,627 4,230,745 0.26United States Treasury Bond 2.125% 17 - 29.02.24 3,633,000 USD 3,732,663 3,856,089 0.24United States Treasury Bond 2.125% 17 - 31.03.24 9,743,000 USD 10,045,982 10,353,460 0.63United States Treasury Bond 2.125% 17 - 31.07.24 3,710,000 USD 3,871,006 3,963,613 0.24United States Treasury Bond 2.125% 17 - 30.09.24 3,853,000 USD 3,978,753 4,125,419 0.25United States Treasury Bond 2.125% 17 - 30.11.24 3,713,000 USD 3,859,720 3,984,803 0.24United States Treasury Bond 2.125% 19 - 15.05.22 4,858,000 USD 4,926,957 4,990,836 0.30United States Treasury Bond 2.125% 19 - 31.05.26 4,254,000 USD 4,524,449 4,644,172 0.28United States Treasury Bond 2.25% 14 - 15.11.24 9,055,700 USD 9,412,958 9,758,224 0.60United States Treasury Bond 2.25% 15 - 15.11.25 8,845,100 USD 9,315,964 9,661,198 0.59United States Treasury Bond 2.25% 16 - 15.08.46 5,495,600 USD 5,693,229 6,271,424 0.38United States Treasury Bond 2.25% 17 - 31.12.23 3,806,000 USD 3,950,677 4,043,875 0.25
Xtrackers II
Xtrackers II US TREASURIES UCITS ETF (continued)
Statement of Investmentsas at 31 December 2020(expressed in USD)
The accompanying notes form an integral part of these financial statements.
141

DescriptionNominal
ValueCurrency
(local) Cost Market Value
% ofNet
Assets
Transferable securities and money market instruments admitted to an official stock exchange listing
Bonds (continued)
United States (continued)United States Treasury Bond 2.25% 17 - 31.01.24 3,800,000 USD 3,918,126 4,043,438 0.25United States Treasury Bond 2.25% 17 - 15.02.27 8,375,000 USD 8,852,200 9,256,338 0.57United States Treasury Bond 2.25% 17 - 15.08.27 8,613,000 USD 9,200,825 9,548,991 0.58United States Treasury Bond 2.25% 17 - 31.10.24 3,709,000 USD 3,867,904 3,993,840 0.24United States Treasury Bond 2.25% 17 - 15.11.27 8,614,000 USD 9,110,711 9,561,540 0.58United States Treasury Bond 2.25% 18 - 31.12.24 3,847,000 USD 4,020,138 4,152,656 0.25United States Treasury Bond 2.25% 19 - 31.03.26 4,424,000 USD 4,627,094 4,853,266 0.30United States Treasury Bond 2.25% 19 - 15.04.22 4,883,400 USD 4,952,580 5,017,312 0.31United States Treasury Bond 2.25% 19 - 30.04.24 5,551,000 USD 5,783,922 5,930,030 0.36United States Treasury Bond 2.25% 19 - 15.08.49 6,873,000 USD 7,627,578 7,860,994 0.48United States Treasury Bond 2.375% 14 - 15.08.24 9,017,500 USD 9,423,070 9,721,288 0.59United States Treasury Bond 2.375% 17 - 15.05.27 8,638,000 USD 9,213,169 9,634,744 0.59United States Treasury Bond 2.375% 18 - 31.01.23 4,604,000 USD 4,721,943 4,818,733 0.29United States Treasury Bond 2.375% 19 - 29.02.24 5,499,000 USD 5,695,356 5,879,634 0.36United States Treasury Bond 2.375% 19 - 15.03.22 5,035,000 USD 5,115,738 5,171,103 0.32United States Treasury Bond 2.375% 19 - 30.04.26 4,500,000 USD 4,839,571 4,970,391 0.30United States Treasury Bond 2.375% 19 - 15.05.29 10,130,000 USD 11,032,786 11,445,318 0.70United States Treasury Bond 2.375% 19 - 15.11.49 6,742,000 USD 7,643,271 7,915,529 0.48United States Treasury Bond 2.50% 13 - 15.08.23 8,995,200 USD 9,293,448 9,551,778 0.58United States Treasury Bond 2.50% 14 - 15.05.24 8,972,000 USD 9,370,540 9,667,330 0.59United States Treasury Bond 2.50% 15 - 15.02.45 5,625,800 USD 6,197,423 6,707,448 0.41United States Treasury Bond 2.50% 16 - 15.02.46 5,293,900 USD 5,901,892 6,321,661 0.39United States Treasury Bond 2.50% 16 - 15.05.46 5,225,700 USD 5,922,210 6,240,221 0.38United States Treasury Bond 2.50% 18 - 31.01.25 3,633,000 USD 3,799,242 3,963,376 0.24United States Treasury Bond 2.50% 18 - 31.03.23 4,617,000 USD 4,778,367 4,862,278 0.30United States Treasury Bond 2.50% 19 - 15.01.22 5,154,000 USD 5,240,621 5,280,837 0.32United States Treasury Bond 2.50% 19 - 31.01.24 5,420,000 USD 5,659,082 5,808,292 0.35United States Treasury Bond 2.50% 19 - 15.02.22 5,213,000 USD 5,303,010 5,351,877 0.33United States Treasury Bond 2.50% 19 - 28.02.26 4,207,000 USD 4,471,268 4,664,511 0.28United States Treasury Bond 2.625% 18 - 28.02.23 4,690,000 USD 4,854,017 4,941,355 0.30United States Treasury Bond 2.625% 18 - 31.03.25 3,754,000 USD 3,965,250 4,125,587 0.25United States Treasury Bond 2.625% 18 - 30.06.23 4,707,000 USD 4,888,642 4,998,246 0.31United States Treasury Bond 2.625% 18 - 31.12.23 5,569,000 USD 5,813,629 5,978,408 0.36United States Treasury Bond 2.625% 18 - 31.12.25 4,182,000 USD 4,437,749 4,652,148 0.28United States Treasury Bond 2.625% 19 - 31.01.26 4,330,000 USD 4,653,859 4,824,229 0.29United States Treasury Bond 2.625% 19 - 15.02.29 10,073,000 USD 11,111,069 11,555,620 0.71United States Treasury Bond 2.75% 12 - 15.08.42 5,568,700 USD 6,415,630 6,896,922 0.42United States Treasury Bond 2.75% 12 - 15.11.42 5,489,000 USD 6,368,487 6,793,924 0.41United States Treasury Bond 2.75% 13 - 15.11.23 9,015,000 USD 9,443,053 9,684,787 0.59United States Treasury Bond 2.75% 14 - 15.02.24 8,970,400 USD 9,426,635 9,692,237 0.59United States Treasury Bond 2.75% 17 - 15.08.47 5,172,000 USD 6,163,993 6,481,163 0.40United States Treasury Bond 2.75% 17 - 15.11.47 5,223,000 USD 5,973,702 6,552,417 0.40United States Treasury Bond 2.75% 18 - 15.02.28 8,887,000 USD 9,788,252 10,189,501 0.62United States Treasury Bond 2.75% 18 - 28.02.25 3,877,000 USD 4,178,772 4,274,393 0.26United States Treasury Bond 2.75% 18 - 30.04.23 4,817,500 USD 5,016,992 5,109,937 0.31United States Treasury Bond 2.75% 18 - 31.05.23 4,821,000 USD 5,001,860 5,123,819 0.31United States Treasury Bond 2.75% 18 - 30.06.25 4,019,000 USD 4,294,977 4,457,636 0.27United States Treasury Bond 2.75% 18 - 31.07.23 5,053,000 USD 5,296,177 5,392,498 0.33
Xtrackers II
Xtrackers II US TREASURIES UCITS ETF (continued)
Statement of Investmentsas at 31 December 2020(expressed in USD)
The accompanying notes form an integral part of these financial statements.
142

DescriptionNominal
ValueCurrency
(local) Cost Market Value
% ofNet
Assets
Transferable securities and money market instruments admitted to an official stock exchange listing
Bonds (continued)
United States (continued)United States Treasury Bond 2.75% 18 - 31.08.23 4,895,000 USD 5,122,753 5,233,061 0.32United States Treasury Bond 2.75% 18 - 31.08.25 4,119,000 USD 4,381,629 4,580,457 0.28United States Treasury Bond 2.875% 13 - 15.05.43 5,572,000 USD 6,538,731 7,039,003 0.43United States Treasury Bond 2.875% 15 - 15.08.45 5,731,800 USD 6,844,236 7,289,685 0.44United States Treasury Bond 2.875% 16 - 15.11.46 5,271,000 USD 6,342,240 6,731,232 0.41United States Treasury Bond 2.875% 18 - 30.04.25 4,118,000 USD 4,456,160 4,576,128 0.28United States Treasury Bond 2.875% 18 - 15.05.28 9,275,000 USD 10,144,707 10,743,783 0.66United States Treasury Bond 2.875% 18 - 31.05.25 4,251,000 USD 4,611,068 4,731,230 0.29United States Treasury Bond 2.875% 18 - 31.07.25 3,892,000 USD 4,139,999 4,345,357 0.27United States Treasury Bond 2.875% 18 - 15.08.28 9,789,000 USD 10,926,229 11,367,476 0.69United States Treasury Bond 2.875% 18 - 30.09.23 5,317,000 USD 5,557,798 5,713,283 0.35United States Treasury Bond 2.875% 18 - 31.10.23 5,032,000 USD 5,295,520 5,417,656 0.33United States Treasury Bond 2.875% 18 - 30.11.23 5,228,000 USD 5,479,644 5,640,113 0.34United States Treasury Bond 2.875% 18 - 30.11.25 4,494,800 USD 4,851,517 5,047,520 0.31United States Treasury Bond 2.875% 19 - 15.05.49 6,764,000 USD 8,363,524 8,727,674 0.53United States Treasury Bond 3.00% 12 - 15.05.42 5,628,000 USD 6,752,702 7,233,739 0.44United States Treasury Bond 3.00% 14 - 15.11.44 5,589,300 USD 6,799,356 7,231,593 0.44United States Treasury Bond 3.00% 15 - 15.05.45 5,739,700 USD 6,989,805 7,444,122 0.45United States Treasury Bond 3.00% 15 - 15.11.45 5,686,300 USD 6,994,291 7,396,188 0.45United States Treasury Bond 3.00% 17 - 15.02.47 5,208,000 USD 6,363,711 6,806,612 0.42United States Treasury Bond 3.00% 17 - 15.05.47 5,312,000 USD 6,478,166 6,952,910 0.42United States Treasury Bond 3.00% 18 - 15.02.48 5,580,000 USD 6,936,084 7,321,135 0.45United States Treasury Bond 3.00% 18 - 15.08.48 6,478,000 USD 7,968,692 8,516,546 0.52United States Treasury Bond 3.00% 18 - 30.09.25 4,190,000 USD 4,565,998 4,715,387 0.29United States Treasury Bond 3.00% 18 - 31.10.25 4,378,700 USD 4,753,107 4,936,984 0.30United States Treasury Bond 3.00% 19 - 15.02.49 6,940,000 USD 8,310,317 9,147,246 0.56United States Treasury Bond 3.125% 11 - 15.11.41 5,568,000 USD 6,848,179 7,275,375 0.44United States Treasury Bond 3.125% 12 - 15.02.42 5,783,800 USD 6,990,678 7,576,326 0.46United States Treasury Bond 3.125% 13 - 15.02.43 5,859,200 USD 7,282,145 7,680,130 0.47United States Treasury Bond 3.125% 14 - 15.08.44 5,555,000 USD 6,785,426 7,322,184 0.45United States Treasury Bond 3.125% 18 - 15.05.48 5,807,000 USD 7,265,158 7,791,361 0.48United States Treasury Bond 3.125% 18 - 15.11.28 10,026,500 USD 11,331,059 11,865,736 0.72United States Treasury Bond 3.375% 14 - 15.05.44 5,791,600 USD 7,445,492 7,915,489 0.48United States Treasury Bond 3.375% 18 - 15.11.48 6,858,800 USD 8,829,992 9,626,969 0.59United States Treasury Bond 3.50% 09 - 15.02.39 3,696,000 USD 4,732,709 5,014,721 0.31United States Treasury Bond 3.625% 13 - 15.08.43 5,949,000 USD 7,899,028 8,396,921 0.51United States Treasury Bond 3.625% 14 - 15.02.44 5,569,900 USD 7,422,211 7,881,844 0.48United States Treasury Bond 3.75% 11 - 15.08.41 5,882,700 USD 7,815,949 8,352,515 0.51United States Treasury Bond 3.75% 13 - 15.11.43 5,629,000 USD 7,507,599 8,097,404 0.49United States Treasury Bond 3.875% 10 - 15.08.40 5,633,200 USD 7,476,288 8,067,359 0.49United States Treasury Bond 4.25% 09 - 15.05.39 5,203,000 USD 7,274,877 7,714,667 0.47United States Treasury Bond 4.25% 10 - 15.11.40 5,749,700 USD 8,117,702 8,630,839 0.53United States Treasury Bond 4.375% 08 - 15.02.38 3,186,000 USD 4,623,607 4,732,454 0.29United States Treasury Bond 4.375% 09 - 15.11.39 6,021,000 USD 8,554,797 9,096,884 0.56United States Treasury Bond 4.375% 10 - 15.05.40 5,834,800 USD 8,247,758 8,849,295 0.54United States Treasury Bond 4.375% 11 - 15.05.41 5,615,700 USD 8,219,807 8,602,989 0.53United States Treasury Bond 4.50% 06 - 15.02.36 3,405,300 USD 4,673,189 4,994,351 0.30United States Treasury Bond 4.50% 08 - 15.05.38 3,338,700 USD 4,742,630 5,038,307 0.31
Xtrackers II
Xtrackers II US TREASURIES UCITS ETF (continued)
Statement of Investmentsas at 31 December 2020(expressed in USD)
The accompanying notes form an integral part of these financial statements.
143

DescriptionNominal
ValueCurrency
(local) Cost Market Value
% ofNet
Assets
Transferable securities and money market instruments admitted to an official stock exchange listing
Bonds (continued)
United States (continued)United States Treasury Bond 4.50% 09 - 15.08.39 5,635,400 USD 8,148,263 8,614,678 0.53United States Treasury Bond 4.625% 10 - 15.02.40 6,018,000 USD 8,902,668 9,372,565 0.57United States Treasury Bond 4.75% 07 - 15.02.37 2,286,000 USD 3,352,322 3,482,935 0.21United States Treasury Bond 4.75% 11 - 15.02.41 5,813,900 USD 8,827,451 9,280,438 0.57United States Treasury Bond 5.00% 07 - 15.05.37 2,910,600 USD 4,298,794 4,558,500 0.28United States Treasury Bond 5.25% 98 - 15.11.28 1,458,000 USD 1,863,867 1,965,680 0.12United States Treasury Bond 5.25% 99 - 15.02.29 1,517,000 USD 1,980,806 2,057,313 0.13United States Treasury Bond 5.375% 01 - 15.02.31 2,256,300 USD 3,070,972 3,242,197 0.20United States Treasury Bond 5.50% 98 - 15.08.28 1,728,000 USD 2,275,696 2,345,490 0.14United States Treasury Bond 6.00% 96 - 15.02.26 1,818,000 USD 2,266,167 2,337,550 0.14United States Treasury Bond 6.125% 97 - 15.11.27 3,059,800 USD 4,055,655 4,202,205 0.26United States Treasury Bond 6.125% 99 - 15.08.29 1,453,000 USD 1,976,450 2,105,374 0.13United States Treasury Bond 6.25% 93 - 15.08.23 2,931,800 USD 3,316,294 3,401,117 0.21United States Treasury Bond 6.25% 00 - 15.05.30 2,287,700 USD 3,243,156 3,409,388 0.21United States Treasury Bond 6.375% 97 - 15.08.27 1,288,000 USD 1,714,646 1,775,830 0.11United States Treasury Bond 6.50% 96 - 15.11.26 1,406,300 USD 1,820,784 1,897,077 0.12United States Treasury Bond 6.625% 97 - 15.02.27 1,370,300 USD 1,797,319 1,877,632 0.11United States Treasury Bond 6.75% 96 - 15.08.26 1,138,000 USD 1,494,364 1,537,011 0.09United States Treasury Bond 6.875% 95 - 15.08.25 1,619,000 USD 2,063,551 2,105,332 0.13United States Treasury Bond 7.125% 93 - 15.02.23 2,092,000 USD 2,371,613 2,401,878 0.15United States Treasury Bond 7.25% 92 - 15.08.22 1,494,900 USD 1,656,485 1,667,514 0.10United States Treasury Bond 7.50% 94 - 15.11.24 1,244,100 USD 1,576,893 1,593,420 0.10United States Treasury Bond 7.625% 92 - 15.11.22 845,000 USD 941,243 963,498 0.06United States Treasury Bond 7.625% 95 - 15.02.25 1,512,000 USD 1,910,740 1,968,553 0.12
1,586,968,624 1,631,209,847 99.60
Total - Bonds 1,586,968,624 1,631,209,847 99.60
Total Transferable securities and money market instruments admitted to an officialstock exchange listing 1,586,968,624 1,631,209,847 99.60
TOTAL INVESTMENT PORTFOLIO 1,586,968,624 1,631,209,847 99.60
TOTAL INVESTMENT PORTFOLIO INCLUDING ACCRUED INTEREST 1,638,429,617 100.04
Xtrackers II
Xtrackers II US TREASURIES UCITS ETF (continued)
Statement of Investmentsas at 31 December 2020(expressed in USD)
The accompanying notes form an integral part of these financial statements.
144

DescriptionNominal
ValueCurrency
(local) Cost Market Value
% ofNet
Assets
Transferable securities and money market instruments admitted to an official stock exchange listing
Bonds
United StatesUnited States Treasury Bond 0.125% 20 - 30.04.22 931,000 USD 930,251 931,218 1.14United States Treasury Bond 0.125% 20 - 15.05.23 913,000 USD 911,629 912,929 1.11United States Treasury Bond 0.125% 20 - 31.05.22 975,000 USD 974,553 975,229 1.19United States Treasury Bond 0.125% 20 - 30.06.22 975,000 USD 974,603 975,152 1.19United States Treasury Bond 0.125% 20 - 15.07.23 1,001,000 USD 1,001,171 1,000,609 1.22United States Treasury Bond 0.125% 20 - 31.07.22 1,045,000 USD 1,045,262 1,045,245 1.28United States Treasury Bond 0.125% 20 - 15.08.23 1,022,000 USD 1,021,472 1,021,601 1.25United States Treasury Bond 0.125% 20 - 31.08.22 1,038,000 USD 1,037,901 1,038,081 1.27United States Treasury Bond 0.125% 20 - 15.09.23 1,061,000 USD 1,060,206 1,060,337 1.29United States Treasury Bond 0.125% 20 - 30.09.22 1,098,000 USD 1,098,041 1,098,000 1.34United States Treasury Bond 0.125% 20 - 15.10.23 1,093,000 USD 1,090,945 1,092,317 1.33United States Treasury Bond 0.125% 20 - 31.10.22 1,131,000 USD 1,130,538 1,131,177 1.38United States Treasury Bond 0.125% 20 - 30.11.22 1,165,000 USD 1,164,524 1,165,182 1.42United States Treasury Bond 0.125% 20 - 15.12.23 1,219,000 USD 1,217,433 1,217,381 1.49United States Treasury Bond 0.125% 20 - 31.12.22 1,237,000 USD 1,236,956 1,237,097 1.51United States Treasury Bond 0.25% 20 - 15.04.23 856,000 USD 856,339 858,408 1.05United States Treasury Bond 0.25% 20 - 15.06.23 947,000 USD 948,784 949,589 1.16United States Treasury Bond 0.25% 20 - 15.11.23 1,163,000 USD 1,165,212 1,166,362 1.42United States Treasury Bond 0.375% 20 - 31.03.22 862,000 USD 863,869 864,828 1.06United States Treasury Bond 0.50% 20 - 15.03.23 805,000 USD 809,569 811,604 0.99United States Treasury Bond 1.125% 20 - 28.02.22 862,000 USD 871,336 872,169 1.07United States Treasury Bond 1.25% 16 - 31.07.23 590,000 USD 606,788 606,870 0.74United States Treasury Bond 1.375% 16 - 30.06.23 568,000 USD 585,792 585,484 0.72United States Treasury Bond 1.375% 16 - 31.08.23 576,000 USD 594,771 594,855 0.73United States Treasury Bond 1.375% 16 - 30.09.23 570,000 USD 588,595 589,238 0.72United States Treasury Bond 1.375% 19 - 15.10.22 832,000 USD 833,841 850,590 1.04United States Treasury Bond 1.375% 20 - 31.01.22 868,000 USD 868,462 879,799 1.07United States Treasury Bond 1.375% 20 - 15.02.23 822,000 USD 831,530 843,642 1.03United States Treasury Bond 1.50% 15 - 31.01.22 630,000 USD 626,170 639,401 0.78United States Treasury Bond 1.50% 16 - 28.02.23 608,000 USD 624,108 625,860 0.76United States Treasury Bond 1.50% 16 - 31.03.23 631,000 USD 648,810 650,275 0.79United States Treasury Bond 1.50% 19 - 15.08.22 826,000 USD 826,414 844,520 1.03United States Treasury Bond 1.50% 19 - 15.09.22 821,000 USD 819,928 840,178 1.03United States Treasury Bond 1.50% 20 - 15.01.23 826,000 USD 831,223 849,102 1.04United States Treasury Bond 1.625% 12 - 15.08.22 1,434,000 USD 1,439,803 1,468,954 1.79United States Treasury Bond 1.625% 12 - 15.11.22 2,220,000 USD 2,228,685 2,282,264 2.79United States Treasury Bond 1.625% 16 - 30.04.23 597,000 USD 616,935 617,662 0.75United States Treasury Bond 1.625% 16 - 31.05.23 568,000 USD 587,876 588,324 0.72United States Treasury Bond 1.625% 16 - 31.10.23 572,000 USD 595,350 595,953 0.73United States Treasury Bond 1.625% 17 - 31.08.22 703,000 USD 705,374 720,520 0.88United States Treasury Bond 1.625% 19 - 15.12.22 793,000 USD 795,212 816,294 1.00United States Treasury Bond 1.625% 19 - 31.12.21 844,000 USD 844,862 856,660 1.05United States Treasury Bond 1.75% 12 - 15.05.22 1,383,000 USD 1,386,115 1,413,901 1.73United States Treasury Bond 1.75% 13 - 15.05.23 1,419,000 USD 1,471,297 1,473,321 1.80United States Treasury Bond 1.75% 15 - 28.02.22 617,000 USD 614,754 628,665 0.77United States Treasury Bond 1.75% 15 - 31.03.22 601,000 USD 600,157 613,208 0.75United States Treasury Bond 1.75% 15 - 30.04.22 606,000 USD 607,417 619,162 0.76United States Treasury Bond 1.75% 15 - 30.09.22 625,000 USD 630,195 642,676 0.78
Xtrackers II
Xtrackers II US TREASURIES 1-3 UCITS ETF
Statement of Investmentsas at 31 December 2020(expressed in USD)
The accompanying notes form an integral part of these financial statements.
145

DescriptionNominal
ValueCurrency
(local) Cost Market Value
% ofNet
Assets
Transferable securities and money market instruments admitted to an official stock exchange listing
Bonds (continued)
United States (continued)United States Treasury Bond 1.75% 16 - 31.01.23 608,000 USD 618,943 628,567 0.77United States Treasury Bond 1.75% 17 - 31.05.22 739,000 USD 739,838 756,032 0.92United States Treasury Bond 1.75% 17 - 30.06.22 731,000 USD 731,517 748,818 0.91United States Treasury Bond 1.75% 19 - 15.06.22 815,000 USD 819,474 834,165 1.02United States Treasury Bond 1.75% 19 - 15.07.22 794,000 USD 794,159 813,912 0.99United States Treasury Bond 1.875% 15 - 31.05.22 593,000 USD 595,092 607,686 0.74United States Treasury Bond 1.875% 15 - 31.08.22 591,000 USD 595,116 608,130 0.74United States Treasury Bond 1.875% 15 - 31.10.22 622,000 USD 626,263 641,923 0.78United States Treasury Bond 1.875% 17 - 31.01.22 739,000 USD 737,108 753,029 0.92United States Treasury Bond 1.875% 17 - 28.02.22 729,000 USD 729,330 743,808 0.91United States Treasury Bond 1.875% 17 - 31.03.22 711,000 USD 713,595 726,553 0.89United States Treasury Bond 1.875% 17 - 30.04.22 700,000 USD 702,080 716,297 0.87United States Treasury Bond 1.875% 17 - 31.07.22 720,000 USD 726,300 739,913 0.90United States Treasury Bond 1.875% 17 - 30.09.22 732,000 USD 736,499 754,189 0.92United States Treasury Bond 2.00% 12 - 15.02.22 1,397,000 USD 1,397,239 1,426,359 1.74United States Treasury Bond 2.00% 13 - 15.02.23 1,396,000 USD 1,431,172 1,451,186 1.77United States Treasury Bond 2.00% 15 - 31.07.22 598,000 USD 604,096 615,613 0.75United States Treasury Bond 2.00% 15 - 30.11.22 1,337,000 USD 1,354,140 1,384,944 1.69United States Treasury Bond 2.00% 17 - 31.12.21 706,000 USD 708,377 719,182 0.88United States Treasury Bond 2.00% 17 - 31.10.22 729,000 USD 734,209 754,002 0.92United States Treasury Bond 2.125% 14 - 31.12.21 630,000 USD 630,484 642,551 0.78United States Treasury Bond 2.125% 15 - 30.06.22 598,000 USD 602,671 615,893 0.75United States Treasury Bond 2.125% 15 - 31.12.22 1,326,000 USD 1,349,789 1,378,833 1.68United States Treasury Bond 2.125% 16 - 30.11.23 620,000 USD 655,434 655,602 0.80United States Treasury Bond 2.125% 19 - 15.05.22 803,000 USD 810,330 824,957 1.01United States Treasury Bond 2.25% 19 - 15.04.22 824,000 USD 827,483 846,596 1.03United States Treasury Bond 2.375% 18 - 31.01.23 711,000 USD 732,863 744,161 0.91United States Treasury Bond 2.375% 19 - 15.03.22 790,000 USD 793,398 811,355 0.99United States Treasury Bond 2.50% 13 - 15.08.23 1,400,000 USD 1,486,217 1,486,625 1.82United States Treasury Bond 2.50% 18 - 31.03.23 754,000 USD 792,049 794,056 0.97United States Treasury Bond 2.50% 19 - 15.01.22 814,000 USD 820,659 834,032 1.02United States Treasury Bond 2.50% 19 - 15.02.22 826,000 USD 830,747 848,005 1.04United States Treasury Bond 2.625% 18 - 28.02.23 766,000 USD 804,902 807,053 0.99United States Treasury Bond 2.625% 18 - 30.06.23 761,000 USD 808,520 808,087 0.99United States Treasury Bond 2.75% 13 - 15.11.23 1,384,000 USD 1,485,820 1,486,827 1.82United States Treasury Bond 2.75% 18 - 30.04.23 721,000 USD 763,817 764,767 0.93United States Treasury Bond 2.75% 18 - 31.05.23 782,000 USD 830,404 831,119 1.01United States Treasury Bond 2.75% 18 - 31.07.23 782,000 USD 834,457 834,541 1.02United States Treasury Bond 2.75% 18 - 31.08.23 804,000 USD 859,485 859,526 1.05United States Treasury Bond 2.875% 18 - 30.09.23 819,000 USD 879,187 880,041 1.07United States Treasury Bond 2.875% 18 - 31.10.23 840,000 USD 903,808 904,378 1.10United States Treasury Bond 2.875% 18 - 30.11.23 876,000 USD 944,851 945,053 1.15United States Treasury Bond 6.25% 93 - 15.08.23 492,000 USD 570,714 570,758 0.70United States Treasury Bond 7.125% 93 - 15.02.23 366,000 USD 414,172 420,214 0.51
Xtrackers II
Xtrackers II US TREASURIES 1-3 UCITS ETF (continued)
Statement of Investmentsas at 31 December 2020(expressed in USD)
The accompanying notes form an integral part of these financial statements.
146

DescriptionNominal
ValueCurrency
(local) Cost Market Value
% ofNet
Assets
Transferable securities and money market instruments admitted to an official stock exchange listing
Bonds (continued)
United States (continued)United States Treasury Bond 7.25% 92 - 15.08.22 228,000 USD 248,794 254,327 0.31United States Treasury Bond 7.625% 92 - 15.11.22 141,000 USD 156,519 160,773 0.20
80,753,179 81,596,331 99.62
Total - Bonds 80,753,179 81,596,331 99.62
Total Transferable securities and money market instruments admitted to an officialstock exchange listing 80,753,179 81,596,331 99.62
TOTAL INVESTMENT PORTFOLIO 80,753,179 81,596,331 99.62
TOTAL INVESTMENT PORTFOLIO INCLUDING ACCRUED INTEREST 81,891,489 99.98
Xtrackers II
Xtrackers II US TREASURIES 1-3 UCITS ETF (continued)
Statement of Investmentsas at 31 December 2020(expressed in USD)
The accompanying notes form an integral part of these financial statements.
147

DescriptionNominal
ValueCurrency
(local) Cost Market Value
% ofNet
Assets
Transferable securities and money market instruments admitted to an official stock exchange listing(A)
Bonds
AustraliaAmcor Pty Ltd. 2.75% 13 - 22.03.23 200,000 EUR 208,692 212,246 0.01APT Pipelines Ltd. 1.375% 15 - 22.03.22 769,000 EUR 778,850 783,019 0.04APT Pipelines Ltd. 2.00% 15 - 22.03.27 510,000 EUR 540,150 565,605 0.03APT Pipelines Ltd. 2.00% 20 - 15.07.30 459,000 EUR 467,954 517,959 0.02Aurizon Network Pty Ltd. 2.00% 14 - 18.09.24 500,000 EUR 529,571 535,410 0.02Aurizon Network Pty Ltd. 3.125% 16 - 01.06.26 550,000 EUR 583,345 630,019 0.03Ausgrid Finance Pty Ltd. 1.25% 18 - 30.07.25 600,000 EUR 625,234 630,270 0.03AusNet Services Holdings Pty Ltd. 0.625% 20 -25.08.30 641,000 EUR 627,071 664,307 0.03AusNet Services Holdings Pty Ltd. 1.50% 15 -26.02.27 189,000 EUR 200,179 205,846 0.01AusNet Services Holdings Pty Ltd. 3.00% 14 -13.02.24 100,000 EUR 108,096 109,309 0.01Australia & New Zealand Banking Group Ltd. 0.625%18 - 21.02.23 850,000 EUR 861,434 866,694 0.04Australia & New Zealand Banking Group Ltd. 0.75%16 - 29.09.26 1,000,000 EUR 1,024,952 1,049,470 0.05Australia & New Zealand Banking Group Ltd. FRN19 - 21.11.29 778,000 EUR 780,854 792,650 0.04Australia Pacific Airports Melbourne Pty Ltd. 1.75%14 - 15.10.24 100,000 EUR 103,459 104,414 0.01Australia Pacific Airports Melbourne Pty Ltd. 3.125%13 - 26.09.23 516,000 EUR 548,443 553,008 0.03BHP Billiton Finance Ltd. 0.75% 15 - 28.10.22 100,000 EUR 100,737 101,491 0.00BHP Billiton Finance Ltd. 1.50% 15 - 29.04.30 800,000 EUR 814,179 904,440 0.04BHP Billiton Finance Ltd. 3.00% 12 - 29.05.24 400,000 EUR 440,044 444,796 0.02BHP Billiton Finance Ltd. 3.125% 13 - 29.04.33 600,000 EUR 753,954 799,368 0.04BHP Billiton Finance Ltd. 3.25% 12 - 24.09.27 724,000 EUR 843,393 882,397 0.04Brambles Finance Ltd. 2.375% 14 - 12.06.24 400,000 EUR 423,543 432,120 0.02Commonwealth Bank of Australia 0.50% 17 -11.07.22 620,000 EUR 622,571 628,004 0.03Commonwealth Bank of Australia 1.125% 18 -18.01.28 400,000 EUR 440,305 437,816 0.02Commonwealth Bank of Australia FRN 17 - 03.10.29 870,000 EUR 885,697 909,559 0.04Commonwealth Bank of Australia FRN 15 - 22.04.27 843,000 EUR 849,913 861,293 0.04Goodman Australia Finance Pty Ltd. 1.375% 17 -27.09.25 200,000 EUR 199,550 210,834 0.01Macquarie Bank Ltd. 1.125% 15 - 20.01.22 815,000 EUR 822,234 827,046 0.04Macquarie Group Ltd. 0.35% 20 - 03.03.28 840,000 EUR 839,793 843,956 0.04Macquarie Group Ltd. 0.625% 20 - 03.02.27 100,000 EUR 98,242 102,499 0.00Macquarie Group Ltd. FRN 18 - 05.03.25 100,000 EUR 100,507 103,780 0.01National Australia Bank Ltd. 0.25% 19 - 20.05.24 645,000 EUR 645,198 655,417 0.03National Australia Bank Ltd. 0.35% 17 - 07.09.22 295,000 EUR 295,746 298,449 0.01National Australia Bank Ltd. 0.625% 16 - 10.11.23 100,000 EUR 100,473 102,499 0.00National Australia Bank Ltd. 0.625% 17 - 18.09.24 400,000 EUR 398,706 412,096 0.02National Australia Bank Ltd. 0.625% 18 - 30.08.23 679,000 EUR 688,829 695,364 0.03National Australia Bank Ltd. 0.875% 15 - 20.01.22 772,000 EUR 777,918 782,306 0.04National Australia Bank Ltd. 1.125% 19 - 20.05.31 368,000 EUR 394,234 408,285 0.02
Xtrackers II
Xtrackers II EUR CORPORATE BOND UCITS ETF
Statement of Investmentsas at 31 December 2020(expressed in EUR)
The accompanying notes form an integral part of these financial statements.
148

DescriptionNominal
ValueCurrency
(local) Cost Market Value
% ofNet
Assets
Transferable securities and money market instruments admitted to an official stock exchange listing(A)
Bonds (continued)
Australia (continued)National Australia Bank Ltd. 1.25% 16 - 18.05.26 950,000 EUR 988,853 1,019,407 0.05National Australia Bank Ltd. 1.375% 18 - 30.08.28 849,000 EUR 886,955 938,985 0.04National Australia Bank Ltd. 2.75% 12 - 08.08.22 856,000 EUR 893,565 897,670 0.04Origin Energy Finance Ltd. 1.00% 19 - 17.09.29 500,000 EUR 487,390 500,190 0.02Scentre Group Trust 1 2.25% 14 - 16.07.24 300,000 EUR 316,753 319,944 0.01Scentre Group Trust 1 Via Scentre Group Trust2 1.375% 16 - 22.03.23 433,000 EUR 441,120 444,362 0.02Scentre Group Trust 1 Via Scentre Group Trust2 1.45% 19 - 28.03.29 495,000 EUR 486,882 525,616 0.02Scentre Group Trust 1 Via Scentre Group Trust2 1.75% 18 - 11.04.28 500,000 EUR 528,756 540,665 0.02Scentre Group Trust 2 3.25% 13 - 11.09.23 192,000 EUR 204,863 208,625 0.01Stockland Trust 1.625% 18 - 27.04.26 280,000 EUR 277,634 291,119 0.01Sydney Airport Finance Co. Pty Ltd. 1.75% 18 -26.04.28 428,000 EUR 445,457 463,866 0.02Sydney Airport Finance Co. Pty Ltd. 2.75% 14 -23.04.24 623,000 EUR 666,702 675,008 0.03Telstra Corp. Ltd. 1.00% 20 - 23.04.30 453,000 EUR 465,520 487,011 0.02Telstra Corp. Ltd. 1.125% 16 - 14.04.26 593,000 EUR 618,837 630,009 0.03Telstra Corp. Ltd. 1.375% 19 - 26.03.29 859,000 EUR 919,306 950,956 0.04Telstra Corp. Ltd. 2.50% 13 - 15.09.23 600,000 EUR 634,948 643,596 0.03Telstra Corp. Ltd. 3.50% 12 - 21.09.22 924,000 EUR 978,212 983,210 0.05Telstra Corp. Ltd. 3.75% 11 - 16.05.22 300,000 EUR 315,315 316,443 0.01Telstra Corp. Ltd. 3.75% 11 - 16.05.22 100,000 EUR 104,649 105,481 0.01Toyota Finance Australia Ltd. 0.25% 19 - 09.04.24 826,000 EUR 823,777 838,596 0.04Toyota Finance Australia Ltd. 0.50% 18 - 06.04.23 500,000 EUR 503,796 508,230 0.02Toyota Finance Australia Ltd. 1.584% 20 - 21.04.22 798,000 EUR 811,106 817,719 0.04Toyota Finance Australia Ltd. 2.004% 20 - 21.10.24 899,000 EUR 945,210 972,709 0.04Toyota Finance Australia Ltd. 2.28% 20 - 21.10.27 423,000 EUR 465,267 487,880 0.02Transurban Finance Co. Pty Ltd. 1.45% 19 - 16.05.29 740,000 EUR 776,318 806,297 0.04Transurban Finance Co. Pty Ltd. 1.75% 17 - 29.03.28 250,000 EUR 251,407 276,567 0.01Transurban Finance Co. Pty Ltd. 1.875% 14 - 16.09.24 300,000 EUR 308,209 319,647 0.01Transurban Finance Co. Pty Ltd. 2.00% 15 - 28.08.25 300,000 EUR 308,281 325,755 0.02Transurban Finance Co. Pty Ltd. 3.00% 20 - 08.04.30 778,000 EUR 842,087 945,433 0.04Vicinity Centres Trust 1.125% 19 - 07.11.29 460,000 EUR 452,828 476,698 0.02Wesfarmers Ltd. 2.75% 12 - 02.08.22 609,000 EUR 633,065 637,063 0.03Westpac Banking Corp. 0.25% 16 - 17.01.22 650,000 EUR 652,291 654,680 0.03Westpac Banking Corp. 0.375% 17 - 05.03.23 384,000 EUR 386,473 389,629 0.02Westpac Banking Corp. 0.375% 17 - 05.03.23 432,000 EUR 435,915 438,333 0.02Westpac Banking Corp. 0.625% 17 - 22.11.24 230,000 EUR 230,980 237,574 0.01Westpac Banking Corp. 0.75% 18 - 17.10.23 950,000 EUR 951,766 977,502 0.04Westpac Banking Corp. 0.875% 16 - 17.04.27 200,000 EUR 203,612 211,246 0.01Westpac Banking Corp. 1.125% 17 - 05.09.27 530,000 EUR 549,833 569,421 0.03Westpac Banking Corp. 1.45% 18 - 17.07.28 440,000 EUR 464,313 488,110 0.02
41,182,301 42,385,293 1.93AustriaBAWAG Group AG FRN 19 - 26.03.29 300,000 EUR 306,444 309,372 0.01
Xtrackers II
Xtrackers II EUR CORPORATE BOND UCITS ETF (continued)
Statement of Investmentsas at 31 December 2020(expressed in EUR)
The accompanying notes form an integral part of these financial statements.
149

DescriptionNominal
ValueCurrency
(local) Cost Market Value
% ofNet
Assets
Transferable securities and money market instruments admitted to an official stock exchange listing(A)
Bonds (continued)
Austria (continued)BAWAG PSK Bank fuer Arbeit und Wirtschaft undOesterreichische Postsparkasse AG 0.375% 19 -03.09.27 300,000 EUR 276,558 297,381 0.01Borealis AG 1.75% 18 - 10.12.25 152,000 EUR 161,174 163,905 0.01CA Immobilien Anlagen AG 0.875% 20 - 05.02.27 500,000 EUR 488,863 502,805 0.02CA Immobilien Anlagen AG 1.00% 20 - 27.10.25 300,000 EUR 300,087 305,247 0.01Erste Group Bank AG 0.05% 20 - 16.09.25 500,000 EUR 500,292 502,535 0.02Erste Group Bank AG FRN 20 - 16.11.28 900,000 EUR 896,704 896,598 0.04Erste Group Bank AG 0.375% 19 - 16.04.24 100,000 EUR 100,836 101,771 0.01Erste Group Bank AG 0.875% 19 - 22.05.26 100,000 EUR 102,809 104,214 0.01Erste Group Bank AG 0.875% 20 - 13.05.27 1,100,000 EUR 1,122,796 1,159,136 0.05Erste Group Bank AG FRN 19 - 10.06.30 100,000 EUR 99,566 100,688 0.01Erste Group Bank AG FRN 19 - 10.06.30 200,000 EUR 189,251 201,376 0.01Erste Group Bank AG FRN 20 - 08.09.31 500,000 EUR 501,223 520,750 0.02IMMOFINANZ AG 2.50% 20 - 15.10.27 400,000 EUR 394,608 417,840 0.02IMMOFINANZ AG 2.625% 19 - 27.01.23 300,000 EUR 300,985 309,402 0.01Mondi Finance Europe GmbH 2.375% 20 - 01.04.28 498,000 EUR 522,958 570,877 0.03OMV AG Zero Coupon 19 - 03.07.25 371,000 EUR 371,423 372,721 0.02OMV AG Zero Coupon 20 - 16.06.23 686,000 EUR 683,998 689,039 0.03OMV AG 0.75% 18 - 04.12.23 505,000 EUR 513,611 518,383 0.02OMV AG 0.75% 20 - 16.06.30 716,000 EUR 709,637 750,690 0.03OMV AG 1.00% 17 - 14.12.26 1,183,000 EUR 1,214,273 1,258,771 0.06OMV AG 1.00% 19 - 03.07.34 448,000 EUR 457,267 471,740 0.02OMV AG 1.50% 20 - 09.04.24 599,000 EUR 613,937 631,148 0.03OMV AG 1.875% 18 - 04.12.28 200,000 EUR 212,372 228,838 0.01OMV AG 2.00% 20 - 09.04.28 499,000 EUR 532,307 568,556 0.03OMV AG 2.375% 20 - 09.04.32 643,000 EUR 710,239 779,110 0.04OMV AG FRN 20 - 31.12.99 700,000 EUR 700,036 727,860 0.03OMV AG 2.625% 12 - 27.09.22 200,000 EUR 209,179 210,090 0.01OMV AG FRN 18 - 31.12.99 300,000 EUR 319,840 313,785 0.01OMV AG FRN 20 - 31.12.99 500,000 EUR 500,520 525,395 0.02OMV AG 3.50% 12 - 27.09.27 600,000 EUR 718,367 741,114 0.03OMV AG FRN 15 - 29.12.49 600,000 EUR 722,637 735,000 0.03Raiffeisen Bank International AG 0.25% 20 - 22.01.25 700,000 EUR 687,008 707,756 0.03Raiffeisen Bank International AG 0.375% 19 -25.09.26 600,000 EUR 599,745 612,324 0.03Raiffeisen Bank International AG 1.00% 18 - 04.12.23 200,000 EUR 198,818 206,432 0.01Raiffeisen Bank International AG FRN 19 - 12.03.30 500,000 EUR 476,536 499,120 0.02Raiffeisen Bank International AG FRN 20 - 18.06.32 500,000 EUR 503,500 539,560 0.03Raiffeisen Bank International AG 6.00% 13 - 16.10.23 400,000 EUR 458,591 466,240 0.02Raiffeisenlandesbank Niederoesterreich-Wien AG0.25% 19 - 16.04.24 600,000 EUR 593,338 604,272 0.03Raiffeisenlandesbank Oberoesterreich AG 0.75% 17 -22.05.23 400,000 EUR 403,418 406,828 0.02Telekom Finanzmanagement GmbH 1.50% 16 -07.12.26 700,000 EUR 736,527 762,552 0.04Telekom Finanzmanagement GmbH 3.50% 13 -04.07.23 100,000 EUR 108,296 109,061 0.01
Xtrackers II
Xtrackers II EUR CORPORATE BOND UCITS ETF (continued)
Statement of Investmentsas at 31 December 2020(expressed in EUR)
The accompanying notes form an integral part of these financial statements.
150

DescriptionNominal
ValueCurrency
(local) Cost Market Value
% ofNet
Assets
Transferable securities and money market instruments admitted to an official stock exchange listing(A)
Bonds (continued)
Austria (continued)Telekom Finanzmanagement GmbH 4.00% 12 -04.04.22 994,000 EUR 1,042,446 1,046,135 0.05UNIQA Insurance Group AG 1.375% 20 - 09.07.30 500,000 EUR 519,734 544,470 0.03UNIQA Insurance Group AG FRN 15 - 27.07.46 400,000 EUR 468,201 490,000 0.02UNIQA Insurance Group AG FRN 13 - 31.07.43 300,000 EUR 352,380 346,251 0.02Vienna Insurance Group AG Wiener VersicherungGruppe FRN 15 - 02.03.46 350,000 EUR 389,349 391,034 0.02Vienna Insurance Group AG Wiener VersicherungGruppe FRN 13 - 09.10.43 200,000 EUR 224,627 227,936 0.01Volksbank Wien AG FRN 17 - 06.10.27 300,000 EUR 292,762 300,855 0.01
23,510,073 24,246,963 1.11BelgiumAG Insurance SA FRN 15 - 30.06.47 300,000 EUR 312,172 342,024 0.02Ageas SA/NV FRN 20 - 24.11.51 400,000 EUR 401,101 406,128 0.02Ageas SA/NV FRN 19 - 02.07.49 100,000 EUR 101,512 114,000 0.00Ageas SA/NV FRN 19 - 02.07.49 400,000 EUR 422,250 456,000 0.02Anheuser-Busch InBev SA/NV 1.125% 19 - 01.07.27 570,000 EUR 580,682 608,999 0.03Anheuser-Busch InBev SA/NV 1.125% 19 - 01.07.27 600,000 EUR 622,568 641,052 0.03Anheuser-Busch InBev SA/NV 1.15% 18 - 22.01.27 1,429,000 EUR 1,452,853 1,524,143 0.07Anheuser-Busch InBev SA/NV 1.50% 15 - 18.04.30 1,146,000 EUR 1,171,642 1,280,964 0.06Anheuser-Busch InBev SA/NV 1.50% 16 - 17.03.25 1,814,000 EUR 1,881,588 1,937,751 0.09Anheuser-Busch InBev SA/NV 1.65% 19 - 28.03.31 114,000 EUR 114,400 128,159 0.01Anheuser-Busch InBev SA/NV 1.65% 19 - 28.03.31 900,000 EUR 932,462 1,011,780 0.05Anheuser-Busch InBev SA/NV 2.00% 16 - 17.03.28 954,000 EUR 1,044,832 1,082,513 0.05Anheuser-Busch InBev SA/NV 2.00% 16 - 17.03.28 1,664,000 EUR 1,778,474 1,888,157 0.09Anheuser-Busch InBev SA/NV 2.00% 18 - 23.01.35 600,000 EUR 622,622 695,418 0.03Anheuser-Busch InBev SA/NV 2.125% 20 - 02.12.27 954,000 EUR 1,006,008 1,084,784 0.05Anheuser-Busch InBev SA/NV 2.70% 14 - 31.03.26 1,106,000 EUR 1,232,163 1,264,855 0.06Anheuser-Busch InBev SA/NV 2.75% 16 - 17.03.36 1,154,000 EUR 1,291,084 1,453,036 0.07Anheuser-Busch InBev SA/NV 2.75% 16 - 17.03.36 1,097,000 EUR 1,247,230 1,381,266 0.06Anheuser-Busch InBev SA/NV 2.875% 12 - 25.09.24 503,000 EUR 548,823 558,340 0.03Anheuser-Busch InBev SA/NV 2.875% 20 - 02.04.32 1,229,000 EUR 1,238,423 1,542,100 0.07Anheuser-Busch InBev SA/NV 2.875% 20 - 02.04.32 100,000 EUR 111,775 125,476 0.01Anheuser-Busch InBev SA/NV 3.25% 13 - 24.01.33 400,000 EUR 478,786 522,224 0.02Anheuser-Busch InBev SA/NV 3.70% 20 - 02.04.40 1,429,000 EUR 1,469,689 2,021,278 0.09Anheuser-Busch InBev SA/NV 3.70% 20 - 02.04.40 141,000 EUR 169,117 199,440 0.01Argenta Spaarbank NV 1.00% 19 - 06.02.24 300,000 EUR 301,789 310,926 0.01Argenta Spaarbank NV 1.00% 20 - 29.01.27 300,000 EUR 298,093 307,365 0.01Argenta Spaarbank NV 1.00% 20 - 13.10.26 400,000 EUR 400,000 408,480 0.02Barry Callebaut Services NV 2.375% 16 - 24.05.24 178,000 EUR 189,243 189,987 0.01Belfius Bank SA Zero Coupon 19 - 28.08.26 1,100,000 EUR 1,080,530 1,100,891 0.05Belfius Bank SA 0.01% 20 - 15.10.25 600,000 EUR 601,258 601,374 0.03Belfius Bank SA 0.375% 19 - 13.02.26 200,000 EUR 198,802 201,934 0.01Belfius Bank SA 0.375% 19 - 13.02.26 100,000 EUR 99,291 100,967 0.00Belfius Bank SA 0.375% 20 - 02.09.25 600,000 EUR 599,254 606,042 0.03Belfius Bank SA 0.625% 18 - 30.08.23 100,000 EUR 100,454 102,113 0.00Belfius Bank SA 0.75% 17 - 12.09.22 500,000 EUR 500,221 507,680 0.02Belfius Bank SA 1.00% 17 - 26.10.24 600,000 EUR 593,190 622,674 0.03
Xtrackers II
Xtrackers II EUR CORPORATE BOND UCITS ETF (continued)
Statement of Investmentsas at 31 December 2020(expressed in EUR)
The accompanying notes form an integral part of these financial statements.
151

DescriptionNominal
ValueCurrency
(local) Cost Market Value
% ofNet
Assets
Transferable securities and money market instruments admitted to an official stock exchange listing(A)
Bonds (continued)
Belgium (continued)Belfius Bank SA 3.125% 16 - 11.05.26 100,000 EUR 109,415 114,559 0.01Brussels Airport Co. NV/SA 1.00% 17 - 03.05.24 100,000 EUR 99,312 100,565 0.00Cofinimmo SA 0.875% 20 - 02.12.30 400,000 EUR 401,151 406,444 0.02Elia Group SA/NV 1.50% 18 - 05.09.28 300,000 EUR 312,756 329,454 0.01Elia Group SA/NV FRN 18 - 31.12.49 600,000 EUR 620,783 630,126 0.03Elia Transmission Belgium SA 0.875% 20 - 28.04.30 700,000 EUR 719,092 737,198 0.03Elia Transmission Belgium SA 1.375% 15 - 27.05.24 300,000 EUR 312,174 314,130 0.01Elia Transmission Belgium SA 1.375% 19 - 14.01.26 900,000 EUR 936,415 959,508 0.04Elia Transmission Belgium SA 3.00% 14 - 07.04.29 100,000 EUR 110,469 122,939 0.01Elia Transmission Belgium SA 3.25% 13 - 04.04.28 600,000 EUR 721,647 734,340 0.03Ethias SA 5.00% 15 - 14.01.26 500,000 EUR 546,962 582,920 0.03Euroclear Bank SA 0.125% 20 - 07.07.25 473,000 EUR 477,591 479,149 0.02Euroclear Bank SA 0.25% 18 - 07.09.22 553,000 EUR 555,894 558,110 0.03Euroclear Bank SA 0.50% 18 - 10.07.23 800,000 EUR 810,247 816,648 0.04Groupe Bruxelles Lambert SA 1.375% 17 - 23.05.24 200,000 EUR 209,404 209,318 0.01Groupe Bruxelles Lambert SA 1.875% 18 - 19.06.25 200,000 EUR 215,518 215,640 0.01KBC Group NV FRN 20 - 10.09.26 700,000 EUR 696,714 701,295 0.03KBC Group NV FRN 20 - 16.06.27 400,000 EUR 399,798 407,556 0.02KBC Group NV FRN 19 - 03.12.29 800,000 EUR 784,782 795,544 0.04KBC Group NV 0.625% 19 - 10.04.25 600,000 EUR 603,593 616,308 0.03KBC Group NV 0.75% 16 - 18.10.23 700,000 EUR 708,172 717,815 0.03KBC Group NV 0.75% 17 - 01.03.22 800,000 EUR 806,242 809,768 0.04KBC Group NV 0.75% 20 - 24.01.30 200,000 EUR 197,225 209,786 0.01KBC Group NV 0.875% 18 - 27.06.23 100,000 EUR 100,735 102,740 0.00KBC Group NV 1.125% 19 - 25.01.24 700,000 EUR 707,827 725,571 0.03KBC Group NV FRN 17 - 18.09.29 800,000 EUR 818,532 831,744 0.04KBC Group NV FRN 15 - 11.03.27 200,000 EUR 207,135 203,964 0.01KBC Group NV FRN 15 - 11.03.27 900,000 EUR 914,231 917,838 0.04Lonza Finance International NV 1.625% 20 - 21.04.27 299,000 EUR 322,937 327,309 0.01Lonza Finance International NV 1.625% 20 - 21.04.27 106,000 EUR 109,563 116,036 0.01Solvay SA 0.50% 19 - 06.09.29 600,000 EUR 600,262 611,004 0.03Solvay SA 1.625% 15 - 02.12.22 500,000 EUR 510,345 515,325 0.02Solvay SA 2.75% 15 - 02.12.27 400,000 EUR 444,815 468,476 0.02
41,286,119 43,719,447 2.00BermudaBacardi Ltd. 2.75% 13 - 03.07.23 500,000 EUR 511,290 524,340 0.02Fidelity International Ltd. 2.50% 16 - 04.11.26 500,000 EUR 541,470 546,975 0.03
1,052,760 1,071,315 0.05BrazilVale SA 3.75% 12 - 10.01.23 530,000 EUR 562,363 566,294 0.03
562,363 566,294 0.03British Virgin IslandsCheung Kong Infrastructure Finance BVI Ltd. 1.00%17 - 12.12.24 945,000 EUR 944,675 957,143 0.04Global Switch Holdings Ltd. 1.50% 17 - 31.01.24 350,000 EUR 357,706 363,786 0.02Global Switch Holdings Ltd. 2.25% 17 - 31.05.27 507,000 EUR 526,458 557,203 0.02Huarong Universe Investment Holdings Ltd. 1.625%17 - 05.12.22 221,000 EUR 214,779 213,818 0.01
Xtrackers II
Xtrackers II EUR CORPORATE BOND UCITS ETF (continued)
Statement of Investmentsas at 31 December 2020(expressed in EUR)
The accompanying notes form an integral part of these financial statements.
152

DescriptionNominal
ValueCurrency
(local) Cost Market Value
% ofNet
Assets
Transferable securities and money market instruments admitted to an official stock exchange listing(A)
Bonds (continued)
British Virgin Islands (continued)Rail Transit International Development Co. Ltd.1.625% 18 - 22.06.22 400,000 EUR 401,531 401,008 0.02Talent Yield Euro Ltd. 1.00% 20 - 24.09.25 568,000 EUR 574,050 576,242 0.03Talent Yield Euro Ltd. 1.30% 17 - 21.04.22 300,000 EUR 302,749 303,561 0.01
3,321,948 3,372,761 0.15CanadaAlimentation Couche-Tard Inc. 1.875% 16 - 06.05.26 674,000 EUR 708,995 726,397 0.03Bank of Nova Scotia 0.125% 19 - 04.09.26 809,000 EUR 802,449 815,577 0.04Bank of Nova Scotia 0.375% 17 - 06.04.22 200,000 EUR 200,781 201,766 0.01Bank of Nova Scotia 0.50% 19 - 30.04.24 925,000 EUR 926,882 944,036 0.04Canadian Imperial Bank of Commerce 0.375% 19 -03.05.24 736,000 EUR 734,643 745,767 0.03Canadian Imperial Bank of Commerce 0.75% 18 -22.03.23 774,000 EUR 786,119 791,523 0.04Fairfax Financial Holdings Ltd. 2.75% 18 - 29.03.28 800,000 EUR 826,885 890,104 0.04Great-West Lifeco Inc. 1.75% 16 - 07.12.26 492,000 EUR 523,006 543,630 0.02Great-West Lifeco Inc. 2.50% 13 - 18.04.23 200,000 EUR 208,530 212,214 0.01Magna International Inc. 1.50% 17 - 25.09.27 555,000 EUR 570,477 602,841 0.03Magna International Inc. 1.90% 15 - 24.11.23 132,000 EUR 139,049 139,182 0.01Magna International Inc. 1.90% 15 - 24.11.23 200,000 EUR 208,410 210,882 0.01Royal Bank of Canada 0.125% 19 - 23.07.24 941,000 EUR 940,394 949,554 0.04Royal Bank of Canada 0.25% 19 - 02.05.24 466,000 EUR 464,660 472,310 0.02Toronto-Dominion Bank 0.375% 19 - 25.04.24 1,133,000 EUR 1,140,559 1,150,652 0.05Toronto-Dominion Bank 0.625% 18 - 20.07.23 1,432,000 EUR 1,448,493 1,464,793 0.07Total Capital Canada Ltd. 1.125% 14 - 18.03.22 600,000 EUR 608,207 610,950 0.03Total Capital Canada Ltd. 2.125% 14 - 18.09.29 1,400,000 EUR 1,556,833 1,660,778 0.08
12,795,372 13,132,956 0.60Cayman IslandsCK Hutchison Europe Finance 18 Ltd. 1.25% 18 -13.04.25 200,000 EUR 203,460 209,556 0.01CK Hutchison Europe Finance 18 Ltd. 2.00% 18 -13.04.30 400,000 EUR 434,935 463,348 0.02CK Hutchison Finance 16 II Ltd. 0.875% 16 -03.10.24 842,000 EUR 841,535 865,450 0.04CK Hutchison Finance 16 Ltd. 1.25% 16 - 06.04.23 1,200,000 EUR 1,213,089 1,232,844 0.06CK Hutchison Finance 16 Ltd. 2.00% 16 - 06.04.28 407,000 EUR 428,971 458,795 0.02Hutchison Whampoa Europe Finance 12 Ltd. 3.625%12 - 06.06.22 668,000 EUR 698,799 702,061 0.03XLIT Ltd. FRN 17 - 29.06.47 334,000 EUR 370,431 378,489 0.02
4,191,220 4,310,543 0.20ChinaChina Merchants Bank Co. Ltd 0.25% 19 - 19.06.22 200,000 EUR 200,371 198,742 0.01
200,371 198,742 0.01Czech RepublicEP Infrastructure AS 1.659% 18 - 26.04.24 586,000 EUR 583,778 604,828 0.03EP Infrastructure AS 1.698% 19 - 30.07.26 500,000 EUR 504,026 516,740 0.02EP Infrastructure AS 2.045% 19 - 09.10.28 450,000 EUR 444,749 468,018 0.02
1,532,553 1,589,586 0.07
Xtrackers II
Xtrackers II EUR CORPORATE BOND UCITS ETF (continued)
Statement of Investmentsas at 31 December 2020(expressed in EUR)
The accompanying notes form an integral part of these financial statements.
153

DescriptionNominal
ValueCurrency
(local) Cost Market Value
% ofNet
Assets
Transferable securities and money market instruments admitted to an official stock exchange listing(A)
Bonds (continued)
DenmarkAP Moller - Maersk A/S 1.75% 18 - 16.03.26 468,000 EUR 477,590 502,707 0.02Carlsberg Breweries A/S 0.375% 20 - 30.06.27 557,000 EUR 551,854 565,344 0.03Carlsberg Breweries A/S 0.50% 17 - 06.09.23 292,000 EUR 295,122 296,806 0.01Carlsberg Breweries A/S 0.625% 20 - 09.03.30 479,000 EUR 452,767 490,367 0.02Carlsberg Breweries A/S 0.875% 19 - 01.07.29 500,000 EUR 510,042 524,140 0.02Carlsberg Breweries A/S 2.50% 14 - 28.05.24 600,000 EUR 636,780 650,118 0.03Carlsberg Breweries A/S 2.625% 12 - 15.11.22 310,000 EUR 324,667 326,740 0.01Danfoss A/S 1.375% 14 - 23.02.22 325,000 EUR 328,873 329,140 0.02Danica Pension Livsforsikrings AB FRN 15 - 29.09.45 262,000 EUR 290,286 297,784 0.01Danica Pension Livsforsikrings AB FRN 15 - 29.09.45 100,000 EUR 113,031 113,658 0.01Danske Bank A/S 0.25% 17 - 28.11.22 809,000 EUR 810,691 815,820 0.04Danske Bank A/S FRN 19 - 27.08.25 1,200,000 EUR 1,185,608 1,208,364 0.06Danske Bank A/S 0.625% 20 - 26.05.25 690,000 EUR 688,192 708,202 0.03Danske Bank A/S 0.75% 16 - 02.06.23 1,379,000 EUR 1,392,020 1,410,414 0.06Danske Bank A/S 0.875% 18 - 22.05.23 800,000 EUR 798,836 815,832 0.04Danske Bank A/S 0.875% 18 - 22.05.23 200,000 EUR 202,644 203,958 0.01Danske Bank A/S 1.375% 19 - 24.05.22 824,000 EUR 836,475 841,147 0.04Danske Bank A/S FRN 19 - 12.02.30 671,000 EUR 659,804 680,729 0.03Danske Bank A/S FRN 20 - 02.09.30 337,000 EUR 337,413 344,330 0.02Danske Bank A/S 1.625% 19 - 15.03.24 200,000 EUR 204,685 209,802 0.01Danske Bank A/S FRN 19 - 21.06.29 681,000 EUR 694,629 721,485 0.03DSV PANALPINA A/S-S- 0.375% 20 - 26.02.27 434,000 EUR 418,422 437,793 0.02H Lundbeck A/S 0.875% 20 - 14.10.27 545,000 EUR 549,163 556,527 0.03ISS Global A/S 0.875% 19 - 18.06.26 650,000 EUR 648,875 641,537 0.03ISS Global A/S 1.50% 17 - 31.08.27 521,000 EUR 516,078 526,913 0.02ISS Global A/S 2.125% 14 - 02.12.24 407,000 EUR 433,136 429,190 0.02Jyske Bank A/S FRN 20 - 15.10.25 429,000 EUR 430,855 431,497 0.02Jyske Bank A/S FRN 19 - 20.06.24 112,000 EUR 110,116 113,680 0.01Jyske Bank A/S FRN 17 - 05.04.29 262,000 EUR 270,422 272,535 0.01Nykredit Realkredit A/S 0.125% 19 - 10.07.24 180,000 EUR 178,687 180,263 0.01Nykredit Realkredit A/S 0.50% 18 - 19.01.22 1,018,000 EUR 1,021,239 1,024,342 0.05Nykredit Realkredit A/S 0.625% 19 - 17.01.25 100,000 EUR 100,439 101,877 0.00Nykredit Realkredit A/S 0.75% 20 - 20.01.27 1,060,000 EUR 1,040,123 1,086,521 0.05Nykredit Realkredit A/S 0.875% 19 - 17.01.24 300,000 EUR 293,018 307,815 0.01Nykredit Realkredit A/S FRN 15 - 17.11.27 450,000 EUR 467,424 469,350 0.02Nykredit Realkredit AS 0.25% 19 - 20.01.23 560,000 EUR 557,640 563,226 0.03Nykredit Realkredit AS 0.25% 20 - 13.01.26 856,000 EUR 856,706 856,248 0.04Nykredit Realkredit AS 0.50% 20 - 10.07.25 486,000 EUR 490,563 497,990 0.02Sydbank A/S 1.25% 19 - 04.02.22 500,000 EUR 503,462 507,590 0.02Sydbank AS 1.375% 18 - 18.09.23 166,000 EUR 166,212 171,880 0.01
20,844,589 21,233,661 0.97EstoniaLuminor Bank AS Via Estonia FRN 20 - 03.12.24 400,000 EUR 402,415 402,492 0.02Luminor Bank AS Via Estonia 1.375% 19 - 21.10.22 200,000 EUR 199,879 203,640 0.01
602,294 606,132 0.03FinlandCRH Finland Services OYJ 0.875% 20 - 05.11.23 455,000 EUR 457,615 467,731 0.02Elenia Verkko OYJ 0.375% 20 - 06.02.27 468,000 EUR 460,852 472,006 0.02
Xtrackers II
Xtrackers II EUR CORPORATE BOND UCITS ETF (continued)
Statement of Investmentsas at 31 December 2020(expressed in EUR)
The accompanying notes form an integral part of these financial statements.
154

DescriptionNominal
ValueCurrency
(local) Cost Market Value
% ofNet
Assets
Transferable securities and money market instruments admitted to an official stock exchange listing(A)
Bonds (continued)
Finland (continued)Elisa OYJ 0.25% 20 - 15.09.27 240,000 EUR 238,855 241,298 0.01Elisa OYJ 0.875% 17 - 17.03.24 162,000 EUR 164,054 166,716 0.01Elisa OYJ 1.125% 19 - 26.02.26 160,000 EUR 162,781 168,584 0.01Kojamo OYJ 1.50% 17 - 19.06.24 100,000 EUR 102,527 104,446 0.00Kojamo OYJ 1.625% 18 - 07.03.25 168,000 EUR 172,665 176,729 0.01Kojamo OYJ 1.875% 20 - 27.05.27 807,000 EUR 818,301 871,625 0.04Metso Outotec OYJ 0.875% 20 - 26.05.28 261,000 EUR 261,584 263,245 0.01Metso Outotec OYJ 1.125% 17 - 13.06.24 352,000 EUR 358,416 362,233 0.02Nordea Bank Abp 0.30% 17 - 30.06.22 600,000 EUR 602,102 605,766 0.03Nordea Bank Abp 0.375% 19 - 28.05.26 900,000 EUR 907,901 925,002 0.04Nordea Bank Abp 0.50% 20 - 14.05.27 1,218,000 EUR 1,227,142 1,259,485 0.06Nordea Bank Abp 0.875% 18 - 26.06.23 790,000 EUR 803,336 811,551 0.04Nordea Bank Abp 1.00% 16 - 22.02.23 1,330,000 EUR 1,356,741 1,366,588 0.06Nordea Bank Abp FRN 19 - 27.06.29 100,000 EUR 101,094 101,354 0.00Nordea Bank Abp 1.125% 15 - 12.02.25 1,300,000 EUR 1,348,018 1,372,449 0.06Nordea Bank Abp 1.125% 17 - 27.09.27 585,000 EUR 612,645 632,362 0.03Nordea Bank Abp 3.25% 12 - 05.07.22 600,000 EUR 629,527 631,998 0.03OP Corporate Bank PLC 0.10% 20 - 16.11.27 1,275,000 EUR 1,275,554 1,277,932 0.06OP Corporate Bank PLC 0.125% 20 - 01.07.24 1,315,000 EUR 1,313,683 1,327,887 0.06OP Corporate Bank PLC 0.375% 17 - 11.10.22 300,000 EUR 301,329 303,654 0.01OP Corporate Bank PLC 0.375% 18 - 29.08.23 221,000 EUR 224,809 224,808 0.01OP Corporate Bank PLC 0.375% 19 - 26.02.24 202,000 EUR 203,210 206,038 0.01OP Corporate Bank PLC 0.375% 19 - 19.06.24 100,000 EUR 100,084 101,219 0.00OP Corporate Bank PLC 0.50% 20 - 12.08.25 1,054,000 EUR 1,059,115 1,080,898 0.05OP Corporate Bank PLC 0.60% 20 - 18.01.27 340,000 EUR 333,891 348,150 0.02OP Corporate Bank PLC 0.625% 19 - 12.11.29 318,000 EUR 314,776 326,751 0.02OP Corporate Bank PLC 0.75% 15 - 03.03.22 950,000 EUR 958,319 962,065 0.04OP Corporate Bank PLC 1.00% 18 - 22.05.25 214,000 EUR 219,714 225,006 0.01OP Corporate Bank PLC FRN 20 - 09.06.30 815,000 EUR 813,532 845,701 0.04OP Corporate Bank PLC 5.75% 12 - 28.02.22 592,000 EUR 628,698 631,184 0.03Sampo OYJ 1.00% 16 - 18.09.23 200,000 EUR 207,505 207,328 0.01Sampo OYJ 1.25% 17 - 30.05.25 433,000 EUR 452,565 460,478 0.02Sampo OYJ 1.625% 18 - 21.02.28 600,000 EUR 632,171 668,466 0.03Sampo OYJ 2.25% 18 - 27.09.30 300,000 EUR 326,463 359,529 0.02Sampo OYJ FRN 20 - 03.09.52 833,000 EUR 839,060 901,931 0.04Sampo OYJ FRN 19 - 23.05.49 530,000 EUR 565,992 609,071 0.03SATO OYJ 1.375% 19 - 31.05.24 100,000 EUR 99,291 103,193 0.00SATO OYJ 1.375% 20 - 24.02.28 128,000 EUR 128,792 131,389 0.01SATO OYJ 2.25% 20 - 07.04.23 39,000 EUR 39,146 40,786 0.00SBB Treasury OYJ 0.75% 20 - 14.12.28 600,000 EUR 595,740 594,348 0.03Stora Enso OYJ 0.625% 20 - 02.12.30 434,000 EUR 430,604 441,261 0.02Stora Enso OYJ 2.125% 16 - 16.06.23 400,000 EUR 411,196 420,184 0.02Stora Enso OYJ 2.50% 17 - 07.06.27 200,000 EUR 196,269 226,594 0.01Stora Enso OYJ 2.50% 18 - 21.03.28 200,000 EUR 202,387 228,696 0.01UPM-Kymmene OYJ 0.125% 20 - 19.11.28 645,000 EUR 642,897 642,878 0.03
24,302,948 24,898,593 1.14FranceAir Liquide Finance SA 0.375% 16 - 18.04.22 300,000 EUR 301,623 302,031 0.01
Xtrackers II
Xtrackers II EUR CORPORATE BOND UCITS ETF (continued)
Statement of Investmentsas at 31 December 2020(expressed in EUR)
The accompanying notes form an integral part of these financial statements.
155

DescriptionNominal
ValueCurrency
(local) Cost Market Value
% ofNet
Assets
Transferable securities and money market instruments admitted to an official stock exchange listing(A)
Bonds (continued)
France (continued)Air Liquide Finance SA 0.50% 16 - 13.06.22 300,000 EUR 300,422 303,102 0.01Air Liquide Finance SA 0.625% 19 - 20.06.30 100,000 EUR 99,129 106,058 0.01Air Liquide Finance SA 0.625% 19 - 20.06.30 600,000 EUR 606,024 636,348 0.03Air Liquide Finance SA 0.75% 16 - 13.06.24 700,000 EUR 713,501 723,100 0.03Air Liquide Finance SA 1.00% 17 - 08.03.27 400,000 EUR 411,459 429,176 0.02Air Liquide Finance SA 1.00% 20 - 02.04.25 700,000 EUR 717,754 734,356 0.03Air Liquide Finance SA 1.00% 20 - 02.04.25 200,000 EUR 206,840 209,816 0.01Air Liquide Finance SA 1.25% 15 - 03.06.25 200,000 EUR 210,846 212,360 0.01Air Liquide Finance SA 1.25% 16 - 13.06.28 700,000 EUR 742,464 773,745 0.04Air Liquide Finance SA 1.375% 20 - 02.04.30 400,000 EUR 423,153 451,120 0.02Air Liquide Finance SA 1.875% 14 - 05.06.24 100,000 EUR 104,246 107,417 0.01Air Liquide SA 2.375% 13 - 06.09.23 300,000 EUR 321,371 321,198 0.01ALD SA 0.375% 19 - 18.07.23 600,000 EUR 582,669 605,112 0.03ALD SA 0.375% 20 - 19.10.23 300,000 EUR 301,333 302,544 0.01ALD SA 0.875% 17 - 18.07.22 600,000 EUR 603,455 608,604 0.03ALD SA 1.25% 18 - 11.10.22 500,000 EUR 504,609 511,845 0.02Alstom SA 0.25% 19 - 14.10.26 600,000 EUR 596,433 607,728 0.03Altarea SCA 1.75% 20 - 16.01.30 300,000 EUR 301,917 301,182 0.01Altarea SCA 1.875% 19 - 17.01.28 500,000 EUR 491,291 518,200 0.02Altarea SCA 2.25% 17 - 05.07.24 400,000 EUR 409,675 420,988 0.02Altareit SCA 2.875% 18 - 02.07.25 200,000 EUR 200,224 213,914 0.01APRR SA Zero Coupon 20 - 20.01.23 400,000 EUR 401,377 401,932 0.02APRR SA 0.125% 20 - 18.01.29 500,000 EUR 497,970 505,005 0.02APRR SA 1.125% 16 - 09.01.26 500,000 EUR 518,376 531,300 0.02APRR SA 1.25% 16 - 06.01.27 200,000 EUR 208,275 216,284 0.01APRR SA 1.25% 19 - 18.01.28 600,000 EUR 622,211 653,040 0.03APRR SA 1.25% 20 - 14.01.27 600,000 EUR 616,101 648,774 0.03APRR SA 1.50% 15 - 15.01.24 100,000 EUR 101,687 104,633 0.01APRR SA 1.50% 15 - 15.01.24 800,000 EUR 836,062 837,064 0.04APRR SA 1.50% 17 - 17.01.33 700,000 EUR 757,946 806,120 0.04APRR SA 1.50% 18 - 25.01.30 500,000 EUR 524,985 565,090 0.03APRR SA 1.625% 17 - 13.01.32 300,000 EUR 315,333 346,029 0.02APRR SA 1.875% 14 - 15.01.25 500,000 EUR 529,780 539,705 0.02APRR SA 1.875% 16 - 06.01.31 300,000 EUR 339,956 351,801 0.02Arkema SA 0.125% 20 - 14.10.26 300,000 EUR 301,020 302,775 0.01Arkema SA 0.75% 19 - 03.12.29 300,000 EUR 299,585 314,412 0.01Arkema SA 1.50% 15 - 20.01.25 700,000 EUR 740,517 745,878 0.03Arkema SA 1.50% 17 - 20.04.27 800,000 EUR 819,851 871,784 0.04Arkema SA FRN 20 - 31.12.99 500,000 EUR 455,938 495,680 0.02Arkema SA FRN 19 - 31.12.99 100,000 EUR 100,829 105,078 0.01Atos SE 0.75% 18 - 07.05.22 500,000 EUR 502,819 506,280 0.02Atos SE 1.75% 18 - 07.05.25 300,000 EUR 301,112 321,975 0.02Atos SE 1.75% 18 - 07.05.25 800,000 EUR 841,896 858,600 0.04Atos SE 2.50% 18 - 07.11.28 100,000 EUR 113,544 117,822 0.01Auchan Holding SA 2.375% 19 - 25.04.25 800,000 EUR 804,985 863,520 0.04Auchan Holding SA 2.625% 19 - 30.01.24 900,000 EUR 929,053 961,137 0.04Auchan Holding SA 2.875% 20 - 29.01.26 900,000 EUR 919,645 996,714 0.05Auchan Holding SA 3.25% 20 - 23.07.27 600,000 EUR 611,697 691,770 0.03
Xtrackers II
Xtrackers II EUR CORPORATE BOND UCITS ETF (continued)
Statement of Investmentsas at 31 December 2020(expressed in EUR)
The accompanying notes form an integral part of these financial statements.
156

DescriptionNominal
ValueCurrency
(local) Cost Market Value
% ofNet
Assets
Transferable securities and money market instruments admitted to an official stock exchange listing(A)
Bonds (continued)
France (continued)Autoroutes du Sud de la France SA 1.00% 16 -13.05.26 100,000 EUR 103,535 106,145 0.01Autoroutes du Sud de la France SA 1.125% 17 -20.04.26 200,000 EUR 199,660 214,138 0.01Autoroutes du Sud de la France SA 1.125% 17 -20.04.26 700,000 EUR 732,227 749,483 0.03Autoroutes du Sud de la France SA 1.25% 17 -18.01.27 300,000 EUR 300,455 325,038 0.02Autoroutes du Sud de la France SA 1.25% 17 -18.01.27 800,000 EUR 827,346 866,768 0.04Autoroutes du Sud de la France SA 1.375% 18 -22.01.30 500,000 EUR 533,043 561,025 0.03Autoroutes du Sud de la France SA 1.375% 18 -27.06.28 500,000 EUR 519,923 553,960 0.03Autoroutes du Sud de la France SA 1.375% 19 -21.02.31 1,000,000 EUR 1,060,231 1,122,710 0.05Autoroutes du Sud de la France SA 2.875% 13 -18.01.23 500,000 EUR 529,296 532,145 0.02Autoroutes du Sud de la France SA 2.95% 14 -17.01.24 500,000 EUR 538,514 543,985 0.03Autoroutes du Sud de la France SA 5.625% 07 -04.07.22 900,000 EUR 976,830 979,641 0.05AXA SA 1.125% 16 - 15.05.28 400,000 EUR 426,102 440,872 0.02AXA SA FRN 18 - 28.05.49 1,612,000 EUR 1,746,128 1,882,864 0.09AXA SA FRN 16 - 06.07.47 1,353,000 EUR 1,477,646 1,566,152 0.07AXA SA FRN 14 - 20.05.49 900,000 EUR 974,112 1,021,194 0.05AXA SA FRN 14 - 29.11.49 500,000 EUR 549,056 558,750 0.03AXA SA FRN 14 - 29.11.49 379,000 EUR 412,016 423,532 0.02AXA SA FRN 13 - 04.07.43 932,000 EUR 1,050,018 1,045,294 0.05Banque Federative du Credit Mutuel SA 0.10% 20 -08.10.27 500,000 EUR 500,997 503,495 0.02Banque Federative du Credit Mutuel SA 0.125% 19 -05.02.24 1,500,000 EUR 1,500,917 1,516,455 0.07Banque Federative du Credit Mutuel SA 0.375% 17 -13.01.22 1,100,000 EUR 1,103,125 1,108,965 0.05Banque Federative du Credit Mutuel SA 0.50% 18 -16.11.22 1,600,000 EUR 1,611,045 1,624,096 0.07Banque Federative du Credit Mutuel SA 0.625% 20 -21.02.31 1,100,000 EUR 1,097,701 1,118,788 0.05Banque Federative du Credit Mutuel SA 0.75% 18 -17.07.25 1,300,000 EUR 1,313,795 1,350,804 0.06Banque Federative du Credit Mutuel SA 0.75% 19 -15.06.23 1,400,000 EUR 1,415,159 1,435,392 0.07Banque Federative du Credit Mutuel SA 0.75% 19 -08.06.26 1,300,000 EUR 1,321,418 1,356,823 0.06Banque Federative du Credit Mutuel SA 0.75% 20 -17.01.30 900,000 EUR 900,310 933,939 0.04
Xtrackers II
Xtrackers II EUR CORPORATE BOND UCITS ETF (continued)
Statement of Investmentsas at 31 December 2020(expressed in EUR)
The accompanying notes form an integral part of these financial statements.
157

DescriptionNominal
ValueCurrency
(local) Cost Market Value
% ofNet
Assets
Transferable securities and money market instruments admitted to an official stock exchange listing(A)
Bonds (continued)
France (continued)Banque Federative du Credit Mutuel SA 1.25% 15 -14.01.25 1,000,000 EUR 1,039,983 1,056,600 0.05Banque Federative du Credit Mutuel SA 1.25% 17 -26.05.27 1,200,000 EUR 1,240,682 1,297,824 0.06Banque Federative du Credit Mutuel SA 1.25% 20 -03.06.30 800,000 EUR 807,748 864,512 0.04Banque Federative du Credit Mutuel SA 1.375% 18 -16.07.28 800,000 EUR 850,612 882,320 0.04Banque Federative du Credit Mutuel SA 1.625% 16 -19.01.26 1,100,000 EUR 1,161,025 1,195,304 0.05Banque Federative du Credit Mutuel SA 1.625% 17 -15.11.27 500,000 EUR 505,067 536,315 0.02Banque Federative du Credit Mutuel SA 1.75% 19 -15.03.29 1,100,000 EUR 1,173,275 1,236,983 0.06Banque Federative du Credit Mutuel SA 1.875% 16 -04.11.26 500,000 EUR 512,528 541,075 0.02Banque Federative du Credit Mutuel SA 1.875% 19 -18.06.29 800,000 EUR 831,912 880,344 0.04Banque Federative du Credit Mutuel SA 2.375% 16 -24.03.26 900,000 EUR 924,906 991,953 0.05Banque Federative du Credit Mutuel SA 2.50% 18 -25.05.28 400,000 EUR 414,683 456,312 0.02Banque Federative du Credit Mutuel SA 2.625% 14 -18.03.24 1,100,000 EUR 1,177,123 1,199,847 0.06Banque Federative du Credit Mutuel SA 2.625% 17 -31.03.27 500,000 EUR 537,768 564,390 0.03Banque Federative du Credit Mutuel SA 3.00% 13 -28.11.23 900,000 EUR 968,343 985,248 0.05Banque Federative du Credit Mutuel SA 3.00% 14 -21.05.24 890,000 EUR 946,348 975,102 0.04Banque Federative du Credit Mutuel SA 3.00% 15 -11.09.25 900,000 EUR 969,571 1,013,454 0.05Banque Federative du Credit Mutuel SA 3.25% 12 -23.08.22 1,300,000 EUR 1,373,810 1,376,908 0.06BNP Paribas Cardif SA 1.00% 17 - 29.11.24 500,000 EUR 481,517 512,615 0.02BNP Paribas Cardif SA FRN 14 - 29.11.49 800,000 EUR 862,726 906,896 0.04BNP Paribas SA 0.125% 19 - 04.09.26 1,100,000 EUR 1,076,858 1,094,566 0.05BNP Paribas SA FRN 20 - 14.10.27 700,000 EUR 698,777 707,973 0.03BNP Paribas SA 0.50% 16 - 01.06.22 500,000 EUR 502,629 506,395 0.02BNP Paribas SA FRN 19 - 15.07.25 600,000 EUR 601,320 609,312 0.03BNP Paribas SA FRN 19 - 04.06.26 700,000 EUR 702,354 712,726 0.03BNP Paribas SA FRN 20 - 19.02.28 1,300,000 EUR 1,276,235 1,314,079 0.06BNP Paribas SA FRN 20 - 01.09.28 900,000 EUR 895,210 908,496 0.04BNP Paribas SA 0.625% 20 - 03.12.32 1,300,000 EUR 1,297,792 1,314,235 0.06BNP Paribas SA 0.75% 16 - 11.11.22 859,000 EUR 868,941 876,068 0.04BNP Paribas SA 1.00% 17 - 27.06.24 870,000 EUR 880,501 900,372 0.04BNP Paribas SA 1.00% 18 - 17.04.24 200,000 EUR 205,087 206,970 0.01BNP Paribas SA 1.125% 16 - 15.01.23 1,165,000 EUR 1,191,148 1,198,214 0.05
Xtrackers II
Xtrackers II EUR CORPORATE BOND UCITS ETF (continued)
Statement of Investmentsas at 31 December 2020(expressed in EUR)
The accompanying notes form an integral part of these financial statements.
158

DescriptionNominal
ValueCurrency
(local) Cost Market Value
% ofNet
Assets
Transferable securities and money market instruments admitted to an official stock exchange listing(A)
Bonds (continued)
France (continued)BNP Paribas SA 1.125% 17 - 10.10.23 681,000 EUR 684,088 704,944 0.03BNP Paribas SA 1.125% 18 - 11.06.26 1,200,000 EUR 1,199,076 1,258,416 0.06BNP Paribas SA 1.125% 18 - 22.11.23 752,000 EUR 766,615 778,861 0.04BNP Paribas SA 1.125% 19 - 28.08.24 900,000 EUR 917,965 937,791 0.04BNP Paribas SA FRN 20 - 15.01.32 900,000 EUR 897,013 912,969 0.04BNP Paribas SA FRN 20 - 17.04.29 1,200,000 EUR 1,203,785 1,265,952 0.06BNP Paribas SA 1.25% 18 - 19.03.25 644,000 EUR 656,150 676,561 0.03BNP Paribas SA 1.375% 19 - 28.05.29 1,000,000 EUR 1,015,629 1,085,480 0.05BNP Paribas SA 1.50% 16 - 25.05.28 1,135,000 EUR 1,237,687 1,256,581 0.06BNP Paribas SA 1.50% 17 - 17.11.25 900,000 EUR 919,677 960,462 0.04BNP Paribas SA 1.50% 17 - 23.05.28 600,000 EUR 622,125 656,034 0.03BNP Paribas SA 1.625% 16 - 23.02.26 1,155,000 EUR 1,243,399 1,258,546 0.06BNP Paribas SA 1.625% 19 - 02.07.31 800,000 EUR 805,312 851,256 0.04BNP Paribas SA FRN 19 - 23.01.27 1,800,000 EUR 1,904,229 1,972,206 0.09BNP Paribas SA 2.25% 16 - 11.01.27 900,000 EUR 955,861 982,278 0.05BNP Paribas SA 2.375% 14 - 20.05.24 538,000 EUR 568,237 584,838 0.03BNP Paribas SA 2.375% 15 - 17.02.25 1,590,000 EUR 1,674,970 1,711,508 0.08BNP Paribas SA FRN 18 - 20.11.30 300,000 EUR 317,491 323,835 0.02BNP Paribas SA FRN 14 - 14.10.27 400,000 EUR 406,341 415,776 0.02BNP Paribas SA 2.75% 15 - 27.01.26 479,000 EUR 504,654 530,967 0.02BNP Paribas SA 2.875% 12 - 24.10.22 932,000 EUR 973,586 986,597 0.05BNP Paribas SA 2.875% 13 - 26.09.23 1,502,000 EUR 1,608,595 1,629,970 0.07BNP Paribas SA 2.875% 16 - 01.10.26 679,000 EUR 734,535 765,966 0.04BNP Paribas SA 4.125% 11 - 14.01.22 1,265,000 EUR 1,320,943 1,324,063 0.06BNP Paribas SA 4.50% 11 - 21.03.23 1,419,000 EUR 1,564,422 1,569,088 0.07Bouygues SA 1.125% 20 - 24.07.28 1,100,000 EUR 1,149,039 1,190,904 0.05Bouygues SA 1.375% 16 - 07.06.27 600,000 EUR 632,651 658,692 0.03Bouygues SA 3.625% 12 - 16.01.23 1,000,000 EUR 1,076,424 1,080,550 0.05Bouygues SA 4.50% 12 - 09.02.22 300,000 EUR 314,219 315,963 0.01BPCE SA 0.125% 19 - 04.12.24 700,000 EUR 699,515 707,504 0.03BPCE SA 0.25% 20 - 15.01.26 1,300,000 EUR 1,296,577 1,319,292 0.06BPCE SA 0.375% 16 - 05.10.23 400,000 EUR 398,753 406,868 0.02BPCE SA 0.50% 19 - 24.02.27 700,000 EUR 695,178 713,328 0.03BPCE SA FRN 20 - 15.09.27 1,200,000 EUR 1,193,285 1,217,964 0.06BPCE SA 0.625% 18 - 26.09.23 600,000 EUR 604,078 614,460 0.03BPCE SA 0.625% 19 - 26.09.24 800,000 EUR 804,530 817,952 0.04BPCE SA 0.625% 19 - 26.09.24 400,000 EUR 404,582 408,976 0.02BPCE SA 0.625% 20 - 15.01.30 700,000 EUR 693,065 728,637 0.03BPCE SA 0.625% 20 - 28.04.25 1,500,000 EUR 1,510,393 1,546,245 0.07BPCE SA 0.875% 18 - 31.01.24 500,000 EUR 499,443 513,835 0.02BPCE SA 1.00% 16 - 05.10.28 1,100,000 EUR 1,139,697 1,180,795 0.05BPCE SA 1.00% 19 - 15.07.24 1,500,000 EUR 1,539,746 1,562,235 0.07BPCE SA 1.00% 19 - 01.04.25 1,100,000 EUR 1,120,285 1,143,967 0.05BPCE SA 1.125% 15 - 14.12.22 200,000 EUR 205,505 205,584 0.01BPCE SA 1.125% 17 - 18.01.23 900,000 EUR 905,113 923,724 0.04BPCE SA 1.375% 18 - 23.03.26 500,000 EUR 499,639 532,095 0.02BPCE SA 1.625% 18 - 31.01.28 300,000 EUR 317,853 329,514 0.02BPCE SA FRN 15 - 30.11.27 800,000 EUR 819,922 838,520 0.04
Xtrackers II
Xtrackers II EUR CORPORATE BOND UCITS ETF (continued)
Statement of Investmentsas at 31 December 2020(expressed in EUR)
The accompanying notes form an integral part of these financial statements.
159

DescriptionNominal
ValueCurrency
(local) Cost Market Value
% ofNet
Assets
Transferable securities and money market instruments admitted to an official stock exchange listing(A)
Bonds (continued)
France (continued)BPCE SA 2.875% 13 - 16.01.24 300,000 EUR 327,479 328,338 0.02BPCE SA 2.875% 16 - 22.04.26 500,000 EUR 544,734 566,580 0.03BPCE SA 3.00% 14 - 19.07.24 1,100,000 EUR 1,206,640 1,223,310 0.06BPCE SA 4.25% 12 - 06.02.23 700,000 EUR 755,014 766,304 0.04BPCE SA 4.50% 12 - 10.02.22 1,300,000 EUR 1,368,157 1,370,317 0.06BPCE SA 4.625% 13 - 18.07.23 500,000 EUR 542,305 557,585 0.03Caisse Federale du Credit Mutuel Nord EuropeSCOFAV 2.125% 16 - 12.09.26 300,000 EUR 303,730 319,080 0.01Caisse Nationale de Reassurance Mutuelle AgricoleGroupama 2.125% 19 - 16.09.29 400,000 EUR 377,481 417,840 0.02Caisse Nationale de Reassurance Mutuelle AgricoleGroupama 3.375% 18 - 24.09.28 400,000 EUR 417,281 450,692 0.02Caisse Nationale de Reassurance Mutuelle AgricoleGroupama 6.00% 17 - 23.01.27 500,000 EUR 604,002 626,170 0.03Caisse Nationale de Reassurance Mutuelle AgricoleGroupama FRN 14 - 29.05.49 1,000,000 EUR 1,127,996 1,152,750 0.05Capgemini SE 0.625% 20 - 23.06.25 1,000,000 EUR 1,000,896 1,028,350 0.05Capgemini SE 1.00% 18 - 18.10.24 400,000 EUR 409,712 415,756 0.02Capgemini SE 1.125% 20 - 23.06.30 600,000 EUR 596,180 638,178 0.03Capgemini SE 1.25% 20 - 15.04.22 200,000 EUR 201,502 203,400 0.01Capgemini SE 1.625% 20 - 15.04.26 400,000 EUR 412,257 432,264 0.02Capgemini SE 1.75% 18 - 18.04.28 500,000 EUR 542,559 555,835 0.03Capgemini SE 2.00% 20 - 15.04.29 800,000 EUR 840,562 907,888 0.04Capgemini SE 2.375% 20 - 15.04.32 1,100,000 EUR 1,188,588 1,309,836 0.06Capgemini SE 2.50% 15 - 01.07.23 200,000 EUR 211,564 211,982 0.01Capgemini SE 2.50% 15 - 01.07.23 700,000 EUR 731,230 741,937 0.03Carmila SA 1.625% 20 - 30.05.27 200,000 EUR 201,340 203,654 0.01Carmila SA 2.125% 18 - 07.03.28 400,000 EUR 394,786 422,384 0.02Carmila SA 2.375% 15 - 18.09.23 500,000 EUR 517,501 530,605 0.02Carmila SA 2.375% 16 - 16.09.24 400,000 EUR 423,023 431,820 0.02Carrefour SA 0.75% 16 - 26.04.24 679,000 EUR 678,623 696,946 0.03Carrefour SA 0.875% 18 - 12.06.23 600,000 EUR 605,494 613,416 0.03Carrefour SA 1.00% 19 - 17.05.27 400,000 EUR 406,031 423,752 0.02Carrefour SA 1.25% 15 - 03.06.25 888,000 EUR 928,953 936,778 0.04Carrefour SA 1.75% 14 - 15.07.22 600,000 EUR 614,233 614,928 0.03Carrefour SA 1.75% 18 - 04.05.26 500,000 EUR 498,357 545,410 0.03Carrefour SA 2.625% 20 - 15.12.27 800,000 EUR 860,084 933,400 0.04Ceetrus SA 2.75% 19 - 26.11.26 200,000 EUR 198,469 215,576 0.01Cie de Saint-Gobain 0.625% 19 - 15.03.24 1,000,000 EUR 1,008,917 1,025,070 0.05Cie de Saint-Gobain 0.875% 18 - 21.09.23 800,000 EUR 812,237 822,608 0.04Cie de Saint-Gobain 1.00% 17 - 17.03.25 500,000 EUR 499,278 525,100 0.02Cie de Saint-Gobain 1.125% 18 - 23.03.26 900,000 EUR 912,346 951,300 0.04Cie de Saint-Gobain 1.375% 17 - 14.06.27 700,000 EUR 733,323 760,116 0.03Cie de Saint-Gobain 1.75% 20 - 03.04.23 400,000 EUR 402,052 416,880 0.02Cie de Saint-Gobain 1.875% 18 - 21.09.28 600,000 EUR 637,139 673,866 0.03Cie de Saint-Gobain 1.875% 19 - 15.03.31 800,000 EUR 855,427 921,408 0.04Cie de Saint-Gobain 2.375% 20 - 04.10.27 400,000 EUR 397,634 457,024 0.02Cie de Saint-Gobain 3.625% 12 - 28.03.22 600,000 EUR 626,288 627,738 0.03
Xtrackers II
Xtrackers II EUR CORPORATE BOND UCITS ETF (continued)
Statement of Investmentsas at 31 December 2020(expressed in EUR)
The accompanying notes form an integral part of these financial statements.
160

DescriptionNominal
ValueCurrency
(local) Cost Market Value
% ofNet
Assets
Transferable securities and money market instruments admitted to an official stock exchange listing(A)
Bonds (continued)
France (continued)Cie Financiere et Industrielle des Autoroutes SA0.375% 16 - 07.02.25 500,000 EUR 502,086 512,940 0.02Cie Financiere et Industrielle des Autoroutes SA0.75% 16 - 09.09.28 500,000 EUR 516,954 532,895 0.02Cie Financiere et Industrielle des Autoroutes SA1.00% 20 - 19.05.31 900,000 EUR 907,318 970,623 0.04Cie Financiere et Industrielle des Autoroutes SA1.125% 17 - 13.10.27 500,000 EUR 502,469 541,705 0.03Cie Generale des Etablissements Michelin SCA ZeroCoupon 20 - 02.11.28 400,000 EUR 399,093 399,204 0.02Cie Generale des Etablissements Michelin SCA 0.25%20 - 02.11.32 400,000 EUR 398,840 402,600 0.02Cie Generale des Etablissements Michelin SCA0.625% 20 - 02.11.40 400,000 EUR 402,510 408,668 0.02Cie Generale des Etablissements Michelin SCA0.875% 18 - 03.09.25 400,000 EUR 401,591 418,900 0.02Cie Generale des Etablissements Michelin SCA1.125% 15 - 28.05.22 100,000 EUR 101,697 101,659 0.00Cie Generale des Etablissements Michelin SCA 1.75%15 - 28.05.27 500,000 EUR 532,541 559,680 0.03Cie Generale des Etablissements Michelin SCA 1.75%18 - 03.09.30 500,000 EUR 527,717 580,440 0.03Cie Generale des Etablissements Michelin SCA 1.75%18 - 03.09.30 400,000 EUR 445,077 464,352 0.02Cie Generale des Etablissements Michelin SCA 2.50%18 - 03.09.38 700,000 EUR 824,254 949,375 0.04CNP Assurances 0.375% 20 - 08.03.28 400,000 EUR 400,176 399,800 0.02CNP Assurances 1.875% 16 - 20.10.22 700,000 EUR 713,114 723,170 0.03CNP Assurances FRN 19 - 27.07.50 700,000 EUR 688,617 743,610 0.03CNP Assurances FRN 20 - 30.06.51 600,000 EUR 598,380 651,498 0.03CNP Assurances 2.75% 19 - 05.02.29 400,000 EUR 429,533 460,116 0.02CNP Assurances FRN 14 - 29.11.49 100,000 EUR 108,292 111,000 0.01CNP Assurances FRN 14 - 05.06.45 800,000 EUR 879,269 917,192 0.04CNP Assurances FRN 15 - 10.06.47 700,000 EUR 827,847 841,813 0.04Coface SA 4.125% 14 - 27.03.24 100,000 EUR 108,222 110,672 0.01Covivio 1.125% 19 - 17.09.31 300,000 EUR 306,391 307,353 0.01Covivio 1.125% 19 - 17.09.31 100,000 EUR 93,320 102,451 0.00Covivio 1.50% 17 - 21.06.27 400,000 EUR 394,789 423,152 0.02Covivio 1.625% 17 - 17.10.24 150,000 EUR 148,521 157,532 0.01Covivio 1.625% 20 - 23.06.30 500,000 EUR 499,765 537,470 0.02Covivio 1.875% 16 - 20.05.26 400,000 EUR 432,213 432,688 0.02Covivio 2.375% 18 - 20.02.28 200,000 EUR 202,149 221,404 0.01Covivio Hotels SACA 1.875% 18 - 24.09.25 200,000 EUR 200,126 204,006 0.01Credit Agricole Assurances SA 2.00% 20 - 17.07.30 800,000 EUR 810,600 856,416 0.04Credit Agricole Assurances SA FRN 18 - 29.01.48 900,000 EUR 897,416 973,224 0.04Credit Agricole Assurances SA FRN 15 - 31.12.49 400,000 EUR 433,350 448,036 0.02Credit Agricole Assurances SA FRN 15 - 31.12.49 100,000 EUR 109,673 112,009 0.01Credit Agricole Assurances SA FRN 14 - 31.10.49 800,000 EUR 901,611 914,040 0.04
Xtrackers II
Xtrackers II EUR CORPORATE BOND UCITS ETF (continued)
Statement of Investmentsas at 31 December 2020(expressed in EUR)
The accompanying notes form an integral part of these financial statements.
161

DescriptionNominal
ValueCurrency
(local) Cost Market Value
% ofNet
Assets
Transferable securities and money market instruments admitted to an official stock exchange listing(A)
Bonds (continued)
France (continued)Credit Agricole Assurances SA FRN 16 - 27.09.48 900,000 EUR 1,043,320 1,118,394 0.05Credit Agricole SA 0.125% 20 - 09.12.27 900,000 EUR 901,062 900,117 0.04Credit Agricole SA 0.375% 19 - 21.10.25 400,000 EUR 399,587 407,132 0.02Credit Agricole SA 0.50% 19 - 24.06.24 1,200,000 EUR 1,203,298 1,223,196 0.06Credit Agricole SA 0.75% 16 - 01.12.22 800,000 EUR 808,300 818,568 0.04Credit Agricole SA 0.75% 18 - 05.12.23 900,000 EUR 913,360 925,605 0.04Credit Agricole SA 0.875% 15 - 19.01.22 800,000 EUR 807,638 811,288 0.04Credit Agricole SA 0.875% 20 - 14.01.32 1,000,000 EUR 966,522 1,049,110 0.05Credit Agricole SA 1.00% 17 - 16.09.24 300,000 EUR 311,209 313,530 0.01Credit Agricole SA 1.00% 19 - 03.07.29 700,000 EUR 723,822 756,693 0.03Credit Agricole SA FRN 20 - 22.04.26 1,400,000 EUR 1,403,685 1,456,448 0.07Credit Agricole SA 1.25% 16 - 14.04.26 1,400,000 EUR 1,440,399 1,499,680 0.07Credit Agricole SA 1.375% 17 - 03.05.27 1,300,000 EUR 1,359,765 1,416,181 0.06Credit Agricole SA 1.375% 18 - 13.03.25 1,200,000 EUR 1,237,887 1,267,512 0.06Credit Agricole SA FRN 20 - 05.06.30 700,000 EUR 709,522 730,345 0.03Credit Agricole SA 1.75% 19 - 05.03.29 1,200,000 EUR 1,267,971 1,341,672 0.06Credit Agricole SA 1.875% 16 - 20.12.26 1,400,000 EUR 1,480,728 1,543,304 0.07Credit Agricole SA 2.00% 19 - 25.03.29 1,200,000 EUR 1,224,430 1,325,784 0.06Credit Agricole SA 2.375% 14 - 20.05.24 1,100,000 EUR 1,180,120 1,195,095 0.05Credit Agricole SA 2.625% 15 - 17.03.27 1,680,000 EUR 1,809,803 1,886,371 0.09Credit Agricole SA 3.125% 13 - 17.07.23 1,000,000 EUR 1,082,459 1,090,930 0.05Credit Agricole SA 3.125% 14 - 05.02.26 1,000,000 EUR 1,152,890 1,166,240 0.05Credit Agricole SA 5.125% 11 - 18.04.23 600,000 EUR 672,239 677,100 0.03Credit Logement SA FRN 17 - 28.11.29 600,000 EUR 596,098 612,660 0.03Credit Mutuel Arkea SA 0.01% 20 - 28.01.26 800,000 EUR 799,591 801,208 0.04Credit Mutuel Arkea SA 0.375% 19 - 03.10.28 300,000 EUR 298,170 306,285 0.01Credit Mutuel Arkea SA 0.875% 18 - 05.10.23 300,000 EUR 305,971 308,784 0.01Credit Mutuel Arkea SA 0.875% 20 - 07.05.27 600,000 EUR 605,012 632,334 0.03Credit Mutuel Arkea SA 1.00% 15 - 26.01.23 100,000 EUR 102,331 102,617 0.00Credit Mutuel Arkea SA 1.125% 19 - 23.05.29 500,000 EUR 513,610 541,705 0.03Credit Mutuel Arkea SA 1.25% 17 - 31.05.24 700,000 EUR 720,577 727,405 0.03Credit Mutuel Arkea SA FRN 20 - 11.06.29 700,000 EUR 700,749 744,114 0.03Credit Mutuel Arkea SA 1.375% 19 - 17.01.25 600,000 EUR 627,871 636,090 0.03Credit Mutuel Arkea SA 1.625% 19 - 15.04.26 300,000 EUR 307,542 322,611 0.02Credit Mutuel Arkea SA FRN 17 - 25.10.29 400,000 EUR 388,712 416,300 0.02Credit Mutuel Arkea SA 3.25% 16 - 01.06.26 300,000 EUR 325,737 344,271 0.02Credit Mutuel Arkea SA 3.375% 19 - 11.03.31 700,000 EUR 791,543 855,974 0.04Credit Mutuel Arkea SA 3.50% 17 - 09.02.29 500,000 EUR 576,314 604,685 0.03Danone SA 0.395% 20 - 10.06.29 900,000 EUR 903,881 927,504 0.04Danone SA 0.424% 16 - 03.11.22 900,000 EUR 906,718 910,926 0.04Danone SA 0.571% 20 - 17.03.27 700,000 EUR 701,563 729,638 0.03Danone SA 0.709% 16 - 03.11.24 1,400,000 EUR 1,430,474 1,450,708 0.07Danone SA 1.00% 18 - 26.03.25 300,000 EUR 308,649 315,252 0.01Danone SA 1.125% 15 - 14.01.25 400,000 EUR 415,688 421,160 0.02Danone SA 1.208% 16 - 03.11.28 1,500,000 EUR 1,600,301 1,652,700 0.08Danone SA 1.25% 15 - 30.05.24 700,000 EUR 726,914 734,972 0.03Danone SA FRN 17 - 31.12.99 800,000 EUR 802,412 821,616 0.04Danone SA 2.60% 13 - 28.06.23 400,000 EUR 422,853 429,244 0.02
Xtrackers II
Xtrackers II EUR CORPORATE BOND UCITS ETF (continued)
Statement of Investmentsas at 31 December 2020(expressed in EUR)
The accompanying notes form an integral part of these financial statements.
162

DescriptionNominal
ValueCurrency
(local) Cost Market Value
% ofNet
Assets
Transferable securities and money market instruments admitted to an official stock exchange listing(A)
Bonds (continued)
France (continued)Dassault Systemes SE Zero Coupon 19 - 16.09.22 400,000 EUR 401,114 401,744 0.02Dassault Systemes SE Zero Coupon 19 - 16.09.24 800,000 EUR 794,439 806,144 0.04Dassault Systemes SE 0.125% 19 - 16.09.26 500,000 EUR 499,822 506,215 0.02Dassault Systemes SE 0.125% 19 - 16.09.26 500,000 EUR 500,508 506,215 0.02Dassault Systemes SE 0.375% 19 - 16.09.29 1,000,000 EUR 1,002,205 1,032,080 0.05Edenred 1.375% 15 - 10.03.25 200,000 EUR 206,670 211,472 0.01Edenred 1.375% 20 - 18.06.29 700,000 EUR 705,584 754,033 0.03Edenred 1.875% 17 - 30.03.27 200,000 EUR 211,680 222,280 0.01Edenred 1.875% 18 - 06.03.26 800,000 EUR 818,198 875,760 0.04Engie Alliance GIE 5.75% 03 - 24.06.23 936,000 EUR 1,066,578 1,072,094 0.05Engie SA Zero Coupon 19 - 04.03.27 500,000 EUR 492,254 500,090 0.02Engie SA 0.375% 17 - 28.02.23 700,000 EUR 705,364 707,952 0.03Engie SA 0.375% 19 - 21.06.27 800,000 EUR 809,353 816,664 0.04Engie SA 0.375% 20 - 11.06.27 800,000 EUR 805,281 816,528 0.04Engie SA 0.50% 15 - 13.03.22 600,000 EUR 601,758 604,548 0.03Engie SA 0.50% 19 - 24.10.30 800,000 EUR 795,387 822,768 0.04Engie SA 0.875% 17 - 27.03.24 600,000 EUR 610,577 619,368 0.03Engie SA 0.875% 18 - 19.09.25 500,000 EUR 510,494 521,970 0.02Engie SA 1.00% 15 - 13.03.26 700,000 EUR 720,126 737,345 0.03Engie SA 1.25% 19 - 24.10.41 500,000 EUR 511,884 559,725 0.03Engie SA 1.375% 17 - 28.02.29 500,000 EUR 514,647 550,275 0.03Engie SA FRN 18 - 31.12.99 700,000 EUR 695,512 709,387 0.03Engie SA 1.375% 18 - 22.06.28 900,000 EUR 934,879 984,177 0.05Engie SA 1.375% 19 - 21.06.39 600,000 EUR 621,076 685,500 0.03Engie SA 1.375% 19 - 21.06.39 100,000 EUR 100,977 114,250 0.01Engie SA 1.375% 20 - 27.03.25 1,000,000 EUR 1,021,393 1,060,430 0.05Engie SA 1.50% 15 - 13.03.35 300,000 EUR 319,356 341,829 0.02Engie SA 1.50% 17 - 27.03.28 700,000 EUR 737,083 770,189 0.04Engie SA FRN 20 - 31.12.99 600,000 EUR 599,697 610,950 0.03Engie SA FRN 19 - 31.12.99 200,000 EUR 200,285 204,790 0.01Engie SA FRN 19 - 31.12.99 200,000 EUR 199,092 204,790 0.01Engie SA 1.75% 20 - 27.03.28 300,000 EUR 312,830 335,259 0.02Engie SA 1.875% 18 - 19.09.33 500,000 EUR 543,007 592,365 0.03Engie SA 2.00% 17 - 28.09.37 700,000 EUR 777,020 858,648 0.04Engie SA 2.125% 20 - 30.03.32 300,000 EUR 318,893 359,958 0.02Engie SA 2.125% 20 - 30.03.32 300,000 EUR 339,306 359,958 0.02Engie SA 2.375% 14 - 19.05.26 1,100,000 EUR 1,212,471 1,245,200 0.06Engie SA 2.625% 12 - 20.07.22 300,000 EUR 313,090 313,185 0.01Engie SA 3.00% 12 - 01.02.23 520,000 EUR 551,688 555,282 0.03Engie SA FRN 19 - 31.12.99 900,000 EUR 937,098 986,670 0.05Engie SA 3.50% 10 - 18.10.22 464,000 EUR 492,887 495,427 0.02Engie SA FRN 14 - 02.06.49 500,000 EUR 552,444 552,960 0.03Engie SA 5.95% 11 - 16.03.11 257,000 EUR 487,494 528,130 0.02EssilorLuxottica SA Zero Coupon 19 - 27.05.23 800,000 EUR 801,401 803,152 0.04EssilorLuxottica SA 0.125% 19 - 27.05.25 1,600,000 EUR 1,597,660 1,614,624 0.07EssilorLuxottica SA 0.25% 20 - 05.01.24 500,000 EUR 501,226 506,060 0.02EssilorLuxottica SA 0.375% 19 - 27.11.27 1,300,000 EUR 1,299,008 1,325,285 0.06EssilorLuxottica SA 0.375% 20 - 05.01.26 1,200,000 EUR 1,198,752 1,227,492 0.06
Xtrackers II
Xtrackers II EUR CORPORATE BOND UCITS ETF (continued)
Statement of Investmentsas at 31 December 2020(expressed in EUR)
The accompanying notes form an integral part of these financial statements.
163

DescriptionNominal
ValueCurrency
(local) Cost Market Value
% ofNet
Assets
Transferable securities and money market instruments admitted to an official stock exchange listing(A)
Bonds (continued)
France (continued)EssilorLuxottica SA 0.50% 20 - 05.06.28 1,200,000 EUR 1,195,134 1,239,168 0.06EssilorLuxottica SA 0.75% 19 - 27.11.31 600,000 EUR 605,532 626,826 0.03EssilorLuxottica SA 2.375% 14 - 09.04.24 200,000 EUR 215,638 215,340 0.01EssilorLuxottica SA 2.625% 14 - 10.02.24 192,000 EUR 208,376 208,512 0.01Eutelsat SA 1.50% 20 - 13.10.28 500,000 EUR 498,614 507,955 0.02Eutelsat SA 2.00% 18 - 02.10.25 700,000 EUR 713,980 751,478 0.03Eutelsat SA 2.25% 19 - 13.07.27 400,000 EUR 417,315 433,448 0.02Eutelsat SA 2.25% 19 - 13.07.27 200,000 EUR 192,542 216,724 0.01Eutelsat SA 3.125% 12 - 10.10.22 100,000 EUR 105,296 105,444 0.01Firmenich Productions Participations SAS 1.375%20 - 30.10.26 822,000 EUR 845,633 879,219 0.04Firmenich Productions Participations SAS 1.75% 20 -30.04.30 598,000 EUR 609,829 665,120 0.03Gecina SA 1.00% 16 - 30.01.29 300,000 EUR 309,363 320,103 0.01Gecina SA 1.375% 17 - 30.06.27 800,000 EUR 840,381 872,408 0.04Gecina SA 1.375% 17 - 26.01.28 500,000 EUR 511,326 544,580 0.03Gecina SA 1.50% 15 - 20.01.25 400,000 EUR 419,872 425,932 0.02Gecina SA 1.625% 18 - 14.03.30 400,000 EUR 406,555 449,020 0.02Gecina SA 1.625% 19 - 29.05.34 600,000 EUR 640,345 680,454 0.03Gecina SA 2.00% 15 - 17.06.24 300,000 EUR 321,804 321,561 0.01Gecina SA 2.00% 17 - 30.06.32 400,000 EUR 403,049 468,672 0.02Groupe VYV 1.625% 19 - 02.07.29 500,000 EUR 497,437 528,755 0.02Holding d’Infrastructures de Transport SASU 0.625%17 - 27.03.23 300,000 EUR 302,063 302,808 0.01Holding d’Infrastructures de Transport SASU 1.625%17 - 27.11.27 500,000 EUR 489,182 532,230 0.02Holding d’Infrastructures de Transport SASU 1.625%20 - 18.09.29 600,000 EUR 599,775 637,950 0.03Holding d’Infrastructures de Transport SASU 2.25%14 - 24.03.25 300,000 EUR 307,757 323,487 0.02Holding d’Infrastructures de Transport SASU 2.50%20 - 04.05.27 700,000 EUR 703,683 783,195 0.04HSBC Continental Europe SA 0.10% 19 - 03.09.27 1,000,000 EUR 991,906 1,004,560 0.05HSBC Continental Europe SA 0.25% 19 - 17.05.24 1,200,000 EUR 1,204,637 1,216,464 0.06HSBC Continental Europe SA 0.60% 18 - 20.03.23 300,000 EUR 302,726 305,592 0.01HSBC Continental Europe SA 0.60% 18 - 20.03.23 900,000 EUR 909,457 916,776 0.04HSBC Continental Europe SA 1.375% 18 - 04.09.28 600,000 EUR 646,502 662,208 0.03Icade 1.75% 16 - 10.06.26 500,000 EUR 526,971 543,740 0.03ICADE 1.125% 16 - 17.11.25 500,000 EUR 504,881 524,735 0.02ICADE 1.50% 17 - 13.09.27 700,000 EUR 724,559 761,964 0.04ICADE 1.625% 18 - 28.02.28 500,000 EUR 523,117 540,775 0.02ICADE 1.875% 15 - 14.09.22 300,000 EUR 308,323 308,673 0.01Icade Sante SAS 0.875% 19 - 04.11.29 400,000 EUR 383,182 410,812 0.02Icade Sante SAS 1.375% 20 - 17.09.30 600,000 EUR 606,486 641,970 0.03Imerys SA 0.875% 16 - 31.03.22 200,000 EUR 200,627 201,896 0.01Imerys SA 1.50% 17 - 15.01.27 200,000 EUR 196,033 208,124 0.01Imerys SA 1.50% 17 - 15.01.27 200,000 EUR 187,870 208,124 0.01Imerys SA 1.875% 16 - 31.03.28 400,000 EUR 413,153 421,600 0.02
Xtrackers II
Xtrackers II EUR CORPORATE BOND UCITS ETF (continued)
Statement of Investmentsas at 31 December 2020(expressed in EUR)
The accompanying notes form an integral part of these financial statements.
164

DescriptionNominal
ValueCurrency
(local) Cost Market Value
% ofNet
Assets
Transferable securities and money market instruments admitted to an official stock exchange listing(A)
Bonds (continued)
France (continued)Imerys SA 2.00% 14 - 10.12.24 600,000 EUR 612,322 636,528 0.03Indigo Group SAS 1.625% 18 - 19.04.28 600,000 EUR 587,369 618,888 0.03Indigo Group SAS 2.125% 14 - 16.04.25 800,000 EUR 841,357 862,280 0.04In’li SA 1.125% 19 - 02.07.29 300,000 EUR 311,801 321,870 0.01JCDecaux SA 1.00% 16 - 01.06.23 400,000 EUR 403,243 408,712 0.02JCDecaux SA 2.00% 20 - 24.10.24 300,000 EUR 301,516 318,273 0.01JCDecaux SA 2.625% 20 - 24.04.28 600,000 EUR 612,998 656,622 0.03Kering SA 0.25% 20 - 13.05.23 1,000,000 EUR 1,001,718 1,009,960 0.05Kering SA 0.75% 20 - 13.05.28 400,000 EUR 404,608 420,700 0.02Kering SA 1.25% 16 - 10.05.26 100,000 EUR 104,932 107,079 0.01Kering SA 1.50% 17 - 05.04.27 100,000 EUR 105,325 109,583 0.01Kering SA 2.75% 14 - 08.04.24 600,000 EUR 649,624 658,584 0.03Klepierre SA 0.625% 19 - 01.07.30 600,000 EUR 590,695 602,508 0.03Klepierre SA 0.875% 20 - 17.02.31 500,000 EUR 500,825 509,255 0.02Klepierre SA 1.00% 15 - 17.04.23 1,100,000 EUR 1,110,151 1,126,543 0.05Klepierre SA 1.25% 16 - 29.09.31 500,000 EUR 519,136 526,615 0.02Klepierre SA 1.375% 17 - 16.02.27 500,000 EUR 529,944 532,450 0.02Klepierre SA 1.625% 17 - 13.12.32 600,000 EUR 624,905 652,224 0.03Klepierre SA 1.75% 14 - 06.11.24 300,000 EUR 311,342 321,375 0.01Klepierre SA 1.875% 16 - 19.02.26 200,000 EUR 208,894 218,326 0.01Klepierre SA 2.00% 20 - 12.05.29 600,000 EUR 602,090 671,028 0.03La Mondiale SAM 0.75% 20 - 20.04.26 500,000 EUR 498,626 505,475 0.02La Mondiale SAM 2.125% 20 - 23.06.31 400,000 EUR 396,688 423,352 0.02La Mondiale SAM FRN 14 - 29.12.49 603,000 EUR 671,418 696,465 0.03Legrand SA 0.50% 17 - 09.10.23 300,000 EUR 299,007 305,367 0.01Legrand SA 0.625% 19 - 24.06.28 500,000 EUR 500,752 522,410 0.02Legrand SA 0.75% 17 - 06.07.24 200,000 EUR 205,715 207,122 0.01Legrand SA 0.75% 20 - 20.05.30 600,000 EUR 601,080 635,550 0.03Legrand SA 1.00% 18 - 06.03.26 200,000 EUR 203,110 210,194 0.01Legrand SA 1.875% 15 - 16.12.27 200,000 EUR 212,322 223,248 0.01Legrand SA 1.875% 17 - 06.07.32 400,000 EUR 447,453 473,116 0.02Legrand SA 3.375% 12 - 19.04.22 400,000 EUR 416,325 418,244 0.02LVMH Moet Hennessy Louis Vuitton SE Zero Coupon20 - 11.02.24 1,100,000 EUR 1,097,770 1,106,380 0.05LVMH Moet Hennessy Louis Vuitton SE Zero Coupon20 - 11.02.24 400,000 EUR 397,080 402,320 0.02LVMH Moet Hennessy Louis Vuitton SE Zero Coupon20 - 11.02.26 1,100,000 EUR 1,089,641 1,108,723 0.05LVMH Moet Hennessy Louis Vuitton SE 0.125% 19 -28.02.23 1,100,000 EUR 1,101,583 1,108,833 0.05LVMH Moet Hennessy Louis Vuitton SE 0.125% 20 -11.02.28 1,600,000 EUR 1,577,571 1,620,528 0.07LVMH Moet Hennessy Louis Vuitton SE 0.375% 17 -26.05.22 602,000 EUR 604,994 606,762 0.03LVMH Moet Hennessy Louis Vuitton SE 0.375% 20 -11.02.31 1,300,000 EUR 1,273,944 1,328,405 0.06LVMH Moet Hennessy Louis Vuitton SE 0.75% 17 -26.05.24 290,000 EUR 293,601 299,019 0.01
Xtrackers II
Xtrackers II EUR CORPORATE BOND UCITS ETF (continued)
Statement of Investmentsas at 31 December 2020(expressed in EUR)
The accompanying notes form an integral part of these financial statements.
165

DescriptionNominal
ValueCurrency
(local) Cost Market Value
% ofNet
Assets
Transferable securities and money market instruments admitted to an official stock exchange listing(A)
Bonds (continued)
France (continued)LVMH Moet Hennessy Louis Vuitton SE 0.75% 20 -07.04.25 800,000 EUR 816,959 829,640 0.04LVMH Moet Hennessy Louis Vuitton SE 0.75% 20 -07.04.25 400,000 EUR 408,656 414,820 0.02Mercialys SA 1.787% 14 - 31.03.23 500,000 EUR 492,229 513,895 0.02Mercialys SA 1.80% 18 - 27.02.26 200,000 EUR 182,568 196,822 0.01Mercialys SA 4.625% 20 - 07.07.27 300,000 EUR 306,288 330,177 0.02Orange SA Zero Coupon 19 - 04.09.26 600,000 EUR 600,005 602,922 0.03Orange SA Zero Coupon 19 - 04.09.26 100,000 EUR 99,941 100,487 0.00Orange SA 0.125% 20 - 16.09.29 400,000 EUR 398,581 403,168 0.02Orange SA 0.50% 19 - 15.01.22 300,000 EUR 301,589 302,355 0.01Orange SA 0.50% 19 - 04.09.32 500,000 EUR 498,032 512,060 0.02Orange SA 0.50% 19 - 04.09.32 600,000 EUR 559,901 614,472 0.03Orange SA 0.75% 17 - 11.09.23 800,000 EUR 813,190 819,560 0.04Orange SA 0.875% 16 - 03.02.27 800,000 EUR 809,908 845,328 0.04Orange SA 1.00% 16 - 12.05.25 600,000 EUR 606,781 628,074 0.03Orange SA 1.00% 18 - 12.09.25 800,000 EUR 823,009 841,480 0.04Orange SA 1.125% 19 - 15.07.24 900,000 EUR 921,447 937,998 0.04Orange SA 1.20% 19 - 11.07.34 100,000 EUR 103,079 107,420 0.01Orange SA 1.25% 20 - 07.07.27 700,000 EUR 737,121 756,959 0.03Orange SA 1.375% 18 - 16.01.30 700,000 EUR 741,583 783,629 0.04Orange SA 1.375% 18 - 20.03.28 900,000 EUR 943,580 988,425 0.05Orange SA 1.375% 19 - 04.09.49 600,000 EUR 589,102 679,776 0.03Orange SA 1.375% 19 - 04.09.49 100,000 EUR 108,735 113,296 0.01Orange SA 1.50% 17 - 09.09.27 300,000 EUR 318,479 329,937 0.02Orange SA 1.625% 20 - 07.04.32 900,000 EUR 974,280 1,031,715 0.05Orange SA FRN 19 - 31.12.99 400,000 EUR 393,495 412,548 0.02Orange SA FRN 20 - 31.12.99 600,000 EUR 597,639 620,784 0.03Orange SA 1.875% 18 - 12.09.30 1,200,000 EUR 1,312,212 1,400,808 0.06Orange SA 2.00% 19 - 15.01.29 1,000,000 EUR 1,068,701 1,152,810 0.05Orange SA FRN 19 - 31.12.99 900,000 EUR 925,481 948,366 0.04Orange SA 2.50% 12 - 01.03.23 300,000 EUR 312,863 317,826 0.01Orange SA 3.125% 13 - 09.01.24 600,000 EUR 651,474 659,760 0.03Orange SA 3.375% 10 - 16.09.22 400,000 EUR 424,089 424,988 0.02Orange SA FRN 14 - 29.10.49 1,032,000 EUR 1,202,297 1,248,937 0.06Orange SA FRN 14 - 29.12.49 714,000 EUR 787,043 812,025 0.04Orange SA 8.125% 03 - 28.01.33 1,149,000 EUR 2,013,782 2,187,616 0.10Pernod Ricard SA Zero Coupon 19 - 24.10.23 300,000 EUR 300,261 301,041 0.01Pernod Ricard SA Zero Coupon 19 - 24.10.23 500,000 EUR 495,552 501,735 0.02Pernod Ricard SA 0.50% 19 - 24.10.27 300,000 EUR 301,246 311,343 0.01Pernod Ricard SA 0.50% 19 - 24.10.27 500,000 EUR 500,307 518,905 0.02Pernod Ricard SA 0.875% 19 - 24.10.31 200,000 EUR 202,835 213,400 0.01Pernod Ricard SA 0.875% 19 - 24.10.31 100,000 EUR 106,879 106,700 0.01Pernod Ricard SA 1.125% 20 - 07.04.25 800,000 EUR 822,703 841,016 0.04Pernod Ricard SA 1.50% 16 - 18.05.26 100,000 EUR 105,763 108,474 0.01Pernod Ricard SA 1.75% 20 - 08.04.30 700,000 EUR 748,722 799,897 0.04Pernod Ricard SA 1.875% 15 - 28.09.23 900,000 EUR 934,908 945,396 0.04Pernod Ricard SA 2.125% 14 - 27.09.24 400,000 EUR 425,758 432,512 0.02
Xtrackers II
Xtrackers II EUR CORPORATE BOND UCITS ETF (continued)
Statement of Investmentsas at 31 December 2020(expressed in EUR)
The accompanying notes form an integral part of these financial statements.
166

DescriptionNominal
ValueCurrency
(local) Cost Market Value
% ofNet
Assets
Transferable securities and money market instruments admitted to an official stock exchange listing(A)
Bonds (continued)
France (continued)Peugeot SA 1.125% 19 - 18.09.29 300,000 EUR 299,501 314,427 0.01Peugeot SA 2.00% 17 - 23.03.24 970,000 EUR 993,469 1,023,272 0.05Peugeot SA 2.00% 18 - 20.03.25 500,000 EUR 516,013 531,585 0.02Peugeot SA 2.375% 16 - 14.04.23 300,000 EUR 311,335 315,342 0.01Peugeot SA 2.75% 20 - 15.05.26 700,000 EUR 702,907 781,186 0.04PSA Banque France SA 0.50% 19 - 12.04.22 643,000 EUR 642,875 648,195 0.03PSA Banque France SA 0.625% 17 - 10.10.22 350,000 EUR 350,242 354,571 0.02PSA Banque France SA 0.625% 19 - 21.06.24 636,000 EUR 631,815 647,486 0.03PSA Banque France SA 0.75% 18 - 19.04.23 179,000 EUR 178,633 182,342 0.01PSA Tresorerie GIE 6.00% 03 - 19.09.33 580,000 EUR 732,923 874,077 0.04Publicis Groupe SA 0.50% 16 - 03.11.23 300,000 EUR 301,470 305,484 0.01Publicis Groupe SA 1.625% 14 - 16.12.24 500,000 EUR 514,549 533,320 0.02RCI Banque SA 0.25% 19 - 08.03.23 910,000 EUR 892,741 909,627 0.04RCI Banque SA 0.50% 16 - 15.09.23 499,000 EUR 493,184 501,430 0.02RCI Banque SA 0.75% 17 - 12.01.22 646,000 EUR 649,391 650,050 0.03RCI Banque SA 0.75% 17 - 26.09.22 409,000 EUR 410,472 413,262 0.02RCI Banque SA 0.75% 19 - 10.04.23 320,000 EUR 321,066 323,581 0.02RCI Banque SA 1.00% 16 - 17.05.23 250,000 EUR 249,530 253,763 0.01RCI Banque SA 1.125% 20 - 15.01.27 686,000 EUR 677,222 699,185 0.03RCI Banque SA 1.25% 15 - 08.06.22 200,000 EUR 202,163 203,600 0.01RCI Banque SA 1.375% 17 - 08.03.24 715,000 EUR 721,485 731,488 0.03RCI Banque SA 1.625% 17 - 11.04.25 700,000 EUR 691,582 729,176 0.03RCI Banque SA 1.625% 18 - 26.05.26 624,000 EUR 624,633 654,239 0.03RCI Banque SA 1.75% 19 - 10.04.26 800,000 EUR 802,446 844,344 0.04RCI Banque SA 2.00% 19 - 11.07.24 800,000 EUR 794,293 837,744 0.04SANEF SA 0.95% 16 - 19.10.28 100,000 EUR 94,296 101,867 0.00SANEF SA 1.875% 15 - 16.03.26 400,000 EUR 427,594 428,680 0.02Sanofi Zero Coupon 16 - 13.09.22 500,000 EUR 501,077 502,655 0.02Sanofi Zero Coupon 19 - 21.03.22 700,000 EUR 701,696 702,982 0.03Sanofi 0.50% 16 - 13.01.27 1,400,000 EUR 1,418,669 1,460,214 0.07Sanofi 0.50% 18 - 21.03.23 1,600,000 EUR 1,614,710 1,626,976 0.07Sanofi 0.625% 16 - 05.04.24 200,000 EUR 204,393 205,906 0.01Sanofi 0.875% 19 - 21.03.29 500,000 EUR 514,653 540,360 0.02Sanofi 1.00% 18 - 21.03.26 1,500,000 EUR 1,560,225 1,596,045 0.07Sanofi 1.00% 20 - 01.04.25 1,100,000 EUR 1,133,009 1,155,825 0.05Sanofi 1.125% 14 - 10.03.22 500,000 EUR 506,598 507,010 0.02Sanofi 1.125% 16 - 05.04.28 800,000 EUR 851,449 875,288 0.04Sanofi 1.25% 19 - 21.03.34 400,000 EUR 431,384 463,692 0.02Sanofi 1.375% 18 - 21.03.30 1,800,000 EUR 1,922,998 2,040,714 0.09Sanofi 1.50% 15 - 22.09.25 600,000 EUR 631,916 648,312 0.03Sanofi 1.50% 20 - 01.04.30 900,000 EUR 964,752 1,028,898 0.05Sanofi 1.75% 14 - 10.09.26 1,200,000 EUR 1,280,626 1,332,468 0.06Sanofi 1.875% 18 - 21.03.38 1,000,000 EUR 1,126,003 1,287,980 0.06Sanofi 2.50% 13 - 14.11.23 800,000 EUR 854,433 858,984 0.04Schlumberger Finance France SAS 1.00% 18 -18.02.26 878,000 EUR 896,433 925,561 0.04Schneider Electric SE Zero Coupon 20 - 12.06.23 400,000 EUR 399,783 402,384 0.02Schneider Electric SE 0.25% 16 - 09.09.24 900,000 EUR 908,341 915,516 0.04
Xtrackers II
Xtrackers II EUR CORPORATE BOND UCITS ETF (continued)
Statement of Investmentsas at 31 December 2020(expressed in EUR)
The accompanying notes form an integral part of these financial statements.
167

DescriptionNominal
ValueCurrency
(local) Cost Market Value
% ofNet
Assets
Transferable securities and money market instruments admitted to an official stock exchange listing(A)
Bonds (continued)
France (continued)Schneider Electric SE 0.25% 20 - 11.03.29 700,000 EUR 672,100 715,834 0.03Schneider Electric SE 0.875% 15 - 11.03.25 600,000 EUR 610,553 627,348 0.03Schneider Electric SE 0.875% 17 - 13.12.26 300,000 EUR 305,881 317,967 0.01Schneider Electric SE 1.00% 20 - 09.04.27 800,000 EUR 829,163 854,360 0.04Schneider Electric SE 1.375% 18 - 21.06.27 700,000 EUR 743,379 765,387 0.04Schneider Electric SE 1.50% 15 - 08.09.23 700,000 EUR 726,626 730,240 0.03Schneider Electric SE 1.50% 19 - 15.01.28 600,000 EUR 638,486 665,784 0.03SCOR SE FRN 20 - 17.09.51 300,000 EUR 296,764 304,344 0.01SCOR SE FRN 15 - 08.06.46 600,000 EUR 638,599 676,788 0.03SCOR SE FRN 16 - 27.05.48 100,000 EUR 118,918 119,523 0.01SCOR SE FRN 16 - 27.05.48 400,000 EUR 465,547 478,092 0.02Societe Fonciere Lyonnaise SA 1.50% 18 - 29.05.25 400,000 EUR 412,143 421,868 0.02Societe Fonciere Lyonnaise SA 1.50% 20 - 05.06.27 500,000 EUR 506,983 532,520 0.02Societe Generale SA Zero Coupon 19 - 27.05.22 1,100,000 EUR 1,100,664 1,104,895 0.05Societe Generale SA 0.125% 20 - 24.02.26 1,000,000 EUR 981,066 1,008,240 0.05Societe Generale SA 0.125% 20 - 24.02.26 300,000 EUR 297,177 302,472 0.01Societe Generale SA 0.25% 18 - 18.01.22 1,400,000 EUR 1,401,127 1,409,324 0.06Societe Generale SA 0.50% 17 - 13.01.23 700,000 EUR 695,275 708,428 0.03Societe Generale SA 0.75% 16 - 26.05.23 800,000 EUR 807,586 819,368 0.04Societe Generale SA 0.75% 20 - 25.01.27 1,000,000 EUR 996,108 1,025,060 0.05Societe Generale SA 0.875% 19 - 01.07.26 500,000 EUR 505,262 515,990 0.02Societe Generale SA 0.875% 19 - 24.09.29 700,000 EUR 678,546 718,249 0.03Societe Generale SA FRN 20 - 22.09.28 800,000 EUR 798,598 825,472 0.04Societe Generale SA 1.00% 16 - 01.04.22 1,000,000 EUR 1,007,575 1,015,400 0.05Societe Generale SA FRN 20 - 24.11.30 1,100,000 EUR 1,098,979 1,102,750 0.05Societe Generale SA 1.125% 18 - 23.01.25 1,400,000 EUR 1,428,596 1,458,184 0.07Societe Generale SA FRN 20 - 21.04.26 700,000 EUR 697,149 728,581 0.03Societe Generale SA 1.25% 19 - 15.02.24 1,400,000 EUR 1,411,990 1,452,990 0.07Societe Generale SA 1.25% 20 - 12.06.30 900,000 EUR 915,728 954,954 0.04Societe Generale SA 1.375% 17 - 13.01.28 500,000 EUR 519,579 532,755 0.02Societe Generale SA FRN 18 - 23.02.28 1,100,000 EUR 1,107,265 1,118,447 0.05Societe Generale SA 1.75% 19 - 22.03.29 1,100,000 EUR 1,150,066 1,208,537 0.06Societe Generale SA 2.125% 18 - 27.09.28 1,100,000 EUR 1,146,839 1,237,775 0.06Societe Generale SA 2.625% 15 - 27.02.25 1,200,000 EUR 1,265,697 1,302,492 0.06Societe Generale SA 4.00% 13 - 07.06.23 500,000 EUR 521,023 545,295 0.03Societe Generale SA 4.00% 13 - 07.06.23 300,000 EUR 320,272 327,177 0.02Societe Generale SA 4.25% 12 - 13.07.22 800,000 EUR 853,439 855,112 0.04Sodexo SA 0.50% 20 - 17.01.24 273,000 EUR 274,841 277,990 0.01Sodexo SA 0.75% 16 - 14.04.27 747,000 EUR 739,588 778,225 0.04Sodexo SA 0.75% 20 - 27.04.25 728,000 EUR 735,991 752,956 0.03Sodexo SA 1.00% 20 - 27.04.29 838,000 EUR 831,215 887,484 0.04Sodexo SA 1.00% 20 - 17.07.28 473,000 EUR 476,071 501,314 0.02Sodexo SA 1.125% 18 - 22.05.25 229,000 EUR 234,732 240,077 0.01Sodexo SA 1.75% 14 - 24.01.22 517,000 EUR 526,345 525,437 0.02Sodexo SA 2.50% 14 - 24.06.26 192,000 EUR 216,068 218,473 0.01Sogecap SA FRN 14 - 29.12.49 800,000 EUR 850,799 893,752 0.04Suez SA 0.50% 19 - 14.10.31 500,000 EUR 495,514 506,670 0.02Suez SA 1.00% 17 - 03.04.25 600,000 EUR 611,199 625,200 0.03
Xtrackers II
Xtrackers II EUR CORPORATE BOND UCITS ETF (continued)
Statement of Investmentsas at 31 December 2020(expressed in EUR)
The accompanying notes form an integral part of these financial statements.
168
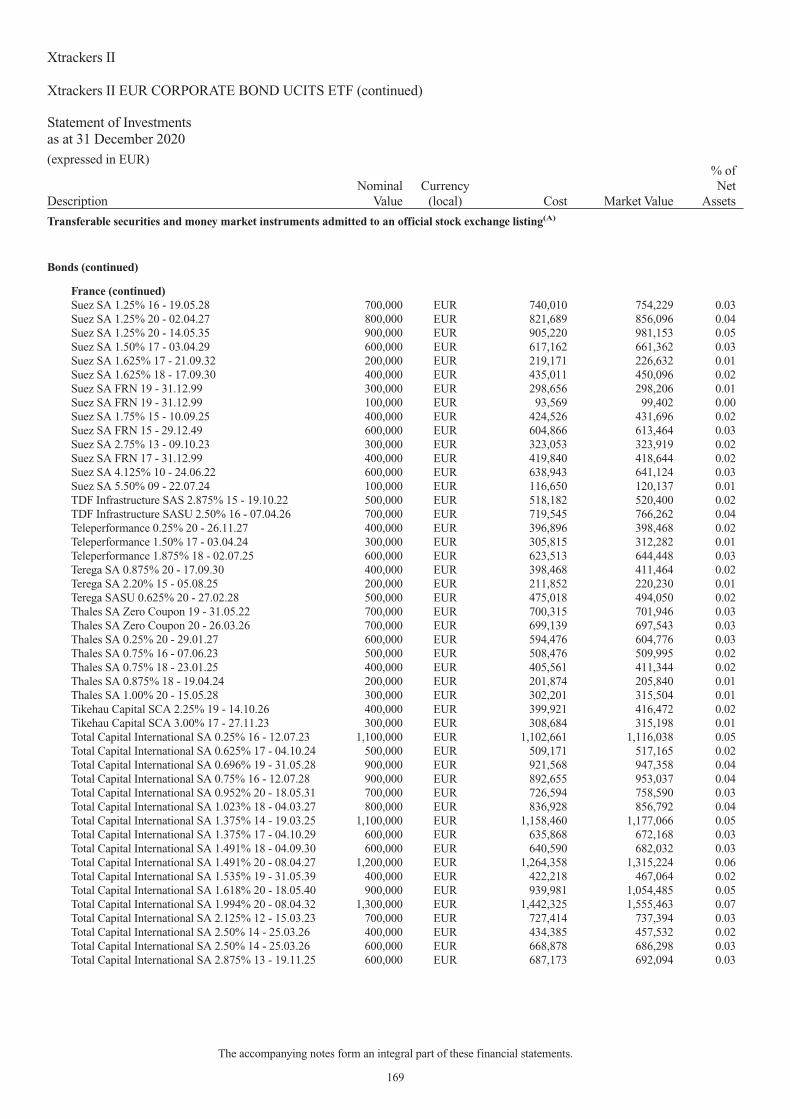
DescriptionNominal
ValueCurrency
(local) Cost Market Value
% ofNet
Assets
Transferable securities and money market instruments admitted to an official stock exchange listing(A)
Bonds (continued)
France (continued)Suez SA 1.25% 16 - 19.05.28 700,000 EUR 740,010 754,229 0.03Suez SA 1.25% 20 - 02.04.27 800,000 EUR 821,689 856,096 0.04Suez SA 1.25% 20 - 14.05.35 900,000 EUR 905,220 981,153 0.05Suez SA 1.50% 17 - 03.04.29 600,000 EUR 617,162 661,362 0.03Suez SA 1.625% 17 - 21.09.32 200,000 EUR 219,171 226,632 0.01Suez SA 1.625% 18 - 17.09.30 400,000 EUR 435,011 450,096 0.02Suez SA FRN 19 - 31.12.99 300,000 EUR 298,656 298,206 0.01Suez SA FRN 19 - 31.12.99 100,000 EUR 93,569 99,402 0.00Suez SA 1.75% 15 - 10.09.25 400,000 EUR 424,526 431,696 0.02Suez SA FRN 15 - 29.12.49 600,000 EUR 604,866 613,464 0.03Suez SA 2.75% 13 - 09.10.23 300,000 EUR 323,053 323,919 0.02Suez SA FRN 17 - 31.12.99 400,000 EUR 419,840 418,644 0.02Suez SA 4.125% 10 - 24.06.22 600,000 EUR 638,943 641,124 0.03Suez SA 5.50% 09 - 22.07.24 100,000 EUR 116,650 120,137 0.01TDF Infrastructure SAS 2.875% 15 - 19.10.22 500,000 EUR 518,182 520,400 0.02TDF Infrastructure SASU 2.50% 16 - 07.04.26 700,000 EUR 719,545 766,262 0.04Teleperformance 0.25% 20 - 26.11.27 400,000 EUR 396,896 398,468 0.02Teleperformance 1.50% 17 - 03.04.24 300,000 EUR 305,815 312,282 0.01Teleperformance 1.875% 18 - 02.07.25 600,000 EUR 623,513 644,448 0.03Terega SA 0.875% 20 - 17.09.30 400,000 EUR 398,468 411,464 0.02Terega SA 2.20% 15 - 05.08.25 200,000 EUR 211,852 220,230 0.01Terega SASU 0.625% 20 - 27.02.28 500,000 EUR 475,018 494,050 0.02Thales SA Zero Coupon 19 - 31.05.22 700,000 EUR 700,315 701,946 0.03Thales SA Zero Coupon 20 - 26.03.26 700,000 EUR 699,139 697,543 0.03Thales SA 0.25% 20 - 29.01.27 600,000 EUR 594,476 604,776 0.03Thales SA 0.75% 16 - 07.06.23 500,000 EUR 508,476 509,995 0.02Thales SA 0.75% 18 - 23.01.25 400,000 EUR 405,561 411,344 0.02Thales SA 0.875% 18 - 19.04.24 200,000 EUR 201,874 205,840 0.01Thales SA 1.00% 20 - 15.05.28 300,000 EUR 302,201 315,504 0.01Tikehau Capital SCA 2.25% 19 - 14.10.26 400,000 EUR 399,921 416,472 0.02Tikehau Capital SCA 3.00% 17 - 27.11.23 300,000 EUR 308,684 315,198 0.01Total Capital International SA 0.25% 16 - 12.07.23 1,100,000 EUR 1,102,661 1,116,038 0.05Total Capital International SA 0.625% 17 - 04.10.24 500,000 EUR 509,171 517,165 0.02Total Capital International SA 0.696% 19 - 31.05.28 900,000 EUR 921,568 947,358 0.04Total Capital International SA 0.75% 16 - 12.07.28 900,000 EUR 892,655 953,037 0.04Total Capital International SA 0.952% 20 - 18.05.31 700,000 EUR 726,594 758,590 0.03Total Capital International SA 1.023% 18 - 04.03.27 800,000 EUR 836,928 856,792 0.04Total Capital International SA 1.375% 14 - 19.03.25 1,100,000 EUR 1,158,460 1,177,066 0.05Total Capital International SA 1.375% 17 - 04.10.29 600,000 EUR 635,868 672,168 0.03Total Capital International SA 1.491% 18 - 04.09.30 600,000 EUR 640,590 682,032 0.03Total Capital International SA 1.491% 20 - 08.04.27 1,200,000 EUR 1,264,358 1,315,224 0.06Total Capital International SA 1.535% 19 - 31.05.39 400,000 EUR 422,218 467,064 0.02Total Capital International SA 1.618% 20 - 18.05.40 900,000 EUR 939,981 1,054,485 0.05Total Capital International SA 1.994% 20 - 08.04.32 1,300,000 EUR 1,442,325 1,555,463 0.07Total Capital International SA 2.125% 12 - 15.03.23 700,000 EUR 727,414 737,394 0.03Total Capital International SA 2.50% 14 - 25.03.26 400,000 EUR 434,385 457,532 0.02Total Capital International SA 2.50% 14 - 25.03.26 600,000 EUR 668,878 686,298 0.03Total Capital International SA 2.875% 13 - 19.11.25 600,000 EUR 687,173 692,094 0.03
Xtrackers II
Xtrackers II EUR CORPORATE BOND UCITS ETF (continued)
Statement of Investmentsas at 31 December 2020(expressed in EUR)
The accompanying notes form an integral part of these financial statements.
169

DescriptionNominal
ValueCurrency
(local) Cost Market Value
% ofNet
Assets
Transferable securities and money market instruments admitted to an official stock exchange listing(A)
Bonds (continued)
France (continued)Total Capital SA 3.125% 10 - 16.09.22 257,000 EUR 270,607 272,117 0.01Total Capital SA 5.125% 09 - 26.03.24 670,000 EUR 777,299 788,295 0.04TOTAL SA FRN 16 - 29.12.49 1,127,000 EUR 1,235,982 1,267,176 0.06TOTAL SE FRN 19 - 31.12.99 1,532,000 EUR 1,536,560 1,573,364 0.07TOTAL SE FRN 20 - 31.12.99 834,000 EUR 838,627 863,590 0.04TOTAL SE FRN 15 - 29.12.49 715,000 EUR 737,515 761,475 0.04TOTAL SE FRN 15 - 29.12.49 1,300,000 EUR 1,372,382 1,384,500 0.06TOTAL SE FRN 15 - 29.12.49 100,000 EUR 108,422 106,500 0.01TOTAL SE FRN 16 - 29.12.49 734,000 EUR 760,971 767,705 0.04TOTAL SE FRN 16 - 29.12.49 1,495,000 EUR 1,575,030 1,565,803 0.07Unibail-Rodamco SE Via Westfield Corp. 1.875% 18 -15.01.31 800,000 EUR 838,322 850,616 0.04Unibail-Rodamco-Westfield SE 0.625% 20 - 04.05.27 900,000 EUR 894,532 895,887 0.04Unibail-Rodamco-Westfield SE 0.875% 16 - 21.02.25 650,000 EUR 650,682 667,134 0.03Unibail-Rodamco-Westfield SE 0.875% 19 - 29.03.32 700,000 EUR 678,692 666,134 0.03Unibail-Rodamco-Westfield SE 1.00% 15 - 14.03.25 500,000 EUR 522,540 517,270 0.02Unibail-Rodamco-Westfield SE 1.00% 19 - 27.02.27 500,000 EUR 490,786 511,080 0.02Unibail-Rodamco-Westfield SE 1.125% 16 - 28.04.27 472,000 EUR 488,288 484,154 0.02Unibail-Rodamco-Westfield SE 1.125% 18 - 15.09.25 500,000 EUR 508,836 515,110 0.02Unibail-Rodamco-Westfield SE 1.375% 15 - 15.04.30 600,000 EUR 606,355 620,622 0.03Unibail-Rodamco-Westfield SE 1.375% 16 - 09.03.26 453,000 EUR 460,343 473,924 0.02Unibail-Rodamco-Westfield SE 1.375% 20 - 04.12.31 900,000 EUR 897,649 906,327 0.04Unibail-Rodamco-Westfield SE 1.50% 17 - 22.02.28 571,000 EUR 589,699 598,602 0.03Unibail-Rodamco-Westfield SE 1.50% 17 - 29.05.29 392,000 EUR 397,353 408,829 0.02Unibail-Rodamco-Westfield SE 1.75% 19 - 27.02.34 600,000 EUR 597,957 623,352 0.03Unibail-Rodamco-Westfield SE 1.75% 19 - 01.07.49 400,000 EUR 397,706 393,912 0.02Unibail-Rodamco-Westfield SE 2.00% 16 - 28.04.36 450,000 EUR 482,976 479,448 0.02Unibail-Rodamco-Westfield SE 2.00% 17 - 29.05.37 500,000 EUR 517,015 530,910 0.02Unibail-Rodamco-Westfield SE 2.00% 20 - 29.06.32 700,000 EUR 698,263 748,993 0.03Unibail-Rodamco-Westfield SE FRN 18 - 31.12.99 1,100,000 EUR 1,020,491 1,034,517 0.05Unibail-Rodamco-Westfield SE 2.125% 20 - 09.04.25 500,000 EUR 506,902 536,875 0.02Unibail-Rodamco-Westfield SE 2.25% 18 - 14.05.38 400,000 EUR 393,345 439,488 0.02Unibail-Rodamco-Westfield SE 2.50% 13 - 12.06.23 300,000 EUR 318,272 317,931 0.01Unibail-Rodamco-Westfield SE 2.50% 14 - 26.02.24 657,000 EUR 695,737 707,963 0.03Unibail-Rodamco-Westfield SE 2.50% 14 - 04.06.26 460,000 EUR 488,707 506,336 0.02Unibail-Rodamco-Westfield SE 2.625% 20 - 09.04.30 600,000 EUR 623,370 681,858 0.03Unibail-Rodamco-Westfield SE FRN 18 - 31.12.99 600,000 EUR 583,171 571,080 0.03Veolia Environnement SA 0.314% 16 - 04.10.23 600,000 EUR 603,587 607,506 0.03Veolia Environnement SA 0.664% 20 - 15.01.31 400,000 EUR 396,242 414,640 0.02Veolia Environnement SA 0.672% 17 - 30.03.22 400,000 EUR 402,666 403,704 0.02Veolia Environnement SA 0.80% 20 - 15.01.32 500,000 EUR 501,060 525,485 0.02Veolia Environnement SA 0.892% 19 - 14.01.24 600,000 EUR 609,271 617,526 0.03Veolia Environnement SA 0.927% 16 - 04.01.29 100,000 EUR 99,147 105,951 0.01Veolia Environnement SA 1.25% 20 - 15.04.28 800,000 EUR 833,531 865,800 0.04Veolia Environnement SA 1.496% 17 - 30.11.26 600,000 EUR 632,144 654,804 0.03Veolia Environnement SA 1.59% 15 - 10.01.28 500,000 EUR 523,362 551,625 0.03Veolia Environnement SA 1.94% 18 - 07.01.30 600,000 EUR 636,464 689,358 0.03Veolia Environnement SA 4.625% 12 - 30.03.27 800,000 EUR 1,021,090 1,032,744 0.05
Xtrackers II
Xtrackers II EUR CORPORATE BOND UCITS ETF (continued)
Statement of Investmentsas at 31 December 2020(expressed in EUR)
The accompanying notes form an integral part of these financial statements.
170

DescriptionNominal
ValueCurrency
(local) Cost Market Value
% ofNet
Assets
Transferable securities and money market instruments admitted to an official stock exchange listing(A)
Bonds (continued)
France (continued)Veolia Environnement SA 5.125% 07 - 24.05.22 750,000 EUR 799,709 806,107 0.04Veolia Environnement SA 6.125% 03 - 25.11.33 549,000 EUR 895,475 936,435 0.04Vinci SA Zero Coupon 20 - 27.11.28 500,000 EUR 502,811 501,235 0.02Vinci SA 1.00% 18 - 26.09.25 1,000,000 EUR 1,041,539 1,058,540 0.05Vinci SA 1.625% 19 - 18.01.29 1,200,000 EUR 1,288,577 1,354,476 0.06Vinci SA 1.75% 18 - 26.09.30 800,000 EUR 876,071 928,576 0.04Vivendi SA Zero Coupon 19 - 13.06.22 900,000 EUR 895,857 903,141 0.04Vivendi SA 0.625% 19 - 11.06.25 600,000 EUR 603,024 617,946 0.03Vivendi SA 0.875% 17 - 18.09.24 1,000,000 EUR 1,020,627 1,034,710 0.05Vivendi SA 1.125% 16 - 24.11.23 700,000 EUR 721,689 724,997 0.03Vivendi SA 1.125% 19 - 11.12.28 700,000 EUR 706,216 748,860 0.03Vivendi SA 1.875% 16 - 26.05.26 100,000 EUR 105,345 109,755 0.01Wendel SE 1.00% 16 - 20.04.23 500,000 EUR 505,656 510,295 0.02Wendel SE 1.375% 19 - 26.04.26 100,000 EUR 99,879 105,637 0.01Wendel SE 1.375% 19 - 26.04.26 100,000 EUR 99,053 105,637 0.01Wendel SE 2.50% 15 - 09.02.27 400,000 EUR 422,105 451,040 0.02Wendel SE 2.75% 14 - 02.10.24 500,000 EUR 528,158 547,465 0.03Worldline SA 0.25% 19 - 18.09.24 300,000 EUR 299,637 302,709 0.01Worldline SA 0.25% 19 - 18.09.24 400,000 EUR 395,734 403,612 0.02Worldline SA 0.50% 20 - 30.06.23 500,000 EUR 501,717 507,515 0.02Worldline SA 0.875% 20 - 30.06.27 400,000 EUR 397,118 415,452 0.02WPP Finance SA 2.25% 14 - 22.09.26 500,000 EUR 516,159 559,605 0.03WPP Finance SA 2.375% 20 - 19.05.27 611,000 EUR 610,892 684,754 0.03
443,587,772 458,634,689 20.93GermanyAareal Bank AG 0.25% 20 - 23.11.27 400,000 EUR 398,861 400,136 0.02Aareal Bank AG 0.375% 19 - 10.04.24 400,000 EUR 403,695 403,788 0.02Aareal Bank AG 0.50% 20 - 07.04.27 100,000 EUR 101,297 102,286 0.00adidas AG Zero Coupon 20 - 09.09.24 700,000 EUR 703,763 705,530 0.03adidas AG Zero Coupon 20 - 05.10.28 300,000 EUR 298,458 302,043 0.01adidas AG 0.625% 20 - 10.09.35 300,000 EUR 305,398 314,352 0.01Albemarle New Holdings GmbH 1.125% 19 -25.11.25 407,000 EUR 400,334 420,773 0.02Albemarle New Holdings GmbH 1.625% 19 -25.11.28 364,000 EUR 362,217 383,554 0.02Allianz SE FRN 19 - 25.09.49 500,000 EUR 500,308 516,950 0.02Allianz SE FRN 19 - 25.09.49 400,000 EUR 366,937 413,560 0.02Allianz SE FRN 20 - 08.07.50 600,000 EUR 613,350 657,852 0.03Allianz SE FRN 20 - 08.07.50 100,000 EUR 102,169 109,642 0.01Allianz SE FRN 15 - 07.07.45 400,000 EUR 433,642 431,544 0.02Allianz SE FRN 15 - 07.07.45 1,000,000 EUR 1,028,917 1,078,860 0.05Allianz SE FRN 17 - 06.07.47 800,000 EUR 872,308 925,024 0.04Allianz SE FRN 17 - 06.07.47 100,000 EUR 115,238 115,628 0.01Allianz SE FRN 14 - 31.12.99 1,400,000 EUR 1,509,008 1,538,474 0.07Allianz SE FRN 13 - 31.12.49 400,000 EUR 454,389 447,000 0.02Allianz SE FRN 13 - 31.12.49 1,000,000 EUR 1,111,617 1,117,500 0.05Allianz SE FRN 12 - 17.10.42 400,000 EUR 443,496 439,372 0.02Allianz SE FRN 12 - 17.10.42 900,000 EUR 1,014,953 988,587 0.05
Xtrackers II
Xtrackers II EUR CORPORATE BOND UCITS ETF (continued)
Statement of Investmentsas at 31 December 2020(expressed in EUR)
The accompanying notes form an integral part of these financial statements.
171

DescriptionNominal
ValueCurrency
(local) Cost Market Value
% ofNet
Assets
Transferable securities and money market instruments admitted to an official stock exchange listing(A)
Bonds (continued)
Germany (continued)alstria office REIT-AG 0.50% 19 - 26.09.25 700,000 EUR 683,097 701,897 0.03alstria office REIT-AG 1.50% 17 - 15.11.27 100,000 EUR 102,380 104,200 0.01alstria office REIT-AG 1.50% 20 - 23.06.26 200,000 EUR 200,813 209,390 0.01alstria office REIT-AG 2.125% 16 - 12.04.23 100,000 EUR 102,901 103,720 0.01Amphenol Technologies Holdings GmbH 0.75% 20 -04.05.26 515,000 EUR 510,483 533,210 0.02Amphenol Technologies Holdings GmbH 2.00% 18 -08.10.28 292,000 EUR 319,176 331,192 0.02BASF SE 0.101% 20 - 05.06.23 1,000,000 EUR 1,001,181 1,006,940 0.05BASF SE 0.25% 20 - 05.06.27 500,000 EUR 499,788 510,945 0.02BASF SE 0.25% 20 - 05.06.27 600,000 EUR 602,294 613,134 0.03BASF SE 0.875% 16 - 06.10.31 535,000 EUR 531,971 582,973 0.03BASF SE 0.875% 17 - 15.11.27 1,175,000 EUR 1,209,832 1,255,946 0.06BASF SE 0.875% 18 - 22.05.25 296,000 EUR 300,881 310,350 0.01BASF SE 1.45% 17 - 13.12.32 100,000 EUR 113,167 115,694 0.01BASF SE 1.50% 18 - 22.05.30 377,000 EUR 413,021 429,855 0.02BASF SE 1.625% 17 - 15.11.37 574,000 EUR 608,108 683,645 0.03BASF SE 2.00% 12 - 05.12.22 1,157,000 EUR 1,201,655 1,207,434 0.06BASF SE 2.50% 14 - 22.01.24 395,000 EUR 422,400 425,008 0.02Bayer AG 0.375% 20 - 06.07.24 1,400,000 EUR 1,402,755 1,419,068 0.07Bayer AG 0.75% 20 - 06.01.27 1,100,000 EUR 1,097,903 1,133,440 0.05Bayer AG 1.125% 20 - 06.01.30 1,000,000 EUR 1,005,669 1,050,640 0.05Bayer AG 1.375% 20 - 06.07.32 1,300,000 EUR 1,311,699 1,386,853 0.06Bayer AG FRN 15 - 02.04.75 1,089,000 EUR 1,084,000 1,108,297 0.05Bayer AG FRN 19 - 12.11.79 900,000 EUR 886,387 913,446 0.04Bayer AG FRN 19 - 12.11.79 700,000 EUR 702,894 734,482 0.03Bayer AG FRN 14 - 01.07.74 701,000 EUR 756,445 749,299 0.03Bayer AG FRN 14 - 01.07.74 658,000 EUR 679,066 703,336 0.03Berlin Hyp AG 0.375% 18 - 28.08.23 700,000 EUR 706,718 714,966 0.03Berlin Hyp AG 0.50% 16 - 26.09.23 600,000 EUR 607,798 608,922 0.03Berlin Hyp AG 0.50% 19 - 05.11.29 700,000 EUR 708,390 734,300 0.03Berlin Hyp AG 1.00% 19 - 05.02.26 600,000 EUR 623,523 641,142 0.03Berlin Hyp AG 1.125% 17 - 25.10.27 200,000 EUR 204,605 213,250 0.01Berlin Hyp AG 1.25% 15 - 22.01.25 200,000 EUR 204,604 210,348 0.01Berlin Hyp AG 1.50% 18 - 18.04.28 400,000 EUR 426,474 436,152 0.02Bertelsmann SE & Co. KGaA 1.125% 16 - 27.04.26 100,000 EUR 99,567 106,517 0.01Bertelsmann SE & Co. KGaA 1.25% 18 - 29.09.25 900,000 EUR 945,236 958,095 0.04Bertelsmann SE & Co. KGaA 1.50% 20 - 15.05.30 500,000 EUR 499,165 549,315 0.03Bertelsmann SE & Co. KGaA 1.75% 14 - 14.10.24 200,000 EUR 208,918 214,304 0.01Bertelsmann SE & Co. KGaA 2.00% 20 - 01.04.28 800,000 EUR 821,155 899,256 0.04Bertelsmann SE & Co. KGaA 2.625% 12 - 02.08.22 1,000,000 EUR 1,040,459 1,045,700 0.05Clearstream Banking AG Zero Coupon 20 - 01.12.25 100,000 EUR 100,585 100,749 0.00Commerzbank AG 0.25% 19 - 16.09.24 300,000 EUR 287,755 299,709 0.01Commerzbank AG 0.375% 20 - 01.09.27 701,000 EUR 696,007 705,984 0.03Commerzbank AG 0.50% 16 - 13.09.23 929,000 EUR 923,158 944,719 0.04Commerzbank AG 0.50% 18 - 28.08.23 1,454,000 EUR 1,456,788 1,479,838 0.07Commerzbank AG 0.50% 19 - 04.12.26 835,000 EUR 836,135 852,552 0.04Commerzbank AG 0.625% 19 - 28.08.24 1,300,000 EUR 1,317,820 1,334,411 0.06
Xtrackers II
Xtrackers II EUR CORPORATE BOND UCITS ETF (continued)
Statement of Investmentsas at 31 December 2020(expressed in EUR)
The accompanying notes form an integral part of these financial statements.
172

DescriptionNominal
ValueCurrency
(local) Cost Market Value
% ofNet
Assets
Transferable securities and money market instruments admitted to an official stock exchange listing(A)
Bonds (continued)
Germany (continued)Commerzbank AG FRN 20 - 24.03.26 400,000 EUR 402,227 405,796 0.02Commerzbank AG 0.875% 20 - 22.01.27 700,000 EUR 688,049 715,659 0.03Commerzbank AG 1.00% 19 - 04.03.26 907,000 EUR 915,179 948,785 0.04Commerzbank AG 1.125% 17 - 24.05.24 300,000 EUR 291,395 310,608 0.01Commerzbank AG 1.125% 17 - 19.09.25 200,000 EUR 205,352 207,492 0.01Commerzbank AG 1.125% 19 - 22.06.26 500,000 EUR 502,542 518,280 0.02Commerzbank AG 1.25% 18 - 23.10.23 400,000 EUR 401,785 413,844 0.02Commerzbank AG 1.50% 15 - 21.09.22 650,000 EUR 662,781 669,448 0.03Commerzbank AG 1.50% 18 - 28.08.28 437,000 EUR 445,441 478,519 0.02Commerzbank AG 1.875% 18 - 28.02.28 300,000 EUR 305,680 326,934 0.02Continental AG Zero Coupon 19 - 12.09.23 200,000 EUR 198,420 199,936 0.01Continental AG 0.375% 19 - 27.06.25 514,000 EUR 509,097 517,726 0.02Continental AG 2.50% 20 - 27.08.26 586,000 EUR 610,709 653,747 0.03Covestro AG 0.875% 20 - 03.02.26 657,000 EUR 660,289 683,714 0.03Covestro AG 1.375% 20 - 12.06.30 404,000 EUR 403,262 434,801 0.02Covestro AG 1.75% 16 - 25.09.24 100,000 EUR 104,557 106,381 0.01Daimler AG Zero Coupon 19 - 08.02.24 611,000 EUR 595,236 610,420 0.03Daimler AG 0.375% 19 - 08.11.26 510,000 EUR 511,361 515,549 0.02Daimler AG 0.375% 19 - 08.11.26 200,000 EUR 196,437 202,176 0.01Daimler AG 0.75% 19 - 08.02.30 686,000 EUR 677,775 706,436 0.03Daimler AG 0.75% 20 - 10.09.30 736,000 EUR 732,711 765,602 0.04Daimler AG 1.00% 17 - 15.11.27 1,114,000 EUR 1,097,892 1,172,697 0.05Daimler AG 1.125% 19 - 08.08.34 407,000 EUR 385,132 432,877 0.02Daimler AG 1.125% 19 - 06.11.31 400,000 EUR 397,821 423,644 0.02Daimler AG 1.125% 19 - 06.11.31 366,000 EUR 361,399 387,634 0.02Daimler AG 1.375% 16 - 11.05.28 1,030,000 EUR 1,028,057 1,112,874 0.05Daimler AG 1.40% 16 - 12.01.24 906,000 EUR 918,989 945,393 0.04Daimler AG 1.50% 16 - 09.03.26 893,000 EUR 934,174 958,823 0.04Daimler AG 1.50% 17 - 03.07.29 1,260,000 EUR 1,297,022 1,387,751 0.06Daimler AG 1.625% 20 - 22.08.23 964,000 EUR 974,499 1,006,734 0.05Daimler AG 1.875% 14 - 08.07.24 542,000 EUR 567,512 577,772 0.03Daimler AG 2.00% 19 - 27.02.31 630,000 EUR 656,143 724,897 0.03Daimler AG 2.00% 20 - 22.08.26 1,118,000 EUR 1,133,615 1,234,339 0.06Daimler AG 2.125% 17 - 03.07.37 1,185,000 EUR 1,293,150 1,452,857 0.07Daimler AG 2.25% 14 - 24.01.22 450,000 EUR 460,325 461,993 0.02Daimler AG 2.375% 13 - 08.03.23 500,000 EUR 518,679 527,895 0.02Daimler AG 2.375% 20 - 22.05.30 611,000 EUR 633,931 717,705 0.03Daimler AG 2.375% 20 - 22.05.30 68,000 EUR 71,976 79,876 0.00Daimler AG 2.625% 20 - 07.04.25 1,196,000 EUR 1,264,666 1,325,539 0.06Daimler AG 2.625% 20 - 07.04.25 25,000 EUR 26,432 27,708 0.00Deutsche Bank AG FRN 20 - 19.11.25 1,300,000 EUR 1,307,352 1,321,242 0.06Deutsche Bank AG 1.125% 15 - 17.03.25 500,000 EUR 492,905 516,885 0.02Deutsche Bank AG 1.125% 18 - 30.08.23 814,000 EUR 818,119 841,000 0.04Deutsche Bank AG FRN 20 - 10.06.26 527,000 EUR 535,068 556,696 0.03Deutsche Bank AG FRN 20 - 03.09.26 500,000 EUR 498,620 515,955 0.02Deutsche Bank AG 1.50% 17 - 20.01.22 600,000 EUR 603,968 609,294 0.03Deutsche Bank AG 1.625% 20 - 20.01.27 3,500,000 EUR 3,513,511 3,654,945 0.17Deutsche Bank AG 1.75% 18 - 17.01.28 2,700,000 EUR 2,576,453 2,841,831 0.13
Xtrackers II
Xtrackers II EUR CORPORATE BOND UCITS ETF (continued)
Statement of Investmentsas at 31 December 2020(expressed in EUR)
The accompanying notes form an integral part of these financial statements.
173

DescriptionNominal
ValueCurrency
(local) Cost Market Value
% ofNet
Assets
Transferable securities and money market instruments admitted to an official stock exchange listing(A)
Bonds (continued)
Germany (continued)Deutsche Bank AG FRN 20 - 19.11.30 1,300,000 EUR 1,334,686 1,365,429 0.06Deutsche Bank AG 1.875% 19 - 14.02.22 200,000 EUR 201,289 204,110 0.01Deutsche Bank AG 2.375% 13 - 11.01.23 700,000 EUR 716,241 732,858 0.03Deutsche Bank AG 2.625% 19 - 12.02.26 800,000 EUR 838,280 877,392 0.04Deutsche Boerse AG 1.125% 18 - 26.03.28 650,000 EUR 678,333 707,304 0.03Deutsche Boerse AG FRN 20 - 16.06.47 400,000 EUR 399,997 410,116 0.02Deutsche Boerse AG 1.625% 15 - 08.10.25 350,000 EUR 372,689 381,710 0.02Deutsche Boerse AG 2.375% 12 - 05.10.22 100,000 EUR 104,596 104,758 0.01Deutsche Boerse AG 2.375% 12 - 05.10.22 400,000 EUR 416,539 419,032 0.02Deutsche Pfandbriefbank AG 0.125% 19 - 05.09.24 300,000 EUR 294,695 301,800 0.01Deutsche Pfandbriefbank AG 0.625% 18 - 23.02.22 800,000 EUR 800,850 803,320 0.04Deutsche Pfandbriefbank AG 0.75% 19 - 07.02.23 300,000 EUR 300,134 305,310 0.01Deutsche Post AG 0.375% 20 - 20.05.26 702,000 EUR 700,930 721,291 0.03Deutsche Post AG 0.75% 20 - 20.05.29 900,000 EUR 920,577 956,790 0.04Deutsche Post AG 1.00% 17 - 13.12.27 140,000 EUR 146,763 149,408 0.01Deutsche Post AG 1.00% 20 - 20.05.32 611,000 EUR 614,758 670,120 0.03Deutsche Post AG 1.25% 16 - 01.04.26 493,000 EUR 516,534 527,683 0.02Deutsche Post AG 1.625% 18 - 05.12.28 820,000 EUR 877,283 922,902 0.04Deutsche Post AG 2.75% 13 - 09.10.23 457,000 EUR 493,747 495,516 0.02Deutsche Post AG 2.875% 12 - 11.12.24 650,000 EUR 709,988 728,715 0.03Deutsche Telekom AG 0.50% 19 - 05.07.27 726,000 EUR 725,886 752,441 0.03Deutsche Telekom AG 0.875% 19 - 25.03.26 900,000 EUR 927,214 945,882 0.04Deutsche Telekom AG 1.375% 19 - 05.07.34 720,000 EUR 737,020 807,732 0.04Deutsche Telekom AG 1.75% 19 - 25.03.31 716,000 EUR 750,430 825,856 0.04Deutsche Telekom AG 1.75% 19 - 09.12.49 479,000 EUR 469,229 559,381 0.03Deutsche Telekom AG 2.25% 19 - 29.03.39 482,000 EUR 511,597 612,906 0.03Deutsche Wohnen SE 1.00% 20 - 30.04.25 400,000 EUR 401,572 417,984 0.02Deutsche Wohnen SE 1.00% 20 - 30.04.25 100,000 EUR 101,104 104,496 0.01Deutsche Wohnen SE 1.50% 20 - 30.04.30 500,000 EUR 506,960 554,665 0.03DVB Bank SE 1.00% 17 - 25.04.22 100,000 EUR 99,689 101,119 0.00DVB Bank SE 1.25% 16 - 16.06.23 700,000 EUR 705,407 716,562 0.03E.ON SE Zero Coupon 19 - 28.08.24 800,000 EUR 801,584 804,600 0.04E.ON SE Zero Coupon 19 - 24.10.22 679,000 EUR 679,328 681,730 0.03E.ON SE Zero Coupon 19 - 29.09.22 305,000 EUR 304,554 306,574 0.01E.ON SE Zero Coupon 20 - 18.12.23 510,000 EUR 504,453 512,616 0.02E.ON SE Zero Coupon 20 - 18.12.23 200,000 EUR 200,173 201,026 0.01E.ON SE 0.25% 19 - 24.10.26 770,000 EUR 766,278 783,837 0.04E.ON SE 0.35% 19 - 28.02.30 370,000 EUR 367,165 376,190 0.02E.ON SE 0.375% 20 - 29.09.27 880,000 EUR 877,816 904,754 0.04E.ON SE 0.375% 20 - 20.04.23 710,000 EUR 710,887 719,308 0.03E.ON SE 0.625% 19 - 07.11.31 570,000 EUR 554,715 592,196 0.03E.ON SE 0.75% 20 - 18.12.30 640,000 EUR 630,189 674,714 0.03E.ON SE 0.75% 20 - 20.02.28 807,000 EUR 809,898 848,101 0.04E.ON SE 0.875% 17 - 22.05.24 400,000 EUR 402,493 413,256 0.02E.ON SE 0.875% 20 - 20.08.31 207,000 EUR 206,619 221,606 0.01E.ON SE 1.00% 20 - 07.10.25 786,000 EUR 811,222 826,023 0.04E.ON SE 1.625% 17 - 22.05.29 700,000 EUR 718,691 785,295 0.04Eurogrid GmbH 1.113% 20 - 15.05.32 500,000 EUR 514,122 546,110 0.03
Xtrackers II
Xtrackers II EUR CORPORATE BOND UCITS ETF (continued)
Statement of Investmentsas at 31 December 2020(expressed in EUR)
The accompanying notes form an integral part of these financial statements.
174

DescriptionNominal
ValueCurrency
(local) Cost Market Value
% ofNet
Assets
Transferable securities and money market instruments admitted to an official stock exchange listing(A)
Bonds (continued)
Germany (continued)Eurogrid GmbH 1.50% 16 - 18.04.28 700,000 EUR 725,583 772,611 0.04Eurogrid GmbH 1.625% 15 - 03.11.23 300,000 EUR 309,646 314,538 0.01Eurogrid GmbH 1.875% 15 - 10.06.25 600,000 EUR 644,941 650,778 0.03Evonik Industries AG 0.625% 20 - 18.09.25 400,000 EUR 399,271 411,996 0.02Evonik Industries AG 0.625% 20 - 18.09.25 500,000 EUR 503,730 514,995 0.02Evonik Industries AG 1.00% 15 - 23.01.23 795,000 EUR 807,217 813,301 0.04Evonik Industries AG FRN 17 - 07.07.77 257,000 EUR 257,774 263,040 0.01Fresenius Medical Care AG & Co. KGaA 0.25% 19 -29.11.23 479,000 EUR 479,833 483,072 0.02Fresenius Medical Care AG & Co. KGaA 0.625% 19 -30.11.26 631,000 EUR 630,020 647,602 0.03Fresenius Medical Care AG & Co. KGaA 1.00% 20 -29.05.26 607,000 EUR 609,496 633,781 0.03Fresenius Medical Care AG & Co. KGaA 1.25% 19 -29.11.29 604,000 EUR 611,342 643,296 0.03Fresenius Medical Care AG & Co. KGaA 1.50% 18 -11.07.25 440,000 EUR 451,421 469,335 0.02Fresenius Medical Care AG & Co. KGaA 1.50% 20 -29.05.30 586,000 EUR 596,615 635,458 0.03Fresenius SE & Co. KGaA 0.375% 20 - 28.09.26 168,000 EUR 166,928 170,421 0.01Fresenius SE & Co. KGaA 0.75% 20 - 15.01.28 560,000 EUR 557,729 578,626 0.03Fresenius SE & Co. KGaA 0.75% 20 - 15.01.28 100,000 EUR 101,471 103,326 0.00Fresenius SE & Co. KGaA 1.125% 20 - 28.01.33 468,000 EUR 466,800 493,927 0.02Fresenius SE & Co. KGaA 1.625% 20 - 08.10.27 703,000 EUR 726,484 768,836 0.04Fresenius SE & Co. KGaA 1.875% 19 - 15.02.25 200,000 EUR 208,944 214,242 0.01Fresenius SE & Co. KGaA 2.875% 19 - 15.02.29 400,000 EUR 436,373 478,220 0.02Fresenius SE & Co. KGaA 4.00% 14 - 01.02.24 553,000 EUR 607,521 621,655 0.03Hamburg Commercial Bank AG 0.50% 19 - 23.05.22 400,000 EUR 397,830 402,188 0.02Hamburg Commercial Bank AG 0.75% 20 - 23.11.23 600,000 EUR 605,262 604,476 0.03Hannover Rueck SE 1.125% 18 - 18.04.28 600,000 EUR 629,358 658,224 0.03Hannover Rueck SE FRN 19 - 09.10.39 400,000 EUR 396,798 409,128 0.02Hannover Rueck SE FRN 19 - 09.10.39 200,000 EUR 194,185 204,564 0.01Hannover Rueck SE FRN 20 - 08.10.40 500,000 EUR 497,790 535,670 0.02Hannover Rueck SE FRN 14 - 29.06.49 200,000 EUR 214,046 225,772 0.01HeidelbergCement AG 1.50% 16 - 07.02.25 780,000 EUR 802,500 822,791 0.04HeidelbergCement AG 2.25% 16 - 30.03.23 749,000 EUR 772,159 783,754 0.04HeidelbergCement AG 2.25% 16 - 03.06.24 713,000 EUR 751,737 764,600 0.04Hella GmbH & Co. KGaA 0.50% 19 - 26.01.27 283,000 EUR 278,408 284,166 0.01Hella GmbH & Co. KGaA 1.00% 17 - 17.05.24 708,000 EUR 714,363 728,652 0.03HOCHTIEF AG 0.50% 19 - 03.09.27 568,000 EUR 564,252 575,214 0.03HOCHTIEF AG 1.75% 18 - 03.07.25 304,000 EUR 310,370 325,216 0.02Infineon Technologies AG 0.75% 20 - 24.06.23 600,000 EUR 603,332 613,026 0.03Infineon Technologies AG 1.125% 20 - 24.06.26 800,000 EUR 801,668 844,536 0.04Infineon Technologies AG 1.50% 15 - 10.03.22 450,000 EUR 455,835 459,234 0.02Infineon Technologies AG 1.625% 20 - 24.06.29 600,000 EUR 599,536 655,014 0.03Infineon Technologies AG 2.00% 20 - 24.06.32 500,000 EUR 506,013 568,180 0.03Knorr-Bremse AG 1.125% 18 - 13.06.25 613,000 EUR 627,876 643,650 0.03LANXESS AG 1.00% 16 - 07.10.26 390,000 EUR 406,309 412,526 0.02
Xtrackers II
Xtrackers II EUR CORPORATE BOND UCITS ETF (continued)
Statement of Investmentsas at 31 December 2020(expressed in EUR)
The accompanying notes form an integral part of these financial statements.
175

DescriptionNominal
ValueCurrency
(local) Cost Market Value
% ofNet
Assets
Transferable securities and money market instruments admitted to an official stock exchange listing(A)
Bonds (continued)
Germany (continued)LANXESS AG 1.125% 18 - 16.05.25 370,000 EUR 376,608 389,244 0.02LANXESS AG 2.625% 12 - 21.11.22 506,000 EUR 530,831 532,737 0.02LEG Immobilien AG 0.875% 19 - 28.11.27 700,000 EUR 710,171 731,703 0.03LEG Immobilien AG 1.25% 17 - 23.01.24 100,000 EUR 101,083 103,472 0.00LEG Immobilien AG 1.625% 19 - 28.11.34 200,000 EUR 197,495 220,388 0.01Merck Financial Services GmbH 0.005% 19 -15.12.23 800,000 EUR 795,036 803,960 0.04Merck Financial Services GmbH 0.125% 20 -16.07.25 1,100,000 EUR 1,098,911 1,115,422 0.05Merck Financial Services GmbH 0.375% 19 -05.07.27 600,000 EUR 601,453 619,068 0.03Merck Financial Services GmbH 0.50% 20 - 16.07.28 500,000 EUR 502,720 520,170 0.02Merck Financial Services GmbH 0.875% 19 -05.07.31 500,000 EUR 501,226 538,150 0.02Merck Financial Services GmbH 1.375% 15 -01.09.22 168,000 EUR 170,999 171,798 0.01Merck KGaA FRN 19 - 25.06.79 500,000 EUR 508,089 512,905 0.02Merck KGaA FRN 20 - 09.09.80 900,000 EUR 905,307 920,574 0.04Merck KGaA FRN 19 - 25.06.79 1,000,000 EUR 1,048,763 1,100,860 0.05Merck KGaA FRN 14 - 12.12.74 183,000 EUR 203,094 201,443 0.01METRO AG 1.125% 18 - 06.03.23 100,000 EUR 98,777 101,095 0.00MTU Aero Engines AG 3.00% 20 - 01.07.25 307,000 EUR 317,805 334,001 0.02Muenchener Hypothekenbank eG 0.50% 19 - 08.06.26 300,000 EUR 295,201 302,202 0.01Muenchener Hypothekenbank eG 0.625% 15 -10.02.22 200,000 EUR 201,743 200,996 0.01Muenchener Hypothekenbank eG 0.875% 17 -11.07.24 200,000 EUR 202,187 204,938 0.01Muenchener Rueckversicherungs-Gesellschaft AG inMuenchen FRN 20 - 26.05.41 1,000,000 EUR 992,636 1,038,240 0.05Muenchener Rueckversicherungs-Gesellschaft AG inMuenchen FRN 18 - 26.05.49 1,100,000 EUR 1,205,028 1,303,654 0.06Muenchener Rueckversicherungs-Gesellschaft AG inMuenchen FRN 12 - 26.05.42 1,000,000 EUR 1,110,237 1,084,840 0.05Münchener Hypothekenbank eG 0.875% 18 - 12.09.25 300,000 EUR 309,938 309,972 0.01O2 Telefonica Deutschland Finanzierungs GmbH1.75% 18 - 05.07.25 300,000 EUR 311,665 319,257 0.01Robert Bosch GmbH 1.75% 14 - 08.07.24 600,000 EUR 636,600 642,876 0.03Santander Consumer Bank AG 0.25% 19 - 15.10.24 700,000 EUR 695,056 704,032 0.03Santander Consumer Bank AG 0.75% 17 - 17.10.22 200,000 EUR 202,607 203,218 0.01SAP SE Zero Coupon 20 - 17.05.23 700,000 EUR 700,548 703,787 0.03SAP SE 0.125% 20 - 18.05.26 500,000 EUR 499,298 507,865 0.02SAP SE 0.25% 18 - 10.03.22 800,000 EUR 802,491 805,024 0.04SAP SE 0.375% 20 - 18.05.29 600,000 EUR 598,428 619,326 0.03SAP SE 0.75% 18 - 10.12.24 1,200,000 EUR 1,221,428 1,244,160 0.06SAP SE 1.00% 15 - 01.04.25 100,000 EUR 101,436 104,982 0.01SAP SE 1.00% 18 - 13.03.26 700,000 EUR 726,479 741,797 0.03SAP SE 1.125% 14 - 20.02.23 550,000 EUR 560,207 564,316 0.03SAP SE 1.125% 14 - 20.02.23 100,000 EUR 102,535 102,603 0.00
Xtrackers II
Xtrackers II EUR CORPORATE BOND UCITS ETF (continued)
Statement of Investmentsas at 31 December 2020(expressed in EUR)
The accompanying notes form an integral part of these financial statements.
176

DescriptionNominal
ValueCurrency
(local) Cost Market Value
% ofNet
Assets
Transferable securities and money market instruments admitted to an official stock exchange listing(A)
Bonds (continued)
Germany (continued)SAP SE 1.25% 18 - 10.03.28 800,000 EUR 823,893 875,688 0.04SAP SE 1.375% 18 - 13.03.30 300,000 EUR 324,179 337,245 0.02SAP SE 1.625% 18 - 10.03.31 1,100,000 EUR 1,209,113 1,273,580 0.06SAP SE 1.75% 14 - 22.02.27 850,000 EUR 919,448 945,455 0.04Talanx AG FRN 17 - 05.12.47 700,000 EUR 706,994 749,294 0.03Talanx AG 2.50% 14 - 23.07.26 400,000 EUR 457,029 461,484 0.02Talanx AG 2.50% 14 - 23.07.26 100,000 EUR 107,701 115,371 0.01Talanx AG 3.125% 13 - 13.02.23 700,000 EUR 745,616 750,827 0.03Vier Gas Transport GmbH 0.125% 19 - 10.09.29 600,000 EUR 581,686 604,662 0.03Vier Gas Transport GmbH 0.50% 19 - 10.09.34 400,000 EUR 392,592 409,004 0.02Vier Gas Transport GmbH 1.50% 18 - 25.09.28 200,000 EUR 206,680 223,468 0.01Vier Gas Transport GmbH 2.875% 13 - 12.06.25 650,000 EUR 719,309 739,440 0.03Vier Gas Transport GmbH 3.125% 13 - 10.07.23 824,000 EUR 890,408 894,831 0.04Volkswagen Bank GmbH 0.375% 19 - 05.07.22 300,000 EUR 299,683 301,908 0.01Volkswagen Bank GmbH 0.375% 19 - 05.07.22 200,000 EUR 201,029 201,272 0.01Volkswagen Bank GmbH 0.75% 17 - 15.06.23 750,000 EUR 749,584 761,850 0.04Volkswagen Bank GmbH 1.25% 17 - 15.12.25 556,000 EUR 555,231 582,821 0.03Volkswagen Bank GmbH 1.25% 18 - 10.06.24 1,000,000 EUR 1,005,584 1,035,450 0.05Volkswagen Bank GmbH 1.25% 19 - 01.08.22 400,000 EUR 402,958 408,536 0.02Volkswagen Bank GmbH 1.875% 19 - 31.01.24 800,000 EUR 818,818 841,864 0.04Volkswagen Bank GmbH 2.50% 19 - 31.07.26 600,000 EUR 642,012 669,402 0.03Volkswagen Financial Services AG 0.625% 19 -01.04.22 906,000 EUR 904,531 914,118 0.04Volkswagen Financial Services AG 0.875% 18 -12.04.23 613,000 EUR 617,960 624,310 0.03Volkswagen Financial Services AG 1.375% 18 -16.10.23 520,000 EUR 528,472 538,096 0.02Volkswagen Financial Services AG 1.50% 19 -01.10.24 510,000 EUR 513,108 534,424 0.02Volkswagen Financial Services AG 1.50% 19 -01.10.24 422,000 EUR 429,907 442,210 0.02Volkswagen Financial Services AG 2.25% 18 -16.10.26 540,000 EUR 550,715 597,132 0.03Volkswagen Financial Services AG 2.25% 19 -01.10.27 620,000 EUR 648,281 693,606 0.03Volkswagen Financial Services AG 2.50% 20 -06.04.23 494,000 EUR 492,303 520,883 0.02Volkswagen Financial Services AG 3.00% 20 -06.04.25 558,000 EUR 552,750 622,750 0.03Volkswagen Financial Services AG 3.375% 20 -06.04.28 608,000 EUR 611,518 728,402 0.03Volkswagen Leasing GmbH 0.50% 19 - 20.06.22 1,161,000 EUR 1,162,350 1,170,671 0.05Volkswagen Leasing GmbH 1.00% 18 - 16.02.23 998,000 EUR 998,928 1,018,818 0.05Volkswagen Leasing GmbH 1.125% 17 - 04.04.24 402,000 EUR 406,544 414,333 0.02Volkswagen Leasing GmbH 1.375% 17 - 20.01.25 789,000 EUR 802,644 825,176 0.04Volkswagen Leasing GmbH 1.50% 19 - 19.06.26 543,000 EUR 555,649 575,520 0.03Volkswagen Leasing GmbH 1.625% 18 - 15.08.25 682,000 EUR 698,156 724,516 0.03Volkswagen Leasing GmbH 2.125% 14 - 04.04.22 450,000 EUR 460,683 462,551 0.02
Xtrackers II
Xtrackers II EUR CORPORATE BOND UCITS ETF (continued)
Statement of Investmentsas at 31 December 2020(expressed in EUR)
The accompanying notes form an integral part of these financial statements.
177

DescriptionNominal
ValueCurrency
(local) Cost Market Value
% ofNet
Assets
Transferable securities and money market instruments admitted to an official stock exchange listing(A)
Bonds (continued)
Germany (continued)Volkswagen Leasing GmbH 2.375% 12 - 06.09.22 900,000 EUR 922,683 936,054 0.04Volkswagen Leasing GmbH 2.625% 14 - 15.01.24 1,070,000 EUR 1,120,374 1,151,085 0.05WPP Finance Deutschland GmbH 1.625% 15 -23.03.30 619,000 EUR 639,587 677,656 0.03
171,577,652 177,962,786 8.12GuernseyCredit Suisse Group Funding Guernsey Ltd. 1.25%15 - 14.04.22 2,096,000 EUR 2,123,064 2,134,420 0.09Globalworth Real Estate Investments Ltd. 2.95% 20 -29.07.26 378,000 EUR 375,222 397,161 0.02Globalworth Real Estate Investments Ltd. 3.00% 18 -29.03.25 600,000 EUR 614,808 634,380 0.03
3,113,094 3,165,961 0.14HungaryMOL Hungarian Oil & Gas PLC 1.50% 20 - 08.10.27 479,000 EUR 471,187 492,886 0.02MOL Hungarian Oil & Gas PLC 2.625% 16 -28.04.23 692,000 EUR 715,501 729,479 0.04
1,186,688 1,222,365 0.06IcelandArion Banki HF 0.625% 20 - 27.05.24 400,000 EUR 399,879 399,800 0.02Arion Banki HF 1.00% 18 - 20.03.23 100,000 EUR 97,783 101,386 0.00
497,662 501,186 0.02IrelandAbbott Ireland Financing DAC 0.10% 19 - 19.11.24 300,000 EUR 299,246 303,036 0.01Abbott Ireland Financing DAC 0.375% 19 - 19.11.27 700,000 EUR 711,754 718,375 0.03Abbott Ireland Financing DAC 0.875% 18 - 27.09.23 976,000 EUR 993,870 1,005,300 0.05Abbott Ireland Financing DAC 1.50% 18 - 27.09.26 862,000 EUR 905,348 936,330 0.04AIB Group PLC 1.25% 19 - 28.05.24 650,000 EUR 655,085 674,382 0.03AIB Group PLC 1.50% 18 - 29.03.23 579,000 EUR 577,239 597,956 0.03AIB Group PLC 2.25% 18 - 03.07.25 100,000 EUR 102,271 109,003 0.01Aon PLC 2.875% 14 - 14.05.26 400,000 EUR 446,134 457,028 0.02Aquarius & Investments PLC for Zurich Insurance Co.Ltd. FRN 13 - 02.10.43 697,000 EUR 762,715 772,213 0.04Atlas Copco Finance DAC 0.125% 19 - 03.09.29 230,000 EUR 227,651 231,870 0.01Bank of Ireland Group PLC FRN 19 - 08.07.24 100,000 EUR 99,894 101,565 0.00Bank of Ireland Group PLC FRN 19 - 25.11.25 798,000 EUR 799,817 819,123 0.04Bank of Ireland Group PLC 1.375% 18 - 29.08.23 819,000 EUR 810,625 847,747 0.04Cloverie PLC for Swiss Reinsurance Co. Ltd. FRN12 - 01.09.42 242,000 EUR 273,123 267,831 0.01Cloverie PLC for Zurich Insurance Co. Ltd. 1.50%18 - 15.12.28 290,000 EUR 308,260 323,814 0.02Cloverie PLC for Zurich Insurance Co. Ltd. 1.75%14 - 16.09.24 200,000 EUR 201,874 214,728 0.01CRH Finance Dac 1.375% 16 - 18.10.28 500,000 EUR 520,257 545,960 0.03CRH Finance Dac 3.125% 13 - 03.04.23 493,000 EUR 526,819 529,408 0.02CRH Finance Dac 3.125% 13 - 03.04.23 200,000 EUR 214,043 214,770 0.01CRH SMW Finance DAC 1.25% 20 - 05.11.26 699,000 EUR 704,721 747,860 0.03Dell Bank International Dac 0.625% 19 - 17.10.22 112,000 EUR 110,912 112,983 0.01
Xtrackers II
Xtrackers II EUR CORPORATE BOND UCITS ETF (continued)
Statement of Investmentsas at 31 December 2020(expressed in EUR)
The accompanying notes form an integral part of these financial statements.
178

DescriptionNominal
ValueCurrency
(local) Cost Market Value
% ofNet
Assets
Transferable securities and money market instruments admitted to an official stock exchange listing(A)
Bonds (continued)
Ireland (continued)Dell Bank International Dac 1.625% 20 - 24.06.24 457,000 EUR 459,933 473,813 0.02Eaton Capital Unlimited Co. 0.697% 19 - 14.05.25 567,000 EUR 581,636 586,216 0.03Eaton Capital Unlimited Co. 0.75% 16 - 20.09.24 514,000 EUR 520,639 531,049 0.02Fresenius Finance Ireland PLC 0.875% 17 - 31.01.22 358,000 EUR 359,937 361,004 0.02Fresenius Finance Ireland PLC 1.50% 17 - 30.01.24 916,000 EUR 942,516 954,793 0.04Fresenius Finance Ireland PLC 2.125% 17 - 01.02.27 600,000 EUR 634,139 669,018 0.03Fresenius Finance Ireland PLC 3.00% 17 - 30.01.32 306,000 EUR 341,924 388,170 0.02GE Capital European Funding Unlimited Co. 4.625%07 - 22.02.27 700,000 EUR 832,050 874,923 0.04GE Capital European Funding Unlimited Co. 6.025%08 - 01.03.38 589,000 EUR 820,322 906,707 0.04Glencore Capital Finance DAC 1.125% 20 - 10.03.28 896,000 EUR 894,559 917,325 0.04Johnson Controls International PLC 1.00% 17 -15.09.23 875,000 EUR 893,053 899,981 0.04Johnson Controls International PLC 1.375% 16 -25.02.25 250,000 EUR 254,934 263,680 0.01Johnson Controls International PLC Via Tyco Fire &Security Finance SCA 0.375% 20 - 15.09.27 434,000 EUR 434,936 439,898 0.02Johnson Controls International PLC Via Tyco Fire &Security Finance SCA 1.00% 20 - 15.09.32 518,000 EUR 525,815 545,858 0.03Kerry Group Financial Services Unltd Co. 0.625%19 - 20.09.29 462,000 EUR 457,966 475,869 0.02Kerry Group Financial Services Unltd Co. 2.375%15 - 10.09.25 1,110,000 EUR 1,207,455 1,238,660 0.06Liberty Mutual Finance Europe DAC 1.75% 17 -27.03.24 500,000 EUR 513,497 526,600 0.02PartnerRe Ireland Finance DAC 1.25% 16 - 15.09.26 651,000 EUR 673,278 693,198 0.03Roadster Finance Dac 1.625% 17 - 09.12.24 500,000 EUR 491,317 507,730 0.02Roadster Finance DAC 2.375% 17 - 08.12.27 100,000 EUR 101,773 102,635 0.00Ryanair Dac 2.875% 20 - 15.09.25 696,000 EUR 702,794 746,905 0.03Ryanair DAC 1.125% 15 - 10.03.23 700,000 EUR 689,234 706,013 0.03Ryanair DAC 1.125% 17 - 15.08.23 509,000 EUR 519,214 513,113 0.02Transmission Finance DAC 1.50% 16 - 24.05.23 555,000 EUR 567,444 573,787 0.03Willow No 2 Ireland PLC for Zurich Insurance Co.Ltd. 3.375% 12 - 27.06.22 800,000 EUR 836,137 843,224 0.04Zurich Finance Ireland Designated Activity Co.1.625% 19 - 17.06.39 470,000 EUR 515,049 556,950 0.03Zurich Finance Ireland Designated Activity Co. FRN20 - 17.09.50 529,000 EUR 528,459 564,639 0.03
26,551,668 27,393,040 1.25Italy2i Rete Gas SpA 1.608% 17 - 31.10.27 625,000 EUR 637,267 676,444 0.032i Rete Gas SpA 1.75% 17 - 28.08.26 200,000 EUR 206,004 215,360 0.012i Rete Gas SpA 2.195% 18 - 11.09.25 670,000 EUR 702,828 729,945 0.032i Rete Gas SpA 3.00% 14 - 16.07.24 644,000 EUR 702,666 711,871 0.03Aeroporti di Roma SpA 1.625% 17 - 08.06.27 400,000 EUR 386,311 405,772 0.02Aeroporti di Roma SpA 1.625% 20 - 02.02.29 250,000 EUR 250,984 251,668 0.01Assicurazioni Generali SpA 2.124% 19 - 01.10.30 650,000 EUR 649,848 691,360 0.03
Xtrackers II
Xtrackers II EUR CORPORATE BOND UCITS ETF (continued)
Statement of Investmentsas at 31 December 2020(expressed in EUR)
The accompanying notes form an integral part of these financial statements.
179

DescriptionNominal
ValueCurrency
(local) Cost Market Value
% ofNet
Assets
Transferable securities and money market instruments admitted to an official stock exchange listing(A)
Bonds (continued)
Italy (continued)Assicurazioni Generali SpA 2.429% 20 - 14.07.31 483,000 EUR 491,138 528,595 0.02Assicurazioni Generali SpA 3.875% 19 - 29.01.29 366,000 EUR 397,998 435,328 0.02Assicurazioni Generali SpA 4.125% 14 - 04.05.26 800,000 EUR 873,868 943,200 0.04Assicurazioni Generali SpA FRN 16 - 08.06.48 700,000 EUR 764,475 847,000 0.04Assicurazioni Generali SpA 5.125% 09 - 16.09.24 1,587,000 EUR 1,849,342 1,908,368 0.09Assicurazioni Generali SpA FRN 15 - 27.10.47 1,100,000 EUR 1,271,640 1,353,803 0.06Assicurazioni Generali SpA FRN 12 - 12.12.42 400,000 EUR 465,067 458,296 0.02Assicurazioni Generali SpA FRN 12 - 10.07.42 300,000 EUR 372,260 346,866 0.02ASTM SpA 1.625% 18 - 08.02.28 500,000 EUR 484,525 516,530 0.02ASTM SpA 3.375% 14 - 13.02.24 379,000 EUR 405,953 411,279 0.02Azimut Holding SpA 1.625% 19 - 12.12.24 250,000 EUR 251,780 252,875 0.01Azimut Holding SpA 2.00% 17 - 28.03.22 326,000 EUR 330,920 331,884 0.02Buzzi Unicem SpA 2.125% 16 - 28.04.23 171,000 EUR 176,923 178,890 0.01Enel SpA FRN 20 - 31.12.99 662,000 EUR 664,785 689,804 0.03Enel SpA FRN 18 - 24.11.78 516,000 EUR 515,693 537,899 0.02Enel SpA FRN 18 - 24.11.81 561,000 EUR 577,868 621,027 0.03Enel SpA FRN 19 - 24.05.80 806,000 EUR 841,340 880,071 0.04Enel SpA 5.25% 04 - 20.05.24 620,000 EUR 708,775 734,192 0.03Enel SpA 5.625% 07 - 21.06.27 800,000 EUR 1,034,176 1,085,224 0.05Eni SpA 0.625% 16 - 19.09.24 456,000 EUR 459,723 468,695 0.02Eni SpA 0.625% 20 - 23.01.30 780,000 EUR 785,395 805,607 0.04Eni SpA 0.75% 16 - 17.05.22 500,000 EUR 504,626 507,165 0.02Eni SpA 1.00% 17 - 14.03.25 500,000 EUR 501,872 522,520 0.02Eni SpA 1.00% 19 - 11.10.34 386,000 EUR 381,771 413,093 0.02Eni SpA 1.125% 16 - 19.09.28 589,000 EUR 599,724 630,436 0.03Eni SpA 1.25% 20 - 18.05.26 914,000 EUR 927,428 969,937 0.04Eni SpA 1.25% 20 - 18.05.26 100,000 EUR 101,686 106,120 0.01Eni SpA 1.50% 15 - 02.02.26 931,000 EUR 964,961 1,000,415 0.05Eni SpA 1.50% 17 - 17.01.27 679,000 EUR 709,986 734,882 0.03Eni SpA 1.625% 16 - 17.05.28 706,000 EUR 745,527 779,459 0.04Eni SpA 1.75% 15 - 18.01.24 511,000 EUR 526,794 540,337 0.03Eni SpA 1.75% 15 - 18.01.24 375,000 EUR 391,927 396,529 0.02Eni SpA 2.00% 20 - 18.05.31 1,054,000 EUR 1,134,596 1,230,629 0.06Eni SpA FRN 20 - 31.12.99 1,335,000 EUR 1,324,900 1,393,433 0.06Eni SpA 3.25% 13 - 10.07.23 875,000 EUR 936,780 951,676 0.04Eni SpA FRN 20 - 31.12.99 1,335,000 EUR 1,326,375 1,432,789 0.07Eni SpA 3.625% 14 - 29.01.29 832,000 EUR 997,369 1,057,505 0.05Eni SpA 3.75% 13 - 12.09.25 1,008,000 EUR 1,145,660 1,188,049 0.05ERG SpA 0.50% 20 - 11.09.27 468,000 EUR 467,188 472,296 0.02ERG SpA 1.875% 19 - 11.04.25 199,000 EUR 203,789 213,967 0.01FCA Bank SpA 0.125% 20 - 16.11.23 744,000 EUR 743,393 743,725 0.03FCA Bank SpA 0.25% 20 - 28.02.23 778,000 EUR 763,716 780,490 0.04FCA Bank SpA 0.50% 19 - 13.09.24 500,000 EUR 485,193 505,325 0.02FCA Bank SpA 0.50% 20 - 18.09.23 749,000 EUR 747,909 756,108 0.03FCA Bank SpA 0.625% 19 - 24.11.22 695,000 EUR 690,247 702,395 0.03FCA Bank SpA 1.00% 18 - 21.02.22 589,000 EUR 589,056 596,227 0.03FCA Bank SpA 1.25% 19 - 21.06.22 615,000 EUR 616,359 626,285 0.03Intesa Sanpaolo SpA 0.75% 19 - 04.12.24 568,000 EUR 576,344 582,251 0.03
Xtrackers II
Xtrackers II EUR CORPORATE BOND UCITS ETF (continued)
Statement of Investmentsas at 31 December 2020(expressed in EUR)
The accompanying notes form an integral part of these financial statements.
180
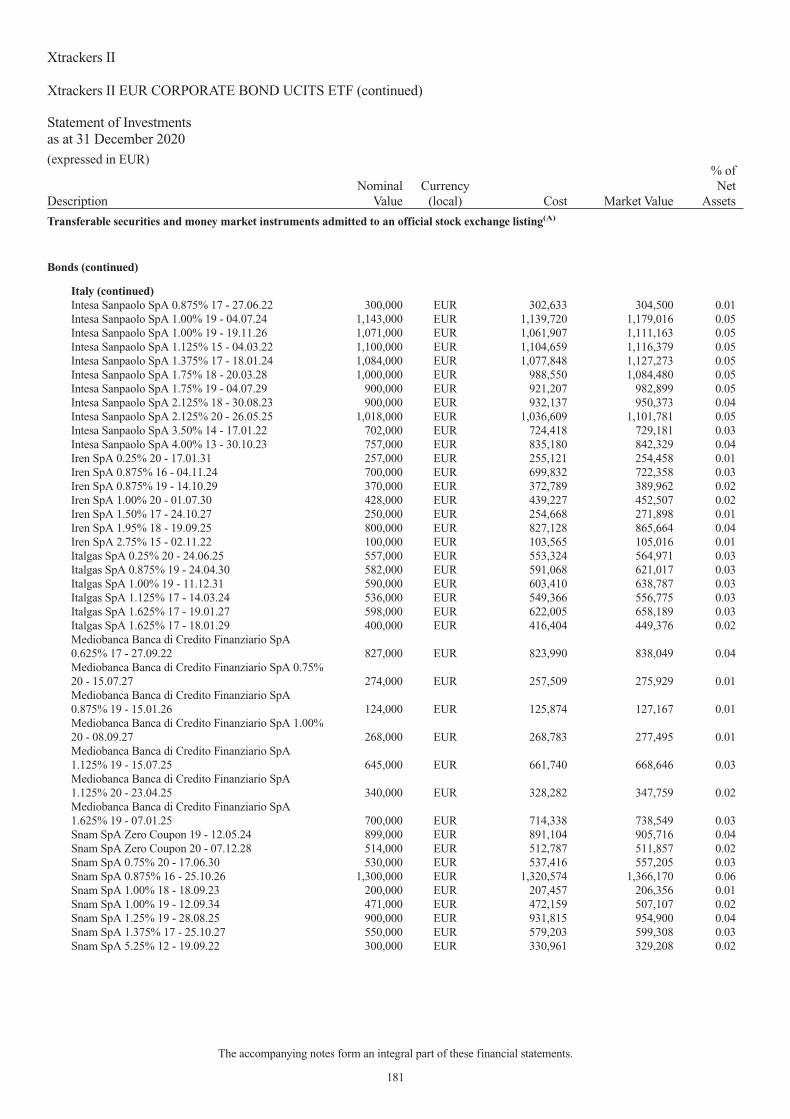
DescriptionNominal
ValueCurrency
(local) Cost Market Value
% ofNet
Assets
Transferable securities and money market instruments admitted to an official stock exchange listing(A)
Bonds (continued)
Italy (continued)Intesa Sanpaolo SpA 0.875% 17 - 27.06.22 300,000 EUR 302,633 304,500 0.01Intesa Sanpaolo SpA 1.00% 19 - 04.07.24 1,143,000 EUR 1,139,720 1,179,016 0.05Intesa Sanpaolo SpA 1.00% 19 - 19.11.26 1,071,000 EUR 1,061,907 1,111,163 0.05Intesa Sanpaolo SpA 1.125% 15 - 04.03.22 1,100,000 EUR 1,104,659 1,116,379 0.05Intesa Sanpaolo SpA 1.375% 17 - 18.01.24 1,084,000 EUR 1,077,848 1,127,273 0.05Intesa Sanpaolo SpA 1.75% 18 - 20.03.28 1,000,000 EUR 988,550 1,084,480 0.05Intesa Sanpaolo SpA 1.75% 19 - 04.07.29 900,000 EUR 921,207 982,899 0.05Intesa Sanpaolo SpA 2.125% 18 - 30.08.23 900,000 EUR 932,137 950,373 0.04Intesa Sanpaolo SpA 2.125% 20 - 26.05.25 1,018,000 EUR 1,036,609 1,101,781 0.05Intesa Sanpaolo SpA 3.50% 14 - 17.01.22 702,000 EUR 724,418 729,181 0.03Intesa Sanpaolo SpA 4.00% 13 - 30.10.23 757,000 EUR 835,180 842,329 0.04Iren SpA 0.25% 20 - 17.01.31 257,000 EUR 255,121 254,458 0.01Iren SpA 0.875% 16 - 04.11.24 700,000 EUR 699,832 722,358 0.03Iren SpA 0.875% 19 - 14.10.29 370,000 EUR 372,789 389,962 0.02Iren SpA 1.00% 20 - 01.07.30 428,000 EUR 439,227 452,507 0.02Iren SpA 1.50% 17 - 24.10.27 250,000 EUR 254,668 271,898 0.01Iren SpA 1.95% 18 - 19.09.25 800,000 EUR 827,128 865,664 0.04Iren SpA 2.75% 15 - 02.11.22 100,000 EUR 103,565 105,016 0.01Italgas SpA 0.25% 20 - 24.06.25 557,000 EUR 553,324 564,971 0.03Italgas SpA 0.875% 19 - 24.04.30 582,000 EUR 591,068 621,017 0.03Italgas SpA 1.00% 19 - 11.12.31 590,000 EUR 603,410 638,787 0.03Italgas SpA 1.125% 17 - 14.03.24 536,000 EUR 549,366 556,775 0.03Italgas SpA 1.625% 17 - 19.01.27 598,000 EUR 622,005 658,189 0.03Italgas SpA 1.625% 17 - 18.01.29 400,000 EUR 416,404 449,376 0.02Mediobanca Banca di Credito Finanziario SpA0.625% 17 - 27.09.22 827,000 EUR 823,990 838,049 0.04Mediobanca Banca di Credito Finanziario SpA 0.75%20 - 15.07.27 274,000 EUR 257,509 275,929 0.01Mediobanca Banca di Credito Finanziario SpA0.875% 19 - 15.01.26 124,000 EUR 125,874 127,167 0.01Mediobanca Banca di Credito Finanziario SpA 1.00%20 - 08.09.27 268,000 EUR 268,783 277,495 0.01Mediobanca Banca di Credito Finanziario SpA1.125% 19 - 15.07.25 645,000 EUR 661,740 668,646 0.03Mediobanca Banca di Credito Finanziario SpA1.125% 20 - 23.04.25 340,000 EUR 328,282 347,759 0.02Mediobanca Banca di Credito Finanziario SpA1.625% 19 - 07.01.25 700,000 EUR 714,338 738,549 0.03Snam SpA Zero Coupon 19 - 12.05.24 899,000 EUR 891,104 905,716 0.04Snam SpA Zero Coupon 20 - 07.12.28 514,000 EUR 512,787 511,857 0.02Snam SpA 0.75% 20 - 17.06.30 530,000 EUR 537,416 557,205 0.03Snam SpA 0.875% 16 - 25.10.26 1,300,000 EUR 1,320,574 1,366,170 0.06Snam SpA 1.00% 18 - 18.09.23 200,000 EUR 207,457 206,356 0.01Snam SpA 1.00% 19 - 12.09.34 471,000 EUR 472,159 507,107 0.02Snam SpA 1.25% 19 - 28.08.25 900,000 EUR 931,815 954,900 0.04Snam SpA 1.375% 17 - 25.10.27 550,000 EUR 579,203 599,308 0.03Snam SpA 5.25% 12 - 19.09.22 300,000 EUR 330,961 329,208 0.02
Xtrackers II
Xtrackers II EUR CORPORATE BOND UCITS ETF (continued)
Statement of Investmentsas at 31 December 2020(expressed in EUR)
The accompanying notes form an integral part of these financial statements.
181

DescriptionNominal
ValueCurrency
(local) Cost Market Value
% ofNet
Assets
Transferable securities and money market instruments admitted to an official stock exchange listing(A)
Bonds (continued)
Italy (continued)Terna Rete Elettrica Nazionale SpA 0.125% 19 -25.07.25 896,000 EUR 891,774 907,101 0.04Terna Rete Elettrica Nazionale SpA 0.375% 20 -25.09.30 360,000 EUR 358,255 367,286 0.02Terna Rete Elettrica Nazionale SpA 0.75% 20 -24.07.32 473,000 EUR 474,682 498,230 0.02Terna Rete Elettrica Nazionale SpA 0.875% 15 -02.02.22 497,000 EUR 499,644 503,163 0.02Terna Rete Elettrica Nazionale SpA 1.00% 16 -11.10.28 550,000 EUR 574,615 590,557 0.03Terna Rete Elettrica Nazionale SpA 1.00% 18 -23.07.23 800,000 EUR 815,716 825,752 0.04Terna Rete Elettrica Nazionale SpA 1.00% 19 -10.04.26 100,000 EUR 101,229 105,477 0.01Terna Rete Elettrica Nazionale SpA 1.375% 17 -26.07.27 852,000 EUR 876,058 930,537 0.04Terna Rete Elettrica Nazionale SpA 4.90% 04 -28.10.24 1,128,000 EUR 1,336,778 1,349,088 0.06UniCredit SpA 0.50% 19 - 09.04.25 1,100,000 EUR 1,087,333 1,114,113 0.05UniCredit SpA 1.00% 18 - 18.01.23 1,221,000 EUR 1,209,091 1,244,675 0.06UniCredit SpA FRN 20 - 20.01.26 1,101,000 EUR 1,081,988 1,118,506 0.05UniCredit SpA FRN 19 - 25.06.25 900,000 EUR 913,610 929,304 0.04UniCredit SpA FRN 20 - 16.06.26 1,243,000 EUR 1,240,770 1,290,072 0.06UniCredit SpA FRN 19 - 03.07.25 750,000 EUR 739,207 776,085 0.04UniCredit SpA 1.80% 20 - 20.01.30 780,000 EUR 769,450 815,747 0.04UniCredit SpA 2.00% 16 - 04.03.23 600,000 EUR 611,463 627,798 0.03UniCredit SpA 2.125% 16 - 24.10.26 640,000 EUR 671,572 707,955 0.03UniCredit SpA FRN 20 - 22.07.27 1,182,000 EUR 1,183,797 1,254,882 0.06Unione di Banche Italiane SpA 0.75% 17 - 17.10.22 1,135,000 EUR 1,116,927 1,152,683 0.05Unione di Banche Italiane SpA 1.00% 19 - 22.07.22 642,000 EUR 644,727 652,798 0.03Unione di Banche Italiane SpA 1.50% 19 - 10.04.24 200,000 EUR 204,241 209,600 0.01
79,144,422 82,115,078 3.75JapanAsahi Group Holdings Ltd. 0.155% 20 - 23.10.24 712,000 EUR 714,120 716,187 0.03Asahi Group Holdings Ltd. 0.541% 20 - 23.10.28 712,000 EUR 714,589 723,477 0.03Asahi Group Holdings Ltd. 1.151% 17 - 19.09.25 378,000 EUR 390,960 397,202 0.02Mercedes-Benz Finance Co. Ltd. Zero Coupon 19 -21.08.22 500,000 EUR 497,989 500,775 0.02Mitsubishi UFJ Financial Group Inc. 0.339% 19 -19.07.24 600,000 EUR 595,182 608,106 0.03Mitsubishi UFJ Financial Group Inc. 0.68% 18 -26.01.23 299,000 EUR 303,239 304,316 0.01Mitsubishi UFJ Financial Group Inc. 0.848% 19 -19.07.29 262,000 EUR 261,204 277,592 0.01Mitsubishi UFJ Financial Group Inc. 0.872% 17 -07.09.24 559,000 EUR 564,653 577,861 0.03Mitsubishi UFJ Financial Group Inc. 0.978% 20 -09.06.24 857,000 EUR 868,609 887,706 0.04
Xtrackers II
Xtrackers II EUR CORPORATE BOND UCITS ETF (continued)
Statement of Investmentsas at 31 December 2020(expressed in EUR)
The accompanying notes form an integral part of these financial statements.
182

DescriptionNominal
ValueCurrency
(local) Cost Market Value
% ofNet
Assets
Transferable securities and money market instruments admitted to an official stock exchange listing(A)
Bonds (continued)
Japan (continued)Mitsubishi UFJ Financial Group Inc. 0.98% 18 -09.10.23 400,000 EUR 398,678 412,668 0.02Mizuho Financial Group Inc. 0.118% 19 - 06.09.24 750,000 EUR 740,799 754,635 0.03Mizuho Financial Group Inc. 0.214% 20 - 07.10.25 445,000 EUR 445,644 450,020 0.02Mizuho Financial Group Inc. 0.402% 19 - 06.09.29 400,000 EUR 382,210 405,300 0.02Mizuho Financial Group Inc. 0.523% 19 - 10.06.24 911,000 EUR 910,420 929,448 0.04Mizuho Financial Group Inc. 0.693% 20 - 07.10.30 890,000 EUR 891,165 918,231 0.04Mizuho Financial Group Inc. 0.797% 20 - 15.04.30 768,000 EUR 734,535 799,288 0.04Mizuho Financial Group Inc. 0.956% 17 - 16.10.24 102,000 EUR 104,209 105,969 0.01Mizuho Financial Group Inc. 1.02% 18 - 11.10.23 107,000 EUR 109,650 110,236 0.01Mizuho Financial Group Inc. 1.598% 18 - 10.04.28 207,000 EUR 212,296 229,130 0.01MUFG Bank Ltd. 0.875% 15 - 11.03.22 150,000 EUR 151,336 152,140 0.01MUFG Bank Ltd. 0.875% 15 - 11.03.22 600,000 EUR 605,276 608,562 0.03Nissan Motor Co. Ltd. 1.94% 20 - 15.09.23 168,000 EUR 170,421 175,049 0.01Nissan Motor Co. Ltd. 2.652% 20 - 17.03.26 702,000 EUR 705,095 742,365 0.03Nissan Motor Co. Ltd. 3.201% 20 - 17.09.28 702,000 EUR 704,901 761,923 0.04Sumitomo Mitsui Banking Corp. 1.00% 15 - 19.01.22 852,000 EUR 859,735 863,204 0.04Sumitomo Mitsui Banking Corp. 2.75% 13 - 24.07.23 200,000 EUR 211,348 215,142 0.01Sumitomo Mitsui Financial Group Inc. 0.303% 20 -28.10.27 645,000 EUR 646,875 652,411 0.03Sumitomo Mitsui Financial Group Inc. 0.465% 19 -30.05.24 436,000 EUR 437,706 444,646 0.02Sumitomo Mitsui Financial Group Inc. 0.606% 17 -18.01.22 500,000 EUR 499,641 504,495 0.02Sumitomo Mitsui Financial Group Inc. 0.632% 19 -23.10.29 855,000 EUR 838,099 883,018 0.04Sumitomo Mitsui Financial Group Inc. 0.819% 18 -23.07.23 623,000 EUR 633,876 638,793 0.03Sumitomo Mitsui Financial Group Inc. 0.934% 17 -11.10.24 179,000 EUR 178,794 185,732 0.01Sumitomo Mitsui Financial Group Inc. 1.413% 17 -14.06.27 420,000 EUR 432,764 456,406 0.02Sumitomo Mitsui Financial Group Inc. 1.546% 16 -15.06.26 1,386,000 EUR 1,443,693 1,500,581 0.07Takeda Pharmaceutical Co. Ltd. 0.75% 20 - 09.07.27 279,000 EUR 280,616 289,733 0.01Takeda Pharmaceutical Co. Ltd. 1.00% 20 - 09.07.29 911,000 EUR 916,806 953,780 0.04Takeda Pharmaceutical Co. Ltd. 1.125% 18 - 21.11.22 1,349,000 EUR 1,364,585 1,380,540 0.06Takeda Pharmaceutical Co. Ltd. 1.375% 20 - 09.07.32 862,000 EUR 872,265 925,236 0.04Takeda Pharmaceutical Co. Ltd. 2.00% 20 - 09.07.40 823,000 EUR 819,413 934,936 0.04Takeda Pharmaceutical Co. Ltd. 2.25% 18 - 21.11.26 1,296,000 EUR 1,385,732 1,457,637 0.07Takeda Pharmaceutical Co. Ltd. 3.00% 18 - 21.11.30 1,432,000 EUR 1,597,729 1,763,365 0.08
25,596,857 26,597,841 1.21JerseyAptiv PLC 1.50% 15 - 10.03.25 814,000 EUR 831,881 858,037 0.04Aptiv PLC 1.60% 16 - 15.09.28 300,000 EUR 298,646 324,210 0.02Atrium European Real Estate Ltd. 3.00% 18 - 11.09.25 374,000 EUR 376,402 383,219 0.02Glencore Finance Europe Ltd. 0.625% 19 - 11.09.24 242,000 EUR 241,731 244,764 0.01Glencore Finance Europe Ltd. 1.50% 19 - 15.10.26 260,000 EUR 263,114 274,381 0.01
Xtrackers II
Xtrackers II EUR CORPORATE BOND UCITS ETF (continued)
Statement of Investmentsas at 31 December 2020(expressed in EUR)
The accompanying notes form an integral part of these financial statements.
183

DescriptionNominal
ValueCurrency
(local) Cost Market Value
% ofNet
Assets
Transferable securities and money market instruments admitted to an official stock exchange listing(A)
Bonds (continued)
Jersey (continued)Glencore Finance Europe Ltd. 1.625% 14 - 18.01.22 288,000 EUR 290,534 291,845 0.01Glencore Finance Europe Ltd. 1.75% 15 - 17.03.25 780,000 EUR 789,385 822,276 0.04Glencore Finance Europe Ltd. 1.875% 16 - 13.09.23 1,208,000 EUR 1,222,986 1,261,575 0.06Glencore Finance Europe Ltd. 3.75% 14 - 01.04.26 550,000 EUR 610,473 641,679 0.03Heathrow Funding Ltd. 1.50% 15 - 11.02.30 574,000 EUR 593,372 604,634 0.03Heathrow Funding Ltd. 1.50% 20 - 12.10.27 668,000 EUR 668,000 698,735 0.03Heathrow Funding Ltd. 1.875% 14 - 23.05.22 687,000 EUR 697,916 705,391 0.03Heathrow Funding Ltd. 1.875% 17 - 12.07.32 500,000 EUR 491,021 542,940 0.02Heathrow Funding Ltd. 1.875% 19 - 14.03.34 500,000 EUR 517,235 544,185 0.03Kennedy Wilson Europe Real Estate Ltd. 3.25% 15 -12.11.25 500,000 EUR 500,713 507,115 0.02
8,393,409 8,704,986 0.40KoreaLG Chem Ltd. 0.50% 19 - 15.04.23 146,000 EUR 145,678 147,491 0.00POSCO 0.50% 20 - 17.01.24 399,000 EUR 392,567 399,810 0.02Shinhan Bank Co. Ltd. 0.25% 19 - 16.10.24 199,000 EUR 195,986 201,760 0.01
734,231 749,061 0.03LuxembourgAlpha Trains Finance SA 2.064% 15 - 30.06.25 424,000 EUR 443,860 446,264 0.02Aroundtown SA Zero Coupon 20 - 16.07.26 900,000 EUR 883,878 883,314 0.04Aroundtown SA 0.375% 19 - 23.09.22 100,000 EUR 100,329 100,572 0.00Aroundtown SA 0.625% 19 - 09.07.25 700,000 EUR 705,372 710,584 0.03Aroundtown SA 1.00% 17 - 07.01.25 600,000 EUR 612,481 618,672 0.03Aroundtown SA 1.45% 19 - 09.07.28 300,000 EUR 299,193 317,685 0.01Aroundtown SA 1.50% 19 - 28.05.26 700,000 EUR 698,742 740,488 0.03Aroundtown SA 1.625% 18 - 31.01.28 800,000 EUR 807,180 856,024 0.04Aroundtown SA 1.875% 17 - 19.01.26 300,000 EUR 305,620 323,265 0.01Aroundtown SA 2.00% 18 - 02.11.26 700,000 EUR 712,407 762,692 0.03Aroundtown SA FRN 18 - 31.12.99 600,000 EUR 573,074 601,188 0.03Aroundtown SA FRN 19 - 31.12.99 300,000 EUR 289,348 307,899 0.01Banque Internationale a Luxembourg SA 1.50% 18 -28.09.23 100,000 EUR 100,061 102,713 0.00Becton Dickinson Euro Finance Sarl 0.632% 19 -04.06.23 400,000 EUR 399,884 405,652 0.02Becton Dickinson Euro Finance Sarl 0.632% 19 -04.06.23 200,000 EUR 199,788 202,826 0.01Becton Dickinson Euro Finance Sarl 1.208% 19 -04.06.26 650,000 EUR 663,035 679,068 0.03Bevco Lux Sarl 1.50% 20 - 16.09.27 468,000 EUR 469,760 493,061 0.02Blackstone Property Partners Europe Holdings Sarl0.50% 19 - 12.09.23 110,000 EUR 107,717 111,015 0.01Blackstone Property Partners Europe Holdings Sarl1.25% 20 - 26.04.27 770,000 EUR 767,187 789,081 0.04Blackstone Property Partners Europe Holdings Sarl1.40% 18 - 06.07.22 200,000 EUR 202,931 203,126 0.01Blackstone Property Partners Europe Holdings Sarl1.75% 19 - 12.03.29 450,000 EUR 444,902 474,062 0.02
Xtrackers II
Xtrackers II EUR CORPORATE BOND UCITS ETF (continued)
Statement of Investmentsas at 31 December 2020(expressed in EUR)
The accompanying notes form an integral part of these financial statements.
184
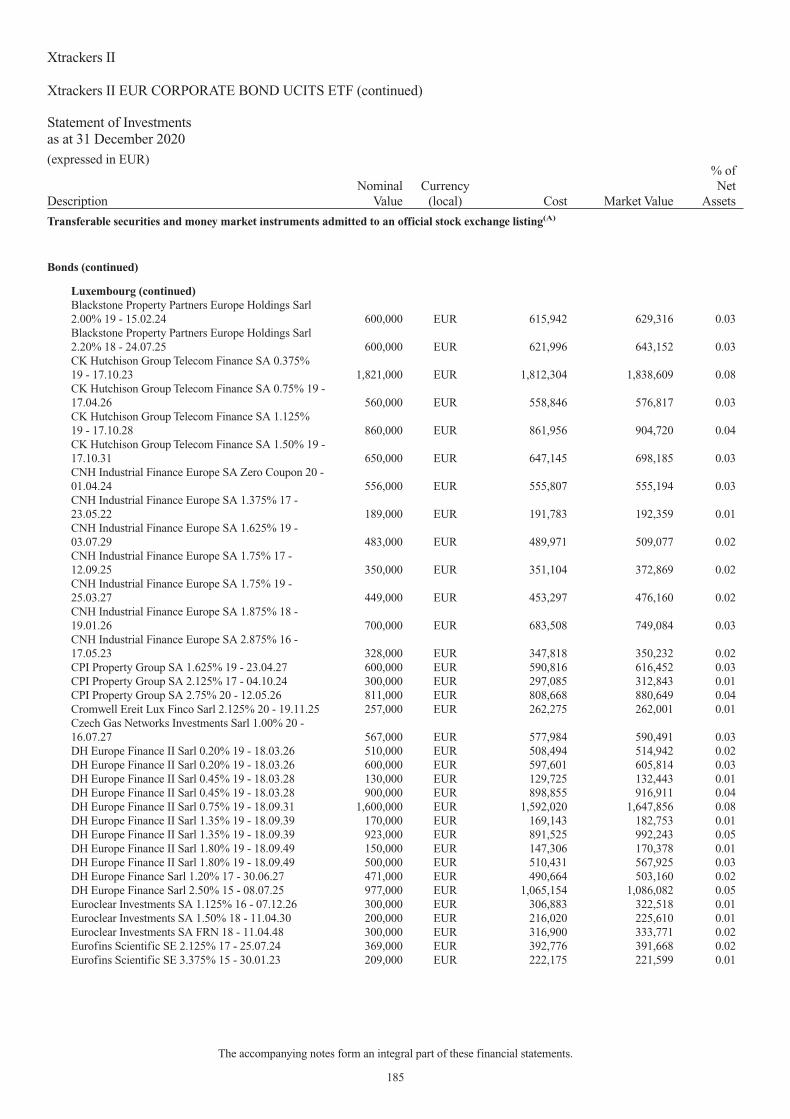
DescriptionNominal
ValueCurrency
(local) Cost Market Value
% ofNet
Assets
Transferable securities and money market instruments admitted to an official stock exchange listing(A)
Bonds (continued)
Luxembourg (continued)Blackstone Property Partners Europe Holdings Sarl2.00% 19 - 15.02.24 600,000 EUR 615,942 629,316 0.03Blackstone Property Partners Europe Holdings Sarl2.20% 18 - 24.07.25 600,000 EUR 621,996 643,152 0.03CK Hutchison Group Telecom Finance SA 0.375%19 - 17.10.23 1,821,000 EUR 1,812,304 1,838,609 0.08CK Hutchison Group Telecom Finance SA 0.75% 19 -17.04.26 560,000 EUR 558,846 576,817 0.03CK Hutchison Group Telecom Finance SA 1.125%19 - 17.10.28 860,000 EUR 861,956 904,720 0.04CK Hutchison Group Telecom Finance SA 1.50% 19 -17.10.31 650,000 EUR 647,145 698,185 0.03CNH Industrial Finance Europe SA Zero Coupon 20 -01.04.24 556,000 EUR 555,807 555,194 0.03CNH Industrial Finance Europe SA 1.375% 17 -23.05.22 189,000 EUR 191,783 192,359 0.01CNH Industrial Finance Europe SA 1.625% 19 -03.07.29 483,000 EUR 489,971 509,077 0.02CNH Industrial Finance Europe SA 1.75% 17 -12.09.25 350,000 EUR 351,104 372,869 0.02CNH Industrial Finance Europe SA 1.75% 19 -25.03.27 449,000 EUR 453,297 476,160 0.02CNH Industrial Finance Europe SA 1.875% 18 -19.01.26 700,000 EUR 683,508 749,084 0.03CNH Industrial Finance Europe SA 2.875% 16 -17.05.23 328,000 EUR 347,818 350,232 0.02CPI Property Group SA 1.625% 19 - 23.04.27 600,000 EUR 590,816 616,452 0.03CPI Property Group SA 2.125% 17 - 04.10.24 300,000 EUR 297,085 312,843 0.01CPI Property Group SA 2.75% 20 - 12.05.26 811,000 EUR 808,668 880,649 0.04Cromwell Ereit Lux Finco Sarl 2.125% 20 - 19.11.25 257,000 EUR 262,275 262,001 0.01Czech Gas Networks Investments Sarl 1.00% 20 -16.07.27 567,000 EUR 577,984 590,491 0.03DH Europe Finance II Sarl 0.20% 19 - 18.03.26 510,000 EUR 508,494 514,942 0.02DH Europe Finance II Sarl 0.20% 19 - 18.03.26 600,000 EUR 597,601 605,814 0.03DH Europe Finance II Sarl 0.45% 19 - 18.03.28 130,000 EUR 129,725 132,443 0.01DH Europe Finance II Sarl 0.45% 19 - 18.03.28 900,000 EUR 898,855 916,911 0.04DH Europe Finance II Sarl 0.75% 19 - 18.09.31 1,600,000 EUR 1,592,020 1,647,856 0.08DH Europe Finance II Sarl 1.35% 19 - 18.09.39 170,000 EUR 169,143 182,753 0.01DH Europe Finance II Sarl 1.35% 19 - 18.09.39 923,000 EUR 891,525 992,243 0.05DH Europe Finance II Sarl 1.80% 19 - 18.09.49 150,000 EUR 147,306 170,378 0.01DH Europe Finance II Sarl 1.80% 19 - 18.09.49 500,000 EUR 510,431 567,925 0.03DH Europe Finance Sarl 1.20% 17 - 30.06.27 471,000 EUR 490,664 503,160 0.02DH Europe Finance Sarl 2.50% 15 - 08.07.25 977,000 EUR 1,065,154 1,086,082 0.05Euroclear Investments SA 1.125% 16 - 07.12.26 300,000 EUR 306,883 322,518 0.01Euroclear Investments SA 1.50% 18 - 11.04.30 200,000 EUR 216,020 225,610 0.01Euroclear Investments SA FRN 18 - 11.04.48 300,000 EUR 316,900 333,771 0.02Eurofins Scientific SE 2.125% 17 - 25.07.24 369,000 EUR 392,776 391,668 0.02Eurofins Scientific SE 3.375% 15 - 30.01.23 209,000 EUR 222,175 221,599 0.01
Xtrackers II
Xtrackers II EUR CORPORATE BOND UCITS ETF (continued)
Statement of Investmentsas at 31 December 2020(expressed in EUR)
The accompanying notes form an integral part of these financial statements.
185

DescriptionNominal
ValueCurrency
(local) Cost Market Value
% ofNet
Assets
Transferable securities and money market instruments admitted to an official stock exchange listing(A)
Bonds (continued)
Luxembourg (continued)Eurofins Scientific SE 3.75% 20 - 17.07.26 667,000 EUR 754,229 781,250 0.04GELF Bond Issuer I SA 1.125% 19 - 18.07.29 300,000 EUR 294,147 310,695 0.01GELF Bond Issuer I SA 1.625% 16 - 20.10.26 500,000 EUR 510,466 535,370 0.02Grand City Properties SA 1.375% 17 - 03.08.26 900,000 EUR 914,354 956,970 0.04Grand City Properties SA 1.50% 15 - 17.04.25 100,000 EUR 103,489 106,123 0.00Grand City Properties SA 1.50% 18 - 22.02.27 600,000 EUR 607,087 641,064 0.03Grand City Properties SA FRN 20 - 31.12.99 600,000 EUR 593,850 594,630 0.03Grand City Properties SA 1.70% 20 - 09.04.24 800,000 EUR 813,295 843,944 0.04Grand City Properties SA FRN 18 - 31.12.99 300,000 EUR 297,300 308,358 0.01Hannover Finance Luxembourg SA FRN 12 - 30.06.43 500,000 EUR 563,662 558,970 0.03Harman Finance International SCA 2.00% 15 -27.05.22 300,000 EUR 306,558 306,579 0.01HeidelbergCement Finance Luxembourg SA 0.50%18 - 09.08.22 600,000 EUR 596,375 604,338 0.03HeidelbergCement Finance Luxembourg SA 1.125%19 - 01.12.27 479,000 EUR 494,346 506,538 0.02HeidelbergCement Finance Luxembourg SA 1.50%17 - 14.06.27 480,000 EUR 486,443 517,934 0.02HeidelbergCement Finance Luxembourg SA 1.625%17 - 07.04.26 1,200,000 EUR 1,220,491 1,288,560 0.06HeidelbergCement Finance Luxembourg SA 1.75%18 - 24.04.28 513,000 EUR 521,882 563,520 0.03HeidelbergCement Finance Luxembourg SA 2.50%20 - 09.10.24 648,000 EUR 683,111 706,929 0.03Helvetia Europe SA FRN 20 - 30.09.41 549,000 EUR 551,579 604,877 0.03Holcim Finance Luxembourg SA 0.50% 19 - 29.11.26 267,000 EUR 260,878 272,335 0.01Holcim Finance Luxembourg SA 0.50% 20 - 23.04.31 544,000 EUR 543,308 546,241 0.03Holcim Finance Luxembourg SA 1.375% 16 -26.05.23 465,000 EUR 473,718 481,270 0.02Holcim Finance Luxembourg SA 1.75% 17 - 29.08.29 600,000 EUR 603,111 668,514 0.03Holcim Finance Luxembourg SA 2.25% 16 - 26.05.28 1,200,000 EUR 1,306,029 1,368,756 0.06Holcim Finance Luxembourg SA 2.375% 20 -09.04.25 599,000 EUR 623,443 656,911 0.03Holcim Finance Luxembourg SA 3.00% 14 - 22.01.24 455,000 EUR 484,038 496,737 0.02John Deere Cash Management SA 0.50% 17 -15.09.23 445,000 EUR 455,707 455,747 0.02John Deere Cash Management SA 1.375% 20 -02.04.24 706,000 EUR 708,814 743,383 0.03John Deere Cash Management SA 1.65% 19 -13.06.39 660,000 EUR 699,697 792,858 0.04John Deere Cash Management SA 1.85% 20 -02.04.28 255,000 EUR 258,075 289,374 0.01John Deere Cash Management SA 2.20% 20 -02.04.32 555,000 EUR 589,779 672,155 0.03Logicor Financing Sarl 0.75% 19 - 15.07.24 1,080,000 EUR 1,066,517 1,101,762 0.05Logicor Financing Sarl 1.50% 18 - 14.11.22 750,000 EUR 751,642 768,000 0.04Logicor Financing Sarl 1.50% 18 - 14.11.22 141,000 EUR 144,534 144,384 0.01Logicor Financing Sarl 1.50% 20 - 13.07.26 273,000 EUR 274,244 288,007 0.01
Xtrackers II
Xtrackers II EUR CORPORATE BOND UCITS ETF (continued)
Statement of Investmentsas at 31 December 2020(expressed in EUR)
The accompanying notes form an integral part of these financial statements.
186

DescriptionNominal
ValueCurrency
(local) Cost Market Value
% ofNet
Assets
Transferable securities and money market instruments admitted to an official stock exchange listing(A)
Bonds (continued)
Luxembourg (continued)Logicor Financing Sarl 1.625% 19 - 15.07.27 950,000 EUR 961,303 1,009,138 0.05Logicor Financing Sarl 2.25% 18 - 13.05.25 500,000 EUR 497,283 540,835 0.02Logicor Financing Sarl 3.25% 18 - 13.11.28 506,000 EUR 557,470 595,243 0.03Medtronic Global Holdings SCA Zero Coupon 19 -02.12.22 500,000 EUR 500,872 502,095 0.02Medtronic Global Holdings SCA Zero Coupon 20 -15.03.23 970,000 EUR 972,096 974,317 0.04Medtronic Global Holdings SCA Zero Coupon 20 -15.10.25 936,000 EUR 932,657 939,594 0.04Medtronic Global Holdings SCA 0.25% 19 - 02.07.25 900,000 EUR 902,674 913,527 0.04Medtronic Global Holdings SCA 0.375% 19 -07.03.23 930,000 EUR 935,717 941,383 0.04Medtronic Global Holdings SCA 0.375% 19 -07.03.23 600,000 EUR 603,531 607,344 0.03Medtronic Global Holdings SCA 0.375% 20 -15.10.28 836,000 EUR 839,318 858,104 0.04Medtronic Global Holdings SCA 0.75% 20 - 15.10.32 936,000 EUR 949,896 981,284 0.04Medtronic Global Holdings SCA 1.00% 19 - 02.07.31 912,000 EUR 932,058 983,100 0.04Medtronic Global Holdings SCA 1.125% 19 -07.03.27 959,000 EUR 993,835 1,024,442 0.05Medtronic Global Holdings SCA 1.375% 20 -15.10.40 906,000 EUR 920,289 986,942 0.05Medtronic Global Holdings SCA 1.50% 19 - 02.07.39 880,000 EUR 896,830 980,074 0.04Medtronic Global Holdings SCA 1.625% 19 -07.03.31 866,000 EUR 939,539 986,071 0.05Medtronic Global Holdings SCA 1.625% 20 -15.10.50 836,000 EUR 839,306 932,575 0.04Medtronic Global Holdings SCA 1.75% 19 - 02.07.49 800,000 EUR 793,174 926,200 0.04Medtronic Global Holdings SCA 1.75% 19 - 02.07.49 100,000 EUR 101,601 115,775 0.01Medtronic Global Holdings SCA 2.25% 19 - 07.03.39 806,000 EUR 904,793 999,166 0.05Mohawk Capital Finance SA 1.75% 20 - 12.06.27 400,000 EUR 412,152 412,240 0.02Nestle Finance International Ltd. Zero Coupon 20 -12.11.24 929,000 EUR 927,263 938,086 0.04Nestle Finance International Ltd. Zero Coupon 20 -03.12.25 438,000 EUR 445,117 442,647 0.02Nestle Finance International Ltd. Zero Coupon 20 -03.03.33 429,000 EUR 424,160 422,539 0.02Nestle Finance International Ltd. 0.125% 20 -12.11.27 792,000 EUR 788,599 804,189 0.04Nestle Finance International Ltd. 0.375% 17 -18.01.24 559,000 EUR 566,521 570,091 0.03Nestle Finance International Ltd. 0.375% 20 -12.05.32 764,000 EUR 752,952 789,800 0.04Nestle Finance International Ltd. 0.375% 20 -03.12.40 438,000 EUR 440,016 443,935 0.02Nestle Finance International Ltd. 0.75% 15 - 16.05.23 116,000 EUR 117,707 118,713 0.01Nestle Finance International Ltd. 1.125% 20 -01.04.26 936,000 EUR 974,314 999,152 0.05
Xtrackers II
Xtrackers II EUR CORPORATE BOND UCITS ETF (continued)
Statement of Investmentsas at 31 December 2020(expressed in EUR)
The accompanying notes form an integral part of these financial statements.
187

DescriptionNominal
ValueCurrency
(local) Cost Market Value
% ofNet
Assets
Transferable securities and money market instruments admitted to an official stock exchange listing(A)
Bonds (continued)
Luxembourg (continued)Nestle Finance International Ltd. 1.25% 17 - 02.11.29 374,000 EUR 412,245 419,033 0.02Nestle Finance International Ltd. 1.25% 17 - 02.11.29 100,000 EUR 105,902 112,041 0.01Nestle Finance International Ltd. 1.50% 20 - 01.04.30 1,086,000 EUR 1,169,165 1,237,269 0.06Nestle Finance International Ltd. 1.75% 12 - 12.09.22 570,000 EUR 588,133 590,115 0.03Nestle Finance International Ltd. 1.75% 17 - 02.11.37 600,000 EUR 676,985 750,828 0.03Novartis Finance SA Zero Coupon 20 - 23.09.28 1,632,000 EUR 1,629,274 1,640,682 0.07Novartis Finance SA 0.125% 16 - 20.09.23 619,000 EUR 623,464 627,016 0.03Novartis Finance SA 0.50% 18 - 14.08.23 998,000 EUR 1,012,476 1,018,219 0.05Novartis Finance SA 0.625% 16 - 20.09.28 300,000 EUR 312,647 318,150 0.01Novartis Finance SA 1.125% 17 - 30.09.27 1,000,000 EUR 1,053,698 1,087,470 0.05Novartis Finance SA 1.375% 18 - 14.08.30 568,000 EUR 588,642 642,942 0.03Novartis Finance SA 1.625% 14 - 09.11.26 521,000 EUR 567,270 578,451 0.03Novartis Finance SA 1.70% 18 - 14.08.38 509,000 EUR 561,134 641,880 0.03Prologis International Funding II SA 0.875% 19 -09.07.29 504,000 EUR 507,315 533,413 0.02Prologis International Funding II SA 1.625% 20 -17.06.32 382,000 EUR 399,252 431,225 0.02Prologis International Funding II SA 1.75% 18 -15.03.28 290,000 EUR 300,382 324,240 0.01Prologis International Funding II SA 1.876% 15 -17.04.25 125,000 EUR 128,821 135,324 0.01Prologis International Funding II SA 2.375% 18 -14.11.30 250,000 EUR 272,734 300,600 0.01Prologis International Funding II SA 2.875% 14 -04.04.22 406,000 EUR 420,778 421,083 0.02Richemont International Holdings SA 0.75% 20 -26.05.28 453,000 EUR 462,218 478,925 0.02Richemont International Holdings SA 1.00% 18 -26.03.26 1,335,000 EUR 1,377,282 1,414,793 0.06Richemont International Holdings SA 1.125% 20 -26.05.32 796,000 EUR 828,708 882,828 0.04Richemont International Holdings SA 1.50% 18 -26.03.30 1,081,000 EUR 1,145,086 1,226,589 0.06Richemont International Holdings SA 1.625% 20 -26.05.40 589,000 EUR 611,033 689,483 0.03Richemont International Holdings SA 2.00% 18 -26.03.38 1,057,000 EUR 1,163,694 1,314,284 0.06SELP Finance Sarl 1.25% 16 - 25.10.23 379,000 EUR 385,264 391,189 0.02SELP Finance Sarl 1.50% 17 - 20.11.25 259,000 EUR 264,144 274,615 0.01SELP Finance Sarl 1.50% 19 - 20.12.26 700,000 EUR 724,020 751,191 0.03SES SA 0.875% 19 - 04.11.27 429,000 EUR 428,227 438,309 0.02SES SA 1.625% 18 - 22.03.26 257,000 EUR 259,920 273,859 0.01SES SA 2.00% 20 - 02.07.28 410,000 EUR 408,280 441,283 0.02Simon International Finance SCA 1.25% 16 - 13.05.25 399,000 EUR 405,428 415,690 0.02Simon International Finance SCA 1.375% 15 -18.11.22 648,000 EUR 651,925 663,014 0.03SIX Finance Luxembourg SA Zero Coupon 20 -02.12.25 800,000 EUR 799,311 799,456 0.04
Xtrackers II
Xtrackers II EUR CORPORATE BOND UCITS ETF (continued)
Statement of Investmentsas at 31 December 2020(expressed in EUR)
The accompanying notes form an integral part of these financial statements.
188

DescriptionNominal
ValueCurrency
(local) Cost Market Value
% ofNet
Assets
Transferable securities and money market instruments admitted to an official stock exchange listing(A)
Bonds (continued)
Luxembourg (continued)Swiss Re Finance Luxembourg SA FRN 19 - 30.04.50 500,000 EUR 539,473 561,815 0.03Talanx Finanz Luxembourg SA FRN 12 - 15.06.42 800,000 EUR 922,657 896,088 0.04Tyco Electronics Group SA Zero Coupon 20 -14.02.25 169,000 EUR 166,700 170,320 0.01Tyco Electronics Group SA 1.10% 15 - 01.03.23 925,000 EUR 944,281 950,095 0.04Whirlpool EMEA Finance Sarl 0.50% 20 - 20.02.28 347,000 EUR 326,620 352,961 0.02Whirlpool Finance Luxembourg Sarl 1.10% 17 -09.11.27 180,000 EUR 178,660 192,254 0.01Whirlpool Finance Luxembourg Sarl 1.10% 17 -09.11.27 380,000 EUR 386,332 405,870 0.02Whirlpool Finance Luxembourg Sarl 1.25% 16 -02.11.26 600,000 EUR 607,914 641,562 0.03
95,667,461 99,761,272 4.55MexicoAmerica Movil SAB de CV 0.75% 19 - 26.06.27 800,000 EUR 811,568 824,520 0.04America Movil SAB de CV 1.50% 16 - 10.03.24 811,000 EUR 828,844 849,936 0.04America Movil SAB de CV 2.125% 16 - 10.03.28 542,000 EUR 577,396 612,579 0.03America Movil SAB de CV 3.259% 13 - 22.07.23 630,000 EUR 673,329 682,826 0.03America Movil SAB de CV 4.75% 10 - 28.06.22 725,000 EUR 775,163 778,389 0.03America Movil SAB de CV FRN 13 - 06.09.73 500,000 EUR 560,327 572,870 0.03Fomento Economico Mexicano SAB de CV 1.75%16 - 20.03.23 785,000 EUR 806,105 815,191 0.04Sigma Alimentos SA de CV 2.625% 17 - 07.02.24 278,000 EUR 283,640 295,520 0.01
5,316,372 5,431,831 0.25NetherlandsABB Finance BV 0.625% 16 - 03.05.23 462,000 EUR 470,036 470,626 0.02ABB Finance BV 0.75% 17 - 16.05.24 693,000 EUR 708,660 714,462 0.03ABN AMRO Bank NV 0.50% 18 - 17.07.23 1,113,000 EUR 1,121,188 1,134,492 0.05ABN AMRO Bank NV 0.50% 19 - 15.04.26 467,000 EUR 468,719 482,710 0.02ABN AMRO Bank NV 0.60% 20 - 15.01.27 800,000 EUR 795,097 823,176 0.04ABN AMRO Bank NV 0.625% 16 - 31.05.22 450,000 EUR 452,793 456,278 0.02ABN AMRO Bank NV 0.875% 18 - 22.04.25 711,000 EUR 732,863 742,696 0.03ABN AMRO Bank NV 0.875% 19 - 15.01.24 1,500,000 EUR 1,522,828 1,548,900 0.07ABN AMRO Bank NV 1.00% 15 - 16.04.25 1,039,000 EUR 1,072,245 1,091,012 0.05ABN AMRO Bank NV 1.25% 20 - 28.05.25 1,300,000 EUR 1,310,716 1,368,874 0.06ABN AMRO Bank NV 2.50% 13 - 29.11.23 950,000 EUR 1,018,788 1,025,553 0.05ABN AMRO Bank NV FRN 16 - 18.01.28 1,100,000 EUR 1,146,466 1,157,486 0.05ABN AMRO Bank NV 4.125% 12 - 28.03.22 1,000,000 EUR 1,049,204 1,055,470 0.05ABN AMRO Bank NV 7.125% 12 - 06.07.22 906,000 EUR 997,892 1,002,154 0.05Achmea Bank NV 1.125% 15 - 25.04.22 290,000 EUR 293,576 295,110 0.01Achmea BV 1.50% 20 - 26.05.27 911,000 EUR 920,492 982,942 0.05Achmea BV FRN 15 - 29.12.49 600,000 EUR 633,440 659,964 0.03Achmea BV FRN 13 - 04.04.43 400,000 EUR 451,498 448,548 0.02Adecco International Financial Services BV 1.00%16 - 02.12.24 668,000 EUR 686,593 698,180 0.03Adecco International Financial Services BV 1.25%19 - 20.11.29 144,000 EUR 147,034 155,968 0.01
Xtrackers II
Xtrackers II EUR CORPORATE BOND UCITS ETF (continued)
Statement of Investmentsas at 31 December 2020(expressed in EUR)
The accompanying notes form an integral part of these financial statements.
189

DescriptionNominal
ValueCurrency
(local) Cost Market Value
% ofNet
Assets
Transferable securities and money market instruments admitted to an official stock exchange listing(A)
Bonds (continued)
Netherlands (continued)Adecco International Financial Services BV 1.50%15 - 22.11.22 218,000 EUR 221,809 223,816 0.01Aegon Bank NV 0.625% 19 - 21.06.24 631,000 EUR 644,953 648,883 0.03Aegon NV 1.00% 16 - 08.12.23 100,000 EUR 102,069 103,607 0.00Aegon NV FRN 14 - 25.04.44 700,000 EUR 754,139 769,447 0.04Airbus Finance BV 0.875% 16 - 13.05.26 204,000 EUR 205,369 212,446 0.01Airbus Finance BV 1.375% 16 - 13.05.31 850,000 EUR 877,735 915,577 0.04Airbus Finance BV 2.125% 14 - 29.10.29 566,000 EUR 636,266 652,649 0.03Airbus Finance BV 2.375% 14 - 02.04.24 646,000 EUR 687,141 692,215 0.03Airbus SE 1.375% 20 - 09.06.26 1,343,000 EUR 1,367,649 1,427,918 0.07Airbus SE 1.625% 20 - 07.04.25 568,000 EUR 591,250 604,136 0.03Airbus SE 1.625% 20 - 07.04.25 200,000 EUR 205,684 212,724 0.01Airbus SE 1.625% 20 - 09.06.30 1,043,000 EUR 1,055,294 1,147,769 0.05Airbus SE 2.00% 20 - 07.04.28 798,000 EUR 839,545 892,507 0.04Airbus SE 2.375% 20 - 07.04.32 790,000 EUR 868,272 936,118 0.04Airbus SE 2.375% 20 - 09.06.40 806,000 EUR 836,501 964,701 0.04Akelius Residential Property Financing BV 1.00%20 - 17.01.28 268,000 EUR 268,029 276,217 0.01Akelius Residential Property Financing BV 1.125%20 - 11.01.29 446,000 EUR 447,552 460,932 0.02Akzo Nobel NV 1.125% 16 - 08.04.26 100,000 EUR 101,251 107,433 0.01Akzo Nobel NV 1.625% 20 - 14.04.30 698,000 EUR 737,289 787,581 0.04Akzo Nobel NV 1.75% 14 - 07.11.24 383,000 EUR 411,680 412,300 0.02Akzo Nobel NV 2.625% 12 - 27.07.22 950,000 EUR 986,482 993,348 0.05Allianz Finance II BV Zero Coupon 20 - 14.01.25 200,000 EUR 200,835 202,360 0.01Allianz Finance II BV Zero Coupon 20 - 14.01.25 100,000 EUR 99,528 101,180 0.00Allianz Finance II BV 0.25% 17 - 06.06.23 400,000 EUR 401,027 405,224 0.02Allianz Finance II BV 0.50% 20 - 14.01.31 700,000 EUR 713,168 730,317 0.03Allianz Finance II BV 0.875% 17 - 06.12.27 800,000 EUR 843,024 858,384 0.04Allianz Finance II BV 0.875% 19 - 15.01.26 300,000 EUR 309,797 316,599 0.01Allianz Finance II BV 1.375% 16 - 21.04.31 700,000 EUR 740,414 796,425 0.04Allianz Finance II BV 1.50% 19 - 15.01.30 700,000 EUR 749,340 798,952 0.04Allianz Finance II BV 3.00% 13 - 13.03.28 800,000 EUR 958,305 986,896 0.05Allianz Finance II BV 3.50% 12 - 14.02.22 1,300,000 EUR 1,351,366 1,356,940 0.06Argentum Netherlands BV for Givaudan SA 1.125%18 - 17.09.25 600,000 EUR 616,220 633,684 0.03Argentum Netherlands BV for Givaudan SA 2.00%18 - 17.09.30 800,000 EUR 879,923 939,608 0.04Argentum Netherlands BV for Swiss Life AG FRN15 - 29.12.49 800,000 EUR 881,947 908,000 0.04Argentum Netherlands BV for Zurich Insurance Co.Ltd. FRN 19 - 19.02.49 400,000 EUR 412,125 457,084 0.02Argentum Netherlands BV for Zurich Insurance Co.Ltd. FRN 16 - 01.10.46 748,000 EUR 837,518 863,259 0.04ASML Holding NV 0.25% 20 - 25.02.30 671,000 EUR 668,138 684,641 0.03ASML Holding NV 0.625% 16 - 07.07.22 920,000 EUR 928,838 930,838 0.04ASML Holding NV 0.625% 20 - 07.05.29 998,000 EUR 998,961 1,047,501 0.05ASML Holding NV 1.375% 16 - 07.07.26 808,000 EUR 853,461 873,844 0.04
Xtrackers II
Xtrackers II EUR CORPORATE BOND UCITS ETF (continued)
Statement of Investmentsas at 31 December 2020(expressed in EUR)
The accompanying notes form an integral part of these financial statements.
190

DescriptionNominal
ValueCurrency
(local) Cost Market Value
% ofNet
Assets
Transferable securities and money market instruments admitted to an official stock exchange listing(A)
Bonds (continued)
Netherlands (continued)ASML Holding NV 1.625% 16 - 28.05.27 303,000 EUR 331,663 335,506 0.02ASML Holding NV 3.375% 13 - 19.09.23 350,000 EUR 377,079 384,433 0.02ASR Nederland NV FRN 19 - 02.05.49 529,000 EUR 552,732 591,158 0.03ASR Nederland NV FRN 14 - 30.09.49 300,000 EUR 327,970 338,196 0.02ASR Nederland NV FRN 15 - 29.09.45 400,000 EUR 464,721 475,000 0.02ATF Netherlands BV FRN 16 - 29.12.49 100,000 EUR 103,581 104,014 0.00ATF Netherlands BV FRN 16 - 29.12.49 200,000 EUR 196,857 208,028 0.01BASF Finance Europe NV 0.75% 16 - 10.11.26 424,000 EUR 443,432 447,278 0.02BAT Netherlands Finance BV 2.375% 20 - 07.10.24 731,000 EUR 759,751 791,212 0.04BAT Netherlands Finance BV 3.125% 20 - 07.04.28 611,000 EUR 655,506 712,658 0.03BAT Netherlands Finance BV 3.125% 20 - 07.04.28 200,000 EUR 212,942 233,276 0.01Bayer Capital Corp. BV 0.625% 18 - 15.12.22 900,000 EUR 908,466 913,122 0.04Bayer Capital Corp. BV 1.25% 14 - 13.11.23 462,000 EUR 469,802 479,907 0.02Bayer Capital Corp. BV 1.50% 18 - 26.06.26 1,500,000 EUR 1,553,149 1,604,985 0.07Bayer Capital Corp. BV 2.125% 18 - 15.12.29 1,400,000 EUR 1,497,535 1,601,992 0.07BMW Finance NV Zero Coupon 19 - 24.03.23 1,000,000 EUR 1,000,971 1,003,110 0.05BMW Finance NV Zero Coupon 20 - 14.04.23 580,000 EUR 579,882 581,891 0.03BMW Finance NV 0.125% 19 - 13.07.22 910,000 EUR 910,521 914,850 0.04BMW Finance NV 0.25% 18 - 14.01.22 509,000 EUR 510,211 511,744 0.02BMW Finance NV 0.375% 18 - 10.07.23 1,400,000 EUR 1,392,518 1,419,026 0.06BMW Finance NV 0.375% 19 - 24.09.27 574,000 EUR 574,276 589,027 0.03BMW Finance NV 0.375% 20 - 14.01.27 686,000 EUR 683,980 702,622 0.03BMW Finance NV 0.50% 18 - 22.11.22 1,289,000 EUR 1,293,304 1,306,414 0.06BMW Finance NV 0.625% 19 - 06.10.23 1,706,000 EUR 1,722,194 1,742,031 0.08BMW Finance NV 0.75% 16 - 15.04.24 779,000 EUR 774,471 801,599 0.04BMW Finance NV 0.75% 17 - 12.07.24 300,000 EUR 303,452 309,402 0.01BMW Finance NV 0.75% 19 - 13.07.26 973,000 EUR 991,493 1,015,608 0.05BMW Finance NV 0.875% 17 - 03.04.25 350,000 EUR 343,735 364,893 0.02BMW Finance NV 0.875% 20 - 14.01.32 320,000 EUR 313,413 344,234 0.02BMW Finance NV 1.00% 15 - 21.01.25 668,000 EUR 696,615 698,755 0.03BMW Finance NV 1.00% 16 - 15.02.22 639,000 EUR 646,061 648,323 0.03BMW Finance NV 1.00% 18 - 29.08.25 74,000 EUR 75,828 77,844 0.00BMW Finance NV 1.00% 18 - 29.08.25 100,000 EUR 96,603 105,195 0.01BMW Finance NV 1.00% 18 - 14.11.24 1,200,000 EUR 1,220,568 1,251,600 0.06BMW Finance NV 1.125% 18 - 10.01.28 638,000 EUR 658,711 690,826 0.03BMW Finance NV 1.125% 18 - 22.05.26 588,000 EUR 600,663 626,338 0.03BMW Finance NV 1.25% 14 - 05.09.22 950,000 EUR 964,204 974,149 0.04BMW Finance NV 1.50% 19 - 06.02.29 1,111,000 EUR 1,170,897 1,238,254 0.06BMW Finance NV 2.375% 13 - 24.01.23 588,000 EUR 614,790 619,840 0.03BMW Finance NV 2.625% 14 - 17.01.24 400,000 EUR 429,329 433,696 0.02BP Capital Markets BV 0.933% 20 - 04.12.40 643,000 EUR 651,025 648,575 0.03Brenntag Finance BV 1.125% 17 - 27.09.25 262,000 EUR 265,508 274,673 0.01Bunge Finance Europe BV 1.85% 16 - 16.06.23 522,000 EUR 532,112 537,916 0.02Citycon Treasury BV 1.25% 16 - 08.09.26 350,000 EUR 320,536 337,719 0.02Citycon Treasury BV 2.375% 18 - 15.01.27 255,000 EUR 235,519 259,501 0.01Citycon Treasury BV 2.50% 14 - 01.10.24 265,000 EUR 265,081 275,094 0.01Coca-Cola HBC Finance BV 0.625% 19 - 21.11.29 302,000 EUR 293,829 312,277 0.01Coca-Cola HBC Finance BV 1.00% 19 - 14.05.27 666,000 EUR 672,757 704,368 0.03
Xtrackers II
Xtrackers II EUR CORPORATE BOND UCITS ETF (continued)
Statement of Investmentsas at 31 December 2020(expressed in EUR)
The accompanying notes form an integral part of these financial statements.
191

DescriptionNominal
ValueCurrency
(local) Cost Market Value
% ofNet
Assets
Transferable securities and money market instruments admitted to an official stock exchange listing(A)
Bonds (continued)
Netherlands (continued)Coca-Cola HBC Finance BV 1.625% 19 - 14.05.31 450,000 EUR 480,199 507,263 0.02Coca-Cola HBC Finance BV 1.875% 16 - 11.11.24 1,006,000 EUR 1,070,853 1,085,675 0.05Compass Group Finance Netherlands BV 0.625% 17 -03.07.24 859,000 EUR 858,892 882,708 0.04Compass Group Finance Netherlands BV 1.50% 18 -05.09.28 606,000 EUR 653,032 674,345 0.03Conti-Gummi Finance BV 1.125% 20 - 25.09.24 940,000 EUR 945,898 972,956 0.04Conti-Gummi Finance BV 2.125% 20 - 27.11.23 490,000 EUR 503,076 517,955 0.02Cooperatieve Rabobank UA 0.25% 19 - 30.10.26 400,000 EUR 398,270 407,828 0.02Cooperatieve Rabobank UA 0.50% 17 - 06.12.22 1,101,000 EUR 1,112,790 1,118,924 0.05Cooperatieve Rabobank UA 0.625% 19 - 27.02.24 1,100,000 EUR 1,108,441 1,126,213 0.05Cooperatieve Rabobank UA 0.75% 18 - 29.08.23 700,000 EUR 706,360 717,311 0.03Cooperatieve Rabobank UA FRN 20 - 05.05.28 900,000 EUR 911,694 944,082 0.04Cooperatieve Rabobank UA 1.125% 19 - 07.05.31 700,000 EUR 709,303 768,705 0.04Cooperatieve Rabobank UA 1.25% 16 - 23.03.26 1,567,000 EUR 1,645,186 1,676,690 0.08Cooperatieve Rabobank UA 1.375% 15 - 03.02.27 1,494,000 EUR 1,589,819 1,622,589 0.07Cooperatieve Rabobank UA 2.375% 13 - 22.05.23 1,550,000 EUR 1,630,135 1,649,525 0.08Cooperatieve Rabobank UA 3.875% 13 - 25.07.23 350,000 EUR 381,168 384,524 0.02Cooperatieve Rabobank UA 3.875% 13 - 25.07.23 100,000 EUR 109,499 109,864 0.01Cooperatieve Rabobank UA 4.00% 12 - 11.01.22 1,450,000 EUR 1,507,726 1,515,975 0.07Cooperatieve Rabobank UA 4.125% 10 - 14.07.25 2,601,000 EUR 3,052,521 3,107,779 0.14Cooperatieve Rabobank UA 4.125% 12 - 14.09.22 1,006,000 EUR 1,072,087 1,077,708 0.05Cooperatieve Rabobank UA 4.75% 07 - 06.06.22 1,551,000 EUR 1,658,674 1,663,928 0.08Cooperatieve Rabobank UA 4.75% 07 - 06.06.22 650,000 EUR 692,875 697,326 0.03CRH Funding BV 1.625% 20 - 05.05.30 536,000 EUR 544,512 601,569 0.03CRH Funding BV 1.875% 15 - 09.01.24 749,000 EUR 776,552 791,071 0.04CTP BV 0.625% 20 - 27.11.23 525,000 EUR 528,217 529,095 0.02CTP BV 2.125% 20 - 01.10.25 508,000 EUR 510,369 537,271 0.02Daimler International Finance BV 0.25% 18 -11.05.22 47,000 EUR 46,728 47,321 0.00Daimler International Finance BV 0.25% 18 -11.05.22 887,000 EUR 884,765 893,067 0.04Daimler International Finance BV 0.25% 19 -06.11.23 790,000 EUR 790,232 795,301 0.04Daimler International Finance BV 0.25% 19 -06.11.23 500,000 EUR 488,068 503,355 0.02Daimler International Finance BV 0.625% 19 -27.02.23 1,067,000 EUR 1,072,871 1,084,029 0.05Daimler International Finance BV 0.625% 19 -06.05.27 750,000 EUR 749,125 767,535 0.04Daimler International Finance BV 0.625% 19 -06.05.27 107,000 EUR 99,259 109,502 0.01Daimler International Finance BV 0.75% 16 -11.05.23 809,000 EUR 819,614 826,847 0.04Daimler International Finance BV 0.85% 17 -28.02.25 20,000 EUR 19,991 20,666 0.00Daimler International Finance BV 0.85% 17 -28.02.25 977,000 EUR 964,663 1,009,524 0.05
Xtrackers II
Xtrackers II EUR CORPORATE BOND UCITS ETF (continued)
Statement of Investmentsas at 31 December 2020(expressed in EUR)
The accompanying notes form an integral part of these financial statements.
192

DescriptionNominal
ValueCurrency
(local) Cost Market Value
% ofNet
Assets
Transferable securities and money market instruments admitted to an official stock exchange listing(A)
Bonds (continued)
Netherlands (continued)Daimler International Finance BV 0.875% 18 -09.04.24 312,000 EUR 317,555 320,262 0.01Daimler International Finance BV 0.875% 18 -09.04.24 612,000 EUR 603,926 628,206 0.03Daimler International Finance BV 1.00% 18 -11.11.25 750,000 EUR 759,331 783,330 0.04Daimler International Finance BV 1.00% 18 -11.11.25 382,000 EUR 370,006 398,976 0.02Daimler International Finance BV 1.375% 19 -26.06.26 930,000 EUR 942,783 992,487 0.05Daimler International Finance BV 1.50% 18 -09.02.27 80,000 EUR 79,902 86,167 0.00Daimler International Finance BV 1.50% 18 -09.02.27 410,000 EUR 423,439 441,607 0.02Daimler International Finance BV 2.375% 12 -12.09.22 592,000 EUR 612,355 617,989 0.03de Volksbank NV 0.01% 19 - 16.09.24 100,000 EUR 98,952 100,662 0.00de Volksbank NV 0.75% 18 - 25.06.23 900,000 EUR 905,386 919,242 0.04de Volksbank NV FRN 20 - 22.10.30 400,000 EUR 410,431 422,224 0.02Deutsche Post Finance BV 2.95% 12 - 27.06.22 257,000 EUR 268,842 269,495 0.01Deutsche Telekom International Finance BV 0.625%16 - 03.04.23 1,655,000 EUR 1,670,448 1,687,686 0.08Deutsche Telekom International Finance BV 0.625%17 - 13.12.24 503,000 EUR 510,450 520,032 0.02Deutsche Telekom International Finance BV 0.625%18 - 01.12.22 400,000 EUR 404,942 406,648 0.02Deutsche Telekom International Finance BV 0.875%17 - 30.01.24 1,132,000 EUR 1,152,051 1,170,092 0.05Deutsche Telekom International Finance BV 1.125%17 - 22.05.26 785,000 EUR 801,534 837,540 0.04Deutsche Telekom International Finance BV 1.375%17 - 30.01.27 1,143,000 EUR 1,182,728 1,242,898 0.06Deutsche Telekom International Finance BV 1.375%18 - 01.12.25 573,000 EUR 598,033 615,688 0.03Deutsche Telekom International Finance BV 1.50%16 - 03.04.28 1,432,000 EUR 1,494,226 1,582,374 0.07Deutsche Telekom International Finance BV 2.00%18 - 01.12.29 941,000 EUR 1,008,337 1,100,499 0.05Deutsche Telekom International Finance BV 2.75%12 - 24.10.24 550,000 EUR 599,655 613,129 0.03Deutsche Telekom International Finance BV 3.25%13 - 17.01.28 700,000 EUR 798,513 857,311 0.04Deutsche Telekom International Finance BV 4.25%10 - 13.07.22 1,145,000 EUR 1,216,879 1,224,348 0.06Deutsche Telekom International Finance BV 4.50%10 - 28.10.30 227,000 EUR 303,851 318,858 0.01Deutsche Telekom International Finance BV 4.875%10 - 22.04.25 400,000 EUR 473,566 487,824 0.02
Xtrackers II
Xtrackers II EUR CORPORATE BOND UCITS ETF (continued)
Statement of Investmentsas at 31 December 2020(expressed in EUR)
The accompanying notes form an integral part of these financial statements.
193
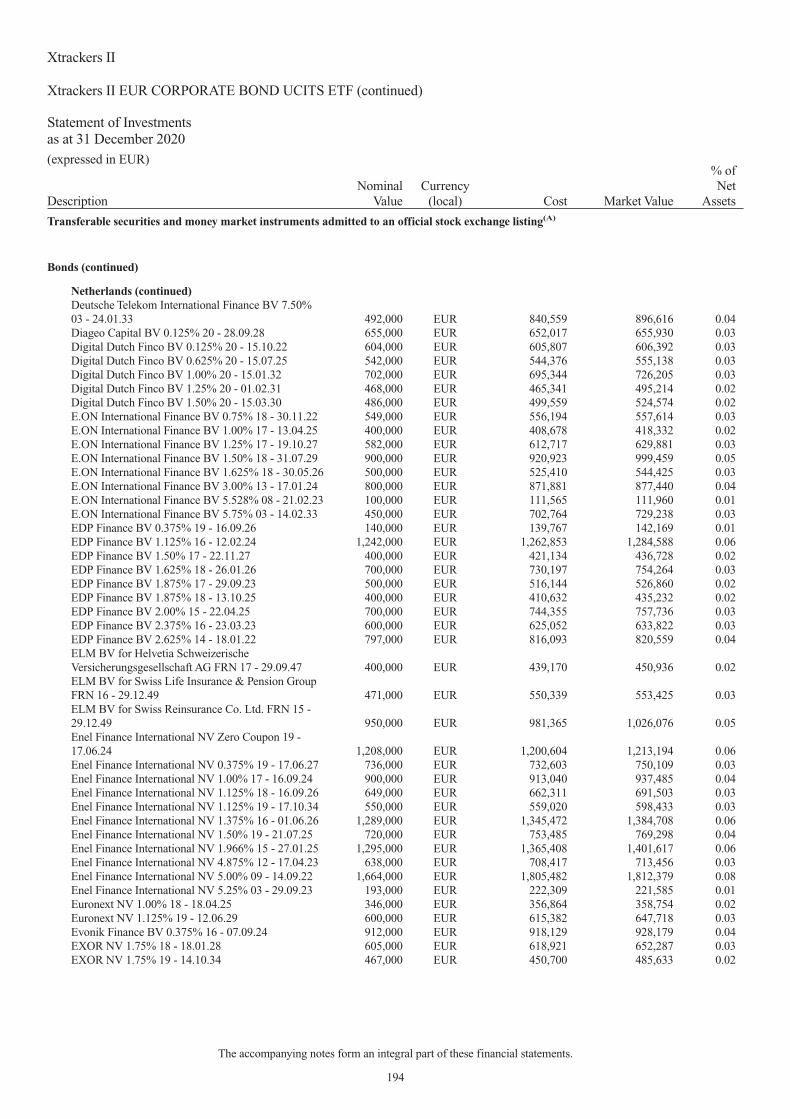
DescriptionNominal
ValueCurrency
(local) Cost Market Value
% ofNet
Assets
Transferable securities and money market instruments admitted to an official stock exchange listing(A)
Bonds (continued)
Netherlands (continued)Deutsche Telekom International Finance BV 7.50%03 - 24.01.33 492,000 EUR 840,559 896,616 0.04Diageo Capital BV 0.125% 20 - 28.09.28 655,000 EUR 652,017 655,930 0.03Digital Dutch Finco BV 0.125% 20 - 15.10.22 604,000 EUR 605,807 606,392 0.03Digital Dutch Finco BV 0.625% 20 - 15.07.25 542,000 EUR 544,376 555,138 0.03Digital Dutch Finco BV 1.00% 20 - 15.01.32 702,000 EUR 695,344 726,205 0.03Digital Dutch Finco BV 1.25% 20 - 01.02.31 468,000 EUR 465,341 495,214 0.02Digital Dutch Finco BV 1.50% 20 - 15.03.30 486,000 EUR 499,559 524,574 0.02E.ON International Finance BV 0.75% 18 - 30.11.22 549,000 EUR 556,194 557,614 0.03E.ON International Finance BV 1.00% 17 - 13.04.25 400,000 EUR 408,678 418,332 0.02E.ON International Finance BV 1.25% 17 - 19.10.27 582,000 EUR 612,717 629,881 0.03E.ON International Finance BV 1.50% 18 - 31.07.29 900,000 EUR 920,923 999,459 0.05E.ON International Finance BV 1.625% 18 - 30.05.26 500,000 EUR 525,410 544,425 0.03E.ON International Finance BV 3.00% 13 - 17.01.24 800,000 EUR 871,881 877,440 0.04E.ON International Finance BV 5.528% 08 - 21.02.23 100,000 EUR 111,565 111,960 0.01E.ON International Finance BV 5.75% 03 - 14.02.33 450,000 EUR 702,764 729,238 0.03EDP Finance BV 0.375% 19 - 16.09.26 140,000 EUR 139,767 142,169 0.01EDP Finance BV 1.125% 16 - 12.02.24 1,242,000 EUR 1,262,853 1,284,588 0.06EDP Finance BV 1.50% 17 - 22.11.27 400,000 EUR 421,134 436,728 0.02EDP Finance BV 1.625% 18 - 26.01.26 700,000 EUR 730,197 754,264 0.03EDP Finance BV 1.875% 17 - 29.09.23 500,000 EUR 516,144 526,860 0.02EDP Finance BV 1.875% 18 - 13.10.25 400,000 EUR 410,632 435,232 0.02EDP Finance BV 2.00% 15 - 22.04.25 700,000 EUR 744,355 757,736 0.03EDP Finance BV 2.375% 16 - 23.03.23 600,000 EUR 625,052 633,822 0.03EDP Finance BV 2.625% 14 - 18.01.22 797,000 EUR 816,093 820,559 0.04ELM BV for Helvetia SchweizerischeVersicherungsgesellschaft AG FRN 17 - 29.09.47 400,000 EUR 439,170 450,936 0.02ELM BV for Swiss Life Insurance & Pension GroupFRN 16 - 29.12.49 471,000 EUR 550,339 553,425 0.03ELM BV for Swiss Reinsurance Co. Ltd. FRN 15 -29.12.49 950,000 EUR 981,365 1,026,076 0.05Enel Finance International NV Zero Coupon 19 -17.06.24 1,208,000 EUR 1,200,604 1,213,194 0.06Enel Finance International NV 0.375% 19 - 17.06.27 736,000 EUR 732,603 750,109 0.03Enel Finance International NV 1.00% 17 - 16.09.24 900,000 EUR 913,040 937,485 0.04Enel Finance International NV 1.125% 18 - 16.09.26 649,000 EUR 662,311 691,503 0.03Enel Finance International NV 1.125% 19 - 17.10.34 550,000 EUR 559,020 598,433 0.03Enel Finance International NV 1.375% 16 - 01.06.26 1,289,000 EUR 1,345,472 1,384,708 0.06Enel Finance International NV 1.50% 19 - 21.07.25 720,000 EUR 753,485 769,298 0.04Enel Finance International NV 1.966% 15 - 27.01.25 1,295,000 EUR 1,365,408 1,401,617 0.06Enel Finance International NV 4.875% 12 - 17.04.23 638,000 EUR 708,417 713,456 0.03Enel Finance International NV 5.00% 09 - 14.09.22 1,664,000 EUR 1,805,482 1,812,379 0.08Enel Finance International NV 5.25% 03 - 29.09.23 193,000 EUR 222,309 221,585 0.01Euronext NV 1.00% 18 - 18.04.25 346,000 EUR 356,864 358,754 0.02Euronext NV 1.125% 19 - 12.06.29 600,000 EUR 615,382 647,718 0.03Evonik Finance BV 0.375% 16 - 07.09.24 912,000 EUR 918,129 928,179 0.04EXOR NV 1.75% 18 - 18.01.28 605,000 EUR 618,921 652,287 0.03EXOR NV 1.75% 19 - 14.10.34 467,000 EUR 450,700 485,633 0.02
Xtrackers II
Xtrackers II EUR CORPORATE BOND UCITS ETF (continued)
Statement of Investmentsas at 31 December 2020(expressed in EUR)
The accompanying notes form an integral part of these financial statements.
194

DescriptionNominal
ValueCurrency
(local) Cost Market Value
% ofNet
Assets
Transferable securities and money market instruments admitted to an official stock exchange listing(A)
Bonds (continued)
Netherlands (continued)EXOR NV 2.125% 15 - 02.12.22 850,000 EUR 872,798 881,288 0.04EXOR NV 2.25% 20 - 29.04.30 300,000 EUR 304,387 330,345 0.02EXOR NV 2.50% 14 - 08.10.24 450,000 EUR 478,274 488,466 0.02Givaudan Finance Europe BV 1.00% 20 - 22.04.27 357,000 EUR 368,918 380,419 0.02Givaudan Finance Europe BV 1.625% 20 - 22.04.32 399,000 EUR 423,557 454,549 0.02Global Switch Finance BV 1.375% 20 - 07.10.30 608,000 EUR 615,425 633,378 0.03Heimstaden Bostad Treasury BV 1.375% 20 -03.03.27 575,000 EUR 571,820 604,003 0.03Heineken NV 1.00% 16 - 04.05.26 700,000 EUR 718,882 739,543 0.03Heineken NV 1.25% 18 - 17.03.27 598,000 EUR 618,375 644,160 0.03Heineken NV 1.25% 20 - 07.05.33 600,000 EUR 599,196 658,206 0.03Heineken NV 1.375% 16 - 29.01.27 415,000 EUR 421,045 450,196 0.02Heineken NV 1.50% 15 - 07.12.24 182,000 EUR 191,477 193,470 0.01Heineken NV 1.50% 17 - 03.10.29 500,000 EUR 527,329 559,745 0.03Heineken NV 1.625% 20 - 30.03.25 955,000 EUR 986,601 1,024,619 0.05Heineken NV 1.75% 18 - 17.03.31 600,000 EUR 629,514 688,788 0.03Heineken NV 1.75% 20 - 07.05.40 680,000 EUR 702,851 781,184 0.04Heineken NV 2.25% 20 - 30.03.30 695,000 EUR 751,826 822,324 0.04Heineken NV 2.875% 12 - 04.08.25 923,000 EUR 1,045,857 1,048,399 0.05Heineken NV 3.50% 12 - 19.03.24 415,000 EUR 460,040 464,427 0.02Iberdrola International BV 0.375% 16 - 15.09.25 400,000 EUR 402,993 408,796 0.02Iberdrola International BV 1.125% 15 - 27.01.23 600,000 EUR 613,340 616,650 0.03Iberdrola International BV 1.125% 16 - 21.04.26 1,000,000 EUR 1,039,081 1,063,390 0.05Iberdrola International BV 1.75% 15 - 17.09.23 900,000 EUR 940,337 947,304 0.04Iberdrola International BV FRN 20 - 31.12.99 1,600,000 EUR 1,606,914 1,648,000 0.08Iberdrola International BV 1.875% 14 - 08.10.24 800,000 EUR 845,539 861,112 0.04Iberdrola International BV FRN 17 - 31.12.99 700,000 EUR 697,776 717,507 0.03Iberdrola International BV FRN 20 - 31.12.99 1,200,000 EUR 1,200,218 1,260,456 0.06Iberdrola International BV 2.50% 14 - 24.10.22 500,000 EUR 522,633 524,910 0.02Iberdrola International BV FRN 18 - 31.12.99 600,000 EUR 619,759 634,158 0.03Iberdrola International BV 3.00% 13 - 31.01.22 400,000 EUR 412,903 414,028 0.02Iberdrola International BV FRN 19 - 31.12.99 500,000 EUR 525,977 547,445 0.03ING Bank NV Zero Coupon 19 - 08.04.22 400,000 EUR 400,597 402,052 0.02ING Bank NV 4.50% 12 - 21.02.22 1,336,000 EUR 1,403,195 1,411,177 0.06ING Groep NV FRN 19 - 03.09.25 200,000 EUR 199,211 200,776 0.01ING Groep NV FRN 19 - 03.09.25 500,000 EUR 492,921 501,940 0.02ING Groep NV FRN 20 - 18.02.29 1,100,000 EUR 1,093,521 1,098,999 0.05ING Groep NV 0.75% 17 - 09.03.22 1,100,000 EUR 1,106,411 1,112,705 0.05ING Groep NV 1.00% 18 - 20.09.23 600,000 EUR 604,092 619,470 0.03ING Groep NV FRN 19 - 13.11.30 900,000 EUR 884,663 911,277 0.04ING Groep NV 1.125% 18 - 14.02.25 700,000 EUR 714,036 732,676 0.03ING Groep NV 1.375% 17 - 11.01.28 400,000 EUR 423,999 436,248 0.02ING Groep NV FRN 17 - 26.09.29 700,000 EUR 690,712 726,488 0.03ING Groep NV FRN 18 - 22.03.30 600,000 EUR 591,096 634,866 0.03ING Groep NV 2.00% 18 - 20.09.28 1,400,000 EUR 1,481,174 1,597,344 0.07ING Groep NV 2.125% 19 - 10.01.26 900,000 EUR 962,233 994,509 0.05ING Groep NV FRN 20 - 26.05.31 1,400,000 EUR 1,427,106 1,495,998 0.07ING Groep NV FRN 17 - 15.02.29 800,000 EUR 836,342 850,128 0.04
Xtrackers II
Xtrackers II EUR CORPORATE BOND UCITS ETF (continued)
Statement of Investmentsas at 31 December 2020(expressed in EUR)
The accompanying notes form an integral part of these financial statements.
195

DescriptionNominal
ValueCurrency
(local) Cost Market Value
% ofNet
Assets
Transferable securities and money market instruments admitted to an official stock exchange listing(A)
Bonds (continued)
Netherlands (continued)ING Groep NV 2.50% 18 - 15.11.30 1,500,000 EUR 1,706,097 1,854,165 0.08ING Groep NV FRN 17 - 11.04.28 1,200,000 EUR 1,243,118 1,270,248 0.06ISS Finance BV 1.25% 20 - 07.07.25 373,000 EUR 380,866 381,120 0.02JAB Holdings BV 1.00% 19 - 20.12.27 600,000 EUR 612,281 625,968 0.03JAB Holdings BV 1.25% 17 - 22.05.24 600,000 EUR 624,995 623,292 0.03JAB Holdings BV 1.625% 15 - 30.04.25 300,000 EUR 302,936 318,654 0.01JAB Holdings BV 1.625% 15 - 30.04.25 700,000 EUR 722,386 743,526 0.03JAB Holdings BV 1.75% 16 - 25.05.23 600,000 EUR 628,800 626,904 0.03JAB Holdings BV 1.75% 18 - 25.06.26 500,000 EUR 518,122 536,885 0.02JAB Holdings BV 2.00% 17 - 18.05.28 600,000 EUR 621,537 660,042 0.03JAB Holdings BV 2.125% 15 - 16.09.22 300,000 EUR 311,299 312,186 0.01JAB Holdings BV 2.25% 19 - 19.12.39 600,000 EUR 608,675 669,186 0.03JAB Holdings BV 2.50% 18 - 25.06.29 700,000 EUR 740,367 802,088 0.04JAB Holdings BV 2.50% 20 - 17.04.27 400,000 EUR 409,622 448,512 0.02JAB Holdings BV 3.375% 20 - 17.04.35 300,000 EUR 325,286 381,276 0.02JAB Holdings BV 3.375% 20 - 17.04.35 100,000 EUR 110,809 127,092 0.01JT International Financial Services BV 1.00% 19 -26.11.29 314,000 EUR 320,151 330,074 0.02JT International Financial Services BV 1.125% 18 -28.09.25 810,000 EUR 824,397 854,914 0.04JT International Financial Services BV FRN 20 -07.04.81 445,000 EUR 461,554 474,050 0.02JT International Financial Services BV FRN 20 -07.10.83 345,000 EUR 369,019 381,891 0.02Koninklijke Ahold Delhaize NV 0.25% 19 - 26.06.25 400,000 EUR 404,120 407,960 0.02Koninklijke Ahold Delhaize NV 0.875% 17 - 19.09.24 733,000 EUR 748,977 761,037 0.03Koninklijke Ahold Delhaize NV 1.125% 18 - 19.03.26 500,000 EUR 525,661 532,200 0.02Koninklijke Ahold Delhaize NV 1.75% 20 - 02.04.27 429,000 EUR 444,051 475,821 0.02Koninklijke DSM NV 0.25% 20 - 23.06.28 466,000 EUR 465,245 475,697 0.02Koninklijke DSM NV 0.625% 20 - 23.06.32 400,000 EUR 397,202 417,340 0.02Koninklijke DSM NV 0.75% 16 - 28.09.26 800,000 EUR 817,202 843,296 0.04Koninklijke DSM NV 1.00% 15 - 09.04.25 892,000 EUR 925,559 936,100 0.04Koninklijke DSM NV 1.375% 15 - 26.09.22 300,000 EUR 305,901 309,204 0.01Koninklijke DSM NV 2.375% 14 - 03.04.24 200,000 EUR 211,320 215,914 0.01Koninklijke KPN NV 0.625% 16 - 09.04.25 200,000 EUR 200,017 203,194 0.01Koninklijke KPN NV 0.875% 20 - 14.12.32 600,000 EUR 595,764 608,898 0.03Koninklijke KPN NV 1.125% 16 - 11.09.28 500,000 EUR 509,306 517,555 0.02Koninklijke KPN NV 4.25% 12 - 01.03.22 600,000 EUR 628,546 627,924 0.03Koninklijke KPN NV 5.625% 09 - 30.09.24 300,000 EUR 355,279 356,109 0.02Koninklijke Philips NV 0.50% 17 - 06.09.23 562,000 EUR 565,739 571,627 0.03Koninklijke Philips NV 0.50% 19 - 22.05.26 516,000 EUR 525,372 532,362 0.02Koninklijke Philips NV 0.75% 18 - 02.05.24 319,000 EUR 323,245 327,922 0.02Koninklijke Philips NV 1.375% 18 - 02.05.28 427,000 EUR 452,345 470,063 0.02Koninklijke Philips NV 1.375% 20 - 30.03.25 579,000 EUR 593,463 613,503 0.03Koninklijke Philips NV 2.00% 20 - 30.03.30 307,000 EUR 338,955 356,274 0.02LeasePlan Corp. NV 0.125% 19 - 13.09.23 500,000 EUR 496,479 501,505 0.02LeasePlan Corp. NV 0.125% 19 - 13.09.23 100,000 EUR 98,592 100,301 0.00LeasePlan Corp. NV 0.75% 17 - 03.10.22 1,042,000 EUR 1,047,591 1,055,734 0.05
Xtrackers II
Xtrackers II EUR CORPORATE BOND UCITS ETF (continued)
Statement of Investmentsas at 31 December 2020(expressed in EUR)
The accompanying notes form an integral part of these financial statements.
196

DescriptionNominal
ValueCurrency
(local) Cost Market Value
% ofNet
Assets
Transferable securities and money market instruments admitted to an official stock exchange listing(A)
Bonds (continued)
Netherlands (continued)LeasePlan Corp. NV 1.00% 18 - 02.05.23 466,000 EUR 469,249 476,727 0.02LeasePlan Corp. NV 1.00% 19 - 25.02.22 849,000 EUR 844,054 860,402 0.04LeasePlan Corp. NV 1.375% 19 - 07.03.24 150,000 EUR 153,543 156,222 0.01LeasePlan Corp. NV 3.50% 20 - 09.04.25 499,000 EUR 518,927 567,917 0.03Linde Finance BV 0.25% 17 - 18.01.22 708,000 EUR 709,591 711,866 0.03Linde Finance BV 0.25% 20 - 19.05.27 600,000 EUR 600,305 611,628 0.03Linde Finance BV 0.25% 20 - 19.05.27 300,000 EUR 300,777 305,814 0.01Linde Finance BV 0.55% 20 - 19.05.32 600,000 EUR 600,565 625,650 0.03Linde Finance BV 1.00% 16 - 20.04.28 658,000 EUR 687,957 714,108 0.03Linde Finance BV 1.875% 14 - 22.05.24 389,000 EUR 411,398 418,331 0.02Linde Finance BV 2.00% 13 - 18.04.23 750,000 EUR 784,861 788,707 0.04LYB International Finance II BV 0.875% 19 -17.09.26 400,000 EUR 399,652 413,440 0.02LYB International Finance II BV 1.625% 19 -17.09.31 383,000 EUR 383,839 429,603 0.02Madrilena Red de Gas Finance BV 1.375% 17 -11.04.25 400,000 EUR 404,419 413,308 0.02Madrilena Red de Gas Finance BV 2.25% 17 -11.04.29 174,000 EUR 184,806 189,284 0.01Mondelez International Holdings Netherlands BVZero Coupon 20 - 22.09.26 768,000 EUR 764,012 770,627 0.04Mondelez International Holdings Netherlands BV0.375% 20 - 22.09.29 390,000 EUR 388,257 395,651 0.02Mondelez International Holdings Netherlands BV0.875% 19 - 01.10.31 800,000 EUR 807,925 849,208 0.04Nationale-Nederlanden Bank NV 0.375% 19 -31.05.23 100,000 EUR 101,065 101,377 0.00Nationale-Nederlanden Bank NV 0.375% 19 -26.02.25 500,000 EUR 501,584 511,100 0.02Nationale-Nederlanden LevensverzekeringMaatschappij NV FRN 12 - 29.08.42 524,000 EUR 645,633 599,964 0.03Naturgy Finance BV 0.75% 19 - 28.11.29 800,000 EUR 799,555 833,592 0.04Naturgy Finance BV 0.875% 17 - 15.05.25 700,000 EUR 705,978 726,831 0.03Naturgy Finance BV 1.25% 16 - 19.04.26 500,000 EUR 523,145 530,015 0.02Naturgy Finance BV 1.25% 20 - 15.01.26 600,000 EUR 615,346 635,610 0.03Naturgy Finance BV 1.375% 15 - 21.01.25 400,000 EUR 414,209 423,760 0.02Naturgy Finance BV 1.375% 17 - 19.01.27 900,000 EUR 911,236 966,141 0.04Naturgy Finance BV 1.50% 18 - 29.01.28 800,000 EUR 835,203 873,152 0.04Naturgy Finance BV 1.875% 17 - 05.10.29 100,000 EUR 103,102 113,656 0.01Naturgy Finance BV 2.875% 14 - 11.03.24 400,000 EUR 429,833 437,564 0.02Naturgy Finance BV 3.875% 13 - 17.01.23 200,000 EUR 215,235 216,218 0.01Naturgy Finance BV 3.875% 13 - 11.04.22 300,000 EUR 314,362 315,387 0.01NE Property BV 1.75% 17 - 23.11.24 650,000 EUR 616,587 665,782 0.03NE Property BV 1.875% 19 - 09.10.26 500,000 EUR 488,735 502,095 0.02NE Property BV 2.625% 19 - 22.05.23 165,000 EUR 165,488 171,541 0.01NE Property BV 3.375% 20 - 14.07.27 373,000 EUR 372,616 405,410 0.02NIBC Bank NV 0.875% 19 - 08.07.25 300,000 EUR 299,953 307,443 0.01NIBC Bank NV 1.125% 18 - 19.04.23 450,000 EUR 451,091 461,516 0.02
Xtrackers II
Xtrackers II EUR CORPORATE BOND UCITS ETF (continued)
Statement of Investmentsas at 31 December 2020(expressed in EUR)
The accompanying notes form an integral part of these financial statements.
197

DescriptionNominal
ValueCurrency
(local) Cost Market Value
% ofNet
Assets
Transferable securities and money market instruments admitted to an official stock exchange listing(A)
Bonds (continued)
Netherlands (continued)NIBC Bank NV 1.50% 17 - 31.01.22 446,000 EUR 452,922 453,983 0.02NIBC Bank NV 2.00% 19 - 09.04.24 300,000 EUR 306,342 313,878 0.01NN Group NV 0.875% 17 - 13.01.23 500,000 EUR 505,762 509,595 0.02NN Group NV 1.00% 15 - 18.03.22 600,000 EUR 605,410 608,958 0.03NN Group NV 1.625% 17 - 01.06.27 300,000 EUR 307,774 329,178 0.02NN Group NV FRN 14 - 29.06.49 664,000 EUR 721,038 735,466 0.03NN Group NV FRN 14 - 15.07.49 641,000 EUR 698,595 739,477 0.03NN Group NV FRN 14 - 08.04.44 1,100,000 EUR 1,206,059 1,234,937 0.06NN Group NV FRN 17 - 13.01.48 800,000 EUR 904,060 962,488 0.04PACCAR Financial Europe BV Zero Coupon 20 -03.03.23 200,000 EUR 200,583 200,212 0.01PACCAR Financial Europe BV Zero Coupon 20 -03.03.23 200,000 EUR 195,391 200,212 0.01PACCAR Financial Europe BV 0.125% 19 - 07.03.22 100,000 EUR 99,962 100,337 0.00PostNL NV 0.625% 19 - 23.09.26 30,000 EUR 29,828 31,097 0.00PostNL NV 0.625% 19 - 23.09.26 100,000 EUR 98,990 103,658 0.00PostNL NV 1.00% 17 - 21.11.24 200,000 EUR 203,566 207,454 0.01Prosus NV 1.539% 20 - 03.08.28 729,000 EUR 741,991 751,482 0.03Prosus NV 2.031% 20 - 03.08.32 623,000 EUR 640,473 648,250 0.03Reckitt Benckiser Treasury Services Nederland BV0.375% 20 - 19.05.26 792,000 EUR 793,159 813,574 0.04Reckitt Benckiser Treasury Services Nederland BV0.75% 20 - 19.05.30 811,000 EUR 817,728 859,984 0.04Redexis Gas Finance BV 1.875% 15 - 27.04.27 400,000 EUR 412,238 434,968 0.02Redexis Gas Finance BV 1.875% 20 - 28.05.25 200,000 EUR 205,883 212,932 0.01RELX Finance BV Zero Coupon 20 - 18.03.24 872,000 EUR 861,368 874,668 0.04RELX Finance BV 0.50% 20 - 10.03.28 506,000 EUR 483,032 516,459 0.02RELX Finance BV 0.875% 20 - 10.03.32 566,000 EUR 550,036 590,355 0.03RELX Finance BV 1.00% 17 - 22.03.24 400,000 EUR 410,085 413,320 0.02RELX Finance BV 1.375% 16 - 12.05.26 420,000 EUR 444,215 450,710 0.02RELX Finance BV 1.50% 18 - 13.05.27 300,000 EUR 308,914 325,764 0.02Ren Finance BV 1.75% 16 - 01.06.23 655,000 EUR 676,204 683,551 0.03Ren Finance BV 1.75% 18 - 18.01.28 200,000 EUR 217,430 219,334 0.01Ren Finance BV 2.50% 15 - 12.02.25 192,000 EUR 204,793 212,519 0.01Repsol International Finance BV 0.125% 20 -05.10.24 900,000 EUR 899,722 905,445 0.04Repsol International Finance BV 0.25% 19 - 02.08.27 600,000 EUR 585,980 604,620 0.03Repsol International Finance BV 0.50% 17 - 23.05.22 100,000 EUR 100,495 101,035 0.00Repsol International Finance BV 2.00% 20 - 15.12.25 1,100,000 EUR 1,144,039 1,203,389 0.06Repsol International Finance BV 2.25% 14 - 10.12.26 100,000 EUR 106,698 113,509 0.01Repsol International Finance BV 2.625% 20 -15.04.30 600,000 EUR 655,013 715,596 0.03Robert Bosch Investment Nederland BV 2.625% 13 -24.05.28 700,000 EUR 812,854 837,928 0.04Roche Finance Europe BV 0.50% 16 - 27.02.23 1,064,000 EUR 1,075,736 1,082,812 0.05Roche Finance Europe BV 0.875% 15 - 25.02.25 640,000 EUR 663,923 669,696 0.03Schlumberger Finance BV Zero Coupon 19 - 15.10.24 299,000 EUR 299,642 301,078 0.01Schlumberger Finance BV 0.25% 19 - 15.10.27 70,000 EUR 69,869 71,021 0.00
Xtrackers II
Xtrackers II EUR CORPORATE BOND UCITS ETF (continued)
Statement of Investmentsas at 31 December 2020(expressed in EUR)
The accompanying notes form an integral part of these financial statements.
198

DescriptionNominal
ValueCurrency
(local) Cost Market Value
% ofNet
Assets
Transferable securities and money market instruments admitted to an official stock exchange listing(A)
Bonds (continued)
Netherlands (continued)Schlumberger Finance BV 0.25% 19 - 15.10.27 303,000 EUR 279,037 307,421 0.01Schlumberger Finance BV 0.50% 19 - 15.10.31 759,000 EUR 689,637 772,518 0.04Schlumberger Finance BV 1.375% 20 - 28.10.26 890,000 EUR 892,791 959,028 0.04Schlumberger Finance BV 2.00% 20 - 06.05.32 914,000 EUR 940,564 1,067,744 0.05Shell International Finance BV 0.125% 19 - 08.11.27 1,040,000 EUR 1,008,429 1,052,761 0.05Shell International Finance BV 0.375% 16 - 15.02.25 1,073,000 EUR 1,080,042 1,099,321 0.05Shell International Finance BV 0.50% 19 - 08.11.31 912,000 EUR 883,841 933,833 0.04Shell International Finance BV 0.50% 20 - 11.05.24 641,000 EUR 645,644 656,724 0.03Shell International Finance BV 0.50% 20 - 11.05.24 100,000 EUR 100,821 102,453 0.00Shell International Finance BV 0.75% 16 - 12.05.24 437,000 EUR 447,534 451,500 0.02Shell International Finance BV 0.75% 16 - 15.08.28 400,000 EUR 383,474 421,484 0.02Shell International Finance BV 0.875% 19 - 08.11.39 866,000 EUR 836,019 884,420 0.04Shell International Finance BV 1.00% 14 - 06.04.22 760,000 EUR 770,608 772,662 0.04Shell International Finance BV 1.125% 20 - 07.04.24 1,097,000 EUR 1,126,455 1,145,904 0.05Shell International Finance BV 1.25% 15 - 15.03.22 793,000 EUR 805,367 808,234 0.04Shell International Finance BV 1.25% 15 - 15.03.22 200,000 EUR 203,570 203,842 0.01Shell International Finance BV 1.25% 16 - 12.05.28 1,200,000 EUR 1,273,956 1,307,724 0.06Shell International Finance BV 1.25% 20 - 11.11.32 689,000 EUR 702,135 761,090 0.03Shell International Finance BV 1.50% 20 - 07.04.28 897,000 EUR 944,679 994,854 0.05Shell International Finance BV 1.50% 20 - 07.04.28 400,000 EUR 423,726 443,636 0.02Shell International Finance BV 1.625% 14 - 20.01.27 1,138,000 EUR 1,231,786 1,254,702 0.06Shell International Finance BV 1.875% 15 - 15.09.25 900,000 EUR 965,050 988,650 0.05Shell International Finance BV 1.875% 15 - 15.09.25 200,000 EUR 217,308 219,700 0.01Shell International Finance BV 1.875% 20 - 07.04.32 832,000 EUR 902,788 976,560 0.04Shell International Finance BV 2.50% 14 - 24.03.26 600,000 EUR 658,149 684,174 0.03Siemens Financieringsmaatschappij NV Zero Coupon19 - 05.09.24 190,000 EUR 191,317 191,594 0.01Siemens Financieringsmaatschappij NV Zero Coupon20 - 20.02.23 1,000,000 EUR 1,001,914 1,005,290 0.05Siemens Financieringsmaatschappij NV Zero Coupon20 - 20.02.26 800,000 EUR 795,828 808,088 0.04Siemens Financieringsmaatschappij NV Zero Coupon20 - 20.02.26 300,000 EUR 296,744 303,033 0.01Siemens Financieringsmaatschappij NV 0.125% 19 -05.09.29 784,000 EUR 770,110 797,955 0.04Siemens Financieringsmaatschappij NV 0.125% 20 -05.06.22 1,100,000 EUR 1,101,215 1,106,611 0.05Siemens Financieringsmaatschappij NV 0.25% 20 -20.02.29 900,000 EUR 893,098 924,021 0.04Siemens Financieringsmaatschappij NV 0.25% 20 -05.06.24 900,000 EUR 902,015 915,309 0.04Siemens Financieringsmaatschappij NV 0.30% 19 -28.02.24 709,000 EUR 714,209 722,641 0.03Siemens Financieringsmaatschappij NV 0.375% 18 -06.09.23 900,000 EUR 907,243 916,641 0.04Siemens Financieringsmaatschappij NV 0.375% 20 -05.06.26 1,000,000 EUR 1,003,585 1,028,710 0.05
Xtrackers II
Xtrackers II EUR CORPORATE BOND UCITS ETF (continued)
Statement of Investmentsas at 31 December 2020(expressed in EUR)
The accompanying notes form an integral part of these financial statements.
199
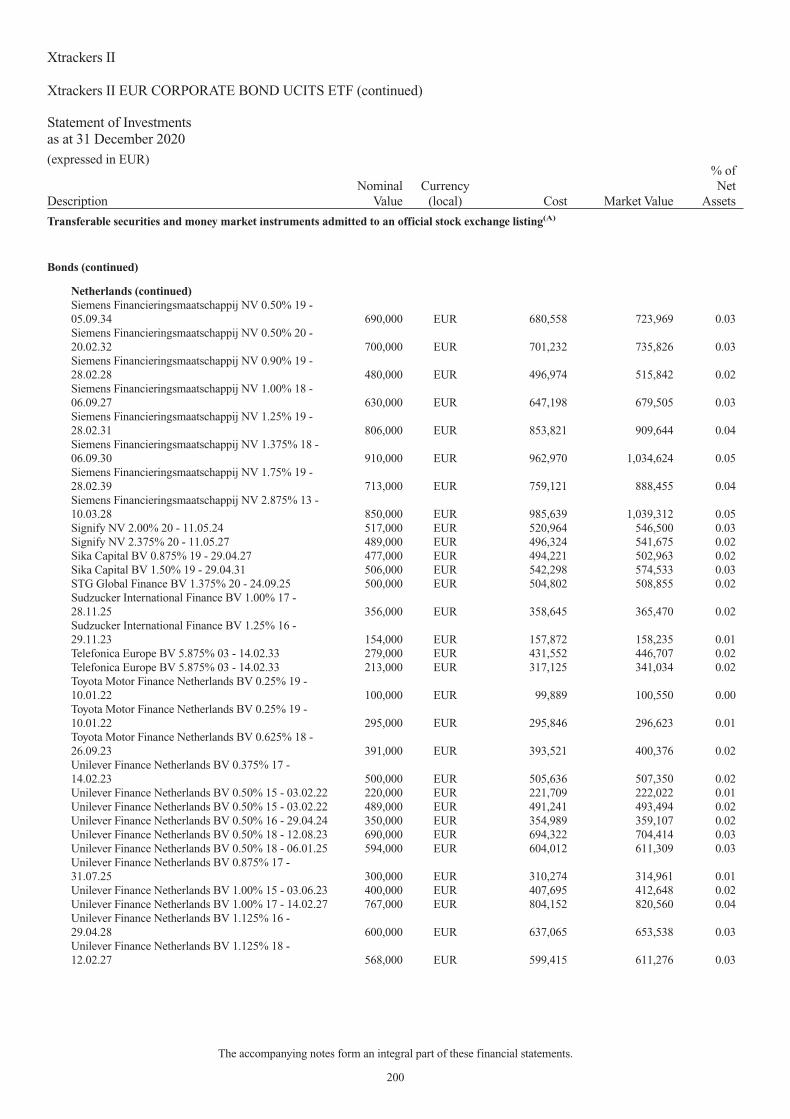
DescriptionNominal
ValueCurrency
(local) Cost Market Value
% ofNet
Assets
Transferable securities and money market instruments admitted to an official stock exchange listing(A)
Bonds (continued)
Netherlands (continued)Siemens Financieringsmaatschappij NV 0.50% 19 -05.09.34 690,000 EUR 680,558 723,969 0.03Siemens Financieringsmaatschappij NV 0.50% 20 -20.02.32 700,000 EUR 701,232 735,826 0.03Siemens Financieringsmaatschappij NV 0.90% 19 -28.02.28 480,000 EUR 496,974 515,842 0.02Siemens Financieringsmaatschappij NV 1.00% 18 -06.09.27 630,000 EUR 647,198 679,505 0.03Siemens Financieringsmaatschappij NV 1.25% 19 -28.02.31 806,000 EUR 853,821 909,644 0.04Siemens Financieringsmaatschappij NV 1.375% 18 -06.09.30 910,000 EUR 962,970 1,034,624 0.05Siemens Financieringsmaatschappij NV 1.75% 19 -28.02.39 713,000 EUR 759,121 888,455 0.04Siemens Financieringsmaatschappij NV 2.875% 13 -10.03.28 850,000 EUR 985,639 1,039,312 0.05Signify NV 2.00% 20 - 11.05.24 517,000 EUR 520,964 546,500 0.03Signify NV 2.375% 20 - 11.05.27 489,000 EUR 496,324 541,675 0.02Sika Capital BV 0.875% 19 - 29.04.27 477,000 EUR 494,221 502,963 0.02Sika Capital BV 1.50% 19 - 29.04.31 506,000 EUR 542,298 574,533 0.03STG Global Finance BV 1.375% 20 - 24.09.25 500,000 EUR 504,802 508,855 0.02Sudzucker International Finance BV 1.00% 17 -28.11.25 356,000 EUR 358,645 365,470 0.02Sudzucker International Finance BV 1.25% 16 -29.11.23 154,000 EUR 157,872 158,235 0.01Telefonica Europe BV 5.875% 03 - 14.02.33 279,000 EUR 431,552 446,707 0.02Telefonica Europe BV 5.875% 03 - 14.02.33 213,000 EUR 317,125 341,034 0.02Toyota Motor Finance Netherlands BV 0.25% 19 -10.01.22 100,000 EUR 99,889 100,550 0.00Toyota Motor Finance Netherlands BV 0.25% 19 -10.01.22 295,000 EUR 295,846 296,623 0.01Toyota Motor Finance Netherlands BV 0.625% 18 -26.09.23 391,000 EUR 393,521 400,376 0.02Unilever Finance Netherlands BV 0.375% 17 -14.02.23 500,000 EUR 505,636 507,350 0.02Unilever Finance Netherlands BV 0.50% 15 - 03.02.22 220,000 EUR 221,709 222,022 0.01Unilever Finance Netherlands BV 0.50% 15 - 03.02.22 489,000 EUR 491,241 493,494 0.02Unilever Finance Netherlands BV 0.50% 16 - 29.04.24 350,000 EUR 354,989 359,107 0.02Unilever Finance Netherlands BV 0.50% 18 - 12.08.23 690,000 EUR 694,322 704,414 0.03Unilever Finance Netherlands BV 0.50% 18 - 06.01.25 594,000 EUR 604,012 611,309 0.03Unilever Finance Netherlands BV 0.875% 17 -31.07.25 300,000 EUR 310,274 314,961 0.01Unilever Finance Netherlands BV 1.00% 15 - 03.06.23 400,000 EUR 407,695 412,648 0.02Unilever Finance Netherlands BV 1.00% 17 - 14.02.27 767,000 EUR 804,152 820,560 0.04Unilever Finance Netherlands BV 1.125% 16 -29.04.28 600,000 EUR 637,065 653,538 0.03Unilever Finance Netherlands BV 1.125% 18 -12.02.27 568,000 EUR 599,415 611,276 0.03
Xtrackers II
Xtrackers II EUR CORPORATE BOND UCITS ETF (continued)
Statement of Investmentsas at 31 December 2020(expressed in EUR)
The accompanying notes form an integral part of these financial statements.
200

DescriptionNominal
ValueCurrency
(local) Cost Market Value
% ofNet
Assets
Transferable securities and money market instruments admitted to an official stock exchange listing(A)
Bonds (continued)
Netherlands (continued)Unilever Finance Netherlands BV 1.125% 18 -12.02.27 210,000 EUR 225,021 226,000 0.01Unilever Finance Netherlands BV 1.25% 20 - 25.03.25 714,000 EUR 742,317 756,483 0.03Unilever Finance Netherlands BV 1.375% 17 -31.07.29 630,000 EUR 660,169 705,871 0.03Unilever Finance Netherlands BV 1.375% 18 -04.09.30 300,000 EUR 318,726 341,106 0.02Unilever Finance Netherlands BV 1.625% 18 -12.02.33 588,000 EUR 653,997 686,443 0.03Unilever NV 1.75% 20 - 25.03.30 1,008,000 EUR 1,113,354 1,164,754 0.05Upjohn Finance BV 0.816% 20 - 23.06.22 315,000 EUR 316,415 319,284 0.01Upjohn Finance BV 1.023% 20 - 23.06.24 386,000 EUR 387,956 398,306 0.02Upjohn Finance BV 1.362% 20 - 23.06.27 877,000 EUR 883,763 929,743 0.04Upjohn Finance BV 1.908% 20 - 23.06.32 1,143,000 EUR 1,168,417 1,263,815 0.06Vesteda Finance BV 1.50% 19 - 24.05.27 302,000 EUR 300,112 326,592 0.02Vesteda Finance BV 2.00% 18 - 10.07.26 616,000 EUR 642,342 679,577 0.03Volkswagen International Finance NV 0.05% 20 -10.06.24 400,000 EUR 401,592 401,648 0.02Volkswagen International Finance NV 0.875% 15 -16.01.23 757,000 EUR 764,266 771,118 0.04Volkswagen International Finance NV 0.875% 20 -22.09.28 1,000,000 EUR 996,553 1,034,670 0.05Volkswagen International Finance NV 1.125% 17 -02.10.23 1,500,000 EUR 1,513,372 1,547,550 0.07Volkswagen International Finance NV 1.25% 20 -23.09.32 600,000 EUR 596,239 636,948 0.03Volkswagen International Finance NV 1.625% 15 -16.01.30 854,000 EUR 855,869 937,197 0.04Volkswagen International Finance NV 1.875% 17 -30.03.27 2,500,000 EUR 2,602,225 2,734,375 0.12Volkswagen International Finance NV FRN 15 -29.12.49 850,000 EUR 852,700 859,571 0.04Volkswagen International Finance NV 2.625% 18 -16.11.27 300,000 EUR 303,809 347,907 0.02Volkswagen International Finance NV 2.625% 18 -16.11.27 200,000 EUR 203,680 231,938 0.01Volkswagen International Finance NV FRN 17 -31.12.99 1,300,000 EUR 1,302,602 1,327,183 0.06Volkswagen International Finance NV 3.25% 18 -18.11.30 900,000 EUR 968,876 1,124,262 0.05Volkswagen International Finance NV 3.30% 13 -22.03.33 700,000 EUR 811,573 893,095 0.04Volkswagen International Finance NV FRN 18 -31.12.99 1,000,000 EUR 992,153 1,046,440 0.05Volkswagen International Finance NV FRN 15 -29.12.49 1,236,000 EUR 1,211,103 1,305,525 0.06Volkswagen International Finance NV FRN 20 -31.12.99 1,300,000 EUR 1,304,928 1,371,760 0.06
Xtrackers II
Xtrackers II EUR CORPORATE BOND UCITS ETF (continued)
Statement of Investmentsas at 31 December 2020(expressed in EUR)
The accompanying notes form an integral part of these financial statements.
201

DescriptionNominal
ValueCurrency
(local) Cost Market Value
% ofNet
Assets
Transferable securities and money market instruments admitted to an official stock exchange listing(A)
Bonds (continued)
Netherlands (continued)Volkswagen International Finance NV FRN 17 -31.12.99 1,800,000 EUR 1,846,050 1,934,010 0.09Volkswagen International Finance NV FRN 20 -31.12.99 1,300,000 EUR 1,296,963 1,405,157 0.06Volkswagen International Finance NV 4.125% 18 -16.11.38 1,100,000 EUR 1,286,411 1,575,266 0.07Volkswagen International Finance NV FRN 14 -29.03.49 1,373,000 EUR 1,457,148 1,521,559 0.07Volkswagen International Finance NV FRN 18 -31.12.99 1,300,000 EUR 1,370,049 1,462,539 0.07Volkswagen International Finance NV FRN 13 -29.09.49 644,000 EUR 692,476 702,185 0.03Vonovia Finance BV 0.125% 19 - 06.04.23 800,000 EUR 799,740 805,032 0.04Vonovia Finance BV 0.50% 19 - 14.09.29 400,000 EUR 394,624 409,248 0.02Vonovia Finance BV 0.625% 19 - 07.10.27 300,000 EUR 299,138 310,470 0.01Vonovia Finance BV 0.625% 20 - 09.07.26 500,000 EUR 501,885 515,785 0.02Vonovia Finance BV 0.75% 17 - 25.01.22 300,000 EUR 301,411 303,159 0.01Vonovia Finance BV 0.75% 18 - 15.01.24 800,000 EUR 798,358 821,472 0.04Vonovia Finance BV 0.875% 16 - 10.06.22 200,000 EUR 201,495 203,206 0.01Vonovia Finance BV 0.875% 18 - 03.07.23 800,000 EUR 807,604 819,712 0.04Vonovia Finance BV 1.00% 20 - 09.07.30 700,000 EUR 705,905 741,972 0.03Vonovia Finance BV 1.125% 17 - 08.09.25 400,000 EUR 405,031 422,928 0.02Vonovia Finance BV 1.125% 19 - 14.09.34 400,000 EUR 389,837 424,536 0.02Vonovia Finance BV 1.25% 16 - 06.12.24 600,000 EUR 607,416 632,526 0.03Vonovia Finance BV 1.50% 15 - 31.03.25 400,000 EUR 411,432 427,696 0.02Vonovia Finance BV 1.50% 16 - 10.06.26 500,000 EUR 519,225 540,350 0.02Vonovia Finance BV 1.50% 18 - 14.01.28 800,000 EUR 826,233 877,272 0.04Vonovia Finance BV 1.50% 18 - 22.03.26 400,000 EUR 412,369 431,644 0.02Vonovia Finance BV 1.625% 19 - 07.10.39 400,000 EUR 389,159 445,240 0.02Vonovia Finance BV 1.625% 20 - 07.04.24 300,000 EUR 309,074 315,960 0.01Vonovia Finance BV 1.625% 20 - 07.04.24 500,000 EUR 513,613 526,600 0.02Vonovia Finance BV 1.75% 17 - 25.01.27 300,000 EUR 309,875 330,543 0.02Vonovia Finance BV 1.80% 19 - 29.06.25 200,000 EUR 202,825 216,128 0.01Vonovia Finance BV 1.80% 19 - 29.06.25 300,000 EUR 320,961 324,192 0.01Vonovia Finance BV 2.125% 14 - 09.07.22 300,000 EUR 310,137 310,566 0.01Vonovia Finance BV 2.125% 18 - 22.03.30 100,000 EUR 108,859 116,749 0.01Vonovia Finance BV 2.25% 15 - 15.12.23 500,000 EUR 521,247 535,595 0.02Vonovia Finance BV 2.25% 20 - 07.04.30 600,000 EUR 648,422 703,752 0.03Vonovia Finance BV 2.75% 18 - 22.03.38 500,000 EUR 556,109 646,935 0.03Wintershall Dea Finance BV 0.452% 19 - 25.09.23 700,000 EUR 679,438 705,796 0.03Wintershall Dea Finance BV 0.84% 19 - 25.09.25 600,000 EUR 598,965 611,934 0.03Wintershall Dea Finance BV 1.332% 19 - 25.09.28 900,000 EUR 903,073 931,329 0.04Wintershall Dea Finance BV 1.823% 19 - 25.09.31 900,000 EUR 890,577 945,297 0.04Wolters Kluwer NV 0.75% 20 - 03.07.30 700,000 EUR 695,291 730,723 0.03Wolters Kluwer NV 1.50% 17 - 22.03.27 100,000 EUR 104,984 109,273 0.01Wolters Kluwer NV 2.875% 13 - 21.03.23 800,000 EUR 844,025 854,352 0.04WPC Eurobond BV 1.35% 19 - 15.04.28 567,000 EUR 564,399 590,661 0.03WPC Eurobond BV 2.125% 18 - 15.04.27 300,000 EUR 303,641 326,949 0.02
Xtrackers II
Xtrackers II EUR CORPORATE BOND UCITS ETF (continued)
Statement of Investmentsas at 31 December 2020(expressed in EUR)
The accompanying notes form an integral part of these financial statements.
202

DescriptionNominal
ValueCurrency
(local) Cost Market Value
% ofNet
Assets
Transferable securities and money market instruments admitted to an official stock exchange listing(A)
Bonds (continued)
Netherlands (continued)WPC Eurobond BV 2.25% 17 - 19.07.24 880,000 EUR 933,299 944,293 0.04WPC Eurobond BV 2.25% 18 - 09.04.26 400,000 EUR 428,386 438,408 0.02Wurth Finance International BV 0.75% 20 - 22.11.27 811,000 EUR 822,460 852,888 0.04Wurth Finance International BV 1.00% 15 - 19.05.22 150,000 EUR 150,576 152,261 0.01Wurth Finance International BV 1.00% 18 - 26.05.25 588,000 EUR 609,707 617,488 0.03
344,883,128 356,951,684 16.29New ZealandANZ New Zealand Int’l Ltd. 0.375% 19 - 17.09.29 262,000 EUR 260,320 268,846 0.01ANZ New Zealand Int’l Ltd. 0.40% 17 - 01.03.22 300,000 EUR 300,933 302,538 0.01ANZ New Zealand Int’l Ltd. 1.125% 18 - 20.03.25 500,000 EUR 509,267 525,850 0.02ASB Finance Ltd. 0.50% 17 - 10.06.22 445,000 EUR 447,655 450,211 0.02ASB Finance Ltd. 0.50% 19 - 24.09.29 400,000 EUR 395,626 415,496 0.02ASB Finance Ltd. 0.75% 19 - 13.03.24 650,000 EUR 658,065 669,513 0.03BNZ International Funding Ltd. 0.375% 19 - 14.09.24 1,150,000 EUR 1,147,812 1,173,023 0.05BNZ International Funding Ltd. 0.50% 17 - 13.05.23 485,000 EUR 490,454 493,051 0.02BNZ International Funding Ltd. 0.625% 19 - 23.04.22 473,000 EUR 476,185 478,704 0.02Chorus Ltd. 0.875% 19 - 05.12.26 177,000 EUR 175,847 183,299 0.01Chorus Ltd. 1.125% 16 - 18.10.23 300,000 EUR 302,205 309,240 0.02Fonterra Co-operative Group Ltd. 0.75% 16 - 08.11.24 150,000 EUR 151,563 152,216 0.01Westpac Securities NZ Ltd. 0.30% 19 - 25.06.24 955,000 EUR 953,312 970,242 0.05
6,269,244 6,392,229 0.29NorwayDNB Bank ASA 0.05% 19 - 14.11.23 1,023,000 EUR 1,021,558 1,031,051 0.05DNB Bank ASA 0.05% 19 - 14.11.23 500,000 EUR 495,915 503,935 0.02DNB Bank ASA 0.25% 19 - 09.04.24 1,030,000 EUR 1,035,718 1,045,048 0.05DNB Bank ASA 0.60% 18 - 25.09.23 600,000 EUR 608,008 613,932 0.03DNB Bank ASA 1.125% 16 - 01.03.23 877,000 EUR 899,548 903,880 0.04DNB Bank ASA FRN 18 - 20.03.28 100,000 EUR 99,998 102,466 0.00DNB Bank ASA FRN 17 - 01.03.27 600,000 EUR 606,642 608,772 0.03DNB Bank ASA 4.25% 12 - 18.01.22 725,000 EUR 758,333 760,155 0.04Norsk Hydro ASA 1.125% 19 - 11.04.25 400,000 EUR 395,173 413,476 0.02Norsk Hydro ASA 2.00% 19 - 11.04.29 250,000 EUR 243,942 264,578 0.01Santander Consumer Bank AS 0.125% 19 - 11.09.24 700,000 EUR 683,410 704,214 0.03Santander Consumer Bank AS 0.125% 20 - 25.02.25 600,000 EUR 588,306 601,584 0.03Santander Consumer Bank AS 0.75% 18 - 01.03.23 500,000 EUR 500,738 510,230 0.02Santander Consumer Bank AS 0.875% 19 - 21.01.22 700,000 EUR 704,151 708,260 0.03Sparebank 1 Oestlandet 0.25% 19 - 30.09.24 700,000 EUR 706,093 708,134 0.03Sparebank 1 Oestlandet 0.875% 18 - 13.03.23 173,000 EUR 176,071 176,829 0.01SpareBank 1 SMN 0.125% 19 - 11.09.26 182,000 EUR 174,484 183,256 0.01SpareBank 1 SMN 0.50% 17 - 09.03.22 468,000 EUR 470,151 472,521 0.02SpareBank 1 SMN 0.75% 18 - 03.07.23 500,000 EUR 501,356 511,940 0.02SpareBank 1 SR-Bank ASA 0.375% 16 - 10.02.22 492,000 EUR 493,882 495,168 0.02SpareBank 1 SR-Bank ASA 0.625% 19 - 25.03.24 848,000 EUR 844,182 865,613 0.04Storebrand Livsforsikring AS FRN 13 - 04.04.43 100,000 EUR 115,829 112,743 0.01
12,123,488 12,297,785 0.56
Xtrackers II
Xtrackers II EUR CORPORATE BOND UCITS ETF (continued)
Statement of Investmentsas at 31 December 2020(expressed in EUR)
The accompanying notes form an integral part of these financial statements.
203
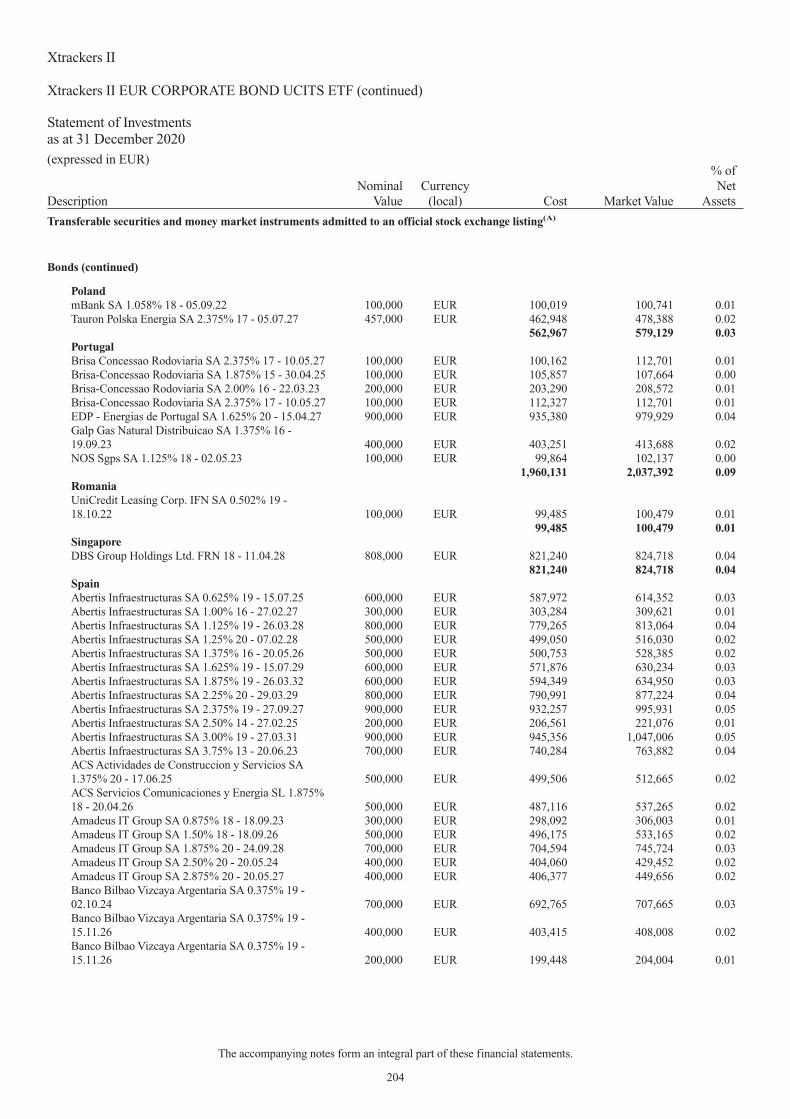
DescriptionNominal
ValueCurrency
(local) Cost Market Value
% ofNet
Assets
Transferable securities and money market instruments admitted to an official stock exchange listing(A)
Bonds (continued)
PolandmBank SA 1.058% 18 - 05.09.22 100,000 EUR 100,019 100,741 0.01Tauron Polska Energia SA 2.375% 17 - 05.07.27 457,000 EUR 462,948 478,388 0.02
562,967 579,129 0.03PortugalBrisa Concessao Rodoviaria SA 2.375% 17 - 10.05.27 100,000 EUR 100,162 112,701 0.01Brisa-Concessao Rodoviaria SA 1.875% 15 - 30.04.25 100,000 EUR 105,857 107,664 0.00Brisa-Concessao Rodoviaria SA 2.00% 16 - 22.03.23 200,000 EUR 203,290 208,572 0.01Brisa-Concessao Rodoviaria SA 2.375% 17 - 10.05.27 100,000 EUR 112,327 112,701 0.01EDP - Energias de Portugal SA 1.625% 20 - 15.04.27 900,000 EUR 935,380 979,929 0.04Galp Gas Natural Distribuicao SA 1.375% 16 -19.09.23 400,000 EUR 403,251 413,688 0.02NOS Sgps SA 1.125% 18 - 02.05.23 100,000 EUR 99,864 102,137 0.00
1,960,131 2,037,392 0.09RomaniaUniCredit Leasing Corp. IFN SA 0.502% 19 -18.10.22 100,000 EUR 99,485 100,479 0.01
99,485 100,479 0.01SingaporeDBS Group Holdings Ltd. FRN 18 - 11.04.28 808,000 EUR 821,240 824,718 0.04
821,240 824,718 0.04SpainAbertis Infraestructuras SA 0.625% 19 - 15.07.25 600,000 EUR 587,972 614,352 0.03Abertis Infraestructuras SA 1.00% 16 - 27.02.27 300,000 EUR 303,284 309,621 0.01Abertis Infraestructuras SA 1.125% 19 - 26.03.28 800,000 EUR 779,265 813,064 0.04Abertis Infraestructuras SA 1.25% 20 - 07.02.28 500,000 EUR 499,050 516,030 0.02Abertis Infraestructuras SA 1.375% 16 - 20.05.26 500,000 EUR 500,753 528,385 0.02Abertis Infraestructuras SA 1.625% 19 - 15.07.29 600,000 EUR 571,876 630,234 0.03Abertis Infraestructuras SA 1.875% 19 - 26.03.32 600,000 EUR 594,349 634,950 0.03Abertis Infraestructuras SA 2.25% 20 - 29.03.29 800,000 EUR 790,991 877,224 0.04Abertis Infraestructuras SA 2.375% 19 - 27.09.27 900,000 EUR 932,257 995,931 0.05Abertis Infraestructuras SA 2.50% 14 - 27.02.25 200,000 EUR 206,561 221,076 0.01Abertis Infraestructuras SA 3.00% 19 - 27.03.31 900,000 EUR 945,356 1,047,006 0.05Abertis Infraestructuras SA 3.75% 13 - 20.06.23 700,000 EUR 740,284 763,882 0.04ACS Actividades de Construccion y Servicios SA1.375% 20 - 17.06.25 500,000 EUR 499,506 512,665 0.02ACS Servicios Comunicaciones y Energia SL 1.875%18 - 20.04.26 500,000 EUR 487,116 537,265 0.02Amadeus IT Group SA 0.875% 18 - 18.09.23 300,000 EUR 298,092 306,003 0.01Amadeus IT Group SA 1.50% 18 - 18.09.26 500,000 EUR 496,175 533,165 0.02Amadeus IT Group SA 1.875% 20 - 24.09.28 700,000 EUR 704,594 745,724 0.03Amadeus IT Group SA 2.50% 20 - 20.05.24 400,000 EUR 404,060 429,452 0.02Amadeus IT Group SA 2.875% 20 - 20.05.27 400,000 EUR 406,377 449,656 0.02Banco Bilbao Vizcaya Argentaria SA 0.375% 19 -02.10.24 700,000 EUR 692,765 707,665 0.03Banco Bilbao Vizcaya Argentaria SA 0.375% 19 -15.11.26 400,000 EUR 403,415 408,008 0.02Banco Bilbao Vizcaya Argentaria SA 0.375% 19 -15.11.26 200,000 EUR 199,448 204,004 0.01
Xtrackers II
Xtrackers II EUR CORPORATE BOND UCITS ETF (continued)
Statement of Investmentsas at 31 December 2020(expressed in EUR)
The accompanying notes form an integral part of these financial statements.
204

DescriptionNominal
ValueCurrency
(local) Cost Market Value
% ofNet
Assets
Transferable securities and money market instruments admitted to an official stock exchange listing(A)
Bonds (continued)
Spain (continued)Banco Bilbao Vizcaya Argentaria SA 0.50% 20 -14.01.27 1,100,000 EUR 1,084,790 1,123,793 0.05Banco Bilbao Vizcaya Argentaria SA 0.625% 17 -17.01.22 500,000 EUR 503,432 505,225 0.02Banco Bilbao Vizcaya Argentaria SA 0.75% 17 -11.09.22 1,200,000 EUR 1,204,959 1,219,056 0.06Banco Bilbao Vizcaya Argentaria SA 0.75% 17 -11.09.22 400,000 EUR 402,096 406,352 0.02Banco Bilbao Vizcaya Argentaria SA 0.75% 20 -04.06.25 1,300,000 EUR 1,303,160 1,350,024 0.06Banco Bilbao Vizcaya Argentaria SA 1.00% 19 -21.06.26 900,000 EUR 918,554 946,809 0.04Banco Bilbao Vizcaya Argentaria SA FRN 20 -16.01.30 800,000 EUR 775,763 798,688 0.04Banco Bilbao Vizcaya Argentaria SA 1.125% 19 -28.02.24 1,300,000 EUR 1,319,553 1,343,186 0.06Banco Bilbao Vizcaya Argentaria SA 1.375% 18 -14.05.25 500,000 EUR 499,512 530,750 0.02Banco Bilbao Vizcaya Argentaria SA FRN 19 -22.02.29 600,000 EUR 617,052 632,082 0.03Banco Bilbao Vizcaya Argentaria SA 3.50% 17 -10.02.27 900,000 EUR 991,101 1,050,435 0.05Banco de Sabadell SA FRN 19 - 07.11.25 200,000 EUR 195,809 201,580 0.01Banco de Sabadell SA 0.875% 17 - 05.03.23 800,000 EUR 806,666 814,200 0.04Banco de Sabadell SA 0.875% 19 - 22.07.25 800,000 EUR 799,409 817,296 0.04Banco de Sabadell SA 1.125% 19 - 27.03.25 600,000 EUR 560,879 609,888 0.03Banco de Sabadell SA FRN 20 - 11.03.27 400,000 EUR 400,890 413,640 0.02Banco de Sabadell SA 1.625% 18 - 07.03.24 700,000 EUR 714,833 730,205 0.03Banco de Sabadell SA 1.75% 19 - 10.05.24 600,000 EUR 585,220 620,748 0.03Banco de Sabadell SA FRN 20 - 29.06.23 800,000 EUR 807,294 820,696 0.04Banco Santander SA 0.25% 19 - 19.06.24 1,100,000 EUR 1,103,282 1,114,465 0.05Banco Santander SA 0.30% 19 - 04.10.26 1,000,000 EUR 1,000,229 1,019,040 0.05Banco Santander SA 0.50% 20 - 04.02.27 900,000 EUR 890,400 914,589 0.04Banco Santander SA 1.125% 18 - 17.01.25 800,000 EUR 813,874 831,744 0.04Banco Santander SA 1.125% 20 - 23.06.27 900,000 EUR 906,190 954,144 0.04Banco Santander SA 1.375% 15 - 14.12.22 1,600,000 EUR 1,634,886 1,651,328 0.08Banco Santander SA 1.375% 17 - 09.02.22 1,500,000 EUR 1,516,910 1,527,270 0.07Banco Santander SA 1.375% 20 - 05.01.26 1,700,000 EUR 1,714,647 1,802,867 0.08Banco Santander SA 1.625% 20 - 22.10.30 1,000,000 EUR 1,005,551 1,045,930 0.05Banco Santander SA 2.125% 18 - 08.02.28 1,100,000 EUR 1,124,752 1,199,803 0.06Banco Santander SA 2.50% 15 - 18.03.25 1,000,000 EUR 1,053,269 1,083,660 0.05Banco Santander SA 3.125% 17 - 19.01.27 800,000 EUR 869,736 913,776 0.04Banco Santander SA 3.25% 16 - 04.04.26 900,000 EUR 981,763 1,022,706 0.05Bankia SA 0.75% 19 - 09.07.26 700,000 EUR 691,540 720,727 0.03Bankia SA 0.875% 19 - 25.03.24 600,000 EUR 611,243 616,968 0.03Bankia SA 1.00% 19 - 25.06.24 100,000 EUR 96,765 103,016 0.01Bankia SA 1.125% 19 - 12.11.26 100,000 EUR 99,848 104,321 0.01Bankia SA 1.125% 19 - 12.11.26 400,000 EUR 378,940 417,284 0.02
Xtrackers II
Xtrackers II EUR CORPORATE BOND UCITS ETF (continued)
Statement of Investmentsas at 31 December 2020(expressed in EUR)
The accompanying notes form an integral part of these financial statements.
205

DescriptionNominal
ValueCurrency
(local) Cost Market Value
% ofNet
Assets
Transferable securities and money market instruments admitted to an official stock exchange listing(A)
Bonds (continued)
Spain (continued)Bankinter SA 0.625% 20 - 06.10.27 600,000 EUR 586,780 611,244 0.03Bankinter SA 0.875% 19 - 05.03.24 600,000 EUR 618,713 618,522 0.03Bankinter SA 0.875% 19 - 08.07.26 900,000 EUR 897,344 927,621 0.04Bankinter SA FRN 17 - 06.04.27 200,000 EUR 201,765 204,336 0.01CaixaBank SA 0.375% 20 - 03.02.25 700,000 EUR 696,051 708,372 0.03CaixaBank SA FRN 20 - 18.11.26 900,000 EUR 901,503 903,888 0.04CaixaBank SA 0.625% 19 - 01.10.24 1,000,000 EUR 983,908 1,017,560 0.05CaixaBank SA 0.75% 18 - 18.04.23 800,000 EUR 805,285 815,856 0.04CaixaBank SA FRN 20 - 10.07.26 1,000,000 EUR 1,006,120 1,027,630 0.05CaixaBank SA 1.125% 17 - 17.05.24 1,200,000 EUR 1,220,164 1,246,656 0.06CaixaBank SA 1.125% 17 - 12.01.23 900,000 EUR 902,059 920,538 0.04CaixaBank SA 1.125% 19 - 27.03.26 900,000 EUR 909,816 945,585 0.04CaixaBank SA 1.375% 19 - 19.06.26 1,100,000 EUR 1,092,848 1,159,048 0.05CaixaBank SA 1.75% 18 - 24.10.23 800,000 EUR 815,622 838,592 0.04CaixaBank SA FRN 18 - 17.04.30 700,000 EUR 704,774 731,458 0.03CaixaBank SA 2.375% 19 - 01.02.24 600,000 EUR 629,880 642,162 0.03CaixaBank SA FRN 17 - 14.07.28 900,000 EUR 912,198 941,679 0.04CaixaBank SA FRN 17 - 15.02.27 900,000 EUR 914,815 927,828 0.04Criteria Caixa SA 0.875% 20 - 28.10.27 500,000 EUR 498,133 511,950 0.02Criteria Caixa SA 1.375% 19 - 10.04.24 600,000 EUR 606,353 625,248 0.03Criteria Caixa SA 1.50% 17 - 10.05.23 500,000 EUR 511,239 517,255 0.02Criteria Caixa SA 1.50% 17 - 10.05.23 600,000 EUR 613,313 620,706 0.03Criteria Caixa SA 1.625% 15 - 21.04.22 600,000 EUR 610,073 613,812 0.03Enagas Financiaciones SA 0.375% 20 - 05.11.32 500,000 EUR 501,029 503,895 0.02Enagas Financiaciones SA 0.75% 16 - 27.10.26 500,000 EUR 502,325 524,850 0.02Enagas Financiaciones SA 1.00% 15 - 25.03.23 100,000 EUR 101,663 102,475 0.01Enagas Financiaciones SA 1.25% 15 - 06.02.25 500,000 EUR 520,402 528,415 0.02Enagas Financiaciones SA 1.375% 16 - 05.05.28 700,000 EUR 740,388 773,871 0.04Enagas Financiaciones SA 2.50% 14 - 11.04.22 700,000 EUR 722,256 724,213 0.03FCC Aqualia SA 1.413% 17 - 08.06.22 450,000 EUR 450,915 456,696 0.02FCC Aqualia SA 2.629% 17 - 08.06.27 529,000 EUR 547,616 576,912 0.03FCC Servicios Medio Ambiente Holdings SAU0.815% 19 - 04.12.23 550,000 EUR 549,347 560,477 0.03FCC Servicios Medio Ambiente Holdings SAU1.661% 19 - 04.12.26 400,000 EUR 410,663 420,276 0.02Ferrovial Emisiones SA 0.375% 16 - 14.09.22 500,000 EUR 504,307 504,890 0.02Ferrovial Emisiones SA 0.54% 20 - 12.11.28 400,000 EUR 404,785 403,900 0.02Ferrovial Emisiones SA 1.375% 17 - 31.03.25 100,000 EUR 99,722 105,234 0.01Ferrovial Emisiones SA 1.382% 20 - 14.05.26 1,000,000 EUR 999,516 1,062,500 0.05Ferrovial Emisiones SA 2.50% 14 - 15.07.24 300,000 EUR 322,610 326,148 0.02Iberdrola Finanzas SA 0.875% 20 - 16.06.25 1,000,000 EUR 1,023,792 1,040,730 0.05Iberdrola Finanzas SA 1.00% 16 - 07.03.24 400,000 EUR 405,429 413,572 0.02Iberdrola Finanzas SA 1.00% 17 - 07.03.25 800,000 EUR 823,339 836,112 0.04Iberdrola Finanzas SA 1.25% 17 - 13.09.27 200,000 EUR 207,829 217,686 0.01Iberdrola Finanzas SA 1.25% 18 - 28.10.26 500,000 EUR 522,135 537,135 0.02Iberdrola Finanzas SA 1.621% 17 - 29.11.29 500,000 EUR 550,896 567,445 0.03IE2 Holdco SAU 2.375% 15 - 27.11.23 200,000 EUR 206,334 212,490 0.01IE2 Holdco SAU 2.875% 16 - 01.06.26 700,000 EUR 773,135 795,417 0.04
Xtrackers II
Xtrackers II EUR CORPORATE BOND UCITS ETF (continued)
Statement of Investmentsas at 31 December 2020(expressed in EUR)
The accompanying notes form an integral part of these financial statements.
206

DescriptionNominal
ValueCurrency
(local) Cost Market Value
% ofNet
Assets
Transferable securities and money market instruments admitted to an official stock exchange listing(A)
Bonds (continued)
Spain (continued)Inmobiliaria Colonial Socimi SA 1.35% 20 - 14.10.28 400,000 EUR 402,821 413,608 0.02Inmobiliaria Colonial Socimi SA 1.45% 16 - 28.10.24 500,000 EUR 501,534 521,755 0.02Inmobiliaria Colonial Socimi SA 1.625% 17 -28.11.25 700,000 EUR 734,716 740,061 0.03Inmobiliaria Colonial Socimi SA 2.00% 18 - 17.04.26 100,000 EUR 103,097 107,601 0.01Inmobiliaria Colonial Socimi SA 2.00% 18 - 17.04.26 300,000 EUR 323,080 322,803 0.02Inmobiliaria Colonial Socimi SA 2.50% 17 - 28.11.29 200,000 EUR 214,431 224,236 0.01Kutxabank SA 0.50% 19 - 25.09.24 300,000 EUR 295,953 305,412 0.01Mapfre SA 1.625% 16 - 19.05.26 900,000 EUR 950,817 986,544 0.05Mapfre SA FRN 18 - 07.09.48 500,000 EUR 555,493 579,565 0.03Mapfre SA FRN 17 - 31.03.47 500,000 EUR 549,800 580,645 0.03Merlin Properties Socimi SA 1.75% 17 - 26.05.25 892,000 EUR 904,649 935,387 0.04Merlin Properties Socimi SA 1.875% 16 - 02.11.26 675,000 EUR 690,868 714,332 0.03Merlin Properties Socimi SA 1.875% 19 - 04.12.34 500,000 EUR 466,256 506,640 0.02Merlin Properties Socimi SA 2.225% 16 - 25.04.23 150,000 EUR 153,502 156,503 0.01Merlin Properties Socimi SA 2.375% 16 - 23.05.22 700,000 EUR 716,285 719,579 0.03Merlin Properties Socimi SA 2.375% 17 - 18.09.29 200,000 EUR 211,520 216,020 0.01Merlin Properties Socimi SA 2.375% 20 - 13.07.27 500,000 EUR 504,210 539,620 0.02Naturgy Capital Markets SA 1.125% 17 - 11.04.24 1,100,000 EUR 1,126,637 1,139,479 0.05NorteGas Energia Distribucion SA 0.918% 17 -28.09.22 525,000 EUR 525,716 530,759 0.02NorteGas Energia Distribucion SA 2.065% 17 -28.09.27 588,000 EUR 614,100 641,467 0.03Prosegur Cash SA 1.375% 17 - 04.02.26 400,000 EUR 403,521 420,984 0.02Prosegur Cia de Seguridad SA 1.00% 18 - 08.02.23 400,000 EUR 398,863 406,868 0.02Red Electrica Corp. SA 0.875% 20 - 14.04.25 800,000 EUR 821,562 832,856 0.04Red Electrica Financiaciones SAU 0.375% 20 -24.07.28 500,000 EUR 506,885 514,710 0.02Red Electrica Financiaciones SAU 1.00% 16 -21.04.26 300,000 EUR 308,959 317,190 0.01Red Electrica Financiaciones SAU 1.125% 15 -24.04.25 400,000 EUR 419,675 422,060 0.02Red Electrica Financiaciones SAU 1.25% 18 -13.03.27 200,000 EUR 205,085 215,484 0.01Red Electrica Financiaciones SAU 2.125% 14 -01.07.23 300,000 EUR 314,980 317,187 0.01Red Electrica Financiaciones SAU 3.875% 13 -25.01.22 400,000 EUR 417,087 416,872 0.02Santander Consumer Finance SA 0.375% 19 -27.06.24 900,000 EUR 894,871 912,501 0.04Santander Consumer Finance SA 0.375% 19 -27.06.24 300,000 EUR 296,295 304,167 0.01Santander Consumer Finance SA 0.375% 20 -17.01.25 1,000,000 EUR 995,684 1,014,390 0.05Santander Consumer Finance SA 0.50% 19 - 14.11.26 200,000 EUR 195,476 204,614 0.01Santander Consumer Finance SA 0.875% 17 -24.01.22 700,000 EUR 703,856 708,603 0.03
Xtrackers II
Xtrackers II EUR CORPORATE BOND UCITS ETF (continued)
Statement of Investmentsas at 31 December 2020(expressed in EUR)
The accompanying notes form an integral part of these financial statements.
207

DescriptionNominal
ValueCurrency
(local) Cost Market Value
% ofNet
Assets
Transferable securities and money market instruments admitted to an official stock exchange listing(A)
Bonds (continued)
Spain (continued)Santander Consumer Finance SA 0.875% 18 -30.05.23 300,000 EUR 300,451 308,064 0.01Santander Consumer Finance SA 1.00% 19 - 27.02.24 500,000 EUR 497,416 516,800 0.02Santander Consumer Finance SA 1.125% 18 -09.10.23 800,000 EUR 815,963 828,400 0.04Telefonica Emisiones SA 0.664% 20 - 03.02.30 700,000 EUR 700,773 718,767 0.03Telefonica Emisiones SA 0.75% 16 - 13.04.22 800,000 EUR 805,349 810,584 0.04Telefonica Emisiones SA 1.069% 19 - 05.02.24 500,000 EUR 505,784 517,530 0.02Telefonica Emisiones SA 1.069% 19 - 05.02.24 700,000 EUR 716,484 724,542 0.03Telefonica Emisiones SA 1.201% 20 - 21.08.27 1,000,000 EUR 1,019,966 1,068,440 0.05Telefonica Emisiones SA 1.447% 18 - 22.01.27 1,000,000 EUR 1,046,417 1,077,890 0.05Telefonica Emisiones SA 1.46% 16 - 13.04.26 1,300,000 EUR 1,345,072 1,401,023 0.06Telefonica Emisiones SA 1.495% 18 - 11.09.25 700,000 EUR 724,890 748,517 0.03Telefonica Emisiones SA 1.528% 17 - 17.01.25 1,100,000 EUR 1,138,771 1,172,611 0.05Telefonica Emisiones SA 1.715% 17 - 12.01.28 1,000,000 EUR 1,040,106 1,108,170 0.05Telefonica Emisiones SA 1.788% 19 - 12.03.29 1,000,000 EUR 1,044,532 1,122,500 0.05Telefonica Emisiones SA 1.807% 20 - 21.05.32 700,000 EUR 716,518 784,966 0.04Telefonica Emisiones SA 1.864% 20 - 13.07.40 400,000 EUR 422,597 449,292 0.02Telefonica Emisiones SA 1.93% 16 - 17.10.31 600,000 EUR 624,742 689,616 0.03Telefonica Emisiones SA 1.957% 19 - 01.07.39 477,000 EUR 502,406 549,704 0.03Telefonica Emisiones SA 2.242% 14 - 27.05.22 1,100,000 EUR 1,128,927 1,138,654 0.05Telefonica Emisiones SA 2.318% 17 - 17.10.28 600,000 EUR 666,531 697,476 0.03Telefonica Emisiones SA 2.932% 14 - 17.10.29 300,000 EUR 352,213 369,537 0.02Telefonica Emisiones SA 2.932% 14 - 17.10.29 300,000 EUR 320,814 369,537 0.02Telefonica Emisiones SA 3.987% 13 - 23.01.23 1,300,000 EUR 1,394,871 1,412,983 0.06
107,817,409 111,512,643 5.09SwedenAkelius Residential Property AB 1.125% 17 -14.03.24 746,000 EUR 749,734 767,537 0.04Akelius Residential Property AB 1.50% 16 - 23.01.22 750,000 EUR 758,077 763,080 0.04Akelius Residential Property AB 1.75% 17 - 07.02.25 300,000 EUR 311,187 317,346 0.01Alfa Laval Treasury International AB 0.25% 19 -25.06.24 100,000 EUR 99,915 100,344 0.00Alfa Laval Treasury International AB 1.375% 14 -12.09.22 718,000 EUR 728,607 733,494 0.03Atlas Copco AB 0.625% 16 - 30.08.26 400,000 EUR 401,023 416,152 0.02Atlas Copco AB 2.50% 13 - 28.02.23 206,000 EUR 218,130 218,135 0.01Castellum AB 0.75% 19 - 04.09.26 600,000 EUR 600,213 602,844 0.03Castellum AB 2.125% 18 - 20.11.23 138,000 EUR 142,672 145,847 0.01Essity AB 0.50% 20 - 03.02.30 104,000 EUR 102,850 106,136 0.01Essity AB 0.625% 17 - 28.03.22 705,000 EUR 706,003 711,119 0.03Essity AB 1.125% 15 - 05.03.25 100,000 EUR 100,594 104,809 0.01Essity AB 1.125% 17 - 27.03.24 700,000 EUR 718,709 726,565 0.03Essity AB 1.625% 17 - 30.03.27 316,000 EUR 333,557 345,119 0.02Essity AB 2.50% 13 - 09.06.23 179,000 EUR 190,281 190,653 0.01Fastighets AB Balder 1.125% 17 - 14.03.22 900,000 EUR 898,404 910,602 0.04Fastighets AB Balder 1.125% 19 - 29.01.27 250,000 EUR 241,880 253,198 0.01Fastighets AB Balder 1.25% 20 - 28.01.28 404,000 EUR 387,761 407,200 0.02
Xtrackers II
Xtrackers II EUR CORPORATE BOND UCITS ETF (continued)
Statement of Investmentsas at 31 December 2020(expressed in EUR)
The accompanying notes form an integral part of these financial statements.
208

DescriptionNominal
ValueCurrency
(local) Cost Market Value
% ofNet
Assets
Transferable securities and money market instruments admitted to an official stock exchange listing(A)
Bonds (continued)
Sweden (continued)Fastighets AB Balder 1.875% 17 - 14.03.25 600,000 EUR 610,683 630,180 0.03Fastighets AB Balder 1.875% 17 - 23.01.26 492,000 EUR 503,621 519,621 0.02Heimstaden Bostad AB 1.125% 20 - 21.01.26 440,000 EUR 435,669 455,466 0.02Heimstaden Bostad AB 2.125% 19 - 05.09.23 870,000 EUR 888,561 916,319 0.04Hemso Fastighets AB 1.00% 16 - 09.09.26 192,000 EUR 194,637 202,762 0.01Investor AB 0.375% 20 - 29.10.35 534,000 EUR 528,597 534,790 0.02Investor AB 1.50% 18 - 12.09.30 500,000 EUR 529,763 566,970 0.03Investor AB 1.50% 19 - 20.06.39 470,000 EUR 494,227 559,653 0.03Investor AB 4.50% 11 - 12.05.23 664,000 EUR 732,226 740,247 0.03Lansforsakringar Bank AB 0.125% 20 - 19.02.25 447,000 EUR 444,431 448,685 0.02Lansforsakringar Bank AB 0.50% 17 - 19.09.22 918,000 EUR 920,010 927,052 0.04Lansforsakringar Bank AB 0.875% 18 - 25.09.23 200,000 EUR 201,353 205,114 0.01Molnlycke Holdings AB 0.625% 20 - 15.01.31 300,000 EUR 301,656 301,353 0.01Molnlycke Holdings AB 0.875% 19 - 05.09.29 365,000 EUR 362,230 376,738 0.02Molnlycke Holdings AB 1.75% 15 - 28.02.24 657,000 EUR 676,703 692,458 0.03Molnlycke Holdings AB 1.875% 17 - 28.02.25 400,000 EUR 409,680 428,748 0.02ORLEN Capital AB 2.50% 16 - 07.06.23 407,000 EUR 421,334 423,597 0.02Sagax AB 1.125% 20 - 30.01.27 254,000 EUR 252,746 257,310 0.01Sagax AB 2.00% 18 - 17.01.24 600,000 EUR 615,123 626,172 0.03Sagax AB 2.25% 19 - 13.03.25 114,000 EUR 117,527 121,460 0.01Samhallsbyggnadsbolaget i Norden AB 1.00% 20 -12.08.27 671,000 EUR 661,870 679,300 0.03Samhallsbyggnadsbolaget i Norden AB 1.125% 19 -04.09.26 160,000 EUR 156,602 164,688 0.01Samhallsbyggnadsbolaget i Norden AB 1.75% 19 -14.01.25 600,000 EUR 604,587 630,318 0.03Sandvik AB 3.00% 14 - 18.06.26 200,000 EUR 224,405 231,218 0.01Scania CV AB Zero Coupon 20 - 23.11.22 370,000 EUR 370,175 370,185 0.02Scania CV AB 0.125% 20 - 13.02.23 18,000 EUR 18,000 18,028 0.00Scania CV AB 0.50% 20 - 06.10.23 468,000 EUR 469,203 473,480 0.02Scania CV AB 2.25% 20 - 03.06.25 577,000 EUR 589,683 622,958 0.03Securitas AB 1.125% 17 - 20.02.24 200,000 EUR 202,525 206,000 0.01Securitas AB 1.25% 16 - 15.03.22 200,000 EUR 201,471 203,356 0.01Securitas AB 1.25% 18 - 06.03.25 200,000 EUR 198,317 208,404 0.01Skandinaviska Enskilda Banken AB 0.05% 19 -01.07.24 736,000 EUR 732,918 742,101 0.03Skandinaviska Enskilda Banken AB 0.25% 20 -19.05.23 1,314,000 EUR 1,315,579 1,330,136 0.06Skandinaviska Enskilda Banken AB 0.30% 17 -17.02.22 182,000 EUR 182,748 183,389 0.01Skandinaviska Enskilda Banken AB 0.375% 20 -11.02.27 1,195,000 EUR 1,187,427 1,215,064 0.06Skandinaviska Enskilda Banken AB 0.50% 18 -13.03.23 800,000 EUR 810,307 813,576 0.04Skandinaviska Enskilda Banken AB 0.625% 19 -12.11.29 716,000 EUR 707,456 746,724 0.03Skandinaviska Enskilda Banken AB FRN 16 -31.10.28 400,000 EUR 395,774 409,656 0.02
Xtrackers II
Xtrackers II EUR CORPORATE BOND UCITS ETF (continued)
Statement of Investmentsas at 31 December 2020(expressed in EUR)
The accompanying notes form an integral part of these financial statements.
209

DescriptionNominal
ValueCurrency
(local) Cost Market Value
% ofNet
Assets
Transferable securities and money market instruments admitted to an official stock exchange listing(A)
Bonds (continued)
Sweden (continued)SKF AB 0.875% 19 - 15.11.29 230,000 EUR 230,620 243,862 0.01SKF AB 1.25% 18 - 17.09.25 350,000 EUR 361,396 369,667 0.02Svenska Handelsbanken AB 0.01% 20 - 02.12.27 760,000 EUR 759,022 759,194 0.03Svenska Handelsbanken AB 0.05% 19 - 03.09.26 159,000 EUR 158,734 159,860 0.01Svenska Handelsbanken AB 0.05% 19 - 03.09.26 50,000 EUR 49,129 50,271 0.00Svenska Handelsbanken AB 0.125% 19 - 18.06.24 732,000 EUR 731,674 740,996 0.03Svenska Handelsbanken AB 0.125% 19 - 18.06.24 200,000 EUR 199,538 202,458 0.01Svenska Handelsbanken AB 0.25% 17 - 28.02.22 932,000 EUR 934,495 939,559 0.04Svenska Handelsbanken AB 0.375% 18 - 03.07.23 350,000 EUR 347,832 356,059 0.02Svenska Handelsbanken AB 0.50% 18 - 21.03.23 800,000 EUR 801,672 814,904 0.04Svenska Handelsbanken AB 0.50% 20 - 18.02.30 795,000 EUR 785,754 817,761 0.04Svenska Handelsbanken AB 1.00% 20 - 15.04.25 1,143,000 EUR 1,177,732 1,199,201 0.06Svenska Handelsbanken AB 1.125% 15 - 14.12.22 1,301,000 EUR 1,330,043 1,339,640 0.06Svenska Handelsbanken AB FRN 18 - 02.03.28 300,000 EUR 304,622 306,621 0.01Svenska Handelsbanken AB FRN 18 - 05.03.29 400,000 EUR 403,366 417,052 0.02Svenska Handelsbanken AB 2.625% 12 - 23.08.22 932,000 EUR 971,910 977,817 0.04Swedbank AB 0.25% 17 - 07.11.22 600,000 EUR 601,820 605,130 0.03Swedbank AB 0.25% 19 - 09.10.24 700,000 EUR 691,585 706,146 0.03Swedbank AB 0.30% 17 - 06.09.22 840,000 EUR 839,622 847,526 0.04Swedbank AB 0.40% 18 - 29.08.23 200,000 EUR 200,564 203,148 0.01Swedbank AB 0.75% 20 - 05.05.25 1,197,000 EUR 1,208,044 1,239,553 0.06Swedbank AB 1.00% 15 - 01.06.22 664,000 EUR 671,860 676,218 0.03Swedbank AB FRN 17 - 22.11.27 100,000 EUR 98,707 100,885 0.00Swedbank AB FRN 18 - 18.09.28 192,000 EUR 191,615 196,476 0.01Swedish Match AB 0.875% 16 - 23.09.24 100,000 EUR 100,660 102,099 0.00Swedish Match AB 0.875% 20 - 26.02.27 277,000 EUR 265,539 278,011 0.01Tele2 AB 1.125% 18 - 15.05.24 399,000 EUR 407,292 412,662 0.02Tele2 AB 2.125% 18 - 15.05.28 433,000 EUR 475,727 486,341 0.02Telefonaktiebolaget LM Ericsson 1.875% 17 -01.03.24 429,000 EUR 452,256 451,325 0.02Telia Co. AB 0.125% 20 - 27.11.30 420,000 EUR 417,453 418,139 0.02Telia Co. AB FRN 20 - 11.05.81 147,000 EUR 142,843 148,838 0.01Telia Co. AB 1.625% 15 - 23.02.35 433,000 EUR 455,987 496,655 0.02Telia Co. AB 2.125% 19 - 20.02.34 310,000 EUR 335,293 374,350 0.02Telia Co. AB 3.00% 12 - 07.09.27 432,000 EUR 506,942 519,065 0.02Telia Co. AB FRN 17 - 04.04.78 1,212,000 EUR 1,240,367 1,274,018 0.06Telia Co. AB 3.50% 13 - 05.09.33 500,000 EUR 603,841 694,010 0.03Telia Co. AB 3.625% 12 - 14.02.24 698,000 EUR 774,617 781,907 0.04Telia Co. AB 3.875% 10 - 01.10.25 510,000 EUR 593,430 607,553 0.03Telia Co. AB 4.00% 11 - 22.03.22 300,000 EUR 312,070 315,624 0.01Volvo Treasury AB Zero Coupon 20 - 11.02.23 468,000 EUR 468,859 469,156 0.02Volvo Treasury AB 0.10% 19 - 24.05.22 100,000 EUR 100,227 100,317 0.00Volvo Treasury AB 0.125% 20 - 17.09.24 468,000 EUR 468,047 470,476 0.02Volvo Treasury AB 1.625% 20 - 26.05.25 507,000 EUR 515,665 540,416 0.02Volvo Treasury AB FRN 14 - 10.03.78 559,000 EUR 612,303 605,827 0.03
49,660,195 50,820,249 2.32SwitzerlandCredit Suisse AG 0.45% 20 - 19.05.25 262,000 EUR 262,540 268,353 0.01
Xtrackers II
Xtrackers II EUR CORPORATE BOND UCITS ETF (continued)
Statement of Investmentsas at 31 December 2020(expressed in EUR)
The accompanying notes form an integral part of these financial statements.
210

DescriptionNominal
ValueCurrency
(local) Cost Market Value
% ofNet
Assets
Transferable securities and money market instruments admitted to an official stock exchange listing(A)
Bonds (continued)
Switzerland (continued)Credit Suisse AG 1.00% 16 - 07.06.23 1,365,000 EUR 1,388,039 1,406,728 0.06Credit Suisse AG 1.375% 14 - 31.01.22 1,333,000 EUR 1,353,058 1,358,820 0.06Credit Suisse AG 1.50% 16 - 10.04.26 1,560,000 EUR 1,661,499 1,684,098 0.08Credit Suisse Group AG 0.65% 19 - 10.09.29 680,000 EUR 677,228 699,768 0.03Credit Suisse Group AG FRN 20 - 14.01.28 751,000 EUR 747,558 768,739 0.03Credit Suisse Group AG FRN 19 - 24.06.27 1,537,000 EUR 1,546,426 1,599,525 0.07Credit Suisse Group AG FRN 17 - 17.07.25 1,677,000 EUR 1,685,480 1,745,472 0.08Credit Suisse Group AG FRN 20 - 02.04.26 1,427,000 EUR 1,543,879 1,615,592 0.07UBS AG 0.25% 18 - 10.01.22 800,000 EUR 800,917 805,024 0.04UBS AG 0.625% 18 - 23.01.23 1,094,000 EUR 1,105,709 1,113,090 0.05UBS AG 0.75% 20 - 21.04.23 1,663,000 EUR 1,679,480 1,700,235 0.08UBS Group AG FRN 20 - 29.01.26 1,071,000 EUR 1,063,297 1,079,140 0.05UBS Group AG FRN 20 - 05.11.28 1,335,000 EUR 1,323,350 1,340,113 0.06UBS Group AG 1.25% 16 - 01.09.26 1,555,000 EUR 1,609,360 1,655,951 0.08UBS Group AG FRN 18 - 17.04.25 1,373,000 EUR 1,400,098 1,430,185 0.07UBS Group AG 1.50% 16 - 30.11.24 950,000 EUR 975,190 993,234 0.05UBS Group AG 1.75% 15 - 16.11.22 1,300,000 EUR 1,337,946 1,348,789 0.06UBS Group AG 2.125% 16 - 04.03.24 600,000 EUR 622,414 642,462 0.03
22,783,468 23,255,318 1.06United KingdomAmcor UK Finance PLC 1.125% 20 - 23.06.27 457,000 EUR 459,544 482,295 0.02Anglo American Capital PLC 1.625% 17 - 18.09.25 250,000 EUR 255,928 265,750 0.01Anglo American Capital PLC 1.625% 19 - 11.03.26 857,000 EUR 865,901 910,477 0.04Anglo American Capital PLC 3.25% 14 - 03.04.23 522,000 EUR 546,567 560,169 0.03Anglo American Capital PLC 3.50% 12 - 28.03.22 200,000 EUR 209,220 209,076 0.01Annington Funding PLC 1.65% 17 - 12.07.24 961,000 EUR 999,971 1,008,473 0.05AstraZeneca PLC 0.75% 16 - 12.05.24 500,000 EUR 503,202 513,690 0.02AstraZeneca PLC 1.25% 16 - 12.05.28 948,000 EUR 1,007,650 1,028,068 0.05Aviva PLC 0.625% 16 - 27.10.23 405,000 EUR 407,336 415,072 0.02Aviva PLC 1.875% 18 - 13.11.27 479,000 EUR 510,921 540,221 0.02Aviva PLC 1.875% 18 - 13.11.27 100,000 EUR 110,302 112,781 0.01Aviva PLC FRN 15 - 04.12.45 700,000 EUR 740,027 777,791 0.04Aviva PLC FRN 14 - 03.07.44 500,000 EUR 536,582 554,550 0.03Aviva PLC FRN 13 - 05.07.43 780,000 EUR 894,574 891,275 0.04Babcock International Group PLC 1.375% 19 -13.09.27 421,000 EUR 414,897 435,343 0.02Babcock International Group PLC 1.75% 14 -06.10.22 800,000 EUR 809,425 819,584 0.04Barclays Bank PLC 2.25% 14 - 10.06.24 150,000 EUR 161,112 162,417 0.01Barclays Bank PLC 6.625% 11 - 30.03.22 1,264,000 EUR 1,353,541 1,364,033 0.06Barclays PLC FRN 17 - 14.11.23 473,000 EUR 470,777 478,548 0.02Barclays PLC FRN 19 - 09.06.25 664,000 EUR 656,434 676,862 0.03Barclays PLC FRN 18 - 24.01.26 857,000 EUR 860,524 898,684 0.04Barclays PLC 1.50% 14 - 01.04.22 516,000 EUR 524,326 526,583 0.02Barclays PLC 1.50% 18 - 03.09.23 456,000 EUR 454,631 475,489 0.02Barclays PLC 1.875% 16 - 08.12.23 1,000,000 EUR 1,019,054 1,053,720 0.05Barclays PLC FRN 17 - 07.02.28 1,631,000 EUR 1,626,607 1,667,485 0.08Barclays PLC FRN 20 - 02.04.25 1,580,000 EUR 1,620,590 1,742,661 0.08
Xtrackers II
Xtrackers II EUR CORPORATE BOND UCITS ETF (continued)
Statement of Investmentsas at 31 December 2020(expressed in EUR)
The accompanying notes form an integral part of these financial statements.
211

DescriptionNominal
ValueCurrency
(local) Cost Market Value
% ofNet
Assets
Transferable securities and money market instruments admitted to an official stock exchange listing(A)
Bonds (continued)
United Kingdom (continued)BAT International Finance PLC 0.875% 15 - 13.10.23 800,000 EUR 806,027 817,720 0.04BAT International Finance PLC 1.00% 15 - 23.05.22 204,000 EUR 206,261 206,644 0.01BAT International Finance PLC 1.25% 15 - 13.03.27 550,000 EUR 553,828 571,466 0.03BAT International Finance PLC 2.00% 15 - 13.03.45 500,000 EUR 467,238 525,925 0.02BAT International Finance PLC 2.25% 17 - 16.01.30 1,023,000 EUR 1,049,363 1,124,318 0.05BAT International Finance PLC 2.375% 12 - 19.01.23 900,000 EUR 931,576 945,189 0.04BAT International Finance PLC 2.75% 13 - 25.03.25 510,000 EUR 545,996 563,157 0.03BAT International Finance PLC 2.75% 13 - 25.03.25 200,000 EUR 216,049 220,846 0.01BAT International Finance PLC 3.125% 14 - 06.03.29 609,000 EUR 677,490 715,106 0.03BG Energy Capital PLC 1.25% 14 - 21.11.22 750,000 EUR 765,553 767,790 0.04BG Energy Capital PLC 2.25% 14 - 21.11.29 628,000 EUR 702,754 733,228 0.03BP Capital Markets PLC 0.83% 16 - 19.09.24 509,000 EUR 518,923 525,222 0.02BP Capital Markets PLC 0.831% 19 - 08.11.27 750,000 EUR 769,038 783,930 0.04BP Capital Markets PLC 0.90% 18 - 03.07.24 600,000 EUR 607,815 620,682 0.03BP Capital Markets PLC 1.077% 17 - 26.06.25 932,000 EUR 968,457 976,456 0.04BP Capital Markets PLC 1.104% 19 - 15.11.34 659,000 EUR 656,955 697,584 0.03BP Capital Markets PLC 1.109% 15 - 16.02.23 770,000 EUR 787,731 792,661 0.04BP Capital Markets PLC 1.117% 16 - 25.01.24 456,000 EUR 465,873 472,826 0.02BP Capital Markets PLC 1.231% 19 - 08.05.31 955,000 EUR 953,389 1,033,377 0.05BP Capital Markets PLC 1.373% 16 - 03.03.22 599,000 EUR 607,457 610,860 0.03BP Capital Markets PLC 1.373% 16 - 03.03.22 5,000 EUR 5,058 5,099 0.00BP Capital Markets PLC 1.526% 14 - 26.09.22 559,000 EUR 573,897 576,787 0.03BP Capital Markets PLC 1.573% 15 - 16.02.27 1,081,000 EUR 1,129,159 1,174,755 0.05BP Capital Markets PLC 1.594% 18 - 03.07.28 591,000 EUR 618,308 650,070 0.03BP Capital Markets PLC 1.637% 17 - 26.06.29 550,000 EUR 566,078 610,005 0.03BP Capital Markets PLC 1.876% 20 - 07.04.24 797,000 EUR 814,213 847,769 0.04BP Capital Markets PLC 1.953% 16 - 03.03.25 300,000 EUR 310,571 324,879 0.01BP Capital Markets PLC 1.953% 16 - 03.03.25 200,000 EUR 204,331 216,586 0.01BP Capital Markets PLC 2.213% 14 - 25.09.26 451,000 EUR 494,617 507,470 0.02BP Capital Markets PLC 2.519% 20 - 07.04.28 997,000 EUR 1,063,080 1,161,834 0.05BP Capital Markets PLC 2.822% 20 - 07.04.32 1,193,000 EUR 1,323,759 1,506,926 0.07BP Capital Markets PLC 2.972% 14 - 27.02.26 936,000 EUR 1,047,239 1,077,991 0.05BP Capital Markets PLC FRN 20 - 31.12.99 2,165,000 EUR 2,189,337 2,306,439 0.11BP Capital Markets PLC FRN 20 - 31.12.99 1,938,000 EUR 1,952,712 2,120,773 0.10Brambles Finance PLC 1.50% 17 - 04.10.27 429,000 EUR 458,964 467,237 0.02British Telecommunications PLC 0.50% 17 - 23.06.22 538,000 EUR 539,605 542,761 0.02British Telecommunications PLC 0.50% 19 - 12.09.25 430,000 EUR 424,653 437,676 0.02British Telecommunications PLC 0.875% 18 -26.09.23 383,000 EUR 388,393 392,452 0.02British Telecommunications PLC 1.00% 17 - 23.06.24 805,000 EUR 813,236 831,654 0.04British Telecommunications PLC 1.00% 17 - 21.11.24 863,000 EUR 868,797 892,817 0.04British Telecommunications PLC 1.125% 16 -10.03.23 1,100,000 EUR 1,116,261 1,130,360 0.05British Telecommunications PLC 1.125% 19 -12.09.29 650,000 EUR 663,351 683,592 0.03British Telecommunications PLC 1.50% 17 - 23.06.27 997,000 EUR 1,030,497 1,073,490 0.05British Telecommunications PLC 1.75% 16 - 10.03.26 500,000 EUR 519,511 541,520 0.02British Telecommunications PLC 1.75% 16 - 10.03.26 240,000 EUR 249,532 259,930 0.01
Xtrackers II
Xtrackers II EUR CORPORATE BOND UCITS ETF (continued)
Statement of Investmentsas at 31 December 2020(expressed in EUR)
The accompanying notes form an integral part of these financial statements.
212

DescriptionNominal
ValueCurrency
(local) Cost Market Value
% ofNet
Assets
Transferable securities and money market instruments admitted to an official stock exchange listing(A)
Bonds (continued)
United Kingdom (continued)British Telecommunications PLC 2.125% 18 -26.09.28 479,000 EUR 519,726 540,346 0.02Cadent Finance PLC 0.625% 16 - 22.09.24 398,000 EUR 401,590 409,701 0.02Cadent Finance PLC 0.75% 20 - 11.03.32 477,000 EUR 457,654 488,772 0.02Coca-Cola European Partners PLC 0.20% 20 -02.12.28 610,000 EUR 607,816 609,176 0.03Coca-Cola European Partners PLC 0.70% 19 -12.09.31 400,000 EUR 395,059 404,484 0.02Coca-Cola European Partners PLC 0.75% 16 -24.02.22 450,000 EUR 452,338 454,748 0.02Coca-Cola European Partners PLC 1.125% 16 -26.05.24 875,000 EUR 901,384 910,271 0.04Coca-Cola European Partners PLC 1.125% 19 -12.04.29 400,000 EUR 398,450 425,248 0.02Coca-Cola European Partners PLC 1.50% 18 -08.11.27 850,000 EUR 900,969 924,519 0.04Coca-Cola European Partners PLC 1.75% 16 -26.05.28 250,000 EUR 272,548 277,423 0.01Coca-Cola European Partners PLC 1.75% 20 -27.03.26 155,000 EUR 158,507 168,054 0.01Coca-Cola European Partners PLC 1.875% 15 -18.03.30 500,000 EUR 552,402 566,045 0.03Coca-Cola European Partners PLC 2.375% 13 -07.05.25 230,000 EUR 253,056 253,053 0.01Coca-Cola European Partners PLC 2.625% 13 -06.11.23 400,000 EUR 428,299 428,872 0.02Compass Group PLC 1.875% 14 - 27.01.23 111,000 EUR 114,943 115,860 0.01Diageo Finance PLC 0.125% 19 - 12.10.23 909,000 EUR 908,279 916,890 0.04Diageo Finance PLC 0.50% 17 - 19.06.24 477,000 EUR 481,828 487,857 0.02Diageo Finance PLC 1.00% 18 - 22.04.25 544,000 EUR 558,174 569,541 0.03Diageo Finance PLC 1.50% 18 - 22.10.27 431,000 EUR 440,956 473,876 0.02Diageo Finance PLC 1.75% 14 - 23.09.24 100,000 EUR 103,411 106,871 0.01Diageo Finance PLC 1.875% 20 - 27.03.27 668,000 EUR 697,744 744,185 0.03Diageo Finance PLC 2.375% 14 - 20.05.26 600,000 EUR 666,918 676,092 0.03Diageo Finance PLC 2.50% 20 - 27.03.32 906,000 EUR 1,022,094 1,107,050 0.05DS Smith PLC 0.875% 19 - 12.09.26 359,000 EUR 353,983 366,001 0.02DS Smith PLC 1.375% 17 - 26.07.24 600,000 EUR 604,424 621,192 0.03DS Smith PLC 2.25% 15 - 16.09.22 473,000 EUR 482,355 488,775 0.02easyJet PLC 0.875% 19 - 11.06.25 380,000 EUR 358,587 362,737 0.02easyJet PLC 1.125% 16 - 18.10.23 500,000 EUR 483,012 490,000 0.02easyJet PLC 1.75% 16 - 09.02.23 327,000 EUR 336,103 327,078 0.02Experian Finance PLC 1.375% 17 - 25.06.26 100,000 EUR 101,672 107,415 0.01G4S International Finance PLC 1.50% 16 - 09.01.23 252,000 EUR 248,067 252,900 0.01G4S International Finance PLC 1.50% 17 - 02.06.24 400,000 EUR 402,266 400,680 0.02G4S International Finance PLC 1.875% 18 - 24.05.25 514,000 EUR 520,354 514,941 0.02GlaxoSmithKline Capital PLC Zero Coupon 19 -23.09.23 466,000 EUR 463,603 468,288 0.02GlaxoSmithKline Capital PLC 0.125% 20 - 12.05.23 642,000 EUR 641,227 647,393 0.03
Xtrackers II
Xtrackers II EUR CORPORATE BOND UCITS ETF (continued)
Statement of Investmentsas at 31 December 2020(expressed in EUR)
The accompanying notes form an integral part of these financial statements.
213

DescriptionNominal
ValueCurrency
(local) Cost Market Value
% ofNet
Assets
Transferable securities and money market instruments admitted to an official stock exchange listing(A)
Bonds (continued)
United Kingdom (continued)GlaxoSmithKline Capital PLC 1.00% 17 - 12.09.26 634,000 EUR 653,200 671,305 0.03GlaxoSmithKline Capital PLC 1.25% 18 - 21.05.26 906,000 EUR 943,195 967,554 0.04GlaxoSmithKline Capital PLC 1.375% 14 - 02.12.24 700,000 EUR 729,923 742,252 0.03GlaxoSmithKline Capital PLC 1.375% 17 - 12.09.29 200,000 EUR 214,170 222,814 0.01GlaxoSmithKline Capital PLC 1.375% 17 - 12.09.29 150,000 EUR 164,932 167,111 0.01GlaxoSmithKline Capital PLC 1.75% 18 - 21.05.30 559,000 EUR 605,528 641,659 0.03GlaxoSmithKline Capital PLC 4.00% 05 - 16.06.25 900,000 EUR 1,052,462 1,065,708 0.05Hammerson PLC 1.75% 16 - 15.03.23 400,000 EUR 385,632 382,968 0.02Hammerson PLC 2.00% 14 - 01.07.22 380,000 EUR 354,614 373,308 0.02HBOS PLC FRN 05 - 18.03.30 200,000 EUR 226,953 228,862 0.01HBOS PLC FRN 05 - 18.03.30 300,000 EUR 333,482 343,293 0.02Hitachi Capital UK PLC 0.125% 19 - 29.11.22 520,000 EUR 519,057 518,201 0.02HSBC Holdings PLC FRN 20 - 13.11.26 1,075,000 EUR 1,083,107 1,089,093 0.05HSBC Holdings PLC FRN 20 - 13.11.31 875,000 EUR 885,988 906,001 0.04HSBC Holdings PLC 0.875% 16 - 06.09.24 1,225,000 EUR 1,228,728 1,269,039 0.06HSBC Holdings PLC 1.50% 16 - 15.03.22 1,571,000 EUR 1,595,125 1,606,489 0.07HSBC Holdings PLC FRN 18 - 04.12.24 932,000 EUR 949,920 976,410 0.04HSBC Holdings PLC 2.50% 16 - 15.03.27 1,048,000 EUR 1,150,547 1,208,334 0.06HSBC Holdings PLC 3.00% 15 - 30.06.25 1,100,000 EUR 1,193,985 1,230,108 0.06HSBC Holdings PLC 3.125% 16 - 07.06.28 800,000 EUR 893,098 955,328 0.04Imperial Brands Finance PLC 1.125% 19 - 14.08.23 1,160,000 EUR 1,160,431 1,190,601 0.05Imperial Brands Finance PLC 1.375% 17 - 27.01.25 100,000 EUR 100,316 104,149 0.00Imperial Brands Finance PLC 2.125% 19 - 12.02.27 790,000 EUR 815,456 854,977 0.04Imperial Brands Finance PLC 3.375% 14 - 26.02.26 300,000 EUR 329,046 342,408 0.02Informa PLC 1.25% 19 - 22.04.28 450,000 EUR 435,809 451,166 0.02Informa PLC 1.50% 18 - 05.07.23 300,000 EUR 295,264 307,818 0.01Informa PLC 2.125% 20 - 06.10.25 607,000 EUR 614,196 639,602 0.03InterContinental Hotels Group PLC 1.625% 20 -08.10.24 560,000 EUR 557,695 574,521 0.03InterContinental Hotels Group PLC 2.125% 18 -15.05.27 400,000 EUR 403,348 422,428 0.02Intermediate Capital Group PLC 1.625% 20 - 17.02.27 347,000 EUR 344,614 351,834 0.02ITV PLC 1.375% 19 - 26.09.26 749,000 EUR 750,282 770,332 0.04ITV PLC 2.125% 15 - 21.09.22 106,000 EUR 107,406 108,956 0.01Leeds Building Society 1.375% 15 - 05.05.22 571,000 EUR 580,681 583,276 0.03Lloyds Bank Corporate Markets PLC 0.25% 19 -04.10.22 539,000 EUR 539,087 542,385 0.02Lloyds Bank Corporate Markets PLC 0.375% 20 -28.01.25 610,000 EUR 613,373 618,131 0.03Lloyds Bank Corporate Markets PLC 2.375% 20 -09.04.26 758,000 EUR 792,624 847,489 0.04Lloyds Bank PLC 1.25% 15 - 13.01.25 850,000 EUR 878,993 898,951 0.04Lloyds Bank PLC 1.375% 15 - 08.09.22 300,000 EUR 305,963 308,730 0.01Lloyds Banking Group PLC FRN 19 - 12.11.25 1,340,000 EUR 1,300,217 1,355,785 0.06Lloyds Banking Group PLC FRN 18 - 15.01.24 1,197,000 EUR 1,184,218 1,210,550 0.06Lloyds Banking Group PLC 1.00% 16 - 09.11.23 400,000 EUR 403,285 412,220 0.02Lloyds Banking Group PLC 1.50% 17 - 12.09.27 550,000 EUR 573,218 601,337 0.03Lloyds Banking Group PLC FRN 18 - 07.09.28 600,000 EUR 592,953 617,790 0.03
Xtrackers II
Xtrackers II EUR CORPORATE BOND UCITS ETF (continued)
Statement of Investmentsas at 31 December 2020(expressed in EUR)
The accompanying notes form an integral part of these financial statements.
214

DescriptionNominal
ValueCurrency
(local) Cost Market Value
% ofNet
Assets
Transferable securities and money market instruments admitted to an official stock exchange listing(A)
Bonds (continued)
United Kingdom (continued)Lloyds Banking Group PLC FRN 20 - 01.04.26 1,437,000 EUR 1,520,657 1,633,754 0.07Lloyds Banking Group PLC FRN 20 - 18.03.30 300,000 EUR 319,719 343,110 0.02London Stock Exchange Group PLC 0.875% 17 -19.09.24 500,000 EUR 508,270 516,240 0.02London Stock Exchange Group PLC 1.75% 17 -19.09.29 332,000 EUR 355,258 367,677 0.02London Stock Exchange Group PLC 1.75% 18 -06.12.27 430,000 EUR 447,512 473,851 0.02Mondi Finance PLC 1.50% 16 - 15.04.24 514,000 EUR 529,101 538,600 0.02Mondi Finance PLC 1.625% 18 - 27.04.26 634,000 EUR 670,096 683,528 0.03Motability Operations Group PLC 0.375% 19 -03.01.26 521,000 EUR 528,482 531,983 0.02Motability Operations Group PLC 0.875% 17 -14.03.25 300,000 EUR 308,779 313,287 0.01Motability Operations Group PLC 1.625% 15 -09.06.23 662,000 EUR 688,520 693,207 0.03National Grid Electricity Transmission PLC 0.19%20 - 20.01.25 358,000 EUR 360,483 362,045 0.02National Grid Electricity Transmission PLC 0.823%20 - 07.07.32 709,000 EUR 722,423 741,302 0.03National Grid Electricity Transmission PLC 0.872%20 - 26.11.40 429,000 EUR 436,666 435,804 0.02National Grid PLC 0.553% 20 - 18.09.29 440,000 EUR 440,000 451,123 0.02Nationwide Building Society 0.25% 20 - 22.07.25 1,225,000 EUR 1,231,101 1,237,507 0.06Nationwide Building Society 0.625% 17 - 19.04.23 642,000 EUR 649,381 653,274 0.03Nationwide Building Society 1.125% 15 - 03.06.22 600,000 EUR 610,262 611,442 0.03Nationwide Building Society 1.25% 15 - 03.03.25 600,000 EUR 618,236 633,432 0.03Nationwide Building Society FRN 18 - 08.03.26 640,000 EUR 657,985 677,907 0.03Nationwide Building Society FRN 17 - 25.07.29 942,000 EUR 951,396 984,578 0.05Natwest Group PLC FRN 19 - 15.11.25 671,000 EUR 655,321 684,890 0.03Natwest Group PLC FRN 18 - 02.03.26 1,606,000 EUR 1,636,591 1,704,496 0.08Natwest Group PLC FRN 17 - 08.03.23 1,182,000 EUR 1,200,124 1,211,054 0.06Natwest Group PLC FRN 18 - 04.03.25 644,000 EUR 655,733 680,663 0.03Natwest Group PLC 2.50% 16 - 22.03.23 1,500,000 EUR 1,567,520 1,583,475 0.07NatWest Markets PLC 0.625% 18 - 02.03.22 800,000 EUR 802,809 806,728 0.04NatWest Markets PLC 1.00% 19 - 28.05.24 800,000 EUR 806,370 827,040 0.04NatWest Markets PLC 1.125% 18 - 14.06.23 433,000 EUR 439,732 445,713 0.02NatWest Markets PLC 2.75% 20 - 02.04.25 898,000 EUR 922,401 997,795 0.05NGG Finance PLC FRN 19 - 05.12.79 192,000 EUR 187,752 194,945 0.01NGG Finance PLC FRN 19 - 05.09.82 636,000 EUR 636,905 656,721 0.03Omnicom Finance Holdings PLC 0.80% 19 - 08.07.27 507,000 EUR 500,647 522,291 0.02Omnicom Finance Holdings PLC 1.40% 19 - 08.07.31 357,000 EUR 356,864 388,430 0.02OTE PLC 0.875% 19 - 24.09.26 500,000 EUR 483,342 517,180 0.02OTE PLC 2.375% 18 - 18.07.22 100,000 EUR 103,485 103,492 0.00Pearson Funding PLC 1.375% 15 - 06.05.25 154,000 EUR 156,795 158,070 0.01Phoenix Group Holdings PLC 4.375% 18 - 24.01.29 450,000 EUR 474,414 515,142 0.02Rentokil Initial PLC 0.50% 20 - 14.10.28 934,000 EUR 938,631 943,135 0.04Rentokil Initial PLC 0.875% 19 - 30.05.26 467,000 EUR 475,871 485,974 0.02
Xtrackers II
Xtrackers II EUR CORPORATE BOND UCITS ETF (continued)
Statement of Investmentsas at 31 December 2020(expressed in EUR)
The accompanying notes form an integral part of these financial statements.
215

DescriptionNominal
ValueCurrency
(local) Cost Market Value
% ofNet
Assets
Transferable securities and money market instruments admitted to an official stock exchange listing(A)
Bonds (continued)
United Kingdom (continued)Rentokil Initial PLC 0.95% 17 - 22.11.24 114,000 EUR 116,251 118,039 0.01Rio Tinto Finance PLC 2.875% 12 - 11.12.24 150,000 EUR 165,322 168,623 0.01Royal Mail PLC 1.25% 19 - 08.10.26 221,000 EUR 222,136 229,016 0.01Royal Mail PLC 2.375% 14 - 29.07.24 907,000 EUR 948,066 975,506 0.04Santander UK Group Holdings PLC FRN 20 -28.02.25 871,000 EUR 845,221 877,942 0.04Santander UK Group Holdings PLC 1.125% 16 -08.09.23 690,000 EUR 694,796 710,610 0.03Santander UK PLC 1.125% 15 - 14.01.22 500,000 EUR 505,698 507,825 0.02Santander UK PLC 1.125% 15 - 10.03.25 400,000 EUR 397,852 419,892 0.02Sky Ltd. 1.875% 14 - 24.11.23 796,000 EUR 828,834 842,988 0.04Sky Ltd. 2.25% 15 - 17.11.25 100,000 EUR 107,951 111,399 0.01Sky Ltd. 2.25% 15 - 17.11.25 346,000 EUR 374,806 385,441 0.02Sky Ltd. 2.50% 14 - 15.09.26 236,000 EUR 251,244 270,194 0.01Sky Ltd. 2.50% 14 - 15.09.26 855,000 EUR 965,081 978,881 0.04Smiths Group PLC 1.25% 15 - 28.04.23 200,000 EUR 204,259 204,566 0.01Smiths Group PLC 2.00% 17 - 23.02.27 644,000 EUR 671,550 697,987 0.03SSE PLC 0.875% 17 - 06.09.25 100,000 EUR 102,577 104,069 0.00SSE PLC 1.25% 20 - 16.04.25 978,000 EUR 1,000,918 1,029,404 0.05SSE PLC 1.375% 18 - 04.09.27 410,000 EUR 427,190 443,727 0.02SSE PLC 1.75% 15 - 08.09.23 751,000 EUR 781,862 789,729 0.04SSE PLC 1.75% 20 - 16.04.30 549,000 EUR 582,332 614,660 0.03SSE PLC 2.375% 13 - 10.02.22 462,000 EUR 473,817 475,287 0.02SSE PLC FRN 20 - 31.12.99 373,000 EUR 386,295 397,006 0.02Standard Chartered PLC FRN 17 - 03.10.23 450,000 EUR 451,269 457,070 0.02Standard Chartered PLC FRN 20 - 27.01.28 510,000 EUR 509,694 527,595 0.02Standard Chartered PLC FRN 19 - 02.07.27 600,000 EUR 604,318 628,128 0.03Standard Chartered PLC FRN 17 - 03.10.27 107,000 EUR 109,343 116,090 0.01Standard Chartered PLC FRN 20 - 09.09.30 1,030,000 EUR 1,051,476 1,103,799 0.05Standard Chartered PLC 3.125% 14 - 19.11.24 850,000 EUR 903,472 934,974 0.04Standard Chartered PLC 3.625% 12 - 23.11.22 599,000 EUR 628,418 636,731 0.03Swiss Re Finance UK PLC 1.375% 16 - 27.05.23 500,000 EUR 506,882 518,215 0.02Swiss Re Finance UK PLC FRN 20 - 04.06.52 700,000 EUR 727,408 782,061 0.04Tesco Corporate Treasury Services PLC 0.875% 19 -29.05.26 670,000 EUR 665,220 690,388 0.03Tesco Corporate Treasury Services PLC 1.375% 18 -24.10.23 1,000,000 EUR 1,021,253 1,036,380 0.05Tesco Corporate Treasury Services PLC 2.50% 14 -01.07.24 274,000 EUR 290,175 296,901 0.01Tesco PLC 5.125% 07 - 10.04.47 326,000 EUR 474,158 482,288 0.02Trinity Acquisition PLC 2.125% 16 - 26.05.22 304,000 EUR 310,081 311,564 0.01Unilever PLC 1.50% 19 - 11.06.39 610,000 EUR 657,738 724,881 0.03Virgin Money UK PLC FRN 20 - 24.06.25 657,000 EUR 658,165 699,422 0.03Vodafone Group PLC 0.50% 16 - 30.01.24 545,000 EUR 549,034 554,799 0.03Vodafone Group PLC 0.90% 19 - 24.11.26 400,000 EUR 405,550 421,240 0.02Vodafone Group PLC 1.125% 17 - 20.11.25 200,000 EUR 203,000 211,004 0.01Vodafone Group PLC 1.125% 17 - 20.11.25 714,000 EUR 730,642 753,284 0.03Vodafone Group PLC 1.50% 17 - 24.07.27 500,000 EUR 528,048 544,060 0.03
Xtrackers II
Xtrackers II EUR CORPORATE BOND UCITS ETF (continued)
Statement of Investmentsas at 31 December 2020(expressed in EUR)
The accompanying notes form an integral part of these financial statements.
216

DescriptionNominal
ValueCurrency
(local) Cost Market Value
% ofNet
Assets
Transferable securities and money market instruments admitted to an official stock exchange listing(A)
Bonds (continued)
United Kingdom (continued)Vodafone Group PLC 1.60% 16 - 29.07.31 999,000 EUR 1,009,737 1,118,690 0.05Vodafone Group PLC 1.625% 19 - 24.11.30 814,000 EUR 854,558 910,036 0.04Vodafone Group PLC 1.75% 16 - 25.08.23 1,015,000 EUR 1,049,722 1,065,892 0.05Vodafone Group PLC 1.875% 14 - 11.09.25 1,214,000 EUR 1,294,332 1,317,833 0.06Vodafone Group PLC 1.875% 17 - 20.11.29 616,000 EUR 666,587 703,571 0.03Vodafone Group PLC 2.20% 16 - 25.08.26 1,315,000 EUR 1,412,971 1,473,405 0.07Vodafone Group PLC 2.20% 16 - 25.08.26 270,000 EUR 289,232 302,524 0.01Vodafone Group PLC 2.50% 19 - 24.05.39 600,000 EUR 636,958 730,038 0.03Vodafone Group PLC 2.875% 17 - 20.11.37 700,000 EUR 762,116 897,337 0.04Vodafone Group PLC 4.65% 10 - 20.01.22 1,090,000 EUR 1,143,038 1,145,612 0.05Vodafone Group PLC 5.375% 07 - 06.06.22 206,000 EUR 220,958 222,523 0.01Wellcome Trust Ltd. 1.125% 15 - 21.01.27 300,000 EUR 304,491 322,671 0.01WPP Finance 2013 3.00% 13 - 20.11.23 1,071,000 EUR 1,142,282 1,167,754 0.05WPP Finance 2016 1.375% 18 - 20.03.25 370,000 EUR 379,442 389,854 0.02Yorkshire Building Society 0.625% 20 - 21.09.25 268,000 EUR 269,706 274,770 0.01Yorkshire Building Society 0.875% 18 - 20.03.23 205,000 EUR 205,368 209,442 0.01Yorkshire Building Society 1.25% 15 - 17.03.22 700,000 EUR 710,674 711,914 0.03
157,121,702 162,462,979 7.41United States3M Co. 0.375% 16 - 15.02.22 431,000 EUR 432,921 433,776 0.023M Co. 0.95% 15 - 15.05.23 600,000 EUR 610,909 618,246 0.033M Co. 1.50% 14 - 09.11.26 860,000 EUR 913,421 943,024 0.043M Co. 1.50% 16 - 02.06.31 500,000 EUR 539,688 575,625 0.033M Co. 1.75% 15 - 15.05.30 206,000 EUR 227,426 240,011 0.01AbbVie Inc. 0.75% 19 - 18.11.27 700,000 EUR 699,871 727,412 0.03AbbVie Inc. 1.25% 19 - 18.11.31 500,000 EUR 506,510 540,285 0.02AbbVie Inc. 1.375% 16 - 17.05.24 1,210,000 EUR 1,241,712 1,263,288 0.06AbbVie Inc. 2.125% 16 - 17.11.28 468,000 EUR 515,643 533,628 0.02AbbVie Inc. 2.625% 20 - 15.11.28 550,000 EUR 587,512 650,666 0.03Air Products & Chemicals Inc. 0.50% 20 - 05.05.28 570,000 EUR 571,017 589,688 0.03Air Products & Chemicals Inc. 0.80% 20 - 05.05.32 457,000 EUR 459,414 485,741 0.02Air Products & Chemicals Inc. 1.00% 15 - 12.02.25 100,000 EUR 100,956 104,885 0.01Air Products & Chemicals Inc. 1.00% 15 - 12.02.25 100,000 EUR 100,699 104,885 0.01Altria Group Inc. 1.00% 19 - 15.02.23 1,000,000 EUR 1,013,995 1,020,320 0.05Altria Group Inc. 1.70% 19 - 15.06.25 680,000 EUR 705,486 719,970 0.03Altria Group Inc. 1.70% 19 - 15.06.25 108,000 EUR 112,871 114,348 0.01Altria Group Inc. 2.20% 19 - 15.06.27 920,000 EUR 958,855 1,003,582 0.05Altria Group Inc. 3.125% 19 - 15.06.31 1,057,000 EUR 1,143,460 1,260,335 0.06American Honda Finance Corp. 0.35% 19 - 26.08.22 663,000 EUR 665,681 669,139 0.03American Honda Finance Corp. 0.55% 18 - 17.03.23 400,000 EUR 397,631 406,384 0.02American Honda Finance Corp. 0.55% 18 - 17.03.23 400,000 EUR 402,946 406,384 0.02American Honda Finance Corp. 0.75% 17 - 17.01.24 162,000 EUR 163,496 166,142 0.01American Honda Finance Corp. 1.375% 15 - 10.11.22 488,000 EUR 498,871 502,635 0.02American Honda Finance Corp. 1.60% 20 - 20.04.22 299,000 EUR 300,616 305,958 0.01American Honda Finance Corp. 1.95% 20 - 18.10.24 997,000 EUR 1,025,521 1,072,822 0.05American International Group Inc. 1.50% 16 -08.06.23 799,000 EUR 822,165 827,476 0.04
Xtrackers II
Xtrackers II EUR CORPORATE BOND UCITS ETF (continued)
Statement of Investmentsas at 31 December 2020(expressed in EUR)
The accompanying notes form an integral part of these financial statements.
217

DescriptionNominal
ValueCurrency
(local) Cost Market Value
% ofNet
Assets
Transferable securities and money market instruments admitted to an official stock exchange listing(A)
Bonds (continued)
United States (continued)American International Group Inc. 1.875% 17 -21.06.27 800,000 EUR 823,140 881,064 0.04American Tower Corp. 0.50% 20 - 15.01.28 702,000 EUR 697,923 706,268 0.03American Tower Corp. 1.00% 20 - 15.01.32 471,000 EUR 470,045 479,596 0.02American Tower Corp. 1.375% 17 - 04.04.25 575,000 EUR 585,156 605,768 0.03American Tower Corp. 1.95% 18 - 22.05.26 456,000 EUR 488,752 496,876 0.02Amgen Inc. 1.25% 16 - 25.02.22 677,000 EUR 684,449 686,024 0.03Amgen Inc. 1.25% 16 - 25.02.22 400,000 EUR 405,014 405,332 0.02Amgen Inc. 2.00% 16 - 25.02.26 309,000 EUR 326,203 341,303 0.02Apple Inc. Zero Coupon 19 - 15.11.25 828,000 EUR 828,800 836,619 0.04Apple Inc. 0.50% 19 - 15.11.31 778,000 EUR 779,664 815,717 0.04Apple Inc. 0.875% 17 - 24.05.25 1,018,000 EUR 1,053,207 1,065,215 0.05Apple Inc. 1.00% 14 - 10.11.22 1,000,000 EUR 1,019,377 1,024,650 0.05Apple Inc. 1.00% 14 - 10.11.22 200,000 EUR 203,000 204,930 0.01Apple Inc. 1.375% 15 - 17.01.24 914,000 EUR 951,543 961,025 0.04Apple Inc. 1.375% 17 - 24.05.29 1,250,000 EUR 1,328,241 1,391,225 0.06Apple Inc. 1.625% 14 - 10.11.26 1,053,000 EUR 1,110,919 1,161,933 0.05Apple Inc. 2.00% 15 - 17.09.27 552,000 EUR 612,406 630,599 0.03Apple Inc. 2.00% 15 - 17.09.27 512,000 EUR 580,424 584,904 0.03Archer-Daniels-Midland Co. 1.00% 18 - 12.09.25 610,000 EUR 628,964 642,300 0.03Archer-Daniels-Midland Co. 1.75% 15 - 23.06.23 300,000 EUR 312,145 315,111 0.01AT&T Inc. 0.25% 19 - 04.03.26 170,000 EUR 169,574 171,386 0.01AT&T Inc. 0.25% 19 - 04.03.26 696,000 EUR 684,793 701,672 0.03AT&T Inc. 0.80% 19 - 04.03.30 970,000 EUR 943,426 999,216 0.05AT&T Inc. 1.05% 18 - 05.09.23 300,000 EUR 299,807 308,844 0.01AT&T Inc. 1.30% 15 - 05.09.23 900,000 EUR 917,987 931,068 0.04AT&T Inc. 1.45% 14 - 01.06.22 900,000 EUR 911,310 917,550 0.04AT&T Inc. 1.45% 14 - 01.06.22 418,000 EUR 425,345 426,151 0.02AT&T Inc. 1.60% 20 - 19.05.28 1,485,000 EUR 1,509,951 1,621,234 0.07AT&T Inc. 1.80% 18 - 05.09.26 1,496,000 EUR 1,560,928 1,630,386 0.07AT&T Inc. 1.80% 19 - 14.09.39 80,000 EUR 79,918 85,151 0.00AT&T Inc. 1.80% 19 - 14.09.39 550,000 EUR 534,598 585,415 0.03AT&T Inc. 1.95% 18 - 15.09.23 600,000 EUR 627,812 630,768 0.03AT&T Inc. 1.95% 19 - 15.09.23 200,000 EUR 209,946 210,256 0.01AT&T Inc. 2.05% 20 - 19.05.32 611,000 EUR 627,999 697,023 0.03AT&T Inc. 2.35% 18 - 05.09.29 1,189,000 EUR 1,275,345 1,377,623 0.06AT&T Inc. 2.40% 14 - 15.03.24 1,100,000 EUR 1,168,786 1,178,991 0.05AT&T Inc. 2.45% 15 - 15.03.35 331,000 EUR 349,548 388,942 0.02AT&T Inc. 2.45% 15 - 15.03.35 750,000 EUR 776,409 881,287 0.04AT&T Inc. 2.50% 13 - 15.03.23 1,270,000 EUR 1,315,135 1,336,345 0.06AT&T Inc. 2.60% 14 - 17.12.29 645,000 EUR 723,436 764,377 0.04AT&T Inc. 2.60% 20 - 19.05.38 407,000 EUR 432,762 482,547 0.02AT&T Inc. 2.75% 16 - 19.05.23 200,000 EUR 208,755 213,736 0.01AT&T Inc. 3.15% 17 - 04.09.36 1,550,000 EUR 1,684,495 1,961,277 0.09AT&T Inc. 3.375% 14 - 15.03.34 400,000 EUR 460,716 515,664 0.02AT&T Inc. 3.50% 13 - 17.12.25 552,000 EUR 615,130 642,324 0.03AT&T Inc. 3.50% 13 - 17.12.25 362,000 EUR 417,368 421,234 0.02AT&T Inc. 3.55% 12 - 17.12.32 1,200,000 EUR 1,422,445 1,568,796 0.07
Xtrackers II
Xtrackers II EUR CORPORATE BOND UCITS ETF (continued)
Statement of Investmentsas at 31 December 2020(expressed in EUR)
The accompanying notes form an integral part of these financial statements.
218

DescriptionNominal
ValueCurrency
(local) Cost Market Value
% ofNet
Assets
Transferable securities and money market instruments admitted to an official stock exchange listing(A)
Bonds (continued)
United States (continued)Athene Global Funding 1.125% 20 - 02.09.25 200,000 EUR 203,121 206,772 0.01Athene Global Funding 1.875% 20 - 23.06.23 557,000 EUR 564,131 582,104 0.03Autoliv Inc. 0.75% 18 - 26.06.23 429,000 EUR 431,923 435,585 0.02Avery Dennison Corp. 1.25% 17 - 03.03.25 300,000 EUR 311,452 313,089 0.01Avery Dennison Corp. 1.25% 17 - 03.03.25 170,000 EUR 177,591 177,417 0.01Bank of America Corp. FRN 19 - 08.08.29 432,000 EUR 432,789 442,100 0.02Bank of America Corp. FRN 20 - 26.10.31 1,335,000 EUR 1,320,005 1,367,721 0.06Bank of America Corp. 0.75% 16 - 26.07.23 1,292,000 EUR 1,304,861 1,322,168 0.06Bank of America Corp. FRN 19 - 09.05.26 1,543,000 EUR 1,555,676 1,593,379 0.07Bank of America Corp. 1.375% 15 - 26.03.25 600,000 EUR 626,755 635,976 0.03Bank of America Corp. FRN 17 - 07.02.25 1,400,000 EUR 1,417,758 1,459,402 0.07Bank of America Corp. FRN 19 - 09.05.30 881,000 EUR 910,342 962,184 0.04Bank of America Corp. 1.625% 15 - 14.09.22 850,000 EUR 873,300 877,089 0.04Bank of America Corp. FRN 18 - 25.04.28 1,265,000 EUR 1,324,833 1,380,925 0.06Bank of America Corp. FRN 17 - 04.05.27 1,130,000 EUR 1,179,003 1,229,508 0.06Bank of America Corp. 2.375% 14 - 19.06.24 750,000 EUR 798,740 813,000 0.04Bank of America Corp. FRN 20 - 31.03.29 1,637,000 EUR 1,827,472 2,035,053 0.09BAT Capital Corp. 1.125% 17 - 16.11.23 274,000 EUR 272,456 281,623 0.01Baxter International Inc. 0.40% 19 - 15.05.24 160,000 EUR 159,443 162,851 0.01Baxter International Inc. 0.40% 19 - 15.05.24 670,000 EUR 667,791 681,939 0.03Baxter International Inc. 1.30% 17 - 30.05.25 973,000 EUR 1,015,263 1,027,936 0.05Baxter International Inc. 1.30% 19 - 15.05.29 188,000 EUR 196,685 204,249 0.01Baxter International Inc. 1.30% 19 - 15.05.29 300,000 EUR 312,503 325,929 0.02Becton Dickinson and Co. 1.00% 16 - 15.12.22 107,000 EUR 107,913 108,863 0.01Becton Dickinson and Co. 1.401% 18 - 24.05.23 650,000 EUR 654,533 670,410 0.03Becton Dickinson and Co. 1.90% 16 - 15.12.26 255,000 EUR 265,941 275,372 0.01Berkshire Hathaway Inc. Zero Coupon 20 - 12.03.25 985,000 EUR 966,630 990,230 0.05Berkshire Hathaway Inc. 0.625% 17 - 17.01.23 750,000 EUR 757,440 763,425 0.04Berkshire Hathaway Inc. 0.75% 15 - 16.03.23 600,000 EUR 607,413 611,808 0.03Berkshire Hathaway Inc. 1.125% 15 - 16.03.27 200,000 EUR 198,853 213,680 0.01Berkshire Hathaway Inc. 1.125% 15 - 16.03.27 965,000 EUR 991,839 1,031,006 0.05Berkshire Hathaway Inc. 1.30% 16 - 15.03.24 1,000,000 EUR 1,031,865 1,044,920 0.05Berkshire Hathaway Inc. 1.625% 15 - 16.03.35 800,000 EUR 831,073 946,120 0.04Berkshire Hathaway Inc. 2.15% 16 - 15.03.28 200,000 EUR 226,558 230,224 0.01Berkshire Hathaway Inc. 2.15% 16 - 15.03.28 300,000 EUR 336,632 345,336 0.02Berry Global Inc. 1.00% 20 - 15.01.25 600,000 EUR 608,286 606,126 0.03Berry Global Inc. 1.50% 20 - 15.01.27 321,000 EUR 329,205 327,603 0.02BlackRock Inc. 1.25% 15 - 06.05.25 623,000 EUR 652,822 663,358 0.03Blackstone Holdings Finance Co. LLC 1.00% 16 -05.10.26 811,000 EUR 803,216 853,091 0.04Blackstone Holdings Finance Co. LLC 1.50% 19 -10.04.29 300,000 EUR 310,954 330,402 0.02Blackstone Holdings Finance Co. LLC 2.00% 15 -19.05.25 200,000 EUR 210,040 217,470 0.01BMW US Capital LLC 0.625% 15 - 20.04.22 1,036,000 EUR 1,041,822 1,048,204 0.05BMW US Capital LLC 1.00% 15 - 20.04.27 500,000 EUR 515,156 532,575 0.02Booking Holdings Inc. 0.80% 17 - 10.03.22 500,000 EUR 502,965 505,085 0.02Booking Holdings Inc. 1.80% 15 - 03.03.27 658,000 EUR 688,721 722,333 0.03
Xtrackers II
Xtrackers II EUR CORPORATE BOND UCITS ETF (continued)
Statement of Investmentsas at 31 December 2020(expressed in EUR)
The accompanying notes form an integral part of these financial statements.
219

DescriptionNominal
ValueCurrency
(local) Cost Market Value
% ofNet
Assets
Transferable securities and money market instruments admitted to an official stock exchange listing(A)
Bonds (continued)
United States (continued)Booking Holdings Inc. 2.15% 15 - 25.11.22 700,000 EUR 722,399 725,809 0.03Booking Holdings Inc. 2.15% 15 - 25.11.22 300,000 EUR 311,474 311,061 0.01Booking Holdings Inc. 2.375% 14 - 23.09.24 1,058,000 EUR 1,110,776 1,144,047 0.05BorgWarner Inc. 1.80% 15 - 07.11.22 300,000 EUR 308,676 307,899 0.01Boston Scientific Corp. 0.625% 19 - 01.12.27 889,000 EUR 885,479 897,819 0.04Bristol-Myers Squibb Co. 1.00% 15 - 15.05.25 750,000 EUR 782,964 789,900 0.04Bristol-Myers Squibb Co. 1.75% 15 - 15.05.35 400,000 EUR 441,025 482,312 0.02Brown-Forman Corp. 1.20% 16 - 07.07.26 200,000 EUR 203,072 212,670 0.01Capital One Financial Corp. 0.80% 19 - 12.06.24 420,000 EUR 420,088 429,324 0.02Capital One Financial Corp. 1.65% 19 - 12.06.29 300,000 EUR 290,450 321,606 0.01Capital One Financial Corp. 1.65% 19 - 12.06.29 200,000 EUR 207,564 214,404 0.01Cargill Inc. 2.50% 14 - 15.02.23 200,000 EUR 208,326 211,836 0.01Celanese US Holdings LLC 1.125% 16 - 26.09.23 118,000 EUR 117,247 120,457 0.01Celanese US Holdings LLC 1.25% 17 - 11.02.25 222,000 EUR 220,120 226,922 0.01Celanese US Holdings LLC 1.25% 17 - 11.02.25 144,000 EUR 146,793 147,192 0.01Celanese US Holdings LLC 2.125% 18 - 01.03.27 399,000 EUR 409,515 426,886 0.02Chubb INA Holdings Inc. 0.30% 19 - 15.12.24 400,000 EUR 402,396 405,800 0.02Chubb INA Holdings Inc. 0.875% 19 - 15.06.27 800,000 EUR 820,786 841,560 0.04Chubb INA Holdings Inc. 0.875% 19 - 15.12.29 500,000 EUR 490,529 530,025 0.02Chubb INA Holdings Inc. 1.40% 19 - 15.06.31 600,000 EUR 626,221 664,674 0.03Chubb INA Holdings Inc. 1.55% 18 - 15.03.28 540,000 EUR 554,328 593,384 0.03Chubb INA Holdings Inc. 1.55% 18 - 15.03.28 400,000 EUR 429,653 439,544 0.02Chubb INA Holdings Inc. 2.50% 18 - 15.03.38 768,000 EUR 865,950 1,007,524 0.05Citigroup Inc. 0.50% 19 - 29.01.22 883,000 EUR 886,453 891,318 0.04Citigroup Inc. 0.50% 19 - 29.01.22 7,000 EUR 7,045 7,066 0.00Citigroup Inc. FRN 19 - 08.10.27 1,172,000 EUR 1,155,569 1,188,619 0.05Citigroup Inc. 0.75% 16 - 26.10.23 1,492,000 EUR 1,499,677 1,528,151 0.07Citigroup Inc. 1.25% 19 - 10.04.29 1,148,000 EUR 1,177,987 1,234,410 0.06Citigroup Inc. FRN 20 - 06.07.26 1,847,000 EUR 1,862,818 1,945,445 0.09Citigroup Inc. 1.50% 16 - 26.10.28 850,000 EUR 889,139 927,868 0.04Citigroup Inc. FRN 18 - 24.07.26 1,395,000 EUR 1,411,468 1,481,853 0.07Citigroup Inc. 1.625% 18 - 21.03.28 508,000 EUR 533,387 558,292 0.03Citigroup Inc. 1.75% 15 - 28.01.25 1,265,000 EUR 1,328,169 1,355,751 0.06Citigroup Inc. 2.125% 14 - 10.09.26 1,030,000 EUR 1,121,357 1,144,083 0.05Citigroup Inc. 2.375% 14 - 22.05.24 900,000 EUR 958,406 974,709 0.04Citigroup Inc. FRN 05 - 25.02.30 155,000 EUR 180,549 177,907 0.01Coca-Cola Co. 0.125% 20 - 15.03.29 900,000 EUR 896,852 906,102 0.04Coca-Cola Co. 0.375% 20 - 15.03.33 680,000 EUR 670,693 685,896 0.03Coca-Cola Co. 0.50% 17 - 08.03.24 300,000 EUR 304,711 306,966 0.01Coca-Cola Co. 0.75% 15 - 09.03.23 1,100,000 EUR 1,112,068 1,120,724 0.05Coca-Cola Co. 0.75% 19 - 22.09.26 1,180,000 EUR 1,208,156 1,237,761 0.06Coca-Cola Co. 0.80% 20 - 15.03.40 796,000 EUR 791,827 821,289 0.04Coca-Cola Co. 1.10% 16 - 02.09.36 300,000 EUR 304,992 330,531 0.02Coca-Cola Co. 1.125% 15 - 09.03.27 700,000 EUR 711,065 750,869 0.03Coca-Cola Co. 1.125% 15 - 09.03.27 360,000 EUR 382,710 386,161 0.02Coca-Cola Co. 1.25% 19 - 08.03.31 675,000 EUR 698,722 751,437 0.03Coca-Cola Co. 1.625% 15 - 09.03.35 1,292,000 EUR 1,406,261 1,509,030 0.07Coca-Cola Co. 1.875% 14 - 22.09.26 1,114,000 EUR 1,203,808 1,242,567 0.06
Xtrackers II
Xtrackers II EUR CORPORATE BOND UCITS ETF (continued)
Statement of Investmentsas at 31 December 2020(expressed in EUR)
The accompanying notes form an integral part of these financial statements.
220

DescriptionNominal
ValueCurrency
(local) Cost Market Value
% ofNet
Assets
Transferable securities and money market instruments admitted to an official stock exchange listing(A)
Bonds (continued)
United States (continued)Colgate-Palmolive Co. 0.50% 19 - 06.03.26 100,000 EUR 99,643 103,697 0.00Colgate-Palmolive Co. 0.875% 19 - 12.11.39 310,000 EUR 307,954 339,295 0.02Colgate-Palmolive Co. 1.375% 19 - 06.03.34 762,000 EUR 848,094 884,164 0.04Comcast Corp. 0.25% 20 - 20.05.27 416,000 EUR 416,633 422,115 0.02Comcast Corp. 0.75% 20 - 20.02.32 1,200,000 EUR 1,212,765 1,248,036 0.06Comcast Corp. 1.25% 20 - 20.02.40 716,000 EUR 710,012 775,850 0.04CyrusOne LP Via CyrusOne Finance Corp. 1.45% 20 -22.01.27 500,000 EUR 493,502 506,110 0.02Danaher Corp. 1.70% 20 - 30.03.24 768,000 EUR 777,789 812,429 0.04Danaher Corp. 2.10% 20 - 30.09.26 438,000 EUR 455,785 488,466 0.02Danaher Corp. 2.50% 20 - 30.03.30 625,000 EUR 685,217 746,325 0.03Digital Euro Finco LLC 1.125% 19 - 09.04.28 600,000 EUR 581,650 632,082 0.03Digital Euro Finco LLC 2.50% 19 - 16.01.26 640,000 EUR 669,846 712,749 0.03Digital Euro Finco LLC 2.625% 16 - 15.04.24 400,000 EUR 418,104 433,184 0.02Discovery Communications LLC 1.90% 15 - 19.03.27 334,000 EUR 339,803 358,275 0.02Discovery Communications LLC 2.375% 14 -07.03.22 200,000 EUR 203,602 205,316 0.01Dover Corp. 0.75% 19 - 04.11.27 365,000 EUR 364,396 377,702 0.02Dover Corp. 1.25% 16 - 09.11.26 78,000 EUR 77,585 83,406 0.00Dover Corp. 1.25% 16 - 09.11.26 600,000 EUR 629,853 641,586 0.03Dow Chemical Co. 0.50% 20 - 15.03.27 1,295,000 EUR 1,260,386 1,309,737 0.06Dow Chemical Co. 1.125% 20 - 15.03.32 571,000 EUR 556,336 592,590 0.03Dow Chemical Co. 1.875% 20 - 15.03.40 347,000 EUR 342,907 386,138 0.02DXC Technology Co. 1.75% 18 - 15.01.26 350,000 EUR 346,498 358,747 0.02Eastman Chemical Co. 1.50% 16 - 26.05.23 798,000 EUR 813,262 820,783 0.04Eastman Chemical Co. 1.875% 16 - 23.11.26 262,000 EUR 270,654 279,481 0.01Ecolab Inc. 1.00% 16 - 15.01.24 340,000 EUR 349,378 350,554 0.02Ecolab Inc. 2.625% 15 - 08.07.25 230,000 EUR 252,998 257,138 0.01Ecolab Inc. 2.625% 15 - 08.07.25 200,000 EUR 223,093 223,598 0.01Eli Lilly & Co. 0.625% 19 - 01.11.31 577,000 EUR 591,105 609,531 0.03Eli Lilly & Co. 1.00% 15 - 02.06.22 200,000 EUR 202,330 203,104 0.01Eli Lilly & Co. 1.625% 15 - 02.06.26 1,009,000 EUR 1,089,762 1,101,475 0.05Eli Lilly & Co. 1.70% 19 - 01.11.49 850,000 EUR 863,385 1,003,782 0.05Eli Lilly & Co. 2.125% 15 - 03.06.30 466,000 EUR 513,903 558,310 0.03Emerson Electric Co. 0.375% 19 - 22.05.24 600,000 EUR 604,385 611,100 0.03Emerson Electric Co. 1.25% 19 - 15.10.25 922,000 EUR 956,759 982,400 0.05Emerson Electric Co. 2.00% 19 - 15.10.29 106,000 EUR 120,017 122,398 0.01Emerson Electric Co. 2.00% 19 - 15.10.29 50,000 EUR 53,131 57,735 0.00Equinix Inc. 2.875% 17 - 01.02.26 406,000 EUR 420,028 412,001 0.02Euronet Worldwide Inc. 1.375% 19 - 22.05.26 449,000 EUR 435,337 446,382 0.02Expedia Group Inc. 2.50% 15 - 03.06.22 250,000 EUR 247,705 256,128 0.01Exxon Mobil Corp. 0.142% 20 - 26.06.24 1,213,000 EUR 1,216,683 1,224,426 0.06Exxon Mobil Corp. 0.524% 20 - 26.06.28 1,115,000 EUR 1,123,178 1,142,752 0.05Exxon Mobil Corp. 0.835% 20 - 26.06.32 815,000 EUR 809,915 837,404 0.04Exxon Mobil Corp. 1.408% 20 - 26.06.39 815,000 EUR 813,378 854,625 0.04FedEx Corp. 0.45% 19 - 05.08.25 200,000 EUR 201,242 204,294 0.01FedEx Corp. 0.70% 19 - 13.05.22 738,000 EUR 739,702 746,472 0.03FedEx Corp. 1.00% 16 - 11.01.23 230,000 EUR 232,618 234,722 0.01
Xtrackers II
Xtrackers II EUR CORPORATE BOND UCITS ETF (continued)
Statement of Investmentsas at 31 December 2020(expressed in EUR)
The accompanying notes form an integral part of these financial statements.
221

DescriptionNominal
ValueCurrency
(local) Cost Market Value
% ofNet
Assets
Transferable securities and money market instruments admitted to an official stock exchange listing(A)
Bonds (continued)
United States (continued)FedEx Corp. 1.00% 16 - 11.01.23 100,000 EUR 100,763 102,053 0.00FedEx Corp. 1.30% 19 - 05.08.31 475,000 EUR 461,536 510,744 0.02FedEx Corp. 1.625% 16 - 11.01.27 1,015,000 EUR 1,050,575 1,107,385 0.05Fidelity National Information Services Inc. 0.125%19 - 03.12.22 906,000 EUR 899,780 910,684 0.04Fidelity National Information Services Inc. 0.625%19 - 03.12.25 392,000 EUR 385,623 403,356 0.02Fidelity National Information Services Inc. 0.75% 19 -21.05.23 1,227,000 EUR 1,241,629 1,251,749 0.06Fidelity National Information Services Inc. 1.00% 19 -03.12.28 400,000 EUR 397,807 419,528 0.02Fidelity National Information Services Inc. 1.10% 17 -15.07.24 650,000 EUR 667,254 675,434 0.03Fidelity National Information Services Inc. 1.50% 19 -21.05.27 1,020,000 EUR 1,054,842 1,099,835 0.05Fidelity National Information Services Inc. 2.00% 19 -21.05.30 862,000 EUR 916,474 979,439 0.04Fidelity National Information Services Inc. 2.95% 19 -21.05.39 350,000 EUR 393,538 448,067 0.02Fidelity National Information Services Inc. 2.95% 19 -21.05.39 100,000 EUR 118,466 128,019 0.01Fiserv Inc. 0.375% 19 - 01.07.23 500,000 EUR 498,618 506,165 0.02Fiserv Inc. 1.125% 19 - 01.07.27 300,000 EUR 307,389 317,664 0.01Fiserv Inc. 1.625% 19 - 01.07.30 200,000 EUR 206,083 219,904 0.01Fiserv Inc. 1.625% 19 - 01.07.30 101,000 EUR 107,015 111,052 0.01Flowserve Corp. 1.25% 15 - 17.03.22 300,000 EUR 293,880 300,081 0.01Flowserve Corp. 1.25% 15 - 17.03.22 207,000 EUR 207,440 207,056 0.01General Electric Co. 0.375% 17 - 17.05.22 472,000 EUR 466,717 474,922 0.02General Electric Co. 0.875% 17 - 17.05.25 1,230,000 EUR 1,217,083 1,264,674 0.06General Electric Co. 0.875% 17 - 17.05.25 384,000 EUR 381,016 394,825 0.02General Electric Co. 1.25% 15 - 26.05.23 819,000 EUR 822,155 841,776 0.04General Electric Co. 1.50% 17 - 17.05.29 1,258,000 EUR 1,200,416 1,339,707 0.06General Electric Co. 1.875% 15 - 28.05.27 816,000 EUR 828,003 880,146 0.04General Electric Co. 2.125% 17 - 17.05.37 650,000 EUR 644,392 695,818 0.03General Electric Co. 2.125% 17 - 17.05.37 171,000 EUR 157,580 183,054 0.01General Electric Co. 4.125% 05 - 19.09.35 100,000 EUR 124,735 130,737 0.01General Electric Co. 4.125% 05 - 19.09.35 579,000 EUR 660,780 756,967 0.03General Mills Inc. 0.45% 20 - 15.01.26 776,000 EUR 776,191 792,769 0.04General Mills Inc. 1.00% 15 - 27.04.23 367,000 EUR 374,750 375,995 0.02General Mills Inc. 1.00% 15 - 27.04.23 100,000 EUR 101,669 102,451 0.00General Mills Inc. 1.50% 15 - 27.04.27 170,000 EUR 173,771 185,184 0.01General Motors Financial Co. Inc. 0.20% 19 -02.09.22 565,000 EUR 555,397 566,350 0.03General Motors Financial Co. Inc. 0.85% 20 -26.02.26 368,000 EUR 341,177 370,642 0.02General Motors Financial Co. Inc. 0.955% 16 -07.09.23 668,000 EUR 678,325 681,266 0.03
Xtrackers II
Xtrackers II EUR CORPORATE BOND UCITS ETF (continued)
Statement of Investmentsas at 31 December 2020(expressed in EUR)
The accompanying notes form an integral part of these financial statements.
222

DescriptionNominal
ValueCurrency
(local) Cost Market Value
% ofNet
Assets
Transferable securities and money market instruments admitted to an official stock exchange listing(A)
Bonds (continued)
United States (continued)General Motors Financial Co. Inc. 1.694% 18 -26.03.25 400,000 EUR 386,052 420,956 0.02General Motors Financial Co. Inc. 2.20% 19 -01.04.24 1,178,000 EUR 1,186,154 1,246,995 0.06Goldman Sachs Group Inc. 0.125% 19 - 19.08.24 900,000 EUR 893,728 903,528 0.04Goldman Sachs Group Inc. 0.875% 20 - 21.01.30 682,000 EUR 686,917 716,086 0.03Goldman Sachs Group Inc. 0.875% 20 - 21.01.30 200,000 EUR 193,007 209,996 0.01Goldman Sachs Group Inc. 1.25% 16 - 01.05.25 868,000 EUR 860,264 902,095 0.04Goldman Sachs Group Inc. 1.375% 15 - 26.07.22 797,000 EUR 809,758 817,252 0.04Goldman Sachs Group Inc. 1.375% 17 - 15.05.24 1,558,000 EUR 1,587,558 1,608,168 0.07Goldman Sachs Group Inc. 1.625% 16 - 27.07.26 2,000,000 EUR 2,079,334 2,161,620 0.10Goldman Sachs Group Inc. 2.00% 15 - 27.07.23 1,521,000 EUR 1,571,766 1,604,351 0.07Goldman Sachs Group Inc. 2.00% 18 - 22.03.28 472,000 EUR 482,072 530,514 0.02Goldman Sachs Group Inc. 2.00% 18 - 01.11.28 1,386,000 EUR 1,470,349 1,573,346 0.07Goldman Sachs Group Inc. 2.125% 14 - 30.09.24 900,000 EUR 945,474 968,652 0.04Goldman Sachs Group Inc. 2.875% 14 - 03.06.26 634,000 EUR 696,350 726,469 0.03Goldman Sachs Group Inc. 3.00% 16 - 12.02.31 708,000 EUR 825,819 893,942 0.04Goldman Sachs Group Inc. 3.25% 13 - 01.02.23 850,000 EUR 898,373 910,698 0.04Goldman Sachs Group Inc. 3.375% 20 - 27.03.25 2,016,000 EUR 2,139,849 2,297,010 0.11Harley-Davidson Financial Services Inc. 0.90% 19 -19.11.24 514,000 EUR 516,027 521,659 0.02Harley-Davidson Financial Services Inc. 3.875% 20 -19.05.23 629,000 EUR 639,307 682,182 0.03Honeywell International Inc. Zero Coupon 20 -10.03.24 553,000 EUR 540,650 555,638 0.03Honeywell International Inc. 0.75% 20 - 10.03.32 279,000 EUR 261,128 290,726 0.01Honeywell International Inc. 1.30% 16 - 22.02.23 1,155,000 EUR 1,181,655 1,192,087 0.05Honeywell International Inc. 2.25% 16 - 22.02.28 235,000 EUR 264,976 273,145 0.01Honeywell International Inc. 2.25% 16 - 22.02.28 450,000 EUR 505,332 523,044 0.02Illinois Tool Works Inc. 0.25% 19 - 05.12.24 259,000 EUR 262,485 263,038 0.01Illinois Tool Works Inc. 0.25% 19 - 05.12.24 300,000 EUR 301,874 304,677 0.01Illinois Tool Works Inc. 0.625% 19 - 05.12.27 383,000 EUR 380,254 399,343 0.02Illinois Tool Works Inc. 1.00% 19 - 05.06.31 390,000 EUR 400,842 426,169 0.02Illinois Tool Works Inc. 1.25% 15 - 22.05.23 700,000 EUR 718,174 722,442 0.03Illinois Tool Works Inc. 1.25% 15 - 22.05.23 100,000 EUR 103,010 103,206 0.00Illinois Tool Works Inc. 1.75% 14 - 20.05.22 500,000 EUR 508,626 511,550 0.02Illinois Tool Works Inc. 2.125% 15 - 22.05.30 475,000 EUR 528,231 566,718 0.03Illinois Tool Works Inc. 3.00% 14 - 19.05.34 306,000 EUR 377,590 414,355 0.02International Business Machines Corp. 0.30% 20 -11.02.28 1,363,000 EUR 1,343,251 1,386,048 0.06International Business Machines Corp. 0.375% 19 -31.01.23 99,000 EUR 98,867 100,181 0.00International Business Machines Corp. 0.375% 19 -31.01.23 1,540,000 EUR 1,545,760 1,558,372 0.07International Business Machines Corp. 0.65% 20 -11.02.32 1,425,000 EUR 1,410,426 1,472,780 0.07International Business Machines Corp. 0.875% 19 -31.01.25 420,000 EUR 420,675 437,951 0.02
Xtrackers II
Xtrackers II EUR CORPORATE BOND UCITS ETF (continued)
Statement of Investmentsas at 31 December 2020(expressed in EUR)
The accompanying notes form an integral part of these financial statements.
223

DescriptionNominal
ValueCurrency
(local) Cost Market Value
% ofNet
Assets
Transferable securities and money market instruments admitted to an official stock exchange listing(A)
Bonds (continued)
United States (continued)International Business Machines Corp. 0.875% 19 -31.01.25 600,000 EUR 612,784 625,644 0.03International Business Machines Corp. 0.95% 17 -23.05.25 1,000,000 EUR 1,006,224 1,049,830 0.05International Business Machines Corp. 1.125% 16 -06.09.24 550,000 EUR 568,105 576,978 0.03International Business Machines Corp. 1.125% 16 -06.09.24 200,000 EUR 208,607 209,810 0.01International Business Machines Corp. 1.20% 20 -11.02.40 692,000 EUR 681,095 741,623 0.03International Business Machines Corp. 1.25% 14 -26.05.23 915,000 EUR 938,597 947,583 0.04International Business Machines Corp. 1.25% 19 -29.01.27 566,000 EUR 587,808 608,852 0.03International Business Machines Corp. 1.50% 17 -23.05.29 700,000 EUR 724,357 780,724 0.04International Business Machines Corp. 1.75% 16 -07.03.28 200,000 EUR 218,631 223,896 0.01International Business Machines Corp. 1.75% 16 -07.03.28 200,000 EUR 215,742 223,896 0.01International Business Machines Corp. 1.75% 19 -31.01.31 500,000 EUR 532,993 573,330 0.03International Business Machines Corp. 1.75% 19 -31.01.31 643,000 EUR 683,953 737,302 0.03International Business Machines Corp. 2.875% 13 -07.11.25 800,000 EUR 904,467 917,568 0.04International Flavors & Fragrances Inc. 1.75% 16 -14.03.24 150,000 EUR 154,443 158,124 0.01International Flavors & Fragrances Inc. 1.80% 18 -25.09.26 745,000 EUR 763,612 804,049 0.04Jefferies Group LLC 1.00% 19 - 19.07.24 100,000 EUR 99,559 101,903 0.00Johnson & Johnson 0.25% 16 - 20.01.22 651,000 EUR 653,379 655,368 0.03Johnson & Johnson 0.25% 16 - 20.01.22 200,000 EUR 201,064 201,342 0.01Johnson & Johnson 0.65% 16 - 20.05.24 879,000 EUR 901,168 906,460 0.04Johnson & Johnson 1.15% 16 - 20.11.28 450,000 EUR 475,822 497,745 0.02Johnson & Johnson 1.15% 16 - 20.11.28 300,000 EUR 327,821 331,830 0.02Johnson & Johnson 1.65% 16 - 20.05.35 349,000 EUR 395,513 428,087 0.02Johnson & Johnson 1.65% 16 - 20.05.35 700,000 EUR 777,612 858,627 0.04JPMorgan Chase & Co. FRN 20 - 24.02.28 965,000 EUR 948,016 979,620 0.04JPMorgan Chase & Co. 0.625% 16 - 25.01.24 1,812,000 EUR 1,824,742 1,848,784 0.08JPMorgan Chase & Co. FRN 19 - 25.07.31 998,000 EUR 1,022,702 1,065,814 0.05JPMorgan Chase & Co. FRN 19 - 25.07.31 300,000 EUR 309,949 320,385 0.01JPMorgan Chase & Co. FRN 19 - 04.11.32 1,480,000 EUR 1,477,622 1,592,228 0.07JPMorgan Chase & Co. FRN 19 - 11.03.27 2,400,000 EUR 2,436,233 2,523,456 0.12JPMorgan Chase & Co. 1.50% 15 - 27.01.25 1,116,000 EUR 1,152,079 1,186,766 0.05JPMorgan Chase & Co. 1.50% 15 - 26.10.22 1,292,000 EUR 1,319,113 1,334,403 0.06JPMorgan Chase & Co. 1.50% 16 - 29.10.26 1,290,000 EUR 1,362,931 1,404,333 0.06JPMorgan Chase & Co. FRN 17 - 18.05.28 1,629,000 EUR 1,710,267 1,783,022 0.08
Xtrackers II
Xtrackers II EUR CORPORATE BOND UCITS ETF (continued)
Statement of Investmentsas at 31 December 2020(expressed in EUR)
The accompanying notes form an integral part of these financial statements.
224

DescriptionNominal
ValueCurrency
(local) Cost Market Value
% ofNet
Assets
Transferable securities and money market instruments admitted to an official stock exchange listing(A)
Bonds (continued)
United States (continued)JPMorgan Chase & Co. FRN 18 - 12.06.29 885,000 EUR 949,731 993,545 0.05JPMorgan Chase & Co. 2.75% 12 - 24.08.22 1,119,000 EUR 1,167,177 1,174,514 0.05JPMorgan Chase & Co. 2.75% 13 - 01.02.23 900,000 EUR 950,289 956,358 0.04JPMorgan Chase & Co. 2.875% 13 - 24.05.28 1,130,000 EUR 1,308,915 1,360,554 0.06JPMorgan Chase & Co. 3.00% 14 - 19.02.26 900,000 EUR 985,435 1,040,202 0.05Kellogg Co. 0.80% 17 - 17.11.22 565,000 EUR 570,460 575,430 0.03Kellogg Co. 1.00% 16 - 17.05.24 500,000 EUR 497,813 516,995 0.02Kellogg Co. 1.00% 16 - 17.05.24 100,000 EUR 100,837 103,399 0.00Kellogg Co. 1.25% 15 - 10.03.25 300,000 EUR 306,402 315,417 0.01Kimberly-Clark Corp. 0.625% 17 - 07.09.24 300,000 EUR 304,641 309,012 0.01Kinder Morgan Inc. 1.50% 15 - 16.03.22 669,000 EUR 678,197 680,995 0.03Kinder Morgan Inc. 2.25% 15 - 16.03.27 392,000 EUR 426,432 433,509 0.02KKR Group Finance Co. V LLC 1.625% 19 - 22.05.29 629,000 EUR 644,907 687,000 0.03Liberty Mutual Group Inc. 2.75% 16 - 04.05.26 450,000 EUR 490,179 511,281 0.02Linde Inc/CT 1.20% 16 - 12.02.24 393,000 EUR 402,216 410,579 0.02ManpowerGroup Inc. 1.75% 18 - 22.06.26 207,000 EUR 212,272 222,291 0.01ManpowerGroup Inc. 1.875% 15 - 11.09.22 500,000 EUR 509,785 513,190 0.02Marsh & McLennan Cos Inc. 1.349% 19 - 21.09.26 257,000 EUR 263,838 274,486 0.01Marsh & McLennan Cos Inc. 1.349% 19 - 21.09.26 100,000 EUR 100,856 106,804 0.01Marsh & McLennan Cos Inc. 1.979% 19 - 21.03.30 200,000 EUR 215,368 228,502 0.01Marsh & McLennan Cos Inc. 1.979% 19 - 21.03.30 200,000 EUR 203,841 228,502 0.01Mastercard Inc. 1.10% 15 - 01.12.22 100,000 EUR 101,256 102,446 0.00Mastercard Inc. 1.10% 15 - 01.12.22 909,000 EUR 928,078 931,234 0.04Mastercard Inc. 2.10% 15 - 01.12.27 200,000 EUR 213,358 228,932 0.01Mastercard Inc. 2.10% 15 - 01.12.27 572,000 EUR 648,565 654,746 0.03McDonald’s Corp. 0.625% 17 - 29.01.24 1,100,000 EUR 1,104,343 1,126,235 0.05McDonald’s Corp. 0.90% 19 - 15.06.26 300,000 EUR 307,987 315,216 0.01McDonald’s Corp. 1.00% 16 - 15.11.23 700,000 EUR 713,083 723,786 0.03McDonald’s Corp. 1.125% 15 - 26.05.22 900,000 EUR 914,086 916,992 0.04McDonald’s Corp. 1.50% 17 - 28.11.29 600,000 EUR 623,214 666,546 0.03McDonald’s Corp. 1.60% 19 - 15.03.31 300,000 EUR 317,520 337,734 0.02McDonald’s Corp. 1.75% 16 - 03.05.28 700,000 EUR 739,701 783,489 0.04McDonald’s Corp. 1.875% 15 - 26.05.27 500,000 EUR 521,967 556,575 0.03McDonald’s Corp. 2.00% 13 - 01.06.23 300,000 EUR 314,025 316,068 0.01McDonald’s Corp. 2.625% 14 - 11.06.29 300,000 EUR 349,692 357,957 0.02McDonald’s Corp. 2.875% 13 - 17.12.25 500,000 EUR 557,025 570,335 0.03McKesson Corp. 1.50% 17 - 17.11.25 100,000 EUR 100,266 106,343 0.01McKesson Corp. 1.50% 17 - 17.11.25 187,000 EUR 197,844 198,861 0.01McKesson Corp. 1.625% 18 - 30.10.26 462,000 EUR 473,319 499,122 0.02Merck & Co. Inc. 0.50% 16 - 02.11.24 445,000 EUR 454,073 456,984 0.02Merck & Co. Inc. 1.375% 16 - 02.11.36 279,000 EUR 296,527 321,531 0.01Merck & Co. Inc. 1.875% 14 - 15.10.26 966,000 EUR 1,053,257 1,074,260 0.05Merck & Co. Inc. 2.50% 14 - 15.10.34 400,000 EUR 487,865 522,520 0.02Metropolitan Life Global Funding I Zero Coupon 19 -23.09.22 600,000 EUR 598,418 602,748 0.03Metropolitan Life Global Funding I 0.375% 19 -09.04.24 820,000 EUR 827,048 834,161 0.04
Xtrackers II
Xtrackers II EUR CORPORATE BOND UCITS ETF (continued)
Statement of Investmentsas at 31 December 2020(expressed in EUR)
The accompanying notes form an integral part of these financial statements.
225

DescriptionNominal
ValueCurrency
(local) Cost Market Value
% ofNet
Assets
Transferable securities and money market instruments admitted to an official stock exchange listing(A)
Bonds (continued)
United States (continued)Metropolitan Life Global Funding I 0.55% 20 -16.06.27 157,000 EUR 160,710 162,964 0.01Metropolitan Life Global Funding I 0.875% 15 -20.01.22 770,000 EUR 775,172 780,172 0.04Metropolitan Life Global Funding I 2.375% 13 -11.01.23 500,000 EUR 523,434 526,900 0.02Microsoft Corp. 2.625% 13 - 02.05.33 400,000 EUR 494,983 531,960 0.02Microsoft Corp. 3.125% 13 - 06.12.28 1,776,000 EUR 2,158,148 2,237,689 0.10MMS USA Investments Inc. 0.625% 19 - 13.06.25 400,000 EUR 396,520 408,000 0.02MMS USA Investments Inc. 1.25% 19 - 13.06.28 800,000 EUR 812,970 839,392 0.04MMS USA Investments Inc. 1.75% 19 - 13.06.31 700,000 EUR 674,160 761,852 0.04Mohawk Industries Inc. 2.00% 15 - 14.01.22 379,000 EUR 384,910 384,325 0.02Molson Coors Beverage Co. 1.25% 16 - 15.07.24 451,000 EUR 442,486 464,390 0.02Mondelez International Inc. 1.00% 15 - 07.03.22 431,000 EUR 435,101 436,155 0.02Mondelez International Inc. 1.625% 15 - 08.03.27 200,000 EUR 199,979 218,384 0.01Mondelez International Inc. 1.625% 15 - 08.03.27 200,000 EUR 204,988 218,384 0.01Mondelez International Inc. 1.625% 16 - 20.01.23 850,000 EUR 873,963 879,189 0.04Mondelez International Inc. 2.375% 15 - 06.03.35 150,000 EUR 170,441 181,710 0.01Moody’s Corp. 0.95% 19 - 25.02.30 671,000 EUR 675,047 712,615 0.03Moody’s Corp. 1.75% 15 - 09.03.27 370,000 EUR 395,881 407,407 0.02Morgan Stanley FRN 20 - 26.10.29 1,658,000 EUR 1,656,904 1,685,705 0.08Morgan Stanley FRN 19 - 26.07.24 1,468,000 EUR 1,465,241 1,494,028 0.07Morgan Stanley 1.00% 16 - 02.12.22 900,000 EUR 914,122 920,250 0.04Morgan Stanley FRN 17 - 23.10.26 664,000 EUR 676,924 704,358 0.03Morgan Stanley 1.375% 16 - 27.10.26 1,350,000 EUR 1,390,666 1,450,183 0.07Morgan Stanley 1.75% 15 - 30.01.25 1,136,000 EUR 1,189,664 1,215,236 0.06Morgan Stanley 1.75% 16 - 11.03.24 1,328,000 EUR 1,374,112 1,404,572 0.06Morgan Stanley 1.875% 14 - 30.03.23 1,077,000 EUR 1,111,153 1,126,585 0.05Morgan Stanley 1.875% 17 - 27.04.27 1,619,000 EUR 1,704,554 1,800,053 0.08Mylan Inc. 2.125% 18 - 23.05.25 300,000 EUR 323,022 323,043 0.01Nasdaq Inc. 0.875% 20 - 13.02.30 723,000 EUR 718,228 751,067 0.03Nasdaq Inc. 1.75% 16 - 19.05.23 744,000 EUR 764,558 773,373 0.04Nasdaq Inc. 1.75% 19 - 28.03.29 400,000 EUR 407,443 444,848 0.02National Grid North America Inc. 0.75% 15 - 11.02.22 700,000 EUR 703,778 707,189 0.03National Grid North America Inc. 0.75% 18 - 08.08.23 600,000 EUR 607,880 613,470 0.03National Grid North America Inc. 1.00% 17 - 12.07.24 400,000 EUR 410,705 415,068 0.02Nestle Holdings Inc. 0.875% 17 - 18.07.25 966,000 EUR 997,016 1,013,334 0.05New York Life Global Funding 0.25% 20 - 23.01.27 844,000 EUR 844,666 863,007 0.04Oracle Corp. 3.125% 13 - 10.07.25 701,000 EUR 796,761 803,479 0.04Parker-Hannifin Corp. 1.125% 17 - 01.03.25 298,000 EUR 302,531 310,376 0.01PepsiCo Inc. 0.25% 20 - 06.05.24 614,000 EUR 614,037 623,112 0.03PepsiCo Inc. 0.40% 20 - 09.10.32 646,000 EUR 649,707 655,141 0.03PepsiCo Inc. 0.50% 20 - 06.05.28 906,000 EUR 906,775 937,674 0.04PepsiCo Inc. 0.75% 19 - 18.03.27 300,000 EUR 312,120 315,195 0.01PepsiCo Inc. 0.75% 19 - 18.03.27 630,000 EUR 657,310 661,909 0.03PepsiCo Inc. 0.875% 16 - 18.07.28 700,000 EUR 717,963 744,401 0.03PepsiCo Inc. 0.875% 19 - 16.10.39 370,000 EUR 365,744 392,126 0.02PepsiCo Inc. 1.05% 20 - 09.10.50 668,000 EUR 679,615 707,526 0.03
Xtrackers II
Xtrackers II EUR CORPORATE BOND UCITS ETF (continued)
Statement of Investmentsas at 31 December 2020(expressed in EUR)
The accompanying notes form an integral part of these financial statements.
226

DescriptionNominal
ValueCurrency
(local) Cost Market Value
% ofNet
Assets
Transferable securities and money market instruments admitted to an official stock exchange listing(A)
Bonds (continued)
United States (continued)PepsiCo Inc. 1.125% 19 - 18.03.31 470,000 EUR 488,148 517,503 0.02PepsiCo Inc. 2.625% 14 - 28.04.26 100,000 EUR 108,839 114,223 0.01PerkinElmer Inc. 1.875% 16 - 19.07.26 262,000 EUR 277,227 282,077 0.01Pfizer Inc. 0.25% 17 - 06.03.22 862,000 EUR 865,001 867,793 0.04Pfizer Inc. 1.00% 17 - 06.03.27 600,000 EUR 610,176 639,348 0.03Philip Morris International Inc. 0.125% 19 - 03.08.26 100,000 EUR 97,348 99,940 0.00Philip Morris International Inc. 0.625% 17 - 08.11.24 927,000 EUR 927,296 949,081 0.04Philip Morris International Inc. 0.80% 19 - 01.08.31 640,000 EUR 624,366 648,205 0.03Philip Morris International Inc. 1.45% 19 - 01.08.39 640,000 EUR 602,387 651,891 0.03Philip Morris International Inc. 1.875% 17 - 06.11.37 400,000 EUR 397,331 441,260 0.02Philip Morris International Inc. 2.00% 16 - 09.05.36 483,000 EUR 511,748 539,762 0.02Philip Morris International Inc. 2.75% 13 - 19.03.25 30,000 EUR 31,660 33,459 0.00Philip Morris International Inc. 2.75% 13 - 19.03.25 300,000 EUR 325,157 334,590 0.02Philip Morris International Inc. 2.875% 12 - 30.05.24 500,000 EUR 537,268 549,995 0.03Philip Morris International Inc. 2.875% 14 - 03.03.26 1,079,000 EUR 1,199,018 1,231,894 0.06Philip Morris International Inc. 2.875% 14 - 14.05.29 300,000 EUR 357,092 364,650 0.02Philip Morris International Inc. 3.125% 13 - 03.06.33 483,000 EUR 570,467 606,595 0.03PPG Industries Inc. 0.875% 15 - 13.03.22 904,000 EUR 910,023 912,407 0.04PPG Industries Inc. 0.875% 16 - 03.11.25 771,000 EUR 772,507 804,084 0.04PPG Industries Inc. 1.40% 15 - 13.03.27 354,000 EUR 360,784 378,430 0.02Praxair Inc. 1.625% 14 - 01.12.25 206,000 EUR 222,896 223,180 0.01Procter & Gamble Co. 0.50% 17 - 25.10.24 700,000 EUR 716,422 720,195 0.03Procter & Gamble Co. 0.625% 18 - 30.10.24 890,000 EUR 910,835 919,406 0.04Procter & Gamble Co. 1.125% 15 - 02.11.23 138,000 EUR 141,973 143,599 0.01Procter & Gamble Co. 1.125% 15 - 02.11.23 443,000 EUR 460,610 460,973 0.02Procter & Gamble Co. 1.20% 18 - 30.10.28 920,000 EUR 980,809 1,011,798 0.05Procter & Gamble Co. 1.25% 17 - 25.10.29 100,000 EUR 105,629 111,199 0.01Procter & Gamble Co. 1.875% 18 - 30.10.38 450,000 EUR 514,998 573,431 0.03Procter & Gamble Co. 2.00% 12 - 16.08.22 875,000 EUR 900,405 908,075 0.04Procter & Gamble Co. 4.875% 07 - 11.05.27 300,000 EUR 386,958 396,336 0.02Procter & Gamble Co. 4.875% 07 - 11.05.27 707,000 EUR 919,487 934,032 0.04Prologis Euro Finance LLC 0.25% 19 - 10.09.27 544,000 EUR 524,641 551,436 0.03Prologis Euro Finance LLC 0.375% 20 - 06.02.28 292,000 EUR 292,338 298,258 0.01Prologis Euro Finance LLC 0.625% 19 - 10.09.31 279,000 EUR 277,703 284,973 0.01Prologis Euro Finance LLC 1.00% 20 - 06.02.35 581,000 EUR 575,535 609,748 0.03Prologis Euro Finance LLC 1.00% 20 - 06.02.35 200,000 EUR 190,381 209,896 0.01Prologis Euro Finance LLC 1.50% 19 - 10.09.49 390,000 EUR 376,685 423,946 0.02Prologis Euro Finance LLC 1.875% 18 - 05.01.29 510,000 EUR 541,603 576,963 0.03Prologis LP 3.00% 14 - 02.06.26 700,000 EUR 789,003 811,769 0.04Prologis LP 3.375% 14 - 20.02.24 622,000 EUR 673,705 686,327 0.03Public Storage 0.875% 20 - 24.01.32 424,000 EUR 419,516 438,318 0.02PVH Corp. 3.125% 17 - 15.12.27 450,000 EUR 463,193 498,218 0.02PVH Corp. 3.625% 16 - 15.07.24 233,000 EUR 246,309 254,636 0.01Raytheon Technologies Corp. 2.15% 18 - 18.05.30 377,000 EUR 412,261 435,197 0.02RELX Capital Inc. 1.30% 15 - 12.05.25 467,000 EUR 487,583 493,913 0.02RELX Capital Inc. 1.30% 15 - 12.05.25 100,000 EUR 101,978 105,763 0.01Southern Power Co. 1.00% 16 - 20.06.22 617,000 EUR 622,964 627,273 0.03Southern Power Co. 1.85% 16 - 20.06.26 300,000 EUR 324,671 327,939 0.02
Xtrackers II
Xtrackers II EUR CORPORATE BOND UCITS ETF (continued)
Statement of Investmentsas at 31 December 2020(expressed in EUR)
The accompanying notes form an integral part of these financial statements.
227

DescriptionNominal
ValueCurrency
(local) Cost Market Value
% ofNet
Assets
Transferable securities and money market instruments admitted to an official stock exchange listing(A)
Bonds (continued)
United States (continued)Southern Power Co. 1.85% 16 - 20.06.26 100,000 EUR 106,951 109,313 0.01Stryker Corp. 0.25% 19 - 03.12.24 711,000 EUR 707,369 719,738 0.03Stryker Corp. 0.75% 19 - 01.03.29 694,000 EUR 694,831 720,851 0.03Stryker Corp. 1.00% 19 - 03.12.31 671,000 EUR 668,489 702,161 0.03Stryker Corp. 1.125% 18 - 30.11.23 721,000 EUR 734,187 747,252 0.03Stryker Corp. 2.125% 18 - 30.11.27 509,000 EUR 548,338 577,868 0.03Stryker Corp. 2.625% 18 - 30.11.30 583,000 EUR 680,264 703,751 0.03Sysco Corp. 1.25% 16 - 23.06.23 145,000 EUR 147,299 148,822 0.01Thermo Fisher Scientific Inc. 0.125% 19 - 01.03.25 500,000 EUR 489,099 503,815 0.02Thermo Fisher Scientific Inc. 0.50% 19 - 01.03.28 550,000 EUR 548,371 565,433 0.03Thermo Fisher Scientific Inc. 0.75% 16 - 12.09.24 700,000 EUR 699,093 720,944 0.03Thermo Fisher Scientific Inc. 0.75% 16 - 12.09.24 400,000 EUR 400,693 411,968 0.02Thermo Fisher Scientific Inc. 0.875% 19 - 01.10.31 715,000 EUR 715,553 753,674 0.03Thermo Fisher Scientific Inc. 1.375% 16 - 12.09.28 600,000 EUR 624,814 655,518 0.03Thermo Fisher Scientific Inc. 1.40% 17 - 23.01.26 400,000 EUR 399,583 428,132 0.02Thermo Fisher Scientific Inc. 1.40% 17 - 23.01.26 300,000 EUR 317,877 321,099 0.01Thermo Fisher Scientific Inc. 1.45% 17 - 16.03.27 500,000 EUR 523,954 542,360 0.02Thermo Fisher Scientific Inc. 1.50% 19 - 01.10.39 775,000 EUR 777,180 851,027 0.04Thermo Fisher Scientific Inc. 1.75% 20 - 15.04.27 514,000 EUR 520,830 566,546 0.03Thermo Fisher Scientific Inc. 1.875% 19 - 01.10.49 766,000 EUR 752,424 885,389 0.04Thermo Fisher Scientific Inc. 1.875% 19 - 01.10.49 100,000 EUR 97,966 115,586 0.01Thermo Fisher Scientific Inc. 1.95% 17 - 24.07.29 700,000 EUR 756,069 800,737 0.04Thermo Fisher Scientific Inc. 2.00% 14 - 15.04.25 700,000 EUR 747,878 759,899 0.03Thermo Fisher Scientific Inc. 2.15% 15 - 21.07.22 300,000 EUR 308,298 309,999 0.01Thermo Fisher Scientific Inc. 2.375% 20 - 15.04.32 378,000 EUR 400,292 458,023 0.02Thermo Fisher Scientific Inc. 2.875% 17 - 24.07.37 349,000 EUR 397,636 462,432 0.02Thermo Fisher Scientific Inc. 2.875% 17 - 24.07.37 300,000 EUR 365,840 397,506 0.02Toyota Motor Credit Corp. 0.25% 20 - 16.07.26 466,000 EUR 468,160 473,717 0.02Toyota Motor Credit Corp. 0.625% 17 - 21.11.24 160,000 EUR 159,760 164,856 0.01Toyota Motor Credit Corp. 0.75% 15 - 21.07.22 766,000 EUR 774,379 778,195 0.04Toyota Motor Credit Corp. 2.375% 13 - 01.02.23 728,000 EUR 763,102 767,843 0.04United Parcel Service Inc. 0.375% 17 - 15.11.23 820,000 EUR 823,815 833,620 0.04United Parcel Service Inc. 1.00% 16 - 15.11.28 200,000 EUR 202,266 216,180 0.01United Parcel Service Inc. 1.50% 17 - 15.11.32 350,000 EUR 382,239 406,091 0.02United Parcel Service Inc. 1.625% 15 - 15.11.25 850,000 EUR 903,269 923,797 0.04US Bancorp 0.85% 17 - 07.06.24 791,000 EUR 789,501 818,487 0.04Utah Acquisition Sub Inc. 2.25% 16 - 22.11.24 1,105,000 EUR 1,132,284 1,190,881 0.05Utah Acquisition Sub Inc. 3.125% 16 - 22.11.28 692,000 EUR 769,437 824,068 0.04Verizon Communications Inc. 0.875% 16 - 02.04.25 716,000 EUR 730,374 746,187 0.03Verizon Communications Inc. 0.875% 16 - 02.04.25 250,000 EUR 255,199 260,540 0.01Verizon Communications Inc. 0.875% 19 - 08.04.27 855,000 EUR 860,068 898,331 0.04Verizon Communications Inc. 0.875% 19 - 08.04.27 300,000 EUR 300,822 315,204 0.01Verizon Communications Inc. 0.875% 19 - 19.03.32 444,000 EUR 417,795 464,801 0.02Verizon Communications Inc. 1.25% 19 - 08.04.30 1,011,000 EUR 1,044,341 1,099,644 0.05Verizon Communications Inc. 1.30% 20 - 18.05.33 1,399,000 EUR 1,429,713 1,521,399 0.07Verizon Communications Inc. 1.375% 16 - 02.11.28 882,000 EUR 903,207 965,446 0.04Verizon Communications Inc. 1.375% 16 - 02.11.28 250,000 EUR 265,060 273,653 0.01Verizon Communications Inc. 1.375% 17 - 27.10.26 940,000 EUR 972,186 1,014,758 0.05
Xtrackers II
Xtrackers II EUR CORPORATE BOND UCITS ETF (continued)
Statement of Investmentsas at 31 December 2020(expressed in EUR)
The accompanying notes form an integral part of these financial statements.
228

DescriptionNominal
ValueCurrency
(local) Cost Market Value
% ofNet
Assets
Transferable securities and money market instruments admitted to an official stock exchange listing(A)
Bonds (continued)
United States (continued)Verizon Communications Inc. 1.50% 19 - 19.09.39 10,000 EUR 9,997 10,994 0.00Verizon Communications Inc. 1.50% 19 - 19.09.39 238,000 EUR 245,168 261,662 0.01Verizon Communications Inc. 1.625% 14 - 01.03.24 626,000 EUR 655,082 661,914 0.03Verizon Communications Inc. 1.85% 20 - 18.05.40 651,000 EUR 664,127 748,012 0.03Verizon Communications Inc. 1.875% 17 - 26.10.29 100,000 EUR 101,110 114,206 0.01Verizon Communications Inc. 1.875% 17 - 26.10.29 450,000 EUR 489,996 513,927 0.02Verizon Communications Inc. 2.625% 14 - 01.12.31 863,000 EUR 984,780 1,068,998 0.05Verizon Communications Inc. 2.875% 17 - 15.01.38 550,000 EUR 650,868 722,903 0.03Verizon Communications Inc. 2.875% 17 - 15.01.38 900,000 EUR 1,022,126 1,182,933 0.05Verizon Communications Inc. 3.25% 14 - 17.02.26 1,000,000 EUR 1,137,099 1,169,770 0.05Verizon Communications Inc. 3.25% 14 - 17.02.26 100,000 EUR 107,767 116,977 0.01VF Corp. 0.25% 20 - 25.02.28 147,000 EUR 146,543 148,530 0.01VF Corp. 0.625% 16 - 20.09.23 204,000 EUR 205,047 208,180 0.01VF Corp. 0.625% 16 - 20.09.23 500,000 EUR 500,655 510,245 0.02VF Corp. 0.625% 20 - 25.02.32 575,000 EUR 551,484 579,824 0.03Walgreens Boots Alliance Inc. 2.125% 14 - 20.11.26 451,000 EUR 470,305 485,028 0.02Walgreens Boots Alliance Inc. 2.125% 14 - 20.11.26 450,000 EUR 472,280 483,953 0.02Walmart Inc. 1.90% 14 - 08.04.22 500,000 EUR 509,943 511,770 0.02Walmart Inc. 1.90% 14 - 08.04.22 104,000 EUR 106,635 106,448 0.01Walmart Inc. 2.55% 14 - 08.04.26 692,000 EUR 779,526 790,458 0.04Walmart Inc. 4.875% 09 - 21.09.29 716,000 EUR 966,344 1,021,811 0.05Walmart Inc. 4.875% 09 - 21.09.29 200,000 EUR 281,943 285,422 0.01Wells Fargo & Co. 0.50% 19 - 26.04.24 840,000 EUR 841,389 852,020 0.04Wells Fargo & Co. 0.625% 19 - 25.03.30 790,000 EUR 789,664 804,402 0.04Wells Fargo & Co. 0.625% 20 - 14.08.30 814,000 EUR 783,657 828,131 0.04Wells Fargo & Co. 1.00% 16 - 02.02.27 1,520,000 EUR 1,502,246 1,587,093 0.07Wells Fargo & Co. 1.00% 16 - 02.02.27 500,000 EUR 519,493 522,070 0.02Wells Fargo & Co. FRN 20 - 04.05.25 1,596,000 EUR 1,610,145 1,661,851 0.08Wells Fargo & Co. 1.375% 16 - 26.10.26 1,388,000 EUR 1,446,380 1,475,722 0.07Wells Fargo & Co. 1.50% 15 - 12.09.22 859,000 EUR 877,800 884,220 0.04Wells Fargo & Co. 1.50% 15 - 12.09.22 500,000 EUR 509,232 514,680 0.02Wells Fargo & Co. 1.50% 17 - 24.05.27 1,298,000 EUR 1,352,823 1,395,051 0.06Wells Fargo & Co. 1.625% 15 - 02.06.25 1,250,000 EUR 1,318,427 1,331,475 0.06Wells Fargo & Co. FRN 20 - 04.05.30 1,372,000 EUR 1,400,112 1,522,042 0.07Wells Fargo & Co. 2.00% 15 - 27.04.26 756,000 EUR 778,128 826,762 0.04Wells Fargo & Co. 2.00% 15 - 27.04.26 800,000 EUR 865,385 874,880 0.04Wells Fargo & Co. 2.125% 14 - 04.06.24 750,000 EUR 773,111 802,440 0.04Wells Fargo & Co. 2.25% 13 - 02.05.23 650,000 EUR 676,999 686,283 0.03Wells Fargo & Co. 2.625% 12 - 16.08.22 1,338,000 EUR 1,388,395 1,398,759 0.06Westlake Chemical Corp. 1.625% 19 - 17.07.29 700,000 EUR 706,518 729,372 0.03Xylem Inc. 2.25% 16 - 11.03.23 100,000 EUR 102,871 104,513 0.01Zimmer Biomet Holdings Inc. 1.164% 19 - 15.11.27 414,000 EUR 418,269 433,437 0.02
Xtrackers II
Xtrackers II EUR CORPORATE BOND UCITS ETF (continued)
Statement of Investmentsas at 31 December 2020(expressed in EUR)
The accompanying notes form an integral part of these financial statements.
229

DescriptionNominal
ValueCurrency
(local) Cost Market Value
% ofNet
Assets
Transferable securities and money market instruments admitted to an official stock exchange listing(A)
Bonds (continued)
United States (continued)Zimmer Biomet Holdings Inc. 1.414% 16 - 13.12.22 106,000 EUR 108,918 108,909 0.01Zimmer Biomet Holdings Inc. 2.425% 16 - 13.12.26 379,000 EUR 387,160 423,396 0.02
354,163,266 367,964,120 16.79
Total - Bonds 2,095,017,922 2,168,771,107 98.98
Total Transferable securities and money market instruments admitted to an officialstock exchange listing 2,095,017,922 2,168,771,107 98.98
Other transferable securities and money market instruments(A)
Bonds
United StatesAbbVie Inc. 1.25% 20 - 01.06.24 547,000 EUR 551,916 568,585 0.03AbbVie Inc. 1.50% 20 - 15.11.23 410,000 EUR 418,317 428,122 0.02AbbVie Inc. 2.125% 20 - 01.06.29 443,000 EUR 472,732 507,740 0.02
1,442,965 1,504,447 0.07
Total - Bonds 1,442,965 1,504,447 0.07
Total Other transferable securities and money market instruments 1,442,965 1,504,447 0.07
TOTAL INVESTMENT PORTFOLIO 2,096,460,887 2,170,275,554 99.05
TOTAL INVESTMENT PORTFOLIO INCLUDING ACCRUED INTEREST 2,187,984,155 99.85(A) Any duplicate securities appearing herein with the same name are either quoted on different stock exchanges or have different ISINs.
Xtrackers II
Xtrackers II EUR CORPORATE BOND UCITS ETF (continued)
Statement of Investmentsas at 31 December 2020(expressed in EUR)
The accompanying notes form an integral part of these financial statements.
230

DescriptionNominal
ValueCurrency
(local) Cost Market Value
% ofNet
Assets
Transferable securities and money market instruments admitted to an official stock exchange listing(A)
Bonds
GermanyBundesobligation Zero Coupon 17 - 08.04.22 3,564,802 EUR 3,593,301 3,597,563 1.51Bundesobligation Zero Coupon 17 - 07.10.22 3,404,042 EUR 3,443,157 3,447,137 1.44Bundesobligation Zero Coupon 18 - 14.04.23 3,296,438 EUR 3,340,468 3,353,631 1.40Bundesobligation Zero Coupon 18 - 13.10.23 3,305,000 EUR 3,359,512 3,376,256 1.41Bundesobligation Zero Coupon 19 - 05.04.24 4,125,000 EUR 4,207,667 4,229,528 1.77Bundesobligation Zero Coupon 19 - 18.10.24 3,945,000 EUR 4,052,336 4,059,839 1.70Bundesobligation Zero Coupon 20 - 11.04.25 3,468,000 EUR 3,576,238 3,580,690 1.50Bundesobligation Zero Coupon 20 - 10.10.25 4,476,000 EUR 4,635,625 4,636,356 1.94Bundesobligation Zero Coupon 20 - 10.10.25 914,000 EUR 947,580 947,311 0.40Bundesrepublik Deutschland Zero Coupon 16 -15.08.26 5,239,339 EUR 5,360,447 5,460,858 2.29Bundesrepublik Deutschland Zero Coupon 19 -15.08.29 4,642,000 EUR 4,854,155 4,898,888 2.05Bundesrepublik Deutschland Zero Coupon 19 -15.08.50 3,084,000 EUR 3,138,534 3,241,963 1.36Bundesrepublik Deutschland Zero Coupon 20 -15.02.30 4,398,000 EUR 4,612,666 4,645,151 1.94Bundesrepublik Deutschland Zero Coupon 20 -15.05.35 3,948,000 EUR 4,117,160 4,172,515 1.75Bundesrepublik Deutschland Zero Coupon 20 -15.11.27 3,898,000 EUR 4,068,041 4,086,430 1.71Bundesrepublik Deutschland Zero Coupon 20 -15.08.30 5,375,000 EUR 5,652,071 5,678,526 2.38Bundesrepublik Deutschland Zero Coupon 20 -15.08.30 1,166,000 EUR 1,229,394 1,236,391 0.52Bundesrepublik Deutschland 0.25% 17 - 15.02.27 5,364,943 EUR 5,589,748 5,693,975 2.38Bundesrepublik Deutschland 0.25% 18 - 15.08.28 4,465,000 EUR 4,660,529 4,789,159 2.01Bundesrepublik Deutschland 0.25% 19 - 15.02.29 4,690,000 EUR 4,934,668 5,043,485 2.11Bundesrepublik Deutschland 0.50% 15 - 15.02.25 4,844,975 EUR 5,053,318 5,100,741 2.14Bundesrepublik Deutschland 0.50% 16 - 15.02.26 5,338,943 EUR 5,598,544 5,685,707 2.38Bundesrepublik Deutschland 0.50% 17 - 15.08.27 5,191,339 EUR 5,496,528 5,618,586 2.35Bundesrepublik Deutschland 0.50% 18 - 15.02.28 4,477,611 EUR 4,761,121 4,868,820 2.04Bundesrepublik Deutschland 1.00% 14 - 15.08.24 3,934,802 EUR 4,157,534 4,189,817 1.75Bundesrepublik Deutschland 1.00% 15 - 15.08.25 4,802,975 EUR 5,140,173 5,198,252 2.18Bundesrepublik Deutschland 1.25% 17 - 15.08.48 4,494,599 EUR 5,822,820 6,328,713 2.65Bundesrepublik Deutschland 1.50% 12 - 04.09.22 3,584,802 EUR 3,712,889 3,720,881 1.56Bundesrepublik Deutschland 1.50% 13 - 15.02.23 3,584,802 EUR 3,747,444 3,757,410 1.57Bundesrepublik Deutschland 1.50% 13 - 15.05.23 3,934,802 EUR 4,134,673 4,147,045 1.74Bundesrepublik Deutschland 1.50% 14 - 15.05.24 4,030,802 EUR 4,313,009 4,342,464 1.82Bundesrepublik Deutschland 1.75% 12 - 04.07.22 4,664,579 EUR 4,833,300 4,838,428 2.03Bundesrepublik Deutschland 1.75% 14 - 15.02.24 3,956,802 EUR 4,250,317 4,271,130 1.79Bundesrepublik Deutschland 2.00% 11 - 04.01.22 3,923,007 EUR 4,029,016 4,032,459 1.69Bundesrepublik Deutschland 2.00% 13 - 15.08.23 3,948,802 EUR 4,222,997 4,237,696 1.77Bundesrepublik Deutschland 2.50% 12 - 04.07.44 5,023,339 EUR 7,670,351 8,434,136 3.53Bundesrepublik Deutschland 2.50% 14 - 15.08.46 5,375,878 EUR 8,402,498 9,277,905 3.88Bundesrepublik Deutschland 3.25% 10 - 04.07.42 3,436,837 EUR 5,724,954 6,189,056 2.59Bundesrepublik Deutschland 4.00% 05 - 04.01.37 4,846,975 EUR 7,945,196 8,392,740 3.51Bundesrepublik Deutschland 4.25% 07 - 04.07.39 3,260,074 EUR 5,768,545 6,150,799 2.58
Xtrackers II
Xtrackers II GERMANY GOVERNMENT BOND UCITS ETF
Statement of Investmentsas at 31 December 2020(expressed in EUR)
The accompanying notes form an integral part of these financial statements.
231

DescriptionNominal
ValueCurrency
(local) Cost Market Value
% ofNet
Assets
Transferable securities and money market instruments admitted to an official stock exchange listing(A)
Bonds (continued)
Germany (continued)Bundesrepublik Deutschland 4.75% 98 - 04.07.28 2,404,338 EUR 3,315,636 3,418,608 1.43Bundesrepublik Deutschland 4.75% 03 - 04.07.34 4,341,007 EUR 7,185,852 7,527,283 3.15Bundesrepublik Deutschland 4.75% 08 - 04.07.40 654,438 EUR 1,278,811 1,332,005 0.56Bundesrepublik Deutschland 4.75% 08 - 04.07.40 2,959,000 EUR 5,618,087 6,022,578 2.52Bundesrepublik Deutschland 5.50% 00 - 04.01.31 3,779,042 EUR 5,963,108 6,164,449 2.58Bundesrepublik Deutschland 5.625% 98 - 04.01.28 3,051,376 EUR 4,338,224 4,450,432 1.86Bundesrepublik Deutschland 6.25% 94 - 04.01.24 2,253,734 EUR 2,721,104 2,737,228 1.15Bundesrepublik Deutschland 6.25% 00 - 04.01.30 2,065,971 EUR 3,286,894 3,391,245 1.42Bundesrepublik Deutschland 6.50% 97 - 04.07.27 2,423,338 EUR 3,524,375 3,593,257 1.50Bundesschatzanweisungen Zero Coupon 20 - 11.03.22 2,480,000 EUR 2,502,416 2,500,559 1.05Bundesschatzanweisungen Zero Coupon 20 - 10.06.22 2,682,000 EUR 2,709,242 2,708,822 1.13Bundesschatzanweisungen Zero Coupon 20 - 16.09.22 2,649,000 EUR 2,681,599 2,681,238 1.12Bundesschatzanweisungen Zero Coupon 20 - 15.12.22 1,410,000 EUR 1,430,365 1,429,740 0.60
230,714,237 236,915,881 99.19
Total - Bonds 230,714,237 236,915,881 99.19
Total Transferable securities and money market instruments admitted to an officialstock exchange listing 230,714,237 236,915,881 99.19
TOTAL INVESTMENT PORTFOLIO 230,714,237 236,915,881 99.19
TOTAL INVESTMENT PORTFOLIO INCLUDING ACCRUED INTEREST 238,801,802 99.98(A) Any duplicate securities appearing herein with the same name are either quoted on different stock exchanges or have different ISINs.
Xtrackers II
Xtrackers II GERMANY GOVERNMENT BOND UCITS ETF (continued)
Statement of Investmentsas at 31 December 2020(expressed in EUR)
The accompanying notes form an integral part of these financial statements.
232

DescriptionNominal
ValueCurrency
(local) Cost Market Value
% ofNet
Assets
Transferable securities and money market instruments admitted to an official stock exchange listing
Bonds
GermanyBundesobligation Zero Coupon 17 - 08.04.22 1,023,000 EUR 1,031,964 1,032,401 7.57Bundesobligation Zero Coupon 17 - 07.10.22 973,000 EUR 985,721 985,318 7.22Bundesobligation Zero Coupon 18 - 14.04.23 923,000 EUR 939,285 939,014 6.88Bundesobligation Zero Coupon 18 - 13.10.23 924,000 EUR 946,115 943,921 6.92Bundesrepublik Deutschland 1.50% 12 - 04.09.22 1,023,000 EUR 1,062,444 1,061,833 7.78Bundesrepublik Deutschland 1.50% 13 - 15.02.23 1,025,000 EUR 1,075,357 1,074,354 7.87Bundesrepublik Deutschland 1.50% 13 - 15.05.23 1,123,000 EUR 1,182,200 1,183,575 8.68Bundesrepublik Deutschland 1.75% 12 - 04.07.22 1,323,000 EUR 1,373,621 1,372,308 10.06Bundesrepublik Deutschland 2.00% 11 - 04.01.22 1,117,000 EUR 1,147,566 1,148,164 8.42Bundesrepublik Deutschland 2.00% 13 - 15.08.23 1,123,000 EUR 1,203,533 1,205,159 8.83Bundesschatzanweisungen Zero Coupon 20 - 11.03.22 699,000 EUR 705,176 704,795 5.17Bundesschatzanweisungen Zero Coupon 20 - 10.06.22 749,000 EUR 756,533 756,491 5.54Bundesschatzanweisungen Zero Coupon 20 - 16.09.22 749,000 EUR 758,236 758,115 5.56Bundesschatzanweisungen Zero Coupon 20 - 15.12.22 399,000 EUR 404,776 404,586 2.97
13,572,527 13,570,034 99.47
Total - Bonds 13,572,527 13,570,034 99.47
Total Transferable securities and money market instruments admitted to an officialstock exchange listing 13,572,527 13,570,034 99.47
TOTAL INVESTMENT PORTFOLIO 13,572,527 13,570,034 99.47
TOTAL INVESTMENT PORTFOLIO INCLUDING ACCRUED INTEREST 13,640,568 99.98
Xtrackers II
Xtrackers II GERMANY GOVERNMENT BOND 1-3 UCITS ETF
Statement of Investmentsas at 31 December 2020(expressed in EUR)
The accompanying notes form an integral part of these financial statements.
233

DescriptionNominal
ValueCurrency
(local) Cost Market Value
% ofNet
Assets
Transferable securities and money market instruments admitted to an official stock exchange listing(A)
Bonds
AustraliaAusNet Services Holdings Pty Ltd. 0.625% 20 -25.08.30 366,000 EUR 371,917 379,308 0.04AusNet Services Holdings Pty Ltd. 1.50% 15 -26.02.27 200,000 EUR 210,931 217,826 0.02AusNet Services Holdings Pty Ltd. 3.00% 14 -13.02.24 100,000 EUR 107,029 109,309 0.01Australia & New Zealand Banking Group Ltd. 0.625%18 - 21.02.23 500,000 EUR 507,681 509,820 0.05Australia & New Zealand Banking Group Ltd. 0.75%16 - 29.09.26 500,000 EUR 512,100 524,735 0.05Australia & New Zealand Banking Group Ltd. FRN19 - 21.11.29 540,000 EUR 541,252 550,168 0.06Australia Pacific Airports Melbourne Pty Ltd. 1.75%14 - 15.10.24 200,000 EUR 207,597 208,828 0.02Australia Pacific Airports Melbourne Pty Ltd. 3.125%13 - 26.09.23 300,000 EUR 319,636 321,516 0.03Brambles Finance Ltd. 2.375% 14 - 12.06.24 300,000 EUR 316,476 324,090 0.03Commonwealth Bank of Australia 0.50% 17 -11.07.22 420,000 EUR 424,038 425,422 0.04Commonwealth Bank of Australia 1.125% 18 -18.01.28 300,000 EUR 330,229 328,362 0.03Commonwealth Bank of Australia FRN 17 - 03.10.29 593,000 EUR 610,404 619,964 0.06Commonwealth Bank of Australia FRN 15 - 22.04.27 550,000 EUR 558,597 561,935 0.06Goodman Australia Finance Pty Ltd. 1.375% 17 -27.09.25 200,000 EUR 205,404 210,834 0.02Macquarie Bank Ltd. 1.125% 15 - 20.01.22 250,000 EUR 252,395 253,695 0.03Macquarie Group Ltd. 0.35% 20 - 03.03.28 550,000 EUR 550,170 552,590 0.06Macquarie Group Ltd. 0.625% 20 - 03.02.27 237,000 EUR 236,901 242,923 0.02Macquarie Group Ltd. FRN 18 - 05.03.25 100,000 EUR 99,082 103,780 0.01National Australia Bank Ltd. 0.25% 19 - 20.05.24 420,000 EUR 418,461 426,783 0.04National Australia Bank Ltd. 0.35% 17 - 07.09.22 280,000 EUR 282,102 283,273 0.03National Australia Bank Ltd. 0.625% 16 - 10.11.23 237,000 EUR 241,995 242,923 0.03National Australia Bank Ltd. 0.625% 17 - 18.09.24 200,000 EUR 202,782 206,048 0.02National Australia Bank Ltd. 0.625% 18 - 30.08.23 420,000 EUR 427,457 430,122 0.04National Australia Bank Ltd. 0.875% 15 - 20.01.22 431,000 EUR 435,524 436,754 0.04National Australia Bank Ltd. 1.125% 19 - 20.05.31 300,000 EUR 318,559 332,841 0.03National Australia Bank Ltd. 1.25% 16 - 18.05.26 580,000 EUR 610,006 622,375 0.06National Australia Bank Ltd. 1.375% 18 - 30.08.28 700,000 EUR 751,479 774,193 0.08National Australia Bank Ltd. 2.75% 12 - 08.08.22 698,000 EUR 729,742 731,979 0.07Scentre Group Trust 1 2.25% 14 - 16.07.24 300,000 EUR 310,928 319,944 0.03Scentre Group Trust 1 Via Scentre Group Trust2 1.375% 16 - 22.03.23 450,000 EUR 460,271 461,808 0.05Scentre Group Trust 1 Via Scentre Group Trust2 1.45% 19 - 28.03.29 300,000 EUR 300,525 318,555 0.03Scentre Group Trust 1 Via Scentre Group Trust2 1.75% 18 - 11.04.28 250,000 EUR 258,920 270,332 0.03Scentre Group Trust 2 3.25% 13 - 11.09.23 200,000 EUR 215,716 217,318 0.02Stockland Trust 1.625% 18 - 27.04.26 200,000 EUR 203,359 207,942 0.02
Xtrackers II
Xtrackers II ESG EUR CORPORATE BOND UCITS ETF
Statement of Investmentsas at 31 December 2020(expressed in EUR)
The accompanying notes form an integral part of these financial statements.
234

DescriptionNominal
ValueCurrency
(local) Cost Market Value
% ofNet
Assets
Transferable securities and money market instruments admitted to an official stock exchange listing(A)
Bonds (continued)
Australia (continued)Sydney Airport Finance Co. Pty Ltd. 1.75% 18 -26.04.28 300,000 EUR 315,337 325,140 0.03Sydney Airport Finance Co. Pty Ltd. 2.75% 14 -23.04.24 300,000 EUR 317,261 325,044 0.03Telstra Corp. Ltd. 1.00% 20 - 23.04.30 233,000 EUR 238,349 250,494 0.03Telstra Corp. Ltd. 1.125% 16 - 14.04.26 400,000 EUR 419,165 424,964 0.04Telstra Corp. Ltd. 1.375% 19 - 26.03.29 500,000 EUR 540,852 553,525 0.06Telstra Corp. Ltd. 2.50% 13 - 15.09.23 450,000 EUR 478,569 482,697 0.05Telstra Corp. Ltd. 3.50% 12 - 21.09.22 500,000 EUR 529,963 532,040 0.05Telstra Corp. Ltd. 3.75% 11 - 16.05.22 400,000 EUR 420,857 421,924 0.04Toyota Finance Australia Ltd. 0.25% 19 - 09.04.24 300,000 EUR 301,436 304,575 0.03Toyota Finance Australia Ltd. 0.50% 18 - 06.04.23 150,000 EUR 151,640 152,469 0.02Toyota Finance Australia Ltd. 1.584% 20 - 21.04.22 449,000 EUR 457,420 460,095 0.05Toyota Finance Australia Ltd. 2.004% 20 - 21.10.24 233,000 EUR 245,664 252,104 0.03Toyota Finance Australia Ltd. 2.28% 20 - 21.10.27 233,000 EUR 252,214 268,737 0.03Transurban Finance Co. Pty Ltd. 1.45% 19 - 16.05.29 400,000 EUR 416,050 435,836 0.04Transurban Finance Co. Pty Ltd. 1.75% 17 - 29.03.28 200,000 EUR 204,639 221,254 0.02Transurban Finance Co. Pty Ltd. 1.875% 14 - 16.09.24 200,000 EUR 206,341 213,098 0.02Transurban Finance Co. Pty Ltd. 2.00% 15 - 28.08.25 300,000 EUR 321,823 325,755 0.03Transurban Finance Co. Pty Ltd. 3.00% 20 - 08.04.30 420,000 EUR 458,917 510,388 0.05Vicinity Centres Trust 1.125% 19 - 07.11.29 300,000 EUR 284,608 310,890 0.03Wesfarmers Ltd. 2.75% 12 - 02.08.22 465,000 EUR 485,787 486,427 0.05Westpac Banking Corp. 0.25% 16 - 17.01.22 500,000 EUR 501,904 503,600 0.05Westpac Banking Corp. 0.375% 17 - 05.03.23 400,000 EUR 403,227 405,864 0.04Westpac Banking Corp. 0.625% 17 - 22.11.24 281,000 EUR 286,619 290,253 0.03Westpac Banking Corp. 0.75% 18 - 17.10.23 350,000 EUR 356,808 360,132 0.04Westpac Banking Corp. 0.875% 16 - 17.04.27 300,000 EUR 313,303 316,869 0.03Westpac Banking Corp. 1.125% 17 - 05.09.27 407,000 EUR 428,536 437,273 0.04Westpac Banking Corp. 1.45% 18 - 17.07.28 500,000 EUR 536,291 554,670 0.06
22,403,245 22,854,412 2.28AustriaBAWAG Group AG FRN 19 - 26.03.29 200,000 EUR 205,602 206,248 0.02BAWAG PSK Bank fuer Arbeit und Wirtschaft undOesterreichische Postsparkasse AG 0.375% 19 -03.09.27 200,000 EUR 197,582 198,254 0.02CA Immobilien Anlagen AG 0.875% 20 - 05.02.27 200,000 EUR 192,919 201,122 0.02CA Immobilien Anlagen AG 1.00% 20 - 27.10.25 300,000 EUR 300,223 305,247 0.03Erste Group Bank AG 0.05% 20 - 16.09.25 300,000 EUR 300,161 301,521 0.03Erste Group Bank AG FRN 20 - 16.11.28 500,000 EUR 498,536 498,110 0.05Erste Group Bank AG 0.375% 19 - 16.04.24 300,000 EUR 304,469 305,313 0.03Erste Group Bank AG 0.875% 19 - 22.05.26 200,000 EUR 198,184 208,428 0.02Erste Group Bank AG 0.875% 20 - 13.05.27 500,000 EUR 510,802 526,880 0.05Erste Group Bank AG FRN 19 - 10.06.30 200,000 EUR 199,418 201,376 0.02Erste Group Bank AG FRN 20 - 08.09.31 300,000 EUR 302,683 312,450 0.03Erste Group Bank AG 7.125% 12 - 10.10.22 120,000 EUR 135,522 135,134 0.01IMMOFINANZ AG 2.50% 20 - 15.10.27 300,000 EUR 301,739 313,380 0.03IMMOFINANZ AG 2.625% 19 - 27.01.23 300,000 EUR 301,153 309,402 0.03Mondi Finance Europe GmbH 2.375% 20 - 01.04.28 380,000 EUR 437,135 435,609 0.05
Xtrackers II
Xtrackers II ESG EUR CORPORATE BOND UCITS ETF (continued)
Statement of Investmentsas at 31 December 2020(expressed in EUR)
The accompanying notes form an integral part of these financial statements.
235

DescriptionNominal
ValueCurrency
(local) Cost Market Value
% ofNet
Assets
Transferable securities and money market instruments admitted to an official stock exchange listing(A)
Bonds (continued)
Austria (continued)Raiffeisen Bank International AG 0.25% 20 - 22.01.25 300,000 EUR 296,292 303,324 0.03Raiffeisen Bank International AG 0.375% 19 -25.09.26 400,000 EUR 397,252 408,216 0.04Raiffeisen Bank International AG 1.00% 18 - 04.12.23 400,000 EUR 407,865 412,864 0.04Raiffeisen Bank International AG FRN 19 - 12.03.30 300,000 EUR 290,428 299,472 0.03Raiffeisen Bank International AG FRN 20 - 18.06.32 300,000 EUR 303,409 323,736 0.03Raiffeisen Bank International AG 6.00% 13 - 16.10.23 200,000 EUR 231,164 233,120 0.02Telekom Finanzmanagement GmbH 1.50% 16 -07.12.26 600,000 EUR 642,121 653,616 0.07Telekom Finanzmanagement GmbH 3.50% 13 -04.07.23 100,000 EUR 108,604 109,061 0.01Telekom Finanzmanagement GmbH 4.00% 12 -04.04.22 437,000 EUR 458,690 459,921 0.05UNIQA Insurance Group AG 1.375% 20 - 09.07.30 300,000 EUR 324,929 326,682 0.03UNIQA Insurance Group AG FRN 15 - 27.07.46 300,000 EUR 366,937 367,500 0.04UNIQA Insurance Group AG FRN 13 - 31.07.43 200,000 EUR 231,210 230,834 0.02Vienna Insurance Group AG Wiener VersicherungGruppe FRN 15 - 02.03.46 300,000 EUR 332,859 335,172 0.03Vienna Insurance Group AG Wiener VersicherungGruppe FRN 13 - 09.10.43 300,000 EUR 337,166 341,904 0.04
9,115,054 9,263,896 0.92BelgiumAG Insurance SA FRN 15 - 30.06.47 300,000 EUR 323,244 342,024 0.04Ageas SA/NV FRN 20 - 24.11.51 300,000 EUR 299,958 304,596 0.03Ageas SA/NV FRN 19 - 02.07.49 200,000 EUR 216,900 228,000 0.02Barry Callebaut Services NV 2.375% 16 - 24.05.24 220,000 EUR 229,273 234,815 0.03Belfius Bank SA Zero Coupon 19 - 28.08.26 500,000 EUR 498,422 500,405 0.05Belfius Bank SA 0.01% 20 - 15.10.25 200,000 EUR 200,404 200,458 0.02Belfius Bank SA 0.375% 19 - 13.02.26 200,000 EUR 198,374 201,934 0.02Belfius Bank SA 0.375% 20 - 02.09.25 400,000 EUR 399,953 404,028 0.04Belfius Bank SA 0.625% 18 - 30.08.23 300,000 EUR 304,935 306,339 0.03Belfius Bank SA 0.75% 17 - 12.09.22 300,000 EUR 300,138 304,608 0.03Belfius Bank SA 1.00% 17 - 26.10.24 300,000 EUR 303,829 311,337 0.03Belfius Bank SA 3.125% 16 - 11.05.26 300,000 EUR 329,445 343,677 0.04Cofinimmo SA 0.875% 20 - 02.12.30 300,000 EUR 306,528 304,833 0.03Elia Group SA/NV 1.50% 18 - 05.09.28 200,000 EUR 207,319 219,636 0.02Elia Group SA/NV FRN 18 - 31.12.49 400,000 EUR 413,042 420,084 0.04Elia Transmission Belgium SA 0.875% 20 - 28.04.30 400,000 EUR 407,288 421,256 0.04Elia Transmission Belgium SA 1.375% 15 - 27.05.24 300,000 EUR 310,996 314,130 0.03Elia Transmission Belgium SA 1.375% 19 - 14.01.26 300,000 EUR 313,238 319,836 0.03Elia Transmission Belgium SA 3.00% 14 - 07.04.29 100,000 EUR 120,309 122,939 0.01Elia Transmission Belgium SA 3.25% 13 - 04.04.28 400,000 EUR 479,084 489,560 0.05Groupe Bruxelles Lambert SA 1.375% 17 - 23.05.24 400,000 EUR 420,058 418,636 0.04Groupe Bruxelles Lambert SA 1.875% 18 - 19.06.25 300,000 EUR 325,614 323,460 0.03KBC Group NV FRN 20 - 10.09.26 300,000 EUR 298,593 300,555 0.03KBC Group NV FRN 20 - 16.06.27 300,000 EUR 301,684 305,667 0.03KBC Group NV FRN 19 - 03.12.29 500,000 EUR 493,159 497,215 0.05KBC Group NV 0.625% 19 - 10.04.25 300,000 EUR 303,912 308,154 0.03
Xtrackers II
Xtrackers II ESG EUR CORPORATE BOND UCITS ETF (continued)
Statement of Investmentsas at 31 December 2020(expressed in EUR)
The accompanying notes form an integral part of these financial statements.
236

DescriptionNominal
ValueCurrency
(local) Cost Market Value
% ofNet
Assets
Transferable securities and money market instruments admitted to an official stock exchange listing(A)
Bonds (continued)
Belgium (continued)KBC Group NV 0.75% 16 - 18.10.23 500,000 EUR 507,573 512,725 0.05KBC Group NV 0.75% 17 - 01.03.22 800,000 EUR 806,519 809,768 0.08KBC Group NV 0.75% 20 - 24.01.30 200,000 EUR 204,263 209,786 0.02KBC Group NV 0.875% 18 - 27.06.23 200,000 EUR 204,413 205,480 0.02KBC Group NV 1.125% 19 - 25.01.24 600,000 EUR 617,039 621,918 0.06KBC Group NV FRN 17 - 18.09.29 300,000 EUR 307,394 311,904 0.03KBC Group NV FRN 15 - 11.03.27 400,000 EUR 404,317 407,928 0.04Lonza Finance International NV 1.625% 20 - 21.04.27 233,000 EUR 243,339 255,060 0.03Solvay SA 0.50% 19 - 06.09.29 100,000 EUR 99,078 101,834 0.01Solvay SA 0.50% 19 - 06.09.29 200,000 EUR 197,679 203,668 0.02Solvay SA 1.625% 15 - 02.12.22 500,000 EUR 512,916 515,325 0.05Solvay SA 2.75% 15 - 02.12.27 300,000 EUR 340,851 351,357 0.04
12,751,080 12,954,935 1.29CanadaBank of Nova Scotia 0.125% 19 - 04.09.26 300,000 EUR 294,235 302,439 0.03Bank of Nova Scotia 0.375% 17 - 06.04.22 400,000 EUR 402,526 403,532 0.04Bank of Nova Scotia 0.50% 19 - 30.04.24 600,000 EUR 602,747 612,348 0.06Canadian Imperial Bank of Commerce 0.375% 19 -03.05.24 277,000 EUR 269,739 280,676 0.03Canadian Imperial Bank of Commerce 0.375% 19 -03.05.24 285,000 EUR 286,178 288,782 0.03Canadian Imperial Bank of Commerce 0.75% 18 -22.03.23 562,000 EUR 570,746 574,724 0.06Great-West Lifeco Inc. 1.75% 16 - 07.12.26 350,000 EUR 374,805 386,729 0.04Great-West Lifeco Inc. 2.50% 13 - 18.04.23 100,000 EUR 104,493 106,107 0.01Magna International Inc. 1.50% 17 - 25.09.27 200,000 EUR 201,910 217,240 0.02Magna International Inc. 1.50% 17 - 25.09.27 100,000 EUR 100,829 108,620 0.01Magna International Inc. 1.90% 15 - 24.11.23 300,000 EUR 313,102 316,323 0.03Royal Bank of Canada 0.125% 19 - 23.07.24 600,000 EUR 600,800 605,454 0.06Royal Bank of Canada 0.25% 19 - 02.05.24 300,000 EUR 301,528 304,062 0.03Toronto-Dominion Bank 0.375% 19 - 25.04.24 800,000 EUR 804,588 812,464 0.08Toronto-Dominion Bank 0.625% 18 - 20.07.23 754,000 EUR 767,440 771,266 0.08
5,995,666 6,090,766 0.61Cayman IslandsXLIT Ltd. FRN 17 - 29.06.47 400,000 EUR 439,227 453,280 0.05
439,227 453,280 0.05ChinaChina Merchants Bank Co. Ltd 0.25% 19 - 19.06.22 300,000 EUR 298,494 298,113 0.03
298,494 298,113 0.03DenmarkAP Moller - Maersk A/S 1.75% 18 - 16.03.26 400,000 EUR 413,122 429,664 0.04DSV PANALPINA A/S-S- 0.375% 20 - 26.02.27 300,000 EUR 288,793 302,622 0.03H Lundbeck A/S 0.875% 20 - 14.10.27 350,000 EUR 354,367 357,403 0.04ISS Global A/S 0.875% 19 - 18.06.26 250,000 EUR 249,980 246,745 0.03ISS Global A/S 1.50% 17 - 31.08.27 300,000 EUR 301,626 303,405 0.03ISS Global A/S 2.125% 14 - 02.12.24 300,000 EUR 313,878 316,356 0.03Jyske Bank A/S FRN 20 - 15.10.25 370,000 EUR 369,498 372,154 0.04Jyske Bank A/S FRN 19 - 20.06.24 300,000 EUR 298,786 304,500 0.03
Xtrackers II
Xtrackers II ESG EUR CORPORATE BOND UCITS ETF (continued)
Statement of Investmentsas at 31 December 2020(expressed in EUR)
The accompanying notes form an integral part of these financial statements.
237

DescriptionNominal
ValueCurrency
(local) Cost Market Value
% ofNet
Assets
Transferable securities and money market instruments admitted to an official stock exchange listing(A)
Bonds (continued)
Denmark (continued)Jyske Bank A/S FRN 17 - 05.04.29 130,000 EUR 132,904 135,227 0.02Nykredit Realkredit A/S 0.125% 19 - 10.07.24 320,000 EUR 315,620 320,467 0.03Nykredit Realkredit A/S 0.50% 18 - 19.01.22 300,000 EUR 299,982 301,869 0.03Nykredit Realkredit A/S 0.625% 19 - 17.01.25 300,000 EUR 298,538 305,631 0.03Nykredit Realkredit A/S 0.75% 20 - 20.01.27 410,000 EUR 411,235 420,258 0.04Nykredit Realkredit A/S 0.875% 19 - 17.01.24 300,000 EUR 303,835 307,815 0.03Nykredit Realkredit A/S FRN 15 - 17.11.27 500,000 EUR 515,329 521,500 0.05Nykredit Realkredit AS 0.25% 19 - 20.01.23 430,000 EUR 426,488 432,477 0.04Nykredit Realkredit AS 0.25% 20 - 13.01.26 380,000 EUR 380,124 380,110 0.04Nykredit Realkredit AS 0.50% 20 - 10.07.25 400,000 EUR 406,857 409,868 0.04Sydbank A/S 1.25% 19 - 04.02.22 200,000 EUR 200,451 203,036 0.02Sydbank A/S 1.375% 18 - 18.09.23 300,000 EUR 310,182 310,626 0.03
6,591,595 6,681,733 0.67FinlandCRH Finland Services OYJ 0.875% 20 - 05.11.23 400,000 EUR 404,933 411,192 0.04Elisa OYJ 0.25% 20 - 15.09.27 240,000 EUR 239,117 241,298 0.02Elisa OYJ 0.875% 17 - 17.03.24 200,000 EUR 204,968 205,822 0.02Elisa OYJ 1.125% 19 - 26.02.26 200,000 EUR 205,250 210,730 0.02Kojamo OYJ 1.50% 17 - 19.06.24 235,000 EUR 241,171 245,448 0.02Kojamo OYJ 1.625% 18 - 07.03.25 235,000 EUR 240,135 247,211 0.02Kojamo OYJ 1.875% 20 - 27.05.27 300,000 EUR 309,997 324,024 0.03Metso Outotec OYJ 0.875% 20 - 26.05.28 250,000 EUR 250,388 252,150 0.02Metso Outotec OYJ 1.125% 17 - 13.06.24 100,000 EUR 101,128 102,907 0.01Nordea Bank Abp 0.30% 17 - 30.06.22 300,000 EUR 301,732 302,883 0.03Nordea Bank Abp 0.375% 19 - 28.05.26 450,000 EUR 457,312 462,501 0.05Nordea Bank Abp 0.50% 20 - 14.05.27 820,000 EUR 835,419 847,929 0.08Nordea Bank Abp 0.875% 18 - 26.06.23 550,000 EUR 560,638 565,004 0.06Nordea Bank Abp 1.00% 16 - 22.02.23 700,000 EUR 716,307 719,257 0.07Nordea Bank Abp FRN 19 - 27.06.29 200,000 EUR 198,133 202,708 0.02Nordea Bank Abp 1.125% 15 - 12.02.25 650,000 EUR 675,598 686,224 0.07Nordea Bank Abp 1.125% 17 - 27.09.27 400,000 EUR 421,498 432,384 0.04Nordea Bank Abp 3.25% 12 - 05.07.22 600,000 EUR 630,036 631,998 0.06OP Corporate Bank PLC 0.10% 20 - 16.11.27 600,000 EUR 600,442 601,380 0.06OP Corporate Bank PLC 0.125% 20 - 01.07.24 660,000 EUR 660,585 666,468 0.07OP Corporate Bank PLC 0.375% 17 - 11.10.22 300,000 EUR 302,637 303,654 0.03OP Corporate Bank PLC 0.375% 18 - 29.08.23 300,000 EUR 303,869 305,169 0.03OP Corporate Bank PLC 0.375% 19 - 26.02.24 300,000 EUR 304,376 305,997 0.03OP Corporate Bank PLC 0.375% 19 - 19.06.24 200,000 EUR 200,440 202,438 0.02OP Corporate Bank PLC 0.50% 20 - 12.08.25 550,000 EUR 556,359 564,036 0.06OP Corporate Bank PLC 0.60% 20 - 18.01.27 277,000 EUR 280,868 283,640 0.03OP Corporate Bank PLC 0.625% 19 - 12.11.29 300,000 EUR 295,804 308,256 0.03OP Corporate Bank PLC 0.75% 15 - 03.03.22 450,000 EUR 454,319 455,715 0.05OP Corporate Bank PLC 1.00% 18 - 22.05.25 150,000 EUR 153,869 157,715 0.02OP Corporate Bank PLC FRN 20 - 09.06.30 500,000 EUR 501,444 518,835 0.05OP Corporate Bank PLC 5.75% 12 - 28.02.22 200,000 EUR 211,836 213,238 0.02Sampo OYJ 1.00% 16 - 18.09.23 200,000 EUR 207,454 207,328 0.02Sampo OYJ 1.25% 17 - 30.05.25 220,000 EUR 232,036 233,961 0.02Sampo OYJ 1.625% 18 - 21.02.28 320,000 EUR 352,284 356,515 0.04
Xtrackers II
Xtrackers II ESG EUR CORPORATE BOND UCITS ETF (continued)
Statement of Investmentsas at 31 December 2020(expressed in EUR)
The accompanying notes form an integral part of these financial statements.
238
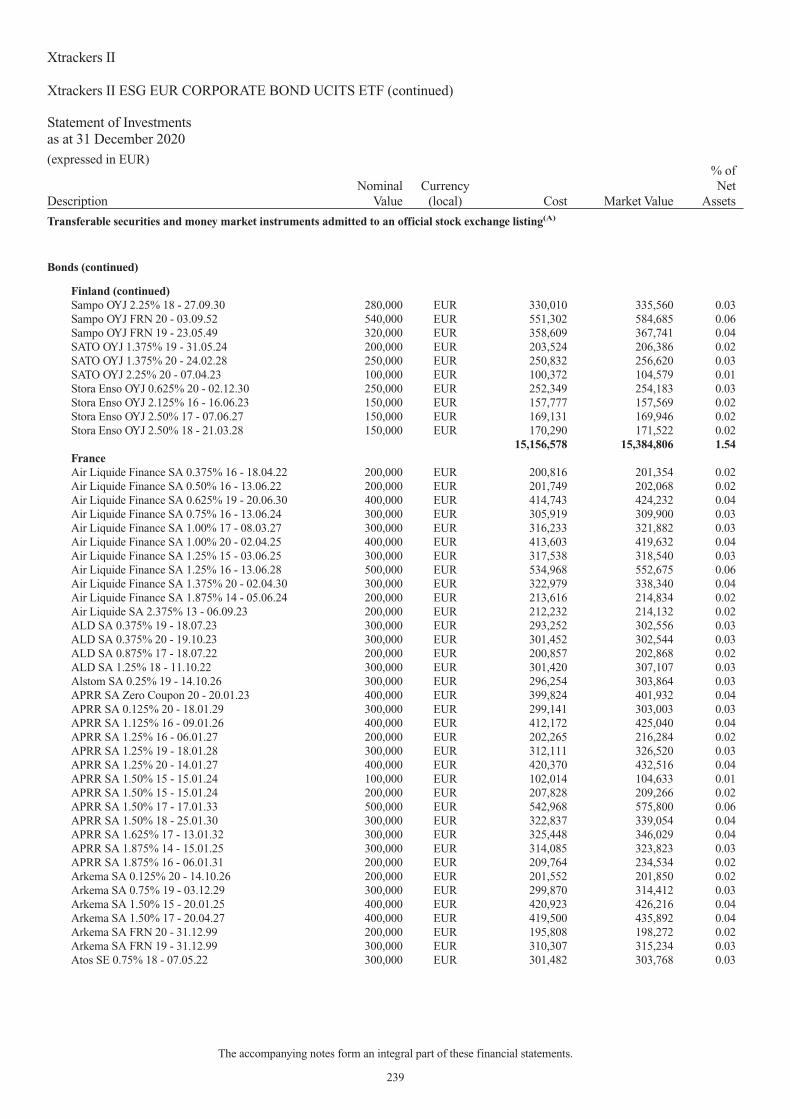
DescriptionNominal
ValueCurrency
(local) Cost Market Value
% ofNet
Assets
Transferable securities and money market instruments admitted to an official stock exchange listing(A)
Bonds (continued)
Finland (continued)Sampo OYJ 2.25% 18 - 27.09.30 280,000 EUR 330,010 335,560 0.03Sampo OYJ FRN 20 - 03.09.52 540,000 EUR 551,302 584,685 0.06Sampo OYJ FRN 19 - 23.05.49 320,000 EUR 358,609 367,741 0.04SATO OYJ 1.375% 19 - 31.05.24 200,000 EUR 203,524 206,386 0.02SATO OYJ 1.375% 20 - 24.02.28 250,000 EUR 250,832 256,620 0.03SATO OYJ 2.25% 20 - 07.04.23 100,000 EUR 100,372 104,579 0.01Stora Enso OYJ 0.625% 20 - 02.12.30 250,000 EUR 252,349 254,183 0.03Stora Enso OYJ 2.125% 16 - 16.06.23 150,000 EUR 157,777 157,569 0.02Stora Enso OYJ 2.50% 17 - 07.06.27 150,000 EUR 169,131 169,946 0.02Stora Enso OYJ 2.50% 18 - 21.03.28 150,000 EUR 170,290 171,522 0.02
15,156,578 15,384,806 1.54FranceAir Liquide Finance SA 0.375% 16 - 18.04.22 200,000 EUR 200,816 201,354 0.02Air Liquide Finance SA 0.50% 16 - 13.06.22 200,000 EUR 201,749 202,068 0.02Air Liquide Finance SA 0.625% 19 - 20.06.30 400,000 EUR 414,743 424,232 0.04Air Liquide Finance SA 0.75% 16 - 13.06.24 300,000 EUR 305,919 309,900 0.03Air Liquide Finance SA 1.00% 17 - 08.03.27 300,000 EUR 316,233 321,882 0.03Air Liquide Finance SA 1.00% 20 - 02.04.25 400,000 EUR 413,603 419,632 0.04Air Liquide Finance SA 1.25% 15 - 03.06.25 300,000 EUR 317,538 318,540 0.03Air Liquide Finance SA 1.25% 16 - 13.06.28 500,000 EUR 534,968 552,675 0.06Air Liquide Finance SA 1.375% 20 - 02.04.30 300,000 EUR 322,979 338,340 0.04Air Liquide Finance SA 1.875% 14 - 05.06.24 200,000 EUR 213,616 214,834 0.02Air Liquide SA 2.375% 13 - 06.09.23 200,000 EUR 212,232 214,132 0.02ALD SA 0.375% 19 - 18.07.23 300,000 EUR 293,252 302,556 0.03ALD SA 0.375% 20 - 19.10.23 300,000 EUR 301,452 302,544 0.03ALD SA 0.875% 17 - 18.07.22 200,000 EUR 200,857 202,868 0.02ALD SA 1.25% 18 - 11.10.22 300,000 EUR 301,420 307,107 0.03Alstom SA 0.25% 19 - 14.10.26 300,000 EUR 296,254 303,864 0.03APRR SA Zero Coupon 20 - 20.01.23 400,000 EUR 399,824 401,932 0.04APRR SA 0.125% 20 - 18.01.29 300,000 EUR 299,141 303,003 0.03APRR SA 1.125% 16 - 09.01.26 400,000 EUR 412,172 425,040 0.04APRR SA 1.25% 16 - 06.01.27 200,000 EUR 202,265 216,284 0.02APRR SA 1.25% 19 - 18.01.28 300,000 EUR 312,111 326,520 0.03APRR SA 1.25% 20 - 14.01.27 400,000 EUR 420,370 432,516 0.04APRR SA 1.50% 15 - 15.01.24 100,000 EUR 102,014 104,633 0.01APRR SA 1.50% 15 - 15.01.24 200,000 EUR 207,828 209,266 0.02APRR SA 1.50% 17 - 17.01.33 500,000 EUR 542,968 575,800 0.06APRR SA 1.50% 18 - 25.01.30 300,000 EUR 322,837 339,054 0.04APRR SA 1.625% 17 - 13.01.32 300,000 EUR 325,448 346,029 0.04APRR SA 1.875% 14 - 15.01.25 300,000 EUR 314,085 323,823 0.03APRR SA 1.875% 16 - 06.01.31 200,000 EUR 209,764 234,534 0.02Arkema SA 0.125% 20 - 14.10.26 200,000 EUR 201,552 201,850 0.02Arkema SA 0.75% 19 - 03.12.29 300,000 EUR 299,870 314,412 0.03Arkema SA 1.50% 15 - 20.01.25 400,000 EUR 420,923 426,216 0.04Arkema SA 1.50% 17 - 20.04.27 400,000 EUR 419,500 435,892 0.04Arkema SA FRN 20 - 31.12.99 200,000 EUR 195,808 198,272 0.02Arkema SA FRN 19 - 31.12.99 300,000 EUR 310,307 315,234 0.03Atos SE 0.75% 18 - 07.05.22 300,000 EUR 301,482 303,768 0.03
Xtrackers II
Xtrackers II ESG EUR CORPORATE BOND UCITS ETF (continued)
Statement of Investmentsas at 31 December 2020(expressed in EUR)
The accompanying notes form an integral part of these financial statements.
239
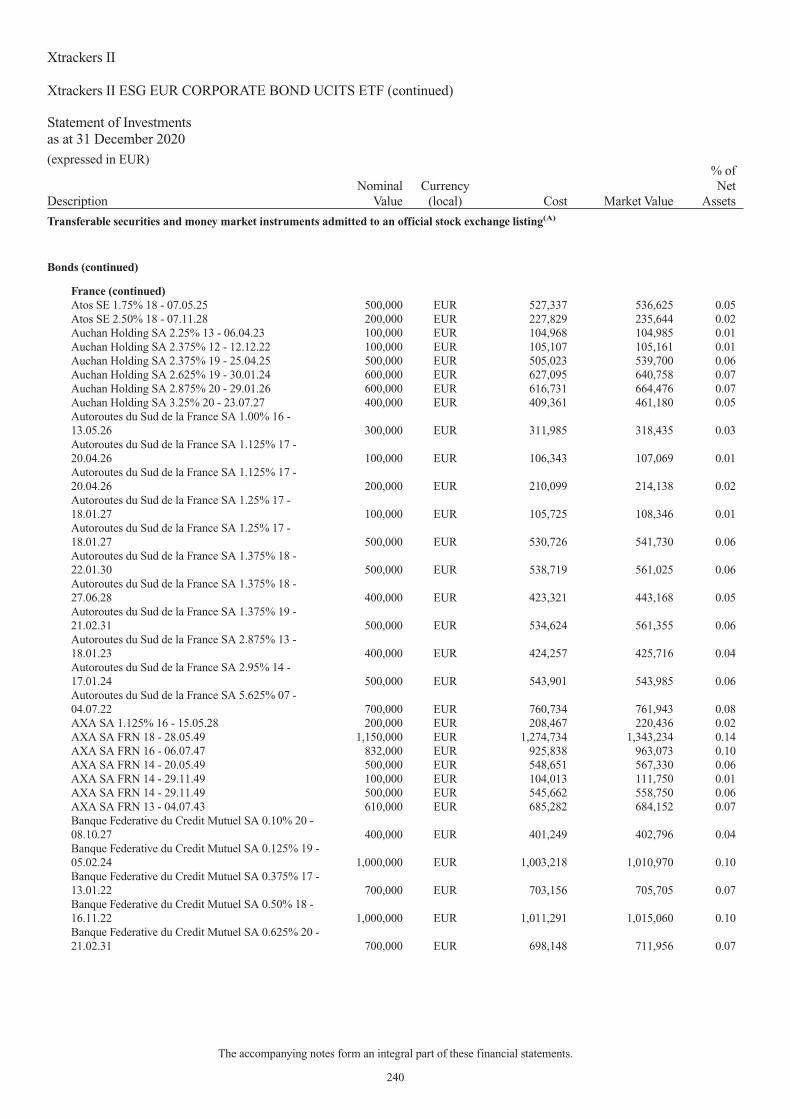
DescriptionNominal
ValueCurrency
(local) Cost Market Value
% ofNet
Assets
Transferable securities and money market instruments admitted to an official stock exchange listing(A)
Bonds (continued)
France (continued)Atos SE 1.75% 18 - 07.05.25 500,000 EUR 527,337 536,625 0.05Atos SE 2.50% 18 - 07.11.28 200,000 EUR 227,829 235,644 0.02Auchan Holding SA 2.25% 13 - 06.04.23 100,000 EUR 104,968 104,985 0.01Auchan Holding SA 2.375% 12 - 12.12.22 100,000 EUR 105,107 105,161 0.01Auchan Holding SA 2.375% 19 - 25.04.25 500,000 EUR 505,023 539,700 0.06Auchan Holding SA 2.625% 19 - 30.01.24 600,000 EUR 627,095 640,758 0.07Auchan Holding SA 2.875% 20 - 29.01.26 600,000 EUR 616,731 664,476 0.07Auchan Holding SA 3.25% 20 - 23.07.27 400,000 EUR 409,361 461,180 0.05Autoroutes du Sud de la France SA 1.00% 16 -13.05.26 300,000 EUR 311,985 318,435 0.03Autoroutes du Sud de la France SA 1.125% 17 -20.04.26 100,000 EUR 106,343 107,069 0.01Autoroutes du Sud de la France SA 1.125% 17 -20.04.26 200,000 EUR 210,099 214,138 0.02Autoroutes du Sud de la France SA 1.25% 17 -18.01.27 100,000 EUR 105,725 108,346 0.01Autoroutes du Sud de la France SA 1.25% 17 -18.01.27 500,000 EUR 530,726 541,730 0.06Autoroutes du Sud de la France SA 1.375% 18 -22.01.30 500,000 EUR 538,719 561,025 0.06Autoroutes du Sud de la France SA 1.375% 18 -27.06.28 400,000 EUR 423,321 443,168 0.05Autoroutes du Sud de la France SA 1.375% 19 -21.02.31 500,000 EUR 534,624 561,355 0.06Autoroutes du Sud de la France SA 2.875% 13 -18.01.23 400,000 EUR 424,257 425,716 0.04Autoroutes du Sud de la France SA 2.95% 14 -17.01.24 500,000 EUR 543,901 543,985 0.06Autoroutes du Sud de la France SA 5.625% 07 -04.07.22 700,000 EUR 760,734 761,943 0.08AXA SA 1.125% 16 - 15.05.28 200,000 EUR 208,467 220,436 0.02AXA SA FRN 18 - 28.05.49 1,150,000 EUR 1,274,734 1,343,234 0.14AXA SA FRN 16 - 06.07.47 832,000 EUR 925,838 963,073 0.10AXA SA FRN 14 - 20.05.49 500,000 EUR 548,651 567,330 0.06AXA SA FRN 14 - 29.11.49 100,000 EUR 104,013 111,750 0.01AXA SA FRN 14 - 29.11.49 500,000 EUR 545,662 558,750 0.06AXA SA FRN 13 - 04.07.43 610,000 EUR 685,282 684,152 0.07Banque Federative du Credit Mutuel SA 0.10% 20 -08.10.27 400,000 EUR 401,249 402,796 0.04Banque Federative du Credit Mutuel SA 0.125% 19 -05.02.24 1,000,000 EUR 1,003,218 1,010,970 0.10Banque Federative du Credit Mutuel SA 0.375% 17 -13.01.22 700,000 EUR 703,156 705,705 0.07Banque Federative du Credit Mutuel SA 0.50% 18 -16.11.22 1,000,000 EUR 1,011,291 1,015,060 0.10Banque Federative du Credit Mutuel SA 0.625% 20 -21.02.31 700,000 EUR 698,148 711,956 0.07
Xtrackers II
Xtrackers II ESG EUR CORPORATE BOND UCITS ETF (continued)
Statement of Investmentsas at 31 December 2020(expressed in EUR)
The accompanying notes form an integral part of these financial statements.
240

DescriptionNominal
ValueCurrency
(local) Cost Market Value
% ofNet
Assets
Transferable securities and money market instruments admitted to an official stock exchange listing(A)
Bonds (continued)
France (continued)Banque Federative du Credit Mutuel SA 0.75% 18 -17.07.25 100,000 EUR 100,904 103,908 0.01Banque Federative du Credit Mutuel SA 0.75% 18 -17.07.25 700,000 EUR 718,154 727,356 0.07Banque Federative du Credit Mutuel SA 0.75% 19 -15.06.23 800,000 EUR 812,748 820,224 0.08Banque Federative du Credit Mutuel SA 0.75% 19 -08.06.26 900,000 EUR 919,904 939,339 0.10Banque Federative du Credit Mutuel SA 0.75% 20 -17.01.30 500,000 EUR 500,842 518,855 0.05Banque Federative du Credit Mutuel SA 1.25% 15 -14.01.25 800,000 EUR 832,543 845,280 0.09Banque Federative du Credit Mutuel SA 1.25% 17 -26.05.27 700,000 EUR 739,384 757,064 0.08Banque Federative du Credit Mutuel SA 1.25% 20 -03.06.30 600,000 EUR 615,851 648,384 0.07Banque Federative du Credit Mutuel SA 1.375% 18 -16.07.28 500,000 EUR 534,465 551,450 0.06Banque Federative du Credit Mutuel SA 1.625% 16 -19.01.26 600,000 EUR 640,716 651,984 0.07Banque Federative du Credit Mutuel SA 1.625% 17 -15.11.27 300,000 EUR 308,856 321,789 0.03Banque Federative du Credit Mutuel SA 1.75% 19 -15.03.29 700,000 EUR 761,884 787,171 0.08Banque Federative du Credit Mutuel SA 1.875% 16 -04.11.26 500,000 EUR 522,586 541,075 0.06Banque Federative du Credit Mutuel SA 1.875% 19 -18.06.29 500,000 EUR 521,448 550,215 0.06Banque Federative du Credit Mutuel SA 2.375% 16 -24.03.26 500,000 EUR 528,364 551,085 0.06Banque Federative du Credit Mutuel SA 2.50% 18 -25.05.28 400,000 EUR 434,714 456,312 0.05Banque Federative du Credit Mutuel SA 2.625% 14 -18.03.24 800,000 EUR 864,401 872,616 0.09Banque Federative du Credit Mutuel SA 2.625% 17 -31.03.27 300,000 EUR 327,367 338,634 0.04Banque Federative du Credit Mutuel SA 3.00% 13 -28.11.23 800,000 EUR 868,638 875,776 0.09Banque Federative du Credit Mutuel SA 3.00% 14 -21.05.24 500,000 EUR 535,560 547,810 0.06Banque Federative du Credit Mutuel SA 3.00% 15 -11.09.25 500,000 EUR 544,410 563,030 0.06Banque Federative du Credit Mutuel SA 3.25% 12 -23.08.22 600,000 EUR 631,083 635,496 0.06BNP Paribas Cardif SA 1.00% 17 - 29.11.24 500,000 EUR 500,801 512,615 0.05BNP Paribas Cardif SA FRN 14 - 29.11.49 500,000 EUR 544,260 566,810 0.06BNP Paribas SA 0.125% 19 - 04.09.26 600,000 EUR 583,662 597,036 0.06BNP Paribas SA FRN 20 - 14.10.27 500,000 EUR 501,408 505,695 0.05
Xtrackers II
Xtrackers II ESG EUR CORPORATE BOND UCITS ETF (continued)
Statement of Investmentsas at 31 December 2020(expressed in EUR)
The accompanying notes form an integral part of these financial statements.
241

DescriptionNominal
ValueCurrency
(local) Cost Market Value
% ofNet
Assets
Transferable securities and money market instruments admitted to an official stock exchange listing(A)
Bonds (continued)
France (continued)BNP Paribas SA 0.50% 16 - 01.06.22 400,000 EUR 403,395 405,116 0.04BNP Paribas SA FRN 19 - 15.07.25 500,000 EUR 503,791 507,760 0.05BNP Paribas SA FRN 19 - 04.06.26 300,000 EUR 296,449 305,454 0.03BNP Paribas SA FRN 20 - 19.02.28 800,000 EUR 793,474 808,664 0.08BNP Paribas SA FRN 20 - 01.09.28 600,000 EUR 596,359 605,664 0.06BNP Paribas SA 0.625% 20 - 03.12.32 1,000,000 EUR 998,023 1,010,950 0.10BNP Paribas SA 0.75% 16 - 11.11.22 850,000 EUR 863,661 866,889 0.09BNP Paribas SA 1.00% 17 - 27.06.24 400,000 EUR 408,055 413,964 0.04BNP Paribas SA 1.00% 18 - 17.04.24 320,000 EUR 325,369 331,152 0.03BNP Paribas SA 1.125% 16 - 15.01.23 700,000 EUR 714,278 719,957 0.07BNP Paribas SA 1.125% 17 - 10.10.23 600,000 EUR 610,798 621,096 0.06BNP Paribas SA 1.125% 18 - 11.06.26 750,000 EUR 766,734 786,510 0.08BNP Paribas SA 1.125% 18 - 22.11.23 400,000 EUR 407,561 414,288 0.04BNP Paribas SA 1.125% 19 - 28.08.24 400,000 EUR 411,460 416,796 0.04BNP Paribas SA FRN 20 - 15.01.32 500,000 EUR 495,896 507,205 0.05BNP Paribas SA FRN 20 - 17.04.29 700,000 EUR 707,819 738,472 0.07BNP Paribas SA 1.25% 18 - 19.03.25 600,000 EUR 619,904 630,336 0.06BNP Paribas SA 1.375% 19 - 28.05.29 600,000 EUR 620,658 651,288 0.07BNP Paribas SA 1.50% 16 - 25.05.28 605,000 EUR 655,225 669,808 0.07BNP Paribas SA 1.50% 17 - 17.11.25 700,000 EUR 733,409 747,026 0.08BNP Paribas SA 1.50% 17 - 23.05.28 400,000 EUR 416,152 437,356 0.04BNP Paribas SA 1.625% 16 - 23.02.26 700,000 EUR 753,882 762,755 0.08BNP Paribas SA 1.625% 19 - 02.07.31 500,000 EUR 506,784 532,035 0.05BNP Paribas SA FRN 19 - 23.01.27 1,100,000 EUR 1,173,231 1,205,237 0.12BNP Paribas SA 2.25% 16 - 11.01.27 650,000 EUR 697,285 709,423 0.07BNP Paribas SA 2.375% 14 - 20.05.24 600,000 EUR 645,397 652,236 0.07BNP Paribas SA 2.375% 15 - 17.02.25 700,000 EUR 735,527 753,494 0.08BNP Paribas SA FRN 18 - 20.11.30 300,000 EUR 314,031 323,835 0.03BNP Paribas SA FRN 14 - 14.10.27 343,000 EUR 358,736 356,528 0.04BNP Paribas SA 2.75% 15 - 27.01.26 400,000 EUR 433,725 443,396 0.05BNP Paribas SA 2.875% 12 - 24.10.22 604,000 EUR 636,370 639,382 0.07BNP Paribas SA 2.875% 13 - 26.09.23 950,000 EUR 1,023,617 1,030,940 0.10BNP Paribas SA 2.875% 16 - 01.10.26 500,000 EUR 550,917 564,040 0.06BNP Paribas SA 4.125% 11 - 14.01.22 400,000 EUR 418,608 418,676 0.04BNP Paribas SA 4.125% 11 - 14.01.22 400,000 EUR 417,796 418,676 0.04BNP Paribas SA 4.50% 11 - 21.03.23 843,000 EUR 930,744 932,164 0.09Bouygues SA 1.125% 20 - 24.07.28 600,000 EUR 652,037 649,584 0.07Bouygues SA 1.375% 16 - 07.06.27 400,000 EUR 440,863 439,128 0.05Bouygues SA 3.625% 12 - 16.01.23 400,000 EUR 432,811 432,220 0.04Bouygues SA 4.50% 12 - 09.02.22 400,000 EUR 421,573 421,284 0.04BPCE SA 0.125% 19 - 04.12.24 500,000 EUR 500,728 505,360 0.05BPCE SA 0.25% 20 - 15.01.26 800,000 EUR 802,512 811,872 0.08BPCE SA 0.375% 16 - 05.10.23 400,000 EUR 402,637 406,868 0.04BPCE SA 0.50% 19 - 24.02.27 500,000 EUR 498,185 509,520 0.05BPCE SA FRN 20 - 15.09.27 700,000 EUR 699,627 710,479 0.07BPCE SA 0.625% 18 - 26.09.23 700,000 EUR 706,643 716,870 0.07BPCE SA 0.625% 19 - 26.09.24 100,000 EUR 100,315 102,244 0.01BPCE SA 0.625% 19 - 26.09.24 600,000 EUR 599,366 613,464 0.06
Xtrackers II
Xtrackers II ESG EUR CORPORATE BOND UCITS ETF (continued)
Statement of Investmentsas at 31 December 2020(expressed in EUR)
The accompanying notes form an integral part of these financial statements.
242

DescriptionNominal
ValueCurrency
(local) Cost Market Value
% ofNet
Assets
Transferable securities and money market instruments admitted to an official stock exchange listing(A)
Bonds (continued)
France (continued)BPCE SA 0.625% 20 - 15.01.30 500,000 EUR 510,060 520,455 0.05BPCE SA 0.625% 20 - 28.04.25 700,000 EUR 709,088 721,581 0.07BPCE SA 0.875% 18 - 31.01.24 400,000 EUR 401,171 411,068 0.04BPCE SA 1.00% 16 - 05.10.28 600,000 EUR 627,762 644,070 0.07BPCE SA 1.00% 19 - 15.07.24 800,000 EUR 823,848 833,192 0.08BPCE SA 1.00% 19 - 01.04.25 600,000 EUR 610,949 623,982 0.06BPCE SA 1.125% 15 - 14.12.22 200,000 EUR 204,805 205,584 0.02BPCE SA 1.125% 17 - 18.01.23 600,000 EUR 607,889 615,816 0.06BPCE SA 1.375% 18 - 23.03.26 400,000 EUR 415,191 425,676 0.04BPCE SA 1.625% 18 - 31.01.28 300,000 EUR 316,703 329,514 0.03BPCE SA FRN 15 - 30.11.27 600,000 EUR 626,815 628,890 0.06BPCE SA 2.875% 13 - 16.01.24 600,000 EUR 652,191 656,676 0.07BPCE SA 2.875% 16 - 22.04.26 400,000 EUR 431,383 453,264 0.05BPCE SA 3.00% 14 - 19.07.24 400,000 EUR 441,013 444,840 0.05BPCE SA 4.25% 12 - 06.02.23 300,000 EUR 327,292 328,416 0.03BPCE SA 4.50% 12 - 10.02.22 700,000 EUR 736,734 737,863 0.07BPCE SA 4.625% 13 - 18.07.23 500,000 EUR 551,387 557,585 0.06Caisse Nationale de Reassurance Mutuelle AgricoleGroupama 2.125% 19 - 16.09.29 300,000 EUR 303,706 313,380 0.03Caisse Nationale de Reassurance Mutuelle AgricoleGroupama 3.375% 18 - 24.09.28 300,000 EUR 315,601 338,019 0.03Caisse Nationale de Reassurance Mutuelle AgricoleGroupama 6.00% 17 - 23.01.27 400,000 EUR 481,168 500,936 0.05Caisse Nationale de Reassurance Mutuelle AgricoleGroupama FRN 14 - 29.05.49 600,000 EUR 686,068 691,650 0.07Capgemini SE 0.625% 20 - 23.06.25 500,000 EUR 504,956 514,175 0.05Capgemini SE 1.00% 18 - 18.10.24 400,000 EUR 407,771 415,756 0.04Capgemini SE 1.125% 20 - 23.06.30 500,000 EUR 504,024 531,815 0.05Capgemini SE 1.25% 20 - 15.04.22 200,000 EUR 201,685 203,400 0.02Capgemini SE 1.625% 20 - 15.04.26 200,000 EUR 206,129 216,132 0.02Capgemini SE 1.625% 20 - 15.04.26 300,000 EUR 318,482 324,198 0.03Capgemini SE 1.75% 18 - 18.04.28 200,000 EUR 210,547 222,334 0.02Capgemini SE 2.00% 20 - 15.04.29 500,000 EUR 539,950 567,430 0.06Capgemini SE 2.375% 20 - 15.04.32 700,000 EUR 779,472 833,532 0.08Capgemini SE 2.50% 15 - 01.07.23 500,000 EUR 523,961 529,955 0.05Carmila SA 1.625% 20 - 30.05.27 300,000 EUR 301,774 305,481 0.03Carmila SA 2.125% 18 - 07.03.28 200,000 EUR 194,213 211,192 0.02Carmila SA 2.375% 15 - 18.09.23 200,000 EUR 204,007 212,242 0.02Carmila SA 2.375% 16 - 16.09.24 200,000 EUR 198,383 215,910 0.02Carrefour SA 0.75% 16 - 26.04.24 480,000 EUR 493,739 492,686 0.05Carrefour SA 0.875% 18 - 12.06.23 300,000 EUR 306,898 306,708 0.03Carrefour SA 1.00% 19 - 17.05.27 300,000 EUR 319,829 317,814 0.03Carrefour SA 1.25% 15 - 03.06.25 420,000 EUR 444,557 443,071 0.05Carrefour SA 1.75% 14 - 15.07.22 500,000 EUR 513,393 512,440 0.05Carrefour SA 1.75% 18 - 04.05.26 200,000 EUR 219,104 218,164 0.02Carrefour SA 2.625% 20 - 15.12.27 600,000 EUR 701,552 700,050 0.07Ceetrus SA 2.75% 19 - 26.11.26 200,000 EUR 210,020 215,576 0.02Cie de Saint-Gobain 0.625% 19 - 15.03.24 500,000 EUR 507,338 512,535 0.05
Xtrackers II
Xtrackers II ESG EUR CORPORATE BOND UCITS ETF (continued)
Statement of Investmentsas at 31 December 2020(expressed in EUR)
The accompanying notes form an integral part of these financial statements.
243

DescriptionNominal
ValueCurrency
(local) Cost Market Value
% ofNet
Assets
Transferable securities and money market instruments admitted to an official stock exchange listing(A)
Bonds (continued)
France (continued)Cie de Saint-Gobain 0.875% 18 - 21.09.23 300,000 EUR 305,659 308,478 0.03Cie de Saint-Gobain 1.00% 17 - 17.03.25 400,000 EUR 416,126 420,080 0.04Cie de Saint-Gobain 1.125% 18 - 23.03.26 400,000 EUR 413,070 422,800 0.04Cie de Saint-Gobain 1.375% 17 - 14.06.27 400,000 EUR 422,031 434,352 0.04Cie de Saint-Gobain 1.75% 20 - 03.04.23 600,000 EUR 618,467 625,320 0.06Cie de Saint-Gobain 1.875% 18 - 21.09.28 300,000 EUR 316,370 336,933 0.03Cie de Saint-Gobain 1.875% 19 - 15.03.31 600,000 EUR 647,462 691,056 0.07Cie de Saint-Gobain 2.375% 20 - 04.10.27 400,000 EUR 416,682 457,024 0.05Cie de Saint-Gobain 3.625% 12 - 28.03.22 400,000 EUR 418,660 418,492 0.04Cie Financiere et Industrielle des Autoroutes SA0.375% 16 - 07.02.25 400,000 EUR 408,314 410,352 0.04Cie Financiere et Industrielle des Autoroutes SA0.75% 16 - 09.09.28 400,000 EUR 407,865 426,316 0.04Cie Financiere et Industrielle des Autoroutes SA1.00% 20 - 19.05.31 400,000 EUR 408,279 431,388 0.04Cie Financiere et Industrielle des Autoroutes SA1.00% 20 - 19.05.31 100,000 EUR 107,357 107,847 0.01Cie Financiere et Industrielle des Autoroutes SA1.125% 17 - 13.10.27 400,000 EUR 421,616 433,364 0.04Cie Generale des Etablissements Michelin SCA ZeroCoupon 20 - 02.11.28 400,000 EUR 399,642 399,204 0.04Cie Generale des Etablissements Michelin SCA 0.25%20 - 02.11.32 400,000 EUR 400,820 402,600 0.04Cie Generale des Etablissements Michelin SCA0.625% 20 - 02.11.40 400,000 EUR 399,706 408,668 0.04Cie Generale des Etablissements Michelin SCA0.875% 18 - 03.09.25 400,000 EUR 415,029 418,900 0.04Cie Generale des Etablissements Michelin SCA1.125% 15 - 28.05.22 100,000 EUR 101,413 101,659 0.01Cie Generale des Etablissements Michelin SCA 1.75%15 - 28.05.27 100,000 EUR 108,363 111,936 0.01Cie Generale des Etablissements Michelin SCA 1.75%18 - 03.09.30 100,000 EUR 109,949 116,088 0.01Cie Generale des Etablissements Michelin SCA 1.75%18 - 03.09.30 400,000 EUR 453,130 464,352 0.05Cie Generale des Etablissements Michelin SCA 2.50%18 - 03.09.38 300,000 EUR 353,961 406,875 0.04CNP Assurances 0.375% 20 - 08.03.28 300,000 EUR 300,132 299,850 0.03CNP Assurances 1.875% 16 - 20.10.22 600,000 EUR 614,029 619,860 0.06CNP Assurances FRN 19 - 27.07.50 400,000 EUR 402,188 424,920 0.04CNP Assurances FRN 20 - 30.06.51 400,000 EUR 406,695 434,332 0.04CNP Assurances 2.75% 19 - 05.02.29 300,000 EUR 330,689 345,087 0.04CNP Assurances FRN 14 - 29.11.49 300,000 EUR 329,573 333,000 0.03CNP Assurances FRN 14 - 05.06.45 300,000 EUR 337,607 343,947 0.04CNP Assurances FRN 15 - 10.06.47 400,000 EUR 472,788 481,036 0.05Coface SA 4.125% 14 - 27.03.24 300,000 EUR 325,836 332,016 0.03Covivio 1.125% 19 - 17.09.31 300,000 EUR 296,830 307,353 0.03Covivio 1.50% 17 - 21.06.27 300,000 EUR 306,374 317,364 0.03
Xtrackers II
Xtrackers II ESG EUR CORPORATE BOND UCITS ETF (continued)
Statement of Investmentsas at 31 December 2020(expressed in EUR)
The accompanying notes form an integral part of these financial statements.
244

DescriptionNominal
ValueCurrency
(local) Cost Market Value
% ofNet
Assets
Transferable securities and money market instruments admitted to an official stock exchange listing(A)
Bonds (continued)
France (continued)Covivio 1.625% 17 - 17.10.24 100,000 EUR 100,964 105,021 0.01Covivio 1.625% 20 - 23.06.30 300,000 EUR 300,667 322,482 0.03Covivio 1.875% 16 - 20.05.26 300,000 EUR 317,849 324,516 0.03Covivio 2.375% 18 - 20.02.28 200,000 EUR 221,171 221,404 0.02Credit Agricole Assurances SA 2.00% 20 - 17.07.30 600,000 EUR 612,567 642,312 0.07Credit Agricole Assurances SA FRN 18 - 29.01.48 500,000 EUR 510,946 540,680 0.06Credit Agricole Assurances SA FRN 15 - 31.12.49 100,000 EUR 105,150 112,009 0.01Credit Agricole Assurances SA FRN 15 - 31.12.49 500,000 EUR 538,248 560,045 0.06Credit Agricole Assurances SA FRN 14 - 31.10.49 400,000 EUR 436,126 457,020 0.05Credit Agricole Assurances SA FRN 16 - 27.09.48 600,000 EUR 700,845 745,596 0.08Credit Agricole SA 0.125% 20 - 09.12.27 500,000 EUR 500,590 500,065 0.05Credit Agricole SA 0.375% 19 - 21.10.25 100,000 EUR 99,897 101,783 0.01Credit Agricole SA 0.375% 19 - 21.10.25 500,000 EUR 498,157 508,915 0.05Credit Agricole SA 0.50% 19 - 24.06.24 700,000 EUR 704,234 713,531 0.07Credit Agricole SA 0.75% 16 - 01.12.22 400,000 EUR 407,117 409,284 0.04Credit Agricole SA 0.75% 18 - 05.12.23 600,000 EUR 611,885 617,070 0.06Credit Agricole SA 0.875% 15 - 19.01.22 500,000 EUR 504,049 507,055 0.05Credit Agricole SA 0.875% 20 - 14.01.32 700,000 EUR 701,062 734,377 0.07Credit Agricole SA 1.00% 17 - 16.09.24 400,000 EUR 415,364 418,040 0.04Credit Agricole SA 1.00% 19 - 03.07.29 700,000 EUR 735,415 756,693 0.08Credit Agricole SA FRN 20 - 22.04.26 800,000 EUR 807,683 832,256 0.08Credit Agricole SA 1.25% 16 - 14.04.26 800,000 EUR 843,338 856,960 0.09Credit Agricole SA 1.375% 17 - 03.05.27 900,000 EUR 957,411 980,433 0.10Credit Agricole SA 1.375% 18 - 13.03.25 500,000 EUR 518,076 528,130 0.05Credit Agricole SA FRN 20 - 05.06.30 500,000 EUR 506,880 521,675 0.05Credit Agricole SA 1.75% 19 - 05.03.29 700,000 EUR 745,525 782,642 0.08Credit Agricole SA 1.875% 16 - 20.12.26 800,000 EUR 855,199 881,888 0.09Credit Agricole SA 2.00% 19 - 25.03.29 700,000 EUR 731,522 773,374 0.08Credit Agricole SA 2.375% 14 - 20.05.24 700,000 EUR 754,212 760,515 0.08Credit Agricole SA 2.625% 15 - 17.03.27 1,150,000 EUR 1,248,973 1,291,266 0.13Credit Agricole SA 3.125% 13 - 17.07.23 700,000 EUR 756,080 763,651 0.08Credit Agricole SA 3.125% 14 - 05.02.26 600,000 EUR 689,394 699,744 0.07Credit Agricole SA 5.125% 11 - 18.04.23 400,000 EUR 449,609 451,400 0.05Credit Mutuel Arkea SA 0.01% 20 - 28.01.26 500,000 EUR 500,155 500,755 0.05Credit Mutuel Arkea SA 0.375% 19 - 03.10.28 300,000 EUR 298,268 306,285 0.03Credit Mutuel Arkea SA 0.875% 18 - 05.10.23 200,000 EUR 205,523 205,856 0.02Credit Mutuel Arkea SA 0.875% 20 - 07.05.27 400,000 EUR 408,017 421,556 0.04Credit Mutuel Arkea SA 1.00% 15 - 26.01.23 300,000 EUR 305,667 307,851 0.03Credit Mutuel Arkea SA 1.125% 19 - 23.05.29 200,000 EUR 202,990 216,682 0.02Credit Mutuel Arkea SA 1.25% 17 - 31.05.24 300,000 EUR 309,088 311,745 0.03Credit Mutuel Arkea SA FRN 20 - 11.06.29 300,000 EUR 305,553 318,906 0.03Credit Mutuel Arkea SA FRN 20 - 11.06.29 100,000 EUR 106,211 106,302 0.01Credit Mutuel Arkea SA 1.375% 19 - 17.01.25 300,000 EUR 309,421 318,045 0.03Credit Mutuel Arkea SA 1.625% 19 - 15.04.26 300,000 EUR 312,800 322,611 0.03Credit Mutuel Arkea SA FRN 17 - 25.10.29 100,000 EUR 98,464 104,075 0.01Credit Mutuel Arkea SA FRN 17 - 25.10.29 200,000 EUR 198,990 208,150 0.02Credit Mutuel Arkea SA 3.25% 16 - 01.06.26 200,000 EUR 219,214 229,514 0.02Credit Mutuel Arkea SA 3.375% 19 - 11.03.31 500,000 EUR 570,085 611,410 0.06
Xtrackers II
Xtrackers II ESG EUR CORPORATE BOND UCITS ETF (continued)
Statement of Investmentsas at 31 December 2020(expressed in EUR)
The accompanying notes form an integral part of these financial statements.
245

DescriptionNominal
ValueCurrency
(local) Cost Market Value
% ofNet
Assets
Transferable securities and money market instruments admitted to an official stock exchange listing(A)
Bonds (continued)
France (continued)Credit Mutuel Arkea SA 3.50% 17 - 09.02.29 300,000 EUR 340,994 362,811 0.04Danone SA 0.395% 20 - 10.06.29 400,000 EUR 403,810 412,224 0.04Danone SA 0.424% 16 - 03.11.22 700,000 EUR 705,364 708,498 0.07Danone SA 0.571% 20 - 17.03.27 500,000 EUR 510,783 521,170 0.05Danone SA 0.709% 16 - 03.11.24 600,000 EUR 613,196 621,732 0.06Danone SA 1.00% 18 - 26.03.25 200,000 EUR 208,461 210,168 0.02Danone SA 1.125% 15 - 14.01.25 400,000 EUR 416,545 421,160 0.04Danone SA 1.208% 16 - 03.11.28 800,000 EUR 850,532 881,440 0.09Danone SA 1.25% 15 - 30.05.24 500,000 EUR 520,482 524,980 0.05Danone SA FRN 17 - 31.12.99 700,000 EUR 703,791 718,914 0.07Danone SA 2.60% 13 - 28.06.23 300,000 EUR 321,085 321,933 0.03Dassault Systemes SE Zero Coupon 19 - 16.09.22 400,000 EUR 400,837 401,744 0.04Dassault Systemes SE Zero Coupon 19 - 16.09.24 400,000 EUR 400,553 403,072 0.04Dassault Systemes SE 0.125% 19 - 16.09.26 600,000 EUR 601,271 607,458 0.06Dassault Systemes SE 0.375% 19 - 16.09.29 700,000 EUR 704,820 722,456 0.07Edenred 1.375% 15 - 10.03.25 200,000 EUR 210,176 211,472 0.02Edenred 1.375% 20 - 18.06.29 300,000 EUR 300,989 323,157 0.03Edenred 1.875% 17 - 30.03.27 300,000 EUR 322,196 333,420 0.03Edenred 1.875% 18 - 06.03.26 400,000 EUR 421,279 437,880 0.04EssilorLuxottica SA Zero Coupon 19 - 27.05.23 400,000 EUR 400,700 401,576 0.04EssilorLuxottica SA 0.125% 19 - 27.05.25 1,000,000 EUR 1,003,453 1,009,140 0.10EssilorLuxottica SA 0.25% 20 - 05.01.24 400,000 EUR 402,363 404,848 0.04EssilorLuxottica SA 0.375% 19 - 27.11.27 800,000 EUR 807,750 815,560 0.08EssilorLuxottica SA 0.375% 20 - 05.01.26 700,000 EUR 702,445 716,037 0.07EssilorLuxottica SA 0.50% 20 - 05.06.28 700,000 EUR 703,943 722,848 0.07EssilorLuxottica SA 0.75% 19 - 27.11.31 600,000 EUR 616,329 626,826 0.06EssilorLuxottica SA 2.375% 14 - 09.04.24 100,000 EUR 107,081 107,670 0.01EssilorLuxottica SA 2.625% 14 - 10.02.24 200,000 EUR 215,239 217,200 0.02Eutelsat SA 1.50% 20 - 13.10.28 400,000 EUR 400,882 406,364 0.04Eutelsat SA 2.00% 18 - 02.10.25 400,000 EUR 403,942 429,416 0.04Eutelsat SA 2.25% 19 - 13.07.27 300,000 EUR 315,946 325,086 0.03Eutelsat SA 3.125% 12 - 10.10.22 200,000 EUR 210,770 210,888 0.02Gecina SA 1.00% 16 - 30.01.29 300,000 EUR 306,250 320,103 0.03Gecina SA 1.375% 17 - 30.06.27 500,000 EUR 538,806 545,255 0.06Gecina SA 1.375% 17 - 26.01.28 300,000 EUR 311,981 326,748 0.03Gecina SA 1.50% 15 - 20.01.25 300,000 EUR 315,356 319,449 0.03Gecina SA 1.625% 18 - 14.03.30 300,000 EUR 310,723 336,765 0.03Gecina SA 1.625% 19 - 29.05.34 400,000 EUR 425,446 453,636 0.05Gecina SA 2.00% 15 - 17.06.24 300,000 EUR 315,633 321,561 0.03Gecina SA 2.00% 17 - 30.06.32 200,000 EUR 219,711 234,336 0.02HSBC Continental Europe SA 0.10% 19 - 03.09.27 800,000 EUR 789,310 803,648 0.08HSBC Continental Europe SA 0.25% 19 - 17.05.24 500,000 EUR 503,365 506,860 0.05HSBC Continental Europe SA 0.60% 18 - 20.03.23 300,000 EUR 304,193 305,592 0.03HSBC Continental Europe SA 0.60% 18 - 20.03.23 400,000 EUR 405,634 407,456 0.04HSBC Continental Europe SA 1.375% 18 - 04.09.28 400,000 EUR 435,368 441,472 0.05Icade 1.75% 16 - 10.06.26 400,000 EUR 421,409 434,992 0.04ICADE 1.125% 16 - 17.11.25 300,000 EUR 307,819 314,841 0.03ICADE 1.50% 17 - 13.09.27 400,000 EUR 416,102 435,408 0.04
Xtrackers II
Xtrackers II ESG EUR CORPORATE BOND UCITS ETF (continued)
Statement of Investmentsas at 31 December 2020(expressed in EUR)
The accompanying notes form an integral part of these financial statements.
246

DescriptionNominal
ValueCurrency
(local) Cost Market Value
% ofNet
Assets
Transferable securities and money market instruments admitted to an official stock exchange listing(A)
Bonds (continued)
France (continued)ICADE 1.625% 18 - 28.02.28 300,000 EUR 305,425 324,465 0.03ICADE 1.875% 15 - 14.09.22 300,000 EUR 307,122 308,673 0.03Icade Sante SAS 0.875% 19 - 04.11.29 300,000 EUR 285,546 308,109 0.03Icade Sante SAS 1.375% 20 - 17.09.30 300,000 EUR 303,243 320,985 0.03Imerys SA 0.875% 16 - 31.03.22 100,000 EUR 100,356 100,948 0.01Imerys SA 1.50% 17 - 15.01.27 300,000 EUR 287,173 312,186 0.03Imerys SA 1.875% 16 - 31.03.28 200,000 EUR 209,118 210,800 0.02Imerys SA 2.00% 14 - 10.12.24 300,000 EUR 307,572 318,264 0.03JCDecaux SA 1.00% 16 - 01.06.23 400,000 EUR 398,238 408,712 0.04JCDecaux SA 2.00% 20 - 24.10.24 300,000 EUR 297,329 318,273 0.03JCDecaux SA 2.625% 20 - 24.04.28 400,000 EUR 424,562 437,748 0.04Kering SA 0.25% 20 - 13.05.23 400,000 EUR 402,104 403,984 0.04Kering SA 0.75% 20 - 13.05.28 300,000 EUR 303,294 315,525 0.03Kering SA 1.25% 16 - 10.05.26 300,000 EUR 319,074 321,237 0.03Kering SA 1.50% 17 - 05.04.27 200,000 EUR 213,919 219,166 0.02Kering SA 2.75% 14 - 08.04.24 200,000 EUR 216,523 219,528 0.02Klepierre SA 0.625% 19 - 01.07.30 300,000 EUR 292,637 301,254 0.03Klepierre SA 0.875% 20 - 17.02.31 400,000 EUR 403,227 407,404 0.04Klepierre SA 1.00% 15 - 17.04.23 600,000 EUR 610,144 614,478 0.06Klepierre SA 1.25% 16 - 29.09.31 300,000 EUR 288,932 315,969 0.03Klepierre SA 1.375% 17 - 16.02.27 300,000 EUR 311,357 319,470 0.03Klepierre SA 1.625% 17 - 13.12.32 400,000 EUR 417,640 434,816 0.04Klepierre SA 1.75% 14 - 06.11.24 300,000 EUR 312,544 321,375 0.03Klepierre SA 1.875% 16 - 19.02.26 200,000 EUR 203,980 218,326 0.02Klepierre SA 2.00% 20 - 12.05.29 400,000 EUR 415,760 447,352 0.05Legrand SA 0.50% 17 - 09.10.23 300,000 EUR 303,607 305,367 0.03Legrand SA 0.625% 19 - 24.06.28 100,000 EUR 100,228 104,482 0.01Legrand SA 0.625% 19 - 24.06.28 100,000 EUR 100,786 104,482 0.01Legrand SA 0.75% 17 - 06.07.24 300,000 EUR 308,703 310,683 0.03Legrand SA 0.75% 20 - 20.05.30 300,000 EUR 303,708 317,775 0.03Legrand SA 1.00% 18 - 06.03.26 200,000 EUR 204,276 210,194 0.02Legrand SA 1.875% 15 - 16.12.27 200,000 EUR 218,347 223,248 0.02Legrand SA 1.875% 17 - 06.07.32 300,000 EUR 346,375 354,837 0.04Mercialys SA 1.787% 14 - 31.03.23 200,000 EUR 198,505 205,558 0.02Mercialys SA 1.80% 18 - 27.02.26 200,000 EUR 181,578 196,822 0.02Mercialys SA 4.625% 20 - 07.07.27 200,000 EUR 205,211 220,118 0.02Orange SA Zero Coupon 19 - 04.09.26 500,000 EUR 503,638 502,435 0.05Orange SA 0.125% 20 - 16.09.29 400,000 EUR 405,002 403,168 0.04Orange SA 0.50% 19 - 15.01.22 300,000 EUR 302,488 302,355 0.03Orange SA 0.50% 19 - 04.09.32 600,000 EUR 616,354 614,472 0.06Orange SA 0.75% 17 - 11.09.23 400,000 EUR 410,317 409,780 0.04Orange SA 0.875% 16 - 03.02.27 400,000 EUR 424,040 422,664 0.04Orange SA 1.00% 16 - 12.05.25 600,000 EUR 629,789 628,074 0.06Orange SA 1.00% 18 - 12.09.25 400,000 EUR 421,968 420,740 0.04Orange SA 1.125% 19 - 15.07.24 800,000 EUR 835,563 833,776 0.08Orange SA 1.20% 19 - 11.07.34 200,000 EUR 218,887 214,840 0.02Orange SA 1.25% 20 - 07.07.27 400,000 EUR 434,043 432,548 0.04Orange SA 1.375% 18 - 16.01.30 500,000 EUR 562,433 559,735 0.06
Xtrackers II
Xtrackers II ESG EUR CORPORATE BOND UCITS ETF (continued)
Statement of Investmentsas at 31 December 2020(expressed in EUR)
The accompanying notes form an integral part of these financial statements.
247

DescriptionNominal
ValueCurrency
(local) Cost Market Value
% ofNet
Assets
Transferable securities and money market instruments admitted to an official stock exchange listing(A)
Bonds (continued)
France (continued)Orange SA 1.375% 18 - 20.03.28 500,000 EUR 550,737 549,125 0.06Orange SA 1.375% 19 - 04.09.49 400,000 EUR 452,809 453,184 0.05Orange SA 1.50% 17 - 09.09.27 400,000 EUR 440,837 439,916 0.05Orange SA 1.625% 20 - 07.04.32 400,000 EUR 459,625 458,540 0.05Orange SA FRN 19 - 31.12.99 300,000 EUR 307,560 309,411 0.03Orange SA FRN 20 - 31.12.99 400,000 EUR 409,566 413,856 0.04Orange SA 1.875% 18 - 12.09.30 600,000 EUR 702,809 700,404 0.07Orange SA 2.00% 19 - 15.01.29 600,000 EUR 695,142 691,686 0.07Orange SA FRN 19 - 31.12.99 500,000 EUR 527,217 526,870 0.05Orange SA 2.50% 12 - 01.03.23 300,000 EUR 318,436 317,826 0.03Orange SA 3.125% 13 - 09.01.24 400,000 EUR 440,633 439,840 0.05Orange SA 3.375% 10 - 16.09.22 250,000 EUR 265,670 265,618 0.03Orange SA FRN 14 - 29.10.49 730,000 EUR 883,887 883,453 0.09Orange SA FRN 14 - 29.12.49 600,000 EUR 682,977 682,374 0.07Orange SA 8.125% 03 - 28.01.33 850,000 EUR 1,621,679 1,618,340 0.16Peugeot SA 1.125% 19 - 18.09.29 400,000 EUR 387,095 419,236 0.04Peugeot SA 2.00% 17 - 23.03.24 405,000 EUR 410,312 427,243 0.04Peugeot SA 2.00% 18 - 20.03.25 300,000 EUR 309,665 318,951 0.03Peugeot SA 2.375% 16 - 14.04.23 300,000 EUR 311,206 315,342 0.03Peugeot SA 2.75% 20 - 15.05.26 500,000 EUR 509,860 557,990 0.06PSA Tresorerie GIE 6.00% 03 - 19.09.33 320,000 EUR 448,574 482,250 0.05Publicis Groupe SA 0.50% 16 - 03.11.23 400,000 EUR 403,135 407,312 0.04Publicis Groupe SA 1.625% 14 - 16.12.24 200,000 EUR 209,690 213,328 0.02RCI Banque SA 0.25% 19 - 08.03.23 350,000 EUR 344,493 349,857 0.04RCI Banque SA 0.50% 16 - 15.09.23 450,000 EUR 440,719 452,191 0.05RCI Banque SA 0.75% 17 - 12.01.22 400,000 EUR 398,551 402,508 0.04RCI Banque SA 0.75% 17 - 26.09.22 475,000 EUR 478,255 479,949 0.05RCI Banque SA 0.75% 19 - 10.04.23 291,000 EUR 288,040 294,256 0.03RCI Banque SA 1.00% 16 - 17.05.23 350,000 EUR 346,680 355,268 0.04RCI Banque SA 1.125% 20 - 15.01.27 406,000 EUR 396,725 413,803 0.04RCI Banque SA 1.25% 15 - 08.06.22 500,000 EUR 506,302 509,000 0.05RCI Banque SA 1.375% 17 - 08.03.24 364,000 EUR 367,628 372,394 0.04RCI Banque SA 1.625% 17 - 11.04.25 250,000 EUR 255,594 260,420 0.03RCI Banque SA 1.625% 18 - 26.05.26 540,000 EUR 541,455 566,168 0.06RCI Banque SA 1.75% 19 - 10.04.26 400,000 EUR 408,112 422,172 0.04RCI Banque SA 2.00% 19 - 11.07.24 328,000 EUR 339,228 343,475 0.04Sanofi Zero Coupon 16 - 13.09.22 600,000 EUR 602,378 603,186 0.06Sanofi Zero Coupon 19 - 21.03.22 400,000 EUR 401,113 401,704 0.04Sanofi 0.50% 16 - 13.01.27 500,000 EUR 504,866 521,505 0.05Sanofi 0.50% 18 - 21.03.23 1,000,000 EUR 1,012,098 1,016,860 0.10Sanofi 0.625% 16 - 05.04.24 400,000 EUR 408,988 411,812 0.04Sanofi 0.875% 19 - 21.03.29 500,000 EUR 528,682 540,360 0.06Sanofi 1.00% 18 - 21.03.26 700,000 EUR 732,318 744,821 0.08Sanofi 1.00% 20 - 01.04.25 500,000 EUR 517,193 525,375 0.05Sanofi 1.125% 14 - 10.03.22 400,000 EUR 405,257 405,608 0.04Sanofi 1.125% 16 - 05.04.28 400,000 EUR 424,081 437,644 0.04Sanofi 1.25% 19 - 21.03.34 300,000 EUR 330,794 347,769 0.04Sanofi 1.375% 18 - 21.03.30 1,100,000 EUR 1,196,709 1,247,103 0.13
Xtrackers II
Xtrackers II ESG EUR CORPORATE BOND UCITS ETF (continued)
Statement of Investmentsas at 31 December 2020(expressed in EUR)
The accompanying notes form an integral part of these financial statements.
248

DescriptionNominal
ValueCurrency
(local) Cost Market Value
% ofNet
Assets
Transferable securities and money market instruments admitted to an official stock exchange listing(A)
Bonds (continued)
France (continued)Sanofi 1.50% 15 - 22.09.25 300,000 EUR 319,113 324,156 0.03Sanofi 1.50% 20 - 01.04.30 600,000 EUR 662,478 685,932 0.07Sanofi 1.75% 14 - 10.09.26 1,000,000 EUR 1,091,407 1,110,390 0.11Sanofi 1.875% 18 - 21.03.38 700,000 EUR 820,894 901,586 0.09Sanofi 2.50% 13 - 14.11.23 600,000 EUR 642,671 644,238 0.07Schneider Electric SE Zero Coupon 20 - 12.06.23 300,000 EUR 302,054 301,788 0.03Schneider Electric SE 0.25% 16 - 09.09.24 500,000 EUR 510,237 508,620 0.05Schneider Electric SE 0.25% 20 - 11.03.29 400,000 EUR 411,231 409,048 0.04Schneider Electric SE 0.875% 15 - 11.03.25 400,000 EUR 419,698 418,232 0.04Schneider Electric SE 0.875% 17 - 13.12.26 500,000 EUR 531,726 529,945 0.05Schneider Electric SE 1.00% 20 - 09.04.27 200,000 EUR 214,818 213,590 0.02Schneider Electric SE 1.375% 18 - 21.06.27 600,000 EUR 658,788 656,046 0.07Schneider Electric SE 1.50% 15 - 08.09.23 400,000 EUR 417,819 417,280 0.04Schneider Electric SE 1.50% 19 - 15.01.28 500,000 EUR 557,008 554,820 0.06SCOR SE FRN 20 - 17.09.51 200,000 EUR 197,693 202,896 0.02SCOR SE FRN 15 - 08.06.46 300,000 EUR 333,794 338,394 0.04SCOR SE FRN 16 - 27.05.48 300,000 EUR 349,128 358,569 0.04Societe Fonciere Lyonnaise SA 1.50% 18 - 29.05.25 300,000 EUR 306,507 316,401 0.03Societe Fonciere Lyonnaise SA 1.50% 20 - 05.06.27 300,000 EUR 305,475 319,512 0.03Societe Generale SA Zero Coupon 19 - 27.05.22 1,000,000 EUR 1,000,607 1,004,450 0.10Societe Generale SA 0.125% 20 - 24.02.26 400,000 EUR 394,737 403,296 0.04Societe Generale SA 0.125% 20 - 24.02.26 200,000 EUR 198,725 201,648 0.02Societe Generale SA 0.25% 18 - 18.01.22 900,000 EUR 901,867 905,994 0.09Societe Generale SA 0.50% 17 - 13.01.23 500,000 EUR 498,843 506,020 0.05Societe Generale SA 0.75% 16 - 26.05.23 500,000 EUR 508,424 512,105 0.05Societe Generale SA 0.75% 20 - 25.01.27 800,000 EUR 789,354 820,048 0.08Societe Generale SA 0.875% 19 - 01.07.26 500,000 EUR 509,660 515,990 0.05Societe Generale SA 0.875% 19 - 24.09.29 500,000 EUR 496,078 513,035 0.05Societe Generale SA FRN 20 - 22.09.28 500,000 EUR 501,623 515,920 0.05Societe Generale SA 1.00% 16 - 01.04.22 500,000 EUR 505,172 507,700 0.05Societe Generale SA FRN 20 - 24.11.30 600,000 EUR 601,384 601,500 0.06Societe Generale SA 1.125% 18 - 23.01.25 800,000 EUR 812,767 833,248 0.08Societe Generale SA FRN 20 - 21.04.26 400,000 EUR 402,166 416,332 0.04Societe Generale SA 1.25% 19 - 15.02.24 1,000,000 EUR 1,018,849 1,037,850 0.10Societe Generale SA 1.25% 20 - 12.06.30 600,000 EUR 606,340 636,636 0.06Societe Generale SA 1.375% 17 - 13.01.28 400,000 EUR 408,094 426,204 0.04Societe Generale SA FRN 18 - 23.02.28 600,000 EUR 604,852 610,062 0.06Societe Generale SA 1.75% 19 - 22.03.29 700,000 EUR 731,935 769,069 0.08Societe Generale SA 2.125% 18 - 27.09.28 700,000 EUR 760,790 787,675 0.08Societe Generale SA 2.625% 15 - 27.02.25 700,000 EUR 747,428 759,787 0.08Societe Generale SA 4.00% 13 - 07.06.23 100,000 EUR 108,165 109,059 0.01Societe Generale SA 4.00% 13 - 07.06.23 500,000 EUR 540,157 545,295 0.06Societe Generale SA 4.25% 12 - 13.07.22 500,000 EUR 534,166 534,445 0.05Sodexo SA 0.50% 20 - 17.01.24 300,000 EUR 302,780 305,484 0.03Sodexo SA 0.75% 16 - 14.04.27 450,000 EUR 461,112 468,810 0.05Sodexo SA 0.75% 20 - 27.04.25 600,000 EUR 610,768 620,568 0.06Sodexo SA 1.00% 20 - 27.04.29 430,000 EUR 429,846 455,391 0.05Sodexo SA 1.00% 20 - 17.07.28 230,000 EUR 231,137 243,768 0.03
Xtrackers II
Xtrackers II ESG EUR CORPORATE BOND UCITS ETF (continued)
Statement of Investmentsas at 31 December 2020(expressed in EUR)
The accompanying notes form an integral part of these financial statements.
249
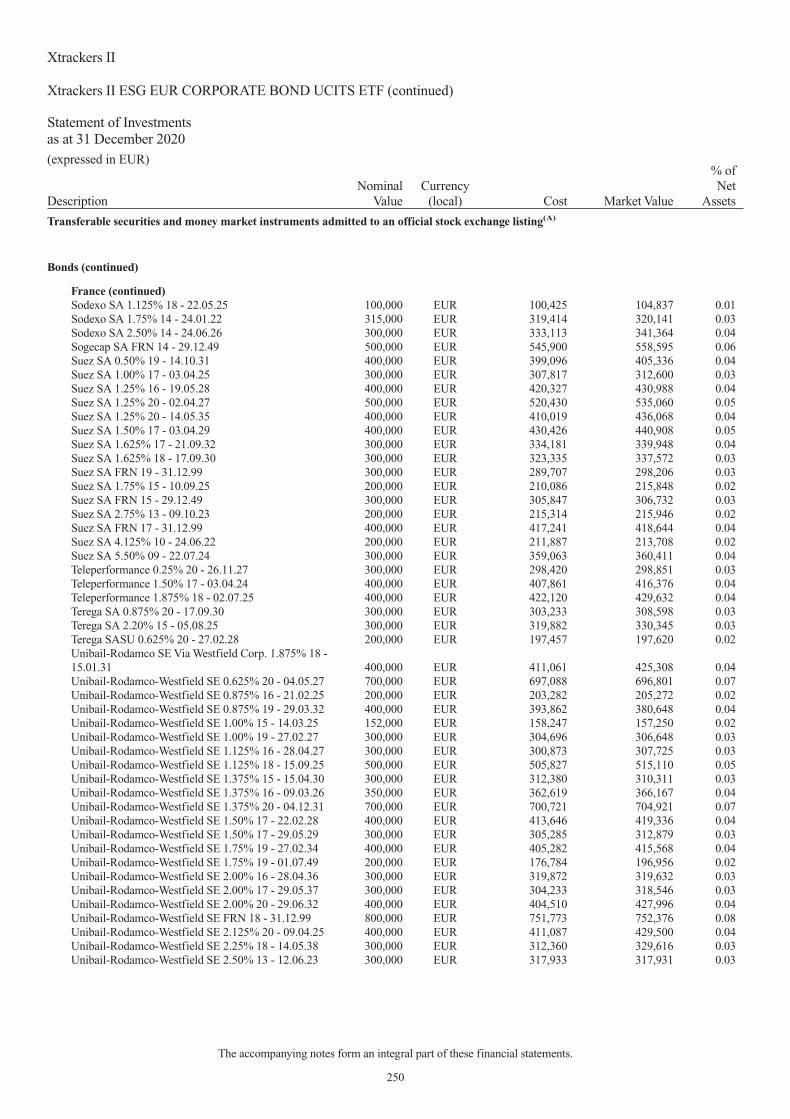
DescriptionNominal
ValueCurrency
(local) Cost Market Value
% ofNet
Assets
Transferable securities and money market instruments admitted to an official stock exchange listing(A)
Bonds (continued)
France (continued)Sodexo SA 1.125% 18 - 22.05.25 100,000 EUR 100,425 104,837 0.01Sodexo SA 1.75% 14 - 24.01.22 315,000 EUR 319,414 320,141 0.03Sodexo SA 2.50% 14 - 24.06.26 300,000 EUR 333,113 341,364 0.04Sogecap SA FRN 14 - 29.12.49 500,000 EUR 545,900 558,595 0.06Suez SA 0.50% 19 - 14.10.31 400,000 EUR 399,096 405,336 0.04Suez SA 1.00% 17 - 03.04.25 300,000 EUR 307,817 312,600 0.03Suez SA 1.25% 16 - 19.05.28 400,000 EUR 420,327 430,988 0.04Suez SA 1.25% 20 - 02.04.27 500,000 EUR 520,430 535,060 0.05Suez SA 1.25% 20 - 14.05.35 400,000 EUR 410,019 436,068 0.04Suez SA 1.50% 17 - 03.04.29 400,000 EUR 430,426 440,908 0.05Suez SA 1.625% 17 - 21.09.32 300,000 EUR 334,181 339,948 0.04Suez SA 1.625% 18 - 17.09.30 300,000 EUR 323,335 337,572 0.03Suez SA FRN 19 - 31.12.99 300,000 EUR 289,707 298,206 0.03Suez SA 1.75% 15 - 10.09.25 200,000 EUR 210,086 215,848 0.02Suez SA FRN 15 - 29.12.49 300,000 EUR 305,847 306,732 0.03Suez SA 2.75% 13 - 09.10.23 200,000 EUR 215,314 215,946 0.02Suez SA FRN 17 - 31.12.99 400,000 EUR 417,241 418,644 0.04Suez SA 4.125% 10 - 24.06.22 200,000 EUR 211,887 213,708 0.02Suez SA 5.50% 09 - 22.07.24 300,000 EUR 359,063 360,411 0.04Teleperformance 0.25% 20 - 26.11.27 300,000 EUR 298,420 298,851 0.03Teleperformance 1.50% 17 - 03.04.24 400,000 EUR 407,861 416,376 0.04Teleperformance 1.875% 18 - 02.07.25 400,000 EUR 422,120 429,632 0.04Terega SA 0.875% 20 - 17.09.30 300,000 EUR 303,233 308,598 0.03Terega SA 2.20% 15 - 05.08.25 300,000 EUR 319,882 330,345 0.03Terega SASU 0.625% 20 - 27.02.28 200,000 EUR 197,457 197,620 0.02Unibail-Rodamco SE Via Westfield Corp. 1.875% 18 -15.01.31 400,000 EUR 411,061 425,308 0.04Unibail-Rodamco-Westfield SE 0.625% 20 - 04.05.27 700,000 EUR 697,088 696,801 0.07Unibail-Rodamco-Westfield SE 0.875% 16 - 21.02.25 200,000 EUR 203,282 205,272 0.02Unibail-Rodamco-Westfield SE 0.875% 19 - 29.03.32 400,000 EUR 393,862 380,648 0.04Unibail-Rodamco-Westfield SE 1.00% 15 - 14.03.25 152,000 EUR 158,247 157,250 0.02Unibail-Rodamco-Westfield SE 1.00% 19 - 27.02.27 300,000 EUR 304,696 306,648 0.03Unibail-Rodamco-Westfield SE 1.125% 16 - 28.04.27 300,000 EUR 300,873 307,725 0.03Unibail-Rodamco-Westfield SE 1.125% 18 - 15.09.25 500,000 EUR 505,827 515,110 0.05Unibail-Rodamco-Westfield SE 1.375% 15 - 15.04.30 300,000 EUR 312,380 310,311 0.03Unibail-Rodamco-Westfield SE 1.375% 16 - 09.03.26 350,000 EUR 362,619 366,167 0.04Unibail-Rodamco-Westfield SE 1.375% 20 - 04.12.31 700,000 EUR 700,721 704,921 0.07Unibail-Rodamco-Westfield SE 1.50% 17 - 22.02.28 400,000 EUR 413,646 419,336 0.04Unibail-Rodamco-Westfield SE 1.50% 17 - 29.05.29 300,000 EUR 305,285 312,879 0.03Unibail-Rodamco-Westfield SE 1.75% 19 - 27.02.34 400,000 EUR 405,282 415,568 0.04Unibail-Rodamco-Westfield SE 1.75% 19 - 01.07.49 200,000 EUR 176,784 196,956 0.02Unibail-Rodamco-Westfield SE 2.00% 16 - 28.04.36 300,000 EUR 319,872 319,632 0.03Unibail-Rodamco-Westfield SE 2.00% 17 - 29.05.37 300,000 EUR 304,233 318,546 0.03Unibail-Rodamco-Westfield SE 2.00% 20 - 29.06.32 400,000 EUR 404,510 427,996 0.04Unibail-Rodamco-Westfield SE FRN 18 - 31.12.99 800,000 EUR 751,773 752,376 0.08Unibail-Rodamco-Westfield SE 2.125% 20 - 09.04.25 400,000 EUR 411,087 429,500 0.04Unibail-Rodamco-Westfield SE 2.25% 18 - 14.05.38 300,000 EUR 312,360 329,616 0.03Unibail-Rodamco-Westfield SE 2.50% 13 - 12.06.23 300,000 EUR 317,933 317,931 0.03
Xtrackers II
Xtrackers II ESG EUR CORPORATE BOND UCITS ETF (continued)
Statement of Investmentsas at 31 December 2020(expressed in EUR)
The accompanying notes form an integral part of these financial statements.
250

DescriptionNominal
ValueCurrency
(local) Cost Market Value
% ofNet
Assets
Transferable securities and money market instruments admitted to an official stock exchange listing(A)
Bonds (continued)
France (continued)Unibail-Rodamco-Westfield SE 2.50% 14 - 26.02.24 300,000 EUR 315,810 323,271 0.03Unibail-Rodamco-Westfield SE 2.50% 14 - 04.06.26 250,000 EUR 263,488 275,183 0.03Unibail-Rodamco-Westfield SE 2.625% 20 - 09.04.30 500,000 EUR 533,668 568,215 0.06Unibail-Rodamco-Westfield SE FRN 18 - 31.12.99 400,000 EUR 380,196 380,720 0.04Vinci SA Zero Coupon 20 - 27.11.28 300,000 EUR 300,951 300,741 0.03Vinci SA 1.00% 18 - 26.09.25 500,000 EUR 520,510 529,270 0.05Vinci SA 1.625% 19 - 18.01.29 500,000 EUR 549,407 564,365 0.06Vinci SA 1.75% 18 - 26.09.30 600,000 EUR 657,239 696,432 0.07Vivendi SA Zero Coupon 19 - 13.06.22 500,000 EUR 500,219 501,745 0.05Vivendi SA 0.625% 19 - 11.06.25 600,000 EUR 612,383 617,946 0.06Vivendi SA 0.875% 17 - 18.09.24 400,000 EUR 407,424 413,884 0.04Vivendi SA 1.125% 16 - 24.11.23 400,000 EUR 411,747 414,284 0.04Vivendi SA 1.125% 19 - 11.12.28 300,000 EUR 301,688 320,940 0.03Vivendi SA 1.875% 16 - 26.05.26 200,000 EUR 209,960 219,510 0.02Wendel SE 1.00% 16 - 20.04.23 100,000 EUR 102,209 102,059 0.01Wendel SE 1.375% 19 - 26.04.26 200,000 EUR 205,982 211,274 0.02Wendel SE 2.50% 15 - 09.02.27 300,000 EUR 334,494 338,280 0.03Wendel SE 2.75% 14 - 02.10.24 300,000 EUR 323,221 328,479 0.03Worldline SA 0.25% 19 - 18.09.24 100,000 EUR 99,899 100,903 0.01Worldline SA 0.25% 19 - 18.09.24 200,000 EUR 199,691 201,806 0.02Worldline SA 0.50% 20 - 30.06.23 400,000 EUR 402,978 406,012 0.04Worldline SA 0.875% 20 - 30.06.27 300,000 EUR 303,958 311,589 0.03WPP Finance SA 2.25% 14 - 22.09.26 336,000 EUR 351,541 376,055 0.04WPP Finance SA 2.375% 20 - 19.05.27 400,000 EUR 417,030 448,284 0.05
238,336,073 243,707,887 24.34GermanyAareal Bank AG 0.25% 20 - 23.11.27 300,000 EUR 299,972 300,102 0.03Aareal Bank AG 0.375% 19 - 10.04.24 200,000 EUR 199,636 201,894 0.02Aareal Bank AG 0.50% 20 - 07.04.27 200,000 EUR 202,885 204,572 0.02adidas AG Zero Coupon 20 - 09.09.24 200,000 EUR 201,120 201,580 0.02adidas AG Zero Coupon 20 - 05.10.28 300,000 EUR 299,846 302,043 0.03adidas AG 0.625% 20 - 10.09.35 300,000 EUR 307,913 314,352 0.03Albemarle New Holdings GmbH 1.125% 19 -25.11.25 200,000 EUR 204,451 206,768 0.02Albemarle New Holdings GmbH 1.625% 19 -25.11.28 300,000 EUR 309,384 316,116 0.03Allianz SE FRN 19 - 25.09.49 300,000 EUR 299,479 310,170 0.03Allianz SE FRN 19 - 25.09.49 300,000 EUR 303,143 310,170 0.03Allianz SE FRN 20 - 08.07.50 600,000 EUR 622,633 657,852 0.07Allianz SE FRN 15 - 07.07.45 100,000 EUR 98,257 107,886 0.01Allianz SE FRN 15 - 07.07.45 700,000 EUR 738,269 755,202 0.08Allianz SE FRN 17 - 06.07.47 100,000 EUR 113,613 115,628 0.01Allianz SE FRN 17 - 06.07.47 400,000 EUR 444,429 462,512 0.05Allianz SE FRN 14 - 31.12.99 800,000 EUR 863,837 879,128 0.09Allianz SE FRN 13 - 31.12.49 300,000 EUR 334,952 335,250 0.03Allianz SE FRN 13 - 31.12.49 500,000 EUR 559,394 558,750 0.06Allianz SE FRN 12 - 17.10.42 100,000 EUR 116,021 109,843 0.01Allianz SE FRN 12 - 17.10.42 900,000 EUR 1,008,854 988,587 0.10
Xtrackers II
Xtrackers II ESG EUR CORPORATE BOND UCITS ETF (continued)
Statement of Investmentsas at 31 December 2020(expressed in EUR)
The accompanying notes form an integral part of these financial statements.
251

DescriptionNominal
ValueCurrency
(local) Cost Market Value
% ofNet
Assets
Transferable securities and money market instruments admitted to an official stock exchange listing(A)
Bonds (continued)
Germany (continued)alstria office REIT-AG 0.50% 19 - 26.09.25 300,000 EUR 292,471 300,813 0.03alstria office REIT-AG 0.50% 19 - 26.09.25 100,000 EUR 100,326 100,271 0.01alstria office REIT-AG 1.50% 17 - 15.11.27 100,000 EUR 103,531 104,200 0.01alstria office REIT-AG 1.50% 20 - 23.06.26 200,000 EUR 200,677 209,390 0.02alstria office REIT-AG 2.125% 16 - 12.04.23 100,000 EUR 102,182 103,720 0.01Amphenol Technologies Holdings GmbH 0.75% 20 -04.05.26 300,000 EUR 303,486 310,608 0.03Amphenol Technologies Holdings GmbH 0.75% 20 -04.05.26 100,000 EUR 103,568 103,536 0.01Amphenol Technologies Holdings GmbH 2.00% 18 -08.10.28 200,000 EUR 211,672 226,844 0.02Berlin Hyp AG 0.375% 18 - 28.08.23 300,000 EUR 304,162 306,414 0.03Berlin Hyp AG 0.50% 16 - 26.09.23 300,000 EUR 304,271 304,461 0.03Berlin Hyp AG 0.50% 19 - 05.11.29 300,000 EUR 306,384 314,700 0.03Berlin Hyp AG 1.00% 19 - 05.02.26 400,000 EUR 418,762 427,428 0.04Berlin Hyp AG 1.125% 17 - 25.10.27 300,000 EUR 308,389 319,875 0.03Berlin Hyp AG 1.25% 15 - 22.01.25 300,000 EUR 304,018 315,522 0.03Berlin Hyp AG 1.50% 18 - 18.04.28 300,000 EUR 320,461 327,114 0.03Bertelsmann SE & Co. KGaA 1.125% 16 - 27.04.26 400,000 EUR 419,289 426,068 0.04Bertelsmann SE & Co. KGaA 1.25% 18 - 29.09.25 500,000 EUR 521,625 532,275 0.05Bertelsmann SE & Co. KGaA 1.50% 20 - 15.05.30 400,000 EUR 416,190 439,452 0.04Bertelsmann SE & Co. KGaA 1.75% 14 - 14.10.24 300,000 EUR 316,561 321,456 0.03Bertelsmann SE & Co. KGaA 2.00% 20 - 01.04.28 300,000 EUR 308,489 337,221 0.03Bertelsmann SE & Co. KGaA 2.625% 12 - 02.08.22 500,000 EUR 520,553 522,850 0.05Clearstream Banking AG Zero Coupon 20 - 01.12.25 200,000 EUR 201,107 201,498 0.02Commerzbank AG 0.25% 19 - 16.09.24 200,000 EUR 198,079 199,806 0.02Commerzbank AG 0.375% 20 - 01.09.27 300,000 EUR 297,863 302,133 0.03Commerzbank AG 0.50% 16 - 13.09.23 650,000 EUR 650,600 660,998 0.07Commerzbank AG 0.50% 18 - 28.08.23 904,000 EUR 912,002 920,064 0.09Commerzbank AG 0.50% 19 - 04.12.26 590,000 EUR 588,921 602,402 0.06Commerzbank AG 0.625% 19 - 28.08.24 610,000 EUR 618,953 626,147 0.06Commerzbank AG FRN 20 - 24.03.26 200,000 EUR 199,394 202,898 0.02Commerzbank AG 0.875% 20 - 22.01.27 500,000 EUR 491,292 511,185 0.05Commerzbank AG 1.00% 19 - 04.03.26 720,000 EUR 724,273 753,170 0.08Commerzbank AG 1.125% 17 - 24.05.24 260,000 EUR 259,282 269,194 0.03Commerzbank AG 1.125% 17 - 19.09.25 200,000 EUR 201,021 207,492 0.02Commerzbank AG 1.125% 19 - 22.06.26 300,000 EUR 304,990 310,968 0.03Commerzbank AG 1.25% 18 - 23.10.23 100,000 EUR 99,209 103,461 0.01Commerzbank AG 1.50% 15 - 21.09.22 397,000 EUR 406,896 408,878 0.04Commerzbank AG 1.50% 18 - 28.08.28 250,000 EUR 262,643 273,753 0.03Commerzbank AG 1.875% 18 - 28.02.28 300,000 EUR 311,202 326,934 0.03Continental AG Zero Coupon 19 - 12.09.23 100,000 EUR 99,730 99,968 0.01Continental AG 0.375% 19 - 27.06.25 306,000 EUR 306,657 308,218 0.03Continental AG 2.50% 20 - 27.08.26 490,000 EUR 522,286 546,649 0.06Covestro AG 0.875% 20 - 03.02.26 250,000 EUR 250,910 260,165 0.03Covestro AG 1.375% 20 - 12.06.30 270,000 EUR 271,044 290,585 0.03Covestro AG 1.75% 16 - 25.09.24 200,000 EUR 208,036 212,762 0.02Daimler AG Zero Coupon 19 - 08.02.24 525,000 EUR 520,863 524,501 0.05
Xtrackers II
Xtrackers II ESG EUR CORPORATE BOND UCITS ETF (continued)
Statement of Investmentsas at 31 December 2020(expressed in EUR)
The accompanying notes form an integral part of these financial statements.
252

DescriptionNominal
ValueCurrency
(local) Cost Market Value
% ofNet
Assets
Transferable securities and money market instruments admitted to an official stock exchange listing(A)
Bonds (continued)
Germany (continued)Daimler AG 0.375% 19 - 08.11.26 200,000 EUR 201,028 202,176 0.02Daimler AG 0.375% 19 - 08.11.26 400,000 EUR 393,919 404,352 0.04Daimler AG 0.75% 19 - 08.02.30 450,000 EUR 447,804 463,405 0.05Daimler AG 0.75% 20 - 10.09.30 490,000 EUR 488,513 509,708 0.05Daimler AG 1.00% 17 - 15.11.27 530,000 EUR 525,711 557,926 0.06Daimler AG 1.125% 19 - 08.08.34 370,000 EUR 368,929 393,525 0.04Daimler AG 1.125% 19 - 06.11.31 240,000 EUR 238,227 254,186 0.03Daimler AG 1.125% 19 - 06.11.31 300,000 EUR 300,966 317,733 0.03Daimler AG 1.375% 16 - 11.05.28 650,000 EUR 679,524 702,299 0.07Daimler AG 1.40% 16 - 12.01.24 420,000 EUR 426,260 438,262 0.04Daimler AG 1.40% 16 - 12.01.24 100,000 EUR 103,661 104,348 0.01Daimler AG 1.50% 16 - 09.03.26 559,000 EUR 584,388 600,204 0.06Daimler AG 1.50% 17 - 03.07.29 820,000 EUR 847,802 903,140 0.09Daimler AG 1.625% 20 - 22.08.23 630,000 EUR 647,647 657,928 0.07Daimler AG 1.875% 14 - 08.07.24 200,000 EUR 204,397 213,200 0.02Daimler AG 1.875% 14 - 08.07.24 100,000 EUR 106,672 106,600 0.01Daimler AG 2.00% 19 - 27.02.31 380,000 EUR 405,075 437,239 0.04Daimler AG 2.00% 20 - 22.08.26 680,000 EUR 715,234 750,761 0.08Daimler AG 2.125% 17 - 03.07.37 740,000 EUR 806,923 907,270 0.09Daimler AG 2.25% 14 - 24.01.22 450,000 EUR 461,054 461,992 0.05Daimler AG 2.375% 13 - 08.03.23 300,000 EUR 315,058 316,737 0.03Daimler AG 2.375% 20 - 22.05.30 470,000 EUR 507,808 552,081 0.06Daimler AG 2.625% 20 - 07.04.25 398,000 EUR 420,851 441,107 0.04Daimler AG 2.625% 20 - 07.04.25 445,000 EUR 484,611 493,198 0.05Deutsche Bank AG FRN 20 - 19.11.25 900,000 EUR 908,109 914,706 0.09Deutsche Bank AG 1.125% 15 - 17.03.25 500,000 EUR 500,970 516,885 0.05Deutsche Bank AG 1.125% 18 - 30.08.23 600,000 EUR 613,635 619,902 0.06Deutsche Bank AG FRN 20 - 10.06.26 250,000 EUR 254,257 264,088 0.03Deutsche Bank AG FRN 20 - 03.09.26 400,000 EUR 398,813 412,764 0.04Deutsche Bank AG 1.50% 17 - 20.01.22 700,000 EUR 703,803 710,843 0.07Deutsche Bank AG 1.625% 20 - 20.01.27 1,700,000 EUR 1,692,997 1,775,259 0.18Deutsche Bank AG 1.75% 18 - 17.01.28 1,300,000 EUR 1,278,811 1,368,289 0.14Deutsche Bank AG FRN 20 - 19.11.30 1,100,000 EUR 1,136,707 1,155,363 0.12Deutsche Bank AG FRN 20 - 19.11.30 100,000 EUR 104,974 105,033 0.01Deutsche Bank AG 1.875% 19 - 14.02.22 500,000 EUR 504,670 510,275 0.05Deutsche Bank AG 2.375% 13 - 11.01.23 700,000 EUR 711,333 732,858 0.07Deutsche Bank AG 2.625% 19 - 12.02.26 400,000 EUR 420,177 438,696 0.04Deutsche Boerse AG 1.125% 18 - 26.03.28 300,000 EUR 317,761 326,448 0.03Deutsche Boerse AG FRN 20 - 16.06.47 300,000 EUR 300,544 307,587 0.03Deutsche Boerse AG 1.625% 15 - 08.10.25 212,000 EUR 229,416 231,207 0.02Deutsche Boerse AG 2.375% 12 - 05.10.22 50,000 EUR 51,963 52,379 0.01Deutsche Boerse AG 2.375% 12 - 05.10.22 350,000 EUR 365,104 366,653 0.04Deutsche Pfandbriefbank AG 0.125% 19 - 05.09.24 300,000 EUR 295,662 301,800 0.03Deutsche Pfandbriefbank AG 0.625% 18 - 23.02.22 300,000 EUR 301,512 301,245 0.03Deutsche Pfandbriefbank AG 0.75% 19 - 07.02.23 300,000 EUR 302,004 305,310 0.03Deutsche Post AG 0.375% 20 - 20.05.26 430,000 EUR 435,561 441,816 0.05Deutsche Post AG 0.75% 20 - 20.05.29 430,000 EUR 439,863 457,133 0.05Deutsche Post AG 1.00% 17 - 13.12.27 150,000 EUR 155,455 160,080 0.02
Xtrackers II
Xtrackers II ESG EUR CORPORATE BOND UCITS ETF (continued)
Statement of Investmentsas at 31 December 2020(expressed in EUR)
The accompanying notes form an integral part of these financial statements.
253

DescriptionNominal
ValueCurrency
(local) Cost Market Value
% ofNet
Assets
Transferable securities and money market instruments admitted to an official stock exchange listing(A)
Bonds (continued)
Germany (continued)Deutsche Post AG 1.00% 20 - 20.05.32 380,000 EUR 390,289 416,769 0.04Deutsche Post AG 1.25% 16 - 01.04.26 250,000 EUR 266,125 267,588 0.03Deutsche Post AG 1.625% 18 - 05.12.28 430,000 EUR 470,622 483,961 0.05Deutsche Post AG 2.75% 13 - 09.10.23 300,000 EUR 324,997 325,284 0.03Deutsche Post AG 2.875% 12 - 11.12.24 470,000 EUR 518,420 526,917 0.05Deutsche Telekom AG 0.50% 19 - 05.07.27 630,000 EUR 655,726 652,945 0.07Deutsche Telekom AG 0.875% 19 - 25.03.26 350,000 EUR 368,993 367,843 0.04Deutsche Telekom AG 1.375% 19 - 05.07.34 530,000 EUR 595,825 594,580 0.06Deutsche Telekom AG 1.75% 19 - 25.03.31 500,000 EUR 578,147 576,715 0.06Deutsche Telekom AG 1.75% 19 - 09.12.49 330,000 EUR 386,197 385,377 0.04Deutsche Telekom AG 2.25% 19 - 29.03.39 350,000 EUR 444,636 445,056 0.05Deutsche Wohnen SE 1.00% 20 - 30.04.25 500,000 EUR 513,089 522,480 0.05Deutsche Wohnen SE 1.50% 20 - 30.04.30 300,000 EUR 312,692 332,799 0.03DVB Bank SE 1.00% 17 - 25.04.22 300,000 EUR 301,989 303,357 0.03DVB Bank SE 1.25% 16 - 16.06.23 200,000 EUR 204,789 204,732 0.02Eurogrid GmbH 1.113% 20 - 15.05.32 500,000 EUR 526,982 546,110 0.06Eurogrid GmbH 1.50% 16 - 18.04.28 400,000 EUR 430,796 441,492 0.04Eurogrid GmbH 1.625% 15 - 03.11.23 400,000 EUR 417,493 419,384 0.04Eurogrid GmbH 1.875% 15 - 10.06.25 400,000 EUR 429,541 433,852 0.04Evonik Industries AG 0.625% 20 - 18.09.25 300,000 EUR 306,393 308,997 0.03Evonik Industries AG 1.00% 15 - 23.01.23 450,000 EUR 459,545 460,359 0.05Evonik Industries AG FRN 17 - 07.07.77 300,000 EUR 298,864 307,050 0.03Fresenius Medical Care AG & Co. KGaA 0.25% 19 -29.11.23 451,000 EUR 451,026 454,833 0.05Fresenius Medical Care AG & Co. KGaA 0.625% 19 -30.11.26 258,000 EUR 261,765 264,788 0.03Fresenius Medical Care AG & Co. KGaA 1.00% 20 -29.05.26 300,000 EUR 303,907 313,236 0.03Fresenius Medical Care AG & Co. KGaA 1.25% 19 -29.11.29 250,000 EUR 252,666 266,265 0.03Fresenius Medical Care AG & Co. KGaA 1.50% 18 -11.07.25 300,000 EUR 307,178 320,001 0.03Fresenius Medical Care AG & Co. KGaA 1.50% 20 -29.05.30 370,000 EUR 378,001 401,228 0.04Fresenius SE & Co. KGaA 0.375% 20 - 28.09.26 310,000 EUR 308,022 314,467 0.03Fresenius SE & Co. KGaA 0.75% 20 - 15.01.28 267,000 EUR 264,257 275,880 0.03Fresenius SE & Co. KGaA 0.75% 20 - 15.01.28 151,000 EUR 156,001 156,022 0.02Fresenius SE & Co. KGaA 1.125% 20 - 28.01.33 410,000 EUR 412,612 432,714 0.04Fresenius SE & Co. KGaA 1.625% 20 - 08.10.27 467,000 EUR 498,037 510,735 0.05Fresenius SE & Co. KGaA 1.875% 19 - 15.02.25 278,000 EUR 293,898 297,796 0.03Fresenius SE & Co. KGaA 2.875% 19 - 15.02.29 278,000 EUR 321,389 332,363 0.03Fresenius SE & Co. KGaA 4.00% 14 - 01.02.24 260,000 EUR 287,601 292,279 0.03Hannover Rueck SE 1.125% 18 - 18.04.28 500,000 EUR 535,968 548,520 0.06Hannover Rueck SE FRN 19 - 09.10.39 200,000 EUR 198,399 204,564 0.02Hannover Rueck SE FRN 19 - 09.10.39 100,000 EUR 99,560 102,282 0.01Hannover Rueck SE FRN 20 - 08.10.40 300,000 EUR 301,060 321,402 0.03Hannover Rueck SE FRN 14 - 29.06.49 300,000 EUR 330,948 338,658 0.03HeidelbergCement AG 1.50% 16 - 07.02.25 592,000 EUR 610,147 624,477 0.06
Xtrackers II
Xtrackers II ESG EUR CORPORATE BOND UCITS ETF (continued)
Statement of Investmentsas at 31 December 2020(expressed in EUR)
The accompanying notes form an integral part of these financial statements.
254

DescriptionNominal
ValueCurrency
(local) Cost Market Value
% ofNet
Assets
Transferable securities and money market instruments admitted to an official stock exchange listing(A)
Bonds (continued)
Germany (continued)HeidelbergCement AG 2.25% 16 - 30.03.23 450,000 EUR 465,391 470,880 0.05HeidelbergCement AG 2.25% 16 - 03.06.24 364,000 EUR 381,025 390,343 0.04Hella GmbH & Co. KGaA 0.50% 19 - 26.01.27 300,000 EUR 300,233 301,236 0.03Hella GmbH & Co. KGaA 1.00% 17 - 17.05.24 170,000 EUR 173,922 174,959 0.02HOCHTIEF AG 0.50% 19 - 03.09.27 350,000 EUR 355,700 354,445 0.04HOCHTIEF AG 1.75% 18 - 03.07.25 250,000 EUR 268,144 267,448 0.03Infineon Technologies AG 0.75% 20 - 24.06.23 500,000 EUR 507,141 510,855 0.05Infineon Technologies AG 1.125% 20 - 24.06.26 500,000 EUR 511,658 527,835 0.05Infineon Technologies AG 1.125% 20 - 24.06.26 100,000 EUR 105,586 105,567 0.01Infineon Technologies AG 1.50% 15 - 10.03.22 200,000 EUR 202,311 204,104 0.02Infineon Technologies AG 1.625% 20 - 24.06.29 400,000 EUR 407,119 436,676 0.04Infineon Technologies AG 2.00% 20 - 24.06.32 300,000 EUR 301,366 340,908 0.03Knorr-Bremse AG 1.125% 18 - 13.06.25 500,000 EUR 518,970 525,000 0.05LANXESS AG 1.00% 16 - 07.10.26 350,000 EUR 361,257 370,216 0.04LANXESS AG 1.125% 18 - 16.05.25 300,000 EUR 312,001 315,603 0.03LANXESS AG 2.625% 12 - 21.11.22 100,000 EUR 104,762 105,284 0.01LEG Immobilien AG 0.875% 19 - 28.11.27 300,000 EUR 304,156 313,587 0.03LEG Immobilien AG 1.25% 17 - 23.01.24 300,000 EUR 304,804 310,416 0.03LEG Immobilien AG 1.625% 19 - 28.11.34 200,000 EUR 209,835 220,388 0.02Merck Financial Services GmbH 0.005% 19 -15.12.23 500,000 EUR 501,308 502,475 0.05Merck Financial Services GmbH 0.125% 20 -16.07.25 400,000 EUR 400,405 405,608 0.04Merck Financial Services GmbH 0.375% 19 -05.07.27 300,000 EUR 301,002 309,534 0.03Merck Financial Services GmbH 0.50% 20 - 16.07.28 300,000 EUR 302,594 312,102 0.03Merck Financial Services GmbH 0.875% 19 -05.07.31 400,000 EUR 415,726 430,520 0.04Merck Financial Services GmbH 1.375% 15 -01.09.22 50,000 EUR 50,814 51,131 0.01Merck Financial Services GmbH 1.375% 15 -01.09.22 290,000 EUR 296,832 296,557 0.03Merck KGaA FRN 19 - 25.06.79 300,000 EUR 305,091 307,743 0.03Merck KGaA FRN 20 - 09.09.80 500,000 EUR 499,986 511,430 0.05Merck KGaA FRN 19 - 25.06.79 600,000 EUR 634,196 660,516 0.07Merck KGaA FRN 14 - 12.12.74 330,000 EUR 361,672 363,257 0.04METRO AG 1.125% 18 - 06.03.23 300,000 EUR 304,307 303,285 0.03Muenchener Hypothekenbank eG 0.50% 19 - 08.06.26 300,000 EUR 299,797 302,202 0.03Muenchener Hypothekenbank eG 0.625% 15 -10.02.22 100,000 EUR 100,492 100,498 0.01Muenchener Hypothekenbank eG 0.875% 17 -11.07.24 200,000 EUR 205,177 204,938 0.02Muenchener Rueckversicherungs-Gesellschaft AG inMuenchen FRN 20 - 26.05.41 700,000 EUR 699,673 726,768 0.07Muenchener Rueckversicherungs-Gesellschaft AG inMuenchen FRN 18 - 26.05.49 700,000 EUR 796,215 829,598 0.08Muenchener Rueckversicherungs-Gesellschaft AG inMuenchen FRN 12 - 26.05.42 600,000 EUR 669,679 650,904 0.07
Xtrackers II
Xtrackers II ESG EUR CORPORATE BOND UCITS ETF (continued)
Statement of Investmentsas at 31 December 2020(expressed in EUR)
The accompanying notes form an integral part of these financial statements.
255

DescriptionNominal
ValueCurrency
(local) Cost Market Value
% ofNet
Assets
Transferable securities and money market instruments admitted to an official stock exchange listing(A)
Bonds (continued)
Germany (continued)Münchener Hypothekenbank eG 0.875% 18 - 12.09.25 300,000 EUR 308,725 309,972 0.03O2 Telefonica Deutschland Finanzierungs GmbH1.75% 18 - 05.07.25 400,000 EUR 419,048 425,676 0.04Santander Consumer Bank AG 0.25% 19 - 15.10.24 300,000 EUR 300,675 301,728 0.03Santander Consumer Bank AG 0.75% 17 - 17.10.22 400,000 EUR 405,359 406,436 0.04SAP SE Zero Coupon 20 - 17.05.23 300,000 EUR 300,602 301,623 0.03SAP SE 0.125% 20 - 18.05.26 500,000 EUR 503,716 507,865 0.05SAP SE 0.25% 18 - 10.03.22 400,000 EUR 401,502 402,512 0.04SAP SE 0.375% 20 - 18.05.29 500,000 EUR 504,572 516,105 0.05SAP SE 0.75% 18 - 10.12.24 500,000 EUR 515,535 518,400 0.05SAP SE 1.00% 15 - 01.04.25 370,000 EUR 384,685 388,433 0.04SAP SE 1.00% 18 - 13.03.26 200,000 EUR 208,756 211,942 0.02SAP SE 1.125% 14 - 20.02.23 100,000 EUR 102,720 102,603 0.01SAP SE 1.125% 14 - 20.02.23 399,000 EUR 406,600 409,386 0.04SAP SE 1.25% 18 - 10.03.28 500,000 EUR 528,801 547,305 0.06SAP SE 1.375% 18 - 13.03.30 300,000 EUR 318,970 337,245 0.03SAP SE 1.625% 18 - 10.03.31 700,000 EUR 773,678 810,460 0.08SAP SE 1.75% 14 - 22.02.27 500,000 EUR 548,012 556,150 0.06Talanx AG FRN 17 - 05.12.47 400,000 EUR 409,022 428,168 0.04Talanx AG 2.50% 14 - 23.07.26 100,000 EUR 110,861 115,371 0.01Talanx AG 2.50% 14 - 23.07.26 100,000 EUR 112,141 115,371 0.01Talanx AG 3.125% 13 - 13.02.23 100,000 EUR 107,077 107,261 0.01Talanx AG 3.125% 13 - 13.02.23 400,000 EUR 427,615 429,044 0.04WPP Finance Deutschland GmbH 1.625% 15 -23.03.30 400,000 EUR 402,106 437,904 0.04
83,244,288 85,380,381 8.53GuernseyCredit Suisse Group Funding Guernsey Ltd. 1.25%15 - 14.04.22 1,300,000 EUR 1,316,005 1,323,829 0.13Globalworth Real Estate Investments Ltd. 2.875% 17 -20.06.22 100,000 EUR 102,497 102,977 0.01Globalworth Real Estate Investments Ltd. 2.95% 20 -29.07.26 260,000 EUR 258,784 273,179 0.03Globalworth Real Estate Investments Ltd. 3.00% 18 -29.03.25 300,000 EUR 306,636 317,190 0.03
1,983,922 2,017,175 0.20IrelandAIB Group PLC 1.25% 19 - 28.05.24 310,000 EUR 315,876 321,628 0.03AIB Group PLC 1.50% 18 - 29.03.23 400,000 EUR 405,429 413,096 0.04AIB Group PLC 2.25% 18 - 03.07.25 300,000 EUR 312,411 327,009 0.03Aquarius & Investments PLC for Zurich Insurance Co.Ltd. FRN 13 - 02.10.43 500,000 EUR 559,238 553,955 0.06Atlas Copco Finance DAC 0.125% 19 - 03.09.29 200,000 EUR 197,630 201,626 0.02Cloverie PLC for Swiss Reinsurance Co. Ltd. FRN12 - 01.09.42 300,000 EUR 345,607 332,022 0.03Cloverie PLC for Zurich Insurance Co. Ltd. 1.50%18 - 15.12.28 250,000 EUR 264,411 279,150 0.03
Xtrackers II
Xtrackers II ESG EUR CORPORATE BOND UCITS ETF (continued)
Statement of Investmentsas at 31 December 2020(expressed in EUR)
The accompanying notes form an integral part of these financial statements.
256

DescriptionNominal
ValueCurrency
(local) Cost Market Value
% ofNet
Assets
Transferable securities and money market instruments admitted to an official stock exchange listing(A)
Bonds (continued)
Ireland (continued)Cloverie PLC for Zurich Insurance Co. Ltd. 1.75%14 - 16.09.24 280,000 EUR 296,743 300,619 0.03CRH Finance Dac 1.375% 16 - 18.10.28 300,000 EUR 314,736 327,576 0.03CRH Finance Dac 3.125% 13 - 03.04.23 400,000 EUR 426,627 429,540 0.04CRH SMW Finance DAC 1.25% 20 - 05.11.26 530,000 EUR 549,150 567,047 0.06Dell Bank International Dac 0.625% 19 - 17.10.22 190,000 EUR 187,983 191,668 0.02Dell Bank International Dac 1.625% 20 - 24.06.24 220,000 EUR 221,407 228,094 0.02Eaton Capital Unlimited Co. 0.697% 19 - 14.05.25 300,000 EUR 306,846 310,167 0.03Eaton Capital Unlimited Co. 0.75% 16 - 20.09.24 400,000 EUR 410,704 413,268 0.04Fresenius Finance Ireland PLC 0.875% 17 - 31.01.22 399,000 EUR 401,217 402,348 0.04Fresenius Finance Ireland PLC 1.50% 17 - 30.01.24 400,000 EUR 413,515 416,940 0.04Fresenius Finance Ireland PLC 2.125% 17 - 01.02.27 349,000 EUR 379,709 389,145 0.04Fresenius Finance Ireland PLC 3.00% 17 - 30.01.32 200,000 EUR 236,632 253,706 0.03Johnson Controls International PLC 1.00% 17 -15.09.23 520,000 EUR 524,709 534,846 0.06Johnson Controls International PLC 1.375% 16 -25.02.25 300,000 EUR 308,684 316,416 0.03Johnson Controls International PLC Via Tyco Fire &Security Finance SCA 0.375% 20 - 15.09.27 320,000 EUR 319,573 324,349 0.03Johnson Controls International PLC Via Tyco Fire &Security Finance SCA 1.00% 20 - 15.09.32 220,000 EUR 220,990 231,832 0.02Kerry Group Financial Services Unltd Co. 0.625%19 - 20.09.29 350,000 EUR 347,061 360,507 0.04Kerry Group Financial Services Unltd Co. 2.375%15 - 10.09.25 467,000 EUR 508,453 521,130 0.05PartnerRe Ireland Finance DAC 1.25% 16 - 15.09.26 400,000 EUR 407,096 425,928 0.04Willow No 2 Ireland PLC for Zurich Insurance Co.Ltd. 3.375% 12 - 27.06.22 300,000 EUR 314,689 316,209 0.03Zurich Finance Ireland Designated Activity Co.1.625% 19 - 17.06.39 300,000 EUR 323,511 355,500 0.04Zurich Finance Ireland Designated Activity Co. FRN20 - 17.09.50 370,000 EUR 372,433 394,927 0.04
10,193,070 10,440,248 1.04ItalyAssicurazioni Generali SpA 2.124% 19 - 01.10.30 400,000 EUR 403,113 425,452 0.04Assicurazioni Generali SpA 2.429% 20 - 14.07.31 330,000 EUR 333,414 361,152 0.04Assicurazioni Generali SpA 3.875% 19 - 29.01.29 200,000 EUR 215,659 237,884 0.02Assicurazioni Generali SpA 4.125% 14 - 04.05.26 600,000 EUR 671,788 707,400 0.07Assicurazioni Generali SpA FRN 16 - 08.06.48 550,000 EUR 613,247 665,500 0.07Assicurazioni Generali SpA 5.125% 09 - 16.09.24 833,000 EUR 979,975 1,001,682 0.10Assicurazioni Generali SpA FRN 15 - 27.10.47 670,000 EUR 795,290 824,589 0.08Assicurazioni Generali SpA FRN 12 - 12.12.42 400,000 EUR 460,354 458,296 0.05Assicurazioni Generali SpA FRN 12 - 10.07.42 100,000 EUR 125,574 115,622 0.01ASTM SpA 1.625% 18 - 08.02.28 332,000 EUR 331,795 342,976 0.04ASTM SpA 3.375% 14 - 13.02.24 211,000 EUR 225,946 228,971 0.02Buzzi Unicem SpA 2.125% 16 - 28.04.23 260,000 EUR 268,356 271,996 0.03Intesa Sanpaolo SpA 0.75% 19 - 04.12.24 600,000 EUR 606,797 615,054 0.06Intesa Sanpaolo SpA 0.875% 17 - 27.06.22 300,000 EUR 303,349 304,500 0.03
Xtrackers II
Xtrackers II ESG EUR CORPORATE BOND UCITS ETF (continued)
Statement of Investmentsas at 31 December 2020(expressed in EUR)
The accompanying notes form an integral part of these financial statements.
257

DescriptionNominal
ValueCurrency
(local) Cost Market Value
% ofNet
Assets
Transferable securities and money market instruments admitted to an official stock exchange listing(A)
Bonds (continued)
Italy (continued)Intesa Sanpaolo SpA 1.00% 19 - 04.07.24 608,000 EUR 613,867 627,158 0.06Intesa Sanpaolo SpA 1.00% 19 - 19.11.26 710,000 EUR 704,707 736,625 0.07Intesa Sanpaolo SpA 1.125% 15 - 04.03.22 700,000 EUR 704,085 710,423 0.07Intesa Sanpaolo SpA 1.375% 17 - 18.01.24 500,000 EUR 504,968 519,960 0.05Intesa Sanpaolo SpA 1.75% 18 - 20.03.28 700,000 EUR 718,347 759,136 0.08Intesa Sanpaolo SpA 1.75% 19 - 04.07.29 600,000 EUR 622,036 655,266 0.07Intesa Sanpaolo SpA 2.125% 18 - 30.08.23 600,000 EUR 621,890 633,582 0.06Intesa Sanpaolo SpA 2.125% 20 - 26.05.25 600,000 EUR 614,572 649,380 0.07Intesa Sanpaolo SpA 3.50% 14 - 17.01.22 300,000 EUR 308,708 311,616 0.03Intesa Sanpaolo SpA 4.00% 13 - 30.10.23 550,000 EUR 594,355 611,996 0.06Italgas SpA 0.25% 20 - 24.06.25 500,000 EUR 501,901 507,155 0.05Italgas SpA 0.875% 19 - 24.04.30 300,000 EUR 304,440 320,112 0.03Italgas SpA 1.00% 19 - 11.12.31 300,000 EUR 313,872 324,807 0.03Italgas SpA 1.125% 17 - 14.03.24 300,000 EUR 308,617 311,628 0.03Italgas SpA 1.625% 17 - 19.01.27 500,000 EUR 537,543 550,325 0.06Italgas SpA 1.625% 17 - 18.01.29 300,000 EUR 313,758 337,032 0.03Snam SpA Zero Coupon 19 - 12.05.24 400,000 EUR 397,055 402,988 0.04Snam SpA Zero Coupon 20 - 07.12.28 340,000 EUR 339,198 338,582 0.03Snam SpA 0.75% 20 - 17.06.30 350,000 EUR 355,384 367,966 0.04Snam SpA 0.875% 16 - 25.10.26 900,000 EUR 921,371 945,810 0.10Snam SpA 1.00% 18 - 18.09.23 200,000 EUR 207,458 206,356 0.02Snam SpA 1.00% 19 - 12.09.34 400,000 EUR 407,416 430,664 0.04Snam SpA 1.25% 17 - 25.01.25 100,000 EUR 106,206 105,969 0.01Snam SpA 1.25% 19 - 28.08.25 300,000 EUR 311,854 318,300 0.03Snam SpA 1.375% 17 - 25.10.27 300,000 EUR 309,121 326,895 0.03Snam SpA 3.25% 14 - 22.01.24 100,000 EUR 111,091 110,850 0.01Snam SpA 5.25% 12 - 19.09.22 200,000 EUR 220,640 219,472 0.02Terna Rete Elettrica Nazionale SpA 0.125% 19 -25.07.25 500,000 EUR 496,394 506,195 0.05Terna Rete Elettrica Nazionale SpA 0.375% 20 -25.09.30 340,000 EUR 341,430 346,882 0.04Terna Rete Elettrica Nazionale SpA 0.75% 20 -24.07.32 230,000 EUR 231,130 242,268 0.02Terna Rete Elettrica Nazionale SpA 0.875% 15 -02.02.22 600,000 EUR 605,330 607,440 0.06Terna Rete Elettrica Nazionale SpA 1.00% 16 -11.10.28 330,000 EUR 344,173 354,334 0.04Terna Rete Elettrica Nazionale SpA 1.00% 18 -23.07.23 530,000 EUR 541,048 547,061 0.06Terna Rete Elettrica Nazionale SpA 1.00% 19 -10.04.26 300,000 EUR 311,997 316,431 0.03Terna Rete Elettrica Nazionale SpA 1.375% 17 -26.07.27 700,000 EUR 734,051 764,526 0.08Terna Rete Elettrica Nazionale SpA 4.90% 04 -28.10.24 250,000 EUR 294,284 299,000 0.03UniCredit SpA 0.50% 19 - 09.04.25 600,000 EUR 587,742 607,698 0.06UniCredit SpA 1.00% 18 - 18.01.23 750,000 EUR 745,375 764,542 0.08UniCredit SpA FRN 20 - 20.01.26 593,000 EUR 586,939 602,429 0.06
Xtrackers II
Xtrackers II ESG EUR CORPORATE BOND UCITS ETF (continued)
Statement of Investmentsas at 31 December 2020(expressed in EUR)
The accompanying notes form an integral part of these financial statements.
258

DescriptionNominal
ValueCurrency
(local) Cost Market Value
% ofNet
Assets
Transferable securities and money market instruments admitted to an official stock exchange listing(A)
Bonds (continued)
Italy (continued)UniCredit SpA FRN 19 - 25.06.25 600,000 EUR 600,834 619,536 0.06UniCredit SpA FRN 20 - 16.06.26 670,000 EUR 675,993 695,373 0.07UniCredit SpA FRN 19 - 03.07.25 500,000 EUR 502,601 517,390 0.05UniCredit SpA 1.80% 20 - 20.01.30 500,000 EUR 508,778 522,915 0.05UniCredit SpA 2.00% 16 - 04.03.23 700,000 EUR 726,423 732,431 0.07UniCredit SpA 2.125% 16 - 24.10.26 500,000 EUR 522,569 553,090 0.06UniCredit SpA FRN 20 - 22.07.27 650,000 EUR 652,241 690,079 0.07Unione di Banche Italiane SpA 0.75% 17 - 17.10.22 600,000 EUR 600,816 609,348 0.06Unione di Banche Italiane SpA 1.00% 19 - 22.07.22 500,000 EUR 506,057 508,410 0.05Unione di Banche Italiane SpA 1.50% 19 - 10.04.24 300,000 EUR 310,700 314,400 0.03
29,736,022 30,622,905 3.06JapanMercedes-Benz Finance Co. Ltd. Zero Coupon 19 -21.08.22 300,000 EUR 299,187 300,465 0.03Mitsubishi UFJ Financial Group Inc. 0.339% 19 -19.07.24 200,000 EUR 199,368 202,702 0.02Mitsubishi UFJ Financial Group Inc. 0.68% 18 -26.01.23 300,000 EUR 303,948 305,334 0.03Mitsubishi UFJ Financial Group Inc. 0.848% 19 -19.07.29 200,000 EUR 207,750 211,902 0.02Mitsubishi UFJ Financial Group Inc. 0.872% 17 -07.09.24 400,000 EUR 407,687 413,496 0.04Mitsubishi UFJ Financial Group Inc. 0.978% 20 -09.06.24 200,000 EUR 205,118 207,166 0.02Mitsubishi UFJ Financial Group Inc. 0.98% 18 -09.10.23 400,000 EUR 407,115 412,668 0.04Mizuho Financial Group Inc. 0.118% 19 - 06.09.24 250,000 EUR 251,497 251,545 0.03Mizuho Financial Group Inc. 0.214% 20 - 07.10.25 450,000 EUR 455,372 455,076 0.05Mizuho Financial Group Inc. 0.402% 19 - 06.09.29 250,000 EUR 252,316 253,313 0.03Mizuho Financial Group Inc. 0.523% 19 - 10.06.24 350,000 EUR 357,073 357,087 0.04Mizuho Financial Group Inc. 0.693% 20 - 07.10.30 550,000 EUR 561,744 567,446 0.06Mizuho Financial Group Inc. 0.797% 20 - 15.04.30 450,000 EUR 466,924 468,333 0.05Mizuho Financial Group Inc. 0.956% 17 - 16.10.24 250,000 EUR 259,891 259,728 0.03Mizuho Financial Group Inc. 1.02% 18 - 11.10.23 200,000 EUR 206,043 206,048 0.02Mizuho Financial Group Inc. 1.598% 18 - 10.04.28 250,000 EUR 275,613 276,728 0.03MUFG Bank Ltd. 0.875% 15 - 11.03.22 500,000 EUR 505,133 507,135 0.05Sumitomo Mitsui Banking Corp. 1.00% 15 - 19.01.22 457,000 EUR 461,955 463,010 0.05Sumitomo Mitsui Banking Corp. 2.75% 13 - 24.07.23 320,000 EUR 342,304 344,227 0.03Sumitomo Mitsui Financial Group Inc. 0.303% 20 -28.10.27 280,000 EUR 281,593 283,217 0.03Sumitomo Mitsui Financial Group Inc. 0.465% 19 -30.05.24 280,000 EUR 280,473 285,552 0.03Sumitomo Mitsui Financial Group Inc. 0.606% 17 -18.01.22 100,000 EUR 100,598 100,899 0.01Sumitomo Mitsui Financial Group Inc. 0.632% 19 -23.10.29 600,000 EUR 596,326 619,662 0.06Sumitomo Mitsui Financial Group Inc. 0.819% 18 -23.07.23 300,000 EUR 304,990 307,605 0.03
Xtrackers II
Xtrackers II ESG EUR CORPORATE BOND UCITS ETF (continued)
Statement of Investmentsas at 31 December 2020(expressed in EUR)
The accompanying notes form an integral part of these financial statements.
259

DescriptionNominal
ValueCurrency
(local) Cost Market Value
% ofNet
Assets
Transferable securities and money market instruments admitted to an official stock exchange listing(A)
Bonds (continued)
Japan (continued)Sumitomo Mitsui Financial Group Inc. 0.934% 17 -11.10.24 325,000 EUR 333,553 337,223 0.03Sumitomo Mitsui Financial Group Inc. 1.413% 17 -14.06.27 300,000 EUR 317,343 326,004 0.03Sumitomo Mitsui Financial Group Inc. 1.546% 16 -15.06.26 850,000 EUR 889,015 920,269 0.09Takeda Pharmaceutical Co. Ltd. 0.75% 20 - 09.07.27 420,000 EUR 426,706 436,157 0.04Takeda Pharmaceutical Co. Ltd. 1.00% 20 - 09.07.29 430,000 EUR 431,397 450,193 0.04Takeda Pharmaceutical Co. Ltd. 1.125% 18 - 21.11.22 780,000 EUR 793,000 798,236 0.08Takeda Pharmaceutical Co. Ltd. 1.375% 20 - 09.07.32 560,000 EUR 567,200 601,082 0.06Takeda Pharmaceutical Co. Ltd. 2.00% 20 - 09.07.40 555,000 EUR 572,843 630,486 0.06Takeda Pharmaceutical Co. Ltd. 2.25% 18 - 21.11.26 750,000 EUR 816,182 843,540 0.08Takeda Pharmaceutical Co. Ltd. 3.00% 18 - 21.11.30 900,000 EUR 1,047,844 1,108,260 0.11
14,185,101 14,511,794 1.45JerseyAptiv PLC 1.50% 15 - 10.03.25 400,000 EUR 399,970 421,640 0.04Aptiv PLC 1.60% 16 - 15.09.28 300,000 EUR 309,037 324,210 0.03Atrium European Real Estate Ltd. 3.00% 18 - 11.09.25 300,000 EUR 304,825 307,395 0.03Heathrow Funding Ltd. 1.50% 15 - 11.02.30 400,000 EUR 413,898 421,348 0.04Heathrow Funding Ltd. 1.50% 20 - 12.10.27 440,000 EUR 444,918 460,244 0.05Heathrow Funding Ltd. 1.875% 14 - 23.05.22 420,000 EUR 425,040 431,243 0.05Heathrow Funding Ltd. 1.875% 17 - 12.07.32 200,000 EUR 213,172 217,176 0.02Heathrow Funding Ltd. 1.875% 19 - 14.03.34 450,000 EUR 457,303 489,767 0.05Kennedy Wilson Europe Real Estate Ltd. 3.25% 15 -12.11.25 300,000 EUR 288,488 304,269 0.03
3,256,651 3,377,292 0.34KoreaShinhan Bank Co. Ltd. 0.25% 19 - 16.10.24 300,000 EUR 297,717 304,161 0.03
297,717 304,161 0.03LuxembourgBanque Internationale a Luxembourg SA 1.50% 18 -28.09.23 200,000 EUR 202,972 205,426 0.02Becton Dickinson Euro Finance Sarl 0.632% 19 -04.06.23 430,000 EUR 434,423 436,076 0.04Becton Dickinson Euro Finance Sarl 0.632% 19 -04.06.23 100,000 EUR 100,752 101,413 0.01Becton Dickinson Euro Finance Sarl 1.208% 19 -04.06.26 500,000 EUR 510,401 522,360 0.05CNH Industrial Finance Europe SA Zero Coupon 20 -01.04.24 440,000 EUR 439,699 439,362 0.04CNH Industrial Finance Europe SA 1.375% 17 -23.05.22 200,000 EUR 199,607 203,554 0.02CNH Industrial Finance Europe SA 1.625% 19 -03.07.29 300,000 EUR 301,147 316,197 0.03CNH Industrial Finance Europe SA 1.75% 17 -12.09.25 400,000 EUR 416,038 426,136 0.04CNH Industrial Finance Europe SA 1.75% 19 -25.03.27 350,000 EUR 347,983 371,172 0.04
Xtrackers II
Xtrackers II ESG EUR CORPORATE BOND UCITS ETF (continued)
Statement of Investmentsas at 31 December 2020(expressed in EUR)
The accompanying notes form an integral part of these financial statements.
260

DescriptionNominal
ValueCurrency
(local) Cost Market Value
% ofNet
Assets
Transferable securities and money market instruments admitted to an official stock exchange listing(A)
Bonds (continued)
Luxembourg (continued)CNH Industrial Finance Europe SA 1.875% 18 -19.01.26 300,000 EUR 308,737 321,036 0.03CNH Industrial Finance Europe SA 2.875% 16 -17.05.23 200,000 EUR 207,733 213,556 0.02CPI Property Group SA 1.45% 18 - 14.04.22 200,000 EUR 202,860 202,928 0.02CPI Property Group SA 1.625% 19 - 23.04.27 380,000 EUR 381,534 390,420 0.04CPI Property Group SA 2.125% 17 - 04.10.24 320,000 EUR 330,065 333,699 0.03CPI Property Group SA 2.75% 20 - 12.05.26 380,000 EUR 404,615 412,634 0.04GELF Bond Issuer I SA 1.125% 19 - 18.07.29 200,000 EUR 202,961 207,130 0.02GELF Bond Issuer I SA 1.625% 16 - 20.10.26 200,000 EUR 208,943 214,148 0.02Grand City Properties SA 1.375% 17 - 03.08.26 300,000 EUR 300,370 318,990 0.03Grand City Properties SA 1.50% 15 - 17.04.25 200,000 EUR 202,822 212,246 0.02Grand City Properties SA 1.50% 18 - 22.02.27 300,000 EUR 307,074 320,532 0.03Grand City Properties SA FRN 20 - 31.12.99 400,000 EUR 395,900 396,420 0.04Grand City Properties SA 1.70% 20 - 09.04.24 500,000 EUR 516,340 527,465 0.05Grand City Properties SA FRN 18 - 31.12.99 200,000 EUR 199,135 205,572 0.02Hannover Finance Luxembourg SA FRN 12 - 30.06.43 300,000 EUR 339,171 335,382 0.03Harman Finance International SCA 2.00% 15 -27.05.22 200,000 EUR 204,327 204,386 0.02HeidelbergCement Finance Luxembourg SA 0.50%18 - 09.08.22 500,000 EUR 502,479 503,615 0.05HeidelbergCement Finance Luxembourg SA 1.125%19 - 01.12.27 350,000 EUR 354,969 370,122 0.04HeidelbergCement Finance Luxembourg SA 1.50%17 - 14.06.27 300,000 EUR 303,336 323,709 0.03HeidelbergCement Finance Luxembourg SA 1.625%17 - 07.04.26 550,000 EUR 563,257 590,590 0.06HeidelbergCement Finance Luxembourg SA 1.75%18 - 24.04.28 400,000 EUR 413,477 439,392 0.04HeidelbergCement Finance Luxembourg SA 2.50%20 - 09.10.24 423,000 EUR 444,316 461,468 0.05HeidelbergCement Finance Luxembourg SA 2.50%20 - 09.10.24 100,000 EUR 109,160 109,094 0.01Helvetia Europe SA FRN 20 - 30.09.41 314,000 EUR 320,197 345,959 0.04Holcim Finance Luxembourg SA 0.50% 19 - 29.11.26 350,000 EUR 350,463 356,993 0.04Holcim Finance Luxembourg SA 0.50% 20 - 23.04.31 530,000 EUR 530,219 532,184 0.05Holcim Finance Luxembourg SA 1.375% 16 -26.05.23 368,000 EUR 378,337 380,876 0.04Holcim Finance Luxembourg SA 1.75% 17 - 29.08.29 400,000 EUR 410,134 445,676 0.05Holcim Finance Luxembourg SA 2.25% 16 - 26.05.28 600,000 EUR 656,748 684,378 0.07Holcim Finance Luxembourg SA 2.375% 20 -09.04.25 200,000 EUR 209,271 219,336 0.02Holcim Finance Luxembourg SA 3.00% 14 - 22.01.24 200,000 EUR 215,121 218,346 0.02John Deere Cash Management SA 0.50% 17 -15.09.23 400,000 EUR 407,975 409,660 0.04John Deere Cash Management SA 1.375% 20 -02.04.24 421,000 EUR 430,439 443,292 0.04
Xtrackers II
Xtrackers II ESG EUR CORPORATE BOND UCITS ETF (continued)
Statement of Investmentsas at 31 December 2020(expressed in EUR)
The accompanying notes form an integral part of these financial statements.
261

DescriptionNominal
ValueCurrency
(local) Cost Market Value
% ofNet
Assets
Transferable securities and money market instruments admitted to an official stock exchange listing(A)
Bonds (continued)
Luxembourg (continued)John Deere Cash Management SA 1.65% 19 -13.06.39 400,000 EUR 452,684 480,520 0.05John Deere Cash Management SA 1.85% 20 -02.04.28 366,000 EUR 385,836 415,337 0.04John Deere Cash Management SA 2.20% 20 -02.04.32 266,000 EUR 279,684 322,150 0.03Medtronic Global Holdings SCA Zero Coupon 19 -02.12.22 400,000 EUR 396,388 401,676 0.04Medtronic Global Holdings SCA Zero Coupon 20 -15.03.23 650,000 EUR 651,777 652,892 0.07Medtronic Global Holdings SCA Zero Coupon 20 -15.10.25 490,000 EUR 489,024 491,882 0.05Medtronic Global Holdings SCA 0.25% 19 - 02.07.25 474,000 EUR 469,337 481,124 0.05Medtronic Global Holdings SCA 0.375% 19 -07.03.23 750,000 EUR 749,205 759,180 0.08Medtronic Global Holdings SCA 0.375% 20 -15.10.28 660,000 EUR 666,732 677,450 0.07Medtronic Global Holdings SCA 0.75% 20 - 15.10.32 500,000 EUR 508,893 524,190 0.05Medtronic Global Holdings SCA 1.00% 19 - 02.07.31 574,000 EUR 573,254 618,749 0.06Medtronic Global Holdings SCA 1.125% 19 -07.03.27 821,000 EUR 843,454 877,025 0.09Medtronic Global Holdings SCA 1.375% 20 -15.10.40 540,000 EUR 553,286 588,244 0.06Medtronic Global Holdings SCA 1.50% 19 - 02.07.39 624,000 EUR 624,493 694,961 0.07Medtronic Global Holdings SCA 1.625% 19 -07.03.31 624,000 EUR 666,743 710,518 0.07Medtronic Global Holdings SCA 1.625% 20 -15.10.50 570,000 EUR 585,785 635,846 0.06Medtronic Global Holdings SCA 1.75% 19 - 02.07.49 574,000 EUR 570,740 664,548 0.07Medtronic Global Holdings SCA 2.25% 19 - 07.03.39 524,000 EUR 569,153 649,582 0.07Mohawk Capital Finance SA 1.75% 20 - 12.06.27 300,000 EUR 295,352 309,180 0.03Nestle Finance International Ltd. Zero Coupon 20 -12.11.24 400,000 EUR 401,174 403,912 0.04Nestle Finance International Ltd. Zero Coupon 20 -03.12.25 200,000 EUR 203,259 202,122 0.02Nestle Finance International Ltd. Zero Coupon 20 -03.03.33 250,000 EUR 246,868 246,235 0.03Nestle Finance International Ltd. 0.125% 20 -12.11.27 490,000 EUR 490,199 497,541 0.05Nestle Finance International Ltd. 0.375% 17 -18.01.24 350,000 EUR 353,130 356,944 0.04Nestle Finance International Ltd. 0.375% 20 -12.05.32 570,000 EUR 574,003 589,249 0.06Nestle Finance International Ltd. 0.375% 20 -03.12.40 300,000 EUR 303,998 304,065 0.03Nestle Finance International Ltd. 0.75% 15 - 16.05.23 300,000 EUR 306,895 307,017 0.03Nestle Finance International Ltd. 1.125% 20 -01.04.26 677,000 EUR 711,665 722,677 0.07
Xtrackers II
Xtrackers II ESG EUR CORPORATE BOND UCITS ETF (continued)
Statement of Investmentsas at 31 December 2020(expressed in EUR)
The accompanying notes form an integral part of these financial statements.
262

DescriptionNominal
ValueCurrency
(local) Cost Market Value
% ofNet
Assets
Transferable securities and money market instruments admitted to an official stock exchange listing(A)
Bonds (continued)
Luxembourg (continued)Nestle Finance International Ltd. 1.25% 17 - 02.11.29 200,000 EUR 212,038 224,082 0.02Nestle Finance International Ltd. 1.25% 17 - 02.11.29 300,000 EUR 333,467 336,123 0.03Nestle Finance International Ltd. 1.50% 20 - 01.04.30 487,000 EUR 529,338 554,834 0.06Nestle Finance International Ltd. 1.75% 12 - 12.09.22 426,000 EUR 439,608 441,034 0.04Nestle Finance International Ltd. 1.75% 17 - 02.11.37 400,000 EUR 469,146 500,552 0.05Novartis Finance SA Zero Coupon 20 - 23.09.28 1,110,000 EUR 1,111,669 1,115,905 0.11Novartis Finance SA 0.125% 16 - 20.09.23 650,000 EUR 658,209 658,417 0.07Novartis Finance SA 0.50% 18 - 14.08.23 430,000 EUR 438,505 438,712 0.04Novartis Finance SA 0.625% 16 - 20.09.28 320,000 EUR 338,409 339,360 0.03Novartis Finance SA 1.125% 17 - 30.09.27 460,000 EUR 499,341 500,236 0.05Novartis Finance SA 1.375% 18 - 14.08.30 330,000 EUR 370,273 373,540 0.04Novartis Finance SA 1.625% 14 - 09.11.26 360,000 EUR 399,087 399,697 0.04Novartis Finance SA 1.70% 18 - 14.08.38 430,000 EUR 530,226 542,256 0.05Richemont International Holdings SA 0.75% 20 -26.05.28 400,000 EUR 412,038 422,892 0.04Richemont International Holdings SA 1.00% 18 -26.03.26 900,000 EUR 942,917 953,793 0.10Richemont International Holdings SA 1.125% 20 -26.05.32 520,000 EUR 541,352 576,722 0.06Richemont International Holdings SA 1.50% 18 -26.03.30 700,000 EUR 761,322 794,276 0.08Richemont International Holdings SA 1.625% 20 -26.05.40 400,000 EUR 421,562 468,240 0.05Richemont International Holdings SA 2.00% 18 -26.03.38 640,000 EUR 755,312 795,782 0.08SES SA 0.875% 19 - 04.11.27 200,000 EUR 192,903 204,340 0.02SES SA 1.625% 18 - 22.03.26 300,000 EUR 309,682 319,680 0.03SES SA 2.00% 20 - 02.07.28 230,000 EUR 230,303 247,549 0.03Swiss Re Finance Luxembourg SA FRN 19 - 30.04.50 400,000 EUR 423,941 449,452 0.05Talanx Finanz Luxembourg SA FRN 12 - 15.06.42 300,000 EUR 345,482 336,033 0.03Tyco Electronics Group SA Zero Coupon 20 -14.02.25 300,000 EUR 297,207 302,343 0.03Tyco Electronics Group SA 1.10% 15 - 01.03.23 350,000 EUR 357,711 359,496 0.04
40,509,566 41,913,092 4.19MexicoFomento Economico Mexicano SAB de CV 1.75%16 - 20.03.23 500,000 EUR 520,325 519,230 0.05
520,325 519,230 0.05NetherlandsABB Finance BV 0.625% 16 - 03.05.23 350,000 EUR 357,056 356,535 0.04ABB Finance BV 0.75% 17 - 16.05.24 480,000 EUR 496,169 494,866 0.05ABN AMRO Bank NV 0.50% 18 - 17.07.23 700,000 EUR 708,373 713,517 0.07ABN AMRO Bank NV 0.50% 19 - 15.04.26 500,000 EUR 508,297 516,820 0.05ABN AMRO Bank NV 0.60% 20 - 15.01.27 600,000 EUR 610,392 617,382 0.06ABN AMRO Bank NV 0.625% 16 - 31.05.22 280,000 EUR 282,126 283,906 0.03ABN AMRO Bank NV 0.875% 18 - 22.04.25 300,000 EUR 307,451 313,374 0.03ABN AMRO Bank NV 0.875% 19 - 15.01.24 700,000 EUR 716,051 722,820 0.07ABN AMRO Bank NV 1.00% 15 - 16.04.25 810,000 EUR 843,150 850,549 0.09
Xtrackers II
Xtrackers II ESG EUR CORPORATE BOND UCITS ETF (continued)
Statement of Investmentsas at 31 December 2020(expressed in EUR)
The accompanying notes form an integral part of these financial statements.
263
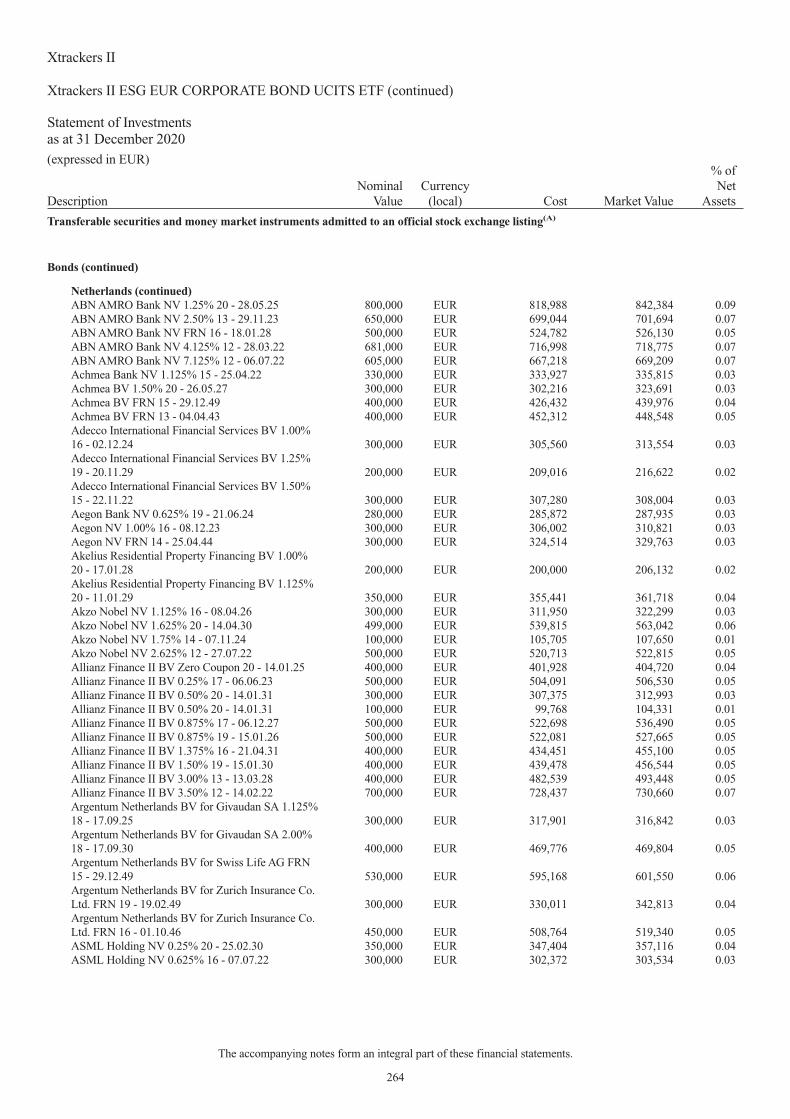
DescriptionNominal
ValueCurrency
(local) Cost Market Value
% ofNet
Assets
Transferable securities and money market instruments admitted to an official stock exchange listing(A)
Bonds (continued)
Netherlands (continued)ABN AMRO Bank NV 1.25% 20 - 28.05.25 800,000 EUR 818,988 842,384 0.09ABN AMRO Bank NV 2.50% 13 - 29.11.23 650,000 EUR 699,044 701,694 0.07ABN AMRO Bank NV FRN 16 - 18.01.28 500,000 EUR 524,782 526,130 0.05ABN AMRO Bank NV 4.125% 12 - 28.03.22 681,000 EUR 716,998 718,775 0.07ABN AMRO Bank NV 7.125% 12 - 06.07.22 605,000 EUR 667,218 669,209 0.07Achmea Bank NV 1.125% 15 - 25.04.22 330,000 EUR 333,927 335,815 0.03Achmea BV 1.50% 20 - 26.05.27 300,000 EUR 302,216 323,691 0.03Achmea BV FRN 15 - 29.12.49 400,000 EUR 426,432 439,976 0.04Achmea BV FRN 13 - 04.04.43 400,000 EUR 452,312 448,548 0.05Adecco International Financial Services BV 1.00%16 - 02.12.24 300,000 EUR 305,560 313,554 0.03Adecco International Financial Services BV 1.25%19 - 20.11.29 200,000 EUR 209,016 216,622 0.02Adecco International Financial Services BV 1.50%15 - 22.11.22 300,000 EUR 307,280 308,004 0.03Aegon Bank NV 0.625% 19 - 21.06.24 280,000 EUR 285,872 287,935 0.03Aegon NV 1.00% 16 - 08.12.23 300,000 EUR 306,002 310,821 0.03Aegon NV FRN 14 - 25.04.44 300,000 EUR 324,514 329,763 0.03Akelius Residential Property Financing BV 1.00%20 - 17.01.28 200,000 EUR 200,000 206,132 0.02Akelius Residential Property Financing BV 1.125%20 - 11.01.29 350,000 EUR 355,441 361,718 0.04Akzo Nobel NV 1.125% 16 - 08.04.26 300,000 EUR 311,950 322,299 0.03Akzo Nobel NV 1.625% 20 - 14.04.30 499,000 EUR 539,815 563,042 0.06Akzo Nobel NV 1.75% 14 - 07.11.24 100,000 EUR 105,705 107,650 0.01Akzo Nobel NV 2.625% 12 - 27.07.22 500,000 EUR 520,713 522,815 0.05Allianz Finance II BV Zero Coupon 20 - 14.01.25 400,000 EUR 401,928 404,720 0.04Allianz Finance II BV 0.25% 17 - 06.06.23 500,000 EUR 504,091 506,530 0.05Allianz Finance II BV 0.50% 20 - 14.01.31 300,000 EUR 307,375 312,993 0.03Allianz Finance II BV 0.50% 20 - 14.01.31 100,000 EUR 99,768 104,331 0.01Allianz Finance II BV 0.875% 17 - 06.12.27 500,000 EUR 522,698 536,490 0.05Allianz Finance II BV 0.875% 19 - 15.01.26 500,000 EUR 522,081 527,665 0.05Allianz Finance II BV 1.375% 16 - 21.04.31 400,000 EUR 434,451 455,100 0.05Allianz Finance II BV 1.50% 19 - 15.01.30 400,000 EUR 439,478 456,544 0.05Allianz Finance II BV 3.00% 13 - 13.03.28 400,000 EUR 482,539 493,448 0.05Allianz Finance II BV 3.50% 12 - 14.02.22 700,000 EUR 728,437 730,660 0.07Argentum Netherlands BV for Givaudan SA 1.125%18 - 17.09.25 300,000 EUR 317,901 316,842 0.03Argentum Netherlands BV for Givaudan SA 2.00%18 - 17.09.30 400,000 EUR 469,776 469,804 0.05Argentum Netherlands BV for Swiss Life AG FRN15 - 29.12.49 530,000 EUR 595,168 601,550 0.06Argentum Netherlands BV for Zurich Insurance Co.Ltd. FRN 19 - 19.02.49 300,000 EUR 330,011 342,813 0.04Argentum Netherlands BV for Zurich Insurance Co.Ltd. FRN 16 - 01.10.46 450,000 EUR 508,764 519,340 0.05ASML Holding NV 0.25% 20 - 25.02.30 350,000 EUR 347,404 357,116 0.04ASML Holding NV 0.625% 16 - 07.07.22 300,000 EUR 302,372 303,534 0.03
Xtrackers II
Xtrackers II ESG EUR CORPORATE BOND UCITS ETF (continued)
Statement of Investmentsas at 31 December 2020(expressed in EUR)
The accompanying notes form an integral part of these financial statements.
264
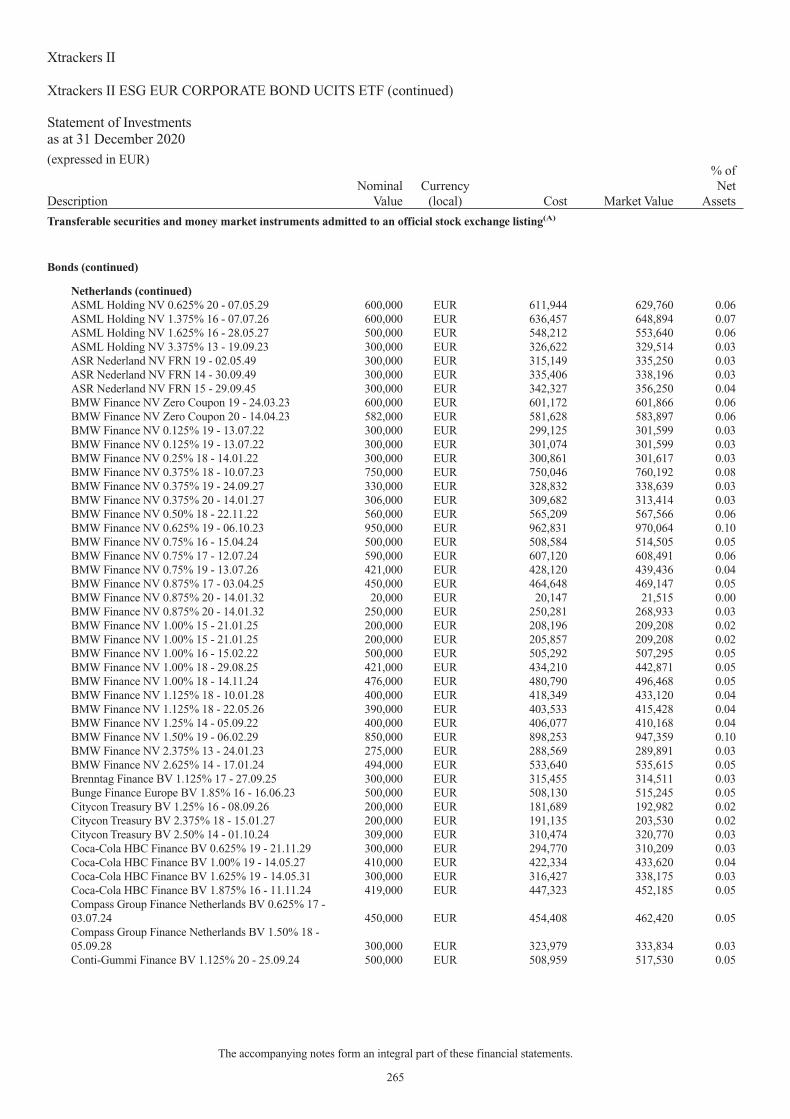
DescriptionNominal
ValueCurrency
(local) Cost Market Value
% ofNet
Assets
Transferable securities and money market instruments admitted to an official stock exchange listing(A)
Bonds (continued)
Netherlands (continued)ASML Holding NV 0.625% 20 - 07.05.29 600,000 EUR 611,944 629,760 0.06ASML Holding NV 1.375% 16 - 07.07.26 600,000 EUR 636,457 648,894 0.07ASML Holding NV 1.625% 16 - 28.05.27 500,000 EUR 548,212 553,640 0.06ASML Holding NV 3.375% 13 - 19.09.23 300,000 EUR 326,622 329,514 0.03ASR Nederland NV FRN 19 - 02.05.49 300,000 EUR 315,149 335,250 0.03ASR Nederland NV FRN 14 - 30.09.49 300,000 EUR 335,406 338,196 0.03ASR Nederland NV FRN 15 - 29.09.45 300,000 EUR 342,327 356,250 0.04BMW Finance NV Zero Coupon 19 - 24.03.23 600,000 EUR 601,172 601,866 0.06BMW Finance NV Zero Coupon 20 - 14.04.23 582,000 EUR 581,628 583,897 0.06BMW Finance NV 0.125% 19 - 13.07.22 300,000 EUR 299,125 301,599 0.03BMW Finance NV 0.125% 19 - 13.07.22 300,000 EUR 301,074 301,599 0.03BMW Finance NV 0.25% 18 - 14.01.22 300,000 EUR 300,861 301,617 0.03BMW Finance NV 0.375% 18 - 10.07.23 750,000 EUR 750,046 760,192 0.08BMW Finance NV 0.375% 19 - 24.09.27 330,000 EUR 328,832 338,639 0.03BMW Finance NV 0.375% 20 - 14.01.27 306,000 EUR 309,682 313,414 0.03BMW Finance NV 0.50% 18 - 22.11.22 560,000 EUR 565,209 567,566 0.06BMW Finance NV 0.625% 19 - 06.10.23 950,000 EUR 962,831 970,064 0.10BMW Finance NV 0.75% 16 - 15.04.24 500,000 EUR 508,584 514,505 0.05BMW Finance NV 0.75% 17 - 12.07.24 590,000 EUR 607,120 608,491 0.06BMW Finance NV 0.75% 19 - 13.07.26 421,000 EUR 428,120 439,436 0.04BMW Finance NV 0.875% 17 - 03.04.25 450,000 EUR 464,648 469,147 0.05BMW Finance NV 0.875% 20 - 14.01.32 20,000 EUR 20,147 21,515 0.00BMW Finance NV 0.875% 20 - 14.01.32 250,000 EUR 250,281 268,933 0.03BMW Finance NV 1.00% 15 - 21.01.25 200,000 EUR 208,196 209,208 0.02BMW Finance NV 1.00% 15 - 21.01.25 200,000 EUR 205,857 209,208 0.02BMW Finance NV 1.00% 16 - 15.02.22 500,000 EUR 505,292 507,295 0.05BMW Finance NV 1.00% 18 - 29.08.25 421,000 EUR 434,210 442,871 0.05BMW Finance NV 1.00% 18 - 14.11.24 476,000 EUR 480,790 496,468 0.05BMW Finance NV 1.125% 18 - 10.01.28 400,000 EUR 418,349 433,120 0.04BMW Finance NV 1.125% 18 - 22.05.26 390,000 EUR 403,533 415,428 0.04BMW Finance NV 1.25% 14 - 05.09.22 400,000 EUR 406,077 410,168 0.04BMW Finance NV 1.50% 19 - 06.02.29 850,000 EUR 898,253 947,359 0.10BMW Finance NV 2.375% 13 - 24.01.23 275,000 EUR 288,569 289,891 0.03BMW Finance NV 2.625% 14 - 17.01.24 494,000 EUR 533,640 535,615 0.05Brenntag Finance BV 1.125% 17 - 27.09.25 300,000 EUR 315,455 314,511 0.03Bunge Finance Europe BV 1.85% 16 - 16.06.23 500,000 EUR 508,130 515,245 0.05Citycon Treasury BV 1.25% 16 - 08.09.26 200,000 EUR 181,689 192,982 0.02Citycon Treasury BV 2.375% 18 - 15.01.27 200,000 EUR 191,135 203,530 0.02Citycon Treasury BV 2.50% 14 - 01.10.24 309,000 EUR 310,474 320,770 0.03Coca-Cola HBC Finance BV 0.625% 19 - 21.11.29 300,000 EUR 294,770 310,209 0.03Coca-Cola HBC Finance BV 1.00% 19 - 14.05.27 410,000 EUR 422,334 433,620 0.04Coca-Cola HBC Finance BV 1.625% 19 - 14.05.31 300,000 EUR 316,427 338,175 0.03Coca-Cola HBC Finance BV 1.875% 16 - 11.11.24 419,000 EUR 447,323 452,185 0.05Compass Group Finance Netherlands BV 0.625% 17 -03.07.24 450,000 EUR 454,408 462,420 0.05Compass Group Finance Netherlands BV 1.50% 18 -05.09.28 300,000 EUR 323,979 333,834 0.03Conti-Gummi Finance BV 1.125% 20 - 25.09.24 500,000 EUR 508,959 517,530 0.05
Xtrackers II
Xtrackers II ESG EUR CORPORATE BOND UCITS ETF (continued)
Statement of Investmentsas at 31 December 2020(expressed in EUR)
The accompanying notes form an integral part of these financial statements.
265

DescriptionNominal
ValueCurrency
(local) Cost Market Value
% ofNet
Assets
Transferable securities and money market instruments admitted to an official stock exchange listing(A)
Bonds (continued)
Netherlands (continued)Conti-Gummi Finance BV 2.125% 20 - 27.11.23 430,000 EUR 441,940 454,531 0.05Cooperatieve Rabobank UA 0.25% 19 - 30.10.26 400,000 EUR 401,819 407,828 0.04Cooperatieve Rabobank UA 0.50% 17 - 06.12.22 600,000 EUR 608,400 609,768 0.06Cooperatieve Rabobank UA 0.625% 19 - 27.02.24 700,000 EUR 706,860 716,681 0.07Cooperatieve Rabobank UA 0.75% 18 - 29.08.23 700,000 EUR 712,533 717,311 0.07Cooperatieve Rabobank UA FRN 20 - 05.05.28 600,000 EUR 613,730 629,388 0.06Cooperatieve Rabobank UA FRN 20 - 05.05.28 100,000 EUR 104,936 104,898 0.01Cooperatieve Rabobank UA 1.125% 19 - 07.05.31 500,000 EUR 515,980 549,075 0.06Cooperatieve Rabobank UA 1.25% 16 - 23.03.26 1,110,000 EUR 1,171,174 1,187,700 0.12Cooperatieve Rabobank UA 1.375% 15 - 03.02.27 850,000 EUR 912,928 923,159 0.09Cooperatieve Rabobank UA 2.375% 13 - 22.05.23 780,000 EUR 825,654 830,084 0.08Cooperatieve Rabobank UA 3.875% 13 - 25.07.23 200,000 EUR 218,564 219,728 0.02Cooperatieve Rabobank UA 3.875% 13 - 25.07.23 400,000 EUR 436,468 439,456 0.04Cooperatieve Rabobank UA 4.00% 12 - 11.01.22 929,000 EUR 968,545 971,269 0.10Cooperatieve Rabobank UA 4.125% 10 - 14.07.25 1,537,000 EUR 1,818,300 1,836,469 0.18Cooperatieve Rabobank UA 4.125% 12 - 14.09.22 720,000 EUR 764,688 771,322 0.08Cooperatieve Rabobank UA 4.75% 07 - 06.06.22 600,000 EUR 642,240 643,686 0.07Cooperatieve Rabobank UA 4.75% 07 - 06.06.22 650,000 EUR 693,890 697,326 0.07CRH Funding BV 1.625% 20 - 05.05.30 402,000 EUR 421,587 451,177 0.05CRH Funding BV 1.875% 15 - 09.01.24 400,000 EUR 418,244 422,468 0.04Daimler International Finance BV 0.25% 18 -11.05.22 150,000 EUR 150,346 151,026 0.02Daimler International Finance BV 0.25% 18 -11.05.22 500,000 EUR 501,814 503,420 0.05Daimler International Finance BV 0.25% 19 -06.11.23 430,000 EUR 430,045 432,885 0.04Daimler International Finance BV 0.25% 19 -06.11.23 496,000 EUR 495,700 499,328 0.05Daimler International Finance BV 0.625% 19 -27.02.23 750,000 EUR 753,857 761,970 0.08Daimler International Finance BV 0.625% 19 -06.05.27 240,000 EUR 239,193 245,611 0.03Daimler International Finance BV 0.625% 19 -06.05.27 377,000 EUR 382,477 385,814 0.04Daimler International Finance BV 0.75% 16 -11.05.23 500,000 EUR 508,216 511,030 0.05Daimler International Finance BV 0.85% 17 -28.02.25 82,000 EUR 83,680 84,730 0.01Daimler International Finance BV 0.85% 17 -28.02.25 550,000 EUR 557,011 568,309 0.06Daimler International Finance BV 0.875% 18 -09.04.24 150,000 EUR 151,108 153,972 0.02Daimler International Finance BV 0.875% 18 -09.04.24 400,000 EUR 405,018 410,592 0.04Daimler International Finance BV 1.00% 18 -11.11.25 70,000 EUR 69,771 73,111 0.01Daimler International Finance BV 1.00% 18 -11.11.25 660,000 EUR 674,335 689,330 0.07
Xtrackers II
Xtrackers II ESG EUR CORPORATE BOND UCITS ETF (continued)
Statement of Investmentsas at 31 December 2020(expressed in EUR)
The accompanying notes form an integral part of these financial statements.
266

DescriptionNominal
ValueCurrency
(local) Cost Market Value
% ofNet
Assets
Transferable securities and money market instruments admitted to an official stock exchange listing(A)
Bonds (continued)
Netherlands (continued)Daimler International Finance BV 1.375% 19 -26.06.26 562,000 EUR 581,552 599,761 0.06Daimler International Finance BV 1.50% 18 -09.02.27 50,000 EUR 51,171 53,855 0.01Daimler International Finance BV 1.50% 18 -09.02.27 350,000 EUR 351,881 376,981 0.04Daimler International Finance BV 2.375% 12 -12.09.22 350,000 EUR 363,816 365,365 0.04de Volksbank NV 0.01% 19 - 16.09.24 200,000 EUR 199,472 201,324 0.02de Volksbank NV 0.75% 18 - 25.06.23 300,000 EUR 300,502 306,414 0.03de Volksbank NV FRN 20 - 22.10.30 300,000 EUR 306,144 316,668 0.03Deutsche Post Finance BV 2.95% 12 - 27.06.22 350,000 EUR 366,144 367,017 0.04Deutsche Telekom International Finance BV 0.625%16 - 03.04.23 1,080,000 EUR 1,102,957 1,101,330 0.11Deutsche Telekom International Finance BV 0.625%17 - 13.12.24 480,000 EUR 497,562 496,253 0.05Deutsche Telekom International Finance BV 0.625%18 - 01.12.22 250,000 EUR 254,694 254,155 0.03Deutsche Telekom International Finance BV 0.875%17 - 30.01.24 730,000 EUR 756,219 754,564 0.08Deutsche Telekom International Finance BV 1.125%17 - 22.05.26 380,000 EUR 407,043 405,433 0.04Deutsche Telekom International Finance BV 1.375%17 - 30.01.27 730,000 EUR 796,915 793,802 0.08Deutsche Telekom International Finance BV 1.375%18 - 01.12.25 500,000 EUR 539,608 537,250 0.05Deutsche Telekom International Finance BV 1.50%16 - 03.04.28 850,000 EUR 943,161 939,258 0.09Deutsche Telekom International Finance BV 2.00%18 - 01.12.29 600,000 EUR 703,932 701,700 0.07Deutsche Telekom International Finance BV 2.75%12 - 24.10.24 330,000 EUR 368,913 367,877 0.04Deutsche Telekom International Finance BV 3.25%13 - 17.01.28 400,000 EUR 491,348 489,892 0.05Deutsche Telekom International Finance BV 4.25%10 - 13.07.22 730,000 EUR 781,420 780,589 0.08Deutsche Telekom International Finance BV 4.50%10 - 28.10.30 150,000 EUR 211,528 210,699 0.02Deutsche Telekom International Finance BV 4.875%10 - 22.04.25 250,000 EUR 305,847 304,890 0.03Deutsche Telekom International Finance BV 7.50%03 - 24.01.33 250,000 EUR 458,086 455,597 0.05ELM BV for Helvetia SchweizerischeVersicherungsgesellschaft AG FRN 17 - 29.09.47 300,000 EUR 318,584 338,202 0.03ELM BV for Swiss Life Insurance & Pension GroupFRN 16 - 29.12.49 350,000 EUR 404,397 411,250 0.04ELM BV for Swiss Reinsurance Co. Ltd. FRN 15 -29.12.49 200,000 EUR 208,877 216,016 0.02
Xtrackers II
Xtrackers II ESG EUR CORPORATE BOND UCITS ETF (continued)
Statement of Investmentsas at 31 December 2020(expressed in EUR)
The accompanying notes form an integral part of these financial statements.
267

DescriptionNominal
ValueCurrency
(local) Cost Market Value
% ofNet
Assets
Transferable securities and money market instruments admitted to an official stock exchange listing(A)
Bonds (continued)
Netherlands (continued)ELM BV for Swiss Reinsurance Co. Ltd. FRN 15 -29.12.49 232,000 EUR 247,045 250,579 0.03Euronext NV 1.00% 18 - 18.04.25 300,000 EUR 308,958 311,058 0.03Euronext NV 1.125% 19 - 12.06.29 500,000 EUR 523,211 539,765 0.05Evonik Finance BV 0.375% 16 - 07.09.24 500,000 EUR 504,440 508,870 0.05Evonik Finance BV 0.75% 16 - 07.09.28 200,000 EUR 202,677 210,518 0.02EXOR NV 1.75% 18 - 18.01.28 300,000 EUR 311,813 323,448 0.03EXOR NV 1.75% 19 - 14.10.34 240,000 EUR 235,423 249,576 0.03EXOR NV 2.125% 15 - 02.12.22 400,000 EUR 412,413 414,724 0.04EXOR NV 2.25% 20 - 29.04.30 330,000 EUR 343,487 363,380 0.04EXOR NV 2.50% 14 - 08.10.24 400,000 EUR 428,423 434,192 0.04Givaudan Finance Europe BV 1.00% 20 - 22.04.27 350,000 EUR 373,468 372,960 0.04Givaudan Finance Europe BV 1.625% 20 - 22.04.32 350,000 EUR 399,141 398,727 0.04ING Bank NV Zero Coupon 19 - 08.04.22 300,000 EUR 300,280 301,539 0.03ING Bank NV 4.50% 12 - 21.02.22 750,000 EUR 787,845 792,202 0.08ING Groep NV FRN 19 - 03.09.25 300,000 EUR 299,238 301,164 0.03ING Groep NV FRN 19 - 03.09.25 200,000 EUR 192,147 200,776 0.02ING Groep NV FRN 20 - 18.02.29 700,000 EUR 695,842 699,363 0.07ING Groep NV 0.75% 17 - 09.03.22 800,000 EUR 805,637 809,240 0.08ING Groep NV 1.00% 18 - 20.09.23 500,000 EUR 509,681 516,225 0.05ING Groep NV FRN 19 - 13.11.30 600,000 EUR 590,991 607,518 0.06ING Groep NV 1.125% 18 - 14.02.25 500,000 EUR 509,580 523,340 0.05ING Groep NV 1.375% 17 - 11.01.28 500,000 EUR 524,493 545,310 0.06ING Groep NV FRN 17 - 26.09.29 600,000 EUR 602,865 622,704 0.06ING Groep NV FRN 18 - 22.03.30 400,000 EUR 411,253 423,244 0.04ING Groep NV 2.00% 18 - 20.09.28 800,000 EUR 879,876 912,768 0.09ING Groep NV 2.125% 19 - 10.01.26 600,000 EUR 645,270 663,006 0.07ING Groep NV FRN 20 - 26.05.31 800,000 EUR 818,184 854,856 0.09ING Groep NV FRN 17 - 15.02.29 400,000 EUR 421,818 425,064 0.04ING Groep NV 2.50% 18 - 15.11.30 900,000 EUR 1,046,490 1,112,499 0.11ING Groep NV FRN 17 - 11.04.28 700,000 EUR 735,633 740,978 0.08ISS Finance BV 1.25% 20 - 07.07.25 290,000 EUR 295,982 296,313 0.03Koninklijke Ahold Delhaize NV 0.25% 19 - 26.06.25 500,000 EUR 511,335 509,950 0.05Koninklijke Ahold Delhaize NV 0.875% 17 - 19.09.24 380,000 EUR 395,622 394,535 0.04Koninklijke Ahold Delhaize NV 1.125% 18 - 19.03.26 350,000 EUR 373,535 372,540 0.04Koninklijke Ahold Delhaize NV 1.75% 20 - 02.04.27 250,000 EUR 278,217 277,285 0.03Koninklijke DSM NV 0.25% 20 - 23.06.28 300,000 EUR 299,735 306,243 0.03Koninklijke DSM NV 0.625% 20 - 23.06.32 250,000 EUR 252,402 260,838 0.03Koninklijke DSM NV 0.75% 16 - 28.09.26 500,000 EUR 515,350 527,060 0.05Koninklijke DSM NV 1.00% 15 - 09.04.25 400,000 EUR 416,013 419,776 0.04Koninklijke DSM NV 1.375% 15 - 26.09.22 276,000 EUR 283,085 284,468 0.03Koninklijke DSM NV 2.375% 14 - 03.04.24 200,000 EUR 213,463 215,914 0.02Koninklijke KPN NV 0.625% 16 - 09.04.25 300,000 EUR 298,010 304,791 0.03Koninklijke KPN NV 0.875% 20 - 14.12.32 400,000 EUR 400,852 405,932 0.04Koninklijke KPN NV 1.125% 16 - 11.09.28 300,000 EUR 303,985 310,533 0.03Koninklijke KPN NV 4.25% 12 - 01.03.22 300,000 EUR 314,428 313,962 0.03Koninklijke KPN NV 5.625% 09 - 30.09.24 200,000 EUR 234,577 237,406 0.02LeasePlan Corp. NV 0.125% 19 - 13.09.23 200,000 EUR 197,993 200,602 0.02
Xtrackers II
Xtrackers II ESG EUR CORPORATE BOND UCITS ETF (continued)
Statement of Investmentsas at 31 December 2020(expressed in EUR)
The accompanying notes form an integral part of these financial statements.
268

DescriptionNominal
ValueCurrency
(local) Cost Market Value
% ofNet
Assets
Transferable securities and money market instruments admitted to an official stock exchange listing(A)
Bonds (continued)
Netherlands (continued)LeasePlan Corp. NV 0.125% 19 - 13.09.23 441,000 EUR 437,296 442,327 0.05LeasePlan Corp. NV 0.75% 17 - 03.10.22 500,000 EUR 506,017 506,590 0.05LeasePlan Corp. NV 1.00% 18 - 02.05.23 300,000 EUR 299,745 306,906 0.03LeasePlan Corp. NV 1.00% 19 - 25.02.22 200,000 EUR 198,972 202,686 0.02LeasePlan Corp. NV 1.375% 19 - 07.03.24 200,000 EUR 205,889 208,296 0.02LeasePlan Corp. NV 3.50% 20 - 09.04.25 333,000 EUR 350,303 378,991 0.04Linde Finance BV 0.25% 17 - 18.01.22 541,000 EUR 543,005 543,954 0.06Linde Finance BV 0.25% 20 - 19.05.27 300,000 EUR 302,524 305,814 0.03Linde Finance BV 0.55% 20 - 19.05.32 400,000 EUR 402,308 417,100 0.04Linde Finance BV 1.00% 16 - 20.04.28 560,000 EUR 596,554 607,751 0.06Linde Finance BV 1.875% 14 - 22.05.24 200,000 EUR 212,357 215,080 0.02Linde Finance BV 2.00% 13 - 18.04.23 454,000 EUR 476,922 477,431 0.05LYB International Finance II BV 0.875% 19 -17.09.26 200,000 EUR 193,519 206,720 0.02LYB International Finance II BV 1.625% 19 -17.09.31 300,000 EUR 314,940 336,504 0.03Madrilena Red de Gas Finance BV 1.375% 17 -11.04.25 100,000 EUR 102,152 103,327 0.01Madrilena Red de Gas Finance BV 2.25% 17 -11.04.29 200,000 EUR 217,107 217,568 0.02Mondelez International Holdings Netherlands BVZero Coupon 20 - 22.09.26 360,000 EUR 358,780 361,231 0.04Mondelez International Holdings Netherlands BV0.375% 20 - 22.09.29 420,000 EUR 420,797 426,086 0.04Mondelez International Holdings Netherlands BV0.875% 19 - 01.10.31 300,000 EUR 297,007 318,453 0.03Nationale-Nederlanden Bank NV 0.375% 19 -31.05.23 300,000 EUR 302,467 304,131 0.03Nationale-Nederlanden Bank NV 0.375% 19 -26.02.25 400,000 EUR 403,921 408,880 0.04Nationale-Nederlanden LevensverzekeringMaatschappij NV FRN 12 - 29.08.42 100,000 EUR 125,594 114,497 0.01Nationale-Nederlanden LevensverzekeringMaatschappij NV FRN 12 - 29.08.42 100,000 EUR 121,710 114,497 0.01NE Property BV 1.75% 17 - 23.11.24 400,000 EUR 374,954 409,712 0.04NE Property BV 1.875% 19 - 09.10.26 200,000 EUR 192,946 200,838 0.02NE Property BV 2.625% 19 - 22.05.23 280,000 EUR 281,879 291,099 0.03NE Property BV 3.375% 20 - 14.07.27 290,000 EUR 298,012 315,198 0.03NIBC Bank NV 0.875% 19 - 08.07.25 200,000 EUR 198,542 204,962 0.02NIBC Bank NV 1.125% 18 - 19.04.23 200,000 EUR 200,310 205,118 0.02NIBC Bank NV 1.50% 17 - 31.01.22 200,000 EUR 203,240 203,580 0.02NIBC Bank NV 2.00% 19 - 09.04.24 400,000 EUR 401,531 418,504 0.04NN Group NV 0.875% 17 - 13.01.23 400,000 EUR 406,885 407,676 0.04NN Group NV 1.00% 15 - 18.03.22 305,000 EUR 306,898 309,554 0.03NN Group NV 1.625% 17 - 01.06.27 400,000 EUR 420,597 438,904 0.04NN Group NV FRN 14 - 29.06.49 500,000 EUR 536,145 553,815 0.06NN Group NV FRN 14 - 15.07.49 500,000 EUR 549,705 576,815 0.06NN Group NV FRN 14 - 08.04.44 600,000 EUR 667,435 673,602 0.07
Xtrackers II
Xtrackers II ESG EUR CORPORATE BOND UCITS ETF (continued)
Statement of Investmentsas at 31 December 2020(expressed in EUR)
The accompanying notes form an integral part of these financial statements.
269

DescriptionNominal
ValueCurrency
(local) Cost Market Value
% ofNet
Assets
Transferable securities and money market instruments admitted to an official stock exchange listing(A)
Bonds (continued)
Netherlands (continued)NN Group NV FRN 17 - 13.01.48 400,000 EUR 456,288 481,244 0.05PACCAR Financial Europe BV Zero Coupon 20 -03.03.23 100,000 EUR 100,261 100,106 0.01PACCAR Financial Europe BV 0.125% 19 - 07.03.22 100,000 EUR 100,381 100,337 0.01PostNL NV 0.625% 19 - 23.09.26 100,000 EUR 100,056 103,658 0.01PostNL NV 1.00% 17 - 21.11.24 200,000 EUR 202,111 207,454 0.02Prosus NV 1.539% 20 - 03.08.28 480,000 EUR 489,065 494,803 0.05Prosus NV 2.031% 20 - 03.08.32 420,000 EUR 432,250 437,023 0.04Reckitt Benckiser Treasury Services Nederland BV0.375% 20 - 19.05.26 500,000 EUR 504,457 513,620 0.05Reckitt Benckiser Treasury Services Nederland BV0.75% 20 - 19.05.30 460,000 EUR 469,533 487,784 0.05RELX Finance BV Zero Coupon 20 - 18.03.24 494,000 EUR 487,369 495,512 0.05RELX Finance BV 0.50% 20 - 10.03.28 421,000 EUR 412,895 429,702 0.04RELX Finance BV 0.875% 20 - 10.03.32 338,000 EUR 327,134 352,544 0.04RELX Finance BV 1.00% 17 - 22.03.24 300,000 EUR 306,831 309,990 0.03RELX Finance BV 1.375% 16 - 12.05.26 300,000 EUR 314,173 321,936 0.03RELX Finance BV 1.50% 18 - 13.05.27 250,000 EUR 256,300 271,470 0.03Ren Finance BV 1.75% 16 - 01.06.23 300,000 EUR 312,126 313,077 0.03Ren Finance BV 1.75% 18 - 18.01.28 200,000 EUR 211,540 219,334 0.02Ren Finance BV 2.50% 15 - 12.02.25 300,000 EUR 326,700 332,061 0.03Roche Finance Europe BV 0.50% 16 - 27.02.23 426,000 EUR 430,842 433,532 0.04Roche Finance Europe BV 0.875% 15 - 25.02.25 700,000 EUR 731,363 732,480 0.07Siemens Financieringsmaatschappij NV Zero Coupon19 - 05.09.24 250,000 EUR 252,844 252,098 0.03Siemens Financieringsmaatschappij NV Zero Coupon20 - 20.02.23 600,000 EUR 604,264 603,174 0.06Siemens Financieringsmaatschappij NV Zero Coupon20 - 20.02.26 500,000 EUR 507,308 505,055 0.05Siemens Financieringsmaatschappij NV 0.125% 19 -05.09.29 600,000 EUR 613,849 610,680 0.06Siemens Financieringsmaatschappij NV 0.125% 20 -05.06.22 800,000 EUR 805,302 804,808 0.08Siemens Financieringsmaatschappij NV 0.25% 20 -20.02.29 600,000 EUR 618,945 616,014 0.06Siemens Financieringsmaatschappij NV 0.25% 20 -05.06.24 500,000 EUR 509,776 508,505 0.05Siemens Financieringsmaatschappij NV 0.30% 19 -28.02.24 380,000 EUR 388,292 387,311 0.04Siemens Financieringsmaatschappij NV 0.375% 18 -06.09.23 500,000 EUR 510,134 509,245 0.05Siemens Financieringsmaatschappij NV 0.375% 20 -05.06.26 600,000 EUR 619,909 617,226 0.06Siemens Financieringsmaatschappij NV 0.50% 19 -05.09.34 600,000 EUR 630,710 629,538 0.06Siemens Financieringsmaatschappij NV 0.50% 20 -20.02.32 400,000 EUR 423,828 420,472 0.04
Xtrackers II
Xtrackers II ESG EUR CORPORATE BOND UCITS ETF (continued)
Statement of Investmentsas at 31 December 2020(expressed in EUR)
The accompanying notes form an integral part of these financial statements.
270

DescriptionNominal
ValueCurrency
(local) Cost Market Value
% ofNet
Assets
Transferable securities and money market instruments admitted to an official stock exchange listing(A)
Bonds (continued)
Netherlands (continued)Siemens Financieringsmaatschappij NV 0.90% 19 -28.02.28 400,000 EUR 431,850 429,868 0.04Siemens Financieringsmaatschappij NV 1.00% 18 -06.09.27 380,000 EUR 412,013 409,860 0.04Siemens Financieringsmaatschappij NV 1.25% 19 -28.02.31 500,000 EUR 567,001 564,295 0.06Siemens Financieringsmaatschappij NV 1.375% 18 -06.09.30 700,000 EUR 799,071 795,865 0.08Siemens Financieringsmaatschappij NV 1.75% 19 -28.02.39 400,000 EUR 499,733 498,432 0.05Siemens Financieringsmaatschappij NV 2.875% 13 -10.03.28 500,000 EUR 614,472 611,360 0.06Signify NV 2.00% 20 - 11.05.24 410,000 EUR 417,328 433,395 0.04Signify NV 2.375% 20 - 11.05.27 280,000 EUR 286,162 310,162 0.03Sika Capital BV 0.875% 19 - 29.04.27 400,000 EUR 417,279 421,772 0.04Sika Capital BV 1.50% 19 - 29.04.31 300,000 EUR 324,306 340,632 0.04Sudzucker International Finance BV 1.00% 17 -28.11.25 300,000 EUR 290,822 307,980 0.03Sudzucker International Finance BV 1.25% 16 -29.11.23 100,000 EUR 100,416 102,750 0.01Telefonica Europe BV 5.875% 03 - 14.02.33 300,000 EUR 462,816 480,330 0.05Toyota Motor Finance Netherlands BV 0.25% 19 -10.01.22 200,000 EUR 200,331 201,100 0.02Toyota Motor Finance Netherlands BV 0.625% 18 -26.09.23 500,000 EUR 509,184 511,990 0.05Unilever Finance Netherlands BV 0.375% 17 -14.02.23 300,000 EUR 303,477 304,410 0.03Unilever Finance Netherlands BV 0.50% 15 - 03.02.22 400,000 EUR 402,500 403,676 0.04Unilever Finance Netherlands BV 0.50% 16 - 29.04.24 300,000 EUR 305,412 307,806 0.03Unilever Finance Netherlands BV 0.50% 18 - 12.08.23 200,000 EUR 201,469 204,178 0.02Unilever Finance Netherlands BV 0.50% 18 - 06.01.25 300,000 EUR 302,332 308,742 0.03Unilever Finance Netherlands BV 0.875% 17 -31.07.25 600,000 EUR 623,502 629,922 0.06Unilever Finance Netherlands BV 1.00% 15 - 03.06.23 400,000 EUR 412,210 412,648 0.04Unilever Finance Netherlands BV 1.00% 17 - 14.02.27 400,000 EUR 423,691 427,932 0.04Unilever Finance Netherlands BV 1.125% 16 -29.04.28 300,000 EUR 314,494 326,769 0.03Unilever Finance Netherlands BV 1.125% 18 -12.02.27 400,000 EUR 423,973 430,476 0.04Unilever Finance Netherlands BV 1.25% 20 - 25.03.25 487,000 EUR 509,667 515,976 0.05Unilever Finance Netherlands BV 1.375% 17 -31.07.29 500,000 EUR 551,050 560,215 0.06Unilever Finance Netherlands BV 1.375% 18 -04.09.30 350,000 EUR 389,742 397,957 0.04Unilever Finance Netherlands BV 1.625% 18 -12.02.33 500,000 EUR 565,788 583,710 0.06Unilever NV 1.75% 20 - 25.03.30 577,000 EUR 636,539 666,729 0.07Vonovia Finance BV 0.125% 19 - 06.04.23 300,000 EUR 301,116 301,887 0.03
Xtrackers II
Xtrackers II ESG EUR CORPORATE BOND UCITS ETF (continued)
Statement of Investmentsas at 31 December 2020(expressed in EUR)
The accompanying notes form an integral part of these financial statements.
271
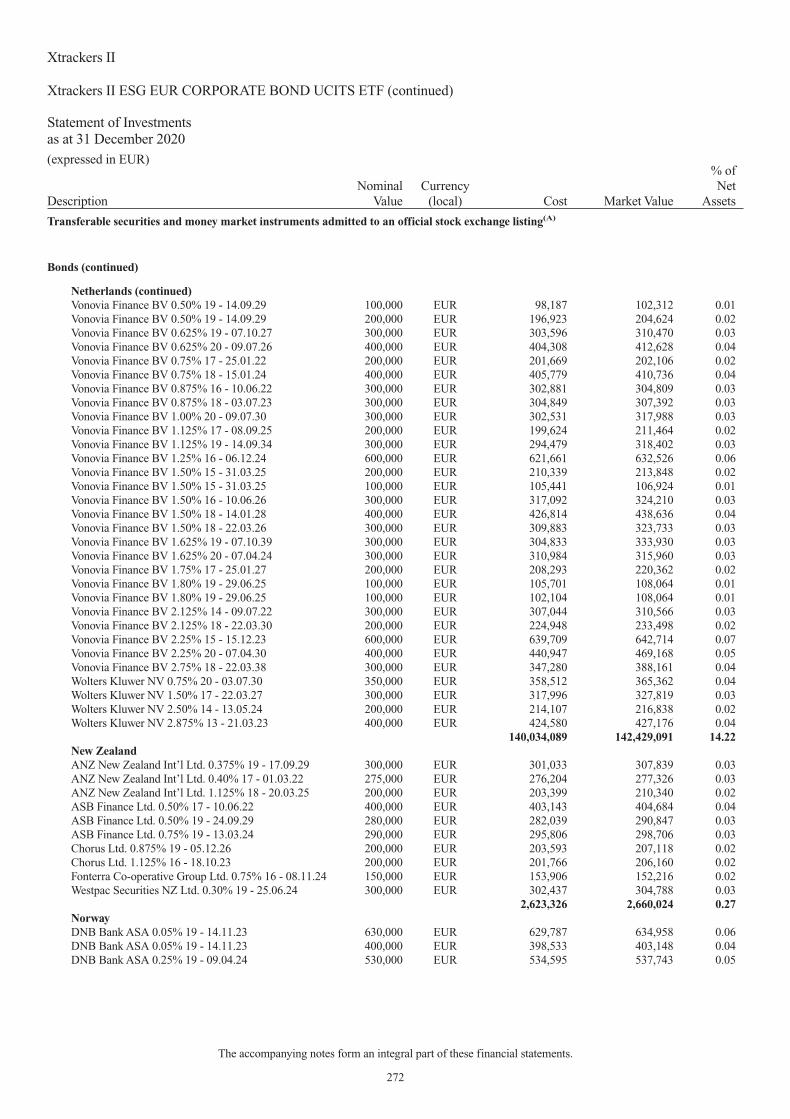
DescriptionNominal
ValueCurrency
(local) Cost Market Value
% ofNet
Assets
Transferable securities and money market instruments admitted to an official stock exchange listing(A)
Bonds (continued)
Netherlands (continued)Vonovia Finance BV 0.50% 19 - 14.09.29 100,000 EUR 98,187 102,312 0.01Vonovia Finance BV 0.50% 19 - 14.09.29 200,000 EUR 196,923 204,624 0.02Vonovia Finance BV 0.625% 19 - 07.10.27 300,000 EUR 303,596 310,470 0.03Vonovia Finance BV 0.625% 20 - 09.07.26 400,000 EUR 404,308 412,628 0.04Vonovia Finance BV 0.75% 17 - 25.01.22 200,000 EUR 201,669 202,106 0.02Vonovia Finance BV 0.75% 18 - 15.01.24 400,000 EUR 405,779 410,736 0.04Vonovia Finance BV 0.875% 16 - 10.06.22 300,000 EUR 302,881 304,809 0.03Vonovia Finance BV 0.875% 18 - 03.07.23 300,000 EUR 304,849 307,392 0.03Vonovia Finance BV 1.00% 20 - 09.07.30 300,000 EUR 302,531 317,988 0.03Vonovia Finance BV 1.125% 17 - 08.09.25 200,000 EUR 199,624 211,464 0.02Vonovia Finance BV 1.125% 19 - 14.09.34 300,000 EUR 294,479 318,402 0.03Vonovia Finance BV 1.25% 16 - 06.12.24 600,000 EUR 621,661 632,526 0.06Vonovia Finance BV 1.50% 15 - 31.03.25 200,000 EUR 210,339 213,848 0.02Vonovia Finance BV 1.50% 15 - 31.03.25 100,000 EUR 105,441 106,924 0.01Vonovia Finance BV 1.50% 16 - 10.06.26 300,000 EUR 317,092 324,210 0.03Vonovia Finance BV 1.50% 18 - 14.01.28 400,000 EUR 426,814 438,636 0.04Vonovia Finance BV 1.50% 18 - 22.03.26 300,000 EUR 309,883 323,733 0.03Vonovia Finance BV 1.625% 19 - 07.10.39 300,000 EUR 304,833 333,930 0.03Vonovia Finance BV 1.625% 20 - 07.04.24 300,000 EUR 310,984 315,960 0.03Vonovia Finance BV 1.75% 17 - 25.01.27 200,000 EUR 208,293 220,362 0.02Vonovia Finance BV 1.80% 19 - 29.06.25 100,000 EUR 105,701 108,064 0.01Vonovia Finance BV 1.80% 19 - 29.06.25 100,000 EUR 102,104 108,064 0.01Vonovia Finance BV 2.125% 14 - 09.07.22 300,000 EUR 307,044 310,566 0.03Vonovia Finance BV 2.125% 18 - 22.03.30 200,000 EUR 224,948 233,498 0.02Vonovia Finance BV 2.25% 15 - 15.12.23 600,000 EUR 639,709 642,714 0.07Vonovia Finance BV 2.25% 20 - 07.04.30 400,000 EUR 440,947 469,168 0.05Vonovia Finance BV 2.75% 18 - 22.03.38 300,000 EUR 347,280 388,161 0.04Wolters Kluwer NV 0.75% 20 - 03.07.30 350,000 EUR 358,512 365,362 0.04Wolters Kluwer NV 1.50% 17 - 22.03.27 300,000 EUR 317,996 327,819 0.03Wolters Kluwer NV 2.50% 14 - 13.05.24 200,000 EUR 214,107 216,838 0.02Wolters Kluwer NV 2.875% 13 - 21.03.23 400,000 EUR 424,580 427,176 0.04
140,034,089 142,429,091 14.22New ZealandANZ New Zealand Int’l Ltd. 0.375% 19 - 17.09.29 300,000 EUR 301,033 307,839 0.03ANZ New Zealand Int’l Ltd. 0.40% 17 - 01.03.22 275,000 EUR 276,204 277,326 0.03ANZ New Zealand Int’l Ltd. 1.125% 18 - 20.03.25 200,000 EUR 203,399 210,340 0.02ASB Finance Ltd. 0.50% 17 - 10.06.22 400,000 EUR 403,143 404,684 0.04ASB Finance Ltd. 0.50% 19 - 24.09.29 280,000 EUR 282,039 290,847 0.03ASB Finance Ltd. 0.75% 19 - 13.03.24 290,000 EUR 295,806 298,706 0.03Chorus Ltd. 0.875% 19 - 05.12.26 200,000 EUR 203,593 207,118 0.02Chorus Ltd. 1.125% 16 - 18.10.23 200,000 EUR 201,766 206,160 0.02Fonterra Co-operative Group Ltd. 0.75% 16 - 08.11.24 150,000 EUR 153,906 152,216 0.02Westpac Securities NZ Ltd. 0.30% 19 - 25.06.24 300,000 EUR 302,437 304,788 0.03
2,623,326 2,660,024 0.27NorwayDNB Bank ASA 0.05% 19 - 14.11.23 630,000 EUR 629,787 634,958 0.06DNB Bank ASA 0.05% 19 - 14.11.23 400,000 EUR 398,533 403,148 0.04DNB Bank ASA 0.25% 19 - 09.04.24 530,000 EUR 534,595 537,743 0.05
Xtrackers II
Xtrackers II ESG EUR CORPORATE BOND UCITS ETF (continued)
Statement of Investmentsas at 31 December 2020(expressed in EUR)
The accompanying notes form an integral part of these financial statements.
272

DescriptionNominal
ValueCurrency
(local) Cost Market Value
% ofNet
Assets
Transferable securities and money market instruments admitted to an official stock exchange listing(A)
Bonds (continued)
Norway (continued)DNB Bank ASA 0.60% 18 - 25.09.23 400,000 EUR 406,538 409,288 0.04DNB Bank ASA 1.125% 16 - 01.03.23 430,000 EUR 441,488 443,179 0.05DNB Bank ASA FRN 18 - 20.03.28 300,000 EUR 300,459 307,398 0.03DNB Bank ASA FRN 17 - 01.03.27 600,000 EUR 608,101 608,772 0.06DNB Bank ASA 4.25% 12 - 18.01.22 400,000 EUR 418,737 419,396 0.04Norsk Hydro ASA 1.125% 19 - 11.04.25 250,000 EUR 258,104 258,423 0.03Norsk Hydro ASA 2.00% 19 - 11.04.29 150,000 EUR 156,406 158,747 0.02Santander Consumer Bank AS 0.125% 19 - 11.09.24 500,000 EUR 498,064 503,010 0.05Santander Consumer Bank AS 0.125% 20 - 25.02.25 300,000 EUR 295,671 300,792 0.03Santander Consumer Bank AS 0.75% 18 - 01.03.23 200,000 EUR 199,704 204,092 0.02Santander Consumer Bank AS 0.875% 19 - 21.01.22 200,000 EUR 200,708 202,360 0.02Sparebank 1 Oestlandet 0.25% 19 - 30.09.24 500,000 EUR 503,698 505,810 0.05Sparebank 1 Oestlandet 0.875% 18 - 13.03.23 100,000 EUR 100,092 102,213 0.01SpareBank 1 SMN 0.125% 19 - 11.09.26 200,000 EUR 194,729 201,380 0.02SpareBank 1 SMN 0.50% 17 - 09.03.22 300,000 EUR 300,643 302,898 0.03SpareBank 1 SMN 0.75% 18 - 03.07.23 200,000 EUR 201,637 204,776 0.02SpareBank 1 SR-Bank ASA 0.375% 16 - 10.02.22 300,000 EUR 299,328 301,932 0.03SpareBank 1 SR-Bank ASA 0.625% 19 - 25.03.24 400,000 EUR 405,147 408,308 0.04Sparebanken Vest 0.50% 17 - 29.11.22 200,000 EUR 201,505 202,798 0.02Storebrand Livsforsikring AS FRN 13 - 04.04.43 110,000 EUR 127,149 124,017 0.01
7,680,823 7,745,438 0.77PolandmBank SA 1.058% 18 - 05.09.22 300,000 EUR 297,882 302,223 0.03
297,882 302,223 0.03PortugalNOS Sgps SA 1.125% 18 - 02.05.23 300,000 EUR 303,694 306,411 0.03
303,694 306,411 0.03RomaniaUniCredit Leasing Corp. IFN SA 0.502% 19 -18.10.22 300,000 EUR 300,844 301,437 0.03
300,844 301,437 0.03SingaporeDBS Group Holdings Ltd. FRN 18 - 11.04.28 400,000 EUR 403,267 408,276 0.04
403,267 408,276 0.04SpainACS Actividades de Construccion y Servicios SA1.375% 20 - 17.06.25 400,000 EUR 408,126 410,132 0.04ACS Servicios Comunicaciones y Energia SL 1.875%18 - 20.04.26 400,000 EUR 411,974 429,812 0.04Amadeus IT Group SA 0.875% 18 - 18.09.23 200,000 EUR 200,464 204,002 0.02Amadeus IT Group SA 1.50% 18 - 18.09.26 200,000 EUR 199,137 213,266 0.02Amadeus IT Group SA 1.875% 20 - 24.09.28 400,000 EUR 397,299 426,128 0.04Amadeus IT Group SA 2.50% 20 - 20.05.24 300,000 EUR 306,046 322,089 0.03Amadeus IT Group SA 2.875% 20 - 20.05.27 300,000 EUR 313,554 337,242 0.04Banco Bilbao Vizcaya Argentaria SA 0.375% 19 -02.10.24 500,000 EUR 494,761 505,475 0.05Banco Bilbao Vizcaya Argentaria SA 0.375% 19 -15.11.26 600,000 EUR 600,884 612,012 0.06
Xtrackers II
Xtrackers II ESG EUR CORPORATE BOND UCITS ETF (continued)
Statement of Investmentsas at 31 December 2020(expressed in EUR)
The accompanying notes form an integral part of these financial statements.
273
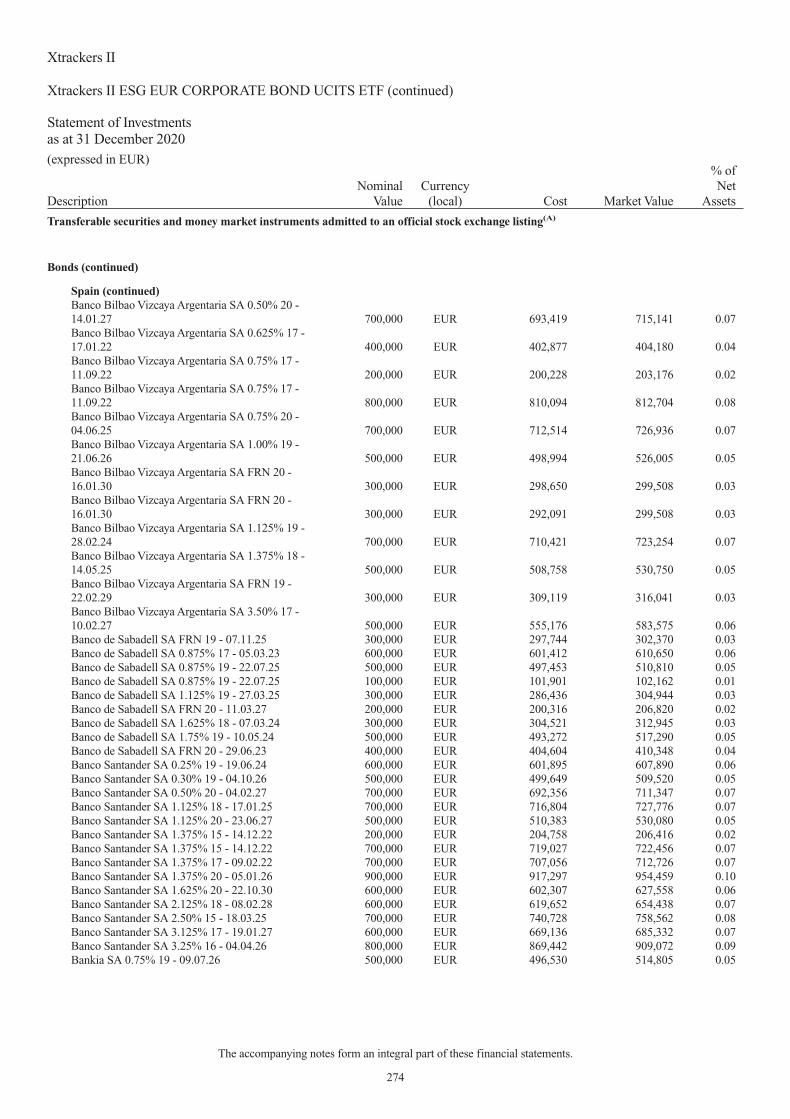
DescriptionNominal
ValueCurrency
(local) Cost Market Value
% ofNet
Assets
Transferable securities and money market instruments admitted to an official stock exchange listing(A)
Bonds (continued)
Spain (continued)Banco Bilbao Vizcaya Argentaria SA 0.50% 20 -14.01.27 700,000 EUR 693,419 715,141 0.07Banco Bilbao Vizcaya Argentaria SA 0.625% 17 -17.01.22 400,000 EUR 402,877 404,180 0.04Banco Bilbao Vizcaya Argentaria SA 0.75% 17 -11.09.22 200,000 EUR 200,228 203,176 0.02Banco Bilbao Vizcaya Argentaria SA 0.75% 17 -11.09.22 800,000 EUR 810,094 812,704 0.08Banco Bilbao Vizcaya Argentaria SA 0.75% 20 -04.06.25 700,000 EUR 712,514 726,936 0.07Banco Bilbao Vizcaya Argentaria SA 1.00% 19 -21.06.26 500,000 EUR 498,994 526,005 0.05Banco Bilbao Vizcaya Argentaria SA FRN 20 -16.01.30 300,000 EUR 298,650 299,508 0.03Banco Bilbao Vizcaya Argentaria SA FRN 20 -16.01.30 300,000 EUR 292,091 299,508 0.03Banco Bilbao Vizcaya Argentaria SA 1.125% 19 -28.02.24 700,000 EUR 710,421 723,254 0.07Banco Bilbao Vizcaya Argentaria SA 1.375% 18 -14.05.25 500,000 EUR 508,758 530,750 0.05Banco Bilbao Vizcaya Argentaria SA FRN 19 -22.02.29 300,000 EUR 309,119 316,041 0.03Banco Bilbao Vizcaya Argentaria SA 3.50% 17 -10.02.27 500,000 EUR 555,176 583,575 0.06Banco de Sabadell SA FRN 19 - 07.11.25 300,000 EUR 297,744 302,370 0.03Banco de Sabadell SA 0.875% 17 - 05.03.23 600,000 EUR 601,412 610,650 0.06Banco de Sabadell SA 0.875% 19 - 22.07.25 500,000 EUR 497,453 510,810 0.05Banco de Sabadell SA 0.875% 19 - 22.07.25 100,000 EUR 101,901 102,162 0.01Banco de Sabadell SA 1.125% 19 - 27.03.25 300,000 EUR 286,436 304,944 0.03Banco de Sabadell SA FRN 20 - 11.03.27 200,000 EUR 200,316 206,820 0.02Banco de Sabadell SA 1.625% 18 - 07.03.24 300,000 EUR 304,521 312,945 0.03Banco de Sabadell SA 1.75% 19 - 10.05.24 500,000 EUR 493,272 517,290 0.05Banco de Sabadell SA FRN 20 - 29.06.23 400,000 EUR 404,604 410,348 0.04Banco Santander SA 0.25% 19 - 19.06.24 600,000 EUR 601,895 607,890 0.06Banco Santander SA 0.30% 19 - 04.10.26 500,000 EUR 499,649 509,520 0.05Banco Santander SA 0.50% 20 - 04.02.27 700,000 EUR 692,356 711,347 0.07Banco Santander SA 1.125% 18 - 17.01.25 700,000 EUR 716,804 727,776 0.07Banco Santander SA 1.125% 20 - 23.06.27 500,000 EUR 510,383 530,080 0.05Banco Santander SA 1.375% 15 - 14.12.22 200,000 EUR 204,758 206,416 0.02Banco Santander SA 1.375% 15 - 14.12.22 700,000 EUR 719,027 722,456 0.07Banco Santander SA 1.375% 17 - 09.02.22 700,000 EUR 707,056 712,726 0.07Banco Santander SA 1.375% 20 - 05.01.26 900,000 EUR 917,297 954,459 0.10Banco Santander SA 1.625% 20 - 22.10.30 600,000 EUR 602,307 627,558 0.06Banco Santander SA 2.125% 18 - 08.02.28 600,000 EUR 619,652 654,438 0.07Banco Santander SA 2.50% 15 - 18.03.25 700,000 EUR 740,728 758,562 0.08Banco Santander SA 3.125% 17 - 19.01.27 600,000 EUR 669,136 685,332 0.07Banco Santander SA 3.25% 16 - 04.04.26 800,000 EUR 869,442 909,072 0.09Bankia SA 0.75% 19 - 09.07.26 500,000 EUR 496,530 514,805 0.05
Xtrackers II
Xtrackers II ESG EUR CORPORATE BOND UCITS ETF (continued)
Statement of Investmentsas at 31 December 2020(expressed in EUR)
The accompanying notes form an integral part of these financial statements.
274

DescriptionNominal
ValueCurrency
(local) Cost Market Value
% ofNet
Assets
Transferable securities and money market instruments admitted to an official stock exchange listing(A)
Bonds (continued)
Spain (continued)Bankia SA 0.875% 19 - 25.03.24 500,000 EUR 507,338 514,140 0.05Bankia SA 1.00% 19 - 25.06.24 100,000 EUR 100,439 103,016 0.01Bankia SA 1.125% 19 - 12.11.26 500,000 EUR 510,353 521,605 0.05Bankinter SA 0.625% 20 - 06.10.27 300,000 EUR 296,879 305,622 0.03Bankinter SA 0.875% 19 - 05.03.24 400,000 EUR 410,121 412,348 0.04Bankinter SA 0.875% 19 - 08.07.26 400,000 EUR 396,530 412,276 0.04Bankinter SA FRN 17 - 06.04.27 300,000 EUR 300,643 306,504 0.03CaixaBank SA 0.375% 20 - 03.02.25 500,000 EUR 503,725 505,980 0.05CaixaBank SA FRN 20 - 18.11.26 500,000 EUR 501,502 502,160 0.05CaixaBank SA 0.625% 19 - 01.10.24 600,000 EUR 589,422 610,536 0.06CaixaBank SA 0.75% 18 - 18.04.23 700,000 EUR 705,816 713,874 0.07CaixaBank SA FRN 20 - 10.07.26 600,000 EUR 604,416 616,578 0.06CaixaBank SA 1.125% 17 - 17.05.24 600,000 EUR 615,163 623,328 0.06CaixaBank SA 1.125% 17 - 12.01.23 600,000 EUR 605,207 613,692 0.06CaixaBank SA 1.125% 19 - 27.03.26 500,000 EUR 502,691 525,325 0.05CaixaBank SA 1.375% 19 - 19.06.26 600,000 EUR 609,127 632,208 0.06CaixaBank SA 1.75% 18 - 24.10.23 500,000 EUR 505,626 524,120 0.05CaixaBank SA FRN 18 - 17.04.30 600,000 EUR 608,744 626,964 0.06CaixaBank SA 2.375% 19 - 01.02.24 500,000 EUR 525,012 535,135 0.06CaixaBank SA FRN 17 - 14.07.28 700,000 EUR 722,237 732,417 0.08CaixaBank SA FRN 17 - 15.02.27 600,000 EUR 619,250 618,552 0.06Enagas Financiaciones SA 0.375% 20 - 05.11.32 300,000 EUR 298,893 302,337 0.03Enagas Financiaciones SA 0.75% 16 - 27.10.26 300,000 EUR 310,443 314,910 0.03Enagas Financiaciones SA 1.00% 15 - 25.03.23 200,000 EUR 202,688 204,950 0.02Enagas Financiaciones SA 1.25% 15 - 06.02.25 300,000 EUR 311,710 317,049 0.03Enagas Financiaciones SA 1.375% 16 - 05.05.28 400,000 EUR 428,293 442,212 0.05Enagas Financiaciones SA 2.50% 14 - 11.04.22 400,000 EUR 412,986 413,836 0.04FCC Aqualia SA 1.413% 17 - 08.06.22 300,000 EUR 301,434 304,464 0.03FCC Aqualia SA 2.629% 17 - 08.06.27 400,000 EUR 420,629 436,228 0.05FCC Servicios Medio Ambiente Holdings SAU0.815% 19 - 04.12.23 100,000 EUR 100,542 101,905 0.01FCC Servicios Medio Ambiente Holdings SAU0.815% 19 - 04.12.23 300,000 EUR 300,904 305,715 0.03FCC Servicios Medio Ambiente Holdings SAU1.661% 19 - 04.12.26 300,000 EUR 306,543 315,207 0.03Ferrovial Emisiones SA 0.375% 16 - 14.09.22 400,000 EUR 401,700 403,912 0.04Ferrovial Emisiones SA 0.54% 20 - 12.11.28 300,000 EUR 303,263 302,925 0.03Ferrovial Emisiones SA 1.375% 17 - 31.03.25 300,000 EUR 310,624 315,702 0.03Ferrovial Emisiones SA 1.382% 20 - 14.05.26 400,000 EUR 405,272 425,000 0.04Ferrovial Emisiones SA 2.50% 14 - 15.07.24 100,000 EUR 106,704 108,716 0.01Inmobiliaria Colonial Socimi SA 1.35% 20 - 14.10.28 300,000 EUR 302,891 310,206 0.03Inmobiliaria Colonial Socimi SA 1.45% 16 - 28.10.24 300,000 EUR 308,342 313,053 0.03Inmobiliaria Colonial Socimi SA 1.625% 17 -28.11.25 300,000 EUR 305,108 317,169 0.03Inmobiliaria Colonial Socimi SA 2.00% 18 - 17.04.26 300,000 EUR 315,141 322,803 0.03Inmobiliaria Colonial Socimi SA 2.50% 17 - 28.11.29 100,000 EUR 111,790 112,118 0.01Inmobiliaria Colonial Socimi SA 2.728% 15 -05.06.23 200,000 EUR 214,264 213,958 0.02
Xtrackers II
Xtrackers II ESG EUR CORPORATE BOND UCITS ETF (continued)
Statement of Investmentsas at 31 December 2020(expressed in EUR)
The accompanying notes form an integral part of these financial statements.
275

DescriptionNominal
ValueCurrency
(local) Cost Market Value
% ofNet
Assets
Transferable securities and money market instruments admitted to an official stock exchange listing(A)
Bonds (continued)
Spain (continued)Mapfre SA 1.625% 16 - 19.05.26 600,000 EUR 640,846 657,696 0.07Mapfre SA FRN 18 - 07.09.48 300,000 EUR 336,743 347,739 0.04Mapfre SA FRN 17 - 31.03.47 300,000 EUR 327,751 348,387 0.04Red Electrica Corp. SA 0.875% 20 - 14.04.25 200,000 EUR 206,621 208,214 0.02Red Electrica Financiaciones SAU 0.375% 20 -24.07.28 300,000 EUR 304,607 308,826 0.03Red Electrica Financiaciones SAU 1.00% 16 -21.04.26 300,000 EUR 310,766 317,190 0.03Red Electrica Financiaciones SAU 1.125% 15 -24.04.25 300,000 EUR 314,085 316,545 0.03Red Electrica Financiaciones SAU 1.25% 18 -13.03.27 400,000 EUR 422,745 430,968 0.04Red Electrica Financiaciones SAU 2.125% 14 -01.07.23 200,000 EUR 211,774 211,458 0.02Red Electrica Financiaciones SAU 3.875% 13 -25.01.22 200,000 EUR 208,553 208,436 0.02Santander Consumer Finance SA 0.375% 19 -27.06.24 300,000 EUR 300,585 304,167 0.03Santander Consumer Finance SA 0.375% 19 -27.06.24 200,000 EUR 198,756 202,778 0.02Santander Consumer Finance SA 0.375% 20 -17.01.25 600,000 EUR 596,890 608,634 0.06Santander Consumer Finance SA 0.50% 19 - 14.11.26 400,000 EUR 389,336 409,228 0.04Santander Consumer Finance SA 0.875% 17 -24.01.22 600,000 EUR 604,891 607,374 0.06Santander Consumer Finance SA 0.875% 18 -30.05.23 400,000 EUR 407,327 410,752 0.04Santander Consumer Finance SA 1.00% 19 - 27.02.24 600,000 EUR 609,258 620,160 0.06Santander Consumer Finance SA 1.125% 18 -09.10.23 600,000 EUR 614,052 621,300 0.06Telefonica Emisiones SA 0.664% 20 - 03.02.30 600,000 EUR 600,554 616,086 0.06Telefonica Emisiones SA 0.75% 16 - 13.04.22 500,000 EUR 503,730 506,615 0.05Telefonica Emisiones SA 1.069% 19 - 05.02.24 600,000 EUR 615,918 621,036 0.06Telefonica Emisiones SA 1.201% 20 - 21.08.27 500,000 EUR 515,906 534,220 0.06Telefonica Emisiones SA 1.447% 18 - 22.01.27 600,000 EUR 629,415 646,734 0.07Telefonica Emisiones SA 1.46% 16 - 13.04.26 800,000 EUR 834,132 862,168 0.09Telefonica Emisiones SA 1.495% 18 - 11.09.25 500,000 EUR 523,248 534,655 0.06Telefonica Emisiones SA 1.528% 17 - 17.01.25 700,000 EUR 738,870 746,207 0.08Telefonica Emisiones SA 1.715% 17 - 12.01.28 700,000 EUR 745,779 775,719 0.08Telefonica Emisiones SA 1.788% 19 - 12.03.29 600,000 EUR 651,487 673,500 0.07Telefonica Emisiones SA 1.807% 20 - 21.05.32 400,000 EUR 423,235 448,552 0.05Telefonica Emisiones SA 1.864% 20 - 13.07.40 300,000 EUR 313,037 336,969 0.04Telefonica Emisiones SA 1.93% 16 - 17.10.31 400,000 EUR 417,735 459,744 0.05Telefonica Emisiones SA 1.957% 19 - 01.07.39 300,000 EUR 311,414 345,726 0.04Telefonica Emisiones SA 2.242% 14 - 27.05.22 600,000 EUR 617,830 621,084 0.06Telefonica Emisiones SA 2.318% 17 - 17.10.28 400,000 EUR 444,358 464,984 0.05Telefonica Emisiones SA 2.932% 14 - 17.10.29 100,000 EUR 107,674 123,179 0.01Telefonica Emisiones SA 2.932% 14 - 17.10.29 100,000 EUR 111,648 123,179 0.01
Xtrackers II
Xtrackers II ESG EUR CORPORATE BOND UCITS ETF (continued)
Statement of Investmentsas at 31 December 2020(expressed in EUR)
The accompanying notes form an integral part of these financial statements.
276

DescriptionNominal
ValueCurrency
(local) Cost Market Value
% ofNet
Assets
Transferable securities and money market instruments admitted to an official stock exchange listing(A)
Bonds (continued)
Spain (continued)Telefonica Emisiones SA 2.932% 14 - 17.10.29 200,000 EUR 235,688 246,358 0.03Telefonica Emisiones SA 3.987% 13 - 23.01.23 900,000 EUR 970,146 978,219 0.10
56,617,060 58,077,253 5.80SwedenAkelius Residential Property AB 1.125% 17 -14.03.24 200,000 EUR 197,509 205,774 0.02Akelius Residential Property AB 1.50% 16 - 23.01.22 350,000 EUR 354,691 356,104 0.04Akelius Residential Property AB 1.75% 17 - 07.02.25 200,000 EUR 205,796 211,564 0.02Alfa Laval Treasury International AB 0.25% 19 -25.06.24 150,000 EUR 150,402 150,516 0.02Alfa Laval Treasury International AB 1.375% 14 -12.09.22 350,000 EUR 357,633 357,553 0.04Atlas Copco AB 0.625% 16 - 30.08.26 200,000 EUR 203,118 208,076 0.02Atlas Copco AB 2.50% 13 - 28.02.23 100,000 EUR 105,742 105,891 0.01Atlas Copco AB 2.50% 13 - 28.02.23 200,000 EUR 210,276 211,782 0.02Castellum AB 0.75% 19 - 04.09.26 300,000 EUR 289,928 301,422 0.03Castellum AB 2.125% 18 - 20.11.23 200,000 EUR 204,051 211,372 0.02Essity AB 0.50% 20 - 03.02.30 200,000 EUR 201,878 204,108 0.02Essity AB 0.625% 17 - 28.03.22 200,000 EUR 201,234 201,736 0.02Essity AB 1.125% 15 - 05.03.25 100,000 EUR 102,763 104,809 0.01Essity AB 1.125% 17 - 27.03.24 400,000 EUR 406,200 415,180 0.04Essity AB 1.625% 17 - 30.03.27 300,000 EUR 318,480 327,645 0.03Essity AB 2.50% 13 - 09.06.23 200,000 EUR 211,769 213,020 0.02Fastighets AB Balder 1.125% 17 - 14.03.22 300,000 EUR 301,513 303,534 0.03Fastighets AB Balder 1.125% 19 - 29.01.27 300,000 EUR 287,798 303,837 0.03Fastighets AB Balder 1.25% 20 - 28.01.28 100,000 EUR 97,965 100,792 0.01Fastighets AB Balder 1.875% 17 - 14.03.25 250,000 EUR 255,198 262,575 0.03Fastighets AB Balder 1.875% 17 - 23.01.26 300,000 EUR 304,591 316,842 0.03Investor AB 0.375% 20 - 29.10.35 370,000 EUR 367,489 370,548 0.04Investor AB 1.50% 18 - 12.09.30 300,000 EUR 315,961 340,182 0.03Investor AB 1.50% 19 - 20.06.39 300,000 EUR 329,205 357,225 0.04Investor AB 4.50% 11 - 12.05.23 315,000 EUR 346,921 351,171 0.04Lansforsakringar Bank AB 0.125% 20 - 19.02.25 266,000 EUR 263,610 267,003 0.03Lansforsakringar Bank AB 0.50% 17 - 19.09.22 300,000 EUR 300,152 302,958 0.03Lansforsakringar Bank AB 0.875% 18 - 25.09.23 400,000 EUR 409,884 410,228 0.04Molnlycke Holdings AB 0.625% 20 - 15.01.31 230,000 EUR 231,270 231,037 0.02Molnlycke Holdings AB 0.875% 19 - 05.09.29 250,000 EUR 252,079 258,040 0.03Molnlycke Holdings AB 0.875% 19 - 05.09.29 100,000 EUR 103,219 103,216 0.01Molnlycke Holdings AB 1.75% 15 - 28.02.24 300,000 EUR 310,837 316,191 0.03Molnlycke Holdings AB 1.875% 17 - 28.02.25 242,000 EUR 250,499 259,393 0.03Sagax AB 1.125% 20 - 30.01.27 200,000 EUR 201,979 202,606 0.02Sagax AB 2.00% 18 - 17.01.24 200,000 EUR 202,388 208,724 0.02Sagax AB 2.25% 19 - 13.03.25 200,000 EUR 202,562 213,088 0.02Sandvik AB 3.00% 14 - 18.06.26 200,000 EUR 231,691 231,218 0.02Skandinaviska Enskilda Banken AB 0.05% 19 -01.07.24 200,000 EUR 199,971 201,658 0.02Skandinaviska Enskilda Banken AB 0.05% 19 -01.07.24 500,000 EUR 501,260 504,145 0.05
Xtrackers II
Xtrackers II ESG EUR CORPORATE BOND UCITS ETF (continued)
Statement of Investmentsas at 31 December 2020(expressed in EUR)
The accompanying notes form an integral part of these financial statements.
277

DescriptionNominal
ValueCurrency
(local) Cost Market Value
% ofNet
Assets
Transferable securities and money market instruments admitted to an official stock exchange listing(A)
Bonds (continued)
Sweden (continued)Skandinaviska Enskilda Banken AB 0.25% 20 -19.05.23 710,000 EUR 713,490 718,719 0.07Skandinaviska Enskilda Banken AB 0.30% 17 -17.02.22 300,000 EUR 301,388 302,289 0.03Skandinaviska Enskilda Banken AB 0.375% 20 -11.02.27 400,000 EUR 398,942 406,716 0.04Skandinaviska Enskilda Banken AB 0.50% 18 -13.03.23 507,000 EUR 512,813 515,604 0.05Skandinaviska Enskilda Banken AB 0.625% 19 -12.11.29 600,000 EUR 607,219 625,746 0.06Skandinaviska Enskilda Banken AB FRN 16 -31.10.28 400,000 EUR 400,585 409,656 0.04SKF AB 0.875% 19 - 15.11.29 200,000 EUR 207,200 212,054 0.02SKF AB 1.25% 18 - 17.09.25 200,000 EUR 203,926 211,238 0.02Svenska Handelsbanken AB 0.01% 20 - 02.12.27 410,000 EUR 410,141 409,565 0.04Svenska Handelsbanken AB 0.05% 19 - 03.09.26 300,000 EUR 297,677 301,623 0.03Svenska Handelsbanken AB 0.125% 19 - 18.06.24 200,000 EUR 200,526 202,458 0.02Svenska Handelsbanken AB 0.125% 19 - 18.06.24 300,000 EUR 301,821 303,687 0.03Svenska Handelsbanken AB 0.25% 17 - 28.02.22 500,000 EUR 501,186 504,055 0.05Svenska Handelsbanken AB 0.375% 18 - 03.07.23 200,000 EUR 201,764 203,462 0.02Svenska Handelsbanken AB 0.50% 18 - 21.03.23 500,000 EUR 504,702 509,315 0.05Svenska Handelsbanken AB 0.50% 20 - 18.02.30 531,000 EUR 524,162 546,203 0.06Svenska Handelsbanken AB 1.00% 20 - 15.04.25 750,000 EUR 777,772 786,877 0.08Svenska Handelsbanken AB 1.125% 15 - 14.12.22 770,000 EUR 788,681 792,869 0.08Svenska Handelsbanken AB FRN 18 - 02.03.28 500,000 EUR 504,967 511,035 0.05Svenska Handelsbanken AB FRN 18 - 05.03.29 400,000 EUR 414,276 417,052 0.04Svenska Handelsbanken AB 2.625% 12 - 23.08.22 600,000 EUR 627,804 629,496 0.06Swedbank AB 0.25% 17 - 07.11.22 300,000 EUR 300,554 302,565 0.03Swedbank AB 0.25% 19 - 09.10.24 300,000 EUR 295,617 302,634 0.03Swedbank AB 0.30% 17 - 06.09.22 400,000 EUR 401,985 403,584 0.04Swedbank AB 0.40% 18 - 29.08.23 400,000 EUR 404,528 406,296 0.04Swedbank AB 0.75% 20 - 05.05.25 566,000 EUR 575,240 586,121 0.06Swedbank AB 1.00% 15 - 01.06.22 400,000 EUR 405,796 407,360 0.04Swedbank AB FRN 17 - 22.11.27 350,000 EUR 346,762 353,098 0.04Swedbank AB FRN 18 - 18.09.28 200,000 EUR 198,080 204,662 0.02Tele2 AB 1.125% 18 - 15.05.24 400,000 EUR 408,702 413,696 0.04Tele2 AB 2.125% 18 - 15.05.28 300,000 EUR 327,976 336,957 0.03Telefonaktiebolaget LM Ericsson 1.875% 17 -01.03.24 250,000 EUR 263,590 263,010 0.03Telia Co. AB 0.125% 20 - 27.11.30 260,000 EUR 257,977 258,848 0.03Telia Co. AB FRN 20 - 11.05.81 266,000 EUR 261,759 269,325 0.03Telia Co. AB 1.625% 15 - 23.02.35 300,000 EUR 315,364 344,103 0.03Telia Co. AB 2.125% 19 - 20.02.34 300,000 EUR 332,417 362,274 0.04Telia Co. AB 3.00% 12 - 07.09.27 200,000 EUR 228,746 240,308 0.02Telia Co. AB FRN 17 - 04.04.78 600,000 EUR 616,289 630,702 0.06Telia Co. AB 3.50% 13 - 05.09.33 300,000 EUR 389,974 416,406 0.04Telia Co. AB 3.625% 12 - 14.02.24 330,000 EUR 363,598 369,669 0.04Telia Co. AB 3.875% 10 - 01.10.25 350,000 EUR 406,130 416,948 0.04
Xtrackers II
Xtrackers II ESG EUR CORPORATE BOND UCITS ETF (continued)
Statement of Investmentsas at 31 December 2020(expressed in EUR)
The accompanying notes form an integral part of these financial statements.
278
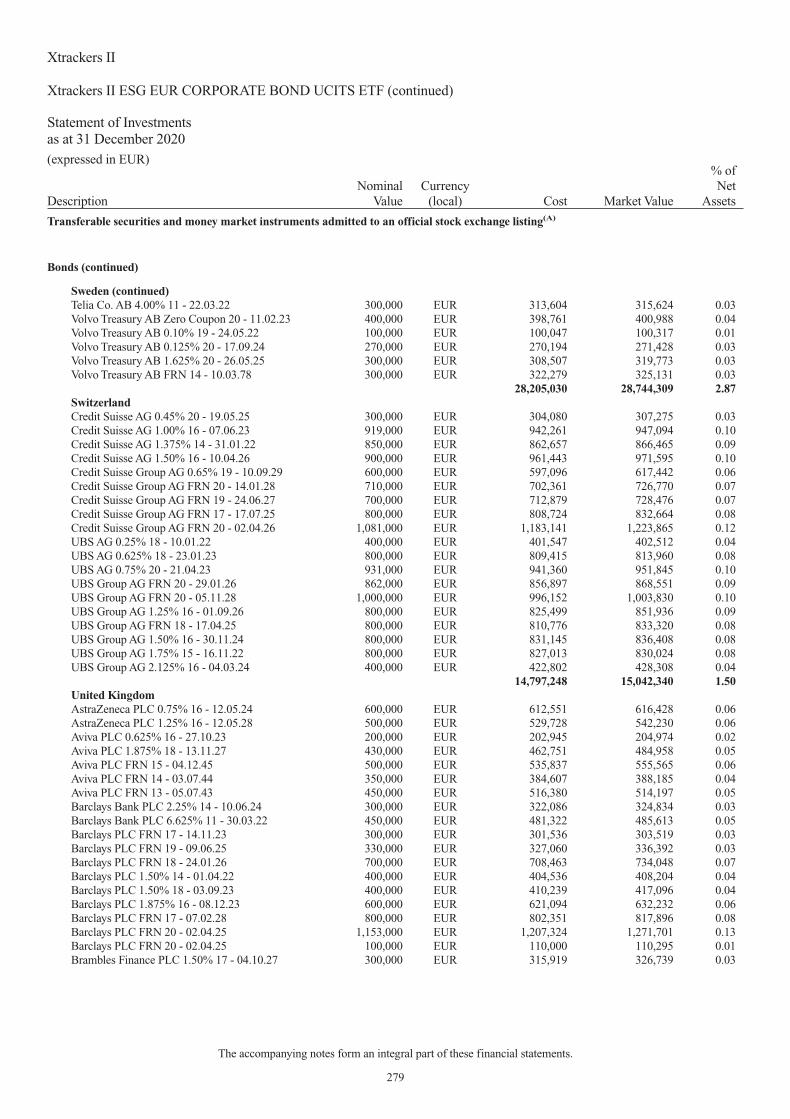
DescriptionNominal
ValueCurrency
(local) Cost Market Value
% ofNet
Assets
Transferable securities and money market instruments admitted to an official stock exchange listing(A)
Bonds (continued)
Sweden (continued)Telia Co. AB 4.00% 11 - 22.03.22 300,000 EUR 313,604 315,624 0.03Volvo Treasury AB Zero Coupon 20 - 11.02.23 400,000 EUR 398,761 400,988 0.04Volvo Treasury AB 0.10% 19 - 24.05.22 100,000 EUR 100,047 100,317 0.01Volvo Treasury AB 0.125% 20 - 17.09.24 270,000 EUR 270,194 271,428 0.03Volvo Treasury AB 1.625% 20 - 26.05.25 300,000 EUR 308,507 319,773 0.03Volvo Treasury AB FRN 14 - 10.03.78 300,000 EUR 322,279 325,131 0.03
28,205,030 28,744,309 2.87SwitzerlandCredit Suisse AG 0.45% 20 - 19.05.25 300,000 EUR 304,080 307,275 0.03Credit Suisse AG 1.00% 16 - 07.06.23 919,000 EUR 942,261 947,094 0.10Credit Suisse AG 1.375% 14 - 31.01.22 850,000 EUR 862,657 866,465 0.09Credit Suisse AG 1.50% 16 - 10.04.26 900,000 EUR 961,443 971,595 0.10Credit Suisse Group AG 0.65% 19 - 10.09.29 600,000 EUR 597,096 617,442 0.06Credit Suisse Group AG FRN 20 - 14.01.28 710,000 EUR 702,361 726,770 0.07Credit Suisse Group AG FRN 19 - 24.06.27 700,000 EUR 712,879 728,476 0.07Credit Suisse Group AG FRN 17 - 17.07.25 800,000 EUR 808,724 832,664 0.08Credit Suisse Group AG FRN 20 - 02.04.26 1,081,000 EUR 1,183,141 1,223,865 0.12UBS AG 0.25% 18 - 10.01.22 400,000 EUR 401,547 402,512 0.04UBS AG 0.625% 18 - 23.01.23 800,000 EUR 809,415 813,960 0.08UBS AG 0.75% 20 - 21.04.23 931,000 EUR 941,360 951,845 0.10UBS Group AG FRN 20 - 29.01.26 862,000 EUR 856,897 868,551 0.09UBS Group AG FRN 20 - 05.11.28 1,000,000 EUR 996,152 1,003,830 0.10UBS Group AG 1.25% 16 - 01.09.26 800,000 EUR 825,499 851,936 0.09UBS Group AG FRN 18 - 17.04.25 800,000 EUR 810,776 833,320 0.08UBS Group AG 1.50% 16 - 30.11.24 800,000 EUR 831,145 836,408 0.08UBS Group AG 1.75% 15 - 16.11.22 800,000 EUR 827,013 830,024 0.08UBS Group AG 2.125% 16 - 04.03.24 400,000 EUR 422,802 428,308 0.04
14,797,248 15,042,340 1.50United KingdomAstraZeneca PLC 0.75% 16 - 12.05.24 600,000 EUR 612,551 616,428 0.06AstraZeneca PLC 1.25% 16 - 12.05.28 500,000 EUR 529,728 542,230 0.06Aviva PLC 0.625% 16 - 27.10.23 200,000 EUR 202,945 204,974 0.02Aviva PLC 1.875% 18 - 13.11.27 430,000 EUR 462,751 484,958 0.05Aviva PLC FRN 15 - 04.12.45 500,000 EUR 535,837 555,565 0.06Aviva PLC FRN 14 - 03.07.44 350,000 EUR 384,607 388,185 0.04Aviva PLC FRN 13 - 05.07.43 450,000 EUR 516,380 514,197 0.05Barclays Bank PLC 2.25% 14 - 10.06.24 300,000 EUR 322,086 324,834 0.03Barclays Bank PLC 6.625% 11 - 30.03.22 450,000 EUR 481,322 485,613 0.05Barclays PLC FRN 17 - 14.11.23 300,000 EUR 301,536 303,519 0.03Barclays PLC FRN 19 - 09.06.25 330,000 EUR 327,060 336,392 0.03Barclays PLC FRN 18 - 24.01.26 700,000 EUR 708,463 734,048 0.07Barclays PLC 1.50% 14 - 01.04.22 400,000 EUR 404,536 408,204 0.04Barclays PLC 1.50% 18 - 03.09.23 400,000 EUR 410,239 417,096 0.04Barclays PLC 1.875% 16 - 08.12.23 600,000 EUR 621,094 632,232 0.06Barclays PLC FRN 17 - 07.02.28 800,000 EUR 802,351 817,896 0.08Barclays PLC FRN 20 - 02.04.25 1,153,000 EUR 1,207,324 1,271,701 0.13Barclays PLC FRN 20 - 02.04.25 100,000 EUR 110,000 110,295 0.01Brambles Finance PLC 1.50% 17 - 04.10.27 300,000 EUR 315,919 326,739 0.03
Xtrackers II
Xtrackers II ESG EUR CORPORATE BOND UCITS ETF (continued)
Statement of Investmentsas at 31 December 2020(expressed in EUR)
The accompanying notes form an integral part of these financial statements.
279

DescriptionNominal
ValueCurrency
(local) Cost Market Value
% ofNet
Assets
Transferable securities and money market instruments admitted to an official stock exchange listing(A)
Bonds (continued)
United Kingdom (continued)British Telecommunications PLC 0.50% 17 - 23.06.22 400,000 EUR 402,033 403,540 0.04British Telecommunications PLC 0.50% 19 - 12.09.25 300,000 EUR 302,156 305,355 0.03British Telecommunications PLC 0.875% 18 -26.09.23 300,000 EUR 305,525 307,404 0.03British Telecommunications PLC 1.00% 17 - 23.06.24 400,000 EUR 407,580 413,244 0.04British Telecommunications PLC 1.00% 17 - 21.11.24 530,000 EUR 535,687 548,311 0.06British Telecommunications PLC 1.125% 16 -10.03.23 600,000 EUR 611,332 616,560 0.06British Telecommunications PLC 1.125% 19 -12.09.29 100,000 EUR 99,474 105,168 0.01British Telecommunications PLC 1.125% 19 -12.09.29 400,000 EUR 408,415 420,672 0.04British Telecommunications PLC 1.50% 17 - 23.06.27 600,000 EUR 621,543 646,032 0.07British Telecommunications PLC 1.75% 16 - 10.03.26 100,000 EUR 103,895 108,304 0.01British Telecommunications PLC 1.75% 16 - 10.03.26 500,000 EUR 525,676 541,520 0.05British Telecommunications PLC 2.125% 18 -26.09.28 300,000 EUR 320,842 338,421 0.03Cadent Finance PLC 0.625% 16 - 22.09.24 270,000 EUR 273,027 277,938 0.03Cadent Finance PLC 0.75% 20 - 11.03.32 280,000 EUR 278,192 286,910 0.03Coca-Cola European Partners PLC 0.20% 20 -02.12.28 500,000 EUR 497,677 499,325 0.05Coca-Cola European Partners PLC 0.70% 19 -12.09.31 100,000 EUR 100,763 101,121 0.01Coca-Cola European Partners PLC 0.70% 19 -12.09.31 100,000 EUR 99,422 101,121 0.01Coca-Cola European Partners PLC 0.75% 16 -24.02.22 350,000 EUR 352,985 353,693 0.04Coca-Cola European Partners PLC 1.125% 16 -26.05.24 474,000 EUR 490,884 493,107 0.05Coca-Cola European Partners PLC 1.125% 19 -12.04.29 300,000 EUR 313,711 318,936 0.03Coca-Cola European Partners PLC 1.50% 18 -08.11.27 400,000 EUR 432,101 435,068 0.04Coca-Cola European Partners PLC 1.75% 16 -26.05.28 300,000 EUR 319,542 332,907 0.03Coca-Cola European Partners PLC 1.75% 20 -27.03.26 266,000 EUR 274,879 288,403 0.03Coca-Cola European Partners PLC 1.875% 15 -18.03.30 200,000 EUR 213,963 226,418 0.02Coca-Cola European Partners PLC 2.375% 13 -07.05.25 200,000 EUR 217,024 220,046 0.02Coca-Cola European Partners PLC 2.625% 13 -06.11.23 200,000 EUR 214,658 214,436 0.02Compass Group PLC 1.875% 14 - 27.01.23 300,000 EUR 309,916 313,134 0.03DS Smith PLC 0.875% 19 - 12.09.26 300,000 EUR 306,376 305,850 0.03DS Smith PLC 1.375% 17 - 26.07.24 380,000 EUR 393,699 393,422 0.04DS Smith PLC 2.25% 15 - 16.09.22 250,000 EUR 258,625 258,338 0.03easyJet PLC 0.875% 19 - 11.06.25 250,000 EUR 238,650 238,643 0.02
Xtrackers II
Xtrackers II ESG EUR CORPORATE BOND UCITS ETF (continued)
Statement of Investmentsas at 31 December 2020(expressed in EUR)
The accompanying notes form an integral part of these financial statements.
280

DescriptionNominal
ValueCurrency
(local) Cost Market Value
% ofNet
Assets
Transferable securities and money market instruments admitted to an official stock exchange listing(A)
Bonds (continued)
United Kingdom (continued)easyJet PLC 1.125% 16 - 18.10.23 350,000 EUR 343,282 343,000 0.04easyJet PLC 1.75% 16 - 09.02.23 250,000 EUR 250,298 250,060 0.03Experian Finance PLC 1.375% 17 - 25.06.26 200,000 EUR 205,003 214,830 0.02GlaxoSmithKline Capital PLC Zero Coupon 19 -23.09.23 200,000 EUR 200,055 200,982 0.02GlaxoSmithKline Capital PLC 0.125% 20 - 12.05.23 430,000 EUR 431,724 433,612 0.04GlaxoSmithKline Capital PLC 1.00% 17 - 12.09.26 400,000 EUR 415,825 423,536 0.04GlaxoSmithKline Capital PLC 1.25% 18 - 21.05.26 600,000 EUR 630,199 640,764 0.06GlaxoSmithKline Capital PLC 1.375% 14 - 02.12.24 600,000 EUR 632,355 636,216 0.06GlaxoSmithKline Capital PLC 1.375% 17 - 12.09.29 200,000 EUR 213,370 222,814 0.02GlaxoSmithKline Capital PLC 1.75% 18 - 21.05.30 500,000 EUR 557,136 573,935 0.06GlaxoSmithKline Capital PLC 4.00% 05 - 16.06.25 400,000 EUR 468,002 473,648 0.05Hammerson PLC 1.75% 16 - 15.03.23 200,000 EUR 191,399 191,484 0.02Hammerson PLC 2.00% 14 - 01.07.22 400,000 EUR 398,994 392,956 0.04HBOS PLC FRN 05 - 18.03.30 200,000 EUR 217,048 228,862 0.02Hitachi Capital UK PLC 0.125% 19 - 29.11.22 100,000 EUR 100,054 99,654 0.01HSBC Holdings PLC FRN 20 - 13.11.26 560,000 EUR 565,447 567,342 0.06HSBC Holdings PLC FRN 20 - 13.11.31 670,000 EUR 683,353 693,738 0.07HSBC Holdings PLC 0.875% 16 - 06.09.24 1,123,000 EUR 1,152,271 1,163,372 0.12HSBC Holdings PLC 1.50% 16 - 15.03.22 670,000 EUR 681,387 685,135 0.07HSBC Holdings PLC FRN 18 - 04.12.24 700,000 EUR 727,798 733,355 0.07HSBC Holdings PLC 2.50% 16 - 15.03.27 600,000 EUR 680,455 691,794 0.07HSBC Holdings PLC 3.00% 15 - 30.06.25 750,000 EUR 817,456 838,710 0.08HSBC Holdings PLC 3.125% 16 - 07.06.28 600,000 EUR 687,713 716,496 0.07Informa PLC 1.25% 19 - 22.04.28 300,000 EUR 281,192 300,777 0.03Informa PLC 1.50% 18 - 05.07.23 350,000 EUR 357,120 359,121 0.04Informa PLC 2.125% 20 - 06.10.25 450,000 EUR 449,156 474,169 0.05InterContinental Hotels Group PLC 1.625% 20 -08.10.24 250,000 EUR 256,290 256,483 0.03InterContinental Hotels Group PLC 2.125% 18 -15.05.27 350,000 EUR 368,863 369,624 0.04Intermediate Capital Group PLC 1.625% 20 - 17.02.27 266,000 EUR 259,753 269,705 0.03ITV PLC 1.375% 19 - 26.09.26 300,000 EUR 305,519 308,544 0.03ITV PLC 2.125% 15 - 21.09.22 270,000 EUR 277,369 277,530 0.03Lloyds Bank Corporate Markets PLC 0.25% 19 -04.10.22 400,000 EUR 398,242 402,512 0.04Lloyds Bank Corporate Markets PLC 0.375% 20 -28.01.25 461,000 EUR 462,199 467,145 0.05Lloyds Bank Corporate Markets PLC 2.375% 20 -09.04.26 466,000 EUR 496,590 521,016 0.05Lloyds Bank PLC 1.25% 15 - 13.01.25 500,000 EUR 520,755 528,795 0.05Lloyds Bank PLC 1.375% 15 - 08.09.22 530,000 EUR 542,953 545,423 0.06Lloyds Banking Group PLC FRN 19 - 12.11.25 700,000 EUR 691,504 708,246 0.07Lloyds Banking Group PLC FRN 18 - 15.01.24 700,000 EUR 698,663 707,924 0.07Lloyds Banking Group PLC 1.00% 16 - 09.11.23 450,000 EUR 456,721 463,747 0.05Lloyds Banking Group PLC 1.50% 17 - 12.09.27 550,000 EUR 568,695 601,337 0.06Lloyds Banking Group PLC FRN 18 - 07.09.28 500,000 EUR 500,670 514,825 0.05Lloyds Banking Group PLC FRN 20 - 01.04.26 815,000 EUR 880,604 926,590 0.09
Xtrackers II
Xtrackers II ESG EUR CORPORATE BOND UCITS ETF (continued)
Statement of Investmentsas at 31 December 2020(expressed in EUR)
The accompanying notes form an integral part of these financial statements.
281

DescriptionNominal
ValueCurrency
(local) Cost Market Value
% ofNet
Assets
Transferable securities and money market instruments admitted to an official stock exchange listing(A)
Bonds (continued)
United Kingdom (continued)Lloyds Banking Group PLC FRN 20 - 18.03.30 200,000 EUR 215,005 228,740 0.02London Stock Exchange Group PLC 0.875% 17 -19.09.24 300,000 EUR 305,936 309,744 0.03London Stock Exchange Group PLC 1.75% 17 -19.09.29 200,000 EUR 215,375 221,492 0.02London Stock Exchange Group PLC 1.75% 18 -06.12.27 300,000 EUR 318,471 330,594 0.03Mondi Finance PLC 1.50% 16 - 15.04.24 350,000 EUR 367,749 366,751 0.04Mondi Finance PLC 1.625% 18 - 27.04.26 500,000 EUR 541,629 539,060 0.05Motability Operations Group PLC 0.375% 19 -03.01.26 550,000 EUR 557,196 561,594 0.06Motability Operations Group PLC 0.875% 17 -14.03.25 200,000 EUR 200,549 208,858 0.02Motability Operations Group PLC 1.625% 15 -09.06.23 400,000 EUR 417,559 418,856 0.04Nationwide Building Society 0.25% 20 - 22.07.25 590,000 EUR 595,014 596,024 0.06Nationwide Building Society 0.625% 17 - 19.04.23 400,000 EUR 405,844 407,024 0.04Nationwide Building Society 1.125% 15 - 03.06.22 150,000 EUR 152,428 152,861 0.02Nationwide Building Society 1.125% 15 - 03.06.22 200,000 EUR 203,487 203,814 0.02Nationwide Building Society 1.25% 15 - 03.03.25 550,000 EUR 573,983 580,646 0.06Nationwide Building Society FRN 18 - 08.03.26 498,000 EUR 516,995 527,497 0.05Nationwide Building Society FRN 17 - 25.07.29 600,000 EUR 610,129 627,120 0.06Natwest Group PLC FRN 19 - 15.11.25 390,000 EUR 390,793 398,073 0.04Natwest Group PLC FRN 18 - 02.03.26 880,000 EUR 918,553 933,970 0.09Natwest Group PLC FRN 17 - 08.03.23 900,000 EUR 919,921 922,122 0.09Natwest Group PLC FRN 18 - 04.03.25 390,000 EUR 408,201 412,203 0.04Natwest Group PLC 2.50% 16 - 22.03.23 880,000 EUR 923,549 928,972 0.09NatWest Markets PLC 0.625% 18 - 02.03.22 780,000 EUR 784,295 786,560 0.08NatWest Markets PLC 1.00% 19 - 28.05.24 680,000 EUR 690,940 702,984 0.07NatWest Markets PLC 1.125% 18 - 14.06.23 290,000 EUR 295,612 298,514 0.03NatWest Markets PLC 2.75% 20 - 02.04.25 540,000 EUR 586,133 600,010 0.06Omnicom Finance Holdings PLC 0.80% 19 - 08.07.27 300,000 EUR 298,170 309,048 0.03Omnicom Finance Holdings PLC 1.40% 19 - 08.07.31 300,000 EUR 309,419 326,412 0.03OTE PLC 0.875% 19 - 24.09.26 250,000 EUR 244,654 258,590 0.03OTE PLC 2.375% 18 - 18.07.22 200,000 EUR 207,072 206,984 0.02Pearson Funding PLC 1.375% 15 - 06.05.25 100,000 EUR 101,703 102,643 0.01Phoenix Group Holdings PLC 4.375% 18 - 24.01.29 300,000 EUR 319,252 343,428 0.04Rentokil Initial PLC 0.50% 20 - 14.10.28 340,000 EUR 342,141 343,325 0.04Rentokil Initial PLC 0.875% 19 - 30.05.26 350,000 EUR 353,809 364,220 0.04Rentokil Initial PLC 0.95% 17 - 22.11.24 200,000 EUR 206,293 207,086 0.02Royal Mail PLC 1.25% 19 - 08.10.26 300,000 EUR 302,978 310,881 0.03Royal Mail PLC 2.375% 14 - 29.07.24 400,000 EUR 422,807 430,212 0.04Santander UK Group Holdings PLC FRN 20 -28.02.25 548,000 EUR 545,004 552,368 0.06Santander UK Group Holdings PLC 1.125% 16 -08.09.23 500,000 EUR 502,140 514,935 0.05Santander UK PLC 1.125% 15 - 14.01.22 300,000 EUR 303,645 304,695 0.03Santander UK PLC 1.125% 15 - 10.03.25 300,000 EUR 308,392 314,919 0.03
Xtrackers II
Xtrackers II ESG EUR CORPORATE BOND UCITS ETF (continued)
Statement of Investmentsas at 31 December 2020(expressed in EUR)
The accompanying notes form an integral part of these financial statements.
282
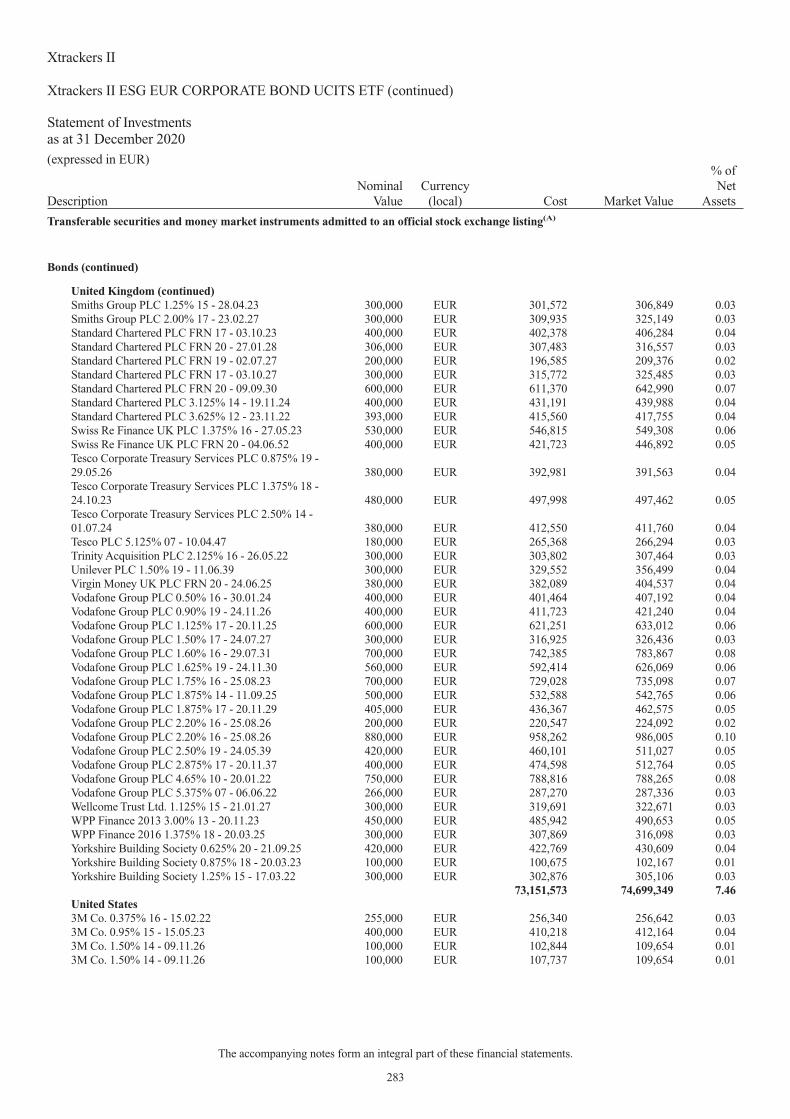
DescriptionNominal
ValueCurrency
(local) Cost Market Value
% ofNet
Assets
Transferable securities and money market instruments admitted to an official stock exchange listing(A)
Bonds (continued)
United Kingdom (continued)Smiths Group PLC 1.25% 15 - 28.04.23 300,000 EUR 301,572 306,849 0.03Smiths Group PLC 2.00% 17 - 23.02.27 300,000 EUR 309,935 325,149 0.03Standard Chartered PLC FRN 17 - 03.10.23 400,000 EUR 402,378 406,284 0.04Standard Chartered PLC FRN 20 - 27.01.28 306,000 EUR 307,483 316,557 0.03Standard Chartered PLC FRN 19 - 02.07.27 200,000 EUR 196,585 209,376 0.02Standard Chartered PLC FRN 17 - 03.10.27 300,000 EUR 315,772 325,485 0.03Standard Chartered PLC FRN 20 - 09.09.30 600,000 EUR 611,370 642,990 0.07Standard Chartered PLC 3.125% 14 - 19.11.24 400,000 EUR 431,191 439,988 0.04Standard Chartered PLC 3.625% 12 - 23.11.22 393,000 EUR 415,560 417,755 0.04Swiss Re Finance UK PLC 1.375% 16 - 27.05.23 530,000 EUR 546,815 549,308 0.06Swiss Re Finance UK PLC FRN 20 - 04.06.52 400,000 EUR 421,723 446,892 0.05Tesco Corporate Treasury Services PLC 0.875% 19 -29.05.26 380,000 EUR 392,981 391,563 0.04Tesco Corporate Treasury Services PLC 1.375% 18 -24.10.23 480,000 EUR 497,998 497,462 0.05Tesco Corporate Treasury Services PLC 2.50% 14 -01.07.24 380,000 EUR 412,550 411,760 0.04Tesco PLC 5.125% 07 - 10.04.47 180,000 EUR 265,368 266,294 0.03Trinity Acquisition PLC 2.125% 16 - 26.05.22 300,000 EUR 303,802 307,464 0.03Unilever PLC 1.50% 19 - 11.06.39 300,000 EUR 329,552 356,499 0.04Virgin Money UK PLC FRN 20 - 24.06.25 380,000 EUR 382,089 404,537 0.04Vodafone Group PLC 0.50% 16 - 30.01.24 400,000 EUR 401,464 407,192 0.04Vodafone Group PLC 0.90% 19 - 24.11.26 400,000 EUR 411,723 421,240 0.04Vodafone Group PLC 1.125% 17 - 20.11.25 600,000 EUR 621,251 633,012 0.06Vodafone Group PLC 1.50% 17 - 24.07.27 300,000 EUR 316,925 326,436 0.03Vodafone Group PLC 1.60% 16 - 29.07.31 700,000 EUR 742,385 783,867 0.08Vodafone Group PLC 1.625% 19 - 24.11.30 560,000 EUR 592,414 626,069 0.06Vodafone Group PLC 1.75% 16 - 25.08.23 700,000 EUR 729,028 735,098 0.07Vodafone Group PLC 1.875% 14 - 11.09.25 500,000 EUR 532,588 542,765 0.06Vodafone Group PLC 1.875% 17 - 20.11.29 405,000 EUR 436,367 462,575 0.05Vodafone Group PLC 2.20% 16 - 25.08.26 200,000 EUR 220,547 224,092 0.02Vodafone Group PLC 2.20% 16 - 25.08.26 880,000 EUR 958,262 986,005 0.10Vodafone Group PLC 2.50% 19 - 24.05.39 420,000 EUR 460,101 511,027 0.05Vodafone Group PLC 2.875% 17 - 20.11.37 400,000 EUR 474,598 512,764 0.05Vodafone Group PLC 4.65% 10 - 20.01.22 750,000 EUR 788,816 788,265 0.08Vodafone Group PLC 5.375% 07 - 06.06.22 266,000 EUR 287,270 287,336 0.03Wellcome Trust Ltd. 1.125% 15 - 21.01.27 300,000 EUR 319,691 322,671 0.03WPP Finance 2013 3.00% 13 - 20.11.23 450,000 EUR 485,942 490,653 0.05WPP Finance 2016 1.375% 18 - 20.03.25 300,000 EUR 307,869 316,098 0.03Yorkshire Building Society 0.625% 20 - 21.09.25 420,000 EUR 422,769 430,609 0.04Yorkshire Building Society 0.875% 18 - 20.03.23 100,000 EUR 100,675 102,167 0.01Yorkshire Building Society 1.25% 15 - 17.03.22 300,000 EUR 302,876 305,106 0.03
73,151,573 74,699,349 7.46United States3M Co. 0.375% 16 - 15.02.22 255,000 EUR 256,340 256,642 0.033M Co. 0.95% 15 - 15.05.23 400,000 EUR 410,218 412,164 0.043M Co. 1.50% 14 - 09.11.26 100,000 EUR 102,844 109,654 0.013M Co. 1.50% 14 - 09.11.26 100,000 EUR 107,737 109,654 0.01
Xtrackers II
Xtrackers II ESG EUR CORPORATE BOND UCITS ETF (continued)
Statement of Investmentsas at 31 December 2020(expressed in EUR)
The accompanying notes form an integral part of these financial statements.
283

DescriptionNominal
ValueCurrency
(local) Cost Market Value
% ofNet
Assets
Transferable securities and money market instruments admitted to an official stock exchange listing(A)
Bonds (continued)
United States (continued)3M Co. 1.50% 14 - 09.11.26 300,000 EUR 327,065 328,962 0.033M Co. 1.50% 16 - 02.06.31 300,000 EUR 331,888 345,375 0.033M Co. 1.75% 15 - 15.05.30 100,000 EUR 114,611 116,510 0.013M Co. 1.75% 15 - 15.05.30 100,000 EUR 108,780 116,510 0.01AbbVie Inc. 0.75% 19 - 18.11.27 500,000 EUR 504,246 519,580 0.05AbbVie Inc. 1.25% 19 - 18.11.31 430,000 EUR 444,024 464,645 0.05AbbVie Inc. 1.375% 16 - 17.05.24 700,000 EUR 722,173 730,828 0.07AbbVie Inc. 2.125% 16 - 17.11.28 300,000 EUR 321,366 342,069 0.03AbbVie Inc. 2.625% 20 - 15.11.28 330,000 EUR 373,914 390,400 0.04Air Products & Chemicals Inc. 0.50% 20 - 05.05.28 350,000 EUR 356,484 362,089 0.04Air Products & Chemicals Inc. 0.80% 20 - 05.05.32 233,000 EUR 235,515 247,653 0.03Air Products & Chemicals Inc. 1.00% 15 - 12.02.25 200,000 EUR 206,466 209,770 0.02American Honda Finance Corp. 0.35% 19 - 26.08.22 700,000 EUR 702,351 706,482 0.07American Honda Finance Corp. 0.55% 18 - 17.03.23 300,000 EUR 301,838 304,788 0.03American Honda Finance Corp. 0.75% 17 - 17.01.24 300,000 EUR 306,139 307,671 0.03American Honda Finance Corp. 1.375% 15 - 10.11.22 450,000 EUR 462,749 463,496 0.05American Honda Finance Corp. 1.60% 20 - 20.04.22 233,000 EUR 234,522 238,422 0.02American Honda Finance Corp. 1.95% 20 - 18.10.24 500,000 EUR 519,968 538,025 0.05American Tower Corp. 0.50% 20 - 15.01.28 380,000 EUR 377,485 382,310 0.04American Tower Corp. 1.00% 20 - 15.01.32 400,000 EUR 400,249 407,300 0.04American Tower Corp. 1.375% 17 - 04.04.25 300,000 EUR 312,990 316,053 0.03American Tower Corp. 1.95% 18 - 22.05.26 300,000 EUR 317,156 326,892 0.03Amgen Inc. 1.25% 16 - 25.02.22 700,000 EUR 708,338 709,331 0.07Amgen Inc. 2.00% 16 - 25.02.26 250,000 EUR 267,449 276,135 0.03Apple Inc. Zero Coupon 19 - 15.11.25 559,000 EUR 559,903 564,819 0.06Apple Inc. 0.50% 19 - 15.11.31 550,000 EUR 559,477 576,664 0.06Apple Inc. 0.875% 17 - 24.05.25 780,000 EUR 810,618 816,176 0.08Apple Inc. 1.00% 14 - 10.11.22 800,000 EUR 817,314 819,720 0.08Apple Inc. 1.375% 15 - 17.01.24 100,000 EUR 104,151 105,145 0.01Apple Inc. 1.375% 15 - 17.01.24 400,000 EUR 417,413 420,580 0.04Apple Inc. 1.375% 17 - 24.05.29 600,000 EUR 640,499 667,788 0.07Apple Inc. 1.625% 14 - 10.11.26 800,000 EUR 867,790 882,760 0.09Apple Inc. 2.00% 15 - 17.09.27 600,000 EUR 675,281 685,434 0.07Archer-Daniels-Midland Co. 1.00% 18 - 12.09.25 430,000 EUR 454,155 452,769 0.05Archer-Daniels-Midland Co. 1.00% 18 - 12.09.25 100,000 EUR 105,393 105,295 0.01Archer-Daniels-Midland Co. 1.75% 15 - 23.06.23 300,000 EUR 315,569 315,111 0.03Autoliv Inc. 0.75% 18 - 26.06.23 290,000 EUR 289,720 294,452 0.03Baxter International Inc. 0.40% 19 - 15.05.24 420,000 EUR 428,177 427,484 0.04Baxter International Inc. 1.30% 17 - 30.05.25 340,000 EUR 359,764 359,196 0.04Baxter International Inc. 1.30% 19 - 15.05.29 420,000 EUR 458,560 456,301 0.05Becton Dickinson and Co. 1.00% 16 - 15.12.22 200,000 EUR 202,130 203,482 0.02Becton Dickinson and Co. 1.401% 18 - 24.05.23 100,000 EUR 101,780 103,140 0.01Becton Dickinson and Co. 1.90% 16 - 15.12.26 200,000 EUR 210,686 215,978 0.02BlackRock Inc. 1.25% 15 - 06.05.25 400,000 EUR 419,858 425,912 0.04BMW US Capital LLC 0.625% 15 - 20.04.22 550,000 EUR 553,685 556,479 0.06BMW US Capital LLC 1.00% 15 - 20.04.27 475,000 EUR 486,681 505,946 0.05Booking Holdings Inc. 0.80% 17 - 10.03.22 600,000 EUR 604,918 606,102 0.06Booking Holdings Inc. 1.80% 15 - 03.03.27 600,000 EUR 630,819 658,662 0.07
Xtrackers II
Xtrackers II ESG EUR CORPORATE BOND UCITS ETF (continued)
Statement of Investmentsas at 31 December 2020(expressed in EUR)
The accompanying notes form an integral part of these financial statements.
284
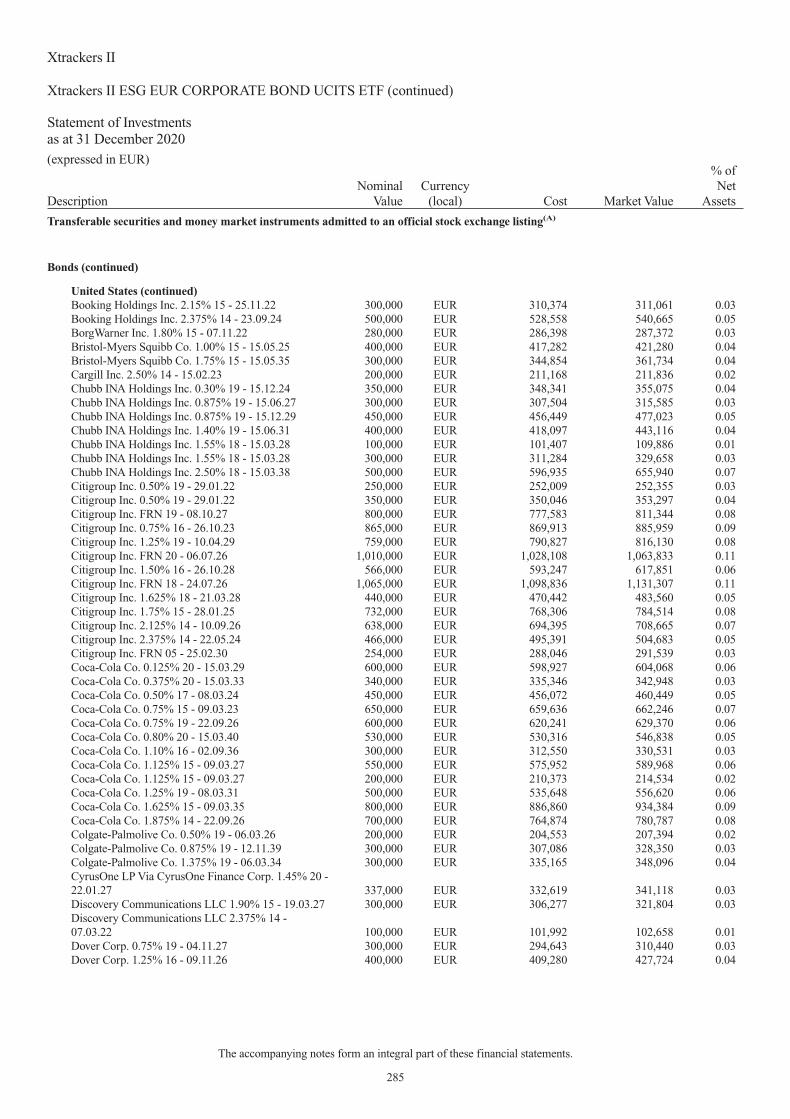
DescriptionNominal
ValueCurrency
(local) Cost Market Value
% ofNet
Assets
Transferable securities and money market instruments admitted to an official stock exchange listing(A)
Bonds (continued)
United States (continued)Booking Holdings Inc. 2.15% 15 - 25.11.22 300,000 EUR 310,374 311,061 0.03Booking Holdings Inc. 2.375% 14 - 23.09.24 500,000 EUR 528,558 540,665 0.05BorgWarner Inc. 1.80% 15 - 07.11.22 280,000 EUR 286,398 287,372 0.03Bristol-Myers Squibb Co. 1.00% 15 - 15.05.25 400,000 EUR 417,282 421,280 0.04Bristol-Myers Squibb Co. 1.75% 15 - 15.05.35 300,000 EUR 344,854 361,734 0.04Cargill Inc. 2.50% 14 - 15.02.23 200,000 EUR 211,168 211,836 0.02Chubb INA Holdings Inc. 0.30% 19 - 15.12.24 350,000 EUR 348,341 355,075 0.04Chubb INA Holdings Inc. 0.875% 19 - 15.06.27 300,000 EUR 307,504 315,585 0.03Chubb INA Holdings Inc. 0.875% 19 - 15.12.29 450,000 EUR 456,449 477,023 0.05Chubb INA Holdings Inc. 1.40% 19 - 15.06.31 400,000 EUR 418,097 443,116 0.04Chubb INA Holdings Inc. 1.55% 18 - 15.03.28 100,000 EUR 101,407 109,886 0.01Chubb INA Holdings Inc. 1.55% 18 - 15.03.28 300,000 EUR 311,284 329,658 0.03Chubb INA Holdings Inc. 2.50% 18 - 15.03.38 500,000 EUR 596,935 655,940 0.07Citigroup Inc. 0.50% 19 - 29.01.22 250,000 EUR 252,009 252,355 0.03Citigroup Inc. 0.50% 19 - 29.01.22 350,000 EUR 350,046 353,297 0.04Citigroup Inc. FRN 19 - 08.10.27 800,000 EUR 777,583 811,344 0.08Citigroup Inc. 0.75% 16 - 26.10.23 865,000 EUR 869,913 885,959 0.09Citigroup Inc. 1.25% 19 - 10.04.29 759,000 EUR 790,827 816,130 0.08Citigroup Inc. FRN 20 - 06.07.26 1,010,000 EUR 1,028,108 1,063,833 0.11Citigroup Inc. 1.50% 16 - 26.10.28 566,000 EUR 593,247 617,851 0.06Citigroup Inc. FRN 18 - 24.07.26 1,065,000 EUR 1,098,836 1,131,307 0.11Citigroup Inc. 1.625% 18 - 21.03.28 440,000 EUR 470,442 483,560 0.05Citigroup Inc. 1.75% 15 - 28.01.25 732,000 EUR 768,306 784,514 0.08Citigroup Inc. 2.125% 14 - 10.09.26 638,000 EUR 694,395 708,665 0.07Citigroup Inc. 2.375% 14 - 22.05.24 466,000 EUR 495,391 504,683 0.05Citigroup Inc. FRN 05 - 25.02.30 254,000 EUR 288,046 291,539 0.03Coca-Cola Co. 0.125% 20 - 15.03.29 600,000 EUR 598,927 604,068 0.06Coca-Cola Co. 0.375% 20 - 15.03.33 340,000 EUR 335,346 342,948 0.03Coca-Cola Co. 0.50% 17 - 08.03.24 450,000 EUR 456,072 460,449 0.05Coca-Cola Co. 0.75% 15 - 09.03.23 650,000 EUR 659,636 662,246 0.07Coca-Cola Co. 0.75% 19 - 22.09.26 600,000 EUR 620,241 629,370 0.06Coca-Cola Co. 0.80% 20 - 15.03.40 530,000 EUR 530,316 546,838 0.05Coca-Cola Co. 1.10% 16 - 02.09.36 300,000 EUR 312,550 330,531 0.03Coca-Cola Co. 1.125% 15 - 09.03.27 550,000 EUR 575,952 589,968 0.06Coca-Cola Co. 1.125% 15 - 09.03.27 200,000 EUR 210,373 214,534 0.02Coca-Cola Co. 1.25% 19 - 08.03.31 500,000 EUR 535,648 556,620 0.06Coca-Cola Co. 1.625% 15 - 09.03.35 800,000 EUR 886,860 934,384 0.09Coca-Cola Co. 1.875% 14 - 22.09.26 700,000 EUR 764,874 780,787 0.08Colgate-Palmolive Co. 0.50% 19 - 06.03.26 200,000 EUR 204,553 207,394 0.02Colgate-Palmolive Co. 0.875% 19 - 12.11.39 300,000 EUR 307,086 328,350 0.03Colgate-Palmolive Co. 1.375% 19 - 06.03.34 300,000 EUR 335,165 348,096 0.04CyrusOne LP Via CyrusOne Finance Corp. 1.45% 20 -22.01.27 337,000 EUR 332,619 341,118 0.03Discovery Communications LLC 1.90% 15 - 19.03.27 300,000 EUR 306,277 321,804 0.03Discovery Communications LLC 2.375% 14 -07.03.22 100,000 EUR 101,992 102,658 0.01Dover Corp. 0.75% 19 - 04.11.27 300,000 EUR 294,643 310,440 0.03Dover Corp. 1.25% 16 - 09.11.26 400,000 EUR 409,280 427,724 0.04
Xtrackers II
Xtrackers II ESG EUR CORPORATE BOND UCITS ETF (continued)
Statement of Investmentsas at 31 December 2020(expressed in EUR)
The accompanying notes form an integral part of these financial statements.
285

DescriptionNominal
ValueCurrency
(local) Cost Market Value
% ofNet
Assets
Transferable securities and money market instruments admitted to an official stock exchange listing(A)
Bonds (continued)
United States (continued)Dow Chemical Co. 0.50% 20 - 15.03.27 531,000 EUR 508,031 537,043 0.05Dow Chemical Co. 1.125% 20 - 15.03.32 448,000 EUR 435,106 464,939 0.05Dow Chemical Co. 1.875% 20 - 15.03.40 266,000 EUR 269,797 296,002 0.03DXC Technology Co. 1.75% 18 - 15.01.26 400,000 EUR 406,871 409,996 0.04Ecolab Inc. 1.00% 16 - 15.01.24 500,000 EUR 513,648 515,520 0.05Ecolab Inc. 2.625% 15 - 08.07.25 200,000 EUR 220,645 223,598 0.02Eli Lilly & Co. 0.625% 19 - 01.11.31 400,000 EUR 405,819 422,552 0.04Eli Lilly & Co. 1.00% 15 - 02.06.22 300,000 EUR 304,098 304,656 0.03Eli Lilly & Co. 1.625% 15 - 02.06.26 600,000 EUR 647,492 654,990 0.07Eli Lilly & Co. 1.70% 19 - 01.11.49 530,000 EUR 561,745 625,888 0.06Eli Lilly & Co. 2.125% 15 - 03.06.30 300,000 EUR 341,889 359,427 0.04Emerson Electric Co. 0.375% 19 - 22.05.24 237,000 EUR 235,649 241,385 0.02Emerson Electric Co. 1.25% 19 - 15.10.25 300,000 EUR 318,540 319,653 0.03Emerson Electric Co. 1.25% 19 - 15.10.25 137,000 EUR 137,052 145,975 0.01Emerson Electric Co. 2.00% 19 - 15.10.29 237,000 EUR 256,901 273,664 0.03Equinix Inc. 2.875% 17 - 01.02.26 250,000 EUR 257,542 253,695 0.03FedEx Corp. 0.45% 19 - 05.08.25 230,000 EUR 234,448 234,938 0.02FedEx Corp. 0.70% 19 - 13.05.22 390,000 EUR 394,946 394,477 0.04FedEx Corp. 1.00% 16 - 11.01.23 340,000 EUR 346,934 346,980 0.04FedEx Corp. 1.30% 19 - 05.08.31 330,000 EUR 349,521 354,833 0.04FedEx Corp. 1.625% 16 - 11.01.27 670,000 EUR 726,706 730,983 0.07Fidelity National Information Services Inc. 0.125%19 - 03.12.22 500,000 EUR 503,347 502,585 0.05Fidelity National Information Services Inc. 0.625%19 - 03.12.25 310,000 EUR 320,269 318,981 0.03Fidelity National Information Services Inc. 0.75% 19 -21.05.23 700,000 EUR 714,934 714,119 0.07Fidelity National Information Services Inc. 1.00% 19 -03.12.28 310,000 EUR 326,534 325,134 0.03Fidelity National Information Services Inc. 1.10% 17 -15.07.24 350,000 EUR 364,733 363,696 0.04Fidelity National Information Services Inc. 1.50% 19 -21.05.27 730,000 EUR 790,083 787,137 0.08Fidelity National Information Services Inc. 2.00% 19 -21.05.30 600,000 EUR 684,170 681,744 0.07Fidelity National Information Services Inc. 2.95% 19 -21.05.39 250,000 EUR 321,087 320,048 0.03Fiserv Inc. 0.375% 19 - 01.07.23 350,000 EUR 354,603 354,316 0.04Fiserv Inc. 1.125% 19 - 01.07.27 250,000 EUR 265,277 264,720 0.03Fiserv Inc. 1.625% 19 - 01.07.30 250,000 EUR 275,589 274,880 0.03Flowserve Corp. 1.25% 15 - 17.03.22 170,000 EUR 170,541 170,046 0.02General Mills Inc. 0.45% 20 - 15.01.26 350,000 EUR 346,889 357,564 0.04General Mills Inc. 1.00% 15 - 27.04.23 100,000 EUR 102,132 102,451 0.01General Mills Inc. 1.00% 15 - 27.04.23 100,000 EUR 100,612 102,451 0.01General Mills Inc. 1.50% 15 - 27.04.27 200,000 EUR 207,452 217,864 0.02Goldman Sachs Group Inc. 0.125% 19 - 19.08.24 500,000 EUR 498,597 501,960 0.05Goldman Sachs Group Inc. 0.875% 20 - 21.01.30 93,000 EUR 93,404 97,648 0.01Goldman Sachs Group Inc. 0.875% 20 - 21.01.30 657,000 EUR 657,402 689,837 0.07
Xtrackers II
Xtrackers II ESG EUR CORPORATE BOND UCITS ETF (continued)
Statement of Investmentsas at 31 December 2020(expressed in EUR)
The accompanying notes form an integral part of these financial statements.
286

DescriptionNominal
ValueCurrency
(local) Cost Market Value
% ofNet
Assets
Transferable securities and money market instruments admitted to an official stock exchange listing(A)
Bonds (continued)
United States (continued)Goldman Sachs Group Inc. 1.25% 16 - 01.05.25 650,000 EUR 663,246 675,532 0.07Goldman Sachs Group Inc. 1.375% 15 - 26.07.22 750,000 EUR 765,580 769,057 0.08Goldman Sachs Group Inc. 1.375% 17 - 15.05.24 1,002,000 EUR 1,018,593 1,034,264 0.10Goldman Sachs Group Inc. 1.625% 16 - 27.07.26 1,120,000 EUR 1,173,753 1,210,507 0.12Goldman Sachs Group Inc. 2.00% 15 - 27.07.23 960,000 EUR 1,003,684 1,012,608 0.10Goldman Sachs Group Inc. 2.00% 18 - 22.03.28 450,000 EUR 482,023 505,787 0.05Goldman Sachs Group Inc. 2.00% 18 - 01.11.28 750,000 EUR 800,847 851,377 0.09Goldman Sachs Group Inc. 2.125% 14 - 30.09.24 500,000 EUR 524,769 538,140 0.05Goldman Sachs Group Inc. 2.875% 14 - 03.06.26 451,000 EUR 496,368 516,778 0.05Goldman Sachs Group Inc. 3.00% 16 - 12.02.31 607,000 EUR 722,182 766,416 0.08Goldman Sachs Group Inc. 3.25% 13 - 01.02.23 560,000 EUR 595,112 599,990 0.06Goldman Sachs Group Inc. 3.375% 20 - 27.03.25 1,153,000 EUR 1,253,535 1,313,717 0.13Harley-Davidson Financial Services Inc. 0.90% 19 -19.11.24 300,000 EUR 302,243 304,470 0.03Harley-Davidson Financial Services Inc. 3.875% 20 -19.05.23 410,000 EUR 420,217 444,666 0.04Illinois Tool Works Inc. 0.25% 19 - 05.12.24 100,000 EUR 99,636 101,559 0.01Illinois Tool Works Inc. 0.25% 19 - 05.12.24 400,000 EUR 403,454 406,236 0.04Illinois Tool Works Inc. 0.625% 19 - 05.12.27 300,000 EUR 304,413 312,801 0.03Illinois Tool Works Inc. 1.00% 19 - 05.06.31 300,000 EUR 308,877 327,822 0.03Illinois Tool Works Inc. 1.25% 15 - 22.05.23 300,000 EUR 308,674 309,618 0.03Illinois Tool Works Inc. 1.75% 14 - 20.05.22 200,000 EUR 204,649 204,620 0.02Illinois Tool Works Inc. 2.125% 15 - 22.05.30 300,000 EUR 338,177 357,927 0.04Illinois Tool Works Inc. 3.00% 14 - 19.05.34 200,000 EUR 249,403 270,820 0.03International Business Machines Corp. 0.30% 20 -11.02.28 631,000 EUR 629,249 641,670 0.06International Business Machines Corp. 0.375% 19 -31.01.23 100,000 EUR 100,813 101,193 0.01International Business Machines Corp. 0.375% 19 -31.01.23 900,000 EUR 905,384 910,737 0.09International Business Machines Corp. 0.65% 20 -11.02.32 930,000 EUR 928,485 961,183 0.10International Business Machines Corp. 0.875% 19 -31.01.25 500,000 EUR 513,884 521,370 0.05International Business Machines Corp. 0.95% 17 -23.05.25 700,000 EUR 722,482 734,881 0.07International Business Machines Corp. 1.125% 16 -06.09.24 400,000 EUR 416,512 419,620 0.04International Business Machines Corp. 1.125% 16 -06.09.24 100,000 EUR 102,942 104,905 0.01International Business Machines Corp. 1.20% 20 -11.02.40 482,000 EUR 484,332 516,564 0.05International Business Machines Corp. 1.25% 14 -26.05.23 600,000 EUR 617,888 621,366 0.06International Business Machines Corp. 1.25% 19 -29.01.27 550,000 EUR 578,179 591,640 0.06International Business Machines Corp. 1.50% 17 -23.05.29 600,000 EUR 645,808 669,192 0.07
Xtrackers II
Xtrackers II ESG EUR CORPORATE BOND UCITS ETF (continued)
Statement of Investmentsas at 31 December 2020(expressed in EUR)
The accompanying notes form an integral part of these financial statements.
287
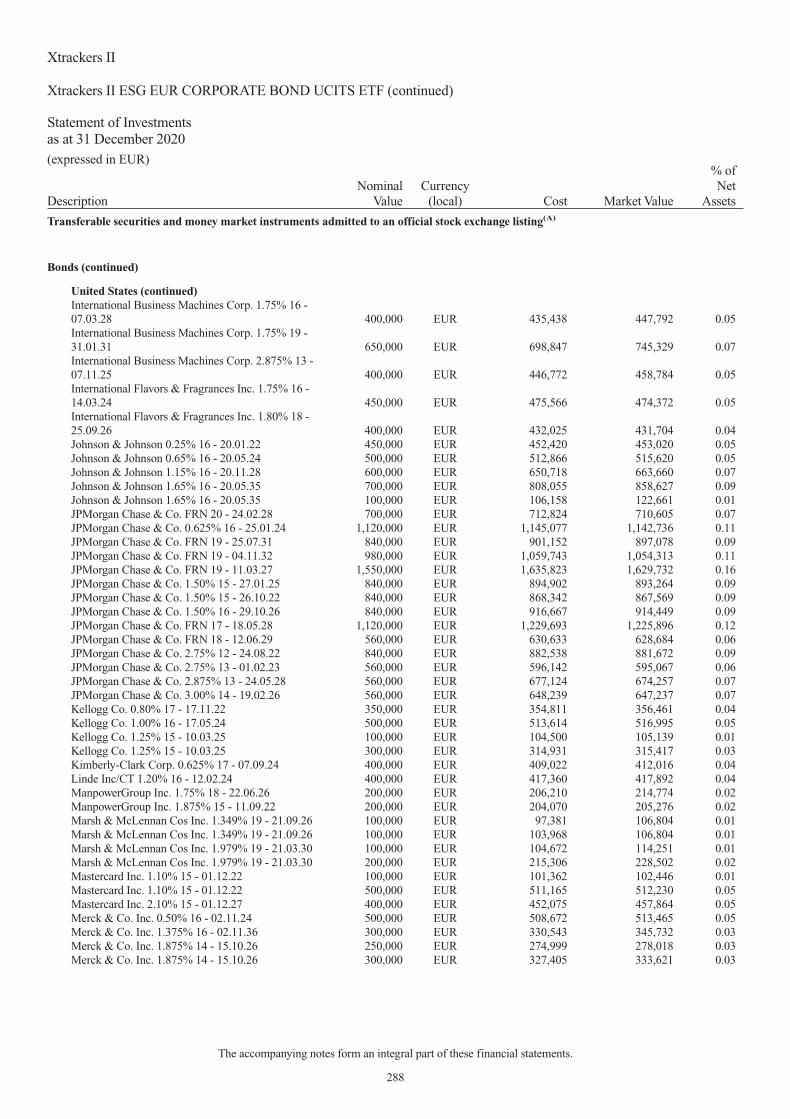
DescriptionNominal
ValueCurrency
(local) Cost Market Value
% ofNet
Assets
Transferable securities and money market instruments admitted to an official stock exchange listing(A)
Bonds (continued)
United States (continued)International Business Machines Corp. 1.75% 16 -07.03.28 400,000 EUR 435,438 447,792 0.05International Business Machines Corp. 1.75% 19 -31.01.31 650,000 EUR 698,847 745,329 0.07International Business Machines Corp. 2.875% 13 -07.11.25 400,000 EUR 446,772 458,784 0.05International Flavors & Fragrances Inc. 1.75% 16 -14.03.24 450,000 EUR 475,566 474,372 0.05International Flavors & Fragrances Inc. 1.80% 18 -25.09.26 400,000 EUR 432,025 431,704 0.04Johnson & Johnson 0.25% 16 - 20.01.22 450,000 EUR 452,420 453,020 0.05Johnson & Johnson 0.65% 16 - 20.05.24 500,000 EUR 512,866 515,620 0.05Johnson & Johnson 1.15% 16 - 20.11.28 600,000 EUR 650,718 663,660 0.07Johnson & Johnson 1.65% 16 - 20.05.35 700,000 EUR 808,055 858,627 0.09Johnson & Johnson 1.65% 16 - 20.05.35 100,000 EUR 106,158 122,661 0.01JPMorgan Chase & Co. FRN 20 - 24.02.28 700,000 EUR 712,824 710,605 0.07JPMorgan Chase & Co. 0.625% 16 - 25.01.24 1,120,000 EUR 1,145,077 1,142,736 0.11JPMorgan Chase & Co. FRN 19 - 25.07.31 840,000 EUR 901,152 897,078 0.09JPMorgan Chase & Co. FRN 19 - 04.11.32 980,000 EUR 1,059,743 1,054,313 0.11JPMorgan Chase & Co. FRN 19 - 11.03.27 1,550,000 EUR 1,635,823 1,629,732 0.16JPMorgan Chase & Co. 1.50% 15 - 27.01.25 840,000 EUR 894,902 893,264 0.09JPMorgan Chase & Co. 1.50% 15 - 26.10.22 840,000 EUR 868,342 867,569 0.09JPMorgan Chase & Co. 1.50% 16 - 29.10.26 840,000 EUR 916,667 914,449 0.09JPMorgan Chase & Co. FRN 17 - 18.05.28 1,120,000 EUR 1,229,693 1,225,896 0.12JPMorgan Chase & Co. FRN 18 - 12.06.29 560,000 EUR 630,633 628,684 0.06JPMorgan Chase & Co. 2.75% 12 - 24.08.22 840,000 EUR 882,538 881,672 0.09JPMorgan Chase & Co. 2.75% 13 - 01.02.23 560,000 EUR 596,142 595,067 0.06JPMorgan Chase & Co. 2.875% 13 - 24.05.28 560,000 EUR 677,124 674,257 0.07JPMorgan Chase & Co. 3.00% 14 - 19.02.26 560,000 EUR 648,239 647,237 0.07Kellogg Co. 0.80% 17 - 17.11.22 350,000 EUR 354,811 356,461 0.04Kellogg Co. 1.00% 16 - 17.05.24 500,000 EUR 513,614 516,995 0.05Kellogg Co. 1.25% 15 - 10.03.25 100,000 EUR 104,500 105,139 0.01Kellogg Co. 1.25% 15 - 10.03.25 300,000 EUR 314,931 315,417 0.03Kimberly-Clark Corp. 0.625% 17 - 07.09.24 400,000 EUR 409,022 412,016 0.04Linde Inc/CT 1.20% 16 - 12.02.24 400,000 EUR 417,360 417,892 0.04ManpowerGroup Inc. 1.75% 18 - 22.06.26 200,000 EUR 206,210 214,774 0.02ManpowerGroup Inc. 1.875% 15 - 11.09.22 200,000 EUR 204,070 205,276 0.02Marsh & McLennan Cos Inc. 1.349% 19 - 21.09.26 100,000 EUR 97,381 106,804 0.01Marsh & McLennan Cos Inc. 1.349% 19 - 21.09.26 100,000 EUR 103,968 106,804 0.01Marsh & McLennan Cos Inc. 1.979% 19 - 21.03.30 100,000 EUR 104,672 114,251 0.01Marsh & McLennan Cos Inc. 1.979% 19 - 21.03.30 200,000 EUR 215,306 228,502 0.02Mastercard Inc. 1.10% 15 - 01.12.22 100,000 EUR 101,362 102,446 0.01Mastercard Inc. 1.10% 15 - 01.12.22 500,000 EUR 511,165 512,230 0.05Mastercard Inc. 2.10% 15 - 01.12.27 400,000 EUR 452,075 457,864 0.05Merck & Co. Inc. 0.50% 16 - 02.11.24 500,000 EUR 508,672 513,465 0.05Merck & Co. Inc. 1.375% 16 - 02.11.36 300,000 EUR 330,543 345,732 0.03Merck & Co. Inc. 1.875% 14 - 15.10.26 250,000 EUR 274,999 278,018 0.03Merck & Co. Inc. 1.875% 14 - 15.10.26 300,000 EUR 327,405 333,621 0.03
Xtrackers II
Xtrackers II ESG EUR CORPORATE BOND UCITS ETF (continued)
Statement of Investmentsas at 31 December 2020(expressed in EUR)
The accompanying notes form an integral part of these financial statements.
288

DescriptionNominal
ValueCurrency
(local) Cost Market Value
% ofNet
Assets
Transferable securities and money market instruments admitted to an official stock exchange listing(A)
Bonds (continued)
United States (continued)Merck & Co. Inc. 2.50% 14 - 15.10.34 200,000 EUR 239,645 261,260 0.03Microsoft Corp. 2.625% 13 - 02.05.33 300,000 EUR 377,935 398,970 0.04Microsoft Corp. 3.125% 13 - 06.12.28 1,030,000 EUR 1,265,478 1,297,759 0.13MMS USA Investments Inc. 0.625% 19 - 13.06.25 400,000 EUR 393,087 408,000 0.04MMS USA Investments Inc. 1.25% 19 - 13.06.28 500,000 EUR 502,210 524,620 0.05MMS USA Investments Inc. 1.75% 19 - 13.06.31 400,000 EUR 405,264 435,344 0.04Mohawk Industries Inc. 2.00% 15 - 14.01.22 300,000 EUR 304,352 304,215 0.03Mondelez International Inc. 1.00% 15 - 07.03.22 300,000 EUR 303,610 303,588 0.03Mondelez International Inc. 1.625% 15 - 08.03.27 308,000 EUR 324,916 336,311 0.03Mondelez International Inc. 1.625% 15 - 08.03.27 100,000 EUR 100,807 109,192 0.01Mondelez International Inc. 1.625% 16 - 20.01.23 500,000 EUR 514,944 517,170 0.05Mondelez International Inc. 2.375% 15 - 06.03.35 300,000 EUR 343,402 363,420 0.04Moody’s Corp. 0.95% 19 - 25.02.30 400,000 EUR 410,539 424,808 0.04Moody’s Corp. 1.75% 15 - 09.03.27 300,000 EUR 319,935 330,330 0.03Morgan Stanley FRN 20 - 26.10.29 1,000,000 EUR 1,000,447 1,016,710 0.10Morgan Stanley FRN 19 - 26.07.24 800,000 EUR 807,292 814,184 0.08Morgan Stanley 1.00% 16 - 02.12.22 600,000 EUR 611,047 613,500 0.06Morgan Stanley FRN 17 - 23.10.26 600,000 EUR 619,963 636,468 0.06Morgan Stanley 1.375% 16 - 27.10.26 800,000 EUR 830,913 859,368 0.09Morgan Stanley 1.75% 15 - 30.01.25 700,000 EUR 729,470 748,825 0.08Morgan Stanley 1.75% 16 - 11.03.24 873,000 EUR 912,210 923,337 0.09Morgan Stanley 1.875% 14 - 30.03.23 800,000 EUR 829,623 836,832 0.08Morgan Stanley 1.875% 17 - 27.04.27 1,180,000 EUR 1,274,695 1,311,959 0.13Nasdaq Inc. 0.875% 20 - 13.02.30 340,000 EUR 355,280 353,199 0.04Nasdaq Inc. 1.75% 16 - 19.05.23 340,000 EUR 353,906 353,423 0.04Nasdaq Inc. 1.75% 19 - 28.03.29 340,000 EUR 380,375 378,121 0.04Nestle Holdings Inc. 0.875% 17 - 18.07.25 600,000 EUR 624,689 629,400 0.06Oracle Corp. 3.125% 13 - 10.07.25 380,000 EUR 436,770 435,552 0.04Parker-Hannifin Corp. 1.125% 17 - 01.03.25 300,000 EUR 304,978 312,459 0.03PepsiCo Inc. 0.25% 20 - 06.05.24 360,000 EUR 361,726 365,342 0.04PepsiCo Inc. 0.40% 20 - 09.10.32 360,000 EUR 362,596 365,094 0.04PepsiCo Inc. 0.50% 20 - 06.05.28 600,000 EUR 606,588 620,976 0.06PepsiCo Inc. 0.75% 19 - 18.03.27 300,000 EUR 306,373 315,195 0.03PepsiCo Inc. 0.875% 16 - 18.07.28 500,000 EUR 522,346 531,715 0.05PepsiCo Inc. 0.875% 19 - 16.10.39 220,000 EUR 224,169 233,156 0.02PepsiCo Inc. 1.05% 20 - 09.10.50 440,000 EUR 452,925 466,035 0.05PepsiCo Inc. 1.125% 19 - 18.03.31 300,000 EUR 320,994 330,321 0.03PepsiCo Inc. 2.625% 14 - 28.04.26 300,000 EUR 339,764 342,669 0.03PerkinElmer Inc. 1.875% 16 - 19.07.26 300,000 EUR 311,261 322,989 0.03PPG Industries Inc. 0.875% 15 - 13.03.22 300,000 EUR 301,979 302,790 0.03PPG Industries Inc. 0.875% 16 - 03.11.25 300,000 EUR 305,050 312,873 0.03PPG Industries Inc. 1.40% 15 - 13.03.27 300,000 EUR 309,937 320,703 0.03Praxair Inc. 1.625% 14 - 01.12.25 250,000 EUR 270,874 270,850 0.03Procter & Gamble Co. 0.50% 17 - 25.10.24 300,000 EUR 305,400 308,655 0.03Procter & Gamble Co. 0.625% 18 - 30.10.24 400,000 EUR 409,570 413,216 0.04Procter & Gamble Co. 1.125% 15 - 02.11.23 600,000 EUR 619,869 624,342 0.06Procter & Gamble Co. 1.20% 18 - 30.10.28 550,000 EUR 594,860 604,879 0.06Procter & Gamble Co. 1.25% 17 - 25.10.29 200,000 EUR 216,923 222,398 0.02
Xtrackers II
Xtrackers II ESG EUR CORPORATE BOND UCITS ETF (continued)
Statement of Investmentsas at 31 December 2020(expressed in EUR)
The accompanying notes form an integral part of these financial statements.
289

DescriptionNominal
ValueCurrency
(local) Cost Market Value
% ofNet
Assets
Transferable securities and money market instruments admitted to an official stock exchange listing(A)
Bonds (continued)
United States (continued)Procter & Gamble Co. 1.875% 18 - 30.10.38 300,000 EUR 365,616 382,287 0.04Procter & Gamble Co. 2.00% 12 - 16.08.22 407,000 EUR 421,157 422,385 0.04Procter & Gamble Co. 4.875% 07 - 11.05.27 675,000 EUR 881,899 891,756 0.09Prologis Euro Finance LLC 0.25% 19 - 10.09.27 400,000 EUR 392,624 405,468 0.04Prologis Euro Finance LLC 0.375% 20 - 06.02.28 300,000 EUR 299,499 306,429 0.03Prologis Euro Finance LLC 0.625% 19 - 10.09.31 400,000 EUR 398,433 408,564 0.04Prologis Euro Finance LLC 1.00% 20 - 06.02.35 400,000 EUR 392,384 419,792 0.04Prologis Euro Finance LLC 1.50% 19 - 10.09.49 200,000 EUR 203,346 217,408 0.02Prologis Euro Finance LLC 1.875% 18 - 05.01.29 400,000 EUR 436,860 452,520 0.05Prologis LP 3.00% 14 - 02.06.26 400,000 EUR 452,171 463,868 0.05Prologis LP 3.375% 14 - 20.02.24 400,000 EUR 437,548 441,368 0.04PVH Corp. 3.125% 17 - 15.12.27 300,000 EUR 315,403 332,145 0.03PVH Corp. 3.625% 16 - 15.07.24 300,000 EUR 316,222 327,858 0.03RELX Capital Inc. 1.30% 15 - 12.05.25 300,000 EUR 314,087 317,289 0.03Sysco Corp. 1.25% 16 - 23.06.23 200,000 EUR 198,671 205,272 0.02Thermo Fisher Scientific Inc. 0.125% 19 - 01.03.25 455,000 EUR 454,531 458,472 0.05Thermo Fisher Scientific Inc. 0.50% 19 - 01.03.28 490,000 EUR 485,421 503,749 0.05Thermo Fisher Scientific Inc. 0.75% 16 - 12.09.24 460,000 EUR 467,640 473,763 0.05Thermo Fisher Scientific Inc. 0.875% 19 - 01.10.31 520,000 EUR 522,719 548,127 0.06Thermo Fisher Scientific Inc. 1.375% 16 - 12.09.28 310,000 EUR 328,821 338,684 0.03Thermo Fisher Scientific Inc. 1.40% 17 - 23.01.26 250,000 EUR 260,618 267,583 0.03Thermo Fisher Scientific Inc. 1.45% 17 - 16.03.27 280,000 EUR 295,319 303,722 0.03Thermo Fisher Scientific Inc. 1.50% 19 - 01.10.39 520,000 EUR 523,055 571,012 0.06Thermo Fisher Scientific Inc. 1.75% 20 - 15.04.27 210,000 EUR 223,325 231,468 0.02Thermo Fisher Scientific Inc. 1.875% 19 - 01.10.49 560,000 EUR 569,997 647,282 0.07Thermo Fisher Scientific Inc. 1.95% 17 - 24.07.29 450,000 EUR 501,984 514,760 0.05Thermo Fisher Scientific Inc. 2.00% 14 - 15.04.25 530,000 EUR 570,817 575,352 0.06Thermo Fisher Scientific Inc. 2.15% 15 - 21.07.22 280,000 EUR 287,673 289,332 0.03Thermo Fisher Scientific Inc. 2.375% 20 - 15.04.32 310,000 EUR 360,363 375,627 0.04Thermo Fisher Scientific Inc. 2.875% 17 - 24.07.37 450,000 EUR 569,020 596,259 0.06Toyota Motor Credit Corp. 0.25% 20 - 16.07.26 274,000 EUR 275,350 278,537 0.03Toyota Motor Credit Corp. 0.25% 20 - 16.07.26 300,000 EUR 301,811 304,968 0.03Toyota Motor Credit Corp. 0.625% 17 - 21.11.24 300,000 EUR 306,540 309,105 0.03Toyota Motor Credit Corp. 0.75% 15 - 21.07.22 600,000 EUR 608,155 609,552 0.06Toyota Motor Credit Corp. 2.375% 13 - 01.02.23 418,000 EUR 439,640 440,877 0.04United Parcel Service Inc. 0.375% 17 - 15.11.23 400,000 EUR 404,492 406,644 0.04United Parcel Service Inc. 1.00% 16 - 15.11.28 200,000 EUR 201,639 216,180 0.02United Parcel Service Inc. 1.50% 17 - 15.11.32 300,000 EUR 324,592 348,078 0.04United Parcel Service Inc. 1.625% 15 - 15.11.25 500,000 EUR 537,906 543,410 0.05United Parcel Service Inc. 1.625% 15 - 15.11.25 100,000 EUR 106,548 108,682 0.01Verizon Communications Inc. 0.875% 16 - 02.04.25 600,000 EUR 626,522 625,296 0.06Verizon Communications Inc. 0.875% 19 - 08.04.27 730,000 EUR 767,825 766,996 0.08Verizon Communications Inc. 0.875% 19 - 19.03.32 400,000 EUR 415,951 418,740 0.04Verizon Communications Inc. 1.25% 19 - 08.04.30 830,000 EUR 901,134 902,774 0.09Verizon Communications Inc. 1.30% 20 - 18.05.33 680,000 EUR 734,035 739,493 0.07Verizon Communications Inc. 1.375% 16 - 02.11.28 630,000 EUR 690,277 689,604 0.07Verizon Communications Inc. 1.375% 17 - 27.10.26 730,000 EUR 789,732 788,057 0.08Verizon Communications Inc. 1.50% 19 - 19.09.39 250,000 EUR 272,165 274,855 0.03
Xtrackers II
Xtrackers II ESG EUR CORPORATE BOND UCITS ETF (continued)
Statement of Investmentsas at 31 December 2020(expressed in EUR)
The accompanying notes form an integral part of these financial statements.
290

DescriptionNominal
ValueCurrency
(local) Cost Market Value
% ofNet
Assets
Transferable securities and money market instruments admitted to an official stock exchange listing(A)
Bonds (continued)
United States (continued)Verizon Communications Inc. 1.625% 14 - 01.03.24 340,000 EUR 360,232 359,506 0.04Verizon Communications Inc. 1.85% 20 - 18.05.40 500,000 EUR 571,927 574,510 0.06Verizon Communications Inc. 1.875% 17 - 26.10.29 380,000 EUR 433,345 433,983 0.04Verizon Communications Inc. 2.625% 14 - 01.12.31 600,000 EUR 740,048 743,220 0.07Verizon Communications Inc. 2.875% 17 - 15.01.38 850,000 EUR 1,108,067 1,117,214 0.11Verizon Communications Inc. 3.25% 14 - 17.02.26 830,000 EUR 973,227 970,909 0.10VF Corp. 0.25% 20 - 25.02.28 266,000 EUR 263,243 268,769 0.03VF Corp. 0.625% 16 - 20.09.23 500,000 EUR 506,609 510,245 0.05VF Corp. 0.625% 20 - 25.02.32 300,000 EUR 290,436 302,517 0.03Walgreens Boots Alliance Inc. 2.125% 14 - 20.11.26 480,000 EUR 523,109 516,216 0.05Xylem Inc. 2.25% 16 - 11.03.23 100,000 EUR 103,845 104,513 0.01Xylem Inc. 2.25% 16 - 11.03.23 50,000 EUR 52,230 52,257 0.01
150,128,555 153,223,473 15.30
Total - Bonds 969,557,065 990,715,730 98.94
Total Transferable securities and money market instruments admitted to an officialstock exchange listing 969,557,065 990,715,730 98.94
Other transferable securities and money market instruments(A)
Bonds
United StatesAbbVie Inc. 1.25% 20 - 01.06.24 290,000 EUR 296,913 301,443 0.03AbbVie Inc. 1.50% 20 - 15.11.23 330,000 EUR 341,717 344,586 0.03AbbVie Inc. 2.125% 20 - 01.06.29 320,000 EUR 357,254 366,765 0.04
995,884 1,012,794 0.10
Total - Bonds 995,884 1,012,794 0.10
Total Other transferable securities and money market instruments 995,884 1,012,794 0.10
TOTAL INVESTMENT PORTFOLIO 970,552,949 991,728,524 99.04
TOTAL INVESTMENT PORTFOLIO INCLUDING ACCRUED INTEREST 999,577,654 99.82(A) Any duplicate securities appearing herein with the same name are either quoted on different stock exchanges or have different ISINs.
Xtrackers II
Xtrackers II ESG EUR CORPORATE BOND UCITS ETF (continued)
Statement of Investmentsas at 31 December 2020(expressed in EUR)
The accompanying notes form an integral part of these financial statements.
291

DescriptionNominal
ValueCurrency
(local) Cost Market Value
% ofNet
Assets
Transferable securities and money market instruments admitted to an official stock exchange listing
Bonds
FranceFrance OAT Zero Coupon 09 - 25.04.24 1,600,000 EUR 1,635,598 1,634,640 2.61France OAT Zero Coupon 09 - 25.10.28 8,200,000 EUR 8,501,846 8,507,664 13.58France OAT Zero Coupon 09 - 25.04.30 1,100,000 EUR 1,134,256 1,135,167 1.81France OAT Zero Coupon 09 - 25.10.32 3,200,000 EUR 3,233,471 3,260,000 5.20France OAT Zero Coupon 09 - 25.04.39 3,800,000 EUR 3,728,815 3,720,884 5.94France OAT Zero Coupon 13 - 25.05.24 2,950,000 EUR 3,018,271 3,018,263 4.82
21,252,257 21,276,618 33.96GermanyBundesrepublik Deutschland Principal Strips ZeroCoupon 00 - 04.01.31 2,200,000 EUR 2,288,631 2,335,872 3.73Deutsche Bundesrepublik Coupon Strips Zero Coupon97 - 04.01.23 3,000,000 EUR 3,042,501 3,040,140 4.85Deutsche Bundesrepublik Coupon Strips Zero Coupon97 - 04.07.25 7,900,000 EUR 7,993,722 8,132,260 12.98Deutsche Bundesrepublik Coupon Strips Zero Coupon98 - 04.01.25 3,200,000 EUR 3,248,217 3,281,472 5.24Deutsche Bundesrepublik Coupon Strips Zero Coupon03 - 04.07.33 11,200,000 EUR 11,914,880 11,849,488 18.91Deutsche Bundesrepublik Coupon Strips Zero Coupon07 - 04.07.36 5,900,000 EUR 5,853,230 6,265,387 10.00Deutsche Bundesrepublik Coupon Strips Zero Coupon07 - 04.07.37 4,200,000 EUR 4,267,815 4,450,992 7.11
38,608,996 39,355,611 62.82
Total - Bonds 59,861,253 60,632,229 96.78
Total Transferable securities and money market instruments admitted to an officialstock exchange listing 59,861,253 60,632,229 96.78
Other transferable securities and money market instruments
Bonds
ItalyItaly Buoni Poliennali del Tesoro Coupon Strip ZeroCoupon 98 - 01.05.23 1,700,000 EUR 1,706,143 1,711,526 2.73
1,706,143 1,711,526 2.73
Total - Bonds 1,706,143 1,711,526 2.73
Total Other transferable securities and money market instruments 1,706,143 1,711,526 2.73
TOTAL INVESTMENT PORTFOLIO 61,567,396 62,343,755 99.51
TOTAL INVESTMENT PORTFOLIO INCLUDING ACCRUED INTEREST 62,343,755 99.52
Xtrackers II
Xtrackers II EUROZONE AAA GOVERNMENT BOND SWAP UCITS ETF
Statement of Investmentsas at 31 December 2020(expressed in EUR)
The accompanying notes form an integral part of these financial statements.
292

DescriptionNominal
ValueCurrency
(local) Cost Market Value
% ofNet
Assets
Transferable securities and money market instruments admitted to an official stock exchange listing(A)
Bonds
IrelandIreland Zero Coupon 17 - 18.10.22 2,020,000 EUR 2,030,632 2,045,023 0.16Ireland 0.20% 20 - 15.05.27 2,955,000 EUR 3,035,754 3,083,028 0.24Ireland 0.20% 20 - 18.10.30 3,241,000 EUR 3,342,879 3,405,643 0.27Ireland 0.40% 20 - 15.05.35 1,930,000 EUR 2,010,860 2,072,743 0.16Ireland 0.80% 15 - 15.03.22 2,692,000 EUR 2,731,596 2,741,102 0.22Ireland 0.90% 18 - 15.05.28 3,245,000 EUR 3,394,511 3,581,052 0.28Ireland 1.00% 16 - 15.05.26 4,484,000 EUR 4,704,408 4,873,301 0.39Ireland 1.10% 19 - 15.05.29 3,902,000 EUR 4,196,258 4,407,699 0.35Ireland 1.30% 18 - 15.05.33 1,934,000 EUR 2,107,225 2,300,145 0.18Ireland 1.35% 18 - 18.03.31 2,445,000 EUR 2,697,157 2,859,948 0.23Ireland 1.50% 19 - 15.05.50 2,380,000 EUR 2,773,871 3,195,793 0.25Ireland 1.70% 17 - 15.05.37 2,339,000 EUR 2,630,914 2,996,733 0.24Ireland 2.00% 15 - 18.02.45 3,495,000 EUR 4,254,752 5,010,255 0.40Ireland 2.40% 14 - 15.05.30 3,771,000 EUR 4,441,841 4,767,524 0.38Ireland 3.40% 14 - 18.03.24 3,219,000 EUR 3,590,281 3,643,844 0.29Ireland 3.90% 13 - 20.03.23 2,808,000 EUR 3,074,402 3,095,483 0.25Ireland 5.40% 09 - 13.03.25 4,705,000 EUR 5,771,550 5,911,879 0.47
56,788,891 59,991,195 4.76ItalyItaly 5.125% 04 - 31.07.24 1,000,000 EUR 1,159,962 1,182,468 0.09Italy 5.20% 04 - 31.07.34 80,000 EUR 115,656 121,441 0.01Italy Buoni Poliennali Del Tesoro Zero Coupon 20 -15.01.24 4,787,000 EUR 4,813,532 4,827,433 0.38Italy Buoni Poliennali Del Tesoro 0.05% 19 - 15.01.23 6,315,000 EUR 6,326,934 6,374,487 0.51Italy Buoni Poliennali Del Tesoro 0.30% 20 - 15.08.23 6,710,000 EUR 6,755,400 6,823,198 0.54Italy Buoni Poliennali Del Tesoro 0.35% 19 - 01.02.25 7,802,000 EUR 7,764,831 7,973,254 0.63Italy Buoni Poliennali Del Tesoro 0.50% 20 - 01.02.26 5,948,000 EUR 6,052,497 6,099,615 0.48Italy Buoni Poliennali Del Tesoro 0.60% 20 - 15.06.23 5,538,000 EUR 5,563,858 5,674,622 0.45Italy Buoni Poliennali Del Tesoro 0.65% 16 - 15.10.23 6,600,000 EUR 6,510,625 6,783,628 0.54Italy Buoni Poliennali Del Tesoro 0.85% 19 - 15.01.27 7,855,000 EUR 7,906,629 8,205,097 0.65Italy Buoni Poliennali Del Tesoro 0.90% 17 - 01.08.22 7,275,000 EUR 7,285,747 7,429,755 0.59Italy Buoni Poliennali Del Tesoro 0.90% 20 - 01.04.31 4,841,000 EUR 4,965,602 5,007,700 0.40Italy Buoni Poliennali Del Tesoro 0.95% 16 - 15.03.23 6,333,000 EUR 6,324,591 6,521,445 0.52Italy Buoni Poliennali Del Tesoro 0.95% 18 - 01.03.23 6,801,000 EUR 6,811,993 6,999,884 0.56Italy Buoni Poliennali Del Tesoro 0.95% 20 - 01.08.30 6,851,000 EUR 6,670,600 7,158,833 0.57Italy Buoni Poliennali Del Tesoro 0.95% 20 - 15.09.27 7,834,000 EUR 8,079,654 8,220,183 0.65Italy Buoni Poliennali Del Tesoro 1.00% 19 - 15.07.22 3,431,000 EUR 3,457,187 3,507,768 0.28Italy Buoni Poliennali Del Tesoro 1.00% 19 - 15.07.22 1,950,000 EUR 1,976,123 1,993,631 0.16Italy Buoni Poliennali Del Tesoro 1.20% 17 - 01.04.22 6,795,000 EUR 6,835,765 6,936,948 0.55Italy Buoni Poliennali Del Tesoro 1.25% 16 - 01.12.26 7,571,000 EUR 7,512,770 8,100,184 0.64Italy Buoni Poliennali Del Tesoro 1.35% 15 - 15.04.22 7,128,000 EUR 7,187,808 7,292,158 0.58Italy Buoni Poliennali Del Tesoro 1.35% 19 - 01.04.30 9,137,000 EUR 9,442,734 9,886,965 0.78Italy Buoni Poliennali Del Tesoro 1.45% 15 - 15.09.22 6,606,000 EUR 6,681,258 6,819,879 0.54Italy Buoni Poliennali Del Tesoro 1.45% 17 - 15.11.24 6,532,000 EUR 6,578,736 6,952,108 0.55Italy Buoni Poliennali Del Tesoro 1.45% 18 - 15.05.25 5,907,000 EUR 5,885,673 6,314,229 0.50Italy Buoni Poliennali Del Tesoro 1.45% 18 - 15.05.25 273,000 EUR 289,254 291,821 0.02Italy Buoni Poliennali Del Tesoro 1.45% 20 - 01.03.36 5,731,000 EUR 5,793,876 6,152,770 0.49Italy Buoni Poliennali Del Tesoro 1.50% 15 - 01.06.25 6,341,000 EUR 6,327,702 6,794,635 0.54
Xtrackers II
Xtrackers II IBOXX EUROZONE GOVERNMENT BOND YIELD PLUS UCITS ETF
Statement of Investmentsas at 31 December 2020(expressed in EUR)
The accompanying notes form an integral part of these financial statements.
293

DescriptionNominal
ValueCurrency
(local) Cost Market Value
% ofNet
Assets
Transferable securities and money market instruments admitted to an official stock exchange listing(A)
Bonds (continued)
Italy (continued)Italy Buoni Poliennali Del Tesoro 1.50% 15 - 01.06.25 1,589,000 EUR 1,665,301 1,702,677 0.13Italy Buoni Poliennali Del Tesoro 1.60% 16 - 01.06.26 7,895,000 EUR 7,976,499 8,573,754 0.68Italy Buoni Poliennali Del Tesoro 1.65% 15 - 01.03.32 9,923,000 EUR 9,715,209 11,012,149 0.87Italy Buoni Poliennali Del Tesoro 1.65% 20 - 01.12.30 9,338,000 EUR 9,870,693 10,358,457 0.82Italy Buoni Poliennali Del Tesoro 1.70% 20 - 01.09.51 3,233,000 EUR 3,321,782 3,438,586 0.27Italy Buoni Poliennali Del Tesoro 1.75% 19 - 01.07.24 6,508,000 EUR 6,748,408 6,956,987 0.55Italy Buoni Poliennali Del Tesoro 1.75% 19 - 01.07.24 435,000 EUR 461,240 465,011 0.04Italy Buoni Poliennali Del Tesoro 1.80% 20 - 01.03.41 4,058,000 EUR 4,289,249 4,486,809 0.36Italy Buoni Poliennali Del Tesoro 1.85% 17 - 15.05.24 6,124,000 EUR 6,201,817 6,559,156 0.52Italy Buoni Poliennali Del Tesoro 1.85% 20 - 01.07.25 7,617,000 EUR 8,031,955 8,288,858 0.66Italy Buoni Poliennali Del Tesoro 2.00% 15 - 01.12.25 7,872,000 EUR 8,130,430 8,672,640 0.69Italy Buoni Poliennali Del Tesoro 2.00% 18 - 01.02.28 9,351,000 EUR 9,601,958 10,513,236 0.83Italy Buoni Poliennali Del Tesoro 2.05% 17 - 01.08.27 7,744,000 EUR 7,879,955 8,698,525 0.69Italy Buoni Poliennali Del Tesoro 2.10% 19 - 15.07.26 6,727,000 EUR 7,122,642 7,492,357 0.59Italy Buoni Poliennali Del Tesoro 2.20% 17 - 01.06.27 6,943,000 EUR 7,194,343 7,854,049 0.62Italy Buoni Poliennali Del Tesoro 2.25% 16 - 01.09.36 6,239,000 EUR 6,297,581 7,425,658 0.59Italy Buoni Poliennali Del Tesoro 2.45% 17 - 01.09.33 7,678,000 EUR 8,041,893 9,245,387 0.73Italy Buoni Poliennali Del Tesoro 2.45% 18 - 01.10.23 6,381,000 EUR 6,604,558 6,874,135 0.55Italy Buoni Poliennali Del Tesoro 2.45% 20 - 01.09.50 6,409,000 EUR 7,136,299 8,012,564 0.64Italy Buoni Poliennali Del Tesoro 2.50% 14 - 01.12.24 8,169,000 EUR 8,540,281 9,024,968 0.72Italy Buoni Poliennali Del Tesoro 2.50% 18 - 15.11.25 6,709,000 EUR 7,013,350 7,551,115 0.60Italy Buoni Poliennali Del Tesoro 2.70% 16 - 01.03.47 7,006,000 EUR 7,345,827 9,082,808 0.72Italy Buoni Poliennali Del Tesoro 2.80% 16 - 01.03.67 3,904,000 EUR 4,089,126 5,239,285 0.42Italy Buoni Poliennali Del Tesoro 2.80% 18 - 01.12.28 8,041,000 EUR 8,555,085 9,602,482 0.76Italy Buoni Poliennali Del Tesoro 2.95% 18 - 01.09.38 6,092,000 EUR 6,527,439 7,945,872 0.63Italy Buoni Poliennali Del Tesoro 3.00% 19 - 01.08.29 8,267,000 EUR 9,274,658 10,091,362 0.80Italy Buoni Poliennali Del Tesoro 3.10% 19 - 01.03.40 5,406,000 EUR 6,445,118 7,221,065 0.57Italy Buoni Poliennali Del Tesoro 3.25% 15 - 01.09.46 6,673,000 EUR 7,563,744 9,452,104 0.75Italy Buoni Poliennali Del Tesoro 3.35% 19 - 01.03.35 6,058,000 EUR 7,027,303 8,069,317 0.64Italy Buoni Poliennali Del Tesoro 3.45% 17 - 01.03.48 5,754,000 EUR 6,492,006 8,471,902 0.67Italy Buoni Poliennali Del Tesoro 3.45% 17 - 01.03.48 832,000 EUR 1,180,183 1,224,995 0.10Italy Buoni Poliennali Del Tesoro 3.50% 14 - 01.03.30 10,103,000 EUR 11,469,476 12,882,032 1.02Italy Buoni Poliennali Del Tesoro 3.75% 14 - 01.09.24 8,206,000 EUR 8,923,476 9,395,749 0.74Italy Buoni Poliennali Del Tesoro 3.85% 19 - 01.09.49 5,415,000 EUR 6,978,576 8,548,201 0.68Italy Buoni Poliennali Del Tesoro 4.00% 05 - 01.02.37 11,273,000 EUR 13,772,508 16,287,005 1.29Italy Buoni Poliennali Del Tesoro 4.50% 10 - 01.03.26 8,996,000 EUR 10,327,591 11,092,226 0.88Italy Buoni Poliennali Del Tesoro 4.50% 13 - 01.05.23 5,875,000 EUR 6,321,689 6,547,995 0.52Italy Buoni Poliennali Del Tesoro 4.50% 13 - 01.05.23 1,351,000 EUR 1,489,453 1,505,760 0.12Italy Buoni Poliennali Del Tesoro 4.50% 13 - 01.03.24 9,698,000 EUR 10,723,034 11,166,673 0.89Italy Buoni Poliennali Del Tesoro 4.75% 08 - 01.08.23 8,988,000 EUR 9,802,848 10,189,859 0.81Italy Buoni Poliennali Del Tesoro 4.75% 13 - 01.09.28 9,679,000 EUR 11,671,864 12,929,679 1.03Italy Buoni Poliennali Del Tesoro 4.75% 13 - 01.09.44 7,293,000 EUR 10,111,119 12,455,863 0.99Italy Buoni Poliennali Del Tesoro 5.00% 03 - 01.08.34 10,870,000 EUR 14,483,123 16,730,017 1.33Italy Buoni Poliennali Del Tesoro 5.00% 07 - 01.08.39 9,218,000 EUR 12,693,856 15,303,908 1.21Italy Buoni Poliennali Del Tesoro 5.00% 09 - 01.03.25 10,004,000 EUR 11,491,836 12,163,263 0.96Italy Buoni Poliennali Del Tesoro 5.00% 09 - 01.09.40 8,956,000 EUR 12,303,604 15,021,093 1.19Italy Buoni Poliennali Del Tesoro 5.00% 11 - 01.03.22 8,470,000 EUR 8,898,545 9,009,572 0.71Italy Buoni Poliennali Del Tesoro 5.25% 98 - 01.11.29 11,562,000 EUR 14,727,237 16,436,192 1.30
Xtrackers II
Xtrackers II IBOXX EUROZONE GOVERNMENT BOND YIELD PLUS UCITS ETF (continued)
Statement of Investmentsas at 31 December 2020(expressed in EUR)
The accompanying notes form an integral part of these financial statements.
294

DescriptionNominal
ValueCurrency
(local) Cost Market Value
% ofNet
Assets
Transferable securities and money market instruments admitted to an official stock exchange listing(A)
Bonds (continued)
Italy (continued)Italy Buoni Poliennali Del Tesoro 5.50% 12 - 01.09.22 7,850,000 EUR 8,448,155 8,622,267 0.68Italy Buoni Poliennali Del Tesoro 5.50% 12 - 01.11.22 8,752,000 EUR 9,494,396 9,697,375 0.77Italy Buoni Poliennali Del Tesoro 5.75% 02 - 01.02.33 8,397,000 EUR 11,588,130 13,294,427 1.05Italy Buoni Poliennali Del Tesoro 6.00% 00 - 01.05.31 12,008,000 EUR 16,375,016 18,543,538 1.47Italy Buoni Poliennali Del Tesoro 6.50% 97 - 01.11.27 10,872,000 EUR 14,191,315 15,494,335 1.23Italy Buoni Poliennali Del Tesoro 7.25% 97 - 01.11.26 5,094,000 EUR 6,712,186 7,226,654 0.57Italy Buoni Poliennali Del Tesoro 9.00% 93 - 01.11.23 6,145,000 EUR 7,579,026 7,780,860 0.62Italy Certificati di Credito Del Tesoro Zero Coupon20 - 30.05.22 6,553,000 EUR 6,552,546 6,591,642 0.52Italy Certificati di Credito Del Tesoro Zero Coupon20 - 28.09.22 3,337,000 EUR 3,350,689 3,359,140 0.27
627,904,223 684,329,734 54.26PortugalPortugal Obrigacoes do Tesouro OT 0.475% 20 -18.10.30 3,343,000 EUR 3,414,770 3,487,619 0.28Portugal Obrigacoes do Tesouro OT 0.70% 20 -15.10.27 2,219,000 EUR 2,276,603 2,361,970 0.19Portugal Obrigacoes do Tesouro OT 0.90% 20 -12.10.35 1,603,000 EUR 1,664,920 1,718,829 0.14Portugal Obrigacoes do Tesouro OT 1.95% 19 -15.06.29 4,359,000 EUR 4,841,236 5,113,696 0.41Portugal Obrigacoes do Tesouro OT 1.95% 19 -15.06.29 467,000 EUR 541,105 547,854 0.04Portugal Obrigacoes do Tesouro OT 2.125% 18 -17.10.28 5,083,000 EUR 5,597,080 5,991,756 0.47Portugal Obrigacoes do Tesouro OT 2.20% 15 -17.10.22 3,911,000 EUR 4,074,197 4,117,110 0.33Portugal Obrigacoes do Tesouro OT 2.25% 18 -18.04.34 2,829,000 EUR 3,265,213 3,563,862 0.28Portugal Obrigacoes do Tesouro OT 2.875% 15 -15.10.25 5,758,000 EUR 6,388,189 6,680,777 0.53Portugal Obrigacoes do Tesouro OT 2.875% 16 -21.07.26 4,691,000 EUR 5,282,144 5,541,900 0.44Portugal Obrigacoes do Tesouro OT 3.875% 14 -15.02.30 2,544,000 EUR 3,188,931 3,448,799 0.27Portugal Obrigacoes do Tesouro OT 3.875% 14 -15.02.30 386,000 EUR 515,407 523,285 0.04Portugal Obrigacoes do Tesouro OT 4.10% 06 -15.04.37 3,810,000 EUR 5,189,833 6,022,337 0.48Portugal Obrigacoes do Tesouro OT 4.10% 15 -15.02.45 1,700,000 EUR 2,477,280 2,961,842 0.23Portugal Obrigacoes do Tesouro OT 4.125% 17 -14.04.27 3,934,000 EUR 4,770,254 5,036,248 0.40Portugal Obrigacoes do Tesouro OT 4.95% 08 -25.10.23 4,984,000 EUR 5,665,355 5,769,329 0.46
Xtrackers II
Xtrackers II IBOXX EUROZONE GOVERNMENT BOND YIELD PLUS UCITS ETF (continued)
Statement of Investmentsas at 31 December 2020(expressed in EUR)
The accompanying notes form an integral part of these financial statements.
295

DescriptionNominal
ValueCurrency
(local) Cost Market Value
% ofNet
Assets
Transferable securities and money market instruments admitted to an official stock exchange listing(A)
Bonds (continued)
Portugal (continued)Portugal Obrigacoes do Tesouro OT 5.65% 13 -15.02.24 4,843,000 EUR 5,631,240 5,787,627 0.46Portugal Obrigacoes do Tesouro OT 5.65% 13 -15.02.24 251,000 EUR 299,530 299,958 0.02
65,083,287 68,974,798 5.47SloveniaSlovenia 0.20% 20 - 31.03.23 749,000 EUR 755,169 760,015 0.06Slovenia 1.00% 18 - 06.03.28 942,000 EUR 972,061 1,028,734 0.08Slovenia 1.188% 19 - 14.03.29 842,000 EUR 900,626 940,930 0.07Slovenia 1.25% 17 - 22.03.27 1,236,000 EUR 1,307,749 1,358,147 0.11Slovenia 1.50% 15 - 25.03.35 902,000 EUR 972,640 1,089,080 0.09Slovenia 1.75% 16 - 03.11.40 1,222,000 EUR 1,361,816 1,584,440 0.13Slovenia 2.125% 15 - 28.07.25 802,000 EUR 878,248 896,757 0.07Slovenia 2.25% 16 - 03.03.32 810,000 EUR 948,499 1,022,833 0.08
8,096,808 8,680,936 0.69SpainSpain Zero Coupon 20 - 30.04.23 8,859,000 EUR 8,931,188 8,977,711 0.71Spain Zero Coupon 20 - 31.01.25 8,532,000 EUR 8,607,555 8,701,190 0.69Spain Zero Coupon 20 - 31.01.26 1,845,000 EUR 1,879,084 1,882,220 0.15Spain 0.25% 19 - 30.07.24 6,510,000 EUR 6,622,669 6,691,904 0.53Spain 0.35% 18 - 30.07.23 8,490,000 EUR 8,577,083 8,688,576 0.69Spain 0.40% 17 - 30.04.22 7,270,000 EUR 7,320,001 7,369,381 0.58Spain 0.40% 17 - 30.04.22 1,106,000 EUR 1,119,139 1,121,119 0.09Spain 0.45% 17 - 31.10.22 7,671,000 EUR 7,753,217 7,816,749 0.62Spain 0.50% 20 - 30.04.30 8,429,000 EUR 8,612,809 8,839,998 0.70Spain 0.60% 19 - 31.10.29 8,691,000 EUR 8,975,440 9,196,309 0.73Spain 0.80% 20 - 30.07.27 7,453,000 EUR 7,787,004 7,980,076 0.63Spain 1.00% 20 - 31.10.50 5,219,000 EUR 4,961,519 5,394,663 0.43Spain 1.20% 20 - 31.10.40 5,412,000 EUR 5,707,716 5,985,627 0.48Spain 1.25% 20 - 31.10.30 10,143,000 EUR 10,906,614 11,335,462 0.90Spain 1.30% 16 - 31.10.26 10,065,000 EUR 10,540,232 11,059,623 0.88Spain 1.40% 18 - 30.04.28 8,840,000 EUR 9,268,049 9,886,302 0.78Spain 1.40% 18 - 30.07.28 8,638,000 EUR 9,037,350 9,674,241 0.77Spain 1.45% 17 - 31.10.27 9,047,000 EUR 9,519,544 10,096,143 0.80Spain 1.45% 19 - 30.04.29 7,279,000 EUR 7,682,071 8,218,578 0.65Spain 1.45% 19 - 30.04.29 1,420,000 EUR 1,580,969 1,603,295 0.13Spain 1.50% 17 - 30.04.27 8,187,000 EUR 8,658,464 9,135,565 0.72Spain 1.60% 15 - 30.04.25 8,943,000 EUR 9,449,864 9,753,360 0.77Spain 1.85% 19 - 30.07.35 7,687,000 EUR 8,760,703 9,302,508 0.74Spain 1.95% 15 - 30.07.30 9,368,000 EUR 10,256,245 11,106,627 0.88Spain 1.95% 16 - 30.04.26 8,683,000 EUR 9,422,280 9,783,310 0.78Spain 2.15% 15 - 31.10.25 6,916,000 EUR 7,501,643 7,790,805 0.62Spain 2.15% 15 - 31.10.25 2,509,000 EUR 2,732,091 2,826,363 0.22Spain 2.35% 17 - 30.07.33 7,738,000 EUR 8,819,534 9,759,452 0.77Spain 2.70% 18 - 31.10.48 5,839,000 EUR 7,416,227 8,563,091 0.68Spain 2.75% 14 - 31.10.24 9,944,000 EUR 10,923,347 11,198,237 0.89Spain 2.90% 16 - 31.10.46 7,006,000 EUR 8,745,210 10,486,095 0.83Spain 3.45% 16 - 30.07.66 6,044,000 EUR 9,158,320 10,950,134 0.87
Xtrackers II
Xtrackers II IBOXX EUROZONE GOVERNMENT BOND YIELD PLUS UCITS ETF (continued)
Statement of Investmentsas at 31 December 2020(expressed in EUR)
The accompanying notes form an integral part of these financial statements.
296
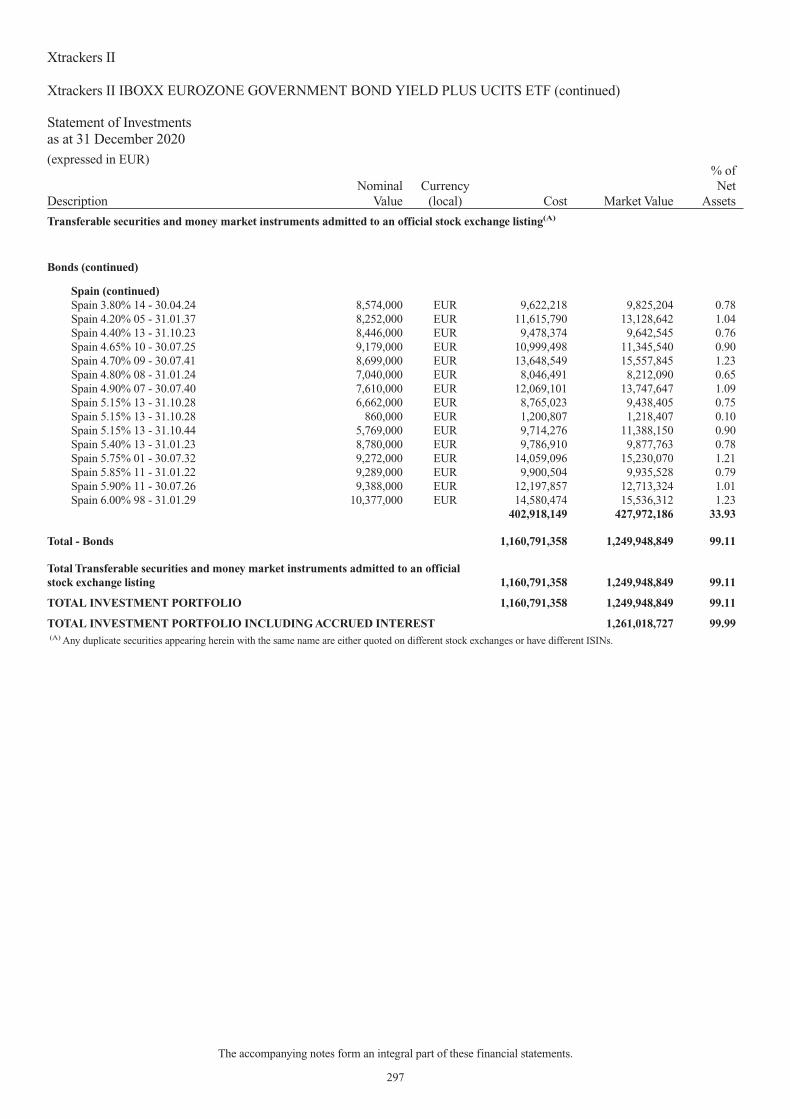
DescriptionNominal
ValueCurrency
(local) Cost Market Value
% ofNet
Assets
Transferable securities and money market instruments admitted to an official stock exchange listing(A)
Bonds (continued)
Spain (continued)Spain 3.80% 14 - 30.04.24 8,574,000 EUR 9,622,218 9,825,204 0.78Spain 4.20% 05 - 31.01.37 8,252,000 EUR 11,615,790 13,128,642 1.04Spain 4.40% 13 - 31.10.23 8,446,000 EUR 9,478,374 9,642,545 0.76Spain 4.65% 10 - 30.07.25 9,179,000 EUR 10,999,498 11,345,540 0.90Spain 4.70% 09 - 30.07.41 8,699,000 EUR 13,648,549 15,557,845 1.23Spain 4.80% 08 - 31.01.24 7,040,000 EUR 8,046,491 8,212,090 0.65Spain 4.90% 07 - 30.07.40 7,610,000 EUR 12,069,101 13,747,647 1.09Spain 5.15% 13 - 31.10.28 6,662,000 EUR 8,765,023 9,438,405 0.75Spain 5.15% 13 - 31.10.28 860,000 EUR 1,200,807 1,218,407 0.10Spain 5.15% 13 - 31.10.44 5,769,000 EUR 9,714,276 11,388,150 0.90Spain 5.40% 13 - 31.01.23 8,780,000 EUR 9,786,910 9,877,763 0.78Spain 5.75% 01 - 30.07.32 9,272,000 EUR 14,059,096 15,230,070 1.21Spain 5.85% 11 - 31.01.22 9,289,000 EUR 9,900,504 9,935,528 0.79Spain 5.90% 11 - 30.07.26 9,388,000 EUR 12,197,857 12,713,324 1.01Spain 6.00% 98 - 31.01.29 10,377,000 EUR 14,580,474 15,536,312 1.23
402,918,149 427,972,186 33.93
Total - Bonds 1,160,791,358 1,249,948,849 99.11
Total Transferable securities and money market instruments admitted to an officialstock exchange listing 1,160,791,358 1,249,948,849 99.11
TOTAL INVESTMENT PORTFOLIO 1,160,791,358 1,249,948,849 99.11
TOTAL INVESTMENT PORTFOLIO INCLUDING ACCRUED INTEREST 1,261,018,727 99.99(A) Any duplicate securities appearing herein with the same name are either quoted on different stock exchanges or have different ISINs.
Xtrackers II
Xtrackers II IBOXX EUROZONE GOVERNMENT BOND YIELD PLUS UCITS ETF (continued)
Statement of Investmentsas at 31 December 2020(expressed in EUR)
The accompanying notes form an integral part of these financial statements.
297

DescriptionNominal
ValueCurrency
(local) Cost Market Value
% ofNet
Assets
Transferable securities and money market instruments admitted to an official stock exchange listing(A)
Bonds
AustraliaAustralia 0.25% 20 - 21.11.24 1,831,000 AUD 1,823,712 1,835,431 3.77Australia 0.25% 20 - 21.11.25 1,579,000 AUD 1,565,527 1,572,258 3.23Australia 0.50% 20 - 21.09.26 1,673,000 AUD 1,677,349 1,676,463 3.45Australia 1.00% 20 - 21.12.30 1,939,000 AUD 1,954,973 1,943,809 4.00Australia 1.00% 20 - 21.11.31 1,642,000 AUD 1,656,856 1,632,263 3.35Australia 1.25% 20 - 21.05.32 1,181,000 AUD 1,215,911 1,200,345 2.47Australia 1.50% 19 - 21.06.31 1,673,000 AUD 1,747,128 1,753,404 3.60Australia 1.75% 20 - 21.06.51 947,000 AUD 916,998 900,502 1.85Australia 2.00% 17 - 21.12.21 1,025,000 AUD 1,035,354 1,044,280 2.15Australia 2.25% 16 - 21.05.28 1,675,000 AUD 1,786,109 1,864,158 3.83Australia 2.25% 16 - 21.05.28 201,000 AUD 199,334 223,699 0.46Australia 2.25% 17 - 21.11.22 1,673,000 AUD 1,720,308 1,741,008 3.58Australia 2.50% 18 - 21.05.30 2,235,000 AUD 2,484,734 2,552,705 5.25Australia 2.75% 12 - 21.04.24 1,844,000 AUD 1,955,853 2,004,354 4.12Australia 2.75% 12 - 21.04.24 234,000 AUD 238,993 254,349 0.52Australia 2.75% 15 - 21.06.35 540,000 AUD 610,637 640,597 1.32Australia 2.75% 16 - 21.11.27 388,000 AUD 389,718 443,825 0.91Australia 2.75% 16 - 21.11.27 1,380,000 AUD 1,522,128 1,578,554 3.24Australia 2.75% 17 - 21.11.28 1,964,000 AUD 2,167,850 2,265,022 4.66Australia 2.75% 18 - 21.11.29 1,912,000 AUD 2,147,758 2,219,278 4.56Australia 2.75% 18 - 21.11.29 166,000 AUD 170,510 192,678 0.40Australia 2.75% 18 - 21.05.41 796,000 AUD 937,324 937,067 1.93Australia 3.00% 16 - 21.03.47 840,000 AUD 985,262 1,034,485 2.13Australia 3.25% 12 - 21.04.29 2,021,000 AUD 2,316,999 2,418,329 4.97Australia 3.25% 13 - 21.04.25 1,824,000 AUD 1,997,541 2,057,308 4.23Australia 3.25% 13 - 21.04.25 222,000 AUD 231,591 250,396 0.51Australia 3.25% 15 - 21.06.39 115,000 AUD 114,359 145,097 0.30Australia 3.25% 15 - 21.06.39 491,000 AUD 602,585 619,500 1.27Australia 3.75% 14 - 21.04.37 758,000 AUD 960,391 1,010,785 2.08Australia 4.25% 14 - 21.04.26 1,839,000 AUD 2,132,285 2,211,195 4.55Australia 4.25% 14 - 21.04.26 270,000 AUD 296,187 324,645 0.67Australia 4.50% 13 - 21.04.33 903,000 AUD 1,190,198 1,253,111 2.58Australia 4.75% 11 - 21.04.27 1,939,000 AUD 2,343,301 2,445,661 5.03Australia 5.50% 11 - 21.04.23 2,160,000 AUD 2,385,684 2,426,630 4.99Australia 5.75% 10 - 15.07.22 1,208,000 AUD 1,298,393 1,313,060 2.70Australia 5.75% 10 - 15.07.22 356,000 AUD 374,061 386,961 0.79
47,153,901 48,373,212 99.45
Total - Bonds 47,153,901 48,373,212 99.45
Total Transferable securities and money market instruments admitted to an officialstock exchange listing 47,153,901 48,373,212 99.45
TOTAL INVESTMENT PORTFOLIO 47,153,901 48,373,212 99.45
TOTAL INVESTMENT PORTFOLIO INCLUDING ACCRUED INTEREST 48,584,070 99.88(A) Any duplicate securities appearing herein with the same name are either quoted on different stock exchanges or have different ISINs.
Xtrackers II
Xtrackers II AUSTRALIA GOVERNMENT BOND UCITS ETF
Statement of Investmentsas at 31 December 2020(expressed in AUD)
The accompanying notes form an integral part of these financial statements.
298

DescriptionNominal
ValueCurrency
(local) Cost Market Value
% ofNet
Assets
Transferable securities and money market instruments admitted to an official stock exchange listing
Bonds
ItalyItaly Buoni Poliennali del Tesoro Coupon Strip ZeroCoupon 98 - 01.05.21 3,000,000 EUR 3,000,934 3,004,140 3.52Italy Buoni Poliennali Del Tesoro Hybrid Strip ZeroCoupon 98 - 01.11.29 8,200,000 EUR 7,174,492 7,820,668 9.17
10,175,426 10,824,808 12.69
Total - Bonds 10,175,426 10,824,808 12.69
Total Transferable securities and money market instruments admitted to an officialstock exchange listing 10,175,426 10,824,808 12.69
Transferable securities and money market instruments dealt in on another regulated market
Bonds
ItalyItaly Buoni Poliennali del Tesoro Coupon Strip ZeroCoupon 98 - 01.05.26 2,500,000 EUR 2,410,733 2,483,600 2.91Italy Buoni Poliennali del Tesoro Coupon Strip ZeroCoupon 02 - 01.02.22 6,000,000 EUR 5,977,073 6,017,880 7.05Italy Buoni Poliennali del Tesoro Coupon Strip ZeroCoupon 13 - 01.03.22 6,700,000 EUR 6,722,987 6,728,341 7.89Italy Buoni Poliennali del Tesoro Coupon Strip ZeroCoupon 13 - 01.03.27 2,200,000 EUR 2,042,099 2,168,276 2.54
17,152,892 17,398,097 20.39
Total - Bonds 17,152,892 17,398,097 20.39
Total Transferable securities and money market instruments dealt in on anotherregulated market 17,152,892 17,398,097 20.39
Other transferable securities and money market instruments
Bonds
ItalyItaly Buoni Poliennali del Tesoro Coupon Strip ZeroCoupon 98 - 01.05.24 3,800,000 EUR 3,652,330 3,819,798 4.48Italy Buoni Poliennali del Tesoro Coupon Strip ZeroCoupon 02 - 01.02.21 1,850,000 EUR 1,845,664 1,850,481 2.17Italy Buoni Poliennali del Tesoro Coupon Strip ZeroCoupon 02 - 01.02.23 1,200,000 EUR 1,180,350 1,207,728 1.42Italy Buoni Poliennali del Tesoro Coupon Strip ZeroCoupon 02 - 01.02.24 2,200,000 EUR 2,154,708 2,214,740 2.60Italy Buoni Poliennali del Tesoro Coupon Strip ZeroCoupon 02 - 01.08.24 1,900,000 EUR 1,834,743 1,910,241 2.24
Xtrackers II
Xtrackers II ITALY GOVERNMENT BOND 0-1 SWAP UCITS ETF
Statement of Investmentsas at 31 December 2020(expressed in EUR)
The accompanying notes form an integral part of these financial statements.
299
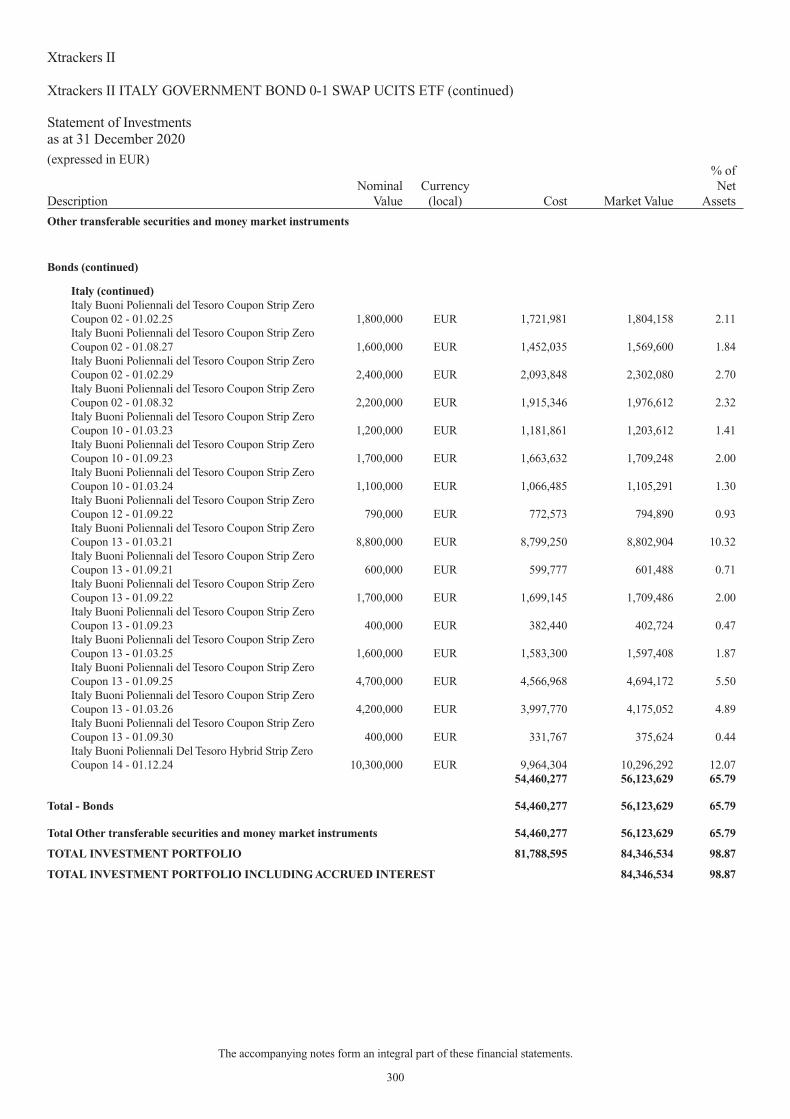
DescriptionNominal
ValueCurrency
(local) Cost Market Value
% ofNet
Assets
Other transferable securities and money market instruments
Bonds (continued)
Italy (continued)Italy Buoni Poliennali del Tesoro Coupon Strip ZeroCoupon 02 - 01.02.25 1,800,000 EUR 1,721,981 1,804,158 2.11Italy Buoni Poliennali del Tesoro Coupon Strip ZeroCoupon 02 - 01.08.27 1,600,000 EUR 1,452,035 1,569,600 1.84Italy Buoni Poliennali del Tesoro Coupon Strip ZeroCoupon 02 - 01.02.29 2,400,000 EUR 2,093,848 2,302,080 2.70Italy Buoni Poliennali del Tesoro Coupon Strip ZeroCoupon 02 - 01.08.32 2,200,000 EUR 1,915,346 1,976,612 2.32Italy Buoni Poliennali del Tesoro Coupon Strip ZeroCoupon 10 - 01.03.23 1,200,000 EUR 1,181,861 1,203,612 1.41Italy Buoni Poliennali del Tesoro Coupon Strip ZeroCoupon 10 - 01.09.23 1,700,000 EUR 1,663,632 1,709,248 2.00Italy Buoni Poliennali del Tesoro Coupon Strip ZeroCoupon 10 - 01.03.24 1,100,000 EUR 1,066,485 1,105,291 1.30Italy Buoni Poliennali del Tesoro Coupon Strip ZeroCoupon 12 - 01.09.22 790,000 EUR 772,573 794,890 0.93Italy Buoni Poliennali del Tesoro Coupon Strip ZeroCoupon 13 - 01.03.21 8,800,000 EUR 8,799,250 8,802,904 10.32Italy Buoni Poliennali del Tesoro Coupon Strip ZeroCoupon 13 - 01.09.21 600,000 EUR 599,777 601,488 0.71Italy Buoni Poliennali del Tesoro Coupon Strip ZeroCoupon 13 - 01.09.22 1,700,000 EUR 1,699,145 1,709,486 2.00Italy Buoni Poliennali del Tesoro Coupon Strip ZeroCoupon 13 - 01.09.23 400,000 EUR 382,440 402,724 0.47Italy Buoni Poliennali del Tesoro Coupon Strip ZeroCoupon 13 - 01.03.25 1,600,000 EUR 1,583,300 1,597,408 1.87Italy Buoni Poliennali del Tesoro Coupon Strip ZeroCoupon 13 - 01.09.25 4,700,000 EUR 4,566,968 4,694,172 5.50Italy Buoni Poliennali del Tesoro Coupon Strip ZeroCoupon 13 - 01.03.26 4,200,000 EUR 3,997,770 4,175,052 4.89Italy Buoni Poliennali del Tesoro Coupon Strip ZeroCoupon 13 - 01.09.30 400,000 EUR 331,767 375,624 0.44Italy Buoni Poliennali Del Tesoro Hybrid Strip ZeroCoupon 14 - 01.12.24 10,300,000 EUR 9,964,304 10,296,292 12.07
54,460,277 56,123,629 65.79
Total - Bonds 54,460,277 56,123,629 65.79
Total Other transferable securities and money market instruments 54,460,277 56,123,629 65.79
TOTAL INVESTMENT PORTFOLIO 81,788,595 84,346,534 98.87
TOTAL INVESTMENT PORTFOLIO INCLUDING ACCRUED INTEREST 84,346,534 98.87
Xtrackers II
Xtrackers II ITALY GOVERNMENT BOND 0-1 SWAP UCITS ETF (continued)
Statement of Investmentsas at 31 December 2020(expressed in EUR)
The accompanying notes form an integral part of these financial statements.
300

DescriptionNominal
ValueCurrency
(local) Cost Market Value
% ofNet
Assets
Transferable securities and money market instruments admitted to an official stock exchange listing
Bonds
AustraliaCommonwealth Bank of Australia 3.00% 12 -03.05.22 400,000 EUR 437,480 418,517 5.84Westpac Banking Corp. 0.75% 18 - 17.10.23 300,000 EUR 302,609 308,622 4.31
740,089 727,139 10.15CanadaBank of Montreal 2.35% 17 - 11.09.22 225,000 USD 196,640 190,363 2.66
196,640 190,363 2.66FranceCredit Agricole Home Loan SFH SA 0.625% 14 -28.11.22 100,000 EUR 100,948 102,148 1.42Credit Mutuel Home Loan SFH SA 1.75% 14 -19.06.24 400,000 EUR 422,188 431,001 6.01France OAT Zero Coupon 09 - 25.04.31 1,410,000 EUR 1,451,037 1,451,468 20.26
1,974,173 1,984,617 27.69GermanyDeutsche Bundesrepublik Principal Strips ZeroCoupon 13 - 15.02.23 550,000 EUR 558,892 558,674 7.80
558,892 558,674 7.80ItalyIntesa Sanpaolo SpA 2.00% 14 - 18.06.21 450,000 EUR 465,746 454,792 6.35Italy Buoni Poliennali Del Tesoro Hybrid Strip ZeroCoupon 98 - 01.11.29 400,000 EUR 365,808 381,496 5.32
831,554 836,288 11.67NetherlandsING Bank NV 3.625% 11 - 31.08.21 700,000 EUR 765,702 719,327 10.04
765,702 719,327 10.04SpainSpain 3.45% 16 - 30.07.66 35,000 EUR 61,089 63,411 0.88Spain Coupon Strip Zero Coupon 98 - 31.01.22 200,000 EUR 200,925 201,056 2.81Spain Coupon Strip Zero Coupon 01 - 30.07.21 100,000 EUR 100,195 100,258 1.40Spain Coupon Strip Zero Coupon 05 - 31.01.30 100,000 EUR 96,191 99,673 1.39Spain Coupon Strip Zero Coupon 07 - 30.07.33 100,000 EUR 92,936 95,906 1.34
551,336 560,304 7.82
Total - Bonds 5,618,386 5,576,712 77.83
Total Transferable securities and money market instruments admitted to an officialstock exchange listing 5,618,386 5,576,712 77.83
Xtrackers II
Xtrackers II EUR COVERED BOND SWAP UCITS ETF
Statement of Investmentsas at 31 December 2020(expressed in EUR)
The accompanying notes form an integral part of these financial statements.
301

DescriptionNominal
ValueCurrency
(local) Cost Market Value
% ofNet
Assets
Transferable securities and money market instruments dealt in on another regulated market
Bonds
ItalyItaly Buoni Poliennali del Tesoro Coupon Strip ZeroCoupon 98 - 01.05.26 600,000 EUR 593,263 596,064 8.32Italy Buoni Poliennali del Tesoro Coupon Strip ZeroCoupon 13 - 01.03.22 700,000 EUR 701,467 702,961 9.81
1,294,730 1,299,025 18.13
Total - Bonds 1,294,730 1,299,025 18.13
Total Transferable securities and money market instruments dealt in on anotherregulated market 1,294,730 1,299,025 18.13
Other transferable securities and money market instruments
Bonds
ItalyItaly Buoni Poliennali del Tesoro Coupon Strip ZeroCoupon 98 - 01.05.22 100,000 EUR 99,719 100,434 1.40Italy Buoni Poliennali Del Tesoro Hybrid Strip ZeroCoupon 15 - 01.06.25 100,000 EUR 95,422 99,792 1.39
195,141 200,226 2.79
Total - Bonds 195,141 200,226 2.79
Total Other transferable securities and money market instruments 195,141 200,226 2.79
TOTAL INVESTMENT PORTFOLIO 7,108,257 7,075,963 98.75
TOTAL INVESTMENT PORTFOLIO INCLUDING ACCRUED INTEREST 7,103,479 99.13
Xtrackers II
Xtrackers II EUR COVERED BOND SWAP UCITS ETF (continued)
Statement of Investmentsas at 31 December 2020(expressed in EUR)
The accompanying notes form an integral part of these financial statements.
302

DescriptionNominal
ValueCurrency
(local) Cost Market Value
% ofNet
Assets
Transferable securities and money market instruments admitted to an official stock exchange listing(A)
Bonds
IrelandIreland Zero Coupon 17 - 18.10.22 4,360,000 EUR 4,401,710 4,414,010 0.89Ireland 0.80% 15 - 15.03.22 6,027,000 EUR 6,121,157 6,136,932 1.24Ireland 3.90% 13 - 20.03.23 6,169,000 EUR 6,771,804 6,800,582 1.37
17,294,671 17,351,524 3.50ItalyItaly Buoni Poliennali Del Tesoro 0.05% 19 - 15.01.23 13,527,000 EUR 13,541,336 13,654,424 2.76Italy Buoni Poliennali Del Tesoro 0.30% 20 - 15.08.23 14,522,000 EUR 14,620,444 14,766,986 2.98Italy Buoni Poliennali Del Tesoro 0.60% 20 - 15.06.23 12,572,000 EUR 12,726,867 12,882,151 2.60Italy Buoni Poliennali Del Tesoro 0.65% 16 - 15.10.23 14,645,000 EUR 15,004,790 15,052,459 3.04Italy Buoni Poliennali Del Tesoro 0.90% 17 - 01.08.22 15,983,000 EUR 16,216,957 16,322,994 3.29Italy Buoni Poliennali Del Tesoro 0.95% 16 - 15.03.23 13,738,000 EUR 13,938,732 14,146,789 2.85Italy Buoni Poliennali Del Tesoro 0.95% 18 - 01.03.23 14,676,000 EUR 14,897,915 15,105,175 3.05Italy Buoni Poliennali Del Tesoro 1.00% 19 - 15.07.22 8,043,000 EUR 8,150,733 8,222,961 1.66Italy Buoni Poliennali Del Tesoro 1.00% 19 - 15.07.22 3,779,000 EUR 3,840,476 3,863,555 0.78Italy Buoni Poliennali Del Tesoro 1.20% 17 - 01.04.22 14,509,000 EUR 14,652,322 14,812,093 2.99Italy Buoni Poliennali Del Tesoro 1.35% 15 - 15.04.22 15,609,000 EUR 15,809,152 15,968,475 3.22Italy Buoni Poliennali Del Tesoro 1.45% 15 - 15.09.22 14,351,000 EUR 14,718,750 14,815,635 2.99Italy Buoni Poliennali Del Tesoro 2.45% 18 - 01.10.23 13,743,000 EUR 14,757,791 14,805,084 2.99Italy Buoni Poliennali Del Tesoro 4.50% 13 - 01.05.23 15,554,000 EUR 17,076,791 17,335,748 3.50Italy Buoni Poliennali Del Tesoro 4.75% 08 - 01.08.23 19,748,000 EUR 22,155,807 22,388,667 4.52Italy Buoni Poliennali Del Tesoro 5.00% 11 - 01.03.22 18,034,000 EUR 19,015,305 19,182,836 3.87Italy Buoni Poliennali Del Tesoro 5.50% 12 - 01.09.22 17,246,000 EUR 18,854,918 18,942,627 3.82Italy Buoni Poliennali Del Tesoro 5.50% 12 - 01.11.22 18,824,000 EUR 20,684,187 20,857,335 4.21Italy Buoni Poliennali Del Tesoro 9.00% 93 - 01.11.23 13,472,000 EUR 17,050,253 17,058,381 3.44Italy Certificati di Credito Del Tesoro Zero Coupon20 - 30.05.22 14,397,000 EUR 14,395,068 14,481,896 2.92Italy Certificati di Credito Del Tesoro Zero Coupon20 - 28.09.22 7,332,000 EUR 7,360,777 7,380,647 1.49
309,469,371 312,046,918 62.97PortugalPortugal Obrigacoes do Tesouro OT 2.20% 15 -17.10.22 8,509,000 EUR 8,919,068 8,957,424 1.81Portugal Obrigacoes do Tesouro OT 4.95% 08 -25.10.23 10,949,000 EUR 12,658,357 12,674,234 2.56
21,577,425 21,631,658 4.37SloveniaSlovenia 0.20% 20 - 31.03.23 1,761,000 EUR 1,775,771 1,786,899 0.36
1,775,771 1,786,899 0.36SpainSpain Zero Coupon 20 - 30.04.23 19,192,000 EUR 19,349,606 19,449,173 3.93Spain 0.35% 18 - 30.07.23 18,653,000 EUR 19,012,048 19,089,283 3.85Spain 0.40% 17 - 30.04.22 13,373,000 EUR 13,514,585 13,555,809 2.74Spain 0.40% 17 - 30.04.22 5,030,000 EUR 5,086,004 5,098,760 1.03Spain 0.45% 17 - 31.10.22 16,445,000 EUR 16,696,738 16,757,455 3.38Spain 4.40% 13 - 31.10.23 18,660,000 EUR 21,309,145 21,303,562 4.30
Xtrackers II
Xtrackers II IBOXX EUROZONE GOVERNMENT BOND YIELD PLUS 1-3 UCITS ETF
Statement of Investmentsas at 31 December 2020(expressed in EUR)
The accompanying notes form an integral part of these financial statements.
303

DescriptionNominal
ValueCurrency
(local) Cost Market Value
% ofNet
Assets
Transferable securities and money market instruments admitted to an official stock exchange listing(A)
Bonds (continued)
Spain (continued)Spain 5.40% 13 - 31.01.23 19,078,000 EUR 21,389,419 21,463,322 4.33Spain 5.85% 11 - 31.01.22 20,034,000 EUR 21,375,566 21,428,396 4.32
137,733,111 138,145,760 27.88
Total - Bonds 487,850,349 490,962,759 99.08
Total Transferable securities and money market instruments admitted to an officialstock exchange listing 487,850,349 490,962,759 99.08
TOTAL INVESTMENT PORTFOLIO 487,850,349 490,962,759 99.08
TOTAL INVESTMENT PORTFOLIO INCLUDING ACCRUED INTEREST 495,545,391 100.00(A) Any duplicate securities appearing herein with the same name are either quoted on different stock exchanges or have different ISINs.
Xtrackers II
Xtrackers II IBOXX EUROZONE GOVERNMENT BOND YIELD PLUS 1-3 UCITS ETF (continued)
Statement of Investmentsas at 31 December 2020(expressed in EUR)
The accompanying notes form an integral part of these financial statements.
304

DescriptionNominal
ValueCurrency
(local) Cost Market Value
% ofNet
Assets
Transferable securities and money market instruments admitted to an official stock exchange listing(A)
Bonds
JapanJapan Government Five Year Bond 0.10% 17 -20.03.22 251,250,000 JPY 252,089,157 251,898,225 0.17Japan Government Five Year Bond 0.10% 17 -20.06.22 412,250,000 JPY 413,929,908 413,593,935 0.28Japan Government Five Year Bond 0.10% 17 -20.09.22 524,050,000 JPY 526,441,198 526,140,959 0.36Japan Government Five Year Bond 0.10% 17 -20.12.22 415,350,000 JPY 417,524,109 417,239,843 0.29Japan Government Five Year Bond 0.10% 18 -20.03.23 571,950,000 JPY 575,138,365 574,901,262 0.40Japan Government Five Year Bond 0.10% 18 -20.06.23 236,100,000 JPY 237,656,445 237,467,019 0.16Japan Government Five Year Bond 0.10% 18 -20.09.23 306,550,000 JPY 308,749,367 308,524,182 0.21Japan Government Five Year Bond 0.10% 19 -20.12.23 494,000,000 JPY 498,021,705 497,502,460 0.34Japan Government Five Year Bond 0.10% 19 -20.03.24 528,600,000 JPY 533,532,526 532,643,790 0.37Japan Government Five Year Bond 0.10% 19 -20.06.24 705,300,000 JPY 712,630,676 710,836,605 0.49Japan Government Five Year Bond 0.10% 19 -20.09.24 809,150,000 JPY 817,169,818 815,922,585 0.56Japan Government Five Year Bond 0.10% 20 -20.12.24 691,700,000 JPY 699,390,365 697,842,296 0.48Japan Government Five Year Bond 0.10% 20 -20.03.25 704,600,000 JPY 711,650,672 711,448,712 0.49Japan Government Five Year Bond 0.10% 20 -20.06.25 1,084,800,000 JPY 1,094,825,760 1,095,789,024 0.76Japan Government Five Year Bond 0.10% 20 -20.09.25 1,659,450,000 JPY 1,675,488,837 1,676,127,472 1.16Japan Government Forty Year Bond 0.40% 16 -20.03.56 709,150,000 JPY 675,931,374 650,999,700 0.45Japan Government Forty Year Bond 0.50% 19 -20.03.59 851,550,000 JPY 863,531,880 801,913,150 0.55Japan Government Forty Year Bond 0.50% 20 -20.03.60 659,100,000 JPY 628,348,128 620,944,701 0.43Japan Government Forty Year Bond 0.80% 18 -20.03.58 687,500,000 JPY 749,112,194 716,581,250 0.49Japan Government Forty Year Bond 0.90% 17 -20.03.57 709,700,000 JPY 786,977,829 763,055,246 0.53Japan Government Forty Year Bond 1.40% 15 -20.03.55 314,150,000 JPY 404,532,098 385,477,758 0.27Japan Government Forty Year Bond 1.70% 14 -20.03.54 352,950,000 JPY 475,301,454 462,953,927 0.32Japan Government Forty Year Bond 1.90% 13 -20.03.53 327,650,000 JPY 462,725,215 446,111,858 0.31Japan Government Forty Year Bond 2.00% 12 -20.03.52 569,400,000 JPY 805,032,517 785,857,410 0.54
Xtrackers II
Xtrackers II JAPAN GOVERNMENT BOND UCITS ETF
Statement of Investmentsas at 31 December 2020(expressed in JPY)
The accompanying notes form an integral part of these financial statements.
305

DescriptionNominal
ValueCurrency
(local) Cost Market Value
% ofNet
Assets
Transferable securities and money market instruments admitted to an official stock exchange listing(A)
Bonds (continued)
Japan (continued)Japan Government Forty Year Bond 2.20% 09 -20.03.49 375,550,000 JPY 542,460,876 531,110,321 0.37Japan Government Forty Year Bond 2.20% 10 -20.03.50 363,900,000 JPY 531,183,596 516,723,444 0.36Japan Government Forty Year Bond 2.20% 11 -20.03.51 543,400,000 JPY 800,119,749 774,252,622 0.53Japan Government Forty Year Bond 2.40% 07 -20.03.48 231,600,000 JPY 345,010,898 337,566,264 0.23Japan Government Ten Year Bond 0.10% 16 - 20.03.26 295,000,000 JPY 298,700,290 298,180,100 0.21Japan Government Ten Year Bond 0.10% 16 - 20.06.26 300,400,000 JPY 304,276,969 303,758,472 0.21Japan Government Ten Year Bond 0.10% 16 - 20.09.26 500,550,000 JPY 507,706,202 506,341,364 0.35Japan Government Ten Year Bond 0.10% 16 - 20.12.26 782,200,000 JPY 793,095,331 791,547,290 0.55Japan Government Ten Year Bond 0.10% 17 - 20.03.27 411,150,000 JPY 417,377,677 416,420,943 0.29Japan Government Ten Year Bond 0.10% 17 - 20.06.27 544,950,000 JPY 553,449,133 552,072,496 0.38Japan Government Ten Year Bond 0.10% 17 - 20.09.27 404,850,000 JPY 410,557,562 410,234,505 0.28Japan Government Ten Year Bond 0.10% 17 - 20.12.27 342,400,000 JPY 347,681,897 347,018,976 0.24Japan Government Ten Year Bond 0.10% 18 - 20.03.28 414,550,000 JPY 420,710,639 420,113,261 0.29Japan Government Ten Year Bond 0.10% 18 - 20.06.28 482,450,000 JPY 489,013,276 488,847,287 0.34Japan Government Ten Year Bond 0.10% 18 - 20.09.28 409,500,000 JPY 415,161,213 415,175,670 0.29Japan Government Ten Year Bond 0.10% 19 - 20.12.28 424,600,000 JPY 431,112,232 430,043,372 0.30Japan Government Ten Year Bond 0.10% 19 - 20.03.29 423,850,000 JPY 430,555,348 429,427,866 0.30Japan Government Ten Year Bond 0.10% 19 - 20.06.29 516,600,000 JPY 525,532,557 523,109,160 0.36Japan Government Ten Year Bond 0.10% 19 - 20.09.29 964,400,000 JPY 977,467,702 975,963,156 0.67Japan Government Ten Year Bond 0.10% 20 - 20.12.29 1,273,350,000 JPY 1,292,507,557 1,286,580,106 0.89Japan Government Ten Year Bond 0.10% 20 - 20.03.30 1,145,250,000 JPY 1,156,474,186 1,156,725,405 0.80Japan Government Ten Year Bond 0.10% 20 - 20.06.30 1,476,350,000 JPY 1,487,254,533 1,489,253,299 1.03Japan Government Ten Year Bond 0.10% 20 - 20.09.30 2,041,750,000 JPY 2,056,112,599 2,058,839,447 1.42Japan Government Ten Year Bond 0.30% 15 - 20.12.24 263,450,000 JPY 268,643,558 267,883,864 0.18Japan Government Ten Year Bond 0.30% 15 - 20.12.25 332,450,000 JPY 339,984,850 339,218,682 0.23Japan Government Ten Year Bond 0.40% 15 - 20.03.25 329,300,000 JPY 336,888,818 336,534,721 0.23Japan Government Ten Year Bond 0.40% 15 - 20.06.25 573,600,000 JPY 587,501,675 587,125,488 0.40Japan Government Ten Year Bond 0.40% 15 - 20.09.25 296,550,000 JPY 304,436,547 303,886,647 0.21Japan Government Ten Year Bond 0.50% 14 - 20.09.24 542,050,000 JPY 555,464,820 554,668,924 0.38Japan Government Ten Year Bond 0.50% 14 - 20.12.24 200,750,000 JPY 205,988,579 205,726,593 0.14Japan Government Ten Year Bond 0.60% 13 - 20.03.23 1,417,350,000 JPY 1,441,628,993 1,440,013,426 0.99Japan Government Ten Year Bond 0.60% 13 - 20.09.23 200,800,000 JPY 204,911,066 204,767,808 0.14Japan Government Ten Year Bond 0.60% 13 - 20.12.23 1,258,600,000 JPY 1,287,117,771 1,285,836,104 0.89Japan Government Ten Year Bond 0.60% 14 - 20.03.24 520,500,000 JPY 533,185,695 532,690,110 0.37Japan Government Ten Year Bond 0.60% 14 - 20.06.24 497,900,000 JPY 510,775,047 510,457,038 0.35Japan Government Ten Year Bond 0.70% 12 - 20.12.22 665,350,000 JPY 676,694,020 676,088,749 0.47Japan Government Ten Year Bond 0.80% 12 - 20.06.22 1,048,650,000 JPY 1,063,555,432 1,062,628,504 0.73Japan Government Ten Year Bond 0.80% 12 - 20.09.22 1,907,300,000 JPY 1,939,161,336 1,937,454,413 1.34Japan Government Ten Year Bond 0.80% 13 - 20.12.22 1,423,200,000 JPY 1,450,311,327 1,448,959,920 1.00Japan Government Ten Year Bond 0.80% 13 - 20.06.23 1,399,600,000 JPY 1,433,153,940 1,431,860,780 0.99Japan Government Ten Year Bond 0.80% 13 - 20.09.23 634,550,000 JPY 651,192,459 650,540,660 0.45Japan Government Ten Year Bond 0.90% 12 - 20.03.22 497,800,000 JPY 504,168,979 503,893,072 0.35Japan Government Ten Year Bond 0.90% 12 - 20.06.22 595,800,000 JPY 605,192,159 604,611,882 0.42Japan Government Ten Year Bond 1.00% 12 - 20.03.22 1,192,300,000 JPY 1,209,244,465 1,208,336,435 0.83
Xtrackers II
Xtrackers II JAPAN GOVERNMENT BOND UCITS ETF (continued)
Statement of Investmentsas at 31 December 2020(expressed in JPY)
The accompanying notes form an integral part of these financial statements.
306

DescriptionNominal
ValueCurrency
(local) Cost Market Value
% ofNet
Assets
Transferable securities and money market instruments admitted to an official stock exchange listing(A)
Bonds (continued)
Japan (continued)Japan Government Thirty Year Bond 0.30% 16 -20.06.46 430,000,000 JPY 412,058,818 406,470,400 0.28Japan Government Thirty Year Bond 0.40% 19 -20.06.49 708,350,000 JPY 705,878,159 669,312,831 0.46Japan Government Thirty Year Bond 0.40% 19 -20.09.49 727,250,000 JPY 720,414,522 685,854,930 0.47Japan Government Thirty Year Bond 0.40% 20 -20.12.49 651,850,000 JPY 643,520,632 613,560,331 0.42Japan Government Thirty Year Bond 0.40% 20 -20.03.50 689,600,000 JPY 667,086,672 647,810,240 0.45Japan Government Thirty Year Bond 0.50% 16 -20.09.46 549,850,000 JPY 552,828,617 544,785,881 0.38Japan Government Thirty Year Bond 0.50% 19 -20.03.49 652,050,000 JPY 660,198,842 634,457,691 0.44Japan Government Thirty Year Bond 0.60% 16 -20.12.46 395,050,000 JPY 406,756,608 400,264,660 0.28Japan Government Thirty Year Bond 0.60% 20 -20.06.50 884,700,000 JPY 888,697,244 877,507,389 0.60Japan Government Thirty Year Bond 0.60% 20 -20.09.50 896,100,000 JPY 886,854,308 887,416,791 0.61Japan Government Thirty Year Bond 0.70% 18 -20.06.48 717,100,000 JPY 755,418,088 738,555,632 0.51Japan Government Thirty Year Bond 0.70% 19 -20.12.48 614,600,000 JPY 652,518,483 630,665,644 0.43Japan Government Thirty Year Bond 0.80% 16 -20.03.46 459,350,000 JPY 497,985,426 489,253,685 0.34Japan Government Thirty Year Bond 0.80% 17 -20.03.47 387,400,000 JPY 418,904,964 410,705,984 0.28Japan Government Thirty Year Bond 0.80% 17 -20.06.47 451,050,000 JPY 484,233,953 478,284,399 0.33Japan Government Thirty Year Bond 0.80% 17 -20.09.47 490,050,000 JPY 522,942,896 519,149,169 0.36Japan Government Thirty Year Bond 0.80% 17 -20.12.47 545,250,000 JPY 588,939,380 576,378,322 0.40Japan Government Thirty Year Bond 0.80% 18 -20.03.48 665,100,000 JPY 719,497,548 702,325,647 0.48Japan Government Thirty Year Bond 0.90% 18 -20.09.48 469,500,000 JPY 518,317,066 506,576,415 0.35Japan Government Thirty Year Bond 1.10% 03 -20.03.33 156,900,000 JPY 175,442,951 175,403,217 0.12Japan Government Thirty Year Bond 1.40% 15 -20.09.45 213,850,000 JPY 262,320,996 257,520,309 0.18Japan Government Thirty Year Bond 1.40% 15 -20.12.45 294,100,000 JPY 360,650,323 355,002,228 0.24Japan Government Thirty Year Bond 1.50% 14 -20.12.44 304,550,000 JPY 379,339,160 373,871,671 0.26Japan Government Thirty Year Bond 1.50% 15 -20.03.45 497,700,000 JPY 615,628,111 611,220,393 0.42
Xtrackers II
Xtrackers II JAPAN GOVERNMENT BOND UCITS ETF (continued)
Statement of Investmentsas at 31 December 2020(expressed in JPY)
The accompanying notes form an integral part of these financial statements.
307

DescriptionNominal
ValueCurrency
(local) Cost Market Value
% ofNet
Assets
Transferable securities and money market instruments admitted to an official stock exchange listing(A)
Bonds (continued)
Japan (continued)Japan Government Thirty Year Bond 1.60% 15 -20.06.45 233,000,000 JPY 296,153,978 291,380,480 0.20Japan Government Thirty Year Bond 1.70% 03 -20.06.33 202,400,000 JPY 241,012,673 241,633,216 0.17Japan Government Thirty Year Bond 1.70% 13 -20.12.43 455,400,000 JPY 581,148,168 577,032,786 0.40Japan Government Thirty Year Bond 1.70% 14 -20.03.44 519,350,000 JPY 667,247,026 658,561,767 0.45Japan Government Thirty Year Bond 1.70% 14 -20.06.44 362,350,000 JPY 467,106,595 459,847,515 0.32Japan Government Thirty Year Bond 1.70% 14 -20.09.44 393,300,000 JPY 505,175,669 499,502,799 0.34Japan Government Thirty Year Bond 1.80% 02 -22.11.32 151,550,000 JPY 181,227,865 181,914,558 0.13Japan Government Thirty Year Bond 1.80% 13 -20.03.43 649,250,000 JPY 838,378,618 833,760,357 0.57Japan Government Thirty Year Bond 1.80% 13 -20.09.43 423,150,000 JPY 551,177,196 544,505,188 0.38Japan Government Thirty Year Bond 1.90% 12 -20.09.42 1,172,600,000 JPY 1,534,813,682 1,526,091,996 1.05Japan Government Thirty Year Bond 1.90% 13 -20.06.43 557,700,000 JPY 736,915,984 728,378,508 0.50Japan Government Thirty Year Bond 2.00% 04 -20.12.33 219,500,000 JPY 270,810,802 271,363,460 0.19Japan Government Thirty Year Bond 2.00% 10 -20.09.40 993,950,000 JPY 1,302,501,254 1,295,912,010 0.89Japan Government Thirty Year Bond 2.00% 11 -20.09.41 979,200,000 JPY 1,293,871,183 1,284,171,840 0.89Japan Government Thirty Year Bond 2.00% 12 -20.03.42 940,300,000 JPY 1,247,512,136 1,239,080,325 0.85Japan Government Thirty Year Bond 2.10% 03 -20.09.33 175,550,000 JPY 219,677,129 218,742,322 0.15Japan Government Thirty Year Bond 2.20% 09 -20.09.39 688,500,000 JPY 920,895,483 913,708,350 0.63Japan Government Thirty Year Bond 2.20% 11 -20.03.41 861,250,000 JPY 1,167,482,720 1,160,586,050 0.80Japan Government Thirty Year Bond 2.30% 02 -20.05.32 172,750,000 JPY 216,255,121 215,916,770 0.15Japan Government Thirty Year Bond 2.30% 05 -20.03.35 355,100,000 JPY 459,368,142 459,463,890 0.32Japan Government Thirty Year Bond 2.30% 05 -20.06.35 234,550,000 JPY 303,663,545 304,194,932 0.21Japan Government Thirty Year Bond 2.30% 06 -20.12.35 292,400,000 JPY 381,533,196 380,915,328 0.26Japan Government Thirty Year Bond 2.30% 07 -20.12.36 314,300,000 JPY 414,907,473 414,181,397 0.29Japan Government Thirty Year Bond 2.30% 09 -20.03.39 764,300,000 JPY 1,035,154,906 1,023,787,493 0.71
Xtrackers II
Xtrackers II JAPAN GOVERNMENT BOND UCITS ETF (continued)
Statement of Investmentsas at 31 December 2020(expressed in JPY)
The accompanying notes form an integral part of these financial statements.
308

DescriptionNominal
ValueCurrency
(local) Cost Market Value
% ofNet
Assets
Transferable securities and money market instruments admitted to an official stock exchange listing(A)
Bonds (continued)
Japan (continued)Japan Government Thirty Year Bond 2.30% 10 -20.03.40 876,300,000 JPY 1,192,278,504 1,186,764,327 0.82Japan Government Thirty Year Bond 2.40% 01 -20.11.31 155,900,000 JPY 195,326,596 195,322,433 0.13Japan Government Thirty Year Bond 2.40% 04 -20.03.34 297,000,000 JPY 383,820,379 383,824,980 0.26Japan Government Thirty Year Bond 2.40% 05 -20.12.34 272,150,000 JPY 354,965,105 355,022,397 0.24Japan Government Thirty Year Bond 2.40% 07 -20.03.37 565,600,000 JPY 754,694,143 754,742,296 0.52Japan Government Thirty Year Bond 2.40% 08 -20.09.38 712,450,000 JPY 966,982,458 964,194,207 0.66Japan Government Thirty Year Bond 2.50% 04 -20.06.34 347,000,000 JPY 454,592,518 454,254,230 0.31Japan Government Thirty Year Bond 2.50% 04 -20.09.34 233,450,000 JPY 307,369,482 306,475,495 0.21Japan Government Thirty Year Bond 2.50% 05 -20.09.35 247,050,000 JPY 328,499,177 328,200,984 0.23Japan Government Thirty Year Bond 2.50% 06 -20.03.36 344,500,000 JPY 459,006,935 460,706,740 0.32Japan Government Thirty Year Bond 2.50% 06 -20.06.36 310,900,000 JPY 413,914,052 416,966,644 0.29Japan Government Thirty Year Bond 2.50% 06 -20.09.36 208,700,000 JPY 279,584,947 280,680,630 0.19Japan Government Thirty Year Bond 2.50% 07 -20.09.37 530,750,000 JPY 722,938,635 721,374,170 0.50Japan Government Thirty Year Bond 2.50% 08 -20.03.38 691,600,000 JPY 945,432,099 943,086,508 0.65Japan Government Twenty Year Bond 0.20% 16 -20.06.36 561,950,000 JPY 560,032,576 557,903,960 0.38Japan Government Twenty Year Bond 0.30% 19 -20.06.39 941,000,000 JPY 949,323,463 929,199,860 0.64Japan Government Twenty Year Bond 0.30% 19 -20.09.39 907,200,000 JPY 908,230,905 894,462,912 0.62Japan Government Twenty Year Bond 0.30% 20 -20.12.39 934,450,000 JPY 936,890,627 919,881,924 0.63Japan Government Twenty Year Bond 0.40% 16 -20.03.36 436,850,000 JPY 445,481,117 447,067,922 0.31Japan Government Twenty Year Bond 0.40% 19 -20.03.39 828,450,000 JPY 843,573,229 833,420,700 0.57Japan Government Twenty Year Bond 0.40% 20 -20.03.40 866,600,000 JPY 873,788,348 868,740,502 0.60Japan Government Twenty Year Bond 0.40% 20 -20.06.40 1,195,250,000 JPY 1,197,007,100 1,196,552,822 0.82Japan Government Twenty Year Bond 0.40% 20 -20.09.40 1,179,950,000 JPY 1,179,804,902 1,179,572,416 0.81Japan Government Twenty Year Bond 0.50% 16 -20.09.36 456,450,000 JPY 471,178,870 473,238,231 0.33
Xtrackers II
Xtrackers II JAPAN GOVERNMENT BOND UCITS ETF (continued)
Statement of Investmentsas at 31 December 2020(expressed in JPY)
The accompanying notes form an integral part of these financial statements.
309

DescriptionNominal
ValueCurrency
(local) Cost Market Value
% ofNet
Assets
Transferable securities and money market instruments admitted to an official stock exchange listing(A)
Bonds (continued)
Japan (continued)Japan Government Twenty Year Bond 0.50% 18 -20.03.38 709,850,000 JPY 731,132,874 731,464,932 0.50Japan Government Twenty Year Bond 0.50% 18 -20.06.38 854,950,000 JPY 877,223,545 878,751,808 0.61Japan Government Twenty Year Bond 0.50% 19 -20.12.38 879,950,000 JPY 910,965,148 902,723,106 0.62Japan Government Twenty Year Bond 0.60% 16 -20.12.36 679,100,000 JPY 713,892,352 714,012,531 0.49Japan Government Twenty Year Bond 0.60% 17 -20.06.37 500,950,000 JPY 525,457,656 526,172,832 0.36Japan Government Twenty Year Bond 0.60% 17 -20.09.37 701,550,000 JPY 735,059,584 736,452,112 0.51Japan Government Twenty Year Bond 0.60% 17 -20.12.37 572,850,000 JPY 599,141,755 600,043,189 0.41Japan Government Twenty Year Bond 0.70% 17 -20.03.37 611,050,000 JPY 651,215,150 651,629,830 0.45Japan Government Twenty Year Bond 0.70% 18 -20.09.38 728,600,000 JPY 775,637,755 773,824,202 0.53Japan Government Twenty Year Bond 0.80% 03 -20.06.23 207,900,000 JPY 212,829,198 212,692,095 0.15Japan Government Twenty Year Bond 1.00% 03 -20.03.23 177,750,000 JPY 182,329,822 182,165,310 0.13Japan Government Twenty Year Bond 1.00% 15 -20.12.35 740,000,000 JPY 825,421,124 823,338,800 0.57Japan Government Twenty Year Bond 1.20% 14 -20.12.34 734,200,000 JPY 835,432,408 836,452,034 0.58Japan Government Twenty Year Bond 1.20% 15 -20.03.35 712,700,000 JPY 811,411,068 812,428,111 0.56Japan Government Twenty Year Bond 1.20% 15 -20.09.35 586,300,000 JPY 670,187,861 669,038,656 0.46Japan Government Twenty Year Bond 1.30% 15 -20.06.35 536,950,000 JPY 619,220,879 619,957,100 0.43Japan Government Twenty Year Bond 1.40% 03 -20.12.22 158,050,000 JPY 162,954,759 162,772,534 0.11Japan Government Twenty Year Bond 1.40% 14 -20.09.34 904,250,000 JPY 1,054,046,701 1,052,375,192 0.73Japan Government Twenty Year Bond 1.50% 12 -20.06.32 324,000,000 JPY 375,874,949 375,972,840 0.26Japan Government Twenty Year Bond 1.50% 13 -20.03.33 418,650,000 JPY 488,403,292 488,757,129 0.34Japan Government Twenty Year Bond 1.50% 14 -20.03.34 637,800,000 JPY 748,295,088 748,892,004 0.52Japan Government Twenty Year Bond 1.50% 14 -20.06.34 699,100,000 JPY 822,852,928 821,945,852 0.57Japan Government Twenty Year Bond 1.60% 10 -20.06.30 363,050,000 JPY 417,493,340 417,692,656 0.29Japan Government Twenty Year Bond 1.60% 12 -20.03.32 340,750,000 JPY 397,690,176 398,490,088 0.27
Xtrackers II
Xtrackers II JAPAN GOVERNMENT BOND UCITS ETF (continued)
Statement of Investmentsas at 31 December 2020(expressed in JPY)
The accompanying notes form an integral part of these financial statements.
310
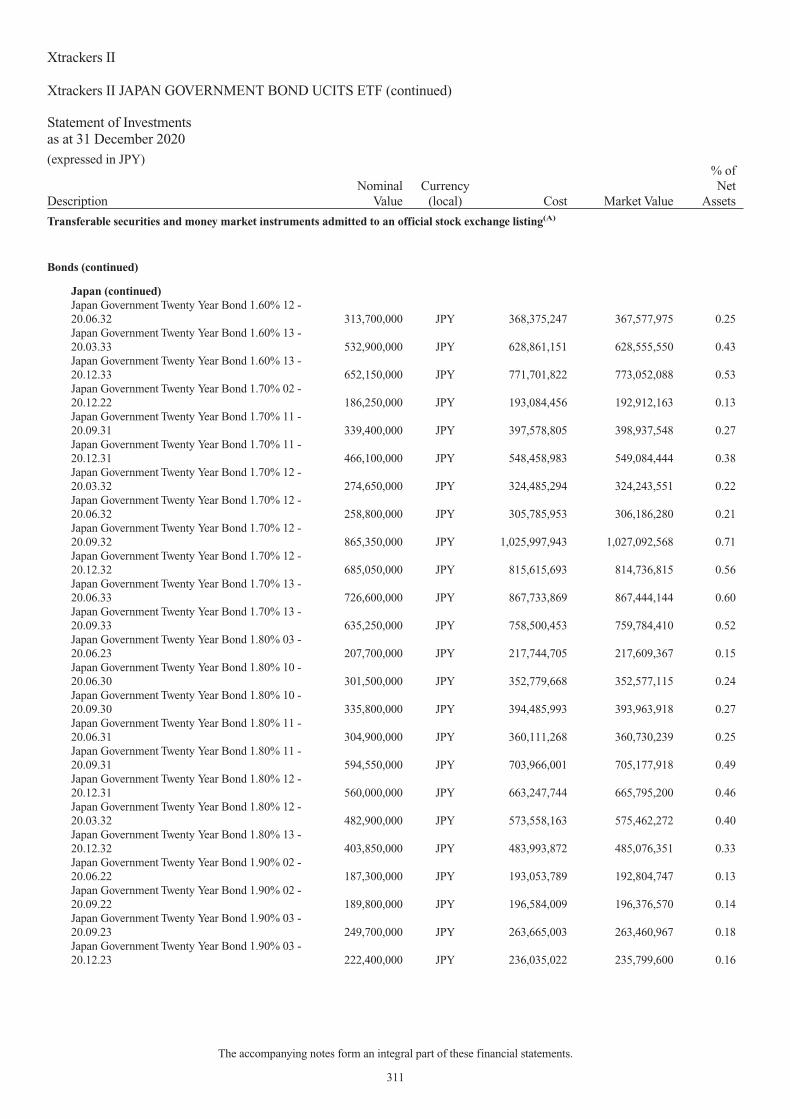
DescriptionNominal
ValueCurrency
(local) Cost Market Value
% ofNet
Assets
Transferable securities and money market instruments admitted to an official stock exchange listing(A)
Bonds (continued)
Japan (continued)Japan Government Twenty Year Bond 1.60% 12 -20.06.32 313,700,000 JPY 368,375,247 367,577,975 0.25Japan Government Twenty Year Bond 1.60% 13 -20.03.33 532,900,000 JPY 628,861,151 628,555,550 0.43Japan Government Twenty Year Bond 1.60% 13 -20.12.33 652,150,000 JPY 771,701,822 773,052,088 0.53Japan Government Twenty Year Bond 1.70% 02 -20.12.22 186,250,000 JPY 193,084,456 192,912,163 0.13Japan Government Twenty Year Bond 1.70% 11 -20.09.31 339,400,000 JPY 397,578,805 398,937,548 0.27Japan Government Twenty Year Bond 1.70% 11 -20.12.31 466,100,000 JPY 548,458,983 549,084,444 0.38Japan Government Twenty Year Bond 1.70% 12 -20.03.32 274,650,000 JPY 324,485,294 324,243,551 0.22Japan Government Twenty Year Bond 1.70% 12 -20.06.32 258,800,000 JPY 305,785,953 306,186,280 0.21Japan Government Twenty Year Bond 1.70% 12 -20.09.32 865,350,000 JPY 1,025,997,943 1,027,092,568 0.71Japan Government Twenty Year Bond 1.70% 12 -20.12.32 685,050,000 JPY 815,615,693 814,736,815 0.56Japan Government Twenty Year Bond 1.70% 13 -20.06.33 726,600,000 JPY 867,733,869 867,444,144 0.60Japan Government Twenty Year Bond 1.70% 13 -20.09.33 635,250,000 JPY 758,500,453 759,784,410 0.52Japan Government Twenty Year Bond 1.80% 03 -20.06.23 207,700,000 JPY 217,744,705 217,609,367 0.15Japan Government Twenty Year Bond 1.80% 10 -20.06.30 301,500,000 JPY 352,779,668 352,577,115 0.24Japan Government Twenty Year Bond 1.80% 10 -20.09.30 335,800,000 JPY 394,485,993 393,963,918 0.27Japan Government Twenty Year Bond 1.80% 11 -20.06.31 304,900,000 JPY 360,111,268 360,730,239 0.25Japan Government Twenty Year Bond 1.80% 11 -20.09.31 594,550,000 JPY 703,966,001 705,177,918 0.49Japan Government Twenty Year Bond 1.80% 12 -20.12.31 560,000,000 JPY 663,247,744 665,795,200 0.46Japan Government Twenty Year Bond 1.80% 12 -20.03.32 482,900,000 JPY 573,558,163 575,462,272 0.40Japan Government Twenty Year Bond 1.80% 13 -20.12.32 403,850,000 JPY 483,993,872 485,076,351 0.33Japan Government Twenty Year Bond 1.90% 02 -20.06.22 187,300,000 JPY 193,053,789 192,804,747 0.13Japan Government Twenty Year Bond 1.90% 02 -20.09.22 189,800,000 JPY 196,584,009 196,376,570 0.14Japan Government Twenty Year Bond 1.90% 03 -20.09.23 249,700,000 JPY 263,665,003 263,460,967 0.18Japan Government Twenty Year Bond 1.90% 03 -20.12.23 222,400,000 JPY 236,035,022 235,799,600 0.16
Xtrackers II
Xtrackers II JAPAN GOVERNMENT BOND UCITS ETF (continued)
Statement of Investmentsas at 31 December 2020(expressed in JPY)
The accompanying notes form an integral part of these financial statements.
311

DescriptionNominal
ValueCurrency
(local) Cost Market Value
% ofNet
Assets
Transferable securities and money market instruments admitted to an official stock exchange listing(A)
Bonds (continued)
Japan (continued)Japan Government Twenty Year Bond 1.90% 04 -20.03.24 166,050,000 JPY 177,038,721 176,886,423 0.12Japan Government Twenty Year Bond 1.90% 05 -20.03.25 238,700,000 JPY 259,597,085 259,077,819 0.18Japan Government Twenty Year Bond 1.90% 05 -20.06.25 184,750,000 JPY 201,902,639 201,438,468 0.14Japan Government Twenty Year Bond 1.90% 09 -20.12.28 385,000,000 JPY 445,757,338 445,360,300 0.31Japan Government Twenty Year Bond 1.90% 09 -20.03.29 360,800,000 JPY 418,710,610 419,098,064 0.29Japan Government Twenty Year Bond 1.90% 10 -20.09.30 441,500,000 JPY 521,565,081 522,254,765 0.36Japan Government Twenty Year Bond 1.90% 11 -20.03.31 357,200,000 JPY 424,011,651 425,153,728 0.29Japan Government Twenty Year Bond 1.90% 11 -20.06.31 630,800,000 JPY 752,434,982 752,872,416 0.52Japan Government Twenty Year Bond 2.00% 02 -21.03.22 234,450,000 JPY 240,618,571 240,447,231 0.17Japan Government Twenty Year Bond 2.00% 02 -20.06.22 140,600,000 JPY 145,042,981 144,937,510 0.10Japan Government Twenty Year Bond 2.00% 04 -20.12.24 326,350,000 JPY 354,118,460 353,913,521 0.24Japan Government Twenty Year Bond 2.00% 05 -20.09.25 195,350,000 JPY 215,108,368 214,988,536 0.15Japan Government Twenty Year Bond 2.00% 06 -20.12.25 345,700,000 JPY 382,691,411 382,039,984 0.26Japan Government Twenty Year Bond 2.00% 07 -20.03.27 238,600,000 JPY 270,338,724 269,808,880 0.19Japan Government Twenty Year Bond 2.00% 10 -20.06.30 360,550,000 JPY 428,857,126 428,445,171 0.30Japan Government Twenty Year Bond 2.00% 11 -20.12.30 392,800,000 JPY 469,015,119 470,103,040 0.32Japan Government Twenty Year Bond 2.00% 11 -20.03.31 368,950,000 JPY 441,251,958 442,891,270 0.31Japan Government Twenty Year Bond 2.10% 04 -20.03.24 263,600,000 JPY 282,800,081 282,500,120 0.19Japan Government Twenty Year Bond 2.10% 04 -20.09.24 472,200,000 JPY 511,844,164 511,350,102 0.35Japan Government Twenty Year Bond 2.10% 05 -20.03.25 133,600,000 JPY 146,250,124 146,134,352 0.10Japan Government Twenty Year Bond 2.10% 05 -20.09.25 188,400,000 JPY 208,511,020 208,230,984 0.14Japan Government Twenty Year Bond 2.10% 05 -20.12.25 205,050,000 JPY 227,835,857 227,628,056 0.16Japan Government Twenty Year Bond 2.10% 06 -20.03.26 285,150,000 JPY 318,865,083 318,076,271 0.22Japan Government Twenty Year Bond 2.10% 06 -20.12.26 582,200,000 JPY 660,533,696 658,951,426 0.45
Xtrackers II
Xtrackers II JAPAN GOVERNMENT BOND UCITS ETF (continued)
Statement of Investmentsas at 31 December 2020(expressed in JPY)
The accompanying notes form an integral part of these financial statements.
312

DescriptionNominal
ValueCurrency
(local) Cost Market Value
% ofNet
Assets
Transferable securities and money market instruments admitted to an official stock exchange listing(A)
Bonds (continued)
Japan (continued)Japan Government Twenty Year Bond 2.10% 07 -20.03.27 376,150,000 JPY 428,634,684 427,697,596 0.29Japan Government Twenty Year Bond 2.10% 07 -20.06.27 191,650,000 JPY 219,066,299 219,069,366 0.15Japan Government Twenty Year Bond 2.10% 07 -20.09.27 247,550,000 JPY 284,564,506 284,278,994 0.20Japan Government Twenty Year Bond 2.10% 07 -20.12.27 635,800,000 JPY 733,912,989 733,446,164 0.51Japan Government Twenty Year Bond 2.10% 08 -20.06.28 221,600,000 JPY 258,018,820 257,780,632 0.18Japan Government Twenty Year Bond 2.10% 08 -20.09.28 420,450,000 JPY 490,729,856 491,119,236 0.34Japan Government Twenty Year Bond 2.10% 08 -20.12.28 238,300,000 JPY 279,407,667 279,471,091 0.19Japan Government Twenty Year Bond 2.10% 09 -20.03.29 473,450,000 JPY 557,734,336 557,757,241 0.38Japan Government Twenty Year Bond 2.10% 09 -20.06.29 496,450,000 JPY 586,564,871 587,022,338 0.40Japan Government Twenty Year Bond 2.10% 09 -20.09.29 478,700,000 JPY 568,217,264 568,097,225 0.39Japan Government Twenty Year Bond 2.10% 09 -20.12.29 505,250,000 JPY 601,956,300 601,161,607 0.41Japan Government Twenty Year Bond 2.10% 10 -20.03.30 652,900,000 JPY 779,594,938 779,745,412 0.54Japan Government Twenty Year Bond 2.10% 10 -20.12.30 676,650,000 JPY 815,661,153 816,540,621 0.56Japan Government Twenty Year Bond 2.20% 04 -20.03.24 147,800,000 JPY 159,109,408 158,873,176 0.11Japan Government Twenty Year Bond 2.20% 06 -20.03.26 226,800,000 JPY 254,741,902 254,174,760 0.18Japan Government Twenty Year Bond 2.20% 06 -20.06.26 167,900,000 JPY 189,567,649 189,129,276 0.13Japan Government Twenty Year Bond 2.20% 06 -20.09.26 351,650,000 JPY 399,271,354 398,127,581 0.27Japan Government Twenty Year Bond 2.20% 07 -20.09.27 296,250,000 JPY 343,467,101 342,204,300 0.24Japan Government Twenty Year Bond 2.20% 08 -20.03.28 518,950,000 JPY 605,144,901 604,924,446 0.42Japan Government Twenty Year Bond 2.20% 08 -20.09.28 205,700,000 JPY 241,814,239 241,870,288 0.17Japan Government Twenty Year Bond 2.20% 09 -20.06.29 256,600,000 JPY 305,321,450 305,595,204 0.21Japan Government Twenty Year Bond 2.20% 10 -20.12.29 299,750,000 JPY 359,690,105 359,340,300 0.25Japan Government Twenty Year Bond 2.20% 10 -20.03.30 338,900,000 JPY 408,157,593 407,862,761 0.28Japan Government Twenty Year Bond 2.20% 11 -20.03.31 423,600,000 JPY 517,313,304 517,113,936 0.36
Xtrackers II
Xtrackers II JAPAN GOVERNMENT BOND UCITS ETF (continued)
Statement of Investmentsas at 31 December 2020(expressed in JPY)
The accompanying notes form an integral part of these financial statements.
313

DescriptionNominal
ValueCurrency
(local) Cost Market Value
% ofNet
Assets
Transferable securities and money market instruments admitted to an official stock exchange listing(A)
Bonds (continued)
Japan (continued)Japan Government Twenty Year Bond 2.30% 06 -20.03.26 205,050,000 JPY 231,556,729 230,873,997 0.16Japan Government Twenty Year Bond 2.30% 06 -20.06.26 350,050,000 JPY 397,001,873 396,232,097 0.27Japan Government Twenty Year Bond 2.30% 07 -20.06.27 270,550,000 JPY 313,358,485 312,774,739 0.22Japan Government Twenty Year Bond 2.30% 08 -20.06.28 246,350,000 JPY 290,203,032 290,269,278 0.20Japan Government Twenty Year Bond 2.40% 04 -20.06.24 348,150,000 JPY 379,212,328 378,689,718 0.26Japan Government Twenty Year Bond 2.40% 08 -20.03.28 237,050,000 JPY 280,612,507 279,759,299 0.19Japan Government Twenty Year Bond 2.40% 08 -20.06.28 366,600,000 JPY 434,510,334 434,706,948 0.30Japan Government Two Year Bond 0.10% 20 -01.01.22 272,550,000 JPY 273,256,847 273,157,787 0.19Japan Government Two Year Bond 0.10% 20 -01.02.22 386,600,000 JPY 387,920,902 387,535,572 0.27Japan Government Two Year Bond 0.10% 20 -01.03.22 483,200,000 JPY 484,813,559 484,451,488 0.33Japan Government Two Year Bond 0.10% 20 -01.04.22 172,000,000 JPY 172,608,055 172,478,160 0.12Japan Government Two Year Bond 0.10% 20 -01.05.22 367,400,000 JPY 368,732,673 368,487,504 0.25Japan Government Two Year Bond 0.10% 20 -01.06.22 238,350,000 JPY 239,206,164 239,134,172 0.16Japan Government Two Year Bond 0.10% 20 -01.07.22 541,700,000 JPY 543,734,967 543,666,371 0.37Japan Government Two Year Bond 0.10% 20 -01.08.22 629,000,000 JPY 631,324,463 631,509,710 0.44Japan Government Two Year Bond 0.10% 20 -01.09.22 317,150,000 JPY 318,464,701 318,428,115 0.22Japan Government Two Year Bond 0.10% 20 -01.10.22 533,350,000 JPY 535,554,212 535,510,067 0.37Japan Government Two Year Bond 0.10% 20 -01.11.22 340,450,000 JPY 341,995,157 341,958,194 0.24Japan Government Two Year Bond 0.10% 20 -01.12.22 880,200,000 JPY 884,046,474 884,002,464 0.61
145,613,646,952 144,804,010,912 99.82
Total - Bonds 145,613,646,952 144,804,010,912 99.82
Total Transferable securities and money market instruments admitted to an officialstock exchange listing 145,613,646,952 144,804,010,912 99.82
TOTAL INVESTMENT PORTFOLIO 145,613,646,952 144,804,010,912 99.82
TOTAL INVESTMENT PORTFOLIO INCLUDING ACCRUED INTEREST 145,067,791,986 100.00(A) Any duplicate securities appearing herein with the same name are either quoted on different stock exchanges or have different ISINs.
Xtrackers II
Xtrackers II JAPAN GOVERNMENT BOND UCITS ETF (continued)
Statement of Investmentsas at 31 December 2020(expressed in JPY)
The accompanying notes form an integral part of these financial statements.
314

DescriptionNominal
ValueCurrency
(local) Cost Market Value
% ofNet
Assets
Transferable securities and money market instruments admitted to an official stock exchange listing
Bonds
AustraliaAustralia 2.25% 16 - 21.05.28 24,000,000 AUD 17,134,899 20,615,653 2.67Australia 3.25% 15 - 21.06.39 10,500,000 AUD 8,639,526 10,221,977 1.33BHP Billiton Finance Ltd. 0.75% 15 - 28.10.22 500,000 EUR 596,564 620,896 0.08National Australia Bank Ltd. 1.875% 12 - 13.01.23 1,000,000 EUR 1,247,115 1,280,956 0.17Scentre Group Trust 1 Via Scentre Group Trust2 1.75% 18 - 11.04.28 600,000 EUR 725,314 793,842 0.10Treasury Corp. of Victoria 2.50% 19 - 22.10.29 11,000,000 AUD 7,629,412 9,507,155 1.23Westpac Banking Corp. 0.75% 18 - 17.10.23 500,000 EUR 603,972 629,359 0.08
36,576,802 43,669,838 5.66AustriaAustria Principal Strip Zero Coupon 97 - 15.07.27 3,715,000 EUR 4,190,655 4,714,989 0.61Telekom Finanzmanagement GmbH 4.00% 12 -04.04.22 800,000 EUR 1,001,468 1,029,982 0.14
5,192,123 5,744,971 0.75BelgiumAnheuser-Busch InBev SA/NV 1.65% 19 - 28.03.31 1,150,000 EUR 1,464,981 1,579,721 0.21Anheuser-Busch InBev SA/NV 2.75% 16 - 17.03.36 750,000 EUR 1,080,971 1,154,316 0.15Elia Transmission Belgium SA 1.375% 19 - 14.01.26 300,000 EUR 351,915 391,399 0.05Euroclear Bank SA 0.125% 20 - 07.07.25 500,000 EUR 598,795 618,936 0.08Kingdom of Belgium Government Bond Coupon StripZero Coupon 98 - 28.03.22 2,300,000 EUR 2,570,371 2,838,395 0.37Kingdom of Belgium Government Bond Coupon StripZero Coupon 98 - 28.03.23 2,200,000 EUR 2,483,890 2,729,630 0.35Kingdom of Belgium Government Bond Coupon StripZero Coupon 98 - 28.03.24 1,000,000 EUR 1,131,830 1,249,783 0.16Kingdom of Belgium Government Bond Coupon StripZero Coupon 98 - 28.03.25 1,000,000 EUR 1,124,383 1,252,315 0.16Kingdom of Belgium Government Bond Coupon StripZero Coupon 98 - 28.03.26 2,000,000 EUR 2,255,512 2,529,151 0.33Kingdom of Belgium Government Bond Coupon StripZero Coupon 98 - 28.03.28 4,600,000 EUR 5,038,365 5,847,046 0.76
18,101,013 20,190,692 2.62British Virgin IslandsGlobal Switch Holdings Ltd. 2.25% 17 - 31.05.27 516,000 EUR 652,163 692,855 0.09
652,163 692,855 0.09CanadaProvince of Quebec Canada 0.75% 14 - 21.11.24 10,000,000 CHF 10,740,325 11,838,000 1.53
10,740,325 11,838,000 1.53DenmarkDanske Bank A/S FRN 20 - 24.05.23 500,000 EUR 601,288 622,383 0.08Danske Bank A/S FRN 19 - 21.06.29 1,100,000 EUR 1,273,649 1,423,301 0.19ISS Global A/S 2.125% 14 - 02.12.24 500,000 EUR 582,603 644,921 0.08
2,457,540 2,690,605 0.35FranceAeroports de Paris 2.75% 13 - 05.06.28 400,000 EUR 539,719 588,237 0.08APRR SA 1.125% 16 - 09.01.26 100,000 EUR 116,214 129,921 0.02Banque Federative du Credit Mutuel SA 2.50% 18 -25.05.28 400,000 EUR 447,982 557,601 0.07
Xtrackers II
Xtrackers II GLOBAL AGGREGATE BOND SWAP UCITS ETF
Statement of Investmentsas at 31 December 2020(expressed in USD)
The accompanying notes form an integral part of these financial statements.
315

DescriptionNominal
ValueCurrency
(local) Cost Market Value
% ofNet
Assets
Transferable securities and money market instruments admitted to an official stock exchange listing
Bonds (continued)
France (continued)BNP Paribas SA 1.125% 18 - 11.06.26 500,000 EUR 609,226 640,588 0.08BNP Paribas SA 1.25% 18 - 19.03.25 150,000 EUR 183,523 192,686 0.02Bouygues SA 1.375% 16 - 07.06.27 200,000 EUR 239,097 268,511 0.03BPCE SA 0.625% 20 - 28.04.25 1,200,000 EUR 1,452,010 1,512,127 0.20BPCE SA FRN 15 - 30.11.27 400,000 EUR 474,931 512,765 0.07Caisse de Refinancement de l’Habitat SA 3.60% 12 -08.03.24 2,000,000 EUR 2,569,264 2,769,949 0.36Caisse de Refinancement de l’Habitat SA 3.90% 11 -18.01.21 1,800,000 EUR 2,008,247 2,205,892 0.29Caisse Francaise de Financement Local 5.50% 01 -16.07.26 217,000 GBP 361,331 377,807 0.05Cie de Financement Foncier SA 2.00% 14 - 07.05.24 800,000 EUR 994,408 1,060,530 0.14Cie de Financement Foncier SA 5.50% 01 - 26.01.27 1,600,000 GBP 2,709,699 2,833,870 0.37Cie Financiere et Industrielle des Autoroutes SA0.375% 16 - 07.02.25 900,000 EUR 1,013,758 1,129,116 0.15Coentreprise de Transport d’Electricite SA 2.125%17 - 29.07.32 700,000 EUR 972,893 1,022,799 0.13Credit Agricole Home Loan SFH SA 0.625% 14 -28.11.22 900,000 EUR 1,024,439 1,124,851 0.15Credit Agricole SA 1.00% 17 - 16.09.24 1,400,000 EUR 1,553,684 1,789,441 0.23Credit Agricole SA 1.375% 17 - 03.05.27 500,000 EUR 643,852 665,939 0.09Credit Agricole SA 3.125% 14 - 05.02.26 1,000,000 EUR 1,335,140 1,426,240 0.18Dexia Credit Local SA 1.125% 17 - 15.06.22 2,400,000 GBP 3,166,388 3,329,709 0.43Dexia Credit Local SA 1.375% 19 - 07.12.22 4,500,000 GBP 5,981,436 6,292,233 0.82Dexia Credit Local SA 2.125% 15 - 12.02.25 10,000,000 GBP 13,743,559 14,680,666 1.90Electricite de France SA 2.00% 19 - 09.12.49 500,000 EUR 651,928 711,402 0.09Electricite de France SA 5.625% 03 - 21.02.33 500,000 EUR 950,909 986,568 0.13EssilorLuxottica SA 1.75% 14 - 09.04.21 1,800,000 EUR 2,018,329 2,203,359 0.28France OAT Zero Coupon 09 - 25.04.30 21,400,000 EUR 26,782,761 27,021,070 3.50France OAT Zero Coupon 09 - 25.04.31 22,700,000 EUR 28,478,799 28,591,433 3.71France OAT Zero Coupon 09 - 25.04.32 22,500,000 EUR 28,113,535 28,183,432 3.65France OAT Zero Coupon 09 - 25.04.34 11,600,000 EUR 14,317,698 14,399,406 1.87Indigo Group SAS 1.625% 18 - 19.04.28 500,000 EUR 593,282 630,950 0.08Orange SA 3.125% 13 - 09.01.24 1,100,000 EUR 1,397,075 1,479,026 0.19Orange SA 4.125% 11 - 14.09.21 1,000,000 USD 1,026,500 1,025,129 0.13Publicis Groupe SA 0.50% 16 - 03.11.23 1,400,000 EUR 1,542,614 1,743,516 0.23RTE Reseau de Transport d’Electricite SADIR 2.875%13 - 12.09.23 600,000 EUR 770,886 796,578 0.10Schneider Electric SE 1.50% 19 - 15.01.28 1,000,000 EUR 1,315,899 1,356,160 0.18Thales SA 0.875% 18 - 19.04.24 500,000 EUR 608,477 629,465 0.08Total Capital International SA 0.25% 16 - 12.07.23 100,000 EUR 119,062 124,067 0.02Total Capital International SA 2.50% 14 - 25.03.26 300,000 EUR 387,898 419,536 0.05Unibail-Rodamco-Westfield SE 0.125% 18 - 14.05.21 500,000 EUR 588,315 612,179 0.08Unibail-Rodamco-Westfield SE 1.375% 16 - 09.03.26 600,000 EUR 721,801 767,329 0.10Veolia Environnement SA 0.664% 20 - 15.01.31 300,000 EUR 357,125 380,026 0.05Veolia Environnement SA 0.927% 16 - 04.01.29 200,000 EUR 245,172 259,019 0.03
153,128,865 157,431,128 20.41
Xtrackers II
Xtrackers II GLOBAL AGGREGATE BOND SWAP UCITS ETF (continued)
Statement of Investmentsas at 31 December 2020(expressed in USD)
The accompanying notes form an integral part of these financial statements.
316

DescriptionNominal
ValueCurrency
(local) Cost Market Value
% ofNet
Assets
Transferable securities and money market instruments admitted to an official stock exchange listing
Bonds (continued)
GermanyBayer AG 1.375% 20 - 06.07.32 400,000 EUR 493,423 521,461 0.07Bertelsmann SE & Co. KGaA 2.625% 12 - 02.08.22 600,000 EUR 742,552 767,475 0.10Commerzbank AG 0.50% 19 - 04.12.26 723,000 EUR 857,101 901,918 0.12Commerzbank AG 0.625% 19 - 28.08.24 1,955,000 EUR 2,090,558 2,453,244 0.32Daimler AG 1.50% 17 - 03.07.29 950,000 EUR 1,183,329 1,279,903 0.16Deutsche Bahn Finance GMBH 0.75% 20 - 16.07.35 400,000 EUR 448,628 526,120 0.07Deutsche Bundesrepublik Coupon Strips Zero Coupon97 - 04.01.22 10,200,000 EUR 12,411,214 12,559,084 1.63Deutsche Bundesrepublik Coupon Strips Zero Coupon10 - 04.07.42 16,000,000 EUR 20,290,525 20,601,644 2.67DVB Bank SE 1.25% 16 - 15.09.21 200,000 EUR 237,541 246,832 0.03EnBW Energie Baden-Wuerttemberg AG FRN 19 -05.08.79 300,000 EUR 348,219 370,605 0.05Evonik Industries AG FRN 17 - 07.07.77 724,000 EUR 767,514 905,459 0.12LANXESS AG 0.25% 16 - 07.10.21 450,000 EUR 533,584 552,029 0.07METRO AG 1.50% 15 - 19.03.25 600,000 EUR 675,290 758,099 0.10SAP SE 1.25% 18 - 10.03.28 700,000 EUR 833,855 936,688 0.12State of North Rhine-Westphalia Germany 1.95% 18 -26.09.78 2,600,000 EUR 5,198,869 5,434,129 0.70Talanx AG 2.50% 14 - 23.07.26 800,000 EUR 1,020,882 1,127,480 0.14Volkswagen Bank GmbH 1.25% 19 - 01.08.22 1,100,000 EUR 1,255,774 1,373,948 0.18Volkswagen Financial Services AG 2.25% 19 -01.10.27 1,126,000 EUR 1,253,048 1,538,567 0.20Volkswagen Leasing GmbH 0.25% 18 - 16.02.21 1,000,000 EUR 1,106,101 1,224,321 0.16
51,748,007 54,079,006 7.01GuernseyCredit Suisse Group Funding Guernsey Ltd. 1.25%15 - 14.04.22 1,000,000 EUR 1,144,178 1,245,884 0.16Credit Suisse Group Funding Guernsey Ltd. FRN 16 -16.04.21 500,000 USD 503,000 503,193 0.06Credit Suisse Group Funding Guernsey Ltd. 3.80%16 - 15.09.22 550,000 USD 574,899 580,905 0.08
2,222,077 2,329,982 0.30IrelandGAS Networks Ireland 0.125% 19 - 04.12.24 100,000 EUR 119,103 123,287 0.02
119,103 123,287 0.02ItalyItaly 5.125% 04 - 31.07.24 100,000,000 EUR 140,535,113 144,680,800 18.76Snam SpA 1.00% 19 - 12.09.34 525,000 EUR 646,731 690,838 0.09
141,181,844 145,371,638 18.85JapanAsahi Group Holdings Ltd. 0.321% 17 - 19.09.21 220,000 EUR 244,459 270,285 0.04Japan Government Forty Year Bond 1.90% 13 -20.03.53 10,000,000 JPY 126,798 131,729 0.02Japan Government Forty Year Bond 2.00% 12 -20.03.52 25,300,000 JPY 326,004 337,946 0.04Japan Government Forty Year Bond 2.20% 11 -20.03.51 150,000,000 JPY 1,970,630 2,069,301 0.27
Xtrackers II
Xtrackers II GLOBAL AGGREGATE BOND SWAP UCITS ETF (continued)
Statement of Investmentsas at 31 December 2020(expressed in USD)
The accompanying notes form an integral part of these financial statements.
317
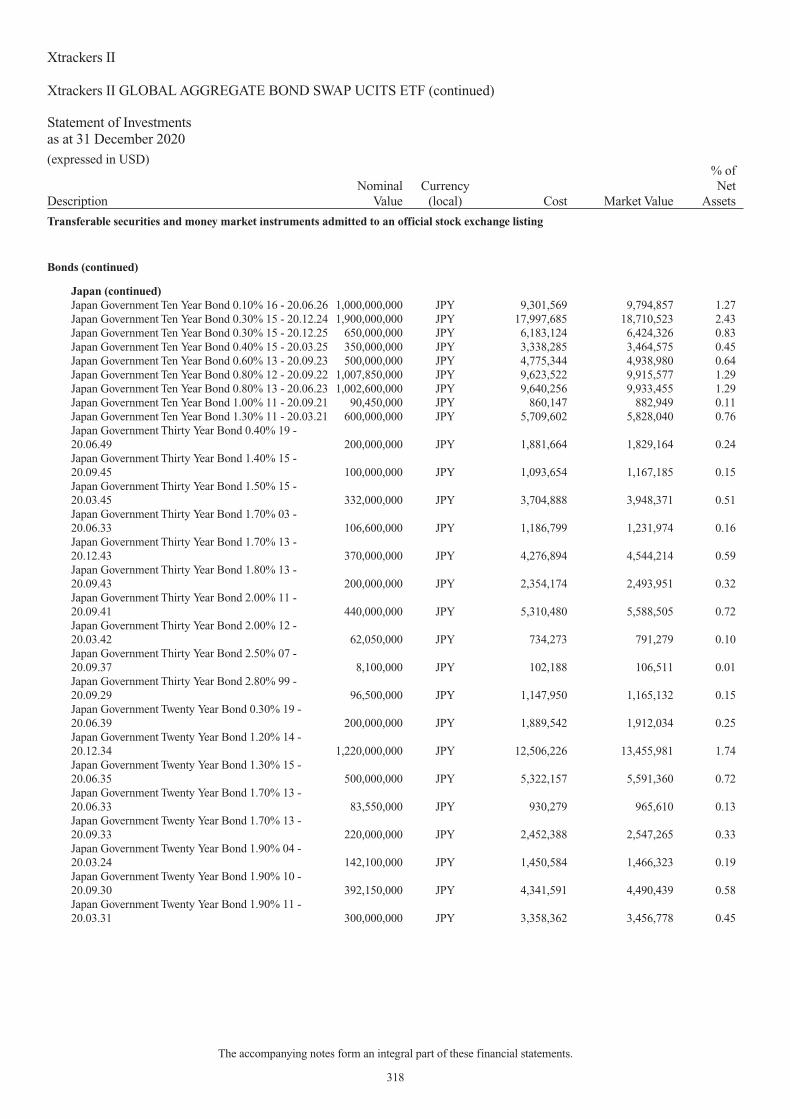
DescriptionNominal
ValueCurrency
(local) Cost Market Value
% ofNet
Assets
Transferable securities and money market instruments admitted to an official stock exchange listing
Bonds (continued)
Japan (continued)Japan Government Ten Year Bond 0.10% 16 - 20.06.26 1,000,000,000 JPY 9,301,569 9,794,857 1.27Japan Government Ten Year Bond 0.30% 15 - 20.12.24 1,900,000,000 JPY 17,997,685 18,710,523 2.43Japan Government Ten Year Bond 0.30% 15 - 20.12.25 650,000,000 JPY 6,183,124 6,424,326 0.83Japan Government Ten Year Bond 0.40% 15 - 20.03.25 350,000,000 JPY 3,338,285 3,464,575 0.45Japan Government Ten Year Bond 0.60% 13 - 20.09.23 500,000,000 JPY 4,775,344 4,938,980 0.64Japan Government Ten Year Bond 0.80% 12 - 20.09.22 1,007,850,000 JPY 9,623,522 9,915,577 1.29Japan Government Ten Year Bond 0.80% 13 - 20.06.23 1,002,600,000 JPY 9,640,256 9,933,455 1.29Japan Government Ten Year Bond 1.00% 11 - 20.09.21 90,450,000 JPY 860,147 882,949 0.11Japan Government Ten Year Bond 1.30% 11 - 20.03.21 600,000,000 JPY 5,709,602 5,828,040 0.76Japan Government Thirty Year Bond 0.40% 19 -20.06.49 200,000,000 JPY 1,881,664 1,829,164 0.24Japan Government Thirty Year Bond 1.40% 15 -20.09.45 100,000,000 JPY 1,093,654 1,167,185 0.15Japan Government Thirty Year Bond 1.50% 15 -20.03.45 332,000,000 JPY 3,704,888 3,948,371 0.51Japan Government Thirty Year Bond 1.70% 03 -20.06.33 106,600,000 JPY 1,186,799 1,231,974 0.16Japan Government Thirty Year Bond 1.70% 13 -20.12.43 370,000,000 JPY 4,276,894 4,544,214 0.59Japan Government Thirty Year Bond 1.80% 13 -20.09.43 200,000,000 JPY 2,354,174 2,493,951 0.32Japan Government Thirty Year Bond 2.00% 11 -20.09.41 440,000,000 JPY 5,310,480 5,588,505 0.72Japan Government Thirty Year Bond 2.00% 12 -20.03.42 62,050,000 JPY 734,273 791,279 0.10Japan Government Thirty Year Bond 2.50% 07 -20.09.37 8,100,000 JPY 102,188 106,511 0.01Japan Government Thirty Year Bond 2.80% 99 -20.09.29 96,500,000 JPY 1,147,950 1,165,132 0.15Japan Government Twenty Year Bond 0.30% 19 -20.06.39 200,000,000 JPY 1,889,542 1,912,034 0.25Japan Government Twenty Year Bond 1.20% 14 -20.12.34 1,220,000,000 JPY 12,506,226 13,455,981 1.74Japan Government Twenty Year Bond 1.30% 15 -20.06.35 500,000,000 JPY 5,322,157 5,591,360 0.72Japan Government Twenty Year Bond 1.70% 13 -20.06.33 83,550,000 JPY 930,279 965,610 0.13Japan Government Twenty Year Bond 1.70% 13 -20.09.33 220,000,000 JPY 2,452,388 2,547,265 0.33Japan Government Twenty Year Bond 1.90% 04 -20.03.24 142,100,000 JPY 1,450,584 1,466,323 0.19Japan Government Twenty Year Bond 1.90% 10 -20.09.30 392,150,000 JPY 4,341,591 4,490,439 0.58Japan Government Twenty Year Bond 1.90% 11 -20.03.31 300,000,000 JPY 3,358,362 3,456,778 0.45
Xtrackers II
Xtrackers II GLOBAL AGGREGATE BOND SWAP UCITS ETF (continued)
Statement of Investmentsas at 31 December 2020(expressed in USD)
The accompanying notes form an integral part of these financial statements.
318

DescriptionNominal
ValueCurrency
(local) Cost Market Value
% ofNet
Assets
Transferable securities and money market instruments admitted to an official stock exchange listing
Bonds (continued)
Japan (continued)Japan Government Twenty Year Bond 2.10% 01 -22.03.21 121,850,000 JPY 1,179,408 1,185,702 0.15Japan Government Twenty Year Bond 2.20% 08 -20.09.28 275,000,000 JPY 3,077,002 3,132,249 0.41
128,397,928 133,772,570 17.34LuxembourgAroundtown SA 1.50% 16 - 15.07.24 100,000 EUR 114,659 128,983 0.02Aroundtown SA 2.00% 18 - 02.11.26 800,000 EUR 945,923 1,065,438 0.14CPI Property Group SA 2.75% 20 - 12.05.26 520,000 EUR 638,032 689,603 0.09Richemont International Holdings SA 1.00% 18 -26.03.26 500,000 EUR 627,297 647,818 0.08
2,325,911 2,531,842 0.33NetherlandsABN AMRO Bank NV 4.125% 12 - 28.03.22 850,000 EUR 1,033,693 1,097,604 0.14Aegon NV 1.00% 16 - 08.12.23 100,000 EUR 113,954 126,623 0.02Allianz Finance II BV 0.25% 17 - 06.06.23 500,000 EUR 595,689 619,552 0.08Allianz Finance II BV 3.00% 13 - 13.03.28 1,100,000 EUR 1,427,035 1,654,296 0.22Argentum Netherlands BV for Givaudan SA 2.00%18 - 17.09.30 500,000 EUR 687,885 717,244 0.09ASML Holding NV 1.375% 16 - 07.07.26 530,000 EUR 624,315 700,709 0.09BMW Finance NV 0.125% 18 - 29.11.21 470,000 EUR 506,104 577,708 0.08BMW Finance NV 0.625% 19 - 06.10.23 700,000 EUR 786,077 874,407 0.11Coca-Cola HBC Finance BV 1.875% 16 - 11.11.24 659,000 EUR 784,124 870,009 0.11Cooperatieve Rabobank UA 0.50% 17 - 06.12.22 950,000 EUR 1,065,841 1,180,945 0.15Cooperatieve Rabobank UA 0.75% 18 - 29.08.23 500,000 EUR 600,200 626,693 0.08Cooperatieve Rabobank UA 4.50% 11 - 11.01.21 923,000 USD 949,121 923,643 0.12de Volksbank NV 0.01% 19 - 16.09.24 500,000 EUR 590,167 614,859 0.08Deutsche Post Finance BV 2.95% 12 - 27.06.22 400,000 EUR 494,623 513,133 0.07Deutsche Telekom International Finance BV 0.375%17 - 30.10.21 1,150,000 EUR 1,277,140 1,415,089 0.18Deutsche Telekom International Finance BV 0.625%18 - 01.12.22 150,000 EUR 168,443 186,555 0.03ING Groep NV 2.00% 18 - 20.09.28 600,000 EUR 806,652 836,281 0.11JAB Holdings BV 1.75% 16 - 25.05.23 800,000 EUR 951,701 1,022,349 0.13Koninklijke DSM NV 0.75% 16 - 28.09.26 100,000 EUR 113,924 128,852 0.02LeasePlan Corp. NV 1.00% 16 - 24.05.21 1,300,000 EUR 1,439,685 1,597,948 0.21Shell International Finance BV 0.375% 16 - 15.02.25 600,000 EUR 721,534 751,604 0.10TenneT Holdings BV 0.75% 17 - 26.06.25 500,000 EUR 615,467 635,951 0.08Volkswagen International Finance NV FRN 18 -16.11.24 500,000 EUR 593,504 633,933 0.08Vonovia Finance BV 0.875% 16 - 10.06.22 700,000 EUR 792,008 869,806 0.11
17,738,886 19,175,793 2.49New ZealandBNZ International Funding Ltd. 0.50% 17 - 13.05.23 605,000 EUR 669,818 752,492 0.10
669,818 752,492 0.10
Xtrackers II
Xtrackers II GLOBAL AGGREGATE BOND SWAP UCITS ETF (continued)
Statement of Investmentsas at 31 December 2020(expressed in USD)
The accompanying notes form an integral part of these financial statements.
319

DescriptionNominal
ValueCurrency
(local) Cost Market Value
% ofNet
Assets
Transferable securities and money market instruments admitted to an official stock exchange listing
Bonds (continued)
NorwayEquinor ASA 2.875% 13 - 10.09.25 750,000 EUR 1,015,844 1,052,088 0.13Statkraft AS 1.50% 15 - 21.09.23 706,000 EUR 865,254 898,726 0.12
1,881,098 1,950,814 0.25SpainBanco Bilbao Vizcaya Argentaria SA 3.50% 17 -10.02.27 500,000 EUR 663,585 713,019 0.09Kutxabank SA 1.75% 14 - 27.05.21 100,000 EUR 119,288 123,429 0.02Naturgy Capital Markets SA 1.125% 17 - 11.04.24 700,000 EUR 851,249 886,968 0.12Spain Coupon Strip Zero Coupon 01 - 30.07.25 2,200,000 EUR 2,704,200 2,737,974 0.35Spain Coupon Strip 5.25% 99 - 06.04.29 1,000,000 GBP 1,691,378 1,807,289 0.23
6,029,700 6,268,679 0.81SupranationalsEuropean Investment Bank 1.00% 16 - 14.04.32 500,000 EUR 593,871 704,659 0.09
593,871 704,659 0.09SwedenSkandinaviska Enskilda Banken AB FRN 16 -31.10.28 500,000 EUR 596,992 626,077 0.08
596,992 626,077 0.08SwitzerlandCredit Suisse AG 1.75% 14 - 15.01.21 600,000 EUR 707,850 734,585 0.10UBS AG 1.375% 14 - 16.04.21 1,000,000 EUR 1,165,525 1,230,035 0.16
1,873,375 1,964,620 0.26United KingdomAstraZeneca PLC 0.25% 16 - 12.05.21 300,000 EUR 333,056 367,285 0.05Barclays PLC 1.50% 18 - 03.09.23 550,000 EUR 667,896 701,645 0.09Coca-Cola European Partners PLC 1.50% 18 -08.11.27 700,000 EUR 900,840 930,680 0.12G4S International Finance PLC 1.875% 18 - 24.05.25 500,000 EUR 568,939 611,285 0.08GlaxoSmithKline Capital PLC 1.00% 17 - 12.09.26 500,000 EUR 628,724 647,143 0.08GlaxoSmithKline Capital PLC 1.375% 14 - 02.12.24 500,000 EUR 628,368 647,963 0.08Motability Operations Group PLC 1.625% 15 -09.06.23 583,000 EUR 676,315 746,847 0.10Network Rail Infrastructure Finance PLC 2.75% 06 -06.10.21 10,000,000 CHF 10,743,664 11,603,484 1.51Prs Finance PLC 1.75% 16 - 24.11.26 4,829,660 GBP 6,585,285 7,118,911 0.92Prs Finance PLC 2.00% 19 - 23.01.29 5,250,000 GBP 7,290,855 7,941,932 1.03Sky Ltd. 2.50% 14 - 15.09.26 680,000 EUR 919,392 951,210 0.12
29,943,334 32,268,385 4.18United StatesAbbVie Inc. 4.30% 16 - 14.05.36 200,000 USD 218,306 246,115 0.03AbbVie Inc. 4.40% 13 - 06.11.42 250,000 USD 269,952 313,939 0.04Aetna Inc. 3.50% 14 - 15.11.24 100,000 USD 103,503 109,757 0.01Albemarle Corp. 1.875% 14 - 08.12.21 190,000 EUR 213,965 236,348 0.03Altria Group Inc. 1.70% 19 - 15.06.25 600,000 EUR 704,920 776,385 0.10Amazon.com Inc. 2.80% 18 - 22.08.24 200,000 USD 205,280 216,437 0.03Amazon.com Inc. 3.15% 18 - 22.08.27 200,000 USD 210,482 227,713 0.03Amazon.com Inc. 4.95% 14 - 05.12.44 150,000 USD 195,295 220,051 0.03Amgen Inc. 2.65% 17 - 11.05.22 215,000 USD 216,536 221,652 0.03
Xtrackers II
Xtrackers II GLOBAL AGGREGATE BOND SWAP UCITS ETF (continued)
Statement of Investmentsas at 31 December 2020(expressed in USD)
The accompanying notes form an integral part of these financial statements.
320

DescriptionNominal
ValueCurrency
(local) Cost Market Value
% ofNet
Assets
Transferable securities and money market instruments admitted to an official stock exchange listing
Bonds (continued)
United States (continued)Anheuser-Busch InBev Finance Inc. 3.65% 16 -01.02.26 200,000 USD 204,971 226,545 0.03Anheuser-Busch InBev Finance Inc. 4.625% 14 -01.02.44 100,000 USD 101,746 124,177 0.02Apple Inc. FRN 17 - 09.02.22 154,000 USD 154,627 154,822 0.02Apple Inc. 0.875% 17 - 24.05.25 300,000 EUR 344,908 383,915 0.05Apple Inc. 2.15% 15 - 09.02.22 200,000 USD 200,740 204,146 0.03Apple Inc. 2.40% 13 - 03.05.23 590,000 USD 597,300 618,889 0.08Apple Inc. 2.45% 16 - 04.08.26 300,000 USD 303,869 327,454 0.04Apple Inc. 2.50% 17 - 09.02.22 400,000 USD 402,807 409,105 0.05Apple Inc. 3.70% 15 - 28.08.22 1,000,000 AUD 745,629 815,773 0.11Apple Inc. 4.375% 15 - 13.05.45 175,000 USD 210,773 239,832 0.03AT&T Inc. FRN 18 - 01.06.21 522,000 USD 523,126 523,435 0.07AT&T Inc. FRN 17 - 15.07.21 1,128,000 USD 1,131,613 1,133,049 0.15AT&T Inc. 1.80% 18 - 05.09.26 1,000,000 EUR 1,193,524 1,332,605 0.17AT&T Inc. 1.95% 19 - 15.09.23 805,000 EUR 999,062 1,035,208 0.13AT&T Inc. 2.45% 15 - 15.03.35 200,000 EUR 240,566 287,129 0.04AT&T Inc. 2.75% 16 - 19.05.23 200,000 EUR 240,835 261,517 0.03Bank of America Corp. FRN 17 - 21.07.23 1,000,000 USD 1,016,440 1,038,431 0.14Bank of America Corp. FRN 17 - 24.04.23 525,000 USD 531,238 541,756 0.07Baxter International Inc. 1.30% 19 - 15.05.29 700,000 EUR 886,806 929,468 0.12Bayer US Finance II LLC FRN 18 - 15.12.23 800,000 USD 811,292 808,226 0.11Becton Dickinson and Co. 1.401% 18 - 24.05.23 800,000 EUR 962,701 1,009,576 0.13BlackRock Inc. 1.25% 15 - 06.05.25 500,000 EUR 627,776 650,759 0.08BorgWarner Inc. 1.80% 15 - 07.11.22 100,000 EUR 114,042 125,523 0.02Citigroup Inc. FRN 16 - 01.09.23 704,000 USD 714,404 716,044 0.09Comcast Corp. 3.30% 17 - 01.02.27 550,000 USD 541,965 620,501 0.08Dover Corp. 1.25% 16 - 09.11.26 350,000 EUR 427,062 457,728 0.06Exelon Corp. 3.497% 17 - 01.06.22 600,000 USD 618,144 624,115 0.08Federal National Mortgage Association 5.375% 98 -07.12.28 2,820,000 GBP 4,976,986 5,228,724 0.68Fidelity National Information Services Inc. 1.00% 19 -03.12.28 1,200,000 EUR 1,462,653 1,539,225 0.20Illinois Tool Works Inc. 0.625% 19 - 05.12.27 50,000 EUR 56,387 63,738 0.01International Flavors & Fragrances Inc. 0.50% 18 -25.09.21 500,000 EUR 590,887 614,216 0.08JPMorgan Chase & Co. FRN 16 - 24.10.23 919,000 USD 926,570 935,460 0.12JPMorgan Chase & Co. 2.70% 16 - 18.05.23 425,000 USD 425,988 446,822 0.06JPMorgan Chase & Co. 2.95% 16 - 01.10.26 100,000 USD 100,062 110,944 0.01JPMorgan Chase & Co. 2.972% 16 - 15.01.23 900,000 USD 908,316 924,512 0.12JPMorgan Chase & Co. 3.125% 15 - 23.01.25 100,000 USD 101,224 109,526 0.01JPMorgan Chase & Co. 3.625% 14 - 13.05.24 425,000 USD 437,599 469,908 0.06JPMorgan Chase & Co. 3.625% 16 - 01.12.27 150,000 USD 151,714 170,481 0.02JPMorgan Chase & Co. 3.90% 15 - 15.07.25 200,000 USD 208,543 227,208 0.03JPMorgan Chase & Co. FRN 18 - 23.04.29 200,000 USD 209,242 234,808 0.03JPMorgan Chase & Co. 4.95% 15 - 01.06.45 100,000 USD 114,193 141,672 0.02Mastercard Inc. 1.10% 15 - 01.12.22 500,000 EUR 605,714 626,155 0.08McDonald’s Corp. 1.60% 19 - 15.03.31 500,000 EUR 662,775 687,884 0.09
Xtrackers II
Xtrackers II GLOBAL AGGREGATE BOND SWAP UCITS ETF (continued)
Statement of Investmentsas at 31 December 2020(expressed in USD)
The accompanying notes form an integral part of these financial statements.
321
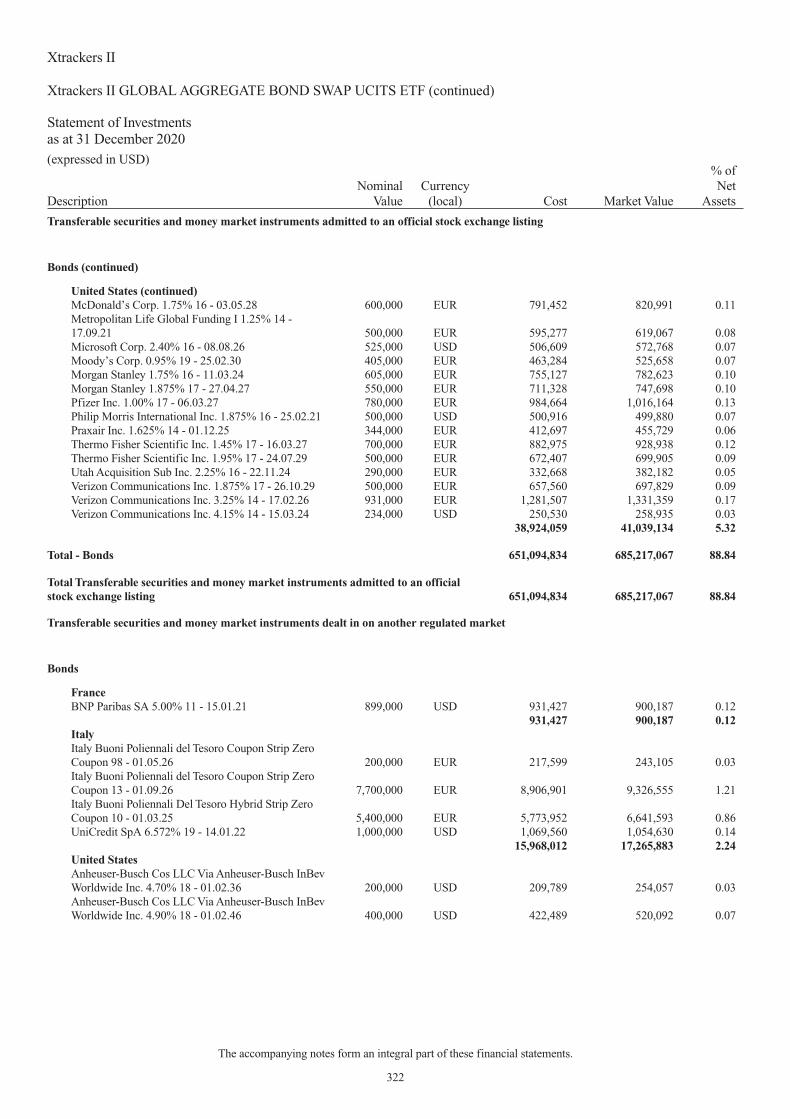
DescriptionNominal
ValueCurrency
(local) Cost Market Value
% ofNet
Assets
Transferable securities and money market instruments admitted to an official stock exchange listing
Bonds (continued)
United States (continued)McDonald’s Corp. 1.75% 16 - 03.05.28 600,000 EUR 791,452 820,991 0.11Metropolitan Life Global Funding I 1.25% 14 -17.09.21 500,000 EUR 595,277 619,067 0.08Microsoft Corp. 2.40% 16 - 08.08.26 525,000 USD 506,609 572,768 0.07Moody’s Corp. 0.95% 19 - 25.02.30 405,000 EUR 463,284 525,658 0.07Morgan Stanley 1.75% 16 - 11.03.24 605,000 EUR 755,127 782,623 0.10Morgan Stanley 1.875% 17 - 27.04.27 550,000 EUR 711,328 747,698 0.10Pfizer Inc. 1.00% 17 - 06.03.27 780,000 EUR 984,664 1,016,164 0.13Philip Morris International Inc. 1.875% 16 - 25.02.21 500,000 USD 500,916 499,880 0.07Praxair Inc. 1.625% 14 - 01.12.25 344,000 EUR 412,697 455,729 0.06Thermo Fisher Scientific Inc. 1.45% 17 - 16.03.27 700,000 EUR 882,975 928,938 0.12Thermo Fisher Scientific Inc. 1.95% 17 - 24.07.29 500,000 EUR 672,407 699,905 0.09Utah Acquisition Sub Inc. 2.25% 16 - 22.11.24 290,000 EUR 332,668 382,182 0.05Verizon Communications Inc. 1.875% 17 - 26.10.29 500,000 EUR 657,560 697,829 0.09Verizon Communications Inc. 3.25% 14 - 17.02.26 931,000 EUR 1,281,507 1,331,359 0.17Verizon Communications Inc. 4.15% 14 - 15.03.24 234,000 USD 250,530 258,935 0.03
38,924,059 41,039,134 5.32
Total - Bonds 651,094,834 685,217,067 88.84
Total Transferable securities and money market instruments admitted to an officialstock exchange listing 651,094,834 685,217,067 88.84
Transferable securities and money market instruments dealt in on another regulated market
Bonds
FranceBNP Paribas SA 5.00% 11 - 15.01.21 899,000 USD 931,427 900,187 0.12
931,427 900,187 0.12ItalyItaly Buoni Poliennali del Tesoro Coupon Strip ZeroCoupon 98 - 01.05.26 200,000 EUR 217,599 243,105 0.03Italy Buoni Poliennali del Tesoro Coupon Strip ZeroCoupon 13 - 01.09.26 7,700,000 EUR 8,906,901 9,326,555 1.21Italy Buoni Poliennali Del Tesoro Hybrid Strip ZeroCoupon 10 - 01.03.25 5,400,000 EUR 5,773,952 6,641,593 0.86UniCredit SpA 6.572% 19 - 14.01.22 1,000,000 USD 1,069,560 1,054,630 0.14
15,968,012 17,265,883 2.24United StatesAnheuser-Busch Cos LLC Via Anheuser-Busch InBevWorldwide Inc. 4.70% 18 - 01.02.36 200,000 USD 209,789 254,057 0.03Anheuser-Busch Cos LLC Via Anheuser-Busch InBevWorldwide Inc. 4.90% 18 - 01.02.46 400,000 USD 422,489 520,092 0.07
Xtrackers II
Xtrackers II GLOBAL AGGREGATE BOND SWAP UCITS ETF (continued)
Statement of Investmentsas at 31 December 2020(expressed in USD)
The accompanying notes form an integral part of these financial statements.
322
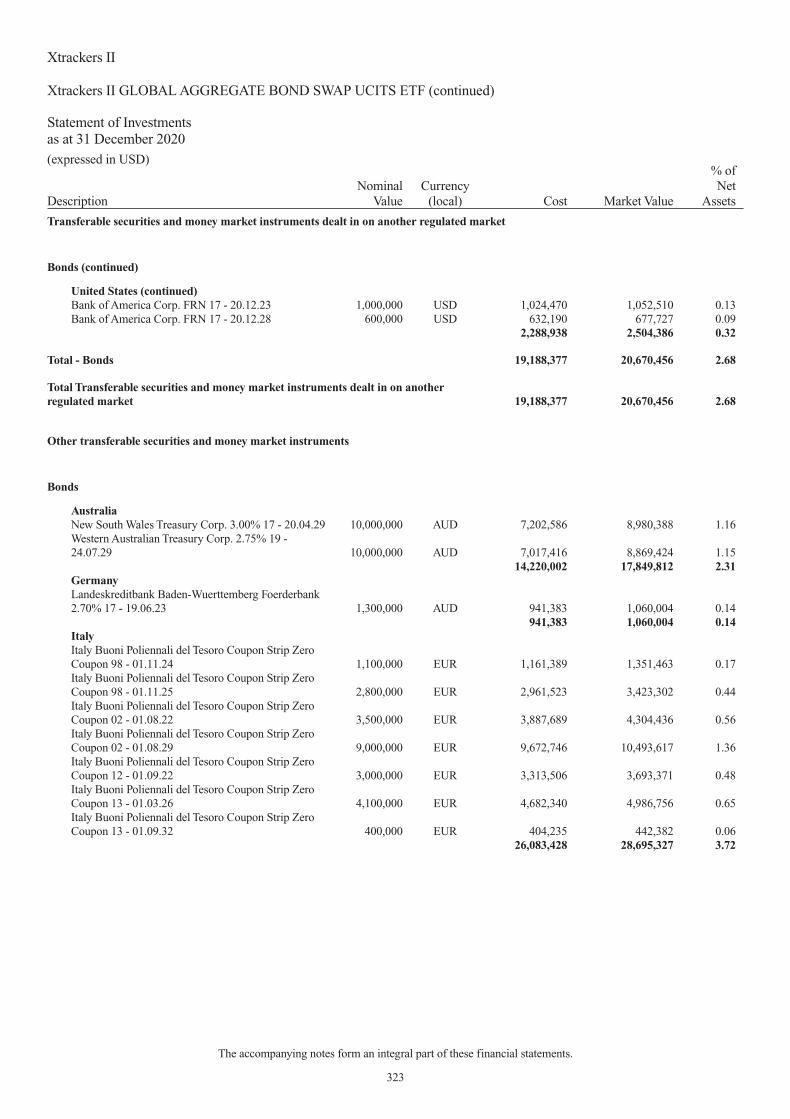
DescriptionNominal
ValueCurrency
(local) Cost Market Value
% ofNet
Assets
Transferable securities and money market instruments dealt in on another regulated market
Bonds (continued)
United States (continued)Bank of America Corp. FRN 17 - 20.12.23 1,000,000 USD 1,024,470 1,052,510 0.13Bank of America Corp. FRN 17 - 20.12.28 600,000 USD 632,190 677,727 0.09
2,288,938 2,504,386 0.32
Total - Bonds 19,188,377 20,670,456 2.68
Total Transferable securities and money market instruments dealt in on anotherregulated market 19,188,377 20,670,456 2.68
Other transferable securities and money market instruments
Bonds
AustraliaNew South Wales Treasury Corp. 3.00% 17 - 20.04.29 10,000,000 AUD 7,202,586 8,980,388 1.16Western Australian Treasury Corp. 2.75% 19 -24.07.29 10,000,000 AUD 7,017,416 8,869,424 1.15
14,220,002 17,849,812 2.31GermanyLandeskreditbank Baden-Wuerttemberg Foerderbank2.70% 17 - 19.06.23 1,300,000 AUD 941,383 1,060,004 0.14
941,383 1,060,004 0.14ItalyItaly Buoni Poliennali del Tesoro Coupon Strip ZeroCoupon 98 - 01.11.24 1,100,000 EUR 1,161,389 1,351,463 0.17Italy Buoni Poliennali del Tesoro Coupon Strip ZeroCoupon 98 - 01.11.25 2,800,000 EUR 2,961,523 3,423,302 0.44Italy Buoni Poliennali del Tesoro Coupon Strip ZeroCoupon 02 - 01.08.22 3,500,000 EUR 3,887,689 4,304,436 0.56Italy Buoni Poliennali del Tesoro Coupon Strip ZeroCoupon 02 - 01.08.29 9,000,000 EUR 9,672,746 10,493,617 1.36Italy Buoni Poliennali del Tesoro Coupon Strip ZeroCoupon 12 - 01.09.22 3,000,000 EUR 3,313,506 3,693,371 0.48Italy Buoni Poliennali del Tesoro Coupon Strip ZeroCoupon 13 - 01.03.26 4,100,000 EUR 4,682,340 4,986,756 0.65Italy Buoni Poliennali del Tesoro Coupon Strip ZeroCoupon 13 - 01.09.32 400,000 EUR 404,235 442,382 0.06
26,083,428 28,695,327 3.72
Xtrackers II
Xtrackers II GLOBAL AGGREGATE BOND SWAP UCITS ETF (continued)
Statement of Investmentsas at 31 December 2020(expressed in USD)
The accompanying notes form an integral part of these financial statements.
323

DescriptionNominal
ValueCurrency
(local) Cost Market Value
% ofNet
Assets
Other transferable securities and money market instruments
Bonds (continued)
JapanJapanese Government CPI Linked Bond 0.10% 13 -10.09.23 166,886,500 JPY 1,574,453 1,620,470 0.21
1,574,453 1,620,470 0.21
Total - Bonds 42,819,266 49,225,613 6.38
Total Other transferable securities and money market instruments 42,819,266 49,225,613 6.38
TOTAL INVESTMENT PORTFOLIO 713,102,477 755,113,136 97.90
TOTAL INVESTMENT PORTFOLIO INCLUDING ACCRUED INTEREST 762,409,411 98.84
Xtrackers II
Xtrackers II GLOBAL AGGREGATE BOND SWAP UCITS ETF (continued)
Statement of Investmentsas at 31 December 2020(expressed in USD)
The accompanying notes form an integral part of these financial statements.
324

DescriptionNominal
ValueCurrency
(local) Cost Market Value
% ofNet
Assets
Transferable securities and money market instruments admitted to an official stock exchange listing(A)
Bonds
Austriaams AG 6.00% 20 - 31.07.25 1,260,000 EUR 1,307,535 1,334,674 0.28Novomatic AG 1.625% 16 - 20.09.23 675,000 EUR 649,630 646,407 0.14Raiffeisenlandesbank Niederoesterreich-Wien AG5.875% 13 - 27.11.23 100,000 EUR 107,393 110,082 0.02Raiffeisenlandesbank Niederoesterreich-Wien AG5.875% 13 - 27.11.23 300,000 EUR 329,212 330,246 0.07Sappi Papier Holding GmbH 4.00% 16 - 01.04.23 500,000 EUR 483,473 498,000 0.10Sappi Papier Holdings GmbH 3.125% 19 - 15.04.26 650,000 EUR 619,262 631,258 0.13Wienerberger AG 2.00% 18 - 02.05.24 350,000 EUR 361,021 364,084 0.08Wienerberger AG 2.75% 20 - 04.06.25 600,000 EUR 612,044 638,343 0.13
4,469,570 4,553,094 0.95BelgiumHouse of Finance NV 4.375% 19 - 15.07.26 500,000 EUR 488,619 492,150 0.10Sarens Finance Co. NV 5.75% 20 - 21.02.27 200,000 EUR 184,133 184,137 0.04Sarens Finance Co. NV 5.75% 20 - 21.02.27 200,000 EUR 170,930 184,137 0.04
843,682 860,424 0.18British Virgin IslandsFortune Star BVI Ltd. 4.35% 19 - 06.05.23 700,000 EUR 693,737 708,050 0.15
693,737 708,050 0.15BulgariaBulgarian Energy Holdings EAD 3.50% 18 - 28.06.25 850,000 EUR 879,553 889,060 0.19Bulgarian Energy Holdings EAD 4.875% 16 -02.08.21 850,000 EUR 865,527 869,789 0.18
1,745,080 1,758,849 0.37CanadaBausch Health Cos Inc. 4.50% 15 - 15.05.23 100,000 EUR 99,243 100,000 0.02
99,243 100,000 0.02Czech RepublicEnergo-Pro AS 4.00% 17 - 07.12.22 500,000 EUR 488,734 487,437 0.10Energo-Pro AS 4.50% 18 - 04.05.24 400,000 EUR 394,394 387,167 0.08Sazka Group AS 3.875% 20 - 15.02.27 280,000 EUR 273,514 268,478 0.06Sazka Group AS 3.875% 20 - 15.02.27 200,000 EUR 168,001 191,770 0.04Sazka Group AS 4.125% 19 - 20.11.24 400,000 EUR 386,507 399,300 0.08
1,711,150 1,734,152 0.36DenmarkDKT Finance ApS 7.00% 18 - 17.06.23 1,500,000 EUR 1,529,756 1,542,135 0.32Norican A/S 4.50% 17 - 15.05.23 500,000 EUR 446,243 428,125 0.09TDC A/S 5.00% 12 - 02.03.22 700,000 EUR 727,389 734,213 0.15
2,703,388 2,704,473 0.56FinlandNokia OYJ 1.00% 17 - 15.03.21 500,000 EUR 499,942 499,983 0.10Nokia OYJ 2.00% 17 - 15.03.24 1,050,000 EUR 1,079,187 1,088,111 0.23Nokia OYJ 2.00% 19 - 11.03.26 1,150,000 EUR 1,162,626 1,192,667 0.25Nokia OYJ 2.375% 20 - 15.05.25 750,000 EUR 779,296 792,568 0.16Nokia OYJ 3.125% 20 - 15.05.28 700,000 EUR 729,686 769,023 0.16Outokumpu OYJ 4.125% 18 - 18.06.24 380,000 EUR 373,517 383,212 0.08Teollisuuden Voima OYJ 1.125% 19 - 09.03.26 930,000 EUR 886,931 864,779 0.18Teollisuuden Voima OYJ 2.00% 18 - 08.05.24 700,000 EUR 705,428 701,689 0.15
Xtrackers II
Xtrackers II EUR HIGH YIELD CORPORATE BOND UCITS ETF
Statement of Investmentsas at 31 December 2020(expressed in EUR)
The accompanying notes form an integral part of these financial statements.
325

DescriptionNominal
ValueCurrency
(local) Cost Market Value
% ofNet
Assets
Transferable securities and money market instruments admitted to an official stock exchange listing(A)
Bonds (continued)
Finland (continued)Teollisuuden Voima OYJ 2.125% 15 - 04.02.25 460,000 EUR 465,373 458,139 0.09Teollisuuden Voima OYJ 2.125% 15 - 04.02.25 200,000 EUR 199,106 199,191 0.04Teollisuuden Voima OYJ 2.625% 16 - 13.01.23 700,000 EUR 718,144 717,261 0.15
7,599,236 7,666,623 1.59France3AB Optique Developpement SAS 4.00% 17 -01.10.23 300,000 EUR 286,145 302,991 0.06Accor SA 1.25% 17 - 25.01.24 900,000 EUR 904,936 920,850 0.19Accor SA 1.75% 19 - 04.02.26 900,000 EUR 911,288 937,330 0.19Accor SA 3.625% 15 - 17.09.23 700,000 EUR 729,658 738,149 0.15Altice France SA 2.125% 20 - 15.02.25 700,000 EUR 677,484 673,768 0.14Altice France SA 2.50% 19 - 15.01.25 750,000 EUR 745,495 734,764 0.15Altice France SA 3.375% 19 - 15.01.28 1,500,000 EUR 1,485,888 1,480,208 0.31Altice France SA 4.125% 20 - 15.01.29 800,000 EUR 804,488 815,800 0.17Altice France SA 5.875% 18 - 01.02.27 1,450,000 EUR 1,533,003 1,544,214 0.32Banijay Entertainment SASU 3.50% 20 - 01.03.25 850,000 EUR 841,171 845,742 0.18Banijay Group SAS 6.50% 20 - 01.03.26 640,000 EUR 629,504 642,236 0.13Burger King France SAS FRN 17 - 01.05.23 400,000 EUR 393,388 401,000 0.08Burger King France SAS 6.00% 17 - 01.05.24 450,000 EUR 457,075 460,575 0.10Casino Guichard Perrachon SA 1.865% 17 - 13.06.22 440,000 EUR 420,169 444,084 0.09Casino Guichard Perrachon SA 3.58% 14 - 07.02.25 500,000 EUR 454,860 450,293 0.09Casino Guichard Perrachon SA 4.498% 14 - 07.03.24 900,000 EUR 884,250 877,210 0.18Casino Guichard Perrachon SA 4.561% 13 - 25.01.23 400,000 EUR 419,360 416,216 0.09Casino Guichard Perrachon SA 6.625% 20 - 15.01.26 600,000 EUR 609,000 604,005 0.13CMA CGM SA 5.25% 17 - 15.01.25 1,150,000 EUR 995,341 1,144,506 0.24CMA CGM SA 6.50% 17 - 15.07.22 950,000 EUR 914,385 961,305 0.20CMA CGM SA 7.50% 20 - 15.01.26 700,000 EUR 691,142 748,368 0.16Constellium SE 4.25% 17 - 15.02.26 600,000 EUR 598,645 611,769 0.13Crown European Holdings SA 0.75% 19 - 15.02.23 700,000 EUR 692,407 697,198 0.14Crown European Holdings SA 2.25% 18 - 01.02.23 500,000 EUR 509,441 510,420 0.11Crown European Holdings SA 2.625% 16 - 30.09.24 950,000 EUR 980,970 994,769 0.21Crown European Holdings SA 2.875% 18 - 01.02.26 760,000 EUR 791,505 814,174 0.17Crown European Holdings SA 3.375% 15 - 15.05.25 850,000 EUR 891,409 918,991 0.19Crown European Holdings SA 4.00% 14 - 15.07.22 1,050,000 EUR 1,094,659 1,094,096 0.23Elis SA 1.00% 19 - 03.04.25 400,000 EUR 388,361 395,454 0.08Elis SA 1.00% 19 - 03.04.25 300,000 EUR 291,638 296,591 0.06Elis SA 1.625% 19 - 03.04.28 500,000 EUR 482,566 490,823 0.10Elis SA 1.75% 19 - 11.04.24 800,000 EUR 803,700 809,951 0.17Elis SA 1.875% 18 - 15.02.23 1,000,000 EUR 1,004,033 1,016,550 0.21Elis SA 2.875% 18 - 15.02.26 500,000 EUR 505,082 531,484 0.11Faurecia SE 2.375% 19 - 15.06.27 1,000,000 EUR 977,910 1,006,979 0.21Faurecia SE 2.625% 18 - 15.06.25 1,100,000 EUR 1,098,982 1,117,194 0.23Faurecia SE 2.625% 18 - 15.06.25 300,000 EUR 295,882 304,689 0.06Faurecia SE 3.125% 19 - 15.06.26 1,150,000 EUR 1,163,494 1,180,342 0.25Faurecia SE 3.75% 20 - 15.06.28 1,000,000 EUR 1,013,938 1,048,217 0.22Fnac Darty SA 1.875% 19 - 30.05.24 500,000 EUR 499,365 504,438 0.10Fnac Darty SA 2.625% 19 - 30.05.26 400,000 EUR 404,930 412,160 0.09Getlink SE 3.50% 20 - 30.10.25 1,000,000 EUR 1,013,086 1,031,700 0.21
Xtrackers II
Xtrackers II EUR HIGH YIELD CORPORATE BOND UCITS ETF (continued)
Statement of Investmentsas at 31 December 2020(expressed in EUR)
The accompanying notes form an integral part of these financial statements.
326

DescriptionNominal
ValueCurrency
(local) Cost Market Value
% ofNet
Assets
Transferable securities and money market instruments admitted to an official stock exchange listing(A)
Bonds (continued)
France (continued)Kapla Holdings SAS FRN 19 - 15.12.26 600,000 EUR 578,019 588,280 0.12Kapla Holdings SAS 3.375% 19 - 15.12.26 600,000 EUR 573,690 588,900 0.12La Financiere Atalian SASU 4.00% 17 - 15.05.24 900,000 EUR 765,611 827,168 0.17La Financiere Atalian SASU 5.125% 18 - 15.05.25 550,000 EUR 460,634 508,825 0.11Louvre Bidco SAS 4.25% 17 - 30.09.24 350,000 EUR 339,192 345,697 0.07Loxam SAS 2.875% 19 - 15.04.26 400,000 EUR 376,286 393,554 0.08Loxam SAS 3.25% 19 - 14.01.25 1,050,000 EUR 1,021,259 1,050,669 0.22Loxam SAS 3.50% 16 - 03.05.23 400,000 EUR 393,156 401,426 0.08Loxam SAS 3.50% 17 - 15.04.22 400,000 EUR 397,483 402,933 0.08Loxam SAS 3.75% 19 - 15.07.26 600,000 EUR 598,923 608,403 0.13Loxam SAS 4.25% 17 - 15.04.24 400,000 EUR 398,746 405,800 0.08Loxam SAS 5.75% 19 - 15.07.27 400,000 EUR 365,515 401,375 0.08Loxam SAS 6.00% 17 - 15.04.25 350,000 EUR 326,385 349,967 0.07Mobilux Finance SAS 5.50% 16 - 15.11.24 550,000 EUR 543,822 555,264 0.12Nexans SA 3.25% 16 - 26.05.21 300,000 EUR 300,874 301,045 0.06Nexans SA 3.75% 18 - 08.08.23 100,000 EUR 104,818 107,129 0.02Nexans SA 3.75% 18 - 08.08.23 400,000 EUR 421,795 428,517 0.09Novafives SAS FRN 18 - 15.06.25 450,000 EUR 386,980 391,541 0.08Novafives SAS 5.00% 18 - 15.06.25 450,000 EUR 373,286 391,436 0.08Orano SA 2.75% 20 - 08.03.28 700,000 EUR 699,173 733,491 0.15Orano SA 3.125% 14 - 20.03.23 1,200,000 EUR 1,234,894 1,254,425 0.26Orano SA 3.375% 19 - 23.04.26 1,100,000 EUR 1,148,596 1,196,679 0.25Orano SA 3.50% 10 - 22.03.21 1,000,000 EUR 1,005,268 1,007,323 0.21Paprec Holdings SA 4.00% 18 - 31.03.25 800,000 EUR 746,365 794,174 0.17Parts Europe SA FRN 16 - 01.05.22 472,233 EUR 462,781 470,462 0.10Parts Europe SA 6.50% 20 - 16.07.25 850,000 EUR 853,058 883,568 0.18Picard Groupe SAS FRN 17 - 30.11.23 1,850,000 EUR 1,818,481 1,845,583 0.38Quatrim SASU 5.875% 19 - 15.01.24 360,000 EUR 363,545 372,897 0.08Quatrim SASU 5.875% 19 - 15.01.24 800,000 EUR 805,128 828,660 0.17Renault SA 1.00% 17 - 08.03.23 1,100,000 EUR 1,090,077 1,099,804 0.23Renault SA 1.00% 17 - 28.11.25 1,100,000 EUR 1,041,215 1,064,652 0.22Renault SA 1.00% 18 - 18.04.24 1,000,000 EUR 966,733 984,556 0.20Renault SA 1.125% 19 - 04.10.27 700,000 EUR 636,591 668,795 0.14Renault SA 1.25% 19 - 24.06.25 800,000 EUR 764,220 780,378 0.16Renault SA 1.25% 19 - 24.06.25 600,000 EUR 561,875 585,283 0.12Renault SA 2.00% 18 - 28.09.26 1,100,000 EUR 1,051,468 1,093,145 0.23Renault SA 2.375% 20 - 25.05.26 1,500,000 EUR 1,507,838 1,516,584 0.32Rexel SA 2.125% 17 - 15.06.25 750,000 EUR 744,090 754,345 0.16Rexel SA 2.75% 19 - 15.06.26 900,000 EUR 903,628 917,606 0.19Rubis Terminal Infra SAS 5.625% 20 - 15.05.25 800,000 EUR 832,860 850,957 0.18SPCM SA 2.00% 20 - 01.02.26 500,000 EUR 501,089 506,083 0.11SPCM SA 2.625% 20 - 01.02.29 500,000 EUR 500,888 512,944 0.11Spie SA 2.625% 19 - 18.06.26 900,000 EUR 909,573 940,560 0.20SPIE SA 3.125% 17 - 22.03.24 900,000 EUR 931,265 948,128 0.20Tereos Finance Groupe I SA 4.125% 16 - 16.06.23 900,000 EUR 809,920 880,320 0.18Tereos Finance Groupe I SA 7.50% 20 - 30.10.25 450,000 EUR 451,091 474,704 0.10Valeo SA 0.375% 17 - 12.09.22 900,000 EUR 888,959 900,684 0.19Valeo SA 0.625% 17 - 11.01.23 700,000 EUR 694,226 702,541 0.15
Xtrackers II
Xtrackers II EUR HIGH YIELD CORPORATE BOND UCITS ETF (continued)
Statement of Investmentsas at 31 December 2020(expressed in EUR)
The accompanying notes form an integral part of these financial statements.
327

DescriptionNominal
ValueCurrency
(local) Cost Market Value
% ofNet
Assets
Transferable securities and money market instruments admitted to an official stock exchange listing(A)
Bonds (continued)
France (continued)Valeo SA 1.50% 18 - 18.06.25 900,000 EUR 889,966 918,606 0.19Valeo SA 1.625% 16 - 18.03.26 900,000 EUR 889,593 921,660 0.19Valeo SA 3.25% 14 - 22.01.24 1,000,000 EUR 1,051,375 1,079,801 0.22
67,772,336 69,468,930 14.43GermanyAdler Pelzer Holdings GmbH 4.125% 17 - 01.04.24 300,000 EUR 292,789 280,650 0.06Adler Pelzer Holdings GmbH 4.125% 17 - 01.04.24 200,000 EUR 174,426 187,100 0.04ADLER Real Estate AG 1.50% 17 - 06.12.21 700,000 EUR 699,837 699,877 0.15ADLER Real Estate AG 1.50% 19 - 17.04.22 600,000 EUR 597,495 597,751 0.12ADLER Real Estate AG 1.875% 18 - 27.04.23 800,000 EUR 796,360 803,387 0.17ADLER Real Estate AG 2.125% 17 - 06.02.24 490,000 EUR 483,408 494,723 0.10ADLER Real Estate AG 3.00% 18 - 27.04.26 400,000 EUR 409,310 420,560 0.09Bilfinger SE 5.75% 19 - 14.06.24 400,000 EUR 405,700 417,218 0.09CeramTec BondCo GmbH 5.25% 17 - 15.12.25 550,000 EUR 544,754 561,055 0.12Cheplapharm Arzneimittel GmbH 3.50% 20 -11.02.27 680,000 EUR 671,879 680,928 0.14Cheplapharm Arzneimittel GmbH 4.375% 20 -15.01.28 900,000 EUR 905,239 920,524 0.19Commerzbank AG 4.00% 16 - 23.03.26 1,520,000 EUR 1,580,781 1,700,683 0.35Commerzbank AG 4.00% 17 - 30.03.27 930,000 EUR 962,731 1,049,322 0.22Consus Real Estate AG 9.625% 19 - 15.05.24 600,000 EUR 605,285 642,302 0.13DEMIRE Deutsche Mittelstand Real Estate AG1.875% 19 - 15.10.24 400,000 EUR 400,934 389,940 0.08DEMIRE Deutsche Mittelstand Real Estate AG1.875% 19 - 15.10.24 500,000 EUR 484,248 487,424 0.10Deutsche Bank AG 2.75% 15 - 17.02.25 1,800,000 EUR 1,813,029 1,868,095 0.39Deutsche Bank AG 4.50% 16 - 19.05.26 400,000 EUR 423,303 449,052 0.09Deutsche Bank AG 4.50% 16 - 19.05.26 700,000 EUR 744,460 785,841 0.16Deutsche Lufthansa AG 0.25% 19 - 06.09.24 700,000 EUR 626,186 645,014 0.13Deutsche Lufthansa AG 3.00% 20 - 29.05.26 1,500,000 EUR 1,502,278 1,495,207 0.31Douglas GmbH 6.25% 15 - 15.07.22 500,000 EUR 461,824 448,850 0.09Hapag-Lloyd AG 5.125% 17 - 15.07.24 233,333 EUR 238,805 239,775 0.05Hornbach Baumarkt AG 3.25% 19 - 25.10.26 400,000 EUR 410,812 430,144 0.09HT Troplast GmbH 9.25% 20 - 15.07.25 500,000 EUR 523,398 554,231 0.12INEOS Styrolution Group GmbH 2.25% 20 - 16.01.27 900,000 EUR 855,726 871,007 0.18K+S AG 2.625% 17 - 06.04.23 900,000 EUR 869,010 878,675 0.18K+S AG 3.00% 12 - 20.06.22 200,000 EUR 206,772 199,124 0.04K+S AG 3.00% 12 - 20.06.22 500,000 EUR 494,058 497,809 0.10K+S AG 3.25% 18 - 18.07.24 900,000 EUR 860,393 874,710 0.18K+S AG 4.125% 13 - 06.12.21 644,000 EUR 655,181 655,187 0.14Kaefer Isoliertechnik GmbH & Co. KG 5.50% 18 -10.01.24 320,000 EUR 302,400 321,870 0.07KION Group AG 1.625% 20 - 24.09.25 700,000 EUR 704,328 722,683 0.15Kirk Beauty One GmbH 8.75% 15 - 15.07.23 100,000 EUR 90,500 62,723 0.01Kirk Beauty One GmbH 8.75% 15 - 15.07.23 400,000 EUR 274,614 250,891 0.05KME SE 6.75% 18 - 01.02.23 400,000 EUR 318,751 321,800 0.07METRO AG 1.375% 14 - 28.10.21 780,000 EUR 783,132 785,557 0.16METRO AG 1.50% 15 - 19.03.25 890,000 EUR 896,899 917,925 0.19
Xtrackers II
Xtrackers II EUR HIGH YIELD CORPORATE BOND UCITS ETF (continued)
Statement of Investmentsas at 31 December 2020(expressed in EUR)
The accompanying notes form an integral part of these financial statements.
328
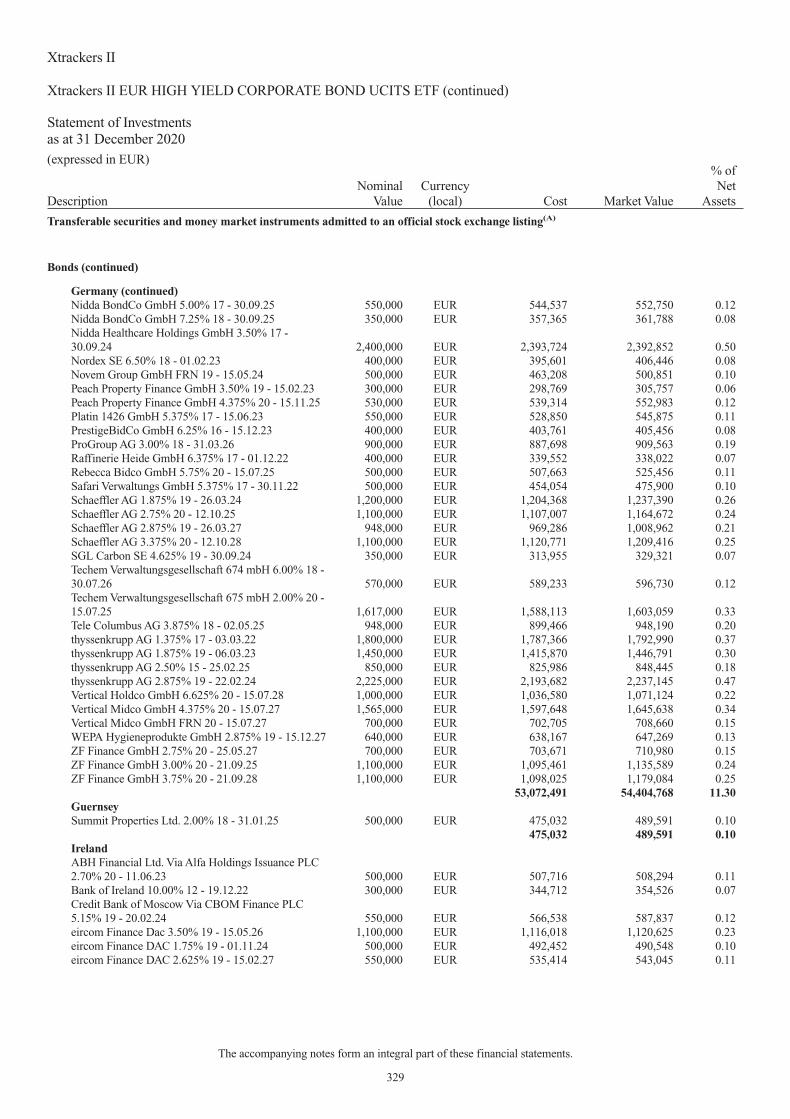
DescriptionNominal
ValueCurrency
(local) Cost Market Value
% ofNet
Assets
Transferable securities and money market instruments admitted to an official stock exchange listing(A)
Bonds (continued)
Germany (continued)Nidda BondCo GmbH 5.00% 17 - 30.09.25 550,000 EUR 544,537 552,750 0.12Nidda BondCo GmbH 7.25% 18 - 30.09.25 350,000 EUR 357,365 361,788 0.08Nidda Healthcare Holdings GmbH 3.50% 17 -30.09.24 2,400,000 EUR 2,393,724 2,392,852 0.50Nordex SE 6.50% 18 - 01.02.23 400,000 EUR 395,601 406,446 0.08Novem Group GmbH FRN 19 - 15.05.24 500,000 EUR 463,208 500,851 0.10Peach Property Finance GmbH 3.50% 19 - 15.02.23 300,000 EUR 298,769 305,757 0.06Peach Property Finance GmbH 4.375% 20 - 15.11.25 530,000 EUR 539,314 552,983 0.12Platin 1426 GmbH 5.375% 17 - 15.06.23 550,000 EUR 528,850 545,875 0.11PrestigeBidCo GmbH 6.25% 16 - 15.12.23 400,000 EUR 403,761 405,456 0.08ProGroup AG 3.00% 18 - 31.03.26 900,000 EUR 887,698 909,563 0.19Raffinerie Heide GmbH 6.375% 17 - 01.12.22 400,000 EUR 339,552 338,022 0.07Rebecca Bidco GmbH 5.75% 20 - 15.07.25 500,000 EUR 507,663 525,456 0.11Safari Verwaltungs GmbH 5.375% 17 - 30.11.22 500,000 EUR 454,054 475,900 0.10Schaeffler AG 1.875% 19 - 26.03.24 1,200,000 EUR 1,204,368 1,237,390 0.26Schaeffler AG 2.75% 20 - 12.10.25 1,100,000 EUR 1,107,007 1,164,672 0.24Schaeffler AG 2.875% 19 - 26.03.27 948,000 EUR 969,286 1,008,962 0.21Schaeffler AG 3.375% 20 - 12.10.28 1,100,000 EUR 1,120,771 1,209,416 0.25SGL Carbon SE 4.625% 19 - 30.09.24 350,000 EUR 313,955 329,321 0.07Techem Verwaltungsgesellschaft 674 mbH 6.00% 18 -30.07.26 570,000 EUR 589,233 596,730 0.12Techem Verwaltungsgesellschaft 675 mbH 2.00% 20 -15.07.25 1,617,000 EUR 1,588,113 1,603,059 0.33Tele Columbus AG 3.875% 18 - 02.05.25 948,000 EUR 899,466 948,190 0.20thyssenkrupp AG 1.375% 17 - 03.03.22 1,800,000 EUR 1,787,366 1,792,990 0.37thyssenkrupp AG 1.875% 19 - 06.03.23 1,450,000 EUR 1,415,870 1,446,791 0.30thyssenkrupp AG 2.50% 15 - 25.02.25 850,000 EUR 825,986 848,445 0.18thyssenkrupp AG 2.875% 19 - 22.02.24 2,225,000 EUR 2,193,682 2,237,145 0.47Vertical Holdco GmbH 6.625% 20 - 15.07.28 1,000,000 EUR 1,036,580 1,071,124 0.22Vertical Midco GmbH 4.375% 20 - 15.07.27 1,565,000 EUR 1,597,648 1,645,638 0.34Vertical Midco GmbH FRN 20 - 15.07.27 700,000 EUR 702,705 708,660 0.15WEPA Hygieneprodukte GmbH 2.875% 19 - 15.12.27 640,000 EUR 638,167 647,269 0.13ZF Finance GmbH 2.75% 20 - 25.05.27 700,000 EUR 703,671 710,980 0.15ZF Finance GmbH 3.00% 20 - 21.09.25 1,100,000 EUR 1,095,461 1,135,589 0.24ZF Finance GmbH 3.75% 20 - 21.09.28 1,100,000 EUR 1,098,025 1,179,084 0.25
53,072,491 54,404,768 11.30GuernseySummit Properties Ltd. 2.00% 18 - 31.01.25 500,000 EUR 475,032 489,591 0.10
475,032 489,591 0.10IrelandABH Financial Ltd. Via Alfa Holdings Issuance PLC2.70% 20 - 11.06.23 500,000 EUR 507,716 508,294 0.11Bank of Ireland 10.00% 12 - 19.12.22 300,000 EUR 344,712 354,526 0.07Credit Bank of Moscow Via CBOM Finance PLC5.15% 19 - 20.02.24 550,000 EUR 566,538 587,837 0.12eircom Finance Dac 3.50% 19 - 15.05.26 1,100,000 EUR 1,116,018 1,120,625 0.23eircom Finance DAC 1.75% 19 - 01.11.24 500,000 EUR 492,452 490,548 0.10eircom Finance DAC 2.625% 19 - 15.02.27 550,000 EUR 535,414 543,045 0.11
Xtrackers II
Xtrackers II EUR HIGH YIELD CORPORATE BOND UCITS ETF (continued)
Statement of Investmentsas at 31 December 2020(expressed in EUR)
The accompanying notes form an integral part of these financial statements.
329

DescriptionNominal
ValueCurrency
(local) Cost Market Value
% ofNet
Assets
Transferable securities and money market instruments admitted to an official stock exchange listing(A)
Bonds (continued)
Ireland (continued)James Hardie International Finance DAC 3.625% 18 -01.10.26 600,000 EUR 606,754 617,934 0.13Motion Bondco DAC 4.50% 19 - 15.11.27 500,000 EUR 464,344 481,542 0.10Smurfit Kappa Acquisitions ULC 2.375% 17 -01.02.24 750,000 EUR 778,451 794,437 0.17Smurfit Kappa Acquisitions ULC 2.75% 15 - 01.02.25 400,000 EUR 420,800 433,627 0.09Smurfit Kappa Acquisitions ULC 2.875% 18 -15.01.26 1,400,000 EUR 1,484,075 1,544,736 0.32Smurfit Kappa Treasury ULC 1.50% 19 - 15.09.27 1,150,000 EUR 1,153,314 1,202,359 0.25
8,470,588 8,679,510 1.80Isle Of ManPlaytech PLC 3.75% 18 - 12.10.23 750,000 EUR 745,985 760,621 0.16Playtech PLC 4.25% 19 - 07.03.26 500,000 EUR 494,341 515,465 0.11
1,240,326 1,276,086 0.27ItalyAlmaviva-The Italian Innovation Co. SpA 7.25% 17 -15.10.22 400,000 EUR 368,364 405,710 0.08Amplifon SpA 1.125% 20 - 13.02.27 300,000 EUR 298,996 297,651 0.06Amplifon SpA 1.125% 20 - 13.02.27 200,000 EUR 193,974 198,434 0.04Atlantia SpA 1.625% 17 - 03.02.25 1,100,000 EUR 1,076,398 1,092,016 0.23Atlantia SpA 1.875% 17 - 13.07.27 1,500,000 EUR 1,452,380 1,473,390 0.31Autostrade per l’Italia SpA 1.75% 16 - 01.02.27 900,000 EUR 867,884 892,246 0.19Autostrade per l’Italia SpA 1.875% 15 - 04.11.25 750,000 EUR 732,556 748,290 0.16Azzurra Aeroporti SpA 2.125% 20 - 30.05.24 500,000 EUR 510,632 508,779 0.11Azzurra Aeroporti SpA 2.625% 20 - 30.05.27 400,000 EUR 401,070 399,500 0.08Banca del Mezzogiorno-MedioCredito Centrale SpA1.50% 19 - 24.10.24 400,000 EUR 398,686 404,440 0.08Banca Farmafactoring SpA 1.75% 19 - 23.05.23 400,000 EUR 399,985 407,206 0.08Banca IFIS SpA 1.75% 20 - 25.06.24 500,000 EUR 475,253 486,814 0.10Banca Monte dei Paschi di Siena SpA 1.875% 20 -09.01.26 1,100,000 EUR 1,101,375 1,089,369 0.23Banca Monte dei Paschi di Siena SpA 2.625% 20 -28.04.25 1,100,000 EUR 1,068,026 1,128,116 0.23Banca Monte dei Paschi di Siena SpA 3.625% 19 -24.09.24 1,150,000 EUR 1,173,573 1,211,855 0.25Banca Monte dei Paschi di Siena SpA 4.00% 19 -10.07.22 650,000 EUR 659,686 673,032 0.14Banca Monte dei Paschi di Siena SpA 10.50% 19 -23.07.29 450,000 EUR 444,555 539,550 0.11Banca Popolare di Sondrio SCPA 2.375% 19 -03.04.24 650,000 EUR 641,576 673,203 0.14Banco BPM SpA 1.625% 20 - 18.02.25 1,000,000 EUR 966,040 988,891 0.21Banco BPM SpA 1.75% 18 - 24.04.23 750,000 EUR 752,802 769,255 0.16Banco BPM SpA 1.75% 19 - 28.01.25 400,000 EUR 398,846 411,037 0.09Banco BPM SpA 1.75% 19 - 28.01.25 350,000 EUR 353,070 359,657 0.07Banco BPM SpA 2.00% 19 - 08.03.22 1,100,000 EUR 1,104,438 1,120,842 0.23Banco BPM SpA 2.50% 19 - 21.06.24 800,000 EUR 810,642 841,394 0.17Banco BPM SpA 6.375% 11 - 31.05.21 520,000 EUR 528,758 530,297 0.11
Xtrackers II
Xtrackers II EUR HIGH YIELD CORPORATE BOND UCITS ETF (continued)
Statement of Investmentsas at 31 December 2020(expressed in EUR)
The accompanying notes form an integral part of these financial statements.
330

DescriptionNominal
ValueCurrency
(local) Cost Market Value
% ofNet
Assets
Transferable securities and money market instruments admitted to an official stock exchange listing(A)
Bonds (continued)
Italy (continued)Banco BPM SpA 7.125% 11 - 01.03.21 650,000 EUR 654,190 656,468 0.14Bormioli Pharma Bidco SpA FRN 17 - 15.11.24 380,000 EUR 360,702 370,128 0.08BPER Banca 1.875% 20 - 07.07.25 700,000 EUR 702,187 719,243 0.15Centurion Bidco SpA 5.875% 20 - 30.09.26 850,000 EUR 842,118 877,025 0.18Credito Valtellinese SpA 2.00% 19 - 27.11.22 400,000 EUR 399,876 409,793 0.09Diocle Spa FRN 19 - 30.06.26 495,000 EUR 493,038 493,827 0.10doValue SpA 5.00% 20 - 04.08.25 400,000 EUR 403,366 416,356 0.09Esselunga SpA 0.875% 17 - 25.10.23 700,000 EUR 696,784 705,174 0.15Esselunga SpA 1.875% 17 - 25.10.27 800,000 EUR 814,702 835,654 0.17EVOCA SpA FRN 19 - 01.11.26 800,000 EUR 716,356 749,280 0.16Fabric BC SpA FRN 18 - 30.11.24 900,000 EUR 881,931 890,475 0.18Gamma Bidco SpA FRN 20 - 15.07.25 400,000 EUR 393,895 400,768 0.08Gamma Bidco SpA 6.25% 20 - 15.07.25 500,000 EUR 499,676 518,459 0.11Guala Closures SpA FRN 18 - 15.04.24 600,000 EUR 597,826 599,989 0.12Iccrea Banca SpA FRN 18 - 01.02.21 500,000 EUR 499,856 499,819 0.10Iccrea Banca SpA 1.50% 17 - 11.10.22 900,000 EUR 901,863 906,201 0.19Illimity Bank SpA 3.375% 20 - 11.12.23 400,000 EUR 408,875 406,834 0.08Immobiliare Grande Distribuzione SIIQ SpA 2.125%19 - 28.11.24 600,000 EUR 534,681 562,302 0.12Infrastrutture Wireless Italiane SpA 1.625% 20 -21.10.28 1,050,000 EUR 1,058,812 1,077,032 0.22Infrastrutture Wireless Italiane SpA 1.875% 20 -08.07.26 1,450,000 EUR 1,484,967 1,516,562 0.31International Design Group SPA FRN 18 - 15.11.25 480,000 EUR 457,448 479,026 0.10International Design Group SPA 6.50% 18 - 15.11.25 560,000 EUR 542,748 580,487 0.12Intesa Sanpaolo SpA 2.855% 15 - 23.04.25 700,000 EUR 723,892 735,368 0.15Intesa Sanpaolo SpA 2.925% 20 - 14.10.30 500,000 EUR 501,158 525,384 0.11Intesa Sanpaolo SpA 6.625% 13 - 13.09.23 2,100,000 EUR 2,352,511 2,393,522 0.50Italmatch Chemicals SpA FRN 18 - 30.09.24 1,000,000 EUR 944,559 954,798 0.20Leonardo SpA 1.50% 17 - 07.06.24 900,000 EUR 900,373 914,774 0.19Leonardo SpA 2.375% 20 - 08.01.26 700,000 EUR 708,153 726,086 0.15Leonardo SpA 4.50% 13 - 19.01.21 1,000,000 EUR 1,001,598 1,001,810 0.21Limacorporate SpA FRN 17 - 15.08.23 420,000 EUR 410,630 416,419 0.09LKQ Italia Bondco SpA 3.875% 16 - 01.04.24 700,000 EUR 737,735 755,646 0.16Marcolin SpA FRN 17 - 15.02.23 400,000 EUR 356,538 369,956 0.08Mediobanca Banca di Credito Finanziario SpA 3.75%16 - 16.06.26 410,000 EUR 432,009 442,180 0.09Mediobanca Banca di Credito Finanziario SpA 5.75%13 - 18.04.23 700,000 EUR 757,705 775,428 0.16Nexi SpA 1.75% 19 - 31.10.24 600,000 EUR 602,642 606,761 0.13Nexi SpA 1.75% 19 - 31.10.24 700,000 EUR 695,059 707,888 0.15Piaggio & C SpA 3.625% 18 - 30.04.25 350,000 EUR 352,891 357,091 0.07Pro-Gest SpA 3.25% 17 - 15.12.24 400,000 EUR 324,568 373,533 0.08Rekeep SpA 9.00% 17 - 15.06.22 500,000 EUR 483,367 512,939 0.11Sisal Group SpA 7.00% 16 - 31.07.23 343,750 EUR 342,848 346,844 0.07Sisalpay Group SpA FRN 19 - 17.12.26 700,000 EUR 681,398 698,425 0.15Sofima Holdings SPA 3.75% 20 - 15.01.28 1,200,000 EUR 1,216,109 1,215,274 0.25Sofima Holdings SPA FRN 20 - 15.01.28 160,000 EUR 159,600 161,616 0.03
Xtrackers II
Xtrackers II EUR HIGH YIELD CORPORATE BOND UCITS ETF (continued)
Statement of Investmentsas at 31 December 2020(expressed in EUR)
The accompanying notes form an integral part of these financial statements.
331

DescriptionNominal
ValueCurrency
(local) Cost Market Value
% ofNet
Assets
Transferable securities and money market instruments admitted to an official stock exchange listing(A)
Bonds (continued)
Italy (continued)TeamSystem SpA FRN 18 - 15.04.23 778,000 EUR 771,110 776,309 0.16Telecom Italia SpA 2.375% 17 - 12.10.27 1,750,000 EUR 1,744,152 1,819,980 0.38Telecom Italia SpA 2.50% 17 - 19.07.23 1,350,000 EUR 1,388,339 1,411,389 0.29Telecom Italia SpA 2.75% 19 - 15.04.25 1,350,000 EUR 1,383,627 1,412,122 0.29Telecom Italia SpA 2.875% 18 - 28.01.26 1,100,000 EUR 1,135,133 1,162,947 0.24Telecom Italia SpA 3.00% 16 - 30.09.25 1,400,000 EUR 1,452,700 1,491,075 0.31Telecom Italia SpA 3.25% 15 - 16.01.23 1,500,000 EUR 1,559,809 1,578,796 0.33Telecom Italia SpA 3.625% 16 - 19.01.24 1,010,000 EUR 1,065,524 1,081,719 0.22Telecom Italia SpA 3.625% 16 - 25.05.26 1,400,000 EUR 1,499,979 1,539,302 0.32Telecom Italia SpA 4.00% 19 - 11.04.24 1,700,000 EUR 1,801,801 1,837,374 0.38Telecom Italia SpA 4.50% 14 - 25.01.21 800,000 EUR 802,016 802,252 0.17UniCredit SpA 6.95% 12 - 31.10.22 2,100,000 EUR 2,267,587 2,335,789 0.49Unione di Banche Italiane SpA 1.625% 19 - 21.04.25 750,000 EUR 752,856 778,045 0.16Unione di Banche Italiane SpA 1.75% 18 - 12.04.23 600,000 EUR 594,884 619,109 0.13Unione di Banche Italiane SpA 2.625% 19 - 20.06.24 800,000 EUR 825,421 854,225 0.18Unipol Gruppo SpA 3.00% 15 - 18.03.25 1,500,000 EUR 1,539,723 1,599,837 0.33Unipol Gruppo SpA 3.25% 20 - 23.09.30 1,000,000 EUR 1,015,849 1,054,437 0.22Unipol Gruppo SpA 3.25% 20 - 23.09.30 400,000 EUR 417,635 421,775 0.09Unipol Gruppo SpA 3.50% 17 - 29.11.27 750,000 EUR 783,072 805,085 0.17UnipolSai Assicurazioni SpA 3.875% 18 - 01.03.28 750,000 EUR 764,342 798,828 0.17Vittoria Assicurazioni SpA 5.75% 18 - 11.07.28 350,000 EUR 379,933 388,106 0.08Webuild SpA 1.75% 17 - 26.10.24 700,000 EUR 632,330 643,767 0.13Webuild SpA 3.625% 20 - 28.01.27 325,000 EUR 308,806 302,625 0.06Webuild SpA 5.875% 20 - 15.12.25 350,000 EUR 350,000 361,088 0.07
71,447,433 73,189,599 15.20JapanSoftBank Group Corp. 3.125% 17 - 19.09.25 1,690,000 EUR 1,682,157 1,730,619 0.36SoftBank Group Corp. 4.00% 15 - 30.07.22 450,000 EUR 461,761 465,910 0.10SoftBank Group Corp. 4.00% 18 - 20.04.23 1,430,000 EUR 1,478,072 1,489,715 0.31SoftBank Group Corp. 4.50% 18 - 20.04.25 600,000 EUR 630,616 645,783 0.13SoftBank Group Corp. 4.75% 15 - 30.07.25 1,050,000 EUR 1,110,839 1,143,510 0.24SoftBank Group Corp. 5.00% 18 - 15.04.28 1,650,000 EUR 1,740,210 1,834,113 0.38
7,103,655 7,309,650 1.52JerseyAdient Global Holdings Ltd. 3.50% 16 - 15.08.24 1,450,000 EUR 1,325,919 1,440,553 0.30Avis Budget Finance PLC 4.125% 16 - 15.11.24 400,000 EUR 376,461 390,333 0.08Avis Budget Finance PLC 4.50% 17 - 15.05.25 400,000 EUR 337,616 390,442 0.08Avis Budget Finance PLC 4.75% 18 - 30.01.26 480,000 EUR 475,259 467,870 0.10Walnut Bidco PLC 6.75% 19 - 01.08.24 700,000 EUR 693,256 725,958 0.15
3,208,511 3,415,156 0.71LithuaniaMaxima Grupe UAB 3.25% 18 - 13.09.23 500,000 EUR 511,794 521,872 0.11
511,794 521,872 0.11LuxembourgADLER Group SA 1.50% 17 - 26.07.24 600,000 EUR 573,362 587,355 0.12ADLER Group SA 2.75% 20 - 13.11.26 600,000 EUR 604,358 614,760 0.13ADLER Group SA 3.25% 20 - 05.08.25 500,000 EUR 499,689 519,827 0.11Altice Financing SA 2.25% 20 - 15.01.25 900,000 EUR 862,884 869,130 0.18
Xtrackers II
Xtrackers II EUR HIGH YIELD CORPORATE BOND UCITS ETF (continued)
Statement of Investmentsas at 31 December 2020(expressed in EUR)
The accompanying notes form an integral part of these financial statements.
332

DescriptionNominal
ValueCurrency
(local) Cost Market Value
% ofNet
Assets
Transferable securities and money market instruments admitted to an official stock exchange listing(A)
Bonds (continued)
Luxembourg (continued)Altice Financing SA 3.00% 20 - 15.01.28 1,560,000 EUR 1,499,818 1,501,441 0.31Altice Finco SA 4.75% 17 - 15.01.28 950,000 EUR 892,042 917,516 0.19Altice France Holdings SA 4.00% 20 - 15.02.28 750,000 EUR 700,671 712,813 0.15AnaCap Financial Europe SA SICAV-RAIF FRN 17 -01.08.24 500,000 EUR 415,877 417,248 0.09Aramark International Finance Sarl 3.125% 17 -01.04.25 500,000 EUR 492,286 501,250 0.10ArcelorMittal SA 0.95% 17 - 17.01.23 600,000 EUR 599,895 602,726 0.12ArcelorMittal SA 1.00% 19 - 19.05.23 1,100,000 EUR 1,086,638 1,108,050 0.23ArcelorMittal SA 1.75% 19 - 19.11.25 1,050,000 EUR 1,027,655 1,081,237 0.22ArcelorMittal SA 2.25% 19 - 17.01.24 1,400,000 EUR 1,413,877 1,461,390 0.30Arena Luxembourg Finance Sarl 1.875% 20 - 01.02.28 746,000 EUR 711,169 707,452 0.15Cirsa Finance International Sarl FRN 19 - 30.09.25 750,000 EUR 700,291 701,937 0.15Cirsa Finance International Sarl 4.75% 19 - 22.05.25 500,000 EUR 456,280 488,025 0.10Cirsa Finance International Sarl 6.25% 18 - 20.12.23 1,050,000 EUR 1,011,659 1,046,046 0.22ContourGlobal Power Holdings SA 2.75% 20 -01.01.26 254,000 EUR 254,000 252,489 0.05ContourGlobal Power Holdings SA 3.125% 20 -01.01.28 130,000 EUR 130,000 130,676 0.03ContourGlobal Power Holdings SA 3.375% 18 -01.08.23 700,000 EUR 706,513 711,270 0.15ContourGlobal Power Holdings SA 4.125% 18 -01.08.25 600,000 EUR 606,847 613,920 0.13Corestate Capital Holdings SA 3.50% 18 - 15.04.23 400,000 EUR 342,010 320,533 0.07Crystal Almond SARL 4.25% 19 - 15.10.24 700,000 EUR 695,185 703,920 0.15eDreams ODIGEO SA 5.50% 18 - 01.09.23 650,000 EUR 581,265 614,120 0.13Fiat Chrysler Finance Europe SENC 4.75% 14 -22.03.21 1,400,000 EUR 1,411,752 1,412,483 0.29Fiat Chrysler Finance Europe SENC 4.75% 14 -15.07.22 2,050,000 EUR 2,152,235 2,184,655 0.45Garfunkelux Holdco 3 SA FRN 20 - 01.05.26 900,000 EUR 902,421 901,820 0.19Garfunkelux Holdco 3 SA 6.75% 20 - 01.11.25 1,200,000 EUR 1,241,355 1,230,390 0.25Gestamp Funding Luxembourg SA 3.50% 16 -15.05.23 750,000 EUR 738,597 752,623 0.16Groupe Ecore Holdings SAS FRN 18 - 15.11.23 350,000 EUR 283,237 305,542 0.06Hanesbrands Finance Luxembourg SCA 3.50% 16 -15.06.24 750,000 EUR 778,866 786,102 0.16INEOS Group Holdings SA 5.375% 16 - 01.08.24 900,000 EUR 901,949 908,610 0.19Lincoln Financing SARL 3.625% 19 - 01.04.24 1,750,000 EUR 1,719,921 1,764,529 0.37Lincoln Financing SARL FRN 19 - 01.04.24 900,000 EUR 877,346 897,894 0.19Matterhorn Telecom SA 2.625% 19 - 15.09.24 400,000 EUR 396,381 402,634 0.08Matterhorn Telecom SA 3.125% 19 - 15.09.26 950,000 EUR 938,168 938,746 0.19Matterhorn Telecom SA 4.00% 17 - 15.11.27 600,000 EUR 610,987 614,245 0.13Monitchem HoldCo 3 SA 5.25% 19 - 15.03.25 400,000 EUR 400,505 414,079 0.09Motion Finco Sarl 7.00% 20 - 15.05.25 800,000 EUR 817,039 842,254 0.17Mytilineos Financial Partners SA 2.50% 19 - 01.12.24 700,000 EUR 692,905 717,729 0.15Picard Bondco SA 5.50% 17 - 30.11.24 400,000 EUR 396,215 409,500 0.08PLT VII Finance Sarl 4.625% 20 - 05.01.26 600,000 EUR 612,480 621,175 0.13
Xtrackers II
Xtrackers II EUR HIGH YIELD CORPORATE BOND UCITS ETF (continued)
Statement of Investmentsas at 31 December 2020(expressed in EUR)
The accompanying notes form an integral part of these financial statements.
333

DescriptionNominal
ValueCurrency
(local) Cost Market Value
% ofNet
Assets
Transferable securities and money market instruments admitted to an official stock exchange listing(A)
Bonds (continued)
Luxembourg (continued)PLT VII Finance Sarl FRN 20 - 05.01.26 400,000 EUR 400,698 401,787 0.08Rossini Sarl FRN 19 - 30.10.25 1,000,000 EUR 986,654 996,403 0.21Rossini Sarl 6.75% 18 - 30.10.25 900,000 EUR 952,468 956,831 0.20Samsonite Finco Sarl 3.50% 18 - 15.05.26 550,000 EUR 487,713 521,868 0.11SIG Combibloc PurchaseCo Sarl 1.875% 20 -18.06.23 650,000 EUR 659,682 670,737 0.14SIG Combibloc PurchaseCo Sarl 2.125% 20 -18.06.25 800,000 EUR 819,628 839,849 0.17Stena International SA 3.75% 20 - 01.02.25 400,000 EUR 380,350 387,653 0.08Summer BC Holdco A Sarl 9.25% 19 - 31.10.27 720,842 EUR 705,708 759,624 0.16Summer BC Holdco B SARL 5.75% 19 - 31.10.26 1,400,000 EUR 1,402,555 1,471,750 0.30Takko Luxembourg 2 SCA 5.375% 17 - 15.11.23 430,000 EUR 358,607 387,333 0.08Telenet Finance Luxembourg Notes Sarl 3.50% 17 -01.03.28 400,000 EUR 408,587 413,676 0.09Telenet Finance Luxembourg Notes Sarl 3.50% 17 -01.03.28 400,000 EUR 413,774 413,676 0.09Vivion Investments Sarl 3.00% 19 - 08.08.24 300,000 EUR 302,078 275,258 0.06Vivion Investments Sarl 3.00% 19 - 08.08.24 800,000 EUR 753,861 734,022 0.15Vivion Investments Sarl 3.50% 19 - 01.11.25 400,000 EUR 386,437 373,562 0.08
42,155,430 42,894,170 8.91MexicoCemex SAB de CV 2.75% 17 - 05.12.24 900,000 EUR 888,336 909,300 0.19Cemex SAB de CV 3.125% 19 - 19.03.26 600,000 EUR 592,850 617,810 0.13Credito Real SAB de CV SOFOM ER 5.00% 19 -01.02.27 500,000 EUR 468,706 466,852 0.10Nemak SAB de CV 3.25% 17 - 15.03.24 650,000 EUR 633,000 658,937 0.13
2,582,892 2,652,899 0.55NetherlandsAshland Services BV 2.00% 20 - 30.01.28 750,000 EUR 728,437 745,981 0.15Axalta Coating Systems Dutch Holdings B BV 3.75%16 - 15.01.25 600,000 EUR 601,445 610,500 0.13CBR Fashion Finance BV 5.125% 17 - 01.10.22 600,000 EUR 567,803 592,140 0.12Darling Global Finance BV 3.625% 18 - 15.05.26 800,000 EUR 813,258 816,250 0.17Diamond BC BV 5.625% 17 - 15.08.25 600,000 EUR 570,309 605,829 0.13Diebold Nixdorf Dutch Holdings BV 9.00% 20 -15.07.25 500,000 EUR 514,523 542,399 0.11Dtek Renewables Finance BV 8.50% 19 - 12.11.24 450,000 EUR 402,096 402,726 0.08Dufry One BV 2.00% 19 - 15.02.27 1,050,000 EUR 972,825 983,060 0.20Dufry One BV 2.50% 17 - 15.10.24 1,200,000 EUR 1,144,951 1,149,180 0.24Energizer Gamma Acquisition BV 4.625% 18 -15.07.26 900,000 EUR 916,957 930,694 0.19Fiat Chrysler Automobiles NV 3.375% 20 - 07.07.23 1,850,000 EUR 1,928,473 1,968,664 0.41Fiat Chrysler Automobiles NV 3.75% 16 - 29.03.24 1,840,000 EUR 1,966,009 2,016,871 0.42Fiat Chrysler Automobiles NV 3.875% 20 - 05.01.26 1,800,000 EUR 1,950,732 2,042,375 0.42Fiat Chrysler Automobiles NV 4.50% 20 - 07.07.28 1,400,000 EUR 1,583,244 1,706,239 0.35Frigoglass Finance BV 6.875% 20 - 12.02.25 350,000 EUR 268,536 265,738 0.06Goodyear Europe BV 3.75% 15 - 15.12.23 300,000 EUR 287,725 300,875 0.06Intertrust Group BV 3.375% 18 - 15.11.25 700,000 EUR 712,802 716,642 0.15
Xtrackers II
Xtrackers II EUR HIGH YIELD CORPORATE BOND UCITS ETF (continued)
Statement of Investmentsas at 31 December 2020(expressed in EUR)
The accompanying notes form an integral part of these financial statements.
334
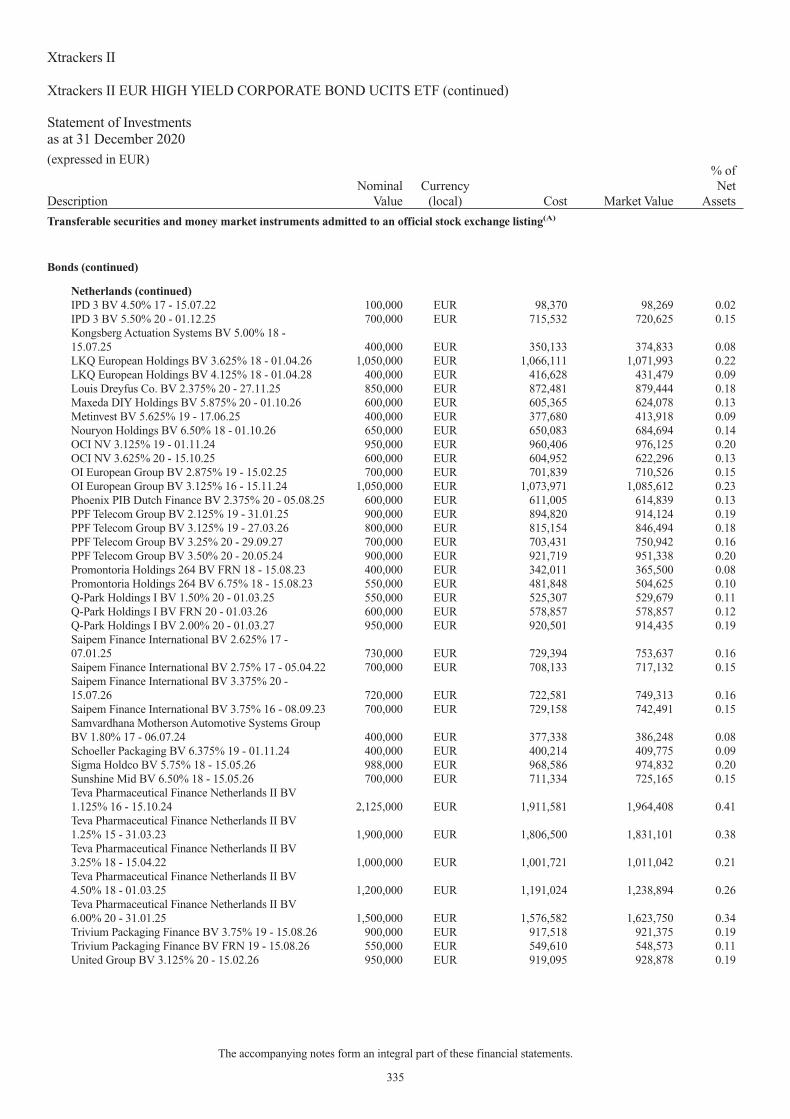
DescriptionNominal
ValueCurrency
(local) Cost Market Value
% ofNet
Assets
Transferable securities and money market instruments admitted to an official stock exchange listing(A)
Bonds (continued)
Netherlands (continued)IPD 3 BV 4.50% 17 - 15.07.22 100,000 EUR 98,370 98,269 0.02IPD 3 BV 5.50% 20 - 01.12.25 700,000 EUR 715,532 720,625 0.15Kongsberg Actuation Systems BV 5.00% 18 -15.07.25 400,000 EUR 350,133 374,833 0.08LKQ European Holdings BV 3.625% 18 - 01.04.26 1,050,000 EUR 1,066,111 1,071,993 0.22LKQ European Holdings BV 4.125% 18 - 01.04.28 400,000 EUR 416,628 431,479 0.09Louis Dreyfus Co. BV 2.375% 20 - 27.11.25 850,000 EUR 872,481 879,444 0.18Maxeda DIY Holdings BV 5.875% 20 - 01.10.26 600,000 EUR 605,365 624,078 0.13Metinvest BV 5.625% 19 - 17.06.25 400,000 EUR 377,680 413,918 0.09Nouryon Holdings BV 6.50% 18 - 01.10.26 650,000 EUR 650,083 684,694 0.14OCI NV 3.125% 19 - 01.11.24 950,000 EUR 960,406 976,125 0.20OCI NV 3.625% 20 - 15.10.25 600,000 EUR 604,952 622,296 0.13OI European Group BV 2.875% 19 - 15.02.25 700,000 EUR 701,839 710,526 0.15OI European Group BV 3.125% 16 - 15.11.24 1,050,000 EUR 1,073,971 1,085,612 0.23Phoenix PIB Dutch Finance BV 2.375% 20 - 05.08.25 600,000 EUR 611,005 614,839 0.13PPF Telecom Group BV 2.125% 19 - 31.01.25 900,000 EUR 894,820 914,124 0.19PPF Telecom Group BV 3.125% 19 - 27.03.26 800,000 EUR 815,154 846,494 0.18PPF Telecom Group BV 3.25% 20 - 29.09.27 700,000 EUR 703,431 750,942 0.16PPF Telecom Group BV 3.50% 20 - 20.05.24 900,000 EUR 921,719 951,338 0.20Promontoria Holdings 264 BV FRN 18 - 15.08.23 400,000 EUR 342,011 365,500 0.08Promontoria Holdings 264 BV 6.75% 18 - 15.08.23 550,000 EUR 481,848 504,625 0.10Q-Park Holdings I BV 1.50% 20 - 01.03.25 550,000 EUR 525,307 529,679 0.11Q-Park Holdings I BV FRN 20 - 01.03.26 600,000 EUR 578,857 578,857 0.12Q-Park Holdings I BV 2.00% 20 - 01.03.27 950,000 EUR 920,501 914,435 0.19Saipem Finance International BV 2.625% 17 -07.01.25 730,000 EUR 729,394 753,637 0.16Saipem Finance International BV 2.75% 17 - 05.04.22 700,000 EUR 708,133 717,132 0.15Saipem Finance International BV 3.375% 20 -15.07.26 720,000 EUR 722,581 749,313 0.16Saipem Finance International BV 3.75% 16 - 08.09.23 700,000 EUR 729,158 742,491 0.15Samvardhana Motherson Automotive Systems GroupBV 1.80% 17 - 06.07.24 400,000 EUR 377,338 386,248 0.08Schoeller Packaging BV 6.375% 19 - 01.11.24 400,000 EUR 400,214 409,775 0.09Sigma Holdco BV 5.75% 18 - 15.05.26 988,000 EUR 968,586 974,832 0.20Sunshine Mid BV 6.50% 18 - 15.05.26 700,000 EUR 711,334 725,165 0.15Teva Pharmaceutical Finance Netherlands II BV1.125% 16 - 15.10.24 2,125,000 EUR 1,911,581 1,964,408 0.41Teva Pharmaceutical Finance Netherlands II BV1.25% 15 - 31.03.23 1,900,000 EUR 1,806,500 1,831,101 0.38Teva Pharmaceutical Finance Netherlands II BV3.25% 18 - 15.04.22 1,000,000 EUR 1,001,721 1,011,042 0.21Teva Pharmaceutical Finance Netherlands II BV4.50% 18 - 01.03.25 1,200,000 EUR 1,191,024 1,238,894 0.26Teva Pharmaceutical Finance Netherlands II BV6.00% 20 - 31.01.25 1,500,000 EUR 1,576,582 1,623,750 0.34Trivium Packaging Finance BV 3.75% 19 - 15.08.26 900,000 EUR 917,518 921,375 0.19Trivium Packaging Finance BV FRN 19 - 15.08.26 550,000 EUR 549,610 548,573 0.11United Group BV 3.125% 20 - 15.02.26 950,000 EUR 919,095 928,878 0.19
Xtrackers II
Xtrackers II EUR HIGH YIELD CORPORATE BOND UCITS ETF (continued)
Statement of Investmentsas at 31 December 2020(expressed in EUR)
The accompanying notes form an integral part of these financial statements.
335

DescriptionNominal
ValueCurrency
(local) Cost Market Value
% ofNet
Assets
Transferable securities and money market instruments admitted to an official stock exchange listing(A)
Bonds (continued)
Netherlands (continued)United Group BV FRN 20 - 15.02.26 600,000 EUR 574,754 582,300 0.12United Group BV 3.625% 20 - 15.02.28 900,000 EUR 858,799 880,344 0.18United Group BV 4.00% 20 - 15.11.27 600,000 EUR 600,647 598,399 0.12United Group BV FRN 19 - 15.05.25 700,000 EUR 691,380 698,862 0.15United Group BV 4.875% 17 - 01.07.24 700,000 EUR 698,539 714,551 0.15VZ Vendor Financing II BV 2.875% 20 - 15.01.29 480,000 EUR 480,000 477,616 0.10ZF Europe Finance BV 1.25% 19 - 23.10.23 700,000 EUR 655,900 692,671 0.14ZF Europe Finance BV 2.00% 19 - 23.02.26 1,300,000 EUR 1,207,380 1,283,661 0.27ZF Europe Finance BV 2.50% 19 - 23.10.27 900,000 EUR 840,657 904,949 0.19ZF Europe Finance BV 3.00% 19 - 23.10.29 1,000,000 EUR 923,734 1,019,450 0.21Ziggo Bond Co. BV 3.375% 20 - 28.02.30 1,300,000 EUR 1,267,716 1,306,012 0.27Ziggo BV 2.875% 19 - 15.01.30 700,000 EUR 703,590 711,608 0.15Ziggo BV 4.25% 16 - 15.01.27 880,000 EUR 918,762 918,936 0.19
56,860,556 58,376,861 12.13NorwayAdevinta ASA 2.625% 20 - 15.11.25 950,000 EUR 966,804 969,433 0.20Adevinta ASA 3.00% 20 - 15.11.27 600,000 EUR 618,441 619,651 0.13
1,585,245 1,589,084 0.33PanamaCarnival Corp. 1.875% 15 - 07.11.22 800,000 EUR 699,713 751,480 0.16Carnival Corp. 7.625% 20 - 01.03.26 700,000 EUR 730,711 739,978 0.15Carnival Corp. 10.125% 20 - 01.02.26 600,000 EUR 634,040 691,283 0.14
2,064,464 2,182,741 0.45PortugalCaixa Geral de Depositos SA 1.25% 19 - 25.11.24 800,000 EUR 799,197 819,753 0.17Transportes Aereos Portugueses SA 5.625% 19 -02.12.24 500,000 EUR 386,073 357,500 0.07
1,185,270 1,177,253 0.24RomaniaRCS & RDS SA 2.50% 20 - 05.02.25 700,000 EUR 684,066 692,615 0.14RCS & RDS SA 3.25% 20 - 05.02.28 600,000 EUR 577,995 598,185 0.13
1,262,061 1,290,800 0.27SpainBanco de Sabadell SA 1.125% 19 - 27.03.25 700,000 EUR 679,981 711,209 0.15Banco de Sabadell SA 1.75% 19 - 10.05.24 1,500,000 EUR 1,499,797 1,550,725 0.32Banco de Sabadell SA 5.625% 16 - 06.05.26 700,000 EUR 765,477 816,687 0.17Bankia SA 1.00% 19 - 25.06.24 800,000 EUR 801,523 823,458 0.17Bankia SA 1.125% 19 - 12.11.26 700,000 EUR 700,183 729,006 0.15Bankia SA 1.125% 19 - 12.11.26 400,000 EUR 408,529 416,575 0.09Cellnex Telecom SA 1.00% 20 - 20.04.27 600,000 EUR 587,330 592,651 0.12Cellnex Telecom SA 1.75% 20 - 23.10.30 1,500,000 EUR 1,484,147 1,512,258 0.31Cellnex Telecom SA 1.875% 20 - 26.06.29 1,100,000 EUR 1,102,459 1,128,520 0.23Cellnex Telecom SA 2.375% 16 - 16.01.24 300,000 EUR 308,237 314,849 0.07Cellnex Telecom SA 2.375% 16 - 16.01.24 700,000 EUR 728,923 734,649 0.15Cellnex Telecom SA 2.875% 17 - 18.04.25 700,000 EUR 748,479 756,580 0.16Cellnex Telecom SA 3.125% 15 - 27.07.22 900,000 EUR 935,836 940,791 0.20El Corte Ingles SA 3.00% 18 - 15.03.24 1,000,000 EUR 1,005,919 1,010,519 0.21El Corte Ingles SA 3.625% 20 - 15.03.24 900,000 EUR 910,912 932,977 0.19
Xtrackers II
Xtrackers II EUR HIGH YIELD CORPORATE BOND UCITS ETF (continued)
Statement of Investmentsas at 31 December 2020(expressed in EUR)
The accompanying notes form an integral part of these financial statements.
336

DescriptionNominal
ValueCurrency
(local) Cost Market Value
% ofNet
Assets
Transferable securities and money market instruments admitted to an official stock exchange listing(A)
Bonds (continued)
Spain (continued)Foodco Bondco SA 6.25% 19 - 15.05.26 510,000 EUR 482,460 447,270 0.09Gestamp Automocion SA 3.25% 18 - 30.04.26 550,000 EUR 532,441 557,296 0.12Grifols SA 1.625% 19 - 15.02.25 1,300,000 EUR 1,302,051 1,300,255 0.27Grifols SA 2.25% 19 - 15.11.27 1,100,000 EUR 1,104,107 1,112,994 0.23Grifols SA 3.20% 17 - 01.05.25 1,400,000 EUR 1,409,331 1,410,643 0.29Grupo Antolin-Irausa SA 3.25% 17 - 30.04.24 600,000 EUR 545,901 590,751 0.12Grupo Antolin-Irausa SA 3.375% 18 - 30.04.26 330,000 EUR 308,744 317,722 0.07International Consolidated Airlines Group SA 0.50%19 - 04.07.23 800,000 EUR 705,528 738,253 0.15International Consolidated Airlines Group SA 1.50%19 - 04.07.27 700,000 EUR 561,494 612,500 0.13Lorca Telecom Bondco SA 4.00% 20 - 18.09.27 1,200,000 EUR 1,236,655 1,261,047 0.26NH Hotel Group SA 3.75% 16 - 01.10.23 539,524 EUR 516,101 528,377 0.11Tendam Brands SAU FRN 17 - 15.09.24 450,000 EUR 404,928 413,425 0.09
21,777,473 22,261,987 4.62SupranationalsArdagh Packaging Finance PLC Via Ardagh HoldingsUSA Inc. 2.125% 19 - 15.08.26 700,000 EUR 697,101 700,429 0.15Ardagh Packaging Finance PLC Via Ardagh HoldingsUSA Inc. 2.125% 20 - 15.08.26 1,109,000 EUR 1,086,690 1,109,679 0.23CANPACK SA Via Eastern PA Land InvestmentHoldings LLC 2.375% 20 - 01.11.27 900,000 EUR 910,254 928,447 0.19Clarios Global LP Via Clarios US Finance Co. 4.375%19 - 15.05.26 1,000,000 EUR 1,007,294 1,035,217 0.22Eagle Intermediate Global Holdings BV Via Ruyi USFinance LLC 5.375% 18 - 01.05.23 350,000 EUR 264,718 301,438 0.06
3,966,057 4,075,210 0.85SwedenAssemblin Financing AB FRN 19 - 15.05.25 400,000 EUR 386,512 397,334 0.08Dometic Group AB 3.00% 18 - 13.09.23 450,000 EUR 455,788 467,550 0.10Dometic Group AB 3.00% 19 - 08.05.26 500,000 EUR 497,176 512,653 0.11Intrum AB 3.00% 19 - 15.09.27 1,200,000 EUR 1,098,703 1,151,430 0.24Intrum AB 3.125% 17 - 15.07.24 1,300,000 EUR 1,247,951 1,299,317 0.27Intrum AB 3.50% 19 - 15.07.26 1,200,000 EUR 1,161,843 1,187,222 0.25Intrum AB 4.875% 20 - 15.08.25 1,220,000 EUR 1,220,575 1,258,933 0.26Polygon AB 4.00% 18 - 23.02.23 400,000 EUR 379,148 402,000 0.08Unilabs Subholding AB 5.75% 17 - 15.05.25 550,000 EUR 554,182 562,102 0.12Verisure Holdings AB 3.50% 18 - 15.05.23 750,000 EUR 758,279 758,040 0.16Verisure Holdings AB 3.875% 20 - 15.07.26 1,100,000 EUR 1,109,267 1,125,451 0.23Verisure Midholding AB 5.75% 17 - 01.12.23 1,542,000 EUR 1,540,018 1,563,669 0.32Volvo Car AB 2.00% 17 - 24.01.25 650,000 EUR 644,663 667,025 0.14Volvo Car AB 2.125% 19 - 02.04.24 950,000 EUR 956,681 978,155 0.20Volvo Car AB 2.50% 20 - 07.10.27 710,000 EUR 719,841 749,295 0.16Volvo Car AB 3.25% 16 - 18.05.21 200,000 EUR 202,232 202,343 0.04Volvo Car AB 3.25% 16 - 18.05.21 550,000 EUR 554,756 556,444 0.12
13,487,615 13,838,963 2.88
Xtrackers II
Xtrackers II EUR HIGH YIELD CORPORATE BOND UCITS ETF (continued)
Statement of Investmentsas at 31 December 2020(expressed in EUR)
The accompanying notes form an integral part of these financial statements.
337
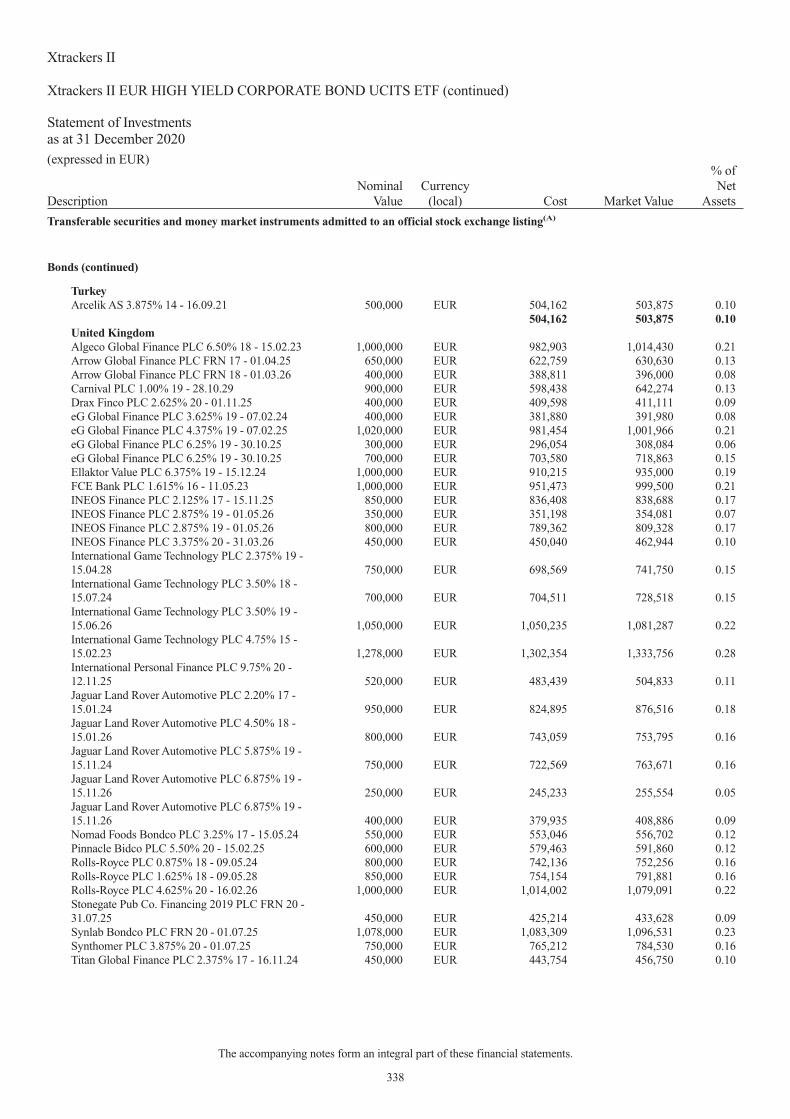
DescriptionNominal
ValueCurrency
(local) Cost Market Value
% ofNet
Assets
Transferable securities and money market instruments admitted to an official stock exchange listing(A)
Bonds (continued)
TurkeyArcelik AS 3.875% 14 - 16.09.21 500,000 EUR 504,162 503,875 0.10
504,162 503,875 0.10United KingdomAlgeco Global Finance PLC 6.50% 18 - 15.02.23 1,000,000 EUR 982,903 1,014,430 0.21Arrow Global Finance PLC FRN 17 - 01.04.25 650,000 EUR 622,759 630,630 0.13Arrow Global Finance PLC FRN 18 - 01.03.26 400,000 EUR 388,811 396,000 0.08Carnival PLC 1.00% 19 - 28.10.29 900,000 EUR 598,438 642,274 0.13Drax Finco PLC 2.625% 20 - 01.11.25 400,000 EUR 409,598 411,111 0.09eG Global Finance PLC 3.625% 19 - 07.02.24 400,000 EUR 381,880 391,980 0.08eG Global Finance PLC 4.375% 19 - 07.02.25 1,020,000 EUR 981,454 1,001,966 0.21eG Global Finance PLC 6.25% 19 - 30.10.25 300,000 EUR 296,054 308,084 0.06eG Global Finance PLC 6.25% 19 - 30.10.25 700,000 EUR 703,580 718,863 0.15Ellaktor Value PLC 6.375% 19 - 15.12.24 1,000,000 EUR 910,215 935,000 0.19FCE Bank PLC 1.615% 16 - 11.05.23 1,000,000 EUR 951,473 999,500 0.21INEOS Finance PLC 2.125% 17 - 15.11.25 850,000 EUR 836,408 838,688 0.17INEOS Finance PLC 2.875% 19 - 01.05.26 350,000 EUR 351,198 354,081 0.07INEOS Finance PLC 2.875% 19 - 01.05.26 800,000 EUR 789,362 809,328 0.17INEOS Finance PLC 3.375% 20 - 31.03.26 450,000 EUR 450,040 462,944 0.10International Game Technology PLC 2.375% 19 -15.04.28 750,000 EUR 698,569 741,750 0.15International Game Technology PLC 3.50% 18 -15.07.24 700,000 EUR 704,511 728,518 0.15International Game Technology PLC 3.50% 19 -15.06.26 1,050,000 EUR 1,050,235 1,081,287 0.22International Game Technology PLC 4.75% 15 -15.02.23 1,278,000 EUR 1,302,354 1,333,756 0.28International Personal Finance PLC 9.75% 20 -12.11.25 520,000 EUR 483,439 504,833 0.11Jaguar Land Rover Automotive PLC 2.20% 17 -15.01.24 950,000 EUR 824,895 876,516 0.18Jaguar Land Rover Automotive PLC 4.50% 18 -15.01.26 800,000 EUR 743,059 753,795 0.16Jaguar Land Rover Automotive PLC 5.875% 19 -15.11.24 750,000 EUR 722,569 763,671 0.16Jaguar Land Rover Automotive PLC 6.875% 19 -15.11.26 250,000 EUR 245,233 255,554 0.05Jaguar Land Rover Automotive PLC 6.875% 19 -15.11.26 400,000 EUR 379,935 408,886 0.09Nomad Foods Bondco PLC 3.25% 17 - 15.05.24 550,000 EUR 553,046 556,702 0.12Pinnacle Bidco PLC 5.50% 20 - 15.02.25 600,000 EUR 579,463 591,860 0.12Rolls-Royce PLC 0.875% 18 - 09.05.24 800,000 EUR 742,136 752,256 0.16Rolls-Royce PLC 1.625% 18 - 09.05.28 850,000 EUR 754,154 791,881 0.16Rolls-Royce PLC 4.625% 20 - 16.02.26 1,000,000 EUR 1,014,002 1,079,091 0.22Stonegate Pub Co. Financing 2019 PLC FRN 20 -31.07.25 450,000 EUR 425,214 433,628 0.09Synlab Bondco PLC FRN 20 - 01.07.25 1,078,000 EUR 1,083,309 1,096,531 0.23Synthomer PLC 3.875% 20 - 01.07.25 750,000 EUR 765,212 784,530 0.16Titan Global Finance PLC 2.375% 17 - 16.11.24 450,000 EUR 443,754 456,750 0.10
Xtrackers II
Xtrackers II EUR HIGH YIELD CORPORATE BOND UCITS ETF (continued)
Statement of Investmentsas at 31 December 2020(expressed in EUR)
The accompanying notes form an integral part of these financial statements.
338

DescriptionNominal
ValueCurrency
(local) Cost Market Value
% ofNet
Assets
Transferable securities and money market instruments admitted to an official stock exchange listing(A)
Bonds (continued)
United Kingdom (continued)Titan Global Finance PLC 2.75% 20 - 09.07.27 400,000 EUR 404,479 412,541 0.09Victoria PLC 5.25% 19 - 15.07.24 700,000 EUR 684,079 723,450 0.15Virgin Media Finance PLC 3.75% 20 - 15.07.30 700,000 EUR 690,895 711,630 0.15Viridian Group FinanceCo PLC Via Viridian Power &Energy 4.00% 17 - 15.09.25 550,000 EUR 550,771 554,125 0.12Vmed O2 UK Financing I PLC 3.25% 20 - 31.01.31 1,380,000 EUR 1,385,872 1,413,653 0.29
26,885,358 27,722,073 5.76United StatesAvantor Funding Inc. 2.625% 20 - 01.11.25 1,000,000 EUR 1,027,413 1,020,908 0.21Avantor Funding Inc. 3.875% 20 - 15.07.28 500,000 EUR 504,660 524,133 0.11Ball Corp. 0.875% 19 - 15.03.24 1,050,000 EUR 1,043,258 1,048,861 0.22Ball Corp. 1.50% 19 - 15.03.27 150,000 EUR 151,733 153,909 0.03Ball Corp. 1.50% 19 - 15.03.27 650,000 EUR 643,485 666,938 0.14Ball Corp. 4.375% 15 - 15.12.23 1,100,000 EUR 1,197,420 1,209,804 0.25Banff Merger Sub Inc. 8.375% 18 - 01.09.26 400,000 EUR 397,714 417,313 0.09Belden Inc. 2.875% 17 - 15.09.25 350,000 EUR 343,938 352,841 0.07Belden Inc. 3.375% 17 - 15.07.27 700,000 EUR 694,202 717,127 0.15Belden Inc. 3.875% 18 - 15.03.28 500,000 EUR 508,945 519,594 0.11Berry Global Inc. 1.00% 20 - 15.01.25 170,000 EUR 169,246 171,327 0.04Berry Global Inc. 1.00% 20 - 15.01.25 830,000 EUR 807,064 836,479 0.17Berry Global Inc. 1.50% 20 - 15.01.27 500,000 EUR 489,063 509,315 0.11Boxer Parent Co. Inc. 6.50% 20 - 02.10.25 600,000 EUR 626,037 635,957 0.13Catalent Pharma Solutions Inc. 2.375% 20 - 01.03.28 1,200,000 EUR 1,156,244 1,202,516 0.25CGG Holdings US Inc. 7.875% 18 - 01.05.23 350,000 EUR 353,874 355,664 0.07Chemours Co. 4.00% 18 - 15.05.26 660,000 EUR 601,097 655,420 0.14Cogent Communications Group Inc. 4.375% 19 -30.06.24 500,000 EUR 513,204 511,178 0.11Colfax Corp. 3.25% 17 - 15.05.25 500,000 EUR 501,094 506,880 0.10Coty Inc. 4.00% 18 - 15.04.23 800,000 EUR 763,729 766,133 0.16Coty Inc. 4.75% 18 - 15.04.26 320,000 EUR 299,986 299,200 0.06Encore Capital Group Inc. 4.875% 20 - 15.10.25 500,000 EUR 503,485 519,125 0.11Fluor Corp. 1.75% 16 - 21.03.23 700,000 EUR 575,361 658,439 0.14Ford Motor Credit Co. LLC FRN 18 - 07.12.22 1,100,000 EUR 1,000,834 1,058,492 0.22Ford Motor Credit Co. LLC FRN 17 - 01.12.24 900,000 EUR 759,705 835,470 0.17Ford Motor Credit Co. LLC FRN 18 - 15.11.23 500,000 EUR 431,146 475,965 0.10Ford Motor Credit Co. LLC 1.355% 18 - 07.02.25 650,000 EUR 584,276 632,901 0.13Ford Motor Credit Co. LLC 1.514% 19 - 17.02.23 150,000 EUR 147,453 149,325 0.03Ford Motor Credit Co. LLC 1.514% 19 - 17.02.23 1,400,000 EUR 1,330,954 1,393,700 0.29Ford Motor Credit Co. LLC 1.744% 20 - 19.07.24 1,300,000 EUR 1,188,479 1,290,321 0.27Ford Motor Credit Co. LLC 2.33% 19 - 25.11.25 890,000 EUR 805,533 902,248 0.19Ford Motor Credit Co. LLC 2.386% 19 - 17.02.26 1,100,000 EUR 987,788 1,116,628 0.23Ford Motor Credit Co. LLC 3.021% 19 - 06.03.24 540,000 EUR 551,526 558,090 0.12Ford Motor Credit Co. LLC 3.021% 19 - 06.03.24 1,300,000 EUR 1,186,393 1,343,550 0.28Ford Motor Credit Co. LLC 3.25% 20 - 15.09.25 1,100,000 EUR 1,102,082 1,154,954 0.24IQVIA Inc. 2.25% 19 - 15.01.28 1,100,000 EUR 1,107,966 1,108,731 0.23IQVIA Inc. 2.875% 17 - 15.09.25 600,000 EUR 605,142 606,149 0.13IQVIA Inc. 2.875% 20 - 15.06.28 1,000,000 EUR 1,010,627 1,030,726 0.21IQVIA Inc. 3.25% 17 - 15.03.25 2,000,000 EUR 2,019,846 2,022,255 0.42
Xtrackers II
Xtrackers II EUR HIGH YIELD CORPORATE BOND UCITS ETF (continued)
Statement of Investmentsas at 31 December 2020(expressed in EUR)
The accompanying notes form an integral part of these financial statements.
339

DescriptionNominal
ValueCurrency
(local) Cost Market Value
% ofNet
Assets
Transferable securities and money market instruments admitted to an official stock exchange listing(A)
Bonds (continued)
United States (continued)Kraft Heinz Foods Co. 1.50% 16 - 24.05.24 800,000 EUR 808,106 821,211 0.17Kraft Heinz Foods Co. 2.00% 15 - 30.06.23 1,100,000 EUR 1,128,510 1,137,578 0.24Kraton Polymers LLC Via Kraton Polymers CapitalCorp. 5.25% 18 - 15.05.26 500,000 EUR 502,582 516,650 0.11Kronos International Inc. 3.75% 17 - 15.09.25 550,000 EUR 543,310 555,919 0.12Levi Strauss & Co. 3.375% 17 - 15.03.27 700,000 EUR 716,003 723,566 0.15Mauser Packaging Solutions Holdings Co. 4.75% 18 -15.04.24 600,000 EUR 592,214 599,035 0.12MPT Operating Partnership LP Via MPT FinanceCorp. 3.325% 17 - 24.03.25 650,000 EUR 680,898 690,426 0.14MPT Operating Partnership LP Via MPT FinanceCorp. 4.00% 15 - 19.08.22 800,000 EUR 831,213 835,918 0.17Netflix Inc. 3.00% 20 - 15.06.25 700,000 EUR 727,436 748,273 0.16Netflix Inc. 3.625% 17 - 15.05.27 1,900,000 EUR 2,032,382 2,119,216 0.44Primo Water Holdings Inc. 3.875% 20 - 31.10.28 600,000 EUR 597,237 613,611 0.13Refinitiv US Holdings Inc. 4.50% 18 - 15.05.26 1,200,000 EUR 1,248,967 1,262,496 0.26Refinitiv US Holdings Inc. 6.875% 18 - 15.11.26 500,000 EUR 529,847 541,007 0.11Scientific Games International Inc. 3.375% 18 -15.02.26 450,000 EUR 431,757 443,862 0.09Scientific Games International Inc. 5.50% 18 -15.02.26 350,000 EUR 321,888 346,500 0.07Sealed Air Corp. 4.50% 15 - 15.09.23 300,000 EUR 321,698 326,760 0.07Sealed Air Corp. 4.50% 15 - 15.09.23 200,000 EUR 213,903 217,840 0.04Silgan Holdings Inc. 2.25% 20 - 01.06.28 700,000 EUR 695,140 710,503 0.15Silgan Holdings Inc. 3.25% 18 - 15.03.25 948,000 EUR 956,232 957,421 0.20Spectrum Brands Inc. 4.00% 16 - 01.10.26 600,000 EUR 606,951 618,778 0.13Standard Industries Inc. 2.25% 19 - 21.11.26 1,200,000 EUR 1,169,537 1,212,856 0.25Superior Industries International Inc. 6.00% 17 -15.06.25 400,000 EUR 346,031 383,020 0.08Tenneco Inc. FRN 17 - 15.04.24 450,000 EUR 434,914 450,151 0.09Tenneco Inc. 5.00% 17 - 15.07.24 550,000 EUR 522,738 556,319 0.12UGI International LLC 3.25% 18 - 01.11.25 600,000 EUR 611,421 616,406 0.13WMG Acquisition Corp. 2.75% 20 - 15.07.28 400,000 EUR 403,940 410,813 0.08WMG Acquisition Corp. 3.625% 18 - 15.10.26 750,000 EUR 773,900 774,636 0.16ZF North America Capital Inc. 2.75% 15 - 27.04.23 1,600,000 EUR 1,578,596 1,635,280 0.34
49,019,353 50,764,617 10.55
Total - Bonds 456,503,188 468,171,360 97.26
Total Transferable securities and money market instruments admitted to an officialstock exchange listing 456,503,188 468,171,360 97.26
Xtrackers II
Xtrackers II EUR HIGH YIELD CORPORATE BOND UCITS ETF (continued)
Statement of Investmentsas at 31 December 2020(expressed in EUR)
The accompanying notes form an integral part of these financial statements.
340

DescriptionNominal
ValueCurrency
(local) Cost Market Value
% ofNet
Assets
Other transferable securities and money market instruments(A)
Bonds
LuxembourgAltice France Holdings SA 8.00% 20 - 15.05.27 1,900,000 EUR 1,977,860 2,062,069 0.43
1,977,860 2,062,069 0.43
Total - Bonds 1,977,860 2,062,069 0.43
Total Other transferable securities and money market instruments 1,977,860 2,062,069 0.43
TOTAL INVESTMENT PORTFOLIO 458,481,048 470,233,429 97.69
TOTAL INVESTMENT PORTFOLIO INCLUDING ACCRUED INTEREST 475,823,913 98.85(A) Any duplicate securities appearing herein with the same name are either quoted on different stock exchanges or have different ISINs.
Xtrackers II
Xtrackers II EUR HIGH YIELD CORPORATE BOND UCITS ETF (continued)
Statement of Investmentsas at 31 December 2020(expressed in EUR)
The accompanying notes form an integral part of these financial statements.
341

DescriptionNominal
ValueCurrency
(local) Cost Market Value
% ofNet
Assets
Transferable securities and money market instruments admitted to an official stock exchange listing
Bonds
AustriaSappi Papier Holding GmbH 4.00% 16 - 01.04.23 1,325,000 EUR 1,253,459 1,322,907 0.72
1,253,459 1,322,907 0.72DenmarkDKT Finance ApS 7.00% 18 - 17.06.23 2,200,000 EUR 2,307,440 2,274,250 1.24TDC A/S 5.00% 12 - 02.03.22 300,000 EUR 328,548 315,075 0.17
2,635,988 2,589,325 1.41FinlandTeollisuuden Voima OYJ 2.125% 15 - 04.02.25 461,000 EUR 448,604 459,322 0.25Teollisuuden Voima OYJ 2.50% 14 - 17.03.21 800,000 EUR 802,856 803,256 0.43Teollisuuden Voima OYJ 2.625% 16 - 13.01.23 768,000 EUR 788,897 787,738 0.43
2,040,357 2,050,316 1.11FranceAPRR SA 1.50% 15 - 15.01.24 500,000 EUR 526,075 522,855 0.29Casino Guichard Perrachon SA 1.865% 17 - 13.06.22 900,000 EUR 845,720 910,332 0.50Casino Guichard Perrachon SA 4.561% 13 - 25.01.23 1,700,000 EUR 1,635,154 1,771,060 0.96CMA CGM SA 5.25% 17 - 15.01.25 200,000 EUR 181,053 199,340 0.11CMA CGM SA 6.50% 17 - 15.07.22 1,500,000 EUR 1,402,140 1,522,500 0.83Constellium SE 4.25% 17 - 15.02.26 200,000 EUR 197,196 204,244 0.11Crown European Holdings SA 0.75% 19 - 15.02.23 1,880,000 EUR 1,845,310 1,873,834 1.02Electricite de France SA 4.625% 09 - 11.09.24 1,000,000 EUR 1,176,309 1,174,750 0.64Elis SA 1.875% 18 - 15.02.23 2,100,000 EUR 2,106,480 2,137,590 1.16France OAT Zero Coupon 09 - 25.04.31 11,800,000 EUR 12,192,288 12,147,038 6.61France OAT Zero Coupon 09 - 25.04.40 2,000,000 EUR 1,944,549 1,946,380 1.06Louvre Bidco SAS FRN 18 - 30.09.24 57,143 EUR 57,797 57,779 0.03Orano SA 3.125% 14 - 20.03.23 2,300,000 EUR 2,327,007 2,409,250 1.31Picard Groupe SAS FRN 17 - 30.11.23 800,000 EUR 784,901 798,496 0.43Renault SA 1.00% 17 - 08.03.23 2,547,000 EUR 2,475,302 2,543,307 1.38Tereos Finance Groupe I SA 4.125% 16 - 16.06.23 600,000 EUR 425,922 589,068 0.32
30,123,203 30,807,823 16.76GermanyADLER Real Estate AG 1.875% 18 - 27.04.23 1,800,000 EUR 1,786,356 1,807,686 0.98ADLER Real Estate AG 2.125% 17 - 06.02.24 200,000 EUR 201,351 202,346 0.11ADLER Real Estate AG 3.00% 18 - 27.04.26 500,000 EUR 505,190 526,080 0.29Douglas GmbH 6.25% 15 - 15.07.22 1,120,000 EUR 1,018,674 1,013,958 0.55K+S AG 2.625% 17 - 06.04.23 701,000 EUR 661,676 686,980 0.37K+S AG 3.00% 12 - 20.06.22 1,500,000 EUR 1,422,268 1,496,250 0.81K+S AG 3.25% 18 - 18.07.24 900,000 EUR 796,576 875,250 0.48K+S AG 4.125% 13 - 06.12.21 1,380,000 EUR 1,357,534 1,407,600 0.77KME SE 6.75% 18 - 01.02.23 1,000,000 EUR 727,244 799,690 0.43Kreditanstalt fuer Wiederaufbau 5.75% 01 - 07.06.32 1,050,000 GBP 1,833,680 1,849,853 1.01METRO AG 1.125% 18 - 06.03.23 200,000 EUR 193,934 201,854 0.11METRO AG 1.50% 15 - 19.03.25 100,000 EUR 95,970 103,265 0.06Nordex SE 6.50% 18 - 01.02.23 1,100,000 EUR 1,117,171 1,125,179 0.61Raffinerie Heide GmbH 6.375% 17 - 01.12.22 600,000 EUR 486,664 508,416 0.28thyssenkrupp AG 1.375% 17 - 03.03.22 4,100,000 EUR 4,030,856 4,084,748 2.22thyssenkrupp AG 1.875% 19 - 06.03.23 3,600,000 EUR 3,439,812 3,595,176 1.96
19,674,956 20,284,331 11.04
Xtrackers II
Xtrackers II EUR HIGH YIELD CORPORATE BOND 1-3 SWAP UCITS ETF
Statement of Investmentsas at 31 December 2020(expressed in EUR)
The accompanying notes form an integral part of these financial statements.
342

DescriptionNominal
ValueCurrency
(local) Cost Market Value
% ofNet
Assets
Transferable securities and money market instruments admitted to an official stock exchange listing
Bonds (continued)
IrelandSmurfit Kappa Acquisitions ULC 2.375% 17 -01.02.24 1,300,000 EUR 1,350,750 1,378,039 0.75Willow No 2 Ireland PLC for Zurich Insurance Co.Ltd. 3.375% 12 - 27.06.22 100,000 EUR 108,164 105,404 0.06
1,458,914 1,483,443 0.81ItalyAtlantia SpA 1.625% 17 - 03.02.25 250,000 EUR 240,692 248,293 0.13Banco BPM SpA 1.75% 18 - 24.04.23 500,000 EUR 500,758 513,240 0.28Banco BPM SpA 2.00% 19 - 08.03.22 2,069,000 EUR 2,078,366 2,109,221 1.15Banco BPM SpA 7.125% 11 - 01.03.21 250,000 EUR 265,787 252,447 0.14Iccrea Banca SpA FRN 18 - 01.02.21 1,500,000 EUR 1,498,666 1,499,625 0.82Intesa Sanpaolo SpA 2.855% 15 - 23.04.25 900,000 EUR 925,173 947,673 0.52Leonardo SpA 1.50% 17 - 07.06.24 200,000 EUR 195,129 203,828 0.11Leonardo SpA 4.50% 13 - 19.01.21 1,000,000 EUR 1,001,984 1,001,420 0.54Mediobanca Banca di Credito Finanziario SpA1.625% 16 - 19.01.21 500,000 EUR 500,373 500,390 0.27Mediobanca Banca di Credito Finanziario SpA 5.75%13 - 18.04.23 1,426,000 EUR 1,560,900 1,581,819 0.86Telecom Italia SpA 2.375% 17 - 12.10.27 144,000 EUR 135,542 149,962 0.08Telecom Italia SpA 2.50% 17 - 19.07.23 150,000 EUR 151,277 156,917 0.09Telecom Italia SpA 2.75% 19 - 15.04.25 600,000 EUR 610,515 627,750 0.34Telecom Italia SpA 3.25% 15 - 16.01.23 1,579,000 EUR 1,655,678 1,662,150 0.90Telecom Italia SpA 3.625% 16 - 19.01.24 1,500,000 EUR 1,536,097 1,605,690 0.87UniCredit SpA 6.95% 12 - 31.10.22 2,400,000 EUR 2,644,032 2,670,456 1.45Webuild SpA 3.75% 16 - 24.06.21 100,000 EUR 93,861 101,301 0.06
15,594,830 15,832,182 8.61JapanSoftBank Group Corp. 3.125% 17 - 19.09.25 350,000 EUR 371,872 358,834 0.19SoftBank Group Corp. 4.75% 15 - 30.07.25 600,000 EUR 655,614 654,000 0.36Takeda Pharmaceutical Co. Ltd. 3.00% 18 - 21.11.30 1,300,000 EUR 1,587,014 1,597,710 0.87
2,614,500 2,610,544 1.42LuxembourgArcelorMittal SA 0.95% 17 - 17.01.23 1,900,000 EUR 1,894,775 1,911,913 1.04ArcelorMittal SA 1.00% 19 - 19.05.23 1,900,000 EUR 1,888,503 1,915,979 1.04Fiat Chrysler Finance Europe SENC 4.75% 14 -22.03.21 600,000 EUR 644,318 606,000 0.33Fiat Chrysler Finance Europe SENC 4.75% 14 -15.07.22 2,555,000 EUR 2,705,895 2,727,462 1.49
7,133,491 7,161,354 3.90NetherlandsFiat Chrysler Automobiles NV 3.375% 20 - 07.07.23 1,000,000 EUR 1,044,738 1,065,700 0.58Fiat Chrysler Automobiles NV 3.75% 16 - 29.03.24 950,000 EUR 1,036,985 1,042,625 0.57Saipem Finance International BV 2.625% 17 -07.01.25 600,000 EUR 595,371 620,268 0.34Saipem Finance International BV 3.75% 16 - 08.09.23 200,000 EUR 206,090 212,402 0.11
2,883,184 2,940,995 1.60
Xtrackers II
Xtrackers II EUR HIGH YIELD CORPORATE BOND 1-3 SWAP UCITS ETF (continued)
Statement of Investmentsas at 31 December 2020(expressed in EUR)
The accompanying notes form an integral part of these financial statements.
343

DescriptionNominal
ValueCurrency
(local) Cost Market Value
% ofNet
Assets
Transferable securities and money market instruments admitted to an official stock exchange listing
Bonds (continued)
PanamaCarnival Corp. 1.875% 15 - 07.11.22 1,500,000 EUR 1,235,190 1,414,050 0.77
1,235,190 1,414,050 0.77SpainCellnex Telecom SA 2.375% 16 - 16.01.24 1,900,000 EUR 2,030,967 1,995,361 1.09Grifols SA 3.20% 17 - 01.05.25 1,100,000 EUR 1,130,173 1,111,000 0.60Spain Coupon Strip Zero Coupon 98 - 31.01.21 1,400,000 EUR 1,400,589 1,400,224 0.76Spain Coupon Strip Zero Coupon 01 - 30.07.22 1,900,000 EUR 1,915,508 1,913,585 1.04Spain Coupon Strip Zero Coupon 01 - 30.07.24 2,600,000 EUR 2,642,133 2,641,314 1.44Spain Coupon Strip Zero Coupon 01 - 30.07.25 2,300,000 EUR 2,325,342 2,339,445 1.27Spain Coupon Strip Zero Coupon 01 - 30.07.26 700,000 EUR 701,859 712,677 0.39
12,146,571 12,113,606 6.59SupranationalsEuropean Investment Bank 5.625% 00 - 07.06.32 1,035,000 GBP 1,783,542 1,804,594 0.98
1,783,542 1,804,594 0.98SwedenDometic Group AB 3.00% 19 - 08.05.26 600,000 EUR 620,790 618,990 0.34Intrum AB 2.75% 17 - 15.07.22 65,000 EUR 66,021 65,051 0.04Telefonaktiebolaget LM Ericsson 1.875% 17 -01.03.24 200,000 EUR 203,176 210,250 0.11Unilabs Subholding AB 5.75% 17 - 15.05.25 200,000 EUR 207,520 205,122 0.11Verisure Midholding AB 5.75% 17 - 01.12.23 1,200,000 EUR 1,237,512 1,216,116 0.66Volvo Car AB 2.00% 17 - 24.01.25 800,000 EUR 782,754 822,000 0.45Volvo Car AB 2.125% 19 - 02.04.24 500,000 EUR 514,021 515,580 0.28
3,631,794 3,653,109 1.99United KingdomAlgeco Global Finance PLC 6.50% 18 - 15.02.23 1,000,000 EUR 1,005,470 1,017,900 0.55FCE Bank PLC 1.615% 16 - 11.05.23 2,100,000 EUR 2,037,693 2,102,625 1.15International Game Technology PLC 4.75% 15 -15.02.23 1,570,000 EUR 1,598,313 1,640,650 0.89Viridian Group FinanceCo PLC Via Viridian Power &Energy 4.00% 17 - 15.09.25 200,000 EUR 199,206 201,750 0.11
4,840,682 4,962,925 2.70United StatesBall Corp. 4.375% 15 - 15.12.23 1,000,000 EUR 1,146,210 1,102,440 0.60Banff Merger Sub Inc. 8.375% 18 - 01.09.26 100,000 EUR 94,527 104,422 0.06Belden Inc. 3.375% 17 - 15.07.27 650,000 EUR 662,779 666,244 0.36Colfax Corp. 3.25% 17 - 15.05.25 200,000 EUR 204,155 203,004 0.11Coty Inc. 4.00% 18 - 15.04.23 1,730,000 EUR 1,498,656 1,662,201 0.90Ford Motor Credit Co. LLC FRN 18 - 07.12.22 2,250,000 EUR 2,125,371 2,168,572 1.18Ford Motor Credit Co. LLC 1.514% 19 - 17.02.23 3,500,000 EUR 3,412,535 3,491,250 1.90IQVIA Inc. 3.25% 17 - 15.03.25 1,100,000 EUR 1,124,728 1,111,957 0.61
Xtrackers II
Xtrackers II EUR HIGH YIELD CORPORATE BOND 1-3 SWAP UCITS ETF (continued)
Statement of Investmentsas at 31 December 2020(expressed in EUR)
The accompanying notes form an integral part of these financial statements.
344

DescriptionNominal
ValueCurrency
(local) Cost Market Value
% ofNet
Assets
Transferable securities and money market instruments admitted to an official stock exchange listing
Bonds (continued)
United States (continued)MPT Operating Partnership LP Via MPT FinanceCorp. 4.00% 15 - 19.08.22 200,000 EUR 211,761 209,346 0.11ZF North America Capital Inc. 2.75% 15 - 27.04.23 2,900,000 EUR 2,950,982 2,965,250 1.61
13,431,704 13,684,686 7.44
Total - Bonds 122,482,365 124,716,190 67.85
Total Transferable securities and money market instruments admitted to an officialstock exchange listing 122,482,365 124,716,190 67.85
Transferable securities and money market instruments dealt in on another regulated market
Bonds
ItalyItaly Buoni Poliennali del Tesoro Coupon Strip ZeroCoupon 98 - 01.05.26 800,000 EUR 790,434 794,752 0.44Italy Buoni Poliennali del Tesoro Coupon Strip ZeroCoupon 02 - 01.02.22 22,600,000 EUR 22,679,244 22,667,348 12.33Italy Buoni Poliennali del Tesoro Coupon Strip ZeroCoupon 13 - 01.03.22 3,700,000 EUR 3,714,699 3,715,651 2.02UniCredit SpA 6.572% 19 - 14.01.22 1,000,000 USD 882,846 861,943 0.47
28,067,223 28,039,694 15.26
Total - Bonds 28,067,223 28,039,694 15.26
Total Transferable securities and money market instruments dealt in on anotherregulated market 28,067,223 28,039,694 15.26
Other transferable securities and money market instruments
Bonds
ItalyItaly Buoni Poliennali del Tesoro Coupon Strip ZeroCoupon 98 - 01.05.27 6,000,000 EUR 5,865,558 5,893,920 3.21Italy Buoni Poliennali del Tesoro Coupon Strip ZeroCoupon 02 - 01.02.21 12,100,000 EUR 12,103,995 12,103,146 6.58Italy Buoni Poliennali del Tesoro Coupon Strip ZeroCoupon 02 - 01.02.23 3,000,000 EUR 2,987,256 3,019,320 1.64
Xtrackers II
Xtrackers II EUR HIGH YIELD CORPORATE BOND 1-3 SWAP UCITS ETF (continued)
Statement of Investmentsas at 31 December 2020(expressed in EUR)
The accompanying notes form an integral part of these financial statements.
345

DescriptionNominal
ValueCurrency
(local) Cost Market Value
% ofNet
Assets
Other transferable securities and money market instruments
Bonds (continued)
Italy (continued)Italy Buoni Poliennali del Tesoro Coupon Strip ZeroCoupon 12 - 01.09.22 1,400,000 EUR 1,400,404 1,408,666 0.77Italy Buoni Poliennali del Tesoro Coupon Strip ZeroCoupon 13 - 01.03.29 2,900,000 EUR 2,753,446 2,781,419 1.51
25,110,659 25,206,471 13.71
Total - Bonds 25,110,659 25,206,471 13.71
Total Other transferable securities and money market instruments 25,110,659 25,206,471 13.71
TOTAL INVESTMENT PORTFOLIO 175,660,247 177,962,355 96.82
TOTAL INVESTMENT PORTFOLIO INCLUDING ACCRUED INTEREST 179,597,400 97.71
Xtrackers II
Xtrackers II EUR HIGH YIELD CORPORATE BOND 1-3 SWAP UCITS ETF (continued)
Statement of Investmentsas at 31 December 2020(expressed in EUR)
The accompanying notes form an integral part of these financial statements.
346

DescriptionNominal
ValueCurrency
(local) Cost Market Value
% ofNet
Assets
Transferable securities and money market instruments admitted to an official stock exchange listing
Bonds
ChinaChina 1.99% 20 - 09.04.25 100,000,000 CNY 14,284,748 14,702,816 11.96China 2.41% 20 - 19.06.25 20,000,000 CNY 2,858,777 2,985,899 2.43China 2.71% 20 - 19.06.27 20,000,000 CNY 2,878,577 2,977,591 2.42China 2.85% 20 - 04.06.27 130,000,000 CNY 18,953,733 19,524,655 15.89China 3.02% 20 - 22.10.25 80,000,000 CNY 12,103,466 12,288,382 10.00China 3.12% 19 - 05.12.26 90,000,000 CNY 13,135,846 13,773,279 11.21China 3.22% 18 - 06.12.25 130,000,000 CNY 19,032,082 20,176,247 16.42China 3.25% 19 - 06.06.26 130,000,000 CNY 18,784,650 20,170,516 16.41China 3.28% 20 - 03.12.27 20,000,000 CNY 3,056,226 3,079,758 2.51China 3.60% 18 - 06.09.25 40,000,000 CNY 5,935,543 6,360,845 5.18China 3.61% 18 - 07.06.25 10,000,000 CNY 1,533,244 1,574,532 1.28China 3.77% 18 - 08.03.25 10,000,000 CNY 1,566,155 1,587,756 1.29
114,123,047 119,202,276 97.00
Total - Bonds 114,123,047 119,202,276 97.00
Total Transferable securities and money market instruments admitted to an officialstock exchange listing 114,123,047 119,202,276 97.00
TOTAL INVESTMENT PORTFOLIO 114,123,047 119,202,276 97.00
TOTAL INVESTMENT PORTFOLIO INCLUDING ACCRUED INTEREST 120,514,190 98.07
Xtrackers II
Xtrackers II HARVEST CHINA GOVERNMENT BOND UCITS ETF
Statement of Investmentsas at 31 December 2020(expressed in USD)
The accompanying notes form an integral part of these financial statements.
347

DescriptionNominal
ValueCurrency
(local) Cost Market Value
% ofNet
Assets
Transferable securities and money market instruments admitted to an official stock exchange listing
Bonds
AustraliaCNOOC Curtis Funding No 1 Pty Ltd. 4.50% 13 -03.10.23 200,000 USD 210,502 216,988 1.09
210,502 216,988 1.09British Virgin IslandsChina Cinda Finance 2015 I Ltd. 4.25% 15 - 23.04.25 200,000 USD 210,254 220,974 1.11China Cinda Finance 2017 I Ltd. 4.75% 18 - 08.02.28 200,000 USD 198,879 229,367 1.15China Southern Power Grid International Finance BVICo. Ltd. 3.50% 17 - 08.05.27 200,000 USD 215,424 219,179 1.10CNOOC Finance 2013 Ltd. 2.875% 19 - 30.09.29 200,000 USD 199,984 208,051 1.05CNOOC Finance 2013 Ltd. 3.00% 13 - 09.05.23 200,000 USD 197,903 207,995 1.05Coastal Emerald Ltd. FRN 19 - 31.12.99 200,000 USD 204,203 202,568 1.02COSCO Finance 2011 Ltd. 4.00% 12 - 03.12.22 200,000 USD 203,670 209,226 1.05COSL Finance BVI Ltd. 3.25% 12 - 06.09.22 200,000 USD 200,133 205,458 1.03Elect Global Investments Ltd. FRN 20 - 31.12.99 200,000 USD 193,337 201,450 1.01Hongkong Electric Finance Ltd. 2.875% 16 - 03.05.26 200,000 USD 200,121 215,070 1.08Huarong Finance 2017 Co. Ltd. 4.25% 17 - 07.11.27 200,000 USD 194,075 218,230 1.10Huarong Finance 2017 Co. Ltd. FRN 17 - 31.12.99 200,000 USD 194,852 203,343 1.02Huarong Finance 2019 Co. Ltd. 3.75% 19 - 29.05.24 200,000 USD 199,691 210,631 1.06Sinopec Group Overseas Development 2012 Ltd.3.90% 12 - 17.05.22 200,000 USD 202,569 207,627 1.04Sinopec Group Overseas Development 2012 Ltd.4.875% 12 - 17.05.42 200,000 USD 215,604 256,383 1.29Sinopec Group Overseas Development 2017 Ltd.3.00% 17 - 12.04.22 200,000 USD 200,240 204,871 1.03Sinopec Group Overseas Development 2017 Ltd.3.25% 17 - 13.09.27 200,000 USD 208,550 215,337 1.08Sinopec Group Overseas Development 2017 Ltd.3.625% 17 - 12.04.27 200,000 USD 216,285 219,170 1.10Sinopec Group Overseas Development 2018 Ltd.2.50% 19 - 08.08.24 200,000 USD 199,997 207,746 1.04SPIC MTN Co. Ltd. 1.625% 20 - 27.07.25 280,000 USD 282,751 281,609 1.42State Grid Overseas Investment 2014 Ltd. 4.125% 14 -07.05.24 200,000 USD 204,540 219,767 1.11State Grid Overseas Investment 2016 Ltd. 3.50% 17 -04.05.27 200,000 USD 209,465 221,780 1.12State Grid Overseas Investment 2016 Ltd. 4.25% 18 -02.05.28 200,000 USD 201,554 233,435 1.17TSMC Global Ltd. 1.375% 20 - 28.09.30 250,000 USD 246,205 245,135 1.23
5,000,286 5,264,402 26.46CanadaCNOOC Finance 2014 ULC 4.25% 14 - 30.04.24 200,000 USD 205,909 217,121 1.09
205,909 217,121 1.09Cayman IslandsAlibaba Group Holding Ltd. 4.40% 17 - 06.12.57 200,000 USD 208,214 266,239 1.34Alibaba Group Holdings Ltd. 3.40% 17 - 06.12.27 200,000 USD 224,568 223,705 1.12Alibaba Group Holdings Ltd. 3.60% 15 - 28.11.24 300,000 USD 315,259 330,318 1.66Azure Orbit IV International Finance Ltd. 3.75% 18 -25.01.23 200,000 USD 203,330 208,601 1.05
Xtrackers II
Xtrackers II USD ASIA EX JAPAN CORPORATE BOND UCITS ETF
Statement of Investmentsas at 31 December 2020(expressed in USD)
The accompanying notes form an integral part of these financial statements.
348

DescriptionNominal
ValueCurrency
(local) Cost Market Value
% ofNet
Assets
Transferable securities and money market instruments admitted to an official stock exchange listing
Bonds (continued)
Cayman Islands (continued)Baidu Inc. 3.50% 12 - 28.11.22 200,000 USD 202,137 209,699 1.05China Overseas Finance Cayman VII Ltd. 4.75% 18 -26.04.28 200,000 USD 222,105 225,938 1.14CK Hutchison International 19 Ltd. 3.25% 19 -11.04.24 200,000 USD 213,471 214,027 1.08Country Garden Holdings Co. Ltd. 7.25% 19 -08.04.26 200,000 USD 217,902 224,473 1.13Formosa Group Cayman Ltd. 3.375% 15 - 22.04.25 200,000 USD 213,036 214,242 1.08Hutchison Whampoa International 03 Via 33 Ltd.7.45% 03 - 24.11.33 110,000 USD 146,706 172,731 0.87Hutchison Whampoa International 11 Ltd. 4.625%12 - 13.01.22 200,000 USD 204,084 207,918 1.04Meituan 2.125% 20 - 28.10.25 200,000 USD 202,852 203,054 1.02Meituan 3.05% 20 - 28.10.30 200,000 USD 201,824 207,926 1.04Shimao Property Holdings Ltd. 6.125% 19 - 21.02.24 200,000 USD 207,796 211,884 1.06Sun Hung Kai Properties Capital Market Ltd. 4.50%12 - 14.02.22 200,000 USD 202,587 207,458 1.04Tencent Holdings Ltd. 1.81% 20 - 26.01.26 200,000 USD 204,337 204,430 1.03Tencent Holdings Ltd. 2.39% 20 - 03.06.30 200,000 USD 203,538 204,818 1.03Tencent Holdings Ltd. 3.24% 20 - 03.06.50 200,000 USD 202,419 205,977 1.04Tencent Holdings Ltd. 3.28% 19 - 11.04.24 200,000 USD 214,506 213,446 1.07Tencent Holdings Ltd. 3.925% 18 - 19.01.38 200,000 USD 197,559 228,866 1.15Weibo Corp. 3.375% 20 - 08.07.30 200,000 USD 206,458 204,197 1.03
4,414,688 4,589,947 23.07ChinaBank of China Ltd. 5.00% 14 - 13.11.24 300,000 USD 310,901 336,680 1.69China Construction Bank Corp. FRN 20 - 24.06.30 200,000 USD 199,633 205,075 1.03China Construction Bank Corp. FRN 19 - 27.02.29 270,000 USD 270,469 292,029 1.47China Minmetals Corp. FRN 17 - 31.12.99 200,000 USD 195,178 202,837 1.02Industrial & Commercial Bank of China Ltd. 4.875%15 - 21.09.25 250,000 USD 262,168 285,117 1.43
1,238,349 1,321,738 6.64Hong KongAIA Group Ltd. 3.20% 20 - 16.09.40 200,000 USD 207,195 212,529 1.07AIA Group Ltd. 3.60% 19 - 09.04.29 200,000 USD 201,060 227,190 1.14Bank of China Hong Kong Ltd. FRN 18 - 31.12.99 220,000 USD 229,232 237,535 1.19CITIC Ltd. 3.70% 16 - 14.06.26 200,000 USD 202,151 219,284 1.10CMB International Leasing Management Ltd. 3.00%19 - 03.07.24 200,000 USD 202,850 206,279 1.04CNAC HK Finbridge Co. Ltd. 3.875% 19 - 19.06.29 200,000 USD 200,489 202,130 1.02CNAC HK Finbridge Co. Ltd. 4.875% 18 - 14.03.25 200,000 USD 212,326 213,830 1.07CNAC HK Finbridge Co. Ltd. 5.125% 18 - 14.03.28 200,000 USD 217,356 217,914 1.10ICBCIL Finance Co. Ltd. 1.75% 20 - 25.08.25 200,000 USD 200,935 200,540 1.01ICBCIL Finance Co. Ltd. 3.375% 17 - 05.04.22 200,000 USD 198,531 205,119 1.03
2,072,125 2,142,350 10.77IndiaAdani Ports & Special Economic Zone Ltd. 4.20%20 - 04.08.27 210,000 USD 211,457 226,878 1.14
Xtrackers II
Xtrackers II USD ASIA EX JAPAN CORPORATE BOND UCITS ETF (continued)
Statement of Investmentsas at 31 December 2020(expressed in USD)
The accompanying notes form an integral part of these financial statements.
349
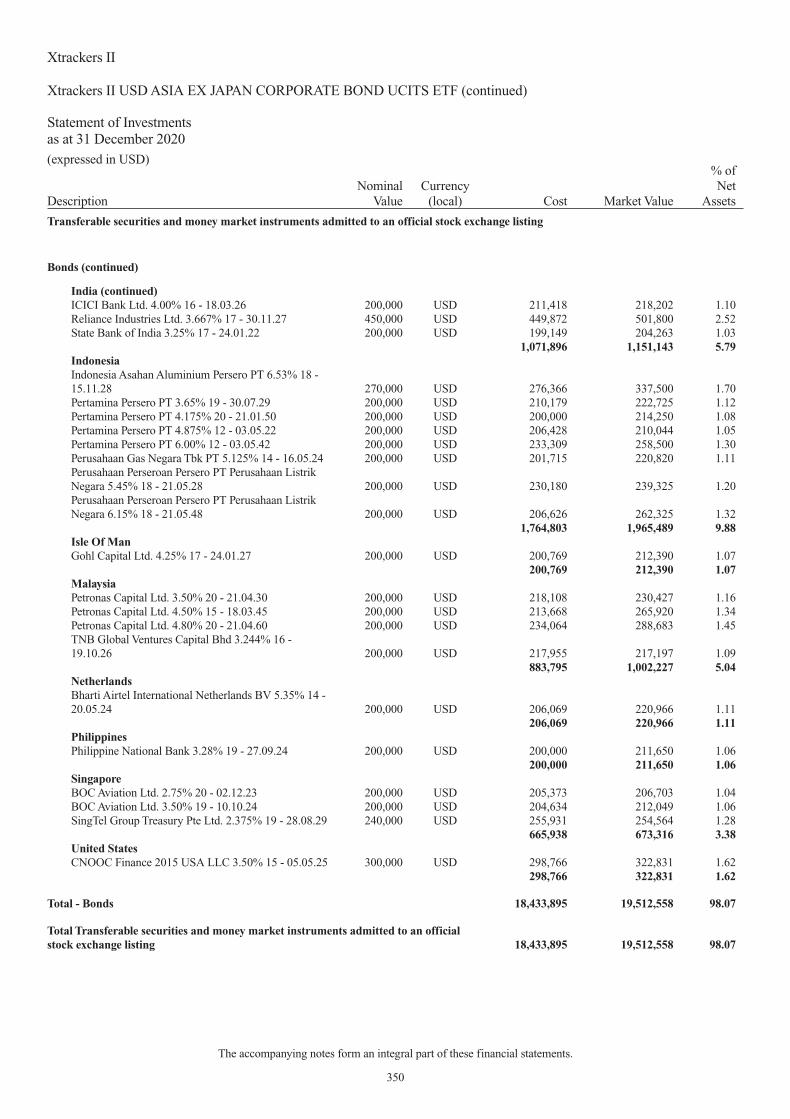
DescriptionNominal
ValueCurrency
(local) Cost Market Value
% ofNet
Assets
Transferable securities and money market instruments admitted to an official stock exchange listing
Bonds (continued)
India (continued)ICICI Bank Ltd. 4.00% 16 - 18.03.26 200,000 USD 211,418 218,202 1.10Reliance Industries Ltd. 3.667% 17 - 30.11.27 450,000 USD 449,872 501,800 2.52State Bank of India 3.25% 17 - 24.01.22 200,000 USD 199,149 204,263 1.03
1,071,896 1,151,143 5.79IndonesiaIndonesia Asahan Aluminium Persero PT 6.53% 18 -15.11.28 270,000 USD 276,366 337,500 1.70Pertamina Persero PT 3.65% 19 - 30.07.29 200,000 USD 210,179 222,725 1.12Pertamina Persero PT 4.175% 20 - 21.01.50 200,000 USD 200,000 214,250 1.08Pertamina Persero PT 4.875% 12 - 03.05.22 200,000 USD 206,428 210,044 1.05Pertamina Persero PT 6.00% 12 - 03.05.42 200,000 USD 233,309 258,500 1.30Perusahaan Gas Negara Tbk PT 5.125% 14 - 16.05.24 200,000 USD 201,715 220,820 1.11Perusahaan Perseroan Persero PT Perusahaan ListrikNegara 5.45% 18 - 21.05.28 200,000 USD 230,180 239,325 1.20Perusahaan Perseroan Persero PT Perusahaan ListrikNegara 6.15% 18 - 21.05.48 200,000 USD 206,626 262,325 1.32
1,764,803 1,965,489 9.88Isle Of ManGohl Capital Ltd. 4.25% 17 - 24.01.27 200,000 USD 200,769 212,390 1.07
200,769 212,390 1.07MalaysiaPetronas Capital Ltd. 3.50% 20 - 21.04.30 200,000 USD 218,108 230,427 1.16Petronas Capital Ltd. 4.50% 15 - 18.03.45 200,000 USD 213,668 265,920 1.34Petronas Capital Ltd. 4.80% 20 - 21.04.60 200,000 USD 234,064 288,683 1.45TNB Global Ventures Capital Bhd 3.244% 16 -19.10.26 200,000 USD 217,955 217,197 1.09
883,795 1,002,227 5.04NetherlandsBharti Airtel International Netherlands BV 5.35% 14 -20.05.24 200,000 USD 206,069 220,966 1.11
206,069 220,966 1.11PhilippinesPhilippine National Bank 3.28% 19 - 27.09.24 200,000 USD 200,000 211,650 1.06
200,000 211,650 1.06SingaporeBOC Aviation Ltd. 2.75% 20 - 02.12.23 200,000 USD 205,373 206,703 1.04BOC Aviation Ltd. 3.50% 19 - 10.10.24 200,000 USD 204,634 212,049 1.06SingTel Group Treasury Pte Ltd. 2.375% 19 - 28.08.29 240,000 USD 255,931 254,564 1.28
665,938 673,316 3.38United StatesCNOOC Finance 2015 USA LLC 3.50% 15 - 05.05.25 300,000 USD 298,766 322,831 1.62
298,766 322,831 1.62
Total - Bonds 18,433,895 19,512,558 98.07
Total Transferable securities and money market instruments admitted to an officialstock exchange listing 18,433,895 19,512,558 98.07
Xtrackers II
Xtrackers II USD ASIA EX JAPAN CORPORATE BOND UCITS ETF (continued)
Statement of Investmentsas at 31 December 2020(expressed in USD)
The accompanying notes form an integral part of these financial statements.
350

DescriptionNominal
ValueCurrency
(local) Cost Market Value
% ofNet
Assets
Transferable securities and money market instruments dealt in on another regulated market
Bonds
SingaporeOversea-Chinese Banking Corp. Ltd. FRN 20 -10.09.30 200,000 USD 201,823 203,044 1.02
201,823 203,044 1.02
Total - Bonds 201,823 203,044 1.02
Total Transferable securities and money market instruments dealt in on anotherregulated market 201,823 203,044 1.02
TOTAL INVESTMENT PORTFOLIO 18,635,718 19,715,602 99.09
TOTAL INVESTMENT PORTFOLIO INCLUDING ACCRUED INTEREST 19,874,585 99.89
Xtrackers II
Xtrackers II USD ASIA EX JAPAN CORPORATE BOND UCITS ETF (continued)
Statement of Investmentsas at 31 December 2020(expressed in USD)
The accompanying notes form an integral part of these financial statements.
351

DescriptionNominal
ValueCurrency
(local) Cost Market Value
% ofNet
Assets
Transferable securities and money market instruments admitted to an official stock exchange listing
Bonds
AustraliaAustralia & New Zealand Banking Group Ltd. 0.625%18 - 21.02.23 100,000 EUR 102,150 101,964 0.19Australia Pacific Airports Melbourne Pty Ltd. 3.125%13 - 26.09.23 100,000 EUR 107,266 107,172 0.20Commonwealth Bank of Australia 0.50% 17 -11.07.22 100,000 EUR 101,368 101,291 0.19Commonwealth Bank of Australia FRN 15 - 22.04.27 100,000 EUR 102,186 102,170 0.19National Australia Bank Ltd. 0.25% 19 - 20.05.24 100,000 EUR 101,706 101,615 0.19National Australia Bank Ltd. 0.35% 17 - 07.09.22 100,000 EUR 101,210 101,169 0.19Scentre Group Trust 1 Via Scentre Group Trust2 1.375% 16 - 22.03.23 100,000 EUR 102,711 102,624 0.19Telstra Corp. Ltd. 3.75% 11 - 16.05.22 100,000 EUR 106,536 105,481 0.20Toyota Finance Australia Ltd. 0.25% 19 - 09.04.24 100,000 EUR 101,770 101,525 0.19Toyota Finance Australia Ltd. 1.584% 20 - 21.04.22 100,000 EUR 102,770 102,471 0.19Transurban Finance Co. Pty Ltd. 1.875% 14 - 16.09.24 100,000 EUR 104,771 106,549 0.20Wesfarmers Ltd. 1.25% 14 - 07.10.21 100,000 EUR 101,356 101,189 0.19Westpac Banking Corp. 0.375% 17 - 05.03.23 100,000 EUR 101,532 101,466 0.19Westpac Banking Corp. 0.75% 18 - 17.10.23 100,000 EUR 102,694 102,895 0.19
1,440,026 1,439,581 2.69AustriaErste Group Bank AG 0.375% 19 - 16.04.24 100,000 EUR 101,244 101,771 0.19Raiffeisen Bank International AG 0.25% 20 - 22.01.25 100,000 EUR 100,100 101,108 0.19Telekom Finanzmanagement GmbH 3.125% 13 -03.12.21 100,000 EUR 103,319 103,138 0.19
304,663 306,017 0.57BelgiumBelfius Bank SA 0.625% 18 - 30.08.23 100,000 EUR 102,206 102,113 0.19Belfius Bank SA 0.75% 17 - 12.09.22 100,000 EUR 101,330 101,536 0.19Groupe Bruxelles Lambert SA 1.375% 17 - 23.05.24 100,000 EUR 105,034 104,659 0.20Groupe Bruxelles Lambert SA 1.875% 18 - 19.06.25 100,000 EUR 107,954 107,820 0.20KBC Group NV 0.625% 19 - 10.04.25 100,000 EUR 102,500 102,718 0.19KBC Group NV 0.75% 17 - 01.03.22 200,000 EUR 202,722 202,442 0.38KBC Group NV 1.125% 19 - 25.01.24 100,000 EUR 103,727 103,653 0.19
825,473 824,941 1.54CanadaCanadian Imperial Bank of Commerce 0.75% 18 -22.03.23 100,000 EUR 102,390 102,264 0.19Federation des Caisses Desjardins du Quebec 0.25%18 - 27.09.21 100,000 EUR 100,611 100,535 0.19Magna International Inc. 1.90% 15 - 24.11.23 100,000 EUR 105,504 105,441 0.20Royal Bank of Canada 0.25% 19 - 02.05.24 100,000 EUR 100,990 101,354 0.19Toronto-Dominion Bank 0.375% 19 - 25.04.24 100,000 EUR 101,300 101,558 0.19
510,795 511,152 0.96ChinaChina Merchants Bank Co. Ltd 0.25% 19 - 19.06.22 100,000 EUR 99,201 99,371 0.19
99,201 99,371 0.19DenmarkJyske Bank A/S 0.875% 18 - 03.12.21 100,000 EUR 101,161 101,073 0.19
Xtrackers II
Xtrackers II ESG EUR CORPORATE BOND SHORT DURATION UCITS ETF(B)
Statement of Investmentsas at 31 December 2020(expressed in EUR)
The accompanying notes form an integral part of these financial statements.
352

DescriptionNominal
ValueCurrency
(local) Cost Market Value
% ofNet
Assets
Transferable securities and money market instruments admitted to an official stock exchange listing
Bonds (continued)
Denmark (continued)Nykredit Realkredit A/S 0.875% 19 - 17.01.24 100,000 EUR 101,724 102,605 0.19Sydbank A/S 1.25% 19 - 04.02.22 100,000 EUR 101,380 101,518 0.19
304,265 305,196 0.57FinlandNordea Bank Abp 1.00% 16 - 22.02.23 100,000 EUR 103,030 102,751 0.19Nordea Bank Abp FRN 16 - 07.09.26 100,000 EUR 100,010 100,524 0.19Nordea Bank Abp 1.125% 15 - 12.02.25 100,000 EUR 105,626 105,573 0.20OP Corporate Bank PLC 0.125% 20 - 01.07.24 100,000 EUR 100,520 100,980 0.19OP Corporate Bank PLC 0.50% 20 - 12.08.25 100,000 EUR 102,791 102,552 0.19OP Corporate Bank PLC 0.75% 15 - 03.03.22 100,000 EUR 101,440 101,270 0.19Sampo OYJ 1.25% 17 - 30.05.25 100,000 EUR 105,650 106,346 0.20SATO OYJ 1.375% 19 - 31.05.24 100,000 EUR 103,249 103,193 0.19SATO OYJ 2.25% 20 - 07.04.23 100,000 EUR 104,598 104,579 0.20
926,914 927,768 1.74FranceAir Liquide Finance SA 1.00% 20 - 02.04.25 100,000 EUR 105,096 104,908 0.20Air Liquide SA 2.375% 13 - 06.09.23 100,000 EUR 107,890 107,066 0.20ALD SA 0.375% 19 - 18.07.23 100,000 EUR 99,170 100,852 0.19APRR SA Zero Coupon 20 - 20.01.23 100,000 EUR 100,528 100,483 0.19APRR SA 1.50% 15 - 15.01.24 100,000 EUR 104,690 104,633 0.20Arkema SA 1.50% 15 - 20.01.25 100,000 EUR 106,832 106,554 0.20Atos SE 0.75% 18 - 07.05.22 100,000 EUR 101,280 101,256 0.19Auchan Holding SA 2.625% 19 - 30.01.24 100,000 EUR 102,730 106,793 0.20Autoroutes du Sud de la France SA 2.95% 14 -17.01.24 100,000 EUR 109,229 108,797 0.20AXA SA FRN 14 - 29.11.49 100,000 EUR 111,578 111,750 0.21AXA SA FRN 13 - 04.07.43 100,000 EUR 112,290 112,156 0.21Banque Federative du Credit Mutuel SA 0.125% 19 -05.02.24 100,000 EUR 100,582 101,097 0.19Banque Federative du Credit Mutuel SA 0.375% 17 -13.01.22 100,000 EUR 100,818 100,815 0.19Banque Federative du Credit Mutuel SA 0.50% 18 -16.11.22 100,000 EUR 101,420 101,506 0.19Banque Federative du Credit Mutuel SA 0.75% 18 -17.07.25 100,000 EUR 103,971 103,908 0.19Banque Federative du Credit Mutuel SA 0.75% 19 -15.06.23 100,000 EUR 102,760 102,528 0.19Banque Federative du Credit Mutuel SA 1.25% 15 -14.01.25 100,000 EUR 105,600 105,660 0.20Banque Federative du Credit Mutuel SA 2.625% 14 -18.03.24 100,000 EUR 109,730 109,077 0.20BNP Paribas Cardif SA 1.00% 17 - 29.11.24 100,000 EUR 102,626 102,523 0.19BNP Paribas SA 0.50% 16 - 01.06.22 100,000 EUR 101,274 101,279 0.19BNP Paribas SA 1.00% 17 - 27.06.24 100,000 EUR 102,840 103,491 0.19BNP Paribas SA 1.125% 16 - 15.01.23 100,000 EUR 103,025 102,851 0.19BNP Paribas SA 1.125% 18 - 22.11.23 100,000 EUR 103,622 103,572 0.19BNP Paribas SA 1.50% 17 - 17.11.25 100,000 EUR 106,740 106,718 0.20BNP Paribas SA 2.375% 15 - 17.02.25 100,000 EUR 106,840 107,642 0.20
Xtrackers II
Xtrackers II ESG EUR CORPORATE BOND SHORT DURATION UCITS ETF(B) (continued)
Statement of Investmentsas at 31 December 2020(expressed in EUR)
The accompanying notes form an integral part of these financial statements.
353

DescriptionNominal
ValueCurrency
(local) Cost Market Value
% ofNet
Assets
Transferable securities and money market instruments admitted to an official stock exchange listing
Bonds (continued)
France (continued)BNP Paribas SA FRN 14 - 14.10.27 100,000 EUR 104,144 103,944 0.19BNP Paribas SA 2.875% 13 - 26.09.23 100,000 EUR 109,640 108,520 0.20BNP Paribas SA FRN 14 - 20.03.26 100,000 EUR 101,410 100,578 0.19BNP Paribas SA 4.125% 11 - 14.01.22 100,000 EUR 105,213 104,669 0.20BPCE SA 0.625% 18 - 26.09.23 100,000 EUR 102,227 102,410 0.19BPCE SA 0.625% 19 - 26.09.24 100,000 EUR 101,600 102,244 0.19BPCE SA 0.625% 20 - 28.04.25 100,000 EUR 102,700 103,083 0.19BPCE SA 1.00% 19 - 15.07.24 100,000 EUR 104,200 104,149 0.19BPCE SA 1.125% 17 - 18.01.23 100,000 EUR 102,766 102,636 0.19BPCE SA FRN 15 - 30.11.27 100,000 EUR 104,858 104,815 0.20BPCE SA 4.50% 12 - 10.02.22 100,000 EUR 105,502 105,409 0.20Capgemini SE 0.50% 16 - 09.11.21 100,000 EUR 100,455 100,435 0.19Capgemini SE 0.625% 20 - 23.06.25 100,000 EUR 101,681 102,835 0.19Carrefour SA 0.75% 16 - 26.04.24 100,000 EUR 102,950 102,643 0.19Carrefour SA 1.25% 15 - 03.06.25 100,000 EUR 105,605 105,493 0.20Carrefour SA 1.75% 14 - 15.07.22 100,000 EUR 102,613 102,488 0.19Cie de Saint-Gobain 1.75% 20 - 03.04.23 200,000 EUR 209,138 208,440 0.39Cie de Saint-Gobain 3.625% 12 - 15.06.21 100,000 EUR 102,165 101,750 0.19Cie Generale des Etablissements Michelin SCA0.875% 18 - 03.09.25 100,000 EUR 105,160 104,725 0.20CNP Assurances FRN 14 - 29.11.49 100,000 EUR 111,129 111,000 0.21CNP Assurances FRN 11 - 30.09.41 100,000 EUR 105,913 104,891 0.20Credit Agricole Assurances SA FRN 15 - 31.12.49 100,000 EUR 109,382 112,009 0.21Credit Agricole SA 0.50% 19 - 24.06.24 100,000 EUR 102,069 101,933 0.19Credit Agricole SA 0.75% 18 - 05.12.23 100,000 EUR 102,961 102,845 0.19Credit Agricole SA FRN 20 - 22.04.26 100,000 EUR 103,972 104,032 0.19Credit Agricole SA 1.375% 18 - 13.03.25 100,000 EUR 104,969 105,626 0.20Credit Agricole SA 3.125% 13 - 17.07.23 100,000 EUR 109,482 109,093 0.20Credit Mutuel Arkea SA 0.875% 18 - 05.10.23 100,000 EUR 102,640 102,928 0.19Credit Mutuel Arkea SA 1.375% 19 - 17.01.25 100,000 EUR 106,070 106,015 0.20Danone SA 0.424% 16 - 03.11.22 100,000 EUR 101,193 101,214 0.19Danone SA 1.00% 18 - 26.03.25 100,000 EUR 105,196 105,084 0.20Danone SA 1.25% 15 - 30.05.24 100,000 EUR 105,277 104,996 0.20Danone SA FRN 17 - 31.12.99 100,000 EUR 101,490 102,702 0.19Danone SA 2.25% 13 - 15.11.21 100,000 EUR 101,643 101,596 0.19Dassault Systemes SE Zero Coupon 19 - 16.09.22 100,000 EUR 100,130 100,436 0.19EssilorLuxottica SA Zero Coupon 19 - 27.05.23 100,000 EUR 100,290 100,394 0.19EssilorLuxottica SA 0.125% 19 - 27.05.25 100,000 EUR 101,010 100,914 0.19Eutelsat SA 1.125% 16 - 23.06.21 100,000 EUR 100,440 100,263 0.19Gecina SA 1.50% 15 - 20.01.25 100,000 EUR 106,538 106,483 0.20HSBC Continental Europe SA 0.20% 18 - 04.09.21 100,000 EUR 100,535 100,463 0.19HSBC Continental Europe SA 0.60% 18 - 20.03.23 100,000 EUR 102,077 101,864 0.19JCDecaux SA 1.00% 16 - 01.06.23 100,000 EUR 100,500 102,178 0.19Kering SA 0.25% 20 - 13.05.23 100,000 EUR 100,992 100,996 0.19Kering SA 1.375% 14 - 01.10.21 100,000 EUR 101,258 101,230 0.19Klepierre SA 1.00% 15 - 17.04.23 100,000 EUR 101,270 102,413 0.19Legrand SA 0.75% 17 - 06.07.24 100,000 EUR 103,778 103,561 0.19Orange SA 0.50% 19 - 15.01.22 100,000 EUR 100,917 100,785 0.19
Xtrackers II
Xtrackers II ESG EUR CORPORATE BOND SHORT DURATION UCITS ETF(B) (continued)
Statement of Investmentsas at 31 December 2020(expressed in EUR)
The accompanying notes form an integral part of these financial statements.
354

DescriptionNominal
ValueCurrency
(local) Cost Market Value
% ofNet
Assets
Transferable securities and money market instruments admitted to an official stock exchange listing
Bonds (continued)
France (continued)Orange SA 0.75% 17 - 11.09.23 100,000 EUR 102,687 102,445 0.19Orange SA 1.00% 16 - 12.05.25 100,000 EUR 104,837 104,679 0.20Orange SA 1.00% 18 - 12.09.25 100,000 EUR 105,251 105,185 0.20Orange SA FRN 19 - 31.12.99 100,000 EUR 105,350 105,374 0.20Orange SA 3.125% 13 - 09.01.24 100,000 EUR 110,000 109,960 0.20Peugeot SA 2.00% 17 - 23.03.24 30,000 EUR 30,756 31,648 0.06Peugeot SA 2.00% 18 - 20.03.25 100,000 EUR 106,450 106,317 0.20Publicis Groupe SA 0.50% 16 - 03.11.23 100,000 EUR 101,751 101,828 0.19Publicis Groupe SA 1.125% 14 - 16.12.21 100,000 EUR 101,071 101,038 0.19RCI Banque SA 0.25% 18 - 12.07.21 100,000 EUR 100,277 100,208 0.19RCI Banque SA 0.50% 16 - 15.09.23 100,000 EUR 98,939 100,487 0.19RCI Banque SA 0.625% 16 - 10.11.21 100,000 EUR 100,494 100,469 0.19RCI Banque SA 0.75% 17 - 12.01.22 50,000 EUR 49,715 50,313 0.09RCI Banque SA 0.75% 19 - 10.04.23 20,000 EUR 19,790 20,224 0.04RCI Banque SA 1.25% 15 - 08.06.22 100,000 EUR 101,819 101,800 0.19RCI Banque SA 1.375% 17 - 08.03.24 50,000 EUR 51,286 51,153 0.09RCI Banque SA 1.625% 17 - 11.04.25 30,000 EUR 30,603 31,250 0.06Sanofi Zero Coupon 19 - 21.03.22 100,000 EUR 100,440 100,426 0.19Sanofi 0.625% 16 - 05.04.24 100,000 EUR 103,044 102,953 0.19Sanofi 0.875% 15 - 22.09.21 100,000 EUR 100,663 100,599 0.19Sanofi 1.125% 14 - 10.03.22 100,000 EUR 101,496 101,402 0.19Sanofi 2.50% 13 - 14.11.23 100,000 EUR 108,256 107,373 0.20Schneider Electric SE Zero Coupon 20 - 12.06.23 100,000 EUR 100,678 100,596 0.19Schneider Electric SE 0.25% 16 - 09.09.24 100,000 EUR 101,997 101,724 0.19Schneider Electric SE 2.50% 13 - 06.09.21 100,000 EUR 102,097 101,909 0.19Societe Fonciere Lyonnaise SA 1.50% 18 - 29.05.25 100,000 EUR 103,870 105,467 0.20Societe Generale SA Zero Coupon 19 - 27.05.22 100,000 EUR 100,450 100,445 0.19Societe Generale SA 0.75% 16 - 19.02.21 100,000 EUR 100,580 100,156 0.19Societe Generale SA 1.00% 16 - 01.04.22 100,000 EUR 101,623 101,540 0.19Societe Generale SA FRN 20 - 24.11.30 100,000 EUR 100,202 100,250 0.19Societe Generale SA 1.125% 18 - 23.01.25 100,000 EUR 102,470 104,156 0.19Societe Generale SA FRN 18 - 23.02.28 100,000 EUR 101,749 101,677 0.19Societe Generale SA FRN 14 - 16.09.26 100,000 EUR 101,653 101,539 0.19Societe Generale SA 4.00% 13 - 07.06.23 100,000 EUR 109,571 109,059 0.20Sodexo SA 0.75% 20 - 27.04.25 100,000 EUR 103,349 103,428 0.19Suez SA FRN 15 - 29.12.49 100,000 EUR 102,000 102,244 0.19Suez SA 2.75% 13 - 09.10.23 100,000 EUR 108,607 107,973 0.20Suez SA 4.125% 10 - 24.06.22 100,000 EUR 107,099 106,854 0.20Teleperformance 1.875% 18 - 02.07.25 100,000 EUR 107,682 107,408 0.20Terega SA 2.20% 15 - 05.08.25 100,000 EUR 110,218 110,115 0.21Unibail-Rodamco-Westfield SE FRN 18 - 31.12.99 100,000 EUR 93,960 94,047 0.18Unibail-Rodamco-Westfield SE 2.125% 20 - 09.04.25 100,000 EUR 104,680 107,375 0.20Unibail-Rodamco-Westfield SE 2.50% 14 - 26.02.24 100,000 EUR 107,236 107,757 0.20Vinci SA 1.00% 18 - 26.09.25 100,000 EUR 105,838 105,854 0.20Vivendi SA Zero Coupon 19 - 13.06.22 100,000 EUR 100,403 100,349 0.19Vivendi SA 0.875% 17 - 18.09.24 100,000 EUR 102,840 103,471 0.19
Xtrackers II
Xtrackers II ESG EUR CORPORATE BOND SHORT DURATION UCITS ETF(B) (continued)
Statement of Investmentsas at 31 December 2020(expressed in EUR)
The accompanying notes form an integral part of these financial statements.
355

DescriptionNominal
ValueCurrency
(local) Cost Market Value
% ofNet
Assets
Transferable securities and money market instruments admitted to an official stock exchange listing
Bonds (continued)
France (continued)Wendel SE 1.00% 16 - 20.04.23 100,000 EUR 102,252 102,059 0.19Worldline SA 0.50% 20 - 30.06.23 100,000 EUR 101,578 101,503 0.19
12,199,966 12,213,211 22.85GermanyAlbemarle New Holdings GmbH 1.125% 19 -25.11.25 100,000 EUR 103,508 103,384 0.19Allianz SE FRN 15 - 07.07.45 100,000 EUR 107,681 107,886 0.20Allianz SE FRN 14 - 31.12.99 100,000 EUR 108,920 109,891 0.20Allianz SE FRN 12 - 17.10.42 100,000 EUR 110,390 109,843 0.20Berlin Hyp AG 0.375% 18 - 28.08.23 100,000 EUR 102,459 102,138 0.19Berlin Hyp AG 1.25% 15 - 22.01.25 100,000 EUR 105,201 105,174 0.20Bertelsmann SE & Co. KGaA 1.25% 18 - 29.09.25 100,000 EUR 106,853 106,455 0.20Commerzbank AG 0.50% 18 - 28.08.23 100,000 EUR 101,886 101,777 0.19Commerzbank AG 0.50% 18 - 06.12.21 100,000 EUR 100,840 100,778 0.19Commerzbank AG 0.625% 19 - 28.08.24 100,000 EUR 101,540 102,647 0.19Commerzbank AG FRN 20 - 24.03.26 100,000 EUR 101,388 101,449 0.19Continental AG 0.375% 19 - 27.06.25 100,000 EUR 100,770 100,725 0.19Covestro AG 1.75% 16 - 25.09.24 35,000 EUR 37,076 37,233 0.07Daimler AG Zero Coupon 19 - 08.02.24 100,000 EUR 99,995 99,905 0.19Daimler AG 1.40% 16 - 12.01.24 50,000 EUR 52,138 52,174 0.10Daimler AG 1.625% 20 - 22.08.23 80,000 EUR 83,272 83,546 0.16Daimler AG 2.00% 13 - 25.06.21 100,000 EUR 101,288 101,046 0.19Daimler AG 2.25% 14 - 24.01.22 100,000 EUR 102,751 102,665 0.19Daimler AG 2.625% 20 - 07.04.25 150,000 EUR 165,677 166,247 0.31Deutsche Bank AG FRN 20 - 19.11.25 100,000 EUR 101,549 101,634 0.19Deutsche Bank AG 1.125% 15 - 17.03.25 100,000 EUR 100,420 103,377 0.19Deutsche Bank AG 1.25% 14 - 08.09.21 100,000 EUR 100,760 100,873 0.19Deutsche Bank AG 1.50% 17 - 20.01.22 100,000 EUR 101,548 101,549 0.19Deutsche Bank AG 2.375% 13 - 11.01.23 100,000 EUR 103,988 104,694 0.20Deutsche Boerse AG 1.625% 15 - 08.10.25 100,000 EUR 109,170 109,060 0.20Deutsche Boerse AG 2.375% 12 - 05.10.22 100,000 EUR 105,450 104,758 0.20Deutsche Post AG 0.375% 16 - 01.04.21 20,000 EUR 20,042 20,000 0.04Deutsche Post AG 2.75% 13 - 09.10.23 115,000 EUR 125,346 124,692 0.23Deutsche Post AG 2.875% 12 - 11.12.24 30,000 EUR 33,840 33,633 0.06DVB Bank SE 1.00% 17 - 25.04.22 100,000 EUR 100,450 101,119 0.19Eurogrid GmbH 1.875% 15 - 10.06.25 100,000 EUR 108,535 108,463 0.20Evonik Industries AG 1.00% 15 - 23.01.23 100,000 EUR 102,419 102,302 0.19Evonik Industries AG FRN 17 - 07.07.77 50,000 EUR 50,255 51,175 0.10Fresenius Medical Care AG & Co. KGaA 1.50% 18 -11.07.25 100,000 EUR 106,771 106,667 0.20Fresenius SE & Co. KGaA 3.00% 14 - 01.02.21 30,000 EUR 30,417 30,065 0.06HeidelbergCement AG 2.25% 16 - 30.03.23 40,000 EUR 41,748 41,856 0.08HeidelbergCement AG 2.25% 16 - 03.06.24 30,000 EUR 31,848 32,171 0.06Hella GmbH & Co. KGaA 1.00% 17 - 17.05.24 30,000 EUR 30,861 30,875 0.06Henkel AG & Co. KGaA Zero Coupon 16 - 13.09.21 50,000 EUR 50,100 50,077 0.09HOCHTIEF AG 1.75% 18 - 03.07.25 100,000 EUR 107,584 106,979 0.20Infineon Technologies AG 1.50% 15 - 10.03.22 130,000 EUR 132,747 132,668 0.25Knorr-Bremse AG 0.50% 16 - 08.12.21 20,000 EUR 20,098 20,090 0.04
Xtrackers II
Xtrackers II ESG EUR CORPORATE BOND SHORT DURATION UCITS ETF(B) (continued)
Statement of Investmentsas at 31 December 2020(expressed in EUR)
The accompanying notes form an integral part of these financial statements.
356

DescriptionNominal
ValueCurrency
(local) Cost Market Value
% ofNet
Assets
Transferable securities and money market instruments admitted to an official stock exchange listing
Bonds (continued)
Germany (continued)Knorr-Bremse AG 1.125% 18 - 13.06.25 20,000 EUR 21,034 21,000 0.04LANXESS AG 1.125% 18 - 16.05.25 20,000 EUR 20,940 21,040 0.04LANXESS AG 2.625% 12 - 21.11.22 40,000 EUR 42,456 42,114 0.08Merck Financial Services GmbH 0.005% 19 -15.12.23 100,000 EUR 100,528 100,495 0.19Merck KGaA FRN 14 - 12.12.74 40,000 EUR 43,844 44,031 0.08Muenchener Rueckversicherungs-Gesellschaft AG inMuenchen FRN 12 - 26.05.42 100,000 EUR 110,170 108,484 0.20Münchener Hypothekenbank eG 0.875% 18 - 12.09.25 100,000 EUR 103,232 103,324 0.19SAP SE Zero Coupon 20 - 17.05.23 100,000 EUR 100,460 100,541 0.19SAP SE 0.25% 18 - 10.03.22 100,000 EUR 100,633 100,628 0.19
4,352,876 4,355,397 8.15GuernseyCredit Suisse Group Funding Guernsey Ltd. 1.25%15 - 14.04.22 200,000 EUR 204,143 203,666 0.38Globalworth Real Estate Investments Ltd. 2.875% 17 -20.06.22 100,000 EUR 103,043 102,977 0.19
307,186 306,643 0.57IrelandAIB Group PLC 1.50% 18 - 29.03.23 100,000 EUR 102,207 103,274 0.19CRH Finance Dac 3.125% 13 - 03.04.23 100,000 EUR 107,953 107,385 0.20Dell Bank International Dac 0.625% 19 - 17.10.22 100,000 EUR 101,039 100,878 0.19Eaton Capital Unlimited Co. 0.697% 19 - 14.05.25 100,000 EUR 103,817 103,389 0.20Johnson Controls International PLC 1.00% 17 -15.09.23 100,000 EUR 102,580 102,855 0.19Willow No 2 Ireland PLC for Zurich Insurance Co.Ltd. 3.375% 12 - 27.06.22 100,000 EUR 105,549 105,403 0.20
623,145 623,184 1.17ItalyAssicurazioni Generali SpA FRN 12 - 12.12.42 100,000 EUR 116,500 114,574 0.22Intesa Sanpaolo SpA 1.00% 19 - 04.07.24 100,000 EUR 101,516 103,151 0.19Intesa Sanpaolo SpA 1.125% 15 - 04.03.22 100,000 EUR 101,240 101,489 0.19Intesa Sanpaolo SpA 1.375% 17 - 18.01.24 100,000 EUR 103,961 103,992 0.20Intesa Sanpaolo SpA 4.00% 13 - 30.10.23 100,000 EUR 111,233 111,272 0.21Italgas SpA 1.125% 17 - 14.03.24 100,000 EUR 103,899 103,876 0.19Snam SpA Zero Coupon 19 - 12.05.24 100,000 EUR 100,886 100,747 0.19Terna Rete Elettrica Nazionale SpA 0.125% 19 -25.07.25 100,000 EUR 101,339 101,239 0.19Terna Rete Elettrica Nazionale SpA 1.00% 18 -23.07.23 100,000 EUR 102,830 103,219 0.19Terna Rete Elettrica Nazionale SpA 4.75% 11 -15.03.21 100,000 EUR 101,301 100,987 0.19UniCredit SpA 0.50% 19 - 09.04.25 100,000 EUR 101,276 101,283 0.19UniCredit SpA FRN 19 - 25.06.25 100,000 EUR 101,230 103,256 0.19UniCredit SpA FRN 20 - 16.06.26 100,000 EUR 100,840 103,787 0.19UniCredit SpA 2.00% 16 - 04.03.23 100,000 EUR 104,921 104,633 0.20Unione di Banche Italiane SpA 0.75% 17 - 17.10.22 100,000 EUR 101,747 101,558 0.19
1,554,719 1,559,063 2.92
Xtrackers II
Xtrackers II ESG EUR CORPORATE BOND SHORT DURATION UCITS ETF(B) (continued)
Statement of Investmentsas at 31 December 2020(expressed in EUR)
The accompanying notes form an integral part of these financial statements.
357

DescriptionNominal
ValueCurrency
(local) Cost Market Value
% ofNet
Assets
Transferable securities and money market instruments admitted to an official stock exchange listing
Bonds (continued)
JapanMitsubishi UFJ Financial Group Inc. 0.872% 17 -07.09.24 100,000 EUR 102,890 103,374 0.19Mizuho Financial Group Inc. 0.214% 20 - 07.10.25 100,000 EUR 101,332 101,128 0.19Sumitomo Mitsui Banking Corp. 2.75% 13 - 24.07.23 100,000 EUR 108,008 107,571 0.20Takeda Pharmaceutical Co. Ltd. 1.125% 18 - 21.11.22 100,000 EUR 102,230 102,338 0.19
414,460 414,411 0.77JerseyHeathrow Funding Ltd. 1.875% 14 - 23.05.22 100,000 EUR 102,490 102,677 0.19
102,490 102,677 0.19LuxembourgBecton Dickinson Euro Finance Sarl 0.174% 19 -04.06.21 100,000 EUR 100,040 100,100 0.19Becton Dickinson Euro Finance Sarl 0.632% 19 -04.06.23 100,000 EUR 101,499 101,413 0.19CNH Industrial Finance Europe SA 1.375% 17 -23.05.22 100,000 EUR 101,822 101,777 0.19Grand City Properties SA 1.50% 15 - 17.04.25 100,000 EUR 104,220 106,123 0.20Hannover Finance Luxembourg SA FRN 12 - 30.06.43 100,000 EUR 112,570 111,794 0.21Harman Finance International SCA 2.00% 15 -27.05.22 100,000 EUR 102,155 102,193 0.19HeidelbergCement Finance Luxembourg SA 0.50%18 - 09.08.22 100,000 EUR 100,928 100,723 0.19HeidelbergCement Finance Luxembourg SA 2.50%20 - 09.10.24 70,000 EUR 75,166 76,366 0.14HeidelbergCement Finance Luxembourg SA 3.25%13 - 21.10.21 100,000 EUR 102,910 102,832 0.19Holcim Finance Luxembourg SA 1.375% 16 -26.05.23 100,000 EUR 103,570 103,499 0.19John Deere Cash Management SA 1.375% 20 -02.04.24 100,000 EUR 105,496 105,295 0.20Medtronic Global Holdings SCA Zero Coupon 20 -15.03.23 100,000 EUR 100,366 100,445 0.19Medtronic Global Holdings SCA Zero Coupon 20 -15.10.25 100,000 EUR 100,468 100,384 0.19Medtronic Global Holdings SCA 0.25% 19 - 02.07.25 100,000 EUR 101,274 101,503 0.19Nestle Finance International Ltd. Zero Coupon 20 -12.11.24 70,000 EUR 70,546 70,685 0.13Nestle Finance International Ltd. 0.75% 15 - 16.05.23 15,000 EUR 15,411 15,351 0.03Nestle Finance International Ltd. 1.75% 12 - 12.09.22 50,000 EUR 51,974 51,764 0.09Novartis Finance SA Zero Coupon 17 - 31.03.21 100,000 EUR 100,105 100,056 0.19Tyco Electronics Group SA 1.10% 15 - 01.03.23 100,000 EUR 102,798 102,713 0.19
1,753,318 1,755,016 3.28NetherlandsABN AMRO Bank NV 0.25% 18 - 03.12.21 100,000 EUR 100,719 100,660 0.19ABN AMRO Bank NV 0.50% 18 - 17.07.23 100,000 EUR 102,122 101,931 0.19ABN AMRO Bank NV 1.00% 15 - 16.04.25 100,000 EUR 105,092 105,006 0.20ABN AMRO Bank NV 1.25% 20 - 28.05.25 100,000 EUR 104,010 105,298 0.20ABN AMRO Bank NV FRN 16 - 18.01.28 100,000 EUR 104,867 105,226 0.20
Xtrackers II
Xtrackers II ESG EUR CORPORATE BOND SHORT DURATION UCITS ETF(B) (continued)
Statement of Investmentsas at 31 December 2020(expressed in EUR)
The accompanying notes form an integral part of these financial statements.
358

DescriptionNominal
ValueCurrency
(local) Cost Market Value
% ofNet
Assets
Transferable securities and money market instruments admitted to an official stock exchange listing
Bonds (continued)
Netherlands (continued)ABN AMRO Bank NV 4.125% 12 - 28.03.22 100,000 EUR 105,669 105,547 0.20Achmea Bank NV 2.75% 14 - 18.02.21 100,000 EUR 100,978 100,379 0.19Achmea BV FRN 13 - 04.04.43 100,000 EUR 111,700 112,137 0.21Adecco International Financial Services BV 1.00%16 - 02.12.24 100,000 EUR 104,751 104,518 0.20Aegon Bank NV 0.625% 19 - 21.06.24 100,000 EUR 103,034 102,834 0.19Akzo Nobel NV 2.625% 12 - 27.07.22 100,000 EUR 105,046 104,563 0.20Allianz Finance II BV Zero Coupon 20 - 14.01.25 100,000 EUR 101,501 101,180 0.19ASR Nederland NV FRN 15 - 29.09.45 100,000 EUR 118,785 118,750 0.22BMW Finance NV Zero Coupon 19 - 24.03.23 100,000 EUR 100,463 100,311 0.19BMW Finance NV Zero Coupon 20 - 14.04.23 50,000 EUR 50,095 50,163 0.09BMW Finance NV 0.125% 18 - 29.11.21 30,000 EUR 30,159 30,138 0.06BMW Finance NV 0.125% 19 - 13.07.22 150,000 EUR 150,763 150,799 0.28BMW Finance NV 0.50% 18 - 22.11.22 150,000 EUR 152,192 152,026 0.28BMW Finance NV 0.625% 19 - 06.10.23 60,000 EUR 61,386 61,267 0.11BMW Finance NV 0.75% 17 - 12.07.24 100,000 EUR 102,899 103,134 0.19BMW Finance NV 0.875% 17 - 03.04.25 25,000 EUR 26,145 26,064 0.05BMW Finance NV 1.00% 15 - 21.01.25 100,000 EUR 104,606 104,604 0.20BMW Finance NV 1.00% 18 - 29.08.25 30,000 EUR 31,692 31,559 0.06BMW Finance NV 1.00% 18 - 14.11.24 50,000 EUR 52,200 52,150 0.10Conti-Gummi Finance BV 1.125% 20 - 25.09.24 60,000 EUR 61,074 62,104 0.12Cooperatieve Rabobank UA 0.50% 17 - 06.12.22 100,000 EUR 101,727 101,628 0.19Cooperatieve Rabobank UA 0.625% 19 - 27.02.24 100,000 EUR 102,586 102,383 0.19Cooperatieve Rabobank UA 2.375% 13 - 22.05.23 100,000 EUR 106,554 106,421 0.20Cooperatieve Rabobank UA FRN 14 - 26.05.26 100,000 EUR 101,044 100,981 0.19Cooperatieve Rabobank UA 4.00% 12 - 11.01.22 100,000 EUR 104,676 104,550 0.20Cooperatieve Rabobank UA 4.125% 10 - 14.07.25 100,000 EUR 121,520 119,484 0.22Cooperatieve Rabobank UA 4.375% 06 - 07.06.21 100,000 EUR 102,104 102,048 0.19Cooperatieve Rabobank UA 4.75% 07 - 06.06.22 100,000 EUR 109,440 107,281 0.20CRH Funding BV 1.875% 15 - 09.01.24 100,000 EUR 105,727 105,617 0.20Daimler International Finance BV 0.20% 17 -13.09.21 100,000 EUR 100,435 100,405 0.19Daimler International Finance BV 0.25% 18 -11.05.22 100,000 EUR 100,440 100,684 0.19Daimler International Finance BV 0.25% 19 -06.11.23 50,000 EUR 49,795 50,336 0.09Daimler International Finance BV 0.625% 19 -27.02.23 100,000 EUR 101,827 101,596 0.19Daimler International Finance BV 0.85% 17 -28.02.25 40,000 EUR 40,536 41,332 0.08Daimler International Finance BV 0.875% 18 -09.04.24 50,000 EUR 50,765 51,324 0.10Daimler International Finance BV 1.00% 18 -11.11.25 50,000 EUR 52,450 52,222 0.10de Volksbank NV 0.75% 18 - 25.06.23 100,000 EUR 101,890 102,138 0.19Deutsche Telekom International Finance BV 0.25%16 - 19.04.21 100,000 EUR 100,300 100,175 0.19
Xtrackers II
Xtrackers II ESG EUR CORPORATE BOND SHORT DURATION UCITS ETF(B) (continued)
Statement of Investmentsas at 31 December 2020(expressed in EUR)
The accompanying notes form an integral part of these financial statements.
359

DescriptionNominal
ValueCurrency
(local) Cost Market Value
% ofNet
Assets
Transferable securities and money market instruments admitted to an official stock exchange listing
Bonds (continued)
Netherlands (continued)Deutsche Telekom International Finance BV 0.625%16 - 03.04.23 100,000 EUR 102,198 101,975 0.19Deutsche Telekom International Finance BV 0.625%17 - 13.12.24 100,000 EUR 103,667 103,386 0.19Deutsche Telekom International Finance BV 0.625%18 - 01.12.22 100,000 EUR 101,794 101,662 0.19Deutsche Telekom International Finance BV 0.875%17 - 30.01.24 100,000 EUR 103,615 103,365 0.19Deutsche Telekom International Finance BV 1.375%18 - 01.12.25 100,000 EUR 107,498 107,450 0.20ELM BV for Swiss Reinsurance Co. Ltd. FRN 15 -29.12.49 100,000 EUR 107,894 108,008 0.20EXOR NV 2.125% 15 - 02.12.22 100,000 EUR 103,700 103,681 0.19ING Bank NV FRN 14 - 25.02.26 100,000 EUR 100,621 100,503 0.19ING Groep NV FRN 19 - 03.09.25 100,000 EUR 99,410 100,388 0.19ING Groep NV 0.75% 17 - 09.03.22 100,000 EUR 101,310 101,155 0.19ING Groep NV FRN 19 - 13.11.30 100,000 EUR 101,217 101,253 0.19ING Groep NV FRN 17 - 26.09.29 100,000 EUR 102,350 103,784 0.19ING Groep NV FRN 17 - 11.04.28 100,000 EUR 106,082 105,854 0.20ISS Finance BV 1.25% 20 - 07.07.25 100,000 EUR 102,211 102,177 0.19Koninklijke Ahold Delhaize NV 0.875% 17 - 19.09.24 100,000 EUR 104,170 103,825 0.19Koninklijke DSM NV 1.375% 15 - 26.09.22 100,000 EUR 103,353 103,068 0.19Koninklijke KPN NV 0.625% 16 - 09.04.25 100,000 EUR 101,816 101,597 0.19LeasePlan Corp. NV 0.125% 19 - 13.09.23 100,000 EUR 98,380 100,301 0.19LeasePlan Corp. NV 0.75% 17 - 03.10.22 100,000 EUR 101,609 101,318 0.19Linde Finance BV 0.25% 17 - 18.01.22 70,000 EUR 70,483 70,382 0.13Linde Finance BV 2.00% 13 - 18.04.23 150,000 EUR 158,197 157,741 0.30Nationale-Nederlanden Bank NV 0.375% 19 -31.05.23 100,000 EUR 101,462 101,377 0.19NE Property BV 2.625% 19 - 22.05.23 100,000 EUR 103,774 103,964 0.19NIBC Bank NV 1.125% 18 - 19.04.23 100,000 EUR 100,610 102,559 0.19NN Group NV FRN 14 - 08.04.44 100,000 EUR 111,570 112,267 0.21Nomura Europe Finance NV 1.50% 14 - 12.05.21 100,000 EUR 100,776 100,669 0.19RELX Finance BV Zero Coupon 20 - 18.03.24 100,000 EUR 99,870 100,306 0.19Roche Finance Europe BV 0.50% 16 - 27.02.23 15,000 EUR 15,307 15,265 0.03Roche Finance Europe BV 0.875% 15 - 25.02.25 125,000 EUR 131,315 130,800 0.24Siemens Financieringsmaatschappij NV Zero Coupon20 - 20.02.23 100,000 EUR 100,600 100,529 0.19Siemens Financieringsmaatschappij NV 0.125% 20 -05.06.22 100,000 EUR 100,799 100,601 0.19Siemens Financieringsmaatschappij NV 0.25% 20 -05.06.24 100,000 EUR 102,044 101,701 0.19Siemens Financieringsmaatschappij NV 1.75% 13 -12.03.21 100,000 EUR 100,462 100,281 0.19Sudzucker International Finance BV 1.25% 16 -29.11.23 100,000 EUR 103,500 102,750 0.19Toyota Motor Finance Netherlands BV 0.625% 18 -26.09.23 100,000 EUR 102,647 102,398 0.19
Xtrackers II
Xtrackers II ESG EUR CORPORATE BOND SHORT DURATION UCITS ETF(B) (continued)
Statement of Investmentsas at 31 December 2020(expressed in EUR)
The accompanying notes form an integral part of these financial statements.
360

DescriptionNominal
ValueCurrency
(local) Cost Market Value
% ofNet
Assets
Transferable securities and money market instruments admitted to an official stock exchange listing
Bonds (continued)
Netherlands (continued)Unilever Finance Netherlands BV 0.375% 17 -14.02.23 100,000 EUR 101,680 101,470 0.19Unilever Finance Netherlands BV 0.50% 16 - 29.04.24 100,000 EUR 102,661 102,602 0.19Unilever Finance Netherlands BV 0.50% 18 - 06.01.25 100,000 EUR 103,007 102,914 0.19Unilever Finance Netherlands BV 1.00% 15 - 03.06.23 100,000 EUR 103,180 103,162 0.19Vonovia Finance BV 0.125% 19 - 06.04.23 100,000 EUR 100,613 100,629 0.19Vonovia Finance BV 0.75% 18 - 15.01.24 100,000 EUR 102,695 102,684 0.19Vonovia Finance BV 1.80% 19 - 29.06.25 100,000 EUR 106,940 108,064 0.20
8,222,851 8,222,818 15.39New ZealandANZ New Zealand Int’l Ltd. 0.40% 17 - 01.03.22 100,000 EUR 100,853 100,846 0.19
100,853 100,846 0.19NorwayDNB Bank ASA 0.05% 19 - 14.11.23 100,000 EUR 100,530 100,787 0.19DNB Bank ASA 1.125% 16 - 01.03.23 100,000 EUR 103,155 103,065 0.19DNB Bank ASA 4.375% 11 - 24.02.21 100,000 EUR 100,958 100,676 0.19Santander Consumer Bank AS 0.125% 19 - 11.09.24 100,000 EUR 100,871 100,602 0.18SpareBank 1 SMN 0.50% 17 - 09.03.22 100,000 EUR 100,981 100,966 0.19SpareBank 1 SR-Bank ASA 2.125% 14 - 14.04.21 100,000 EUR 101,720 100,711 0.19
608,215 606,807 1.13PortugalNOS Sgps SA 1.125% 18 - 02.05.23 100,000 EUR 102,112 102,137 0.19
102,112 102,137 0.19SpainAmadeus IT Group SA 0.875% 18 - 18.09.23 100,000 EUR 99,660 102,001 0.19Banco Bilbao Vizcaya Argentaria SA 0.75% 17 -11.09.22 200,000 EUR 202,988 203,176 0.38Banco Bilbao Vizcaya Argentaria SA FRN 20 -16.01.30 100,000 EUR 95,820 99,836 0.19Banco Bilbao Vizcaya Argentaria SA 1.125% 19 -28.02.24 100,000 EUR 103,399 103,322 0.19Banco de Sabadell SA 0.875% 19 - 22.07.25 100,000 EUR 102,112 102,162 0.19Banco de Sabadell SA 1.75% 19 - 10.05.24 100,000 EUR 98,460 103,458 0.19Banco de Sabadell SA FRN 20 - 29.06.23 100,000 EUR 102,530 102,587 0.19Banco Santander SA 0.25% 19 - 19.06.24 100,000 EUR 101,117 101,315 0.19Banco Santander SA 1.375% 15 - 14.12.22 100,000 EUR 103,386 103,208 0.19Banco Santander SA 2.50% 15 - 18.03.25 100,000 EUR 106,450 108,366 0.20Bankia SA 0.875% 19 - 25.03.24 100,000 EUR 102,497 102,828 0.19Bankinter SA 0.875% 19 - 05.03.24 100,000 EUR 103,349 103,087 0.19CaixaBank SA 0.375% 20 - 03.02.25 100,000 EUR 101,409 101,196 0.19CaixaBank SA 0.625% 19 - 01.10.24 100,000 EUR 100,262 101,756 0.19CaixaBank SA 0.75% 18 - 18.04.23 100,000 EUR 102,060 101,982 0.19CaixaBank SA FRN 20 - 10.07.26 100,000 EUR 102,876 102,763 0.19CaixaBank SA FRN 17 - 14.07.28 100,000 EUR 103,120 104,631 0.20CaixaBank SA FRN 17 - 15.02.27 100,000 EUR 103,101 103,092 0.19Enagas Financiaciones SA 1.25% 15 - 06.02.25 100,000 EUR 106,094 105,683 0.20FCC Aqualia SA 1.413% 17 - 08.06.22 100,000 EUR 101,674 101,488 0.19Ferrovial Emisiones SA 0.375% 16 - 14.09.22 200,000 EUR 201,637 201,956 0.38
Xtrackers II
Xtrackers II ESG EUR CORPORATE BOND SHORT DURATION UCITS ETF(B) (continued)
Statement of Investmentsas at 31 December 2020(expressed in EUR)
The accompanying notes form an integral part of these financial statements.
361

DescriptionNominal
ValueCurrency
(local) Cost Market Value
% ofNet
Assets
Transferable securities and money market instruments admitted to an official stock exchange listing
Bonds (continued)
Spain (continued)Red Electrica Corp. SA 0.875% 20 - 14.04.25 100,000 EUR 103,961 104,107 0.20Santander Consumer Finance SA 0.375% 20 -17.01.25 100,000 EUR 101,403 101,439 0.19Santander Consumer Finance SA 0.50% 17 - 04.10.21 100,000 EUR 100,824 100,678 0.19Santander Consumer Finance SA 0.875% 17 -24.01.22 100,000 EUR 101,120 101,229 0.19Santander Consumer Finance SA 1.125% 18 -09.10.23 100,000 EUR 103,500 103,550 0.20Telefonica Emisiones SA 0.75% 16 - 13.04.22 200,000 EUR 202,964 202,646 0.38Telefonica Emisiones SA 1.069% 19 - 05.02.24 100,000 EUR 103,580 103,506 0.20Telefonica Emisiones SA 1.528% 17 - 17.01.25 100,000 EUR 106,311 106,601 0.20Telefonica Emisiones SA 3.961% 13 - 26.03.21 100,000 EUR 101,389 100,952 0.19Telefonica Emisiones SA 3.987% 13 - 23.01.23 100,000 EUR 109,079 108,691 0.20
3,478,132 3,493,292 6.54SwedenAkelius Residential Property AB 1.50% 16 - 23.01.22 100,000 EUR 101,830 101,744 0.19Essity AB 0.625% 17 - 28.03.22 100,000 EUR 100,939 100,868 0.19Essity AB 1.125% 17 - 27.03.24 100,000 EUR 103,885 103,795 0.19Investor AB 4.875% 09 - 18.11.21 70,000 EUR 74,648 73,171 0.14Molnlycke Holdings AB 1.875% 17 - 28.02.25 100,000 EUR 107,560 107,187 0.20Sagax AB 2.00% 18 - 17.01.24 100,000 EUR 104,566 104,362 0.19Skandinaviska Enskilda Banken AB 0.05% 19 -01.07.24 100,000 EUR 100,777 100,829 0.19Skandinaviska Enskilda Banken AB 0.30% 17 -17.02.22 100,000 EUR 100,752 100,763 0.19Skandinaviska Enskilda Banken AB 0.75% 16 -24.08.21 100,000 EUR 101,100 100,777 0.19SKF AB 1.25% 18 - 17.09.25 100,000 EUR 105,632 105,619 0.20Svenska Handelsbanken AB 0.25% 17 - 28.02.22 100,000 EUR 100,839 100,811 0.19Svenska Handelsbanken AB 0.50% 18 - 21.03.23 100,000 EUR 101,887 101,863 0.19Svenska Handelsbanken AB 1.00% 20 - 15.04.25 100,000 EUR 104,970 104,917 0.19Svenska Handelsbanken AB 1.125% 15 - 14.12.22 100,000 EUR 102,995 102,970 0.19Swedbank AB 0.30% 17 - 06.09.22 100,000 EUR 100,959 100,896 0.19Swedbank AB 0.75% 20 - 05.05.25 100,000 EUR 103,070 103,555 0.19Telefonaktiebolaget LM Ericsson 0.875% 17 -01.03.21 100,000 EUR 100,220 100,141 0.19Telia Co. AB FRN 17 - 04.04.78 100,000 EUR 104,000 105,117 0.20Telia Co. AB 4.00% 11 - 22.03.22 100,000 EUR 106,500 105,208 0.20Volvo Treasury AB 0.125% 20 - 17.09.24 100,000 EUR 100,435 100,529 0.19
2,027,564 2,025,122 3.79SwitzerlandCredit Suisse AG 1.00% 16 - 07.06.23 100,000 EUR 103,150 103,057 0.19Credit Suisse Group AG FRN 17 - 17.07.25 100,000 EUR 103,269 104,083 0.20UBS AG 0.75% 20 - 21.04.23 230,000 EUR 235,014 235,150 0.44UBS AG 1.25% 14 - 03.09.21 100,000 EUR 101,204 101,150 0.19UBS Group AG FRN 18 - 17.04.25 200,000 EUR 208,224 208,330 0.39
750,861 751,770 1.41
Xtrackers II
Xtrackers II ESG EUR CORPORATE BOND SHORT DURATION UCITS ETF(B) (continued)
Statement of Investmentsas at 31 December 2020(expressed in EUR)
The accompanying notes form an integral part of these financial statements.
362

DescriptionNominal
ValueCurrency
(local) Cost Market Value
% ofNet
Assets
Transferable securities and money market instruments admitted to an official stock exchange listing
Bonds (continued)
United KingdomAstraZeneca PLC 0.75% 16 - 12.05.24 100,000 EUR 103,150 102,738 0.19AstraZeneca PLC 0.875% 14 - 24.11.21 100,000 EUR 101,430 101,078 0.19Aviva PLC FRN 13 - 05.07.43 100,000 EUR 113,854 114,266 0.21Barclays Bank PLC 6.625% 11 - 30.03.22 100,000 EUR 108,415 107,914 0.20Barclays PLC FRN 17 - 14.11.23 100,000 EUR 101,234 101,173 0.19Barclays PLC 1.875% 16 - 23.03.21 100,000 EUR 100,877 100,471 0.19Barclays PLC FRN 17 - 07.02.28 100,000 EUR 99,433 102,237 0.19Barclays PLC FRN 20 - 02.04.25 100,000 EUR 109,070 110,295 0.21British Telecommunications PLC 0.50% 19 - 12.09.25 100,000 EUR 102,140 101,785 0.19British Telecommunications PLC 0.625% 16 -10.03.21 100,000 EUR 100,202 100,167 0.19British Telecommunications PLC 1.00% 17 - 21.11.24 100,000 EUR 102,770 103,455 0.19Coca-Cola European Partners PLC 0.75% 16 -24.02.22 100,000 EUR 101,250 101,055 0.19Compass Group PLC 1.875% 14 - 27.01.23 100,000 EUR 104,500 104,378 0.19DS Smith PLC 1.375% 17 - 26.07.24 100,000 EUR 103,860 103,532 0.19easyJet PLC 1.125% 16 - 18.10.23 100,000 EUR 98,250 98,000 0.18GlaxoSmithKline Capital PLC Zero Coupon 19 -23.09.23 100,000 EUR 100,441 100,491 0.19GlaxoSmithKline Capital PLC 4.00% 05 - 16.06.25 100,000 EUR 119,149 118,412 0.22HSBC Holdings PLC FRN 20 - 13.11.26 100,000 EUR 100,897 101,311 0.19HSBC Holdings PLC 0.875% 16 - 06.09.24 100,000 EUR 102,570 103,595 0.19HSBC Holdings PLC FRN 18 - 04.12.24 100,000 EUR 104,136 104,765 0.20Informa PLC 1.50% 18 - 05.07.23 100,000 EUR 102,690 102,606 0.19Lloyds Bank Corporate Markets PLC 0.25% 19 -04.10.22 100,000 EUR 100,522 100,628 0.19Lloyds Bank PLC 1.00% 14 - 19.11.21 100,000 EUR 101,298 101,289 0.19Lloyds Banking Group PLC FRN 19 - 12.11.25 100,000 EUR 100,736 101,178 0.19Lloyds Banking Group PLC FRN 18 - 15.01.24 100,000 EUR 100,530 101,132 0.19Lloyds Banking Group PLC FRN 20 - 01.04.26 100,000 EUR 113,030 113,692 0.21Mondi Finance PLC 1.50% 16 - 15.04.24 100,000 EUR 105,119 104,786 0.20Motability Operations Group PLC 1.625% 15 -09.06.23 100,000 EUR 105,170 104,714 0.20Nationwide Building Society 0.25% 20 - 22.07.25 100,000 EUR 101,180 101,021 0.19Nationwide Building Society FRN 18 - 08.03.26 100,000 EUR 105,558 105,923 0.20Natwest Group PLC FRN 18 - 02.03.26 100,000 EUR 104,300 106,133 0.20Natwest Group PLC FRN 17 - 08.03.23 200,000 EUR 204,758 204,916 0.38NatWest Markets PLC 2.75% 20 - 02.04.25 100,000 EUR 111,308 111,113 0.21OTE PLC 2.375% 18 - 18.07.22 100,000 EUR 103,698 103,492 0.19Santander UK PLC 1.125% 15 - 14.01.22 100,000 EUR 101,595 101,565 0.19Standard Chartered PLC FRN 17 - 03.10.23 100,000 EUR 101,514 101,571 0.19Standard Chartered PLC 3.125% 14 - 19.11.24 100,000 EUR 109,603 109,997 0.21Tesco Corporate Treasury Services PLC 1.375% 18 -24.10.23 100,000 EUR 103,883 103,638 0.19Vodafone Group PLC 0.50% 16 - 30.01.24 100,000 EUR 101,818 101,798 0.19Vodafone Group PLC 1.125% 17 - 20.11.25 100,000 EUR 105,844 105,502 0.20Vodafone Group PLC 1.25% 16 - 25.08.21 100,000 EUR 101,357 101,050 0.19Vodafone Group PLC 1.75% 16 - 25.08.23 100,000 EUR 105,530 105,014 0.20
Xtrackers II
Xtrackers II ESG EUR CORPORATE BOND SHORT DURATION UCITS ETF(B) (continued)
Statement of Investmentsas at 31 December 2020(expressed in EUR)
The accompanying notes form an integral part of these financial statements.
363

DescriptionNominal
ValueCurrency
(local) Cost Market Value
% ofNet
Assets
Transferable securities and money market instruments admitted to an official stock exchange listing
Bonds (continued)
United Kingdom (continued)Vodafone Group PLC 4.65% 10 - 20.01.22 100,000 EUR 105,248 105,102 0.20WPP Finance 2013 3.00% 13 - 20.11.23 100,000 EUR 109,462 109,034 0.20
4,683,379 4,688,012 8.77United States3M Co. 0.375% 16 - 15.02.22 100,000 EUR 100,860 100,644 0.193M Co. 0.95% 15 - 15.05.23 100,000 EUR 103,155 103,041 0.19American Express Credit Corp. 0.625% 16 - 22.11.21 100,000 EUR 100,945 100,783 0.19American Honda Finance Corp. 0.75% 17 - 17.01.24 100,000 EUR 102,771 102,557 0.19American Honda Finance Corp. 1.95% 20 - 18.10.24 100,000 EUR 107,759 107,605 0.20Apple Inc. 0.875% 17 - 24.05.25 100,000 EUR 105,310 104,638 0.20Apple Inc. 1.375% 15 - 17.01.24 100,000 EUR 105,281 105,145 0.20Archer-Daniels-Midland Co. 1.00% 18 - 12.09.25 100,000 EUR 105,742 105,295 0.20BMW US Capital LLC 0.625% 15 - 20.04.22 200,000 EUR 202,505 202,356 0.38BMW US Capital LLC 1.125% 15 - 18.09.21 150,000 EUR 151,902 151,590 0.28Booking Holdings Inc. 0.80% 17 - 10.03.22 100,000 EUR 101,033 101,017 0.19Bristol-Myers Squibb Co. 1.00% 15 - 15.05.25 100,000 EUR 105,368 105,320 0.20Citigroup Inc. 0.75% 16 - 26.10.23 100,000 EUR 102,190 102,423 0.19Citigroup Inc. FRN 20 - 06.07.26 100,000 EUR 103,577 105,330 0.20Citigroup Inc. 1.375% 14 - 27.10.21 200,000 EUR 203,511 202,998 0.38Citigroup Inc. FRN 18 - 24.07.26 100,000 EUR 106,601 106,226 0.20Coca-Cola Co. 0.50% 17 - 08.03.24 100,000 EUR 102,441 102,322 0.19Ecolab Inc. 1.00% 16 - 15.01.24 100,000 EUR 103,616 103,104 0.19Emerson Electric Co. 1.25% 19 - 15.10.25 100,000 EUR 106,653 106,551 0.20Fidelity National Information Services Inc. 0.75% 19 -21.05.23 100,000 EUR 102,176 102,017 0.19Fidelity National Information Services Inc. 1.10% 17 -15.07.24 100,000 EUR 103,928 103,913 0.19Fiserv Inc. 0.375% 19 - 01.07.23 100,000 EUR 101,308 101,233 0.19Goldman Sachs Group Inc. 1.375% 15 - 26.07.22 100,000 EUR 102,605 102,541 0.19Goldman Sachs Group Inc. 1.375% 17 - 15.05.24 100,000 EUR 102,850 103,220 0.19Goldman Sachs Group Inc. 2.00% 15 - 27.07.23 100,000 EUR 105,698 105,480 0.20Goldman Sachs Group Inc. 2.125% 14 - 30.09.24 100,000 EUR 107,622 107,628 0.20Goldman Sachs Group Inc. 2.50% 14 - 18.10.21 100,000 EUR 102,391 102,306 0.19Goldman Sachs Group Inc. 3.375% 20 - 27.03.25 100,000 EUR 113,330 113,939 0.21Harley-Davidson Financial Services Inc. 3.875% 20 -19.05.23 100,000 EUR 107,490 108,455 0.20Illinois Tool Works Inc. 0.25% 19 - 05.12.24 100,000 EUR 101,508 101,559 0.19International Business Machines Corp. 0.375% 19 -31.01.23 100,000 EUR 101,462 101,193 0.19International Business Machines Corp. 0.875% 19 -31.01.25 100,000 EUR 104,080 104,274 0.20International Business Machines Corp. 0.95% 17 -23.05.25 100,000 EUR 104,995 104,983 0.20International Business Machines Corp. 1.125% 16 -06.09.24 100,000 EUR 105,338 104,905 0.20International Flavors & Fragrances Inc. 1.75% 16 -14.03.24 100,000 EUR 105,821 105,416 0.20Johnson & Johnson 0.25% 16 - 20.01.22 100,000 EUR 100,849 100,671 0.19
Xtrackers II
Xtrackers II ESG EUR CORPORATE BOND SHORT DURATION UCITS ETF(B) (continued)
Statement of Investmentsas at 31 December 2020(expressed in EUR)
The accompanying notes form an integral part of these financial statements.
364
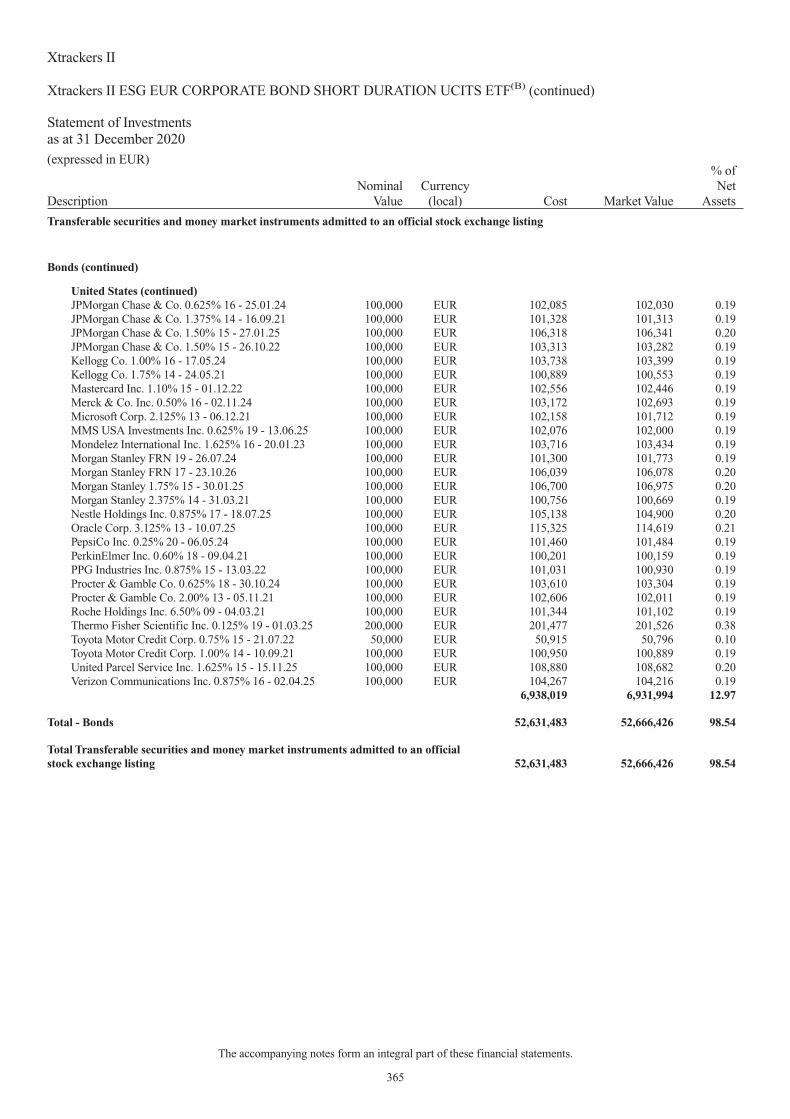
DescriptionNominal
ValueCurrency
(local) Cost Market Value
% ofNet
Assets
Transferable securities and money market instruments admitted to an official stock exchange listing
Bonds (continued)
United States (continued)JPMorgan Chase & Co. 0.625% 16 - 25.01.24 100,000 EUR 102,085 102,030 0.19JPMorgan Chase & Co. 1.375% 14 - 16.09.21 100,000 EUR 101,328 101,313 0.19JPMorgan Chase & Co. 1.50% 15 - 27.01.25 100,000 EUR 106,318 106,341 0.20JPMorgan Chase & Co. 1.50% 15 - 26.10.22 100,000 EUR 103,313 103,282 0.19Kellogg Co. 1.00% 16 - 17.05.24 100,000 EUR 103,738 103,399 0.19Kellogg Co. 1.75% 14 - 24.05.21 100,000 EUR 100,889 100,553 0.19Mastercard Inc. 1.10% 15 - 01.12.22 100,000 EUR 102,556 102,446 0.19Merck & Co. Inc. 0.50% 16 - 02.11.24 100,000 EUR 103,172 102,693 0.19Microsoft Corp. 2.125% 13 - 06.12.21 100,000 EUR 102,158 101,712 0.19MMS USA Investments Inc. 0.625% 19 - 13.06.25 100,000 EUR 102,076 102,000 0.19Mondelez International Inc. 1.625% 16 - 20.01.23 100,000 EUR 103,716 103,434 0.19Morgan Stanley FRN 19 - 26.07.24 100,000 EUR 101,300 101,773 0.19Morgan Stanley FRN 17 - 23.10.26 100,000 EUR 106,039 106,078 0.20Morgan Stanley 1.75% 15 - 30.01.25 100,000 EUR 106,700 106,975 0.20Morgan Stanley 2.375% 14 - 31.03.21 100,000 EUR 100,756 100,669 0.19Nestle Holdings Inc. 0.875% 17 - 18.07.25 100,000 EUR 105,138 104,900 0.20Oracle Corp. 3.125% 13 - 10.07.25 100,000 EUR 115,325 114,619 0.21PepsiCo Inc. 0.25% 20 - 06.05.24 100,000 EUR 101,460 101,484 0.19PerkinElmer Inc. 0.60% 18 - 09.04.21 100,000 EUR 100,201 100,159 0.19PPG Industries Inc. 0.875% 15 - 13.03.22 100,000 EUR 101,031 100,930 0.19Procter & Gamble Co. 0.625% 18 - 30.10.24 100,000 EUR 103,610 103,304 0.19Procter & Gamble Co. 2.00% 13 - 05.11.21 100,000 EUR 102,606 102,011 0.19Roche Holdings Inc. 6.50% 09 - 04.03.21 100,000 EUR 101,344 101,102 0.19Thermo Fisher Scientific Inc. 0.125% 19 - 01.03.25 200,000 EUR 201,477 201,526 0.38Toyota Motor Credit Corp. 0.75% 15 - 21.07.22 50,000 EUR 50,915 50,796 0.10Toyota Motor Credit Corp. 1.00% 14 - 10.09.21 100,000 EUR 100,950 100,889 0.19United Parcel Service Inc. 1.625% 15 - 15.11.25 100,000 EUR 108,880 108,682 0.20Verizon Communications Inc. 0.875% 16 - 02.04.25 100,000 EUR 104,267 104,216 0.19
6,938,019 6,931,994 12.97
Total - Bonds 52,631,483 52,666,426 98.54
Total Transferable securities and money market instruments admitted to an officialstock exchange listing 52,631,483 52,666,426 98.54
Xtrackers II
Xtrackers II ESG EUR CORPORATE BOND SHORT DURATION UCITS ETF(B) (continued)
Statement of Investmentsas at 31 December 2020(expressed in EUR)
The accompanying notes form an integral part of these financial statements.
365

DescriptionNominal
ValueCurrency
(local) Cost Market Value
% ofNet
Assets
Other transferable securities and money market instruments
Bonds
United StatesAbbVie Inc. 1.25% 20 - 01.06.24 100,000 EUR 104,045 103,946 0.19AbbVie Inc. 1.50% 20 - 15.11.23 100,000 EUR 104,020 104,420 0.20
208,065 208,366 0.39
Total - Bonds 208,065 208,366 0.39
Total Other transferable securities and money market instruments 208,065 208,366 0.39
TOTAL INVESTMENT PORTFOLIO 52,839,548 52,874,792 98.93
TOTAL INVESTMENT PORTFOLIO INCLUDING ACCRUED INTEREST 53,276,199 99.68
(B) The Sub-Fund was launched on 23 July 2020. Please see point 1 in the significant events of the year section of the Notes to the Financial Statements of this annualreport for further information.
Xtrackers II
Xtrackers II ESG EUR CORPORATE BOND SHORT DURATION UCITS ETF(B) (continued)
Statement of Investmentsas at 31 December 2020(expressed in EUR)
The accompanying notes form an integral part of these financial statements.
366

1. General
a) The Company
Xtrackers II (the “Company”) is registered in the Grand Duchy of Luxembourg as an undertaking for collective investment pursuant toPart I of the Luxembourg law of 17 December 2010 relating to undertakings for collective investment, as may be amended (the “Law”).
The Company is an investment company that has been incorporated under the laws of the Grand Duchy of Luxembourg as a sociétéd’investissement à capital variable (“SICAV”) under the name �db x-trackers II� on 7 February 2007 for an unlimited period. It changedits name to �Xtrackers II� on 16 February 2018. The minimum capital required by Luxembourg law is Euro 1,250,000.
The Articles of Incorporation have been deposited with the Luxembourg Trade and Companies’Register (“Registre de Commerce et desSociétés de Luxembourg”) and were published in the Mémorial of the Grand Duchy of Luxembourg (the “Mémorial”) on 1 March 2007.The Articles of Incorporation were last amended by an extraordinary general meeting of shareholders on 6 May 2020 and the minutes ofsuch meeting were published in the Recueil Electronique des Sociétés et Associations (Luxembourg) (the �RESA�) on 11 May 2020. TheCompany is registered with the Luxembourg Trade and Companies’ Register under number B-124.284.
The Company is presently structured as an umbrella fund to provide both institutional and retail investors with a variety of sub-funds (the�Sub-Funds� or individually a �Sub-Fund�) of which the performance may be linked partially or in full to the performance of anunderlying asset, such as, for instance, a basket of securities or an index.
As at 31 December 2020, all Sub-Funds of the Company are exchange traded funds (�ETF�).
As at 31 December 2020, the Company has 39 active Sub-Funds:
Sub-Fund Launch DateXtrackers II EUROZONE GOVERNMENT BOND UCITS ETF 22 May 2007Xtrackers II EUR OVERNIGHT RATE SWAP UCITS ETF 25 May 2007Xtrackers II EUROZONE GOVERNMENT BOND 1-3 UCITS ETF 25 May 2007Xtrackers II EUROZONE GOVERNMENT BOND 3-5 UCITS ETF 25 May 2007Xtrackers II EUROZONE GOVERNMENT BOND 5-7 UCITS ETF 30 May 2007Xtrackers II EUROZONE GOVERNMENT BOND 7-10 UCITS ETF 30 May 2007Xtrackers II EUROZONE GOVERNMENT BOND 15-30 UCITS ETF 1 June 2007Xtrackers II EUROZONE GOVERNMENT BOND 25+ UCITS ETF 5 June 2007Xtrackers II EUROZONE INFLATION-LINKED BOND UCITS ETF 8 June 2007Xtrackers II GLOBAL INFLATION-LINKED BOND UCITS ETF 8 June 2007Xtrackers II ITRAXX CROSSOVER SWAP UCITS ETF 16 July 2007Xtrackers II ITRAXX EUROPE SWAP UCITS ETF 16 July 2007Xtrackers II GBP OVERNIGHT RATE SWAP UCITS ETF 10 October 2007Xtrackers II IBOXX GERMANY COVERED BOND SWAP UCITS ETF 10 October 2007Xtrackers II USD OVERNIGHT RATE SWAP UCITS ETF 10 October 2007Xtrackers II ITRAXX CROSSOVER SHORT DAILY SWAP UCITS ETF 7 November 2007Xtrackers II EUROZONE GOVERNMENT BOND SHORT DAILY SWAP UCITS ETF 6 May 2008Xtrackers II USD EMERGING MARKETS BOND UCITS ETF 6 May 2008Xtrackers II GLOBAL GOVERNMENT BOND UCITS ETF 20 October 2008Xtrackers II US TREASURIES 1-3 UCITS ETF 7 July 2009Xtrackers II US TREASURIES UCITS ETF 7 July 2009Xtrackers II GERMANY GOVERNMENT BOND 1-3 UCITS ETF 5 January 2010Xtrackers II GERMANY GOVERNMENT BOND UCITS ETF 5 January 2010Xtrackers II EUR CORPORATE BOND UCITS ETF 23 February 2010Xtrackers II SINGAPORE GOVERNMENT BOND UCITS ETF 11 May 2010Xtrackers II AUSTRALIA GOVERNMENT BOND UCITS ETF 19 May 2010Xtrackers II EUROZONE AAA GOVERNMENT BOND SWAP UCITS ETF 22 September 2010Xtrackers II IBOXX EUROZONE GOVERNMENT BOND YIELD PLUS UCITS ETF 22 September 2010Xtrackers II ESG EUR CORPORATE BOND UCITS ETF 18 October 2010Xtrackers II ITALY GOVERNMENT BOND 0-1 SWAP UCITS ETF 12 January 2012Xtrackers II EUR COVERED BOND SWAP UCITS ETF 27 November 2012Xtrackers II IBOXX EUROZONE GOVERNMENT BOND YIELD PLUS 1-3 UCITS ETF 14 August 2013
Xtrackers II
Notes to the Financial Statements
367

1. General (continued)
a) The Company (continued)
Sub-Fund Launch DateXtrackers II JAPAN GOVERNMENT BOND UCITS ETF 15 November 2013Xtrackers II GLOBAL AGGREGATE BOND SWAP UCITS ETF 6 March 2014Xtrackers II EUR HIGH YIELD CORPORATE BOND 1-3 SWAP UCITS ETF 8 January 2015Xtrackers II EUR HIGH YIELD CORPORATE BOND UCITS ETF 8 January 2015Xtrackers II HARVEST CHINA GOVERNMENT BOND UCITS ETF 8 July 2015Xtrackers II USD ASIA EX JAPAN CORPORATE BOND UCITS ETF 2 September 2016Xtrackers II ESG EUR CORPORATE BOND SHORT DURATION UCITS ETF 23 July 2020
The liabilities of each Sub-Fund shall be segregated on a Sub-Fund by Sub-Fund basis with third party creditors having recourse only tothe assets of the Sub-Fund concerned.
Significant events of the year:
1. During the year ending 31 December 2020, the following Sub-Fund has been launched:
Sub-Fund Launch DateXTRACKERS II ESG EUR CORPORATE BOND SHORT DURATION UCITS ETF 23 July 2020
2. On 10 January 2020, the Company informed Shareholders that the Prospectus was updated to clarify in more detail the operation ofDirect Replication Sub-Funds. The update made clear that Sub-Funds following a Full Index Replication methodology may notcontain all of the constituents of the relevant index, and accordingly such Sub-Funds may hold other transferable securities or othereligible assets on a time to time basis as opposed to on an exceptional basis. The notice further explained that certain Sub-Fundsclassified as following a Full Index Replication methodology or an Optimised Index Replication methodology respectively would bere-designated. These changes took effect on 12 February 2020.
3. On 10 January 2020, the Company informed Shareholders that with effect from 12 February 2020, DWS Investment GmbH, actingas investment manager of the Company for Direct Replication Funds, intended to extend the practical operation of the delegation toinclude DWS Investments Hong Kong Limited, such that the Investment Manager may, from time to time and in accordance with anagreed process, delegate certain of its sub-portfolio management functions in respect of Direct Replication Funds to DWSInvestments UK Limited and/or DWS Investments Hong Kong Limited.
4. During a reconvened extraordinary general meeting of shareholders held on 6 May 2020 it was decided to amend article 21 of theArticles of Incorporation in order to provide for the possibility of the Board of Directors to decide on the split or consolidation of theShares of any Sub-Fund or Class, with effect from 7 May 2020.
5. During the annual general meeting of shareholders held on 17 April 2020, the following proposed resolution was not passed: “6.Statutory appointments and remuneration”. The current Directors remained in office and convened a general meeting ofshareholders on 26 June 2020 (the “General Meeting”) in order to vote on the appointment of Directors. All resolutions broughtbefore the General Meeting passed and Manooj Mistry, Philippe Ah-Sun, Alex McKenna and Freddy Brausch were re-elected to theBoard of Directors. Thilo Wendenburg was newly elected to the Board of Directors. The remuneration of EUR 15,000 for FreddyBrausch for the period from the annual general meeting held on 8 April 2019 to the next annual general meeting (which was held on17 April 2020) was approved by a majority of Shareholders at the annual general meeting dated 8 April 2019. In order to bring theapproval of Director’s remuneration in line with the appointment letters of Freddy Brausch and Thilo Wendenburg, remuneration forthe period from 17 April 2020 until the annual general meeting of Shareholders that will approve the annual accounts for thefinancial year ending 31 December 2020 (the “2021 AGM”) will be voted upon by Shareholders at the 2021 AGM. As such, noresolutions to approve the remuneration of Directors were brought before the General Meeting.
6. Manooj Mistry resigned as a Director with effect from 30 June 2020.
7. The Covid-19 coronavirus has spread since January 2020 and has subsequently led to a serious economic crisis. The rapidproliferation of the virus was reflected in, among other things, significant price market distortions and substantially increasedvolatility at the same time. Restrictions on freedom of movement, repeated lockdown measures, production stoppages, as well asdisrupted supply chains, are exerting major pressure on downstream economic processes, which caused global economic prospectsto deteriorate considerably. Even though gradual recovery was to be observed again in the markets in the interim – due, among otherthings, to assistance programs in the context of monetary and fiscal policy as well as the introduction of vaccination campaigns – theactual or possible mid- to long-term effects of the crisis on the economy, individual markets and sectors, as well as the socialimplications, cannot be reliably evaluated or adequately forecast at the time of preparing this report in light of the pace of the globalspread of the virus and the associated high degree of uncertainty. Consequently, there may still be a material influence on the
Xtrackers II
Notes to the Financial Statements (continued)
368

1. General (continued)
a) The Company (continued)
respective Sub-Funds assets. A high level of uncertainty exists in relation to the financial implications of the pandemic, as these aredependent on external factors such as the spread of the virus and the measures taken by individual governments and central banks,the successful stemming of the development of infection rates and the speedy and sustainable restart of the economy.
The Management Company is therefore continuing its efforts, within the framework of its risk management strategy, to assess theseuncertainties and their possible impact on the activities, liquidity and performance of the respective Sub-Funds. The Board ofDirectors is ensuring that the Management Company is taking all measures deemed appropriate to protect investor interests to thegreatest possible extent. In coordination with the service providers, the Board of Directors observed the consequences of theCovid-19 coronavirus crisis and adequately included its impact on the respective Sub-Funds and the markets in which the respectiveSub-Funds invest into its decision-making processes. As of the date of this report, no significant redemption requests had been madein respect of the respective Sub-Funds; the effects on the respective Sub-Funds’ share certificate transactions are continuouslymonitored by the Management Company; the performance capability of the most important service providers did not experience anysignificant impairment. In this context, the Board of Directors satisfied itself in line with numerous national guidelines andfollowing discussions with the most important service providers (especially the Depositary, the portfolio management and the fundadministration) that the measures taken and the business continuity plans put in place (including extensive hygiene measures on thepremises, restrictions on business travel and events, precautions to ensure the reliable and smooth running of business processes inthe event of a suspected case of Covid-19 coronavirus infection, expansion of the technical options for mobile working) will curb thecurrently foreseeable or ongoing operational risks and will ensure that the respective Sub-Funds’ activities will not be disrupted.
At the time of preparing this report, the Board of Directors is of the opinion that there are no signs indicating that any of therespective Sub-Funds should not be continued, nor were there any liquidity problems for the respective Sub-Funds.
8. With effect from 31 January 2020 the United Kingdom is no longer a Member State of the European Union. A transitional periodended on 31 December 2020 while the United Kingdom and EU negotiate additional arrangements. Notwithstanding the departureof the United Kingdom from the European Union and the end of the transitional period there is no need to amend the structure of theCompany or replace certain service providers and the Company continues to be able to fully operate in this post-Brexit environment.Funds that were passported for public offer into the United Kingdom under the UCITS Directive can continue to be offered in theUnited Kingdom pursuant to the temporary permissions regime.
For other significant events of the year, please refer to point 4 in the section �Information for Shareholders - unaudited�.
b) Investment Objectives and Policies
A Sub-Fund may carry out its Investment Objective via an Indirect Investment Policy and/or a Direct Investment Policy as more fullydescribed in the following paragraphs.
Sub-Funds with an Indirect Investment Policy
The Sub-Funds with an Indirect Investment Policy are identified by the reference �SWAP� in their name. Sub-Funds with an IndirectInvestment Policy (�Indirect Replication Funds�) may not invest directly in the constituents of the Reference Index. Instead, the exposureto the performance of the Reference Index will be achieved by way of derivative transactions and/or instruments (the �DerivativeTransaction(s)�). In particular, an Indirect Replication Fund will conclude OTC swap transactions negotiated at arm’s length with one ormore Swap Counterparties (the �OTC Swap Transaction(s)�). For the avoidance of doubt, the OTC Swap Transactions would qualify astotal return swaps within the meaning of Regulation (EU) 2015/2365 of the European Parliament and of the Council of 25 November2015 on transparency of securities financing transactions and of reuse and amending Regulation (EU) No 648/2012 (the �SFTRRegulation�). Indirect Replication Funds do not currently provide for the possibility to enter into securities lending agreements, buy-sellor sell-buy back transactions, margin lending transactions or repurchase agreements (and/or reverse repurchase agreements), as coveredby the SFTR Regulation.
In order to achieve its Investment Objective and in accordance with the Investment Restrictions, an Indirect Replication Fund may at anytime invest part or all of the net proceeds of any issue of its Shares:
(a) in Invested Assets and use one or more Derivative Transactions the purpose of which is to exchange all or part of theperformance and/or income of such Invested Assets to gain exposure to the Reference Index (an �Unfunded Swap�) (refer toNote 4); and/or,
(b) in one or more Derivative Transactions the purpose of which is to exchange all or part of the invested proceeds to gain exposureto the Reference Index (a �Funded Swap�).
The Invested Assets that can be subject to an Unfunded Swap are UCITS eligible fixed income securities, unless otherwise specified inthe relevant Product Annex.
Xtrackers II
Notes to the Financial Statements (continued)
369

1. General (continued)
b) Investment Objectives and Policies (continued)
For Funded Swaps, the maximum proportion of Net Asset Value that is subject to Derivative Transactions is 110 percent. excluding theimpact of fees and foreign exchange (�FX�) hedging arrangements, as applicable; whilst the expected proportion of Net Asset Value thatis subject to Derivative Transactions is 100 percent. of the Net Asset Value, excluding the impact of fees and FX hedging arrangements,as applicable.
For Unfunded Swaps, the maximum proportion of the Net Asset Value that is subject to Derivatives Transactions in relation to theReference Index is 110 percent. of the Net Asset Value excluding the impact of fees and FX hedging arrangements, as applicable; whilstthe expected proportion of the Net Asset Value that is subject to Derivative Transactions in relation to the Reference Index is 100 percent.of the Net Asset Value, excluding the impact of fees and FX hedging arrangements, as applicable.
For Unfunded Swaps, the maximum and expected proportion of the Net Asset Value that is subject to Derivatives Transactions in relationto Invested Assets is the same proportion as the proportion of the value of Invested Assets to the Net Asset Value of the relevantSub-Fund.
An Indirect Replication Fund may, with due regard to the best interests of its Shareholders and subject to any conditions set forth in eachspecific ProductAnnex, decide from time to time to switch partially or totally from a Funded Swap to an Unfunded Swap, and vice versa.
The Invested Assets, Derivative Transactions and any techniques used to link the Invested Assets to the Reference Index or the DerivativeTransactions, or the invested proceeds to the Reference Index will be managed by the relevant Investment Manager and/or theSub-Portfolio Manager. The management of the Invested Assets will generally not involve the active buying and selling of securities onthe basis of investment judgement and economic, financial and market analysis.
In principle, the return that the Shareholder will receive will largely be dependent on the performance of the Invested Assets, theperformance of the Reference Index and the performance of any techniques used to link the Invested Assets and/or the net proceeds fromthe issue of Shares to the Reference Index.
Depending on the value of the Derivative Transactions and its chosen policy, an Indirect Replication Fund may be at any time fully orpartially exposed to one or more counterparties (including one or more Swap Counterparties), in which case appropriate collateral orother counterparty risk mitigation arrangements compliant with the Regulations and EMIR will be taken/implemented and/or paymentwill be received from the Derivative Transactions counterparties so that the percentage of the counterparty risk exposure remains withinthe limits set out in the Regulations and EMIR (refer to Note 9).
Sub-Funds with a Direct Investment Policy
Sub-Funds with a Direct Investment Policy (�Direct Replication Funds�) may carry out their investment objective by investing in aportfolio of transferable securities or other eligible assets that may comprise either:
(i) all, or a substantial number of, the constituents of the Reference Index (such Sub-Fund a �Full Replication Fund�), or
(ii) an optimised sample of the constituents of the Index, or unrelated transferable securities or other eligible assets (such Sub-Fund an�Optimised Replication Fund�).
Optimised Replication Funds may not hold every constituent or the exact weighting of a constituent in the Reference Index but will seekto provide a return similar to that of its Reference Index by (i) investing either in a sub-set of the constituents of the Reference Index,(ii) seeking to gain exposure to the Reference Index by utilising optimisation techniques and/or (iii) by investing in securities that are notpart of that Reference Index. Use of these investment techniques, the implementation of which is subject to a number of constraintsdetailed in the �Investment Restrictions� section of the Prospectus, may not produce the intended results.
Full Replication Funds may from time to time not contain all of the constituents of the Reference Index, and accordingly such Sub-Fundsmay hold other transferable securities or other eligible assets in accordance with the Investment Restrictions. The extent to which a FullReplication Fund does not contain all of the constituents of the Reference Index will vary, and will be dependent on a number of factorswhich may include, but are not limited to; the nature and number of the constituents of the Reference Index (for example, where aReference Index comprises a large number of securities, contains a number of illiquid securities or where the availability of constituentsecurities for purchase is limited), legal or regulatory restrictions, the size of the Sub-Fund, and the utilisation of efficient portfoliomanagement techniques.
A Direct Investment Policy provides for the possibility to enter into securities lending agreements but does not currently provide for thepossibility to enter into margin lending transactions or repurchase agreements (and/or reverse repurchase agreements), buy-sell orsell-buy back transactions or total return swaps as covered by the SFTR Regulation. Should the Board of Directors decide to provide forsuch possibility, the Prospectus will be updated prior to the entry into force of such decision in order for the Company to comply with therelevant disclosure requirements of the SFTR Regulation for these Direct Replication Funds.
Xtrackers II
Notes to the Financial Statements (continued)
370

1. General (continued)
b) Investment Objectives and Policies (continued)
The types of securities in which Direct Replication Funds may invest include American depositary receipts (�ADRs�), global depositaryreceipts (�GDRs�), and/or non-voting depositary receipts (�NVDRs�). Direct Replication Funds may receive income in respect of thesecurities held by them. Taxes may be imposed on income received from securities held by a Sub-Fund.
Direct Replication Funds may from time to time invest temporary cash balances (such as subscription proceeds which are pendinginvestment or any other temporary cash balances) in FDIs to gain market exposure and to seek to reduce Tracking Error.
In addition, the Investment Manager reserve the right to exclude from the portfolios of the Sub-Funds any securities which do not complywith the Investment Manager’s policies. This will include those securities which have been identified as parties involved in theproduction or manufacturing of controversial conventional weapons, production of delivery devices and the deliberate and knowingproduction of primary key components of controversial conventional weapons, each as determined by the DWS ControversialConventional Weapons identification methodology.
Notwithstanding the foregoing, it should be noted that due to exceptional circumstances, such as, but not limited to, disruptive marketconditions or extremely volatile markets, instances may arise which cause a Direct Replication Fund’s tracking accuracy to divergesubstantially from the Reference Index. Due to various factors, including the Sub-Fund’s fees and expenses involved, the concentrationlimits described in the Investment Restrictions, other legal or regulatory restrictions, and, in certain instances, certain securities beingilliquid, it may not be possible or practicable to purchase all of the constituents in proportion to their weighting in the Reference Index orpurchase certain of them at all.
c) The Shares
The Shares will be issued by the Company exclusively in relation to Sub-Funds with the Investment Policies described in the Prospectusand may be subscribed in cash or in kind (or a combination of both in cash and in kind).
The Shares may be differentiated between Distribution Shares (identified by the letter “D”) and Capitalisation Shares (identified by theletter “C”). Other Classes may be offered with specific features such as fee structures, minimum subscription amount, investor eligibilitycriteria or other specific features. The Shares will be listed for trading on one or more stock exchanges unless otherwise specified in therelevant Product Annex of the Prospectus.
2. Accounting policies
The financial statements of the Company have been prepared according to accounting principles generally accepted in Luxembourg andapplicable for investment funds. The significant accounting policies used are as follows:
a) Valuation of investments
The Net Asset Value of the Company is at any time equal to the total of the Net Asset Values of the Sub-Funds.
The Net Asset Value of the Sub-Funds shall be determined in accordance with the following rules:
(i) the value of any cash on hand or on deposit, bills and demand notes and accounts receivable, prepaid expenses,cash dividends and interest declared or accrued and not yet received is deemed to be the full amount thereof,unless in any case the same is unlikely to be paid or received in full, in which case the value thereof shall bedetermined after making such discount as may be considered appropriate in such case to reflect the true valuethereof;
(ii) the value of all securities which are listed or traded on an official stock exchange or traded on any otherRegulated Market will be valued on the basis of the last available prices on the Business Day immediatelypreceding the Valuation Day or on the basis of the last available prices on the main market on which theinvestments of the Sub-Funds are principally traded. The Board of Directors will approve a pricing servicewhich will supply the above prices. If, in the opinion of the Board of Directors, such prices do not truly reflectthe fair market value of the relevant securities, the value of such securities will be determined in good faith bythe Board of Directors either by reference to any other publicly available source or by reference to such othersources as it deems in its discretion appropriate;
(iii) securities not listed or traded on a stock exchange or a Regulated Market will be valued on the basis of theprobable sales price determined prudently and in good faith by the Board of Directors;
(iv) securities issued by open-ended investment funds shall be valued at their last available net asset value or inaccordance with item (ii) above where such securities are listed;
Xtrackers II
Notes to the Financial Statements (continued)
371
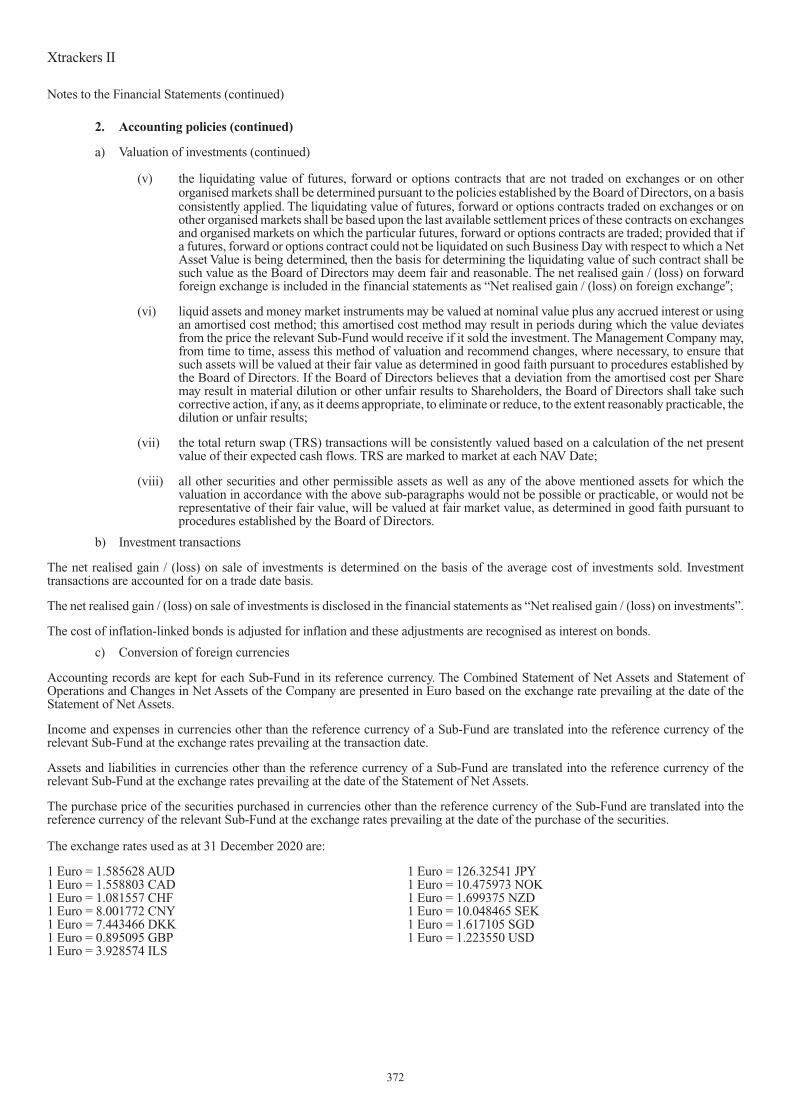
2. Accounting policies (continued)
a) Valuation of investments (continued)
(v) the liquidating value of futures, forward or options contracts that are not traded on exchanges or on otherorganised markets shall be determined pursuant to the policies established by the Board of Directors, on a basisconsistently applied. The liquidating value of futures, forward or options contracts traded on exchanges or onother organised markets shall be based upon the last available settlement prices of these contracts on exchangesand organised markets on which the particular futures, forward or options contracts are traded; provided that ifa futures, forward or options contract could not be liquidated on such Business Day with respect to which a NetAsset Value is being determined, then the basis for determining the liquidating value of such contract shall besuch value as the Board of Directors may deem fair and reasonable. The net realised gain / (loss) on forwardforeign exchange is included in the financial statements as “Net realised gain / (loss) on foreign exchange�;
(vi) liquid assets and money market instruments may be valued at nominal value plus any accrued interest or usingan amortised cost method; this amortised cost method may result in periods during which the value deviatesfrom the price the relevant Sub-Fund would receive if it sold the investment. The Management Company may,from time to time, assess this method of valuation and recommend changes, where necessary, to ensure thatsuch assets will be valued at their fair value as determined in good faith pursuant to procedures established bythe Board of Directors. If the Board of Directors believes that a deviation from the amortised cost per Sharemay result in material dilution or other unfair results to Shareholders, the Board of Directors shall take suchcorrective action, if any, as it deems appropriate, to eliminate or reduce, to the extent reasonably practicable, thedilution or unfair results;
(vii) the total return swap (TRS) transactions will be consistently valued based on a calculation of the net presentvalue of their expected cash flows. TRS are marked to market at each NAV Date;
(viii) all other securities and other permissible assets as well as any of the above mentioned assets for which thevaluation in accordance with the above sub-paragraphs would not be possible or practicable, or would not berepresentative of their fair value, will be valued at fair market value, as determined in good faith pursuant toprocedures established by the Board of Directors.
b) Investment transactions
The net realised gain / (loss) on sale of investments is determined on the basis of the average cost of investments sold. Investmenttransactions are accounted for on a trade date basis.
The net realised gain / (loss) on sale of investments is disclosed in the financial statements as “Net realised gain / (loss) on investments”.
The cost of inflation-linked bonds is adjusted for inflation and these adjustments are recognised as interest on bonds.
c) Conversion of foreign currencies
Accounting records are kept for each Sub-Fund in its reference currency. The Combined Statement of Net Assets and Statement ofOperations and Changes in Net Assets of the Company are presented in Euro based on the exchange rate prevailing at the date of theStatement of Net Assets.
Income and expenses in currencies other than the reference currency of a Sub-Fund are translated into the reference currency of therelevant Sub-Fund at the exchange rates prevailing at the transaction date.
Assets and liabilities in currencies other than the reference currency of a Sub-Fund are translated into the reference currency of therelevant Sub-Fund at the exchange rates prevailing at the date of the Statement of Net Assets.
The purchase price of the securities purchased in currencies other than the reference currency of the Sub-Fund are translated into thereference currency of the relevant Sub-Fund at the exchange rates prevailing at the date of the purchase of the securities.
The exchange rates used as at 31 December 2020 are:
1 Euro = 1.585628 AUD1 Euro = 1.558803 CAD1 Euro = 1.081557 CHF1 Euro = 8.001772 CNY1 Euro = 7.443466 DKK1 Euro = 0.895095 GBP1 Euro = 3.928574 ILS
1 Euro = 126.32541 JPY1 Euro = 10.475973 NOK1 Euro = 1.699375 NZD1 Euro = 10.048465 SEK1 Euro = 1.617105 SGD1 Euro = 1.223550 USD
Xtrackers II
Notes to the Financial Statements (continued)
372

2. Accounting policies (continued)
d) Income
Interest is recorded on an accrual basis net of withholding tax and includes amortization on a straight line basis of premiums andaccretion of discounts that are disclosed in the financial statements as “Accretion of discount or Amortization of premium”. Dividendsare accounted for on the ex-date, net of withholding tax.
e) Net Asset Value
This annual report is prepared on the basis of the last available official net asset value of the Sub-Funds as at 31 December 2020.
3. Taxation of the Company
Under current law and practice, the Company is not liable to any Luxembourg income taxes, stamp or other tax. Investment income andcapital gains, if any, received or realised by the Company may, however, be subject to taxation in the country of origin at varying rates,which normally cannot be recovered by the Company.
Although the Company is, in principle, subject in Luxembourg to a subscription tax (“Taxe d’Abonnement”) at an annual rate of 0.05%or 0.01% for the category of shares reserved to institutional investors, all Sub-Funds which are index-tracking ETFs are exempt fromsuch tax as (i) their Shares are listed or traded on at least one stock exchange or another regulated market operating regularly, recognisedand open to the public; and (ii) their exclusive objective is to reflect the performance of one or more indices, it being understood that thiscondition of exclusive objective does not prevent the management of liquid assets, if any, on an ancillary basis, or the use of techniquesand instruments used for hedging or for purposes of efficient portfolio management. A Grand-Ducal regulation may determineadditional or alternative criteria with respect to the indices under that exemption.
4. Total Return Swaps
The Total Return Swap agreements are concluded at the beginning of the life of the Sub-Funds with the transferable securities and moneymarket instruments having a similar cost to the notional value of the Reference Index. This position may however change during the lifeof the swap whereby the cost of the transferable securities and money market instruments, including net purchased accrued interest, maybecome higher / lower than the notional value of the Reference Index due to additional purchases / sales of transferable securities andmoney market instruments compared to the index notional.
The difference between these notional values is accounted for and disclosed in the financial statements as “Receivable due from swapcounterparty” or as “Payable due to swap counterparty” depending on which notional is higher. The receivable balances will be settled tothe Sub-Fund and the payable balances will be settled to the swap counterparty on termination of the respective Total Return Swapagreement.
The table below lists the notional values of the invested asset and underlying asset of the swap and the unrealised gain / (loss) on swap perSub-Fund as at 31 December 2020.
Sub-Fund Underlying asset Currency NotionalValue -
Investedasset
NotionalValue -
Underlyingasset
Receivable/ (Payable)due from /
(to) swapcounterparty
Unrealisedgain / (loss)
on swap
Unrealisedgain / (loss)
in % ofnet assets
Xtrackers II EUR OVERNIGHTRATE SWAP UCITS ETF
DEUTSCHE BANK EUROOVERNIGHT RATE INDEX®(1) EUR 400,698,686 430,514,615 29,815,929 (23,952,683) 5.58%
Xtrackers II ITRAXX EUROPESWAP UCITS ETF
MARKIT ITRAXX® EUROPE5-YEAR TOTAL RETURN INDEX
EUR 10,064,952 10,050,621 (14,331) 41,412 0.39%
Xtrackers II ITRAXX CROSSOVERSWAP UCITS ETF
MARKIT ITRAXX® CROSSOVER5-YEAR TOTAL RETURN INDEX
EUR 101,368,801 102,751,955 1,383,154 (52,124) 0.05%
Xtrackers II ITRAXX CROSSOVERSHORT DAILY SWAP UCITS ETF
MARKIT ITRAXX® CROSSOVER5-YEAR SHORT TOTAL RETURNINDEX
EUR 87,076,008 96,369,983 9,293,975 (7,678,627) 8.50%
Xtrackers II EUROZONEGOVERNMENT BOND SHORTDAILY SWAP UCITS ETF
SHORT IBOXX® € SOVEREIGNSEUROZONE TOTAL RETURNINDEX
EUR 27,988,050 33,817,665 5,829,615 (5,400,744) 19.12%
Xtrackers II IBOXX GERMANYCOVERED BOND SWAP UCITSETF
IBOXX € GERMANY COVERED®INDEX
EUR 77,075,208 69,058,272 (8,016,936) 8,379,930 10.64%
Xtrackers II USD OVERNIGHTRATE SWAP UCITS ETF
FED FUNDS EFFECTIVE RATETOTAL RETURN INDEX®
USD 173,651,278 203,641,284 29,990,006 (28,672,078) 13.96%
Xtrackers II GBP OVERNIGHTRATE SWAP UCITS ETF
SONIA TOTAL RETURN INDEX® GBP 73,319,582 79,893,602 6,574,020 (4,787,472) 5.96%
Xtrackers II
Notes to the Financial Statements (continued)
373

4. Total Return Swaps (continued)
Sub-Fund Underlying asset Currency NotionalValue -
Investedasset
NotionalValue -
Underlyingasset
Receivable/ (Payable)due from /
(to) swapcounterparty
Unrealisedgain / (loss)
on swap
Unrealisedgain / (loss)
in % ofnet assets
Xtrackers II EUROZONE AAAGOVERNMENT BOND SWAPUCITS ETF
IBOXX € SOVEREIGNSEUROZONE AAA® INDEX
EUR 61,024,162 59,098,492 (1,925,670) 2,238,308 3.57%
Xtrackers II ITALY GOVERNMENTBOND 0-1 SWAP UCITS ETF
FTSE MTS EX-BANK OF ITALYBOT INDEX
EUR 83,976,004 85,319,794 1,343,790 (352,584) 0.41%
Xtrackers II EUR COVERED BONDSWAP UCITS ETF
MARKIT IBOXX EUR LIQUIDCOVERED INDEX®
EUR 6,893,933 6,870,372 (23,561) 86,033 1.20%
Xtrackers II GLOBALAGGREGATE BOND SWAPUCITS ETF
BLOOMBERG BARCLAYSGLOBAL AGGREGATE BONDINDEX
USD 75,772,161 670,752,610 594,980,449 (585,933,122) 75.96%
Xtrackers II EUR HIGH YIELDCORPORATE BOND 1-3 SWAPUCITS ETF
MARKIT IBOXX EUR LIQUIDHIGH YIELD 1-3 INDEX
EUR 139,424,261 183,732,416 44,308,155 (40,064,116) 21.80%
(1)The underlying asset has been changed as of 16 December 2020.
As required by the Securities Financing Transactions Regulation (see Note 5), the Company is required to disclose the amount of assetsengaged in total return swaps expressed as an absolute amount and as a proportion of the Sub-Funds’Net Asset Value. The percentage ofnet assets disclosed in the above table is calculated using the Unrealised gain / (loss) on Swap in absolute terms divided by the total NetAsset Value. This figure is not representative of the counterparty risk calculation.
The table below lists the exposure to invested assets and the underlying asset (index) as at 31 December 2020.
Sub-Fund Underlying asset Currency Exposure -Invested assets
Exposure -Invested
assets in % ofnet assets
Exposure -Underlying asset
Exposure -Underlying asset
in %of net assets
Xtrackers II EUR OVERNIGHT RATESWAP UCITS ETF
DEUTSCHE BANK EUROOVERNIGHT RATE INDEX®(1) EUR 422,956,366 98.56% 429,162,989 100.00%
Xtrackers II ITRAXX EUROPE SWAPUCITS ETF
MARKIT ITRAXX® EUROPE5-YEAR TOTAL RETURN INDEX
EUR 10,489,359 99.74% 10,517,906 100.01%
Xtrackers II ITRAXX CROSSOVERSWAP UCITS ETF
MARKIT ITRAXX® CROSSOVER5-YEAR TOTAL RETURN INDEX
EUR 106,361,697 98.70% 107,767,830 100.01%
Xtrackers II ITRAXX CROSSOVERSHORT DAILY SWAP UCITS ETF
MARKIT ITRAXX® CROSSOVER5-YEAR SHORT TOTAL RETURNINDEX
EUR 88,751,125 98.22% 90,367,152 100.01%
Xtrackers II EUROZONEGOVERNMENT BOND SHORTDAILY SWAP UCITS ETF
SHORT IBOXX® € SOVEREIGNSEUROZONE TOTAL RETURN INDEX
EUR 27,796,909 98.43% 28,245,759 100.02%
Xtrackers II IBOXX GERMANYCOVERED BOND SWAP UCITS ETF
IBOXX € GERMANY COVERED®INDEX
EUR 78,287,622 99.41% 78,765,005 100.02%
Xtrackers II USD OVERNIGHT RATESWAP UCITS ETF
FED FUNDS EFFECTIVE RATETOTAL RETURN INDEX®
USD 203,988,630 99.30% 205,438,487 100.00%
Xtrackers II GBP OVERNIGHT RATESWAP UCITS ETF
SONIA TOTAL RETURN INDEX® GBP 78,506,749 97.73% 80,333,261 100.01%
Xtrackers II EUROZONE AAAGOVERNMENT BOND SWAP UCITSETF
IBOXX € SOVEREIGNS EUROZONEAAA® INDEX
EUR 62,343,755 99.52% 62,656,392 100.01%
Xtrackers II ITALY GOVERNMENTBOND 0-1 SWAP UCITS ETF
FTSE MTS EX-BANK OF ITALY BOTINDEX
EUR 84,346,534 98.87% 85,337,651 100.03%
Xtrackers II EUR COVERED BONDSWAP UCITS ETF
MARKIT IBOXX EUR LIQUIDCOVERED INDEX®
EUR 7,075,963 98.75% 7,165,951 100.00%
Xtrackers II GLOBAL AGGREGATEBOND SWAP UCITS ETF
BLOOMBERG BARCLAYS GLOBALAGGREGATE BOND INDEX
USD 755,113,136 97.89% 771,456,738 100.01%
Xtrackers II EUR HIGH YIELDCORPORATE BOND 1-3 SWAPUCITS ETF
MARKIT IBOXX EUR LIQUID HIGHYIELD 1-3 INDEX
EUR 177,962,355 96.82% 183,894,312 100.05%
(1)The underlying asset has been changed as of 16 December 2020.
Deutsche Bank AG is the counterparty to the swap positions entered into by the Company.
Xtrackers II
Notes to the Financial Statements (continued)
374

4. Total Return Swaps (continued)
All trades open at the end of the financial year ended 31 December 2020 have been transacted through bilateral settlement.
For all the Sub-Funds, there are no maturities for the above swap agreements.
5. Securities financing transactions
The Company is subject to the Regulation (EU) 2015/2365 of the European Parliament and of the Council on transparency of securitiesfinancing transactions and of reuse and amending Regulation (EU) No 648/2012 of the European Parliament (“SFTR”).
A Securities Financing Transaction (“SFT”) is defined in Article 3(11) of the SFTR as:
� a repurchase transaction or a reverse repurchase transaction;� a securities or commodities lending and securities or commodities borrowing;� a buy-sell back transaction or sell-buy back transaction;� a margin lending transaction.
As at 31 December 2020, the Company executed securities lending transactions (refer to Note 8 and Note 9.2).
The SFTR also covers transactions that are commonly referred to as total return swaps (“TRS”) (refer to Note 4).The Company held totalreturn swaps as at 31 December 2020.
As at 31 December 2020, there was no re-investment of cash collateral for any of the Sub-Funds.
6. Futures Contracts
As at 31 December 2020, there were no outstanding futures contracts.
7. Forward Foreign Exchange Contracts
As at 31 December 2020, the Sub-Fund Xtrackers II EUROZONE GOVERNMENT BOND UCITS ETF had the following forwardforeign exchange contracts:
Purchased currency Purchased amount Sold currency Sold amount Maturity Unrealised gain / (loss)EUR
USD 606,756 EUR 495,122 02/02/2021 439
Net unrealised appreciation 439
BNP Paribas SA is the counterparty to this open forward foreign exchange contract.
As at 31 December 2020, the Sub-Fund Xtrackers II GLOBAL INFLATION-LINKED BOND UCITS ETF had the following forwardforeign exchange contracts:
Purchased currency Purchased amount Sold currency Sold amount Maturity Unrealised gain / (loss)EUR
AUD 32,800 EUR 20,483 02/02/2021 195
AUD 16,400 GBP 9,261 02/02/2021 (2)
AUD 76,000 USD 58,197 02/02/2021 380
CAD 51,900 EUR 33,050 02/02/2021 226
CAD 101,700 GBP 58,565 02/02/2021 (195)
CAD 163,400 USD 127,985 02/02/2021 234
CHF 977,893 AUD 1,452,500 02/02/2021 (11,363)
CHF 1,584,439 CAD 2,294,100 02/02/2021 (5,610)
CHF 195,205 DKK 1,340,900 02/02/2021 388
CHF 16,726,227 EUR 15,443,500 02/02/2021 24,550
CHF 26,517,605 GBP 22,226,670 02/02/2021 (297,282)
CHF 2,616,602 JPY 306,653,400 02/02/2021 (6,890)
Xtrackers II
Notes to the Financial Statements (continued)
375

7. Forward Foreign Exchange Contracts (continued)
Purchased currency Purchased amount Sold currency Sold amount Maturity Unrealised gain / (loss)EUR
CHF 471,266 NZD 744,800 02/02/2021 (2,261)
CHF 624,637 SEK 5,797,000 02/02/2021 931
CHF 40,829,451 USD 46,197,800 02/02/2021 26,712
DKK 34,000 CHF 4,963 02/02/2021 (22)
DKK 850,800 EUR 114,381 02/02/2021 (86)
DKK 202,400 GBP 24,604 02/02/2021 (285)
DKK 144,200 USD 23,838 02/02/2021 (97)
EUR 14,013,480 AUD 22,541,600 02/02/2021 (197,390)
EUR 22,702,309 CAD 35,601,800 02/02/2021 (123,822)
EUR 2,836,037 DKK 21,104,300 02/02/2021 932
EUR 380,138,336 GBP 345,084,963 02/02/2021 (5,212,793)
EUR 37,492,230 JPY 4,758,805,900 02/02/2021 (166,025)
EUR 6,745,002 NZD 11,545,600 02/02/2021 (45,906)
EUR 8,953,188 SEK 89,955,800 02/02/2021 3,856
EUR 585,784,709 USD 718,007,618 02/02/2021 (639,011)
GBP 2,163,819 AUD 3,834,300 02/02/2021 (949)
GBP 3,549,671 CAD 6,131,500 02/02/2021 32,646
GBP 443,811 DKK 3,637,200 02/02/2021 6,983
GBP 37,512,912 EUR 41,321,668 02/02/2021 568,430
GBP 5,825,698 JPY 814,510,400 02/02/2021 59,935
GBP 1,041,543 NZD 1,963,800 02/02/2021 8,005
GBP 1,382,670 SEK 15,302,500 02/02/2021 21,624
GBP 91,564,116 USD 123,619,085 02/02/2021 1,283,918
JPY 6,923,900 EUR 54,502 02/02/2021 290
JPY 8,501,800 GBP 60,516 02/02/2021 (299)
JPY 20,040,700 USD 193,942 02/02/2021 190
NZD 900 CHF 572 02/02/2021 0
NZD 16,900 EUR 9,891 02/02/2021 49
NZD 8,500 GBP 4,499 02/02/2021 (24)
NZD 44,000 USD 31,626 02/02/2021 50
SEK 130,100 EUR 12,917 02/02/2021 27
SEK 65,200 GBP 5,853 02/02/2021 (49)
SEK 288,400 USD 35,212 02/02/2021 (68)
USD 1,031,586 AUD 1,354,100 02/02/2021 (11,128)
USD 1,705,139 CAD 2,182,000 02/02/2021 (6,341)
USD 213,009 DKK 1,293,900 02/02/2021 152
USD 18,778,191 EUR 15,319,333 02/02/2021 17,519
USD 28,585,268 GBP 21,172,842 02/02/2021 (296,732)
USD 2,798,742 JPY 289,872,600 02/02/2021 (8,036)
USD 500,134 NZD 698,500 02/02/2021 (2,366)
USD 657,168 SEK 5,389,900 02/02/2021 516
Net unrealised depreciation (4,976,294)
Citigroup Global Markets Europe AG, HSBC France, J.P. Morgan AG and Royal Bank of Canada (UK) are the counterparties to theseopen forward foreign exchange contracts.
Xtrackers II
Notes to the Financial Statements (continued)
376

7. Forward Foreign Exchange Contracts (continued)
As at 31 December 2020, the Sub-Fund Xtrackers II USD EMERGING MARKETS BOND UCITS ETF had the following forwardforeign exchange contracts:
Purchased currency Purchased amount Sold currency Sold amount Maturity Unrealised gain / (loss)USD
EUR 503,478,321 USD 617,023,460 02/02/2021 (572,852)
Net unrealised depreciation (572,852)
Citigroup Global Markets Europe AG and HSBC France are the counterparties to this open forward foreign exchange contract.
As at 31 December 2020, the Sub-Fund Xtrackers II GLOBAL GOVERNMENT BOND UCITS ETF had the following forward foreignexchange contracts:
Purchased currency Purchased amount Sold currency Sold amount Maturity Unrealised gain / (loss)EUR
AUD 13,500 CHF 9,155 02/02/2021 45
AUD 50,400 EUR 31,477 02/02/2021 297
AUD 75,200 GBP 42,468 02/02/2021 (15)
AUD 82,200 USD 63,186 02/02/2021 215
CAD 34,600 GBP 19,925 02/02/2021 (66)
CAD 46,000 USD 36,063 02/02/2021 39
CHF 2,703,779 AUD 4,016,200 02/02/2021 (31,531)
CHF 1,949,966 CAD 2,823,400 02/02/2021 (6,940)
CHF 520,347 DKK 3,574,200 02/02/2021 1,057
CHF 41,549,996 EUR 38,361,800 02/02/2021 62,729
CHF 6,703,063 GBP 5,618,200 02/02/2021 (74,912)
CHF 449,118 ILS 1,635,400 02/02/2021 (871)
CHF 20,882,490 JPY 2,447,334,600 02/02/2021 (55,027)
CHF 224,524 NOK 2,189,800 02/02/2021 (1,249)
CHF 342,671 SEK 3,180,200 02/02/2021 510
CHF 437,161 SGD 656,600 02/02/2021 (1,489)
CHF 42,449,545 USD 48,030,000 02/02/2021 28,513
DKK 4,800 USD 794 02/02/2021 (4)
EUR 29,008,438 AUD 46,668,400 02/02/2021 (412,654)
EUR 20,968,773 CAD 32,883,000 02/02/2021 (114,197)
EUR 5,594,084 DKK 41,627,900 02/02/2021 1,880
EUR 72,081,364 GBP 65,433,300 02/02/2021 (987,008)
EUR 4,828,992 ILS 19,047,000 02/02/2021 (18,423)
EUR 224,568,509 JPY 28,503,535,100 02/02/2021 (990,890)
EUR 2,414,248 NOK 25,503,900 02/02/2021 (18,553)
EUR 3,686,597 SEK 37,039,500 02/02/2021 1,689
EUR 4,700,622 SGD 7,646,800 02/02/2021 (24,955)
EUR 456,718,030 USD 559,725,257 02/02/2021 (430,555)
GBP 3,049,579 AUD 5,403,900 02/02/2021 (1,354)
GBP 2,196,032 CAD 3,793,300 02/02/2021 20,197
GBP 580,586 DKK 4,758,300 02/02/2021 9,112
GBP 46,365,763 EUR 51,070,500 02/02/2021 705,443
GBP 501,084 ILS 2,177,200 02/02/2021 5,461
GBP 23,528,085 JPY 3,289,540,800 02/02/2021 242,057
GBP 250,483 NOK 2,915,200 02/02/2021 1,631
Xtrackers II
Notes to the Financial Statements (continued)
377

7. Forward Foreign Exchange Contracts (continued)
Purchased currency Purchased amount Sold currency Sold amount Maturity Unrealised gain / (loss)EUR
GBP 382,554 SEK 4,233,800 02/02/2021 5,988
GBP 487,820 SGD 874,100 02/02/2021 4,564
GBP 47,438,477 USD 64,032,300 02/02/2021 676,248
JPY 31,437,100 GBP 223,768 02/02/2021 (1,105)
JPY 41,122,700 USD 398,430 02/02/2021 7
SEK 1,100 USD 135 02/02/2021 0
SGD 4,300 USD 3,251 02/02/2021 2
USD 2,662,491 AUD 3,494,000 02/02/2021 (28,161)
USD 1,916,933 CAD 2,452,800 02/02/2021 (6,984)
USD 502,228 DKK 3,050,300 02/02/2021 417
USD 40,410,126 EUR 32,968,300 02/02/2021 36,164
USD 6,557,178 GBP 4,855,357 02/02/2021 (66,410)
USD 433,277 ILS 1,394,000 02/02/2021 (896)
USD 20,540,405 JPY 2,127,182,100 02/02/2021 (57,089)
USD 216,736 NOK 1,867,600 02/02/2021 (1,132)
USD 330,512 SEK 2,710,600 02/02/2021 275
USD 424,851 SGD 563,900 02/02/2021 (1,488)
Net unrealised depreciation (1,529,418)
Citigroup Global Markets Europe AG, HSBC France, J.P. Morgan AG and Royal Bank of Canada (UK) are the counterparties to theseopen forward foreign exchange contracts.
As at 31 December 2020, the Sub-Fund Xtrackers II US TREASURIES UCITS ETF had the following forward foreign exchangecontracts:
Purchased currency Purchased amount Sold currency Sold amount Maturity Unrealised gain / (loss)USD
EUR 832,986,691 USD 1,020,830,997 02/02/2021 (935,739)
USD 6,411,400 EUR 5,208,811 02/02/2021 33,818
Net unrealised depreciation (901,921)
Citigroup Global Markets Europe AG, HSBC France and Royal Bank of Canada (UK) are the counterparties to these open forwardforeign exchange contracts.
Xtrackers II
Notes to the Financial Statements (continued)
378

8. Securities lending
Sub-Funds with a Direct Investment Policy may enter into securities lending transactions (“Securities Lending Transactions”) for up to50% (or up to 30% forAuthorised Sub-Funds with a Direct Investment Policy) of their assets to generate additional income and therewithoffset part or all of their costs. Such transactions are strictly regulated and must, amongst other things, be able to be terminated at anytime at the initiative of the Company. Securities Lending Transactions nonetheless give rise to certain risks including valuation andoperational risks and market and counterparty risks.
Depending on the value of the Securities Lending Transactions and its chosen policy, a Sub-Fund may be at any time fully or partiallyexposed to one or more counterparties, in which case appropriate collateral or other counterparty risk mitigation arrangements compliantwith, (i) Part I of the Luxembourg law of 17 December 2010, as amended, (ii) any amendment or replacement legislation thereto for thetime being in force, (iii) any regulation of any type taken in pursuance of (i) and (ii), (iv) the Directive 2014/91/EU of the EuropeanParliament and of the Council of 23 July 2014 as regards depositary functions, remunerations policies and sanctions, including itsmandatory implementing legislations on an EU or Home Member State level, (v) any sub-custodian agreement entered into between theSecurities Lending Agent (as defined below), the Company, the Management Company and State Street Bank International GmbH,Luxembourg Branch (“SSBL”) as well as (vi) any rule, guideline and general or specific position from time to time adopted by the CSSFpursuant thereto (the “Regulations”) will be taken/implemented and/or payment will be received from the Securities LendingTransactions counterparties so that the percentage of the counterparty risk exposure remains within the limits set out in the Regulations.
For the Sub-Funds with a Direct Investment Policy, the Company has appointed Deutsche Bank AG, acting through its Frankfurt amMain head office and its London and New York branches as the Securities Lending Agent (the “Securities Lending Agent”). TheSecurities LendingAgent has been authorised (i) to enter into Securities LendingTransactions on behalf of the Company and (ii) to investany cash received/held on behalf of the Company as collateral pursuant to such Securities Lending Transactions, in accordance with andwithin the limits set forth in the Agency Securities Lending and Repurchase Agreement, the rules set out in the Prospectus and theRegulations.
The Depositary has delegated the safekeeping function of certain non-cash collateral received by the Sub-Funds to Deutsche Bank AG.
Any income generated by Securities Lending Transactions (reduced by any applicable direct or indirect operational costs and fees arisingtherefrom and paid to the Securities Lending Agent and, as the case may be, to the relevant Investment Manager and/or the Sub-PortfolioManager) will be payable to the relevant Sub-Fund. Unless otherwise specified in the relevant Product Annex and to the extent theSecurities Lending Agent undertakes Securities Lending Transactions in relation to a Sub-Fund, the Securities Lending Agent, therelevant Investment Manager and/or the Portfolio Manager, as the case may be, shall receive a fee for the services provided in thisrespect.
For the year ended 31 December 2020, the Sub-Funds earned net income which is included in the Statement of Operations and Changesin Net Assets as “Income on securities lending, net”.
During the financial year ending 31 December 2020, the Securities Lending Agent and DWS Investments UK Limited (�DWS UK�)received the following portions of the gross lending revenues generated, in order to cover their estimated direct or indirect operationalcosts and fees associated with the services provided in this respect and the oversight of the Securities Lending Transactions.
All securities lending transactions are settled in a bilateral way.
Sub-Fund SecuritiesLending
Agent
DWSUK
Sub-Fund
Xtrackers II EUROZONE GOVERNMENT BOND UCITS ETF 15% 15% 70%Xtrackers II EUROZONE GOVERNMENT BOND 1-3 UCITS ETF 15% 15% 70%Xtrackers II EUROZONE GOVERNMENT BOND 3-5 UCITS ETF 15% 15% 70%Xtrackers II EUROZONE GOVERNMENT BOND 5-7 UCITS ETF 15% 15% 70%Xtrackers II EUROZONE GOVERNMENT BOND 7-10 UCITS ETF 15% 15% 70%Xtrackers II EUROZONE GOVERNMENT BOND 15-30 UCITS ETF 15% 15% 70%Xtrackers II EUROZONE GOVERNMENT BOND 25+ UCITS ETF 15% 15% 70%Xtrackers II GLOBAL INFLATION-LINKED BOND UCITS ETF 15% 15% 70%Xtrackers II GLOBAL GOVERNMENT BOND UCITS ETF 15% 15% 70%Xtrackers II US TREASURIES UCITS ETF 15% 15% 70%Xtrackers II EUR CORPORATE BOND UCITS ETF 15% 15% 70%Xtrackers II GERMANY GOVERNMENT BOND UCITS ETF 15% 15% 70%Xtrackers II GERMANY GOVERNMENT BOND 1-3 UCITS ETF 15% 15% 70%Xtrackers II EUR HIGH YIELD CORPORATE BOND UCITS ETF 15% 15% 70%
Xtrackers II
Notes to the Financial Statements (continued)
379

8. Securities lending (continued)
The value of the securities lent and the market value of the cash collateral and non-cash collateral received for each Sub-Fund as at31 December 2020 is detailed in the following table:
Sub-Fund Sub-FundCurrency
MarketValue of
SecuritiesLent as at
31 December2020 (in EUR)
Market Valueof Collateral
Receivedas at
31 December2020 (in EUR)
Collateral asa Percentage of
the Market Valueof Securities
Lent as at31 December
2020
Xtrackers II EUROZONE GOVERNMENT BOND UCITS ETF EUR 239,264,681 254,322,436 106.29%
Xtrackers II EUROZONE GOVERNMENT BOND 1-3 UCITS ETF EUR 63,762,352 67,193,902 105.38%
Xtrackers II EUROZONE GOVERNMENT BOND 3-5 UCITS ETF EUR 13,469,105 14,227,416 105.63%
Xtrackers II EUROZONE GOVERNMENT BOND 5-7 UCITS ETF EUR 52,085,768 55,018,197 105.63%
Xtrackers II EUROZONE GOVERNMENT BOND 7-10 UCITS ETF EUR 13,777,047 14,537,172 105.52%
Xtrackers II EUROZONE GOVERNMENT BOND 15-30 UCITS ETF EUR 906,631 957,675 105.63%
Xtrackers II EUROZONE GOVERNMENT BOND 25+ UCITS ETF EUR 10,399,452 10,984,943 105.63%
Xtrackers II GLOBAL GOVERNMENT BOND UCITS ETF EUR 32,802,591 34,677,045 105.71%
Xtrackers II EUR CORPORATE BOND UCITS ETF EUR 1,992,598 2,352,740 118.07%
Xtrackers II GERMANY GOVERNMENT BOND UCITS ETF EUR 49,057,989 52,054,231 106.11%
Xtrackers II EUR HIGH YIELD CORPORATE BOND UCITS ETF EUR 2,223,571 2,667,617 119.97%
The following summarises the value of securities that are not split by currency, collateral received, analysed by borrowing counterparty,as at 31 December 2020:
Sub-Fund Sub-FundCurrency
Counterparty Counterparty’scountry ofincorporation
MarketValue of
securities onloan in EUR
MarketValue of
non-cashcollateral
received inEUR
% of NetAssets
Xtrackers II EUROZONEGOVERNMENT BONDUCITS ETF
EUR
Bank of America United States 0 291,573 0.00%
Barclays Bank PLC United Kingdom 9,162,199 10,991,223 0.24%
BNP Paribas BrokerageServices
France 178,881,691 188,952,732 4.56%
Citigroup Global MarketsLimited
United Kingdom 49,525,706 52,152,657 1.26%
Morgan Stanley CapitalServices LLC
United States 1,695,085 1,934,251 0.04%
Xtrackers II EUROZONEGOVERNMENT BOND1-3 UCITS ETF
EUR
BNP Paribas BrokerageServices
France 14,302,820 15,108,070 3.10%
Citigroup Global MarketsLimited
United Kingdom 49,459,532 52,085,832 10.72%
Xtrackers II EUROZONEGOVERNMENT BOND3-5 UCITS ETF
EURBNP Paribas BrokerageServices
France 13,469,105 14,227,416 4.60%
Xtrackers II EUROZONEGOVERNMENT BOND5-7 UCITS ETF
EURBNP Paribas BrokerageServices
France 52,085,768 55,018,197 13.35%
Xtrackers II
Notes to the Financial Statements (continued)
380

8. Securities lending (continued)
Sub-Fund Sub-FundCurrency
Counterparty Counterparty’scountry ofincorporation
MarketValue of
securities onloan in EUR
MarketValue of
non-cashcollateral
received inEUR
% of NetAssets
Xtrackers II EUROZONEGOVERNMENT BOND7-10 UCITS ETF
EUR
BNP Paribas BrokerageServices
France 8,926,471 9,429,032 6.54%
Citigroup Global MarketsLimited
United Kingdom 4,850,576 5,108,140 3.55%
Xtrackers II EUROZONEGOVERNMENT BOND15-30 UCITS ETF
EURBNP Paribas BrokerageServices
France 906,631 957,675 2.98%
Xtrackers II EUROZONEGOVERNMENT BOND25+ UCITS ETF
EURBNP Paribas BrokerageServices
France 10,399,452 10,984,943 6.94%
Xtrackers II GLOBALGOVERNMENT BONDUCITS ETF
EUR
BNP Paribas BrokerageServices
France 22,867,620 24,155,067 1.03%
Citigroup Global MarketsLimited
United Kingdom 9,934,971 10,462,516 0.45%
JP Morgan Securities PLC United States 0 59,462 0.00%
Xtrackers II EURCORPORATE BONDUCITS ETF
EUR
Barclays Bank PLC United Kingdom 1,421,128 1,704,926 0.06%
BNP Paribas BrokerageServices
France 571,470 647,814 0.03%
Xtrackers II GERMANYGOVERNMENT BONDUCITS ETF
EUR
Barclays Bank PLC United Kingdom 1,616,858 1,939,744 0.68%
BNP Paribas BrokerageServices
France 47,441,131 50,114,487 19.86%
Xtrackers II EUR HIGHYIELD CORPORATEBOND UCITS ETF
EUR Barclays Bank PLC United Kingdom 2,223,571 2,667,617 0.46%
Please, refer to Note 9.2 in order to see market value on securities on loan by maturity tenor.
The following summarises the value of collateral received (analysed by currency), as at 31 December 2020:
Sub-Fund Sub-FundCurrency
SecurityCurrency
Non-cash collateral receivedin EUR
Xtrackers II EUROZONE GOVERNMENT BOND UCITS ETF EUR EUR 235,561,464
Xtrackers II EUROZONE GOVERNMENT BOND UCITS ETF EUR CAD 18,760,972
Xtrackers II GLOBAL GOVERNMENT BOND UCITS ETF EUR EUR 34,677,045
Xtrackers II GERMANY GOVERNMENT BOND UCITS ETF EUR EUR 52,054,231
Xtrackers II EUROZONE GOVERNMENT BOND 1-3 UCITS ETF EUR EUR 67,193,902
Xtrackers II EUROZONE GOVERNMENT BOND 3-5 UCITS ETF EUR EUR 14,227,416
Xtrackers II EUROZONE GOVERNMENT BOND 5-7 UCITS ETF EUR EUR 55,018,197
Xtrackers II EUROZONE GOVERNMENT BOND 7-10 UCITS ETF EUR EUR 14,537,172
Xtrackers II EUROZONE GOVERNMENT BOND 15-30 UCITS ETF EUR EUR 957,675
Xtrackers II EUR HIGH YIELD CORPORATE BOND UCITS ETF EUR EUR 2,667,617
Xtrackers II EUROZONE GOVERNMENT BOND 25+ UCITS ETF EUR EUR 10,984,943
Xtrackers II EUR CORPORATE BOND UCITS ETF EUR EUR 2,352,740
Xtrackers II
Notes to the Financial Statements (continued)
381

9. Collateral
9.1 Collateral in respect of swap transactions
The Company may have to provide variation margin for a Sub-Fund (i.e. collateral collected by a counterparty to reflect the results of thedaily marking-to-market or marking-to-model of outstanding non-cleared OTC derivative contracts) to its counterparty to an OTCderivative transaction. In relation to the OTC derivative transactions entered into between the Company and counterparties (includingSwap Counterparties), the Company may deliver or receive requested collateral by way of title transfer or by way of pledge, dependingon the terms of the agreement between the relevant Sub-Fund and the counterparty.
The value of non-cash collateral pledged and cash collateral received by counterparty for each Sub-Fund is detailed in the followingtable, as at 31 December 2020:
Sub-Funds Sub-FundsCurrency
Counterparty Counterparty’scountry
Non-cashCollateral
Pledged (inSub-Fund’s
currency)
CashCollateral
Received (inSub-Fund’s
currency)
% of NetAssets
Xtrackers II EUR OVERNIGHTRATE SWAP UCITS ETF
EUR Deutsche BankAG - London
branch
United Kingdom 0 5,284,120 1.23%
Xtrackers II ITRAXX CROSSOVERSWAP UCITS ETF
EUR Deutsche BankAG - London
branch
United Kingdom 0 2,297,536 2.13%
Xtrackers II ITRAXX CROSSOVERSHORT DAILY SWAP UCITS ETF
EUR Deutsche BankAG - London
branch
United Kingdom 0 731,401 0.81%
Xtrackers II EUROZONEGOVERNMENT BOND SHORTDAILY SWAP UCITS ETF
EUR Deutsche BankAG - London
branch
United Kingdom 0 610,000 2.16%
Xtrackers II IBOXX GERMANYCOVERED BOND SWAP UCITSETF
EUR Deutsche BankAG - London
branch
United Kingdom 0 653,741 0.83%
Xtrackers II USD OVERNIGHTRATE SWAP UCITS ETF
USD Deutsche BankAG - London
branch
United Kingdom 0 269,280 0.13%
Xtrackers II GBP OVERNIGHTRATE SWAP UCITS ETF
GBP Deutsche BankAG - London
branch
United Kingdom 0 768,282 0.96%
Xtrackers II EUROZONE AAAGOVERNMENT BOND SWAPUCITS ETF
EUR Deutsche BankAG - London
branch
United Kingdom 0 674,511 1.08%
Xtrackers II ITALY GOVERNMENTBOND 0-1 SWAP UCITS ETF
EUR Deutsche BankAG - London
branch
United Kingdom 0 1,161,523 1.36%
Xtrackers II EUR COVERED BONDSWAP UCITS ETF
EUR Deutsche BankAG - London
branch
United Kingdom 0 33,024 0.46%
Xtrackers II GLOBALAGGREGATE BOND SWAPUCITS ETF
USD Deutsche BankAG - London
branch
United Kingdom 0 11,420,295 1.48%
Xtrackers II EUR HIGH YIELDCORPORATE BOND 1-3 SWAPUCITS ETF
EUR Deutsche BankAG - London
branch
United Kingdom 0 4,240,623 2.31%
Xtrackers II
Notes to the Financial Statements (continued)
382

9. Collateral (continued)
9.1 Collateral in respect of swap transactions (continued)
The following table provides an analysis by currency of the underlying non-cash collateral pledged and cash collateral received as at31 December 2020:
Sub-Funds Currency ofUnderlying asset
Non-cashCollateral Pledged
(in Sub-Fund’s currency)
Cash Collateral Received(in Sub-Fund’s currency)
Xtrackers II EUR OVERNIGHTRATE SWAP UCITS ETF
EUR 0 5,284,120
Xtrackers II ITRAXX CROSSOVERSWAP UCITS ETF
EUR 0 2,297,536
Xtrackers II ITRAXX CROSSOVERSHORT DAILY SWAP UCITS ETF
EUR 0 731,401
Xtrackers II EUROZONEGOVERNMENT BOND SHORTDAILY SWAP UCITS ETF
EUR 0 610,000
Xtrackers II IBOXX GERMANYCOVERED BOND SWAP UCITSETF
EUR 0 653,741
Xtrackers II USD OVERNIGHTRATE SWAP UCITS ETF
USD 0 269,280
Xtrackers II GBP OVERNIGHTRATE SWAP UCITS ETF
GBP 0 768,282
Xtrackers II EUROZONE AAAGOVERNMENT BOND SWAPUCITS ETF
EUR 0 674,511
Xtrackers II ITALY GOVERNMENTBOND 0-1 SWAP UCITS ETF
EUR 0 1,161,523
Xtrackers II EUR COVERED BONDSWAP UCITS ETF
EUR 0 33,024
Xtrackers II GLOBAL AGGREGATEBOND SWAP UCITS ETF
USD 0 11,420,295
Xtrackers II EUR HIGH YIELDCORPORATE BOND 1-3 SWAPUCITS ETF
EUR 0 4,240,623
As at 31 December 2020, none of the cash collateral received in respect of the swap transactions is re-used.
The Depositary has delegated the safekeeping function of certain non-cash collateral received by the Sub-Funds to State Street Bank andTrust Company. State Street Bank and Trust Company as global sub-custodian has appointed local sub-custodians within the State StreetGlobal Custody Network.
The following table provides an analysis of the maturity tenor of non-cash collateral pledged and cash collateral received in respect ofswap transactions, as at 31 December 2020:
Xtrackers II
Notes to the Financial Statements (continued)
383

9. Collateral (continued)
9.1 Collateral in respect of swap transactions (continued)
Sub-Funds Sub-FundsCurrency
Maturity tenor Non-CashCollateral Pledged
(in Sub-Fund’scurrency)
Cash CollateralReceived
(in Sub-Fund’scurrency)
Xtrackers II EUR OVERNIGHT RATE SWAPUCITS ETF
EUR Open transactions 0 5,284,120
Xtrackers II ITRAXX CROSSOVER SWAPUCITS ETF
EUR Open transactions 0 2,297,536
Xtrackers II ITRAXX CROSSOVER SHORTDAILY SWAP UCITS ETF
EUR Open transactions 0 731,401
Xtrackers II EUROZONE GOVERNMENTBOND SHORT DAILY SWAP UCITS ETF
EUR Open transactions 0 610,000
Xtrackers II IBOXX GERMANY COVEREDBOND SWAP UCITS ETF
EUR Open transactions 0 653,741
Xtrackers II USD OVERNIGHT RATE SWAPUCITS ETF
USD Open transactions 0 269,280
Xtrackers II GBP OVERNIGHT RATE SWAPUCITS ETF
GBP Open transactions 0 768,282
Xtrackers II EUROZONE AAAGOVERNMENT BOND SWAP UCITS ETF
EUR Open transactions 0 674,511
Xtrackers II ITALY GOVERNMENT BOND0-1 SWAP UCITS ETF
EUR Open transactions 0 1,161,523
Xtrackers II EUR COVERED BOND SWAPUCITS ETF
EUR Open transactions 0 33,024
Xtrackers II GLOBAL AGGREGATE BONDSWAP UCITS ETF
USD Open transactions 0 11,420,295
Xtrackers II EUR HIGH YIELD CORPORATEBOND 1-3 SWAP UCITS ETF
EUR Open transactions 0 4,240,623
As at 31 December 2020, there was no non-cash collateral received by the Sub-Funds by way of title transfer collateral arrangementacross swap transactions. As a consequence, there is no need to disclose the ten largest issuers by value of non-cash collateral receivedand credit rating of non-cash collateral received.
9.2 Collateral received in respect of securities lending transactions
The following table provides an analysis of the maturity tenor of associated cash collateral and non-cash collateral received as at31 December 2020:
Sub-Fund Maturity Tenor Market Value on Loanin (EUR)
Collateral receivedin (EUR)
Xtrackers II EUROZONE GOVERNMENT BOND UCITSETF
91 to 365 days 7,148,280 45,800,288
More than 365 days 232,116,401 208,522,148
Total 239,264,681 254,322,436
Xtrackers II EUROZONE GOVERNMENT BOND1-3 UCITS ETF
91 to 365 days 11,678,880 0
More than 365 days 52,083,472 67,193,902
Total 63,762,352 67,193,902
Xtrackers II EUROZONE GOVERNMENT BOND3-5 UCITS ETF
More than 365 days 13,469,105 14,227,416
Total 13,469,105 14,227,416
Xtrackers II
Notes to the Financial Statements (continued)
384

9. Collateral (continued)
9.2 Collateral received in respect of securities lending transactions (continued)
Sub-Fund Maturity Tenor Market Value on Loanin (EUR)
Collateral receivedin (EUR)
Xtrackers II EUROZONE GOVERNMENT BOND5-7 UCITS ETF
More than 365 days 52,085,768 55,018,197
Total 52,085,768 55,018,197
Xtrackers II EUROZONE GOVERNMENT BOND7-10 UCITS ETF
91 to 365 days 0 20,715
More than 365 days 13,777,047 14,516,457
Total 13,777,047 14,537,172
Xtrackers II EUROZONE GOVERNMENT BOND15-30 UCITS ETF
More than 365 days 906,631 957,675
Total 906,631 957,675
Xtrackers II EUROZONE GOVERNMENT BOND 25+UCITS ETF
More than 365 days 10,399,452 10,984,943
Total 10,399,452 10,984,943
Xtrackers II GLOBAL GOVERNMENT BOND UCITS ETF
91 to 365 days 1,308,840 0
More than 365 days 31,493,751 34,677,045
Total 32,802,591 34,677,045
Xtrackers II EUR CORPORATE BOND UCITS ETF
More than 365 days 571,470 2,352,740
Open Transactions 1,421,128 0
Total 1,992,598 2,352,740
Xtrackers II GERMANY GOVERNMENT BOND UCITSETF
91 to 365 days 0 954,735
More than 365 days 49,057,989 51,099,496
Total 49,057,989 52,054,231
Xtrackers II EUR HIGH YIELD CORPORATE BOND UCITSETF
More than 365 days 2,223,571 2,667,617
Total 2,223,571 2,667,617
The following table lists the ten largest issuers by value of non-cash collateral received by the Sub-Funds by way of title transfer collateralarrangement across securities lending transactions, as at 31 December 2020:
Sub-Fund Type of Collateral Issuer of CollateralMarket Value of
Collateral (in EUR)% of Net Assets
Xtrackers II EUROZONEGOVERNMENT BOND UCITSETF
Fixed income Austria Government Bond 81,119,674 2.07%
Fixed income Netherlands Government Bond 53,834,164 1.37%
Fixed income France Government Bond 51,986,198 1.33%
Fixed income Germany Government Bond 32,711,506 0.83%
Fixed income Canadian Government Bond 18,760,972 0.48%
Fixed income Finland Government Bond 15,909,922 0.41%
Xtrackers II EUROZONEGOVERNMENT BOND1-3 UCITS ETF
Fixed income France Government Bond 42,474,314 9.21%
Fixed income Germany Government Bond 17,451,179 3.78%
Fixed income Netherlands Government Bond 7,268,409 1.58%
Xtrackers II EUROZONEGOVERNMENT BOND3-5 UCITS ETF
Fixed income Germany Government Bond 11,472,001 3.92%
Fixed income France Government Bond 2,755,415 0.94%
Xtrackers II EUROZONEGOVERNMENT BOND5-7 UCITS ETF
Fixed income Germany Government Bond 50,232,183 12.88%
Fixed income France Government Bond 4,786,014 1.23%
Xtrackers II EUROZONEGOVERNMENT BOND7-10 UCITS ETF
Fixed income Germany Government Bond 10,168,597 7.45%
Fixed income France Government Bond 4,037,300 2.96%
Fixed income Netherlands Government Bond 331,275 0.24%
Xtrackers II
Notes to the Financial Statements (continued)
385

9. Collateral (continued)
9.2 Collateral received in respect of securities lending transactions (continued)
Sub-Fund Type of Collateral Issuer of CollateralMarket Value of
Collateral (in EUR)% of Net Assets
Xtrackers II EUROZONEGOVERNMENT BOND15-30 UCITS ETF
Fixed income Germany Government Bond 922,931 3.03%
Fixed income France Government Bond 34,744 0.11%
Xtrackers II EUROZONEGOVERNMENT BOND 25+UCITS ETF
Fixed income Germany Government Bond 3,753,375 2.50%
Fixed income France Government Bond 3,733,970 2.49%
Fixed income Netherlands Government Bond 3,497,598 2.33%
Xtrackers II GLOBALGOVERNMENT BOND UCITSETF
Fixed income France Government Bond 20,261,961 0.91%
Fixed income Germany Government Bond 10,573,359 0.48%
Fixed income Netherlands Government Bond 3,841,725 0.17%
Xtrackers II EUR CORPORATEBOND UCITS ETF
Fixed income France Government Bond 1,689,418 0.08%
Fixed income Netherlands Government Bond 581,443 0.03%
Fixed income Austria Government Bond 81,879 0.00%
Xtrackers II GERMANYGOVERNMENT BOND UCITSETF
Fixed income Netherlands Government Bond 16,357,566 6.85%
Fixed income Austria Government Bond 15,262,090 6.39%
Fixed income France Government Bond 13,779,376 5.77%
Fixed income Germany Government Bond 6,655,199 2.79%
Xtrackers II EUR HIGH YIELDCORPORATE BOND UCITSETF
Fixed income France Government Bond 2,667,617 0.55%
Fixed Income securities are those issued by an investment grade credit rating from at least one globally recognised credit ratingagency: Standard & Poor’s, Moody’s or Fitch.
10. Management Company Fee and Fixed Fee
a) Management Company Fee
In accordance with and subject to the terms of the Management CompanyAgreement, the annual Management Company Fee will accrueon each calendar day and will be calculated on each Valuation Day on the basis of a percentage of (i) the last available Net Asset Value ofeach Sub-Fund or Class of Shares or (ii) the Initial Issue Price multiplied by the number of outstanding Shares of each Sub-Fund or Classof Shares (as indicated for each Sub-Fund or Class of Shares in the relevant Product Annex).
The Management Company is also entitled to receive reimbursement for any reasonable expenses that were made in its capacity asmanagement company of the Company in the context of the execution of the Management Company Agreement and that were notreasonably foreseeable in the ordinary course of business.
Notwithstanding the above, the Management Company and the Company may agree on a different fee structure in respect of a certainSub-Fund or Class of Shares, as indicated in the relevant Product Annex.
The Management Company may pay a Distribution Fee to the Distributor out of the Management Company Fee. A Distributor mayre-allocate an amount of the Distribution Fee to a sub-distributor (as applicable). The Management Company shall remunerate theInvestment Managers out of the Management Company Fee as agreed from time to time between the two parties. Each InvestmentManager shall remunerate out of the applicable Investment Management Fee any appointed Sub-Portfolio Manager, as agreed from timeto time between the parties.
b) Fixed Fee
Under the terms of an arrangement between the Company and DWS Investments UK Limited(1) (the �Fixed Fee Agent�), the Fixed FeeAgent will, in exchange for the payment of a Fixed Fee calculated on the average daily NetAssetValue per Sub-Fund or per Class at a rateas specified in the table below and payable periodically, pay certain fees and expenses, unless otherwise specified in the relevant ProductAnnex.
Xtrackers II
Notes to the Financial Statements (continued)
(1)Please refer to note 13. Related Parties.
386

10. Management Company Fee and Fixed Fee (continued)
b) Fixed Fee (continued)
The fees and expenses covered by the arrangement are the Administrative Agent Fee, the Depositary Fee, the Registrar, Transfer Agentand Listing Agent Fee, the annual tax in Luxembourg (if any) (the �Taxe d’Abonnement�), the formation expenses and certain OtherAdministrative Expenses.
The Fixed Fee does not include the following fees, expenses and costs:
- the Investment Management Fee;
- the Management Company Fee;
- the costs of any marketing agencies appointed by the Company or the Management Company to provide certain marketing anddistribution services to the Company or the Management Company;
- any taxes or fiscal charges which the Company may be required to pay, except the Taxe d’Abonnement, if any, or if it should bepayable, any value added tax or similar sales or services tax payable by the Company (VAT) (all such taxes or fiscal charges), unlessotherwise specified in the relevant Product Annex;
- expenses arising out of any advertising or promotional activities in connection with the Company; nor,
- any costs and expenses incurred outside of the Company’s ordinary course of business such as extraordinary expenses (e.g. legal feesincurred in prosecuting or defending, a claim or allegation, by or against, the Company).
In particular, the Fixed Fee Agent will pay the invoices of legal advisers, local paying agents and translators provided and to the extentthat these invoices do not in aggregate exceed the overall threshold of Euro ten million (10,000,000) per financial year and the Companywill be liable to pay for any amount that exceeds this threshold. The Company will pay this amount out of the relevant Sub-Fund’s assetsto which the specific costs are attributed.
Sub-Fund ManagementCompany Fee
in % p.a.
Fixed Feein % p.a.
Xtrackers II EUROZONE GOVERNMENT BOND UCITS ETF for Share Class 1C up to 0.05% p.a. 0.10%
Xtrackers II EUROZONE GOVERNMENT BOND UCITS ETF for Share Class 1D up to 0.01% p.a. 0.08%
Xtrackers II EUROZONE GOVERNMENT BOND UCITS ETF for Share Class 2C-USD Hedged up to 0.10% p.a. 0.10%
Xtrackers II EUROZONE GOVERNMENT BOND 1-3 UCITS ETF up to 0.05% p.a. 0.10%
Xtrackers II EUROZONE GOVERNMENT BOND 3-5 UCITS ETF up to 0.05% p.a. 0.10%
Xtrackers II EUROZONE GOVERNMENT BOND 5-7 UCITS ETF up to 0.05% p.a. 0.10%
Xtrackers II EUROZONE GOVERNMENT BOND 7-10 UCITS ETF up to 0.05% p.a. 0.10%
Xtrackers II EUROZONE GOVERNMENT BOND 15-30 UCITS ETF up to 0.05% p.a. 0.10%
Xtrackers II EUROZONE GOVERNMENT BOND 25+ UCITS ETF up to 0.05% p.a. 0.10%
Xtrackers II GLOBAL INFLATION-LINKED BOND UCITS ETF for Share Classes 1C-EURHedged, 1D-EUR Hedged, 2C-USD Hedged, 3D-GBP Hedged and 4D-CHF Hedged
up to 0.15% p.a. 0.10%
Xtrackers II GLOBAL INFLATION-LINKED BOND UCITS ETF for Share Class 5C up to 0.10% p.a. 0.10%
Xtrackers II EUROZONE INFLATION-LINKED BOND UCITS ETF up to 0.10% p.a. 0.10%
Xtrackers II EUR OVERNIGHT RATE SWAP UCITS ETF up to 0.02% p.a. 0.08%
Xtrackers II ITRAXX EUROPE SWAP UCITS ETF up to 0.08% p.a. 0.10%
Xtrackers II ITRAXX CROSSOVER SWAP UCITS ETF up to 0.14% p.a. 0.10%
Xtrackers II ITRAXX CROSSOVER SHORT DAILY SWAP UCITS ETF up to 0.14% p.a. 0.10%
Xtrackers II USD EMERGING MARKETS BOND UCITS ETF for Share Class 1C-EUR Hedged up to 0.30% p.a. 0.10%
Xtrackers II USD EMERGING MARKETS BOND UCITS ETF for Share Classes 2C and 2D up to 0.15% p.a. 0.10%
Xtrackers II EUROZONE GOVERNMENT BOND SHORT DAILY SWAP UCITS ETF up to 0.05% p.a. 0.10%
Xtrackers II IBOXX GERMANY COVERED BOND SWAP UCITS ETF up to 0.05% p.a. 0.10%
Xtrackers II USD OVERNIGHT RATE SWAP UCITS ETF up to 0.05% p.a. 0.10%
Xtrackers II GBP OVERNIGHT RATE SWAP UCITS ETF up to 0.05% p.a. 0.10%
Xtrackers II GLOBAL GOVERNMENT BOND UCITS ETF for Share Classes 1C-EUR Hedged,1D-EUR Hedged, 2D-GBP Hedged, 3C-USD Hedged and 4C-CHF Hedged
up to 0.15% p.a. 0.10%
Xtrackers II GLOBAL GOVERNMENT BOND UCITS ETF for Share Class 5C up to 0.10% p.a. 0.10%
Xtrackers II
Notes to the Financial Statements (continued)
387

10. Management Company Fee and Fixed Fee (continued)
b) Fixed Fee (continued)
Sub-Fund ManagementCompany Fee
in % p.a.
Fixed Feein % p.a.
Xtrackers II SINGAPORE GOVERNMENT BOND UCITS ETF up to 0.10% p.a. 0.10%
Xtrackers II US TREASURIES UCITS ETF for Share Class 1D up to 0.01% p.a. 0.06%
Xtrackers II US TREASURIES UCITS ETF for Share Class 2D-EUR Hedged up to 0.01% p.a. 0.09%
Xtrackers II US TREASURIES 1-3 UCITS ETF up to 0.01% p.a. 0.06%
Xtrackers II EUR CORPORATE BOND UCITS ETF up to 0.02% p.a.(1) 0.10%
Xtrackers II GERMANY GOVERNMENT BOND UCITS ETF up to 0.05% p.a. 0.10%
Xtrackers II GERMANY GOVERNMENT BOND 1-3 UCITS ETF up to 0.05% p.a. 0.10%
Xtrackers II ESG EUR CORPORATE BOND UCITS ETF up to 0.06% p.a. 0.10%
Xtrackers II EUROZONE AAA GOVERNMENT BOND SWAP UCITS ETF up to 0.05% p.a. 0.10%
Xtrackers II IBOXX EUROZONE GOVERNMENT BOND YIELD PLUS UCITS ETF up to 0.05% p.a. 0.10%
Xtrackers II AUSTRALIA GOVERNMENT BOND UCITS ETF up to 0.15% p.a. 0.10%
Xtrackers II ITALY GOVERNMENT BOND 0-1 SWAP UCITS ETF up to 0.05% p.a. 0.10%
Xtrackers II EUR COVERED BOND SWAP UCITS ETF up to 0.10% p.a. 0.10%
Xtrackers II IBOXX EUROZONE GOVERNMENT BOND YIELD PLUS 1-3 UCITS ETF up to 0.05% p.a. 0.10%
Xtrackers II JAPAN GOVERNMENT BOND UCITS ETF up to 0.05% p.a. 0.10%
Xtrackers II GLOBAL AGGREGATE BOND SWAP UCITS ETF for Share Class 1D up to 0.05% p.a. 0.10%
Xtrackers II GLOBAL AGGREGATE BOND SWAP UCITS ETF for Share Classes 2C-USD Hedged,3D-GBP Hedged, 4C-CHF Hedged and 5C-EUR Hedged
up to 0.10% p.a. 0.10%
Xtrackers II EUR HIGH YIELD CORPORATE BOND UCITS ETF up to 0.10% p.a. 0.10%
Xtrackers II EUR HIGH YIELD CORPORATE BOND 1-3 SWAP UCITS ETF (2) up to 0.15% p.a. 0.10%
Xtrackers II HARVEST CHINA GOVERNMENT BOND UCITS ETF up to 0.25% p.a. 0.15%
Xtrackers II USD ASIA EX JAPAN CORPORATE BOND UCITS ETF up to 0.20% p.a. 0.10%
Xtrackers II ESG EUR CORPORATE BOND SHORT DURATION UCITS ETF (3) up to 0.06% p.a. 0.10%
(1) Reduction from 0.06% to 0.02% with effect from 1 September 2020.(2) From 1 August 2020 until 31 July 2021 inclusive, the Management Company fee of this Sub-Fund is reduced from 0.25% to 0.15%.(3) The Sub-Fund was launched on 23 July 2020. Please see point 1 in the significant events of the year section of the Notes to the Financial Statements of this annualreport for further information.
11. Transaction Costs
Transaction costs are any costs and expenses incurred in respect of the buying and selling of portfolio securities and financialinstruments, brokerage fees and commissions, interest or taxes payable in respect of such purchase and sale transactions, as may be morefully described in the relevant Product Annex of the Prospectus.
Sub-Fund Currency Transaction costs(in Sub-Fund’s
currency)
Xtrackers II EUROZONE GOVERNMENT BOND UCITS ETF EUR 273,970
Xtrackers II GLOBAL INFLATION-LINKED BOND UCITS ETF EUR 1,056,923,232
Xtrackers II EUR OVERNIGHT RATE SWAP UCITS ETF EUR 706,226,361
Xtrackers II ITRAXX EUROPE SWAP UCITS ETF EUR 1,205,669
Xtrackers II ITRAXX CROSSOVER SWAP UCITS ETF EUR 382,480
Xtrackers II ITRAXX CROSSOVER SHORT DAILY SWAP UCITS ETF EUR 1,249,483
Xtrackers II USD EMERGING MARKETS BOND UCITS ETF USD 1,536
Xtrackers II EUROZONE GOVERNMENT BOND SHORT DAILY SWAP UCITS ETF EUR 36,438
Xtrackers II
Notes to the Financial Statements (continued)
388

11. Transaction Costs (continued)
Sub-Fund Currency Transaction costs(in Sub-Fund’s
currency)
Xtrackers II IBOXX GERMANY COVERED BOND SWAP UCITS ETF EUR 18,364
Xtrackers II USD OVERNIGHT RATE SWAP UCITS ETF USD 1,002,869,520
Xtrackers II GBP OVERNIGHT RATE SWAP UCITS ETF GBP 239,804,495
Xtrackers II GLOBAL GOVERNMENT BOND UCITS ETF EUR 1,985,396,678
Xtrackers II US TREASURIES UCITS ETF USD 62,649,937
Xtrackers II EUR CORPORATE BOND UCITS ETF EUR 3,112
Xtrackers II ESG EUR CORPORATE BOND UCITS ETF EUR 777
Xtrackers II EUROZONE AAA GOVERNMENT BOND SWAP UCITS ETF EUR 30,849
Xtrackers II ITALY GOVERNMENT BOND 0-1 SWAP UCITS ETF EUR 31,415
Xtrackers II EUR COVERED BOND SWAP UCITS ETF EUR 72,324
Xtrackers II GLOBAL AGGREGATE BOND SWAP UCITS ETF USD 2,572,726,317
Xtrackers II EUR HIGH YIELD CORPORATE BOND UCITS ETF EUR 523
Xtrackers II EUR HIGH YIELD CORPORATE BOND 1-3 SWAP UCITS ETF EUR 17,176,340
Xtrackers II HARVEST CHINA GOVERNMENT BOND UCITS ETF USD 93,030,175
12. Directors Fees and Interests
Further to shareholder approval at the annual general meeting of the Company on 8 April 2019 (the “2019 AGM”), the remuneration ofFreddy Brausch as independent director has been approved from the 2019 AGM until the annual general meeting held on 17 April2020 (the “2020 AGM”). Freddy Brausch received 4,385.25 EUR during the period 1 January 2020 to the 2020 AGM. IndependentDirector remuneration is paid through the Fixed Fee and not out of the assets of the Sub-Funds.
In order to bring the approval of remuneration for independent Directors in line with each independent Director’s appointment letter,remuneration for the period from the 2020 AGM, where relevant, until the annual general meeting of Shareholders that will be held on23 April 2021 (the “2021 AGM”) will be voted upon by Shareholders at the 2021 AGM. Please see point 4 in the Subsequent Eventssection of the Information for Shareholders of this annual report for further information on the proposed amounts.
For the avoidance of doubt, non-independent Directors do not receive remuneration for their role as Directors nor any other materialdirect benefit paid to them by the Company or the Fixed Fee Agent.
13. Related Parties
DWS Investment S.A. has been appointed to act as Management Company under the Management Company Agreement and isresponsible for providing investment management services, administration services and distribution and marketing services to thevarious Sub-Funds unless otherwise indicated in the relevant Product Annex. DWS Investment S.A. is entitled to receive ManagementCompany Fees as further detailed in Note 10, as a compensation for its services to the Company.
The Fixed Fee Agent is entitled to receive Fixed Fees as further detailed in Note 10.
DWS Investments UK Limited, DWS Investment GmbH and DWS Investments Hong Kong Limited are acting as Investment Managerand/or Sub-Portfolio Manager with respect to certain Sub-Funds as further detailed in Note 14. The Management Company shallremunerate the Investment Managers out of the Management Company Fee as agreed from time to time between the parties.
Each Investment Manager shall remunerate out of the applicable Investment Management Fee any appointed Sub-Portfolio Manager, asagreed from time to time between the parties.
DWS Investments UK Limited, as agreed from time to time, has been appointed to provide certain services including, but not limited to,legal, regulatory and tax advice, relationship management, marketing, assistance in relation to structuring and restructuring andassistance in relation to the registrations of the Company.
During the year ending 31 December 2020, Deutsche Bank AG was the counterparty to all swap positions entered into by the Company.
Deutsche Bank AG, acting through its Frankfurt am Main head office and its London and New York branches as the Securities LendingAgent is entitled to receive fees covering direct or indirect operational costs and fees arising from Securities Lending Transactions asfurther detailed in Note 8.
Xtrackers II
Notes to the Financial Statements (continued)
389

13. Related Parties (continued)
In the normal course of its operations, each Sub-Fund may enter into transactions on securities or other investments with Deutsche BankAG or other Deutsche Bank AG affiliates.
DWS Investments UK Limited is entitled to receive fees arising from Securities Lending Transactions as further detailed in Note 8.
Deutsche Bank AG, acting through its London Branch has been appointed with regards to the position reporting services.
14. Appointed Investment Managers and Sub-Portfolio Managers
As at 31 December 2020, DWS Investment GmbH is acting as Investment Manager for the below listed Sub-Funds:
- Xtrackers II EUROZONE GOVERNMENT BOND UCITS ETF
- Xtrackers II EUROZONE GOVERNMENT BOND 1-3 UCITS ETF
- Xtrackers II EUROZONE GOVERNMENT BOND 3-5 UCITS ETF
- Xtrackers II EUROZONE GOVERNMENT BOND 5-7 UCITS ETF
- Xtrackers II EUROZONE GOVERNMENT BOND 7-10 UCITS ETF
- Xtrackers II EUROZONE GOVERNMENT BOND 15-30 UCITS ETF
- Xtrackers II EUROZONE GOVERNMENT BOND 25+ UCITS ETF
- Xtrackers II GLOBAL INFLATION-LINKED BOND UCITS ETF
- Xtrackers II EUROZONE INFLATION-LINKED BOND UCITS ETF
- Xtrackers II USD EMERGING MARKETS BOND UCITS ETF
- Xtrackers II GLOBAL GOVERNMENT BOND UCITS ETF
- Xtrackers II SINGAPORE GOVERNMENT BOND UCITS ETF
- Xtrackers II US TREASURIES UCITS ETF
- Xtrackers II US TREASURIES 1-3 UCITS ETF
- Xtrackers II EUR CORPORATE BOND UCITS ETF
- Xtrackers II GERMANY GOVERNMENT BOND UCITS ETF
- Xtrackers II GERMANY GOVERNMENT BOND 1-3 UCITS ETF
- Xtrackers II ESG EUR CORPORATE BOND UCITS ETF
- Xtrackers II IBOXX EUROZONE GOVERNMENT BOND YIELD PLUS UCITS ETF
- Xtrackers II AUSTRALIA GOVERNMENT BOND UCITS ETF
- Xtrackers II IBOXX EUROZONE GOVERNMENT BOND YIELD PLUS 1-3 UCITS ETF
- Xtrackers II JAPAN GOVERNMENT BOND UCITS ETF
- Xtrackers II EUR HIGH YIELD CORPORATE BOND UCITS ETF
- Xtrackers II USD ASIA EX JAPAN CORPORATE BOND UCITS ETF
- Xtrackers II ESG EUR CORPORATE BOND SHORT DURATION UCITS ETF(1)
(1) The Sub-Fund was launched on 23 July 2020. Please see point 1 in the significant events of the year section of the Notes to the Financial Statements of this annualreport for further information.
As at 31 December 2020, DWS Investments UK Limited is acting as Investment Manager for the following Sub-Funds:
- Xtrackers II EUR OVERNIGHT RATE SWAP UCITS ETF
- Xtrackers II ITRAXX EUROPE SWAP UCITS ETF
- Xtrackers II ITRAXX CROSSOVER SWAP UCITS ETF
- Xtrackers II ITRAXX CROSSOVER SHORT DAILY SWAP UCITS ETF
- Xtrackers II EUROZONE GOVERNMENT BOND SHORT DAILY SWAP UCITS ETF
- Xtrackers II IBOXX GERMANY COVERED BOND SWAP UCITS ETF
- Xtrackers II USD OVERNIGHT RATE SWAP UCITS ETF
- Xtrackers II GBP OVERNIGHT RATE SWAP UCITS ETF
- Xtrackers II EUROZONE AAA GOVERNMENT BOND SWAP UCITS ETF
- Xtrackers II ITALY GOVERNMENT BOND 0-1 SWAP UCITS ETF
Xtrackers II
Notes to the Financial Statements (continued)
390

14. Appointed Investment Managers and Sub-Portfolio Managers (continued)
- Xtrackers II EUR COVERED BOND SWAP UCITS ETF
- Xtrackers II GLOBAL AGGREGATE BOND SWAP UCITS ETF
- Xtrackers II EUR HIGH YIELD CORPORATE BOND 1-3 SWAP UCITS ETF
As at 31 December 2020, Harvest Global Investments Limited is acting as Investment Manager for the following Sub-Fund:
- Xtrackers II HARVEST CHINA GOVERNMENT BOND UCITS ETF
DWS Investments UK Limited has appointed DWS International GmbH to provide best execution services in respect to IndirectReplication Funds.
Unless otherwise provided in the relevant Product Annex, DWS Investments UK Limited and DWS Investments Hong Kong Limitedmay act as Sub-Portfolio Manager with respect to Direct Replication Funds for which DWS Investment GmbH is acting as InvestmentManager.
15. Dividends distributed
During the year ending 31 December 2020, the Company resolved to pay to the Shareholders of the Distribution Shares of the Sub-Fundsmentioned below, dividends as follows:
Sub-FundShareClass
Ex-dividenddate
Share Classcurrency
DividendPer Share
Xtrackers II EUROZONE GOVERNMENT BOND UCITS ETF 1D 17 June 2020 EUR 0.6589
Xtrackers II EUROZONE GOVERNMENT BOND 3-5 UCITS ETF 1D 17 June 2020 EUR 0.7696
Xtrackers II GLOBAL INFLATION-LINKED BOND UCITS ETF 1D - EUR Hedged 17 June 2020 EUR 3.3104
Xtrackers II GLOBAL INFLATION-LINKED BOND UCITS ETF 3D - GBP Hedged 17 June 2020 GBP 0.2864
Xtrackers II GLOBAL INFLATION-LINKED BOND UCITS ETF 4D - CHF Hedged 17 June 2020 CHF 1.6914
Xtrackers II USD EMERGING MARKETS BOND UCITS ETF 2D 17 June 2020 USD 0.6579
Xtrackers II GBP OVERNIGHT RATE SWAP UCITS ETF 1D 17 June 2020 GBP 1.0178
Xtrackers II GLOBAL GOVERNMENT BOND UCITS ETF 1D - EUR Hedged 17 June 2020 EUR 2.2827
Xtrackers II GLOBAL GOVERNMENT BOND UCITS ETF 2D - GBP Hedged 17 June 2020 GBP 0.2800
Xtrackers II US TREASURIES UCITS ETF 1D 17 June 2020 USD 2.5811
Xtrackers II US TREASURIES UCITS ETF 2D - EUR Hedged 17 June 2020 EUR 2.3076
Xtrackers II US TREASURIES 1-3 UCITS ETF 1D 17 June 2020 USD 4.2047
Xtrackers II ESG EUR CORPORATE BOND UCITS ETF 1D 17 June 2020 EUR 0.6950
Xtrackers II IBOXX EUROZONE GOVERNMENT BOND YIELD PLUS UCITS ETF 1D 17 June 2020 EUR 2.1012
Xtrackers II IBOXX EUROZONE GOVERNMENT BOND YIELD PLUS 1-3 UCITSETF 1D 17 June 2020 EUR 0.6478
Xtrackers II GLOBAL AGGREGATE BOND SWAP UCITS ETF 1D 17 June 2020 USD 0.6838
Xtrackers II GLOBAL AGGREGATE BOND SWAP UCITS ETF 3D - GBP Hedged 17 June 2020 GBP 1.1025
Xtrackers II EUR HIGH YIELD CORPORATE BOND UCITS ETF 1D 17 June 2020 EUR 0.3976
Xtrackers II EUR HIGH YIELD CORPORATE BOND 1-3 SWAP UCITS ETF 1D 17 June 2020 EUR 0.2885
Xtrackers II HARVEST CHINA GOVERNMENT BOND UCITS ETF 1D 17 June 2020 USD 0.4521
Xtrackers II USD ASIA EX JAPAN CORPORATE BOND UCITS ETF 1D 17 June 2020 USD 3.4651
16. Soft Commissions
No soft commission arrangements were entered into by the Management Company or the applicable Investment Manager and/orSub-Portfolio Manager with brokers during the financial year ending 31 December 2020.
Xtrackers II
Notes to the Financial Statements (continued)
391

1. Online publication of investment portfolios, collateral holdings and swap exposures
Shareholders can view the swap exposures and investment portfolios or collateral holdings for each Sub-Fund on www.etf.dws.com. Theinformation is available under the “ETF Information” tab section for each Sub-Fund.
2. Adjustment to OTC Swap Transactions to reflect index replication costs
As per the Prospectus, each of the Swap Counterparties may enter into hedging transactions in respect of the OTC Swap Transaction(s).According to the OTC Swap Transaction(s) entered into between the Sub-Funds and the Swap Counterparty, the Sub-Funds shall receivethe performance of the Reference Index adjusted to reflect certain index replication costs, taxes and any other transaction costs or chargesincurred by the Swap Counterparty in relation to the OTC Swap Transaction. These costs may include, amongst other things, costs, taxesor other duties associated with the buying, selling, custody, holding or any other transactions relating to investments in transferablesecurities and/or OTC Swap Transactions and/or collateral. The nature of these costs may differ depending on the Reference Index whoseperformance the Sub-Funds aim to reflect.
•Situation 1: the Reference Index is �long� (i.e. its objective is to reflect the performance of its constituents). Then the index replicationcosts will be associated with (i) the buying and selling by the Swap Counterparty of the constituents of the Reference Index in order toreflect the Reference Index performance; or (ii) custody or other related costs incurred by the Swap Counterparty in relation to holdingthe constituents of the Reference Index; or (iii) taxes or other duties imposed on the buying or selling of the constituents of the ReferenceIndex; or (iv) taxes imposed on any income derived from the constituents of the Reference Index; or (v) any other transactions performedby the Swap Counterparty in relation to the constituents of the Reference Index.
•Situation 2: the Reference Index is �leveraged� (i.e. its objective is to reflect the daily leveraged performance of the long version of theReference Index). Then the index replication costs will be associated with (i) the buying and selling and any borrowing and/or financingof the constituents of the Reference Index in order to reflect the Reference Index performance, (ii) custody or other related costs incurredby the Swap Counterparty in relation to holding the constituents of the Reference Index, (iii) financing charges incurred to safeguardagainst severe market movements of the constituents of the Reference Index, (iv) unexpected financing costs in the event of severemarket movements, (v) taxes imposed on any income derived from the constituents of the Reference Index, or (vi) any other transactionsperformed by the Swap Counterparty in relation to the constituents of the Reference Index.
•Situation 3: the Reference Index is �short� (i.e. its objective is to reflect the daily inverse performance of the long version of theReference Index) or �short and leveraged� (i.e. its objective is to reflect the leveraged daily inverse performance of the long version of theReference Index). Then the index replication costs will be associated with (i) the borrowing and/or financing of the constituents of theReference Index in order to reflect the Reference Index performance, (ii) financing charges incurred to safeguard against severe marketmovements of the constituents of the Reference Index, (iii) unexpected financing costs in the event of severe market movements or(iv) any other transactions performed by the Swap Counterparty in relation to the constituents of the Reference Index.
In addition, from time to time each Swap Counterparty may achieve certain benefits or enhancements as a result of its hedging activities.In certain circumstances, the Swap Counterparty may, in its absolute and sole discretion, decide to pay some or all of such benefits orenhancements to the Sub-Fund under the OTC Swap Transaction(s) in addition to any payments contractually due under the OTC SwapTransaction(s). The OTC Swap Transactions of the following Sub-Funds were adjusted by the below figures in the valuation of the swapsprevailing as at 31 December 2020. A positive figure in the table means that the OTC Swap Transactions of the relevant Sub-Fund weresubject to a negative adjustment. These figures are netted against the benefits or enhancements as a result of a Swap Counterparty’shedging activities that were received under the OTC Swap Transaction(s), if any. These costs may vary over time in accordance withmarket conditions and market practice.
Sub-Fund Share Class ISIN AdjustmentXtrackers II EUR High Yield Corporate Bond 1-3 Swap UCITS ETF 1D LU1109939865 37
3. Determination of the Global Exposure
For all Sub-Funds, the methodology used in order to calculate the Global Exposure resulting from the use of financial derivativeinstruments is the commitment approach in accordance with the CSSF Circular 11/512.
4. Other significant events of the year
1. During the year ending 31 December 2020, the following Share Classes have been launched:
Xtrackers II
Information for Shareholders - unaudited
392

4. Other significant events of the year (continued)
Sub-Fund Share Class ISIN Launch dateXtrackers II EUROZONE GOVERNMENT BONDUCITS ETF
2C-USD Hedged LU2009147591 11 March 2020
Xtrackers II USD EMERGING MARKETS BONDUCITS ETF
2C LU1920015440 11 March 2020
2. On 10 March 2020, the below Share Classes were de-listed from the Borsa Italiana:Sub-Fund Share Class / ISIN
Xtrackers II EUROZONE GOVERNMENT BOND SHORT DAILY SWAP UCITS ETF 1C / LU0321463258
Xtrackers II GERMANY GOVERNMENT BOND UCITS ETF 1D / LU0468896575
Xtrackers II GERMANY GOVERNMENT BOND 1-3 UCITS ETF 1D / LU0468897110
Xtrackers II EUR COVERED BOND SWAP UCITS ETF 1C / LU0820950128
3. On 27 February 2020, the Company informed the Shareholders of Xtrackers II USD EMERGING MARKETS BOND UCITS ETFabout material changes to the methodology of its Reference Index. Due to the exceptional market conditions, these changes werepostponed and the IndexAdministrator, FTSE Fixed Income LLC staggered the change in exposure over three month end rebalancesfrom September 2020 to November 2020.
4. On 3 August 2020, the Company informed the Shareholders of the Share Class 1D (ISIN: LU1109939865) of XTRACKERS IIEUR HIGH YIELD CORPORATE BOND 1-3 SWAP UCITS ETF that DWS Investment S.A., acting in its role as a managementcompany, agreed to waive part of the Management Company Fee from “up to 0.25% per annum” to “0.15% per annum” for theperiod from 1 August 2020 until 31 July 2021 inclusive (the “Waiver Period”). As a result, the All-in Fee of the Share Class has beenalso reduced to “up to 0.25% per annum” during the Waiver Period.
5. On 1 September 2020, the Management Company Fee of the Share Class 1C (ISIN: LU0478205379) of XTRACKERS II EURCORPORATE BOND UCITS ETF was permanently reduced from “up to 0.06% per annum” to “0.02% per annum”. As a result, theAll-in Fee of the Sub-Fund was also reduced to “up to 0.12% per annum”.
6. On 13 November 2020, the Company informed the Shareholders of XTRACKERS II EUR OVERNIGHT RATE SWAP UCITSETF of certain changes to its Reference Index, with effect from 16 December 2020. The Sub-Fund’s Reference Index was designedto reflect the performance of a deposit earning interest at the rate of the Euro Over Night Index Average (“EONIA”). EONIA in itscurrent form was not compliant with EU Regulation (EU) 2016/2011, given the lack of underlying transactions and highconcentration of volumes by only a few contributors and therefore, EONIA’s administrator, the European Money Markets Institute,announced it would stop publishing it on 3 January 2020. The European Central Bank’s working group on euro-risk ratesrecommended that the Euro short term rate (“€STR”) replace the EONIA as the Euro risk-free rate. As a result of the foregoing,Deutsche Bank AG, the index administrator of the Reference Index, announced its intention to replace EONIA with €STR plus8.5 basis points adjustment. As a result, the Sub-Fund’s Reference Index changed its name from DEUTSCHE BANK EONIATOTAL RETURN INDEX® to DEUTSCHE BANK EURO OVERNIGHT RATE INDEX®.
7. On 21 December 2020, the Company informed the Shareholders of XTRACKERS II HARVEST CHINA GOVERNMENT BONDUCITS ETF that, with effect from 1 February 2021 (the “Effective Date”), the Reference Index of the Sub-Fund will change fromCSI Gilt-Edged Medium Term Treasury Note Index (administered by China Securities Index Co., Ltd) to FTSE ChineseGovernment and Policy Bank Bond 1-10 Years Capped Index (administered by FTSE Fixed Income LLC). As of the Effective Date,the Management Company Fee of the Share Class 1D of the Sub-Fund (ISIN: LU1094612022) will be reduced from “up to 0.25%per annum” to “up to 0.20% per annum”. As a result, the All-In Fee applicable to the Share Class will be also reduced from �up to0.40% per annum� to �up to 0.35% per annum�. On or around the Effective Date, the Product Annex of the Sub-Fund will be alsoupdated to provide additional flexibility for the Sub-Fund to be able to invest directly via the China Bond Connect.
5. Subsequent events
1. On 25 January 2021, the Company informed Shareholders holding Shares in “D” Classes that the Paragraph ‘I.c: Dividend policy’of the section entitled ‘GENERAL INFORMATION ONTHE COMPANYANDTHE SHARES’of the Prospectus will be amendedas follows: The sentence “Dividends will generally be paid within 10 Luxembourg Banking Days of the date of Declaration” will bedeleted and replaced with “Dividends will be paid within the period disclosed in the dividend announcements.”
Xtrackers II
Information for Shareholders - unaudited (continued)
393

5. Subsequent events (continued)
2. On 29 January 2021, the Company informed Shareholders that the following Share Classes will be de-listed from SIX SwissExchange with effect from 30 April 2021.
Sub-Fund Share Class ISIN
XTRACKERS II GLOBAL AGGREGATE BOND SWAP UCITS ETF 3D – GBP Hedged LU0942970368
XTRACKERS II GLOBAL AGGREGATE BOND SWAP UCITS ETF 5C – EUR Hedged LU0942970798
XTRACKERS II GLOBAL GOVERNMENT BOND UCITS ETF 3C – USD Hedged LU0641006456
XTRACKERS II GLOBAL INFLATION-LINKED BOND UCITS 1C – EUR Hedged LU0290357929
XTRACKERS II GLOBAL INFLATION-LINKED BOND UCITS ETF 1D – EUR Hedged LU0962078753
XTRACKERS II USD EMERGING MARKETS BOND UCITS ETF 1C – EUR Hedged LU0321462953
3. On 22 February 2021, the Company informed Shareholders of XTRACKERS II GLOBAL AGGREGATE BOND SWAP UCITSETF that the Share Classes 2C-USD Hedged (ISIN: LU0942970285) and 5C-EUR Hedged (ISIN: LU0942970798) of theSub-Fund (the “Currency Hedged Share Classes”) will change their Investment Objective to track the Bloomberg Barclays GlobalAggregate Bond Index (the “Reference Index”), instead of the currency hedged versions of the Reference Index that they arecurrently tracking. State Street Bank & Trust Company, London Branch will be appointed as currency hedging manager for theSub-Fund in relation to the Currency Hedged Share Class. The changes will be carried out on a date between 31 March 2021 and30 June 2021 (the �Effective Date�). Once the changes have been implemented, a notice will be published on the website of theCompany confirming the Effective Date.
4. The annual general meeting of Shareholders that will be held on 23 April 2021 (the “2021 AGM”) will approve the remuneration forthe independent Directors Freddy Brausch and Thilo Wendenburg. The proposed amount for Freddy Brausch, who acted aschairman since the annual general meeting held in 2020 (the “2020 AGM”), is 25,000 euros per annum, which will be paid inrelation to his duties for the period from the 2020 AGM until the date of the 2021 AGM on a pro rata basis. The proposed amount forThilo Wendenburg is 20,000 euros per annum, which will be paid in relation to his duties for the period from 26 June 2020 (being thedate of his appointment by the General Meeting of Shareholders) until the date of the 2021 AGM on a pro rata basis. The proposedamount is based on the number of Sub-Funds at the end of the financial year ending on 31 December 2020. For the avoidance ofdoubt, the non-independent Directors do not receive remuneration from the Company.
6. Remuneration disclosures under UCITS V regulation
DWS Investment S.A. is a subsidiary of DWS Group GmbH & Co. KGaA (“DWS KGaA”), Frankfurt - Main, one of the world’s leadingasset managers providing a broad range of investment products and services across all major asset classes as well as solutions aligned togrowth trends to its clients globally.
DWS KGaA is a publicly traded company listed on the Frankfurt Stock Exchange, which is majority owned by Deutsche Bank AG.
As a result of the sector specific legislation under UCITS V (Undertakings for Collective Investment in Transferable Securities DirectiveV) and in accordance with Sec. 1 and Sec. 27 of the German “Institutsvergütungsverordnung” (“InstVV”), the Management Company iscarved-out from Deutsche Bank Group’s (“DB Group”) compensation policy and strategy. DWS KGaA and its subsidiaries (“DWSGroup” or only “Group”) have established their own compensation governance, policies and structures, including a DWS group-wideguideline of identifying “Material Risk Takers” (“MRTs”) at Management Company level as well as DWS Group level in line with thecriteria stated in UCITS V and in the guidelines on sound remuneration policies under UCITS V published by the European Securitiesand Markets Authority (“ESMA Guidelines”).
Governance Structure
The DWS Group is managed through its General Partner, DWS Management GmbH. The General Partner changed its remit in June2020 and now has six Managing Directors who serve as the Executive Board (“EB”) of the Group. The EB – supported by the DWSCompensation Committee (“DCC”) – is responsible for establishing and operating the compensation system for employees. It isoverseen by the DWS KGaA Supervisory Board which has established a Remuneration Committee (“RC”). The RC reviews thecompensation system of the Group’s employees and its appropriateness. The RC supports the Supervisory Board in monitoring theappropriate structure of the remuneration systems for the Group’s employees. This is done by taking into account the effects of theremuneration system on the group-wide risk, capital and liquidity management as well as the consistency of the remuneration strategywith the business and risk strategy of the DWS Group.
Xtrackers II
Information for Shareholders - unaudited (continued)
394

6. Remuneration disclosures under UCITS V regulation (continued)
The DCC is mandated to develop and design sustainable compensation frameworks and operating principles, to preparerecommendations on total compensation levels, and to ensure appropriate compensation and benefits governance and oversight for theGroup. The DCC establishes quantitative and qualitative factors to assess performance as a basis for compensation related decisions andmakes appropriate recommendations to the EB regarding the annual Variable Compensation pool and its allocation across the businessareas and infrastructure functions. Voting members of the DCC comprise the Chief Executive Officer (“CEO”), Chief Financial Officer(“CFO”), Chief Operating Officer (“COO”), and the Global Head of HR. The Head of Reward & Analytics is a nonvoting member.Control Functions such as Compliance, Anti-Financial Crime, and Risk Management are represented by the CFO and COO in the DCCand are appropriately engaged in the design and application of the Group’s remuneration systems in the context of the tasks and functionsassigned to them, to ensure that the remuneration systems do not create conflicts of interests, and to review the effects on the risk profileof the Group. The DCC reviews the remuneration framework of DWS Group regularly, at least annually, which includes the principlesapplying to the Management Company, and assesses if substantial changes or amendments due to irregularities have to be made.
The DCC is supported by two sub-committees: The DWS Compensation Operating Committee (“COC”) implemented to assist the DCCin reviewing the technical validity, operationalizing and approving new or existing compensation plans. The Integrity Review Committeeimplemented to review and decide on suspension and forfeiture matters involving DWS deferred compensation awards.
The internal annual review at DWS Group level concluded the design of the remuneration system to be appropriate, no significantirregularities were recognised.
Compensation Structure
The employees of the Management Company are subject to the compensation standards and principles as outlined in the DWSCompensation Policy. The policy is reviewed on an annual basis. As part of the Compensation Policy, the Group, including theManagement Company, employs a Total Compensation (“TC”) philosophy which comprises Fixed Pay (“FP”) and VariableCompensation (“VC”).
The Group ensures an appropriate relationship between FP and VC across all categories and groups of employees. TC structures andlevels reflect the Sub-Divisional and regional compensation structures, internal relativities, and market data, and assist in seekingconsistency across the Group. One of the main objectives of the Group’s strategy is to align reward for sustainable performance at alllevels whilst enhancing the transparency of compensation decisions and their impact on shareholders and employees with regard to DWSGroup and as applicable DB Group performance. Achieving a sustainable balance between employee, shareholder and client interests isa key aspect of DWS’ Group compensation strategy.
FP is used to compensate employees for their skills, experience and competencies, commensurate with the requirements, size and scopeof their role. The appropriate level of FP is determined with reference to the prevailing market rates for each role, internal comparisonsand applicable regulatory requirements.
VC is a discretionary compensation element that enables the Group to provide additional reward to employees for their performance andbehaviours without encouraging excessive risk-taking. VC determination considers sound risk measures by taking into account theGroup’s Risk Appetite as well as the Group affordability and financial situation and providing for a fully flexible policy on granting or“not-granting” VC. VC generally consists of two elements – the “Group Component” and the “Individual Component”. There continuesto be no guarantee of VC in an existing employment relationship.
For the 2020 financial year, the Group Component is dominantly determined based upon the performance of three Key PerformanceIndicators (KPIs) at DWS Group level: Adjusted Cost Income Ratio (“CIR”), Net Flows and Dividend Payout. These three KPIsrepresent important metrics for DWS Group’s financial targets and provide a good indication of its sustainable performance.
For employees at management level the Group Component additionally considers four equally weighted KPIs at DB Group level (1).
Depending on eligibility, the “Individual Component” is delivered either in the form of Individual VC (“IVC”) or a Recognition Award.IVC takes into consideration a number of financial and non-financial factors, relativities within the employee’s peer group and retentionconsiderations. The Recognition Award provides the opportunity to acknowledge and reward outstanding contributions made byemployees outside the scope of IVC eligibility (these are generally employees at lower hierarchical levels). Generally, there are twonomination cycles per year.
Xtrackers II
Information for Shareholders - unaudited (continued)
(1)DB Group KPIs: Common Equity Tier 1 (“CET1”) capital ratio, leverage ratio, adjusted costs and post-tax return on tangible equity (“RoTE”).
395

6. Remuneration disclosures under UCITS V regulation (continued)
Both Group and Individual Component may be awarded in cash, share-based or fund-based instruments under the Group deferralarrangements. The Group retains the right to reduce the total amount of VC, including the Group Component, to zero in cases ofsignificant misconduct, performance-related measures, disciplinary outcomes or unsatisfactory conduct or behaviour by the employeesubject to applicable local law.
Determination of VC and appropriate risk-adjustment
The Group’s VC pools are subject to appropriate risk-adjustment measures which include ex-ante and ex-post risk adjustments. Therobust methodology in place aims at ensuring that the determination of VC reflects the risk-adjusted performance as well as the capitaland liquidity position of the Group.The total amount ofVC is primarily driven by (i) the Group affordability (i.e. what “can” DWS Groupsustainably afford award in alignment with regulatory requirements) and (ii) performance (what “should” the Group award in order toprovide an appropriate compensation for performance while protecting the long-term health of the franchise).
At the level of the individual employee, the Group has established “Variable Compensation Guiding Principles” which detail the factorsand metrics that must be taken into account when making IVC decisions. These include, for instance, investment performance, clientretention, culture considerations, and objective setting and performance assessment based on the “Total Performance’ approach.Furthermore, any control function inputs and disciplinary sanctions and their impact on the VC have to be considered as well.
As part of a discretionary decision-making process, the DWS DCC uses (financial and non-financial) key figures to identifydifferentiated and performance linked VC pools for business and infrastructure areas.
Compensation for 2020
Despite the ongoing pandemic, the diverse range of investment products and solutions as well as stabilizing markets contributed tosignificant net flows in 2020 and allowed the Group to execute its strategic priorities effectively. The intensified focus on investmentperformance and increased investor demand for targeted asset classes were key drivers of the success.
Against this backdrop, the DCC has monitored the affordability of VC for 2020. The committee has concluded that the capital andliquidity base of the Group remain above regulatory minimum requirements, and internal risk appetite threshold.
As part of the overall 2020 VC awards to be granted in March 2021, the Group Component was awarded to eligible employees in linewith the assessment of the defined KPIs. The Executive Board recognised the considerable contribution of employees and determined atarget achievement rate of 98.50% for 2020 for DWS Group. Considering the DB Group target achievement as determined by theDeutsche Bank AG Management Board, the hybrid achievement rate for employees at management level was determined of 85.50% for2020.
Identification of Material Risk Takers
In accordance with the Law as of 17 December 2010 on Undertakings for Collective Investments (as subsequently amended) inconjunction with the ESMA Guidelines with accordance to UCITS Directive, the Management Company has identified individuals whohave a material impact of the Management Company’s risk profile (“Material Risk Takers”). The identification process has been basedon an assessment of the impact of the following categories of staff on the risk profile of the Management Company or on a fund itmanages: (a) Board Members/Senior Management, (b) Portfolio/Investment managers, (c) Control Functions, (d) Staff headingAdministration, Marketing and Human Resources, (e) other individuals (Risk Takers) in a significant position of influence, (f) otheremployees in the same remuneration bracket as other Risk Takers, whose roles have an impact on the risk profile of the ManagementCompany or the Group. At least 40% of the VC for Material Risk Takers is deferred. Additionally, at least 50% of both, the upfront andthe deferred proportion, are granted in the Group share-based instruments or fund-linked instruments for Key Investment Professionals.All deferred components are subject to a number of performance conditions and forfeiture provisions which ensure an appropriateex-post risk adjustment. In case the VC is lower than EUR 50,000, the Material Risk Takers receive their entire VC in cash without anydeferral.
Xtrackers II
Information for Shareholders - unaudited (continued)
396

6. Remuneration disclosures under UCITS V regulation (continued)
Aggregate Compensation Information for the Management Company for 2020(2).
Number of employees on an annual average 146Total Compensation(3) EUR 17,680,609
Fixed Pay EUR 15,248,995Variable Compensation EUR 2,431,614
Thereof: Carried Interest EUR 0Total Compensation for Senior Management(4) EUR 1,964,735Total Compensation for other Material Risk Takers(5) EUR 0Total Compensation for Control Function employees EUR 954,201
(2) In cases where portfolio or risk management activities have been delegated by the Management Company, the compensation data for delegates are not included inthe table.(3) Considering various elements of remuneration as defined in the ESMA Guidelines which may include monetary payments or benefits (such as cash, shares, options,pension contributions) or none (directly) monetary benefits (such as fringe benefits or special allowances for car, mobile phone, etc.).(4) Senior Management refers to the members of the Management Board of the Management Company, only. Members of the Management Board meet the definition ofmanagers. Apart from the members of Senior Management, no further managers have been identified.(5) Identified other material Risk Takers with control functions are shown in the line “Control Function employees”.
7. Changes in the composition of the investment portfolio
Changes are made available to the Shareholders by the Depositary and Administrative Agent at the Company’s registered office. Theywill be sent free of charge to any interested Shareholder upon request
Xtrackers II
Information for Shareholders - unaudited (continued)
397

8. Total Expense Ratio
The following table presents the Total Expense Ratio (TER) for the Share Classes which are allowed for distribution to non-qualified investors in Switzerland for the business year for everySub-Fund, ended 31 December 2020.
Sub-Fund TER (p.a.)Xtrackers II EUROZONE GOVERNMENT BOND UCITS ETF - 1C 0,15%Xtrackers II EUROZONE GOVERNMENT BOND UCITS ETF - 1D 0,09%Xtrackers II EUROZONE GOVERNMENT BOND UCITS ETF - 2C - USD Hedged(1) 0,20%Xtrackers II EUROZONE GOVERNMENT BOND 1-3 UCITS ETF - 1C 0,15%Xtrackers II EUROZONE GOVERNMENT BOND 1-3 UCITS ETF - 1D 0,15%Xtrackers II EUROZONE GOVERNMENT BOND 3-5 UCITS ETF - 1C 0,15%Xtrackers II EUROZONE GOVERNMENT BOND 3-5 UCITS ETF - 1D 0,15%Xtrackers II EUROZONE GOVERNMENT BOND 5-7 UCITS ETF - 1C 0,15%Xtrackers II EUROZONE GOVERNMENT BOND 7-10 UCITS ETF - 1C 0,15%Xtrackers II GLOBAL INFLATION-LINKED BOND UCITS ETF - 1C - EUR Hedged 0,25%Xtrackers II GLOBAL INFLATION-LINKED BOND UCITS ETF - 1D - EUR Hedged 0,25%Xtrackers II GLOBAL INFLATION-LINKED BOND UCITS ETF - 2C - USD Hedged 0,25%Xtrackers II GLOBAL INFLATION-LINKED BOND UCITS ETF - 3D - GBP Hedged 0,25%Xtrackers II GLOBAL INFLATION-LINKED BOND UCITS ETF - 4D - CHF Hedged 0,25%Xtrackers II GLOBAL INFLATION-LINKED BOND UCITS ETF - 5C 0,20%Xtrackers II EUROZONE INFLATION-LINKED BOND UCITS ETF - 1C 0,20%Xtrackers II EUR OVERNIGHT RATE SWAP UCITS ETF - 1C 0,10%Xtrackers II EUR OVERNIGHT RATE SWAP UCITS ETF - 1D 0,10%Xtrackers II ITRAXX CROSSOVER SWAP UCITS ETF - 1C 0,24%Xtrackers II USD EMERGING MARKETS BOND UCITS ETF - 1C - EUR Hedged 0,40%Xtrackers II USD EMERGING MARKETS BOND UCITS ETF - 2C(1) 0,25%Xtrackers II USD EMERGING MARKETS BOND UCITS ETF - 2D 0,25%Xtrackers II EUROZONE GOVERNMENT BOND SHORT DAILY SWAP UCITS ETF - 1C 0,15%Xtrackers II USD OVERNIGHT RATE SWAP UCITS ETF - 1C 0,15%Xtrackers II GLOBAL GOVERNMENT BOND UCITS ETF - 1C - EUR Hedged 0,25%Xtrackers II GLOBAL GOVERNMENT BOND UCITS ETF - 1D - EUR Hedged 0,25%
(1)The share class was launched on 11 March 2020. Please see point 1 in the other significant events of the year section of the Information for Shareholders of this annual report for further information.
Xtrackers II
Information for Shareholders - unaudited (continued)
398

8. Total Expense Ratio (continued)
Sub-Fund TER (p.a.)Xtrackers II GLOBAL GOVERNMENT BOND UCITS ETF - 2D - GBP Hedged 0,25%Xtrackers II GLOBAL GOVERNMENT BOND UCITS ETF - 3C - USD Hedged 0,25%Xtrackers II GLOBAL GOVERNMENT BOND UCITS ETF - 4C - CHF Hedged 0,25%Xtrackers II GLOBAL GOVERNMENT BOND UCITS ETF - 5C 0,20%Xtrackers II US TREASURIES UCITS ETF - 1D 0,07%Xtrackers II US TREASURIES UCITS ETF - 2D - EUR Hedged 0,10%Xtrackers II EUR CORPORATE BOND UCITS ETF - 1C 0,12%Xtrackers II GERMANY GOVERNMENT BOND UCITS ETF - 1C 0,15%Xtrackers II GERMANY GOVERNMENT BOND UCITS ETF - 1D 0,15%Xtrackers II ESG EUR CORPORATE BOND UCITS ETF - 1D 0,16%Xtrackers II IBOXX EUROZONE GOVERNMENT BOND YIELD PLUS 1-3 UCITS ETF - 1C 0,15%Xtrackers II IBOXX EUROZONE GOVERNMENT BOND YIELD PLUS 1-3 UCITS ETF - 1D 0,15%Xtrackers II JAPAN GOVERNMENT BOND UCITS ETF - 1C 0,15%Xtrackers II GLOBAL AGGREGATE BOND SWAP UCITS ETF - 1D 0,15%Xtrackers II GLOBAL AGGREGATE BOND SWAP UCITS ETF - 2C - USD Hedged 0,20%Xtrackers II GLOBAL AGGREGATE BOND SWAP UCITS ETF - 3D - GBP Hedged 0,20%Xtrackers II GLOBAL AGGREGATE BOND SWAP UCITS ETF - 4C - CHF Hedged 0,20%Xtrackers II GLOBAL AGGREGATE BOND SWAP UCITS ETF - 5C - EUR Hedged 0,20%Xtrackers II EUR HIGH YIELD CORPORATE BOND UCITS ETF - 1C 0,20%Xtrackers II EUR HIGH YIELD CORPORATE BOND UCITS ETF - 1D 0,20%Xtrackers II ESG EUR CORPORATE BOND SHORT DURATION UCITS ETF - 1C(2) 0,16%
(2)The Sub-Fund was launched on 23 July 2020. Please see point 1 in the significant events of the year section of the Notes to the Financial Statements of this annual report for further information.
The TER percentage for each Sub-Fund is presented in the Share Class’s currency.
The TER expresses the sum of all fees and incidental costs charged on an ongoing basis to the collective investment scheme’s assets (operating expenses) taken retrospectively as apercentage of the net assets, and is in principle calculated using the following formula according to the Guidelines on the calculation and disclosure of the Total Expense Ratio (TER) ofcollective investment schemes from 16 May 2008 (dated 20 April 2015):
TER % = Total operating expenses in CU* / 100 Average net assets in CU* *100
* CU = currency units in the accounting currency of the collective investment scheme
Xtrackers II
Information for Shareholders - unaudited (continued)
399
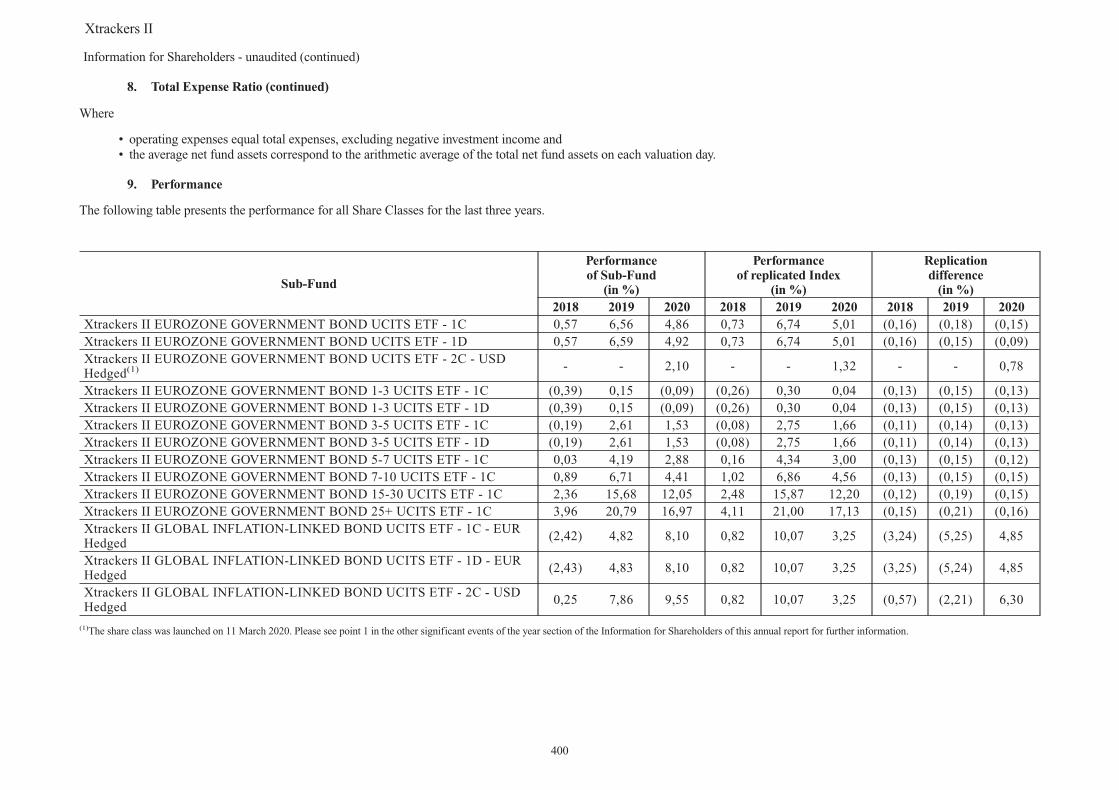
8. Total Expense Ratio (continued)
Where
• operating expenses equal total expenses, excluding negative investment income and• the average net fund assets correspond to the arithmetic average of the total net fund assets on each valuation day.
9. Performance
The following table presents the performance for all Share Classes for the last three years.
Sub-Fund
Performanceof Sub-Fund
(in %)
Performanceof replicated Index
(in %)
Replicationdifference
(in %)2018 2019 2020 2018 2019 2020 2018 2019 2020
Xtrackers II EUROZONE GOVERNMENT BOND UCITS ETF - 1C 0,57 6,56 4,86 0,73 6,74 5,01 (0,16) (0,18) (0,15)Xtrackers II EUROZONE GOVERNMENT BOND UCITS ETF - 1D 0,57 6,59 4,92 0,73 6,74 5,01 (0,16) (0,15) (0,09)Xtrackers II EUROZONE GOVERNMENT BOND UCITS ETF - 2C - USDHedged(1) - - 2,10 - - 1,32 - - 0,78
Xtrackers II EUROZONE GOVERNMENT BOND 1-3 UCITS ETF - 1C (0,39) 0,15 (0,09) (0,26) 0,30 0,04 (0,13) (0,15) (0,13)Xtrackers II EUROZONE GOVERNMENT BOND 1-3 UCITS ETF - 1D (0,39) 0,15 (0,09) (0,26) 0,30 0,04 (0,13) (0,15) (0,13)Xtrackers II EUROZONE GOVERNMENT BOND 3-5 UCITS ETF - 1C (0,19) 2,61 1,53 (0,08) 2,75 1,66 (0,11) (0,14) (0,13)Xtrackers II EUROZONE GOVERNMENT BOND 3-5 UCITS ETF - 1D (0,19) 2,61 1,53 (0,08) 2,75 1,66 (0,11) (0,14) (0,13)Xtrackers II EUROZONE GOVERNMENT BOND 5-7 UCITS ETF - 1C 0,03 4,19 2,88 0,16 4,34 3,00 (0,13) (0,15) (0,12)Xtrackers II EUROZONE GOVERNMENT BOND 7-10 UCITS ETF - 1C 0,89 6,71 4,41 1,02 6,86 4,56 (0,13) (0,15) (0,15)Xtrackers II EUROZONE GOVERNMENT BOND 15-30 UCITS ETF - 1C 2,36 15,68 12,05 2,48 15,87 12,20 (0,12) (0,19) (0,15)Xtrackers II EUROZONE GOVERNMENT BOND 25+ UCITS ETF - 1C 3,96 20,79 16,97 4,11 21,00 17,13 (0,15) (0,21) (0,16)Xtrackers II GLOBAL INFLATION-LINKED BOND UCITS ETF - 1C - EURHedged
(2,42) 4,82 8,10 0,82 10,07 3,25 (3,24) (5,25) 4,85
Xtrackers II GLOBAL INFLATION-LINKED BOND UCITS ETF - 1D - EURHedged
(2,43) 4,83 8,10 0,82 10,07 3,25 (3,25) (5,24) 4,85
Xtrackers II GLOBAL INFLATION-LINKED BOND UCITS ETF - 2C - USDHedged
0,25 7,86 9,55 0,82 10,07 3,25 (0,57) (2,21) 6,30
(1)The share class was launched on 11 March 2020. Please see point 1 in the other significant events of the year section of the Information for Shareholders of this annual report for further information.
Xtrackers II
Information for Shareholders - unaudited (continued)
400
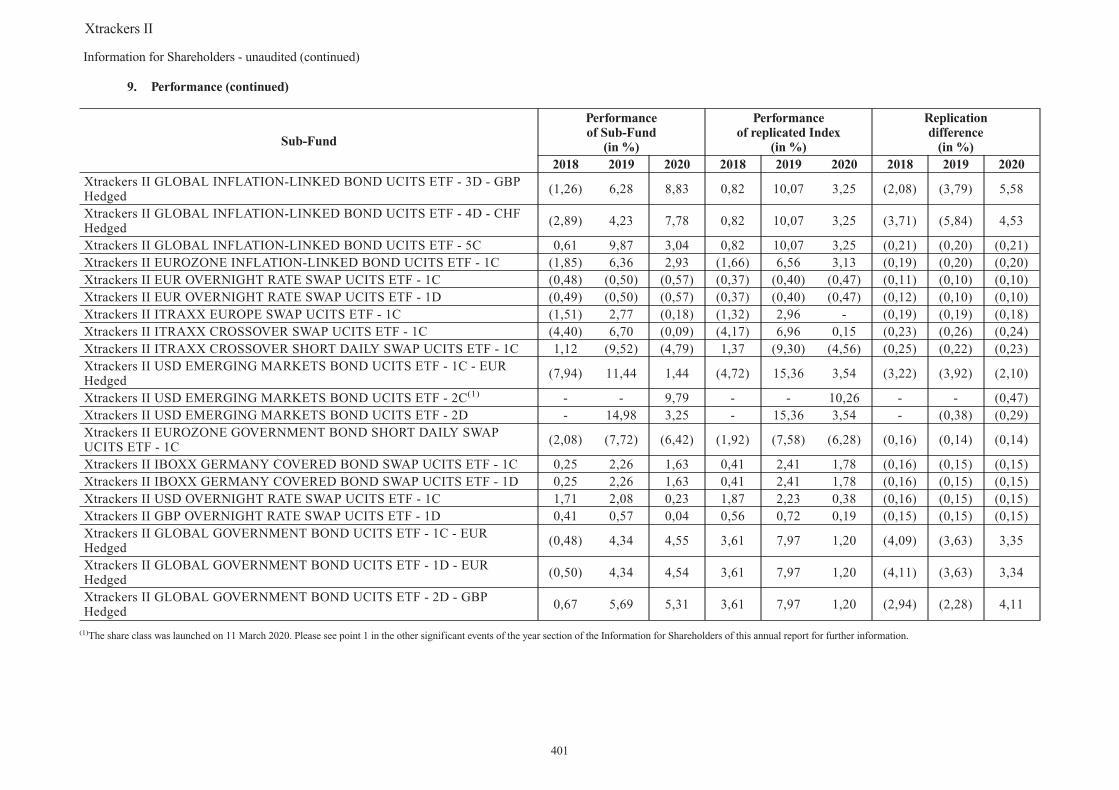
9. Performance (continued)
Sub-Fund
Performanceof Sub-Fund
(in %)
Performanceof replicated Index
(in %)
Replicationdifference
(in %)2018 2019 2020 2018 2019 2020 2018 2019 2020
Xtrackers II GLOBAL INFLATION-LINKED BOND UCITS ETF - 3D - GBPHedged
(1,26) 6,28 8,83 0,82 10,07 3,25 (2,08) (3,79) 5,58
Xtrackers II GLOBAL INFLATION-LINKED BOND UCITS ETF - 4D - CHFHedged
(2,89) 4,23 7,78 0,82 10,07 3,25 (3,71) (5,84) 4,53
Xtrackers II GLOBAL INFLATION-LINKED BOND UCITS ETF - 5C 0,61 9,87 3,04 0,82 10,07 3,25 (0,21) (0,20) (0,21)Xtrackers II EUROZONE INFLATION-LINKED BOND UCITS ETF - 1C (1,85) 6,36 2,93 (1,66) 6,56 3,13 (0,19) (0,20) (0,20)Xtrackers II EUR OVERNIGHT RATE SWAP UCITS ETF - 1C (0,48) (0,50) (0,57) (0,37) (0,40) (0,47) (0,11) (0,10) (0,10)Xtrackers II EUR OVERNIGHT RATE SWAP UCITS ETF - 1D (0,49) (0,50) (0,57) (0,37) (0,40) (0,47) (0,12) (0,10) (0,10)Xtrackers II ITRAXX EUROPE SWAP UCITS ETF - 1C (1,51) 2,77 (0,18) (1,32) 2,96 - (0,19) (0,19) (0,18)Xtrackers II ITRAXX CROSSOVER SWAP UCITS ETF - 1C (4,40) 6,70 (0,09) (4,17) 6,96 0,15 (0,23) (0,26) (0,24)Xtrackers II ITRAXX CROSSOVER SHORT DAILY SWAP UCITS ETF - 1C 1,12 (9,52) (4,79) 1,37 (9,30) (4,56) (0,25) (0,22) (0,23)Xtrackers II USD EMERGING MARKETS BOND UCITS ETF - 1C - EURHedged
(7,94) 11,44 1,44 (4,72) 15,36 3,54 (3,22) (3,92) (2,10)
Xtrackers II USD EMERGING MARKETS BOND UCITS ETF - 2C(1) - - 9,79 - - 10,26 - - (0,47)Xtrackers II USD EMERGING MARKETS BOND UCITS ETF - 2D - 14,98 3,25 - 15,36 3,54 - (0,38) (0,29)Xtrackers II EUROZONE GOVERNMENT BOND SHORT DAILY SWAPUCITS ETF - 1C
(2,08) (7,72) (6,42) (1,92) (7,58) (6,28) (0,16) (0,14) (0,14)
Xtrackers II IBOXX GERMANY COVERED BOND SWAP UCITS ETF - 1C 0,25 2,26 1,63 0,41 2,41 1,78 (0,16) (0,15) (0,15)Xtrackers II IBOXX GERMANY COVERED BOND SWAP UCITS ETF - 1D 0,25 2,26 1,63 0,41 2,41 1,78 (0,16) (0,15) (0,15)Xtrackers II USD OVERNIGHT RATE SWAP UCITS ETF - 1C 1,71 2,08 0,23 1,87 2,23 0,38 (0,16) (0,15) (0,15)Xtrackers II GBP OVERNIGHT RATE SWAP UCITS ETF - 1D 0,41 0,57 0,04 0,56 0,72 0,19 (0,15) (0,15) (0,15)Xtrackers II GLOBAL GOVERNMENT BOND UCITS ETF - 1C - EURHedged
(0,48) 4,34 4,55 3,61 7,97 1,20 (4,09) (3,63) 3,35
Xtrackers II GLOBAL GOVERNMENT BOND UCITS ETF - 1D - EURHedged
(0,50) 4,34 4,54 3,61 7,97 1,20 (4,11) (3,63) 3,34
Xtrackers II GLOBAL GOVERNMENT BOND UCITS ETF - 2D - GBPHedged
0,67 5,69 5,31 3,61 7,97 1,20 (2,94) (2,28) 4,11
(1)The share class was launched on 11 March 2020. Please see point 1 in the other significant events of the year section of the Information for Shareholders of this annual report for further information.
Xtrackers II
Information for Shareholders - unaudited (continued)
401

9. Performance (continued)
Sub-Fund
Performanceof Sub-Fund
(in %)
Performanceof replicated Index
(in %)
Replicationdifference
(in %)2018 2019 2020 2018 2019 2020 2018 2019 2020
Xtrackers II GLOBAL GOVERNMENT BOND UCITS ETF - 3C - USDHedged
2,23 7,37 5,94 3,61 7,97 1,20 (1,38) (0,60) 4,74
Xtrackers II GLOBAL GOVERNMENT BOND UCITS ETF - 4C - CHF Hedged (0,96) 3,77 4,19 3,61 7,97 1,20 (4,57) (4,20) 2,99Xtrackers II GLOBAL GOVERNMENT BOND UCITS ETF - 5C 3,41 7,73 0,99 3,61 7,97 1,20 (0,20) (0,24) (0,21)Xtrackers II SINGAPORE GOVERNMENT BOND UCITS ETF - 1C 1,70 4,80 7,57 1,94 5,07 7,86 (0,24) (0,27) (0,29)Xtrackers II US TREASURIES UCITS ETF - 1D 0,59 7,08 8,24 0,70 7,20 8,33 (0,11) (0,12) (0,09)Xtrackers II US TREASURIES UCITS ETF - 2D - EUR Hedged (2,14) 3,96 6,79 0,70 7,20 8,33 (2,84) (3,24) (1,54)Xtrackers II US TREASURIES 1-3 UCITS ETF - 1D 1,43 3,49 3,05 1,55 3,61 3,12 (0,12) (0,12) (0,07)Xtrackers II EUR CORPORATE BOND UCITS ETF - 1C (1,46) 6,12 2,47 (1,27) 6,26 2,77 (0,19) (0,14) (0,30)Xtrackers II GERMANY GOVERNMENT BOND UCITS ETF - 1C 2,15 2,86 2,85 2,29 3,02 2,99 (0,14) (0,16) (0,14)Xtrackers II GERMANY GOVERNMENT BOND UCITS ETF - 1D 2,15 2,86 2,85 2,29 3,02 2,99 (0,14) (0,16) (0,14)Xtrackers II GERMANY GOVERNMENT BOND 1-3 UCITS ETF - 1D (0,49) (0,88) (0,72) (0,35) (0,72) (0,59) (0,14) (0,16) (0,13)Xtrackers II ESG EUR CORPORATE BOND UCITS ETF - 1D (1,41) 5,81 2,37 (1,19) 5,93 2,62 (0,22) (0,12) (0,25)Xtrackers II EUROZONE AAA GOVERNMENT BOND SWAP UCITS ETF -1C
2,13 2,99 2,99 2,28 3,15 3,14 (0,15) (0,16) (0,15)
Xtrackers II EUROZONE AAA GOVERNMENT BOND SWAP UCITS ETF -1D
2,12 3,00 2,98 2,28 3,15 3,14 (0,16) (0,15) (0,16)
Xtrackers II IBOXX EUROZONE GOVERNMENT BOND YIELD PLUSUCITS ETF - 1C
(0,90) 9,41 6,17 (0,75) 9,60 6,32 (0,15) (0,19) (0,15)
Xtrackers II IBOXX EUROZONE GOVERNMENT BOND YIELD PLUSUCITS ETF - 1D
(0,89) 9,41 6,17 (0,75) 9,60 6,32 (0,14) (0,19) (0,15)
Xtrackers II AUSTRALIA GOVERNMENT BOND UCITS ETF - 1C 4,92 8,10 4,15 5,20 8,41 4,43 (0,28) (0,31) (0,28)Xtrackers II ITALY GOVERNMENT BOND 0-1 SWAP UCITS ETF - 1C (0,42) (0,01) (0,21) (0,27) 0,15 (0,06) (0,15) (0,16) (0,15)Xtrackers II EUR COVERED BOND SWAP UCITS ETF - 1C 0,04 4,68 2,87 0,25 4,89 3,08 (0,21) (0,21) (0,21)Xtrackers II IBOXX EUROZONE GOVERNMENT BOND YIELD PLUS1-3 UCITS ETF - 1C
(0,11) 1,21 0,59 0,05 1,39 0,75 (0,16) (0,18) (0,16)
Xtrackers II IBOXX EUROZONE GOVERNMENT BOND YIELD PLUS1-3 UCITS ETF - 1D
(0,11) 1,21 0,59 0,05 1,39 0,75 (0,16) (0,18) (0,16)
Xtrackers II JAPAN GOVERNMENT BOND UCITS ETF - 1C 0,98 2,12 (1,24) 1,14 2,29 (1,09) (0,16) (0,17) (0,15)
Xtrackers II
Information for Shareholders - unaudited (continued)
402

9. Performance (continued)
Sub-Fund
Performanceof Sub-Fund
(in %)
Performanceof replicated Index
(in %)
Replicationdifference
(in %)2018 2019 2020 2018 2019 2020 2018 2019 2020
Xtrackers II GLOBAL AGGREGATE BOND SWAP UCITS ETF - 1D (1,27) 6,93 9,03 (1,14) 7,09 9,20 (0,13) (0,16) (0,17)Xtrackers II GLOBAL AGGREGATE BOND SWAP UCITS ETF - 2C - USDHedged
1,48 8,13 5,37 1,69 8,35 5,58 (0,21) (0,22) (0,21)
Xtrackers II GLOBAL AGGREGATE BOND SWAP UCITS ETF - 3D - GBPHedged
(0,15) 6,36 4,75 0,03 6,57 4,96 (0,18) (0,21) (0,21)
Xtrackers II GLOBAL AGGREGATE BOND SWAP UCITS ETF - 4C - CHFHedged
(1,74) 4,49 3,67 (1,54) 4,71 3,88 (0,20) (0,22) (0,21)
Xtrackers II GLOBAL AGGREGATE BOND SWAP UCITS ETF - 5C - EURHedged
(1,30) 5,00 4,02 (1,10) 5,20 4,24 (0,20) (0,20) (0,22)
Xtrackers II EUR HIGH YIELD CORPORATE BOND UCITS ETF - 1C (3,65) 9,29 1,53 (3,39) 9,58 1,65 (0,26) (0,29) (0,12)Xtrackers II EUR HIGH YIELD CORPORATE BOND UCITS ETF - 1D (3,65) 9,29 1,53 (3,39) 9,58 1,65 (0,26) (0,29) (0,12)Xtrackers II EUR HIGH YIELD CORPORATE BOND 1-3 SWAP UCITS ETF -1D
(2,38) 5,80 0,77 (2,03) 6,16 1,71 (0,35) (0,36) (0,94)
Xtrackers II HARVEST CHINA GOVERNMENT BOND UCITS ETF - 1D 1,34 1,92 9,25 2,60 2,78 9,65 (1,26) (0,86) (0,40)Xtrackers II USD ASIA EX JAPAN CORPORATE BOND UCITS ETF - 1D (0,63) 11,77 6,56 (0,30) 12,05 7,16 (0,33) (0,28) (0,60)Xtrackers II ESG EUR CORPORATE BOND SHORT DURATION UCITS ETF- 1C(2) - - 1,00 - - 1,21 - - (0,21)
(2)The Sub-Fund was launched on 23 July 2020. Please see point 1 in the significant events of the year section of the Notes to the Financial Statements of this annual report for further information.
The performance of each Share Class corresponds to the change in Net Asset Value during the current period, adjusted for gross distribution for the Distribution Shares, expressed in theShare Class’s currency.
For the Share Classes shown in the table that were launched during this period, the performance was calculated for the first period since inception. Historical performance is not an indicatorof the current or future performance; commissions and costs charged for the issue and redemption of units are not taken into account.
Xtrackers II
Information for Shareholders - unaudited (continued)
403