WYSIWYT testing in the spreadsheet paradigm: an empirical evaluation
10
-
Upload
oregonstate -
Category
Documents
-
view
1 -
download
0
Transcript of WYSIWYT testing in the spreadsheet paradigm: an empirical evaluation
WYSIWYT Testing in the Spreadsheet Paradigm:An Empirical EvaluationKaren J. Rothermely, Curtis R. Cooky, Margaret M. Burnetty,Justin Schonfeldy, T. R. G. Greenz, Gregg RothermelyyDepartment of Computer ScienceOregon State UniversityCorvallis, OR 97331 zComputer-Based Learning UnitUniversity of LeedsLeeds LS2 9JT, U.K.yfrotherka,cook,burnett,schonfju,[email protected] [email protected] it possible to achieve some of the bene�ts of formaltesting within the informal programming conventions ofthe spreadsheet paradigm? We have been working on anapproach that attempts to do so via the development ofa testing methodology for this paradigm. Our \WhatYou See Is What You Test" (WYSIWYT) methodol-ogy supplements the convention by which spreadsheetsprovide automatic immediate visual feedback about val-ues by providing automatic immediate visual feedbackabout \testedness". In previous work we described thismethodology; in this paper, we present empirical dataabout the methodology's e�ectiveness. Our results showthat the use of the methodology was associated withsigni�cant improvement in testing e�ectiveness and e�-ciency, even with no training on the theory of testing ortest adequacy that the model implements. These resultsmay be due at least in part to the fact that use of themethodology was associated with a signi�cant reductionin overcon�dence.Keywordsspreadsheets, testing, visual programming, empiricalstudies1 INTRODUCTIONPerhaps the most widely used programming paradigmtoday is the spreadsheet paradigm. Yet, almost nowork has been done to help with the software engineer-ing tasks that arise in the creation and maintenance ofspreadsheets. This inattention is rather surprising giventhe in uential role played by spreadsheets in decisionsProceedings of the International Conference on SoftwareEngineering, June, 2000, pages 230-239.
about a variety of real-world issues, such as those in-volving budgets, student grades, and tax calculations.Spreadsheet languages di�er from most other com-monly used programming languages in that they pro-vide a declarative approach to programming, character-ized by a dependence-driven, direct-manipulation work-ing model [1]. Users of spreadsheet languages createcells and de�ne formulas for those cells. These formulasreference values contained in other cells and use themin calculations. As soon as a cell's formula is de�ned,the underlying evaluation engine automatically calcu-lates the cell's value and those of a�ected cells (at leastthose that are visible), and immediately displays newresults. Spreadsheet languages are used for computa-tional tasks ranging from simple \scratchpad" applica-tions developed by single users to large-scale, complexsystems developed by multiple users [18].Despite the perceived simplicity of the spreadsheetparadigm, research shows that spreadsheets may oftencontain faults. A survey of the literature provides de-tails: in 4 �eld audits of operational spreadsheets, errorswere found in an average of 20.6% of spreadsheets au-dited; in 11 experiments in which participants createdspreadsheets, errors were found in an average of 60.8% ofthe spreadsheets; in 4 experiments in which the partici-pants inspected spreadsheets for errors, the participantsmissed an average of 55.8% of the errors [18].Contributing to the problem of reliability is the unwar-ranted con�dence that spreadsheet programmers seemto have in the correctness of their spreadsheets [3, 28].A possible cause of this overcon�dence could be re-lated to the �ndings of Gilmore and of Svendsen, whoshowed that too much feedback and responsiveness, asfeatured in the immediate visual feedback of values inspreadsheet languages, can actually interfere with peo-ple's problem-solving ability in solving puzzles [10, 25],

a task with much in common with programming.To address the reliability problem associated withspreadsheets, we are investigating the possibility ofbringing some of the bene�ts of formal testing tothe informal, highly interactive, declarative spreadsheetparadigm. Our theory is that by providing feedbackabout the \testedness" of a spreadsheet, as opposed tojust the values, we can cause programmers to have lessovercon�dence about the correctness of their spread-sheets. This testing feedback may motivate program-mers to test their spreadsheets more thoroughly, andprovide guidance that helps them test more e�ciently.This could lead to better testing even in this informalprogramming domain, and to a reduction in faults be-fore a spreadsheet is relied upon in decision making.We have therefore developed a \What You See IsWhat You Test" (WYSIWYT) methodology for testingspreadsheets [23]. Our methodology is designed to ac-commodate the declarative evaluation model of spread-sheet formulas, the incremental style of development,and the immediate visual feedback expected of spread-sheet languages. The methodology is designed for use bythe wide range of programmers using spreadsheet lan-guages, especially taking into account the lack of formalbackground of many of these programmers.Given such a methodology, determining whether it canbe used in a way that brings any bene�t to programmersrequires answers to three questions:First, is the methodology e�cient enough to coexistwith the immediate cell redisplay expected after eachformula edit? In our previous work, we showed thatmost of our algorithms can be implemented in ways thatadd only O(1) to the existing cost of maintaining the in-teractive environment.Second, will the methodology uncover faults in pro-grams? Our methodology guides programmers (thoughthey need not be aware of it) in meeting a data ow testadequacy criterion. (This criterion will be describedin the next section.) We used our implementation toempirically study the fault detection characteristics oftest suites that meet this criterion. Our results suggestthat such test suites can provide fault detection rates forspreadsheets at a signi�cantly higher rate than equiva-lently sized randomly generated test suites [20, 23].Third, will programmers who use the methodology beless overcon�dent and be more e�ective, more e�cienttesters than programmers who do not use the methodol-ogy? To investigate this third question, we have beguna series of empirical studies with human subjects. The�rst of these studies is now complete, and is the subjectof this paper.2 BACKGROUND
The literature on testing primarily addresses the test-ing of imperative programs (e.g. [7, 9, 11, 15, 19, 27]),with a few attempts to address the testing of functionaland logic programs (e.g. [2, 12, 14, 17]). However, dif-ferences between the spreadsheet and imperative lan-guage paradigms directly impact the development of atesting methodology for spreadsheets. First, evaluationof spreadsheets is driven by data dependencies betweencells, and spreadsheets contain explicit control ow onlywithin cell formulas. This dependence-driven evalua-tion model allows evaluation engines for spreadsheets exibility in the scheduling algorithms and optimiza-tion devices they employ to perform computations. Amethodology for testing spreadsheets must be compat-ible with this exibility, and not rely upon any par-ticular evaluation order. Second, spreadsheets are de-veloped incrementally, and there is an immediate vi-sual response after each addition of or modi�cation of aformula. A testing methodology for spreadsheets mustbe exible enough to operate upon partially-completedprograms and e�cient enough to support responsive-ness. Third, and most critical, whereas most imperativeprograms are developed by professional programmers,spreadsheets are developed by a wide variety of users,many of whom have no training in formal testing prin-ciples. Our methodology for testing spreadsheets takesthese factors into account. We overview the foundationsof that methodology here; a detailed presentation canbe found in [22, 23].Spreadsheet programmers are not likely to write spec-i�cations for their spreadsheets; thus, our methodol-ogy relies, behind the scenes, on code-based test ade-quacy criteria. Code-based test adequacy criteria pro-vide help in selecting test data and in deciding whethera program has been tested \enough" by relating test-ing e�ort to coverage of code components. Such crite-ria have been well researched for imperative languages(e.g. [9, 15, 19]), and several empirical studies (e.g.[8, 11, 27]) have demonstrated their usefulness.Our methodology incorporates a test adequacy crite-rion adapted from the output-in uencing-all-du-pairsdata ow adequacy criterion de�ned originally for im-perative programs [7]. This criterion, which we calldu-adequacy for brevity, focuses on the de�nition-useassociations (du-associations) in a spreadsheet, wherea du-association links an expression (in a cell formula)that de�nes a cell's value with expressions in other cellformulas that reference (use) the de�ned cell. The crite-rion requires that each executable du-association in thespreadsheet be exercised by test data in such a way thatthe du-association contributes (directly or indirectly) tothe display of a value that is subsequently pronouncedcorrect (validated) by the programmer.It is not always possible to exercise all du-associations;
those that cannot be exercised are called nonexecutable.Determining whether a du-association is executable isprovably impossible in general and frequently infeasiblein practice [9, 27]; thus, data ow test adequacy criteriatypically require that test data exercise (cover) only ex-ecutable du-associations. In this respect, our criterion isno exception. In our experience with spreadsheets, how-ever, most of the nonexecutable du-associations we haveencountered have involved direct contradictions betweenconditions that are relatively easy for persons capableof creating those spreadsheets to identify.The appropriateness of the du-adequacy criterion forspreadsheets stems from the fact that by relating testcoverage to interactions between de�nitions and uses ofcells, the criterion requires these interactions to be ex-ercised; since such interactions are a primary source offaults in spreadsheets this is valuable. Moreover, the cri-terion does not enforce any expectation of a particularcell execution order: the du-associations in a spread-sheet are the same regardless of the order in which theevaluation engine executes cells. Further, by linking testcoverage to cell validation, the criterion avoids problemsin which du-associations in uencing only values that arehidden or o�-screen are considered exercised simply byapplying test inputs; instead, the du-association mustparticipate in producing a visible result judged correctby the programmer. Finally, the criterion facilitates theincremental testing of spreadsheets, allowing a test toinvolve entry of values into a small subset of the poten-tially large set of input cells in a spreadsheet, followedby validations of multiple cells.3 EXPERIMENT DESIGNThe objectives of our study were to investigate the fol-lowing research questions:RQ 1: Do programmers who use our testing methodol-ogy create test suites that are more e�ective in termsof du-adequacy than programmers who use an ad hocapproach?RQ 2: Do programmers who use our testing methodologycreate test suites more e�ciently than programmers whouse an ad hoc approach?RQ 3: Are programmers who use our testing methodol-ogy less overcon�dent about the quality of their testingthan programmers who use an ad hoc approach?These questions were translated directly into hypothe-ses. We also took care that the design of our experimentwould provide insight into the following question:Is training in the underlying test adequacy criterion andits relationship to the visual devices needed in order forspreadsheet programmers to gain testing e�ectiveness ore�ciency from using our methodology?
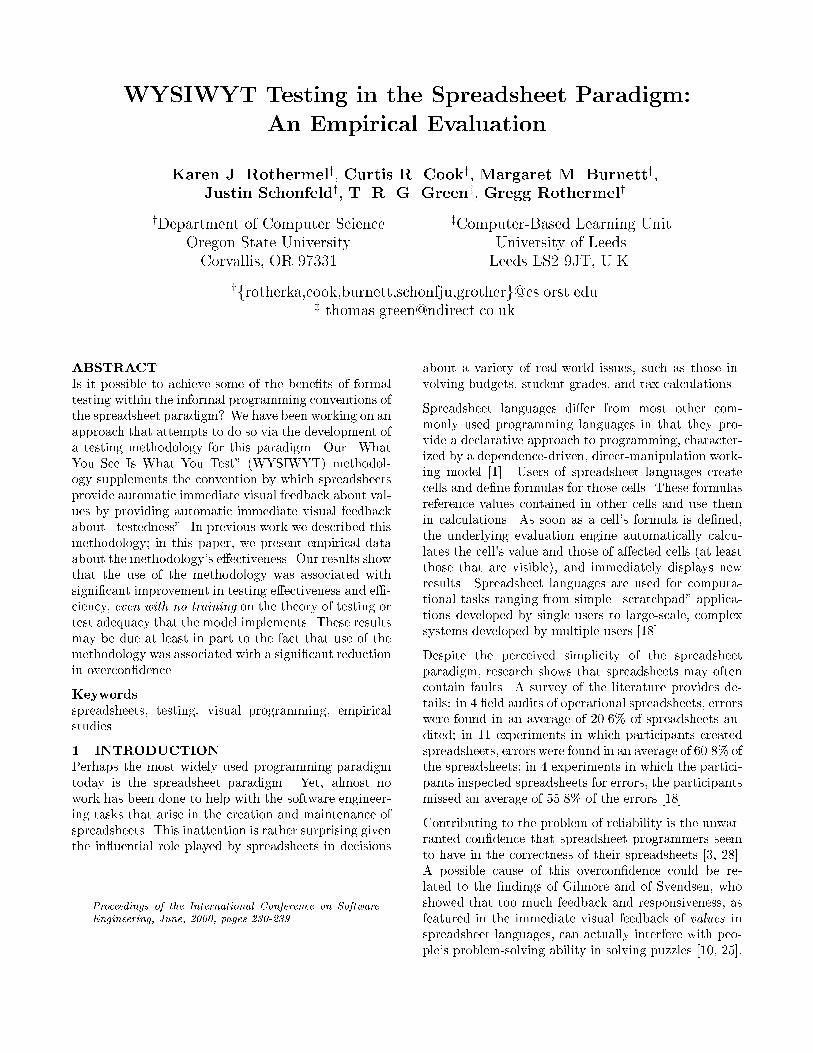
Figure 1: Spreadsheet for calculating student grades.To investigate these questions, we conducted a con-trolled laboratory experiment. In the experiment, thesubjects tested spreadsheets. Half of the subjects didso using a spreadsheet environment that includes theWYSIWYT methodology, and the other half used thesame environment minus the testing methodology.We collected the actions of each subject throughout thetesting sessions, automatically recorded in transcript�les; the test suites created by the subjects' actions (de-rived from the information in the transcript �les); sub-ject background questionnaires; and post-experimentquestionnaires in which all subjects rated how well theythought they tested the spreadsheet and WYSIWYTsubjects answered additional questions about their useand understanding of our methodology's feedback.The Experimental EnvironmentWe have prototyped our WYSIWYT testing methodol-ogy in the research language Forms/3 [4], one of manyspreadsheet language research systems (e.g. [4, 5, 13, 16,24, 26]). This choice is motivated partly by the fact thatwe have access to the implementation of Forms/3, andthus, we can implement and experiment with varioustesting technologies within that environment. More im-portant, however, is that by working with Forms/3, wecan investigate language features common to commer-cial spreadsheet languages as well as advanced languagefeatures found in research spreadsheet languages.As in other spreadsheet languages, Forms/3 spread-sheets are a collection of cells; each cell's value is de-�ned by the cell's formula. The programmer enters acell's formula and receives immediate visual feedback asto the cell's value. In Forms/3, ordinary formulas canbe used for both numeric and graphical computations.Figure 1 shows a gradebook spreadsheet that computesaverages for each student and for the class. Figure 2shows a spreadsheet that translates numeric input val-ues for hour and minute into a graphical clock face withhour and minute hands. As this �gure shows, the pro-grammer can freely reposition a cell and can choose todisplay or hide the cell's formula. In the Clock spread-
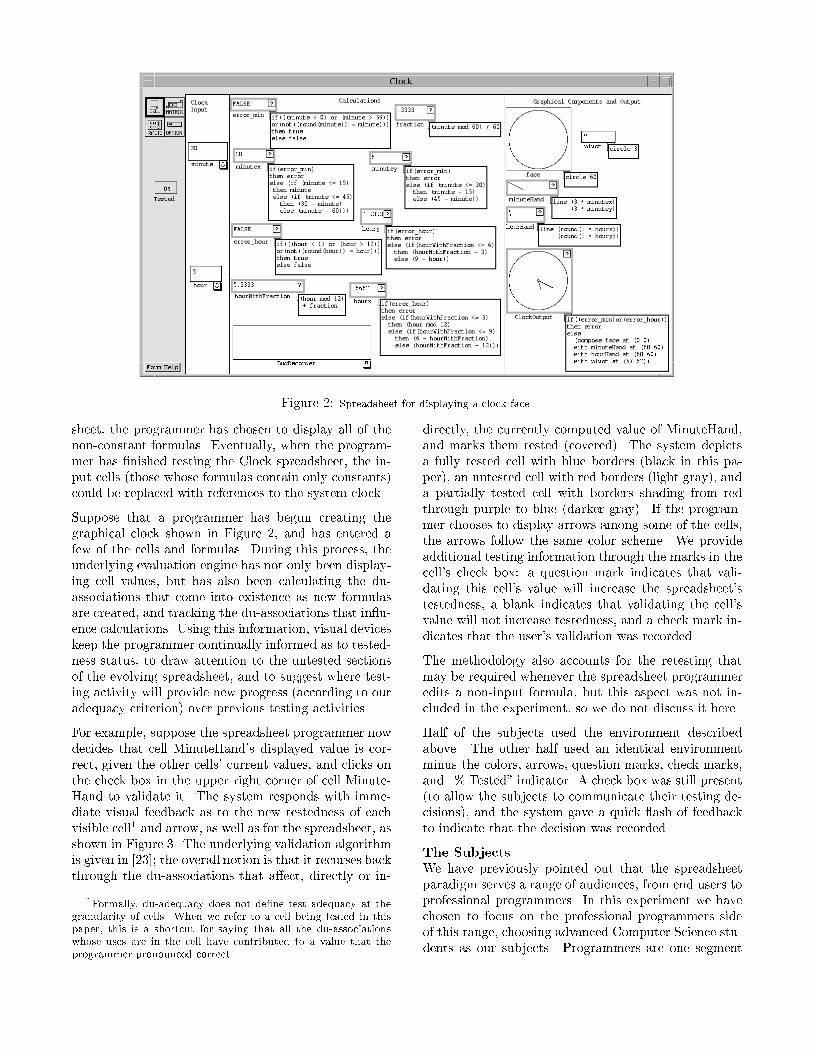
Figure 2: Spreadsheet for displaying a clock face.sheet, the programmer has chosen to display all of thenon-constant formulas. Eventually, when the program-mer has �nished testing the Clock spreadsheet, the in-put cells (those whose formulas contain only constants)could be replaced with references to the system clock.Suppose that a programmer has begun creating thegraphical clock shown in Figure 2, and has entered afew of the cells and formulas. During this process, theunderlying evaluation engine has not only been display-ing cell values, but has also been calculating the du-associations that come into existence as new formulasare created, and tracking the du-associations that in u-ence calculations. Using this information, visual deviceskeep the programmer continually informed as to tested-ness status, to draw attention to the untested sectionsof the evolving spreadsheet, and to suggest where test-ing activity will provide new progress (according to ouradequacy criterion) over previous testing activities.For example, suppose the spreadsheet programmer nowdecides that cell MinuteHand's displayed value is cor-rect, given the other cells' current values, and clicks onthe check box in the upper right corner of cell Minute-Hand to validate it. The system responds with imme-diate visual feedback as to the new testedness of eachvisible cell1 and arrow, as well as for the spreadsheet, asshown in Figure 3. The underlying validation algorithmis given in [23]; the overall notion is that it recurses backthrough the du-associations that a�ect, directly or in-1Formally, du-adequacy does not de�ne test adequacy at thegranularity of cells. When we refer to a cell being tested in thispaper, this is a shortcut for saying that all the du-associationswhose uses are in the cell have contributed to a value that theprogrammer pronounced correct.
directly, the currently computed value of MinuteHand,and marks them tested (covered). The system depictsa fully tested cell with blue borders (black in this pa-per), an untested cell with red borders (light gray), anda partially tested cell with borders shading from redthrough purple to blue (darker gray). If the program-mer chooses to display arrows among some of the cells,the arrows follow the same color scheme. We provideadditional testing information through the marks in thecell's check box: a question mark indicates that vali-dating this cell's value will increase the spreadsheet'stestedness, a blank indicates that validating the cell'svalue will not increase testedness, and a check mark in-dicates that the user's validation was recorded.The methodology also accounts for the retesting thatmay be required whenever the spreadsheet programmeredits a non-input formula, but this aspect was not in-cluded in the experiment, so we do not discuss it here.Half of the subjects used the environment describedabove. The other half used an identical environmentminus the colors, arrows, question marks, check marks,and \% Tested" indicator. A check box was still present(to allow the subjects to communicate their testing de-cisions), and the system gave a quick ash of feedbackto indicate that the decision was recorded.The SubjectsWe have previously pointed out that the spreadsheetparadigm serves a range of audiences, from end users toprofessional programmers. In this experiment we havechosen to focus on the professional programmers sideof this range, choosing advanced Computer Science stu-dents as our subjects. Programmers are one segment

Figure 3: \Under construction" Clock after a validation.of the population served by spreadsheets, and are anespecially interesting group of subjects for explorationof our research questions because of their previous ex-perience with testing. That is, programmers and CSstudents are typically more experienced in testing thanare end users; hence, because of their previous experi-ence and practice with testing, they might already bee�cient and e�ective at testing without much room forimprovement due to our methodology.78 subjects participated in the experiment, drawn fromthree Computer Science courses: two upper-division un-dergraduate courses and one graduate course in Com-puter Science. The subjects had very little or no pre-vious exposure to the experimental environment. Thesubjects were randomly divided into two groups, subjectto balancing the number of undergraduate and gradu-ate students between the groups. The control (Ad Hoc)group did not have access to our WYSIWYT methodol-ogy and represents programmers who test in an ad hocfashion. The treatment (WYSIWYT) group did haveaccess to our methodology.Of the 78 subjects, the Ad Hoc group and WYSIWYTgroups contained 37 and 41 subjects, respectively. Thedi�erence in group size was due to a few subjects failingto arrive for their appointments. The group sizes weresubsequently reduced when we decided to omit data forsubjects whose measurable activity level was zero (asrevealed by transcripts of the sessions), whose computercrashed during the experiment, or who inadvertentlycorrupted their data in other ways. The removal of thesesubjects reduced the number of subjects in the Ad Hocand WYSIWYT groups to 30 and 39, respectively.To ascertain whether the subjects in the two groupshad reasonably similar backgrounds, we administered abackground questionnaire to each subject and analyzedthe data. Results are summarized in Table 1. Our anal-ysis showed homogeneity between the groups except forthe GPA category, where we found that the Ad Hocsubjects had signi�cantly higher GPAs than the WYSI-WYT subjects. Since the GPAs were self-reported bythe subjects and approximately one-third of the subjectsdid not report a GPA, this non-homogenity of GPAs is
tenuous. More to the point, however, is that if anything,the di�erence in GPAs would work against the hypoth-esis that the methodology would improve subjects' test-ing ability; hence the presence of this non-homogeneitywould only further strengthen our results.The TutorialThe experiment was conducted in a lab with subjectsseated one per workstation, using Forms/3. The ex-periment began with a 20-minute tutorial of Forms/3,in which each subject worked with the example spread-sheets on their workstations following instructions givenby the lecturer. Throughout the tutorial the partici-pants had access to a handout containing a quick refer-ence of the spreadsheet features they were being taught.They could make notes on these handouts which re-mained available to them throughout the experiment.The �rst part of the tutorial introduced the subjectsto language features (e.g., basic syntax of formulas)and environmental features (e.g., how to edit cells) thatwould eventually be needed in testing the spreadsheets.The second part of the tutorial described how to recordtesting decisions. Testing was described as the processof trying various input values and recording decisionsmade about the correctness of values in the other cells.All subjects were instructed to use the check boxes torecord decisions about correct cell values and to recordinformation about incorrect cell values in a special cellnamed BugRecorder. All subjects received the same in-formation in the �rst and second parts of the tutorial.The third part of the tutorial explained how to inter-pret the testing feedback and here the instructions forthe Ad Hoc subjects diverged from those for the WYSI-WYT subjects. For the Ad Hoc subjects, the lecturerdescribed the feedback (a quick ash) from validating acell's value as indicating that the system had recordedthe decision. After several examples of trying inputsand recording decisions, the Ad Hoc subjects were givenunstructured time to practice their Forms/3 skills.In designing this third tutorial part for the WYSI-WYT group, we were faced with an important decision:whether or not to provide a technical explanation of theunderlying concepts of such things as du-associations.Because one of our goals is that our testing method-ology not require an understanding of the underlyingtheory, we chose to explain only that red means \nottested", blue means \tested", and purple means \par-tially tested". The question marks were described asmeaning \recording a decision here will help test partof the spreadsheet that has not been tested", checkmarks as \you have recorded a decision here", blanksas \you have previously recorded a decision that coversthis case". We did not mention the underlying conceptsof du-associations, nor did we describe nonexecutable

No. of Overall CS programming grad students subjects with subjects withSubjects GPA GPA languages known per group spreadsheet experience professional experienceAd Hoc 30 3.45 3.7 4 10 12 11WYSIWYT 39 3.2 3.5 4 8 10 20Table 1: Subject group demographics (medians).
Figure 4: Version of Grades spreadsheet used in experiment.du-associations. At the end of these explanations, theWYSIWYT subjects were given unstructured time topractice their Forms/3 skills.Regardless of which group a subject was in, the totaltime of training received was identical; subjects notreceiving explanations of our methodology's feedbackwere given more unstructured time to practice usingForms/3. It was important to equalize the total time,because the additional instructions given the WYSI-WYT subjects in the third part also provided themwith additional practice in Forms/3 skills, and addi-tional practice time could have confounded the results.Since the subjects had very little or no previous expo-sure to the experiment's environment, at the conclusionof the tutorial the subjects could be considered equal intheir knowledge of Forms/3.Task and MaterialsFollowing the tutorial, the subjects were asked to testtwo spreadsheets, Clock and Grades. Using two di�er-ent spreadsheets reduced the chances that the resultsof our study would be tied to any one spreadsheet'sparticular characteristics. The Clock spreadsheet wasshown in Figure 2 and discussed earlier in this section.The Grades spreadsheet (Figure 4) is a single-studentvariant of the spreadsheet presented in Figure 1; it cal-culates the �nal letter grade for a student.The di�erences between Clock and Grades are that (1)they represent di�erent problem domains (numeric and
graphics), (2) the formulas for Grades are relativelyeasy to understand (lending themselves to straightfor-ward reasoning by examining the code) whereas those ofClock are relatively di�cult to understand, and (3) theoracle problem|determining whether the displayed an-swer is correct|may be more di�cult for Grades thanfor Clock. Both spreadsheets were tested by all subjects.The numeric domain is of interest because of the tra-ditional uses of spreadsheets. The graphical domain isof interest because of the increasing use of spreadsheetsto produce graphics (e.g., [5, 24]). The two particularspreadsheets were deliberately designed to be di�erentfrom each other in this respect and in the other respectsenumerated above. They were designed to be similar inthe familiarity of their problem domains (grades andclocks) to the subjects and to be of reasonable size andcomplexity given a limited amount of time.The subjects were given 15 minutes per spreadsheet.The experiment was counterbalanced with respect toproblem type: subjects in each group worked both prob-lems, but half the subjects in each group tested Grades�rst, whereas the other half tested Clock �rst. At thebeginning of each testing session we instructed the sub-jects to read a description of the spreadsheet they wereabout to test. The descriptions included details of whatthe spreadsheet was to accomplish, the range of ac-cepted input and output values and the error messagesexpected for out-of-range inputs.
Clock Grades
Ad Hoc
WYSIWYT
du-a
dequ
acy
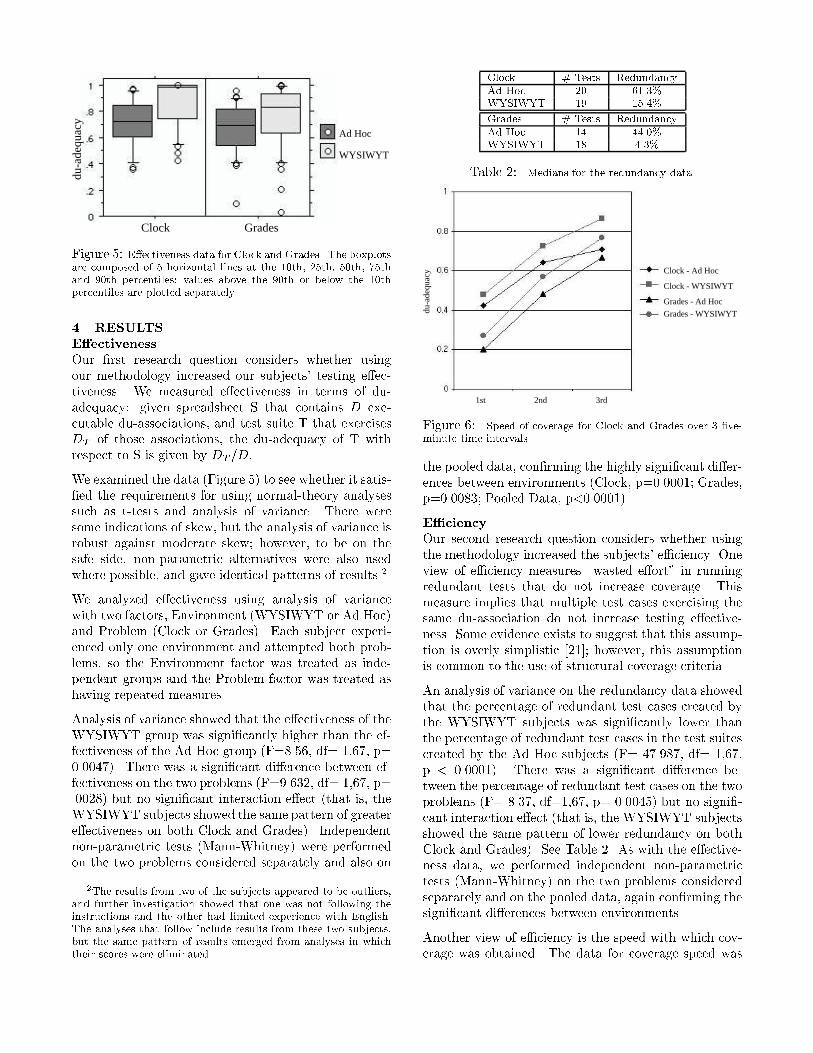
Figure 5: E�ectiveness data for Clock and Grades. The boxplotsare composed of 5 horizontal lines at the 10th, 25th, 50th, 75thand 90th percentiles; values above the 90th or below the 10thpercentiles are plotted separately.4 RESULTSE�ectivenessOur �rst research question considers whether usingour methodology increased our subjects' testing e�ec-tiveness. We measured e�ectiveness in terms of du-adequacy: given spreadsheet S that contains D exe-cutable du-associations, and test suite T that exercisesDT of those associations, the du-adequacy of T withrespect to S is given by DT =D:We examined the data (Figure 5) to see whether it satis-�ed the requirements for using normal-theory analysessuch as t-tests and analysis of variance. There weresome indications of skew, but the analysis of variance isrobust against moderate skew; however, to be on thesafe side, non-parametric alternatives were also usedwhere possible, and gave identical patterns of results.2We analyzed e�ectiveness using analysis of variancewith two factors, Environment (WYSIWYT or Ad Hoc)and Problem (Clock or Grades). Each subject experi-enced only one environment and attempted both prob-lems, so the Environment factor was treated as inde-pendent groups and the Problem factor was treated ashaving repeated measures.Analysis of variance showed that the e�ectiveness of theWYSIWYT group was signi�cantly higher than the ef-fectiveness of the Ad Hoc group (F=8.56, df= 1,67, p=0.0047). There was a signi�cant di�erence between ef-fectiveness on the two problems (F=9.632, df= 1,67, p=.0028) but no signi�cant interaction e�ect (that is, theWYSIWYT subjects showed the same pattern of greatere�ectiveness on both Clock and Grades). Independentnon-parametric tests (Mann-Whitney) were performedon the two problems considered separately and also on2The results from two of the subjects appeared to be outliers,and further investigation showed that one was not following theinstructions and the other had limited experience with English.The analyses that follow include results from these two subjects,but the same pattern of results emerged from analyses in whichtheir scores were eliminated.
Clock # Tests RedundancyAd Hoc 20 61.3%WYSIWYT 19 15.4%Grades # Tests RedundancyAd Hoc 14 44.0%WYSIWYT 18 4.3%Table 2: Medians for the redundancy data.Clock - Ad Hoc
Clock - WYSIWYT
Grades - WYSIWYT
Grades - Ad Hoc
1st 2nd 3rd
du-a
dequ
acy
Figure 6: Speed of coverage for Clock and Grades over 3 �ve-minute time intervals.the pooled data, con�rming the highly signi�cant di�er-ences between environments (Clock, p=0.0001; Grades,p=0.0083; Pooled Data, p<0.0001).E�ciencyOur second research question considers whether usingthe methodology increased the subjects' e�ciency. Oneview of e�ciency measures \wasted e�ort" in runningredundant tests that do not increase coverage. Thismeasure implies that multiple test cases exercising thesame du-association do not increase testing e�ective-ness. Some evidence exists to suggest that this assump-tion is overly simplistic [21]; however, this assumptionis common to the use of structural coverage criteria.An analysis of variance on the redundancy data showedthat the percentage of redundant test cases created bythe WYSIWYT subjects was signi�cantly lower thanthe percentage of redundant test cases in the test suitescreated by the Ad Hoc subjects (F= 47.987, df= 1,67,p < 0.0001). There was a signi�cant di�erence be-tween the percentage of redundant test cases on the twoproblems (F= 8.37, df=1,67, p= 0.0045) but no signi�-cant interaction e�ect (that is, the WYSIWYT subjectsshowed the same pattern of lower redundancy on bothClock and Grades). See Table 2. As with the e�ective-ness data, we performed independent non-parametrictests (Mann-Whitney) on the two problems consideredseparately and on the pooled data, again con�rming thesigni�cant di�erences between environments.Another view of e�ciency is the speed with which cov-erage was obtained. The data for coverage speed was
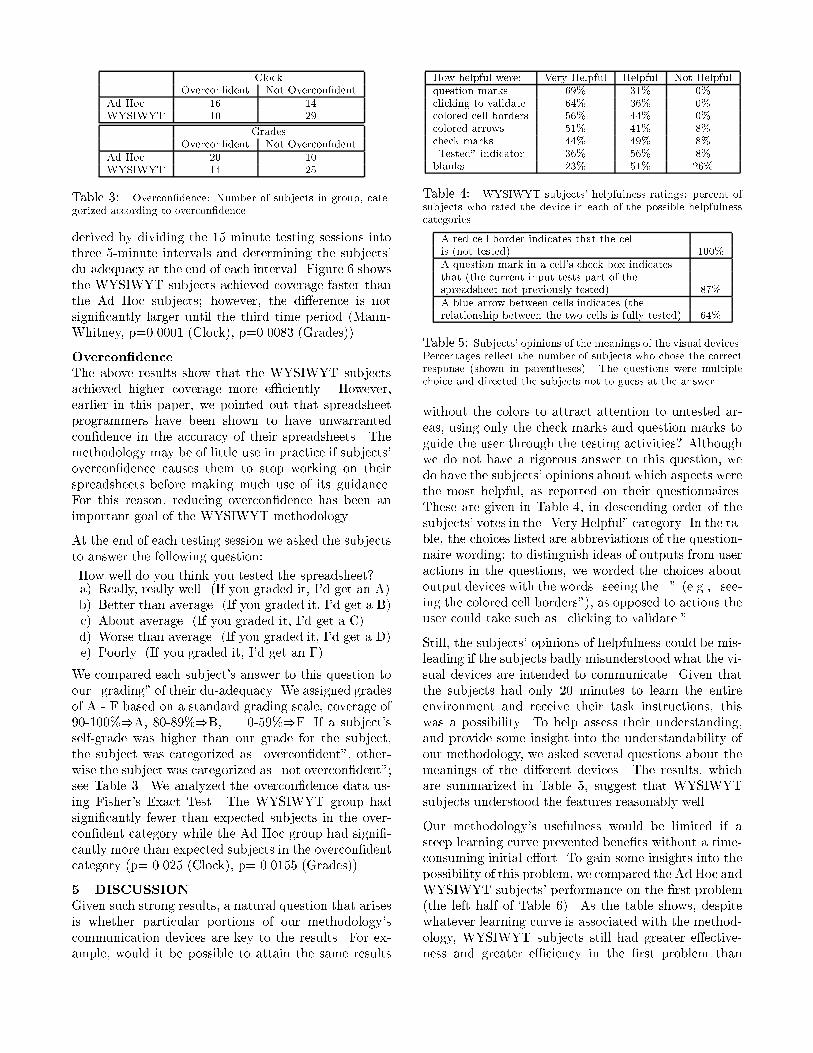
ClockOvercon�dent Not Overcon�dentAd Hoc 16 14WYSIWYT 10 29GradesOvercon�dent Not Overcon�dentAd Hoc 20 10WYSIWYT 14 25Table 3: Overcon�dence: Number of subjects in group, cate-gorized according to overcon�dence.derived by dividing the 15 minute testing sessions intothree 5-minute intervals and determining the subjects'du-adequacy at the end of each interval. Figure 6 showsthe WYSIWYT subjects achieved coverage faster thanthe Ad Hoc subjects; however, the di�erence is notsigni�cantly larger until the third time period (Mann-Whitney, p=0.0001 (Clock), p=0.0083 (Grades)).Overcon�denceThe above results show that the WYSIWYT subjectsachieved higher coverage more e�ciently. However,earlier in this paper, we pointed out that spreadsheetprogrammers have been shown to have unwarrantedcon�dence in the accuracy of their spreadsheets. Themethodology may be of little use in practice if subjects'overcon�dence causes them to stop working on theirspreadsheets before making much use of its guidance.For this reason, reducing overcon�dence has been animportant goal of the WYSIWYT methodology.At the end of each testing session we asked the subjectsto answer the following question:How well do you think you tested the spreadsheet?a) Really, really well. (If you graded it, I'd get an A)b) Better than average. (If you graded it, I'd get a B)c) About average. (If you graded it, I'd get a C)d) Worse than average. (If you graded it, I'd get a D)e) Poorly. (If you graded it, I'd get an F)We compared each subject's answer to this question toour \grading" of their du-adequacy. We assigned gradesof A - F based on a standard grading scale, coverage of90-100%)A, 80-89%)B, ... 0-59%)F. If a subject'sself-grade was higher than our grade for the subject,the subject was categorized as \overcon�dent", other-wise the subject was categorized as \not overcon�dent";see Table 3. We analyzed the overcon�dence data us-ing Fisher's Exact Test. The WYSIWYT group hadsigni�cantly fewer than expected subjects in the over-con�dent category while the Ad Hoc group had signi�-cantly more than expected subjects in the overcon�dentcategory (p= 0.025 (Clock), p= 0.0155 (Grades)).5 DISCUSSIONGiven such strong results, a natural question that arisesis whether particular portions of our methodology'scommunication devices are key to the results. For ex-ample, would it be possible to attain the same results
How helpful were: Very Helpful Helpful Not Helpfulquestion marks 69% 31% 0%clicking to validate 64% 36% 0%colored cell borders 56% 44% 0%colored arrows 51% 41% 8%check marks 44% 49% 8%\Tested" indicator 36% 56% 8%blanks 23% 51% 26%Table 4: WYSIWYT subjects' helpfulness ratings: percent ofsubjects who rated the device in each of the possible helpfulnesscategories.A red cell border indicates that the cellis (not tested) 100%A question mark in a cell's check box indicatesthat (the current input tests part of thespreadsheet not previously tested) 87%A blue arrow between cells indicates (therelationship between the two cells is fully tested) 64%Table 5: Subjects' opinions of the meanings of the visual devices.Percentages re ect the number of subjects who chose the correctresponse (shown in parentheses). The questions were multiplechoice and directed the subjects not to guess at the answer.without the colors to attract attention to untested ar-eas, using only the check marks and question marks toguide the user through the testing activities? Althoughwe do not have a rigorous answer to this question, wedo have the subjects' opinions about which aspects werethe most helpful, as reported on their questionnaires.These are given in Table 4, in descending order of thesubjects' votes in the \Very Helpful" category. In the ta-ble, the choices listed are abbreviations of the question-naire wording: to distinguish ideas of outputs from useractions in the questions, we worded the choices aboutoutput devices with the words \seeing the..." (e.g., \see-ing the colored cell borders"), as opposed to actions theuser could take such as \clicking to validate."Still, the subjects' opinions of helpfulness could be mis-leading if the subjects badly misunderstood what the vi-sual devices are intended to communicate. Given thatthe subjects had only 20 minutes to learn the entireenvironment and receive their task instructions, thiswas a possibility. To help assess their understanding,and provide some insight into the understandability ofour methodology, we asked several questions about themeanings of the di�erent devices. The results, whichare summarized in Table 5, suggest that WYSIWYTsubjects understood the features reasonably well.Our methodology's usefulness would be limited if asteep learning curve prevented bene�ts without a time-consuming initial e�ort. To gain some insights into thepossibility of this problem, we compared the Ad Hoc andWYSIWYT subjects' performance on the �rst problem(the left half of Table 6). As the table shows, despitewhatever learning curve is associated with the method-ology, WYSIWYT subjects still had greater e�ective-ness and greater e�ciency in the �rst problem than
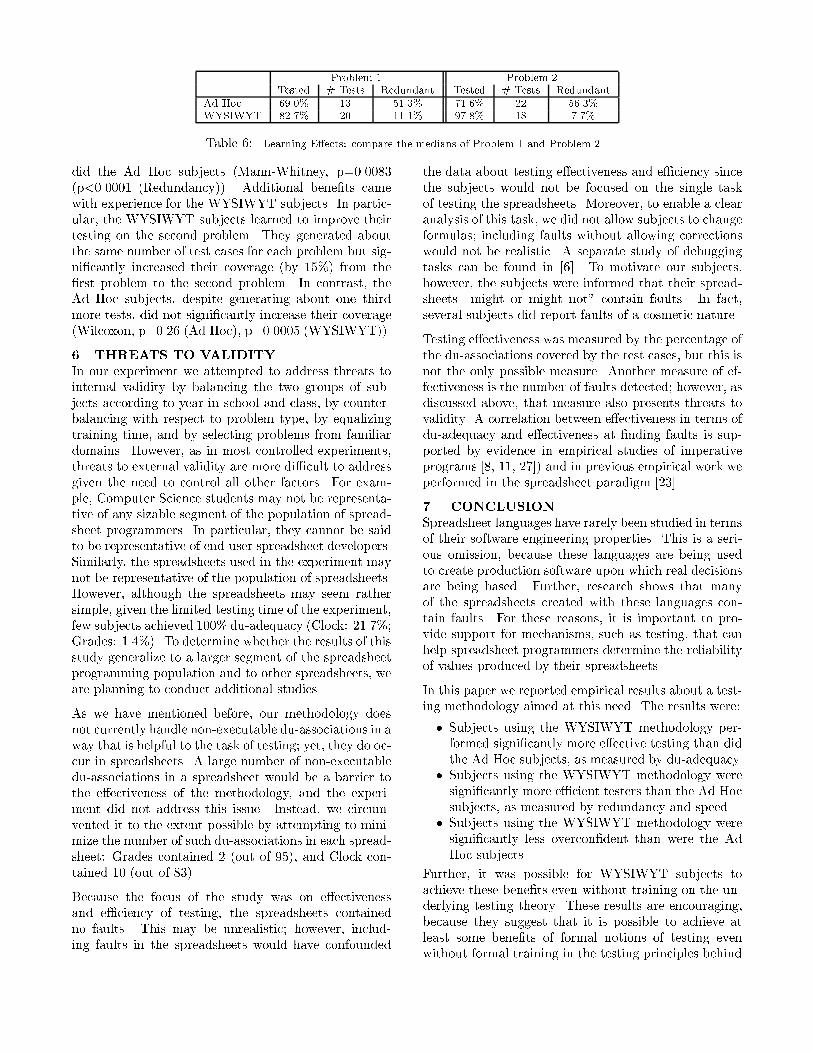
Problem 1 Problem 2Tested # Tests Redundant Tested # Tests RedundantAd Hoc 69.0% 13 51.3% 71.6% 22 56.3%WYSIWYT 82.7% 20 11.1% 97.8% 18 7.7%Table 6: Learning E�ects: compare the medians of Problem 1 and Problem 2.did the Ad Hoc subjects (Mann-Whitney, p=0.0083(p<0.0001 (Redundancy)). Additional bene�ts camewith experience for the WYSIWYT subjects. In partic-ular, the WYSIWYT subjects learned to improve theirtesting on the second problem. They generated aboutthe same number of test cases for each problem but sig-ni�cantly increased their coverage (by 15%) from the�rst problem to the second problem. In contrast, theAd Hoc subjects, despite generating about one thirdmore tests, did not signi�cantly increase their coverage(Wilcoxon, p=0.26 (Ad Hoc), p=0.0005 (WYSIWYT)).6 THREATS TO VALIDITYIn our experiment we attempted to address threats tointernal validity by balancing the two groups of sub-jects according to year in school and class, by counter-balancing with respect to problem type, by equalizingtraining time, and by selecting problems from familiardomains. However, as in most controlled experiments,threats to external validity are more di�cult to addressgiven the need to control all other factors. For exam-ple, Computer Science students may not be representa-tive of any sizable segment of the population of spread-sheet programmers. In particular, they cannot be saidto be representative of end-user spreadsheet developers.Similarly, the spreadsheets used in the experiment maynot be representative of the population of spreadsheets.However, although the spreadsheets may seem rathersimple, given the limited testing time of the experiment,few subjects achieved 100% du-adequacy (Clock: 21.7%;Grades: 1.4%). To determine whether the results of thisstudy generalize to a larger segment of the spreadsheetprogramming population and to other spreadsheets, weare planning to conduct additional studies.As we have mentioned before, our methodology doesnot currently handle non-executable du-associations in away that is helpful to the task of testing; yet, they do oc-cur in spreadsheets. A large number of non-executabledu-associations in a spreadsheet would be a barrier tothe e�ectiveness of the methodology, and the experi-ment did not address this issue. Instead, we circum-vented it to the extent possible by attempting to mini-mize the number of such du-associations in each spread-sheet: Grades contained 2 (out of 95), and Clock con-tained 10 (out of 83).Because the focus of the study was on e�ectivenessand e�ciency of testing, the spreadsheets containedno faults. This may be unrealistic; however, includ-ing faults in the spreadsheets would have confounded
the data about testing e�ectiveness and e�ciency sincethe subjects would not be focused on the single taskof testing the spreadsheets. Moreover, to enable a clearanalysis of this task, we did not allow subjects to changeformulas; including faults without allowing correctionswould not be realistic. A separate study of debuggingtasks can be found in [6]. To motivate our subjects,however, the subjects were informed that their spread-sheets \might or might not" contain faults. In fact,several subjects did report faults of a cosmetic nature.Testing e�ectiveness was measured by the percentage ofthe du-associations covered by the test cases, but this isnot the only possible measure. Another measure of ef-fectiveness is the number of faults detected; however, asdiscussed above, that measure also presents threats tovalidity. A correlation between e�ectiveness in terms ofdu-adequacy and e�ectiveness at �nding faults is sup-ported by evidence in empirical studies of imperativeprograms [8, 11, 27]) and in previous empirical work weperformed in the spreadsheet paradigm [23].7 CONCLUSIONSpreadsheet languages have rarely been studied in termsof their software engineering properties. This is a seri-ous omission, because these languages are being usedto create production software upon which real decisionsare being based. Further, research shows that manyof the spreadsheets created with these languages con-tain faults. For these reasons, it is important to pro-vide support for mechanisms, such as testing, that canhelp spreadsheet programmers determine the reliabilityof values produced by their spreadsheets.In this paper we reported empirical results about a test-ing methodology aimed at this need. The results were:� Subjects using the WYSIWYT methodology per-formed signi�cantly more e�ective testing than didthe Ad Hoc subjects, as measured by du-adequacy.� Subjects using the WYSIWYT methodology weresigni�cantly more e�cient testers than the Ad Hocsubjects, as measured by redundancy and speed.� Subjects using the WYSIWYT methodology weresigni�cantly less overcon�dent than were the AdHoc subjects.Further, it was possible for WYSIWYT subjects toachieve these bene�ts even without training on the un-derlying testing theory. These results are encouraging,because they suggest that it is possible to achieve atleast some bene�ts of formal notions of testing evenwithout formal training in the testing principles behind
a testing methodology. However, this experiment is the�rst step in a series of planned experiments, and thusincludes only one slice of the population using spread-sheet languages. Future experiments will be requiredbefore it will be clear whether the methodology bringssimilar bene�ts to other kinds of users, especially endusers, working on larger, more complex spreadsheets.ACKNOWLEDGEMENTSWe thank the members of the Visual Programming Re-search Group for their help with experiment adminis-tration and implementation and their feedback on thetesting methodology. We also wish to express our grat-itude to the students in Fall 1999 CS381, CS411, andCS511 who participated in the study. This work wassupported in part by NSF under CCR-9806821, CA-REER Award CCR-9703108, and Young InvestigatorAward CCR-9457473. Patent pending.REFERENCES[1] A. Ambler, M. Burnett, and B. Zimmerman. Opera-tional versus de�nitional: A perspective on program-ming paradigms. Computer, 25(9):28{43, Sept. 1992.[2] F. Belli and O. Jack. A test coverage notion for logicprogramming. In The 6th Intl. Symp. Softw. Rel. Eng.,pages 133{142, 1995.[3] P. Brown and J. Gould. Experimental study of peoplecreating spreadsheets. ACM Trans. O�ce Info. Sys.,5(3):258{272, July 1987.[4] M. Burnett and H. Gottfried. Graphical de�nitions: Ex-panding spreadsheet languages lhrough direct manip-ulation and gestures. ACM Trans. Computer-HumanInteraction, pages 1{33, Mar. 1998.[5] E. H. Chi, P. Barry, J. Riedl, and J. Konstan. A spread-sheet approach to information visualization. In IEEESymp. Info. Visualization, Oct. 1997.[6] C. Cook, K. Rothermel, M. Burnett, T. Adams,G. Rothermel, A. Sheretov, F. Cort, and J. Reichwein.Does Immediate Visual Feedback about Testing Aid De-bugging in Spreadsheet Languages? Technical ReportTR: 99-60-07, Oregon State University, Mar. 1999.[7] E. Duesterwald, R. Gupta, and M. L. So�a. Rigorousdata ow testing through output in uences. In Proc.2nd Irvine Softw. Symp., Mar. 1992.[8] P. Frankl and S. Weiss. An experimental comparison ofthe e�ectiveness of branch testing and data ow testing.IEEE Trans. Softw. Eng., 19(8):774{787, Aug. 1993.[9] P. Frankl and E. Weyuker. An applicable family of data ow criteria. IEEE Trans. Softw. Eng., 14(10):1483{1498, Oct. 1988.[10] D. Gilmore. Interface design: Have we got it wrong?In K. Nordby, D. Gilmore, and S. Arnesen, editors, IN-TERACT'95. Chapman and Hall, London, 1995.[11] M. Hutchins, H. Foster, T. Goradia, and T. Os-trand. Experiments on the e�ectiveness of data ow-
and control ow-based test adequacy criteria. In 16thIntl. Conf. Softw. Eng., pages 191{200, May 1994.[12] W. Kuhn and A. U. Frank. The use of functional pro-gramming in the speci�cation and testing process. InIntl. Conf. and Wkshp. Interoperating Geographic Info.Systems, Dec. 1997.[13] J. Leopold and A. Ambler. Keyboardless visual pro-gramming using voice, handwriting, and gesture. In1997 IEEE Symp. Vis. Lang., pages 28{35, Sept. 1997.[14] G. Luo, G. Bochmann, B. Sarikaya, and M. Boyer.Control- ow based testing of prolog programs. In The3rd Intl. Symp. Softw. Rel. Eng., pages 104{113, 1992.[15] M. Marre and A. Bertolino. Reducing and estimatingthe cost of test coverage criteria. In 1996 IEEE 18thIntl. Conf. Softw. Eng., pages 486{494, Mar. 1996.[16] B. Myers. Graphical techniques in a spreadsheet forspecifying user interfaces. In ACM CHI '91, pages 243{249, Apr. 1991.[17] F. Ouabdesselam and I. Parissis. Testing techniquesfor data- ow synchronous programs. In AADEBUG'95:2nd Intl. Wkshp. Automated and Algorithmic Debug-ging, May 1995.[18] R. Panko. What we know about spreadsheet errors. J.End User Comp., pages 15{21, Spring 1998.[19] S. Rapps and E. J. Weyuker. Selecting software testdata using data ow information. IEEE Trans. Softw.Eng., 11(4):367{375, Apr. 1985.[20] G. Rothermel, M. Burnett, L. Li, C. DuPuis, andA. Sheretov. A methodology for testing spreadsheets.Technical Report TR: 99-60-02, Oregon State Univer-sity, Jan. 1999.[21] G. Rothermel, M. Harrold, J. Ostrin, and C. Hong. Anempirical study of the e�ects of minimization on thefault detection capabilities of test suites. In Proc. Int'l.Conf. Softw. Maint., pages 34{43, Nov. 1998.[22] G. Rothermel, L. Li, and M. Burnett. Testing strategiesfor form-based visual programs. In The 8th Intl. Symp.Softw. Rel. Eng., pages 96{107, Nov. 1997.[23] G. Rothermel, L. Li, C. DuPuis, and M. Burnett. Whatyou see is what you test: A methodology for testingform-based visual programs. In The 20th Intl. Conf.Softw. Eng., pages 198{207, Apr. 1998.[24] T. Smedley, P. Cox, and S. Byrne. Expanding the utilityof spreadsheets through the integration of visual pro-gramming and user interface objects. In Adv. Vis. Int.'96, May 1996.[25] G. Svendsen. The in uence of interface style onproblem-solving. Intl. J. Man-Machine Studies, 35:379{397, 1991.[26] G. Viehstaedt and A. Ambler. Visual representationand manipulation of matrices. J. Vis. Lang. and Comp.,3(3):273{298, Sept. 1992.[27] E. J. Weyuker. More experience with data ow testing.IEEE Trans. Softw. Eng., 19(9), Sept. 1993.[28] E. Wilcox, J. Atwood, M. Burnett, J. Cadiz, andC. Cook. Does continuous visual feedback aid debug-ging in direct-manipulation programming systems? InACM CHI'97, pages 22{27, Mar. 1997.