World Bank Document
83
ii Document of The World Bank FOR OFFICIAL USE ONLY Report No. 77006-ZA INTERNATIONAL BANK FOR RECONSTRUCTION AND DEVELOPMENT INTERNATIONAL FINANCE CORPORATION MULTILATERAL INVESTMENT GUARANTEE AGENCY COUNTRY PARTNERSHIP STRATEGY FOR THE REPUBLIC OF SOUTH AFRICA FOR THE PERIOD FY2014-2017 October 17, 2013 Southern Africa Country Department 1 Africa Region International Finance Corporation Sub-Saharan Africa Department Multilateral Investment Guarantee Agency Sub-Saharan Africa Department This document has a restricted distribution and may be used by recipients only in the performance of their official duties. Its contents may not otherwise be disclosed without World Bank authorization. Public Disclosure Authorized Public Disclosure Authorized Public Disclosure Authorized Public Disclosure Authorized Public Disclosure Authorized Public Disclosure Authorized Public Disclosure Authorized Public Disclosure Authorized
-
Upload
khangminh22 -
Category
Documents
-
view
0 -
download
0
Transcript of World Bank Document

ii
Document of The World Bank
FOR OFFICIAL USE ONLY
Report No. 77006-ZA
INTERNATIONAL BANK FOR RECONSTRUCTION AND DEVELOPMENT
INTERNATIONAL FINANCE CORPORATION
MULTILATERAL INVESTMENT GUARANTEE AGENCY
COUNTRY PARTNERSHIP STRATEGY
FOR
THE REPUBLIC OF SOUTH AFRICA
FOR THE PERIOD FY2014-2017
October 17, 2013
Southern Africa Country Department 1 Africa Region International Finance Corporation Sub-Saharan Africa Department Multilateral Investment Guarantee Agency Sub-Saharan Africa Department
This document has a restricted distribution and may be used by recipients only in the performance of their official duties. Its contents may not otherwise be disclosed without World Bank authorization.
Pub
lic D
iscl
osur
e A
utho
rized
Pub
lic D
iscl
osur
e A
utho
rized
Pub
lic D
iscl
osur
e A
utho
rized
Pub
lic D
iscl
osur
e A
utho
rized
Pub
lic D
iscl
osur
e A
utho
rized
Pub
lic D
iscl
osur
e A
utho
rized
Pub
lic D
iscl
osur
e A
utho
rized
Pub
lic D
iscl
osur
e A
utho
rized

ii
LAST BOARD CPS DISCUSSION: JANUARY 15, 2008 CURRENCY EQUIVALENTS
(Exchange Rate as of September 27, 2013) Currency Unit = Rand Rand 10.08 = US$1
WEIGHTS AND MEASURES Metric System
FISCAL YEAR April 1 – March 31
ABBREVIATIONS AND ACRONYMS
AAA – Analytical & Advisory ANC – African National Congress AU – African Union BRICS – Brazil, Russia, India, China & South Africa CABRI – Collaborative Africa Budget Reform Initiative CEPF – Critical Ecosystem Partnership Fund COP17 – Conference of Parties COSATU – Congress of South African Trade Unions CPS – Country Partnership Strategy CR – Completion Report CSO – Civil Society Organization CTF – Clean Technology Fund DA – Democratic Alliance DBSA – Development Bank of South Africa DPME – Department of Monitoring and Evaluation EISP – Eskom Investment Support Project FCS – Fragile and Conflict States GDP – Gross Domestic Product GEF – Global Environment Facility GER – Gross Enrollment Rate HOI – Human Opportunity Index HSRC – Human Sciences Research Council IBRD – International Bank for Reconstruction and Development IDF – Institutional Development Facility IEG – Independent Evaluation Group IFC – International Finance Corporation M&E – Monitoring and Evaluation MDG – Millennium Development Goal MIC – Middle Income Country MIGA – Multilateral Investment Guarantee Agency MOU – Memorandum of Understanding
MSME – Medium Small & Micro Enterprises
MW – Megawatts NDP – National Development Plan NEPAD – New Partnership for African Development NGO – Non-Governmental Organization NHI – National Health Insurance NT – National Treasury OECD – Organization for Economic Co-operation and Development PCF – Prototype Carbon Financing PETS – Public Expenditure Tracking Survey PIC – Public Investment Corporation PPIAF – Public-Private Infrastructure Advisory Facility PPP – Public Private Partnership RAMP – Reserve Advisory Management Program RAS – Reimbursable Advisory Services S&P – Standard and Poor’s SACP – South African Communist Party SACU – Southern African Custom Union SADC – South African Development Union SARB – South African Reserve Bank SARS – South African Revenue Service SASSA – South African Social Security Agency SME – Small & Medium Enterprises SOS – Save our Species program TA – Technical Assistance T&IS – Township & Informal Settlements TB – Tuberculosis TR – Trust Funds WBI – World Bank Institute WHO – World Health Organization
IBRD IFC MIGA
Vice President Makhtar Diop Jean Philippe Prosper Keiko Honda
Director TTLs
Asad Alam
Ivan Velev, Marco Scuriatti Oumar Seydi
Saleem Karimjee Ravi Vish
Stephan Dreyhaupt

iii
Acknowledgments This World Bank Group CPS was prepared under the guidance of Asad Alam, Country Director, AFCS1 and Saleem Karimjee, Senior Manager, CAFE4. The core team comprised Marco Scuriatti, Ivan Velev, David Sislen, Sandeep Mahajan, Patrick Osewe, Chunlin Zhang, Joel Kolker, Gert Van der Linde, and Claus Astrup. John Barham and Stephan Dreyhaupt contributed from the IFC and MIGA. The CPS team would like to express its gratitude and appreciation to Government representatives at National Treasury and various line Departments for their valuable contributions and suggestions. In particular, the team wishes to recognize the valuable inputs and suggestions of Messrs/Mmes: Dondo Mogajane, Renosi Mokate, Kurt Morais, Mmakgoshi Phetla-Lekhethe, Cleo Rose-Innes and Themba Zulu. The core team is also much obliged to representatives of the donor community, civil society and the private sector who helped inform this CPS through several in-country consultations. Finally, this was a team effort, and many other contributions did come from across the World Bank Group, reflecting the keen interest that the South Africa program generates. Special thanks to Mr. Makhtar Diop, Regional Vice President for his support and guidance. Thanks also to Lawrence Bouton, Colin Bruce, Julie Dana, Shantayanan Devarajan, Shirley Faragher, Michael Fuchs, Marcelo Giugale, Gladys Glicker, Phillip Hay, Sarwat HussainFernando Im, Hannah Kikaya, Paivi Koljonen, Paula Lamptey, Guo Li, Bernard Murira, Sekai Ndoro, Phindile Ngwenya, Elizabeth Ninan, Edward Olowo-Okere, Catriona Purfield, Ritva Reinikka, Jamal Saghir, Mmenyane Seoposengwe, Claudia Sobrevilla, R. Sudharshan Canagarajah, Gaiv Tata, Jan Walliser, Marcus Wishart, and to many others who provided comments and helped in the preparation of this CPS.

iv
FY2014-17 COUNTRY PARTNERSHIP STRATEGY FOR THE REPUBLIC OF SOUTH AFRICA
TABLE OF CONTENTS
EXECUTIVE SUMMARY ....................................................................................................................... vi
I. INTRODUCTION ............................................................................................................................... 1
II. COUNTRY CONTEXT ...................................................................................................................... 1
1. South Africa’s commendable progress since 1994 ..................................................................... 1
2. Deep challenges persist—accelerating job creation and reducing poverty and inequality ........ 3
3. Recent Economic Developments ................................................................................................. 6
III. GOVERNMENT VISION .................................................................................................................. 8
IV. WORLD BANK GROUP PARTNERSHIP ..................................................................................... 9
1. Evolution of WBG Program ........................................................................................................ 9
2. Evaluation of Previous Country Partnership Strategy and Lessons ......................................... 12
3. Proposed Partnership Strategy ................................................................................................. 14
V. PROGRAM DESCRIPTION ........................................................................................................... 18
Pillar 1: Reducing Inequality ......................................................................................................... 18
Pillar 2: Promoting Investments .................................................................................................... 21
Pillar 3: Strengthening Institutions ............................................................................................... 24
VI. RISK ASSESSMENT ...................................................................................................................... 26
Annex 1: CPS Results Matrix ..................................................................................................................... 27
Annex 2: List of Ongoing Trust Fund activities ......................................................................................... 33
Annex 3: WB Regional Activities in which South Africa is participating ................................................. 34
Annex 4: Statistical System in South Africa ............................................................................................... 36
Annex 5: Completion Report ...................................................................................................................... 37
Annex 6: Country At-A-Glance .................................................................................................................. 63
Annex 7: Selected Indicators of Bank Portfolio Performance and Management ....................................... 66
Annex 8: South Africa IFC Investment Operations Program ..................................................................... 67
Annex 9: South Africa IBRD Program Summary....................................................................................... 68
Annex 10: South Africa Summary of Non-lending Services ...................................................................... 69
Annex 11: South Africa Social Indicators .................................................................................................. 70
Annex 12: South Africa Key Economic Indicators..................................................................................... 71
Annex 13: South Africa Key Exposure Indicators ...................................................................................... 73
Annex 14: IFC Committed and Disbursed Outstanding Investment Portfolio ........................................... 74
Annex 15: South Africa Operations Portfolio ............................................................................................. 75
Annex 16: Map of South Africa .................................................................................................................. 76

v
BOXES
Box 1: A Regional Leader and Influential Global Player.……………………………………………….....2 Box 2: Use of Trust Funds in the Bank’s South Africa Program...………………………………...……...10 Box 3: Developing a Knowledge Hub in South Africa ....……..…….……………………...…….………16 Box 4: The GEF Financing Window……….…...……………………….……………………….………..23
FIGURES
Figure 1: D-Indices and HOIs for Key Opportunities of South African Children, 2010……….………….5 Figure 2: Persistently High Unemployment Rate (2000-2013)..……………………………………....…...6
TABLES Table 1: Key Economic Indicators .……..….……………………………………………………....…..…..7 Table 2: CPS Pillars and Areas of Engagement.….……………………………………………….………15

vi
EXECUTIVE SUMMARY
Nineteen years after the end of the apartheid, South Africa has made substantial progress in overcoming the legacy of the past. Solid legal, financial and physical infrastructure supports a significant degree of political and economic stability. Important facets that characterized extreme poverty and inequality of pre-apartheid South Africa have been tackled head-on, and service provision has been broadened and millions who were previously excluded have gained access to housing, water, electricity, education, health care and social security. South Africa’s GDP ranks 25th in the world and is the largest in Africa, representing 17 percent of the continent’s GDP. South Africa’s prosperity is essential to promote growth, and economic opportunity, and reduce poverty on the African continent.
These laudable achievements notwithstanding, South Africa remains a highly unequal society where too many people continue to live in poverty and too few have work. About one in three South Africans is poor, and with an income Gini of 0.70, inequality is one of the highest in the world. Unemployment rates hover around 25 percent, with much higher rates among the youth and black population. The country’s life expectancy at birth is 60 years, amongst the lowest in middle-income countries (MICs) with similar endowments. Indeed, the apartheid spatial divide continues to dominate the economic and physical landscape and determine life opportunities for the poor, particularly in education, health and employment. The Government has generally been effective in policy formulation; however, it has been constrained in implementing its decisions, particularly at the local level.
Today South Africa finds itself at a critical juncture. Even though the Government successfully restored macroeconomic balances and stability, the country faces large social imbalances and a fragile social cohesion. The slow-down of growth and job creation, the poor quality of the social service provision and the debate over how the benefits from the mineral wealth should be distributed is fueling popular discontent and protests. The formidable challenge ahead will be to deliver sustainable outcomes on employment, education, health, housing, and public infrastructure to all while preserving macroeconomic stability. The Government is determined to accelerate economic growth through changing the current economic trajectory towards a labor-intensive growth path, ensuring that a greater share of the benefits flows to the poor. Released in 2012, the Government’s National Development Plan (NDP), presents a broad strategic framework to guide policies aimed at eliminating poverty, reducing inequality and improving job creation, and adding 11 million jobs by 2030. The goal of this FY2014-17 Country Partnership Strategy (CPS) is to deepen the Bank-Client engagement and trust by supporting Government’s implementation of the NDP in three engagement areas – reducing inequality, promoting investments and strengthening institutions. This CPS is designed as an adaptable framework for provision of knowledge services and evidence-based development solutions in eight high priority programmatic areas with clear demand for Bank services. These are program areas where the WBG exerts comparative advantage, which suits South Africa’s higher-end needs as a MIC client. IBRD financing will be available at the client’s discretion (see paragraph 55).

vii
IFC and MIGA investments will form a backbone for the new CPS. Their programs are a reflection of private sector growth in South Africa and the region in general. In addition, WBI extensively works with South African institutions to collaborate and deliver knowledge products regionally and globally. Support to the regional integration agenda will also be an integral part of the World Bank Group strategy. The World Bank Group will be working synergistically to support the programs envisaged in this CPS. The choice of interventions will be governed by four principles—selectivity, knowledge, implementation, and programmatic approaches (SKIP). Selectivity will be guided by the potential of the programs to reduce poverty and boost shared prosperity. A Knowledge Hub will facilitate the implementation of development solutions and assist the Government’s goal of improving implementation and service delivery.

1
I. INTRODUCTION
1. This document presents the Country Partnership Strategy (CPS) with South Africa for FY14 to FY17. The goal of this CPS is to deepen the Bank-Client engagement and trust through activities in programs were the Bank can provide value to a sophisticated MIC. The CPS is aligned with the National Development Plan (NDP) and its priorities of addressing poverty, unemployment and inequality. IBRD strategy will be centered on carefully calibrated and demand driven technical cooperation as well as support to the implementation of the ongoing lending programs in energy and the environment. IFC and MIGA will continue to seek opportunities to grow their programs to support private sector growth. This document provides a summary of the country context and current challenges, South Africa’s development plan, lessons learned from the previous CPS and the strategy for the World Bank Group in South Africa.
II. COUNTRY CONTEXT
1. South Africa’s commendable progress since 1994 2. South Africa’s peaceful political transition was one of the most remarkable political feats of the past century. The magnitude of the constitutional and institutional re-design had a deep transformative impact on the entire system of government as well as the region. Today, South Africa is a stable, multi-racial democracy with a vibrant civil society. The African National Congress (ANC) has been driving the policy agenda since 1994. ANC holds a majority of 65 percent under South Africa's proportional representation system, and governs eight of the country’s nine provinces.1 The ANC leads the government in a tripartite alliance with the Congress of South African Trade Unions (COSATU) and the South African Communist Party (SACP). In December 2012, President Zuma was re-elected as the ANC President and the presidential candidate for the 2014 election. 3. A sustained record of macroeconomic prudence and a supportive global environment enabled South Africa’s GDP to grow at a steady pace for the decade up to the beginning of the global financial crisis in 2008. Improvements in the public budget management system and efforts to restore the macro fundamentals by National Treasury played an essential role. Fiscal balances consistently improved, causing central government gross debt to fall from around 50 percent of GDP in FY1994/95 to 40 percent today. Revenue collection quadrupled and the number of taxpayers more than doubled between 1996 and 2007. At the heart of the fiscal achievements were dramatic improvements in revenue collection by the South African Revenue Service (SARS) and disciplined spending choices.
1 The main opposition party, the Democratic Alliance (DA), won 17 percent of the votes in the last general election
and governs the Western Cape Province.

2
4. Due to consistent and sound budgetary policies South Africa has been able to tap into international bond markets with reasonable sovereign risk spreads. South African government bonds were the first in Africa to be included in Citigroup's World Government Bond Index in 2012. The 2012 Open Budget Index prepared by the International Budget Partnership ranked South Africa second among 94 countries surveyed, behind New Zealand, and ahead of the United Kingdom, France and the United States. 5. Pro-poor orientation of public spending has contributed to improved social development indicators in a range of areas. Millennium Development Goals (MDG) on primary education, gender, several health indicators and environmental sustainability are likely to be achieved. Social grants expenditure and the number of beneficiaries have quadrupled since 1994. Social insurance programs including state old-age pensions, child support grants, conditional grants for school feeding and early childhood development and disability grants, currently cover around 16 million people. These programs, managed by the South Africa Social Security Agency (SASSA), are well targeted and provide income relief for the poor.
6. Much has also been achieved in the provision of social infrastructure and environmental management over the last 19 years. Capital spending has supported the construction of 56,000 new classrooms and 1,700 new clinics, as well as their access to basic utility services. In addition, approximately 2 million free housing units have been constructed for low-income families. Household electrification has expanded substantially, with 73 percent of
Box 1. A Regional Leader and Influential Global Player
South Africa is a powerhouse in Africa’s economic momentum. It is a source of expertise and investment into the continent. In banking, construction, farming, tourism, retailing, telecommunications and many other sectors, South African companies are setting new service standards and opening up new opportunities across the continent. A Ernest & Young report points out the South Africa invested in more projects in the rest of Africa than any other country in 2012, helping to develop the service sectors needed to diversify economies in the region.
South Africa is also one of the driving forces behind a variety of regional frameworks and networks. These include the New Partnership for African Development (NEPAD) and the African Peer Review Mechanism, and an anchor of other regional partnerships such as the African Union (AU), South African Development Community (SADC), Southern African Customs Union (SACU), Collaborative Africa Budget Reform Initiative (CABRI) and the Independent Electoral Commission (IEC).
In 2010 South Africa joined the BRIC group (subsequently BRICS), comprising Brazil, Russia, India and China, which together account for more than a quarter of the world’s GDP. The membership reflects South Africa’s dominant regional position in Africa, its vast mineral wealth and BRICS desire to represent all of the key emerging‐market regions. South Africa hosted the BRICS summit in March 2013.
South Africa has successfully presented itself as a good global citizen and a voice of the “South” on issues such as governance of the Bretton Woods institutions. South Africa has also recently become an IDA contributor. Convening the CoP‐17 climate talks in Durban in 2011 is an illustration of the South Africa’s rising international role. The 2010 Football World Cup, hosted for the first time on the African continent, stands as a testament of South Africa’s organizational ability and can‐do spirit.

3
households electrified by 2009; and potable water supply and basic sanitation services were provided to additional 9 million and 6.4 million people, respectively, during the same time period. Investment was also directed to the construction, rehabilitation and maintenance of 6,000 km of national roads and 15,000 km of provincial roads. On the environment front, South Africa is a global leader in biodiversity conservation and wildlife management and has in place a first-rate network of protected areas making it an ecotourism destination of choice.
2. Deep challenges persist—accelerating job creation and reducing poverty and inequality 7. Despite the notable accomplishments, South Africa’s economic transformation agenda remains incomplete. A range of enduring legacy issues from the apartheid system continues to undermine economic efficiency and job creation. The limited progress since 1994 in lifting the living standards of the majority and reducing the income inequality has put the social contract under pressure and has grown into an open public debate. Service delivery protests by underserved groups suggest that parts of the population have become frustrated and disillusioned with the pace of reform, the poor quality of public health, education and infrastructure services, and modest job growth prospects. In addition, the August 2012 Marikana platinum mine incident, with 34 striking miners killed by police, and the ensuing wildcat strikes in the mining, energy, transport and farming sectors have put into question labor and business relations in the country. 8. South Africa remains a dual economy, with one of the highest inequality rates in the world. Spatially, an advanced, modern urban economy coexists in sharp contrast with the socioeconomic poverty of disadvantaged townships, informal settlements and rural areas. With an income Gini of around 0.70 in 2008 and consumption Gini of 0.63 in 2009, the top decile of the population accounts for 58 percent of the country’s income, while the bottom decile accounts for 0.5 percent and the bottom half less than 8 percent. Land distribution is one of the most unequal in the world, with 55,000 white farmers owning 85 percent of the agricultural land. Despite South Africa’s sophisticated financial sector, financial services do not adequately reach the poorer segments of the economy—only around 28 percent of adult South Africans have access to credit—stifling entrepreneurship and growth, particularly in the townships, informal settlements and rural areas and thus further perpetuating inequality and exclusion. 9. With limited growth potential for the advanced part of the South African economy, faster growth would come from the less-developed part of the economy. The latter has the potential to take off in the same way that the emerging market economies did in mid-1990s. GDP growth in South Africa has averaged 3.2 percent a year since 1995, or 1.6 percent in per capita terms. This, however, has proven insufficient to absorb the wave of new entrants to the labor market ushered in by the dismantling of apartheid barriers, resulting in a persistently stubborn high unemployment rate. The potential for growth and shared prosperity has been held back by industrial concentration, skill shortages, labor market rigidities, chronically low savings and investment rates and spatial barriers from the former apartheid system. As the dichotomous urban structure is likely to remain in the foreseeable future, focused policy attention is needed both to invigorate the hitherto flailing township and rural economies and, over time, to enable their steady convergence with the advanced economy.

4
10. Even though economic growth and rising social welfare payments have made a dent into poverty levels, large pockets of poverty remain deeply entrenched, mostly among the black population in townships and informal settlements (T&IS). A 30 percent increase in per capita GDP since the late 1990s and a sharp expansion of the social grant coverage enabled a significant decline in the poverty rate—from 50.8 percent of the population living below R422 a month (in constant 2009 rands) in 2000 to 34.5 percent in 2010. However, pockets of poverty remain deeply entrenched, mostly among the black population, which constitutes 80 percent of the overall population while accounting for over 90 percent of the people living in poverty. Poor social outcomes are particularly persistent in the health and education sectors, which together make up 30 percent of Government expenditures. South Africa's educational outcomes in terms of reading and math scores do not augur well for the development of a skilled labor force in the long run. 11. Women in South Africa are disproportionately affected by poverty: female-headed households have a 50 percent higher poverty rate than male-headed households, with rural women suffering more than their urban counterparts. South Africa has developed progressive legislation promoting gender equality. In Parliament, 45 percent of seats are held by women, a number that is high by global standards. Nevertheless, according to the United Nations 2013 Gender Inequality Index (GII), South Africa ranks 90th out of 148 countries.2 Gender-based violence and its consequences remains a large issue as does HIV/AIDS which is much more prevalent among female adults under the age of 40.3 When it comes to women’s economic participation, the 2012 Annual Report of the Commission for Employment Equity finds women facing higher unemployment and lower labor force participation rates. Boys and girls are afforded the same level of schooling, yet evidence shows that boys have better economic prospects post schooling, suggesting that sexism and gender stereotypes continue to limit women’s roles. The 2010 gender review of South Africa’s implementation of the MDGs by the Commission on Gender Equality recommends, inter alia, that South Africa reviews its macro-economic policies to ensure they are gender responsive and to address the rural-urban disparity as a key factor in the access to necessary services impacting on women’s quality of life.
12. Differences in economic circumstances, especially at birth, continue to play a disproportionate role in South African children’s access to some of the basic opportunities, as measured by the Human Opportunity Index (HOI). Some opportunities, like school attendance and access to telecommunications, are on par with the universal levels (HOI above 90 percent) among South African children. At the other end are opportunities—health insurance, access to safe water and improved sanitation, adequate space without overcrowding, and finishing primary school—which are highly inadequate and unequally distributed among children of different circumstances. In between, there are other opportunities—access to early childhood development programs, safety in the neighborhood, access to electricity—which have low to moderate inequality of opportunity. While South Africa fares well in international comparisons on HOI for school attendance, it is surpassed by most of its Latin American peers for completion of primary school on time. On access to safe water and improved sanitation South
2 This index is a composite measure which captures the loss of achievement within a country due to gender
inequality, and uses three dimensions to do so: reproductive health, empowerment, and labor market participation 3 Roughly 4 in every 5 people with HIV/AIDS aged 20–24 are women. HIV/AIDS Where are we? Report
Commissioned by the Human Sciences Research Council, 2011.

5
Africa, though ahead of other African countries, lags behind all Latin American countries, except the poorest (e.g. El Salvador and Honduras).
13. Life expectancy, after falling dramatically from 62 years in 1992 to 53 years in 2010, recovered to 60 years in 2012. The recent recovery was in large part due to the rapid expansion of the antiretroviral treatment programs to fight HIV/AIDS, for example, since 2009 new HIV infections among children have been reduced by 50 percent or more. Nonetheless, the adult mortality rate is still three times higher in South Africa than in MICs with similar income per capita. Infant mortality rates have also fallen from 73 per 1000 live births in 2006 to 42 per 1000 live births in 2012, but still remain higher than in peer countries. The poor are particularly vulnerable, and high HIV/ AIDS infection rates, as well as TB infections, have severely strained the health system, contributing to poor health indicators.
14. Despite the Government’s substantial investment in public infrastructure and free housing, spatial divisions and past development patterns persist, and one-quarter of the population continues to live in sub-standard, informal dwellings. This is due to large and growing backlogs fueled by the high migration rate to urban areas. The paradox is that South Africa's major cities are simultaneously the main source of about 60 percent of South Africa's GDP, but, fueled by a massive migration, are also the centers for chronic unemployment, stark social inequality, poverty, crime and HIV/AIDS and TB infections.
15. The unresolved set of complex economic challenges has locked South Africa into a low-level equilibrium of low growth, persistent poverty and widespread exclusion and unemployment. The required structural change to break-out of this state will have to come from investment in employment-intensive growth, tackling the unemployment and education
4 D-Index is measuring the inequality of opportunity (IOO), based on General Household Survey (2010). The D-Index refers to between-group inequality, such as groups differentiated by gender, ethnicity, education, and age, etc. Source: South Africa Economic Update (3, p. 10), July 2013, World Bank.
Figure 1: D-Indices and HOIs for Key Opportunities of South African Children, 20104
0%10%20%30%40%50%
0%20%40%60%80%100%
Have health insurance
Access to water on site
No overcrowding
Finish primary (13‐15 yr)
Access to im
proved
sanitation
ECD Exposure
Safe location
Access to electricity
Adequate Infrastructure
in School
Access to
telecomunications
Adequate Teachers in
School
School A
tten
dance (12‐
15 yr)
School A
tten
dance (6‐11
yr)
Not universal, high IOO Not universal,moderate IOO
Nearly universal, low IOO
D‐Index
HOI
HOI 2010 D‐Index 2010

6
challenges together and improving the policy coordination and implementation capacity of the state. Shifting South Africa’s developmental trajectory to one of reducing poverty and inclusive growth will require the active participation of all citizens. Although many of the required policy actions are known to the policy-makers, implementation of these has been hampered by a lack of broad political consensus and the “deficit in trust between business, labor and government” (NDP 2012). This need for a new trajectory of growth is also underscored by the recent sovereign rating downgrade by several international ratings agencies, based on concerns about the Government’s ability to maintain stability and resolve internal conflicts.
3. Recent Economic Developments
16. South Africa’s growth slowed from 3.5 percent in 2011 to 2.5 percent in 2012, reflecting primarily the sluggish external environment and domestic labor strife. Growth declined in 8 of the 10 major subsectors (all but agriculture and construction). GDP growth decelerated in the first half of 2013, declining from 2.5 percent year-on-year in the fourth quarter of 2012 to 1.8 percent by the second quarter of 2013. Production in both mining and manufacturing sectors remains well below their pre-crisis peak levels. Against the backdrop of a much weaker domestic investment climate, deceleration in consumer spending, and a subdued external demand environment, medium-term growth prospects for South Africa remain modest: GDP growth is projected at 2.0 percent for 2013, 2.8 percent for 2014, and 3.2 percent for 2015.
17. The post-2008 economic slowdown has exacerbated the structural problems of exclusion and modest trend growth, with an especially severe impact on employment. The unemployment rate, already extremely high at about 21.9 percent in 2008, has since risen to 25.6 percent in the second quarter of 2013. The unemployment rate remains elevated relative to the pre-crisis level, even though real GDP has exceeded its pre-crisis peak since 2010. At the end of the second quarter of 2012, youth unemployment (15-24 years) stood at 52.8 percent; 59.8 percent of the unemployed had less than secondary school education and two-thirds (or about 17 percent of the labor force) had been unemployed for over a year, highlighting the underlying structural problem of low skill levels to suit the needs of a dynamic economy.
18. Owing to a solid record of fiscal prudence, South Africa entered the 2008 economic crisis in a sound budgetary position, enabling an aggressive countercyclical fiscal and monetary policy response. Fiscal space generated by several years of budgetary discipline, together with the country’s deep and liquid capital markets and access to global capital markets, allowed the Government to undertake a substantial fiscal expansion to offset weak private sector
20
25
30
35
40
unem
ploym
ent tren
ds (%
)
Source: Stats SA
Figure 2. Persistently High Unemployment rate (2000‐2013)
unemployment
including discouraged work seekers

7
demand. The emphasis has been on scaling up infrastructure and social sector spending, despite a significant slowdown in revenue collection. As a result, the budget balance moved from a surplus over 2005/06-2007/08 to a deficit equivalent to 6.5 percent of GDP in 2009/10, and came in at 5.2 percent of GDP in 2012/13. Fiscal balances are projected to improve gradually over the medium term, predicated upon revenues picking up with sustained economic recovery and moderation of current expenditure growth. Net public debt is projected to peak at slightly over 40 percent of GDP in FY15/16 as the fiscal deficit falls to 3.1 percent of GDP (on revised GFS basis) towards the end of the period.

8
19. The South African Reserve Bank (SARB) has pursued a countercyclical monetary policy to soften the economic downturn. SARB has cut the repo rate from 12 percent at the onset of the crisis to a historical low of 5 percent currently. Inflationary pressures are mainly on the supply side (driven by higher food and fuel prices, exchange rate depreciation, and higher unit labor costs), while demand pressures remain subdued (due to the weak economic recovery, the high levels of excess capacity, uncertainty for the mining sector, and unresolved labor disputes). Headline CPI inflation in July 2013 stood at 6.3 percent, breaching the upper bound of the SARB’s 3-6 percent target inflation band. The acceleration in July largely reflects the impact of rising electricity and fuel prices the effects of which are expected to abate in the coming months. Still, exchange rate movements represent a potential risk to the inflation outlook, especially given the depreciation of the rand and widening of the current account deficit (see below). 20. External balances have worsened in recent months as a result of deterioration in the trade, services, income and current transfer accounts. The current account deficit rose from 3.4 percent of GDP in 2011 to 6.3 percent in 2012, and is projected to hover around 6 percent in the medium term. Weak exports due to slow recovery in global demand, exacerbated by production disruptions in mining and rising dividend payments on stock of external liabilities, have been the main contributing factors. The increase in the current account deficit was also a reflection of the marked decline in the gross national savings rate in 2012 that resulted largely from higher government dissaving as the fiscal deficit widened. 21. The exchange rate has weakened reflecting generalized pressures on emerging markets as well as domestic factors. With the US Federal reserve expected to begin tapering its quantitative easing program, various emerging markets that have relied on short-term capital inflows to finance their current account deficits have seen their exchange rates come under pressure. Purchases of South African sovereign bonds by foreigners which amounted to over US$11 billion in 2012 have eased considerably in recent months, as events in the mining sector, sovereign rating downgrades, and rising US interest rates discouraged investors. The rand has depreciated against the US dollar by about 13 percent over January to September 2013.
III. GOVERNMENT VISION 22. The current administration is acutely aware of the immense challenges to accelerate progress, eradicate extreme poverty, and build a more inclusive society. The Government vision and priorities to address them are outlined in the 2030 National Development Plan (NDP). Released in 2012, the report is the product of extensive nationwide consultations led by the National Planning Commission, an independent advisory body consisting of 26 eminent people drawn largely from outside the government, appointed by the current administration to draft a vision and development plan for the country. The NDP was embraced by the ANC at their 2012 National conference as a platform for united action by all South Africans to eradicate poverty, create full employment and reduce inequality. The Cabinet has also endorsed the NDP in 2012 as the country’s overarching strategic plan to implement its development vision. It also underpins the 2013 Budget.

9
23. The NDP calls for a broad, multidimensional action framework for changing the current development trajectory of South Africa. It identifies the failure to implement policies and an absence of broad partnerships as the main causes for the slow progress in eliminating poverty and reducing inequality. The main strategic goals framed by the NDP 2030 vision are to: (i) double GDP and eliminate extreme poverty5, (ii) reduce inequality, as measured by the income Gini coefficient, from 0.70 to 0.60, and (iii) create 11 million new jobs. 24. Three priorities are identified by the NDP for achieving these two overarching objectives: (i) raising employment through faster economic growth; (ii) improving the quality of education, skills development and innovation; and (iii) building the capacity of the state to play a developmental, transformative role. These priorities are interlinked, with progress in one area supporting advances in others—a sustainable increase in employment will require a faster growing economy and the removal of structural impediments, such as poor education quality and spatial settlements patterns that exclude the majority. The state, in turn, will need to improve its service delivery efficiency by enhancing its capabilities and strengthening the skills profile of public servants.
25. The NDP identifies the failure to implement policies and an absence of broad partnerships as the main cause for the slow progress in eliminating poverty and reducing inequality. To achieve its main strategic goals, the NDP lists several critical factors for successful implementation: (i) focused leadership that provides policy consistency; (ii) ownership of the plan by all formations of society; (iii) strong institutional capacity at technical and managerial levels; (iv) efficiency in all areas of Government spending including management of the public service wage bill and making resources available for other priorities; and (v) prioritization and clarity on levels of responsibility and accountability at every sphere of government as well as a common understanding of the roles of business; labor and civil society.
IV. WORLD BANK GROUP PARTNERSHIP
1. Evolution of WBG Program 26. The World Bank resumed activities in South Africa in 1991, after 25 years of suspended membership during the apartheid period. The first Bank program was geared to economic policy advice and capacity building. Technical assistance (TA) was provided through two loans: the US$46 million Industrial Competiveness and Job Creation Project approved in 1996 to enhance industrial competitiveness of South African firms; and (ii) the US$15 million Municipal Financial Management Project approved in 2002 to help strengthen the capacity of local authorities to sustain services within a sound fiscal framework. Both these operations were fully implemented and closed with satisfactory outcomes as rated by the Bank’s Independent Evaluation Group (IEG). 27. The FY2009-12 CPS period saw a noticeable evolution in the relationship between the Bank and the Government. The number of new activities as well as the choice of available
5 As measured by people who live in households with a monthly income below R419 per person (in 2009 prices).

10
instruments increased the level of engagement. This evolution was in part due to the global economic crisis; the Bank’s reformulation of its engagement with MIC clients; decentralization of Bank technical teams to the Pretoria Country Office; and the growth of IFC and MIGA portfolio’s fueled by growing private sector demand. 28. The first post-apartheid large-scale investment loan to South Africa, the Eskom Investment Support Project (EISP) in an amount of US$3.75 billion, was approved by the Bank’s Board in 2010. The difficulty of accessing capital markets during the height of the global crisis and the urgency of investing in new power generation led South Africa to approach the Bank for a loan for the state energy company Eskom. The operation supported urgent investments in energy generation to ensure energy security for South Africa’s economy as well as initiatives that have successfully introduced lower-carbon generation sources into the country’s energy mix.
29. During this last CPS period, the select use of Trust Funds (TFs) to support Bank activities has also evolved. These have been primarily used to support activities in the areas of the environment and energy but smaller, more specific TFs, have also assisted ramping up knowledge and capacity building work in information communication technology, water, transport, health and the private sector as illustrated in Box 2 below.
30. The Bank’s engagement has had a strong knowledge sharing and TA partnership. This modality of support was strengthened, partly through new instruments such as the first Reimbursable Advisory Service (RAS) for Bank knowledge services, which was agreed with the Department of Rural Development and Land Reform in 2010 to support the development and
Box 2. Use of Trust Funds in the Bank’s South Africa Program
As of September 2013, the South Africa country program oversaw 10 TF activities for a total commitment amount of US$268 million. The bulk of these commitments are shared by four Financial Intermediary Funds (FIF) supporting global programs in response to climate change and biodiversity: (i) US$250 million Clean Technology Fund (CTF) to support the expansion of renewable energy by co‐financing a utility‐scale 100 megawatt wind power project in Sere and a 100 megawatt concentrated solar power project with storage in Upington (these investments are being co‐financed by the Eskom Loan as well as the African Development bank—US$250 million and US$100 million respectively); (ii) US$15 million Prototype Carbon Fund (PCF) financing the Durban landfill gas‐to‐electricity project; (iii) two projects financed by the Global Environment Facility (GEF) for a total of US$15 million—US$6 million Renewable Energy Market Transformation and the US$9 million Isimangaliso Wetland Park; and (iv) a program supported by the GEF and the Development Grant Facility (and co‐financed by the Governments of Japan and France), the recipient‐executed Critical Ecosystem Partnership Fund (CEPF), provides small grants to civil society to build their capacity to protect nature.
In addition, InfoDev has supported technology, innovation and entrepreneurship programs though financing tech incubators around the country for an aggregate value of approx. US$2 million. It is currently facilitating South African technology entrepreneurs in the climate and mobile space through specialized labs and incubators in partnership with the Department of Science and Technology. The remaining TFs, amounting to over US$2 million, comprise small, targeted interventions (Bank or recipient executed, including PPIAFs, IDFs, all of no more than US$300,000) to help ramp‐up knowledge and capacity building in key areas of Bank engagement (Annex 4 ‐ List of active Trust Funds).

11
implementation of the Comprehensive Rural Development Program. New analytical work was also developed during this period that helped strengthen the knowledge base. The Bank undertook a significant number of flagship AAA programs, including: (i) the 2011 report on Closing the Skills Gaps, aimed at developing a policy agenda to improve the quality of the labor force; (ii) the 2010 report on Accountability in Public Services in South Africa tackling service delivery capacity and quality challenges in South Africa; (iii) the ongoing Public Expenditure Tracking Survey (PETS) in KwaZulu-Natal province to help strengthen effectiveness of public expenditures in the HIV/AIDS area; (iv) the second Investment Climate Assessment in 2010 to assess South Africa’s overall business environment and policy options for greater job creation and faster growth; (v) Financing of Small and Medium Enterprises (SMEs) in the Republic of South Africa (2011) to assess the impact of the economic downturn on SMEs; (vi) policy and capacity support to the National Upgrading Support Program which has institutionalized in situ upgrading in South Africa with a target to impact 400,000 households by 2014; and (vii) an ongoing Risk Assessment and Implementation Strategy for the office of the Accountant General regarding a new integrated financial management system. Over the last several years, the Bank also launched regular semi-annually Economic Updates to promote public debate and new thinking on the most pressing development challenges; recent topics have included savings and investment, green growth and inequality of opportunity. 31. The last several years have seen an increase in the World Bank’s Treasury support to assist in institutional development. The focus of this line of support has been: (i) implementing the Reserve Advisory Management Program (RAMP) with SARB, for enhancing the investment policy framework, strategic asset allocation and systems renewal; (ii) strengthening technical capacity for improving secondary market architecture, developing a debt management strategy and understanding better the implications for the debt portfolio of non-resident demand for South African government securities (with the National Treasury); and (iii) improving access of sub-national entities and state-owned enterprises (e.g. Eskom) to hedging products and services to manage interest rate and currency risks; and (iv) building an asset management and capacity-building partnership with the Public Investment Corporation (PIC), currently Africa's largest asset manager. 32. In addition, the World Bank Institute (WBI) has made South Africa one of its focus countries. WBI increased staffing in the country office, answering to specific knowledge demand from key stakeholders in South Africa and the South African Development Community (SADC) region. Key areas of the WBI program in South Africa include: (i) PPPs in collaboration with the SADC and Development Bank of South Africa (DBSA); (ii) urban leadership training in collaboration with the University of Cape Town; (iii) support for the Government’s urban slum upgrading and impact evaluation, in collaboration with Cities Alliance and the Department of Human Settlements; and (iv) the development of a program on crime and violence e-learning and knowledge exchange between the African and Latin American countries under the UN Habitat-supported Global Network on Safer Cities. More generally, WBI uses South African institutions as collaborating partners on several other areas to support regional and global platforms. These efforts support capacity building in diverse areas such a public financial management, media, parliamentary strengthening, social accountability, open contracting, extractive industries, urban development, South-South Knowledge exchanges, public private partnerships and urban development.

12
33. IFC’s new commitment volumes in South Africa followed a downward trend in FY2008-12, reflecting shifts in local market dynamics. The Corporation’s annual investment commitments declined to US$100.7 million in FY12 from US$179.9 million in FY08. That pattern has been sharply reversed in FY13 with commitments reaching US$276.4 million. IFC booked several major transactions in the CPS period, such as the twin solar power projects !KaXu and !Khi; Farmsecure RSF, a US$60 million pre-harvest working capital facility for farmers; and a US$67 million financing for SRF South Africa, a packaging film producer. 34. As of February 2013, IFC’s committed portfolio in South Africa stood at U$857 million, covering 42 projects. This makes it the second largest portfolio in Sub-Saharan Africa (SSA), after Nigeria. In light of the global economic crisis, IFC implemented a countercyclical strategy in South Africa focused on: (i) enhanced private sector access to funding, by providing short-term liquidity and longer-term foreign currency funding to financial institutions; (ii) supporting South African companies “going north” and “going global”; (iii) providing advice and financing in underserved niches of the South African market, where IFC can add value and accelerate job creation; (iv) providing technical assistance and related support for small business, with a focus on the informal sector and education; and (v) supporting the development of renewable energy and energy efficiency market intermediaries. 35. MIGA has engaged with South African investors to promote South-South investment, particularly in other countries in Africa. South Africa is MIGA’s fifth largest investor country with exposure of US$366 million, the largest for a MIC. South African investors include MTN, Absa Capital, Standard Bank, Eskom, Pan African Infrastructure Development Fund and Sasol. MIGA operations within South Africa cover various sectors such as agribusiness, finance and infrastructure. 36. 34. The World Bank Group’s program has evolved and strengthened over the last CPS period. A key component of the program’s value addition is knowledge. While all WBG entities are engaged, exploring further the full potential of WBG support by the client could benefit the reform objectives of the new NDP (see Chapter V, "Program Description").
2. Evaluation of Previous Country Partnership Strategy and Lessons 37. The Completion Report (Annex 5) rates overall program performance of the FY2009-12 CPS as moderately unsatisfactory. Based on the stated outcome objectives in the CPS, the Bank’s program did not make acceptable progress towards most of its major expected outcomes. This was in part because the expected outcomes were highly ambitious and perhaps not realistically attainable (with the exception of the Eskom loan) with a relatively narrow program of knowledge services envisaged and implemented. 38. Bank performance is rated moderately satisfactory. The Bank’s performance during the CPS period had a number of favorable features, including: (i) responsiveness to demand for both knowledge activities and, in the case of Eskom, lending to help place South Africa as a global player in renewables, for example, the Upington Concentrated Solar Plant when

13
completed will be the second largest energy plant of its kind in the world; (ii) widespread recognition of the high technical quality of the Bank’s work; and (iii) carefully-selected, Bank-driven work in high priority areas. While many activities were sector-specific, some—such as the upcoming study on the economy of townships—cut across many sectors and have the potential to support a coordinated, integrated approach to addressing development challenges.
39. The EISP and the Eskom Renewables Support Project have been significant milestones for the Bank’s engagement, particularly considering the scale and complexity of these operations. These interventions have been limited to the power sector and did not lead to similar commitments of IBRD financing in other sectors. This clearly reflects the evolving needs of South Africa as a MIC client, with an emphasis on finding development solutions that are anchored in the Bank Group’s new primary role as provider knowledge, rather than lending services.
40. Consequently, the Completion Report sees scope for improvement in a number of areas. Knowledge work could be enhanced with a stronger focus on providing integrated development solutions to South Africa. There were cases where related knowledge activities are carried out in a fragmented and disconnected manner, despite obvious thematic synergies. The Completion Report highlights the need for two-way learning knowledge models, similar to comparator MICs such as India, Brazil or Mexico. It is also clear that the Bank and IFC have to enhance efforts towards fully exploiting potential synergies within their South Africa programs. 41. During this last CPS period the overall relevance and the quality of specific Bank knowledge activities have been effective and acknowledged by the client as adding substantial value. Bank AAA work has been recognized as high quality, demonstrating solid diagnostics, international benchmarking, and convening power. The Bank brought to the client international best practice and often also leading global practitioners. Drawing on the Bank’s strengths as an international knowledge broker, it was possible to secure world-class experts to interact with South African policy makers, public officials and academics. The Bank was also perceived as willing to listen and deliver. The African intra-ministerial meetings organized by the Bank in the lead up to the South African-hosted CoP17 in 2011 on green agriculture and energy provides a good example of these strengths.
42. Developments during this last CPS period have created a strong platform for further deepening Bank engagement in South Africa. Many stakeholders, from Government to the private sector, are looking to work with the Bank as long as it adds value. The new CPS is building on this, continuing to leverage Bank’s technical expertise and global knowledge. 43. This CPS takes into account five main lessons from the prior CPS period. It will: (i) focus on providing integrated development solutions to the client; (ii) be anchored in the country’s own National Development Plan; (iii) be client-driven, and reflect Bank interventions at the intersection of country development priorities, client demand and Bank Group comparative advantage; (iv) reflect an integrated Bank Group strategy that will seek to maximize synergies between various parts of the World Bank; and (v) provide a more realistic, precise and measurable results framework—for example, using client surveys to gauge client satisfaction.

14
44. To increase its effectiveness, the new 2014-17 CPS will be guided by the principles of selectivity, knowledge, implementation and programmatic approaches (SKIP). Given the large development agenda and limited Bank resources, applying the SKIP filter to new operations will help maximize the value added of Bank interventions. 45. The Bank will also improve internal and external coordination to address the inherent tension between the need for strategic selectivity and demand-driven flexibility. Internal efforts will be reinforced through better coordination within the World Bank Group and through the development of programmatic approaches (see next section). The external coordination will be strengthened by: (i) building stronger Government ownership than in the past, through involving the Government’s economic and social clusters in strategy formulation earlier in the process; and (ii) using annual consultation to revise programs and activity planning. In the case of IBRD, a formal mechanism of annual discussions with interested line departments and the National Treasury will guide program development and implementation. In the case of IFC and MIGA, this process will be arranged around the demands of the private sector. 46. Monitoring and Evaluation. The monitoring of task- and project-level results will be conducted via regular project and program supervision as well as joint annual reviews of the lending and knowledge portfolio with National Treasury and line departments. The program area results will be evaluated during the preparation of the CPS Progress Report at mid-term.
3. Proposed Partnership Strategy 47. The proposed FY2014-17 CPS will be based on a partnership for development solutions in support of the Government’s programs. It builds upon the evolution of the past program and the growth in Bank-Client engagement. South Africa is a unique client for the Bank. It is a large MIC with sizeable own revenues which obviate the need for significant external financing. It already has a substantial public and private capacity in a number of technical areas. In this context, WBG support will be carefully calibrated to client specific needs. IBRD strategy will be centered on knowledge and technical cooperation as well as support to the implementation of the ongoing lending program in energy and the environment. New IBRD financing will be available at the client’s discretion (as elaborated in paragraph 55). IFC and MIGA will continue to seek opportunities to expand their programs to support private sector growth. The WBG will also work with South Africa to distill the emerging lessons from its unique development experience that can be beneficial to other countries. 48. The CPS will be anchored to the Government’s National Development Plan objectives of eliminating poverty, reducing inequality and improving job creation. The CPS program will focus on the 3 I’s of (i) reducing Inequality, (ii) promoting Investments, and (iii) strengthening Institutions. These three interlinked strategic areas will form the pillars around which Bank Group programs and activities will be organized. 49. The programs listed under these three pillars reflect client demand and World Bank Group’s comparative advantage. The programs under the pillar of reducing inequality respond to priorities in improving access and quality of public service delivery at the national level as well as in smaller cities and townships. The programs that fall within the promoting

15
investments pillar refer to the large infrastructure deficit in the country and ambitious plans to meet this demand through both public and private investments. This is important for both short-term job creation through employment in infrastructure projects, and for medium- to longer-term development of the country’s productive base and thereby higher growth, employment and poverty reduction. The programs of the third pillar, strengthening institutions, aim to improve efficiency in the use of public resources as well as promote a better business environment for private investments. 50. Eight programs are currently identified in selected areas with prior agreement with the Government where the Bank Group would provide global experience and tailored products and services. These programs will be programmatic, with the objective of providing deeper and more focused engagement as they evolve. Some of these programs, such as energy and environment, will focus on the implementation of the existing activities. Others, such as health, will seek to bring new dimensions for Bank engagement. There also exist several areas for potential additional programs should Government make an explicit request and contingent on availability of financing (as elaborated in paragraph 87). The results framework is currently tracking six out of the eight programs and will be updated at mid-term with the Progress Report.
Table 2. CPS Pillars and Areas of Engagement
51. The government has a high awareness about addressing gender concerns through gender analysis, consultations and policy. The NDP provides a strong cross-cutting gender dimension. Given Bank’s priorities at the time, gender issues were not a component part of the previous CPS. Going forward, the contribution of the Bank will be in the introducing gender considerations across all programmatic areas of engagement. The gender issues will be addressed through gender informed dialogue and more gender-responsive knowledge activities.

16
52. A Knowledge Hub will be the primary vehicle for delivering development solutions. Its approach will be pragmatic, starting small in a few selected areas, showing quick results, developing momentum, and growing the Hub over time. It is currently hosted by the South African National Treasury, with support from the World Bank Country Office. Box 3 below highlights its main features. An MOU on creating a Knowledge Hub for service delivery has been signed.
53. Support to the regional integration agenda will be a key part of this CPS. Given South Africa’s preeminent role as the largest African economy there are many opportunities to support South Africa’s collaboration and co-operation with its regional trade partners in Africa and the global south:
IBRD, together with IFC and MIGA, will join forces with South Africa in facilitating the growth of intra-regional flows by facilitating South Africa’s private and public investment within Africa, especially in the priority sectors of energy, water and trade. These could be in the management of common-pool resources, burden sharing and the creation of institutions to manage these resources. Examples of ongoing and potential deeper engagement include the Southern Africa Power Pool, Inga Power, Kudu Gas, Lesotho Highlands Water Project, and North-South Corridor (Annex 3 contains a list of the principal ongoing regional activities that include South Africa’s participation).
Via the Knowledge Hub, the Bank will support efforts by South Africa and other regional countries to fight TB in the mining sector, as the mining sector employs migrant workers from several countries of the SADC region. Another component of the Hub related to regional integration efforts will be to share South African knowledge in support of Africa’s development. For example, the Bank will develop 10-12 case studies of South African
Box 3: Developing a Knowledge Hub in South Africa
The objective of the Knowledge Hub is to support evidence‐based implementation support for service delivery, or “knowledge in action”. This Hub intends to fill a critical gap in connecting the fragmented knowledge space, bringing in the Bank’s global expertise of practitioners in implementing development solutions, and in taking it to scale.
The Hub is being organized around three product lines: Bringing the best of the Bank and global experience to South Africa to find solutions to the
country's problems. To start, it will be providing support to the (i) Cities Support Program, which targets cities and townships as growth poles and thus the drivers for improving the development indicators (economic growth, unemployment and poverty) of South Africa, (ii) health service delivery improvements, with a special focus on combating tuberculosis in the mining sector in the sub‐region, and (iii) education service delivery improvements.
Exporting knowledge from South Africa. Several types of activities are being considered. The Bank could develop objective, systematic case studies on 10‐12 success stories from South Africa's development experience, so as to be able to export them. The Bank would also develop South‐South exchanges more strategically, and organize regional and international workshops for knowledge sharing.
Disseminating knowledge within the country. The Bank can play a catalytic role in organizing networks of practitioners in the country to help connect knowledge, link it to policy and budget, and take it to scale. In particular, the Bank will promote networks of experts involved in impact evaluations in the country and support development of “systems of knowledge management".
17
success stories. In addition, the Bank is currently exploring partnership opportunities with South Africa to coordinate TA aimed at capacity building in Africa’s fragile and conflict-affected states in areas such as payroll review and public service reforms.
54. Financing of knowledge services will come from the Bank’s internal resources, trust funds and other donor funding as well as from cost-sharing arrangements with the Government. Given the limited Bank resources and donor funding, the extent of Bank program interventions and scale will depend largely upon the availability of RASs and, where available, TF support. Over the last few years, Government has indicated its willingness to increasingly deploy its own budget to finance Bank knowledge services. In this context, RASs will play an increasing role to help grow the program and deepen engagement, as has been the practice in many other MICs. The streamlining for processing RASs is currently being reviewed by National Treasury in order to harmonize and facilitate their use across line departments.
55. Access to IBRD financing will also be available to South Africa. In the current economic environment, the Government does not envisage IBRD borrowing. Should the need arise—in particular given the launch of Government’s 2012 National Infrastructure Plan and the outstanding social investment needs—the Government would be able to access close to US$3 billion of IBRD resources for the FY2014-17 period, subject to considerations regarding how government performance evolves in the course of the CPS period, IBRD lending capacity and demand from other borrowers.
56. Donor coordination and local partnerships. Government's success in mobilizing its own revenues has dampened demand for external financing. Donors are focused on aligning their programs with those of the Government. Government officials often assess the transaction costs of dealing with individual donors as too high compared with the limited benefits. The ongoing donor coordination collaboration in the energy program is a strong example of donor efforts to support a government led program. During consultations, donors also agreed that focusing on knowledge and on implementation of service delivery to support the Government’s NDP vision is timely. Moving forward, the Bank intends to partner with selected donors and pool resources for supporting this agenda, particularly in the context of Knowledge Hub activities. The Bank will also strengthen local partnership and outreach to think tanks and CSOs by participating in knowledge sharing events and activities that underscore our developmental work. Partnerships with the Development Bank of Southern Africa (DBSA) and the Human Science Research Council (HSRC) will be deepened—an MOU has been recently signed between the Bank and HSRC. The Bank will also engage in a more frequent dialogue with civil society, especially organizations representing women’s rights to help better understand gender issues affecting South Africa’s development. There have been several expressions of interest in the World Bank Group engaging directly with civil society without the dialogue being mediated by the government.
57. Consultations process for the CPS. Several public consultations reviewed the directions of the proposed CPS. Bank staff met with representatives of NGOs, academia, professional associations, think-tanks, private/banking sector representatives, and the donor community. The Bank’s proposed focus on knowledge services, and the development of the Knowledge Hub in particular, was viewed positively given the Bank’s comparative advantage, whether in the form of global research and data, ability to deliver high quality analysis or facilitation of cross-country exchanges.

18
V. PROGRAM DESCRIPTION
Pillar 1: Reducing Inequality Cities Support Program 58. South Africa’s cities are critical to its prospects for economic growth and poverty reduction. Most South Africans live in a complex network of towns and cities, which generate about 85 percent of all economic activity. Towns and cities are affected by a host of challenges, including: continued urban migration, putting pressure on services; rising number of young people, requiring the creation of employment opportunities; spatial fragmentation, imposing high costs on households and the economy; and poor public transportation, further accentuating the spatial divide. Institutional structures that ensure greater public financial management capacity and better collaboration and planning across levels of government must be considered. 59. Within these urban areas, townships and informal settlements remain home to a majority of the urban black population and remain an enduring legacy of apartheid’s dichotomous urban spatial structure. Affluent white-majority and mixed residential urban areas may coexist, but they remain at a “safe” distance. The significant productivity gains needed for faster and more inclusive growth are achievable by untangling and removing these historical spatial distortions, thus creating the necessary opportunities to create shared prosperity. The low-income township economy under transition has the potential to take off in the same way that the successful emerging market economies of the world have, acting as a driver for faster and more inclusive growth. The Government has recently launched a US$5 billion, multi-year program of investment, policy reform and capacity building aimed at improving service delivery in cities and addressing the deeply-entrenched issues of spatial division, poor planning and social fragmentation that continue to characterize urban space in the country. 60. The Bank has maintained a long-standing dialogue with authorities around a program of technical engagement focused on capacity building, technical analysis, learning-by-doing and international knowledge transfer in support of national programs. This engagement has been structured around six areas: (i) Jobs and City Competitiveness; (ii) Environmental and Social Management of Urban Investments; (iii) Infrastructure Finance; (iv) Public Financial Management and Governance; (v) Land and Housing Markets; and (vi) Integrated Urban Transport Planning. The recently-signed US$5 million Cities Support RAS program is underpinning Bank support in this area. IFC aims to complement this with investments and advisory work to benefit urban and periurban settings by supporting improvements in the local business environment and fostering entrepreneurship. An example of this is the successful uptake of IFC’s Business Edge and SME Toolkit advisory products in South Africa. Business Edge reaches approximately 500 SMEs annually in South Africa; the SME Toolkit site attracts about 300,000 users a year, and posts a 2%-3% annual increase. 61. The Bank will also support the Government’s efforts to better understand how the townships and informal settlements and their populations are situated in the overall economy, the role they play in overall economic activity and employment (including self-employment) opportunities, the situation of housing and social services and linkages to the non-township

19
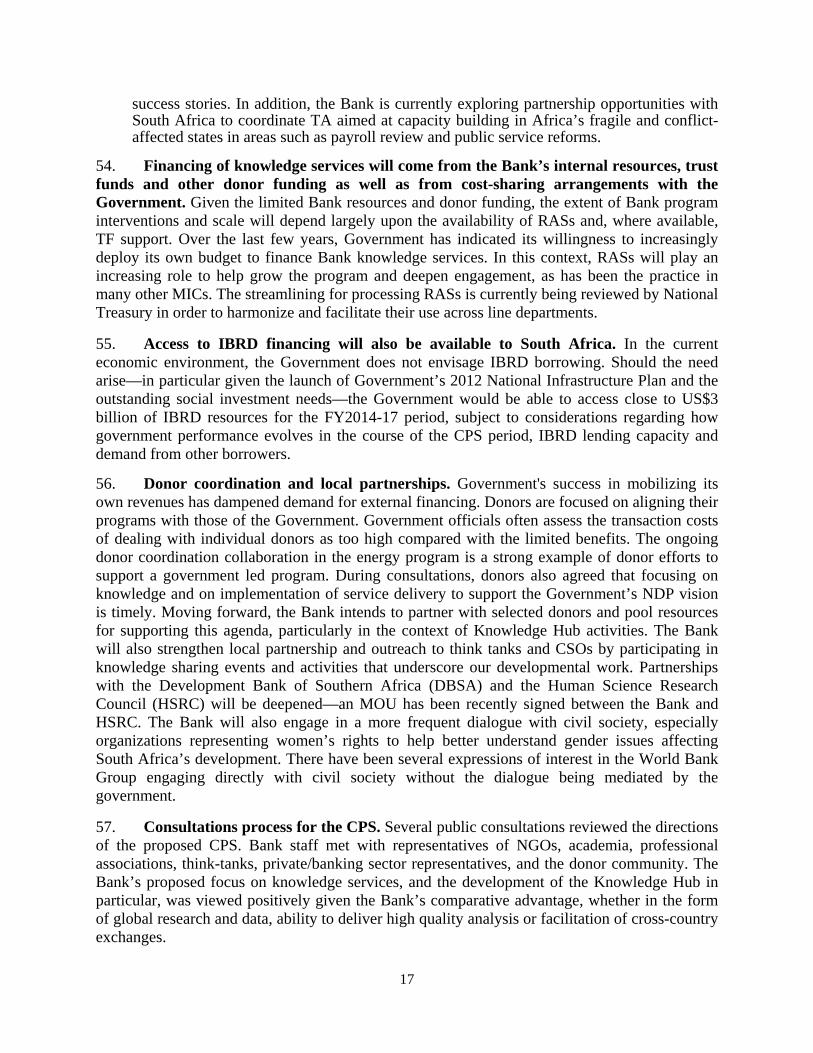
economy in urban and rural areas. The Bank will support the Government’s efforts on piloting targeted interventions in townships for job creation and enhanced public service delivery in the context of its overall urban program. Health Program 62. One of the key drivers to address inequality in the NDP is to progressively improve tuberculosis (TB) prevention and cure, strengthen the health system, and reduce the disease burden. The NDP also refers to the public health system as being in a state of multiple system failure across a range of programs, including maternal and child health, HIV and AIDS, tuberculosis and others, with a devastating combined impact. Despite its status as an upper-middle income country, South Africa’s health indicators are typical of other sub-Saharan countries. Inequalities in health outcomes and access to services are a severe and deep-rooted problem, which persists partly as a result of the country’s parallel public and private health care systems that consume roughly equal proportions of GDP (4 percent) but serve vastly different shares of the national population: 84 percent and 16 percent, respectively. 63. Among the many health sector challenges it is addressing, the Government is currently exercising strong leadership in eradicating TB and stands behind the ongoing regional efforts aimed at ending the TB/HIV co-epidemic in SADC countries. These countries are leading the Africa region by number of people dying from TB each year and most of them are not on track to reach the UNAIDS goal of 50 percent reduction in TB/HIV deaths by 2015. The Government has also launched a wide-ranging and long-term series of health reforms under the banner of a National Health Insurance (NHI) scheme with the aim of improving outcomes in service delivery. 64. Within this context, the Bank’s health program will focus on three specific areas: (i) Addressing TB in the mining sector across the sub-region. The Bank is working to address the TB crisis through an economic analysis of tuberculosis in the mining sector in the sub-region; facilitating harmonization of treatment protocols for tuberculosis in partnership with the World Health Organization; collaborating with industry to develop a strategy for tracking miners and ex-miners as they move across borders; and developing mechanisms for post-employment surveillance, follow-up and access to appropriate compensation; (ii) technical cooperation to improve revenue collection and financial management infrastructure in highly specialized hospitals; and (iii) supporting an assessment of service delivery challenges at the sub-national level through application of public expenditure tracking and quantitative service delivery surveys on health spending and outputs. 65. In addition, IFC intends to support South Africa’s healthcare sector by: (i) supporting local clinics, diagnostics, and imaging companies focused on underserved low- and middle-income market segments; (ii) backing for South Africa-based manufacturers of healthcare equipment and pharmaceuticals; and (iii) financing for more mature health service providers as they expand into other less developed Sub-Saharan markets.

20
Financial Inclusion Program
66. In the particular structure of the South African financial services industry, financial institutions that leverage relationships and links to more informal enterprises are absent. As a result, the credit landscape is segmented in a similar way to the real economy. Financing constraints tend to be more difficult to overcome for small and micro enterprises than for larger firms. Limited access is largely due to the high administrative costs of small-scale lending, high risk perception attributed to smaller enterprises, absence of reliable credit information and small enterprises’ lack of collateral. 67. Among topics within the financial inclusion agenda which the Government is considering to tackle are: (i) the apparent ‘paradox’ of consumer over-indebtedness’ and constrained enterprise credit--while the availability of enterprise credit (especially for micro, small and medium enterprises) remains a major constraint, household debt has been a large and growing problem over the last decade, with almost half of borrowing consumers with impaired records according to the National Credit Regulator (NCR); (ii) the low level of banking competition and high costs--the oligopolistic structure of the banking sector can potentially magnify costs for users of banking services and has implications for provision of services to low-income segments; (iii) the role of branchless banking and innovation -- while South Africa has been one of the world leaders in mobile banking initiatives as early as 2004, these initiative have not grown to scale; and (iv) the absence of micro finance institutions relative to emerging market peers--while the market for formal credit is well-developed in South Africa, there is a dearth of smaller financial institutions with capacity and focus on provision of micro and small enterprise finance. 68. Efforts to promote financial inclusion will be provided through the FIRST initiative where the Bank is providing technical assistance to support National Treasury in three areas: (a) expanding financial inclusion for underserved segments of the population and economy; (b) reorganization of the financial services regulatory structure; and (c) effective resolution of insolvent financial institutions, including systemically significant entities. While building on the efforts already undertaken and still underway, the intention of this program will be to provide more programmatic, multi-year support commensurate with the broad scope and priorities as set out by the authorities. The proposed programmatic approach will allow the authorities to deploy the proposed funding effectively. It will also be designed and implemented so as to allow the authorities to efficiently combine donor funding with funding of their own. 69. In addition, IFC has a significant portfolio and pipeline of new investments in the financial industry. Its focus, as in the past, will be to foster financial inclusion through support for SMEs and the expansion of financial services to low- and middle-income groups. Looking ahead, IFC hopes to further expand financial inclusion through ongoing support for microfinance institutions, particularly those able to innovate and develop savings, insurance, and other financial services for low-income groups. The Corporation expects to continue its support for second tier banks and non-banks focused on SMEs and low- and middle-income market segments. IFC also intends to encourage the development of specialized players in market niches, such as leasing, factoring, as well as SME lending. An important part of IFC’s financial markets strategy in South Africa is to increase the availability of Trade and Supply Chain financial products to smaller banks, enabling them to better meet the needs of agricultural and SME clients as well as encourage greater intra-regional trade. IFC also expects to continue

21
engaging with South Africa’s major financial institutions where its development goals coincide with clients’ business strategies. In this regard, IFC also expects to provide both finance and advice to South African banks, particularly second tier institutions, as they expand into faster-growing neighboring economies, increasing competition, liquidity, and technology in these less mature markets.
Pillar 2: Promoting Investments
Energy Program 70. The South African energy crisis of December 2007-January 2008 highlighted the country’s vulnerability to an energy shock and the potential for adverse economic consequences. South Africa's electricity sector has a total installed generation capacity of approximately 42,000 megawatts (MW) — with approximately 5,000MW offline at any given time for scheduled maintenance. In this context, the US$3.75 billion Eskom Investment Support Project (EISP) helps to meet South Africa's future energy demands by supporting the building of the Medupi 4800MW coal fired power plant. Bringing additional installed capacity is essential for sustaining growth and poverty reduction. 71. In addition to providing financing to support the completion of the Medupi coal-fired power station using efficient supercritical technology, EISP includes US$260 million for piloting a utility-scale 100MW wind power project in Sere and a 100MW concentrated solar power project with storage in Upington. These investments are also being supported by US$350 million in financing from the Clean Technology Fund (CTF) under the proposed Eskom Renewable Support Project (US$250 million to be channeled through the World Bank and US$100 million though the African Development Bank). To complement these investments, the Bank is supporting a number of technical cooperation activities and advisory services, including support to National Treasury and the Development Bank of South Africa for renewable energy market transformation and carbon capture and storage technologies. 72. Construction of the Medupi power plant and associated infrastructure is proceeding, albeit slower than envisaged. As of September 2013, 35 percent of the EISP commitment amount (US$1.311 billion) had been disbursed. The Eskom Renewables EISP component and CTF project has yet to disburse - all key procurement for the Sere wind farm has now been completed while procurement plans for the more complex Concentrated Solar Plant are still in design stage. Given the size and reputational risks of the Eskom operations, the Bank has stepped up implementation support. 73. Additionally, IFC has made important investments in the energy industry and intends to remain active in the renewables and energy efficiency sectors. Its solar power projects !KaXu and !Khi were landmark investments that demonstrated the viability of solar power in South Africa. Investments in renewable energy will continue whenever client demand and regulatory conditions permit. The Corporation’s Advisory Services arm expects to concentrate on energy efficiency and access to renewable energy projects, with the aim of boosting economic efficiency, raising disposable incomes and improving quality of life, while reducing carbon

22
emissions. Six such projects are in various stages of implementation, in addition to four ongoing projects.
Private Investment Program 74. Promotion of private investment and job creation is at the top of the Government agenda and activities by the IBRD, IFC and MIGA will remain central to this program. The IBRD will continue its support for economic diversification and micro, small and medium enterprise (MSME) development, including technical assistance to the Department of Trade and Industry in promoting MSME development in poorer regions, as well support for enhancement of policies aiming at improving Research and Development efficiency. 75. IFC’s strategy in South Africa will remain focused on innovation, job creation, and poverty reduction by: (i) supporting South African companies “going north” and “going global”; (ii) providing advice and financing in underserved niches of the South African market where IFC can add value; (iii) providing technical assistance and related support for small business, with a focus on the informal sector and education; and (iv) supporting the development of renewable energy and energy efficiency projects. Given that IFC activities are based on the needs of the private sector, outlining expected results in advance is a challenge. IFC expects to remain engaged in the agribusiness sector on a selective basis, particularly through investment and advisory work that strengthens farm supply chains that benefit smaller properties and/or low-income farmers; raise rural employment and create jobs along the food supply chain; expand new domestic and export markets; and deploy a range of Trade and Supply Chain financial tools designed to strengthen the finances of the agricultural sector. 76. For MIGA, South Africa is the fifth largest investor country with exposure of US$366 million, and the largest MIGA client among MIC countries. South African investors utilizing MIGA guarantees include MTN, IDC, Absa Capital, Standard Bank, Eskom, Pan African Infrastructure Development Fund and Sasol. While MIGA views South Africa predominantly as an investor country, it continues to facilitate inbound investment in an effort to foster South African development. MIGA operations in South Africa include four small guarantee projects in agribusiness and financial sectors, with a total exposure of US$28 million. MIGA demand from South African investors is likely to continue, though demand is likely to be dependent on individual investment projects and will be difficult to predict. MIGA remains open for business in South Africa across all of its political risk insurance product lines, including transfer restriction, expropriation, breach of contract, war and civil disturbance and the non-honoring of sovereign obligations. Moreover, the Board of Directors recently approved the expansion of the Non-Honoring of Financial Obligations guarantee available through MIGA to include financial obligations of creditworthy SOEs. This guarantee instrument could provide a diversification of long-term funding sources for SOEs in South Africa and would enable the SOEs to borrow on the strength of their own balance sheet without any additional sovereign support.

23
Environment Program 77. South Africa is the third-most biologically diverse country in the world, after Indonesia and Brazil. It occupies only 2%of the world's surface area but is home to nearly 10% of the world's plants, around 7% of the world's vertebrate species and 5.5%of the world's known insect species. The Government, through the Department of Environmental Affairs, is strongly committed to ensuring the protection of the environment and conservation of natural resources, balanced with sustainable development and the equitable distribution of the benefits derived from natural resources. 78. The Bank maintains a modest but important set of activities supported by the GEF, and over the last 10 years a number of national and regional activities have been implemented to support biodiversity conservation and renewable energy (see also Box 2 on page 10). Recently-closed GEF programs, including Cape Action for People and Environment (US$9 million), Maloti-Drakensberg Transfrontier Conservation and Development Project (US$8.2 million), and the Greater Addo Elephant National Park Project (US$5.5 million), have helped boost South Africa’s global reputation as a leader in sustainable conservation of biodiversity. Ongoing GEF-financed activities include support for conservation, empowerment and development in the Isimangaliso Wetland Park (US$9 million) and the Renewable Energy Market Transformation Project (US$6 million). This is aimed at removing barriers, reducing implementation costs of renewable energy technologies to mitigate greenhouse gas emissions, and supporting sustainable and equitable environmental management.
79. The Bank’s focus during this CPS period will be on the implementation of the two ongoing GEF operations. New GEF operations would be subject to the Government selecting the Bank as an implementing partner of choice. There are also two ongoing regional GEF operations that include South Africa: the US$11 million Western Indian Ocean Marine Highway Development and Coastal Marine Contamination project to help reduce the risk of ship-based environmental contamination from oil and chemical spills and to strengthen the capacity of countries to respond to spill emergencies in the Mozambique Channel; and the US$14 million South West Indian Fisheries Project to assess the current status of offshore fisheries within the 200 nautical miles Exclusive Economic Zone of nine coastal states bordering the Southwest Indian Ocean.
Box 4. The GEF Financing Window
The two on‐going and several now closed operations used GEF funds from the first to the fourth GEF replenishment. For the fifth replenishment initiated in 2011 and which will end in 2014, countries were assigned a defined envelope based on their respective biodiversity and climate indexes. South Africa has been assigned US$25.7 million for climate change, US$21.7 million for biodiversity and US$5.3 million for land degradation. The Government has accessed these funds only partially and during the ongoing fifth replenishment has worked with UNDP, rather than the World Bank, as their primary implementing agency. South Africa is also eligible for investments under two global GEF projects: the US$130 million Critical Ecosystem Partnership Fund (CEPF) that supports civil society capacity to protect nature, out of which South Africa is eligible to apply for funds from US$6.9 million earmarked for southern Africa; and the US$11 million Save Our Species (SOS) program that supports civil society efforts to protect threatened species.

24
Pillar 3: Strengthening Institutions
Asset, Debt and Risk Management Program
80. The increasing complexity of debt, asset, and risk management in an interconnected world call for continuous strengthening of institutional and staff capacity. Policies and institutional frameworks need to be able to adjust to new circumstances and opportunities while at the same time being transparent and predictable. Incentives need to be in place to support good planning and preparation, and decision-making based on evidence and analysis. Markets, in general, can provide risk management tools and resources but only if sound regulatory frameworks are in place. This program of the CPS aims to strengthen institutional capacity in all of these areas to help ensure the sustainability of development goals, since managing risks responsibly and effectively can mitigate economic shocks which adversely impact the poor, and create opportunities for growth and poverty reduction. 81. Over the last several years the Government and other official institutions have placed a high priority on strengthening financial risk management. Therefore, one of the key programs in the WBG’s new strategy is to strengthen public institutions' ability to manage risks so that economic development and achievement of policy objectives are not disrupted by macroeconomic shocks, adverse market movements or unexpected costs of hidden contingent liabilities. 82. Partnering with the South African Reserve Bank (SARB), the Bank has been supporting efforts in the area of the foreign currency reserves management (including enhancement of SARB’s governance and risk management frameworks as well as its investment operations and systems infrastructure) and by supporting the National Treasury in preparing the debt management strategy, reviewing strategic benchmarks and improving the secondary debt market architecture. Going forward, the partnership with the SARB and National Treasury will continue to focus on foreign currency reserves management, risk management frameworks and debt management. A new partnership with the Public Investment Corporation (PIC), which manages public assets, will focus on strengthening all aspects of investment operations and infrastructure. 83. At the request of Eskom, the Bank is preparing to provide hedging services and help manage currency and interest rate risk in a more cost effective way. Other sub-national entities and state-owned enterprises may benefit from similar access to hedging products and services, and from assistance in strengthening institutional and operational frameworks for managing risks. Efforts to export South African expertise on sound practices for financial and fiscal management in the official sector can be shared with other countries in the region, as SARB is doing in partnership with the Bank to support reserves management in neighboring countries such as Mozambique. Expected results of this work are to reduce South Africa's vulnerability to financial shocks, to allow the Government to respond quickly to changing market circumstances, and to strengthen foreign currency reserves management, pension funds and other official sector portfolios.

25
Basic Education Program
84. Access to basic education has improved in South Africa with a Gross Enrollment Rate (GER)6 for Grade R (pre-school) through Grade 9 of 92 percent, and 80 percent for Grades 10 through 12 in 2010. This relatively high level of participation in schooling has largely been equal for girls and boys in South Africa with a Gender Parity Index7 of 0.98 for Grade R through Grade 9 in 2010. However, large disparities persist in education performance by race and socio-economic status. Apart from a small minority of black children who attend former white schools and a small minority of schools performing well in largely black areas, the quality of public education remains poor. Literacy and numeracy test scores are low by African and global standards, despite the fact that government spent about 6 percent of GDP on education in 2010/11 and South Africa’s teachers were among the highest paid in the world (in purchasing power parity terms)8. 85. Several government studies have tried to identify the main causes of this poor performance in education. Many of these point to what happens inside South African classrooms as an important factor of why children are not learning effectively. In this context, the Bank is currently engaging with the Department of Basic Education to strengthen the annual national assessments in order to improve teaching and learning in schools. Other areas of programmatic technical assistance could include improving mathematics education through exchanges with East Asia as well as strengthening early childhood development programs. 86. Additionally, vocational training, particularly for low-income youths, is a strategic priority and an area of focus for IFC in Sub-Saharan Africa. It will explore the possibility of supporting private sector for- and non-profit technical education in South Africa, with the aim of (i) increasing employment opportunities; (ii) raising the productivity of South African firms; and (iii) improving income distribution, given the significant returns to education in the country. Additional programs 87. The Bank will remain flexible and adapt to new demand to the extent possible within the complement of available resources. Possible additional programs—most of which fall under the strengthening institutions pillar— are in early development stage:
Water - potential collaboration to support the Department of Water Affairs leverage the global experience of the World Bank in formulating sustainable solutions for improving service delivery, finding financial solutions for infrastructure and integrating climate considerations into water resource management;
Rural development - the objective of the 2nd RAS is to strengthen the capacity of the Department of Rural Development and Land Reform in policy development and program implementation to help in its efforts of boosting investment and growth in rural communities;
6 The GER is calculated as total enrollment in the level of education divided by the population of relevant age for that
level. 7 The GPI is calculated as the GER for girls divided by the GER for boys. 8 National Planning Commission, Diagnostic Overview, 2011.

26
Monitoring and evaluation - the Bank may support further technical assistance to the Department of Monitoring and Evaluation in the Presidency to help design and implement the national evaluation policy framework, should an RAS activity or TF resources become available;
Open government partnership - discussions are underway with the Department of Public Services and Administration on possible support in the implementation of the Government’s open government partnership commitments as well as on helping South Africa, as a founding member of this program, to support open government abroad; and
State capabilities – knowledge exchange discussions are underway to leverage the Bank’s global experiences and strengthen public service capacity and accountability, especially at the local level.
VI. RISK ASSESSMENT
88. Global economic risks combined with domestic policy weaknesses could impede the implementation of this CPS. Continued austerity measures and low growth in the Eurozone, South Africa’s largest export market, will impact export demand and inhibit economic growth. The indirect channels of transmission arising from confidence effects are likely to be even stronger, with precautionary savings among firms increasing and heightened risk aversion delaying investment. Potential lower commodity prices from the global downturn present another related risk. With much of the recent increase in commodity prices driven by strong demand from Asia, a cooling of these economies coupled with weak demand from Europe would further hit South Africa’s growth prospects. In this context, a perceived lack of pro-active policies to address high unemployment and poverty could lead to higher social discontent, unrest and instability, which may adversely impact the implementation of this CPS and the achievement of CPS objectives. The Bank will continue discussing with the government its economic assessment and adapt the CPS to changing realities.
89. A second set of risks is linked to implementation issues of the NDP, as well as coordination challenges between the client and the WBG and within the WBG itself. With regards to the NDP, despite its broad political buy-in, questions remain on what it will take to be implemented effectively. Failure to implement the NDP or a shift in its main priorities may affect the CPS implementation, given their close alignment. With regard to the WBG, as highlighted in the CPS Completion Report, past programming has reflected some degree of fragmentation and lack of coherence, and a preponderance of opportunistic interventions. The current CPS seeks to move away from this approach and promote more coherent and integrated programming, and to strengthen institutional mechanisms for improving internal and external coordination as highlighted in paragraphs 44-45. Within this context, program expectations will have to be properly managed, particularly vis-à-vis the scalability of programs, should additional RASs not materialize or TF funding become uncertain.
90. The third set of risks relate to the implementation of the two Eskom operations, given their centrality to the ongoing program and their importance to South Africa’s energy strategy. Initial "teething problems" related to procurement have been largely overcome for the Medupi operation. Significant safeguards risks are being effectively addressed by the South African authorities through the country’s legal and regulatory system and close Bank implementation support. However, worker relations issues and labor strikes affecting Medupi pose risks slowing down implementation. The project will likely require an extension.

27
Annex 1: CPS Results Matrix
ENGAGEMENT AREA 1: REDUCING INEQUALITY
Country Development Goals: (a) Reduce inequality by decreasing spatial divisions and social fragmentation; change development patters through shifts in spatial form, transforming fundamentally jobs and livelihoods of the poor; creating more jobs in or close to dense, urban townships; reducing travel distances and costs for poor households; more efficient land use. (b) Lower the cost of living for the poor by improving the provision of public services, progressively improve TB prevention and cure, strengthen the health system, reduce the disease burden and implement national health insurance.
Country issues and challenges: Integrate township development into economic policy and programs by implementing the Local Government and Human Settlements Program Implement pilot program on township growth for catalyzing public and private investment Reduce disease burden of TB across four selected SADC countries by harmonization of treatment protocols Transfer practitioner’s global knowledge and capturing and exporting lessons of South African experience to other countries regionally and globally
Outcomes to which CPS contributes CPS Program Milestones and Outputs Activities, Instruments and Partners
1. Cities Support Program
Objective 1: Inform evidence-based policy options for effective development and management of cities’ land and housing markets, transport system and services.
Knowledge products provided to design and scope of the quality review of informal settlements in two cities; E-training course developed on land-use planning; City strategies and city doing business assessments
completed in cities covered under the RAS; Policy advisory products shared on removing
governance and PFM impediments hampering the provision of infrastructure;
Cities Support Program Reimbursable Advisory Services (RAS) (new);
Knowledge Hub (new) Partners: South Africa Cities Network; National Treasury; Municipality of Johannesburg; University of Cape Town Partners
Objective 2: Inform the policy debate on the improvement of T&IS strategy and policy formulation, on the identification of a pilot township for development, and on the support sought from the private sector.
Modeling of relationships of the township- and the main economy conducted; Workshop of the working advisory group organized
to finalize the township development strategy; A feasibility study completed for piloting policy and
financing innovations;
Economics of Townships Report (ongoing) Potential IFC investments and advisory support for financial institutions and real sector clients

28
Outcomes to which CPS contributes CPS Program Milestones and Outputs Activities, Instruments and Partners
Analyses completed, and a bundle for the sectoral cluster identified by a panel of SEZ experts; M&E framework developed to monitor the efficacy
of township pilot projects and policies; Innovation and learning lab established, as a virtual
learning network of academics and practitioners for knowledge generation on township economy; Approximately $200 million in IFC direct financing
to financial institutions focused on SME sector; projected $140 million in financing to manufacturing sector. (Note: IFC investments are subject to prevailing market and regulatory conditions).
based in, or benefiting, urban and periurban communities. Knowledge Hub (new) Partners: Advisory Committee with representatives from NT, HS, Ministry of Transportation and NPC and selected municipalities (to be established).
2. Health Program
Objective 3: Grow the knowledge base of customized solutions for effective management of the health system, for effective responses to TB in the mining sector and for an improved revenue collection and FM in the hospital system;
Knowledge Hub program on regional TB in the mining sector established; Economic analysis of the impact of TB and TB/HIV
in the mining sector conducted; Common treatment protocol developed and adopted
in the sub-region; delivery system for fighting TB in the mining sector developed; Tracking system for sick mining workers and their
families developed; data base provides gender-disaggregated data; Costing of services in the tertiary and quaternary
facilities conducted and validated; Technical assistance for developing of new financial
management systems provided; Skills transferred for strengthening the IT systems in
the health sector provided;
Piloting National Health Insurance Reform Project; PETS of HIV/AIDS in Kwa Zulu Natal; National Health Insurance TA; TB and HIV/AIDS Program; Regional Capacity and Knowledge Sharing in Strengthening Health Systems (IDF)(ongoing)
Knowledge Hub (new) IFC investment in health services providers and equipment suppliers/manufacturers.
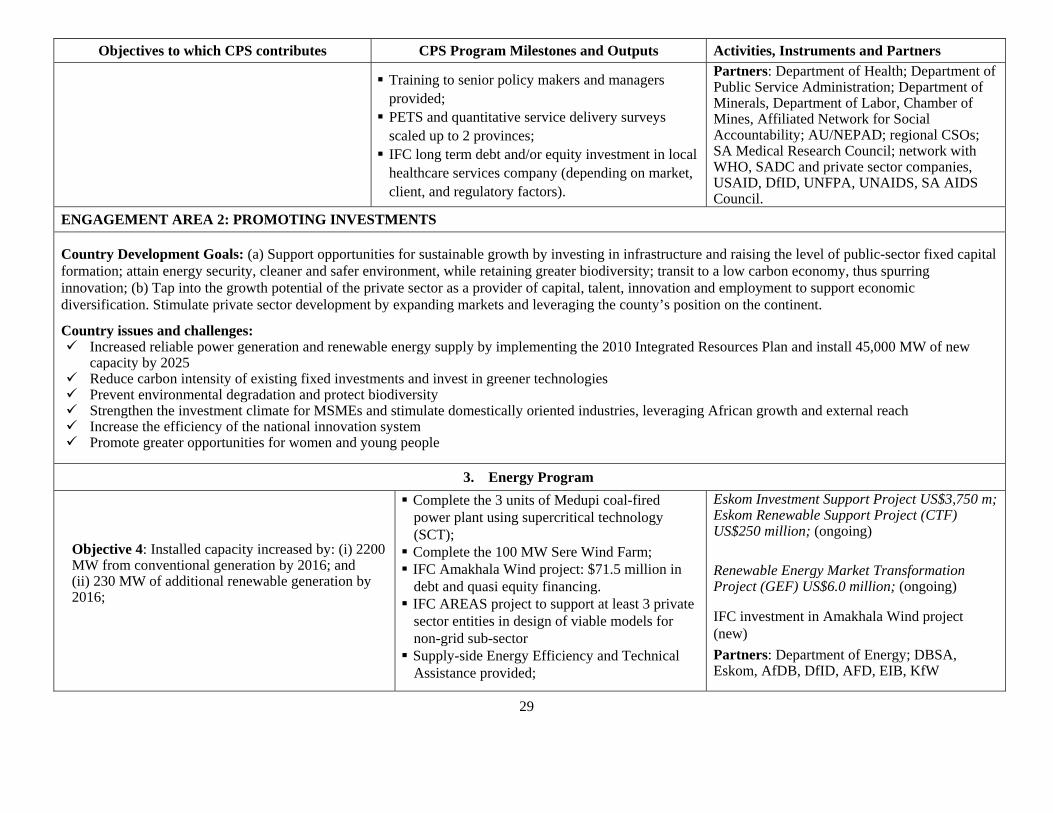
29
Objectives to which CPS contributes CPS Program Milestones and Outputs Activities, Instruments and Partners
Training to senior policy makers and managers provided; PETS and quantitative service delivery surveys
scaled up to 2 provinces; IFC long term debt and/or equity investment in local
healthcare services company (depending on market, client, and regulatory factors).
Partners: Department of Health; Department of Public Service Administration; Department of Minerals, Department of Labor, Chamber of Mines, Affiliated Network for Social Accountability; AU/NEPAD; regional CSOs; SA Medical Research Council; network with WHO, SADC and private sector companies, USAID, DfID, UNFPA, UNAIDS, SA AIDS Council.
ENGAGEMENT AREA 2: PROMOTING INVESTMENTS
Country Development Goals: (a) Support opportunities for sustainable growth by investing in infrastructure and raising the level of public-sector fixed capital formation; attain energy security, cleaner and safer environment, while retaining greater biodiversity; transit to a low carbon economy, thus spurring innovation; (b) Tap into the growth potential of the private sector as a provider of capital, talent, innovation and employment to support economic diversification. Stimulate private sector development by expanding markets and leveraging the county’s position on the continent.
Country issues and challenges: Increased reliable power generation and renewable energy supply by implementing the 2010 Integrated Resources Plan and install 45,000 MW of new
capacity by 2025 Reduce carbon intensity of existing fixed investments and invest in greener technologies Prevent environmental degradation and protect biodiversity Strengthen the investment climate for MSMEs and stimulate domestically oriented industries, leveraging African growth and external reach Increase the efficiency of the national innovation system Promote greater opportunities for women and young people
3. Energy Program
Objective 4: Installed capacity increased by: (i) 2200 MW from conventional generation by 2016; and (ii) 230 MW of additional renewable generation by 2016;
Complete the 3 units of Medupi coal-fired power plant using supercritical technology (SCT); Complete the 100 MW Sere Wind Farm; IFC Amakhala Wind project: $71.5 million in
debt and quasi equity financing. IFC AREAS project to support at least 3 private
sector entities in design of viable models for non-grid sub-sector Supply-side Energy Efficiency and Technical
Assistance provided;
Eskom Investment Support Project US$3,750 m; Eskom Renewable Support Project (CTF) US$250 million; (ongoing)
Renewable Energy Market Transformation Project (GEF) US$6.0 million; (ongoing)
IFC investment in Amakhala Wind project (new)
Partners: Department of Energy; DBSA, Eskom, AfDB, DfID, AFD, EIB, KfW

30
Outcomes to which CPS contributes CPS Program Milestones and Outputs Activities, Instruments and Partners
Objective 5: Carbon emissions from electricity generation reduced by applying SCT and reducing coal transportation costs;
Objective 6: Inform the implementation of the South Africa long-term carbon mitigation strategy ; validate developing solutions for carbon capture and storage (CCS) technologies, and advise the formulation of regulatory frameworks;
Objective 7: IFC to mobilize financing for companies across electrification value chain and reducing greenhouse gas (GHG) emissions;
Objective 8: CIPA disburse sub-loans through participating banks. IFC advisory services to facilitate client bank disbursement of sub-loans.
Providing knowledge advice for power plant efficiency improvement and identified RE; Convert Majuba coal transportation mode from
road to rail; Technical assistance provided for improving
powerplant efficiency for the Eskom Fleet; Implementation plan for the SA CCS Roadmap
developed; Regulatory framework for implementation of
SA CCS Roadmap developed; Identification and follow-up assessment of pilot
test injection project conducted; At least two CCS thematic workshops
conducted; Study tour of an existing test injection site; Additional IFC investment and advisory projects
contingent on market and regulatory environment, as well as client demand; 200 jobs created to enhance shared prosperity; GHG emissions reduced; Partnerships with two Banks.
Carbon Capture and Storage Development TA, US$14 million (ongoing) Partners: Department of Energy; DBSA, Eskom, South African Centre for Carbon Capture and Storage; IFC advisory services to continue engagement in energy efficiency; Ongoing Advisory projects: Climate Change Investment Program in Africa for South Africa (CIPA); Cleaner Production Advisory Services Program; AREAS South Africa. Forecast: TUHF Pty Energy Efficiency.
4. Environment Program
Objective 9: Capture and provide sector knowledge to enhance the functioning of one ecosystem by increasing employment opportunities and entrepreneurial capacity for local youth in conservation and tourism sectors in the Lake St Lucia area, of which at least 50% are women.
Technical studies and the Environmental Impact Assessment (EIA) completed and integrated into management decisions; Increased number of youth passing courses each
year at tertiary level; Increased number of targeted SMEs that achieve
financial and commercial viability over the project period;
Development, Empowerment and Conservation in the Greater St Lucia Wetland Park and Surrounding Region, GEF, US$9 million (ongoing)
IFC Advisory Services planned Environmental Performance & Market Development risk management project (new)
Partners: Ministry of Environmental Affairs and Tourism; Department of Water Affairs and Forestry (DWAF); Wetland Authority;

31
Outcomes to which CPS contributes CPS Program Milestones and Outputs Activities, Instruments and Partners
Objective 10: Global knowledge and technical solutions captured and transferred for establishing policy and regulatory frameworks for renewable energy in South Africa, and for assisting potential RE power generation developers.
10-12 renewable energy firms (promoters) assisted with pre-feasibility studies by 2014; 200 Commercial Solar Water Heating (CSWHs)
systems installed by 2014;
Renewable Energy Market Transformation Project, US$6 million (ongoing)
Partners: Development Bank of Southern Africa (DBSA); Department of Minerals and Energy (DME); National Energy Regulator of South Africa (NERSA)
5. Private Investment Program
Objective 11: Inform policy actions for inclusive output growth and employment generation which targets creation of opportunities for low-skilled workers, especially women, increasing private sector investment, and outbound/inbound guarantee support for South Africa companies.
The Implementation of the Government's Regional Industrial Development Plan is informed by WBG assistance; Analytical and advisory services provided on
private sector development in two less developed regions and follow-up policy dialogue and TA; IFC portfolio expanded, especially in agribusiness,
financial sector, renewable energy, EE, and support for SMEs, fostering innovation; MIGA portfolio expanded with focus on infrastructure, energy and agribusiness sectors. IFC investment/ MIGA guarantees activities
contingent on market conditions, regulatory environment, and client demand.
Policy Dialogue (ongoing)
TA supporting enhancement of policies aiming at improving R&D efficiency (new). IFC direct debt and equity investments in private sector companies and financial institutions; provision of short term Trade and Supply Chain financial products (new); IFC investments in banks and non-banks to expand access to finance for SMEs, and low- and middle income communities (new); IFC South Africa Sub-national Investment Climate Reform Program (ongoing; new). Partners: National Treasury PPP unit; SADC
32
ENGAGEMENT AREAS 3: STRENGTHENING INSTITUTIONS
Country Development Goals: Provide stable and enabling macro-economic platform capable of mitigating the growing risks of globalization and the uncertainty and volatility of the global financial system.
Country issues and challenges: Sound macroeconomic and fiscal management and reduced vulnerability to financial shocks Strengthen financial risk management
Outcomes to which CPS contributes CPS Program Milestones and Outputs Activities, Instruments and Partners
6. Asset, Debt and Risk Management Program
Outcome 12: Improve asset, debt and risk management by providing practitioner advice on: debt management strategy and secondary debt market architecture to the National Treasury; and strengthening the asset management frameworks of SARB, PIC and GEPF.
Advisory services and knowledge products for:
Shifting the debt portfolio composition to reduce vulnerability to shocks (measured in stress testing); Implementing strategies and frameworks to
develop annual borrowing and risk management plans (including hedging operations) based on the debt management strategy and benchmarks; Implementing domestic borrowing programs; Sharing via SSKE South African expertise and
sound practices for financial and fiscal management.
RAMP: Technical advisory services with the SARB and GEPF/PIC on the management of the official foreign currency reserves and the pension assets respectively (ongoing)
Global Debt & Risk Management Program (funded by SECO; ongoing); TA supporting the revision of the strategic benchmarks by the NT based on cost and risk analysis through an analytical tool to be developed (new); TA on helping the NT and the relevant stakeholders decide on how to improve the secondary market architecture (new); Providing support for the development and delivery of training programs to share the South African expertise (new). Partners; National Treasury; SARB, PIC, GEPF.
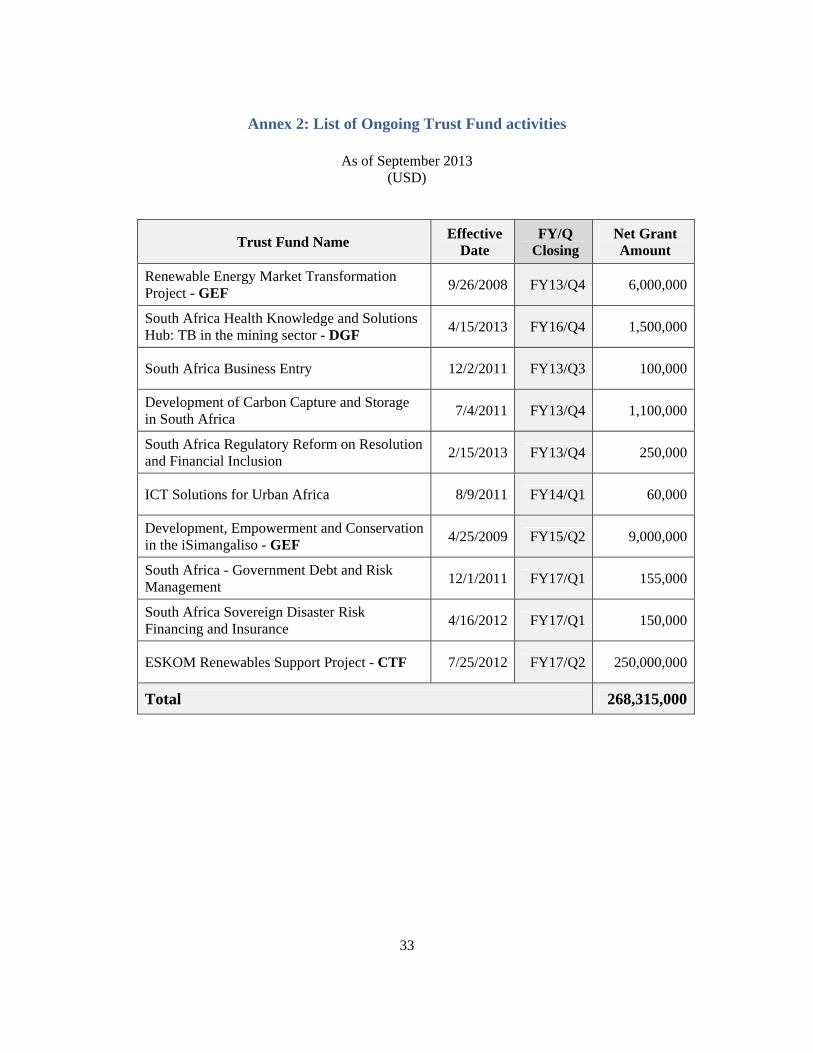
33
Annex 2: List of Ongoing Trust Fund activities
As of September 2013 (USD)
Trust Fund Name Effective
Date FY/Q
Closing Net Grant Amount
Renewable Energy Market Transformation Project - GEF
9/26/2008 FY13/Q4 6,000,000
South Africa Health Knowledge and Solutions Hub: TB in the mining sector - DGF
4/15/2013 FY16/Q4 1,500,000
South Africa Business Entry 12/2/2011 FY13/Q3 100,000
Development of Carbon Capture and Storage in South Africa
7/4/2011 FY13/Q4 1,100,000
South Africa Regulatory Reform on Resolution and Financial Inclusion
2/15/2013 FY13/Q4 250,000
ICT Solutions for Urban Africa 8/9/2011 FY14/Q1 60,000
Development, Empowerment and Conservation in the iSimangaliso - GEF
4/25/2009 FY15/Q2 9,000,000
South Africa - Government Debt and Risk Management
12/1/2011 FY17/Q1 155,000
South Africa Sovereign Disaster Risk Financing and Insurance
4/16/2012 FY17/Q1 150,000
ESKOM Renewables Support Project - CTF 7/25/2012 FY17/Q2 250,000,000
Total 268,315,000

34
Annex 3: WB Regional Activities in which South Africa is participating
Sustainable Development
Quantifying the Tradeoffs of the Water-Energy Nexus
The main objective of the flagship is to support integrated planning of energy and water investments to achieve sustainable economic growth by demonstrating the extent to which water affects energy planning through development and piloting of a suite of assessment tools for enhancing integrated water and energy resource planning in client countries. Advanced discussions suggest that South Africa could be one of the cases as it is a country with scarce water resources that is starting to plan water and energy in an integrated manner for a sustainable future.
Environment, Energy, Water
Western Indian Ocean Marine Highway Dev. and Coastal and Marine Contamination Prevention (GEF)
Reduce the risk of ship-based environmental contamination (from oil and chemical spills) and to strengthen the capacity of countries to respond to oil or chemical spill emergencies in the Mozambique Channel. Electronic nautical charts completed for route corridor along Mozambique Channel. Updated oil spill contamination prevention plans in 8 participating countries.
Environment, Infrastructure
South West Indian Fisheries Project (GEF)
The SWIOF Project Development Objective is to assess the current status of offshore fisheries within the 200 nautical miles Exclusive Economic Zone (EEZ) of nine coastal states bordering the Southwest Indian Ocean (Kenya, Tanzania, Mozambique, South Africa, Comoros, Madagascar, Seychelles, Mauritius and France). The South West Indian Ocean Fisheries Commission (SWIOFC) acts as the Regional Policy and Steering Committee of the project.
Environment
SACU Trade and Transport Facilitation Assessment
Regional Trade and Transport Facilitation Assessment support requested by SACU stemming from recent dialogue with the Bank. Will be an integral part of SACUs work on trade facilitation and will provide inputs to the regional industrial strategy that is being defined. Funded through the trade facilitation trust fund + small BB allocation from AFCRI.
Regional Integration
Southern Africa Power Market Development APL1a
The program will increase the availability and reliability of low cost, environmentally friendly electric energy in the Southern African Power Pool, as well as support further integration and trade between SAPP countries. Project provides support to the SAPP Co-ordination Center and rehabilitation of transmission lines linking the Inga hydropower site in the Democratic Republic of Congo to the border of Zambia, allowing for power trading with the SAPP.
Regional Integration, Infrastructure,
Southern Africa Power Market Development APL1b
Rehabilitation of the hydroelectric facilities at Inga 1 and 2 in the Democratic Republic of Congo, increasing capacity from 700MW to 1300MW, allowing for export to the Southern Africa Power Pool as well as domestic consumption through construction of a 400kV transmission line to Kinshasa.
Regional Integration, Infrastructure,
Mozambique-South Africa Transmission Interconnection (FY14 Pipeline)
Transmission Interconnection between the generation centers in Tete Province with the transmission network in the south, a distance of 1,300km, as well as serve as a route for electricity export to the Southern African Power Pool via the South African network. Would convey power from the Moatize Coal-fired Generation Project, Mphanda Nkuwa Hydropower, Temane Gas-fired Power Generation Project and North Bank of the Cahora Bassa dam with a combined new generation capacity in excess of 4,000MW. $2.8 billion investment to be structured as a PPP with a portion financed by IDA and private sector financing leveraged through IDA guarantees.
Regional Integration, Infrastructure,

35
Annex 3 - WB Regional Activities in which South Africa is participating (continued)
Human Development
Comprehensive Africa Agricultural Development Program (CAADP) Multi-Donor Trust Fund
The World Bank has been administering a $31 million USD multi-donor trust fund to assist African institutions with implementation of the Comprehensive Africa Agricultural Development Program (CAADP) since 2008. CAADP is a NEPAD initiative aimed at promoting economic growth through agriculture-led development under four key pillars: (I) Land and Water Management; (II) Market Access; (III) Food Supply and Hunger; (IV) Agricultural Research. NPCA is is a child trust fund recipient under the program to support development and execution of their strategic and operational plan and a similar trust fund is under preparation for SADC. The MDTF also supports Bank led technical assistance, including supporting African-owned CAADP processes, including African peer reviews of national agriculture and food security investment plans.
Regional Integration, Inclusive Growth, Rural Development
Impact of Tuberculosis and HIV in the Mining Sector in Southern Africa
South Africa's mine workers have the highest TB incidence in the world and high rates of HIV co-infection. Many of the workers migrate from surrounding countries, particularly Lesotho, Swaziland and Mozambique. At the request of regional governments (SA, Lesotho, Mozambique, Swaziland) the Bank and the Stop TB Partnership are collaborating in an effort to: Document the magnitude of TB-HIV in the mining sector in southern Africa and highlight the knowledge gap in addressing the problem; Recommend innovative and integrated public private partnerships in addressing prevention and treatment ; and Highlight the impact of TB-HIV for the mining sector in southern Africa and the escalating cost of diagnosis and treatment of resistant strains.
Regional Integration, Health (part of the Knowledge Hub)
Regional Services Trade in Health and Education
Analytical work aimed at providing the basis for effective dialogue and engagement on integrating the markets for professionals in the education and medical services sectors within COMESA and SADC. The objective will be to facilitate improved access to a greater variety and lower cost medical and education services.
Regional Integration, Health, Basic Education
World Bank Institute
SADC Development Finance Resource Centre PPP partnership
Capacity Development support to SADC PPP Network. Infrastructure
GDLN--Global Development Learning Network
Working with DBSA, UCT and HSRC on linking with the WB / GDLN VC network for country-country knowledge sharing activities.
Inclusive Citizenship
Parliamentary Strengthening Program
The PSP is a regional program working through the Pan-African Parliament, country public accounts committees and the REC's aimed at strengthening the capacity of African parliamentarians.
Inclusive Citizenship
Connect4Climate initiative
A global social media campaign to build awareness on climate change Environment Global

36
Annex 4: Statistical System in South Africa
South Africa has a modern and independent statistical system meeting the Special Data Dissemination Standard (SDDS) and complying with international standards of coverage, periodicity, and timeliness. Macro data dissemination is in accordance to SSDS format and micro data are openly available to the public (based on IHSN/ADP international standards):
National Accounts data are reported quarterly on a SNA 1993 basis. The consumer price index (CPI) covers households in metropolitan and urban areas that
comprise 56 percent of all households and 75 percent of consumption. Government finance statistics are compiled and disseminated according to GFSM 2001. Monetary Statistics, compiled by the SARB, are consistent with the methodology of the
Monetary and Financial Statistics Manual and are reported to the IFS. Balance of payments data, including international reserves, are consistent with the fifth
edition of the Balance of Payments Manual (BPM5) and the IMF’s international reserves template.
The household survey system provides micro data for policy analysis, including annual General Households Surveys (GHS), frequent Households Income and Expenditure Survey (NHIES) and quarterly Labor Force Survey (LFS).
Micro data from all households’ surveys are openly available to the public. Stats SA follows DDI standards for surveys meta data preservation and dissemination.
The 2011 Population Census is comprehensive. Survey results have been published and a sample of the census data is planned to be publicly released.
The National Statistical Development Strategy (NSDS) for 2009-2014 outlines a vision to address gaps and develop a government-wide statistical system that provides evidence that can be used to improve policy design and public sector effectiveness. The key gaps identified by the strategy include the need to compile a nationally representative CPI, improve the periodicity and timeliness of unemployment and wage data, and better firm registry data. The strategy also envisages (i) expanding data measurement beyond the national and provincial levels to cover municipal and sectors (economic, social, or developmental) to enable planning, implementation, and monitoring of development initiatives and service provision; (ii) shifting the data production system away from unique products towards integration and cross cutting analysis; (iii) extending Stats SA quality standards to all government agencies involved in the production of statistics; and (iv) developing the skills and capacity of Stats SA to train staff in other government agencies involved in statistics.

Annex 5: Completion Report
37
Annex 5: Completion Report
SOUTH AFRICA: COUNTRY PARTNERSHIP STRATEGY (2008-2012)
March 19, 2013 Date of CPS: December 12, 2007 (Report No. 38156-ZA) Board discussion on: January 25, 2008
Assessment of Program Performance
1. The CPS was issued in December 2007, and covered the period FY2008-FY2012. The CPS focused on poverty eradication and the reduction of inequality, and identified two pillars and one cross-cutting theme. The two pillars were Urban and Rural Development, and Regional Integration, while the cross-cutting theme was Improved Service Delivery. The urban and rural development pillar was a general catch-all of the Bank’s substantive activities in South Africa, reflecting the Bank’s ongoing engagement in issues of municipal and urban development and the interest of the Department of Agriculture and Land Affairs in programs of technical assistance and analytic work. Issues of private sector development (in association with IFC/MIGA), environment and infrastructure development were also folded into this category. The second pillar, regional integration aimed at supporting investment by South African companies in Africa; working to strengthen the efforts of the Southern Africa Development Community (SADC) to foster regional integration; and knowledge-sharing activities with other African countries. Finally, the cross-cutting service delivery pillar covered a range of technical assistance activities with the focus on support for enhanced Monitoring and Evaluation.
Pillar 1: Urban and Rural Development
Component 1: Urban development. CPS outcome: Implementation of effective strategies for investment in municipal infrastructure, spatial development and housing. 2. The Bank has had a long involvement in urban development issues in South Africa, dating back to the very early days of the Bank’s engagement after Apartheid. There has been considerable continuity of engagement on the Bank side and strong relationships have been built with a broad range of key players, including central departments—notably National Treasury, Human Settlements, and Department of Co-operative governance and Traditional Affairs (COGTA)—municipalities, the South Africa Cities Network (an organization bringing together linking the metropolitan areas), and the South Africa Local Government Association (SALGA).

Annex 5: Completion Report
38
3. The Bank has supported the urban development agenda through a variety of instruments, including lending (the Municipal Financial Management Technical Assistance Project, MFMTAP), a variety of capacity building grants, and a number of pieces of AAA. 4. The US$15 million MFMTAP was initiated in 2002 and completed early on during the CPS period, in March 2008. Noting that the project supported a significantly higher number of municipalities than planned (41 compared to 15 planned), and that the Project generated a number of useful background policy papers feeding into subsequent policy design, the ICR concluded that MFMTAP satisfactorily achieved its project development objectives. A key element of the Bank’s urban engagement during the CPS period was through the Cities Alliance-funded National Upgrading Support Program (NUSP). NUSP is widely seen as having contributed significantly to a marked housing policy shift: For the first time, in-situ upgrading—as opposed to “build new”—has gained traction in the South African housing policy, offering more flexible approaches to large scale subsidized housing production, with more efficient and sustainable approaches to the needs of the urban poor. The Government of South Africa has institutionalized NUSP through the Presidential Delivery Agreement with the Department of Human Settlements. The Bank’s support for NUSP was complemented by a strong impact evaluation TA program supporting the Department of Human Settlement’s Monitoring and Evaluation unit, which provided a critical evidence base for policy development (see below). In addition, IFC has provided a 12-year, subordinated local currency Tier II ZAR350 million loan to the African Bank largely to be used for incremental housing construction and education purposes. Notably among the AAAs completed during the CPS period was the South African Urban Agenda: Municipal Infrastructure Finance Synthesis Report”—was completed in May 2009. The ESW outlined policy options for enhancing municipal access to infrastructure financing across a topology of municipalities ranging from metropolitan areas to rural towns. In addition, a number of activities have been carried out in collaboration with National Treasury and other partners. For example, in February 2012 WBI co-hosted with University of Cape Town a week-long Urban Leadership Course attended by nearly 90 officials, including seven Mayors, from all 8 Metropolitans in South Africa. 5. Noting that the Bank has provided meaningful support for the design of urban policies, even if the Government’s reform efforts in the area are still under development, the CPS outcome for Urban Development is considered partially achieved. Component 2: Private Sector Development. CPS outcome: Improved investment climate for labor intensive informal and formal enterprises 6. The Bank’s work on PSD during the CPS period can broadly be categorized into three areas, namely work on: (i) business environment and economic diversification, especially focused on small and medium sized enterprises (SMSE’s), (ii) financial sector stability, and (iii) skills and technology development. The Bank’s PSD program was entirely AAA driven, while being supported by a number of IFC investments. 7. The 2010 ICA provided important directions for the Bank’s PSD engagement in South Africa, by emphasizing the challenges facing SMSEs in terms of access to finance and lack of in-

Annex 5: Completion Report
39
house training and skills development. The ICA also noted the need for further efforts to enhance competition in many economic sectors. While there was broad consensus about the findings of the ICA, the data collection was completed shortly before the global economic crisis hit South Africa and during the electricity crisis, raising some questions about its usefulness. The ICA was followed by a number of analytical pieces, including a report on fostering technology absorption, a report on access to finance for small and medium enterprises, and a policy note on the East Asian Experience with industrial policy and implications for South Africa. These products have been disseminated widely, and in the words of Minister of Trade and Industry have been welcomed as “tools of dialogue, discussion and debate”. 8. In parallel with the Bank’s AAA, IFC has made efforts to directly build business sector capacity. Two relevant programs in this regard are (i) the IFC’s collaboration with Business Partners Limited South Africa who are rolling out a toolkit offering free information and training for SMEs, and (ii) implementation of IFC’s Business Edge program providing free classroom seminars focusing on SME management. The IFC has also made investments in a range of financial sector institutions to support financial intermediation and investments in SME’s and underserved markets in South Africa. 9. The Bank’s work on financial sector stability is to a large extent anchored in the 2010 RoSC and the Government’s policy document “A Safer Financial Sector to serve South Africa Better”, which National Treasury released in 2011. In support of this policy program, the Bank provided a range of targeted TAs, including: (i) a review of NT and SARB contingency planning and crisis management framework (supported by a FIRST grant); (ii) specific TA on the implementing the proposed new institutional set-up of financial sector supervision, including the split of supervisory responsibilities between SARB and the FSB, (iii) an assessment of Insolvency and Creditor Rights, assessing South African laws, regulation and practice on insolvency and creditor rights against international best practice codified in the RoSC methodology, and (iv) support for South Africa’s role in the Reform of International Supervisory and Regulatory Standards through the G20 Financial Stability Board and the Basel Committee of Banking Supervision (BCBS). During the global economic crisis, the IFC contributed to financial sector stabilization by providing short-term liquidity funding to two of the largest commercial banks in South Africa (a US$150 million standby credit for Absa Bank, and US$400 million to Standard Bank Group under IFC’s Global Trade Liquidity Program). Finally, the Bank has collaborated with the National Treasury and the South African Financial Services Board in advancing financial literacy and consumer. 10. The Bank invested significant resources in a flagship report on Closing the Skills and Technology Gap. However, even if a series of outputs have been produced, significant delays in completing the work made it difficult to sustain the dialogue with government and other partners on this agenda. For this reason, this work program is viewed (both inside and outside the Bank) as one of the significant failures of the CPS program. 11. As concluded in the Bank’s June 2011 Economic Update, South Africa’s investment levels are structurally low. Although the impact of the global economic crisis blurs the picture, this seems not to have changed during the CPS period, indicating that there have been, at best,

Annex 5: Completion Report
40
limited improvements in the investment climate for labor intensive informal and formal enterprises in recent years. At the same time, a number of Bank and IFC products, especially in the financial sector, have had a direct and positive impact on policy and sector developments. Therefore, the CPS outcome for Private Sector Development is considered to be partially achieved. Component 3: Rural Development. CPS Objective: Contribute to accelerated delivery to black farmers of land under land reform program to meet the national target of 30 percent by 2014. 12. The discussions on a Reimbursable Technical Assistance (RTA) Program with the (former) Department of Agriculture and Land Affairs were already under way at the time of the CPS and reflected the close working relationship the Bank had built up with the department before the CPS. An agreement for a US$450,000 program was signed in January 2010 and the program was completed in June 2011. The funding was used for a number of different activities including; rural sector profiling, a review of the cadastral system, initial planning for a CDD pilot, an international workshop in Cape Town on comparative rural development experiences, work on monitoring and evaluation, etc. The Department sees significant value in the Bank’s involvement in these studies.
13. In terms of the stated CPS outcome, available data does not suggest that delivery of land to black farmers has accelerated noticeably during the CPS period, and there is still a long way to go before the national target of 30 percent is reached—according to the Government it stood at about 7 percent in 2011. The Department of Rural Development and Land Affairs published its Green Paper on Land Reform in September 2011, as a first step towards a significant overhaul of the South African rural land market. But actual new policy implementation is most likely still a while away. However, the RTA program has clearly added significant value to policy thinking in the Department of Rural Development and Land Reform, especially perhaps in the roll-out strategy for the Comprehensive Rural Development Program (CRDP), where Bank-support profiling of marginalized rural communities provided the Department with an effective targeting tool to confirm the 160 wards where the CRDP will be rolled out by 2014. More broadly, the Bank’s work also highlighted that in the absence of a comprehensive assessment of rural areas, long term planning is not possible. On balance, therefore, the outcomes under component 3 are deemed to be partially achieved. Component 4: Environment. CPS outcomes: (i) Employment generation through improved biodiversity and conservation; (ii) Strategies for climate change designed. 14. The Bank has a long-standing involvement in environmental issues in South Africa, mainly built around a substantial GEF funded program. The capacity of the GEF to provide grant funding for biodiversity, marine pollution and climate change-related activities has been a key entry point. The specific outcome indicators in the CPS, although not quantified, were aligned with the broad focus on of the GEF portfolio, namely hectares brought under terrestrial or marine conservation, and sustainable jobs created around biodiversity conservation objectives. More recently the Bank has increased the scale of its activities in support of South Africa’s efforts to reduce its carbon emissions.

Annex 5: Completion Report
41
15. There were three South Africa-specific GEF projects funding biodiversity conservation during the CPS period (the Cape Action Plan Project, the Greater Addo Elephant Natural Park, and the Isimangaliso Wetland Park). These projects have all been individually successful. The projects gave an impetus to enhanced conservation efforts and to rethinking the conservation-job creation nexus. The weakness of the program is the failure thus far to take a more holistic approach and develop a national action plan to focus conservation efforts. 16. The Bank-supported program during the CPS period included a number of activities related to lowering carbon emissions, by supporting selected high-impact elements of its low carbon strategy. Perhaps most importantly was the inclusion of US$510 million in financing (US$260 million IBRD lending and US$250 million from the Clean Technology Fund (CTF)) for enhanced wind and solar power generation capacity as part of the Eskom loan (see paragraph 19 below). The Concentrating Solar Power (CSP) plant is a flagship activity: as the largest facility in the world using central receiver technology, it will establish cost and performance benchmarks for the broader deployment of CSP technology in the country and potentially in the sub-region. Similarly, the strong potential for wind power to scale up to utility-scale faces major barriers such as high costs relative to coal-fired production, inability to provide base-load power due to output intermittency, and incremental transmission costs to connect isolated wind power sites to the grid. South Africa intends to attract private sector investment into wind power, as a more mature renewable technology. The 100MW wind Bank-supported power project is a demonstration and facilitation project. Both the wind and the concentrating solar project are in their early stages of implementation.
17. In terms of improving energy efficiency, the US$411 million IBRD funding for the Armelo-Majuba railway line is a major component. The main benefit will be to shift nearly 500 loaded coal trucks per day to rail, achieving major reduction in green-house gas emissions, reducing accidents and congestion on rural roads as well as saving road maintenance costs. Examples of other activities in this area include the US$6 million GEF funded Renewable Energy Market Transformation Project which focuses on helping establishing a policy and regulatory framework and building institutional capacity for enhance renewable energy development in South Africa, an ESW on Carbon Tax, and a TA program on Carbon Capture and Storage. In parallel, IFC is expanding its activities into renewable energy and energy efficiency. For example, in 2008, IFC (as a financial intermediary) agreed to purchase up to 900,000 carbon credits worth approximately US$38 million from South African fertilizer producer Omnia and sell them to buyers in developed countries. The transaction was IFC’s first carbon finance operation in Africa. In addition, IFC—jointly with the AfDB—manages US$150 million of South Africa’s US$500 million CTF Investment Plan, focused on the private sector. 18. While acknowledging the limited, but growing, scale of the Bank’s interventions in the areas of environment and climate change, and noting that implementation of the major planned investments in renewable energy supported by the Bank is not very far advanced, the generally successful achievements of the development objectives of the various planned environmental projects implies that the CPS outcomes in this area are considered achieved.

Annex 5: Completion Report
42
Component 5: Infrastructure. CPS outcome: Increased power generation capacity. 19. The most significant change over the CPS period was the approval in April 2010 of the US$3.75 billion IBRD loan to Eskom for the Eskom Investment Support Project, including as mentioned above US$260 million supporting renewable energy investments (wind and concentrated solar). Even if the Eskom loan is perhaps less of a traditional “bundled” finance and knowledge product that supports or strengthens new policy directions, it has had a number of significant impacts. First, the Bank’s contribution has diversified the pool of financing available to Eskom; secondly, through more rigorous monitoring and procurement mechanisms, significant cost savings have been realized. The Bank also facilitated an earlier installation of flue gas desulfurization equipment and, as mentioned above, the conversion of coal transportation for the Majuba Power Plant. In addition, the Bank helped leverage concessional funding for Eskom’s renewable energy program and for its overall investment program. 20. In terms of implementation status, the first of the six generation units at Medupi is about one year behind schedule for reasons outside the Bank’s control. The first unit was supposed to have been commissioned in mid-2012, but this has now been postponed until 2013. For the renewable energy components the bidding process for the Sere Wind farm has been closed; selection and award are in process. The process for the Concentrated Solar Plant is less advanced: with Bank support, Eskom is currently developing a procurement process that can help mitigate the risks associated with procuring such new technology. Therefore, even if the Bank’s lending to Eskom has not yet resulted in any additional power supply being brought to the South African grid the CPS outcome of increased power generation capacity is deemed to have been partially achieved. Pillar 2: Regional Integration
21. The CPS objectives for regional integration were focused on three areas. The first is increased regional trade and investment; the second is HIV&AIDS; and the third is regional environmental conservation. For all three areas, the CPS had broad and highly ambitious outcome objectives, namely (i) Improved regional investment climate and regional trade liberalization; (ii) reduce new HIV infections by 50% by 2011 and place all persons with HIV on treatment; and (iii) improved regional environmental conservation9. 22. As far as regional trade and integration are concerned, the Bank’s efforts were focused on two pieces of ESW, namely a regional ICA and a report on Harnessing Regional Integration for Trade and Growth in Southern Africa. Both reports were of good quality, and according to interlocutors are considered to have made very useful contributions as a basis for further progress in market integration. The regional ICA was a report requested by the SADC Investment Sub-Committee, and is currently being used by SADC in guiding its policy discussions with member
9 It should be noted that the CPS outcome objective related to improved regional environmental conservation in the
CPS results framework is placed under Pillar 1 (Rural and Urban development), this appears to be a mistake. Given its explicit focus on regional cooperation the outcome is discussed under Regional Integration.

Annex 5: Completion Report
43
states. However, in terms of actual improvements during the CPS in the regional investment and trade climate progress has been extremely limited. Regional economic integration is an important part of IFC’s strategy in South Africa wherein supporting South African companies to expand to the rest of Africa is a key element. In addition, IFC has invested in a number of private equity funds focusing on sub-Saharan investment. 23. The two specific outcomes for HIVAIDS in the CPS (reducing new infections by 50% by 2011 and enrolling into ART treatment all eligible persons with HIV). The latter outcome – enrolling all eligible patients into treatment was achieved by the end of 2011. Meeting the former target – reducing new HIV infections by 50% – appears to have been unrealistic, especially considering the modest program of support that was planned under the CPS, namely technical support to SADC governments and impact evaluations of various HIV/AIDS programs. Nevertheless, estimates of HIV incidence among adults in 2012 is 0.94%, down from estimates of between 1.2% and 2.2% in 2005, and suggestive of the fact that South Africa has made progress toward the targets. 24. During this CPS period the Bank undertook four activities: (i) a Know Your HIV Epidemic (KYE) Report for South Africa that examined the trends, magnitude, drivers and risk factors of the HIV epidemic in South Africa; (ii) an analysis of the fiscal dimension of HIV/AIDS in the SADC region; (iii) a combined Public Expenditure Tracking Survey and Qualitative Service Delivery Survey of the HIV & AIDS program in KwaZulu and, finally (iv) support for SADC to bringing together Ministers of Health and Labour from the 15 SADC member states to agree on a SADC Declaration and a Code of Conduct on TB in the Mining Sector. 25. In support of the outcome of improved regional environmental conservation the Bank has implemented several regional GEF projects, including the US$8 million Maloti-Drakensberg Transfrontier Conservation Project between Lesotho and South Africa, the US$11 million nine-country Western Indian Ocean Marine Highway and Coastal Contamination Project and the US$7 million SADC Groundwater and Drought Management Project. The ICR’s for both the Maloti-Drakensberg and the SADC Groundwater projects rated the achievements of the project development objectives moderately satisfactory. A common problem among the regional projects is that during the design phase, given the governance and decision-making structures in both SADC and its Member States, the projects under-estimated the resources and time required to fully achieve consensus on SADC or bilateral policies and implementation procedures, which generally slowed down implementation, and reduced the impact of the projects10. 26. In summary, considering the modest progress in terms of regional economic integration and the Bank’s overall modest contributions in this regard, and despite some notable successes in the Bank’s HIV/AIDS programs, the CPS outcomes in terms of Regional Integration are considered not achieved.
10 In the case of the Maloti-Drakensberg Project however, these problems were to some extent mitigated by deciding
from the outset to separate the implementation into two individual projects to be implemented in parallel. This enhanced individual country ownership, but also created its own implementation problems such as higher project costs and combining both projects’ lists of activities during appraisal.

Annex 5: Completion Report
44
Cross-cutting theme: Improved Service Delivery
27. The CPS outcome within the cross-cutting theme on improved service delivery was “Improved capacity to monitor and evaluate key performance indicators” 28. The Bank’s support for the cross-cutting theme mostly consisted of technical assistance for a number of impact evaluations of various government activities, and some direct TA to the Department of Monitoring and Evaluation. 29. Examples of impact evaluations include two evaluations supported by the Bank’s Development Impact Evaluation Initiative (DIME) on education and urban settlement. The first program evaluated the Dinaledi schools program of the Department of Basic Education, which strengthens secondary school education in mathematics and science by distributing resources according to the schools’ needs (mostly reflecting historical disadvantages). The second program evaluated the Upgrading of Informal Settlements Program of the National Department of Human Settlements which strives to promote cohesion, improve livelihoods and support community-led development in informal settlements. Both impact evaluations strengthened the two departments confidence in impact evaluation research as a tool for policy making, and in case of the upgrading work played a role in building the evidence base for the policy shift towards urban upgrading as a complement to “build new”. A number of impact evaluations are still ongoing which makes it difficult to ascertain the degree to which they will help achieve the CPS outcomes. It is clear, though, that their long gestation times (design of experiment, data gathering, analysis, recommendations) and the experience of the Bank’s program in South Africa suggest that it is a significant challenge to maintain momentum for all parties throughout the time - often several years - it takes to complete an impact evaluation. 30. More recently, the Bank has been providing targeted support to the Department of Monitoring and Evaluation (DPME), including through the IEG’s CLEAR initiative, with the overarching objective of improving the quality of the PM&E systems and improving the integration of planning, budgeting and M&E across the central government. Finally, in an attempt to provide an overarching framework for the Bank’s work on service delivery, a flagship report on “Accountability in Public Services in South Africa” was produced. However, while the quality of the report has been highly praised by peer reviewers and counterparts alike, it did not produce any significant momentum around the agenda.
31. Overall, considering the limited systematic impact that is discernible from the Bank’s support for enhance monitoring and evaluation, the CPA objective of the cross-cutting theme is considered not achieved.
Overall assessment of program performance 32. Based on the stated outcome objectives in the CPS, the Bank’s program in South Africa did not make acceptable progress towards most of its major expected outcomes. This is in part because the expected outcomes were highly ambitious and perhaps not realistically attainable
Annex 5: Completion Report
45
with a relatively “narrow” program of knowledge services as envisaged—and with the exception of the Eskom loan—implemented. But it also reflects that some parts of the program—for example the work on Closing the Skills and Technology Gap and several of the impact evaluations—did not deliver the kind of outputs and impacts that had been envisaged. For these reasons, overall program performance is considered moderately unsatisfactory.
Assessment of Bank Performance
33. The Completion Report evaluates Bank performance by distinguishing between the design of the CPS and its implementation. Key elements in the design dimension include (i) relevance of the strategy and its alignment with government priorities, (ii) realism of expected outcomes and quality of the results framework, and (iii) identification of critical risks. In terms of implementation the assessment focuses in on (i) relevance, quality and dissemination of knowledge based activities, (ii) quality of implementation support for lending operations, and (iii) the Bank’s responsiveness and effectiveness within its dialogue with the authorities.
Design of the CPS
34. The South Africa program prior to the CPS period had not yielded a close partnership between the Bank and South Africa. This was in part because South Africa had neither the need nor the desire to borrow from the Bank, and in part because even though South Africa was open to the Bank’s analytic work, it had a significant analytic capacity of its own, with many internationally recognized experts in various fields. Therefore questions were raised whether even with regard to the provision of knowledge services the Bank was able to add value. A Quality Assurance Group (QAG) review of Bank ESW in 2003 judged only one South Africa program unsatisfactory out of the 30 or so programs reviewed. While individual studies were of good technical quality their impact was limited and they lacked strategic coherence. 35. CPS Relevance and Alignment with Government priorities. The CPS program was originally intended to support the Government’s 2006 Accelerated and Shared Growth Initiative for South Africa (ASGISA), which in turn has five broad development goals: (i) accelerating the pace of growth by increasing investments; (ii) intervening decisively to advance the involvement of marginalized households and communities in the economy; (ii) maintaining a progressive social security net and investing in human development; (iv) improving the effectiveness of the state; and (v) building regional and international partnerships. While the broad pillars of the CPS—and the equally broad themes of the ASGISA—make it difficult to argue that the program was not consistent with government priorities, it is probably fair to say that actual alignment could have been strengthened by defining more precisely which Government priorities the various Bank programs supported. At the same time, it should be recognized that the implications of the ANC’s leadership transition in 2007 on the priorities of the ASGISA were difficult to predict. This may have led the Bank to “broaden” its stated areas of focus.

Annex 5: Completion Report
46
36. Realism of CPS outcomes and quality of results framework. The basic modality for the CPS was a “flexible and demand-driven” approach. The CPS recognizes that “there is an inherent tension between the need for strategic selectivity and demand-driven flexibility.” It argues that this can best be handled by building ex ante consensus around the strategy and putting in place better coordination mechanisms such as regular joint reviews of the work program. While the CPS had the usual table to outcomes and milestones, these reflected South Africa’s own published policies in the major areas, while it was less clear how the CPS’s specific programs would contribute to these outcomes. The challenge is compounded by the fact that the program has operated mainly through knowledge-sharing which inherently makes it challenging to attribute specific outcomes to the various activities. 37. Identification of risks. The 2008 CPS did not contain a detailed assessment of risks, although it noted risks related to an end of the ongoing commodity price boom at that time, and risks associated with possible lack of ownership by the Government of the strategy outlined in the CPS. The CPS-CR deepened the risk analysis. It rightly projected a moderate macro-economic risk arising from the global economic crisis. Also, noting that while there had been a political transition following the 2009 election, the broad policy thrust remained in place—it appropriately rated policy risks. In addition, with the benefit of hindsight, the assessment of substantial risks in terms of implementation of the Eskom loan because of unfamiliarity with Bank processes and procedures was appropriate. In addition, the CPS-CR rightly emphasized that the reputational risk for the Bank associated with lending for coals was assessed to be high.
Implementation of the CPS
38. Relevance, quality and dissemination of knowledge based activities. In preparing this CPS completion report, interviews were undertaken with about 20 different agencies with whom the Bank worked during the period of the CPS. These interviews revealed a complex but promising picture of the evolution of the Bank’s relationship with South Africa. 39. A striking finding of the fieldwork was that in one agency after another the AAA of the Bank was seen as adding substantial value to the agency’s own efforts. A listing of a large number of the knowledge-sharing programs, in which the Bank participated, is included in Attachment 1. This attachment forms an intrinsic part of the CPS. It provides a review of some 20 programs (by no means all) supported by the Bank. For each of these programs, meetings were held with the key partners in Government. Relevant excerpts from those meetings are included in the table, selected to reflect the general reaction to the question of whether the programs added value. These interviews form an important part of the evidence base for the judgments of this CR on the added value of the Bank’s AAA. 40. Several common threads run through the perceptions regarding the Bank’s AAA program. First, there was almost universal recognition of the high technical quality of the Bank’s work. Second, it was noted that Bank analysis was not just academic, but included useful and practice recommendations. Third, many counterparts noted the Bank’s ability to bring to the table both experience with international good practice, and often the practitioners themselves.

Annex 5: Completion Report
47
Fourth, the Bank’s convening power secured world class authorities to interact with South African officials and academics. Fifth, the seriousness with which the Bank played its part often helped to engage senior government policy makers and officials on issues that had perhaps not received as much prominence before. Finally and perhaps most important of all, the Bank was perceived as willing to listen and because of this, counterparts were willing to listen to the Bank. 41. It also needs to be noted however that the interviews highlight the need to do even more in making its program of analytic support effective. The program is not generally well coordinated and often the Bank undertakes closely related activities in various agencies without helping these agencies to share knowledge and exploit potential synergies. In addition some activities seem awkwardly integrated into the government’s own programs e.g. one-shot efforts at capacity building where a sustained effort over a period of time is obviously needed. 42. Quality of implementation support for lending operations, principally the Eskom Investment Support Project. To date, disbursements under the loan have not been at the pace that Eskom and the Bank anticipated. This is partly because the construction of the Medupi plant has been delayed by approximately one year. There have been significant teething problems, and there is a perception within Eskom that the Bank’s procurement procedures have been the cause of considerable problems, given Eskom’s own procedures and its unfamiliarity with the Bank’s processes. An example: Eskom’s impression is that developing bidding documents using the Bank’s standard bidding documents is exceeding laborious and that the Bank’s turn-around time is too slow. Problems have been particularly pronounced in the wind and solar components, as these are new territory for Eskom and even to some extent for the Bank. At the same time, even Eskom concedes that part of the problem is found in bureaucratic challenges within its own environment, procurement and financial units.11 Moreover, central Government Departments have expressed appreciation for the rigor and thoroughness of the Bank team. 43. Environmental and social safeguards are a matter of concern for both the South Africans and the World Bank. A great deal of effort was put into a careful and detailed safeguard diagnostics review, which eventually paved the way for the adoption of Country Systems under the Project. Nevertheless, a request for an inspection panel investigation was filed at the time the Project went to the Board12. 11 It should also be noted, however, the earlier procurement of the remaining Medupi packages was done on
schedule and with minor issues despite the fact that this was the first time Eskom had followed the World Bank procurement process. Regarding the renewable components, Eskom’s insistence to apportion risk to the bidders, some of which bidders are not in control of, has contributed to the laborious process.
12 It was the first Inspection Panel investigation relating to the application of the Bank’s Operational Policy 4.00, Piloting the Use of Borrower Systems to Address Environmental and Social Safeguard Issues in Bank-Supported Projects. The Inspection Panel process was concluded on May 22, 2012. The Panel found that in most respects, the Bank’s analysis of equivalence of safeguards complied with its policy on the “Use of Country Systems” in deciding to use the South African system for environmental and social impact management. The Panel found specific instances of non-compliance or inconsistency with Bank policies, but did not find instances of current harm stemming from non-compliance. It was agreed that Management will provide the Board with a summary of progress on project implementation in the context of the Country Partnership Strategy progress reports. It was also agreed that the Bank will provide intensive support for project implementation, covering technical issues and environmental and social safeguards, including monitoring the project through 2022.

Annex 5: Completion Report
48
44. Responsiveness and the effectiveness of dialogue with the authorities. As noted earlier, the finalization of the 2008 CPS publication was followed almost immediately by the global recession. In 2009, with a looming crisis in energy supply unless major new investment was undertaken, and sharply curtailed access for Eskom to international capital markets, the South African government approached the Bank for the Eskom loan. The loan was approved in 2010. However, the Bank’s response to the request for the Eskom loan must be considered an unqualified success, especially considering the technical and reputational challenges associated with the project. The conclusion of the first cost-sharing agreement for Bank knowledge services by the Department of Land Reform and Rural Development is another good example of the Bank’s responsiveness. This was indeed foreseen in the CPS, and reflects the close relationships built previously.
In summary, in view of the generally positive achievements of the Bank, but noting some of the weaknesses of the program discussed above, the Bank’s performance is rated moderately satisfactory.
Key Lessons and suggestions for the new CPS
45. The lessons are summarized below, classified as strengths and weaknesses. Obviously the
lessons are to build on the strengths and to try to tackle the weaknesses. Strengths of the Program:
Responsiveness to demand: The Bank has been highly responsive to requests from the National Treasury and other counterpart agencies for support for both knowledge activities, and in the case of Eskom, for Bank lending. The vast majority of the activities included in the program are demand-driven.
High technical quality: There is widespread recognition of the technical quality of the Bank’s work. There is agreement that the Bank uses highly qualified staff and consultants, and builds on that with effective quality assurance mechanisms.
Effective knowledge brokering: The Bank has been able to support a dialogue between world class academics and practitioners from middle income and OECD countries and their South African counterparts. In a number of areas, this dialogue has had a direct impact on policy.
Carefully selected Bank-driven work in high priority areas: In those areas where the program is still supply-driven, such as the upcoming study on the economy of the townships, the topics often cut across sectors and have the potential for bringing a coordinated view of topics that get neglected through the demand-based approach.
Weaknesses of the Program:
The need for better horizontal integration: Activities requested by a particular agency should not preclude interest from other agencies. The Bank has not played a pro-

Annex 5: Completion Report
49
active role in bringing together different stakeholders and in fine-tuning the design of studies to increase their relevance.
The inappropriate results framework of the CPS: The standard CPS results framework has not worked well for South Africa and does not provide an effective basis for productive consultations and meaningful monitoring of the program. The CPS did not frame the issues and outcomes in a realistic way that related to a possible Bank program.
The complexity and bureaucracy of the Bank’s investment lending: The Bank showed speed and flexibility in its support for the Eskom project, but once approved it has been business as usual, with the Bank bureaucracy able to turn the most peripheral issues into disputes requiring lengthy exchanges and reports to resolve.
Limited synergy between the Bank and IFC programs: They have functioned as two separate institutions, speaking with separate voices to largely separate audiences, and with limited structured attempts to develop synergies between their programs.
The absence of a strategic vision for how the CPS could support Regional Integration. The work under the CPS on regional integration has been somewhat arbitrary and has not yielded significant impacts. The Bank has defined some broad areas of engagement, but there are no specific objectives that could drive program design.
In conclusion, it should be emphasized, that these measures are very much in the nature of fine-tuning what is emerging as a strong program with real potential for supporting South Africa as it tackles its immediate and long-term challenges. Over the past five years the Bank has demonstrated that it can add value in helping South Africa make progress in its environmental agenda, its energy needs, its urban management, and in adding to the analysis and dialogue within the country on a host of important issues.

Annex 5: Completion Report
50
ATTACHMENT 1: Representative Sound-Bites from Fieldwork
Note: Italics denote direct quotations from participants at the meeting. The ratings are impressionistic. The discussions tried to assess whether the program had relevant objectives, whether the objectives were owned by the partner agency, and whether the program as implemented met the objectives. The comments are not intended to fully capture the insights provided by the discussion, thus for example, even though the comments on the fourth item below on Financing SMEs were generally positive, the rating was downgraded because two interviewed agencies that are directly involved in policies and programs for SME development were not even aware of the study.
Program Partner/s Rating Comments from partners
1. Closing the Skills and Technology Gap
Department of Higher Education
Human Resources Department
MU
The program started well, but we are still waiting for the final report. The Ministry is interested in collaboration going forward and will participate actively in CPS consultations.
At the outset the Bank committed itself 100 percent. This was intended as a huge project with a focus on employability, and the purpose of helping the HRD develop its strategy. Huge objectives – the project was scaled back tremendously and a huge opportunity was missed. By now the program is marginal. The whole point was the multi-sector plan.
2. Non-Tariff barriers in trade and services in the SADC region
SA Institute for International Affairs
S
Very good work which has added value. Bank did not try to reinvent the wheel. Bank used locals and built on their work. The report highlighted the priority issues and the comparative element provided by the Bank was especially useful. This is a useful input into the African Union summit on barriers to intra-African trade.
3. SADC region ICA SA Institute for International Affairs
S Regional ICA was requested by SADC. Great that it was done. It filled a gap. Not just a comparison, but also identified cross-cutting issues. It discussed how to grow SADC as a region: borders, people movement, capital, corruption, access to finance, skills, etc.
4. Financing SMEs in South Africa.
Banking Association
Financial Sector Unit Department of Treasury
MS
We are currently in the midst of a lot of restructuring and the units dealing with SMEs have found the work of the Bank very useful.
The survey was very useful. It has been published and several recommendations have been implemented, such as the proposal to set up a business bureau.
5. Consumer Protection Study
Financial Sector Unit Department of Treasury
Financial Services Board
MS
This is a diagnostic review on consumer protection, since the Bank is at the forefront in defining good practice in this area. We looked at other suppliers but decided the Bank was best. We could perhaps have done this study ourselves, but stakeholders would not have attached the same level of credibility to it.
I have a mixed impression of this, not just positive. It is unrealistic for a team to come for a week

Annex 5: Completion Report
51
and do a credible job. The draft report was ‘average’ – some good parts, but often repetition of what we knew and some half-baked statements and factual errors.
6. Report on the Observance of Standards and Codes (ROSC)
Financial Sector Unit Department of Treasury
Financial Services Board
HS
Bank did ROSCs on Banking in 2010 and insolvency in 2011. These were very comprehensive reports. A steering committee was set up including the drafter of the new Act. For the securities part of the ROSC the Bank brought in the former Secretary of the US Securities and Exchange Commission. We had a very useful conversation on the appropriate way of handling the securities market. The approach of the ROSC of benchmarking South Africa against the more developed countries was very useful – it is pointless comparing us with Vietnam and Laos. Policy recommendations were simple and clear.
The 2011 ROSC was hugely helpful and has informed the legislative and regulatory agenda by identifying the gaps around group supervision.
7. Six-monthly economic updates
Banking Association
Macro-analysis unit of National Treasury
Department of Development Economics
National Planning Commission Secretariat
HS
Puts some of the big issues on the table such as Savings and Investment and Green Growth. The work is useful background but does not feed directly into any policy or strategy work.
Work on green growth was quite useful. The timing was good. There was a conference on modeling and climate change and a proposal to take the model and spread its use throughout the government. We will approach the Bank for support on this. The six monthly updates have been very useful and could be used for workshops with government officials. The work on savings is excellent.
8. Workshops between the Economic Development Department and the Bank
Haroon Bhorat
Leading South African Economist
S
The first policy workshop was on the exchange rate and this turned out to be very useful. The Government was concerned about the strength of the exchange rate. The Bank lined up 3 or 4 international speakers. The Minister chaired the session. The speakers made it clear that there are no easy answers. Since then the workshop topic has ‘fallen off the table’. (In his personal view the workshop was instrumental in this). The Bank can provide new ideas and debunk bad ones. The Bank makes effective use of South African researchers but also provides the opportunity for them to work with leading international economists.

Annex 5: Completion Report
52
9. Technology Acquisition Department of
Trade and Industry S
The support on industrial development has been unequivocally excellent. The technology study was particularly useful for developing an approach. The World Bank study pointed out that it is not enough to provide support through financial instruments. It also requires support for the implementation of new management and production systems. So we have deepened the support instruments. South Africa is characterized by lots of high level studies which are often too theoretical. The technology acquisition study is supported by very concrete research and recommendations.
10. Support for macro-economic modeling
Macro-analysis unit of National Treasury
MU There was a mismatch between what the Bank thinks is important and what we think is important. The CGE work had limited impact. We have developed the model further. The Bank was very prescriptive.
11. Doing Business reports
Macro-analysis unit of National Treasury
S These reports are very useful – they allow for benchmarking. The strength is that this is a neutral assessment.
12. Carbon Taxation study
Macro-analysis unit of National Treasury
S The paper that has been prepared has extensive references to the Bank’s work. The work was excellent and the paper had an impact.
13. Survey on Nature and Causes of HIV/AIDS infection.
Department for Public Service and Administration
S
We had not done such a study before. The new national strategic plan on HIV/AIDS was influenced by the findings of this survey. Why the Bank? I had gone to a conference in the UN where Botswana and Namibia were able to present systematic data on the epidemic and response, but we could not. The World Bank was the institution supporting Botswana and Namibia in using this methodology. We are also working with the Bank on a National AIDS spending assessment. We are also considering a Public Expenditure Tracking Survey (PETS) on HIV/AIDS expenditure using Kwazulu Natal as a pilot (see below). There is real value-added from the Bank. This is not pie in the sky – this is practical and down to earth.
14. Review of HIV/AIDS spending in Kwazulu Natal province
Human Development Directorate Kwazulu Natal
S We had no understanding of whether the money we were spending was being used efficiently and reaching the beneficiaries. It was suggested we talk to the Bank which had this expertise. We received a good response and work started 12 months ago.
15. Public Expenditure Tracking Survey for education in Kwazulu Natal
Human Development Directorate Kwazulu Natal
S
A new study – the Bank sent people last November to look at the different questions the study is designed to answer. The Bank’s value comes first through its technical expertise. Even the idea of this being doable comes from the Bank. Secondly the Bank helped us to define a strategic plan. Third is the capacity building – starting with identifying what capacity we lack. The Bank manages its own funding and procures the consultants. It was scary to realize how weak the level of capacity was, but the interviews with the Bank team themselves helped develop capacity.

Annex 5: Completion Report
53
16. INFODEV Support for the Climate Innovation Centre.
Science and Technology hub, Government of Gauteng
S We have enjoyed the relationship with the World Bank. They are very committed and professional and want to understand our point of view. The Bank office has helped through organizing VCRs and through sourcing local consultants.
17. The Investment Climate Assessment (ICA)
Research Unit, Department of Trade and Industry.
MS
There is a need for better internal coordination and better inter-action with the Bank. We need to move away from the model of the Bank doing the research and then asking us for a more collaborative approach. Unfortunately the data was obtained just before the global crisis so we have not made much use of the data. This said the ICA clearly had an impact. There was a great deal of media coverage and lots of questions on skill shortages, regulation, and comparisons with other countries. The ICA is a key data source and policy makers refer to it.
18. Workshops on trade and competitive-ness
Trade and Policy Strategies (NGO)
S
The Bank has been a good partner and has brought experts from overseas and staff to participate in the workshops. The latest workshop on competitiveness is perhaps the best example of work with the World Bank in trying to change and move South Africa. There was good media coverage, and green industry has been getting stronger and stronger. The workshops allow face time for the Bank and other partners with policy-makers. The workshop on inequality with the Presidency was quite critical in highlighting growing inequality across all racial groups. The Bank’s presence helps to get more buy-in. There is a lot of engagement and sharing of knowledge.
19. AAA on Slum Upgrading Department of
Human Settlements HS
We started in 2008 with a grant of $500,000 from the Bank. The report was produced in 2009 and all recommendations were accepted. In 2010 we focused on getting buy-in from cities and local government. The Bank has had a long presence and impact in terms of knowledge. For South Africa this is valuable. The Bank had credible people on the ground in South Africa and built on this. It also used a credible local team of South African consultants. This proved better than a team of international experts. The Bank listened to us and we listened to them. There was a relationship which fed into the national program and influenced the Plan. This was seen as our own program. The Bank’s insistence on specific outcomes was also important for us. To summarise the value added of the Bank: 1. A targeted, specific and brief analysis of what was needed; 2. In-depth knowledge; 3. Selection of an appropriate team; 4. The Bank’s attitude to working in partnership – not the ‘external donor’ syndrome. 5. Our Bank counterparts kept the Bank bureaucracy at bay. 6. The presence of the Bank depoliticized issues and made for a more neutral environment in which there could be technical discussions. The issue of relationships is important – there was a great deal of trust and honesty. The Cities Alliance has made a major contribution through its focus on slum upgrading. There were two years of constant pushing. To be honest the department would have gotten distracted without this.

Annex 5: Completion Report
54
20. Fee-based program of studies
Department of Rural Development and Land Reform
S
The program of fee-based studies has given us access to international experts. It has allowed us to draw lessons from other countries, particularly from China and India. The department transfers funds to the Bank and the Bank handles the program. The TORs for the studies are developed together; the Bank handles the consultants; and the Bank and the Government jointly review the study. It is strictly speaking a cost-sharing program rather than just fee-based, since the Bank provides substantial funding such as for the study tour for the Minister and senior officials to China and India. Some of the studies, such as the rural sector profiling have been used in the agricultural policy. The topics included in the study are entirely the choice of the department, but of course our inter-action with the Bank has influenced our thinking. The Bank adds value through its comments, its convening power; the quality control it provides; and the access to the World Bank network and a range of useful contacts. The Bank is also contributing to capacity building. The Bank also plays an important role in dissemination. It helps us bring together a wide group of stakeholders. The Bank is in many ways more radical in its approach than the stakeholders. The Bank’s presence also increases the press coverage since the media is very interested in what the Bank has to say.

Annex 5: Completion Report
55
Table 1. Summary of CPS Program Self-Evaluation
CPS Outcome Status and Evaluation
Summary Contributing lending and non-
lending activities Lessons for the new CPS
PILLAR 1: URBAN AND RURAL DEVELOPMENT Effective Strategies for investment in municipal infrastructure, spatial development and housing.
Partially Achieved
New budgeting and financial system introduced in more than 40 local governments. Government has adopted a strategy of slum upgrading, moving away from construction of new settlements.
Municipal Financial Management Technical Assistance Project (mostly undertaken prior to the CPS period).
Urban Knowledge Program Urban Sector Dialogue Strengthening the South African National Upgrading Support Programme of South Africa Workshop on Spatial Development and Human Settlement WBI training.
Need for more careful framing of CPS outcomes and milestones.
Value of continuing engagement in selected sector.
Improved investment climate for labor intensive informal and formal sector enterprises
Partially Achieved
Investment climate remains not conducive to labor intensive enterprises, given labor union-driven high real wages and labor regulation.
TA Financial Sector Contingency Planning
TA Support for Financial Sector Policy and Strategy for financial sector stability
TA Evaluating the use of Entertainment Education to Improve Financial Capability in South Africa.
ICR ROSC update TA on Economic Diversification and SME Development ESW, South Africa Economic Updates
Need to keep expectations modest about what studies and technical assistance can achieve.
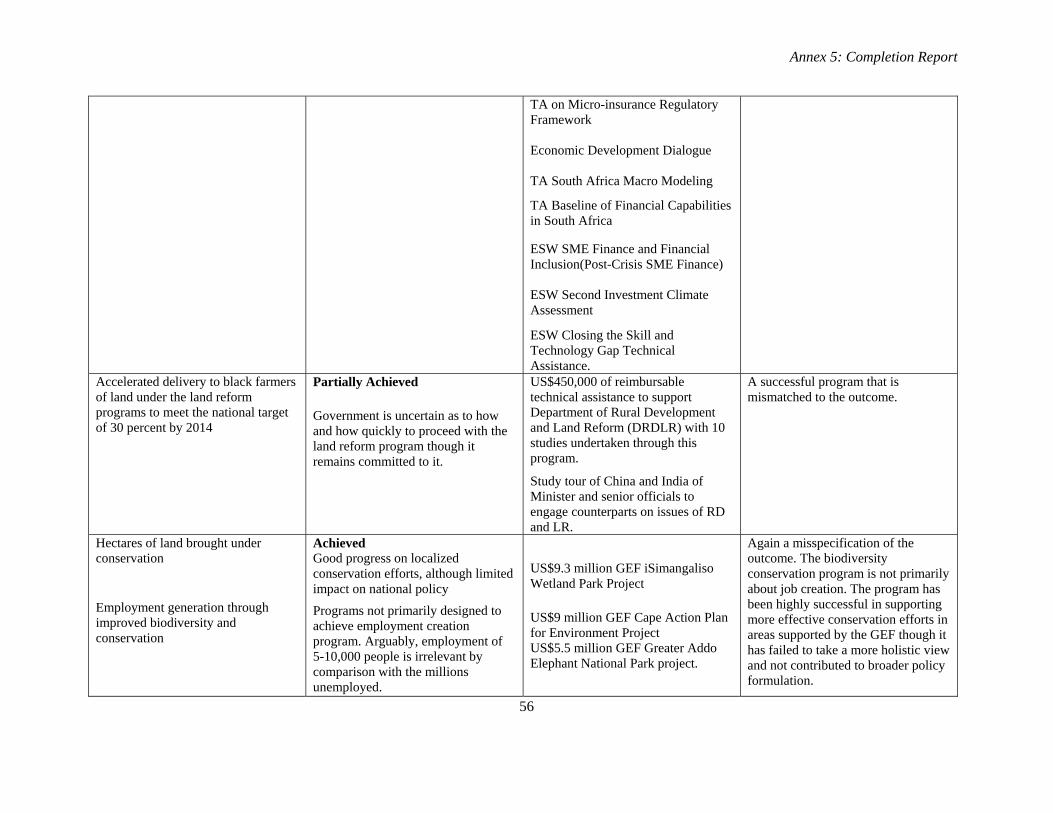
Annex 5: Completion Report
56
TA on Micro-insurance Regulatory Framework Economic Development Dialogue TA South Africa Macro Modeling
TA Baseline of Financial Capabilities in South Africa
ESW SME Finance and Financial Inclusion(Post-Crisis SME Finance) ESW Second Investment Climate Assessment
ESW Closing the Skill and Technology Gap Technical Assistance.
Accelerated delivery to black farmers of land under the land reform programs to meet the national target of 30 percent by 2014
Partially Achieved
Government is uncertain as to how and how quickly to proceed with the land reform program though it remains committed to it.
US$450,000 of reimbursable technical assistance to support Department of Rural Development and Land Reform (DRDLR) with 10 studies undertaken through this program.
Study tour of China and India of Minister and senior officials to engage counterparts on issues of RD and LR.
A successful program that is mismatched to the outcome.
Hectares of land brought under conservation
Employment generation through improved biodiversity and conservation
Achieved Good progress on localized conservation efforts, although limited impact on national policy
Programs not primarily designed to achieve employment creation program. Arguably, employment of 5-10,000 people is irrelevant by comparison with the millions unemployed.
US$9.3 million GEF iSimangaliso Wetland Park Project
US$9 million GEF Cape Action Plan for Environment Project US$5.5 million GEF Greater Addo Elephant National Park project.
Again a misspecification of the outcome. The biodiversity conservation program is not primarily about job creation. The program has been highly successful in supporting more effective conservation efforts in areas supported by the GEF though it has failed to take a more holistic view and not contributed to broader policy formulation.

Annex 5: Completion Report
57
Strategies for dealing with climate change designed
Government has adopted a Long-term Mitigation Scenario (LTMS) and is committed to reducing SA’s carbon footprint.
US$260 million IBRD loan for renewable energy (Concentrating Solar and wind) complemented by $250 million from the Clean Investment Fund though the Bank and $100 million through IFC/AfDB
US$6 million GEF Renewable Energy Market
Increased power generation capacity
Gradual shift to low carbon trajectory
Partially Achieved
This was added in the CPS Progress Report issued in 2010 in view of the decision to finance the Eskom loan – although the outcome and the milestone imply that the capacity would come on-stream during the CPS period. The milestone of supporting private investment in renewable energy way not achieved.
US$3.75 million Eskom Investment Support Project.
GEF-financed Renewable Energy Market Transformation project. Six monthly economic update analyzing green growth.
Although this is rated partially achieved, increased generation capacity will only be achieved on completion of the Eskom project, some years away. This problem of the mismatch in timing between CAS programs and results is a general issue, not confined to the South Africa program.
PILLAR 2: REGIONAL INTEGRATION Improved regional investment climate.
Regional trade liberalization.
Not Achieved
The outcome was over-ambitious, but the milestones are more appropriate – framing policy options and carrying out a diagnostic of trade policies and the rating is given in terms of those milestones.
Regional ICA for Southern Africa.
AAA on Regional Trade and Integration. ESMAP study on Regulating Electricity Trading. Southern Africa Regional Power Market Generation and Transmission Expansion Study.
Regional ICA was very well received and filled a gap. This is one of the few cases where the milestones are clearly and appropriately formulated.
Reduce new HIV/AIDS infections by 50% by 2011.
Place all persons with HIV on treatment.
Not Achieved
There has been a great deal of progress in this area during the CPS period, but the outcomes are so ambitious and so unrelated to the Bank’s modest technical support for governments on gathering
Technical support to SADC government to collect better information on the effectiveness of HIV financing.
Once again a modest, sensible program is linked to an outcome that is largely unrelated to the program.

Annex 5: Completion Report
58
information on what is happening, that it makes it impossible to give a more positive rating.
Improved regional conservation Partially Achieved
The various activities that were undertaken for cross-boundary environmental projects in Southern Africa are grouped under this vague outcome.
US$11 million Western Indian Ocean Marine Highway and Coastal Contamination Prevention Project
US$8 million Maloti-Drakensberg Trans-frontier Project US$7 million SADC Ground Water and Drought Management Project.
An object lesson in how not to frame an outcome for the CPS. Almost any program in this area would be consistent with this outcome.
CROSS-CUTTING THEME: Improved Service Delivery
Improved capacity to monitor and evaluate key performance outcomes: Indicator: Number of departments reporting on key performance outcomes.
Partially Achieved
This program seems to have been driven mainly by the interest of the Bank at the time of the CPS and does not appear to have figured consistently in the work program in the past three years. There has been movement on the Government side in this direction however, so the rating is as above. PETS being undertaken for HIV/AIDS spending in Kwazulu Natal.
Impact Evaluation of the Small Enterprise Development Agency's Core Services on SMMEs in South Africa's Western Cape
Impact evaluation of Daneli school program Impact evaluation of informal settlements upgrading program TA to Department of Performance Monitoring and Evaluation to prepare an indicator framework for the MTSF. PETS program for HIV/AIDS
It is not clear to what extent the program in this area was demand driven. During the CPSCR study no mention was made of it by any of the officials the mission encountered.

Annex 5: Completion Report
59
Table 2. Planned and Actual Deliverables (Lending and AAA)
FY PROJECT
ID PROJECT NAME
PRODUCT LINE
BB ($Th)
Grant/Loan amount (S$m)
PROJECT STATUS
Tasks in CPS/CPR and Delivered PILLAR 1--Urban and Rural Development Urban 2008 P076901 Municipal Financial Management TA 607 15 Delivered 2008 P104101 Urban Knowledge Program TA 28 0 Delivered
2009 P107319 Urban ESW: strategic analysis of challenges facing South Africa's cities (Urban Sector Support)
ESW 377 0 Delivered
2009 P112960 PPIAF: SOUTH AFRICA: Capacity Building Support to National Treasury PPP Unit - Municipal Desk
TA 0 0.364 Delivered
2009 P106109 Upgrading Inform IE 0 0 Delivered 2010 P117525 South Africa Urban Policy Dialogue(Urban Crime and Violence Prevention) TA 286 0 Delivered 2010 P119375 Housing Workshop/: Workshop on Spatial Development and Human Settlement TA Delivered
2010 P104669 South Africa: LG Capacity Initiative TA 275 Delivered
2010 P119372 TF095327 - PPIAF-SNTA: SOUTH AFRICA: Enhancing the Policy Framework for Development Charges to Support Private Sector Participation in Municipal Infrastructure
TA 0 0.067 Delivered
2012 P111510 South Africa National Upgrading Support TA 57 652 Delivered 2012 P123235 ZA Urban Sector Dialogue TA 86 0 Active 2012 P120774 SNTA: Sus. Municipal Finance for Infrastructure Development TA 0 0 Active Private sector Development 2008 P102408 Analysis of Investment Climate Variables ESW 263 0 Delivered 2008 P110211 FSAP update South Africa EW 296 0 Delivered 2009 P114557 ZA-FSAP follow up TA 62 0 Delivered 2009 P107001 ZA-ICA Update (FY09) ESW 155 0 Active 2010 P113938 South Africa Support to Grassroots Business Organizations - TA TA 79 0 Delivered 2010 P117133 WB Financial Projection Model Pilot: South Africa Reserve Bank (TA) TA 56 0 Delivered 2010 P120937 ROSC South Africa ESW 92 0 Delivered 2011 P118672 ZA- SME Finance and Financial Inclusion(Post-Crisis SME Finance) TA 101 0 Delivered 2011 P113919 South Africa, Analysis of Investment Climate Constraints - ESW TA 244 0.019 Active 2011 P121262 ZA - Support to Sustained financial stability TA/Active 200 0 Active 2011 P123588 South Africa Entertainment Education TA/Active 0 0.297 Active 2012 P120051 South Africa - ICR ROSC UPDATE ESW 109 0 Delivered

Annex 5: Completion Report
60
2012 P122514 Economic Diversification and SME Development in South Africa (TA) TA 237 0 Delivered
2012 P126353 Evaluating the use of Entertainment Education to Improve Financial Capability in South Africa.
IE 28 0.071 Active
2012 P127213 Baseline of Financial Capabilities in South Africa TA 0 0.100 Active 2012 P127122 Support for Financial Sector Policy and Strategy TA 61 0 Active 2012 P123601 S. Africa: Contingency Planning # 10053 TA 0 0.165 Active 2012 P128026 Economic Diversification and Micro, Small, Medium Enterprises Development TA 123 0 Active
2012 P122424 South Africa: Finalizing Micro-insurance Regulatory Framework #9006 TA 0 0.061 Active 2009 P112925 ZA-Macro Modeling TA 68 0 Delivered 2010 P119361 ZA-Macro Modeling (Economic/Poverty Monitoring and Macro-modeling) TA 41 0 Delivered 2012 P122886 ZA Economic Development Dialogue TA 121 0.032 Delivered 2012 P124928 South Africa Macro Modeling TA 3 0 Delivered 2012 P125988 South Africa Economic Update ESW 379 0 Active 2010 P107039 ZA-WIOFish Capacity Building (FY10) TA 14 0.200 Delivered
Rural Development 2008 P107151 ZA-2 Land Reform (FY08) TA 139 0 Delivered 2011 P118654 ZA-Rural Development and Land Reform TA 122 0 Delivered
Environment
2008 P073322 Renewable Energy Market Transformation GE 616 6 Active
2009 P110934 ZA: Climate Change Economic Modeling of Climate Change Mitigation: A Pilot Study
ESW 64 0 Delivered
2009 P116511 CTF in ZA TA 0 0 Delivered
2010 P086528 Development, Empowerment and Conservation in the Greater St Lucia Wetland Park and Surrounding Region
GEF (SIL) 425 1.65 Active
2010 P120029 BEIA- Promotion of Improved Biomass Rocket Stoves in South Africa TA 0.414 0.134 Active 2010 P119455 South African Cities Energy Efficiency and Renewable Energy Program TA 0 0.360 Active 2011 P064438 Greater Addo Elephant National Park Project GEP/SIL 513 5.5 Delivered 2011 P108461 ESMAP Low Carbon Growth (FY11) ESW 0 0.339 Active 2012 P122329 Eskom Renewables Support Project SIL/Active 301 250 Active
Infrastructure
2010 P116410 Eskom Investment Support Project PE-SIL 0 3750 Active 2011 P120878 ZA:PPIAF - Regulatory Framework for IPPs TA 10 0.030 Active
Pillar 2--Regional Integration
Regional integration
2008 African Infrastructure Diagnostic Report, November

Annex 5: Completion Report
61
2010 P114908 Regional Trade, FDI and Technology Absorption ESW 170 0.445 Delivered
2010 P110059 Regional Trade and Integration ESW 846 0.828 Delivered 2010 P111496 Regional ICA ESW 244 0.117 Delivered 2011 P107587 Africa Science, Technology, and Innovation Capacity Building TA 77 0.067 Delivered 2010 P120140 Southern Africa HIV/AIDS and TB Action Plan TA 67 0 Delivered 2008 P102235 Africa Competiveness Report (WEF Africa) June ESW 180 0 Delivered 2010 P097142 SADC Public Sector Accounting Standards IDF 0 0.500 Delivered
Cross-cutting theme: service delivery
2008 P103131 Multi Sector Service Delivery ESW 438 0 Delivered 2008 P101079 Municipal Services Citizens Report Card IE 89 0.104 Delivered 2009 P112944 ZA-Monitoring & Evaluation Advisory Serv TA 94 0 Delivered
2012 P120906 Human Rights and Gender-Based Violence: Identifying Opportunities for Engagement in South Africa
KN 0 0 Active
2012 P128250 South Africa Performance Monitoring and Evaluation Technical Assistance TA 8 0 Active 2008 P096533 School Infrastructure Investment Plan for Equity and Quality - TA TA 232 0.366 Delivered 2009 P112926 ZA-Physical Teach & Learn Environ (FY09 TA 39 0 Delivered
2010 P121268 The Education Leadership Initiative: Developing Educational Leadership Capacity in Southern Africa
GPP 100 0 Active
2012 P112927 Closing The Skills and Technology Gap in South Africa ESW 984 0.036 Delivered 2010 P108699 HIV/AIDS Impact Evaluation IE 5 0 Delivered 2012 P119119 HIV/AIDS Technical Assistance in South Africa TA 175 0 Active 2012 P125034 Public Expenditures and Service Del for HIV/AIDS Programs in KZN Province ESW 275 0 Active
2012 P116338 Impact Evaluation of the Small Enterprise Development Agency's Core Services on SMMEs in South Africa's Western Cape
IE 60 0.070 Active
Tasks not in CPS/CPS-PR, but delivered 2009 P109598 ZA-Social Protection Policy (FY09) TA 103 0 Delivered 2011 P125776 ZA-Flood Rapid Response(GFDRR) TA 0 0.044 Delivered 2012 P123198 South Africa - Water Sector Dialogue TA 40 0 Active 2012 P127804 TA for Social Security Reform TA 24 0 Active 2012 P128864 ZA Youth ALMP TA 50 0 Active Tasks in CPS/CPS-PR not delivered 2008 P094760 Methyl Bromide Phase-out GE/SIL 0 7 Dropped 2008 P099858 Energy Efficiency Improvement TA 0 20 Dropped 2009 P112845 Adaptation to climate change in agriculture, water and health sectors EW 78 0 Dropped 2009 P102455 Environment Knowledge Program (DR) ESW 7 0 Dropped 2009 P108442 En. Sector Dialogue ESKOM TA 14 0 Dropped
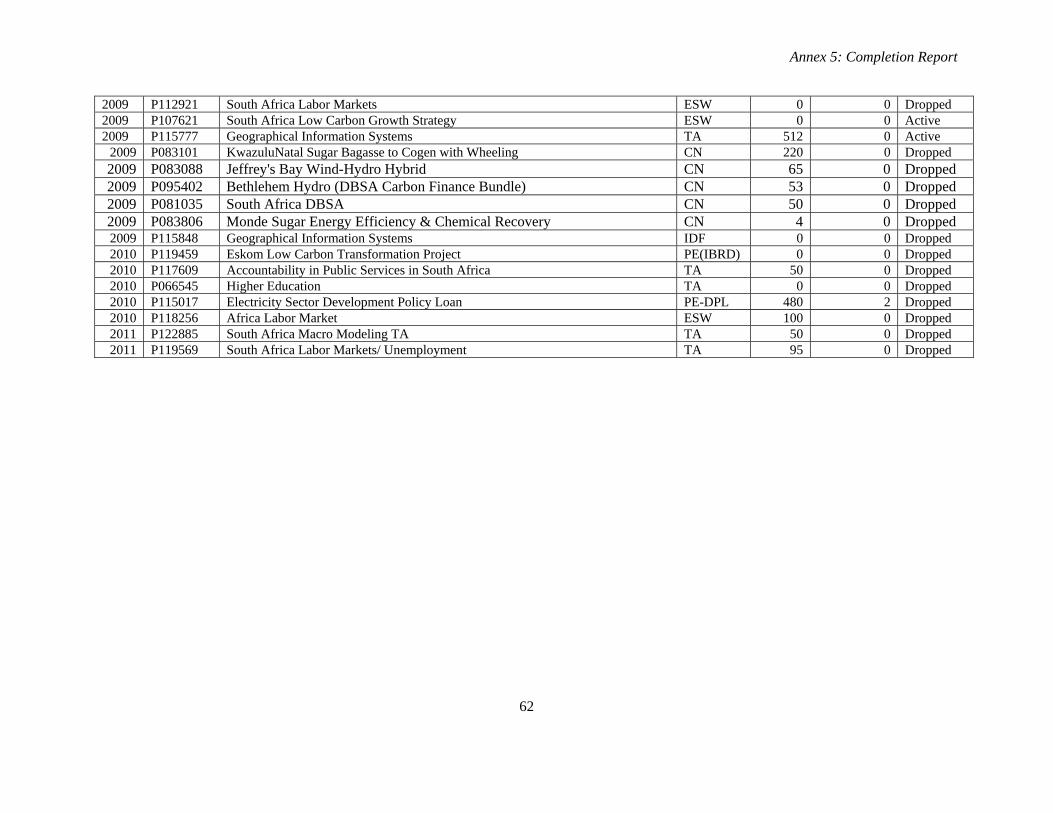
Annex 5: Completion Report
62
2009 P112921 South Africa Labor Markets ESW 0 0 Dropped 2009 P107621 South Africa Low Carbon Growth Strategy ESW 0 0 Active 2009 P115777 Geographical Information Systems TA 512 0 Active
2009 P083101 KwazuluNatal Sugar Bagasse to Cogen with Wheeling CN 220 0 Dropped 2009 P083088 Jeffrey's Bay Wind-Hydro Hybrid CN 65 0 Dropped 2009 P095402 Bethlehem Hydro (DBSA Carbon Finance Bundle) CN 53 0 Dropped 2009 P081035 South Africa DBSA CN 50 0 Dropped 2009 P083806 Monde Sugar Energy Efficiency & Chemical Recovery CN 4 0 Dropped 2009 P115848 Geographical Information Systems IDF 0 0 Dropped 2010 P119459 Eskom Low Carbon Transformation Project PE(IBRD) 0 0 Dropped 2010 P117609 Accountability in Public Services in South Africa TA 50 0 Dropped 2010 P066545 Higher Education TA 0 0 Dropped 2010 P115017 Electricity Sector Development Policy Loan PE-DPL 480 2 Dropped 2010 P118256 Africa Labor Market ESW 100 0 Dropped 2011 P122885 South Africa Macro Modeling TA TA 50 0 Dropped 2011 P119569 South Africa Labor Markets/ Unemployment TA 95 0 Dropped

63
Annex 6: Country At-A-Glance
South Africa at a glance 10/15/13
Sub- UpperKey D evelo pment Indicato rs South Saharan middle
Africa Africa income(2012)
Population, mid-year (millions) 52.3 875 2,490Surface area (thousand sq. km) 1,221 24,244 61,034Population growth (%) 1.3 2.5 0.7Urban population (% of to tal population) 61 36 61
GNI (Atlas method, US$ billions) 389.8 1,101 16,341GNI per capita (Atlas method, US$) 7,460 1,258 6,563GNI per capita (PPP, international $) 10,710 2,225 10,703
GDP growth (%) 2.5 4.7 6.6GDP per capita growth (%) 1.2 2.1 5.9
(mo st recent est imate, 2005–2012)
Poverty headcount ratio at $1.25 a day (PPP, %) 11 48 9.0Poverty headcount ratio at $2.00 a day (PPP, %) 26 69 20.4Life expectancy at birth (years) 57 55 73Infant mortality (per 1,000 live births) 38 69 16Child malnutrition (% of children under 5) 21 21 3
Adult literacy, male (% of ages 15 and o lder) 91 71 96Adult literacy, female (% of ages 15 and o lder) 87 54 91Gross primary enro llment, male (% of age group) 99 103 111Gross primary enro llment, female (% of age group) 96 96 111
Access to an improved water source (% of population) 93 61 93Access to improved sanitation facilities (% of population) 75 31 73
N et A id F lo ws 1980 1990 2000 2012 a
(US$ millions)Net ODA and o fficial aid .. 270 486 1,031Top 3 donors (in 2010): United States .. 66 106 530 European Union Institutions .. 83 120 153 France .. 0 18 48
Aid (% of GNI) .. 0.2 0.4 0.3Aid per capita (US$) .. 7 11 21
Lo ng-T erm Eco no mic T rends
Consumer prices (annual % change) 13.8 14.3 5.4 5.6GDP implicit deflator (annual % change) 24.9 15.5 8.8 5.5
Exchange rate (annual average, local per US$) 0.8 2.6 6.9 8.2Terms of trade index (2000 = 100) 134 112 100 122
1980–90 1990–2000 2000–12
Population, mid-year (millions) 27.6 35.2 44.0 52.3 2.4 2.2 1.4GDP (US$ millions) 80,710 112,014 132,878 384,316 1.4 2.1 3.6
Agriculture 6.2 4.6 3.3 2.6 2.9 1.0 2.0Industry 48.4 40.1 31.8 28.4 0.5 1.0 2.4 M anufacturing 21.6 23.6 19.0 12.4 1.1 1.6 2.6Services 45.4 55.3 64.9 69.0 2.5 2.6 4.3
Household final consumption expenditure 48.2 57.3 63.2 61.2 1.5 2.3 4.3General gov't final consumption expenditure 14.3 19.7 18.1 22.4 3.5 0.3 4.8Gross capital formation (includes inventories) 29.5 17.6 15.7 19.4 -4.3 4.7 7.1
Exports of goods and services 35.4 24.2 27.9 28.3 2.1 5.8 1.7Imports of goods and services 27.3 18.8 24.9 31.3 -0.6 7.1 6.4Gross savings 33.6 18.9 15.6 13.2
Note: Figures in italics are for years other than those specified. .. indicates data are not available.a. A id data are for 2010.
Development Economics, Development Data Group (DECDG).
(average annual growth %)
(% of GDP)
10 5 0 5 10
0-4
15-19
30-34
45-49
60-64
75-79
percent of total population
Age distribution, 2011
Male Female
020406080
100120140160180200
1990 1995 2000 2011
South Africa Sub-Saharan Africa
Under-5 mortality rate (per 1,000)
-6
-4
-2
0
2
4
6
8
95 05
GDP GDP per capi ta
Growth of GDP and GDP per capita (%)

64
Annex 6: Country At-A-Glance (continued)
South Africa
B alance o f P ayments and T rade 2000 2012
(US$ millions)
Total merchandise exports (fob) 32,019 93,452Total merchandise imports (cif) 20,749 102,654Net trade in goods and services 3,930 -11,720
Current account balance -168 -24,068 as a % of GDP -0.1 -6.3
Personal transfers and compensation of employees (receipts) 344 1,158
Reserves, including go ld 7,533 50,735
Go vernment F inance (f iscal year)1/
(% of GDP)Current revenue (including grants) 24.2 28.1
Tax revenue 23.0 24.3Current expenditure 23.5 31.2
T echno lo gy and Infrastructure 2000 2011Overall surplus/deficit -0.6 -5.2
Paved roads (% of to tal) 20.3 32.0Highest marginal tax rate (%) Fixed line and mobile phone Individual 40 40 subscribers (per 100 people) 30 135
Corporate 38 28 High techno logy exports (% of manufactured exports) 7.0 5.1
External D ebt and R eso urce F lo ws
Enviro nment(US$ millions)Total debt outstanding and disbursed 25,148 137,508 Agricultural land (% of land area) 81 79Total debt service 3,899 12,650 Forest area (% of land area) 7.6 7.6Debt relief (HIPC, M DRI) – – Terrestrial pro tected areas (% of land area) 6.9 6.9
Total debt (% of GDP) 18.9 35.8 Freshwater resources per capita (cu. meters) 984 886Total debt service (% of exports) 9.9 11.0 Freshwater withdrawal (billion cubic meters) .. ..
Foreign direct investment (net inflows) 617 204 CO2 emissions per capita (mt) 8.4 10.1Portfo lio equity (net inflows) -7,861 6,657
GDP per unit o f energy use (2005 PPP $ per kg o f o il equivalent) 3.1 3.5
Energy use per capita (kg o f o il equivalent) 2,483 2,738
Wo rld B ank Gro up po rt fo lio 2000 2012
(US$ millions)
IBRD Total debt outstanding and disbursed 3 1,228 Disbursements 3 650 Principal repayments 0 5 Interest payments 0 8
IDA Total debt outstanding and disbursed 0 – Disbursements – –
P rivate Secto r D evelo pment 2000 2012 Total debt service – –
Time required to start a business (days) – 19 IFC (fiscal year)Cost to start a business (% of GNI per capita) – 0.3 Total disbursed and outstanding portfo lio 55 536Time required to register property (days) – 23 o f which IFC own account 55 536
Disbursements for IFC own account 25 5Ranked as a major constraint to business 2000 2011 Portfo lio sales, prepayments and (% of managers surveyed who agreed) repayments for IFC own account 3 8 Skills and education of workers 35.5 .. Labor regulations 32.8 .. M IGA
Gross exposure 12 15Stock market capitalization (% of GDP) 154.2 213.0 New guarantees 0 10Bank capital to asset ratio (%) 8.7 7.8
Note: Figures in italics are for years o ther than those specified. 10/15/13.. indicates data are not available. – indicates observation is not applicable.1/ Fiscal year: April - M archDevelopment Economics, Development Data Group (DECDG).
0.0 25.0 50.0 75.0 100.0
Control of corruption
Rule of law
Regulatory quality
Polit ical stability andabsence of violence
Voice and accountability
Country's percentile rank (0-100)higher values imply better ratings
2011
2000
Governance indicators, 2000 and 2011
Source: Worldw ide Governance Indicators (ww w.govindicators.org)
IBRD, 583IDA, 0IMF, 2,741
Other multi-lateral, 488
Bilateral, 0
Private, 90,460
Short-term, 18,862
Composition of total external debt, 2011
US$ millions

65
Annex 6: Country At-A-Glance (continued)
Millennium Development Goals South Africa
With selected targets to achieve between 1990 and 2015(estimate closest to date shown, +/- 2 years)
Go al 1: halve the rates fo r extreme po verty and malnutrit io n 1990 1995 2000 2011
Poverty headcount ratio at $1.25 a day (PPP, % of population) .. 21.4 26.2 11.0 Poverty headcount ratio at national poverty line (% of population) .. 31.0 38.0 27.3 Share o f income or consumption to the poorest qunitile (%) .. 3.6 3.1 .. Prevalence of malnutrition (% of children under 5) .. 22.9 24.0 21.2
Go al 2: ensure that children are able to co mplete primary scho o ling
Primary school enro llment (net, %) 90 .. 90 87 Primary completion rate (% of relevant age group) 76 .. 86 .. Secondary school enrollment (gross, %) 66 80 85 94 Youth literacy rate (% of people ages 15-24) .. 94 .. 97
Go al 3: e liminate gender disparity in educatio n and empo wer wo men
Ratio o f girls to boys in primary and secondary education (%) 104 .. 100 100 Women employed in the nonagricultural sector (% of nonagricultural employment) .. .. 41 42 Proportion o f seats held by women in national parliament (%) 3 25 30 45
Go al 4: reduce under-5 mo rtality by two -thirds
Under-5 mortality rate (per 1,000) 56 57 88 54 Infant mortality rate (per 1,000 live births) 44 43 52 38 M easles immunization (proportion of one-year o lds immunized, %) 79 76 72 62
Go al 5: reduce maternal mo rtality by three-fo urths
M aternal mortality ratio (modeled estimate, per 100,000 live births) .. 81 98 410 B irths attended by skilled health staff (% of total) .. 82 84 .. Contraceptive prevalence (% of women ages 15-49) 57 .. 56 60
Go al 6: halt and begin to reverse the spread o f H IV/ A ID S and o ther majo r diseases
Prevalence of HIV (% of population ages 15-49) 0.5 4.9 14.8 17.3 Incidence of tuberculosis (per 100,000 people) 301 317 576 808 Tuberculosis case detection rate (%, all forms) 73 56 59 69
Go al 7: halve the pro po rt io n o f peo ple witho ut sustainable access to basic needs
Access to an improved water source (% of population) 81 83 89 93 Access to improved sanitation facilities (% of population) 55 54 68 75 Forest area (% of land area) 7.6 7.6 7.6 7.6 Terrestrial protected areas (% of land area) 6.5 6.9 6.9 6.9 CO2 emissions (metric tons per capita) 9.5 9.0 8.4 10.1 GDP per unit o f energy use (constant 2005 PPP $ per kg o f o il equivalent) 3.1 2.8 3.1 3.5
Go al 8: develo p a glo bal partnership fo r develo pment
Telephone mainlines (per 100 people) 9.0 9.7 11.1 8.2 M obile phone subscribers (per 100 people) 0.0 1.3 18.6 126.8 Internet users (per 100 people) 0.0 0.7 5.4 20.9 Households with a computer (%) .. .. 8.6 18.3
Note: Figures in italics are for years o ther than those specified. .. indicates data are not available. 10/15/13
Development Economics, Development Data Group (DECDG).
So uth A frica
0
25
50
75
100
125
2000 2005 2010
Prim ary net enrol lment ra tio
Ratio of gi rls to boy s in primary & secondaryeducation
Education indicators (%)
0
20
40
60
80
100
120
140
160
2000 2005 2010
Fixed + mobile subscribers Internet users
ICT indicators (per 100 people)
0
25
50
75
100
1990 1995 2000 2011
South Africa Sub-Saharan Africa
Measles immunization (% of 1-year olds)

66
Annex 7: Selected Indicators of Bank Portfolio Performance and Management As of September 2013
Indicator 2011 2012 2013 2014Portfolio Assessment
Number of Projects Under Implementation a 5 3 4 4
Average Implementation Period (years) b 1.3 2.3 3.3 3.9
Percent of Problem Projects by Number a, c 0.0 0.0 0.0 0.0
Percent of Problem Projects by Amount a, c 0.0 0.0 0.0 0.0
Percent of Projects at Risk by Number a, d 0.0 0.0 0.0 0.0
Percent of Projects at Risk by Amount a, d 0.0 0.0 0.0 0.0
Disbursement Ratio (%) e 53 14 7 1Portfolio ManagementCPPR during the year (yes/no) No No No NoSupervision Resources (total US$) 120 600 540 500Average Supervision (US$/project) 120 600 540 500
Memorandum Item Since FY 80 Last Five FYsProj Eval by OED by Number 4 1Proj Eval by OED by Amt (US$ millions) 35.5 0.0% of OED Projects Rated U or HU by Number 0.0 0.0% of OED Projects Rated U or HU by Amt 0.0 0.0
a. As shown in the Annual Report on Portfolio Performance (except for current FY). b. Average age of projects in the Bank's country portfolio.c. Percent of projects rated U or HU on development objectives (DO) and/or implementation progress (IP).d. As defined under the Portfolio Improvement Program.e. Ratio of disbursements during the year to the undisbursed balance of the Bank's portfolio at the
beginning of the year: Investment projects only.* All indicators are for projects active in the Portfolio, with the exception of Disbursement Ratio, which includes all active projects as well as projects which exited during the fiscal year.

67
Annex 8: South Africa IFC Investment Operations Program
2010 2011 2012 2013
Original Commitments (US$m)IFC and Participants 126.6 119.4 100.7 276.4IFC's Own Accounts only 126.6 119.4 100.7 276.4
Original Commitments by Sector (%)- IFC Accounts onlyAGRICULTURE AND FORESTRY 0.8 58.4 12.5CHEMICALS 14.5COLLECTIVE INVESTMENT VEHICLES 7.7EDUCATION SERVICES 7.4ELECTRIC POWER 53.4FINANCE & INSURANCE 7.7 76.8 41.6 1.1FOOD & BEVERAGES 4.0HEALTH CARE 79.0INDUSTRIAL & CONSUMER PRODUCTS 18.3INFORMATION 4.2OIL, GAS AND MINING 2.0 10.9Total 100.0 100.0 100.0 100.0
Original Commitments by Investment Instrument (%) - IFC Accounts onlyEquity 79.0 1.7 20.8 22.0Guarantee 7.7 18.2 13.0 1.1Loan 11.4 77.5 66.1 71.7Quasi loan 2.0 2.5 4.3Risk product 0.1 0.2 0.9Total 100.0 100.0 100.0 100.0
Data as of September 2013

68
Annex 9: South Africa IBRD Program Summary
Proposed IBRD Base-Case Lending Program
Strategic Rewards (H/M/L)
Implementation Risks
(H/M/L)
N/A N/A N/A
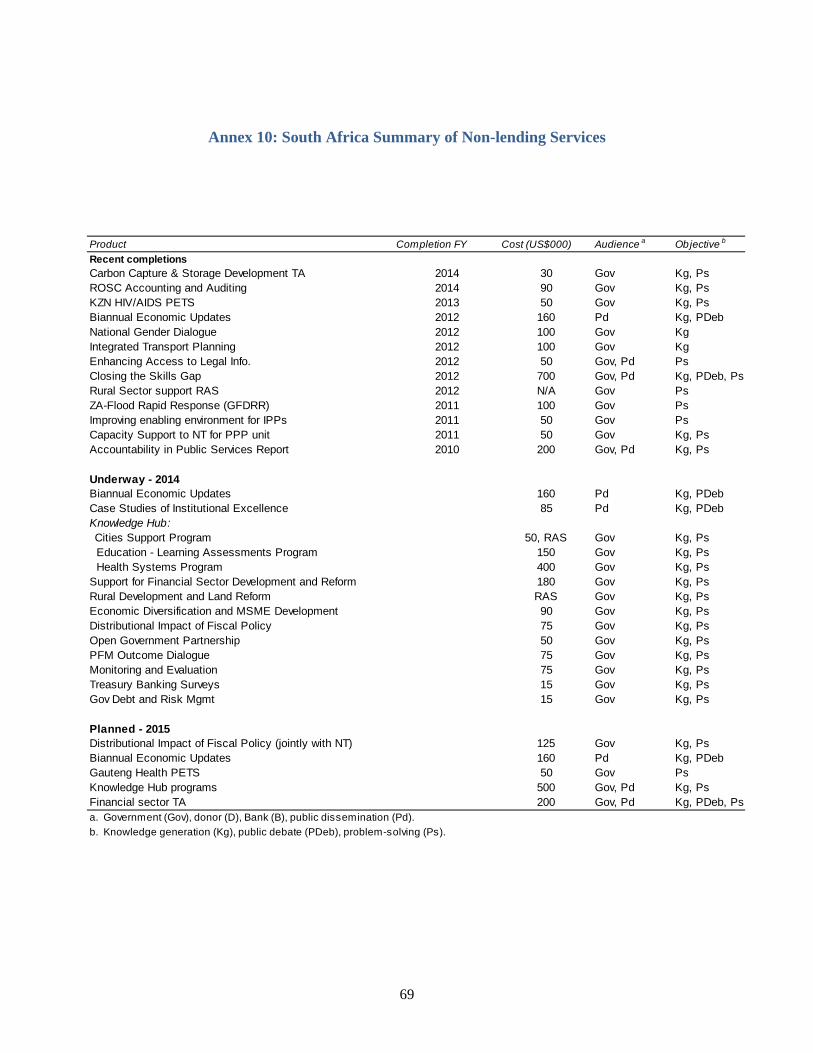
69
Annex 10: South Africa Summary of Non-lending Services
Product Completion FY Cost (US$000) Audience a Objective b
Recent completionsCarbon Capture & Storage Development TA 2014 30 Gov Kg, PsROSC Accounting and Auditing 2014 90 Gov Kg, PsKZN HIV/AIDS PETS 2013 50 Gov Kg, PsBiannual Economic Updates 2012 160 Pd Kg, PDebNational Gender Dialogue 2012 100 Gov KgIntegrated Transport Planning 2012 100 Gov KgEnhancing Access to Legal Info. 2012 50 Gov, Pd PsClosing the Skills Gap 2012 700 Gov, Pd Kg, PDeb, PsRural Sector support RAS 2012 N/A Gov PsZA-Flood Rapid Response (GFDRR) 2011 100 Gov PsImproving enabling environment for IPPs 2011 50 Gov PsCapacity Support to NT for PPP unit 2011 50 Gov Kg, PsAccountability in Public Services Report 2010 200 Gov, Pd Kg, Ps
Underway - 2014Biannual Economic Updates 160 Pd Kg, PDebCase Studies of Institutional Excellence 85 Pd Kg, PDebKnowledge Hub: Cities Support Program 50, RAS Gov Kg, Ps Education - Learning Assessments Program 150 Gov Kg, Ps Health Systems Program 400 Gov Kg, PsSupport for Financial Sector Development and Reform 180 Gov Kg, PsRural Development and Land Reform RAS Gov Kg, PsEconomic Diversification and MSME Development 90 Gov Kg, PsDistributional Impact of Fiscal Policy 75 Gov Kg, PsOpen Government Partnership 50 Gov Kg, PsPFM Outcome Dialogue 75 Gov Kg, PsMonitoring and Evaluation 75 Gov Kg, PsTreasury Banking Surveys 15 Gov Kg, PsGov Debt and Risk Mgmt 15 Gov Kg, Ps
Planned - 2015Distributional Impact of Fiscal Policy (jointly with NT) 125 Gov Kg, PsBiannual Economic Updates 160 Pd Kg, PDebGauteng Health PETS 50 Gov PsKnowledge Hub programs 500 Gov, Pd Kg, PsFinancial sector TA 200 Gov, Pd Kg, PDeb, Psa. Government (Gov), donor (D), Bank (B), public dissemination (Pd).
b. Knowledge generation (Kg), public debate (PDeb), problem-solving (Ps).

70
Annex 11: South Africa Social IndicatorsAs of September 2013
Latest single year Same region/income groupSub- Upper-
Saharan middle-1980-85 1990-95 2005-11 Africa income
POPULATION Total population, mid-year (millions) 31.3 39.1 50.6 853.4 2,452.1 Grow th rate (% annual average for period) 2.5 2.1 1.1 2.5 0.7Urban population (% of population) 49.4 54.5 60.7 37.4 57.4Total fertility rate (births per w oman) 4.3 3.1 2.5 4.9 1.8
POVERTY(% of population)National headcount index .. 52.0 34.5 Urban headcount index .. .. .. Rural headcount index .. .. ..
INCOMEGNI per capita (US$) 2,400 3,740 6,950 1,176 5,884Consumer price index (2005=100) 21 72 117 147 127Food price index (2000=100) .. .. .. .. ..
INCOME/CONSUMPTION DISTRIBUTIONShare of income or consumptionGini index .. 0.7 0.7Low est quintile (% of income or consumption .. 1.7 1.6Highest quintile (% of income or consumption) .. 72.5 70.0
SOCIAL INDICATORS
Public expenditure Health (% of GDP) .. .. 8.6 3.0 3.0 Education (% of GNI) .. .. 5.7 5.0 4.8 Social security and w elfare (% of GDP) .. .. 4.8 .. ..
Net primary school enrollment rate
(% of age group) Total .. 90 87 75 94 Male .. 89 87 77 93 Female .. 91 88 73 95
Access to an improved water source
(% of population) Total .. 83 91 61 93 Urban .. 98 100 83 98 Rural .. 65 82 49 86
Immunization rate
(% of children ages 12-23 months) Measles 70 76 65 75 96 DPT 75 72 73 77 96Child malnutrition (% under 5 years) .. 23 21 22 3
Life expectancy at birth
(years) Total 60 60 57 54 73 Male 56 57 55 53 71 Female 63 64 59 55 75
Mortality Infant (per 1,000 live births) 54 43 38 76 17 Under 5 (per 1,000 live births) 71 57 54 121 20 Adult (15-59) Male (per 1,000 population) .. .. 577 379 161 Female (per 1,000 population) .. .. 511 346 100 Maternal (per 100,000 live births) .. .. 410 650 60Births attended by skilled health staff (%) .. 82 91 46 98
Note: 0 or 0.0 means zero or less than half the unit show n. Net enrollment rate: break in series betw een 1997 and 1998 due to
change from ISCED76 to ISCED97. Immunization: refers to children ages 12-23 months w ho received vaccinations before one
year of age or at any time before the survey.

71
Annex 12: South Africa Key Economic Indicators

72
Annex 12 – South Africa Key Economic Indicators (continued)
Actual Estimate ProjectedIndicator 2007 2008 2009 2010 2011 2012 2013 2014 2015
Public finance (as % of GDP at market prices)e
Current revenues 31.1 30.3 27.6 28.5 28.7 28.1 28.6 28.8 28.8 Current expenditures 27.6 28.7 30.5 30.1 30.5 31.2 31.0 30.4 29.7 Current fiscal surplus (+) or deficit (-) 3.4 1.6 -2.9 -1.6 -1.8 -3.0 -2.4 -1.6 -0.9 Capital expenditure 1.7 2.7 3.8 2.9 2.2 2.3 2.3 2.4 2.3 Foreign financing -0.2 0.2 1.0 0.2 0.4 -0.3 -0.1 0.1 0.2
Monetary indicators M2/GDP 82.7 84.8 81.0 78.3 77.3 75.2 .. .. .. Growth of M2 (%) 23.6 14.8 1.8 6.9 8.3 5.2 .. .. .. Private sector credit growth / 114.7 95.7 -12.9 59.1 57.1 88.1 .. .. .. total credit growth (%)
Price indices( YR05 =100) Merchandise export price index 87.3 85.8 106.6 102.0 96.3 96.2 98.2 98.6 110.1 Merchandise import price index 77.6 76.5 92.5 84.5 77.0 72.4 73.4 73.7 77.4 Merchandise terms of trade index 112.6 112.3 115.2 120.8 125.1 132.9 133.8 133.8 142.2
Real exchange rate (US$/LCU)f
105.1 94.1 101.4 113.9 110.1 104.1 .. .. ..
Real interest rates Consumer price index (% change) 6.1 9.9 7.2 4.3 5.0 5.6 5.9 5.5 4.8 GDP deflator (% change) 8.1 8.0 8.3 7.2 6.0 5.5 7.0 7.0 5.9
a. GDP at factor costb. "GNFS" denotes "goods and nonfactor services."c. Includes net unrequited transfers excluding official capital grants.d. Includes use of IMF resources.e. Consolidated central government.f. "LCU" denotes "local currency units." An increase in US$/LCU denotes appreciation.

73
Annex 13: South Africa Key Exposure Indicators Actual Estimated
Indicator 2007 2008 2009 2010 2011 2012 2013 2014 2015
Total debt outstanding and 69364 68052 77275 102348 113135 104366 97284 92838 90562
disbursed (TDO) (US$m)a
Net disbursements (US$m)a
8727 1871 4339 5698 8036 1291 1252 932 743
Total debt service (TDS) 2550 2360 2314 3636 4023 2213 1805 1387 1140
(US$m)a
Debt and debt service indicators
(%)
TDO/XGSb
5.8 8.5 2.3 13.0 39.0 23.5 39.3 47.1 69.7
TDO/GDP 24.2 24.9 27.2 28.2 28.2 27.2 28.5 22.9 20.4
TDS/XGS 2.6 2.3 2.8 3.5 3.3 1.9 1.4 1.1 0.8
Concessional/TDO
IBRD exposure indicators (%)
IBRD DS/public DS 0.2 0.1 0.3 0.6 0.4 0.2 0.3 0.9 2.4
Preferred creditor DS/public 2.6 1.3 2.2 2.4 2.6 1.0 1.1 2.7 19.8
DS (%)c
IBRD DS/XGS 0.0 0.0 0.0 0.0 0.0 0.0 0.0 0.0 0.0
IBRD TDO (US$m)d
27 26 21 384 583 1228 1910 2524 3016
Of which present value of
guarantees (US$m)
Share of IBRD portfolio (%) 0 0 0 0 0 0 0 0 0
IDA TDO (US$m)d
IFC (US$m)
Loans 109 0 50 14 82 67 225 100 150
Equity and quasi-equity /c 60 141 60 103 5 21 98 N/A N/A
** Combined debt and equity financing
MIGA
MIGA guarantees (US$m - Gros 12.3 12.3 12.62 12.62 15.32 27.6 .. .. ..
a. Includes public and publicly guaranteed debt, private nonguaranteed, use of IMF credits and net short-
term capital.
b. "XGS" denotes exports of goods and services, including workers' remittances.
c. Preferred creditors are defined as IBRD, IDA, the regional multilateral development banks, the IMF, and the
Bank for International Settlements.
d. Includes present value of guarantees.
e. Includes equity and quasi-equity types of both loan and equity instruments.
Projected
pp y f p f f f ginvestments are made elsewhere in the region, but credit risk is carried on South African parent's balance sheet.

74
Annex 14: IFC Committed and Disbursed Outstanding Investment Portfolio As of September 2013
(USD Millions) Committed Disbursed Outstanding
FY Approval Company Loan Equity**Quasi Equity *GT/RM
Partici pant Loan Equity
**Quasi Equity *GT/RM
Partici pant
2009 African bank 0 0 39.02 0 0 0 0 39.02 0 02011 Apollo sa 16.72 0 0 0 0 8.36 0 0 0 02012 Assupol 0 20.33 0 0 0 0 20.33 0 0 02002 Bioventures 0 0.13 0 0 0 0 0.04 0 0 02009 Columbus 20.44 0 0 0 0 20.44 0 0 0 02010 Curro holdings 8.1 0 0 0 0 0 0 0 0 02006 Ethos v 0 18.79 0 0 0 0 13.91 0 0 02012 Farmsecure pty 55.74 0 0 0 0 55.74 0 0 0 02013 Hans merensky 0 34.52 0 0 0 0 34.52 0 0 02004 Hernic 3.34 4.7 6.63 3.73 0 3.34 4.7 5.18 0 02007 Horizon iii 0 7.47 0 0 0 0 2.52 0 0 02013 Ihs 0 20.75 0 0 0 0 0 0 0 02006 Karsten farms 1.91 0 0 0 0 1.91 0 0 0 02012 Kaxu 73.02 0 0 1.33 0 6.89 0 0 0.17 00/12 Khi 55.74 0 11.41 1.22 0 11.65 0 1.69 0.25 02010 Life healthcare 0 70.7 0 0 0 0 70.7 0 0 02007 Lonmin 0 16.38 0 0 0 0 16.02 0 0 02011 Mercantile (sa) 53 0 0 0.16 0 53 0 0 0.05 02007 Nedbank 0 0 111.48 0 0 0 0 111.48 0 02007 Omnia fertilizer 0 0 0 7.25 0 0 0 0 1.48 02011 Petra diamonds 60 0 0 0 0 60 0 0 0 02011 Safal steel 17.14 0 5 0 0 17.14 0 5 0 01999 Sapef 0 1.71 0 0 0 0 0 0 0 02009 Sasfin 7.27 0 9.19 0.15 0 7.27 0 9.19 0.08 02008 Sasfin group 0 10 0 0 0 0 10 0 0 02007 Sonae novobord 4 0 0 0 0 4 0 0 0 02010 Sphere i 0 0.52 0 0 0 0 0.02 0 0 02012 Srf flexipak 40 0 0 0 0 7 0 0 0 02011 Teraco 0 1.72 2.64 0 0 0 1.72 2.64 0 02008 Wizzit 0 0.47 0 0 0 0 0.16 0 0 0
Total Portfolio: 416.42 208.19 185.37 13.84 0 256.74 174.64 174.2 2.03 0
* Denotes Guarantee and Risk Management Products.** Quasi Equity includes both loan and equity types.

75
Annex 15: South Africa Operations Portfolio (IBRD, CTF and GEF) As of September 2013
Closed Projects 17
IBRD Total Disbursed (Active) 1,233 of which has been repaid 0Total Disbursed (Closed) 26 of which has been repaid 36Total Disbursed (Active + Closed) 1,269 of which has been repaid 36Total Undisbursed (Active) 2,923Total Undisbursed (Closed) 0Total Undisbursed (Active + Closed) 2,923
Active Projects
Project ID Project NameDevelopment
ObjectivesImplementation Progress
Fiscal Year IBRD GRANT (GEF/CTF) Cancel. Undisb. Orig. Frm Rev'd
P086528 GEF Isimangaliso Wetland Park S S 2010 9 6 8 2
P073322 GEF Rnwbl Enrgy Mkt Trnsfrm (FY07) S S 2007 6 1 6 5
P122329 CTF Eskom Renewable Support Project S MS 2010 250 249 50 0
P116410 Eskom Investment Support Project S MS 2010 3750 2439 1228 1144
Overall Result 3750 265 2681 1292 1151
Original Amount in US$ Millions Disbursements a/
Difference Between
Expected and Actual
Supervision Rating
Last PSR

Great Karroo
Dr a
k
en
sb
er
g
G r o a t G r o a tV l o e rV l o e r
T r a n s v a a lT r a n s v a a l
N O R T H E R N C A P EN O R T H E R N C A P E
W E S T E R N C A P EW E S T E R N C A P E
E A S T E R N C A P EE A S T E R N C A P E
F R E E S TAT EF R E E S TAT EK WA Z U L U -K WA Z U L U -
N ATA LN ATA L
L I M P O P OL I M P O P O
N O R T H W E S TN O R T H W E S TMPUMALANGAMPUMALANGA
LLiimmppooppoo
OOlliiffaannttss
HHaarrttss
OOrraannggee
OOrraannggee
CCaalleedd
oonn
VVaaaall
UpingtonUpingtonKeimoesKeimoes
KenhardtKenhardt
VanrhynsdorpVanrhynsdorp
De AarDe Aar
MiddleburgMiddleburgUmtataUmtata
KokstadKokstadAiwal NorthAiwal North
WitdraalWitdraal
SpringbokSpringbok
CalviniaCalviniaBitterfonteinBitterfontein
PaarlPaarl SwellendamSwellendam GeorgeGeorgeUitenhageUitenhage
Graaff-Graaff-ReinetReinet
QueenstownQueenstown
OudtshoorOudtshoor
BeaufortBeaufortWestWest
Victoria WestVictoria West
BritsownBritsown
PrieskaPrieska
WorcesterWorcester
HotazelHotazel
SishenSishen
UlundiUlundi
VryheidVryheid
StandertonStanderton
NewcastleNewcastle
ErmeloErmelo
MiddleburgMiddleburg
BethelBethel
RustenburgRustenburg
VereenigingVereenigingSpringsSprings
BethlehemBethlehem
KroonstadKroonstad
LadysmithLadysmithHarrismithHarrismith
JohannesburgJohannesburg
PolokwanePolokwane(Pietersburg)(Pietersburg)
NelspruitNelspruit
UlundiUlundi(Pietermaritzburg)(Pietermaritzburg)
BishoBisho
KimberleyKimberley
BloemfonteinBloemfontein
PRETORIAPRETORIA
To To SitekiSiteki
B O T S W A N AB O T S W A N A MOZAMBIQUEMOZAMBIQUE
ZIMBABWEZIMBABWE
N A M I B I AN A M I B I ASWSW
LESOTHOLESOTHO
To To KarasburgKarasburg
To To KarasburgKarasburg
To To KanyeKanye
To To MochudiMochudi
To To Serowe Serowe
To To MazungaMazunga To To
NuanetsiNuanetsi
To To MaputoMaputo
To To MbabaneMbabane
To To MaseruMaseru MafadiMafadi
(3451 m)(3451 m)N O R T H E R N C A P E
W E S T E R N C A P E
E A S T E R N C A P E
F R E E S TAT EK WA Z U L U -
N ATA L
L I M P O P O
N O R T H W E S T
GAUTENG
MPUMALANGA
UpingtonKeimoes
Kenhardt
Port Nollth
Vanrhynsdorp
De Aar
MiddleburgUmtata
Kokstad Port ShepstoneAiwal North
Reitfontein
Witdraal
Springbok
CalviniaBitterfontein
Saldanha
Paarl Swellendam
Mosselbaai
GeorgeUitenhage
Graaff-Reinet
Queenstown
Oudtshoor
BeaufortWest
Victoria West
Britsown
Prieska
Worcester
Hotazel
Sishen
Port Elizabeth
Durban
Richards Bay
Ulundi
Vryheid
Standerton
Newcastle
Ermelo
Middleburg
Bethel
Rustenburg
VereenigingSprings
Bethlehem
Kroonstad
LadysmithHarrismith
JohannesburgMmabatho
Polokwane(Pietersburg)
Nelspruit
Ulundi(Pietermaritzburg)
Bisho
Cape Town
Kimberley
Bloemfontein
PRETORIA
B O T S W A N A MOZAMBIQUE
ZIMBABWE
N A M I B I ASWAZILAND
LESOTHO
Limpopo
Olifants
Harts
Orange
Orange
Caled
on
Vaal
ATLANTIC
OCEAN
INDIAN
OCEAN
To Karasburg
To Karasburg
To Kanye
To Mochudi
To Serowe
To Mazunga To
Nuanetsi
To Maputo
To Mbabane
To Siteki
To Maseru
Great Karroo
Dr a
k
en
sb
er
g
Cape of Good Hope
G r o a tV l o e r
T r a n s v a a l
Mafadi(3451 m)
14°E 16°E 18°E
14°E 16°E 18°E
20°E 22°E 24°E 26°E 28°E 30°E 32°E 34°E 36°E
20°E 22°E 24°E 26°E 28°E 30°E 32°E 34°E
34°S
32°S
30°S
28°S
26°S
24°S
22°S
34°S
32°S
30°S
28°S
26°S
24°S
22°S
SOUTHAFRICA
0 100
0 100 200 Miles
200 Kilometers
IBRD 33484R
DEC
EMBER 2008
SOUTH AFRICASELECTED CITIES AND TOWNS
PROVINCE CAPITALS
NATIONAL CAPITAL
RIVERS
MAIN ROADS
RAILROADS
PROVINCE BOUNDARIES
INTERNATIONAL BOUNDARIES
This map was produced by the Map Design Unit of The World Bank. The boundaries, colors, denominations and any other information shown on this map do not imply, on the part of The World Bank Group, any judgment on the legal status of any territory, or any endorsement or acceptance ofsuch boundaries.