Workshop of Participants in the Joint FAO/IOC/WHO/IAEA ...
187
Intergovernmental Oceanographic Commission Workshop Report No. 41 First Workshop of Participants in the Joint FAO-IOC-WHO-IAEA-UNEP Project on Monitoring of Pollution - in the Marine Environment of the West and Central African Region (WACAFl2 - Pilot Phase) Dakar,Senegal, 28 October4 November 1985 Unesco
-
Upload
khangminh22 -
Category
Documents
-
view
1 -
download
0
Transcript of Workshop of Participants in the Joint FAO/IOC/WHO/IAEA ...

Intergovernmental Oceanographic Commission Workshop Report No. 41
First Workshop of Participants in the Joint FAO-IOC-WHO-IAEA-UNEP Project on Monitoring of Pollution - in the Marine Environment of the West and Central African Region (WACAFl2 - Pilot Phase) Dakar, Senegal, 28 October4 November 1985
Unesco

IOC Workshop Reports
The Scientific Workshops of the Intergovernmental Oceanographic Commission are usually jointly sponsored with other intergovernmental or non governmental bodies. In each case, by mutual agreement, one of the sponsoring bodies assumes responsibility for publication of the final report. Copies ma: be requested from the publishing bodies as listed below. m. 1
2
3
4
5
6
7
8
9
10
11
11 sw.
12
13
14
15
OlficsdmePrqed Manaeer
UNDPICCOP do ESAP salasanamam Banekolr2mailand MVhJardWitw sdanoer. u r n
P!aa de Fonlenoy 75700 Parb. Francs Ioc, unmm place de Fonlenoy 75700 Paris, France
EngM m, unesa, FlKa de Flnllq 75700 Paris, France m, unesa, placa de Fonlemy 75700 Paris. Francs
English French Russian English
m. unesa, placedeFontemy 75700 Paris. F r m
English
18
19
20
21
22
23
24
25
28
27
28
29
30
31
32
DivismdMnrlne
FlKadeFontemy sdenoes. u r n
75700 Park, France DMshndMarine sdences, u r n
FlKa de Frnemy 75700 Paris. F r m
English French spsrvsh Russian EngM French spansh Russian kabic English
FAO Vu delle Tern d cardla
00100 h, Italy Ioc. unmm ~ d e F o n t e n o y 75700 Paris. Francs
~nglish (an d spsrvsh
m, unesm FlKa de Fontenoy 75700 Paris. France Ioc. u r n
PlacadeFantenoY 75700 Paris, Francs m, unesm
FlKadeFMlteroy 75700 Pari$, Francs
English French spamsh Russian
English French ** Russian English Russian
Ioc. u r n -deFontenoy 75700 Paris. Francs
English French spansh Russian
Third loUwM0 Workshop on Marine
11-15 Fe- 1980. M M MGiming. New Delhi.
Ioc. unesm place de Fontenoy 75700 Paris. F r m
m, unesa, PlacedeFan(en0Y 75700 P a France m, unmm
placedeFontenay 75700 Perla Francs Ioc, unesm
PlacedeFMlteroy
m. unepx, PlacedeFontemy 75700 Pais. France
75700 Paris. Francs
English (an d W)
Ioc, unmm pbcsdeFon(en0y 75700 Paria. France
m. unesm RacsdeFontemy 75700 Paria France Ioc, u r n
placedeFontenay 75700 Paris, Francs m, u r n
PlaCedeFontemy 75700 Paris. Francs
English
Ioc. unmm placedeFontenoy 75700 P a , Francs m, unesa,
PlacedeFOntenoy 75700 Pais. France
EngM
m, unmm FlKa de Fonlenoy 75700 P a . France
Enplbh French spanlsh
Ioc, unesa,
75700 Pari$, Fram Ioc. u m PlaCsdeFontemy, 75700 Patis, Francs m, u r n RacadeFonteroy 75700 P d . Francs Ioc, u r n PlacedeFonteroy 75700 Pwia Fram
English
English (Our d boa) Spanish m, u r n
PlacsdeFOntenoy 75700 Paris. F f m
Enplii Spanish
Ioc, unmm P l a c S d e F ~ 75700 P&, Francs
English French
Ioc, unmm pbcr de Fonlawy 75700 P d . F f m
IWNrD ON INSIDE OF BACK COVER

Intergovernmental Oceanographic Commission Workshop Report No. 41
First Workshop of .Participants in the Joint FAO-IOC-WHO-IAEA-UNEP Project on Monitoring of Pollution in the Marine Environment of the West and Central African Region (WACAFl2 - Pilot Phase) Dakar, Senegal, 28 October-I November 1985
Unesco

IOC Workshop Report no. 41
INTRODUCTION
As part of UNEP's preparatory activities for the development of an Action Plan for the Protection and Development of the Marine and Coastal Environment in the West and Central African Region, an International Workshop on Marine Pollution in the Gulf of Guinea and Adjacent Areas was convened jointly by IOC, FAO, WHO and UNEP in Abidjan, 2-9 May 1978, where thirty-one experts from seventeen countries reviewed the major marine pollution problems of the region and provided scientific guidance on activities that would promote the protection of human health, fisheries resources and coastal and marine ecosystems (IOC Workshop Report no. 14, Unesco, 1978).
After the signature of the Abidjan Convention for the Co-operation in the Protection and Development of the Marine and Coastal Environment of the West and Central African Region, in March 1981, and the recommendations of the Second Meeting of the Steering Committee for the Marine Environment of West and Central Africa, April 1982, the Project Document on the joint FAO/IOC/WHO/IAEA/UNEP Project on Monitoring of Pollution in the Marine Environment of the West and Central African Region (WACAF/Z-Pilot Phase) was signed in April 1983.
The WACAF/2 Project co-ordinated by FAO and supervised by UNEP, combines four components which are implemented by the co-operating UN Organization, as follows :
(i)
(ii)
(iii)
analyses of metals, chlorinated hydrocarbons and petroleum hydrocarbons in marine biota (FAO) ; intercalibration of sampling and analytical techniques ( IAEA/FAO ) ; observations on floating oil slicks and tar on beaches, sampling and analysis of floating tar balls, and basic oceanographic observations necessary for the understanding of pollutant transport in the region (IOC); monitoring of the microbiological quality of recreational waters and seafood (WHO).
The present Workshop was convened by the Intergovernmental Oceanographic Commission, on behalf of and in collaboration with, the co-operating UN Organizations in order to review the results so far obtained by the participating scientists in the region and to consider a long-term regional collaborative programme on marine pollution research and monitoring in West and Central Africa.
The Report of the Workshop is printed in English only; however, the scientific contributions have been printed in their original languages : 10 in English and 7 in French.
( SC .8 6 / WS / 4 3 )

IOC Workshop Report no. 41 page 2
TABLE OF CONTENTS
INTRODUCTION SUMMARY REPORT 1. Opening of the Workshop 2. Administrative arrangements 3. 4. 5.
6.
7.
General statement on the Action Plan for West and Central Africa Progress Report on the implementation of the WACAF/2 Project Individual scientific reports of participating research centres by responsible leading scientists The state of contamination of the marine environment in the WACAF Region Future co-operation in marine pollution research and monitoring in the WACAF Region
8. Other business 9. Adoption of the report 10. Closing of the Workshop
Page 1
3 3 4 4
5
6
8 12 12 13
v.l v.2
v. 3
v.4 v.5 V.6 v. 7 V. 8 v.9
ANNEXES 1. Agenda I1 List of Participants 111 Progress Report on WACAF/2 IV V
Results of WACAF Intercalibration Exercise for trace metals Individual Scientific Reports of Participating Research Centres
Trace metal analysis in fish
Preliminary survey on mercury and cadmium levels in some ~
marine fishery products Recherche et dosage des traces de metaux lourds dans des organisrnes marins au S6negal Teneurs en metaux lourds dans les produits de peche en CBte d'Ivoire The monitoring of marine pollution in Sierra Leone Monitoring organochlorines in fish Echantillonnage du goudron de plage Monitoring of tar on beaches in Cameroon Tar balls as indicator of crdde petroleum pollution of the beaches
V.10 Stranded pelagic tar ball loadings on Badagry Beach, Nigeria V.ll Surveillance continue de la pollution par les hydrocarbures V.12 Surveillance microbiologique des eaux cBti8res et des fruits de mer V.13 Surveillance bacteriologique des eaux cBti&res V.14 Surveillance rnicrobiologique des eaux cBtibres

IOC Workshop Report no. 41 page 2bis
VI The State of Contamination of the Marine Environment in the WACAF Region
VI.1 VI.2
VI.3
Present trends in environmental pollution studies Factors influencing marine pollution surveys in West and Central
A Review of the hydrography and physical oceanography of West and Central Africa.
. Africa

IOC Workshop Report no. 41 Page 3
1. OPENING OF THE WORKSHOP
The First Workshop of Participants in the Joint FAO/IOC/WHO/IAEA/UNEP Project on Monitoring of Pollution in the Marine Environment of the West and Central African Region (WACAF/2) was opened by his Excellency Mr. Cheikh Abdoul Khadre Cissokho, the Minister for the Protection of Nature of the Republic of Senegal, at 10.00 on Monday, 28 October 1985, at the Unesco Regional Office for Education in Africa (BREDA).
The Participants in the Workshop were welcomed, on behalf of the Director of BREDA, by its Acting Director, Mr. Ogunniyi, who recalled the important role of BREDA in the development and execution of programmes in the West and Central African Reqion.The Technical Secretary Oceanographic Commission (IOC), Dr. Rolf Schneider, welcomed the Participants on behalf of the Secretary IOC and on behalf of the co-operating United Nations Agencies, expressing their gratitude to the Government BREDA for hosting the Workshop and explaining the aims of this Workshop and the attention expected to be paid to it by the relevant bodies of the UN Agencies, in particular of IOC
for the Intergovernmental
of Senegal and to
His Excellency the Minister for the Protection of Nature, in his opening address, recalling the history of WACAF/2, indicated that in particular pollution by hydrocarbons is regarded as constantly increasing in the coastal waters and on the beaches of the Gulf of Guinea and the adjacent regions, thus causing adverse effects on coastal ecosystems and fishery resources. He therefore considered it necessary for the WACAF/2. Project to contribute to the knowledge of pollution by petroleum hydrocarbons as well as by other pollutants, such as heavy metals, organochlorines and micro-organisms, in order to fight marine pollution.
2. ADMINISTRATIVE ARRANGEMENTS
2.1 DESIGNATION OF THE CHAIRMAN, VICE-CHAIRMAN AND RAPPORTEURS
Mr. D. BQ (Senegal) was proposed and unanimously elected as Chairman for the Workshop. Mr. A.C. Ibe (Nigeria) was unanimously designated as Vice-chairman and Mrs. Mbi (Cameroon) and Mr. D. Kouam6 (Ivory Coast) as Rapporteurs.
The List of Participants is attached to this Report as Annex 11.
2.2 CONSIDERATION OF THE AGENDA
After minor comments and suggestions from Participants, the Provisional Agenda was adopted as proposed by the joint Secretariat of IOC, FAO, WHO and IAEA, and is given in Annex I.
2.3 CONDUCT OF THE WORKSHOP , TIMETABLE AND DOCUMENTATION
The Technical Secretary for IOC, on behalf of,the joint Secretariat informed the Bureau and the Participants about the servicing arrangements for the Workshop in BREDA and introduced the Provisional List of Documents. He also proposed a provisional timetable for the Workshop which was found acceptable.
IOC Workshop Report no. 41 Page 4
3. GENERAL STATEMENT ON THE ACTION PLAN FOR WEST AND CENTRAL AFRICA
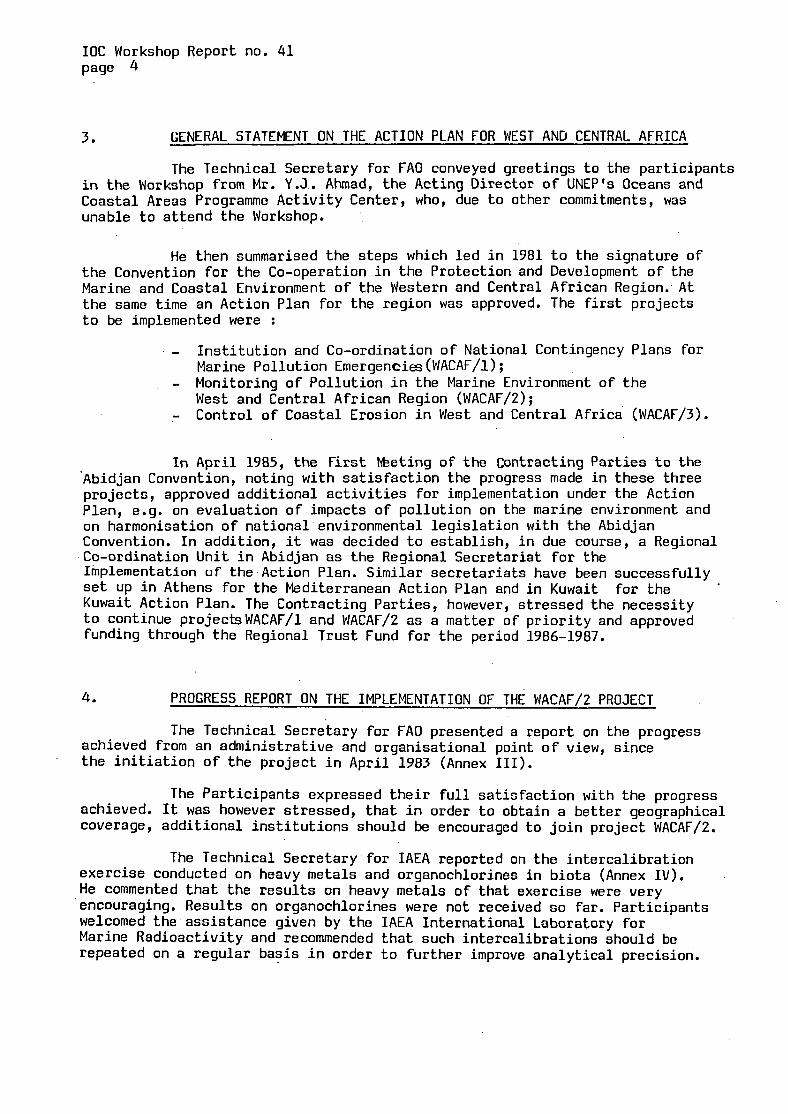
The Technical Secretary for FAO conveyed greetings to the participants in the Workshop from Mr. Y .J . Ahmad, the Acting Director of UNEP's Oceans and Coastal Areas Programme Activity Center, who, due to other commitments, was unable to attend the Workshop.
He then summarised the steps which led in 1981 the Convention for the Co-operation in the Protection and Marine and Coastal Environment of the Western and Central the same time an Action Plan for the region was approved. to be implemented were :
to the signature of Development of the African Region. At The first projects
- Institution and Co-ordination of National Contingency Plans for
- -
Marine Pollution Emergencies (WACAF/l) ; Monitoring of Pollution in the Marine Environment of the West and Central African Region (WACAF/Z) ; Control of Coastal Erosion in West and Central Africa (WACAF/3).
In April 1985, the First keting of the Contracting Parties to the 'Abidjan Convention, noting with satisfaction the progress made in these three projects, approved additional activities for implementation under the Action Plan, e.g. on evaluation of impacts of pollution on the marine environment and on harmonisation of national environmental legislation with the Abidjan Convention. In addition, it was decided to establish, in due course, a Regional Co-ordination Unit in Abidjan as the Regional Secretariat for the Implementation of the Action Plan. Similar secretariats have been successfully set up in Athens for the Mediterranean Action Plan and in Kuwait Kuwait Action Plan. The Contracting Parties, however, stressed the necessity to continue projectsWACAF/l and WACAF/2 as a matter of priority and approved funding through the Regional Trust Fund for the period 1986-1987.
for the
4. PROGRESS REPORT ON THE IMPLEMENTATION OF THE WACAF/Z PROJECT
The Technical Secretary for FAO presented a report on the progress achieved from an administrative and organisational point of view, since the initiation of the project in April 1983 (Annex 111).
The Participants expressed their full satisfaction with the progress achieved. It was however stressed, that in order to obtain a better geographical coverage, additional institutions should be encouraged to join project WACAF/Z.
exercise conducted on heavy metals and organochlorines in biota (Annex IV). He commented that the results on heavy metals of that exercise were very encouraging. Results on organochlorines were not received so far. Participants welcomed the assistance given by the IAEA International Laboratory for Marine Radioactivity and recommended that such intercalibrations should be repeated on a regular basis in order to further improve analytical precision.
The Technical Secretary for IAEA reported on the intercalibration

IOC Workshop Report no. 41 Page 5
5. INDIVIDUAL SCIENTIFIC REPORTS OF PARTICIPATING RESEARCH CENTRES BY RESPONSIBLE LEADING SCIENTISTS
The Participants summarised the results so far obtained in the course of the WACAF/2 Pilot Phase and outlined their planned activities in the forthcoming operational phase. The following reports were presented and are annexe Vin the original language to this Report, as agreed upon under Item 9.
Heavy metals in seafood
C. Biney (Ghana) 1 . (Annex V/1) I. L. Mbome (Cameroon) (Annex V/2) D. B$ (Senegal) (Annex V/3) B.S. Metongo (Ivory Coast) (Annex V/4)
Orqanochlorines in seafood
D. Faulkner (Sierra Leone) (Annex V/5) N. N'Jie (The Gambia) (Annex V/6)
Tar on beaches
P.K. Koffi (Ivory Coast) (Annex V/7) J.C. Njock .(Cameroon) (Annex V/8) U.K. Enyenihi (Nigeria) (Annex V/9) E.C. Okonya (Nigeria) (Annex V/10) P. N'Diaye (Senegal) (Annex V/11)
Pollution by micro-orqanisms
I. Sow (Senegal) (Annex V/12) R. Paris and D. Diallo (Annex V/13)
D. Kouame (Ivory Coast) (Annex V/14) (Senegal)
Each presentation was followed by in-depth discussions and' suggestions for future activities which were taken up again under Agenda Item 7.
J.B. Babadounga (Gabon) announced that a laboratory in Gabon is being established and will hopefully be able to participate in the components on monitoring of petroleum hydrocarbons and micro-organisms starting at the end of this year.
The results so far obtained in the Project were then summarized under Agenda Item 6.

IOC Workshop Report no. 41 Page 6
6. THE STATE OF CONTAMINATION OF THE MARINE ENVIRONMENT IN THE WACAF REGION
Under this item both, experts from, and outside, the WACAF Region, as well as Technical Secretaries of the co-operating UN Organizations summarised mainly on the basis of the individual scientific reports, the present knowledge on the state of contamination of the marine environment in the West and Central African Region, as compared with other areas.
6.1 GENERAL PHYSICAL OCEANOGRAPHY AND HYDROGRAPHY IN THE WACAF REGION
Mr. A.C. Ibe (Nigeria) summarised the knowledge on the physical oceanographic phenomena that affect the transport and deposition of contaminants in the marine and coastal environment. He stressed that these dynamic phenomena include both large scale events that originate for the most part outside of national boundaries as well as smaller scale processes that are triggered off in the vicinity or on national coastlines.
The large scale events are the oceanic currents. The oceanic currents directly affecting the hydrography of the WACAF Region are the Canary, Benguela, the Equatorial Counter Current, the South Equatorial Current and the Guinea Current. In the immediate vicinity of the coasts, tide and wave generated currents are the dominant processes. Tidal currents are particularly effective around river mouths but they are less effective on the continuous and straight shorelines except in areas with high 6 4 m ) tidal ranges. Wave-induced currents are, however, more prevalent everywhere and attain velocities generally less than lm/s. The recognition of the interplay between oceanographic phenomena and the spread and deposition of pollutants would stimulate the acquisition of oceanographic data as an integral part of the WACAF/2 Project. At first, such studies could be on national basis but because of the across boundary nature of the processes, a regional approach is imperative.
should urgently be intensified (see item 7.1). The Participants unanimously agreed that oceanographic observations
6.2 LEVELS OF HEAVY METALS AND ORGANOCHLORINES IN MARINE ORGANISMS
Mr E. Bacci (Italy) summarised that, from the results presented by the participating Research Centers, some.first preliminary conclusions can be drawn. Concerning mercury, levels found in tuna fish muscle, 0.1. - 0.3. mg kg-l wet weight (WW), are lower than those typical in similar samples from the Mediterranean area (0.5 - (cynnabar or deposits, volcanic activities, degassing) as well as anthropogenic contamination are present. Figures for mercury levels of tuna fish muscle from "unpolluted" and non-anomalous areas range from 0.1 to 1.0 mg kg-1 WW. Results from other samples, i.e. fish, other than tuna, shrimp muscle, and bivalve mollusc soft parts (C 0.1 m9.kg-l WW) indicate typical natural levels and are, consequently, lower than those found in similar samples from the Mediterranean (0.1.-1.0 mg kg-1 WW).
2.5 mg kg-1 WW), where natural contributions

IOC Workshop Report no. 41 Page 7
Cadmium concentrations in fish and crustacean muscles are, in general, lower than the detection limit of the analytical technique used (flame AAS) which is 0.2 mg kg-1 WW. However, in bivalve mollusc soft parts, results range from 0.2 to 2.0 mg kg-l WW. According to recent literature, 0.001 - 0.010 mg kg-l WW appears to be the range of the levels of cadmium in marine fish muscle, where probably the concentration of this element is physiologically regulated. Higher levels are reported for bivalve mollusc soft parts from other areas (0.1 - 1.0 m g kg-' WW).
The few figures available for lead are near to or lower than the detection limit (0.5 mg kg-l WW) by hydride generation - AAS. In other regions, the Mediterranean included, levels of lead in fish and crustacean muscle are often in the range 0.05-0.50 mg kg'l.WW.
Copper and zinc concentrations in marine animal tissues are almost similar to the findings from other areas regarded as unpolluted.
First results on chlorinated pesticides and PCBs seem, at present, to indicate a "backgroundI1 level, as in other regions, more than a hot spot situation.
In an informal round-table session, two additional documents on thisbpic were presented :
- Bacci, E. and Gaggi, C. "Present trends in environmental
- Whitehead, N.E., "Factors influencing marine pollution surveys in Pollution Studies", (Annex VI/1)
West and Central Africa", (Annex VI/2).
The results of the subsequent discussions are summarised under item 7.1.
6.3 FLOATING OIL SLICKS AND TAR BALLS, TAR ON BEACHES
The Technical Secretary for IOC recalled to the Participants that during the Pilot Phase of the Project, only six research centres (in-Senegal, Ivory Coast, observations on beach tar dedication to this component that he had experienced during the individual reports under item 5 and the following discussions. He appreciated the fact that at least 5 additional centres in Senegal, the Gambia, Sierra Leone, Ghana and Gabon, had expressed their wish to joint in these observations. Summarizing the individual contributions he regretted that there had apparently been-confusion on the methodology to be applied, rendering unsatisfactory any scientifically sound evaluation of the results so far obtained.
Nigeria (21, Cameroon and Congo), had participated in the and expressed his satisfaction with the
Reviewing the results obtained in spite of all constraints concerning intercomparability, he concluded that there appears to be a tendency of elevated levels of beach tar in the Eastern Gulf of Guinea (up to several kg m-' in Nigeria, -Cameroon and Congo), whereas those in the -western and northern parts of the Region reached values only an order of magnitude lower (few hundreds of g m-' in Ivory Coast and Senk'gal3.' This can easily be attributed to the high level of mineral oil exploitation and transportation in the first area, and perhaps also to the current distribution. In total, the range of weights of beach tar in the area compares with data obtained in the Mediterranean Sea.

IOC Workshop Report no. 41 Page 8
He concluded that longer-term observations carried out by more participants floating oil slicks and oceanographic parameters are necessary before any final conclusions can be drawn as to the state of contamination by oil in West and Central Africa.
and using the same methodology, together with observations on
The results of the subsequent discussions are summarised under Agenda Item 7.1.
6.4 CONTAMINATION BY MICRO-ORGANISMS
Mr. Mujeriego (Spain) summarised the results on surveillance of the micro-biological quality of coastal waters. The work has begun this year in Senegal and Ivory Coast. The two institutions have now gathered practical experience concerning sampling, analysis and statistical data handling.
The methods used for sampling and enumeration of three types of faecal bacteria in coastal waters have been adequate,necessitating only some refinements and standardizztion. The participating laboratories were commended for work done up to now and encouraged to continue according to the lines agreed. As the number of samples counted in both laboratories was still low, there was no way to reach any statistically valid conclusions.
Concern was expressed that no results from Nigeria were available so far.
The results of the subsequent discussions are listed under Agenda Item 7.1.
7. FUTURE CO-OPERATION IN MARINE POLLUTION RESEARCH AND MONITORING IN THE WACAF REGION
IDENTIFICATION OF MAJOR SCIENTIFIC PROBLEMS AND FUTURE NATIONAL 7.1 AND REGIONAL CO-OPERATION, TRAINING, EDUCATION AND EQUIPMENT
The Participants discussed a detailed programme for the period 1986/1987 for the analysis of contaminants in biota. It was decided that heavy metals (mandatory : Hg, Cd) and organochlorines (mandatory : DDT and PCB), should be analysed in the following mandatory species :
Top predator fish : Sphyraena sphyraena (European barracuda)
: Pseudotolithus seneqalensis (Cassava croaker)
(if not available : Thunnus obesus) (Bigeye tuna)
(if not available : Epinephelus aeneus) (White grouper)
(if not available : Paqellus belottii) (Red pandora)
Predator fish
Bottom feeding fish : Cynoqlossus monodi (Guinean tongue sole)
IOC Workshop Report no. 41 Page 9
Plankton feeding fish
Shrimp
Oyster (sea-)
Oyster (Mangrove)
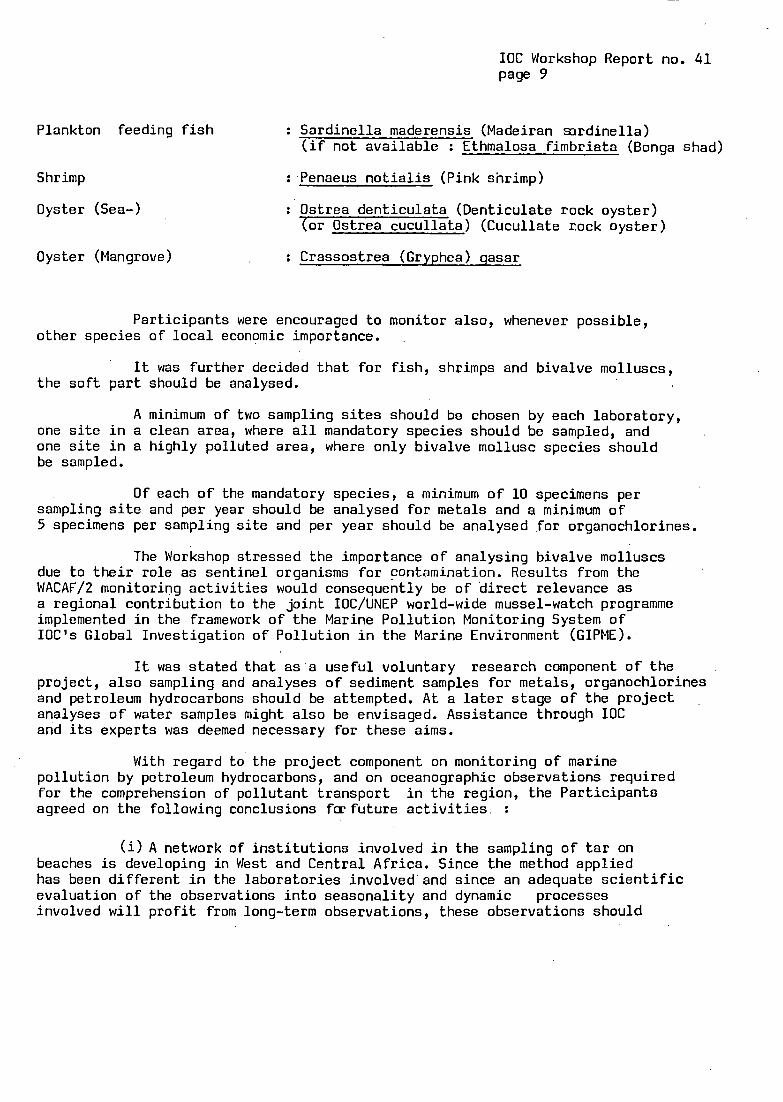
Sardinella maderensis (Madeiran ardinella) (if not available : Ethmalosa fimbriata (Bonga shad)
Penaeus notialis (Pink shrimp)
Ostrea denticulata (Denticulate rock oyster) (or Ostrea cucullata) (Cucullate rock oyster)
Crassostrea (Gryphea) qasar
Participants were encouraged to monitor also, whenever possible, other species of local economic importance.
It was further decided that for fish, shrimps and bivalve molluscs, the soft part should be analysed.
A minimum of two sampling sites should be chosen by each laboratory, one site in a clean area, where all mandatory species should be sampled, and one site in a highly polluted area, where only bivalve mollusc species should be sampled.
Of each of the mandatory species, a minimum of 10 specimens per sampling site and per year should be analysed for metals and a minimum of 5 specimens per sampling site and per year should be analysed for organochlorines.
The Workshop stressed the importance of analysing bivalve molluscs due to their role as sentinel organisms for contamination. Results from the WACAF/2 monitoring activities would consequently be of direct relevance as a regional contribution to the joint IOC/UNEP world-wide mussel-watch programme implemented in the framework of the Marine Pollution Monitoring System of IOC's Global Investigation of Pollution in the Marine Environment (GIPME).
It was stated that as a useful voluntary research component of the project, also sampling and analyses of sediment samples for metals, organochlorines and petroleum hydrocarbons should be attempted. At a later stage of the project analyses of water samples might also be envisaged. Assistance through IOC and its experts was deemed necessary for these aims.
With regard to the project component on monitoring of marine pollution by petroleum hydrocarbons, and on oceanographic observations required for the comprehension of pollutant transport agreed on the following conclusions fcr future activities. :
in the region, the Participants
(i) A network of institutions involved in the sampling of tar on beaches is developing in West and Central Africa. Since the method applied has been different in the laboratories involved and since an adequate scientific evaluation of the observations into seasonality and dynamic involved will profit from long-term observations, these observations should
processes

IOC Workshop Report no. 41 page 10
be carried on through two more years adhering strictly to the method given in UNEP/IOC/IAEA Reference Methods no. 15 (draft) which has been copied to all participants in this component. The extension observations over this'period will also allow for the inclusion of new participants to obtain a better coverage of the region and to strengthen the network of participating Research Centres.
of these
(ii) In several countries, the implementation of this component still requires the provision of basic equipment, such as balances, anemometers, compasses, etc., and training, which can now be offered by some of the more experienced participants if funds are made available for the travel and subsistence expenses. IOC should now attribute highest priority to'these aims. Governments, as well as the more experienced institutions, should also assist by granting fellowships in these more experienced institutions. would at the same time increase international collaboration within the region.
This assistance
(iii) Concerning the desirable observations of floating oil sicks, only limited additional equipment and training would be required. Research vessels not being available in some of the countries, these observations should nevertheless be carried out by national collaborative efforts involving e.g. the navies, the merchant marines, civil aviation and air forces. Such a collaboration has already been agreed upon in one of the countries.
(iv) The participating scientific experts also recommended that whilst all former and additional participating Research Centers carry on their observations, those of them which already have the basic equipment and vessels at their disposal, be encouraged and supported to initiate in-depth studies into the chemical analysis of floating oil slicks and tar balls, as well as sediments, for petroleum hydrocarbons.
(VI One prerequisite for a successful performance of chemical analysis for petroleum hydrocarbons was seen in intercalibration exercises on sampling and analytical methodology for which the assistance through IOCws requested.
(vi) On the basis of the results of these exercises and as a matter of general need, a training workshop was recommended on all aspects of monitoring oil pollution, for which assistance through IOC was also requested.
(Vii) It was further concluded that currents, waves, winds, interaction with sediments, suspended particles and biota will influence the transfer and distribution of pollutants. In order to relate the distribution and concentration levels to sources of pollutants, the influence of these dynamical factors ,
on the environment need to be ascertained and understood. For this purpose, a series of detailed oceanographic studies, comprising further measurements and analysis of currents, waves, water levels, sediment patterns, nutrient concentrations need to be carried out from the nearshore, littoral zone to the open ocean.

IOC Workshop Report no. 41 page 11
(viii) Assistance through IOC was therefore requested in terms of additional equipment and training. Practical training could be provided by the more advanced institutions in the Region through participation of trainees of other countries in oceanographic research cruises, where equipment is employed, data collected, reported and analysed. In this context, it was requested that IOC assist in obtaining the permission of Governments to enter their territorial waters for research vessels from other countries carrying out such activities under WACAF/2.
(ix) Training should also be provided in the form of a more continuous
Identified gaps should be type at technical and scientific levels. An inventory of suitable facilities and opportunities in,the Region should be up-dated. supplemented through support from the Project.
Concerning.further developments of monitoring of micro-biological contamination there are four areas to be activited :
(i) The participating laboratories should now widen the scope of their work and begin,the micro-biological surveillance of sea-food, like oysters or mussels, which are of national or of local interest.
(ii) WHO will approach countries that are not yet participating in this programme, and ask them to nominate a national laboratory for participating in the micro-biological surveillance of coastal waters and sea-food in the context of WACAF/2. The inclusion of 5 more laboratories would be realistic.
(iii) As far as possible WHO will strive to arrange a training and
for one week workshop on sampling, enumeration and data intercalibration exercise by inviting participants from all the laboratories to one laboratory handling in order to secure the use of identical methods in all laboratories and to improve the
(iv) Concerning the individual laboratories they are requested to do the minimum surveillance programme agreed but they are completely free to widen the scope of their individual work, in areas such as adaptation of the enumeration methods for the three indicator bacteria and the study of the relevancy of these three indicator organisms in tropical coastal waters. WACAF/2, WHO and other agencies cannot extra activities, but that support for such a work could possibly be given through other WHO programmes.
methodology in use.
It is to be noted, that in the framework of assist the laboratories in these
IOC Workshop Report no. 41 page 12
7.2 REQUIREMENTS IN SUPPORT TO THE PLANNED ACTIVITIES
Participants in the Workshop discussed ways and means to improve scientific support and co-operation between participating laboratories in the implementation of their future work programme. The following specific proposals were made :
(i) To facilitate communication and avoid bureaucratic delays, correspondence between UN Organizations and National Focal Points should be copied to research institutions concerned.
(ii) To encourage technical co-operation between developing countries (TCDC) funds should be made available for exchange or visits for scientists within the region.
(iii) Ways and means should be found to improve the access of participating laboratories to up-to-date scientific literature.
c
(iv) Contacts should be initiated by UN Organizations between participating institutions in the region and advanced research institutions in developed countries with the aim of establishing informal partnerships through which experienced scientists, on a voluntary basis, would give special assistance and advice to laboratories participating in WACAF/2.
a. OTHER BUSINESS
The Workshopwas informed by the Secretariat that it was planned to hold the Second Scientific Workshop on WACAF/2 late in 1987. Participants suggested that it be held in a country not having hosted a WACAF/2 Meeting so far and the Secretariat was requested to investigate with Governments in that direction.
9. ADOPTION OF THE REPORT
The Report in its English version was thoroughly discussed by the Participants, and was approved with some amendments; editorial matters were left to the Secretariat. It was agreed that the progress report prepared by UN Organizations, the individual scientific reports, after editorial changes as to uniformity in format, and discussion papers, be annexed to the report.

IOC Workshop Report no. 41 page 13
10. CLOSING OF THE WORKSHOP
The Chairman thanked all Participants for their valuable
Mr. F.E. Ikoms (Cameroon), on behalf of the Participants,
contributions to the Workshop.
extended their thanks to the Government of Senegal, to the Unesco Regional Office for Education in Africa for hosting this Workshop, to the Chairman, Mr. D. B%,and the Secretariat for the efficient conduct of the Workshop.
The Chairman closed the Session at 15.20 hours on Friday 1 November 1985.

IOC Workshop Report no. 41 Annex I
ANNEX I
AGENDA
1.
2.
3.
4.
5.
6.
7.
0.
9.
OPENING
ADMINISTRATIVE ARRANGEMENTS
2.1 DESIGNATION OF THE CHAIRMAN, VICE-CHAIRMAN AND RAPPORTEURS
2.2 CONSIDERATION OF THE AGENDA
2.3 CONDUCT OF THE WORKSHOPy TIMETABLE AND DOCUMENTATION
GENERAL STATEMENT ON THE ACTION PLAN FOR WEST AND CENTRAL AFRICA
PROGRESS REPORT ON THE IMPLEMENTATION OF THE WACAF/2 PROJECT
INDIVIDUAL SCIENTIFIC REPORTS OF PARTICIPATING RESEARCH CENTERS BY RESPONSIBLE LEADING SCIENTISTS
THE STATE OF CONTAMINATION OF THE MARINE ENVIRONMENT IN THE WACAF REGION
6.1 GENERAL PHYSICAL OCEANOGRAPHY IN THE WACAF REGION
6.2 LEVELS OF HEAVY METALS AND ORGANOCHLORINES IN COMMERCIAL SPECIES
6.3 FLOATING OIL SLICKS AND TAR BALLS, TAR ON BEACH
6.4 CONTAMINATION BY MICRO-ORGANISMS
FUTURE CO-OPERATION IN MARINE POLLUTION RESEARCH AND MONITORING IN T.HE WACAF REGION
7.1 IDENTIFICATION OF MAJOR SCIENTIFIC PROBLEMS AND FUTURE NATIONAL AND REGIONAL CO-OPERATIONy TRAINING, EDUCATION AND EQUIPMENT
7.2 REQUIREMENTS IN SUPPORT OF THE PLANNED ACTIVITIES
OTHER BUSINESS
ADOPTION OF THE REPORT AND RECOMMENDATIONS
10. CLOSURE OF THE WORKSHOP

IOC Workshop Report no. 41 Annex I1
I.
ANNEX I1
LIST OF PARTICIPANTS
EXPERTS FROM THE REGION
B%, D.
Babadounga, J.B.
Biney, C.
Ciss, M.
Cooper, J.F.
Diaw, P.A.
Diop, A.
'Enyenihi, U.K.
Laboratoire de chimie analytique et toxicoloqie FacultB-de medecine et de pharmacie Universite de Dakar Dakar SBnBgal
Centre National anti-pollution Ministere de 1'Environnernent et de la Protection de la Nature BP 3241 Libreville Gabon
Institute for Aquatic Biology Box 38 Achimota Ghana
Laboratoire de chimie analytique et toxicoloqie Facult6 de medecine et de pharmacie Universit6 de Dakar Dakar SCnBgal
Laboratoire de chimie analytique et toxicologie Facult6 de mBdecine et de pharmacie UniversitB de Dakar Dakar SBnBgal
Ecole Inter-Etats des Sciences de M6decine V6tBrinaire 8, rue Woro Sicap Fann Karack Dakar SCnBgal
Ministere de la Protection de la Nature Building administratif Dakar S Bn Bgal
Institute of Oceanography University of Calabar PMB 115 Calabar Nigeria

IOC Workshop Report no. 41 Annex I1 - page 2
Faulkner, D.F.
Ib6, A.C.
Ikome, F.
Koffi, P.K.
Kouadio, B.C.
Kouam6, D.
Mbi, C.
Mbome, I.L.
MBtongo, B.S.
'Institute of Marine Biology and Oceanography University of Sierra Leone Private Mail Bag Freetown Sierra Leone
Nigerian Institute for Oceanography and Marine Research PMB. 12729 Victoria Island Lagos Nigeria
Station de recherches halieutiques de Limb6 PMB. 77 Limb6 Cameroun
Centre de recherches oc6anographiques 29, rue des Pecheurs BP V18 Abidjan Cbte d'Ivoire
Laboratoire de microbiologie du Centre medical des gens de mer c/o Ministere de la marine Abidjan CBte d'Ivoire
Laboratoire de rnicrobiologie du Centre rn6dical des gens de mer c/o Ministere de la marine Abidjan Cbte d'Ivoire
Institut de recherches medicales et d'etudes des plantes mddicinales BP 6163 Yaounde Cameroun
Institut de recherches medicales et d'Btudes des plantes mddicinales BP 6163 Y aound6 Cameroun
Centre de recherches ocdanographiques (GRO) BP V18 29, rue des Pecheurs Abidjan Cbte d'Ivoire

N'Diaye, P.
N'Jie, M.
N jock, J .C ..
Okonya, E.C.
Paris, R.
sow, I.
IOC Workshop Report no. 41 Annex I1 - page 3
Ddpartement de biologie marine (IFAN) Universit6 de Dakar Dakar S6n6gal
Fisheries Department 6, Marina Parade Banjul Gambia
Station de recherches halieutiques de Limb6 P.M.B. 77 Limb6 Came r o un
Nigerian Institute for Oceanography and Marine Research PMB. 12729 Victoria Island Lagos N ige r ia
Ecole Nationale Supdrieure Universitaire de Technologie (ENSUT) BP 5085 Dakar Sendgal
Division de Prevention et ContrBle de Pollution et Nuisance Direction de 1'Environnement 104, rue Carnot Dakar Sendgal

IOC Workshop Report no. 41 Annex I1 - page 4
2. INVITED EXPERTS
Bacci, E. , . I . .
Gaggi, C.
Mujeriego, R. ..
I 3. OBSERVER
Flamion, B.
4. SECRETARIAT
Aalto, V.
Naeve, H.
Schneider, R.
Whitehead, N.E.
Dipartimento di Biologia Ambientale Universita di Siena via delle Cerchia 3 53000 Siena Italy
Dipartimento di Biologia Ambientale Universita di Siena Via delle Cerchia 3 53000 Siena Italy
Escuela Tecnica Superior d'Enginyers de Camins, Canals, Ports Universitat Politecnica de Barcelona Jordi Girona Salgado 08034 Barcelona Spain
Unesco Regional Office for Science and Technology in Africa Dakar Sdn6gal
World Health Organization Regional Office for Africa Brazzaville Congo
Food and Agriculture Organization via delle Terme di Caracalla 00100 Roma Italy
Intergovernmental Oceanographic Commission Unesco 7, place de Fontenoy ,75700 Paris France
International Atomic Energy Agency International Laboratory of Marine Radioactivity Mus6e OcGanographique Monaco

IOC Workshop Report no. 41 Annex 111
ANNEX I11
PROGRESS REPORT ON WACAF/2
1. Introduction
After the signature in March 1981 of the Abidjan Convention for the Co- operation in the Protection and Development of the Marine and Coastal Environment of the West and Central African Region, the primary scope of the WACAF 2 project is to support the development and implementation of the Action Plan conceived on the basis of the Convention through the preliminary assessment of the levels of selected pollutants in marine biota, through a survey of tar balls on beaches and the establishment of the degree to which recreational waters and seafood represent a health hazard. The present report is largely based on the one prepared for the Fourth Meeting of the WACAF Steering Committee and the First Meeting of Contracting Parties to the Abidjan Convention, convened in Abidjan from 15 to 17 and from 18 to 20 April respectively. It aims at giving a comprehensive picture of the progress made up to September 1985 from an administrative and organizational point of view.
Z History and Organiratim of the Pilot Project
The project document between FAO, IOC (of Unesco), WHO, IAEA and UNEP was signed on 19 April 1983 for a duration from November 1982 to October 1384. Total cost of the project: U.S.$632 700 (U.S.$509 500 from the Environment Fund of UNEP, U.S..$47 000 contributed by FAO, U.S.$33 600 contributed by IOC, U.S.818 600 con- tributed by WHO and U.S.S24 000 contributed by IAEA).
WACAF 2 combines 4 components technically coordinated by UN organizations, with FAO serving as the lead agency. The components are:
A.
'B.
C.
D.
Analysis of metals, chlorinated hydrocarbons and petroleum components in marine biota (coordinated by FAO)
Intercalibration exercise for sampling and analytical techniques (coordinated by IAEA in cooperation with FAO)
Observation of oil slicks and tar on beaches, sampling and analysis of floating tar balls and basic oceanographic observations (coordinated by IOC)
Monitoring of the microbiological quality of recreational waters 'and seafood (coordinated by WHO)
UNEP is responsible for the coordination of this project with the other ones carried out under the WACAF Action Plan umbrella. The UN bodies have informed the WACAF National Authorities and Focal Points on the initiation and workplan of the project and have invited them to designate their national institutions which should participate in a project implementation. FAO has circulated a letter on this subject on 29 March 1983, and IOC oh 9 M a y 1983 (see Annexes IV and V in UNEP/G.50/3). WHO has .initiated, through its regional office in Brazzaville, contacts with several countries to serve as first sites for bacteriological studies and water quality control.

IOC Workshop Report no. 41 Annex I11 - page 2
A broad array of institutions replied, although at times with many months delay, to the initial call for participation. Many research agreements were finalized only in the second half of 1984 and the first few months of 1985. A s a result, the project duration was extended by 1 year to October 1985, although, in line with available funding, research agreements were signed initially for a duration through 1984 in the hope that n e w funds would become available upon reaching the operational state of the Regional Trust Fund to beef up project activities begun in 1984. By September 1985, a total of 17 research or university institutes and laboratories from 10 countries, some
of which are participating in more than one component, had joined the WACAF 2 project (Appendix- 1) This total excludes one institute phasing out its participation in favour of another, upon request by. the National Focal Point for WACAF. The First Meeting of Contracting Parties to the Abidjan Convention, convened from 18 to 20 April in Abidjan, has now approved extension of the project through 1987 and urged National Focal Points to provide additional support to participating institutions. It was further decided that, upon the Regional Trust Fund becoming operational, funds should be made available to WACAF 2 as a matter of priority. This is n o w the case, and financial support for the first year of the new project phase is,thus secured. With this in mind, amendments to the previously stipulated research contracts have been forwarded to all participants in components A and 8 so as to guarantee smooth transition from the pilot phase to the long-term monitoring phase. Project amendments cover primarily running costs, while training, eventual expenses for repairs and spare parts will be dealt with on a case-by-case basis.
3. Provisim of Equipment, Accessories, Glassware, Chemicals, etc.
The major equipment delivered to participating institutes were 3 gas-liquid chromatographs, 3 atomic absorption spectrophotometers, one freeze-dryer, 6 'teflon bombs' for the decomposition of the organic sample matrix, 5 soxhlet extraction units in the project component on analyses of heavy metals and chlorinated hydrocarbons, as well as 3 complete membrane filtration sets in the microbiological monitoring component. Of the latter, only one was delivered to a research institute while the other two remained with WACAF National Focal Points, pending the designation of participating institutes.
'
. Other equipment supplied comprised complete sets of glassware indispensable for the execution of work and voltage stabilizers to back-up sensitive electronic equip- ment for those countries known to suffer from strong variations in voltage.
Furthermore, chemicals and standards for analyses of pesticides, heavy metals and petroleum hydrocarbons were delivered to participating institutes according to their commitments. In three cases, nitrogen carrier gas had to be bought because IoEally available grades were insufficient for GLC analyses. In the microbiological project component, chemicals, reagents and culture media were brought for three participants.
A number of spare parts were purchased to repair or upgrade already existing equ'rpment in participating laboratories, as well as an AAS in IAEA's Monaco laboratory, involved in the intercalibration. Upgrading of one GC with an electron capture detector for pesticide analysis of a centre already involved in heavy metal analysb is still under way.
IOC Workshop Report no. 41 Annex 111 - page 3
Delays were encountered in the installation of the GLCs and AASs bought through the project, partially due tu late availability of material essential for the installatian, but also, to some extent, to manpower shortage of the manufacturer,ln two cases, difficulties in the installation resulted from faulty components which were adjusted orreplaced as part of the warranty. All six instruments are now operational.
A tutal ~ l : UL$220 000 was spent on equipment. and materials, and institutes adhering to the eomponenL on heavy metal and hydrocarbon analyses have been informed in an d o f - y e a r statnnent on the expenditures incurred for them against their allocation in-their research agreement The total allotment for 1984 has, in all cases but one been paid wd in s o m e cases exceeded, wtrile nn substantial expenditures for equipment wefe effected m 1985-
4. Training
Training has, since the formulation of the project document, been considered one of the most important activities of the project. In 1984 it consisted primarily of an external training component and to a lesser extent of other locaI training. Fourteen participants from 11 institutes in eight countries in the project components on heavy metal and hydrocarbon analyses and on microbiological monitoring of water quality had participated in training courses or scientific visits abroad lasting between 1 and 5 weeks and in another 4 cases project funds had been m a d e available for local training. Training focussed on sampling, sample preparation, analytical methods and calculation and interpretation of results. In 1985, more emphasis has been laid oh on-the-job training; a national seminar on work within the component on microbiological safety, held in two countries by a WHO consultant, covered the following programme:' (a) moni toring programmes, (d) inter- pretation of chronological results, and A training course is being planned for 1986 on microbiological methodology for laboratory personnel of participating and interested institutes. All institutes but one participating in the component on pollutant analyses in marine organisms have been visited by F A O consultants in preparation for the project's scientific workshop.
(b) analytical procedures, (c) quality control, (e) evaluation of results.
5. Visiting Experts
In 1983 and 1984, a number of missions were staged by all UN agencies involved with the scope of identifying, in close collaboration with the respective National WACAF Authorities and Focal Points, potential participants for the individual project components while, at the same time, assessing their needs for equipment and training as well as to sort out obstacles on the way to a successful participation in the project. A total of 28 institutes, in addition to National Focal Points, in ten countries were visited by the various missions. The countries were: Benin, Cameroon, Congo, The Gambia, Ghana, Ivory Coast, Nigeria, Senegal, Sierra Leone and Zaire (Appendixr2-t Project implementation being we11 under way, the major objective of consultant missions in 1985 was on-the-job: training, development of work programmes and preparation of the project's first scientific workshop.

IOC Workshop Report no. 41 Annex I11 - page 4
6. Data Collection, Handling and Reporting
According to the respective research agreements, participants were expected to submit six-monthly progress reports and a final report at the end of the pilot phase of the project.
To facilitate this job, data reporting forms and method manuals developed originally for similar projects in other Regional Seas projects and plsewhere were distributed to participants in the beach tar component (Appendix 3) and in the component on contaminants in organisms. If larger amounts of data become available during subsequent project phases, standardized reporting should allow for computer processing.
Because of the initial delays in the signature process of research agreements and the relatively great quantities of equipment and expendables to be supplied essentially from outside the region, analytical work had not yet started in the project component on heavy metal and hydrocarbon analyses by the end of 1984. Therefore, the travel reports from the trainees were considered sufficient reporting for the previous period. First tentative results on contaminant levels were nevertheless obtained during the training courses through analyses on a few samples of marine biota bought in the Dakar and Oouala fish markets respectively. As might have been expected, metal levels (cadmium, zinc, selenium with the exception of total mercury) were much higher in sessile filter-feeding oysters than in migratory pelagic mackeiel. The latter compared well with those of the international standard MA-A2.
All institutes but one in that project component have initiated analytical work and started reporting results on the intercalibration exercise (see below) and of analyses carried out on locally-sampled materia1 (Appendix -4) Results are being presented individually by participants at the workshop.
Following consultant missions (see Section 5); six laboratories reported beach-tar observations (Appendix-5) Sampling routine involved between 1 and 3 stations visited in half-monthly to approximately two-monthly intervals. Since data are somewhat scanty and m a y range over 4 orders of magnitude in an individual station (most data reported vary between 10 and 200 g per sampling station of a 2-rn broad stretch from sea level up the beach) they do not lend themselves easily for interpretation at this stage.
' .
7. Intercalibration
Parallel with analyses of heavy metals and chlorinated hydrocarbons, all insti- tutes agreed to participate in a regional intercalibration exercise. IAEA's Inter- national Laboratory of Marine Radioactivity in Monaco has distributed sets of well- homogenized shrimp and mussel samples for analysis of trace metals and chlorinated hydrocarbons, together with detailed descriptions and instructions. The material has been analysed by standard methods with the scope of enforcing quality control from the very beginning of the analyses. Six institutes have so far reported results to IAEA (Appendix 4).

IOC Workshop Report no. 41 Annex ‘111 - page 5
8. Project Publications
The IAEA Laboratory in Monaco has been involved, as part of the Regional Seas Programme’s efforts and thus also within the framework of WACAF, in standardizing methodology and developing easy-to-follow instructions for all aspects of the monitoring programme. A series of Reference Methods for Marine Pollution Studies has been and is still being issued (Appendix 6). They cover -_-- - sanitary quality of coastal, recreational and shellfish-growing waters, and
- chemical contaminants in marine organisms. Those already available have been distributed among participants.
As of June 1984, a quarterly bilingual project newsletter has been issued to serve as a vehicle for information exchange and a forum to present and discuss environ- mental and methodological issues of relevance to WACAF 2. Six issues have been published so far.
% Summary, Cmclusions and Rocanmendations
- Although it took considerably more time than evisaged, the pilot project reached its operational phase in the course of 1984. By September 1985, a total of 17 institutes from ten countries, some collaborating in more than one project component, had joined the WACAF 2 project.
- Five institutes committed themselves fof analyses of organochlorines in marine biota, seven for heavy metal analyses, including participation in a regional intercalibration exercise, two for microbiological monitoring .and water quality control, and six for beach-tar surveys.
- As agreed in the respective research agreements, equipment and material Follow- indispensable for analyses have been made available to participants.
up amendments are awaiting approval of the respective National Focal Points.
- External training was arranged for most participants in 1984, while some on- the-job training was provided during consultant travels in 1985.
- Serious information gaps were identified with many participants and concerted action will have to be taken to beef up regional research capabilities, e.g. through:
- further training, external and on-the-job; - improvement of library facilities in participating institutes through sub- - increase of exchange of relevant scientific papers and reprints; - enhancement of communication among participants; - setting up of a system of tutorship by which more experienced scientists
extend, on a voluntary basis, special assistance and advice to WACAF participants;
scription to key journals and acquisition of books;

IOC Workshop Report no. 41 Annex I11 - page 6
- encouragement of presentation and outside publication of research findings. O n the equipment side, it will be necessary to earmark, in the forthcoming budgets of research institutes, funds for petrol, particularly in those cases where gas shortages for displacements occur and where frequent powercuts render operation of a stand-by generator indispensable.
O n the whole, it would be desirable to reach a more equal geographical coverage through involvement of new institutes and countries in WACAF 2 and improve performance of already-participating ones. It seems quite clear that the performance of all institutes should be improved in the next project phase in order to build up the capabilities (manpower, institutional and equipment) to meet the ambitious objectives of the project born out of the need of national governments to obtain the baseline and monitoring data required for their management and policy decision.
The Workplan and Timetable. of the pilot phase of Project WACAF 2 is attached as Appendix 7.
IOC Workshop Report no. 41 Annex I11 - page 7
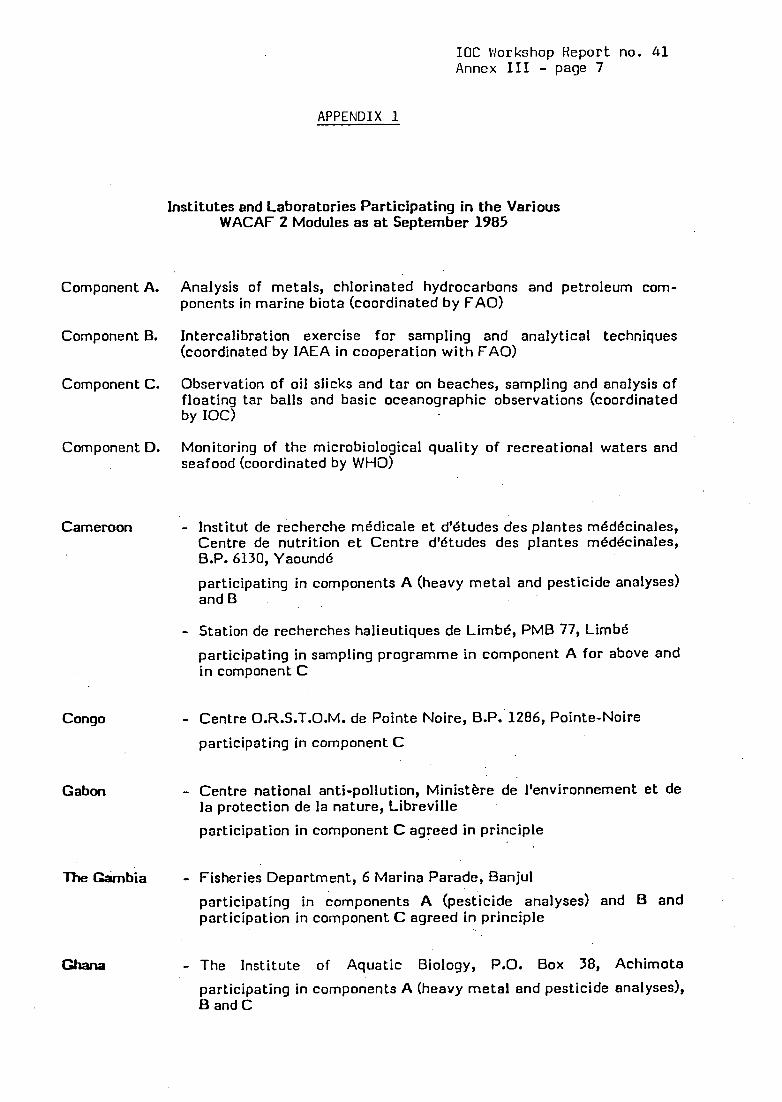
APPENDIX 1
Component A.
C o m p one n t B.
Component C.
Component D.
Cameroon
Congo
Gabon
Ghana
Institutes and Laboratories Participating in the Various WACAF 2 Modules as at September 1985
Analysis of metals, chlorinated hydrocarbons and petroleum com- ponents in marine biota (coordinated by FAO)
Intercalibration exercise for sampling and analytical techniques (coordinated by IAEA in cooperation with FAO)
Observation of oil slicks and tar on beaches, sampling and analysis of floating tar balls and basic oceanographic observations (coordinated by IOC)
Monitoring of the microbiological quality of recreational waters and seafood (coordinated by WHO)
Institut de recherche medicale et d'etudes des plantes med6cinales, Centre de nutrition et Centre d'etudes des plantes medecinales, B.P. 6130, Yaounde participating in components A (heavy metal and pesticide analyses) and B
Station de recherches halieutiques de Limbd, PMB 77, Limb6 participating in sampling programme in component A for above and in component C
Centre O.R.S.T.O.M. de Pointe Noire, B.P..1286, Pointe-Noire participating in component C
Centre national anti-pollution, Ministere de I'environnement et de la protection de la nature, Libreville participation in component C agreed in principle
Fisheries Department, 6 Marina Parade, Banjul participating in components A (pesticide analyses) and B and participation in component C agreed in principle
The Institute of Aquatic Biology, P.O. Box 38, Achimota participating in components A (heavy metal and pesticide analyses), €3 and C
IOC Workshop Report no. 41 Annex I11 - page 8
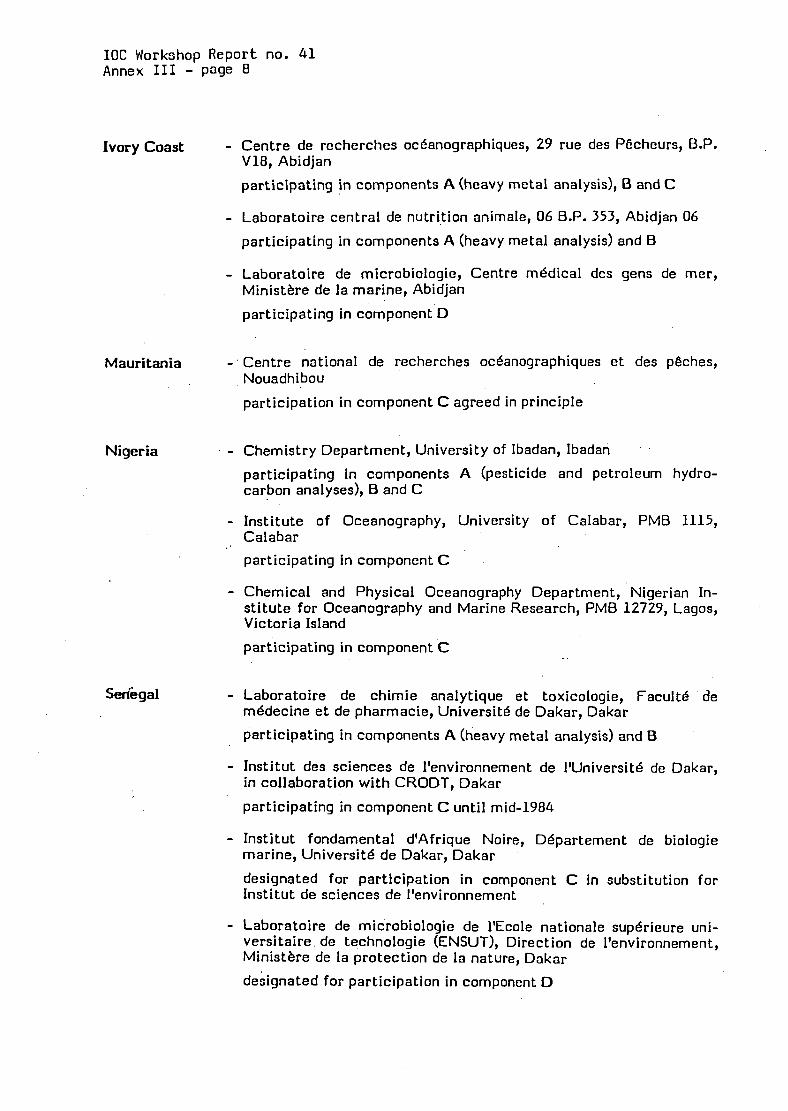
Ivory Coast - Centre de recherches oc6anographiques, 29 rue des Pgcheurs, B.P. V18, Abidjan participating in components A (heavy metal analysis), B and C
- Laboratoire central de nutrition anirnale, 06 B.P. 353, Abidjan 06 participating in components A (heavy metal analysis) and B
- Laboratoire de microbiologie, Centre mddical des gens de mer, Ministhe de la marine, Abidjan participating in component D
Mauritania - Centre national de recherches oc6anographiques et des p&ches, Nouadhibou participation in component C agreed in principle
Nigeria - Chemistry Department, University of Ibadan, Ibadan participating in components A (pesticide and petroleum hydro- carbon analyses), B and C
- Institute of Oceanography, University of Calabar, PMB 1115, Calabar participating in component C
- Chemical and Physical Oceanography Department, Nigerian In- stitute for Oceanography and Marine Research, PMB 12729, Lagos, Victoria Island participating in component C
Seriegd - Laboratoire de chimie analytique et toxicologie, Facult6 de mBdecine et de pharmacie, Universit6 de Dakar, Dakar participating in components A (heavy metal analysis) and B
- Institut des sciences de I'environnernent de I'Universitd de Dakar, in collaboration with CRODT, Dakar participating in component C until mid-1984
- Institut fondamental d'Afrique Noire, Ddpartement de biologie marine, Universitd de Dakar, Dakar designated for participation in component C in substitution for Institut de sciences de I'environnement
- Laboratoire de microbiologie de 1'Ecole nationale superieure uni- versitaire de technologie (ENSUT), Direction de I'environnement, Ministere de la protection de la nature, Dakar designated for participation in component D

IOC Workshop Report no. 41 Annex 111- page 9
Sierra Leone - Institute of Marine Biology and Oceanography, Fourah Bay College, Private Mail Bag, Freetown participating in components A (heavy metal and pesticide analyses), B and C
IOC Workshop Report no. 41 Annex 111 - page 10
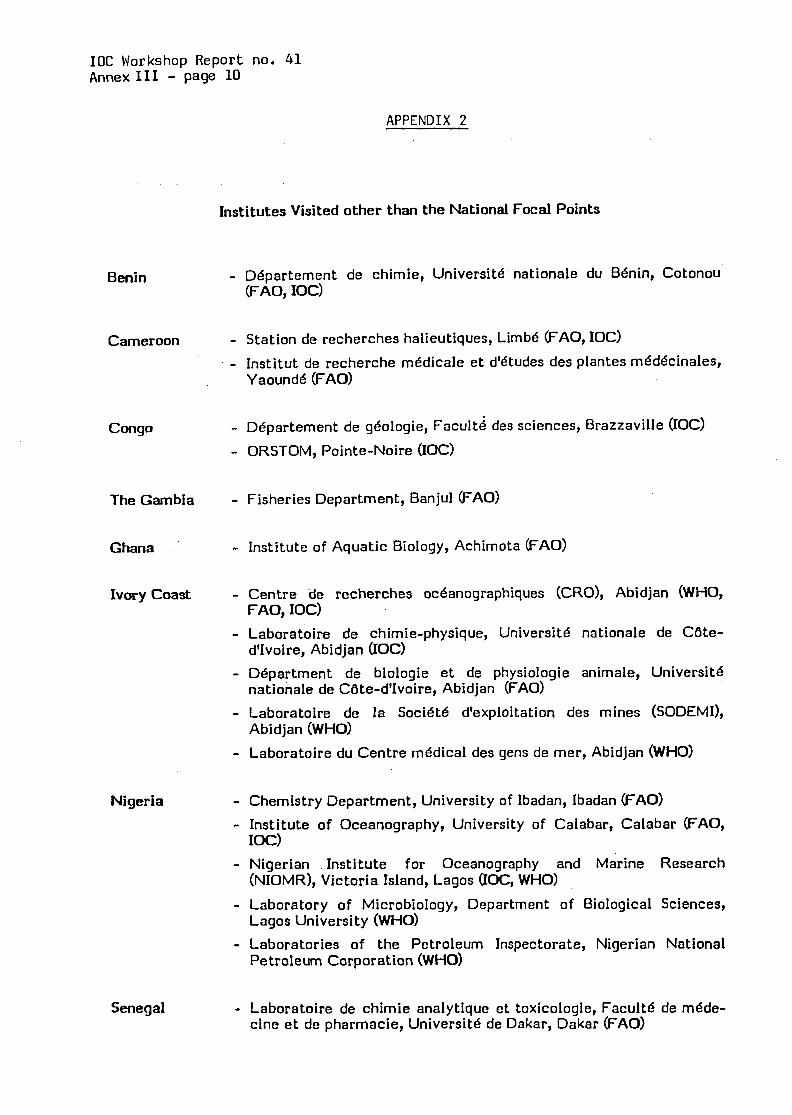
APPENDIX 2
Benin
Institutes Visited other than the National Focal Points
- Departement de chimie, Universite nationale du Benin, Cotonou (FAO, IOC)
Cameroon - Station de recherches halieutiques, Limb6 (FAO, IOC) - Institut de recherche medicale et d'etudes des plantes medecinales,
Yaounde (FAO)
Congo - Departement de geologic, Facultg des sciences, Brazzaville (IOC) - ORSTOM, Pointe-Noire (IOC)
The Gambia - Fisheries Department, Banjul (FAO) Ghana - Institute of Aquatic Biology, Achimota (FAO) Ivory Coast - Centre de recherches oc6anographiques (CRO), Abidjan (WHO,
- Laboratoire de chimie-physique, Universite nationale de C8te-
- Department de biologie et de physiologie animale, Universit6
- Laboratoire de la SociBtB d'exploitation des mines (SODEMI),
- Laboratoire du Centre medical des gens de mer, Abidjan (WHO)
FAO, IOC)
d'Ivoire, Abidjan (IOC)
nationale de C8te-d'Ivoire, Abidjan (FAO)
Abidjan (WHO)
Nigeria
Senegal
- Chemistry Department, University of Ibadan, Ibadan (FAO) - Institute of Oceanography, University of Calabar, Calabar (FAO, roc)
- Nigerian Institute for Oceanography and Marine Research
- Laboratory of Microbiology, Department of Biological Sciences, - Laboratories of the Petroleum Inspectorate, Nigerian National
(NIOMR), Victoria Island, Lagos (IOC, WHO)
Lagos University (WHO)
Petroleum Corporation (WHO)
- Laboratoire de chimie analytique et toxicologie, Facult6 de mdde- cine et de pharmacie, Universite de Dakar, Dakar (FAO)

IUC Workshop Report no. 41 Annex 111 - page 11
- Institut des sciences de I'environnement, Facult6 des sciences, - Centre de recherche ockanographique de Dakar-Thiaroye (CRODT) - ORSTOM, Dakar (IOC) - Laboratoire de la 4oci6t6 nationale d'exploitation des eaux du
Universit6 de Dakar, Dakar (IOC)
(WHO, FAO, IOC)
Sdnegal (SONNES), Dakar (WHO) - Institut technologique de I'alimentation (ITA), Dakar (WHO) - Institut Pasteur de Dakar (WHO)
Sierra Leone - Institute of Marine Biology and Oceanography, Fourah Bay College, Freetown (FAO)
- Faculty of Pure and Applied- Science, Fourah Bay College, Freetown (FAO)
- Faculty of Engineering, Fourah Bay College, Freetown (FAO) Zaire - Ddpartement de l'environnement, Kinshasa (IOC)

IOC Workshop Report no. 41 Annex I11 - pacje 12
APPENDIX 3
Method Manuals Distributed to Participants in the Beach Tar Component (IOC)
I O C / W H O Manuals and Guides No. 7, Guide to operational procedures for the IGOSS Pilot Project on Marine Pollution (Petroleum) Monitoring, Unesco, 1976
I O C / W M O / U N E P Manuals and Guides No. 7 (Supplement), Manual for monitoring of oil and petroleum hydrocarbons in marine waters and on beaches (for use in the I O C / W M O / U N E P Pilot Project on Baseline Studies and Monitoring of Oil and Petroleum Hydrocarbons in Marine Waters (MED I) as part of the
* Coordinated Mediterranean Pollution .Monitoring and Research Pro- gramme), Unesco, 1977
IOC Manuals and Guides No. 11, The determination of petroleum hydrocarbons in sediments, Unesco, 1982
IOC Manuals and Guides No. 13, Manual for monitoring oil and dissolved/dispersed petroleum hydrocarbons in marine waters and on beaches (Procedures for the petroleum component of the IOC Marine Pollution Monitoring System (MARPOLMON-P), Unesco 1984
IOC Technical Series No. 12, Oceanographic products and methods of analysis and prediction, Unesco, 1977

IOC Workshop Report no. 41 Annex I11 - page 13
APPENDIX 4
Institutes Reporting Results on their Participation in the Component on Analyses of Pollutants in Biota
These were, by September 1985
Cameroon -
The Gambia -
Ghana
Ivory Coast -
-
Nigeria
saragal
Institut de recherches medicales et d'6tudes des plantes m6d6ci- nales, Yaounde Intercalibration results have been reported. Field sampling of fish has been carried out in February 1985 with the assistance of the Fisheries Research Station at Limb6. Sixteen species of fish and marine invertebrates were cdllected and results on H g and C d levels reported.
Fisheries Department, Banjul
Is completing setting up of its laboratory and will start reporting results soon.
Institute of Aquatic Biology, Achimota Reported intercalibration results for Hg, C d and 3 other trace metals in mussel and shrimp samples.
Laboratoire central de nutrition animale, Abidjan Reported intercalib,ration results for H g and C d in the mussel and shrimp samples, as well as for 7 other trace metals
Centre de recherches oc6anographiques, Abidjan Is completing its laboratory set up and will start reporting results soon.
Chemistry Department, Ibadan University Reported intercalibration results for C d and '6 other -trace metals in mussel and shrimp samples.
Laboratoire de chimie analytique et toxicologie, Universit6 de Dakar Reported intercalibration results for Hg, C d and 3 other trace metals in mussel and shrimp samples.

IOC Workshop Report no. 41 Annex I11 - page 14
Sierra Leone - Institute of Marine Biology and Oceanography, Fourah Bay College, Freetown Reported results on analysis of PCB, DOT and its derivatives.and lindane in 4 fish species caught in the estuary of Sierra Leone River.

IOC Workshop Report no. 41 Annex 111 - page 15 a
APPENDIX 5
Institutes Reporting on their Participation in the Beach Tar Component
These were, by September 1985:
Cameroon - Fisheries Research Station, Limb6 Started on 3 stations on a 25-km coastline in February 1984. Results were received from sampling on 13 occasions between February and November 1984. N o results were received since December 1984.
Congo - Centre O R S T O M de Pointe-Noire Started on two stations on one beach in December 1983. Results received for one sampling per month during December 1983 I
December 1984. N o results were received since then.
,
Ivory Coast - Centre de recherches oc6anographiques (ORSTOM), Abidjan Started in October 1984 on two stations.
Nigeria - Institute of Oceanography, University of Calabar Between July 1984 and April 1985, 7 to 8 transections of one beach were sampled on 10 occasions. No reporting since M a y 1985.
- Nigerian Institute for Oceanography and Marine Research (NIOMR), Lagos Observations were made on 11 occasions on one beach between M a y 1984 and August 1985.
Senegal - Institut de sciences de I'environnement, Universite de Dakar Started in January 1984 on one station. Results of 2-3 subsequent samplings during one low-tide period on one day per month received for January to June 1984. After that time the Sene- galese National Focal Point for WACAF designated the D6parte- ment de biologie marine of F A N as the Senegalese participant. Sampling has not yet been resumed
Four othm twntries are at present evaluating their possibilities fur participating in this component by nominating suitable research centres.

IOC Workshop Report no. 41 Annex 111 - page 16
APPENDIX 6
Reference Methods for Marine Pollution Studies
A. Sanitary Quality of Coastal Recreational and Shellfish-growing Waters
draf t(E) 09.05.84
Rev.l(E) 31.08.84 Rev.l(F 31.10.84
Rev.l(E) 31.08.84 Rev.l(F) 31.10.84
Rev.l(E) 31.08.84 Rev.l(F) 31.10.84
R e v .1(E) 3 1.08.84 Rev.l(F) 31.10.84
in ,preparation
in preparation
in preparation
'1.
in preparation
in preparation
No. 1
No.2
No.3
No. 4
No. 5
No. 21
No. 22
No. 23
O
M
UNEP/WHO: of coastal recreational and shellfish-growing waters
UNEP/WHO: Determination of total coliforms in sea-water by the membrane filtration culture method
UNEP/WHO: Determination of faecal coliforms in sea-water by the membrane filtration culture method
UNEP/WHO: Determination of faecal streptococci in sea-water by the membrane filtration culture method
UNEP/WHO: Determination of faecal coliforms in bivalves by multiple test tube method
UNEP/WHO: Determination of total coliforms in sea-water by multiple test tube method
UNEP/WHO: Determination of faecal coliforms in sea-water by multiple test tube method
UNEP/WHO: D e termination of faecal streptococci in sea-water by multiple test tube method
UNEP/WHO: Determination of faecal coliforms in in estuarine waters, suspended matters and sediments
UNEP/WHO: Statistical methods for the evaluation of results from monitoring the quality of coastal recreational and shellfish-growing waters
Guidelines for monitoring the quality
B.
in preparation No. 6 UNEP/FAO/IAEA: Guidelines for monitoring chemi-
Rev.Z(E) 12.11.84 No. 7 UNEP/FAO/IAEA/IOC: Sampling of seiected marine
Chemical Contaminants in Marine Organisms
cal contaminants in marine organisms
organisms and sample preparation for trace metal - analysis
Rev.l(D) 12.11.84 No. 8 UNEP/FAO/IAEA/IOC: Determination of total mer- cury in selected marine organisms by cold vapour atomic absorption spectrophotometry
'

IOC Workshop Report no. 41 Annex I11 - page 17
draft(€) 30.08.84 No. 9 UNEP/FAO/IAEA: Determination of total arsenic in selected marine organisms by flameless atomic ab- sorption spectrophotometry
(E) 12.11.84 No. 10 UNEP/FAO/IAEA: Determination of total selenium in selected marine organisms by hydride generation atomic absorption spectrophotometry
Rev.l(E) 12.11.84 No. 11 UNEP/FAO/IAEA/IOC: Determination of total cadmium, zinc, lead and copper in selected marine organisms by flameless atomic absorption 'spectro- photome try
Rev.l(E) 12.11.84 No. 12 UNEP/FAO/IAEA: Sampling of selected marine organisms and sample preparation for the analysis of
I chlorinated hydrocarbons
(E) 12.11.84 No. 13 UNEP/FAO/IAEA: Determination of methylmercury in selected marine organisms by gas chromatography
(E) 17.09.82 No. 14 UNEP/FAO/IAEA: Determination of DOTS and PCBs in selected marine organisms by gas-liquid chro- matography

IOC Workshop Report no. 41
Annex I11 - page 18
U)
Q) U L
U
.e
.-. C 0
Q) 0
>
5 "
E 3
m
Q) U C
m U
v)
v)
U)
m .-.
al 0
C
m U v) v)
v)
m .-
a
W Z 3
- m C 0 m C 0
.I U
bb
v)
0)
U C
0) m
m
.I
5 .-. 3
al 5 5 3 .I
5 *- '
3
Q) U C
m U
v)
v)
(0
m .-.
m
C
.I U
2 a 0
0
U
a
v)
C 0
3
.I U
U
5 .I 3 Q
W Z 3
al 2 ac
to rT\
eo L
al 9
Q) o E 6
Y 0
d
ii n
m > Q) C
U 6
Jz 0
tn al C 3
r)
I M
m m x L m 1 C (rJ r)
M
eo N
L
s Q) E 0
I
m
m v
IY M
U\
al C 1
r)
I M
CO
eo
L
Q) n E a U
a"
I M
to U
m L
5 al
0" 2
L
n E
n Q) 0
al >
U
L
Q) n E al o 6
I x
r" x
r"
L 0
y.
U C
E n .e 1 0- al
2 P dU
CQ)
mc
'c 0
C 0
v)
al "
z m v) .-. U
U
m C
._ .- .-.
m
C
U
a, .-.
r" m
C U
Q) .-.
i! 3
Q) >
.-. 2
v)
U C
E 3 L U 2 .I Y-
O
L 0
Y-
3 Q) >
.L
2 x U C al m a
C
2 U CI
U C
m x
U C
al m
al C
E U
CI
C 0
m m U v) C
.I u - U
C 0
0
al Q) Ln .I U
- nn
n
U
W
m1
3
ww
n
n n
Y-
ww
w

- (21 C 0 m C
.L
Y
5 .- 3 C 0
.L Y
2 al a 0 0 0
4
(21 C 0
m C
.e Y
5 .e 3 C 0
Y
m L a Q 0
0
0
.e
x
L
m C .-
a 0 C
m Y
U)
v)
U)
m .e
al -5 5 .- 3 In C 0
3
.L Y
Y
.I
n
E n
W
-. W
uu
cc
(21m
a-
w .!!!
7Y
L
al n E I
a0
a 0
ui 0"
L
al 0
n
2 (21 1 C m r)
Y
8
a
U C
m (21 0
5 Y
.- In
n
$73
-U a
ss:
n
C U
IOC Workshop Report no. 41
Annex I11 - page 19

IOC Workshop Report no. 41 Annex IV
ANNEX IV
RESULTS OF WACAF INTERCALIBRATION EXERCISE FOR TRACE METALS by
International Laboratory of Marine Radioactivity (Monaco)
Introduction
This document reports results of the first intercalibration exercise carried out within the framework of WACAF/2. It records results only for trace elements since no results were supplied for chlorinated hydrocarbons by the date of the Dakar Workshop.
The exercise was organized and evaluated by the International Laboratory .
of Marine Radioactivity, part of the International Atomic Energy Agency, and situated at Monaco. We have organized many such exercises over the years.
The samples distributed were Mussel powder (MA-M-Z/TM) and Shrimp powder (MA-A-A3/TM). The latter was prepared specially for the WACAF group, but will be used for other intercomparisons as well.
Participants were asked to analyse the samples according to the reference methods originated by and supplied by UNEP.
The participating laboratories were given code numbers 1-6 in a random fashion. This follows the convention of the IAEA to not reveal the identity of participants unless it is commonly agreed amongst them that this be done.
The participants are listed alphabetically by country in the appendix.
Results
The results were submitted in many cases after the deadlines set, but arrived early enough for this document to be produced. The promptness is actually slightly better than for usual worldwide intercalibrations carried out by the Monaco Laboratory.
In the tables which follow, the results are given, in ascending order, together with the standard deviation of the supplied results. All results are in mg kg-1. In one case a laboratory did not supply the figures for the multiple analyses requested, nor their standard deviation.
The results were supposed to be supplied in terms of dry weight. One laboratory did not do so, nor did they supply the moisture content of their samples. This makes it data they supply, but when the overall scatter of results in seen, this really makes little difference. Their results are therefore included unchanged along with the others.
inpossible to estimate the dry weight figures ftom the
For another participant it is not stated whether his results are fresh weight or dry weight basis. It is assumed they are dry weight basis.

IOC Workshop Report no. 41 Annex IV - page 2
Also included are the certified values for the mussel powder, and the 95% confidence'limits. That is, the median value of results submitted in an intercomparison exercise worldwide, after statistical tests to reject -&+s obvious that one can be 95% confident the real median lies within them. The limits are known as Ilconfidence limits". These are not yet available for the shrimp powder.
outliers. Following that, limits are established statistically, such
Some results from the Monaco laboratory are included where available, for comparison, although the laboratory was not a formal participant in the intercomparison exercise.
VANADIUM -~
Only laboratory 6 ontributed values for this element. They report values of less than 0.3 mg kg-' for both samples. Analysis at Monaco gave 0,.745fl.016 mg kg'l for the shrimp samples only. No certified values are available.
CHROMIUM
Only laboratory 1 reported values, for mussel and shrimp of 6.38 and 4.64 respectively.
Certified value : (mussel) 1.25 : confidence limits 0.95-1.62.
MANGANESE
Mussel powder:
Laboratory Value (mg kg-') and S.D.
56 . 4+2.2 70 . 7+1 . 1
- 6
- h M C 0
1 72.40
Certified value: 67.1 Confidence interval 60.7-75.3
Shrimp powder:
Laboratory
1 3.63
Value (mg kg-') and S.D.
6 3.67+0 . 26 -

IOC Workshop Report no. 41 Annex IV - page 3
IRON
Mussel powder:
Laboratory Value (mg kg'l) and S.D.
6 1a5.8+4.2 - 1 362.98
Certified value: 256.2: confidence limits 229.2-268.2
Shrimp powder:
Laboratory
6
1 78.73
Value (mg k&-') and S.D.
41.b2.7 -
NICKEL
Mussel powder:
Laboratory
6
1 U. 09
Value (mg Q-') and S.D.
2.5 2H.27 -
Certified value: not given.
Shrimp powder:
Iaboratory
6 0.253-0.044 - I 12.05
Value (mg kg'l) and S.D.

IOC Workshop Report no. 41 Annex IV - page 4
COPPER
Mu8Sel powder:
Laboratory
4
5
Value (mg kg-'> and S.D.
5.8otO.50 - 7.04+0.37 - 7.7otO .56 -.
8.77
Certified value: 7.96: confidence limits 7.53-8.44
Shrimp powder:
Laboratory
Mmaco
1
4
5
2
6
Value (mg kg-'> and S.D.
la . 6 w - . 41 27.00
21.2+1.7 - a .57+0. a3 22 . 1+2 - * 2 - 23.N1.4 -
Mussel powder:
Laboratory
5
4
Monaco
Value (mg k&-') and S.D.
68.1+3 - . 3 161+12 - 172.S2.2 - 238 . 18 296+22 - 297.9+9 - . 5
Certified value: 156.5 Confidence limits: 152.8-166.7

Shrimp powder:
Laboratory
5
Monaco.
4
2
1
6
CADMIUM
Mussel powder:
Laboratory
5
6
Monaco
1
3
4
2
IOC Workshop Report no. 41 Annex IV - page 5
Value (mg kg'l) and S.D.
38.5+1.6
69. k l .2
- -
78 7+1. 5 - 143.2+6.5 - 149.32
157+12 -
Value (mg *k&'l) and S.D.
1 . 31+0.10 - 1.4W.26 - 1.58M - .02l 1.80
2.01+0 - 012 *
2.72M.45 -
Certified value: 1.32 Confidence llmits: 1.16-1.54
Shrimp powder:
Laboratory
6
5
Monaco
4
Value (mg kgoll and S.D.
less than 0.1
0.368+O . 051 0.533+0.031 -
- 0.72+0.12 -
3 1.113+0 -034 - 2
1
2.09to.31
2.39

IOC Workshop Report no. 41 Annex IV - page 6 MERCURY
Mussel powder:
Laboratory
4
5
3
1
2
Value. (mg kg'l) and S.D.
0 . 67+0 . 13 - 1 . 2S0.19 1.237M.083 - - 1.43
1.58i-O.29 - Certified value: 0.95
Shrimp powder:
Iaboratory
4
1
2
3
5
Confidence limits: 0.851.06
Value (mg kg'l) and S.D.
1 . 77+0 . U. 1.88
- 2.17+0 -56 - 2.188M.043 - 2.6M.28 -
Mussel powder:
Laboratoq
2
Monaco
1 2.24
4 5 . 43.3 6.5+1.0 5
6
Value (mg kg-') and S.D.
1 . 5 2H.17 1.650+0.035
- -
- 11.5+1.5 -
Certified value: 1.92 Confidence limits: 1.53-2.50

IOC Workshop Report no. 41 Annex IV - page 7
Shrimp powder:
Laboratory
6 0 . 2 5 M . - 044" 2 2.27% - 31 5 2 . 45H.12 -
Value (mg k6-l) and 'S.D.
1
4
2.84
3.10+0.80 - * This result is an outlier.

IOC Workshop Report no. 41 Annex IV - page 8
Discussion
It is difficult to comment in detail on the shrimp esults. As mentioned the e _ _ are no medians or confidence limits available yet. However, it is possible to do some statistical tests on the results from the WACAF Group, and the results are that with one exception they form a coherent group and are likely to be acceptable. More comparison will be available later when results come from the worldwide intercomparison.
An interesting exercise is to'take the submitted results and determine their overall mean and standard deviation. This is a measure of how good the WACAF analysts are as a group.
If another group had a greater spread, they would be worse analysts as a whole but if available another interesting group within the Regional Seas Programme to compare WACAF with. The other group is MEDPOL, the Regional Seas group for the Mediterranean.
their spread was less, they would be better analysts. There is
Last year a similar exercise was organised for them, and they also analysed the mussel sample. It is therefore possible to compare WACAF and MEDPOL analyses directly. However, it should be pointed out Dhht'the laboratories in the MEDPOL Group were chosen specially because they had some experience.
In the following table we give the means and standard deviations for all the analyses submitted by both groups and in brackets the standard deviation expressed as a percentage of the mean.
Sample : Mussel powder
E leme n t cu Zn Cd "9 Pb
WACAF 7 921. 7(22%) 212298 (46%) 2.06g.69 (34%) 1.23s. 40 (32%) 5.423.9 (73%) MEDPOL 9.7k3 l(323 158244 (28%) 1.52# .64(42%) 0.86+0.25(29%) - 5.7+4.8( 84%)
The important figures to examine are the ones in brackets. They are comparable between the two groups and show that in general the analytical performance of the two groups is equally scattered.
Another general conclusion, only obvious from a comparison with worldwide intercalibrations, is that there is a tendency for values to be higher that the certified ones. This is due to inadequate'blank corrections, and inadequate checking for matrix effects.
In addition, though not obvious in the table, analysts in both groups need to check their analysis for zinc. The standard deviations for this element for their groups are significantly larger than for the worldwide intercalibration group.
How good are individual laboratories? How should one compare them with the median and confidence limits? How does an analyst know if this result is acceptable or not ?

IOC Workshop Report no. 41 Annex 11 - page 9
We must return to an examination of how results are treated statistically. They are tested for the presence of outliers. If an outlier is found, it is not further considered. For the present results, only one value from one laboratory can be classified as lloutliersll. That is for an analysis on the lead in the shrimp sample. All the other results from both samples form a consistent distribution and none can be rejected. In statistical terms they are "accepted". That does not mean necessarily that the analyst should be satisfied. His results should be as near the median as possible. One useful test could be that his results should be within a standard deviations of the accepted results. Those analysts whose figures fall outside those limits can probably improve their analysis.
You will note in .the figure that the confidence limits are much closer than the lines for the standard deviation. The greater the number of laboratories, .
the closer those lines become. Obviously it is very difficult to be close th those limits each time even for an experienced analyst.'
How good are these results for an international monitoring network ? We would have to say that values are likely to be accurate only to 2 30% on average and some values may be much more inaccurate than that. necessary to improve the accuracy (which seems generally much worse than the precision in this case). However it should also be noted that imppovement will be rather slow. Since the apparently experienced MEDPOL laboratories did not do significantly better than the WACAF ones, it is clear that a lot of effort is needed, even beyond what they have already put in.
Obviously a lot of work is
It should also be noted that the values obtained here are for samples with essentially background concentrations, and therefore the results of the inter- calibration exercise are relatively pessimistic. A pollution accident will produce levels which are an order of magnitude higher, and those levels should be easier to measure. In such a case one would hope that values would be able to be compared to better than the 230% mentioned above.
Conclusions
This exercise has proven relatively successful for a first-time one. Mostly. WACAF analysts are capable of producing results for trace elements (for some of which the analysis is not easy) which are certainly of the correct order of magnitude.
In addition to that their performance compares well with that of a group which is supposed to have had much more experience.
However, it is clear that in both cases many of the results submitted do not fall within a standard deviation of the median where this is known. That means there is plenty of room for improvement. Such improvement is not simple and demnds very careful attention to follow precisely to monitor closely analytical performance by taking part in as many intercalibration exercises as possible.
the reference methods and to continue

IOC Workshop Report no. 41 Annex IV - page 10
Appendix
Participants (who were able to supply results)
Centre de Nutrition, Institut de recherches medicales et d'6tudes des plantes mGdicinales, Yaound6, Cameroon.
Institute of Aquatic Biology, P.O. Box 38, Achimota, Ghana. '
Centre de recherches oc6anographiques, B.P. V 18, Abidjan, Ivory Coast.
Laboratoire Central de Nutrition Animale (Lacena), 06 B.P. 353, Abidjan 06, ' Ivory Coast.
Department of Chemistry, University of Ibadan, Ibadan, Nigeria.
Laboratoire de chimie analytique et toxicologie, Facult6 de M6decine et Pharrnacie, Universit6 de Dakar, Dakar, SBnBgal.

IOC Workshop Report no. 41 Annex IV.-- page 11
kg"
Figure 1. Comparison of reported results for trace elements in Mussel powder. Dotted lines are 95% confidence limits. Bold lines are one standard deviation each si'de of the mean.

IOC Workshop Report no. 41 Annex V
ANNEX V
INDIVIDUAL SCIENTIFIC REPORTS OF PARTICIPATING RESEARCH CENTRES
by Responsible Leading Scientists

IOC Workshop Report no. 41 Annex V.l - Page 1
THACE METAL ANALYSIS IN FISH .
GHANA : INSTITUTE OF AQUATIC BIOLOGY, ACHIMOTA by C.A. Biney
1. INTERCALIBRATION EXERCISE
The period between May and the end of July was used for this exercise. Trace metal analyses were conducted on lyophilised shrimp and mussel tissues supplied by IAEA, Monaco, the results of which have already been submitted.
2. TRACE METAL ANALYSIS OF FISH
This has been carried on since September 1985 on ten fish species namely :
Apex predators Sphyraena sphyraena Epinephelus aenus Thunnus obsesus
Demersal stationary tinfish Pseudolithus senegalensis Mugil cephalus Cynoglossus senegalensis Cynoglossus monodi Balistes capriseus Balistes punctatus
Pelagic filter feeder E thmalosa f imbr iata Pseudopeneus prayensis
3. METHODS
Analytical procedures were basically according to the recommended methodology1.2.3. 1.009 of fish tissue was decomposed in a pressure container (Groteklaes teflon bomb) in the presence of 2.5 ml nitric acid at 120°C for 8 hours. Copper, lead, zinc and cadmium were determined by flame atomisation while mercury was determined by cold vapour atomic absorption spectropho- tometry using a Varian 1275 AAS. This preliminary digestion was normally followed by a second digestion of the same fish tissue but involving the addition of aqueous standard solutions to the samples. The amounts added were based on the results of the preliminary digestion.

IOC Workshop Report no. 41 Annex V.l - page 2
Some modifications from the recommended methodology were made during the course of analyses
(i) When using the flame atomisation technique lead was determined at 217.0nminstead of the recommended 283.3 nm and zinc was measured at 213.9 nm instead of 307.6 nm.
(ii) With the cold vapour method the stannous ChlorideLhydro- xylamine hydrochloride solution was prepared as follows :
Solution 1 - 6% sodium chloride + 6% hydroxylamine hydrochoride in distilled water.
Solution 2 - 10% stannous chloride in in H2SO4 1 ml each of solutions 1 and 2 were added to 1 ml of the digested
fish sample in a boiling tube. Metallic mercury was volatilised by aeration using a small pump. A schematic drawing of the apparatus used is shown in Fig. 1.
4. RESULTS AND DISCUSSION
The results of trace metal analyses for the ten fish species are in Tables 1 and 2. Some of the data have also been interpreted outlined
graphically in Figs 2-4.
Data obtained so far do not allow the reaching of definite conclusions because not enough fish species have been analysed from any given area. The general pattern which has emerged is that the apex predators in the food chain concentrations of especially Hg and Zn. The highest levels of mercury and zinc recorded so far occured in the dark muscle of Thunnus obsesus (Fig. 2). However wide variations occured with fishes from all levels of the food chain. For instance, three individuals of Pseudolithus seneqalensis which is a demersal stationary species had Zn levels close to or higher than the apex predators (Table 1).
eg Sphyraena sphyraena and Thunnus obsesus show higher
Variation also occurred with fishes of the same species. An exemple is given in Fig. 3 which shows the levels of Hg, Zn and Cu for two individuals each of Sphyraena sphyraena and Cynoglossus seneqalensis. This could be due to sexual and age differences.
Not much can be deduced with respect to the evaluation of metal accumulation at this stage since an ample range of sizes of the same species from a given area have yet to be analysed. Uata obtained for Balistes capriscus (Fig. 4) seem to indicate an accumulation of mercury but not zinc. Mercury accumulation in fish has already been demonstrated.
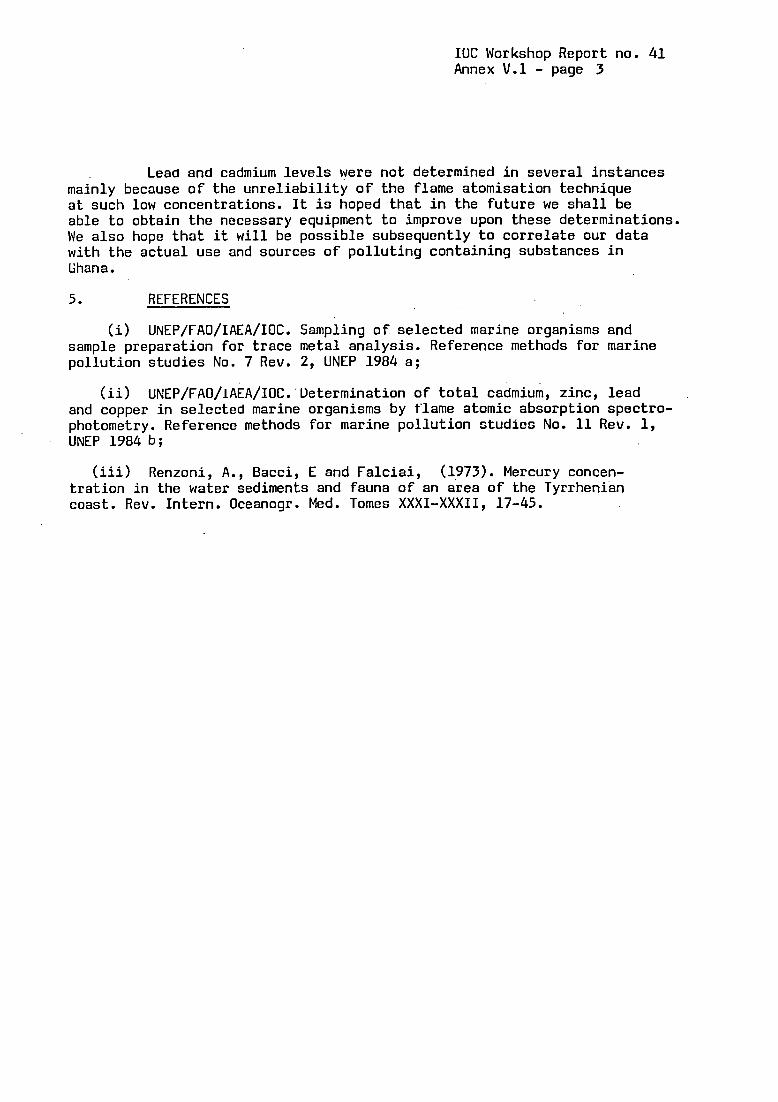
IUC Workshop Report no. 41 Annex V.l - page 3
Lead and cadmium levels were not determined in several instances mainly because of the unreliability of the flame atomisation technique at such low concentrations. It is hoped that in the future we shall be able to obtain the necessary equipment to improve upon these determinations. We also hope that it will be possible subsequently to correlate our data with the actual use and sources of polluting containing substances in tihana.
5. REFERENCES
(i) UNEP/FAO/IAEA/IOC. Sampling of selected marine organisms and sample preparation for trace metal analysis. Reference methods for marine pollution studies No. 7 Rev. 2, UNEP 1984 a;
(ii) UNEP/FAO/lAEA/IOC. Ueterrnination of total cadmium, zinc, lead and copper in selected marine organisms by flame atomic absorption spectro- photometry. Reference methods for marine pollution studies No. 11 Rev. 1, UNEP 1984 b;
(iii) Renzoni, A., Bacci, E and Falciai, (1973). Mercury concen- tration in the water sediments and fauna of an area of the Tyrrhenian coast. Rev. Intern. Oceanogr. Med. Tomes XXXI-XXXII, 17-45.

IOC Workshop Report no. 41
Annex V.l - page 4
SI
al 0
m k I- ..
0
CM
NI N"
hl
n
E
0
M
..
0
.:I :
UN
00
-0
4M
0
000
U3 ooln
w
NMV)
3000006000000
ON
mN
00
00
wm
w0
0
MN
bb
Ul
Nb
NN
MN
NN
M
w
- 0 4 z=w
00
--

IOC Workshop Report no. 41
Annex V.l - page 5
ZI 000
mar-
U3M.J
n
rl (II C
m rl (II c, E" al 0
(II k
I- .. N al d
m I- n
N
(v
0 m
[I) 3
4J m 4J 0
C J a
v) al .iJ 0
.rl rl
4
m m
m
m
v) -4
t
al >r m f4 Q

IOC Workshop Report no. 41 Annex V.l - page 6
F.IGURE 1
Quartz Cell in Atomic Absorption Spectrometer
Glass tube with
1 ml Solution 1
1 ml Solution 2
Fig. 1. Arrangement for mercury determination by the cold-vapour method.

0 .r 1
IOC Workshop Report no. 41 Annex V.l - page 7
FIGURI 2
Zn
I 2 3
1. Thunnus obesus - dark muscle 2. Thunnus obesus - light muscle 3. Sphyraena sphyraena
4. Pseudolithus senegalensis
5. Cynoglossus monodi
6. Ethmalosa fimbriata
i 4 5 6
Fig. 2. Comparison of Mercury (Hg) and Zinc (Zn) contents from fish at different trophic levels.

IOC Workshop Report no. 41 Annex V.l - page 8
FIGURE 3
Zn
:U 1
I I I I I I I I I I I I I I I I I I I I ri
Cynoglossus senegalensis Sphyraena Sphyraena
Fig. 3. Comparison of Mercury (Hg), Zinc (Zn) and Copper (Cu) levels in individuals of the same species.

IOC Workshop Report no. 41 Annex V.l - page 9
11000
10000
9000
8000 r5 0 .
7000
6000
5000
4000
3000
2000
1000
300
200 w I
0) c P
100
FIGURf: 4
-
- - .-
- - - -
- -
- - - -
- - 0
0
- 0
I I I I I I I I I I I 100 200 300 400 500 600 700 800 900 1000
0
0 0
0 0
0 0
Weight (9)
Fig. 4. Mercury (Hg) and Zinc (Zn) concentrations in relation to body weight of Balistes sp.

IOC Workshop Report no. 41 Annex V.l - page 10
FIGURE 5
Pointe des Almadies .-\.? f 0 HANN
5 Pointe de Bel-Air SOUMBE-DIOUNE 7 (
v fle des Madeleines
Stations de pr6lbvements

IOC Workshop Report no. 41 Annex V.2 - page 1
PRELIMINARY SURVEY ON MERCURY AND CADMIUM LEVELS IN SOME MAKINE FISHERY PRODUCTS
CAMEROON : INSTITUT DE RECHERCHES MEDICALES ET D'ETUDES DES PLANTES MEDICINALES, YAOUNDE
STATION DE RECHERCHES HALIEUTIQUES DE LIMBE by I. Mbome Lape; T. Agbor Egbe, G.E. Martin, C. Njock, F. Ikome and C. Mbi
ABSTRACT
Mercury and Cadmium levels were determined in the tissue samples of about sixteen marine organisms from Cameroon. indicate that marine pollution by these two heavy metals is not yet a problem in Cameroon.
The results obtained
INTRODUCTION
Heavy metals, particularly mercury and cadmium, have received much attention from researchers because of their high toxic, transport, bioaccumulutation and bioconcentration potentials (1). Their input to marine environment can originate both from natural and anthropogenic sources.
Concerning the Cameroonian coastal waters, Hg natural input should be low compared to other areas, such as the Mediterranean, where cinnabar deposits are located. Similarly, Cd inputs from natural sources should be low.
However, the growing industrialisation along the coast, especially in the cape Limbo and the Douala - Bonaberi areas may raise the input of Hg and Cd to the marine coastal environment. contaminated suspended matter, biological transformation (i.e. mercury methylation), bioaccumulation and bioconcentration phenomena can result in the pollution of local fishery products.
There, sedimentation of
Within the framework of the FAO/UNEP WACAF 2 pilot project work was therefore initiated to evaluate the state of pollution in marine or- ganisms along. the coastal areas of Cameroon. studies fishery products were obtained from the coastal area indicated in Figure 1 (map).
However, for our preliminary
1. MATERIALS AND METHOD
1.1 SPECIES
The species collected are listed in Table 1. Most of them are of commercial importance and inhabit the coastal waters of West and Central

IOC Workshop Report no. 41 Annex V.2 - page 2
Africa, from Senegal to Angola. usual maximum lengths are indicated.
1.2 SAMPLE PRETREATMENT
Their feeding habits as well as their
Fish and crustacean muscles and molluscs soft parts were analysed, pretreatment was carried out as f'ollows : after identification at the Limb6 Fishery station, specimens were deep-frozen and transported to the Centre for Nutrition laboratory in Yaound6. freeze-dried, ground into fine'powder and passed through a 150 Aliquots of 0,25 g of lyophilised material were used for pressure decom- position with nitric acid according to Stoeppler and Backhaus (2) and homogenous subsamples were used to determine the residual water content.
1.3 ANALYSES
Tissue samples were prepared , urn sieve.
An atomic absorption spectrophotometer, Varian series 175 was used with hallow cathode lamps. cold vapour method and cadmium by air - acetylene flame. Total mercury was determined by the
The method of standard addition (3) was used to check interference due to the biological and acid matrices. Precision was tested on 6 homo- genous replicates and results were around 10% and 15% (coefficient of variation) for Hg and Cd respectively, at the.1000 microgram per kilogram level.
The accuracy of the analytical methods was tested by participating in the IAtA intercalibration exercise.
2. RESULTS ..
The results for the preliminary survey on mercury and cadmium levels in fishery products from Cameroon are presented in table 11.
Mercury levels found can be considered as typical natural back- ground representatives (4). Mean mercury concentrations of 200 ug/kg wet weight have been reported for Pomadasis jubelini from Senegal by Gras et al. (5).
As for Cd, levels in fish muscles are generally lower than the detection limits of the analytical method used. agreement with the low cadmium levels found in other surveys (4) (6). It is likely that Cd levels in fish muscles could be regulated (7) and do not reflect the water level. The Cd concentration found in the shrimp and oyster soft-part samples are almost similar to typical background levels which are generally higher than those in fish muscles.
Our results are in

IOC Workshop Report no. 41 Annex V.2 - page 3
3. CONCLUSION
For this preliminary survey the idea was to determine mercury and cadmium levels in as many species ,of marine organisms as possible. The organisms studied were collected during a six-day period in early march 1985.
The results obtained indicate that marine pollution by mercury and cadmium is not yet a problem in Cameroon. should be extended to other coastal areas and larger sampling made throughout the year.
However, investigations
Since pollution in general is not limited to the marine environ- ment only, it is necessary in the future, using other indicators in the hinterland, to evaluate the true background and "hotspot" levels of Hg and Cd, and other heavy metals in Cameroon.

IOC Workshop Report no. 41 Annex V.2 - page 4
REFERENCES
1.
2.
3.
4.
5.
6.
7.
JERNELOV, A. - Heavy metals in the marine environment. In "Discharge of sewage from sea outfalls", Edited by A.L.H. Gameson Pergamon Press (1975) 115 - 122.
STOEPPLER, M. and BACKHAUS, F. - Pretreatment studies with biological and environmental materials. Freseniuz Z. Anal. Chem. 291(1978) 116 - 120.
JULSHAMN, K. and BRAELLAN, O.R. - Determination of trace elements' in fish tissue by the standard addition method. Atomic Absorption Newsletter, 14(1975) 49 - 52.
MURRAY, A. J. - Aquatic' environment monitoring report no. 5, Ministry of Agriculture, Fisheries and Food, Directorate of Fisheries Research, U.K. (1981).
GRAS, G. and MONDAIN, J. - Teneur en mercure de quelques esphces de poissons pQch6s sur les cotes du S6nBgal. Rev. Int. OcBanogr. Med. Tomes LI - LII (1978) 83 - 88.
LEONZIO, C;,*BACCI,-E-. , -FOCARDI;*.S., RENZONI, A. - Heavy metals in organisms from the Northern Tyrrhenian Sea. The Sci. Total Env. 20, (1981) 131 - 146.
PHILLIPS, D.J.H. - The use of biological indicator organisms to monitor trace metal pollution in marine and estuarine environments. A Review. Environ. Pollut. 13 (1977) 281 - 317.

1OC Workshop Report no. 41 Annex V.2 - page 5
N
I - /

IOC Workshop Report no. 41 Annex V.2 - page 6
I 1 I I t I I I I I I I
' I t I I I I I I I I I I 1
I I I f I I f I I I I I I t I I I I I I I I I
( I
I I
- 1 I
- I I
I I I I I I I
I I - I I I I
fi.h I I 1 I ! I I
Pink shrimp IPonwua notirli. famala I 17 frsels 1
I - I I I I
Emtuerfna prawn
I Itlfnndichthy. rffiniat 25 I Fwming flying
0 1 , I - - lCprnn spp
I I *Pdunar hwtrtuo I 7.5 I I
I
- I Mngravo Oyrtor ICrif.. guu I - I
1 I I I .. - I I I Sem Oyrtar -

IOC Workshop Report no. 41 Annex V.2 - page 7
I I I I I
I I t I I Scientific name I
I mi.0 INU.bd;e I AV. I Hgc~nc. 1 CdoaKI. I I longthe! ug/kg W.Y. I Ughg W-W- I I rurplms
I .ndymd I (CIF) I AV. I Rnp 1 AV. I R.ng. I
I rn * * I a I I
I 1 I I I I 1 I I I I I I I I I I I 1 I I I I I I I !
I S coohrms tritor I . I I Ablsnnso hime I Lutjnue goreenria I 1 I Pmetti.8 Sebm I I Ilimha Afrhna I
I I Pomdaeya Jubslinf I I Ethaarlosa f M r i o t a I I S u d h l l r nder-im I 1 L k a falciphia
Himndichthya eCPinb 1 t I Cmrmx Spp I I P e n m a notirlia
P ~ o t m l i t m .long- 1 8kUl
31
3x
1c
U=
1c
31
lc
IC
lc
lc
31
U:
le
1c
lc
U:
1 I I I I I 1 I I I I I I I I I I I I I I I 1 I I t I I I 1 I 1 I
I I
42 I 23-58 ! < ! 32 1 1 I
I I 118 96-140 190 270-210 I I
l4 I I
I I I I I I
30 I 96 I 78-132 I 4 I I I I I I 1
I 21 320 f 280-360 345 ! 295-395 I I I I I
I I
I I ! 1 1 I I
I I I
I I
I 190-225 I 1 61 58-65 565 H5-5#l I I 72 70-75 205 'I 18b2M
' 46 ! 40-52 1 <
l8 I I I I I 50 1 45-55 ; 4 45 t 20-65 ; 4 t 14 1 2048 < I I
57 1 52-63 < I 1
I I
21 I 4 1 t 1 I
1 I 1
= I
9 1 - 1 I 52; 50-55 f 205
1 - 1
- 1 I I I -- I I 1

IOC Workshop Report no. 41 Annex V.3 - page 1
RECHERCHE ET DOSAGE DES TRACES DE METAUX LOURDS DANS DES ORGANISMES MARINS AU SENEGAL
SENEGAL : LABORATOIRE DE CHIMIE ANALYTIQUE ET TOXICOLOGIE, par D. Ba*, M. Ciss, J.F. Cooper et B. Niane
DAKAR
INTRODUCTION
En collaboration etroite avec la FAO, les pays atlantiques de 1'Afrique de 1'0uest et du Centre ont entrepris un large programme de surveillance continue de la pollution de leur environnement aquatique.
Au titre de notre participation au projet WACAF 2, nous avons assure la recherche des traces de m6taux lourds (Cadmium, Cuivre, Mercure, Plomb et Zinc) dans des dchantillons de poissons, crustaces et coquillages, prdleves prhs des cBtes sen6galaises.
Six esphces marines ont 6t6 retenues pour ce travail :
! ! ! ! !
! ! ! ! ! ! NOM LATIN ! FRANCAIS ! WOLOF(**) ! FAMILLE !
! ! ! EPINEPHELUS AENEUS i M6rou blanc !
!WGIL Sp. ! Mule t ! GUISS ! WGILIDAE ! ! !
1 'PAGELLUS BELOTTlI Pageot (dorade rosei Y OUFOUF ! !SARDINELLA ! ! ! ! ! MADERENSIS !Grande allache ! YABOY ! CLUPEIDAE !
t ! ! 'PENAEUS NOTIALIS ;Crevette Rodch6e SIPPAX ! !
! ANADARA ! ! ! ! ! SENEGALENSIS !Arche du SBnBgal ! BOUTH ! AREIDAE !
SERRANIDAE !
! SPARIDAE !
COOF (Thiof) !
! PENAEIDAE !
Tableau 1 : Noms,latins, francais, Wolof et famille des esphces analysees.
*Laboratoire de Chimie Analytique et Toxicologie - Facult6 de Pharmacie - Dakar/Senegal
**Langue vernaculaire du SBn6gal

IOC Workshop Report no. 41 Annex V.3 - page 2
Apres avoir participe 2 l'exercice dlintercalibration contrble par le Laboratoire International de la Radioactivitd Marine LIRM) de l'Agknce Internationale de 1'Energie Atomique B Monaco, nous avons procede 1985. Ce programme doit se poursuivre sur le rythme d'un contrble rnensuel de chacune des six esp8ces.
L'approvisionnement en poissons a dtd rkalise par les services du Centre de Recherche Ocdanographique de Dakar/Thiaroye (CRODT) , direc- tement 2 l'arrivee des pgcheurs de Yoff (10 km au nord de Dakar) et de Hann (quartier Sud-Est de la ville).
2 l'analyse de 56 echantillons entre le 14 mars et le 10 septembre
Nous avo'ns pu distinguer trois zones de p€?che :
(i) zone de Dakar/Yoff, au nord de Dakar, entre 14O47' et 14O52' nord et 17O16' et 17O34'W correspondant aux lieux de p$che N'Gor, Yoff, Cambarene qtMalika.
(ii) zone de Dakar/Baie de Hann entre 14O37' et 14O43' et 17O20' et 17O32'W des 41es de la Madeleine jusqu'g M'Bao.
zone de M'Bour et Joal-Fadiouth 5 une centaine de km au sud de Dakar : 14O09' - 14O24'N et 16O52' - 17OO3'W. (iii)
De par sa situation, la baie de Hann (port et zone industrielle de Uakar) pouvait sembler la zone la plus exposde aux phenomenes de pollution.
La profondeur des captures'a pu etre Bvalu6e dans la majeure partie des prglevements et a pu atteindre 50 2 60 metres notamment dans le cas des Thiofs.
1. METHODOLOGIE
Les rnethodes d'dchantillonnage et de traitement des 6chantillons avant analyse, proposges par la FAO(~) ont Bt6 scrupuleusement respectees tout au long de ce travail.
9
La determination des concentrations a dtt? toujours effectude par la mdthode des ajouts dosds.
Pour l'analyse du Cadmium, Cuivre et Zinc, nous avons applique les rnethodes PNUE-FAO(Z), utilisant la spectrophotom6trie d'absorption atomique avec aspiration directe dans la flamme air-acdtylhne.
En ce qui concerne le Mercure et le Plomb, des amdnagements ont et6 apportes, conformdment aux methodes proposdes par les Etablissements Varian(3).

IOC Workshop Report no. 4'1' Annex V.3 - page 3
Dans le cas du Mercure, nous avons, par rapport la technique preconisee(4), apporte des modifications au niveau du reactif 4.6" de la mQme revue et utilise le generateur de vapeur "Model 65" fourni par la FAO.
Cet amhagement confkre a la m6thode la mQme sensibilite et la mQme fiabilite que la methode de reference citee prgcGdemment, tout en etant de pratique plus simple.
Dans le cas du Plomb, la methode par entralnement de la vapeur de PbH4 apr&s reduction du Plomb dans le generateur de vapeur "Model 65", bien que plus longue que celle de la flamme directe, montre une sensi- bilite bien meilleure.
Le contrble des resultats positifs a pu Qtre realist5 par la mesure de l'absorption aspecifique aux longueurs d'onde 213,8 et 220,4 nm, nettement diffdrentes de la longueur d'onde de travail initialement choisie (217 nm) .
Cette absorption aspecifique n'a jamais excede 0,006 unites d'absorbance tandis que les valeurs lues pour les 6chantillons positifs Btaient Bgales ou superieures & 0,020.
L'int6gralitB de la m6thodologie particulikre figure en annexe de ce rapport.
2. RESULTATS
Tous nos resultats ont et6 consignes dans les tableaux I11 5 VIII. Les concentrations sont exprimees en milligrammes par kilogramme de poids frais (mg/kg).
La mentidn 1 1 ~ ~ 1 1 signifie que la teneur est inferieure B la limite de detection de la methode. Bvaluee pour chaque element (Tableau 11).
Cette limite de detection a pu Qtre
I ! ! ! !LIMITE DE DETECTION POURUNE PRISE D'ESSAI ! ! ELEMENT ! DE lg DE POISSON FRAIS ! ! ! !
! 0,1 mg/kg ! 0,4 mg/kg ! 0,04 mg/kg !
! Zn ! 0,4 mq/kq !
! ! !
Cd cu
Pb
! ! ! ! 0,5 mg/kg 1
Hg !
Tableau I1 : Evaluation des limites de detection de notre mdthode. Nous prBcitxRp' cepenclant :que l'ermur peut Qtre tr&s importante
au voisinage de cette limite de detection.
* reactif utilise : HC1 B 10% SnC12, 2H20 3 20% dans HCl tr&s pur.

IOC Workshop Report no. 41 Annex V.3 - page 4
! ! ! ! ! ! ! ! ! Cd ! cu Hg ! Pb ! Zn !
! ! ! ! ! ! ! Zone Dakar/Yoff ! ! ! ! ! ! ! ! Y6 3/5/85 ! ND ! ND ! ND ! OY5 ! 6,5 !
! 095 ! OY5 ! 895 ! ! Y7 10/5/85 !
! y12 6/6/85 ! ND ! 095 ! OY05 ! 0,5 ! 5,8 !
! ! ! No ! !
! ND ! !
1 1 ;Zone Dakar/Baie de Hann; ! s4 4/3/85 !
! ! ! H2 12/4/85 !
! H6 22/4/85 ! ! !
! ! H11 ! H15 30/5/85 ! ! ! ! H20 17/6/85
10/7/85 ! !
! H25
! 8/8/85 ! ! H31 ! H36 10/9/85 !
10/5/85
ND ND ND ND ND ND ND ND ND
! ! ! ! ! ! ! ! ! ! ! ! ! ! !
094
OY8
ND
ND ND ND ND ND ND
! ! ! ! !. 0,05 ! ND
095 ! ! OY05 !
! ! 0,05 ! OY5
OY7 ! !
! ! ! . OY05 ! 193
! !
! ! ! 0,04 ! OY5
OY5 ! !
! ! ! OY07 ! OY8
ND
ND ND
ND
! ! 1 6
' 6,3 ! ! ! 7,4 ! 8,7 ! ! 6,5 ! ! 6 ! 6
! ! 6y3 ! 7,4
! ! ! ! ! ! ! ! ! ! ! ! ! ! !
Tableau 111 : Concentration en d t a u x lourds (mg/kg) relev6es dans les tissus de Sardinella Maderensis (Yaboye)

IOC Workshop Report no. 41 Annex V.3 - page 5
! ! ! ! ! ! 1
! Cd ! cu ! Hg ! Zn ! ! ! ! ! ! !
Zone Dakar/Yoff ! ! ! ! ! !
394 ! y4 3/5/85 ! ND ! NU ! ND ! 1 ! 4,2 !
298 ! 6/6/85 ! ND ! ND ! ND ! 0,5 ! 3,8 !
! Pb
! ! !
! !
ND !
! 0,5 ! !
! ! ! ! ! ! ! ! ! ! ! ! ! ! !
! 0,12 ! ! ND ! ND !
! ND !
!
Zone Dakar/Baie de Hann;
Y1 10/4/85
! 0,l ! ND Y1o 20/5/85
y14 1
! ! ! ! 1 ! ! ! !
!- !
1
! ! H5 22/4/85 ! ND ! ND ! ND ! ND ! 3 ! !
395 !
! Zone M'Bour/Joal ! ! ! ! ! !
392 ! NU ! ND ! 4,5 !
; 295 ! 8/8/85 ! ND ! ND ! ND ! ND ! 1,8 !
! H33 295 !
! H32
! ! ! ND ! ! ND ! ! ND !
! ! ! ND !
! ! ! ND !
I I ! H26 ! 0,16 ! ND ND ! ! ! ND ! 10/7/85
! ND ! ! ! ! ND !
ND ! !
! 0,08
! H10 10/5/85 !
! ! H16 ! H19 ! !
!
! ND ! 30/5/85
17/6/85 ! ND ! ND !
!
! !
! ! ! 0,04 ND 10/9/8 5
Tableau IV : Concentrations en m6taux lourds (mg/kg) relevees dans les tissus de Epinephelus aeneus ( Tiof)

IOC Workshop Report no. 41 Annex V.3 - page 6
- ! I ! ! !
! ! Cd ! cu ! Hg ! Pb ! Zn ! ! Zone Dakar/Yoff ! ! ! ! ! !
! 1 ! ! ! ! N3 14/3/85 ! ND ! NU ! ND ! ND ! 2,8 !
I !
! !
! ! ; y2 10/4/85
! Yg 3/5/85 ! ND ! ND ! ! 20/5/85
! !
!
! 2,5 ! ND ! O,1
! NU I ! ND ! ND ! 2,7 !
ND !
ND I ! ! 2,5 ! NU ! ! ! ND I ! 0,08
, 6/5/85 ! ND ! ND ! 0,l ! ND ! 3,2 ! ! ! ! ! ! !
! y11 !
I I I I 1 ! ! ! ! ! I ! !
! ! ! ! ! Zone Dakar/Baie de Hann!
! ND ! ! 1 H9 10/5/85
17/6/85 ! ND ! ND ND ! ND ! 10/7/85 ; “23
! ! ! ! ! ! Zone M’Bour/Joal ! ! ! ! !
! 0,04 ! 095 ! 2,5 !
! ! ! H30 ! H35 10/9/85 ! ND ! ND
! ! ! ! ! ! ! ! ! ! I ! ! !
!’ H7 22/4/85 ! ND ! ND ! 0,05 ! ND ! 2,8 !
! NU ! ND ! 3,2 , ! ! H21
! !
! ! ! ! ! ! !
! ! !
! 2,5 ! ND ! !
0,12 i ND
ND ! ! ND !
! !
ND !
1 ! 2,8 1
! ! 1,3 I
I 1
ND ! NU ! I ND 8/8/85 1
Tableau V : Concentrations en m6taux lourds (mg/kg) relev6es dans les filets de Pagelus bellottii (Dorade)

IOC Workshop Report no. 41 Annex V.3 - page 7
! ! ! ! ! ! ! ! Cd ! cu Hg ! Pb ! Zn !
! ! Zone Dakar/Yoff ! ! ! ! !
I !
! ! ! ! ! ! ! ! ! ! ! ! ! ! ! ! ! ! !
! !
! 095 ! 4.7 ! ! H, 12/4/85 ! ND ! ND ! ND
-- 1 1 1
! Y5 3/5/85 ! ND ! ND ! ND ! ND ! 5,5 .
Zone Dakar/Baie de Hann
I
! H4 .!
! ! 14 ! y13 !
! "12
! H22 ! ! H24
H29 H37
22/4/85 10/5/85 30/5/85 06/6/85 17/6/85
10/7/85 8/8/85 10/9/85
! !
! ! ! ND !
! ND ! ND ! ! !
! ! ND !
! ! ND I ND !
- ! !
! ! ' ND !
! ! ! ND !
! ! ND ! 0,7 ! ! ND 1 0,6 !
ND
ND
ND
095 !
! ! ND
ND ! 0,04 * ! ND !
! ! ND ! ! ND
ND ! 0,04 !
I
ND
095 ND ND ND
ND ND
195
1 2,8 *
! ! ! ! 3,5 ! .
! 296 I ! ! ! 3,4 !
! ! ! 3,6 ! ! !
! ! 3 !
296 !
! 5 ! 1
Tableau VI : Concentrations en m6taux lourds (rng/kg) relev6es dans les tissus de Mugil sp. (Guiss)
! ! ! ! ! ! ! ! ! Cd ! cu ! Hg ! Pb ! Zn ! ! ! ! ! ! ! ! !Zone de Dakar/Baie de Hann ! ! ! ! ! !
! ! ND !
! 0,06 ! ND ! 10,5 ! ! H8 22/4/85 ! 091 ! 2 !
! ! 0,05 !
!
! ! ! 0,04
! 14
! 15 !
! 15 !
! H3 12/4/8 5 091 ! 095 ! ! !
! !
! !
2 ! ! !
ND ! !
! ND !
!
! YE 20/5/85 ! ! H13 ! H17 17/6/85 !
NU 3 ! !
! !
30/5/85 ! ND ! 2,3 ! ND ! 095 ! 13 !
ND 391 ! ! 3,5 ! ND ! ND ! 15 !
! !
! 091 ! !
! 13- ! ND ! 0905 ! !
! 1 ! ! ND
! Hl8 17/6/05 10/7/85 !
! H27 ! .H28 10/7/85 .. 1 ND ! 1,5 ! 0,11 ! 095
10/9/85 ! ND ! 1 ! 0,04 ! 095 ! H34
! 14 ! ! 12 !
!
1 1 1 1 I . 1 1
1 ! ! !. ! !
Tableau VI1 : Concentrations en m6taux lourds (mg/kg) relevbes dans les tissus abdominaux de Penaeus notialis (crevette)

IOC Workshop Report no. 41 Annex V.3 - page 8
~~
! ! ! ! ! ! ! Cd ! cu ! Hg ! Pb ! Zn !
! ! ! ! ! ! ! ! ! ! Zone Dakar/Baie de Hann ! ! ! ! ! ! ! ! ! ! ! ! !
4/3/85 ! 198 ! 0,5 ! 0,05 ! ND I 9 ! ! !
! 55 ! !
17/6/85 ! 099 ! 0,7 ! 0,04 ! ND ! 14 ! ! ! ! ! ! !
! s7 !
096 ! ! ND ! ! 0,4 ! ! 14 ! '6 17/6/85 ! ! 1,5
Tableau VI11 : Concentrations en mCtaux lourds (mg/kg) relevees dans les tissus de Anadara Seneqalensis (Arche du SBnCgal)
! ! ! !
Esphces !
Valeurs (mg/kg) I ! Nombre d'6jNombre I de , ! I !
! ! I ! ositifs I Min. iMoyenne(SD4 Max. I
Valeurs (mg/kg) ! ! I ! ! !
Nombre d 6j Nombre de ! !chantillons !- 'rdsultats !! 1 Esphces
! ! ! P I ! ! ! P ositifs I Min. iMoyenne(SD4 Max. I
!chantillons 'rdsultats !- I i ' 1
! ! ! ! ! !
! !
! ! Poissons toutes esphces !
! ! ! ! ! ! ! !
! ! ! ! ! ! ! ! Penaeus mtialis ! 9 ! 3 ! 0,l ! ! ! ! ! ! ! ! ! ! ! ! ! ! ! ! ! ! Anadara senegalensis ! 3 ! 3 ! 0,9 ! ! 1,8 ! ! ! ! ! ! ! !
091 ! ! 0 44
Tableau IX : Rgcapitulatif des teneurs en Cadmium dans les organismes marins au Sendgal.
La pollution locale par le Cadmium apparatt donc tr&s limitCe. Les teneurs retrouvees dans les invertCbrCs marins au SBn6gal ont QtB compar6es A d'autres donn6es (tableau X).
! ! ! ! ! ! ! ! ! ! !
~
! ! !
! !
! ! ! !
Moules 2 mg/kg
Crabes 13 mg/kg
Coquilles St Jacques
HuPtres 3 mg/kg !
Homards 17 mg/kg !
jusqu '3 120 mg/kg
Tableau X : Concentration en Cadmium des invert6brBs marins (Source : Conseil National de Recherches au Canada, 197915

IOC Workshop Report no. 41 Annex V.3 - page 9
! Valeurs (rng/kg) !
! ! Nornbre 1 jNornbre de I ! !
! Moyenne ! ! 'd'dchantil-,r6sultats ! !
! (SDI ! Max. ! ! ! ! ! ! ! ! ! ! ! ! Sardinella maderensis ! 12 ! 4 ! 0,4 ! ! 0,8 !
Especes lons i positifs ! Min.
! Epinephelus aeneus ! 11 ! 0 ! (0,4 ! ! !
! Pagellus belottii ! 11 ! 0 ! <0,4 ! ! !
! ! ! ! ! ! ! ! ! ! ! ! ! !
! ! ! ! ! ! ! ! ! ! ! ! ! ! Mugil sp. ! 10 ! 3 ! 0,5 ! ! 0,7 ! ! ! ! ! ! ! ! ! ! ! ! ! ! ! ! Penaeus notialis ! 9 ! 9 ! 1 !2,1 (0,9)! 3,5 ! ! ! ! ! ! ! ! ! ! ! ! ! ! ! ! Anadara enegalensis ! 3 ! 3 ! 0,5 ! ! 0,7 ! ! ! ! ! ! ! !
Tableau XI : Rdcapitulatif des teneurs en Cuivre dans les organisrnes rnarins au S6nBgal.
A l'exception de quelques rdsultats positifs sporadiques dans les poissons, le cuivre n'a dt6 retrouvd rdguli&rement que dans les crevettes (valeur moyenne 2,l mg/kg) et 3 un niveau rnoindre (0,5 rng/kg) dans les arches du Sdndgal.
! !
! ! !
! ! ! ! ! ! ! ! ! ! ! Sardinella m:aderensis ! 12 ! 7 ! 0,04 ! 0,07 ! 0,07 ! ! ! ! ! ! ! ! ! ! ! ! ! ! !
! 0,08 ! 0,11 ! 0,16 ! ! ! !
! Epinephelus a.eneus ! 11 ! 4 ! ! ! ! I
! ! ! ! ! ! ! ! Pagellus belottii ! 11 ! 6 ! 0,04 ! 0,08 ! 0,12 ! ! ! ! ! ! ! ! ! ! ! ! ! ! !
Valeurs (mg/kg) I ! Nornbre ; Nornbre de ! Esphces 'd'khantil-; resultats , I ! ! lons ! positifs ; Min. jMoyenne ! Max.
! Mugil sp. ! 10 ! 2 ! 0,04 ! ! 0,04 ! ! ! ! \ ! ! ! ! ! ! ! ! ! ! ! ! Penaeus notialis ! 9 ! 6 ! 0,04 ! 0,06 ! 0,11 ! ! ! ! ! ! ! ! ! Anadara senegalensis ! 3 ! 2 ! 0,04 ! ! 0,05 !
! ! ! ! ! ! Tableau XI1 : Rdcapitulatif des teneurs en Mercure dans les organisrnes rnarins du
Sdndgal.

IOC Workshop Report no. 41 Annex V.3 - page 10
Les teneurs positives rencontrees dans 48% des echantillons apparaissent faibles, sensiblement infdrieures aux 0,36 et 0,21 rng/kg d6celds prgc6dernrnent au Senegal (6) dans les thiofs et les dorades.
Elles ont Btd dans tous les cas nettement inf6rieures B la concentration rnaximale admissible dans les poissons (CMA) fix6e dans la plupart des pays 21 0,5 ppm (6).
! Valeurs (rng/kg) !
! Esphces !chantillons Iresultats ! Min. ! ! !
! I ! ! ! !Nornbre d'd-!Nornbre de !
! * ! ' ! positifs ! ! ! 10 ! ! 095 ! '0 9 6 (0,l) i 1,3 i !
! I !
! ;Sardinella maderensis ! ! ! ! ! !
! ! ! 0,5 ! !
! !
I ! ! ;Epinephelus aeneus
! ! ! ! ! ! ! 1,5 !
! ! 0,5 ! ! ! !
I ! ! 'Pagellus belittii !
Moyenne Max. I I
12
! I 1 ! ! 3 ! 11
1 11 ! ! ! ! ! ! !
! ! ! ! ! !
1 ! ! ;Mugil sp. 10 ! ! 3 ! ! 0,5
! ! ! ! ! ! ! ! ! ! ! ! ! ! !Penaeus notialis ! 9 ! 4 ! 0,5 ! ! ! ! ! ! ! ! ! ! ! ! ! I I ! ! !Anadara senegalensis ! 3 ! 1 ! 0,4 ! ! ! ! ! ! ! ! ! !
Tableau XI11 : Rgcapitulatif des teneurs en Plomb dans les organisrnes marins au SBnBgal.
Les valeurs positives retrouvees se sont situdes le plus souvent au voisinage de la lirnite de detection.
Parmi les six especes etudiees, seule Sardinella mderensis 'a fourni regulihrernent des resultats positifs.

IOC Workshop Report no. 41 Annex V.3 - page 11
! Valeurs (mg/kg) ! ! ! ! ! ! ! ! ! positifs ! Min. ! (SD) ! Max. !
! Nombre ! Nombre ! !
! Sardinella maderensis ! 12 ! 12 ! 6 ! 6,8(1) ! 8,7 !
!d16chantillord deresultatd ! Moyenne ! !
! ! ! ! ! ! ! ! !
! ! !
! !
Especes
1 I I I I
11 ! 1,8 ! 3,2 (0,8): 4,5 ! !
! ! Epinephelus aeneus
! ! Pagellus belottii !
! ! ! 11
Mugil sp. ! !
! ! !
' 1 ! 5 9 5 ! ' 296 i 3,4(1) 10 - ! 10 !
!
I 1 I I I ! ! ! !
! 1095 ,13,5(1,5) ! ! 15 ! ! 9 !
! 9 1 ! ; Penaeus notialis ! 1 I I I I ! !
! Anadara senegalensis ! 3 ! 3 ! 9 ' i12,3(2,8) i 14 !
Tableau XIV : Rdcapitulatif des teneurs en Zinc dans les organismes marins au S6n6gal.
Le zinc a donc et6 retrouve dans la totalit6 des 6chantillons. Les con- centrations, plus Blev6es pour Penaeus notialis et Anadara seneqalensis apparais- sent homogenes 21 l'int6rieur de chacune des six especes consid6r6es.
CONCLUSION
Llaide efficace de la FAO nous a permis d'entreprendre l'dtude de la pollution par les m6taux des organismes issus de la p@che au S6nBga1, en particulier dans les regions du Cap-Vert et de Thi&s.
56 analyses de Cadmium, Cuivre, Mercure, Plomb et Zinc ont &e effec-
Le nombre de donn6es ainsi collect6es reste cependant insuffisant, notamment pour esperer Btablir d'eventuelles correlations entre les teneurs en m6taux et certains parametres comme,l'8ge, la taille, le poids, le sexe des poissons, la date et le lieu de prdlgvement.
A ce stade du programme, notre travail, que nous pouvons qualifier de simple sondage, nous permet cependant de degager quelques,observations :
- aucune difference significative n'a pu etre mise en evidence entre les trois zones de pgche. tante dans la Baie de Hann ne semble pas devoir etre retenue dans le cas des mdtaux.
tu6es sur six especes differentes entre Mars et Septembre 1985. / .
L'hypothese d'une pollution localement plus impor-

IOC Workshop Report no. 41 Annex V.3 - page 12
- la comparaison des resultats releves dans les quatre esphces de poissons 6tudids ne fait pas apparaftre de differences significatives entre Epinephelus aeneus, Pagellus belottii et Mugil sp. Par contre, Sardinella maderensis a montr6 des teneurs de cuivre, plomb et zinc leghrement supdrieures.
- les invert6br6s marins retenus pour cette Qtude (Penaeus notialis et Anadara seneqalensis) renferment des teneurs en cadmium, cuivre et zinc sensiblement plus Blevdes, en relation probable avec leur localisation dans les vases.
- l'examen des teneurs en mercure ne fait pas apparaftre de differences importantes entre les six espbces Btudiees. sont dans tous les cas comparables A celles relevees dans des milieux marins consid6r6s comme peu pollues.
Ces valeurs
Les r6sultats obtenus 2 ce jour ne permettent pas de conclure B l'atteinte de la cote d'alerte en ce qui concerne les metaux recherches.
Cependant, ce travail ne pourra trouver sa pleine justification que dans un suivi A long terme.
REFERENCES
1.
2.
3.
4.
5.
6.
Manuel des mCthodes de recherche sur l'environnement aquatique. 9 O
partie. Analyse- des mCtaux et des organochlords contenus dans les poissons.
DBtermination of total cadmium, zinc, lead and copper in selected marine organisms by atomic absorption spectrophotometry. Reference methods for marine pollution studies, N o 11, UNEP 1982.
FAO Document Technique sur les pbches, FIRI/T 212.
Bropie, K.G. : Analysis of arsenic and other trace elements by vapor generation. Paper presented at the Pittsburgh Conference on Analy- tical and Applied Spectroscopy, Cleveland, March 5-9, 1979. Reprinted from "American Laboratory", Distributed by Varian Company.
Determination of total mercury in selected marine organisms by flameless atomic absorption spectrophotometry. Reference methods for marine pollution no 8, UNEP 1982.
Cornit6 associt? du CNRS sur les crithres scientifiques concernant 1'6tat de l'environnement. Les effets du cadmium dans l'environnement canadien. Conseil National de Recherches au Canada - Sous-Cornit6 sur les metaux lourds et certains autres BNments, 1979. Extrait de "Dossier Cadmium", synthhse documentaire, Tecmin, Paris, 1983. Gras, G. et Mondain, J.- Pollution des produits de la pbche par le Mercure et le M6thylmercure. Incidence toxicologique sur la sante humaine. Repport present8 aux IXhmes Journ6es Medicales de Dakar.
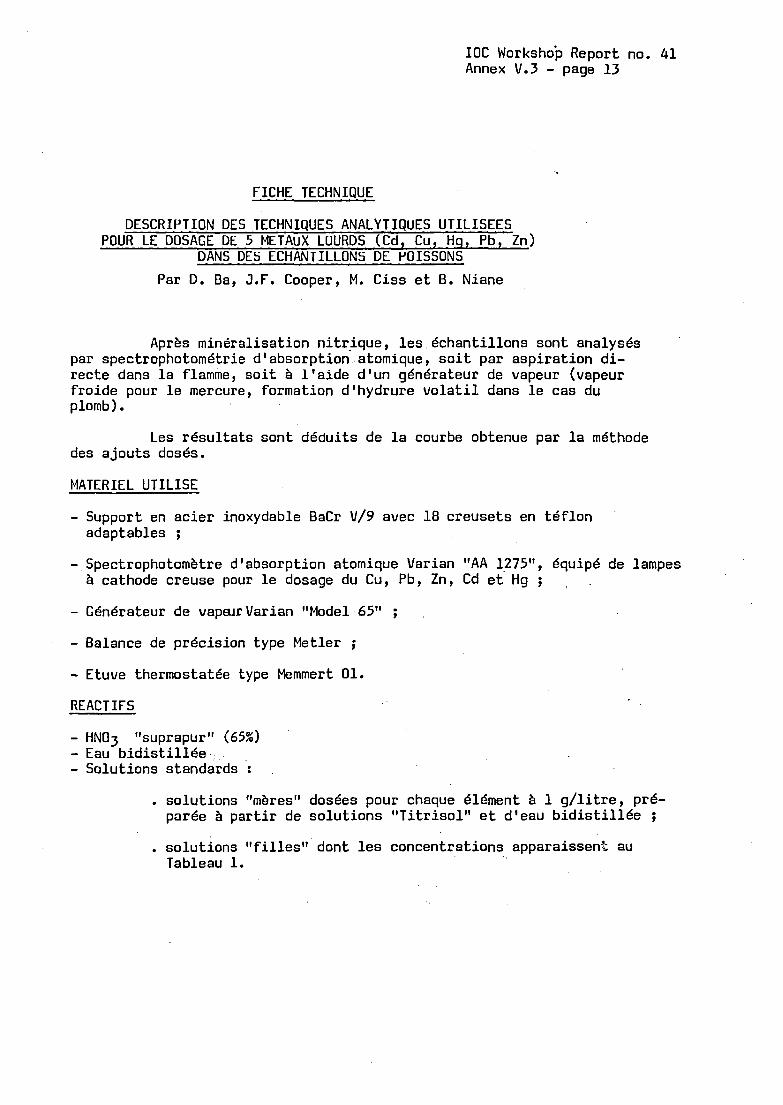
IOC Workshop Report no. 41 Annex V.3 - page 13
FICHE TECHNIQUE
DESCRIPTION DES TECHNIQUES ANALYTIQUES UTILISEES POUR LE DOSAGE DL 5 METAUX LOURDS (Cd, Cu, Hq, Pb, Zn>
DANS DES ECHANTILLONS DE POISSONS Par D. Ba, J.F. Cooper, M. Ciss et B. Niane
Aprks mineralisation nitrique, les dchantillons sont analyses par spectrophotom6trie d'absorption atomique, soit par aspiration di- recte dans la flamme, soit l'aide d'un generateur de vapeur (vapeur froide pour le mercure, formation d'hydrure volatil dans le cas du plomb) .
Les resultats sont deduits de la courbe obtenue par la rnethode des ajouts doses.
MATERIEL UTILISE
- Support en acier inoxydable BaCr V/9 avec 18 creusets en teflon adaptables ;
- Spectrophotomhtre d'absorption atomique Varian "AA 1275", equip6 de lampes ?I cathode creuse pour le dosage du Cu, Pb, Zn, Cd e t Hg ;
- GCnerateur de vaparvarian "Model 65'' ; - Balance de precision type Metler ; - Etuve thermostatee type Memmert 01. RE ACT IFS
- HNO3 "suprapur" (65%) - Eau bidistillge - Solutions standards : . solutions "rn8res" dosees pour chaque 616ment CI 1 g/litre, pr6- paree 3 partir de solutions "Titrisol" et d'eau bidistillge ;
. solutions "filles" dont les concentrations apparaissent au Tableau 1.

IOC Workshop Report no. 41 Annex V.3 - page 14
! ! ! ! !
Tableau 1 : Concentration des solutions A, 6, C, D (en microgrammes/millilitre)
- Solution d'acide chlorhydrique (HC1 pour analyse 37%) B 1% dans l'eau bidistillee.
- Solution de dichromate de potassium (K2Cr207 pa) B 3% dans l'eau bidistillde.
- Solution d'aci.de tartrique (C4H606 pa) B 7,5k dans l'eau bidistillde.
- Solution de borohydrure de sodium (NaBH4 pa) B 2,576 dans une solutlon - Solution d'acide chlorhydrique (HC1 pa) B 10% dans l'eau bidistillde. - Solution de chlorure stanneux (SnC12 pa) B 20% dans l'acide chlorhy-
de soude (NaOH pure B.O,l%>
drique concentrd.
MODE OPERATOIRE
1) Ddtermination du pourcentaqe d'humiditB
Placer une prise d'essai voisine de 1 g, exactement pesBe dans une Btuve B llOo jusqu'3 poids constant (pendant une nuit)..
2) Preparation des Bchantillons
Pour chacun des deux Bchantillons d'essai de 1 g exactement pesdes dans les creusets en tdflon adaptables sur le support BaCr V/9.
(p.X, p.Y), rdpartir 4 prises
ProcBder h des ajouts selon le tableau suivant :

IOC Workshop Report no. 41 Annex V.3 - page 15
! ! ! ! Poisson ,distillee !Solution AiSolution B ,Solution C,
! ! ! ! ! !
! ! ! ! ! I
! !
Creuset! ! 1 ! ! ! Eau ! !
!
! !
! 2 m l I ! ! ! 2 ! lg p.X ! 2 ml ! ! !
!
- - - No !
l ! !
- ! - - - - - lg P-x ! 1 m l ! 1 m ~ ! ! ! 3
! !
- ! 4 ! lg p.X ! 1 ml ! - ! 1 ml ! - ! 1 m l I ! ! !
- ! lg p . ~ 1 1 ml ! 5 ! ! !
! ! ! ! ! !
- - ! !
! 6 ! lg p.Y ! 2 ml -!. - - lg p . ~ 1 ml ! ! 1,ml I !
! 7 ! ' ! ! - ! 8 ! lg p.Y ! 1 ml ! - ! 1 ml ! ! ! - ! 1 m l ! - !
! ! !' lg p.Y ; 1 ml ! 9 !
! ! Tableau I1 : Preparation de l'analyse de deux poissons.
3) Mineralis at ion
Introduire dans chaque creuset 2,5 ml HNO3 "suprapur". Fixer ces creusets dans les emplacements numerotes sur le support BaCr V/9. Effectuer une predigestion 21 1'Btuve 3 80-90° pendant 1 heure. Amener la temperature temperature pendant 5 heures. Laisser refroidir 3 la temperature arnbiante.
135-140° et maintenir l'ensemble 21 cette
4) Determination analytique
Effectuer les rnesures B l'aide du spectrophotom&tre d'absorption . atornique dans les conditions suivantes :
- - Cadmium : dosage par aspiration directe dans la flamme air-acetylhe
: dosage par aspiration directe dans la flhme air-acetylhne
: 228,8 nm slit : 0,5 nm lamp current : 4 mA
- Cuivre : 324,8 nm slit : 0,5 nm lamp current : 4 m A
- Mercure : dosage par absorption atomique sans flamme. Principe : le mercure ionique est reduit en mercure metallique volatil qui est entrafne dans une cellule de mesure par un courant d'azote.
Mode operatoire :dans le rgacteur du "model 65" introduire :

IOC Workshop Report no. 41 Annex V.3 - page 16
18 ml HC1 10%
Refermer. Agiter pour homogen6iser. Injecter travers le septum 1 ml de chlorure stanneux 2 20%. Agiter pendant 90 secondes. Introduire l'azote sous un debit de 41/mn. Effectuer la mesure de l'absorbance par l'option "peak height" ou "peak area" programmCe pour une lecture de 15 secondes.
2 ml de mineralisat
253,7 nm slit : 0,5 nm lamp current : 4 mA
- Plomb : dosage par generation d'un hydrure de Pb (PbH4 ou plumbane}, entralnable par un courant d'azote.
Mode operatoire : dans le reacteur du "Model 65" introduire :
8 ml HC1 l!% 2 ml de mineralisat 6 ml d'acide tartrique 2. 7,5% 3 ml KzCr207 3%. Refermer. Faire arriver un courant d'azote de 2 litres par minute. Injecter 2i travers le septum 5 ml de solution de NaBHq 2 2,5%. Faire les mesures de l'absorbance par la m6thode "peak height" ou "peak area". = 217 nm slit : 1 nm lamp current : 5 mA
- - Zinc : dosage par aspiration directe dans'la flamme air-acetylhne = 213,9 nm slit : 1 nm lamp current : 5 m A
Tous les resultats sont Bvaluds par la m6thode des ajouts doses. Les limites de detection de cette methode ont et6 Bvaluees :
! ! ! ! ! Limite de detection pour une ! ! Element ! prise d'essai de 1 g de pois- !
! ! ! son frais ! !
! ! ! 100 ug/kg ! Cd
cu
Hg Pb Zn
! 400 ug/kg ! 40-50 ug/kg ! ! 500 ug/kg ! 400 ug/kg 1
~~
Tableau I11 : Evaluation des limites de detection de notre methode.

, IOC Workshop Report no. 41 Annex V.4 - page 1
TENEURS EN METAUX LOURDS DANS LES PRODUITS DE PECHE EN COTE D'IVOIRE
par Bernard Soro Metongo
RESUME
Les concentrations de cadmium, cobalt, cuivre, fer, mercure, manganese, nickel et de zinc ont 6t6 d6termin6es dans les muscles de poissons (Ethmalosa fimbriata, Chrysichthys filamentosus, Elops la- certa, Tilapia guineensis, Pseudotolithus senegalensis, Pagellus bellottii, Dentex angolensis et canariensis, Sardinella aurita et eba, Sparus pagrus africanus, Thunnus albacares) et dans les parties molles de mollusques (Arca senilis) collect6s dans les lagunes et dans les zones cdtieres de Cote d'Ivoire de juillet 3 octobre 1985.
Ces rgsultats pr6liminaires ne montrent pas de difference entre les differents milieux d'origine. Le cobalt, le cuivre, le nickel et le manganese ont des teneurs infdrieures B la limite de detection de m&me que le cadmium sauf pour les Arca senilis. Le mercure et le zinc presentent des valeurs consider6es comme normales. Le fer a des valeurs plus 6lev6es dans les Arca senilis que dans les poissons.
INTRODUCTION
C'est dans le cadre du projet WACAF 2 relatif 3 la surveillance de la pollution marine dans les zones cdti8res de 1'Afrique de l'0uest et du Centre que nous avons entrepris des mesures de m6taux-lourds. En particulier le mercure et la cadmium qui par leur toxicit6 ont retenu l'attention de plusieurs chercheurs dans les autres parties du monde. Le choix des especes fut dict6 par leur niveau de consommation dans le pays. Les esphces 6tudi6es ont 6t6 les suivantes :
1. POISSONS
1.1 PR ED ATEUR S
- Thunnus albacares (thon albacore) 1.2 PETITS PREDATEURS ET PELAGIQUES'
- Pseudotolithus senegalensis (Otolithe senegalais) ; station - Pagellus bellottii (Pagest 3 tache rouge) ; station 1 - Dentex angolensis '(Dent6 angolais) ; station 2 - Dentex canariensis (Dent6 B tache rouge) ; station 1 1,2 et 3

IOC Workshop Report no. 41 Annex V.4 - page 2
.
- Sparus pagrus .africanus (Pagre des Tropiques) ; station 3 1.3 PELAGIQUES
- Sardinella aurita (Allache) ; station 1, 2 et 3 - Sardinella eba (Grande allache) ; station 1 et 2 - Ethmalosa fimbriata (Ethmalose d' Afrique) ; station 4 - Gerres nigri (Friture rayee) ; station 4 - Elops lacerta (Guide du Senegal) ; station 4 1.4 BENTHIQUES
- Chrysichthys nigrodigitatus (Wchoiron) ; station 4 - Chrysichthys f ilamentosus (MQchoiron) ; station 4 1.5 SEMI-BENTHIQUES
- Tilapia guineensis (Carpe) ; station 4 1.6 MoLLUSqUES
- Arca senilis (mactre) ; station 5 Les echantillons ont et6 pQch6s au cours de la periode de
juillet Si octobre 1985 dans les stations indiquees sur la Figure 1. Ces divers sites d'echantillonnage ont et6 choisis pour leur degre de pollution potentielle. Celui-ci est fonction de l'eloignement Si la source de pollution maximale situde dans la zone urbaine et portuaire d'Abidjian. comparativement aux r6sultats.obtenus pour un milieu de reference non ou peu pollue (lagune Aby).
Les diverses valeurs seront interprBt6es
2. MATERIEL ET METHODES
Les especes ont et6 capturees par des piroguiers et des chalutiers. Apr&s identification et determination de la taille, du poids et du sexe les echantillons ont et6 conserves par congelation au laboratoire. Des filets de poissons et de parties molles de mol- lusques ont Bt6 preleves pour l'analyse selon les techniques de pre- paration preconisees par le programme des Nations-Unies pour 1 'Environ- nement et l'organisation des Nations-Unies pour 1'Alirnentation et 1'A- griculture (1). : l'acide nitrique dans le systeme sous pression mis au point par Stoeppler et Backhaus (5); ' .
La decomposition de la matiere organique a et6 realisee par
La determination des Blements : Cd, C, Cu, Fe, Mnp

IOC Workshop Report no. 41
Annex V.4 - page 3
I Y
7
Lu t, 0

UJ w 2
IOC Workshop Report no. 41
Annex V.4 - page 4
U
0
9 - m
- 0 0
V
'9 -
9
N
V
U)
N
0
V

IOC Workshop Report no.
41 Annex V.4 - page 5
V V - -
I
uu
99
N
N
v-
-
99
e
n
vv
03
03
00
9
9
N-
ma
00
c
oc
o
00
v
v
99
N
N
V
mm
N
N
00
v
v
r.c
ha
m
u
hl-4
-e
lna
Wl
n
nc
L -
'Ifi z N V - 0
CO
9
N
V -
9
c.
V - 9 0 9 - N
m -
0
W 0
V - 9
N
V
-
m N
0
V -
r.4
.hl N 'r V V +
99
h
lN
V
V
-
c
9
9
N
V -
9
n
V -
Fl
0
9 -
U
r- e
-
m
rD . c
9
0
N
V
-
m N 0
V
p1
-
a
co N
c.
7
?
U
-
9
N
V -
0
V c.
-
ul
0
9 -
0
-. c
u; N
0
V r I_
c'! h h
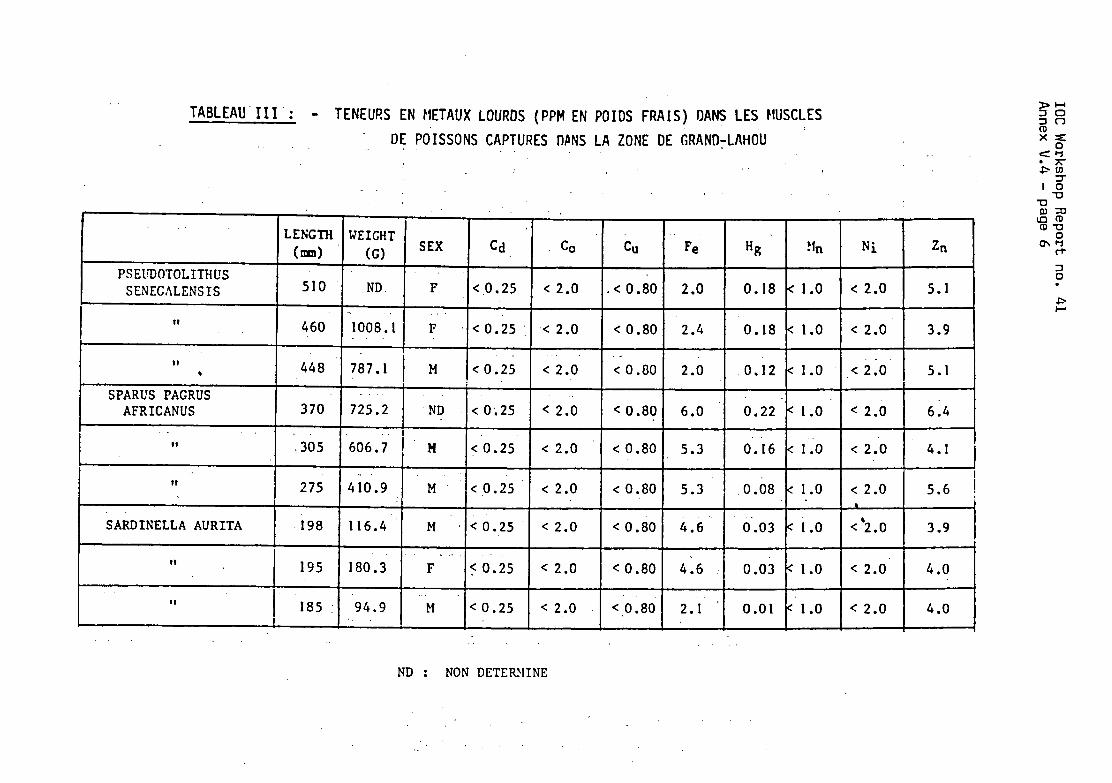
IOC Workshop Report no. 41
Annex V.4 - page 6
m
m V
c.
V
Q) - N
v V
N
V
c
CO 0
0
e
- - -A
.. w H
U
3
4
W
-I e
I- m
R
m
99
N
hl
V
99
c.
V
N
00
c
49
N
00
00
'v
"0.0.
99
N
N
V
mm
N
00
V
Lf
:
-.
R
h
'CO
h
ow
-
U
uu
e
:I
z 0
z .. P 2

IOC Workshop Report no. 41
Annex V.4 - page 7

IOC Workshop Report no. 41
Annex V.4 - page 8
I
.. P z

IOC Workshop Report no. 41 Annex V.4 - page 9
Ni et Zn a 6t6 realisee par Spectrophotom6trie d'absorption atomique a la flamme air-acetylgne (Varian SBrie 1275). ' Le mercure a et6 atomise par la technique de la vapeur froide selon les m6thodes d'etudes pour la pollution marine du Programme des Nations-hies pour 1'Environnement (7; 8). La sensibilitd de l'apparedl a 6t6 calculee avec la methode d'addition selon Julshamn et Braekkan (2).
3. RESULTATS ET DISCUSSION
Les resultats d'analyse sont donnes dans les tableaux ci- dessous. Les concentrations sont en ppm exprimees en fonction du poids frais d ' echantillon.
Le mercure dans tous les 6chantillons Btudies et pour toutes les stations pr6sente des valeurs comprises entre 0.22 et 0.01 ppm (0.09 ppm de moyenne) except6 pour le thon (0.60 ppm de moyenne). Ces valeurs sont consid6r6es comme normales (4).
Le cadmium dans toutes les stations presente des valeurs inferieures B la limite de detection (0.25 ppm) pour les poissons. Dans les echantillons d'Arca senilis on a determine des concentrations significatives voisines de 0.4 ppm.
Le cobalt, le' cuivre, le mangangse et le nickel presentent des teneurs inferieures & la limite de detection dans presque tous les dchantillons examines. lentes voisines de 5 ppm pour les poissons et les Arca senilis.
Le zinc montre des concentrations Bquiva-
Le fer quant & lui montre des valeurs comprises entre 5 et 15 ppm dans les muscles de poissons et de 100 B 150 ppm pour Arca senilis.
De ces resultats preliminaires il ressort qu'il n'existe pas de difference significative selon les lieux d'origine des dchantillons notamment entre la zone urbaine d'Abidjian et la lagune Aby., (Cf. Tableau VI). des valeurs homoghes dont les coefficients de variation sont respec- tivement de 13k, 20% et 25% tandis que en zone urbaine d'Abidjian ils sont respectivement de Zl%, 49% et 37%. Ceci denote une dis- persion accentuee des valeurs en particulier pour le mercure.
En lagune Aby le fer, le mercure et le zinc pr6sentent
! ! ! ZONE D'ABIDJIAN ! LAGUNE ABY !
I t I 1 1 L
! i n ; Pi !Fe+.33<5,.76<8.1(12 ! 4.33<5..78(7.23 I 9 1 !H I 91 !0.01<0.07C0.1~12 0.03(0.05<0.07 9 i fZ i1.50<5.92<10.3412 f 2.59<5.23<7.83 9 I ! I I L i
TABLEAU VI : LIMITES DE CONFIANCE DES ECHANTILLONS EN ZONE URBAINE D'ABIDJIAN ET.EN LAGUNE ABY. n = NOMBRE D'ECHANTILLONS.

IOC Workshop Report no. 41 Annex V.4 - page 10 *
Dans une etude pr6cBdante relative aux teneurs de mdtaux lourds dans les sediments de la lagune EbriB, Marchand et a1 (1983) avait montrd que bien que les concentrations soient gen6ralement faibles elles traduisent une legere augmentation de..l.'indice de pol- lution dans la zone urbaine d'Abidjian. I1 est donc souhaitable dans les prochaines investigations de confirmer ces donnees au niveau des poissons mais surtout des mollusques benthiques colo- nisant les milieux sedimentaires des lagunes de CBte d'Ivoire.
CONCLUSION
Ces resultats d'analyse preliminaires ne permettent pas de formuler des conclusions definitives. I1 est souhaitable dans les annees a venir d'etendre le domaine de la recherche des pollutions par les mdtaux lourds dans le milieu marin aux crustact% et surtout aux mollusques. En effet ces derniers sont de bons bioindicateurs de niveau de pollution par les mdtaux autres que le mercure. est aussi necessaire de connaftre le niveau actuel de la pollution dans les lagunes de CBte d'Ivoire soumises aux fortes pressions ,
industrielle, urbaine et portuaire et d'en contrbler sa tendance.
I1

IOC Workshop Report no. 41 Annex V.4 - page 11
IIEFERENCES BIBLIOGRAPHIOUES
F.A.O. Fiches F.A.O. d'identification pour les besoins de la peche Atlantique Centre-Est. Zones de p k h e 34 et 47 (en partie) Canada Fonds Piduciaircs vol. I B V.
Julshamn, K. and Rraekkan, 0.R. (1975) : Determination of trace elements in fishtissues by the standard addition method. At Absorpt. Newsl., 14; 49-52.
llarchand N., Martin I.L. et Chantraine J.11. (1983) : DGtermination de la pollu- tion chimique de la lagune d'Abidjan par l'6tude des s6diments; hydro- carbures- Organochlorfis-?lEtaux. Sous presse.
Hurray A.J. : Netals, organochlorine pesticides and PCB residue levels in fish and shellfish landed in England and Wales during 1975. Lowestoft 1981.
Stoeppler M. and Backhaus F. (1978) : Pretreatment Studies vith biological ans environmental' materials. 1.Systems for pressureed multisanple decom- position. Fresenius Z. Anal. Chem. 291; 116-120.
UNEP/FAO/IhEA : Determination of total cadmium, zinc, lead and Copper in selected llarine organisms by atomic absorption spectrophotometry. Reference Methods for Marine Pollution Studies. No 1 1 - UNEP 1962.
UNEP/FAO/IAEA : Determination of total mercury in selected narine organisms by cold vapeur atomic absorption Spectro7hotometry - Reference Methods for Marine Pollution Studies : No 8 Rev. 1 UNEP 1984.
UNEP/FAO/IAEA : Sampling of selected marine organisms and sample preparation for trace metal analysis. Reference Methods for Marine Pollution Studies. No 7 Rev. 2, UNEP 1984.

IOC Workshop Report no. 41 ,
Annex V.5 - page 1
THE MONITORING.OF MARINE POLLUTION
By D.F. Faulkner and Stephen J. Jusu IN SIERRA LEONE
Sierra Leone's participation in WACAF Project 2 finally got off the ground in May 1985 after various setbacks ; water supply and energy being'the two most responsible. Several re arts have appeared about marine pollution in the Sierra Leone inshore waferways but none has dealt comprehensively with the levels of organochlorines and heavy metals in commercial fish and shellfish species. Fourteen species, (Table I), are to be studied under the current programme.
Only organochlorines have been analyzed at the moment because of technical problems and installation of the monochromator accessory for the Atomic Absorption Spectrophotometer. The Research Assistant has been working on "Levels of Pollutants in Fishes and Shell Fishes of Sierre Leone Inshore waterways". The study will try to correlate the levels of the various pollutants pecticides or PCB's with possible hot spots or sinks in the marine environment of Sierra Leone. The results obtained so far on organochlorines are shown in Table 11. done. No definitive deduction can therefore be made until more de- tailed studies with sampling of more than five per species is done.
In almost all the species analyzed, unit sampling was
The exact locus of each sample collected for the survey was not possible as the trawlers used lacked appropriate equipment. It is envisaged that future sampling will be in boats that have better faci- lities to give the geometric locus of each catch from which samples are drawn. The project faces a few teething problems, of which were indicated earlier. Basic to the research is the question of energy. This is beyond the research team. the situation. However it appears that a generator to run the equip- ment. is absolutely necessary to enable results to be submitted against targets set.
comprehensive look at various indicators of pollution levels. regard a survey of foliage and the atmosphere in various areas in the country is being considered by the author. that require investigation if not yet looked at are :
Everything is being done to remedy
Current thinking in Environmental Studies demands a more In this
Mind boggling questiens
(i) possibility of shells being accumulators or better -markers af the level of pollution. Shrimps-are eaten with the shells on by some cultures. .If there is ac-; cumulation what are the consequences 7

IOC Workshop Report no. 41 Annex V.5 - page 2
(ii) Does a correlation exist between lipid content and shell content of pollutants as heavy metals or pesticides.
These studies will complement those of the marine environ- ment and give a better picture of the level of pollution in the Sierra Leone environment.
Last but not least the project team in Sierra Leone wishes to commenton the visit ~f Dr. Carlo Gaggi of the University of Siena who delivered a talk on "Current Trends in Pollution Studies". The visit, we hope, will apprise the coordinators and benefactors of the project of some of the dreams, realities and frustrations of those of us in the third world who become attached zealously and academi- cally to studies that will hopefully lead to an improvement of the quality of life in our environment.
TABLE 1
Sphypreana sphyreana/atra Epinephelus aeneus Thunnus albacares T. obesus Pseudotolithus senegalensis Mugil cephalus Cynoglossus senegalensis/goreensis C. monodi Pomadays peroteti/jubelini Ilisha africana Callineetes ammicola
- barracuda - white grouper - yellow fin tuna - bigeye tuna - lady/cassava croaker - flat head grey mullet - Senegalese tongue sole - guinean tongue sole - crocus - lati - big fisted crab
Penaeus duorarum notialis
P. kerathurus - tiger shrimp - pink shrimp

IOC Workshop Report no. 41
Annex V.5 - page 3
C
.d

IOC Workshop Report no. 41 Annex V.6 - page 1
MONITORING ORGANOCHLORINES IN FISH BY THE GAMBIA FISHERIES DEPARTMENT, BANJUL
ABSTRACT
On the presentation of a scientific report on the assessment of marine pollution levels in the Gambia, it has been infeasible for my Institution to do so due to problems encountered.
However, producing a report at this first workshop has been inevitable so that this one has been managed. It discusses the im- plementation of the project and associated problems, and deals with the general use of pesticides in the Gambia.
INTRODUCTION
The Gambia lying within 13O45'N, 13O07'N and 16O15'W,
Its shelf area extending to about 200 13O45'W has a land area of 10,403 km2 and a population estimate of 700,000 inhabitants. meters is 3,855 km2 and the length of the coastline approximately 70 km.
Its important river divides the country into two parts along its length to form a north bank and a south bank, with agri- cultural land covering a large percentage of each of these banks.
The river serves many purposes : transportation, irrigation to name a few apart from its valuable source of fishery products for consumption by its inhabitants and export earnings of the country.
As participant in this project, the Gambia has been unable to present scientific data or report on the level of pollution in the environment, since pollution studies have not been going on until recently.
As far as the implementation of the WACAF2 Project in the Gambia is concerned, we have been unsuccessful up to now due.to numerous problems encountered.
The studies involved in this Project are of great importance since the pollutants in our environment can be numerous but are not yet definitively idehtified.
Acute problems have occured which have been difficult to These problems range from the apparatus to be used in overcome.
the analytical'work to the national problems of electricity and water

.IOC Workshop Report no. 41 Annex V.6 - page 2
shortage. water and electricity supplies have been very irregular and unstable when they were available.
The apparatus available has been insufficient and
In preparationfor the Workshop Dr. C. Gaggi, FAO Con- sultant paid a visit to our Institution which lasted for five days. of discussions on methodology, instrumentation, problems solving and transport and fate of pollutants, it was not possible for us to produce any figures, due to the already mentioned problems.
Although the visit has been most useful to us, in terms
RESULTS AND DISCUSSION
Pesticide usage in Gambia has been general and large quantities may have through the years been applied, according to sources from two agencies (Gambia Produce Marketing Board and the Crop Protection Services), who play a major role in the importation and use of pesticides in the country.
A wide variety has been tried,cand reportedly effective ones have been in common use for many years and many are still used. New ones have been introduced as well.
The fate of these pesticides has not been studied and their transportation not understood. cides have been identified to be in use in the country :
However, the following pesti-
1. INSECTICIDES
1.1 CHLOKINATED HYDROCARBONS (ORGANOCHLORINES)
Aldrin 40% WP
DDT - Technical 15% EC ; 25% EC ; 50% WP Didigam 55% EC ; 85% EC *Didigam 20% EC ; 45% WP *Endosulfan (Thimul) 35% EC ; Thiodan Endrin 20% EC ' ; 50% EC Heptachlor
*BHC (HCH) 3:; D ; 25~; D
*Lindane 0.5% D (Gammalin) ; 1% D ; 3% D
1.2 ORGANOPHOSPHATES
"Actellic (Pirimiphos methyl) 1% D ; 2%D "Agrothion (Fenitrothion) 50X EC "Basudin (Diazinon) 60% EC Bromophos Chlorpyrifos (Dursban) * Diazinon 10% G ; 14% G ; 50% EC

IOC Workshop Report no. 41 Annex V.6 - page 3
Dichlorvos (DDVP) Dicrotophos (Bidrin) 25% EC
Dipterex (Trichlorfon) 5% D Fenitrothion (Sumithion) 50% EC ; (Nuvano1)500% ULV ; (Iodofenfos) Gardona (tetrachlorvinphos) 5% D *Malathion 2% D ; 50% EC Monocrotophos (Azodrin) 4% D ; (Nuvacron) Morfotox oil (Ekatin) Phorate (Thimet) 10% G Phoxim (Baythion) Supracide 40
'ADimethoate (Rogor) 40% EC ; (Perfekthion)
1.3 CARBAMATES
Baygon (Propoxur Karbaryl (Sevin) 85% WP ; (Ravyon) 50% WP *Carbofuran (Furadan) 10% G ; 3% G ; 75% WP Mesurol (methiocarb), 75
1.4 SYNTHETIC PYRETHROIDS
"Permethrine (Ambush) 0.5% D *Cypermethrin (Ripcord) 50% EC
1.5 CITRUS OIL - MINERAL OILS ' Biotrol (Bacillus thuringiensis) - Microbial Insecticide
2. FUNGICIDES
3.
Bla. S Bordeaux mixture (lime & Copper sulfate) Benlate (Benomyl) 50% WP Captan (orthocide) 50% WP Kocide (copper hydroxide) 71% WP Copper oxychloride 50% WP
Sulphur . Dithane D14 (Nabam) ; M22 (Maneb);M45 (Mancozeb); 278 (Zineb) *Thiram/Aldrin (Aldrex T) *Thiram/Lindane (Fernasan D) Hinosan *Per enox
RODENT IC IDES "Ratilan (Coumachlor ) Warfarin (d - con) Zinc phosphide Rodine

IOC Workshop Report no. 41 Annex V.6 -page 4
4.
5.
ti.
FUMIGANTS ( S o i l i g a n t s , Nematicides and Stored Product Fumigants)
Methyl bromide (Dowfume) Chloropicrin Nemagon "Phostoxin (Aluminium phosphide) Tablets
HERBICIDES
Ronstar (oxadiazon) 2% D *Roundup (Glyphosate)
AVICIDES (Birdrepellants etc)
Alpha chloralose *Carbofuran (furadan) 3% G ; 10% G ;, 75% WP
Note : *Pesticides presently in use in the Gambia
ULV : Ultra Low Volume ; G : Granule
- WP : Wettable powder ; D : Dust ; EC : Emulpifiable concentrate ;
From the statistics of the pesticides applied in various agricultural practices, it is evident that they may easily find their way into the environment, widely distributed and thus form part of the numerous pollutants found in not only the marine environment but the total environment.
The country being agricultural with a wide variety of crops affected by various' pests, both during growth and at storage, the
I means for controlling them inevitably involves the use of pesticides in uncontrolled quantities. can be easily washed into the river and eventually find themselves in system. Another very important route of transport of these pesticides is through the troposphere, and eventually these pesticides may reach the marine environment. solubility but are highly lipophilic and thus high concentration could be found in marine biota.
These, and particularly organochlorines,
the marine environment to be incorporated into the marine eco-
Some of these compounds may have a low water
As there exists no regulations to the use of pesticides in the Gambia studies on levels of contamination of the environment are very essential so that advice could be given to legislative authorities and action taken to introduce measures against use.

IOC Workshop Report no. 41 Annex V.6 - page 5
Also due to lack of regulations the quantities that are used annually in the country are not documented. Similar problems are ex- pected for the PCBs, whose presence in our environment are unknown to what levels they may exist. Another impartant aspect of the study is that the transportation fate and distribution in the environment of these pecticides evoke concern.
With the expectation of a regular supply in water and elec- tricity and the provision of metal ferrules etc, in the near future analytical work could begin since the instrument has been optirnised, for' use.

IOC Workshop Report no. 41 Annex V.7 - page 1
ECHANTILLONNAGE DU GOUDRON DE PLACE STATION DE MONDOUKOU ET GRAND BASSAM KM 26
par Philibert Koffi KOFFI
INTRODUCTION
Le suivi de la pollution des plages par les rdsidus de goudron est realise depuis novembre 1984 aux stations de Mondoukou (5O11'N - 3O41'W) et Grand Bassam km 26 (5O13'N et 3O5O'W) (Fig.1). Cette Btude qui constitue un des volets du programme "WACAF 2" a pour objet de determiner les concentrations de- goudron qui se ddposent sur 1'Estran. Les mesures sont rdalisdes B la faveur d'un programme de dynamique s6dimentaire littorale en cours au Centre de Recherches Oc6anographiques.
1. GENERALITES ET PARAMETRES DYNAMIQUES
1.1 SECTEUR D'ETUDE
Le littoral ivoirien est form6 de trois types de c8tes : les c8tes mixtes rocheuses (Sdrie m6tamorphique)et sableuses A l'0uest (Tabou - Sassandra), les cotes B plateaux avec un cordon littoral sableux quaternaire (Sassandra - Fresno) et les cBtes basses 2 1'Est form&s exclusivernent de sables quaternaires (Grand-Lahou - frontiere du Ghana). Le secteur d'6tude de Mondoukou et Grand-Bassam Km 26 est une c8te basse et sableuse.
La plage Grand-Bassam Km 26 a une pente assez forte qui varie entre 5 et 10% pour les diffdrents profils 16vds. Cependant le haut-estran et la mi-estran sont soulignds par une berme,avec une pente tres faible. Le sable de plage est moyen B grossier (500 < 0 <315 urn).
La plage 2 Mondoukou est en pente relativement douce (4 B 6%). Le sable de plage est fin (315 u m ~ O < 1 6 3 um).
1.2 PARAMETRES DYNAMIqUES
La r6gion'du Golfe de G u i n k se situe dans la zone des calmes Quatoriaux et ne connalt pas de depressions importantes. Les facteurs ocdaniques sont modBrds.
- Le vent : Le vent est moddrd B faible et la deflation dolienne sur la
plage est quasi nulle. Les vents enregistrds( **) pendant 1'6chantil- lonnage sont faibles (2 B 4 m/s) et proviennent du secteur Sud B Sud- Sud-Ouest (180 B 240O) (cf. tableaux rksultats).
* Centre de Recherches O c 6 a n o g r a p h i q u e s ; B.P. V 18 A b i d j a n
** Enregistrement 3 10 m d u sol - ANAM Port-Bouet (CBte d'Ivoire)

IOC Workshop Report no. 41 Annex V.7 - page 2
- La mar& :
La mar& du type semi-diurne provoque un marnage faible 0.50 Grand Bassam km 26 au maximum sur une cinquantaine de metres.
1.50 m sur le littoral. La plage d6couvre B Mondoukou et
- La houle : La houle provient des secteurs SS et SSW et 21 une amplitude
moyenne (hauteur comprise entre '1 et 2 m). Elle attaque la c8te avec un angle d'incidence de l'ordre de 1l0 2I 4 2 O et entrafne une derive littorale Ouest-Est. La p6riode 1a.plus agitde est juin-juillet-aoOt.
Les hauteurs de vagues observ6es pendant les periodes d'6chantillonnage sont comprises entre 1 et 2 metres. L'dtat excep- tionnel du 23 aoOt 1985 correspond 2I une houle de temp@te (hauteur estim6e entre 3 et 4 metres).
- La courantologie : 11 existe sur le plateau continental deux courants :
- un courant superficiel orient6 vers l'Est, le courant de Guin& (Plutohark, 1966) dont l'dpaisseur est variable (20 B 50 m) et le maximum de vitesse varie de 30 B 110 cm/s.
- un sous-courant orient6 vers l'0uest dont la vitesse varie de 30 B 70 cm sur une 6paisseur.de 50 mhtres.
L'influence de ces courants est primordiale pour la r6parti- tion des sediments sur le plateau continental (Martin, 1971).
2. RESULTATS
2.1 METHODOLOGIE
2.1.1 Implantation des stations
Pour le secteur d'btude, les stations de Mondougou et de Bassam km 26 repondaient le mieux au critere defini dans le protocole du projet COI-IAEA 1985 isolde de certaines activites humaines (industries et autres sources de pollution).
savoir une plage h pente douce et relativement
2.1.2 Echantillonnaqe
L'Bchantillonnage des boulettes de goudron est effectu6 dans le profil de l'estran sur un metre lindaire de plage.
du niveau (ou th6odolite) ou au cordage pour les experiences du 7 novembre 1984 et 14 ddcembre 1984.
- Les points de pr6levements sont positionn6s dans le profil

IOC Workshop Report no. 41 Annex V.7 - page 3
- Les prglhvements s'effectuent sur une surface de 2 m2 et gBn6- ralement au niveau des laisses de pleine.mer (PM) et consistent A ramasser avec une raclette le goudron visible dans le profil. Les echantillons sont recueillis dans des bocaux.
Laisses Pt? I
- . A Xiveau ou Thbodol ite
Lev4e de profil et 6,chanFillonr
,* . -. . laye ..
1, 2, 3 points de prelkvement du goudron
2.1.3 Traiternent au laboratoire
Les dchantillons s6ches A l'airsont tries par tamisage sommaire (tamis 0 mm), puis 3 la main afin de separer le goudron des sediments (sable) et autres debris.
Le goudron est pes6 et on determine le poids de chaque 6chantillon ainsi que la moyenne et le cumul par profil.

IOC Workshop Report no.41 Annex V.7 - page 4
2.2 RESULTATS (cf. tableaux des r6sultats)*
I1 a 6t6 pr6lev6 au total 30 6chantillons sur les deux stations Pour les Btats du 13 juin 1985 et 16 octobre 1985 il n l a pas et6 observe de goudron sur la.plage (les mois de janvier-fBvrier-avril et mai 1985 n'ont pas 6t6 6chantillonnes).
Les concentrations (poids) de goudron pour 1 'ensemble des 6chantillons sur les deux stations varient entre 0.5 g et 30 g. La concentration maximale de goudron a 6t6 mesuree le 22 mars 1985 Mondoukou avec 101.32 g.
Pour 1'6tat exceptionnel du 23 aoOt (tempete) il n'a pas 6t6 observe des concentrations de goudron plus importantes que celles des autres Btats sur les deux sites : Mondoukou 0.39 g 2I 9.79 g et Bassam Km 26; 6.81 g 2I 21.87 g.
Les concentrations de goudron sont sensiblement 6quivalentes sur les deux stations. Les poids cumul6s par metre lin6aire de plage sont du meme ordre de grandeur (Tableaux des resultats).
La repartition du goudron dans le profil de plage. Le goudron est remont6 progressivement par 'lllUp-rushlt et le "Swash" vers la mi- estran et le'haut de plage oh il se dBpose. Les prelhvements sur les deux stations se localisent du haut de plage 21 la mi-estran (Fig. '2, Fig. 3).
CONCLUSION
Les r6sultats prCsent6s dans le cadre de cette 6tude sont plus qu'indicatifs du phenomene de pollution des plages par les residus de goudron. Cette forme de pollution n'est pas negligeable avec des concen- trations de 20 21 30 g par metre lineaire de plage (voire mQme 100 g) sur des sites qui, 21 notre sens ne sont pas les plus pollues du littoral ivoirien. Toutefois le suivi d'un seul secteur comme celui de Mondoukou et Bassam Km 26 situ6 2I une trentaine de kilomhtres'seulernent du p81e industriel Abidjan, n'est pas reprgsentatif de l'ensemble du littoral. I1 faut envisager Btendre ces mesures 2I d'autres stations plus 61oign6es d'Abidjan.
* E = 6chantillonnage sur une surface de Zm', le poids +(concentration) est donc- exprime Xg/2m2
, les 6chantillons El,
meme proel, le meme jour C est exprim6 en g/m lineaire de plage
E1 + E2 + a.. En Moyenne des paids M : M = n E2, ... E sur le
Cumul des poids, C : C = E1 + E2 + ... En

IOC Workshop !report no.
41 Annex
V.7 - page 5
.. . .

IOC Workshop Report no. 41
Annex V.7 - page 6
U¶ a I
(D 0 I
",
In QD I
6 s I
m a
6 I IQ cu
I I
I I
I#
I
I I
I I
I I
II
- 07
- + O';
+ -
0-
-0-
+ I
+ I
+ I
F 0' E

7
c
U)
Q) I r- 0
I OD - 7
+ 0';
+
IOC Workshop Report no. 41
Annex V.7 - page. 7
I
E
N

IOC Workshop Report no. 41 Annex V.8 - page 1
MONITORING OF TAR ON BEACHES IN CAMEROON by J.C. Njock; Flavius E. Ikome*
INTRODUCTION
Since the month of February 1984, the amount of tar deposited on beaches was recorded twice a month on three miles along a of shore running from Limbe to Debauncha.
35km portion - 1 lat. 4 O 1'N long 9 O 13'E
(lat. 4 O 6'N long 8 O 58'E
The sites all met the recommended criteria, viz: - a uniform shoreline - a gentle slope - a minimum of human activity. .
In addition, the sites were chosen in such a way that, sampling could be done on fine sand, rock slabs and something between fine and coarse sand.
At each station three narrow strips of 1 1/2m were chosen randomly and sampled, running across the beach from the backshore to the water mark (low-tide mark). Sampling was done near time of low tide.
MATERIALS AND METHODS
Samplingsconsisted in picking up with a small rake, all semi-solid and solid particles of tar after having broken up the beach surface to a depth of about 3cm (for what concerns fine sand and coarse sand).
As regards the rocky beach sampled, the particles of tar were scraped from the rocks with the rake, or just simply picked up.
A few time, when the particles were densely covered with sand, they were introduced into a graduated cylinder and water added to cover them entirely. The water was then decanted into a second cylinder and the smaller volume subtracted from the larger. A density of 0.859m1 was assumed. All this was done in the lab.
CONCLUSIONS
First of all it must be remarked that an oil refinery operates at about half-way between our sampling sites, since 1981. The first sampling on rock slabs showed a tremendous quantity of tar (4.800qI). On the sand beaches, the amount of tar found was generally low but persistent.
* Fisheries Research Station, Limbe, Cameroon

IOC Wdrkshop Report no. 41 Annex V.8 - page 2
TABLE I
R E S U L T S : Results (presented as mean. of 2 samplings) of sampling of tar on beaches.
I1 1
91 1 (g)
I1 I1 I I
I' Seashore 11 Length Of 11 Weight of tar 11 Observation ) ( ( 1984 Location Il surface (
I1
11
tl shqrefront Il I1
11 11 11 \
I1 ( Bota ll Rock slabs I t 75m 11 4.800 * I t c i
~~
11 11 I
( FEBRUARY Essongo 11 Fine sand 40Om 1 :47 It . - .. 11 11 11 11
1 1
1 1 1
I1 1 1 1 1 remnants of first
11 1 1
11 1 1 1
1 1 1 1
I1
11 II 11 11
11 It 11 11
I t Debauncha Coarse sand 175m 11 1.46 ( ( ( ( (
( ( ( ( (
( ( ( II
!I
Bota It Rock slabs Il 75m lt
11 I1 11 I1
MARCH Essongo Fine sand 40Om I1 2.4 I1
t1 Debauncha €oarse sand 175m 11 4.4 11
I1 11 I1 11
I 1 I1 I1 1 1
11
11 11 11
11
11 11 11
11
11 11 11
11 66 .O
1.8
2.2
Rock slabs 75m 11 It Bota 11
I1
11 ( APRIL ".Essongo ,, Fine sand I' 4QOm
Debauncha Coarse sand It 175m 11
I1 I1
11 _.
11 11 11 . I1
Bota 'I Rock slabs 75m It 55.7 11 ( t
1 \ l l I
11 1 1 1
1 1 1 1 1 1
1 1 1 1 1 1 1 1 1
11 11 I 1 ; MAY 1l Essongo It Fine sand lI 40Om I1 1.6 I1 11
11 I 1 11 I1
II I1 11 1 1
Debauncha Coarse sand I, t75m I1 1.4 11
Bota 'I Rock slabs 75m I1 44.2 11
JUNE Essongo 'I Fine sand 40Om It 2.2 I1
l l Debauncha It Coarse sand 175m 11 2.6 11
( ( ( (
( (
(
( ( ( (
( ( ( 11 11 I1 11
11
I1 1 1 II I1 I1
It 11 11 I1 It
11 11 I1 11 I1
( 1 Bota 11 I1 77.7 I1 I1 11 1 1
11 11 I1 II
11 11 11
11
JULY Essongo Fine sand 40Om I1 1.2 11
II Debauncha 'I Coarse sand 175m I1 0.9 11
Bota 'I Rock slabs 11 75m 11 33.9 11
I1
11 1 1
11 II 11 I
( AUGUST Essongo It Fine sand :: 40Om I1 1 Oi5 Rains heavy 11
II I1 11 I1
II Debauncha It Coarse sand 175m 11 10.6 11 11
. . ./. ..

TABLE I Continue IOC Workshop Report no. 41 Annex V.8 - page 3
I Observation 1
\
11 Seashore I1 Length Of 11 Weight of tar I1
surface II shorefront 11 (g) 11 ( 1984 It Location ( II
1 1 1 1 1 1 1 1 ) 1 1 1 1 1 1 ) 1 1
1 1 1
1 1
I1 I 1 I1 I1 I1
II Bota Rock slabs II 75m I1 66.9 11 ( (
( ( ( ( (
( ( ( (
( ( ( ( (
( ( (
I1 I1 I I I1 I1
( SEPTEMBER,, Essongo Fine sand 11 40Om I1 3.2 II
I1 II I1 I1 II II Debauncha Coarse sand II 175m 11 2.6 I1
II Bota Rock slabs II 75m 11 93.6 II
OCTOBER Essongo II Fine sand lI 40Om I1 3.6 11
Debauncha II Coarse sand 175m I1 3.7 11
II Bota It Rock slabs II 75m I1 26.2 11
I1 11’ II II 11
I1 I1 11 I1 I1
I1 11 II I1 II
I1 II I1 I1 I I
I1 I1 I1 II II
( NOVEMBER II Essongo II Fine sand II 40Om I1 13.2 I1
11 I1 II I1 II II Debauncha II Coarse sand 175m I1 11.0 I1
II Bota II Rock slabs II 75m II 40.4 I1
II I1 II I1 I t
I1 II II I1 I I ‘ DECEMBER II Essongo II Fine sand II 40Om I1 7 03 11
I1 II 11 I1 II
II Debauncha II Coarse sand II 175m 11 3.8 I1
I1 II II II I1
I1 1 1985 11 Bota II Rock slabs 75m 11 80.4 11- -~ I I II I 1 II
JANUARY 11 Essongo 11 Fine sand 40Om I1 6.2 I1
I 1 11 II I 1 1 1
) 1 1 1 1
11
11 Debauncha II Coarse sand 175m 11 4.4 I1
II Bota II Rock slabs II 751x1 11 80.4 I1
( ( ( (
( ( (
I 1 I 1 I I II I I
II I I
( FEBRUARY :: Essongo :: Fine sand :: 40Om I1 3.2 I1
I1 II I1 11 II II Debauncha Coarse sand II 175m 11 3 04 I1
* There was a very huge deposit on rock slabs when the work just started.

IOC Workshop Report no. 41 Annex V.8 - page 4
I ATLANTIC OCEAN
4mbas B~,, v
Cape Nachtigal light house fiy MBE
war bay
SAMPLING CITE : BOTA
(Scale : 1/200 '000)
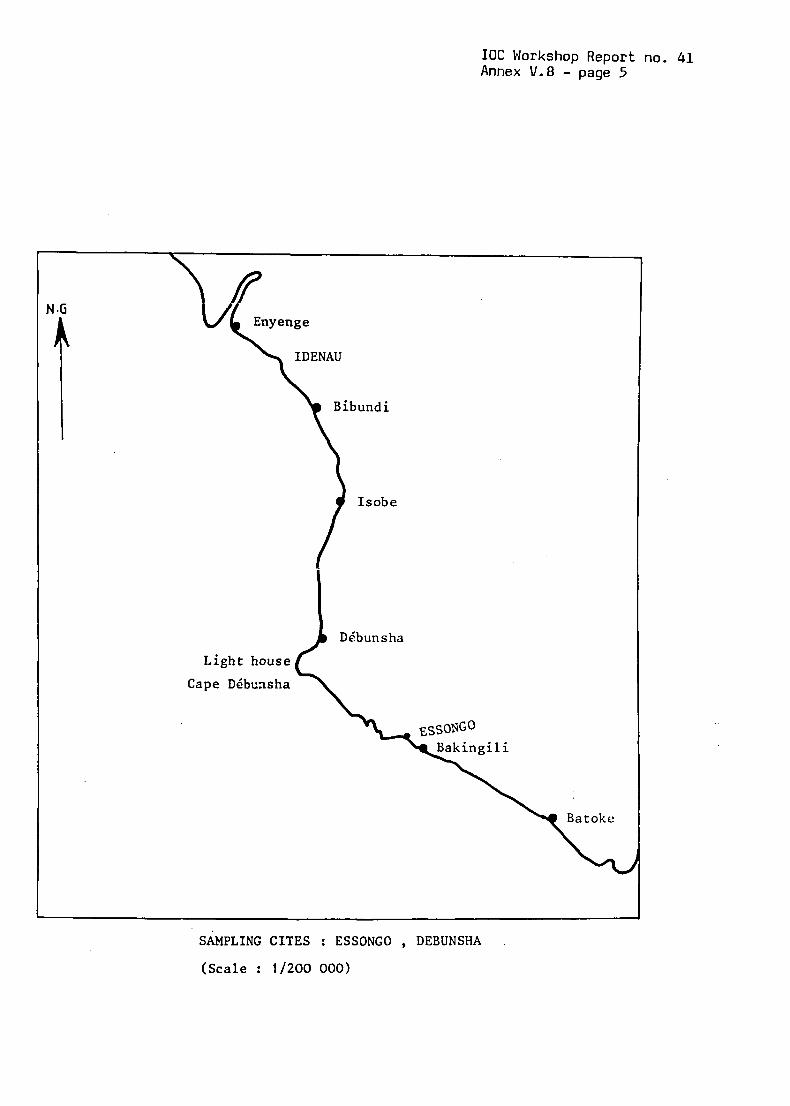
IOC Workshop Report no. 41 Annex V.8 - page 5
Cape
SAMPLING CITES : ESSONGO , DEBUNSHA .
(Scale : 1/200 000)
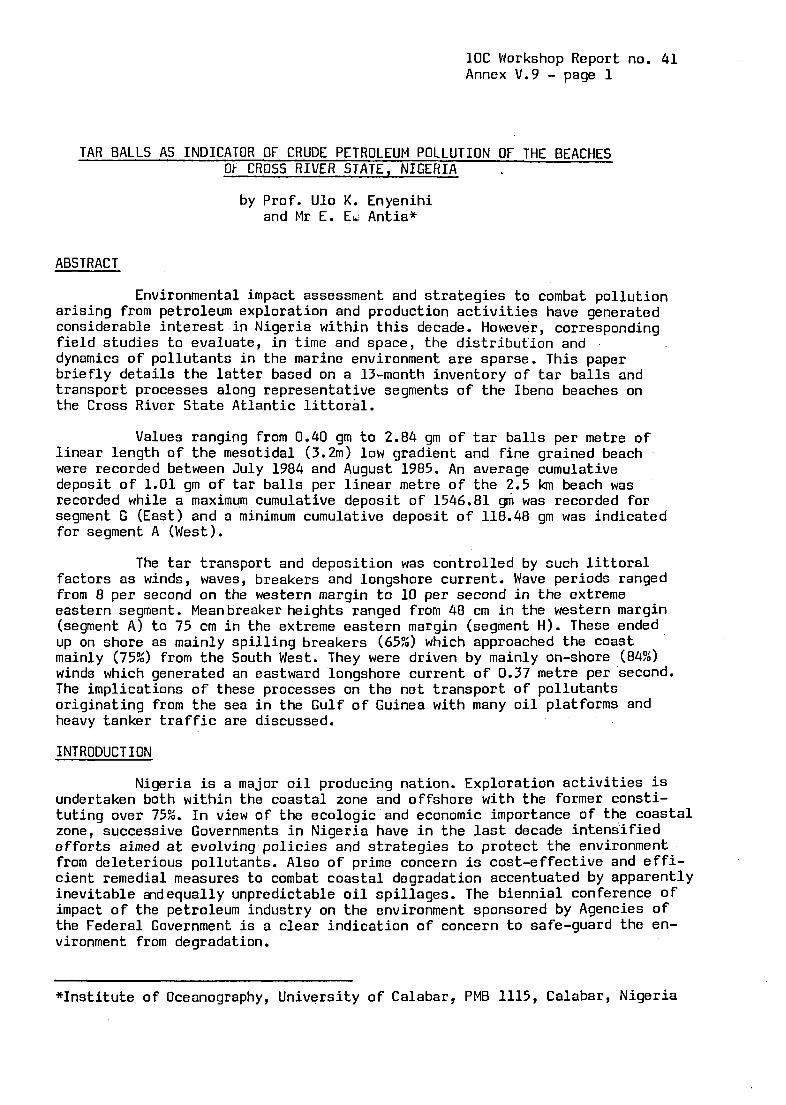
1OC Workshop Report no. 41 Annex V.9 - page 1
TAR BALLS AS INDICATOR OF CRUDE PETROLEUM POLLUTION OF THE BEACHES OF CROSS RIVER STATE, NIGERIA
by Prof. Ulo K. Enyenihi and Mr E. El.: Antia*
ABSTRACT
Environmental impact assessment and strategies to combat pollution arising from petroleum exploration and production activities have generated considerable interest in Nigeria within this decade. However, corresponding field studies to evaluate, in time and space, the distribution and dynamics of pollutants in the marine environment are sparse. This paper briefly details the latter based on a 13-month inventory of tar balls and transport processes along representative segments of the Ibeno beaches on the Cross River State Atlantic littoral.
Values ranging from 0.40 gm to 2.84 gm of tar balls per metre of linear length of the mesotidal (3.2m) low gradient and fine grained beach were recorded between July 1984 and August 1985. An average cumulative deposit of 1.01 gm of tar balls per linear metre of the 2.5 lan beach was recorded while a maximum cumulative deposit of 1546.81 gm was recorded for segment G (East) and a minimum cumulative deposit of 118.48 gm was indicated for segment A (West).
The tar transport and deposition was controlled by such littoral factors as winds, waves, breakers and longshore current. Wave periods ranged from 8 per second on the western margin to 10 per second in the extreme eastern segment. Meanbreaker heights ranged from 48 cm in the western margin (segment A) to 75 cm in the extreme eastern margin (segment H). These ended up on shore as mainly spilling breakers (65%) which approached the coast mainly (75%) from the South West. They were driven by mainly on-shore (84%) winds which generated an eastward longshore current of 0.37 metre per second. The implications of these processes on the net transport of pollutants originating from the sea in the Gulf of Guinea with many oil platforms and heavy tanker traffic are discussed.
INTRODUCTION
Nigeria is a major oil producing nation. Exploration activities is undertaken both within the coastal zone and offshore with the former consti- tuting over 75%. In view of the ecologic and economic importance of the coastal zone, successive Governments in Nigeria have in the last decade intensified efforts aimed at evolving policies and strategies to protect the environment from deleterious pollutants. Also of prime concern is cost-effective and effi- cient remedial measures to combat coastal degradation accentuated by apparently inevitable and equally unpredictable oil spillages. The biennial conference of impact of the petroleum industry on the environment sponsored by Agencies of the Federal Government is a clear indication of concern to safe-guard the en- vironment from degradation.
*Institute of Oceanography, University of Calabar, PMB 1115, Calabar, Nigeria

IOC Workshop Report no. 41 Annex V.9 - page 2
However, notwithstanding the high level of consciousness of environmental impact of oil pollutants, actual field monitoring of the distribution and dynamics of these pollutants over time are rare. Also sparse are ecological studies aimed at establishing baseline data for the, present and projected pollution levels.
This study details the results of tarball inventory on a segment of the Cross River State coastline. It was initiated principally to provide information on ambient levels and trend of marine pollution from oil spills. Presented data on transport processes is indispensable in developing reliable contingency plans for responding to oil spillage in the locality.
STUDY SITE AND METHOD
The Cross River State coastline (Fig. 1) is mesotidal and in general fronted by sandy beaches. The beaches'have low gradient ranging from almost flat at the low tide waterline to between Z0 and 4 O at the mid-tide level and rarely exceed loo at the steepest portion o f the upper foreshore. Texturally, the beaches are fine grained and well sorted.
Fronting the 2.5h segment of the coastline studied, are petroleum exploration and production activities (see Fig. I). The study site stretches coastwards from the qua-Iboe estuary to the vicinity of the Mobil oil tank farm. In order to evaluate spatial distribution in amount of deposited tar balls from offshore and longshore , inequidistant (mostly between 150-500m) monitoring stations were established and designated AI to HI. The configuration of the coastline and the nearshore morphology were some of the salient factors considered in siting the stations. Furthermore, the somewhat short beach length chosen was designed for effective monitoring of the processes that influence dynamics of tar balls within the litoral zone.
period at or near low tide. Also observed from the monitoring stations was the presence of oil slick. Tar sampling however entailed picking all visible tar balls from the surface and the upper 2 cm of a meter strip of beach between the backshore and the water line. Length of beach front during sampling was also recorded with aid of a tape.
In most cases, tar collection was done during a 24-hour observation
At the commencement of investigation in July 1984, data were collected at monthly intervals. The frequency was later increased between April and August 1985. During each field visit of 1-4 days, processes and parameters of tar transport namely wave period and direction, breaker height, longshore current velocity and direction as well as wind direction were documented.
by bi-weekly
Wave period and longshore current velocity were obtained with the aid of i~ stop watch. In the former, time taken for successive wave crests to pass a given point was divided by one less the number o f crests counted. Current velocity on the other hand was obtained by noting the time taken by a buoyant object to freely drift alongshore over known distances. All direc- tions were determined with a clinometer while breaker height was estimated with the aid of a graduated staff held close to the breaker point. Breaker type was visualy determined from observations of various sets of breakers. Collected tar samples were carefully labelled and quantified in the laboratory.

IOC Workshop Report no. 41 Annex V. 9 - page 3
RESULTS AND DISCUSSION
Data on tar ball and litoral processes for the study period (July, 1985-August 1985) are presented in Tables 1 and 2. No field visit was made in September, 1985. Evident from table 1 is the absence.of tar at all the stations between July, 1984 and February, 1985. Oil slick was never observed throughout the study period. Furthermore, with the exception of station Al, quantity of tar deposited was highest during the month of June at each of the monitoring stations. Available data tend to suggest a general eastward increase in both absolute amount and montly monitoring variation in tar weight per metre of beach front from the estuary. Over the time interval under consideration, total amount of deposited tar was highest at station G1 and least in station Al.
Data on mean weight of tar per metre of beach front depicts a more pronounced longshore increasing pattern compared with monthly variations or total amount. However, because of paucity of data, temporal variability of deposited tar can not at present be linked with any meteorologic or other periodic changes in coastal condition. Also in view of the multivariable nature of factors affecting amount of tar, deposited on the beach, the present discussion on spatial distribution can at best be viewed as a preliminary attempt.
However, while transport processes can be fairly predicted, pollution load and point of discharge as well as the residence time of pollutants are vital information which were not thoroughly evaluated during the investigation documented in this report. Nevertheless, based on existing data onlittoral processes previously documented by Ibe and Antia (1983) and from on-going studies, dynamics and deposition of available pollutants on beach segments would be largely influenced by breaker height, breaker type, wave approach and period, and longshore current velocity and direction. In addition to the aforementioned factors are intensity of tidal currents and characteristics of the beach profile.
Breaker height which is a function of wave energy would generally influence the amount of tar balls transportable: The higher waves would transport larger amount of tar balls compared with the low waves typical of station Al. Since depositional processes on beach foreshores progress through swash action, breaker type is considered significant in determining the accumulation of tar balls on beach foreshores. Apart from the lower degree of entrainment of transported materials by spilling breakers compared with plunging reported earlier, spilling breakers flat foreshore profile of stations Al-01 have relatively lower swash force associated with plunging and surging breakers results from minimal inter- action between the shoaling wave and the sea bottom topography. Thus intense swash will enhance tar accumulation on the beach foreshores.
characteristic of very
Recorded variations in wave period and longshore current velocity are not significant enough to influence the distribution pattern of tar balls. However, shorter wave period of the order of 6 seconds and less often associated with storm activities have a seaward transport tendency of entrained materials which would ultimately deplete the amount of tar reaching the beach. Similarly, low rate of tar ball transport associated with low values of longshore current velocity as in station BI would tend to enhance the compe- tency of swash to accumulate tar balls on foreshore.

IOC Workshop Report no. 41 Annex V. 9 - page 4
However, by far the most significant factors controlling the distribution pattern of available tar balls are the directions of wave approach and longshore current. With the exception of refraction associated with wave shoaling and the interaction of offshore wind, one would generally expect wave inclination data to correlate highly with observation of current direction. This expectation is well effected in the present study.
The importance of current direction is indicated by a higher rarity of tar balls on the beach segment between AI and BI compared with other stations. At stations AI and BI net direction o f current is westwards hence available tar ball in these locations are susceptible to being transported away from the study site. Absence of tar balls at stations other than AI at certain instances may be attributed to a general scarcity of tar as on May 31 1985 on seaward transport by rip currents.
Of particular interest in this study is the consistent low value of tar balls deposited on beach segment adjacent to the estuary. The outcome of this would beside the net westward transport direction, appear to be related to the extremely short residence time of tar and the action of tidal currents. The low lying profile in the vicinity of the estuary is most vulnerable to wave incursion resulting in resuspension of previously deposited tzr balls. Coupled with the tidal currents, especially during load stage, entrained tar would be transported along the estuary and t:ltimately into the creeks and nearby mangrove swamps where they finally undergo>sedimentation processes.
On the contrary, because of the relatively steeper foreshore profile at stations DI, EI,. GI and HI and the presence of bern scarp howbeit transient in some cases, vulnerability to wave overstopping would be low and consequently residence time of tar ball higher. Station FI has foreshore characteristics comparable to that of station AI.
CONCLUSION
This study was intended to document and relate the standing stock of tar on a representative segment of the mesotidal coastline of Cross River State to the transport processes. The object was to provide, in addition, data which would greatly aid in ascertaining the degree of oil pollution and the sensitivity of the coastline in the event of a major oil spill. To some extent, these objectives have been realized. Presented data and foregone discussion indicate that the vicinity of the Qua Iboe River estuary and other low lying beach segments devoid of berm scarp eastward of it are likely to be more susceptible to pollutants emanating from offshore oil spill.
It is premature at this stage to predict any future trends or ascertain seasonal or other cyclic changes in magnitude or intensity of pollution in the environment. However, average values of tar weight per
-metre of beach front from all the monitoring stations for the 7-10 instances when tar was visible and collections made range between 0.40 and 2.84 gim. The generally low values of tar weight per metre of beach front documented from this 13-month pilot monitoring is indicative of a low or light level oil pollution.
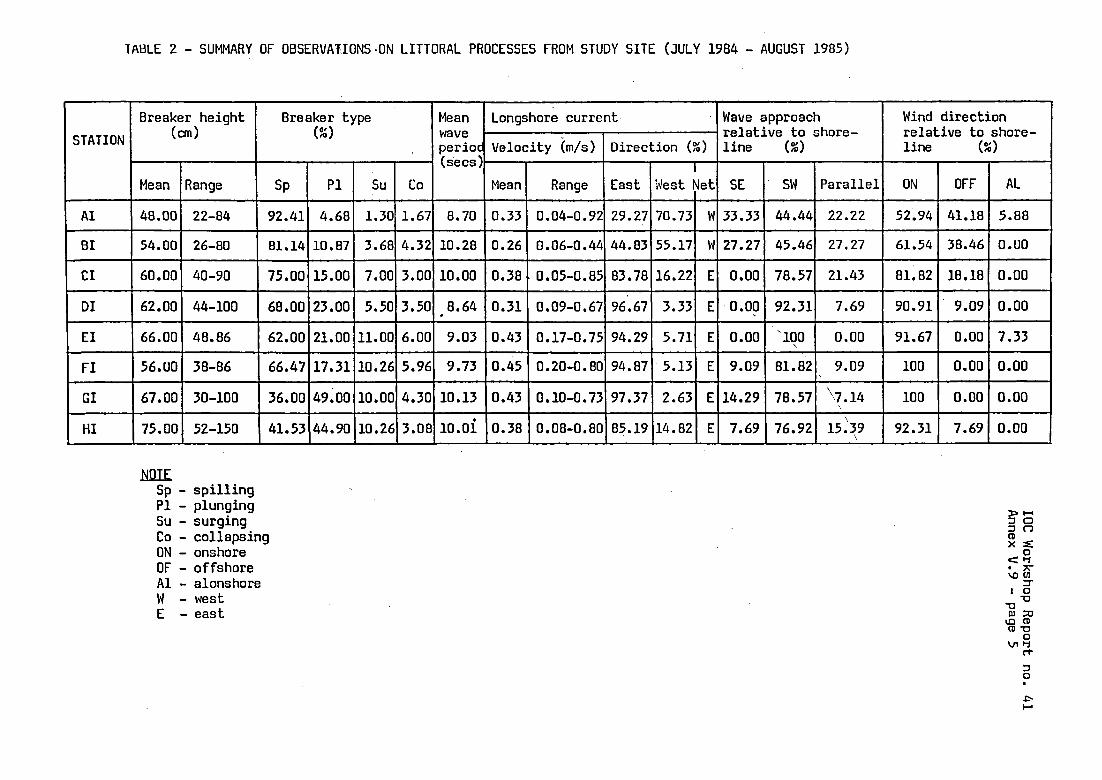
z 0
w t
v)
c-l 2
a
IOC Workshop Report no. 41
Annex V.9 - page 5
I1
11
11
11
1
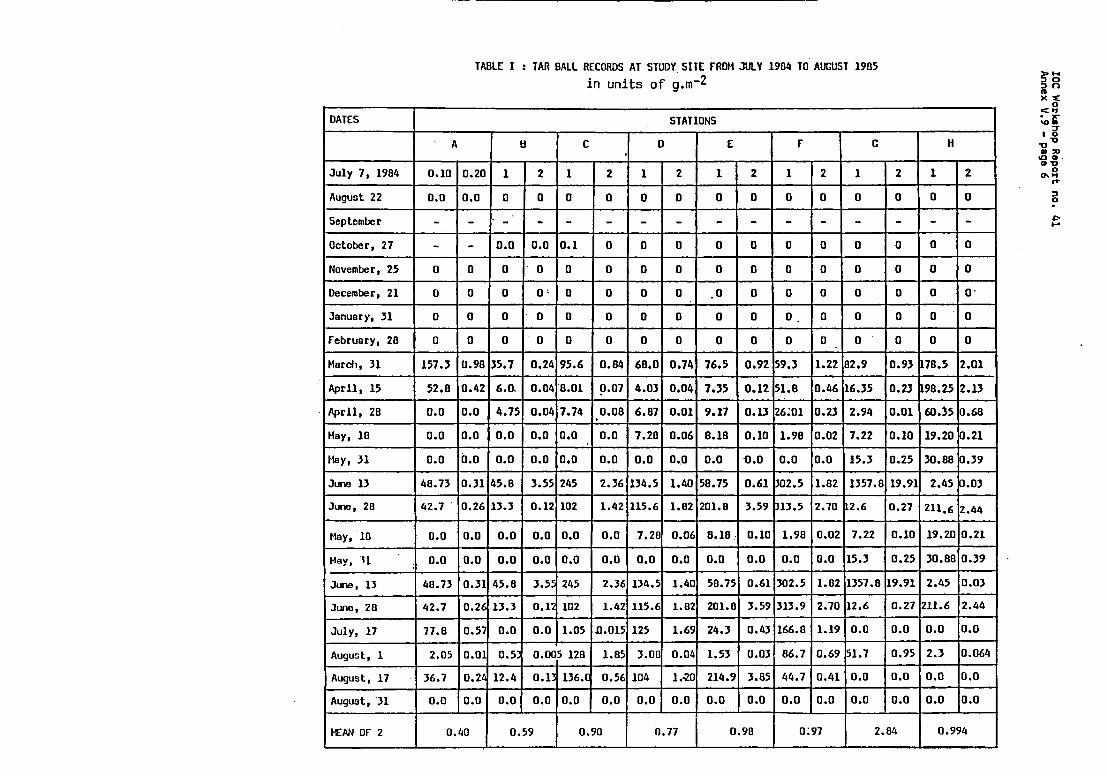
IOC Workshop Report no. 41
Annex V.9 - page 6
I .. U
I W d
U
m
i c

IOC Workshop Report no. Annex V.9 - page 7
- L
0
0
.- e
569
41 r m

IOC Workshop Report no. Annex V.9 - page 8
A U 0
I-
A
a
t;' z 0
L 0
t hl
5
rn U t
I z 0
U c
I= U
I- U)
-
0
0
m
m 4
hl
rl m
9
!
-
-
? - M
4
cI(
rz eo I-
0
0
W
N
U) 4
m
M
eo In
0
1 In
0
m
0
0
0
rl
0
M 0
I-
0
In 4
0
In I-
4
-
"I -
9 -
-
c'! 'I ?
9
1
9
9
9
9
9
-
-
- -
-
-
-
-
0
m I 0
U
0
0
U)
-
3 -
CI
U - O
M
OI-
??
qF m
o
1
514 0
0
"I" -
M
M 1 -
rl
In 'I 1
mI-
? T 00 I
-
U
OD '0. -
M 9
m
q-F MU)
p Mrl
NN
0
0
eoN
v)U)
99
U
CO m 9)

IOC Workshop Report no. 41 Annex V-10 - page 1
STRANDED PELAGIC TARBALL LOADINGS ON BADAGRY BEACH, NIGERIA DY E.C. Okonya and A.C. Ibe*
INTRODUCTION
Petroleum and its products are the principal pollutants in coastal and marine environments. Sources of oil input into the marine environment are:
(i) Tanker ballasting (ii) (iii) (iv) Explorations (oil-based drilling mud) (v) Production (vi) Pipeline breaks (vii) Natural seepages.
Pumping of bilges by vessels other than tankers Inport losses during loading and unloading
Oceans and coastal waters,of the world therefore contain floating masses of weathered petroleum residues (pelagic tar) which come ashore as stranded pelagic or beach tar through the influence of tides, waves and their generated currents. The presence of petroleum tar or lumps on coastal beaches not only poses public health hazard but also constitutes a serious threat to the productive potential of coastal and marine fisheries resources.
Judging by the volume and intensity of oil exploration, production and tanker traffic, Nigeria would be expected to have large quantities of pelagic tar. Indeed a vast majority of the sandy beaches of the barrier bar complexes that much of the Nigerian coastline are almost always littered with tar balls. It is more so in the Niger Delta where much of the oil production comes from.
LOCATION AND METHOD OF STUDY
This paper presents the results and interpretations from a quantitative sampling of stranded pelagic tarballs at the Badagry Beach which began in May 1984 and is continuing. The study is part of the pilot phase of the FAO/IOC/WHO/IAEA/UNEP/WACAF/2 Project on Monitoring pollution in the marine environment of the West and Central African Region.
sandy beach close to the Nigeria/Benin border. It was chosen for study because of its location away from any known area of crude oil production in Nigeria.
IOC Manuals and Guides No. 13 (Unesco, 1984).
Badagry Beach (Lat 6O22#N, Long. 2O52'E) is an open coarse-grained
Sampling and calculations were carried out as described in
* Nigerian Institute for Oceanography and Marine Research, Lagos, Nigeria

IOC Workshop Report no. 41 Annex V.10 - page 2
RESULTS AND DISCUSSION
The incidence of stranded pelagic tarballs on Badagry Beach between 1984 and October 1985 is shown in Table I. Tar loadings range between 13.96 and 57.24 gm-2 month-1.
The distribution of tar balls was not uniform. Some parts of the beach were almost free of.tarballs whereas other parts were heavily loaded. Maximum deposition occurred nearly always at the high side mark. lhis suggests the importance of tides and waves in the transportation of these pollutants. In many cases tarballs were found in soft or almost melting conditions because of heat as they became mixed with or buried by sand.
The size of tarballs varied a great deal from as small as a pin head to almost the size of a normal football. Extraneous materials found on the tarballs were debris, pieces of plastics, polyethylene strips, sand grains, broken pieces of wood, bivalve mollusc shells, broken pieces of glass and mangrove (Rhizophora) seedlings and fruits.
Some deposition^also occurred in the backshore. This was mostly flattened tarballs and were either partially or fully buried having been brought this far by the occasional storm waves.
The origin of the tarballs found on the beach is not entirely clear. As stated earlier, Badagry is remote from any known area of crude oil production in Nigeria. Benin, Togo, Ghana and Ivory Coast to the West of Nigeria, produce very modest quantities of petroleum mostly from fields in the coastal and shallow marine environment. Crude oil from these sources would be transported by longshore currents which originate from as far West as the Ivory Coast and which are reinforced locally in the vicinity of' Badagry Beach to attain velocities of up to .meters per second (7).
production in the north-western flank of the Niger Delta. Increased onshore and offshore production in Nigeria between 1958 (onshore 250,000 m tons) and the oil glut by late 1977-79, (on shore over 1 million m tons) was accompanied by increased incidents of oil spillage (petroleum inspectorate annual report., 1978). Awobajo (1) showed that between 1976 and 1980, 780 oil spill incidents occurred with the release of 1,336,875 barrels of oil into the environment. In 1981 there were 233 oil spillages with the loss of 22,840 barrels of oil. The corresponding figures for 1982 were 216 oil spill incidents with the loss of 34,475 barrels (see Table 2).
However, it is known that countries such as
Another likely source of the tarballs is the area of oil
Other sources of petroleum hydrocarbon input into the marine environment include natural seepages from the numerous growth faults and associated crustal faults that criss-cross the shallow continental shelf of Nigeria in particular Niger Delga (6).

IOC Workshop Report no. 41 Annex V.10 - page 3
Oil from these sources would be distributed offshore to the west either by large gyral system known to be operative in the Bright of Benin or by currents associated with the periodic reversal of the Guinea Currents in this sector (8). From offshore the tarballs would be washed ashore by swell waves.
In the same mechanism could be adduced for the transportation to the Badagry Beachoof any petroleum residues contributed bia ebb tidal currents from shipping activities in the inlet as Lagos, about 86 km to the east of Badagry and from fluvial sources farther inland. The ebb currents at peak attaign average velocities of 3.5m/s (5).
The beach at Badagry is on the West African shipping lame because of the port of Lagos and the tarballs may drive their origin from the general pollution attributable to this marine activity.
Though the data obtained during this*short period are not enough to highlight definite trends in the distribution of tarballs along BadagryBeach, they (data) show a slight decline in tarball loadings.
Robertson Smith and Knap (10) reported a decline in the amount of Tar stranding on Bermuda and attributed this decline to a reduction in operational discharges of oil tankers and a global decrease in the occurence of maritime oil spills since 1980. There have been no reports in the West African subregion since 1981 of any major oil spillages or tanker disaster.
CONCLUSION
This study shows that Badagry Beach and probably the entire marine beaches of Nigeria are continuously impacted by stranded tarballs.
The tarballs owe their origin to three or four possible sources, both national and international. A more definitive knowledge of the source(s) would depend on a better understanding of the physical oceanographic process operative in this region and which bear on the problem of pollutant transport in the coastal and marine environments in the region. It also would require perhaps more sophisticated analyses o f the tarballs themselves by gas chromatography or gas chromatography/mass spectrometry.
ACKNOWLEDGEMENTS /
The authors are grateful to Messrs. E. 0. Oyewo, M. Nimako, J.P. Unyimadu, A.I. Irere and C.E. Ibe for field assistance at various times. The interest shown in the project by the Director, Mr. J.G. Tobor has been a source of inspiration to the authors.

IOC Workshop Report no. 41 Annex V.10 - page 4
REFERENCES
1.
2.
3.
4.
5.
6.
7.
0.
9.
10.
AWOBAJO, O.A. 1981
BLUMER, M. (1967)
BLUMER, M. SOUZA, G.
- "An Analysis of oil spill incidents in Nigeria" 1976-1980. Proceedings of the 1981 Seminar on the Petroleum Industry and Nigerian Environmental Warri, Nigeria (Nov. 9-12).
- Hydrocarbons in the digestive tract and liver of a/ basking shark. Science N.Y., 156 (3773) : 390-1 '
- and SASS, J. (1970) : Hydrocarbon pollution of edible shellfish by an oil spill (WHO1 70-1) Jan. 1970 : 14 p. Also issued in Mae. Biol., 6:. 226-36.
GEORGES, C. and OOTDAM - B.L. (1983) : The characteristics and dynamics of tar pollution on the beaches of Trinidad and Tobago. Mar. POLLUT. BULL., l4, 170 - 178.
IBE, A.C. (1985) - Nearshore dynamics and coastal erosion in Nigeria. Presented the WACAF/3 Experts workshop on control of erosion in West and Central Africa. Dakar 11-19.
IBE, A.C. and AJAYI T.0- Possible upwelling phenomenon of the Nigerian Coast NIOMR Tech. Paper.
IBE, A.C. and ANTIA E.E- A preliminary assessment of the impact of erosion along the Nigerian coastline. NIOMR Tech. Paper 13 - 17p.
IBE, A.C., AWOSIKA L.F and ANTIA E.E(l984) : Progress Report no 2 Coastal erosion research programme.
NIOMR Special publication 106 p.
Nigerian National Petroleum Corporation, Petroleum Inspectorate Annual Report 1978.
PORTMAN, L. (1978) - in The Gulf of Guinea : Pollution and the need for control and possible mechanisms thereof (Rome : UN, FAO/UNEP 1978).
ROBERTSON SMITH, H. and KNAP, A.H. (1985)- Significant decrease in the amount of tar stranding
on Bermuda. Mar. Pollut. Bull., 16 (l), 19 - 2. United Nations Environmental Programme Regional Seas Reports and Studies no 4 (1982)
The status of oil pollution and oil pollution control in the West and Central African Region.

IOC Workshop Report no. 41 Annex V.10 - page 5
TABLE1 RECORD OFSTRANDED PELAGIC m S SAMPLED AT BADAGRY BEAM (LCNG, 2O52', MT. 6O221N) NIGEEUA FAaM MAY 1984 TO 23rd EKBER 1985
2nd MAY 30 th MAY 13 th JUNE 5 t h m 6 t h W 7 t h m 18 th 31 st MAY 30 th JULY
1984 1493 52.66 1984 3867 40.20 1984 1317 38.66 1984 486.30 38.0 1984 635 37.0 1985 680 1985 550 1985 450 1985 390
13 thAUG 1985 416 23rd 7985 491 10 th SEPT 1985 451 24 th SEPT 1985 6 57 9 t h m 1985 409 23 rd OCC 1985 289
18 20 19 25 25 25 25 25 25 25
28 -35 96.19 34.06 12.80 17.16 37 . 78 27.50 23.68 15.60 15.64 19.64 18.04 26 . 28 16.36 11.56

IOC Workshop Report no. 41 Annex V.10 - page 6
TABLE 2 YEARLY DISTRIBUTION OF SPILLS 1970 - 82
1 Year no of Spills Net Vol. EBLS )
1
( ( no (
1 2 3 4 5 , 6
7 8 9 10
1 1 12 13 .
1970 1971 .
1972 1973 1974 1975 1976 . 1977 1978 1979 1980 1981 1982
. .
1 14 41 59 105 128 128 104 154 157 24 1 233 216
150 15,ll 51,390 95,580 65,714 56 , 854.82 20 , 023 31,144 97 , 250 630 , 405 558,053 22,840 34 , 474.6
( 7 ( m A L 13 YRS 1,581 ~ 1,678,989.4 1 ( 1

IOC Workshop Report' Annex V.ll - page 1
Fonds de 0-10 m surface
km2 4 700
no. 41
10-50 m 50-200 Tot a1
14 200 9 800 28 700
SURVEILLANCE CONTINUE DE LA POLLUTION PAR LES HYDROCARBURES par P. N'Diaye*
1. DESCRIPTION DU PLATEAU CONTINENTAL SENEGALAIS
Le S6n6gal a une facade maritime longue de 700 kin (12O 20' N B 1 6 O 20' N). La cBte est basse et bord6e d'un cordon dunaire, se poursuit par un plateau continental peu accidentd. La superficie de ce plateau est r6surn6e dans le tableau ci-dessous.
Elle n'est pas uniforme, B l'isobathe 200 m, sa largeur est de 27 milles marins au large de Saint Louis, 5 milles au niveau des Almadies et 54 milles au large de la Casamance.
2. IMPORTANCE DE CE PROJET POUR LE SENEGAL
Comme le Senegal n'est pas un producteur de petrole, il importe de l'exterieur du goudron et tous les produits p6troliers.
L'importance de ces approvisionnements est li& au ddveloppement 6conomique. C'est ainsi que de 1970 B 1984 les importations p6trolihres n'ont cess6 d'augrnenter, passant de 700.000 B 1.000.000 de tonnes.
Le transport est assure par des bateaux de 30 & 80.000 tonnes 21 la cadence d'un 2 deux par mois. Ce trafic trhs important n'est pas & l'abri d'incidents sur les plages, d'oh l'int6ri3t port6 A ce sujet.
3. LES DIFFERENTES PHASES DU PROJET
3.1, OBSERVATIONS DE NAPPES DE PETROLE ET DE GOUDRON
Ce travail sera ex6cut6 au niveau des plages de .la r6gion de Dakar qui est la capitale Bconomique du S6n6gal. Nous aurons B 6valuer la quantite de goudron pr6sente sur les plages.
3.2 ECHANTILLONNAGE ET RELEVE DES RESIDUS PETROLIERS PARTICULAIRES (agglorn6rats de goudron)
I1 consiste B faire des 6chantillonnages d'agglorn6rats de goudron en m g / d de surface oc6anographique. Nous essayerons de prospecter tout le plateau continental s6nCgalais & l'aide du navire de recherche oc6anographique.
* Departernent de Biologie Marine (IFAN) , SBn6gal

IOC Workshop Report no. 41 Annex V.ll - page 2
3.3 OBSERVATIONS DE NAPPES DE PETROLE ET AUTRES POLLUANTS
Ce travail concernera tout le plateau continental senegalais.
3.4 OBSERVATIONS OCEANOGRAPHIQUES
Le 'transport de tous ces polluants depend des conditions hydrologiques et met6orologiques du plateau continental.
Pour la rdussite de cette phase, nous travaillerons avec le Centre de Recherches Ocdanographiques Dakar-Thiaroye, la marine et l'aviation nationales. Nous avons n6anmoins besoin de deux andmom&tres.
4. COOPERATION AFRICAINE
Nous sommes disposes a cooperer avec tous les laboratoires de 1'Afrique de l'0uest et du Centre.
5. COOPERATION INTERNATIONALE
Sur le plan international, nous comptons effectuer un voyage d'etudes dans deux laboratoires (Centre IFREMER de Brest et le Laboratoire d'Oc6anographique Chimique de 1 'Universitd de Brest) qui ont accumuld beaucoup d'exp6riences pour de telles recherches 3 cause des nombreux accidents petroliers survenus sur les cdtes bretonnes.

IOC Workshop Report no. 41 Annex V.12 - page 1
SURVEILLANCE MICROBIOLOGIQUE DES EAUX COTIERES ET DES FRUITS DE MER par I. Sow
Le projet WACAF/2, dans sa composante OMS "Surveillance micro- biologique des eaux c8tibres et des fruits de mer" est execute au Sdnegal conjointement par la Direction de 1'Environnement du Ministbre de la Protection de la Nature (Point focal) et le laboratoire de microbiologie de l'ENSUT, Universite de Dakar.
La Direction de 1'Environnement est charg6e d'effectuer les echantillonnages tandis que les analyses sont faites au laboratoire de microbiologie de 1 'Ensut.
1. LES OBJECTIFS DU PROJET
2.
Les objectifs du' projet consistent :
(i) A mettre au point des methodes de reference uniformis6es qui permettront de comparer les resultats obtenus par les differents laboratoires et organismes de surveillance, sur le plan national et sous-regional, voire international ;
(ii) 2 reunir des donndes de base pour l'evaluation sur le plan national de la pollution cbtibre resultant du d6versement en mer d'effluents microbiologiques pathogenes d'origine terrestre ;
(iii) 2 Blaborer des strategies contre la pollution et A mettre en oeuvre des programmes qui en assurent l'efficacit6 pratique ;
(iv) A contribuer B l'evaluation globale de la situation dans la sous-r Bgion.
ECHANTILLONNAGE
Les zones de pr6lbvement ont et6 selectionndes en fonction des crithres suivants :
- Importance sur 1'6conomie nationale - Zones - Zones de commercialisation des produits de mer (poissons notamment) - Presence de matibres fecales - Presence d industries trans formatrices de poissons - Presence de canaux d'evacuation d'effluents domestiques.
de pgche et de tourisme
2.1 STATIONS DE PRELEVEMENT
Les stations de prelbvement retenues sont les suivantes (voir localisation sur la carte en annexe) :
- HANN - . Hann 1 Terminal Pont Plaisanciers . Hann 2 = Hann Pgcheurs . Hann 3 = Hann Capas

IOC Workshop Report no. 41 Annex V.12 - page 2
- SOUMBEDIOUNE . Soumbedioune Pecheurs - NGOR 9 . Ngor Pgcheurs (Zone d'embarquement vers Ile)
2.2 METHODES D'ECHANTILLONNAGE
Les methodes d'6chantillonnage utilis6es sont celles prescrites par 1'OMS dans les "Directives applicables 2I la surveillance sanitaire de la qualit6 des eaux littorales" :
- Les materiels et les echantillons sont conserves 2I l'abri de la
- Les Bchantillons sont pris 21 l'aide de flacons sterilises - Les Bchantillons sont preleves une profondeur de 20 cm - Le transport des dchantillons des stations de pr&l&vement au laboratoire d'analyse s'effectue en moins de deux heures de temps, ce qui fait Bviter les risques de ddgradation.
lunigre
20 m de la cBte en general 21
Par ailleurs, il est prBvu -1 'am6lioration des methodes de pr618- vement notamment par 1 'utilisation du systeme de conservation (refroidisse- ment des Bchantillons durant leur conservation).
2.3 PARAMETRES I
Les parametres suivants ont et6 consid6rBs durant les echantillon- nages :
- Temperature - Mar6e - Date et heure de prBl&vement 2.3 DEMARRAGE DU PROJET
10 avril 1985.
2.4 . PERIODICITE ECHANTILLONAGE
Une (1) fois par semaine.
2.5 OBSERVATIONS
Le projet nla pu se derouler pendant la periode des vacances, le personnel du laboratoire de microbiologie de 1'ENSUT &ant en conge durant cette pgriode. I1 faut signaler egalement que le laboratoire de I'ENSUT n'a pas actuellement 21 sa disposition un technicien pour faire les analyses. Cependant, des negotiations entre la Direction de 1'Environnement et de I'ENSUT sont en cours afin de contourner cet obstacle, et que le principe de continuer le projet a dt6 retenu par les deux parties.

IOC Workshop Report no. 41 Annex V.12 - page 3
he du Yoff
PRESQU’fLE DU CAP VERT Psinte des Almadies
Pointe de Bel-Air
Pointe de Fann
SOUMBE-DIOUNE
1le des Madeleines cap
0 Stations de prblhvements

IOC Workshop Report no. 41 Annex V.13 - page 1
SURVEILLANCE BACTERIOLOGIQUE DES EAUX COTIERES par Mme Ren& Paris et M. Babacar Diallo"
La surveillance des eaux cbtieres dans la region de effectu6e chaque semaine du 10 avril 1985 au 12 juin'1985.
Dakar a 6t6
OBJECT IFS
I1 s'agit de se rendre compte de l'evolution de la qualit6 bactkriologique de ces eaux.
L'intBrgt de cette etude reside dans le fait qu'il existe une relation entre la qualit6 bact6riologique de l'eau de mer et la qualit6 des produits marins y vivant et consommes par la population.
Cette pollution a donc une influence sur la sant6 des popu- lations ainsi que sur 1'6conomie du pays.
Pour Bvaluer cette contamination, nous faisons appel & des indicateurs de pollution d'origine fecale qui sont les especes microbiennes suivantes :
- les coliformes fecaux, - les streptocoques fecaux. Ces gerrnes ont et6 choisis pour les raisons suivantes :
1) ce sont des hbtes habituels du milieu intestinals, 2) leur dur& de vie dans l'eau n'est pas tres importante et leur
presence signe donc une contamination relativement recente, 3) leur mise en evidence peut se faire & l'aide de techniques
simples et rapides.
La presence de ces germes : coliformes et streptocoques f6caux dans l'eau indique qu'un risque de pollution par des gerrnes pathogenes transmis par voie intestinale (salmonella, sbigella par exemple) existe. Ces germes pathogenes peuvent contaminer les animaux marins et etre par le suite responsables de maladies chez l'homme consommant ces produits.
METHODOLOGIE
1. LES PRELEVEMENTS
11s ont et$ realis6s par le service de 1'Environnement regulihre- ment chaque semaine. Trois sites ont et6 choisis :
- Ngor, - Soumbedioune, - Hann ; au niveau de ce dernier site, 3 produits de preli?vement ont 6t6 choisis.
* Laboratoire de microbiologie, ENSUT, Dakar

IOC Workshop Report no. 41 Annex V.13 - page 2
Le laboratoire de 1'ENSUT recevait les flacons d'eau d8s le retour des agents charges des prelhements et rdalisait les analyses immediatement.
Les flacons d'eau Btaient conserves au refrigerateur 3 +4OC jusqu'8 lecture des resultats.
2. L'ANALYSE BACTERIOLOGIQUE
2.1 La technique utilish a et6 la mkthode par filtration sur membranne Millipore (0,45u).
2.2 Les volumes filtres ont et6 - de 100 ml pour l'eau non diluee, - de 10 ml pour les dilutions. Nous avons travail16 sur les dilutions de 10-I B en milieu
tryptone-sel.
2.3 Les milieux de culture utilises
Au depart, nous avons fait une etude parallhle utilisant :
- d'une part les milieux utilises habituellement au laboratoire,
- d'autre part, les milieux Difco fournis par 1'OMS. (Nous n'avions pas l'habitude de ces milieux Difco et nous n'avions
aucune indication les concernant).
Par la suite, nous n'avons travail16 qu'avec les milieux Difco. Nous avons 6galement realise des tests de confirmation afin d'Btre sQrs des resultats avances.
2.3.1 Recherche des streptocoques fecaux :
Le denombrernent a et6 realise : - sur milieu MK streptococcus agar (Difco) - sur milieu.de Slanetz. Ce test de confirmation a BtB fait sur le milieu de Sitsky.
2.3.2 Recherche des coliformes fecaux
Le d6nombrement a Bte realise : - sur milieu m FC Bioth base (Difco) auquel nous ajoutions 15 g d'agar par litre, - sur gelose lactos6e au TTC +
Pour la confirmation, nous'avons utilise les milieux de Schubert et de Kligler Hajna R. Tous les essais ont et6 rdalises en double.

IOC Workshop Report no. 41 Annex V.13 - page 3
RESULTATS
1) Streptocoques fdcaux : les rdsultats ont toujours et6 ndgatifs.
2) Coliforrnes fdcaux (voir tableau).
Ces resultats ne peuvent donner lieu & une interpretation valable car la dur& de surveillance n'a pas et6 assez longue. Les travaux ont &e arret& par manque de technicien B partir des vacances scolaires.
Pour la reprise des travaux, il serait necessaire qu3 le technicien prornis par la Direction de 1'Environnement soit affect6 au laboratoire de 1'ENSUT. La seule conclusion partielle possible est l'existance d'une pollution d'origine bacteriologique qui semble presenter des variations dans le temps sans que l'on puisse en preciser les causes possibles.
Cette experimentation demanderait B etre poursuivie afin de pouvoir tirer des conclusions valables.

IOC Workshop Rpport no. 41 Annex V.13 - page 4
: HANN I1 : H?NN I11 : NSOR : SOUMBEDICUNE) 1
( (
0 0 : 2.600 0 1 (
1 ( 10/04/85 : 1.600
1 (
( 17/04/85 : 0 0 175 0 0 1 1
(
(
( 24/04/85 : 90 : 6.000 0 240 : 6.000 1 (
1 1
(
( 6/05/85 : 10 : 9.800 34 250 710 1 (
1 1
(
( 8/05/85 : 4.400 : 11.000 30 140 : 6.300 1 (
1 (
( 15/05/85 : 4.100 : 11.500 30 3.000 : 8.400 1 (
1 1
(
( 23/05/85 : 4.500 : 8.700 : 7.00 19.500 : 7.800 1 (
1 1
( ( ( 29/05/85 : 2.300 : 5.000 30 3.900 : 1.900 1
1 1
( ( ( 5/06/85 : 1 .ooo : 6.000 210 53.900 : 40.800 1
1 1
(
( 12/06/85 : 800 : 1.600 90 32.000 : 22.000 1 (

IOC Workshop Report no. 41 Annex V.14 - page 1
SURVEILLANCE MICROBIOLOGIQUE DES EAUX COTIERES par Kouam6 M. Djamabara*
(Extrait)
Le Laboratoire de Microbiologie du Centre Medical des Gens de Mer a 6t6 nomm6 comme participant au projet WACAF 2 en 1983. J'ai pour ce faire, assist6 3 un exercice d'intercalibrage 2I Barcelone (Espagne) en novembre 1983.
Le materiel de base (pompe, rampe de filtration, milieux) pour mettre en oeuvre la mBthode recommand&, a Bt6 envoy6 en 1984 par inadvertance en CBte d'Ivoire au Ministhe de 1'Environnement qui quelque temps aprks a 6t6 dissout. Des n6gociations sont actuellement en c o w s en vue du transfert dudit materiel au Ministhe de la Marine pour sa mise en service dans les activit6s de projet WACAF 2,
Cependant, le Ministere de la Marine a sign6 un accord avec le C.R.O. (Centre de Recherches Oc6anographiques) pour la mise en oeuvre du programme de surveillance. Les r6sultats des analyses effectu6es par le C.R.O. seront disponibles d'ici la fin.'de .l'ann& 1985.
Tout le personnel du Laboratoire de Microbiologie du Centre M6dical des Gens de Mer a particip6 3 un shinaire technique, organise par 1'OMS en juillet 1985. Ce sGminaire, anim6 par un consultant de 1'OMS (Dr. Rafael Mujeriego) a port6 sur les aspects m6thodologiques relatifs B 1'6chantillonnage, 3 l'analyse, 21 l'interpr6tation et au compte rendu des resultats obtenus au cours du programme de WACAF 2. Ce personnel form6 est disposible pour la mise en oeuvre du programme. Notre seul handicap est le manque de materiel. Nous esp6rons que 1'OMS nous aidera 3 entrer en possession de-l'gquipement dont nous avons fait mention plus haut .
* Laboratoire de Microbioloqie du Centre MBdical des Gens de Mer, CBte d'Ivoire
IOC Workshop Report no. 41 Annex VI
ANNEX VI
THE STATE OF CONTAMINATION OF THE MARINE ENVIRONMENT IN THE WACAF REGION

IOC Workshop Report no. 41 Annex VI.l - page 1
PRESENT TRENDS IN ENVIRONMENTAL POLLUTION STUDIES by E. Bacci and C. Gaggi*
ABSTRACT
Physico-chemical and partitioning properties driving the environmental transport, distribution and persistence of synthetic organic chemicals are reported. 1-he use of chemical monitoring data to assess the environmental behaviour of pollutants is discussed.
INTRODUCTION
The technological growth characterising the last 50 years has been largely based on the development of industrial chemistry. On the other hand several synthetic chemicals, probably unknown to the biota before (xenobiotics), have been introduced in large quantities (for some of them, millions of tons) in the natural system. Some of them are quickly degraded to inert substances, other are long-living and easily carried far away from the immission area.
From the sixties to the first half of the seventies an exponential growth of literature about the environment has been observed. A great number of papers have dealt with the chemical monitoring of pollutants, mainly with a retrospective approach, describing environmental distribution of chemicals already in the environ- ment. Some of them, as in the 'historical' Minamata Disease case, pointed up the link between a certain pollution source and observed deleterious effects on the environment (man included). In other circumstances 'hot- spots' were put in evidence, leading to environmental recovery actions. From these experiences analytical methods were greatly improved and regulations and restrictions for the use of more persistent chemicals (e. g . organochlorine insecticide, polychlorinated biphenyls) were approved by several governments. Tolerance limits in sewage, foodstuffs and feed promoted the activation of analytical routines in governmental and private laboratories.
The studies on environmental impact assessment of chemicals received an important and essential impulse from the passing, in the USA, of the Toxic Substances Control Act (TSCA), in 1976 (l), followed, after 3 years by the European Economic Community Directive No. 831 (2). In these the need of predictive tools concerning the environmental behaviour of new chemicals was formalized.
This paper emphasizes the use of chemical monitoring data to assess the environmental distribution and fate of chemicals.
* Dipartimento di Biologia Ambientale, Universith di Siena, Italy .
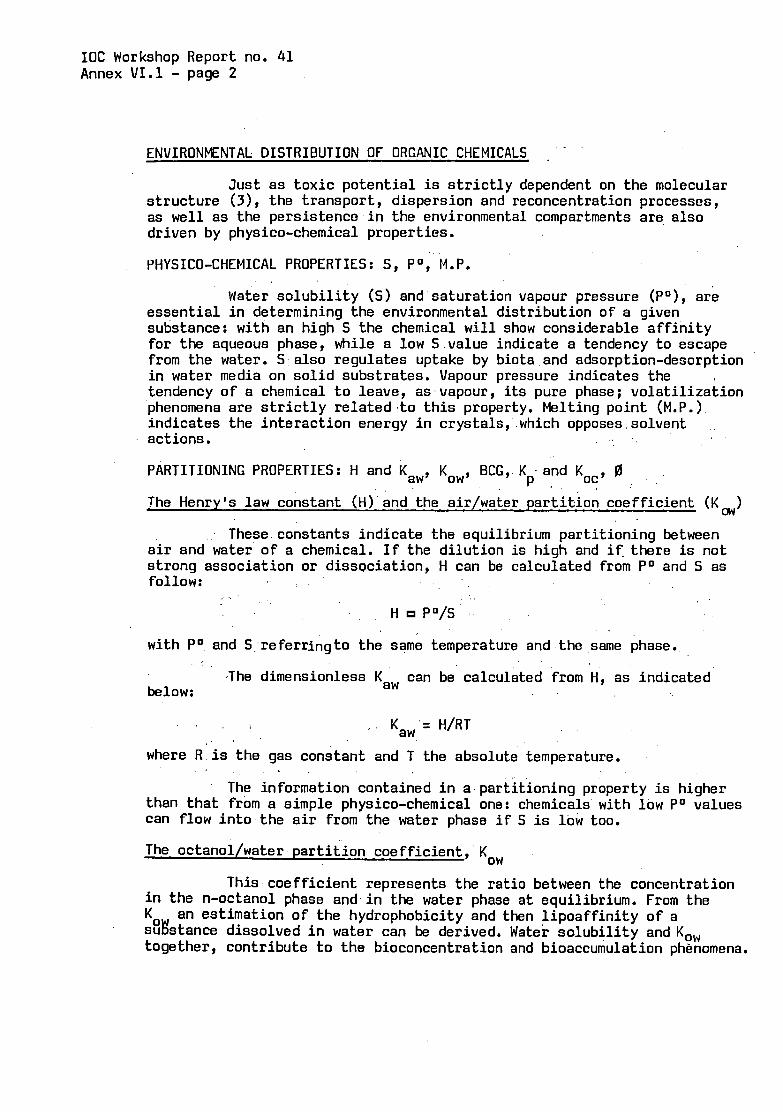
IOC Workshop Report no. 41 Annex VI.l - page 2
ENVIRONMENTAL DISTRIBUTION OF ORGANIC CHEMICALS ,
Just as toxic potential is strictly dependent on the molecular structure (31, the transport, dispersion and reconcentration processes, as well as the persistence in the environmental compartments are also driven by physico-chemical properties.
PHYSICO-CHEMICAL PROPERTIES: S, Po, M.P.
Water solubility (S) and saturation vapour pressure (PO), are essential in determining the environmental distribution of a given substance: with an high S the chemical will show considerable affinity for the aqueous phase, while a low S value indicate a tendency to escape from the water. S also regulates uptake by biota and adsorption-desorption in water media on solid substrates. Vapour pressure indicates the tendency of a chemical to leave, as vapour, its pure phase; volatilization phenomena are strictly related .to this property. Melting point (M.P. ) indicates the interaction energy in crystals, which opposes solvent act ions.
PARTITIONING PROPERTIES: H and Kaw, Kow, BCG, K . and Koc, Id The Henry's law constant (H) and the air/water partition coefficient (Km)
P .
These constants indicate the equilibrium partitioning between air and water of a chemical. If the dilution is high and if. there is not stronq association or disssciation, H can be calculated from Po and S as follow:
/ .
H PO/S
with Po and S referringto the same temperature and the
,The dimensionless Kaw can be calculated from below:
same phase.
H, as indicated
Kaw'= H/RT ,
where R is the gas constant and T the absolute temperature.
than that from a simple physico-chemical one: chemicals with low Po values can flow into the air from the water phase if S is low too.
The octanol/water partition coefficient, Kow
The information contained in a partitioning property is higher
This coefficient represents the ratio between the concentration in the n-octanol phase and in the water phase at equilibrium. From the K an estimation of the hydrophobicity and then lipoaffinity of a s%stance dissolved in water can be derived. Water solubility and Kow together, contribute to the bioconcentration and bioaccumulation phenomena.
*
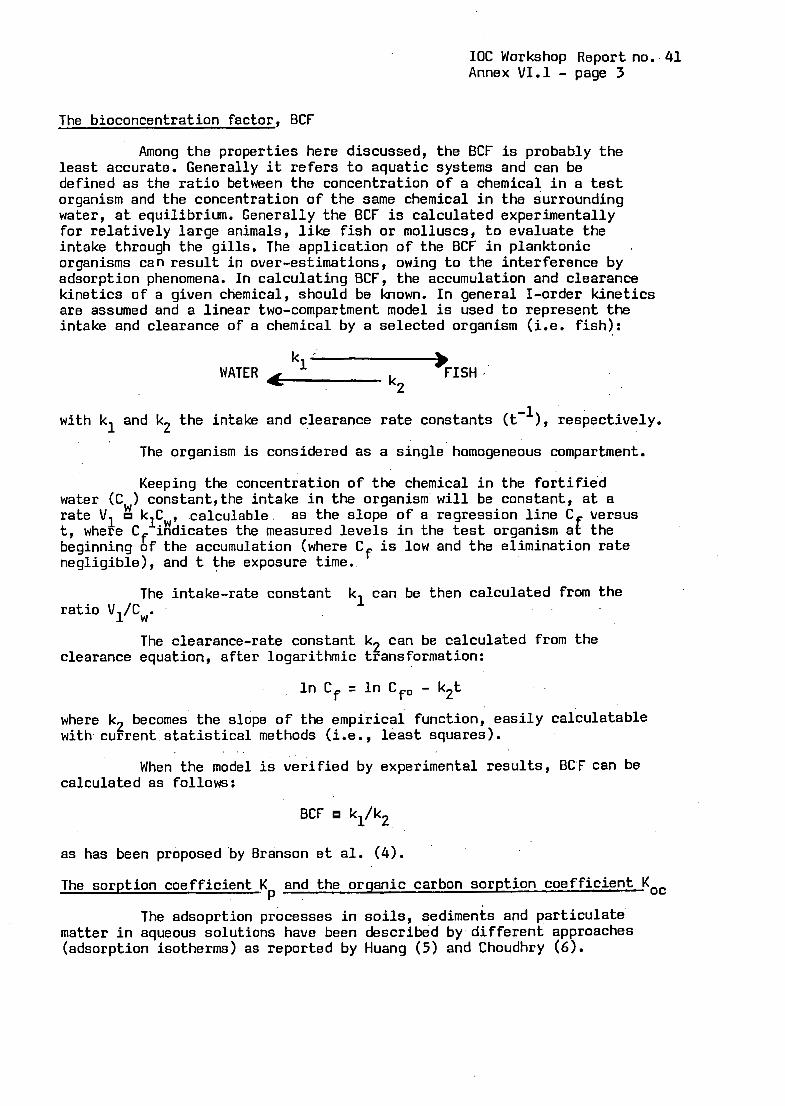
IOC Workshop Report no. 41 Annex VI.1 - page 3
The bioconcentration factor, BCF
Among the properties here discussed, the BCF is probably the least accurate. Generally it refers to aquatic systems and can be defined as the ratio between the concentration of a chemical in a test organism and the concentration of the same chemical in the surrounding water, at equilibrium. Generally the BCF is calculated experimentally for relatively large animals, like fish or molluscs, to evaluate the intake through the gills. The application of the BCF in planktonic organisms can result in over-estimations, owing to the interference by adsorption phenomena. In calculating BCF, the accumulation and clearance kinetics of a given chemical, should be known. In general I-order kinetics are assumed and a linear two-compartment model is used to represent the intake and clearance of a chemical by a selected organism (i.e. fish):
WATER
with kl and k2 the intake
The organism is
and clearance rate constants (t-’), respectively.
considered as a single homogeneous compartment.
Keeping the concentration of the chemical in the fortified water (Cw) constant,the intake in the organism will be constant, at a rate V1 klCw, calculable t, where Cf indicates the measured levels in the test organism a€ the beginning of the accumulation (where Cf is low and the elimination rate negligible), and t the exposure time.
as the slope of a regression line C versus
The intake-rate constant kl can be then calculated from the ratio V1/Cw.
clearance equation, after logarithmic transformation: The clearance-rate constant k2 can be calculated from the
k2t In Cf = In Cfo - where k2 becomes the slope of the empirical function, easily calculatable with, current statistical methods (i.e., least squares).
When the model is verified by experimental results, BCF can be calculated as follows:
BCF kl/k2
as has been proposed .by Branson et al. (4).
The sorption coefficient K . P and the orqanic carbon sorption coefficient Koc
The adsoprtion processes in soils, sediments and particulate matter in aqueous solutions have been described by different approaches (adsorption isotherms) as reported by Huang (5) and Choudhry (6).

IOC Workshop Report no. 41 Annex VI.l - page 4
According to Freundlich (7) the adsorption isotherms for many dilute solutions could be fitted by the following equation:
l/n x/m = K C where x/m is the amount of adsorbate per unit amount of adsorbent, C is the equilibrium concentration of adsorbate, K and n are constants related to the bonding energy.
At low pollutant concentrations, lower than half the solubility, with neutral hydrophobic substances (i.e. DDT, PCBs), the sorption isotherms onto soils and sediments are linear and reversible (8):
S = K C P
where S is the concentration of the chemical in the adsorbed phase, C the concentration of the chemical in the water phase, and K coefficient.
the partition P
Different soils and sediments, normalized to the organic carbon (oc) can show very similar K organic materials. If so the previous relation between
values, the adsorption being mostly on P S and C becomes:
S = Koc C where K is the organic carbon sorption coefficient, related to K as
P f 0 11 0 ws PC = K /F Koc p oc
where Foc represents the organic carbon fraction in the soil and sediment phase.
The aerosol/vapor partitioninq coefficient, 0
Organic traces in the atmosphere exist both as vapours and adsorbed to particulate matter. As reported by Eisenreich (9) the aerosol/vapour partitioning depends on the vapour pressure of the .
chemical, the surface and organic content of suspended particles. Accord- ing to Junge (lo), aerosol/vapour partitioning can be represented as follows :
fl = &/(Po + CO)
where: ld is the ratio of adsorbed organic vapour in the air, Q the aerosol surface, Po the saturation vapour pressure and c a constant depending on heat of condensation and molecular weight.
From this approach, in 'clean' air conditions, chemicals with Po levels greater than 10-6 mm Hg are characterized by small ld values (9). The implications of 0 in the environmental transport of pollutants are of great.concern.

IOC Workshop Report no. 41 Annex VI.l - page 5
SEARCHING FOR THE MINIMUM OF NEEDED DATA: THE RELATIONSHIPS BETWEEN PROPERTIES
During the last years a growing effort has been made to examine quantitative relationships between one of the above reported properties and another. Thus in the case of many hylrophobic organic chemicals, starting from water solubility, S, as Mol 1-1, and melting point, M.P., such as OC, Kow, K oc and BCF can be obtained:
for liquids: '
Log Kow = -Log S + 0.515 (11)
for solids:
Log Kow = -Log S - 0.01 (M.P. -25) + 0.51 (11)
then:
Koc = 0.41 Kow (8)
Log BCF 0.851 Log Kow - 0.70 (12)
If Po is also known too, the Henry's law constant H, as well as can be calculated and information on fd derived.
Ki)w3
Therefore a possible minimum series of data to obtain the '
principal environmental distribution properties of a chemical could be:
name of the compound molecular weight saturation vapour pressure water solubility melting point (only if solid).
Differences in reported figures -concerning these basic properties are often evident in current literature and manuals. Probably in the near future more accurate data will be available.
PERSISTENCE
Chemical transformations, transfer to other compartment and advection determinate the persistence of a chemical in a given environ- mental phase. Photolysis, hydrolysis, oxidation and biodegradation represent the main reactions that may occur in the environment. All these reactions can be assumed as following I-order kinetics. If so, the rate of each degradative process is expressed as the product of the concentration of the chemical in the compartment considered and the rate constant (t-1). Consequently, all reactions rates in a given phase can be added, obtaining a total I-order rate constant, K, and by multiplying this and the concentration of.the chemical in the compartment, C, the

IOC Workshop Report no. 41 Annex VI.1 - page 6
total degradation rate in the compartment, KC, can be calculated (13):
degradation rate = K1C+K2C+KJC+ ...+ K C = KC n As can easily be seen, the importance of an environmental
compartment as sink of a given chemical is strictly dependent on its total degradation rate constant and on its potential for attaining a high concentration of the pollutant.
Advection, which is generally negligible for soils, is particu- larly important for fluid phases (air, water), can be considered as a I-order process with rate constant Ka (as t-l), defined as follows (assuming steady-state conditions):
Ka = I/4 where I is the input rate (or output), and Q is the total amount of the chemical in the compartment.
The overall persistence, or mean residence time of the chemical in the compartment in steady-state conditions, T, will be:
where K and Ka are the overall degradation rate constant and the advection rate constant, respectively, previously defined.
MODELS
Hazard assessment and risk evaluation require both an estimation of the environmental distribution and fate, and information about the toxic potential of a chemical.
The development of environmental studies justifies separating the former and latter, as two specific research fields. In the field of the environmental distribution and fate of chemicals, with which the present paper deals, models are classifiable as follows:
- laboratory microecosystems; - mathematical simulations. Metcalf et al. (14) studied the biodegradability and ecological
magnification of some chlorinated insecticides introducing a small laboratory model ecosystem, which has since been used to test the environ- mental fate of more than 100 chemicals (15).
Other systems have been tried, as is reported in Gillet's review (151, like the Terrestrial Microcosm Chamber (16). This model ecosystem consisted of a synthethic soil, agricultural crops, invertebrates and voles, and was used to test the fate of dieldrin. Nash (17) studied pesticide volatilization rates by means of microagroecosysterns and small

IOC Workshop Report no. 41 Annex VI.l - page 7
green-houses were recently employed to study the mechanism of PCB uptake in plant foliage (18).
Mathematical models have been recently grouped into two main categories (19) : models for Potential Environmental Distribution (PED) and for Potential Environmental Concentration (PEC) .
PED models deal with equilibrium distribution of chemicals between environmental phases (e.g. air, water, soil, biota), in arbitrary ecosystems, indicating potential reservoirs and sinks. Therefore the PED approach has the limitation of not referring to any actual system. However this can be useful for regulatory purposes and in decision making,' where general trends are more important than particular situations.
PEC are simulations of actual environments. Generally their aim is the calculation of spatial and temporal variations of the concentration of a chemical in the principal environmental phases, in natural conditions. Owing to that, PEC models are complicated and difficult to use for nonspecialists and need a great number of experimental measurements for gradual adjustment. Besides PEC models are often rigid, the results not being applicable to other systems, not even to a same one studied at another time.
Of course PED models may become PEC if suitably modified, and vice versa.-However the dominant philosophy of each can be easily recognized.
PED models seem to be a very useful tool both in interpreting environmental data from chemical monitoring and for predictive approaches.
The PED philosophy began a'few years ago, when Baughrnan and Lassiter (20) suggested the use of 'evaluative models' to describe essential mechanisms in the transport and fate of chemicals, rather than complicatedsimulations of actual environment. One of the best PED models is Mackay's fugacity approach (13, 21, 22).
Mackay's PED model
In an arbitrary ecosystem ( 'unit world') equilibrium parti- tioning between the principal environmental compartments can be determined by calculating the fugacity (a pressure indicating the escaping tendency of a chemical from the phase in which it is calculated). If the rate constants of degradative processes and of advection are known, assuming a steady-state condition and I-order kinetics, environ- mental compartments.where the degradation potential is highest can be indicated. Higher levels of complications are also proposed bringing the model up to PEC refinement.
By this approach potential environmental reservoirs (level I) and sinks (level 11) can be pointed out.

IOC Workshop Report no. 41 Annex VI.l - page 8
CONCLUSIONS
Chemical monitoring, i.e. the repeated analysis of chemical residues in environmental compartments (biotic and abiotic), should be directed to the interpretation of environmental distribution and fate of pollutants, rather than to describe 'fish pollution', 'marine pollution', 'air pollution', and so forth.
Therefore the first step in environmental pollution-research planning should be the selection of chemicals, on the basis of expected environmental inputs, persistence and toxic potential.
The second step should be the identification of possible pollution sources (e.g.: industrial effluents, dumps, pesticide application areas) and their description.
The third step could be the calculation of the potential environ- mental distribution of the selected chemicals, using PED model, followed by laboratory model ecosystem validation, at least for the principal environmental phases (air, water, soil).
The fourth step could be chemical monitoring both where pollution is assumed to exist ('local' problems) and where pollution does not theoretically exist (background level, possible 'global implications).
The last 'one is the interpretation of all data obtained.
Regarding the WACAF 2 Project, concerning the analysis of some heavy metals and organochlorine residues in fish samples, the first step has already been taken. The second should be carried out with particular care: looking at marine fish pollution only, it is possible that strong contamination problems might be overlooked. The third step only needs to be performed once and results for PCBs and chlorinated pesticides are already available (23), or in preparation (24). The fourth calls for an extension of monitoring programmes, according to the findings from step I1 and 111.
From such an approach, it is likely that conclusions of far greater scope than the description of the degree of contamination of some item of human food (i.e. fish) could be reached.
A final aspect to be kept in mind is the scientific signifi- cance of information on the environmental behaviour of chemicals in tropical and equatorial regions, as in West Africa.
ACKNOWLEDGEMENTS
The authors are greatly indebted to Mrs. Ann Henderson for the accurate correction of the English text.

IOC Workshop Report no. 41 Annex VI.l - page 9
REFERENCES
1.
2.
3.
4.
5.
6.
7.
8.
9.
US EPA Fed. Regist. 43, 4108, Washington D.C. (1978).
EEC, Council Directive 79/831 Off. Jour. Eur. Comm., L 259/10(1979).
Kaiser K.L.E. (ed) : 'QSAR in Environmental Toxicology". D. Reidel Publishing Company, Dordrect (1984).
Branson D.R., G,E. Blau, H.C. Alexander and W.B. Neely, Trans. Am. Fish. Soc., 104, 785(1975), quoted by Neely W.B. : "Chemicals in the Environment', Marcel Dekker, Inc., New York (1960).
Huang P.M., in "The Handbook of Environmental Chemistry", 0. Hutzinger (ed), Vol. 2, Part A, pp 47-59, Springer-Verlag, Berlin (1980).
Choudhry G.G., in "The Handbook of Environmental Chemistry", 0. Hutzinger (ed), Vol. 2, Part B, pp 103-128, Springer-Verlag, Berlin (1982).
Freundlich H., IIColloid and capillary chemistry", Methuen, London (1926).
Karickhoff S.W. Semi-Empirical Estimation of Sorption of Hydrophobic Pollutants on Natural Sediments and Soils. Chemosphere, XI, 833 (1981).
Eisenreich S.J., B.B. Looney and J.D. Thornton. Airborne organic contaminants in the Great Lakes ecosystem. Environ. Sci. Technol., - 15, 30-38 (1981).
10. Junge C.E., in "Fate of Pollutants in the Air and Water Environments" Part 1, I.H. Suffet (ed), Wiley-Interscience, New York, pp. 7-25 (1977).
11. Yalkowsky S.H., S.C. Valvani and D. Mackay. Estimation of the aqueous solubility of some aromatic compounds. Res. Rev., 85, 43-55 (1983)
12. Veith D.G., D.L. deFoe and B.V. Bergstedt. Measuring and estimating .
the Bioconcentration Factor of Chemicals in Fish. J. Fish. Res. Board Can., - 36, 1040-1048 (1979).
13. Mackay D. and S. Paterson. Calculating fugacity. Environ. Sci. Technol., - 15 , 1006-1014 (1981).
14. Metcalf R.L., K.G. Sangha and I.P. Kapoor. Model Ecosystem for the Evaluation of Pesticide Biodegradability and Ecological Magnification. Environ. Sci. Technol., 2, 709-713(1971).
Transport and Effects of ToxicChemicals. In R. Haque (ed) Dynamics, Exposure and Hazard Assessment' of Toxic Chemicals, Ann Arbor Science, Ann Arbor, pp. 231-249 (1980).
15. Gillett J.W. Terrestrial Microcosm Technology in Assessing Fate,

IOC Workshop Report no. 41 Annex VI.l - page 10
16.
17.
18.
19.
20.
21.
22.
23.
24.
Gile J.D. and Gillett J.W. Fate of 14C Dieldrin in a simulated Terrestrial Ecosystem. Arch. Environm. Contam. Toxicol., El, 107-124( 1979).
Nash R.G. Determining environmental fate of pesticides with microagroecosystems. Res. Rev., 85, 199-215 (1983).
Bacci E. and C. Gaggi. Polychlorinated Biphenyls in plant foliage : translocation or volatilization from polluted soils ? Bull. Environm. Contam. Toxicol., - 35(1985), in press.
Halfon E. Predicting the environmental fate of toxic contaminants in large lakes: data requirements for mathematical models. In Kaiser K.L.E. (ed) 'QSAR in Environmental Toxicology'. D. Reidel Publishing Company, Dordrect, pp. 137-151 (1984).
Baughman G.L. and R.R. Lassiter. Prediction of Environmental Pollutant Concentration. In J. Cairns, Jr. K.L. Dickson and A.W. Maki (eds) "Estimating the hazard of chemical substances to aquatic life". American Society for Testing and Materials, Philadelphia, pp 35-54(1978).
Mackay D. Finding fugacity feasible. Environ. Sci. Technol., l3, 1218-1223(1979).
Mackay D. and S. Paterson. Fugacity revisited. Environ. Sci. Technol., - 16, 654 A'- 660 A (1982).
Gaggi C., E. Bacci, D. Calamari and R. Fanelli. Chlorinated Hydrocarbons in Plant Foliage : an Indication of the Tropospheric Contamination Level. Submitted to Chemosphere.
Calamari D., C. Gaggi, E. Bacci and M. Vighi. Experimental Evaluation of a PED model in Simulation Chambers. In preparation.

IOC Workshop Report no. 41 Annex VI.2 - page 1
FACTORS INFLUENCING MARINE POLLUTION SURVEYS IN WEST AND CENTRAL AFRICA
N.E. Whitehead
International Laboratory of Marine radioactivity International Atomic Energy Agency
Musee Oceanographique, Monaco Ville MONACO
ABSTRACT
Marine pollution monitoring for trace metals and chlorinated hydrocarbons in the West and Central African,region is starting under the WACAF/2 programme. Important factors influencing the probable results are surveyed. They include and other natural precipitation, and the high phytoplankton productivity of the area. Sources for the pollution in likely descending order of importance include municipal wastes, spills and drilling mud release from the oil industry, then other industries, car emissions, and use of agricultural fertilizers. Possible features important for interpreting the pollution and its causes are the tropical promotion of rapid biogeochemical turnover, and the lagoons and mangrove ecosystems in some areas. The erosion in the area is likely to dilute pollution at least 1000 times through mixing. Suggested background figures for metals and chlorinated hydrocarbons are presented and it is emphasised that since there are so few data from the region it presents a fine opportunity for fresh research.
the discharge of large rivers, the input of aeolian Saharan-dust
INTRODUCTION
The occasion for this paper is the commencement of analysis by personnel of the laboratories of the region as part of the WACAFJ2 (West and Central Africa Fund) project, initially funded by the United Nations Environment Programme and now being brought under more local control with the establishment of a trust fund by the nations concerned, to finance the development and maintenance of a marine pollution monitoring network.
Little attention will therefore be paid in this paper to the inland environment, though many of the factors mentioned will also be relevant to it.
The purpose of this paper is to summarise information known about the marine occurrence of trace metals and chlorinated hydrocarbons in the region, as a resource for participants. The literature is scattered and data of local concern may have been omitted. The author would appreciate gaps being brought to his attention, because a revised edition of the material on trace elements may be submitted for publication later.
Even for studies done outside the region the facts are scattered and this document cannot be complete. It is almost impossible-to consider in detail all possible backgrounds and sources of pollution.
produce pollution in ecosystems. The subject of petroleum hydrocarbons is covered in a different paper by a representative of the Intergovernmental Oceanic Commission of UNESCO. However it will be suggested in this paper that oil spills can also influence the metal content of sediments and possibly affect chlorinated hydrocarbon distribution. Other important pollutants such as greases, phenols, fluoride, and ammonia, are not considered here but mentioned in UNEP (1984).
This paper considers trace metals and chlorinated hydrocarbons. Both may

IUC Workshop Report no. 41 Annex VI.2 - page 2
Also not included though a possible source of pollution for the marine environment is one material included in the large onchocerciasis control programme (Antwi (1985)) . Although this material, chlorophoxim, contains chlorine, it is O,O-diethyl-2chloro~-cyanobenzylidine amino-oxyphosphonothoate, hence not strictly a chlorinated hydrocarbon and will not be further considered. Similarly there is a significant possibility of the marine environment being affected by use of the insecticide Deltamethrine, Dejoux (19831, but since it is a synthetic pyrethroid, it also falls outside the scope of this review.
what the background or baseline values are likely to be and what natural biogeochemical features are likely to influence them. However it will be essential to reason on general grounds, because there are so few data from the region.
in UNEP (19841, but the present paper tries to apply those data more directly to marine trace analysis.
When starting a pollution monitoring programme it is important to consider
An excellent general introduction to the features of the region is given
PHYSICAL GEOGRAPHY
A good summary of this is found in UNEP (1984). The countries of the region are found in the Equatorial Humid Zone except Senegal and The Gambia which are partly in the North Arid Zone. This means high coastal rainfall and high temperatures and these are important factors in the geochemical environment. The average rainfall is 2 m y-1 and in some places more than 5.5 m y-1 are recorded. From the point of view of trace metals it is clear that geochemical leaching and weathering must be intense in such a region. The intense sunlight (1600-1800 MCal m-2 yr-1) promotes very rapid growth and hence biogeochemical turnover. This could somewhat affect the persistence of the chlorinated hydrocarbons. It also has the consequence that any pollution event could make its effects felt faster than in temperate regions, because of faster diffusion and absorption processes, but some consequences would also vanish faster. It could be necessary to finish analysis and interpretation faster than would normally be the case, if action is necessary against the pollution.
known for North Australia (Personal communication B.T.Hart) . There, in a region almost without industry, the pH of rain is 3.9-4.5. This arises from volatilisation and oxidation of organic compounds from plants (especially isoprene). In the intense sunlight, that compound is photolysed to formaldehyde and ultimately formic acid. Acetic acid is also present. It is clear that suck aciGic rain will'readily leach trace elements from soils. Whether the same situation holds for West Africa will depend on the precise vegetation and the organic compounds they exude, and the subsequent photochemistry.
Some information is available from Wright (1982) for the Jong river in Sierra Leone. He showed that rainfall was pH 5.4-6.0 and the pH of the river was 5-44-6076. This suggests that the photochemistry may be different in the WACAF region, and the rain less acidic. However Wright (1982) also showed that the river he studied contained very low dissolved solids (less than 10 mg 1-11 and suggested that the region was already so heavily leached that little material remained accessible to leaching. He thought this would mean .that growth of biota in the river (and by extension in the sea nearby) would be very likely limited because of lack of nutrients in the river.
It is possible that some rain in the region is relatively acidic. This is

IOC Workshop Report no. 41 Annex V1.2 - page 3
When the rivers reach the sea the content of pollution, natural or anthropogenic will influence the natural marine background near the coast. This is because of the mixing of the fresh water with the saline. In general this causes a precipitation of many trace elements, especially if the origin is anthropogenic. The latter tend to be in forms which may be different from those from natural sources. For example, a fertiliser factory may release phosphate in particulate form to a river, which would be uncommon in the natural environment. These particulates may well precipitate in an estuary.
There is a general principle which tends to operate and is important for pollution surveys. Anthropogenic pollution released to rivers even if initially soluble, tends to remain close to the point of release. This is ironic, because the point of releasing it is to remove it far from the factory. But because of geochemical principles this will not usually work well. Polluters generally pollute their back doors, or the local coast.
and hence more time for precipitation of pollutants, or adsorption onto the sediments and local vegetation. It is almost certain that pollutant levels will be higher than in other coastal environments.
where the mixing with salt water occurs. That depends again on the volume of water coming down the river, and also depends on the salinity of the sea water. The Niger and Congo are very significant rivers and have created their own large alluvial fans, and have a large and significant region around them where the salinity is quite low, strongly in contrast to the tropical Atlantic in general where the salinity is quite high. (Much of the general data presented here is derived from the Times Atlas (1983) unless otherwise indicated). Most precipitation of trace metals seems to take place at salinities of 5% or less, in any case, but it rather seems that the volume of water is such, that near the major rivers, precipitation of trace elements will be rather further out to sea than the polluters deserve. Some elements will desorb rather than precipitate, e.g. Ba (Edmond -- et al. 1978).
(1983) for the Sierra Leone river. They compared it with the Ooster and Westerscheldt rivers, in Europe, and found that Cd and Pb were in the range 30-400 ng kg-l, and Cu was 200 ng kg'l or greater. Pb was mostly the particulate matter, but Cu was dissolved and released to some extent in the estuary.
The types of trace elements coming down a river will also be a function of the different types of geology. In very simplified terms, (Emery and Noakes 1985) the geology of the region is mixed. However there are very significant regions of igneous intrusive rocks, and marine Tertiary sediments. How will these affect the output .of trace dements?
In a lagoon or mangrove environment, there is greater residence time of water,
The site at which the elemental content of a river precipitates depends on
Some actual data on description is available from the work of Valenta et a1
attached to
One consequence of the presence of igneous or metamorphic rocks clsse to shore is the possibility of deposition of residual heavy minerals just offshore after the rest of the rock is weathered away. The usual minerals concerned are gold, tin, platinum, titanium (ilmenite, rutile), zirconium (zircon), thorium and rare earths (monazite). (Bruckner and Morgan (1964)) Diamonds also occur but obviously do not affect the trace element content.
which might be exploited in future. They include sources of thorium, rare earths, gold, iron and tin. Additional possible pollution from inland mining should be considered.
Emery and Noakes (1985) show that there are significant coastal deposits

IOC Workshop Report no. 41 Annex VI.2 - page 4
These deposits are not likely to produce widespread effects on background levels of metal concentrations in biota because these particular metals are, with the exception of iron, not essential elements and tend to be excluded from cells. They are also detrital and tend to be more insoluble than many other ores. However some very local effects could be found, and would be probably be very interesting.
m e Tertiary sediments may produce a few minor unusual effects on trace metal concentrations when they erode and this is covered later.
m e local oceanic currents produce a well-known eastward drift of material towards the mouth of the Niger and a northwards drift opposite Central Africa. Emery and Noakes (1985) point out that in general terms the region near the Niger can be considered as a general zone of deposition, and the other areas as areas of erosion. This coastal erosion, for the countries which suffer it, has at least the advantage that local pollution may also tend to be removed, but contrariwise pollution of the next country to the west or south may be deposited. It is certain that any pollution will have international dimensions and the WACAF group may therefore have a useful function to perform.
pollution, smothering colonies of living organisms, rather than altering the trace element balance significantly. Similarly the intense mixing this causes will rapidly dilute any pollution present. Following Akle (1985) and estimating a redistribution of 4 million tonne of sand in the Gulf of Benin each year, it will be clear later in this paper that pollution releases will be probably diluted several thousand times to harmless levels.
water is the presence of an area of upwelling. Middlebrooks et al. (1981) quote a region of upwelling from Cape Palmas to approximately Cotonou during the period June-October each year. This should bring to the surface, water containing greater amounts than normal of some elements, since they are regenerated at depth. This is true, for example, of copper, which is thought to diffuse out of sediments. It is certain that copper itself will be immediately involved in biological processes, which occur in great abundance in such upwelling regions and may not therefore survive very long to be carried north by currents. The intense biological productivity in such regions will also lead to a rather high sedimentation rate.
However reasonably close to shore they become calcareous (See Seibold and Futterer (1982)). The Congo fan has beyond it, some significant quanities of silicaceous sediments, but they are sufficiently distant not to influence coastal studies.
The coastal erosion itself is mostly likely to produce biological
A possible source of alterations to concentrations of elements in ocean
The marine sediments in the region can be broadly classed as terrigenous.
Baselines
1 . Waters Some metals are deposited as a type of fallout in rain. There is an
interesting recent study on this (GESAMP (1985)). Some results are given in table 1 which follows:
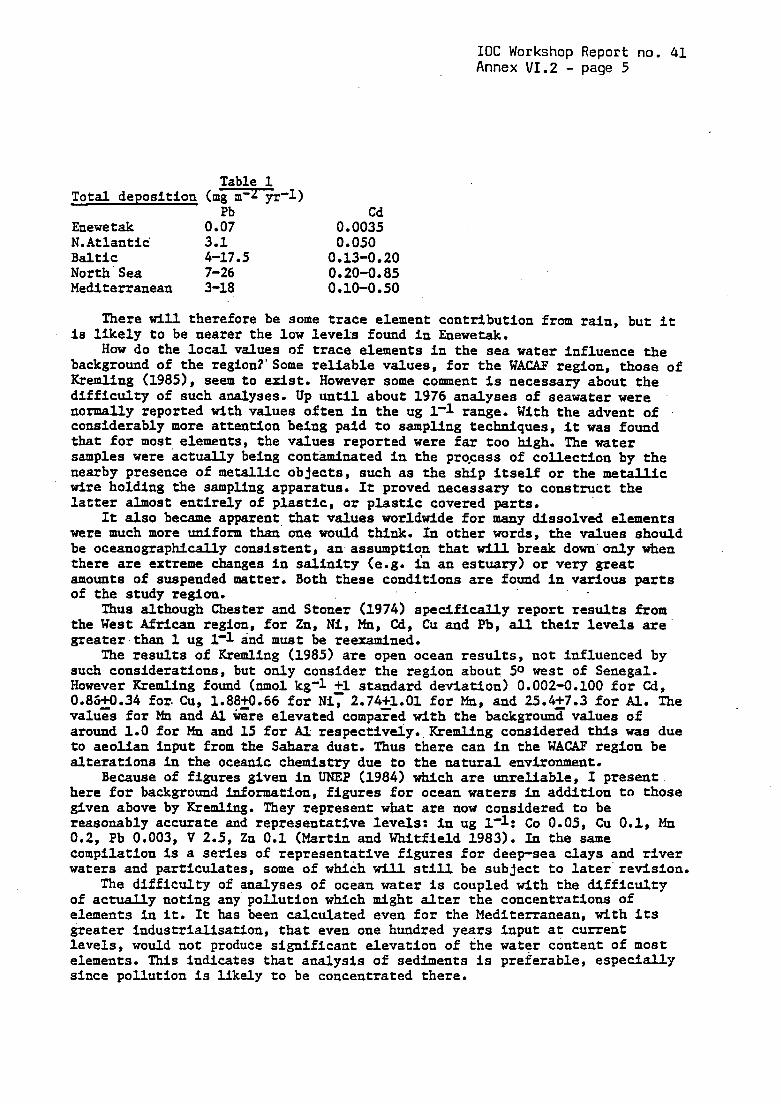
IOC Workshop Report no. 41 Annex VI.2 - page 5
Enewe tak 0.07 0.0035 N. Atlantic' 3.1 0.050 Baltic 4-17 . 5 0.13-0 . 20 North Sea 7-26 0.20-0.85 Mediterranean 3-18 0.10-0 . 50
There will therefore be some trace element contribution from rain, but it
How do the local values of trace elements in the sea water influence the is likely to be nearer the low levels found in Enewetalc.
background of the region?'Some reliable values, for the WACAF region, those of Kremling (19851, seem to exist. However some comment is necessary about the difficulty of such analyses. Up until about 1976 analyses of seawater were normally reported with values often in the ug 1-1 range. With the advent of considerably more attention being paid to sampling techniques, it was fouad that for most elements, the values reported were far too high. The water samples were actually being contaminated in the prgcess of collection by the nearby presence of metallic objects, such as the ship itself or the metallic wire holding the sampling apparatus. It proved necessary to construct the latter almost entirely of plastic, or plastic covered parts.
It also became apparent that values worldwide for many dissolved elements were much more uniform than one would think. In other words, the values should be oceanographically consistent, an assumptiop that will break down only &en there are extreme changes in salinity (e.g. in an estuary) or very great amounts of suspended matter. Both these conditions are found in various parts of the study region.
Thus although Chester and Stoner (1974) specifically report results from the West African region, for Zn, Ni, &, Cd, Cu and Pb, all their levels are greater than 1 ug 1-1 and must be reammined.
The results of Kremling (1985) are open ocean results, not influenced by such considerations, but only consider the region about 50 west of Senegal. However Kremllng found (nmol kg-1 +1 standard deviation) 0.002-0.100 for Cd, 0.86+0.34 for. Cu, 1.88tO.66 for Ni; 2.74+1.01 for Mn, and 25.427.3 for Al. The valuzs for Mn and 81 &re elevated conpaTed with the background values of around 1.0 for & and 15 for Al respectively. KremUng considered this was due to aeolian input from the Sahara dust. Thus there can in the W A W region be alterations in the oceanic chemistry due to the natural environment.
Because of figures given in UNEP (1984) which are unreliable, I present here for background information, figures for ocean waters in addition to those given above by Kremling. They represent what are now considered to be reasonably accurate and representative levels: in ug 1.1: CO 0.05, Cu 0.1, Mn 0.2, Pb 0.003, V 2.5, Zn 0.1 (Martin and Whitfield 1983). In the same compilation is a series of representative figures for deep-sea clays and river waters and particulates, some of which will still be subject to later revision.
of actually noting any pollution which might alter the concentrations of elements in it. It has been calculated even for the Mediterranean, with its greater industrialisation, that even one hundred years input at current levels, would not produce significant elevation of the water content of most elements. This indicates that analysis of sediments is preferable, especially since pollution is likely to be concentrated there.
The difficulty of analyses of ocean water is coupled with the difficulty

IOC Workshop Report no. 41 Annex VI.2 - page 6
Another possibility for analysis, in theory is river water, but the same precautions as for sea water are needed, and many of the concentrations reported for river water in the literature need reeexamination, except perhaps where pollution is fairly obvious (Ndiokwere and Cuinn 1983).
rather heavily mineralised groundwater. For example Gaye and Travi (1982) report from Senegal that water leached from lower Marine Sediments may be extremely hard and contain significant quantities of fluoride ion. Similarly Lavoie et a1 (19821, report on amounts of manganese so high that the maximum permissible concentration may even be exceeded. It will be a general.feature of tropical waters that manganese will be significantly high because of the intense leaching and results should be carefully interpreted in that light. However because of dilution the above groundwater factor is likely to be quite minor as an influence on results except locally.
known to alter the concentrations of trace metals. It is thought that the percentage dissolved (rather than in particulate form) increases during flooding at least for some metals, but the literature is somewhat contradictory (Bradley 1984, Habib and Minski 1982) and more clarification is needed.
Contamination problems have also arisen during sampling of suspended particulates making subsequent analysis futile, though the general recognition of this is slow to come. Many results reported for particulates from the open ocean or from rivers suggest that most metals in these particles are present in at least the 100's of mg kg-1 range and often much higher.
rivers or on the sea bed, but seem in many cases to be due to a type of contamination similar to that described for sea-water analysis. It is-very easy to contaminate a sea-water or river-water sample to a level of a few tens of ug 1-1 with a metal, when the true value is probably at least ten times lower. If that occurs how will it interact with the particulates present? Most of the particulates complex metal ions very strongly, and distribution ratios of lo5 or more are possible. That will mean that a large part of the ions will attach themselves to the particulates which are generally present in small amounts. This artificially boosts the apparent metal content, and gives rise to the values mentioned earlier.
particulates in the sample. Our experience at Monaco is that if the content of solids in the water is greater than 10 mg 1'1 then one can usually consider the effect of this adsorption to be small. I think it likely that such will be the case in many water samples in the region, and recommend this guideline. However we still recommend sampling with extensively precleaned bottles where possible, and much rinsing of the bottles with the sample before final closure. For sea water sampling quite special samplers are needed, beyond the scope of this paper.
For. river particulates taken from regions in South France and in Italy we sug est background figures for copper of about 5-10 mg kg-1 and lead of 1-5 mg kg-f (unpublished work). Other figures are reported in Martin and Whitfield (1983) - (all in mg kg-1) As 5, Cd 1, Cr 100, NI 90, B 70. Meybeck (1979) should be consulted.
Also possibly affecting some river water analysis is the addition of
Another influence on river water will be the large runoff. Flooding is
The results are much higher than for the corresponding sediments in the
The effect becomes less and less significant the more the content of
There exist a few specific figures for the Congo.for which Martin and

IOC Workshop Report no. 41 Annex VI.2 - page .7
River waters certainly contribute significant amounts of metals to the marine environment, but how does this compare with the amounts mentioned earlier, which fall in rain? The following table 2 is an interesting comparison taken from GESAMP (1985) and is for the Mediterranean only:
Element
Table 2 Atmospheric input y-1 Riverine input y-1
Pb 5000-30000 tonnes 2200-3100 tonnes Zn 4000-25000 " 11000-17000 *' ., 350-1900 *' Cr 200-1000 Hi3 20-100 I, 0 30-150
The interpretation of these figures is complicated by the fact that some of this tonnage is natural and some anthropogenic. However the amounts are quite large. It is quite impossible to estimate the likely relative contributions in the WACAF region at present owing to lack of data, but obviously any full study would consider natural or background inputs like these and compare pollution with them. When that is finally done it is likely that as for the Mediterranean, deposition from the air to the marine environment will be a significant source.
2. Sediments
What are good background values likely to be for sediments in the coastal regions of the study area? To some extent this can be found only by studies in the area. However parts of this may already be affected by pollution before full scale monitoring can start. In such cases or to check whether such is the case it is important to analyse cores of sediments. The assumption is that the lower levels of such sediments are not contaminated, which for many elements which do not diffuse readily is probably true. If the sediment is anoxic, however, many elements are mobilised and the assumption probably will not be true . Mediterranean, (Whitehead et a1 1985 in press) which are quite similar to those from the Pacific, and may also be of interest in the study region: Cr 15 mg kg-1, Cu 15 mg kg-1, Zn 50 mg kg-1, Cd 0.15 mg kg-1, Pb 25 mg kg-1, with standard deviation of 5 mg kg-1 or 0.05 ng kg-1 in the case of Cd.
South-West Africa by Calvert and Price (1970). They comment that the metals are associated with the organic fraction - Cu 130 mg kg-1, Ni 460 mg kg-1, Pb 30 mg kg-1, Zn 340 mg kg'l.
Nigerian coast and within the river Niger. The coastal figures are given in the table below.
However here are suggested sediment background figures for the
Rather higher figures are reported for organic-rich sediments off
Ndiokwere (1984) reports some values for trace metals in sediments on the
Element As Au cd Hg Mn Ni Pb Sb Zn
Table 3
Range (mg kg-1 dry weight) 4.7-7.6 0 . 03-0.06 1.84-2.8 0.04-0.16 181-243 5.2-8.7 47.6-87.2 0.78-1.7 67.4-78

IOC Workshop Report no. 41 Annex. VI.2 - page 8
A few of the above figures may be compared with the background figures derived from elsewhere. It will be noted that they are slightly higher. The figure for the element Cd is ten times higher. The figures for the river environment were mostly a little higher, with an exception for Cd which is close to oceanic background figures elsewhere.
Chester (1982) comments about one feature of the sediments of West Africa which may affect analysis. The input from the Saharan dust Is substantial, so much so that its content may be more than 20% of total (on a carbonate-free basis). This rather clearly indicates the probability of a need for a local determination of background, which is likely to be enriched in Al, Fe, Mn, CO, Cu, Zn.
The carbonate content and organic matter content will vary considerably also. Seibold and Futterer (1982) give a useful map for the Senegal region.
For a general background description of the Niger delta, the paper by Allen (1964) should be consulted.. Generally sediments are likely to be organic rich in the mangrove areas, and at the river mouth, quartz sand, clean silt and clayey silt with plant debris. Much bioturbation is noted. There is likely to be some complexation of metals by the plant debris.
3. Biota
There are a few figures available for metal concentrations in biota from
According to Calvert and Price (1970) the plankton have Cu 300-6000 mg the region or near it.
kg-1, Ni 60-90, Pb 1200-1800, Zn 6000-9000. This is in the Benguela current. However even though this is a zone of upwelling, it is feared that these figures are much too high and have fallen prey to the contamination problems during sampling mentioned earlier, where the material has a high affinity for the metals, and the sample mass is small.
A good compilation where great care was taken to avoid contamination, still remains that by Martin and Knauer (1973). Some typical figures are Pb 2-3.3 mg kg-1 (dry weight), Hg 0.08-0.014, Cd 2.3-6.4, Ni 2-8.4, Cu 6.5-15.6, Zn 70-180.
Some figures are available as a claimed baseline for various marine organisms in unpolluted areas on the West coast of Africa (Fourie 1976) which could prove of use to researchers. In terms of wet weight, Zn contents are often 1-20 mg kg-1, Cu 0.2-4, Pb 0.1-1.6, Cd 0.1-0.9, Ni 0.1-1.2, Cr indetectable to 1.2. Several organisms are represented in the compilation.
Ndiokwere (1984) reports concentrations of metals in algae. The ranges found are given in table 4 below.
Element As Au Cd Hg Mn Ni Pb Sb Zn
Table 4
Range (mg kg-1 dry weight) 1.74-3.4 less than 0.02 0.78-1.36 less than 0.001 35.6-67 . 4 1.5-3.1 4.8-7.63 0.16-0.43 78.5-104

IOC Workshop Report no. 41 Annex VI.2 - page 9
These figures are for the sea. For the river Niger they were often about
Ndiokwere (1983) also reports figures for intertidal molluscs, which had half the above values.
high levels of some of the elements. The molluscs were periwinkles and the figures in table 5 below are given in terms of mg kg-1 wet weight.
Table 5
Element As Au Hg Sb
Warri 2.43i-O. 23
Samples from: Port Harcourt 2.48+0.21
0.053:O. 025 less Than 0.01
0 . 087+0.007 0. ogito. 006 0.0 7 2%. 04 less Than 0.01
Relatively high values were reported for the some of the major elements in the shells also. The author suspects pollution, though the details of the source are not clear.
Banus (1977) has suggested mangrove seedlings as pollution indicators and found unpolluted values of Cu 2.5 mg kg'l, Fe 12 mg kg-1, Mn 10 mg kg-1. However only copper seemed to vary with pollution. The work was done with Red Mangroves at Puerto Rico. It is also worth noting that mangroves are known to accumulate Sn to ten times the normal level in mineralised areas (work from West Malaysia by Peterson et al. (1979)).
Finally there are some figures reported for fish analysis. Establier (1972) reported mercury concentrations in fish as far south as Dakar, and found values mostly less than or equal to 1 mg kg-1 Hg. However Auxis thazard and Scylliorhinus stellaris contained about 3 and 2 mg kg-1 respectively.
the coast of Senegal. The values were 0.02-1.14 mg kg'l depending on species. Similar results were found by Gras and Mondain (1978) for fish caught on
They report more values in later publications (Gras et al. 1980, Gras and Mondain 1981)
Some Russian work (Morozov et a1 1974) reported a wide range of values for fish in the East Atlantic. They analysed for Fe, Zn, Sr, Mn, Ni, Cr, Pb, Cu, CO, Cd. In general Mn, Ni, Cr, Pb were 2-10 mg kg-1 with CO and Cd less than 2 mg kg'l. The first three elements were mostly 10-100 mg kg-1. Anchovy, herring and shark were among fish analysed.
Sources of pollution
As regards possible sources of metallic pollution they are many and a limited amount is known or may be inferred. As summed up in UNEP (1984) they are industrial pollution, muncipal sewage, agricultural waste and oil pollution.

IOC Workshop Report no. 41 Annex VI.2 - page 10
1.Municipal wastes
Municipal wastes are an important source of trace metals with greater or lesser degrees of availability to biota. According to Forstner and Wittmann (1979), typical input to a sewage treatment plant may contain Cr 120 ug 1-1, Cu 100, Ni 160, Pb 60. Assuming the UNEP (1984) estimate of 400 1'1 person -1 day-1, and a total population on the coast of about 17 million in the region, and assuming no contribution from inland sources, we arrive at a total release per year of the order of 300 tonne Cr, 250 Cu, 400 Ni, and 150 tonne Pb.
These figures should be compared with those for oil spill contributions in the next section and It is clear they are larger for municipal wastes, and larger still if there is some contribution from inland sources.
trace metals with the 4 million tonne of sand moved by erosion each year (Akle (1985)). If mixing occurs, pollution is quite unlikely because of the dilution factor of 1000 present. Local pollution in lagoons, where erosion is not taking place, is much more credible.
rich in trace metals, and relatively pure effluent. However the problem of disposal of sludge then remains. Since one of the obvious routes of disposal for coastal areas is dumping at sea, (Forstner and Wittmann 1979) a conservative view must be that ultimately the trace metals will be released to the marine environment in any case. Chattopadhyay (19771, gives the following ranges of concentrations (in mg kg-1) for raw sludge; V 9.5-38, Cr 600-5700, Mn 120-1000, Ni 20-1800, Cu 410-2400, Zn 230-2800, As 1.5-16, Cd 5-66, Hg 2.6-61, Pb 60-2900.
the amounts of these elements fall off exponentially with distance from the roads. Near roads vegetation may easily contain 1000 mg kg-1 of Pb, however effects are seldom seen more than a hundred metres from the road. This means that effects will generally be very localised, little lead'and bromine will reach the sea, and this Is not likely to be a source of significant pollution except where a road runs alongside the sea.
It is highly important to compare these figures of hundreds of tonnes of
It is possible to treat sewage by processes which produce sewage sludge
Cars also pollute, especially with lead and bromine. Studies usually show
2.011 Industry wastes
Crude oil contains various metals. The concentrations are low, but the
With an estimate of loss (UNEP 1984) of 0.5% of total oil shipment this amounts of crude produced each year are very large.
would indicate at least 2,000,000 tonnes loss near West Africa each year based on some older figures for oil exports from the region. There could be a substantial amount of metal released. Even if a metal is present in oil at the mg kg-1 level we are talking about amounts potentially available for release to the environment of the order of one tonne of metal per year.
As examples, according to Carter et a1 (1975) Fuel oil has 0.3 mg kg-1 Pb and 0.01 mg kg-1 Cd, and according to Sheibley (1975) an NBS-EPA round-robin oil sample contained 0.25 mg kg-1 CO, 0.116 mg kg'l Cr, 0.22 mg kg'l Cu, 0.022 mg kg-1 Hg, 0.19 mg kg'l Mn 39.5 mg kg-1 Ni, 0.0146 mg kg-1 Sb, 266 mg kg-1 V and 0.48 mg kg-1 Zn.
The nickel.and vanadium figures are so high that if a crude oil contained them and was released at the above spillage rate, then we are talking about tens to hundreds of tonnes of vanadium and nickel released into the environment. However the amounts of the other elements are not negligible.
This is.potentially one of the more serious sources of metallic pollution,. and is the subject of current research since there are still gaps in our knowledge of how the metals distribute themselves in the environment from such RDJ 1 1 s.

IOC Workshop Report no. 41 Annex VI.2 - page 11
In addition there is the possibility of pollution from the actual process of drilling. This arises from the discharge of drilling fluid to the marine environment. The subject is well dealt with in Panel.. et al. (1983). They mention that 1.1 tonne of drilling fluid are lost for each well 5 km deep, and that the composition (in mg kg-1) includes Ba 37,400, Cr 191, Cd less than 1, Pb 3, Hg 3, Ni 4, V 5, Zn 50. The barium is the form of barite, or barium sulphate, and in theory should not be available to marine organisms. The chromium is thought to be in the CrIII state and hence less toxic to biota, but significant fractions may be in the more toxic oxidised form. Studies have also shown that in spite of the theoretical non-availability of elements, drilling fluid is reasonable toxic to marine organisms and in addition the organisms contain significantly higher than normal amounts of barium and chromium. This is therefore potentially another source of pollution. The quantity of Cr discharged per well drilled is usually between 0.3-1.3 tonne.
Clearly if ten wells are being drilled somewhere in the WACAF region during the course of a year, the potential metal release is about equivalent to the nickel and vanadium released in oil spills.
The work of Armannsson et al. (1985) showed that copper could also be present in enhanced amounts in the sediments near an oil refinery. The amount was about 350 mg kg'l, which is significantly above the results suggested earlier as representative of background ones.
3.0ther Industrial wastes
Other industries may create pollution. For trace metals, only a few figures are readily available for likely trace metal outputs. The following data are from Forstner and Wittmann (1979). They are for a study of the New York bight and contrast municipal trace metal input with industrial. greatest contributor to the percentages (not quoted here) was direct barge dumping of metal rich material.
The
Table 5
Cd Cr cu Fe Hg Pb Zn
X waste municipal 5 0.6
% waste industrial
22 0.8 11 9 5 0.5 71 2 19 3 8 2
This shows that even in New York, municipal wastes are an order of magnitude more important than industrial wastes. This is likely to be true for the WACAF region also. It suggests industrial wastes for a developed country are only one tenth as important as municipal wastes, and since the countries in the WACAF region are developing, it is likely industrial wastes will be much less impartant than oil industry wastes. We suggest'therefore that they are third in order of importance.
cleansing contaminated urban surfaces was about as impprtant as municipal releases, for its actual content of trace metals. This point- is underemphasised. However probably most of the load is in the form of particulates and its metal availability may be somewhat diminished.
The report also showed however that direct runoff of trace metals in rain

IOC Workshop Report no. 41 Annex VI.2 - page 12
Mining Can potentially contribute considerable quanitites of metals to rivers reaching the sea. For this region, it is important to consider the effects these may produce, which are very site and management dependent. It is obvious that mining a metallic ore may produce contamination of that particular metal. Geochemically most metal ores have been deposited under reducing conditions, and mining exposes them to oxidising conditions and hence solubilisation. This especially applies to the first transition series metals. In addition since many are essential elements they will be absorbed by biota, and the principle has even been used before mining, for prospecting. But the actual likelihood of significant quantities of these elements reaching the sea is not clear.
metals involved are not so obvious. However bauxite, phosphate, cement industries give rise to various contaminants.
Production of aluminium from bauxite involves releases of significant quanities of fluoride to the environment from the molten electrolyte, the effects of which are summarised in UNEP (1984).
Rankama and Sahama (1950) suggest that elements concentrated in bauxite are Ti (35,000 mg kg'l), Zr 500-900 mg kg-1, V 600 mg kg-1, Co 300 mg kg-1, Ni 180 mg kg-1, and Be, which is surprisingly high at 2-36 mg kg-1. The consequences of these concentrations, and even whether they are accurately mirrored in West African deposits is not clear.
270-900 mg kg-1 Ba (Rankama and Sahama 1950). However again the ultimate fate of these elements during processing is not always known. For fertil-.er factories Forstner and Wittmann (1979) quote Cd, Cr, Cu, Fe, Hg, Mn, Pb, Ni and Zn as possible contaminants of effluents and Cr from cement production. Chromium is also an important effluent from textile mills and leather tanning. Pulp mills or board mills potentially contribute Cr, Cu, Hg, Pb, Ni and Zn. Electroplating releases substantial quantities of Cu, Cr, Ni, Zn and Cd and Soap and candle factories also release Zn.
interesting as an indication of relative importances of effluents from various industries.
For other mining and processing of non-metallic resources, the trace
Phosphorite is known to contain large amounts of Zn, Cd, In and Bi, and
Finally the following table, adapted from Forstner and Wittmann (1979) is
Table 6
Average concentrations in ug kg-1 effluent Cd
Meat processing 150 150 70 460 11 Fish processing 240 230 140 1600 14 Brewery 150 60 40 470 5 Soft drinks 2040 18 0 220 3000 3 Textile dyeing 37 820 250 500 30
- Zn - Cr Ni - cu - Industry
For some industries, such as edible oil production, figures do not seem so
It is obvious that the relative importance of any pollution caused by readily available.
local industry will depend on the local circumstances, but overall it is unlikely that the effects will be greater than those contributed by the municipal wastes. This emphasises that it is people who pollute.

IOC Workshop Report no. 41 Annex VI.2 - page 13
4. Agricultural wastes
Fertilisers used in agriculture contain trace elements. If these leach into rivers and into the sea, there is in theory the potential for pollution. To calculate this one must know the content of trace elements in the fertilisers and the tonnages of fertilisers used each year. Table’7 shows total tonnages for the WACAF region, of fertilisers actually cons-aed for various recent years (FAO 1983).
Table 7 Tonnes used per year.
Year 1979180 80181 81/82 82/83 86 (extrapolated 1
N 125000 154000 1- 1- 180000 P 70000 90000 122000 92000 110000 K 69000 74000 103000 90000 110000
Pollution from these should be a relatively minor problem. For potassium fertilisers it is known for example that the trace element content is not normally enough to supply the plants’ needs. There is supposed to be a trace of cadmium in phosphate fertilisers which could potentially reach the sea. However there are many barriers on the’way. Only a small proportion of the trace elements will be absorbed by the plants themselves. But a large proportion will be fixed strongly to the soils, and it will be easier for pollutant anions to reach waterways than pollutant cations.
It is possible to calculate an approximate figure for the overall scale of the trace elements introduced. We assume the total N+P+K tonneage is 5OOkTonne for next year.
fertilisers, both derived from sewage sludge, and chemical fertilisers (Chattopadhyay (197711, as in table 8.
Some approximate figures are available for trace element contents in
v Cr Mn Ni cu Zn As Cd Hg Pb
Sludge fertiliser 12-29 170-2200 12 0-58 0 46-123 110-860 100-410 1-13 15-38 1.4-26 132-1200
Chemical fertilisers 2-23 10-40 10-700 1-14 10-50 30-500 0.5-1.6 0 . 16-4.8 0.1-1.3 2.5-56
It is immediately obvious from this table that chemical fertilisers in general have much less content of most trace elements compared with sludge fertilisers and that in general the former are not likely to add more than about 20-30 mg kg-1 to the soil for most trace elements. This suggests that amounts added are likely to be of the order of perhaps 10 tonne per year given the calculated fertiliser consumption. That is less than the oil industry and much less than from municipal wastes.
is another potential source of pollution but we have not yet found figures for the amounts of these used in the countries of the region.
The possible pollution from fungicides and pesticides containing mercury

IOC Workshop Report no. 41 Annex VI.2 - page 14
Research is certainly needed for determining trace element distribution. Figure 1 shows how many papers were produced from the various regions of the world for occurrence of Zn, one of the commoner trace elements, and recorded in Chemical Abstracts for the year 1981. the WACAF region, and there 1s therefore a vast field for research.
It is clear that there are few from c9
CHLORINATED HYDROCARBONS
There is a little scanty information on chlorinated hydrocarbon levels in the Atlantic. Harvey et a1 (1974) found an average of 30 ng 1-1 of PCB's in the eastern Atlantic in 1971-2 compared'with levels in the Sargasso Sea in 1973-4 of 0.8-1.0 ng 1'1. Harvey - et al. (1972) reported DDT in zooplankton from western Atlantic areas from less than 0.001 to 0.95 ug kg'l wet weight.
Clearly some of the environmental features of the WACAF region are important in the distribution and degradation of the chlorinated compounds. According to Goring et a1 (1975) organic matter content, temperature and rainfall and amount of aluminium and iron oxides in the soils, will all increase the rate of degradation significantly. The well known volatilisation of some pesticides will be increased by the high temperatures, but the high rainfall will produce a rainout effect. In addition the tendency of these compounds to attach themselves strongly to the surfaces of soil particles means that substantial transport will be under flood conditions in rivers when the bulk of particle transport occurs.
According to Larsson (1984) however, one of the features influencing most strongly the sedimentation rate of at least PCB's in relatively uncontaminated areas is direct precipitation from air. This is important since a major route for ecosystem cycling in the WACAF region will be through evaporation. He found no statistically significant differences in PCB content between Swedish lakes and the Baltic. He also records the possibility of recycling from the sediments for PCB'a which is worthy of study.
in air - PCB's 0.21-0.65 ng m-3. Comparable figures for other regions are Mediterranean 0,04-0.3, North Sea 0.96, Central Pacific 0.19-0.32, N. Pacific Trades 0.049, S.Pacific Trades 0.012.
Some of this deposits in rain but some compounds deposit even in dry conditions.
Recent figures from our laboratory (Villeneuve et a1 1985 unpublished) give the following table for dry deposition and concentrations in rain in the Western Mediterranean. They are likely to be higher figures than those for the WACAF region. ~
GESAMP (1985) reports the following figures for the tropical N. Atlantic
Table 9
Dry deposition Rain Compound ug m-L y-1 n g T 7 Arochlor 1254 14.6 1.3 pp * DDT 3.8 1.54 Toxaphene 40 7.2 HCB 0.08 0.64 Lindane 2.37 30 Alpha HCH 2.36 4.7 pp * DDE 2.44 0.06

IOC Workshop Report no. 41 Annex VI.2 - page 15
There are no figures recorded for chlorinated hydrocarbons in sediments from the East Atlantic, even in the recent compilation of Sericano and Pucci (1984). However, they note the usual trend for the southern hemisphere - even though their results may have been influenced by the outflow of the main sewer of their local town, the concentrations found were lower than most others elsewhere.
All these factors combine to suggest these compounds will be available to marine organisms through river transport and deposition from the air and any filter-feeding organisms are likely to accumulate these compounds in fatty tissues, as reported in many other parts of the world.
One additional speculative factor is that hydrocarbon residues from oil spills may also tend to accumulate non-polar compounds such as some of those being considered, and any food chain which starts with the slow degradation and assimilation of oil spill residues is therefore interesting for study, though hardly for routine monitoring.
Tar balls indeed, are well known for their ability to accumulate pesticide residues with concentration factors ranging from 102 to 105. However the concentrations are quite erratic, with uneven distribution, and a considerable number would need to be analysed to obtain a mean representative of the local environment. In addition tar balls appear to absorb various metals from the environment not present in the original hydrocarbon material. (Sunay et al. 1979) I
done.under the aegis of the International Council for the Exploration of the Sea (ICES 1977). For open ocean areas pesticide levels in cod muscle varied from less than 0.1 to 1.0 ug kg-1 wet weight. Liver concentrations were considerably larger also showing variations between regions. Total DDT levels were about 1.8 ug kg-1. PCB levels in cod, liver were in the range 0.44-4.1 mg kg'l (note that in UNEP (1984)they are erroneously given as ng kg-1).
rather than marine fish (Osibanjo and Jensen 1980).
concentratioh in higher trophic levels of a food chain (e.g. Tanabe et al. 1984). The overall bioconcentration of lo7 found in striped dolphins is representative of the general concentrating that occurs, but the authors also emphasise the accumulation process is very complicated with the related factors varying according to the organisms, localities, temporal and spatial conditions. This suggests that specific studies in the WACAF region are not only useful but an essential part of the unravelling of the complexities worldwide, because they represent rather extreme conditions.
historical reasons the concentrations of PCB's DDT's and HCH's are lower in the Southern Hemisphere than the Northern though use in the former is rapidly increasing. This does not necessarily apply to the concentrations at the highest trophic levels however, since the authors found in some cases such as the Dusky dolphin, that the concentrations were similar in both hemispheres. In the WACAF region detailed study is necessary. The authors recommend a "comprehensive study .... to trace the time trends on a global scale, especially in the southern hemisphere".
In addition to the above meager information it is possible to draw on work
DDT figures for Nigeria seem only available for freshwater fish so far,
It is well known that PCB's, DDT's and hexachlorocyclohexanes increase in
In earlier studies, Tanabe et al. (1983) it is pointed out that fot

IOC Workshop Report no. 41 Annex VI.2 - page 16
There therefore seems the necessity to establish baseline levels for each region. The lowest figures recorded for predatory marine mammals are those from Antarctica (McClurg 1984) (mostly less than 0.1 ug kg-1) and in one sense are a type of world baseline, but figures from the WACAF region are likely to be much higher.
The main conclusion from these facts is that more research on chlorinated hydrocarbons is needed in the WACAF area, and results will be of interest to the scientific community. this conclusion is even stronger than for the case of Zn as reported in the section on trace metals.
easily available. Although UNEP (1984) mentions the substantial use of pesticides in the region, it does not present current figures of usage. However it must be several tens of thousands of tonnes per year when the figures for 1972 and 1974 are considered. Because of the constant need to control pests the usage is not likely to decrease in the foreseeable future.
In the case of trace elements, they were usually a small fraction of the wastes. In the case of chlorinated hydrocarbons it is the pure compound which is'added to the ecosystem. Since this is tens of thousands of tonnes, the pollution could ultimately be more significant than for trace metals.
C"3NCLUSIONS
As regards the sources of pollutioc, there seems rather little information
The paper has presented likely background figures for trace elements in sediments, water and marine biota and some data for chlorinated hydrocarbons. They are often an extrapolation from other parts of the world and it will be necessary to establish accurate figures for the WACAF region.
cycling of elements in the environment. The upwelling regions offshore may increase the levels of a few elements, and the erosion and deposition patterns must also be considered. The latter are likely to dilute most widespread pollution to harmless levels, except in very localised areas.
likely to be increased above background levels by municipal wastes, then activities associated with the oil industry, then other industries, and contributions from the fertilisers used in agriculture. Many of the latter contributions are likely to be rather small, and possibly not detectable in the marine environment.
The levels of pesticides residues in various biota are likely to be measurable, but somewhat low compared with worldwide data. Very little data are available for the WACAF region. The distribution is again likely to be strongly influenced by the climate and deposition from air from evaporated compounds should be significant.
It is also emphasised that in view of the relative lack of data, a significant amount of research is possible which will produce new and useful results.
The tropical nature of the region will probably increase the rate of
It is concluded that trace element levels in the the WACAF region are most
ACKNOWLEDGPlENTS
I would like to thank Ms C.Nauen and Mr,H.Naeve of FAO, Rome for supplying data.

IOC Workshop Repor Annex VI.2 - page
N
,t no. 41
17 4
a3 m 4
k 0
cc 0
U 0
CO k
U
cn cb 4
m 0 -4
E
a, Jz 0
n
-0 a, U k 0
0'
Q, 64
t 0
.I+ rn'
a, k
U 0
k
II c
N t 0
2 -
hi a
-8
+E
.- 0
ce 0 k
a, E 3
z
n
IOC Workshop Report no. 41 Annex V1.2 - page 18
REFERENCES
&le, M. (1985). Problems of coastal erosion in the Gulf of Benin. Siren 29, 20-31.
Allen, J.Rz. (1964). Sedimentation in the modern delta of the river Niger, West Africa. in "Developments in Sedimentation, I. Deltaic and Shallow Marine deposits. ** Ed. Van Straaten, L.M.J.U. Elsevier, Amsterdam 29-34.
acetylcholinesterase activity of fish from three rivers in the Ivory Coast. Environ. Pollut. (A) 39(2) ,151-159.
hydrocarbons in sediments from the Southampton Water region with particular reference to the Influence of oil refinery effluent. Mar. Environ. Res. 15,31-44.
from Puerto Rico. in "Biological Implications of trace metals in the environment." Eds. Drucher, H. and Wildung, R.E., N.T.I.S. Springfield, VA. 380-389 .
Bradley, S.B. (1984). Flood effects on the transport of heavy metals. Int. J. Environ. Stud. 22,225-230.
Bruckner, W.D. and Morgan H.J. (1964). Heavy metal distribution on the continental shelf off Accra, Ghana, West Africa. in "Developments in Sedimentation, I. Deltaic and Shallow Marine deposits. ** Ed. Van Straaten, L.M.J.U. Elsevier, Amsterdam. 54-61.
rich sediments off South West Africa. Nature 227,593-595. and Sites, J.R. (1975mrace Impurities in fuels
by isotope dilution mass spectrometry. in "Trace elements in fuel." ed. Babu, S.P. American Chemical Society, Washington D.C. 74-83.
activation analyses for multielement determinations in sewage sludges. J. Radioanal. Chem. 37,785-799.
aluminosilicates and trace metals in recent North Atlantic deep-sea sediments. Bull. Inst. Geol. Bassiq d'Aquitane, Bordeaux. 31,325-335.
Chester, R. and Stoner, J.H. (1974) The distribution of zinc, nickel, manganese, cadmium, copper and iron in some surface waters from the world ocean. Mar. Chem. 2,17-32.
Dejoux, C. (1983) The Toxicity for aquatic fauna of several new insecticides. Rev. Hydrobiol. Trop. 16(3), 263-275.
Edmond, J.M. Boyle, E.D., Drummond, D., Grant, B. and Mislick, T. (1978). Desorption of barium in the plume of the Zaire (Congo) River. Neth. J. Sea Res. 12(3/4),324-328.
Emery, IC. and Noakes, '-5). in Luepke, G. Ed. "Economic Placer Deposits of the Continental Shelf." Van Nostrand, New York. 272-274.
Establier, R. (1972). A new contribution on the content of mercury in fishes molluscs and crustaceans from the Gulf of Cadiz and inlets of the West African Coast. Inv. Pesq. 36(2),355-364.
environment. *' Springer-Verlag , Berlin.
Lagoon prior to industrialization. S. Afr. J. Sci. - 72,110-113.
htwi, L.A.K. (1985). Effects of aerial spraying of chlorophoxim on the brain
Armannsson, H. Burton, J.D. Jones, G.B. and Knap A.H. (1985). Trace metals and
Banus , M.D. (1977)TCopper , Iron and Manganese Content of Mangrove seedlings
Calvert, S.E. and Price, N.B. (1970). Minor metal contents of recent organic-
Carter, J.A., Walker, R.L.
Chattopadhyay, A. (1977). Optimal use of instrumental neutron and photon
Chester, R. (1982). RegiGal trends in the distribution and sources of
- FAO (1984). FAO fertiliser yearbook. 33. FAO, Rome. Forstner, U. and Wittmann, G.T.W. (19E), "Metal pollution in the aquatic
Fourie, H.O. (1976). Metals in organisms from Saldanha Bay and Langebaan

IOC Workshop Report no. 41. Annex VI.2 - page 19
Gaye, C.B. and Travi, Y. (1982). Chemical quality of groundwater in Senegal.
GESAMP (1985). Atmospheric transport of contaminants into the Mediterranean
Goring, C.A.I., Laskowski, D.A., Hamaker, J.W. and Meikle, R.W. (1975).
Water Qual. Bull. - 7(4),178-181.
region. Reports and Studies
Principles of pesticide degradation in soil. in Haque, R. and Freed, V.H. Eds, "Environmental -Dynamics of pesticides." Plenum, New York. 135-172.
Gras, G. and Mondain, J. (1978) Level of mercury in several species of fish caught on the Coast of Senegal. Rev. Int. Oceanogr. Med. 51/52,83-88.
Gras, G. Mondain, J. and Pellissier, C. (1980) Levels of mercury in several species of fish and in seawater off the coast of Senegal. Med. d'Afrique Noire 27(4), 661-664.
methylmercury - toxicological effects on human health. Toxic. Europ. Res. - 3(5) , 243-59.
the non-tidal region of the River Thames and River Kennet, U.K. Sci. Tot. Environ. - 22,253-273.
hydrocarbons in open-ocean Atlantic organisms. ia eds. Dryssen, D., and Jagner, D. "The changing chemistry of the oceans." Nobel Symposium 20, Almquist and Wiskell, Stockholm, 177-186.
Observations on the distribution of chlorinated hydrocarbons in Atlantic Ocean organisms. J. Mar. Res. 32,103-117.
living resources of the North Atlantic. Coop. Res. Rep. No - 69. ICES, Copenhagen.
Kremling, K. (1985). The distribution of cadmium, copper, nickel, manganese, and aluminium in surface water of the open Atlantic and European shelf area. Deep Sea Res. z(5) 531-555.
limnic and marine environments. Water Res. 18(11) ,1389-1394.
the quality of water coming from different types of wells in the Ivory Coast. Eau meb. 15(4) ,401-404.
Geochim. Cosmochim. Acta 37,1639-1653.
carried by major'world rivers. Mar. Chem. 7,173-206.
chemical elements to the ocean. in "Trace Metals in Sea Water.", Eds Wong,C., et al. Plenum, New York. 265-296.
from Antarctica. Mar. Poll. Bull. 15(10), 384-389.
pollution discharges from the West African Region. Environ. Int. 2,177-191.
26. World Meteorological Organisation. Geneva.
- Gras G. and Mondain, J. (1981) Pollution of fish products by mercury and
Habib, S. and Minski, M.J. (1982). Incidence and variability of some elemnts in
Harvey, G.R., Brown, V.T., Bachus, R.H. and Grice G.D. (1972) Chlorinated
Harvey, G.R., Mikles, H.P., Bowen, V.T. and Steinhauer, W.G. (1974).
ICES (1977). A baseline study of t G level of contaminating substances in
Larsson, P. (1984). Sedimentation of polychlorinated biphenyls (PCB's) in
Iavoie, M.C., LeGrand, M., Richard, D. and Rouleau, A. (1982). Comparison of
Martin, J.H. and Knauer, G.A. (19731.. The elemental composition of plankton.
Martin, J.-M. and Meybeck, M.71979) . Elemental mass-balance of material Martin, J.-M. and Whitfield, M. (1983) The sigEificance of the river input of
McClurg, T.P.'(1984) . Trace metals and chlorinated hydrocarbons in Ross seals Middlebrooks, E.J. , Armenante, P.M. and Carmichael, J.B. (1981). Industrial

IOC Workshop Report no. 41 Annex VI.2 - page 20
MOrozov, N.P, Tikhomirova, A.A. and Tkachenko, V.N. (1974). Metals in fish from the West Atlantic. Trudy Vsesoiuznyi Nauchno-Issledovatel'skii Institut Morskogo
Ndiokwere, C.L. (1983) Arsenic, antimony, gold and mercury levels in the soft tissues of intertidal molluscs and trace element composition of their shells. Radioisotopes 32, 117-20.
sediments and algae from the River Niger and Nigerian Atlantic coastal waters. Environ. Poll. (B) 7, 247-254.
in Nigerian river and harbour water samples by neutron activation analysis. J. Radioanal. Chem. 79(1),146-151.
perspective of pesticides pollution. Proc. 1st Natl. Conf. Water Poll. Pest. Resid. Foods. 206-220.
marine environment, Marine Board, Commission on engineering and technical systems and National Research Council. (1983) "Drilling discharges in the marine environment." National Academy Press, Washington D.C. 180 pp.
Ammulation of tin by mangrove species in West Malaysia. Sci. Tot. Envir. ll, 213-221.
Chicago, IL.
continental margin. in "The Ocean Floor." Scrutton, R.A. and Talwani, M. Us. John Wiley, Chichester, New York, Brisbane, Toronto, Singapore. 147-163.
and surface sediments of Blanca Bay, Argentina. Est. Coast. Shelf Sci.
Rybnogo Khozialistva I Okeanografii - 100, 45-5.0.
Ndiokwere, C.L. (1984). An investigation of the heavy metal content of
Ndiokwere C.L and Guinn, V.P. 71983) Determination of some toxic trace metals
Osibanjo, 0. and Jensen S. (1980). Ecological and environmental health
Panel on assessment of fates and effects of drilling fluids and cuttings in the
-Peterson, P.J., Burton, M.A.S., Gregson, M., Nye, S.M. and Ponter, E.K.
Rankama, IC. and Sahama, T.G. (1950). "Geochemistry." U. Chicago Press,
Seibold, E. and Futterer, D. (1982h Sediment dynamcis on the Northwest African
Sericano J.L. and Pucci, A.E. (1984). Chlorinated hydrocarbons in the seawater
19,27-51 . SheiKey D.W. (1975) Trace elements by instrumental neutron activation analysis
for-pollution monitoring. in "Trace elements in fuel." ed. Babu, S.P. American Chemical Society, Washington D.C.,98-117.
and distribution of organochlorine residues and heavy metals in tar balls. Ives Journees Etud. Pollutions Antalya CIESM 1978, 165-170.
Tanabe, S., Mori, T. and Tatsukawa, R. (1983) . Global pollution of marine mammals by PCB's, DDT's and HCH's (BHC's). Chemosph. 12(9) ,1269-1275.
Tanabe, S. , Tanaka, H. and Tatsukawa, R. (1984) .. Polychlorobiphenyls, DDT and hexachlorocyclohexane isomers in the Uestern North Pacific ecosystem. Arch. Environ. Contam. Toxicol. 13, 731-738.
London . African region and its state of pollution. UNEP regional Seas Reports and Studies No 46. Geneva.
Reddy, S.J. (1983). A comparative study of toxic trace metals in the estuaries of the Ooster and Westerscheldt and of the Sierra Leone River. Mahasagar 16( 21, 109-126.
(R. Jong in Sierra Leone). Rev. D'Hydrobiol. Trop. 15(3) ,193-199.
-
Sunay M., Balkas, T.I., Salihoglu, I. and- Ramelow, G. (1979) Determination
n The Times Atlas (1983). "Atlas of thyoceans.
UNEP (1984). The marine and coastal environment of the West and Central
Couper, A. , Ed. Times Books Ltd.
Valenta, P, N u a e r g , H.W., Klahre, P, Rutzel, H., Merks A.G.A. , and
Wright, R. ( 1 9 c S e a s o n a l variation in water quality of a West brican River

IOC Workshop Report no. 41 Annex VI.3 - page 1
A REVIEW OF THE HYDROGRAPHY AND PHYSICAL OCEANOGRAPHY OF WEST AND CENTRAL AFRICA
A.C. Ibe Nigerian Institute for Oceanography
.and Marine Research Lagos
INTRODUCTION
The objective of this review is to provide an overview of the physical oceanographic and hydrographic setting in the West and Central Africa Region in relation to the problem of marine and coastal pollution in the region.
A regional perspective is imperative because of the physical oceanogrz2hic phenomena that affect the transport and deposition of pollutants are usually large scale events that for the most part traverse national boundaries.
The report covers 20 countries from Mauritania to Angola (Fig.1) and is written for the benefit of participants in the joint FAO/IOC/WHO/IAEA/UhEP Project on Monitoring of Pollution in the Marine Environment of the Sub-region.
West and Central Africa is a vast low table land dominated by a narrow coastal plain, a narrow continental shelf, a number of remnant erosion surfaces and an immature drainage. Generally, three main climatic zones are distinguishahle,namely, the North and South Arid Zones separated by the Equatorial Humid Zone. The vegetation o f West and Central Africa reflects the climatic (and in particular, rainfall) variations of the region. The region is relatively well endowed with rivers. Large drainage systems such as the Niger and Congo-Zaire with extensive catchments debouch considerable quantities of water and sediment to the Atlantic Ocean.
d
The discussion on the hydrography and oceanography is preceded by background material on the Geology and Meteorology of the sub-region. Meteorology is especially important because most of the physical oceanographic phenomena have their trigger mechanisms in meteorologic events. Meteorology also has a bearing on the local redistribution of pollutants. The geology influences the mobility, affinity and fate of the pollutants and, hence, the nature of the impact of the pollutants on the environment.
GEOLOGY
The evolution ofthe continental margin of West and Central Africa is linked with the separation of South America from Africa. The dating o f this separation is inexact as it consisted of a series of overlapping events.

IOC Workshop Report no. 41 Annex VI.3 - page 2
According to an account by Emery et a1 (1974), the earliest of the events in the region was the development o f small basins and troughs (the Liberia and Sierra Leone basins), when North America separated from Africa about 180 million years ago. Then followed the separation of South America from Africa which probably began at the south and proceeded northward occupying a time span of about 165 million years to about 135 million years. The general date of separation is indicated by the general continuity of Precambrian and Paleozoic strata and structures in Africa and South America and the disruption of Jurassic and.younger structures. This separation led to the formation of the basins farther south (Mossamedes, Cuanza, Congo-cabinda, Gabon, Cameroon, Nigeria, Dahomey and Ivory Coast basins).
Continued separation of South America from Africa produced easily recognizable ocean - floor provinces (see Emery et a1 1974 for details).
GEOMORPHOLOGY
The coasts in the West and Central Africa Region are mostly low plain, sandy and surf beatean. Four broad types are recognised; drowned coasts in the northern area; sand bar or lagoon coasts along the north of the Gulf of Guinea; deltas associated with most of the major rivers, e.g. Niger Delta usually with mangrove swamps and marshes; coasts with sand spits (and tombolos) formed by accumulation of longshore transported sand in bays found in the southern parts of Angola.
Landwards, the coastal lowlands rise through a series of steps which are essentially erosional surfaces to the highlands inland. The highlands are for the most part outcrops of the Basement complex although resistant sedimentary formations, mostly sandstones, are also common.
continental shelf except near the northwestern limits of the region about 220 km northwest of Monrovia where the shelf reaches its greatest width. The shelf break occurs in an average water depth of 100 m except to the southeast, inshore of Walvis Ridge, where they are more nearly 400 m.
Oceanwards, the coasts descend to a generally narrow (100 km)
The shelf appears to be flat except off seacliffs of basement rocks and in areas where beachrock and coral - algal reefs are present. seven large subnarine canyons etch the seaward edge of the shelf and one, the Congo Submarine Canyon, crosses the entire shelf from at least 25 km within an estuary (Veatch and Smith, 1939; Heezen et al, 1964; Shepard and Emery, 1973).
dominated by salt (or shale) submarine canyons into the continental Rises and Abyssal Plains.
At least
The continental shelf descends through the continental slope which is diapirs and is disected by at least a score of

IOC Workshop Report no. 41 Annex V1.3 - page 3
Three continental rises located in turn by the Walvis Ridge, the Guinea Ridge (plus the Cameroon Volcanic Zone), the Ivory Coast Rise, and the Sierra Leone Rise occur in the region. The largest and best known is the Angola continental rise (about 2,800 by 800 km). The other two (guinea and Sierra Leone continental rises) are slightly shallowed and more irregular in outline because of greater influence by basement topography related to fracture zones, The continental rises show features known as continental rise swells that are similar but more subdued in relief than the lower continental rise hills off the eastern United States (Heezen et a1 1959, p. 27; Emery and Uchipi, 1972, p. 711, Pagoda structures are also common on the continental rises and the adjacent abyssal plains, where probably most of the deepsea channels terminate.
Beyond the Abyssal plains are the Abyssal Hills, Mid Atlantic Ridge and other ridges.
SEDIMENTOLOGY
The land margin of West and Central Africa is bordered by lowlands that mark the areas o f basins underlying major river valleys (such as the Niger - Benue) and the coastal zone. The basins date from the Mesozoic and therefore have been filled with continental, lacustrine, evaporitic and normal marine sediments. Seismic research and deepsea coring have revealed that the sedimentary basins in the region consists of huge piles of sediments, that range from 1.0 - 1.5 km or less off Sierra Leone through 5 - 6 km in much of the Gulf of Guinea to more than 8 km in the Niger Delta. The Gabon Basin contains 16 to 18 h of sediments (Brink, 1984) but in the southern most part of the region, the sedimentary layers again thin to about 3 - 4 km (Litvin, 1980). Calculated rates of sedimentation vary between 30 - 100 mm per 1,000 years north of the Congo decreasing to 10 - 30 mm per 1,000 years further south.
.
The fringing territory’is mostly sandy beaches. Sediments of the shelf consist largely of sand being buried under recent silt and clay with an admixture of faecal pellets. The continental slope is covered by silt (e.g. Gabon basin and Cuanza basin) and Shale (e.g. Niger Delta).
they contain graded sand layers. Surface sediments of the continental rises and abyssal plains -re indicated by Murray and Renard (1891) as terrigenous on the upper rise, with globigerina coze in most of the deeper region and red clay in the Angola Abyssal plain. The later Charts of Lisitzin (1969, Charts 5-81 show that sediments of the upper continental rises to be terrigenic silts and clays having 5-10 per cent iron. The lower rises and the abyssal plains on the other hand have chemogenic silts and clays with 10 - 30 per cent calciur: carbonates, 3 - 10 per cent iron, and 0.1 to 0.5 per cent manganese.
Cores taken from the continental rises and abyssal plains show that

IOC Workshop Report no. 41 Annex V1.3 - page 4
Sediments in the complex topography of the abyssal hills, Mid Atlantic Ridge and the ridges that separate units of the continental rise are highly irregular (Ewing et al, 1964, 1966; Emery et al, 1974). As shown by Lisitzin (1969, Charts 5 - El), the surface sediments of this region are mainly biogenic silts and fine sands with more than 50 per cent by weight composed of grains between'0.1 and 0.001 mm. Calcium carbonate is 70 to 90 per cent of total weight and consists of foraminiferams, coccoliths, and other calcareous skeletal debris. Iron and manganese each constitute less than 1 per cent by weight. Some volcanic sediments surround both St. Helena and Ascencion Islands as well as the volcanic islands of Fernado Poo, Principe and Sao Tome.
METEOROLOGY
TEMPERATURE
Temperatures in the West and Central Africa remain high throughout the year and reflect the perennial high level of solar radiation (insolation).
In general, mean temperatures vary between 2 3 O to 36" giving a relatively small annual range. The lower temperatures occur during the rainy season although along the Coast of Mauritania, Senegal and Gabon, there is a curious situation in which the wet season's mean daily temperatures are higher than the dry season's temperature. This is thought to be related to the cooling effect on dry season temperature of the cool Canary current. Hardly anywhere in the region does the temperature The highest temperatures occur in the desertlands to the North and South of the Region. Both the diurnal and annual range of temperature increases from the coast inland. Most coastal locations have a range of 3 O - 8 O C but farther inland the range reaches 10 - 12OC.
fall below 2OoC even for the coldest months.
PRESURE FIELDS
In West and Central Africa, as indeed in the rest of Africa, seasonal characteristics of the surface atmospheric circulation and those of ground wind systems are determined by the position and intensity of four major pressure fields.
Two of these fields, the anticyclones of the Azors and St. Helen '
are permanent marine systems. The third, the Libyan or Maghrebian anticyclone is a seasonal continental system. The fourth pressure field is the Intertropical Discontinuity (ITD, also known variously as ITF, ITZ etc.) and is situated in the intertropical low pressure zone where the marine and continental air masses converge.
The seasonal migration and dominance of these pressure fields determine the occurrence and characteristics of climatic seasons in West and Central Africa.

IOC Workshop Report no. 41 Annex VI .3 - page 5
WINDS
The regime (i.e. direction, intensities and duration) of surface winds particularly those that influence the oceanography and hydrography of the region is linked to the barometric distribution, gradients and stability o f the main pressure fields.
The Equatorial Maritime air mass is associated with the moisture laden south-west winds while the Equatorial Continental air mass is associated with the dry and dusty north-east trade or the Harmattan. The meeting zone of the two air masses is the Intertropical Discontinuity. The year in this region may be divided strictly into two seasons corresponding to the periods when each of these winds influence most of West Africa and further south although here the influence of the Benguela current m climatic patterns is more pronounced. Along the coast, the two seasonal winds are sometimes replaced by sea and land breezes. Sea breezes prevail during the afternoon and evening while the land breezes dominate in the night and early mornings.
PRECIPITATION
The commonest form of precipitation in the West and Central Africa region is rain. Another form is hail'which consists of rounded lumps of ice and is usually associated with thunderstorms and linesqualls, which occur mostly at the onset and decline of the rainy season.
The narrow coastal belt (except for the Accra dry Belt) is under the influence of the southwest winds all the year round and receives the most rain. The rainfall season increases in duration from the coast inland except where local relief (e.g. Jos Plateau in Nigeria and Togo Highlands) results in higher total annual rainfall for inland areas. from 3,050mm per annum along the coast of Sierra Leone and Liberia and the Niger Delta to below 250m in the areas north of latitude 15ON and south of 15OS. For instance, the high annual rainfall of 10,000 mm for Debuncha at the foot of the Cameroon mountain results from the relief effect of that mountain.
There is a general decrease in rainfall
The south of the region including southern West Africa has a two-maxima rainfall regime in which the wettest months are June and October while the northwest areas of the region have a one maximum regime with September as the rainiest month.
HYDROGRAPHY AND PHYSICAL OCEANOGRAPHY
BATHYEE TRY
The bathymetry of the West and Central Africa region is fairly complicated (see e.g. Emery et a1 1974 reflecting in general the complex physiographic setting. The broad coastal indentation north of latitude 5OS is the Gulf o f Guinea.

IOC Workshop Report no. 41 Annex V1.3 - page 6
GENERAL OCEANIC CIRCULATION
The surface oceanic circulation of Western and Central Africa derive their origin from two oceanic gyral currents of the North and South Atlantic which in turn hemispheres. Hence the following currents are observed in the area.
are fueled by the gyral surface wind system of the two
To the north, the south flowing cold Canary Current flows along the coasts of Mauritania and Senegal, warms up as the equator is approaching and splits into a west-ward North Equatorial Current and eastward flowing Guinea Current.
To the South of the region, the cold Benguela Current flows northwards along the coasts of Namibia and Angola, and warms up as the equator is approached. Its main mass goes westwards as the South Equatorial Current while a tongue of it streams northwards till it hits the Bight of Biafra (Bonny) where it perhaps contributes to the reversal of the Guinea Current.
An eastward flowing current, the Equatorial Counter Current is enbedded between the North and South Equatorial Currents and at its landward end contributes to the eastward flowing Guinea currents (Fig. 2).
Thus the oceanic currents directly affecting the hydrography of the West and Central Africa region are the Canary and Benguela currents, the Equatorial Counter Current, the South Equatorial Current and the Guinea Current.
Those principal currents are fairly constant in their main directions of flow, but locally along most coasts, their directions at any one time are influenced by local oceanic phenomena.
TIDES
The tides that affect the coasts of West and Central Africa are mainly semi-diurnal, with two daily maxima and minima.
The tidal range varies from one area to the other but as Table 1 shows, with a few exceptions, the coasts having a mean tidal range of 1 to 2 m. The following broad pattern is discernible :
(i 1
(ii)
(iii) (iv) (V)
(vi) (vii) (viii)
a decrease from a mean height of 1.9 m in Mauritania to 1.2m in Dakar, Senegal, a significant increase southward to a mean range of 5.lm in Guinea Bissau, a southward downward plunge to a mean range of lm in Ivory Coast, a slight rise southward to 1.4m at Togo, a drop eastward to a tidal range of l.lm at Lagos in Western Nigeria, a progressive rise to 3 m at Calabar in the eastern extremity of Nigeria, a decrease southward with few exceptions to 2m in Cameroon and Gabon, a further decrease southward to a mean range of 1.2 - 1.3m in Zaire and Angola with the exception of Cabinda (Angola) where it is 1.8m.

IOC Workshop Report no. 41 Annex VI.3 - page 7
The tidal range is especially important because two energy factors of high significance in the consideration of the hydrographic regime, namely wave energy and tidal energy, can be example, the efficiency of wave action disminishes and tidal current action increases with increase in the vertical tidal range. On the basis of tidal range, Davis (1964) classified shorelines as follows :
directly related to tidal range. For
Class - Microtidal coasts Mesotidal coasts Macrotidal coasts
Tidal range
0 - 2m 2 - 4m 4 - 7m
According to this classification, most of the coastlines in the region are microtidal. In general, coasts of this nature are dominated by wave energy while coasts with large tidal ranges are dominated by tidal currents. Only the coast of Guinea Bissau belongs to the later category.
WAVES
Detailed information on the wave climate is not uniformly available. In the area from Mauritania to North Senegal, the northwesterly swell with a period of 8 - 12 sec. and a' wave length of 300m is very dominant (up to 98%) over the southwesterly one. This swell is stronger during the dry season than during the winter and during storms it affects the sea bottom as deep as 30m. It is the principal agent that controls sedimentation in the region. The swell regime from South Senegal to Gambia is similar to that described above. The Cape Verde Peninsula however, disturbs the hydrodynamic processes as it represents an obstacle to the swell direction. That strongly depletes the energy as the swell enters the Bay of Goree, a sheltered area north of the bay of Rufisque.
To the south, the northern boundary of Guinea-Bissau separates the two main regimes of swell affecting the shores in this region. It is in that area that the southerly and northerly swells run into each other and the drift direction remains' uncertain; crossswell series are often observed.
There is a superposition of 2 swell series in the Sherbro Islands (Sierra-Leone) to Cape Palmas (Liberia) region: the first are long waves with 12 S. period generated by south Atlantic storms and the second are shorter period waves formed by local winds. Swells attaining a height of 4.8 - 6m occur with a 10 to 20 years periodicity. The strongest swells occur during the July to September period commonly approaching from the south to southwest.
Between Cape Palms to Cape Three Points the swells reaching the Ivorian Coast originate mainly (84%) from the south to southwest. They are strongest from March to July with a maximum in May. The mean significant height of swells is 0.80m, the mean height being 1.5m and the annual significant swell is 3.3m.
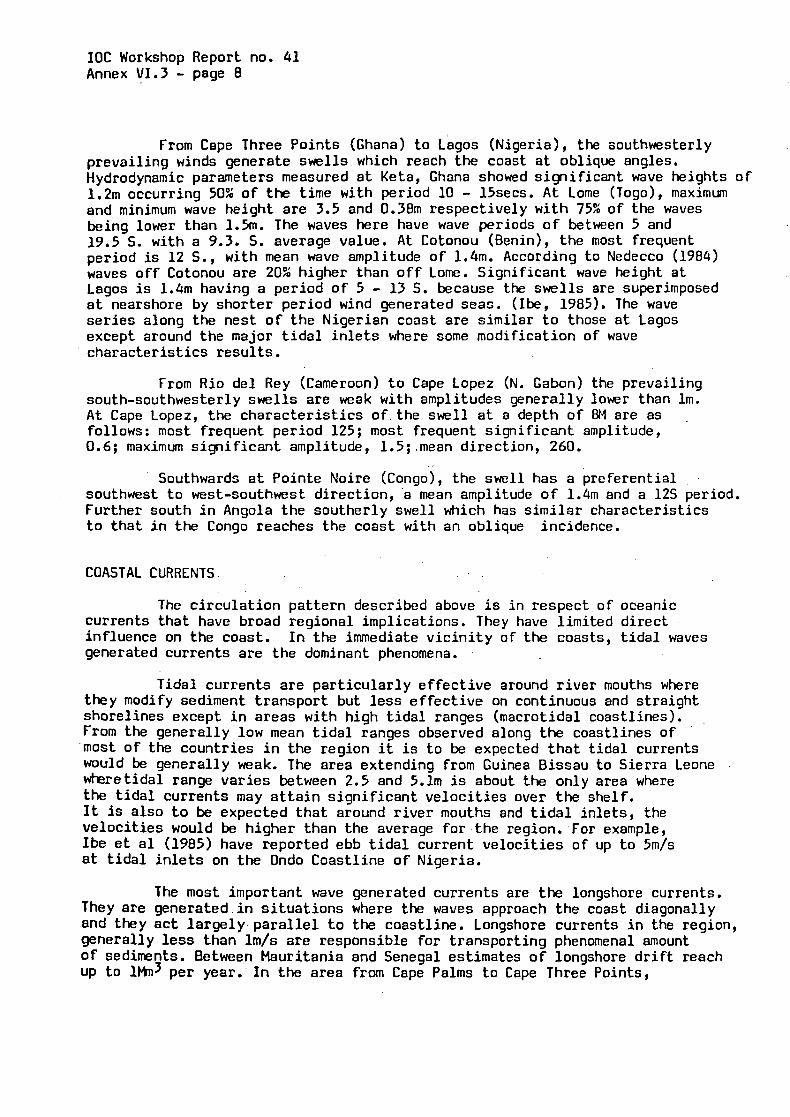
IOC Workshop Report no. 41 Annex VI.3 - page 8
From Cape Three Points (Ghana) to Lagos (Nigeria), the southwesterly prevailing winds generate swells which reach the coast at oblique angles, Hydrodynamic parameters measured at Keta, Ghana showed significant wave heights of 1.2m occurring 50% of the time with period 10 - 15secs. At Lome (Togo), maximum and minimum wave height are 3.5 and 0.38m respectively with 75% of the waves being lower than 1.5~1. The waves here have wave periods of between 5 and 19.5 S. with a 9.3. S. average value. At Cotonou (Benin), the most frequent period is 12 S., with mean wave amplitude of 1.4m. According to Nedecco (1984) waves off Cotonou are 20% higher than off Lome. Significant wave height at Lagos is 1.4m having a period of 5 - 13 S. because the swells are superimposed at nearshore by shorter period wind generated seas. ( I b e , 1985). The wave series along the nest of the Nigerian coast are similar to those at Lagos except around the major tidal inlets where some modification of wave characteristics results.
From Rio del Rey (Cameroon) to Cape Lopez (N. Gabon) the prevailing south-southwesterly swells are weak with amplitudes generally lower than lm. At Cape Lopez, the characteristics of the swell at a depth of BM are as follows: most frequent period 125; most frequent significant amplitude, 0.6; maximum significant amplitude, 1.5;,mean direction, 260.
.
Southwards at Pointe Noire (Congo), the swell has a preferential southwest to west-southwest direction, a mean amplitude of 1.4m and a 125 period. Further south in Angola the southerly swell which has similar characteristics to that in the Congo reaches the coast with an oblique incidence.
COASTAL CURRENTS
The circulation pattern described above is in respect of currents that have broad regional implications. They have limited influence on the coast. In the immediate vicinity of the coasts, generated currents are the dominant phenomena.
oceanic direct ti da 1 waves
Tidal currents are particularly effective around river mouths where t k y modify sediment transport but less effective on continuous and straight shorelines except in areas with high tidal ranges (macrotidal coastlines). from the generally low mean tidal ranges observed along the coastlines of most of the countries in the region it is to be expected that tidal currents would be generally weak. The area extending from Guinea Bissau to Sierra Leone wheretidal range varies between 2.5 and 5.lm is about the only area where the tidal currents may attain significant velocities over the shelf. It is also to be expected that around river mouths and tidal inlets, the velocities would be higher than the average for the region. For example, Ibe et a1 (1985) have reported ebb tidal current velocities of up to 5m/s at tidal inlets on the Ondo Coastline of Nigeria.
The most important wave generated currents are the longshore currents. They are generated in situations where the waves approach the coast diagonally and they act largely.paralle1 to the coastline. Longshore currents in the region, generally less than lm/s are responsible for transporting phenomenal amount of sediments. Between Mauritania and Senegal estimates of longshore drift reach up to l h 3 per year. In the area from Cape Palms to Cape Three Points,

IOC Workshop Report no. 41 Annex VI.3 - page 9
littoral drift is about 0.8Mm3 per year. Between Cape Three Points and Lagos estimates of longshore transport vary between 25M1-n~ per year in Ghana to 1.5Mm3 per year in Nigeria. From Rio Del Rey (Cameroon) to (N. Gabon) longshore transport is thought to drop to 2Mm3/year in a dominantly northerly direction.
Cape Lopez
Another effect of the breaking waves along the coasts of this region is to set up rip currents. Although localised in their action, they have an appreciable impact on offward transportation of sediments from shore.
Apart from the current discussed above, other physical oceanographic phenomena that affect the transportation and dispersal of pollutants within the marine envirorrnent are turbulent mixing and the upwelling phenanenon. The latter play an important role along several parts of the coast, in the northern and central zones.
CONCLUSION
Oceanographic phenomena that affect the different national coastlines in the West and Central African Region derive directly or indirectly from large scale events that originate for the most part outside of national boundaries. The implication for pollution in the region is that a nation may suffer from deleterious effects of pollutants transported from outside its area of juridiction and therefore over which it has no control. The recognition of the interplay between spread of pollutants in the region calls for co-operation between countries in the region. It is hoped thatthis recognition will fuel the co-operative acquisition of oceanographic data as part of the WACAF/2 Project.
hydrographic and physical oceanographic phenomena and the
It should be possible in the near future to organise periodic regional research cruises involving scientists from nations in the sub-region and aimed at obtaining an integrated picture of the physical oceanography and hydrography of this region. However, it is important as a prelude to this regional ,
co-operation for countries to begin to understand the pattern within their individual boundaries. In this regard it is hoped that the countries which do not have the necessary expertise to initiate this kind of work would benefit from assistance provided under the WACAF/2 Scheme.

IOC Workshop Report no. 41 Annex VI. 3 - page 10
REFERENCES
Brink, A.H., 1974. Petroleum Geology of Gabon Basin: AAPG Bull., 50, 108 - 158. Emery, K.O., and Uchupi, E., 1972. Western North Atlantic Ocean: Topography,
Rocks, Structure, Water, Life, and Sediments: AAPG Mem. 17,532~.
Emery, K.O., Uchupi, E., Phillips, J., Bowin, C. and Mascle, J. 1974. The Continental Margin of Western Africa : Angola to Sierra Leone. Contribution No.3481 of the Woods Hole Oceanographic Institution.
Ewing, M., Ewing, J.I., Talwani, M., 1964. Sediment distribution in the oceans: the Mid-Atlantic Ridge; Geol. Soc. America Bull., 75, 17 - 36.
Ewing, M., Le Piclon, X. and Ewing, J., 1966. Coastal Structure of the Mid-Ocean Ridges 4. Sediment Distribution in the South Atlantlic Ocean and the Cenozoic History of the Mid-Atlantic Ridge: Jour. Geophys. Research, 71, 1611 - 1653.
Goslin, J., 3. Mascle, J.C. Sibuet, and H. Hoskins, 1974. Geophysical Study of the Easternmost Walvis Ridge, South Atlantic: Morphology and Shallow Structure: Geol. Soc. America Bull., v. 85, p.619-632.
Heezen, B.C., Bunce, J.B., Schneider, E.D., Ewing, E.W. and Graneli, N.C.L. 1964b. Congo Submarine Canyon. AAPG Bull., 48 - 1126 - 1149.
Heezen, B.C., Tharp, M., Ewing, M., 1959. The Floors of the Oceans, 1. The North Atlantic: Geol. Soc. America Spec. Paper 65, 122p.
Ibe, A.C., 1985a. Nearshore Dynamics and Coasta1,Erosion in Nigeria. Presented at the Unesco/3 UN(DUESA)/UNEP Expert Workshop on Control of Erosion in West and CentralAfrica. Dakar, Senegal, 11 - 19 March, 1985.
Lisitizin, A.P. e.d., 1969. Atlanticheskii Okean (Atlas of Atlantic Ocean Sediments). Moscow Akad. Nauk SSSR, Mezhdyve Donstvennyi Geofizicheskii Komitet, Adad., 13 sheets.
Litvin, V.M. 1980. Morphostructure of the Atlantic Ocean Bottom and its Development in the Mesozoic and Cenozoic. Nauka, Moscow.
Murray, J. and Renard, A.F., 1891. Report on Deep-sea Deposits Based on the Specimens Collected during the Voyage of HMS Challenger in the Years 1872 to 1876. London. Her Majesty's Stationery Office, 525p.
Nedeco, 1984. In UNEP(1985) Coastal Erosion in West and Central Africa p.145.
Robb, J.M., J. Schlee, and J.C. Behrendt, 1973. Bathymetry of Continental Margin o f Liberia, West Africa: U.S. Geol. Survey Jour. Research, V. 1. p. 563-567.
Shepard, F.P. and Emery, K.O. 1973. Congo Submarine Canyon and Fan Valley. AAPG Bull., 57, 1679 - 1691.

IOC Workshop Report no. 41 Annex VI.3 - page 11
Uchupi, E. 1971. Bathymetric atlas of the Atlantic, Caribbean and Gulf of Mexico. Woods Hole Oceanographic Inst., Ref. No. 71-72, Scale 1: 5,000,000, 10 sheets.
UNEP 1984. The Marine and Coastal Environment of the West and Central African Region and its State of Pollution. UNEP Regional Seas Reports and Studies No. 46.
UNEP.1985. Coastal Erosion in West and Central Africa. 169p.
Van Andel Tj.-H., D.C. Rea, R.P. Von Herzen, and H. Hoskins, 1973. Ascension Fracture Zone, Ascension Island, and the Mid-Atlantic Ridge: Geol. Soc.. America Bull., v. 84, p. 1527-1546.

IOC Workshop Report no. 41 Annex V1.3 - page 12
Tableau 1 - Tableau des mar6es. (vive-eau) dans les principaux ports de 1'Afrique de 1'0uest et du Centre Modified after Collins et al. (1983)
Table 1 - Western and Central African coastline tidal ranges Modified after Collins et al. (1983)
COUNTRY
Mauritania
Senegal
Gambia Guinea Bissau Guinea Sierra Leone
Liberia
Ivory Coast Ghana
Togo Benin Nigeria
Cameroon Equatorial Guinea Gabon
Congo Zaire Angola
~
PORT
Bahia de Villa Cisneros Nouadhibou St. Louis Dakar Banjul Bissau Conakry Pepal Freetown Monrovia Buchanan Abidjan Ta koradi Accra Lome Cotonou Lagos Forcados Estuary Imo Estuary Cross Estuary Douala Bata Libreville Cap Lopez Pointe Noire Banana Cabinda Luanda Lobi to Mocamedes
TIDAL RANGE (m> MARNAGE
1.9 1.8 1.2 1.3 1.6 5.1 3.2 2.9 2.6 1.1 1.0 1.0 1.3 1.3 1.4 1.2 1.1 1.5 2.0 3.0 2.0 1.G 1.G 2.0 1.3 1.3 1.8 1.2 1.2 1.2

IOC Workshop Report no. 41 Annex VI.3 - page 13
LOCATION MAP CARTE DE LOCALISATION
+
OCEMZ ATLANTIQUE ATLANTIC OCEAN
c
Source : WACAF/3 Publication on Coastal Erosion (1985)

IOC Workshop Report no. 41 Annex VI.3 - page 14
h
4 i e-- c I FIGURE 2
CURRENTS/CIRCULATION PATTERfdS
C I RC U L AT I 0 N 0 C EA NIQ UE
+ +
Source : WACAF/3 Publication on Coastal Erosion (1985)

m. unesm PlkedsFOIlblWj 757W P d . France
m. u r n WdsFCillUKy 75700 Pa&. France
loc, u r n PlacedsFOlaaoy 75700 Paris. Francs
m, unesm P l a C e d e F ~ 75700 Par$. F r m
IOC, u r n ErgIish AaCedeFCillUKy 75700 Paris. France