WorkOp-IV summary: lessons from iron opacities
15
* Corresponding author. Tel.: #925-422-6592. E-mail address: serdukel@llnl.gov (F.J.D. Serduke) Journal of Quantitative Spectroscopy & Radiative Transfer 65 (2000) 527}541 WorkOp-IV summary: lessons from iron opacities Franklin J.D. Serduke!,*, Emilio Minguez", Steven J. Davidson#, Carlos A. Iglesias! !Lawrence Livermore National Laboratory, L-183, P.O. Box 808, Livermore, CA 94550, USA "Institute for Nuclear Fusion, Polytechnical University of Madrid, Madrid, Spain #AWE Aldermaston, Aldermaston, UK Abstract The fourth international LTE opacity workshop and code comparison study, WorkOp-IV, was held in Madrid in 1997. Results of this workshop are summarized with a focus on iron opacities. In particular, the astrophysically important photon absorption region between 50 and 80 eV is emphasized for a sequence of iron plasmas at densities and temperatures that produce nearly the same average ionization stage (ZH&8.6). Experimental data that addressed this spectral region is also reviewed. ( 2000 Published by Elsevier Science Ltd. All rights reserved. 1. Introduction Computer models to calculate photon absorption coe$cients for astrophysics, laser-created plasmas, inertial con"nement fusion, and other applications have been under development for many decades. The pace of these developments has accelerated over the past ten years. The WorkOp series of opacity workshops (conceived by Frank Serduke in collaboration with Carlos Iglesias in 1988) has been helpful to this acceleration. The list of workshops, the hosts and host institutions are summarized in Table 1. In this note, we give an overview of WorkOp-IV and present a summary description of the plasma cases studied. For the remainder of this article, we focus on a subset of the cases and use the unique opportunity of having calculations from over a dozen opacity codes to present some observations on the status of opacity modeling and on an important recent experiment. The format of these workshops is the following: 0022-4073/00/$ - see front matter ( 2000 Published by Elsevier Science Ltd. All rights reserved. PII: S 0 0 2 2 - 4 0 7 3 ( 9 9 ) 0 0 0 9 4 - 1
-
Upload
independent -
Category
Documents
-
view
2 -
download
0
Transcript of WorkOp-IV summary: lessons from iron opacities
*Corresponding author. Tel.: #925-422-6592.E-mail address: [email protected] (F.J.D. Serduke)
Journal of Quantitative Spectroscopy &Radiative Transfer 65 (2000) 527}541
WorkOp-IV summary: lessons from iron opacities
Franklin J.D. Serduke!,*, Emilio Minguez", Steven J. Davidson#, Carlos A. Iglesias!
!Lawrence Livermore National Laboratory, L-183, P.O. Box 808, Livermore, CA 94550, USA"Institute for Nuclear Fusion, Polytechnical University of Madrid, Madrid, Spain
#AWE Aldermaston, Aldermaston, UK
Abstract
The fourth international LTE opacity workshop and code comparison study, WorkOp-IV, was held inMadrid in 1997. Results of this workshop are summarized with a focus on iron opacities. In particular, theastrophysically important photon absorption region between 50 and 80 eV is emphasized for a sequence ofiron plasmas at densities and temperatures that produce nearly the same average ionization stage (ZH&8.6).Experimental data that addressed this spectral region is also reviewed. ( 2000 Published by ElsevierScience Ltd. All rights reserved.
1. Introduction
Computer models to calculate photon absorption coe$cients for astrophysics, laser-createdplasmas, inertial con"nement fusion, and other applications have been under development formany decades. The pace of these developments has accelerated over the past ten years. TheWorkOp series of opacity workshops (conceived by Frank Serduke in collaboration with CarlosIglesias in 1988) has been helpful to this acceleration. The list of workshops, the hosts and hostinstitutions are summarized in Table 1.
In this note, we give an overview of WorkOp-IV and present a summary description of theplasma cases studied. For the remainder of this article, we focus on a subset of the cases and use theunique opportunity of having calculations from over a dozen opacity codes to present someobservations on the status of opacity modeling and on an important recent experiment.
The format of these workshops is the following:
0022-4073/00/$ - see front matter ( 2000 Published by Elsevier Science Ltd. All rights reserved.PII: S 0 0 2 2 - 4 0 7 3 ( 9 9 ) 0 0 0 9 4 - 1
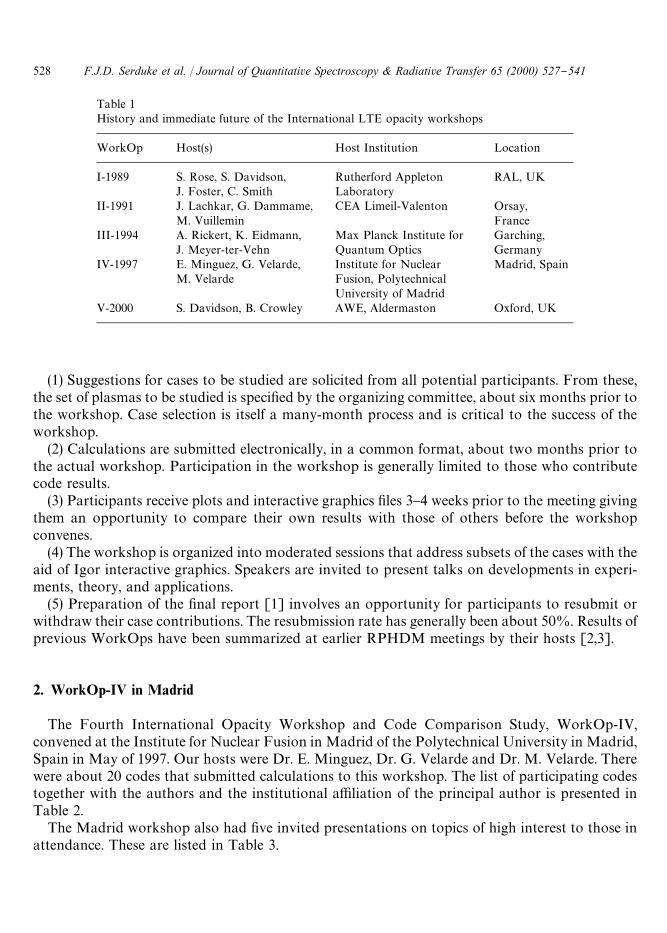
Table 1History and immediate future of the International LTE opacity workshops
WorkOp Host(s) Host Institution Location
I-1989 S. Rose, S. Davidson, Rutherford Appleton RAL, UKJ. Foster, C. Smith Laboratory
II-1991 J. Lachkar, G. Dammame, CEA Limeil-Valenton Orsay,M. Vuillemin France
III-1994 A. Rickert, K. Eidmann, Max Planck Institute for Garching,J. Meyer-ter-Vehn Quantum Optics Germany
IV-1997 E. Minguez, G. Velarde, Institute for Nuclear Madrid, SpainM. Velarde Fusion, Polytechnical
University of MadridV-2000 S. Davidson, B. Crowley AWE, Aldermaston Oxford, UK
(1) Suggestions for cases to be studied are solicited from all potential participants. From these,the set of plasmas to be studied is speci"ed by the organizing committee, about six months prior tothe workshop. Case selection is itself a many-month process and is critical to the success of theworkshop.
(2) Calculations are submitted electronically, in a common format, about two months prior tothe actual workshop. Participation in the workshop is generally limited to those who contributecode results.
(3) Participants receive plots and interactive graphics "les 3}4 weeks prior to the meeting givingthem an opportunity to compare their own results with those of others before the workshopconvenes.
(4) The workshop is organized into moderated sessions that address subsets of the cases with theaid of Igor interactive graphics. Speakers are invited to present talks on developments in experi-ments, theory, and applications.
(5) Preparation of the "nal report [1] involves an opportunity for participants to resubmit orwithdraw their case contributions. The resubmission rate has generally been about 50%. Results ofprevious WorkOps have been summarized at earlier RPHDM meetings by their hosts [2,3].
2. WorkOp-IV in Madrid
The Fourth International Opacity Workshop and Code Comparison Study, WorkOp-IV,convened at the Institute for Nuclear Fusion in Madrid of the Polytechnical University in Madrid,Spain in May of 1997. Our hosts were Dr. E. Minguez, Dr. G. Velarde and Dr. M. Velarde. Therewere about 20 codes that submitted calculations to this workshop. The list of participating codestogether with the authors and the institutional a$liation of the principal author is presented inTable 2.
The Madrid workshop also had "ve invited presentations on topics of high interest to those inattendance. These are listed in Table 3.
528 F.J.D. Serduke et al. / Journal of Quantitative Spectroscopy & Radiative Transfer 65 (2000) 527}541
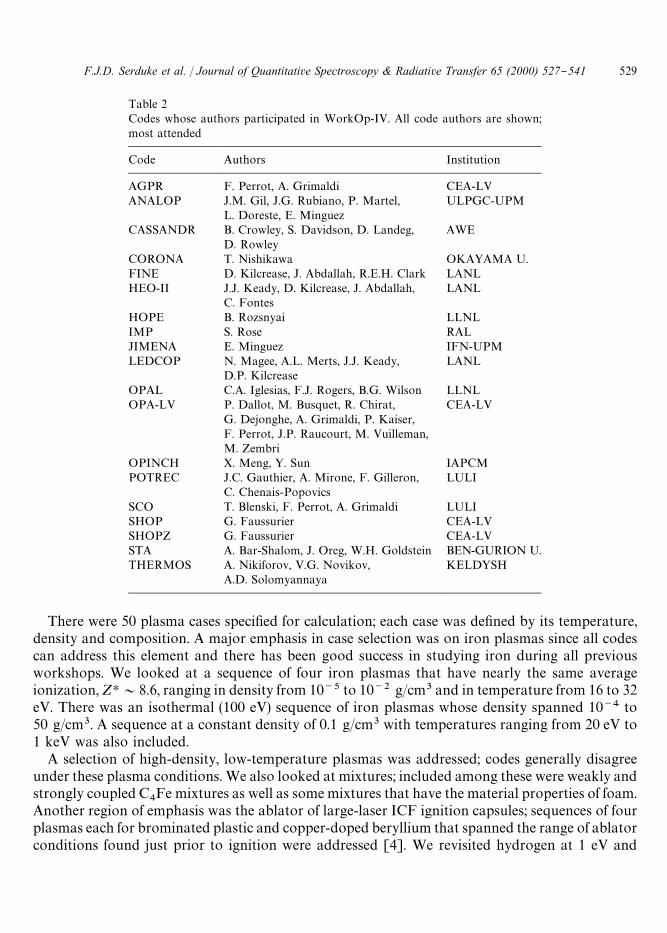
Table 2Codes whose authors participated in WorkOp-IV. All code authors are shown;most attended
Code Authors Institution
AGPR F. Perrot, A. Grimaldi CEA-LVANALOP J.M. Gil, J.G. Rubiano, P. Martel,
L. Doreste, E. MinguezULPGC-UPM
CASSANDR B. Crowley, S. Davidson, D. Landeg,D. Rowley
AWE
CORONA T. Nishikawa OKAYAMA U.FINE D. Kilcrease, J. Abdallah, R.E.H. Clark LANLHEO-II J.J. Keady, D. Kilcrease, J. Abdallah,
C. FontesLANL
HOPE B. Rozsnyai LLNLIMP S. Rose RALJIMENA E. Minguez IFN-UPMLEDCOP N. Magee, A.L. Merts, J.J. Keady,
D.P. KilcreaseLANL
OPAL C.A. Iglesias, F.J. Rogers, B.G. Wilson LLNLOPA-LV P. Dallot, M. Busquet, R. Chirat,
G. Dejonghe, A. Grimaldi, P. Kaiser,F. Perrot, J.P. Raucourt, M. Vuilleman,M. Zembri
CEA-LV
OPINCH X. Meng, Y. Sun IAPCMPOTREC J.C. Gauthier, A. Mirone, F. Gilleron,
C. Chenais-PopovicsLULI
SCO T. Blenski, F. Perrot, A. Grimaldi LULISHOP G. Faussurier CEA-LVSHOPZ G. Faussurier CEA-LVSTA A. Bar-Shalom, J. Oreg, W.H. Goldstein BEN-GURION U.THERMOS A. Nikiforov, V.G. Novikov,
A.D. SolomyannayaKELDYSH
There were 50 plasma cases speci"ed for calculation; each case was de"ned by its temperature,density and composition. A major emphasis in case selection was on iron plasmas since all codescan address this element and there has been good success in studying iron during all previousworkshops. We looked at a sequence of four iron plasmas that have nearly the same averageionization, ZH&8.6, ranging in density from 10~5 to 10~2 g/cm3 and in temperature from 16 to 32eV. There was an isothermal (100 eV) sequence of iron plasmas whose density spanned 10~4 to50 g/cm3. A sequence at a constant density of 0.1 g/cm3 with temperatures ranging from 20 eV to1 keV was also included.
A selection of high-density, low-temperature plasmas was addressed; codes generally disagreeunder these plasma conditions. We also looked at mixtures; included among these were weakly andstrongly coupled C
4Fe mixtures as well as some mixtures that have the material properties of foam.
Another region of emphasis was the ablator of large-laser ICF ignition capsules; sequences of fourplasmas each for brominated plastic and copper-doped beryllium that spanned the range of ablatorconditions found just prior to ignition were addressed [4]. We revisited hydrogen at 1 eV and
F.J.D. Serduke et al. / Journal of Quantitative Spectroscopy & Radiative Transfer 65 (2000) 527}541 529

Table 3Invited speakers at WorkOp-IV
Invited speakers A$liation Topic
Jacques Bauche and Laboratoire Aime Transition ArraysClaire Bauche-Arnoult CottonKlaus Eidmann MPQ } Garching Laser ExperimentsMarcel Klapisch Naval Research New Directions in Opacity
Laboratory ModelingPaul Springer Lawrence Livermore Opacity Experiments of
National Laboratory Astrophysical RelevanceSteven Rose Rutherford-Appleton-
Laboratory Integrated Opacity Experi-ments with Short-pulse Lasers
10~6 g/cm3 to look especially at line shapes since in this case line wings determine the Rosselandmean. Several aluminum cases were also considered. Cold and low-temperature holmium wasstudied. We attempted to compute a number of new experiments but di$culties in specifying, withsu$cient accuracy, the experimental conditions prior to the full analysis of the data made validdetailed comparisons di$cult. A full list of the cases may be found in the "nal report [1] forWorkOp-IV.
3. Opacity of iron plasmas
Iron makes interesting case studies. It has su$cient complexity to be reasonably approximatedby statistical techniques such as those using unresolved-transition-array (UTA) or super-transition-array (STA) approaches, yet is tractable by detailed term accounting (DTA) models. Wepresent several comparisons of iron plasma calculations that address the di!erences between thesetwo types of models.
Fig. 1 illustrates various features of the spectroscopy and opacity of iron plasmas. The shadedarea in the lower-left portion of the "gure indicates where the opacity of iron is dominated byspectral lines. Moving to higher densities in this line-dominated region, results from statisticalmodels and DTA model converge. Outside of this region, it is the continuum features and not thebound}bound absorption that dominate of the Rosseland mean opacity. Continuum loweringbecomes important at higher densities; the area where the maximum bound orbital is the 6s and 3sis indicated by the long-dashed lines. There are regions near closed shells where bound}boundabsorption features are reduced to a relatively small number of narrow lines. The trajectories, inthis density-temperature space of empty 2s and empty 3s orbitals, are indicated by the solid blacklines. The density-temperature positions of the WorkOp-IV cases are shown as circles. TheZH&8.6 sequence straddles a temperature of 20 eV at the bottom of the plot. The 100 eVisothermal sequence sits above the middle of the line-dominated region. As we will see shortly, theparticipating codes had the largest variance in Rosseland mean opacity for the very low-densityplasmas. There were also some signi"cant di!erences in mean ionization for the highest densitycase, 50 gm/cm3.
530 F.J.D. Serduke et al. / Journal of Quantitative Spectroscopy & Radiative Transfer 65 (2000) 527}541
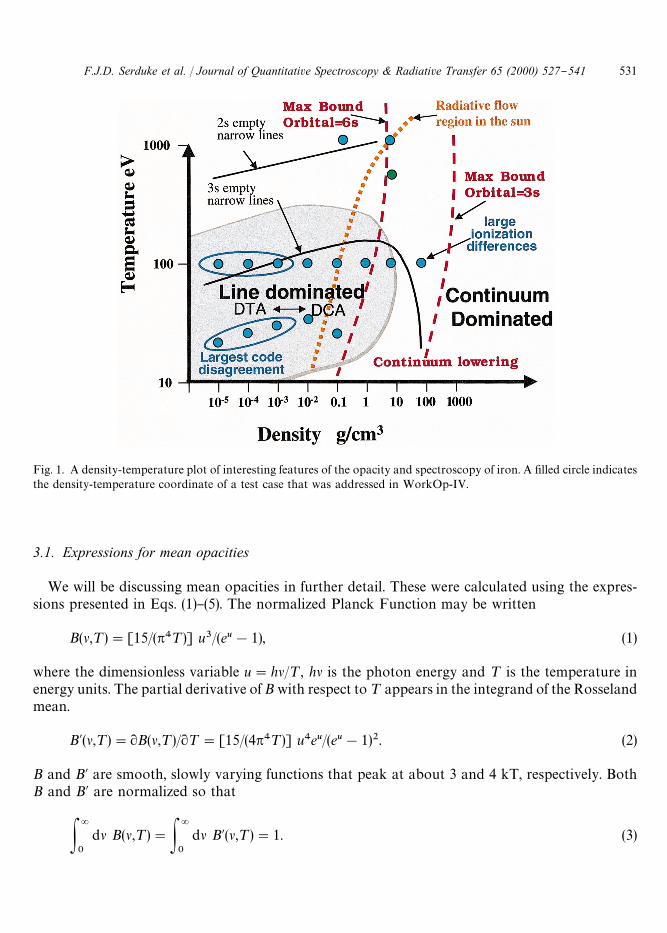
Fig. 1. A density-temperature plot of interesting features of the opacity and spectroscopy of iron. A "lled circle indicatesthe density-temperature coordinate of a test case that was addressed in WorkOp-IV.
3.1. Expressions for mean opacities
We will be discussing mean opacities in further detail. These were calculated using the expres-sions presented in Eqs. (1)}(5). The normalized Planck Function may be written
B(l,¹)"[15/(p4¹)] u3/(eu!1), (1)
where the dimensionless variable u"hl/¹, hl is the photon energy and ¹ is the temperature inenergy units. The partial derivative of B with respect to ¹ appears in the integrand of the Rosselandmean.
B@(l,¹)"RB(l,¹)/R¹"[15/(4p4¹)] u4eu/(eu!1)2. (2)
B and B@ are smooth, slowly varying functions that peak at about 3 and 4 kT, respectively. BothB and B@ are normalized so that
P=
0
dl B(l,¹)"P=
0
dl B@(l,¹)"1. (3)
F.J.D. Serduke et al. / Journal of Quantitative Spectroscopy & Radiative Transfer 65 (2000) 527}541 531
The Rosseland mean opacity is a weighted harmonic mean
1/iR044%-!/$
(o,¹)"P=
0
dl B@(l,¹)/i505!-
(o,¹, l) (4)
and the Planck mean opacity is a weighted mean
iP-!/#,
(o,¹)"P=
0
dl B(l,¹)[i505!-
(o,¹, l)!i4#!55%3*/'
(o,¹, l)]. (5)
where i505!-
is the total absorption coe$cient including the bound}bound, bound}free, free}freeand scattering contributions; it depends on the plasma density o and temperature ¹, as well as onthe photon energy hl.
3.2. Iron mean opacities
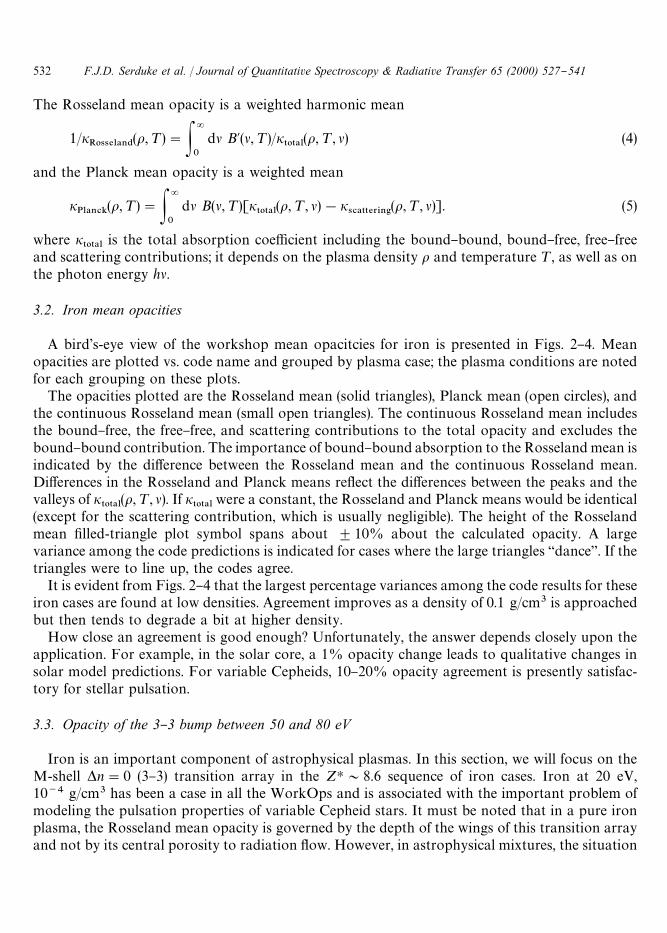
A bird's-eye view of the workshop mean opacitcies for iron is presented in Figs. 2}4. Meanopacities are plotted vs. code name and grouped by plasma case; the plasma conditions are notedfor each grouping on these plots.
The opacities plotted are the Rosseland mean (solid triangles), Planck mean (open circles), andthe continuous Rosseland mean (small open triangles). The continuous Rosseland mean includesthe bound}free, the free}free, and scattering contributions to the total opacity and excludes thebound}bound contribution. The importance of bound}bound absorption to the Rosseland mean isindicated by the di!erence between the Rosseland mean and the continuous Rosseland mean.Di!erences in the Rosseland and Planck means re#ect the di!erences between the peaks and thevalleys of i
505!-(o,¹, l). If i
505!-were a constant, the Rosseland and Planck means would be identical
(except for the scattering contribution, which is usually negligible). The height of the Rosselandmean "lled-triangle plot symbol spans about $10% about the calculated opacity. A largevariance among the code predictions is indicated for cases where the large triangles `dancea. If thetriangles were to line up, the codes agree.
It is evident from Figs. 2}4 that the largest percentage variances among the code results for theseiron cases are found at low densities. Agreement improves as a density of 0.1 g/cm3 is approachedbut then tends to degrade a bit at higher density.
How close an agreement is good enough? Unfortunately, the answer depends closely upon theapplication. For example, in the solar core, a 1% opacity change leads to qualitative changes insolar model predictions. For variable Cepheids, 10}20% opacity agreement is presently satisfac-tory for stellar pulsation.
3.3. Opacity of the 3}3 bump between 50 and 80 eV
Iron is an important component of astrophysical plasmas. In this section, we will focus on theM-shell *n"0 (3}3) transition array in the ZH&8.6 sequence of iron cases. Iron at 20 eV,10~4 g/cm3 has been a case in all the WorkOps and is associated with the important problem ofmodeling the pulsation properties of variable Cepheid stars. It must be noted that in a pure ironplasma, the Rosseland mean opacity is governed by the depth of the wings of this transition arrayand not by its central porosity to radiation #ow. However, in astrophysical mixtures, the situation
532 F.J.D. Serduke et al. / Journal of Quantitative Spectroscopy & Radiative Transfer 65 (2000) 527}541
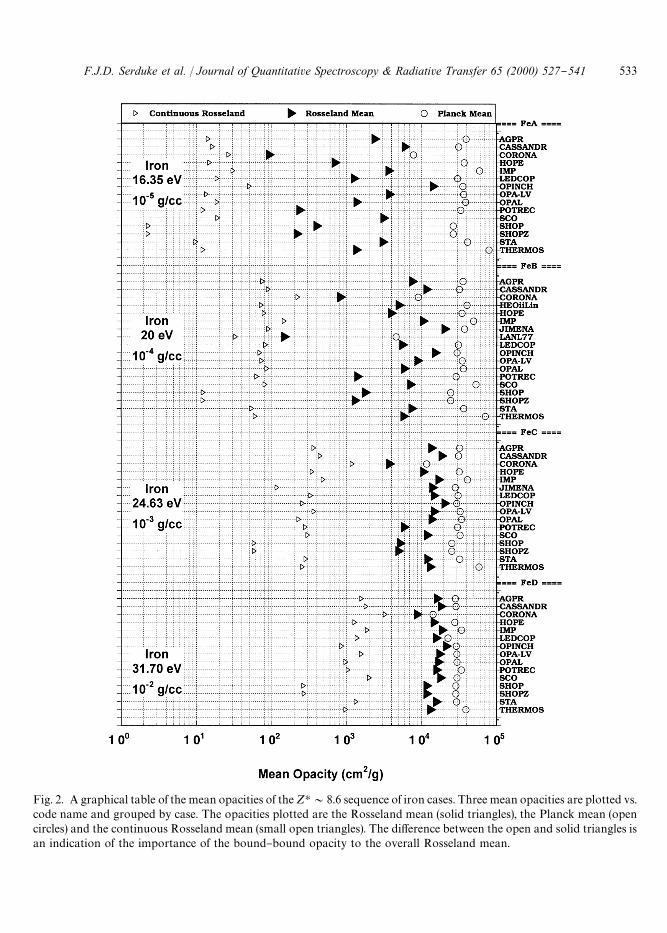
Fig. 2. A graphical table of the mean opacities of the ZH&8.6 sequence of iron cases. Three mean opacities are plotted vs.code name and grouped by case. The opacities plotted are the Rosseland mean (solid triangles), the Planck mean (opencircles) and the continuous Rosseland mean (small open triangles). The di!erence between the open and solid triangles isan indication of the importance of the bound}bound opacity to the overall Rosseland mean.
F.J.D. Serduke et al. / Journal of Quantitative Spectroscopy & Radiative Transfer 65 (2000) 527}541 533

Fig. 3. A graphical table of the mean opacities of the lower-density part of the 100 eV isothermal sequence of iron cases.See Fig. 2 caption for more information.
534 F.J.D. Serduke et al. / Journal of Quantitative Spectroscopy & Radiative Transfer 65 (2000) 527}541
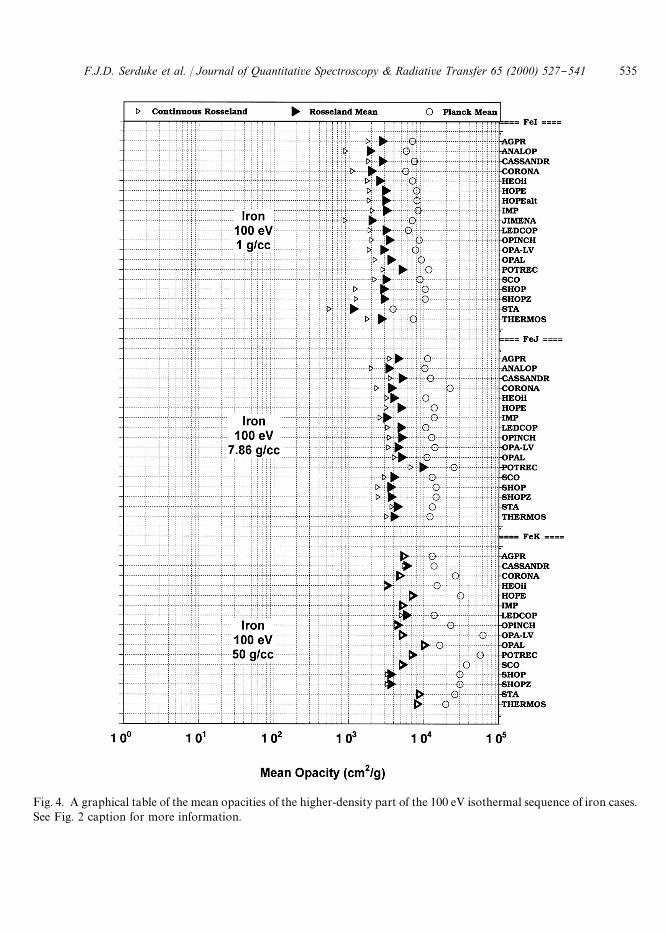
Fig. 4. A graphical table of the mean opacities of the higher-density part of the 100 eV isothermal sequence of iron cases.See Fig. 2 caption for more information.
F.J.D. Serduke et al. / Journal of Quantitative Spectroscopy & Radiative Transfer 65 (2000) 527}541 535

Fig. 5. A plot of the bound}bound opacity of the ZH&8.6 iron sequence for a subset of the codes that participated. Thefour plots are for densities ranging from 10~5 to 10~2 g/cm3. Separation of the plots was achieved by multiplication ofthe opacity by a factor of ten for each increase in a factor of ten in density.
changes as the dominant hydrogen and helium components "ll in the wings of the iron *n"0bump making the porosity of the central part of the bump important.
The temperature of the ZH&8.6 sequence of iron cases increases with increasing density. Thissequence has transition arrays that are nominally produced by con"gurations with the same totalnumbers of bound electrons. Of course as we progress to higher densities through this ZH&8.6sequence, there is a large change in the electron density in which the ion is immersed withconsequent e!ects on spectral line shapes, bound electron #uctuations and line merging.
Because the Rosseland weighting factor depends of temperature (see Eq. (4)) and we would like touse the same weighting function for all members of the ZH&8.6 sequence, we choose to representthe `porositya of the bump by introducing a harmonic bump opacity
1/i"6.1
"P80 %V
50 %V
dl/[base#i(l)], (6)
536 F.J.D. Serduke et al. / Journal of Quantitative Spectroscopy & Radiative Transfer 65 (2000) 527}541
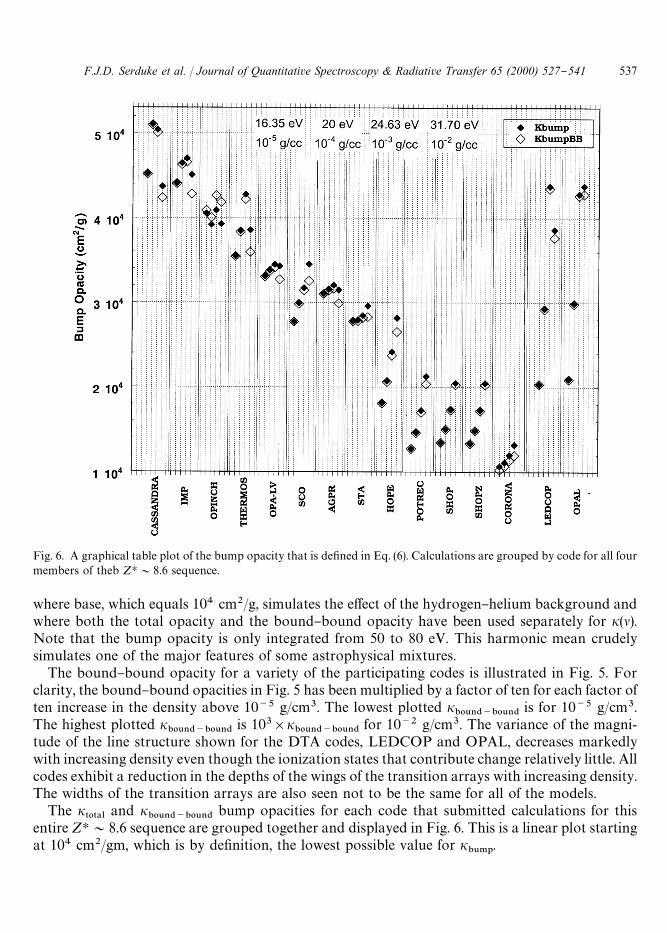
Fig. 6. A graphical table plot of the bump opacity that is de"ned in Eq. (6). Calculations are grouped by code for all fourmembers of theb ZH&8.6 sequence.
where base, which equals 104 cm2/g, simulates the e!ect of the hydrogen}helium background andwhere both the total opacity and the bound}bound opacity have been used separately for i(l).Note that the bump opacity is only integrated from 50 to 80 eV. This harmonic mean crudelysimulates one of the major features of some astrophysical mixtures.
The bound}bound opacity for a variety of the participating codes is illustrated in Fig. 5. Forclarity, the bound}bound opacities in Fig. 5 has been multiplied by a factor of ten for each factor often increase in the density above 10~5 g/cm3. The lowest plotted i
"06/$~"06/$is for 10~5 g/cm3.
The highest plotted i"06/$~"06/$
is 103]i"06/$~"06/$
for 10~2 g/cm3. The variance of the magni-tude of the line structure shown for the DTA codes, LEDCOP and OPAL, decreases markedlywith increasing density even though the ionization states that contribute change relatively little. Allcodes exhibit a reduction in the depths of the wings of the transition arrays with increasing density.The widths of the transition arrays are also seen not to be the same for all of the models.
The i505!-
and i"06/$~"06/$
bump opacities for each code that submitted calculations for thisentire ZH&8.6 sequence are grouped together and displayed in Fig. 6. This is a linear plot startingat 104 cm2/gm, which is by de"nition, the lowest possible value for i
"6.1.
F.J.D. Serduke et al. / Journal of Quantitative Spectroscopy & Radiative Transfer 65 (2000) 527}541 537
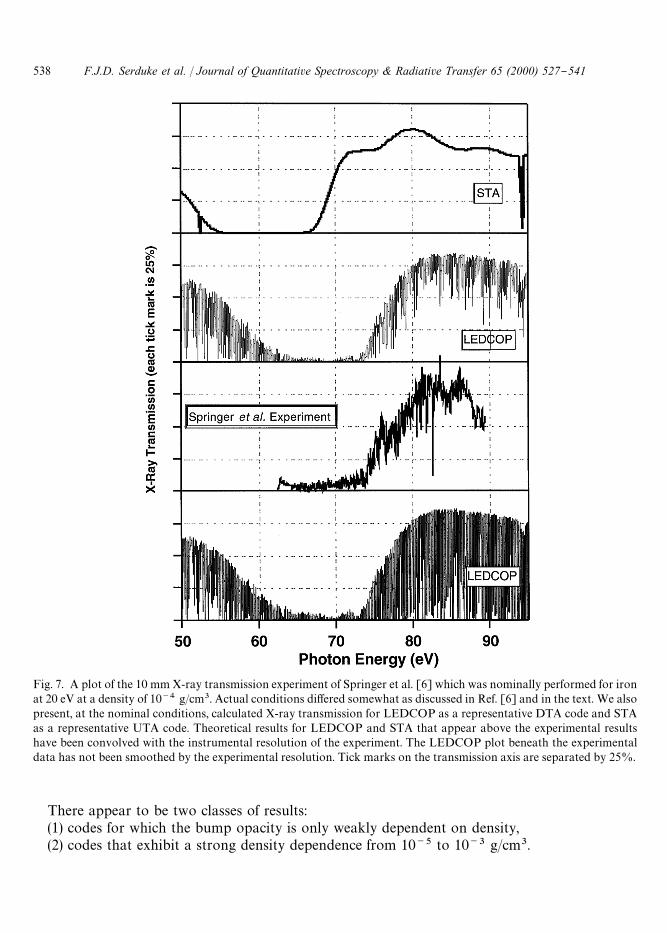
Fig. 7. A plot of the 10 mm X-ray transmission experiment of Springer et al. [6] which was nominally performed for ironat 20 eV at a density of 10~4 g/cm3. Actual conditions di!ered somewhat as discussed in Ref. [6] and in the text. We alsopresent, at the nominal conditions, calculated X-ray transmission for LEDCOP as a representative DTA code and STAas a representative UTA code. Theoretical results for LEDCOP and STA that appear above the experimental resultshave been convolved with the instrumental resolution of the experiment. The LEDCOP plot beneath the experimentaldata has not been smoothed by the experimental resolution. Tick marks on the transmission axis are separated by 25%.
There appear to be two classes of results:(1) codes for which the bump opacity is only weakly dependent on density,(2) codes that exhibit a strong density dependence from 10~5 to 10~3 g/cm3.
538 F.J.D. Serduke et al. / Journal of Quantitative Spectroscopy & Radiative Transfer 65 (2000) 527}541
The experiment of Springer et al. [6] strongly suggests, for iron plasmas in the vicinity of 20 eVand 10~4 g/cm3, the existence of discrete line structure (porosity) in the iron transition arrays thatso far appears to be addressable only by DTA opacity models. For the 50}80 eV bump at densitiesbelow 10~3 g/cm3, the results suggest that codes approximating transition arrays by broadstructures may only get the bump opacity, (and by implication astrophysical opacities) correct ata limited range of densities.
4. Experiments
Experiments have been extremely important to the development and validation of opacitymodels. A signi"cant number of useful experiments have been performed over the past decade andhave served to test, in some manner, virtually all of today's sophisticated opacity codes.
As with all previous WorkOps, we included cases that addressed recent experiments. For manyof these cases, the data were in early stages of analysis. Unfortunately, the "nal conditions of theexperiments turned out to be signi"cantly di!erent from the conditions requested of WorkOpparticipants; thus it is not possible to present detailed comparisons of theoretical predictions ofexperimentally measured X-ray transmission or emission. Furthermore, for some of these experi-ments, uniformity of the temperature and density of the plasma was an issue; this subject has beendiscussed by Perry et al. [7].
The iron experiment performed by Springer et al. [6] studied opacities for stellar envelopes bymeasuring X-ray transmission in the vicinity of the M-shell *n"0 bump discussed above. This wasan important "rst step in a new class of opacity experiments. LTE plasma conditions were achievedin the laboratory that had not been approached previously. The long-duration Planckian radiation"eld that heated the sample uniformly to close to 20 eV, the low plasma density (10~4 g/cm3), and thegood resolving power (E/*E'2000) were all impressive. Although it was stated that X-ray transmis-sion through two lengths, 10 and 2 mm, of 10~4 g/cm3 plasma were measured, only the 10 mmresults were reported [6] in the sole published account of this experiment.
We present calculational results, in Fig. 7, for transmission through a pure iron plasma, 10 mmlong at 20 eV and 10~4 g/cm3. Two codes were selected: plasma LEDCOP as a representative ofDTA codes and STA as a representative of UTA codes. Transmission results that appear above theexperimental data have been convolved with a Gaussian whose full-width at half-maximum is thestated experimental resolution; those beneath have not. The separation of tick marks on theTransmission axis is 25%.
The conditions of the experiment may potentially be di!erent from those of the 20 eV,10~4 g/cm3 of thee calculations. For example, the temperature was possibly several eV away from20 eV and there was signi"cant oxygen contamination of the sample a!ecting the electron densityby as much as 20%. In addition, experimental details such as background subtraction andhigher-order crystal di!raction are known to be problems in other plasma transmission experi-ments. It would be important to learn know how these were addressed here. The experimentpresents compelling evidence of the need for detailed-line accounting in modeling iron plasmas ofthis density and temperature. The photon energy and pro"le of the high-energy side of the bump ismeasured by the experiment which represents an advance as its location and shape presentsdi$culties for several opacity models.
F.J.D. Serduke et al. / Journal of Quantitative Spectroscopy & Radiative Transfer 65 (2000) 527}541 539
4.1. Need for more experiments
The opacity community in general and the workshops have bene"ted greatly from the experi-mental data provided. Experiments provide crucial, independent tests of the opacity codes as wellas an impetus for further theoretical developments.
Although the Springer et al. [6] iron measurement described made a substantial contribution toopacity research, further development of such experiments would be valued and is encouraged. Inparticular, we would suggest the following:
(1) The width of the *n"0 bump remains an outstanding issue to be experimentally addressed.This would require an extension of the measured spectral region to photon energies below 60 eV.
(2) The astrophysically important structure of the central region of the *n"0 bump should beaddressed experimentally by the use of a signi"cantly thinner sample. This was already done butnot yet reported by Springer et al. [6] with of a 2 mm sample that would be expected to exhibit verylittle saturation of the transmission in this spectral region.
(3) Simultaneous measurements of transmission through samples of two di!erent thicknessesmay be used to check many aspects of the data [5] such as saturation e!ects, the presence ofunresolved structure, and data reduction di$culties involving sample emission. Experience hasshown that this can be a very sensitive test of the "delity of X-ray "lm processing, backgroundsubtraction, and assumptions about the uniformity of the sample.
In short, the further development of experimental techniques and their application to a widerange of opacity problems is not only welcomed but essential for continuing progress in the "eld.
5. Conclusions
These LTE opacity workshops have been valuable tool to both code developers and users ofopacities. WorkOps I}IV have coincided with and have served as a signi"cant calculational testingground for major advances in the state of the art. A full presentation of the contributions to theWorkOp is beyond the scope of this paper but may be found in the "nal report [1].
In WorkOp-IV, we have found or recon"rmed several aspects of opacity modeling:
f High densities at low temperatures pose major computational di$culties for codes. This ismanifested in ionization balance as well as opacity.
f Iron (Z"26) provides important test cases as the two major competing approaches, statisticalmethods and DTA methods, are both applicable to the modeling of iron.
f Near 20 eV and for densities of 0.001 g/cm3 or higher, DTA and UTA tend to agree on thecomputed Rosseland mean opacity. However, at 20 eV and a density of 10~4 g/cm3 or lower, theporosity of transition arrays predicted by DTA models and supported by experiment, is not wellrepresented by statistical treatments.
f The above mentioned di!erence in the porosity has implications for stellar pulsation models.The Rosseland mean opacities for pure iron may agree for DTA and UTA models because it isdetermined by the wings of the bump, not the wings of the individual line transitions. But wheniron appears in an astrophysical mixture at the same electron density, it is the porosity of thecentral part of the bump, determined by the shapes of myriad lines, that governs its contribution
540 F.J.D. Serduke et al. / Journal of Quantitative Spectroscopy & Radiative Transfer 65 (2000) 527}541
to the mixture opacity; the wings of the bump are "lled by the dominant hydrogen and heliumcomponents of the mixture.
f Experiments, although di$cult, are essential to further progress in the understanding andmodeling of opacities. Comparisons of experimental results with several calculations show thatnumerous issues remain to be addressed.
References
[1] Serduke F, Minguez E. Final Report on WorkOp-IV:97, University of California, Lawrence Livermore NationalLaboratory, Internal Report, unpublished.
[2] Rose SJ. JQSRT 1994;51:317.[3] Rickert A. JQSRT 1995;54:325.[4] Haan S. LLNL, private communication, 1997.[5] Perry TS, Davidson SJ, Serduke FJD, Bach DR, Smith CC, Foster JM, Doyas RJ, Ward RA, Iglesias CA, Rogers FJ,
Abdallah Jr. J, Stewart RE, Kilkenny JD, Lee RW. Phys Rev Lett 1991;67:3784.[6] Springer PT, Wong KL, Iglesias CA, Hammer JH, Porter JL, Toor A, Goldstein WH, Wilson BG, Rogers FJ,
Deeney C, Dearborn DS, Bruns C, Emig J, Stewart RE. JQSRT 1997;58:927.[7] Perry TS, Springer PT, Fields DF, Bach DR, Serduke FJD, Iglesias CA, Rogers FJ, Nash JK, Chen MH, Wilson BG,
Goldstein WH, Rozsynai B, Ward RA, Kilkenny JD, Doyas R, Da Silva LB, Back CA, Cauble R, Davidson SJ,Foster JM, Smith CC, Bar-Shalon A, Lee RW. Phys Rev E 1996;54:5617.
F.J.D. Serduke et al. / Journal of Quantitative Spectroscopy & Radiative Transfer 65 (2000) 527}541 541