Working Paper: e-Commerce Behavior in different Countries
31
Document de travail du LEM 2008-04 E-COMMERCE BEHAVIOR IN DIFFERENT COUNTRIES Frank G. Goethals, Andrea Carugati, Aurélie Leclercq IÉSEG School of Management, CNRS-LEM (UMR 8179)
Transcript of Working Paper: e-Commerce Behavior in different Countries
Document de travail du LEM 2008-04
E-COMMERCE BEHAVIOR IN DIFFERENT
COUNTRIES
Frank G. Goethals, Andrea Carugati, Aurélie Leclercq
IÉSEG School of Management, CNRS-LEM (UMR 8179)

2
Working Paper: e-Commerce Behavior in different Countries
Frank G. Goethals, Andrea Carugati, Aurélie Leclercq IESEG School of Management
3, Rue de la Digue, 59000 Lille, France {f.goethals; a.carugati; a.leclercq}@ieseg.fr
Draft version; do not quote without author’s permission Abstract: It is often assumed that e-commerce behavior is similar in
countries with a similar culture. Through a survey, this paper proves there are actually significant differences in e-commerce behavior, even between two culturally similar countries. In this study, statistically significant differences are found in the stated appropriateness of different media to find product information, to find a supplier and to make the actual purchase.
Introduction The Internet can play a role in several steps of the purchasing process. Many different models of the purchasing process have been presented in the past (Engel, Blackwell, Miniard, 1995; Anderson & Chambers, 1985; Hansen, 2005). Potential customers can use the Internet for example to find information about a product or service they need, to find (evaluations of) suppliers, to actually make a purchase, etc. Different websites allow a different functionality in terms of the phases they support in the purchasing process. The question is, to what extent companies have to foresee and excel in some functionality in different countries. After all, offering multiple features comes at a cost. Several researchers have investigated what website features are appreciated by site visitors. In a Canadian experiment using Amazon.com, Kumar and Benbasat (2006) have shown that providing recommendations to customers and providing consumer reviews increases the perceived usefulness of a website. Riegner (2007) studied broadband users in the USA. She found that consumers find emotional and practical benefits in participating in online discussions and that such discussions have profound commercial implications for sales of consumer electronics products. The way a website is designed can also influence trust. In a study in the USA and Finland, Fogg et al. (2001) for example evaluated website elements which affect the consumers’ perception of credibility. Elements that highlight the brick-and-mortar nature of the organization, such as listing a physical address and a contact phone number, were stated to enhance web credibility. Similarly, Wang and Emurian (2005) and Lee, Kim & Moon (2000) looked for trust-inducing interface design elements. Furthermore, field experiments conducted in Hong kong by Tam and Ho (2005) indicate that personalizing web sites plays a role in persuading customers to buy. Similarly, Fogg et al. (2001) and Singh, Zhao, and Hu. (2003) find that tailoring the website to the

3
user experience leads to increased perceptions of web credibility. The general conclusion is that it is profitable for companies to tailor their websites to the desires of the local population by adapting content, language, and style (Singh, Furrer, and Ostinelli, 2004; Singh & Boughton, 2002; Sinkovics, Yamin & Hossinger, 2007). Nowadays, companies are forced to find newer forms of market understanding and customers’ appreciation. Building on extant literature, this paper investigates an important aspect of e-commerce, namely the differences in the buying process in countries with similar cultures. Customers can use a website in several steps of the purchasing process. While culturally customizing websites and adding features to a website may be evaluated positively by an actual site visitor, companies need to know whether and for what functional purpose customers actually use the website. The justification of certain investments – e.g. being indexed in portals - depends on the expected online behavior of customers with respect to a specific localized website. This paper investigates this process considering not one but three fundamental steps of the purchasing process: from information gathering, over supplier selection, to buying the product. To reflect these three steps, we adopt the following working definition of e-commerce: “E-commerce entails the use of Internet technology to find information about a product or service for which a need is felt, to find a supplier and to actually buy the product”. For companies that have to decide upon the tailoring of their websites, it is important to know for what step in the purchasing process customers are actually accessing their website. Are they looking at the website to find product information but not to actually buy the product?, or the other way around? or both?. Similarly, it is important to know whether website adaptations to end up high in Internet search engine rankings are justifiable, or whether customers do not use search engines anyway to search a supplier. It should be noted that the research reported in this paper investigates customer behavior in two neighboring countries. This is because doing business on the Internet is not boundary-less or culture-free (Lim et al., 2004) and findings from one country are thus not necessarily transferable to other countries. Extant literature focuses to a big extent on U.S. culture and companies (Hoffman, Kalsbeek and Novak, 1996; Rodgers and Harris, 2003; Wells & Chen, 1999; Seock & Bailey, 2008), a trait that has been criticized by several authors (e.g. Sinkovics et al., 2007). Other literature does investigate differences between two or more countries, but focuses on countries that are geographically and culturally very distant (Pavlou & Chai, 2002; Lynch, Kent and Srinivasan, 2001; Singh et al. 2003; Singh et al. 2004). In order to maximize the chances of finding some differences, previous research interested in cultural issues in e-commerce highlights the importance of culture investigating the differences between countries that are clearly very different (such as China and the USA, see (Pavlou & Chai, 2002)). However, this research overlooks that generally the easiest place for a company to sell abroad is in the neighboring countries and buying in a neighboring country is easy for customers. Moreover, prices often differ considerably among neighboring countries so that customers can investigate the product locally (e.g., physically in their local shop, or on a local website) but buy the product on the Internet from a company in their neighboring country; a country which may be similar to theirs and that is reachable when a problem with the product shows up. This is certainly the case in Europe where few hours drive can take you across multiple countries. There is thus a gap in extant research as to what extent e-commerce attitudes of customers differ between neighboring countries that are considered to have similar

4
cultures. Our research intends to fill this gap. In this paper, we examine the behavior of customers in two ‘similar’ neighboring countries - Belgium and France - in order to deal with the important and longstanding question as to what extent customers of neighboring countries behave differently in the different steps of the e-commerce process. In the next section, the extant literature on cultural issues in electronic commerce and our research questions are presented. Next, we present our survey and the results of the analysis. Finally, the findings are discussed and conclusions are drawn.
Literature review and goals Globalisation is an important issue for many companies. Therefore, it is necessary to research the cultural dimensions of e-commerce adoption. According to Hofstede (1980), culture is "the collective programming of the mind which distinguishes the members of one human group from another" (1980, p. 260). Hofstede (1980) defines four dimensions that allow differentiating cultures: Power Distance, Individualism/Collectivism, Masculinity and Uncertainty Avoidance. In later studies, Hofstede added a 5th dimension: Long Term Orientation. Hofstede's dimensions of national culture are often used in information system research to explain the link between IT and culture in cross-country research. Some research in information systems has indeed shown how national culture may affect user acceptance of a technology (Straub, 1994; Straub et al., 1997; Gallivan and Srite, 2005; Karahanna et al., 2005). Pavlou and Chai (2002) studied the cross cultural effects in e-commerce adoption. They applied the theory of planned behaviour (TPB) to understand the drivers of individuals’ intentions to buy online and incorporate three of Hofstede’s cultural dimensions in their model. Several inhibiting factors for Internet shopping have been discussed in literature. Reasons not to shop on-line are worries about payment security, worries about privacy, absence of confidence in e-retailers, the need to physically examine the product, worries about not receiving the goods or receiving them late and/or in bad condition (Hui, 2001). Literature on adoption of e-commerce shows that trust issues are important inhibitors of e-commerce adoption (Hoffman et al., 1999; van Slyke, Belanger & Comunale, 2004; Palmer, Bailey & Faraj, 2000; Pavlou, 2003). Furthermore, important differences have been pointed out as regards uncertainty avoidance depending on the country and culture of individuals. Straub (1994), for example, applies Hofstede’s dimensions to compare the diffusion of e-mail in Japan and in the United-Sates, and puts forward the significant role of uncertainty avoidance in the adoption process of communication media. More recently, Bartikowski, Fassot and Singh (2006) extended the TAM model to integrate a dimension entitled “cultural adaptation”. In a cross cultural empirical study, they identify the cultural aspect of consumers’ acceptance of international websites. Their study is very useful from a practical point of view insofar as it enables marketing managers to adapt their e-commerce websites to the profile of international consumers. Other authors apply Davis’ TAM model (Davis, 1989) to explain individual intentions to make purchases via the Internet and put forward the importance of risk aversion (Lederer et al., 2000; Lin and Lu, 2000). Srite and Karahanna (2006) identify “espoused national cultural values” as an important moderator of individual intention to use an information technology. If one looks at neighbouring countries, one often gets the impression that cultural differences are limited. Table 1 for example compares the values of Belgium and

5
France on the Hofstede cultural dimensions. While there are some differences, differences are much smaller than the ones that are normally looked for in studies of cultural differences. Pavlou and Chai (2002) for example compared 58 China and 55 USA customers to investigate the role of three of Hofstede’s cultural dimensions on e-commerce adoption in China and the USA. These two countries differ to a big extent on the three researched dimensions. (1) The Individualism/Collectivism is 20 for China, while it is 91 for the USA. (2) The Long-Term Orientation for China is 118, while it is 29 for the USA. (3) The Power Distance Index for China is 80, while it is 40 for the USA. In a similar vein, Bartikowski, Fassot and Singh (2006) carried out an empirical research to measure the acceptance by consumers of the websites of American and Japanese companies. The differences are clearly much smaller between Belgium and France. Table 1: Scores on the Hofstede cultural dimensions for France and Belgium (http://www.geert-hofstede.com)1
Power Distance Index Individualism Masculinity Uncertainty Avoidance index France 68 71 43 86
Belgium 65 75 54 94
In short, research has attributed differences in e-commerce behavior to big differences in cultural dimensions. The question is what happens in case countries do not show big differences in cultural dimensions. Some studies implicitly assume that the consumers in those countries behave similarly. Lynch, Kent and Srinivasan (2001) for example conducted an experiment with respect to the shopping behavior of 299 respondents in 12 countries. The respondents were divided in three regions: “North America”, “Latin America” and “Western Europe”. Their research seems to indicate that site quality, trust, and positive affect are useful to explain the purchase intentions and loyalty of visitors to the site and that the impact of these factors varies across different regions of the world and across different product categories. However, there were only few respondents from each ‘region’. For example, there were in total only 104 respondents from Western Europe (which comprises at least ten countries). Such a figure can only be representative for a region if that region is homogeneous2. In the light of studies such as the one of Pavlou and Chai (2002), differences between the neighboring countries Belgium and France (see Table 1) seem small. In this paper, we test the assumption that has been made implicitly by many researchers: Hypothesis: There are no differences in purchasing practices among culturally
similar, neighboring countries.
1 Data for the Long-Term Orientation dimension is currently not yet available for Belgium and France. Still, this dimension focuses on Asian value systems, which are not the primary interest of the study at hand. 2 Please note that gender and age distribution of the respondents in that paper is unclear. Furthermore, only two products were investigated in that research: T-shirts and CD-players. Contrary to the research of Lynch, Kent and Srinivasan (2001), many more than two products are considered in our research. Rieger (2007) did investigate a big number of products. However, consumers were asked to identify a product they had purchased in the last three months, either online or offline. This way, the set of products the customer thinks about, is – of course – not controlled by the researcher, and no legitimate conclusions could be made with respect to an ‘average’ product. Moreover, given the fact that this was a study about Internet behavior, the product the customer chose may distort the research results.

6
Contrary to the literature presented above, the main goal of this paper is thus to investigate whether significant differences exist between two neighboring, culturally similar countries, something that is of great relevance to practitioners (for commercial reasons) and to researchers (for reasons of rigor and relevance).
Research Methodology Given the fact that different individuals may identify with national culture to varying degrees (Srite & Karahana, 2006), it is advisable to consider a large number of individuals in both countries. Therefore, a large survey was set up. It was considered appropriate to get some qualitative input next to the quantitative input from the surveys, in order to be able to give a better interpretation to the statistical test results. As e-commerce behavior of people evolves, surveying both France and Belgium had to be done in a limited span of time.
Setup and instrument development The survey was conducted in October and November 2007. Business students from the 3rd year bachelor were explained the role of the Internet in doing business and were introduced to the survey. The survey contained questions based on a task that the students had to carry out. As a task, they had to interview a number of other people, both private individuals (‘private persons’) and professional purchasers (‘company representatives’). In order to motivate the students to collect the data rigorously, to get more qualitative feedback (and of course to have them learn about the issue), they got the additional task to write a paper, formulating findings on the basis of the data they collected. Having the survey done by a big amount of interviewers (the students) was considered to be a good way to collect a large amount of data in a limited time. The survey was conducted in two neighboring countries – France and Belgium - by Belgian (Flemish) Economics students and by Northern France Economics students. We note that, while this survey cannot claim to have taken a sample of the entire population of the countries, it has taken similar people (by starting out from Economics students) in both countries. Each student was asked to fill in a questionnaire related to three steps in the acquisition of a product: 1. information gathering; 2. supplier selection; and 3. purchasing; for different products. Two questionnaires were used, group 1 and group 2, covering 25 products each (50 in total). A list of the products is shown in Appendix A. Twenty products that seemed particularly appropriate for Internet purchasing (such as books, airplane seats, etc.) were chosen consciously from the yellow pages directory. To this, 30 products were added that were chosen randomly from the yellow pages directory. The French and the Flemish online version of the yellow pages were used to determine the category-names for the French and the Belgian survey. If the same product or service was not found in both, the Van Dale dictionary was used for translation. The correct meaning of the terms in the survey was checked with native French and Dutch-speaking colleagues. Given the fact that products were also chosen randomly, there are several products in the survey that may seem irrelevant to consumers on first sight. The products would typically be considered indirect products by company purchasers. These products were deliberately kept in the survey, as this is exactly a survey on how consumers find information on products, find possible suppliers, etc. The respondents were asked to give their opinion – related to each of the 25 products – on how they bought the

7
product before, or on how they would buy it in the future if they had not bought it before. No distinction was made in the research between an actual buy and the reflection of how a customer intends to make a buy, following the reasoning of Jackson et al. (1997). For each product, the respondent was asked about his/her opinion on the appropriateness of some medium for several tasks in the purchasing process. The items in the questionnaire are shown in Appendix B. For each product, the respondent had to give a value of 1 to 4 to reveal his opinion about the information medium that could be used to achieve the task (e.g., to find a supplier). The value ‘1’ was used to denote that a medium was considered ‘very appropriate’; the value ‘2’ indicated ‘appropriate, but less important’, the value ‘3’ was used to denote that a medium was ‘somewhat appropriate’ and the value ‘4’ indicated that a medium was considered ‘not appropriate at all’. By using this legend and a limited number of values, it was tried to overcome – to the extent that this is possible in any study of culture – the fact that scale use can systematically differ between individuals of different countries (Ji et al., 2000; Peng et al., 1997). Moreover, it was decided to use only the scores on the extreme values ‘1’ and ‘4’ in the calculations (see below).
Sample characteristics In total, 863 questionnaires of private respondents were returned. Their age distribution is shown in Figure 1. This picture clearly illustrates that the data is not representative for the entire French and Belgian population. Two age groups are well represented and were selected for further investigation: people aged 18-25 (inclusive) and people aged 42-54 (inclusive). Of the 863 respondents, 774 fell in those age categories: 573 in the category 18-25 and 201 in the category 42-54. Of the people aged 18-25 it should be noted that 90% had a University degree or were pursuing a University degree). After cleaning the data (for example by omitting records where people entered wrong values, such as ‘0’), 762 records were retained. Of these, 62% were filled out by students. Using students for a study often raises concerns of generalizability of the results. This concern is valid if the students are asked about a task that is not of direct relevance to them. However, the negative effects of the use of students are mitigated if the research domain is of relevance to the subjects (Gopal et al., 1992-1993). In the research at hand, students (and others) were surveyed about a topic that is directly relevant to them and it is thus reasonable to expect the findings to be valid (Slyke et al., 2004). Moreover, several studies of technology acceptance and usage have employed students as their subjects (Slyke et al., 2004; Chin & Gopal, 1995; Davis, 1989; Taylor & Todd, 1995).

8
Age distribution of private respondents
0
20
40
60
80
100
120
140
10 15 20 25 30 35 40 45 50 55 60 65 70 75
France
Belgium
Figure 1:Age distribution of private respondents The survey was also filled out by 131 Belgian (Flemish) and 103 French company representatives. After cleaning the data, 125 Belgian (90 male, 35 female) and 97 French (66 male, 31 female) questionnaires were retained. Fifteen of the Belgian company questionnaires were dropped to get an equal distribution of genders in the French and the Belgian sample. The average age was 43 in the Belgian sample and 45 in the French sample. In total, 969 questionnaires were thus used in the statistical tests. To be able to respond to the research questions, the total sample was split in ten response groups. These were formed as follows:
- Distinguishing private persons from company representatives. - Distinguishing French people from Belgian people. - For the private persons: distinguishing males from females. - For the private persons: distinguishing between ‘young’ and ‘senior’ people
(respectively age 18-25 inclusive and 42-54 inclusive). The distribution of the respondents over different response group is shown in Table 2. Table 2: Number of respondents per response group
Nationality Gender Private/company Age Nr of respondents (Total = 969) French Male Private 18-25 166 French Male Private 42-54 14 French Female Private 18-25 87 French Female Private 42-54 24 French Both Company / 97 Belgian Male Private 18-25 180 Belgian Male Private 42-54 72 Belgian Female Private 18-25 131 Belgian Female Private 42-54 88 Belgian Both Company / 110

9
Data analysis The percentage of respondents in the French sample and in the Belgian sample considering product group 1 and product group 2 were quite similar. 53% of the Belgian sample concerned group 1 and 47% concerned group 2. For the French sample the figures were 52% and 48% respectively. Furthermore, the similarity of responses on product group 1 and product group 2 was tested for specific response groups with the Mann-Whitney test and the Kolmogorov-Smirnov test. Differences were only rarely statistically significant. Therefore, it was justifiable to group the responses of similar respondents (in terms of company representative or private consumer, gender, country and age) for both product groups. Given the fact that some response groups had only a low number of respondents, aggregating group 1 and group 2 data was important. To enable a presentation of the results, the answers of respondents with respect to a number of options on different questions were grouped as shown in Appendix B. For example, the survey asked about the appropriateness of “Google” and “other search engines (such as Yahoo, MSN, etc.)” to find a supplier. The research results show that the market share of Google is overwhelming in both countries and that 90% of people who do use another search engine also use Google. Hence, the two options were grouped in one option to find a supplier: ‘Using an Internet Search Engine’. Grouping happened on the basis of keeping the lowest score that was given on the different options. That is, if ‘1’ was answered for at least one of the options in a category, this category got the value ‘1’. If ‘2’ was the lowest figure over all options, this category got the value ‘2’; and so on. Please note that for each question the option ‘other’ was included. This option was, however, hardly selected by any of the respondents (reflecting the fact that the suggested options were sufficient) and is not reported further in the research results. Furthermore, as this research paper investigates differences among countries, rather than differences among different products, the responses of a respondent on different products were grouped to one average (per response option) for the respondent. This way, the percentage of 1’s, 2’s, 3’s and 4’s on each option was determined for each respondent. The tests were run on this aggregated data, focusing only on the percentages of 1’s and 4’s to enable a clear presentation.
Statistical tests Through the Shapiro-Wilk test, the normality of the distribution of responses from different customers in a response group was tested. Except in a few cases, the hypothesis of a normal distribution could not be accepted for the responses on the questions (i.e., p > 0.05). Applying a logarithmic or a square-root transformation did not return normally distributed data either. Consequently, non-parametric statistical tests had to be used. The Mann-Whitney test was used to compare responses from different response groups (following Kerr et al., 2002). The ‘exact’ method was used. If calculating this was impossible, the asymptotic method was used, denoted by "(A)" next to the significance level in the tables that follow. This only happened in cases of big sample sizes and is thus justifiable. When comparing different media for one response group, the Wilcoxon paired test was used (following Kerr et al., 2002). Non-parametric tests unfortunately have a limited statistical power in that they are less likely to detect an effect in the data than parametric tests (which, nevertheless, cannot be used with this data set). The power of our research is further restricted by

10
the limited number of respondents in two response groups. Nevertheless, several statistically significant differences were found between French and Belgian response groups. Nevertheless, to improve the power especially in cases of small sample size response groups, not only the Mann-Whitney test was performed, but also the Kolmogorov-Smirnov Z-test. If the Mann-Whitney test returned a significance level between 0.05 and 0.10, and the exact Kolmogorov-Smirnov Z-test returned a significance level below 0.05, statistical significance was concluded. Such exceptions are mentioned explicitly in the text and tables. All statistical tests were performed using SPSS 15.0.
Results In Table 3, the results are shown of the Mann-Whitney-test to compare Belgian and French response groups on how appropriate they find a medium to gather product (or service) information. In this table, similar respondents (in terms of age, gender, and private or company) from different countries are compared. Significant values (p<0.05) are shown in bold. In Appendix C, the average responses of the response groups on the appropriateness of different media are presented. Averages are weighted averages, with a weight of 20% for each of the five response groups (per country). These tables show that:
- On average about 27% of responses say that “Friends and Family” are very appropriate to gather product information and 35% say that they are not appropriate at all. Per response group, responses are the same for French and Belgian responses.
- On average 26% of Belgian responses say that “Communication with the seller” is very appropriate whereas 39% of French responses say so. Statistically significant differences (p<0.05) between Belgian and French responses show up in every response group 3, except in the group of the senior female respondents (p=0.0508). The significant differences are small to medium. 45% of Belgian responses say that “Communication with the seller” is not appropriate at all whereas only 36% of French responses say this. The difference with respect to being ‘not appropriate at all’ is statistically significant for the young response groups, as well as for the senior female respondents (with the Kolmogorov-Smirnov test: z=1.2336; p=0.0495) and the company representatives (p<0.05).
- On average 42% of Belgian responses and 40% of French responses say that websites are very appropriate to find information about products or services. 26% of Belgian responses and 32% of French responses say that websites are not appropriate at all to gather product information. The difference between Belgian and French responses is not statistically significant for any of the response groups.
3 There are also big differences between different user groups. There are two eye-catching outliers: of the senior Belgian private male responses only 21% indicate that Communication with the seller is very appropriate. On the other hand, 45% of ‘Young’ French private female responses say that Communication with the seller is very appropriate.

11
Table 3: Mann-Whitney test to compare the appropriateness of different media to find product or service information across countries. (A) denotes the result of the asymptotic method instead of the exact method. (B) denotes a difference that was concluded to be significant with the Kolmogorov-Smirnov Z-test
Friends & Family = 1
Friends & Family = 4
Commun. Sel. = 1
Commun. Sel. = 4
Internet = 1 Internet = 4
Mann-Whitney U 5534 5266.5 3687 4411.5 5056.5 4969
Z -0.36154 -0.94918 -4.41939 -2.8265 -1.40963 -1.60723
Estimated difference size 0.024486 0.064287 0.299319 0.191435 0.095472 0.108856 Young Females
Exact Sig. (2-tailed) 0.7187 0.3435 0.0000 0.0046 0.1591 0.1082
Mann-Whitney U 14193.5 14828 10930.5 12218.5 14327.5 13565
Z -0.80551 -0.12069 -4.32133 -2.93171 -0.65965 -1.4875
Estimated difference size 0.043305 0.006488 0.232316 0.157609 0.035463 0.079968 Young Males
Exact Sig. (2-tailed) 0.4205 (A) 0.9030 (A) 0.0000 (A) 0.0034 (A) 0.5095 (A) 0.1369 (A)
Mann-Whitney U 1039 965.5 782 805 1004.5 1014
Z -0.12088 -0.64292 -1.95136 -1.78188 -0.36595 -0.29848
Estimated difference size 0.011422 0.06075 0.184387 0.168372 0.034579 0.028204 Senior Females
Exact Sig. (2-tailed) 0.9058 0.5238 0.0508 0.0749 (B) 0.7175 0.7682
Mann-Whitney U 381 493.5 315.5 458.5 476.5 351.5
Z -1.44381 -0.12309 -2.2203 -0.53299 -0.32225 -1.79111
Estimated difference size 0.15569 0.013273 0.239421 0.057474 0.034749 0.193141 Senior Males
Exact Sig. (2-tailed) 0.1511 0.9054 0.0255 0.5998 0.7521 0.0735
Mann-Whitney U 5077 5243,5 3881 4171 5067 5026,5
Z -0,60207 -0,21303 -3,3869 -2,71038 -0,62399 -0,71927
Estimated difference size 0,04187 0,014807 0,235406 0,188384 0,043371 0,049992
Company representatives
Exact Sig. (2-tailed) 0,5483 0,8321 0,0007 0,0066 0,5338 0,4731
By performing a Wilcoxon test for paired samples, the stated appropriateness of ‘Communication with the seller’ was compared to the stated appropriateness of ‘the Internet’ to find product or service information. Results are shown in Table 4.

12
Table 4: Wilcoxon-test to compare responses for ‘very appropriate’ for ‘Communication with seller’ and ‘Internet’ to find product information for a specific response group. (a=based on negative ranks; b=based on positive ranks)
Z -5.5904
Estimated difference size 0.4884 Belgian Young
Female Asymp. Sig. (2-tailed) 0.0000 (a)
Z -6.0888
Estimated difference size 0.4538 Belgian Young Male
Asymp. Sig. (2-tailed) 0.0000 (a)
Z -2.8218
Estimated difference size 0.3008 Belgian Senior
Female Asymp. Sig. (2-tailed) 0.0048 (a)
Z -4.2189
Estimated difference size 0.4972 Belgian Senior Male
Asymp. Sig. (2-tailed) 0.0000 (a)
Z -0.1461
Estimated difference size 0.0157 French Young Female
Asymp. Sig. (2-tailed) 0.8838 (b)
Z -1.9943
Estimated difference size 0.1548 French Young Male
Asymp. Sig. (2-tailed) 0.0461 (a)
Z -0.0813
Estimated difference size 0.0166 French Senior Female
Asymp. Sig. (2-tailed) 0.9352 (a)
Z -0.3147
Estimated difference size 0.0841 French Senior Male
Asymp. Sig. (2-tailed) 0.7530 (a)
For all Belgian response groups, there is a statistically significant difference (p<0.005). That is, all Belgian response groups (thus also the senior ones) find the Internet more appropriate to find product information than Communication with the seller. This difference is only moderate (0.3) for the senior female Belgians, but large (0.5) for the other response groups. Differences between French response groups are not statistically significant, except for one response group (p<0.05) where a small difference is noted: young French males also say that communication with the seller is less appropriate than the Internet to get product information. This suggests that Belgian respondents find websites more appropriate to find product and service information than communication with the seller, whereas French respondents do not.

13
Table 5: Mann-Whitney comparison across countries of ways to find a supplier. (A) denotes the result of the asymptotic method instead of the exact method. (B) denotes a difference that was concluded to be significant with the Kolmogorov-Smirnov Z-test.
Friends & Family = 1
Friends & Family = 4
Yellow Pages
Offline = 1
Yellow Pages
Offline = 4
Yellow Pages
Online = 1
Yellow Pages
Online = 4
Internet search = 1
Internet search = 4
Other site = 1
Other site = 4
Fixed Supplier = 1
Fixed Supplier = 4
Mann-Whitney U 5670 4816.5 4235 4907 3785.5 4594.5 5591 4919 4122.5 4520 4950 5252.5
Z -0.0626 -1.93818 -3.2617 -1.74148 -4.30219 -2.43053 -0.23608 -1.71465 -4.0534 -2.70845 -1.67216 -0.98604
Estimated difference size 0.00424 0.13127 0.22091 0.117948 0.291381 0.164616 0.015989 0.116131 0.274531 0.183439 0.113253 0.066783 Young Females
Exact Sig. (2-tailed) 0.9506 0.0525 (B) 0.0010 0.0816 (A, B) 0.0000 0.0149 0.8142 0.0865 0.0000 0.0066 0.0946 0.3241 (A)
Mann-Whitney U 14570.5 14343 10673.5 10497 8900.5 10246.5 14125 14048 11457.5 11255 13702.5 14286
Z -0.39858 -0.64315 -4.75458 -4.80487 -6.75395 -5.08789 -0.87806 -0.96495 -4.23382 -4.03995 -1.37161 -0.71122
Estimated difference size 0.021428 0.034576 0.255608 0.258312 0.363095 0.273527 0.047205 0.051876 0.227611 0.217189 0.073738 0.038235 Young Males
Exact Sig. (2-tailed) 0.6902 (A) 0.5201 (A) 0.0000 0.0000 (A) 0.0000 0.0000 (A) 0.3799 (A) 0.3346 (A) 0.0000 0.0001 (A) 0.1705 0.4769 (A)
Mann-Whitney U 952.5 1038.5 917.5 1018.5 698.5 754.5 984 978 876 619 880.5 943
Z -0.73663 -0.12432 -0.99724 -0.26636 -2.74523 -2.1859 -0.51658 -0.55432 -2.29482 -4.02504 -1.26285 -0.80491
Estimated difference size 0.069605 0.011748 0.094231 0.025169 0.2594 0.206548 0.048812 0.052378 0.21684 0.380331 0.119328 0.076057 Senior Females
Exact Sig. (2-tailed) 0.4649 0.9031 0.3217 0.7927 0.0056 0.0283 0.6089 0.5828 0.0196 0.0001 0.2087 0.4243
Mann-Whitney U 411.5 335 346 443 317.5 465 416.5 194 352 383 397 485.5
Z -1.08685 -1.98093 -1.89544 -0.71453 -2.31277 -0.46049 -1.02901 -3.63511 -2.76652 -1.63375 -1.27064 -0.21733
Estimated difference size 0.117198 0.213609 0.204391 0.07705 0.249392 0.049656 0.110961 0.391984 0.298322 0.176172 0.137016 0.023435 Senior Males
Exact Sig. (2-tailed) 0.2818 0.0471 0.0578 (B) 0.4808 0.0196 0.6508 0.3085 0.0001 0.0079 0.1026 0.2074 0.8321
Mann-Whitney U 5022 4806,5 4075,5 4464 3832 4738,5 5066,5 4634 4115 3852,5 4774,5 5274 Z -0,73128 -1,23162 -3,0391 -2,03582 -3,63484 -1,39557 -0,62662 -1,63488 -3,70104 -3,68552 -1,3098054 -0,1421
Estimated difference size 0,050828 0,085603 0,211232 0,141499 0,252639 0,096999 0,043553 0,113632 0,25724 0,256161 0,0910378 0,009876
Company representatives
Exact Sig. (2-tailed) 0,4657 0,2188 0,0023 0,04177 (A) 0,0003 0,1628 (A) 0,5321 0,1023 0,0002 0,0002 0,1909 0,8877

14
Different media can be used to find a supplier of a product or service.
Table 5 shows the difference in responses among similar response groups (in terms of age, gender, and private or company) from different countries with respect to the appropriateness of different media. Appendix D shows the average responses of the response groups on the appropriateness of different media to find a supplier. From these tables, we can say that,
- On average about 26% of both, Belgian and French responses say that “Friends and Family” are very appropriate to find a supplier. On average 34% of Belgian response and 39% of French responses indicate that Friends and Family are not appropriate at all. Responses of most French and Belgian private respondents are not statistically significantly different when considering the ‘very appropriate’ answers. However, when considering the ‘not appropriate at all’ answers, half of the private response groups show a statistically significant difference. Specifically, on average 50% of the French senior male responses find Friends and Family not appropriate at all, whereas only 36% of the Belgian senior male responses do not find Friends and Family appropriate to find a supplier. Statistically significant differences (p<0.05) in this direction are also found for young females (through the Kolmogorov-Smirnov Z-test, z=1.456, p=0.0129). The estimated difference sizes are small.
- In general, the Yellow Pages are considered a more appropriate medium to find a supplier in France than in Belgium. This is true for both, the offline and the online version of the Yellow Pages. Only 15% of Belgian responses show that the Offline version of the Yellow Pages is very appropriate to find a supplier, whereas 60% say it is not appropriate at all. More than 21% of French responses indicate that the Offline version of the Yellow Pages is very appropriate, whereas 54% say that it is not appropriate at all. Statistically significant differences (p<0.05) between Belgium and France are found for all response groups except for the senior females4. Differences are small to moderate. When considering the online version of the Yellow Pages, the difference between Belgian and French responses is statistically significant for all response groups (p<0.05). On average 23% of French responses indicate that the online version of the Yellow Pages is very appropriate, whereas this is only 14% for Belgian responses. Similarly, 62% of Belgian responses state that the online version of the Yellow Pages is not appropriate at all, whereas this is only 53% of French responses. Considering the ‘very appropriate’ answers, estimated difference sizes among countries are somewhat bigger among youngsters than among senior people.
- While the online version of the Yellow Pages is considered more appropriate in France than in Belgium, Internet search engines are not considered more appropriate in France than in Belgium to find a supplier. On average 36% of Belgian responses indicate that an Internet search engine is very appropriate to find a supplier, whereas 32% of French responses indicate this. Similarly, 44%
4 For the senior men group, the Kolmogorov-Smirnov Z-test reveals the significant difference (z=1.4061, p=0.0183).

15
of French responses say that Internet search engines are not appropriate at all, whereas this is only 33% with Belgian responses. Breaking down the sample in different response groups only results in a moderate, statistical significant difference (p<0.005) for the senior male respondents.
- When considering other websites (such as electronic marketplaces) than Internet search engines and the Yellow Pages online, about 90% of Belgian responses and 86% of French responses indicate that ‘other websites’ are not appropriate at all. On average 2% of Belgian responses and 6% of French responses show that other websites are very appropriate. Differences between French and Belgian responses are statistically significant (p<0.05) for all response groups and are generally moderately sized. French respondents are thus more likely than Belgian respondents to turn to websites such as e-bay for example to find a supplier of a product. This is also true for company representatives.
- Finally, when considering the appropriateness of having a fixed supplier for some product, differences between French and Belgian responses were all statistically insignificant. On average 12% of Belgian responses and 16% of French responses indicate that there is a fixed supplier for some product or service, so that there is in fact no need to search a supplier.
From this we can say that, in general, French and Belgian people have a different meaning about the appropriateness of some medium to look for a supplier5. This is less so for ‘media’ that still have another role to play in their lives (such as Friends and Family), but more so for media that are made to communicate this kind of information (such as Yellow Pages and websites such as e-bay). Getting a good place in the Yellow Pages comes at a price. Similarly, getting high in Search Engine rankings can be a tedious, costly effort. Therefore, it is interesting for companies to know whether the online or the offline Yellow Pages are more popular or whether Internet search engines are more popular or whether it are Friends and Family that are believed to be most appropriate to find a supplier. A number of comparisons by means of the paired Wilcoxon-test are shown in Table 6.
5 There are also differences between different products but this paper focuses on differences between countries rather than on differences between products. Still, some interesting issues can be mentioned. First, in general, chances that people and companies use the Yellow Pages to find a supplier are remote. There is one big exception to this rule: to find a taxi, about 50% of French companies and French (young and senior) people say that the offline Yellow Pages are considered very appropriate. Also, about 50% of French companies and French youngsters say that the online Yellow Pages are considered very appropriate. Of the senior French people, 36% consider the online version of the Yellow Pages very appropriate to find a taxi. Secondly, only for a few products and services it is stated that there is a ‘fixed supplier’. Given the nature of the products that were surveyed this is no real surprise when it comes to private persons. However, for companies one might expect more companies to have fixed suppliers for all kinds of (indirect) products. Notably, more than 50% of Belgian respondents (companies, and young and senior people) and of French companies say they have a fixed doctor. Of the French youngsters, only 38% say they have a fixed doctor and of the senior French people only 29% say they have a fixed doctor. Finally, using another site than an Internet search engine and the online Yellow Pages to find a supplier is hardly considered. Two product groups score here particularly better than other products: to buy CDs and DVDs and to buy computers, 35% of French youngsters and 26% of Belgian youngsters state that ‘another website’ is very appropriate.

16
Table 6: Wilcoxon-test, comparing the stated appropriateness of different media to find a supplier (for specific response groups). (a=based on positive ranks, b=based on negative ranks; A=asymptotic value used instead of exact value)
Yellow Pages Online vs.
Yellow Pages Offline
Internet search engine vs.
Yellow Pages Online
Internet search engine vs.
Yellow Pages Offline
Fixed supplier vs. Internet
search engine
Internet search engine vs.
Friends and Family
Other site vs. Internet search
engine
Z -0.3590 (a) -6.8023 (b) -6.8142 (b) -7.9176 (a) -1.6556 (b) -9.3330 (a)
Estimated difference size 0.0314 0.5943 0.5954 0.6918 0.1446 0.8154 Belgian Young Female Exact Sig. (2-tailed) 0.7215 0.0000 0.0000 0.0000 0.0981 0.0000
Z -0.6924 (a) -9.1951 (b) -9.2725 (b) -9.7094 (a) -5.6202 (b) -10.5224 (a)
Estimated difference size 0.0516 0.6854 0.6911 0.7237 0.4189 0.7843 Belgian
Young Male Exact Sig. (2-tailed) 0.4909 0.0000 0.0000 0.0000 0.0000 (A) 0.0000
Z -3.8166 (a) -4.3658 (b) -1.6208 (b) -3.5025 (a) -0.0141 (a) -6.7995 (a)
Estimated difference size 0.4069 0.4654 0.1728 0.3734 0.0015 0.7248 Belgian Senior Female Exact Sig. (2-tailed) 0.0001 0.0000 0.1057 0.0004 0.9897 0.0000
Z -1.3152 (a) -4.3874 (b) -3.8220 (b) -4.4981 (a) -2.3205 (b) -6.3141 (a)
Estimated difference size 0.1550 0.5171 0.4504 0.5301 0.2735 0.7441 Belgian
Senior Male Exact Sig. (2-tailed) 0.1909 0.0000 0.0001 0.0000 0.0197 0.0000
Z -1.5781 (b) -3.0873 (b) -3.9592 (b) -6.6178 (a) -1.1140 (b) -7.6037 (a)
Estimated difference size 0.1692 0.3310 0.4245 0.7095 0.1194 0.8152 French Young
Female Exact Sig. (2-tailed) 0.1154 0.0017 0.0000 0.0000 0.2673 0.0000
Z -1.4878 (b) -4.8194 (b) -6.1420 (b) -9.6279 (a) -3.8846 (b) -10.2852 (a)
Estimated difference size 0.1155 0.3741 0.4767 0.7473 0.3015 0.7983 French Young
Male Exact Sig. (2-tailed) 0.1373 0.0000 (A) 0.0000 0.0000 0.0001 (A) 0.0000
Z -0.3445 (a) -1.4267 (b) -1.0790 (b) -1.4814 (a) -0.0650 (b) -3.10186 (a)
Estimated difference size 0.0703 0.2912 0.2202 0.3024 0.0133 0.6332 French Senior
Female Exact Sig. (2-tailed) 0.7444 0.1593 0.2926 0.1431 0.9555 0.0009
Z -0.7367 (a) -0.7383 (b) 0.0000 -0.3846 (a) -0.5949 (a) -2.4308 (a)
Estimated difference size 0.1969 0.1973 0.0000 0.1028 0.1590 0.6496 French Senior
Male Exact Sig. (2-tailed) 0.4822 0.4954 1.0000 0.7231 0.5728 0.0117
Z -0.4691 (a) -4.4793 (b) -3.4820 (b) -4.8389 (a) -2.0339 (b) -6.8087 (a)
Estimated difference size 0.05 0.4775 0.3712 0.5158 0.2168 0.7258 Population
Sample Exact Sig. (2-tailed) 0.6424 0.0000 0.0004 0.0000 0.0416 0.0000
A comparison of the appropriateness of the online and offline versions of the Yellow Pages to find a supplier reveals there is only a (statistically significant) difference (p<0.0005) in stated appropriateness between online and offline for senior Belgian females. Notably, this difference is moderate. That is, senior Belgian females are considerably more in favor of the offline version than the online version of the Yellow Pages to find a supplier, whereas other response groups seem indifferent. By all response groups, except the senior French response groups, the Internet is deemed more appropriate to find a supplier than the online Yellow Pages (p<0.005). Interestingly, this difference is quite large among Belgian respondents, and moderate for the two young French response groups. For example, on average 40% of young Belgian female responses indicate that Internet search engines are ‘very appropriate’, but only 15% find the online versions of the Yellow Pages appropriate. Exactly the same reasoning goes for the offline version of the Yellow Pages, except for the fact that no statistically significant difference could be found for senior Belgian women

17
between the appropriateness of an Internet search engine and the offline version of the Yellow Pages. Looking for a supplier via an Internet search engine is generally considered more applicable than having a fixed supplier. The difference between both is statistically significant (p<0.0001) and large for all young response groups. The difference is smaller, but still statistically significant (p<0.0005) for the senior Belgian response groups. For senior French response groups, there is no significant difference. A comparison of the stated appropriateness of “Internet search engines” and “Friends and Family” to find a supplier shows a moderate, statistically significant higher appropriateness of Internet search engines by the two young male response groups (p<0.0005) and the senior Belgian male response group (p<0.05). For all female response groups and the senior French male response group, no significant difference can be concluded. This may give the impression that women rely more upon Friends and Family to find suppliers than men. However, a Mann-Whitney-test6 (not reported in the tables) to compare the usage of this medium by different genders, shows there is no statistically significant difference (U=930,5; z=-0.314; p=0.756; n=88). Still, performing the Mann-Whitney-test for Belgium and France separately gives a different picture. Belgian women rely significantly more on Friends and Family to find a supplier than Belgian men (Mann-Whitney U=5353, z=-2.207, p=0.014 one-tailed; n=226). For French men and women, no statistically significant difference is detected between men and women’s recourse to Friends and Family to find a supplier (Mann-Whitney U=238; z=-0.094; p=0.465 one-tailed; n=44), but this may be due to the small sample size.
Table 5 showed that French respondents are more likely to turn to ‘other websites’ (such as e-bay) to find a supplier than Belgian respondents. Still, the results in Table 6 indicate that even for French respondents ‘other websites’ only play a marginal role. There is a large, statistically significant difference between the stated usage of an Internet search engine and the use of ‘other websites’ to find suppliers for all response groups. It should be noted that for senior French people there is no statistically significant difference between Internet search engines and any of the other media in Table 6, except for ‘other sites’. For all response groups the difference is large, showing the fact that other sites, such as e-bay are remotely considered. As a side note, the last row of Table 6 shows the results of a Wilcoxon-test on a subset of the data, containing 63% records of senior respondents (42-54 years, 63% of the years covered in the research) and 37% of young respondents (18-25, 37% of the years covered in the research), equally distributed among Belgium and France. This test shows that if one would not split the sample into subgroups, poor conclusions could be drawn. For some comparisons among media no statistical significance is concluded, whereas there is a statistical significant difference for subpopulations. The other way around, sometimes statistical significance would be concluded, while this is not appropriate for all subpopulations.
6 The test was performed on a subset of the data, containing 63% records of senior respondents (age 42-54, 63% of the years covered in the research) and 37% of ‘young’ respondents (age 18-25, 37% of the years covered in the research).

18
Table 7: Mann-Whitney comparison across countries of ways to make the buy. (A) denotes the result of the asymptotic method instead of the exact method. (B) denotes a difference that was concluded to be significant with the Kolmogorov-Smirnov Z-test.
Personal contact = 1
Personal contact = 4
Internet = 1
Internet = 4 E-
procurement = 1
E- procurement
= 4
Mann-Whitney U 4998 4542 3537 4772
Z -1.54085 -2.5792 -4.79019 -2.03506
Estimated difference size 0.10436 0.174686 0.324433 0.137832 Young Females
Exact Sig. (2-tailed) 0.1234 (A) 0.0097 0.0000 0.0418 (A)
Mann-Whitney U 12966 12350 10976.5 12590.5
Z -2.12867 -2.82811 -4.29725 -2.5319
Estimated difference size 0.114438 0.15204 0.231021 0.136116 Young Males
Exact Sig. (2-tailed) 0.0333 (A) 0.0047 (A) 0.0000 (A) 0.0113 (A)
Mann-Whitney U 624.5 496 564.5 718
Z -3.07867 -4.04399 -3.60938 -2.41406
Estimated difference size 0.290907 0.382121 0.341054 0.228107 Senior Females
Exact Sig. (2-tailed) 0.0018 0.0000 0.0002 0.0152
Mann-Whitney U 393.5 343 351.5 488.5
Z -1.30122 -1.91263 -1.81414 -0.18217
Estimated difference size 0.140315 0.206245 0.195624 0.019644 Senior Males
Exact Sig. (2-tailed) 0.1965 0.0555 0.0697 (B) 0.8593
Mann-Whitney U 4509,5 4600,5 3812,5 4511 5020,5 5214,5
Z -1,92497 -1,72222 -3,60699 -1,92293 -0,9473 -0,3115
Estimated difference size 0,133795 0,119703 0,250703 0,133653 0,065842 0,02165
Company representatives
Exact Sig. (2-tailed) 0,0542 (A, B) 0,0851 0,0003 0,0545 (A, B) 0,3449 0,7564
The last aspect of the purchasing process that was investigated, concerned the purchasing act itself. In Table 7, the results are shown of the Mann-Whitney-test to compare Belgian and French response groups on how appropriate they find a medium to make a purchase. For private respondents, the evaluation of two alternatives is presented: buying through personal contact with the seller and buying via the Internet. For company representatives a third alternative is shown: buying through an e-procurement system. Appendix E shows the average responses of the response groups on the appropriateness of different media. From these tables one can conclude that:
- On average 71% of Belgian responses show that the product was bought or would be bought through personal contact with the seller, whereas this is only 62% for French responses. Similarly, only 18% of Belgian responses indicate that buying through personal contact with the seller would not at all be considered, whereas this is 29% for French responses. Differences between the two countries are statistically significant for several response groups (p<0.05) and are quite large for the senior female respondents. The difference between senior male respondents is, in contrast, not statistically significant. For company representatives there is only a statistically significant difference on the ‘very appropriate’ answers (with the Kolmogorov-Smirnov Z-test; z=1.4043; p=0.0195)
- When buying on the Internet is considered, the picture is turned around. On average 20% of French responses show that the product was bought or would be bought through a website, whereas this is only 11% for Belgian responses. In a similar vein, 72% of Belgian responses indicate that websites would not at all be considered to make the purchase, whereas this is 66% for French

19
responses. Statistically significant differences are noted for all user groups (p<0.05) 7.
- For most companies, the products that were listed would be considered Indirect products. This may explain the low average figures that show up when company representatives assess the usage of an e-procurement system. Only 7% of Belgian responses and 5% of French responses indicate that an e-procurement system would be used to buy the product or service. While more Belgian than French responses seem to indicate that an e-procurement system would be used, no statistically significant differences are noted.
The Internet buying behavior of all different private response groups is compared with a Mann-Whitney test in Table 8. No statistically significant differences are found among different French response groups. However, almost every comparison of a French response group with a Belgian response group (no matter what age or gender) results in a statistically significant difference, except when comparing the responses of senior French men with those of (young and senior) Belgian men. Moreover, the difference is sometimes quite large. For example when comparing senior Belgian women with young French women, the estimated difference size is 0.449, what also shows in the averages in Appendix E: on average 21% of young French female responses indicate that the Internet is a very appropriate means to make a buy, whereas only 8% of senior Belgian female responses say the same. The findings of Tracy (1998), Kwak et al. (2002), Wells & Chen (1999) and others that the Internet is used more by men to shop than by women is not confirmed in our research, except when comparing senior Belgian women with senior Belgian men. No statistically significant difference is found between the two genders among young Belgians, young French and senior French people.
7 For the senior men the Kolmogorov-Smirnov test returned a z=1.2363 and p=0.0353. For the company representatives, the Kolmogorov-Smirnov test returned a z=1.448 and p=0.014.

20
Table 8: Mann-Whitney test to compare Buying on the Internet across responses groups (exact method, except where (A) asymptotic method)
Senior French Males
Senior French
Females
Young French Males
Young French
Females
Senior Belgian Males
Senior Belgian Females
Young Belgian Males
Mann-Whitney U 594.5 1048.5 6900.5 3537.0 4613.5 4747.0 10617.5
Z -2.1951 -2.6332 -5.4535 -4.7902 -0.2616 -2.2804 -1.52169
Estimated difference size -0.182292 -0.211506 -0.31644 -0.32443 -0.01836 -0.15409 -0.08629
Belgian Young
Females
Exact Sig. (2-tailed) 0.0272 0.0079 0.0000 0.0000 0.7946 0.0224 0.1283
Mann-Whitney U 971.5 1627 10976.5 5663.5 5971.5 5843
Z -1.442391 -1.9858 -4.29725 -3.69587 -0.98847 -3.56236
Estimated difference size -0.103558 -0.139034 -0.23102 -0.22618 -0.06227 -0.21761
Young Belgian Males
Exact Sig. (2-tailed) 0.1511 0.0467 0.0000 (A) 0.0002 0.3239 0.0003
Mann-Whitney U 287 564.5 3692.5 1868.5 2602.5
Z -3.313615 -3.609377 -6.5567 -5.94201 -2.01678
Estimated difference size -0.328097 -0.341054 -0.4114 -0.44917 -0.15944
Senior Belgian Females
Exact Sig. (2-tailed) 0.0006 0.0002 0.0000 0.0000 0.0436
Mann-Whitney U 351.5 597 4020.5 2070.5
Z -1.814138 -2.299609 -4.03881 -3.70681
Estimated difference size -0.195624 -0.234703 -0.2618 -0.29397
Senior Belgian Males
Exact Sig. (2-tailed) 0.0697 0.0209 0.0000 0.0002
Mann-Whitney U 542 1035 7131.5
Z -0.661166 -0.06478 -0.16257
Estimated difference size -0.065788 -0.006149 -0.01022
Young French
Females
Exact Sig. (2-tailed) 0.5141 0.9501 0.8715
Mann-Whitney U 1036.5 1964
Z -0.67316 -0.111711
Estimated difference size -0.050174 -0.008104
Young French Males
Exact Sig. (2-tailed) 0.5057 0.9124
Mann-Whitney U 155.5
Z -0.380375
Estimated difference size -0.061705
Senior French
Females
Exact Sig. (2-tailed) 0.7088
A per-response-group comparison among private buyers of the appropriateness of different ways to make a buy shows a big (statistically significant) difference between online and offline buying. That is, buying offline is in both countries still by far considered to be the most appropriate way to make a buy8. The results of the Wilcoxon-test are shown in Table 9. In conclusion we can say that Belgians find the Internet less appropriate than French people to actually buy a product or service but that responses from both countries show that buying via the Internet is still considerably less appropriate than buying through personal communication.
8 Figures for the company representative responses are most similar. Tests show that buying via personal contact is considered more appropriate than buying via a website. Moreover, buying via a website is considered more appropriate than buying via an e-procurement system.

21
Table 9: Wilcoxon-test for per-response-group comparison of the appropriateness of different ways to make a buy. (All based on positive ranks.)
Z -9.7328
Estimated difference size 0.8504 Belgian Young Female
Asymp. Sig. (2-tailed) 0.0000
Z -10.8629
Estimated difference size 0.8097 Belgian Young Male
Asymp. Sig. (2-tailed) 0.0000
Z -7.9586
Estimated difference size 0.8484 Belgian Senior Female
Asymp. Sig. (2-tailed) 0.0000
Z -7.0177
Estimated difference size 0.8270 Belgian Senior Male
Asymp. Sig. (2-tailed) 0.0000
Z -7.6277
Estimated difference size 0.8178 French Young Female
Asymp. Sig. (2-tailed) 0.0000
Z -9.9330
Estimated difference size 0.7709 French Young Male
Asymp. Sig. (2-tailed) 0.0000
Z -2.6928
Estimated difference size 0.5497 French Senior Female
Asymp. Sig. (2-tailed) 0.0055
Z -2.9834
Estimated difference size 0.7973 French Senior Male
Asymp. Sig. (2-tailed) 0.0011
Discussion The hypothesis can clearly be rejected. The research results show that there are statistically significant differences in all steps of the e-commerce process in the two neighboring countries. For example, there are less responses in Belgium saying that it is appropriate to buy on the Internet than responses saying the same in France. Interestingly, this is true for all response groups: for both age groups, for both genders and for both, private consumers and company representatives there is difference between Belgium and France! One factor that tends to determine the Internet usage is – of course – the extent to which people have access to Internet. According to Internetworldstats.com the Internet penetration rate was 54,7% in France in November 2007, and was 52.8% in Belgium in December 2007. The countries are on places 37 and 39 in the list of countries with the highest Internet penetration rates [www.Internetworldstats.com]. Penetration rates in Belgium and France are thus similar. Furthermore, France and Belgium respectively take places 23 and 24 with scores of 4.99 and 4.93 on the 2006-2007 Networked Readiness Index of the World Economic Forum (World Economic Forum, 2007), what suggests the countries have a comparable level of ICT development. Also according to this report, the number of broadband subscribers per 100 inhabitants is comparable: 19.13 for Belgium, 20.91 for France. From this, we can say that a difference in available IT infrastructure can hardly be considered the cause of detected differences between the two countries.

22
Something else must thus be causing these differences. While many researchers would consider Belgium and France to be similar in terms of Hofstede’s dimensions, they are not exactly the same. Interestingly, the Uncertainty Avoidance Index of Belgium is 8 points higher than that of France. As stated before, trust issues have been shown to be important inhibitors of e-commerce. This suggests that the lower Uncertainty Avoidance Index value of France could be a predictive variable of the higher considered appropriateness of buying online. It is not possible on the basis of this research to determine whether a difference of 8 points should be considered a substantial difference anyway, or that there are yet other drivers for the difference, but in both cases the important final conclusion is that it is wrong to assume that countries which seem to have a similar culture will not show differences in on-line buying behavior! From a practitioner’s viewpoint, there are important consequences for companies that would like to sell in the neighboring countries. Estimating the number of future Internet sales abroad on the basis of inland Internet sales would lead to a wrong decision on how many costs are justifiable to create a tailored website. This proves even to be the case among countries with a ‘similar’ (but somewhat different) Hofstede profile. Furthermore, witnessing that customers switch your local brick-and-mortar shop for your website shop does not imply that this will be the same abroad and that a percentage of shops abroad can just be closed like that. In addition to the findings concerning differences in buying, there are also several statistically significant differences with respect to how information is gathered in the course of the e-commerce process. This has important consequences for researchers. Unlike what Lynch, Kent and Srinivasan (2001) have done, our research proves that one cannot assume to get an accurate image of a ‘region’ with the size of Europe if only 108 people are surveyed in that region. Even if all countries would score almost the same on Hofstede’s cultural dimensions, the assumption that there are no differences between these countries would be wrong. Notably, while differences between Belgium and France are small in terms of Hofstede’s cultural dimensions; big differences also show up within Europe and several countries have a unique mix of scores. For example, (amongst others) Denmark only scores 23 on the Uncertainty Index, whereas France scores 86. Our research suggests that a comparison of the purchasing process between two regions, such as Asia and Europe for example, cannot be scientifically correct if not enough respondents are taken in each part of the region. By all means, it is of profound importance for any research concerning Internet adoption to define at least the country in which the survey was done. Even this was often not explicitly stated in prior research (see e.g. (Kwak, Fox & Zinkhan, 2002)). For practitioners there are important consequences as well. When it comes to the global medium, Internet search engines, there are almost no statistically significant differences noted between the two countries: Belgian and French customers say it has a similar appropriateness. Investing in search engine optimization of a ‘standardized web site’ could thus pay off in both countries. When comparing the use of Internet search engines to find a supplier with other media, Internet search engines are considered much more appropriate than any of the other media in Belgium, but this is not at all the case among senior French people. That is, for senior French people, other media are considered as appropriate as Internet search engines. Consequently, it may be more appropriate to invest in a search engine optimizer for an entirely culturally customized website in one country than in another. For example, investing in search engine optimization of entirely culturally customized websites is more appropriate in Belgium than in France (if senior people are the target audience)

23
because the French target audience can be reached as well through other media such as the online Yellow Pages. Similarly, investments to get a good placement in the online Yellow Pages may be justifiable in one country but not in another; not even in neighboring countries (of which often a similar customer behavior is assumed). As an example, good experiences with the Yellow Pages in France are not likely to be replicated (to the same extent) with investments in the Belgian Yellow Pages. Especially with the online Yellow Pages there are big differences between both countries. For example, while 25% of young Frenchmen say that the online Yellow Pages are very appropriate to find a supplier, only 11% of the young Belgian men say this. It is also remarkable that senior Belgian women do not seem to make the switch to the online Yellow Pages although they would use Internet search engines to find suppliers as often as they would use the offline version of the Yellow Pages. Furthermore, for practitioners it is important to understand the importance of a local shop to give product and service information. French people find communication with the seller much more appropriate to gather product information then Belgians. Consequently, opening or having a local brick-and-mortar shop in France may be appropriate for reasons of communicating product information. The other way around, buying on the Internet is considered less appropriate in Belgium, so opening or having a local brick-and-mortar shop in Belgium may be more important for reasons of selling, rather than communicating product information. This finding should be kept in mind when evaluating the performance of local shops and Internet shops. It is quite possible that, as the brick-and-mortar shops have a different role to play, the role of employees, their necessary knowledge, the locally required product stock etcetera may be different in two neighboring countries (such as France and Belgium). Further research on this is wanted.
Limitations to the study The findings in this paper concern ‘the average product’. By aggregating the rough data in another dimension (namely by grouping responses of different respondents within a response group per product), it is possible to see that there are big differences between different products. This paper mentions a few eye-catching differences in footnote 5, but in general, responses for all products are different. The goal of this paper was, however, not to investigate product issues, but to investigate differences among countries. Given the fact that different individuals may identify with national culture to varying degrees (Srite & Karahana, 2006), it was attempted to get a large number of respondents in both countries. The statistical tests were finally run on data from 388 French and 581 Belgian respondents, what seems appropriate. Still, there were only 14 senior French males in the sample. Often, the medians of Belgian and French senior males were quite distinct, but no statistically significant difference was found, what may be due to the fact that there were only a limited number of French senior males in the sample. We note that findings from this study, like all results from studies on the influence of culture, cannot just be applied to a specific individual in the population. “The effect of culture is not homogeneous but rather dependent on the extent to which the individual subscribes to various cultural values” (Srite & Karahanna, 2006, p681). As such, it is appropriate to assess the individual’s espoused cultural values.

24
Conclusion Organizations should investigate whether customers actually look on the Internet for product information and for a supplier and whether customers actually buy products and services online, before investing in website development and search engine optimization. In this paper, differences in e-commerce behavior in two neighboring countries are discovered through a survey of private consumers and company representatives on several products. The research at hand reveals big differences in e-commerce behavior between people from two neighboring countries which seem rather similar in terms of Hofstede’s cultural dimensions. This has far-reaching consequences for practitioners and researchers. We can say that, in general, for any combination of two countries, companies that consider selling abroad (thus even to consumers that are only 30 kilometers away in a neighboring country) should be aware of big differences in e-commerce behavior when they evaluate some investment option. Given the costs to create and to maintain a culturally customized website, customer Internet behavior should be decently investigated upfront. It should be noted that companies have to tailor this investigation to their specific target group, as there are big differences between different response groups. For researchers there is the important conclusion that they have wrongly assumed in the past that a sample of a few countries in a geographical region is sufficient to give a scientifically correct image of that region.
References Anderson P.F., Chambers T.M. (1985). A Reward/Measurement model of organizational buying behavior, Journal of Marketing, Vol. 49, pp. 7-23.
Bartikowski, B, Fassot G. and Singh N. (2006). L’acceptation des sites Web à l’international Une étude Franco-Allemande, Revue du Management Technologique, France.
Chin W., Gopal 1. (1995). Adoption intention in GSS: Relative importance of beliefs, Database, Vol. 26:2&3, pp. 42-61.
Davis F.D. (1989). Perceived usefulness, perceived ease of use, and user acceptance of information technology, MIS Quarterly, Vol. 13:3, pp. 319-340.
D’Iribarne P. (1989), La logique de l’honneur, Paris, Le Seuil.
Donthu N., Garcia A. (1999). The Internet shopper, Journal of Advertising Research, Vol. 39:3, pp. 52-58.
Engel, J.F., Blackwell, R.D., & Miniard, P.W. (1995). Consumer behavior (8th ed.), Chicago: the Dryden Press.
Fogg, B.J., Marshall J., Laraki O., et al. (2001) What Makes Web Sites Credible? A Report on a Large Quantitative Study, In Proceedings of CHI 2001 ACM Press, pp. 61-68.
Gallivan M., Srite M. (2005) “Information Technology and Culture: Identifying Fragmentary and Holistic Perspectives of Culture”, Information & Organization, Vol. 15:4, pp. 295-338.
Gefen D., Straub D.W. (1997). Gender Differences in the Perception and Use of E-Mail: An Extension to the Technology Acceptance Model, MIS Quarterly, Vol. 21: 4, pp. 389-400.
Gopal A., Bostrom R., Chin . (1992-1993). Applying adaptive structuration theory to investigate the process of group support system use, Journal of Management Information Systems, Vol. 9:3, pp. 45-69.
Hansen T. (2005). Perspectives on consumer decision making: an integrated approach, Journal of Consumer Behaviour, Vol.4:6, pp. 420-437.
Hoffman D.L, Kalsbeek W.D., Novak T.P. (1996). Internet and Web use in the U.S., Communications of the ACM, Vol. 39:12, pp. 36-46.
Hoffman D.L., Novak T.P., Peralta M. (1999). Building consumer trust online, Communications of the ACM, Vol. 42:4, pp. 80-85.

25
Hofstede G. (1980). Culture’s Consequences, Sage, Beverly Hills.
Hofstede G. (1987). Relativité culturelle des pratiques et théorie de l’organisation, Revue Française de Gestion, Septembre – Octobre, pp.10-21.
Hui, D.C.S. (2001). Barriers facing Hong Kong Internet Non-Shoppers - An Empirical Study. Available at SSRN: http://ssrn.com/abstract=287972
Jackson C.M., Chow S., Leitch R.A. (1997). Towards an understanding of the behavioral intention to use an information system, Decision Sciences, spring 1997.
Jarvenpaa S.L., Tractinsky N., Vitale M. (2000). Consumer trust in an Internet store, Information technology and management, Vol. 1:1, pp. 45-71.
Ji L.J., Schwartz N., Nisbett R.E. (2000). Culture, anthropological memory, and behavioral frequency report: measurement issues in cross-cultural studies, Personality and social psychology bulletin, Vol. 26, pp. 585-593.
Karahanna E., Evaristo R., Srite M. (2005). Levels of Culture and Individual Behavior: An Integrated Perspective, Journal of Global Information Management, Vol 13:2, pp. 1-20.
Kerr A.W., Hall H.K., Kozub S.A. (2002). Doing statistics with SPSS, Sage Publications, p 238.
Kwak H., Fox R.J., Zinkhan G.M. (2002). What products can be successfully promoted and sold via the Internet?, Journal of Advertising Research, Vol. 42:1, pp. 23-38.
Kumar N., Benbasat I. (2006). The influence of recommendations and consumer reviews on evaluations of websites, Information Systems Research, Vol. 17:4, pp. 425-439.
Lederer A., Maupin D., Sena M., Zhuang Y. (2000). The technology acceptance model and the world Wide Web, Decision Support System, Vol. 29, p. 269-282.
Lee, J., Kim, J., & Moon, J.Y. (2000). What makes Internet users visit cyber stores again? Key design factors for customer loyalty. In Proceedings of the ACM CHI 2000, The Hague, Amsterdam, pp. 305-312.
Lightner N.J. (2003). What users want in e-commerce design: effects of age, education and income, Ergonomics, Vol. 46:1-3, pp. 153-168.
Lim K.H., Leung K., Sia C.L., Lee M.K. (2004). Is ecommerce boundary-less? Effects of individualism-collectivism and uncertainty avoidance on Internet shopping, Journal of International Business Studies, Vold. 35:6, pp. 545-559.
Lin J.C.C., Lu H.P. (2000). Towards an understanding of the behavioral intention to use a web site, International Journal of Information Management, Vol. 20:3, pp. 197-208. Lynch P.D., Kent R.J., Srinivasan S.S. (2001). The global internet shopper: evidence from shopping tasks in twelve countries, Journal of Advertising Research, Vol. 41:3, pp. 15-23. Palmer J.W., Bailey J.P., Faraj S. (2000). The role of intermediaries in the development of trust on the WWW: the use and prominence of trusted third parties and privacy statements, Journal of Computer-mediated communication, Vol.5:3, Retrieved from http://www.ascusc.org/jcmc/vol5/issue3/palmer.html on June 2, 2008.
Pavlou P.A. (2003). Consumer acceptance of electronic commerce – integrating trust and risk with the Technology Acceptance Model, International journal of electronic commerce, Vol. 7:3, pp. 101-134.
Pavlou P.A., Chai L. (2002). What drives electronic commerce across cultures? A cross-cultural empirical investigation of the theory of planned behavior. Journal of Electronic Commerce Research, Vol; 3:4, pp. 240-253.
Peng K., Nisbett R.E., Wong N.Y.C. (1997). Validity problems comparing values across cultures and possible solutions, Psychological methods, Vold. 2, pp. 329-344.
Riegner C. (2007). Word of Mouth on the Web: The impact of web 2.0 on consumer purchase decisions, Journal of Advertising Research, December 2007, pp. 436-447.
Rodgers S., Harris M.A. (2003). Gender and E-commerce: An exploratory study, Journal of Advertising Research, September 2003, pp. 322-329.

26
Seock Y., Bailey L.R. (2008). The influence of college student’s shopping orientations and gender differences on online information searches and purchase behaviours, International journal of Consumer Studies, Vol. 32, pp. 113-121.
Simon S.J. (2000). The impact of culture and gender on web sites: an empirical study, Database for Advances in Information Systems, Vol. 32:1, pp. 18-37.
Singh N., Boughton P.D. (2002). Measuring web site globalization: a cross-sectional country and industry level analysis, American Marketing Association Conference Proceedings, Vol.13, pp. 302-303.
Singh, N., Zhao, H.X., Hu, X.R. (2003), "Cultural adaptation on the web: a study of American companies' domestic and Chinese web sites", Journal of Global Information Management, Vol. 11 No.3, pp.63-81.
Singh N., Furrer OK, Ostinelli M. (2004). To localize or to standardize on the web: empirical evidence from Italy, India, Netherlands, Spain, and Switzerland, The Multinational Business Review, Vol. 12:1, pp. 69-87.
Sinkovics R.R., Yamin M., Hossinger M. (2007). Cultural adaptation in cross border e-commerce: a study of German companies, Journal of Electronic Commerce Research, Vol. 8:4, pp. 221-235.
Slyke C. van, Belanger F., Comunale C.L. (2004). Factors influencing the adoption of web-based shopping: the impact of trust, Database for advances in information systems, Vol. 35:2, pp. 32-49.
Srite M., Karahanna E., (2006). The Role of Espoused National Cultural Values in Technology Acceptance, MIS Quarterly, Vol. 30: 3, pp. 679-704.
Straub D.W. (1994). The Effect of Culture on IT Diffusion: E-Mail & Fax in Japan and the U.S., Information Systems Research, Vol.5:1, pp. 23-47.
Straub D.W, Keil M., & Brenner W. (1997). Testing the Technology Acceptance Model across cultures: A three country study. Information & Management, Vol.33, pp. 1-11.
Tam K.Y., Ho S.Y. (2005). Web personalization as a persuasion strategy: an elaboration likelihood model perspective, Information Systems Research, Vol. 16:3, pp. 271-291.
Taylor S., Todd P.A. (1995). Understanding information technology usage: A test of competing models, Information Systems Research, Vol. 6:2, pp. 144-176.
Tracy B. (1998). Seasoned users lead in e-commerce, Advertising Age.
Venkatesh, V., Morris, M. G., Davis, G. B., and Davis, F. D. "User Acceptance of Information Technology: Towards a Unified View," MIS Quarterly (27:3), 2003, pp. 425-478.
Wang, Y.D. and Emurian, H.H. Trust in E-Commerce: Consideration of Interface Design Factors, Journal of Electronic Commerce in Organizations, Vol.3:4, 2005, pp. 42-60.
Wells W.D., Chen Q. (1999). Surf’s up – differences between web surfers and non-surfers: theoretical and practical implications, In: Proceedings of the Conference of The American Academy of Advertising.
World Economic Forum (2007). The Networked Readiness Index 2006-2007 rankings. Retrieved from www.weforum.org/pdf/gitr/rankings2007.pdf on June 2, 2008.
Yang B., Lester D. (2005). Gender differences in e-commerce, Applied Economics, Vol. 37:18, pp. 2077-2089.
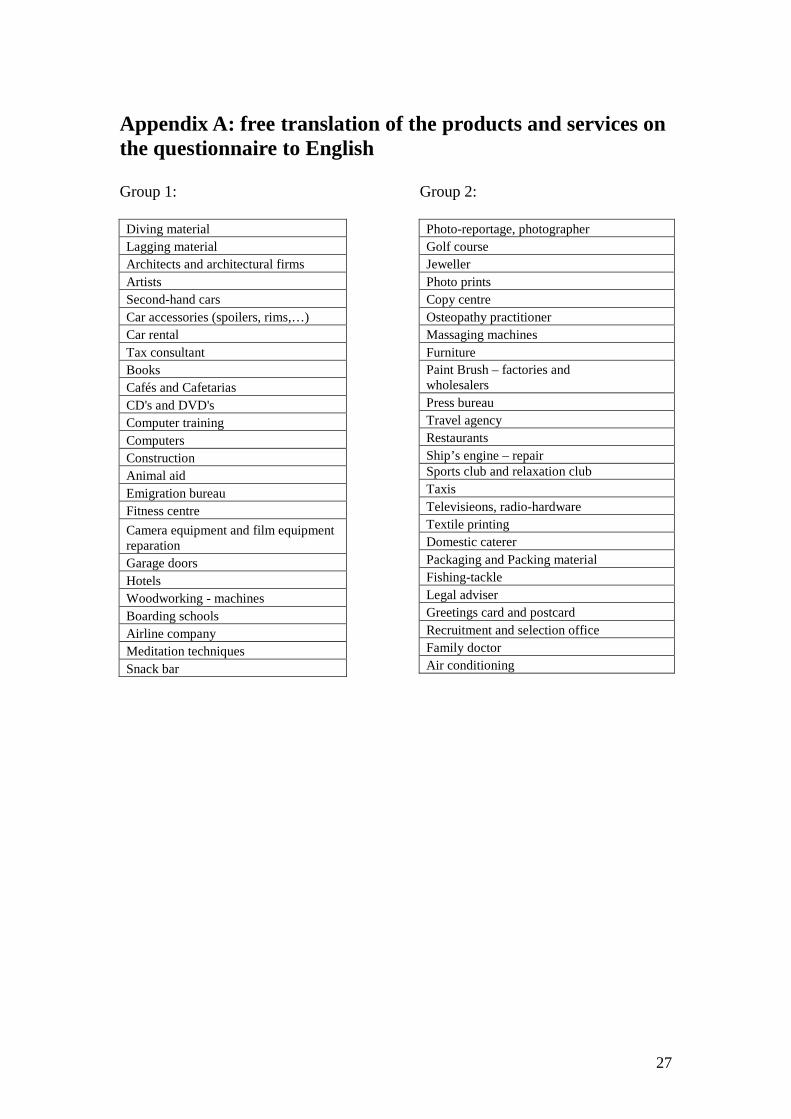
27
Appendix A: free translation of the products and services on the questionnaire to English Group 1: Diving material Lagging material Architects and architectural firms Artists Second-hand cars Car accessories (spoilers, rims,…) Car rental Tax consultant Books Cafés and Cafetarias CD's and DVD's Computer training Computers Construction Animal aid Emigration bureau Fitness centre
Camera equipment and film equipment reparation Garage doors Hotels Woodworking - machines Boarding schools Airline company Meditation techniques Snack bar
Group 2: Photo-reportage, photographer Golf course Jeweller Photo prints Copy centre Osteopathy practitioner Massaging machines Furniture Paint Brush – factories and wholesalers Press bureau Travel agency Restaurants Ship’s engine – repair Sports club and relaxation club Taxis Televisieons, radio-hardware Textile printing Domestic caterer Packaging and Packing material Fishing-tackle Legal adviser Greetings card and postcard Recruitment and selection office Family doctor Air conditioning

28
Appendix B Table 10: Tasks in the e-commerce process and options to evaluate in the survey (left column) vs. in the paper reported options (right column)
To gather information about the product or service:
Offline: magazines & books /
Offline: Friends and Family Friends and Family
Offline: Sellers Communication with the seller
Online: Webpages found with Google
Online: On a site I knew
Online: Webpages found with another search engine (Yahoo, MSN,…)
The Internet
Online: Other /
To find a supplier:
Offline: magazines & books /
Offline: Friends and Family Friends and Family
Offline: Other people /
Offline: The Yellow Pages Yellow Pages offline version
Offline: I already had a fixed supplier Fixed supplier
Offline: Other /
Online: Google
Online: Other search engine (Yahoo, MSN,…) Internet search engine
Online: Yellow Pages online Yellow Pages online version
Online: An online auction (e-bay, …)
Online: Other website I knew
Other website (such as electronic marketplaces like e-bay or websites they already knew)
To make the purchase:
Face-to-face contact or via telephone Personal contact with the seller
Via e-mail /
Via the website of the seller itself
Via another website (e.g. e-bay) Through a website
E-procurement solution (only for company representatives)
E-procurement solution (only for company representatives)
Other /

29
Appendix C Table 11: Average scores of different media to find product and service information. '1'-column: response = “medium is very appropriate”; '4'-column: response = “medium is not appropriate at all”. Overall mean = unweighted mean of different response groups.
Friends & Family = 1
Friends & Family = 4
Commun. Sel. = 1
Commun. Sel. = 4
Internet = 1
Internet = 4
Mean Belgium 0.3133 0.2809 0.2846 0.3945 0.4892 0.1994 Young Females Mean France 0.2961 0.3011 0.4506 0.2864 0.4354 0.2409
Mean Belgium 0.2356 0.3488 0.2687 0.4136 0.4607 0.2093 Young Males Mean France 0.24482 0.3463 0.3788 0.3198 0.4374 0.2419
Mean Belgium 0.2964 0.3418 0.2545 0.5055 0.3509 0.3382 Senior Females Mean France 0.28 0.3617 0.3400 0.3933 0.3583 0.3683
Mean Belgium 0.2433 0.3528 0.2056 0.4983 0.3883 0.2650 Senior Males Mean France 0.3314 0.3286 0.3686 0.4486 0.36 0.3914
Mean Belgium 0,2335 0,4058 0,2869 0,4458 0,4106 0,2818 Company representatives Mean France 0,2297 0,4351 0,3909 0,3538 0,3856 0,3369
Overall Mean Belgium 0,2644 0,3460 0,2601 0,4515 0,4199 0,2587
Overall Mean France 0,2764 0,3546 0,3858 0,3604 0,3953 0,3159

30
Appendix D Table 12: Average scores of different media to find a supplier. '1'-column: response = “medium is very appropriate”; '4'-column: response = “medium is not appropriate at all”. Overall mean = unweighted mean of different response groups.
Friends & Family = 1
Friends & Family = 4
Yellow Pages
Offline = 1
Yellow Pages
Offline = 4
Yellow Pages
Online = 1
Yellow Pages
Online = 4
Internet search = 1
Internet search = 4
Other site = 1
Other site = 4
Fixed Supplier =
1
Fixed Supplier =
4
Mean Belgium 0.3221382 0.2766412 0.1465656 0.6036641 0.1520618 0.5691603 0.3957252 0.2650458 0.0280924 0.8720611 0.0964893 0.7963282 Young Females Mean France 0.3121724 0.3218402 0.2216092 0.5291954 0.2671264 0.4478161 0.3632299 0.3236782 0.0680471 0.8409195 0.1204609 0.7641264
Mean Belgium 0.2522228 0.3508889 0.1131117 0.6826667 0.1095556 0.6846667 0.4257778 0.2611111 0.0415561 0.8675556 0.0835561 0.8213278 Young Males Mean France 0.2566265 0.3643373 0.2053012 0.5161446 0.246747 0.4956627 0.3920482 0.2968675 0.0698795 0.8272289 0.1033741 0.7978313
Mean Belgium 0.2690909 0.3681818 0.2122727 0.5431818 0.1245455 0.6881818 0.2822614 0.4250011 0.019092 0.9531705 0.1154557 0.7668068 Senior Females Mean France 0.288375 0.3666667 0.193375 0.535 0.185 0.553375 0.2782917 0.4566708 0.0650042 0.8582917 0.1716667 0.708375
Mean Belgium 0.2211111 0.3550139 0.1738903 0.5405417 0.1433333 0.5811111 0.3422083 0.3327792 0.0150014 0.9311111 0.1111111 0.775 Senior Males Mean France 0.2657143 0.5 0.2371429 0.6085714 0.2 0.6628571 0.2285786 0.6857857 0.0314357 0.9342143 0.1885714 0.78
Mean Belgium 0,249455 0,364364 0,120373 0,624 0,147273 0,573818 0,353455 0,348364 0,017464 0,895273 0,193827 0,661818 Company representatives Mean France 0,251959 0,41733 0,207433 0,522887 0,257742 0,516701 0,314237 0,42599 0,069279 0,832175 0,202072 0,660216
Overall Mean Belgium 0,2628 0,3430 0,1532 0,5988 0,1354 0,6194 0,3599 0,3265 0,0242 0,9038 0,1201 0,7643
Overall Mean France 0,2750 0,3940 0,2130 0,5424 0,2313 0,5353 0,3153 0,4378 0,0607 0,8586 0,1572 0,7421

31
Appendix E Table 13: Average scores of different media to make the buy. '1'-column: response = “medium is very appropriate”; '4'-column: response = “medium is not appropriate at all”. Overall mean = unweighted mean of different response groups.
Personal contact = 1
Personal contact = 4
Internet = 1
Internet = 4
E-procurement
= 1
E- procurement
= 4
Mean Belgium 0.7392366 0.1389313 0.1032061 0.6977099 Young Females Mean France 0.6721724 0.2298862 0.2133345 0.639069
Mean Belgium 0.6942222 0.1797778 0.1357778 0.6917833 Young Males Mean France 0.6248193 0.273741 0.2026506 0.6325301
Mean Belgium 0.7322727 0.1445455 0.0781818 0.7713636 Senior Females Mean France 0.5316667 0.3633333 0.2333333 0.615
Mean Belgium 0.7183333 0.1844444 0.1238903 0.7227778 Senior Males Mean France 0.6542143 0.3000071 0.1657214 0.7742143
Mean Belgium 0,666182 0,231273 0,117455 0,698182 0,069828 0,878545 Company representatives Mean France 0,603299 0,280412 0,194227 0,630515 0,046619 0,816073
Overall Mean Belgium 0,7100 0,1758 0,1117 0,7164 0,069828 0,878545
Overall Mean France 0,6172 0,2895 0,2019 0,6583 0,046619 0,816073