Individual Differences in Working Memory Capacity and the ...

Working Memory and Dyslexia
Roderick I. Nicolson*, Angela J. Fawcett*and Alan D. Baddeley†
*Department of Psychology †MRC Applied Psychology Unit
University of Sheffield Cambridge
Abstract
Recent research has demonstrated that dyslexic children suffer impairments in
both phonological skills and in working memory performance. In principle
either a phonological deficit or a working memory deficit could underlie both
sets of symptoms. This issue was addressed via a series of experiments
designed to explore the relationships between dyslexia, age, phonological
performance and working memory. Two groups of dyslexic children
participated, with mean ages 15 and 11 years respectively, together with three
groups of non-dyslexic children (mean ages 15, 11 and 8 years) matched for IQ
with the dyslexic children and selected so as to provide both chronological and
reading age controls for the two dyslexic groups. The performance of the older
dyslexics across the range of tasks was slightly but not significantly worse than
their chronological age controls and indistinguishable from that of their reading
age controls. By contrast, the performance of the younger dyslexics was
significantly worse than that of their chronological age controls on phonological
discrimination, articulation rate, and nonword repetition, and was significantly
worse even that of their reading age controls on repetition of longer nonwords.
On tests of memory span, all five groups showed the normal phonological
similarity effect and the normal word length effect. When memory span was
regressed as a function of articulation rate, there was no evidence of impaired
slope or intercept for the dyslexic children. It is concluded that the 11 year old
dyslexic children show residual problems on phonological processing,
especially for tasks involving unfamiliar stimuli, but that by their mid-teens
dyslexic children have overcome these problems. The major remaining problem
for the dyslexic children appears to be a continuing lack of fluency in
articulation, a factor which is sufficient to account for the slight deficits on
memory span. Furthermore, it is argued that the articulation rate deficit
provides a parsimonious explanation of the range of deficits shown by the
younger dyslexic children. It is concluded that neither impaired phonological
skills nor impaired working memory is sufficient in itself to explain the deficits,
but that some deeper explanation must be sought.

Acknowledgements
The research reported in this chapter was supported by a grant from the Leverhulme Trust to the
first author. We acknowledge gratefully the support of the participants in this study, and of the
staff and pupils at Ecclesall Junior School and High Storrs and Silverdale Secondary schools,
Sheffield.
1 . Introduction
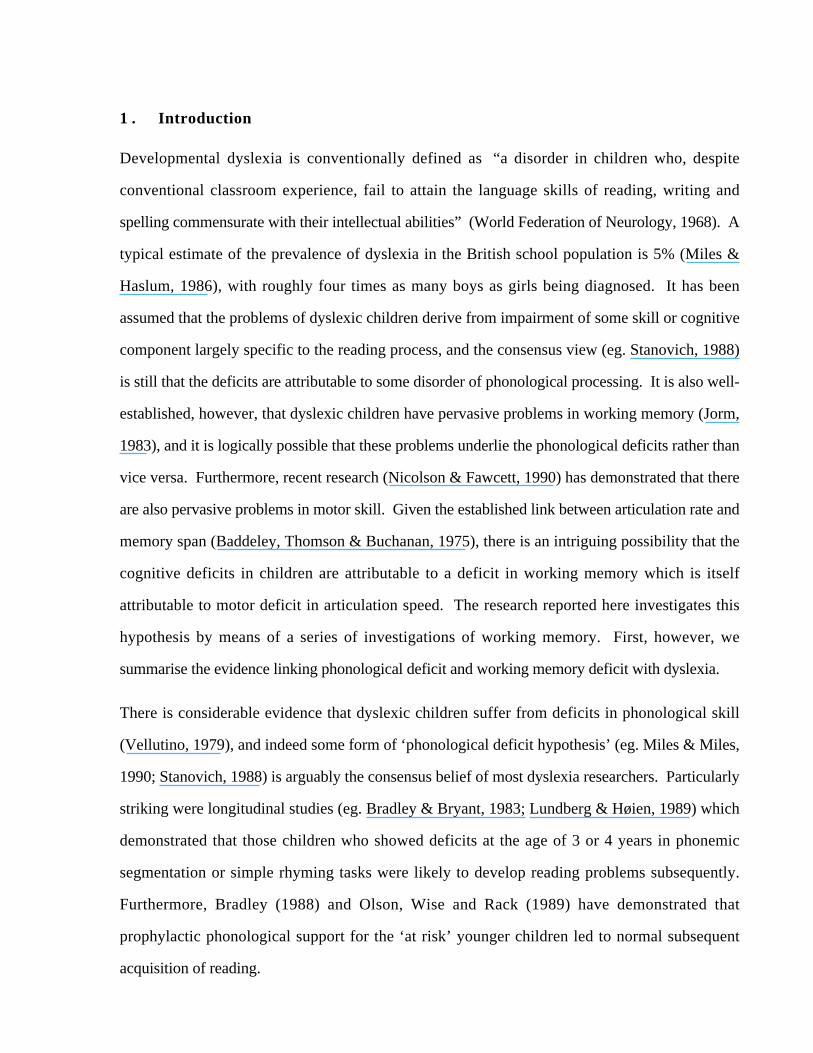
Developmental dyslexia is conventionally defined as “a disorder in children who, despite
conventional classroom experience, fail to attain the language skills of reading, writing and
spelling commensurate with their intellectual abilities” (World Federation of Neurology, 1968). A
typical estimate of the prevalence of dyslexia in the British school population is 5% (Miles &
Haslum, 1986), with roughly four times as many boys as girls being diagnosed. It has been
assumed that the problems of dyslexic children derive from impairment of some skill or cognitive
component largely specific to the reading process, and the consensus view (eg. Stanovich, 1988)
is still that the deficits are attributable to some disorder of phonological processing. It is also well-
established, however, that dyslexic children have pervasive problems in working memory (Jorm,
1983), and it is logically possible that these problems underlie the phonological deficits rather than
vice versa. Furthermore, recent research (Nicolson & Fawcett, 1990) has demonstrated that there
are also pervasive problems in motor skill. Given the established link between articulation rate and
memory span (Baddeley, Thomson & Buchanan, 1975), there is an intriguing possibility that the
cognitive deficits in children are attributable to a deficit in working memory which is itself
attributable to motor deficit in articulation speed. The research reported here investigates this
hypothesis by means of a series of investigations of working memory. First, however, we
summarise the evidence linking phonological deficit and working memory deficit with dyslexia.
There is considerable evidence that dyslexic children suffer from deficits in phonological skill
(Vellutino, 1979), and indeed some form of ‘phonological deficit hypothesis’ (eg. Miles & Miles,
1990; Stanovich, 1988) is arguably the consensus belief of most dyslexia researchers. Particularly
striking were longitudinal studies (eg. Bradley & Bryant, 1983; Lundberg & Høien, 1989) which
demonstrated that those children who showed deficits at the age of 3 or 4 years in phonemic
segmentation or simple rhyming tasks were likely to develop reading problems subsequently.
Furthermore, Bradley (1988) and Olson, Wise and Rack (1989) have demonstrated that
prophylactic phonological support for the ‘at risk’ younger children led to normal subsequent
acquisition of reading.

However, dyslexic children often show equally severe problems in immediate memory — for
instance, Miles (1983) has shown that a deficit on digit span is one of the most common
symptoms of dyslexia, with particular deficits often shown on backwards span. In a
comprehensive review of working memory, Jorm (1983), having noted that much of the evidence
was confusing owing to problems of definition of dyslexia and inadequate experimental control,
concluded that “… there is fairly consistent evidence that [specific] reading retardation1 can be
associated with a deficit in the long-term storage of phonological information. This deficit may
affect retarded readers’ ability to utilize the articulatory loop, a short-term store which appears to
play an important role in certain aspects of normal reading acquisition.” (1983, p311). In other
words, Jorm attributed the working memory deficits of dyslexic children to the established
phonological deficits. Further evidence of impaired phonological working memory was provided
by Snowling and her colleagues, who discovered that dyslexic children show a deficit compared
even with reading age controls on nonword repetition, that is, accurately repeating a spoken
nonsense word (Snowling, 1981, Snowling,Goulandris, Bowlby & Howell, 1986).
A systematic investigation of the relationship between working memory and phonological skill
was reported in Gathercole and Baddeley (1990) in which they investigated several of the skills
potentially underlying phonemic segmentation. The participants in the study were five ‘language
disordered’ children with ages in the range from 7:2 to 8:10, with symptoms largely consistent
with a diagnosis of dyslexia. Their performance was compared with two sets of individually
selected control children, with one set matched for nonverbal performance, and another set of
younger children matched for verbal performance. The distinction corresponds fairly closely to
the chronological age match and reading match groups advocated by Backman, Mamen and
Ferguson (1984).
Gathercole and Baddeley assessed five separate competences: phonological discrimination (the
ability to detect whether two stimuli, differing in at most one phoneme, were different);
1 Jorm was using ‘specific reading retardation’ as a more precisely defined synonym of dyslexia (see Rutter and
Yule, 1975). We prefer to use the word dyslexia to avoid premature commitment as to the underlying cause.

articulation rate (the time taken to repeat a word 10 times), a test of vocal sequencing and control;
and voice onset latency (the time taken to start saying a given word), a test of vocal response
initiation time. In addition to these straightforward performance tests, three theoretically motivated
tests were performed. The first was a non-word repetition (NWR) test which measured the ability
to repeat accurately a nonsense word spoken by the experimenter. Performance typically declines
as the nonsense words get longer, and thus it is taken to be a valuable early test of working
memory performance. The NWR test is thought to be a useful indicator of a child’s ability to
acquire new vocabulary, since any word will appear to be a nonword the first time it is heard by
the child. The two remaining experiments tested memory span for words, an analogue of the digit
span test on which dyslexic children have well-documented problems. Two experiments were
performed, in one the acoustic confusability of the words was manipulated, and in the other the
length of words was manipulated.
Gathercole and Baddeley established that: all three groups were equivalent on the phonological
discrimination and on voice onset latency tasks; the language disordered group were equivalent to
the verbal controls but non-significantly worse than the nonverbal controls on articulation rate;
and, most notably, that they were significantly worse even than the verbal controls on NWR and
on memory span. Furthermore, all three groups showed the same qualitative effects of acoustic
confusability and word length on memory span. Consequently Gathercole and Baddeley
concluded that the language disordered children were showing a specific deficit in the capacity of
the phonological store component of the working memory system (Baddeley, 1986), whereas their
articulatory rehearsal processes appeared to be normal. The authors went on to speculate that this
deficit might underlie problems in acquiring reading skills and vocabulary knowledge.
Interestingly, taking the stronger form of the above argument, it is logically possible that this
working memory deficit might be the factor underlying all the established phonological deficits of
dyslexic children. Consider first the early problems of phonemic segmentation and rhyming
awareness that have often been associated with reading impairment. To segment a word into
phonemes requires that one holds it in temporary store while attempting to analyse it — a
significant working memory load. If one cannot hold an unfamiliar word long enough to repeat it,

how could one hope to segment it? Telling whether two words rhyme is arguably an even more
demanding task for working memory, in that two words must be stored concurrently and
analysed. It is also important to note that Gathercole and Baddeley’s results were eliminative
rather than prescriptive. They demonstrated that the working memory deficit was probably not
attributable to a qualitative difference in utilizing the phonological loop, but it is possible that the
deficit might lie either in reduced phonological storage capacity or in some working memory
component other than the phonological store.
2 . The Experimental Programme
It is unsatisfactory from a theoretical viewpoint to have two alternative factors underlying the
problems of dyslexia, and the experiments reported here were designed to explore the issue as
directly as possible.
Overall Design of the Study
It is clearly valuable to identify whether dyslexic children perform significantly worse than their
age-matched controls, but one of the key discriminants between theories is a test of performance of
dyslexic children against reading age controls, since a significant impairment compared with
reading age controls is indicative of developmental disorder rather than just a developmental lag
(cf. Bryant & Goswami, 1986). Since the specific nature of dyslexic children’s deficits may also
change with age, it is important to examine the effects of age separately. These considerations
suggest an experiment with at least six groups of subjects: two groups of dyslexic children of
different mean ages; two groups of non-dyslexic children matched to the dyslexic children on
chronological age; and two groups of non-dyslexic children matched to the dyslexic children on
reading age.
Three separate issues are of interest in the statistical analyses for each experiment. First, whether
there are any between-group differences at all. This involves a design which treats all the six
groups within one factor, irrespective of age and presence/absence of dyslexia. We refer to this as
the ‘Overall Analysis’. A lack of a significant effect here would suggest that the variable under
investigation was unaffected by either age or dyslexia. Second, it is important to identify whether

dyslexic children perform worse than their age-matched controls. This design has the two level
factor age and the two level factor presence/absence of dyslexia. We refer to this as ‘CA &
Dyslexia’. A main effect of age would indicate a developmental trend in the variable in question,
while a main effect of dyslexia would suggest a reliable difference between dyslexic and control
subjects of equivalent age. Such a difference may, however, be attributable either to a
fundamental difference, or to a developmental lag. Deciding between these requires a third
analysis, one involving a comparison with reading age controls; this also has two factors, namely
a two level factor reading age, and a two level factor presence/absence of dyslexia. We refer to
this as ‘RA & Dyslexia’. A negative effect of dyslexia on this analysis would indicate that
dyslexic subjects are performing more poorly than younger children of equivalent reading age, and
would argue against a developmental lag interpretation.
Note that the latter two analyses are based on only four of the experimental groups. Fortunately,
as described in the next section we were able to select two groups of dyslexic children who were
sufficiently similar in IQ to allow a single control group to be used both as RA control for the older
dyslexics and CA control for the younger dyslexics, thus leading to a total of only five groups.
2 . 2 . The subject panel
Five groups of subjects participated. The groups were; 12 dyslexic children around 15 years old;
11 dyslexic children around 11 years old; a group of 12 non-dyslexic children matched to the older
dyslexics for age and full IQ; a group of 11 non-dyslexic children of similar IQ to the two dyslexic
groups, matched for chronological age with the younger dyslexics and for reading age with the
older dyslexics; and a fifth group of 10 non-dyslexic children around 8 years old matched for
reading age and full IQ with the younger dyslexics. All the dyslexic children had been diagnosed
as dyslexic between the ages of 7 and 10, based on discrepancies of at least 18 months between
chronological and reading age. Their IQ levels fell in the normal to superior range on the Wechsler
Intelligence Scale for Children (Wechsler, 1976) and they had no known neurological deficit or
primary emotional difficulty. For several dyslexic children IQ and/or reading age deficit had
changed since diagnosis, and a criterion of at least one year deficit in reading age compared with
chronological age at the time of the experiment was adopted (this led to the exclusion of 5 children

from a larger original pool). The dyslexic children were recruited via the local British Dyslexia
Association and the Dyslexia Institute2, and the non-dyslexic controls were recruited from local
schools. Summary data for chronological age, reading age and IQ are presented in Table 1, and
full individual data are presented in Appendix 1.
**Insert table 1 here**
3 . The Experiments
Our experiments were a straightforward replication of the Gathercole and Baddeley experiments,
with the further addition that we included a more detailed investigation of the children’s
articulatory rate for words of different length. The experiments were all re-implemented within an
automatic computerised hypermedia format, in order to facilitate subsequent replication. Explicit
comparison of experimental results using both hypermedia and traditional presentation confirmed
that comparable results should be obtained, with the hypermedia implementation adding greater
experimental control, consistency and recording accuracy (see Nicolson, note 1 for a detailed
discussion of the issues involved). We will report the procedure and results briefly for each
experiment in turn before providing an overall discussion
3 . 1 . Experiment 1. Phonological Discrimination.
The experimental design was based directly on stimuli constructed by Bishop (1985) comprising
36 pairs of single syllable words and 36 pairs of single syllable nonwords. One third of the pairs
in each set were identical, one third differed by one fricative/affricative feature (eg. fuse vs views),
and the remaining third differed in a nasal/plosive feature (eg. cub vs cup). The results for the five
groups are shown in figure 1. The error markers represent the standard error for that
group/condition. It is clear that all subjects found the fricative decisions the most difficult,
especially in the nonword condition, and that performance was close to ceiling on the nasal/plosive
difference conditions.
2 We are grateful to Dr. Harry Chasty and to Mrs Jean Walker of the Dyslexia Institute for allowing us to approach
the parents of the children involved and for permitting access (with parental consent) to the original diagnostic data.

**Insert Figure 1 here**
Overall Analysis. An analysis of variance was undertaken with group (5 levels) and difference
condition (6 levels) as the two factors. Significant main effects were found for group and
difference condition [F(4,52)=3.3, p<.05; F(5,260)=68.8, p<.0001 respectively]. The interaction
between group and difference condition was also significant [F(20,260)=2.1, p<.01]. Tukey
pairwise comparisons indicated that the younger dyslexics performed significantly worse overall
than the oldest controls (p<.05). Analysis of the simple effects of group in the individual
conditions revealed that the younger dyslexics performed significantly worse than the oldest
controls on the ‘Fricative Difference’ condition for Words, and the ‘Same’ condition for
Nonwords [F(4,52)=3.83 p<.01; F(4,52)=2.57, p<.05 respectively]. No other difference was
significant.
Comparisons with CA Controls. A second analysis of variance was then undertaken limited to the
four older groups, taking age and presence/absence of dyslexia as two factors and difference
condition as the third. The main effect of dyslexia was significant at the .05 level [F(1,43)=5.1,
p<.05], whereas the effect of age did not reach significance [F(1,43)=3.0, NS]. There was a
significant interaction between age and dyslexia, and a significant interaction between dyslexia and
condition [F(1,43)=4.9, p<.05; F(5,215)=3.6, p<.01 respectively]. Difference condition again
had a highly significant main effect, and no other effects were significant.
Comparisons with RA Controls. A third analysis of variance was conducted, omitting the oldest
controls and comparing the two dyslexic groups with their reading age controls. The main effect
of dyslexia was not significant, whereas that of reading age was significant [F(1,41)=1.7, NS;
F(1,41)=8.1, p<.01 respectively]. Difference condition again had a highly significant main effect,
and no other effects were significant.
These results suggest that dyslexic children are discriminating at the same level as reading age
controls, as would be predicted by a developmental lag hypothesis.

3 . 2 . Experiment 2. Voice Onset Latency
In this test the subject was primed with a common word, and told to say that word as soon as
possible on seeing the light flash on a computer screen. The initial energy in saying the word
triggered the computer via a microphone, leading to the automatic recording of the latency between
the flash and the voice onset. A range of words were used of varying lengths and complexities.
The one syllable words were: tap, cat, pig, lamb, bed and egg and the three syllable words were:
pineapple, elephant, ladybird, catapult, banana and telephone. The results are shown in Figure 2.
The data presented are the mean times (averaged over five repetitions excluding outliers of more
than 1.0 second latency).
**Insert Figure 2 here**
Overall Analyses. A 5 group analysis of variance indicated that there was no difference in latency
between short and long words for any group, [F(1,53)=1.9, NS] but that there were significant
differences between groups [F(4,53)=6.1, p<.001]. Tukey hsd post-hoc analyses indicated that
the group effect was attributable to slower performance by the younger dyslexics and the youngest
controls than the oldest controls (p<.01) and the older dyslexics (p<.05).
Comparisons with CA controls. A second analysis of variance of the four older groups by age
and presence/absence of dyslexia revealed that the overall effect of age was significant whereas
that of dyslexia was not [F(1,44)=13.1, p=<.001; F(1,44)=2.7, NS respectively]. No other
effect approached significance.
Comparisons with RA controls. A third analysis of variance by reading age and presence/absence
of dyslexia, excluding the oldest controls, revealed that the overall effect of reading age was
significant whereas that of dyslexia was not [F(1,41)=8.9, p=<.01; F(1,41)=1.4, NS
respectively]. No other effect approached significance.
The results suggest therefore that voice onset latency is a simple function of age, and shows no
reliable effect of dyslexia.

3 . 3 . Experiment 2a. Articulation Rate
Articulation rate was measured by asking the subjects to say a given word five times speaking as
rapidly as possible. The speech was recorded onto the computer and the duration of the five
repetitions was measured to the nearest centisecond from the digitised signal. The same words
were used as for the voice onset latency tests. The mean articulation times per word are shown in
figure 3.
**Insert Figure 3 here**
Overall analyses. As one would expect, articulation rate was significantly slower for the longer
words [F(1,53)=591.7, p<.0001]. There was also a significant group effect [F(4,53)=4.0,
p<.01]. Tukey hsd analysis indicated that the group effect was attributable to a significant
difference (p<.01) between the oldest controls and the younger dyslexics.
Comparisons with CA controls. When the four older groups were split into the age factor and the
presence/absence of dyslexia factor, dyslexia had a significant main effect [F(1,44)=10.0, p<.01]
whereas the main effect of age was not significant [F (1,44)=4.0, p>.05]. The effect of syllables
was of course highly significant.
Comparisons with RA controls. A third analysis of variance by reading age and presence/absence
of dyslexia, excluding the oldest controls, revealed that neither the main effect of reading age nor
that of dyslexia was significant [F(1,41)=2.5, NS; F(1,41)=2.0, NS respectively]. The effect of
syllables was highly significant and no other effect approached significance.
This pattern of results suggests that dyslexic subjects do articulate more slowly, but that this could
be most easily interpreted as reflecting a developmental lag rather than as a developmental
disorder.
3 . 4 . Experiment 3. Nonword Repetition
The set of 40 nonwords constructed by Gathercole and Baddeley (1990) was used. The stimuli
were recorded as digitised speech, and re-recorded until a panel of adult subjects made no errors
when repeating them, in order to ensure that the test was one of memory rather than

discrimination3. Nonwords varied both in terms of number of syllables (2, 3, 4 or 5) and
complexity (presence of absence of consonant clusters). Each nonword was presented in turn by
the computer program, and the subject’s task was to repeat it correctly. Each response was scored
either as correct or error, and if an error was made the experimenter recorded the response.
**Insert Figure 4 here**
The data, pooled across consonant complexity for visual clarity, are shown in figure 4. Full
means and standard deviations are presented in Appendix 2. It may be seen that the younger
dyslexics performed worse than the other groups for longer stimuli.
Overall Analyses. A five group analysis of variance was undertaken with three factors: group,
number of syllables and consonant complexity. All three factors had significant main effects
[F(4,53)=14.3, p<.0001; F(3,159)=6.5 p<.001; F(1,53)=4.1, p<.05 for group, syllables and
complexity respectively]. The interaction between group and syllables was also significant, as
was that between complexity and syllables [F(12,159)=2.5, p<.01; F(3,159)=2.7, p<.05
respectively]. A Tukey hsd analysis of the group effect showed a number of significant
differences: the younger dyslexics recalled significantly less than all other groups except the
youngest controls (p<.01); the youngest controls recalled significantly less than the oldest controls
(p<.01) and the older dyslexics (p<.05); and the 11 year old controls recalled significantly less
than the oldest controls (p<.05). Analysis of the simple effects in the interaction between group
and syllables indicated that the younger dyslexics were the only group for whom syllables had a
significant effect (p<.05). Pairwise comparisons of the terms in the interaction between syllables
and complexity indicated that performance was significantly worse for the complex 5 syllable
stimuli than for the simple or complex stimuli with 2 3, or 4 syllables, except for complex stimuli
of 3 syllables.
Since the effect of increasing the number of syllables was of theoretical interest, a further 5 group
analysis of variance was undertaken excluding the data for the shortest (2 syllable) stimuli. The
3 We were unable to reach this perfect criterion with the word ‘brasterer’, for which we had to be satisfied with a
10% error rate.

results were, of course, very similar to the full analysis, with the additional finding that the
younger dyslexics performed significantly worse even than the youngest controls (p<.05).
Comparison with CA controls. The analysis of the four older groups in terms of age and
presence/absence of dyslexia indicated that both age and dyslexia had significant main effects
[F(1,43)=39.1, p<.0001; F(1,43)=9.7, p<.01 respectively], whereas the interaction between age
and dyslexia was not significant [F(1,43)=3.7, p>.05].
Comparisons with RA controls. A third analysis of variance by reading age and presence/absence
of dyslexia, excluding the oldest controls, revealed that the the main effect of reading age was
highly significant, whereas that of dyslexia was not [F(1,41)=21.5, p<.0001; F(1,41)=0.1, NS
respectively]. The interaction between RA and dyslexia was also significant [F(1,41)=11.3,
p<.01]. The effect of syllables was highly significant (p<.001), and there was a significant
interaction between reading age and number of syllables (p<.01). No other effect was significant.
This rather complex pattern of results suggests that nonword repetition is influenced by both age
and dyslexia. However, the interaction in the RA controls comparison, with poorer performance
by the young dyslexics than that shown by the even younger RA controls, is consistent with the
view that this test may be tapping a causal factor underlying dyslexia, and not simply reflecting a
developmental lag. The fact that there is no such discrepancy between dyslexic subjects and RA
controls for the older group suggests that this handicap may diminish as the child develops.
3 . 5 . Experiment 4. Memory Span and Phonological Similarity
The traditional technique for measuring span is to present two words, asking the subject to recall
them in order, then a list of 3 words, then 4 and so on, until two consecutive failures are made. In
this experiment, following Gathercole and Baddeley, two pools of six single syllable words were
constructed, with one pool comprising phonologically similar words (bat, cap, cat, pan, pram,
tap) and the other pool comprising six phonologically dissimilar words (bus, clock, hand, horse,
girl , spoon). Stimuli were stored as digitised speech on the computer. Lists for recall were
generated in a pre-specified sequence, with four cycles in each of which a two word list was
followed by a three word list, then a four word list, then a five word list, and then a six word list

(with the next cycle starting again at a two word list). The procedure for a single trial was as
follows: the experimenter checked that the subject was ready, then clicked the ‘start’ button. The
appropriate number of stimuli were then presented auditorily by the computer at the rate of one per
second. Immediately after the final stimulus, the subject was required to point to the stimuli in the
correct order, with the eight year olds pointing by hand, and the other groups using the mouse.
Data analysis and storage were performed automatically. Memory span was calculated following
the standard formula, in effect by adding 0.5 to the longest sequence of stimuli for which the
subject responded correctly4 . Thus, if a child consistently recalled all the stimuli for lists up to
and including four words, but made one or more errors on five word lists, the memory span
calculated would be 4.5. The results are shown in Figure 5.
**Insert Figure 5 here**
Overall analyses. A five group analysis of variance indicated significant main effects for group
and phonological similarity [F(4,50)=5.5, p<.001; F(1,50)=306.9, p<.0001 respectively]. The
interaction between group and similarity did not approach significance [F(4,50)=1.1, NS]. Tukey
hsd analysis indicated that the group effect was attributable to the oldest controls outperforming the
younger dyslexics and the youngest controls (p<.01).
Comparisons with CA controls. An analysis of the effects of age and of presence/absence of
dyslexia for the four older groups indicated that both factors had significant main effects
[F(1,41)=8.6, p<.01; F(1,41)= 7.8, p<.01 respectively] but the interaction between them was not
significant [F(1,46)=1.2, NS].
Comparisons with RA controls. A third analysis of variance by reading age and presence/absence
of dyslexia, excluding the oldest controls, revealed that neither the main effect of reading age nor
that of dyslexia was significant [F(1,39)=3.4, p>.05; F(1,39)=0.0, NS respectively]. The effect
of similarity was of course highly significant, and no other effect was significant.
4 In fact the formula used was ‘span = 0.5 + mean number of correct trials per cycle + 1’, which is a slightly more
general form of that cited above, and allows credit to be given where, say, the child errs on lists of length 3 but gets
some right at length 4.

This pattern of results therefore suggests that phonological similarity has a comparable effect on all
the groups tested.
3 . 6 . Experiment 5. Memory Span, Word Length and Articulation Rate
Baddeley, Thomson and Buchanan (1975) demonstrated that adults have a higher memory span
for short words than for long words. They showed further that the span was directly related to the
rate at which the subjects could articulate the words involved and interpreted their results in terms
of an auxiliary storage system that they termed the ‘articulatory loop’. Nicolson (1981)
demonstrated that this effect was sufficient to account for the increase in children’s memory span
with age, in that the increase in memory span directly paralleled the increase in reading rate. This
finding has been replicated and extended by Hitch and by Hulme and their co-workers (eg. Hitch,
Halliday & Littler, 1983; Hulme, Thomson, Muir & Lawrence, 1984). The power of the
technique for analysis of dyslexia is that it provides a method of determining whether the
established immediate memory problems of dyslexic children should be thought of as
developmental lag or developmental disorder. The lag hypothesis would suggest that the span
would be exactly as predicted from the articulation rate, whereas the disorder hypothesis would
require that the deficit in span should be more extreme than predicted from articulation rate.
3 . 6 . 1 . Experiment 5a. Memory Span and Word Length
In order to be able to test this hypothesis, we extended the word length experiment reported in
Gathercole and Baddeley (1990) by using three word lengths and by measuring the articulation
rate for words in each of the three word length pools. The procedure used was adapted from those
used recently by Hitch, Halliday, Dodd and Littler (1989) and Hulme and Tordoff (1989) in
investigating the development of memory span as children get older. The stimuli used were taken
from a pool of one-syllable words (pig, bus, car, fish, leaf, spoon, bed, and egg); a pool of two-
syllable words (monkey, rocket, tiger, apple, pencil, scissors, hammer, and flower); and a pool
of three-syllable words (helicopter, elephant, banana, butterfly, umbrella, christmas tree,
kangaroo, and fire engine). The memory span data were collected as in the previous experiment,
with four cycles of presentation of lists of 2, 3, 4, 5 and then 6 words for each of the three word
pools. Stimuli were presented auditorily at the rate of one per second, and subjects attempted

spoken recall of the list in order directly following each presentation. Results were recorded
online and memory span determined automatically. The results for memory span are shown in
figure 6.
**Insert Figure 6 here**
It may be seen that all four groups showed the usual effect of word length, in that the memory
span decreased as the word length increased.
Overall Analysis. A five group analysis of variance was undertaken. Both group and length had
significant main effects [F(4,51)=4.9, p<.01; F(2,102)=71.1, p<.0001 respectively], whereas
their interaction did not approach significance (F<1). Tukey hsd analysis indicated that the group
effect was attributable to the oldest controls outperforming the younger dyslexics (p<.05) and the
youngest controls (p<.01).
Comparison with CA controls. Analysis by age and dyslexia for the four older groups indicated
that both had significant main effects [F(1,42)= 5.9, p<.05; F(1,42)=4.1, p<.05 respectively]
with the interaction non-significant (F<1).
Comparisons with RA controls. A third analysis of variance by reading age and presence/absence
of dyslexia, excluding the oldest controls, revealed that the main effect of reading age was
significant whereas that of dyslexia was not [F(1,38)=7.1, p<.05; F(1,38)=0.9, NS respectively].
The effect of syllables was of course highly significant and no other effect approached
significance.
This pattern of results is consistent with the assumption that the effects of word length on recall by
the dyslexic subjects are the result of a developmental lag.
3 . 6 . 2 . Experiment 5b. Articulation Rate and Word Length
Articulation rate for 1 syllable, 2 syllable and 3 syllable words was tested by timing the subjects
repeating each word in each list five times, following the procedure outlined in experiment 2b
above. For each child the mean articulation time for a given syllable length was then obtained by

averaging the times for the words in that list. The results are shown in figure 7. Overall, as one
would expect, the data follow a similar pattern to that of Experiment 2b.
**Insert Figure 7 here**
Overall analysis. A five group analysis of variance indicated that both group and syllables had
significant main effects [F(4,49)=11.5, p<.0001; F(2,98)=5050.8, p<.0001 respectively]. The
interaction between group and word length was also significant [F(8,98)=2.7, p<.05]. Tukey hsd
analysis indicated that the group effect was attributable to the younger dyslexics and the youngest
controls performing significantly slower than the oldest controls and the 11 year old controls
(p<.01) together with the younger dyslexics also performing significantly slower than the older
dyslexics (p<.05).
Comparison with CA controls. Analysis in terms of age and presence/absence of dyslexia for the
four older groups indicated that both had a significant main effect [F(1,41)=10.0, p<.01;
F(1,41)=23.9, p<.0001 for age, dyslexia respectively], thus replicating the results of Experiment
2a. The interaction between age and dyslexia was not significant [F(1,42)=3.7, p>.05], and the
only significant interaction was between group and word length [F(2,82)=4.6, p<.05].
Comparison with RA controls. The analysis by reading age and presence/absence of dyslexia,
excluding the oldest controls, revealed that the main effect of reading age was significant whereas
that of dyslexia was not [F(1,38)=20.9, p<.001; F(1,38)=2.5, NS respectively]. The effect of
syllables was of course highly significant, and the only significant interaction was that between
reading age and word length [F(2,76)=5.5, p<.01].
This pattern of results is therefore broadly consistent with a developmental lag interpretation of the
deficit in articulation rate by the dyslexic subjects.
3.6.3. Analysis 5c. Memory Span and Articulation Rate
As noted earlier, however, a key theoretical question is whether the memory span differences
between the groups parallel the differences in articulatory rate. The data are replotted in figure 8 in

terms of memory span as a function of articulation rate. Each group contributes three points to the
graph (one for each list length). The regression line through the five sets of three points gives an
estimate of the relationship between memory span and articulation rate. The value of r2 represents
the square of the correlation between span and articulation rate for the groups, with 1.0 reflecting
perfect collinearity.
**Insert Figure 8 here**
The mean group data show a reasonably linear relationship between memory span and articulation
rate, though the scatter in the individual results was marked. The population mean slope was
0.54, with an intercept of 3.31, and an overall correlation given by r2=0.83. It may be seen that
all the points (except that for the longest words for the youngest controls) fall close to the overall
line, and there is no obvious discrepancy between the groups on the basis of the presence or
absence of dyslexia. The normal interpretation of the intercept and slope following Baddeley’s
(1986) working memory framework would be that the intercept reflects the contribution of the
phonological input store, whereas the slope of the line reflects the efficiency of the phonological
rehearsal process. Given this interpretation it is possible to test directly the possibility that there is
some deficit in one or other phonological component of the working memory system. The
regression technique does not yield inferential statistics, and so we performed regressions for
slope and intercept on all the individual sets of three data point pairs. A 5 group analysis of
variance was then undertaken separately for intercept and for slope and no significant differences
were found in either analysis. Unfortunately the data thus obtained are somewhat unreliable,
depending critically on how closely the individual data correspond to a straight line. Furthermore,
the intercept correlates negatively with the slope, since it represents the back-projection of the
regression line to the zero articulation rate axis. Consequently little reliance can be placed on the
null results obtained.
In an attempt to control for these problems, for each individual the ‘centroid’ of their three data
points was calculated (ie. their mean span and their mean articulation rate). The centroid is the
most reliable summary statistic for the overall data, and the regression line will always travel
through it. Two separate analyses were then undertaken, first calculating the intercept by

projecting backwards a line from the individual’s centroid with slope equal to the population mean
(0.54), and second calculating the slope of the line from the individual’s centroid to the population
mean intercept (3.31). These represent the most robust, unbiased estimates possible for the
intercept and slope respectively. The mean data are shown in Table 2. Separate analyses of
variance performed on the adjusted slopes and intercepts indicated there was no significant
difference between groups [F(4,47)=1.1, NS; F(4,47)=1.06, NS for slope, intercept
respectively].
4 . Overall Discussion of Phonological Processing and Working Memory
The results follow a similar general pattern to that found by Gathercole and Baddeley (1990),
though there are also notable differences. For voice onset latency there was no evidence of any
effect related to dyslexia, findings also obtained by Gathercole and Baddeley. For articulation rate
Gathercole and Baddeley found a non-significant trend towards slower articulation for the dyslexic
children, whereas our results were more clear-cut, indicating a significant effect of dyslexia,
whereas that of age was not significant. For memory span, the qualitative effects of word length
and of phonological similarity were equivalent for all groups, as was found by Gathercole and
Baddeley. On the other hand, the degree of overall impairment was less marked than found by
Gathercole and Baddeley, with neither dyslexic group performing significantly worse even than
their age-matched controls. For phonological discrimination there was an effect of dyslexia but
not age, with the younger dyslexics showing significant impairments in two conditions.
Gathercole and Baddeley found no such impairment, though the language-disordered children
showed a tendency to impairment on nonword discriminations. For nonword repetition there was
a clear effect both of age and dyslexia (deriving from the younger dyslexic subjects) and
furthermore the younger dyslexics were even out-performed by their reading age controls on the
longer stimuli, as found by Gathercole and Baddeley.
The group effects are summarised in Table 3. Note that the second column gives the mean
performance of each group (collapsed over the other experimental variables).

**Insert table 3 here**
In summary, it would appear that the fifteen year old dyslexic children have effectively overcome
any earlier handicaps in phonological discrimination, nonword repetition and memory span,
performing at levels close to those of non-dyslexic children of similar age. By contrast, the eleven
year old dyslexic children still show evidence of deficits in phonological skills such as nonword
repetition which are known to be particularly marked in younger dyslexic children. In this
connection it should be noted that the language-disordered subjects tested by Gathercole and
Baddeley averaged eight years of age, as compared to the 11 and 15 year old groups in the present
study. Our subjects are therefore likely to have had both more remedial teaching and more time for
any developmental lag to catch up. The fact that the 15 year old dyslexics were not significantly
inferior to age-matched controls on any of our tests contrasts with the performance of the 11 year
old dyslexics, who broadly speaking performed at the level of the younger reading-matched
controls. This, together with Gathercole and Baddeley’s finding that 8 year old language
disordered children performed phonological memory tasks at a level below that of reading-matched
controls, suggests a process of gross initial impairment followed by gradual recovery. Any
attempt to draw strong conclusions of a causal nature thus runs into problems — it is quite
possible that whatever deficit was initially responsible for poor reading may well have recovered in
our 15 year old group. The good performance of our group of older dyslexic children is
underlined by the fact that these 12 dyslexic children were the lower performers in a group of over
20 dyslexic children whom we had been monitoring since the age of 11. Six of the remainder had
achieved normal reading levels and were thus no longer technically ‘dyslexic’.
Before considering the possible reasons for the deficit of the 11 year old dyslexics, it is therefore
important to make the applied point that the full recovery of the older dyslexics is particularly
encouraging for long-term alleviation of their problems. It suggests that many of their long-term
reading-related problems are probably attributable entirely to the cumulative impairments caused by
lack of reading skill (termed by Stanovich, 1986, the ‘Matthew Effect’, a biblical reference to the
poor getting poorer). In particular, it would suggest that if the early problems are diagnosed and
remedied quickly, this should prevent any subsequent ‘recurrence’ of reading problems.

Let us now consider the implications of the findings for our original research issue — which is the
primary deficit, phonological skill or working memory? This is a difficult issue to tackle owing to
the close relationship between the two, not least because of their co-variation with fluency of
articulation. Insofar as the issue can be addressed, one would expect a phonological anomaly to
show up either as a phonological discrimination deficit, or as an abnormal phonological
confusability effect, or as an impairment of the phonological input store. For working memory
(WM) it is useful to distinguish between the architecture and the performance of the WM system,
with the performance reflecting not only the architecture but also the efficiency of the control
processes involved. The improvement of a child’s WM with age indicates a performance
improvement, but with the same architecture. With this analysis, a WM architecture disorder
should show up either as an anomalous slope or intercept for the memory span vs articulation rate
regression. Although the latter regression data are noisy, there is no evidence whatever of an
abnormality in either slope or intercept, and the slight deficit in overall span is accounted for
completely by an equivalent deficit in articulation rate. One might conclude therefore that,
although there is a slight impairment in working memory performance, this reflects impairment of
the control processes (as reflected by articulation rate) rather than an underlying disorder of the
WM architecture.
On the other hand, the evidence for a causal role of phonological skill deficits is barely more
convincing. The deficit in phonological discrimination is difficult to interpret, owing to difficulties
with the test used and also discrepancies between the results of the different components of the
test. There was no evidence of any abnormality in the phonological confusability effect, and no
evidence of impairment for repeating short nonwords. Even the deficit in articulation rate is
problematic for a pure phonological deficit hypothesis. Since the children were merely repeating a
given word, little or no perceptual processing is required, and only a single access to the motor
articulation codes for the word, an access which occurs before timing starts. The most natural
interpretations of an articulation rate deficit are either motor skill deficit or perhaps inefficiencies in
the stored articulatory codes, neither being directly related to phonological skill.

It would appear, therefore, that any adequate explanation of the deficits of dyslexic children would
need to confront the issues of why there was an articulation rate deficit, why there was a nonword
repetition deficit for the younger dyslexics. Neither of our original hypotheses provides a
convincing account of both deficits.
In an attempt to investigate further the cause of the deficit on repeating nonwords, the errors made
were inspected. The errors for the younger dyslexics and the youngest controls are reproduced in
Appendix 3. It may be seen that for both groups the errors were relatively minor, almost always
preserving the overall ‘auditory shape’ of the stimulus, and generally involving the substitution or
addition of a single phoneme. Interestingly, the ‘error phoneme’ is usually phonologically
plausible and often occurs elsewhere in the stimulus (cf. empliforvent-emplifLorvent;
perplisteronk-pLerplisteronk; stopograttic-stRopograttic; vultularity-vultuRarity; detraterpilic-
detraPerpilic; confrantually-confLantually). This pattern of errors suggests that the subjects are
able to make use of two sources of information: first, the fading echoic trace of the original
stimulus, which presumably retains prosodic cues, giving an ‘auditory blueprint’ which constrains
the possible matches for each phoneme; and, second, the activation energies of the individual
‘phoneme detectors’ which are activated by the auditory input. As the blueprint fades, it will
constrain the possible matches less, thus allowing intrusions or substitutions of phonemes which
were highly activated because of a match elsewhere in the stimulus. Deficits in this process might
be caused in several ways. One possibility would be that the phoneme activation process was
slower, which would mean that by the time all the phonemes had been processed the blueprint
would be more degraded. A related possibility would be that the phoneme activation process was
more noisy, leading to activation not only of the correct phoneme but also several related
phonemes. Subsequent input of a related phoneme might well lead to ‘swamping’ of the correct
phoneme by the related one.
Our data do not discriminate between these hypotheses, which should prove a valuable target for
subsequent research. However, regardless of the underlying cause, let us consider the likely
effect of the observed articulation rate deficit on nonword repetition (NWR). There is a clear
analogy between NWR and memory span. It is well established that the ‘stimuli’ in a memory

experiment depend upon the notion of a ‘cognitive unit’ or chunk (Miller, 1956). Presumably, a
cognitive unit is the largest component that is explicitly represented. In a span experiment the
stimuli are words as are the cognitive units, and the task is to repeat back the words in the right
order. In the NWR task the stimuli are nonwords, but the units are word fragments (phonemes,
phoneme clusters, or syllables), and the subject’s task is to repeat back the units in the right order.
There is no doubt a high correlation between the rate of phoneme or syllable articulation and the
rate of articulation of words, and so there is every reason to believe that nonword repetition should
co-vary with articulation rate in much the same way as does memory span, and hence that the
reduced nonword repetition ‘span’ is also attributable to the reduced articulation rate. This
interpretation would therefore allow a parsimonious account of the data in terms only of the
articulation rate deficit. Whether articulation rate deficits can provide a complete account of the
data remains questionable, however. A slight problem for this interpretation derives from our own
data, in that the younger dyslexic children had a slightly better memory span than their age-
matched controls despite a slightly slower articulation rate. More worrying, however, is
Gathercole and Baddeley’s finding (1990) of significantly reduced memory span in their 8 year old
children, despite no significant difference in articulation rate.
The reason for an articulation rate deficit remains unclear. One possibility, which receives support
from experiments on gross motor skill in dyslexic children, is that it reflects a deficit in skill
automatisation (Nicolson & Fawcett, 1990). However, the experiments reported here were not
designed to investigate this possibility, and the relationship between articulation rate, working
memory and automatisation would again make a valuable focus for further research.
5 . Conclusions
The issue that initially motivated this research was an attempt to discriminate between two possible
theoretical explanations of the impairments of dyslexic children, namely the phonological deficit
hypothesis and the working memory deficit hypothesis. The most parsimonious account of the
data is that the 11 year old dyslexic children suffered from a deficit in articulation rate, and that the
articulation rate deficit mediates the performance deficits across the range of tasks reported.
Unfortunately, neither working memory nor phonological deficits provide a natural explanation of

the significantly slower articulation rate of the dyslexic children. The automatisation deficit
hypothesis (Nicolson & Fawcett, 1990) provides a natural account of the articulation rate deficits
but provides no insight into the linkage between articulation rate and working memory. We
propose that all three theories are best seen as symptoms, each providing a different perspective on
some underlying deficit.
In terms of the theoretical interpretation of the results, discovery of the articulation rate deficit is a
potentially significant breakthrough in dyslexia research. The finding has not previously been
reported in the literature, but it is clear that subsequent research on working memory and on
phonological processing must monitor this variable. The reasons for the deficit in articulation rate
remain unclear, and should prove a valuable target for subsequent research. It is also worth
emphasising the need to consider longitudinal effects, in that the developmental pattern of working
memory performance is one of fairly severe initial deficit (as established by Gathercole &
Baddeley, 1990, with 8 year old children), through mild deficit at 11 years to little or no deficit at
15 years.
The applied implications of the research seem clear. The established links between phonological
deficits and problems in learning to read (eg. Bradley & Bryant, 1983) suggest that dyslexic
children are not ‘phonologically ready’ to read at the normal age of around six years. Related
work (eg. Bradley, 1988) has shown that pre-school phonological training for ‘at risk’ children
can allow an apparently normal acquisition of reading, but there has been uncertainty as to how
completely the problems have been remedied, and whether in the absence of continuing support
the children might start to lose ground again. Our research leads to the positive conclusion that
there is a good chance of an essentially complete recovery, and it therefore further strengthens the
case for very early diagnosis of dyslexia backed up by a remediation programme which provides
extensive, carefully designed support for phonological skills and other skills upon which reading
is based.

References
Note 1
Nicolson, R. I. (submitted). Hypermedia: An enabling technology for empirical psychology.
Currently available as Report LRG 6/90, Dept. of Psychology, University of Sheffield.
Backman, J.E., Mamen, N. & Ferguson, H.B. (1984). Reading level design: Conceptual and
methodological issues in reading research. Psychological Bulletin, 96, 560-568.
Baddeley, A. D. (1986). Working Memory. Oxford, Oxford University Press.
Baddeley, A.D., Thomson, N. & Buchanan, M. (1975). Word length and the structure of short
term memory. Journal of Verbal Learning and Verbal Behaviour, 14, 575-589.
Bishop, D. (1985). Spelling ability in congenital dysarthria: Evidence against articulatory coding
in translating between graphemes and phonemes. Cognitive Neuropsychology, 2, 229-251.
Bradley, L. & Bryant, P.E. (1983). Categorising sounds and learning to read: A causal
connection. Nature, 301, 419-421.
Bradley, L. (1988). Making connections in learning to read and to spell. Applied Cognitive
Psychology, 2, 3-18.
Bryant, P. & Goswami, U. (1986). Strengths and weaknesses of the reading level design.
Psychological Bulletin , 100, 101-103.
Gathercole, S.E. & Baddeley, A.D. (1990). Phonological memory deficits in language disordered
children: Is there a causal connection? Journal of Memory and Language, 29, 336-360.
Hitch, G.J., Halliday, M.S., & Littler, J.E. (1984). Memory span and the speed of mental
operations. Paper presented at the joint Experimental Psychology Society/Netherlands
Psychonomic Foundation Meeting, Amsterdam. Cited in Baddeley, A.D. (1986). Working
Memory. Oxford University Press, Oxford.
Hitch, G.J., Halliday, M.S., Dodd, A. & Littler, J.E. (1989). Development of rehearsal in short
term memory: Differences between pictorial and spoken stimuli. British Journal of
Developmental Psychology, 7, 347-362.
Hulme, C., Thomson, N., Muir, C. & Lawrence, A. (1984). Speech rate and the development of
short term memory span. Journal of Experimental Child Psychology, 38, 247-250.

Hulme, C. & Tordoff, V. (1989). Working memory development. The effects of speech rate,
word length and acoustic similarity in serial recall. Journal of Experimental Child
Psychology, 47, 72-87.
Jorm, A.F. (1983). Specific reading retardation and working memory: a review. British Journal
of Psychology, 74, 311-342.
Lundberg, I. & Høien, T. (1989). Phonemic deficits: A core symptom of developmental
dyslexia? Irish Journal of Psychology, 10, 579-592.
Miles, T.R. (1983). Dyslexia: the pattern of difficulties. London: Granada.
Miles, T.R. & Haslum, M.N. (1986). Dyslexia: Anomaly or normal variation? Annals of
Dyslexia, 36,103-118.
Miles, T.R. & Miles, E. (1990). Dyslexia: a hundred years on. Milton Keynes, Open University
Press.
Miller, G. (1956). The magical number seven, plus or minus two: some limits of our capacity for
processing information. Psychological Review. 63: 81-97.
Nicolson, R.I. (1981). The relationship between memory span and processing speed. In M.P.
Freedman, J.P. Das & N. O'Connor (Eds). Intelligence and Learning. New York: Plenum
Press.
Nicolson, R.I & Fawcett, A.J. (1990). Automaticity: a new framework for dyslexia research?
Cognition, 30, 159-182.
Olson, R.K., Wise, B.W. & Rack, J.P. (1989). Dyslexia: Deficits, genetic aetiology and
computer based remediation. Irish Journal of Psychology, 10, 594-508.
Snowling, M.J. (1981). Phonemic deficits in developmental dyslexia. Psychological Research,
43, 219-34.
Snowling, M.J., Goulandris, N., Bowlby, M. & Howell, P. (1986). Segmentation and speech
perception in relation to reading skill: a developmental analysis. Journal of Experimental
Child Psychology, 41, 487-507.
Stanovich, K.E. (1986). Matthew effects in reading Some consequences of individual
differences in the acquisition of literacy. Reading Research Quarterly, 21, 360-407.
Stanovich, K.E. (1988). The right and wrong places to look for the cognitive locus of reading
disability. Annals of Dyslexia, 38, 154-177.
Vellutino, F.R. (1979). Dyslexia: Theory and Research. Cambridge MA: MIT Press.

Wechsler, D. (1976). Wechsler Intelligence Scale for Children (WISCR). NFER, Slough.
World Federation of Neurologists (1968). Report of research group on dyslexia and world
illiteracy. Dallas,WFN.

Appendix 1. Psychometric Details on the Subject Panel
ActualAge (yrs)
FullIQ
ReadingAge (yrs)
ActualAge (yrs)
FullIQ
ReadingAge (yrs)
Cont 15 Dys 15AJ 15.5 130 15.0 DK 15.8 118 11.4AV 15.1 105 14.6 GF 15.8 102 11.1DB 15.6 95 14.5 JN 14.2 100 12.2JE 15.0 115 15.0 JB 15.8 124 13.9KT 15.2 101 15.0 JA 16.0 126 14.4MG 15.0 117 15.0 JH 16.2 91 11.3NM 16.0 112 15.0 MH 16.1 117 13.9NS 15.4 104 14.4 NL 14.9 114 13.1PB 15.6 92 15.0 PS 14.4 102 8.1PC 15.9 118 15.0 RF 15.8 115 12.8SW 15.2 101 14.8 SP 15.5 92 11.2TB 15.2 91 15.0 SG 15.0 92 10.8
Cont 11 Dys 11AJ 12.1 117 12.6 AB 12.4 101 10.8BD 10.8 96 9.8 CJ 11.3 119 8.9CA 12.2 111 12.1 CE 9.7 109 7.0DG 10.8 121 11.4 DP 10.8 109 7.3JM 10.8 103 10.2 IT 12.0 112 9.5JD 11.0 96 11.0 MC 11.3 114 8.3KH 11.7 100 10.6 MC 12.9 109 9.8KG 11.7 126 11.6 RH 12.5 105 8.0LL 12.1 107 12.0 SA 11.3 128 9.6RM 11.7 105 12.7 TA 10.5 109 8.3SE 11.8 114 12.2 TF 9.7 109 6.9SW 11.7 119 12.0
Cont 8AM 7.9 102 8.2CE 8.2 133 8.0DT 8.5 121 9.5KN 7.0 129 7.7MC 8.8 105 8.1MCh 8.0 112 10.6PT 8.2 105 7.7SS 8.6 101 9.6TW 8.1 112 9.5VS 8.1 117 8.2

Appendix 2. Mean Scores for Nonword Repetition
Maximun score is 5; standard deviations are in parentheses.
2 syllables 3 syllables 4 syllables 5 syllables
Simple Complex Simple Complex Simple Complex Simple Complex
Cont 15 4.92 (0.29) 4.75 (0.45) 4.92 (0.29) 4.83 (0.39) 4.33 (0.78) 4.67 (0.65) 4.67 (0.89) 4.75 (0.45)
Dys 15 4.92 (0.28) 4.85 (0.38) 4.85 (0.38) 4.38 (0.77) 4.62 (0.65) 4.62 (0.65) 4.46 (0.66) 4.31 (0.85)
Cont 11 3.83 (1.03) 4.25 (0.63) 4.42 (0.79) 4.17 (0.72) 4.83 (0.39) 4.67 (0.49) 4.58 (0.51) 3.75 (0.87)
Dys 11 4.64 (0.67) 4.18 (0.75)4.00 (1.26) 3.55 (0.69) 3.64 (1.03) 4.00 (1.18) 3.36 (1.03) 3.27 (1.56)
Cont 8 4.30 (1.06) 4.30 (0.67) 4.40 (0.97) 3.90 (0.74) 4.30 (0.48) 4.30 (0.82) 3.80 (0.63) 3.60 (0.84)

Appendix 3. Nonword Repetition Errors
** this is in a separate file since it needs printing out as landscape page setup

Table 1. Summary Psychometric Data for the 5 groups of subjects
Group Number MeanChron.Age (CA)
MeanIQ
MeanReadingAge (RA)
CA Range IQ Range RA Range
Dys 15 12 15.3 107.7 11.9 14.2 to 16.2 91 to 126 8.1 to 14.4
Cont 15 12 15.4 106.8 14.9 15.1 to 15.9 91 to 130 14.4 to 15.0*
Dys 11 11 11.5 111.5 8.6 9.7 to 12.9 101 to 128 6.9 to 10.8
Cont 11 12 11.5 109.6 11.5 10.8 to 12.1 96 to 126 9.8 to 12.7
Cont 8 10 8.1 113.7 8.7 7.0 to 8.8 101 to 133 7.7 to 10.6
* 15.0 represents ceiling on the Schonell test of reading age used. Most of this group werereading at this level.

Table 2. Mean data for slope and Intercept (standard deviations in parentheses)
†Slope3.31* Intercept0.54
Cont 15 0.61 (0.18) 3.54 (0.49)
Dys 15 0.56 (0.18) 3.34 (0.46)
Cont 11 0.53 (0.23) 3.26 (0.54)
Dys 11 0.62 (0.24) 3.39 (0.42)
Cont 8 0.47 (0.25) 3.16 (0.49)
† Slope3.31 is the mean of the individual slopes per group, with the regressionconstrained to pass through the population mean intercept of 3.31 items.
* Intercept0.54 is the mean of the individual intercepts per group, with theregression constrained to have the population mean slope of 0.54 items/sec..

Table 3. Summary of the Between-Group Effects in the Six Experiments
MeanScores
Overall 5 groupanalyses
Comparisonwith CAControls
Comparisonwith RAControls
C15vs
D15
D15vs
C11
C11vs
D11
D11vsC8
AgeCA DysCA AgeRA DysRA
PhonologicalDiscrimination(% correct)
C15 85D15 84C11 85D11 80C8 83
NS NS * NS NS * * NS
Voice OnsetLatency(sec.)
C15 .36D15 .38C11 .42D11 .45C8 .46
NS NS NS NS *** NS * NS
Articulation TimeI(sec / word)
C15 .35D15 .44C11 .41D11 .50C8 .45
NS NS NS NS NS ** NS NS
Articulation TimeII(sec / word)
C15 .34D15 .37C11 .35D11 .48C8 .46
NS NS ** NS ** *** *** NS
NonwordRepetition(% correct)
C15 95D15 92C11 86D11 77C8 84
NS NS ** NS* *** ** *** NS*
Memory Span &PhonologicalSimilarity(words)
C15 4.9D15 4.2C11 4.1D11 3.8C8 3.8
NS NS NS NS ** ** NS NS
Memory Span &Word Length(words)
C15 5.1D15 4.7C11 4.7D11 4.4C8 4.2
NS NS NS NS * NS * NS
Intercept(words)
C15 3.5D15 3.3C11 3.3D11 3.4C8 3.1
NS NS NS NS NS NS NS NS
Slope(sec)
C15 .61D15 .58C11 .55D11 .62C8 .44
NS NS NS NS NS NS NS NS
KeyC15 Controls age 15 *** difference significant at the .001 levelD15 Dyslexics age 15 ** difference significant at the .01 levelC11 Controls age 11 * difference significant at the .05 levelD11 Dyslexics age 11 NS difference not significant at the .05 levelC8 Controls age 8 NS* main effect NS, but interaction sig. at .05 level

Figures
Figure 1. Results for Phonological Discrimination
Figure 2. Voice Onset Latency Results
Figure 3. Articulation Times
Figure 4. Nonword Repetition Performance
Figure 5. The Effects of Phonological Similarity on Memory Span
Figure 6. Memory Span and Word Length
Figure 7. Articulation Rate and Word Length
Figure 8. Memory Span as a function of Articulation Rate

Figure 1. Results for Phonological Discrimination
50
60
70
80
90
100Cont 15Dys 15Cont 11Dys 11Cont 8
% C
orre
ct
WordsSame
NonwordsSame
WordsFric
NonwordsFric
WordsPlosive
NonwordsPlosive

Figure 2. Voice Onset Latency Results
1 syll 3 syll0
0.1
0.2
0.3
0.4
0.5Cont 15Dys 15Cont 11Dys 11Cont 8
Vo
ice
On
set
La
ten
cy (
sec)

Figure 3. Articulation Times
1 syll 3 syll0
0.2
0.4
0.6
0.8
Cont 15Dys 15Cont 11Dys 11Cont 8
Art
icu
latio
n
Tim
e
(se
c)

Figure 4. Nonword Repetition Performance
5432
50
60
70
80
90
100
Cont 15Dys 15Cont 11Dys 11Cont 8
Syllables
Per
cent
Cor
rect

Figure 5. The Effects of Phonological Similarity on Memory Span
Normal Confusable0
1.0
2.0
3.0
4.0
5.0
6.0
Cont 15Dys 15Cont 11Dys 11Cont 8
Me
mo
ry S
pa
n

Figure 6. Memory Span and Word Length
1 syll 2 syll 3 syll0
1.0
2.0
3.0
4.0
5.0
6.0Cont 15Dys 15Cont 11Dys 11Cont 8
Mem
ory
Spa
n
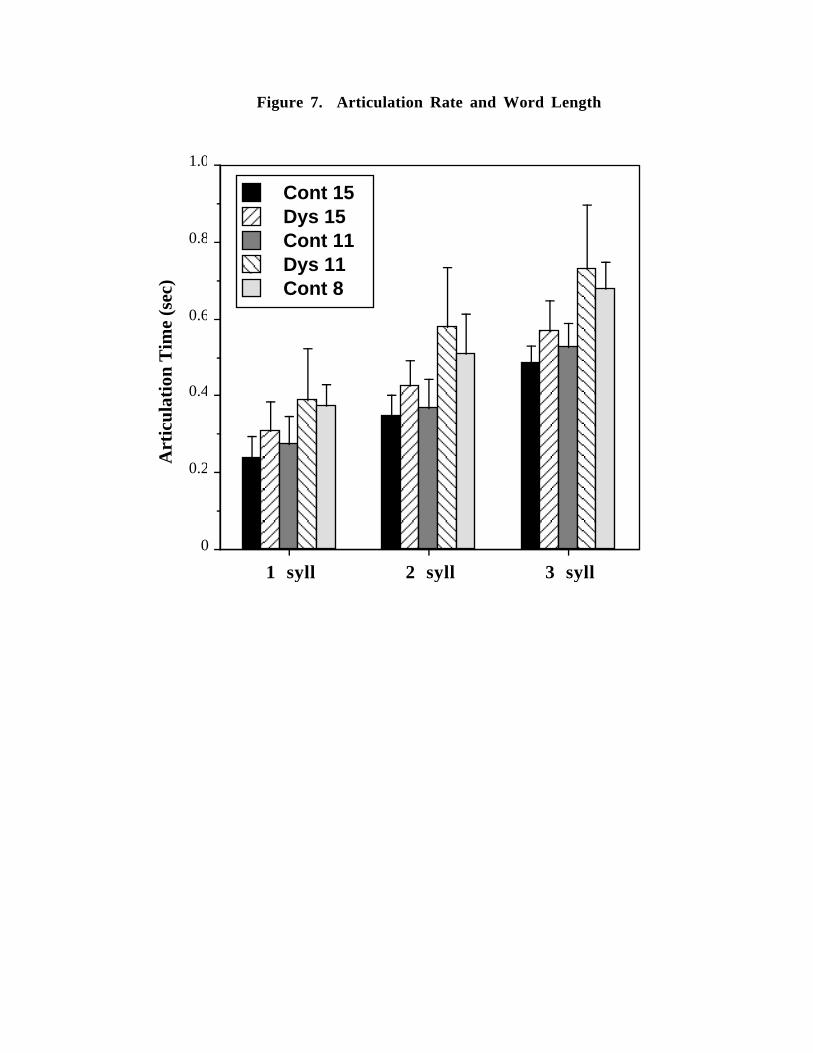
Figure 7. Articulation Rate and Word Length
1 syll 2 syll 3 syll
0
0.2
0.4
0.6
0.8
1.0
Cont 15Dys 15Cont 11Dys 11Cont 8
Art
icul
atio
n T
ime
(sec
)

Figure 8. Memory Span as a function of Articulation Rate
543210
3
4
5
6
Dys 15Cont 15
Cont 8
Cont 11Dys 11
Articulation Rate (Words / sec)
Mem
ory
Sp
an (
wo
rds)
MS = 3.31 + 0.54 AR (
R = 0.83)
2
Copyright © 2022 FDOKUMEN