WORK STUDY (TIME AND MOTION STUDY)
34
7.1 INTRODUCTION Productivity has now become an everyday watch word. It is crucial to the welfare of industrial firm as well as for the economic progress of the country. High productivity refers to doing the work in a shortest possible time with least expenditure on inputs without sacrificing quality and with minimum wastage of resources. Work-study forms the basis for work system design. The purpose of work design is to identify the most effective means of achieving necessary functions. This work-study aims at improving the existing and proposed ways of doing work and establishing standard times for work performance. Work-study is encompassed by two techniques, i.e., method study and work measurement. “Method study is the systematic recording and critical examination of existing and proposed ways of doing work, as a means of developing and applying easier and more effective methods and reducing costs.” “Work measurement is the application or techniques designed to establish the time for a qualified worker to carry out a specified job at a defined level or performance.” 171 7.1 Introduction 7.2 Productivity 7.3 Work Study 7.4 Method Study 7.5 Motion Study 7 7.6 Work Measurement 7.7 Time Study • Exercises • Skill Development • Caselet WORK STUDY (TIME AND MOTION STUDY) CHAPTER OUTLINE
-
Upload
khangminh22 -
Category
Documents
-
view
1 -
download
0
Transcript of WORK STUDY (TIME AND MOTION STUDY)

7.1 INTRODUCTION
Productivity has now become an everyday watch word. It is crucial to the welfare of industrialfirm as well as for the economic progress of the country. High productivity refers to doing thework in a shortest possible time with least expenditure on inputs without sacrificing quality andwith minimum wastage of resources.
Work-study forms the basis for work system design. The purpose of work design is to identifythe most effective means of achieving necessary functions. This work-study aims at improving theexisting and proposed ways of doing work and establishing standard times for work performance.Work-study is encompassed by two techniques, i.e., method study and work measurement.
“Method study is the systematic recording and critical examination of existing andproposed ways of doing work, as a means of developing and applying easier and moreeffective methods and reducing costs.”
“Work measurement is the application or techniques designed to establish the time fora qualified worker to carry out a specified job at a defined level or performance.”
1 7 1
7.1 Introduction
7.2 Productivity
7.3 Work Study
7.4 Method Study
7.5 Motion Study
7
7.6 Work Measurement
7.7 Time Study
• Exercises
• Skill Development
• Caselet
WORK STUDY (TIME AND MOTION STUDY)
CHAPTER OUTLINE
��� ��������� �� �������� ��������
There is a close link between method study and work measurement. Method study isconcerned with the reduction of the work content and establishing the one best way of doing thejob whereas work measurement is concerned with investigation and reduction of any ineffectivetime associated with the job and establishing time standards for an operation carried out as perthe standard method.
7.2 PRODUCTIVITY
Productivity is the quantitative relation between what we produce and we use as a resource toproduce them, i.e., arithmetic ratio of amount produced (output) to the amount of resources(input). Productivity can be expressed as:
Productivity =OutputInput
Productivity refers to the efficiency of the production system. It is the concept that guidesthe management of production system. It is an indicator to how well the factors of production(land, capital, labour and energy) are utilised.
European Productivity Agency (EPA) has defined productivity as,“Productivity is an attitude of mind. It is the mentality of progress, of the constant
improvements of that which exists. It is the certainty of being able to do better today thanyesterday and continuously. It is the constant adaptation of economic and social life tochanging conditions. It is the continual effort to apply new techniques and methods. It is thefaith in progress.”
A major problem with productivity is that it means many things to many people. Economistsdetermine it from Gross National Product (GNP), managers view it as cost cutting and speed up,engineers think of it in terms of more output per hour. But generally accepted meaning is that it isthe relationship between goods and services produced and the resources employed in their production.
7.2.1 Factors Influencing Productivity
Factors influencing productivity can be classified broadly into two categories: (A) controllable (orinternal) factors and (B) un-controllable (or external) factors.
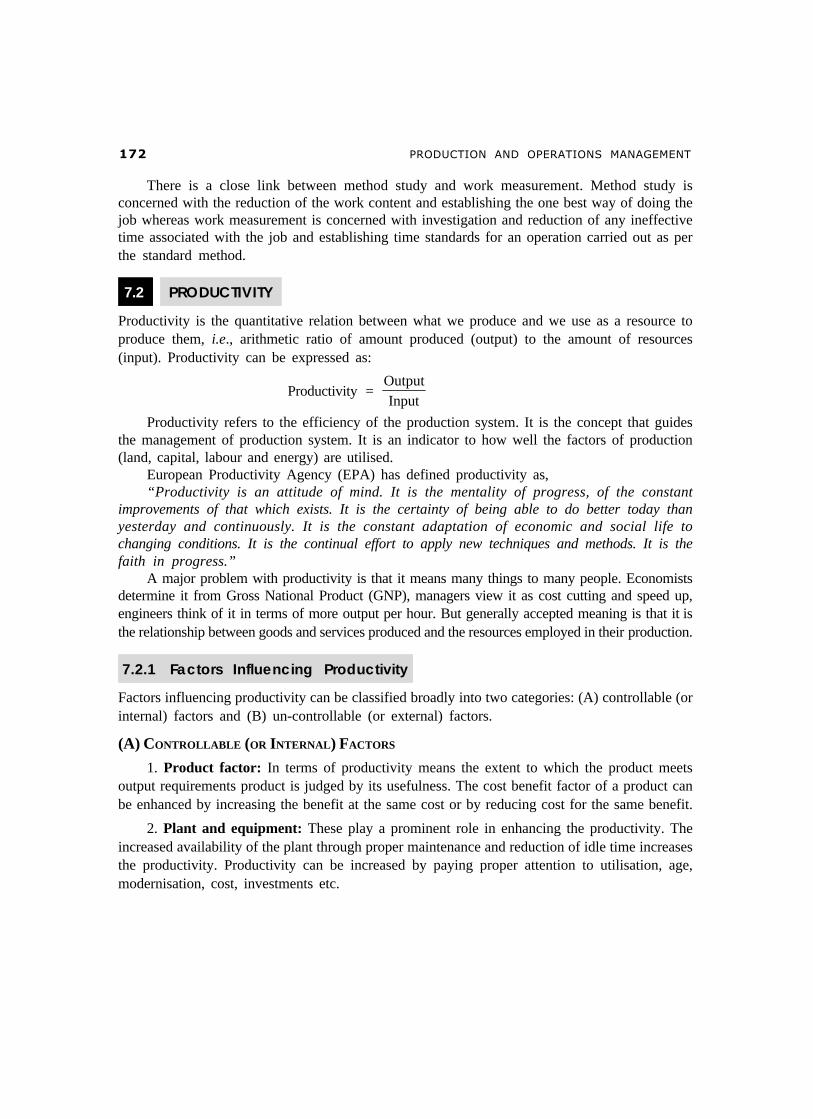
(A) CONTROLLABLE (OR INTERNAL) FACTORS
1. Product factor: In terms of productivity means the extent to which the product meetsoutput requirements product is judged by its usefulness. The cost benefit factor of a product canbe enhanced by increasing the benefit at the same cost or by reducing cost for the same benefit.
2. Plant and equipment: These play a prominent role in enhancing the productivity. Theincreased availability of the plant through proper maintenance and reduction of idle time increasesthe productivity. Productivity can be increased by paying proper attention to utilisation, age,modernisation, cost, investments etc.

���� ���� ����� �� ����� ����� ���
Fig. 7.1 Factors influencing productivity
3. Technology: Innovative and latest technology improves productivity to a greater extent.Automation and information technology helps to achieve improvements in material handling,storage, communication system and quality control. The various aspects of technology factors tobe considered are:
(i) Size and capacity of the plant,(ii) Timely supply and quality of inputs,(iii) Production planning and control,(iv) Repairs and maintenance,(v) Waste reduction, and
(vi) Efficient material handling system.4. Material and energy: Efforts to reduce materials and energy consumption brings about
considerable improvement in productivity.1. Selection of quality material and right material.2. Control of wastage and scrap.3. Effective stock control.4. Development of sources of supply.5. Optimum energy utilisation and energy savings.5. Human factors: Productivity is basically dependent upon human competence and skill.
Ability to work effectively is governed by various factors such as education, training, experienceaptitude etc., of the employees. Motivation of employees will influence productivity.
6. Work methods: Improving the ways in which the work is done (methods) improvesproductivity, work study and industrial engineering techniques and training are the areas whichimprove the work methods, which in term enhances the productivity.
7. Management style: This influence the organizational design, communication in organization,policy and procedures. A flexible and dynamic management style is a better approach to achievehigher productivity.
(B) UN-CONTROLLABLE (OR EXTERNAL) FACTORS
1. Structural adjustments: Structural adjustments include both economic and social changes.Economic changes that influence significantly are:
��� ��������� �� �������� ��������
(a) Shift in employment from agriculture to manufacturing industry,(b) Import of technology, and(c) Industrial competitiveness.Social changes such as women’s participation in the labour force, education, cultural values,
attitudes are some of the factors that play a significant role in the improvement of productivity.2. Natural resources: Manpower, land and raw materials are vital to the productivity
improvement.3. Government and infrastructure: Government policies and programmes are significant
to productivity practices of government agencies, transport and communication power, fiscalpolicies (interest rates, taxes) influence productivity to the greater extent.
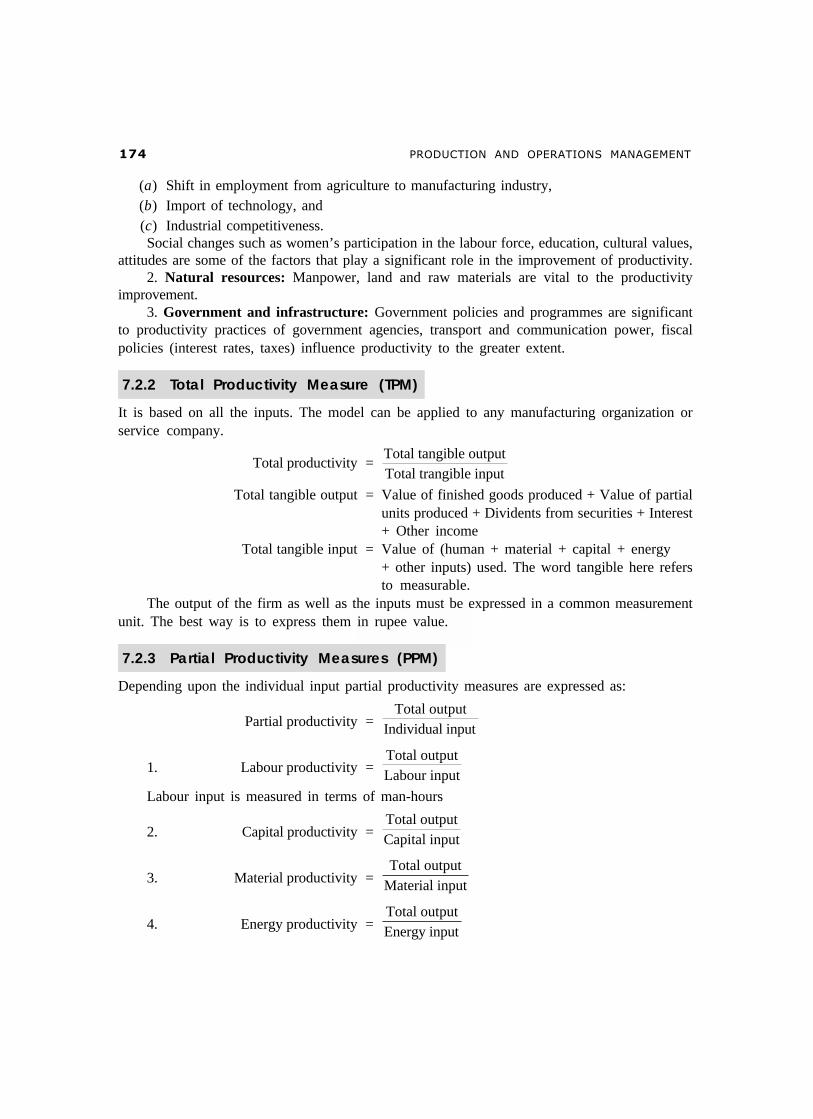
7.2.2 Total Productivity Measure (TPM)
It is based on all the inputs. The model can be applied to any manufacturing organization orservice company.
Total productivity =Total tangible outputTotal trangible input
Total tangible output = Value of finished goods produced + Value of partialunits produced + Dividents from securities + Interest+ Other income
Total tangible input = Value of (human + material + capital + energy+ other inputs) used. The word tangible here refersto measurable.
The output of the firm as well as the inputs must be expressed in a common measurementunit. The best way is to express them in rupee value.
7.2.3 Partial Productivity Measures (PPM)
Depending upon the individual input partial productivity measures are expressed as:
Partial productivity =Total output
Individual input
1. Labour productivity =Total outputLabour input
Labour input is measured in terms of man-hours
2. Capital productivity =Total outputCapital input
3. Material productivity =Total output
Material input
4. Energy productivity =Total outputEnergy input
���� ���� ����� �� ����� ����� ���
One of the major disadvantage of partial productivity measures is that there is an overemphasis on one input factor to the extent that other input are underestimated or even ignored.
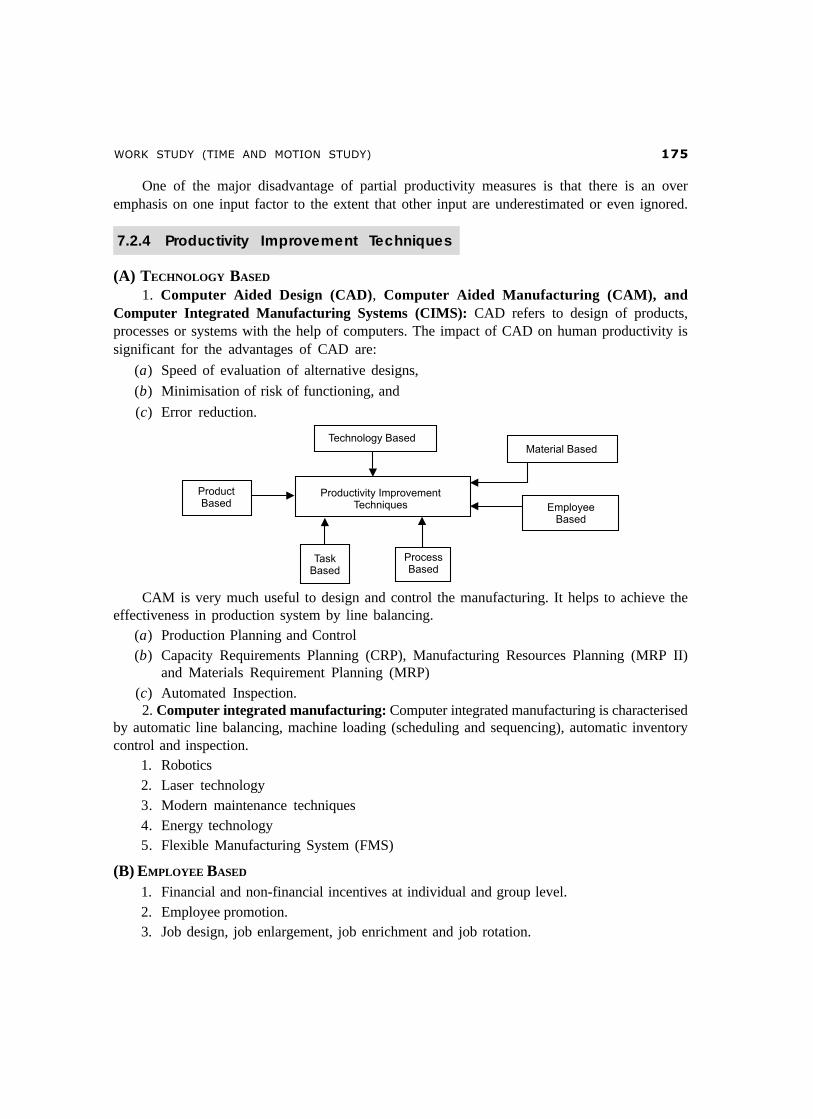
7.2.4 Productivity Improvement Techniques
(A) TECHNOLOGY BASED
1. Computer Aided Design (CAD), Computer Aided Manufacturing (CAM), andComputer Integrated Manufacturing Systems (CIMS): CAD refers to design of products,processes or systems with the help of computers. The impact of CAD on human productivity issignificant for the advantages of CAD are:
(a) Speed of evaluation of alternative designs,
(b) Minimisation of risk of functioning, and
(c) Error reduction.
CAM is very much useful to design and control the manufacturing. It helps to achieve theeffectiveness in production system by line balancing.
(a) Production Planning and Control(b) Capacity Requirements Planning (CRP), Manufacturing Resources Planning (MRP II)
and Materials Requirement Planning (MRP)
(c) Automated Inspection.2. Computer integrated manufacturing: Computer integrated manufacturing is characterised
by automatic line balancing, machine loading (scheduling and sequencing), automatic inventorycontrol and inspection.
1. Robotics2. Laser technology3. Modern maintenance techniques4. Energy technology5. Flexible Manufacturing System (FMS)
(B) EMPLOYEE BASED
1. Financial and non-financial incentives at individual and group level.2. Employee promotion.3. Job design, job enlargement, job enrichment and job rotation.

��� ��������� �� �������� ��������
4. Worker participation in decision-making
5. Quality Circles (QC), Small Group Activities (SGA)
6. Personal development.
(C) MATERAL BASED
1. Material planning and control
2. Purchasing, logistics
3. Material storage and retrieval
4. Source selection and procurement of quality material
5. Waste elimination.
(D) PROCESS BASED
1. Methods engineering and work simplification2. Job design evaluation, job safety
3. Human factors engineering.
(E) PRODUCT BASED
1. Value analysis and value enginering2. Product diversification3. Standardisation and simplification4. Reliability engineering5. Product mix and promotion.
(F) TASK BASED
1. Management style2. Communication in the organisation3. Work culture4. Motivation5. Promotion group activity.
ILLUSTRATION 1: A company produces 160 kg of plastic moulded parts of acceptablequality by consuming 200 kg of raw materials for a particular period. For the next period,the output is doubled (320 kg) by consuming 420 kg of raw material and for a thirdperiod, the output is increased to 400 kg by consuming 400 kg of raw materal.
SOLUTION: During the first year, production is 160 kg
Productivity =OutputInput =
160200
= 0.8 or 80%
For the second year, production is increased by 100%
Productivity =OutputInput =
320420
= 0.76 or 76% ↓
For the third period, production is increased by 150%
Productivity =OutputInput =
400400
= 1.0, i.e., 100% ↑

���� ���� ����� �� ����� ����� ���
From the above illustration it is clear that, for second period, though production has doubled,productivity has decreased from 80% to 76% for period third, production is increased by 150%and correspondingly productivity increased from 80% to 100%.
ILLUSTRATION 2 : The following information regarding the output produced andinputs consumed for a particular time period for a particular company is given below:
Output – Rs. 10,000
Human input – Rs. 3,000
Material input – Rs. 2,000
Capital input – Rs. 3,000
Energy input – Rs. 1,000
Other misc. input – Rs. 500The values are in terms of base year rupee value. Compute various productivity
indices.SOLUTION:Partial productivity
1. Labour productivity = Output
Human input =
10,0003,000 = 3.33
2. Capital productivity = Output
Capital input =
10,0003,000 = 3.33
3. Material productivity = Output
Material input =
10,0002,000 = 5.00
4. Energy productivity = Output
Energy input =
10,0001,000 = 10.00
5. Other misc. expenses = Output
Other misc. input = 10,000
500 = 20.00
6. Total productivity = Total outputTotal input
= Total output
(Human + Material + Capital + Energy + Other misc. input)
= 10,000
3,000 + 2,000 + 3,000 +1,000 + 500
= 10,0009,500 = 1.053

��� ��������� �� �������� ��������
7. Total factor productivity (TFP) =Net output
(Labour + Capital) Input
=Total output Material and services purchased
(Labour + Capital) Input−
Assume that the company purchases all its material and services including energy, misc. andequipment (leasing). Then,
Total factor productivity =10,000 − + + +
+2 000 3 000 1 000 500
3 000 3 000
, , ,
, ,� �
=3 5006 000,,
= 0.583
7.3 WORK STUDY
“Work study is a generic term for those techniques, method study and work measurement whichare used in the examination of human work in all its contexts. And which lead systematically tothe investigation of all the factors which affect the efficiency and economy of the situation beingreviewed, in order to effect improvement.”
Fig. 7.2 Framework of work study
Work study is a means of enhancing the production efficiency (productivity) of the firm byelimination of waste and unnecessary operations. It is a technique to identify non-value addingoperations by investigation of all the factors affecting the job. It is the only accurate andsystematic procedure oriented technique to establish time standards. It is going to contribute tothe profit as the savings will start immediately and continue throughout the life of the product.
Method study and work measurement is part of work study. Part of method study is motionstudy, work measurement is also called by the name ‘Time study’.
���� ���� ����� �� ����� ����� ��
7.3.1 Advantages of Work Study
Following are the advantages of work study:
1. It helps to achieve the smooth production flow with minimum interruptions.
2. It helps to reduce the cost of the product by eliminating waste and unnecessary operations.
3. Better worker-management relations.
4. Meets the delivery commitment.
5. Reduction in rejections and scrap and higher utilisation of resources of the organization.
6. Helps to achieve better working conditions.
7. Better workplace layout.
8. Improves upon the existing process or methods and helps in standardisation andsimplification.
9. Helps to establish the standard time for an operation or job which has got application inmanpower planning, production planning.
7.4 METHOD STUDY
Method study enables the industrial engineer to subject each operation to systematic analysis.The main purpose of method study is to eliminate the unnecessary operations and to achieve thebest method of performing the operation.
Method study is also called methods engineering or work design. Method engineeringis used to describe collection of analysis techniques which focus on improving the effectivenessof men and machines.
According to British Standards Institution (BS 3138): “Method study is the systematicrecording and critical examination or existing and proposed ways or doing work as ameans or developing and applying easier and more effective methods and reducing cost.”
Fundamentally method study involves the breakdown of an operation or procedure into itscomponent elements and their systematic analysis. In carrying out the method study, the rightattitude of mind is important. The method study man should have:
1. The desire and determination to produce results.
2. Ability to achieve results.
3. An understanding of the human factors involved.Method study scope lies in improving work methods through process and operation analysis,
such as:
1. Manufacturing operations and their sequence.
2. Workmen.
3. Materials, tools and gauges.
4. Layout of physical facilities and work station design.
5. Movement of men and material handling.
6. Work environment.
�� ��������� �� �������� ��������
7.4.1 Objectives of Method Study
Method study is essentially concerned with finding better ways of doing things. It adds valueand increases the efficiency by eliminating unnecessary operations, avoidable delays and otherforms of waste.
The improvement in efficiency is achieved through:
1. Improved layout and design of workplace.
2. Improved and efficient work procedures.
3. Effective utilisation of men, machines and materials.
4. Improved design or specification of the final product.
The objectives of method study techniques are:
1. Present and analyse true facts concerning the situation.
2. To examine those facts critically.
3. To develop the best answer possible under given circumstances based on criticalexamination of facts.
7.4.2 Scope of Method Study
The scope of method study is not restricted to only manufacturing industries. Method studytechniques can be applied effectively in service sector as well. It can be applied in offices,hospitals, banks and other service organizations.
The areas to which method study can be applied successfully in manufacturing are:
1. To improve work methods and procedures.
2. To determine the best sequence of doing work.
3. To smoothen material flow with minimum of back tracking and to improve layout.
4. To improve the working conditions and hence to improve labour efficiency.
5. To reduce monotony in the work.
6. To improve plant utilisation and material utilisation.
7. Elimination of waste and unproductive operations.
8. To reduce the manufacturing costs through reducing cycle time of operations.
7.4.3 Steps or Procedure Involved in Methods Study
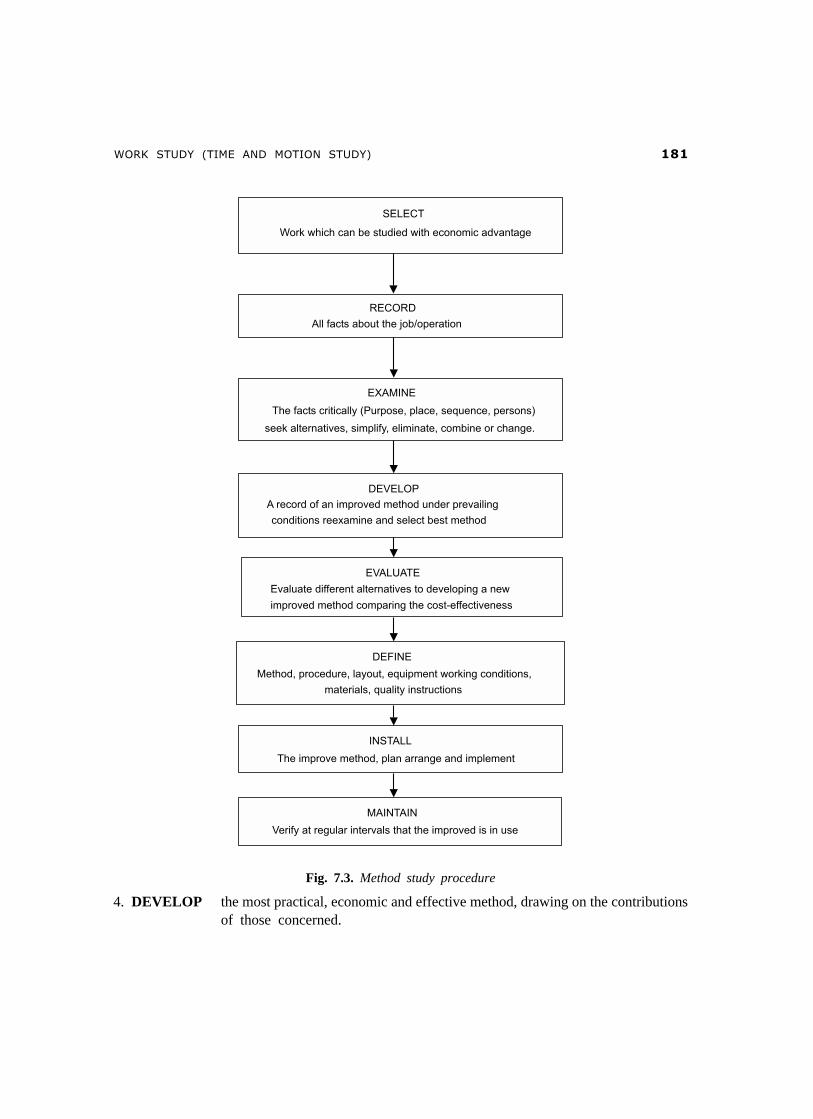
The basic approach to method study consists of the following eight steps. The detailed procedurefor conducting the method study is shown in Fig. 7.3.
1. SELECT the work to be studied and define its boundaries.
2. RECORD the relevant facts about the job by direct observation and collect such additionaldata as may be needed from appropriate sources.
3. EXAMINE the way the job is being performed and challenge its purpose, place sequenceand method of performance.
���� ���� ����� �� ����� ����� ���
Fig. 7.3. Method study procedure
4. DEVELOP the most practical, economic and effective method, drawing on the contributionsof those concerned.

��� ��������� �� �������� ��������
5. EVALUATE different alternatives to developing a new improved method comparing thecost-effectiveness of the selected new method with the current method withthe current method of performance.
6. DEFINE the new method, as a result, in a clear manner and present it to those concerned,i.e., management, supervisors and workers.
7. INSTALL the new method as a standard practice and train the persons involved inapplying it.
8. MAINTAIN the new method and introduce control procedures to prevent a drifting back tothe previous method of work.
Note: Only the first two steps have been dealt in detail.
7.4.4 Selection of the Job for Method Study
Cost is the main criteria for selection of a job, process and department for methods analysis. Tocarry out the method study, a job is selected such that the proposed method achieves one or moreof the following results:
(a) Improvement in quality with lesser scrap.
(b) Increased production through better utilisation of resources.
(c) Elimination of unnecessary operations and movements.
(d) Improved layout leading to smooth flow of material and a balanced production line.
(e) Improved working conditions.
CONSIDERATIONS FOR SELECTION OF METHOD STUDY
The job should be selected for the method study based upon the following considerations:1. Economic aspect 2. Technical aspect, and 3. Human aspect.
A. Economic AspectsThe method study involves cost and time. If sufficient returns are not attained, the whole exercisewill go waste. Thus, the money spent should be justified by the savings from it. The followingguidelines can be used for selecting a job:
(a) Bottleneck operations which are holding up other production operations.
(b) Operations involving excessive labour.
(c) Operations producing lot of scrap or defectives.
(d) Operations having poor utilisation of resources.
(e) Backtracking of materials and excessive movement of materials.
B. Technical AspectsThe method study man should be careful enough to select a job in which he has the technicalknowledge and expertise. A person selecting a job in his area of expertise is going to do fulljustice.

���� ���� ����� �� ����� ����� ���
Other factors which favour selection in technical aspect are:
1. Job having in consistent quality.
2. Operations generating lot of scraps.
3. Frequent complaints from workers regarding the job.
C. Human ConsiderationsMethod study means a change as it is going to affect the way in which the job is done
presently and is not fully accepted by workman and the union. Human considerations play a vitalrole in method study. These are some of the situations where human aspect should be given dueimportance:
1. Workers complaining about unnecessary and tiring work.
2. More frequency of accidents.
3. Inconsistent earning.
7.4.5 Recording Techniques for Method Study
The next step in basic procedure, after selecting the work to be studied is to record all factsrelating to the existing method. In order that the activities selected for investigation may bevisualised in their entirety and in order to improve them through subsequent critical examination,it is essential to have some means of placing on record all the necessary facts about the existingmethod. Records are very much useful to make before and after comparison to assess theeffectiveness of the proposed improved method.
The recording techniques are designed to simplify and standardise the recording work. Forthis purpose charts and diagrams are used.
Fig. 7.4 Recording techniques for method study
CHARTS USED IN METHODS STUDY
This is the most popular method of recording the facts. The activities comprising the jobs arerecorded using method study symbols. A great care is to be taken in preparing the charts so that
��� ��������� �� �������� ��������
the information it shows is easily understood and recognized. The following information shouldbe given in the chart. These charts are used to measure the movement of operator or work (i.e.,in motion study).
(a) Adequate description of the activities.
(b) Whether the charting is for present or proposed method.
(c) Specific reference to when the activities will begin and end.
(d) Time and distance scales used wherever necessary.
(e) The date of charting and the name of the person who does charting.
Types of Charts
It can be broadly divided into (A) Macro motion charts and (B) Micro motion charts.Macro motion charts are used for macro motion study and micro motion charts are used for
micro motion study.Macro motion study is one which can be measured through ‘stop watch’ and micro motion
study is one which cannot be measured through stop watch.
(A) MACRO MOTION CHARTS
Following four charts are used under this type:
1. Operation Process ChartIt is also called outline process chart. An operation process chart gives the bird’s eye view
of the whole process by recording only the major activities and inspections involved in theprocess. Operation process chart uses only two symbols, i.e., operation and inspection. Operation,process chart is helpful to:
(a) Visualise the complete sequence of the operations and inspections in the process.
(b) Know where the operation selected for detailed study fits into the entire process.
(c) In operation process chart, the graphic representation of the points at which materials areintroduced into the process and what operations and inspections are carried on themare shown.
2. Flow Process ChartFlow process chart gives the sequence of flow of work of a product or any part of it through
the work centre or the department recording the events using appropriate symbols. It is theamplification of the operation process chart in which operations; inspection, storage, delay andtransportation are represented. However, process charts are of three types:
(a) Material type—Which shows the events that occur to the materials.
(b) Man type—Activities performed by the man.
(c) Equipment type—How equipment is used.
The flow process chart is useful:
(a) to reduce the distance travelled by men (or materials).
(b) to avoid waiting time and unnecessary delays.

���� ���� ����� �� ����� ����� ���
(c) to reduce the cycle time by combining or eliminating operations.
(d) to fix up the sequence of operations.
(e) to relocate the inspection stages.Like operation process chart, flow process chart is constructed by placing symbols one
below another as per the occurrence of the activities and are joined by a vertical line. A briefdescription of the activity is written on the right hand side of the activity symbol and time ordistance is given on the left hand side.
3. Two Handed Process ChartA two handed (operator process chart) is the most detailed type of flow chart in which the
activities of the workers hands are recorded in relation to one another. The two handed processchart is normally confined to work carried out at a single workplace. This also gives synchronisedand graphical representation of the sequence of manual activities of the worker. The applicationof this charts are:
� To visualise the complete sequence of activities in a repetitive task.� To study the work station layout.
4. Multiple Activity ChartIt is a chart where activities of more than subject (worker or equipment) are each recorded
on a common time scale to show their inter-relationship. Multiple activity chart is made:
� to study idle time of the man and machines,
� to determine number of machines handled by one operator, and
� to determine number of operators required in teamwork to perform the given job.
Diagrams Used in Method Study
The flow process chart shows the sequence and nature of movement but it does not clearly showthe path of movements. In the paths of movements, there are often undesirable features such ascongestion, back tracking and unnecessary long movements. To record these unnecessary features,representation of the working area in the form of flow diagrams, string diagrams can be made:
1. To study the different layout plans and thereby; select the most optimal layout.
2. To study traffic and frequency over different routes of the plant.
3. Identification of back tracking and obstacles during movements. Diagrams are of twotypes: 1. Flow diagram and 2. String diagram.
1. FLOW DIAGRAM
Flow diagram is a drawing, of the working area, showing the location of the various activitiesidentified by their numbered symbols and are associated with particular flow process chart eitherman type or machine type.
The routes followed in transport are shown by joining the symbols in sequence by a linewhich represents as nearly as possible the path or movement of the subject concerned.
Following are the procedures to make the flow diagram:

��� ��������� �� �������� ��������
1. The layout of the workplace is drawn to scale.
2. Relative positions of the machine tools, work benches, storage, and inspection benchesare marked on the scale.
3. Path followed by the subject under study is tracked by drawing lines.
4. Each movement is serially numbered and indicated by arrow for direction.
5. Different colours are used to denote different types of movements.
2. STRING DIAGRAM
The string diagram is a scale layout drawing on which, length of a string is used to record theextent as well as the pattern of movement of a worker working within a limited area during acertain period of time. The primary function of a string diagram is to produce a record of aexisting set of conditions so that the job of seeing what is actually taking place is made as simpleas possible.
One of the most valuable features of the string diagram is the actual distance travelledduring the period of study to be calculated by relating the length of the thread used to the scaleof drawing. Thus, it helps to make a very effective comparison between different layouts ormethods of doing job in terms of the travelling involved.
The main advantages of string diagram compared to flow diagram is that respective movementsbetween work stations which are difficult to be traced on the flow diagram can be convenientlyshown on string diagram.
Folloging are the procedures to draw string diagram:
1. A layout of the work place of factory is drawn to scale on the soft board.
2. Pins are fixed into boards to mark the locations of work stations, pins are also driven atthe turning points of the routes.
3. A measured length of the thread is taken to trace the movements (path).
4. The distance covered by the object is obtained by measuring the remaining part of thethread and subtracting it from original length.
Symbols Used in Method Study
Graphical method of recording was originated by Gilberth, in order to make the presentation ofthe facts clearly without any ambiguity and to enable to grasp them quickly and clearly. It isuseful to use symbols instead of written description.
(A) METHOD STUDY SYMBOLS
Ο OPERATION
� INSPECTION
→ TRANSPORTATION
D DELAY
∇ STORAGE
���� ���� ����� �� ����� ����� ���
Operation OAn operation occurs when an object is intentionally changed in one or more of its characteristics
(physical or chemical). This indicates the main steps in a process, method or procedure.
An operation always takes the object one stage ahead towards completion.
Examples of operation are:
� Turning, drilling, milling, etc.
� A chemical reaction.
� Welding, brazing and riveting.
� Lifting, loading, unloading.
� Getting instructions from supervisor.
� Taking dictation.
Inspection �
An inspection occurs when an object is examined and compared with standard for qualityand quantity. The inspection examples are:
� Visual observations for finish.
� Count of quantity of incoming material.
� Checking the dimensions.
Transportation →→→→→A transport indicates the movement of workers, materials or equipment from one place to
another.Example: Movement of materials from one work station to another.
Workers travelling to bring tools.
Delay D: Delay (Temporary Storage)A delay occurs when the immediate performance of the next planned thing does not take
place.
Example: Work waiting between consecutive operations.
Workers waiting at tool cribs.
Operators waiting for instructions from supervisor.
Storage ∇∇ ∇∇ ∇Storage occurs when the object is kept in an authorised custody and is protected against
unauthorised removal. For example, materials kept in stores to be distributed to various work.
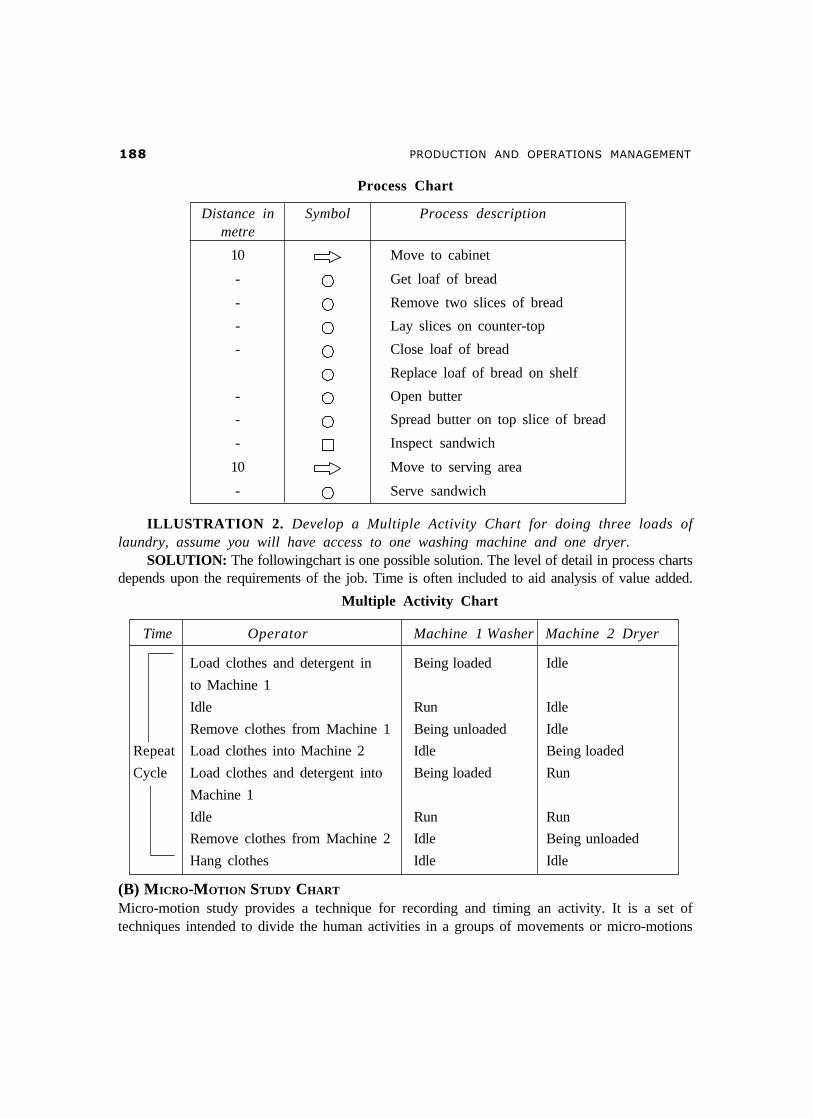
ILLUSTRATION 1. Develop a Process Chart for making a cheese sandwich.SOLUTION. The following chart is one possible solution. The level of detail in process
charts depends upon the requirements of the job. Time is often included to aid analysis of valueadded.
��� ��������� �� �������� ��������
Process Chart
Distance in Symbol Process descriptionmetre
10 Move to cabinet
- Get loaf of bread
- Remove two slices of bread
- Lay slices on counter-top
- Close loaf of bread
Replace loaf of bread on shelf
- Open butter
- Spread butter on top slice of bread
- Inspect sandwich
10 Move to serving area
- Serve sandwich
ILLUSTRATION 2. Develop a Multiple Activity Chart for doing three loads oflaundry, assume you will have access to one washing machine and one dryer.
SOLUTION: The followingchart is one possible solution. The level of detail in process chartsdepends upon the requirements of the job. Time is often included to aid analysis of value added.
Multiple Activity Chart
Time Operator Machine 1 Washer Machine 2 Dryer
Load clothes and detergent in Being loaded Idle
to Machine 1
Idle Run Idle
Remove clothes from Machine 1 Being unloaded Idle
Repeat Load clothes into Machine 2 Idle Being loaded
Cycle Load clothes and detergent into Being loaded Run
Machine 1
Idle Run Run
Remove clothes from Machine 2 Idle Being unloaded
Hang clothes Idle Idle
(B) MICRO-MOTION STUDY CHART
Micro-motion study provides a technique for recording and timing an activity. It is a set oftechniques intended to divide the human activities in a groups of movements or micro-motions
���� ���� ����� �� ����� ����� ��
(called Therbligs) and the study of such movements helps to find for an operator one best patternof movements that consumes less time and requires less effort to accomplish the task. Therbligswere suggested by Frank O. Gilbreth, the founder of motion study. Micro-motion study wasmainly employed for the job analysis. Its other applications includes:
1. As an aid in studying the activities of two or more persons on a group work?
2. As an aid in studying the relationship of the activities of the operator and the machineas a means of timing operations.
3. As an aid in obtaining motion time data for time standards.
4. Acts as permanent record of the method and time of activities of the operator and themachine.
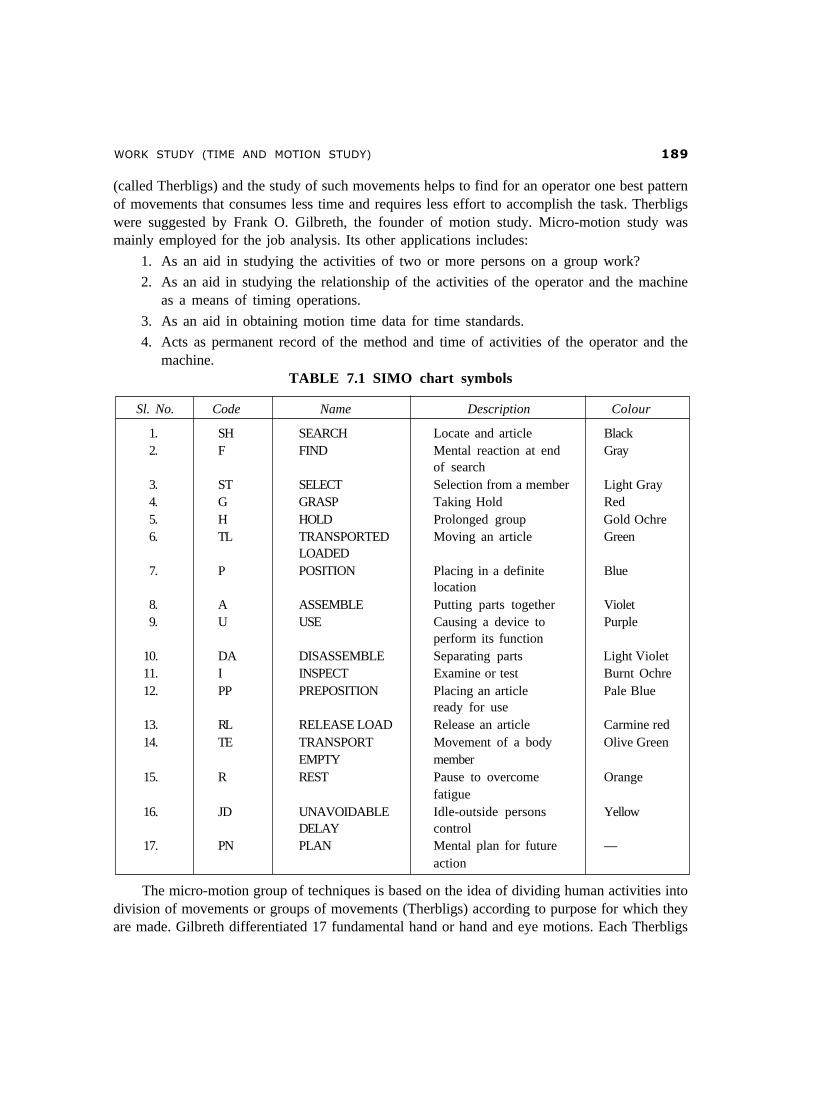
TABLE 7.1 SIMO chart symbols
Sl. No. Code Name Description Colour
1. SH SEARCH Locate and article Black2. F FIND Mental reaction at end Gray
of search3. ST SELECT Selection from a member Light Gray4. G GRASP Taking Hold Red5. H HOLD Prolonged group Gold Ochre6. TL TRANSPORTED Moving an article Green
LOADED7. P POSITION Placing in a definite Blue
location8. A ASSEMBLE Putting parts together Violet9. U USE Causing a device to Purple
perform its function10. DA DISASSEMBLE Separating parts Light Violet11. I INSPECT Examine or test Burnt Ochre12. PP PREPOSITION Placing an article Pale Blue
ready for use13. RL RELEASE LOAD Release an article Carmine red14. TE TRANSPORT Movement of a body Olive Green
EMPTY member15. R REST Pause to overcome Orange
fatigue16. JD UNAVOIDABLE Idle-outside persons Yellow
DELAY control17. PN PLAN Mental plan for future —
action
The micro-motion group of techniques is based on the idea of dividing human activities intodivision of movements or groups of movements (Therbligs) according to purpose for which theyare made. Gilbreth differentiated 17 fundamental hand or hand and eye motions. Each Therbligs
� ��������� �� �������� ��������
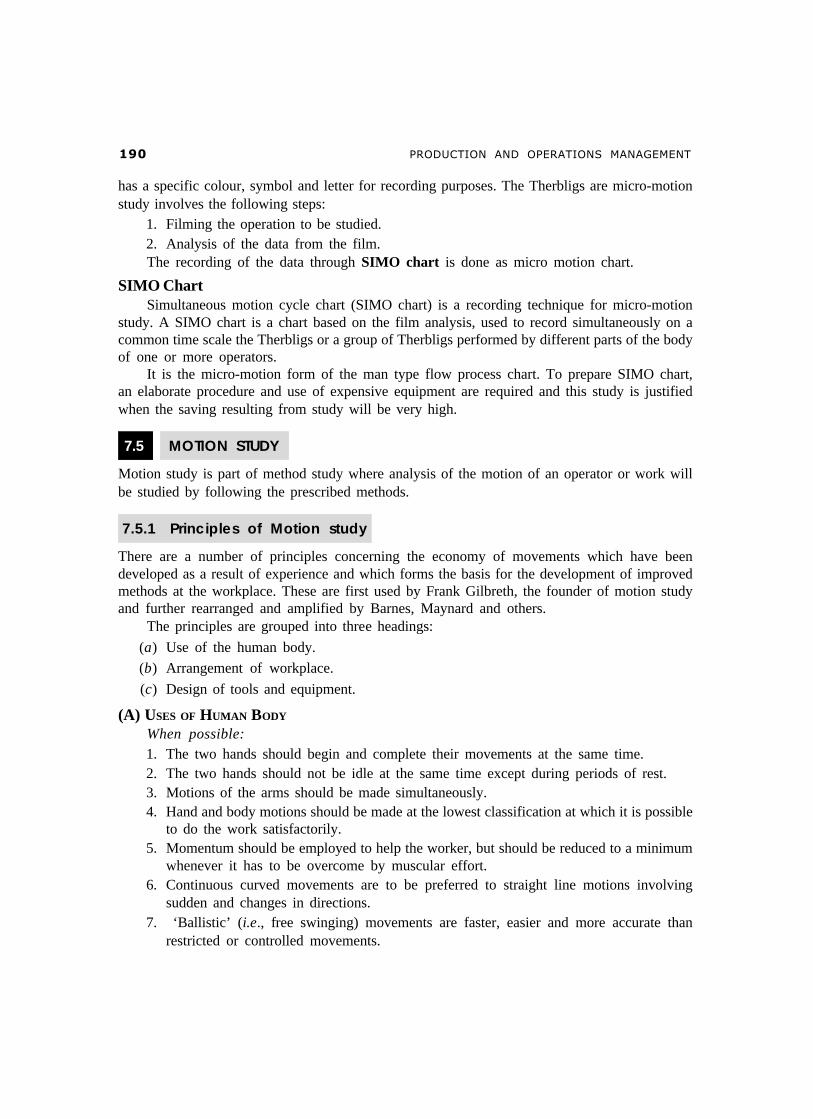
has a specific colour, symbol and letter for recording purposes. The Therbligs are micro-motionstudy involves the following steps:
1. Filming the operation to be studied.2. Analysis of the data from the film.The recording of the data through SIMO chart is done as micro motion chart.
SIMO ChartSimultaneous motion cycle chart (SIMO chart) is a recording technique for micro-motion
study. A SIMO chart is a chart based on the film analysis, used to record simultaneously on acommon time scale the Therbligs or a group of Therbligs performed by different parts of the bodyof one or more operators.
It is the micro-motion form of the man type flow process chart. To prepare SIMO chart,an elaborate procedure and use of expensive equipment are required and this study is justifiedwhen the saving resulting from study will be very high.
7.5 MOTION STUDY
Motion study is part of method study where analysis of the motion of an operator or work willbe studied by following the prescribed methods.
7.5.1 Principles of Motion study
There are a number of principles concerning the economy of movements which have beendeveloped as a result of experience and which forms the basis for the development of improvedmethods at the workplace. These are first used by Frank Gilbreth, the founder of motion studyand further rearranged and amplified by Barnes, Maynard and others.
The principles are grouped into three headings:
(a) Use of the human body.
(b) Arrangement of workplace.
(c) Design of tools and equipment.
(A) USES OF HUMAN BODY
When possible:1. The two hands should begin and complete their movements at the same time.2. The two hands should not be idle at the same time except during periods of rest.3. Motions of the arms should be made simultaneously.4. Hand and body motions should be made at the lowest classification at which it is possible
to do the work satisfactorily.5. Momentum should be employed to help the worker, but should be reduced to a minimum
whenever it has to be overcome by muscular effort.6. Continuous curved movements are to be preferred to straight line motions involving
sudden and changes in directions.7. ‘Ballistic’ (i.e., free swinging) movements are faster, easier and more accurate than
restricted or controlled movements.
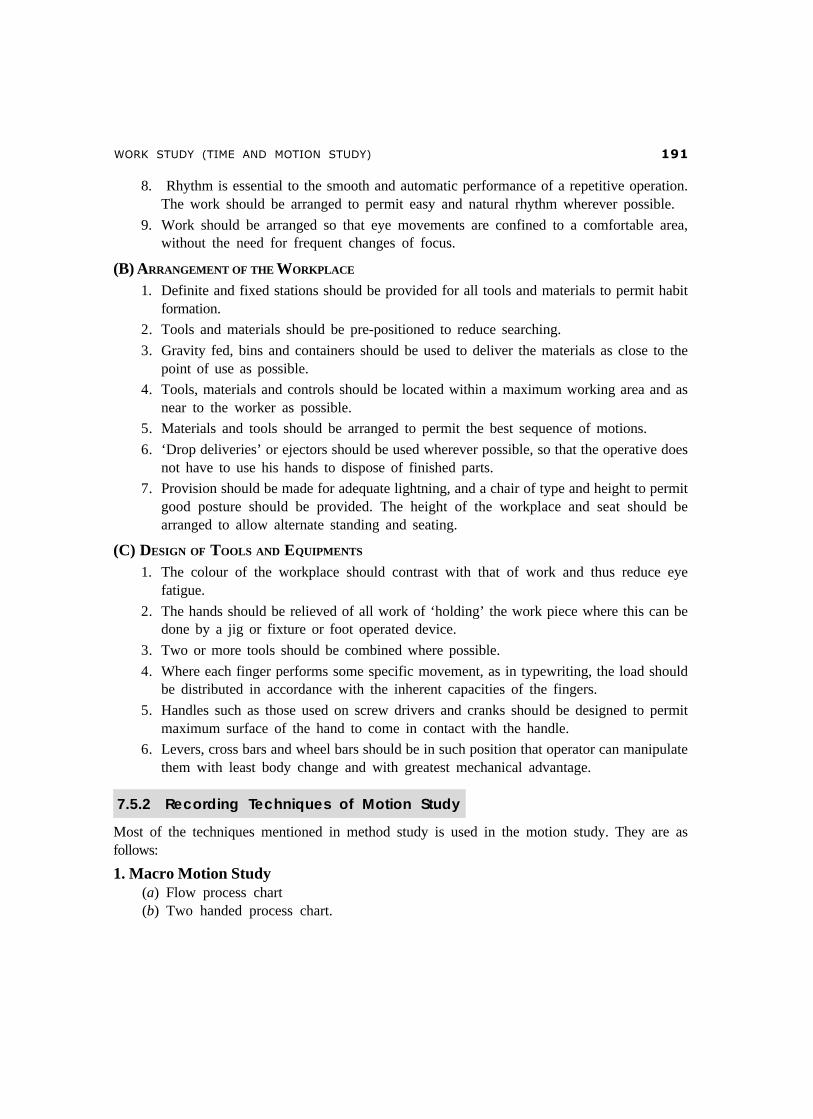
���� ���� ����� �� ����� ����� ��
8. Rhythm is essential to the smooth and automatic performance of a repetitive operation.The work should be arranged to permit easy and natural rhythm wherever possible.
9. Work should be arranged so that eye movements are confined to a comfortable area,without the need for frequent changes of focus.
(B) ARRANGEMENT OF THE WORKPLACE
1. Definite and fixed stations should be provided for all tools and materials to permit habitformation.
2. Tools and materials should be pre-positioned to reduce searching.
3. Gravity fed, bins and containers should be used to deliver the materials as close to thepoint of use as possible.
4. Tools, materials and controls should be located within a maximum working area and asnear to the worker as possible.
5. Materials and tools should be arranged to permit the best sequence of motions.
6. ‘Drop deliveries’ or ejectors should be used wherever possible, so that the operative doesnot have to use his hands to dispose of finished parts.
7. Provision should be made for adequate lightning, and a chair of type and height to permitgood posture should be provided. The height of the workplace and seat should bearranged to allow alternate standing and seating.
(C) DESIGN OF TOOLS AND EQUIPMENTS
1. The colour of the workplace should contrast with that of work and thus reduce eyefatigue.
2. The hands should be relieved of all work of ‘holding’ the work piece where this can bedone by a jig or fixture or foot operated device.
3. Two or more tools should be combined where possible.
4. Where each finger performs some specific movement, as in typewriting, the load shouldbe distributed in accordance with the inherent capacities of the fingers.
5. Handles such as those used on screw drivers and cranks should be designed to permitmaximum surface of the hand to come in contact with the handle.
6. Levers, cross bars and wheel bars should be in such position that operator can manipulatethem with least body change and with greatest mechanical advantage.
7.5.2 Recording Techniques of Motion Study
Most of the techniques mentioned in method study is used in the motion study. They are asfollows:
1. Macro Motion Study(a) Flow process chart(b) Two handed process chart.

�� ��������� �� �������� ��������
2. Micro Motion StudySIMO chart.[Note: Explained earlier in this chapter.]
7.6 WORK MEASUREMENT
Work measurement is also called by the name ‘time study’. Work measurement is absolutelyessential for both the planning and control of operations. Without measurement data, we cannotdetermine the capacity of facilities or it is not possible to quote delivery dates or costs. Weare not in a position to determine the rate of production and also labour utilisation and efficiency.It may not be possible to introduce incentive schemes and standard costs for budget control.
7.6.1 Objectives of Work Measurement
The use of work measurement as a basis for incentives is only a small part of its total application.The objectives of work measurement are to provide a sound basis for:
1. Comparing alternative methods.
2. Assessing the correct initial manning (manpower requirement planning).
3. Planning and control.
4. Realistic costing.
5. Financial incentive schemes.
6. Delivery date of goods.
7. Cost reduction and cost control.
8. Identifying substandard workers.
9. Training new employees.
7.6.2 Techniques of Work Measurement
For the purpose of work measurement, work can be regarded as:1. Repetitive work: The type of work in which the main operation or group of operations
repeat continuously during the time spent at the job. These apply to work cycles of extremelyshort duration.
2. Non-repetitive work: It includes some type of maintenance and construction work,where the work cycle itself is hardly ever repeated identically.
Various techniques of work measurement are:
1. Time study (stop watch technique),
2. Synthesis,
3. Work sampling,
4. Predetermined motion and time study,
5. Analytical estimating.

���� ���� ����� �� ����� ����� ��
Time study and work sampling involve direct observation and the remaining are data basedand analytical in nature.
1. Time study: A work measurement technique for recording the times and rates ofworking for the elements of a specified job carried out under specified conditions and foranalysing the data so as to determine the time necessary for carrying out the job at the definedlevel of performance. In other words measuring the time through stop watch is called time study.
2. Synthetic data: A work measurement technique for building up the time for a job or pansof the job at a defined level of performance by totalling element times obtained previously fromtime studies on other jobs containing the elements concerned or from synthetic data.
3. Work sampling: A technique in which a large number of observations are made over aperiod of time of one or group of machines, processes or workers. Each observation records whatis happening at that instant and the percentage of observations recorded for a particular activity,or delay, is a measure of the percentage of time during which that activities delay occurs.
4. Predetermined motion time study (PMTS): A work measurement technique wherebytimes established for basic human motions (classified according to the nature of the motion andconditions under which it is made) are used to build up the time for a job at the defined level ofperformance. The most commonly used PMTS is known as Methods Time Measurement (MTM).
5. Analytical estimating: A work measurement technique, being a development of estimating,whereby the time required to carry out elements of a job at a defined level of performance isestimated partly from knowledge and practical experience of the elements concerned and partlyfrom synthetic data.
The work measurement techniques and their applications are shown in Table 7.2.
TABLE 7.2: Work measurement techniques and their application
Techniques Applications Unit of measurement
1. Time study Short cycle repetitive jobs. Centiminute (0.01 min)Widely used for direct work.
2. Synthetic Data Short cycle repetitive jobs. Centi minutes
3. Working sampling Long cycle jobs/heterogeneous Minutesoperations.
4. MTM Manual operations confined to TMU (1 TMU = 0.006 min)one work centre.
5. Analytical estimation Short cycle non-repetitive job. Minutes
7.7 TIME STUDY
Time study is also called work measurement. It is essential for both planning and control ofoperations.
According to British Standard Institute time study has been defined as “The application oftechniques designed to establish the time for a qualified worker to carry out a specifiedjob at a defined level of performance.”

�� ��������� �� �������� ��������
7.7.1 Steps in Making Time Study
Stop watch time is the basic technique for determining accurate time standards. They areeconomical for repetitive type of work. Steps in taking the time study are:
1. Select the work to be studied.2. Obtain and record all the information available about the job, the operator and the
working conditions likely to affect the time study work.3. Breakdown the operation into elements. An element is a instinct part of a specified
activity composed of one or more fundamental motions selected for convenience ofobservation and timing.
4. Measure the time by means of a stop watch taken by the operator to perform eachelement of the operation. Either continuous method or snap back method of timing couldbe used.
5. At the same time, assess the operators effective speed of work relative to the observer’sconcept of ‘normal’ speed. This is called performance rating.
6. Adjust the observed time by rating factor to obtain normal time for each element
NormalObserved time Rating
100= ×
7. Add the suitable allowances to compensate for fatigue, personal needs, contingencies.etc. to give standard time for each element.
8. Compute allowed time for the entire job by adding elemental standard times consideringfrequency of occurrence of each element.
9. Make a detailed job description describing the method for which the standard time isestablished.
10. Test and review standards wherever necessary. The basic steps in time study arerepresented by a block diagram in Fig. 7.5.
7.7.2 Computation of Standard Time
Standard time is the time allowed to an operator to carry out the specified task under specifiedconditions and defined level of performance. The various allowances are added to the normaltime as applicable to get the standard time as shown in Fig. 7.6.
Standard time may be defined as the, amount of time required to complete a unit of work:(a) under existing working conditions, (b) using the specified method and machinery, (c) by anoperator, able to the work in a proper manner, and (d) at a standard pace.
Thus basic constituents of standard time are:
1. Elemental (observed time).
2. Performance rating to compensate for difference in pace of working.
3. Relaxation allowance.
4. Interference and contingency allowance.
5. Policy allowance.

���� ���� ����� �� ����� ����� ��
Fig. 7.5 Steps in time study
Fig. 7.6 Components standard time

�� ��������� �� �������� ��������
OT – Observed TimePRF – Performance Rating FactorNT – Normal TimePA – Process Allowances
RPA – Rest and Personal AllowancesSA – Special Allowances
PoA – Policy Allowances
Allowances
The normal time for an operation does not contain any allowances for the worker. It is impossibleto work throughout the day even though the most practicable, effective method has been developed.Even under the best working method situation, the job will still demand the expenditure of humaneffort and some allowance must therefore be made for recovery from fatigue and for relaxation.Allowances must also be made to enable the worker to attend to his personal needs. Theallowances are categorised as: (1) Relaxation allowance, (2) Interference allowance, and (3)Contingency allowance.
1. RELAXATION ALLOWANCE
Relaxation allowances are calculated so as to allow the worker to recover from fatigue. Relaxationallowance is a addition to the basic time intended to provide the worker with the opportunity torecover from the physiological and psychological effects of carrying out specified work underspecified conditions and to allow attention to personal needs. The amount of allowance willdepend on nature of the job.
Relaxation allowances are of two types: fixed allowances and variable allowances.Fixed allowances constitute:
(a) Personal needs allowance: It is intended to compensate the operator for the timenecessary to leave, the workplace to attend to personal needs like drinking water, smoking,washing hands. Women require longer personal allowance than men. A fair personalallowance is 5% for men, and 7% for women.
(b) Allowances for basic fatigue: This allowance is given to compensate for energy expendedduring working. A common figure considered as allowance is 4% of the basic time.
2. VARIABLE ALLOWANCE
Variable allowance is allowed to an operator who is working under poor environmental conditionsthat cannot be improved, added stress and strain in performing the job.
The variable fatigue allowance is added to the fixed allowance to an operator who isengaged on medium and heavy work and working under abnormal conditions. The amount ofvariable fatigue allowance varies from organization to organization.
3. INTERFERENCE ALLOWANCE
It is an allowance of time included into the work content of the job to compensate the operatorfor the unavoidable loss of production due to simultaneous stoppage of two or more machinesbeing operated by him. This allowance is applicable for machine or process controlled jobs.

���� ���� ����� �� ����� ����� ��
Interference allowance varies in proportion to number of machines assigned to the operator.The interference of the machine increases the work content.
4. CONTINGENCY ALLOWANCE
A contingency allowance is a small allowance of time which may be included in a standard timeto meet legitimate and expected items of work or delays. The precise measurement of which isuneconomical because of their infrequent or irregular occurrence.
This allowance provides for small unavoidable delays as well as for occasional minor extrawork:
Some of the examples calling for contingency allowance are:
� Tool breakage involving removal of tool from the holder and all other activities to insertnew tool into the tool holder.
� Power failures of small duration.
� Obtaining the necessary tools and gauges from central tool store. Contingency allowanceshould not exceed 5%.
5. POLICY ALLOWANCE
Policy allowances are not the genuine part of the time study and should be used with utmost careand only in clearly defined circumstances.
The usual reason for making the policy allowance is to line up standard times with requirementsof wage agreement between employers and trade unions.
The policy allowance is an increment, other than bonus increment, applied to a standard time(or to some constituent part of it, e.g., work content) to provide a satisfactory level of earningsfor a specified level of performance under exceptional circumstances. Policy allowances aresometimes made as imperfect functioning of a division or part of a plant.
ILLUSTRATION 1: Assuming that the total observed time for an operation ofassembling an electric switch is 1.00 min. If the rating is 120%, find normal time. If anallowance of 10% is allowed for the operation, determine the standard time.
SOLUTION:Obsessed time (or) selected time = 1.00 minRating = 120%Allowance = 10%
As we know that, normal time = Observed time × Rating %
100
= 1.00 × 120100
= 1.20 min
Allowance @ 10% = 1.20 × 10100
= 0.12 min
∴ Standard time = Normal time + Allowances= 1.20 + 0.12 = 1.32 min.

�� ��������� �� �������� ��������
ILLUSTRATION 2: An operator manufactures 50 jobs in 6 hours and 30 minutes.If this time includes the time for setting his machine. Calculate the operator’s efficiency.Standard time allowed for the job was:
Setting time = 35 minProduction time per piece = 8 min
SOLUTION:As standard time = Set up time + Time per piece × No. of pieces produced∴ Standard time for manufacturing 50 jobs
= 35 + 8 × 50= 435 min= 7 hours and 15 min.
Efficiency of operator =Standard time × 100
Actual time
=435 × 100
390 = 111.5%.
ILLUSTRATION 3: Following datas were obtained by a work study. Man from astudy conducted by hours.
(i) Maintenance time(a) Get out and put away tools = 12.0 min/day(b) Cleaning of machine = 5.0 min/day(c) Oiling of machine = 5.0 min/day(d) Replenish coolant supply = 3.0 min/day
(ii) Interruption(a) Interruption by foreman = 5.0 min/day(b) Interruption by porter etc. = 4.0 min/day
(iii) Delay time due to power failure etc. = 6.0 min/day(iv) Personal time = 20.0 min/day
Calculate total allowances, total available cycle time productive hours, considering aworking day of 8 hours.
SOLUTION:Total allowance (sometimes also known as station time)
= Total maintenance time + Interruption time+ Delay time + Personal time
= (12.0 + 5 + 5 + 3.0) + (5.0 + 4.0) + 6.0 + 20.0= 25.0 + 9.0 + 6.0 + 20.0= 60.0 min per day
∴ Total available cycle time = Total work period – Total allowances= 480 – 60 = 420 min/day
Productive hours =Time available
Number of hours
=4208
= 52.5 min.

���� ���� ����� �� ����� ����� �
ILLUSTRATION 4: Find out the standard time using the following data:Average time for machine elements = 6 minAverage time for manual elements = 4 minPerformance rating = 110%Allowances = 10%SOLUTION:Normal time = Machinery time + Manual time × Rating
= 6 + 4 × 1.1= 6 + 4.4 = 10.4 min
∴ Standard time = Normal time + Allowances
= 10.4 + 10.4 × 10100
= 10.4 (1 + 0.1) = 11.44 min.
EXERCISES
Section A1. What do you mean by productivity?2. What is work study?3. What do you mean by work measurement?4. How do you ascertain productivity?5. What do you mean by total productivity measure?6. What do you mean by partial productivity measure?7. What is micro-motion study?8. What is motion study?9. What is time study?
Section B1. How do you achieve efficiency?
2. Explain the scope of method study.
Section C1. Discuss the factors influencing productivity.
2. Discuss the productivity improvement techniques.3. Discuss the steps involved in method study.4. Discuss different types of charts and diagrams used in methods study.5. Discuss the principles of motion study.
6. Discuss the recording technique of motion study.
7. Discuss the various techniques of work measurement.8. Discuss the steps in making time study.9. Discuss the different types of allowances.

� ��������� �� �������� ��������
Skill development
FAST FOOD RESTAURANT VISIT: Get the information for the following questions:
1. Steps involved in the preparation of pizza (method study).
2. Cycle time involved for placing of order till serving (Standard Time Calculation).
3. Process chart used for pizza preparation.
CASELET
1. TOYS AND JOB DESIGN AT THE HOVEY AND BEARD COMPANY
The following is a situation that occurred in the Hovey and Beard Company, as reported byJ. V. Clark.
This company manufactured a line of wooden toys. One part of the process involved spraypainting partially assembled toys, after which the toys were hung on moving hooks that carriedthem through a drying oven. The operation, staffed entirely by women, was plagued withabsenteeism, high turnover, and low morale. Each woman at her paint booth would take a toyfrom the tray beside her, position it in a fixture, and spray on the color according to the requiredpattern. She then would release the toy and hang it on the conveyor hook. The rate at whichthe hooks moved had been calculated so that each woman, once fully trained, would be able tohang a painted toy on each hook before it passed beyond her reach.
The women who worked in the paint room were on a group incentive plan that tied theirearnings to the production of the entire group. Since the operation was new, they received alearning allowance that decreased by regular amounts each month. The learning allowance wasscheduled to fall to zero in six months because it was expected that the women could meetstandard output or more by that time. By the second month of the training period, trouble haddeveloped. The women had progressed more slowly than had been anticipated, and it appearedthat their production level would stabilize somewhat below the planned level. Some of the womencomplained about the speed that was expected of them, and a few of them quit. There wasevidence of resistance to the new situation.
Through the counsel of a consultant, the supervisor finally decided to bring the womentogether for general discussions of working conditions. After two meetings in which relationsbetween the work group and the supervisor were somewhat improved, a third meeting producedthe suggestion that control of the conveyor speed be turned over to the work group. The womenexplained that they felt that they could keep up with the speed of the conveyor but that they couldnot work at that pace all day long. They wished to be able to adjust the speed of the belt,depending on how they felt.
After consultation, the supervisor had a control marked, “low, medium, and fast” installedat the booth of the group leader, who could adjust the speed of the conveyor anywhere betweenthe lower and upper limits that had been set. The women were delighted and spent many lunch
���� ���� ����� �� ����� ����� ��
hours deciding how the speed should be varied from hour to hour throughout the day. Within aweek, a pattern had emerged: the first half-hour of the shift was run on what the women called“medium speed” (a dial setting slightly above the point marked “medium”). The next two andone-half hours were run at high speed, and the half-hour before lunch and the half-hour afterlunch were run at low speed. The rest of the afternoon was run at high speed, with the exceptionof the last 45 minutes of the shift, which were run at medium speed.
In view of the women’s report of satisfaction and ease in their work, it is interesting to notethat the original speed was slightly below medium on the dial of the new control. The averagespeed at which the women were running the belt was on the high side of the dial. Few, if any,empty hooks entered the drying oven, and inspection showed no increase of rejects from the paintroom. Production increased, and within three weeks the women were operating at 30 to 50percent above the level that had been expected according to the original design.
Evaluate the experience of the Hovey and Beard Company as it reflects on job design,human relationships, and the supervisor’s role. How would you react as the supervisor to thesituation where workers determine how the work will be performed? If you were designing thespray-painting set-up, would you design it differently?
[From J. V. Clark, “A Healthy Organization,” California Management Review, 4, 1962]
2. PRODUCTIVITY GAINS AT WHIRLPOOL
Workers and management at Whirlpool Appliance’s Benton Harbor plant in Michigan haveset an example of how to achieve productivity gains, which has benefited not only the companyand its stockholders, but also Whirlpool customers, and the workers themselves.
Things weren’t always rosy at the plant. Productivity and quality weren’t good. Neitherwere labor-management relations. Workers hid defective parts so management wouldn’t findthem, and when machines broke down, workers would simply sit down until sooner or latersomeone came to fix it. All that changed in the late 1980s. Faced with the possibility that theplant would be shut down, management and labor worked together to find a way to keep the plantopen. The way was to increase productivity-producing more without using more resources.Interestingly, the improvement in productivity didn’t come by spending money on fancy machines.Rather, it was accomplished by placing more emphasis on quality. That was a shift from the oldway, which emphasized volume, often at the expense of quality. To motivate workers, thecompany agreed to gain sharing, a plan that rewarded workers by increasing their pay forproductivity increases.
The company overhauled the manufacturing process, and taught its workers how to improvequality. As quality improved, productivity went up because more of the output was good, andcosts went down because of fewer defective parts that had to be scrapped or reworked. Costsof inventory also decreased, because fewer spare parts were needed to replace defective output,both at the factory and for warranty repairs. And workers have been able to see the connectionbetween their efforts to improve quality and productivity.
Not only was Whirlpool able to use the productivity gains to increase workers’ pay, it wasalso able to hold that lid on price increases and to funnel some of the savings into research.
�� ��������� �� �������� ��������
Questions1. What were the two key things that Whirlpool management did to achieve productivity
gains?
2. Who has benefited from the productivity gains?
3. How are productivity and quality related?
4. How can a company afford to pay it workers for productivity gains?(Source: Based on “A Whirlpool Factory Raises Productivity-And Pay of Workers:’ by Rick Wartzman,
from The Wall Street journal, 1992.)
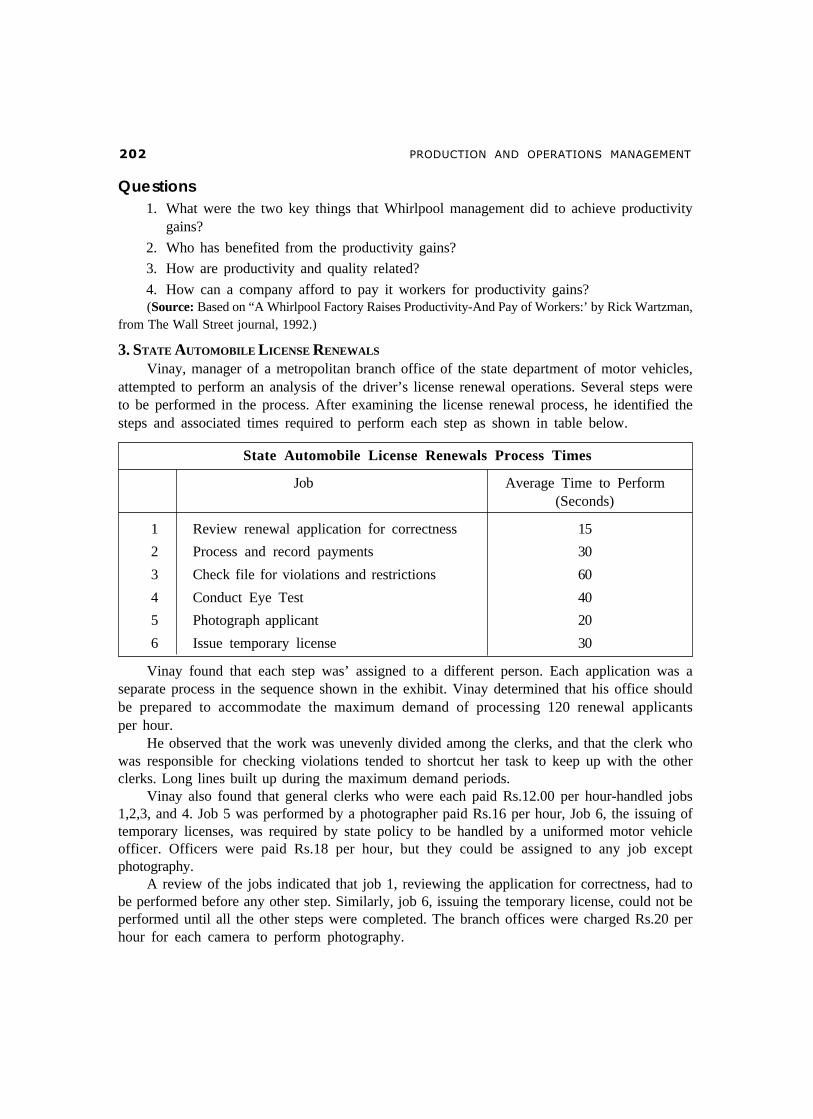
3. STATE AUTOMOBILE LICENSE RENEWALS
Vinay, manager of a metropolitan branch office of the state department of motor vehicles,attempted to perform an analysis of the driver’s license renewal operations. Several steps wereto be performed in the process. After examining the license renewal process, he identified thesteps and associated times required to perform each step as shown in table below.
State Automobile License Renewals Process Times
Job Average Time to Perform(Seconds)
1 Review renewal application for correctness 15
2 Process and record payments 30
3 Check file for violations and restrictions 60
4 Conduct Eye Test 40
5 Photograph applicant 20
6 Issue temporary license 30
Vinay found that each step was’ assigned to a different person. Each application was aseparate process in the sequence shown in the exhibit. Vinay determined that his office shouldbe prepared to accommodate the maximum demand of processing 120 renewal applicantsper hour.
He observed that the work was unevenly divided among the clerks, and that the clerk whowas responsible for checking violations tended to shortcut her task to keep up with the otherclerks. Long lines built up during the maximum demand periods.
Vinay also found that general clerks who were each paid Rs.12.00 per hour-handled jobs1,2,3, and 4. Job 5 was performed by a photographer paid Rs.16 per hour, Job 6, the issuing oftemporary licenses, was required by state policy to be handled by a uniformed motor vehicleofficer. Officers were paid Rs.18 per hour, but they could be assigned to any job exceptphotography.
A review of the jobs indicated that job 1, reviewing the application for correctness, had tobe performed before any other step. Similarly, job 6, issuing the temporary license, could not beperformed until all the other steps were completed. The branch offices were charged Rs.20 perhour for each camera to perform photography.

���� ���� ����� �� ����� ����� ��
Vinay was under severe pressure to increase productivity and reduce costs, but the regionaldirector of the department of motor vehicles also told him that he had better accommodate thedemand for renewals. Otherwise, “heads would roll.”
Questions1. What is the maximum number of applications per hour that can be handled by the present
configuration of the process?
2. How many applications can be processed per hour if a second clerk is added to checkfor violations?
3. Assuming the addition of one more clerk, what is the maximum number of applicationsthe process can handle?
4. How would you suggest modifying the process to accommodate 120 applications perhour?
(Source: P. R. Olsen, W. E. Sasser, and D. D. Wyckoff, Management of Service Operations: Text, Cases,
and Readings, Pp. 95-96, @ 1978.)
4. MAKING HOTPLATES
Group of 10 workers were responsible for assembling hotplates (instruments for heatingsolutions to a given temperature) for hospital and medical laboratory use. A number of differentmodels of hotplates were being manufactured. Some had a vibrating device so that the solutioncould be mixed while being heated. Others heated only test tubes. Still others could heat solutionsin a variety of different containers.
With the appropriate small tools, each worker assembled part of a hotplate. The partiallycompleted hotplate was placed on a moving belt, to be carried from one assembly station to thenext. When the hotplate was completed, an inspector would check it over to ensure that it wasworking properly. Then the last worker would place it in a specially prepared cardboard box forshipping.
The assembly line had been carefully balanced by industrial engineers, who had used a timeand motion study to break the job down into subassembly tasks, each requiring about threeminutes to accomplish. The amount of time calculated for each subassembly had also been“balanced” so that the task performed by each worker was supposed to take almost exactly thesame amount of time. The workers were paid a straight hourly rate.
However, there were some problems. Morale seemed to be low, and the inspector wasfinding a relatively high percentage of badly assembled hotplates. Controllable rejects-those“caused” by the operator rather than by faulty materials-were running about 23 percent.
After discussing the situation, management decided to try something new. The workerswere called together and asked if they would like to build the hotplates individually. The workersdecided they would like to try this approach, provided they could go back to the old program ifthe new one did not work well. After several days of training, each worker began to assemblethe entire hotplate.
The change was made at about the middle of the year. Productivity climbed quickly. By theend of the year, it had leveled off at about 84 percent higher than during the first half of the year,although no other changes had been made in the department or its personnel. Controllable rejects
�� ��������� �� �������� ��������
had dropped from 23 percent to 1 percent during the same period. Absenteeism had droppedfrom 8 percent to less than 1 percent. The workers had responded positively to the change, andtheir morale was higher. As one person put it, “Now, it is my hotplate.” Eventually, the rejectrate dropped so low that the assembly workers themselves did all routine final inspection. Thefulltime inspector was transferred to another job in the organization.
Questions
1. What changes in the work situation might account for the increase in productivity andthe decrease in controllable rejects?
2. What might account for the drop in absenteeism and the increase in morale?
3. What were the major changes in the situation? Which changes were under the controlof the manager? Which were controlled by workers?
4. What might happen if the workers went back to the old assembly line method?(Source: The Modern Manager, by Edgar F. Huse, copyright @ 1979 by West Publishing Company.)