Word level multi-script identification
12
Word level multi-script identification Peeta Basa Pati, A.G. Ramakrishnan * MILE Laboratory, Department of Electrical Engineering, Indian Institute of Science, Bangalore 560 012, Karnataka, India Received 3 May 2006; received in revised form 2 October 2007 Available online 14 February 2008 Communicated by A.M. Alimi Abstract We report an algorithm to identify the script of each word in a document image. We start with a bi-script scenario which is later extended to tri-script and then to eleven-script scenarios. A database of 20,000 words of different font styles and sizes has been collected and used for each script. Effectiveness of Gabor and discrete cosine transform (DCT) features has been independently evaluated using nearest neighbor, linear discriminant and support vector machines (SVM) classifiers. The combination of Gabor features with nearest neighbor or SVM clas- sifier shows promising results; i.e., over 98% for bi-script and tri-script cases and above 89% for the eleven-script scenario. Ó 2008 Elsevier B.V. All rights reserved. Keywords: Gabor filter; DCT; Script identification 1. Introduction Demand for tools with capability to recognize, search and retrieve documents from multi-script and multi-lingual environments, has increased many folds in the recent years. Thus, recognition of the script and language play an impor- tant part for automated processing and utilization of doc- uments. Plenty of research has been carried out for accomplishing this task of script recognition at a para- graph/block or line level. While the former assumes that a full document page is of the same script, the latter imagi- nes documents to contain text from multiple scripts but changing at the level of the line. Though the latter is a real- istic assumption in some cases, most of the practical situa- tions have the script changing with words. In Fig. 1a and b, we show two text images where the script changes at the word level. Fig. 1a shows a bi-script document, where the presence of interspersed English words in a document of Devanagari script is clearly seen. Similarly, using Fig. 1b we show the variation of script at both line and word level and the presence of three scripts in a document, which is a common occurrence in India. Most of the optical character recognition (OCR) systems are designed using statistical pattern recognition techniques. It is generally observed that these systems generate good out- put for specific kinds of documents and when the number of classes is reasonable. Including all the various symbols used for writing in the world, together in one reference set as dif- ferent classes will be prohibitively high. Most of the Indian scripts have 13 vowels (V) and about 35 consonants (C). As reported by the review paper by Pati and Ramakrishnan (2005a), unlike Roman script, in Indian scripts a consonant combines with another consonant or a vowel to generate a completely different symbol. This is demonstrated in Fig. 2 where two different symbols combine to generate a com- pletely new symbol. Fig. 2a presents the combination of two consonants in Odiya script while Fig. 2b presents a sam- ple case in Devanagari. Thus the consonant–vowel (CV) and consonant–consonant–vowel (CCV) combinations, which appear frequently, generate a huge set of graphemes. In Telugu script alone, Rajasekaran and Deekshatulu (1977), have identified some 2000 symbols which are used regularly. Kannada, with a very similar script and rules, 0167-8655/$ - see front matter Ó 2008 Elsevier B.V. All rights reserved. doi:10.1016/j.patrec.2008.01.027 * Corresponding author. Tel.: +91 8022932556; fax: +91 8023600444. E-mail address: [email protected] (A.G. Ramakrishnan). www.elsevier.com/locate/patrec Available online at www.sciencedirect.com Pattern Recognition Letters 29 (2008) 1218–1229
Transcript of Word level multi-script identification

Available online at www.sciencedirect.com
www.elsevier.com/locate/patrec
Pattern Recognition Letters 29 (2008) 1218–1229
Word level multi-script identification
Peeta Basa Pati, A.G. Ramakrishnan *
MILE Laboratory, Department of Electrical Engineering, Indian Institute of Science, Bangalore 560 012, Karnataka, India
Received 3 May 2006; received in revised form 2 October 2007Available online 14 February 2008
Communicated by A.M. Alimi
Abstract
We report an algorithm to identify the script of each word in a document image. We start with a bi-script scenario which is later extendedto tri-script and then to eleven-script scenarios. A database of 20,000 words of different font styles and sizes has been collected and used foreach script. Effectiveness of Gabor and discrete cosine transform (DCT) features has been independently evaluated using nearest neighbor,linear discriminant and support vector machines (SVM) classifiers. The combination of Gabor features with nearest neighbor or SVM clas-sifier shows promising results; i.e., over 98% for bi-script and tri-script cases and above 89% for the eleven-script scenario.� 2008 Elsevier B.V. All rights reserved.
Keywords: Gabor filter; DCT; Script identification
1. Introduction
Demand for tools with capability to recognize, searchand retrieve documents from multi-script and multi-lingualenvironments, has increased many folds in the recent years.Thus, recognition of the script and language play an impor-tant part for automated processing and utilization of doc-uments. Plenty of research has been carried out foraccomplishing this task of script recognition at a para-graph/block or line level. While the former assumes thata full document page is of the same script, the latter imagi-nes documents to contain text from multiple scripts butchanging at the level of the line. Though the latter is a real-istic assumption in some cases, most of the practical situa-tions have the script changing with words. In Fig. 1a and b,we show two text images where the script changes at theword level. Fig. 1a shows a bi-script document, where thepresence of interspersed English words in a document ofDevanagari script is clearly seen. Similarly, using Fig. 1bwe show the variation of script at both line and word level
0167-8655/$ - see front matter � 2008 Elsevier B.V. All rights reserved.
doi:10.1016/j.patrec.2008.01.027
* Corresponding author. Tel.: +91 8022932556; fax: +91 8023600444.E-mail address: [email protected] (A.G. Ramakrishnan).
and the presence of three scripts in a document, which is acommon occurrence in India.
Most of the optical character recognition (OCR) systemsare designed using statistical pattern recognition techniques.It is generally observed that these systems generate good out-put for specific kinds of documents and when the number ofclasses is reasonable. Including all the various symbols usedfor writing in the world, together in one reference set as dif-ferent classes will be prohibitively high. Most of the Indianscripts have 13 vowels (V) and about 35 consonants (C).As reported by the review paper by Pati and Ramakrishnan(2005a), unlike Roman script, in Indian scripts a consonantcombines with another consonant or a vowel to generate acompletely different symbol. This is demonstrated in Fig. 2where two different symbols combine to generate a com-pletely new symbol. Fig. 2a presents the combination oftwo consonants in Odiya script while Fig. 2b presents a sam-ple case in Devanagari. Thus the consonant–vowel (CV) andconsonant–consonant–vowel (CCV) combinations, whichappear frequently, generate a huge set of graphemes.
In Telugu script alone, Rajasekaran and Deekshatulu(1977), have identified some 2000 symbols which are usedregularly. Kannada, with a very similar script and rules,

Fig. 1. Sample documents to demonstrate the variation of script at the word level: (a) a bi-script document showing interspersed Hindi and English wordsand (b) a tri-lingual railway reservation form with words from Kannada, Devanagari and Roman scripts; the first line contains words from all the threescripts.
P.B. Pati, A.G. Ramakrishnan / Pattern Recognition Letters 29 (2008) 1218–1229 1219
has comparable number of symbols. Devanagari and simi-lar scripts have close to 6000 such combinations each andother scripts have around 300 symbols. Thus, script identi-fication can act as the preliminary level of filter and reducethe complexity of the search for classifying a test pattern.Moreover, for scripts such as Devanagari and Bangla, itsidentification decides the further course of processing. Thisincludes removal of the shirorekha,1 the headline, from theword to separate the different symbols forming the word sothat each of them can be individually recognized. Thus,identification of the script is one of the necessary challengesfor the designer of OCR systems when dealing with multi-script documents.
2. Literature review
Quite a few results have been reported in the literature,identifying the scripts at the level of paragraphs or lines.We review this literature in the section below. However,very few research works deal with script identification atthe word level, which we review in Section 2.2.
2.1. Script variation with paragraphs/blocks and lines
Spitz (1997) uses the spatial relationship between thestructural features of characters for distinguishing Hanfrom the Latin script. Japanese, Korean and Chinese aredifferentiated from Roman by an uniform vertical distribu-tion of upward concavities. In the case of the above Asianscripts, the number of ON-pixels per unit area is employedto distinguish one from the other. Hochberg et al. (1997)
1 Both Devanagari and Bangla scripts have a horizontal line at the top,known as shirorekha or headline, which connects the characters in a word.Refer images in Fig. 1 for examples.
use cluster based templates for script identification. Theyconsider thirteen different scripts including Devanagari.They cluster the textual symbols (connected components)and create a representative symbol or a template for eachcluster. Identification is through comparison of textualsymbols of the test documents with those of the templates.However, the requirement of the extraction of connectedcomponents makes this feature a local one. Wood et al.(1995) suggest a method based on Hough transform, mor-phological filtering, and analysis of projection profile.Their work involves the global characteristics of the text.
Chaudhuri et al. (2002) have proposed a method, basedon a decision tree, for recognizing the script of a line oftext. They consider Roman, Bengali and Devanagariscripts. They have used the projection profile, besides sta-tistical, topological and stroke-based features. At the initiallevel, the Roman script is isolated from the other two, byexamining the presence of the headline. Devanagari is dif-ferentiated from Bangla by identifying the principal strokes(Chaudhuri et al., 2002). Pal and Chaudhuri (1999) haveextended the above work to the identification of the scriptfrom a given triplet consisting of Devanagari, Roman anda state language, where each line of text contains only a sin-gle script. Here, they have dealt with almost all the Indianscripts. Besides the headline, they have used some scriptdependent structural properties, such as the distributionof ascenders and descenders, the position of the verticalline in a text block, and the number of horizontal runs.
Tan (1998) has suggested a method for identifying sixdifferent scripts using a texture based approach. Textualblocks of 128 � 128 are taken and filtered with angularspacings of 11.25�. This method requires image blocks con-taining text of same script. Roman, Persian, Chinese, Mal-ayalam, Greek and Russian scripts, with multiple font sizesand styles (font invariance within the block), are identified.

Fig. 2. Example of two consonants combining to form a completely new symbol for (a) Odiya script and (b) Devanagari (Hindi) script.
1220 P.B. Pati, A.G. Ramakrishnan / Pattern Recognition Letters 29 (2008) 1218–1229
Chaudhuri and Seth (1999) have proposed a techniqueusing features such as the horizontal projection profile, Gabortransform and aspect ratio of connected components. Theyhave handled Roman, Hindi, Telugu and Malayalam scripts.
On similar lines, Chan and Sivaswamy (1999) and Joshiet al. (2000) have used Gabor features for classification ofmost of the Indian script documents. They assume a blockof text to consist of characters from the same script andemploy a multi-channel log-Gabor filter bank to discrimi-nate between the various scripts. Manthalkar and Biswas(2002) have used rotation-invariant texture features, usingGabor filterbank, to differentiate between text blocks forvarious Indian scripts. Ablavsky and Stevens (2003) makeuse of geometric properties of the text structures at con-nected component level to classify the script of lines of text.Gllavata and Freisleben (2005) make use of a set of texturaland structural features such as wavelet coefficients and hor-izontal projection profile, to separate the Roman scriptfrom Ideographic scripts.
2.2. Script variation with words
Recognition of the script, using statistical features, atthe word level has been reported by Dhanya et al. (2002).Here the authors differentiated Tamil from Roman script.This work has been extended by Pati et al. (2004) and Patiand Ramakrishnan (2006), for identification of Odiya andHindi scripts, besides Tamil, against Roman. They useGabor filters with linear discriminant classifier. Besides,redesign of the Gabor functions has enhanced the systemefficiency. Ma and Doermann (2003) use Gabor filterbankto separate Roman script from Arabic, Chinese, Devana-gari or Korean. Jaeger et al. (2005) have combined theinformational confidence values of various classifiers toimprove upon the above system. Both of these works dealonly with bi-script documents.
Pal and Chaudhuri have performed script recognition atthe word level (Chaudhuri et al., 2002; Pal et al., 2003) fortwo sets of triplets: Roman, Devanagari and Bengali/Tel-ugu. Later, using the same structural features, they identi-fied 12 different Indian scripts. On similar lines, Padma andNagabhushana (2003) have discriminated Roman, Deva-nagari and Kannada scripts.
3. System description
In the present work, we explore the effectiveness of ourapproach (Pati and Ramakrishnan, 2006) in recognizingword level change of script up to eleven-scripts. We studiedthe structural properties of the scripts before designing an
identifier for these scripts. Since, the scripts of Assameseand Bengali are nearly the same, we consider them as onescript. An observation of these eleven Indian scripts revealsthe following properties:
� Bengali, Devanagari and Punjabi scripts have a shirore-
kha joining the individual symbols forming any word.� These three scripts have a lot of vertical strokes. Besides,
the structural limbs of Devanagari are more circularthan those of Bengali and Punjabi.� There are many limbs along 60� and 120� directions in
Bengali scripts.� Punjabi script has a lot of half-length vertical strokes.� Kannada and Telugu scripts are very similar. There is a
tick feature associated with Telugu script, which doesnot appear in Kannada.� Tamil and Malayalam are somewhat similar to each
other. Malayalam appears like Tamil script with cornerssmoothed.� Visually, Gujarati script looks like Devanagari but has
more loops. In addition to high number of loops, Odiyascript also has a lot of vertical strokes.� Urdu looks quite unlike any other Indian script. It has a
lot of connectivities and curvatures, aligned either alonghorizontal direction or at about 75� angle.
With these observations, we decided to employ texturalfeatures that are both frequency and direction sensitive.Gabor functions generate such filters as well as meet theequality criterion of the space-bandwidth limitation(Gabor, 1946; Daugman, 1985). This, in our opinion,would be best able to discriminate between the scripts. Inaddition, we also used DCT features for comparison.
Two approaches can be pursued for script identificationin a multi-script scenario. One of them extensively studiesthe similarities and differences in the structures betweenthe co-occurring scripts, while the second method dealswith each script as a different texture. In our view, the lattermethod is more robust as it deals with the script regardlessof the size or style of the font. This claim of ours is sup-ported by our earlier employment of a bank of Gabor fil-ters for successful page layout analysis (Raju et al., 2004,2005) and script identification (Dhanya et al., 2002; Patiet al., 2004; Pati and Ramakrishnan, 2006).
We employ a multi-channel filtering approach, usingGabor functions. We have used a radial frequency band-width of one octave. This is because the optical channelof the human visual system (HVS) is studied to have thatbandwidth. It is also observed that the coding of naturalimages is best attained at this bandwidth (Field, 1987).

P.B. Pati, A.G. Ramakrishnan / Pattern Recognition Letters 29 (2008) 1218–1229 1221
An angular bandwidth of 30� is chosen from the study ofthe properties of the scripts.
A feature’s separability is studied by observing: (i) thespread and (ii) the divergence values of the features. Eachfeature is assumed to follow a normal distribution pattern.We evaluate the mean and the standard deviation of eachfeature from each of the classes. When we plot the Gauss-ian curves for the features of the two classes, it generates afigure similar to Fig. 3a, b or c. If the means are close andthe standard deviations large, the two classes are said tohave a large overlap. With the mean values far apart andthe standard deviations small, the feature is said to be dis-criminable. The spread plot for the features, with the distri-butions shown in Fig. 3a–c is shown in Fig. 3d. This plotis generated for all the features to observe theirdiscriminability.
Divergence for a feature (Theodoridis and Koutroum-bas, 1999), in a bi-class scenario, is defined as
d ¼ 1
2
r21
r22
þ r22
r21
� 2
� �þ 1
2ðl1 � l2Þ
2 1
r21
þ 1
r22
� �ð1Þ
where l1 and r1 are the mean and the standard deviation ofthe feature for class 1, respectively. N(l2,r2) represents thedistribution of the same feature for class 2. The bigger thedivergence value, the better the classes are discriminated.
Fig. 3. Demonstration of the discriminability of features and their spread plot:discriminable feature and (d) the spread plots of the features shown in (a)–(c)
Fig. 4a shows a spread plot for the Gabor features for aBengali–Roman bi-script case. Here, we use five radial fre-quencies (1, 0.5, 0.25, 0.125 and 0.0625) and six angles (0�,30�, 60�, 90�, 120� and 150�). Therefore, there are 30 cosineand 30 sine filters giving rise to a feature vector of dimen-sion 60. The first six features correspond to the coefficientsfor cosine filters with radial frequency, u = 0.0625, andincreasing angles in the order mentioned above. Thus, thefeature number 1 comes from the filter with radial fre-quency 0.0625 and angle 0� while the 10th feature corre-sponds to the filter with u = 0.125 and 90� angle. The31st to 60th features are derived in the same order of filterparameters, but with sine filters. A magnified version of thespread plot in 4a is provided in 4b for better observability.The divergence plot for the same case is presented in 4c. Itis seen from Fig. 4c that the features numbered 15, 16, 45and 46 have considerably larger values than others whichmeans these features are better discriminable. On a closerlook at the spread plot shown in 4b, it is these featureswhich are clearly discriminable. Thus, it may be assumedthat these features, would yield a good accuracy for thiscase.
We observed the spread plot and divergence of all the bi-class cases involving separation of Roman script from eachof other ten-scripts. Based on our observation, we decided
(a) a discriminable feature, (b) a partially discriminable feature, (c) a non-.

Fig. 4. Example case of Bengali and English bi-class discriminability analysis: (a) spread plot using the 60-dimensional feature vectors from Bengali andEnglish scripts & (b) a magnified version of the spread plot in (a) and (c) the divergence plot for the same case.
1222 P.B. Pati, A.G. Ramakrishnan / Pattern Recognition Letters 29 (2008) 1218–1229
to use three different radial frequencies (0.125, 0.25 and 0.5)and all the six angles of orientation leading to generation of18 odd and 18 even filters. A given word image is filteredwith these 36 filters. Fig. 5 presents the output images fora sample Hindi word when filtered by the 18 cosine filters.Each of these filtered images is sum-squared to evaluatethe energy content of these images. This energy is normal-
Fig. 5. (a) A sample Devanagari word and (b) the 18 cosine Gabor filtered outporder, and each column corresponds to an angle, in increasing order.
ized by the energy of the input word image to generate a fea-ture. Such a normalization makes the features independentof the size of the input image. Fig. 6a shows a block diagramof the script identification system using the Gabor features.
DCT concentrates the information content in a rela-tively few coefficients. For natural signals and images, thedata compaction of DCT is close to that of the optimal
ut images. Here, each row corresponds to a radial frequency, in increasing

P.B. Pati, A.G. Ramakrishnan / Pattern Recognition Letters 29 (2008) 1218–1229 1223
K–L transform (KLT). Its transform matrix exhibits sym-metries which can be exploited to obtain efficient hardwareand software implementations (Rao and Yip, 1990). Mostimage and video coders employ DCT. It has also beenemployed for other applications such as pitch modificationfor speech synthesis (Muralishankar et al., 2004). Pati(2001) has used DCT coefficients for machine recognitionof printed Odiya characters. Salazar and Tran (2004) havereported better quality image resizing in the DCT domain.DCT has also been used for motion estimation (Koc andLiu, 1998), image compression with morphological descrip-tor (Zhao et al., 2002) and object boundary detection(Tang and Acton, 2004).
For an image I(i, j), the DCT coefficient matrix B(k, l) isgiven by
Bðk; lÞ ¼XR�1
i¼0
XC�1
j¼0
Iði; jÞ cospkð2iþ 1Þ
2R
� �cos
plð2jþ 1Þ2C
� �
ð2Þ
Fig. 6. Block diagrams: (a) Gabor a
where R and C are the number of rows and columns of theimage matrix; k and l are the frequency indices along the i
and j directions, respectively.The energy compactness property of DCT promotes its
use for script identification. Fig. 6b diagrammatically pre-sents the extraction of the DCT feature vector. Initially,the input word image is normalized to a standard size. Itis then vertically divided into two equal blocks. Words ofsome of the Indic scripts such as, Devanagari and Bangla,have a highly asymmetric horizontal projection profile. Onthe other hand, scripts such as Odiya have words with amore symmetric horizontal projection. We divided thewords vertically for the block DCT computation, so thatthe presence or absence of symmetry between bottom andtop halves could be exploited while the frequency compo-nents are evaluated. Subsequent to 2D DCT evaluation,18 low frequency coefficients are chosen from each of theDCT matrices as shown in Fig. 6b. The vectors areappended to form a 36-dimensional feature vector, which
nd (b) DCT feature extractors.

1224 P.B. Pati, A.G. Ramakrishnan / Pattern Recognition Letters 29 (2008) 1218–1229
is used for classification. We have taken 36 coefficients for afair comparison with the Gabor filter based system.
We have used three different classifiers to decide aboutthe script of the test words: (i) the nearest neighbor classi-fier (NNC), (ii) linear discriminant classifier (LDC), and(iii) the support vector machines (SVM’s). Nearest neigh-bor has been a standard and time tested classifier. This clas-sifier has proven to deliver good output, when we haveclass representative training sets. Here, Euclidean distanceof the test pattern is evaluated in the feature space, witheach of the training patterns. The class value of the nearestneighbor is assigned to the test pattern. A linear discrimi-nant function partitions the feature space using a hyper-plane. The two sides of this plane represent the two classes.The class value of the test pattern is decided based onwhich side of the plane it lies. A multi-class scenario couldbe handled as a number of bi-class scenarios. Amongst thediscriminant approaches for classification, the most recentis the support vector machine (Burges, 1998), where theoptimal hyper-plane decides the separation between indi-vidual classes of patterns. The creation of a unique modelto represent a class, derived by training the model with pro-totypes of each class, aids in maximization of the correctclassification rate.
4. Data description
Document images are scanned using: (i) Umax Astra5400 and (ii) Hewlett-Packard Scanjet 2200c scanners at300 dpi resolution and stored in 8-bit gray format. Theimages are scanned from magazines, newspapers, booksand laser printed documents. Variations in printing styleand sizes are ensured. Eleven different scripts are consid-ered for this database, namely, Bengali (Bangla), Roman(English), Devanagari (Hindi/Marathi), Gujarati, Kanna-da, Malayalam, Odiya, Gurumukhi (Punjabi), Tamil, Tel-ugu and Urdu. About 100 pages are scanned from eachof these scripts and are segmented into words by an auto-matic process (Pati, 2001). An automatic skew detectionand correction mechanism is employed to remove any skewpresent in these documents, prior to the segmentation.
Each segmented word is visually inspected to make surethat at least a single base character is present. The blankrows and columns at the beginning and end of each wordare removed to make sure that the word touches theboundaries of the matrix representing it. Each word matrixis available to us in binary form, where ON-pixels form thestructural limbs of a character/pattern in the word. Thesizes of the words are not normalized, i.e., the words areretained in their original sizes as they appeared in the doc-ument image. Words of various lengths and ON-pixel den-sities are retained. Fig. 7 presents the distribution of theaspect ratios and the ON-pixel densities for the word imagedataset. It may be noted from Fig. 7a that the words have awide range of aspect ratios in all the scripts. Similarly,Fig. 7b shows that the ON-pixel densities of words acrossscripts also have a wide variability.
Once a large number of such words are collected, 2DDCT is performed on the size normalized version of thesewords and feature vectors are formed. The Euclidean dis-tance is evaluated between all the combinations of twowords from the same script. If the distance between anytwo words becomes zero, only one of the two is retainedin the database. This ensures that no word is repeated inthe feature space. At the end, 20,000 words are randomlyselected from this large collection. Seven thousand of theseare selected randomly from each script, to form the train-ing set, while the rest 13,000 words form the test set. Thisset is available for public use from the world wide web net-work (Pati and Ramakrishnan, 2005b).
5. Results and discussion
Most of the multi-lingual documents in India are bi-script in nature. So, all bi-script cases are handled first.Based on the encouraging results that we got in theseexperiments, we decided to extend the experiments to tri-script case as well. Since most of the official documentsof national importance have three scripts, such an experi-ment is justified. Finally, we also explore the possibilityof recognizing the script of a word without any prior infor-mation. This is a blind script recognizer, where the trainingset contains samples from all the classes. Thus, it is a ele-ven-script scenario. In the sections below, we present eachof these cases, separately.
In the following sections, the codes BE, EN, GU, HI, KA,MA, OD, PU, TA, TE and UR denote the scripts represent-ing Bengali, English, Gujarati, Hindi, Kannada, Malaya-lam, Odiya, Punjabi, Tamil, Telugu and Urdu, respectively.
5.1. Bi-script recognition
The bi-script documents, such as books, newspapers andmagazines, have a local script as the major script withinterspersed English words. Besides, in the border areasof the states, people know more than one language andthe documents reflect that. Thus, a good recognition inbi-script scenario is very useful. With eleven scripts, wehave 55 different bi-class problems. We report the accura-cies of the bi-class script identification in Tables 1–3. Theperformance is presented in percentage, which gives theaverage recognition accuracy for both the involved scripts.
Table 1 presents the results for all bi-script combinationswith nearest neighbor classifier. In this table, the upper tri-angular part of the matrix presents the results with theDCT based feature vector while the lower triangular partshows the Gabor feature results. Similarly, Tables 2 and3 present the results with linear discriminant classifierand support vector machines, respectively.
Close inspection of Table 1 reveals that though both thefeatures have fared well with NNC, the Gabor (mean(l) = 98.4, standard deviation (r) = 2.0) has performedslightly better than the DCT features (l = 98.3,r = 1.5).The same trend has become much more dominant with
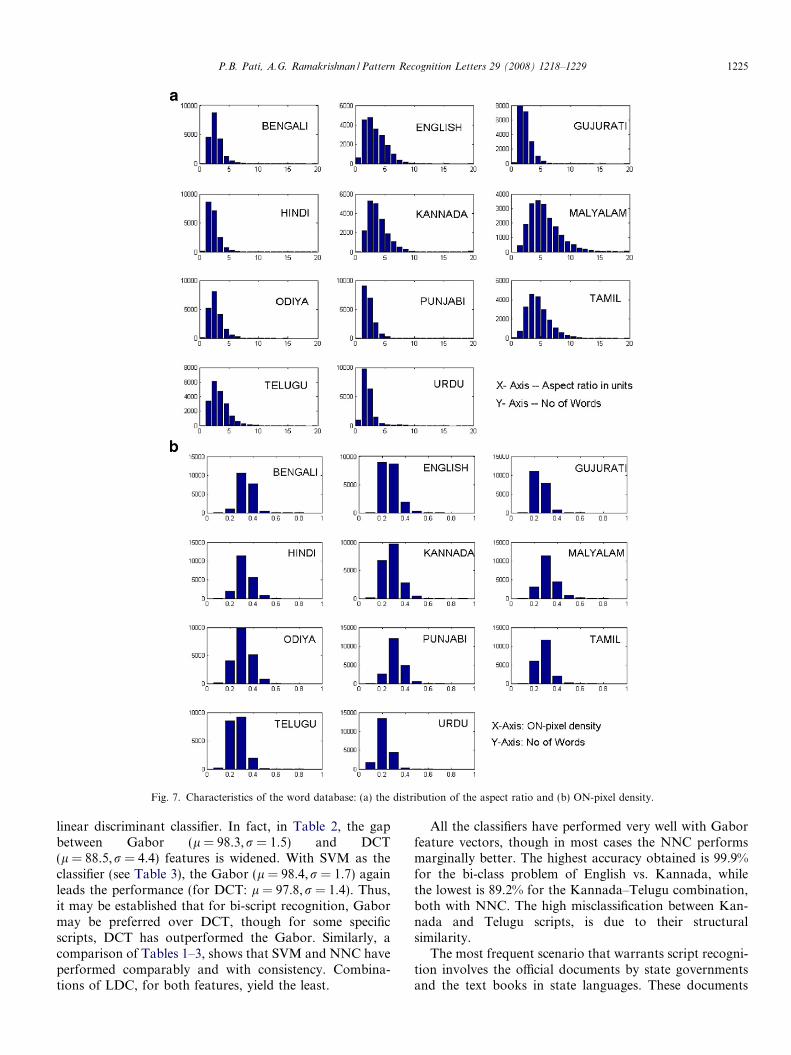
Fig. 7. Characteristics of the word database: (a) the distribution of the aspect ratio and (b) ON-pixel density.
P.B. Pati, A.G. Ramakrishnan / Pattern Recognition Letters 29 (2008) 1218–1229 1225
linear discriminant classifier. In fact, in Table 2, the gapbetween Gabor (l = 98.3,r = 1.5) and DCT(l = 88.5,r = 4.4) features is widened. With SVM as theclassifier (see Table 3), the Gabor (l = 98.4,r = 1.7) againleads the performance (for DCT: l = 97.8,r = 1.4). Thus,it may be established that for bi-script recognition, Gabormay be preferred over DCT, though for some specificscripts, DCT has outperformed the Gabor. Similarly, acomparison of Tables 1–3, shows that SVM and NNC haveperformed comparably and with consistency. Combina-tions of LDC, for both features, yield the least.
All the classifiers have performed very well with Gaborfeature vectors, though in most cases the NNC performsmarginally better. The highest accuracy obtained is 99.9%for the bi-class problem of English vs. Kannada, whilethe lowest is 89.2% for the Kannada–Telugu combination,both with NNC. The high misclassification between Kan-nada and Telugu scripts, is due to their structuralsimilarity.
The most frequent scenario that warrants script recogni-tion involves the official documents by state governmentsand the text books in state languages. These documents

Table 1Mean bi-script recognition accuracies (%) with NNC
BE EN GU HI KA MA OD PU TA TE UR
BE – 99.6 99.1 95.1 99.2 98.9 99.0 96.9 98.9 99.0 99.5EN 99.8 – 99.3 99.6 98.2 97.9 99.1 99.4 97.7 97.5 99.4GU 99.3 99.7 – 99.4 99.4 98.9 98.4 99.3 98.3 98.4 98.2HI 95.2 99.6 99.2 – 99.3 99.0 99.2 94.0 99.1 99.4 99.6
KA 99.3 99.9 99.3 99.5 – 96.8 98.9 99.3 98.9 93.4 99.3MA 98.7 99.1 99.1 98.7 98.5 – 97.7 98.8 93.8 95.9 99.1OD 98.5 99.2 96.1 99.1 97.6 93.4 – 98.3 97.8 98.3 99.0PU 98.2 99.2 99.3 91.5 99.5 96.6 98.6 – 98.9 99.2 99.6
TA 98.5 99.4 99.5 99.0 99.5 96.1 97.4 97.9 – 97.6 98.3TE 99.0 99.8 99.3 99.6 89.2 98.9 97.8 99.6 99.5 – 97.5UR 99.6 99.7 99.2 99.6 98.1 99.2 98.8 99.6 99.2 98.7 –
The lower and upper triangles of the matrix give results with Gabor and DCT features, respectively. The script names are presented in their abbreviatedforms as mentioned in Section 5.
Table 2Mean bi-script recognition accuracies (%) with LDC
BE EN GU HI KA MA OD PU TA TE UR
BE – 96.6 92.3 80.3 91.9 88.4 92.1 87.6 94.0 89.0 95.1EN 99.4 – 88.8 95.3 90.3 87.7 89.4 91.3 88.3 87.0 91.4GU 99.3 98.5 – 91.9 90.7 85.7 88.6 90.3 85.1 86.9 87.5HI 94.6 98.7 99.3 – 91.2 88.6 90.1 78.9 92.4 90.1 93.9KA 98.6 99.0 98.6 98.6 – 84.8 90.0 90.5 91.9 74.8 91.5MA 98.0 98.3 98.4 98.3 98.8 – 80.7 88.0 83.4 76.9 88.6OD 98.8 98.8 93.5 99.2 98.0 97.4 – 87.1 88.4 85.5 91.9PU 99.0 98.8 99.3 93.2 99.6 97.7 99.0 – 89.4 88.7 92.4TA 98.7 98.0 98.7 98.2 99.1 96.0 97.7 97.8 – 86.4 83.9TE 99.2 99.5 98.8 99.2 92.9 99.3 98.4 99.7 99.6 – 85.9UR 99.3 99.4 98.2 99.4 97.7 99.3 98.6 99.7 99.3 99.0 –
The lower and upper triangles of the matrix show the results with Gabor and DCT features, respectively.
Table 3Mean bi-script recognition accuracies (%) using SVM’s
BE EN GU HI KA MA OD PU TA TE UR
BE – 99.5 98.1 95.6 99.1 98.7 98.1 97.2 98.0 98.8 99.5
EN 99.8 – 98.9 98.8 97.5 97.1 99.2 96.4 97.2 98.3 99.0GU 99.1 98.7 – 99.2 98.7 98.8 97.9 98.5 98.4 98.6 96.1HI 95.7 99.8 98.9 – 98.6 97.8 99.2 95.2 97.6 98.6 97.2KA 99.0 99.7 99.0 99.5 – 96.8 97.9 98.2 99.2 94.1 97.8MA 98.7 99.1 98.2 98.9 99.2 – 96.2 98.2 93.9 94.6 98.0OD 99.8 99.3 98.5 99.7 98.2 97.8 – 97.4 98.3 96.9 98.5PU 98.5 99.2 98.7 94.2 99.5 97.4 98.2 – 99.1 98.6 99.0TA 98.9 95.7 98.8 99.2 99.6 96.9 98.6 98.7 – 97.1 96.4TE 99.2 99.8 97.9 99.5 91.0 97.4 97.2 99.1 98.6 – 97.0UR 99.7 99.8 99.3 99.8 98.7 99.6 99.6 93.7 96.2 98.5 –
The lower and upper triangles of the matrix are the results using Gabor and DCT features, respectively.
1226 P.B. Pati, A.G. Ramakrishnan / Pattern Recognition Letters 29 (2008) 1218–1229
contain the script of the official language of the state andEnglish. Table 4 shows the results of these bi-script scenar-ios for various feature–classifier combinations. Here, GT isGabor transform and, hence, the code GT-NNC stands forthe combination of Gabor features with the NNC. It maybe observed from this table that the Gabor-NNC combina-tion is leading with more than 99% for all such bi-scriptcases. The lowest performance is for Malayalam, which is99.1%, whereas the best performance is for Kannada,which is 99.9%.
5.2. Tri-script recognition
A number of official documents in India contain threelanguages, namely, the state’s official language, Hindi andEnglish. We refer to such a combination of three scriptsas the triplet of the state. Fig. 1b presents a train reserva-tion form containing Kannada, Devanagari and Romanscripts. In the second series of experiments, we have dis-criminated amongst such triplets. Here, Devanagari andRoman scripts are common to all the triplets, while the

Table 4The recognition accuracies of the various feature–classifier combinations for the bi-script cases involving English words with one of the ten Indian scripts
BE GU HI KA MA OD PU TA TE UR l r
GT-NNC 99.8 99.7 99.6 99.9 99.1 99.2 99.2 99.4 99.8 99.7 99.6 0.3GT-LDC 99.4 98.5 98.7 99.0 98.3 98.8 98.8 98.0 99.5 99.4 98.8 0.5GT-SVM 99.8 98.7 99.8 99.7 99.1 99.3 99.2 95.7 99.8 99.8 99.1 1.3DCT-NNC 99.6 99.3 99.6 98.2 97.9 99.1 99.4 97.7 97.5 99.4 98.8 0.8DCT-LDC 96.6 88.8 95.3 90.3 87.7 89.4 91.3 88.3 87.0 91.4 90.6 3.2DCT-SVM 99.5 98.9 98.8 97.5 97.1 99.2 96.4 97.2 98.3 99.0 98.2 1.1
Codes denoting the Indian scripts are described in Section 5. The last two columns present the mean (l) and standard deviation (r) of the results shown inthe same row.
P.B. Pati, A.G. Ramakrishnan / Pattern Recognition Letters 29 (2008) 1218–1229 1227
other Indian script varies. The results of such experimentsare presented in Table 5. In this table, the l and r columnsreport the average and standard deviation of the recogni-tion rates for all the nine triplets presented in the same row.
Table 5 shows that the maximum average accuracyobtained is 98.2%. This result occurs for Gabor featureswith NN and SVM classifiers. However, the Gabor-NNCcombination is more consistent and results in lower stan-dard deviation (rNNC = 1.9 while rSVM = 2.1). However,given a prior knowledge of the triplet, one may considerusing a different feature–classifier combination to producea triplet-specific optimal result.
We have compared our results with the earlier reportedresults. Pal et al. (2003) have reported an accuracy of 97.2%for recognition of Devanagari words from the triplet ofTelugu. Padma and Nagabhushana (2003) have reported97% for the same from the triplet involving Kannadascript. We achieve an average of 99.6% for the recognitioninvolving these triplets, with a larger test set.
5.3. Eleven-script recognition
Since our identification scheme depends on statisticalrather than structural features, we have an advantage thatwe could consider any number of scripts together and iden-tify them. On the observation that our feature–classifiercombinations are delivering us very good recognitionaccuracy, we tried to identify the scripts in a eleven-scriptscenario, involving all the eleven earlier mentioned Indianscripts. Here, every test sample is compared with thereference samples from all the classes. The result of correctclassification of each of the eleven scripts for various fea-ture–classifier combinations is reported in Table 6. In this
Table 5Tri-script recognition accuracies (common scripts in all experiments are Deva
BE GU KA MA OD
GABOR
NNC 96.5 99.0 99.4 98.4 98.8LDC 94.5 97.5 97.9 96.9 98.0SVM 97.0 99.2 99.6 98.6 99.0
DCT
NNC 96.5 99.1 98.3 97.9 98.7LDC 82.2 86.1 85.5 82.4 83.6SVM 97.1 99.5 98.7 97.6 99.0
table, the last two rows show the average classificationaccuracy and its standard deviation, respectively, for thecorresponding feature–classifier combination. The resultsreported in this table clearly show that SVM is leading withboth the features. On the feature front, the Gabor is mar-ginally leading. Thus, it may be inferred that for a blind ele-ven-script classification scenario, Gabor features whencombined with SVM as the classifier, result in the optimaloutput.
Using Gabor feature with NNC, the worst performanceof 83.8% is for Telugu, and the best performance of 97.8%is for English. A similar trend is observed for SVM, wherethe minimum of 92.3% and the maximum of 98.2% areobtained for the Telugu and Roman scripts, respectively.Thus, in a eleven-script scenario, with little a priori infor-mation, it makes sense to separate the English words first,and then deal with the remaining scripts in a hierarchicalmanner. The least performance for Telugu script is to beexpected, since the script is very similar to Kannada. Whenthe confusion matrix of this experiment is analyzed, it isobserved that the maximum misclassification of Teluguwords has been to Kannada, which is 12.7%. Similarly,7.1% of the Kannada words are misclassified as Telugu.The next such pair is Hindi–Punjabi, where 7.3% of wordsfrom Hindi go to Punjabi and 7.7%, the reverse way. Not-withstanding all these observations, all the scripts are fairlywell spread out in the Gabor feature space, since with ele-ven different scripts, we are still able to achieve an averagescript recognition accuracy of 94.8%.
Use of DCT features with NNC, improves the recogni-tion of Hindi, Odiya and Punjabi scripts by 4.0%, 9.7% and3.0%, respectively. Similarly, when DCT is used in combi-nation with SVM, there is improvement for Hindi, Odiya
nagari and Roman)
PU TA TE UR l r
93.8 98.8 99.4 99.4 98.2 1.993.4 97.3 98.3 98.3 96.9 1.892.9 98.8 99.2 99.7 98.2 2.1
95.6 97.8 97.9 99.2 97.9 1.277.6 85.5 83.0 87.2 83.7 2.996.3 98.0 98.2 99.1 98.1 1.0

Table 6The recognition accuracies of the various feature–classifier combinationsfor the eleven-script scenario
Gabor DCT
NNC LDC SVM NNC LDC SVM
BE 92.1 89.4 96.2 92.8 51.3 92.6EN 97.8 95.2 98.2 97.7 68.9 96.6GU 90.2 85.7 95.5 94.7 62.2 95.4HI 86.6 66.0 93.3 90.6 49.8 94.3KA 88.7 71.5 93.3 89.6 70.6 90.3MA 88.2 82.4 93.6 90.0 23.5 84.4OD 84.5 77.6 94.0 94.2 32.6 94.3PU 86.2 84.3 93.8 89.2 56.2 92.1TA 91.5 85.9 95.2 87.7 56.7 93.3TE 83.8 82.8 92.3 82.2 15.4 91.0UR 94.5 93.6 97.9 93.0 61.0 98.4l 89.4 83.1 94.8 91.1 49.8 93.8r 4.4 8.8 1.9 4.1 18.3 3.9
The correct classification accuracy for each of the eleven Indian scripts isreported. The last two rows present the mean (l) and standard deviation(r) for the results in the same column.
1228 P.B. Pati, A.G. Ramakrishnan / Pattern Recognition Letters 29 (2008) 1218–1229
and Urdu scripts. Thus, DCT feature is able to evaluateHindi and Odiya better than its Gabor counterpart.
6. Conclusion
The combination of Gabor filter bank with either SVMor NN classifier handles the important issue of script recog-nition at the word level quite well. For most cases, NNCperforms at par with SVM and they both outperformLDC. However, the actual performance is script depen-dent. For example, using the Gabor-NNC combination,the overall classification performance for the tri-script com-bination involving Kannada, Devanagari and English is99.6%, whereas the average correct recognition is only89.2% for the bi-script combination of Kannada with Tel-ugu, and it is only 91.5% when Punjabi is recognizedagainst Hindi. English script has a recognition accuracyof 97.8%, using NNC, against all the eleven scripts whichis the best in the eleven-class scenario.
The fact that LDC does not perform as well as the otherclassifiers clearly indicates that the classes are not linearlyseparable. Now, SVM handles the non-linearity parametri-cally, while the NNC handles it non-parametrically. SinceSVM matches the accuracy of NNC, in our opinion, thenon-linearity is parametric. Further, in the case of NNC,we explored the effect of removing all the outliers fromthe training set. Interestingly, we found that the recogni-tion accuracy actually decreases marginally in this case.Thus, the presence of non-trivial number of outliers inthe training set (2–5% in this case), appears to improvethe recognition accuracy for the outliers in the test set, withNNC. Such a possibility may not exist for SVM. In ouropinion, this could be the cause for the NNC performingbetter than SVM in some of the cases.
When Gabor and DCT features are compared, Gaborseems to be leading in most of the bi-script and tri-script
cases. However, in the eleven-script scenario, using DCTimproves the recognition accuracies of Hindi, Odiya andPunjabi scripts. In bi-script experiments, the average recog-nition accuracy of Kannada and Telugu duo improves to93.4% using DCT features from a value of 89.2% usingGabor. Interestingly, with Gabor features, when LDC isused for the above case, the recognition accuracy increasesto 92.9% from 89.2% with NNC. However, NNC performsbetter (93.4%) with DCT, than LDC which has a recogni-tion accuracy of 74.8%. Thus, it is immediately not veryclear whether it is the feature or the classifier or the specificcombination that is responsible for the peculiar behaviourobserved in this case. We have also observed that the lengthof a word has no significant role to play in the recognitionaccuracy achieved.
Despite all this, the results substantiate our assumptionthat the HVS inspired system is well suited for script iden-tification in multi-script documents. However, this needs tobe tested with other Indian and non-Indian scripts. Fur-ther, it will be interesting to compare the results againstother features.
The size of 7000 training patterns per script is fairlylarge. This consumes a lot of time while NNC is at work.Moreover, LDC and SVM require a selected few boundarypatterns per class. Thus it is worth trying some of the pro-totype selection techniques to reduce the training set.
Filtering an image with 36 Gabor features is a time con-suming process. Our evaluation shows that Gabor featureextraction takes an average of 28 ms per word, while thesame for the DCT features is about 12 ms. These timingsare evaluated using Matlab 7.0 on a Laptop with1.8 GHz processor and 1 GB of RAM. Thus, for a typicalpage containing about 500 words, Gabor and DCT featureextractors would take 14 and 6 s, respectively. However,study of the divergence of the Gabor features, reveals thatsome features are better discriminating than others. Thus aselected set of Gabor features might help in reducing thecomputation. Such a set could be uniquely selected for eachof the cases. Different sets could exist for different bi-classor multi-class cases.
References
Ablavsky, V., Stevens, M.R., 2003. Automatic feature selection withapplications to script identification of degraded documents. In: Proc.Internat. Conf. on Doc. Anal. and Recognition, pp. 750–754.
Burges, C.J.C., 1998. A tutorial on support vector machines for patternrecognition. Data Mining Knowl. Discov. 2 (2), 955–974.
Chan, W., Sivaswamy, J., 1999. Local energy analysis for text scriptclassification. In: Proc. Image Vision Comput., New Zealand.
Chaudhuri, S., Seth, R., 1999. Trainable script identification strategies forIndian languages. In: Proc. Internat. Conf. on Doc. Anal. andRecognition, pp. 657–660.
Chaudhuri, A.R., Mandal, A.K., Chaudhuri, B.B., 2002. Page layoutanalyser for multilingual Indian documents. In: Proc. Lang. Eng.Conf., pp. 24–32.
Daugman, J., 1985. Uncertainty relation for resolution in space, spatialfrequency and orientation optimized by two-dimensional visualcortical filters. J. Opt. Soc. Amer. A 2 (7), 1160–1169.
P.B. Pati, A.G. Ramakrishnan / Pattern Recognition Letters 29 (2008) 1218–1229 1229
Dhanya, D., Ramakrishnan, A.G., Pati, P.B., 2002. Script identification inprinted bilingual documents. Sadhana 27 (1), 73–82.
Field, D.J., 1987. Relation between the statistics of natural images and theresponse properties of cortical cells. J. Opt. Soc. Amer. A 4 (12), 2379–2394.
Gabor, D., 1946. Theory of communication. J. IEE (London) 93, 429–457.Gllavata, J., Freisleben, B., 2005. Script recognition in images with
complex backgrounds. In: Proc. Fifth IEEE Internat. Symp. on SignalProcess. and Info. Tech., 2005, pp. 589–594.
Hochberg, J., Kelly, P., Thomas, T., Kerns, L., 1997. Automatic scriptidentification from document images using cluster based templates.IEEE Trans. PAMI 19 (2), 176–181.
Jaeger, S., Ma, H., Doermann, D., 2005. Identifying script onword-levelwith informational confidence. In: Proc. Internat. Conf. on Doc. Anal.and Recognition, pp. 416–420.
Joshi, G.D., Garg, S., Sivaswamy, J., 2000. Script identification fromIndian documents. In: Seventh IAPR Workshop Doc. Anal. Systems,2006. LNCS, vol. 3872, February, New Zealand, pp. 255–267.
Koc, U.-V., Liu, K.J.R., 1998. DCT based motion estimation. IEEETrans. Image Process. 7 (7), 948–965.
Ma, H., Doermann, D., 2003. Gabor filter based multi-class classifier forscanned document images. In: Proc. Internat. Conf. on Doc. Anal. andRecognition, pp. 968–972.
Manthalkar, R., Biswas, P.K., 2002. An automatic script identificationscheme for Indian languages. In: Proc. Eighth Natl. Conf. on Comm.,2002, Mumbai, India, pp. 31–34.
Muralishankar, R., Ramakrishnan, A.G., Prathibha, P., 2004. Modificationof pitch using DCT in the source domain. Speech Comm. 42, 143–154.
Padma, M.C., Nagabhushana, P., 2003. Identification and separation oftext words of Kannada, Hindi and English languages throughdiscriminating features. In: Proc. Natl. Conf. on Doc. Anal. andRecognition, pp. 252–260.
Pal, U., Chaudhuri, B.B., 1999. Script line separation from Indian multi-script document. In: Proc. Internat. Conf. on Doc. Anal. andRecognition, pp. 406–409.
Pal, U., Sinha, S., Chaudhury, B.B., 2003. Word-wise script identificationfrom a document containing English, Devanagari and Telugu text. In:Proc. Natl. Conf. on Doc. Anal. and Recognition, pp. 213–220.
Pati, P.B., 2001. Machine recognition of printed Odiya text documents.Master’s Thesis, Department of Electrical Engineering, Indian Insti-tute of Science, Bangalore.
Pati, P.B., Ramakrishnan, A.G., 2005a. OCR in Indian scripts: a survey.IETE Tech. Rev. 22 (3), 217–227.
Pati, P.B., Ramakrishnan, A.G., 2005b. Indian Script Word ImageDataset. <www.ee.iisc.ernet.in/new/people/students/phd/pati/>.
Pati, P.B., Ramakrishnan, A.G., 2006. HVS inspired system for scriptidentification in indian multi-script documents. In: Seventh IAPRWorkshop on Doc. Anal. Systems, 2006. LNCS, vol. 3872, February,New Zealand, pp. 380–389.
Pati, P.B., Raju, S.S., Pati, N.K., Ramakrishnan, A.G., 2004. Gaborfilters for document analysis in Indian bilingual documents. In:Proc. Internat. Conf. on Intelligent Sensing and Info. Process., pp.123–126.
Rajasekaran, S.N.S., Deekshatulu, B.L., 1977. Recognition of printedTelugu characters. Comput. Graph. Image Process. 6, 335–360.
Raju, S.S., Pati, P.B., Ramakrishnan, A.G., 2004. Gabor filter based blockenergy analysis for text extraction from digital document images. In:Proc. First Internat. Workshop on Doc. Image Anal. for Lib.,DIAL’04, pp. 233–243.
Raju, S.S., Pati, P.B., Ramakrishnan, A.G., 2005. Text localization andextraction from complex color images. In: Proc. Internat. Symp. onVisual Comput. LNCS, vol. 3804, pp. 486–493.
Rao, K.R., Yip, P., 1990. Discrete Cosine Transform: Algorithms,Advantages, Applications. Academic Press, New York.
Salazar, C.L., Tran, T.D., 2004. On resizing images in the DCT domain.In: Proc. Internat. Conf. on Image Process., pp. 2797–2800.
Spitz, A.L., 1997. Determination of script, language content of documentimages. IEEE Trans. PAMI 19 (3), 235–245.
Tan, T.N., 1998. Rotation invariant texture features and their use inautomatic script identification. IEEE Trans. PAMI 20 (7), 751–756.
Tang, J., Acton, S.T., 2004. A DCT based gradient vector flow snake forobject boundary detection. In: Proc. IEEE Southwest Symp. on ImageAnal. and Interpret., pp. 157–161.
Theodoridis, S., Koutroumbas, K., 1999. Pattern Recognition. AcademicPress, London.
Wood, S.L., Yao, X., Krishnamurthi, K., Dang, L., 1995. Languageidentification for printed text independent of segmentation. In: Proc.Internat. Conf. on Image Process., pp. 428–431.
Zhao, D., Gao, W., Chan, Y.K., 2002. Morphological representation ofDCT coefficients for image compression. IEEE Trans. CSVT 12 (9),819–823.


![2013[2014]: Fuzzy word identification: A case study from the oracle bone inscriptions [pre-publication version]](https://static.fdokumen.com/doc/165x107/631d1effa906b217b90749a6/20132014-fuzzy-word-identification-a-case-study-from-the-oracle-bone-inscriptions.jpg)