Women as Catalysts for Human Development - ScholarWorks ...
131
Georgia State University Georgia State University ScholarWorks @ Georgia State University ScholarWorks @ Georgia State University AYSPS Dissertations Andrew Young School of Policy Studies Summer 8-11-2020 Women as Catalysts for Human Development: Evidence from Women as Catalysts for Human Development: Evidence from Pakistan Pakistan Tareena Musaddiq Follow this and additional works at: https://scholarworks.gsu.edu/aysps_dissertations Recommended Citation Recommended Citation Musaddiq, Tareena, "Women as Catalysts for Human Development: Evidence from Pakistan." Dissertation, Georgia State University, 2020. doi: https://doi.org/10.57709/18541397 This Dissertation is brought to you for free and open access by the Andrew Young School of Policy Studies at ScholarWorks @ Georgia State University. It has been accepted for inclusion in AYSPS Dissertations by an authorized administrator of ScholarWorks @ Georgia State University. For more information, please contact [email protected].
-
Upload
khangminh22 -
Category
Documents
-
view
0 -
download
0
Transcript of Women as Catalysts for Human Development - ScholarWorks ...

Georgia State University Georgia State University
ScholarWorks @ Georgia State University ScholarWorks @ Georgia State University
AYSPS Dissertations Andrew Young School of Policy Studies
Summer 8-11-2020
Women as Catalysts for Human Development: Evidence from Women as Catalysts for Human Development: Evidence from
Pakistan Pakistan
Tareena Musaddiq
Follow this and additional works at: https://scholarworks.gsu.edu/aysps_dissertations
Recommended Citation Recommended Citation Musaddiq, Tareena, "Women as Catalysts for Human Development: Evidence from Pakistan." Dissertation, Georgia State University, 2020. doi: https://doi.org/10.57709/18541397
This Dissertation is brought to you for free and open access by the Andrew Young School of Policy Studies at ScholarWorks @ Georgia State University. It has been accepted for inclusion in AYSPS Dissertations by an authorized administrator of ScholarWorks @ Georgia State University. For more information, please contact [email protected].

ABSTRACT
WOMEN AS CATALYSTS FOR HUMAN DEVELOPMENT: EVIDENCE FROM
PAKISTAN
BY
TAREENA MUSADDIQ
August 2020
Committee Chair: Dr. Thomas Mroz
Major Department: Economics
This dissertation’s essays provide evidence on the impact of different interventions
related to girls’ schooling and health care provision in Pakistan on women’s completed years of
schooling, fertility, maternal health, and health and well being of their children.
Chapter 1 estimates the causal effect of a Conditional Cash Transfer (CCT) program for
girls attending secondary schools in Punjab, Pakistan. We use three rounds of a cross sectional
household survey to estimate the impact of exposure to the program on women’s schooling, age
at marriage and first birth and maternal health care. Importantly, we also analyze inter-
generational effects on health and well being of children. We find that exposure to the CCT
program leads to higher years of completed education, reduces likelihood of marriage and
childbirth in teenage and increases utilization of maternal health care. Further, there are
beneficial inter-generational effects; mother’s exposure to the program leads to better health of

children (in terms of weight and height), reduces incidence of disease and increases probability
of being registered at birth.
Chapter 2 examines the impact of a primary school construction program in Pakistan. I
use two rounds of a cross sectional household survey and implement a difference-in-differences
approach to estimate the causal effect of school construction in district of residence on long run
outcomes such as years of education and fertility. I also estimate marriage market effects and
impact on incidence of domestic violence. I find that women who in their childhood resided in
districts with more schools constructed per capita, under the reform, complete more years of
schooling and reduce overall fertility in the long run. I find, however, little evidence of marriage
market effects or of impacts on incidence of domestic violence.
Chapter 3 evaluates the impact of deploying Community Midwives (CMWs) in Pakistan.
Using the timing of the program, I use a “dosage”- of-treatment approach to estimate the impact
of CMWs per capita across more than 90 districts of Pakistan. I find that women residing in
districts with higher CMWs per capita are more likely to give birth in the presence of a skilled
birth attendant. They are also more likely to birth at a medical facility as opposed to giving birth
at home. I however find no statistical impact on pre- and post-natal check ups.

WOMEN AS CATALYSTS FOR HUMAN DEVELOPMENT:
EVIDENCE FROM PAKISTAN
BY
TAREENA MUSADDIQ
A Dissertation Submitted in Partial Fulfillment
of the Requirements for the Degree
of
Doctor of Philosophy
in the
Economics Department - Andrew Young School of Policy Studies
of
Georgia State University
GEORGIA STATE UNIVERSITY
August 2020

Copyright by Tareena Musaddiq
2020

Acceptance
This dissertation was prepared under the direction of Tareena Musaddiq’s Dissertation Committee. It has been approved and accepted by all members of that committee, and it has been accepted in partial fulfillment of the requirements for the degree of Doctor of Philosophy in Economics in the Andrew Young School of Policy Studies of Georgia State University.
Dissertation Chair: Dr. Thomas Mroz Committee: Dr. Tim Sass
Dr. Alberto Chong Dr. Jonathan Smith Dr. Naved Hamid
Electronic Version Approved: Sally Wallace, Dean Andrew Young School of Policy Studies Georgia State University

iv
Dedication
For the girls in Pakistan, and around the world, who have had to fight for their basic right to education.
And for my girls, Ayma and Zoya - may you grow up to be kind, compassionate and hard working women, and make this world a better place than the one you inherited

v
Acknowledgements
My advisor, Dr. Thomas Mroz, thank you for your guidance and generosity. I have not
seen any other advisor as generous and kind with their time. Thank you for keeping me on my
toes with weekly meetings, correcting my writing (down to apostrophes and spellings) and
pushing me to think hard on econometric models. Dr. Tim Sass, your course in education policy
was a career changing experience for me. Thank you also for the GPL experience and always
making time to read my drafts and attend my presentations. Dr. Jonathan Smith, thank you for
always providing valuable feedback in the kindest of ways. I have learned a lot from my
interaction with you and this work is better because of your feedback. Dr. Alberto Chong, thank
you for providing the development perspective on my work and pushing me to write and sell my
work better. Dr. Naved Hamid, thank you for your insightful comments and words of
encouragement.
I would like to thank my kind and loving husband Kamran for standing by my side every
step of this journey. Thank you for pushing me to work harder when I slacked and calming my
fears when I over worked myself. You have been my biggest critic and cheerleader at the same
time. Your support in getting me here is indispensable.
I cannot thank my parents enough for inculcating the love of learning and the importance
of education in me. Thank you Ami for your tireless effort in teaching me how to learn and excel.
Thank you Abu for always being a listening ear for my fears and thoughts. Thank you both for
being there and helping me get through my PhD.
Friends are the family we choose. I could not have been more fortunate in my choice of
friends both back home and here. Farah and Mahreen, thank you for your support during these

vi
five years-listening to me complain about everything from first semester exams to final defense.
Thank you for lifting my spirits and pushing me through. Farah, thank you for coming on board
and getting me access to all the data. My GSU buddies; Ishtiaque and Isis I cannot thank you
enough for the endless study sessions, discussions on life and sharing the love for food. I have
also greatly benefitted from being part of such a friendly and helpful cohort of graduate students-
thank you all!
I would also like to thank Dr. Dan Kreisman for making my presentations much better
than what they would have been without his input. Thank you to our DGS Dr. Rusty Tchernis for
his support and specially for encouraging me to be on the market this year and having faith in my
ability to manage this.
I would also like to thank The Horowitz Foundation for Social Policy for generously
funding this dissertation and Dr. Thomas Mroz for funding conference and other research
expenses. Thank you to Sarah Hayat in District Government Punjab for providing details on
policy implementation.
I bow to Allah in gratitude for his blessings and graciousness, and thank Him for this
prayer that will always be very close to my heart:
ب زدن ي علمار
{Rabbi- Zidni-Ilma}
“Oh Lord! Increase me in my knowledge” (Al-Quran, 20: 114)
vii
Table of ContentsDedication ...................................................................................................................................... iv
Acknowledgements ......................................................................................................................... v
Table of Contents .......................................................................................................................... vii
List of Figures ................................................................................................................................ ix
List of Tables .................................................................................................................................. x
Introduction ..................................................................................................................................... 1
1. Educate the Girls: Long run Effects of a Secondary School Program for Girls in Pakistan ... 5 1.1 Introduction ...................................................................................................................................... 5 1.2. Motivating Literature ......................................................................................................................... 9 1.3. Background and Policy .................................................................................................................... 11 1.4. Data .................................................................................................................................................. 14 1.5. Methodology .................................................................................................................................... 17
1.5.1 Long Run Effect on Women’s Outcomes .................................................................................. 19 1.5.2 Inter-generational Effects of the Program .................................................................................. 20 1.5.3 Threats to identification ............................................................................................................. 20
1.6. Results .............................................................................................................................................. 21 1.6.1 Inter-generational Effects ........................................................................................................... 26 1.6.2 Robustness Checks ..................................................................................................................... 29 1.6.3 IV Estimation & Discussion ...................................................................................................... 30
1.7. Conclusion ....................................................................................................................................... 33 1.8. Appendix .......................................................................................................................................... 35
2. Does School Construction Provide Long Run Benefits? New Evidence from Primary School Construction in Pakistan ............................................................................................................... 49
2.1. Introduction ...................................................................................................................................... 49 2.2 Literature Review and Contribution ................................................................................................. 52 2.3. Policy & Identification ..................................................................................................................... 55 2.4. Data .................................................................................................................................................. 57 2.5. Methodology .................................................................................................................................... 63
2.5.1 Impact of Total Schools Per Capita ........................................................................................... 64 2.5.2 Impact of “New” Schools Built ................................................................................................. 66
2.6. Results & Discussion ....................................................................................................................... 69 2.6.1 Impact of “New” Schools Built ................................................................................................. 72
2.7. Conclusion .................................................................................................................................... 77 2.8. Appendix .......................................................................................................................................... 78
3. Can Community Midwives Change Maternal Healthcare Utilization? ................................. 81 3.1. Introduction ...................................................................................................................................... 81 3.2. Background & Contribution ............................................................................................................. 83 3.3. Background & Policy ....................................................................................................................... 85 3.4. Data .................................................................................................................................................. 87 3.5. Methodology .................................................................................................................................... 91 3.5.1 Testing for Endogeneity in Placement of CMWs .......................................................................... 93

viii
3.6. Results and Discussion ..................................................................................................................... 95 3.6.1 Further tests .............................................................................................................................. 101
3.7. Conclusion .................................................................................................................................. 102 3.8. Appendix ........................................................................................................................................ 104
References ................................................................................................................................... 110
Vita .............................................................................................................................................. 117

ix
List of Figures
Figure 1.1Geography of Treatment and Control Districts in Punjab by Literacy Rates..................................13
Figure 1.2A Primary and Secondary School Enrollment Rates in Pakistan........................................................35
Figure 1.3A Female School Enrollment Rates in Punjab (2003 and 2014) ..........................................................36
Figure 1.4A Cohort Wise Exposure to the FSSP...........................................................................................................37
Figure 2.1: Primary Schools per Capita.............................................................................................................................60
Figure 2.2: New Schools per Capita...................................................................................................................................60
Figure 2.3A: Schools Per Capita 1980...............................................................................................................................78
Figure 2.4A Schools Per Capita 1985................................................................................................................................79
Figure 2.5A: School Per Capita in 1990............................................................................................................................80
Figure 3.1: Outcomes of interest and their distribution in the sample....................................................................90

x
List of Tables
Table 1.1 Summary Statistics for Women in the Sample............................................................................................15
Table 1.2 Summary Statistics for Children Under the Age of 5...............................................................................17
Table 1.3 Impact of the CCT program on Girls’ Schooling.......................................................................................22
Table 1.4 Impact of FSSP on Marriage & Fertility.......................................................................................................24
Table 1.5 Impact of FSSP Maternal Health Care..........................................................................................................25
Table 1.6: Intergenerational effect- Impact on Child Health (for children under 5)..........................................26
Table 1.7: Intergenerational Effect-Impact on Child Well Being.............................................................................28
Table 1.8 (A-D): Results from Instrumental Variable Regressions.........................................................................31
Table 1.9A District Literacy Rates for Punjab based on 1998 Population Census.............................................38
Table 1.10A Summary Statistics by Control and Treatment Districts....................................................................39
Table 1.11A Summary Statistics by Age Specific Exposure.....................................................................................40
Table 1.12A Impact of the CCT program on Age at Marriage and First Birth...................................................41
Table 1.13A: Impact of the CCT program on Teenage Marriage & First Birth at Different Age Cut-offs41
Table 1.14A Inter-generational effect: Impact on Child Health (with birth order control).............................42
Table 1.15A Inter-generational effect: Impact on Child Well Being (with birth order controlled for).......42
Table 1.16A Robustness Check: Impact of CCT Program on Women’s Outcomes (Excluding Older Cohorts)..............................................................................................................................................................................43
Table 1.17A Robustness Check: Impact of CCT on Children’s Outcomes (Excluding Mother’s from Older Cohorts)..................................................................................................................................................................44
Table 1.18A Robustness Check: Impact of CCT on Women’s Outcomes (Excluding Districts with High and Low Literacy Rates)...............................................................................................................................................45
Table 1.19A Robustness Check: Impact of CCT on Children’s Outcomes (Excluding Districts with High and Low Literacy Rates)...............................................................................................................................................46
Table 1.20A(A-D): Results from a Binary DID Estimation.......................................................................................47
Table 2.1: Summary Statistics on School Availability (in 1981)..............................................................................61
Table 2.2: Summary Statistics for Control & Treatment Cohorts from PDHS 2012 & 2018.........................63
Table 2.3: Impact of School Construction on Educational Outcomes on Fully and Partially Exposed Cohorts................................................................................................................................................................................69
Table 2.4 Estimation for Long Run Outcomes...............................................................................................................70
Table 2.5: Impact on Domestic Violence..........................................................................................................................72

xi
Table 2.6: Difference in Differences Estimation for Educational Outcomes.......................................................73
Table 2.7 Estimation for Long Run Outcomes...............................................................................................................74
Table 2.8: Impact on Domestic Violence..........................................................................................................................76
Table 3.1: Summary Statistics..............................................................................................................................................89
Table 3.2 Predicting Deployment of CMW in the District.........................................................................................94
Table 3.3 Probit Estimations for Maternal Health Care Utilization.........................................................................96
Table 3.4 Marginal Effects of CMWd per capita on Maternal Health Care Utilization...................................97
Table 3.5 Estimation excluding districts with no CMWs.........................................................................................101
Table 3.6 Placebo tests.........................................................................................................................................................102
Table 3.7A. Description of variables in the main model..........................................................................................104
Table 3.8A Description of variables used for testing endogeneity of the treatment variable.......................105
Table 3.9A Probit Estimations for Prenatal Visit........................................................................................................106
Table 3.10A Probit Estimations for Post-natal Checkup..........................................................................................107
Table 3.11A: Probit estimation for Skilled Attendant at birth................................................................................108
Table 3.12A Probit estimation for Institutional birth.................................................................................................109

1
Introduction
Improvements in health and education, especially for women and children, are
universally accepted public policy goals in both developing and developed countries. Human
development gaps are more glaring in the developing countries both in terms of the absolute
numbers as well as the severity of the problem. Governments and international donor agencies
have addressed these problems with interventions on both the demand and the supply side. These
range from free provision of health services to Conditional Cash Transfers (CCTs) for school
attendance.
Programs focusing on educating girls are prominent, strategic initiatives. Investment in
the education of young girls yields not only private but also additional social returns. More
educated women may provide better health care, nutrition and education for their children
(Schultz 2004, Thomas 1991). Most prior studies have been unable to identify the causal impact
of women's education on long run welfare outcomes, and the best evidence is only from the
developed world (see Mensch et al. 2019 & Lochner et al. 2011 for a review). Given the
disproportionate burden of disease, high fertility, maternal mortality and child mortality rates in
developing countries, there is a need to understand better the role that programs for girl’s
education might play in improving these outcomes.
This dissertation answers some of the open questions in the literature on health and well
being of women and children in developing countries. The three chapters focus on Pakistan; the
fifth most populous country in the world with glaring statistics on human development of women
and children. Pakistan has an estimated 25 million children (between the age of 5 and 16) out of
school (Ailaan 2014), ranking second only to Nigeria in the world ranking of Out of School

2
Children. More than half of these children are female (13 million) with the proportion rising with
age. From a global perspective, this is one in every ten out-of-school girls worldwide. With a
maternal mortality ratio of 286 per 100,000 live births, Pakistan bears a substantial proportion of
global maternal deaths (Hogan et al. 2010). In terms of infant mortality, Pakistan ranks the worst
in the world with almost one in twenty infants dying within a month of birth. This accounts for
10 percent of global newborn deaths (Devine and Taylor 2018). Statistics on child health are
also grim; 38 percent children under the age of five are stunted, which is one of the highest
prevalence rates in the world.1
Educating girls and young women is considered a highly effective means for
accomplishing several human development goals such as lowering fertility, improving maternal
and child health and lowering infant and child mortality. Huge investments are therefore made in
girls’ education. The World Bank, for example, committed to spend $ 2.5 billion, between 2016-
2021, on education projects that directly benefit girls in developing countries. Yet, the evidence
from developing countries on the long-run effects of such interventions is limited and at best
mixed.2 This dissertation’s essays contribute to filling this gap in literature.
In Chapter 1, we evaluate the long run effects of a CCT program for girls attending
secondary school in Punjab, Pakistan. We base our identification on differences in outcomes of
women residing in treatment and control districts, and on their exposure to the program based on
their age when the program was introduced. Results show huge gains for women who are
exposed to the program during their school going age in entirety. We find that if the program is
1 https://www.unicef.org/pakistan/stories/saving-children-stunting 2 See Breierova and Duflo (2004), Osili and Long (2008), Andrabi et al. (2012), Grepin and Bharadwaraj (2015), Keats (2018)2 See Breierova and Duflo (2004), Osili and Long (2008), Andrabi et al. (2012), Grepin and Bharadwaraj (2015), Keats (2018)

3
in place during the ten years of primary and secondary schooling, women are more likely to
complete secondary school by six percentage points, less likely to be married or pregnant before
the age of 16 by five and two percentage points respectively, and more likely to access maternal
health care. We also find evidence of inter-generational effects - children of mothers with full
exposure to the program have higher standardized scores for weight and height, are more likely
to be vaccinated (by 7 percentage points) and registered at birth (8 percentage points) and are
less likely to be stunted (-7 percentage points), wasted (-4 percentage points) or experience
morbidity (-5 percentage points). These findings imply that programs aimed at promoting girls'
education lead to substantial beneficial long run gains in multiple dimensions, in addition to
achieving the main goal of increasing education for girls.
In Chapter 2, I evaluate the effect of a school construction program in Pakistan. Under
the Sixth Five Year Development Plan, between 1983 and 1988 the Pakistan government
engaged in a school construction program aimed at increasing primary school enrollment and
expanding education opportunities for girls. I combine differences across districts in number of
schools constructed with differences across cohorts induced by timing of the program. I find that
each girls’ primary school constructed per 10,000 of school aged girls, on average increases
completed years of schooling by 0.4 years. In the long run, women exposed to districts with
more schools per capita reduce fertility. I find little (or no) evidence of impact on the marriage
market and on incidence of domestic violence.
Chapter 3 evaluates a supply-side intervention in health care. I evaluate the impact of
deploying Community Midwives (CMWs) as front line health workers on maternal health care
utilization. Using CMWs deployed per capita in each district of the country, I use a “dosage”-of-
treatment approach to estimate the effect on pre- and post-natal checkups, institutional birth and

4
delivering in presence of a Skilled Birth Attendant (SBA). I find that each additional CMW per
10,000 of the population increases the likelihood of women giving birth at a medical institution
and being assisted by a SBA by 17 and 19 percentage points respectively. However, I find no
statistically significant evidence of increase in pre- and post-natal checkups.
The remainder of this dissertation is organized around the three chapters, including the
background, existing literature, data, methods, results, and conclusions for each.

5
1. Educate the Girls: Long run Effects of a Secondary School Program for Girls in Pakistan
(With Farah Said3)
1.1 Introduction
Programs focusing on educating girls are considered an important policy tool to address a
host of issues in developing countries. Investment in the education of young girls and women
yields not only private but also additional social returns. More educated women may provide
better health care and education for their children (Schultz 2004, Thomas 1991). Most prior
studies have been unable to identify the causal impact of women's education on long-run welfare
outcomes, and the best evidence is only from the developed world (see Mensch et al. 2019 &
Lochner et al. 2011 for reviews). Given the disproportionate burden of disease, high fertility,
maternal mortality and child mortality rates in developing countries, there is a need to understand
better the role that programs for girl’s education might play in improving these outcomes.
This paper estimates the long run effects of a secondary school program for girls in
Pakistan on the health and well-being of beneficiaries and their children. In 2004, the
Government of Punjab introduced a Female Secondary School Stipend Program (FSSP) to
encourage households to send their girls to secondary schools and raise the overall literacy rates
in the recipient districts. Under the FSSP, households in eligible districts with girls enrolled in
grades 6-10 receive a monthly cash stipend conditional on achieving an 80 percent attendance
rate. District eligibility is determined by the literacy rate as per the 1998 Population Census. The
3 Centre for Research in Economics and Business, Lahore School of Economics

6
program was implemented in districts with literacy rates of 40 percent or less and 15 out of the
36 districts qualified by their low literacy rates. As per official figures, cash transfers averaging
USD 14 million annually have been disbursed to more than 411,000 girls from 2004 to 2013
(Alam et al. 2011).
We exploit the exogenous variation in the introduction of the FSSP to investigate long
run effects of the program on the girls’ education (primary and secondary school completion),
teenage marriage and childbirth, and maternal health care utilization (pre and post natal care,
medical assistance at time of birth). This is one of the few studies to examine the impact on the
next generation’s well-being (standardized weight and height measures for children under 5,
incidence of disease, birth registration) in any country. Using three rounds of cross sectional data
from Multiple Indicators Cluster Survey (MICS), we assign to each woman in our sample the
number of years of exposure to the program based on district of residence (treatment vs. control)
and her age at the initiation of the program. We estimate the impact of each year of exposure on
our outcomes of interest, controlling for district and cohort fixed effects. Identification of the
FSSP effects comes from differential exposure to the program based on district of residence and
year of birth.
Programs like FSSP offer transfers and influence decisions of households for multiple
years. We find huge gains in long run outcomes of women when the program is in place for the
entirety of their school going years i.e. from the age at which they start school (6 years) until
secondary school completion (16 years). This full exposure to the program increases the
probability of completing secondary schooling by 6 percentage points, reduces the likelihood of
marriage and first birth before the age of 16 by 5 percentage points and 2 percentage points,
respectively; and improves maternal health care utilization across a host of measures.

7
We also find important evidence of inter-generational effects. Specifically, children of
women exposed to the program are healthier; 0.14 and 0.2 standard deviations higher in terms of
weight for age and height for age respectively. They are less likely to be underweight (-7
percentage points) or stunted (-4 percentage points), are more likely to be vaccinated (7
percentage points) and to have an official birth registration record (8 percentage points). These
results are robust to excluding older cohorts or the highest and lowest literacy districts.
Our results are in line with the literature that finds positive relationships between
schooling and own and children's health (see e.g. Currie et al. 2003, Grossman 2006). Conclusive
evidence on a causal relationship in developing countries is relatively sparse4, so this paper
contributes to the existing literature in several important ways. First, we investigate the effects of
a Conditional Cash Transfer (CCT) program, designed to encourage secondary schooling, on
primary and secondary schooling completion rates, fertility and maternal health outcomes. While
secondary schooling programs are regularly evaluated for their impact on enrollment rates,
evidence on the effects of secondary schooling on fertility and health is rare. The only other
study, to the best of our knowledge, to do so is by Grepin et al. (2015) for a school reform in
Zimbabwe. We add to the findings of this existing study in two main ways. The context in
Pakistan is different and has larger global implications. Pakistan has an estimated 25 million
children (between the age of 5 and 16) out of school (Ailaan 2014), ranking second only to
Nigeria in the world ranking of Out of School Children. 55 percent of these children are female
with the proportion of females rising with age. Pakistan bears a substantial proportion of global
maternal deaths (Hogan et al. 2010). In terms of infant mortality, Pakistan ranks the worst in the
4 See Grepin et al. 2015; Breierova and Duflo 2004; Akresh et al. 2018, Osili et al. 2008, Behrman 2015; Angeles et al. 2005); Mazumder et al. (2019)

8
world with almost one in twenty infants dying within a month of birth. This accounts for 10
percent of global newborn deaths (Devine and Taylor 2018). The implications for the impact on
these outcomes is much more important for countries like Pakistan and no such evidence exists
at present. We also look at the impact of a mother’s exposure to a schooling program on
anthropometric child health measures. There is no comparable evidence for other developing
countries on these measures.
Second, no study has looked at the long run impact of secondary schooling in Pakistan on
fertility, age at marriage and childbirth, and health care utilization for women. Andrabi et al.
(2012) is the only study that estimates the inter-generational transmission of human capital in
Pakistan. Unlike their work, which examines the impact of mother’s education at very low levels
on their time allocation and school enrollment of their children, our study looks at the impact of a
secondary school program on women’s long run well being. Importantly, we estimate the impact
on health outcomes of the children. No prior evidence is available for this on Pakistan.
Third, our work contributes to the growing literature on the long run impacts of CCT
programs. Currently eighty countries have had some form of a CCT program and some recent
studies have estimated the long run effects of earlier programs.5 However, we present novel
evidence on the inter-generational impacts of a CCT in terms of child health and well being for a
developing country. Unlike other CCTs, the FSSP is unique in being a non-means tested program
within treated areas.
5 Barrera-Osorio et al. 2017; Parker and Vogl, 2018; Barham et al. 2013; Araujo et al. 2016

9
1.2. Motivating Literature
The positive correlation between schooling and one’s own and children’s health has been
established widely in literature (See Grossman and Kaestner, 1997 and Grossman 2000, 2006 for
a review). Educating girls is hence often used as a pathway to address a host of problems related
to women’s and children’s well-being in developing countries. Women who are more aware and
knowledgeable are expected to make better informed decisions about their own health and well-
being, as well as their children’s. Educated women may also benefit more from health initiatives
and campaigns. More highly educated women are able to utilize information disseminated
through print since their ability to read and synthesize knowledge is superior. We can likely
expect educated women to be more open to seeking help and information related to health.
It is difficult, however, to disentangle causal effects within the association observed
between education and later life outcomes. Women who choose to complete more education are
likely different on other observable and unobservable characteristics that might lead to different
decisions related to their own health and investments in their children’s human capital in later
life. Exogenous variation in education, introduced by compulsory schooling laws and college
openings (among others), has been used to establish causal relationships between education and
one’s own and the next generations’ outcomes in developed countries (see e.g. Currie and
Moretti, 2003). Evidence on developing countries, however, is not as widespread. Grepin et al.
(2015) use changes in compulsory schooling laws and opening of new schools in Zimbabwe to
establish that women reduce fertility and delay marriage and childbirth as a result of more
education. In addition, parental education reduces infant morality. Likewise, Breierova and
Duflo (2004) use a massive school construction program in Indonesia to show that female
education impacts age of marriage and early fertility. In a more recent study Mazumder et al.

10
(2019) use the same reform to show evidence of intergenerational gains; children whose mothers
were exposed to the reform score higher on the national primary school examination.
Interestingly, there is evidence of positive gains in terms of reducing fertility and improvements
in health for the next generation even from increased schooling at the primary level (Osili and
Long 2007; Behrman 2015). Evidence also exists that women with some education versus no
education in Pakistan tend to spend more time on educational and enrichment activities with their
children; their children are also more likely to be enrolled in school (Andrabi et al. 2012).
CCTs are widely used to improve health and education outcomes in developing countries.
Currently eighty countries have had some form of a CCT program. There is evidence of short-
term gains in health utilization and nutrition, but little is known about the long run, largely
because CCTs began only in the late 1990s. Twenty years on, it is now possible to explore the
longer run impacts. The existing literature shows positive impacts on long run educational
achievement and labor force participation of early life beneficiaries (Barrera-Osorio et al. 2017
for Colombia; Parker and Vogl, 2018 for Mexico and Barham et al. 2013 for Nicaragua). On the
other hand, Araujo et al. (2016) find only modest improvements in secondary school completion
in Ecuador.
In this study we add to the literature by providing novel evidence on the impact of a
schooling program for girls in Pakistan. No such evidence exists on how exposure to education
program alters (or not) long run decisions such as age of marriage and child-birth and health care
utilization for women in Pakistan. In fact, to the best of our knowledge; Grepin et al. (2015) is
the only study that answers this question for secondary schooling for any developing country.
We also fill in key gaps in the literature on inter-generational effects of educational
programs. While existing evidence shows intergenerational gains from school construction

11
programs and compulsory schooling laws on child mortality (Grepin et al. 2015 in Zimbabwe)
and, educational outcomes (Mazumder et al. 2019 in Indonesia; Andrabi et al. 2012 in Pakistan),
unlike our study they do not speak on the quality of health and well-being of children.
Some recent studies have estimated the long run effects of earlier CCT programs, but
none have focused on the intergenerational effects in terms of child health. In addition, since the
FSSP was a program that targeted girls, we are able to place our inter-generational findings
within the broader context of direct or spillover impacts of maternal education. Unlike other
CCTs, the FSSP is unique in not being a means tested program in any of the treated areas.
Existing evaluations of FSSP show increases in enrollment rates up to five years after the
start of the program (Alam et al. 2011). Our study provides the first evidence on long run and
inter-generational effects of this program. While our study, like previous studies, cannot
distinguish specifically which channels might be at play for the case of Pakistan, we are able to
establish that women exposed to the FSSP delay marriage and child-birth and are more likely to
seek better health care for themselves and their children. These results suggest that policy makers
should consider the long run benefits when designing such policies and should factor in these
gains in cost-benefit analyses guiding future expansions of the program.
1.3. Background and Policy
Pakistan is one of the three countries in the world with more than 1 million adolescent
girls out of school (UNESCO 2015). The female gross enrollment rate for the primary level
stands at 86 percent for Pakistan at present. This drops sharply to 42 percent for lower secondary
(grades 6-8) and 24 percent for upper secondary (grades 9 and 10), despite there being no tuition
fees in public schools. This is attributable to a host of subjective (e.g. cultural and psychological

12
barriers) and objective barriers (e.g. costs of textbooks, transportation, street harassment,
preference to the male child when resources are limited in the household, etc.).
FSSP was designed to curb some of the tangible barriers that households face in
educating girls. It is an ongoing CCT program in the province of Punjab, the most populous
province of Pakistan, housing more than half the population of the country. Historically, female
enrollment in primary and secondary schools has been low. This is true both in absolute terms
and in comparison to boys (Behrman and Schneider 1993; Alderman et al. 2001; Holmes 2003;
Lloyd et al. 2005). The low enrollment for girls in Pakistan is further compounded by low
retention and completion rates (Sawada and Lokshin, 2009). Figure 1.2A in Appendix shows the
difference in school enrollment rates between boys and girls. Secondary school enrollment rates
are significantly lower than primary school rates. Girls’ enrollment rates are lower than boys at
both primary and secondary levels. Although the rates have been rising over time, secondary
enrollment rates remain below 50 percent for girls.
The Government of Punjab designed the FSSP to improve educational attainment among
girls and decrease gender inequalities, specifically at the secondary level. In particular, the
program seeks to target girls in districts with low literacy rates overall. Districts with literacy
rates below 40 percent (as per the 1998 Population Census) received the treatment (See
Appendix Table 1.8A for details). Figure 1.1 shows geography of the treatment and control
districts. The treatment districts are located toward the south of the province and are spatially
clustered close to each other.

13
Figure 1.1Geography of Treatment and Control Districts in Punjab by Literacy Rates
Quarterly stipends worth PKR 600 ($10) per female student were disbursed to recipients
in the eligible districts as long as the female student maintained an 80 percent attendance rate (as
reported by the school). Eighty percent of the stipend was designed to cover the costs of
schooling related to transport, uniform and textbooks; factors that are commonly cited as barriers
to girls' attendance. That leaves about 20 percent of the stipend left over for the family to use for
other needs (Alam et al., 2011; Chaudhury and Parajuli 2010).
The stipend was directly disbursed to the household via a postal order from the District
Education Office at the end of each quarter. The first stipends were disbursed to eligible students
in grades 6-8 in the first quarter of 2004 (PERSP 2014). In 2006, the program was extended to
include grades 9 and 10. In 2013, 411,000 girls in more than 6,800 schools were enrolled in the
program, at a cost of USD 14.2 million on average each year (Fiszbein 2009; PESRP 2014).

14
At 3.4 percent of median household expenditure in 2004, the monthly stipend is unlikely
to have been a large income shock for most households (Fiszbein and Schady 2009; Chaudhury
et al. 2010). Stipend size has two important implications. First, it rules out a large income shocks
driving changes in outcomes. Second, given the costs associated with migration (including
giving up housing, livestock and livelihood), the cash stipend on its own is likely insufficient to
incentivize migration from non-recipient to recipient districts.
Enrollment rates reported in the Multiple Indictors Cluster Survey (MICS) for 2003 and
2014 for girls in the relevant age group (11-15 years old) show that enrollment has increased
overall in the decade since the FSSP was rolled out, but the recipient districts still lag behind the
non-recipient districts (See Appendix Figure 1.3A). Existing evaluations have shown that the
FSSP has increased enrollment rates in recipient districts by 9 percentage points compared to the
non-recipient districts, and there is evidence that this effect lasted at least up to 5 years after the
program was initiated (Chaudhry et al. 2010; Alam et al. 2011).
1.4. Data
We employ the Multiple Indicators Cluster Survey (MICS) for Punjab for this study.
MICS is a cross-sectional household survey specifically designed to monitor indicators related to
well being of women and children. To date, over 300 rounds of surveys have been collected in
more than 100 countries. This study uses data from MICS conducted in Punjab, Pakistan in 2003,
2011 and 2014.
For Punjab, MICS is representative at the district level and contains detailed information
regarding age, education, employment and health of all members of the households. More
importantly for our study, MICS has two questionnaires designed for women and children that

15
are aimed at capturing information about maternal and child health. In particular, for women of
childbearing age (15-49 years) MICS has information pertaining to age at marriage and age at
first birth, number of births, and maternal health care utilization (for births in the two years prior
to the survey). For children under the age of five, MICS collects information about current
weight and height (anthropometric measures administered by the survey team), immunization,
incidence of disease and child registration. Detailed questions regarding knowledge about illness
and treatment, as well as health care utilization are also available in the data.
We use the information about the roll out of the program from the Punjab Education
Sector Reform Program (PESRP) to define our control and treatment districts. Table 1 below
Table 1.1 Summary Statistics for Women in the Sample6
Obs. Mean Std.
Dev.
Minimum Maximum Age>10
Years of Exposure 287,270 1.6 2.9 0 10 Age 287,270 27.6 10.7 11 50 Completed Primary 287,270 0.3 0.46 0 1
Age>16 Completed Secondary
SSecondary
240,780 0.20 0.40 0 1 Years of Ed 240,095 4.06 4.7 0 23 Married before 16 209,131 0.12 0.33 0 1 First Birth before 16 209,131 0.042 0.20 0 1
Women who gave birth in the last two years Prenatal Checkup 48,856 0.82 0.39 0 1 Delivery at medical
facility
48,856 0.53 0.5 0 1 Skilled Birth Attendant 48,856 0.73 0.44 0 1 Post natal care 48,856 0.56 0.5 0 1
Women who have ever given birth Child Died 128,885 0.36 0.5 0 1
6See Appendix Table 1.9A and 1.10A for detailed summary statistics. Overall, we can expect these numbers to be less favorable in treatment than control districts since treatment districts have low literacy rates and are economically weaker than control districts. The number of observations for women’s outcome related to maternal care is smaller because those questions were only administered to women who gave birth in the two years prior to the survey.

16
shows the summary statistics for women in the sample. Women in our sample have an average
exposure of 1.6 years to the CCT program. However, conditional on any exposure, the average
exposure is around 4 years. The average years of schooling for women in Punjab is around 4
years; 30% and 20% women in our sample (between the age of 15 and 50 years) report
completing primary and secondary schooling respectively. Twelve percent of them were married
and four and half percent had their first child before the age of sixteen, respectively.7 Roughly
half of the women who gave birth in the two years prior to survey report delivering the child at a
medical facility or getting a post natal check up. Twenty-seven percent of women were not
attended by a skilled health professional at the time of giving birth. From the subset of women in
the sample who report ever having given birth, one in every three reports having a child who
later died.
The MICS survey contains detailed information on the health status of children under the
age of five in the households sampled. Specifically, the survey team is trained to measure height
and weight of children. In addition, parents are surveyed about the incidence of disease and
health care utilization for children, including vaccinations. Summary statistics for these children
are reported in Table 1.2 below. The average age is two years with equal proportions of male and
female children. The average child in Pakistan is more than one standard deviation below weight
for age and height for age standards set by World Health Organization. One in every three
children is underweight and 28 percent are stunted.8 Diarrhea is considered to be one of the three
leading causes of child death in Pakistan from curable and preventable diseases. 16 percent of
7 These statistics rise to 26.6% and 10% respectively when we consider marriage and first birth before 18. The average age at marriage is 20.05 years for women and the average age at first birth is around 22.1. 8 A child is categorized as underweight if the weight-for-age standardized score is two standard deviations below the average. A child is considered stunted if the height-for-age standardized score is two standard deviations below the average.

17
children were reported to have had diarrhea within the two weeks prior to the survey. 83 percent
of children were reported as ever having received a vaccination.
Birth registration is an important concern for child protection in developing countries
across the world. Without a birth record, children are more vulnerable to child rights violations,
Table 1.2 Summary Statistics for Children Under the Age of 5
Obs. Mean Std.
Dev.
Minimum Maximum Weight for Age Z 88,478 -1.49 1.18 -5 5 Height for Age Z 87,548 -1.23 1.38 -5 5 Stunted 87,548 0.28 0.45 0 1 Underweight 88,478 0.33 0.47 0 1 Child had diarrhea 93,380 0.16 0.36 0 1 Vaccinated 93,380 0.83 0.38 0 1 Child registered 88,843 0.44 0.50 0 1 Age 93,380 2.00 1.42 0 4 Gender 93,380 0.51 0.50 0 1 Mother’s Age 93,380 29.87 5.97 11 49
such as child marriage, child labor and trafficking, and becoming child soldiers. In certain
instances, especially emergencies, people without birth certificates can be excluded from health
coverage, access to education, and social protection programs. International agencies like
UNICEF are actively partnering with the local government in Pakistan to increase birth
registration for child protection purposes in Pakistan. As can be seen in Table 2, less than half of
the children in Pakistan have a birth record.
1.5. Methodology
We begin by estimating the effect of the CCT program on women’s education in a
reduced form model. The identification in this setting comes from variability in exposure to the
program, which is composed of two components. First, an individual must be a resident of the

18
district eligible for treatment. This eligibility was based on district literacy rates from the 1998
Population Census. It is unlikely that households chose to locate in districts based on the
availability of the program. As discussed earlier, the stipend amount is not large enough to
induce migration. Only 0.3 percent of families with girls report moving across districts for
reasons related to education (PDHS, 2012).9
For girls residing in the treatment districts, we assign exposure to the program in terms of
the number of years. Years of exposure to the program is determined by two variables: timing of
the intervention (starting in 2004) and the individual’s year of birth (or age at the time of the
intervention). The stipend is offered for grades 6-10. Typically, we can expect girls in these
grades to be aged 11 to 15 years.
We first estimate the effect of the program on years of education as follows:
𝐸𝑑𝑢!"# = 𝛼! + 𝛼! 𝑌𝑒𝑎𝑟𝑠 𝑜𝑓 𝑒𝑥𝑝𝑜𝑠𝑢𝑟𝑒 + 𝛼! 𝑇𝑟𝑒𝑎𝑡 + 𝛿! + 𝜎! + 𝜀!"# (1)
where 𝐸𝑑𝑢!"# is an education outcome for individual i (years of education, completing primary
school and completing secondary school), living in district d, from birth cohort k. Years of
exposure is determined based on the age of the individual in 2004 (i.e. at the start of the
program). Girls’ aged 17 and older in 2004 were too old to benefit from the program and hence
had no exposure to the program. For the more recent cohorts, years of exposure are calculated
based on age in 2004. For example, girls aged 6 and younger in 2004 were exposed to the
program for 10 years, girls aged 7 in 2004 were exposed for 9 years, girls aged 14 in 2004 were
exposed for 2 years and so on (For details see Appendix Figure 1.4A). Note that we also include
the years that younger cohorts of girls spend in primary school as being “exposed” to the 9 We do not have information about place of birth or place of residence during secondary school age. We therefore assume current place of residence as place of residence during school going years. This is a reasonable assumption given low migration rates especially for women.

19
program. The idea is that the option of receiving a stipend in the future at the secondary level
could be a factor in the decision making process of the households regarding enrolling (or
dropping out) the girl at each grade. This is substantiated by our result that girls exposed to the
program are more likely to complete primary schooling.
We include district 𝛿! and cohort (𝜎!) fixed effects to account for any differences
across districts and cohorts other than the program that might be affecting differences in
educational attainment. Treat is an indicator variable equal to one if the individual is from as
treated district and zero otherwise. This estimation helps establish the impact of the CCT
program on educational attainment. A positive value for 𝛼! would indicate that exposure to the
program increases education (e.g. if the outcome of interest is years of education one additional
year of exposure to the program would increase years of education by 𝛼!).
1.5.1 Long Run Effect on Women’s Outcomes
Next, we estimate the impact of the program on long run outcomes for women. We use
exposure to the policy as the main variable of interest and estimate the following model:
𝑌!"# = 𝛽! + 𝛽! 𝑌𝑒𝑎𝑟𝑠 𝑜𝑓 𝐸𝑥𝑝𝑜𝑠𝑢𝑟𝑒!"# + 𝛽! 𝑇𝑟𝑒𝑎𝑡 + 𝛿!! + 𝜎!! + 𝜐!"# (2)
Yidk represents the outcome of interest for woman i, residing in district d, from birth
cohort k. Our main outcomes of interest in Equation 2 are whether the woman is married before
the age of 16, has her first child before the age of 16 and several indicators of maternal health
care utilization (i.e. prenatal check up, delivery at a medical facility, skilled birth attendance and
postnatal check up). 𝛽! captures the impact of one additional year of exposure on the outcome of
interest. A priori, we expect woman exposed to the program to delay marriage and childbirth.
This can be due to several reasons including staying in school longer, greater mobility outside
20
the house, and awareness of rights and being more empowered. We cannot speak to the role of
each of these channels, but our results will reflect whether women exposed to the program
completed more years of schooling.
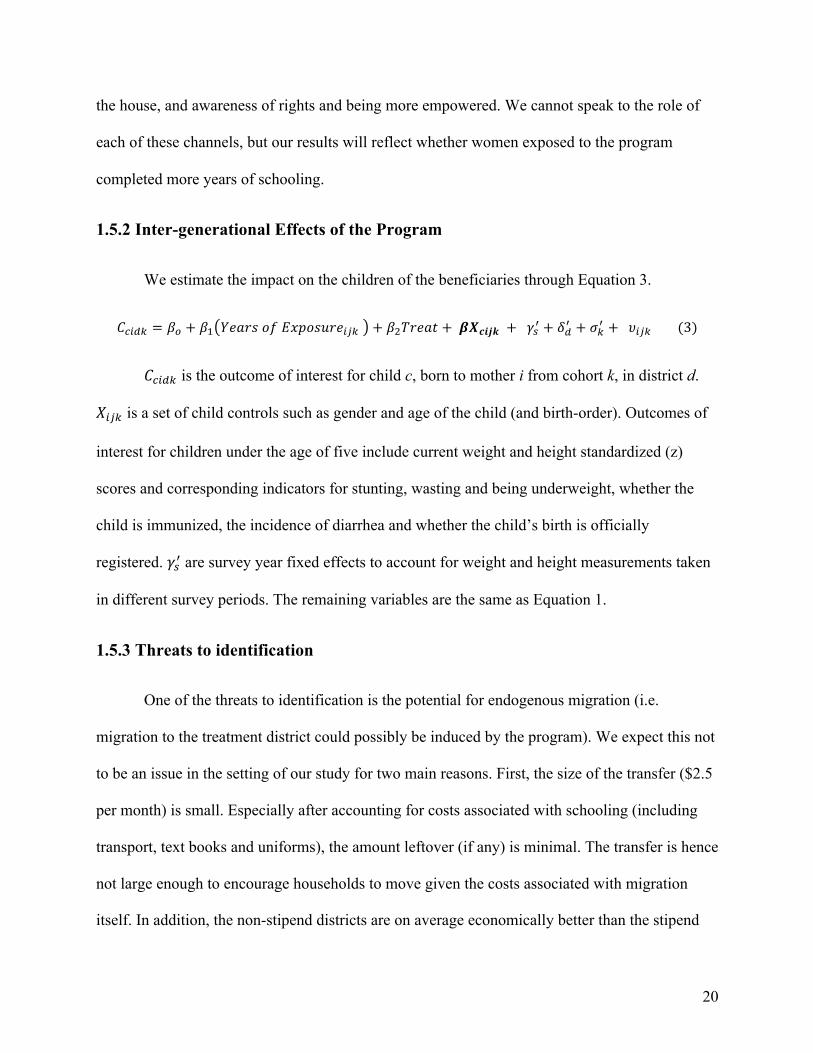
1.5.2 Inter-generational Effects of the Program
We estimate the impact on the children of the beneficiaries through Equation 3.
𝐶!"#$ = 𝛽! + 𝛽! 𝑌𝑒𝑎𝑟𝑠 𝑜𝑓 𝐸𝑥𝑝𝑜𝑠𝑢𝑟𝑒!"# + 𝛽!𝑇𝑟𝑒𝑎𝑡 + 𝜷𝑿𝒄𝒊𝒋𝒌 + 𝛾!! + 𝛿!! + 𝜎!! + 𝜐!"# (3)
𝐶!"#$ is the outcome of interest for child c, born to mother i from cohort k, in district d.
𝑋!"# is a set of child controls such as gender and age of the child (and birth-order). Outcomes of
interest for children under the age of five include current weight and height standardized (z)
scores and corresponding indicators for stunting, wasting and being underweight, whether the
child is immunized, the incidence of diarrhea and whether the child’s birth is officially
registered. 𝛾!! are survey year fixed effects to account for weight and height measurements taken
in different survey periods. The remaining variables are the same as Equation 1.
1.5.3 Threats to identification
One of the threats to identification is the potential for endogenous migration (i.e.
migration to the treatment district could possibly be induced by the program). We expect this not
to be an issue in the setting of our study for two main reasons. First, the size of the transfer ($2.5
per month) is small. Especially after accounting for costs associated with schooling (including
transport, text books and uniforms), the amount leftover (if any) is minimal. The transfer is hence
not large enough to encourage households to move given the costs associated with migration
itself. In addition, the non-stipend districts are on average economically better than the stipend

21
districts, reducing the incentive even further. Unfortunately, MICS does not provide any
information on migration. We use The Pakistan Demographic Health Survey (PDHS) to
estimate rate of migration from control to treatment district. 10 The migration rate is low; around
0.64 percent women move from a control to treatment districts over their lifetime. Out of these
migrations, only 6 percent are reported as migrations for economic opportunities or education.
The second concern, in terms of migration, is that of out migration after receiving the
treatment. Girls who complete secondary schooling might be more likely to move out to districts
that are economically more vibrant. This can be due to better marriage prospects and assortative
matching i.e. finding better partners who work in other districts. It can also be induced by better
employment opportunities available in other districts, which higher educated girls might want to
seek out. This type of out-migration is unlikely in our setting. Most migration in Punjab is in the
form of temporary out migration of a member of the household, most often working men or head
of the household (Alam et al. 2011). Estimates from PDHS show a migration rate of 1.84 percent
from treatment to control districts for women. Out of those migrating, 93 percent report
migrating for marriage or family reasons, while only 1.7 percent migrate for better economic
opportunities.
1.6. Results
We first discuss the impact of the program on girl’s education as modeled in Equation 1.
We examine three outcomes of interest here; total years of education, completion of primary
school, and secondary school completion. Table 1.3 below shows the results. As seen in Column
1, each additional year of exposure to the CCT program increases the probability of completing
10 We calculate these migration rates from the Pakistan Demographic Health Survey 2012 survey that also follows a random sample design.
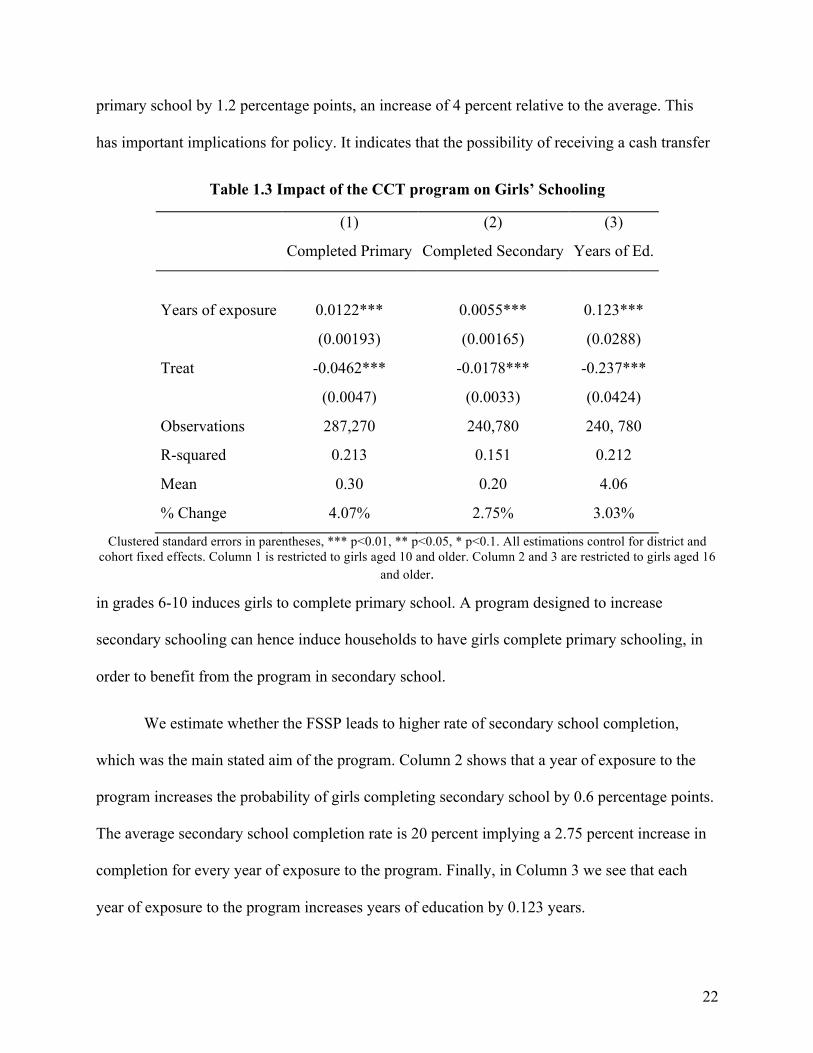
22
primary school by 1.2 percentage points, an increase of 4 percent relative to the average. This
has important implications for policy. It indicates that the possibility of receiving a cash transfer
Table 1.3 Impact of the CCT program on Girls’ Schooling
(1) (2) (3)
Completed Primary Completed Secondary Years of Ed.
Years of exposure 0.0122*** 0.0055*** 0.123***
(0.00193) (0.00165) (0.0288)
Treat -0.0462*** -0.0178*** -0.237***
(0.0047) (0.0033) (0.0424)
Observations 287,270 240,780 240, 780
R-squared 0.213 0.151 0.212
Mean 0.30 0.20 4.06
% Change 4.07% 2.75% 3.03%
Clustered standard errors in parentheses, *** p<0.01, ** p<0.05, * p<0.1. All estimations control for district and cohort fixed effects. Column 1 is restricted to girls aged 10 and older. Column 2 and 3 are restricted to girls aged 16
and older.
in grades 6-10 induces girls to complete primary school. A program designed to increase
secondary schooling can hence induce households to have girls complete primary schooling, in
order to benefit from the program in secondary school.
We estimate whether the FSSP leads to higher rate of secondary school completion,
which was the main stated aim of the program. Column 2 shows that a year of exposure to the
program increases the probability of girls completing secondary school by 0.6 percentage points.
The average secondary school completion rate is 20 percent implying a 2.75 percent increase in
completion for every year of exposure to the program. Finally, in Column 3 we see that each
year of exposure to the program increases years of education by 0.123 years.

23
Results in Table 1.3 estimate the impact of the program for each year of exposure. From
a policy perspective such programs are designed for much longer time periods. In fact, the FSSP
has been in place since 2004 and is still ongoing. If the program is in place when a girl joins
grade 1 in school, she would be “exposed” (i.e. the program would exist) for a total of 10 school
years for her, out of which she would receive stipend in 5 of them (grades 6-10). Estimates in
Table 1.3 imply much bigger impacts over the life of the program. Primary and secondary school
completion rates would in this case increase 40 and 25 percent, from the average, when a girl is
exposed to the program from grade 1 to grade 10. Completed years of schooling would increase
by 30 percent. This indicates that exposure to the program throughout primary and secondary
schooling can lead to large improvements in girls’ secondary school completion. 11
In Table 1.4, we examine the impact of the program on women’s later life decisions. We
first look at the impact on decisions related to marriage and childbirth. For this we look at the
probability of being married before the age of 16 and the probability of having a first child
before the age of 16. We prefer using this measure over age at marriage and age at first birth
since those measures by definition would only include married women or women who have
given birth, excluding some of those who potentially delay marriage and childbirth due to the
program (Results for these measures are in Appendix Table 1.11A and are consistent with our
findings here). A year of exposure to the program reduces the likelihood of marriage before the
age of 16 by 0.52 percentage points and the likelihood of having the first child before 16 by 0.2
percentage points. These correspond to more than 4 percent reduction on average for teenage
marriage and pregnancy for each year of exposure and translate into 40 percent reductions over a
11 We also estimate non-linear models using two different approaches; indicator for each year of exposure and a hazard model to account for dropping out in earlier grades. Results for impact on education remain consistent with higher effects when exposure to the program starts in primary school. Results are made available on request.

24
ten year period. These results are robust to using age cutoffs at 17 and 18 years (See Appendix
Table 1.12A for details).
Table 1.4 Impact of FSSP on Marriage & Fertility
(1) (2)
Married before 16
First birth before 16
Years of Exposure -0.00520*** -0.00197**
(0.00159) (0.000621)
Treat 0.0624*** 0.0235***
(0.0019) (0.0008)
Observations 209,131 209,131
R-squared 0.053 0.018
Mean 0.12 0.042
% Change -4.33% -4.69%
Clustered standard errors in parentheses, *** p<0.01, ** p<0.05, * p<0.1.
All estimations control for district and cohort fixed effects.
Maternal health care utilization in developing countries is often associated with women’s
education. We examine four measures of maternal health care in Table 1.5. We look first at
behavior during pregnancy and after giving birth. Each additional year of exposure to FSSP
increases the probability of women seeking pre-natal care by 0.6 percentage points and post-natal
care by 0.8 percentage points. Looking at utilization at the time of giving birth, there is a positive
but statistically insignificant effect on probability of giving birth at a medical facility versus
giving birth at home. However, we find that a woman exposed to a year of the program is, on
average, 3.3 percent more likely to be attended by a medical professional when giving birth. It is
important to note that lack of a skilled attendant at time of birth is one of the leading reasons for
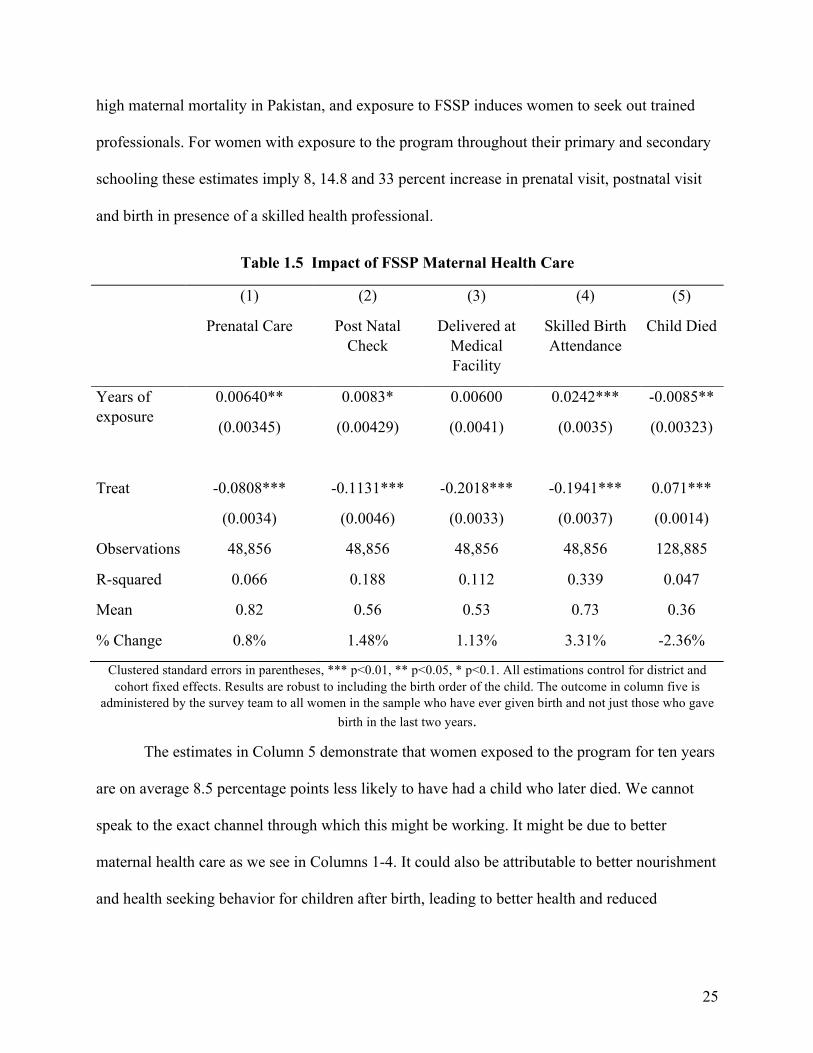
25
high maternal mortality in Pakistan, and exposure to FSSP induces women to seek out trained
professionals. For women with exposure to the program throughout their primary and secondary
schooling these estimates imply 8, 14.8 and 33 percent increase in prenatal visit, postnatal visit
and birth in presence of a skilled health professional.
Table 1.5 Impact of FSSP Maternal Health Care
(1)
Prenatal Care
(2)
Post Natal Check
(3)
Delivered at Medical Facility
(4)
Skilled Birth Attendance
(5)
Child Died
Years of exposure
0.00640**
(0.00345)
0.0083*
(0.00429)
0.00600
(0.0041)
0.0242***
(0.0035)
-0.0085**
(0.00323)
Treat -0.0808*** -0.1131*** -0.2018*** -0.1941*** 0.071***
(0.0034) (0.0046) (0.0033) (0.0037) (0.0014)
Observations 48,856 48,856 48,856 48,856 128,885
R-squared 0.066 0.188 0.112 0.339 0.047
Mean 0.82 0.56 0.53 0.73 0.36
% Change 0.8% 1.48% 1.13% 3.31% -2.36%
Clustered standard errors in parentheses, *** p<0.01, ** p<0.05, * p<0.1. All estimations control for district and cohort fixed effects. Results are robust to including the birth order of the child. The outcome in column five is
administered by the survey team to all women in the sample who have ever given birth and not just those who gave birth in the last two years.
The estimates in Column 5 demonstrate that women exposed to the program for ten years
are on average 8.5 percentage points less likely to have had a child who later died. We cannot
speak to the exact channel through which this might be working. It might be due to better
maternal health care as we see in Columns 1-4. It could also be attributable to better nourishment
and health seeking behavior for children after birth, leading to better health and reduced

26
incidence of disease. We discuss these latter channels more in our next section on the inter-
generational impact.
Results in Table 1.5 are based on information collected from women in child bearing age
but for obvious reasons omits any information on women who had passed away at the time of
survey. If women who survive, and whose children survive, are also likely to be more educated,
the estimates will likely underestimate the impacts.
1.6.1 Inter-generational Effects
The literature documents a positive impact of mother’s education on children’s well
being in multiple dimensions. Educated mothers, for example, tend to have healthier and more
educated kids but the evidence is mostly from simple correlations. We present the effects of the
FSSP on children’s health in Table 1.6, using data on children under the age of five in the
household. Columns 1 and 2 show the impact of the mother being exposed to a year of the FSSP
on the weight of the child, measured by weight for age z (WAZ) score and the incidence of
underweight. 12 We find consistent results across both measures; a child whose mother is
exposed to the FSSP for a year scores 0.014 standard deviations higher on the WAZ score and is
0.7 percentage points less likely to be underweight. Likewise Column 3 and 4, show results for
height-for-age standardized score (HAZ) and stunting.13 We find that children whose mothers
were exposed to the program on average score higher on the HAZ score by 0.02 standard
deviations and are 0.7 percentage points less likely to be stunted. Finally we also check for the
Table 1.6: Intergenerational effect- Impact on Child Health (for children under 5)
12 Children’s weight and height are measured by the survey team. The Z score is calculated based on the WHO standards for weight and height for age. Underweight: weight for age < –2 standard deviations (SD) of the WHO Child Growth Standards median 13 Stunting: height for age < –2 SD of the WHO Child Growth Standards median

27
(1) (2) (3) (4) (5)
WAZ Underweight HAZ Stunting Wasting
Years of Exposure 0.0136* -0.0067** 0.0194** -0.00702*** -0.0042**
(0.00757) (0.00303) (0.00832) (0.00279) (0.00244)
Observations 88,478 88,478 87,548 87,548 88,478
R-squared 0.044 0.030 0.06 0.043 0.025
Mean -1.49 0.33 -1.23 0.28 0.16
% Change 0.9% -2.03% 1.58% -2.50% -2.62%
Clustered standard errors in parentheses,*** p<0.01, ** p<0.05, * p<0.1. Regressions include control for gender of child, district, mother’s birth cohort and year of survey fixed effects. Results are robust to including birth order (See
Appendix Table 1.13A).
impact of being wasted and find a reduction consistent with results in Columns 1-4. 14 If the
mother is exposed to the program throughout her school going years, the child is 20 percent and
25 percent less likely to be underweight and stunted, respectively.
We also explore the impact on other measures of well being for children that are
important for Pakistan and developing countries in general. Table 1.7 shows the impact on
indicators for vaccination, incidence of disease (measured here by diarrhea in last 2 weeks) and
child protection (measured here by whether a child has an official birth record). We find that
children of mother’s exposed to the program are more likely to be vaccinated. However, there we
lose a large fraction of our sample due to lack of reporting on this variable. If missing values in
this case are correlated to whether or not the child is vaccinated, this estimate will be biased.We
check whether there is a difference between control and treatment groups and find no such
difference in reporting.
14Wasting: weight for height < –2 SD of the WHO Child Growth Standards median

28
Table 1.7: Intergenerational Effect-Impact on Child Well Being
(1) (2) (3)
Ever Vaccinated
Diarrhea in last 2 weeks
Child’s birth is Registered
Years of exposure 0.00731*** -0.00517* 0.00784**
(0.00265) (0.00246) (0.00306)
Observations 54,638 93, 380 88,843
R-squared 0.097 0.022 0.192
Mean 0.83 0.16 0.44
% Change 0.8% -3.23% 1.75%
Clustered standard errors in parentheses,*** p<0.01, ** p<0.05, * p<0.1. Regressions include controls for mother’s year of birth, age and gender of child, district and year of survey fixed effects. Results are robust to including birth
order (See Appendix Table 1.14a)
Children with mothers exposed to FSSP are less likely to experience diarrhea (5
percentage point reduction for 10 years of mother’s exposure). Diarrhea is one of the top three
leading causes of under-five mortality in Pakistan from curable and preventable diseases. These
results suggest that educated mothers are more likely to take actions to reduce the incidence of
diarrhea in children (e.g. better informed about hygiene, more open to seeking health care and
information).
Child protection is of particular concern for policy makers in Pakistan. Official recording
of a child’s birth by the government establishes the child’s existence under law. This helps
safeguard a host of rights for children. For example, an exact age record of a child is central to
protection from child labor, child marriage and trafficking, and it ensures adequate treatment in
the criminal justice system. Yet, more than half the children in Pakistan do not have an official
birth record. Column 3 in Table 1.7 shows that children whose mothers were exposed to the
FSSP for a year were 0.8 percentage points more likely to have an official record of birth. This

29
corresponds to 1.75 percent increase from the average for each year the mother is exposed to the
program.
Results in Table 1.3-1.7 show that exposure to FSSP has large gains not only in terms of
the immediate stated goal of improving education but on important policy goals related to
women’s and children’s well being. It is important to consider these long run gains when
weighing the benefits of the program against the costs. Our study provides the first estimates of
these long run benefits. This is timely information given the program is currently being piloted
for expansion in terms of stipend amounts and regions covered.
1.6.2 Robustness Checks
We run several checks on our results. First, we exclude from our analysis women born
before 1980. We then estimate our main models with the sub-sample of women closer in terms
of birth cohorts. Results are shown for all outcomes in Appendix Table 1.15A and Table 1.16A.
Excluding older cohorts does not substantively change any of the main results discussed earlier.
Second, we exclude districts with very low (<20%) and very high literacy rates (>60%).
This allows us to see if the effect is driven by districts at the lower or higher end of the
distribution for pre-period literacy rates. Table 1.17A and Table 1.18A show that excluding
these districts does not significantly change our estimates on women’s outcomes related to
education, marriage and childbirth compared to our main results. Some of the outcomes related
to maternal health care utilization however do lose statistical significance due to lower statistical
power in these smaller samples. However, the direction and magnitude changes little. On the
other hand, these results might also indicate that the excluded districts were driving the results
which in this case is encouraging from a policy perspective since those districts with very low
30
literacy rates likely need the change the most. Results for the inter-generational impact also
remain largely consistent with earlier results using the full sample.
Lastly, we run our main estimation models using a binary difference-in- differences
approach, with indicators for treatment district and whether the women belonged to a cohort that
was young enough to benefit from the program when it was introduced. Compared to our main
model, where we estimate the impact of each year of exposure, in this estimation we estimate the
impact of any exposure to the program versus none. We can therefore, by definition of the
variable of interest, expect the magnitude of the effect to be different from the primary results.
Tables 1.19A(A-D) shows that the impact of the program using this approach. Results are largely
consistent with our main results in Tables 1.3-1.7. The binary difference in differences estimates
are, as expected, larger than the estimates using years of exposure, but are qualitatively
consistent.
1.6.3 IV Estimation & Discussion
We also estimate the causal impact of education (maternal education) on fertility and
health (child health) using the exposure to the program as an instrument for women’s education.
This also allows us to compare our estimates to those from other similar studies in literature. Our
estimations are similar to Equation 2 and 3 in terms of controls and we use years of exposure to
the program as an instrument for women’s education and mother’s education.
Results are shown in Tables 1.8(A-D). Estimates in Table 1.8A show that each additional
year of education reduces likelihood of getting married and giving birth before the age of 16 by
3.1 percentage points and 1 percentage point respectively. These estimates are smaller but
comparable to what Grepin et al. (2015) find (6.1 percentage points and 2.3 percentage points
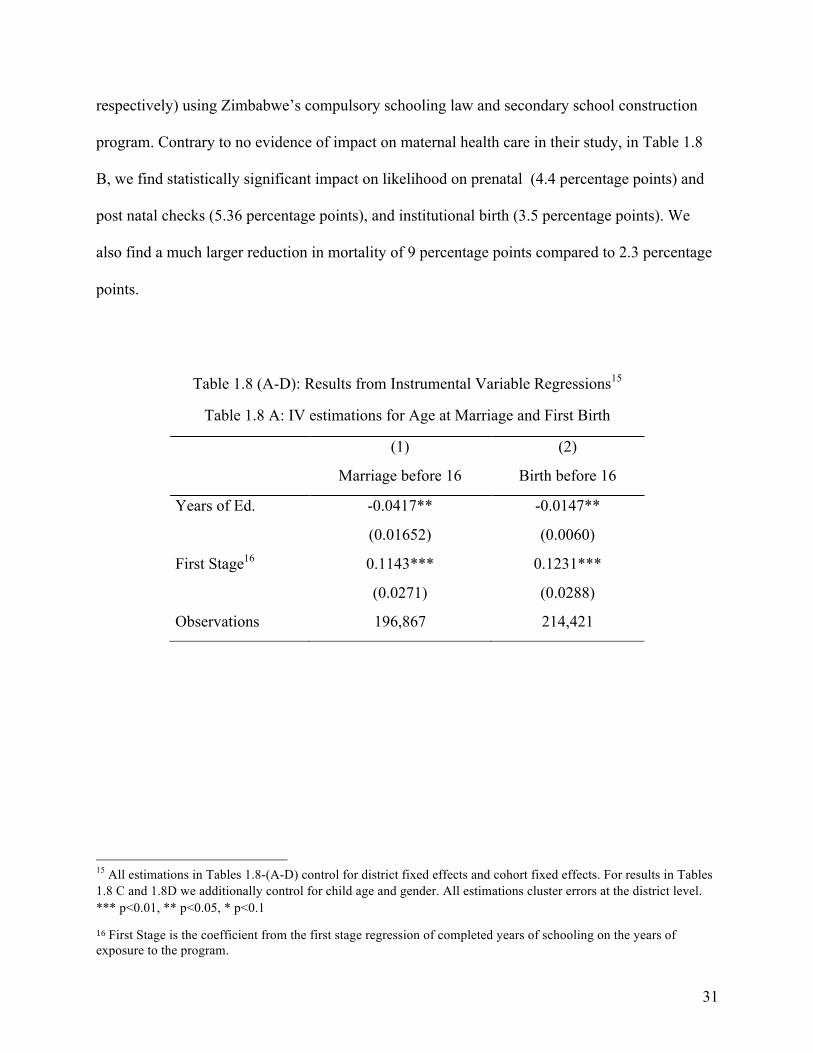
31
respectively) using Zimbabwe’s compulsory schooling law and secondary school construction
program. Contrary to no evidence of impact on maternal health care in their study, in Table 1.8
B, we find statistically significant impact on likelihood on prenatal (4.4 percentage points) and
post natal checks (5.36 percentage points), and institutional birth (3.5 percentage points). We
also find a much larger reduction in mortality of 9 percentage points compared to 2.3 percentage
points.
Table 1.8 (A-D): Results from Instrumental Variable Regressions15
Table 1.8 A: IV estimations for Age at Marriage and First Birth
(1) (2)
Marriage before 16 Birth before 16
Years of Ed. -0.0417** -0.0147**
(0.01652) (0.0060)
First Stage16 0.1143*** 0.1231***
(0.0271) (0.0288)
Observations 196,867 214,421
15 All estimations in Tables 1.8-(A-D) control for district fixed effects and cohort fixed effects. For results in Tables 1.8 C and 1.8D we additionally control for child age and gender. All estimations cluster errors at the district level. *** p<0.01, ** p<0.05, * p<0.1
16First Stage is the coefficient from the first stage regression of completed years of schooling on the years of exposure to the program.

32
Table 1.8 B : IV estimations for Maternal Health & Child Mortality
(1) (2) (3) (4) (6)
Prenatal Post Natal Deliver at
Med. Inst.
SBA Child Died
Years of Ed. 0.0438** 0.0536** 0.0350* 0.135*** -0.0900**
(0.0212) (0.0266) (0.0201) (0.0277) (0.0404)
First Stage 0.1451** 0.1451** 0.162*** 0.1786*** 0.0918**
(0.0418) (0.0419) (0.4546) (0.0450) (0.0426)
Observations 48,652 48,106 45,768 34,115 128,527
Table 1.8 C: IV estimations for Child Health
(1) (2) (3) (4)
WAZ HAZ Underweight Stunted
Mother’s Years of Ed 0.151** 0.193*** -0.0657*** -0.0672***
(0.0624) (0.0688) (0.0254) (0.0235)
First Stage 0.1241*** 0.1251*** 0.1241*** 0.1251***
(0.0205) (0.0206) (0.0205) (0.0206)
Observations 88,471 87,541 88,224 87,541
Table 1.8 D: IV estimations for Child Well Being
(1) (2) (3)
Birth Registration Diarrhea Ever Vaccinated
Mother’s Years of Ed. 0.0606** -0.0388** 0.0633**
(0.0244) (0.0197) (0.0246)
First Stage 0.1239*** 0.1280*** 0.1116***
(0.0203) (0.0203) (0.0214)
Observations 93,116 93,373 54,634
33
For the inter-generational effects, Gunes (2015) is the most relevant comparison
available, with the caveat that Turkey is very different from Pakistan in terms of income per
capita (more than 4 times that of Pakistan in 2017). In Table 1.8C we find each additional year of
mother’s education increases WAZ and HAZ scores by 0.15 and 0.19 standard deviations
respectively. Gunes et al. (2015) find a 1.1 and 1.0 standard deviation change in WAZ and HAZ
respectively for each additional year of schooling. These differences may be due to differences in
availability of health services and health insurance between the two countries.
1.7. Conclusion
Pakistan faces serious challenges with respect to human capital. One of the strategic
development priorities used as a tool to address these problems is increased education for girls,
especially adolescent girls. However, little causal evidence is available on returns to such
programs in developing countries (Mensch et al. 2019). This paper seeks to bridge that gap by
using a CCT program in the province of Punjab to estimate the impact of secondary schooling on
long run outcomes of women, as well as the impact on health and well-being of their children.
Results show that the CCT program was effective in its goal of increasing schooling for girls. In
the long run, as a result of exposure to the program, women delay marriage, are less likely to
give birth before the age of 16 and are more likely to seek maternal health care. Further we find
intergenerational effects in terms of child health and well-being.
From a cost perspective, the amount of stipend disbursed to a girl through grades 6-10 is
$150 in total or $30 per year. Administrative overheads and other overheads add up to average
cost of $125 per year per girl of running the program. Nonetheless, the cost per student seems
reasonably small compared to the gains we see not just in schooling but also in maternal health,

34
child mortality, child health and protection. From a cost-benefit perspective the program
provides large gains in the long run for outcomes that would otherwise be costly to improve.
There are important lessons for policy making for developing countries that can be
derived from this study. Programs that target girl’s education, specifically adolescent girls
education, have long run beneficial effects beyond the aim of increasing schooling for girls.
These benefits must be accounted for when designing these policies since they can potentially
make an important contribution in reducing a host of other problems.
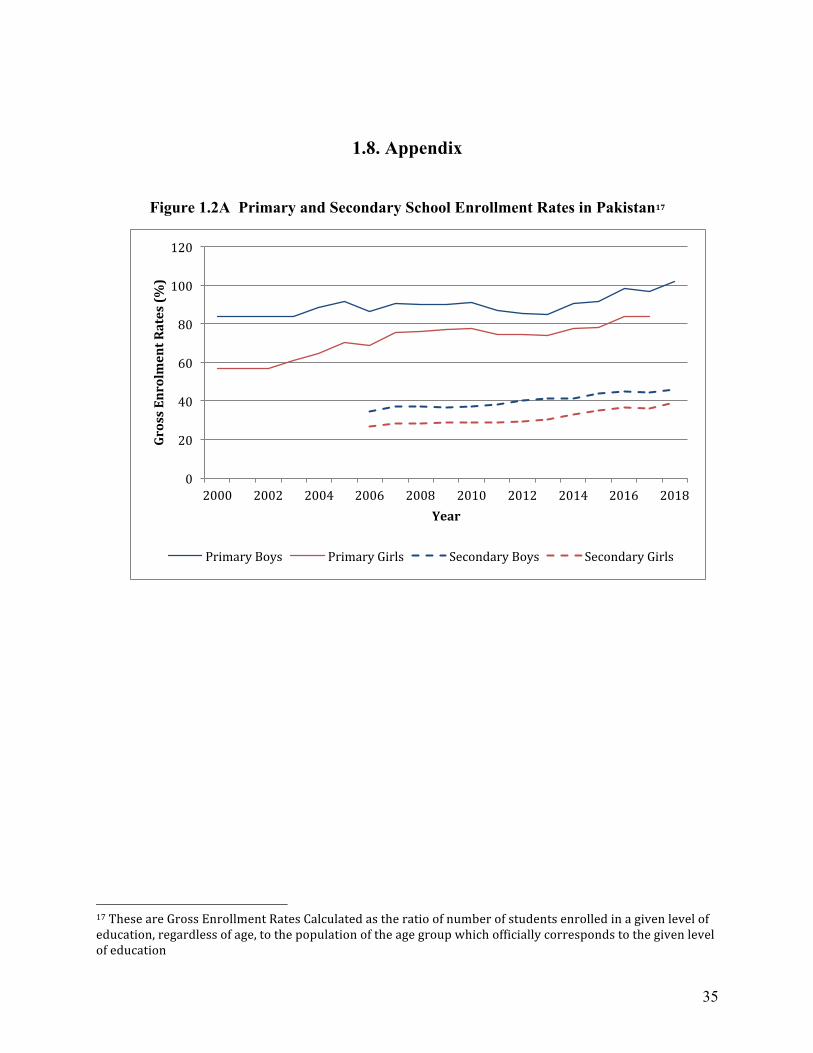
35
1.8. Appendix
Figure 1.2A Primary and Secondary School Enrollment Rates in Pakistan17
17TheseareGrossEnrollmentRatesCalculatedastheratioofnumberofstudentsenrolledinagivenlevelofeducation,regardlessofage,tothepopulationoftheagegroupwhichofficiallycorrespondstothegivenlevelofeducation
0
20
40
60
80
100
120
2000 2002 2004 2006 2008 2010 2012 2014 2016 2018
GrossEnrolmentRates(%
)
Year
PrimaryBoys PrimaryGirls SecondaryBoys SecondaryGirls

36
Figure 1.3A Female School Enrollment Rates in Punjab (2003 and 2014) 18
2003
2014
18 Note that enrollment rates in Punjab are on average higher than average enrollment rates in Pakistan. The enrollment rates calculated here are from cross sectional data in 2003 and 2014. These enrollment rates appear higher than primary and secondary school completion rates we observe in our data. This is because our data looks at women in their adulthood and completion rates historically have been much lower.

37
Figure 1.4A Cohort Wise Exposure to the FSSP
Cohort
1998 and later
1997
1996
1995
1994
1993
1992
1991
1990
1999
1988 and earlier
1 2 3 4 5 6 7 8 9 10
Grade
Program in Place Received Stipend

38
Table 1.9A District Literacy Rates for Punjab based on 1998 Population Census
Treatment Literacy Rate Control Literacy Rate
Rajanpur 20.7 Khushab 40.5
Muzaffargarh 28.5 Hafizabad 40.7
Lodhran 29.9 Mianwali 42.8
D.G.Khan 30.6 Multan 43.4
Rahmiyar Khan 33.1 Shiekhupura 43.8
Bhakkar 34.2 Sahiwal 43.9
Pakpattan 34.7 Sargodha 46.3
Bahwalpur 35.0 Mandi Bahuddin 47.4
Bahawalnagar 35.1 Attock 49.3
Kasur 36.2 T.T.Sing 50.5
Vehari 36.8 Faisalabad 51.9
Jhang 37.1 Narowal 52.7
Okara 37.8 Gujranwala 56.6
Layyah 38.7 Chakwal 56.7
Khanewal 39.9 Sialkot 58.9
Gujrat 62.2
Jhelum 63.9
Lahore 64.7
Rawalpindi 70.5

39
Table 1.10A Summary Statistics by Control and Treatment Districts
Variable Total Sample Treatment Districts Control Districts Difference
N Mean SD Mean SD Mean SD
Age 287,270 27.00 .0207 26.98 0.0327 27.02 0.0269 -0.039
Completed Primary 287,270 0.3 0.46 0.22 0.416 0.35 0.48 -0.123 ***
Completed Secondary 240,780 0.20 0.40 0.149 0.356 0.238 0.426 -0.089 ***
Years of Ed. 240,780 4.06 4.7 3.18 4.44 4.68 4.77 -1.497***
Age at marriage 128,835 20.07 4.38 19.68 4.42 20.38 4.32 -0.692 ***
Married before 18 230,127 0.266 0.44 0.260 0.439 0.192 0.39 0.077 ***
Age at first birth 128,269 22.12 4.34 21.85 4.39 22.32 4.29 -0.464 ***
First Birth before 18 230,127 0.10 0.30 0.121 0.326 0.089 0.29 0.037 ***
Prenatal Checkup 48,856 0.82 0.39 0.735 0.441 0.880 0.32 -0.146 ***
Delivery at medical facility 48,856 0.53 0.5 0.403 0.491 0.622 0.49 -0.219 ***
Skilled Birth Attendant 48,856 0.73 0.44 0.626 0.483 0.801 0.40 -0.175 ***
Post-natal care 48,856 0.56 0.5 0.512 0.50 0.595 0.49 -0.082 ***
Child Died 75,664 0.36 0.48 0.38 0.49 0.35 0.48 0.02***
Age of Child 88,542 2.00 1.42 2.03 1.426 1.98 1.41 0.049***
Gender 88,542 0.51 0.50 0.512 0.50 0.509 0.50 0.003
Weight-for-Age-Z 88,542 -1.49 1.18 -1.643 1.190 -1.365 1.170 -0.277***
Height-for-Age-Z 88,542 -1.23 1.38 -1.374 1.412 -1.126 1.350 -0.247 ***
Stunted 88,542 0.28 0.45 0.326 0.469 0.246 0.430 0.080***
Underweight 88,542 0.33 0.47 0.378 0.485 0.286 0.452 0.090 ***
Child registered 88,843 0.44 0.5 0.286 0.452 0.565 0.496 0.276 ***
Had diarrhea 89,104 0.16 0.36 0.179 0.384 0.144 0.352 0.035***
Ever Vaccinated 52,190 0.83 0.38 0.734 0.442 0.897 0.304 -0.162***
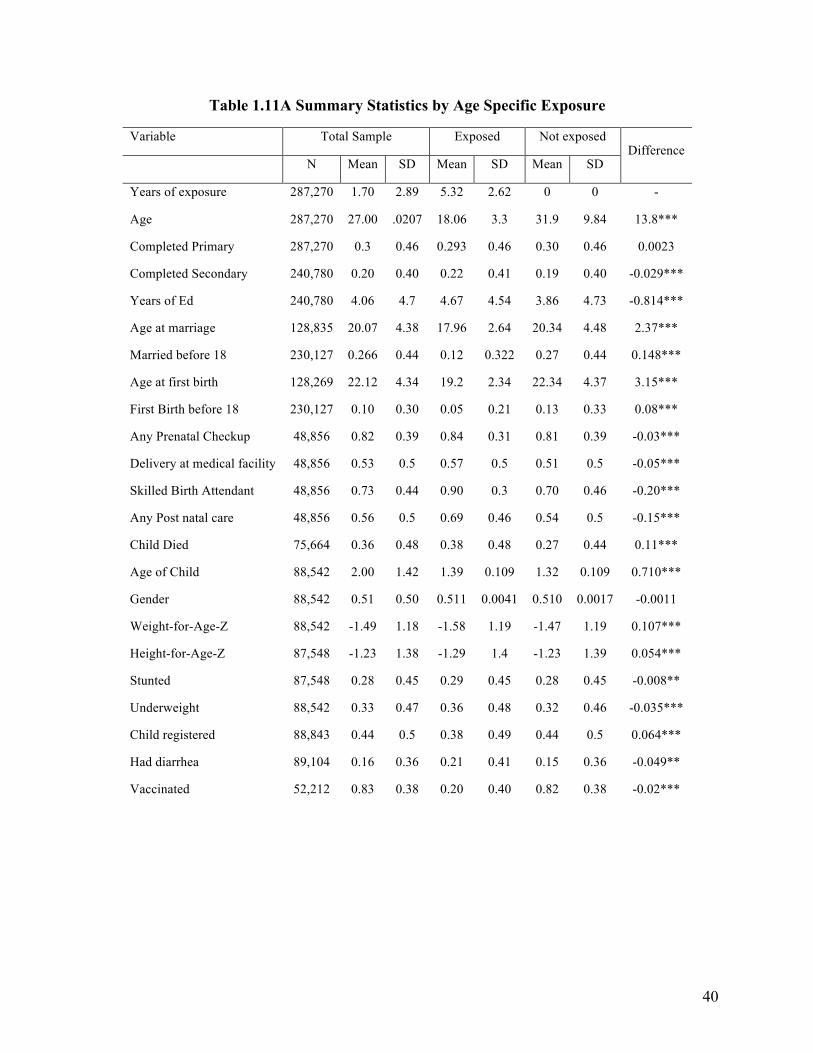
40
Table 1.11A Summary Statistics by Age Specific Exposure
Variable Total Sample Exposed Not exposed Difference
N Mean SD Mean SD Mean SD
Years of exposure 287,270 1.70 2.89 5.32 2.62 0 0 -
Age 287,270 27.00 .0207 18.06 3.3 31.9 9.84 13.8***
Completed Primary 287,270 0.3 0.46 0.293 0.46 0.30 0.46 0.0023
Completed Secondary 240,780 0.20 0.40 0.22 0.41 0.19 0.40 -0.029***
Years of Ed 240,780 4.06 4.7 4.67 4.54 3.86 4.73 -0.814***
Age at marriage 128,835 20.07 4.38 17.96 2.64 20.34 4.48 2.37***
Married before 18 230,127 0.266 0.44 0.12 0.322 0.27 0.44 0.148***
Age at first birth 128,269 22.12 4.34 19.2 2.34 22.34 4.37 3.15***
First Birth before 18 230,127 0.10 0.30 0.05 0.21 0.13 0.33 0.08***
Any Prenatal Checkup 48,856 0.82 0.39 0.84 0.31 0.81 0.39 -0.03***
Delivery at medical facility 48,856 0.53 0.5 0.57 0.5 0.51 0.5 -0.05***
Skilled Birth Attendant 48,856 0.73 0.44 0.90 0.3 0.70 0.46 -0.20***
Any Post natal care 48,856 0.56 0.5 0.69 0.46 0.54 0.5 -0.15***
Child Died 75,664 0.36 0.48 0.38 0.48 0.27 0.44 0.11***
Age of Child 88,542 2.00 1.42 1.39 0.109 1.32 0.109 0.710***
Gender 88,542 0.51 0.50 0.511 0.0041 0.510 0.0017 -0.0011
Weight-for-Age-Z 88,542 -1.49 1.18 -1.58 1.19 -1.47 1.19 0.107***
Height-for-Age-Z 87,548 -1.23 1.38 -1.29 1.4 -1.23 1.39 0.054***
Stunted 87,548 0.28 0.45 0.29 0.45 0.28 0.45 -0.008**
Underweight 88,542 0.33 0.47 0.36 0.48 0.32 0.46 -0.035***
Child registered 88,843 0.44 0.5 0.38 0.49 0.44 0.5 0.064***
Had diarrhea 89,104 0.16 0.36 0.21 0.41 0.15 0.36 -0.049**
Vaccinated 52,212 0.83 0.38 0.20 0.40 0.82 0.38 -0.02***

41
Table 1.12A Impact of the CCT program on Age at Marriage and First Birth
(1) (2)
Age at marriage Age at First Birth
Years of Exposure 0.0454 0.0193
(0.0294) (0.0284)
Observations 128,835 128,302
R-squared 0.063 0.085
Clustered standard errors in parentheses, *** p<0.01, ** p<0.05, * p<0.1. All estimations control for district and cohort fixed effects. Column 1 is restricted to girls aged 10 and younger. Column 2 and 3 are restricted to girls aged
16 and older
Table 1.13A: Impact of the CCT program on Teenage Marriage & First Birth at Different Age Cut-offs
(1) (2) (3) (4)
Married before 17 Married before 18 FB before 17 FB before 18
Years of Exposure
-0.00353** -0.00110 -0.00227** -0.00220
(0.00171) (0.00208) (0.000904) (0.00136)
Observations 197,161 187,813 214,964 205,558
R-squared 0.055 0.059 0.022 0.027
Clustered standard errors in parentheses, *** p<0.01, ** p<0.05, * p<0.1. All estimations control for district and cohort fixed effects.

42
Table 1.14A Inter-generational effect: Impact on Child Health (with birth order control)
(1) (2) (3) (4)
WAZ Underweight HAZ Stunted
Mother’s Yrs. Of Exposure 0.0136* -0.00657** 0.0190** -0.00683**
(0.00760) (0.00303) (0.00845) (0.00285)
Observations 88,478 88,478 87,548 87,548
R-squared 0.040 0.028 0.028 0.025
Clustered standard errors in parentheses,*** p<0.01, ** p<0.05, * p<0.1. Regressions include control for gender of child, district, mother’s birth cohort, birth order and year of survey fixed effects.
Table 1.15A Inter-generational effect: Impact on Child Well Being (with birth order controlled for)
(1) (2) (3)
Birth Registration Incidence of Diarrhea Ever Vaccinated
Mother’s Yrs. Of Exposure 0.00668** -0.00360 0.00645**
(0.00312) (0.00252) (0.00268)
Observations 88,194 88,451 52,212
R-squared 0.197 0.024 0.106
Clustered standard errors in parentheses,*** p<0.01, ** p<0.05, * p<0.1. Regressions include control for gender of child, district, mother’s birth cohort, birth order and year of survey fixed effects.
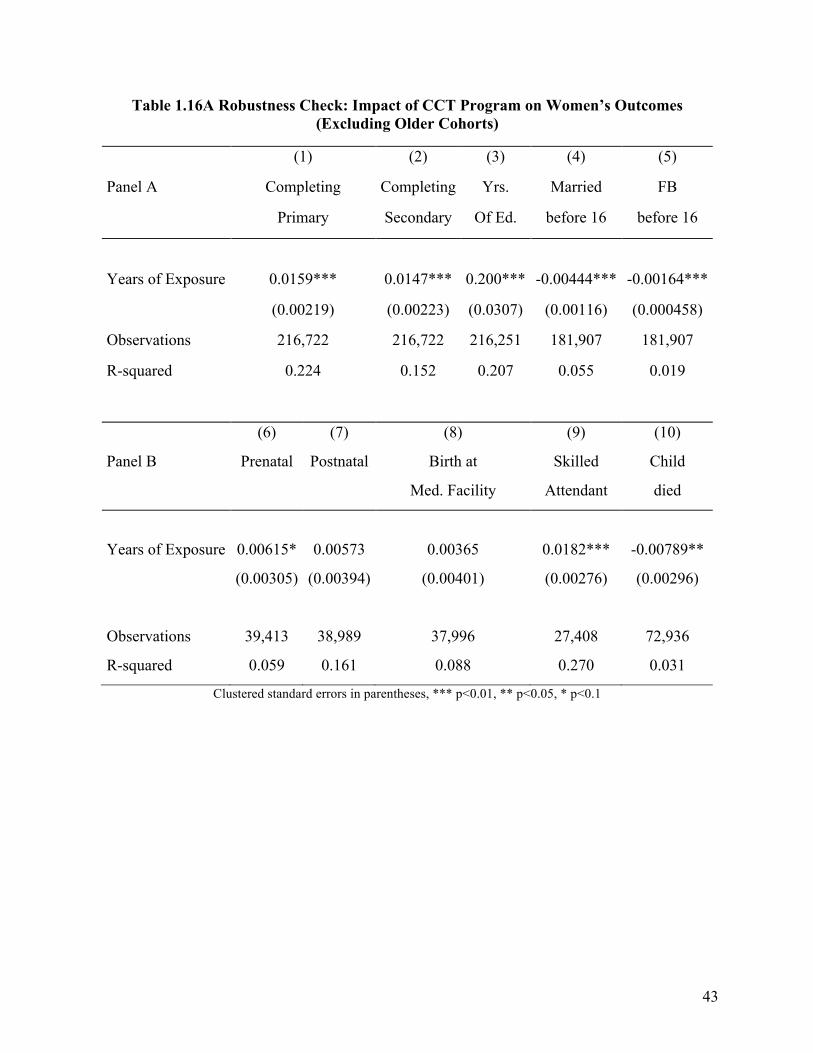
43
Table 1.16A Robustness Check: Impact of CCT Program on Women’s Outcomes (Excluding Older Cohorts)
(1) (2) (3) (4) (5)
Panel A Completing
Primary
Completing
Secondary
Yrs.
Of Ed.
Married
before 16
FB
before 16
Years of Exposure 0.0159*** 0.0147*** 0.200*** -0.00444*** -0.00164***
(0.00219) (0.00223) (0.0307) (0.00116) (0.000458)
Observations 216,722 216,722 216,251 181,907 181,907
R-squared 0.224 0.152 0.207 0.055 0.019
(6) (7) (8) (9) (10)
Panel B Prenatal Postnatal Birth at
Med. Facility
Skilled
Attendant
Child
died
Years of Exposure 0.00615* 0.00573 0.00365 0.0182*** -0.00789**
(0.00305) (0.00394) (0.00401) (0.00276) (0.00296)
Observations 39,413 38,989 37,996 27,408 72,936
R-squared 0.059 0.161 0.088 0.270 0.031
Clustered standard errors in parentheses, *** p<0.01, ** p<0.05, * p<0.1

44
Table 1.17A Robustness Check: Impact of CCT on Children’s Outcomes (Excluding Mother’s from Older Cohorts)
(1) (2) (3) (4)
Panel A WAZ HAZ Underweight Stunted
Years of Exposure 0.0185** 0.0246*** -0.00915*** -0.00890***
(0.00792) (0.00839) (0.00306) (0.00284)
Observations 77,904 76,685 77,904 76,685
R-squared 0.031 0.040 0.021 0.029
(5) (6) (7)
Panel B Birth registration Diarrhea Vaccination
Years of Exposure 0.00772** -0.00459* 0.00683**
(0.00309) (0.00245) (0.00266)
Observations 81,734 81,734 49,540
R-squared 0.191 0.042 0.104
Clustered standard errors in parentheses,*** p<0.01, ** p<0.05, * p<0.1.
Regressions include control for gender of child, district, mother’s
birth cohort, and year of survey fixed effects.

45
Table 1.18A Robustness Check: Impact of CCT on Women’s Outcomes (Excluding Districts with High and Low Literacy Rates)
(1) (2) (3) (4) (5)
Panel A Completing
primary
Completing
Secondary
Yrs. Of Ed. Married
before 16
FB before 16
Years of Exposure 0.00925*** 0.00265*** 0.0772*** -0.00351*** -0.00122**
(0.00139) (0.000899) (0.0240) (0.00123) (0.000584)
Observations 233,641 196,022 195,442 188,520 202,147
R-squared 0.202 0.140 0.204 0.055 0.019
(6) (7) (8) (9) (10)
Panel B Prenatal Postnatal Birth at Med.
Facility
Skilled Attendant
Child died
Years of Exposure
0.00360 0.00146 0.0178*** 0.00391 -0.00421
(0.00373) (0.00398) (0.00251) (0.00405) (0.00294)
Observations 39,668 37,342 27,758 39,222 104,775
R-squared 0.053 0.091 0.355 0.191 0.042
Clustered standard errors in parentheses, *** p<0.01, ** p<0.05, * p<0.1

46
Table 1.19A Robustness Check: Impact of CCT on Children’s Outcomes (Excluding Districts with High and Low Literacy Rates)
(1) (2) (3) (4)
Panel A WAZ HAZ Underweight Stunted
Mother’s Years of Exposure 0.0117 0.0138 -0.00567* -0.00672**
(0.00838) (0.00918) (0.00336) (0.00310)
Observations 73,028 72,322 73,028 72,322
R-squared 0.026 0.034 0.019 0.025
(5) (6) (7)
Panel B Birth registration Diarrhea Vaccination
Mother’s Years of Exposure 0.00785** -0.00456* 0.00658**
(0.00341) (0.00269) (0.00283)
Observations 76,553 76,769 44,871
R-squared 0.174 0.044 0.098
Clustered standard errors in parentheses,*** p<0.01, ** p<0.05, * p<0.1. Regressions include control for gender of child, district, mother’s birth cohort, and year of survey fixed effects.

47
Table 1.20A(A-D): Results from a Binary DID Estimation
1.19A (A): Women’s Outcomes
(1) (2) (3)
Completing Primary Completing Secondary Years of Ed.
Treatment*Exposed 0.0514*** 0.0155 0.451***
(0.0142) (0.0120) (0.153)
Observations 313,001 240,780 240,095
R-squared 0.098 0.070 0.130
1.19 (B): Women’s Outcomes
(1) (2) (3) (4) (5)
Prenatal Deliver Medical SBA Post Natal Child Died
Treatment*Exposed 0.0222 0.0358** 0.108*** 0.00443 -0.0391***
(0.0136) (0.0166) (0.0167) (0.0163) (0.0114)
Observations 48,856 48,856 48,856 48,856 128,885
R-squared 0.066 0.100 0.211 0.090 0.042

48
1.19 (C) Children’s Outcomes
(1) (2) (3) (4)
WAZ Underweight HAZ Stunted
Treatment*Exposed 0.0532** -0.0280*** 0.0534* -0.0141
(0.0260) (0.0102) (0.0294) (0.00963)
Observations 88,495 88,248 87,565 87,565
R-squared 0.029 0.021 0.021 0.018
1.19 (D): Children’s Outcomes
(1) (2) (3)
Birth Registration Diarrhea Ever Vaccinated
Treatment*Exposed 0.0195* -0.0170** 0.0240**
(0.0108) (0.00824) (0.00948)
Observations 88,211 88,468 52,219
R-squared 0.191 0.022 0.097

49
2. Does School Construction Provide Long Run Benefits? New Evidence from Primary School Construction in Pakistan
2.1. Introduction Many developing countries and international development agencies adopt girls’
education as a strategic development priority. The World Bank in 2016 committed to invest USD
2.5 billion (over five years) in education projects that directly benefit girls in developing
countries. Gender equality and empowerment of women and girls through education are also
central to the United Nations’ 2030 Agenda for Sustainable Development and were previously an
important component of Millennium Development Goals (MDGs). These investments in girls’
education are motivated by literature which suggests more educated women have different long
run outcomes compared to their less educated counterparts in terms of marriage, fertility and
agency in the household. The bulk of the evidence, however, comes from the developed world,
where women on average have higher levels of education, and typically exploits the margin of
additional secondary schooling or college education (see e.g. Currie and Moretti 2003). Evidence
on the effect of education at low levels, observed among women in developing countries,
however, still remains thin.
In this paper, I provide evidence on the impact of exposure to primary schools for girls in
Pakistan. Most women in Pakistan, as in most developing countries, have education below the
primary level (3.8 years on average).19 It is therefore important to evaluate whether the benefits
of education extend to such low levels. I estimate the long run impact of a school opening
program in Pakistan on women’s later life outcomes related to marriage, fertility (number of
children) and incidence of domestic violence. I employ two main data sets. The Pakistan 19 The average woman aged 15 and over in 2010 reported 4.8 years of education in India, 5.9 years in Kenya, 1.3 years in Niger, 4.3 years in Guatemala (Barro and Lee 2013)

50
Demographic Health Surveys (PDHS) of 2012 and 2018 provide detailed data on education,
marriage and fertility for women aged 15-50 years. The National Education Census (NEC) of
Pakistan provides data on all school openings in Pakistan, dating as far back as over 200 years. I
combine these two data sets to estimate the impact of a school construction program in Pakistan
on women’s long run outcomes. I exploit exogenous variation in primary school investments
caused by an unprecedented increase in school openings in Pakistan as designed in the Sixth Five
Year Development Plan of the 1980s. For identification, I interact the regional differences in the
intensity of primary school availability with differences in exposure to these schools depending
on the individuals’ age at the time of the reform. In other words, I identify the variation in
availability of schools per capita in the districts due to the reform and the exposure to these
schools based on birth cohort. PDHS provides detailed information on migration, which unlike
previous studies,20 allows me to identify the district of residence during primary school age and
assign exposure to schools accordingly. I also make use of gender segregation of schools in
Pakistan to estimate whether the availability of boys school per capita, girls schools per capita
and co-educational schools per capita at the primary school level influence outcomes related to
marriage and fertility in the long run, and whether these three types of schools impact outcomes
differently.
I find that women residing in districts that had more girls schools per capita available at
their school starting age (6 years of age), complete more years of education and are more likely
to complete primary schooling. However, higher availability of boys’ schools in the district had
the opposite impact. This might be indicative of competition for resources within the household
and preference to enroll the male child in school as opposed to the female child. Increased
20OsiliandLong(2008)

51
availability of boys schools might incentivize families to send boys to school at the cost of not
enrolling girls.
In the long term, I find that exposure to higher number of co-educational school per
capita in the district reduced fertility. By the age of 40, women who (in their childhood) resided
in districts with higher co-educational schools per capita constructed, have fewer children. On
the contrary, I find no statistically significant impact on reduced lifetime fertility of construction
of all girls schools or all boys schools. I find no evidence of women exposed to more girls
primary schools per capita in their childhood marrying more educated men in later life. Likewise,
I do not find any statistically significant impact of school construction on likelihood of women
experiencing domestic violence at home by their husbands in later life.
Despite the numerous gains associated with girls’ education, 130 million girls worldwide
aged between 6 and 17 do not attend school (UNESCO 2015). Pakistan houses approximately
one in every ten of these girls (Ailaan 2014). Pakistan also faces serious challenges in health,
especially for women. One of the reasons for high maternal mortality ratio (286 per 100,000 live
births) is repeated pregnancies and a fertility rate of 3.56, which is high even in comparison to
similar countries. This poses a challenge for population control. Currently the sixth most
populous country in the world, housing 207.8 million people, its population growth rate of 2.40
percent is the highest in South Asia and in sharp contrast to 1-1.5 percent for other South Asian
countries.21 With current fertility rates, the population is expected to reach 460 million by 2050.
Low education of women is considered one of the factors behind such high fertility rates and
educating women is often considered a means to address this problem due to the correlation
21https://www.pk.undp.org/content/pakistan/en/home/library/development_policy/dap-vol6-iss1-population-growth.html

52
between education and fertility. In this paper, I find no evidence of a statistically significant
impact of expanding all girls primary schools in Pakistan on their lifetime fertility. However,
expansion of co-educational schools per capita does reduce fertility and the joint effect of all
three types of schools is significant.
Educating girls is often touted as a policy tool to address various problems women and
children in developing countries face. There is, however, limited evidence on the impact of such
policies for very low levels of education often observed among women in developing countries.22
When evaluating long run effects of school construction programs in countries like Pakistan it is
important however to view them through the lens of cultural practices. To the best of my
knowledge, this is the first study to document how school construction of gender segregated
schools and co-educational schools may impact educational outcomes for girls. Moreover,
providing girls with more educational opportunities is also viewed as an investment that reaps
multiple benefits in the long term such as reduced fertility, improvements in child mortality and
reduced incidence of domestic violence. The results of this study caution that at the primary
school margin, increasing all girls schools may meet the goal of increasing educational
attainment for girls but might not be impacting some of the predicted long-term gains. On the
contrary, the influence of boys and co-educational schools on these long run outcomes should
not be undermined.
2.2 Literature Review and Contribution
Numerous studies report a correlation between education and later life outcomes for
women including marriage, fertility and labor force participation (Behrman and Taubman, 1990;
Behrman and Rosenzweig, 2002). However, this correlation might reflect omitted factors such as 22See e.g. Osili et al. 2008, Andrabi et al. 2012, Breierova and Duflo 2004

53
family background, forward looking behavior and other unobservable characteristics. For
example, women with high discount rates might have lower educational attainment and may also
be different in terms of their fertility decisions than those with low discount rates.
Researchers have tried to isolate the causal impact of education on later life outcomes by
exploiting exogenous variation in education, uncorrelated to other characteristics that might be
driving both education and later life decisions. These include college and school openings,
changes in compulsory schooling laws, proximity to schools, and conditional cash transfers.23
These changes, most of which result from quasi-natural experiments, are assumed to be
correlated with schooling but uncorrelated with other characteristics that may directly impact
outcomes of interest.
Literature on the impact of education on long run outcomes for women in developing
countries, who on average have very low levels of education, is not widespread. The bulk of the
evidence comes from school construction programs or implementation of Universal Primary
Education (UPE). Breierova and Duflo (2004) exploit differences in per capita school
availability in regions across Indonesia, following a school construction program, to show that
female education increases age at marriage and reduces early fertility. In a more recent paper
Mazumder et al. (2019) find intergenerational impacts of the same reform in terms of higher tests
scores of children whose parents were exposed to the reform. Osili and Long (2008) exploit a
similar school reform of new primary school openings in Nigeria to establish that exposure to the
program reduced fertility before the age of 25 by 16%. Implementation of UPE in three sub-
Saharan African countries also reduced women’s ideal family size and very high desired fertility
23 College openings for U.S. (Currie and Moretti, 2003), Changes in compulsory schooling laws (Llreas-Muney, 2005; Black et al. 2015; Arendt, 2005 in Denmark; Oreopolous 2006 in U.K., Albouy and Lequin 2009 in France; Braakman, 2011 in U.K, Clark and Royer, 2013 in U.K.)

54
(Behrman 2015).
While these studies provide evidence that education delays fertility and reduces the
number of children in early years of the fertility cycle, evidence is mixed on whether education
reduces total number of children born. More educated women who delay fertility in adolescence
may eventually catch-up to less educated peers (Breierova et al. 2004; Monstad et al. 2008;
Grepin et al. 2015). The question of whether lifetime fertility is reduced, therefore, still remains
an open question. The evidence is also mixed in terms of the mechanisms at play. More educated
women may be more responsive to educational campaigns promoting safe sex practices (Walque
2007; Duflo et al. 2015; Keats 2018). While some studies show that more education women
delay cohabitation or sexual activity (Grepin et al. 2015), others find no evidence of such
behavior (Keats 2018; Duflo et al. 2015). Assortative mating may also be one of the channels of
reduced fertility but the evidence remains mixed on that too (Keans 2018; Grepin et al. 2015).
I add to this literature by looking at the impact on total fertility by the age of 40 and
exploring some of the potential channels on which literature stands undecided, including
marriage market effects. Additionally, none of the existing studies provide evidence on the
impact of primary school opportunities on domestic violence. Grepin et al. (2015) is the only
study, to the best of my knowledge, that looks at women’s schooling opportunities in a
developing country and its’ impact on domestic violence. They find no evidence of impact of
secondary schooling on domestic violence in Zimbabwe. Unlike their study, I estimate whether
increased availability of all boys school or co-educational schools at the primary level impacts
the incidence of domestic violence as compared to girls only schools.
On a more specific level, very little is known about the impact of educational
interventions for girls in Pakistan. None of the previous studies explore educational interventions

55
in a setting with such high rates of population growth and maternal and infant mortality as those
in Pakistan. Andrabi et al. (2012) is the only study that looks at the impact of school construction
in Pakistan. They find intergenerational gains from school availability. Mothers exposed to
higher school availability in their childhood spend more time on educational activities with their
children and their children are more likely to be enrolled in school. While Andrabi et al.’s (2012)
identification is at the village level and is hence more precise, their analysis is restricted to rural
areas of only three districts in Pakistan. On the other hand, this study uses data covering the
entire country.24 Moreover, unlike this study, their study does not focus on the women’s long run
outcomes considered here. Qureshi (2018) is the only other evidence on impact of school
availability in Pakistan and uses distance from school to document the positive impact of oldest
sisters’ education on younger brother’s school enrollment and literacy.
2.3. Policy & Identification
Pakistan’s Sixth Five Year Development Plan was devised in early 1980s, and
implemented toward the middle of the decade (1983-88). Education was one of the key sectors
that received attention under this plan. In particular, since implementation fell far short of
planned targets for the (previous) Fifth Five Year Plan (late 1970s to early 1980s), a much
stronger emphasis was placed on reforming the education sector in the Sixth Plan. As a result,
outlays on education expanded three fold; PKR 19.85 billion in the Sixth Plan vs. PKR 5.64
billion in the Fifth Plan, an increase of 252%.25 The bulk of the budget allocation for education
was for primary schools. The plan emphasized a “rapid expansion of primary schools” and
“growing educational opportunities for girls”. In particular, village coverage of school
24 Andrabi et al. (2012) are able to identify exposure to schooling at the village level, while my data limitations allow identification only at the district level. 25 This is equivalent to $1.6 billion for the Sixth Five Year Plan, in terms of US $/PKR exchange rate in 1983.

56
construction was ramped up mainly as a result of this plan. The plan envisioned increasing
enrollment by 5.3 million by opening 69,000 new schools across the country and hiring and
training teachers.26
A few characteristics of schooling in Pakistan merit attention. As a matter of policy, the
government structures public schools as gender segregated. Boys’ schools outnumber girls’ and
tend to be of an earlier vintage. The Sixth Five Year Development Plan also called for greater
support for the private sector in education and the number of private schools increased as a
result. Private schools in Pakistan are more likely to be co-educational as opposed to gender
segregated (Andrabi et al. 2007). Pakistan currently has many low-cost private schools,
accessible to the lower income strata as well as families residing in rural areas.27 Culturally,
however, we can expect families to be more inclined toward sending girls to all girls’ schools as
opposed to co-educational schools. Families are more receptive to enrolling boys in co-
educational schools as compared to girls.
School construction under the program took place over a period of time. In my data I am
able to observe women of different ages from the same localities (districts) with differential
access to schooling at the time of their enrollment decisions. The PDHS specifically asks each
member surveyed about his or her migration history. Unlike similar previous studies (e.g. Osili et
al. 2008; Grepin et al. 2015), this helps me in identifying each woman’s district of residence in
her childhood. I am therefore able to assign schools per capita available in the district of
residence during primary school age.
26 For more details see World Bank, 198327 18% of the poorest third in Pakistan are able to send their children to private schools in villages where they existed (PIHS, 2001).

57
One of the concerns regarding identification might be non-random placement of schools.
Girls’ schools could have been placed systematically in different areas; for instance, areas with
higher returns might receive more schools. I address this in a number of ways. First, policy
documents on the construction of primary schools show that population was the primary criterion
for school placement. The official government policy outlined in various program documents
states “Primary schools will be established in those areas where population of school age (boys
and girls) is at least 80, and the total population catchment area is at least 1000 and that
middle/primary school does not exist within a radius of 1.5 km of the school.” Andarbi et al.
(2012) show empirically that exposure to both girls and boys schools increases with village
population, suggesting that the rule was largely followed in practice as well. In this study, I also
estimate specifications that control for number of school age children in the district and school
availability prior to the school construction reform. Second, I address the concern that the
estimates may be representing a pre-existing differential trend in educational attainment and
enrollment across districts by comparing two groups of women from my sample. Women in both
these groups were too old at the time of the reform to benefit from it. If schooling levels were
already increasing faster in districts that received more schools under the reform, we would see a
spurious significant coefficient for the relatively “younger” unaffected cohorts in those districts.
2.4. Data
This study employs two main sources of data. In 2005-06, the Ministry of Education and
the Federal Bureau of Statistics conducted the National Education Census (NEC) for Pakistan.
NEC contains information on all education institutions functioning in the country (both public
and private) from pre-primary to the tertiary level. The census contains detailed information
about the educational institutions such as their management and type, location, gender,

58
enrollment, availability of physical facilities and expenditures. More importantly for this study,
NEC provides the date of establishment and the location of the education institutes. This allows
me to determine the exact number of primary schools, in each district of the country, in each year
from 1800-2006.28 I use the date of establishment of schools from the NEC data to calculate the
number of new schools built each year from 1970-1998. This time frame allows me to look at
school availability across a wide time frame around the school construction reform of 1983-
1988.
I further use the NEC data to differentiate between schools based on gender. Gender
segregation in schools in Pakistan makes the identification unique from studies on other
countries. I use new schools built for girls during the reform as the variable of interest. At the
time at which women in my sample were of primary school age, most families would choose to
send girls to all girls’ schools. Distance to school is often an important concern for many
households in Pakistan when deciding whether to send young girls to school or not. With more
schools constructed for girls, I expect more girls to attend schools and the average years of
education to increase. Since boys cannot attend girls’ schools, any impact observed on increased
girls school per capita would be due to expanded opportunities for girls. The school construction
program, however, added not just all girls schools. The number of all boys schools and co-
educational schools also increased, making access to schooling easier for boys as well. With
limited resources within the household, families are likely to face the choice of choosing which
child to send to school. It is possible that added availability of boys’ schools tips the decision in
favor of enrolling the male child in school and denying access to girls despite more schools per
capita available for girls. On the contrary, if school construction leads to boys getting more
28 Since the NEC data was collected in 2006, we only observe schools that were operational in 2006. Any schools that were present in 1980s but closed down later cannot be accounted for.

59
education, families may also enroll girls in school to “keep up” with the trend of increasing
educational levels.
The NEC data shows that as a result of the reform, Pakistan registered record growth in
schools. The government and private sector together added more than 30,000 new primary
schools between 1983 and 1988. As a result, the number of primary schools added between 1980
and 1990 was more than twice the number of schools constructed in the previous decade. A large
number of these schools were all girls (14, 231) vastly expanding schooling opportunities for
girls. Over the decade, 11, 300 all boys schools and 22,620 co-educational schools were also
constructed.
School openings may potentially be reflective of the increasing population of the country.
I use District Census Reports of 1981, available in print in libraries in Pakistan, and digitize the
exact population of girls and boys aged 5-10 years in each district of the country as of 1981. I use
this data, along with Census of 1998 and population growth rates, to approximate the number of
primary school aged children in each district of the country over the years. Combined with NEC
data on schools, I calculate schools per 10,000 of the school age population (henceforth per
capita for ease of notation).
Figure 2.1 below shows the trend in schools per capita for the country as a whole. There
is an upward trend in total schools per capita over the years, which becomes much steeper after
1980. I disaggregate this between girls, boys and co-educational schools per capita. As expected,
the schools per capita for boys are always higher than those for girls, with the gap narrowing
over

60
Figure 2.1: Primary Schools per Capita29
Figure 2.2: New Schools per Capita
time. Girls’ school per capita, however, rise steeply during the decade of 1980s. Boys’ school per
capita rise slightly in the mid 1980s and then slope downwards. This maybe reflective of the fact 29Through out this paper, per capita calculations for total schools and co-educational schools use total school aged population (i.e. both boys and girls). Boys school per capita calculations use population of school aged boys. Girls schools per capita use population of school aged girls. Schools include both public and private schools.

61
that since culturally it is easier for boys to attend co-educational schools, the rise in co-
educational schools might be compensating for the downward trend in schools per capita for
boys after 1990s.
More importantly, for this study, I look at the trend in the number of new schools opened
per capita. Figure 2.2 shows the trend. New schools per capita began to spike up in the early
1980s and trended upwards till the end of the decade. New girls’ schools per capita, in particular,
start increasing in 1983 and follow an upward trend until 1988 before dropping considerably by
1990.
Figures 2.1 and 2.2 present the overall increase in schools for the country over the years.
These figures, however, mask the geographical variation across the districts of Pakistan. I use
district population figures to construct the number of primary schools per capita of primary
school age population in each district of the country.30 This allows me to determine the exposure
to schooling, during school going age, for the sample of interest.
Table 2.1: Summary Statistics on School Availability (in 1981)
Mean Std. Dev. Min. Max.
All Girls Schools Per 10,000 girls 11.53 8.51 0.376 50.29
All Boys Schools Per 10,000 boys 22.4 14.95 0.83 72.7
Co-educational Schools Per 10,000 youth 9.61 7.50 0.29 39.2
Table 2.1 shows the summary statistics for average schools per capita available in 1981.
For every 10,000 girls of primary school age, there were only 11.5 girls’ schools available on
30Over the years, larger districts in Pakistan have been divided into smaller districts for administrative reasons. Since my analysis is based on women who were of schooling going age in 1970s and 1980s, I reassign new districts to their parent districts as of 1981. I use the 1981 District Census reports for information on the primary school age population.

62
average. For boys this ratio was on average 22.4 schools per 10,000 boys. This is not surprising;
boys schools in Pakistan have historically been both higher in number and of an earlier vintage.
This variation is more apparent in Figures 2.3A-2.5A3 (in Appendix) that map the school
expansion in per capita terms across districts over three years before (1980), during (1985) and
after (1990) the reform period.
I merge these data on school openings with the PDHS of 2012 and 2018. PDHS is a cross
sectional household survey that provides information on women aged 15-40 years. The aim of
the DHS program is to collect and disseminate data on fertility, family planning, nutrition and
maternal and child health in over 90 countries. In addition, the DHS provides information related
to educational attainment and labor force participation. PDHS surveyed 12,943 and 12,338
households in 2012 and 2018 respectively. For rounds combined, there are interviews for around
28,000 women aged 15-50 years of age. The data set has detailed information on age, completed
years of education, age at cohabitation, number of children, husband’s education and other
information related to fertility and maternal health. The sample for domestic violence is smaller
by design. One in every three households from the total sample is selected for the domestic
violence section and the questions are administered (randomly) to only one female from the
selected household.
For the purpose of this study, the analysis is restricted to women born between 1963 and
1982. Women born between 1971 and 1982 (aged 1-12 at the time of reform in 1983) are
“treated” while those born between 1963 and 1969 (aged 14-20 in 1983) form the control group.
Women in the control group were past the primary school age in 1983 and were too old to
benefit from the reform. Primary schooling is Pakistan starts at the age of six and lasts for five
years. However, there can be over-age enrollments due to to which I also include 12 years old at

63
the start of reform as “treated”. In order to ensure a cleaner control group I drop women aged 13
years at the start of the reform from my sample and women aged 14 and older form the control
group.
Table 2.2 shows the summary statistics for the main treatment and control cohorts. As
can be seen women in the treated group on average have 0.95 years more of education and are
more likely to complete primary school. There are also significantly different in terms of long
run outcomes. Women in the treated group have on average fewer children, marry more educated
men and are less likely to have a child that died. These differences, however, may partly be
attributable to other changes over the years or across districts. In the next section, I outline an
empirical model to test whether the differences are due to differential exposure to schools.
Table 2.2: Summary Statistics for Control & Treatment Cohorts from PDHS 2012 & 2018
Treatment Control
Mean Std.Dev Mean Std. Dev. Difference T Stat.
Years of Ed. 3.70 5.06 2.75 4.66 0.95*** -7.85 Primary School Completion 0.37 0.48 0.27 0.45 0.10*** -8.41 Total Children 5.16 2.60 5.88 2.87 0.71*** 8.77 Husband's Education 6.98 7.89 6.17 7.18 0.81*** -4.26 Child Death 0.41 0.85 0.68 1.16 -0.27*** 12.25
2.5. Methodology
The main source of identifying variation, like in previous studies, is the availability of
schools per capita in the woman’s district of residence in primary school age window.31 My
analysis differs from existing studies in two ways. First, unlike existing studies I disaggregate
total school availability into boys, girls and co-educational schools per capita available in the
district. This analysis allows me to estimate how the increased availability of different types of
31 Duflo (2001), Osili et al. (2008) and Chou et al. (2010) use similar variation in their work.

64
schools impacts outcomes. The availability for each of these types of schools varies due to
differential rates of school construction across different districts. Second, current literature on
school opening reforms focuses on estimating impact of “new” schools constructed during the
reform. These estimations provide the impact of the new schools constructed during the reform,
which I also estimate in this study. However, the decision of families to enroll their child in
school (or not) should be impacted by the total schools available rather than just the new schools.
Previous studies do not account for this. I add to the literature on school availability by using the
variation, due to the reform, in total schools available per capita and estimate the impact of
schools on educational and other long run outcomes. I outline these two empirical strategies
below.
2.5.1 Impact of Total Schools Per Capita
For this empirical estimation, I base my identification on two variables; the woman’s year
of birth and the number of primary schools per capita available in her district of residence at the
age of starting school (six years) when her household decides whether or not to enroll her in
school. In general, primary school lasts for five years in Pakistan with the school starting age of
6. I assign to each woman in my sample the number of schools per capita (all girls, all boys and
co-educational schools) in her district when she was six years old. Identification comes from the
change in schools per capita over the years due to the school construction program. Using this
continuous program intensity measure, I estimate, first, the impact of schools per capita on
educational outcomes as follows:
𝐸𝑑𝑢 !"# = 𝛼! + 𝛼! 𝑇𝑟𝑒𝑎𝑡! ∗ 𝐺𝑆𝑃𝐶! + 𝛼! 𝑇𝑟𝑒𝑎𝑡! ∗ 𝐵𝑆𝑃𝐶! + 𝛼! 𝑇𝑟𝑒𝑎𝑡! ∗ 𝐶𝑆𝑃𝐶! + 𝛾! +
𝛿! + 𝜀!"# (1)

65
where Eduijk is the education outcome for woman i, from district j in year k. Treatk is a dummy
variable equal to one for the years of the school construction reform (1983-1988). The variables
GSPCj, BSPCj and CSPCj are all girls, all boys and co-educational schools per capita available
in district j when the woman was six years old. In all estimations, district refers to district of
residence during primary school age. 𝛾! and 𝛿! are cohorts and district fixed effects
respectively. I estimate Equation 1 for two outcome variables; years of schooling completed and
a binary variable indicating completion of primary school.
The parameters of interest 𝛼!,𝛼! and 𝛼! are the reduced form estimates of the effect of
school construction. These coefficients measures whether women who grew up in districts with
more schools per capita during the program experienced increases in educational attainment
larger than women in districts that had lower schools per capita. I can reasonably assume that
district of birth of an individual would not be endogenous with respect to the school opening
reform. Only 10 percent of women in my sample have moved since birth. Out of these only 3
percent report moving for educational opportunities and only 0.3 percent moved before the age
of 12. Moreover, the reform was not marketed by the government, which reduces the chances of
families with children moving to districts with the expectation of increased school availability.
I use the methodology outlined above to examine the impact on long run outcomes of
interest as follows:
𝑌 !"# = 𝛽! + 𝛽! 𝑇𝑟𝑒𝑎𝑡! ∗ 𝐺𝑆𝑃𝐶! + 𝛽! 𝑇𝑟𝑒𝑎𝑡! ∗ 𝐵𝑆𝑃𝐶! + 𝛽! 𝑇𝑟𝑒𝑎𝑡! ∗ 𝐶𝑆𝑃𝐶! + 𝛾! + 𝛿! +
𝜀!"# (2)
where Yijk represents the following outcomes; total children born, husband’s years of education
and binary indicators for experiencing different forms of domestic violence. All other variables

66
are the same as Equation 1.
𝛽! , 𝛽! and 𝛽! are the main coefficients of interest in Equation 2. If women exposed to
higher intensity of schools end up reducing fertility, 𝛽! should be negative. Likewise, if there are
marriage market effects with women in areas with higher intensity of schools per capita marrying
more educated men later in life, this coefficient could be positive. For domestic violence
indicators, I expect this to be negative i.e. women in areas with a high intensity of schools per
capita would be less likely to experience different forms of domestic violence (i.e. being pushed
or slapped by their partners). Each of these outcomes may potentially be impacted by school
opportunities for boys as well (Breierova and Duflo 2004).
2.5.2 Impact of “New” Schools Built
Previous studies on school construction focus on estimating the impact of “new” schools
constructed as opposed to considering the total number of schools available in a district as a
result of the reform.32 In line with this literature, I estimate the impact of new schools built under
the reform during 1983-1988 in Pakistan. I base my identification off two variables; the woman’s
year of birth (which defines treatment and control) and the number of newly constructed primary
schools per capita under the reform, in her district of residence in primary school age. As
discussed earlier, the number of schools constructed varied across districts. I use schools
constructed per capita between 1983 and 1988. Using this continuous program intensity measure,
I estimate, first, the impact of school construction reform on education as follows:
𝐸𝑑𝑢 !"# = 𝜃! + 𝜃! 𝑇𝑟𝑒𝑎𝑡! ∗ 𝑁𝐺𝑆𝑃𝐶! + 𝜃! 𝑇𝑟𝑒𝑎𝑡! ∗ 𝑁𝐵𝑆𝑃𝐶! + 𝜃! 𝑇𝑟𝑒𝑎𝑡! ∗ 𝑁𝐶𝑆𝑃𝐶! +
𝜃!𝑇𝑟𝑒𝑎𝑡! + 𝛾! + 𝛿! + 𝜀!"# (3)
32Duflo(2001),Breierova and Duflo 2004,Mazumderetal.2019,Osilietal.2008

67
where Eduijk is the education outcome for woman i, born in district j in year k. The variables
NGSPCj, , BGSPCj, and CGSPCj, measure the per capita girls, boys and co-educational schools
constructed during the period of the reform in the district. In all estimations district refers to
district of residence during primary school age. 𝛾! and 𝛿! are cohort and district fixed effects,
respectively. I estimate Equation 3 using two definitions of Treatk . First I define Treatk as
dummy variable equal to one if the woman belonged to the “fully treated” cohorts (born 1977 to
1982) and zero for control cohorts (born 1963 to 1968). Second, I estimate Equation 3 with
Treatk indicator equal to one for both “fully treated” (born between 1977 and 1982) and
“partially treated” women (born between 1971 and 1976). I estimate Equation 3 for two outcome
variables; years of schooling completed and a binary variable indicating completion of primary
school.
The parameters of interest 𝜃!,𝜃! and 𝜃! estimate the effect of new schools constructed
under the program. They measure whether women who grew up in districts that received more
schools during the program experienced larger increases in educational attainment than women
in districts that did not receive as much. I therefore expect 𝜃! to be positive, while the impact of
𝜃! and 𝜃! is ambiguous. If more schools made available for boys lead boys to acquire more
schooling, households may also want to educate the girls more as well in which case 𝜃! would be
positive. On the contrary, if resources are limited households might choose to send boys to
school but decide to keep girls at home in which case 𝜃! might be negative. More co-educational
schools result in more educational institutions available for girls and can potentially have the
same effect as girls schools. However, for cultural reason households may be reluctant to enroll
girls in co-educational institutes but may prefer to enroll boys. In that case, we can expect either
a null effect on girls education or the same effect as additional boys schools.

68
I use the same difference in differences methodology to examine the impact on long run
outcomes of interest as follows:
𝑌 !"# = 𝜌! + 𝜌! 𝑇𝑟𝑒𝑎𝑡! ∗ 𝑁𝐺𝑆𝑃𝐶! + 𝜌! 𝑇𝑟𝑒𝑎𝑡! ∗ 𝑁𝐵𝑆𝑃𝐶! + 𝜌! 𝑇𝑟𝑒𝑎𝑡! ∗ 𝑁𝐶𝑆𝑃𝐶! +
𝜌!𝑇𝑟𝑒𝑎𝑡! + 𝛾! + 𝛿! + 𝜀!"# (4)
where Yijk represents the following outcomes; total children born by the age of 40, husband’s
years of education and binary indicators for experiencing different forms of domestic violence.
All other variables are the same as Equation 3.
𝜌!′𝑠 are the main coefficients of interest in Equation 4. If women exposed to higher
intensity of girls schools end up reducing fertility, 𝜌! should be negative. This can be due to
several reasons such as more years spent in schooling, delayed cohabitation or increased use of
contraception. If there are marriage market effects with women in districts with a higher schools
per capita constructed under the reform marrying more educated men later in life, this coefficient
should be positive for husband’s education. For domestic violence indicators, I expect this to be
negative i.e. women in areas of high intensity of schools per capita constructed would be less
likely to experience different forms of domestic violence (i.e. being pushed or slapped by their
partners).
Literature has shown that education of men in the household can impact fertility
decisions and child mortality. This impact can at times be even higher than the impact of
woman’s education (Breierova and Duflo 2004; Chou et al. 2010). 𝜌! and 𝜌! in Equation 4
capture the impact of constructing new schools for boys and co-educational schools on these
outcomes.

69
2.6. Results & Discussion
The aim of the school construction, as laid out in the policy documents, was to expand
educational opportunities, especially for girls, and to increase female enrollment. I begin by
estimating Equation 1 to look at the impact on years of education and primary school
completion. Results are shown in Table 2.3. Column 1 and 2 show, respectively, that women
who were of school going age during the reform years, and who were exposed to higher girls
schools per capita in their district, completed more years of education and were more likely to
complete primary school. For each additional girls school per 10,000 of the school age
population in the district, women complete 0.304 more years of education. Likewise, each
additional girls school
Table 2.3: Impact of School Construction on Educational Outcomes on Fully and Partially Exposed Cohorts
(1) (2)
Yrs. of Ed Primary
Completion
GSPCj x Treat 0.304** 0.0347***
(0.138) (0.0127)
BSPCj x Treat -0.175** -0.0161**
(0.0680) (0.00635)
CSPCj x Treat -0.0367 -0.00699
(0.0610) (0.00552)
Observations 11,238 11,238
R-squared 0.180 0.180
F Stat. 2.42* 2.98**
Prob>F 0.074 0.038
Clustered standard errors in parentheses, *** p<0.01, ** p<0.05, * p<0.1. All estimations control for district and cohort fixed effects. F statistics for joint significance for three variables of interest is shown.

70
per 10,000 girls increases the likelihood of women completing primary school by 3.5 percentage
points, an increase of 11.6 percent on the average primary school completion rate of 30 percent.
Interestingly, a higher number of boys schools per capita have a negative impact on girls
schooling. This might be reflecting the household’s choice to enroll boys in schools (as more
boys schools become available) at the cost of keeping girls at home.
Next, I look at the impact of schools per capita on long run outcomes. Column 1
estimates the impact of the reform on the marriage market. I find no evidence that exposure to a
higher number of girls schools per capita in childhood leads to women marrying more educated
men. In other words, there is no evidence in favor of assortative mating in Pakistan on the
primary school margin. Earlier, Andrabi et al. (2012) also show strong associational evidence for
assortative mating but find no evidence of impact on spousal education.
Table 2.4 Estimation for Long Run Outcomes
(1) (2) (3)
Husband's Ed Fertility Child Died
GSPCj x Treat 0.0482 0.0977 0.00105
(0.139) (0.0661) (0.0176)
BSPCj x Treat -0.0904 -0.0877** 0.00312
(0.0656) (0.0392) (0.00816)
CSPCj x Treat 0.0654 -0.0121 -0.0113
(0.0957) (0.0424) (0.0108)
Observations 11,049 11,238 11,238
R-squared 0.045 0.212 0.046
F Stat. 0.77 1.92 0.39
Prob > F 0.51 0.14 0.76
Clustered standard errors in parentheses, *** p<0.01, ** p<0.05, * p<0.1. All estimations control for district and cohort fixed effects. F statistics for joint significance for three variables of interest is shown.

71
Column 2 estimates the impact of schools per capita on the number of children women
have by the age of 40. Results show that higher number of boys’ schools per capita reduced
fertility in the long run. Given that less than ten percent of the women move out of the district
over their lifetime, most women marry men from their district. The negative coefficient hence
might be indicative of the impact of having more educated men on fertility. This can especially
be true for Pakistan, where men have more agency in the household and control most of the
decision making. Column 3 shows no evidence of impact of school availability in mother’s
childhood on child mortality later in later life.
I also look at the impact of schools per capita on likelihood of experiencing domestic
violence in later life. PDHS administers questions related to domestic violence to randomly
selected subset of women in the sample. In Table 2.5 I look at the impact on two of the most
common forms of domestic violence. In Column 1 and 2 the outcome variable equals one if the
respondent answered yes to “Did your husband ever push you, shake you or throw something at
you” and “ Did your husband ever slap you”, respectively.
Across both outcomes, I find no evidence of a statistically significant impact on incidence
of domestic violence of any of the three schools. The coefficient co-educational schools per
capita indicate a negative effect of school availability for women on the likelihood of
experiencing domestic violence in later life, but are statistically insignificant. These results
caution that although correlation between education and domestic violence might be negative
and may lead policymakers to believe that expanding educational opportunities for women can
be used as a means to fight domestic violence, this is not the case at the primary schooling level.
Grepin et al. (2012) also find no evidence of impact of a secondary school reform on domestic
violence in Zimbabwe.
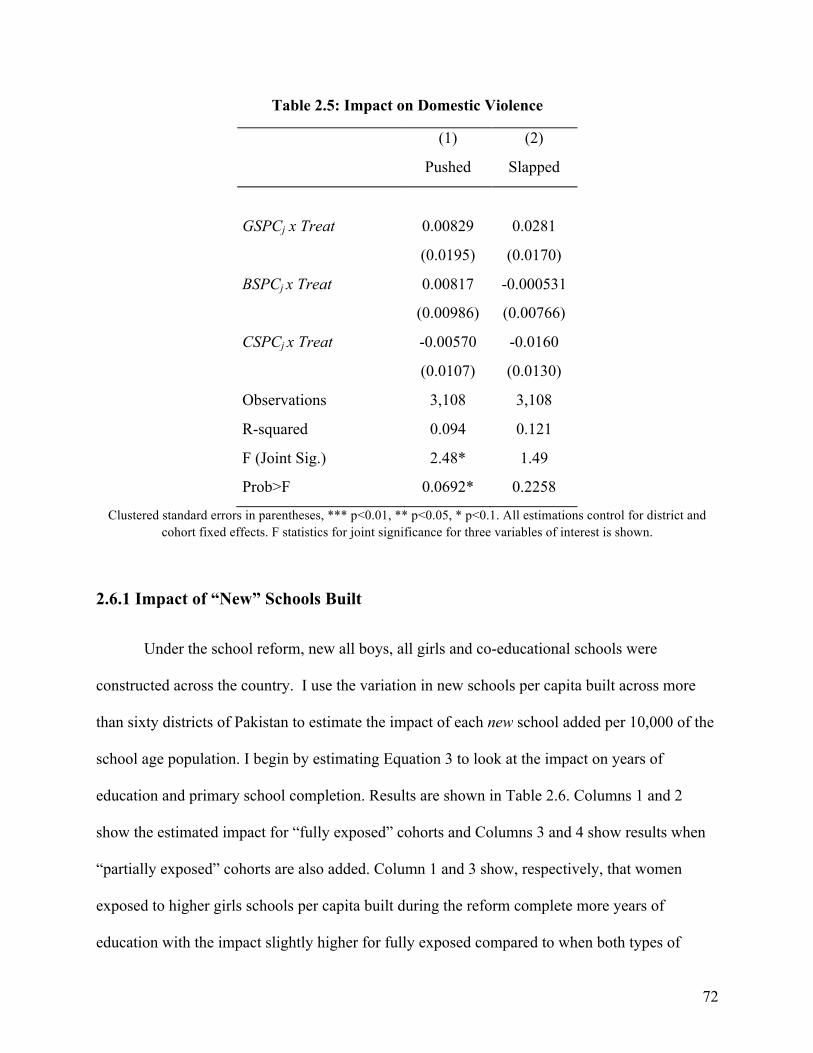
72
Table 2.5: Impact on Domestic Violence
(1) (2)
Pushed Slapped
GSPCj x Treat 0.00829 0.0281
(0.0195) (0.0170)
BSPCj x Treat 0.00817 -0.000531
(0.00986) (0.00766)
CSPCj x Treat -0.00570 -0.0160
(0.0107) (0.0130)
Observations 3,108 3,108
R-squared 0.094 0.121
F (Joint Sig.) 2.48* 1.49
Prob>F 0.0692* 0.2258
Clustered standard errors in parentheses, *** p<0.01, ** p<0.05, * p<0.1. All estimations control for district and cohort fixed effects. F statistics for joint significance for three variables of interest is shown.
2.6.1 Impact of “New” Schools Built
Under the school reform, new all boys, all girls and co-educational schools were
constructed across the country. I use the variation in new schools per capita built across more
than sixty districts of Pakistan to estimate the impact of each new school added per 10,000 of the
school age population. I begin by estimating Equation 3 to look at the impact on years of
education and primary school completion. Results are shown in Table 2.6. Columns 1 and 2
show the estimated impact for “fully exposed” cohorts and Columns 3 and 4 show results when
“partially exposed” cohorts are also added. Column 1 and 3 show, respectively, that women
exposed to higher girls schools per capita built during the reform complete more years of
education with the impact slightly higher for fully exposed compared to when both types of

73
cohorts are considered. For each new girls school added per 10,000 of school age girls in the
district, women complete 0.5 more years of education. On average, during the reform of 1983-88
0.8 new girls schools per 10,000 were added between 1983 and 1988. This implies that on
Table 2.6: Difference in Differences Estimation for Educational Outcomes
Only Fully Exposed Both Fully and Partially Exposed
(1) (2) (3) (4)
Yrs. of Ed Primary Completion Yrs. of Ed Primary Completion
NGSPCj x Treat 0.507** 0.0540** 0.408* 0.0394**
(0.232) (0.0228) (0.223) (0.0196)
NBSPCj x Treat -0.160 -0.0194* -0.0657 -0.00932
(0.101) (0.0111) (0.0831) (0.00882)
NCSPCj x Treat -0.133 -0.0229 -0.153 -0.0212
(0.179) (0.0185) (0.158) (0.0162)
Observations 6,322 6,322 9,288 9,288
R-squared 0.200 0.196 0.192 0.187
F 3.11** 4.56*** 1.72 3.28**
Prob>F 0.0325 0.006 0.171 0.03
Clustered standard errors in parentheses, *** p<0.01, ** p<0.05, * p<0.1. All estimations control for district and cohort fixed effects. F statistics for joint significance for three variables of interest is shown.
average education of women fully exposed to the reform increased by 0.4 years as a result of the
reform. Likewise, Column 2 shows that each additional girls school built per capita increases the
likelihood of women completing primary by 5.4 percentage points. With an average of 0.8 girls
schools added per 10,000 during 1983-88, the reform increased the likelihood of woman
completing primary schooling on average by 4.32 percent.
Table 2.7 documents the impact of the school construction on long run outcomes.

74
Columns 1 and 3 show no statistically significant effect of new schools constructed on the
marriage market, without and with the partially exposed cohorts. The joint effect of the three
types of schools is, however, significant; women residing in districts receiving more schools per
capita on average marry men with 0.24-0.33 more years of completed schooling on average.33
Table 2.7 Estimation for Long Run Outcomes
Full Exposed Only Both Fully and Partially Exposed
(1) (2) (3) (4) (5) (6)
Husband's Ed Fertility at age 40+
Child Died
Husband's Ed
Fertility at age 40+
Child Died
NGSPCj x Treat 0.0462 -0.228 -0.0708 0.117 0.0509 -0.0709
(0.356) (0.306) (0.0628) (0.342) (0.201) (0.0563)
NBSPCj x Treat 0.320 0.130 0.0284 0.345 -0.0873 0.0103
(0.205) (0.181) (0.0370) (0.215) (0.131) (0.0360)
NCSPCj x Treat -0.118 -0.538** -0.159*** -0.134 -0.284* -0.136**
(0.317) (0.209) (0.0545) (0.316) (0.159) (0.0520)
Observations 6,215 2,064 6,322 9,092 3,695 9,288
R-squared 0.059 0.157 0.083 0.053 0.120 0.064
F 3.48** 6.22*** 12.66*** 3.54** 4.23*** 11.94***
Prob > F 0.02 0.0009 0.00 0.0195 0.0087 0.00
Clustered standard errors in parentheses, *** p<0.01, ** p<0.05, * p<0.1. All estimations control for district and cohort fixed effects. F statistics for joint significance for three variables of interest is shown.
I look at the impact on total fertility by age 40 in Columns 2 and 4 of Table 2.7. I find
that each additional co-educational school constructed reduced total children born to a woman on
average by 0.52 for the fully exposed cohorts and 0.37 on average for all cohorts exposed to the
33This is calculated using the average number of NGSPC(0.78), NBSPC (0.95) and NCSPC(0.86) during the period of the reform and their respective coefficients for only fully exposed and both partially and fully exposed women. Total effects for all subsequent outcomes in this section follow the same calculation.

75
reform. It is important to note however that there might be selection among the households that
do and do not choose to enroll their daughters in co-educational schools. This can be due to
cultural factors and beliefs as well as the fact that co-educational schools are more likely to be
private and hence less affordable in comparison to public schools. Overall, the impact of the
three types of school is jointly significant showing that more schools per capita reduced fertility
in the long run by 0.37-0.52 on average. Given the challenge of high fertility for Pakistan this has
important implications for policy making. More schools constructed even at the primary level
lead to reductions in fertility in the long term.
Likewise, I find that more co-educational schools per capita reduce the likelihood of
women experiencing the death of a child with a similar reduction of around 14-16 percentage
points in both Columns 3 and 6. Jointly the three types of schools lead to a reduction of 16
percentage points in child mortality on average. This is very important for child health
challenges Pakistan faces. While I cannot determine the exact mechanism for reduced child
deaths in this case, it is likely that women in the treatment group, due to higher schooling, may
be better at health seeking practices. Their hygiene and nutrition practices and response to illness
of children might be better due to their enhanced numeracy and literacy skills. They might also
be more responsive to preventative health measures and health campaigns, information on which
is often delivered in the form of flyers and brochures distributed by health workers.
I also look at the impact of the school reform on likelihood of experiencing domestic
violence in later life. In Table 2.8 I look at the impact on two of the most common forms of
domestic violence. In Column 1(and 3) and 2(and 4) the outcome variable equals one if the
respondent answered yes to “Did your husband ever push you, shake you or throw something at
you” and “ Did your husband ever slap you”, respectively. I find no statistically significant

76
impact of the reform on likelihood of domestic violence as measured by both measures in
Column 1 and 2 when only fully exposed cohorts are considered. However, when partially
exposed cohorts are also added to the “treated” women, I find that the three types of schools
Table 2.8: Impact on Domestic Violence
Fully Exposed Only Both Fully and Partially Exposed
(1) (2) (3) (4)
Pushed Slapped Pushed Slapped
NGSPCj x Treat -0.0519 -0.0499 -0.0559 -0.0451
(0.0539) (0.0458) (0.0526) (0.0422)
NBSPCj x Treat 0.0126 0.0137 0.00878 0.00630
(0.0195) (0.0226) (0.0191) (0.0221)
NCSPCj x Treat -0.0176 -0.0224 -0.0173 -0.0272
(0.0274) (0.0359) (0.0282) (0.0323)
Observations 1,832 1,830 2,709 2,707
R-squared 0.121 0.130 0.107 0.120
F 1.24 1.16 2.39* 3.71**
Prob>F 0.329 0.33 0.08 0.016
Clustered standard errors in parentheses, *** p<0.01, ** p<0.05, * p<0.1. All estimations control for district and cohort fixed effects. F statistics for joint significance for three variables of interest is shown.
jointly lead to reduction of 7-19 percentage points on average depending on the measure of
domestic violence. This is an important finding for Pakistan where on in every three women
report experiencing some sort of domestic violence at home. The impact of investment in
women’s education on domestic violence is often overlooked in developing countries despite
high prevalence rates. The only similar evidence similar is from Grepin et al. (2012), which in

77
contrast finds no evidence of impact of a school reform on domestic violence.
2.7. Conclusion
In this study I estimate the impact of school availability per capita on the short and long
run outcomes for women in Pakistan, using the district variation from a school construction
reform of 1980s. I find that more girls’ schools per capita increase the educational attainment of
women while more boys schools per capita have the opposite impact. Second, in the long run I
find that exposure to higher girls, boys and co-educational schools jointly reduces fertility and
child mortality. However, I find no evidence of impact on the marriage market and incidence of
domestic violence.
This study provides new evidence on the effects of school construction program, a policy
that has been used by several developing countries around the world34. Unlike previous studies,
I evaluate the impact of gender segregated and co-educational schools. While there are short and
long run returns to primary schools construction this study cautions that the three types of
schools may impact outcomes differently.
34Examples include Indonesia, Nigeria, Zimbabwe

78
2.8. Appendix
Figure 2.3A: Schools Per Capita 1980

79
Figure 2.4A Schools Per Capita 1985

80
Figure 2.5A: School Per Capita in 1990

81
3. Can Community Midwives Change Maternal Healthcare Utilization?
3.1. Introduction
Globally 800 women die every day from preventable causes related to pregnancy and
childbirth. Ninety eight percent of these maternal deaths are from developing countries, with one
in every three occurring in the South Asian region.35 For Pakistan, the fifth most populous
country in the world, the Maternal Mortality Ratio (MMR) stands at 268 deaths per 100,000 live
births compared to just 12 in the developed world.36 Half of all maternal deaths worldwide occur
in six countries; Pakistan is one of them (Hogan et al. 2010). The Pakistan Demographic and
Health Survey (PDHS) of 2006-07 shows that pregnancy related illnesses are the leading cause
of death for women of childbearing age (one in every four deaths)37. These statistics ranked
Pakistan as 149th, out of 179 countries in the world, on the Mother’s Index Rank in the year 2015
(Save the Children 2015).
The state of maternal health in Pakistan can be attributed to both demand and supply side
problems. The low demand for professional maternal health care can be explained by low female
literacy, lack of trust in medical professionals in favor of local traditional practitioners and low
mobility of women. On the supply side, lack of healthcare facilities that provide appropriate pre-
natal care, limited access to emergency obstetric and newborn care (EmONC) and Skilled Birth
Attendants (SBAs) are often cited as the main reasons for high maternal deaths (Technical
Resource Facility 2013).
35 http://www.who.int/mediacentre/factsheets/fs348/en/ 36 http://data.worldbank.org/indicator/ 37 (PDHS, 2007)

82
The proportion of deliveries attended by SBAs is low in developing countries and is one
of the main reasons for high maternal mortality numbers as those in Pakistan. Out of an
estimated 4-5 million births per year in Pakistan, only one in every three is attended by a skilled
health personnel. Likewise, the rates of pre-natal checkups are low as well, with less than 40
percent women receiving four or more pre-natal checkups and one in every three getting no pre-
natal care at all (PDHS 2007).
To address this issue of low utilization, and the broader goal of reducing maternity
related deaths, the Government of Pakistan drafted the Maternal Newborn and Child Health
(MNCH) Policy in 2005. One of the major tools employed was the introduction of Community
Mid-Wives (CMWs) as front line health workers; a concept new to Pakistan’s healthcare system.
The program was inspired by Indonesia’s Village Midwife Program of early 1990s, which
introduced more than 50,000 midwives in rural areas of Indonesia. The Pakistan government
envisioned the program to expand up to one CMW per 5000 of the population in the very long
term, with a short term goal of each CMW being assigned to a catchment area of 10,000.
This study looks at the impact of deploying CMWs on maternal health behaviors in
Pakistan. In particular, I use variation in the availability of CMW per capita across districts of
Pakistan to study the relationship between CMW deployment and take up of pre- and post-natal
check-ups, presence of SBA at the time of delivery, and institutional births as opposed to births
at home. Using six years of the Pakistan Standard of Living Measurement Survey (PSLM) I find
that deployment of CMWs in a district increases the probability of women giving birth at a
medical institution as opposed to delivering at home. Likewise, availability of CMWs in the area
increases the likelihood of women being attended by a SBA at the time of delivery. I find no
statistically significant evidence, however, of increase in pre- and post-natal checkups as a result

83
of deploying CMWs. The program appears successful in increasing the rate of health care
utilization at the time of birth, lack of which is one of the major reasons for high rate of maternal
deaths. The role of CMWs in providing pre- and post-natal care however needs to be expanded
in order to bring the desired change.
3.2. Background & Contribution
Community Health Workers (CHW) are defined as members of the community who are
trained to promote health or carry out some healthcare services (Lipp 2011). These workers
traditionally act as a bridge between the health care delivery system and the community,
leveraging their ability to help others due to their knowledge of the communities they serve and
the close bond they are able to form with them (Kowiit 2015). Recently, there has been a
renewed interest in CHWs. In particular, developing countries are specially interested in
leveraging the cost effectiveness and outreach of these workers to remote areas. These workers
can be trained in a much shorter time and at a substantially lower cost than doctors or nurses.
CHWs are employed for various purposes. Improving maternal, infant and child health,
increasing take up of immunizations and family planning services, promoting health seeking
behavior, and awareness of diseases such as HIV and malaria are some of the most popular ones.
In conservative regions, where women are traditionally restricted in physical movement, female
workers are often very effective in reaching out to women who otherwise have limited access to
healthcare services (Rahman et al. 2008; Bolton, Bass & Neugebaur 2003; Ayias 2015). On the
flip side, opponents of health workers argue that employing them as substitutes for high skilled
ones might be detrimental for the subjects (Bagonza et al. 2014).
Numerous studies find strong support for CHWs, in terms of their association with better
84
health behaviors and outcomes. In the U.S., they have been used to target disadvantaged
communities as enablers of HIV testing (Massnegale, Morrison & Sudha 2016), health care of
aging population (Kaur 2015), chronic disease measurement (Kim 2016), and asthma
interventions in children (Stephens et al. 2009), among others. In the developing world, they are
found to be positively associated with breast-feeding practices, family planning, antenatal care,
neonatal check-ups, and immunizations (Omer et al. 2008; Lipp 2011; Corluka et al.,2009).
In the early 1990s, Indonesia introduced a special cadre of CHWs, Community Midwives
(CMWs), to deal with high fertility, maternal mortality and infant mortality rates. With over
50,000 CMWs introduced in rural areas under the program, evidence on the effectiveness of the
intervention is mixed. Studies have shown that the program was ineffective in terms of
increasing use of contraception (Weaver et al. 2013). Others find that while the deployment of a
mid-wife in every village increased skilled birth attendance, it did not lead to timely referrals to
specialized obstetric care for those in need of it (Ronsman et al. 2001). Evidence from an
evaluation in Bangladesh shows reduced rates of maternal mortality from training and deploying
midwives at the village level (Fauveau et al. 1991).
Studies evaluating the CMW program of Pakistan largely use qualitative techniques such
as focus group discussions and interviews to assess outreach and effectiveness (Noorani et al.
2013; Sarfraz et al. 2014; Ahmed et al. 2017). Other research evaluates the equity, class and
social exclusion aspect of the program in selected districts (Mumtaz et al., 2012). These studies
provide important insights into barriers to outreach and the effectiveness of the program. They
are, however, often geographically restricted to one or two districts of the country (e.g. Chitral,
Layyah), limiting the scope of their findings. In this study, I pool six years of cross sectional
household surveys in Pakistan to quantitatively analyze the impact of deploying CMWs on
85
maternal health care utilization. I make use of information on maternal health care from over 90
districts in the country to assess the average impact at the national level.
This is, to my knowledge, the first attempt to study the impact of the program on this
scale. There are only a few studies around the world that use data to quantitatively assess the
impact of frontline, low cost health workers. This study bridges the gap by evaluating the
effectiveness of such workers for improving maternal health in developing countries and focuses
on a country with one of the highest number of maternal deaths worldwide.
From a policy perspective, the study shows whether the deployment and training of
CMWs is an effective policy tool in encouraging women to seek maternal health care. This cadre
of health workers might be part of an effective solution for improving maternal and infant health
and family planning service utilization for other developing countries struggling with these
issues. Further, it might be worthwhile to expand the role of such health workers to include other
important public health issues, including awareness of diseases like Hepatitis and HIV.
3.3. Background & Policy
The Government of Pakistan drafted its MNCH Policy in the year 2005-06. The policy
was designed to improve the high maternal, infant and child mortality rates in the country, with
the aim of bringing these numbers in line with the Millennium Development Goals. In particular,
the program aimed to achieve these goals by increasing utilization of pre-natal care, institutional
births and and presence of skilled attendants at birth.
Pakistan, on average, invests less than 4.2% of its overall budget in health, which is low
compared to other comparable countries in the region such as Sri Lanka (11.17%), Indonesia

86
(6%), Bangladesh (5.7%), and India (5%).38 Training and deploying CMWs is a low cost
solution to address the problem of maternal health and increase the number of skilled front line
workers to assist in deliveries. CMWs can be trained in a much shorter time period (18 months)
and at a substantially lower cost in comparison to doctors, nurses and other health personnel.
Other developing countries like, Indonesia, Sri Lanka and Sierra Leon, have in the past used
CMWs to address maternal and infant health.
The policy for Pakistan aimed to train and deploy CMWs with the initial target of one
CMW per 10,000 of the population with potential expansion to one CMW per 5000 in the later
years. The eligible candidates for CMW training were females aged 18-35 years, who had
cleared the national level matriculation exam (equivalent of 10th grade). Women from all regions
of the country were to be recruited, trained and deployed back in areas of their residence and
origin, where they would have both the knowledge about, and trust of the local communities,
making it easier for the locals to accept their role. The selected candidates were trained in-class
for a year at one of the certified institutes of Pakistan Nursing Council, followed by six months
of field training.
While inherently a supply side intervention, the policy also catered to barriers in demand
by ensuring CMWs were placed back in areas of their origin upon successful completion of
training. Being accustomed to the local language, culture and community would help the CMWs
in reaching out to women in their areas and the familiarity would make the local community
more receptive to them. Upon deployment, their role was to provide individualized care to the
pregnant women throughout the maternity cycle and subsequently to the newborn. It was
expected that the interaction of the local women with these CMWs would change health-seeking
38 http://apps.who.int/gho/data/

87
behaviors by impacting the take up of pre- and post-natal visits, and the rate of skilled birth
attendance. Additionally, the CMWs were trained to identify actual or anticipated conditions
requiring medical attention and make timely referrals of obstetric and newborn complications,
bringing down the number of deaths due to untreated complications.
In terms of roll out and implementation, the first batch of CMWs completed training in
2008 and graduates were deployed to their respective catchment areas. As of 2013, 45% of the
planned 12,000 CMWs were trained, out of which 64% were deployed successfully.
3.4. Data
The study primarily employs the Pakistan Social and Living Measurement Survey
(PSLM). The PSLM is a cross sectional survey conducted each year across the country,
alternating between being representative at the district or provincial level.39 The survey focuses
on measuring progress toward the Millennium Development Goals (MDGs), along with detailed
sections on employment and household wealth. The universe for the survey consists of all urban
and rural areas of the main provinces of Pakistan, excluding Federally Administered Tribal Areas
(FATA) and military restricted areas, which comprise 2% of the overall population. The data was
obtained from the Pakistan Bureau of Statistics.
For this study, I use six years of the district level representative data sets for the years
between 2004 and 2014. In each of these rounds approximately 75,000 households and their
members were interviewed on questions related to employment, education, water and sanitation,
household wealth and health, with specific sections on the health of children and women of
childbearing age. In addition, questions pertaining to health utilization and satisfaction with
39 District is the third tier of governance in Pakistan, while province is the second after Federal

88
regard to available health services were also included in the survey. The relevant outcomes of
interest for this study are from the section on women’s health, which is applicable to women who
had given birth in the two years prior to the survey. The total sample of such women, over the six
years, used for estimation purposes in this study, is 173,317 with roughly the same number of
observations from each round of the survey.
I supplement this main data set with data on the deployment of CMWs at the district
level. This data was obtained from the MNCH website.40 The data provide information on the
number of midwives deployed, disaggregated by district. Lastly, statistics related to population
sizes and their growth rates, to help with per capita calculations, were obtained from the World
Bank and reports from the Census of Pakistan 1998.41
Summary statistics variables used in the study are shown in Table 1 below.42 The average
number of CMWs in district is around 35, some districts had no CMWs deployed as of 2008.
However districts in Pakistan differ widely in population size. I therefore use CMW per 10,000
of the population as the main variable of interest.
I look at women who are in the childbearing age (16-50 years). This yields a sample size
of more than 173,000 observations over a period of six years. The four outcomes of interest
(binary indicators for pre-natal checkup, post-natal checkup, birth in a medical institution, birth
attended by a SBA) are statistically different in the pre and post periods. Figure 1 shows the
distribution of binary responses for each of these outcomes of interest in the pre- and post-
treatment periods. In the pre-treatment period, one in every two women did not have any pre
natal check ups. In the post period one in every two women did not have any pre natal
40 http://dynasoft.org/mnch/ 41 http://data.worldbank.org/indicator/42 For detailed description of the variables see Table A1

89
Table 3.1: Summary Statistics
Variable Mean Difference Min Max Pre Post CMWd (total) - 35.18 - 0 109 CMWd (per 10,000 of the population) - 0.161 - 0 0.860 Pre-natal checkup 0.521 0.628 -0.107*** 0 1 Inst. birth 0.296 0.429 -0.133*** 0 1 Skilled birth Attendant 0.404 0.475 -0.071*** 0 1 Post-natal check up 0.24 0.275 -0.035*** 0 1 Age 29.012 28.93 0.082** 16 50 Urban residence 0.344 0.504 -0.16*** 0 1 Education of the HH head 4.849 4.766 0.083* 0 21 No. of members in the HH 8.222 7.937 0.285*** 2 20 Real HH income (in 000 PKR.)43 6.878 22.41 -15.533*** 1.50 500 Time to nearest health facility44 2.188 2.029 0.16*** 1 5 LHW visit 0.559 0.569 -0.009*** 0 1 TV ownership 0.475 0.499 -0.024*** 0 1 House ownership 0.873 0.616 0.258*** 0 1 Observations 84681 89022
check ups. In the post period a larger proportion of women (64 percent) report seeking pre-natal
care during pregnancy. In contrast, the number is much lower for post-natal checkups where only
one in every four women underwent a post natal examination in the pretreatment period and the
number increases to only 27 percent in the post period. In terms of healthcare at the time of
delivery, only 42 percent women had a skilled birth attendant assisting them at the time of
delivery in the pre treatment period. This proportion increased to 45 percent in the post-treatment
period. We see a big change in the proportion of births occurring at a medical facility (as
opposed to home). While only 29 percent women gave birth at a medical facility in the pre
period, 40 percent of women report delivering at a medical institution in the post period; a
change of 11 percentage points.
43Household Income is adjusted for inflation over the different years of the surveys and reported in 2010 terms.44 This is a categorical variable: 0-14 minutes, 15-29, 30-44, 45-59, more than 60 minutes.

90
Figure 3.1: Outcomes of interest and their distribution in the sample
As seen in Table 3.1, the average woman in the sample is 29 years of age. Average years
of education for head of the household (HH) is around 4.8 years in both pre- and post time
periods. Each household has around 8 members. In terms of access to health services, 56 percent
of households report that a LHW visited their house in the 30 days prior to the survey. The
average household resides around 15-29 minutes from the closest health facility. 45 Although
these variables are statistically different from each other in the pre- and post-treatment periods,
the size of the difference for each of these variables is negligible.
There is, however, a significant increase in the proportion of households residing in urban
areas; 50 percent in post period compared to 34 percent in the pre-period. The household income
and wealth indicators are also substantially higher on average in the post treatment period. The
change in household income is consistent with the increase in real GDP per capita for Pakistan
45 Nearest Health Facility includes Basic Health Unit, Rural Health Unit, Hospital or a Doctor’s Clinic.
0.51
0.24
0.42
0.29
0.64
0.27
0.450.4
00.10.20.30.40.50.60.70.8
Pre-natalCheck Post-natalCheck SkilledBirthAttendant
InstitutionalDelivery
Percetage
Pre Post

91
for the time period over which the data spans.46 I control for all these variables in my analysis to
account for any difference in outcomes that might be due to these factors.
3.5. Methodology
I use a difference in differences approach with a continuous treatment variable. More
precisely, I use the difference in “dosage” of the treatment, measured by CMWs deployed per
capita in the district, to determine the impact of the program using pre- and post-period data. The
outcomes of interest are binary in nature. I estimate a Probit model as follows.47 Let yi* be the
latent unobserved variable related to the explanatory variables:
𝑦!∗ = 𝑿𝒊!𝜷− 𝜖!
While 𝑦!∗ is not observed, the actual (yes or no) decision made by the individual is
observable and is defined as:
𝑦! = 1 𝑖𝑓 𝑦!∗ > 0
𝑦! = 0 𝑖𝑓 𝑦!∗ ≤ 0
with 𝑦!∗ being unobserved, we model the probability of making a particular choice.
𝑦!∗ = 𝑿𝒊!𝜷− 𝜖! > 0
𝜖! < 𝑿𝒊!𝜷
Then:
Pr (𝑦! = 1)= F (𝑋!!𝛽)
46 Between 2004 and 2014 real GDP per capita in Pakistan increased by more than $150 (or PKR 15000 in 2010 exchange rate terms). This information was collected from www.data.worldbank/indicator.47ResultsareconsistentwithusingaLinearProbabilityModel.

92
where 𝐹! (𝑋!!𝛽) denotes the Cumalative Density Function (C.D.F) of 𝜀 at 𝑋!!𝛽.
In case of the Probit model, 𝜀 ~N (0, I) resulting in the following C.D.F.:
F (𝑋!!𝛽)= !(!!)!/!
𝑒!!.!!!!!!!
!! dt = Φ (𝑋!!𝛽)
The decisions being modeled are as follows: (i) having undergone at least one prenatal
checkup during pregnancy, (ii) having a skilled birth attendant present at the time of delivery,
(iii) delivering at a medical facility (institutional birth), and (iv) having a post-natal checkup
within 6 weeks of delivery.
The probability of each of these outcomes (yid) is modeled as follows:
Pr 𝑦!" = 1 = Φ (𝛽! + 𝛽!𝐶𝑀𝑊! + 𝛽!𝑋!" + 𝛽!𝑍!" + 𝛿! + 𝛾! + 𝜀!") (1)
where 𝑖 indicates the individual, and 𝑑 indicates districts; CMWd is the continuous treatment
variable defined as CMWs deployed per 10,000 of population in district d, taking on a value of
zero for pre-treatment periods. Xid represents individual and household level controls while Zid
represents other controls related to area of residence and the available health facilities. 𝛿! are
year fixed effects while 𝛾! represents district fixed effects (For details on the variables and
outcomes of interest see Appendix Table 3.7A). In order to gauge the magnitude of the impact,
Average Marginal Effects (AME) for the variable of interest (CMWd ) were estimated as follows:
AME = !!
𝜙 (𝑥!!𝛽)𝛽!!!!! , estimated at 𝛽! = 𝛽! (2)
where 𝜙 is the corresponding probability density function.

93
3.5.1 Testing for Endogeneity in Placement of CMWs
The Government of Pakistan implemented the policy at the national level, with a varying
dosage of treatment for each district. There is, however, concern that the treatment may be
endogenous. For example, if districts with worse maternal health care receive a higher dosage of
the treatment, the estimate of the impact will likely be biased. I follow the approach taken by
Bollen, Guilkey and Mroz (1995) to test for endogeneity. I model the treatment variable at the
district level. For this, I aggregate the independent variables at the district level and model the
treatment variable (CMWd) on pre-period values of these variables, using Ordinary Least
Squares (OLS) as follows:
𝐶𝑀𝑊! = 𝛽! + 𝛽! 𝑋! + 𝛽!𝑍! + 𝜀!
where CMWd is the treatment variable defined as the number of CMWs per 10,000 of the
population in district d, Xd represents controls capturing the economic conditions of households
in the districts, Zd represents controls capturing pre-period trends in maternal health practices and
𝜀! represents the random error term (For details on the variables in this model, see Appendix
Table 3.8A).
I test whether district characteristics in the pre-period (2004 and 2006) predict the
deployment of CMWs. In particular, I test whether the outcomes of interest (pre and post natal
check ups, skilled birth attendance and institutional birth) in the years prior to the introduction of
CMWs predict the number of CMWs per capita. In addition, I check whether other
characteristics such as the economic well being of the district (average district income,
proportion of HHs with TV, proportion of rural HHs) and outreach of existing health facilities
(proportion of HHs visited by LHWs) are predictive of the treatment.

94
Table 3.2 shows the results. I find no significant correlation of a district’s economic well
being with the CMWs deployed per capita. I include measures approximating the
Table 3.2 Predicting Deployment of CMW in the District
CMWs per capita Proportion of rural HHs in the district 0.278 (0.210) Average HH income (PKR 000) 0.00547 (0.00937) Proportion of women who had a post-natal check up
3.052 (3.499)
Proportion of women who had a pre-natal check up
-2.228 (2.939)
Proportion of institutionalized births -3.633 (5.836)
Proportion of births with skilled attendance at birth
6.599 (5.621)
Proportion of HHs that own a TV
0.0302 (0.127)
Proportion of HHs that received a LHW visit
0.236*** (0.0812)
Observations 99 R-squared 0.207
Robust standard errors in parentheses *** p<0.01, ** p<0.05, * p<0.1
pre-treatment values of the main outcomes of interest for Equation 1. Finally, I also account for
prevalence of health services in the district as measured by indicator for a LHW visit.
If the policy was designed and implemented to be more beneficial for districts most in
need, we would expect these pre-period characteristics to predict the per capita deployment of
CMWs. This would in turn mean that our estimates from Equation 1 would be biased. In Table
3.2 however, we see that pre-period values of our outcomes of interest do not predict CMWs per
capita in a district. Further, other characteristics are also not significantly correlated with CMW
per capita. However, the proportion of households in the district that received a visit from the
95
Lady Health Worker (LHW) is positively correlated with CMWs per capita. This might indicate
that districts with better services were targeted more by the policy, possibly owing to ease of
implementation, as opposed to the need. Households residing in districts with better health
facilities and outreach of LHWs might be more receptive to the CMW program, since the major
responsibility of LHWs is to visit households to educate people about health services and
promote health seeking behaviors. I control for this in all estimations of Equation 1.
Following Bollen et al. (1995), I predict residuals from the estimation in Table 3.2. I use
these estimated errors in my main estimations of Equation 1, along with other variables. A
statistically insignificant coefficient on these errors terms in Equation 1 would imply that the
CMW per capita variable is exogenous and a simple Probit model can be used to estimate the
impact on outcomes of interest.
3.6. Results and Discussion
Results for estimation of Equation 1 are shown in Table 3.3, which shows coefficients for
CMWs per capita and “residuals” from estimation in Table 3.2 and the indicator for a visit by
LHW (for more detailed results see Table 3.9A-3.12A).48 In each of the estimations in Table 3.3
the coefficient on the residuals from Equation 2 are insignificant. This implies that the simple
probit estimations are valid for analysis purposes.
48Each of the four outcomes of interest was estimated using four different models, with increasing levels of controls. Results are shown in Table 3.9A to 3.12A. All models include district and year fixed effects and control for the age of the individual through yearly dummies. The estimation in the first model controls for the region of residence (urban vs. rural). The second column adds controls for health services around the household’s area of residence (visit by LHW and time taken to reach nearest health facility in minutes). The third estimation further adds individual and household level variables (HH income and education of the head of the HH). Finally, more controls for household wealth (ownership of television and place of residence) and household demographics (number of members in the household) are added.

96
Table 3.3 Probit Estimations for Maternal Health Care Utilization
1 Pre-natal
2 Post-natal checkup
3 Skilled
Attendant at Birth
4 Delivery
at medical inst.
CMW per capita 0.0957 0.294 0.577*** 0.521*** (0.197)
(0.237)
(0.151)
(0.139)
Residuals -0.128 -0.501 -0.455 -0.562 (0.318) (0.331) (0.372) (0.394) Mean 0.58 0.26 0.44 0.36 Observations 173,317 173,317 173,317 173,317
Robust standard errors in parentheses, *** p<0.001, ** p<0.01, * p<0.05 All estimations have the following controls: age dummies, education of the household head, real income, number of
members in the households, wealth of the household, rural/urban locality, time to nearest health facility, district fixed effects and year fixed effects.
I begin by looking at utilization behavior prior to and after delivery. In Columns 1 and 2,
I find no evidence of a significant impact of CMW deployment in the district on the probability
of women seeking pre- and post-natal check ups. The coefficients are however positive,
indicating that women are more likely to see these services where higher CMWs are deployed.
Next, I look at the impact of CMWs on whether the women are attended by a skilled birth
attendant (SBA) at the time of delivering the child. Column 3 shows that women are more likely
to have a SBA at the time of birth if there are more CMWs per capita available in their district.
More precisely, the marginal effects in Table 3.4 show that for each additional CMW per capita,
women are 19 percentage points more likely to have SBA present and assisting at birth.
Likewise, women in areas with high CMW per capita are more likely to deliver the child at a
medical institute (as opposed to home). Column 4 shows for each additional CMW per capita,
women are 17 percentage points more likely to birth at a medical institution, where they receive
better care. With an average of 0.16 CMWs per capita introduced by the program, this implies

97
that as a result of the program women were 2.72 percentage points more likely to give birth at a
medical facility and 3.04 percentage points more likely to be attended by a SBA at time of birth.
Table 3.4 Marginal Effects of CMWd per capita on Maternal Health Care Utilization
Outcomes (Prenatal) (Postnatal) (SBA) (Inst. Deliveries)
CMW per capita 0.0324 0.0911 0.1923*** 0.1710** (0.0668) (0.0740) (0.0528)
(0.0457)
Observations 170,317 170,317 170,317 170,317
Robust standard errors in parentheses, *** p<0.001, ** p<0.01, * p<0.05
The basic aim behind the policy of CMWs was to improve maternal health by increasing
the utilization. This included pre and postnatal checkups, as well as ensuring skilled medical
attendants at birth. Additionally, it was expected CMWs would make timely referrals, when
needed, to medical facilities where higher skilled personnel like doctors would be available,
aiding in reducing the deaths due to undiagnosed or untreated complications.
The results in Table 3.3 and 3.4 imply that each additional CMW per capita increases the
probability of women having a skilled attendant at birth by 19 percentage point. These results are
highly encouraging, and given high fertility rates in Pakistan, CMWs can bring about large
changes in absolute numbers. Results in Table 3.4 also show that the deployment of an additional
CMW per capita increases the probability of giving birth at an institution (as opposed to
delivering at home) by 17 percentage points. This can be explained in two ways. CMWs are
provided resources by the Government under the MNCH to set up their own ‘clinic’ with
‘birthing stations.’ District Public Health Specialists and Lady Health Supervisors are assigned
the role of visiting these birthing stations and ensuring their readiness to be operational. Zafar et
al. (2015) show, in their mixed methods study, that almost half of women interviewed in rural

98
areas of Pakistan expressed a preference for such birthing stations of CMWs, while only 20
percent preferred deliveries at home. Birthing stations were favored because of the availability of
space and equipment and the proximity to their homes. This can explain the huge increase in
institutional births post the deployment of CMWs. Referrals by CMWs in case of complications
to medical facilities higher up in the health system, such as Basic and Rural Health Units (B.H.U
and R.H.U) and hospitals, might also explain this positive impact. Analysis into breakdown of
births within these medical institutions and birthing stations may provide information on these
channels, however the data for this study does not allow such an analysis.
There is, however, no impact on utilization of pre and post-natal check ups. Coupled with
a positive and large impact on giving birth at a medical institution, these results imply that while
utilization at the time of birth is improving, there is no change in the behavior regarding the care
needed during pregnancy and in the time period after childbirth. In terms of outreach then,
utilization of CMWs seems to have improved utilization at the time of birth but similar success is
not seen in terms of pre- and post-natal care.
This has a number of important implications. First, the point of having community
midwives was to bridge any local and cultural barriers so that they are easily accepted in their
roles by the local communities. However, it appears that despite increased contact with skilled
birth attendants at the time of birth, women are not convinced about the importance of post-natal
checkups. Affordability is unlikely to be a barrier here since CMWs are allowed to charge only a
very nominal fee from their patients and their basic compensation comes from the Government.
A large part of the role outlined for CMWs is to provide individualized care during the
entire course of the pregnancy and identify complications at any point during it. Lack of impact
on pre-natal checkups may signal deficiencies in outreach efforts of CMWs in terms of actively

99
reaching out to pregnant women in their communities and making their presence and the services
they offer more salient. If this is the case, CMWs may need to be informed more clearly that
their role is centered not only around delivering the child, but their services pre and post birth
also have equal importance.
On the other hand, this can also be explained by lack of understanding on the patients end
regarding the importance of pre and post-natal checkups and the trust placed in CMWs. In that
case, policy requires that efforts be made to educate people about both the importance of these
checkups, as well as toward building the trust that CMWs are professionally trained to perform
these check ups. Lack of information provision and advertisement might be the missing element
in this case. Unfortunately with the data available for this study, I cannot speak to the channel
that might be at play here.
Existing initiatives like LHWs who visit households can be used to educate people about
the importance and availability of the services offered by CMWs. In Column 4 of Tables A3-A6
we see no evidence of impact of LHWs on most measures of maternal health care utilization. On
the contrary we see a negative correlation with institutional births. This is a puzzling finding.
However, some reports suggest that LHWs have not been used to refer patients to CMWs and
medical health centers (Khan and Khan, 2012) and cite lack of coordination with other health
providers as one of the impediments to the success of this policy. The government can likely use
the help of LHWs already in place to raise awareness about the availability of CMWs and the
services they offer. Also, some community level initiatives, involving the elders of the
communities, aimed at educating and increasing acceptability of services regarding pre- and
post-natal checkups can also be of help.

100
Further, research claims that most CMWs being young and unmarried, are deemed as
untrustworthy or inexperienced by the community with respect to their roles (Khan and Khan,
2012). Faisel (2012) reports that many CMWs feel their title does not depict their level of
expertise, thereby limiting their acceptance. Efforts geared toward selling the role of CMWs to
the local communities is needed, beyond just deploying the CMWs back to their areas of
residence.
Tables 3.9A-3.12A in the Appendix also show other interesting relationships. First,
having a more educated head of the household and a higher income for the household, is
positively related to all the outcomes of interest. This indicates that the policy makers should also
consider the demand side and develop policies that are aimed at informing the less educated
households about the importance of these services. Second, on the supply side, in terms of access
we see a consistent pattern for all outcomes. The longer it takes to reach the nearest health
facility, individuals are less likely to utilize any maternity related service. This has two important
implications. First, health workers like LHWs who are assigned responsibility to visit households
are of great importance especially for households that are away from medical facilities like Basic
Health Units or Rural Health Units. While individuals in these households are less likely to go
out and seek services, providing in house services might help change health behaviors. For
CMWs as well, it is more important to reach out to households that are a considerable distance
away from health facilities.
Results in Table 3.9A-3.12A also reflect the rural urban divide. Individuals residing in
rural areas are less likely to seek maternal health care, even after controlling for other household
and access variables. This has implications for future deployment of such health workers.

101
3.6.1 Further tests
Around 10 percent of the districts receive no CMWs under the program. For robustness, I
exclude these districts from the sample and estimate the main model. Results in Table 3.5 show
that Probit coefficients and marginal effects for institutional births and SBA are robust to
excluding those districts.
Table 3.5 Estimation excluding districts with no CMWs
(1) (2) (3) (4) CMWs Prenatal Postnatal Inst. Birth SBA Probit Coeff. -0.109 0.365 0.374** 0.398** (0.210) (0.260) (0.159) (0.157) Marginal Effect -0.076
(0.1055) 0.0936
(0.0796) 0.1222** (0.0515)
0.1380** (0.0573)
Observations 146,024 146,024 146,024 146,024 Robust standard errors in parentheses
*** p<0.01, ** p<0.05, * p<0.1
I also perform a simple placebo for the main estimation model by using three outcomes in
Equation 1 that are expected not to be impacted by deployment of CMWs. These are (i) whether
an individual was employed last month or not (ii) whether an individual had an illness or injury
in the last 30 days and (iii) in case of an illness/injury whether an individual sought medical
assistance/consultation. These questions, unlike the maternal health care variables, are
administered to all members in the household regardless of their gender (and previous maternity
history).49 If the estimations in Table 3.3 were picking up some arbitrary spurious correlation, we
would see a similar significant relationship here has well. If some differentials in economic well-
being and health facilities between districts over time were being picked up by the main
estimation, I would expect to see a similar effect on employment and medical consultation as
well. Results are shown in Table 3.6. I find no evidence of impact of the CMWs variable on any 49 This explains the difference in sample size in Table 3.5 compared to earlier estimations for Table 3.3 and 3.4.

102
of these outcomes. This is reassuring that there is no spurious correlation being picked up the
variable of interest in the main equations of interest.
Table 3.6 Placebo tests
(1) (2) (3) Variables Employment Illness Consultatio
n CMWs -0.0889 0.1163 -0.0088 (0.0651) (0.1020) (0.2685)
Observations 1,370,360 1,425,041 94,308
Robust standard errors in parentheses, *** p<0.001, ** p<0.01, * p<0.05
3.7. Conclusion
Evidence on the effectiveness of initiatives for safe motherhood in developing countries
is inconclusive. In particular, while it is generally agreed that skilled personnel should attend all
births, the crucial question of where deliveries should take place and who qualifies as a skilled
attendant remains a matter of debate. Nonetheless, indicators such as the proportion of births
attended by skilled health personnel have gained credence.
In this paper, I evaluate the introduction of a new cadre of CMWs in Pakistan as frontline
health workers aimed at impacting maternal health behaviors and increasing skilled attendance at
birth. I find that CMWs positively impact skilled birth attendance and institutional births.
Approximately 2/3rd of maternal deaths in developing countries occur in late pregnancy through
48 hours after delivery (Nabudere et al. 2012). The four main causes of maternal deaths are
obstructed labor, eclampsia, puerperal sepsis and obstetric hemorrhage, collectively accounting
for 54% of maternal deaths in Pakistan (PDHS 2008). SBAs are trained to identify and treat
these causes and refer to higher skilled medical personnel when needed. Graham et al. (2001)
show that these complications are preventable by 20-85% by SBA depending on the

103
complication and whether one takes a pessimistic or optimistic estimate. The authors deduce a
reduction of 16% to 33% in maternal mortality assuming competent skilled attendants as well as
on enabling environment for them to perform the necessary obstetric care, which is provided
under the CMW program of Pakistan as well. Estimates from my study show that each additional
CMW per 10,000 of the population increases the likelihood of women being assisted at birth by a
SBA by 17 percentage points. Using Graham et al.’s (2001) estimates this means a reduction in
likelihood of maternal death by 2.72-5.61 percent. The Value of Statistical Life in Pakistan is
estimated at $0.25 million (Viscusi et al. 2017). In monetary terms then the gain from lives
saved translates to USD 6800-14000 for each CMW per 10,000 of the population. In
comparison, the cost of training and deploying a CMW in Pakistan is estimated at USD 4710
and the cost of each subsequent delivery is USD 38.50
I do not, however, find any evidence of impact on pre and post-natal checkups.
Enhancing the trust of the community and forming better linkages between other health
initiatives (e.g. LHW) and facilities (e.g. linking CMWs to R.H.Us) may potentially lead to
improvements in pre and post-natal check ups as well. Increase in post-natal check ups can
potentially lead to gains in infant health as well, since CMWs are also trained to provide
newborn care. Further research may help inform policy makers how the ultimate goal of
reducing maternal and infant mortality was impacted by the CMWs. This study is also limited
in not being able to speak to the possible mechanisms which might be leading to a significant
impact on utilization at the time of birth but not on pre and post natal check ups. With more
informative data, these questions may be answered to provide insights for better future
implementation.
50 Technical Resource Facility (2013) estimates the cost of training and deploying a community midwife in Pakistan at PKR 200,000 and PKR 270,000 respectively. The cost of each delivery is PKR 3750. These are converted into USD based on the exchange rate in 2013.

104
3.8. Appendix Table 3.7A. Description of variables in the main model
Dependent Variables
Variable Name Description
Prenatal Checkup =1 if the individual got at least one pre natal check up during pregnancy, 0 otherwise
Skilled Attendance at birth
=1 if the individual was assisted by a skilled birth attendant at time of birth, 0 otherwise
Institutionalized birth =1 if the individual gave birth at a medical facility, 0 otherwise
Post-natal Checkup =1 if the individual got at post-natal checkup within 6 weeks of birth, 0 otherwise
Prenatal Vaccination =1 if the individual got vaccinated against tetanus during pregnancy, 0 otherwise
Independent Variables
Variable Name
Description
CMW Number of CMWs per 10,000 of the population
Region =1 if the individual resides in an urban area, 0 otherwise
LHW =1 if the household received a visit from a Lady Health Worker in last 30 days
Time taken to reach the nearest health facility
Dummy variable for each of the following categories: 0-14 minutes (base), 15-29, 30-44, 45-59, more than 60 minutes
HH head education Education of the head of the household (in years)
HH Income Total monthly income of the households (in 000s PKR)
HH members Number of members in the household
TV ownership =1 if the household owns a TV, 0 otherwise
House ownership =1 if the household owns the house it resides in, 0 otherwise

105
Table 3.8A Description of variables used for testing endogeneity of the treatment variable
Mean Std. Dev. Min. Max.
Proportion of rural HHs in the district 0.4788 0.1010 0.141 0.8401
Average HH income (PKR) 12162.31 2460.42 8013.22 27287.32
Number of children under the age of 15 in the HH 3.898 0.8892 0 6.4453
Proportion of births with skilled attendance at birth 0.3399 0.1666 0.0327 0.8243
Proportion of women who had a post natal check up 0.2109 0.1008 0.0271 0.6481
Proportion of institutional births 0.2407 0.1436 0.0149 0.7257
Proportion of women who had a pre-natal check up
0.4633 0.1682 0.1006 0.8689
Proportion of HHs that own a TV 0.4370 0.1947 0.0585 0.8684
Proportion of HHs that received a LHW visit within the last 30 days
0.4430 0.1899 0.0665 0.7828

106
Table 3.9A Probit Estimations for Prenatal Visit
(1) Pre-natal
(2) Pre-natal
(3) Pre-natal
(4) Pre-natal
CMW 0.484* 0.303 0.178 0.0957 (0.264) (0.214) (0.197) (0.197) Residuals -0.532 -0.354 -0.243 -0.128 (0.395) (0.395) (0.362) (0.318) Urban 0.423*** 0.309*** 0.251*** 0.206*** (0.0589) (0.0586) (0.0525) (0.0449) LHW visit 0.0445 0.0500 0.0394 (0.0655) (0.0576) (0.0519) Time to nearest health facility (15-29 mins.)
-0.258*** (0.0323)
-0.201*** (0.0307)
-0.156*** (0.0294)
Time to nearest health facility (30-44 mins.)
-0.421*** (0.0366)
-0.346*** (0.0333)
-0.273*** (0.0309)
Time to nearest health facility (45-59 mins.)
-0.589*** (0.0590)
-0.495*** (0.0531)
-0.397*** (0.0470)
Time to nearest health facility (60+ mins.)
-0.737*** (0.0696)
-0.631*** (0.0654)
-0.505*** (0.0592)
HH head’s education 0.0375*** 0.0299*** (0.00310) (0.00234) HH income (PKR 000s) 0.00791*** 0.00653*** (0.000834) (0.000835) No. of HH members -0.00989** (0.00446) TV ownership 0.370*** (0.0408) House Ownership -0.0210 (0.0396) Constant -0.102 0.198 0.00753 0.00122 (0.163) (0.173) (0.153) (0.180) Observations 170,359 170,359 170,359 170,359

107
Table 3.10A Probit Estimations for Post-natal Checkup
Variables (1) Post-natal
(2) Post-natal
(3) Post-natal
(4) Post-natal
CMW 0.550*** 0.444** 0.341 0.294 (0.194) (0.211) (0.237) (0.237) Residuals -0.783** -0.682* -0.577* -0.501 (0.351) (0.362) (0.340) (0.331) Urban 0.309*** 0.242*** 0.185*** 0.160*** (0.0357) (0.0347) (0.0298) (0.0281) LHW visit 0.0192 0.0323 0.0269 (0.0490) (0.0450) (0.0444) Time to nearest health facility (15-29 mins.) -0.144***
(0.0325) -0.0843***
(0.0316) -0.0557* (0.0310)
Time to nearest health facility (30-44 mins.) -0.227*** (0.0386)
-0.149*** (0.0370)
-0.102*** (0.0361)
Time to nearest health facility (45-59 mins.) -0.388*** (0.0476)
-0.291*** (0.0469)
-0.224*** (0.0457)
Time to nearest health facility (60+ mins.) -0.498*** (0.0779)
-0.387*** (0.0792)
-0.301*** (0.0810)
HH head’s education 0.0355*** (0.00223)
0.0307*** (0.00197)
HH income (PKR 000s) 0.00532*** (0.000431)
0.00477*** (0.000488)
No. of HH members -0.00632 (0.00387) TV ownership 0.233*** (0.0266) House Ownership 0.0250 (0.0310) Constant -1.324*** -1.150*** -1.333*** -1.388*** (0.140) (0.142) (0.152) (0.154) Observations 170,359 170,359 170,359 170,359
Robust standard errors in parentheses *** p<0.01, ** p<0.05, * p<0.

108
Table 3.11A: Probit estimation for Skilled Attendant at birth
(1) (2) (3) (4) SBA SBA SBA SBA CMW 0.917*** 0.785*** 0.655*** 0.557*** (0.249) (0.176) (0.162) (0.151) Residuals -0.876* -0.735 -0.606 -0.455 (0.489) (0.477) (0.434) (0.372) Urban 0.534*** 0.413*** 0.348*** 0.298*** (0.0641) (0.0594) (0.0526) (0.0440) LHW visit -0.0692 -0.0622 -0.0685 (0.0783) (0.0686) (0.0606) Time to nearest health facility (15-29 mins) -0.329***
(0.0393) -0.259*** (0.0351)
-0.206*** (0.0324)
Time to nearest health facility (30-44 mins) -0.501***
(0.0428) -0.408*** (0.0373)
-0.323*** (0.0325)
Time to nearest health facility (45-60 mins) -0.659***
(0.0596) -0.540*** (0.0515)
-0.424*** (0.0433)
Time to nearest health facility (60+ mins) -0.758***
(0.0634) -0.625*** (0.0555)
-0.478*** (0.0451)
HH Head’s Education 0.0466*** 0.0380*** (0.00369) (0.00274) HH Income (PKR 000) 0.00975*** 0.00883*** (0.000838) (0.000925) HH Members -0.0165*** (0.00497) TV ownership 0.411*** (0.0412) House Ownership -0.105*** (0.0387) Constant -0.0880 0.292 0.0559 0.163 (0.209) (0.213) (0.191) (0.212) Observations 170,359 170,359 170,359 170,359
Robust standard errors in parentheses, *** p<0.01, ** p<0.05, * p<0.1

109
Table 3.12A Probit estimation for Institutional birth
(1) (2) (3) (4) Inst. Birth Inst. Birth Inst. Birth Inst. Birth CMW 0.879*** 0.766*** 0.626*** 0.521*** (0.246) (0.161) (0.148) (0.139) Residuals -0.990* -0.864* -0.728 -0.562 (0.531) (0.515) (0.466) (0.394) Urban 0.519*** 0.392*** 0.321*** 0.270*** (0.0673) (0.0607) (0.0531) (0.0437) LHW visit -0.151* -0.145** -0.152** (0.0815) (0.0715) (0.0632) Time to nearest health facility (15-29 mins.) -0.351***
(0.0342) -0.279*** (0.0296)
-0.224*** (0.0275)
Time to nearest health facility (30-44 mins.) -0.520***
(0.0413) -0.423*** (0.0357)
-0.335*** (0.0302)
Time to nearest health facility (45-60 mins.) -0.712***
(0.0621) -0.587*** (0.0534)
-0.462*** (0.0434)
Time to nearest health facility (60+ mins.) -0.809***
(0.0630) -0.668*** (0.0555)
-0.508*** (0.0458)
HH Head’s Education 0.0494*** 0.0404*** (0.00341) (0.00250) HH Income (PKR 000) 0.00964*** 0.00875*** (0.000858) (0.000896) No. of HH Members -0.0176*** (0.00462) TV ownership 0.430*** (0.0457) House Ownership -0.0933** (0.0367) Constant -0.679*** -0.275 -0.531*** -0.443** (0.224) (0.229) (0.203) (0.219) Observations 170,359 170,359 170,359 170,359
Robust standard errors in parentheses *** p<0.01, ** p<0.05, * p<0.1

110
References
Ahmed, J., Rehman, S. U., & Shahab, M. (2017). Community midwives' acceptability in their communities: A qualitative study from two provinces of Pakistan. Midwifery, 47, 53-59.
Ailaan, A., 2014. 25 Million broken promises: The crisis of Pakistan’s out-of-school children. Islamabad: Alif Ailaan.
Alam, A., Baez, J.E. and Del Carpio, X.V., 2011. Does cash for school influence young women's behavior in the longer term? Evidence from Pakistan. IZA DP No. 5703, Bonn: The Institute for the Study of Labor
Albouy, V. and Lequien, L., 2009. Does compulsory education lower mortality?. Journal of Health Economics, 28(1), pp.155-168.
Alderman, H., Orazem, P.F. and Paterno, E.M., 2001. School quality, school cost, and the public/private school choices of low-income households in Pakistan. Journal of Human Resources, pp.304-326.
Andrabi, T., Das, J. and Khwaja, A.I., 2012. What did you do all day? Maternal education and child outcomes. Journal of Human Resources, 47(4), pp.873-912.
Andrabi, T., Das, J., Khwaja, A.I., Vishwanath, T. and Zajonc, T., 2007. Learning and Educational Achievements in Punjab Schools (LEAPS): Insights to inform the education policy debate. World Bank, Washington, DC.
Angeles, G., Guilkey, D.K. and Mroz, T.A., 2005. The effects of education and family planning programs on fertility in Indonesia. Economic Development and Cultural Change, 54(1), pp.165-201.
Araujo, M.C., Bosch, M. and Schady, N., 2017. Can Cash Transfers Help Households Escape an Inter-Generational Poverty Trap? In The Economics of Poverty Traps. University of Chicago Press.
Arendt, J.N., 2005. Does education cause better health? A panel data analysis using school reforms for identification. Economics of Education review, 24(2), pp.149-160.
Ayiasi R.M., Atuyambe, L.M., Kiguli,J. , Orach,J.C., Kolsteren,P., & Criel,B. (2015) Use of mobile phone consultations during home visits by Community Health Workers for maternal and newborn care: community experiences from Masindi and Kiryandongo districts, Uganda. BMC Public Health, 15, 1-13
Bagonza,J. & Kibira, S.P.S., & Rutebemberwa, E.(2014).Performance of community health workers managing malaria, pneumonia and diarrhoea under the community case management programme in central Uganda: a cross sectional study, Malaria Journal, 13,367

111
Barber, S. L., & Gertler, P. J. (2008). The impact of Mexico’s conditional cash transfer programme, Oportunidades, on birthweight. Tropical Medicine & International Health, 13(11), 1405-1414.
Barber, S. L., & Gertler, P. J. (2010). Empowering women: how Mexico's conditional cash transfer programme raised prenatal care quality and birth weight. Journal of Development Effectiveness, 2(1), 51-73.
Barham, T., Macours, K. and Maluccio, J.A., 2013. More schooling and more learning? Effects of a three-year conditional cash transfer program in Nicaragua after 10 years(No. IDB-WP-432). IDB Working Paper Series.
Barrera-Osorio, F., Linden, L. L., & Saavedra, J. (2017). Medium-and Long-Term Educational Consequences of Alternative Conditional Cash Transfer Designs: Experimental Evidence from Colombia (No. w23275). National Bureau of Economic Research.
Barro, R.J. and Lee, J.W., 2013. A new data set of educational attainment in the world, 1950–2010. Journal of Development Economics, 104, pp.184-198.
Basinga, P., Gertler, P. J., Binagwaho, A., Soucat, A. L., Sturdy, J., & Vermeersch, C. M. (2011). Effect on maternal and child health services in Rwanda of payment to primary health-care providers for performance: an impact evaluation. The Lancet, 377(9775), 1421-1428.
Behrman, J. A. (2015). Does schooling affect women’s desired fertility? Evidence from Malawi, Uganda, and Ethiopia. Demography, 52(3), 787-809.
Behrman, J.R. and Rosenzweig, M.R., 2002. Does increasing women's schooling raise the schooling of the next generation?. American Economic Review, 92(1), pp.323-334.
Behrman, J.R. and Schneider, R., 1993. An international perspective on Pakistani human capital investments in the last quarter century. The Pakistan Development Review, pp.1-68.
Behrman, J.R. and Taubman, P., 1990. The Intergenerational Correlation between Children’s Adult Earnings and their Parents’ Income: Results from The Michigan Panel Survey of Income Dynamics. Review of Income and Wealth, 36(2), pp.115-127.
Black, D.A., Hsu, Y.C. and Taylor, L.J., 2015. The effect of early-life education on later-life mortality. Journal of Health Economics, 44, pp.1-9.
Bolton, P., Bass, J. & Neugebauer,R. (2003) Group Interpersonal Psychotherapy for Depression in Rural UgandaA Randomized Controlled Trial Journal of American Medical Association, 289(23):3117-3124
Braakmann, N., 2011. The causal relationship between education, health and health related behaviour: Evidence from a natural experiment in England. Journal of Health Economics, 30(4), pp.753-763.

112
Breierova, L. and Duflo, E., 2004. The impact of education on fertility and child mortality: Do fathers really matter less than mothers? (No. w10513). National Bureau of Economic Research.
Chaudhury, N. and Parajuli, D., 2010. Conditional cash transfers and female schooling: the impact of the female school stipend programme on public school enrolments in Punjab, Pakistan. Applied Economics, 42(28), pp.3565-3583.
Chou, S.Y., Liu, J.T., Grossman, M. and Joyce, T., 2010. Parental education and child health: evidence from a natural experiment in Taiwan. American Economic Journal: Applied Economics, 2(1), pp.33-61.
Clark, D. and Royer, H., 2013. The effect of education on adult mortality and health: Evidence from Britain. American Economic Review, 103(6), pp.2087-2120.
Corluka,A., Walker, D.G., Lewin,S., Glenton, C. & Scheel, I.B. (2009) Are vaccination programmes delivered by lay health workers cost-effective? A systematic review , Human Resources for Health, 7:81
Currie, J. and Moretti, E., 2003. Mother's education and the intergenerational transmission of human capital: Evidence from college openings. The Quarterly Journal of Economics, 118(4), pp.1495-1532.
De Brauw, A., & Gilligan, D. (2011). Using the regression discontinuity design with implicit partitions: The impacts of comunidades solidarias rurales on schooling in El Salvador. IFPRI discussion papers, 1116.
Devine,S. and Taylor.G.,2018. Every Child Alive: The Urgent Need to End Newborn Deaths. Switzerland: UNICEF
Duflo, E., 2001. Schooling and labor market consequences of school construction in Indonesia: Evidence from an unusual policy experiment. American Economic Review, 91(4), pp.795-813.
Duflo, E., Dupas, P. and Kremer, M., 2015. Education, HIV, and early fertility: Experimental evidence from Kenya. American Economic Review, 105(9), pp.2757-97.
Fauveau, V., Stewart, K., Khan, S. A., & Chakraborty, J. (1991). Effect on mortality of
community-based maternity-care programme in rural Bangladesh. The Lancet, 338(8776), 1183-1186.
Field,E. and Vyborny.K., 2016. Female Labor Force Participation in Asia: Pakistan Country
Study, Manila: Asian Development Bank
Fiszbein, A. and Schady, N.R., 2009. Conditional cash transfers: reducing present and future poverty. Washington D.C. World Bank Publications.

113
Frankenberg, E., Suriastini, W., & Thomas, D. (2005). Can expanding access to basic healthcare improve children's health status? Lessons from Indonesia's ‘midwife in the village’programme. Population Studies, 59(1), 5-19.
Graham WJ, Bell JS, Bullough CH. Can skilled attendance at delivery reduce maternal mortality in developing countries? Studies in Health Services Organisation and Policy. 2001(17):97-130.
Grépin, K.A. and Bharadwaj, P., 2015. Maternal education and child mortality in Zimbabwe. Journal of Health Economics, 44, pp.97-117.
Grossman, M., 1972. On the concept of health capital and the demand for health. Journal of Political Economy, 80(2), pp.223-255.
Grossman, M., 2000. The Human Capital Model. In Handbook of health economics, 1, pp. 347-408.
Grossman, M., 2006. Education and nonmarket outcomes. Handbook of the Economics of Education, 1, pp.577-633.
Grossman,M. & and Kaestner,R.1997. Effects of Education on Health. In The Social Benefits of Education, ed. by Behrman, J.R., and Stacey, N., Ann Arbor: University of Michigan Press
Hogan, M. C., Foreman, K. J., Naghavi, M., Ahn, S. Y., Wang, M., Makela, S. M., ... & Murray, C. J. (2010). Maternal mortality for 181 countries, 1980–2008: a systematic analysis of progress towards Millennium Development Goal 5. The lancet, 375(9726), 1609-1623.
Holmes, J., 2003. Measuring the determinants of school completion in Pakistan: analysis of censoring and selection bias. Economics of Education Review, 22(3), pp.249-264.
Kaur, M. (2016) Community Health Workers— Birth of a New Profession, Journal of the American Society on Aging, 40(1), 56-63
Keats, A., 2018. Women's schooling, fertility, and child health outcomes: Evidence from Uganda's free primary education program. Journal of Development Economics, 135, pp.142-159.
Khan,A. & Khan,A. (2012) The Community Midwives Program in Pakistan. Research and
Development Solutions. Policy Briefs Series No. 20 Kim,K.,Choi,J.S., Choi,E.,Nieman,C.L.,Jao.J.H., Lin,F.R.,….Han,H.R. (2016) Effects of
Community-Based Health Worker Interventions to Improve Chronic Disease Management and Care Among Vulnerable Populations: A Systematic Review. American Journal of Public Health, 106(4), 3-28
Kowitt, S.D., Emmerling,D., Fisher,B., & Tanasugarn,C. (2015) Community Health Workers as
Agents of Health Promotion: Analyzing Thailand’s Village Health Volunteer Program. Journal of Community Health, 40, 780-788

114
Lipp,A. (2011). Lay Health Workers in Primary and Community Health Care for Maternal and
Child Health and the Management of Infectious Diseases: A Review Synopsis. Public Health Nursing, 28 (3), 243–245
Lleras-Muney, A. and Glied.S., 2008. Health Inequality, Education and Medical Innovation.
Demography 45(3), pp. 741-761
Lleras-Muney, A., 2005. The relationship between education and adult mortality in the United States. The Review of Economic Studies, 72(1), pp.189-221.
Lloyd, C.B., Mete, C. and Sathar, Z.A., 2005. The effect of gender differences in primary school access, type, and quality on the decision to enroll in rural Pakistan. Economic Development and Cultural Change, 53(3), pp.685-710.
Lundberg, S. and Pollak, R.A., 1993. Separate spheres bargaining and the marriage market. Journal of Political Economy, 101(6), pp.988-1010.
Massnegale, K.E., Morrison, S.D. & Sudha, S. (2016). Community Health Advocate-Identified Enablers of HIV Testing for Latina Immigrant Women. AIDS Education and Prevention, 28(4), 325–340C
Mazumder, B., Rosales-Rueda, M. and Triyana, M., 2019, May. Intergenerational Human Capital Spillovers: Indonesia's School Construction and Its Effects on the Next Generation. In AEA Papers and Proceedings (Vol. 109, pp. 243-49).
Mensch, B.S., Chuang, E.K., Melnikas, A.J. and Psaki, S.R., 2019. Evidence for causal links between education and maternal and child health: systematic review. Tropical Medicine & International Health, 24(5), pp.504-522.
Monstad, K., Propper, C. and Salvanes, K.G., 2008. Education and fertility: Evidence from a natural experiment. Scandinavian Journal of Economics, 110(4), pp.827-852.
Mumtaz, Z., O’Brien, B., Bhatti, A., & Jhangri, G. S. (2012). Are community midwives
addressing the inequities in access to skilled birth attendance in Punjab, Pakistan? Gender, class and social exclusion. BMC health services research, 12(1), 326.
Nabudere, H., Asiimwe, D. and Amandua, J., 2013. Improving access to skilled attendance at
delivery: a policy brief for Uganda. International journal of technology assessment in health care, 29(2), pp.207-211.
National Institute of Population Studies (NIPS) [Pakistan] and ICF International. 2013. Pakistan
Demographic and Health Survey 2012-13. Islamabad, Pakistan, and Calverton, Maryland, USA: NIPS and ICF International.
National Institute of Population Studies (NIPS)[Pakistan] and ICF International, 2008. Pakistan Demographic and Health Survey 2006–07. Islamabad, Pakistan, and Calverton, Maryland, USA: NIPS and ICF International.
115
National Institute of Population Studies (NIPS)[Pakistan], ICF, 2019. Pakistan demographic and health survey 2017-18. Pakistan demographic and health survey 2017–18.
Noorani, Q. A., Azam, I., Shaikh, B. T., Ranasinghe, T., Abbas, S., Wali, S., ... & Javed, W.
(2013). Role of community based savings groups (CBSGs) enhancing the utilization of community midwives in Chitral district of Pakistan. BMC pregnancy and childbirth, 13(1), 185.
Okoli, U., Morris, L., Oshin, A., Pate, M. A., Aigbe, C., & Muhammad, A. (2014). Conditional
cash transfer schemes in Nigeria: potential gains for maternal and child health service uptake in a national pilot programme. BMC pregnancy and childbirth, 14(1), 408.
Omer,K., Mhatrre,S., Ansari,N., Laucirica,J., Andersson,N. (2008). Evidence-based training of
frontline health workers for door-to-door health promotion: A pilot randomized controlled cluster trial with lady health workers in Sindh Province, Pakistan. Patient Education and Counseling, 72, 178–185
Osili, U.O. and Long, B.T., 2008. Does female schooling reduce fertility? Evidence from
Nigeria. Journal of development Economics, 87(1), pp.57-75. Parker, S.W. and Vogl, T., 2018. Do Conditional Cash Transfers Improve Economic Outcomes
in the Next Generation? Evidence from Mexico (No. w24303). National Bureau of Economic Research.
PDHS. (2007). Pakistan Demographic Health Survey 2006-2007 Report. National Institute of Population Studies, Islamabad, Pakistan. Columbia MA: IRD/Macro International, 25.
Qureshi, J.A., 2018. Additional returns to investing in girls’ education: Impact on younger sibling human capital. The Economic Journal.
Rahman,A.,Malik,A., Sikander,S., Roberts,C., & Creed,F.(2008) Cognitive behaviour therapy-based intervention by community health workers for mothers with depression and their infants in rural Pakistan: a cluster-randomised controlled trial. Lancet, 372, 902–09
Randive, B., Diwan, V., & De Costa, A. (2013). India’s conditional cash transfer program (the JSY) to promote institutional birth: is there an association between institutional birth proportion and maternal mortality?. PloS one, 8(6), e67452.
Ronsmans, C., Endang, A., Gunawan, S., Zazri, A., McDermott, J., Koblinsky, M., & Marshall, T. (2001). Evaluation of a comprehensive home-based midwifery programme in South Kalimantan, Indonesia. Tropical Medicine & International Health, 6(10), 799-810.
Rosenzweig, M. R., & Schultz, T. P. (1983). Estimating a household production function: Heterogeneity, the demand for health inputs, and their effects on birth weight. Journal of Political Economy, 91(5), 723-746.

116
Sarfraz, M., & Hamid, S. (2014). Challenges in delivery of skilled maternal care–experiences of community midwives in Pakistan. BMC pregnancy and childbirth, 14(1), 59.
Save the Children (2015). The Urban Disadvantage: The state of the World’s Mothers 2015.
Sawada, Y. and Lokshin, M., 2009. Obstacles to school progression in rural Pakistan: An analysis of gender and sibling rivalry using field survey data. Journal of Development Economics, 88(2), pp.335-347.
Schultz, T.P., 1994. Human capital, family planning, and their effects on population growth. The American Economic Review, 84(2), pp.255-260.
Shrestha, R. (2010). The village midwife program and infant mortality in Indonesia. Bulletin of Indonesian Economic Studies, 46(2), 193-211.
Stephens, T.B., Kurian,C., Guo,R., & Zhao,H. (2009) Impact of a Household Environmental Intervention Delivered by Lay Health Workers on Asthma Symptom Control in Urban, Disadvantaged Children With Asthma. American Journal of Public Health, 99, 657-665
Technical Resource Facility (2013). Pakistan National Maternal and Child Health Programme Mid Term Evaluation
UNESCO, 2015. Fixing the Broken Promise of Education for All. Montreal: UNESCO Institute for Statistics
Viscusi, W.K. and Masterman, C.J., 2017. Income elasticities and global values of a statistical life. Journal of Benefit-Cost Analysis, 8(2), pp.226-250
Walque, D. (2007) How does the impact of an HIV/AIDS information campaign vary with educational attainment? Evidence from rural Uganda. Journal of Development Economics, 84(2), pp.686-714
Weaver, E. H., Frankenberg, E., Fried, B. J., Thomas, D., Wheeler, S. B., & Paul, J. E. (2013). Effect of village midwife program on contraceptive prevalence and method choice in Indonesia. Studies in family planning, 44(4), 389-409.
World Bank, 1983. Pakistan-Review of the Sixth Five-Year Plan. Report No. 4706-PAK, World Bank; Washington D.C.

117
Vita
Tareena Musaddiq was born and raised in Lahore, Pakistan. She completed her BSc
(hon.) in Economics from Lahore University of Management Sciences, Pakistan in 2008 and
MSc in Finance and Economics from University of Warwick, U.K in 2009.
After graduation she worked as a Teaching Fellow in Pakistan where she taught
undergraduate courses in Economics. In Fall of 2015, Tareena began her doctoral studies in
Economics at Georgia State University. Her research interests include Education Economics,
Health Economics and Development Economics. In Fall of 2020, Tareena will join
University of Michigan’s Ford School of Public Policy as a Post-Doctoral Fellow.