Multifocal endometriotic lesions associated with cancer are clonal and carry a high mutation burden
Upload
independentCategory
view
6download
0
Molecular Ecology (2005)
14
, 2669–2681 doi: 10.1111/j.1365-294X.2005.02640.x
© 2005 Blackwell Publishing Ltd
Blackwell Publishing, Ltd.
Within-population spatial genetic structure, neighbourhood size and clonal subrange in the seagrass
Cymodocea nodosa
F ILIPE ALBERTO,
*
L ICÍNIA GOUVEIA,
*
SOPHIE ARNAUD-HAOND,
*
JOSÉ L . PÉREZ-LLORÉNS,
†
CARLOS M. DUARTE
‡
and ESTER A. SERRÃO
*
*
CCMAR, CIMAR-Laboratório Associado, University of Algarve, Campus de Gambelas, 8005–139 Faro, Portugal,
†
Area de Ecología, Universidad de Cadiz, Facultad de Ciencias del Mar y Ambientales, 11510 Puerto Real, Cadiz, Spain,
‡
IMEDEA (CSIC-UIB) Instituto Mediterraneo de Estudios Avanzados, C/Miquel Marques 21, 07190 Esporles, Mallorca, Spain
Abstract
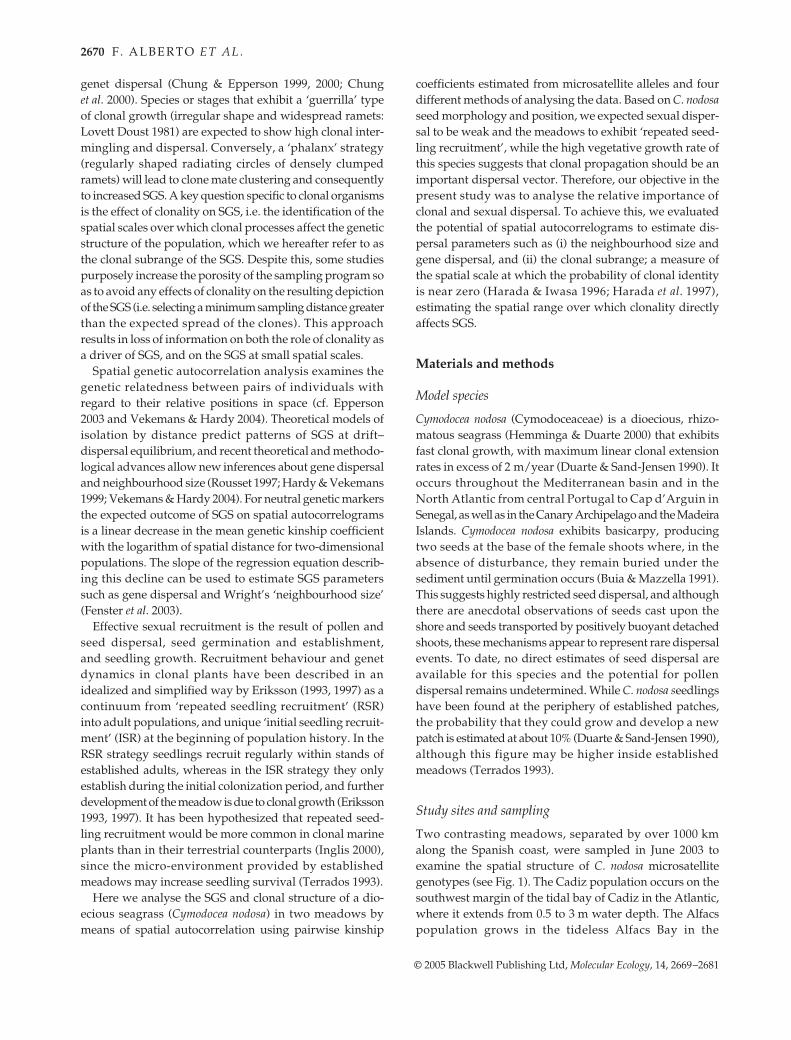
The extent of clonality within populations strongly influences their spatial genetic struc-ture (SGS), yet this is hardly ever thoroughly analysed. We employed spatial autocorrela-tion analysis to study effects of sexual and clonal reproduction on dispersal of the dioeciousseagrass
Cymodocea nodosa
. Analyses were performed both at genet level (i.e. excluding clonalrepeats) and at ramet level. Clonal structure was characterized by the clonal subrange, aspatial measure of the linear limits where clonality still affects SGS. We show that theclonal subrange is equivalent to the distance where the probability of clonal identityapproaches zero. This combined approach was applied to two meadows with differentlevels of disturbance, Cadiz (stable) and Alfacs (disturbed). Genotypic richness, theproportion of the sample representing distinct genotypes, was moderate (0.38 Cadiz, 0.46Alfacs) mostly due to dominance of a few clones. Expected heterozygosities were compara-ble to those found in other clonal plants. SGS analyses at the genet level revealed extremelyrestricted gene dispersal in Cadiz (
Sp
= 0.052, a statistic reflecting the decrease of pairwisekinship with distance), the strongest SGS found for seagrass species, comparable only tovalues for selfing herbaceous land plants. At Cadiz the clonal subrange extended acrossshorter distances (20–25 m) than in Alfacs (30–35 m). Comparisons of sexual and vegetativecomponents of gene dispersal suggest that, as a dispersal vector within meadows, clonalspread is at least as important as sexual reproduction. The restricted dispersal and SGS pat-tern in both meadows indicates that the species follows a repeated seedling recruitmentstrategy.
Keywords
: clonal plant, clonal subrange,
Cymodocea nodosa
, microsatellites, seagrass, SGS
Received 1 February 2005; revision received 15 April 2005; accepted 6 May 2005
Introduction
Genetic structure can be defined as the development of anonrandom distribution of alleles at a given spatial scaleresulting from limited dispersal, selection, genetic driftand population history. An important concept related todispersal is isolation by distance, which predicts the expectedpattern of spatial genetic structure (SGS) under restricteddispersal and local genetic drift (Vekemans & Hardy 2004).The amount and scale of gene flow determines the role oflocal adaptation and population SGS in the evolutionary
process (Wright 1977; Fenster
et al
. 2003). In plants, SGS isthe result of the joint effect of pollen and seed dispersaland, for the numerous plant species exhibiting clonality, ofthe pattern of clonal growth. Indeed, clonality is expectedto greatly influence the patterns of SGS, both because of theexpected aggregated distribution of clone mates with anidentical genotype, and because clonal growth is also acomponent of spatial dispersal (Gliddon
et al
. 1987). Thestrength of the influence of clonality on SGS will depend onthe type and rate of clonal growth (Marbà & Duarte 1998),intermingling among clones, fragmentation and the lifespanof the genets. For example if the clone becomes fragmentedand is present at long distances from the initial seedlinggermination site, then clonal reproduction increases the
Correspondence:
E
ster
A
.
S
errão,
F
ax: +351 289818353; E-mail:[email protected]
2670
F . A L B E R T O
E T A L .
© 2005 Blackwell Publishing Ltd,
Molecular Ecology
, 14, 2669–2681
genet dispersal (Chung & Epperson 1999, 2000; Chung
et al
. 2000). Species or stages that exhibit a ‘guerrilla’ typeof clonal growth (irregular shape and widespread ramets:Lovett Doust 1981) are expected to show high clonal inter-mingling and dispersal. Conversely, a ‘phalanx’ strategy(regularly shaped radiating circles of densely clumpedramets) will lead to clone mate clustering and consequentlyto increased SGS. A key question specific to clonal organismsis the effect of clonality on SGS, i.e. the identification of thespatial scales over which clonal processes affect the geneticstructure of the population, which we hereafter refer to asthe clonal subrange of the SGS. Despite this, some studiespurposely increase the porosity of the sampling program soas to avoid any effects of clonality on the resulting depictionof the SGS (i.e. selecting a minimum sampling distance greaterthan the expected spread of the clones). This approachresults in loss of information on both the role of clonality asa driver of SGS, and on the SGS at small spatial scales.
Spatial genetic autocorrelation analysis examines thegenetic relatedness between pairs of individuals withregard to their relative positions in space (cf. Epperson2003 and Vekemans & Hardy 2004). Theoretical models ofisolation by distance predict patterns of SGS at drift–dispersal equilibrium, and recent theoretical and methodo-logical advances allow new inferences about gene dispersaland neighbourhood size (Rousset 1997; Hardy & Vekemans1999; Vekemans & Hardy 2004). For neutral genetic markersthe expected outcome of SGS on spatial autocorrelogramsis a linear decrease in the mean genetic kinship coefficientwith the logarithm of spatial distance for two-dimensionalpopulations. The slope of the regression equation describ-ing this decline can be used to estimate SGS parameterssuch as gene dispersal and Wright’s ‘neighbourhood size’(Fenster
et al
. 2003).Effective sexual recruitment is the result of pollen and
seed dispersal, seed germination and establishment,and seedling growth. Recruitment behaviour and genetdynamics in clonal plants have been described in anidealized and simplified way by Eriksson (1993, 1997) as acontinuum from ‘repeated seedling recruitment’ (RSR)into adult populations, and unique ‘initial seedling recruit-ment’ (ISR) at the beginning of population history. In theRSR strategy seedlings recruit regularly within stands ofestablished adults, whereas in the ISR strategy they onlyestablish during the initial colonization period, and furtherdevelopment of the meadow is due to clonal growth (Eriksson1993, 1997). It has been hypothesized that repeated seed-ling recruitment would be more common in clonal marineplants than in their terrestrial counterparts (Inglis 2000),since the micro-environment provided by establishedmeadows may increase seedling survival (Terrados 1993).
Here we analyse the SGS and clonal structure of a dio-ecious seagrass (
Cymodocea nodosa
) in two meadows bymeans of spatial autocorrelation using pairwise kinship
coefficients estimated from microsatellite alleles and fourdifferent methods of analysing the data. Based on
C. nodosa
seed morphology and position, we expected sexual disper-sal to be weak and the meadows to exhibit ‘repeated seed-ling recruitment’, while the high vegetative growth rate ofthis species suggests that clonal propagation should be animportant dispersal vector. Therefore, our objective in thepresent study was to analyse the relative importance ofclonal and sexual dispersal. To achieve this, we evaluatedthe potential of spatial autocorrelograms to estimate dis-persal parameters such as (i) the neighbourhood size andgene dispersal, and (ii) the clonal subrange; a measure ofthe spatial scale at which the probability of clonal identityis near zero (Harada & Iwasa 1996; Harada
et al
. 1997),estimating the spatial range over which clonality directlyaffects SGS.
Materials and methods
Model species
Cymodocea nodosa
(Cymodoceaceae) is a dioecious, rhizo-matous seagrass (Hemminga & Duarte 2000) that exhibitsfast clonal growth, with maximum linear clonal extensionrates in excess of 2 m/year (Duarte & Sand-Jensen 1990). Itoccurs throughout the Mediterranean basin and in theNorth Atlantic from central Portugal to Cap d’Arguin inSenegal, as well as in the Canary Archipelago and the MadeiraIslands.
Cymodocea nodosa
exhibits basicarpy, producingtwo seeds at the base of the female shoots where, in theabsence of disturbance, they remain buried under thesediment until germination occurs (Buia & Mazzella 1991).This suggests highly restricted seed dispersal, and althoughthere are anecdotal observations of seeds cast upon theshore and seeds transported by positively buoyant detachedshoots, these mechanisms appear to represent rare dispersalevents. To date, no direct estimates of seed dispersal areavailable for this species and the potential for pollendispersal remains undetermined. While
C. nodosa s
eedlingshave been found at the periphery of established patches,the probability that they could grow and develop a newpatch is estimated at about 10% (Duarte & Sand-Jensen 1990),although this figure may be higher inside establishedmeadows (Terrados 1993).
Study sites and sampling
Two contrasting meadows, separated by over 1000 kmalong the Spanish coast, were sampled in June 2003 toexamine the spatial structure of
C. nodosa
microsatellitegenotypes (see Fig. 1). The Cadiz population occurs on thesouthwest margin of the tidal bay of Cadiz in the Atlantic,where it extends from 0.5 to 3 m water depth. The Alfacspopulation grows in the tideless Alfacs Bay in the
S P A T I A L G E N E T I C S T R U C T U R E I N
C Y M O D O C E A N O D O S A
2671
© 2005 Blackwell Publishing Ltd,
Molecular Ecology
, 14, 2669–2681
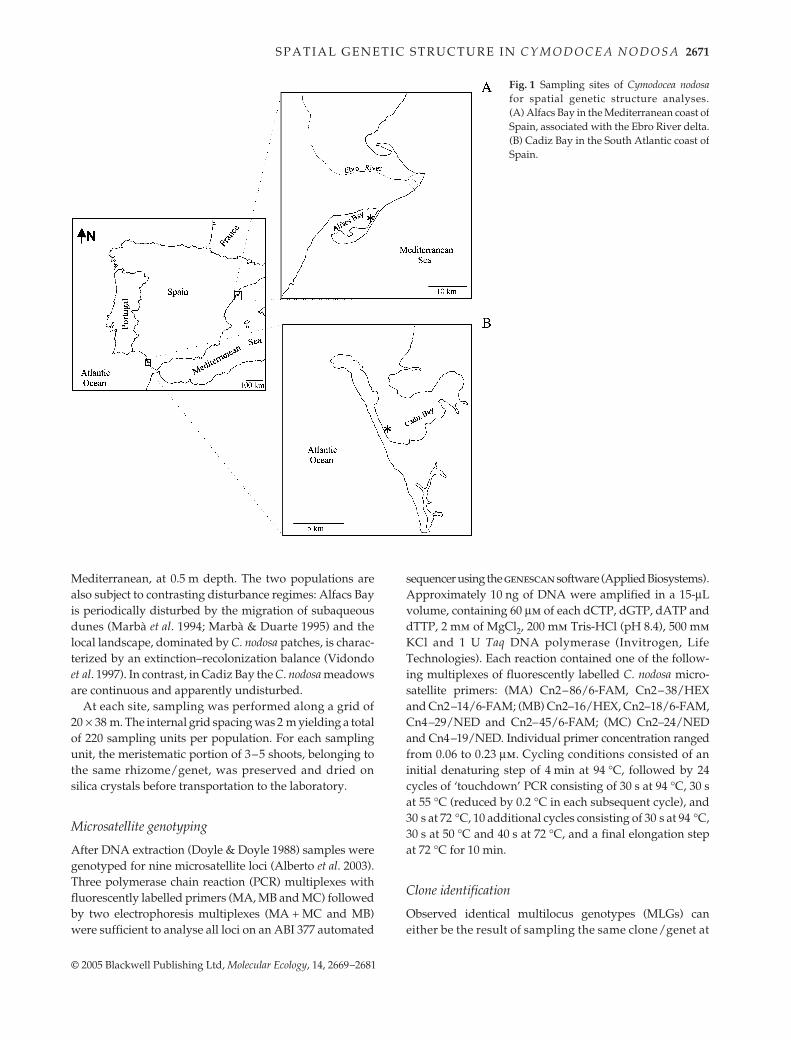
Mediterranean, at 0.5 m depth. The two populations arealso subject to contrasting disturbance regimes: Alfacs Bayis periodically disturbed by the migration of subaqueousdunes (Marbà
et al
. 1994; Marbà & Duarte 1995) and thelocal landscape, dominated by
C. nodosa
patches, is charac-terized by an extinction–recolonization balance (Vidondo
et al
. 1997). In contrast, in Cadiz Bay the
C. nodosa
meadowsare continuous and apparently undisturbed.
At each site, sampling was performed along a grid of20
×
38 m. The internal grid spacing was 2 m yielding a totalof 220 sampling units per population. For each samplingunit, the meristematic portion of 3–5 shoots, belonging tothe same rhizome/genet, was preserved and dried onsilica crystals before transportation to the laboratory.
Microsatellite genotyping
After DNA extraction (Doyle & Doyle 1988) samples weregenotyped for nine microsatellite loci (Alberto
et al
. 2003).Three polymerase chain reaction (PCR) multiplexes withfluorescently labelled primers (MA, MB and MC) followedby two electrophoresis multiplexes (MA + MC and MB)were sufficient to analyse all loci on an ABI 377 automated
sequencer using the
genescan
software (Applied Biosystems).Approximately 10 ng of DNA were amplified in a 15-
µ
Lvolume, containing 60
µ
m
of each dCTP, dGTP, dATP anddTTP, 2 m
m
of MgCl
2
, 200 m
m
Tris-HCl (pH 8.4), 500 m
m
KCl and 1 U
Taq
DNA polymerase (Invitrogen, LifeTechnologies). Each reaction contained one of the follow-ing multiplexes of fluorescently labelled
C. nodosa
micro-satellite primers: (MA) Cn2–86/6-FAM, Cn2–38/HEXand Cn2–14/6-FAM; (MB) Cn2–16/HEX, Cn2–18/6-FAM,Cn4–29/NED and Cn2–45/6-FAM; (MC) Cn2–24/NEDand Cn4–19/NED. Individual primer concentration rangedfrom 0.06 to 0.23
µ
m
. Cycling conditions consisted of aninitial denaturing step of 4 min at 94
°
C, followed by 24cycles of ‘touchdown’ PCR consisting of 30 s at 94
°
C, 30 sat 55
°
C (reduced by 0.2
°
C in each subsequent cycle), and30 s at 72
°
C, 10 additional cycles consisting of 30 s at 94
°
C,30 s at 50
°
C and 40 s at 72
°
C, and a final elongation stepat 72
°
C for 10 min.
Clone identification
Observed identical multilocus genotypes (MLGs) caneither be the result of sampling the same clone/genet at
Fig. 1 Sampling sites of Cymodocea nodosafor spatial genetic structure analyses.(A) Alfacs Bay in the Mediterranean coast ofSpain, associated with the Ebro River delta.(B) Cadiz Bay in the South Atlantic coast ofSpain.
2672
F . A L B E R T O
E T A L .
© 2005 Blackwell Publishing Ltd,
Molecular Ecology
, 14, 2669–2681
two different spatial coordinates, or two different geno-types originated by two distinct sexual reproduction eventsbut sharing the same alleles for all genotyped loci (Arnaud-Haond
et al
. 2005). The probability of encountering thelatter depends on the population frequencies for the allelesin that genotype and the number of loci used to fingerprintsamples. To address this issue, we estimated the probabilityof a given multilocus genotype occurring
n
times as aconsequence of different sexual reproduction events (
P
sex
),according to Parks & Werth (1993). Detailed description of
P
sex
estimation and genet assignment using an appropriateset of markers is reported elsewhere (Arnaud-Haond
et al
.2005). Once clones were identified genotypic richness wasestimated for each site according to Dorken & Eckert (2001)as:
(eqn 1)
Where
G
is the number of distinct genotypes and
N
thesample size. The distribution of clone size was describedusing the distance between the farthest clone mates as aconservative estimate of the linear size of the clone. Inclonal plants this distribution is typically skewed with onlya few clones having large dimensions. Hämmerli & Reusch(2003a) found for the seagrass
Zostera marina
that clonalsize increased with heterozygosity, suggesting that moreoutbred genets would be better competitors for spaceoccupation. We examined the hypothesis of a relationshipbetween genet heterozygosity and clone size (number ofclonal replicates) using a Monte Carlo simulation providedby the program
clonality
version 1 (Prugnolle
et al
. 2004).This program tests if MLGs repeated in the sample (i.e.clonal growth) have an increasing effect on populationheterozygosity, resulting in a decrease of the inbreedingcoefficient
F
IS
. The program first estimates
F
IS
, using Weir& Cockerham’s (1984) unbiased estimator
f,
without remov-ing repeated MLGs (sample
N
) and detects how manyMLGs have multiple copies and how many copies for eachof these. It proceeds by reducing the data to a single copy foreach MLG (sample U), and a new sample is then generated(sample R1) by amplifying randomly chosen genotypesof sample U so that the sample size and the amount ofrepetitions of multilocus genotypes are kept identical tothose found in sample N (see Fig. 1, Prugnolle
et al
. 2004).The procedure is repeated 5000 times (samples R1 to R5000)and a corresponding
f
Ri
is computed each time (
f
R1
to
f
R5000
).A
P
value is obtained by computing the proportion oftimes that
f
Ri
≤
f
.
Population genetic statistics
Allele frequencies, expected heterozygosities (
H
E
) andinbreeding coefficients (
f
) were estimated using the software
genepop
(Raymond & Rousset 1995). Hardy–Weinberg
equilibrium and genotypic linkage disequilibrium (using asingle copy per genet) were tested for each populationusing the exact Hardy–Weinberg test (Weir 1990) and theFisher exact test, respectively, both available in
genepop
.
Spatial genetic structure
Two main types of analyses were performed with both datasets, one with the repetitions of MLGs kept throughout,and another using a single copy per MLG; they are hereaftercalled ramet- and genet-level analyses, respectively. At theramet level one tries to characterize the potential amplifyingeffects of clonality on SGS, created by the genetic correlationbetween clone mate pairs. The genet-level analysis circum-vents the latter problem; however, clonality is a componentof dispersal and so affects the observed SGS pattern evenwhen repeated MLGs are removed.
The genetic co-ancestry between pairs of individuals canbe summarized over a range of distance intervals in termsof multilocus estimates of kinship (
F
ij
). In order to do so, weused a kinship coefficient used in Loiselle
et al
. (1995) andimplemented in the software
spagedi
(Hardy & Vekemans2002). Average kinship coefficients were estimated for thefollowing distance classes: 0–2; 2–4; 4–6; 6–8; 8–10; 10–12;12–14; 14–16; 16–18; 18–20; 20–25; 25–30 and 30–45 m.Correlograms were constructed by plotting mean pairwisekinship coefficients as a function of spatial distance class.Pairwise kinship coefficients were regressed on the logarithmof spatial distance to estimate a regression slope (
blog
).For each population, spatial locations were randomly
permuted among individuals 10 000 times in order to test,for each spatial distance class, whether the observed meankinship values were different from those expected under arandom distribution of genotypes. To test the significanceof the observed SGS pattern, a distribution of regressionslopes was also constructed using a permutation test, and
P
values for the observed regression were estimated as thefraction of this distribution greater than the observed slope(tests available in
spagedi
). Ramet- and genet-level analysesare detailed below.
Ramet-level analysis
Coupled to the traditional ramet-level analyses an additionalmethod was performed using all sampled ramets butnow considering only the kinship values for pairs betweendifferent genets (using the option 4.3.3.5.3, in
spagedi
software, where categories corresponded to different clones).In this analysis all spatial information for a given multi-sampled genet is kept since all repetitions from a givengenotype are used, but the potential inflating effect on SGSproduced by clone mate pairs is removed. Hereafter wewill refer to this method as the among-genet analyses.Where clonal growth results in the spatial clustering of
RGN
=−−
11
S P A T I A L G E N E T I C S T R U C T U R E I N
C Y M O D O C E A N O D O S A
2673
© 2005 Blackwell Publishing Ltd,
Molecular Ecology
, 14, 2669–2681
clone mates, the ‘ramet level’ will produce higher kinshipvalues than the ‘among genet’ within the spatial rangewhere clone mates are clumped, beyond which bothtake similar values. In fact, if we plot both correlogramstogether, we show that the point where the two curvesmerge is an estimate of the spatial range at which clonalityhas non-negligible effects on the SGS, here defined asclonal subrange. In order to further illustrate the clonalsubrange we determined the probability of clonal identity(
F
r
) as a function of spatial distance (Harada & Iwasa 1996).For that purpose we computed, for a set of distanceintervals, the fraction of pairs of ramets sharing the samemultilocus genotype. The values were plotted on top ofthe above-described autocorrelogram. This analysis wasperformed using an
r
1.6.1 (The
r
Development CoreTeam, 2002) code.
Genet-level analysis
SGS was characterized after removing clonal replicatesfrom the data set and considering the central coordinates ofeach clone (average of
x
and
y
coordinates of clone mates).Using a genet’s central coordinates for its spatial represent-ation can be justified as this point is the most parsimoniousposition of the clone’s birthplace. However this assumesisotropic growth and no disturbance causing loss of asector of the clone. The first assumption is not supportedby available information that shows that the origin of thepatch/clone is always displaced relative to the geometriccentre (Duarte & Sand-Jensen 1990; Vidondo
et al
. 1997). Aresampling technique was used to analyse the variancein the estimates resulting from the selection of differentspatial coordinates to represent the clone. A randomrepresentative ramet from each genotype repeated in thesample was resampled to create a matrix with a single copyof each genet, the procedure was repeated 100 times toestimate the dispersion of the estimates. The proportion ofthese 100 data sets yielding significant mean kinship valuesfor the first distance class and/or significant regressionslopes was recorded.
Indirect estimation of dispersal, and neighbourhood size
The intersection between the correlogram curve and the
x
-axis of the plot is often considered as an estimate of thedistance within which individuals reproduce with theirclose relatives, or the radius of a patch (Epperson 2003).However, this method is highly dependent on the spatialscale of sampling (Fenster
et al
. 2003). Thus, we ratherestimated the neighbourhood size (
Nb
), the number ofindividuals that characterize the strength of genetic drift inthe population (Vekemans & Hardy 2004). A redefinitionof the concept is proposed by Fenster
et al. (2003), defining
neighbourhood area as a circular area containing such Nbindividuals, within which biparental inbreeding remainsinsignificant. If the SGS pattern is produced by an isolation-by-distance process, at drift–dispersal equilibrium in atwo-dimensional space, Nb can be estimated from blogand is equal to –(1 – F(1))/blog (Hardy & Vekemans 1999;Fenster et al. 2003), where F1 is the average Fij betweenindividuals belonging to the first distance class (here F1 =F[2m]). However, under the above-mentioned conditions,kinship is expected to decrease linearly with the logarithmof spatial distance for a restricted range (σ to 20σ, where σis the axial standard deviation of gene dispersal distances;Rousset 1997). As σ is unknown, an iterative approachavailable in spagedi was used to estimate blog using theobserved genotype density as the effective populationdensity (D). The neighbourhood area was calculated asthe surface that would contain the Nb individuals foreach population. Because blog depends to some extenton the sampling scale used and it is negative, we alsoestimated the Sp statistic which absolute value reflectsthe rate of decrease of pairwise kinship with distance(Vekemans & Hardy 2004). This allowed us to comparethe SGS pattern in C. nodosa with the strength of patternsobserved among other species. The Sp statistic is equal to–blog/(1 – F(1)).
Finally we evaluated the relative importance of clonalgrowth and sexual reproduction to gene dispersal. First wecomputed the axial variance of gene dispersal mediated byclonal growth (Gliddon et al. 1987), as one-half themean squared distance between a ramet and the centralcoordinates of the clone to which it belongs. To calculate
, we used all sampled genets, not only those that hadmore than one ramet sampled, and in order to do so anarbitrary distance of 1 m (half the minimum distancebetween consecutive sample units) was considered forgenets which appeared only once in the sample. Then weapplied the Gliddon et al. (1987) model of parent–offspringdispersal variance (σ2):
(eqn 2)
where is the pollen dispersal variance and the seeddispersal variance and consequently the sexual mediateddispersal variance is . The genet-levelSGS-based estimate of Nb (see above) is also a function ofthe sexual and vegetative components of dispersal varianceand can be used to estimate the total variance σ2 = Nb/4πD.An estimate of can then be obtained by subtractingfrom σ2 the above-estimated .
Scoring errors and/or somatic mutations effects on SGS
We evaluated the potential bias caused by scoring errors orsomatic mutations, on the strength of positive autocorrelation
σveg2
σveg2
σ σ σ σ σ σ σ2 2 2 2 2 2 212
= + + ⇔ = +p s veg sex veg
σp2 σs
2
σ σ σsex p s2 2 21 2 / = +
σsex2
σveg2
2674 F . A L B E R T O E T A L .
© 2005 Blackwell Publishing Ltd, Molecular Ecology, 14, 2669–2681
at smaller distance classes. This problem can arise if clonemates are erroneously assigned as different, thus beingincluded in the analyses where clonal repeats are excluded.We produced an r 1.6.1 (The r Development Core Team,2002) routine to detect which pairs differ by only a singleallele while being neighbours in the 2-m sampling scale.When such pairs were found the smaller genet was removedfrom the data set as a potential source of error. A total of18 genotypes in Cadiz and 14 genotypes in Alfacs wereremoved. Separate analysis after the exclusion of thesegenotypes did not differ from those with the completedata set.
Results
Genotypic richness and clonal structure
The number of alleles amplified was 41 and 39, and a totalof 83 and 95 different microsatellite multilocus genotypes(MLG) were identified for Cadiz Bay and Alfacs Bay,respectively. All repetitions of the same MLG, for all MLGs
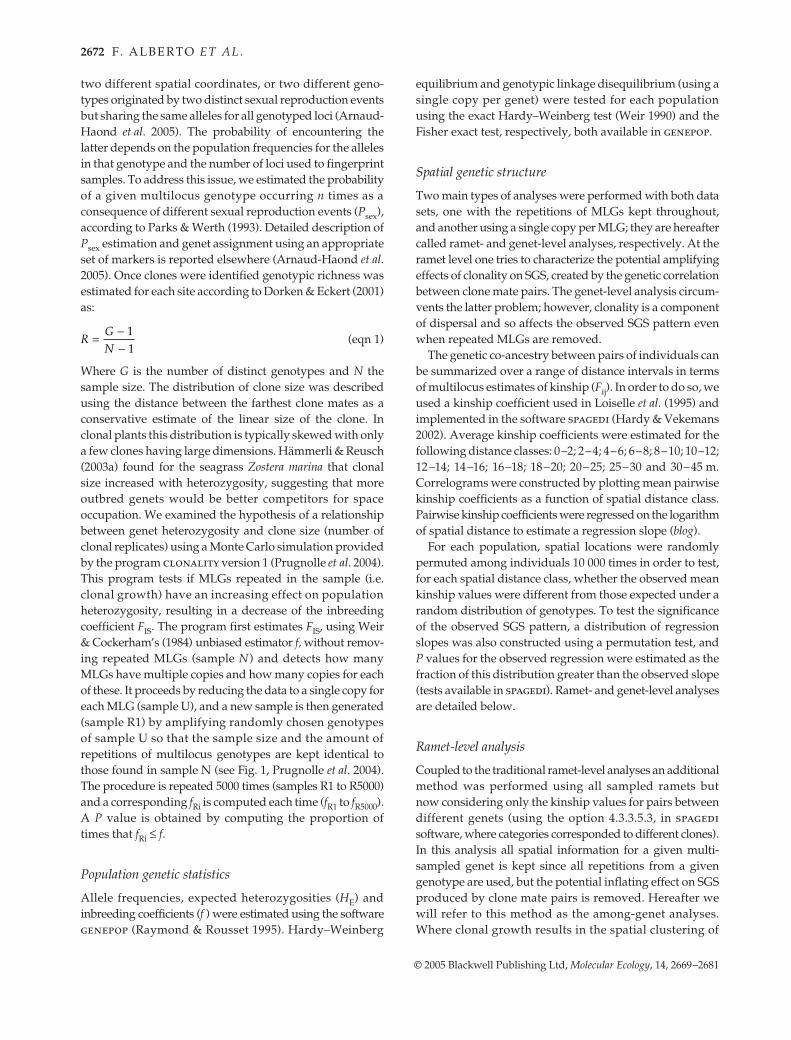
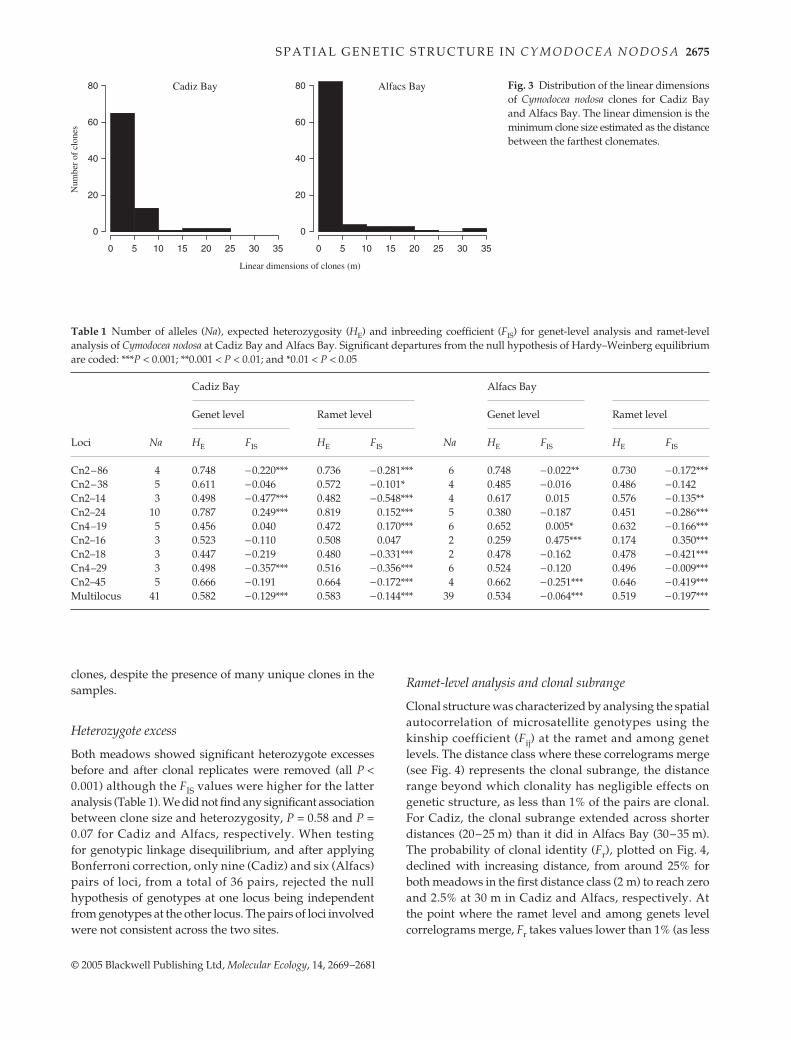
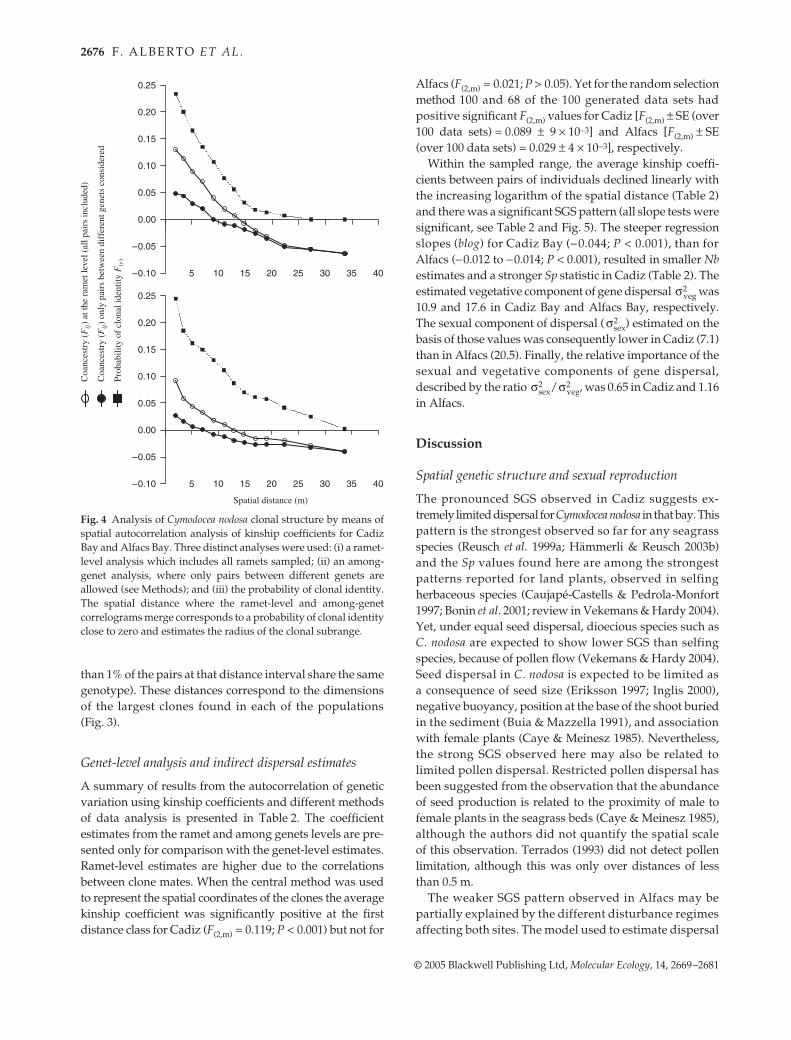
observed in more than one sample unit, had Psex values < 0.05and so were considered to result from repeated samplingof the same clone. Therefore, the number of different MLGsfound corresponds to the number of clones present in oursamples. The spatial organization of clonal repetitions(Fig. 2) shows that both meadows were dominated by afew large clones, which appeared aggregated in space. InCadiz Bay and Alfacs Bay, respectively, only four and twoclones had more than 10 repeats (representing 41% and33% of the 220 sampled shoots) and only 24 and 18 clonesappeared more than once (70% and 57% of the sampledshoots). This resulted in an extremely skewed distributionof clone size, as observed by the distribution of the lineardimension of the clones (Fig. 3), with a median clonaldimension of 3.6 m and 3.4 m in Cadiz Bay and Alfacs Bay,respectively. Genotypic richness was below 0.5 for bothmeadows, although Alfacs Bay showed higher levels(0.46) than Cadiz Bay (0.38). The highly skewed clone sizedistribution, and the low number of clones with more thanone observation, indicate that this moderate genotypicrichness is the result of the dominance of a few, large
Fig. 2 Sampling grids of Cymodocea nodosa inCadiz Bay and Alfacs Bay. The minimumdistance between consecutive sampling pointswas 2 m. The numbers shown code the dif-ferent genets; different patterns are used torepresent each of the clones with more thanone copy. Some sampling sites had no cover;these are represented by blank grid units.
S P A T I A L G E N E T I C S T R U C T U R E I N C Y M O D O C E A N O D O S A 2675
© 2005 Blackwell Publishing Ltd, Molecular Ecology, 14, 2669–2681
clones, despite the presence of many unique clones in thesamples.
Heterozygote excess
Both meadows showed significant heterozygote excessesbefore and after clonal replicates were removed (all P <0.001) although the FIS values were higher for the latteranalysis (Table 1). We did not find any significant associationbetween clone size and heterozygosity, P = 0.58 and P =0.07 for Cadiz and Alfacs, respectively. When testingfor genotypic linkage disequilibrium, and after applyingBonferroni correction, only nine (Cadiz) and six (Alfacs)pairs of loci, from a total of 36 pairs, rejected the nullhypothesis of genotypes at one locus being independentfrom genotypes at the other locus. The pairs of loci involvedwere not consistent across the two sites.
Ramet-level analysis and clonal subrange
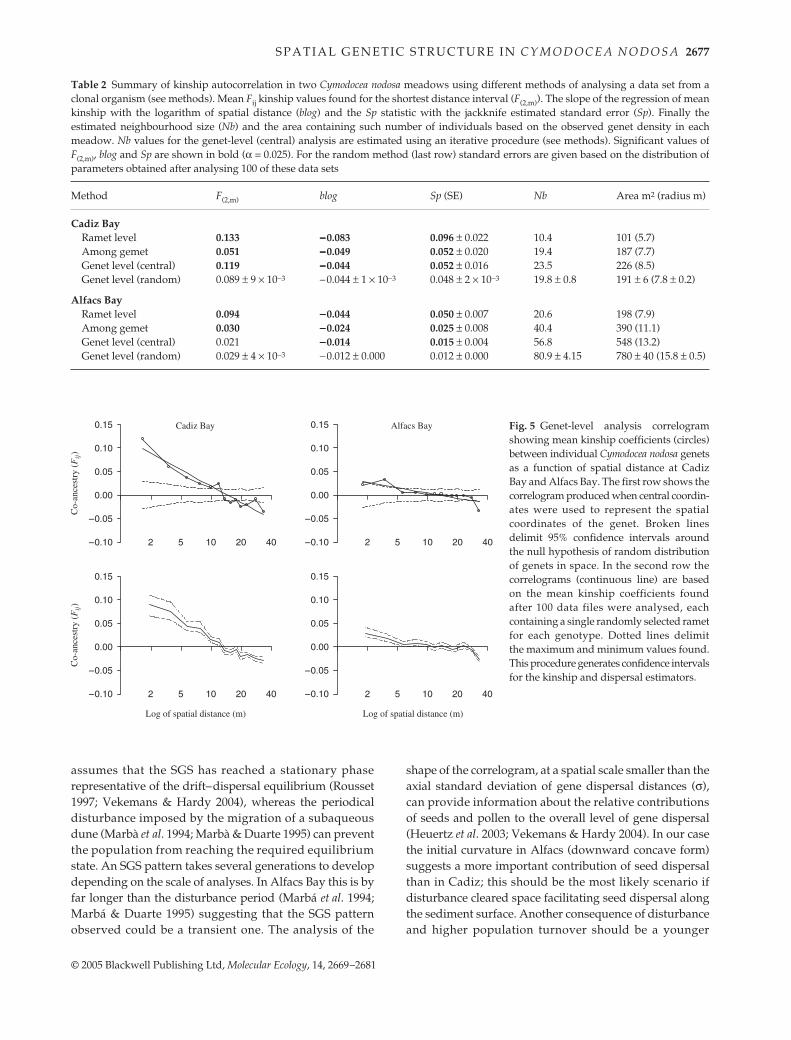
Clonal structure was characterized by analysing the spatialautocorrelation of microsatellite genotypes using thekinship coefficient (Fij) at the ramet and among genetlevels. The distance class where these correlograms merge(see Fig. 4) represents the clonal subrange, the distancerange beyond which clonality has negligible effects ongenetic structure, as less than 1% of the pairs are clonal.For Cadiz, the clonal subrange extended across shorterdistances (20–25 m) than it did in Alfacs Bay (30–35 m).The probability of clonal identity (Fr), plotted on Fig. 4,declined with increasing distance, from around 25% forboth meadows in the first distance class (2 m) to reach zeroand 2.5% at 30 m in Cadiz and Alfacs, respectively. Atthe point where the ramet level and among genets levelcorrelograms merge, Fr takes values lower than 1% (as less
Fig. 3 Distribution of the linear dimensionsof Cymodocea nodosa clones for Cadiz Bayand Alfacs Bay. The linear dimension is theminimum clone size estimated as the distancebetween the farthest clonemates.
Table 1 Number of alleles (Na), expected heterozygosity (HE) and inbreeding coefficient (FIS) for genet-level analysis and ramet-levelanalysis of Cymodocea nodosa at Cadiz Bay and Alfacs Bay. Significant departures from the null hypothesis of Hardy–Weinberg equilibriumare coded: ***P < 0.001; **0.001 < P < 0.01; and *0.01 < P < 0.05
Loci Na
Cadiz Bay
Na
Alfacs Bay
Genet level Ramet level Genet level Ramet level
HE FIS HE FIS HE FIS HE FIS
Cn2–86 4 0.748 −0.220*** 0.736 −0.281*** 6 0.748 −0.022** 0.730 −0.172***Cn2–38 5 0.611 −0.046 0.572 −0.101* 4 0.485 −0.016 0.486 −0.142Cn2–14 3 0.498 −0.477*** 0.482 −0.548*** 4 0.617 0.015 0.576 −0.135**Cn2–24 10 0.787 0.249*** 0.819 0.152*** 5 0.380 −0.187 0.451 −0.286***Cn4–19 5 0.456 0.040 0.472 0.170*** 6 0.652 0.005* 0.632 −0.166***Cn2–16 3 0.523 −0.110 0.508 0.047 2 0.259 0.475*** 0.174 0.350***Cn2–18 3 0.447 −0.219 0.480 −0.331*** 2 0.478 −0.162 0.478 −0.421***Cn4–29 3 0.498 −0.357*** 0.516 −0.356*** 6 0.524 −0.120 0.496 −0.009***Cn2–45 5 0.666 −0.191 0.664 −0.172*** 4 0.662 −0.251*** 0.646 −0.419***Multilocus 41 0.582 −0.129*** 0.583 −0.144*** 39 0.534 −0.064*** 0.519 −0.197***
2676 F . A L B E R T O E T A L .
© 2005 Blackwell Publishing Ltd, Molecular Ecology, 14, 2669–2681
than 1% of the pairs at that distance interval share the samegenotype). These distances correspond to the dimensionsof the largest clones found in each of the populations(Fig. 3).
Genet-level analysis and indirect dispersal estimates
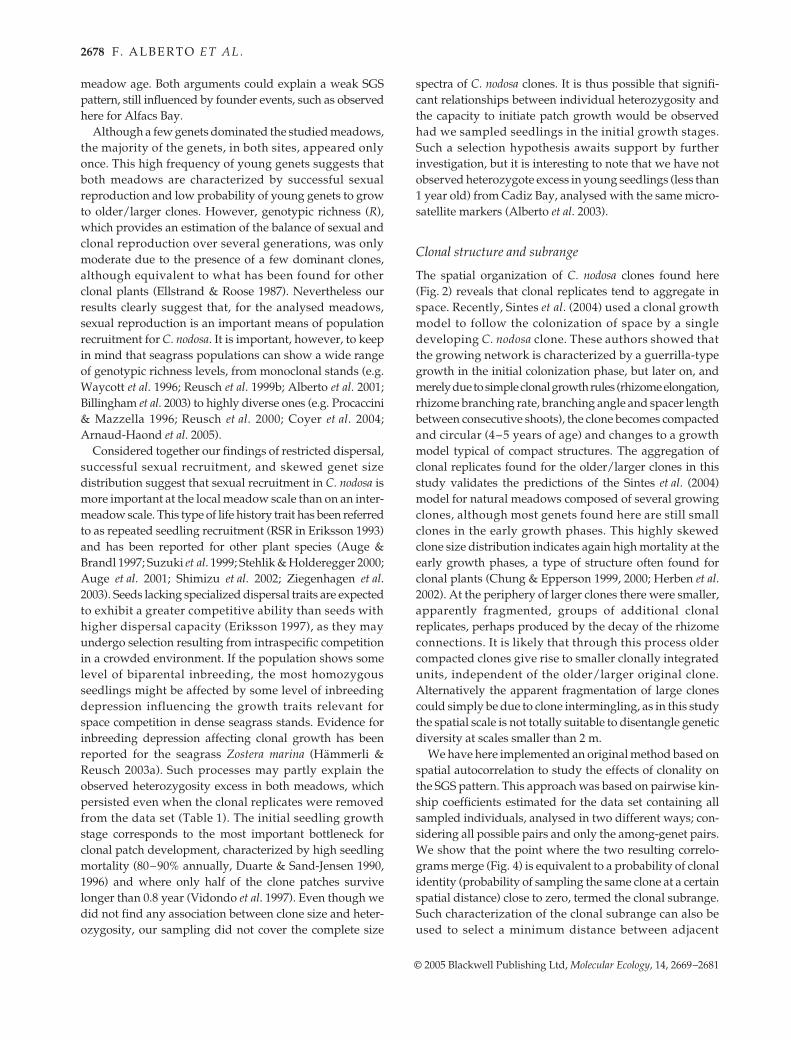
A summary of results from the autocorrelation of geneticvariation using kinship coefficients and different methodsof data analysis is presented in Table 2. The coefficientestimates from the ramet and among genets levels are pre-sented only for comparison with the genet-level estimates.Ramet-level estimates are higher due to the correlationsbetween clone mates. When the central method was usedto represent the spatial coordinates of the clones the averagekinship coefficient was significantly positive at the firstdistance class for Cadiz (F(2,m) = 0.119; P < 0.001) but not for
Alfacs (F(2,m) = 0.021; P > 0.05). Yet for the random selectionmethod 100 and 68 of the 100 generated data sets hadpositive significant F(2,m) values for Cadiz [F(2,m) ± SE (over100 data sets) = 0.089 ± 9 × 10⁻³] and Alfacs [F(2,m) ± SE(over 100 data sets) = 0.029 ± 4 × 10⁻³], respectively.
Within the sampled range, the average kinship coeffi-cients between pairs of individuals declined linearly withthe increasing logarithm of the spatial distance (Table 2)and there was a significant SGS pattern (all slope tests weresignificant, see Table 2 and Fig. 5). The steeper regressionslopes (blog) for Cadiz Bay (−0.044; P < 0.001), than forAlfacs (−0.012 to −0.014; P < 0.001), resulted in smaller Nbestimates and a stronger Sp statistic in Cadiz (Table 2). Theestimated vegetative component of gene dispersal was10.9 and 17.6 in Cadiz Bay and Alfacs Bay, respectively.The sexual component of dispersal ( ) estimated on thebasis of those values was consequently lower in Cadiz (7.1)than in Alfacs (20.5). Finally, the relative importance of thesexual and vegetative components of gene dispersal,described by the ratio / , was 0.65 in Cadiz and 1.16in Alfacs.
Discussion
Spatial genetic structure and sexual reproduction
The pronounced SGS observed in Cadiz suggests ex-tremely limited dispersal for Cymodocea nodosa in that bay. Thispattern is the strongest observed so far for any seagrassspecies (Reusch et al. 1999a; Hämmerli & Reusch 2003b)and the Sp values found here are among the strongestpatterns reported for land plants, observed in selfingherbaceous species (Caujapé-Castells & Pedrola-Monfort1997; Bonin et al. 2001; review in Vekemans & Hardy 2004).Yet, under equal seed dispersal, dioecious species such asC. nodosa are expected to show lower SGS than selfingspecies, because of pollen flow (Vekemans & Hardy 2004).Seed dispersal in C. nodosa is expected to be limited asa consequence of seed size (Eriksson 1997; Inglis 2000),negative buoyancy, position at the base of the shoot buriedin the sediment (Buia & Mazzella 1991), and associationwith female plants (Caye & Meinesz 1985). Nevertheless,the strong SGS observed here may also be related tolimited pollen dispersal. Restricted pollen dispersal hasbeen suggested from the observation that the abundanceof seed production is related to the proximity of male tofemale plants in the seagrass beds (Caye & Meinesz 1985),although the authors did not quantify the spatial scaleof this observation. Terrados (1993) did not detect pollenlimitation, although this was only over distances of lessthan 0.5 m.
The weaker SGS pattern observed in Alfacs may bepartially explained by the different disturbance regimesaffecting both sites. The model used to estimate dispersal
Fig. 4 Analysis of Cymodocea nodosa clonal structure by means ofspatial autocorrelation analysis of kinship coefficients for CadizBay and Alfacs Bay. Three distinct analyses were used: (i) a ramet-level analysis which includes all ramets sampled; (ii) an among-genet analysis, where only pairs between different genets areallowed (see Methods); and (iii) the probability of clonal identity.The spatial distance where the ramet-level and among-genetcorrelograms merge corresponds to a probability of clonal identityclose to zero and estimates the radius of the clonal subrange.
σveg2
σsex2
σsex2 σveg
2
S P A T I A L G E N E T I C S T R U C T U R E I N C Y M O D O C E A N O D O S A 2677
© 2005 Blackwell Publishing Ltd, Molecular Ecology, 14, 2669–2681
assumes that the SGS has reached a stationary phaserepresentative of the drift–dispersal equilibrium (Rousset1997; Vekemans & Hardy 2004), whereas the periodicaldisturbance imposed by the migration of a subaqueousdune (Marbà et al. 1994; Marbà & Duarte 1995) can preventthe population from reaching the required equilibriumstate. An SGS pattern takes several generations to developdepending on the scale of analyses. In Alfacs Bay this is byfar longer than the disturbance period (Marbá et al. 1994;Marbá & Duarte 1995) suggesting that the SGS patternobserved could be a transient one. The analysis of the
shape of the correlogram, at a spatial scale smaller than theaxial standard deviation of gene dispersal distances (σ),can provide information about the relative contributionsof seeds and pollen to the overall level of gene dispersal(Heuertz et al. 2003; Vekemans & Hardy 2004). In our casethe initial curvature in Alfacs (downward concave form)suggests a more important contribution of seed dispersalthan in Cadiz; this should be the most likely scenario ifdisturbance cleared space facilitating seed dispersal alongthe sediment surface. Another consequence of disturbanceand higher population turnover should be a younger
Table 2 Summary of kinship autocorrelation in two Cymodocea nodosa meadows using different methods of analysing a data set from aclonal organism (see methods). Mean Fij kinship values found for the shortest distance interval (F(2,m)). The slope of the regression of meankinship with the logarithm of spatial distance (blog) and the Sp statistic with the jackknife estimated standard error (Sp). Finally theestimated neighbourhood size (Nb) and the area containing such number of individuals based on the observed genet density in eachmeadow. Nb values for the genet-level (central) analysis are estimated using an iterative procedure (see methods). Significant values ofF(2,m), blog and Sp are shown in bold (α = 0.025). For the random method (last row) standard errors are given based on the distribution ofparameters obtained after analysing 100 of these data sets
Method F(2,m) blog Sp (SE) Nb Area m2 (radius m)
Cadiz BayRamet level 0.133 −−−−0.083 0.096 ± 0.022 10.4 101 (5.7)Among gemet 0.051 −−−−0.049 0.052 ± 0.020 19.4 187 (7.7)Genet level (central) 0.119 −−−−0.044 0.052 ± 0.016 23.5 226 (8.5)Genet level (random) 0.089 ± 9 × 10⁻³ −0.044 ± 1 × 10⁻³ 0.048 ± 2 × 10⁻³ 19.8 ± 0.8 191 ± 6 (7.8 ± 0.2)
Alfacs BayRamet level 0.094 −−−−0.044 0.050 ± 0.007 20.6 198 (7.9)Among gemet 0.030 −−−−0.024 0.025 ± 0.008 40.4 390 (11.1)Genet level (central) 0.021 −−−−0.014 0.015 ± 0.004 56.8 548 (13.2)Genet level (random) 0.029 ± 4 × 10⁻³ −0.012 ± 0.000 0.012 ± 0.000 80.9 ± 4.15 780 ± 40 (15.8 ± 0.5)
Fig. 5 Genet-level analysis correlogramshowing mean kinship coefficients (circles)between individual Cymodocea nodosa genetsas a function of spatial distance at CadizBay and Alfacs Bay. The first row shows thecorrelogram produced when central coordin-ates were used to represent the spatialcoordinates of the genet. Broken linesdelimit 95% confidence intervals aroundthe null hypothesis of random distributionof genets in space. In the second row thecorrelograms (continuous line) are basedon the mean kinship coefficients foundafter 100 data files were analysed, eachcontaining a single randomly selected rametfor each genotype. Dotted lines delimitthe maximum and minimum values found.This procedure generates confidence intervalsfor the kinship and dispersal estimators.
2678 F . A L B E R T O E T A L .
© 2005 Blackwell Publishing Ltd, Molecular Ecology, 14, 2669–2681
meadow age. Both arguments could explain a weak SGSpattern, still influenced by founder events, such as observedhere for Alfacs Bay.
Although a few genets dominated the studied meadows,the majority of the genets, in both sites, appeared onlyonce. This high frequency of young genets suggests thatboth meadows are characterized by successful sexualreproduction and low probability of young genets to growto older/larger clones. However, genotypic richness (R),which provides an estimation of the balance of sexual andclonal reproduction over several generations, was onlymoderate due to the presence of a few dominant clones,although equivalent to what has been found for otherclonal plants (Ellstrand & Roose 1987). Nevertheless ourresults clearly suggest that, for the analysed meadows,sexual reproduction is an important means of populationrecruitment for C. nodosa. It is important, however, to keepin mind that seagrass populations can show a wide rangeof genotypic richness levels, from monoclonal stands (e.g.Waycott et al. 1996; Reusch et al. 1999b; Alberto et al. 2001;Billingham et al. 2003) to highly diverse ones (e.g. Procaccini& Mazzella 1996; Reusch et al. 2000; Coyer et al. 2004;Arnaud-Haond et al. 2005).
Considered together our findings of restricted dispersal,successful sexual recruitment, and skewed genet sizedistribution suggest that sexual recruitment in C. nodosa ismore important at the local meadow scale than on an inter-meadow scale. This type of life history trait has been referredto as repeated seedling recruitment (RSR in Eriksson 1993)and has been reported for other plant species (Auge &Brandl 1997; Suzuki et al. 1999; Stehlik & Holderegger 2000;Auge et al. 2001; Shimizu et al. 2002; Ziegenhagen et al.2003). Seeds lacking specialized dispersal traits are expectedto exhibit a greater competitive ability than seeds withhigher dispersal capacity (Eriksson 1997), as they mayundergo selection resulting from intraspecific competitionin a crowded environment. If the population shows somelevel of biparental inbreeding, the most homozygousseedlings might be affected by some level of inbreedingdepression influencing the growth traits relevant forspace competition in dense seagrass stands. Evidence forinbreeding depression affecting clonal growth has beenreported for the seagrass Zostera marina (Hämmerli &Reusch 2003a). Such processes may partly explain theobserved heterozygosity excess in both meadows, whichpersisted even when the clonal replicates were removedfrom the data set (Table 1). The initial seedling growthstage corresponds to the most important bottleneck forclonal patch development, characterized by high seedlingmortality (80–90% annually, Duarte & Sand-Jensen 1990,1996) and where only half of the clone patches survivelonger than 0.8 year (Vidondo et al. 1997). Even though wedid not find any association between clone size and heter-ozygosity, our sampling did not cover the complete size
spectra of C. nodosa clones. It is thus possible that signifi-cant relationships between individual heterozygosity andthe capacity to initiate patch growth would be observedhad we sampled seedlings in the initial growth stages.Such a selection hypothesis awaits support by furtherinvestigation, but it is interesting to note that we have notobserved heterozygote excess in young seedlings (less than1 year old) from Cadiz Bay, analysed with the same micro-satellite markers (Alberto et al. 2003).
Clonal structure and subrange
The spatial organization of C. nodosa clones found here(Fig. 2) reveals that clonal replicates tend to aggregate inspace. Recently, Sintes et al. (2004) used a clonal growthmodel to follow the colonization of space by a singledeveloping C. nodosa clone. These authors showed thatthe growing network is characterized by a guerrilla-typegrowth in the initial colonization phase, but later on, andmerely due to simple clonal growth rules (rhizome elongation,rhizome branching rate, branching angle and spacer lengthbetween consecutive shoots), the clone becomes compactedand circular (4–5 years of age) and changes to a growthmodel typical of compact structures. The aggregation ofclonal replicates found for the older/larger clones in thisstudy validates the predictions of the Sintes et al. (2004)model for natural meadows composed of several growingclones, although most genets found here are still smallclones in the early growth phases. This highly skewedclone size distribution indicates again high mortality at theearly growth phases, a type of structure often found forclonal plants (Chung & Epperson 1999, 2000; Herben et al.2002). At the periphery of larger clones there were smaller,apparently fragmented, groups of additional clonalreplicates, perhaps produced by the decay of the rhizomeconnections. It is likely that through this process oldercompacted clones give rise to smaller clonally integratedunits, independent of the older/larger original clone.Alternatively the apparent fragmentation of large clonescould simply be due to clone intermingling, as in this studythe spatial scale is not totally suitable to disentangle geneticdiversity at scales smaller than 2 m.
We have here implemented an original method based onspatial autocorrelation to study the effects of clonality onthe SGS pattern. This approach was based on pairwise kin-ship coefficients estimated for the data set containing allsampled individuals, analysed in two different ways; con-sidering all possible pairs and only the among-genet pairs.We show that the point where the two resulting correlo-grams merge (Fig. 4) is equivalent to a probability of clonalidentity (probability of sampling the same clone at a certainspatial distance) close to zero, termed the clonal subrange.Such characterization of the clonal subrange can also beused to select a minimum distance between adjacent

S P A T I A L G E N E T I C S T R U C T U R E I N C Y M O D O C E A N O D O S A 2679
© 2005 Blackwell Publishing Ltd, Molecular Ecology, 14, 2669–2681
samples when the objective is to maximize the genotypicrichness in a given sample or to estimate parameters thatrequire removal of clonal replicates. For the meadows ana-lysed, the probability of sampling the same clone declinedto zero at 30 m in Cadiz whereas in Alfacs it was still 2.5%at that distance.
Indirect estimation of dispersal
Neighbourhood size (Nb) estimates indicate the balancebetween drift and gene flow at a local scale (Fenster et al.2003). Smaller Nb estimates, around 20–24 in Cadiz, suggestthat genetic drift and inbreeding play an important role,and that the homogenizing effects of gene flow shouldbe low. In order to estimate the neighbourhood area weshould have used the effective density (D) instead of theobserved genotype density (Hardy & Vekemans 2002).However, the former is extremely difficult to derive forclonal plants, where the simple estimation of the numberof individuals in a population is a challenge (distinctionbetween genets and ramets). By using the observed geno-type density to estimate patch size we are most likelyunderestimating the total number of genotypes (G) in thesurface analysed, because G is a function of the samplingeffort. On the other hand, and partially compensating forthis, the real effective population size is expected to besmaller than G (Orive 1993), an effect which in this case ismagnified by the unbalanced individual contribution toreproduction expected from the skewed distribution ofclone sizes.
We estimated the axial variance of the clone mates’ spa-tial distribution ( ) as an alternative way to quantify thecontribution of clonal growth to gene dispersal. The modelof Gliddon et al. (1987) and the Nb value estimated throughthe SGS analysis can be used to extract the sexual com-ponent, allowing estimation of the relative importance ofsexual vs. vegetative dispersal. The results obtained sug-gest that, at least for Cadiz Bay, clonal spread might bean important gene dispersal vector, equivalent to sexualreproduction. However the comparison is based onassumptions made concerning the effective density andcaution must be exercised in its interpretation. Also Glid-don et al.’s formula does not assume overlapping genera-tions and the regression slope gives a mean estimate ofdispersal over several generations, whereas the axial vari-ance estimated from the width of genets gives the currentvegetative dispersal. Finally, vegetative dispersal may beunderestimated because of edge effects associated with thesampling scale. Ecological and genetic simulation studiessuch as the ones produced by Sintes et al. (2004) andHeuertz et al. (2003) should be employed together in orderto validate the methods presented here and/or provideadditional ways of describing the influence of clonal repro-duction on SGS.
Acknowledgements
This research is a contribution of the EU-project M&MS (ref.EVK3-CT-2000-00044), and project PNAT/1999/BIA/15003/C ofthe Portuguese Science Foundation (FCT). We thank T. Simões, J.J.Vergara and F. Brun for help in field collections and L. Correia fortechnical help, C. Perrin and G. Pearson for a careful reading ofthis manuscript and anonymous reviewers for their suggestions.Fellowships to F. Alberto (PhD) and S. Arnaud-Haond (postdoc-toral) were granted by FCT and the European Social Fund.
References
Alberto F, Mata L, Santos R (2001) Genetic homogeneity in the sea-grass Cymodocea nodosa at its northern Atlantic limit revealedthrough RAPD. Marine Ecology Progress Series, 221, 299–301.
Alberto F, Correia L, Billot C, Duarte CM, Serrão E (2003) Isolationand characterization of microsatellite markers for the seagrassCymodocea nodosa. Molecular Ecology Notes, 3, 397–399.
Arnaud-Haond S, Alberto F, Procaccini G, Serrão EA, Duarte CM(2005) Assessing genetic diversity in clonal organisms: lowdiversity or low resolution? Combining power and cost-efficiencyin selecting markers. Journal of Heredity, 3, 1–7.
Auge H, Brandl R (1997) Seedling recruitment in the invasiveclonal shrub, Mahonia aquifolium Pursh (Nutt). Oecologia, 110,205–211.
Auge H, Neuffer B, Erlinghagen F, Grupe R, Brandl R (2001)Demographic and random amplified polymorphic DNA ana-lyses reveal high levels of genetic diversity in a clonal violet.Molecular Ecology, 10, 1811–1819.
Billingham M, Reusch TB, Alberto F, Serrão EA (2003) Is asexualreproduction more important at geographical limits? A genetictest of the seagrass Zostera marina in the Ria Formosa, Portugal.Marine Ecology Progress Series, 265, 77–83.
Bonin I, Ronfort J, Wozniak F, Olivierri I (2001) Spatial effects andrare outcrossing events in Medicago truncatula (Fabaceae).Molecular Ecology, 10, 1371–1384.
Buia MC, Mazzella L (1991) Reproductive phenology of the Med-iterranean seagrasses Posidonia oceanica (L.) Delile, Cymodoceanodosa (Ucria) Aschers, and Zostera noltii Hornem. AquaticBotany, 40, 343–362.
Caujapé-Castells J, Pedrola-Monfort J (1997) Space-time patternsof genetic structure within a stand of Androcymbium gramineum(Cav.) McBride (Colchicaceae). Heredity, 79, 341–349.
Caye G, Meinesz A (1985) Observations of the vegetative devel-opment, flowering and seeding of Cymodocea nodosa (Ucria)Acherson on the Mediterranean coasts of France. Aquatic Botany,22, 277–289.
Chung MG, Epperson BK (1999) Spatial genetic structure andclonal and sexual reproduction in populations of Adenophoragrandiflora (Campanulaceae). Evolution, 53, 1068–1078.
Chung MG, Epperson BK (2000) Clonal and spatial genetic struc-ture in Eurya emarginata (Theaceae). Heredity, 84, 170–177.
Chung MG, Chung JM, Chung MY, Epperson BK (2000) Spatialdistribution of allozyme polymorphisms following clonal andsexual reproduction in populations of Rhus javanica (Anacar-diaceae). Silvae Genetica, 48, 223–227.
Coyer JA, Diekmann OE, Serrao EA et al. (2004) Genetic differ-entiation of the seagrass, Zostera noltii, populations throughoutits european, asian and african range. Marine Ecology ProgressSeries, 281, 51–62.
σveg2
2680 F . A L B E R T O E T A L .
© 2005 Blackwell Publishing Ltd, Molecular Ecology, 14, 2669–2681
Dorken ME, Eckert CG (2001) Severely reduced sexual reproduc-tion in northern populations of a clonal plant, Decodon verticillatus(Lythraceae). Journal of Ecology, 89, 339–350.
Doyle JJ, Doyle JL (1988) Natural interspecific hybridization ineastern North American Claytonia. American Journal of Botany,75, 1238–1246.
Duarte CM, Sand-Jensen K (1990) Seagrass colonization: patchformation and patch growth in Cymodocea nodosa. Marine EcologyProgress Series, 65, 193–200.
Duarte CM, Sand-Jensen K (1996) Nutrient constraints onestablishment from seed and on vegetative expansion of theMediterranean seagrass Cymodocea nodosa. Aquatic Botany, 54,279–286.
Ellstrand NC, Roose ML (1987) Patterns of genotypic diversity inclonal plant species. American Journal of Botany, 74, 123–131.
Epperson BK (2003) Geographical Genetics: Monographs in Popula-tion Biology. Princeton University Press, Princeton, New Jersey.
Eriksson O (1993) Dynamics of genets in clonal plants. Trends inEcology & Evolution, 8, 313–316.
Eriksson O (1997) Clonal life histories and the evolution of seedrecruitment. In: The Ecology and Evolution of Clonal Plants (eds deKroon H, van Groenendael J), pp. 211–226. Backhuys Publish-ers, Leiden, The Netherlands.
Fenster CB, Vekemans X, Hardy OJ (2003) Quantifying gene flowfrom spatial genetic structure data in a metapopulation ofChamaecrista fasciculate (Leguminosae). Evolution, 57, 995–1007.
Gliddon C, Belhassen E, Gouyon PH (1987) Genetic neighbor-hoods in plants with diverse systems of mating and differentpatterns of growth. Heredity, 59, 29–32.
Hämmerli A, Reusch TBH (2003a) Inbreeding depression influ-ences genet size distribution in a marine angiosperm. MolecularEcology, 12, 619–629.
Hämmerli A, Reusch TBH (2003b) Genetic neighbourhood ofclone structures in eelgrass meadows quantified by spatialautocorrelation of microsatellite markers. Heredity, 91, 448–455.
Harada Y, Iwasa Y (1996) Analyses of spatial patterns and popu-lation processes of clonal plants. Researches on Population Ecology,38, 153–164.
Harada Y, Kawano S, Iwasa Y (1997) Probability of clonal identity:inferring the relative success of sexual versus clonal reproduc-tion from spatial genetic patterns. Journal of Ecology, 85, 591–600.
Hardy OJ, Vekemans X (1999) Isolation by distance in a continu-ous population: reconciliation between spatial autocorrelationand population genetics models. Heredity, 83, 145–154.
Hardy OJ, Vekemans X (2002) spagedi: a versatile computerprogram to analyse spatial genetic structure at the individual orpopulation levels. Molecular Ecology Notes, 2, 618–620.
Hemminga MA, Duarte CM (2000) Seagrass Ecology. CambridgeUniversity Press, Cambridge.
Herben T, Hara T, Handicova V et al. (2002) Neighborhood effectsand genetic structure in a clonal grass: the role of the spatialstructure of the environment. Plant Species Biology, 16, 1–11.
Heuertz M, Vekemans X, Hausman F, Paladas M, Hardy OJ (2003)Estimating seed vs. pollen dispersal from spatial geneticstructure in the common ash. Molecular Ecology, 12, 2483–2495.
Inglis GJ (2000) Variation in the recruitment behaviour of seagrassseeds: implications for population dynamics and resourcemanagement. Pacific Conservation Biology, 5, 251–259.
Loiselle BA, Sork VL, Nason JD, Graham C (1995) Spatial geneticstructure of a tropical understory shrub. American Journal ofBotany, 82, 1420–1425.
Lovett Doust L (1981) Population dynamics and local specializa-tion in a clonal perennial (Rannunculus repens) I. The dynamicsof ramets in contrasting habitats. Journal of Ecology, 69, 743–755.
Marbà N, Cebrian J, Enríquez S, Duarte CM (1994) Migration oflarge scale subaqueous bedforms measured using seagrasses(Cymodocea nodosa) as tracers. Limnology and Oceanography, 39,126–133.
Marbà N, Duarte CM (1995) Coupling of seagrass (Cymodoceanodosa) patch dynamics to subaqueous dune migration. Journalof Ecology, 83, 381–389.
Marbà N, Duarte CM (1998) Rhizome enlongation and seagrassclonal growth. Marine Ecology Progress Series, 174, 269–280.
Orive M (1993) Effective population size in organisms withcomplex life-histories. Theoretical Population Biology, 44, 316–340.
Parks JC, Werth CR (1993) A Study of spatial features of clones ina population of Bracken fern, Pteridium aquilinum (Dennstaed-tiaceae). American Journal of Botany, 80, 537–544.
Procaccini G, Mazzella L (1996) Genetic Variability and Reproductionin Two Mediterranean Seagrasses. Seagrass Biology: Proceedings ofan International Workshop, pp. 85–92. Rottnest Island, WesternAustralia.
Prugnolle F, Choisy M, Théron A, Durand P, De Meeûs T (2004)Sex-specific correlation between heterozygosity and clone sizein the trematode Schistosma mansoni. Molecular Ecology, 13,2859–2864.
Raymond M, Rousset F (1995) genepop (version 1.2): populationgenetics software for exact tests and ecumenicism. Journal ofHeredity, 86, 248–249.
R Development Core Team (2004) R: A language and environment forstatistical computing. R Foundation for Statistical Computing,Vienna, Austria. ISBN 3-900051-00-3, URL http://www.R-project.org.
Reusch TBH, Hukriede W, Stam WT, Olsen JL (1999a) Differenti-ating between clonal growth and limited gene flow using spatialautocorrelation of microsatellites. Heredity, 83, 120–126.
Reusch TBH, Boström C, Stam WT, Olsen JL (1999b) An ancienteelgrass clone in the Baltic Sea. Marine Ecology Progress Series,183, 301–304.
Reusch TBH, Stam WT, Olsen JL (2000) A microsatellite-basedestimation of clonal diversity and population subdivision inZostera marina, a marine flowering plant. Molecular Ecology, 9,127–140.
Rousset F (1997) Genetic differentiation and estimation of geneflow from F-statistics under isolation by distance. Genetics, 145,1219–1228.
Shimizu Y, Ando M, Sakai F (2002) Clonal structure of naturalpopulations of Cryptomeria japonica growing at differentpositions on slopes, detected using RAPD markers. BiochemicalSystematics and Ecology, 30, 733–748.
Sintes T, Marbà N, Duarte CM, Kendrick GA (2004) Nonlinearprocesses in seagrass colonisation explained by simple clonalgrowth rules. Oikos, 108, 165–175.
Stehlik I, Holderegger R (2000) Spatial genetic structure and clonaldiversity of Anemone nemorosa in late successional deciduouswoodlands of Central Europe. Journal of Ecology, 88, 424–435.
Suzuki JI, Herben T, Krahulec F, Hara T (1999) Size and spatialpattern of Festuca rubra genets in a mountain grassland: its relev-ance to genet establishment and dynamics. Journal of Ecology,87, 942–954.
Terrados J (1993) Sexual reproduction and seed banks of Cymodo-cea nodosa (Ucria) Ascherson meadows on the southeastMediterranean coast of Spain. Aquatic Botany, 46, 293–299.
S P A T I A L G E N E T I C S T R U C T U R E I N C Y M O D O C E A N O D O S A 2681
© 2005 Blackwell Publishing Ltd, Molecular Ecology, 14, 2669–2681
Vekemans X, Hardy OJ (2004) New insights from fine-scale spatialgenetic structure analyses in plant populations. Molecular Ecol-ogy, 13, 921–935.
Vidondo B, Duarte CM, Middelboe AL, Stefasen K, Lutzen T,Nielsen SL (1997) Dynamics of a landscape mosaic: size andage distributions, growth and demography of seagrassCymodocea nodosa patches. Marine Ecology Progress Series, 158,131–138.
Waycott M, Walker DI, James SH (1996) Genetic uniformity inAmphibolis antarctica, a dioecious seagrass. Heredity, 76, 578–585.
Weir BS (1990) Genetic Data Analysis. Sinauer Associates, Sunder-land, Massachusetts.
Weir BS, Cockerham CC (1984) Estimating F-statistics for theanalysis of population structure. Evolution, 38, 1358–1370.
Wright S (1977) Evolution and the Genetics of Populations. Vol. 4.Variability Within and Among Populations. University of ChicagoPress, Chicago.
Ziegenhagen B, Bialozyt R, Kuhlenkamp V, Schulze I, Ulrich A,
Wulf M (2003) Spatial patterns of maternal lineages and clonesof Galium odoratum in a large ancient woodland: inferencesabout seedling recruitment. Journal of Ecology, 91, 578–586.
Filipe Alberto conducted this study as part of his PhD, and isinterested in population genetics of marine organisms. LicíniaGouveia collaborated in this study as part of her undergraduatestudies in marine biology. Sophie Arnaud-Haond is a postdoctoral associate interested in marine evolution and populationgenetics, currently focusing on marine plants and clonal organismsin general. José L. Pérez-Llorens is interested in ecophysiology ofmarine macrophytes. Carlos M. Duarte leads a team studyingmarine biodiversity from the genetic, species and habitat levelto global biogeochemical cycles. Ester A. Serrão leads a researchgroup that is primarily interested in marine ecology, adaptationand population genetics.
Copyright © 2022 FDOKUMEN