Quantifying the Clinical Significance of Cannabis Withdrawal

Withdrawal of BDNF from Hippocampal CulturesLeads to Changes in Genes Involved in SynapticFunction
Abigail Mariga,1 Jiri Zavadil,2* Stephen D. Ginsberg,1,3,4,5 Moses V. Chao1,3,4,6
1 Cell and Molecular Biology Program, New York University Langone Medical Center, New York,New York 10016
2 Department of Pathology and Center for Health Informatics and Bioinformatics, New York University,Langone Medical Center, New York, New York 10016
3 Department of Psychiatry, New York University, Langone Medical Center, New York, New York 10016
4 Department of Physiology and Neuroscience, New York University, Langone Medical Center, New York,New York 10016
5 Center for Dementia Research, Nathan Kline Institute, Orangeburg, New York, New York 10962
6 Skirball Institute of Bimolecular Medicine, NYU Langone Medical Center, New York,New York 10016
Received 14 January 2014; revised 26 June 2014; accepted 23 July 2014
ABSTRACT: Neurotrophins play a crucial role in
mediating neuronal survival and synaptic plasticity. A
lack of trophic factor support in the peripheral nervous
system (PNS) is associated with a transcription-
dependent programmed cell death process in developing
sympathetic neurons. While most of the attention has
been on events culminating in cell death in the PNS, the
earliest events that occur after trophic factor withdrawal
in the central nervous system (CNS) have not been inves-
tigated. In the CNS, brain-derived neurotrophic factor
(BDNF) is widely expressed and is released in an activity-
dependent manner to shape the structure and function of
neuronal populations. Reduced neurotrophic factor sup-
port has been proposed as a mechanism to account for
changes in synaptic plasticity during neurodevelopment
to aging and neurodegenerative disorders. To this end,
we performed transcriptional profiling in cultured rat
hippocampal neurons. We used a TrkB ligand scavenger
(TrkB-FC) to sequester endogenous neurotrophic factor
activity from hippocampal neurons in culture. Using a
high-density microarray platform, we identified a signifi-
cant decrease in genes that are associated with vesicular
trafficking and synaptic function, as well as selective
increases in MAP kinase phosphatases. A comparison of
these changes with recent studies of Alzheimer’s disease
and cognitive impairment in postmortem brain tissue
revealed striking similarities in gene expression changes
for genes involved in synaptic function. These changes
are relevant to a wide number of conditions in which lev-
els of BDNF are compromised. VC 2014 Wiley Periodicals, Inc.
Develop Neurobiol 75: 173–192, 2015
Keywords: BDNF deprivation; microarray;
transcription; synaptic function; hippocampus;
neurodegeneration
Additional Supporting Information may be found in the onlineversion of this article.
Correspondence to: A. Mariga ([email protected]).*Present address: Mechanisms of Carcinogenesis Section, Interna-tional Agency for Research on Cancer, Lyon, France.� 2014 Wiley Periodicals, Inc.Published online 25 July 2014 in Wiley Online Library(wileyonlinelibrary.com).DOI 10.1002/dneu.22216
173

INTRODUCTION
Mechanisms leading to neuronal apoptosis have been
extensively studied following deprivation of nerve
growth factor (NGF) in the peripheral nervous system
(PNS) (Levi-Montalcini and Booker, 1960; Gorin
and Johnson, 1979; Oppenheim, 1991; Deckwerth
and Johnson, 1993). A lack of trophic factor support
in sympathetic neurons and PC12 cells results in a
transcription-dependent programmed cell death pro-
cess that could be prevented by inhibitors of gene
transcription (Martin et al., 1988; Batistaou and
Greene, 1991). Although PNS neurons have been
extensively studied in the context of cell death mech-
anisms, the consequences of neurotrophic factor
deprivation in the CNS have not been fully studied.
An underlying hypothesis has been that the lack of
neurotrophin expression and/or activity may underlie
many neurodegenerative disorders (Appel, 1981;
Chao, 2003; Longo et al., 2007).
BDNF is reduced in several neurodegenerative dis-
eases, including Alzheimer’s disease (AD) and Hun-
tington’s diseases (HD) (Zuccato and Cattaneo,
2009). In particular, exogenous delivery of BDNF
can rescue degenerating neurons in animal models of
AD, HD, and Parkinson’s disease (Murer et al., 2001;
Nagahara et al., 2009; Zuccato and Cattaneo, 2009).
For instance, loss of cortical BDNF in animal models
results in age-dependent degeneration of the striatum
that closely resembles HD (Baquet et al., 2004;
Strand et al., 2007). Despite the overwhelming evi-
dence that BDNF levels are reduced in neurodegener-
ation, it remains unclear whether low levels of BDNF
are a cause, or an effect, of the progressive neuronal
loss in vulnerable cell types. It is also likely that
BDNF levels change during the early phases of dis-
ease onset, which then increases vulnerability of neu-
ronal populations to degeneration.
In this study, we sought to determine whether tran-
scriptional changes occurred as a result of depriving
BDNF from primary hippocampal neurons. We were
interested in investigating early transcriptional events
that occur within 12 h following withdrawal of BDNF
before the induction of proapoptotic genes. We found
that apoptotic death results from BDNF withdrawal in
hippocampal neurons, as assayed by caspase-3 activity
(Supporting Information Figure), in a similar time
frame as NGF withdrawal in cultured sympathetic
neurons (Deshmukh and Johnson, 1997). We antici-
pate that events prior to initiation of cell death could
shed light on the cellular processes that are compro-
mised before cells commit to a death program. This is
an early time period that has not been examined before
for a loss of trophic support. Therefore, we used a
high-density microarray platform to enable extensive
coverage of known transcriptional activity. In this arti-
cle, we report the results of a gene expression profiling
experiment and discuss the significance of these find-
ings in synaptic function.
METHODS
Animals
Timed-pregnant Sprague Dawley rats (Charles River Labo-
ratories) were used in all experiments. Animal handling
was in compliance with the New York University Langone
Medical Center guidelines for the care and use of labora-
tory animals.
Hippocampal Neuronal Cultures
Hippocampal neuron cultures were prepared from embry-
onic day 18 (E18) embryos from timed-pregnant Sprague
Dawley rats. Hippocampal tissue was dissected in Hanks
Balanced Salt Solution and dissociated via trypsin treat-
ment. Following dissociation, tissue was neutralized in
DMEM/10% fetal bovine serum, then triturated in neuro-
basal medium using fire polished glass micropipettes. Cells
were plated at a 1 3 106 cells/well in six-well dishes pre-
coated with poly-D-lysine. Neuronal cultures were then
maintained in neurobasal medium supplemented with B27
for 7 days before BDNF deprivation. 5-fluorouracil was
added to the medium to prevent glial proliferation. After 7
days, cultures were treated with a recombinant human TrkB
fusion protein (TrkB-FC; 688-TK; R&D Systems, Minneap-
olis, MN; 100 ng/mL) to sequester endogenous BDNF, as
described previously (Jeanneteau et al., 2010); no prior
treatment of neuronal cultures with exogenous BDNF had
been performed. TrkB-FC was added to each well and incu-
bated for the following timepoints: 1.5, 3, 6, and 12 h.
RNA Extraction
For each timepoint, culture medium was removed and cells
were washed with phosphate buffered saline. Following
washing, Trizol reagent (Invitrogen) was added and cells
were scraped, RNA extracted and precipitated with phenol
and chloroform and stored at 280�C until use. Untreated
wells of hippocampal neurons served as controls. RNA
quality was assessed via bioanalysis (2100, Agilent Tech-
nologies, Santa Clara, CA). cRNA probes were synthesized
and labeled using the GeneChip WT cDNA Synthesis and
Amplification Kit (Affymetrix, Santa Clara, CA)
Microarray Hybridization and DataAnalysis
Microarray analysis was carried out with cRNA probes syn-
thesized and labeled using the GeneChip WT cDNA
174 Mariga et al.
Developmental Neurobiology

Synthesis and Amplification assay (Affymetrix), and sub-
jected to hybridization with GeneChipVR Rat Exon 1.0 ST
array (Affymetrix) according to the manufacturer’s instruc-
tions. Microarrays were hybridized with cRNA derived
from experimental duplicates (n 5 2) of each time point
along with duplicate untreated control samples.
Analysis of microarray data was performed using Gene-
Spring v11 (Agilent Technologies). The expression value
of each probe set was determined after standard normaliza-
tion of the CEL files by Robust Multichip Average, which
includes quantile normalization step for probe intensity
level (Bolstad et al., 2003). Baseline normalization of every
gene to the average of the control samples was performed.
Analysis of variance (ANOVA), (p < 0.05, alpha setting,
and no corrections) was used to identify reproducible mod-
ulation of transcript abundance across all conditions for the
entire timecourse. ANOVA compared all conditions against
each other and assigned a p-value for any significant differ-
ences based on reproducible replicate measurements. A
threshold of 20% fold-change at any given condition differ-
ent from baseline (untreated control) was applied to further
strengthen the lists identified by ANOVA. Probesets were
considered for functional analysis if the probe set intensity
in one or more of the timepoints was greater than the 20%
threshold in the two biological replicates. Hierarchical clus-
ter analysis was used to cluster gene groups defined by the
ANOVA statistical filtering. Functional annotation was per-
formed with the Gene Ontology (GO) classification system
using the web based DAVID software (Huang et al., 2009).
Genes were grouped into classes using the gene enrichment
clustering tool in DAVID. Significant association of a gene
with a specified functional class was determined by the
EASE Score (cut off p-value � 0.1); a modified Fisher
Exact statistical test used to measure gene enrichment
based on functional annotation in the DAVID system
(Huang et al., 2009). The EASE score for each class is
shown as the gene enrichment p-value on the functional
enrichment tables.
Quantitative PCR Validation
Genes relevant to synaptic function were validated via
quantitative PCR (qPCR). Samples were assayed on a real-
time qPCR cycler (7900HT, Applied Biosystems) using
Taqman probes for these genes: Vesicle-Associated Mem-
brane Protein (VAMP4) assay ID:Rn01490252_m1, Dual
Specificity Phosphatase 5 (DUSP5) assay ID:Rn005
92122_m1, Golgin5 (Golga5) assay ID:Rn01517894_m1,
Spry2 assay ID: (Rn02534289_s1), Acan assay ID:Rn00
573424_m1 Rab8b assay ID:Rn00596360_m1. qPCR
assays were performed in triplicate per sample on a 96 well
platform. The ddCT method was used to determine relative
gene level differences with glyceraldehyde-3 phosphate
dehydrogenase (GAPDH) assay ID:Rn01775763_g1, Beta
Actin (Actb) assay ID: Rn00667869_m1 or Ribophorin
assay ID:Rn00565052_m1 as endogenous controls as
described previously (Alldred et al., 2008, 2009).
Statistical Analysis for QuantitativePCR
Statistical analysis for the qPCR data was performed with
Graph Pad PrismVR
(version 6.0a). Data was analyzed using
one-way ANOVA followed by Dunnett’s multiple compari-
sons test (p-value *p < 0.05, **p < 0.01, and ***p <0.001; 95% Confidence Interval of difference.
RESULTS
Transcriptional Profiling and GeneClustering
To address early events following deprivation of
BDNF, we performed transcriptional profiling in pri-
mary hippocampal cultures treated with TrkB-Fc at
four early time points (1.5, 3, 6 and 12 h) to capture
different phases of transcriptional activity. A sche-
matic diagram of the experimental procedure is pre-
sented in [Fig. 1]. This approach may also reflect
sequestration of NT-3 and NT-4, two neurotrophins
that also bind to TrkB.
Microarray analysis of cultured hippocampal neu-
rons following TrkB-Fc treatment identified 1467
Figure 1 Experimental design. Outline of the BDNF with-
drawal assay and high-density microarray profiling experi-
ments. Hippocampal neurons were generated from E18 rat
embryos and cultured for 7 days. On DIV 7, endogenous
BDNF activity was sequestered by adding TrkB-Fc (100ng/
mL) to the culture medium at different timepoints. Each
timepoint was hypothesized to capture distinct transcrip-
tional changes. The 1.5hr time point was anticipated to cap-
ture immediate early gene activity. This would activate a
subsequent wave of early response genes spanning the 3-
6hr timeframe. Late response gene expression would be
captured from 6hrs up to the 12hr timepoint. After BDNF
withdrawal, RNA was extracted from the samples followed
by high density transcriptional profiling and RT-PCR
validation.
Withdrawal of BDNF from Hippocampal Cultures 175
Developmental Neurobiology

genes with significant reproducibility between exper-
imental replicates. Gene clustering (GeneSpring
supervised clustering tool; Agilent Technologies)
revealed several patterns or mosaics of altered gene
expression [Fig. 2(A)]. Cluster 1 (early up and late
up) is comprised of genes that increased on BDNF
withdrawal and remained upregulated throughout the
duration of the time course [Fig. 2(A,B)]. However, a
majority of these genes had Affymetrix probe IDs but
no gene symbol, suggesting that they had not been
functionally characterized. Only a few functionally
annotated genes from this cluster had fold change
expression levels above the 11.2 fold change cut off
mentioned in the methods [Supporting Information
Table 1]. Two striking transcriptional profiles dis-
played immediate upregulation Cluster 2; [Fig.
2(A,C), Table 1] and downregulation, Cluster 3; [Fig.
2(A,D), Table 2] at early timepoints (1.5 and 3 h),
which returned to baseline by 6–12 h. Genes were
also uncovered that showed a marked decrease (Clus-
ter 4) [Fig. 2(A,E), Supporting Information Table 2]
in the late phases of the time course. Among these
were genes that have been implicated in ribosomal
and golgi function as well as protein transport. These
genes showed at least a 50% decrease in expression,
which may point to a significant compromise in func-
tion. Other clusters that were also distinctly repre-
sented were genes that decreased throughout the
entire timecourse [Cluster 5, Table 3 (Supporting
Information)] and genes that increased at the end of
the timecourse [Cluster 6, Table 4 (Supporting Infor-
mation)]. Some of the genes in these clusters were
overlapping with genes identified in Clusters 2 and 3.
Taken together, these results suggest that withdrawal
of BDNF elicits distinct transcriptional events for dif-
ferent genes during the deprivation process.
Figure 2 Hierarchical clustering post BDNF deprivation. (A) Heatmap illustrating profiles of
change for normalized probe sets after the ANOVA statistical filtering. Red (upregulation), Blue
(downregulation), Yellow (no change). Genes showing similar profiles of changes with time were
grouped to identify profile subgroups in a semi-supervised manner in GeneSpring GX. (B-E) Repre-
sentative gene expression profiles (�50 genes per cluster) were used to generate line graph plots
for trends of change over time for each cluster. The graphs show relative fold change (y-axis) with
time (x-axis). Four clusters are shown; Early up-late up (B), Early up-late down (C), Early down-
late up (D), Late down 6-12hrs (E).
176 Mariga et al.
Developmental Neurobiology

Table 1 Gene List from Cluster 2 Showing Genes That Exhibit the Early Up-Late Down Profile with a Fold Change
Cut Off of 11.2.a
Cluster 2: Early Up-Late Down Fold Change Relative to Control
Affymetrix ID p-Value
Gene
Symbol Gene Name 1.5 h 3 h 6 h 12 h
10716080 0.0078 Dusp5 dual specificity phosphatase 5 2.00 2.21 1.19 21.25
10708021 0.0495 Acan aggrecan 1.65 2.04 1.20 21.16
10861303 0.0092 Rnfl48 ring finger protein 148 1.45 1.14 1.20 1.08
10785773 0.0230 Spry2 sprouty homolog 2 (Drosophila] 1.45 1.34 1.11 21.09
10889919 0.0305 Gpr33 G protein-coupled receptor 33 1.43 1.16 1.22 1.24
10769672 0.0203 Rgs4 regulator of G-protein signaling 4 1.36 1.45 1.01 21.28
10767565 0.0107 Mfsd4 major facilitator superfamily
domain containing 4
1.36 1.37 1.20 21.03
10702412 0.0199 Rspo3 R-spondin 3 homolog (Xenopus
laevis)
1.35 1.23 1.06 21.28
10779835 0.0462 Ang1 angiogenin, ribonudease A family,
member 1 j angiogenin,
ribonudease, RNase A family, 5
1.32 1.24 1.10 1.17
10857382 0.0312 Fgd5 FVVE, RhoGEF and PH domain
containing 5
1.30 1.19 1.22 1.08
10837435 0.0024 Olr446 olfactory receptor 446 1.30 1.14 1.15 1.15
10883071 0.0184 RGD1304963 similar to hypothetical protein
MGC38716
1.30 1.21 1.07 1.07
10899967 0.0271 Olr877 olfactory receptor 877 1.29 1.02 1.03 1.09
10724351 0.0437 Olrl45 olfactory receptor 145 1.29 1.22 1.05 1.19
10726223 0.0128 LOC499276 Similar to RIKEN cDNA
1700022C21
1.28 1.15 1.07 1.14
10717278 0.0082 Taar7d trace-amine-associated receptor 7d 1.28 1.09 1.09 1.08
10879343 0.0328 Olr869 olfactory receptor 869 1.28 1.14 1.21 1.15
10824388 0.0137 Fdps farnesyl diphosphate synthase 1.28 1.28 1.10 21.06
10768642 0.0378 Lamc2 laminin, gamma 2 1.27 1.07 1.08 1.00
10715531 0.0376 Cyp2c23 cytochrome P450, family 2,
subfamily c, polypeptide 23
1.27 1.19 1.18 1.18
10860499 0.0285 Sema3d sema domain, immunoglobulin
domain fig), short basic domain,
secreted, (semaphorin) 3D
1.27 1.21 1.10 21.08
10729057 0.0322 0lr379 olfactory receptor 379 1.27 1.16 1.08 1.10
10718351 0.0398 Fpr1 formyl peptide receptor 1 1.27 1.11 1.07 1.11
10724307 0.0335 Olrl27 olfactory receptor 127 1.27 21.04 1.10 1.08
10773146 0.0316 Fgfbp1 fibroblast growth factor binding pro-
tein 1
1.26 1.17 1.10 1.06
10722858 0.0113 Agbj1 ATP/GTP binding protein-like 1 1.26 1.13 21.01 1.24
10855084 0.0389 0lr806 olfactory receptor 806 1.25 1.19 1.12 1.27
10722237 0.0439 Mrgprb2 MAS-related GPR, member B2 1.25 1.16 1.13 1.11
10905602 0.0076 Dnajb7 DnaJ (Hsp40) homolog, subfamily
B, member 7
1.25 1.08 1.11 1.07
10774361 0.0286 Rab1 RAB1, member RAS oncogene
family
1.25 1.20 1.09 21.06
10709544 0.0496 Olrl90 olfactory receptor 190 1.25 1.03 21.06 1.06
10932612 0.0103 RGD1565862 similar to Spindlin-like protein 2
(SPIIM-2)
1.25 1.14 1.08 1.09
10704565 0.0203 Ptgir prostaglandin 12 (prostacyclin)
receptor (IP)
1.24 1.17 1.14 1.13
10855079 0.0185 Tas2rl26 taste receptor, type 2, member 126 1.24 1.14 1.18 1.24
10735765 0.0073 Olrl515 olfactory receptor 1515 1.24 1.18 1.04 1.16
10724270 0.0344 Olrl04 olfactory receptor 104 1.24 1.07 1.09 1.15
Withdrawal of BDNF from Hippocampal Cultures 177
Developmental Neurobiology

Functional Classification of theTranscriptomic Changes
Following microarray hybridization and gene cluster-
ing, we performed functional analysis of genes in the
1467 ANOVA dataset. Functional classification of the
microarray data was conducted using a Gene Ontology
(GO) module of the DAVID software, which maps
genes to function. We identified distinct groups of
genes that reflected a high degree of functional simi-
larity using the gene enrichment EASE score (modi-
fied Fisher exact statistical test threshold p � 0.1) in
the DAVID system. Enrichment in select classes of
genes was present in Clusters 2 and 3. Cluster 2
TABLE 1. Continued
Cluster 2: Early Up-Late Down Fold Change Relative to Control
Affymetrix ID p-Value
Gene
Symbol Gene Name 1.5 h 3 h 6 h 12 h
10728977 0.0072 Olr318 olfactory receptor 318 1.24 1.13 1.09 1.18
10795077 0.0420 Nrsn1 neurensin 1 1.24 1.37 1.08 1.05
10769765 0.0435 Fcrla Fc receptor-like A 1.24 1.08 1.03 1.13
10935245 0.0371 Actrt1 actin-related protein Tl 1.23 1.09 1.19 1.10
10725841 0.0498 RGD1563217 similar to RIKEN cDNA
4930451111
1.23 1.14 1.08 1.13
10835873 0.0405 0lr419 olfactory receptor 419 1.23 1.17 1.07 1.09
10724678 0.0235 Olr259 olfactory receptor 259 1.23 1.10 1.10 1.08
10817845 0.0429 Vtcn1 V-set domain containing T cell
activation inhibitor 1
1.23 1.08 1.00 1.07
10904769 0.0061 Nrbp2 nuclear receptor binding protein 2 1.23 1.31 1.25 21.13
10749816 0.0215 Olrl355jOlrl525 olfactory receptor 1355 j olfactory
receptor 1525
1.23 1.14 1.09 1.12
10936841 0.0246 RGD1559951 similar to 60S ribosomal protein
L37a
1.23 1.17 1.14 1.11
10817074 0.0357 Pglyrp4 peptidoglycan recognition protein 4 1.23 1.13 1.09 1.15
10701802 0.0018 Plagj1 pleomorphic adenoma gene-like 1 1.23 1.19 1.08 21.15
10811832 0.0422 Nupl33 nudeoporin 133 1.23 1.16 1.10 1.03
10823363 0.0122 P2ry13 purinergic receptor P2Y, G-protein
coupled, 13
1.23 1.10 1.07 1.03
10734740 0.0296 Pik3r6 phosphoinositide-3-kinase,
regulatory subunit 6
1.22 1.06 1.03 1.12
10724609 0.0462 01r221 olfactory receptor 221 1.22 1.10 1.06 1.12
10798475 0.0268 Histlh2bc histone cluster 1, H2bc 1.22 1.18 21.11 1.19
10907904 0.0234 Mmp10 matrix metallopeptidase 10 1.22 1.10 1.03 1.06
10851628 0.0238 Spinlw1 serine peptidase inhibitor-like, with
Kunitz and WAP domains
1 (eppin)
1.22 1.15 1.18 1.16
10782387 0.0083 Nid2 nidogen 2 1.22 1.29 1.00 1.03
10819052 0.0238 Lef1 lymphoid enhancer binding factor 1 1.21 1.35 1.05 21.08
10845607 0.0361 Rbms1 RNA binding motif, single stranded
interacting protein 1
1.21 1.23 1.06 21.18
10876765 0.0053 Olr851 olfactory receptor 851 1.21 1.06 1.11 1.17
10916734 0.0400 C2cd2l C2 calcium-dependent domain
containing 2-like
1.20 1.13 1.08 21.13
10795460 0.0196 Psmel-ps1 proteasome [prosome, macropain)
activator subunit 1 (PA28 alpha),
pseudogene 1
1.20 1.12 1.12 1.07
10719824 0.0166 Cnfn cornifelin 1.20 1.11 1.09 1.08
aThe 1.5 hr timepoint highlights an immediate increase in expression for each gene early in the time course. A majority of the genes within
this cluster also reflect an increase in expression at the 3 hr time point before plateauing to baseline by 6–12hrs. The p-value associated with
each gene is based on reproducible replicate measurements and reflects a significant change (p � 0.05) in probe intensity for one or more time-
points relative to the untreated control.
178 Mariga et al.
Developmental Neurobiology

Table 2 Gene List from Cluster 3 Showing Genes That Exhibit the Early Down-Late Up Trend.a
Cluster 3: Early Down-Late Up Fold Change Relative to Control
Affymetrix
ID
p-
Value
Gene
Symbol Gene Name l.5 h 3 h 6 h 12 h
10902409 0.0161 LOC688019 similar to THAP domain containing,
apoptosis associated protein 2
21.82 21.65 21.13 1.17
10912412 0.0081 Tfdp2 transcription factor Dp-2 (E2F dimeri-
zation partner 2)
21.71 21.55 21.04 21.07
10705431 0.0175 LOC499110 similar to Zinc finger protein 354A
(Transcription factor 17) (Renal tran-
scription factor Kid-1)
21.62 21.44 21.18 1.20
10876567 0.0164 XpajNcbpl xeroderma pigmentosum, complemen-
tation group A j nuclear cap binding
protein subunit 1
21.55 21.56 21.17 1.01
10760760 0.0469 LOC288521 similar to Leukostalin precursor (Leu-
cocyte sialoglycoprotein)
(Sialophorin) (CD43) (W3/13
antigen)
21.53 21.41 21.34 1.79
10849813 0.0495 Zc3h8 zinc finger CCCH type containing 8 21.53 21.48 21.19 1.06
10717779 0.0307 Fbxo5 F-box protein 5 21.51 21.38 21.21 1.37
10752007 0.0191 Dgkg diacylglycerol kinase, gamma 21.49 21.52 21.13 1.00
10833668 0.0368 Gpbp1j1 GC-rich promoter binding protein 1-
like 1
21.49 21.45 21.12 1.14
10836633 0.0195 Phospho2 phosphatase, orphan 2 21.48 21.36 21.19 1.18
10304371 0.0328 Ccdc112 coiled-coil domain containing 112 21.47 21.28 21.15 21.17
10917087 0.0105 Fam55b family with sequence similarity 55,
member B
21.47 21.58 21.18 21.04
10871250 0.0361 Gpbp1j1 GC-rich promoter binding protein 1-
like 1
21.47 21.42 21.10 1.16
10819130 0.0343 Gpbp1j1 GC-rich promoter binding protein 1-
like 1
21.47 21.45 21.09 1.15
10908990 0.0348 Pus3 pseudouridylate synthase 3 21.47 21.27 21.16 1.02
10798376 0.0279 Ttrap Traf and Tnf receptor associated
protein
21.46 21.30 21.19 21.00
10811216 0.0380 Adat1 adenosine deaminase, tRNA-specific 1 21.46 21.37 21.13 1.09
10774435 0.0449 Gpbp1j1 GC-rich promoter binding protein 1-
like 1
21.46 21.45 21.09 1.14
10822961 0.0378 Mfsd8 major facilitator superfamily
domain containing 8
21.46 2.1.51 21.18 1.10
10867688 0.0444 Rbm12b RNA binding motif protein 12B 21.46 21.53 21.03 1.01
10876896 0.0180 Ctnnaj1 catenin (cadherin associated
protein), alpha-like 1
21.45 21.34 21.10 21.22
10750812 0.0433 Cep97 centrosomal protein 97kDa 21.45 21.39 21.10 21.08
10931638 0.0251 Cbx8 chromobox homolog 8 (Pc class
homolog, Drosophila)
21.45 21.10 21.11 21.15
10719829 0.0214 Lipe lipase, hormone sensitive 21.45 21.17 21.08 1.16
10885931 0.0269 RGD1560978 similarto hypothetical protein 21.44 21.39 21.17 21.07
10742104 0.0464 Gpbp1j1 GC-rich promoter binding protein 1-
like 1
21.44 21.44 21.08 1.15
10759241 0.0217 Hscb HscB iron-sulfur cluster
co-chaperone homolog (E. coli)
21.43 21.23 21.11 1.00
10704752 0.0300 Fbxo46 F-box protein 46 21.43 21.16 21.18 1.05
10826158 0.0494 Prmt6 protein arginine methyltransferase 6 21.42 21.33 21.15 1.16
10811208 0.0033 Tmem231 transmembrane protein 231 21.41 21.37 21.15 1.08
10705772 0.0063 Zfp84 zinc finger protein 84 21.41 21.39 21.19 1.08
10704234 0.0417 Zfpl28 zinc finger protein 128 21.39 21.20 21.19 1.19
Withdrawal of BDNF from Hippocampal Cultures 179
Developmental Neurobiology

TABLE 2. Continued
Cluster 3: Early Down-Late Up Fold Change Relative to Control
Affymetrix
ID
p-
Value
Gene
Symbol Gene Name l.5 h 3 h 6 h 12 h
10846173 0.0489 Cir1 corepressor interacting with
RBPJ, 1
21.39 21.27 21.13 1.11
10731787 0.0467 Tcfap4 transcription factor AP4 21.38 21.29 21.08 21.04
10918374 0.0460 Rab8b RAB8B, member RAS oncogene
family
21.38 21.35 21.06 1.07
10885464 0.0160 Fut8 fucosyltransferase 8 (alpha (1,6)
fucosyltransferase)
21.38 21.42 21.01 1.07
10807464 0.0057 Pla2gl5 phospholipase A2, group XV 21.37 21.18 21.06 1.02
10794099 0.0040 Uimc1 ubiquitin interaction motif
containing 1
21.37 21.27 21.09 21.07
10753231 0.0498 Setd4 SET domain containing 4 21.29 21.24 21.07 1.04
10852034 0.0350 Zfp64jZfp93 zinc finger protein 64 j zinc finger
protein 93
21.29 21.15 21.12 21.01
10751362 0.0365 Stxbp51 syntaxin binding protein 5-like 21.29 21.40 21.08 1.04
10807430 0.0191 Pskh1 protein serine kinase HI 21.28 21.10 21.03 1.07
10801209 0.0459 Pcdhb21 protocadherin beta 21 21.28 21.26 21.07 1.08
10891271 0.0481 Nek9 NIMA (never in mitosis gene
a)- related kinase 9
21.28 21.12 21.01 1.04
10904233 0.0163 RGD1308133 similar to RIKEN cDNA
1700010C24
21.28 21.20 1.08 1.16
10799893 0.0396 LOC686314 similar to dachshund b 21.28 21.28 21.15 1.14
10910222 0.0449 Hmg20a high mobility group 20A 21.28 21.25 21.12 1.03
10782689 0.0114 Rppl4 ribonuclease P 14 subunit (human) 1.28 21.28 21.28 1.02
10817396 0.0288 Arnt aryl hydrocarbon receptor nuclear
translocator
21.27 21.23 21.04 1.08
10768874 0.0441 Cep350 centrosomal protein 350kDa 21.27 21.25 21.19 21.17
10876717 0.0410 Mrpj50 mitochondrial ribosomal protein
L50
21.27 21.20 21.02 21.19
10706619 0.0465 Vrk3 vaccinia related kinase 3 21.27 21.18 21.05 1.09
10757555 0.0049 Prkrip1 Prkr interacting protein 1
(jL11 inducible)
21.27 21.07 21.02 1.11
10905362 0.0318 Ankrd54 ankyrin repeat domain 54 21.27 21.23 21.19 1.09
10704902 0.0026 Zfp112 zinc finger protein 112 1.27 21.34 21.15 1.13
10789470 0.0310 Dcunld2 DCN1, defective in cullin neddylation
1, domain containing 2 (S.
cerevisiae)
21.27 21.35 21.17 1.10
10876169 0.0351 RGD1306576 similar to hypothetical protein 21.27 21.06 21.13 1.08
10711127 0.0409 Phkg2 phosphorylase kinase, gamma 2
(testis)
21.26 21.11 21.12 1.15
10737389 0.0178 TubdljLOC100363 tubulin, delta 1 j tubulin,
delta 1-like
21.26 21.19 21.05 21.01
10833806 0.0358 Armc2 armadillo repeat containing 2 21.26 21.25 21.09 1.13
10862376 0.0157 Zfp786 zinc finger protein 786 21.26 21.25 21.05 21.00
10912959 0.0398 Tusc4 tumor suppressor candidate 4 21.26 21.12 21.10 1.10
10743600 0.0353 Znf287 zinc finger protein 287 21.26 21.33 21.09 1.23
10742236 0.0151 Thg1j tRNA-histidine guanylyltransf erase
1-like (5. cerevisiae)
21.26 21.15 21.11 1.04
10757239 0.0327 Cnpy4 canopy 4 homolog (zebrafish) 21.26 21.12 21.06 1.10
10875425 0.0370 RGD1309085 similar to F23N19.9 21.25 21.21 21.14 1.03
10907268 0.0129 Tcfcp2 transcription factor CP2 21.25 21.05 21.05 21.02
10767175 0.0068 Insie2 insulin induced gene 2 21.25 21.26 21.18 21.17
180 Mariga et al.
Developmental Neurobiology

TABLE 2. Continued
Cluster 3: Early Down-Late Up Fold Change Relative to Control
Affymetrix
ID
p-
Value
Gene
Symbol Gene Name l.5 h 3 h 6 h 12 h
10725286 0.0251 Gpr139 G protein-coupled receptor 139 21.25 21.40 1.04 1.26
10908827 0.0359 Prdml0 PR domain containing 10 21.25 21.62 21.04 1.02
10914940 0.0478 Kdm4d lysine (K)-specific demethylase 4D 21.25 21.20 21.14 1.25
10912099 0.0374 RGD1561074jLOC Similar to tripartite motif-containing 43
j hypothetical protein
LOC100233177
21.25 21.26 21.15 21.02
10812438 0.0139 Acotl2 acyl-CoAthioesterase 12 21.25 21.35 21.24 1.18
10875771 0.0030 Klh132 kelch-like 32 (Drosophila) 21.25 21.31 21.08 1.15
10710028 0.0445 Arntl aryl hydrocarbon receptor nuclear
translocator-like
21.25 21.08 21.08 1.14
10836570 0.0462 Nostrin nitric oxide synthase trafficker 21.25 21.14 21.12 1.24
10824300 0.0354 Slc25a44 solute carrier family 25, member 44 21.25 21.15 21.19 1.01
10339423 0.0416 Galk2 galactokinase 2 21.25 21.18 21.01 1.13
10772107 0.0407 Cenpc1 centromere protein C 1 21.24 21.36 21.10 1.11
10891445 0.0248 Ston2 stonin 2 21.24 21.24 21.04 21.11
10754506 0.0402 Ptplb protein tyrosine phosphatase-like (pro-
line instead of catalytic arginine],
member b
21.24 21.21 21.06 1.01
10840038 0.0033 RGD1561852 similar to Protein C20 or f29 21.24 21.14 21.03 1.01
10767102 0.0336 Epb4.1j5 erythrocyte protein band 4.1-like 5 21.24 21.14 21.01 21.04
10870929 0.0393 Ttc39a tetratricopeptide repeat domain 39A 21.24 21.22 21.22 1.25
10843634 0.0416 Ubac1 UBA domain containing 1 21.24 21.17 21.15 21.09
10863187 0.0343 Rnf181 ringfingerprotein 181 21.24 21.03 21.06 1.12
10774825 0.0332 RGD1562229 similar to hypothetical protein
FLJ40298
21.24 21.22 21.18 21.00
10885951 0.0316 Vsx2 visual system homeobox 2 21.24 21.20 21.15 21.00
10839803 0.0184 Rpj22j1jRpj22j2 ribosomal protein L22 like 1 j ribo-
somal protein L22-like 2
21.24 21.22 21.20 21.00
10797344 0.0013 Zfp346 zinc finger protein 346 21.24 21.12 21.05 1.04
10901563 0.0170 Chpt1 choline phosphotransferase 1 21.24 21.09 1.03 1.05
10921141 0.0281 Fyco1 FYVE and coiled-coil domain contain-
ing 1
21.23 21.21 21.11 1.05
10833013 0.0172 Unc5b unc-5 homolog B (C elegans) 21.23 21.15 21.00 21.19
10845322 0.0015 Stam2 signal transducing adaptor molecule
[SH3 domain and ITAM motif) 2
21.23 21.02 21.18 21.20
10806698 0.0334 Mri1 methylthioribose-1-phosphate isomer-
ase homolog (S. cerevisiae)
21.23 21.05 21.00 1.26
10901253 0.0109 Pwp1 PWP1 homolog (S. cerevisiae) 21.23 21.10 1.04 21.06
10786422 0.0036 Actr8 ARP8 actin-related protein 8 homolog
(yeast)
21.23 21.17 21.11 1.03
10806703 0.0052 Zswim4 zinc finger, 5WIM-type containing 4 21.23 21.13 21.09 21.10
10809856 0.0016 Orc6j origin recognition complex, subunit 6
like (yeast)
21.23 21.19 21.03 1.05
10786204 0.0004 Fam116a family with sequence similarity 116,
member A
21.23 21.19 21.00 21.01
10731385 0.0090 Parn poly(A)-specific ribonuclease (deade-
nylation nuclease)
21.23 21.13 21.02 21.00
10770566 0.0379 Rpj7ajRGD156295 ribosomal protein L7a j similar to
Rpl7a protein j similar to 60S ribo-
somal protein L7a
21.23 21.11 21.07 21.04
10701717 0.0021 Katna1 katanin p60 (ATPase-containing) subu-
nit Al
21.23 21.09 21.02 1.01
Withdrawal of BDNF from Hippocampal Cultures 181
Developmental Neurobiology

TABLE 2. Continued
Cluster 3: Early Down-Late Up Fold Change Relative to Control
Affymetrix
ID
p-
Value
Gene
Symbol Gene Name l.5 h 3 h 6 h 12 h
10916016 0.0394 St3gaj4 ST3 beta-galactoside alpha-2,3-sialyl-
transferase 4
21.23 21.09 21.09 21.03
10748361 0.0445 Smurf2 SMAD specific E3 ubiQuitin
protein ligase 2
21.23 21.17 21.15 21.15
10891026 0.0283 Zfyve1 zinc finger, FYVE domain
containing 1
21.23 21.11 21.04 1.05
10908960 0.0285 Rpusd4 RNA pseudouridylate synthase
domain containing A21.22 21.07 21.03 21.03
10927233 0.0318 Zfp451 zinc finger protein 451 21.22 21.10 21.06 1.00
10846340 0.0346 Fkbp7 FK506 binding protein 7 21.22 21.21 1.05 21.05
10777337 0.0094 Stxl8 syntaxin 18 21.22 1.04 21.15 21.12
10814398 0.0441 Mtfr1 mitochondrial fission regulator 1 21.22 21.27 21.09 21.37
10859864 0.0493 Rbm33 RNA binding motif protein 33 21.22 21.19 21.07 21.00
10730287 0.0175 RGD1307934 similar to DNA segment, Chr 19,
ERATO Doi 386, expressed
21.22 21.13 21.03 1.33
10911016 0.0056 Csnk1g1 casein kinase 1, gamma 1 21.22 21.19 21.04 21.04
10892381 0.0348 Nudt14 nudix (nucleoside diphosphate linked
moiety Xj-type motif 14
21.22 1.18 21.28 21.23
10910966 0.0165 Mtfmt mitochondrial methionyl-tRNA
formyltransferase
21.22 21.08 21.02 1.20
10710627 0.0369 Plk1 polo-like kinase 1 (Drosophilaj 21.22 21.22 21.08 1.11
10736000 0.0302 Myo1c myosin IC 21.22 21.03 1.03 21.07
10805029 0.0183 Ptpn2 protein tyrosine phosphatase, non-
receptor type 2
21.21 21.17 21.09 1.05
10891436 0.0393 Gtf2a1 general transcription factor IIA, 1 21.21 21.12 21.02 21.17
10905465 0.0306 Unc84b unc-84 homolog B(C. elegans) 21.21 21.19 21.04 21.03
10750373 0.0160 Morc3 MORC family CW-type zinc finger 3 21.21 21.20 21.10 21.06
10886322 0.0123 Ttc8 tetratricopeptide repeat domain 8 21.21 21.12 1.00 1.02
10859264 0.0093 Ddx47 DEAD (Asp-Glu-Ala-Asp) box poly-
peptide 47
21.21 1.05 21.17 21.04
10720539 0.0133 LOC499124 mouse zinc finger protein 14-like 21.21 21.21 21.03 1.04
10787117 0.0126 Med26 mediator complex subunit 26 21.21 21.10 21.14 1.22
10865077 0.0172 Lrtm2 leucine-rich repeats and transmembrane
domains 2
21.21 21.13 21.00 21.16
10905270 0.0494 Rabl4 RAB, member of RAS oncogene fam-
ily-like 4
21.21 21.18 1.01 1.01
10771119 0.0115 Znf644 zinc finger protein 644 21.21 21.14 21.05 1.06
10710806 0.0082 LOC361646 similar to K04F10.2 21.21 21.09 21.12 21.17
10850793 0.0074 Zcchc3 zinc finger, CCHC domain containing 3 21.21 21.13 21.07 1.07
10796455 0.0226 Stam signal transducing adaptor molecule
(SH3 domain and ITAM motif) 1
21.20 21.14 21.10 21.12
10748021 0.0158 Map3k14 mitogen-activated protein kinase kinase
kinase 14
21.20 21.03 21.03 1.03
10729715 0.0146 Sgms1 sphingomyelin synthase 1 21.20 21.19 21.01 1.09
10727867 0.0343 Mus81 MUS81 endonuclease homolog (S.
cerevisiae)
21.20 1.01 1.01 21.00
10800173 0.0282 Rbbp8 retinoblastoma binding protein 8 21.20 21.16 21.03 1.05
aThe 1.5 hr timepoint highlights the fold decrease of each gene early in the time course. The fold change cut off is 21.2. A majority of the
genes within this cluster also reflect a decrease in expression at the 3hr time point before plateauing to baseline by 6–12hrs. The p-value asso-
ciated with each gene is based on reproducible replicate measurements and reflects a significant change (p � 0.05) in probe intensity for one
or more timepoints relative to the untreated control.
182 Mariga et al.
Developmental Neurobiology

(early up and late down) had significant enrichment in
genes coding for G-protein coupled receptor signaling
as well as extracellular matrix components and cell
adhesion [Table 3]. Cluster 3 (early down and late up)
was enriched in genes coding for golgi function, pro-
tein trafficking and localization, vesicle mediated
transport, and transcription regulators [Table 4]. These
genes were characterized by an initial decrease in
expression, which persisted even after 6 h then gradu-
ally returned to baseline levels by 12 h. A few genes
seemed to increase by 12 h, however, the increases
were small and very close to the untreated control.
Genes such as syntaxin 18 and Rab8b showed func-
tional overlap for protein transport and localization.
Table 3 Functional Classification of Genes in Cluster 2 (Table 1).a
G-Protein Coupled Receptor Signaling and
Cell Surface Signaling Transduction Fold Change Relative to Control
Enrichment p-Value: 3.61E-06
Gene symbol Gene Name 1.5 h 3 h 6 h 12 h
Gpr33 G protein-coupled receptor 33 1.43 1.16 1.22 1.24
Mrgprb2 MAS-related G protein-coupled receptor, member
X2-like; MAS-related GPR, member B2
1.25 1.16 1.13 1.11
Rspo3 R-spondin 3 homolog (Xenopus laevis) 1.35 1.23 1.06 21.28
Fpr1 formyl peptide receptor 1 1.27 1.11 1.07 1.11
Lef1 lymphoid enhancer binding factor 1 1.21 1.35 1.05 21.08
Olrl04 olfactory receptor 104 1.24 1.07 1.09 1.15
Olrl27 olfactory receptor 127 1.27 21.04 1.10 1.08
olrl45 olfactory receptor 145 1.29 1.22 1.05 1.19
Olrl5I5 olfactory receptor 1515 1.24 1.18 1.04 1.16
olrl90 olfactory receptor 190 1.25 1.03 21.06 1.06
Olr221 olfactory receptor 221 1.22 1.10 1.06 1.12
Olr259 olfactory receptor 259 1.23 1.10 1.10 1.08
Olr318 olfactory receptor 318 1.24 1.13 1.09 1.18
olr379 olfactory receptor 379 1.27 1.16 1.08 1.10
Olr419 olfactory receptor 419 1.23 1.17 1.07 1.09
Olr446 olfactory receptor 446 1.30 1.14 1.15 1.15
Olr806 olfactory receptor 806 1.25 1.19 1.12 1.27
Olr851 olfactory receptor 851 1.21 1.06 1.11 1.17
Olr869 olfactory receptor 869; olfactory receptor 862 1.28 1.14 1.21 1.15
Olr877 olfactory receptor 877 1.29 1.02 1.03 1.09
Ptgir prostaglandin 12 (prostacyclin) receptor 1.24 1.17 1.14 1.13
P2ryl3 purinergic receptor P2Y, G-protein coupled, 13 1.23 1.10 1.07 1.03
Tas2rl26 taste receptor, type 2, member 126 1.24 1.14 1.18 1.24
Taar7d trace-amine-associated receptor 7d 1.28 1.09 1.09 1.08
Extracellular Matrix Components and Cell Adhesion Fold Change Relative to Control
Enrichment p-Value : 0.013095162
Gene symbol Gene Name l.5 h 3 h 6 h 12 h
Acan aggrecan 1.65 2.04 1.20 21.16
Ang1 angiogenin, ribonuclease A family, member 1 1.32 1.24 1.10 1.17
Lamc2 laminin, gamma 2 1.27 1.07 1.08 1.00
Mmp10 matrix metallopeptidase 10 1.22 1.10 1.03 1.06
Nid2 nidogen 2; similar to nidogen 2 protein 1.22 1.29 1.00 1.03
aThe table highlights gene enrichment for G-protein coupled receptor signaling and extracellular matrix components for genes in the
early up-late down dataset and their corresponding trends of change throughout the time course. Functional annotation was performed
using DAVID gene ontology tool. Gene enrichment is based on the EASE Score (threshold p � 0.1), a modified Fisher Exact test
used to measure gene enrichment in annotation terms in the DAVID system. The EASE score for each class is shown as the gene
enrichment p-value.
Withdrawal of BDNF from Hippocampal Cultures 183
Developmental Neurobiology

Table 4 Functional Classification of Genes in Cluster 3 (Table 2).a
Snare Interaction in Vesicular Transport Fold Change Relative to Control
Enrichment p-Value: 0.004060282
Gene Symbol Gene Name 1.5 h 3 h 6 h 12 h
Bet 1j blocked early in transport 1 homolog (S. cerevisiae) like 21.31 21.10 21.14 21.08
Gosr1 golgi SNAP receptor complex member 1 21.29 21.18 21.07 1.07
Stx18 syntaxin 18 21.22 1.04 21.15 21.12
Protein Transport
Enrichment p-Value: 0.030887946
Rab8b RABSB, member RAS oncogene family 21.38 21.35 21.06 1.07
Rufy1 RUN and FYVE domain containing 1 21.31 21.12 21.09 21.12
Arntl aryl hydrocarbon receptor nuclear translocator-like 21.25 21.08 21.08 1.14
Bet1j blocked early in transport 1 homolog (S. cerevisiae) like 21.31 21.10 21.14 21.08
Gosr1 golgi SNAP receptor complex member 1 21.29 21.18 21.07 1.07
Myo1c myosin IC 21.22 21.03 1.03 21.07
Stam signal transducing adaptor molecule
(SH3 domain and ITAM motif) 1
21.20 21.14 21.10 21.12
Stam2 signal transducing adaptor molecule
(SH3 domain and ITAM motif) 2
21.23 21.02 21.18 21.20
Zfp280b similarto suppressor of hairy wing homolog 2;
zinc finger protein 280b
21.35 21.15 21.09 1.35
Slcl5a4 solute carrier family 15, member 4 21.30 21.35 21.19 21.00
Stx18 syntaxin 18 21.22 1.04 21.15 21.12
Protein Localization
Enrichment p-Value: 0.041166313
Rab8b RABSB, member RAS oncogene family 21.38 21.35 21.06 1.07
Rufy1 RUN and FYVE domain containing 1 21.31 21.12 21.09 21.12
Arnt1 aryl hydrocarbon receptor nuclear translocator-like 21.25 21.08 21.08 1.14
Bet1j blocked early in transport 1 homolog (S. cerevisiae) like 21.31 21.10 21.14 21.08
Gosr1 golgi SNAP receptor complex member 1 21.29 21.18 21.07 1.07
Myo1c myosin IC 21.22 21.03 1.03 21.07
Stam signal transducing adaptor molecule
(SH3 domain and ITAM motif) 1
21.20 21.14 21.10 21.12
Stam2 signal transducing adaptor molecule
(SH3 domain and ITAM motif) 2
21.23 21.02 21.18 21.20
Zfp280b similar to suppressor of hairy wing homolog
2; zinc finger protein 280b
21.35 21.15 21.09 1.35
Slcl5a4 solute carrier family 15, member 4 21.30 21.35 21.19 21.00
Stx18 syntaxin 18 21.22 1.04 21.15 21.12
Intracellular Transport
Enrichment p-Value: 0.086073852
Ankrd54 ankyrin repeat domain 54 21.27 21.23 21.19 1.09
Arntl aryl hydrocarbon receptor nuclear translocator-like 21.25 21.08 21.08 1.14
Bet1j blocked early in transport 1 homolog (S. cerevisiae) like 21.31 21.10 21.14 21.08
Gosr1 golgi SNAP receptor complex member 1 21.29 21.18 21.07 1.07
Golga5 golgi autoantigen, golgin subfamily a, 5 21.61 21.21 21.42 21.35
Stam signal transducing adaptor molecule
(SH3 domain and ITAM motif) 1
21.20 21.14 21.10 21.12
Stam2 signal transducing adaptor molecule
(SH3 domain and ITAM motif) 2
21.23 21.02 21.18 21.20
Zfp280b similar to suppressor of hairy wing
homolog 2; zinc finger protein 280b
21.35 21.15 21.09 1.35
Stx18 syntaxin 18 21.22 1.04 21.15 21.12
Stxbp51 syntaxin binding protein 5-like 21.29 21.40 21.08 1.04
Nostrin nitric oxide synthase trafficker 21.25 21.14 21.12 1.24
184 Mariga et al.
Developmental Neurobiology

Quantitative RT-PCR Validation ofPotential Candidates Genes
We carried out validation of select candidate genes
using quantitative RT-PCR (qPCR) to assess changes
in levels of gene expression. We selected genes for
qPCR validation based on high fold change increase
or decrease (61.2 and above), substantial characteri-
zation in previous literature as well as gene expres-
sion changes associated with cellular processes
(synaptic function and vesicular trafficking) that were
enriched in the gene clusters. We hypothesized that
these processes could increase vulnerability of neu-
rons to degeneration if impaired. We validated three
representative genes from clusters showing signifi-
cant downregulation of expression on BDNF with-
drawal and three genes from clusters that reflected
significant upregulation [Table 5]. Validated gene
targets showed expression patterns that were similar
to the microarray expression profiles [Figs. 3 and 4,
left panel]. We found significant changes in the gene
coding for the extracellular matrix component Acan
(Aggrecan). In the microarray profiling, Acan
increased by 0.5-fold after 1.5 h of BDNF withdrawal
Regulation of Transcription Fold Change Relative to Control
Enrichment p-Value: 1.50E-05
Gene Symbol Gene Name 1.5 h 3 h 6 h 12 h
Cir1 CBF1 interacting corepressor 21.39 21.27 21.13 1.11
Gpbp1j1 GC-rich promoter binding protein 1-like 1; similarto
GC-rich promoter binding protein 1-like 1
21.49 21.45 21.12 1.14
Smarcaj1 Swi/SNF related matrix associated, actin
dependent regulator of chromatin, subfamily a-like 1
21.32 21.19 21.02 1.14
Ahr Aryl hydrocarbon receptor 21.30 21.47 21.08 21.04
Arnt Aryl hydrocarbon receptor nuclear translocator 21.27 21.23 21.04 1.08
Arntl Aryl hydrocarbon receptor nuclear translocator-like 21.25 21.08 21.08 1.14
Atxn3 Ataxin 3 21.36 21.30 21.13 21.13
Gtf2a1 General transcription factor IIA, 1 21.21 21.12 21.02 21.17
Med 26 Mediator complex subunit 26 21.21 21.10 21.14 1.22
LOC499124 Mouse zinc finger protein 14-like 21.21 21.21 21.03 1.04
Prmt6 Protein arginine methyltransferase 6 21.42 21.33 21.15 1.16
Ppp1r1O Protein phosphatase 1, regulatory subunit 10 21.29 21.19 21.09 1.36
Sra1 Steroid receptor RNA activator 1 21.35 21.05 21.19 21.17
Tfam Transcription factor A, mitochondrial 21.37 21.26 21.15 1.02
Tfdp2 Transcription factor Dp-2 {E2F dimerization partner 2) 21.71 21.55 21.04 21.07
Uimc1 Ubiquitin interaction motif containing 1 21.37 21.27 21.09 21.07
Vsx2 Visual system homeobox 2 21.24 21.20 21.15 21.00
Zc3h8 Zinc finger CCCH type containing 8 21.53 21.48 21.19 1.06
Zfpll2 Zinc finger protein 112 21.27 21.34 21.15 1.13
Zfpl28 Zinc finger protein 128 21.39 21.20 21.19 1.19
Znf287 Zinc finger protein 287 21.26 21.33 21.09 1.23
Zfp42612 Zinc finger protein 426-like 2 21.35 21.26 21.07 21.12
Zfp472 Zinc finger protein 472 21.34 21.22 21.11 21.00
Zfp68 Zinc finger protein 68 21.35 21.43 21.15 1.08
Zfp786 Zinc finger protein 786 21.26 21.25 21.05 21.00
Zfp84 Zinc finger protein 84 21.41 21.39 21.19 1.08
Zfp90 Zinc finger protein 90 21.35 21.34 21.10 1.03
aThe table highlights different gene classes that were enriched in the early down-late up dataset and their corresponding trends of change
throughout the time course. Functional annotation was performed using DAVID gene ontology tool. Gene enrichment reflects genes that are
highly associated with the indicated functional terms (i.e., SNARE interaction, protein transport, protein localization and intracellular trans-
port). It is based on the EASE Score (threshold p-value � 0.1), a modified Fisher Exact statistical test used to measure gene enrichment in
annotation terms in the DAVID system. The EASE score for each class is shown as the gene enrichment p-value. Genes are enriched for
SNARE interaction, protein trafficking, vesicle mediated transport and regulation of transcription. A number of genes show overlapping func-
tions in vesicle trafficking and protein localization.
TABLE 4. Continued
Withdrawal of BDNF from Hippocampal Cultures 185
Developmental Neurobiology
peaking to 2-fold by 3 h [Fig. 3(A) left panel]. By 6 h
Acan expression was decreasing, returning to base-
line by 12 h. A similar profile of change was seen in
the qPCR validation [Fig. 3(A) right panel]; however,
Acan increased more than 10-fold as early as 1.5 h
and by 3 h its expression had already begun to
decline although it was still more than 4-fold above
control. At 6 h, expression was still approximately 4-
fold relative to control then declined to baseline by
12 h.
Also from Cluster 2, striking changes were observed
in Dual-Specificity Phosphatases 5 (DUSP5), a MAP
kinase phosphatase which dephosphorylates Erk1/2.
Following BDNF withdrawal, DUSP5 increased 2-fold
as early as 1.5 h, peaked at 3 h to a 2.3-fold increase
then returned to baseline by 6–12 h [Fig. 3(B) left
panel]. This trend was reproduced by qPCR validation
where DUSP5 increased 4-fold at 1.5 h, peaked to
6-fold increase at 3 h then returned to the same levels
as control by 12 h [Fig. 3(B) right panel].
Another gene that had consistent changes for the
microarray and qPCR validation was Sprouty homo-
log 2 (Spry2); an inhibitor of the MAP kinase path-
way. Spry2 expression increased 0.6-fold after 1.5 h
of BDNF withdrawal then gradually declined
throughout the timecourse, returning to baseline by
12 h [Fig. 3(C) left panel]. qPCR validation also
showed Spry2 reproducing a similar profile of change
with a 0.6-fold increase at 1.5 h and corresponding
gradual decline from 3 to 12 h [Fig. 3(C) right panel].
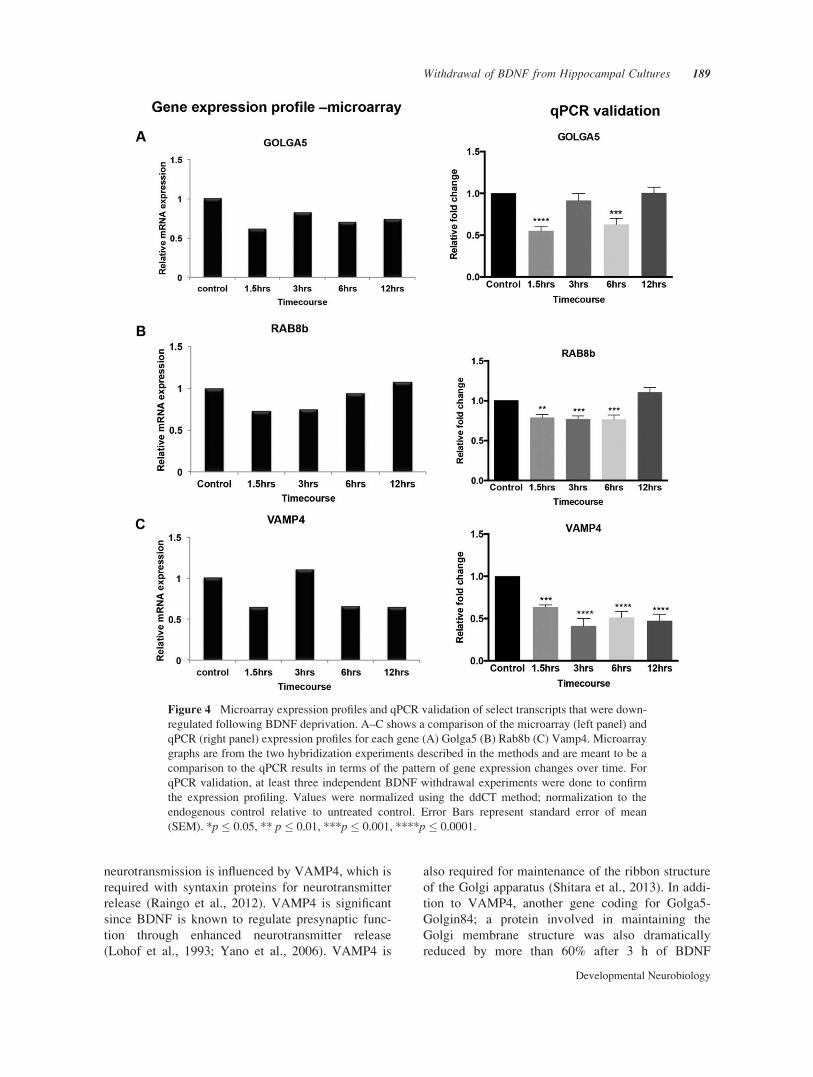
Downregulated genes were selected from Cluster 3
(early down, late up) for qPCR validation. Golga5, a
gene coding for a protein that is important for golgi
structure maintenance showed a reproducible decrease
in expression both by microarray and qPCR. On
BDNF withdrawal, Golga5 expression decreased 0.4-
fold then remained below baseline with another signifi-
cant decrease at 6–12 h [Fig. 4(A) left panel]. In the
qCR validation, the profile of change was similar, how-
ever, expression returned to baseline by 12 h [Fig. 4(A)
right panel]. Rab8b, a Rab-GTPase transport regulator,
also decreased 0.3-fold at 1.5–6 h following BDNF
withdrawal in the microarray [Fig. 4(B) left panel]
which was reliably reproducible by qPCR with a small
but significant decrease of 0.3-fold at 1.5–6 h [Fig.
4(B) right panel]. Vamp4 was also decreased in both
microarray and qPCR although the 3 h timepoint had
an opposite response to the treatment for qPCR com-
pared to microarray. For the microarray, Vamp4
increased slightly above baseline by 3 h then decreased
at 6–12 h. For qPCR, Vamp4 maintained a gradual
decrease; starting with a 0.4-fold decrease at 1.5 h
which was sustained up to the 12 h timepoint. Since
qPCR was a validation for at least three independentTab
le5
Rep
rese
nta
tive
Gen
esS
elec
ted
for
qP
CR
Vali
dati
on
.a
Upre
gula
ted
Gen
esF
old
Chan
ge
Rel
ativ
eto
Contr
ol
Aff
ym
etri
xID
p-V
alue
Gen
e
Sym
bol
Gen
eN
ame
Funct
ion
l.5
h3
h6
h12
h
10708021
0.0
495
Aca
nA
ggre
can
Extr
acel
lula
rm
atri
xco
mponen
t1.6
52.0
41.2
02
1.1
6
10716080
0.0
078
Dusp
5D
ual
spec
ifici
typhosp
hat
ase
5M
apkin
ase
phosp
hat
ase,
dep
hosp
hory
late
sE
RK
1/2
2.0
02.2
11.1
92
1.2
5
10785773
0.0
230
Spry
2S
pro
uty
hom
olo
g2
(Dro
sophil
a)N
egat
ive
regula
tion
of
Map
kin
ase
acti
vit
y1.4
51.3
41.1
12
1.0
9
Dow
nre
gula
ted
Gen
es
10886465
0.0
278
Golg
a5G
olg
iau
toan
tigen
,golg
insu
bfa
mil
ya,
5G
olg
ist
ruct
ure
mai
nta
inan
ce2
1.6
12
1.2
12
1.4
22
1.3
5
10918374
0.0
460
Rab
8b
RA
BS
B,m
ember
RA
Sonco
gen
efa
mil
yV
esic
lem
edia
ted
tran
sport
21.3
82
1.3
52
1.0
61.0
7
10765115
0.0
077
Vam
p4
Ves
icle
-ass
oci
ated
mem
bra
ne
pro
tein
4V
esic
lem
edia
ted
tran
sport
;neu
rotr
ansm
itte
rre
leas
e2
1.5
31.1
12
1.5
12
1.5
4
aT
able
show
sth
esi
xgen
esfr
om
sele
ctcl
asse
shig
hli
ghti
ng
the
tren
dof
chan
ge
thro
ughout
the
tim
eco
urs
e.H
ighes
tch
anges
inex
pre
ssio
nocc
urr
edbet
wee
n1.5
hrs
and
3hrs
.
186 Mariga et al.
Developmental Neurobiology

experiments, the trend for qPCR more likely portrays
an accurate and consistent Vamp4 response to BDNF
withdrawal. Given the well-established functions of
these genes in golgi maintenance, and vesicle traffick-
ing, our results could be suggesting a potential disas-
sembly of the protein trafficking and secretory
machinery on BDNF withdrawal.
DISCUSSION
The experimental goal of this study was to deter-
mine whether there are changes in transcription fol-
lowing neurotrophin starvation in primary
hippocampal neurons. We used a well-established
method of TrkB-FC application to sequester BDNF
Figure 3 Microarray expression profiles and qPCR validation of genes from select clusters that
were upregulated upon BDNF withdrawal. A–C shows a comparison of the microarray (left panel)
and qPCR (right panel) expression profiles for each gene (A) Acan (B) Dusp5 (C) Spry2. Microar-
ray graphs are from the two hybridization experiments described in the methods and are meant to
be a comparison to the qPCR results in terms of the pattern of gene expression changes over time.
For qPCR validation, at least three independent BDNF withdrawal experiments were done to con-
firm the expression profiling. Values were normalized using the ddCT method; normalization to the
endogenous control relative to untreated control. Error Bars represent standard error of mean
(SEM). *p � 0.05, ** p � 0.01, ***p � 0.001, ****p � 0.0001.
Withdrawal of BDNF from Hippocampal Cultures 187
Developmental Neurobiology

and NT-4, which also binds TrkB (Soppet et al.,
1991; Ninkina et al., 1997; Croll et al., 1998; Jia
et al., 2010). Four early timepoints (1.5, 3, 6, and 12
h) were selected to capture different phases of tran-
scriptional activity. These time points were specifi-
cally chosen to identify signaling pathways that
are activated prior to the process of cell death ini-
tiation based on previous reports that commitment
to cell death following NGF deprivation occurs
approximately 16–20 h after removal of NGF
from sympathetic and sensory neurons (Deshmukh
and Johnson, 1997; Nikolaev et al., 2009).
We anticipated identifying individual genes and
groups of transcripts in hippocampal neurons as
BDNF withdrawal proceeds. Early timepoints were
predicated to identify changes in immediate early
genes, among others, whereas later time points would
likely activate initiation of mitochondrial changes
associated with programmed cell death. During NGF
withdrawal, cell death occurs in sympathetic neurons
with increases in c-jun, c-myb, mkp-1, cyclin D1,
and the proapoptotic Bim transcripts (Estus et al.,
1994; Freeman et al., 1994; Ham et al., 1995; Whit-
field et al., 2001). However, due to the time course
examined (1–12 h), the microarray screen would not
be expected to detect genes involved in cell death.
Indeed, instead of proapoptotic genes, we detected
significant enrichment in genes involved in synaptic
function.
Hippocampal neurons were selected for microarray
analysis following BDNF withdrawal, as BDNF has
profound effects on long-term potentiation, synaptic
plasticity, and cell morphology in the hippocampus
(Park and Poo, 2013), where its receptor, TrkB is
highly expressed. The functional analysis with
DAVID indicated that many relevant pathways were
represented although changes in expression levels
were within 20–30% range. It is worth noting that in
neuronal populations, relatively small changes can be
significant given the nature of neuronal signaling rel-
ative to heterologous cell lines or tissue with admixed
cell types (Ginsberg et al., 2012). Most importantly,
BDNF withdrawal resulted in a significant decrease
in genes that are associated with vesicular trafficking
and synaptic function as well as selective increases in
phosphatases and extracellular matrix genes.
DUSP5, a stress inducible MAP kinase phospha-
tase that deactivates Erk1/2 in the MAP kinase path-
way, (Keyse, 2008) was significantly upregulated on
BDNF withdrawal. Recently, the role of MAP kinase
phosphatases in the development of CNS primary
neurons was described in which expression of DUSPs
is regulated by neurotrophins to modulate structural
plasticity. The induction of MKP-1/DUSP1 by
BDNF is influenced by activity-dependent events that
culminate in the regulation of JNK to promote axonal
branching (Jeanneteau et al., 2010). MKP1/DUSP1
has also been implicated in depressive disorders
(Duric et al., 2010), which are downstream of BDNF.
Hence, changes in DUSP5 may reflect downstream
effects of BDNF on structural plasticity, which could
be relevant in disease.
Genes coding for extracellular matrix components,
such as aggrecan (Acan), increased significantly
(2-fold), 1.5–3 h after withdrawal of BDNF. Aggre-
can is highly expressed and regulated by neuronal
activity in hippocampal parvalbumin interneurons
(McRae et al., 2007; Morawski et al., 2012) and is a
major component of extracellular perineuronal nets
where it is involved in the onset of critical periods. It is
highly enriched on presynaptic contacts where it
enwraps synaptic compartments on postsynaptic den-
drites and dendritic spines in human hippocampus
(Lendvai et al., 2013). Elevated levels of Aggrecan
have been reported in severe cases of Alzheimer dis-
ease (Lendvai et al., 2013); Aggrecan is enriched in the
vicinity of plaques around healthy neurons suggesting a
role in preserving the structural integrity of the synapse.
It is also known to be neuroprotective against oxidative
stress in primary neuronal cultures (Suttkus et al.,
2014). Thus, Aggrecan may function downstream of
BDNF to preserve the integrity of synaptic contacts.
Spry2, a member of the Sprouty family of proteins
that negatively regulate receptor tyrosine kinase sig-
naling, was also increased shortly after BDNF with-
drawal. In recent studies, BDNF has been shown to
regulate Spry2 expression in immature primary neu-
ronal cultures (Gross et al., 2007). Overexpression of
Spry2 inhibited neurite outgrowth and increased neu-
ronal apoptosis (Gross et al., 2007). Therefore, low
BDNF may compromise structural plasticity and neu-
ronal survival through increasing levels of Spry2.
Among the genes that changed with BDNF depri-
vation are small GTPases of the Rab family (Rab1A
and Rab8B), intracellular membrane trafficking pro-
teins that direct the identification and routing of
vesicles and organelles, as well as receptors and ion
channels (Pfeffer, 2013). These changes are not iso-
lated events, as other proteins, such as Vesicle Asso-
ciated Membrane Protein 4 (VAMP4) and syntaxins
were also identified. VAMP4 showed a significant
50% decrease in expression post BDNF withdrawal.
It is also intimately associated with Rab proteins
(Simonson et al., 1999); endosomal and Golgi mem-
brane trafficking of proteins depend on Rab regula-
tion of SNARE (Soluble N-ethylmaleimide-sensitive-
factor Attachment protein Receptor) proteins such as
the VAMP4 interacting partner, syntaxin 6. Also,
188 Mariga et al.
Developmental Neurobiology
neurotransmission is influenced by VAMP4, which is
required with syntaxin proteins for neurotransmitter
release (Raingo et al., 2012). VAMP4 is significant
since BDNF is known to regulate presynaptic func-
tion through enhanced neurotransmitter release
(Lohof et al., 1993; Yano et al., 2006). VAMP4 is
also required for maintenance of the ribbon structure
of the Golgi apparatus (Shitara et al., 2013). In addi-
tion to VAMP4, another gene coding for Golga5-
Golgin84; a protein involved in maintaining the
Golgi membrane structure was also dramatically
reduced by more than 60% after 3 h of BDNF
Figure 4 Microarray expression profiles and qPCR validation of select transcripts that were down-
regulated following BDNF deprivation. A–C shows a comparison of the microarray (left panel) and
qPCR (right panel) expression profiles for each gene (A) Golga5 (B) Rab8b (C) Vamp4. Microarray
graphs are from the two hybridization experiments described in the methods and are meant to be a
comparison to the qPCR results in terms of the pattern of gene expression changes over time. For
qPCR validation, at least three independent BDNF withdrawal experiments were done to confirm
the expression profiling. Values were normalized using the ddCT method; normalization to the
endogenous control relative to untreated control. Error Bars represent standard error of mean
(SEM). *p � 0.05, ** p � 0.01, ***p � 0.001, ****p � 0.0001.
Withdrawal of BDNF from Hippocampal Cultures 189
Developmental Neurobiology

deprivation. The decrease in expression of vesicular
trafficking and Golgi maintenance genes suggests
that components of the secretory machinery are
changing following BDNF deprivation.
In this study, we found that many transcriptional
changes occur in hippocampal neurons at early time
points after BDNF withdrawal. Our results indicate
several distinct groups of genes that are markedly
and simultaneously affected by BDNF deprivation.
They include molecules involved with synaptic vesi-
cle trafficking and connectivity and enzymes that are
directly involved with major signal transduction path-
ways, such as MAP kinase phosphatases.
What is the relevance of these alterations in
BDNF-regulated transcription? Neurotrophins, such
as BDNF, are critical in modulating synaptic plastic-
ity, in addition to their well-established roles in neu-
ronal cell survival. Application of neurotrophins to
peripheral and central neurons results in rapid
increases in the frequency of spontaneous action
potentials and excitatory synaptic activity (Park and
Poo, 2013). The work we have presented suggest
there are events that occur early following neurotro-
phin withdrawal that may have an impact on later
events leading to neurodegeneration. This is sup-
ported by previous studies that demonstrated that
NGF withdrawal is linked to changes in APP metabo-
lism (Matrone et al., 2008; Nikolaev et al., 2009).
Synaptic defects are thought to represent early
markers of aging and dementia. Our results suggest
that loss of trophic factors may play a role in this pro-
cess. A lack of BDNF will likely affect pre- and post-
synaptic functions and may lead to morphological
changes and synaptic failure. In fact, many studies
have documented a decrease in BDNF levels in neu-
rodegenerative diseases, most notably in AD (Nari-
sawa-Saito et al., 1996; Connor et al., 1997;
Nagahara et al., 2009), HD (Zuccato et al., 2008) and
Spinocerebellar ataxia (Takahashi et al., 2012).
Administration of BDNF has been shown to be neu-
roprotective against age-related hippocampal synap-
tic loss (Nagahara et al., 2009, 2013).
Our findings of dysregulation of select synaptic
and vesicle trafficking genes, as well as MAP kinase
phosphatases, are consistent with significant
decreases in expression of genes encoding synaptic
proteins that have been documented in microarray
studies of post mortem AD cases (Callahan et al.,
1999; Ginsberg et al., 2010; Gutala et al., 2010;
Berchtold et al., 2013). Moreover, the changes were
more pronounced in the hippocampus (Berchtold
et al., 2013), which matched our findings in rat hippo-
campal cultures. More importantly, the changes we
have observed in gene transcription are consistent
with the hypothesis that early events in neurodegen-
eration may reflect changes in synaptic function (Sel-
koe, 2002; Arancio and Chao, 2007). Deficits in
synaptic transmission have been observed well before
the detected of plaques and tangles. Therefore, a
decrease in BDNF may manifest in changes that have
also been seen in age-related neurodegenerative dis-
eases. Our studies establish an in vitro system model
for understanding the interplay between low trophic
factor support and early synaptic loss associated with
neurodegeneration and aging.
This work was supported by the National Institute of
Health (AG025970; NS21072 to MVC) and NIH grants
AG043375, AG014449, AG017617, and the Alzheimer’s
Association (IIRG-12-237253) to SDG. Microarray analy-
sis was supported by the NYU Genome Technology Center
and by the Cancer Center Support Grant (P30 CA016087].
REFERENCES
Alldred MJ, Che S, Ginsberg SD. 2008. Terminal continua-
tion (TC) RNA amplification enables expression profiling
using minute RNA input obtained from mouse brain. Int J
Mol Sci 9:2091–2104.
Alldred MJ, Che S, Ginsberg SD. 2009. Terminal continua-
tion (TC) RNA amplification without second strand syn-
thesis. J Neurosci Methods 177:381–385.
Appel S. 1981. A unifying hypothesis for the cause of
amyotrophic lateral sclerosis, parkinsonism, and Alzhei-
mer disease. Ann Neurol 10:499–505.
Arancio O, Chao MV. 2007. Neurotrophins, synaptic plas-
ticity, and dementia. Curr Opin Neurobiol 17:325–330.
Baquet ZC, Gorski JA, Jones KR. 2004. Early striatal den-
drite deficits followed by neuron loss with advanced age
in the absence of anterograde cortical brain-derived neu-
rotrophic factor. J Neurosci 24:4250–4258.
Batisatou A, Greene, LA. 1991. Aurintricarboxylic acid
rescues PC12 cells and sympathetic neurons from death
caused by nerve growth factor deprivation: Correlation
with suppression of endonuclease activity. J Cell Biol 15:
461–471.
Berchtold NC, Coleman PD, Cribbs DH, Rogers J, Gillen
DL, Cotman CW. 2013. Synaptic genes are extensively
downregulated across multiple brain regions in normal
human aging and Alzheimer’s disease. Neurobiol Aging
34:1653–1661.
Bolstad, BM, Irizarry, RA, Astrand M, Speed TP. 2003. A
comparison of normalization methods for high-density
oligonucleotide array data based on variance and bias.
Bioinformatics 19:185–193.
Callahan LM, Vaules WA, Coleman PD. 1999. Quantita-
tive decrease in synaptophysin message expression and
increase in cathepsin D message expression in Alzheimer
disease neurons containing neurofibrillary tangles.
J Neuropathol Exp Neurol 58:275–287.
190 Mariga et al.
Developmental Neurobiology

Chao MV. 2003. Neurotrophins and their receptors: A con-
vergence point for many signaling pathways. Nat Rev
Neurosci 4:299–309.
Connor B, Young D, Yan Q, Faull RL, Synek, B,
Dragunow M. 1997. Brain-derived neurotrophic factor is
reduced in Alzheimer’s disease. Brain Res Mol Brain Res
49:71–81.
Croll SD, Chesnutt CR, Rudge JS, Acheson A, Ryan TE,
Siuciak JA, DiStefano PS, et al. 1998. Co-infusion with a
TrkB-FC receptor body carrier enhances BDNF distribu-
tion in the adult brain. Exp Neurobiol 152:20–33.
Deckwerth TL, Johnson EM. 1993. Temporal analysis of
events associated with programmed cell death (apoptosis)
of sympathetic neurons deprived of nerve growth factor.
J Cell Biol 123:1207–1222.
Deshmukh M, Johnson EM. 1997. Programmed cell death
in neurons: Focus on the pathway of nerve growth factor
deprivation-induced death of sympathetic neurons. Mol
Pharmacol 51:897–906.
Duric V, Banasr M, Licznerski P, Schmidt HD, Stockmeier
CA, Simen AA, Newton SS, et al. 2010. A negative regu-
lator of MAP kinase cuases depressive behavior. Nature
Med 16:1328–1332.
Estus S, Zaks WJ, Freeman RS, Gruda M, Bravo R,
Johnson EM Jr. 1994. Altered gene expression in neurons
during programmed cell death: Identifcation of c-jun as
necessary for neuronal apoptosis J Cell Biol 127:1717–
1727.
Freeman RS, Estus S, Johnson EM. 1994. Analysis of cell
cycle-related gene expression in postmitotic neurons:
Selective induction of cyclin D1 during programmed cell
death. Neuron 12:343–355.
Ginsberg SD, Alldred MJ, Che S. 2012. Gene expression
levels assessed by CA1 pyramidal neuron and regional
hippocampal dissections in Alzheimer’s disease. Neuro-
biol Dis 45:99–107.
Ginsberg SD, Mufson EJ, Counts SE, Wuu J, Alldred MJ,
Nixon RA, Che S. 2010. Regional selectivity of rab5 and
rab7 protein upregulation in mild cognitive impairment
and Alzheimer’s disease. J Alzheimers Dis 22:631–639.
Gorin PD, Johnson EM. 1979. Experimental autoimmune
model of nerve growth factor deprivation: Effect on
developing peripheral sympathetic and sensory neurons.
Proc Natl Acad Sci USA 76:5382–5386.
Gross I, Armant O, Benosman S, de Aguilar JL, Freund JN,
Kedinger M, Licht JD, et al. 2007. Sprouty2 inhibits
BDNF-induced signaling and modulates neuronal differ-
entiation and survival. Cell Death Differ 14:1802–1812.
Gutala RV, Reddy PH. 2004. The use of real-time PCR
analysis in a gene expression study of Alzheimer’s dis-
ease post-mortem brains. J Neurosci Methods 132:101–
107.
Ham J, Babij C, Whitfield J, Pfarr CM, Lallemand D,
Yaniv M, Rubin LL. 1995. A c-Jun dominant negative
mutant protects sympathetic neurons against programmed
cell death. Neuron 14:927–939.
Huang da W, Sherman BT, Lempicki RA. 2009. Bioinfor-
matics enrichment tools: Paths toward the comprehensive
functional analysis of large gene lists. Nucleic Acids Res
37:1–13.
Jeanneteau F, Deinhardt K, Miyoshi G, Bennett AM, Chao,
MV. 2010. The MAP kinase phosphatase MKP-1 regu-
lates BDNF-induced axon branching. Nat Neurosci 13:
1373–1379.
Jia Y, Gall CM, Lynch G. 2010. Presynaptic BDNF pro-
motes postsynaptic long-term potentiation in the dorsal
striatum. J Neurosci 30:14440–14445.
Keyse SM. 2008. Dual-specificity MAP kinase phospha-
tases (MKPs) and cancer. Cancer Metastasis Rev 27:
253–261.
Lendvai D, Morawski M, N�egyessy L, G�ati G, J€ager C,
Baksa G, Glasz T, et al. 2013. Neurochemical mapping of
the human hippocampus reveals perisynaptic matrix
around functional synapses in Alzheimer’s disease. Acta
Neuropathol 125:215–229.
Levi-Montalcini R, Booker B. 1960. Destruction of the
sympathetic ganglia in mammalians with an antiserum
against nerve growth protein. Proc Natl Acad Sci USA
46:384–391.
Lohoff AM, Poo, MM. 1993. Potentiation of developing
neuromuscular synapses by the neurotrophins NT-3 and
BDNF. Nature 363:350–353.
Longo FM, Yang T, Knowles JK, Xie Y, Moore LA, Massa
SM. 2007. Small molecule neurotrophin receptor ligands:
Novel strategies for targeting Alzheimer’s disease mecha-
nisms. Curr Alzheimer Res 4:503–506.
Martin DP, Schmidt RE, DiStefano PS, Lowry OH, Carter
JG, Johnson EM. 1988. Inhibitors of protein synthesis
and RNA synthesis prevent neuronal death cause by
nerve growth factor deprivation. J Cell Biol 106:
829–844.
Matrone C, Ciotti MT, Marolda R, Mercanti D, Calissano
P. 2008. NGF and BDNF control amyloidogenic route
and Ab production in hyppocampal neurons. Proc Natl
Acad Sci USA 105:13139–13144.
McRae PA, Rocco MM, Kelly G, Brumberg JC, Matthews
RT. 2007. Sensory deprivation alters aggrecan and peri-
neuronal net expression in the mouse barrel cortex.
J Neurosci 27:5405–5413.
Morawski M, Bruckner G, Arendt T, Matthews RT. 2012.
Aggrecan: beyond cartilage and into the brain. Int J Bio-
chem Cell Biol 44:690–693.
Murer MG, Yan Q, Raisman-Vozari R. 2001. Brain-derived
neurotrophic factor in the control human brain, and in
Alzheimer’s disease and Parkinson’s disease. Prog Neu-
robiol 63:71–124.
Nagahara AH, Mateling M, Kovacs I, Wang L, Eggert
S, Rockenstein E, Koo EH, et al. 2013. Early BDNF
treatment ameliorates cell loss in the entorhinal
cortex of APP transgenic mice. J.Neurosci 39:15596–
15602.
Nagahara AH, Merrill DA, Coppola G, Tsukada, S,
Schroeder BE, Shaked GM, Wang L, et al. 2009. Neuro-
protective effects of brain-derived neurotrophic factor in
rodent and primate models of Alzheimer’s disease. Nat
Med 15:331–337.
Withdrawal of BDNF from Hippocampal Cultures 191
Developmental Neurobiology

Narisawa-Saito M, Wakabayashi K, Tsuji S, Takahashi H,
Nawa H. 1996. Regional specificity of alterations in
NGF, BDNF and NT-3 levels in Alzheimer’s disease.
Neuroreport 7:2925–2928.
Nikolaev A, McLaughlin T, O’Leary DD, Tessier-
Lavigne M. 2009. APP binds DR6 to trigger axon
pruning and neuron death via distinct caspases. Nature
457:981–989.
Ninkina N, Grashchuck M, Buchman VL, Davies, AM.
1997. TrkB variants with deletions in the leucine-rich
motifs of the extracellular domain. J Biol Chem 272:
13019–13025.
Oppenheim RW. 1991. Cell death during development of
the nervous system. Ann Rev Neurosci 14:453–501.
Park H, Poo MM. 2013. Neurotrophin regulation of neural
circuit development and function. Nat Rev Neurosci 14:
7–23.
Pfeffer SR. 2013. Rab GTPase regulation of membrane
identity. Curr Opin Cell Biol 25:414–419.
Raingo J, Khvotchev M, Liu P, Darios F, Li YC,
Ramirez DM, Adachi M, et al. 2012. VAMP4 directs
synaptic vesicles to a pool that selectively maintains
asynchronous neurotransmission. Nat Neurosci 15:738–
745.
Selkoe DJ. 2002. Alzheimer’s disease is a synaptic failure.
Science 298:789–791.
Simonson S, Gaullier JM, D’Arrigo A, Stenmark H. 1999.
The Rab5 effector EEA1 interacts directly with syntaxin-
6. J Biol Chem 274:28857–28860.
Shitara A, Shibui T, Okayama M, Arakawa T, Mizoguchi I,
Sakakura Y, Takuma T. 2013. Vamp4 is required to
maintain the ribbon structure of the Golgi Apparatus. Mol
Cell Biochem 380:11–21.
Soppet D, Escandon E, Maragos J, Middlemas DS, Reid
SW, Blair J, Burton LE, et al. 1991. The neurotrophic
factors brain-derived neurotrophic factor and
neurotrophin-3 are ligands for the TrkB tyrosine kinase
receptor. Cell 65:895–903.
Strand A, Baquet Z, Aragaki A, Holmans P, Yang L,
Cleren C, Beal MF, et al. 2007. Expression profiling of
Huntington’s disease models suggests BDNF depletion
plays a major role in striatal degeneration. J Neurosci 27:
11758–11768.
Suttkus A, Rohn S, Weigel S, Gl€ockner P, Arendt T,
Morawski M. 2014. Aggrecan, link protein and tenascin-
R are essential components of the perineuronal net to pro-
tect neurons against iron-induced oxidative stress. Cell
Death Dis 5:e1119.
Takahashi M, Ishikawa K, Sato N, Obayashi M, Niimi Y,
Ishiguro T, Yamada M, et al. 2012. Reduced brain-
derived neurotrophic factor (BDNF) mRNA expression
and presence of BDNF-immunoreactive granules in the
spinocerebellar ataxia type 6 (SCA6) cerebellum. Neuro-
pathology 32:595–603.
Walsh DM, Selkoe D. 2004. Deciphering the molecular
basis of memory failure in Alzheimer’s disease. Neuron
44:181–183.
Whitfield J, Neame SJ, Paquet L, Bernard O, Ham J. 2001.
Dominant-negative c-Jun promotes neuronal survival by
reducing BIM expression and inhibiting mitochondrial
cytochrome c release. Neuron 29:629–643.
Yano H, Ninan I, Zhang H, Milner TA, Arancio O, Chao
MV. 2006. BDNF-mediated neurotransmission relies
upon a myosin VI motor complex. Nat Neurosci 9:1009–
1018.
Zuccato C, Cattaneo E. 2009. Brain-derived neurotrophic
factor in neurodegenerative diseases. Nat Rev Neurol 5:
311–322.
Zuccato C, Marullo M, Conforti P, MacDonald ME, Tartari
M, Cattaneo E. 2008. Systematic assessment of BDNF
and its receptor levels in human cortices in Huntington’s
disease. Brain Pathol 18:225–238.
192 Mariga et al.
Developmental Neurobiology
Copyright © 2022 FDOKUMEN