WisdomTree Trust Form N-CSR Filed 2019-09-03
290
Business Address 245 PARK AVENUE 35TH FLOOR NEW YORK NY 10167 212.801.2080 Mailing Address 245 PARK AVENUE 35TH FLOOR NEW YORK NY 10167 SECURITIES AND EXCHANGE COMMISSION FORM N-CSR Certified annual shareholder report of registered management investment companies filed on Form N-CSR Filing Date: 2019-09-03 | Period of Report: 2019-06-30 SEC Accession No. 0001193125-19-236194 (HTML Version on secdatabase.com) FILER WisdomTree Trust CIK:1350487| IRS No.: 000000000 | State of Incorp.:DE | Fiscal Year End: 0331 Type: N-CSR | Act: 40 | File No.: 811-21864 | Film No.: 191071491 Copyright © 2019 www.secdatabase.com . All Rights Reserved. Please Consider the Environment Before Printing This Document
-
Upload
khangminh22 -
Category
Documents
-
view
0 -
download
0
Transcript of WisdomTree Trust Form N-CSR Filed 2019-09-03

Business Address245 PARK AVENUE35TH FLOORNEW YORK NY 10167212.801.2080
Mailing Address245 PARK AVENUE35TH FLOORNEW YORK NY 10167
SECURITIES AND EXCHANGE COMMISSION
FORM N-CSRCertified annual shareholder report of registered management investment companies filed on
Form N-CSR
Filing Date: 2019-09-03 | Period of Report: 2019-06-30SEC Accession No. 0001193125-19-236194
(HTML Version on secdatabase.com)
FILERWisdomTree TrustCIK:1350487| IRS No.: 000000000 | State of Incorp.:DE | Fiscal Year End: 0331Type: N-CSR | Act: 40 | File No.: 811-21864 | Film No.: 191071491
Copyright © 2019 www.secdatabase.com. All Rights Reserved.Please Consider the Environment Before Printing This Document

Table of Contents
UNITED STATESSECURITIES AND EXCHANGE COMMISSION
Washington, D.C. 20549
FORM N-CSR
CERTIFIED SHAREHOLDER REPORT OF REGISTEREDMANAGEMENT INVESTMENT COMPANIES
Investment Company Act file number 811-21864
WisdomTree Trust(Exact name of registrant as specified in charter)
245 Park Avenue, 35th FloorNew York, NY 10167
(Address of principal executive offices) (Zip code)
The Corporation Trust Company1209 Orange Street
Wilmington, DE 19801(Name and address of agent for service)
Registrant��s telephone number, including area code: (866) 909-9473
Date of fiscal year end: June 30
Date of reporting period: June 30, 2019
Form N-CSR is to be used by management investment companies to file reports with the Commission not later than 10 days after thetransmission to stockholders of any report that is required to be transmitted to stockholders under Rule 30e-1 under the InvestmentCompany Act of 1940 (17 CFR 270.30e-1). The Commission may use the information provided on Form N-CSR in its regulatory,disclosure review, inspection, and policymaking roles.
A registrant is required to disclose the information specified by Form N-CSR, and the Commission will make this information public. Aregistrant is not required to respond to the collection of information contained in Form N-CSR unless the Form displays a currentlyvalid Office of Management and Budget (�OMB�) control number. Please direct comments concerning the accuracy of the informationcollection burden estimate and any suggestions for reducing the burden to Secretary, Securities and Exchange Commission, 100 F
Copyright © 2019 www.secdatabase.com. All Rights Reserved.Please Consider the Environment Before Printing This Document

Street, NE, Washington, DC 20549. The OMB has reviewed this collection of information under the clearance requirements of 44U.S.C. § 3507.
Copyright © 2019 www.secdatabase.com. All Rights Reserved.Please Consider the Environment Before Printing This Document

Table of ContentsItem 1. Reports to Stockholders.
The Reports to Shareholders are attached hereto.
Copyright © 2019 www.secdatabase.com. All Rights Reserved.Please Consider the Environment Before Printing This Document
Table of Contents
WisdomTree TrustAnnual ReportJune 30, 2019
International Equity ETFs:WisdomTree Dynamic Currency Hedged International Equity Fund (DDWM)WisdomTree Dynamic Currency Hedged International Quality Dividend Growth Fund (DHDG)WisdomTree Dynamic Currency Hedged International SmallCap Equity Fund (DDLS)WisdomTree Emerging Markets Dividend Fund (DVEM)WisdomTree Europe Multifactor Fund (EUMF)(formerly, WisdomTree Dynamic Currency Hedged Europe Equity Fund (DDEZ))
WisdomTree Global ex-Mexico Equity Fund (XMX)WisdomTree ICBCCS S&P China 500 Fund (WCHN)WisdomTree Japan Multifactor Fund (JAMF)(formerly, WisdomTree Dynamic Currency Hedged Japan Equity Fund (DDJP))
Fixed Income ETFs:WisdomTree Fundamental U.S. Corporate Bond Fund (WFIG)WisdomTree Fundamental U.S. High Yield Corporate Bond Fund (WFHY)WisdomTree Fundamental U.S. Short-Term Corporate Bond Fund (SFIG)WisdomTree Fundamental U.S. Short-Term High Yield Corporate Bond Fund (SFHY)
Alternative ETFs:WisdomTree Dynamic Bearish U.S. Equity Fund (DYB)WisdomTree Dynamic Long/Short U.S. Equity Fund (DYLS)
Asset Allocation ETFs:WisdomTree 90/60 U.S. Balanced Fund (NTSX)WisdomTree Balanced Income Fund (WBAL)
IMPORTANT NOTE: Beginning on January 1, 2021, as permitted by regulations adopted by the SEC, paper copies of the WisdomTree Funds�annual and semi-annual shareholder reports will no longer be sent by mail, unless you specifically request paper copies of the reports. Instead, annualand semi-annual shareholder reports will be available on the WisdomTree Funds� website (www.wisdomtree.com), and you will be notified by maileach time a report is posted and provided with a website link to access the report.If you already elected to receive shareholder reports electronically, you will not be affected by this change and you need not take any action. You mayelect to receive shareholder reports and other communications from a Fund electronically anytime by contacting your financial intermediary (such as abroker-dealer or bank).You may elect to receive all future reports in paper free of charge. Please contact your financial intermediary to request to continue receiving papercopies of your shareholder reports. Your election to receive reports in paper will apply to all funds held in your account.
Copyright © 2019 www.secdatabase.com. All Rights Reserved.Please Consider the Environment Before Printing This Document
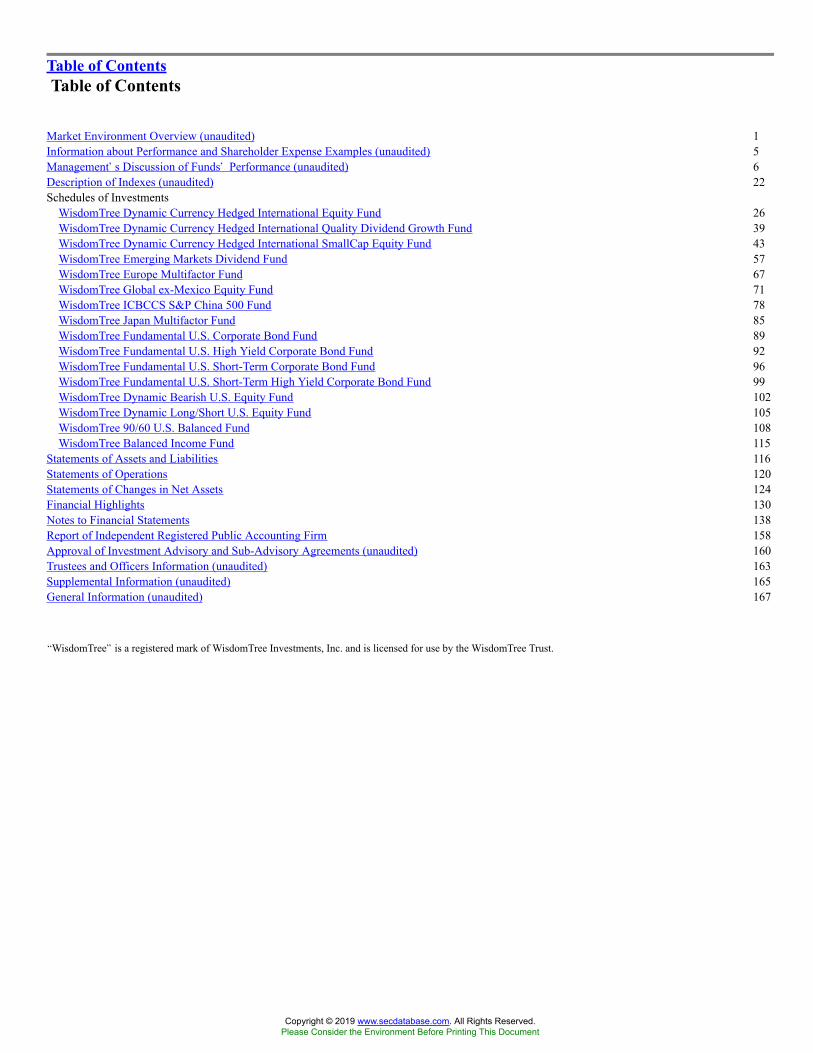
Table of ContentsTable of Contents
Market Environment Overview (unaudited) 1Information about Performance and Shareholder Expense Examples (unaudited) 5Management�s Discussion of Funds� Performance (unaudited) 6Description of Indexes (unaudited) 22Schedules of Investments
WisdomTree Dynamic Currency Hedged International Equity Fund 26WisdomTree Dynamic Currency Hedged International Quality Dividend Growth Fund 39WisdomTree Dynamic Currency Hedged International SmallCap Equity Fund 43WisdomTree Emerging Markets Dividend Fund 57WisdomTree Europe Multifactor Fund 67WisdomTree Global ex-Mexico Equity Fund 71WisdomTree ICBCCS S&P China 500 Fund 78WisdomTree Japan Multifactor Fund 85WisdomTree Fundamental U.S. Corporate Bond Fund 89WisdomTree Fundamental U.S. High Yield Corporate Bond Fund 92WisdomTree Fundamental U.S. Short-Term Corporate Bond Fund 96WisdomTree Fundamental U.S. Short-Term High Yield Corporate Bond Fund 99WisdomTree Dynamic Bearish U.S. Equity Fund 102WisdomTree Dynamic Long/Short U.S. Equity Fund 105WisdomTree 90/60 U.S. Balanced Fund 108WisdomTree Balanced Income Fund 115
Statements of Assets and Liabilities 116Statements of Operations 120Statements of Changes in Net Assets 124Financial Highlights 130Notes to Financial Statements 138Report of Independent Registered Public Accounting Firm 158Approval of Investment Advisory and Sub-Advisory Agreements (unaudited) 160Trustees and Officers Information (unaudited) 163Supplemental Information (unaudited) 165General Information (unaudited) 167
�WisdomTree� is a registered mark of WisdomTree Investments, Inc. and is licensed for use by the WisdomTree Trust.
Copyright © 2019 www.secdatabase.com. All Rights Reserved.Please Consider the Environment Before Printing This Document

Table of ContentsMarket Environment Overview
(unaudited)
U.S. MarketThe U.S. equity market, as measured by the S&P 500® Index, returned +10.42% for the twelve month fiscal period that ended June 30, 2019 (the�period�).
U.S. equities experienced positive returns through September 2018, driven by robust corporate profits and economic growth, the benefit of U.S.corporate tax reform, gradual monetary policy normalization, as well as positive consumer and business survey data.
The positive trend in U.S. equities reversed in the fourth quarter of 2018 with the S&P 500® Index experiencing a market correction of -13.52%,resulting in the first calendar year loss for the index since the 2008 financial crisis. Key drivers of negative returns and heightened volatility in thefourth quarter of 2018 were concerns about the sustainability of U.S. corporate earnings growth, U.S. credit quality, as well as fears of slowing globaltrade and economic growth.
In the last six months of 2018, the U.S. Federal Reserve (the �Fed�) raised the benchmark rate two times, equating to a cumulative increase of 0.50%.Meanwhile, the Consumer Price Index decreased from its 2018 peak and U.S. inflation expectations, as measured by the difference between thenominal and real 10-year U.S. Treasury yields, fell below the +2.0% threshold, a signal from the market that the additional Fed rate hikes in late 2018may not have been warranted.
In the first quarter of 2019 the U.S. equity market, as measured by the S&P 500® Index, rebounded sharply to return +13.65%. Indicators of economicgrowth signaled a mix of moderating growth and continued strength. Purchasing Managers� Index survey data decreased, although the level remainedconsistent with the average it had been across periods of economic expansion. Meanwhile, payroll wage and unemployment data exceededexpectations. The delayed release of fourth-quarter and full-year 2018 gross domestic product (�GDP�) fueled positive equity market returns � 2018real GDP growth of +2.9% was stronger than anticipated and marked a rate of expansion that had only been reached two other times since 2005. TheFed also paused its multi-year rate hike program for the time being and stressed that further rate actions would be data dependent. Easing monetarypolicy and more constructive U.S.-China trade negotiations drove positive sentiment in U.S. equity markets.
The second quarter of 2019 was characterized by a continued relief rally in U.S. stocks through April 2019, followed by a sell-off in May 2019, and asubsequent recovery in June 2019. The release of stronger than anticipated first quarter GDP growth as well the continuation of solid jobs and wagesgains alongside record low unemployment levels helped drive positive equity market returns in April 2019. In early May 2019, U.S.-China tradenegotiations broke down � the U.S. increased tariffs to 25% from 10% on $200 billion in Chinese goods, and China responded in-kind by raising tariffson U.S. imports. Leading up to the Federal Reserve June 2019 meeting, core inflation remained below the Fed�s 2% target, manufacturing survey dataslightly deteriorated, and the May 2019 jobs report came in meaningfully below expectations. In June 2019, the Fed�s outlook for the U.S. economywas markedly uncertain. The Fed left its target monetary policy rate unchanged and indicated that future rate action would be taken if needed to sustainthe U.S. economic expansion. Expectations for future Fed rate cuts along with resumption of U.S.-China trade negotiations at the upcoming G-20forum led U.S. equities higher through the end of June 2019 to return +4.30% in the second quarter of 2019.
Over the period, the increase in U.S. short-term interest rates exceeded the decrease in long-term rates (an anomaly that is generally seen as a recessionindicator if it persists for a protracted period of time), resulting in an inversion of the yields at the short-end of the U.S. Treasury yield curve. The Fedfunds rate increased 0.50% to 2.50% while the 2-Year U.S. Treasury Note yield fell 0.77% to 1.75% and the U.S. 10-Year Treasury yield fell 0.85% to2.00%. The closely monitored spread between the 2- and 10-year U.S. Treasury yields decreased from 0.33% to 0.25% over the period. The rise inshort-term rates was
WisdomTree Trust 1
Copyright © 2019 www.secdatabase.com. All Rights Reserved.Please Consider the Environment Before Printing This Document

Table of ContentsMarket Environment Overview(unaudited) (continued)
driven by tightening monetary policy through the final six months of 2018, while the drop in long-term rates reflected the outlook for slowing globaleconomic growth, declining inflation expectations, as well as the Fed�s dovish shift in monetary policy in early 2019.
Through early January 2019, investment grade and high yield spreads, as measured by the ICE BofA Merrill Lynch U.S. Corporate Master Option-Adjusted Spread and the ICE BofA Merrill Lynch U.S. High Yield Option-Adjusted Spread, both expanded 0.34% and 1.83%, respectively, reflectingfears of slowing global trade and economic growth as well as a potential for deterioration of U.S. credit quality. Early January 2019 marked the peak ininvestment grade and high yield spreads for the twelve month period ended June 30, 2019. From early January 2019 through the end of June 2019,investment grade and high yield spreads tightened, reflecting expectations for easing monetary policy and a more constructive outlook on U.S. creditquality. As of June 30, 2019, investment grade spreads tightened 0.41% and 0.07% from the January 2019 peak and the beginning of the 12-monthperiod ended June 30, 2019, respectively. Meanwhile, high-yield spreads tightened 1.38% from the January 2019 peak, but widened 0.45% from thebeginning of the 12-month period ended June 30, 2019.
Emerging and International MarketsEmerging market (�EM�) equities, as measured by the MSCI Emerging Markets Index, returned +1.84% in local currency terms and +1.21% in U.S.dollar terms over the 12-month period ending June 30, 2019. For much of the period, broad strength in the U.S. dollar hurt foreign EM currencies.Argentina and Turkey experienced even greater negative currency performance due to political and economic shocks. The Argentine peso weakened31.90% versus the U.S. dollar during the period. A sharp contraction in Argentinian economic activity in the fourth quarter of 2018 combined withrampant inflation, high unemployment, and a large fiscal deficit sunk the Argentinian peso, despite a sizeable financial support program from theInternational Monetary Fund. During the fiscal period, the Turkish lira declined 20.73% versus the U.S. dollar as the Turkish economy entered arecession in late 2018 and foreign investors weighed concerns over the country�s political and economic instability. Rising debt burdens andsubsequent bankruptcies led the Turkish lira lower over the period, alongside a meaningful increase in borrowing costs and persistently high inflation.
The first half of the period was characterized by negative equity market returns driven by moderating global economic growth and trade. Signals of aslowdown in China were a meaningful headwind on EM equity returns at the end of 2018 � China�s GDP growth slowed to a level last experienced in2009. The country�s manufacturing activity contracted while trade activity also provided evidence of the negative impact from the U.S.-China tradedispute. These factors all contributed to growing concerns around slowing demand for global products and resources from China. Additionally, manyEM countries with economies that are heavily reliant on the performance of the energy market were negatively impacted by a 40% drop in crude oilprices in the fourth quarter of 2018 due to oversupply.
In the early second half of the period, economic stimulus implemented by the Chinese government and easing trade tensions with the U.S. weresubstantial drivers of positive equity market performance in China as well as in export-oriented countries in the first quarter of 2019. Expectations forflat-to-lower U.S. interest rates also bolstered emerging market returns in the first quarter. Energy-centric economies benefited from a recovery in oilprices following a cut in global production in early 2019. Positive sentiment around global trade was somewhat offset by troubled emerging marketeconomies, including a slow recovery in Argentina, as well as contracting GDP rates in South Africa, South Korea, and Indonesia.
EM equities sold-off in May 2019, driven by the breakdown in U.S.-China trade negotiations. A less constructive outlook for global trade negativelyimpacted oil prices
2 WisdomTree Trust
Copyright © 2019 www.secdatabase.com. All Rights Reserved.Please Consider the Environment Before Printing This Document
Table of ContentsMarket Environment Overview(unaudited) (continued)
amid mounting concerns about oversupply and low demand. Meanwhile, Indian Prime Minister Modi was reelected for a second five-year term, whichwas a positive catalyst for Indian equities during the second quarter of 2019. The resumption of U.S.-China trade negotiations in June 2019 alongsidefalling oil inventories and increased expectations for easing monetary policy in the developed world, especially in the U.S., led EM equities to recoverthrough June 2019.
International equity markets, as measured by the MSCI EAFE Index, a broad measure of equity performance for the developed world outside the U.S.and Canada, returned +2.17% in local currency terms and +1.08% in U.S. dollar terms in the 12-month period ended June 30, 2019. Over the period,the U.S. dollar experienced significant appreciation (i.e. strengthened) against most major currencies. In particular, the British pound and the Euroexperienced negative spot returns vs. the U.S. dollar, while the Japanese yen strengthened vs. the U.S. dollar over the period � together these currenciesaccount for about 75% of the MSCI EAFE Index�s currency exposure.
Modest equity market gains in the third quarter of 2018 were reversed by a sharp market correction in the fourth quarter of 2018. Weak equityperformance through the fourth quarter of 2018 in mainland Europe (�Eurozone�) was primarily driven by softening economic data, decliningeconomic sentiment, and mounting fears of recession. The Eurozone saw two consecutive quarters of declining GDP growth in the last six months of2018. Europe�s largest economies, Germany and France, both released disappointing 2018 GDP growth figures. Importantly, Germany experienced theslowest annual GDP growth rate since 2013. Similarly, the U.K. economy expanded 1.4%, marking the weakest economic growth for the nation in sixyears. Additionally, export-oriented economies within the Eurozone were negatively impacted by the U.S.-China trade dispute. These developmentshad a negative impact on European sentiment and equities over the period.
Political fragmentation and uncertainty also negatively impacted the Eurozone during this time period. The new populist governing body in Italy failedto defuse fears about the country�s budget deficit and slowing economic growth. Meanwhile, protests and demand for political reform in Franceprovided evidence of political and economic divide.
Most notably, a lack of resolution on the ultimate outcome and timing of the United Kingdom�s departure from the European Union (known as�BREXIT�) was a hindrance for the Eurozone during this time period. Following several months of negotiations with European Union counterparts,the draft BREXIT deal released by British Prime Minister Theresa May was met with substantial criticism from British Parliament and from within herown party. Prime Minister May�s exit deal was met with such resistance that she narrowly won a no confidence vote in her leadership from within herConservative party. Multiple variations of a BREXIT resolution were ultimately rejected, including an exit plan negotiated with the European Union, areferendum to revoke BREXIT entirely, and an election to break away from the European Union without a deal altogether.
European equities rebounded alongside global equities in the first half of 2019, despite reductions in Eurozone economic growth forecasts and ongoingconcerns about the political and financial strength of the European Union. Measures taken by the European Central Bank to stimulate private sectorbank lending and more positive news on the U.S.-China trade dispute helped fuel the rebound in European equities in the first quarter of 2019. In thesecond quarter of 2019 incoming economic data continued to show signs of weakening. In Germany, manufacturing survey data contracted, and10-year German government bond yields entered negative territory for the first time since 2016. Meanwhile, concerns about Italy�s growing budgetdeficit remained a negative overhang on the Eurozone. Price inflation also remained stubbornly low, falling to the lowest level in more than a year inMay 2019.
Despite having announced the end of its quantitative easing program in early 2019, the European Central Bank responded to deteriorating economicconditions by signaling an openness to policy rate cuts and a renewed asset purchase program to stimulate economic
WisdomTree Trust 3
Copyright © 2019 www.secdatabase.com. All Rights Reserved.Please Consider the Environment Before Printing This Document

Table of ContentsMarket Environment Overview(unaudited) (concluded)
growth. European equities rallied in the second quarter of 2019 on heightened expectations for easing monetary policy conditions and improved globaltrade relations.
Japan experienced moderating economic growth during this time period, including a sharp decline in Q3 2018 GDP driven by natural disastersfollowed by a recovery in Q4 2018. Japanese export growth also declined over the period due to weak demand from China as well as the U.S.-Chinatrade dispute. In December 2018, the Japanese government unveiled a tax reform package for fiscal year 2019 to serve as a counter to the negativeeffects of a consumption tax hike that will commence later in 2019. Shortly after this announcement, the 2019 budget was announced revealing thiswill be the first time total spending will rise above 100 trillion Japanese yen, showcasing their difficulties curtailing expenditures. The ultra-accommodative monetary policy maintained by the Bank of Japan, including a near zero 10-year yield, did not spur price inflation during the period.Japanese equities recovered in Q1 2019 alongside global equities, driven by more constructive sentiment around global trade. Despite the equity rallyin Q1 2019, Japan�s economic data continued to be negatively impacted by subdued global demand, as evidenced by a contraction in the nation�smanufacturing data and a steep decline in exports.
4 WisdomTree Trust
Copyright © 2019 www.secdatabase.com. All Rights Reserved.Please Consider the Environment Before Printing This Document

Table of ContentsInformation about Performance and Shareholder Expense Examples (unaudited)
PerformanceThe performance tables on the following pages are provided for comparative purposes and represent the period noted. Each Fund�s per share NAV isthe value of one share of the Fund and is calculated by dividing the value of total assets less total liabilities by the number of shares outstanding. TheNAV return is based on the NAV of the Fund and the market price return is based on the market price per share of the Fund. The price used to calculatemarket price returns is the midpoint of the bid and ask price for Fund shares as of the close of trading on the exchange where Fund shares are listed.NAV and market price returns assume that dividends and capital gain distributions have been reinvested in the Fund at NAV and market price,respectively. As with other ETFs, NAV returns and market price returns may differ because of factors such as the supply and demand for Fund sharesand investors� assessments of the underlying value of a Fund�s portfolio securities.
Fund shares are bought and sold at market price (not NAV) and are not individually redeemed from a Fund. Fund NAV returns are calculated using aFund�s daily 4:00 p.m. eastern time NAV. Market price returns reflect the midpoint of the bid and ask price as of the close of trading on the exchangewhere Fund shares are listed. Market price returns do not represent the returns you would receive if you traded shares at other times. The returns do notreflect the deduction of taxes that a shareholder would pay on Fund distributions or on the redemption of Fund shares. Total returns for a period of lessthan one year are cumulative.
Performance is historical and does not guarantee future results. Current performance may be lower or higher than quoted. Investmentreturns and the principal value of an investment will fluctuate so that an investor��s shares, when redeemed, may be worth more or less thantheir original cost.
An index is a statistical measure of a specified financial market or sector. An index does not actually hold a portfolio of securities, incur expenses orpay any transaction costs. Therefore, index returns do not reflect deductions for fees or expenses and an index is not available for direct investment. Incomparison, the Funds� performance is negatively impacted by these deductions. Fund returns do not reflect brokerage commissions or taxes ontransactions in Fund shares or taxes that a shareholder would pay on Fund distributions. Past performance is no guarantee of future results. For the mostrecent month-end performance information visit www.wisdomtree.com.
Shareholder Expense Examples
Each Fund�s performance table is accompanied by a shareholder expense example. As a shareholder of a WisdomTree Fund, you incur two types ofcost: (1) transaction costs, including brokerage commissions on purchases and sales of your Fund shares and (2) ongoing costs, including managementfees and other Fund expenses. The examples are intended to help you understand your ongoing costs (in dollars and cents) of investing in a Fund and tocompare these costs with the ongoing costs of investing in other funds.
The examples are based on an investment of $1,000 invested at the beginning of the period and held for the entire period from January 1, 2019 toJune 30, 2019. Except where noted, expenses are calculated using each Fund�s annualized expense ratio (after the effect of contractual or voluntary feewaivers, if any), multiplied by the average account value for the period, multiplied by 181/365 (to reflect the one-half year period). The annualizedexpense ratio does not include acquired fund fees and expenses (�AFFEs�), which are fees and expenses incurred indirectly by a Fund through itsinvestments in certain underlying investment companies.
Actual expenses
The first line in the shareholder expense example table shown on the following pages provides information about actual account values and actualexpenses. You may use the information in this line, together with the amount you invested, to estimate the expenses that you paid over the period.Simply divide your account value by $1,000 (for example, an $8,600 account value divided by $1,000 = 8.6), then multiply the result by the number inthe first line for your Fund under the heading entitled �Expenses Paid During the Period� to estimate the expenses you paid on your account during theperiod.
Hypothetical example for comparison purposes
The second line in the shareholder expense example table shown on the following pages provides information about hypothetical account values andhypothetical expenses based on the Fund�s actual expense ratio and an assumed rate of return of 5% per year before expenses, which is not the Fund�sactual return. The hypothetical account values and expenses may not be used to estimate the actual ending account balance or expenses you paid for theperiod. You may use this information to compare the ongoing costs of investing in your Fund and other funds. To do so, compare this 5% hypotheticalexample with the 5% hypothetical examples that appear in the shareholder reports of the other funds.
Please note that the expenses shown in the table are meant to highlight your ongoing costs only and do not reflect any transactional costs, such asbrokerage commissions paid on purchases and sales of Fund shares. Therefore, the second line in the table is useful in comparing ongoing Fund costsonly and will not help you determine the relative total costs of owning different funds. In addition, if these transactional costs were included, your costswould have been higher.
WisdomTree Trust 5
Copyright © 2019 www.secdatabase.com. All Rights Reserved.Please Consider the Environment Before Printing This Document

Table of ContentsManagement��s Discussion of Funds�� Performance
as of June 30, 2019 (unaudited)
WisdomTree Dynamic Currency Hedged International Equity Fund (DDWM)Sector Breakdown�
Sector % of Net AssetsFinancials 22.4%Industrials 13.1%Consumer Discretionary 11.4%Consumer Staples 8.8%Communication Services 8.5%Energy 8.4%Health Care 8.0%Materials 7.5%Utilities 5.5%Information Technology 3.7%Real Estate 2.6%Other Assets less Liabilities� 0.1%Total 100.0%
� The Fund�s sector breakdown is expressed as a percentage of net assets and may change over time. In addition, a sector may be comprised of severalindustries. It does not include derivatives (if any).
� Other assets includes investment of cash collateral for securities on loan (if any).
Top Ten Holdings*
Description % of Net AssetsHSBC Holdings PLC 1.4%China Mobile Ltd. 1.4%BP PLC 1.3%Royal Dutch Shell PLC, Class A 1.3%TOTAL S.A. 1.2%Nestle S.A., Registered Shares 1.2%Royal Dutch Shell PLC, Class B 1.2%Novartis AG, Registered Shares 1.2%Toyota Motor Corp. 1.0%British American Tobacco PLC 0.9%* The ten largest holdings are subject to change, and there are no guarantees the Fund will remain invested in any particular company. Excludes derivatives and
investment of cash collateral for securities on loan (if any).The WisdomTree Dynamic Currency Hedged International Equity Fund (the �Fund�) seeks to track the price and yield performance, before fees andexpenses, of the WisdomTree Dynamic Currency Hedged International Equity Index (the �Index�). In seeking to track the Index, the Fund invests individend-paying companies in the industrialized world outside the U.S. and Canada while at the same time dynamically hedging exposure tofluctuations of the value of the applicable foreign currencies relative to the U.S. dollar. The Fund generally uses a representative sampling strategy toachieve its investment objective, meaning it generally will invest in a sample of securities in the Index.
The Fund returned 3.11% at net asset value (�NAV�) for the fiscal year ending June 30, 2019 (for more complete performance information please seethe table below). The Fund�s position in Health Care contributed positively to performance while its position in Consumer Discretionary contributednegatively to performance. The Fund�s position in Russia contributed positively to performance while its position in Mexico contributed negatively toperformance. The Fund uses a rules-based process, combining momentum, value, and interest rate factors, to help determine a currency hedge ratio onthe foreign currency exposure. Over the course of the fiscal year, in a period that saw significant currency volatility globally due to global economictension caused by the U.S.-China trade war, BREXIT, and Middle East oil dispute, the various hedge ratio decisions collectively provided in-lineperformance to an unhedged benchmark of Europe, Australasia and Far East (�EAFE�) stocks. During the fiscal year, the Fund�s use of forwardforeign currency contracts contributed positively to performance as a result of the Fund�s use of dynamic currency hedging during periods in which theU.S. dollar strengthened (more currency hedged) or weakened (less currency hedged) against applicable international currencies.
Shareholder Expense Example (for the six-month period ended June 30, 2019)
BeginningAccount Value
EndingAccount Value
AnnualizedNet Expense
Ratio
Expenses PaidDuring the
PeriodActual $ 1,000.00 $ 1,130.70 0.35 %1 $ 1.85Hypothetical (5% return before expenses) $ 1,000.00 $ 1,023.06 0.35 %1 $ 1.76
1 WisdomTree Asset Management, Inc. has contractually agreed to limit the management fee to 0.35% through October 31, 2019, unless earlier terminated by theBoard of Trustees of the WisdomTree Trust for any reason.
Copyright © 2019 www.secdatabase.com. All Rights Reserved.Please Consider the Environment Before Printing This Document

Performance
Average Annual Total Return1 Year 3 Year Since Inception1
Fund NAV Returns 3.11 % 10.16% 9.26 %Fund Market Price Returns 3.77 % 9.94 % 9.46 %WisdomTree Dynamic Currency Hedged International Equity Index 3.19 % 10.27% 9.35 %MSCI EAFE Local Currency Index 2.17 % 9.80 % 7.75 %MSCI EAFE Index 1.08 % 9.11 % 8.14 %
1 Total returns are calculated based on the commencement of Fund trading on the Cboe BZX Exchange, Inc. on January 7, 2016.
Performance is historical and does not guarantee future results. The returns do not reflect the deduction of taxes that a shareholder would payon Fund distributions or on the redemption of Fund shares.
6 WisdomTree Trust
Copyright © 2019 www.secdatabase.com. All Rights Reserved.Please Consider the Environment Before Printing This Document
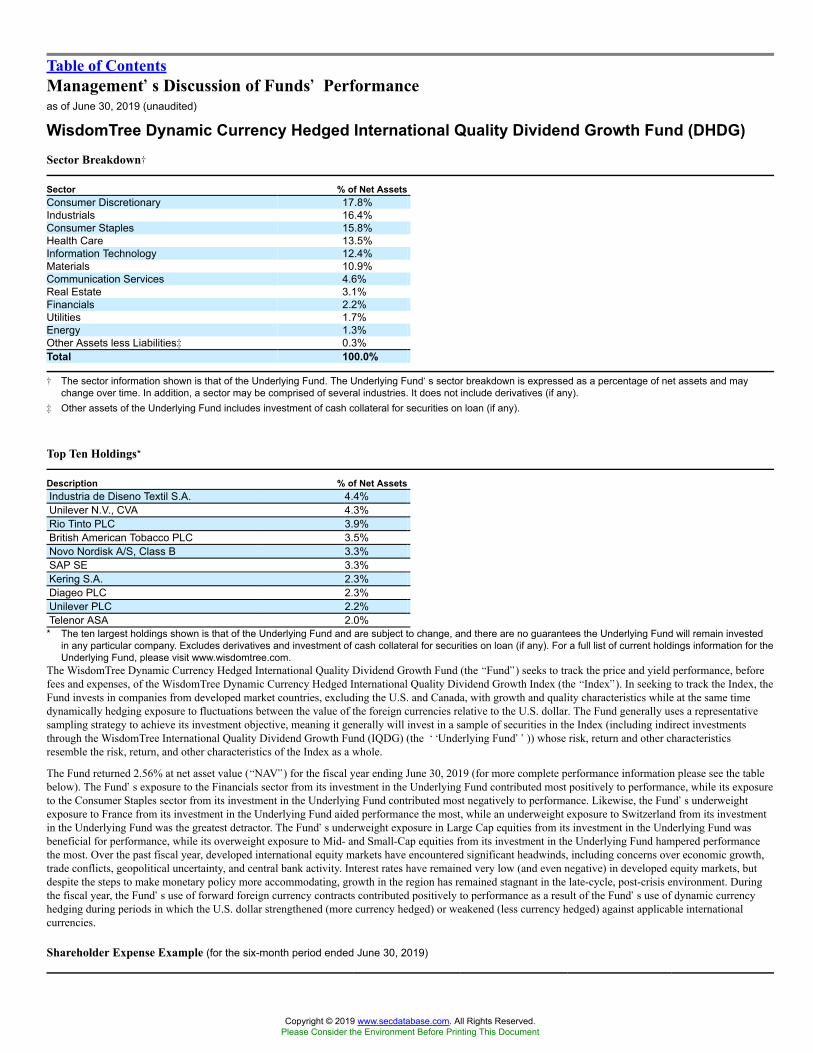
Table of ContentsManagement��s Discussion of Funds�� Performanceas of June 30, 2019 (unaudited)
WisdomTree Dynamic Currency Hedged International Quality Dividend Growth Fund (DHDG)Sector Breakdown�
Sector % of Net AssetsConsumer Discretionary 17.8%Industrials 16.4%Consumer Staples 15.8%Health Care 13.5%Information Technology 12.4%Materials 10.9%Communication Services 4.6%Real Estate 3.1%Financials 2.2%Utilities 1.7%Energy 1.3%Other Assets less Liabilities� 0.3%Total 100.0%
� The sector information shown is that of the Underlying Fund. The Underlying Fund�s sector breakdown is expressed as a percentage of net assets and maychange over time. In addition, a sector may be comprised of several industries. It does not include derivatives (if any).
� Other assets of the Underlying Fund includes investment of cash collateral for securities on loan (if any).
Top Ten Holdings*
Description % of Net AssetsIndustria de Diseno Textil S.A. 4.4%Unilever N.V., CVA 4.3%Rio Tinto PLC 3.9%British American Tobacco PLC 3.5%Novo Nordisk A/S, Class B 3.3%SAP SE 3.3%Kering S.A. 2.3%Diageo PLC 2.3%Unilever PLC 2.2%Telenor ASA 2.0%* The ten largest holdings shown is that of the Underlying Fund and are subject to change, and there are no guarantees the Underlying Fund will remain invested
in any particular company. Excludes derivatives and investment of cash collateral for securities on loan (if any). For a full list of current holdings information for theUnderlying Fund, please visit www.wisdomtree.com.
The WisdomTree Dynamic Currency Hedged International Quality Dividend Growth Fund (the �Fund�) seeks to track the price and yield performance, beforefees and expenses, of the WisdomTree Dynamic Currency Hedged International Quality Dividend Growth Index (the �Index�). In seeking to track the Index, theFund invests in companies from developed market countries, excluding the U.S. and Canada, with growth and quality characteristics while at the same timedynamically hedging exposure to fluctuations between the value of the foreign currencies relative to the U.S. dollar. The Fund generally uses a representativesampling strategy to achieve its investment objective, meaning it generally will invest in a sample of securities in the Index (including indirect investmentsthrough the WisdomTree International Quality Dividend Growth Fund (IQDG) (the ��Underlying Fund��)) whose risk, return and other characteristicsresemble the risk, return, and other characteristics of the Index as a whole.
The Fund returned 2.56% at net asset value (�NAV�) for the fiscal year ending June 30, 2019 (for more complete performance information please see the tablebelow). The Fund�s exposure to the Financials sector from its investment in the Underlying Fund contributed most positively to performance, while its exposureto the Consumer Staples sector from its investment in the Underlying Fund contributed most negatively to performance. Likewise, the Fund�s underweightexposure to France from its investment in the Underlying Fund aided performance the most, while an underweight exposure to Switzerland from its investmentin the Underlying Fund was the greatest detractor. The Fund�s underweight exposure in Large Cap equities from its investment in the Underlying Fund wasbeneficial for performance, while its overweight exposure to Mid- and Small-Cap equities from its investment in the Underlying Fund hampered performancethe most. Over the past fiscal year, developed international equity markets have encountered significant headwinds, including concerns over economic growth,trade conflicts, geopolitical uncertainty, and central bank activity. Interest rates have remained very low (and even negative) in developed equity markets, butdespite the steps to make monetary policy more accommodating, growth in the region has remained stagnant in the late-cycle, post-crisis environment. Duringthe fiscal year, the Fund�s use of forward foreign currency contracts contributed positively to performance as a result of the Fund�s use of dynamic currencyhedging during periods in which the U.S. dollar strengthened (more currency hedged) or weakened (less currency hedged) against applicable internationalcurrencies.
Shareholder Expense Example (for the six-month period ended June 30, 2019)
Copyright © 2019 www.secdatabase.com. All Rights Reserved.Please Consider the Environment Before Printing This Document

BeginningAccount Value
EndingAccount Value
AnnualizedNet Expense
Ratio
Expenses PaidDuring the
PeriodActual $ 1,000.00 $ 1,184.60 0.10 %1 $ 0.54Hypothetical (5% return before expenses) $ 1,000.00 $ 1,024.30 0.10 %1 $ 0.50
1 WisdomTree Asset Management, Inc. has contractually agreed to waive a portion of its management fee in an amount equal to the acquired fund fees andexpenses (�AFFEs�) attributable to the Fund�s investments in the Underlying Fund, as well as an additional 0.10%, through October 31, 2019, unless earlierterminated by the Board of Trustees of the WisdomTree Trust for any reason. The �Annualized Net Expense Ratio� does not include the impact of AFFEs. HadAFFEs been included (as shown in the net expense ratio in the Fund�s prospectus) the �Annualized Net Expense Ratio� would have been higher.
Performance
Average Annual Total Return1 Year Since Inception1
Fund NAV Returns 2.56 % 10.95 %Fund Market Price Returns 2.55 % 11.00 %WisdomTree Dynamic Currency Hedged International Quality Dividend Growth Index 2.76 % 11.54 %MSCI EAFE Local Currency Index 2.17 % 9.14 %
1 Total returns are calculated based on the commencement of Fund trading on the Cboe BZX Exchange, Inc. on November 3, 2016.
Performance is historical and does not guarantee future results. The returns do not reflect the deduction of taxes that a shareholder would payon Fund distributions or on the redemption of Fund shares.
WisdomTree Trust 7
Copyright © 2019 www.secdatabase.com. All Rights Reserved.Please Consider the Environment Before Printing This Document

Table of ContentsManagement��s Discussion of Funds�� Performanceas of June 30, 2019 (unaudited)
WisdomTree Dynamic Currency Hedged International SmallCap Equity Fund (DDLS)Sector Breakdown�
Sector % of Net AssetsIndustrials 24.0%Consumer Discretionary 15.9%Financials 15.8%Materials 10.5%Information Technology 7.2%Real Estate 6.1%Communication Services 5.8%Consumer Staples 5.2%Health Care 3.9%Energy 2.9%Utilities 2.9%Other Assets less Liabilities� -0.2%Total 100.0%
� The Fund�s sector breakdown is expressed as a percentage of net assets and may change over time. In addition, a sector may be comprised of severalindustries. It does not include derivatives (if any).
� Other assets includes investment of cash collateral for securities on loan (if any).
Top Ten Holdings*
Description % of Net AssetsRoyal Mail PLC 0.7%bpost S.A. 0.5%Freenet AG 0.5%Hammerson PLC 0.5%Navigator Co. S.A. (The) 0.5%Azimut Holding SpA 0.5%Elkem ASA 0.4%Siltronic AG 0.4%Air New Zealand Ltd. 0.4%Bank of Queensland Ltd. 0.4%* The ten largest holdings are subject to change, and there are no guarantees the Fund will remain invested in any particular company. Excludes derivatives and
investment of cash collateral for securities on loan (if any).The WisdomTree Dynamic Currency Hedged International SmallCap Equity Fund (the �Fund�) seeks to track the price and yield performance, beforefees and expenses, of the WisdomTree Dynamic Currency Hedged International SmallCap Equity Index (the �Index�). In seeking to track the Index,the Fund invests in the small-capitalization segment of dividend-paying companies in the industrialized world outside the U.S. and Canada while at thesame time dynamically hedging exposure to fluctuations of the value of the applicable foreign currencies relative to the U.S. dollar. The Fund generallyuses a representative sampling strategy to achieve its investment objective, meaning it generally will invest in a sample of securities in the Index.
The Fund returned -3.70% at net asset value (�NAV�) for the fiscal year ending June 30, 2019 (for more complete performance information please seethe table below). The Fund�s position in Utilities contributed positively to performance while its position in Financials contributed negatively toperformance. The Fund�s position in Israel contributed most positively to performance while its position in Japan contributed most negatively toperformance. The Fund uses a rules-based process, combining momentum, value, and interest rate factors, to help determine a currency hedge ratio onthe foreign currency exposure. Over the course of the fiscal year through June of 2019, the various hedge ratio decisions collectively providedrelatively in-line performance to an unhedged benchmark of Europe, Australasia and Far East (�EAFE�) small-cap stocks. During the fiscal year, theFund�s use of forward foreign currency contracts contributed positively to performance as a result of the Fund�s use of dynamic currency hedgingduring periods in which the U.S. dollar strengthened (more currency hedged) or weakened (less currency hedged) against applicable internationalcurrencies.
Shareholder Expense Example (for the six-month period ended June 30, 2019)
BeginningAccount Value
EndingAccount Value
AnnualizedNet Expense
Ratio
Expenses PaidDuring the
PeriodActual $ 1,000.00 $ 1,107.80 0.43 %1 $ 2.25Hypothetical (5% return before expenses) $ 1,000.00 $ 1,022.66 0.43 %1 $ 2.16
1 WisdomTree Asset Management, Inc. has contractually agreed to limit the management fee to 0.43% through October 31, 2019, unless earlier terminated by theBoard of Trustees of the WisdomTree Trust for any reason.
Copyright © 2019 www.secdatabase.com. All Rights Reserved.Please Consider the Environment Before Printing This Document

Performance
Average Annual Total Return1 Year 3 Year Since Inception1
Fund NAV Returns -3.70% 10.07% 8.74 %Fund Market Price Returns -4.07% 9.95 % 8.91 %WisdomTree Dynamic Currency Hedged International SmallCap Equity Index -3.20% 10.63% 9.26 %MSCI EAFE Small Cap Local Currency Index -5.51% 9.99 % 7.73 %MSCI EAFE Small Cap Index -6.35% 9.06 % 8.28 %
1 Total returns are calculated based on the commencement of Fund trading on the Cboe BZX Exchange, Inc. on January 7, 2016.
Performance is historical and does not guarantee future results. The returns do not reflect the deduction of taxes that a shareholder would payon Fund distributions or on the redemption of Fund shares.
8 WisdomTree Trust
Copyright © 2019 www.secdatabase.com. All Rights Reserved.Please Consider the Environment Before Printing This Document

Table of ContentsManagement��s Discussion of Funds�� Performanceas of June 30, 2019 (unaudited)
WisdomTree Emerging Markets Dividend Fund (DVEM)Sector Breakdown�
Sector % of Net AssetsFinancials 22.3%Information Technology 19.1%Energy 11.5%Materials 10.3%Communication Services 7.3%Consumer Staples 7.1%Industrials 6.2%Consumer Discretionary 6.2%Utilities 4.0%Real Estate 3.9%Health Care 1.3%Other Assets less Liabilities� 0.8%Total 100.0%
� The Fund�s sector breakdown is expressed as a percentage of net assets and may change over time. In addition, a sector may be comprised of severalindustries. It does not include derivatives (if any).
� Other assets includes investment of cash collateral for securities on loan (if any).
Top Ten Holdings*
Description % of Net AssetsSamsung Electronics Co., Ltd. 5.8%Taiwan Semiconductor Manufacturing Co.,
Ltd. 3.7%China Construction Bank Corp., Class H 2.4%Gazprom PJSC, ADR 1.6%China Mobile Ltd. 1.6%Industrial & Commercial Bank of China Ltd.,
Class H 1.4%Sberbank of Russia PJSC, ADR 1.3%Tatneft PJSC, ADR 1.3%MMC Norilsk Nickel PJSC, ADR 1.3%Lukoil PJSC, ADR 1.2%* The ten largest holdings are subject to change, and there are no guarantees the Fund will remain invested in any particular company. Excludes derivatives and
investment of cash collateral for securities on loan (if any).The WisdomTree Emerging Markets Dividend Fund (the �Fund�) seeks to track the price and yield performance, before fees and expenses, of theWisdomTree Emerging Markets Dividend Index (the �Index�). In seeking to track the Index, the Fund invests in dividend-paying companies in theemerging markets. The Fund generally uses a representative sampling strategy to achieve its investment objective, meaning it generally will invest in asample of securities in the Index.
The Fund returned 5.25% at net asset value (�NAV�) for the fiscal year ending June 30, 2019 (for more complete performance information please seethe table below). The Fund�s position in Communication Services contributed most positively to performance, while its position in Financialscontributed most negatively to performance. Likewise, the Fund�s allocation to China aided performance the most, reflecting China�s commitment toaccommodative monetary policy and financial market liberalization, while its position in Brazil was the greatest detractor, driven by ongoinggeopolitical uncertainties. A modest underweight to large- and mid-cap equities was most beneficial for performance, while an overweight to small-capequities was less impactful, though additive, nonetheless. Over the past fiscal year, global financial markets have largely been dictated by geopoliticalheadlines, central bank activity, and broad concerns over economic growth in the post-crisis environment. While market performance has largelyremained positive over this timeframe, temporary bouts of significant volatility have tempered investor optimism for continued growth late in theeconomic cycle.
Shareholder Expense Example (for the six-month period ended June 30, 2019)
BeginningAccount Value
EndingAccount Value
AnnualizedExpense Ratio
Expenses PaidDuring the
PeriodActual $ 1,000.00 $ 1,111.20 0.32 % $ 1.68Hypothetical (5% return before expenses) $ 1,000.00 $ 1,023.21 0.32 % $ 1.61
Copyright © 2019 www.secdatabase.com. All Rights Reserved.Please Consider the Environment Before Printing This Document

Performance
Average Annual Total Return1 Year 3 Year Since Inception1
Fund NAV Returns 5.25 % 10.41% 11.29 %Fund Market Price Returns 5.19 % 10.30% 11.42 %WisdomTree Emerging Markets Dividend Index 5.43 % 10.50% 11.39 %MSCI Emerging Markets Index 1.21 % 10.66% 11.22 %
1 Total returns are calculated based on the commencement of Fund trading on the Cboe BZX Exchange, Inc. on April 7, 2016.
Performance is historical and does not guarantee future results. The returns do not reflect the deduction of taxes that a shareholder would payon Fund distributions or on the redemption of Fund shares.
WisdomTree Trust 9
Copyright © 2019 www.secdatabase.com. All Rights Reserved.Please Consider the Environment Before Printing This Document

Table of ContentsManagement��s Discussion of Funds�� Performanceas of June 30, 2019 (unaudited)
WisdomTree Europe Multifactor Fund (EUMF)(formerly, WisdomTree Dynamic Currency Hedged Europe Equity Fund (DDEZ))
Sector Breakdown�
Sector % of Net AssetsConsumer Staples 15.9%Financials 14.1%Industrials 14.1%Health Care 11.3%Consumer Discretionary 11.2%Utilities 8.0%Communication Services 7.7%Real Estate 6.1%Energy 5.2%Information Technology 4.4%Materials 2.4%Other Assets less Liabilities� -0.4%Total 100.0%
� The Fund�s sector breakdown is expressed as a percentage of net assets and may change over time. In addition, a sector may be comprised of severalindustries. It does not include derivatives (if any).
� Other assets includes investment of cash collateral for securities on loan (if any).
Top Ten Holdings*
Description % of Net AssetsRoche Holding AG, Genusschein 0.9%TLG Immobilien AG 0.9%TOTAL S.A. 0.9%Allianz SE, Registered Shares 0.9%Veolia Environnement S.A. 0.9%Swisscom AG, Registered Shares 0.9%Orange S.A. 0.9%Danone S.A. 0.9%LEG Immobilien AG 0.9%Barco N.V. 0.9%* The ten largest holdings are subject to change, and there are no guarantees the Fund will remain invested in any particular company. Excludes derivatives and
investment of cash collateral for securities on loan (if any).The WisdomTree Europe Multifactor Fund (the �Fund�) seeks income and capital appreciation by investing in European equity securities with the highestpotential for returns based on proprietary measures of fundamental factors, such as value and quality, and technical factors, such as momentum and correlation,while seeking to manage currency risk by dynamically hedging currency fluctuations in the relative value of the applicable European currencies against the U.S.dollar, ranging from a 0% to 100% hedge. Prior to March 29, 2019, the Fund sought to track the price and yield performance, before fees and expenses, of theWisdomTree Dynamic Currency Hedged Europe Equity Index (the �Index�) by investing in European dividend-paying companies while at the same timedynamically hedging exposure to fluctuations of the value of the euro relative to the U.S. dollar.
The Fund returned -0.25% at net asset value (�NAV�) for the fiscal year ending June 30, 2019 (for more complete performance information please see the tablebelow). The Fund�s position in Utilities contributed most positively to performance, while its position in Financials detracted the most from performance. TheFund�s position in Switzerland contributed most positively to performance, while its position in Luxembourg contributed most negatively to performance. OnMarch 29, 2019, the Fund changed its investment strategy from a passively-managed index-based strategy to an actively-managed strategy using a model-basedapproach. The Fund�s overall performance can be attributed to the two strategies before and after the investment objective change. During October of 2018 toJanuary of 2019, the Fund saw a loss in returns due the heightened global economic tension caused by the U.S.-China trade war, BREXIT, and Italy�s largebudget deficit. With Europe�s economic indicators pointing to a slowdown, the Fund suffered a negative return as European equities tumbled in the second halfof 2018. After Q1 2019, the Fund had a relatively stable performance as the global tension eased. During the fiscal year, the Fund�s use of forward foreigncurrency contracts contributed positively to performance as a result of the Fund�s use of dynamic currency hedging during periods in which the U.S. dollarstrengthened (more currency hedged) or weakened (less currency hedged) against applicable European currencies.
Shareholder Expense Example (for the six-month period ended June 30, 2019)
BeginningAccount Value
EndingAccount Value
AnnualizedNet Expense
Ratio
Expenses PaidDuring the
PeriodActual $ 1,000.00 $ 1,122.30 0.43 %1 $ 2.26
Copyright © 2019 www.secdatabase.com. All Rights Reserved.Please Consider the Environment Before Printing This Document

Hypothetical (5% return before expenses) $ 1,000.00 $ 1,022.26 0.43 %1 $ 2.161 WisdomTree Asset Management, Inc. has contractually agreed to limit the management fee to 0.43% through October 31, 2019, unless earlier terminated by the
Board of Trustees of the WisdomTree Trust for any reason.
Performance
Average Annual Total Return1 Year 3 Year Since Inception1
Fund NAV Returns -0.25% 10.57% 8.47 %Fund Market Price Returns 0.14 % 10.05% 8.75 %MSCI Europe Index 1.88 % 9.11 % 7.95 %MSCI European Economic and Monetary Union (EMU) Local Currency Index2 2.01 % 9.60 % 6.95 %MSCI European Economic and Monetary Union (EMU) Index2 -0.48% 10.50% 8.49 %
1 Total returns are calculated based on the commencement of Fund trading on the Cboe BZX Exchange, Inc. on January 7, 2016.2 Prior to March 29, 2019, the Fund�s performance was measured against the unaffiliated broad-based securities market indexes of the EMU Local Currency Index
(primary) and the EMU Index (secondary). Effective with the investment objective and strategy change on March 29, 2019, the Fund�s performance is measuredagainst the unaffiliated broad-based securities market index of the MSCI Europe Index.
Performance is historical and does not guarantee future results. The returns do not reflect the deduction of taxes that a shareholder would payon Fund distributions or on the redemption of Fund shares.
10 WisdomTree Trust
Copyright © 2019 www.secdatabase.com. All Rights Reserved.Please Consider the Environment Before Printing This Document

Table of ContentsManagement��s Discussion of Funds�� Performanceas of June 30, 2019 (unaudited)
WisdomTree Global ex-Mexico Equity Fund (XMX)Sector Breakdown�
Sector % of Net AssetsInformation Technology 16.4%Financials 16.2%Health Care 11.8%Industrials 10.7%Consumer Discretionary 10.3%Communication Services 8.3%Consumer Staples 8.0%Energy 5.1%Materials 5.1%Utilities 3.3%Real Estate 2.9%Other Assets less Liabilities� 1.9%Total 100.0%
� The Fund�s sector breakdown is expressed as a percentage of net assets and may change over time. In addition, a sector may be comprised of severalindustries. It does not include derivatives (if any).
� Other assets includes investment of cash collateral for securities on loan (if any).
Top Ten Holdings*
Description % of Net AssetsMicrosoft Corp. 2.2%Apple, Inc. 1.9%Amazon.com, Inc. 1.8%Facebook, Inc., Class A 1.0%Johnson & Johnson 0.8%JPMorgan Chase & Co. 0.8%Alphabet, Inc., Class A 0.8%Tencent Holdings Ltd. 0.7%Nestle S.A., Registered Shares 0.7%Berkshire Hathaway, Inc., Class B 0.7%* The ten largest holdings are subject to change, and there are no guarantees the Fund will remain invested in any particular company. Excludes derivatives and
investment of cash collateral for securities on loan (if any).The WisdomTree Global ex-Mexico Equity Fund (the �Fund�) seeks to track the price and yield performance, before fees and expenses, of theWisdomTree Global ex-Mexico Equity Index (the �Index�). In seeking to track the Index, the Fund invests in large-capitalization companies operatingacross diversified sectors in developed and emerging markets throughout the world, excluding Mexico. The Fund generally uses a representativesampling strategy to achieve its investment objective, meaning it generally will invest in a sample of securities in the Index.
The Fund returned 6.44% at net asset value (�NAV�) for the fiscal year ending June 30, 2019 (for more complete performance information please seethe table below). The Fund�s position in Health Care contributed most positively to performance, while its position in Financials contributed mostnegatively to performance. Likewise, the Fund�s overweight to the United States aided performance the most, while its position in the United Kingdomwas the greatest detractor, reflecting continued BREXIT uncertainty. During the fiscal year, the Fund�s exclusion of Mexican equities positivelycontributed to performance, albeit modestly. Over the past fiscal year, global financial markets have largely been dictated by geopolitical headlines,central bank activity, and broad concerns over economic growth in the post-crisis environment. While market performance has largely remainedpositive over this timeframe, temporary bouts of significant volatility have tempered investor optimism for continued growth late in the economiccycle.
Shareholder Expense Example (for the six-month period ended June 30, 2019)
BeginningAccount Value
EndingAccount Value
AnnualizedExpense Ratio
Expenses PaidDuring the
PeriodActual $ 1,000.00 $ 1,164.40 0.20 % $ 1.07Hypothetical (5% return before expenses) $ 1,000.00 $ 1,023.80 0.20 % $ 1.00
Performance
Average Annual Total Return
Copyright © 2019 www.secdatabase.com. All Rights Reserved.Please Consider the Environment Before Printing This Document
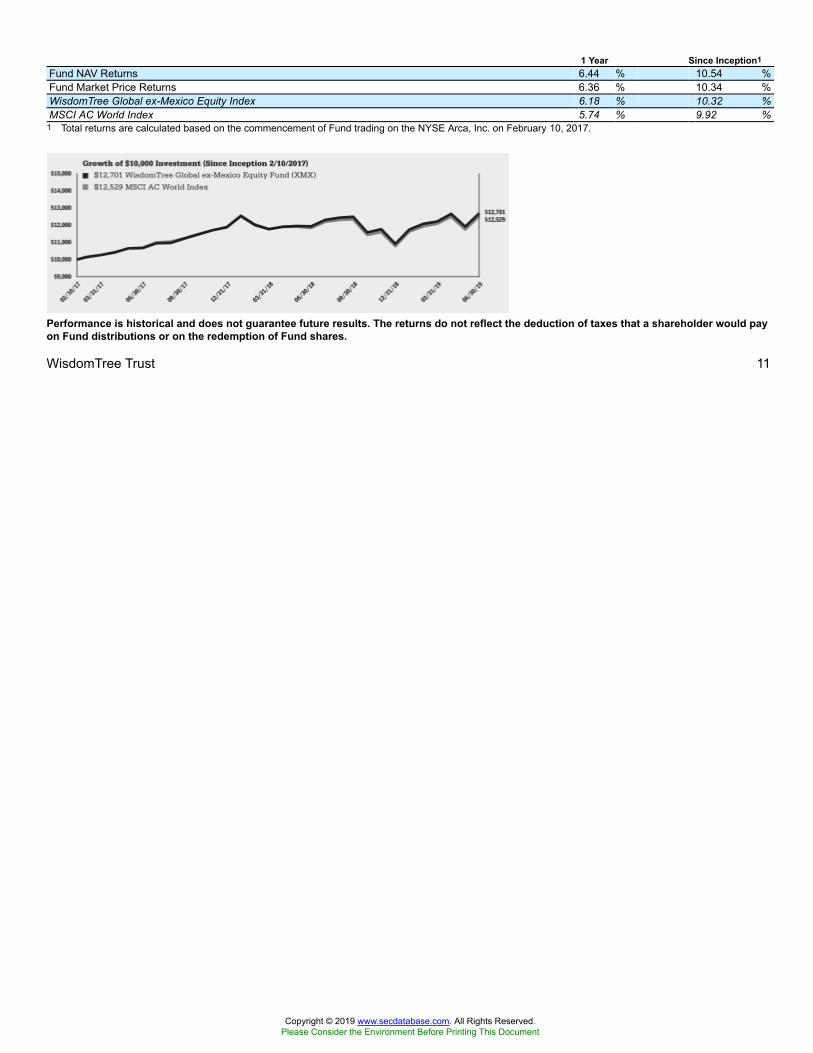
1 Year Since Inception1
Fund NAV Returns 6.44 % 10.54 %Fund Market Price Returns 6.36 % 10.34 %WisdomTree Global ex-Mexico Equity Index 6.18 % 10.32 %MSCI AC World Index 5.74 % 9.92 %
1 Total returns are calculated based on the commencement of Fund trading on the NYSE Arca, Inc. on February 10, 2017.
Performance is historical and does not guarantee future results. The returns do not reflect the deduction of taxes that a shareholder would payon Fund distributions or on the redemption of Fund shares.
WisdomTree Trust 11
Copyright © 2019 www.secdatabase.com. All Rights Reserved.Please Consider the Environment Before Printing This Document
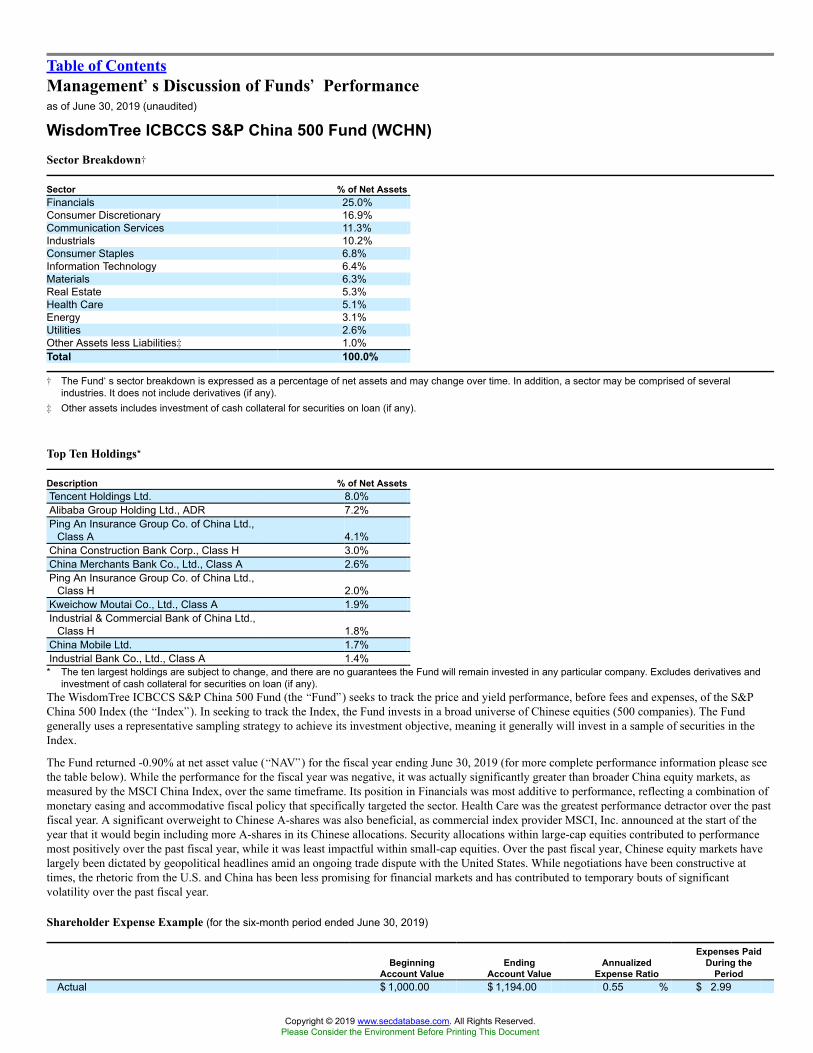
Table of ContentsManagement��s Discussion of Funds�� Performanceas of June 30, 2019 (unaudited)
WisdomTree ICBCCS S&P China 500 Fund (WCHN)Sector Breakdown�
Sector % of Net AssetsFinancials 25.0%Consumer Discretionary 16.9%Communication Services 11.3%Industrials 10.2%Consumer Staples 6.8%Information Technology 6.4%Materials 6.3%Real Estate 5.3%Health Care 5.1%Energy 3.1%Utilities 2.6%Other Assets less Liabilities� 1.0%Total 100.0%
� The Fund�s sector breakdown is expressed as a percentage of net assets and may change over time. In addition, a sector may be comprised of severalindustries. It does not include derivatives (if any).
� Other assets includes investment of cash collateral for securities on loan (if any).
Top Ten Holdings*
Description % of Net AssetsTencent Holdings Ltd. 8.0%Alibaba Group Holding Ltd., ADR 7.2%Ping An Insurance Group Co. of China Ltd.,
Class A 4.1%China Construction Bank Corp., Class H 3.0%China Merchants Bank Co., Ltd., Class A 2.6%Ping An Insurance Group Co. of China Ltd.,
Class H 2.0%Kweichow Moutai Co., Ltd., Class A 1.9%Industrial & Commercial Bank of China Ltd.,
Class H 1.8%China Mobile Ltd. 1.7%Industrial Bank Co., Ltd., Class A 1.4%* The ten largest holdings are subject to change, and there are no guarantees the Fund will remain invested in any particular company. Excludes derivatives and
investment of cash collateral for securities on loan (if any).The WisdomTree ICBCCS S&P China 500 Fund (the �Fund�) seeks to track the price and yield performance, before fees and expenses, of the S&PChina 500 Index (the �Index�). In seeking to track the Index, the Fund invests in a broad universe of Chinese equities (500 companies). The Fundgenerally uses a representative sampling strategy to achieve its investment objective, meaning it generally will invest in a sample of securities in theIndex.
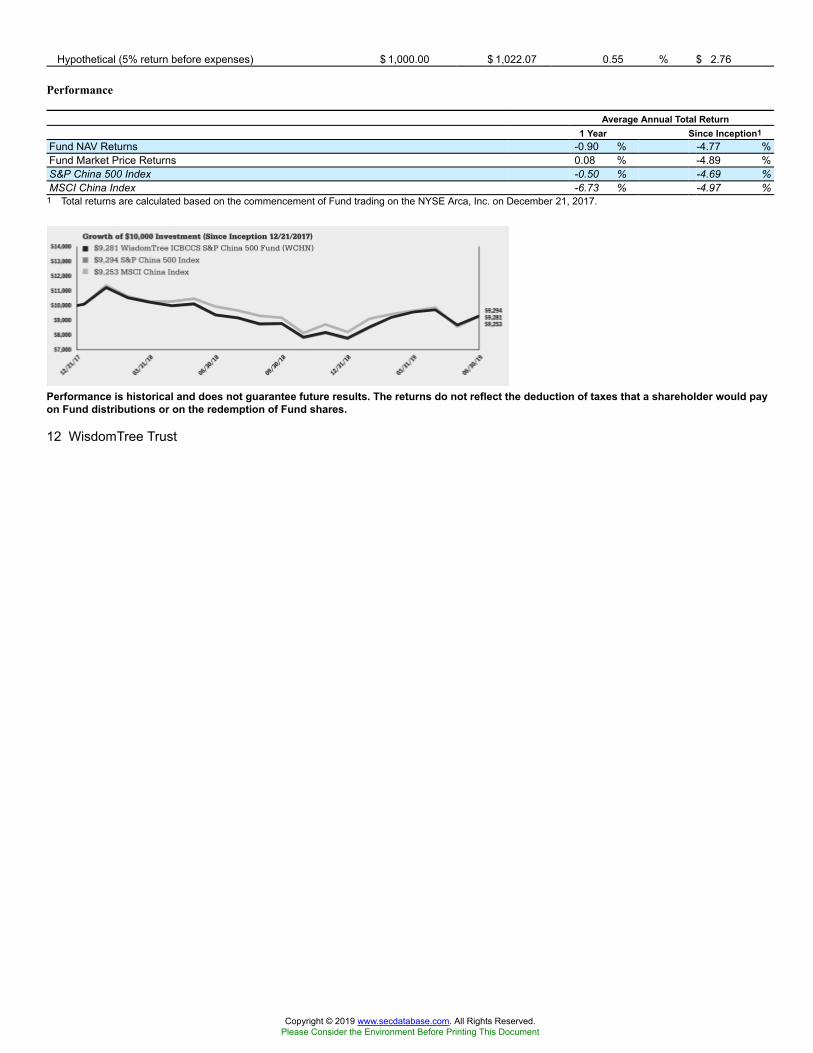
The Fund returned -0.90% at net asset value (�NAV�) for the fiscal year ending June 30, 2019 (for more complete performance information please seethe table below). While the performance for the fiscal year was negative, it was actually significantly greater than broader China equity markets, asmeasured by the MSCI China Index, over the same timeframe. Its position in Financials was most additive to performance, reflecting a combination ofmonetary easing and accommodative fiscal policy that specifically targeted the sector. Health Care was the greatest performance detractor over the pastfiscal year. A significant overweight to Chinese A-shares was also beneficial, as commercial index provider MSCI, Inc. announced at the start of theyear that it would begin including more A-shares in its Chinese allocations. Security allocations within large-cap equities contributed to performancemost positively over the past fiscal year, while it was least impactful within small-cap equities. Over the past fiscal year, Chinese equity markets havelargely been dictated by geopolitical headlines amid an ongoing trade dispute with the United States. While negotiations have been constructive attimes, the rhetoric from the U.S. and China has been less promising for financial markets and has contributed to temporary bouts of significantvolatility over the past fiscal year.
Shareholder Expense Example (for the six-month period ended June 30, 2019)
BeginningAccount Value
EndingAccount Value
AnnualizedExpense Ratio
Expenses PaidDuring the
PeriodActual $ 1,000.00 $ 1,194.00 0.55 % $ 2.99
Copyright © 2019 www.secdatabase.com. All Rights Reserved.Please Consider the Environment Before Printing This Document
Hypothetical (5% return before expenses) $ 1,000.00 $ 1,022.07 0.55 % $ 2.76
Performance
Average Annual Total Return1 Year Since Inception1
Fund NAV Returns -0.90 % -4.77 %Fund Market Price Returns 0.08 % -4.89 %S&P China 500 Index -0.50 % -4.69 %MSCI China Index -6.73 % -4.97 %
1 Total returns are calculated based on the commencement of Fund trading on the NYSE Arca, Inc. on December 21, 2017.
Performance is historical and does not guarantee future results. The returns do not reflect the deduction of taxes that a shareholder would payon Fund distributions or on the redemption of Fund shares.
12 WisdomTree Trust
Copyright © 2019 www.secdatabase.com. All Rights Reserved.Please Consider the Environment Before Printing This Document

Table of ContentsManagement��s Discussion of Funds�� Performanceas of June 30, 2019 (unaudited)
WisdomTree Japan Multifactor Fund (JAMF)(formerly, WisdomTree Dynamic Currency Hedged Japan Equity Fund (DDJP))
Sector Breakdown�
Sector % of Net AssetsIndustrials 22.1%Consumer Discretionary 17.3%Information Technology 12.1%Financials 10.1%Consumer Staples 9.3%Health Care 9.3%Communication Services 7.8%Materials 6.3%Real Estate 3.1%Utilities 1.7%Energy 1.0%Other Assets less Liabilities� -0.1%Total 100.0%
� The Fund�s sector breakdown is expressed as a percentage of net assets and may change over time. In addition, a sector may be comprised of severalindustries. It does not include derivatives (if any).
� Other assets includes investment of cash collateral for securities on loan (if any).
Top Ten Holdings*
Description % of Net AssetsSumitomo Mitsui Trust Holdings, Inc. 1.2%Mitsubishi UFJ Financial Group, Inc. 1.2%Sumitomo Mitsui Financial Group, Inc. 1.2%Toei Co., Ltd. 1.1%Resona Holdings, Inc. 1.1%Matsui Securities Co., Ltd. 1.1%Mebuki Financial Group, Inc. 1.1%Shinsei Bank Ltd. 1.0%Orient Corp. 1.0%Shionogi & Co., Ltd. 0.9%* The ten largest holdings are subject to change, and there are no guarantees the Fund will remain invested in any particular company. Excludes derivatives and
investment of cash collateral for securities on loan (if any).The WisdomTree Japan Multifactor Fund (the �Fund�) seeks income and capital appreciation by investing in Japanese equity securities with thehighest potential for returns based on proprietary measures of fundamental factors, such as value and quality, and technical factors, such as momentumand correlation, while seeking to manage currency risk by dynamically hedging currency fluctuations in the relative value of the Japanese yen againstthe U.S. dollar, ranging from a 0% to 100% hedge. Prior to March 29, 2019, the Fund sought to track the price and yield performance, before fees andexpenses, of the WisdomTree Dynamic Currency Hedged Japan Equity Index (the �Index�) by investing in Japanese dividend-paying companies whileat the same time dynamically hedging exposure to fluctuations of the value of the Japanese yen relative to the U.S. dollar.
The Fund returned -10.20% at net asset value (�NAV�) for the fiscal year ending June 30, 2019 (for more complete performance information pleasesee the table below). The Fund�s position in Information Technology contributed positively to performance, while its position in ConsumerDiscretionary contributed most negatively to performance. On March 29, 2019, the Fund changed its investment strategy from a passively-managedindex-based strategy to an actively-managed strategy using a model-based approach. The Fund�s overall performance can be attributed to the twostrategies before and after the investment objective change. During October of 2018 to January of 2019, the Fund saw a loss in returns due theheightened global economic tension caused by the U.S.-China trade war. Japan�s equities witnessed a selloff due to investor fears and led to negativereturns of the Fund. The Fund rebounded in early 2019 as the global tension eased. After Q1 2019, the Fund had a relatively stable performance as theglobal tension eased. During the fiscal year, the Fund�s use of forward foreign currency contracts detracted from performance as a result of the Fund�suse of dynamic currency hedging during periods in which the U.S. dollar strengthened (more currency hedged) or weakened (less currency hedged)against the Japanese yen.
Shareholder Expense Example (for the six-month period ended June 30, 2019)
BeginningAccount Value
EndingAccount Value
AnnualizedNet Expense
Ratio
Expenses PaidDuring the
PeriodActual $ 1,000.00 $ 1,014.60 0.43 %1 $ 2.15
Copyright © 2019 www.secdatabase.com. All Rights Reserved.Please Consider the Environment Before Printing This Document

Hypothetical (5% return before expenses) $ 1,000.00 $ 1,022.66 0.43 %1 $ 2.161 WisdomTree Asset Management, Inc. has contractually agreed to limit the management fee to 0.43% through October 31, 2019, unless earlier terminated by the
Board of Trustees of the WisdomTree Trust for any reason.
Performance
Average Annual Total Return1 Year 3 Year Since Inception1
Fund NAV Returns -10.20% 6.28 % 2.89 %Fund Market Price Returns -9.86 % 5.95 % 2.96 %MSCI Japan Local Currency Index -6.80 % 9.84 % 3.71 %MSCI Japan Index -4.19 % 8.06 % 6.49 %
1 Total returns are calculated based on the commencement of Fund trading on the Cboe BZX Exchange, Inc. on January 7, 2016.
Performance is historical and does not guarantee future results. The returns do not reflect the deduction of taxes that a shareholder would payon Fund distributions or on the redemption of Fund shares.
WisdomTree Trust 13
Copyright © 2019 www.secdatabase.com. All Rights Reserved.Please Consider the Environment Before Printing This Document

Table of ContentsManagement��s Discussion of Funds�� Performanceas of June 30, 2019 (unaudited)
WisdomTree Fundamental U.S. Corporate Bond Fund (WFIG)Sector Breakdown�
Sector % of Net AssetsFinancials 28.0%Health Care 14.5%Industrials 10.1%Consumer Staples 10.1%Consumer Discretionary 8.2%Information Technology 7.6%Communication Services 7.0%Utilities 4.8%Energy 4.4%Real Estate 2.3%Materials 1.0%U.S. Government Obligations 0.2%Other Assets less Liabilities� 1.8%Total 100.0%
� The Fund�s sector breakdown is expressed as a percentage of net assets and may change over time. In addition, a sector may be comprised of severalindustries. It does not include derivatives (if any).
� Other assets includes investment of cash collateral for securities on loan (if any).
Top Ten Holdings*
Description % of Net AssetsMorgan Stanley,
4.88%, 11/1/22 3.1%Dow Chemical Co. (The),
4.13%, 11/15/21 3.0%Citigroup, Inc.,
5.50%, 9/13/25 3.0%AT&T, Inc.,
4.50%, 3/9/48 2.9%Verizon Communications, Inc.,
4.40%, 11/1/34 2.4%McKesson Corp.,
3.80%, 3/15/24 2.3%Synchrony Financial,
2.70%, 2/3/20 2.2%HSBC USA, Inc.,
5.00%, 9/27/20 2.0%AT&T, Inc.,
3.60%, 7/15/25 2.0%Tyson Foods, Inc.,
3.95%, 8/15/24 1.8%* The ten largest holdings are subject to change, and there are no guarantees the Fund will remain invested in any particular company. Excludes derivatives and
investment of cash collateral for securities on loan (if any).The WisdomTree Fundamental U.S. Corporate Bond Fund (the �Fund�) seeks to track the price and yield performance, before fees and expenses, ofthe WisdomTree Fundamental U.S. Corporate Bond Index (the �Index�). In seeking to track the Index, the Fund invests in issuers in the U.S.investment grade corporate bond market that are deemed to exhibit favorable fundamentals and opportunities for income. The Fund generally uses arepresentative sampling strategy to achieve its investment objective, meaning it generally will invest in a sample of securities in the Index.
The Fund returned 10.44% at net asset value (�NAV�) for the fiscal year ending June 30, 2019 (for more complete performance information please seethe table below). Relative to the benchmark, security allocations within the Utilities sector were the primary detractor (Pacific Gas & Electric Co.). Anoverweight allocation to the Communication Services sector was a positive offset driven by AT&T, Inc. and Verizon Communications, Inc. The fiscalyear was a story of two contrasting markets. The last quarter of 2018 was mainly a �risk-off� environment, where �risk-on� assets like corporate bondsand equities markets fell, credit curves steepened dramatically, and as a result, provided a headwind against Fund performance. This was a result ofglobal trade war fears, rising interest rates, and slowdown in economic data. However, in the first six months of 2019, credit spreads have tightened,global markets have rallied (more than offsetting losses faced in late 2018) and yields across the U.S. curve have come down significantly. This was aresult of easing trade tensions, falling interest rates, and improvement on economic data domestically. The overall market environment during the fiscalyear was very beneficial for Fund performance, as the Fund benefited from the strong rally in corporate bonds, and also, the Fund had an extended
Copyright © 2019 www.secdatabase.com. All Rights Reserved.Please Consider the Environment Before Printing This Document
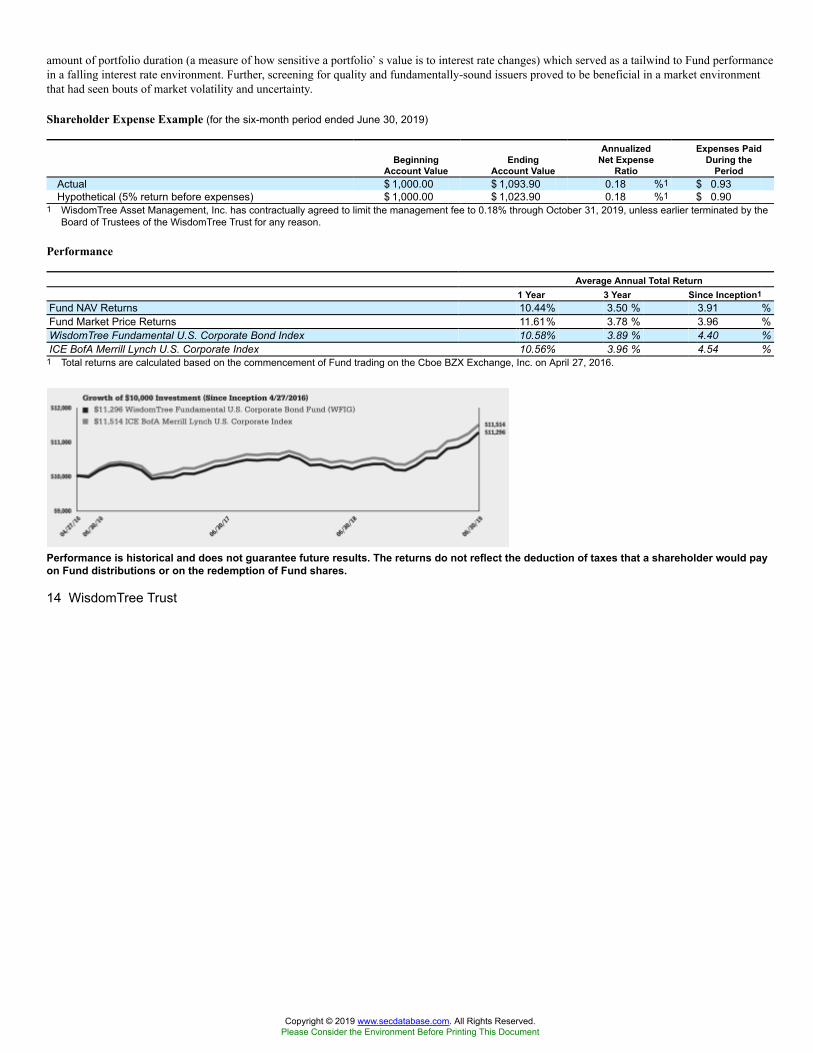
amount of portfolio duration (a measure of how sensitive a portfolio�s value is to interest rate changes) which served as a tailwind to Fund performancein a falling interest rate environment. Further, screening for quality and fundamentally-sound issuers proved to be beneficial in a market environmentthat had seen bouts of market volatility and uncertainty.
Shareholder Expense Example (for the six-month period ended June 30, 2019)
BeginningAccount Value
EndingAccount Value
AnnualizedNet Expense
Ratio
Expenses PaidDuring the
PeriodActual $ 1,000.00 $ 1,093.90 0.18 %1 $ 0.93Hypothetical (5% return before expenses) $ 1,000.00 $ 1,023.90 0.18 %1 $ 0.90
1 WisdomTree Asset Management, Inc. has contractually agreed to limit the management fee to 0.18% through October 31, 2019, unless earlier terminated by theBoard of Trustees of the WisdomTree Trust for any reason.
Performance
Average Annual Total Return1 Year 3 Year Since Inception1
Fund NAV Returns 10.44% 3.50 % 3.91 %Fund Market Price Returns 11.61% 3.78 % 3.96 %WisdomTree Fundamental U.S. Corporate Bond Index 10.58% 3.89 % 4.40 %ICE BofA Merrill Lynch U.S. Corporate Index 10.56% 3.96 % 4.54 %
1 Total returns are calculated based on the commencement of Fund trading on the Cboe BZX Exchange, Inc. on April 27, 2016.
Performance is historical and does not guarantee future results. The returns do not reflect the deduction of taxes that a shareholder would payon Fund distributions or on the redemption of Fund shares.
14 WisdomTree Trust
Copyright © 2019 www.secdatabase.com. All Rights Reserved.Please Consider the Environment Before Printing This Document

Table of ContentsManagement��s Discussion of Funds�� Performanceas of June 30, 2019 (unaudited)
WisdomTree Fundamental U.S. High Yield Corporate Bond Fund (WFHY)Sector Breakdown�
Sector % of Net AssetsConsumer Discretionary 18.0%Health Care 14.0%Industrials 11.1%Materials 9.6%Financials 9.1%Communication Services 8.9%Consumer Staples 8.2%Information Technology 7.5%Energy 7.5%Utilities 2.1%Real Estate 1.9%Other Assets less Liabilities� 2.1%Total 100.0%
� The Fund�s sector breakdown is expressed as a percentage of net assets and may change over time. In addition, a sector may be comprised of severalindustries. It does not include derivatives (if any).
� Other assets includes investment of cash collateral for securities on loan (if any).
Top Ten Holdings*
Description % of Net AssetsCSC Holdings LLC,
5.38%, 2/1/28 1.3%Western Digital Corp.,
4.75%, 2/15/26 1.3%Tenet Healthcare Corp.,
6.75%, 6/15/23 1.3%Community Health Systems,
Inc.,6.25%, 3/31/23 1.1%
Chemours Co. (The),6.63%, 5/15/23 1.1%
L Brands, Inc.,6.88%, 11/1/35 1.1%
Hughes Satellite Systems Corp.,6.63%, 8/1/26 1.1%
Hanesbrands, Inc.,4.88%, 5/15/26 1.0%
B&G Foods, Inc.,5.25%, 4/1/25 1.0%
Beacon Roofing Supply, Inc.,4.88%, 11/1/25 1.0%
* The ten largest holdings are subject to change, and there are no guarantees the Fund will remain invested in any particular company. Excludes derivatives andinvestment of cash collateral for securities on loan (if any).
The WisdomTree Fundamental U.S. High Yield Corporate Bond Fund (the �Fund�) seeks to track the price and yield performance, before fees andexpenses, of the WisdomTree Fundamental U.S. High Yield Corporate Bond Index (the ��Index��). In seeking to track the Index, the Fund invests inissuers in the U.S. non-investment grade corporate bond (�junk bond�) market that are deemed to exhibit favorable fundamentals and opportunities forincome. The Fund generally uses a representative sampling strategy to achieve its investment objective, meaning it generally will invest in a sample ofsecurities in the Index.
The Fund returned 9.43% at net asset value (�NAV�) for the fiscal year ending June 30, 2019 (for more complete performance information please seethe table below). Performance was positively impacted by being underweight in the Wirelines industry, with a position in Frontier CommunicationsCorp. adding the most to outperformance within this industry. In addition, underweight industry allocations to Oil Field Services and IndependentEnergy added to returns, with a position in Transocean, Inc. adding the most to outperformance within this industry. The largest detractor came in theMetals & Mining industry, with a position in Peabody Energy Corp. that underperformed the most within this industry. The fiscal year was a story oftwo contrasting markets. The last quarter of 2018 was mainly a �risk-off� environment, where �risk-on� assets like high yield corporate bonds andequities markets fell, credit curves steepened dramatically, and as a result, provided a headwind against Fund performance. This was a result of globaltrade war fears, rising interest rates, and slowdown in economic data. However, in the first six months of 2019, credit spreads have tightened, global
Copyright © 2019 www.secdatabase.com. All Rights Reserved.Please Consider the Environment Before Printing This Document
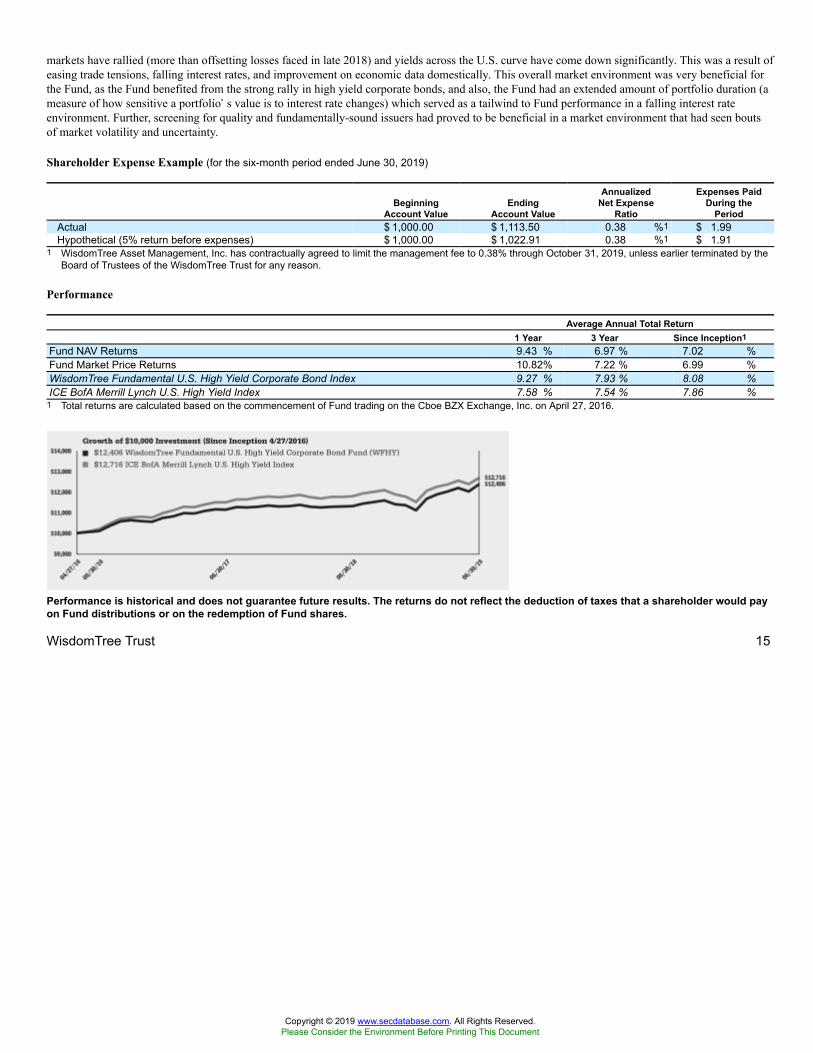
markets have rallied (more than offsetting losses faced in late 2018) and yields across the U.S. curve have come down significantly. This was a result ofeasing trade tensions, falling interest rates, and improvement on economic data domestically. This overall market environment was very beneficial forthe Fund, as the Fund benefited from the strong rally in high yield corporate bonds, and also, the Fund had an extended amount of portfolio duration (ameasure of how sensitive a portfolio�s value is to interest rate changes) which served as a tailwind to Fund performance in a falling interest rateenvironment. Further, screening for quality and fundamentally-sound issuers had proved to be beneficial in a market environment that had seen boutsof market volatility and uncertainty.
Shareholder Expense Example (for the six-month period ended June 30, 2019)
BeginningAccount Value
EndingAccount Value
AnnualizedNet Expense
Ratio
Expenses PaidDuring the
PeriodActual $ 1,000.00 $ 1,113.50 0.38 %1 $ 1.99Hypothetical (5% return before expenses) $ 1,000.00 $ 1,022.91 0.38 %1 $ 1.91
1 WisdomTree Asset Management, Inc. has contractually agreed to limit the management fee to 0.38% through October 31, 2019, unless earlier terminated by theBoard of Trustees of the WisdomTree Trust for any reason.
Performance
Average Annual Total Return1 Year 3 Year Since Inception1
Fund NAV Returns 9.43 % 6.97 % 7.02 %Fund Market Price Returns 10.82% 7.22 % 6.99 %WisdomTree Fundamental U.S. High Yield Corporate Bond Index 9.27 % 7.93 % 8.08 %ICE BofA Merrill Lynch U.S. High Yield Index 7.58 % 7.54 % 7.86 %
1 Total returns are calculated based on the commencement of Fund trading on the Cboe BZX Exchange, Inc. on April 27, 2016.
Performance is historical and does not guarantee future results. The returns do not reflect the deduction of taxes that a shareholder would payon Fund distributions or on the redemption of Fund shares.
WisdomTree Trust 15
Copyright © 2019 www.secdatabase.com. All Rights Reserved.Please Consider the Environment Before Printing This Document
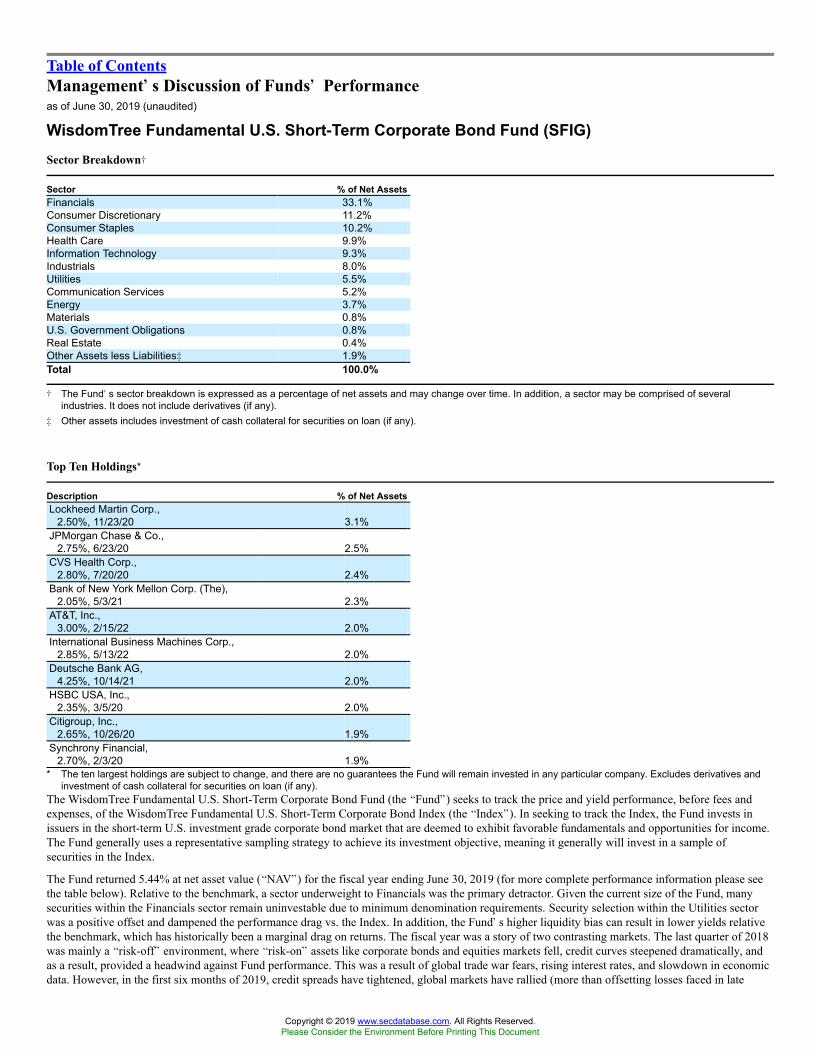
Table of ContentsManagement��s Discussion of Funds�� Performanceas of June 30, 2019 (unaudited)
WisdomTree Fundamental U.S. Short-Term Corporate Bond Fund (SFIG)Sector Breakdown�
Sector % of Net AssetsFinancials 33.1%Consumer Discretionary 11.2%Consumer Staples 10.2%Health Care 9.9%Information Technology 9.3%Industrials 8.0%Utilities 5.5%Communication Services 5.2%Energy 3.7%Materials 0.8%U.S. Government Obligations 0.8%Real Estate 0.4%Other Assets less Liabilities� 1.9%Total 100.0%
� The Fund�s sector breakdown is expressed as a percentage of net assets and may change over time. In addition, a sector may be comprised of severalindustries. It does not include derivatives (if any).
� Other assets includes investment of cash collateral for securities on loan (if any).
Top Ten Holdings*
Description % of Net AssetsLockheed Martin Corp.,
2.50%, 11/23/20 3.1%JPMorgan Chase & Co.,
2.75%, 6/23/20 2.5%CVS Health Corp.,
2.80%, 7/20/20 2.4%Bank of New York Mellon Corp. (The),
2.05%, 5/3/21 2.3%AT&T, Inc.,
3.00%, 2/15/22 2.0%International Business Machines Corp.,
2.85%, 5/13/22 2.0%Deutsche Bank AG,
4.25%, 10/14/21 2.0%HSBC USA, Inc.,
2.35%, 3/5/20 2.0%Citigroup, Inc.,
2.65%, 10/26/20 1.9%Synchrony Financial,
2.70%, 2/3/20 1.9%* The ten largest holdings are subject to change, and there are no guarantees the Fund will remain invested in any particular company. Excludes derivatives and
investment of cash collateral for securities on loan (if any).The WisdomTree Fundamental U.S. Short-Term Corporate Bond Fund (the �Fund�) seeks to track the price and yield performance, before fees andexpenses, of the WisdomTree Fundamental U.S. Short-Term Corporate Bond Index (the �Index�). In seeking to track the Index, the Fund invests inissuers in the short-term U.S. investment grade corporate bond market that are deemed to exhibit favorable fundamentals and opportunities for income.The Fund generally uses a representative sampling strategy to achieve its investment objective, meaning it generally will invest in a sample ofsecurities in the Index.
The Fund returned 5.44% at net asset value (�NAV�) for the fiscal year ending June 30, 2019 (for more complete performance information please seethe table below). Relative to the benchmark, a sector underweight to Financials was the primary detractor. Given the current size of the Fund, manysecurities within the Financials sector remain uninvestable due to minimum denomination requirements. Security selection within the Utilities sectorwas a positive offset and dampened the performance drag vs. the Index. In addition, the Fund�s higher liquidity bias can result in lower yields relativethe benchmark, which has historically been a marginal drag on returns. The fiscal year was a story of two contrasting markets. The last quarter of 2018was mainly a �risk-off� environment, where �risk-on� assets like corporate bonds and equities markets fell, credit curves steepened dramatically, andas a result, provided a headwind against Fund performance. This was a result of global trade war fears, rising interest rates, and slowdown in economicdata. However, in the first six months of 2019, credit spreads have tightened, global markets have rallied (more than offsetting losses faced in late
Copyright © 2019 www.secdatabase.com. All Rights Reserved.Please Consider the Environment Before Printing This Document
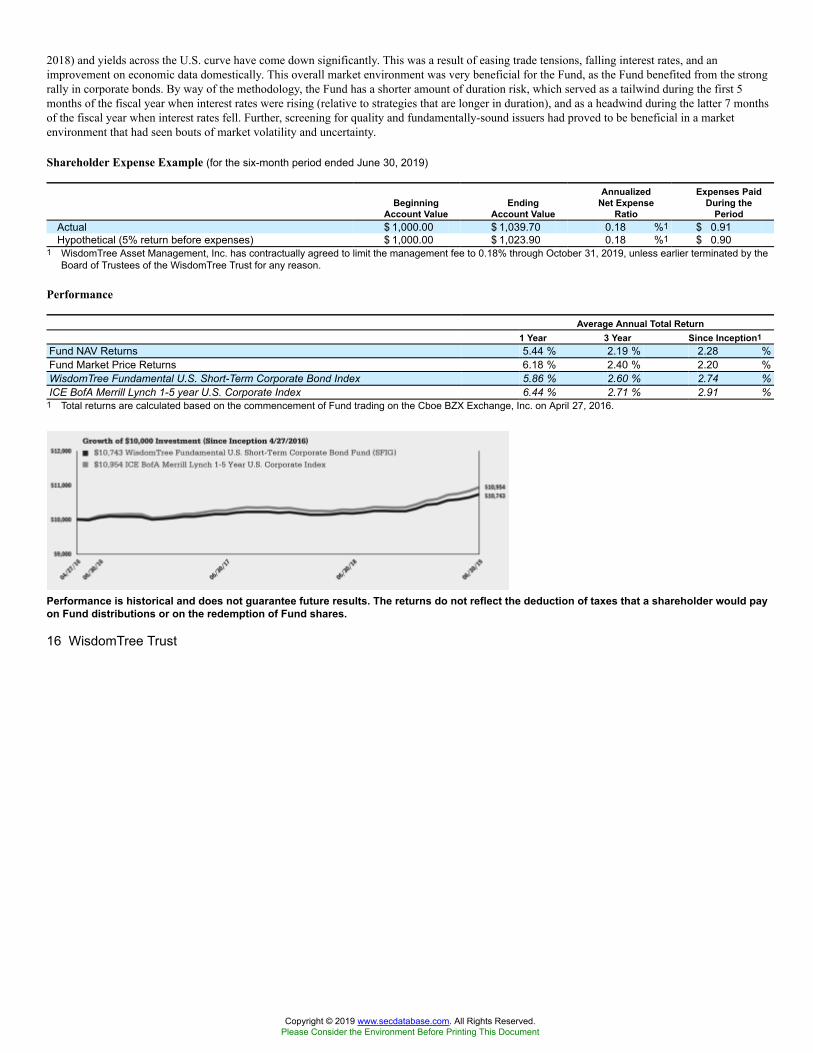
2018) and yields across the U.S. curve have come down significantly. This was a result of easing trade tensions, falling interest rates, and animprovement on economic data domestically. This overall market environment was very beneficial for the Fund, as the Fund benefited from the strongrally in corporate bonds. By way of the methodology, the Fund has a shorter amount of duration risk, which served as a tailwind during the first 5months of the fiscal year when interest rates were rising (relative to strategies that are longer in duration), and as a headwind during the latter 7 monthsof the fiscal year when interest rates fell. Further, screening for quality and fundamentally-sound issuers had proved to be beneficial in a marketenvironment that had seen bouts of market volatility and uncertainty.
Shareholder Expense Example (for the six-month period ended June 30, 2019)
BeginningAccount Value
EndingAccount Value
AnnualizedNet Expense
Ratio
Expenses PaidDuring the
PeriodActual $ 1,000.00 $ 1,039.70 0.18 %1 $ 0.91Hypothetical (5% return before expenses) $ 1,000.00 $ 1,023.90 0.18 %1 $ 0.90
1 WisdomTree Asset Management, Inc. has contractually agreed to limit the management fee to 0.18% through October 31, 2019, unless earlier terminated by theBoard of Trustees of the WisdomTree Trust for any reason.
Performance
Average Annual Total Return1 Year 3 Year Since Inception1
Fund NAV Returns 5.44 % 2.19 % 2.28 %Fund Market Price Returns 6.18 % 2.40 % 2.20 %WisdomTree Fundamental U.S. Short-Term Corporate Bond Index 5.86 % 2.60 % 2.74 %ICE BofA Merrill Lynch 1-5 year U.S. Corporate Index 6.44 % 2.71 % 2.91 %
1 Total returns are calculated based on the commencement of Fund trading on the Cboe BZX Exchange, Inc. on April 27, 2016.
Performance is historical and does not guarantee future results. The returns do not reflect the deduction of taxes that a shareholder would payon Fund distributions or on the redemption of Fund shares.
16 WisdomTree Trust
Copyright © 2019 www.secdatabase.com. All Rights Reserved.Please Consider the Environment Before Printing This Document
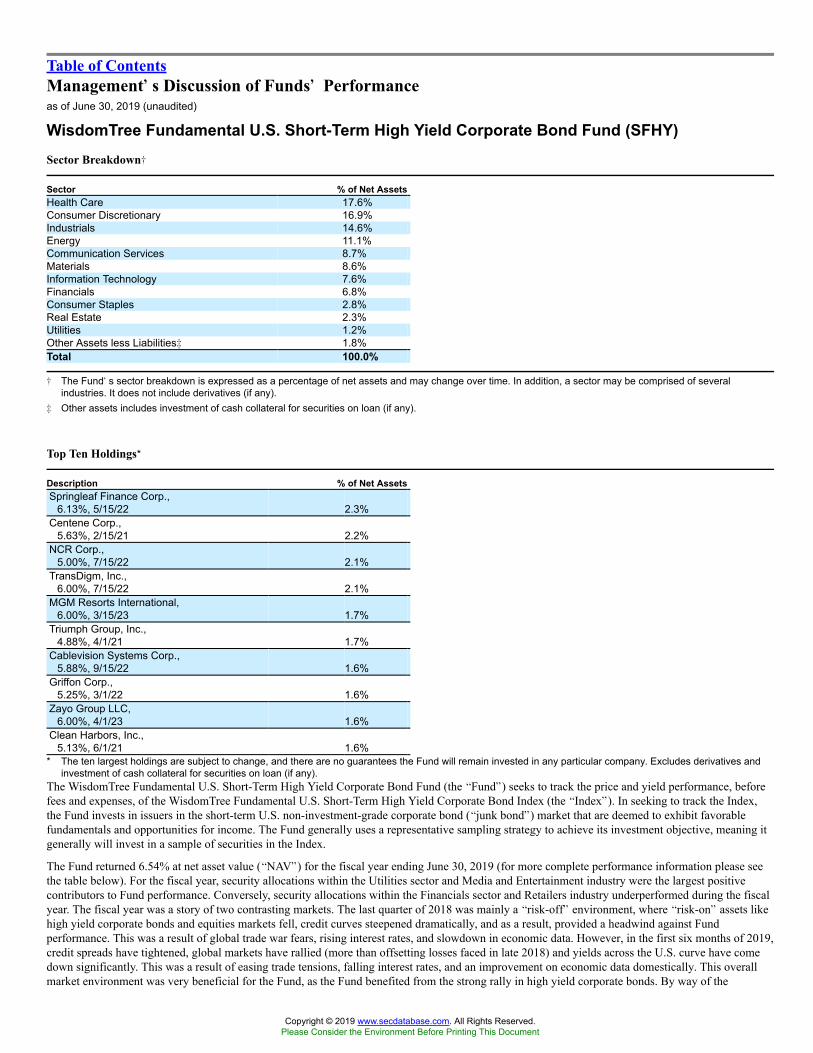
Table of ContentsManagement��s Discussion of Funds�� Performanceas of June 30, 2019 (unaudited)
WisdomTree Fundamental U.S. Short-Term High Yield Corporate Bond Fund (SFHY)Sector Breakdown�
Sector % of Net AssetsHealth Care 17.6%Consumer Discretionary 16.9%Industrials 14.6%Energy 11.1%Communication Services 8.7%Materials 8.6%Information Technology 7.6%Financials 6.8%Consumer Staples 2.8%Real Estate 2.3%Utilities 1.2%Other Assets less Liabilities� 1.8%Total 100.0%
� The Fund�s sector breakdown is expressed as a percentage of net assets and may change over time. In addition, a sector may be comprised of severalindustries. It does not include derivatives (if any).
� Other assets includes investment of cash collateral for securities on loan (if any).
Top Ten Holdings*
Description % of Net AssetsSpringleaf Finance Corp.,
6.13%, 5/15/22 2.3%Centene Corp.,
5.63%, 2/15/21 2.2%NCR Corp.,
5.00%, 7/15/22 2.1%TransDigm, Inc.,
6.00%, 7/15/22 2.1%MGM Resorts International,
6.00%, 3/15/23 1.7%Triumph Group, Inc.,
4.88%, 4/1/21 1.7%Cablevision Systems Corp.,
5.88%, 9/15/22 1.6%Griffon Corp.,
5.25%, 3/1/22 1.6%Zayo Group LLC,
6.00%, 4/1/23 1.6%Clean Harbors, Inc.,
5.13%, 6/1/21 1.6%* The ten largest holdings are subject to change, and there are no guarantees the Fund will remain invested in any particular company. Excludes derivatives and
investment of cash collateral for securities on loan (if any).The WisdomTree Fundamental U.S. Short-Term High Yield Corporate Bond Fund (the �Fund�) seeks to track the price and yield performance, beforefees and expenses, of the WisdomTree Fundamental U.S. Short-Term High Yield Corporate Bond Index (the �Index�). In seeking to track the Index,the Fund invests in issuers in the short-term U.S. non-investment-grade corporate bond (�junk bond�) market that are deemed to exhibit favorablefundamentals and opportunities for income. The Fund generally uses a representative sampling strategy to achieve its investment objective, meaning itgenerally will invest in a sample of securities in the Index.
The Fund returned 6.54% at net asset value (�NAV�) for the fiscal year ending June 30, 2019 (for more complete performance information please seethe table below). For the fiscal year, security allocations within the Utilities sector and Media and Entertainment industry were the largest positivecontributors to Fund performance. Conversely, security allocations within the Financials sector and Retailers industry underperformed during the fiscalyear. The fiscal year was a story of two contrasting markets. The last quarter of 2018 was mainly a �risk-off� environment, where �risk-on� assets likehigh yield corporate bonds and equities markets fell, credit curves steepened dramatically, and as a result, provided a headwind against Fundperformance. This was a result of global trade war fears, rising interest rates, and slowdown in economic data. However, in the first six months of 2019,credit spreads have tightened, global markets have rallied (more than offsetting losses faced in late 2018) and yields across the U.S. curve have comedown significantly. This was a result of easing trade tensions, falling interest rates, and an improvement on economic data domestically. This overallmarket environment was very beneficial for the Fund, as the Fund benefited from the strong rally in high yield corporate bonds. By way of the
Copyright © 2019 www.secdatabase.com. All Rights Reserved.Please Consider the Environment Before Printing This Document

methodology, the Fund has a shorter amount of duration risk, which served as a tailwind during the first 5 months of the fiscal year when interest rateswere rising (relative to strategies that are longer in duration), and as a headwind during the latter 7 months of the fiscal year when interest rates fell.Further, screening for quality and fundamentally-sound issuers had proved to be beneficial in a market environment that had seen bouts of marketvolatility and uncertainty.
Shareholder Expense Example (for the six-month period ended June 30, 2019)
BeginningAccount Value
EndingAccount Value
AnnualizedNet Expense
Ratio
Expenses PaidDuring the
PeriodActual $ 1,000.00 $ 1,073.40 0.38 %1 $ 1.95Hypothetical (5% return before expenses) $ 1,000.00 $ 1,022.91 0.38 %1 $ 1.91
1 WisdomTree Asset Management, Inc. has contractually agreed to limit the management fee to 0.38% through October 31, 2019, unless earlier terminated by theBoard of Trustees of the WisdomTree Trust for any reason.
Performance
Average Annual Total Return1 Year 3 Year Since Inception1
Fund NAV Returns 6.54 % 5.98 % 6.21 %Fund Market Price Returns 8.21 % 6.49 % 6.34 %WisdomTree Fundamental U.S. Short-Term High Yield Corporate Bond Index 6.51 % 6.75 % 7.38 %ICE BofA Merrill Lynch 1-5 year U.S. High Yield Constrained Index 5.48 % 7.25 % 7.80 %
1 Total returns are calculated based on the commencement of Fund trading on the Cboe BZX Exchange, Inc. on April 27, 2016.
Performance is historical and does not guarantee future results. The returns do not reflect the deduction of taxes that a shareholder would payon Fund distributions or on the redemption of Fund shares.
WisdomTree Trust 17
Copyright © 2019 www.secdatabase.com. All Rights Reserved.Please Consider the Environment Before Printing This Document
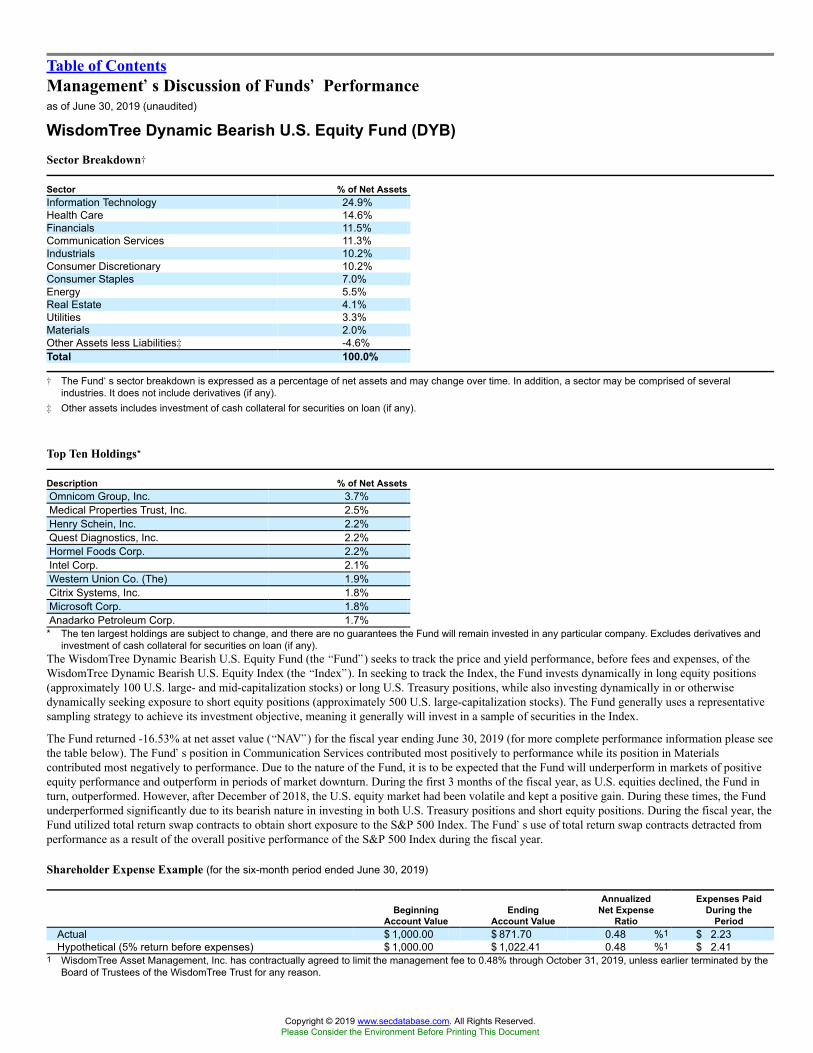
Table of ContentsManagement��s Discussion of Funds�� Performanceas of June 30, 2019 (unaudited)
WisdomTree Dynamic Bearish U.S. Equity Fund (DYB)Sector Breakdown�
Sector % of Net AssetsInformation Technology 24.9%Health Care 14.6%Financials 11.5%Communication Services 11.3%Industrials 10.2%Consumer Discretionary 10.2%Consumer Staples 7.0%Energy 5.5%Real Estate 4.1%Utilities 3.3%Materials 2.0%Other Assets less Liabilities� -4.6%Total 100.0%
� The Fund�s sector breakdown is expressed as a percentage of net assets and may change over time. In addition, a sector may be comprised of severalindustries. It does not include derivatives (if any).
� Other assets includes investment of cash collateral for securities on loan (if any).
Top Ten Holdings*
Description % of Net AssetsOmnicom Group, Inc. 3.7%Medical Properties Trust, Inc. 2.5%Henry Schein, Inc. 2.2%Quest Diagnostics, Inc. 2.2%Hormel Foods Corp. 2.2%Intel Corp. 2.1%Western Union Co. (The) 1.9%Citrix Systems, Inc. 1.8%Microsoft Corp. 1.8%Anadarko Petroleum Corp. 1.7%* The ten largest holdings are subject to change, and there are no guarantees the Fund will remain invested in any particular company. Excludes derivatives and
investment of cash collateral for securities on loan (if any).The WisdomTree Dynamic Bearish U.S. Equity Fund (the �Fund�) seeks to track the price and yield performance, before fees and expenses, of theWisdomTree Dynamic Bearish U.S. Equity Index (the �Index�). In seeking to track the Index, the Fund invests dynamically in long equity positions(approximately 100 U.S. large- and mid-capitalization stocks) or long U.S. Treasury positions, while also investing dynamically in or otherwisedynamically seeking exposure to short equity positions (approximately 500 U.S. large-capitalization stocks). The Fund generally uses a representativesampling strategy to achieve its investment objective, meaning it generally will invest in a sample of securities in the Index.
The Fund returned -16.53% at net asset value (�NAV�) for the fiscal year ending June 30, 2019 (for more complete performance information please seethe table below). The Fund�s position in Communication Services contributed most positively to performance while its position in Materialscontributed most negatively to performance. Due to the nature of the Fund, it is to be expected that the Fund will underperform in markets of positiveequity performance and outperform in periods of market downturn. During the first 3 months of the fiscal year, as U.S. equities declined, the Fund inturn, outperformed. However, after December of 2018, the U.S. equity market had been volatile and kept a positive gain. During these times, the Fundunderperformed significantly due to its bearish nature in investing in both U.S. Treasury positions and short equity positions. During the fiscal year, theFund utilized total return swap contracts to obtain short exposure to the S&P 500 Index. The Fund�s use of total return swap contracts detracted fromperformance as a result of the overall positive performance of the S&P 500 Index during the fiscal year.
Shareholder Expense Example (for the six-month period ended June 30, 2019)
BeginningAccount Value
EndingAccount Value
AnnualizedNet Expense
Ratio
Expenses PaidDuring the
PeriodActual $ 1,000.00 $ 871.70 0.48 %1 $ 2.23Hypothetical (5% return before expenses) $ 1,000.00 $ 1,022.41 0.48 %1 $ 2.41
1 WisdomTree Asset Management, Inc. has contractually agreed to limit the management fee to 0.48% through October 31, 2019, unless earlier terminated by theBoard of Trustees of the WisdomTree Trust for any reason.
Copyright © 2019 www.secdatabase.com. All Rights Reserved.Please Consider the Environment Before Printing This Document

Performance
Average Annual Total Return1 Year 3 Year Since Inception1
Fund NAV Returns -16.53% -3.72 % -3.16 %Fund Market Price Returns -16.56% -3.71 % -3.17 %WisdomTree Dynamic Bearish U.S. Equity Index -18.09% -4.90 % -4.12 %S&P 500® Index 10.42 % 14.19 % 12.87 %S&P 500® Inverse Daily Index -7.48 % -11.23% -10.60 %
1 Total returns are calculated based on the commencement of Fund trading on the Cboe BZX Exchange, Inc. on December 23, 2015.
Performance is historical and does not guarantee future results. The returns do not reflect the deduction of taxes that a shareholder would payon Fund distributions or on the redemption of Fund shares.
18 WisdomTree Trust
Copyright © 2019 www.secdatabase.com. All Rights Reserved.Please Consider the Environment Before Printing This Document

Table of ContentsManagement��s Discussion of Funds�� Performanceas of June 30, 2019 (unaudited)
WisdomTree Dynamic Long/Short U.S. Equity Fund (DYLS)Sector Breakdown�
Sector % of Net AssetsInformation Technology 24.3%Health Care 14.2%Financials 11.2%Communication Services 11.0%Industrials 9.9%Consumer Discretionary 9.9%Consumer Staples 6.8%Energy 5.3%Real Estate 4.0%Utilities 3.2%Materials 1.9%Other Assets less Liabilities� -1.7%Total 100.0%
� The Fund�s sector breakdown is expressed as a percentage of net assets and may change over time. In addition, a sector may be comprised of severalindustries. It does not include derivatives (if any).
� Other assets includes investment of cash collateral for securities on loan (if any).
Top Ten Holdings*
Description % of Net AssetsOmnicom Group, Inc. 3.6%Medical Properties Trust, Inc. 2.4%Henry Schein, Inc. 2.1%Hormel Foods Corp. 2.1%Quest Diagnostics, Inc. 2.1%Intel Corp. 2.0%Western Union Co. (The) 1.9%Citrix Systems, Inc. 1.8%Microsoft Corp. 1.7%Anadarko Petroleum Corp. 1.6%* The ten largest holdings are subject to change, and there are no guarantees the Fund will remain invested in any particular company. Excludes derivatives and
investment of cash collateral for securities on loan (if any).The WisdomTree Dynamic Long/Short U.S. Equity Fund (the �Fund�) seeks to track the price and yield performance, before fees and expenses, of theWisdomTree Dynamic Long/Short U.S. Equity Index (the �Index�). In seeking to track the Index, the Fund invests in long equity positions(approximately 100 U.S. large- and mid-capitalization stocks), while also investing dynamically in or otherwise dynamically seeking exposure to shortequity positions (approximately 500 U.S. large-capitalization stocks). The Fund generally uses a representative sampling strategy to achieve itsinvestment objective, meaning it generally will invest in a sample of securities in the Index.
The Fund returned -14.33% at net asset value (�NAV�) for the fiscal year ending June 30, 2019 (for more complete performance information please seethe table below). The Fund�s position in Communication Services contributed positively to performance while its position in Materials contributedmost negatively to performance. For the fiscal year, there were 3 months where the Fund did not have 100% net long equity exposure. In January of2019, March of 2019, and June of 2019, the hedge ratio went to 100% by shorting the S&P 500 Index by utilizing total return swap contracts to obtainshort exposure, which resulted in a 0% net equity exposure. The Fund�s use of total return swap contracts contributed negatively to the Fund�s NAVreturn compared to those of the unhedged strategies, as the U.S. equities market had a positive gain during those periods. Overall, the underlyingperformance over the fiscal year remained negative due to a volatile equity market.
Shareholder Expense Example (for the six-month period ended June 30, 2019)
BeginningAccount Value
EndingAccount Value
AnnualizedNet Expense
Ratio
Expenses PaidDuring the
PeriodActual $ 1,000.00 $ 953.30 0.48 %1 $ 2.32Hypothetical (5% return before expenses) $ 1,000.00 $ 1,022.41 0.48 %1 $ 2.41
1 WisdomTree Asset Management, Inc. has contractually agreed to limit the management fee to 0.48% through October 31, 2019, unless earlier terminated by theBoard of Trustees of the WisdomTree Trust for any reason.
Performance
Copyright © 2019 www.secdatabase.com. All Rights Reserved.Please Consider the Environment Before Printing This Document

Average Annual Total Return1 Year 3 Year Since Inception1
Fund NAV Returns -14.33% 3.07 % 4.57 %Fund Market Price Returns -14.50% 3.04 % 4.49 %WisdomTree Dynamic Long/Short U.S. Equity Index -14.58% 3.21 % 4.81 %S&P 500® Index 10.42 % 14.19% 12.87 %
1 Total returns are calculated based on the commencement of Fund trading on the Cboe BZX Exchange, Inc. on December 23, 2015.
Performance is historical and does not guarantee future results. The returns do not reflect the deduction of taxes that a shareholder would payon Fund distributions or on the redemption of Fund shares.
WisdomTree Trust 19
Copyright © 2019 www.secdatabase.com. All Rights Reserved.Please Consider the Environment Before Printing This Document
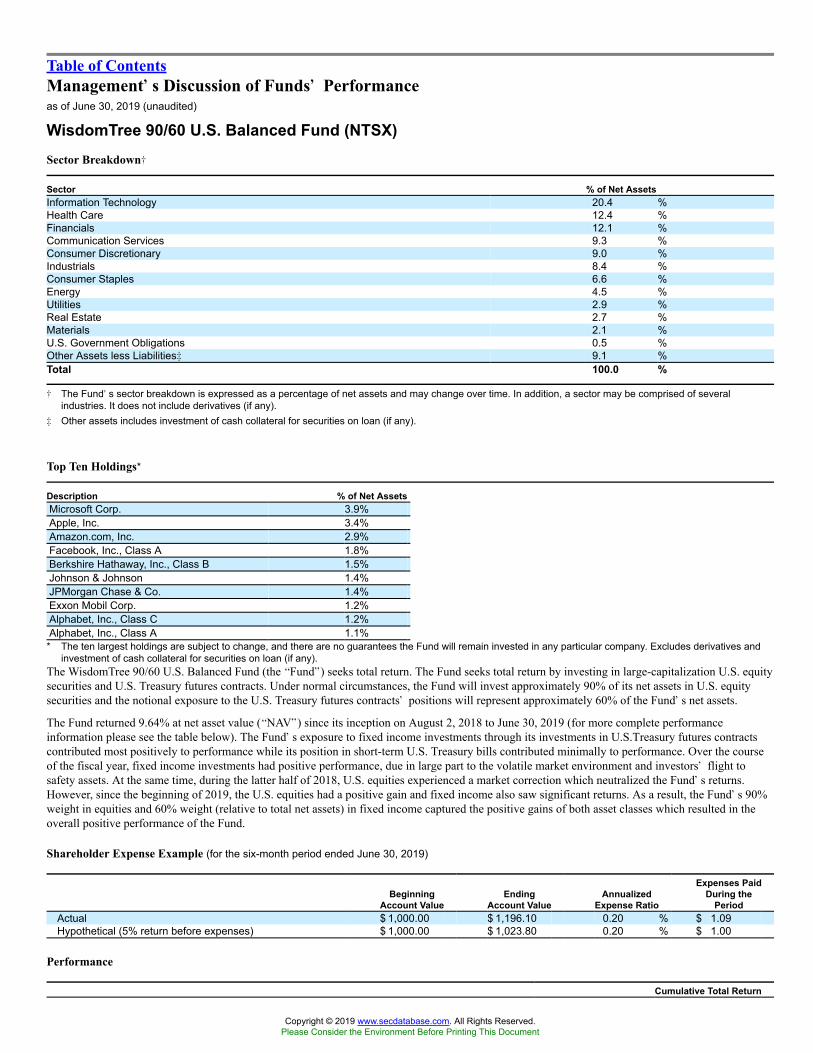
Table of ContentsManagement��s Discussion of Funds�� Performanceas of June 30, 2019 (unaudited)
WisdomTree 90/60 U.S. Balanced Fund (NTSX)Sector Breakdown�
Sector % of Net AssetsInformation Technology 20.4 %Health Care 12.4 %Financials 12.1 %Communication Services 9.3 %Consumer Discretionary 9.0 %Industrials 8.4 %Consumer Staples 6.6 %Energy 4.5 %Utilities 2.9 %Real Estate 2.7 %Materials 2.1 %U.S. Government Obligations 0.5 %Other Assets less Liabilities� 9.1 %Total 100.0 %
� The Fund�s sector breakdown is expressed as a percentage of net assets and may change over time. In addition, a sector may be comprised of severalindustries. It does not include derivatives (if any).
� Other assets includes investment of cash collateral for securities on loan (if any).
Top Ten Holdings*
Description % of Net AssetsMicrosoft Corp. 3.9%Apple, Inc. 3.4%Amazon.com, Inc. 2.9%Facebook, Inc., Class A 1.8%Berkshire Hathaway, Inc., Class B 1.5%Johnson & Johnson 1.4%JPMorgan Chase & Co. 1.4%Exxon Mobil Corp. 1.2%Alphabet, Inc., Class C 1.2%Alphabet, Inc., Class A 1.1%* The ten largest holdings are subject to change, and there are no guarantees the Fund will remain invested in any particular company. Excludes derivatives and
investment of cash collateral for securities on loan (if any).The WisdomTree 90/60 U.S. Balanced Fund (the �Fund�) seeks total return. The Fund seeks total return by investing in large-capitalization U.S. equitysecurities and U.S. Treasury futures contracts. Under normal circumstances, the Fund will invest approximately 90% of its net assets in U.S. equitysecurities and the notional exposure to the U.S. Treasury futures contracts� positions will represent approximately 60% of the Fund�s net assets.
The Fund returned 9.64% at net asset value (�NAV�) since its inception on August 2, 2018 to June 30, 2019 (for more complete performanceinformation please see the table below). The Fund�s exposure to fixed income investments through its investments in U.S.Treasury futures contractscontributed most positively to performance while its position in short-term U.S. Treasury bills contributed minimally to performance. Over the courseof the fiscal year, fixed income investments had positive performance, due in large part to the volatile market environment and investors� flight tosafety assets. At the same time, during the latter half of 2018, U.S. equities experienced a market correction which neutralized the Fund�s returns.However, since the beginning of 2019, the U.S. equities had a positive gain and fixed income also saw significant returns. As a result, the Fund�s 90%weight in equities and 60% weight (relative to total net assets) in fixed income captured the positive gains of both asset classes which resulted in theoverall positive performance of the Fund.
Shareholder Expense Example (for the six-month period ended June 30, 2019)
BeginningAccount Value
EndingAccount Value
AnnualizedExpense Ratio
Expenses PaidDuring the
PeriodActual $ 1,000.00 $ 1,196.10 0.20 % $ 1.09Hypothetical (5% return before expenses) $ 1,000.00 $ 1,023.80 0.20 % $ 1.00
Performance
Cumulative Total Return
Copyright © 2019 www.secdatabase.com. All Rights Reserved.Please Consider the Environment Before Printing This Document

Since Inception1
Fund NAV Returns 9.64 %Fund Market Price Returns 9.61 %60% S&P 500 Index / 40% Bloomberg Barclays U.S. Aggregate Index Composite 6.90 %S&P 500® Index 6.03 %
1 Total returns are calculated based on the commencement of Fund trading on the NYSE Arca, Inc. on August 2, 2018.
Performance is historical and does not guarantee future results. The returns do not reflect the deduction of taxes that a shareholder would payon Fund distributions or on the redemption of Fund shares.
20 WisdomTree Trust
Copyright © 2019 www.secdatabase.com. All Rights Reserved.Please Consider the Environment Before Printing This Document

Table of ContentsManagement��s Discussion of Funds�� Performanceas of June 30, 2019 (unaudited)
WisdomTree Balanced Income Fund (WBAL)Asset Class Breakdown�
Asset Class % of Net AssetsFixed Income 39.9%Domestic Equity 32.8%International Equity 20.6%Emerging Markets Equity 6.7%Other Assets less Liabilities� 0.0% *Total 100.0%
� The Fund�s asset class breakdown is expressed as a percentage of net assets and may change over time. It does not include derivatives (if any).� Other assets includes investment of cash collateral for securities on loan (if any).* Represents less than 0.1%.
Top Ten Holdings*
Description % of Net AssetsWisdomTree U.S. High Dividend Fund (DHS) 21.6%WisdomTree Yield Enhanced U.S. Aggregate
Bond Fund (AGGY) 20.1%WisdomTree International High Dividend Fund
(DTH) 11.5%WisdomTree U.S. LargeCap Dividend Fund
(DLN) 11.2%WisdomTree Dynamic Currency Hedged
International Equity Fund (DDWM) 9.1%WisdomTree Emerging Markets Dividend Fund
(DVEM) 6.7%WisdomTree Fundamental U.S. Corporate Bond
Fund (WFIG) 5.6%WisdomTree Interest Rate Hedged High Yield
Bond Fund (HYZD) 5.2%WisdomTree Emerging Markets Local Debt
Fund (ELD) 3.6%iShares 20+ Year Treasury Bond ETF (TLT) 2.8%* The ten largest holdings are subject to change, and there are no guarantees the Fund will remain invested in any particular Underlying Fund. Excludes
derivatives and investment of cash collateral for securities on loan (if any). For a full list of current holdings information for the underlying WisdomTree fundsplease visit www.wisdomtree.com.
The WisdomTree Balanced Income Fund (the �Fund�) seeks to track the price and yield performance, before fees and expenses, of the WisdomTreeBalanced Income Index (the �Index�). In seeking to track the Index, the Fund invests in other exchange-traded funds (the �Underlying Funds�) withapproximately a 60% allocation to equities and a 40% allocation to fixed income. The Fund generally uses a representative sampling strategy toachieve its investment objective, meaning it generally will invest in a sample of securities in the Index (including indirect investments through theUnderlying Funds) whose risk, return and other characteristics resemble the risk, return, and other characteristics of the Index as a whole.
The Fund returned 7.27% at net asset value (�NAV�) for the fiscal year ending June 30, 2019 (for more complete performance information please seethe table below). The Fund�s exposure to +20-year U.S. government bonds from its investments in the Underlying Funds contributed most positivelyto performance while its exposure to U.S. high-yield corporate bonds from its investments in the Underlying Funds contributed minimally toperformance. Over the course of the fiscal year, fixed income investments had positive performance, due in large part to the volatile marketenvironment and investors� flight to safety assets. At the same time, during the latter half of 2018, U.S. equities experienced a market correction whichneutralized the Fund�s returns. However, since the beginning of 2019, the U.S. equities had a positive gain and fixed income also saw significantreturns. The Fund�s 60% weight in equity and 40% weight in fixed income exchange-traded funds captured the positive gains of both asset classes andresulted in the overall positive performance of the Fund.
Shareholder Expense Example (for the six-month period ended June 30, 2019)
BeginningAccount Value
EndingAccount Value
AnnualizedNet Expense
Ratio
Expenses PaidDuring the
PeriodActual $ 1,000.00 $ 1,113.80 0.03 %1 $ 0.16Hypothetical (5% return before expenses) $ 1,000.00 $ 1,024.65 0.03 %1 $ 0.15
Copyright © 2019 www.secdatabase.com. All Rights Reserved.Please Consider the Environment Before Printing This Document

1 WisdomTree Asset Management, Inc. has contractually agreed to waive a portion of its management fee in an amount equal to the acquired fund fees andexpenses (�AFFEs�) attributable to the Fund�s investments in Underlying Funds, as well as an additional 0.05%, through December 31, 2020, unless earlierterminated by the Board of Trustees of the WisdomTree Trust for any reason. The �Annualized Net Expense Ratio� does not include the impact of AFFEs. HadAFFEs been included (as shown in the net expense ratio in the Fund�s prospectus) the �Annualized Net Expense Ratio� would have been higher.
Performance
Average Annual Total Return1 Year Since Inception1
Fund NAV Returns 7.27 % 3.03 %Fund Market Price Returns 7.31 % 2.96 %WisdomTree Balanced Income Index 7.22 % 2.98 %60% MSCI AC World Index / 40% Bloomberg Barclays U.S. Aggregate Index Composite 6.65 % 4.00 %
1 Total returns are calculated based on the commencement of Fund trading on the NYSE Arca, Inc. on December 21, 2017.
Performance is historical and does not guarantee future results. The returns do not reflect the deduction of taxes that a shareholder would payon Fund distributions or on the redemption of Fund shares.
WisdomTree Trust 21
Copyright © 2019 www.secdatabase.com. All Rights Reserved.Please Consider the Environment Before Printing This Document

Table of ContentsDescription of Indexes (unaudited)
Below are descriptions of each Index referenced in this report:
The 60% MSCI AC World Index / 40% Bloomberg Barclays U.S. Aggregate Index Composite represents a 60% weight to the MSCI AC WorldIndex and a 40% weight to the Bloomberg Barclays U.S. Aggregate Index.The 60% S&P 500 Index / 40% Bloomberg Barclays U.S. Aggregate Index Composite represents a 60% weight to the S&P 500 Index and a 40%weight to the Bloomberg Barclays U.S. Aggregate Index. The Bloomberg Barclays U.S. Aggregate Index measures the performance of the U.S.investment-grade bond market.The ICE BofA Merrill Lynch U.S. Corporate Index tracks the performance of U.S. dollar denominated investment grade corporate debt securitiesissued in the U.S.The ICE BofA Merrill Lynch U.S. High Yield Index tracks the performance of U.S. dollar denominated high-yield corporate debt securities issued inthe U.S.The ICE BofA Merrill Lynch 1-5 Year U.S. Corporate Index is a subset of the ICE BofA Merrill Lynch U.S. Corporate Index including all securitieswith a remaining term to final maturity less than 5 years.The ICE BofA Merrill Lynch 1-5 Year U.S. High Yield Constrained Index tracks the performance of short-term U.S. dollar denominated belowinvestment grade corporate debt publicly issued in the U.S. domestic market.The MSCI AC World Index is a free float adjusted market capitalization index that is designed to measure the performance of the world stock indexescovered by MSCI.The MSCI China Index is a free float-adjusted market capitalization index that is designed to measure developed market equity performance in Chinaand captures large and mid-cap representation across China H-shares, B-shares, red chips, P chips and foreign listings (e.g., ADRs). With 150constituents,the index covers about 85% of this China equity universe.The MSCI EAFE Index is a market cap-weighted index composed of companies representative of the developed market structure of developedcountries in Europe, Australasia and Japan.The MSCI EAFE Local Currency Index is a free float-adjusted market capitalization weighted index that is designed to measure developed marketequity performance, excluding the U.S. and Canada which is calculated in local currency.The MSCI EAFE Small Cap Index is a free float-adjusted market capitalization equity index that is designed to measure the performance of small-cap stocks within the developed equity market, excluding the U.S. and Canada.The MSCI EAFE Small Cap Local Currency Index is a free float-adjusted market capitalization equity index that is designed to measure theperformance of small-cap stocks within the developed equity market, excluding the U.S. and Canada, in local currency.The MSCI Emerging Markets Index is a free float-adjusted market capitalization index that is designed to measure emerging markets equityperformance.The MSCI Europe Index is a free float-adjusted market capitalization index that is designed to measure the performance of large- and mid-cap stockswithin developed market European countries.The MSCI European Economic and Monetary Union (EMU) Index is a free float-adjusted market capitalization-weighted index that is designed tomeasure the equity market performance of countries within the EMU.The MSCI European Economic and Monetary Union (EMU) Local Currency Index is a free float-adjusted market capitalization-weighted indexthat is designed to measure the equity market performance of countries within the EMU and calculated in local currency.The MSCI Japan Index is a free float-adjusted market capitalization index that is designed to measure the performance of the Japanese equity market.
22 WisdomTree Trust
Copyright © 2019 www.secdatabase.com. All Rights Reserved.Please Consider the Environment Before Printing This Document

Table of ContentsDescription of Indexes (unaudited) (continued)
The MSCI Japan Local Currency Index is a free float-adjusted market capitalization index that is designed to measure developed market equityperformance in Japan and calculated in local currency.The S&P 500® Index is a capitalization-weighted index of 500 stocks selected by the Standard & Poor�s Index Committee, designed to represent theperformance of the leading industries in the United States economy.The S&P 500® Inverse Daily Index provides inverse (positive or negative) returns of the S&P 500 Index by taking a short position in the index.The S&P China 500 Index comprises 500 of the largest, most liquid Chinese companies while approximating the sector composition of the broaderChinese equity market. All Chinese share classes including A-shares and offshore listings are eligible for inclusion.The WisdomTree Balanced Income Index is comprised of exchange-traded funds listed on a major U.S. exchange and aims to maintain a 60% equityand 40% fixed income exposure. The equity exposure is diversified across both domestic (U.S.) and foreign equities, including emerging markets. Thefixed income exposure includes government bonds, corporate bonds, mortgage-backed securities and other mortgage-related products.The WisdomTree Dynamic Bearish U.S. Equity Index includes long equity positions or long U.S. Treasury positions and short equity positions. Thelong equity positions consist of approximately 100 U.S. large- and mid-capitalization stocks that meet Index eligibility requirements and have the bestcombined score based on fundamental growth and value signals. Stocks are weighted in the Long Equity Index according to their volatilitycharacteristics. The Short Equity Index consists of short positions in the largest 500 U.S. companies, weighted by market capitalization, designed to actas a market risk hedge. The Index provides a dynamic allocation of exposure to the Long Equity Index ranging from 100% to 0% while employing avariable monthly hedge ratio ranging from 75% to 100% exposure to the Short Equity Index based on a quantitative rules-based market indicator thatscores growth and value market signals.The WisdomTree Dynamic Currency Hedged International Equity Index is a fundamentally weighted index that measures the performance ofdividend-paying companies in the industrialized world, excluding Canada and the United States. To hedge the impact of changes to the value of foreigncurrenciesrelative to the U.S. dollar, a currency hedge ratio (ranging from 0 to 100%) is applied monthly using a rules-based process that combinesmomentum, value, and interest rate signals.The WisdomTree Dynamic Currency Hedged International Quality Dividend Growth Index is designed to provide exposure to the developedmarket companies while at the same time neutralizing exposure to fluctuations between the value of foreign currencies and the U.S. dollar with a hedgeratio ranging from 0 to 100% on a monthly basis.The WisdomTree Dynamic Currency Hedged International SmallCap Equity Index is a fundamentally weighted index that measures theperformance of the small-capitalization segment of the dividend-paying market in the industrialized world, excluding Canada and the United States. Tohedge the impact of changes to the value of foreign currencies relative to the U.S. dollar, a currency hedge ratio (ranging from 0 to 100%) is appliedmonthly using a rules-based process thatcombines momentum, value, and interest rate signals.The WisdomTree Dynamic Long/Short U.S. Equity Index includes long equity positions and short equity positions. The Long Equity Index consistsof approximately 100 U.S. large-and mid-capitalization stocks that meet Index eligibility requirements and have the best combined score based onfundamental growth and value signals. Stocks are weighted in the Long Equity Index according to their volatility characteristics. The Short EquityIndex consists of short positions in the largest 500 U.S. companies, weighted by market capitalization, designed to act as a market risk hedge. TheIndex maintains 100% exposure to the Long Equity Index while employing a variable monthly hedge ratio ranging from 0% to 100% exposure to theShort Equity Index based on a quantitative rules-based market indicator that scores growth and value market signals.
WisdomTree Trust 23
Copyright © 2019 www.secdatabase.com. All Rights Reserved.Please Consider the Environment Before Printing This Document

Table of ContentsDescription of Indexes (unaudited) (concluded)
The WisdomTree Emerging Markets Dividend Index is a fundamentally weighted index that measures the performance of dividend-paying stocksselected from the following 17 emerging market nations: Brazil, Chile, China, Czech Republic, Hungary, India, Indonesia, Korea, Malaysia, Mexico,Philippines, Poland, Russia, South Africa, Taiwan, Thailand, Turkey. Companies are weighted in the Index based on annual cash dividends paid.The WisdomTree Fundamental U.S. Corporate Bond Index is a rule-based alternatively weighted Index designed to capture the performance ofselected issuers in the U.S. investment-grade corporate bond market that are deemed to have attractive fundamental and income characteristics. TheIndex employs a multi-step process, which screens on fundamentals to identify bonds with favorable characteristics and then tilts to those which offerattractive income characteristics. The Index is comprised of US corporate bonds of public issuers domiciled in the United States. To be eligible forinclusion in the Index, debt securities must have fixed coupons with at least $350 million in par amount outstanding and a remaining maturity of atleast one year. Component securities must be rated investment grade.The WisdomTree Fundamental U.S. High Yield Corporate Bond Index is a rule-based alternatively weighted Index designed to capturetheperformance of selected issuers in the U.S. high yield corporate bond market that are deemed to have attractive fundamental and income characteristics.The Index employs a multi-step process, which screens on fundamentals to identify bonds with favorable characteristics and then tilts to those whichoffer attractive income characteristics. The Index is comprised of U.S. corporate bonds of public issuers domiciled in the United States. To be eligiblefor inclusion in the Index, debt securities must have fixed coupons with at least $500 million in par amount outstanding and a remaining maturity of atleast one year. Component securities must be rated non-investment grade by at least one rating agency.The WisdomTree Fundamental U.S. Short-Term Corporate Bond Index is a rule-based alternatively weighted index designed to capture theperformance of selected issuers in the US investment-grade corporate bond market that are deemed to have attractive fundamental and incomecharacteristics. The Index employs a multi-step process, which screens on fundamentals to identify bonds with favorable characteristics and then tilts tothose which offer attractive income characteristics. The Index is comprised of U.S. corporate bonds of public issuers domiciled in the United States. Tobe eligible for inclusion in the Index, debt securities must have fixed coupons with at least $350 million in par amount outstanding and a remainingmaturity of at least one year but not more than five years. Component securities must be rated investment grade.The WisdomTree Fundamental U.S. Short-Term High Yield Corporate Bond Index is a rule-based alternatively weighted index designed tocapture the performance of selected issuers in the US high yield corporate bond market that are deemed to have attractive fundamental and incomecharacteristics. The Index employs a multi-step process, which screens on fundamentals to identify bonds with favorable characteristics and then tilts tothose which offer attractive income characteristics. The Index is comprised of U.S. corporate bonds of public issuers domiciled in the United States. Tobe eligible for inclusion in the Index, debt securities must have fixed coupons with at least $350 million in par amount outstanding and a remainingmaturity of at least one year. Component securities must be rated non-investment grade by at least one rating agency.The WisdomTree Global ex-Mexico Equity Index is a float-adjusted market capitalization weighted index that measures the performance of 2000largest companies in developed and emerging markets throughout the world, excluding Mexico, that meet eligibility requirements. The Index iscalculated in US dollars and is updated to reflect market prices and exchange rates.The Global Industry Classification Standard (�GICS�) was developed by and is the exclusive property and a service mark of MSCI Inc. (�MSCI�) andStandard & Poor�s (�S&P�), a division of The McGraw-Hill Companies, Inc. and is licensed for use by WisdomTree Investments, Inc. Neither MSCI,S&P nor any other party involved in making or compiling the GICS or any GICS
24 WisdomTree Trust
Copyright © 2019 www.secdatabase.com. All Rights Reserved.Please Consider the Environment Before Printing This Document

Table of ContentsDescription of Indexes (unaudited) (continued)
classifications makes any express or implied warranties or representations with respect to such standard or classification (or the results to be obtainedby the use thereof), and all such parties hereby expressly disclaim all warranties of originality, accuracy, completeness, merchantability and fitness fora particular purpose with respect to any such standard or classification. Without limiting any of the foregoing, in no event shall MSCI, S&P, any oftheir affiliates or any third party involved in making or compiling the GICS or any GICS classifications have any liability for any direct, indirect,special, punitive, consequential or any other damages (including lost profits) even if notified of the possibility of such damages.Neither MSCI nor any other party involved in or related to compiling, computing or creating the MSCI data makes any express or implied warrantiesor representations with respect to such data (or the results to be obtained by the use thereof), and all such parties hereby expressly disclaim allwarranties of originality, accuracy, completeness, merchantability or fitness for a particular purpose with respect to any such data. Without limitingany of the foregoing, in no event shall MSCI, any of its affiliates or any third party involved in or related to compiling, computing or creating the datahave any liability for any direct, indirect, special, punitive, consequential or any other damages (including lost profits) even if notified of the possibilityof such damages. No further distribution or dissemination of the MSCI data is permitted without MSCI�s express written consent.WisdomTree Investments, Inc. and WisdomTree Asset Management, Inc. (together, �WisdomTree�) and the Funds make no representation or warranty,express or implied, to the owners of shares of the Funds or any member of the public regarding the advisability of investing in securities generally or inthe Funds particularly or the ability of the underlying Indexes to track the performance of their underlying securities. WisdomTree Investments is thelicensor of certain trademarks, service marks and trade names of the Funds. WisdomTree Investments has no obligation to take the needs of the Fundsor the owners of shares of the Funds into consideration in determining, composing, or calculating the underlying WisdomTree Indexes of the applicableFunds. WisdomTree Investments is not responsible for, and has not participated in, the determination of the timing of, prices of, or quantities of sharesof the Funds to be issued or in the determination or calculation of the equation by which the shares of the Funds are redeemable. WisdomTree and theFunds do not guarantee the accuracy, completeness, or performance of the underlying Indexes or the data included therein and shall have no liability inconnection with the underlying Indexes or their calculation.Index performance information assumes the reinvestment of dividends and excludes management fees, transaction costs and expenses. You cannotdirectly invest in an index.
WisdomTree Trust 25
Copyright © 2019 www.secdatabase.com. All Rights Reserved.Please Consider the Environment Before Printing This Document

Table of ContentsSchedule of InvestmentsWisdomTree Dynamic Currency Hedged International Equity Fund (DDWM)
June 30, 2019
Investments Shares ValueCOMMON STOCKS �� 99.9%Australia �� 7.4%Adelaide Brighton Ltd. 30,353 $86,053AGL Energy Ltd. 18,364 257,868Alumina Ltd. 143,129 234,027APA Group 25,317 191,875Aristocrat Leisure Ltd. 7,141 153,944ASX Ltd. 4,132 238,843Aurizon Holdings Ltd. 42,604 161,446Australia & New Zealand Banking Group Ltd. 56,318 1,114,892Bank of Queensland Ltd. 14,025 93,795Bendigo & Adelaide Bank Ltd. 13,575 110,314BHP Group Ltd. 48,819 1,410,089BHP Group PLC 36,822 944,297Boral Ltd. 27,803 99,895Brambles Ltd. 21,787 196,923Caltex Australia Ltd. 8,568 148,812Challenger Ltd. 16,841 78,473CIMIC Group Ltd. 7,032 220,927Commonwealth Bank of Australia 32,483 1,886,965Crown Resorts Ltd. 24,032 209,962CSL Ltd. 2,422 365,422CSR Ltd. 21,425 58,787Downer EDI Ltd. 23,215 112,735Fortescue Metals Group Ltd. 44,941 284,467GUD Holdings Ltd. 13,031 91,536Harvey Norman Holdings Ltd.(a) 52,019 148,573Iluka Resources Ltd. 10,393 78,549Incitec Pivot Ltd. 36,759 87,963Infomedia Ltd. 49,655 59,411Insurance Australia Group Ltd. 46,379 268,834IOOF Holdings Ltd.(a) 20,329 73,755Japara Healthcare Ltd. 81,884 64,645Macquarie Group Ltd. 5,589 491,790Magellan Financial Group Ltd. 3,034 108,585Medibank Pvt Ltd. 63,696 155,998National Australia Bank Ltd. 62,831 1,178,129New Hope Corp., Ltd. 32,285 61,398NIB Holdings Ltd. 17,701 95,274Origin Energy Ltd. 18,235 93,542Pendal Group Ltd. 16,801 84,299Perpetual Ltd. 3,181 94,291Platinum Asset Management Ltd. 27,115 92,285QBE Insurance Group Ltd. 23,599 195,912Ramsay Health Care Ltd. 2,808 142,350Resolute Mining Ltd. 62,304 58,369Rio Tinto Ltd. 6,552 477,074Santos Ltd. 23,304 115,783Service Stream Ltd. 36,046 71,080Sims Metal Management Ltd. 8,153 62,134Sonic Healthcare Ltd. 9,309 177,033South32 Ltd. 104,253 232,647Suncorp Group Ltd. 28,170 266,279Sydney Airport 50,527 285,077Investments Shares ValueTabcorp Holdings Ltd. 59,301 $185,184Telstra Corp., Ltd. 161,821 437,198
Copyright © 2019 www.secdatabase.com. All Rights Reserved.Please Consider the Environment Before Printing This Document

Transurban Group 38,885 402,218Treasury Wine Estates Ltd. 10,537 110,323Wesfarmers Ltd. 31,005 786,760Westpac Banking Corp. 79,284 1,577,881Whitehaven Coal Ltd. 42,681 109,622Woodside Petroleum Ltd. 21,735 554,582Woolworths Group Ltd. 19,162 446,841WorleyParsons Ltd. 8,444 87,165Total Australia 18,771,180Austria �� 0.5%Andritz AG 3,177 119,755BAWAG Group AG*(b) 2,635 110,607Erste Group Bank AG* 5,862 217,893Lenzing AG 698 77,899Oesterreichische Post AG 3,260 109,704OMV AG 5,339 260,530Porr AG(a) 3,347 73,944Raiffeisen Bank International AG 3,144 73,863UNIQA Insurance Group AG 12,186 113,726Vienna Insurance Group AG Wiener Versicherung Gruppe 4,707 120,876Total Austria 1,278,797Belgium �� 1.2%Ageas 4,006 208,531Anheuser-Busch InBev S.A./N.V. 15,943 1,413,255Colruyt S.A. 2,533 147,114KBC Group N.V. 8,424 552,955Proximus SADP 8,673 256,007Solvay S.A. 1,974 204,792UCB S.A. 2,094 173,888Umicore S.A. 3,572 114,712Total Belgium 3,071,254China �� 3.3%Beijing Tong Ren Tang Chinese Medicine Co., Ltd. 40,000 71,782China Everbright International Ltd. 104,666 96,594China Jinmao Holdings Group Ltd. 266,000 161,728China Mobile Ltd. 376,000 3,424,307China Overseas Grand Oceans Group Ltd. 152,000 66,929China Overseas Land & Investment Ltd. 126,000 464,486China Resources Power Holdings Co., Ltd. 162,000 236,390China Taiping Insurance Holdings Co., Ltd. 26,200 70,090China Unicom Hong Kong Ltd. 256,000 280,822CITIC Ltd. 442,000 637,046CITIC Telecom International Holdings Ltd. 189,000 74,995CNOOC Ltd. 990,000 1,692,979CSPC Pharmaceutical Group Ltd. 62,000 99,994Dah Chong Hong Holdings Ltd. 566,000 189,089Fosun International Ltd. 179,000 237,827Genertec Universal Medical Group Co., Ltd.(b) 129,500 103,600Guangdong Investment Ltd. 112,000 221,635Shenzhen Investment Ltd. 436,000 160,727
See Notes to Financial Statements.
26 WisdomTree Trust
Copyright © 2019 www.secdatabase.com. All Rights Reserved.Please Consider the Environment Before Printing This Document
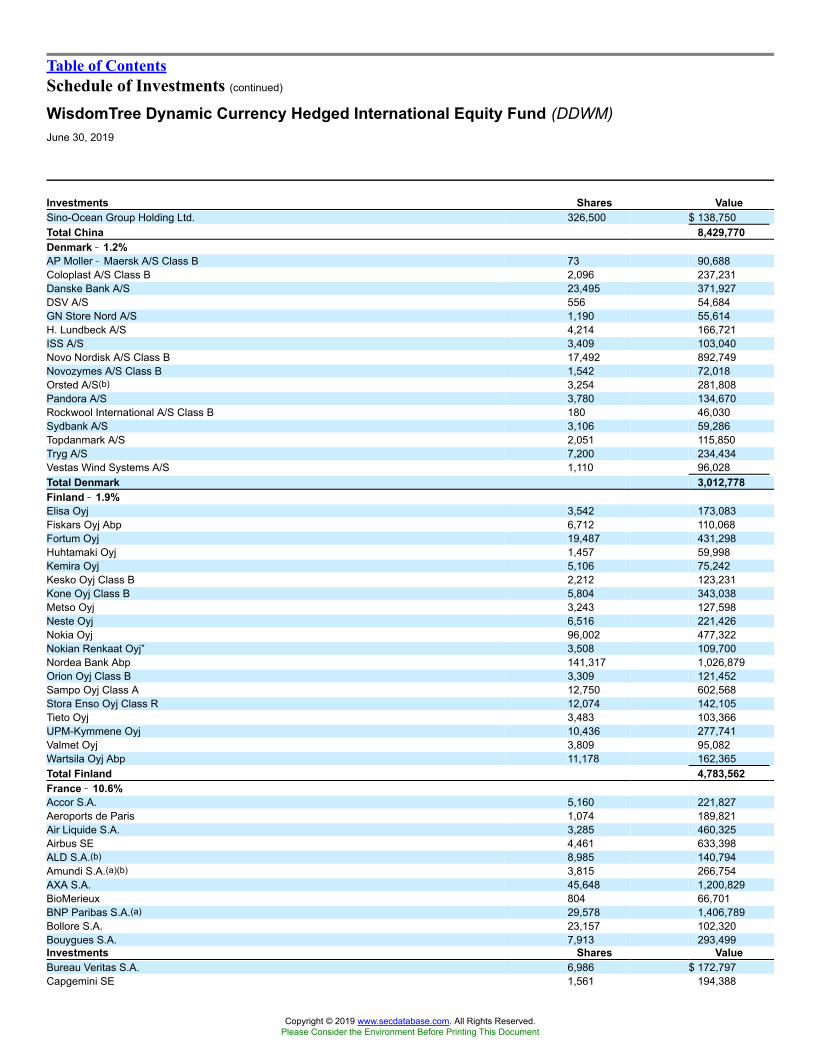
Table of ContentsSchedule of Investments (continued)
WisdomTree Dynamic Currency Hedged International Equity Fund (DDWM)June 30, 2019
Investments Shares ValueSino-Ocean Group Holding Ltd. 326,500 $ 138,750Total China 8,429,770Denmark �� 1.2%AP Moller � Maersk A/S Class B 73 90,688Coloplast A/S Class B 2,096 237,231Danske Bank A/S 23,495 371,927DSV A/S 556 54,684GN Store Nord A/S 1,190 55,614H. Lundbeck A/S 4,214 166,721ISS A/S 3,409 103,040Novo Nordisk A/S Class B 17,492 892,749Novozymes A/S Class B 1,542 72,018Orsted A/S(b) 3,254 281,808Pandora A/S 3,780 134,670Rockwool International A/S Class B 180 46,030Sydbank A/S 3,106 59,286Topdanmark A/S 2,051 115,850Tryg A/S 7,200 234,434Vestas Wind Systems A/S 1,110 96,028Total Denmark 3,012,778Finland �� 1.9%Elisa Oyj 3,542 173,083Fiskars Oyj Abp 6,712 110,068Fortum Oyj 19,487 431,298Huhtamaki Oyj 1,457 59,998Kemira Oyj 5,106 75,242Kesko Oyj Class B 2,212 123,231Kone Oyj Class B 5,804 343,038Metso Oyj 3,243 127,598Neste Oyj 6,516 221,426Nokia Oyj 96,002 477,322Nokian Renkaat Oyj* 3,508 109,700Nordea Bank Abp 141,317 1,026,879Orion Oyj Class B 3,309 121,452Sampo Oyj Class A 12,750 602,568Stora Enso Oyj Class R 12,074 142,105Tieto Oyj 3,483 103,366UPM-Kymmene Oyj 10,436 277,741Valmet Oyj 3,809 95,082Wartsila Oyj Abp 11,178 162,365Total Finland 4,783,562France �� 10.6%Accor S.A. 5,160 221,827Aeroports de Paris 1,074 189,821Air Liquide S.A. 3,285 460,325Airbus SE 4,461 633,398ALD S.A.(b) 8,985 140,794Amundi S.A.(a)(b) 3,815 266,754AXA S.A. 45,648 1,200,829BioMerieux 804 66,701BNP Paribas S.A.(a) 29,578 1,406,789Bollore S.A. 23,157 102,320Bouygues S.A. 7,913 293,499Investments Shares ValueBureau Veritas S.A. 6,986 $ 172,797Capgemini SE 1,561 194,388
Copyright © 2019 www.secdatabase.com. All Rights Reserved.Please Consider the Environment Before Printing This Document
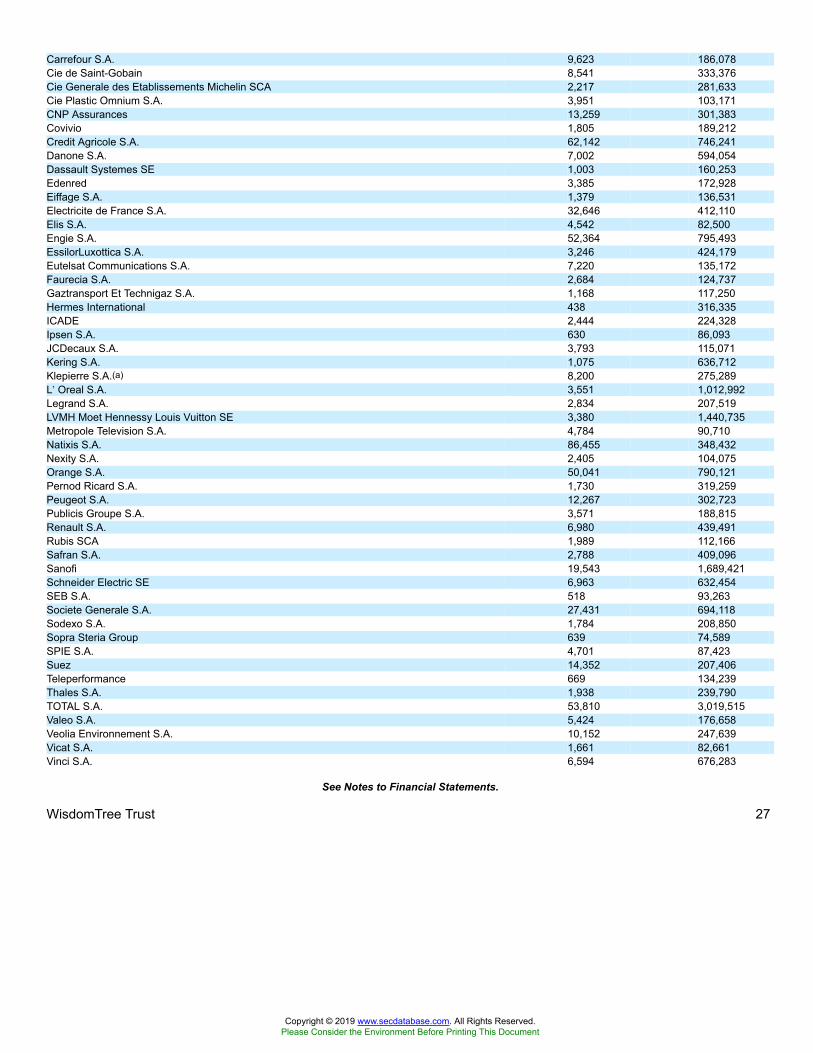
Carrefour S.A. 9,623 186,078Cie de Saint-Gobain 8,541 333,376Cie Generale des Etablissements Michelin SCA 2,217 281,633Cie Plastic Omnium S.A. 3,951 103,171CNP Assurances 13,259 301,383Covivio 1,805 189,212Credit Agricole S.A. 62,142 746,241Danone S.A. 7,002 594,054Dassault Systemes SE 1,003 160,253Edenred 3,385 172,928Eiffage S.A. 1,379 136,531Electricite de France S.A. 32,646 412,110Elis S.A. 4,542 82,500Engie S.A. 52,364 795,493EssilorLuxottica S.A. 3,246 424,179Eutelsat Communications S.A. 7,220 135,172Faurecia S.A. 2,684 124,737Gaztransport Et Technigaz S.A. 1,168 117,250Hermes International 438 316,335ICADE 2,444 224,328Ipsen S.A. 630 86,093JCDecaux S.A. 3,793 115,071Kering S.A. 1,075 636,712Klepierre S.A.(a) 8,200 275,289L�Oreal S.A. 3,551 1,012,992Legrand S.A. 2,834 207,519LVMH Moet Hennessy Louis Vuitton SE 3,380 1,440,735Metropole Television S.A. 4,784 90,710Natixis S.A. 86,455 348,432Nexity S.A. 2,405 104,075Orange S.A. 50,041 790,121Pernod Ricard S.A. 1,730 319,259Peugeot S.A. 12,267 302,723Publicis Groupe S.A. 3,571 188,815Renault S.A. 6,980 439,491Rubis SCA 1,989 112,166Safran S.A. 2,788 409,096Sanofi 19,543 1,689,421Schneider Electric SE 6,963 632,454SEB S.A. 518 93,263Societe Generale S.A. 27,431 694,118Sodexo S.A. 1,784 208,850Sopra Steria Group 639 74,589SPIE S.A. 4,701 87,423Suez 14,352 207,406Teleperformance 669 134,239Thales S.A. 1,938 239,790TOTAL S.A. 53,810 3,019,515Valeo S.A. 5,424 176,658Veolia Environnement S.A. 10,152 247,639Vicat S.A. 1,661 82,661Vinci S.A. 6,594 676,283
See Notes to Financial Statements.
WisdomTree Trust 27
Copyright © 2019 www.secdatabase.com. All Rights Reserved.Please Consider the Environment Before Printing This Document
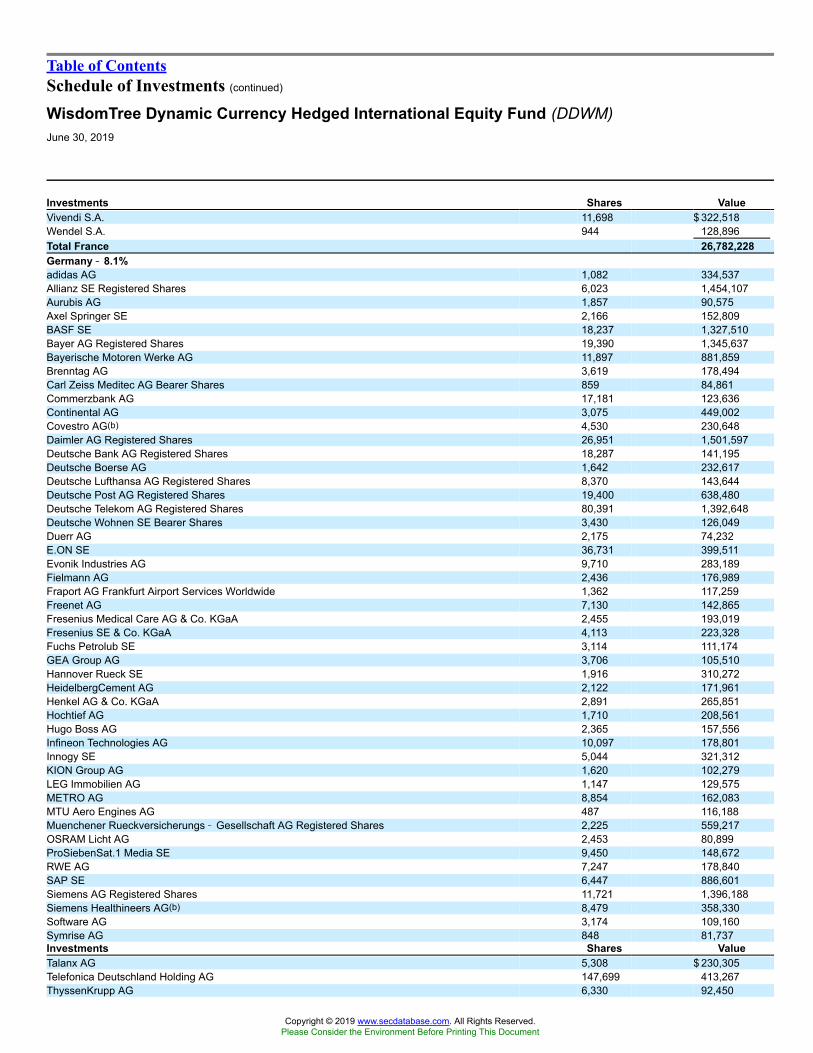
Table of ContentsSchedule of Investments (continued)
WisdomTree Dynamic Currency Hedged International Equity Fund (DDWM)June 30, 2019
Investments Shares ValueVivendi S.A. 11,698 $ 322,518Wendel S.A. 944 128,896Total France 26,782,228Germany �� 8.1%adidas AG 1,082 334,537Allianz SE Registered Shares 6,023 1,454,107Aurubis AG 1,857 90,575Axel Springer SE 2,166 152,809BASF SE 18,237 1,327,510Bayer AG Registered Shares 19,390 1,345,637Bayerische Motoren Werke AG 11,897 881,859Brenntag AG 3,619 178,494Carl Zeiss Meditec AG Bearer Shares 859 84,861Commerzbank AG 17,181 123,636Continental AG 3,075 449,002Covestro AG(b) 4,530 230,648Daimler AG Registered Shares 26,951 1,501,597Deutsche Bank AG Registered Shares 18,287 141,195Deutsche Boerse AG 1,642 232,617Deutsche Lufthansa AG Registered Shares 8,370 143,644Deutsche Post AG Registered Shares 19,400 638,480Deutsche Telekom AG Registered Shares 80,391 1,392,648Deutsche Wohnen SE Bearer Shares 3,430 126,049Duerr AG 2,175 74,232E.ON SE 36,731 399,511Evonik Industries AG 9,710 283,189Fielmann AG 2,436 176,989Fraport AG Frankfurt Airport Services Worldwide 1,362 117,259Freenet AG 7,130 142,865Fresenius Medical Care AG & Co. KGaA 2,455 193,019Fresenius SE & Co. KGaA 4,113 223,328Fuchs Petrolub SE 3,114 111,174GEA Group AG 3,706 105,510Hannover Rueck SE 1,916 310,272HeidelbergCement AG 2,122 171,961Henkel AG & Co. KGaA 2,891 265,851Hochtief AG 1,710 208,561Hugo Boss AG 2,365 157,556Infineon Technologies AG 10,097 178,801Innogy SE 5,044 321,312KION Group AG 1,620 102,279LEG Immobilien AG 1,147 129,575METRO AG 8,854 162,083MTU Aero Engines AG 487 116,188Muenchener Rueckversicherungs � Gesellschaft AG Registered Shares 2,225 559,217OSRAM Licht AG 2,453 80,899ProSiebenSat.1 Media SE 9,450 148,672RWE AG 7,247 178,840SAP SE 6,447 886,601Siemens AG Registered Shares 11,721 1,396,188Siemens Healthineers AG(b) 8,479 358,330Software AG 3,174 109,160Symrise AG 848 81,737Investments Shares ValueTalanx AG 5,308 $ 230,305Telefonica Deutschland Holding AG 147,699 413,267ThyssenKrupp AG 6,330 92,450
Copyright © 2019 www.secdatabase.com. All Rights Reserved.Please Consider the Environment Before Printing This Document

TUI AG 22,419 219,667Uniper SE 5,983 181,442Volkswagen AG 3,536 608,651Wacker Chemie AG 1,099 87,082Wirecard AG 256 43,162Total Germany 20,457,090Hong Kong �� 2.8%AIA Group Ltd. 70,200 757,037Bank of East Asia Ltd. (The) 51,249 143,333BOC Hong Kong Holdings Ltd. 172,500 678,960Cathay Pacific Airways Ltd. 59,000 88,207CLP Holdings Ltd. 33,000 364,109Galaxy Entertainment Group Ltd. 37,000 249,350Hang Lung Properties Ltd. 83,000 197,394Hang Seng Bank Ltd. 24,600 612,441Henderson Land Development Co., Ltd. 65,000 358,176Hong Kong & China Gas Co., Ltd. 150,213 333,016Hong Kong Exchanges & Clearing Ltd. 11,305 399,094MTR Corp., Ltd. 55,342 372,607New World Development Co., Ltd. 169,010 264,359PCCW Ltd. 271,000 156,443Power Assets Holdings Ltd. 39,000 280,550Sino Land Co., Ltd. 122,000 204,570SJM Holdings Ltd. 102,000 116,068Sun Hung Kai Properties Ltd. 36,500 619,040Swire Pacific Ltd. Class A 3,500 43,008Swire Pacific Ltd. Class B 90,000 170,496Swire Properties Ltd. 59,400 239,881Techtronic Industries Co., Ltd. 18,000 137,779Wharf Holdings Ltd. (The) 46,000 121,882Wheelock & Co., Ltd. 24,000 172,032Total Hong Kong 7,079,832Ireland �� 0.4%AIB Group PLC 50,202 205,583Bank of Ireland Group PLC 17,844 93,394CRH PLC 6,979 228,019DCC PLC 1,178 105,247Flutter Entertainment PLC 1,511 113,809Greencore Group PLC 17,079 47,603Smurfit Kappa Group PLC 4,046 122,608Total Produce PLC 49,408 82,148Total Ireland 998,411Israel �� 0.3%Delek Automotive Systems Ltd. 22,006 101,005Delek Group Ltd. 653 112,124First International Bank of Israel Ltd. 5,611 141,921Harel Insurance Investments & Financial Services Ltd. 15,183 113,791Israel Chemicals Ltd. 24,783 129,872Menora Mivtachim Holdings Ltd. 6,407 97,366
See Notes to Financial Statements.
28 WisdomTree Trust
Copyright © 2019 www.secdatabase.com. All Rights Reserved.Please Consider the Environment Before Printing This Document

Table of ContentsSchedule of Investments (continued)
WisdomTree Dynamic Currency Hedged International Equity Fund (DDWM)June 30, 2019
Investments Shares ValueMigdal Insurance & Financial Holding Ltd. 78,560 $ 82,380Total Israel 778,459Italy �� 3.5%A2A SpA 81,830 142,205ACEA SpA 5,676 108,204Ascopiave SpA 26,714 114,995Assicurazioni Generali SpA 25,860 487,682ASTM SpA 1,366 44,179Atlantia SpA 11,511 300,321Azimut Holding SpA(a) 4,707 90,750Banca Generali SpA 3,508 101,151Banca Mediolanum SpA 23,892 176,173Credito Emiliano SpA 27,116 130,776DiaSorin SpA 770 89,529Enel SpA 163,800 1,145,328Eni SpA 78,033 1,297,948ERG SpA 4,572 93,719Esprinet SpA 21,540 78,618Ferrari N.V. 551 89,604FinecoBank Banca Fineco SpA 10,860 121,324Hera SpA 29,714 113,832IMA Industria Macchine Automatiche SpA 935 77,569Infrastrutture Wireless Italiane SpA(b) 15,950 156,754Intesa Sanpaolo SpA 614,893 1,317,852Italgas SpA 20,261 136,317Leonardo SpA 5,868 74,476Mediobanca Banca di Credito Finanziario SpA 17,342 179,045Piaggio & C. SpA 17,921 52,695Pirelli & C SpA(b) 18,357 108,664Poste Italiane SpA(b) 25,561 269,548Recordati SpA 3,123 130,380Saras SpA 52,595 79,301Snam SpA 68,393 340,440Societa Cattolica di Assicurazioni SC 13,038 116,777Societa Iniziative Autostradali e Servizi SpA 7,256 134,772Telecom Italia SpA RSP 160,377 83,301Terna Rete Elettrica Nazionale SpA 36,651 233,734UniCredit SpA 18,597 229,276Unipol Gruppo SpA 17,460 85,161UnipolSai Assicurazioni SpA 79,550 204,646Total Italy 8,737,046Japan �� 19.5%Advantest Corp. 3,500 96,320Aeon Co., Ltd. 11,800 202,727AGC, Inc. 5,100 176,327Ahresty Corp. 21,400 110,635Aisin Seiki Co., Ltd. 6,600 227,269Ajinomoto Co., Inc. 7,300 126,568Amada Holdings Co., Ltd. 12,400 139,606ANA Holdings, Inc. 5,300 175,519Aozora Bank Ltd. 6,200 148,814Artnature, Inc. 30,800 180,100Asahi Group Holdings Ltd. 5,500 247,332Investments Shares ValueAsahi Kasei Corp. 19,500 $ 207,868Astellas Pharma, Inc. 27,200 387,526Azbil Corp. 4,000 97,717
Copyright © 2019 www.secdatabase.com. All Rights Reserved.Please Consider the Environment Before Printing This Document

Bank of the Ryukyus Ltd. 11,500 122,749Bridgestone Corp. 11,300 444,910Brother Industries Ltd. 6,400 120,884Canon Electronics, Inc. 8,100 136,303Canon, Inc.(a) 25,000 729,998Chiba Bank Ltd. (The) 27,700 135,235Chubu Electric Power Co., Inc. 12,000 168,350Citizen Watch Co., Ltd. 18,100 92,902Concordia Financial Group Ltd. 37,000 137,711Dai Nippon Toryo Co., Ltd. 18,100 174,717Dai-ichi Life Holdings, Inc. 17,500 263,946Daido Steel Co., Ltd. 4,000 151,661Daifuku Co., Ltd. 1,600 89,846Daiichi Sankyo Co., Ltd. 4,200 219,668Daikin Industries Ltd. 1,700 221,928Daito Trust Construction Co., Ltd. 1,500 191,224Daiwa House Industry Co., Ltd. 8,900 259,466Daiwa Securities Group, Inc. 44,100 193,239Denso Corp. 10,700 450,187Dentsu, Inc. 3,900 136,105DIC Corp. 4,500 118,786Disco Corp. 600 98,459Dowa Holdings Co., Ltd. 3,700 118,651East Japan Railway Co. 2,300 215,185Electric Power Development Co., Ltd. 5,900 134,056Elematec Corp. 9,200 87,440Enplas Corp. 3,400 100,984FamilyMart UNY Holdings Co., Ltd. 4,000 95,489FANUC Corp. 4,400 813,922Fast Retailing Co., Ltd. 400 241,804Fuji Electric Co., Ltd. 2,800 96,547Fujitsu Ltd. 3,300 230,087Fukuoka Financial Group, Inc. 4,800 87,633Hakuto Co., Ltd. 13,400 150,243Hamamatsu Photonics K.K. 2,800 109,022Hikari Tsushin, Inc. 600 130,815Hino Motors Ltd. 19,600 165,001Hirose Electric Co., Ltd. 900 100,408Hitachi Chemical Co., Ltd. 3,400 92,337Hitachi Construction Machinery Co., Ltd. 5,200 135,237Hitachi High-Technologies Corp. 1,500 77,130Hitachi Ltd. 8,800 322,547Hitachi Metals Ltd. 8,200 92,625Hokuhoku Financial Group, Inc. 12,700 132,022Honda Motor Co., Ltd. 27,500 710,855Hulic Co., Ltd. 20,700 166,384Ichiken Co., Ltd. 8,100 124,650Idemitsu Kosan Co., Ltd. 5,000 150,362IHI Corp. 3,800 91,596Ines Corp. 10,600 112,946Isuzu Motors Ltd. 15,400 175,383
See Notes to Financial Statements.
WisdomTree Trust 29
Copyright © 2019 www.secdatabase.com. All Rights Reserved.Please Consider the Environment Before Printing This Document
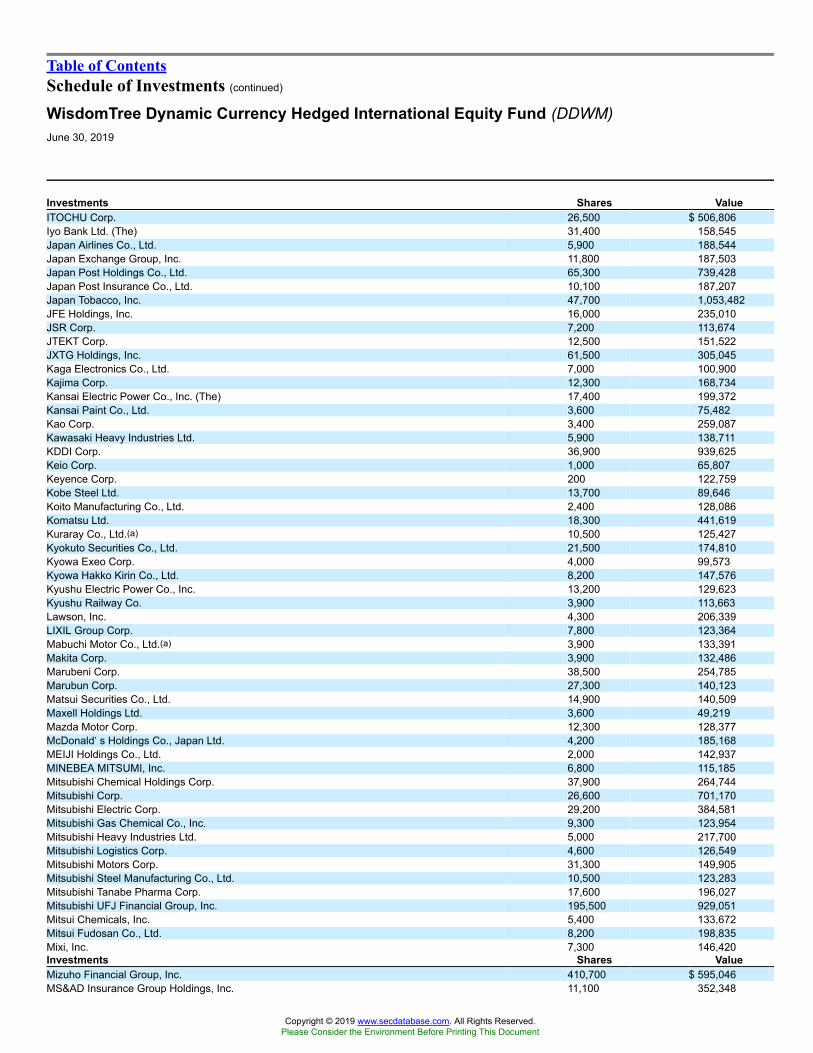
Table of ContentsSchedule of Investments (continued)
WisdomTree Dynamic Currency Hedged International Equity Fund (DDWM)June 30, 2019
Investments Shares ValueITOCHU Corp. 26,500 $ 506,806Iyo Bank Ltd. (The) 31,400 158,545Japan Airlines Co., Ltd. 5,900 188,544Japan Exchange Group, Inc. 11,800 187,503Japan Post Holdings Co., Ltd. 65,300 739,428Japan Post Insurance Co., Ltd. 10,100 187,207Japan Tobacco, Inc. 47,700 1,053,482JFE Holdings, Inc. 16,000 235,010JSR Corp. 7,200 113,674JTEKT Corp. 12,500 151,522JXTG Holdings, Inc. 61,500 305,045Kaga Electronics Co., Ltd. 7,000 100,900Kajima Corp. 12,300 168,734Kansai Electric Power Co., Inc. (The) 17,400 199,372Kansai Paint Co., Ltd. 3,600 75,482Kao Corp. 3,400 259,087Kawasaki Heavy Industries Ltd. 5,900 138,711KDDI Corp. 36,900 939,625Keio Corp. 1,000 65,807Keyence Corp. 200 122,759Kobe Steel Ltd. 13,700 89,646Koito Manufacturing Co., Ltd. 2,400 128,086Komatsu Ltd. 18,300 441,619Kuraray Co., Ltd.(a) 10,500 125,427Kyokuto Securities Co., Ltd. 21,500 174,810Kyowa Exeo Corp. 4,000 99,573Kyowa Hakko Kirin Co., Ltd. 8,200 147,576Kyushu Electric Power Co., Inc. 13,200 129,623Kyushu Railway Co. 3,900 113,663Lawson, Inc. 4,300 206,339LIXIL Group Corp. 7,800 123,364Mabuchi Motor Co., Ltd.(a) 3,900 133,391Makita Corp. 3,900 132,486Marubeni Corp. 38,500 254,785Marubun Corp. 27,300 140,123Matsui Securities Co., Ltd. 14,900 140,509Maxell Holdings Ltd. 3,600 49,219Mazda Motor Corp. 12,300 128,377McDonald�s Holdings Co., Japan Ltd. 4,200 185,168MEIJI Holdings Co., Ltd. 2,000 142,937MINEBEA MITSUMI, Inc. 6,800 115,185Mitsubishi Chemical Holdings Corp. 37,900 264,744Mitsubishi Corp. 26,600 701,170Mitsubishi Electric Corp. 29,200 384,581Mitsubishi Gas Chemical Co., Inc. 9,300 123,954Mitsubishi Heavy Industries Ltd. 5,000 217,700Mitsubishi Logistics Corp. 4,600 126,549Mitsubishi Motors Corp. 31,300 149,905Mitsubishi Steel Manufacturing Co., Ltd. 10,500 123,283Mitsubishi Tanabe Pharma Corp. 17,600 196,027Mitsubishi UFJ Financial Group, Inc. 195,500 929,051Mitsui Chemicals, Inc. 5,400 133,672Mitsui Fudosan Co., Ltd. 8,200 198,835Mixi, Inc. 7,300 146,420Investments Shares ValueMizuho Financial Group, Inc. 410,700 $ 595,046MS&AD Insurance Group Holdings, Inc. 11,100 352,348
Copyright © 2019 www.secdatabase.com. All Rights Reserved.Please Consider the Environment Before Printing This Document

Murata Manufacturing Co., Ltd. 6,300 283,015NGK Insulators Ltd. 13,500 196,849NGK Spark Plug Co., Ltd. 5,500 103,221Nichi-iko Pharmaceutical Co., Ltd. 14,200 155,259Nikon Corp. 9,900 140,037Nintendo Co., Ltd. 1,300 476,490Nippon Express Co., Ltd. 2,500 132,959Nippon Kayaku Co., Ltd. 9,600 115,567Nippon Paint Holdings Co., Ltd.(a) 2,400 93,113Nippon Signal Co., Ltd. 8,500 98,696Nippon Steel Corp. 15,900 272,871Nippon Telegraph & Telephone Corp. 28,300 1,317,812Nissan Chemical Corp. 2,400 108,149Nissan Motor Co., Ltd. 121,000 866,564Nitto Denko Corp. 3,600 177,661NSK Ltd. 18,100 161,277NTN Corp. 43,700 129,794NTT DOCOMO, Inc. 62,300 1,452,838Obayashi Corp. 17,000 167,412Oji Holdings Corp. 19,900 114,886Ono Pharmaceutical Co., Ltd. 8,200 147,043Otsuka Holdings Co., Ltd. 8,400 274,127Panasonic Corp. 41,300 344,077Park24 Co., Ltd. 4,600 107,123Pola Orbis Holdings, Inc. 4,400 122,926Recruit Holdings Co., Ltd. 6,300 210,156Resona Holdings, Inc. 46,900 195,279Ricoh Co., Ltd. 10,000 99,870Rohm Co., Ltd. 1,500 100,798Roland DG Corp. 5,400 121,092Satori Electric Co., Ltd. 12,900 104,766SBI Holdings, Inc. 4,500 111,393Secom Co., Ltd. 2,500 215,194Seika Corp. 15,300 185,179Seiko Epson Corp. 7,800 123,436Sekisui Chemical Co., Ltd. 12,300 184,717Sekisui House Ltd. 15,000 247,192Seven & I Holdings Co., Ltd. 11,100 375,838SG Holdings Co., Ltd. 2,900 82,230Sharp Corp.(a) 8,800 96,544Shimano, Inc. 800 119,027Shimizu Corp. 18,400 152,849Shin-Etsu Chemical Co., Ltd. 3,800 353,935Shindengen Electric Manufacturing Co., Ltd. 3,400 116,131Shizuoka Bank Ltd. (The) 15,700 115,703Softbank Corp. 50,200 652,078SoftBank Group Corp. 4,600 220,522Sojitz Corp. 45,400 145,799Sompo Holdings, Inc. 6,000 231,725Sony Corp. 3,400 178,237Sony Financial Holdings, Inc. 7,200 172,950Subaru Corp. 17,700 430,261
See Notes to Financial Statements.
30 WisdomTree Trust
Copyright © 2019 www.secdatabase.com. All Rights Reserved.Please Consider the Environment Before Printing This Document

Table of ContentsSchedule of Investments (continued)
WisdomTree Dynamic Currency Hedged International Equity Fund (DDWM)June 30, 2019
Investments Shares ValueSUMCO Corp.(a) 8,500 $ 101,142Sumitomo Chemical Co., Ltd. 39,500 183,312Sumitomo Corp. 24,000 363,653Sumitomo Electric Industries Ltd. 16,800 220,564Sumitomo Metal Mining Co., Ltd. 5,700 170,302Sumitomo Mitsui Financial Group, Inc. 19,900 702,983Sumitomo Mitsui Trust Holdings, Inc. 6,400 232,025Sumitomo Rubber Industries Ltd. 13,300 153,813Suntory Beverage & Food Ltd. 3,900 169,589Suzuki Motor Corp. 4,100 192,708T&D Holdings, Inc. 15,100 163,908T. RAD Co., Ltd. 8,300 146,602Taiheiyo Cement Corp. 3,100 93,800Taisei Corp. 4,200 152,617Taiyo Nippon Sanso Corp. 3,000 63,709Takeda Pharmaceutical Co., Ltd. 22,900 812,574TDK Corp. 1,400 108,372Terumo Corp. 4,400 131,093Toho Bank Ltd. (The) 79,100 187,949Toho Co., Ltd. 2,100 89,270Tohoku Electric Power Co., Inc. 15,700 158,690Tokio Marine Holdings, Inc. 9,300 466,036Tokyo Electron Ltd. 3,500 491,182Tokyo Steel Manufacturing Co., Ltd. 7,300 55,153Toray Industries, Inc. 18,000 136,863Torishima Pump Manufacturing Co., Ltd. 16,800 164,819Tosoh Corp. 8,700 122,336TOTO Ltd. 2,900 114,530Toyota Motor Corp. 40,974 2,543,476Toyota Tsusho Corp. 7,700 233,344Unicharm Corp. 4,700 141,515Yahoo Japan Corp. 77,100 226,133Yamaguchi Financial Group, Inc. 16,800 114,765Yamaha Corp. 2,900 137,813Yamaha Motor Co., Ltd. 8,800 156,414Yamato Holdings Co., Ltd. 3,900 79,310Yokogawa Electric Corp. 4,100 80,371Yokohama Rubber Co., Ltd. (The) 8,400 154,372Total Japan 49,106,171Netherlands �� 2.2%ABN AMRO Bank N.V. CVA(b) 24,358 521,908Aegon N.V. 52,173 260,117Akzo Nobel N.V. 1,768 166,387Arcadis N.V. 1,545 29,383ASML Holding N.V. 1,815 379,776BE Semiconductor Industries N.V. 3,258 83,999Heineken Holding N.V. 2,823 296,729Heineken N.V. 4,153 464,147IMCD N.V. 1,171 107,483ING Groep N.V. 88,651 1,029,345Koninklijke Ahold Delhaize N.V. 16,435 370,169Koninklijke DSM N.V. 1,574 194,842Koninklijke KPN N.V. 82,980 255,144Investments Shares ValueKoninklijke Philips N.V. 8,947 $ 389,061Koninklijke Vopak N.V. 2,536 117,108NN Group N.V. 6,201 249,984
Copyright © 2019 www.secdatabase.com. All Rights Reserved.Please Consider the Environment Before Printing This Document

Ordina N.V. 42,114 86,327Randstad N.V. 3,998 219,906Rhi Magnesita N.V. 1,031 63,456SBM Offshore N.V. 3,011 58,223Signify N.V.(b) 2,976 88,116Wolters Kluwer N.V. 3,133 228,415Total Netherlands 5,660,025New Zealand �� 0.5%Air New Zealand Ltd. 47,976 85,391Chorus Ltd. 20,863 79,872Genesis Energy Ltd. 65,652 153,010Heartland Group Holdings Ltd. 73,461 81,411Infratil Ltd. 31,429 98,158Mainfreight Ltd. 3,716 101,581Metlifecare Ltd. 35,571 104,883Port of Tauranga Ltd. 36,342 154,754Ryman Healthcare Ltd. 11,102 87,616Spark New Zealand Ltd. 54,079 145,288Summerset Group Holdings Ltd. 17,312 64,766Z Energy Ltd. 17,679 75,044Total New Zealand 1,231,774Norway �� 1.7%ABG Sundal Collier Holding ASA* 336,714 147,701AF Gruppen ASA 6,045 119,113Aker ASA Class A 2,107 121,289Aker BP ASA 10,076 289,066Austevoll Seafood ASA 8,018 84,214Borregaard ASA 5,222 60,513DNB ASA 28,695 534,116DNO ASA 23,713 42,970Equinor ASA 61,557 1,216,188Gjensidige Forsikring ASA 8,815 177,622Kongsberg Gruppen ASA 5,505 76,964Mowi ASA 11,311 264,598Norsk Hydro ASA 39,058 139,721Orkla ASA 16,736 148,554Salmar ASA 3,187 138,641SpareBank 1 SMN 11,414 130,793Telenor ASA 26,100 554,384TGS Nopec Geophysical Co. ASA 3,152 88,430Total Norway 4,334,877Portugal �� 0.4%Corticeira Amorim, SGPS, S.A. 7,550 87,527EDP � Energias de Portugal S.A. 67,340 256,287Galp Energia, SGPS, S.A. 17,257 265,797Navigator Co. S.A. (The) 33,240 127,113NOS, SGPS, S.A. 19,749 129,993Semapa-Sociedade de Investimento e Gestao 5,690 80,090Total Portugal 946,807
See Notes to Financial Statements.
WisdomTree Trust 31
Copyright © 2019 www.secdatabase.com. All Rights Reserved.Please Consider the Environment Before Printing This Document

Table of ContentsSchedule of Investments (continued)
WisdomTree Dynamic Currency Hedged International Equity Fund (DDWM)June 30, 2019
Investments Shares ValueSingapore �� 2.0%Asian Pay Television Trust 160,600 $ 20,298CapitaLand Ltd. 58,900 153,677China Aviation Oil Singapore Corp., Ltd. 102,400 99,906CSE Global Ltd. 319,800 114,641DBS Group Holdings Ltd. 49,000 940,197Frasers Property Ltd. 131,100 181,202Genting Singapore Ltd. 232,300 157,963Hutchison Port Holdings Trust 465,400 107,042Jardine Cycle & Carriage Ltd. 7,000 187,450Keppel Corp., Ltd. 36,300 178,690NetLink NBN Trust 231,700 152,417Olam International Ltd. 117,500 171,089Oversea-Chinese Banking Corp., Ltd. 51,658 435,272Singapore Exchange Ltd. 24,800 145,176Singapore Technologies Engineering Ltd. 67,500 206,549Singapore Telecommunications Ltd. 319,500 826,527StarHub Ltd. 113,100 128,736United Overseas Bank Ltd. 20,228 390,671Wilmar International Ltd. 87,400 239,018Yanlord Land Group Ltd. 91,700 87,433Total Singapore 4,923,954Spain �� 4.1%ACS Actividades de Construccion y Servicios S.A. 5,030 201,116Aena SME S.A.(b) 2,321 460,702Amadeus IT Group S.A. 3,527 279,793Banco Bilbao Vizcaya Argentaria S.A. 113,818 637,322Banco Santander S.A. 301,250 1,399,871Bankia S.A. 14,998 35,492Bankinter S.A. 22,323 154,003CaixaBank S.A. 137,799 395,138Cie Automotive S.A. 3,058 88,663Enagas S.A. 6,717 179,530Ence Energia y Celulosa S.A. 12,192 55,093Endesa S.A.(a) 25,097 646,204Euskaltel S.A.(b) 9,964 92,478Faes Farma S.A. 23,226 109,634Ferrovial S.A. 11,535 295,693Grifols S.A. 4,206 124,535Grupo Catalana Occidente S.A. 3,728 137,977Iberdrola S.A. 94,596 944,326Industria de Diseno Textil S.A. 40,602 1,222,984Mapfre S.A. 77,742 227,617Naturgy Energy Group S.A. 20,346 561,410Prosegur Cia de Seguridad S.A. 22,952 107,949Red Electrica Corp. S.A. 11,391 237,584Repsol S.A. 35,397 555,675Sacyr S.A. 24,107 58,530Telefonica S.A. 104,378 858,329Tubacex S.A. 26,427 83,363Zardoya Otis S.A. 20,715 157,583Total Spain 10,308,594Investments Shares ValueSweden �� 2.8%AAK AB 7,927 $ 150,369Ahlstrom-Munksjo Oyj 3,218 53,064Alfa Laval AB 6,020 131,454
Copyright © 2019 www.secdatabase.com. All Rights Reserved.Please Consider the Environment Before Printing This Document
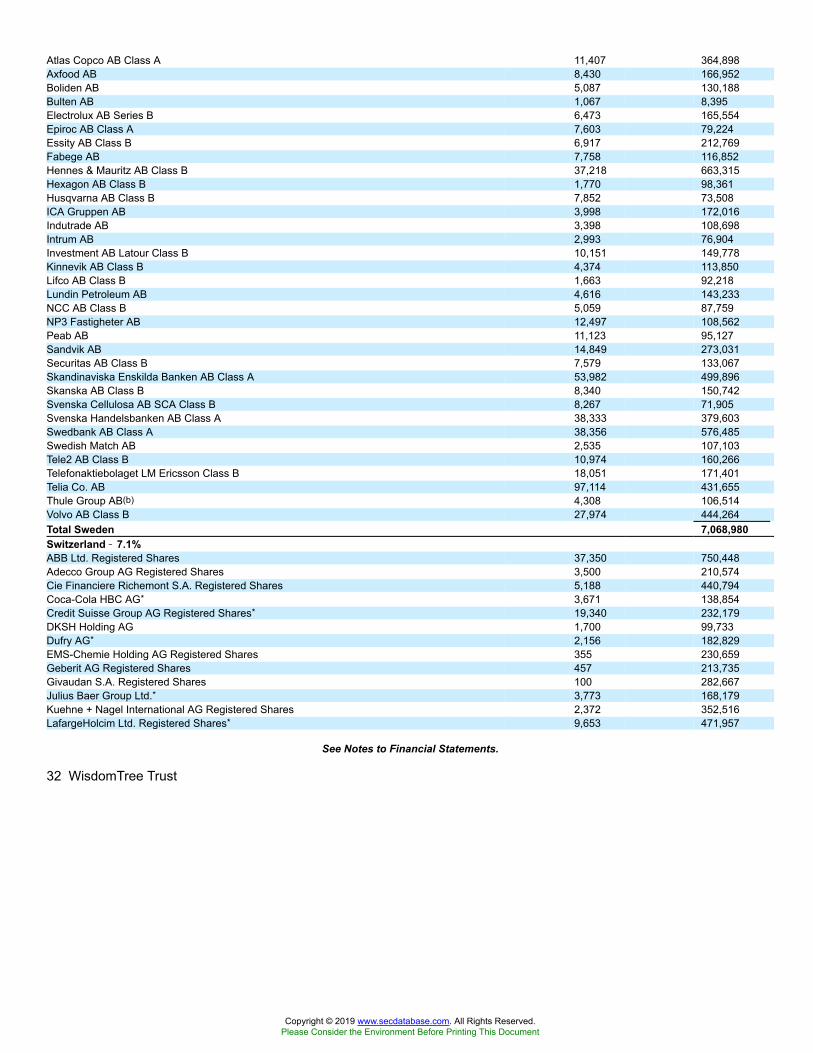
Atlas Copco AB Class A 11,407 364,898Axfood AB 8,430 166,952Boliden AB 5,087 130,188Bulten AB 1,067 8,395Electrolux AB Series B 6,473 165,554Epiroc AB Class A 7,603 79,224Essity AB Class B 6,917 212,769Fabege AB 7,758 116,852Hennes & Mauritz AB Class B 37,218 663,315Hexagon AB Class B 1,770 98,361Husqvarna AB Class B 7,852 73,508ICA Gruppen AB 3,998 172,016Indutrade AB 3,398 108,698Intrum AB 2,993 76,904Investment AB Latour Class B 10,151 149,778Kinnevik AB Class B 4,374 113,850Lifco AB Class B 1,663 92,218Lundin Petroleum AB 4,616 143,233NCC AB Class B 5,059 87,759NP3 Fastigheter AB 12,497 108,562Peab AB 11,123 95,127Sandvik AB 14,849 273,031Securitas AB Class B 7,579 133,067Skandinaviska Enskilda Banken AB Class A 53,982 499,896Skanska AB Class B 8,340 150,742Svenska Cellulosa AB SCA Class B 8,267 71,905Svenska Handelsbanken AB Class A 38,333 379,603Swedbank AB Class A 38,356 576,485Swedish Match AB 2,535 107,103Tele2 AB Class B 10,974 160,266Telefonaktiebolaget LM Ericsson Class B 18,051 171,401Telia Co. AB 97,114 431,655Thule Group AB(b) 4,308 106,514Volvo AB Class B 27,974 444,264Total Sweden 7,068,980Switzerland �� 7.1%ABB Ltd. Registered Shares 37,350 750,448Adecco Group AG Registered Shares 3,500 210,574Cie Financiere Richemont S.A. Registered Shares 5,188 440,794Coca-Cola HBC AG* 3,671 138,854Credit Suisse Group AG Registered Shares* 19,340 232,179DKSH Holding AG 1,700 99,733Dufry AG* 2,156 182,829EMS-Chemie Holding AG Registered Shares 355 230,659Geberit AG Registered Shares 457 213,735Givaudan S.A. Registered Shares 100 282,667Julius Baer Group Ltd.* 3,773 168,179Kuehne + Nagel International AG Registered Shares 2,372 352,516LafargeHolcim Ltd. Registered Shares* 9,653 471,957
See Notes to Financial Statements.
32 WisdomTree Trust
Copyright © 2019 www.secdatabase.com. All Rights Reserved.Please Consider the Environment Before Printing This Document

Table of ContentsSchedule of Investments (continued)
WisdomTree Dynamic Currency Hedged International Equity Fund (DDWM)June 30, 2019
Investments Shares ValueLogitech International S.A. Registered Shares 2,600 $ 104,027Lonza Group AG Registered Shares* 489 165,207Nestle S.A. Registered Shares 28,878 2,993,242Novartis AG Registered Shares 31,923 2,920,545Partners Group Holding AG 388 305,227Roche Holding AG Bearer Shares 2,574 722,304Roche Holding AG Genusschein 8,147 2,294,947Schindler Holding AG Participation Certificate 1,038 231,341SGS S.A. Registered Shares 135 344,354SIG Combibloc Group AG* 6,651 76,537Sika AG 877 149,854STMicroelectronics N.V. 7,167 127,324Sunrise Communications Group AG*(b) 1,904 142,263Swatch Group AG (The) Bearer Shares 829 237,647Swiss Life Holding AG Registered Shares 449 222,796Swiss Re AG 6,202 631,268Swisscom AG Registered Shares 928 466,475Temenos AG Registered Shares* 383 68,606UBS Group AG Registered Shares* 71,932 855,806Vifor Pharma AG 925 133,817Zurich Insurance Group AG 2,782 969,848Total Switzerland 17,938,559United Kingdom �� 18.4%Admiral Group PLC 8,737 245,520Anglo American PLC 19,930 569,316Antofagasta PLC 18,492 218,779Ashmore Group PLC 14,260 92,468Associated British Foods PLC 7,032 220,429AstraZeneca PLC 17,215 1,410,536Aviva PLC 98,560 522,446BAE Systems PLC 64,044 403,795Barclays PLC 236,113 450,151Barratt Developments PLC 32,458 236,537BBA Aviation PLC 29,024 104,241Bellway PLC 3,878 137,455Bloomsbury Publishing PLC 24,393 70,472Bovis Homes Group PLC 9,555 125,620BP PLC 479,320 3,346,628British American Tobacco PLC 65,615 2,295,641British Land Co. PLC (The) 24,282 166,386Britvic PLC 9,160 103,581BT Group PLC 287,190 718,075Bunzl PLC 4,198 110,970Burberry Group PLC 6,188 146,641Carnival PLC 3,641 161,213Centrica PLC 282,741 315,872Cineworld Group PLC 29,675 95,703CNH Industrial N.V. 13,558 139,237Coca-Cola European Partners PLC 5,296 295,222Compass Group PLC 13,316 319,795Croda International PLC 1,385 90,250CYBG PLC 20,623 50,473Diageo PLC 20,868 898,747Direct Line Insurance Group PLC 38,459 162,405Investments Shares ValueDixons Carphone PLC 63,069 $ 87,853Drax Group PLC 18,476 61,184
Copyright © 2019 www.secdatabase.com. All Rights Reserved.Please Consider the Environment Before Printing This Document
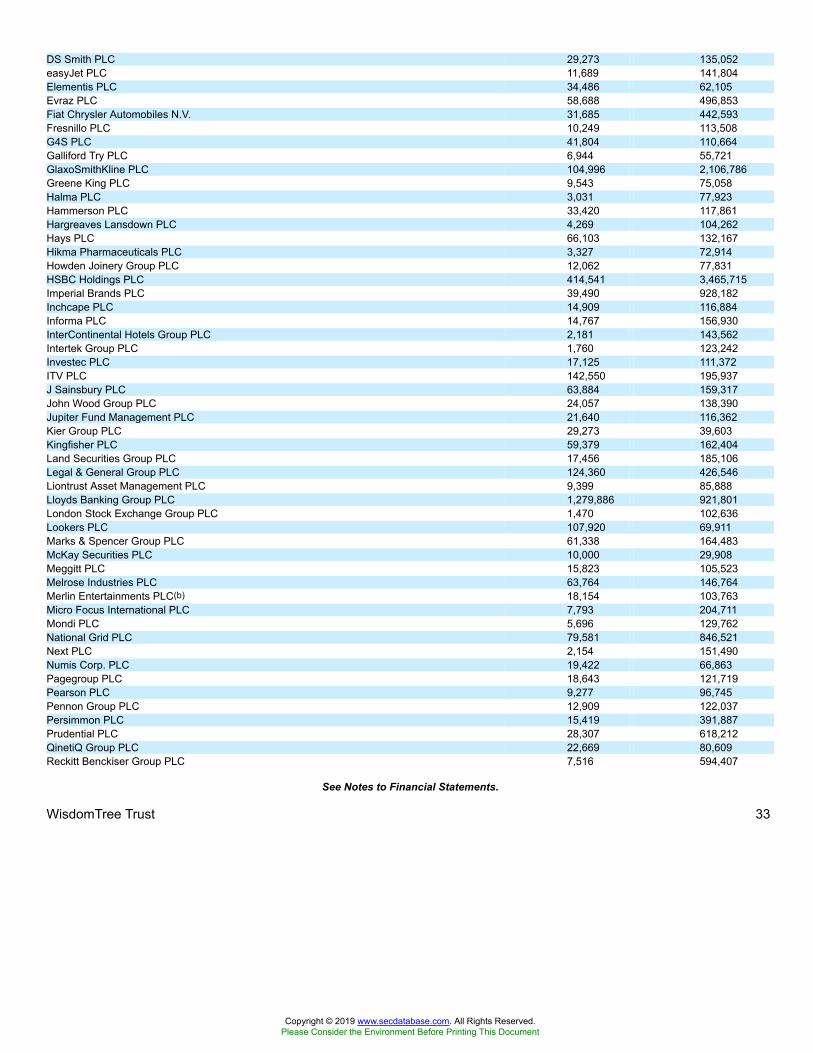
DS Smith PLC 29,273 135,052easyJet PLC 11,689 141,804Elementis PLC 34,486 62,105Evraz PLC 58,688 496,853Fiat Chrysler Automobiles N.V. 31,685 442,593Fresnillo PLC 10,249 113,508G4S PLC 41,804 110,664Galliford Try PLC 6,944 55,721GlaxoSmithKline PLC 104,996 2,106,786Greene King PLC 9,543 75,058Halma PLC 3,031 77,923Hammerson PLC 33,420 117,861Hargreaves Lansdown PLC 4,269 104,262Hays PLC 66,103 132,167Hikma Pharmaceuticals PLC 3,327 72,914Howden Joinery Group PLC 12,062 77,831HSBC Holdings PLC 414,541 3,465,715Imperial Brands PLC 39,490 928,182Inchcape PLC 14,909 116,884Informa PLC 14,767 156,930InterContinental Hotels Group PLC 2,181 143,562Intertek Group PLC 1,760 123,242Investec PLC 17,125 111,372ITV PLC 142,550 195,937J Sainsbury PLC 63,884 159,317John Wood Group PLC 24,057 138,390Jupiter Fund Management PLC 21,640 116,362Kier Group PLC 29,273 39,603Kingfisher PLC 59,379 162,404Land Securities Group PLC 17,456 185,106Legal & General Group PLC 124,360 426,546Liontrust Asset Management PLC 9,399 85,888Lloyds Banking Group PLC 1,279,886 921,801London Stock Exchange Group PLC 1,470 102,636Lookers PLC 107,920 69,911Marks & Spencer Group PLC 61,338 164,483McKay Securities PLC 10,000 29,908Meggitt PLC 15,823 105,523Melrose Industries PLC 63,764 146,764Merlin Entertainments PLC(b) 18,154 103,763Micro Focus International PLC 7,793 204,711Mondi PLC 5,696 129,762National Grid PLC 79,581 846,521Next PLC 2,154 151,490Numis Corp. PLC 19,422 66,863Pagegroup PLC 18,643 121,719Pearson PLC 9,277 96,745Pennon Group PLC 12,909 122,037Persimmon PLC 15,419 391,887Prudential PLC 28,307 618,212QinetiQ Group PLC 22,669 80,609Reckitt Benckiser Group PLC 7,516 594,407
See Notes to Financial Statements.
WisdomTree Trust 33
Copyright © 2019 www.secdatabase.com. All Rights Reserved.Please Consider the Environment Before Printing This Document

Table of ContentsSchedule of Investments (continued)
WisdomTree Dynamic Currency Hedged International Equity Fund (DDWM)June 30, 2019
Investments Shares ValueRedrow PLC 14,821 $102,613RELX PLC 15,629 379,819Rentokil Initial PLC 13,431 67,947Rio Tinto PLC 24,055 1,494,155RM PLC 20,000 60,835Rolls-Royce Holdings PLC* 12,379 132,403Rotork PLC 21,866 88,106Royal Bank of Scotland Group PLC 104,956 293,603Royal Dutch Shell PLC Class A 97,833 3,203,073Royal Dutch Shell PLC Class B 89,594 2,943,019Royal Mail PLC 49,184 132,642RPC Group PLC 7,367 74,314RSA Insurance Group PLC 20,105 147,589Saga PLC 107,923 54,639Sage Group PLC (The) 13,247 135,280Schroders PLC 4,762 184,848SDL PLC 11,608 75,345Segro PLC 19,159 178,049Severn Trent PLC 5,031 131,133Smith & Nephew PLC 7,778 168,779Speedy Hire PLC 108,518 87,010Spirax-Sarco Engineering PLC 1,073 125,431SSE PLC 34,387 491,036St. James�s Place PLC 11,924 166,629Standard Chartered PLC 26,350 239,512Standard Life Aberdeen PLC 75,748 284,008SThree PLC 22,203 80,535Tate & Lyle PLC 10,354 97,303Taylor Wimpey PLC 58,856 118,164TechnipFMC PLC 4,132 106,345Tesco PLC 106,821 308,201TP ICAP PLC 19,205 73,229Travis Perkins PLC 4,013 65,093Tullow Oil PLC 24,693 65,839Ultra Electronics Holdings PLC 2,598 54,557Unilever N.V. CVA 18,749 1,143,579Unilever PLC 13,187 821,449Investments Shares ValueUnited Utilities Group PLC 15,504 $154,462Vertu Motors PLC 123,356 63,112Vodafone Group PLC 691,917 1,138,796Weir Group PLC (The) 5,397 106,225WH Smith PLC 4,879 122,327Whitbread PLC 2,074 122,186Total United Kingdom 46,405,154TOTAL COMMON STOCKS(Cost: $249,705,206) 252,105,302RIGHTS �� 0.0%Spain �� 0.0%ACS Actividades de Construccion y Servicios S.A., expiring 7/11/19* 5,030 7,905Repsol S.A., expiring 7/9/19* 35,397 19,663TOTAL RIGHTS(Cost: $28,324) 27,568INVESTMENT OF CASH COLLATERAL FOR SECURITIES LOANED �� 0.7%United States �� 0.7%State Street Navigator Securities Lending Government Money Market Portfolio, 2.36%(c)(Cost: $1,699,501)(d) 1,699,501 1,699,501
Copyright © 2019 www.secdatabase.com. All Rights Reserved.Please Consider the Environment Before Printing This Document

TOTAL INVESTMENTS IN SECURITIES �� 100.6%(Cost: $251,433,031) 253,832,371Other Assets less Liabilities � (0.6)% (1,470,637 )NET ASSETS �� 100.0% $252,361,734* Non-income producing security.(a) Security, or portion thereof, was on loan at June 30, 2019 (See Note 2).(b) This security is exempt from registration under rule 144A of the Securities Act of 1933. This security may be sold in transactions that are exempt from registration,
normally to qualified institutional buyers.(c) Rate shown represents annualized 7-day yield as of June 30, 2019.(d) At June 30, 2019, the total market value of the Fund�s securities on loan identified in the Schedule of Investments was $3,138,822 and the total market value of
the collateral held by the Fund was $3,375,789. The total market value of the collateral includes non-cash U.S. Government securities collateral having a value of$1,676,288.
CVA � Certificaten Van Aandelen (Certificate of Stock)RSP � Risparmio Italian Savings Shares
FINANCIAL DERIVATIVE INSTRUMENTSFOREIGN CURRENCY CONTRACTS (OTC �� OVER THE COUNTER)
CounterpartySettlement
Date
Amount andDescription of
Currency tobe Purchased
Amount andDescription of
Currency tobe Sold
UnrealizedAppreciation
UnrealizedDepreciation
Bank of America N.A. 7/3/2019 450,547 AUD 311,684 USD $ 4,499 $ �Bank of America N.A. 7/3/2019 4,718,043 AUD 3,311,184 USD � (176 )Bank of America N.A. 7/3/2019 393,402 CHF 401,181 USD 2,347 �Bank of America N.A. 7/3/2019 4,154,864 CHF 4,261,963 USD � (152 )Bank of America N.A. 7/3/2019 289,069 DKK 43,857 USD 253 �Bank of America N.A. 7/3/2019 3,053,256 DKK 465,926 USD � (23 )Bank of America N.A. 7/3/2019 950,419 EUR 1,076,696 USD 5,732 �Bank of America N.A. 7/3/2019 10,043,513 EUR 11,438,316 USD 202 �Bank of America N.A. 7/3/2019 571,417 GBP 725,779 USD 1,501 �Bank of America N.A. 7/3/2019 6,057,649 GBP 7,710,345 USD � (376 )Bank of America N.A. 7/3/2019 45,369 ILS 12,534 USD 187 �Bank of America N.A. 7/3/2019 474,916 ILS 133,158 USD 8 �
See Notes to Financial Statements.
34 WisdomTree Trust
Copyright © 2019 www.secdatabase.com. All Rights Reserved.Please Consider the Environment Before Printing This Document
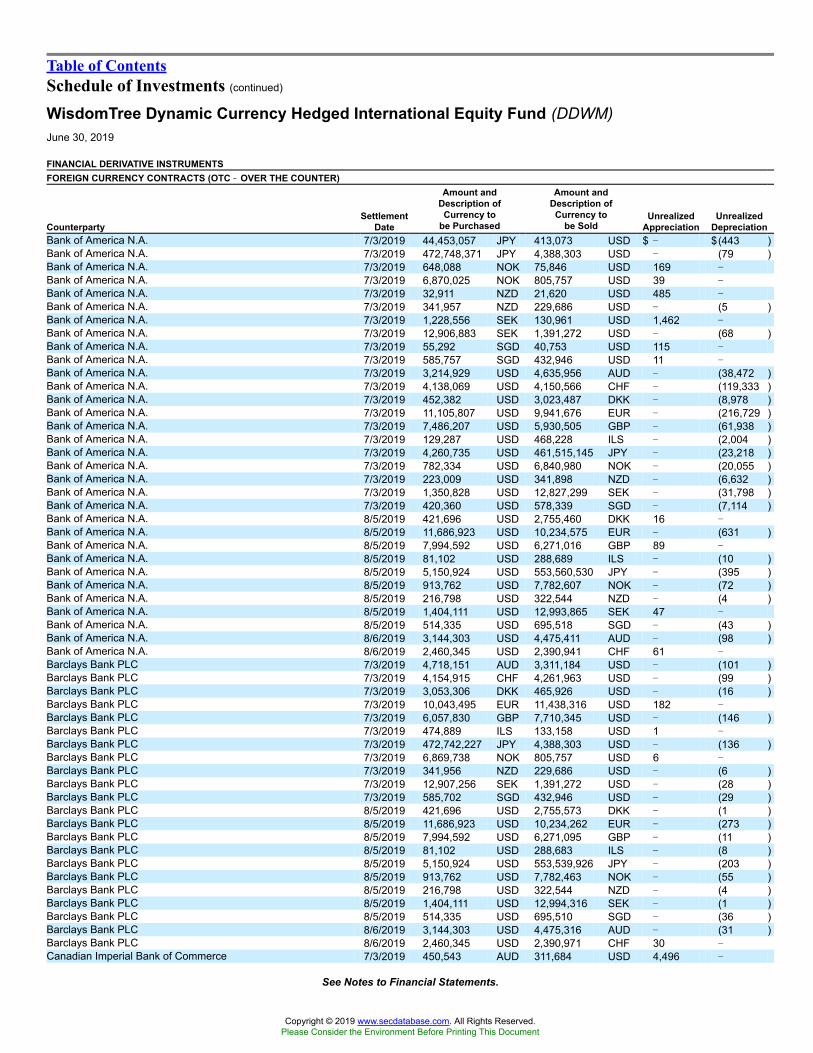
Table of ContentsSchedule of Investments (continued)
WisdomTree Dynamic Currency Hedged International Equity Fund (DDWM)June 30, 2019
FINANCIAL DERIVATIVE INSTRUMENTSFOREIGN CURRENCY CONTRACTS (OTC �� OVER THE COUNTER)
CounterpartySettlement
Date
Amount andDescription of
Currency tobe Purchased
Amount andDescription of
Currency tobe Sold
UnrealizedAppreciation
UnrealizedDepreciation
Bank of America N.A. 7/3/2019 44,453,057 JPY 413,073 USD $ � $(443 )Bank of America N.A. 7/3/2019 472,748,371 JPY 4,388,303 USD � (79 )Bank of America N.A. 7/3/2019 648,088 NOK 75,846 USD 169 �Bank of America N.A. 7/3/2019 6,870,025 NOK 805,757 USD 39 �Bank of America N.A. 7/3/2019 32,911 NZD 21,620 USD 485 �Bank of America N.A. 7/3/2019 341,957 NZD 229,686 USD � (5 )Bank of America N.A. 7/3/2019 1,228,556 SEK 130,961 USD 1,462 �Bank of America N.A. 7/3/2019 12,906,883 SEK 1,391,272 USD � (68 )Bank of America N.A. 7/3/2019 55,292 SGD 40,753 USD 115 �Bank of America N.A. 7/3/2019 585,757 SGD 432,946 USD 11 �Bank of America N.A. 7/3/2019 3,214,929 USD 4,635,956 AUD � (38,472 )Bank of America N.A. 7/3/2019 4,138,069 USD 4,150,566 CHF � (119,333 )Bank of America N.A. 7/3/2019 452,382 USD 3,023,487 DKK � (8,978 )Bank of America N.A. 7/3/2019 11,105,807 USD 9,941,676 EUR � (216,729 )Bank of America N.A. 7/3/2019 7,486,207 USD 5,930,505 GBP � (61,938 )Bank of America N.A. 7/3/2019 129,287 USD 468,228 ILS � (2,004 )Bank of America N.A. 7/3/2019 4,260,735 USD 461,515,145 JPY � (23,218 )Bank of America N.A. 7/3/2019 782,334 USD 6,840,980 NOK � (20,055 )Bank of America N.A. 7/3/2019 223,009 USD 341,898 NZD � (6,632 )Bank of America N.A. 7/3/2019 1,350,828 USD 12,827,299 SEK � (31,798 )Bank of America N.A. 7/3/2019 420,360 USD 578,339 SGD � (7,114 )Bank of America N.A. 8/5/2019 421,696 USD 2,755,460 DKK 16 �Bank of America N.A. 8/5/2019 11,686,923 USD 10,234,575 EUR � (631 )Bank of America N.A. 8/5/2019 7,994,592 USD 6,271,016 GBP 89 �Bank of America N.A. 8/5/2019 81,102 USD 288,689 ILS � (10 )Bank of America N.A. 8/5/2019 5,150,924 USD 553,560,530 JPY � (395 )Bank of America N.A. 8/5/2019 913,762 USD 7,782,607 NOK � (72 )Bank of America N.A. 8/5/2019 216,798 USD 322,544 NZD � (4 )Bank of America N.A. 8/5/2019 1,404,111 USD 12,993,865 SEK 47 �Bank of America N.A. 8/5/2019 514,335 USD 695,518 SGD � (43 )Bank of America N.A. 8/6/2019 3,144,303 USD 4,475,411 AUD � (98 )Bank of America N.A. 8/6/2019 2,460,345 USD 2,390,941 CHF 61 �Barclays Bank PLC 7/3/2019 4,718,151 AUD 3,311,184 USD � (101 )Barclays Bank PLC 7/3/2019 4,154,915 CHF 4,261,963 USD � (99 )Barclays Bank PLC 7/3/2019 3,053,306 DKK 465,926 USD � (16 )Barclays Bank PLC 7/3/2019 10,043,495 EUR 11,438,316 USD 182 �Barclays Bank PLC 7/3/2019 6,057,830 GBP 7,710,345 USD � (146 )Barclays Bank PLC 7/3/2019 474,889 ILS 133,158 USD 1 �Barclays Bank PLC 7/3/2019 472,742,227 JPY 4,388,303 USD � (136 )Barclays Bank PLC 7/3/2019 6,869,738 NOK 805,757 USD 6 �Barclays Bank PLC 7/3/2019 341,956 NZD 229,686 USD � (6 )Barclays Bank PLC 7/3/2019 12,907,256 SEK 1,391,272 USD � (28 )Barclays Bank PLC 7/3/2019 585,702 SGD 432,946 USD � (29 )Barclays Bank PLC 8/5/2019 421,696 USD 2,755,573 DKK � (1 )Barclays Bank PLC 8/5/2019 11,686,923 USD 10,234,262 EUR � (273 )Barclays Bank PLC 8/5/2019 7,994,592 USD 6,271,095 GBP � (11 )Barclays Bank PLC 8/5/2019 81,102 USD 288,683 ILS � (8 )Barclays Bank PLC 8/5/2019 5,150,924 USD 553,539,926 JPY � (203 )Barclays Bank PLC 8/5/2019 913,762 USD 7,782,463 NOK � (55 )Barclays Bank PLC 8/5/2019 216,798 USD 322,544 NZD � (4 )Barclays Bank PLC 8/5/2019 1,404,111 USD 12,994,316 SEK � (1 )Barclays Bank PLC 8/5/2019 514,335 USD 695,510 SGD � (36 )Barclays Bank PLC 8/6/2019 3,144,303 USD 4,475,316 AUD � (31 )Barclays Bank PLC 8/6/2019 2,460,345 USD 2,390,971 CHF 30 �Canadian Imperial Bank of Commerce 7/3/2019 450,543 AUD 311,684 USD 4,496 �
See Notes to Financial Statements.
Copyright © 2019 www.secdatabase.com. All Rights Reserved.Please Consider the Environment Before Printing This Document

WisdomTree Trust 35
Copyright © 2019 www.secdatabase.com. All Rights Reserved.Please Consider the Environment Before Printing This Document
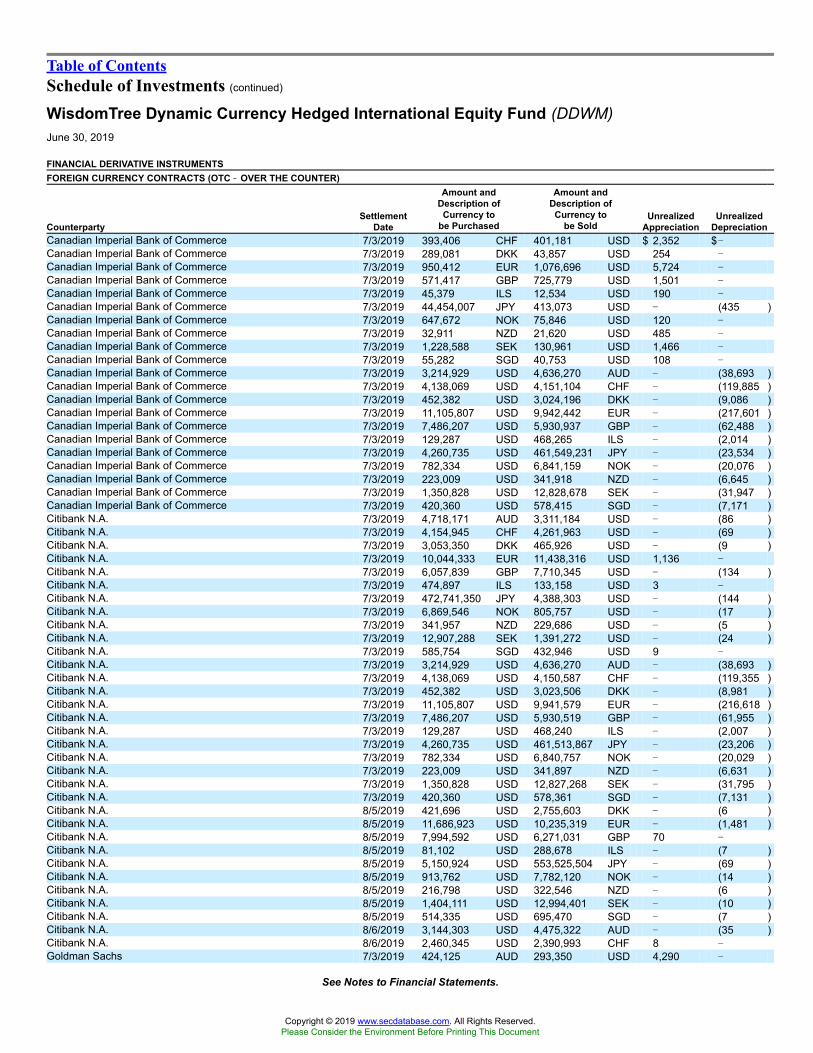
Table of ContentsSchedule of Investments (continued)
WisdomTree Dynamic Currency Hedged International Equity Fund (DDWM)June 30, 2019
FINANCIAL DERIVATIVE INSTRUMENTSFOREIGN CURRENCY CONTRACTS (OTC �� OVER THE COUNTER)
CounterpartySettlement
Date
Amount andDescription of
Currency tobe Purchased
Amount andDescription of
Currency tobe Sold
UnrealizedAppreciation
UnrealizedDepreciation
Canadian Imperial Bank of Commerce 7/3/2019 393,406 CHF 401,181 USD $ 2,352 $�Canadian Imperial Bank of Commerce 7/3/2019 289,081 DKK 43,857 USD 254 �Canadian Imperial Bank of Commerce 7/3/2019 950,412 EUR 1,076,696 USD 5,724 �Canadian Imperial Bank of Commerce 7/3/2019 571,417 GBP 725,779 USD 1,501 �Canadian Imperial Bank of Commerce 7/3/2019 45,379 ILS 12,534 USD 190 �Canadian Imperial Bank of Commerce 7/3/2019 44,454,007 JPY 413,073 USD � (435 )Canadian Imperial Bank of Commerce 7/3/2019 647,672 NOK 75,846 USD 120 �Canadian Imperial Bank of Commerce 7/3/2019 32,911 NZD 21,620 USD 485 �Canadian Imperial Bank of Commerce 7/3/2019 1,228,588 SEK 130,961 USD 1,466 �Canadian Imperial Bank of Commerce 7/3/2019 55,282 SGD 40,753 USD 108 �Canadian Imperial Bank of Commerce 7/3/2019 3,214,929 USD 4,636,270 AUD � (38,693 )Canadian Imperial Bank of Commerce 7/3/2019 4,138,069 USD 4,151,104 CHF � (119,885 )Canadian Imperial Bank of Commerce 7/3/2019 452,382 USD 3,024,196 DKK � (9,086 )Canadian Imperial Bank of Commerce 7/3/2019 11,105,807 USD 9,942,442 EUR � (217,601 )Canadian Imperial Bank of Commerce 7/3/2019 7,486,207 USD 5,930,937 GBP � (62,488 )Canadian Imperial Bank of Commerce 7/3/2019 129,287 USD 468,265 ILS � (2,014 )Canadian Imperial Bank of Commerce 7/3/2019 4,260,735 USD 461,549,231 JPY � (23,534 )Canadian Imperial Bank of Commerce 7/3/2019 782,334 USD 6,841,159 NOK � (20,076 )Canadian Imperial Bank of Commerce 7/3/2019 223,009 USD 341,918 NZD � (6,645 )Canadian Imperial Bank of Commerce 7/3/2019 1,350,828 USD 12,828,678 SEK � (31,947 )Canadian Imperial Bank of Commerce 7/3/2019 420,360 USD 578,415 SGD � (7,171 )Citibank N.A. 7/3/2019 4,718,171 AUD 3,311,184 USD � (86 )Citibank N.A. 7/3/2019 4,154,945 CHF 4,261,963 USD � (69 )Citibank N.A. 7/3/2019 3,053,350 DKK 465,926 USD � (9 )Citibank N.A. 7/3/2019 10,044,333 EUR 11,438,316 USD 1,136 �Citibank N.A. 7/3/2019 6,057,839 GBP 7,710,345 USD � (134 )Citibank N.A. 7/3/2019 474,897 ILS 133,158 USD 3 �Citibank N.A. 7/3/2019 472,741,350 JPY 4,388,303 USD � (144 )Citibank N.A. 7/3/2019 6,869,546 NOK 805,757 USD � (17 )Citibank N.A. 7/3/2019 341,957 NZD 229,686 USD � (5 )Citibank N.A. 7/3/2019 12,907,288 SEK 1,391,272 USD � (24 )Citibank N.A. 7/3/2019 585,754 SGD 432,946 USD 9 �Citibank N.A. 7/3/2019 3,214,929 USD 4,636,270 AUD � (38,693 )Citibank N.A. 7/3/2019 4,138,069 USD 4,150,587 CHF � (119,355 )Citibank N.A. 7/3/2019 452,382 USD 3,023,506 DKK � (8,981 )Citibank N.A. 7/3/2019 11,105,807 USD 9,941,579 EUR � (216,618 )Citibank N.A. 7/3/2019 7,486,207 USD 5,930,519 GBP � (61,955 )Citibank N.A. 7/3/2019 129,287 USD 468,240 ILS � (2,007 )Citibank N.A. 7/3/2019 4,260,735 USD 461,513,867 JPY � (23,206 )Citibank N.A. 7/3/2019 782,334 USD 6,840,757 NOK � (20,029 )Citibank N.A. 7/3/2019 223,009 USD 341,897 NZD � (6,631 )Citibank N.A. 7/3/2019 1,350,828 USD 12,827,268 SEK � (31,795 )Citibank N.A. 7/3/2019 420,360 USD 578,361 SGD � (7,131 )Citibank N.A. 8/5/2019 421,696 USD 2,755,603 DKK � (6 )Citibank N.A. 8/5/2019 11,686,923 USD 10,235,319 EUR � (1,481 )Citibank N.A. 8/5/2019 7,994,592 USD 6,271,031 GBP 70 �Citibank N.A. 8/5/2019 81,102 USD 288,678 ILS � (7 )Citibank N.A. 8/5/2019 5,150,924 USD 553,525,504 JPY � (69 )Citibank N.A. 8/5/2019 913,762 USD 7,782,120 NOK � (14 )Citibank N.A. 8/5/2019 216,798 USD 322,546 NZD � (6 )Citibank N.A. 8/5/2019 1,404,111 USD 12,994,401 SEK � (10 )Citibank N.A. 8/5/2019 514,335 USD 695,470 SGD � (7 )Citibank N.A. 8/6/2019 3,144,303 USD 4,475,322 AUD � (35 )Citibank N.A. 8/6/2019 2,460,345 USD 2,390,993 CHF 8 �Goldman Sachs 7/3/2019 424,125 AUD 293,350 USD 4,290 �
See Notes to Financial Statements.
Copyright © 2019 www.secdatabase.com. All Rights Reserved.Please Consider the Environment Before Printing This Document

36 WisdomTree Trust
Copyright © 2019 www.secdatabase.com. All Rights Reserved.Please Consider the Environment Before Printing This Document
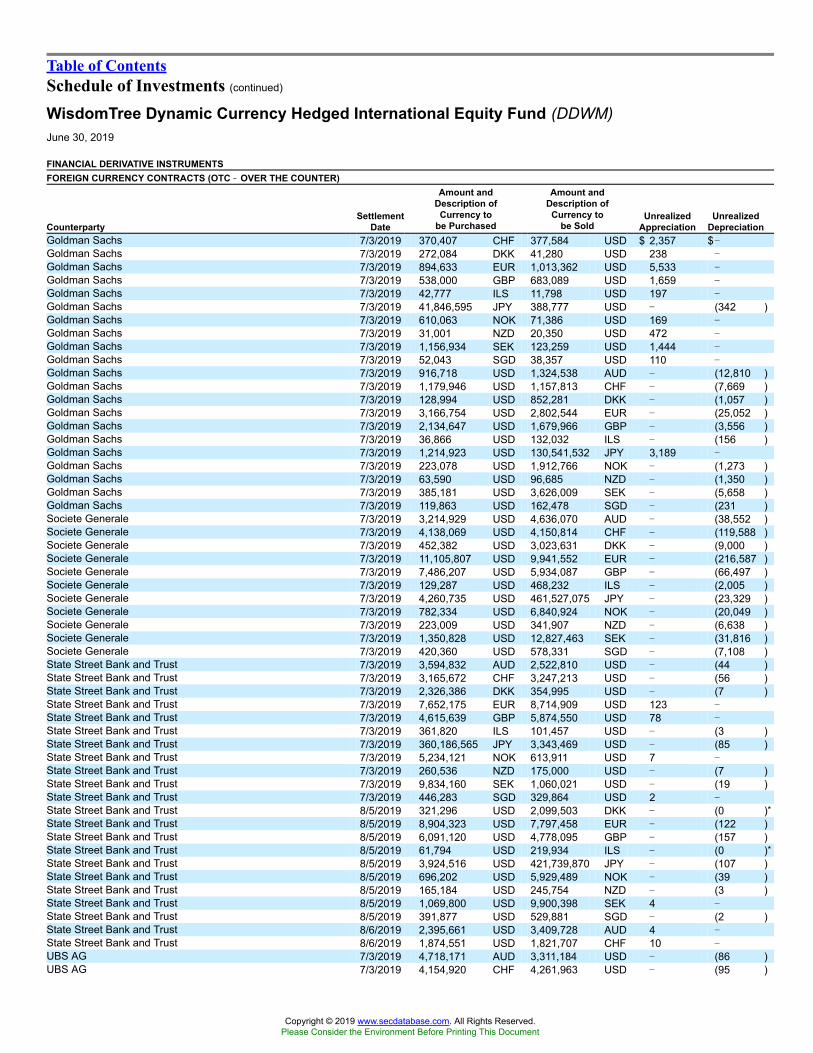
Table of ContentsSchedule of Investments (continued)
WisdomTree Dynamic Currency Hedged International Equity Fund (DDWM)June 30, 2019
FINANCIAL DERIVATIVE INSTRUMENTSFOREIGN CURRENCY CONTRACTS (OTC �� OVER THE COUNTER)
CounterpartySettlement
Date
Amount andDescription of
Currency tobe Purchased
Amount andDescription of
Currency tobe Sold
UnrealizedAppreciation
UnrealizedDepreciation
Goldman Sachs 7/3/2019 370,407 CHF 377,584 USD $ 2,357 $�Goldman Sachs 7/3/2019 272,084 DKK 41,280 USD 238 �Goldman Sachs 7/3/2019 894,633 EUR 1,013,362 USD 5,533 �Goldman Sachs 7/3/2019 538,000 GBP 683,089 USD 1,659 �Goldman Sachs 7/3/2019 42,777 ILS 11,798 USD 197 �Goldman Sachs 7/3/2019 41,846,595 JPY 388,777 USD � (342 )Goldman Sachs 7/3/2019 610,063 NOK 71,386 USD 169 �Goldman Sachs 7/3/2019 31,001 NZD 20,350 USD 472 �Goldman Sachs 7/3/2019 1,156,934 SEK 123,259 USD 1,444 �Goldman Sachs 7/3/2019 52,043 SGD 38,357 USD 110 �Goldman Sachs 7/3/2019 916,718 USD 1,324,538 AUD � (12,810 )Goldman Sachs 7/3/2019 1,179,946 USD 1,157,813 CHF � (7,669 )Goldman Sachs 7/3/2019 128,994 USD 852,281 DKK � (1,057 )Goldman Sachs 7/3/2019 3,166,754 USD 2,802,544 EUR � (25,052 )Goldman Sachs 7/3/2019 2,134,647 USD 1,679,966 GBP � (3,556 )Goldman Sachs 7/3/2019 36,866 USD 132,032 ILS � (156 )Goldman Sachs 7/3/2019 1,214,923 USD 130,541,532 JPY 3,189 �Goldman Sachs 7/3/2019 223,078 USD 1,912,766 NOK � (1,273 )Goldman Sachs 7/3/2019 63,590 USD 96,685 NZD � (1,350 )Goldman Sachs 7/3/2019 385,181 USD 3,626,009 SEK � (5,658 )Goldman Sachs 7/3/2019 119,863 USD 162,478 SGD � (231 )Societe Generale 7/3/2019 3,214,929 USD 4,636,070 AUD � (38,552 )Societe Generale 7/3/2019 4,138,069 USD 4,150,814 CHF � (119,588 )Societe Generale 7/3/2019 452,382 USD 3,023,631 DKK � (9,000 )Societe Generale 7/3/2019 11,105,807 USD 9,941,552 EUR � (216,587 )Societe Generale 7/3/2019 7,486,207 USD 5,934,087 GBP � (66,497 )Societe Generale 7/3/2019 129,287 USD 468,232 ILS � (2,005 )Societe Generale 7/3/2019 4,260,735 USD 461,527,075 JPY � (23,329 )Societe Generale 7/3/2019 782,334 USD 6,840,924 NOK � (20,049 )Societe Generale 7/3/2019 223,009 USD 341,907 NZD � (6,638 )Societe Generale 7/3/2019 1,350,828 USD 12,827,463 SEK � (31,816 )Societe Generale 7/3/2019 420,360 USD 578,331 SGD � (7,108 )State Street Bank and Trust 7/3/2019 3,594,832 AUD 2,522,810 USD � (44 )State Street Bank and Trust 7/3/2019 3,165,672 CHF 3,247,213 USD � (56 )State Street Bank and Trust 7/3/2019 2,326,386 DKK 354,995 USD � (7 )State Street Bank and Trust 7/3/2019 7,652,175 EUR 8,714,909 USD 123 �State Street Bank and Trust 7/3/2019 4,615,639 GBP 5,874,550 USD 78 �State Street Bank and Trust 7/3/2019 361,820 ILS 101,457 USD � (3 )State Street Bank and Trust 7/3/2019 360,186,565 JPY 3,343,469 USD � (85 )State Street Bank and Trust 7/3/2019 5,234,121 NOK 613,911 USD 7 �State Street Bank and Trust 7/3/2019 260,536 NZD 175,000 USD � (7 )State Street Bank and Trust 7/3/2019 9,834,160 SEK 1,060,021 USD � (19 )State Street Bank and Trust 7/3/2019 446,283 SGD 329,864 USD 2 �State Street Bank and Trust 8/5/2019 321,296 USD 2,099,503 DKK � (0 )*State Street Bank and Trust 8/5/2019 8,904,323 USD 7,797,458 EUR � (122 )State Street Bank and Trust 8/5/2019 6,091,120 USD 4,778,095 GBP � (157 )State Street Bank and Trust 8/5/2019 61,794 USD 219,934 ILS � (0 )*State Street Bank and Trust 8/5/2019 3,924,516 USD 421,739,870 JPY � (107 )State Street Bank and Trust 8/5/2019 696,202 USD 5,929,489 NOK � (39 )State Street Bank and Trust 8/5/2019 165,184 USD 245,754 NZD � (3 )State Street Bank and Trust 8/5/2019 1,069,800 USD 9,900,398 SEK 4 �State Street Bank and Trust 8/5/2019 391,877 USD 529,881 SGD � (2 )State Street Bank and Trust 8/6/2019 2,395,661 USD 3,409,728 AUD 4 �State Street Bank and Trust 8/6/2019 1,874,551 USD 1,821,707 CHF 10 �UBS AG 7/3/2019 4,718,171 AUD 3,311,184 USD � (86 )UBS AG 7/3/2019 4,154,920 CHF 4,261,963 USD � (95 )
Copyright © 2019 www.secdatabase.com. All Rights Reserved.Please Consider the Environment Before Printing This Document

See Notes to Financial Statements.
WisdomTree Trust 37
Copyright © 2019 www.secdatabase.com. All Rights Reserved.Please Consider the Environment Before Printing This Document

Table of ContentsSchedule of Investments (concluded)
WisdomTree Dynamic Currency Hedged International Equity Fund (DDWM)June 30, 2019
FINANCIAL DERIVATIVE INSTRUMENTSFOREIGN CURRENCY CONTRACTS (OTC �� OVER THE COUNTER)
CounterpartySettlement
Date
Amount andDescription of
Currency tobe Purchased
Amount andDescription of
Currency tobe Sold
UnrealizedAppreciation
UnrealizedDepreciation
UBS AG 7/3/2019 3,053,338 DKK 465,926 USD $ � $(11 )UBS AG 7/3/2019 10,043,504 EUR 11,438,316 USD 192 �UBS AG 7/3/2019 6,057,663 GBP 7,710,345 USD � (358 )UBS AG 7/3/2019 474,895 ILS 133,158 USD 2 �UBS AG 7/3/2019 472,757,148 JPY 4,388,303 USD 2 �UBS AG 7/3/2019 6,869,786 NOK 805,757 USD 11 �UBS AG 7/3/2019 341,955 NZD 229,686 USD � (7 )UBS AG 7/3/2019 12,907,163 SEK 1,391,272 USD � (38 )UBS AG 7/3/2019 585,748 SGD 432,946 USD 4 �UBS AG 7/3/2019 2,449,471 USD 3,532,174 AUD � (29,323 )UBS AG 7/3/2019 458,359 USD 655,680 AUD � (1,781 )UBS AG 7/3/2019 3,152,816 USD 3,162,322 CHF � (90,905 )UBS AG 7/3/2019 589,973 USD 582,393 CHF � (7,411 )UBS AG 7/3/2019 344,674 USD 2,303,624 DKK � (6,841 )UBS AG 7/3/2019 64,497 USD 426,712 DKK � (616 )UBS AG 7/3/2019 8,461,568 USD 7,574,503 EUR � (165,004 )UBS AG 7/3/2019 1,583,377 USD 1,402,878 EUR � (14,356 )UBS AG 7/3/2019 5,703,778 USD 4,518,417 GBP � (47,108 )UBS AG 7/3/2019 1,067,324 USD 837,261 GBP 1,687 �UBS AG 7/3/2019 98,508 USD 356,775 ILS � (1,532 )UBS AG 7/3/2019 18,433 USD 66,332 ILS � (166 )UBS AG 7/3/2019 3,246,279 USD 351,626,553 JPY � (17,648 )UBS AG 7/3/2019 607,462 USD 65,469,581 JPY � (251 )UBS AG 7/3/2019 596,064 USD 5,212,077 NOK � (15,269 )UBS AG 7/3/2019 111,539 USD 970,682 NOK � (2,314 )UBS AG 7/3/2019 169,913 USD 260,495 NZD � (5,053 )UBS AG 7/3/2019 31,795 USD 47,902 NZD � (379 )UBS AG 7/3/2019 1,029,207 USD 9,773,235 SEK � (24,228 )UBS AG 7/3/2019 192,590 USD 1,812,680 SEK � (2,795 )UBS AG 7/3/2019 320,276 USD 440,659 SGD � (5,433 )UBS AG 7/3/2019 59,932 USD 81,767 SGD � (506 )UBS AG 8/5/2019 421,696 USD 2,755,581 DKK � (3 )UBS AG 8/5/2019 11,686,923 USD 10,234,477 EUR � (518 )UBS AG 8/5/2019 7,994,592 USD 6,271,124 GBP � (49 )UBS AG 8/5/2019 81,102 USD 288,672 ILS � (5 )UBS AG 8/5/2019 5,150,924 USD 553,539,926 JPY � (203 )UBS AG 8/5/2019 913,762 USD 7,782,374 NOK � (44 )UBS AG 8/5/2019 216,798 USD 322,543 NZD � (3 )UBS AG 8/5/2019 1,404,111 USD 12,995,207 SEK � (98 )UBS AG 8/5/2019 514,335 USD 695,601 SGD � (104 )UBS AG 8/6/2019 3,144,303 USD 4,475,341 AUD � (49 )UBS AG 8/6/2019 2,460,345 USD 2,391,008 CHF � (8 )
$ 57,148 $(2,659,701)* Amount represents less than $1.
CURRENCY LEGENDAUD Australian dollarCHF Swiss francDKK Danish kroneEUR EuroGBP British poundILS Israeli new shekelJPY Japanese yenNOK Norwegian kroneNZD New Zealand dollarSEK Swedish kronaSGD Singapore dollarUSD U.S. dollar
Copyright © 2019 www.secdatabase.com. All Rights Reserved.Please Consider the Environment Before Printing This Document

See Notes to Financial Statements.
38 WisdomTree Trust
Copyright © 2019 www.secdatabase.com. All Rights Reserved.Please Consider the Environment Before Printing This Document
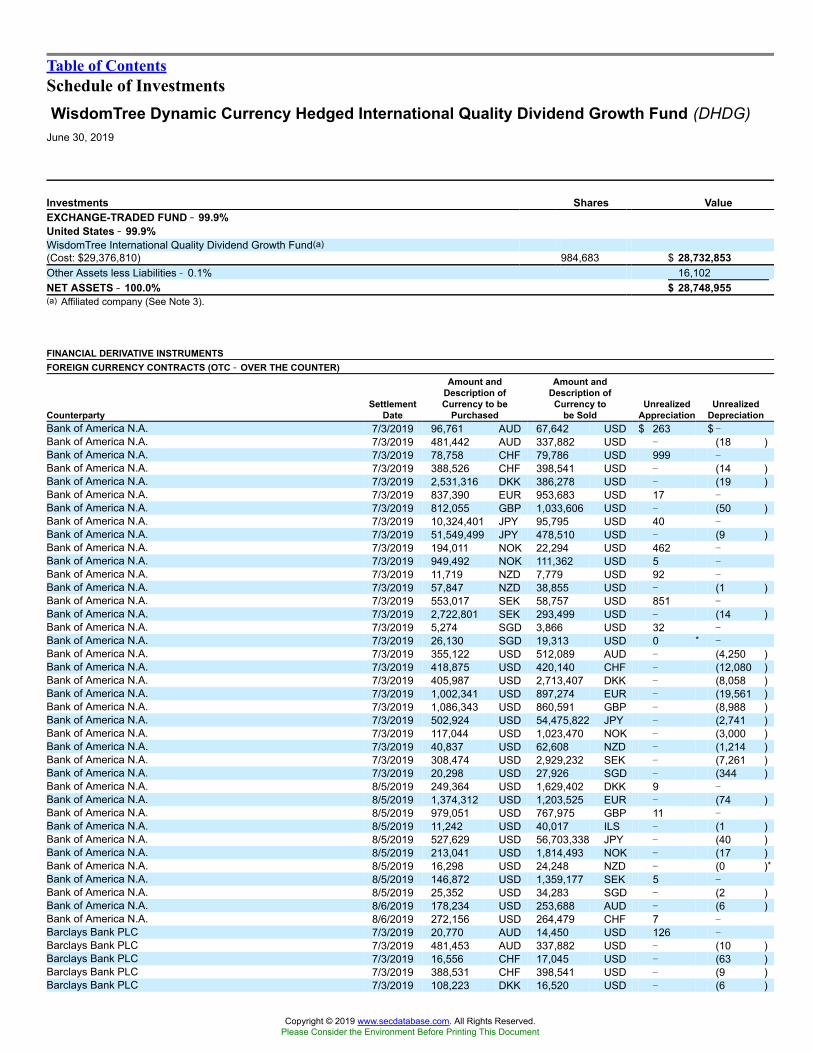
Table of ContentsSchedule of InvestmentsWisdomTree Dynamic Currency Hedged International Quality Dividend Growth Fund (DHDG)
June 30, 2019
Investments Shares ValueEXCHANGE-TRADED FUND �� 99.9%United States �� 99.9%WisdomTree International Quality Dividend Growth Fund(a)(Cost: $29,376,810) 984,683 $ 28,732,853Other Assets less Liabilities � 0.1% 16,102NET ASSETS �� 100.0% $ 28,748,955(a) Affiliated company (See Note 3).
FINANCIAL DERIVATIVE INSTRUMENTSFOREIGN CURRENCY CONTRACTS (OTC �� OVER THE COUNTER)
CounterpartySettlement
Date
Amount andDescription ofCurrency to be
Purchased
Amount andDescription of
Currency tobe Sold
UnrealizedAppreciation
UnrealizedDepreciation
Bank of America N.A. 7/3/2019 96,761 AUD 67,642 USD $ 263 $ �Bank of America N.A. 7/3/2019 481,442 AUD 337,882 USD � (18 )Bank of America N.A. 7/3/2019 78,758 CHF 79,786 USD 999 �Bank of America N.A. 7/3/2019 388,526 CHF 398,541 USD � (14 )Bank of America N.A. 7/3/2019 2,531,316 DKK 386,278 USD � (19 )Bank of America N.A. 7/3/2019 837,390 EUR 953,683 USD 17 �Bank of America N.A. 7/3/2019 812,055 GBP 1,033,606 USD � (50 )Bank of America N.A. 7/3/2019 10,324,401 JPY 95,795 USD 40 �Bank of America N.A. 7/3/2019 51,549,499 JPY 478,510 USD � (9 )Bank of America N.A. 7/3/2019 194,011 NOK 22,294 USD 462 �Bank of America N.A. 7/3/2019 949,492 NOK 111,362 USD 5 �Bank of America N.A. 7/3/2019 11,719 NZD 7,779 USD 92 �Bank of America N.A. 7/3/2019 57,847 NZD 38,855 USD � (1 )Bank of America N.A. 7/3/2019 553,017 SEK 58,757 USD 851 �Bank of America N.A. 7/3/2019 2,722,801 SEK 293,499 USD � (14 )Bank of America N.A. 7/3/2019 5,274 SGD 3,866 USD 32 �Bank of America N.A. 7/3/2019 26,130 SGD 19,313 USD 0 * �Bank of America N.A. 7/3/2019 355,122 USD 512,089 AUD � (4,250 )Bank of America N.A. 7/3/2019 418,875 USD 420,140 CHF � (12,080 )Bank of America N.A. 7/3/2019 405,987 USD 2,713,407 DKK � (8,058 )Bank of America N.A. 7/3/2019 1,002,341 USD 897,274 EUR � (19,561 )Bank of America N.A. 7/3/2019 1,086,343 USD 860,591 GBP � (8,988 )Bank of America N.A. 7/3/2019 502,924 USD 54,475,822 JPY � (2,741 )Bank of America N.A. 7/3/2019 117,044 USD 1,023,470 NOK � (3,000 )Bank of America N.A. 7/3/2019 40,837 USD 62,608 NZD � (1,214 )Bank of America N.A. 7/3/2019 308,474 USD 2,929,232 SEK � (7,261 )Bank of America N.A. 7/3/2019 20,298 USD 27,926 SGD � (344 )Bank of America N.A. 8/5/2019 249,364 USD 1,629,402 DKK 9 �Bank of America N.A. 8/5/2019 1,374,312 USD 1,203,525 EUR � (74 )Bank of America N.A. 8/5/2019 979,051 USD 767,975 GBP 11 �Bank of America N.A. 8/5/2019 11,242 USD 40,017 ILS � (1 )Bank of America N.A. 8/5/2019 527,629 USD 56,703,338 JPY � (40 )Bank of America N.A. 8/5/2019 213,041 USD 1,814,493 NOK � (17 )Bank of America N.A. 8/5/2019 16,298 USD 24,248 NZD � (0 )*Bank of America N.A. 8/5/2019 146,872 USD 1,359,177 SEK 5 �Bank of America N.A. 8/5/2019 25,352 USD 34,283 SGD � (2 )Bank of America N.A. 8/6/2019 178,234 USD 253,688 AUD � (6 )Bank of America N.A. 8/6/2019 272,156 USD 264,479 CHF 7 �Barclays Bank PLC 7/3/2019 20,770 AUD 14,450 USD 126 �Barclays Bank PLC 7/3/2019 481,453 AUD 337,882 USD � (10 )Barclays Bank PLC 7/3/2019 16,556 CHF 17,045 USD � (63 )Barclays Bank PLC 7/3/2019 388,531 CHF 398,541 USD � (9 )Barclays Bank PLC 7/3/2019 108,223 DKK 16,520 USD � (6 )
Copyright © 2019 www.secdatabase.com. All Rights Reserved.Please Consider the Environment Before Printing This Document

See Notes to Financial Statements.
WisdomTree Trust 39
Copyright © 2019 www.secdatabase.com. All Rights Reserved.Please Consider the Environment Before Printing This Document

Table of ContentsSchedule of Investments (continued)
WisdomTree Dynamic Currency Hedged International Quality Dividend Growth Fund (DHDG)June 30, 2019
FINANCIAL DERIVATIVE INSTRUMENTSFOREIGN CURRENCY CONTRACTS (OTC �� OVER THE COUNTER)
CounterpartySettlement
Date
Amount andDescription ofCurrency to be
Purchased
Amount andDescription of
Currency tobe Sold
UnrealizedAppreciation
UnrealizedDepreciation
Barclays Bank PLC 7/3/2019 2,531,357 DKK 386,278 USD $ � $ (13 )Barclays Bank PLC 7/3/2019 35,787 EUR 40,786 USD � (28 )Barclays Bank PLC 7/3/2019 837,388 EUR 953,683 USD 15 �Barclays Bank PLC 7/3/2019 34,724 GBP 44,205 USD � (9 )Barclays Bank PLC 7/3/2019 812,079 GBP 1,033,606 USD � (20 )Barclays Bank PLC 7/3/2019 2,195,806 JPY 20,465 USD � (83 )Barclays Bank PLC 7/3/2019 51,548,829 JPY 478,510 USD � (15 )Barclays Bank PLC 7/3/2019 40,436 NOK 4,763 USD � (20 )Barclays Bank PLC 7/3/2019 949,452 NOK 111,362 USD 1 �Barclays Bank PLC 7/3/2019 57,847 NZD 38,855 USD � (1 )Barclays Bank PLC 7/3/2019 116,740 SEK 12,552 USD 31 �Barclays Bank PLC 7/3/2019 2,722,880 SEK 293,499 USD � (6 )Barclays Bank PLC 7/3/2019 1,118 SGD 826 USD 0 * �Barclays Bank PLC 7/3/2019 26,127 SGD 19,313 USD � (1 )Barclays Bank PLC 8/5/2019 249,364 USD 1,629,469 DKK � (1 )Barclays Bank PLC 8/5/2019 1,374,312 USD 1,203,488 EUR � (32 )Barclays Bank PLC 8/5/2019 979,051 USD 767,984 GBP � (1 )Barclays Bank PLC 8/5/2019 11,242 USD 40,016 ILS � (1 )Barclays Bank PLC 8/5/2019 527,629 USD 56,701,228 JPY � (21 )Barclays Bank PLC 8/5/2019 213,041 USD 1,814,459 NOK � (13 )Barclays Bank PLC 8/5/2019 16,298 USD 24,248 NZD � (0 )*Barclays Bank PLC 8/5/2019 146,872 USD 1,359,224 SEK � (0 )*Barclays Bank PLC 8/5/2019 25,352 USD 34,282 SGD � (2 )Barclays Bank PLC 8/6/2019 178,234 USD 253,682 AUD � (2 )Barclays Bank PLC 8/6/2019 272,156 USD 264,482 CHF 3 �Canadian Imperial Bank of Commerce 7/3/2019 355,122 USD 512,124 AUD � (4,274 )Canadian Imperial Bank of Commerce 7/3/2019 418,875 USD 420,194 CHF � (12,135 )Canadian Imperial Bank of Commerce 7/3/2019 405,987 USD 2,714,043 DKK � (8,155 )Canadian Imperial Bank of Commerce 7/3/2019 1,002,341 USD 897,343 EUR � (19,639 )Canadian Imperial Bank of Commerce 7/3/2019 1,086,343 USD 860,654 GBP � (9,068 )Canadian Imperial Bank of Commerce 7/3/2019 502,924 USD 54,479,845 JPY � (2,778 )Canadian Imperial Bank of Commerce 7/3/2019 117,044 USD 1,023,497 NOK � (3,004 )Canadian Imperial Bank of Commerce 7/3/2019 40,837 USD 62,611 NZD � (1,217 )Canadian Imperial Bank of Commerce 7/3/2019 308,474 USD 2,929,547 SEK � (7,295 )Canadian Imperial Bank of Commerce 7/3/2019 20,298 USD 27,930 SGD � (346 )Citibank N.A. 7/2/2019 27,907 AUD 19,587 USD � (3 )Citibank N.A. 7/2/2019 55,279 CHF 56,614 USD 82 �Citibank N.A. 7/2/2019 247,769 DKK 37,735 USD 70 �Citibank N.A. 7/2/2019 80,193 EUR 91,162 USD 162 �Citibank N.A. 7/2/2019 33,885 GBP 43,023 USD 103 �Citibank N.A. 7/2/2019 1,419,779 JPY 13,169 USD 9 �Citibank N.A. 7/2/2019 117,958 NOK 13,820 USD 15 �Citibank N.A. 7/2/2019 313,282 SEK 33,740 USD 25 �Citibank N.A. 7/2/2019 2,173 SGD 1,606 USD 0 * �Citibank N.A. 7/3/2019 481,455 AUD 337,882 USD � (9 )Citibank N.A. 7/3/2019 388,534 CHF 398,541 USD � (6 )Citibank N.A. 7/3/2019 2,531,393 DKK 386,278 USD � (7 )Citibank N.A. 7/3/2019 837,458 EUR 953,683 USD 95 �Citibank N.A. 7/3/2019 812,080 GBP 1,033,606 USD � (18 )Citibank N.A. 7/3/2019 51,548,733 JPY 478,510 USD � (16 )Citibank N.A. 7/3/2019 949,426 NOK 111,362 USD � (2 )Citibank N.A. 7/3/2019 57,847 NZD 38,855 USD � (1 )Citibank N.A. 7/3/2019 2,722,887 SEK 293,499 USD � (5 )Citibank N.A. 7/3/2019 26,130 SGD 19,313 USD 0 * �Citibank N.A. 7/3/2019 355,122 USD 512,124 AUD � (4,274 )
See Notes to Financial Statements.
Copyright © 2019 www.secdatabase.com. All Rights Reserved.Please Consider the Environment Before Printing This Document

40 WisdomTree Trust
Copyright © 2019 www.secdatabase.com. All Rights Reserved.Please Consider the Environment Before Printing This Document

Table of ContentsSchedule of Investments (continued)
WisdomTree Dynamic Currency Hedged International Quality Dividend Growth Fund (DHDG)June 30, 2019
FINANCIAL DERIVATIVE INSTRUMENTSFOREIGN CURRENCY CONTRACTS (OTC �� OVER THE COUNTER)
CounterpartySettlement
Date
Amount andDescription of
Currency tobe Purchased
Amount andDescription of
Currency tobe Sold
UnrealizedAppreciation
UnrealizedDepreciation
Citibank N.A. 7/3/2019 418,875 USD 420,142 CHF $ � $ (12,082 )Citibank N.A. 7/3/2019 405,987 USD 2,713,423 DKK � (8,060 )Citibank N.A. 7/3/2019 1,002,341 USD 897,265 EUR � (19,551 )Citibank N.A. 7/3/2019 1,086,343 USD 860,593 GBP � (8,991 )Citibank N.A. 7/3/2019 502,924 USD 54,475,671 JPY � (2,739 )Citibank N.A. 7/3/2019 117,044 USD 1,023,437 NOK � (2,997 )Citibank N.A. 7/3/2019 40,837 USD 62,608 NZD � (1,214 )Citibank N.A. 7/3/2019 308,474 USD 2,929,225 SEK � (7,261 )Citibank N.A. 7/3/2019 20,298 USD 27,927 SGD � (344 )Citibank N.A. 8/5/2019 249,364 USD 1,629,487 DKK � (4 )Citibank N.A. 8/5/2019 1,374,312 USD 1,203,612 EUR � (174 )Citibank N.A. 8/5/2019 979,051 USD 767,977 GBP 9 �
Citibank N.A. 8/5/2019 11,242 USD 40,015 ILS � (1 )Citibank N.A. 8/5/2019 527,629 USD 56,699,751 JPY � (7 )Citibank N.A. 8/5/2019 213,041 USD 1,814,379 NOK � (3 )Citibank N.A. 8/5/2019 16,298 USD 24,248 NZD � �
Citibank N.A. 8/5/2019 146,872 USD 1,359,233 SEK � (1 )Citibank N.A. 8/5/2019 25,352 USD 34,280 SGD � (0 )*Citibank N.A. 8/6/2019 178,234 USD 253,682 AUD � (2 )Citibank N.A. 8/6/2019 272,156 USD 264,484 CHF 1 �JP Morgan Chase Bank N.A. 7/3/2019 366,831 AUD 257,438 USD � (5 )JP Morgan Chase Bank N.A. 7/3/2019 296,036 CHF 303,652 USD 4 �JP Morgan Chase Bank N.A. 7/3/2019 1,928,709 DKK 294,310 USD � (4 )JP Morgan Chase Bank N.A. 7/3/2019 638,009 EUR 726,616 USD 10 �JP Morgan Chase Bank N.A. 7/3/2019 618,731 GBP 787,513 USD � (14 )JP Morgan Chase Bank N.A. 7/3/2019 39,276,276 JPY 364,580 USD � (3 )JP Morgan Chase Bank N.A. 7/3/2019 723,412 NOK 84,849 USD 1 �JP Morgan Chase Bank N.A. 7/3/2019 2,509 NZD 1,662 USD 23 �JP Morgan Chase Bank N.A. 7/3/2019 44,076 NZD 29,605 USD � (1 )JP Morgan Chase Bank N.A. 7/3/2019 2,074,594 SEK 223,619 USD � (3 )JP Morgan Chase Bank N.A. 7/3/2019 19,910 SGD 14,716 USD 0 * �JP Morgan Chase Bank N.A. 8/5/2019 189,996 USD 1,241,529 DKK � (1 )JP Morgan Chase Bank N.A. 8/5/2019 1,047,095 USD 916,933 EUR � (13 )JP Morgan Chase Bank N.A. 8/5/2019 745,946 USD 585,127 GBP 7 �JP Morgan Chase Bank N.A. 8/5/2019 8,570 USD 30,503 ILS � (0 )*JP Morgan Chase Bank N.A. 8/5/2019 402,007 USD 43,200,315 JPY � (6 )JP Morgan Chase Bank N.A. 8/5/2019 162,320 USD 1,382,431 NOK � (5 )JP Morgan Chase Bank N.A. 8/5/2019 12,422 USD 18,482 NZD � (1 )JP Morgan Chase Bank N.A. 8/5/2019 111,904 USD 1,035,608 SEK 0 * �JP Morgan Chase Bank N.A. 8/5/2019 19,319 USD 26,123 SGD � (0 )*JP Morgan Chase Bank N.A. 8/6/2019 135,801 USD 193,284 AUD 1 �JP Morgan Chase Bank N.A. 8/6/2019 207,359 USD 201,517 CHF � (3 )Royal Bank of Canada 7/2/2019 8,448 NZD 5,674 USD � (0 )*Societe Generale 7/3/2019 355,122 USD 512,102 AUD � (4,258 )Societe Generale 7/3/2019 418,875 USD 420,165 CHF � (12,105 )Societe Generale 7/3/2019 405,987 USD 2,713,536 DKK � (8,077 )Societe Generale 7/3/2019 1,002,341 USD 897,263 EUR � (19,548 )Societe Generale 7/3/2019 1,086,343 USD 861,111 GBP � (9,650 )Societe Generale 7/3/2019 502,924 USD 54,477,230 JPY � (2,754 )Societe Generale 7/3/2019 117,044 USD 1,023,462 NOK � (2,999 )Societe Generale 7/3/2019 40,837 USD 62,609 NZD � (1,216 )Societe Generale 7/3/2019 308,474 USD 2,929,269 SEK � (7,265 )Societe Generale 7/3/2019 20,298 USD 27,926 SGD � (343 )UBS AG 7/3/2019 481,455 AUD 337,882 USD � (9 )
See Notes to Financial Statements.
Copyright © 2019 www.secdatabase.com. All Rights Reserved.Please Consider the Environment Before Printing This Document

WisdomTree Trust 41
Copyright © 2019 www.secdatabase.com. All Rights Reserved.Please Consider the Environment Before Printing This Document

Table of ContentsSchedule of Investments (concluded)
WisdomTree Dynamic Currency Hedged International Quality Dividend Growth Fund (DHDG)June 30, 2019
FINANCIAL DERIVATIVE INSTRUMENTSFOREIGN CURRENCY CONTRACTS (OTC �� OVER THE COUNTER)
CounterpartySettlement
Date
Amount andDescription of
Currency tobe Purchased
Amount andDescription of
Currency tobe Sold
UnrealizedAppreciation
UnrealizedDepreciation
UBS AG 7/3/2019 388,531 CHF 398,541 USD $ � $(9 )UBS AG 7/3/2019 511,621 DKK 77,331 USD 738 �UBS AG 7/3/2019 2,531,384 DKK 386,278 USD � (9 )UBS AG 7/3/2019 169,158 EUR 190,922 USD 1,731 �UBS AG 7/3/2019 837,389 EUR 953,683 USD 16 �UBS AG 7/3/2019 162,320 GBP 206,923 USD � (327 )UBS AG 7/3/2019 812,057 GBP 1,033,606 USD � (48 )UBS AG 7/3/2019 51,550,456 JPY 478,510 USD 0 * �UBS AG 7/3/2019 949,459 NOK 111,362 USD 2 �UBS AG 7/3/2019 57,847 NZD 38,855 USD � (1 )UBS AG 7/3/2019 2,722,860 SEK 293,499 USD � (8 )UBS AG 7/3/2019 26,129 SGD 19,313 USD 0 * �UBS AG 7/3/2019 270,570 USD 390,166 AUD � (3,239 )UBS AG 7/3/2019 319,147 USD 320,109 CHF � (9,202 )UBS AG 7/3/2019 309,325 USD 2,067,369 DKK � (6,139 )UBS AG 7/3/2019 763,692 USD 683,631 EUR � (14,892 )UBS AG 7/3/2019 827,693 USD 655,682 GBP � (6,836 )UBS AG 7/3/2019 383,184 USD 41,505,264 JPY � (2,083 )UBS AG 7/3/2019 89,178 USD 779,786 NOK � (2,284 )UBS AG 7/3/2019 31,118 USD 47,707 NZD � (925 )UBS AG 7/3/2019 235,028 USD 2,231,800 SEK � (5,533 )UBS AG 7/3/2019 15,468 USD 21,282 SGD � (262 )UBS AG 8/5/2019 249,364 USD 1,629,474 DKK � (2 )UBS AG 8/5/2019 1,374,312 USD 1,203,513 EUR � (61 )UBS AG 8/5/2019 979,051 USD 767,988 GBP � (6 )UBS AG 8/5/2019 11,242 USD 40,014 ILS � (1 )UBS AG 8/5/2019 527,629 USD 56,701,228 JPY � (21 )UBS AG 8/5/2019 213,041 USD 1,814,438 NOK � (10 )UBS AG 8/5/2019 16,298 USD 24,247 NZD � (0 )*UBS AG 8/5/2019 146,872 USD 1,359,317 SEK � (10 )UBS AG 8/5/2019 25,352 USD 34,287 SGD � (5 )UBS AG 8/6/2019 178,234 USD 253,684 AUD � (3 )UBS AG 8/6/2019 272,156 USD 264,486 CHF � (1 )
$ 6,073 $(324,002 )* Amount represents less than $1.
CURRENCY LEGENDAUD Australian dollarCHF Swiss francDKK Danish kroneEUR EuroGBP British poundILS Israeli new shekelJPY Japanese yenNOK Norwegian kroneNZD New Zealand dollarSEK Swedish kronaSGD Singapore dollarUSD U.S. dollar
See Notes to Financial Statements.
42 WisdomTree Trust
Copyright © 2019 www.secdatabase.com. All Rights Reserved.Please Consider the Environment Before Printing This Document

Table of ContentsSchedule of InvestmentsWisdomTree Dynamic Currency Hedged International SmallCap Equity Fund (DDLS)
June 30, 2019
Investments Shares Value
COMMON STOCKS �� 100.2%Australia �� 10.2%Accent Group Ltd. 30,644 $ 29,784Adairs Ltd. 15,589 15,534Adelaide Brighton Ltd. 28,500 80,799ALS Ltd. 11,903 61,310Altium Ltd. 1,053 25,272Ansell Ltd. 3,114 58,674AP Eagers Ltd. 6,282 43,202ARB Corp., Ltd. 2,005 25,608AUB Group Ltd. 2,864 20,982Ausdrill Ltd. 18,453 23,633Australian Pharmaceutical Industries Ltd. 27,400 25,381Bank of Queensland Ltd. 20,800 139,104Bapcor Ltd. 6,958 27,246Blackmores Ltd.(a) 435 27,446Blue Sky Alternative Investments Ltd.*�(a) 40,539 0Breville Group Ltd. 2,394 27,485Brickworks Ltd. 3,567 40,776carsales.com Ltd. 6,301 59,826Codan Ltd. 5,635 13,722Collins Foods Ltd.(a) 3,222 18,767Corporate Travel Management Ltd.(a) 1,540 24,316Costa Group Holdings Ltd. 9,368 26,559Credit Corp. Group Ltd. 1,400 26,055CSR Ltd. 26,089 71,584Dicker Data Ltd. 7,600 28,693Domain Holdings Australia Ltd.(a) 7,628 17,022Domino�s Pizza Enterprises Ltd. 1,800 47,545DuluxGroup Ltd. 7,158 46,816Elders Ltd. 3,533 15,396Estia Health Ltd. 16,719 30,974Event Hospitality and Entertainment Ltd. 4,815 42,237FlexiGroup Ltd. 15,600 17,844Freedom Foods Group Ltd. 2,339 8,338G8 Education Ltd. 16,612 35,322Genworth Mortgage Insurance Australia Ltd.(a) 21,634 42,660GUD Holdings Ltd. 4,132 29,025GWA Group Ltd. 12,350 29,640Hansen Technologies Ltd. 4,421 12,193Healius Ltd. 15,883 33,661HT&E Ltd.(a) 17,155 21,188Independence Group NL 5,820 19,277Ingenia Communities Group 9,962 22,650Inghams Group Ltd.(a) 15,920 44,911Integrated Research Ltd.(a) 5,926 13,723Invocare Ltd.(a) 2,792 31,329IOOF Holdings Ltd.(a) 25,577 92,795IPH Ltd. 5,700 29,840IRESS Ltd. 5,035 49,219JB Hi-Fi Ltd.(a) 4,478 81,232Jupiter Mines Ltd. 208,256 50,420Link Administration Holdings Ltd. 15,000 52,631Lovisa Holdings Ltd.(a) 2,687 21,420Investments Shares Value
Copyright © 2019 www.secdatabase.com. All Rights Reserved.Please Consider the Environment Before Printing This Document

McMillan Shakespeare Ltd. 3,785 $ 32,431Metcash Ltd. 31,945 57,613Mineral Resources Ltd. 4,773 50,175Monadelphous Group Ltd. 2,380 31,416MyState Ltd. 8,082 25,465Navigator Global Investments Ltd. 9,513 26,302New Hope Corp., Ltd. 38,886 73,951NIB Holdings Ltd. 10,730 57,753Nick Scali Ltd.(a) 5,723 25,141Nine Entertainment Co. Holdings Ltd. 50,575 66,546oOh!media Ltd. 6,972 19,081Orora Ltd. 32,200 73,212OZ Minerals Ltd. 5,953 41,901Peet Ltd. 27,502 21,615Pendal Group Ltd. 16,094 80,752Perpetual Ltd. 2,339 69,332Platinum Asset Management Ltd. 27,271 92,816Premier Investments Ltd. 5,246 55,847Regis Healthcare Ltd. 19,163 35,367Regis Resources Ltd. 15,599 57,798Reliance Worldwide Corp., Ltd. 12,200 30,136Sandfire Resources NL 5,945 27,910SeaLink Travel Group Ltd. 9,273 24,793Service Stream Ltd. 13,494 26,609SG Fleet Group Ltd. 14,400 29,810Sigma Healthcare Ltd. 73,800 28,743Sims Metal Management Ltd. 7,998 60,953SmartGroup Corp., Ltd. 5,291 30,966Southern Cross Media Group Ltd. 43,166 37,865Spark Infrastructure Group 73,700 125,677St Barbara Ltd. 18,501 38,170Steadfast Group Ltd. 15,118 37,238Super Retail Group Ltd. 8,254 47,670Tassal Group Ltd. 7,020 24,139Technology One Ltd. 4,500 24,884Total Australia 3,471,143Austria �� 1.3%EVN AG 2,858 43,287Oesterreichische Post AG 3,129 105,296Palfinger AG 815 25,059Porr AG(a) 1,479 32,675S IMMO AG 1,854 40,200UNIQA Insurance Group AG 13,523 126,203Wienerberger AG 2,150 53,131Total Austria 425,851Belgium �� 1.1%Bekaert S.A. 1,525 40,951bpost S.A. 18,306 173,780D�ieteren S.A./N.V. 1,132 52,080Econocom Group S.A./N.V. 8,599 30,749Euronav N.V. 2,827 26,479Ontex Group N.V. 2,067 33,378Orange Belgium S.A. 1,000 19,861
See Notes to Financial Statements.
WisdomTree Trust 43
Copyright © 2019 www.secdatabase.com. All Rights Reserved.Please Consider the Environment Before Printing This Document
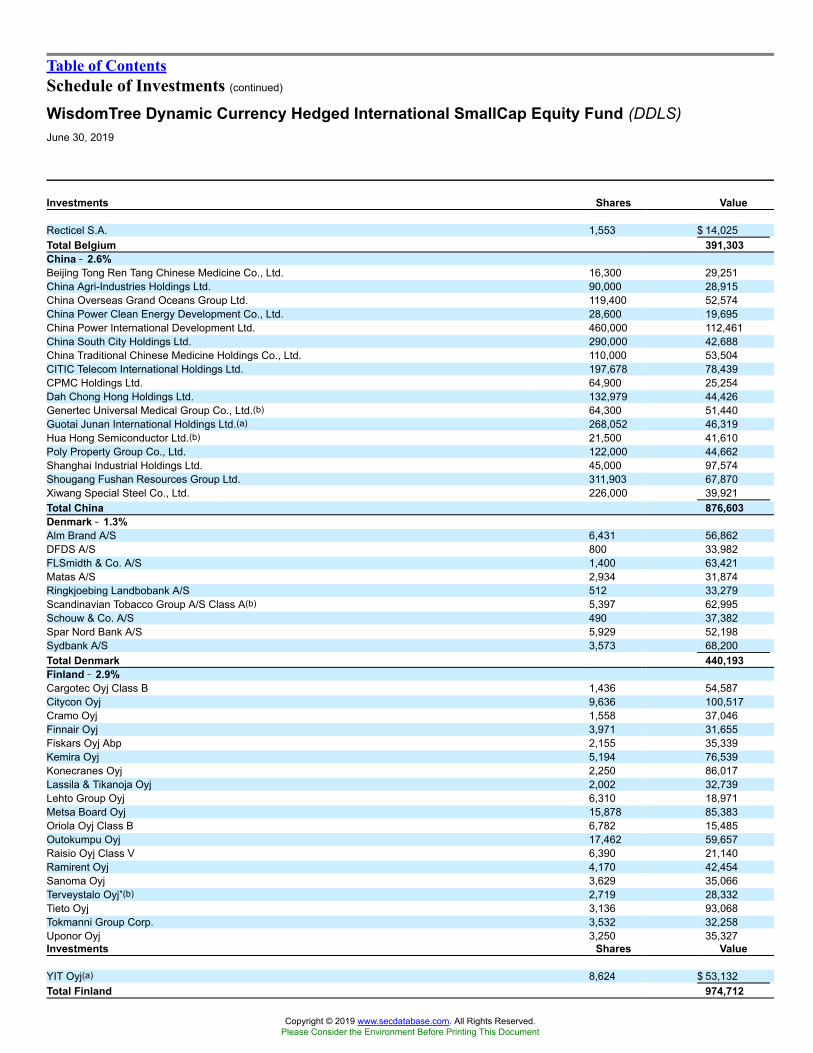
Table of ContentsSchedule of Investments (continued)
WisdomTree Dynamic Currency Hedged International SmallCap Equity Fund (DDLS)June 30, 2019
Investments Shares Value
Recticel S.A. 1,553 $ 14,025Total Belgium 391,303China �� 2.6%Beijing Tong Ren Tang Chinese Medicine Co., Ltd. 16,300 29,251China Agri-Industries Holdings Ltd. 90,000 28,915China Overseas Grand Oceans Group Ltd. 119,400 52,574China Power Clean Energy Development Co., Ltd. 28,600 19,695China Power International Development Ltd. 460,000 112,461China South City Holdings Ltd. 290,000 42,688China Traditional Chinese Medicine Holdings Co., Ltd. 110,000 53,504CITIC Telecom International Holdings Ltd. 197,678 78,439CPMC Holdings Ltd. 64,900 25,254Dah Chong Hong Holdings Ltd. 132,979 44,426Genertec Universal Medical Group Co., Ltd.(b) 64,300 51,440Guotai Junan International Holdings Ltd.(a) 268,052 46,319Hua Hong Semiconductor Ltd.(b) 21,500 41,610Poly Property Group Co., Ltd. 122,000 44,662Shanghai Industrial Holdings Ltd. 45,000 97,574Shougang Fushan Resources Group Ltd. 311,903 67,870Xiwang Special Steel Co., Ltd. 226,000 39,921Total China 876,603Denmark �� 1.3%Alm Brand A/S 6,431 56,862DFDS A/S 800 33,982FLSmidth & Co. A/S 1,400 63,421Matas A/S 2,934 31,874Ringkjoebing Landbobank A/S 512 33,279Scandinavian Tobacco Group A/S Class A(b) 5,397 62,995Schouw & Co. A/S 490 37,382Spar Nord Bank A/S 5,929 52,198Sydbank A/S 3,573 68,200Total Denmark 440,193Finland �� 2.9%Cargotec Oyj Class B 1,436 54,587Citycon Oyj 9,636 100,517Cramo Oyj 1,558 37,046Finnair Oyj 3,971 31,655Fiskars Oyj Abp 2,155 35,339Kemira Oyj 5,194 76,539Konecranes Oyj 2,250 86,017Lassila & Tikanoja Oyj 2,002 32,739Lehto Group Oyj 6,310 18,971Metsa Board Oyj 15,878 85,383Oriola Oyj Class B 6,782 15,485Outokumpu Oyj 17,462 59,657Raisio Oyj Class V 6,390 21,140Ramirent Oyj 4,170 42,454Sanoma Oyj 3,629 35,066Terveystalo Oyj*(b) 2,719 28,332Tieto Oyj 3,136 93,068Tokmanni Group Corp. 3,532 32,258Uponor Oyj 3,250 35,327Investments Shares Value
YIT Oyj(a) 8,624 $ 53,132Total Finland 974,712
Copyright © 2019 www.secdatabase.com. All Rights Reserved.Please Consider the Environment Before Printing This Document

France �� 3.3%Beneteau S.A. 2,014 22,190Chargeurs S.A. 1,168 23,197Coface S.A. 10,051 101,527Derichebourg S.A. 6,842 26,336Elior Group S.A.(b) 4,129 56,848Europcar Mobility Group(b) 3,650 26,041Interparfums S.A. 680 32,640IPSOS(a) 1,529 40,396Jacquet Metal Service S.A. 1,200 24,598Kaufman & Broad S.A. 1,078 41,297Maisons du Monde S.A.(b) 1,095 26,137Manitou BF S.A. 816 25,229Metropole Television S.A. 5,888 111,643Neopost S.A. 1,451 31,065Nexity S.A. 2,623 113,509Rallye S.A.(a) 2,900 23,184Rothschild & Co. 1,566 50,826Sopra Steria Group 400 46,691SPIE S.A. 4,488 83,462Tarkett S.A. 1,574 36,925Television Francaise 1 6,939 73,174Trigano S.A. 450 41,099Vicat S.A. 1,054 52,453Total France 1,110,467Georgia �� 0.1%Bank of Georgia Group PLC 1,773 33,802Germany �� 4.6%Aareal Bank AG 3,561 93,961alstria office REIT-AG 5,181 84,018AURELIUS Equity Opportunities SE & Co. KGaA 969 46,082Aurubis AG 1,350 65,846Bilfinger SE 1,334 43,235CANCOM SE 482 25,645CropEnergies AG 4,097 28,880Dermapharm Holding SE 1,100 37,956Deutsche Pfandbriefbank AG(b) 8,140 98,075Deutz AG 2,199 21,461DIC Asset AG 1,921 22,183Duerr AG 1,549 52,867Encavis AG 5,410 42,264Freenet AG 8,650 173,322Gerresheimer AG 508 37,459Hamburger Hafen und Logistik AG 1,669 44,171Indus Holding AG 569 25,595Jenoptik AG 644 20,865JOST Werke AG(b) 600 21,045Kloeckner & Co. SE 4,820 28,900Koenig & Bauer AG 500 20,646Krones AG 550 44,439MLP SE 5,528 26,125
See Notes to Financial Statements.
44 WisdomTree Trust
Copyright © 2019 www.secdatabase.com. All Rights Reserved.Please Consider the Environment Before Printing This Document
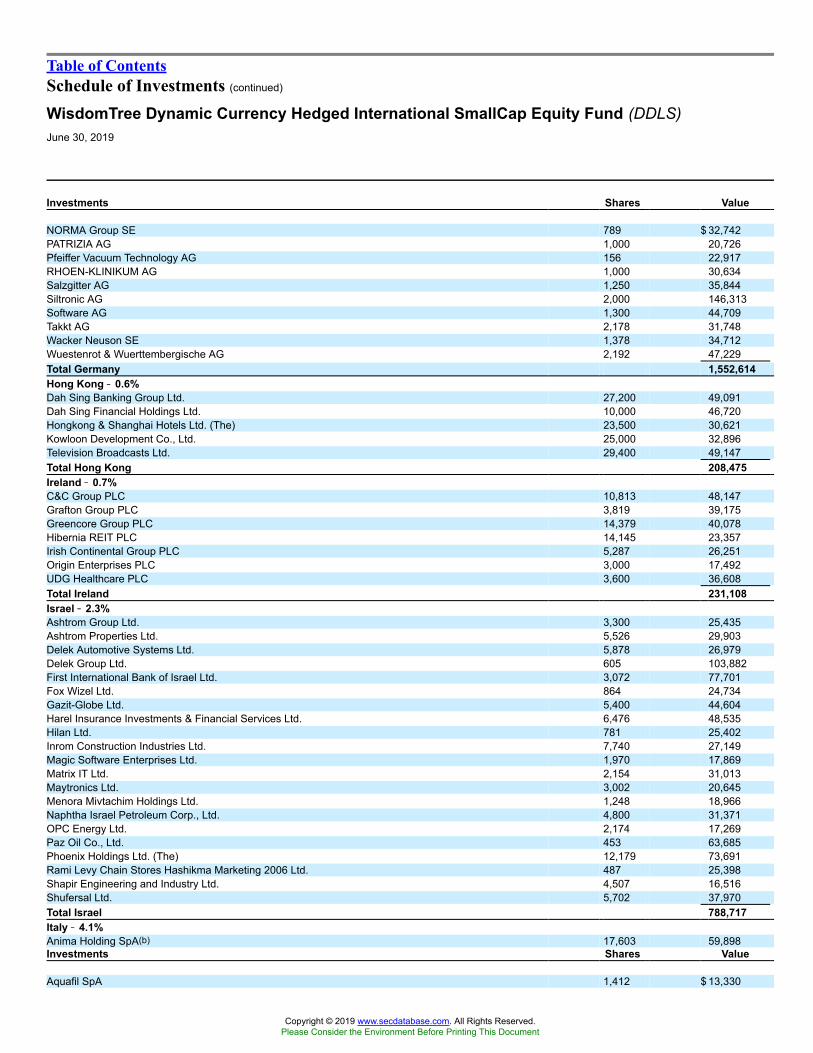
Table of ContentsSchedule of Investments (continued)
WisdomTree Dynamic Currency Hedged International SmallCap Equity Fund (DDLS)June 30, 2019
Investments Shares Value
NORMA Group SE 789 $ 32,742PATRIZIA AG 1,000 20,726Pfeiffer Vacuum Technology AG 156 22,917RHOEN-KLINIKUM AG 1,000 30,634Salzgitter AG 1,250 35,844Siltronic AG 2,000 146,313Software AG 1,300 44,709Takkt AG 2,178 31,748Wacker Neuson SE 1,378 34,712Wuestenrot & Wuerttembergische AG 2,192 47,229Total Germany 1,552,614Hong Kong �� 0.6%Dah Sing Banking Group Ltd. 27,200 49,091Dah Sing Financial Holdings Ltd. 10,000 46,720Hongkong & Shanghai Hotels Ltd. (The) 23,500 30,621Kowloon Development Co., Ltd. 25,000 32,896Television Broadcasts Ltd. 29,400 49,147Total Hong Kong 208,475Ireland �� 0.7%C&C Group PLC 10,813 48,147Grafton Group PLC 3,819 39,175Greencore Group PLC 14,379 40,078Hibernia REIT PLC 14,145 23,357Irish Continental Group PLC 5,287 26,251Origin Enterprises PLC 3,000 17,492UDG Healthcare PLC 3,600 36,608Total Ireland 231,108Israel �� 2.3%Ashtrom Group Ltd. 3,300 25,435Ashtrom Properties Ltd. 5,526 29,903Delek Automotive Systems Ltd. 5,878 26,979Delek Group Ltd. 605 103,882First International Bank of Israel Ltd. 3,072 77,701Fox Wizel Ltd. 864 24,734Gazit-Globe Ltd. 5,400 44,604Harel Insurance Investments & Financial Services Ltd. 6,476 48,535Hilan Ltd. 781 25,402Inrom Construction Industries Ltd. 7,740 27,149Magic Software Enterprises Ltd. 1,970 17,869Matrix IT Ltd. 2,154 31,013Maytronics Ltd. 3,002 20,645Menora Mivtachim Holdings Ltd. 1,248 18,966Naphtha Israel Petroleum Corp., Ltd. 4,800 31,371OPC Energy Ltd. 2,174 17,269Paz Oil Co., Ltd. 453 63,685Phoenix Holdings Ltd. (The) 12,179 73,691Rami Levy Chain Stores Hashikma Marketing 2006 Ltd. 487 25,398Shapir Engineering and Industry Ltd. 4,507 16,516Shufersal Ltd. 5,702 37,970Total Israel 788,717Italy �� 4.1%Anima Holding SpA(b) 17,603 59,898Investments Shares Value
Aquafil SpA 1,412 $ 13,330
Copyright © 2019 www.secdatabase.com. All Rights Reserved.Please Consider the Environment Before Printing This Document

Ascopiave SpA 8,669 37,317ASTM SpA 1,500 48,513Autogrill SpA 3,600 37,779Azimut Holding SpA(a) 7,990 154,046Banca Farmafactoring SpA(b) 13,530 75,499Banca IFIS SpA 3,900 52,719Banca Popolare di Sondrio SCPA 9,641 21,398Banca Sistema SpA(b) 14,630 19,793BPER Banca 13,265 54,125Brunello Cucinelli SpA 603 20,367Cairo Communication SpA 7,681 23,092Cerved Group SpA 6,050 53,706Credito Emiliano SpA 9,419 45,426Datalogic SpA 1,461 28,983doValue SpA(b) 2,731 36,326El.En. SpA 844 17,579Falck Renewables SpA 4,733 19,900Fincantieri SpA 13,284 14,901Gamenet Group SpA(b) 2,596 23,444Gima TT SpA(b) 3,634 33,707Gruppo MutuiOnline SpA 946 16,871Immobiliare Grande Distribuzione SIIQ SpA 7,352 48,560Maire Tecnimont SpA 11,031 35,777MARR SpA 2,036 46,488Piaggio & C. SpA 11,000 32,344RAI Way SpA(b) 6,767 40,535Reply SpA 271 18,501Rizzoli Corriere Della Sera Mediagroup SpA 29,247 31,042Saras SpA 45,320 68,332Societa Cattolica di Assicurazioni SC 6,387 57,206Technogym SpA(b) 2,544 28,363Tod�s SpA 500 23,380Unieuro SpA(b) 1,506 24,148Zignago Vetro SpA 3,091 37,453Total Italy 1,400,848Japan �� 25.3%77 Bank Ltd. (The) 1,535 22,582ADEKA Corp. 1,900 28,075Aeon Delight Co., Ltd. 700 20,693Ai Holdings Corp.(a) 1,400 22,610Aica Kogyo Co., Ltd. 1,000 33,414Aichi Corp. 2,800 18,088Alpen Co., Ltd.(a) 1,600 22,647Amano Corp. 1,300 35,872Anest Iwata Corp. 2,300 20,472Anritsu Corp.(a) 1,100 19,123AOKI Holdings, Inc.(a) 3,100 30,701Aomori Bank Ltd. (The) 848 20,779Aoyama Trading Co., Ltd. 1,500 29,404Arcs Co., Ltd. 1,100 21,931Ariake Japan Co., Ltd. 300 18,934As One Corp. 335 27,829
See Notes to Financial Statements.
WisdomTree Trust 45
Copyright © 2019 www.secdatabase.com. All Rights Reserved.Please Consider the Environment Before Printing This Document

Table of ContentsSchedule of Investments (continued)
WisdomTree Dynamic Currency Hedged International SmallCap Equity Fund (DDLS)June 30, 2019
Investments Shares Value
Asahi Holdings, Inc. 1,100 $ 22,329Asics Corp. 2,100 22,746Autobacs Seven Co., Ltd. 1,600 26,404Awa Bank Ltd. (The) 770 18,439Axial Retailing, Inc. 600 20,633Bank of Nagoya Ltd. (The) 749 23,602Bank of Okinawa Ltd. (The) 642 19,545Bell System24 Holdings, Inc. 1,401 19,349Benesse Holdings, Inc. 1,300 30,262Bic Camera, Inc. 2,400 23,568C.I. Takiron Corp. 3,700 23,112Central Glass Co., Ltd. 1,000 22,202Chugoku Bank Ltd. (The) 2,900 25,571Citizen Watch Co., Ltd. 7,100 36,442Cosel Co., Ltd. 2,300 24,528Cosmo Energy Holdings Co., Ltd. 1,719 38,723Credit Saison Co., Ltd. 3,600 42,135Dai Nippon Toryo Co., Ltd. 3,300 31,854Daibiru Corp. 2,600 24,180Daido Steel Co., Ltd. 800 30,332Daihen Corp. 637 18,269Daiichikosho Co., Ltd. 800 37,201Daikyonishikawa Corp. 2,800 22,220Daishi Hokuetsu Financial Group, Inc. 1,100 28,159Daiwabo Holdings Co., Ltd. 500 23,807Denka Co., Ltd. 1,700 50,413Denyo Co., Ltd. 1,795 24,174DIC Corp. 2,000 52,794Dip Corp. 1,141 19,084DMG Mori Co., Ltd.(a) 2,200 35,224Doshisha Co., Ltd. 1,300 20,536Eagle Industry Co., Ltd. 2,700 26,338Ebara Corp. 1,100 29,853Eidai Co., Ltd. 6,200 18,875en-japan, Inc. 600 23,362EPS Holdings, Inc. 1,500 23,278Exedy Corp. 1,430 29,943FCC Co., Ltd. 900 18,820Financial Products Group Co., Ltd. 3,500 28,912FP Corp. 359 21,925Fuji Corp., Ltd. 4,100 27,666Fuji Oil Holdings, Inc. 800 24,132Fujikura Ltd. 6,600 24,810Fujitec Co., Ltd. 1,900 24,830Fujitsu General Ltd. 1,249 19,847Furukawa Co., Ltd. 1,600 20,731Furukawa Electric Co., Ltd. 1,100 32,212Fuso Chemical Co., Ltd. 1,100 21,849Fuyo General Lease Co., Ltd. 600 34,138Glory Ltd. 900 23,757GMO Financial Holdings, Inc.(a) 3,700 21,807GMO Internet, Inc. 1,200 21,741Goldcrest Co., Ltd. 1,100 19,378GS Yuasa Corp. 1,251 24,128Investments Shares Value
Copyright © 2019 www.secdatabase.com. All Rights Reserved.Please Consider the Environment Before Printing This Document
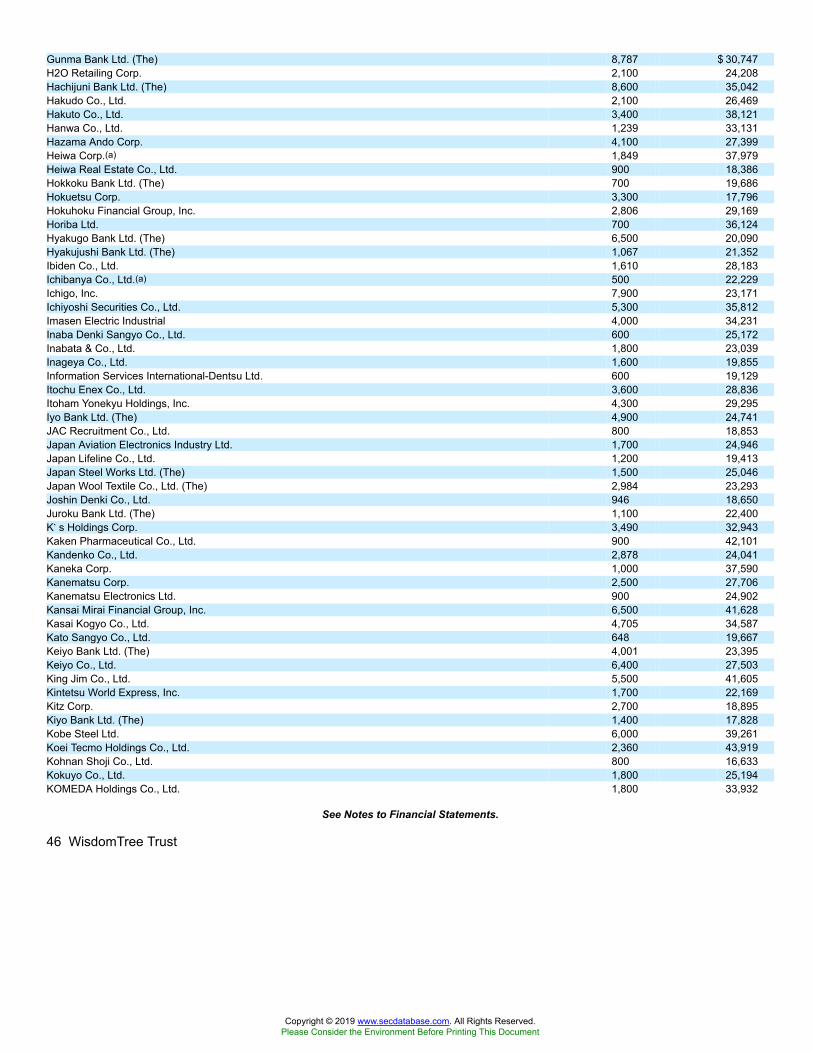
Gunma Bank Ltd. (The) 8,787 $ 30,747H2O Retailing Corp. 2,100 24,208Hachijuni Bank Ltd. (The) 8,600 35,042Hakudo Co., Ltd. 2,100 26,469Hakuto Co., Ltd. 3,400 38,121Hanwa Co., Ltd. 1,239 33,131Hazama Ando Corp. 4,100 27,399Heiwa Corp.(a) 1,849 37,979Heiwa Real Estate Co., Ltd. 900 18,386Hokkoku Bank Ltd. (The) 700 19,686Hokuetsu Corp. 3,300 17,796Hokuhoku Financial Group, Inc. 2,806 29,169Horiba Ltd. 700 36,124Hyakugo Bank Ltd. (The) 6,500 20,090Hyakujushi Bank Ltd. (The) 1,067 21,352Ibiden Co., Ltd. 1,610 28,183Ichibanya Co., Ltd.(a) 500 22,229Ichigo, Inc. 7,900 23,171Ichiyoshi Securities Co., Ltd. 5,300 35,812Imasen Electric Industrial 4,000 34,231Inaba Denki Sangyo Co., Ltd. 600 25,172Inabata & Co., Ltd. 1,800 23,039Inageya Co., Ltd. 1,600 19,855Information Services International-Dentsu Ltd. 600 19,129Itochu Enex Co., Ltd. 3,600 28,836Itoham Yonekyu Holdings, Inc. 4,300 29,295Iyo Bank Ltd. (The) 4,900 24,741JAC Recruitment Co., Ltd. 800 18,853Japan Aviation Electronics Industry Ltd. 1,700 24,946Japan Lifeline Co., Ltd. 1,200 19,413Japan Steel Works Ltd. (The) 1,500 25,046Japan Wool Textile Co., Ltd. (The) 2,984 23,293Joshin Denki Co., Ltd. 946 18,650Juroku Bank Ltd. (The) 1,100 22,400K�s Holdings Corp. 3,490 32,943Kaken Pharmaceutical Co., Ltd. 900 42,101Kandenko Co., Ltd. 2,878 24,041Kaneka Corp. 1,000 37,590Kanematsu Corp. 2,500 27,706Kanematsu Electronics Ltd. 900 24,902Kansai Mirai Financial Group, Inc. 6,500 41,628Kasai Kogyo Co., Ltd. 4,705 34,587Kato Sangyo Co., Ltd. 648 19,667Keiyo Bank Ltd. (The) 4,001 23,395Keiyo Co., Ltd. 6,400 27,503King Jim Co., Ltd. 5,500 41,605Kintetsu World Express, Inc. 1,700 22,169Kitz Corp. 2,700 18,895Kiyo Bank Ltd. (The) 1,400 17,828Kobe Steel Ltd. 6,000 39,261Koei Tecmo Holdings Co., Ltd. 2,360 43,919Kohnan Shoji Co., Ltd. 800 16,633Kokuyo Co., Ltd. 1,800 25,194KOMEDA Holdings Co., Ltd. 1,800 33,932
See Notes to Financial Statements.
46 WisdomTree Trust
Copyright © 2019 www.secdatabase.com. All Rights Reserved.Please Consider the Environment Before Printing This Document
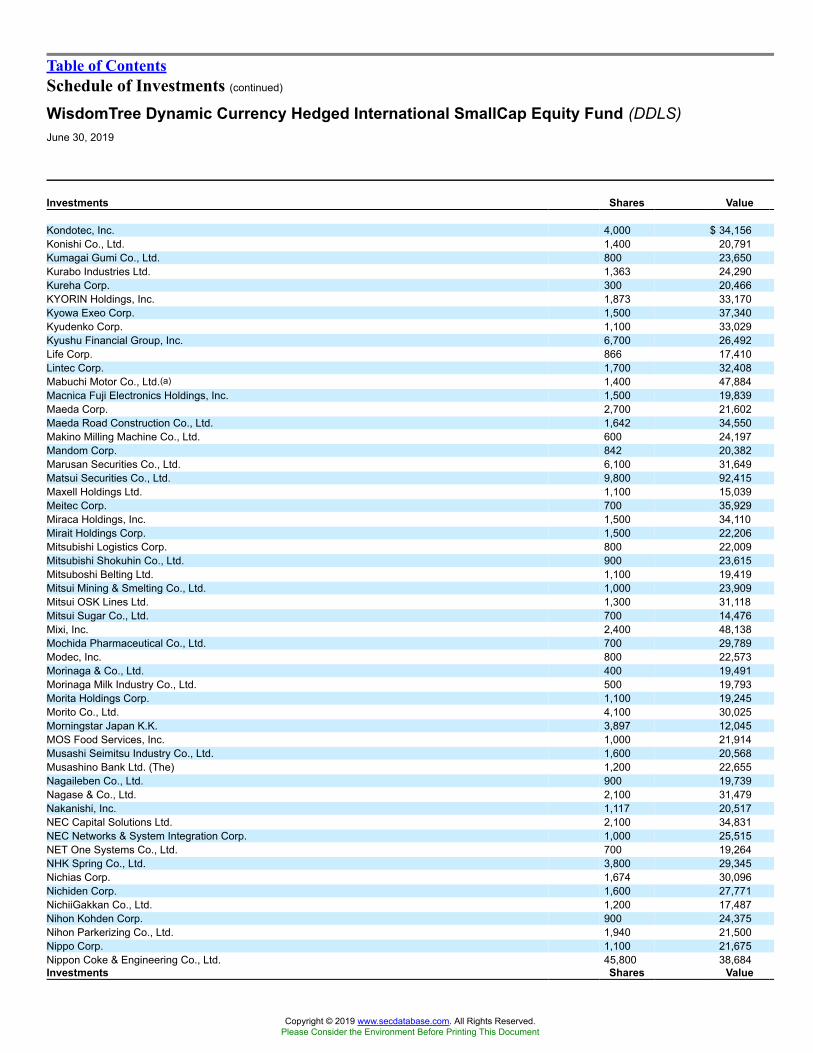
Table of ContentsSchedule of Investments (continued)
WisdomTree Dynamic Currency Hedged International SmallCap Equity Fund (DDLS)June 30, 2019
Investments Shares Value
Kondotec, Inc. 4,000 $ 34,156Konishi Co., Ltd. 1,400 20,791Kumagai Gumi Co., Ltd. 800 23,650Kurabo Industries Ltd. 1,363 24,290Kureha Corp. 300 20,466KYORIN Holdings, Inc. 1,873 33,170Kyowa Exeo Corp. 1,500 37,340Kyudenko Corp. 1,100 33,029Kyushu Financial Group, Inc. 6,700 26,492Life Corp. 866 17,410Lintec Corp. 1,700 32,408Mabuchi Motor Co., Ltd.(a) 1,400 47,884Macnica Fuji Electronics Holdings, Inc. 1,500 19,839Maeda Corp. 2,700 21,602Maeda Road Construction Co., Ltd. 1,642 34,550Makino Milling Machine Co., Ltd. 600 24,197Mandom Corp. 842 20,382Marusan Securities Co., Ltd. 6,100 31,649Matsui Securities Co., Ltd. 9,800 92,415Maxell Holdings Ltd. 1,100 15,039Meitec Corp. 700 35,929Miraca Holdings, Inc. 1,500 34,110Mirait Holdings Corp. 1,500 22,206Mitsubishi Logistics Corp. 800 22,009Mitsubishi Shokuhin Co., Ltd. 900 23,615Mitsuboshi Belting Ltd. 1,100 19,419Mitsui Mining & Smelting Co., Ltd. 1,000 23,909Mitsui OSK Lines Ltd. 1,300 31,118Mitsui Sugar Co., Ltd. 700 14,476Mixi, Inc. 2,400 48,138Mochida Pharmaceutical Co., Ltd. 700 29,789Modec, Inc. 800 22,573Morinaga & Co., Ltd. 400 19,491Morinaga Milk Industry Co., Ltd. 500 19,793Morita Holdings Corp. 1,100 19,245Morito Co., Ltd. 4,100 30,025Morningstar Japan K.K. 3,897 12,045MOS Food Services, Inc. 1,000 21,914Musashi Seimitsu Industry Co., Ltd. 1,600 20,568Musashino Bank Ltd. (The) 1,200 22,655Nagaileben Co., Ltd. 900 19,739Nagase & Co., Ltd. 2,100 31,479Nakanishi, Inc. 1,117 20,517NEC Capital Solutions Ltd. 2,100 34,831NEC Networks & System Integration Corp. 1,000 25,515NET One Systems Co., Ltd. 700 19,264NHK Spring Co., Ltd. 3,800 29,345Nichias Corp. 1,674 30,096Nichiden Corp. 1,600 27,771NichiiGakkan Co., Ltd. 1,200 17,487Nihon Kohden Corp. 900 24,375Nihon Parkerizing Co., Ltd. 1,940 21,500Nippo Corp. 1,100 21,675Nippon Coke & Engineering Co., Ltd. 45,800 38,684Investments Shares Value
Copyright © 2019 www.secdatabase.com. All Rights Reserved.Please Consider the Environment Before Printing This Document

Nippon Electric Glass Co., Ltd.(a) 1,900 $ 48,126Nippon Flour Mills Co., Ltd. 1,381 22,072Nippon Gas Co., Ltd. 700 17,796Nippon Kayaku Co., Ltd. 2,100 25,280Nippon Paper Industries Co., Ltd. 1,300 23,022Nippon Parking Development Co., Ltd. 16,091 25,390Nippon Sheet Glass Co., Ltd. 3,700 25,173Nippon Shokubai Co., Ltd. 500 33,043Nippon Signal Co., Ltd. 2,200 25,545Nippon Steel Trading Corp. 800 32,968Nipro Corp. 2,400 26,620Nishi-Nippon Financial Holdings, Inc. 3,600 25,896Nishimatsu Construction Co., Ltd. 1,450 27,953Nisshin Oillio Group Ltd. (The) 542 15,167Nisshinbo Holdings, Inc. 3,450 26,354Nissin Electric Co., Ltd. 1,800 19,647Nissin Kogyo Co., Ltd. 2,000 27,492Nitta Corp. 756 21,331Noevir Holdings Co., Ltd. 573 31,325NOK Corp. 2,800 41,945Nomura Co., Ltd. 1,558 19,450Noritz Corp. 1,800 21,535North Pacific Bank Ltd. 10,300 24,474NS United Kaiun Kaisha Ltd. 1,100 22,604NSD Co., Ltd. 900 26,021NTN Corp. 12,824 38,089NuFlare Technology, Inc. 300 18,461Obara Group, Inc. 627 21,212Ogaki Kyoritsu Bank Ltd. (The) 1,000 21,951Ohsho Food Service Corp. 472 27,644Oiles Corp. 1,400 20,492Okamoto Industries, Inc. 500 22,461Okamura Corp. 2,400 23,947Oki Electric Industry Co., Ltd. 2,100 26,216Okumura Corp. 1,090 33,335Open House Co., Ltd. 700 28,652OSG Corp. 1,400 27,600Outsourcing, Inc. 1,600 19,395PAL GROUP Holdings Co., Ltd. 545 16,465Paramount Bed Holdings Co., Ltd. 500 19,027Parco Co., Ltd. 1,900 19,081Penta-Ocean Construction Co., Ltd. 5,700 27,934Prima Meat Packers Ltd. 957 18,245Raito Kogyo Co., Ltd. 1,200 15,315Relia, Inc. 2,000 23,427Rengo Co., Ltd. 2,650 21,276Resorttrust, Inc. 1,800 27,550Restar Holdings Corp. 1,554 22,429Riso Kagaku Corp. 1,500 23,891Ryosan Co., Ltd. 1,400 32,694Sac�s Bar Holdings, Inc. 2,400 21,830San ju San Financial Group, Inc. 1,700 23,368San-In Godo Bank Ltd. (The) 3,900 24,977Sanwa Holdings Corp. 3,200 34,394
See Notes to Financial Statements.
WisdomTree Trust 47
Copyright © 2019 www.secdatabase.com. All Rights Reserved.Please Consider the Environment Before Printing This Document

Table of ContentsSchedule of Investments (continued)
WisdomTree Dynamic Currency Hedged International SmallCap Equity Fund (DDLS)June 30, 2019
Investments Shares Value
Sanyo Chemical Industries Ltd. 400 $ 21,088Sapporo Holdings Ltd. 1,100 23,166Sawai Pharmaceutical Co., Ltd. 700 37,813SCREEN Holdings Co., Ltd. 800 33,377Seika Corp. 2,700 32,679Seiko Holdings Corp. 1,100 22,380Seino Holdings Co., Ltd. 2,400 31,966Seiren Co., Ltd. 1,300 18,099Senko Group Holdings Co., Ltd. 2,880 22,748Senshu Ikeda Holdings, Inc. 12,300 22,719Seria Co., Ltd. 900 20,792Shikoku Bank Ltd. (The) 2,800 23,442Shikoku Chemicals Corp. 1,512 15,802Shikoku Electric Power Co., Inc. 3,400 31,431Shimachu Co., Ltd. 1,053 24,483Shinko Electric Industries Co., Ltd. 3,000 25,394Shinmaywa Industries Ltd. 1,800 22,888Ship Healthcare Holdings, Inc. 600 25,896SHO-BOND Holdings Co., Ltd. 600 21,162Showa Corp. 1,600 21,563SKY Perfect JSAT Holdings, Inc. 8,900 34,695Sotetsu Holdings, Inc. 1,100 30,313Space Co., Ltd. 2,500 27,195Sparx Group Co., Ltd. 9,700 20,437SRA Holdings 1,200 29,215Starts Corp., Inc. 1,000 23,575Sumitomo Bakelite Co., Ltd. 700 24,981Sumitomo Densetsu Co., Ltd. 1,000 15,872Sumitomo Forestry Co., Ltd.(a) 3,100 37,146Sumitomo Mitsui Construction Co., Ltd. 3,913 21,682Sumitomo Osaka Cement Co., Ltd. 600 23,835Sumitomo Seika Chemicals Co., Ltd. 625 19,056T-Gaia Corp. 1,800 34,032T. RAD Co., Ltd. 1,700 30,027Tachibana Eletech Co., Ltd. 2,000 31,168Tadano Ltd. 2,100 21,889Taikisha Ltd. 600 18,155Taiyo Holdings Co., Ltd. 700 21,116Takara Holdings, Inc. 2,000 20,921Takara Standard Co., Ltd. 1,300 20,573Takasago Thermal Engineering Co., Ltd. 1,500 24,726Takeuchi Manufacturing Co., Ltd. 1,453 25,961Tamron Co., Ltd. 1,000 20,466Tanseisha Co., Ltd. 1,700 19,739TechnoPro Holdings, Inc. 573 30,421Tekken Corp. 900 24,952THK Co., Ltd. 2,500 59,750Toagosei Co., Ltd. 2,400 25,216Tochigi Bank Ltd. (The) 13,900 22,319Toda Corp. 5,904 32,660Toho Bank Ltd. (The) 8,814 20,943Tokai Carbon Co., Ltd. 2,700 28,168TOKAI Holdings Corp. 2,500 21,139Tokai Rika Co., Ltd. 1,800 29,688Investments Shares Value
Copyright © 2019 www.secdatabase.com. All Rights Reserved.Please Consider the Environment Before Printing This Document
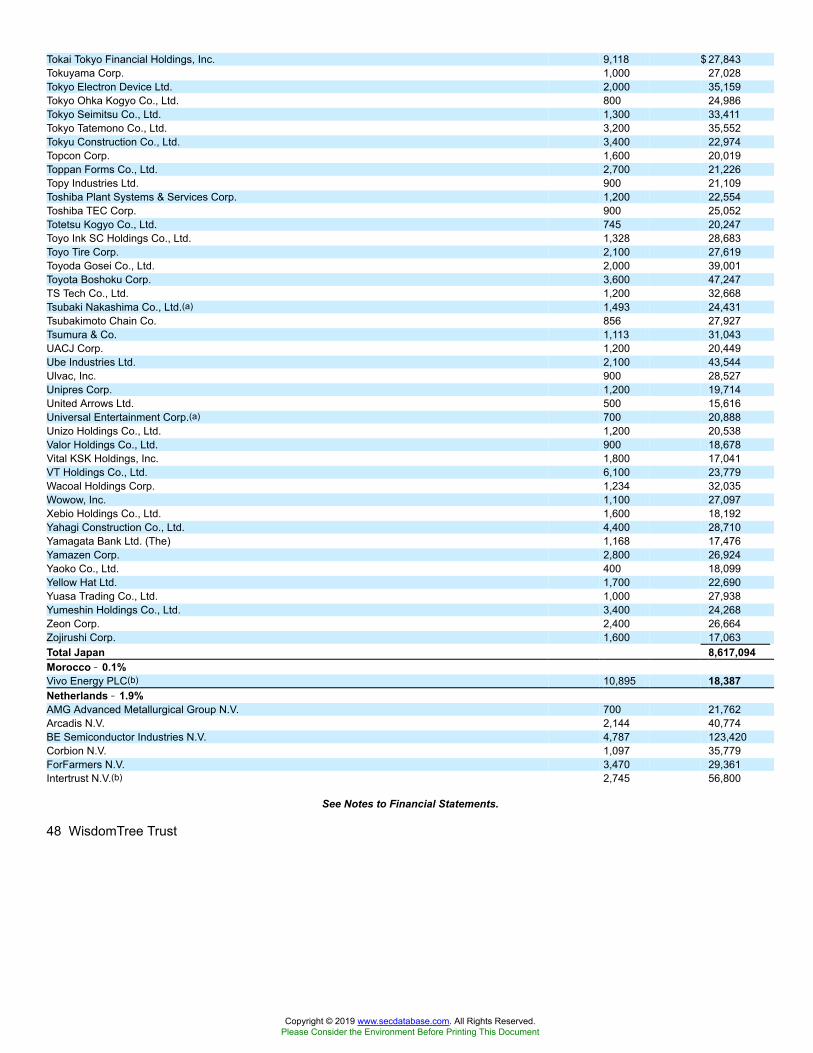
Tokai Tokyo Financial Holdings, Inc. 9,118 $ 27,843Tokuyama Corp. 1,000 27,028Tokyo Electron Device Ltd. 2,000 35,159Tokyo Ohka Kogyo Co., Ltd. 800 24,986Tokyo Seimitsu Co., Ltd. 1,300 33,411Tokyo Tatemono Co., Ltd. 3,200 35,552Tokyu Construction Co., Ltd. 3,400 22,974Topcon Corp. 1,600 20,019Toppan Forms Co., Ltd. 2,700 21,226Topy Industries Ltd. 900 21,109Toshiba Plant Systems & Services Corp. 1,200 22,554Toshiba TEC Corp. 900 25,052Totetsu Kogyo Co., Ltd. 745 20,247Toyo Ink SC Holdings Co., Ltd. 1,328 28,683Toyo Tire Corp. 2,100 27,619Toyoda Gosei Co., Ltd. 2,000 39,001Toyota Boshoku Corp. 3,600 47,247TS Tech Co., Ltd. 1,200 32,668Tsubaki Nakashima Co., Ltd.(a) 1,493 24,431Tsubakimoto Chain Co. 856 27,927Tsumura & Co. 1,113 31,043UACJ Corp. 1,200 20,449Ube Industries Ltd. 2,100 43,544Ulvac, Inc. 900 28,527Unipres Corp. 1,200 19,714United Arrows Ltd. 500 15,616Universal Entertainment Corp.(a) 700 20,888Unizo Holdings Co., Ltd. 1,200 20,538Valor Holdings Co., Ltd. 900 18,678Vital KSK Holdings, Inc. 1,800 17,041VT Holdings Co., Ltd. 6,100 23,779Wacoal Holdings Corp. 1,234 32,035Wowow, Inc. 1,100 27,097Xebio Holdings Co., Ltd. 1,600 18,192Yahagi Construction Co., Ltd. 4,400 28,710Yamagata Bank Ltd. (The) 1,168 17,476Yamazen Corp. 2,800 26,924Yaoko Co., Ltd. 400 18,099Yellow Hat Ltd. 1,700 22,690Yuasa Trading Co., Ltd. 1,000 27,938Yumeshin Holdings Co., Ltd. 3,400 24,268Zeon Corp. 2,400 26,664Zojirushi Corp. 1,600 17,063Total Japan 8,617,094Morocco �� 0.1%Vivo Energy PLC(b) 10,895 18,387Netherlands �� 1.9%AMG Advanced Metallurgical Group N.V. 700 21,762Arcadis N.V. 2,144 40,774BE Semiconductor Industries N.V. 4,787 123,420Corbion N.V. 1,097 35,779ForFarmers N.V. 3,470 29,361Intertrust N.V.(b) 2,745 56,800
See Notes to Financial Statements.
48 WisdomTree Trust
Copyright © 2019 www.secdatabase.com. All Rights Reserved.Please Consider the Environment Before Printing This Document

Table of ContentsSchedule of Investments (continued)
WisdomTree Dynamic Currency Hedged International SmallCap Equity Fund (DDLS)June 30, 2019
Investments Shares Value
Koninklijke BAM Groep N.V. 8,992 $40,018Koninklijke Volkerwessels N.V. 3,512 70,631PostNL N.V.(a) 45,830 79,513Sligro Food Group N.V. 1,257 46,881TKH Group N.V. CVA 847 52,617Van Lanschot Kempen N.V. 2,045 46,484Total Netherlands 644,040New Zealand �� 3.0%Air New Zealand Ltd. 78,435 139,604Chorus Ltd. 16,562 63,406EBOS Group Ltd. 3,826 59,489Freightways Ltd. 4,482 25,407Genesis Energy Ltd. 49,607 115,615Heartland Group Holdings Ltd. 26,000 28,814Infratil Ltd. 20,455 63,885Kathmandu Holdings Ltd. 13,336 19,706Kiwi Property Group Ltd. 50,145 53,888Mainfreight Ltd. 1,150 31,437Metlifecare Ltd. 6,631 19,552New Zealand Refining Co., Ltd. (The) 12,890 18,094NZX Ltd. 43,883 33,011Oceania Healthcare Ltd. 27,909 19,495Port of Tauranga Ltd. 8,238 35,080Skellerup Holdings Ltd. 14,688 23,676SKY Network Television Ltd. 37,221 29,499SKYCITY Entertainment Group Ltd. 34,679 88,277Summerset Group Holdings Ltd. 3,903 14,602Tourism Holdings Ltd. 9,281 23,563Trustpower Ltd. 4,919 24,448Z Energy Ltd. 23,398 99,320Total New Zealand 1,029,868Norway �� 3.5%ABG Sundal Collier Holding ASA* 84,540 37,084AF Gruppen ASA 1,359 26,778American Shipping Co. ASA* 6,478 26,707Atea ASA* 4,728 64,326Austevoll Seafood ASA 5,930 62,283B2Holding ASA 22,800 25,097Borregaard ASA 2,357 27,313DNO ASA 24,900 45,121Elkem ASA(b) 52,033 146,590Entra ASA(b) 4,823 74,104Europris ASA(b) 10,300 31,941Evry A/S(b) 12,200 49,939Fjordkraft Holding ASA(b) 5,500 28,706Grieg Seafood ASA 3,180 44,123Kongsberg Gruppen ASA 2,708 37,860Kvaerner ASA 21,688 34,875Norway Royal Salmon ASA 936 19,881Ocean Yield ASA 12,931 86,752Sbanken ASA(b) 2,370 20,236Selvaag Bolig ASA 6,400 33,028SpareBank 1 SMN 5,461 62,578Investments Shares Value
TGS Nopec Geophysical Co. ASA 2,900 $81,360
Copyright © 2019 www.secdatabase.com. All Rights Reserved.Please Consider the Environment Before Printing This Document

Veidekke ASA 5,902 57,317Wallenius Wilhelmsen ASA 7,115 21,096XXL ASA*(b) 10,718 35,877Total Norway 1,180,972Portugal �� 1.4%Altri, SGPS, S.A. 7,537 52,400Corticeira Amorim, SGPS, S.A. 2,200 25,504CTT-Correios de Portugal S.A. 8,535 20,567Mota-Engil, SGPS, S.A. 9,159 19,870Navigator Co. S.A. (The) 42,530 162,639REN � Redes Energeticas Nacionais, SGPS, S.A. 34,932 95,871Semapa-Sociedade de Investimento e Gestao 2,182 30,713Sonae, SGPS, S.A. 66,528 64,360Total Portugal 471,924Singapore �� 3.1%Accordia Golf Trust 93,000 36,431Asian Pay Television Trust 185,101 23,395Best World International Ltd.� 17,900 17,993Bukit Sembawang Estates Ltd. 7,600 32,412China Aviation Oil Singapore Corp., Ltd. 29,034 28,327Chip Eng Seng Corp., Ltd. 48,705 25,919First Resources Ltd. 29,627 34,818GuocoLand Ltd. 19,300 28,530Hi-P International Ltd. 24,000 24,657Hutchison Port Holdings Trust 483,900 111,297Japfa Ltd. 33,200 13,006Keppel Infrastructure Trust 188,191 70,244NetLink NBN Trust 176,900 116,369Oxley Holdings Ltd. 110,432 26,936Raffles Medical Group Ltd. 28,700 22,061Riverstone Holdings Ltd. 33,100 23,976SBS Transit Ltd. 8,218 24,965Sheng Siong Group Ltd. 47,800 38,863SIA Engineering Co., Ltd. 22,500 41,742Singapore Post Ltd. 51,000 35,811StarHub Ltd. 121,500 138,298Tuan Sing Holdings Ltd. 84,200 21,471UMS Holdings Ltd. 45,700 21,280United Engineers Ltd. 13,300 25,362Wing Tai Holdings Ltd. 9,900 15,147Yanlord Land Group Ltd. 74,409 70,947Total Singapore 1,070,257Spain �� 2.5%Acerinox S.A. 6,500 65,361Applus Services S.A. 1,891 25,734Atresmedia Corp. de Medios de Comunicacion S.A.(a) 17,747 87,066Bolsas y Mercados Espanoles SHMSF S.A. 4,524 110,870Construcciones y Auxiliar de Ferrocarriles S.A. 528 24,232Ence Energia y Celulosa S.A. 13,443 60,746Euskaltel S.A.(b) 5,377 49,905Faes Farma S.A. 8,876 41,898
See Notes to Financial Statements.
WisdomTree Trust 49
Copyright © 2019 www.secdatabase.com. All Rights Reserved.Please Consider the Environment Before Printing This Document

Table of ContentsSchedule of Investments (continued)
WisdomTree Dynamic Currency Hedged International SmallCap Equity Fund (DDLS)June 30, 2019
Investments Shares Value
Liberbank S.A. 49,900 $ 21,549Mediaset Espana Comunicacion S.A. 11,400 83,009Melia Hotels International S.A. 3,200 30,611Metrovacesa S.A.(b) 3,300 35,626Parques Reunidos Servicios Centrales SAU(b) 1,222 19,371Prosegur Cia de Seguridad S.A. 13,124 61,725Sacyr S.A. 20,208 49,063Unicaja Banco S.A.(b) 59,935 53,579Viscofan S.A. 900 47,208Total Spain 867,553Sweden �� 5.0%AddTech AB Class B 959 29,148AF Poyry AB Class B 2,163 49,003Ahlstrom-Munksjo Oyj(a) 3,078 50,756Atrium Ljungberg AB Class B 3,131 56,625Avanza Bank Holding AB 3,355 25,637Beijer Ref AB 1,346 32,496Betsson AB* 6,319 38,684Bilia AB Class A 4,431 40,116BillerudKorsnas AB 2,900 38,617Bonava AB Class B 3,378 42,452Bravida Holding AB(b) 4,116 36,510Clas Ohlson AB Class B(a) 3,324 33,085Cloetta AB Class B 7,968 25,935Coor Service Management Holding AB(b) 3,866 35,751Dios Fastigheter AB 4,694 34,756Dometic Group AB(b) 5,400 54,115Duni AB 1,303 17,779Dustin Group AB(b) 2,358 21,704Fagerhult AB(a) 4,557 30,206Granges AB 2,446 28,050Hemfosa Fastigheter AB 6,201 58,647Hexpol AB 7,600 61,967HIQ International AB* 4,717 26,640JM AB(a) 3,050 70,183KNOW IT AB 1,161 26,716Kungsleden AB 5,278 43,575Loomis AB Class B 1,827 62,855Mycronic AB 2,092 25,434NCC AB Class B 2,644 45,866NetEnt AB* 12,108 38,824Nobia AB 9,735 56,763Nobina AB(b) 5,339 33,145Nolato AB Class B 534 32,604Nordic Waterproofing Holding A/S(b) 2,836 25,645NP3 Fastigheter AB 3,226 28,024Peab AB 9,877 84,471Platzer Fastigheter Holding AB Class B 2,619 24,276Resurs Holding AB(b) 9,335 55,639Scandi Standard AB 3,004 20,721Scandic Hotels Group AB(b) 3,900 34,405SkiStar AB 2,330 28,679Thule Group AB(b) 2,434 60,180Investments Shares Value
Wihlborgs Fastigheter AB 3,577 $ 51,892
Copyright © 2019 www.secdatabase.com. All Rights Reserved.Please Consider the Environment Before Printing This Document
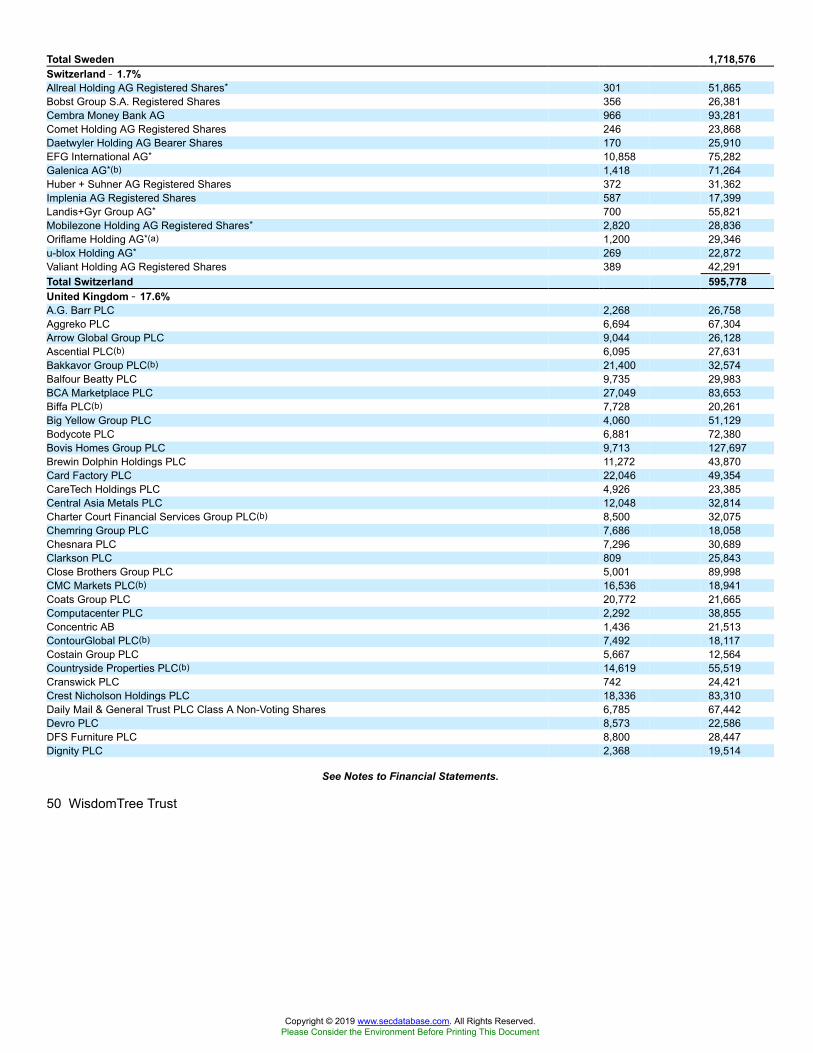
Total Sweden 1,718,576Switzerland �� 1.7%Allreal Holding AG Registered Shares* 301 51,865Bobst Group S.A. Registered Shares 356 26,381Cembra Money Bank AG 966 93,281Comet Holding AG Registered Shares 246 23,868Daetwyler Holding AG Bearer Shares 170 25,910EFG International AG* 10,858 75,282Galenica AG*(b) 1,418 71,264Huber + Suhner AG Registered Shares 372 31,362Implenia AG Registered Shares 587 17,399Landis+Gyr Group AG* 700 55,821Mobilezone Holding AG Registered Shares* 2,820 28,836Oriflame Holding AG*(a) 1,200 29,346u-blox Holding AG* 269 22,872Valiant Holding AG Registered Shares 389 42,291Total Switzerland 595,778United Kingdom �� 17.6%A.G. Barr PLC 2,268 26,758Aggreko PLC 6,694 67,304Arrow Global Group PLC 9,044 26,128Ascential PLC(b) 6,095 27,631Bakkavor Group PLC(b) 21,400 32,574Balfour Beatty PLC 9,735 29,983BCA Marketplace PLC 27,049 83,653Biffa PLC(b) 7,728 20,261Big Yellow Group PLC 4,060 51,129Bodycote PLC 6,881 72,380Bovis Homes Group PLC 9,713 127,697Brewin Dolphin Holdings PLC 11,272 43,870Card Factory PLC 22,046 49,354CareTech Holdings PLC 4,926 23,385Central Asia Metals PLC 12,048 32,814Charter Court Financial Services Group PLC(b) 8,500 32,075Chemring Group PLC 7,686 18,058Chesnara PLC 7,296 30,689Clarkson PLC 809 25,843Close Brothers Group PLC 5,001 89,998CMC Markets PLC(b) 16,536 18,941Coats Group PLC 20,772 21,665Computacenter PLC 2,292 38,855Concentric AB 1,436 21,513ContourGlobal PLC(b) 7,492 18,117Costain Group PLC 5,667 12,564Countryside Properties PLC(b) 14,619 55,519Cranswick PLC 742 24,421Crest Nicholson Holdings PLC 18,336 83,310Daily Mail & General Trust PLC Class A Non-Voting Shares 6,785 67,442Devro PLC 8,573 22,586DFS Furniture PLC 8,800 28,447Dignity PLC 2,368 19,514
See Notes to Financial Statements.
50 WisdomTree Trust
Copyright © 2019 www.secdatabase.com. All Rights Reserved.Please Consider the Environment Before Printing This Document

Table of ContentsSchedule of Investments (continued)
WisdomTree Dynamic Currency Hedged International SmallCap Equity Fund (DDLS)June 30, 2019
Investments Shares Value
Diploma PLC 1,595 $ 31,099Diversified Gas & Oil PLC 34,700 49,021Dixons Carphone PLC 68,919 96,002Domino�s Pizza Group PLC 14,147 50,054Drax Group PLC 14,674 48,594Dunelm Group PLC 4,406 51,589Elementis PLC 20,142 36,273Empiric Student Property PLC 21,536 24,887Equiniti Group PLC(b) 8,713 24,374Essentra PLC 9,466 51,683Euromoney Institutional Investor PLC 2,593 42,967FDM Group Holdings PLC 2,988 35,404Ferrexpo PLC 14,400 50,820First Derivatives PLC 221 9,999Forterra PLC(b) 7,202 27,131Galliford Try PLC 9,493 76,175Games Workshop Group PLC 635 40,133Genus PLC 748 25,208Go-Ahead Group PLC (The) 1,972 49,493Greene King PLC 12,957 101,911Halfords Group PLC 13,049 37,300Hammerson PLC 47,600 167,869Hastings Group Holdings PLC(b) 35,481 88,327Hays PLC 61,500 122,964Headlam Group PLC 5,190 31,706Helical PLC 4,714 22,108Hill & Smith Holdings PLC 1,664 24,799Hilton Food Group PLC 2,552 31,440Ibstock PLC(b) 19,539 60,428IntegraFin Holdings PLC 6,400 30,952International Personal Finance PLC 16,000 24,436iomart Group PLC 4,951 20,416J D Wetherspoon PLC 1,441 26,189James Fisher & Sons PLC 842 20,554John Laing Group PLC(b) 7,958 39,885Johnson Service Group PLC 11,552 21,906Jupiter Fund Management PLC 25,056 134,730Kcom Group PLC 20,452 29,153Keller Group PLC 3,759 29,374Kier Group PLC 30,841 41,724Liontrust Asset Management PLC 2,700 24,673Lookers PLC 28,479 18,449M&C Saatchi PLC(a) 3,713 16,539Marshalls PLC 3,610 31,357Marston�s PLC 40,090 59,543McCarthy & Stone PLC(b) 17,400 30,250MJ Gleeson PLC 2,774 25,702Moneysupermarket.com Group PLC 11,000 57,721Morgan Advanced Materials PLC 9,798 34,666Morgan Sindall Group PLC 1,810 28,518N Brown Group PLC 18,363 30,382National Express Group PLC 13,679 69,881Northgate PLC 5,643 24,957Numis Corp. PLC 7,416 25,531OneSavings Bank PLC 7,030 32,442Investments Shares Value
Copyright © 2019 www.secdatabase.com. All Rights Reserved.Please Consider the Environment Before Printing This Document

Pagegroup PLC 12,513 $ 81,697Paragon Banking Group PLC 8,052 44,967PayPoint PLC 3,253 40,159Pendragon PLC 101,301 20,989Pets at Home Group PLC 17,705 42,160Photo-Me International PLC 31,115 38,174Polar Capital Holdings PLC 5,087 38,845Polypipe Group PLC 2,744 15,520Premier Asset Management Group PLC 8,488 21,119Provident Financial PLC 4,600 24,150PZ Cussons PLC 13,375 36,428QinetiQ Group PLC 9,759 34,702Redde PLC 28,882 38,743Redrow PLC 13,835 95,787Renewi PLC 69,824 25,682Restaurant Group PLC (The) 16,434 27,567Royal Mail PLC 89,300 240,829RPS Group PLC 13,400 18,316RWS Holdings PLC 2,700 22,267Sabre Insurance Group PLC(b) 11,200 38,914Safestore Holdings PLC 4,139 32,317Saga PLC 103,924 52,615Savills PLC 3,663 41,817Senior PLC 11,056 30,365SIG PLC 14,276 23,565Soco International PLC 35,400 31,447Softcat PLC 4,737 58,570Sophos Group PLC(b) 4,100 20,596Spire Healthcare Group PLC(b) 12,722 19,381Spirent Communications PLC 13,415 26,088St. Modwen Properties PLC 4,871 27,153Stagecoach Group PLC 27,360 44,188SThree PLC 7,904 28,669Stock Spirits Group PLC 7,512 21,081Superdry PLC 4,584 26,895Synthomer PLC 8,790 41,772TalkTalk Telecom Group PLC(a) 23,386 33,186TBC Bank Group PLC 1,212 24,495Ted Baker PLC 2,659 27,377Telecom Plus PLC 2,419 43,409Telford Homes PLC 6,300 25,217TI Fluid Systems PLC(b) 17,972 45,014TP ICAP PLC 23,737 90,509Trifast PLC 4,840 14,106TT Electronics PLC 6,305 18,536Tyman PLC 10,300 31,723Ultra Electronics Holdings PLC 1,850 38,849Vesuvius PLC 7,534 52,545Victrex PLC 1,700 46,820Vitec Group PLC (The) 1,425 20,675Volution Group PLC 8,430 19,312WH Smith PLC 2,195 55,034William Hill PLC 56,950 112,018Wincanton PLC 5,831 19,740
See Notes to Financial Statements.
WisdomTree Trust 51
Copyright © 2019 www.secdatabase.com. All Rights Reserved.Please Consider the Environment Before Printing This Document
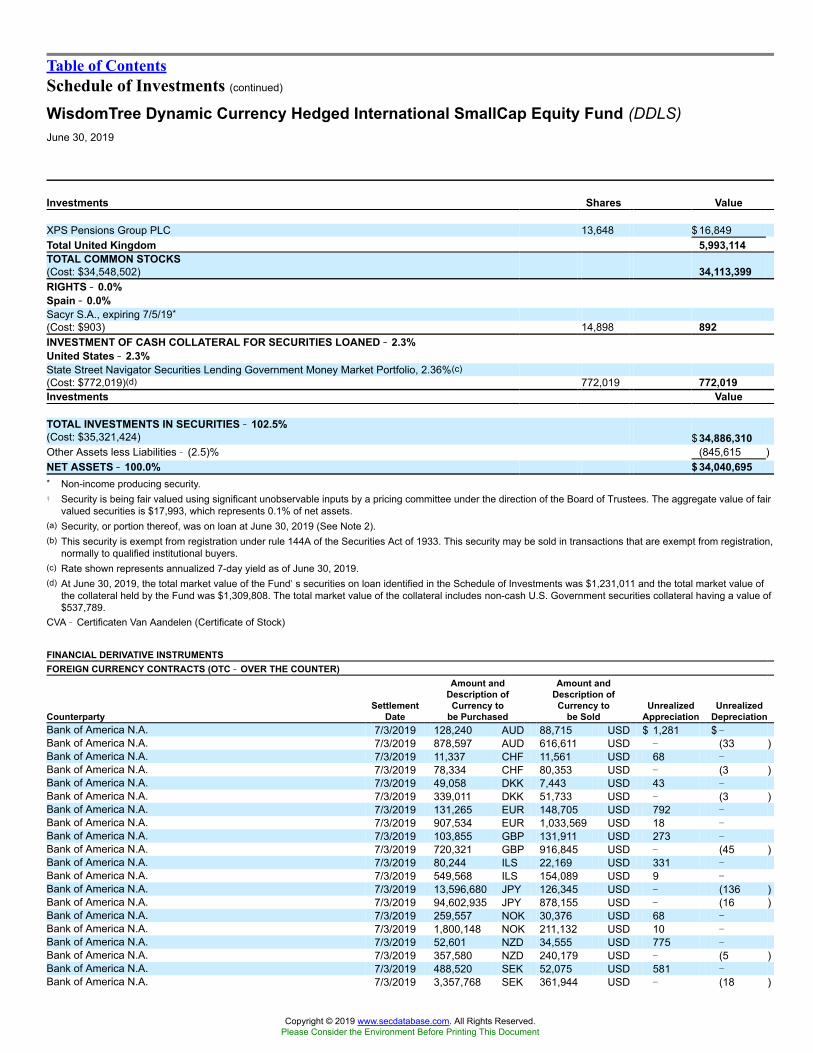
Table of ContentsSchedule of Investments (continued)
WisdomTree Dynamic Currency Hedged International SmallCap Equity Fund (DDLS)June 30, 2019
Investments Shares Value
XPS Pensions Group PLC 13,648 $ 16,849Total United Kingdom 5,993,114TOTAL COMMON STOCKS(Cost: $34,548,502) 34,113,399RIGHTS �� 0.0%Spain �� 0.0%Sacyr S.A., expiring 7/5/19*(Cost: $903) 14,898 892INVESTMENT OF CASH COLLATERAL FOR SECURITIES LOANED �� 2.3%United States �� 2.3%State Street Navigator Securities Lending Government Money Market Portfolio, 2.36%(c)(Cost: $772,019)(d) 772,019 772,019Investments Value
TOTAL INVESTMENTS IN SECURITIES �� 102.5%(Cost: $35,321,424) $ 34,886,310Other Assets less Liabilities � (2.5)% (845,615 )NET ASSETS �� 100.0% $ 34,040,695* Non-income producing security.� Security is being fair valued using significant unobservable inputs by a pricing committee under the direction of the Board of Trustees. The aggregate value of fair
valued securities is $17,993, which represents 0.1% of net assets.(a) Security, or portion thereof, was on loan at June 30, 2019 (See Note 2).(b) This security is exempt from registration under rule 144A of the Securities Act of 1933. This security may be sold in transactions that are exempt from registration,
normally to qualified institutional buyers.(c) Rate shown represents annualized 7-day yield as of June 30, 2019.(d) At June 30, 2019, the total market value of the Fund�s securities on loan identified in the Schedule of Investments was $1,231,011 and the total market value of
the collateral held by the Fund was $1,309,808. The total market value of the collateral includes non-cash U.S. Government securities collateral having a value of$537,789.
CVA � Certificaten Van Aandelen (Certificate of Stock)
FINANCIAL DERIVATIVE INSTRUMENTSFOREIGN CURRENCY CONTRACTS (OTC �� OVER THE COUNTER)
CounterpartySettlement
Date
Amount andDescription of
Currency tobe Purchased
Amount andDescription of
Currency tobe Sold
UnrealizedAppreciation
UnrealizedDepreciation
Bank of America N.A. 7/3/2019 128,240 AUD 88,715 USD $ 1,281 $ �Bank of America N.A. 7/3/2019 878,597 AUD 616,611 USD � (33 )Bank of America N.A. 7/3/2019 11,337 CHF 11,561 USD 68 �Bank of America N.A. 7/3/2019 78,334 CHF 80,353 USD � (3 )Bank of America N.A. 7/3/2019 49,058 DKK 7,443 USD 43 �Bank of America N.A. 7/3/2019 339,011 DKK 51,733 USD � (3 )Bank of America N.A. 7/3/2019 131,265 EUR 148,705 USD 792 �Bank of America N.A. 7/3/2019 907,534 EUR 1,033,569 USD 18 �Bank of America N.A. 7/3/2019 103,855 GBP 131,911 USD 273 �Bank of America N.A. 7/3/2019 720,321 GBP 916,845 USD � (45 )Bank of America N.A. 7/3/2019 80,244 ILS 22,169 USD 331 �Bank of America N.A. 7/3/2019 549,568 ILS 154,089 USD 9 �Bank of America N.A. 7/3/2019 13,596,680 JPY 126,345 USD � (136 )Bank of America N.A. 7/3/2019 94,602,935 JPY 878,155 USD � (16 )Bank of America N.A. 7/3/2019 259,557 NOK 30,376 USD 68 �Bank of America N.A. 7/3/2019 1,800,148 NOK 211,132 USD 10 �Bank of America N.A. 7/3/2019 52,601 NZD 34,555 USD 775 �Bank of America N.A. 7/3/2019 357,580 NZD 240,179 USD � (5 )Bank of America N.A. 7/3/2019 488,520 SEK 52,075 USD 581 �Bank of America N.A. 7/3/2019 3,357,768 SEK 361,944 USD � (18 )
Copyright © 2019 www.secdatabase.com. All Rights Reserved.Please Consider the Environment Before Printing This Document
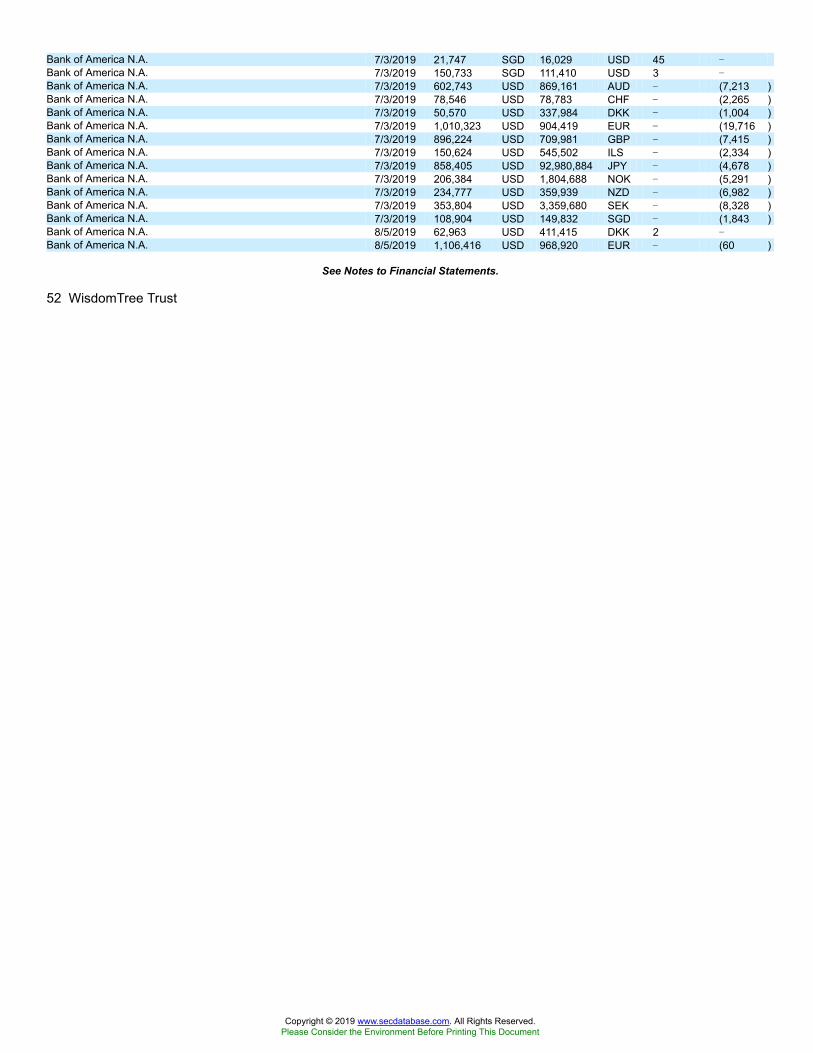
Bank of America N.A. 7/3/2019 21,747 SGD 16,029 USD 45 �Bank of America N.A. 7/3/2019 150,733 SGD 111,410 USD 3 �Bank of America N.A. 7/3/2019 602,743 USD 869,161 AUD � (7,213 )Bank of America N.A. 7/3/2019 78,546 USD 78,783 CHF � (2,265 )Bank of America N.A. 7/3/2019 50,570 USD 337,984 DKK � (1,004 )Bank of America N.A. 7/3/2019 1,010,323 USD 904,419 EUR � (19,716 )Bank of America N.A. 7/3/2019 896,224 USD 709,981 GBP � (7,415 )Bank of America N.A. 7/3/2019 150,624 USD 545,502 ILS � (2,334 )Bank of America N.A. 7/3/2019 858,405 USD 92,980,884 JPY � (4,678 )Bank of America N.A. 7/3/2019 206,384 USD 1,804,688 NOK � (5,291 )Bank of America N.A. 7/3/2019 234,777 USD 359,939 NZD � (6,982 )Bank of America N.A. 7/3/2019 353,804 USD 3,359,680 SEK � (8,328 )Bank of America N.A. 7/3/2019 108,904 USD 149,832 SGD � (1,843 )Bank of America N.A. 8/5/2019 62,963 USD 411,415 DKK 2 �Bank of America N.A. 8/5/2019 1,106,416 USD 968,920 EUR � (60 )
See Notes to Financial Statements.
52 WisdomTree Trust
Copyright © 2019 www.secdatabase.com. All Rights Reserved.Please Consider the Environment Before Printing This Document

Table of ContentsSchedule of Investments (continued)
WisdomTree Dynamic Currency Hedged International SmallCap Equity Fund (DDLS)June 30, 2019
FINANCIAL DERIVATIVE INSTRUMENTSFOREIGN CURRENCY CONTRACTS (OTC �� OVER THE COUNTER)
CounterpartySettlement
Date
Amount andDescription of
Currency tobe Purchased
Amount andDescription of
Currency tobe Sold
UnrealizedAppreciation
UnrealizedDepreciation
Bank of America N.A. 8/5/2019 1,059,884 USD 831,381 GBP $ 12 $ �Bank of America N.A. 8/5/2019 81,531 USD 290,216 ILS � (10 )Bank of America N.A. 8/5/2019 905,474 USD 97,309,660 JPY � (69 )Bank of America N.A. 8/5/2019 243,865 USD 2,077,024 NOK � (19 )Bank of America N.A. 8/5/2019 176,926 USD 263,224 NZD � (4 )Bank of America N.A. 8/5/2019 313,943 USD 2,905,278 SEK 11 �Bank of America N.A. 8/5/2019 96,969 USD 131,128 SGD � (8 )Bank of America N.A. 8/6/2019 607,038 USD 864,021 AUD � (19 )Bank of America N.A. 8/6/2019 76,722 USD 74,558 CHF 2 �Barclays Bank PLC 7/3/2019 878,617 AUD 616,611 USD � (19 )Barclays Bank PLC 7/3/2019 78,335 CHF 80,353 USD � (2 )Barclays Bank PLC 7/3/2019 339,017 DKK 51,733 USD � (2 )Barclays Bank PLC 7/3/2019 907,533 EUR 1,033,569 USD 16 �Barclays Bank PLC 7/3/2019 720,343 GBP 916,845 USD � (17 )Barclays Bank PLC 7/3/2019 549,537 ILS 154,089 USD 1 �Barclays Bank PLC 7/3/2019 94,601,706 JPY 878,155 USD � (27 )Barclays Bank PLC 7/3/2019 1,800,073 NOK 211,132 USD 1 �Barclays Bank PLC 7/3/2019 357,578 NZD 240,179 USD � (6 )Barclays Bank PLC 7/3/2019 3,357,865 SEK 361,944 USD � (7 )Barclays Bank PLC 7/3/2019 150,719 SGD 111,410 USD � (8 )Barclays Bank PLC 8/5/2019 62,963 USD 411,432 DKK � (0 )*Barclays Bank PLC 8/5/2019 1,106,416 USD 968,891 EUR � (26 )Barclays Bank PLC 8/5/2019 1,059,884 USD 831,391 GBP � (1 )Barclays Bank PLC 8/5/2019 81,531 USD 290,210 ILS � (8 )Barclays Bank PLC 8/5/2019 905,474 USD 97,306,039 JPY � (36 )Barclays Bank PLC 8/5/2019 243,865 USD 2,076,985 NOK � (15 )Barclays Bank PLC 8/5/2019 176,926 USD 263,224 NZD � (3 )Barclays Bank PLC 8/5/2019 313,943 USD 2,905,379 SEK � (0 )*Barclays Bank PLC 8/5/2019 96,969 USD 131,126 SGD � (7 )Barclays Bank PLC 8/6/2019 607,038 USD 864,003 AUD � (6 )Barclays Bank PLC 8/6/2019 76,722 USD 74,559 CHF 1 �Canadian Imperial Bank of Commerce 7/3/2019 128,239 AUD 88,715 USD 1,280 �Canadian Imperial Bank of Commerce 7/3/2019 11,337 CHF 11,561 USD 68 �Canadian Imperial Bank of Commerce 7/3/2019 49,060 DKK 7,443 USD 43 �Canadian Imperial Bank of Commerce 7/3/2019 131,264 EUR 148,705 USD 791 �Canadian Imperial Bank of Commerce 7/3/2019 103,855 GBP 131,911 USD 273 �Canadian Imperial Bank of Commerce 7/3/2019 80,263 ILS 22,169 USD 337 �Canadian Imperial Bank of Commerce 7/3/2019 13,596,970 JPY 126,345 USD � (133 )Canadian Imperial Bank of Commerce 7/3/2019 259,390 NOK 30,376 USD 48 �Canadian Imperial Bank of Commerce 7/3/2019 52,601 NZD 34,555 USD 775 �Canadian Imperial Bank of Commerce 7/3/2019 488,533 SEK 52,075 USD 583 �Canadian Imperial Bank of Commerce 7/3/2019 21,744 SGD 16,029 USD 43 �Canadian Imperial Bank of Commerce 7/3/2019 602,743 USD 869,220 AUD � (7,254 )Canadian Imperial Bank of Commerce 7/3/2019 78,546 USD 78,793 CHF � (2,276 )Canadian Imperial Bank of Commerce 7/3/2019 50,570 USD 338,063 DKK � (1,016 )Canadian Imperial Bank of Commerce 7/3/2019 1,010,323 USD 904,489 EUR � (19,796 )Canadian Imperial Bank of Commerce 7/3/2019 896,224 USD 710,032 GBP � (7,481 )Canadian Imperial Bank of Commerce 7/3/2019 150,624 USD 545,545 ILS � (2,346 )Canadian Imperial Bank of Commerce 7/3/2019 858,405 USD 92,987,751 JPY � (4,741 )Canadian Imperial Bank of Commerce 7/3/2019 206,384 USD 1,804,735 NOK � (5,296 )Canadian Imperial Bank of Commerce 7/3/2019 234,777 USD 359,960 NZD � (6,996 )Canadian Imperial Bank of Commerce 7/3/2019 353,804 USD 3,360,041 SEK � (8,367 )Canadian Imperial Bank of Commerce 7/3/2019 108,904 USD 149,852 SGD � (1,858 )Citibank N.A. 7/3/2019 878,621 AUD 616,611 USD � (16 )Citibank N.A. 7/3/2019 78,335 CHF 80,353 USD � (1 )
See Notes to Financial Statements.
Copyright © 2019 www.secdatabase.com. All Rights Reserved.Please Consider the Environment Before Printing This Document

WisdomTree Trust 53
Copyright © 2019 www.secdatabase.com. All Rights Reserved.Please Consider the Environment Before Printing This Document

Table of ContentsSchedule of Investments (continued)
WisdomTree Dynamic Currency Hedged International SmallCap Equity Fund (DDLS)June 30, 2019
FINANCIAL DERIVATIVE INSTRUMENTSFOREIGN CURRENCY CONTRACTS (OTC �� OVER THE COUNTER)
CounterpartySettlement
Date
Amount andDescription of
Currency tobe Purchased
Amount andDescription of
Currency tobe Sold
UnrealizedAppreciation
UnrealizedDepreciation
Citibank N.A. 7/3/2019 339,022 DKK 51,733 USD $ � $ (1 )Citibank N.A. 7/3/2019 907,608 EUR 1,033,569 USD 103 �Citibank N.A. 7/3/2019 720,344 GBP 916,845 USD � (16 )Citibank N.A. 7/3/2019 549,546 ILS 154,089 USD 3 �Citibank N.A. 7/3/2019 94,601,530 JPY 878,155 USD � (29 )Citibank N.A. 7/3/2019 1,800,023 NOK 211,132 USD � (4 )Citibank N.A. 7/3/2019 357,580 NZD 240,179 USD � (5 )Citibank N.A. 7/3/2019 49,900 NZD 33,511 USD 5 �Citibank N.A. 7/3/2019 3,357,874 SEK 361,944 USD � (6 )Citibank N.A. 7/3/2019 150,732 SGD 111,410 USD 2 �Citibank N.A. 7/3/2019 602,743 USD 869,220 AUD � (7,254 )Citibank N.A. 7/3/2019 78,546 USD 78,784 CHF � (2,265 )Citibank N.A. 7/3/2019 50,570 USD 337,986 DKK � (1,004 )Citibank N.A. 7/3/2019 1,010,323 USD 904,410 EUR � (19,706 )Citibank N.A. 7/3/2019 896,224 USD 709,982 GBP � (7,417 )Citibank N.A. 7/3/2019 150,624 USD 545,517 ILS � (2,339 )Citibank N.A. 7/3/2019 858,405 USD 92,980,626 JPY � (4,675 )Citibank N.A. 7/3/2019 206,384 USD 1,804,629 NOK � (5,284 )Citibank N.A. 7/3/2019 234,777 USD 359,938 NZD � (6,981 )Citibank N.A. 7/3/2019 353,804 USD 3,359,672 SEK � (8,328 )Citibank N.A. 7/3/2019 108,904 USD 149,838 SGD � (1,847 )Citibank N.A. 8/5/2019 62,963 USD 411,436 DKK � (1 )Citibank N.A. 8/5/2019 1,106,416 USD 968,991 EUR � (140 )Citibank N.A. 8/5/2019 1,059,884 USD 831,383 GBP 9 �Citibank N.A. 8/5/2019 81,531 USD 290,205 ILS � (7 )Citibank N.A. 8/5/2019 905,474 USD 97,303,503 JPY � (12 )Citibank N.A. 8/5/2019 243,865 USD 2,076,894 NOK � (4 )Citibank N.A. 8/5/2019 176,926 USD 263,226 NZD � (5 )Citibank N.A. 8/5/2019 313,943 USD 2,905,398 SEK � (2 )Citibank N.A. 8/5/2019 96,969 USD 131,119 SGD � (1 )Citibank N.A. 8/6/2019 607,038 USD 864,004 AUD � (7 )Citibank N.A. 8/6/2019 76,722 USD 74,559 CHF 0 * �Goldman Sachs 7/3/2019 120,721 AUD 83,498 USD 1,221 �Goldman Sachs 7/3/2019 10,674 CHF 10,881 USD 68 �Goldman Sachs 7/3/2019 46,178 DKK 7,006 USD 40 �Goldman Sachs 7/3/2019 123,562 EUR 139,960 USD 764 �Goldman Sachs 7/3/2019 97,784 GBP 124,154 USD 302 �Goldman Sachs 7/3/2019 75,659 ILS 20,867 USD 348 �Goldman Sachs 7/3/2019 12,799,486 JPY 118,914 USD � (104 )Goldman Sachs 7/3/2019 244,347 NOK 28,592 USD 68 �Goldman Sachs 7/3/2019 49,549 NZD 32,525 USD 755 �Goldman Sachs 7/3/2019 460,037 SEK 49,012 USD 574 �Goldman Sachs 7/3/2019 20,470 SGD 15,087 USD 43 �Goldman Sachs 7/3/2019 260,928 USD 377,007 AUD � (3,646 )Goldman Sachs 7/3/2019 34,003 USD 33,365 CHF � (221 )Goldman Sachs 7/3/2019 21,892 USD 144,643 DKK � (179 )Goldman Sachs 7/3/2019 437,370 USD 387,068 EUR � (3,460 )Goldman Sachs 7/3/2019 387,976 USD 305,337 GBP � (646 )Goldman Sachs 7/3/2019 65,205 USD 233,526 ILS � (275 )Goldman Sachs 7/3/2019 371,604 USD 39,928,255 JPY 975 �Goldman Sachs 7/3/2019 89,344 USD 766,073 NOK � (510 )Goldman Sachs 7/3/2019 101,635 USD 154,530 NZD � (2,158 )Goldman Sachs 7/3/2019 153,162 USD 1,441,833 SEK � (2,250 )Goldman Sachs 7/3/2019 47,145 USD 63,906 SGD � (91 )Societe Generale 7/3/2019 602,743 USD 869,182 AUD � (7,228 )
See Notes to Financial Statements.
Copyright © 2019 www.secdatabase.com. All Rights Reserved.Please Consider the Environment Before Printing This Document

54 WisdomTree Trust
Copyright © 2019 www.secdatabase.com. All Rights Reserved.Please Consider the Environment Before Printing This Document

Table of ContentsSchedule of Investments (continued)
WisdomTree Dynamic Currency Hedged International SmallCap Equity Fund (DDLS)June 30, 2019
FINANCIAL DERIVATIVE INSTRUMENTSFOREIGN CURRENCY CONTRACTS (OTC �� OVER THE COUNTER)
CounterpartySettlement
Date
Amount andDescription of
Currency tobe Purchased
Amount andDescription of
Currency tobe Sold
UnrealizedAppreciation
UnrealizedDepreciation
Societe Generale 7/3/2019 78,546 USD 78,788 CHF $ � $ (2,270 )Societe Generale 7/3/2019 50,570 USD 338,000 DKK � (1,006 )Societe Generale 7/3/2019 1,010,323 USD 904,408 EUR � (19,703 )Societe Generale 7/3/2019 896,224 USD 710,409 GBP � (7,961 )Societe Generale 7/3/2019 150,624 USD 545,507 ILS � (2,336 )Societe Generale 7/3/2019 858,405 USD 92,983,288 JPY � (4,700 )Societe Generale 7/3/2019 206,384 USD 1,804,673 NOK � (5,289 )Societe Generale 7/3/2019 234,777 USD 359,949 NZD � (6,989 )Societe Generale 7/3/2019 353,804 USD 3,359,723 SEK � (8,333 )Societe Generale 7/3/2019 108,904 USD 149,830 SGD � (1,842 )State Street Bank and Trust 7/3/2019 669,432 AUD 469,799 USD � (8 )State Street Bank and Trust 7/3/2019 59,689 CHF 61,226 USD � (1 )State Street Bank and Trust 7/3/2019 258,324 DKK 39,419 USD � (1 )State Street Bank and Trust 7/3/2019 691,455 EUR 787,484 USD 11 �State Street Bank and Trust 7/3/2019 548,851 GBP 698,550 USD 9 �State Street Bank and Trust 7/3/2019 418,694 ILS 117,405 USD � (4 )State Street Bank and Trust 7/3/2019 72,078,056 JPY 669,072 USD � (17 )State Street Bank and Trust 7/3/2019 1,371,521 NOK 160,866 USD 2 �State Street Bank and Trust 7/3/2019 272,442 NZD 182,997 USD � (7 )State Street Bank and Trust 7/3/2019 2,558,408 SEK 275,770 USD � (5 )State Street Bank and Trust 7/3/2019 114,845 SGD 84,886 USD 1 �State Street Bank and Trust 8/5/2019 47,976 USD 313,498 DKK � (0 )*State Street Bank and Trust 8/5/2019 842,985 USD 738,197 EUR � (12 )State Street Bank and Trust 8/5/2019 807,534 USD 633,459 GBP � (21 )State Street Bank and Trust 8/5/2019 62,123 USD 221,105 ILS � (0 )*State Street Bank and Trust 8/5/2019 689,885 USD 74,137,042 JPY � (19 )State Street Bank and Trust 8/5/2019 185,802 USD 1,582,459 NOK � (10 )State Street Bank and Trust 8/5/2019 134,804 USD 200,556 NZD � (2 )State Street Bank and Trust 8/5/2019 239,195 USD 2,213,615 SEK 1 �State Street Bank and Trust 8/5/2019 73,882 USD 99,900 SGD � (0 )*State Street Bank and Trust 8/6/2019 462,507 USD 658,283 AUD 1 �State Street Bank and Trust 8/6/2019 58,455 USD 56,807 CHF 0 * �UBS AG 7/3/2019 878,621 AUD 616,611 USD � (16 )UBS AG 7/3/2019 78,335 CHF 80,353 USD � (2 )UBS AG 7/3/2019 339,020 DKK 51,733 USD � (1 )UBS AG 7/3/2019 907,533 EUR 1,033,569 USD 17 �UBS AG 7/3/2019 720,323 GBP 916,845 USD � (43 )UBS AG 7/3/2019 549,543 ILS 154,089 USD 3 �UBS AG 7/3/2019 94,604,691 JPY 878,155 USD 0 * �UBS AG 7/3/2019 1,800,086 NOK 211,132 USD 3 �UBS AG 7/3/2019 357,577 NZD 240,179 USD � (7 )UBS AG 7/3/2019 3,357,841 SEK 361,944 USD � (10 )UBS AG 7/3/2019 150,730 SGD 111,410 USD 1 �UBS AG 7/3/2019 459,233 USD 662,221 AUD � (5,498 )UBS AG 7/3/2019 66,038 USD 94,929 AUD � (581 )UBS AG 7/3/2019 59,848 USD 60,028 CHF � (1,726 )UBS AG 7/3/2019 8,606 USD 8,359 CHF 32 �UBS AG 7/3/2019 38,530 USD 257,515 DKK � (765 )UBS AG 7/3/2019 5,541 USD 36,301 DKK 2 �UBS AG 7/3/2019 769,774 USD 689,075 EUR � (15,011 )UBS AG 7/3/2019 110,694 USD 97,127 EUR 77 �UBS AG 7/3/2019 682,841 USD 540,933 GBP � (5,640 )UBS AG 7/3/2019 98,193 USD 77,136 GBP 17 �UBS AG 7/3/2019 114,762 USD 415,644 ILS � (1,784 )UBS AG 7/3/2019 16,503 USD 59,415 ILS � (157 )
See Notes to Financial Statements.
Copyright © 2019 www.secdatabase.com. All Rights Reserved.Please Consider the Environment Before Printing This Document

WisdomTree Trust 55
Copyright © 2019 www.secdatabase.com. All Rights Reserved.Please Consider the Environment Before Printing This Document

Table of ContentsSchedule of Investments (concluded)
WisdomTree Dynamic Currency Hedged International SmallCap Equity Fund (DDLS)June 30, 2019
FINANCIAL DERIVATIVE INSTRUMENTSFOREIGN CURRENCY CONTRACTS (OTC �� OVER THE COUNTER)
CounterpartySettlement
Date
Amount andDescription of
Currency tobe Purchased
Amount andDescription of
Currency tobe Sold
UnrealizedAppreciation
UnrealizedDepreciation
UBS AG 7/3/2019 654,023 USD 70,841,678 JPY $ � $(3,555 )UBS AG 7/3/2019 94,049 USD 10,091,589 JPY 375 �UBS AG 7/3/2019 157,246 USD 1,374,984 NOK � (4,028 )UBS AG 7/3/2019 22,612 USD 191,977 NOK 95 �UBS AG 7/3/2019 178,882 USD 274,246 NZD � (5,319 )UBS AG 7/3/2019 25,723 USD 38,890 NZD � (398 )UBS AG 7/3/2019 269,566 USD 2,559,769 SEK � (6,346 )UBS AG 7/3/2019 38,764 USD 360,547 SEK � (99 )UBS AG 7/3/2019 82,978 USD 114,167 SGD � (1,408 )UBS AG 7/3/2019 11,932 USD 16,153 SGD � (8 )UBS AG 8/5/2019 62,963 USD 411,433 DKK � (0 )*UBS AG 8/5/2019 1,106,416 USD 968,911 EUR � (49 )UBS AG 8/5/2019 1,059,884 USD 831,395 GBP � (6 )UBS AG 8/5/2019 81,531 USD 290,199 ILS � (5 )UBS AG 8/5/2019 905,474 USD 97,306,039 JPY � (36 )UBS AG 8/5/2019 243,865 USD 2,076,962 NOK � (12 )UBS AG 8/5/2019 176,926 USD 263,223 NZD � (3 )UBS AG 8/5/2019 313,943 USD 2,905,578 SEK � (22 )UBS AG 8/5/2019 96,969 USD 131,143 SGD � (20 )UBS AG 8/6/2019 607,038 USD 864,008 AUD � (9 )UBS AG 8/6/2019 76,722 USD 74,560 CHF � (0 )*
$ 14,511 $(336,492 )* Amount represents less than $1.
CURRENCY LEGENDAUD Australian dollarCHF Swiss francDKK Danish kroneEUR EuroGBP British poundILS Israeli new shekelJPY Japanese yenNOK Norwegian kroneNZD New Zealand dollarSEK Swedish kronaSGD Singapore dollarUSD U.S. dollar
See Notes to Financial Statements.
56 WisdomTree Trust
Copyright © 2019 www.secdatabase.com. All Rights Reserved.Please Consider the Environment Before Printing This Document

Table of ContentsSchedule of InvestmentsWisdomTree Emerging Markets Dividend Fund (DVEM)
June 30, 2019
Investments Shares ValueCOMMON STOCKS �� 99.2%Brazil �� 4.2%AES Tiete Energia S.A. 4,828 $14,827Alupar Investimento S.A. 2,315 15,614Ambev S.A. 48,745 227,531B3 S.A. � Brasil Bolsa Balcao 16,360 159,901Banco Bradesco S.A. 9,567 83,497Banco do Brasil S.A. 9,777 137,600Banco Santander Brasil S.A. 3,363 39,889BB Seguridade Participacoes S.A. 9,565 80,809CCR S.A. 24,755 88,230Cia de Saneamento Basico do Estado de Sao Paulo 4,585 56,549Cia de Saneamento de Minas Gerais-COPASA 1,868 32,675Cia de Saneamento do Parana 1,868 39,274Cia Hering 3,192 24,769Cielo S.A. 36,795 64,515Cosan S.A. 1,876 22,589EcoRodovias Infraestrutura e Logistica S.A. 5,601 15,724EDP � Energias do Brasil S.A. 5,065 24,977Energisa S.A. 2,401 28,867Engie Brasil Energia S.A. 6,034 68,438Equatorial Energia S.A. 1,601 38,347Estacio Participacoes S.A. 2,173 16,442Ez Tec Empreendimentos e Participacoes S.A. 4,202 28,179Fleury S.A. 3,468 19,319Grendene S.A. 6,773 13,784Hypera S.A. 6,269 49,054IRB Brasil Resseguros S.A. 933 23,978Itau Unibanco Holding S.A. 4,722 38,354Kroton Educacional S.A. 20,002 57,251Localiza Rent a Car S.A. 2,533 27,084Lojas Renner S.A. 3,875 47,685MRV Engenharia e Participacoes S.A. 6,842 34,936Multiplan Empreendimentos Imobiliarios S.A. 3,043 22,040Natura Cosmeticos S.A. 1,228 18,100Odontoprev S.A. 4,634 22,078Petrobras Distribuidora S.A. 4,936 32,197Petroleo Brasileiro S.A. 4,136 32,396Qualicorp Consultoria e Corretora de Seguros S.A. 7,575 45,399Raia Drogasil S.A. 1,070 21,246Sao Martinho S.A. 2,000 10,510SLC Agricola S.A. 1,866 8,603Smiles Fidelidade S.A. 1,669 18,290Sul America S.A. 1,821 17,827Suzano S.A. 1,733 14,854TIM Participacoes S.A. 9,120 27,674TOTVS S.A. 1,740 19,962Transmissora Alianca de Energia Eletrica S.A. 12,169 86,235Tupy S.A. 2,000 10,901Ultrapar Participacoes S.A. 10,334 54,196WEG S.A. 3,787 21,106Total Brazil 2,104,302Investments Shares ValueChile �� 1.1%AES Gener S.A. 74,593 $20,464Aguas Andinas S.A. Class A 60,879 35,867AntarChile S.A. 1,324 15,951
Copyright © 2019 www.secdatabase.com. All Rights Reserved.Please Consider the Environment Before Printing This Document

Banco de Chile 138,368 20,359Banco de Credito e Inversiones S.A. 507 34,910Banco Santander Chile 653,532 48,610Cencosud S.A. 15,455 30,275Cia Cervecerias Unidas S.A. 1,278 17,976Colbun S.A. 194,190 40,042Empresa Nacional de Telecomunicaciones S.A. 1,258 12,785Empresas CMPC S.A. 7,789 21,338Empresas COPEC S.A. 1,645 17,987Enel Americas S.A. 431,977 76,037Enel Chile S.A. 421,381 39,969Engie Energia Chile S.A. 7,488 13,775Grupo Security S.A. 21,891 8,938Inversiones Aguas Metropolitanas S.A. 13,159 20,351Parque Arauco S.A. 7,407 20,520S.A.C.I. Falabella 5,871 38,263Sociedad Matriz SAAM S.A. 161,063 15,320SONDA S.A. 10,016 13,934Vina Concha y Toro S.A. 6,511 13,761Total Chile 577,432China �� 27.7%AAC Technologies Holdings, Inc. 8,000 45,414Agile Group Holdings Ltd. 42,000 56,233Agricultural Bank of China Ltd. Class A 98,000 51,366Agricultural Bank of China Ltd. Class H 386,000 161,564Air China Ltd. Class H 18,000 18,156Aisino Corp. Class A 2,900 9,732Angang Steel Co., Ltd. Class H(a) 28,600 13,032Anhui Conch Cement Co., Ltd. Class A 6,500 39,275Anhui Conch Cement Co., Ltd. Class H 14,500 90,851Anhui Expressway Co., Ltd. Class H 26,000 16,008ANTA Sports Products Ltd. 13,000 89,274Anxin Trust Co., Ltd. Class A* 12,600 9,264Bank of Beijing Co., Ltd. Class A 33,900 29,170Bank of China Ltd. Class A 81,400 44,325Bank of China Ltd. Class H 1,082,000 457,037Bank of Communications Co., Ltd. Class A 64,600 57,562Bank of Communications Co., Ltd. Class H 299,000 226,953Bank of Jiangsu Co., Ltd. Class A 16,400 17,335Bank of Nanjing Co., Ltd. Class A 15,800 19,001Bank of Ningbo Co., Ltd. Class A 4,600 16,235Bank of Shanghai Co., Ltd. Class A 10,900 18,806Baoshan Iron & Steel Co., Ltd. Class A 45,100 42,682Beijing Capital International Airport Co., Ltd. Class H 22,000 19,290Beijing Enterprises Holdings Ltd. 5,500 27,949Beijing Enterprises Water Group Ltd.* 130,000 77,210Beijing Jingneng Clean Energy Co., Ltd. Class H 66,000 11,405BOE Technology Group Co., Ltd. Class A 42,000 21,036
See Notes to Financial Statements.
WisdomTree Trust 57
Copyright © 2019 www.secdatabase.com. All Rights Reserved.Please Consider the Environment Before Printing This Document
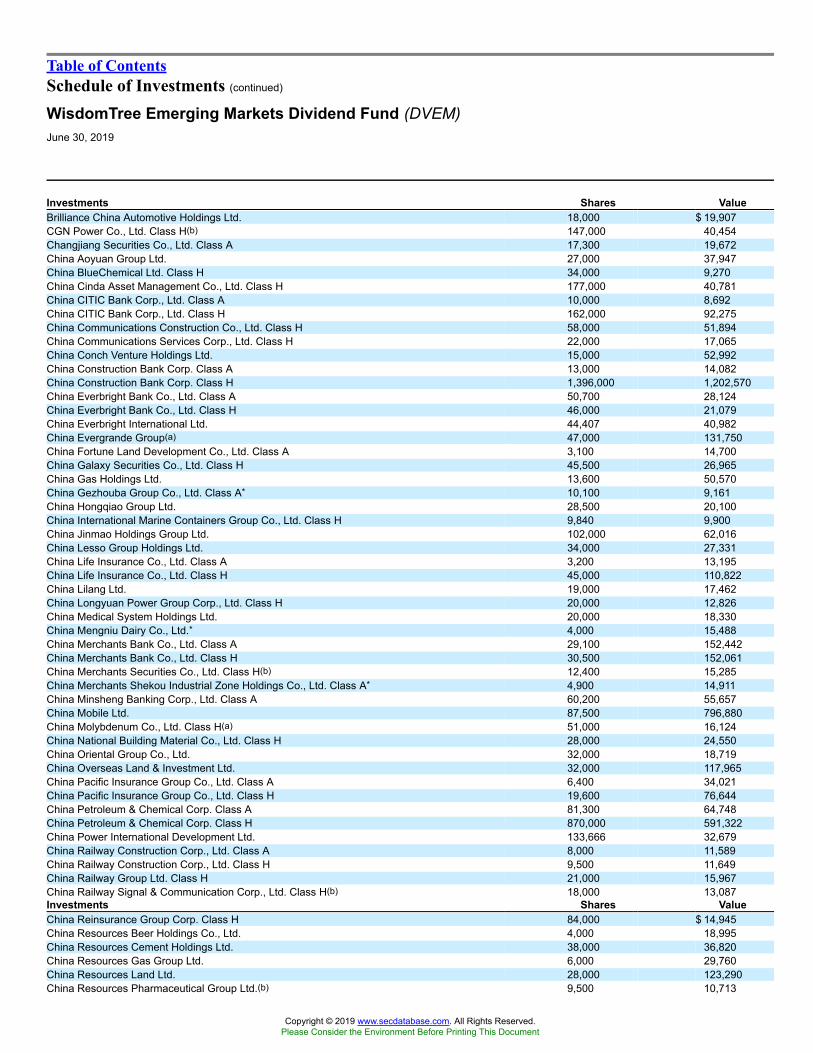
Table of ContentsSchedule of Investments (continued)
WisdomTree Emerging Markets Dividend Fund (DVEM)June 30, 2019
Investments Shares ValueBrilliance China Automotive Holdings Ltd. 18,000 $ 19,907CGN Power Co., Ltd. Class H(b) 147,000 40,454Changjiang Securities Co., Ltd. Class A 17,300 19,672China Aoyuan Group Ltd. 27,000 37,947China BlueChemical Ltd. Class H 34,000 9,270China Cinda Asset Management Co., Ltd. Class H 177,000 40,781China CITIC Bank Corp., Ltd. Class A 10,000 8,692China CITIC Bank Corp., Ltd. Class H 162,000 92,275China Communications Construction Co., Ltd. Class H 58,000 51,894China Communications Services Corp., Ltd. Class H 22,000 17,065China Conch Venture Holdings Ltd. 15,000 52,992China Construction Bank Corp. Class A 13,000 14,082China Construction Bank Corp. Class H 1,396,000 1,202,570China Everbright Bank Co., Ltd. Class A 50,700 28,124China Everbright Bank Co., Ltd. Class H 46,000 21,079China Everbright International Ltd. 44,407 40,982China Evergrande Group(a) 47,000 131,750China Fortune Land Development Co., Ltd. Class A 3,100 14,700China Galaxy Securities Co., Ltd. Class H 45,500 26,965China Gas Holdings Ltd. 13,600 50,570China Gezhouba Group Co., Ltd. Class A* 10,100 9,161China Hongqiao Group Ltd. 28,500 20,100China International Marine Containers Group Co., Ltd. Class H 9,840 9,900China Jinmao Holdings Group Ltd. 102,000 62,016China Lesso Group Holdings Ltd. 34,000 27,331China Life Insurance Co., Ltd. Class A 3,200 13,195China Life Insurance Co., Ltd. Class H 45,000 110,822China Lilang Ltd. 19,000 17,462China Longyuan Power Group Corp., Ltd. Class H 20,000 12,826China Medical System Holdings Ltd. 20,000 18,330China Mengniu Dairy Co., Ltd.* 4,000 15,488China Merchants Bank Co., Ltd. Class A 29,100 152,442China Merchants Bank Co., Ltd. Class H 30,500 152,061China Merchants Securities Co., Ltd. Class H(b) 12,400 15,285China Merchants Shekou Industrial Zone Holdings Co., Ltd. Class A* 4,900 14,911China Minsheng Banking Corp., Ltd. Class A 60,200 55,657China Mobile Ltd. 87,500 796,880China Molybdenum Co., Ltd. Class H(a) 51,000 16,124China National Building Material Co., Ltd. Class H 28,000 24,550China Oriental Group Co., Ltd. 32,000 18,719China Overseas Land & Investment Ltd. 32,000 117,965China Pacific Insurance Group Co., Ltd. Class A 6,400 34,021China Pacific Insurance Group Co., Ltd. Class H 19,600 76,644China Petroleum & Chemical Corp. Class A 81,300 64,748China Petroleum & Chemical Corp. Class H 870,000 591,322China Power International Development Ltd. 133,666 32,679China Railway Construction Corp., Ltd. Class A 8,000 11,589China Railway Construction Corp., Ltd. Class H 9,500 11,649China Railway Group Ltd. Class H 21,000 15,967China Railway Signal & Communication Corp., Ltd. Class H(b) 18,000 13,087Investments Shares ValueChina Reinsurance Group Corp. Class H 84,000 $ 14,945China Resources Beer Holdings Co., Ltd. 4,000 18,995China Resources Cement Holdings Ltd. 38,000 36,820China Resources Gas Group Ltd. 6,000 29,760China Resources Land Ltd. 28,000 123,290China Resources Pharmaceutical Group Ltd.(b) 9,500 10,713
Copyright © 2019 www.secdatabase.com. All Rights Reserved.Please Consider the Environment Before Printing This Document

China Resources Power Holdings Co., Ltd. 40,000 58,368China Sanjiang Fine Chemicals Co., Ltd. 64,000 13,681China SCE Group Holdings Ltd. 45,000 21,658China Shenhua Energy Co., Ltd. Class A 8,100 24,035China Shenhua Energy Co., Ltd. Class H 69,000 144,492China South City Holdings Ltd. 104,000 15,309China Southern Airlines Co., Ltd. Class H 22,000 15,319China State Construction Engineering Corp., Ltd. Class A 52,300 43,784China State Construction International Holdings Ltd. 30,000 30,797China Suntien Green Energy Corp., Ltd. Class H 49,000 12,920China Telecom Corp., Ltd. Class H 148,000 74,450China Unicom Hong Kong Ltd. 20,000 21,939China Vanke Co., Ltd. Class A 14,700 59,521China Vanke Co., Ltd. Class H 14,900 55,881China Yangtze Power Co., Ltd. Class A* 31,200 81,313China Yongda Automobiles Services Holdings Ltd. 30,000 27,456China ZhengTong Auto Services Holdings Ltd. 24,500 10,161China Zhongwang Holdings Ltd. 51,200 25,821Chongqing Rural Commercial Bank Co., Ltd. Class H 34,000 18,496CIFI Holdings Group Co., Ltd. 68,000 44,826CITIC Ltd. 81,000 116,744CITIC Securities Co., Ltd. Class A 13,800 47,840CITIC Securities Co., Ltd. Class H* 18,500 38,551CITIC Telecom International Holdings Ltd. 53,000 21,030CNOOC Ltd. 241,000 412,129Country Garden Holdings Co., Ltd. 101,000 153,585CRRC Corp., Ltd. Class A 17,200 20,259CRRC Corp., Ltd. Class H 34,000 28,419CSPC Pharmaceutical Group Ltd. 22,000 35,482Dah Chong Hong Holdings Ltd. 49,000 16,370Dali Foods Group Co., Ltd.(b) 29,000 19,265Daqin Railway Co., Ltd. Class A 31,800 37,456Datang International Power Generation Co., Ltd. Class H 54,000 13,548Dongfeng Motor Group Co., Ltd. Class H 52,000 42,598Dongyue Group Ltd. 30,000 18,432ENN Energy Holdings Ltd. 4,900 47,667Fangda Carbon New Material Co., Ltd. Class A* 14,602 26,129Fangda Special Steel Technology Co., Ltd. Class A 6,300 8,971Fosun International Ltd. 29,000 38,531Fufeng Group Ltd.* 32,000 17,490Future Land Development Holdings Ltd. 22,000 28,948Fuyao Glass Industry Group Co., Ltd. Class A 3,500 11,583Fuyao Glass Industry Group Co., Ltd. Class H(b) 6,000 18,624GD Power Development Co., Ltd. Class A 44,200 16,346Geely Automobile Holdings Ltd. 45,000 76,954Gemdale Corp. Class A 10,700 18,586
See Notes to Financial Statements.
58 WisdomTree Trust
Copyright © 2019 www.secdatabase.com. All Rights Reserved.Please Consider the Environment Before Printing This Document

Table of ContentsSchedule of Investments (continued)
WisdomTree Emerging Markets Dividend Fund (DVEM)June 30, 2019
Investments Shares ValueGF Securities Co., Ltd. Class A 6,400 $ 12,803Golden Eagle Retail Group Ltd. 13,000 15,142Great Wall Motor Co., Ltd. Class H(a) 50,000 35,776Greatview Aseptic Packaging Co., Ltd. 21,000 11,988Greenland Holdings Group Co., Ltd. Class A 11,100 11,038Guangdong Investment Ltd. 36,000 71,240Guangzhou Automobile Group Co., Ltd. Class H 69,200 73,872Guangzhou R&F Properties Co., Ltd. Class H 25,600 49,218Guotai Junan Securities Co., Ltd. Class A 8,200 21,908Guotai Junan Securities Co., Ltd. Class H(b) 4,200 7,483Haier Electronics Group Co., Ltd.* 10,000 27,648Haier Smart Home Co., Ltd. Class A 7,900 19,887Haitian International Holdings Ltd. 12,000 24,914Haitong Securities Co., Ltd. Class A 16,500 34,089Haitong Securities Co., Ltd. Class H 27,200 30,499Hangzhou Hikvision Digital Technology Co., Ltd. Class A 6,300 25,298Harbin Pharmaceutical Group Co., Ltd. Class A* 26,000 15,672Henan Shuanghui Investment & Development Co., Ltd. Class A 3,600 13,046Hengan International Group Co., Ltd. 10,000 73,536Hisense Home Appliances Group Co., Ltd. Class H 13,000 15,775HLA Corp., Ltd. Class A 7,500 9,904Hopson Development Holdings Ltd. 20,000 21,632Huabao International Holdings Ltd. 35,000 14,784Huadian Fuxin Energy Corp., Ltd. Class H 58,000 10,616Huaneng Power International, Inc. Class H 38,000 22,374Huaneng Renewables Corp., Ltd. Class H 52,000 14,310Huaxia Bank Co., Ltd. Class A 8,200 9,193Huayu Automotive Systems Co., Ltd. Class A 6,800 21,385Industrial & Commercial Bank of China Ltd. Class A 61,200 52,483Industrial & Commercial Bank of China Ltd. Class H 989,000 721,574Industrial Bank Co., Ltd. Class A 41,600 110,779Inner Mongolia Yili Industrial Group Co., Ltd. Class A 12,200 59,345Jiangsu Expressway Co., Ltd. Class H 24,000 34,161Jiangsu Yanghe Brewery Joint-Stock Co., Ltd. Class A 1,400 24,778Jiangxi Copper Co., Ltd. Class H 17,000 22,630Jiayuan International Group Ltd.(a) 4,000 1,761Jinke Properties Group Co., Ltd. Class A 14,600 12,818JNBY Design Ltd. 7,000 12,831Kingboard Holdings Ltd. 16,500 45,936Kingboard Laminates Holdings Ltd. 38,500 35,284Kunlun Energy Co., Ltd. 34,000 29,637Kweichow Moutai Co., Ltd. Class A 600 85,960KWG Group Holdings Ltd.* 32,500 32,989Lee & Man Paper Manufacturing Ltd. 33,000 23,105Lenovo Group Ltd. 126,000 97,574Livzon Pharmaceutical Group, Inc. Class H 4,300 14,310Logan Property Holdings Co., Ltd. 20,000 32,358Longfor Group Holdings Ltd. 18,500 69,738Lonking Holdings Ltd. 47,000 12,513Luye Pharma Group Ltd.(a)(b) 15,500 11,229Luzhou Laojiao Co., Ltd. Class A 2,100 24,714Maanshan Iron & Steel Co., Ltd. Class H(a) 34,000 13,491Investments Shares ValueMetallurgical Corp. of China Ltd. Class H 49,000 $ 13,108MGM China Holdings Ltd. 6,000 10,199Minth Group Ltd. 8,000 21,555NARI Technology Co., Ltd. Class A 3,600 9,770
Copyright © 2019 www.secdatabase.com. All Rights Reserved.Please Consider the Environment Before Printing This Document

New China Life Insurance Co., Ltd. Class H 4,400 21,402Nine Dragons Paper Holdings Ltd. 31,000 27,498Orient Securities Co., Ltd. Class H(b) 18,000 11,750People�s Insurance Co. Group of China Ltd. (The) Class H 29,000 11,322PetroChina Co., Ltd. Class A 26,900 26,946PetroChina Co., Ltd. Class H 214,000 118,060PICC Property & Casualty Co., Ltd. Class H 54,000 58,268Ping An Bank Co., Ltd. Class A 8,100 16,251Ping An Insurance Group Co. of China Ltd. Class A 16,200 209,001Ping An Insurance Group Co. of China Ltd. Class H 30,000 360,192Poly Developments and Holdings Group Co., Ltd. Class A 17,100 31,769Postal Savings Bank of China Co., Ltd. Class H(b) 68,000 40,387Powerlong Real Estate Holdings Ltd. 45,000 22,464Red Star Macalline Group Corp., Ltd. Class H(b) 15,800 13,833SAIC Motor Corp., Ltd. Class A 19,700 73,140Sansteel Minguang Co., Ltd. Fujian Class A 6,900 9,343Sany Heavy Industry Co., Ltd. Class A 11,100 21,139Shaanxi Coal Industry Co., Ltd. Class A 16,100 21,660Shandong Buchang Pharmaceuticals Co., Ltd. Class A 3,000 11,256Shandong Chenming Paper Holdings Ltd. Class H 23,500 10,317Shandong Weigao Group Medical Polymer Co., Ltd. Class H 8,000 7,250Shanghai Electric Group Co., Ltd. Class H 42,000 15,214Shanghai Fosun Pharmaceutical Group Co., Ltd. Class H 2,500 7,568Shanghai Industrial Holdings Ltd. 15,000 32,525Shanghai International Port Group Co., Ltd. Class A 21,100 20,952Shanghai Oriental Pearl Group Co., Ltd. Class A 6,700 10,282Shanghai Pharmaceuticals Holding Co., Ltd. Class H 9,400 18,481Shanghai Pudong Development Bank Co., Ltd. Class A 12,600 21,427Shenzhen Expressway Co., Ltd. Class H 10,000 12,019Shenzhen International Holdings Ltd. 11,245 22,310Shenzhen Investment Ltd. 72,000 26,542Shenzhen Overseas Chinese Town Co., Ltd. Class A 16,200 16,393Shenzhen Zhongjin Lingnan Nonfemet Co., Ltd. Class A 18,900 12,906Shenzhou International Group Holdings Ltd. 4,800 65,987Shimao Property Holdings Ltd. 20,000 60,928Shougang Fushan Resources Group Ltd. 134,000 29,158Shui On Land Ltd. 77,500 17,955Sichuan Expressway Co., Ltd. Class H 30,000 9,216Sihuan Pharmaceutical Holdings Group Ltd. 46,000 10,363Sino Biopharmaceutical Ltd. 28,000 28,636Sino-Ocean Group Holding Ltd. 79,500 33,784Sinopec Engineering Group Co., Ltd. Class H 16,000 13,558Sinopec Kantons Holdings Ltd. 24,000 10,045
See Notes to Financial Statements.
WisdomTree Trust 59
Copyright © 2019 www.secdatabase.com. All Rights Reserved.Please Consider the Environment Before Printing This Document

Table of ContentsSchedule of Investments (continued)
WisdomTree Emerging Markets Dividend Fund (DVEM)June 30, 2019
Investments Shares ValueSinopec Shanghai Petrochemical Co., Ltd. Class H 106,000 $ 42,061Sinopharm Group Co., Ltd. Class H 8,400 29,568Sinotruk Hong Kong Ltd. 13,500 23,363SITC International Holdings Co., Ltd. 31,000 31,585SSY Group Ltd. 10,000 9,037Sun Art Retail Group Ltd. 15,000 14,208Sunac China Holdings Ltd. 16,000 78,643Sunny Optical Technology Group Co., Ltd. 2,800 28,923TBEA Co., Ltd. Class A 13,100 13,828TCL Corp. Class A 39,800 19,296TCL Electronics Holdings Ltd. 28,000 13,512Tencent Holdings Ltd. 6,200 279,823Tianneng Power International Ltd. 22,000 17,713Tingyi Cayman Islands Holding Corp. 8,000 13,353Tong Ren Tang Technologies Co., Ltd. Class H 13,000 15,492TravelSky Technology Ltd. Class H 10,000 20,096Tsingtao Brewery Co., Ltd. Class H 2,000 12,736Uni-President China Holdings Ltd. 13,000 14,477Want Want China Holdings Ltd. 65,000 52,832Weichai Power Co., Ltd. Class A 17,700 31,672Weichai Power Co., Ltd. Class H 43,000 72,653Weifu High-Technology Group Co., Ltd. Class A 3,400 9,188Wens Foodstuffs Group Co., Ltd. Class A 5,900 30,804WH Group Ltd.(b) 158,000 160,174Wuliangye Yibin Co., Ltd. Class A 3,500 60,106Xinyi Glass Holdings Ltd. 58,000 60,877Xinyi Solar Holdings Ltd. 78,000 38,438XTEP International Holdings Ltd. 29,500 17,785Yanzhou Coal Mining Co., Ltd. Class H 38,000 35,507Yonghui Superstores Co., Ltd. Class A 8,200 12,190Yuexiu Property Co., Ltd. 154,000 34,890Yuzhou Properties Co., Ltd. 50,000 23,488Zhejiang Chint Electrics Co., Ltd. Class A 3,400 11,430Zhejiang Zheneng Electric Power Co., Ltd. Class A 17,900 11,519Zhengzhou Yutong Bus Co., Ltd. Class A 5,400 10,237Zhongsheng Group Holdings Ltd. 6,000 16,704Zhuzhou CRRC Times Electric Co., Ltd. Class H 3,000 15,802Zijin Mining Group Co., Ltd. Class A 28,800 15,808Zijin Mining Group Co., Ltd. Class H 70,000 28,403Zoomlion Heavy Industry Science and Technology Co., Ltd. Class A 26,600 23,276Zoomlion Heavy Industry Science and Technology Co., Ltd. Class H 42,600 27,973Total China 13,957,781Czech Republic �� 0.4%CEZ AS 3,277 79,201Komercni Banka AS 1,193 47,575Moneta Money Bank AS(b) 10,255 35,158O2 Czech Republic AS 2,506 24,844Total Czech Republic 186,778Hong Kong �� 0.2%China Water Affairs Group Ltd. 10,000 9,843Chow Tai Fook Jewellery Group Ltd. 34,400 37,427Investments Shares ValueCP Pokphand Co., Ltd. 122,000 $ 10,463Stella International Holdings Ltd. 20,000 33,792United Energy Group Ltd.* 74,000 14,492Total Hong Kong 106,017
Copyright © 2019 www.secdatabase.com. All Rights Reserved.Please Consider the Environment Before Printing This Document

Hungary �� 0.3%Magyar Telekom Telecommunications PLC 9,076 13,481MOL Hungarian Oil & Gas PLC 5,326 59,229OTP Bank Nyrt 1,468 58,526Richter Gedeon Nyrt 772 14,259Total Hungary 145,495India �� 5.4%Adani Ports & Special Economic Zone Ltd. 3,873 23,016Amara Raja Batteries Ltd. 1,262 11,334Ambuja Cements Ltd. 4,468 13,777Apollo Tyres Ltd. 3,362 9,773Ashok Leyland Ltd. 11,972 15,133Asian Paints Ltd. 1,291 25,401Bajaj Auto Ltd. 684 28,014Bharat Heavy Electricals Ltd. 13,867 14,695Bharat Petroleum Corp., Ltd. 23,148 131,606Bharti Airtel Ltd. 12,429 62,417Bharti Infratel Ltd. 18,826 72,833Cadila Healthcare Ltd. 1,817 6,362Care Ratings Ltd. 1,017 13,889Castrol India Ltd. 7,170 13,768Coal India Ltd. 33,438 122,945Cummins India Ltd. 1,066 11,799Dr. Reddy�s Laboratories Ltd. 422 15,592Eicher Motors Ltd. 45 12,477GAIL India Ltd. 5,678 25,660Godrej Consumer Products Ltd. 2,201 21,144Grasim Industries Ltd. 1,426 18,884HCL Technologies Ltd. 2,028 31,279HEG Ltd. 172 3,659Hero MotoCorp Ltd. 1,264 47,271Hindustan Petroleum Corp., Ltd. 20,132 84,594Hindustan Unilever Ltd. 3,924 101,620ICICI Bank Ltd. ADR 3,375 42,491IDFC Bank Ltd. 20,891 13,090Indian Oil Corp., Ltd. 74,644 168,585Infosys Ltd. ADR 34,769 372,028InterGlobe Aviation Ltd.(b) 642 14,490IRB Infrastructure Developers Ltd. 5,500 7,641ITC Ltd. 22,652 89,866JSW Steel Ltd. 4,912 19,683Karnataka Bank Ltd. (The) 9,862 14,844Larsen & Toubro Ltd. GDR Reg S 1,940 43,359Lupin Ltd. 1,136 12,421Mahindra & Mahindra Ltd. GDR 3,775 35,108Marico Ltd. 4,271 22,927Maruti Suzuki India Ltd. 606 57,368Motherson Sumi Systems Ltd. 6,715 11,863National Aluminium Co., Ltd. 20,044 14,345
See Notes to Financial Statements.
60 WisdomTree Trust
Copyright © 2019 www.secdatabase.com. All Rights Reserved.Please Consider the Environment Before Printing This Document
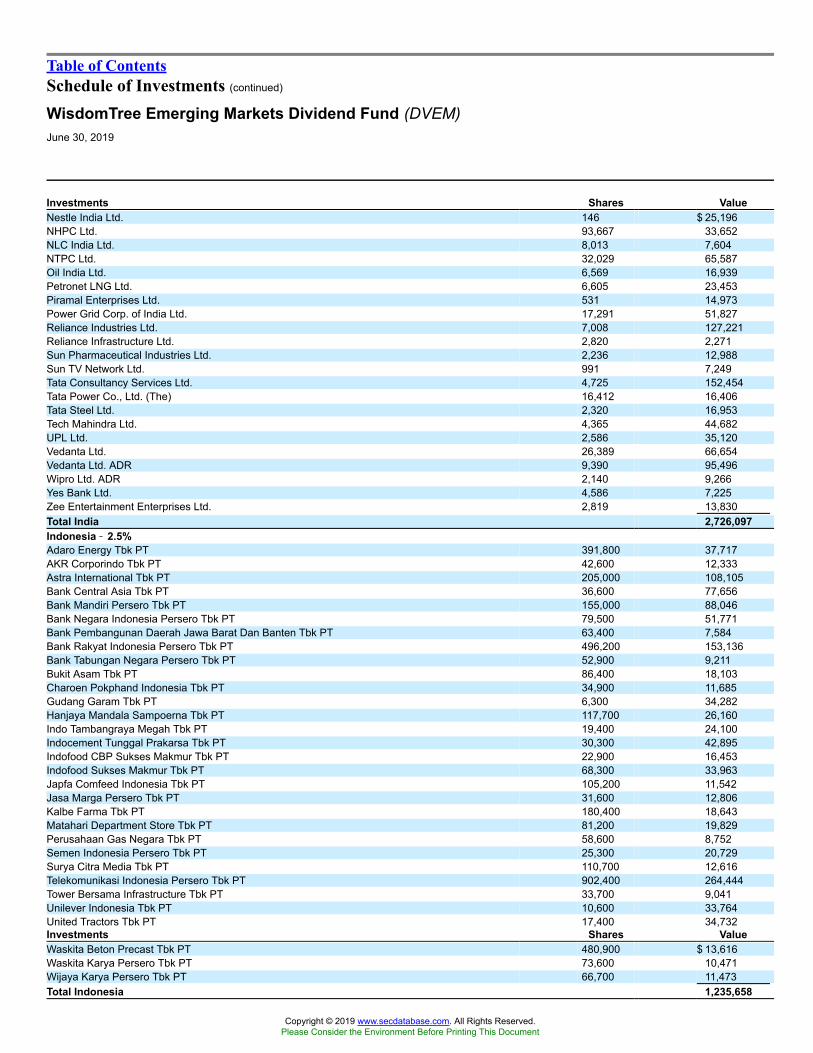
Table of ContentsSchedule of Investments (continued)
WisdomTree Emerging Markets Dividend Fund (DVEM)June 30, 2019
Investments Shares ValueNestle India Ltd. 146 $ 25,196NHPC Ltd. 93,667 33,652NLC India Ltd. 8,013 7,604NTPC Ltd. 32,029 65,587Oil India Ltd. 6,569 16,939Petronet LNG Ltd. 6,605 23,453Piramal Enterprises Ltd. 531 14,973Power Grid Corp. of India Ltd. 17,291 51,827Reliance Industries Ltd. 7,008 127,221Reliance Infrastructure Ltd. 2,820 2,271Sun Pharmaceutical Industries Ltd. 2,236 12,988Sun TV Network Ltd. 991 7,249Tata Consultancy Services Ltd. 4,725 152,454Tata Power Co., Ltd. (The) 16,412 16,406Tata Steel Ltd. 2,320 16,953Tech Mahindra Ltd. 4,365 44,682UPL Ltd. 2,586 35,120Vedanta Ltd. 26,389 66,654Vedanta Ltd. ADR 9,390 95,496Wipro Ltd. ADR 2,140 9,266Yes Bank Ltd. 4,586 7,225Zee Entertainment Enterprises Ltd. 2,819 13,830Total India 2,726,097Indonesia �� 2.5%Adaro Energy Tbk PT 391,800 37,717AKR Corporindo Tbk PT 42,600 12,333Astra International Tbk PT 205,000 108,105Bank Central Asia Tbk PT 36,600 77,656Bank Mandiri Persero Tbk PT 155,000 88,046Bank Negara Indonesia Persero Tbk PT 79,500 51,771Bank Pembangunan Daerah Jawa Barat Dan Banten Tbk PT 63,400 7,584Bank Rakyat Indonesia Persero Tbk PT 496,200 153,136Bank Tabungan Negara Persero Tbk PT 52,900 9,211Bukit Asam Tbk PT 86,400 18,103Charoen Pokphand Indonesia Tbk PT 34,900 11,685Gudang Garam Tbk PT 6,300 34,282Hanjaya Mandala Sampoerna Tbk PT 117,700 26,160Indo Tambangraya Megah Tbk PT 19,400 24,100Indocement Tunggal Prakarsa Tbk PT 30,300 42,895Indofood CBP Sukses Makmur Tbk PT 22,900 16,453Indofood Sukses Makmur Tbk PT 68,300 33,963Japfa Comfeed Indonesia Tbk PT 105,200 11,542Jasa Marga Persero Tbk PT 31,600 12,806Kalbe Farma Tbk PT 180,400 18,643Matahari Department Store Tbk PT 81,200 19,829Perusahaan Gas Negara Tbk PT 58,600 8,752Semen Indonesia Persero Tbk PT 25,300 20,729Surya Citra Media Tbk PT 110,700 12,616Telekomunikasi Indonesia Persero Tbk PT 902,400 264,444Tower Bersama Infrastructure Tbk PT 33,700 9,041Unilever Indonesia Tbk PT 10,600 33,764United Tractors Tbk PT 17,400 34,732Investments Shares ValueWaskita Beton Precast Tbk PT 480,900 $ 13,616Waskita Karya Persero Tbk PT 73,600 10,471Wijaya Karya Persero Tbk PT 66,700 11,473Total Indonesia 1,235,658
Copyright © 2019 www.secdatabase.com. All Rights Reserved.Please Consider the Environment Before Printing This Document

Malaysia �� 2.8%AirAsia Group Bhd 31,500 20,809Alliance Bank Malaysia Bhd 17,500 15,923AMMB Holdings Bhd 20,700 21,188Astro Malaysia Holdings Bhd 82,700 29,018Berjaya Sports Toto Bhd 35,100 23,443Bermaz Auto Bhd 34,000 21,885British American Tobacco Malaysia Bhd 2,600 18,120Carlsberg Brewery Malaysia Bhd 4,300 26,700CIMB Group Holdings Bhd 53,400 69,520Dialog Group Bhd 25,400 20,037DiGi.Com Bhd 40,000 48,881FGV Holdings Bhd* 33,500 9,079Gamuda Bhd 47,800 43,491Genting Malaysia Bhd 33,500 26,265HAP Seng Consolidated Bhd 7,800 18,780Heineken Malaysia Bhd 3,400 19,302Hong Leong Bank Bhd 4,400 20,230IHH Healthcare Bhd 14,000 19,649IJM Corp. Bhd 44,900 26,076Inari Amertron Bhd 29,200 11,306IOI Corp. Bhd 23,800 24,477IOI Properties Group Bhd 28,500 9,517Kuala Lumpur Kepong Bhd 4,300 25,556Lotte Chemical Titan Holding Bhd(b) 12,900 9,302Mah Sing Group Bhd 46,400 10,330Malayan Banking Bhd 78,000 167,608Malaysia Airports Holdings Bhd 9,200 18,990Maxis Bhd 23,600 31,809MISC Bhd 24,700 42,736Petronas Chemicals Group Bhd 26,700 54,272Petronas Dagangan Bhd 3,700 22,742Petronas Gas Bhd 9,700 40,748Public Bank Bhd 17,500 97,399RHB Bank Bhd 16,000 21,643Sime Darby Bhd 161,600 83,272SP Setia Bhd 29,000 15,158Telekom Malaysia Bhd 49,800 48,203Tenaga Nasional Bhd 37,100 124,250Westports Holdings Bhd 19,200 18,306YTL Corp. Bhd 95,800 25,964YTL Power International Bhd 73,024 14,490Total Malaysia 1,416,474Mexico �� 2.1%Alfa S.A.B. de C.V. Class A 30,519 29,960Alsea S.A.B. de C.V.* 4,136 8,133Arca Continental S.A.B. de C.V. 3,205 17,325Banco del Bajio S.A.(b) 5,469 10,928
See Notes to Financial Statements.
WisdomTree Trust 61
Copyright © 2019 www.secdatabase.com. All Rights Reserved.Please Consider the Environment Before Printing This Document

Table of ContentsSchedule of Investments (continued)
WisdomTree Emerging Markets Dividend Fund (DVEM)June 30, 2019
Investments Shares ValueBanco Santander Mexico S.A. Institucion de Banca Multiple Grupo Financiero Santander 12,982 $19,846Bolsa Mexicana de Valores S.A.B. de C.V. 7,470 14,126Concentradora Fibra Danhos S.A. de C.V. 19,568 25,881Fomento Economico Mexicano S.A.B. de C.V. 10,473 101,374GMexico Transportes S.A.B. de C.V.(b) 5,601 6,907Gruma S.A.B. de C.V. Class B 1,717 16,100Grupo Aeroportuario del Centro Norte S.A.B. de C.V. 4,292 26,188Grupo Aeroportuario del Pacifico S.A.B. de C.V. Class B 6,961 72,423Grupo Aeroportuario del Sureste S.A.B. de C.V. Class B 1,584 25,649Grupo Bimbo S.A.B. de C.V. Series A 7,737 16,121Grupo Financiero Banorte S.A.B. de C.V. Class O 18,686 108,313Grupo Financiero Inbursa S.A.B. de C.V. Class O 11,662 16,851Grupo Lala S.A.B. de C.V.(a) 8,937 10,974Grupo Mexico S.A.B. de C.V. Series B 63,142 167,521Grupo Televisa S.A.B. Series CPO 5,601 9,461Industrias Bachoco S.A.B. de C.V. Series B 2,691 11,262Industrias Penoles S.A.B. de C.V. 1,630 21,067Infraestructura Energetica Nova S.A.B. de C.V. 6,441 25,276Kimberly-Clark de Mexico S.A.B. de C.V. Class A* 27,265 50,651Macquarie Mexico Real Estate Management S.A. de C.V.(b) 19,593 22,223Mexichem S.A.B. de C.V. 8,251 17,304Nemak S.A.B. de C.V.(b) 17,618 8,253Prologis Property Mexico S.A. de C.V. 8,402 17,415Promotora y Operadora de Infraestructura S.A.B. de C.V. 2,341 23,241Regional S.A.B. de C.V. 1,601 8,244Wal-Mart de Mexico S.A.B. de C.V. 46,992 128,171Total Mexico 1,037,188Philippines �� 0.8%Aboitiz Equity Ventures, Inc. 26,660 28,619Aboitiz Power Corp. 28,700 19,494Ayala Corp. 1,090 19,019Ayala Land, Inc. 27,200 26,969Bank of the Philippine Islands 12,464 19,097BDO Unibank, Inc. 8,871 24,240DMCI Holdings, Inc. 76,200 15,319Globe Telecom, Inc. 500 22,075International Container Terminal Services, Inc. 9,100 26,003Jollibee Foods Corp. 2,370 13,035Manila Electric Co. 3,940 29,760Metropolitan Bank & Trust Co. 8,194 11,395Pilipinas Shell Petroleum Corp. 16,540 12,509PLDT, Inc. 1,510 38,019Semirara Mining & Power Corp. 28,660 12,950SM Investments Corp. 2,120 40,095SM Prime Holdings, Inc. 35,700 25,851Universal Robina Corp. 9,150 29,646Total Philippines 414,095Investments Shares ValuePoland �� 0.9%Asseco Poland S.A. 2,079 $29,714Bank Handlowy w Warszawie S.A. 404 5,818Bank Polska Kasa Opieki S.A. 3,313 99,322CCC S.A. 160 7,234Ciech S.A. 1,309 14,655Eurocash S.A. 1,422 7,855Grupa Lotos S.A. 576 13,082LC Corp. S.A. 18,508 13,102
Copyright © 2019 www.secdatabase.com. All Rights Reserved.Please Consider the Environment Before Printing This Document

Polski Koncern Naftowy Orlen S.A. 3,640 87,828Powszechna Kasa Oszczednosci Bank Polski S.A. 3,215 36,916Powszechny Zaklad Ubezpieczen S.A. 9,337 109,314Warsaw Stock Exchange 847 9,755Total Poland 434,595Russia �� 8.8%Gazprom Neft PJSC ADR 462 14,599Gazprom PJSC ADR 110,931 812,680LSR Group PJSC GDR Reg S 7,966 20,473Lukoil PJSC ADR 7,275 614,155Magnit PJSC GDR Reg S 7,711 112,388Magnitogorsk Iron & Steel Works PJSC GDR Reg S 4,828 44,418MMC Norilsk Nickel PJSC ADR 28,252 641,603Mobile TeleSystems PJSC ADR 18,212 169,554Novatek PJSC GDR Reg S 475 100,700Novolipetsk Steel PJSC GDR Reg S 4,075 102,853PhosAgro PJSC GDR Reg S 2,061 27,040Polyus PJSC GDR Reg S 1,259 58,216Rosneft Oil Co. PJSC GDR Reg S 20,504 134,301Rostelecom PJSC ADR 5,148 39,485RusHydro PJSC ADR 35,573 32,407Sberbank of Russia PJSC ADR 42,212 649,221Severstal PJSC GDR Reg S 8,862 149,325Tatneft PJSC ADR 8,779 647,890VTB Bank PJSC GDR Reg S 54,741 68,864Total Russia 4,440,172Singapore �� 0.0%IGG, Inc. 15,000 16,723South Africa �� 5.6%Absa Group Ltd. 13,006 162,330Aeci Ltd. 3,323 21,560African Rainbow Minerals Ltd. 2,573 33,240Anglo American Platinum Ltd. 325 19,289AngloGold Ashanti Ltd. 924 16,644Aspen Pharmacare Holdings Ltd. 2,545 18,129Assore Ltd. 1,106 28,768Astral Foods Ltd. 1,343 14,763AVI Ltd. 6,433 41,679Barloworld Ltd. 3,375 30,636Bid Corp., Ltd. 2,516 54,774Bidvest Group Ltd. (The) 3,865 51,899Capitec Bank Holdings Ltd. 254 23,394Clicks Group Ltd. 2,396 34,882Coronation Fund Managers Ltd. 4,313 13,672
See Notes to Financial Statements.
62 WisdomTree Trust
Copyright © 2019 www.secdatabase.com. All Rights Reserved.Please Consider the Environment Before Printing This Document

Table of ContentsSchedule of Investments (continued)
WisdomTree Emerging Markets Dividend Fund (DVEM)June 30, 2019
Investments Shares ValueDiscovery Ltd. 1,506 $ 15,925Exxaro Resources Ltd. 5,929 72,315FirstRand Ltd. 39,145 190,294Foschini Group Ltd. (The) 4,360 55,747Hyprop Investments Ltd. 5,135 25,443Imperial Logistics Ltd. 3,035 11,069Investec Ltd. 3,921 25,543JSE Ltd. 1,625 16,133KAP Industrial Holdings Ltd. 21,969 8,709Kumba Iron Ore Ltd.(a) 2,015 71,359Liberty Holdings Ltd. 2,389 17,901Life Healthcare Group Holdings Ltd. 22,162 35,267Massmart Holdings Ltd. 1,420 6,264Mondi Ltd. 1,247 28,029Mpact Ltd. 4,706 7,402Mr. Price Group Ltd. 3,263 45,935MTN Group Ltd. 45,919 347,618Naspers Ltd. Class N 380 92,149Nedbank Group Ltd. 3,313 59,488Netcare Ltd. 25,817 32,918Omnia Holdings Ltd. 1,506 3,761Pick n Pay Stores Ltd. 4,977 24,353Pioneer Foods Group Ltd. 2,341 11,455PSG Group Ltd. 800 13,560Rand Merchant Investment Holdings Ltd. 6,972 16,796Remgro Ltd. 3,905 52,034Reunert Ltd. 4,707 22,542RMB Holdings Ltd. 10,448 62,534Sanlam Ltd. 17,883 99,121Sappi Ltd. 5,458 21,246Sasol Ltd. 5,310 131,876Shoprite Holdings Ltd. 4,401 49,206SPAR Group Ltd. (The) 3,385 44,849Standard Bank Group Ltd. 18,727 261,185Telkom S.A. SOC Ltd.(a) 8,934 58,408Tiger Brands Ltd. 2,600 41,246Tongaat Hulett Ltd.� 368 345Truworths International Ltd. 8,914 44,250Tsogo Sun Holdings Ltd. 13,682 14,777Tsogo Sun Hotels Ltd.* 15,914 4,740Vodacom Group Ltd. 14,998 127,280Total South Africa 2,836,731South Korea �� 12.5%Amorepacific Corp. 82 11,682BGF Co., Ltd. 724 4,640BNK Financial Group, Inc. 2,993 19,415Cheil Worldwide, Inc. 1,123 28,594CJ CheilJedang Corp. 34 8,745Com2uS Corp. 98 8,615Daelim Industrial Co., Ltd. 207 20,617DB Insurance Co., Ltd. 486 24,960DGB Financial Group, Inc. 2,267 16,001Dongsuh Cos., Inc. 801 13,354Investments Shares ValueDONGSUNG Corp. 4,542 $ 23,209Doosan Bobcat, Inc. 526 16,582Doosan Corp. 245 21,325
Copyright © 2019 www.secdatabase.com. All Rights Reserved.Please Consider the Environment Before Printing This Document

E-Mart, Inc. 78 9,457Grand Korea Leisure Co., Ltd. 561 9,960GS Engineering & Construction Corp. 244 8,527GS Holdings Corp. 626 27,758Hana Financial Group, Inc. 2,976 96,395Hankook Tire & Technology Co., Ltd. 451 13,710Hanon Systems 1,827 18,434Hanwha Chemical Corp. 989 19,443Hanwha Corp. 470 10,868Hanwha Life Insurance Co., Ltd. 4,508 12,786Hite Jinro Co., Ltd. 1,078 18,999Huchems Fine Chemical Corp. 640 12,194Hyundai Engineering & Construction Co., Ltd. 254 11,791Hyundai Glovis Co., Ltd. 236 32,907Hyundai Marine & Fire Insurance Co., Ltd. 735 18,110Hyundai Motor Co. 1,995 241,891Hyundai Steel Co. 531 19,223iMarketKorea, Inc. 978 9,952Industrial Bank of Korea 3,104 37,770IS Dongseo Co., Ltd. 399 13,356Kangwon Land, Inc. 1,584 41,498KB Financial Group, Inc. 3,785 150,299KEPCO Plant Service & Engineering Co., Ltd. 478 12,937Kginicis Co., Ltd. 575 7,495Kia Motors Corp. 2,747 104,679Kolon Industries, Inc. 207 7,655Korea Investment Holdings Co., Ltd. 325 22,715Korea Zinc Co., Ltd. 137 56,478Korean Reinsurance Co. 2,125 16,048KT Corp. ADR 2,428 30,034KT&G Corp. 2,058 175,562LG Chem Ltd. 354 108,685LG Corp. 988 65,801LG Electronics, Inc. 321 22,046LG Hausys Ltd. 237 12,623LG Household & Health Care Ltd. 33 37,526LG Uplus Corp. 2,031 25,505Lotte Chemical Corp. 244 53,358LOTTE Fine Chemical Co., Ltd. 224 10,243LOTTE Himart Co., Ltd. 257 9,727LS Corp. 301 12,383Meritz Fire & Marine Insurance Co., Ltd. 896 16,063Meritz Securities Co., Ltd. 4,744 22,022Mirae Asset Daewoo Co., Ltd. 3,251 23,031Muhak Co., Ltd. 813 7,816NAVER Corp. 187 18,463NCSoft Corp. 127 52,465NH Investment & Securities Co., Ltd. 1,837 23,069OCI Co., Ltd. 171 13,817Orange Life Insurance Ltd.(b) 771 21,134Partron Co., Ltd. 949 14,589
See Notes to Financial Statements.
WisdomTree Trust 63
Copyright © 2019 www.secdatabase.com. All Rights Reserved.Please Consider the Environment Before Printing This Document
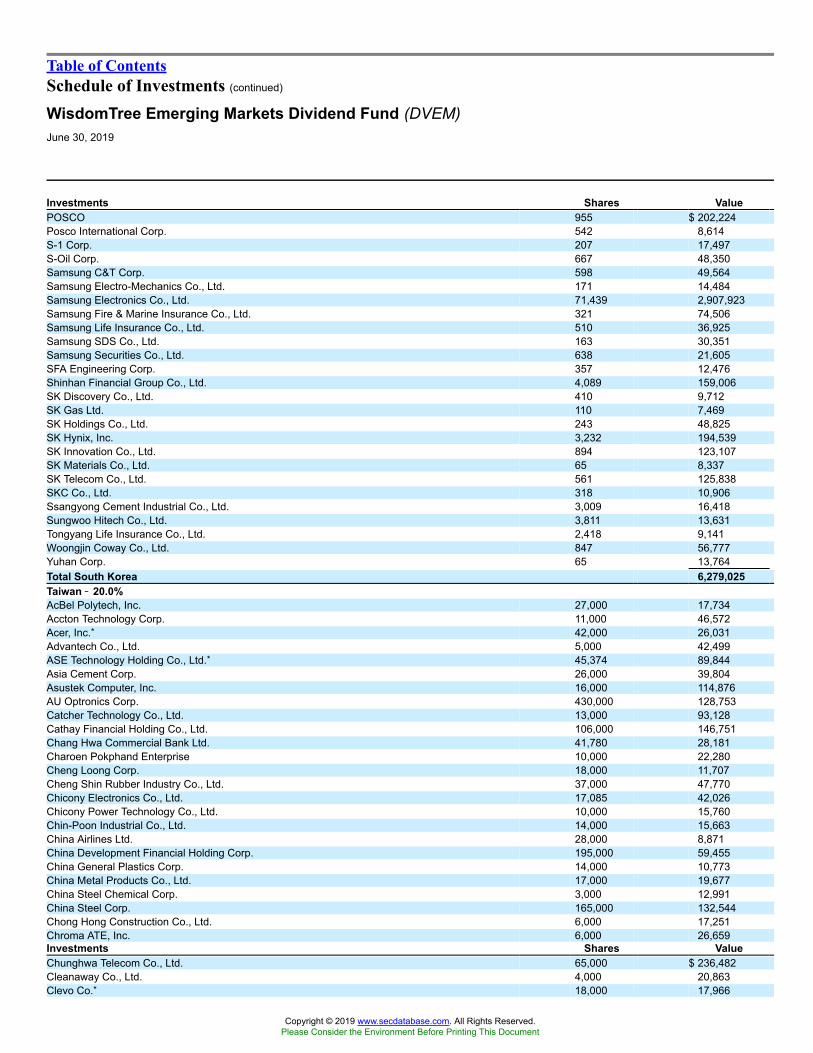
Table of ContentsSchedule of Investments (continued)
WisdomTree Emerging Markets Dividend Fund (DVEM)June 30, 2019
Investments Shares ValuePOSCO 955 $ 202,224Posco International Corp. 542 8,614S-1 Corp. 207 17,497S-Oil Corp. 667 48,350Samsung C&T Corp. 598 49,564Samsung Electro-Mechanics Co., Ltd. 171 14,484Samsung Electronics Co., Ltd. 71,439 2,907,923Samsung Fire & Marine Insurance Co., Ltd. 321 74,506Samsung Life Insurance Co., Ltd. 510 36,925Samsung SDS Co., Ltd. 163 30,351Samsung Securities Co., Ltd. 638 21,605SFA Engineering Corp. 357 12,476Shinhan Financial Group Co., Ltd. 4,089 159,006SK Discovery Co., Ltd. 410 9,712SK Gas Ltd. 110 7,469SK Holdings Co., Ltd. 243 48,825SK Hynix, Inc. 3,232 194,539SK Innovation Co., Ltd. 894 123,107SK Materials Co., Ltd. 65 8,337SK Telecom Co., Ltd. 561 125,838SKC Co., Ltd. 318 10,906Ssangyong Cement Industrial Co., Ltd. 3,009 16,418Sungwoo Hitech Co., Ltd. 3,811 13,631Tongyang Life Insurance Co., Ltd. 2,418 9,141Woongjin Coway Co., Ltd. 847 56,777Yuhan Corp. 65 13,764Total South Korea 6,279,025Taiwan �� 20.0%AcBel Polytech, Inc. 27,000 17,734Accton Technology Corp. 11,000 46,572Acer, Inc.* 42,000 26,031Advantech Co., Ltd. 5,000 42,499ASE Technology Holding Co., Ltd.* 45,374 89,844Asia Cement Corp. 26,000 39,804Asustek Computer, Inc. 16,000 114,876AU Optronics Corp. 430,000 128,753Catcher Technology Co., Ltd. 13,000 93,128Cathay Financial Holding Co., Ltd. 106,000 146,751Chang Hwa Commercial Bank Ltd. 41,780 28,181Charoen Pokphand Enterprise 10,000 22,280Cheng Loong Corp. 18,000 11,707Cheng Shin Rubber Industry Co., Ltd. 37,000 47,770Chicony Electronics Co., Ltd. 17,085 42,026Chicony Power Technology Co., Ltd. 10,000 15,760Chin-Poon Industrial Co., Ltd. 14,000 15,663China Airlines Ltd. 28,000 8,871China Development Financial Holding Corp. 195,000 59,455China General Plastics Corp. 14,000 10,773China Metal Products Co., Ltd. 17,000 19,677China Steel Chemical Corp. 3,000 12,991China Steel Corp. 165,000 132,544Chong Hong Construction Co., Ltd. 6,000 17,251Chroma ATE, Inc. 6,000 26,659Investments Shares ValueChunghwa Telecom Co., Ltd. 65,000 $ 236,482Cleanaway Co., Ltd. 4,000 20,863Clevo Co.* 18,000 17,966
Copyright © 2019 www.secdatabase.com. All Rights Reserved.Please Consider the Environment Before Printing This Document

Compal Electronics, Inc. 76,000 49,795Compeq Manufacturing Co., Ltd. 28,000 23,484CTBC Financial Holding Co., Ltd. 240,720 165,469CTCI Corp. 18,000 26,803Delta Electronics, Inc. 32,000 162,269E.Sun Financial Holding Co., Ltd. 77,218 64,639Eclat Textile Co., Ltd. 2,000 25,628Elan Microelectronics Corp. 10,000 23,439Elite Material Co., Ltd. 9,000 27,151Elite Semiconductor Memory Technology, Inc. 19,000 19,759Epistar Corp. 12,000 9,659Eternal Materials Co., Ltd. 19,624 17,091Everlight Electronics Co., Ltd. 22,000 20,541Far Eastern Department Stores Ltd. 32,000 23,181Far Eastern New Century Corp. 52,000 56,086Far EasTone Telecommunications Co., Ltd. 28,000 70,587Faraday Technology Corp. 10,000 15,551Feng Hsin Steel Co., Ltd. 13,000 26,327Feng TAY Enterprise Co., Ltd. 4,000 31,166First Financial Holding Co., Ltd. 117,966 86,596FLEXium Interconnect, Inc. 7,000 19,427Formosa Chemicals & Fibre Corp. 91,000 301,776Formosa Petrochemical Corp. 33,000 117,404Formosa Plastics Corp. 90,000 331,783Fubon Financial Holding Co., Ltd. 83,000 122,525Getac Technology Corp. 14,000 21,005Giant Manufacturing Co., Ltd. 3,000 23,471Gigabyte Technology Co., Ltd. 18,000 30,831Goldsun Building Materials Co., Ltd. 78,000 21,421Grape King Bio Ltd. 2,000 13,168Great Wall Enterprise Co., Ltd. 16,630 21,390Greatek Electronics, Inc. 15,000 20,767HannStar Display Corp. 77,000 16,362Highwealth Construction Corp. 19,000 30,250Holtek Semiconductor, Inc. 5,000 11,526Holy Stone Enterprise Co., Ltd. 3,000 10,094Hon Hai Precision Industry Co., Ltd. 131,880 328,644Hota Industrial Manufacturing Co., Ltd. 3,000 9,804Hotai Motor Co., Ltd. 7,000 114,490Hua Nan Financial Holdings Co., Ltd. 63,065 42,335Huaku Development Co., Ltd. 10,000 27,431IEI Integration Corp. 15,000 16,058Innolux Corp. 285,000 67,260International CSRC Investment Holdings Co. 13,000 15,633Inventec Corp. 80,000 63,620ITEQ Corp. 9,000 31,585Kenda Rubber Industrial Co., Ltd. 16,020 15,345King Yuan Electronics Co., Ltd. 29,000 25,023King�s Town Bank Co., Ltd. 19,000 20,676Kinik Co. 11,000 21,497Largan Precision Co., Ltd. 1,000 124,117
See Notes to Financial Statements.
64 WisdomTree Trust
Copyright © 2019 www.secdatabase.com. All Rights Reserved.Please Consider the Environment Before Printing This Document

Table of ContentsSchedule of Investments (continued)
WisdomTree Emerging Markets Dividend Fund (DVEM)June 30, 2019
Investments Shares ValueLien Hwa Industrial Corp. 17,403 $ 20,956Lite-On Technology Corp. 7,014 10,275Longchen Paper & Packaging Co., Ltd. 27,158 12,722Macronix International 34,000 25,342Makalot Industrial Co., Ltd. 3,000 20,284MediaTek, Inc. 21,000 212,302Mega Financial Holding Co., Ltd. 156,000 155,199Merida Industry Co., Ltd. 2,000 11,816Merry Electronics Co., Ltd. 7,080 38,523Micro-Star International Co., Ltd. 17,000 48,166Nan Kang Rubber Tire Co., Ltd. 16,000 18,107Nan Ya Plastics Corp. 138,000 349,226Nanya Technology Corp. 30,000 62,300Nien Made Enterprise Co., Ltd. 3,000 22,553Novatek Microelectronics Corp. 13,000 72,409OptoTech Corp. 19,000 12,907Oriental Union Chemical Corp. 15,000 12,436Pan-International Industrial Corp. 26,000 19,797Pegatron Corp. 61,000 105,465Pou Chen Corp. 62,000 76,852Powertech Technology, Inc. 19,000 46,491President Chain Store Corp. 16,000 154,800Primax Electronics Ltd. 13,000 22,644Qisda Corp. 43,000 27,827Quanta Computer, Inc. 71,000 138,070Radiant Opto-Electronics Corp. 14,000 46,878Realtek Semiconductor Corp. 10,000 73,568Rechi Precision Co., Ltd. 18,000 15,126Ruentex Industries Ltd. 13,400 32,573Sercomm Corp. 11,000 23,835Shin Kong Financial Holding Co., Ltd. 81,691 24,802Shinkong Synthetic Fibers Corp. 52,000 23,271Sigurd Microelectronics Corp. 19,000 18,168Sinbon Electronics Co., Ltd. 4,000 14,617SinoPac Financial Holdings Co., Ltd. 131,598 55,292Sitronix Technology Corp. 4,000 16,742Standard Foods Corp. 11,000 21,497Supreme Electronics Co., Ltd. 19,000 19,300Syncmold Enterprise Corp. 12,250 33,130Synnex Technology International Corp. 33,150 41,625TA Chen Stainless Pipe 4,000 5,834Taichung Commercial Bank Co., Ltd. 41,670 16,770Taishin Financial Holding Co., Ltd. 91,482 42,119Taiwan Business Bank 50,000 21,974Taiwan Cement Corp. 50,500 74,873Taiwan Cooperative Financial Holding Co., Ltd. 93,674 62,732Taiwan Glass Industry Corp. 15,000 5,868Taiwan High Speed Rail Corp. 21,000 30,899Taiwan Hon Chuan Enterprise Co., Ltd. 12,000 21,365Taiwan Mobile Co., Ltd. 29,000 114,377Taiwan Paiho Ltd. 5,000 14,440Taiwan PCB Techvest Co., Ltd. 21,000 24,949Taiwan Secom Co., Ltd. 6,000 17,116Taiwan Semiconductor Manufacturing Co., Ltd. 243,000 1,869,863Investments Shares ValueTeco Electric and Machinery Co., Ltd. 34,000 $ 24,959Test Research, Inc. 6,000 9,466
Copyright © 2019 www.secdatabase.com. All Rights Reserved.Please Consider the Environment Before Printing This Document

Tong Hsing Electronic Industries Ltd. 4,000 14,166Tong Yang Industry Co., Ltd. 10,000 14,456Topco Scientific Co., Ltd. 6,097 16,391Transcend Information, Inc. 7,000 16,137Tripod Technology Corp. 14,000 49,582TSRC Corp. 16,000 14,269Tung Ho Steel Enterprise Corp. 27,000 20,255TXC Corp. 17,000 19,047Uni-President Enterprises Corp. 143,000 380,756Unimicron Technology Corp. 19,000 21,563United Microelectronics Corp. 239,000 107,344UPC Technology Corp. 31,000 11,378USI Corp. 49,400 18,768Voltronic Power Technology Corp. 1,000 21,797Walsin Lihwa Corp. 53,000 25,084Walsin Technology Corp. 2,000 10,560Wan Hai Lines Ltd. 15,000 8,741Waterland Financial Holdings Co., Ltd. 67,000 23,082Winbond Electronics Corp. 85,446 41,816Wistron Corp. 65,843 51,302Wistron NeWeb Corp. 11,362 26,778WPG Holdings Ltd. 37,360 48,535WT Microelectronics Co., Ltd. 14,645 18,837Yageo Corp. 3,198 27,182YFY, Inc. 37,000 14,176Yuanta Financial Holding Co., Ltd. 109,000 65,450Yulon Motor Co., Ltd. 18,000 13,213Total Taiwan 10,091,012Thailand �� 2.9%Advanced Info Service PCL NVDR 16,800 119,423Airports of Thailand PCL NVDR 27,200 65,190Bangkok Dusit Medical Services PCL NVDR 35,000 29,673Banpu PCL NVDR 37,944 18,559Beauty Community PCL NVDR 47,400 6,306Berli Jucker PCL NVDR 10,000 16,467BTS Group Holdings PCL NVDR 131,400 51,416Bumrungrad Hospital PCL NVDR 3,400 18,736Charoen Pokphand Foods PCL NVDR 41,600 38,321CP ALL PCL NVDR 32,000 89,737Delta Electronics Thailand PCL NVDR 5,700 12,639Electricity Generating PCL NVDR 4,400 46,629Esso Thailand PCL NVDR 47,000 16,552Hana Microelectronics PCL NVDR 16,000 13,434Indorama Ventures PCL NVDR 21,400 32,797IRPC PCL NVDR 271,800 44,314Jasmine International PCL NVDR 160,000 37,564KCE Electronics PCL NVDR 9,700 6,010Land & Houses PCL NVDR 98,900 35,797Minor International PCL NVDR 16,500 22,059MK Restaurants Group PCL NVDR 7,400 17,796PTT Exploration & Production PCL NVDR 17,100 75,275
See Notes to Financial Statements.
WisdomTree Trust 65
Copyright © 2019 www.secdatabase.com. All Rights Reserved.Please Consider the Environment Before Printing This Document

Table of ContentsSchedule of Investments (concluded)
WisdomTree Emerging Markets Dividend Fund (DVEM)June 30, 2019
Investments Shares ValuePTT Global Chemical PCL NVDR 38,100 $ 79,511PTT PCL NVDR 76,800 122,084Quality Houses PCL NVDR 193,600 19,570Robinson PCL NVDR 8,000 14,674Siam Cement PCL (The) NVDR 5,500 84,650Siam City Cement PCL NVDR 2,077 16,254Siam Commercial Bank PCL (The) NVDR 18,800 85,517Siamgas & Petrochemicals PCL NVDR 30,500 9,945Star Petroleum Refining PCL NVDR 70,400 23,185Thai Oil PCL NVDR 21,300 46,187Thai Union Group PCL NVDR 48,100 28,702Thai Vegetable Oil PCL NVDR 18,900 17,256Tisco Financial Group PCL NVDR 9,700 29,574TMB Bank PCL NVDR 269,600 17,230TPI Polene Power PCL NVDR 103,900 20,666TTW PCL NVDR 54,200 25,096WHA Corp. PCL NVDR 162,800 25,163Total Thailand 1,479,958Turkey �� 1.0%Aksa Akrilik Kimya Sanayii AS 3,439 5,500Albaraka Turk Katilim Bankasi AS* 18,714 3,753Aygaz AS 4,460 6,770BIM Birlesik Magazalar AS 1,868 25,724Emlak Konut Gayrimenkul Yatirim Ortakligi AS 54,393 10,627Enka Insaat ve Sanayi AS 20,949 19,812Eregli Demir ve Celik Fabrikalari T.A.S. 49,230 66,985Ford Otomotiv Sanayi AS 1,871 20,217Haci Omer Sabanci Holding AS 9,457 14,045Iskenderun Demir ve Celik AS 6,800 8,112KOC Holding AS 8,712 26,419TAV Havalimanlari Holding AS 3,455 16,128Tekfen Holding AS 3,018 13,545Tofas Turk Otomobil Fabrikasi AS 1,375 4,588Trakya Cam Sanayii AS 9,216 4,669Tupras Turkiye Petrol Rafinerileri AS 4,492 89,312Turkcell Iletisim Hizmetleri AS 38,363 84,897Turkiye Garanti Bankasi AS* 30,524 48,024Turkiye Sise ve Cam Fabrikalari AS 10,476 9,400Total Turkey 478,527TOTAL COMMON STOCKS(Cost: $48,052,522) 49,964,060RIGHTS �� 0.0%Chile �� 0.0%Enel Americas S.A., expiring 7/26/19* 140,826 2,067Hong Kong �� 0.0%China International Marine Containers Group Co., Ltd., expiring 7/2/19*� 65 0TOTAL RIGHTS(Cost: $0) 2,067Investments Shares ValueWARRANTS �� 0.0%Thailand �� 0.0%Minor International PCL,
expiring 12/31/21*(Cost: $0) 675 $ 122INVESTMENT OF CASH COLLATERAL FOR SECURITIES LOANED �� 0.5%United States �� 0.5%
Copyright © 2019 www.secdatabase.com. All Rights Reserved.Please Consider the Environment Before Printing This Document
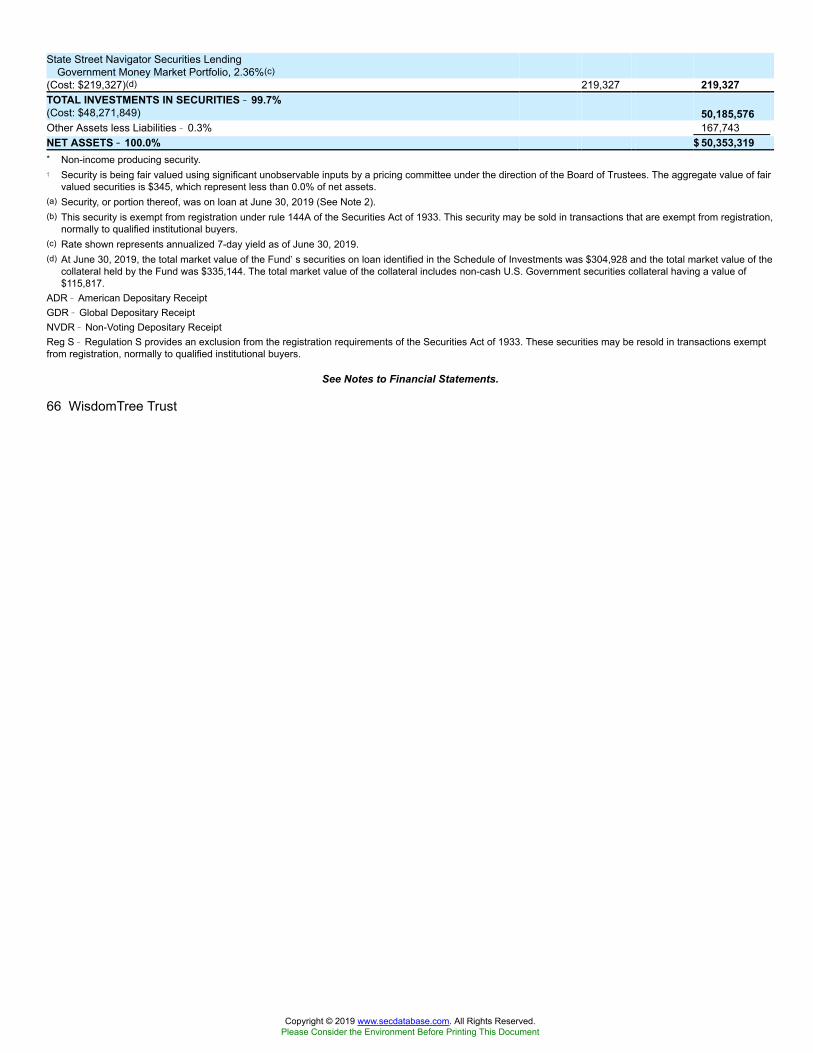
State Street Navigator Securities LendingGovernment Money Market Portfolio, 2.36%(c)
(Cost: $219,327)(d) 219,327 219,327TOTAL INVESTMENTS IN SECURITIES �� 99.7%(Cost: $48,271,849) 50,185,576Other Assets less Liabilities � 0.3% 167,743NET ASSETS �� 100.0% $ 50,353,319* Non-income producing security.� Security is being fair valued using significant unobservable inputs by a pricing committee under the direction of the Board of Trustees. The aggregate value of fair
valued securities is $345, which represent less than 0.0% of net assets.(a) Security, or portion thereof, was on loan at June 30, 2019 (See Note 2).(b) This security is exempt from registration under rule 144A of the Securities Act of 1933. This security may be sold in transactions that are exempt from registration,
normally to qualified institutional buyers.(c) Rate shown represents annualized 7-day yield as of June 30, 2019.(d) At June 30, 2019, the total market value of the Fund�s securities on loan identified in the Schedule of Investments was $304,928 and the total market value of the
collateral held by the Fund was $335,144. The total market value of the collateral includes non-cash U.S. Government securities collateral having a value of$115,817.
ADR � American Depositary ReceiptGDR � Global Depositary ReceiptNVDR � Non-Voting Depositary ReceiptReg S � Regulation S provides an exclusion from the registration requirements of the Securities Act of 1933. These securities may be resold in transactions exemptfrom registration, normally to qualified institutional buyers.
See Notes to Financial Statements.
66 WisdomTree Trust
Copyright © 2019 www.secdatabase.com. All Rights Reserved.Please Consider the Environment Before Printing This Document

Table of ContentsSchedule of InvestmentsWisdomTree Europe Multifactor Fund (EUMF)
June 30, 2019
Investments Shares ValueCOMMON STOCKS �� 100.4%Austria �� 0.5%OMV AG 1,299 $63,388Belgium �� 3.0%Ageas 1,316 68,504Barco N.V. 531 111,991Colruyt S.A. 1,154 67,023Proximus SADP 2,097 61,899UCB S.A. 878 72,910Total Belgium 382,327Denmark �� 3.6%Carlsberg A/S Class B 731 97,058Coloplast A/S Class B 659 74,587H. Lundbeck A/S 744 29,435Novo Nordisk A/S Class B 1,060 54,100Royal Unibrew A/S 799 58,395SimCorp A/S 261 25,288Topdanmark A/S 1,200 67,781Tryg A/S 1,836 59,781Total Denmark 466,425Finland �� 1.7%Kemira Oyj 4,904 72,266Orion Oyj Class B 819 30,060Tieto Oyj 2,610 77,457Valmet Oyj 1,751 43,710Total Finland 223,493France �� 13.3%Air France-KLM* 6,654 64,046Alstom S.A. 2,096 97,386AXA S.A. 4,162 109,487Carrefour S.A. 4,130 79,861Casino Guichard Perrachon S.A.(a) 1,490 50,904Danone S.A. 1,343 113,941Eiffage S.A. 952 94,255Fnac Darty S.A.* 767 57,037Gaztransport Et Technigaz S.A. 699 70,169Ipsen S.A. 588 80,354Korian S.A. 1,777 67,711Lagardere SCA 3,764 98,160Nexity S.A. 2,074 89,751Orange S.A. 7,220 114,000Peugeot S.A. 3,102 76,550Sanofi 1,233 106,588Societe BIC S.A. 1,101 84,069TOTAL S.A. 2,105 118,121Veolia Environnement S.A. 4,764 116,209Total France 1,688,599Germany �� 9.5%Allianz SE Registered Shares 484 116,850alstria office REIT-AG 6,801 110,289CompuGroup Medical SE 1,138 92,013Deutsche Telekom AG Registered Shares 6,429 111,372Investments Shares ValueDeutsche Wohnen SE Bearer Shares 2,825 $103,816E.ON SE 9,393 102,165Grand City Properties S.A. 4,113 94,146
Copyright © 2019 www.secdatabase.com. All Rights Reserved.Please Consider the Environment Before Printing This Document

Hochtief AG 598 72,935LEG Immobilien AG 1,002 113,195ProSiebenSat.1 Media SE 3,270 51,445Siltronic AG 881 64,451Suedzucker AG 3,596 60,977TLG Immobilien AG 4,064 119,173Total Germany 1,212,827Ireland �� 1.2%C&C Group PLC 11,529 51,335Glanbia PLC 1,993 32,456Grafton Group PLC 3,329 34,149Greencore Group PLC 11,946 33,296Total Ireland 151,236Italy �� 5.6%A2A SpA 43,088 74,879Enav SpA(b) 11,479 65,231Enel SpA 14,134 98,828Eni SpA 5,284 87,891Hera SpA 19,287 73,887Italgas SpA 13,379 90,014Recordati SpA 1,567 65,420Reply SpA 1,041 71,070Societa Cattolica di Assicurazioni SC 5,810 52,038Societa Iniziative Autostradali e Servizi SpA 1,847 34,306Total Italy 713,564Netherlands �� 5.4%ASR Nederland N.V. 1,412 57,502EXOR N.V. 917 64,328Heineken Holding N.V. 780 81,987Intertrust N.V.(b) 2,859 59,158Koninklijke Ahold Delhaize N.V. 3,121 70,295Koninklijke KPN N.V. 17,566 54,011NXP Semiconductors N.V. 200 19,522QIAGEN N.V.* 2,424 98,521Randstad N.V. 669 36,798Rhi Magnesita N.V. 809 49,792Signify N.V.(b) 1,121 33,191Wolters Kluwer N.V. 803 58,543Total Netherlands 683,648Norway �� 2.1%DNO ASA 22,213 40,252Equinor ASA 3,847 76,006SpareBank 1 SMN 7,731 88,589Storebrand ASA 8,945 65,760Total Norway 270,607Portugal �� 0.4%NOS, SGPS, S.A. 7,497 49,347Spain �� 7.2%Acciona S.A. 688 73,962Aena SME S.A.(b) 310 61,533
See Notes to Financial Statements.
WisdomTree Trust 67
Copyright © 2019 www.secdatabase.com. All Rights Reserved.Please Consider the Environment Before Printing This Document

Table of ContentsSchedule of Investments (continued)
WisdomTree Europe Multifactor Fund (EUMF)June 30, 2019
Investments Shares ValueBanco Bilbao Vizcaya Argentaria S.A. 7,750 $ 43,396Banco Santander S.A. 11,437 53,146Bolsas y Mercados Espanoles SHMSF S.A. 2,629 64,429Cia de Distribucion Integral Logista Holdings S.A. 2,480 56,258Ebro Foods S.A. 3,748 80,328Enagas S.A. 3,333 89,083Endesa S.A.(a) 3,422 88,111Faes Farma S.A. 11,570 54,614Iberdrola S.A. 9,841 98,240Red Electrica Corp. S.A. 3,870 80,717Telefonica S.A. 8,472 69,668Total Spain 913,485Sweden �� 4.9%Axfood AB 2,885 57,136Bravida Holding AB(b) 4,709 41,770Essity AB Class B 1,716 52,785ICA Gruppen AB 1,340 57,654Securitas AB Class B 3,898 68,438Skandinaviska Enskilda Banken AB Class A 5,772 53,451Skanska AB Class B 2,210 39,945SKF AB Class B 2,546 46,855Svenska Handelsbanken AB Class A 6,651 65,863Swedbank AB Class A 2,163 32,510Swedish Match AB 800 33,800Telia Co. AB 16,733 74,375Total Sweden 624,582Switzerland �� 11.6%Adecco Group AG Registered Shares 1,750 105,287Banque Cantonale Vaudoise 140 109,128Cembra Money Bank AG 1,109 107,090Coca-Cola HBC AG* 1,205 45,579Emmi AG 104 97,387Forbo Holding AG 54 95,483Galenica AG*(b) 1,917 96,342Huber + Suhner AG Registered Shares 952 80,261Landis+Gyr Group AG* 1,095 87,319Nestle S.A. Registered Shares 1,041 107,901Novartis AG Registered Shares 1,179 107,863Roche Holding AG Genusschein 426 120,001Sonova Holding AG Registered Shares 407 92,587Swisscom AG Registered Shares 230 115,613Zurich Insurance Group AG 312 108,768Total Switzerland 1,476,609United Kingdom �� 30.4%A.G. Barr PLC 4,804 56,677Admiral Group PLC 2,317 65,111Aggreko PLC 2,992 30,083Ashmore Group PLC 11,396 73,896Associated British Foods PLC 1,538 48,211Auto Trader Group PLC(b) 6,546 45,638Avast PLC(b) 10,467 39,964Aviva PLC 12,508 66,302Investments Shares ValueB&M European Value Retail S.A. 12,456 $ 52,837Barratt Developments PLC 7,467 54,416BCA Marketplace PLC 14,532 44,943
Copyright © 2019 www.secdatabase.com. All Rights Reserved.Please Consider the Environment Before Printing This Document
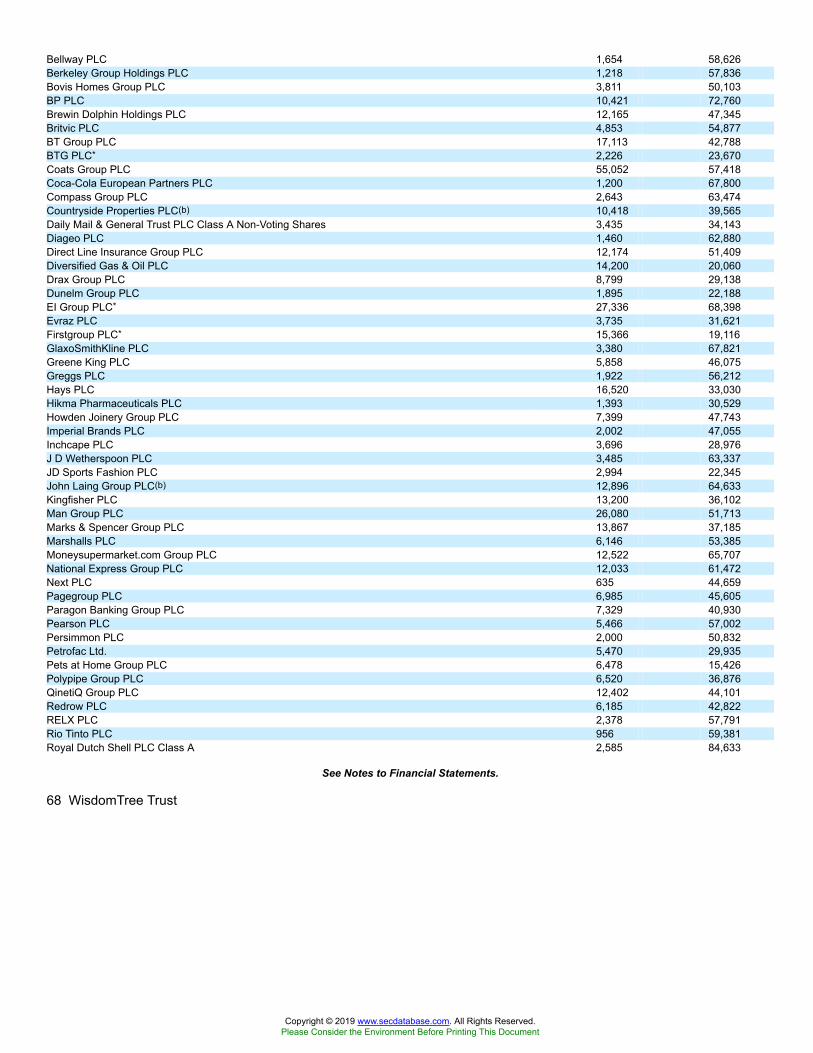
Bellway PLC 1,654 58,626Berkeley Group Holdings PLC 1,218 57,836Bovis Homes Group PLC 3,811 50,103BP PLC 10,421 72,760Brewin Dolphin Holdings PLC 12,165 47,345Britvic PLC 4,853 54,877BT Group PLC 17,113 42,788BTG PLC* 2,226 23,670Coats Group PLC 55,052 57,418Coca-Cola European Partners PLC 1,200 67,800Compass Group PLC 2,643 63,474Countryside Properties PLC(b) 10,418 39,565Daily Mail & General Trust PLC Class A Non-Voting Shares 3,435 34,143Diageo PLC 1,460 62,880Direct Line Insurance Group PLC 12,174 51,409Diversified Gas & Oil PLC 14,200 20,060Drax Group PLC 8,799 29,138Dunelm Group PLC 1,895 22,188EI Group PLC* 27,336 68,398Evraz PLC 3,735 31,621Firstgroup PLC* 15,366 19,116GlaxoSmithKline PLC 3,380 67,821Greene King PLC 5,858 46,075Greggs PLC 1,922 56,212Hays PLC 16,520 33,030Hikma Pharmaceuticals PLC 1,393 30,529Howden Joinery Group PLC 7,399 47,743Imperial Brands PLC 2,002 47,055Inchcape PLC 3,696 28,976J D Wetherspoon PLC 3,485 63,337JD Sports Fashion PLC 2,994 22,345John Laing Group PLC(b) 12,896 64,633Kingfisher PLC 13,200 36,102Man Group PLC 26,080 51,713Marks & Spencer Group PLC 13,867 37,185Marshalls PLC 6,146 53,385Moneysupermarket.com Group PLC 12,522 65,707National Express Group PLC 12,033 61,472Next PLC 635 44,659Pagegroup PLC 6,985 45,605Paragon Banking Group PLC 7,329 40,930Pearson PLC 5,466 57,002Persimmon PLC 2,000 50,832Petrofac Ltd. 5,470 29,935Pets at Home Group PLC 6,478 15,426Polypipe Group PLC 6,520 36,876QinetiQ Group PLC 12,402 44,101Redrow PLC 6,185 42,822RELX PLC 2,378 57,791Rio Tinto PLC 956 59,381Royal Dutch Shell PLC Class A 2,585 84,633
See Notes to Financial Statements.
68 WisdomTree Trust
Copyright © 2019 www.secdatabase.com. All Rights Reserved.Please Consider the Environment Before Printing This Document

Table of ContentsSchedule of Investments (continued)
WisdomTree Europe Multifactor Fund (EUMF)June 30, 2019
Investments Shares ValueRoyal Mail PLC 6,296 $16,979RPC Group PLC 4,086 41,217Safestore Holdings PLC 9,482 74,036Sage Group PLC (The) 4,749 48,498Savills PLC 6,109 69,741Serco Group PLC* 18,422 33,762Smith & Nephew PLC 3,374 73,214Softcat PLC 1,606 19,857SSP Group PLC 6,525 56,968Tate & Lyle PLC 7,800 73,301Taylor Wimpey PLC 27,657 55,527Tesco PLC 20,687 59,686TP ICAP PLC 4,289 16,354Unilever N.V. CVA 1,445 88,137Unilever PLC 1,328 82,724Vesuvius PLC 3,289 22,939WM Morrison Supermarkets PLC 21,900 56,134Total United Kingdom 3,865,680TOTAL COMMON STOCKS(Cost: $12,657,485) 12,785,817Investments Shares ValueINVESTMENT OF CASH COLLATERAL FOR SECURITIES LOANED �� 0.1%United States �� 0.1%State Street Navigator Securities Lending
Government Money Market Portfolio, 2.36%(c)(Cost: $5,482)(d) 5,482 $5,482TOTAL INVESTMENTS IN SECURITIES �� 100.5%(Cost: $12,662,967) 12,791,299Other Assets less Liabilities � (0.5)% (61,531 )NET ASSETS �� 100.0% $12,729,768* Non-income producing security.(a) Security, or portion thereof, was on loan at June 30, 2019 (See Note 2).(b) This security is exempt from registration under rule 144A of the Securities Act of 1933. This security may be sold in transactions that are exempt from registration,
normally to qualified institutional buyers.(c) Rate shown represents annualized 7-day yield as of June 30, 2019.(d) At June 30, 2019, the total market value of the Fund�s securities on loan identified in the Schedule of Investments was $128,988 and the total market value of the
collateral held by the Fund was $142,510. The total market value of the collateral includes non-cash U.S. Government securities collateral having a value of$137,028.
CVA � Certificaten Van Aandelen (Certificate of Stock)
FINANCIAL DERIVATIVE INSTRUMENTSFOREIGN CURRENCY CONTRACTS (OTC �� OVER THE COUNTER)
CounterpartySettlement
Date
Amount andDescription of
Currency tobe Purchased
Amount andDescription of
Currency tobe Sold
UnrealizedAppreciation
UnrealizedDepreciation
Bank of America N.A. 7/3/2019 280,326 USD 281,173 CHF $ � $ (8,084 )Bank of America N.A. 7/3/2019 47,827 USD 319,651 DKK � (949 )Bank of America N.A. 7/3/2019 952,580 USD 852,729 EUR � (18,590 )Bank of America N.A. 7/3/2019 681,644 USD 539,992 GBP � (5,640 )Bank of America N.A. 7/3/2019 57,269 USD 500,779 NOK � (1,468 )Bank of America N.A. 7/3/2019 106,009 USD 1,006,649 SEK � (2,495 )Bank of Montreal 7/1/2019 4,344 USD 4,241 CHF � (6 )Bank of Montreal 7/1/2019 7,380 USD 6,490 EUR � (11 )Bank of Montreal 7/1/2019 4,868 USD 3,842 GBP � (21 )Bank of Montreal 7/3/2019 271,830 USD 215,542 GBP � (2,504 )Barclays Bank PLC 7/3/2019 2,325,940 NOK 272,710 USD 103 �
Copyright © 2019 www.secdatabase.com. All Rights Reserved.Please Consider the Environment Before Printing This Document
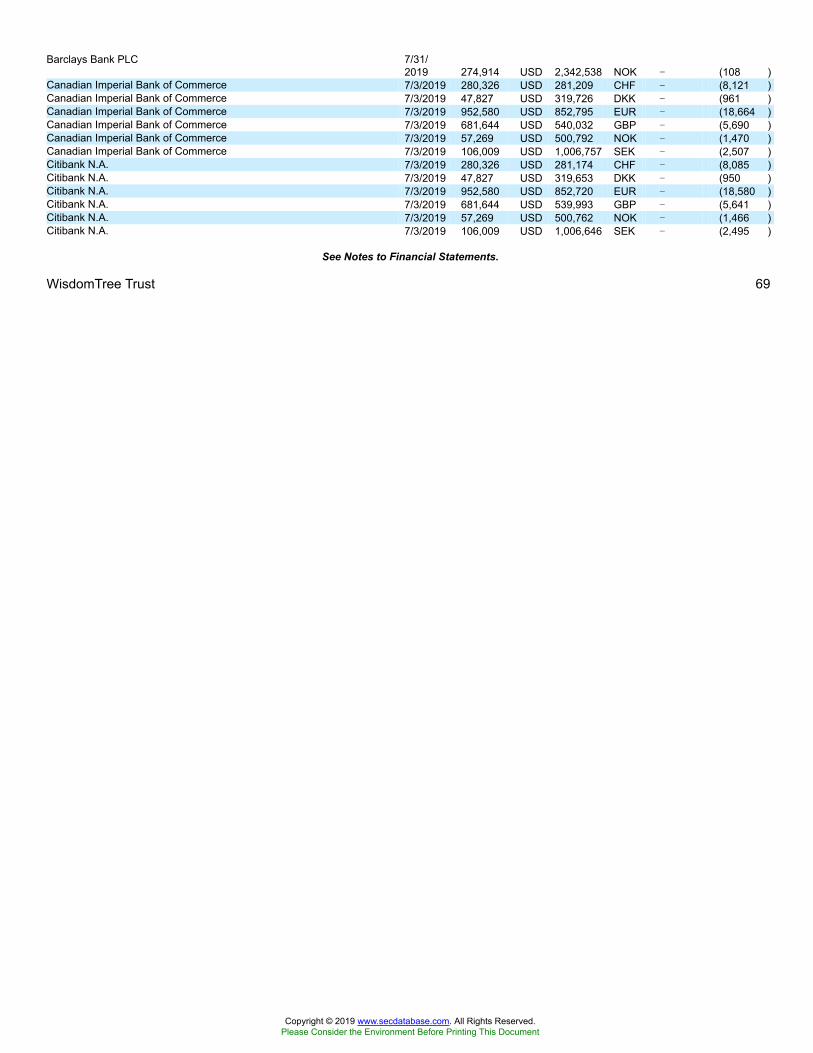
Barclays Bank PLC 7/31/2019 274,914 USD 2,342,538 NOK � (108 )
Canadian Imperial Bank of Commerce 7/3/2019 280,326 USD 281,209 CHF � (8,121 )Canadian Imperial Bank of Commerce 7/3/2019 47,827 USD 319,726 DKK � (961 )Canadian Imperial Bank of Commerce 7/3/2019 952,580 USD 852,795 EUR � (18,664 )Canadian Imperial Bank of Commerce 7/3/2019 681,644 USD 540,032 GBP � (5,690 )Canadian Imperial Bank of Commerce 7/3/2019 57,269 USD 500,792 NOK � (1,470 )Canadian Imperial Bank of Commerce 7/3/2019 106,009 USD 1,006,757 SEK � (2,507 )Citibank N.A. 7/3/2019 280,326 USD 281,174 CHF � (8,085 )Citibank N.A. 7/3/2019 47,827 USD 319,653 DKK � (950 )Citibank N.A. 7/3/2019 952,580 USD 852,720 EUR � (18,580 )Citibank N.A. 7/3/2019 681,644 USD 539,993 GBP � (5,641 )Citibank N.A. 7/3/2019 57,269 USD 500,762 NOK � (1,466 )Citibank N.A. 7/3/2019 106,009 USD 1,006,646 SEK � (2,495 )
See Notes to Financial Statements.
WisdomTree Trust 69
Copyright © 2019 www.secdatabase.com. All Rights Reserved.Please Consider the Environment Before Printing This Document
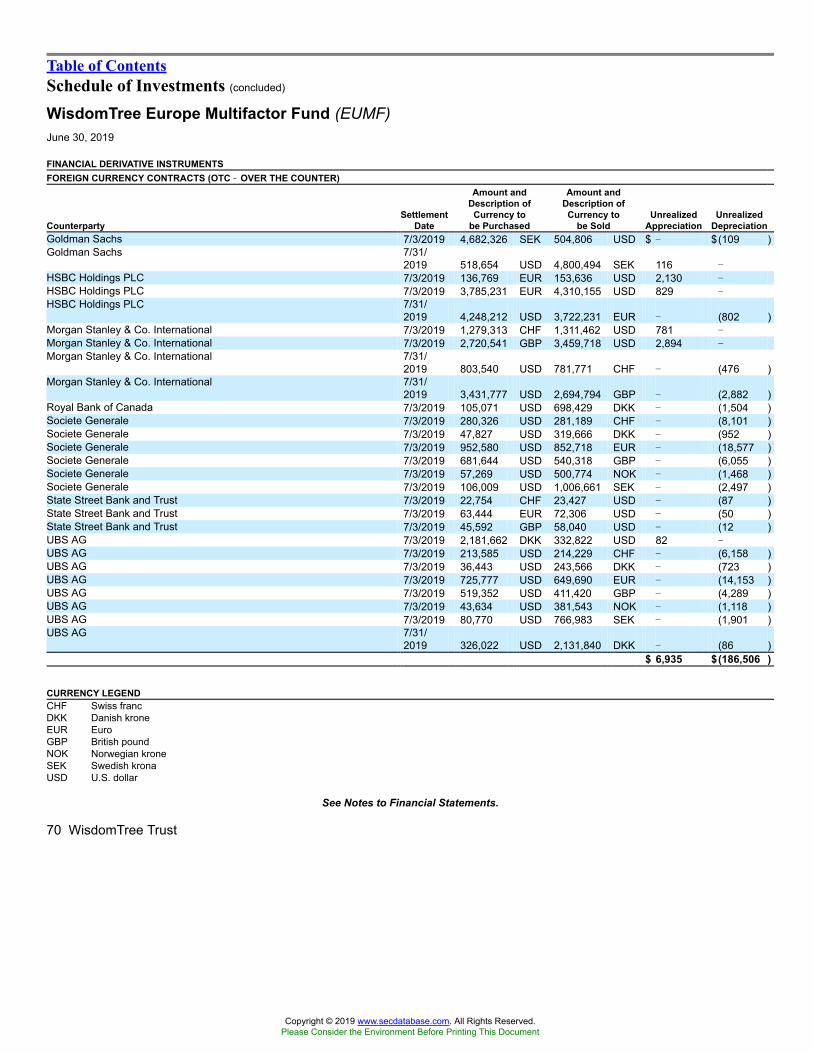
Table of ContentsSchedule of Investments (concluded)
WisdomTree Europe Multifactor Fund (EUMF)June 30, 2019
FINANCIAL DERIVATIVE INSTRUMENTSFOREIGN CURRENCY CONTRACTS (OTC �� OVER THE COUNTER)
CounterpartySettlement
Date
Amount andDescription of
Currency tobe Purchased
Amount andDescription of
Currency tobe Sold
UnrealizedAppreciation
UnrealizedDepreciation
Goldman Sachs 7/3/2019 4,682,326 SEK 504,806 USD $ � $(109 )Goldman Sachs 7/31/
2019 518,654 USD 4,800,494 SEK 116 �HSBC Holdings PLC 7/3/2019 136,769 EUR 153,636 USD 2,130 �HSBC Holdings PLC 7/3/2019 3,785,231 EUR 4,310,155 USD 829 �HSBC Holdings PLC 7/31/
2019 4,248,212 USD 3,722,231 EUR � (802 )Morgan Stanley & Co. International 7/3/2019 1,279,313 CHF 1,311,462 USD 781 �Morgan Stanley & Co. International 7/3/2019 2,720,541 GBP 3,459,718 USD 2,894 �Morgan Stanley & Co. International 7/31/
2019 803,540 USD 781,771 CHF � (476 )Morgan Stanley & Co. International 7/31/
2019 3,431,777 USD 2,694,794 GBP � (2,882 )Royal Bank of Canada 7/3/2019 105,071 USD 698,429 DKK � (1,504 )Societe Generale 7/3/2019 280,326 USD 281,189 CHF � (8,101 )Societe Generale 7/3/2019 47,827 USD 319,666 DKK � (952 )Societe Generale 7/3/2019 952,580 USD 852,718 EUR � (18,577 )Societe Generale 7/3/2019 681,644 USD 540,318 GBP � (6,055 )Societe Generale 7/3/2019 57,269 USD 500,774 NOK � (1,468 )Societe Generale 7/3/2019 106,009 USD 1,006,661 SEK � (2,497 )State Street Bank and Trust 7/3/2019 22,754 CHF 23,427 USD � (87 )State Street Bank and Trust 7/3/2019 63,444 EUR 72,306 USD � (50 )State Street Bank and Trust 7/3/2019 45,592 GBP 58,040 USD � (12 )UBS AG 7/3/2019 2,181,662 DKK 332,822 USD 82 �UBS AG 7/3/2019 213,585 USD 214,229 CHF � (6,158 )UBS AG 7/3/2019 36,443 USD 243,566 DKK � (723 )UBS AG 7/3/2019 725,777 USD 649,690 EUR � (14,153 )UBS AG 7/3/2019 519,352 USD 411,420 GBP � (4,289 )UBS AG 7/3/2019 43,634 USD 381,543 NOK � (1,118 )UBS AG 7/3/2019 80,770 USD 766,983 SEK � (1,901 )UBS AG 7/31/
2019 326,022 USD 2,131,840 DKK � (86 )$ 6,935 $(186,506 )
CURRENCY LEGENDCHF Swiss francDKK Danish kroneEUR EuroGBP British poundNOK Norwegian kroneSEK Swedish kronaUSD U.S. dollar
See Notes to Financial Statements.
70 WisdomTree Trust
Copyright © 2019 www.secdatabase.com. All Rights Reserved.Please Consider the Environment Before Printing This Document
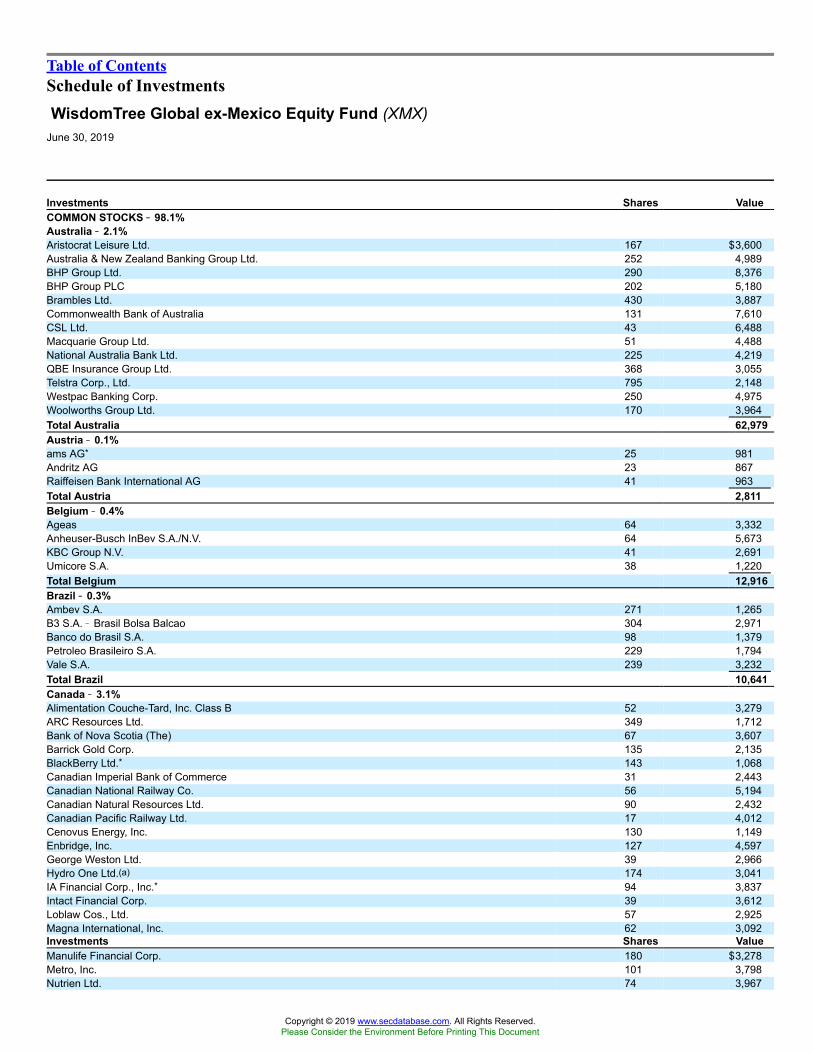
Table of ContentsSchedule of InvestmentsWisdomTree Global ex-Mexico Equity Fund (XMX)
June 30, 2019
Investments Shares ValueCOMMON STOCKS �� 98.1%Australia �� 2.1%Aristocrat Leisure Ltd. 167 $3,600Australia & New Zealand Banking Group Ltd. 252 4,989BHP Group Ltd. 290 8,376BHP Group PLC 202 5,180Brambles Ltd. 430 3,887Commonwealth Bank of Australia 131 7,610CSL Ltd. 43 6,488Macquarie Group Ltd. 51 4,488National Australia Bank Ltd. 225 4,219QBE Insurance Group Ltd. 368 3,055Telstra Corp., Ltd. 795 2,148Westpac Banking Corp. 250 4,975Woolworths Group Ltd. 170 3,964Total Australia 62,979Austria �� 0.1%ams AG* 25 981Andritz AG 23 867Raiffeisen Bank International AG 41 963Total Austria 2,811Belgium �� 0.4%Ageas 64 3,332Anheuser-Busch InBev S.A./N.V. 64 5,673KBC Group N.V. 41 2,691Umicore S.A. 38 1,220Total Belgium 12,916Brazil �� 0.3%Ambev S.A. 271 1,265B3 S.A. � Brasil Bolsa Balcao 304 2,971Banco do Brasil S.A. 98 1,379Petroleo Brasileiro S.A. 229 1,794Vale S.A. 239 3,232Total Brazil 10,641Canada �� 3.1%Alimentation Couche-Tard, Inc. Class B 52 3,279ARC Resources Ltd. 349 1,712Bank of Nova Scotia (The) 67 3,607Barrick Gold Corp. 135 2,135BlackBerry Ltd.* 143 1,068Canadian Imperial Bank of Commerce 31 2,443Canadian National Railway Co. 56 5,194Canadian Natural Resources Ltd. 90 2,432Canadian Pacific Railway Ltd. 17 4,012Cenovus Energy, Inc. 130 1,149Enbridge, Inc. 127 4,597George Weston Ltd. 39 2,966Hydro One Ltd.(a) 174 3,041IA Financial Corp., Inc.* 94 3,837Intact Financial Corp. 39 3,612Loblaw Cos., Ltd. 57 2,925Magna International, Inc. 62 3,092Investments Shares ValueManulife Financial Corp. 180 $3,278Metro, Inc. 101 3,798Nutrien Ltd. 74 3,967
Copyright © 2019 www.secdatabase.com. All Rights Reserved.Please Consider the Environment Before Printing This Document

Ritchie Bros Auctioneers, Inc. 75 2,500Royal Bank of Canada 66 5,256Saputo, Inc. 104 3,120Shopify, Inc. Class A* 9 2,711SNC-Lavalin Group, Inc. 78 1,581Suncor Energy, Inc. 146 4,564TC Energy Corp. 77 3,825Toronto-Dominion Bank (The) 85 4,977Wheaton Precious Metals Corp. 137 3,320Total Canada 93,998Chile �� 0.1%Banco Santander Chile 24,205 1,800China �� 2.2%Bank of China Ltd. Class H 10,000 4,224China Conch Venture Holdings Ltd. 500 1,766China Construction Bank Corp. Class H 8,000 6,891China Petroleum & Chemical Corp. Class H 4,000 2,719CNOOC Ltd. 1,000 1,710Country Garden Holdings Co., Ltd. 1,000 1,521CSPC Pharmaceutical Group Ltd. 2,000 3,226ENN Energy Holdings Ltd. 100 973Geely Automobile Holdings Ltd. 1,000 1,710Industrial & Commercial Bank of China Ltd. Class H 7,000 5,107Lenovo Group Ltd. 2,000 1,549Shenzhou International Group Holdings Ltd. 300 4,124Sino Biopharmaceutical Ltd. 2,000 2,045Sunny Optical Technology Group Co., Ltd. 100 1,033Tencent Holdings Ltd. 500 22,566Want Want China Holdings Ltd. 2,000 1,626Yum China Holdings, Inc. 55 2,541Total China 65,331Denmark �� 0.5%DSV A/S 33 3,245ISS A/S 93 2,811Novo Nordisk A/S Class B 130 6,635Pandora A/S 17 606Vestas Wind Systems A/S 21 1,817Total Denmark 15,114Finland �� 0.4%Elisa Oyj 66 3,225Nokia Oyj 533 2,650Nordea Bank Abp 241 1,751Orion Oyj Class B 27 991Stora Enso Oyj Class R 106 1,248UPM-Kymmene Oyj 69 1,836Total Finland 11,701France �� 3.7%Accor S.A. 65 2,794Air Liquide S.A. 35 4,905
See Notes to Financial Statements.
WisdomTree Trust 71
Copyright © 2019 www.secdatabase.com. All Rights Reserved.Please Consider the Environment Before Printing This Document
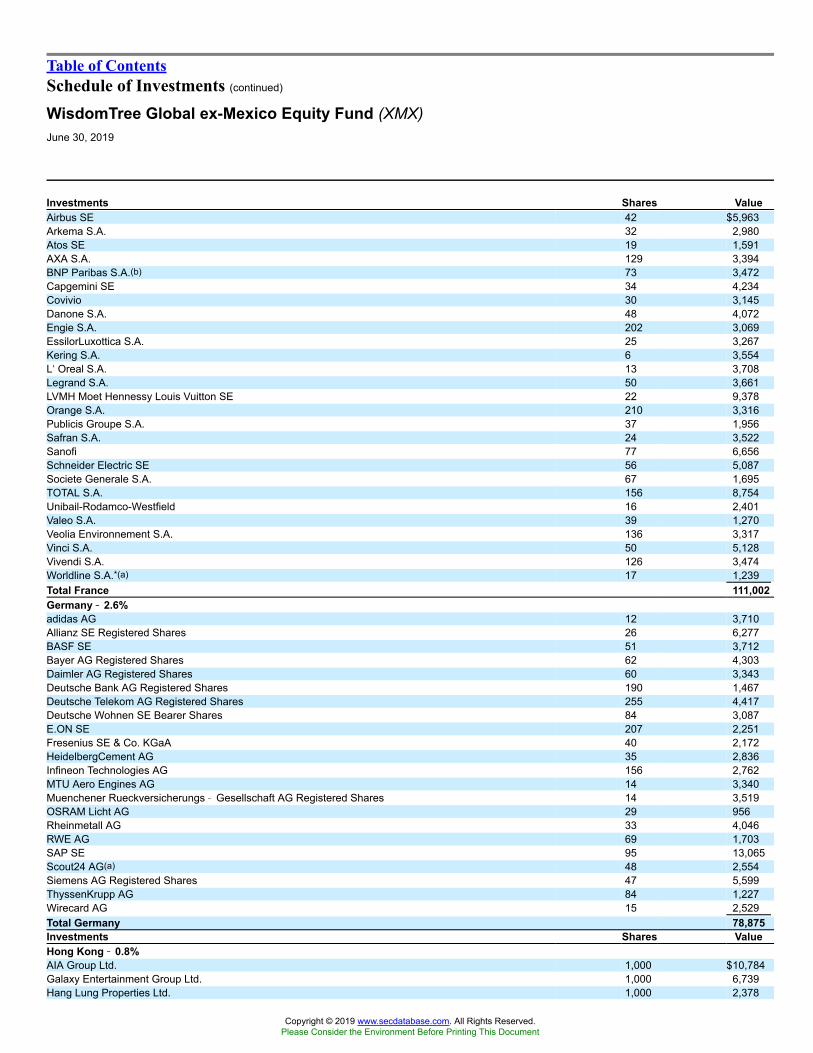
Table of ContentsSchedule of Investments (continued)
WisdomTree Global ex-Mexico Equity Fund (XMX)June 30, 2019
Investments Shares ValueAirbus SE 42 $5,963Arkema S.A. 32 2,980Atos SE 19 1,591AXA S.A. 129 3,394BNP Paribas S.A.(b) 73 3,472Capgemini SE 34 4,234Covivio 30 3,145Danone S.A. 48 4,072Engie S.A. 202 3,069EssilorLuxottica S.A. 25 3,267Kering S.A. 6 3,554L�Oreal S.A. 13 3,708Legrand S.A. 50 3,661LVMH Moet Hennessy Louis Vuitton SE 22 9,378Orange S.A. 210 3,316Publicis Groupe S.A. 37 1,956Safran S.A. 24 3,522Sanofi 77 6,656Schneider Electric SE 56 5,087Societe Generale S.A. 67 1,695TOTAL S.A. 156 8,754Unibail-Rodamco-Westfield 16 2,401Valeo S.A. 39 1,270Veolia Environnement S.A. 136 3,317Vinci S.A. 50 5,128Vivendi S.A. 126 3,474Worldline S.A.*(a) 17 1,239Total France 111,002Germany �� 2.6%adidas AG 12 3,710Allianz SE Registered Shares 26 6,277BASF SE 51 3,712Bayer AG Registered Shares 62 4,303Daimler AG Registered Shares 60 3,343Deutsche Bank AG Registered Shares 190 1,467Deutsche Telekom AG Registered Shares 255 4,417Deutsche Wohnen SE Bearer Shares 84 3,087E.ON SE 207 2,251Fresenius SE & Co. KGaA 40 2,172HeidelbergCement AG 35 2,836Infineon Technologies AG 156 2,762MTU Aero Engines AG 14 3,340Muenchener Rueckversicherungs � Gesellschaft AG Registered Shares 14 3,519OSRAM Licht AG 29 956Rheinmetall AG 33 4,046RWE AG 69 1,703SAP SE 95 13,065Scout24 AG(a) 48 2,554Siemens AG Registered Shares 47 5,599ThyssenKrupp AG 84 1,227Wirecard AG 15 2,529Total Germany 78,875Investments Shares ValueHong Kong �� 0.8%AIA Group Ltd. 1,000 $10,784Galaxy Entertainment Group Ltd. 1,000 6,739Hang Lung Properties Ltd. 1,000 2,378
Copyright © 2019 www.secdatabase.com. All Rights Reserved.Please Consider the Environment Before Printing This Document

Hong Kong Exchanges & Clearing Ltd. 102 3,601Total Hong Kong 23,502India �� 1.0%Axis Bank Ltd.* 241 2,823HDFC Bank Ltd. 161 5,700IndusInd Bank Ltd. 139 2,840Infosys Ltd. 372 3,945Larsen & Toubro Ltd. 125 2,812Maruti Suzuki India Ltd. 21 1,988Reliance Industries Ltd. 285 5,174Tata Consultancy Services Ltd. 113 3,646Total India 28,928Ireland �� 0.2%CRH PLC 61 1,993Kingspan Group PLC 44 2,393Smurfit Kappa Group PLC 49 1,485Total Ireland 5,871Israel �� 0.1%Nice Ltd.* 19 2,584Teva Pharmaceutical Industries Ltd.* 51 468Total Israel 3,052Italy �� 0.6%Assicurazioni Generali SpA 171 3,225Eni SpA 193 3,210Ferrari N.V. 12 1,951Intesa Sanpaolo SpA 975 2,089Moncler SpA 57 2,441Snam SpA 822 4,092UniCredit SpA 182 2,244Total Italy 19,252Japan �� 7.4%Ajinomoto Co., Inc. 100 1,734Astellas Pharma, Inc. 300 4,274Bridgestone Corp. 100 3,937Chugoku Electric Power Co., Inc. (The) 300 3,781Daikin Industries Ltd. 100 13,055Eisai Co., Ltd. 100 5,653Hitachi Ltd. 200 7,331Honda Motor Co., Ltd. 200 5,170Hoya Corp. 100 7,661Isetan Mitsukoshi Holdings Ltd. 100 811ITOCHU Corp. 300 5,737Japan Exchange Group, Inc. 200 3,178Kansai Paint Co., Ltd. 100 2,097KDDI Corp. 200 5,093Kintetsu Group Holdings Co., Ltd. 100 4,789Kirin Holdings Co., Ltd. 200 4,313Koito Manufacturing Co., Ltd. 100 5,337
See Notes to Financial Statements.
72 WisdomTree Trust
Copyright © 2019 www.secdatabase.com. All Rights Reserved.Please Consider the Environment Before Printing This Document
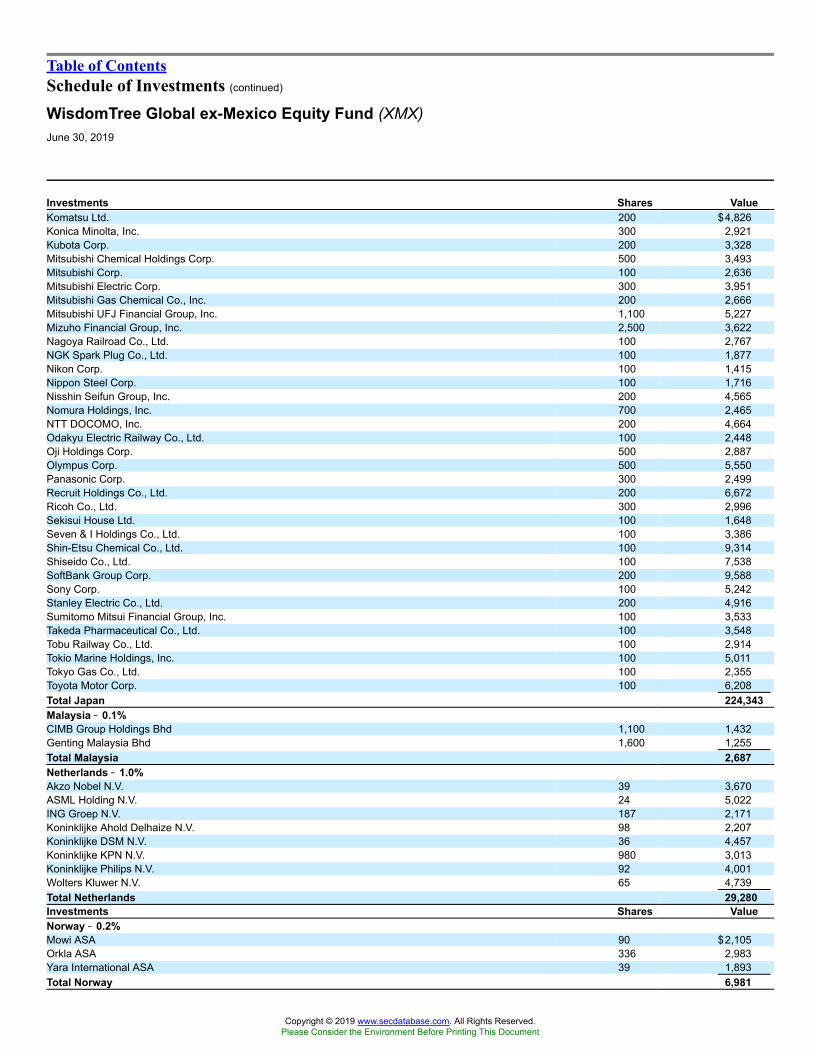
Table of ContentsSchedule of Investments (continued)
WisdomTree Global ex-Mexico Equity Fund (XMX)June 30, 2019
Investments Shares ValueKomatsu Ltd. 200 $4,826Konica Minolta, Inc. 300 2,921Kubota Corp. 200 3,328Mitsubishi Chemical Holdings Corp. 500 3,493Mitsubishi Corp. 100 2,636Mitsubishi Electric Corp. 300 3,951Mitsubishi Gas Chemical Co., Inc. 200 2,666Mitsubishi UFJ Financial Group, Inc. 1,100 5,227Mizuho Financial Group, Inc. 2,500 3,622Nagoya Railroad Co., Ltd. 100 2,767NGK Spark Plug Co., Ltd. 100 1,877Nikon Corp. 100 1,415Nippon Steel Corp. 100 1,716Nisshin Seifun Group, Inc. 200 4,565Nomura Holdings, Inc. 700 2,465NTT DOCOMO, Inc. 200 4,664Odakyu Electric Railway Co., Ltd. 100 2,448Oji Holdings Corp. 500 2,887Olympus Corp. 500 5,550Panasonic Corp. 300 2,499Recruit Holdings Co., Ltd. 200 6,672Ricoh Co., Ltd. 300 2,996Sekisui House Ltd. 100 1,648Seven & I Holdings Co., Ltd. 100 3,386Shin-Etsu Chemical Co., Ltd. 100 9,314Shiseido Co., Ltd. 100 7,538SoftBank Group Corp. 200 9,588Sony Corp. 100 5,242Stanley Electric Co., Ltd. 200 4,916Sumitomo Mitsui Financial Group, Inc. 100 3,533Takeda Pharmaceutical Co., Ltd. 100 3,548Tobu Railway Co., Ltd. 100 2,914Tokio Marine Holdings, Inc. 100 5,011Tokyo Gas Co., Ltd. 100 2,355Toyota Motor Corp. 100 6,208Total Japan 224,343Malaysia �� 0.1%CIMB Group Holdings Bhd 1,100 1,432Genting Malaysia Bhd 1,600 1,255Total Malaysia 2,687Netherlands �� 1.0%Akzo Nobel N.V. 39 3,670ASML Holding N.V. 24 5,022ING Groep N.V. 187 2,171Koninklijke Ahold Delhaize N.V. 98 2,207Koninklijke DSM N.V. 36 4,457Koninklijke KPN N.V. 980 3,013Koninklijke Philips N.V. 92 4,001Wolters Kluwer N.V. 65 4,739Total Netherlands 29,280Investments Shares ValueNorway �� 0.2%Mowi ASA 90 $2,105Orkla ASA 336 2,983Yara International ASA 39 1,893Total Norway 6,981
Copyright © 2019 www.secdatabase.com. All Rights Reserved.Please Consider the Environment Before Printing This Document

Poland �� 0.0%Polski Koncern Naftowy Orlen S.A. 46 1,110Singapore �� 0.4%City Developments Ltd. 400 2,800Genting Singapore Ltd. 1,600 1,088Keppel Corp., Ltd. 500 2,461Oversea-Chinese Banking Corp., Ltd. 274 2,309Singapore Exchange Ltd. 600 3,512Total Singapore 12,170South Africa �� 0.6%FirstRand Ltd. 403 1,959MTN Group Ltd. 198 1,499MultiChoice Group Ltd.* 130 1,235Naspers Ltd. Class N 30 7,275Remgro Ltd. 209 2,785Sasol Ltd. 52 1,292Standard Bank Group Ltd. 107 1,492Total South Africa 17,537South Korea �� 1.4%Celltrion, Inc.* 8 1,424Hana Financial Group, Inc. 58 1,879Hyundai Motor Co. 18 2,182Kakao Corp. 14 1,594KT&G Corp. 28 2,389LG Electronics, Inc. 25 1,717LG Household & Health Care Ltd. 2 2,274NAVER Corp. 18 1,777POSCO 10 2,118Samsung Electronics Co., Ltd. 393 15,997Samsung Fire & Marine Insurance Co., Ltd. 8 1,857Shinhan Financial Group Co., Ltd. 84 3,266SK Hynix, Inc. 42 2,528Total South Korea 41,002Spain �� 0.8%Banco Bilbao Vizcaya Argentaria S.A. 549 3,074Banco Santander S.A. 1,088 5,056Enagas S.A. 124 3,314Industria de Diseno Textil S.A. 92 2,771Red Electrica Corp. S.A. 167 3,483Repsol S.A. 231 3,626Telefonica S.A. 405 3,331Total Spain 24,655Sweden �� 0.7%Assa Abloy AB Class B 144 3,258Atlas Copco AB Class A 116 3,711Castellum AB 247 4,726
See Notes to Financial Statements.
WisdomTree Trust 73
Copyright © 2019 www.secdatabase.com. All Rights Reserved.Please Consider the Environment Before Printing This Document

Table of ContentsSchedule of Investments (continued)
WisdomTree Global ex-Mexico Equity Fund (XMX)June 30, 2019
Investments Shares ValueSecuritas AB Class B 197 $ 3,459Telefonaktiebolaget LM Ericsson Class B 306 2,905Volvo AB Class B 202 3,208Total Sweden 21,267Switzerland �� 3.0%ABB Ltd. Registered Shares 183 3,677Adecco Group AG Registered Shares 54 3,249Alcon, Inc.* 32 1,979Cie Financiere Richemont S.A. Registered Shares 49 4,163Credit Suisse Group AG Registered Shares* 218 2,617Givaudan S.A. Registered Shares 2 5,653LafargeHolcim Ltd. Registered Shares* 63 3,080Nestle S.A. Registered Shares 207 21,456Novartis AG Registered Shares 163 14,912Roche Holding AG Genusschein 40 11,268Schindler Holding AG Participation Certificate 15 3,343Swatch Group AG (The) Registered Shares 50 2,710Temenos AG Registered Shares* 19 3,404UBS Group AG Registered Shares* 314 3,736Zurich Insurance Group AG 13 4,532Total Switzerland 89,779Taiwan �� 1.0%China Development Financial Holding Corp. 12,000 3,659E.Sun Financial Holding Co., Ltd. 5,005 4,190Pegatron Corp. 1,000 1,729Taishin Financial Holding Co., Ltd. 7,898 3,636Taiwan Semiconductor Manufacturing Co., Ltd. 2,000 15,390United Microelectronics Corp. 5,000 2,245Total Taiwan 30,849Thailand �� 0.1%PTT Global Chemical PCL NVDR 1,100 2,296United Kingdom �� 5.7%Anglo American PLC 151 4,313AstraZeneca PLC 93 7,620Babcock International Group PLC 289 1,685BAE Systems PLC 337 2,125Barclays PLC 1,229 2,343BP PLC 1,212 8,462British American Tobacco PLC 161 5,633BT Group PLC 767 1,918Bunzl PLC 107 2,828Carnival PLC 50 2,214Centrica PLC 785 877Cobham PLC* 1,474 1,999Compass Group PLC 190 4,563Diageo PLC 166 7,149Fiat Chrysler Automobiles N.V. 92 1,285GlaxoSmithKline PLC 315 6,321Hays PLC 1,044 2,087HSBC Holdings PLC 1,175 9,824Imperial Brands PLC 82 1,927Intertek Group PLC 56 3,921Investments Shares ValueITV PLC 1,130 $ 1,553Kingfisher PLC 683 1,868Land Securities Group PLC 253 2,683
Copyright © 2019 www.secdatabase.com. All Rights Reserved.Please Consider the Environment Before Printing This Document
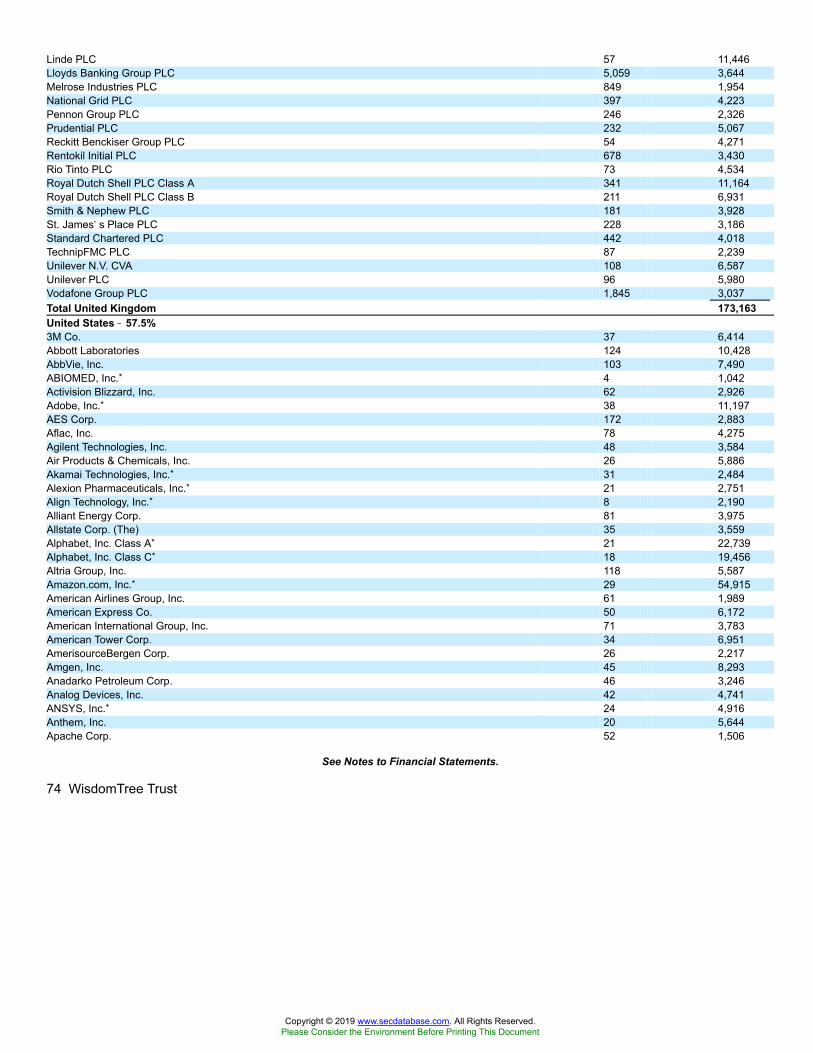
Linde PLC 57 11,446Lloyds Banking Group PLC 5,059 3,644Melrose Industries PLC 849 1,954National Grid PLC 397 4,223Pennon Group PLC 246 2,326Prudential PLC 232 5,067Reckitt Benckiser Group PLC 54 4,271Rentokil Initial PLC 678 3,430Rio Tinto PLC 73 4,534Royal Dutch Shell PLC Class A 341 11,164Royal Dutch Shell PLC Class B 211 6,931Smith & Nephew PLC 181 3,928St. James�s Place PLC 228 3,186Standard Chartered PLC 442 4,018TechnipFMC PLC 87 2,239Unilever N.V. CVA 108 6,587Unilever PLC 96 5,980Vodafone Group PLC 1,845 3,037Total United Kingdom 173,163United States �� 57.5%3M Co. 37 6,414Abbott Laboratories 124 10,428AbbVie, Inc. 103 7,490ABIOMED, Inc.* 4 1,042Activision Blizzard, Inc. 62 2,926Adobe, Inc.* 38 11,197AES Corp. 172 2,883Aflac, Inc. 78 4,275Agilent Technologies, Inc. 48 3,584Air Products & Chemicals, Inc. 26 5,886Akamai Technologies, Inc.* 31 2,484Alexion Pharmaceuticals, Inc.* 21 2,751Align Technology, Inc.* 8 2,190Alliant Energy Corp. 81 3,975Allstate Corp. (The) 35 3,559Alphabet, Inc. Class A* 21 22,739Alphabet, Inc. Class C* 18 19,456Altria Group, Inc. 118 5,587Amazon.com, Inc.* 29 54,915American Airlines Group, Inc. 61 1,989American Express Co. 50 6,172American International Group, Inc. 71 3,783American Tower Corp. 34 6,951AmerisourceBergen Corp. 26 2,217Amgen, Inc. 45 8,293Anadarko Petroleum Corp. 46 3,246Analog Devices, Inc. 42 4,741ANSYS, Inc.* 24 4,916Anthem, Inc. 20 5,644Apache Corp. 52 1,506
See Notes to Financial Statements.
74 WisdomTree Trust
Copyright © 2019 www.secdatabase.com. All Rights Reserved.Please Consider the Environment Before Printing This Document
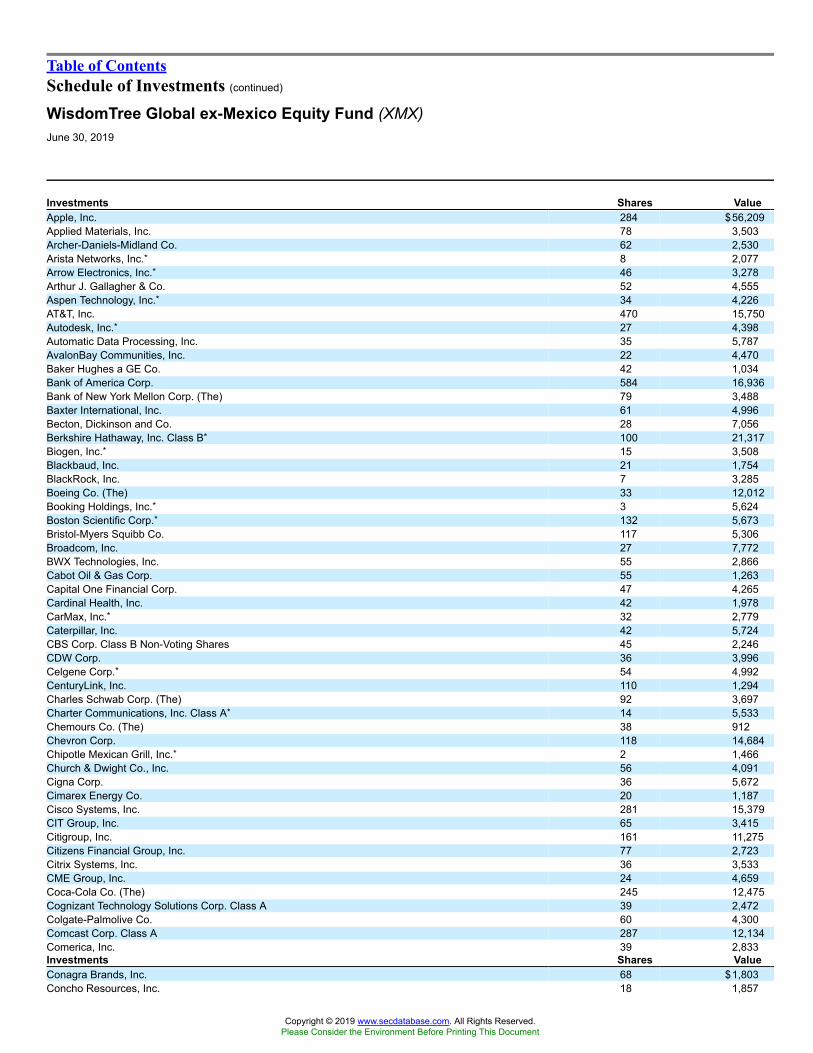
Table of ContentsSchedule of Investments (continued)
WisdomTree Global ex-Mexico Equity Fund (XMX)June 30, 2019
Investments Shares ValueApple, Inc. 284 $56,209Applied Materials, Inc. 78 3,503Archer-Daniels-Midland Co. 62 2,530Arista Networks, Inc.* 8 2,077Arrow Electronics, Inc.* 46 3,278Arthur J. Gallagher & Co. 52 4,555Aspen Technology, Inc.* 34 4,226AT&T, Inc. 470 15,750Autodesk, Inc.* 27 4,398Automatic Data Processing, Inc. 35 5,787AvalonBay Communities, Inc. 22 4,470Baker Hughes a GE Co. 42 1,034Bank of America Corp. 584 16,936Bank of New York Mellon Corp. (The) 79 3,488Baxter International, Inc. 61 4,996Becton, Dickinson and Co. 28 7,056Berkshire Hathaway, Inc. Class B* 100 21,317Biogen, Inc.* 15 3,508Blackbaud, Inc. 21 1,754BlackRock, Inc. 7 3,285Boeing Co. (The) 33 12,012Booking Holdings, Inc.* 3 5,624Boston Scientific Corp.* 132 5,673Bristol-Myers Squibb Co. 117 5,306Broadcom, Inc. 27 7,772BWX Technologies, Inc. 55 2,866Cabot Oil & Gas Corp. 55 1,263Capital One Financial Corp. 47 4,265Cardinal Health, Inc. 42 1,978CarMax, Inc.* 32 2,779Caterpillar, Inc. 42 5,724CBS Corp. Class B Non-Voting Shares 45 2,246CDW Corp. 36 3,996Celgene Corp.* 54 4,992CenturyLink, Inc. 110 1,294Charles Schwab Corp. (The) 92 3,697Charter Communications, Inc. Class A* 14 5,533Chemours Co. (The) 38 912Chevron Corp. 118 14,684Chipotle Mexican Grill, Inc.* 2 1,466Church & Dwight Co., Inc. 56 4,091Cigna Corp. 36 5,672Cimarex Energy Co. 20 1,187Cisco Systems, Inc. 281 15,379CIT Group, Inc. 65 3,415Citigroup, Inc. 161 11,275Citizens Financial Group, Inc. 77 2,723Citrix Systems, Inc. 36 3,533CME Group, Inc. 24 4,659Coca-Cola Co. (The) 245 12,475Cognizant Technology Solutions Corp. Class A 39 2,472Colgate-Palmolive Co. 60 4,300Comcast Corp. Class A 287 12,134Comerica, Inc. 39 2,833Investments Shares ValueConagra Brands, Inc. 68 $1,803Concho Resources, Inc. 18 1,857
Copyright © 2019 www.secdatabase.com. All Rights Reserved.Please Consider the Environment Before Printing This Document

ConocoPhillips 81 4,941Constellation Brands, Inc. Class A 14 2,757Corning, Inc. 122 4,054Corteva, Inc.* 53 1,567Costco Wholesale Corp. 29 7,664Crown Castle International Corp. 38 4,953CSX Corp. 68 5,261Cummins, Inc. 19 3,255CVS Health Corp. 108 5,885D.R. Horton, Inc. 71 3,062Danaher Corp. 45 6,431DaVita, Inc.* 31 1,744Deere & Co. 25 4,143Dell Technologies, Inc. Class C* 33 1,676Delta Air Lines, Inc. 66 3,746Dentsply Sirona, Inc. 46 2,685Devon Energy Corp. 68 1,939DexCom, Inc.* 11 1,648Digital Realty Trust, Inc. 18 2,120Dollar General Corp. 35 4,731Dollar Tree, Inc.* 26 2,792Dominion Energy, Inc. 69 5,335Dover Corp. 38 3,808Dow, Inc.* 53 2,613Duke Energy Corp. 65 5,736DuPont de Nemours, Inc. 53 3,979DXC Technology Co. 29 1,599E*TRADE Financial Corp. 53 2,364Eaton Vance Corp. 68 2,933eBay, Inc. 91 3,595Edwards Lifesciences Corp.* 18 3,325Electronic Arts, Inc.* 27 2,734Eli Lilly & Co. 66 7,312Emerson Electric Co. 70 4,670EOG Resources, Inc. 38 3,540EPR Properties 47 3,506Equinix, Inc. 9 4,539Estee Lauder Cos., Inc. (The) Class A 21 3,845Evergy, Inc. 58 3,489Exelon Corp. 115 5,513Expeditors International of Washington, Inc. 51 3,869Exxon Mobil Corp. 267 20,460F5 Networks, Inc.* 21 3,058Facebook, Inc. Class A* 161 31,073FedEx Corp. 19 3,120Fifth Third Bancorp 123 3,432First Republic Bank 28 2,734FirstEnergy Corp. 80 3,425FleetCor Technologies, Inc.* 14 3,932Ford Motor Co. 339 3,468Fox Corp. Class A 34 1,246Freeport-McMoRan, Inc. 166 1,927
See Notes to Financial Statements.
WisdomTree Trust 75
Copyright © 2019 www.secdatabase.com. All Rights Reserved.Please Consider the Environment Before Printing This Document

Table of ContentsSchedule of Investments (continued)
WisdomTree Global ex-Mexico Equity Fund (XMX)June 30, 2019
Investments Shares ValueGartner, Inc.* 25 $4,024General Dynamics Corp. 23 4,182General Electric Co. 530 5,565General Motors Co. 99 3,814Gentex Corp. 116 2,855Genuine Parts Co. 37 3,832Gilead Sciences, Inc. 90 6,080Goldman Sachs Group, Inc. (The) 24 4,910Halliburton Co. 75 1,706Hartford Financial Services Group, Inc. (The) 55 3,065Hasbro, Inc. 20 2,114HCA Healthcare, Inc. 20 2,703Healthcare Realty Trust, Inc. 120 3,758HEICO Corp. Class A 21 2,171Hess Corp. 48 3,051Hewlett Packard Enterprise Co. 154 2,302Hexcel Corp. 47 3,801Home Depot, Inc. (The) 77 16,014Honeywell International, Inc. 48 8,380HP, Inc. 142 2,952Humana, Inc. 13 3,449Huntington Bancshares, Inc. 211 2,916IAC/InterActiveCorp* 11 2,393Illumina, Inc.* 15 5,522Incyte Corp.* 20 1,699Intel Corp. 289 13,834Intercontinental Exchange, Inc. 45 3,867International Business Machines Corp. 56 7,722International Paper Co. 57 2,469Intuit, Inc. 30 7,840Intuitive Surgical, Inc.* 10 5,246IQVIA Holdings, Inc.* 22 3,540J.M. Smucker Co. (The) 24 2,765Jack Henry & Associates, Inc. 24 3,214Jacobs Engineering Group, Inc. 28 2,363Johnson & Johnson 173 24,095JPMorgan Chase & Co. 212 23,702KeyCorp 150 2,663Kimberly-Clark Corp. 35 4,665Kinder Morgan, Inc. 169 3,529Kraft Heinz Co. (The) 38 1,180Kroger Co. (The) 78 1,693Lam Research Corp. 13 2,442Lear Corp. 16 2,228Lincoln National Corp. 41 2,642LKQ Corp.* 94 2,501Lockheed Martin Corp. 17 6,180Lowe�s Cos., Inc. 63 6,357M&T Bank Corp. 18 3,061Marathon Petroleum Corp. 46 2,570MarketAxess Holdings, Inc. 8 2,571Marriott International, Inc. Class A 34 4,770Masco Corp. 77 3,021MasterCard, Inc. Class A 64 16,930Investments Shares ValueMaxim Integrated Products, Inc. 53 $3,170McCormick & Co., Inc. Non-Voting Shares 21 3,255
Copyright © 2019 www.secdatabase.com. All Rights Reserved.Please Consider the Environment Before Printing This Document

McDonald�s Corp. 50 10,383McKesson Corp. 19 2,553Merck & Co., Inc. 161 13,500MetLife, Inc. 79 3,924Mettler-Toledo International, Inc.* 5 4,200MGM Resorts International 74 2,114Microchip Technology, Inc.(b) 30 2,601Micron Technology, Inc.* 84 3,242Microsoft Corp. 502 67,248Mohawk Industries, Inc.* 14 2,065Mondelez International, Inc. Class A 112 6,037Moody�s Corp. 23 4,492Morgan Stanley 95 4,162MSCI, Inc. 21 5,015National Retail Properties, Inc. 72 3,817Netflix, Inc.* 30 11,020Newmont Goldcorp Corp. 52 2,000NextEra Energy, Inc. 43 8,809NIKE, Inc. Class B 101 8,479Norfolk Southern Corp. 26 5,183Northrop Grumman Corp. 13 4,200Nucor Corp. 46 2,535NVIDIA Corp. 44 7,226O�Reilly Automotive, Inc.* 8 2,955Occidental Petroleum Corp. 60 3,017Omnicom Group, Inc. 40 3,278Oracle Corp. 178 10,141PayPal Holdings, Inc.* 90 10,301People�s United Financial, Inc. 198 3,322PepsiCo, Inc. 96 12,589Pfizer, Inc. 365 15,812Philip Morris International, Inc. 92 7,225Phillips 66 39 3,648Pinnacle West Capital Corp. 39 3,670Pioneer Natural Resources Co. 18 2,769PNC Financial Services Group, Inc. (The) 38 5,217Pool Corp. 16 3,056Portland General Electric Co. 74 4,009PPG Industries, Inc. 40 4,668PPL Corp. 82 2,543Principal Financial Group, Inc. 46 2,664Procter & Gamble Co. (The) 164 17,983Progressive Corp. (The) 58 4,636Prologis, Inc. 73 5,847Prudential Financial, Inc. 40 4,040Public Service Enterprise Group, Inc. 70 4,117Public Storage 18 4,287QUALCOMM, Inc. 84 6,390Qurate Retail, Inc.* 93 1,152Raytheon Co. 25 4,347Realty Income Corp. 52 3,586Red Hat, Inc.* 18 3,380
See Notes to Financial Statements.
76 WisdomTree Trust
Copyright © 2019 www.secdatabase.com. All Rights Reserved.Please Consider the Environment Before Printing This Document

Table of ContentsSchedule of Investments (concluded)
WisdomTree Global ex-Mexico Equity Fund (XMX)June 30, 2019
Investments Shares ValueRegency Centers Corp. 50 $3,337Regeneron Pharmaceuticals, Inc.* 7 2,191Regions Financial Corp. 199 2,973Resideo Technologies, Inc.* 45 986Rockwell Automation, Inc. 20 3,277Roper Technologies, Inc. 16 5,860Ross Stores, Inc. 40 3,965S&P Global, Inc. 25 5,695salesforce.com, Inc.* 61 9,256Sempra Energy 34 4,673Service Corp. International 77 3,602ServiceNow, Inc.* 14 3,844Sherwin-Williams Co. (The) 11 5,041Silicon Laboratories, Inc.* 27 2,792Simon Property Group, Inc. 28 4,473Snap-on, Inc. 14 2,319Southwest Airlines Co. 50 2,539Southwest Gas Holdings, Inc. 31 2,778Splunk, Inc.* 20 2,515Square, Inc. Class A* 36 2,611Starbucks Corp. 89 7,461State Street Corp. 38 2,130Stryker Corp. 26 5,345SunTrust Banks, Inc. 60 3,771Synchrony Financial 70 2,427Synopsys, Inc.* 44 5,662Sysco Corp. 45 3,182T. Rowe Price Group, Inc. 37 4,059Target Corp. 50 4,331Tesla, Inc.*(b) 10 2,235Texas Instruments, Inc. 65 7,459Thermo Fisher Scientific, Inc. 30 8,810Tractor Supply Co. 25 2,720Travelers Cos., Inc. (The) 23 3,439Twitter, Inc.* 53 1,850U.S. Bancorp 87 4,559Union Pacific Corp. 51 8,625United Continental Holdings, Inc.* 20 1,751United Parcel Service, Inc. Class B 42 4,337United Technologies Corp. 58 7,552UnitedHealth Group, Inc. 61 14,885Unum Group 64 2,147Valero Energy Corp. 43 3,681Ventas, Inc. 52 3,554Verizon Communications, Inc. 257 14,682Vertex Pharmaceuticals, Inc.* 25 4,585Visa, Inc. Class A 120 20,826Vulcan Materials Co. 20 2,746W.W. Grainger, Inc. 7 1,878Wabtec Corp. 12 861Walgreens Boots Alliance, Inc. 51 2,788Walmart, Inc. 84 9,281Walt Disney Co. (The) 126 17,595Wells Fargo & Co. 249 11,783Investments Shares ValueWelltower, Inc. 55 $4,484Western Digital Corp. 29 1,379
Copyright © 2019 www.secdatabase.com. All Rights Reserved.Please Consider the Environment Before Printing This Document
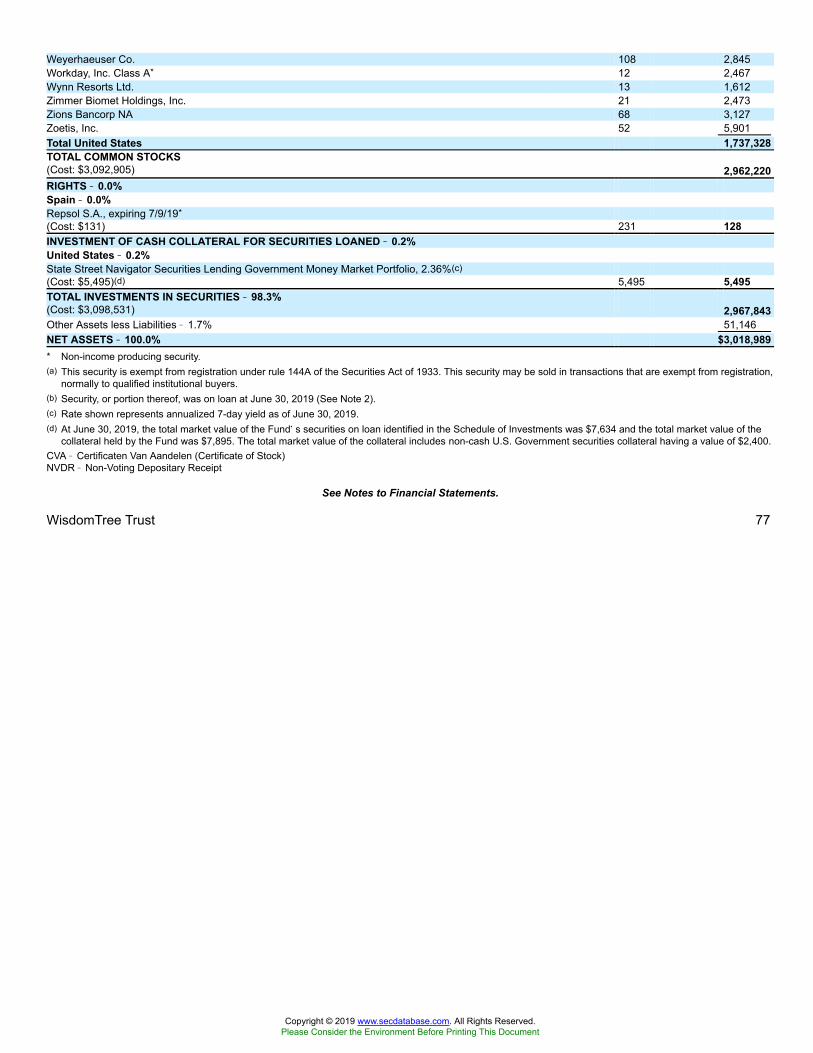
Weyerhaeuser Co. 108 2,845Workday, Inc. Class A* 12 2,467Wynn Resorts Ltd. 13 1,612Zimmer Biomet Holdings, Inc. 21 2,473Zions Bancorp NA 68 3,127Zoetis, Inc. 52 5,901Total United States 1,737,328TOTAL COMMON STOCKS(Cost: $3,092,905) 2,962,220RIGHTS �� 0.0%Spain �� 0.0%Repsol S.A., expiring 7/9/19*(Cost: $131) 231 128INVESTMENT OF CASH COLLATERAL FOR SECURITIES LOANED �� 0.2%United States �� 0.2%State Street Navigator Securities Lending Government Money Market Portfolio, 2.36%(c)(Cost: $5,495)(d) 5,495 5,495TOTAL INVESTMENTS IN SECURITIES �� 98.3%(Cost: $3,098,531) 2,967,843Other Assets less Liabilities � 1.7% 51,146NET ASSETS �� 100.0% $3,018,989* Non-income producing security.(a) This security is exempt from registration under rule 144A of the Securities Act of 1933. This security may be sold in transactions that are exempt from registration,
normally to qualified institutional buyers.(b) Security, or portion thereof, was on loan at June 30, 2019 (See Note 2).(c) Rate shown represents annualized 7-day yield as of June 30, 2019.(d) At June 30, 2019, the total market value of the Fund�s securities on loan identified in the Schedule of Investments was $7,634 and the total market value of the
collateral held by the Fund was $7,895. The total market value of the collateral includes non-cash U.S. Government securities collateral having a value of $2,400.CVA � Certificaten Van Aandelen (Certificate of Stock)NVDR � Non-Voting Depositary Receipt
See Notes to Financial Statements.
WisdomTree Trust 77
Copyright © 2019 www.secdatabase.com. All Rights Reserved.Please Consider the Environment Before Printing This Document
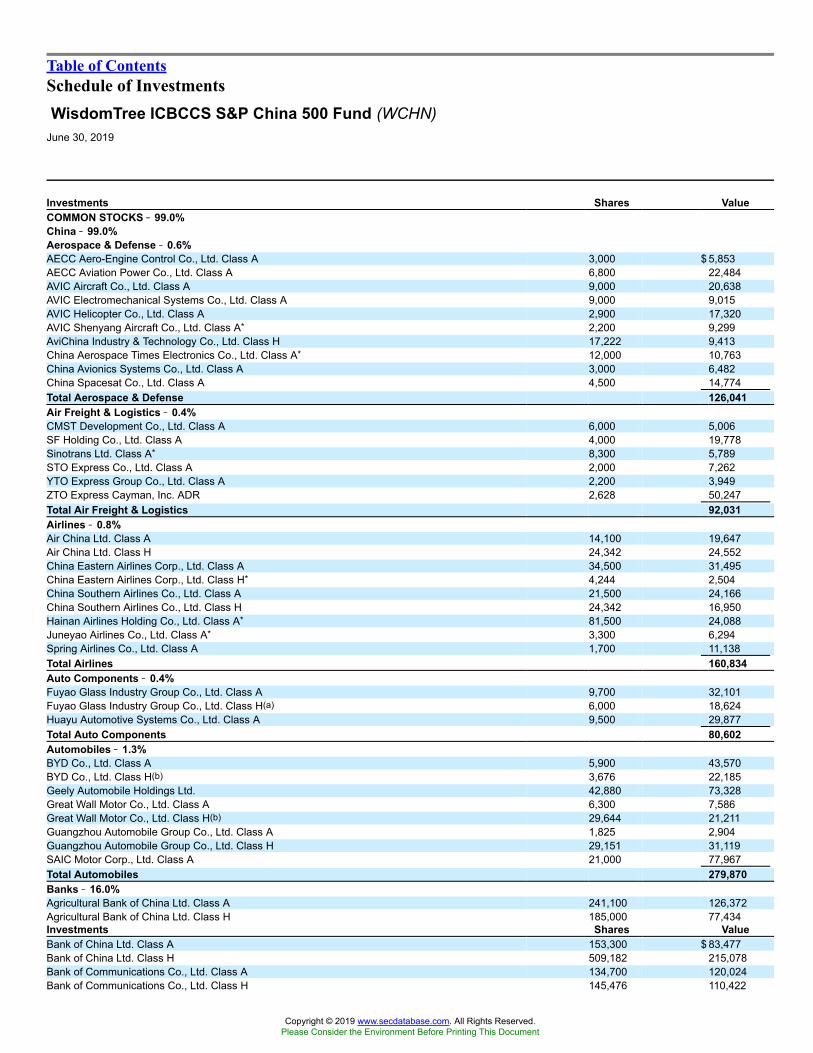
Table of ContentsSchedule of InvestmentsWisdomTree ICBCCS S&P China 500 Fund (WCHN)
June 30, 2019
Investments Shares ValueCOMMON STOCKS �� 99.0%China �� 99.0%Aerospace & Defense �� 0.6%AECC Aero-Engine Control Co., Ltd. Class A 3,000 $ 5,853AECC Aviation Power Co., Ltd. Class A 6,800 22,484AVIC Aircraft Co., Ltd. Class A 9,000 20,638AVIC Electromechanical Systems Co., Ltd. Class A 9,000 9,015AVIC Helicopter Co., Ltd. Class A 2,900 17,320AVIC Shenyang Aircraft Co., Ltd. Class A* 2,200 9,299AviChina Industry & Technology Co., Ltd. Class H 17,222 9,413China Aerospace Times Electronics Co., Ltd. Class A* 12,000 10,763China Avionics Systems Co., Ltd. Class A 3,000 6,482China Spacesat Co., Ltd. Class A 4,500 14,774Total Aerospace & Defense 126,041Air Freight & Logistics �� 0.4%CMST Development Co., Ltd. Class A 6,000 5,006SF Holding Co., Ltd. Class A 4,000 19,778Sinotrans Ltd. Class A* 8,300 5,789STO Express Co., Ltd. Class A 2,000 7,262YTO Express Group Co., Ltd. Class A 2,200 3,949ZTO Express Cayman, Inc. ADR 2,628 50,247Total Air Freight & Logistics 92,031Airlines �� 0.8%Air China Ltd. Class A 14,100 19,647Air China Ltd. Class H 24,342 24,552China Eastern Airlines Corp., Ltd. Class A 34,500 31,495China Eastern Airlines Corp., Ltd. Class H* 4,244 2,504China Southern Airlines Co., Ltd. Class A 21,500 24,166China Southern Airlines Co., Ltd. Class H 24,342 16,950Hainan Airlines Holding Co., Ltd. Class A* 81,500 24,088Juneyao Airlines Co., Ltd. Class A* 3,300 6,294Spring Airlines Co., Ltd. Class A 1,700 11,138Total Airlines 160,834Auto Components �� 0.4%Fuyao Glass Industry Group Co., Ltd. Class A 9,700 32,101Fuyao Glass Industry Group Co., Ltd. Class H(a) 6,000 18,624Huayu Automotive Systems Co., Ltd. Class A 9,500 29,877Total Auto Components 80,602Automobiles �� 1.3%BYD Co., Ltd. Class A 5,900 43,570BYD Co., Ltd. Class H(b) 3,676 22,185Geely Automobile Holdings Ltd. 42,880 73,328Great Wall Motor Co., Ltd. Class A 6,300 7,586Great Wall Motor Co., Ltd. Class H(b) 29,644 21,211Guangzhou Automobile Group Co., Ltd. Class A 1,825 2,904Guangzhou Automobile Group Co., Ltd. Class H 29,151 31,119SAIC Motor Corp., Ltd. Class A 21,000 77,967Total Automobiles 279,870Banks �� 16.0%Agricultural Bank of China Ltd. Class A 241,100 126,372Agricultural Bank of China Ltd. Class H 185,000 77,434Investments Shares ValueBank of China Ltd. Class A 153,300 $ 83,477Bank of China Ltd. Class H 509,182 215,078Bank of Communications Co., Ltd. Class A 134,700 120,024Bank of Communications Co., Ltd. Class H 145,476 110,422
Copyright © 2019 www.secdatabase.com. All Rights Reserved.Please Consider the Environment Before Printing This Document

China CITIC Bank Corp., Ltd. Class A 21,100 18,340China CITIC Bank Corp., Ltd. Class H 77,827 44,330China Construction Bank Corp. Class A 44,300 47,987China Construction Bank Corp. Class H 723,173 622,970China Merchants Bank Co., Ltd. Class A 105,000 550,049China Merchants Bank Co., Ltd. Class H 24,269 120,996China Minsheng Banking Corp., Ltd. Class A 214,140 197,980China Minsheng Banking Corp., Ltd. Class H 46,200 31,993Industrial & Commercial Bank of China Ltd. Class A 148,100 127,005Industrial & Commercial Bank of China Ltd. Class H 505,587 368,876Industrial Bank Co., Ltd. Class A 106,300 283,073Shanghai Pudong Development Bank Co., Ltd. Class A 115,900 197,096Total Banks 3,343,502Beverages �� 3.9%China Resources Beer Holdings Co., Ltd. 9,880 46,918Jiangsu Yanghe Brewery Joint-Stock Co., Ltd. Class A 4,500 79,644Kweichow Moutai Co., Ltd. Class A 2,700 386,821Luzhou Laojiao Co., Ltd. Class A 5,300 62,373Shanxi Xinghuacun Fen Wine Factory Co., Ltd. Class A 1,700 17,091Tsingtao Brewery Co., Ltd. Class A 2,900 21,082Tsingtao Brewery Co., Ltd. Class H 2,000 12,736Wuliangye Yibin Co., Ltd. Class A 11,200 192,339Total Beverages 819,004Biotechnology �� 0.7%3SBio, Inc.(a)(b) 9,411 16,166BeiGene Ltd. ADR* 357 44,250Beijing SL Pharmaceutical Co., Ltd. Class A 3,000 10,291Beijing Tiantan Biological Products Corp., Ltd. Class A 2,004 7,367China Biologic Products Holdings, Inc.*(b) 195 18,584Hualan Biological Engineering, Inc. Class A 6,600 29,299Jinyu Bio-Technology Co., Ltd. Class A 6,330 14,460Shanghai RAAS Blood Products Co., Ltd. Class A* 8,800 8,905Total Biotechnology 149,322Building Products �� 0.1%Beijing New Building Materials PLC Class A 6,000 15,838Capital Markets �� 1.0%CITIC Securities Co., Ltd. Class A 53,300 184,773CITIC Securities Co., Ltd. Class H* 15,356 31,999Total Capital Markets 216,772Chemicals �� 1.6%China Hainan Rubber Industry Group Co., Ltd. Class A 6,700 5,023ENN Ecological Holdings Co., Ltd. Class A 3,200 4,869Hengli Petrochemical Co., Ltd. Class A 6,720 11,897Hengyi Petrochemical Co., Ltd. Class A 7,620 15,155
See Notes to Financial Statements.
78 WisdomTree Trust
Copyright © 2019 www.secdatabase.com. All Rights Reserved.Please Consider the Environment Before Printing This Document

Table of ContentsSchedule of Investments (continued)
WisdomTree ICBCCS S&P China 500 Fund (WCHN)June 30, 2019
Investments Shares ValueHuapont Life Sciences Co., Ltd. Class A 7,800 $ 5,519Inner Mongolia Junzheng Energy & Chemical Industry Group Co., Ltd. Class A 19,800 9,484Kangde Xin Composite Material Group Co., Ltd. Class A 15,700 7,383Kingenta Ecological Engineering Group Co., Ltd. Class A* 9,300 4,929Kingfa Sci & Tech Co., Ltd. Class A 10,500 7,491Lomon Billions Group Co., Ltd. Class A 3,300 7,125Luxi Chemical Group Co., Ltd. Class A 7,500 11,881Ningbo Shanshan Co., Ltd. Class A 4,500 6,978North Huajin Chemical Industries Co., Ltd. Class A 6,000 5,591Qinghai Salt Lake Industry Co., Ltd. Class A* 10,500 9,417Rongsheng Petro Chemical Co., Ltd. Class A 9,000 15,803Shandong Hualu Hengsheng Chemical Co., Ltd. Class A 8,000 17,309Sichuan Hebang Biotechnology Co., Ltd. Class A* 21,300 5,892Sinopec Shanghai Petrochemical Co., Ltd. Class A 13,500 10,142Sinopec Shanghai Petrochemical Co., Ltd. Class H 30,000 11,904Tangshan Sanyou Chemical Industries Co., Ltd. Class A 6,300 5,192Tianqi Lithium Corp. Class A 4,500 16,563Tongkun Group Co., Ltd. Class A 6,180 13,956Transfar Zhilian Co., Ltd. Class A 3,000 3,289Wanhua Chemical Group Co., Ltd. Class A 9,100 56,694Xinjiang Zhongtai Chemical Co., Ltd. Class A 9,000 10,431Xinyangfeng Agricultural Technology Co., Ltd. Class A 4,000 6,249YanAn Bicon Pharmaceutical Listed Co. Class A 1,000 2,533Zhejiang Juhua Co., Ltd. Class A 6,790 7,029Zhejiang Longsheng Group Co., Ltd. Class A 16,500 37,885Zhejiang Runtu Co., Ltd. Class A 3,150 5,715Zibo Qixiang Tengda Chemical Co., Ltd. Class A 3,700 4,175Total Chemicals 343,503Commercial Services & Supplies �� 0.3%China Everbright International Ltd. 17,120 15,800Country Garden Services Holdings Co., Ltd. 7,533 17,414Jihua Group Corp., Ltd. Class A 10,500 5,977Shanghai M&G Stationery, Inc. Class A 2,000 12,804Tus-Sound Environmental Resources Co., Ltd. Class A 5,780 9,922Total Commercial Services & Supplies 61,917Communications Equipment �� 0.7%Fiberhome Telecommunication Technologies Co., Ltd. Class A 3,700 15,008Guangzhou Haige Communications Group, Inc. Co. Class A 9,400 13,056Hengtong Optic-electric Co., Ltd. Class A 8,200 20,010ZTE Corp. Class A* 16,400 77,675ZTE Corp. Class H* 6,000 17,318Total Communications Equipment 143,067Construction & Engineering �� 2.2%Beijing Orient Landscape & Environment Co., Ltd. Class A 9,000 7,862China CAMC Engineering Co., Ltd. Class A 2,300 3,841Investments Shares ValueChina Communications Construction Co., Ltd. Class A 9,300 $ 15,328China Communications Construction Co., Ltd. Class H 41,467 37,101China Gezhouba Group Co., Ltd. Class A* 19,500 17,688China National Chemical Engineering Co., Ltd. Class A 12,200 10,693China Nuclear Engineering Corp., Ltd. Class A 3,300 3,738China Railway Construction Corp., Ltd. Class A 28,500 41,288China Railway Construction Corp., Ltd. Class H 15,000 18,394China Railway Group Ltd. Class A 45,000 42,718China Railway Group Ltd. Class H 30,000 22,810China Railway Hi-tech Industry Co., Ltd. Class A 4,800 8,086
Copyright © 2019 www.secdatabase.com. All Rights Reserved.Please Consider the Environment Before Printing This Document

China State Construction Engineering Corp., Ltd. Class A 131,180 109,821China State Construction International Holdings Ltd. 13,756 14,121Jiangsu Zhongnan Construction Group Co., Ltd. Class A 12,000 15,130Metallurgical Corp. of China Ltd. Class A 28,800 12,747Power Construction Corp. of China Ltd. Class A 31,000 23,876Shanghai Construction Group Co., Ltd. Class A 36,500 19,982Shanghai Tunnel Engineering Co., Ltd. Class A 12,400 11,392Suzhou Gold Mantis Construction Decoration Co., Ltd. Class A 9,500 14,261Total Construction & Engineering 450,877Construction Materials �� 1.3%Anhui Conch Cement Co., Ltd. Class A 14,600 88,217Anhui Conch Cement Co., Ltd. Class H 9,762 61,165BBMG Corp. Class A 22,500 12,318BBMG Corp. Class H(b) 15,000 4,819Beijing Oriental Yuhong Waterproof Technology Co., Ltd. Class A 7,419 24,477China Jushi Co., Ltd. Class A 15,220 21,118China National Building Material Co., Ltd. Class H 17,533 15,373China Resources Cement Holdings Ltd. 4,244 4,112China West Construction Group Co., Ltd. Class A 2,200 3,568CSG Holding Co., Ltd. Class A 14,195 8,598Huaxin Cement Co., Ltd. Class A 4,340 12,795Jilin Yatai Group Co., Ltd. Class A 10,800 5,110Sichuan Shuangma Cement Co., Ltd. Class A* 1,800 4,191Tangshan Jidong Cement Co., Ltd. Class A 3,300 8,461Total Construction Materials 274,322Containers & Packaging �� 0.1%ORG Technology Co., Ltd. Class A 7,800 5,304Shenzhen Jinjia Group Co., Ltd. Class A 6,000 10,841Total Containers & Packaging 16,145Diversified Consumer Services �� 0.8%New Oriental Education & Technology Group, Inc. ADR* 783 75,622TAL Education Group ADR* 2,487 94,755Total Diversified Consumer Services 170,377Electrical Equipment �� 1.1%China XD Electric Co., Ltd. Class A 12,200 6,572
See Notes to Financial Statements.
WisdomTree Trust 79
Copyright © 2019 www.secdatabase.com. All Rights Reserved.Please Consider the Environment Before Printing This Document

Table of ContentsSchedule of Investments (continued)
WisdomTree ICBCCS S&P China 500 Fund (WCHN)June 30, 2019
Investments Shares ValueDongfang Electric Corp., Ltd. Class A* 7,500 $ 11,597Fangda Carbon New Material Co., Ltd. Class A* 12,367 22,129Fullshare Holdings Ltd.* 58,382 3,624Guangdong LY Intelligent Manufacturing Co., Ltd. Class A* 6,900 5,957Guoxuan High-Tech Co., Ltd. Class A 4,500 8,590Hongfa Technology Co., Ltd. Class A 4,280 15,143Jiangsu Zhongtian Technology Co., Ltd. Class A 13,500 18,024NARI Technology Co., Ltd. Class A 10,500 28,496Shanghai Electric Group Co., Ltd. Class A 25,500 19,974Shanghai Electric Group Co., Ltd. Class H 1,413 512TBEA Co., Ltd. Class A 22,500 23,751Xinjiang Goldwind Science & Technology Co., Ltd. Class A 12,400 22,441Xinjiang Goldwind Science & Technology Co., Ltd. Class H(b) 4,756 5,199Zhejiang Chint Electrics Co., Ltd. Class A 5,300 17,818Zhuzhou CRRC Times Electric Co., Ltd. Class H 4,500 23,702Total Electrical Equipment 233,529Electronic Equipment, Instruments & Components �� 2.3%AAC Technologies Holdings, Inc. 3,676 20,868AVIC Jonhon Optronic Technology Co., Ltd. Class A 3,250 15,833BOE Technology Group Co., Ltd. Class A 175,300 87,799Foxconn Industrial Internet Co., Ltd. Class A 7,800 13,685GoerTek, Inc. Class A 12,700 16,438Hangzhou Hikvision Digital Technology Co., Ltd. Class A 20,600 82,720Kingboard Holdings Ltd. 3,676 10,234Luxshare Precision Industry Co., Ltd. Class A 13,320 48,076NAURA Technology Group Co., Ltd. Class A 1,000 10,083OFILM Group Co., Ltd. Class A 12,100 13,812Shengyi Technology Co., Ltd. Class A 6,800 14,900Shennan Circuits Co., Ltd. Class A 360 5,342Sunny Optical Technology Group Co., Ltd. 4,500 46,483Suzhou Dongshan Precision Manufacturing Co., Ltd. Class A 6,000 12,728Tianma Microelectronics Co., Ltd. Class A 6,400 12,524Tunghsu Optoelectronic Technology Co., Ltd. Class A 25,700 19,233Unigroup Guoxin Microelectronics Co., Ltd. Class A 2,200 14,129Unisplendour Corp., Ltd. Class A 2,380 9,443Westone Information Industry, Inc. Class A 3,300 11,747Zhejiang Dahua Technology Co., Ltd. Class A 9,300 19,661Total Electronic Equipment, Instruments & Components 485,738Entertainment �� 0.6%NetEase, Inc. ADR 480 122,770Food & Staples Retailing �� 0.3%Sun Art Retail Group Ltd. 20,731 19,636Yonghui Superstores Co., Ltd. Class A 22,800 33,893Total Food & Staples Retailing 53,529Food Products �� 2.4%China Mengniu Dairy Co., Ltd.* 18,644 72,190Dali Foods Group Co., Ltd.(a) 15,000 9,965Foshan Haitian Flavouring & Food Co., Ltd. Class A 3,200 48,920Investments Shares ValueGuangdong Haid Group Co., Ltd. Class A 4,500 $ 20,245Henan Shuanghui Investment & Development Co., Ltd. Class A 6,500 23,555Inner Mongolia Yili Industrial Group Co., Ltd. Class A 31,320 152,352Muyuan Foodstuff Co., Ltd. Class A 3,940 33,725New Hope Liuhe Co., Ltd. Class A 14,000 35,406Tingyi Cayman Islands Holding Corp. 7,071 11,802Want Want China Holdings Ltd. 46,707 37,964
Copyright © 2019 www.secdatabase.com. All Rights Reserved.Please Consider the Environment Before Printing This Document

WH Group Ltd.(a) 62,722 63,585Total Food Products 509,709Gas Utilities �� 0.5%Beijing Enterprises Holdings Ltd. 1,769 8,990China Gas Holdings Ltd. 18,000 66,931China Resources Gas Group Ltd. 6,244 30,970Total Gas Utilities 106,891Health Care Equipment & Supplies �� 0.1%Jiangsu Yuyue Medical Equipment & Supply Co., Ltd. Class A 4,500 16,131Shandong Weigao Group Medical Polymer Co., Ltd. Class H 13,658 12,377Total Health Care Equipment & Supplies 28,508Health Care Providers & Services �� 0.7%China National Accord Medicines Corp., Ltd. Class A 700 4,263China Reform Health Management and Services Group Co., Ltd. Class A* 3,300 8,245Huadong Medicine Co., Ltd. Class A 5,400 20,410Jointown Pharmaceutical Group Co., Ltd. Class A 4,500 8,098Meinian Onehealth Healthcare Holdings Co., Ltd. Class A 11,180 20,250Shanghai Pharmaceuticals Holding Co., Ltd. Class A 7,500 19,819Shanghai Pharmaceuticals Holding Co., Ltd. Class H 5,376 10,570Sinopharm Group Co., Ltd. Class H 8,658 30,476Topchoice Medical Investment Corp. Class A* 1,200 15,478Total Health Care Providers & Services 137,609Health Care Technology �� 0.1%Ping An Healthcare and Technology Co., Ltd.*(a)(b) 3,213 13,387Hotels, Restaurants & Leisure �� 1.3%China International Travel Service Corp., Ltd. Class A 5,200 67,117Haidilao International Holding Ltd.(a) 5,000 20,896Huazhu Group Ltd. ADR 828 30,015Shenzhen Overseas Chinese Town Co., Ltd. Class A 22,500 22,767Yum China Holdings, Inc. 2,789 128,852Total Hotels, Restaurants & Leisure 269,647Household Durables �� 2.7%Gree Electric Appliances, Inc. of Zhuhai Class A 29,800 238,633Haier Electronics Group Co., Ltd.* 11,364 31,419Haier Smart Home Co., Ltd. Class A 24,700 62,179Midea Group Co., Ltd. Class A 28,951 218,602Oppein Home Group, Inc. Class A 200 3,134Zhejiang Supor Co., Ltd. Class A 900 9,936Total Household Durables 563,903
See Notes to Financial Statements.
80 WisdomTree Trust
Copyright © 2019 www.secdatabase.com. All Rights Reserved.Please Consider the Environment Before Printing This Document

Table of ContentsSchedule of Investments (continued)
WisdomTree ICBCCS S&P China 500 Fund (WCHN)June 30, 2019
Investments Shares ValueIndependent Power & Renewable Electricity Producers �� 1.8%CGN Power Co., Ltd. Class H(a) 75,000 $ 20,640China National Nuclear Power Co., Ltd. Class A 30,300 24,528China Resources Power Holdings Co., Ltd. 5,658 8,256China Yangtze Power Co., Ltd. Class A* 53,300 138,909Datang International Power Generation Co., Ltd. Class A 14,000 6,299GD Power Development Co., Ltd. Class A 77,000 28,476Huadian Power International Corp., Ltd. Class A 19,800 10,868Huaneng Power International, Inc. Class A 27,870 25,280Huaneng Power International, Inc. Class H 30,000 17,664Hubei Energy Group Co., Ltd. Class A 13,800 8,720SDIC Power Holdings Co., Ltd. Class A 23,200 26,246Shanghai Electric Power Co., Ltd. Class A 6,000 7,583Shenergy Co., Ltd. Class A 16,500 14,438Shenzhen Energy Group Co., Ltd. Class A 7,500 6,770Sichuan Chuantou Energy Co., Ltd. Class A 15,500 20,085Zhejiang Zheneng Electric Power Co., Ltd. Class A 21,300 13,707Total Independent Power & Renewable Electricity Producers 378,469Industrial Conglomerates �� 0.4%China Baoan Group Co., Ltd. Class A 13,500 11,223CITIC Ltd. 48,818 70,361Shanghai Industrial Holdings Ltd. 707 1,533Total Industrial Conglomerates 83,117Insurance �� 7.9%China Life Insurance Co., Ltd. Class A 10,200 42,058China Life Insurance Co., Ltd. Class H 48,644 119,796China Pacific Insurance Group Co., Ltd. Class A 24,566 130,586China Pacific Insurance Group Co., Ltd. Class H 17,236 67,400People�s Insurance Co. Group of China Ltd. (The) Class A* 6,500 8,981People�s Insurance Co. Group of China Ltd. (The) Class H 47,000 18,349Ping An Insurance Group Co. of China Ltd. Class A 66,100 852,776Ping An Insurance Group Co. of China Ltd. Class H 34,031 408,590Total Insurance 1,648,536Interactive Media & Services �� 9.1%Baidu, Inc. ADR* 1,887 221,458Tencent Holdings Ltd. 36,902 1,665,491Total Interactive Media & Services 1,886,949Internet & Direct Marketing Retail �� 9.6%Alibaba Group Holding Ltd. ADR* 8,832 1,496,583Ctrip.com International Ltd. ADR* 2,598 95,892JD.com, Inc. ADR* 5,639 170,805Meituan Dianping Class B* 26,400 231,475Total Internet & Direct Marketing Retail 1,994,755IT Services �� 0.2%China TransInfo Technology Co., Ltd. Class A 3,800 9,461DHC Software Co., Ltd. Class A 13,800 14,044GDS Holdings Ltd. ADR*(b) 391 14,690TravelSky Technology Ltd. Class H 2,827 5,681Total IT Services 43,876Investments Shares ValueLife Sciences Tools & Services �� 0.2%Genscript Biotech Corp.* 5,413 $ 13,594Wuxi Biologics Cayman, Inc.*(a) 2,913 26,156Total Life Sciences Tools & Services 39,750Machinery �� 2.7%China Conch Venture Holdings Ltd. 15,000 52,992
Copyright © 2019 www.secdatabase.com. All Rights Reserved.Please Consider the Environment Before Printing This Document
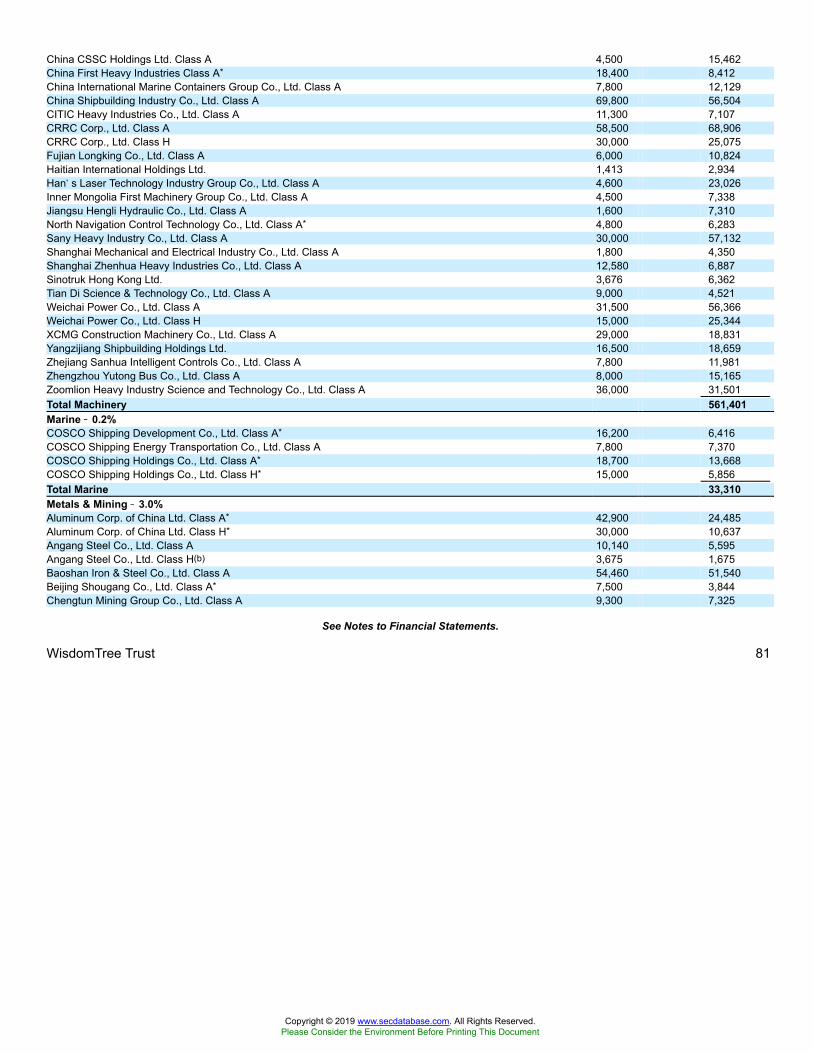
China CSSC Holdings Ltd. Class A 4,500 15,462China First Heavy Industries Class A* 18,400 8,412China International Marine Containers Group Co., Ltd. Class A 7,800 12,129China Shipbuilding Industry Co., Ltd. Class A 69,800 56,504CITIC Heavy Industries Co., Ltd. Class A 11,300 7,107CRRC Corp., Ltd. Class A 58,500 68,906CRRC Corp., Ltd. Class H 30,000 25,075Fujian Longking Co., Ltd. Class A 6,000 10,824Haitian International Holdings Ltd. 1,413 2,934Han�s Laser Technology Industry Group Co., Ltd. Class A 4,600 23,026Inner Mongolia First Machinery Group Co., Ltd. Class A 4,500 7,338Jiangsu Hengli Hydraulic Co., Ltd. Class A 1,600 7,310North Navigation Control Technology Co., Ltd. Class A* 4,800 6,283Sany Heavy Industry Co., Ltd. Class A 30,000 57,132Shanghai Mechanical and Electrical Industry Co., Ltd. Class A 1,800 4,350Shanghai Zhenhua Heavy Industries Co., Ltd. Class A 12,580 6,887Sinotruk Hong Kong Ltd. 3,676 6,362Tian Di Science & Technology Co., Ltd. Class A 9,000 4,521Weichai Power Co., Ltd. Class A 31,500 56,366Weichai Power Co., Ltd. Class H 15,000 25,344XCMG Construction Machinery Co., Ltd. Class A 29,000 18,831Yangzijiang Shipbuilding Holdings Ltd. 16,500 18,659Zhejiang Sanhua Intelligent Controls Co., Ltd. Class A 7,800 11,981Zhengzhou Yutong Bus Co., Ltd. Class A 8,000 15,165Zoomlion Heavy Industry Science and Technology Co., Ltd. Class A 36,000 31,501Total Machinery 561,401Marine �� 0.2%COSCO Shipping Development Co., Ltd. Class A* 16,200 6,416COSCO Shipping Energy Transportation Co., Ltd. Class A 7,800 7,370COSCO Shipping Holdings Co., Ltd. Class A* 18,700 13,668COSCO Shipping Holdings Co., Ltd. Class H* 15,000 5,856Total Marine 33,310Metals & Mining �� 3.0%Aluminum Corp. of China Ltd. Class A* 42,900 24,485Aluminum Corp. of China Ltd. Class H* 30,000 10,637Angang Steel Co., Ltd. Class A 10,140 5,595Angang Steel Co., Ltd. Class H(b) 3,675 1,675Baoshan Iron & Steel Co., Ltd. Class A 54,460 51,540Beijing Shougang Co., Ltd. Class A* 7,500 3,844Chengtun Mining Group Co., Ltd. Class A 9,300 7,325
See Notes to Financial Statements.
WisdomTree Trust 81
Copyright © 2019 www.secdatabase.com. All Rights Reserved.Please Consider the Environment Before Printing This Document

Table of ContentsSchedule of Investments (continued)
WisdomTree ICBCCS S&P China 500 Fund (WCHN)June 30, 2019
Investments Shares ValueChina Molybdenum Co., Ltd. Class A 19,500 $ 11,243China Molybdenum Co., Ltd. Class H 38,636 12,215China Northern Rare Earth Group High-Tech Co., Ltd. Class A 16,500 30,846Chongqing Iron & Steel Co., Ltd. Class A* 44,600 13,052Ganfeng Lithium Co., Ltd. Class A* 5,800 19,786Gansu Jiu Steel Group Hongxing Iron & Steel Co., Ltd. Class A* 18,800 5,557GEM Co., Ltd. Class A 23,200 15,910Guangdong HEC Technology Holding Co., Ltd. Class A 9,000 10,286Hesteel Co., Ltd. Class A 33,500 14,584Hunan Valin Steel Co., Ltd. Class A* 8,680 6,028Inner Mongolia BaoTou Steel Union Co., Ltd. Class A 143,400 35,285Jiangxi Copper Co., Ltd. Class A 6,500 14,896Jiangxi Copper Co., Ltd. Class H 15,000 19,968Jinduicheng Molybdenum Co., Ltd. Class A 6,000 5,853Maanshan Iron & Steel Co., Ltd. Class A 16,800 8,341MMG Ltd.* 5,658 1,977Nanjing Iron & Steel Co., Ltd. Class A 14,300 7,287Pangang Group Vanadium Titanium & Resources Co., Ltd. Class A* 41,000 20,236SGIS Songshan Co., Ltd. Class A* 6,300 4,063Shandong Gold Mining Co., Ltd. Class A* 4,500 26,974Shandong Iron and Steel Co., Ltd. Class A* 30,200 7,343Shandong Nanshan Aluminum Co., Ltd. Class A 36,300 11,945Shanxi Taigang Stainless Steel Co., Ltd. Class A 11,500 6,815Shenghe Resources Holding Co., Ltd. Class A 4,820 7,762Shenzhen Zhongjin Lingnan Nonfemet Co., Ltd. Class A 16,650 11,369Tongling Nonferrous Metals Group Co., Ltd. Class A 42,500 15,222Western Mining Co., Ltd. Class A* 12,500 11,611Xiamen Tungsten Co., Ltd. Class A 4,760 9,917Xinxing Ductile Iron Pipes Co., Ltd. Class A 15,000 9,697Xinyu Iron & Steel Co., Ltd. Class A 8,000 5,824Yintai Resources Co., Ltd. Class A 3,820 7,336Yunnan Aluminium Co., Ltd. Class A* 6,300 4,302Yunnan Chihong Zinc & Germanium Co., Ltd. Class A 15,900 11,760Yunnan Copper Co., Ltd. Class A* 5,200 8,048Yunnan Tin Co., Ltd. Class A* 4,800 7,806Zhejiang Huayou Cobalt Co., Ltd. Class A 2,912 9,035Zhongjin Gold Corp., Ltd. Class A 12,500 18,691Zijin Mining Group Co., Ltd. Class A 87,000 47,754Zijin Mining Group Co., Ltd. Class H 58,587 23,772Total Metals & Mining 625,497Oil, Gas & Consumable Fuels �� 3.1%China Coal Energy Co., Ltd. Class A 11,000 7,688China Coal Energy Co., Ltd. Class H 15,000 6,240China Petroleum & Chemical Corp. Class A 70,400 56,067China Petroleum & Chemical Corp. Class H 187,636 127,533China Shenhua Energy Co., Ltd. Class A 15,000 44,509China Shenhua Energy Co., Ltd. Class H 25,618 53,646CNOOC Ltd. 107,467 183,777PetroChina Co., Ltd. Class A 88,900 89,051Investments Shares ValuePetroChina Co., Ltd. Class H 157,636 $ 86,965Total Oil, Gas & Consumable Fuels 655,476Paper & Forest Products �� 0.2%Lee & Man Paper Manufacturing Ltd. 15,000 10,502Nine Dragons Paper Holdings Ltd. 15,000 13,306Shandong Chenming Paper Holdings Ltd. Class A 9,000 7,024Shandong Sun Paper Industry JSC Ltd. Class A 7,500 7,436
Copyright © 2019 www.secdatabase.com. All Rights Reserved.Please Consider the Environment Before Printing This Document
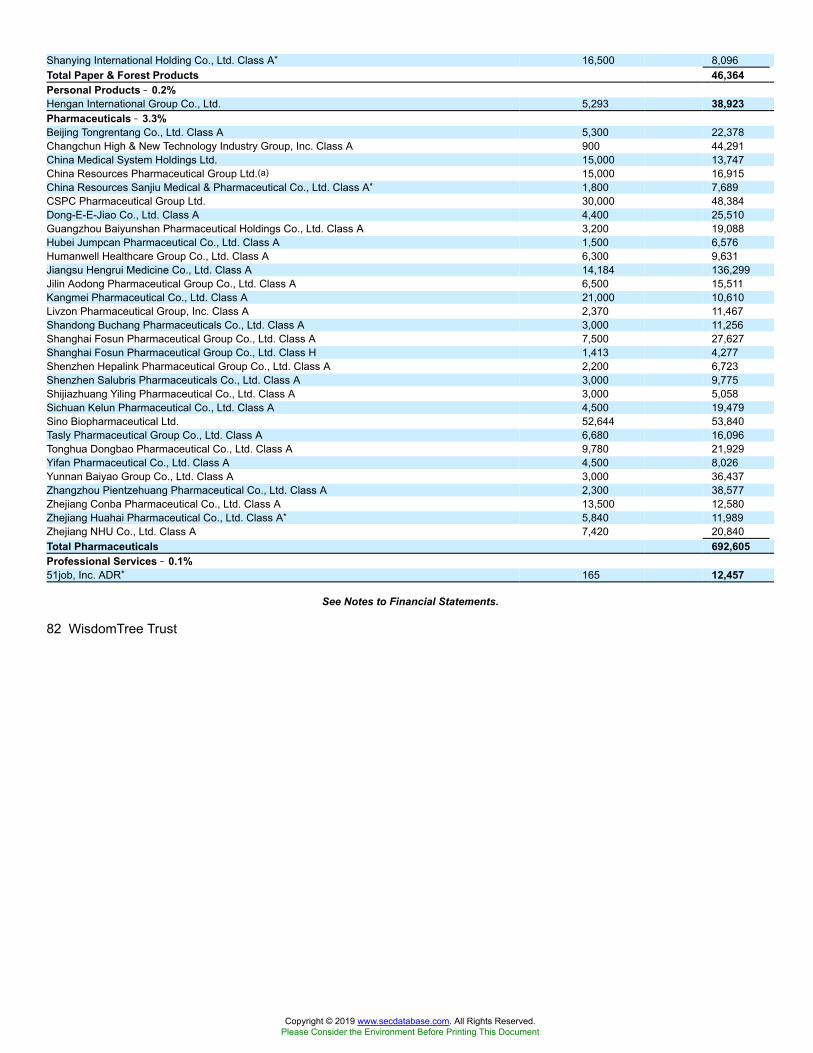
Shanying International Holding Co., Ltd. Class A* 16,500 8,096Total Paper & Forest Products 46,364Personal Products �� 0.2%Hengan International Group Co., Ltd. 5,293 38,923Pharmaceuticals �� 3.3%Beijing Tongrentang Co., Ltd. Class A 5,300 22,378Changchun High & New Technology Industry Group, Inc. Class A 900 44,291China Medical System Holdings Ltd. 15,000 13,747China Resources Pharmaceutical Group Ltd.(a) 15,000 16,915China Resources Sanjiu Medical & Pharmaceutical Co., Ltd. Class A* 1,800 7,689CSPC Pharmaceutical Group Ltd. 30,000 48,384Dong-E-E-Jiao Co., Ltd. Class A 4,400 25,510Guangzhou Baiyunshan Pharmaceutical Holdings Co., Ltd. Class A 3,200 19,088Hubei Jumpcan Pharmaceutical Co., Ltd. Class A 1,500 6,576Humanwell Healthcare Group Co., Ltd. Class A 6,300 9,631Jiangsu Hengrui Medicine Co., Ltd. Class A 14,184 136,299Jilin Aodong Pharmaceutical Group Co., Ltd. Class A 6,500 15,511Kangmei Pharmaceutical Co., Ltd. Class A 21,000 10,610Livzon Pharmaceutical Group, Inc. Class A 2,370 11,467Shandong Buchang Pharmaceuticals Co., Ltd. Class A 3,000 11,256Shanghai Fosun Pharmaceutical Group Co., Ltd. Class A 7,500 27,627Shanghai Fosun Pharmaceutical Group Co., Ltd. Class H 1,413 4,277Shenzhen Hepalink Pharmaceutical Group Co., Ltd. Class A 2,200 6,723Shenzhen Salubris Pharmaceuticals Co., Ltd. Class A 3,000 9,775Shijiazhuang Yiling Pharmaceutical Co., Ltd. Class A 3,000 5,058Sichuan Kelun Pharmaceutical Co., Ltd. Class A 4,500 19,479Sino Biopharmaceutical Ltd. 52,644 53,840Tasly Pharmaceutical Group Co., Ltd. Class A 6,680 16,096Tonghua Dongbao Pharmaceutical Co., Ltd. Class A 9,780 21,929Yifan Pharmaceutical Co., Ltd. Class A 4,500 8,026Yunnan Baiyao Group Co., Ltd. Class A 3,000 36,437Zhangzhou Pientzehuang Pharmaceutical Co., Ltd. Class A 2,300 38,577Zhejiang Conba Pharmaceutical Co., Ltd. Class A 13,500 12,580Zhejiang Huahai Pharmaceutical Co., Ltd. Class A* 5,840 11,989Zhejiang NHU Co., Ltd. Class A 7,420 20,840Total Pharmaceuticals 692,605Professional Services �� 0.1%51job, Inc. ADR* 165 12,457
See Notes to Financial Statements.
82 WisdomTree Trust
Copyright © 2019 www.secdatabase.com. All Rights Reserved.Please Consider the Environment Before Printing This Document
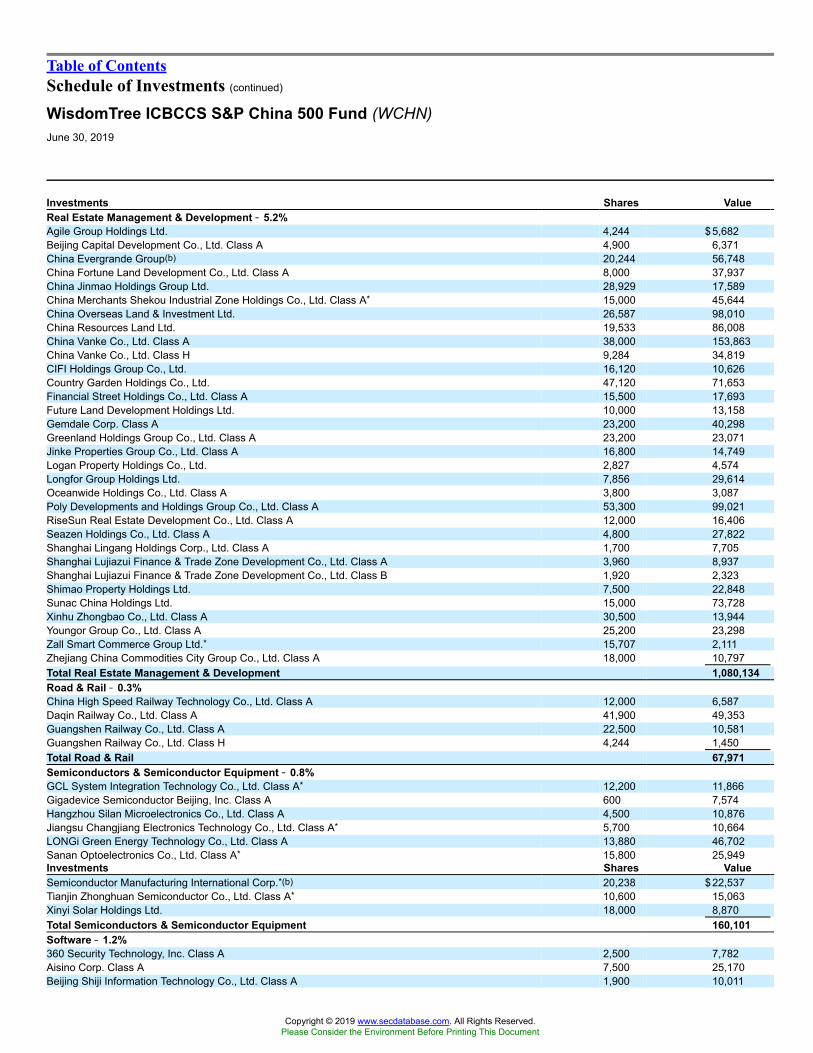
Table of ContentsSchedule of Investments (continued)
WisdomTree ICBCCS S&P China 500 Fund (WCHN)June 30, 2019
Investments Shares ValueReal Estate Management & Development �� 5.2%Agile Group Holdings Ltd. 4,244 $5,682Beijing Capital Development Co., Ltd. Class A 4,900 6,371China Evergrande Group(b) 20,244 56,748China Fortune Land Development Co., Ltd. Class A 8,000 37,937China Jinmao Holdings Group Ltd. 28,929 17,589China Merchants Shekou Industrial Zone Holdings Co., Ltd. Class A* 15,000 45,644China Overseas Land & Investment Ltd. 26,587 98,010China Resources Land Ltd. 19,533 86,008China Vanke Co., Ltd. Class A 38,000 153,863China Vanke Co., Ltd. Class H 9,284 34,819CIFI Holdings Group Co., Ltd. 16,120 10,626Country Garden Holdings Co., Ltd. 47,120 71,653Financial Street Holdings Co., Ltd. Class A 15,500 17,693Future Land Development Holdings Ltd. 10,000 13,158Gemdale Corp. Class A 23,200 40,298Greenland Holdings Group Co., Ltd. Class A 23,200 23,071Jinke Properties Group Co., Ltd. Class A 16,800 14,749Logan Property Holdings Co., Ltd. 2,827 4,574Longfor Group Holdings Ltd. 7,856 29,614Oceanwide Holdings Co., Ltd. Class A 3,800 3,087Poly Developments and Holdings Group Co., Ltd. Class A 53,300 99,021RiseSun Real Estate Development Co., Ltd. Class A 12,000 16,406Seazen Holdings Co., Ltd. Class A 4,800 27,822Shanghai Lingang Holdings Corp., Ltd. Class A 1,700 7,705Shanghai Lujiazui Finance & Trade Zone Development Co., Ltd. Class A 3,960 8,937Shanghai Lujiazui Finance & Trade Zone Development Co., Ltd. Class B 1,920 2,323Shimao Property Holdings Ltd. 7,500 22,848Sunac China Holdings Ltd. 15,000 73,728Xinhu Zhongbao Co., Ltd. Class A 30,500 13,944Youngor Group Co., Ltd. Class A 25,200 23,298Zall Smart Commerce Group Ltd.* 15,707 2,111Zhejiang China Commodities City Group Co., Ltd. Class A 18,000 10,797Total Real Estate Management & Development 1,080,134Road & Rail �� 0.3%China High Speed Railway Technology Co., Ltd. Class A 12,000 6,587Daqin Railway Co., Ltd. Class A 41,900 49,353Guangshen Railway Co., Ltd. Class A 22,500 10,581Guangshen Railway Co., Ltd. Class H 4,244 1,450Total Road & Rail 67,971Semiconductors & Semiconductor Equipment �� 0.8%GCL System Integration Technology Co., Ltd. Class A* 12,200 11,866Gigadevice Semiconductor Beijing, Inc. Class A 600 7,574Hangzhou Silan Microelectronics Co., Ltd. Class A 4,500 10,876Jiangsu Changjiang Electronics Technology Co., Ltd. Class A* 5,700 10,664LONGi Green Energy Technology Co., Ltd. Class A 13,880 46,702Sanan Optoelectronics Co., Ltd. Class A* 15,800 25,949Investments Shares ValueSemiconductor Manufacturing International Corp.*(b) 20,238 $22,537Tianjin Zhonghuan Semiconductor Co., Ltd. Class A* 10,600 15,063Xinyi Solar Holdings Ltd. 18,000 8,870Total Semiconductors & Semiconductor Equipment 160,101Software �� 1.2%360 Security Technology, Inc. Class A 2,500 7,782Aisino Corp. Class A 7,500 25,170Beijing Shiji Information Technology Co., Ltd. Class A 1,900 10,011
Copyright © 2019 www.secdatabase.com. All Rights Reserved.Please Consider the Environment Before Printing This Document

China National Software & Service Co., Ltd. Class A 1,700 13,284Glodon Co., Ltd. Class A 3,700 17,718Hundsun Technologies, Inc. Class A 3,900 38,697Iflytek Co., Ltd. Class A* 9,700 46,944Kingdee International Software Group Co., Ltd. 10,778 11,658Kingsoft Corp., Ltd.*(b) 6,000 12,979Shanghai 2345 Network Holding Group Co., Ltd. Class A 20,000 11,328Venustech Group, Inc. Class A 3,100 12,141Yonyou Network Technology Co., Ltd. Class A 8,840 34,597Total Software 242,309Specialty Retail �� 0.2%Suning.com Co., Ltd. Class A 22,400 37,440Technology Hardware, Storage & Peripherals �� 1.2%China Greatwall Technology Group Co., Ltd. Class A 11,400 17,063Dawning Information Industry Co., Ltd. Class A 4,260 21,770Focus Media Information Technology Co., Ltd. Class A 47,120 36,292Inspur Electronic Information Industry Co., Ltd. Class A 4,800 16,675Lenovo Group Ltd. 35,658 27,613Tsinghua Tongfang Co., Ltd. Class A 15,000 19,765Xiaomi Corp. Class B*(a) 88,000 112,640Total Technology Hardware, Storage & Peripherals 251,818Textiles, Apparel & Luxury Goods �� 0.6%ANTA Sports Products Ltd. 7,644 52,493Shenzhou International Group Holdings Ltd. 5,716 78,579Total Textiles, Apparel & Luxury Goods 131,072Trading Companies & Distributors �� 0.2%China Meheco Co., Ltd. Class A 4,300 8,446Orient Group, Inc. Class A 15,800 8,557Shanghai Waigaoqiao Free Trade Zone Group Co., Ltd. Class A 1,600 4,887Sinochem International Corp. Class A 6,300 6,852Xiamen C & D, Inc. Class A 11,000 14,222Total Trading Companies & Distributors 42,964Transportation Infrastructure �� 1.0%China Merchants Port Holdings Co., Ltd. 13,880 23,594COSCO Shipping Ports Ltd. 5,658 5,584Dalian Port PDA Co., Ltd. Class A 16,500 5,117Guangzhou Baiyun International Airport Co., Ltd. Class A 8,200 21,729Jiangsu Expressway Co., Ltd. Class H 2,827 4,024Ningbo Zhoushan Port Co., Ltd. Class A 24,000 15,340Shanghai International Airport Co., Ltd. Class A 4,500 54,891
See Notes to Financial Statements.
WisdomTree Trust 83
Copyright © 2019 www.secdatabase.com. All Rights Reserved.Please Consider the Environment Before Printing This Document
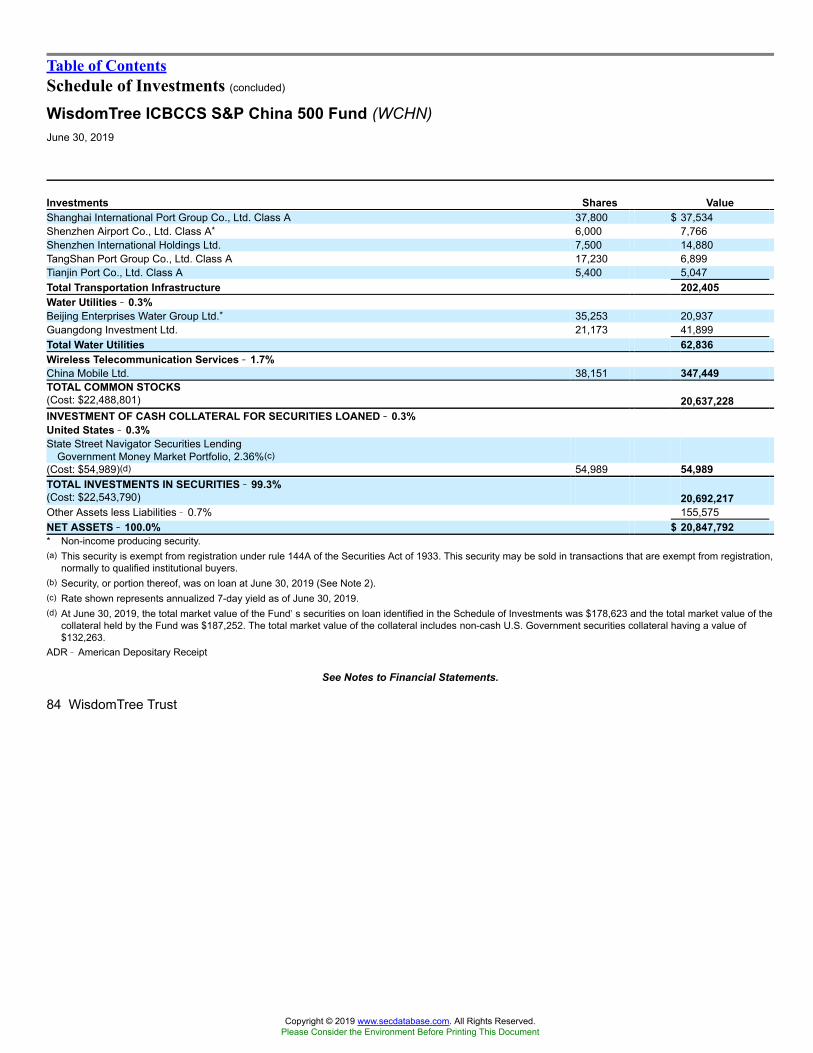
Table of ContentsSchedule of Investments (concluded)
WisdomTree ICBCCS S&P China 500 Fund (WCHN)June 30, 2019
Investments Shares ValueShanghai International Port Group Co., Ltd. Class A 37,800 $ 37,534Shenzhen Airport Co., Ltd. Class A* 6,000 7,766Shenzhen International Holdings Ltd. 7,500 14,880TangShan Port Group Co., Ltd. Class A 17,230 6,899Tianjin Port Co., Ltd. Class A 5,400 5,047Total Transportation Infrastructure 202,405Water Utilities �� 0.3%Beijing Enterprises Water Group Ltd.* 35,253 20,937Guangdong Investment Ltd. 21,173 41,899Total Water Utilities 62,836Wireless Telecommunication Services �� 1.7%China Mobile Ltd. 38,151 347,449TOTAL COMMON STOCKS(Cost: $22,488,801) 20,637,228INVESTMENT OF CASH COLLATERAL FOR SECURITIES LOANED �� 0.3%United States �� 0.3%State Street Navigator Securities Lending
Government Money Market Portfolio, 2.36%(c)(Cost: $54,989)(d) 54,989 54,989TOTAL INVESTMENTS IN SECURITIES �� 99.3%(Cost: $22,543,790) 20,692,217Other Assets less Liabilities � 0.7% 155,575NET ASSETS �� 100.0% $ 20,847,792* Non-income producing security.(a) This security is exempt from registration under rule 144A of the Securities Act of 1933. This security may be sold in transactions that are exempt from registration,
normally to qualified institutional buyers.(b) Security, or portion thereof, was on loan at June 30, 2019 (See Note 2).(c) Rate shown represents annualized 7-day yield as of June 30, 2019.(d) At June 30, 2019, the total market value of the Fund�s securities on loan identified in the Schedule of Investments was $178,623 and the total market value of the
collateral held by the Fund was $187,252. The total market value of the collateral includes non-cash U.S. Government securities collateral having a value of$132,263.
ADR � American Depositary Receipt
See Notes to Financial Statements.
84 WisdomTree Trust
Copyright © 2019 www.secdatabase.com. All Rights Reserved.Please Consider the Environment Before Printing This Document

Table of ContentsSchedule of InvestmentsWisdomTree Japan Multifactor Fund (JAMF)
June 30, 2019
Investments Shares ValueCOMMON STOCKS �� 100.1%Japan �� 100.1%Air Freight & Logistics �� 1.2%Kintetsu World Express, Inc. 448 $ 5,842SG Holdings Co., Ltd. 300 8,507Total Air Freight & Logistics 14,349Airlines �� 1.3%ANA Holdings, Inc. 200 6,623Japan Airlines Co., Ltd. 300 9,587Total Airlines 16,210Auto Components �� 1.1%Press Kogyo Co., Ltd. 1,100 4,983Showa Corp. 300 4,043Tokai Rika Co., Ltd. 300 4,948Total Auto Components 13,974Banks �� 8.1%Fukuoka Financial Group, Inc. 500 9,128Mebuki Financial Group, Inc. 4,970 12,962Mitsubishi UFJ Financial Group, Inc. 3,000 14,257Nishi-Nippon Financial Holdings, Inc. 1,100 7,913Resona Holdings, Inc. 3,200 13,324Shinsei Bank Ltd. 800 12,422Sumitomo Mitsui Financial Group, Inc. 400 14,130Sumitomo Mitsui Trust Holdings, Inc. 400 14,502Total Banks 98,638Beverages �� 1.1%Asahi Group Holdings Ltd. 100 4,497Suntory Beverage & Food Ltd. 200 8,697Total Beverages 13,194Building Products �� 0.4%Nippon Sheet Glass Co., Ltd. 700 4,762Capital Markets �� 1.1%Matsui Securities Co., Ltd. 1,400 13,202Chemicals �� 3.0%Kureha Corp. 100 6,822Mitsui Chemicals, Inc. 300 7,426Osaka Soda Co., Ltd. 300 7,493Showa Denko K.K. 200 5,884Tokai Carbon Co., Ltd. 400 4,173Tokuyama Corp. 200 5,406Total Chemicals 37,204Commercial Services & Supplies �� 1.2%Aeon Delight Co., Ltd. 200 5,912Pilot Corp. 100 3,866Sato Holdings Corp. 200 5,077Total Commercial Services & Supplies 14,855Construction & Engineering �� 3.5%Kandenko Co., Ltd. 800 6,683Kyowa Exeo Corp. 300 7,468Mirait Holdings Corp. 500 7,402Obayashi Corp. 700 6,894Investments Shares ValueSanki Engineering Co., Ltd. 700 $ 8,108Tokyu Construction Co., Ltd. 900 6,081Total Construction & Engineering 42,636
Copyright © 2019 www.secdatabase.com. All Rights Reserved.Please Consider the Environment Before Printing This Document

Construction Materials �� 0.7%Taiheiyo Cement Corp. 300 9,077Consumer Finance �� 1.0%Orient Corp. 11,100 11,848Distributors �� 0.3%Arata Corp. 100 3,402Diversified Consumer Services �� 0.3%Riso Kyoiku Co., Ltd. 900 3,767Diversified Telecommunication Services �� 0.8%Nippon Telegraph & Telephone Corp. 200 9,313Electric Utilities �� 1.7%Chubu Electric Power Co., Inc. 300 4,209Hokkaido Electric Power Co., Inc. 800 4,478Kansai Electric Power Co., Inc. (The) 300 3,437Shikoku Electric Power Co., Inc. 500 4,622Tokyo Electric Power Co. Holdings, Inc.* 800 4,173Total Electric Utilities 20,919Electrical Equipment �� 0.3%Nippon Carbon Co., Ltd. 100 3,833Electronic Equipment, Instruments & Components �� 2.8%Canon Marketing Japan, Inc. 300 6,541Daiwabo Holdings Co., Ltd. 100 4,761Hitachi Ltd. 100 3,665Japan Aviation Electronics Industry Ltd. 300 4,402Oki Electric Industry Co., Ltd. 500 6,242Taiyo Yuden Co., Ltd. 200 3,722V Technology Co., Ltd. 100 4,567Total Electronic Equipment, Instruments & Components 33,900Entertainment �� 4.8%Akatsuki, Inc. 100 5,374Avex, Inc. 800 10,158Capcom Co., Ltd. 300 6,020Daiichikosho Co., Ltd. 200 9,300GungHo Online Entertainment, Inc.(a) 140 3,872Nexon Co., Ltd.* 400 5,799Toei Animation Co., Ltd. 100 4,641Toei Co., Ltd. 100 13,904Total Entertainment 59,068Equity Real Estate Investment Trusts (REITs) �� 0.8%Mirai Corp. 20 9,690Food & Staples Retailing �� 2.3%Arcs Co., Ltd. 300 5,981Cocokara fine, Inc. 100 5,198Kobe Bussan Co., Ltd. 100 4,854Seven & I Holdings Co., Ltd. 200 6,772Sugi Holdings Co., Ltd. 100 4,724Total Food & Staples Retailing 27,529
See Notes to Financial Statements.
WisdomTree Trust 85
Copyright © 2019 www.secdatabase.com. All Rights Reserved.Please Consider the Environment Before Printing This Document

Table of ContentsSchedule of Investments (continued)
WisdomTree Japan Multifactor Fund (JAMF)June 30, 2019
Investments Shares ValueFood Products �� 4.5%Kewpie Corp. 362 $ 8,000Maruha Nichiro Corp. 200 5,875Megmilk Snow Brand Co., Ltd. 300 6,577MEIJI Holdings Co., Ltd. 100 7,147Morinaga & Co., Ltd. 100 4,873Nichirei Corp. 200 4,747Nippon Suisan Kaisha Ltd. 1,100 6,820Nisshin Oillio Group Ltd. (The) 200 5,597Prima Meat Packers Ltd. 300 5,719Total Food Products 55,355Health Care Equipment & Supplies �� 2.1%Hogy Medical Co., Ltd.(a) 200 5,903Hoya Corp. 100 7,661Nikkiso Co., Ltd. 300 3,993Nipro Corp. 700 7,764Total Health Care Equipment & Supplies 25,321Health Care Providers & Services �� 2.6%Alfresa Holdings Corp. 300 7,401BML, Inc. 200 5,681Medipal Holdings Corp. 300 6,624NichiiGakkan Co., Ltd. 400 5,829Suzuken Co., Ltd. 100 5,866Total Health Care Providers & Services 31,401Hotels, Restaurants & Leisure �� 6.0%Doutor Nichires Holdings Co., Ltd. 400 7,574HIS Co., Ltd. 144 3,583KOMEDA Holdings Co., Ltd. 400 7,540Koshidaka Holdings Co., Ltd. 300 4,213Kura Sushi, Inc. 100 4,265McDonald�s Holdings Co., Japan Ltd. 200 8,817Ohsho Food Service Corp. 100 5,857Resorttrust, Inc. 300 4,592Round One Corp. 269 3,413Saizeriya Co., Ltd. 200 4,342Skylark Holdings Co., Ltd. 400 6,983Sushiro Global Holdings Ltd. 100 5,968Tokyo Dome Corp. 700 6,621Total Hotels, Restaurants & Leisure 73,768Household Durables �� 2.8%JVC Kenwood Corp. 2,000 4,641Pressance Corp. 300 4,118Sekisui House Ltd. 400 6,592Sony Corp. 100 5,242Starts Corp., Inc. 300 7,073Tamron Co., Ltd. 300 6,140Total Household Durables 33,806Household Products �� 0.5%Lion Corp. 300 5,589Interactive Media & Services �� 0.4%Dip Corp. 300 5,018Investments Shares ValueInternet & Direct Marketing Retail �� 0.3%Belluna Co., Ltd. 600 $ 4,093IT Services �� 4.5%DTS Corp. 200 4,169
Copyright © 2019 www.secdatabase.com. All Rights Reserved.Please Consider the Environment Before Printing This Document

Future Corp. 400 7,882Information Services International-Dentsu Ltd. 100 3,188NEC Networks & System Integration Corp. 200 5,103Nihon Unisys Ltd. 100 3,355Nomura Research Institute Ltd. 360 5,771NS Solutions Corp. 100 3,174NSD Co., Ltd. 300 8,674Otsuka Corp. 100 4,024SCSK Corp. 100 4,919TIS, Inc. 100 5,096Total IT Services 55,355Leisure Products �� 0.8%Bandai Namco Holdings, Inc. 100 4,854Tomy Co., Ltd. 400 4,652Total Leisure Products 9,506Machinery �� 2.1%Makino Milling Machine Co., Ltd. 100 4,033Noritake Co., Ltd. 100 4,190OKUMA Corp. 100 5,133Sodick Co., Ltd. 600 5,179Sumitomo Heavy Industries Ltd. 200 6,878Total Machinery 25,413Media �� 1.0%Hakuhodo DY Holdings, Inc. 400 6,735SKY Perfect JSAT Holdings, Inc. 1,400 5,457Total Media 12,192Metals & Mining �� 1.9%Nippon Light Metal Holdings Co., Ltd. 3,400 7,353Nippon Steel Corp. 500 8,581Tokyo Steel Manufacturing Co., Ltd. 1,000 7,555Total Metals & Mining 23,489Oil, Gas & Consumable Fuels �� 1.0%Cosmo Energy Holdings Co., Ltd. 100 2,253Iwatani Corp. 200 6,942JXTG Holdings, Inc. 650 3,224Total Oil, Gas & Consumable Fuels 12,419Paper & Forest Products �� 0.6%Oji Holdings Corp. 1,300 7,505Personal Products �� 0.5%Noevir Holdings Co., Ltd. 100 5,467Pharmaceuticals �� 4.6%Astellas Pharma, Inc. 500 7,124Kaken Pharmaceutical Co., Ltd. 200 9,356Nichi-iko Pharmaceutical Co., Ltd. 600 6,560Sawai Pharmaceutical Co., Ltd. 200 10,804Shionogi & Co., Ltd. 200 11,526
See Notes to Financial Statements.
86 WisdomTree Trust
Copyright © 2019 www.secdatabase.com. All Rights Reserved.Please Consider the Environment Before Printing This Document
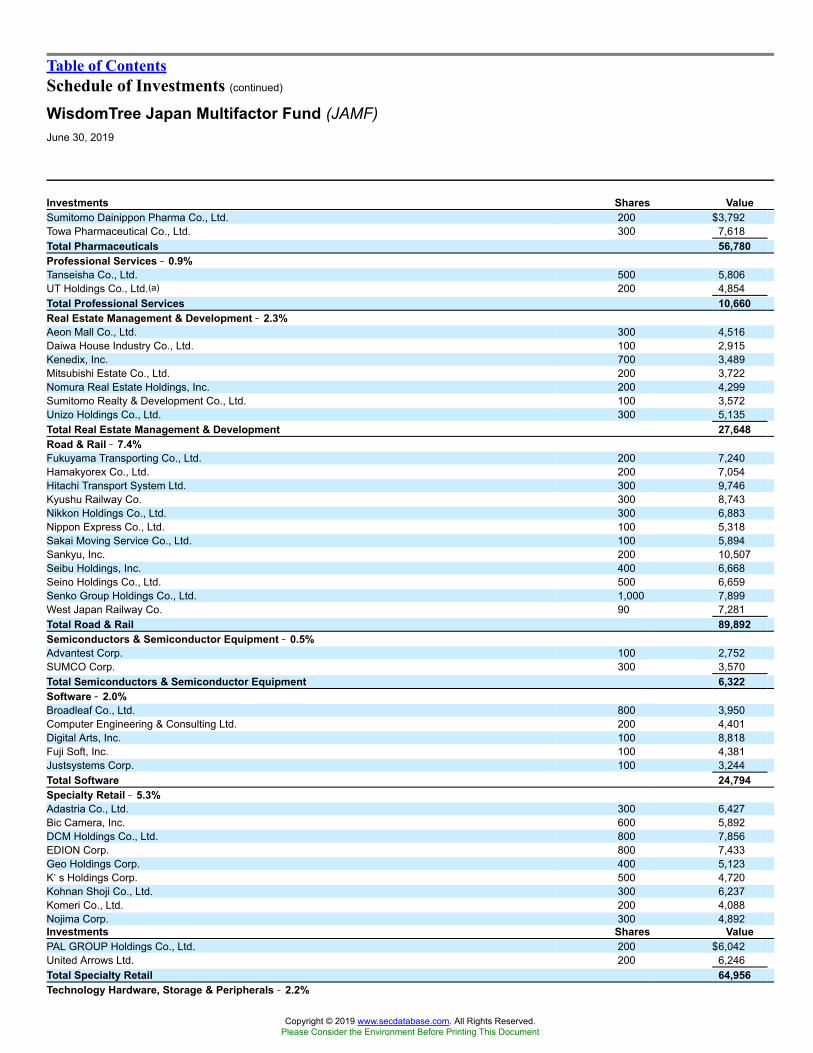
Table of ContentsSchedule of Investments (continued)
WisdomTree Japan Multifactor Fund (JAMF)June 30, 2019
Investments Shares ValueSumitomo Dainippon Pharma Co., Ltd. 200 $3,792Towa Pharmaceutical Co., Ltd. 300 7,618Total Pharmaceuticals 56,780Professional Services �� 0.9%Tanseisha Co., Ltd. 500 5,806UT Holdings Co., Ltd.(a) 200 4,854Total Professional Services 10,660Real Estate Management & Development �� 2.3%Aeon Mall Co., Ltd. 300 4,516Daiwa House Industry Co., Ltd. 100 2,915Kenedix, Inc. 700 3,489Mitsubishi Estate Co., Ltd. 200 3,722Nomura Real Estate Holdings, Inc. 200 4,299Sumitomo Realty & Development Co., Ltd. 100 3,572Unizo Holdings Co., Ltd. 300 5,135Total Real Estate Management & Development 27,648Road & Rail �� 7.4%Fukuyama Transporting Co., Ltd. 200 7,240Hamakyorex Co., Ltd. 200 7,054Hitachi Transport System Ltd. 300 9,746Kyushu Railway Co. 300 8,743Nikkon Holdings Co., Ltd. 300 6,883Nippon Express Co., Ltd. 100 5,318Sakai Moving Service Co., Ltd. 100 5,894Sankyu, Inc. 200 10,507Seibu Holdings, Inc. 400 6,668Seino Holdings Co., Ltd. 500 6,659Senko Group Holdings Co., Ltd. 1,000 7,899West Japan Railway Co. 90 7,281Total Road & Rail 89,892Semiconductors & Semiconductor Equipment �� 0.5%Advantest Corp. 100 2,752SUMCO Corp. 300 3,570Total Semiconductors & Semiconductor Equipment 6,322Software �� 2.0%Broadleaf Co., Ltd. 800 3,950Computer Engineering & Consulting Ltd. 200 4,401Digital Arts, Inc. 100 8,818Fuji Soft, Inc. 100 4,381Justsystems Corp. 100 3,244Total Software 24,794Specialty Retail �� 5.3%Adastria Co., Ltd. 300 6,427Bic Camera, Inc. 600 5,892DCM Holdings Co., Ltd. 800 7,856EDION Corp. 800 7,433Geo Holdings Corp. 400 5,123K�s Holdings Corp. 500 4,720Kohnan Shoji Co., Ltd. 300 6,237Komeri Co., Ltd. 200 4,088Nojima Corp. 300 4,892Investments Shares ValuePAL GROUP Holdings Co., Ltd. 200 $6,042United Arrows Ltd. 200 6,246Total Specialty Retail 64,956Technology Hardware, Storage & Peripherals �� 2.2%
Copyright © 2019 www.secdatabase.com. All Rights Reserved.Please Consider the Environment Before Printing This Document

Brother Industries Ltd. 300 5,666Konica Minolta, Inc. 600 5,842MCJ Co., Ltd. 500 3,662Seiko Epson Corp. 400 6,330Toshiba TEC Corp. 200 5,567Total Technology Hardware, Storage & Peripherals 27,067Textiles, Apparel & Luxury Goods �� 0.3%Seiko Holdings Corp. 200 4,069Tobacco �� 0.5%Japan Tobacco, Inc. 300 6,626Trading Companies & Distributors �� 3.9%ITOCHU Corp. 500 9,562Kanamoto Co., Ltd. 200 5,172Kanematsu Corp. 500 5,541Marubeni Corp. 1,000 6,618Nishio Rent All Co., Ltd. 200 5,652Sojitz Corp. 2,500 8,029Yamazen Corp. 700 6,731Total Trading Companies & Distributors 47,305Wireless Telecommunication Services �� 0.8%KDDI Corp. 400 10,186TOTAL COMMON STOCKS(Cost: $1,238,166) 1,223,372INVESTMENT OF CASH COLLATERAL FOR SECURITIES LOANED �� 0.5%United States �� 0.5%State Street Navigator Securities Lending
Government Money Market Portfolio, 2.36%(b)(Cost: $5,686)(c) 5,686 5,686TOTAL INVESTMENTS IN SECURITIES �� 100.6%(Cost: $1,243,852) 1,229,058Other Assets less Liabilities � (0.6)% (6,881 )NET ASSETS �� 100.0% $1,222,177* Non-income producing security.(a) Security, or portion thereof, was on loan at June 30, 2019 (See Note 2).(b) Rate shown represents annualized 7-day yield as of June 30, 2019.(c) At June 30, 2019, the total market value of the Fund�s securities on loan identified in the Schedule of Investments was $8,351 and the total market value of the
collateral held by the Fund was $8,840. The total market value of the collateral includes non-cash U.S. Government securities collateral having a value of $3,154.
See Notes to Financial Statements.
WisdomTree Trust 87
Copyright © 2019 www.secdatabase.com. All Rights Reserved.Please Consider the Environment Before Printing This Document
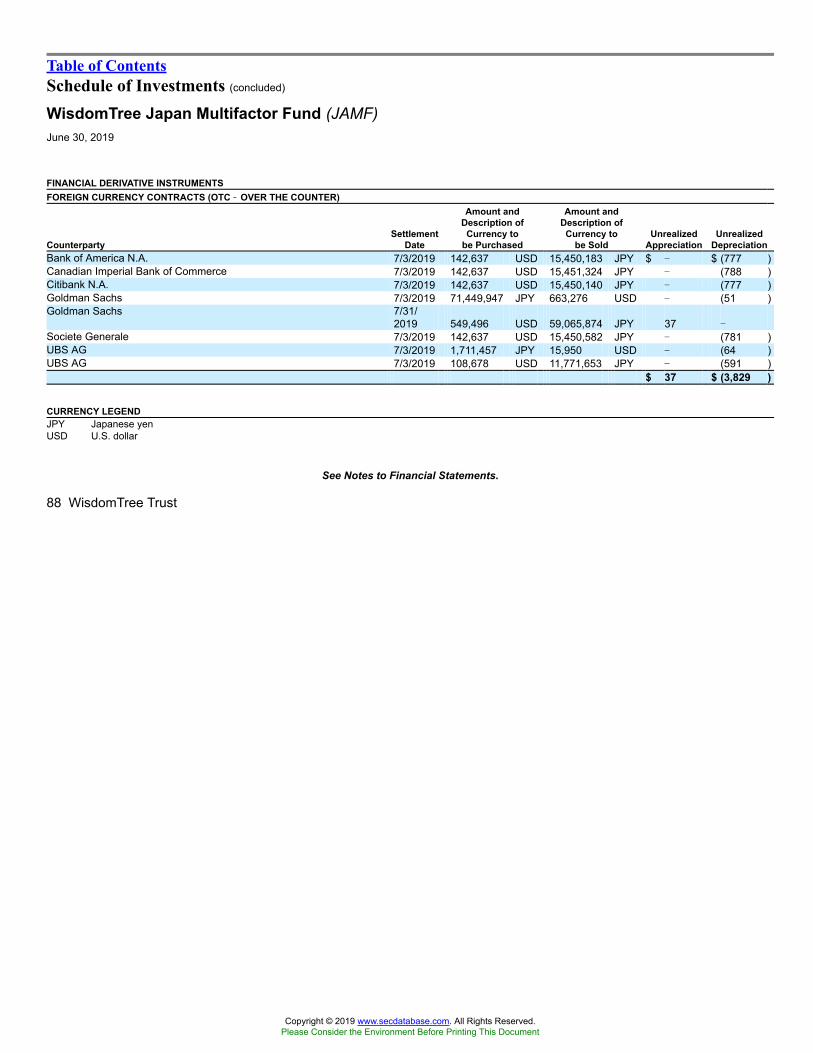
Table of ContentsSchedule of Investments (concluded)
WisdomTree Japan Multifactor Fund (JAMF)June 30, 2019
FINANCIAL DERIVATIVE INSTRUMENTSFOREIGN CURRENCY CONTRACTS (OTC �� OVER THE COUNTER)
CounterpartySettlement
Date
Amount andDescription of
Currency tobe Purchased
Amount andDescription of
Currency tobe Sold
UnrealizedAppreciation
UnrealizedDepreciation
Bank of America N.A. 7/3/2019 142,637 USD 15,450,183 JPY $ � $ (777 )Canadian Imperial Bank of Commerce 7/3/2019 142,637 USD 15,451,324 JPY � (788 )Citibank N.A. 7/3/2019 142,637 USD 15,450,140 JPY � (777 )Goldman Sachs 7/3/2019 71,449,947 JPY 663,276 USD � (51 )Goldman Sachs 7/31/
2019 549,496 USD 59,065,874 JPY 37 �Societe Generale 7/3/2019 142,637 USD 15,450,582 JPY � (781 )UBS AG 7/3/2019 1,711,457 JPY 15,950 USD � (64 )UBS AG 7/3/2019 108,678 USD 11,771,653 JPY � (591 )
$ 37 $ (3,829 )
CURRENCY LEGENDJPY Japanese yenUSD U.S. dollar
See Notes to Financial Statements.
88 WisdomTree Trust
Copyright © 2019 www.secdatabase.com. All Rights Reserved.Please Consider the Environment Before Printing This Document

Table of ContentsSchedule of InvestmentsWisdomTree Fundamental U.S. Corporate Bond Fund (WFIG)
June 30, 2019
InvestmentsPrincipalAmount Value
U.S. CORPORATE BONDS �� 97.5%United States �� 97.5%ABB Finance USA, Inc.
2.88%, 5/8/22 $63,000 $64,091Abbott Laboratories
4.90%, 11/30/46 22,000 27,224AbbVie, Inc.
3.60%, 5/14/25 9,000 9,3064.45%, 5/14/46 37,000 36,399
Alexandria Real Estate Equities, Inc.3.95%, 1/15/28 13,000 13,683
Altria Group, Inc.2.63%, 9/16/26 14,000 13,4413.88%, 9/16/46 13,000 11,573
Amazon.com, Inc.4.05%, 8/22/47 9,000 10,234
American Express Co.2.50%, 8/1/22 10,000 10,0673.63%, 12/5/24 17,000 17,862
American International Group, Inc.3.30%, 3/1/21 35,000 35,4844.80%, 7/10/45 27,000 29,612
Amgen, Inc.5.15%, 11/15/41 61,000 70,244
Analog Devices, Inc.2.50%, 12/5/21 15,000 15,049
Anthem, Inc.3.65%, 12/1/27 19,000 19,7694.65%, 1/15/43 15,000 16,393
Apple, Inc.3.85%, 5/4/43 50,000 53,094
AT&T, Inc.3.00%, 2/15/22 9,000 9,1483.60%, 7/15/25 99,000 102,8204.50%, 3/9/48 143,000 146,440
Bank of America Corp.4.13%, 1/22/24 62,000 66,3554.45%, 3/3/26 47,000 50,7375.00%, 1/21/44 40,000 48,823
Baxter International, Inc.1.70%, 8/15/21 25,000 24,707
BB&T Corp.5.25%, 11/1/19 45,000 45,411
Berkshire Hathaway Energy Co.6.13%, 4/1/36 48,000 64,308
Block Financial LLC5.50%, 11/1/22 46,000 49,101
Brighthouse Financial, Inc.3.70%, 6/22/27 15,000 14,265
Broadcom Corp.3.63%, 1/15/24 17,000 17,1733.13%, 1/15/25 20,000 19,5613.88%, 1/15/27 21,000 20,597
Burlington Northern Santa Fe LLC4.15%, 4/1/45 9,000 10,073
Campbell Soup Co.4.15%, 3/15/28 13,000 13,627
Copyright © 2019 www.secdatabase.com. All Rights Reserved.Please Consider the Environment Before Printing This Document

InvestmentsPrincipalAmount Value
Capital One Financial Corp.3.80%, 1/31/28 $45,000 $46,550
Cardinal Health, Inc.3.41%, 6/15/27 21,000 20,9714.37%, 6/15/47 7,000 6,421
CBS Corp.4.60%, 1/15/45 11,000 11,389
Celgene Corp.2.88%, 8/15/20 74,000 74,4084.35%, 11/15/47 11,000 12,161
Cigna Holding Co.3.88%, 10/15/47 7,000 6,527
Citigroup, Inc.5.50%, 9/13/25 134,000 151,898
Comcast Corp.2.75%, 3/1/23 34,000 34,5243.38%, 2/15/25 9,000 9,4283.15%, 2/15/28 26,000 26,7094.25%, 1/15/33 12,000 13,4734.65%, 7/15/42 46,000 53,010
Commonwealth Edison Co.3.65%, 6/15/46 7,000 7,124
Conagra Brands, Inc.5.40%, 11/1/48 11,000 12,091
Consolidated Edison Co. of New York, Inc.4.50%, 5/15/58 15,000 16,753
Constellation Brands, Inc.3.75%, 5/1/21 58,000 59,295
Continental Resources, Inc.4.50%, 4/15/23 24,000 25,237
CSX Corp.4.25%, 11/1/66 15,000 15,489
CVS Health Corp.3.70%, 3/9/23 14,000 14,4884.88%, 7/20/35 60,000 62,9095.05%, 3/25/48 36,000 38,403
Dow Chemical Co. (The)4.13%, 11/15/21 147,000 152,188
Duke Energy Carolinas LLC3.95%, 11/15/28 35,000 38,131
Duke Energy Corp.2.40%, 8/15/22 32,000 32,002
DuPont de Nemours, Inc.5.42%, 11/15/48 18,000 21,902
eBay, Inc.2.88%, 8/1/21 30,000 30,261
Edison International2.13%, 4/15/20 20,000 19,915
Enterprise Products Operating LLC4.80%, 2/1/49 23,000 25,561
EPR Properties5.75%, 8/15/22 33,000 35,413
Exelon Corp.3.50%, 6/1/22 44,000 45,094
Express Scripts Holding Co.4.80%, 7/15/46 12,000 12,773
See Notes to Financial Statements.
WisdomTree Trust 89
Copyright © 2019 www.secdatabase.com. All Rights Reserved.Please Consider the Environment Before Printing This Document
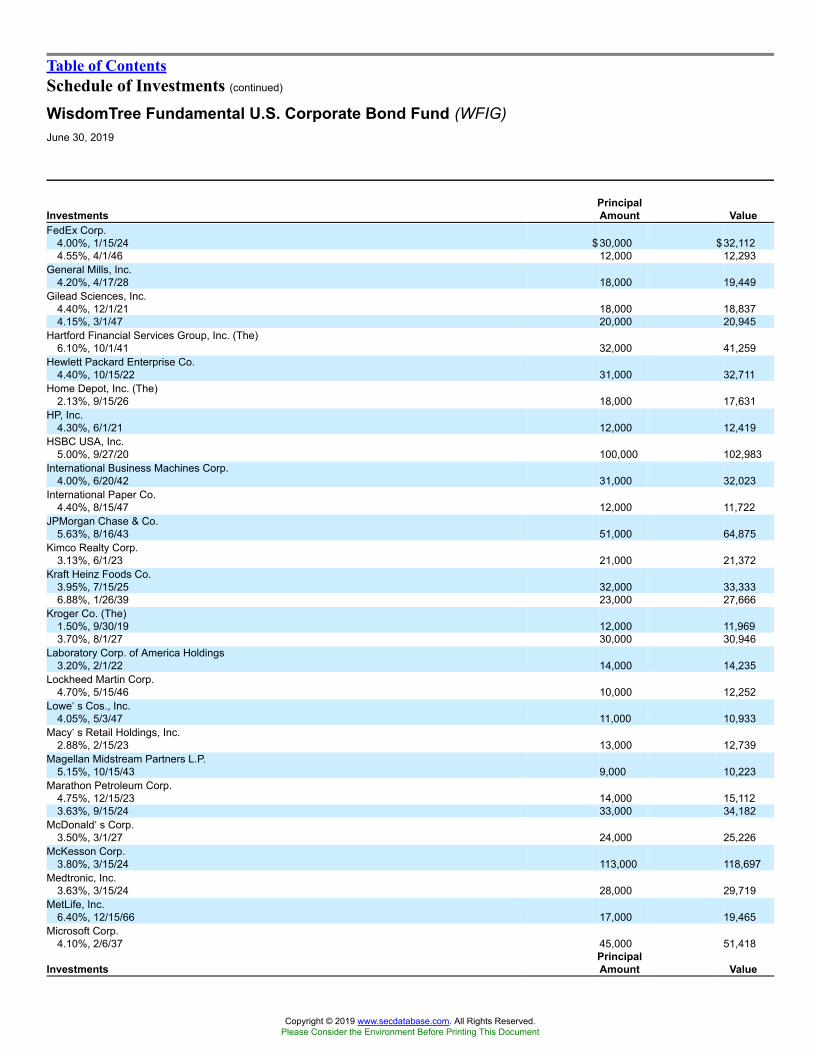
Table of ContentsSchedule of Investments (continued)
WisdomTree Fundamental U.S. Corporate Bond Fund (WFIG)June 30, 2019
InvestmentsPrincipalAmount Value
FedEx Corp.4.00%, 1/15/24 $30,000 $32,1124.55%, 4/1/46 12,000 12,293
General Mills, Inc.4.20%, 4/17/28 18,000 19,449
Gilead Sciences, Inc.4.40%, 12/1/21 18,000 18,8374.15%, 3/1/47 20,000 20,945
Hartford Financial Services Group, Inc. (The)6.10%, 10/1/41 32,000 41,259
Hewlett Packard Enterprise Co.4.40%, 10/15/22 31,000 32,711
Home Depot, Inc. (The)2.13%, 9/15/26 18,000 17,631
HP, Inc.4.30%, 6/1/21 12,000 12,419
HSBC USA, Inc.5.00%, 9/27/20 100,000 102,983
International Business Machines Corp.4.00%, 6/20/42 31,000 32,023
International Paper Co.4.40%, 8/15/47 12,000 11,722
JPMorgan Chase & Co.5.63%, 8/16/43 51,000 64,875
Kimco Realty Corp.3.13%, 6/1/23 21,000 21,372
Kraft Heinz Foods Co.3.95%, 7/15/25 32,000 33,3336.88%, 1/26/39 23,000 27,666
Kroger Co. (The)1.50%, 9/30/19 12,000 11,9693.70%, 8/1/27 30,000 30,946
Laboratory Corp. of America Holdings3.20%, 2/1/22 14,000 14,235
Lockheed Martin Corp.4.70%, 5/15/46 10,000 12,252
Lowe�s Cos., Inc.4.05%, 5/3/47 11,000 10,933
Macy�s Retail Holdings, Inc.2.88%, 2/15/23 13,000 12,739
Magellan Midstream Partners L.P.5.15%, 10/15/43 9,000 10,223
Marathon Petroleum Corp.4.75%, 12/15/23 14,000 15,1123.63%, 9/15/24 33,000 34,182
McDonald�s Corp.3.50%, 3/1/27 24,000 25,226
McKesson Corp.3.80%, 3/15/24 113,000 118,697
Medtronic, Inc.3.63%, 3/15/24 28,000 29,719
MetLife, Inc.6.40%, 12/15/66 17,000 19,465
Microsoft Corp.4.10%, 2/6/37 45,000 51,418
InvestmentsPrincipalAmount Value
Copyright © 2019 www.secdatabase.com. All Rights Reserved.Please Consider the Environment Before Printing This Document

Molson Coors Brewing Co.3.00%, 7/15/26 $18,000 $17,800
Morgan Stanley4.88%, 11/1/22 148,000 158,443
MPLX L.P.4.50%, 7/15/23 22,000 23,3514.13%, 3/1/27 37,000 38,763
Newmont Goldcorp Corp.6.25%, 10/1/39 7,000 9,015
NextEra Energy Capital Holdings, Inc.3.55%, 5/1/27 16,000 16,718
Norfolk Southern Corp.4.15%, 2/28/48 9,000 9,685
Northrop Grumman Corp.3.25%, 8/1/23 84,000 86,937
NVIDIA Corp.2.20%, 9/16/21 24,000 23,947
NVR, Inc.3.95%, 9/15/22 18,000 18,696
O�Reilly Automotive, Inc.3.60%, 9/1/27 6,000 6,175
Omega Healthcare Investors, Inc.4.38%, 8/1/23 22,000 22,869
Omnicom Group, Inc.4.45%, 8/15/20 23,000 23,520
Oracle Corp.4.30%, 7/8/34 31,000 35,3273.85%, 7/15/36 40,000 42,501
Owens Corning4.30%, 7/15/47 7,000 5,918
Pfizer, Inc.3.60%, 9/15/28 24,000 25,591
Philip Morris International, Inc.3.13%, 8/17/27 20,000 20,488
Phillips 664.30%, 4/1/22 26,000 27,393
Phillips 66 Partners L.P.3.55%, 10/1/26 11,000 11,209
Realty Income Corp.4.65%, 8/1/23 22,000 23,784
Reynolds American, Inc.4.00%, 6/12/22 10,000 10,3865.85%, 8/15/45 30,000 32,359
Rockwell Collins, Inc.3.50%, 3/15/27 8,000 8,332
Santander Holdings USA, Inc.2.65%, 4/17/20 81,000 80,989
Sherwin-Williams Co. (The)4.50%, 6/1/47 7,000 7,478
Shire Acquisitions Investments Ireland DAC3.20%, 9/23/26 40,000 40,369
Southern California Edison Co.4.00%, 4/1/47 16,000 15,961
Starbucks Corp.4.00%, 11/15/28 12,000 13,090
See Notes to Financial Statements.
90 WisdomTree Trust
Copyright © 2019 www.secdatabase.com. All Rights Reserved.Please Consider the Environment Before Printing This Document
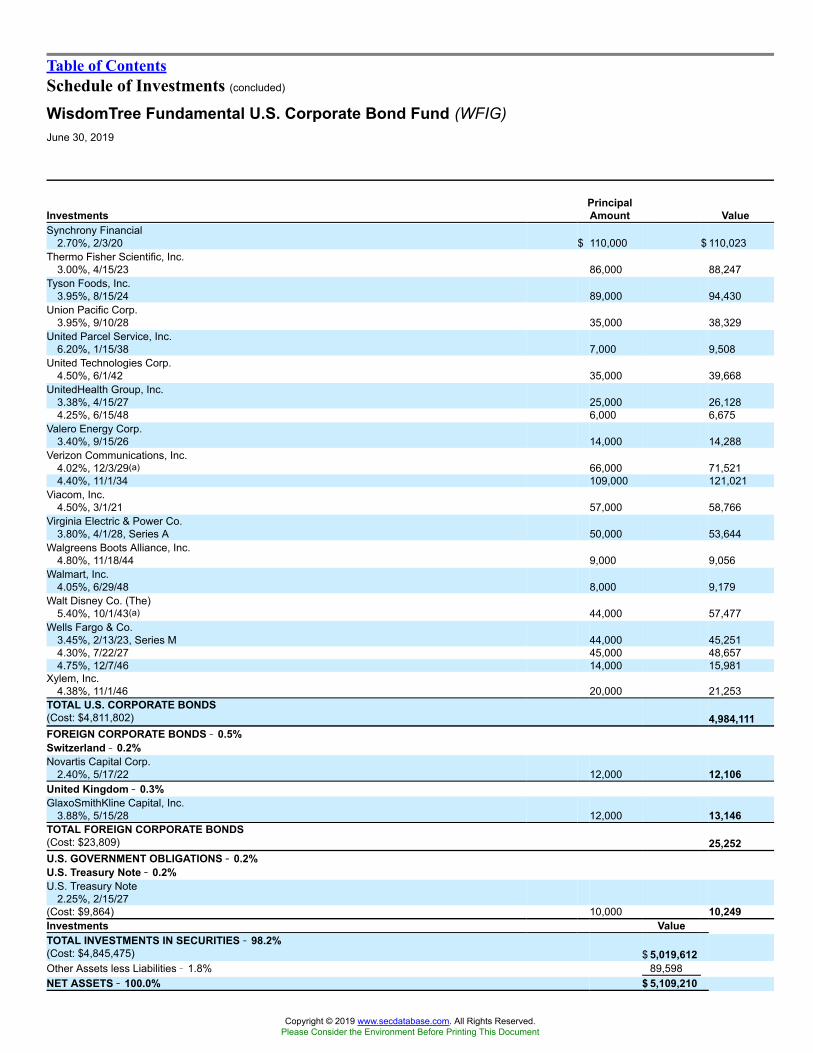
Table of ContentsSchedule of Investments (concluded)
WisdomTree Fundamental U.S. Corporate Bond Fund (WFIG)June 30, 2019
InvestmentsPrincipalAmount Value
Synchrony Financial2.70%, 2/3/20 $ 110,000 $ 110,023
Thermo Fisher Scientific, Inc.3.00%, 4/15/23 86,000 88,247
Tyson Foods, Inc.3.95%, 8/15/24 89,000 94,430
Union Pacific Corp.3.95%, 9/10/28 35,000 38,329
United Parcel Service, Inc.6.20%, 1/15/38 7,000 9,508
United Technologies Corp.4.50%, 6/1/42 35,000 39,668
UnitedHealth Group, Inc.3.38%, 4/15/27 25,000 26,1284.25%, 6/15/48 6,000 6,675
Valero Energy Corp.3.40%, 9/15/26 14,000 14,288
Verizon Communications, Inc.4.02%, 12/3/29(a) 66,000 71,5214.40%, 11/1/34 109,000 121,021
Viacom, Inc.4.50%, 3/1/21 57,000 58,766
Virginia Electric & Power Co.3.80%, 4/1/28, Series A 50,000 53,644
Walgreens Boots Alliance, Inc.4.80%, 11/18/44 9,000 9,056
Walmart, Inc.4.05%, 6/29/48 8,000 9,179
Walt Disney Co. (The)5.40%, 10/1/43(a) 44,000 57,477
Wells Fargo & Co.3.45%, 2/13/23, Series M 44,000 45,2514.30%, 7/22/27 45,000 48,6574.75%, 12/7/46 14,000 15,981
Xylem, Inc.4.38%, 11/1/46 20,000 21,253
TOTAL U.S. CORPORATE BONDS(Cost: $4,811,802) 4,984,111FOREIGN CORPORATE BONDS �� 0.5%Switzerland �� 0.2%Novartis Capital Corp.
2.40%, 5/17/22 12,000 12,106United Kingdom �� 0.3%GlaxoSmithKline Capital, Inc.
3.88%, 5/15/28 12,000 13,146TOTAL FOREIGN CORPORATE BONDS(Cost: $23,809) 25,252U.S. GOVERNMENT OBLIGATIONS �� 0.2%U.S. Treasury Note �� 0.2%U.S. Treasury Note
2.25%, 2/15/27(Cost: $9,864) 10,000 10,249Investments ValueTOTAL INVESTMENTS IN SECURITIES �� 98.2%(Cost: $4,845,475) $ 5,019,612Other Assets less Liabilities � 1.8% 89,598NET ASSETS �� 100.0% $ 5,109,210
Copyright © 2019 www.secdatabase.com. All Rights Reserved.Please Consider the Environment Before Printing This Document
(a) This security is exempt from registration under rule 144A of the Securities Act of 1933. This security may be sold in transactions that are exempt from registration,normally to qualified institutional buyers.
See Notes to Financial Statements.
WisdomTree Trust 91
Copyright © 2019 www.secdatabase.com. All Rights Reserved.Please Consider the Environment Before Printing This Document
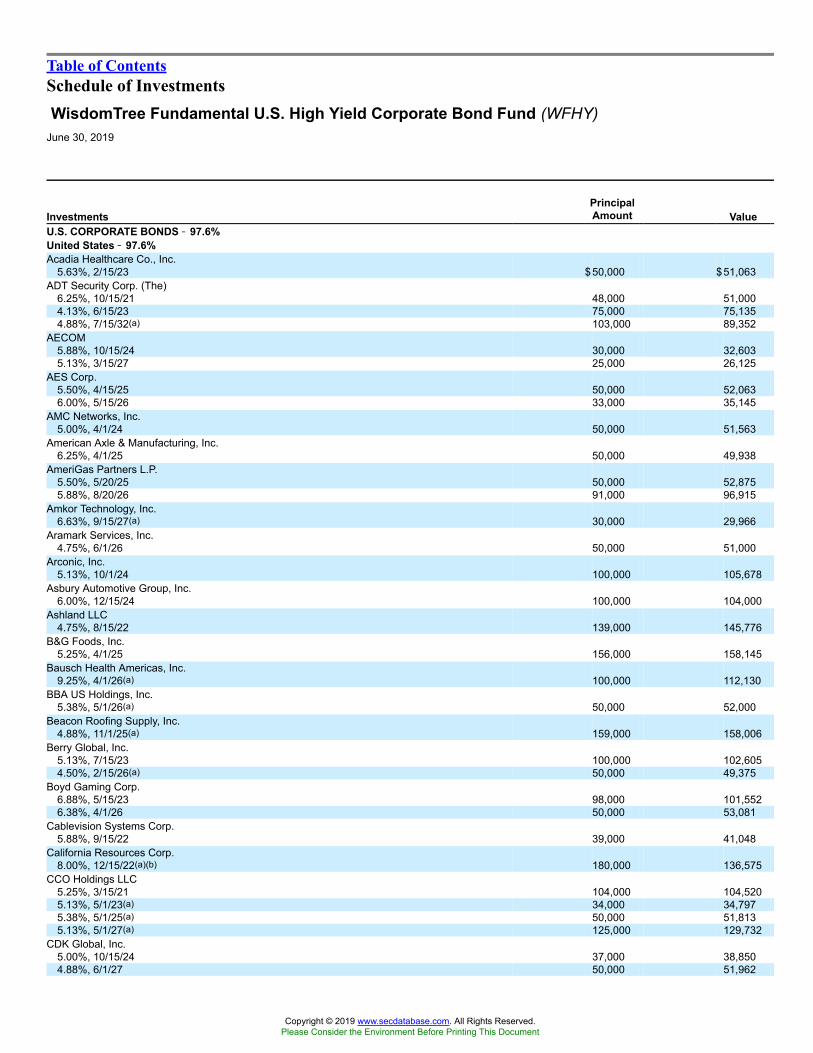
Table of ContentsSchedule of InvestmentsWisdomTree Fundamental U.S. High Yield Corporate Bond Fund (WFHY)
June 30, 2019
InvestmentsPrincipalAmount Value
U.S. CORPORATE BONDS �� 97.6%United States �� 97.6%Acadia Healthcare Co., Inc.
5.63%, 2/15/23 $50,000 $51,063ADT Security Corp. (The)
6.25%, 10/15/21 48,000 51,0004.13%, 6/15/23 75,000 75,1354.88%, 7/15/32(a) 103,000 89,352
AECOM5.88%, 10/15/24 30,000 32,6035.13%, 3/15/27 25,000 26,125
AES Corp.5.50%, 4/15/25 50,000 52,0636.00%, 5/15/26 33,000 35,145
AMC Networks, Inc.5.00%, 4/1/24 50,000 51,563
American Axle & Manufacturing, Inc.6.25%, 4/1/25 50,000 49,938
AmeriGas Partners L.P.5.50%, 5/20/25 50,000 52,8755.88%, 8/20/26 91,000 96,915
Amkor Technology, Inc.6.63%, 9/15/27(a) 30,000 29,966
Aramark Services, Inc.4.75%, 6/1/26 50,000 51,000
Arconic, Inc.5.13%, 10/1/24 100,000 105,678
Asbury Automotive Group, Inc.6.00%, 12/15/24 100,000 104,000
Ashland LLC4.75%, 8/15/22 139,000 145,776
B&G Foods, Inc.5.25%, 4/1/25 156,000 158,145
Bausch Health Americas, Inc.9.25%, 4/1/26(a) 100,000 112,130
BBA US Holdings, Inc.5.38%, 5/1/26(a) 50,000 52,000
Beacon Roofing Supply, Inc.4.88%, 11/1/25(a) 159,000 158,006
Berry Global, Inc.5.13%, 7/15/23 100,000 102,6054.50%, 2/15/26(a) 50,000 49,375
Boyd Gaming Corp.6.88%, 5/15/23 98,000 101,5526.38%, 4/1/26 50,000 53,081
Cablevision Systems Corp.5.88%, 9/15/22 39,000 41,048
California Resources Corp.8.00%, 12/15/22(a)(b) 180,000 136,575
CCO Holdings LLC5.25%, 3/15/21 104,000 104,5205.13%, 5/1/23(a) 34,000 34,7975.38%, 5/1/25(a) 50,000 51,8135.13%, 5/1/27(a) 125,000 129,732
CDK Global, Inc.5.00%, 10/15/24 37,000 38,8504.88%, 6/1/27 50,000 51,962
Copyright © 2019 www.secdatabase.com. All Rights Reserved.Please Consider the Environment Before Printing This Document

InvestmentsPrincipalAmount Value
CDW LLC5.00%, 9/1/25 $30,000 $31,331
Cengage Learning, Inc.9.50%, 6/15/24(a) 50,000 47,875
Centene Corp.5.63%, 2/15/21 102,000 104,040
CenturyLink, Inc.5.80%, 3/15/22, Series T 50,000 52,3756.75%, 12/1/23, Series W(b) 36,000 38,9257.50%, 4/1/24, Series Y(b) 95,000 105,3315.63%, 4/1/25 50,000 51,125
Change Healthcare Holdings LLC5.75%, 3/1/25(a) 104,000 105,950
Chemours Co. (The)6.63%, 5/15/23 170,000 176,480
Clean Harbors, Inc.5.13%, 6/1/21 103,000 103,257
Clearway Energy Operating LLC5.38%, 8/15/24 50,000 51,125
Cleveland-Cliffs, Inc.5.75%, 3/1/25 108,000 107,730
Cloud Crane LLC10.13%, 8/1/24(a) 50,000 53,875
CommScope Technologies LLC6.00%, 6/15/25(a) 65,000 61,2445.00%, 3/15/27(a) 119,000 104,125
CommScope, Inc.5.50%, 6/15/24(a) 50,000 47,950
Community Health Systems, Inc.7.13%, 7/15/20 50,000 47,8756.25%, 3/31/23 183,000 176,824
Consolidated Communications, Inc.6.50%, 10/1/22 165,000 154,636
Coty, Inc.6.50%, 4/15/26(a)(b) 86,000 83,957
Crestwood Midstream Partners L.P.5.75%, 4/1/25 75,000 76,312
Crown Americas LLC4.75%, 2/1/26 50,000 51,500
CSC Holdings LLC5.25%, 6/1/24 75,000 78,0945.38%, 2/1/28(a) 200,000 208,250
DaVita, Inc.5.75%, 8/15/22 100,000 101,2505.00%, 5/1/25 107,000 106,037
Dell International LLC7.13%, 6/15/24(a) 50,000 52,787
Denbury Resources, Inc.9.00%, 5/15/21(a) 67,000 66,330
Diamond Offshore Drilling, Inc.7.88%, 8/15/25 50,000 47,7504.88%, 11/1/43 50,000 31,250
Diamond Resorts International, Inc.10.75%, 9/1/24(a)(b) 86,000 85,140
DISH DBS Corp.5.13%, 5/1/20 50,000 50,375
See Notes to Financial Statements.
92 WisdomTree Trust
Copyright © 2019 www.secdatabase.com. All Rights Reserved.Please Consider the Environment Before Printing This Document
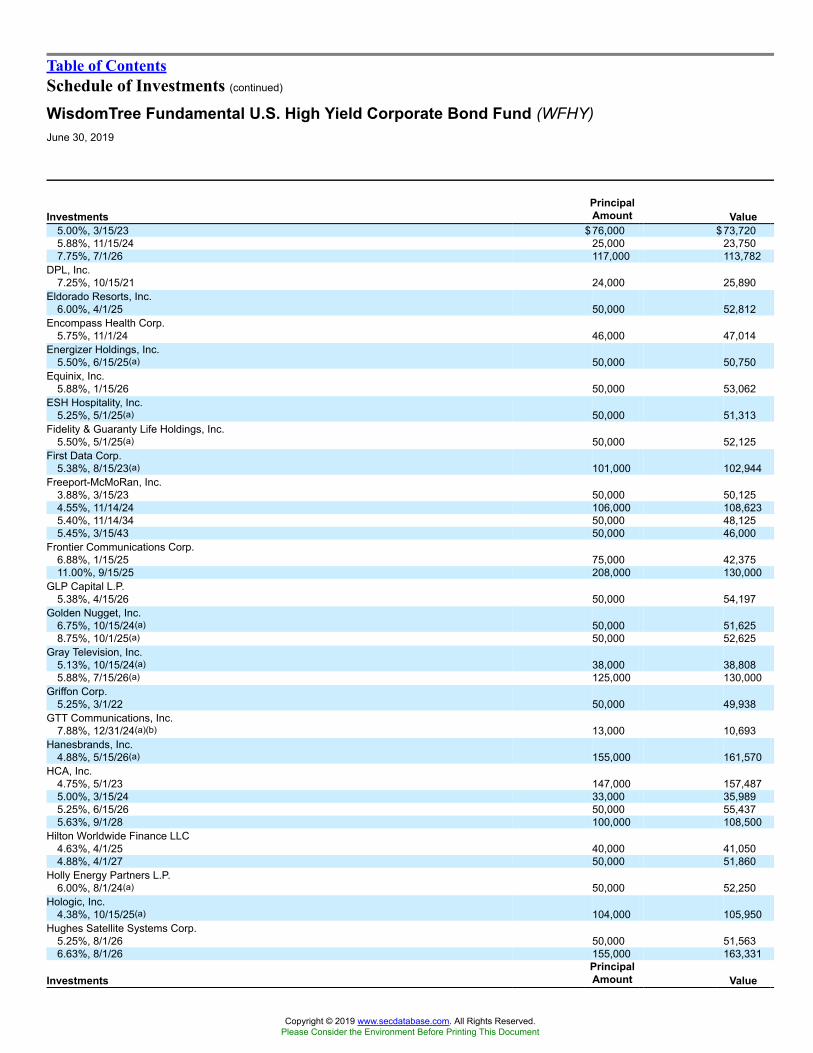
Table of ContentsSchedule of Investments (continued)
WisdomTree Fundamental U.S. High Yield Corporate Bond Fund (WFHY)June 30, 2019
InvestmentsPrincipalAmount Value
5.00%, 3/15/23 $76,000 $73,7205.88%, 11/15/24 25,000 23,7507.75%, 7/1/26 117,000 113,782
DPL, Inc.7.25%, 10/15/21 24,000 25,890
Eldorado Resorts, Inc.6.00%, 4/1/25 50,000 52,812
Encompass Health Corp.5.75%, 11/1/24 46,000 47,014
Energizer Holdings, Inc.5.50%, 6/15/25(a) 50,000 50,750
Equinix, Inc.5.88%, 1/15/26 50,000 53,062
ESH Hospitality, Inc.5.25%, 5/1/25(a) 50,000 51,313
Fidelity & Guaranty Life Holdings, Inc.5.50%, 5/1/25(a) 50,000 52,125
First Data Corp.5.38%, 8/15/23(a) 101,000 102,944
Freeport-McMoRan, Inc.3.88%, 3/15/23 50,000 50,1254.55%, 11/14/24 106,000 108,6235.40%, 11/14/34 50,000 48,1255.45%, 3/15/43 50,000 46,000
Frontier Communications Corp.6.88%, 1/15/25 75,000 42,37511.00%, 9/15/25 208,000 130,000
GLP Capital L.P.5.38%, 4/15/26 50,000 54,197
Golden Nugget, Inc.6.75%, 10/15/24(a) 50,000 51,6258.75%, 10/1/25(a) 50,000 52,625
Gray Television, Inc.5.13%, 10/15/24(a) 38,000 38,8085.88%, 7/15/26(a) 125,000 130,000
Griffon Corp.5.25%, 3/1/22 50,000 49,938
GTT Communications, Inc.7.88%, 12/31/24(a)(b) 13,000 10,693
Hanesbrands, Inc.4.88%, 5/15/26(a) 155,000 161,570
HCA, Inc.4.75%, 5/1/23 147,000 157,4875.00%, 3/15/24 33,000 35,9895.25%, 6/15/26 50,000 55,4375.63%, 9/1/28 100,000 108,500
Hilton Worldwide Finance LLC4.63%, 4/1/25 40,000 41,0504.88%, 4/1/27 50,000 51,860
Holly Energy Partners L.P.6.00%, 8/1/24(a) 50,000 52,250
Hologic, Inc.4.38%, 10/15/25(a) 104,000 105,950
Hughes Satellite Systems Corp.5.25%, 8/1/26 50,000 51,5636.63%, 8/1/26 155,000 163,331
InvestmentsPrincipalAmount Value
Copyright © 2019 www.secdatabase.com. All Rights Reserved.Please Consider the Environment Before Printing This Document
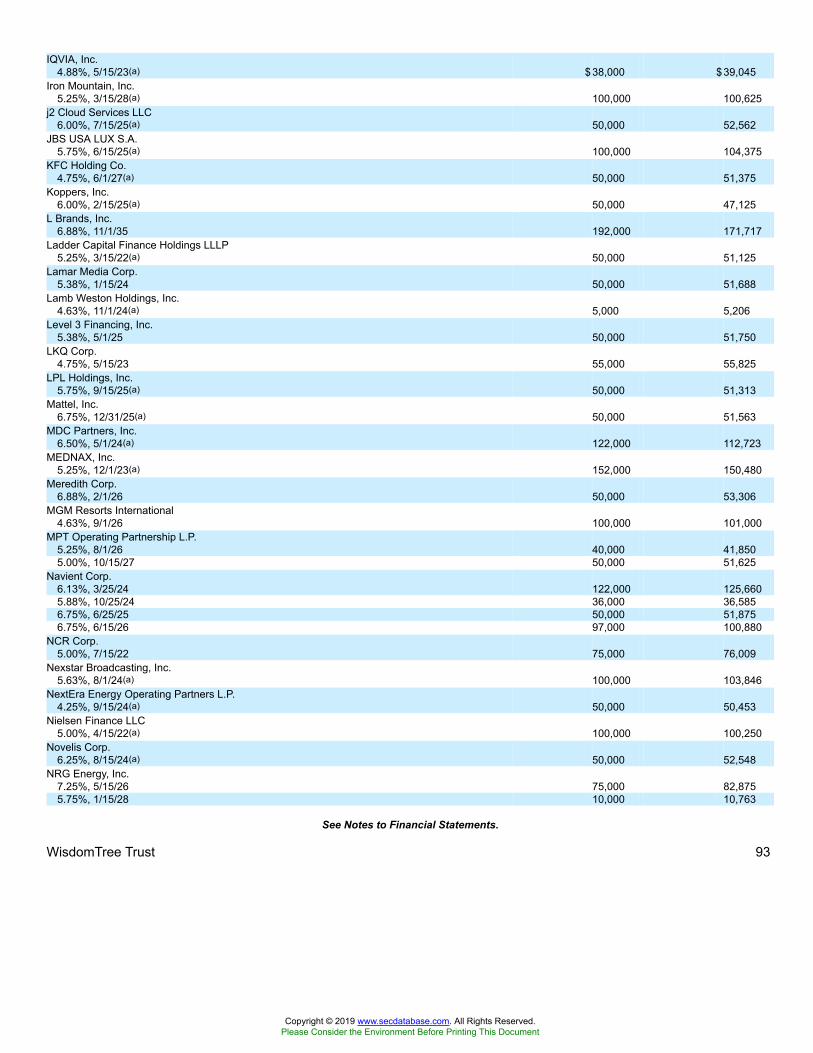
IQVIA, Inc.4.88%, 5/15/23(a) $38,000 $39,045
Iron Mountain, Inc.5.25%, 3/15/28(a) 100,000 100,625
j2 Cloud Services LLC6.00%, 7/15/25(a) 50,000 52,562
JBS USA LUX S.A.5.75%, 6/15/25(a) 100,000 104,375
KFC Holding Co.4.75%, 6/1/27(a) 50,000 51,375
Koppers, Inc.6.00%, 2/15/25(a) 50,000 47,125
L Brands, Inc.6.88%, 11/1/35 192,000 171,717
Ladder Capital Finance Holdings LLLP5.25%, 3/15/22(a) 50,000 51,125
Lamar Media Corp.5.38%, 1/15/24 50,000 51,688
Lamb Weston Holdings, Inc.4.63%, 11/1/24(a) 5,000 5,206
Level 3 Financing, Inc.5.38%, 5/1/25 50,000 51,750
LKQ Corp.4.75%, 5/15/23 55,000 55,825
LPL Holdings, Inc.5.75%, 9/15/25(a) 50,000 51,313
Mattel, Inc.6.75%, 12/31/25(a) 50,000 51,563
MDC Partners, Inc.6.50%, 5/1/24(a) 122,000 112,723
MEDNAX, Inc.5.25%, 12/1/23(a) 152,000 150,480
Meredith Corp.6.88%, 2/1/26 50,000 53,306
MGM Resorts International4.63%, 9/1/26 100,000 101,000
MPT Operating Partnership L.P.5.25%, 8/1/26 40,000 41,8505.00%, 10/15/27 50,000 51,625
Navient Corp.6.13%, 3/25/24 122,000 125,6605.88%, 10/25/24 36,000 36,5856.75%, 6/25/25 50,000 51,8756.75%, 6/15/26 97,000 100,880
NCR Corp.5.00%, 7/15/22 75,000 76,009
Nexstar Broadcasting, Inc.5.63%, 8/1/24(a) 100,000 103,846
NextEra Energy Operating Partners L.P.4.25%, 9/15/24(a) 50,000 50,453
Nielsen Finance LLC5.00%, 4/15/22(a) 100,000 100,250
Novelis Corp.6.25%, 8/15/24(a) 50,000 52,548
NRG Energy, Inc.7.25%, 5/15/26 75,000 82,8755.75%, 1/15/28 10,000 10,763
See Notes to Financial Statements.
WisdomTree Trust 93
Copyright © 2019 www.secdatabase.com. All Rights Reserved.Please Consider the Environment Before Printing This Document

Table of ContentsSchedule of Investments (continued)
WisdomTree Fundamental U.S. High Yield Corporate Bond Fund (WFHY)June 30, 2019
InvestmentsPrincipalAmount Value
Nuance Communications, Inc.5.63%, 12/15/26 $50,000 $52,265
Olin Corp.5.13%, 9/15/27 100,000 103,125
Owens-Brockway Glass Container, Inc.5.88%, 8/15/23(a) 50,000 54,115
Party City Holdings, Inc.6.63%, 8/1/26(a) 30,000 29,175
PBF Holding Co. LLC7.00%, 11/15/23 75,000 78,1887.25%, 6/15/25 100,000 105,125
PBF Logistics L.P.6.88%, 5/15/23 50,000 51,813
Peabody Energy Corp.6.00%, 3/31/22(a) 35,000 35,9636.38%, 3/31/25(a) 50,000 50,750
Pilgrim�s Pride Corp.5.75%, 3/15/25(a) 50,000 50,8755.88%, 9/30/27(a) 102,000 106,080
Pitney Bowes, Inc.3.88%, 10/1/21 46,000 45,3104.63%, 3/15/24 50,000 45,375
Post Holdings, Inc.5.00%, 8/15/26(a) 41,000 41,7185.75%, 3/1/27(a) 100,000 103,7505.63%, 1/15/28(a) 50,000 51,563
PulteGroup, Inc.5.50%, 3/1/26 50,000 54,1875.00%, 1/15/27 75,000 78,923
Rayonier AM Products, Inc.5.50%, 6/1/24(a) 50,000 43,000
RBS Global, Inc.4.88%, 12/15/25(a) 50,000 50,875
Realogy Group LLC4.88%, 6/1/23(a)(b) 164,000 148,420
SBA Communications Corp.4.88%, 9/1/24 55,000 56,856
Scientific Games International, Inc.10.00%, 12/1/22 58,000 61,0455.00%, 10/15/25(a) 106,000 107,325
Sinclair Television Group, Inc.5.63%, 8/1/24(a) 50,000 51,250
Sirius XM Radio, Inc.6.00%, 7/15/24(a) 115,000 118,6225.38%, 7/15/26(a) 50,000 52,000
Six Flags Entertainment Corp.4.88%, 7/31/24(a) 95,000 96,722
Spectrum Brands, Inc.5.75%, 7/15/25 50,000 52,187
Springleaf Finance Corp.7.75%, 10/1/21 60,000 65,8505.63%, 3/15/23 37,000 39,4056.88%, 3/15/25 50,000 54,8747.13%, 3/15/26 103,000 113,042
Steel Dynamics, Inc.5.13%, 10/1/21 101,000 102,179
InvestmentsPrincipalAmount Value
Copyright © 2019 www.secdatabase.com. All Rights Reserved.Please Consider the Environment Before Printing This Document
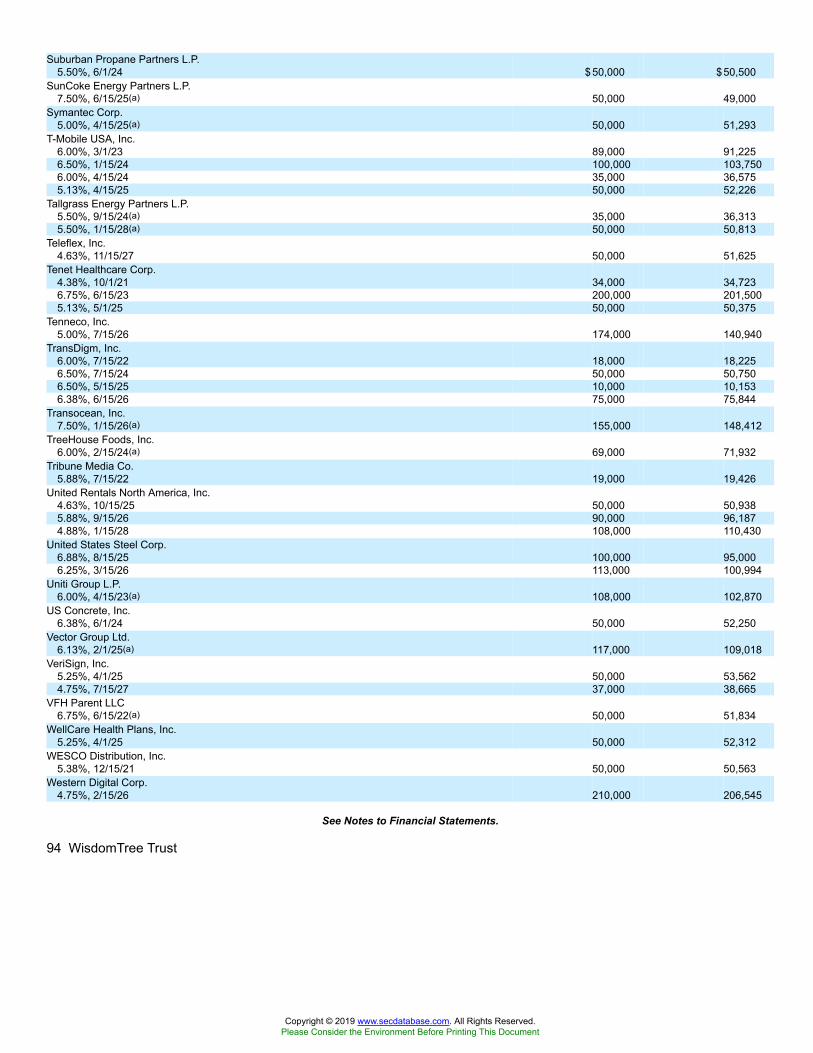
Suburban Propane Partners L.P.5.50%, 6/1/24 $50,000 $50,500
SunCoke Energy Partners L.P.7.50%, 6/15/25(a) 50,000 49,000
Symantec Corp.5.00%, 4/15/25(a) 50,000 51,293
T-Mobile USA, Inc.6.00%, 3/1/23 89,000 91,2256.50%, 1/15/24 100,000 103,7506.00%, 4/15/24 35,000 36,5755.13%, 4/15/25 50,000 52,226
Tallgrass Energy Partners L.P.5.50%, 9/15/24(a) 35,000 36,3135.50%, 1/15/28(a) 50,000 50,813
Teleflex, Inc.4.63%, 11/15/27 50,000 51,625
Tenet Healthcare Corp.4.38%, 10/1/21 34,000 34,7236.75%, 6/15/23 200,000 201,5005.13%, 5/1/25 50,000 50,375
Tenneco, Inc.5.00%, 7/15/26 174,000 140,940
TransDigm, Inc.6.00%, 7/15/22 18,000 18,2256.50%, 7/15/24 50,000 50,7506.50%, 5/15/25 10,000 10,1536.38%, 6/15/26 75,000 75,844
Transocean, Inc.7.50%, 1/15/26(a) 155,000 148,412
TreeHouse Foods, Inc.6.00%, 2/15/24(a) 69,000 71,932
Tribune Media Co.5.88%, 7/15/22 19,000 19,426
United Rentals North America, Inc.4.63%, 10/15/25 50,000 50,9385.88%, 9/15/26 90,000 96,1874.88%, 1/15/28 108,000 110,430
United States Steel Corp.6.88%, 8/15/25 100,000 95,0006.25%, 3/15/26 113,000 100,994
Uniti Group L.P.6.00%, 4/15/23(a) 108,000 102,870
US Concrete, Inc.6.38%, 6/1/24 50,000 52,250
Vector Group Ltd.6.13%, 2/1/25(a) 117,000 109,018
VeriSign, Inc.5.25%, 4/1/25 50,000 53,5624.75%, 7/15/27 37,000 38,665
VFH Parent LLC6.75%, 6/15/22(a) 50,000 51,834
WellCare Health Plans, Inc.5.25%, 4/1/25 50,000 52,312
WESCO Distribution, Inc.5.38%, 12/15/21 50,000 50,563
Western Digital Corp.4.75%, 2/15/26 210,000 206,545
See Notes to Financial Statements.
94 WisdomTree Trust
Copyright © 2019 www.secdatabase.com. All Rights Reserved.Please Consider the Environment Before Printing This Document

Table of ContentsSchedule of Investments (concluded)
WisdomTree Fundamental U.S. High Yield Corporate Bond Fund (WFHY)June 30, 2019
InvestmentsPrincipalAmount Value
Wynn Las Vegas LLC4.25%, 5/30/23(a) $ 75,000 $ 75,0945.50%, 3/1/25(a) 106,000 109,742
XPO Logistics, Inc.6.13%, 9/1/23(a) 50,000 51,938
Zayo Group LLC5.75%, 1/15/27(a) 150,000 153,207
TOTAL U.S. CORPORATE BONDS(Cost: $14,678,599) 15,079,499FOREIGN CORPORATE BOND �� 0.3%United Kingdom �� 0.3%Avon International Operations, Inc.
7.88%, 8/15/22(a)(Cost: $51,309) 50,000 52,125
SharesINVESTMENT OF CASH COLLATERAL FOR SECURITIES LOANED �� 3.3%United States �� 3.3%State Street Navigator Securities Lending Government Money Market Portfolio, 2.36%(c)(Cost: $514,213)(d) 514,213 514,213TOTAL INVESTMENTS IN SECURITIES �� 101.2%(Cost: $15,244,121) 15,645,837Other Assets less Liabilities � (1.2)% (192,389 )NET ASSETS �� 100.0% $ 15,453,448(a) This security is exempt from registration under rule 144A of the Securities Act of 1933. This security may be sold in transactions that are exempt from registration,
normally to qualified institutional buyers.(b) Security, or portion thereof, was on loan at June 30, 2019 (See Note 2).(c) Rate shown represents annualized 7-day yield as of June 30, 2019.(d) At June 30, 2019, the total market value of the Fund�s securities on loan identified in the Schedule of Investments was $500,695 and the total market value of the
collateral held by the Fund was $514,213.
See Notes to Financial Statements.
WisdomTree Trust 95
Copyright © 2019 www.secdatabase.com. All Rights Reserved.Please Consider the Environment Before Printing This Document

Table of ContentsSchedule of InvestmentsWisdomTree Fundamental U.S. Short-Term Corporate Bond Fund (SFIG)
June 30, 2019
InvestmentsPrincipalAmount Value
U.S. CORPORATE BONDS �� 94.2%United States �� 94.2%Abbott Laboratories
2.90%, 11/30/21 $30,000 $30,508AbbVie, Inc.
2.85%, 5/14/23 51,000 51,486Altria Group, Inc.
4.00%, 1/31/24 28,000 29,363American Express Co.
2.50%, 8/1/22 39,000 39,262American Honda Finance Corp.
2.45%, 9/24/20 49,000 49,112American International Group, Inc.
3.38%, 8/15/20 48,000 48,5353.30%, 3/1/21 86,000 87,188
Amgen, Inc.3.88%, 11/15/21 47,000 48,520
Analog Devices, Inc.2.50%, 12/5/21 10,000 10,033
Anthem, Inc.3.13%, 5/15/22 24,000 24,448
Apple, Inc.2.25%, 2/23/21(a) 63,000 63,245
AT&T, Inc.3.00%, 2/15/22 101,000 102,6543.60%, 2/17/23 29,000 30,120
Bank of America Corp.5.70%, 1/24/22 53,000 57,5323.30%, 1/11/23 23,000 23,724
Bank of New York Mellon Corp. (The)2.05%, 5/3/21 114,000 113,809
Baxter International, Inc.1.70%, 8/15/21 22,000 21,742
Block Financial LLC5.50%, 11/1/22 11,000 11,742
BP Capital Markets America, Inc.3.79%, 2/6/24 21,000 22,250
Broadcom Corp.2.65%, 1/15/23 36,000 35,5163.63%, 1/15/24 17,000 17,173
Burlington Northern Santa Fe LLC3.45%, 9/15/21 34,000 34,838
Campbell Soup Co.3.65%, 3/15/23 23,000 23,695
Capital One Financial Corp.4.75%, 7/15/21 59,000 61,695
CBS Corp.2.50%, 2/15/23 28,000 27,868
Celgene Corp.2.88%, 8/15/20 52,000 52,2873.25%, 2/20/23 13,000 13,335
Chevron Corp.1.96%, 3/3/20 25,000 24,955
Cisco Systems, Inc.2.60%, 2/28/23 17,000 17,268
InvestmentsPrincipalAmount Value
Copyright © 2019 www.secdatabase.com. All Rights Reserved.Please Consider the Environment Before Printing This Document

Citigroup, Inc.2.65%, 10/26/20 $96,000 $96,3582.70%, 3/30/21 23,000 23,1262.75%, 4/25/22 34,000 34,324
Comcast Cable Communications Holdings, Inc.9.46%, 11/15/22 14,000 17,255
Comcast Corp.2.75%, 3/1/23 29,000 29,447
Conagra Brands, Inc.3.20%, 1/25/23 14,000 14,249
Consolidated Edison, Inc.2.00%, 5/15/21 75,000 74,657
Constellation Brands, Inc.3.75%, 5/1/21 50,000 51,116
Continental Resources, Inc.4.50%, 4/15/23 20,000 21,031
CVS Health Corp.2.80%, 7/20/20 120,000 120,3293.70%, 3/9/23 45,000 46,568
Discover Financial Services3.85%, 11/21/22 17,000 17,740
Dominion Energy, Inc.2.58%, 7/1/20 49,000 48,940
Duke Energy Corp.2.40%, 8/15/22 32,000 32,002
DuPont de Nemours, Inc.4.21%, 11/15/23 17,000 18,210
eBay, Inc.2.60%, 7/15/22 22,000 22,055
Edison International2.13%, 4/15/20 11,000 10,953
Enterprise Products Operating LLC3.90%, 2/15/24 22,000 23,319
Exelon Corp.3.50%, 6/1/22 44,000 45,094
Express Scripts Holding Co.2.60%, 11/30/20 31,000 31,0923.00%, 7/15/23 23,000 23,298
Exxon Mobil Corp.2.73%, 3/1/23 25,000 25,549
Fifth Third Bancorp2.60%, 6/15/22 36,000 36,261
General Dynamics Corp.2.25%, 11/15/22 19,000 19,096
General Mills, Inc.2.60%, 10/12/22 25,000 25,110
General Motors Financial Co., Inc.3.45%, 1/14/22 64,000 64,9383.70%, 5/9/23 67,000 68,020
Gilead Sciences, Inc.4.40%, 12/1/21 35,000 36,627
Hartford Financial Services Group, Inc. (The)5.50%, 3/30/20 25,000 25,551
Hewlett Packard Enterprise Co.3.60%, 10/15/20 46,000 46,614
See Notes to Financial Statements.
96 WisdomTree Trust
Copyright © 2019 www.secdatabase.com. All Rights Reserved.Please Consider the Environment Before Printing This Document

Table of ContentsSchedule of Investments (continued)
WisdomTree Fundamental U.S. Short-Term Corporate Bond Fund (SFIG)June 30, 2019
InvestmentsPrincipalAmount Value
HP, Inc.4.30%, 6/1/21 $36,000 $37,258
HSBC USA, Inc.2.35%, 3/5/20 100,000 100,025
Huntington Bancshares, Inc.3.15%, 3/14/21 29,000 29,369
Intel Corp.2.88%, 5/11/24 22,000 22,660
International Business Machines Corp.2.85%, 5/13/22 100,000 101,743
Interpublic Group of Cos., Inc. (The)4.20%, 4/15/24 21,000 22,625
JPMorgan Chase & Co.2.75%, 6/23/20 128,000 128,5314.40%, 7/22/20 71,000 72,5912.97%, 1/15/23 36,000 36,547
KeyCorp5.10%, 3/24/21 27,000 28,237
Kimco Realty Corp.3.13%, 6/1/23 19,000 19,337
Kraft Heinz Foods Co.2.80%, 7/2/20 39,000 39,0513.50%, 7/15/22 29,000 29,694
Kroger Co. (The)3.40%, 4/15/22 26,000 26,628
Laboratory Corp. of America Holdings3.20%, 2/1/22 26,000 26,436
Lockheed Martin Corp.2.50%, 11/23/20 155,000 155,658
Macy�s Retail Holdings, Inc.2.88%, 2/15/23 28,000 27,437
Marriott International, Inc.2.30%, 1/15/22 27,000 26,921
Marsh & McLennan Cos., Inc.3.88%, 3/15/24 21,000 22,300
McDonald�s Corp.2.63%, 1/15/22 31,000 31,353
McKesson Corp.2.85%, 3/15/23 13,000 13,107
Medtronic, Inc.3.15%, 3/15/22 26,000 26,740
Molson Coors Brewing Co.2.10%, 7/15/21 15,000 14,905
Morgan Stanley5.50%, 7/28/21 81,000 86,0872.75%, 5/19/22 40,000 40,4353.13%, 1/23/23 62,000 63,443
MPLX L.P.4.50%, 7/15/23 29,000 30,781
NBCUniversal Media LLC4.38%, 4/1/21 41,000 42,531
Newell Brands, Inc.3.85%, 4/1/23 23,000 23,353
NextEra Energy Capital Holdings, Inc.3.15%, 4/1/24 33,000 33,951
InvestmentsPrincipalAmount Value
Copyright © 2019 www.secdatabase.com. All Rights Reserved.Please Consider the Environment Before Printing This Document

Northrop Grumman Corp.2.55%, 10/15/22 $23,000 $23,057
NVIDIA Corp.2.20%, 9/16/21 15,000 14,967
Omnicom Group, Inc.4.45%, 8/15/20 40,000 40,904
Oracle Corp.3.88%, 7/15/20 26,000 26,4603.63%, 7/15/23 22,000 23,214
PepsiCo, Inc.2.75%, 3/1/23 25,000 25,554
Philip Morris International, Inc.2.38%, 8/17/22 21,000 21,020
Phillips 664.30%, 4/1/22 16,000 16,857
Public Service Enterprise Group, Inc.2.65%, 11/15/22 25,000 25,074
Republic Services, Inc.3.55%, 6/1/22 25,000 25,784
Reynolds American, Inc.4.00%, 6/12/22 26,000 27,004
Roper Technologies, Inc.3.13%, 11/15/22 10,000 10,172
Santander Holdings USA, Inc.3.40%, 1/18/23 25,000 25,386
Sempra Energy2.90%, 2/1/23 32,000 32,290
Sherwin-Williams Co. (The)2.25%, 5/15/20 24,000 23,961
Starbucks Corp.3.10%, 3/1/23 13,000 13,380
Synchrony Financial2.70%, 2/3/20 95,000 95,020
Tech Data Corp.3.70%, 2/15/22 30,000 30,526
Thermo Fisher Scientific, Inc.3.30%, 2/15/22 39,000 39,947
Toyota Motor Credit Corp.3.30%, 1/12/22 36,000 37,030
TWDC Enterprises 18 Corp.2.35%, 12/1/22 26,000 26,200
United Parcel Service, Inc.3.13%, 1/15/21 73,000 74,101
United Technologies Corp.3.10%, 6/1/22 27,000 27,6333.65%, 8/16/23 33,000 34,584
UnitedHealth Group, Inc.1.95%, 10/15/20 39,000 38,849
Verizon Communications, Inc.5.15%, 9/15/23 34,000 37,988
Viacom, Inc.4.50%, 3/1/21 45,000 46,394
Walgreens Boots Alliance, Inc.2.70%, 11/18/19 45,000 45,010
Walmart, Inc.3.40%, 6/26/23 22,000 23,138
See Notes to Financial Statements.
WisdomTree Trust 97
Copyright © 2019 www.secdatabase.com. All Rights Reserved.Please Consider the Environment Before Printing This Document
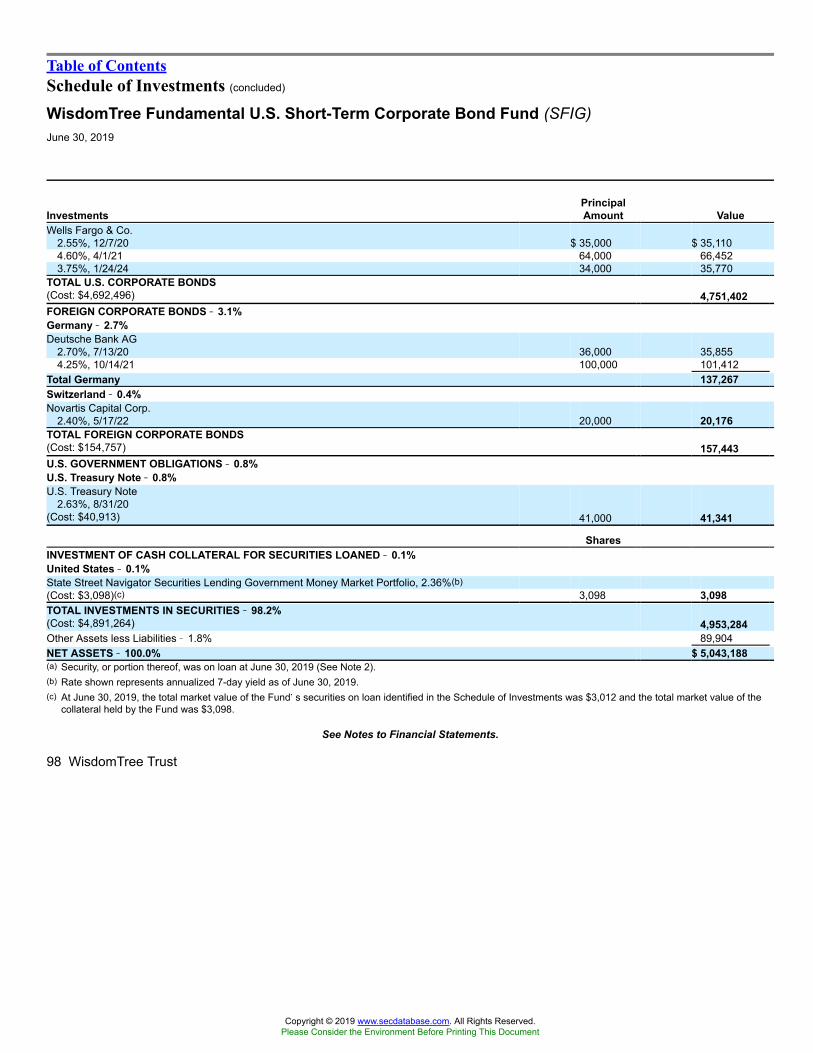
Table of ContentsSchedule of Investments (concluded)
WisdomTree Fundamental U.S. Short-Term Corporate Bond Fund (SFIG)June 30, 2019
InvestmentsPrincipalAmount Value
Wells Fargo & Co.2.55%, 12/7/20 $ 35,000 $ 35,1104.60%, 4/1/21 64,000 66,4523.75%, 1/24/24 34,000 35,770
TOTAL U.S. CORPORATE BONDS(Cost: $4,692,496) 4,751,402FOREIGN CORPORATE BONDS �� 3.1%Germany �� 2.7%Deutsche Bank AG
2.70%, 7/13/20 36,000 35,8554.25%, 10/14/21 100,000 101,412
Total Germany 137,267Switzerland �� 0.4%Novartis Capital Corp.
2.40%, 5/17/22 20,000 20,176TOTAL FOREIGN CORPORATE BONDS(Cost: $154,757) 157,443U.S. GOVERNMENT OBLIGATIONS �� 0.8%U.S. Treasury Note �� 0.8%U.S. Treasury Note
2.63%, 8/31/20(Cost: $40,913) 41,000 41,341
SharesINVESTMENT OF CASH COLLATERAL FOR SECURITIES LOANED �� 0.1%United States �� 0.1%State Street Navigator Securities Lending Government Money Market Portfolio, 2.36%(b)(Cost: $3,098)(c) 3,098 3,098TOTAL INVESTMENTS IN SECURITIES �� 98.2%(Cost: $4,891,264) 4,953,284Other Assets less Liabilities � 1.8% 89,904NET ASSETS �� 100.0% $ 5,043,188(a) Security, or portion thereof, was on loan at June 30, 2019 (See Note 2).(b) Rate shown represents annualized 7-day yield as of June 30, 2019.(c) At June 30, 2019, the total market value of the Fund�s securities on loan identified in the Schedule of Investments was $3,012 and the total market value of the
collateral held by the Fund was $3,098.
See Notes to Financial Statements.
98 WisdomTree Trust
Copyright © 2019 www.secdatabase.com. All Rights Reserved.Please Consider the Environment Before Printing This Document
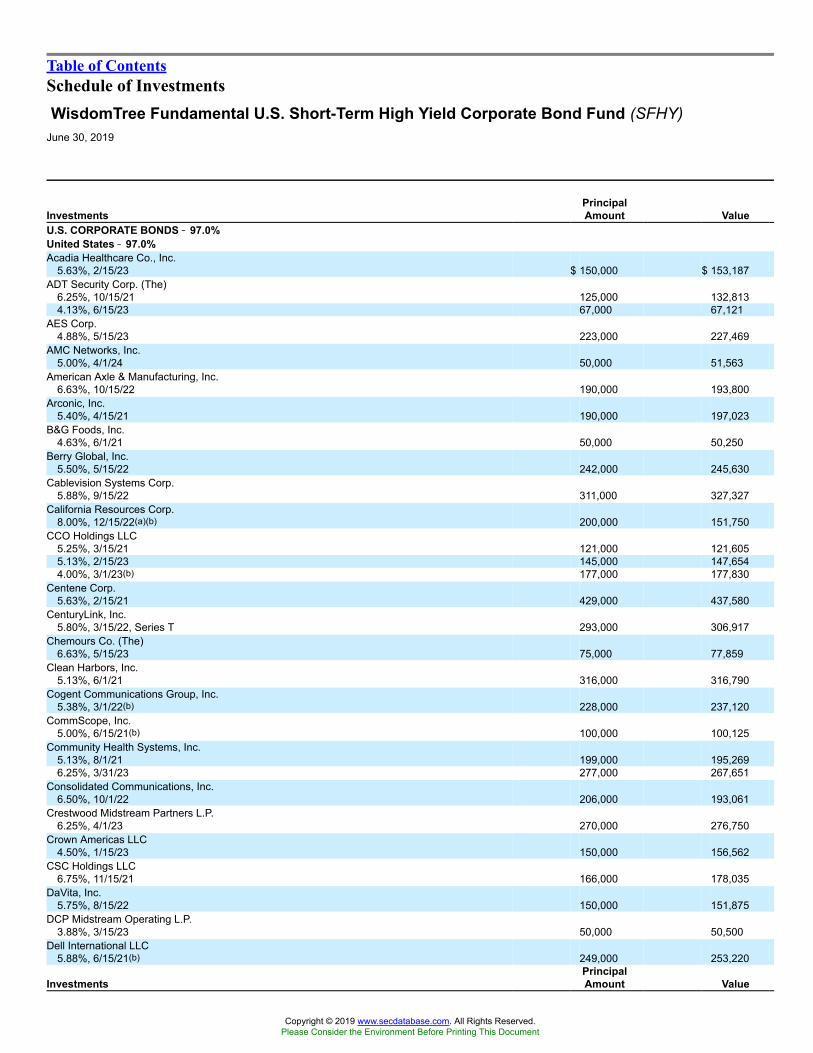
Table of ContentsSchedule of InvestmentsWisdomTree Fundamental U.S. Short-Term High Yield Corporate Bond Fund (SFHY)
June 30, 2019
InvestmentsPrincipalAmount Value
U.S. CORPORATE BONDS �� 97.0%United States �� 97.0%Acadia Healthcare Co., Inc.
5.63%, 2/15/23 $ 150,000 $ 153,187ADT Security Corp. (The)
6.25%, 10/15/21 125,000 132,8134.13%, 6/15/23 67,000 67,121
AES Corp.4.88%, 5/15/23 223,000 227,469
AMC Networks, Inc.5.00%, 4/1/24 50,000 51,563
American Axle & Manufacturing, Inc.6.63%, 10/15/22 190,000 193,800
Arconic, Inc.5.40%, 4/15/21 190,000 197,023
B&G Foods, Inc.4.63%, 6/1/21 50,000 50,250
Berry Global, Inc.5.50%, 5/15/22 242,000 245,630
Cablevision Systems Corp.5.88%, 9/15/22 311,000 327,327
California Resources Corp.8.00%, 12/15/22(a)(b) 200,000 151,750
CCO Holdings LLC5.25%, 3/15/21 121,000 121,6055.13%, 2/15/23 145,000 147,6544.00%, 3/1/23(b) 177,000 177,830
Centene Corp.5.63%, 2/15/21 429,000 437,580
CenturyLink, Inc.5.80%, 3/15/22, Series T 293,000 306,917
Chemours Co. (The)6.63%, 5/15/23 75,000 77,859
Clean Harbors, Inc.5.13%, 6/1/21 316,000 316,790
Cogent Communications Group, Inc.5.38%, 3/1/22(b) 228,000 237,120
CommScope, Inc.5.00%, 6/15/21(b) 100,000 100,125
Community Health Systems, Inc.5.13%, 8/1/21 199,000 195,2696.25%, 3/31/23 277,000 267,651
Consolidated Communications, Inc.6.50%, 10/1/22 206,000 193,061
Crestwood Midstream Partners L.P.6.25%, 4/1/23 270,000 276,750
Crown Americas LLC4.50%, 1/15/23 150,000 156,562
CSC Holdings LLC6.75%, 11/15/21 166,000 178,035
DaVita, Inc.5.75%, 8/15/22 150,000 151,875
DCP Midstream Operating L.P.3.88%, 3/15/23 50,000 50,500
Dell International LLC5.88%, 6/15/21(b) 249,000 253,220
InvestmentsPrincipalAmount Value
Copyright © 2019 www.secdatabase.com. All Rights Reserved.Please Consider the Environment Before Printing This Document

Denbury Resources, Inc.9.00%, 5/15/21(b) $ 150,000 $ 148,5009.25%, 3/31/22(b) 142,000 133,835
Diamond Resorts International, Inc.7.75%, 9/1/23(b) 171,000 176,771
DISH DBS Corp.5.13%, 5/1/20 50,000 50,3755.88%, 7/15/22 198,000 201,7125.00%, 3/15/23 268,000 259,960
DPL, Inc.7.25%, 10/15/21 2,000 2,158
Edgewell Personal Care Co.4.70%, 5/24/22 24,000 24,330
EMC Corp.3.38%, 6/1/23 205,000 204,110
Endo Finance LLC5.75%, 1/15/22(b) 213,000 186,9075.38%, 1/15/23(b) 153,000 110,925
Ferrellgas L.P.6.75%, 1/15/22(a) 145,000 129,050
First Data Corp.5.38%, 8/15/23(b) 219,000 223,216
Forum Energy Technologies, Inc.6.25%, 10/1/21 225,000 204,750
Freeport-McMoRan, Inc.3.55%, 3/1/22 150,000 150,9383.88%, 3/15/23 301,000 301,752
Frontier Communications Corp.8.75%, 4/15/22(a) 50,000 32,25010.50%, 9/15/22 200,000 136,5007.13%, 1/15/23 301,000 181,352
Gap, Inc. (The)5.95%, 4/12/21 50,000 52,236
Genworth Holdings, Inc.4.90%, 8/15/23 140,000 121,100
Global Partners L.P.6.25%, 7/15/22 279,000 283,185
Goodyear Tire & Rubber Co. (The)5.13%, 11/15/23(a) 225,000 228,656
Griffon Corp.5.25%, 3/1/22 327,000 326,591
HCA Healthcare, Inc.6.25%, 2/15/21 69,000 72,450
HCA, Inc.7.50%, 2/15/22 43,000 47,5155.88%, 3/15/22 115,000 125,7225.88%, 5/1/23 180,000 196,178
Hill-Rom Holdings, Inc.5.75%, 9/1/23(b) 170,000 176,128
Hughes Satellite Systems Corp.7.63%, 6/15/21 53,000 56,8436.63%, 8/1/26 50,000 52,688
Huntsman International LLC5.13%, 11/15/22 70,000 74,063
IQVIA, Inc.4.88%, 5/15/23(b) 100,000 102,750
See Notes to Financial Statements.
WisdomTree Trust 99
Copyright © 2019 www.secdatabase.com. All Rights Reserved.Please Consider the Environment Before Printing This Document

Table of ContentsSchedule of Investments (continued)
WisdomTree Fundamental U.S. Short-Term High Yield Corporate Bond Fund (SFHY)June 30, 2019
InvestmentsPrincipalAmount Value
L Brands, Inc.5.63%, 10/15/23 $ 243,000 $ 253,204
Lamar Media Corp.5.38%, 1/15/24 30,000 31,013
Lee Enterprises, Inc.9.50%, 3/15/22(b) 30,000 30,675
Level 3 Financing, Inc.5.38%, 8/15/22 172,000 172,6455.63%, 2/1/23 145,000 147,169
Level 3 Parent LLC5.75%, 12/1/22 49,000 49,551
Martin Midstream Partners L.P.7.25%, 2/15/21(a) 274,000 272,959
Men�s Wearhouse, Inc. (The)7.00%, 7/1/22 192,000 185,760
MGM Resorts International6.00%, 3/15/23 315,000 342,169
Molina Healthcare, Inc.5.38%, 11/15/22 194,000 202,487
Murphy Oil USA, Inc.6.00%, 8/15/23 153,000 157,781
National CineMedia LLC6.00%, 4/15/22 2,000 2,025
Navient Corp.6.50%, 6/15/22 199,000 211,8835.50%, 1/25/23 118,000 121,6887.25%, 9/25/23 122,000 130,693
NCR Corp.5.00%, 7/15/22 423,000 428,694
Newmark Group, Inc.6.13%, 11/15/23 241,000 255,179
Nexstar Broadcasting, Inc.5.88%, 11/15/22 30,000 30,750
Nielsen Finance LLC5.00%, 4/15/22(b) 197,000 197,492
PBF Holding Co. LLC7.00%, 11/15/23 220,000 229,352
PBF Logistics L.P.6.88%, 5/15/23 260,000 269,425
Peabody Energy Corp.6.00%, 3/31/22(b) 302,000 310,305
Pitney Bowes, Inc.3.88%, 10/1/21 49,000 48,2654.63%, 5/15/22 161,000 154,9624.70%, 4/1/23 262,000 248,245
Plantronics, Inc.5.50%, 5/31/23(b) 150,000 149,625
Realogy Group LLC4.88%, 6/1/23(a)(b) 234,000 211,770
Rite Aid Corp.6.13%, 4/1/23(b) 125,000 105,938
RR Donnelley & Sons Co.7.88%, 3/15/21 16,000 16,400
Sabre GLBL, Inc.5.38%, 4/15/23(b) 175,000 179,812
InvestmentsPrincipalAmount Value
Copyright © 2019 www.secdatabase.com. All Rights Reserved.Please Consider the Environment Before Printing This Document

Scientific Games International, Inc.10.00%, 12/1/22 $ 201,000 $ 211,552
Sealed Air Corp.4.88%, 12/1/22(b) 193,000 203,132
Select Medical Corp.6.38%, 6/1/21 143,000 143,372
Service Corp. International5.38%, 1/15/22 57,000 57,177
SESI LLC7.13%, 12/15/21 50,000 35,375
Sirius XM Radio, Inc.3.88%, 8/1/22(b) 172,000 173,2904.63%, 5/15/23(b) 43,000 43,645
Spectrum Brands, Inc.6.63%, 11/15/22 59,000 60,564
Springleaf Finance Corp.6.13%, 5/15/22 429,000 462,247
Steel Dynamics, Inc.5.13%, 10/1/21 46,000 46,5375.25%, 4/15/23 85,000 86,594
T-Mobile USA, Inc.4.00%, 4/15/22(a) 150,000 153,750
TEGNA, Inc.6.38%, 10/15/23 75,000 77,531
Tenet Healthcare Corp.6.00%, 10/1/20 50,000 51,6594.38%, 10/1/21 38,000 38,8088.13%, 4/1/22 171,000 179,9776.75%, 6/15/23 175,000 176,312
Titan International, Inc.6.50%, 11/30/23 134,000 116,915
Toll Brothers Finance Corp.5.88%, 2/15/22 76,000 81,0354.38%, 4/15/23 125,000 129,844
TransDigm, Inc.6.00%, 7/15/22 412,000 417,150
Tribune Media Co.5.88%, 7/15/22 150,000 153,360
Triumph Group, Inc.4.88%, 4/1/21 341,000 337,590
Univar USA, Inc.6.75%, 7/15/23(a)(b) 130,000 133,088
Vista Outdoor, Inc.5.88%, 10/1/23(a) 131,000 128,435
Wynn Las Vegas LLC4.25%, 5/30/23(b) 50,000 50,063
XPO Logistics, Inc.6.13%, 9/1/23(b) 119,000 123,611
Zayo Group LLC6.00%, 4/1/23 315,000 323,662
TOTAL U.S. CORPORATE BONDS(Cost: $19,413,242) 19,564,023FOREIGN CORPORATE BONDS �� 1.2%Israel �� 0.1%Teva Pharmaceutical Finance IV LLC
2.25%, 3/18/20 30,000 29,813
See Notes to Financial Statements.
100 WisdomTree Trust
Copyright © 2019 www.secdatabase.com. All Rights Reserved.Please Consider the Environment Before Printing This Document
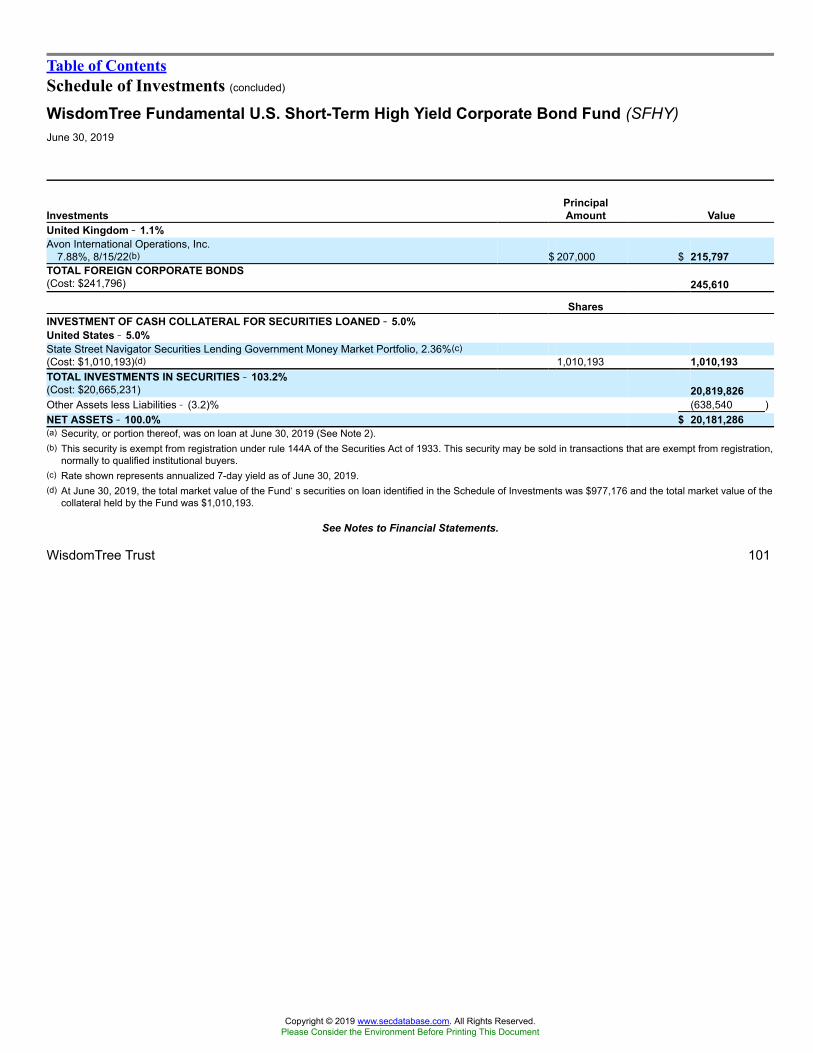
Table of ContentsSchedule of Investments (concluded)
WisdomTree Fundamental U.S. Short-Term High Yield Corporate Bond Fund (SFHY)June 30, 2019
InvestmentsPrincipalAmount Value
United Kingdom �� 1.1%Avon International Operations, Inc.
7.88%, 8/15/22(b) $ 207,000 $ 215,797TOTAL FOREIGN CORPORATE BONDS(Cost: $241,796) 245,610
SharesINVESTMENT OF CASH COLLATERAL FOR SECURITIES LOANED �� 5.0%United States �� 5.0%State Street Navigator Securities Lending Government Money Market Portfolio, 2.36%(c)(Cost: $1,010,193)(d) 1,010,193 1,010,193TOTAL INVESTMENTS IN SECURITIES �� 103.2%(Cost: $20,665,231) 20,819,826Other Assets less Liabilities � (3.2)% (638,540 )NET ASSETS �� 100.0% $ 20,181,286(a) Security, or portion thereof, was on loan at June 30, 2019 (See Note 2).(b) This security is exempt from registration under rule 144A of the Securities Act of 1933. This security may be sold in transactions that are exempt from registration,
normally to qualified institutional buyers.(c) Rate shown represents annualized 7-day yield as of June 30, 2019.(d) At June 30, 2019, the total market value of the Fund�s securities on loan identified in the Schedule of Investments was $977,176 and the total market value of the
collateral held by the Fund was $1,010,193.
See Notes to Financial Statements.
WisdomTree Trust 101
Copyright © 2019 www.secdatabase.com. All Rights Reserved.Please Consider the Environment Before Printing This Document

Table of ContentsSchedule of InvestmentsWisdomTree Dynamic Bearish U.S. Equity Fund (DYB)
June 30, 2019
Investments Shares ValueCOMMON STOCKS �� 104.6%United States �� 104.6%Aerospace & Defense �� 1.9%Boeing Co. (The) 180 $ 65,522Lockheed Martin Corp. 262 95,247Total Aerospace & Defense 160,769Air Freight & Logistics �� 2.2%C.H. Robinson Worldwide, Inc. 1,466 123,657United Parcel Service, Inc. Class B 640 66,093Total Air Freight & Logistics 189,750Automobiles �� 0.7%Harley-Davidson, Inc. 1,647 59,012Banks �� 3.1%Comerica, Inc. 1,066 77,434East West Bancorp, Inc. 1,473 68,892SVB Financial Group* 189 42,448Western Alliance Bancorp* 1,798 80,407Total Banks 269,181Beverages �� 0.8%Brown-Forman Corp. Class B 1,187 65,795Biotechnology �� 2.9%Biogen, Inc.* 200 46,774Gilead Sciences, Inc. 1,491 100,732Ligand Pharmaceuticals, Inc.* 302 34,474United Therapeutics Corp.* 836 65,258Total Biotechnology 247,238Capital Markets �� 3.9%E*TRADE Financial Corp. 2,247 100,216Franklin Resources, Inc. 3,684 128,203Goldman Sachs Group, Inc. (The) 536 109,666Total Capital Markets 338,085Chemicals �� 0.6%Chemours Co. (The) 2,343 56,232Communications Equipment �� 3.5%Cisco Systems, Inc. 2,161 118,272Motorola Solutions, Inc. 830 138,386Ubiquiti Networks, Inc. 361 47,471Total Communications Equipment 304,129Consumer Finance �� 2.5%Discover Financial Services 1,122 87,056SLM Corp. 5,299 51,506Synchrony Financial 2,152 74,610Total Consumer Finance 213,172Diversified Consumer Services �� 1.1%H&R Block, Inc. 3,375 98,888Diversified Telecommunication Services �� 2.0%AT&T, Inc. 1,964 65,814Verizon Communications, Inc. 1,889 107,918Total Diversified Telecommunication Services 173,732Investments Shares ValueElectric Utilities �� 1.0%PPL Corp. 2,687 $ 83,324Electronic Equipment, Instruments & Components �� 0.6%Vishay Intertechnology, Inc. 2,989 49,378Entertainment �� 1.8%
Copyright © 2019 www.secdatabase.com. All Rights Reserved.Please Consider the Environment Before Printing This Document

Activision Blizzard, Inc. 1,901 89,727Electronic Arts, Inc.* 661 66,933Total Entertainment 156,660Equity Real Estate Investment Trusts (REITs) �� 4.1%Lexington Realty Trust 15,011 141,254Medical Properties Trust, Inc. 12,410 216,430Total Equity Real Estate Investment Trusts (REITs) 357,684Food Products �� 3.0%Cal-Maine Foods, Inc. 1,677 69,964Hormel Foods Corp. 4,605 186,687Total Food Products 256,651Health Care Equipment & Supplies �� 0.7%Integer Holdings Corp.* 734 61,597Health Care Providers & Services �� 11.0%AMN Healthcare Services, Inc.* 1,546 83,870Encompass Health Corp. 1,608 101,883HCA Healthcare, Inc. 708 95,700Henry Schein, Inc.* 2,752 192,365Laboratory Corp. of America Holdings* 704 121,722MEDNAX, Inc.* 2,964 74,782Quest Diagnostics, Inc. 1,846 187,941Universal Health Services, Inc. Class B 741 96,619Total Health Care Providers & Services 954,882Hotels, Restaurants & Leisure �� 2.1%Cracker Barrel Old Country Store, Inc.(a) 676 115,413Las Vegas Sands Corp. 1,132 66,890Total Hotels, Restaurants & Leisure 182,303Household Products �� 2.8%Clorox Co. (The) 427 65,378Colgate-Palmolive Co. 802 57,479WD-40 Co. 767 121,984Total Household Products 244,841Independent Power & Renewable Electricity Producers �� 2.4%AES Corp. 4,582 76,794Clearway Energy, Inc. Class C 7,580 127,799Total Independent Power & Renewable Electricity Producers 204,593Insurance �� 0.7%American Equity Investment Life Holding Co. 2,114 57,416Interactive Media & Services �� 3.1%Alphabet, Inc. Class A* 86 93,121Cargurus, Inc.* 2,166 78,214Facebook, Inc. Class A* 513 99,009Total Interactive Media & Services 270,344
See Notes to Financial Statements.
102 WisdomTree Trust
Copyright © 2019 www.secdatabase.com. All Rights Reserved.Please Consider the Environment Before Printing This Document

Table of ContentsSchedule of Investments (continued)
WisdomTree Dynamic Bearish U.S. Equity Fund (DYB)June 30, 2019
Investments Shares ValueInternet & Direct Marketing Retail �� 0.9%eBay, Inc. 1,936 $76,472IT Services �� 3.7%Cognizant Technology Solutions Corp. Class A 1,503 95,275EPAM Systems, Inc.* 352 60,931Western Union Co. (The) 8,342 165,923Total IT Services 322,129Leisure Products �� 0.7%Polaris Industries, Inc. 621 56,654Machinery �� 2.9%Cummins, Inc. 444 76,075Fortive Corp. 1,029 83,884Illinois Tool Works, Inc. 619 93,352Total Machinery 253,311Media �� 4.4%Omnicom Group, Inc. 3,914 320,752TEGNA, Inc. 3,849 58,313Total Media 379,065Metals & Mining �� 1.3%Steel Dynamics, Inc. 3,799 114,730Multiline Retail �� 0.9%Nordstrom, Inc. 2,414 76,910Oil, Gas & Consumable Fuels �� 5.4%Anadarko Petroleum Corp. 2,086 147,188Apache Corp. 1,570 45,483CVR Energy, Inc. 1,739 86,933Equitrans Midstream Corp.* 3,988 78,603Occidental Petroleum Corp. 2,234 112,326Total Oil, Gas & Consumable Fuels 470,533Professional Services �� 0.6%Robert Half International, Inc. 894 50,967Semiconductors & Semiconductor Equipment �� 10.4%Applied Materials, Inc. 1,485 66,691Intel Corp. 3,822 182,959KLA-Tencor Corp. 587 69,383Lam Research Corp. 325 61,048Maxim Integrated Products, Inc. 1,531 91,584Micron Technology, Inc.* 1,303 50,283NVIDIA Corp. 226 37,116Skyworks Solutions, Inc. 1,277 98,674Teradyne, Inc. 1,437 68,847Texas Instruments, Inc. 981 112,580Xilinx, Inc. 563 66,389Total Semiconductors & Semiconductor Equipment 905,554Software �� 6.0%Citrix Systems, Inc. 1,620 158,987Fortinet, Inc.* 993 76,292Investments Shares ValueMicrosoft Corp. 1,174 $157,269Oracle Corp. 2,298 130,917Total Software 523,465Specialty Retail �� 2.3%Best Buy Co., Inc. 838 58,434Gap, Inc. (The) 3,925 70,532Williams-Sonoma, Inc. 1,117 72,605
Copyright © 2019 www.secdatabase.com. All Rights Reserved.Please Consider the Environment Before Printing This Document
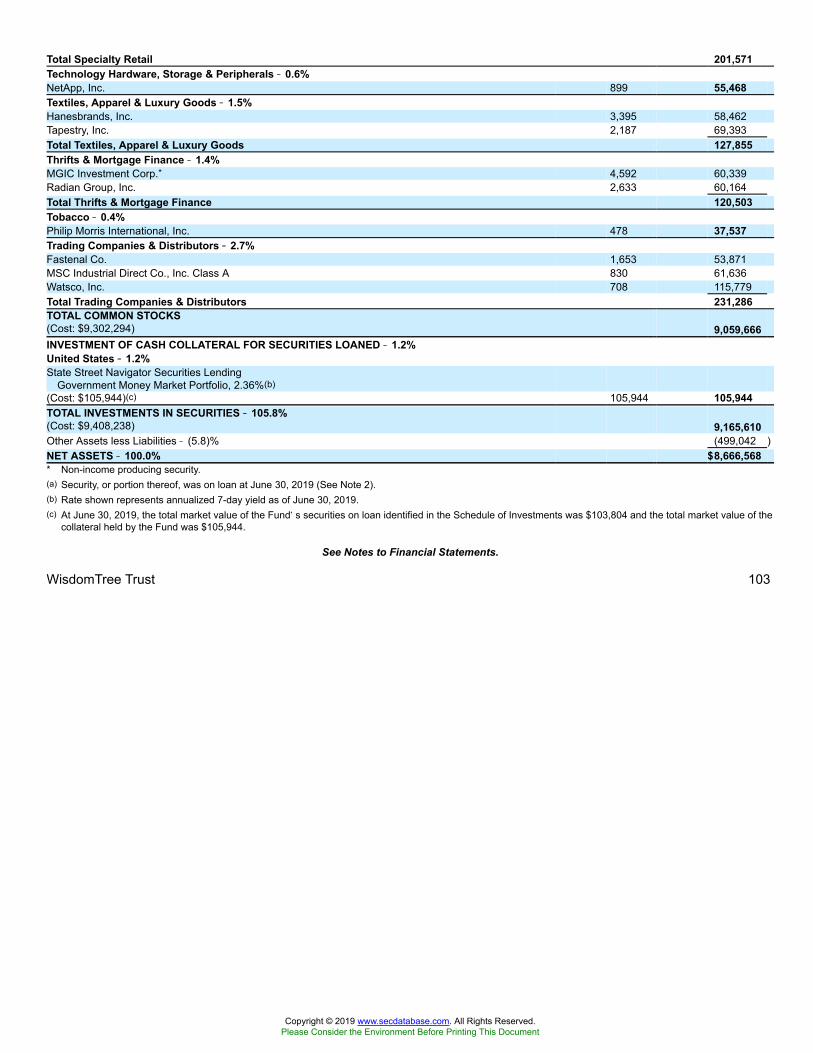
Total Specialty Retail 201,571Technology Hardware, Storage & Peripherals �� 0.6%NetApp, Inc. 899 55,468Textiles, Apparel & Luxury Goods �� 1.5%Hanesbrands, Inc. 3,395 58,462Tapestry, Inc. 2,187 69,393Total Textiles, Apparel & Luxury Goods 127,855Thrifts & Mortgage Finance �� 1.4%MGIC Investment Corp.* 4,592 60,339Radian Group, Inc. 2,633 60,164Total Thrifts & Mortgage Finance 120,503Tobacco �� 0.4%Philip Morris International, Inc. 478 37,537Trading Companies & Distributors �� 2.7%Fastenal Co. 1,653 53,871MSC Industrial Direct Co., Inc. Class A 830 61,636Watsco, Inc. 708 115,779Total Trading Companies & Distributors 231,286TOTAL COMMON STOCKS(Cost: $9,302,294) 9,059,666INVESTMENT OF CASH COLLATERAL FOR SECURITIES LOANED �� 1.2%United States �� 1.2%State Street Navigator Securities Lending
Government Money Market Portfolio, 2.36%(b)(Cost: $105,944)(c) 105,944 105,944TOTAL INVESTMENTS IN SECURITIES �� 105.8%(Cost: $9,408,238) 9,165,610Other Assets less Liabilities � (5.8)% (499,042 )NET ASSETS �� 100.0% $8,666,568* Non-income producing security.(a) Security, or portion thereof, was on loan at June 30, 2019 (See Note 2).(b) Rate shown represents annualized 7-day yield as of June 30, 2019.(c) At June 30, 2019, the total market value of the Fund�s securities on loan identified in the Schedule of Investments was $103,804 and the total market value of the
collateral held by the Fund was $105,944.
See Notes to Financial Statements.
WisdomTree Trust 103
Copyright © 2019 www.secdatabase.com. All Rights Reserved.Please Consider the Environment Before Printing This Document
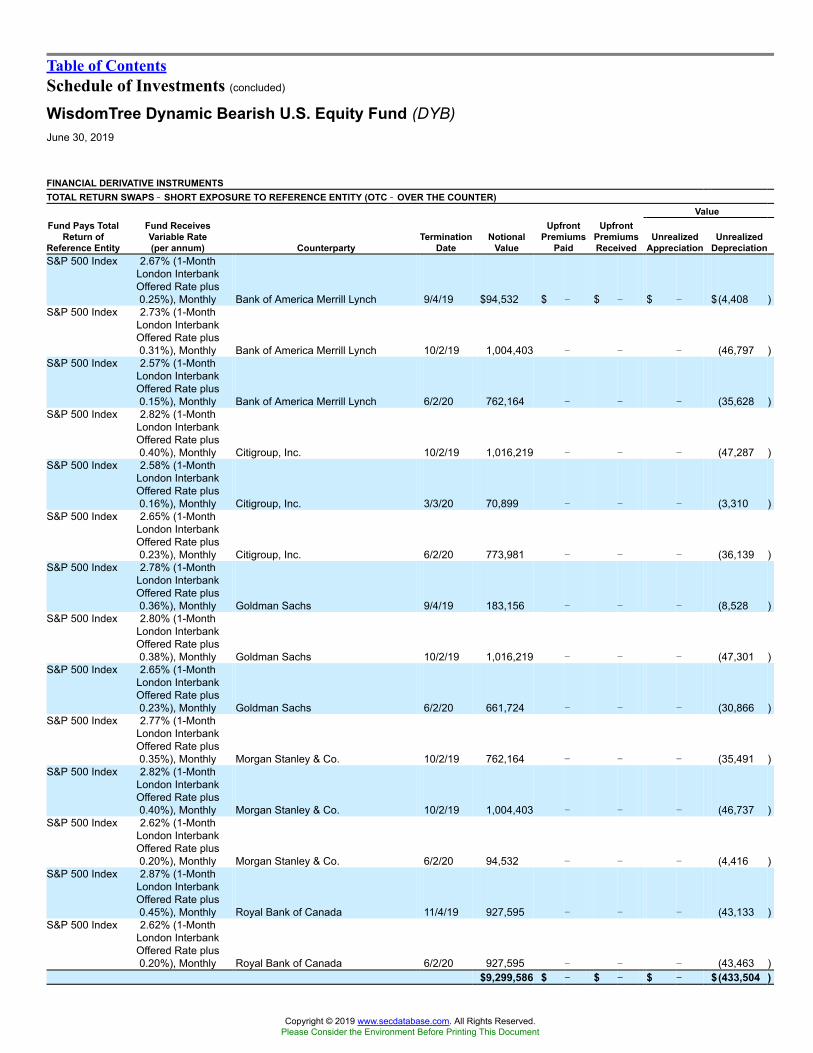
Table of ContentsSchedule of Investments (concluded)
WisdomTree Dynamic Bearish U.S. Equity Fund (DYB)June 30, 2019
FINANCIAL DERIVATIVE INSTRUMENTSTOTAL RETURN SWAPS �� SHORT EXPOSURE TO REFERENCE ENTITY (OTC �� OVER THE COUNTER)
ValueFund Pays Total
Return ofReference Entity
Fund ReceivesVariable Rate(per annum) Counterparty
TerminationDate
NotionalValue
UpfrontPremiums
Paid
UpfrontPremiumsReceived
UnrealizedAppreciation
UnrealizedDepreciation
S&P 500 Index 2.67% (1-MonthLondon InterbankOffered Rate plus0.25%), Monthly Bank of America Merrill Lynch 9/4/19 $94,532 $ � $ � $ � $(4,408 )
S&P 500 Index 2.73% (1-MonthLondon InterbankOffered Rate plus0.31%), Monthly Bank of America Merrill Lynch 10/2/19 1,004,403 � � � (46,797 )
S&P 500 Index 2.57% (1-MonthLondon InterbankOffered Rate plus0.15%), Monthly Bank of America Merrill Lynch 6/2/20 762,164 � � � (35,628 )
S&P 500 Index 2.82% (1-MonthLondon InterbankOffered Rate plus0.40%), Monthly Citigroup, Inc. 10/2/19 1,016,219 � � � (47,287 )
S&P 500 Index 2.58% (1-MonthLondon InterbankOffered Rate plus0.16%), Monthly Citigroup, Inc. 3/3/20 70,899 � � � (3,310 )
S&P 500 Index 2.65% (1-MonthLondon InterbankOffered Rate plus0.23%), Monthly Citigroup, Inc. 6/2/20 773,981 � � � (36,139 )
S&P 500 Index 2.78% (1-MonthLondon InterbankOffered Rate plus0.36%), Monthly Goldman Sachs 9/4/19 183,156 � � � (8,528 )
S&P 500 Index 2.80% (1-MonthLondon InterbankOffered Rate plus0.38%), Monthly Goldman Sachs 10/2/19 1,016,219 � � � (47,301 )
S&P 500 Index 2.65% (1-MonthLondon InterbankOffered Rate plus0.23%), Monthly Goldman Sachs 6/2/20 661,724 � � � (30,866 )
S&P 500 Index 2.77% (1-MonthLondon InterbankOffered Rate plus0.35%), Monthly Morgan Stanley & Co. 10/2/19 762,164 � � � (35,491 )
S&P 500 Index 2.82% (1-MonthLondon InterbankOffered Rate plus0.40%), Monthly Morgan Stanley & Co. 10/2/19 1,004,403 � � � (46,737 )
S&P 500 Index 2.62% (1-MonthLondon InterbankOffered Rate plus0.20%), Monthly Morgan Stanley & Co. 6/2/20 94,532 � � � (4,416 )
S&P 500 Index 2.87% (1-MonthLondon InterbankOffered Rate plus0.45%), Monthly Royal Bank of Canada 11/4/19 927,595 � � � (43,133 )
S&P 500 Index 2.62% (1-MonthLondon InterbankOffered Rate plus0.20%), Monthly Royal Bank of Canada 6/2/20 927,595 � � � (43,463 )
$9,299,586 $ �� $ �� $ �� $(433,504 )
Copyright © 2019 www.secdatabase.com. All Rights Reserved.Please Consider the Environment Before Printing This Document

See Notes to Financial Statements.
104 WisdomTree Trust
Copyright © 2019 www.secdatabase.com. All Rights Reserved.Please Consider the Environment Before Printing This Document
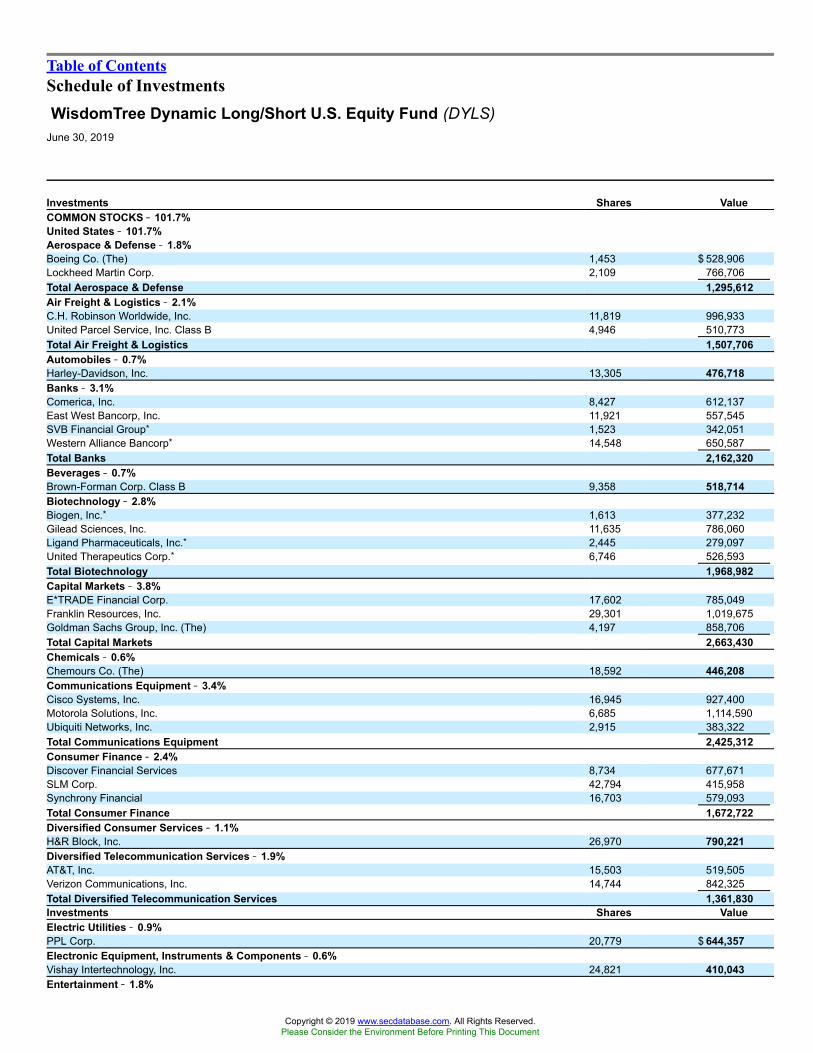
Table of ContentsSchedule of InvestmentsWisdomTree Dynamic Long/Short U.S. Equity Fund (DYLS)
June 30, 2019
Investments Shares ValueCOMMON STOCKS �� 101.7%United States �� 101.7%Aerospace & Defense �� 1.8%Boeing Co. (The) 1,453 $ 528,906Lockheed Martin Corp. 2,109 766,706Total Aerospace & Defense 1,295,612Air Freight & Logistics �� 2.1%C.H. Robinson Worldwide, Inc. 11,819 996,933United Parcel Service, Inc. Class B 4,946 510,773Total Air Freight & Logistics 1,507,706Automobiles �� 0.7%Harley-Davidson, Inc. 13,305 476,718Banks �� 3.1%Comerica, Inc. 8,427 612,137East West Bancorp, Inc. 11,921 557,545SVB Financial Group* 1,523 342,051Western Alliance Bancorp* 14,548 650,587Total Banks 2,162,320Beverages �� 0.7%Brown-Forman Corp. Class B 9,358 518,714Biotechnology �� 2.8%Biogen, Inc.* 1,613 377,232Gilead Sciences, Inc. 11,635 786,060Ligand Pharmaceuticals, Inc.* 2,445 279,097United Therapeutics Corp.* 6,746 526,593Total Biotechnology 1,968,982Capital Markets �� 3.8%E*TRADE Financial Corp. 17,602 785,049Franklin Resources, Inc. 29,301 1,019,675Goldman Sachs Group, Inc. (The) 4,197 858,706Total Capital Markets 2,663,430Chemicals �� 0.6%Chemours Co. (The) 18,592 446,208Communications Equipment �� 3.4%Cisco Systems, Inc. 16,945 927,400Motorola Solutions, Inc. 6,685 1,114,590Ubiquiti Networks, Inc. 2,915 383,322Total Communications Equipment 2,425,312Consumer Finance �� 2.4%Discover Financial Services 8,734 677,671SLM Corp. 42,794 415,958Synchrony Financial 16,703 579,093Total Consumer Finance 1,672,722Diversified Consumer Services �� 1.1%H&R Block, Inc. 26,970 790,221Diversified Telecommunication Services �� 1.9%AT&T, Inc. 15,503 519,505Verizon Communications, Inc. 14,744 842,325Total Diversified Telecommunication Services 1,361,830Investments Shares ValueElectric Utilities �� 0.9%PPL Corp. 20,779 $ 644,357Electronic Equipment, Instruments & Components �� 0.6%Vishay Intertechnology, Inc. 24,821 410,043Entertainment �� 1.8%
Copyright © 2019 www.secdatabase.com. All Rights Reserved.Please Consider the Environment Before Printing This Document
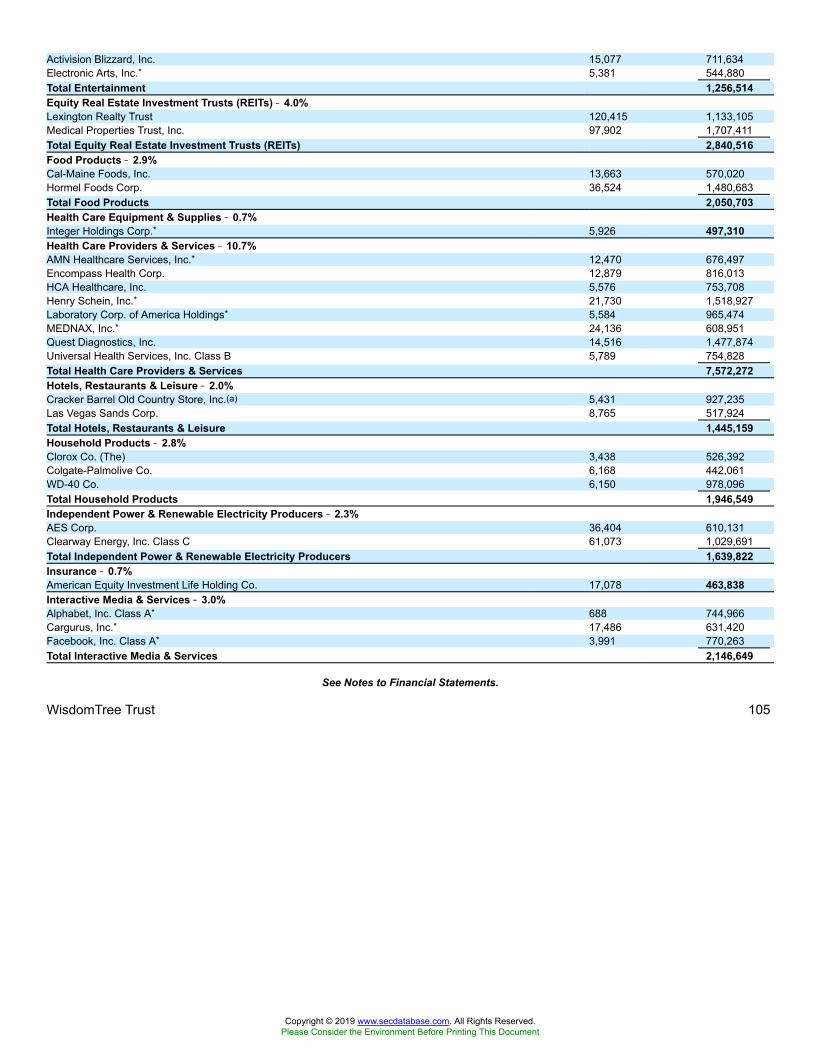
Activision Blizzard, Inc. 15,077 711,634Electronic Arts, Inc.* 5,381 544,880Total Entertainment 1,256,514Equity Real Estate Investment Trusts (REITs) �� 4.0%Lexington Realty Trust 120,415 1,133,105Medical Properties Trust, Inc. 97,902 1,707,411Total Equity Real Estate Investment Trusts (REITs) 2,840,516Food Products �� 2.9%Cal-Maine Foods, Inc. 13,663 570,020Hormel Foods Corp. 36,524 1,480,683Total Food Products 2,050,703Health Care Equipment & Supplies �� 0.7%Integer Holdings Corp.* 5,926 497,310Health Care Providers & Services �� 10.7%AMN Healthcare Services, Inc.* 12,470 676,497Encompass Health Corp. 12,879 816,013HCA Healthcare, Inc. 5,576 753,708Henry Schein, Inc.* 21,730 1,518,927Laboratory Corp. of America Holdings* 5,584 965,474MEDNAX, Inc.* 24,136 608,951Quest Diagnostics, Inc. 14,516 1,477,874Universal Health Services, Inc. Class B 5,789 754,828Total Health Care Providers & Services 7,572,272Hotels, Restaurants & Leisure �� 2.0%Cracker Barrel Old Country Store, Inc.(a) 5,431 927,235Las Vegas Sands Corp. 8,765 517,924Total Hotels, Restaurants & Leisure 1,445,159Household Products �� 2.8%Clorox Co. (The) 3,438 526,392Colgate-Palmolive Co. 6,168 442,061WD-40 Co. 6,150 978,096Total Household Products 1,946,549Independent Power & Renewable Electricity Producers �� 2.3%AES Corp. 36,404 610,131Clearway Energy, Inc. Class C 61,073 1,029,691Total Independent Power & Renewable Electricity Producers 1,639,822Insurance �� 0.7%American Equity Investment Life Holding Co. 17,078 463,838Interactive Media & Services �� 3.0%Alphabet, Inc. Class A* 688 744,966Cargurus, Inc.* 17,486 631,420Facebook, Inc. Class A* 3,991 770,263Total Interactive Media & Services 2,146,649
See Notes to Financial Statements.
WisdomTree Trust 105
Copyright © 2019 www.secdatabase.com. All Rights Reserved.Please Consider the Environment Before Printing This Document
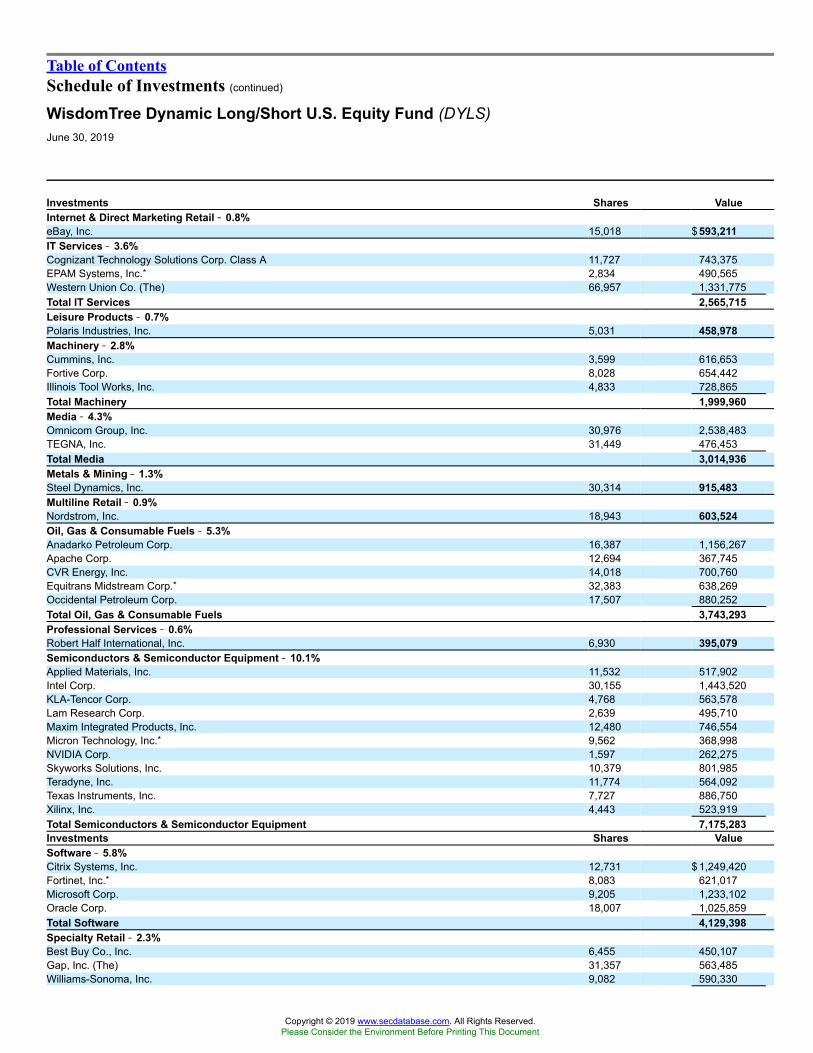
Table of ContentsSchedule of Investments (continued)
WisdomTree Dynamic Long/Short U.S. Equity Fund (DYLS)June 30, 2019
Investments Shares ValueInternet & Direct Marketing Retail �� 0.8%eBay, Inc. 15,018 $ 593,211IT Services �� 3.6%Cognizant Technology Solutions Corp. Class A 11,727 743,375EPAM Systems, Inc.* 2,834 490,565Western Union Co. (The) 66,957 1,331,775Total IT Services 2,565,715Leisure Products �� 0.7%Polaris Industries, Inc. 5,031 458,978Machinery �� 2.8%Cummins, Inc. 3,599 616,653Fortive Corp. 8,028 654,442Illinois Tool Works, Inc. 4,833 728,865Total Machinery 1,999,960Media �� 4.3%Omnicom Group, Inc. 30,976 2,538,483TEGNA, Inc. 31,449 476,453Total Media 3,014,936Metals & Mining �� 1.3%Steel Dynamics, Inc. 30,314 915,483Multiline Retail �� 0.9%Nordstrom, Inc. 18,943 603,524Oil, Gas & Consumable Fuels �� 5.3%Anadarko Petroleum Corp. 16,387 1,156,267Apache Corp. 12,694 367,745CVR Energy, Inc. 14,018 700,760Equitrans Midstream Corp.* 32,383 638,269Occidental Petroleum Corp. 17,507 880,252Total Oil, Gas & Consumable Fuels 3,743,293Professional Services �� 0.6%Robert Half International, Inc. 6,930 395,079Semiconductors & Semiconductor Equipment �� 10.1%Applied Materials, Inc. 11,532 517,902Intel Corp. 30,155 1,443,520KLA-Tencor Corp. 4,768 563,578Lam Research Corp. 2,639 495,710Maxim Integrated Products, Inc. 12,480 746,554Micron Technology, Inc.* 9,562 368,998NVIDIA Corp. 1,597 262,275Skyworks Solutions, Inc. 10,379 801,985Teradyne, Inc. 11,774 564,092Texas Instruments, Inc. 7,727 886,750Xilinx, Inc. 4,443 523,919Total Semiconductors & Semiconductor Equipment 7,175,283Investments Shares ValueSoftware �� 5.8%Citrix Systems, Inc. 12,731 $ 1,249,420Fortinet, Inc.* 8,083 621,017Microsoft Corp. 9,205 1,233,102Oracle Corp. 18,007 1,025,859Total Software 4,129,398Specialty Retail �� 2.3%Best Buy Co., Inc. 6,455 450,107Gap, Inc. (The) 31,357 563,485Williams-Sonoma, Inc. 9,082 590,330
Copyright © 2019 www.secdatabase.com. All Rights Reserved.Please Consider the Environment Before Printing This Document

Total Specialty Retail 1,603,922Technology Hardware, Storage & Peripherals �� 0.6%NetApp, Inc. 7,273 448,744Textiles, Apparel & Luxury Goods �� 1.4%Hanesbrands, Inc. 27,683 476,701Tapestry, Inc. 17,242 547,089Total Textiles, Apparel & Luxury Goods 1,023,790Thrifts & Mortgage Finance �� 1.4%MGIC Investment Corp.* 37,065 487,034Radian Group, Inc. 21,531 491,983Total Thrifts & Mortgage Finance 979,017Tobacco �� 0.4%Philip Morris International, Inc. 3,618 284,122Trading Companies & Distributors �� 2.6%Fastenal Co. 12,779 416,468MSC Industrial Direct Co., Inc. Class A 6,419 476,675Watsco, Inc. 5,718 935,064Total Trading Companies & Distributors 1,828,207TOTAL COMMON STOCKS(Cost: $73,095,897) 71,966,169INVESTMENT OF CASH COLLATERAL FOR SECURITIES LOANED �� 0.4%United States �� 0.4%State Street Navigator Securities Lending Government Money Market Portfolio, 2.36%(b)(Cost: $280,543)(c) 280,543 280,543TOTAL INVESTMENTS IN SECURITIES �� 102.1%(Cost: $73,376,440) 72,246,712Other Assets less Liabilities � (2.1)% (1,479,278 )NET ASSETS �� 100.0% $ 70,767,434* Non-income producing security .(a) Security, or portion thereof, was on loan at June 30, 2019 (See Note 2).(b) Rate shown represents annualized 7-day yield as of June 30, 2019.(c) At June 30, 2019, the total market value of the Fund�s securities on loan identified in the Schedule of Investments was $274,875 and the total market value of the
collateral held by the Fund was $280,543.
See Notes to Financial Statements.
106 WisdomTree Trust
Copyright © 2019 www.secdatabase.com. All Rights Reserved.Please Consider the Environment Before Printing This Document

Table of ContentsSchedule of Investments (concluded)
WisdomTree Dynamic Long/Short U.S. Equity Fund (DYLS)June 30, 2019
FINANCIAL DERIVATIVE INSTRUMENTSTOTAL RETURN SWAPS �� SHORT EXPOSURE TO REFERENCE ENTITY (OTC �� OVER THE COUNTER)Fund Pays Total
Return ofReference Entity
Fund ReceivesVariable Rate(per annum) Counterparty
TerminationDate
NotionalValue
UpfrontPremiums
Paid
UpfrontPremiumsReceived
UnrealizedAppreciation
UnrealizedDepreciation
S&P 500 Index 2.57% (1-MonthLondon InterbankOffered Rate plus0.15%), Monthly Bank of America Merrill Lynch1 6/2/20 $14,156,167 $ � $ � $ � $(661,737 )
S&P 500 Index 2.65% (1-MonthLondon InterbankOffered Rate plus0.23%), Monthly Citigroup, Inc.2 6/2/20 14,156,167 � � � (660,988 )
S&P 500 Index 2.65% (1-MonthLondon InterbankOffered Rate plus0.23%), Monthly Goldman Sachs 6/2/20 14,156,167 � � � (660,314 )
S&P 500 Index 2.62% (1-MonthLondon InterbankOffered Rate plus0.20%), Monthly Morgan Stanley & Co. 6/2/20 14,156,167 � � � (661,269 )
S&P 500 Index 2.62% (1-MonthLondon InterbankOffered Rate plus0.20%), Monthly Royal Bank of Canada3 6/2/20 14,150,259 � � � (663,016 )
S&P 500 Index 2.42% (1-MonthLondon Interbank
Offered Rate), Monthly UBS AG4 6/2/20 2,351,484 � � � (105,750 )$73,126,411 $ �� $ �� $ �� $(3,413,074)
1 As of June 30, 2019, the Fund posted $560,000 of cash collateral to the counterparty, Bank of America Merrill Lynch, for swap contracts.2 As of June 30, 2019, the Fund posted $560,000 of cash collateral to the counterparty, Citigroup Inc., for swap contracts.3 As of June 30, 2019, the Fund posted $560,000 of cash collateral to the counterparty, Royal Bank of Canada, for swap contracts.4 As of June 30, 2019, the Fund posted $500,000 of cash collateral to the counterparty, UBS AG, for swap contracts.
See Notes to Financial Statements.
WisdomTree Trust 107
Copyright © 2019 www.secdatabase.com. All Rights Reserved.Please Consider the Environment Before Printing This Document

Table of ContentsSchedule of InvestmentsWisdomTree 90/60 U.S. Balanced Fund (NTSX)
June 30, 2019
Investments Shares ValueCOMMON STOCKS �� 90.4%Argentina �� 0.1%Internet & Direct Marketing Retail �� 0.1%MercadoLibre, Inc.* 6 $3,671China �� 0.1%Hotels, Restaurants & Leisure �� 0.1%Yum China Holdings, Inc. 83 3,834Israel �� 0.1%Software �� 0.1%Check Point Software Technologies Ltd.* 30 3,468Netherlands �� 0.1%Semiconductors & Semiconductor Equipment �� 0.1%NXP Semiconductors N.V. 64 6,247Peru �� 0.0%Banks �� 0.0%Credicorp Ltd. 2 458Russia �� 0.1%Interactive Media & Services �� 0.1%Yandex N.V. Class A* 84 3,192United Kingdom �� 0.4%Beverages �� 0.0%Coca-Cola European Partners PLC 45 2,542Chemicals �� 0.3%Linde PLC 96 19,277Energy Equipment & Services �� 0.1%TechnipFMC PLC 188 4,877Total United Kingdom 26,696United States �� 89.5%Aerospace & Defense �� 2.3%Arconic, Inc. 84 2,169Boeing Co. (The) 112 40,769General Dynamics Corp. 44 8,000Harris Corp. 18 3,404L3 Technologies, Inc. 14 3,432Lockheed Martin Corp. 50 18,177Northrop Grumman Corp. 32 10,340Raytheon Co. 52 9,042Textron, Inc. 46 2,440TransDigm Group, Inc.* 8 3,870United Technologies Corp. 183 23,827Total Aerospace & Defense 125,470Air Freight & Logistics �� 0.4%C.H. Robinson Worldwide, Inc. 32 2,699Expeditors International of Washington, Inc. 30 2,276FedEx Corp. 22 3,612United Parcel Service, Inc. Class B 147 15,181Total Air Freight & Logistics 23,768Airlines �� 0.3%Delta Air Lines, Inc. 132 7,491Southwest Airlines Co. 86 4,367Investments Shares ValueUnited Continental Holdings, Inc.* 48 $4,202Total Airlines 16,060Auto Components �� 0.1%Aptiv PLC 50 4,042Automobiles �� 0.4%
Copyright © 2019 www.secdatabase.com. All Rights Reserved.Please Consider the Environment Before Printing This Document

Ford Motor Co. 746 7,632General Motors Co. 213 8,207Tesla, Inc.* 20 4,469Total Automobiles 20,308Banks �� 5.0%Bank of America Corp. 1,840 53,360BB&T Corp. 167 8,205Citigroup, Inc. 485 33,964Citizens Financial Group, Inc. 108 3,819Comerica, Inc. 25 1,816Fifth Third Bancorp 156 4,352First Republic Bank 9 879Huntington Bancshares, Inc. 258 3,566JPMorgan Chase & Co. 684 76,471KeyCorp 264 4,686M&T Bank Corp. 26 4,422PNC Financial Services Group, Inc. (The) 90 12,355Regions Financial Corp. 236 3,526SunTrust Banks, Inc. 69 4,337SVB Financial Group* 10 2,246U.S. Bancorp 320 16,768Wells Fargo & Co. 783 37,051Total Banks 271,823Beverages �� 1.8%Brown-Forman Corp. Class B 57 3,160Coca-Cola Co. (The) 788 40,125Constellation Brands, Inc. Class A 32 6,302Molson Coors Brewing Co. Class B 38 2,128Monster Beverage Corp.* 82 5,234PepsiCo, Inc. 293 38,421Total Beverages 95,370Biotechnology �� 1.9%AbbVie, Inc. 245 17,817Alexion Pharmaceuticals, Inc.* 32 4,191Amgen, Inc. 116 21,377Biogen, Inc.* 36 8,419BioMarin Pharmaceutical, Inc.* 24 2,056Celgene Corp.* 144 13,311Exact Sciences Corp.* 21 2,479Gilead Sciences, Inc. 252 17,025Incyte Corp.* 40 3,398Regeneron Pharmaceuticals, Inc.* 14 4,382Vertex Pharmaceuticals, Inc.* 36 6,602Total Biotechnology 101,057
See Notes to Financial Statements.
108 WisdomTree Trust
Copyright © 2019 www.secdatabase.com. All Rights Reserved.Please Consider the Environment Before Printing This Document

Table of ContentsSchedule of Investments (continued)
WisdomTree 90/60 U.S. Balanced Fund (NTSX)June 30, 2019
Investments Shares ValueBuilding Products �� 0.2%Johnson Controls International PLC 212 $8,758Masco Corp. 72 2,825Total Building Products 11,583Capital Markets �� 2.4%Ameriprise Financial, Inc. 30 4,355Bank of New York Mellon Corp. (The) 174 7,682BlackRock, Inc. 24 11,263Charles Schwab Corp. (The) 215 8,641CME Group, Inc. 61 11,841E*TRADE Financial Corp. 46 2,052Franklin Resources, Inc. 70 2,436Goldman Sachs Group, Inc. (The) 76 15,550Intercontinental Exchange, Inc. 110 9,453Moody�s Corp. 38 7,422Morgan Stanley 261 11,434MSCI, Inc. 22 5,253Northern Trust Corp. 44 3,960Raymond James Financial, Inc. 28 2,367S&P Global, Inc. 50 11,390State Street Corp. 91 5,101T. Rowe Price Group, Inc. 44 4,827TD Ameritrade Holding Corp. 87 4,343Total Capital Markets 129,370Chemicals �� 1.1%Air Products & Chemicals, Inc. 42 9,508Albemarle Corp. 23 1,619Celanese Corp. 34 3,665DuPont de Nemours, Inc. 145 10,885Ecolab, Inc. 53 10,464FMC Corp. 32 2,654International Flavors & Fragrances, Inc. 16 2,322LyondellBasell Industries N.V. Class A 72 6,201Mosaic Co. (The) 53 1,327PPG Industries, Inc. 48 5,602Sherwin-Williams Co. (The) 16 7,333Total Chemicals 61,580Commercial Services & Supplies �� 0.4%Cintas Corp. 19 4,509Copart, Inc.* 80 5,979Republic Services, Inc. 49 4,245Waste Management, Inc. 78 8,999Total Commercial Services & Supplies 23,732Communications Equipment �� 1.1%Arista Networks, Inc.* 8 2,077Cisco Systems, Inc. 924 50,571Juniper Networks, Inc. 155 4,128Motorola Solutions, Inc. 28 4,668Total Communications Equipment 61,444Investments Shares ValueConstruction & Engineering �� 0.1%Jacobs Engineering Group, Inc. 38 $3,207Construction Materials �� 0.1%Martin Marietta Materials, Inc. 14 3,221Vulcan Materials Co. 22 3,021Total Construction Materials 6,242
Copyright © 2019 www.secdatabase.com. All Rights Reserved.Please Consider the Environment Before Printing This Document
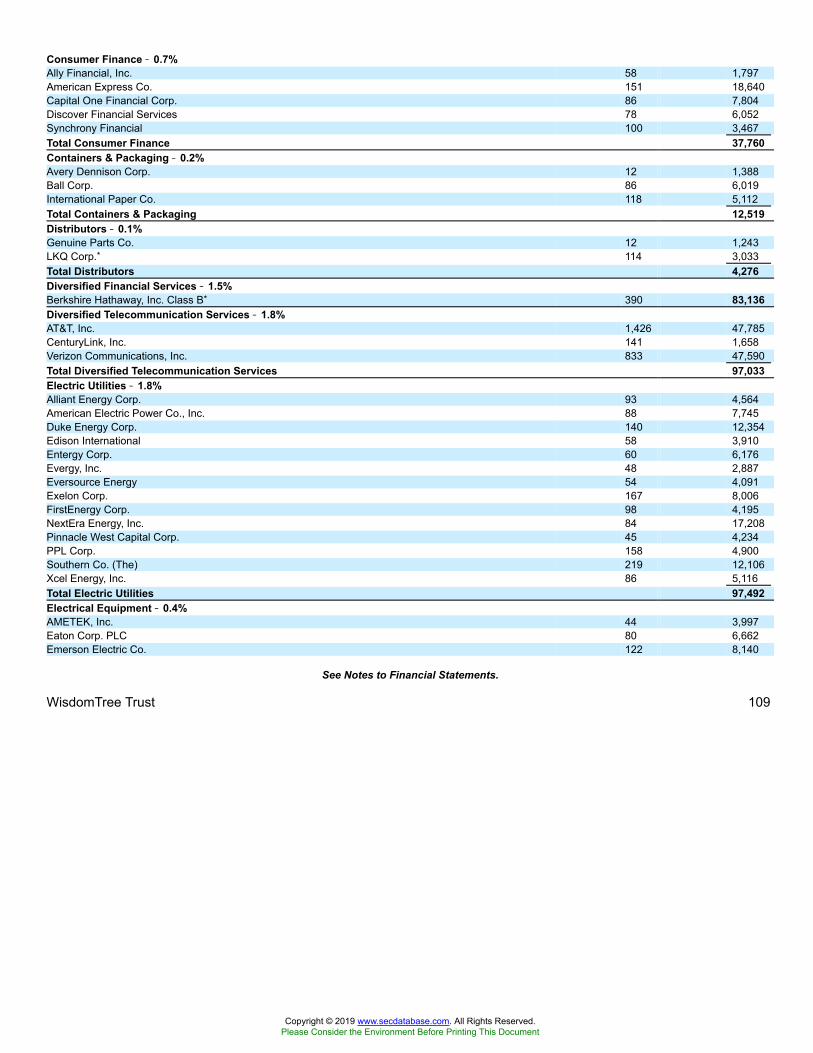
Consumer Finance �� 0.7%Ally Financial, Inc. 58 1,797American Express Co. 151 18,640Capital One Financial Corp. 86 7,804Discover Financial Services 78 6,052Synchrony Financial 100 3,467Total Consumer Finance 37,760Containers & Packaging �� 0.2%Avery Dennison Corp. 12 1,388Ball Corp. 86 6,019International Paper Co. 118 5,112Total Containers & Packaging 12,519Distributors �� 0.1%Genuine Parts Co. 12 1,243LKQ Corp.* 114 3,033Total Distributors 4,276Diversified Financial Services �� 1.5%Berkshire Hathaway, Inc. Class B* 390 83,136Diversified Telecommunication Services �� 1.8%AT&T, Inc. 1,426 47,785CenturyLink, Inc. 141 1,658Verizon Communications, Inc. 833 47,590Total Diversified Telecommunication Services 97,033Electric Utilities �� 1.8%Alliant Energy Corp. 93 4,564American Electric Power Co., Inc. 88 7,745Duke Energy Corp. 140 12,354Edison International 58 3,910Entergy Corp. 60 6,176Evergy, Inc. 48 2,887Eversource Energy 54 4,091Exelon Corp. 167 8,006FirstEnergy Corp. 98 4,195NextEra Energy, Inc. 84 17,208Pinnacle West Capital Corp. 45 4,234PPL Corp. 158 4,900Southern Co. (The) 219 12,106Xcel Energy, Inc. 86 5,116Total Electric Utilities 97,492Electrical Equipment �� 0.4%AMETEK, Inc. 44 3,997Eaton Corp. PLC 80 6,662Emerson Electric Co. 122 8,140
See Notes to Financial Statements.
WisdomTree Trust 109
Copyright © 2019 www.secdatabase.com. All Rights Reserved.Please Consider the Environment Before Printing This Document
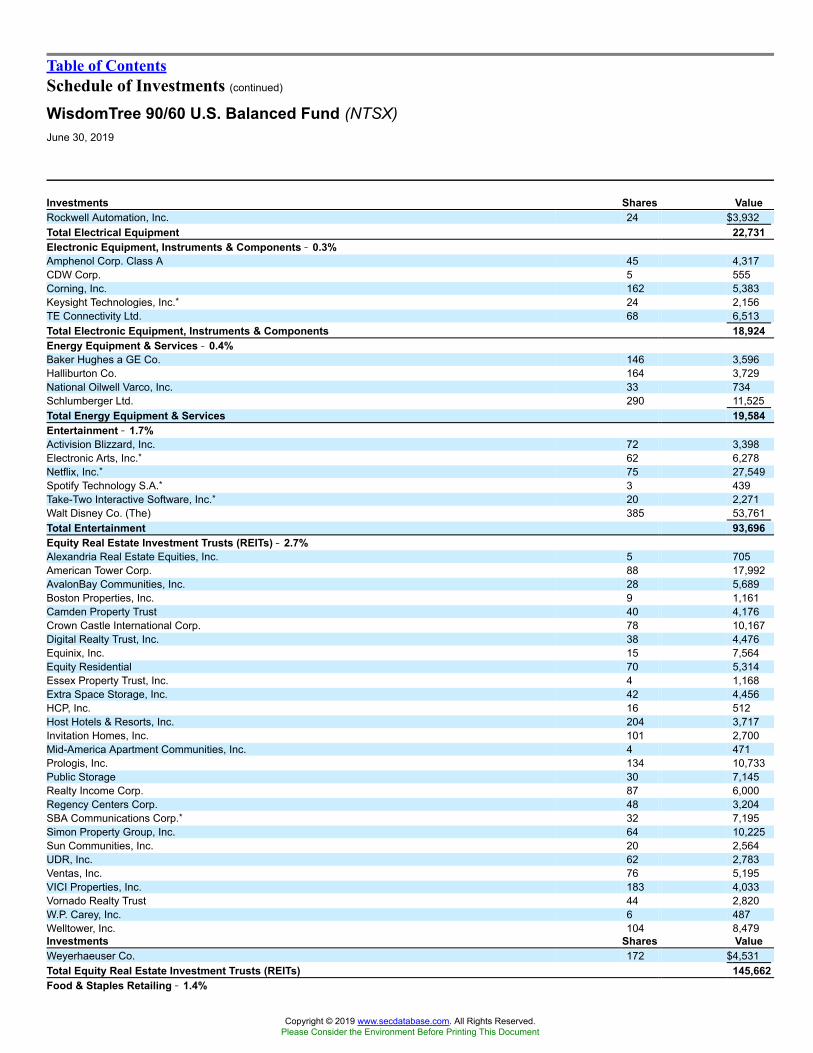
Table of ContentsSchedule of Investments (continued)
WisdomTree 90/60 U.S. Balanced Fund (NTSX)June 30, 2019
Investments Shares ValueRockwell Automation, Inc. 24 $3,932Total Electrical Equipment 22,731Electronic Equipment, Instruments & Components �� 0.3%Amphenol Corp. Class A 45 4,317CDW Corp. 5 555Corning, Inc. 162 5,383Keysight Technologies, Inc.* 24 2,156TE Connectivity Ltd. 68 6,513Total Electronic Equipment, Instruments & Components 18,924Energy Equipment & Services �� 0.4%Baker Hughes a GE Co. 146 3,596Halliburton Co. 164 3,729National Oilwell Varco, Inc. 33 734Schlumberger Ltd. 290 11,525Total Energy Equipment & Services 19,584Entertainment �� 1.7%Activision Blizzard, Inc. 72 3,398Electronic Arts, Inc.* 62 6,278Netflix, Inc.* 75 27,549Spotify Technology S.A.* 3 439Take-Two Interactive Software, Inc.* 20 2,271Walt Disney Co. (The) 385 53,761Total Entertainment 93,696Equity Real Estate Investment Trusts (REITs) �� 2.7%Alexandria Real Estate Equities, Inc. 5 705American Tower Corp. 88 17,992AvalonBay Communities, Inc. 28 5,689Boston Properties, Inc. 9 1,161Camden Property Trust 40 4,176Crown Castle International Corp. 78 10,167Digital Realty Trust, Inc. 38 4,476Equinix, Inc. 15 7,564Equity Residential 70 5,314Essex Property Trust, Inc. 4 1,168Extra Space Storage, Inc. 42 4,456HCP, Inc. 16 512Host Hotels & Resorts, Inc. 204 3,717Invitation Homes, Inc. 101 2,700Mid-America Apartment Communities, Inc. 4 471Prologis, Inc. 134 10,733Public Storage 30 7,145Realty Income Corp. 87 6,000Regency Centers Corp. 48 3,204SBA Communications Corp.* 32 7,195Simon Property Group, Inc. 64 10,225Sun Communities, Inc. 20 2,564UDR, Inc. 62 2,783Ventas, Inc. 76 5,195VICI Properties, Inc. 183 4,033Vornado Realty Trust 44 2,820W.P. Carey, Inc. 6 487Welltower, Inc. 104 8,479Investments Shares ValueWeyerhaeuser Co. 172 $4,531Total Equity Real Estate Investment Trusts (REITs) 145,662Food & Staples Retailing �� 1.4%
Copyright © 2019 www.secdatabase.com. All Rights Reserved.Please Consider the Environment Before Printing This Document
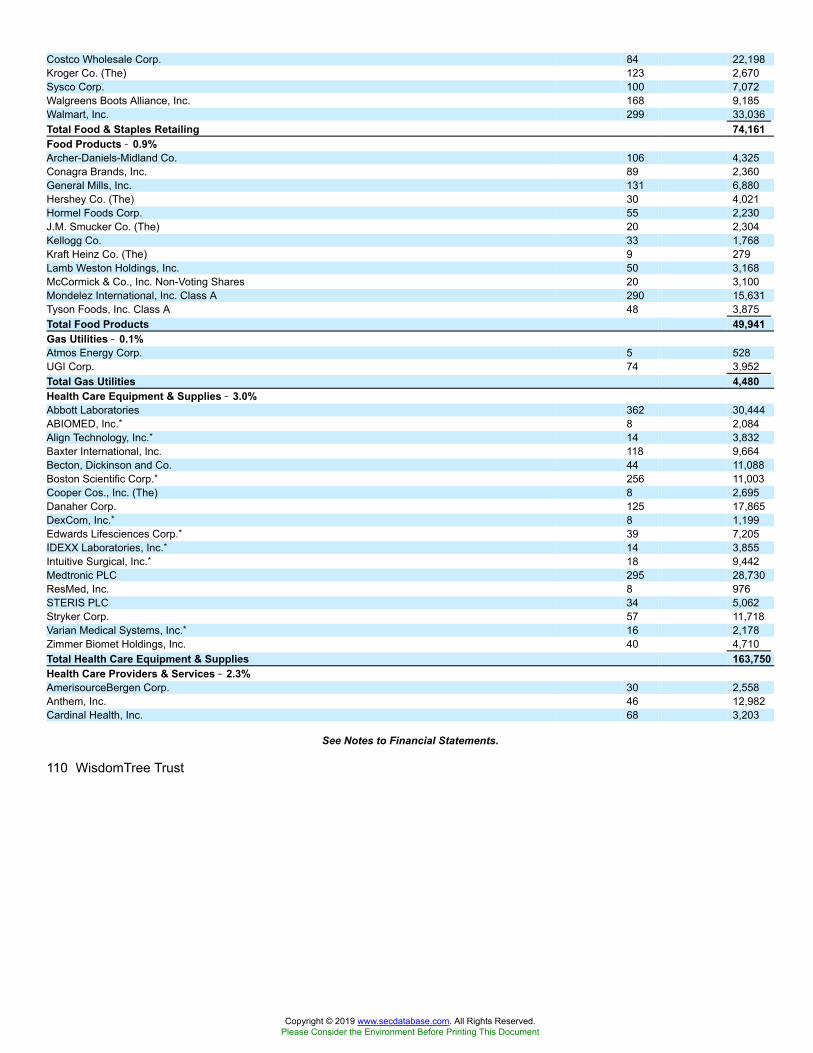
Costco Wholesale Corp. 84 22,198Kroger Co. (The) 123 2,670Sysco Corp. 100 7,072Walgreens Boots Alliance, Inc. 168 9,185Walmart, Inc. 299 33,036Total Food & Staples Retailing 74,161Food Products �� 0.9%Archer-Daniels-Midland Co. 106 4,325Conagra Brands, Inc. 89 2,360General Mills, Inc. 131 6,880Hershey Co. (The) 30 4,021Hormel Foods Corp. 55 2,230J.M. Smucker Co. (The) 20 2,304Kellogg Co. 33 1,768Kraft Heinz Co. (The) 9 279Lamb Weston Holdings, Inc. 50 3,168McCormick & Co., Inc. Non-Voting Shares 20 3,100Mondelez International, Inc. Class A 290 15,631Tyson Foods, Inc. Class A 48 3,875Total Food Products 49,941Gas Utilities �� 0.1%Atmos Energy Corp. 5 528UGI Corp. 74 3,952Total Gas Utilities 4,480Health Care Equipment & Supplies �� 3.0%Abbott Laboratories 362 30,444ABIOMED, Inc.* 8 2,084Align Technology, Inc.* 14 3,832Baxter International, Inc. 118 9,664Becton, Dickinson and Co. 44 11,088Boston Scientific Corp.* 256 11,003Cooper Cos., Inc. (The) 8 2,695Danaher Corp. 125 17,865DexCom, Inc.* 8 1,199Edwards Lifesciences Corp.* 39 7,205IDEXX Laboratories, Inc.* 14 3,855Intuitive Surgical, Inc.* 18 9,442Medtronic PLC 295 28,730ResMed, Inc. 8 976STERIS PLC 34 5,062Stryker Corp. 57 11,718Varian Medical Systems, Inc.* 16 2,178Zimmer Biomet Holdings, Inc. 40 4,710Total Health Care Equipment & Supplies 163,750Health Care Providers & Services �� 2.3%AmerisourceBergen Corp. 30 2,558Anthem, Inc. 46 12,982Cardinal Health, Inc. 68 3,203
See Notes to Financial Statements.
110 WisdomTree Trust
Copyright © 2019 www.secdatabase.com. All Rights Reserved.Please Consider the Environment Before Printing This Document
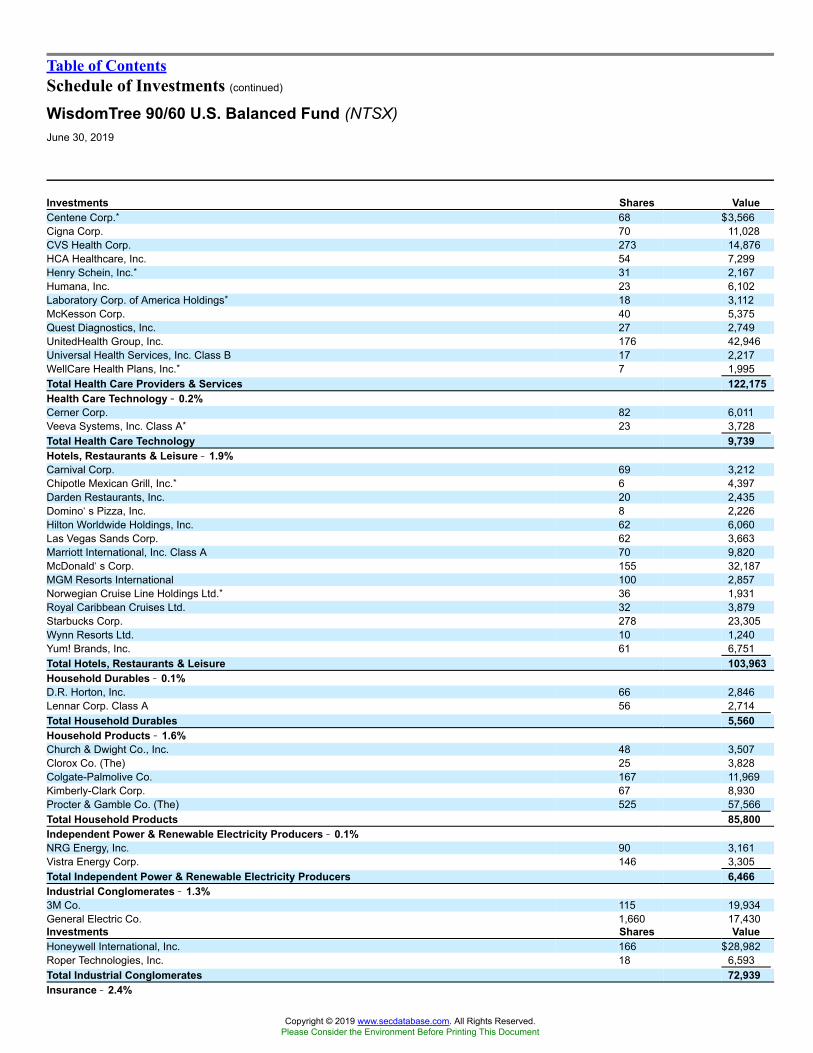
Table of ContentsSchedule of Investments (continued)
WisdomTree 90/60 U.S. Balanced Fund (NTSX)June 30, 2019
Investments Shares ValueCentene Corp.* 68 $3,566Cigna Corp. 70 11,028CVS Health Corp. 273 14,876HCA Healthcare, Inc. 54 7,299Henry Schein, Inc.* 31 2,167Humana, Inc. 23 6,102Laboratory Corp. of America Holdings* 18 3,112McKesson Corp. 40 5,375Quest Diagnostics, Inc. 27 2,749UnitedHealth Group, Inc. 176 42,946Universal Health Services, Inc. Class B 17 2,217WellCare Health Plans, Inc.* 7 1,995Total Health Care Providers & Services 122,175Health Care Technology �� 0.2%Cerner Corp. 82 6,011Veeva Systems, Inc. Class A* 23 3,728Total Health Care Technology 9,739Hotels, Restaurants & Leisure �� 1.9%Carnival Corp. 69 3,212Chipotle Mexican Grill, Inc.* 6 4,397Darden Restaurants, Inc. 20 2,435Domino�s Pizza, Inc. 8 2,226Hilton Worldwide Holdings, Inc. 62 6,060Las Vegas Sands Corp. 62 3,663Marriott International, Inc. Class A 70 9,820McDonald�s Corp. 155 32,187MGM Resorts International 100 2,857Norwegian Cruise Line Holdings Ltd.* 36 1,931Royal Caribbean Cruises Ltd. 32 3,879Starbucks Corp. 278 23,305Wynn Resorts Ltd. 10 1,240Yum! Brands, Inc. 61 6,751Total Hotels, Restaurants & Leisure 103,963Household Durables �� 0.1%D.R. Horton, Inc. 66 2,846Lennar Corp. Class A 56 2,714Total Household Durables 5,560Household Products �� 1.6%Church & Dwight Co., Inc. 48 3,507Clorox Co. (The) 25 3,828Colgate-Palmolive Co. 167 11,969Kimberly-Clark Corp. 67 8,930Procter & Gamble Co. (The) 525 57,566Total Household Products 85,800Independent Power & Renewable Electricity Producers �� 0.1%NRG Energy, Inc. 90 3,161Vistra Energy Corp. 146 3,305Total Independent Power & Renewable Electricity Producers 6,466Industrial Conglomerates �� 1.3%3M Co. 115 19,934General Electric Co. 1,660 17,430Investments Shares ValueHoneywell International, Inc. 166 $28,982Roper Technologies, Inc. 18 6,593Total Industrial Conglomerates 72,939Insurance �� 2.4%
Copyright © 2019 www.secdatabase.com. All Rights Reserved.Please Consider the Environment Before Printing This Document

Aflac, Inc. 186 10,195Allstate Corp. (The) 74 7,525American International Group, Inc. 196 10,443Aon PLC 48 9,263Arch Capital Group Ltd.* 75 2,781Arthur J. Gallagher & Co. 32 2,803Chubb Ltd. 87 12,814Cincinnati Financial Corp. 28 2,903Fidelity National Financial, Inc. 56 2,257Hartford Financial Services Group, Inc. (The) 72 4,012Lincoln National Corp. 52 3,351Loews Corp. 15 820Markel Corp.* 4 4,358Marsh & McLennan Cos., Inc. 97 9,676MetLife, Inc. 190 9,437Principal Financial Group, Inc. 40 2,317Progressive Corp. (The) 118 9,432Prudential Financial, Inc. 82 8,282Reinsurance Group of America, Inc. 5 780Torchmark Corp. 49 4,384Travelers Cos., Inc. (The) 52 7,775Willis Towers Watson PLC 23 4,405Total Insurance 130,013Interactive Media & Services �� 4.3%Alphabet, Inc. Class A* 56 60,637Alphabet, Inc. Class C* 61 65,936Facebook, Inc. Class A* 495 95,535IAC/InterActiveCorp* 14 3,045Snap, Inc. Class A* 134 1,916Twitter, Inc.* 176 6,142Total Interactive Media & Services 233,211Internet & Direct Marketing Retail �� 3.3%Amazon.com, Inc.* 82 155,277Booking Holdings, Inc.* 8 14,998eBay, Inc. 211 8,334Expedia Group, Inc. 22 2,927Total Internet & Direct Marketing Retail 181,536IT Services �� 5.0%Accenture PLC Class A 127 23,466Akamai Technologies, Inc.* 30 2,404Alliance Data Systems Corp. 5 701Automatic Data Processing, Inc. 84 13,888Broadridge Financial Solutions, Inc. 20 2,554Cognizant Technology Solutions Corp. Class A 143 9,065DXC Technology Co. 27 1,489Fidelity National Information Services, Inc. 60 7,361First Data Corp. Class A* 114 3,086Fiserv, Inc.* 80 7,293
See Notes to Financial Statements.
WisdomTree Trust 111
Copyright © 2019 www.secdatabase.com. All Rights Reserved.Please Consider the Environment Before Printing This Document

Table of ContentsSchedule of Investments (continued)
WisdomTree 90/60 U.S. Balanced Fund (NTSX)June 30, 2019
Investments Shares ValueFleetCor Technologies, Inc.* 16 $4,494Gartner, Inc.* 15 2,414Global Payments, Inc. 24 3,843GoDaddy, Inc. Class A* 34 2,385International Business Machines Corp. 175 24,132MasterCard, Inc. Class A 180 47,615Paychex, Inc. 74 6,089PayPal Holdings, Inc.* 226 25,868Square, Inc. Class A* 77 5,585Total System Services, Inc. 44 5,644Twilio, Inc. Class A* 18 2,454VeriSign, Inc.* 20 4,183Visa, Inc. Class A 348 60,395Worldpay, Inc. Class A* 50 6,128Total IT Services 272,536Leisure Products �� 0.0%Hasbro, Inc. 22 2,325Life Sciences Tools & Services �� 0.9%Agilent Technologies, Inc. 84 6,272Illumina, Inc.* 21 7,731IQVIA Holdings, Inc.* 32 5,149Mettler-Toledo International, Inc.* 3 2,520Thermo Fisher Scientific, Inc. 78 22,907Waters Corp.* 14 3,014Total Life Sciences Tools & Services 47,593Machinery �� 1.4%Caterpillar, Inc. 123 16,764Cummins, Inc. 32 5,483Deere & Co. 56 9,280Dover Corp. 28 2,806Fortive Corp. 48 3,913Illinois Tool Works, Inc. 60 9,049Ingersoll-Rand PLC 48 6,080PACCAR, Inc. 72 5,159Parker-Hannifin Corp. 26 4,420Snap-on, Inc. 12 1,988Stanley Black & Decker, Inc. 28 4,049Wabtec Corp. 45 3,229Xylem, Inc. 35 2,927Total Machinery 75,147Media �� 1.4%CBS Corp. Class B Non-Voting Shares 58 2,894Charter Communications, Inc. Class A* 34 13,436Comcast Corp. Class A 906 38,306Discovery, Inc. Class C* 67 1,906Fox Corp. Class A 134 4,910Liberty Broadband Corp. Class C* 49 5,107Liberty Global PLC Class C* 106 2,812Omnicom Group, Inc. 48 3,933Total Media 73,304Investments Shares ValueMetals & Mining �� 0.2%Freeport-McMoRan, Inc. 278 $3,227Newmont Goldcorp Corp. 172 6,617Nucor Corp. 58 3,196Total Metals & Mining 13,040
Copyright © 2019 www.secdatabase.com. All Rights Reserved.Please Consider the Environment Before Printing This Document

Mortgage Real Estate Investment Trusts (REITs) �� 0.0%AGNC Investment Corp. 32 538Annaly Capital Management, Inc. 46 420Total Mortgage Real Estate Investment Trusts (REITs) 958Multi-Utilities �� 0.9%Ameren Corp. 34 2,554CenterPoint Energy, Inc. 17 487CMS Energy Corp. 88 5,096Consolidated Edison, Inc. 80 7,014Dominion Energy, Inc. 130 10,052DTE Energy Co. 28 3,581NiSource, Inc. 99 2,851Public Service Enterprise Group, Inc. 71 4,176Sempra Energy 42 5,772WEC Energy Group, Inc. 88 7,337Total Multi-Utilities 48,920Multiline Retail �� 0.4%Dollar General Corp. 42 5,677Dollar Tree, Inc.* 52 5,584Kohl�s Corp. 10 476Target Corp. 99 8,574Total Multiline Retail 20,311Oil, Gas & Consumable Fuels �� 4.1%Anadarko Petroleum Corp. 123 8,679Apache Corp. 35 1,014Cheniere Energy, Inc.* 62 4,244Chevron Corp. 398 49,527Concho Resources, Inc. 30 3,095ConocoPhillips 229 13,969Devon Energy Corp. 116 3,308Diamondback Energy, Inc. 18 1,962EOG Resources, Inc. 85 7,919Exxon Mobil Corp. 873 66,898Hess Corp. 54 3,433Kinder Morgan, Inc. 372 7,767Marathon Oil Corp. 138 1,961Marathon Petroleum Corp. 155 8,661Noble Energy, Inc. 61 1,366Occidental Petroleum Corp. 69 3,469ONEOK, Inc. 100 6,881Phillips 66 70 6,548Pioneer Natural Resources Co. 30 4,616Targa Resources Corp. 70 2,748Valero Energy Corp. 85 7,277Williams Cos., Inc. (The) 237 6,646Total Oil, Gas & Consumable Fuels 221,988
See Notes to Financial Statements.
112 WisdomTree Trust
Copyright © 2019 www.secdatabase.com. All Rights Reserved.Please Consider the Environment Before Printing This Document
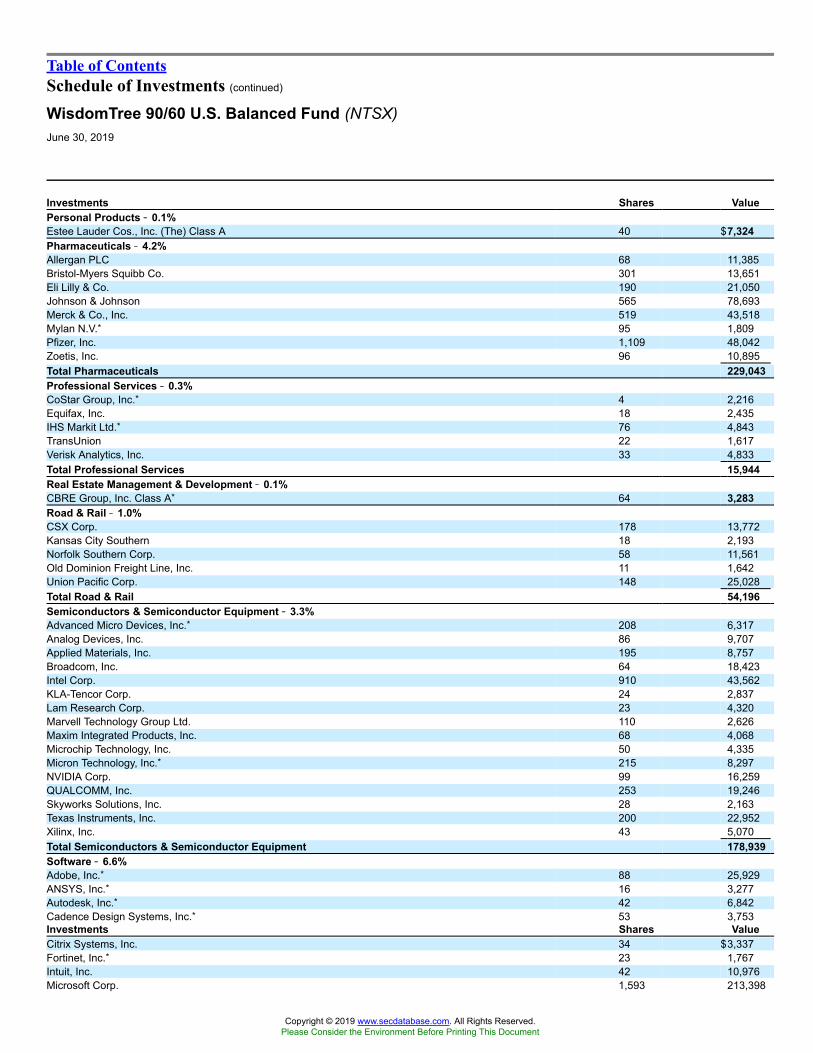
Table of ContentsSchedule of Investments (continued)
WisdomTree 90/60 U.S. Balanced Fund (NTSX)June 30, 2019
Investments Shares ValuePersonal Products �� 0.1%Estee Lauder Cos., Inc. (The) Class A 40 $7,324Pharmaceuticals �� 4.2%Allergan PLC 68 11,385Bristol-Myers Squibb Co. 301 13,651Eli Lilly & Co. 190 21,050Johnson & Johnson 565 78,693Merck & Co., Inc. 519 43,518Mylan N.V.* 95 1,809Pfizer, Inc. 1,109 48,042Zoetis, Inc. 96 10,895Total Pharmaceuticals 229,043Professional Services �� 0.3%CoStar Group, Inc.* 4 2,216Equifax, Inc. 18 2,435IHS Markit Ltd.* 76 4,843TransUnion 22 1,617Verisk Analytics, Inc. 33 4,833Total Professional Services 15,944Real Estate Management & Development �� 0.1%CBRE Group, Inc. Class A* 64 3,283Road & Rail �� 1.0%CSX Corp. 178 13,772Kansas City Southern 18 2,193Norfolk Southern Corp. 58 11,561Old Dominion Freight Line, Inc. 11 1,642Union Pacific Corp. 148 25,028Total Road & Rail 54,196Semiconductors & Semiconductor Equipment �� 3.3%Advanced Micro Devices, Inc.* 208 6,317Analog Devices, Inc. 86 9,707Applied Materials, Inc. 195 8,757Broadcom, Inc. 64 18,423Intel Corp. 910 43,562KLA-Tencor Corp. 24 2,837Lam Research Corp. 23 4,320Marvell Technology Group Ltd. 110 2,626Maxim Integrated Products, Inc. 68 4,068Microchip Technology, Inc. 50 4,335Micron Technology, Inc.* 215 8,297NVIDIA Corp. 99 16,259QUALCOMM, Inc. 253 19,246Skyworks Solutions, Inc. 28 2,163Texas Instruments, Inc. 200 22,952Xilinx, Inc. 43 5,070Total Semiconductors & Semiconductor Equipment 178,939Software �� 6.6%Adobe, Inc.* 88 25,929ANSYS, Inc.* 16 3,277Autodesk, Inc.* 42 6,842Cadence Design Systems, Inc.* 53 3,753Investments Shares ValueCitrix Systems, Inc. 34 $3,337Fortinet, Inc.* 23 1,767Intuit, Inc. 42 10,976Microsoft Corp. 1,593 213,398
Copyright © 2019 www.secdatabase.com. All Rights Reserved.Please Consider the Environment Before Printing This Document

Oracle Corp. 502 28,599Palo Alto Networks, Inc.* 18 3,668Red Hat, Inc.* 43 8,074salesforce.com, Inc.* 155 23,518ServiceNow, Inc.* 28 7,688Splunk, Inc.* 28 3,521SS&C Technologies Holdings, Inc. 16 922Symantec Corp. 84 1,828Synopsys, Inc.* 30 3,861VMware, Inc. Class A 3 501Workday, Inc. Class A* 20 4,111Zendesk, Inc.* 36 3,205Total Software 358,775Specialty Retail �� 2.0%Advance Auto Parts, Inc. 14 2,158AutoZone, Inc.* 4 4,398Best Buy Co., Inc. 46 3,207CarMax, Inc.* 28 2,431Home Depot, Inc. (The) 214 44,505Lowe�s Cos., Inc. 170 17,155O�Reilly Automotive, Inc.* 15 5,540Ross Stores, Inc. 66 6,542Tiffany & Co. 15 1,405TJX Cos., Inc. (The) 256 13,537Tractor Supply Co. 26 2,829Ulta Salon Cosmetics & Fragrance, Inc.* 12 4,163Total Specialty Retail 107,870Technology Hardware, Storage & Peripherals �� 3.8%Apple, Inc. 920 182,086Dell Technologies, Inc. Class C* 55 2,794Hewlett Packard Enterprise Co. 258 3,857HP, Inc. 310 6,445NetApp, Inc. 41 2,530Seagate Technology PLC 74 3,487Western Digital Corp. 90 4,279Total Technology Hardware, Storage & Peripherals 205,478Textiles, Apparel & Luxury Goods �� 0.6%lululemon athletica, Inc.* 19 3,424NIKE, Inc. Class B 251 21,072VF Corp. 64 5,590Total Textiles, Apparel & Luxury Goods 30,086Tobacco �� 0.8%Altria Group, Inc. 364 17,236Philip Morris International, Inc. 312 24,501Total Tobacco 41,737Trading Companies & Distributors �� 0.2%Fastenal Co. 164 5,345United Rentals, Inc.* 16 2,122
See Notes to Financial Statements.
WisdomTree Trust 113
Copyright © 2019 www.secdatabase.com. All Rights Reserved.Please Consider the Environment Before Printing This Document

Table of ContentsSchedule of Investments (concluded)
WisdomTree 90/60 U.S. Balanced Fund (NTSX)June 30, 2019
Investments Shares ValueW.W. Grainger, Inc. 8 $ 2,146Total Trading Companies & Distributors 9,613Water Utilities �� 0.0%American Water Works Co., Inc. 12 1,392Wireless Telecommunication Services �� 0.1%T-Mobile U.S., Inc.* 96 7,117Total United States 4,858,522TOTAL COMMON STOCKS(Cost: $4,531,409) 4,906,088
PrincipalAmount
U.S. GOVERNMENT OBLIGATIONS �� 0.5%U.S. Treasury Bill �� 0.5%U.S. Treasury Bill
2.33%, 9/12/19(a)(b)(Cost: $29,861) $ 30,000 $ 29,875TOTAL INVESTMENTS IN SECURITIES �� 90.9%(Cost: $4,561,270) 4,935,963Other Assets less Liabilities � 9.1% 492,421NET ASSETS �� 100.0% $ 5,428,384* Non-income producing security.(a) Interest rate shown reflects the yield to maturity at the time of purchase.(b) All or a portion of this security is held by the broker as collateral for open futures contracts. The securities collateral posted was comprised entirely of U.S.
Treasury securities having a market value of $29,875 as of June 30, 2019.
FINANCIAL DERIVATIVE INSTRUMENTSFUTURES CONTRACTS (EXCHANGE-TRADED)
Long Exposure ContractsExpiration
DateNotional
Value
UnrealizedAppreciation/(Depreciation)
10 Year U.S. Treasury Note 5 9/19/19 $639,844 $ 13,9462 Year U.S. Treasury Note 3 9/30/19 645,539 4,0315 Year U.S. Treasury Note 6 9/30/19 708,937 10,125U.S. Treasury Long Bond 4 9/19/19 622,375 20,875Ultra 10 Year U.S. Treasury Note 4 9/19/19 552,500 14,750
$3,169,195 $ 63,727
See Notes to Financial Statements.
114 WisdomTree Trust
Copyright © 2019 www.secdatabase.com. All Rights Reserved.Please Consider the Environment Before Printing This Document
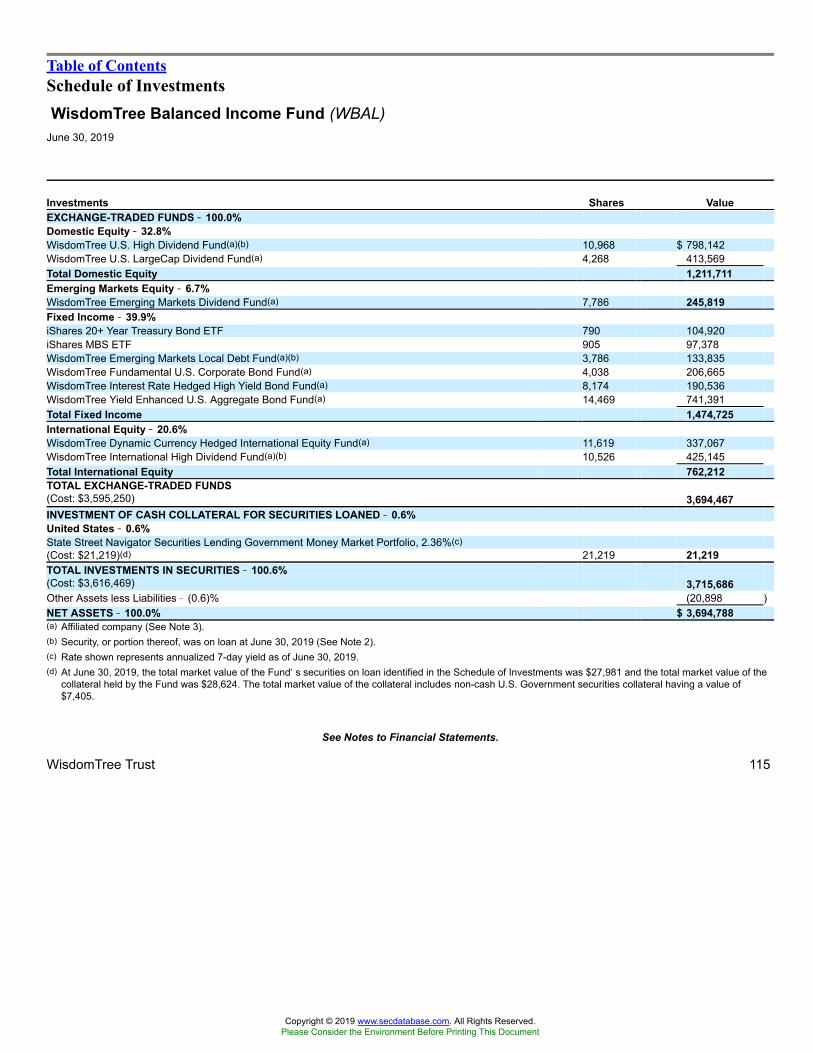
Table of ContentsSchedule of InvestmentsWisdomTree Balanced Income Fund (WBAL)
June 30, 2019
Investments Shares ValueEXCHANGE-TRADED FUNDS �� 100.0%Domestic Equity �� 32.8%WisdomTree U.S. High Dividend Fund(a)(b) 10,968 $ 798,142WisdomTree U.S. LargeCap Dividend Fund(a) 4,268 413,569Total Domestic Equity 1,211,711Emerging Markets Equity �� 6.7%WisdomTree Emerging Markets Dividend Fund(a) 7,786 245,819Fixed Income �� 39.9%iShares 20+ Year Treasury Bond ETF 790 104,920iShares MBS ETF 905 97,378WisdomTree Emerging Markets Local Debt Fund(a)(b) 3,786 133,835WisdomTree Fundamental U.S. Corporate Bond Fund(a) 4,038 206,665WisdomTree Interest Rate Hedged High Yield Bond Fund(a) 8,174 190,536WisdomTree Yield Enhanced U.S. Aggregate Bond Fund(a) 14,469 741,391Total Fixed Income 1,474,725International Equity �� 20.6%WisdomTree Dynamic Currency Hedged International Equity Fund(a) 11,619 337,067WisdomTree International High Dividend Fund(a)(b) 10,526 425,145Total International Equity 762,212TOTAL EXCHANGE-TRADED FUNDS(Cost: $3,595,250) 3,694,467INVESTMENT OF CASH COLLATERAL FOR SECURITIES LOANED �� 0.6%United States �� 0.6%State Street Navigator Securities Lending Government Money Market Portfolio, 2.36%(c)(Cost: $21,219)(d) 21,219 21,219TOTAL INVESTMENTS IN SECURITIES �� 100.6%(Cost: $3,616,469) 3,715,686Other Assets less Liabilities � (0.6)% (20,898 )NET ASSETS �� 100.0% $ 3,694,788(a) Affiliated company (See Note 3).(b) Security, or portion thereof, was on loan at June 30, 2019 (See Note 2).(c) Rate shown represents annualized 7-day yield as of June 30, 2019.(d) At June 30, 2019, the total market value of the Fund�s securities on loan identified in the Schedule of Investments was $27,981 and the total market value of the
collateral held by the Fund was $28,624. The total market value of the collateral includes non-cash U.S. Government securities collateral having a value of$7,405.
See Notes to Financial Statements.
WisdomTree Trust 115
Copyright © 2019 www.secdatabase.com. All Rights Reserved.Please Consider the Environment Before Printing This Document

Table of ContentsStatements of Assets and LiabilitiesWisdomTree TrustJune 30, 2019
WisdomTreeDynamicCurrencyHedged
InternationalEquity Fund
WisdomTreeDynamicCurrencyHedged
InternationalQuality
DividendGrowth Fund
WisdomTreeDynamicCurrencyHedged
InternationalSmallCap
Equity Fund
WisdomTreeEmergingMarketsDividend
Fund
WisdomTreeEurope
MultifactorFund
ASSETS:Investments, at cost $251,433,031 $� $35,321,424 $48,271,849 $12,662,967Investment in affiliates, at cost (Note 3) � 29,376,810 � � �
Foreign currency, at cost 403,209 1,806 � 50,315 4,809Investments in securities, at value1,2 (Note 2) 253,832,371 � 34,886,310 50,185,576 12,791,299Investment in affiliates, at value (Note 3) � 28,732,853 � � �
Cash 154,893 6,107 2,474 6,488 13Foreign currency, at value 404,106 1,811 � 50,417 4,811Unrealized appreciation on foreign currency contracts 57,148 6,073 14,511 � 6,935Receivables:
Investment securities sold 870,081 328,576 194,289 350 49,946Dividends 597,810 � 53,940 342,534 42,593Securities lending income 12,489 � 1,560 283 495Foreign tax reclaims 863,811 � 10,118 100 30,235
Total Assets 256,792,709 29,075,420 35,163,202 50,585,748 12,926,327LIABILITIES:Foreign currency due to custodian, at value � � 2,184 � �
Unrealized depreciation on foreign currency contracts 2,659,701 324,002 336,492 � 186,506Payables:
Cash collateral received for securities loaned (Note 2) 1,699,501 � 772,019 219,327 5,482Advisory fees (Note 3) 70,882 2,358 11,692 12,924 4,525Service fees (Note 2) 891 105 120 178 46
Total Liabilities 4,430,975 326,465 1,122,507 232,429 196,559NET ASSETS $252,361,734 $28,748,955 $34,040,695 $50,353,319 $12,729,768NET ASSETS:Paid-in capital $262,290,915 $29,564,655 $35,921,600 $49,576,279 $14,233,380Total distributable earnings (loss) (9,929,181 ) (815,700 ) (1,880,905 ) 777,040 (1,503,612 )NET ASSETS $252,361,734 $28,748,955 $34,040,695 $50,353,319 $12,729,768Outstanding beneficial interest shares of $0.001 par value (unlimited
number of shares authorized) 8,750,000 1,200,000 1,150,000 1,600,000 450,000Net asset value per share $28.84 $23.96 $29.60 $31.47 $28.291 Includes market value of securities out on loan of: $3,138,822 � $1,231,011 $304,928 $128,9882 Investments in securities include investment of cash collateral for securities loaned (see Schedule of Investments for additional information).
See Notes to Financial Statements.
116 WisdomTree Trust
Copyright © 2019 www.secdatabase.com. All Rights Reserved.Please Consider the Environment Before Printing This Document
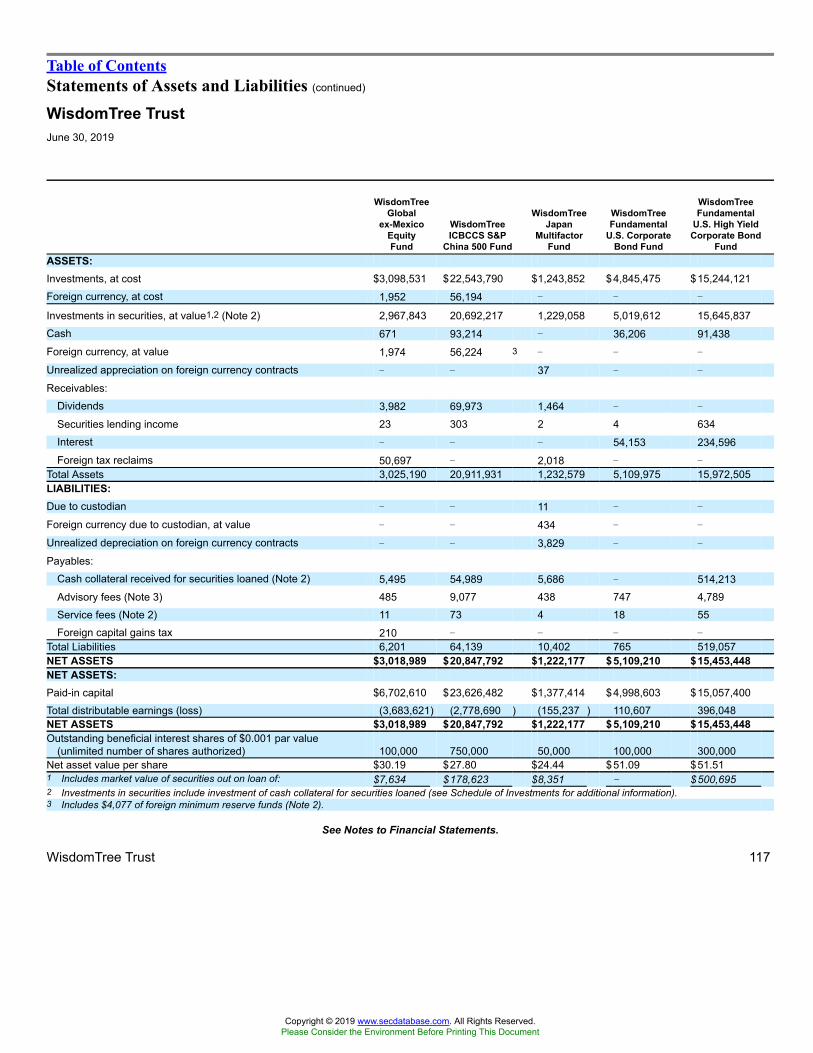
Table of ContentsStatements of Assets and Liabilities (continued)
WisdomTree TrustJune 30, 2019
WisdomTreeGlobal
ex-MexicoEquityFund
WisdomTreeICBCCS S&P
China 500 Fund
WisdomTreeJapan
MultifactorFund
WisdomTreeFundamental
U.S. CorporateBond Fund
WisdomTreeFundamental
U.S. High YieldCorporate Bond
FundASSETS:Investments, at cost $3,098,531 $22,543,790 $1,243,852 $4,845,475 $15,244,121Foreign currency, at cost 1,952 56,194 � � �
Investments in securities, at value1,2 (Note 2) 2,967,843 20,692,217 1,229,058 5,019,612 15,645,837Cash 671 93,214 � 36,206 91,438Foreign currency, at value 1,974 56,224 3 � � �
Unrealized appreciation on foreign currency contracts � � 37 � �
Receivables:Dividends 3,982 69,973 1,464 � �
Securities lending income 23 303 2 4 634Interest � � � 54,153 234,596Foreign tax reclaims 50,697 � 2,018 � �
Total Assets 3,025,190 20,911,931 1,232,579 5,109,975 15,972,505LIABILITIES:Due to custodian � � 11 � �
Foreign currency due to custodian, at value � � 434 � �
Unrealized depreciation on foreign currency contracts � � 3,829 � �
Payables:Cash collateral received for securities loaned (Note 2) 5,495 54,989 5,686 � 514,213Advisory fees (Note 3) 485 9,077 438 747 4,789Service fees (Note 2) 11 73 4 18 55Foreign capital gains tax 210 � � � �
Total Liabilities 6,201 64,139 10,402 765 519,057NET ASSETS $3,018,989 $20,847,792 $1,222,177 $5,109,210 $15,453,448NET ASSETS:Paid-in capital $6,702,610 $23,626,482 $1,377,414 $4,998,603 $15,057,400Total distributable earnings (loss) (3,683,621) (2,778,690 ) (155,237 ) 110,607 396,048NET ASSETS $3,018,989 $20,847,792 $1,222,177 $5,109,210 $15,453,448Outstanding beneficial interest shares of $0.001 par value
(unlimited number of shares authorized) 100,000 750,000 50,000 100,000 300,000Net asset value per share $30.19 $27.80 $24.44 $51.09 $51.511 Includes market value of securities out on loan of: $7,634 $178,623 $8,351 � $500,6952 Investments in securities include investment of cash collateral for securities loaned (see Schedule of Investments for additional information).3 Includes $4,077 of foreign minimum reserve funds (Note 2).
See Notes to Financial Statements.
WisdomTree Trust 117
Copyright © 2019 www.secdatabase.com. All Rights Reserved.Please Consider the Environment Before Printing This Document

Table of ContentsStatements of Assets and Liabilities (continued)
WisdomTree TrustJune 30, 2019
WisdomTreeFundamental
U.S. Short-TermCorporate
BondFund
WisdomTreeFundamental
U.S. Short-TermHigh YieldCorporate
BondFund
WisdomTreeDynamic
Bearish U.S.Equity Fund
WisdomTreeDynamic
Long/Short U.S.
Equity Fund
WisdomTree90/60 U.S.
Balanced FundASSETS:Investments, at cost $ 4,891,264 $20,665,231 $9,408,238 $73,376,440 $ 4,561,270Investments in securities, at value1,2 (Note 2) 4,953,284 20,819,826 9,165,610 72,246,712 4,935,963Cash 48,113 72,426 26,274 � 493,848Deposits at broker for swap contracts � � � 2,180,000 �
Receivables:Investment securities sold � � � 2,800,920 39,796Dividends � � 17,550 155,543 3,893Securities lending income 11 526 15 59 �
Interest 45,640 303,687 � � �
Total Assets 5,047,048 21,196,465 9,209,449 77,383,234 5,473,500LIABILITIES:Due to custodian � � � 7,137 �
Unrealized depreciation on swap contracts � � 433,504 3,413,074 �
Payables:Cash collateral received for securities loaned (Note 2) 3,098 1,010,193 105,944 280,543 �
Investment securities purchased � � � � 43,885Capital shares redeemed � � � 2,770,683 �
Swap contracts closed � � � 113,222 �
Advisory fees (Note 3) 744 4,929 3,403 30,858 876Service fees (Note 2) 18 57 30 283 19Net variation margin on futures contracts � � � � 336
Total Liabilities 3,860 1,015,179 542,881 6,615,800 45,116NET ASSETS $ 5,043,188 $20,181,286 $8,666,568 $70,767,434 $ 5,428,384NET ASSETS:Paid-in capital $ 5,000,691 $20,116,756 $12,600,052 $108,066,785 $ 4,891,590Total distributable earnings (loss) 42,497 64,530 (3,933,484 ) (37,299,351 ) 536,794NET ASSETS $ 5,043,188 $20,181,286 $8,666,568 $70,767,434 $ 5,428,384Outstanding beneficial interest shares of $0.001 par value
(unlimited number of shares authorized) 100,000 400,000 400,000 2,550,000 200,000Net asset value per share $ 50.43 $50.45 $21.67 $27.75 $ 27.141 Includes market value of securities out on loan of: $ 3,012 $977,176 $103,804 $274,875 �2 Investments in securities include investment of cash collateral for securities loaned (see Schedule of Investments for additional information).
See Notes to Financial Statements.
118 WisdomTree Trust
Copyright © 2019 www.secdatabase.com. All Rights Reserved.Please Consider the Environment Before Printing This Document
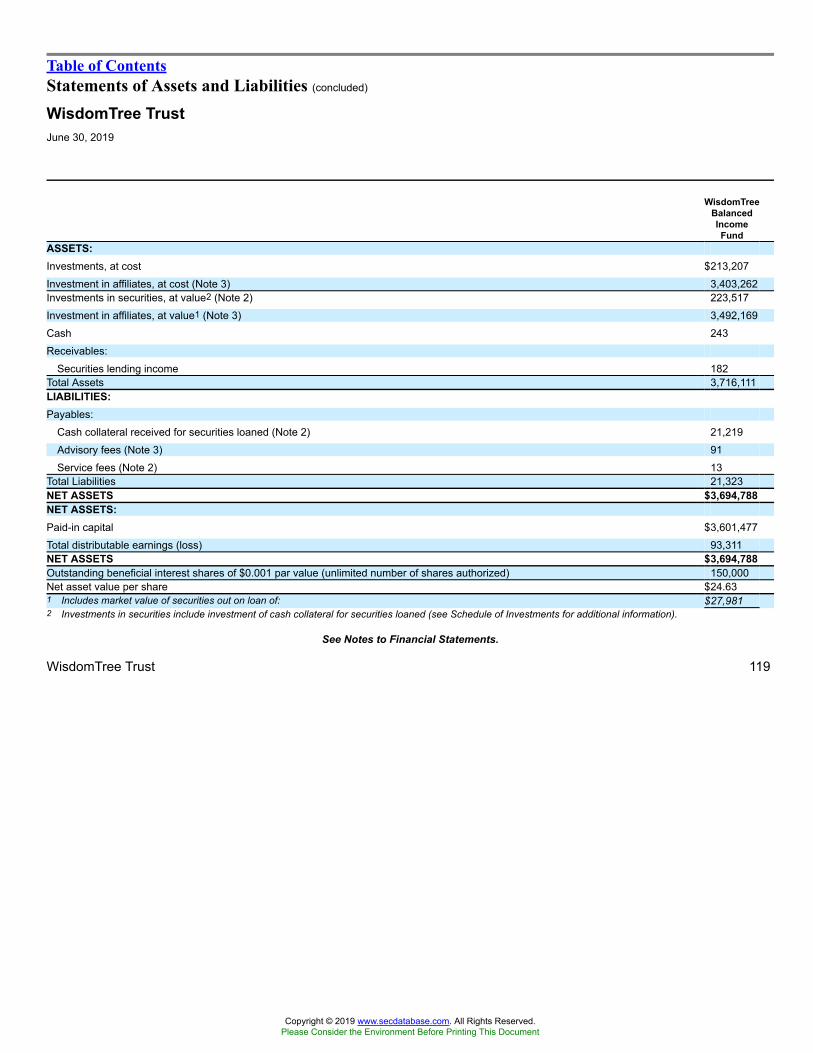
Table of ContentsStatements of Assets and Liabilities (concluded)
WisdomTree TrustJune 30, 2019
WisdomTreeBalancedIncomeFund
ASSETS:Investments, at cost $213,207Investment in affiliates, at cost (Note 3) 3,403,262Investments in securities, at value2 (Note 2) 223,517Investment in affiliates, at value1 (Note 3) 3,492,169Cash 243Receivables:
Securities lending income 182Total Assets 3,716,111LIABILITIES:Payables:
Cash collateral received for securities loaned (Note 2) 21,219Advisory fees (Note 3) 91Service fees (Note 2) 13
Total Liabilities 21,323NET ASSETS $3,694,788NET ASSETS:Paid-in capital $3,601,477Total distributable earnings (loss) 93,311NET ASSETS $3,694,788Outstanding beneficial interest shares of $0.001 par value (unlimited number of shares authorized) 150,000Net asset value per share $24.631 Includes market value of securities out on loan of: $27,9812 Investments in securities include investment of cash collateral for securities loaned (see Schedule of Investments for additional information).
See Notes to Financial Statements.
WisdomTree Trust 119
Copyright © 2019 www.secdatabase.com. All Rights Reserved.Please Consider the Environment Before Printing This Document

Table of ContentsStatements of OperationsWisdomTree TrustFor the Year Ended June 30, 2019
WisdomTreeDynamicCurrencyHedged
InternationalEquity Fund
WisdomTreeDynamicCurrencyHedged
InternationalQuality
DividendGrowthFund
WisdomTreeDynamicCurrencyHedged
InternationalSmallCap
Equity Fund
WisdomTreeEmergingMarketsDividend
Fund
WisdomTreeEurope
MultifactorFund
INVESTMENT INCOME:Dividends1 $9,055,069 $� $990,127 $1,644,701 $405,847Dividends from affiliates (Note 3) � 465,146 � � �
Interest � � � 174 �
Non-cash dividends 261,971 � 18,885 4,356 30,669Securities lending income (Note 2) 102,093 � 23,360 3,321 7,168
Total investment income 9,419,133 465,146 1,032,372 1,652,552 443,684EXPENSES:
Advisory fees (Note 3) 933,906 122,623 117,860 123,151 68,331Service fees (Note 2) 10,273 930 1,080 1,693 627
Total expenses 944,179 123,553 118,940 124,844 68,958Expense waivers (Note 3) (116,738 ) (101,481 ) (12,277 ) � (7,118 )
Net expenses 827,441 22,072 106,663 124,844 61,840Net investment income 8,591,692 443,074 925,709 1,527,708 381,844NET REALIZED AND UNREALIZED GAIN (LOSS) ON INVESTMENTS:Net realized gain (loss) from:
Investment transactions (7,431,805 ) � (1,542,724) (1,167,752) (1,763,683)Investment transactions in affiliates (Note 3) � (238,728 ) � � �
In-kind redemptions 12,261,337 � 625,538 � (147,572 )In-kind redemptions in affiliates (Note 3) � (540,861 ) � � �
Foreign currency contracts 10,400,406 1,056,066 895,383 7,863 887,840Foreign currency related transactions (22,300 ) � (1,708 ) (10,499 ) (26,905 )
Net realized gain (loss) 15,207,638 276,477 (23,511 ) (1,170,388) (1,050,320)Net increase (decrease) in unrealized appreciation/depreciation:
Investment transactions (10,969,239) � (635,316 ) 1,695,874 429,127Investment transactions in affiliates (Note 3) � (505,034 ) � � �
Foreign currency contracts (4,399,047 ) (481,563 ) (484,365 ) � (199,070 )Translation of assets and liabilities denominated in foreign
currencies 16,204 42 511 1,308 86Net increase (decrease) in unrealized appreciation/depreciation (15,352,082) (986,555 ) (1,119,170) 1,697,182 230,143Net realized and unrealized gain (loss) on investments (144,444 ) (710,078 ) (1,142,681) 526,794 (820,177 )NET INCREASE (DECREASE) IN NET ASSETS RESULTING
FROM OPERATIONS $8,447,248 $(267,004 ) $(216,972 ) $2,054,502 $(438,333 )1 Net of foreign withholding tax of: $890,034 � $111,687 $227,562 $61,024
See Notes to Financial Statements.
120 WisdomTree Trust
Copyright © 2019 www.secdatabase.com. All Rights Reserved.Please Consider the Environment Before Printing This Document
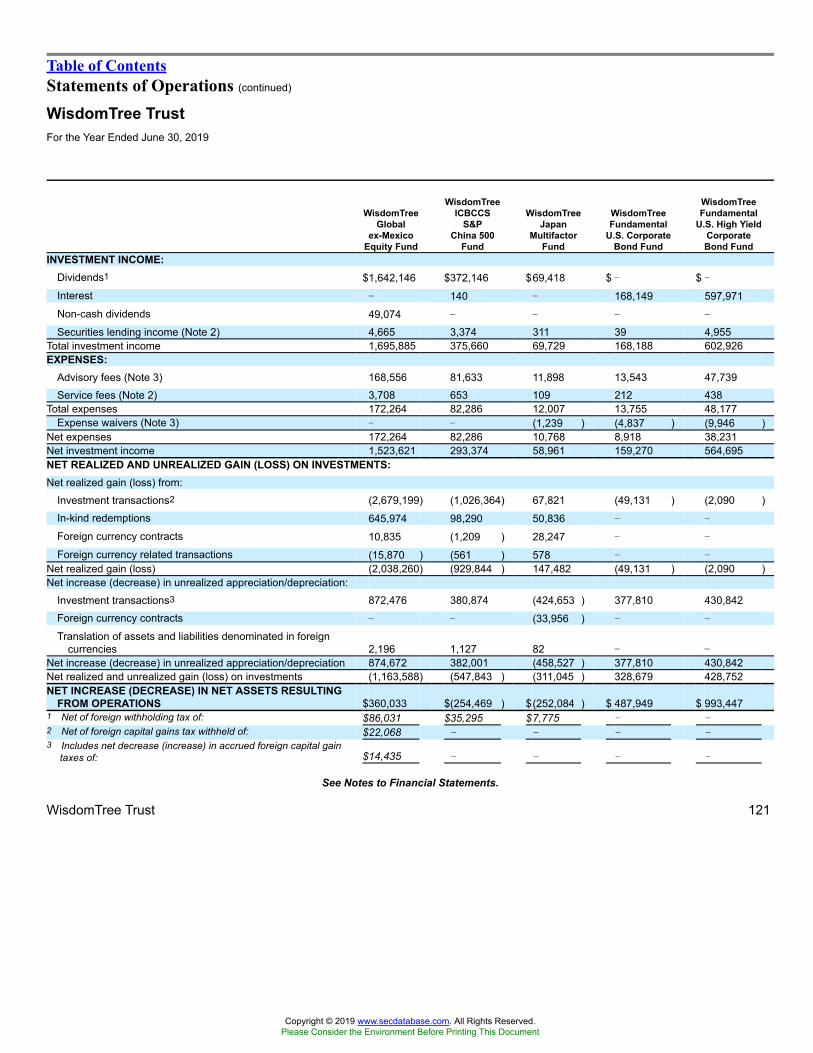
Table of ContentsStatements of Operations (continued)
WisdomTree TrustFor the Year Ended June 30, 2019
WisdomTreeGlobal
ex-MexicoEquity Fund
WisdomTreeICBCCS
S&PChina 500
Fund
WisdomTreeJapan
MultifactorFund
WisdomTreeFundamental
U.S. CorporateBond Fund
WisdomTreeFundamental
U.S. High YieldCorporateBond Fund
INVESTMENT INCOME:Dividends1 $1,642,146 $372,146 $69,418 $ � $ �
Interest � 140 � 168,149 597,971Non-cash dividends 49,074 � � � �
Securities lending income (Note 2) 4,665 3,374 311 39 4,955Total investment income 1,695,885 375,660 69,729 168,188 602,926EXPENSES:
Advisory fees (Note 3) 168,556 81,633 11,898 13,543 47,739Service fees (Note 2) 3,708 653 109 212 438
Total expenses 172,264 82,286 12,007 13,755 48,177Expense waivers (Note 3) � � (1,239 ) (4,837 ) (9,946 )
Net expenses 172,264 82,286 10,768 8,918 38,231Net investment income 1,523,621 293,374 58,961 159,270 564,695NET REALIZED AND UNREALIZED GAIN (LOSS) ON INVESTMENTS:Net realized gain (loss) from:
Investment transactions2 (2,679,199) (1,026,364) 67,821 (49,131 ) (2,090 )In-kind redemptions 645,974 98,290 50,836 � �
Foreign currency contracts 10,835 (1,209 ) 28,247 � �
Foreign currency related transactions (15,870 ) (561 ) 578 � �
Net realized gain (loss) (2,038,260) (929,844 ) 147,482 (49,131 ) (2,090 )Net increase (decrease) in unrealized appreciation/depreciation:
Investment transactions3 872,476 380,874 (424,653 ) 377,810 430,842Foreign currency contracts � � (33,956 ) � �
Translation of assets and liabilities denominated in foreigncurrencies 2,196 1,127 82 � �
Net increase (decrease) in unrealized appreciation/depreciation 874,672 382,001 (458,527 ) 377,810 430,842Net realized and unrealized gain (loss) on investments (1,163,588) (547,843 ) (311,045 ) 328,679 428,752NET INCREASE (DECREASE) IN NET ASSETS RESULTING
FROM OPERATIONS $360,033 $(254,469 ) $(252,084 ) $ 487,949 $ 993,4471 Net of foreign withholding tax of: $86,031 $35,295 $7,775 � �2 Net of foreign capital gains tax withheld of: $22,068 � � � �3 Includes net decrease (increase) in accrued foreign capital gain
taxes of: $14,435 � � � �
See Notes to Financial Statements.
WisdomTree Trust 121
Copyright © 2019 www.secdatabase.com. All Rights Reserved.Please Consider the Environment Before Printing This Document
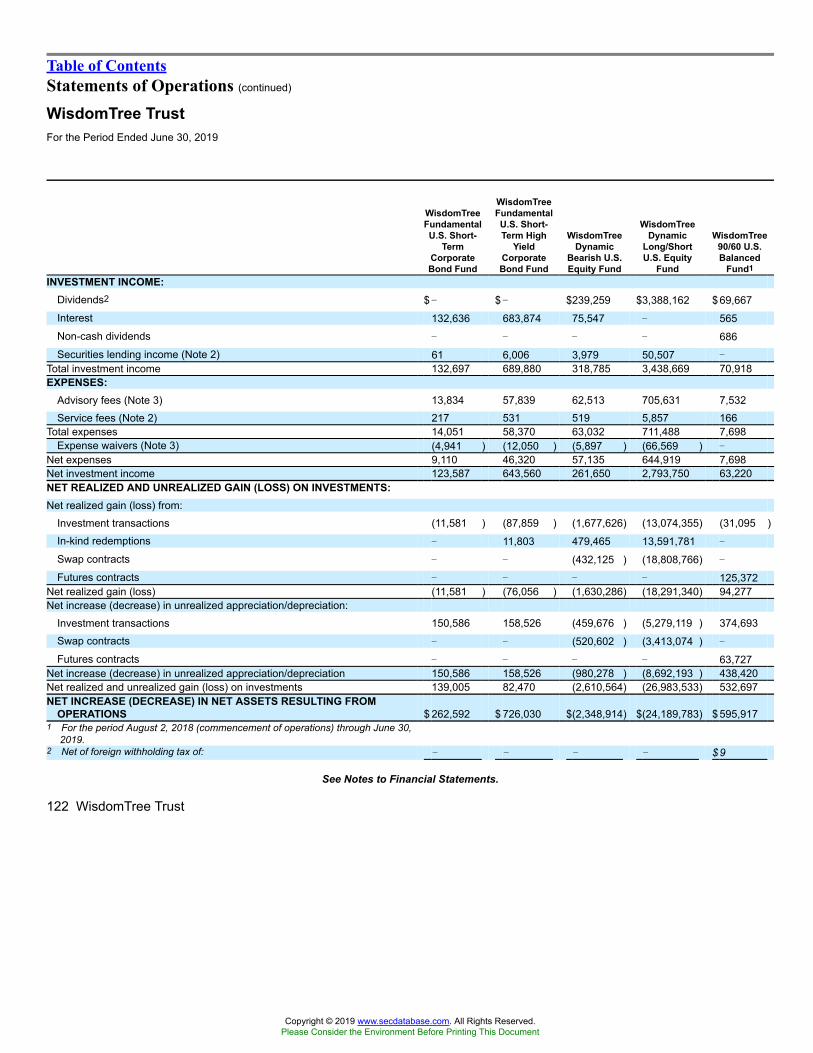
Table of ContentsStatements of Operations (continued)
WisdomTree TrustFor the Period Ended June 30, 2019
WisdomTreeFundamentalU.S. Short-
TermCorporateBond Fund
WisdomTreeFundamentalU.S. Short-Term High
YieldCorporateBond Fund
WisdomTreeDynamic
Bearish U.S.Equity Fund
WisdomTreeDynamic
Long/ShortU.S. Equity
Fund
WisdomTree90/60 U.S.Balanced
Fund1
INVESTMENT INCOME:Dividends2 $ � $ � $239,259 $3,388,162 $69,667Interest 132,636 683,874 75,547 � 565Non-cash dividends � � � � 686Securities lending income (Note 2) 61 6,006 3,979 50,507 �
Total investment income 132,697 689,880 318,785 3,438,669 70,918EXPENSES:
Advisory fees (Note 3) 13,834 57,839 62,513 705,631 7,532Service fees (Note 2) 217 531 519 5,857 166
Total expenses 14,051 58,370 63,032 711,488 7,698Expense waivers (Note 3) (4,941 ) (12,050 ) (5,897 ) (66,569 ) �
Net expenses 9,110 46,320 57,135 644,919 7,698Net investment income 123,587 643,560 261,650 2,793,750 63,220NET REALIZED AND UNREALIZED GAIN (LOSS) ON INVESTMENTS:Net realized gain (loss) from:
Investment transactions (11,581 ) (87,859 ) (1,677,626) (13,074,355) (31,095 )In-kind redemptions � 11,803 479,465 13,591,781 �
Swap contracts � � (432,125 ) (18,808,766) �
Futures contracts � � � � 125,372Net realized gain (loss) (11,581 ) (76,056 ) (1,630,286) (18,291,340) 94,277Net increase (decrease) in unrealized appreciation/depreciation:
Investment transactions 150,586 158,526 (459,676 ) (5,279,119 ) 374,693Swap contracts � � (520,602 ) (3,413,074 ) �
Futures contracts � � � � 63,727Net increase (decrease) in unrealized appreciation/depreciation 150,586 158,526 (980,278 ) (8,692,193 ) 438,420Net realized and unrealized gain (loss) on investments 139,005 82,470 (2,610,564) (26,983,533) 532,697NET INCREASE (DECREASE) IN NET ASSETS RESULTING FROM
OPERATIONS $ 262,592 $ 726,030 $(2,348,914) $(24,189,783) $595,9171 For the period August 2, 2018 (commencement of operations) through June 30,
2019.2 Net of foreign withholding tax of: � � � � $9
See Notes to Financial Statements.
122 WisdomTree Trust
Copyright © 2019 www.secdatabase.com. All Rights Reserved.Please Consider the Environment Before Printing This Document
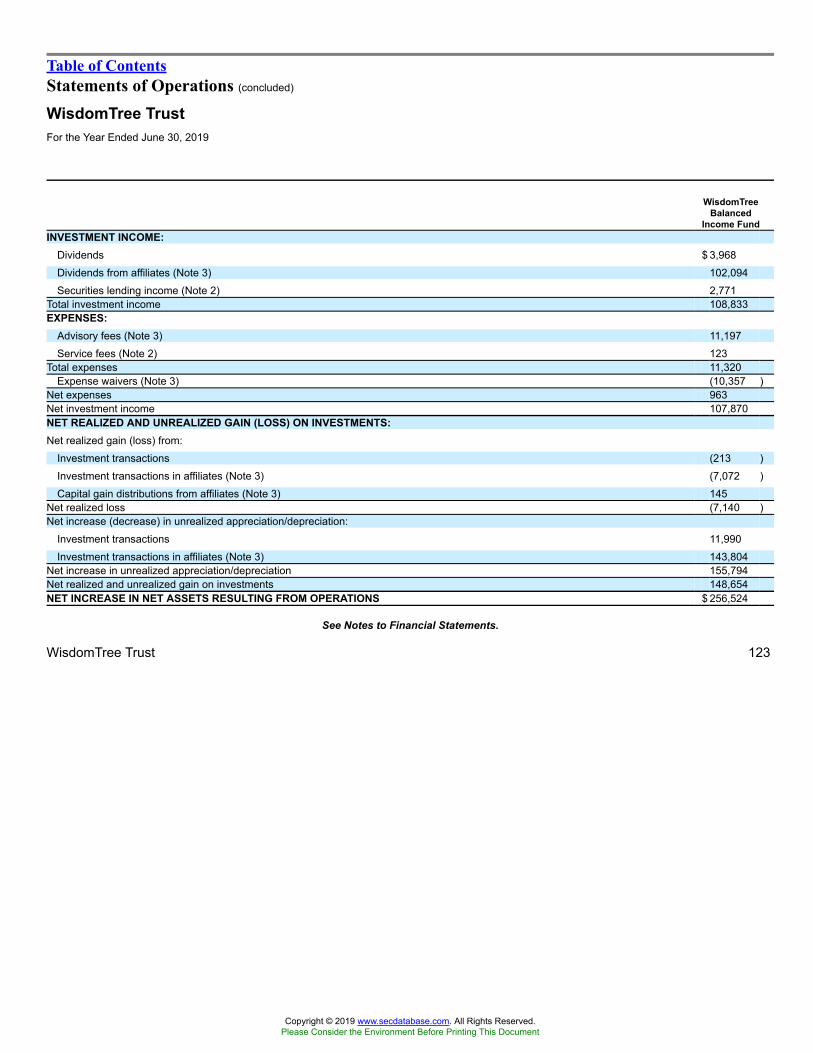
Table of ContentsStatements of Operations (concluded)
WisdomTree TrustFor the Year Ended June 30, 2019
WisdomTreeBalanced
Income FundINVESTMENT INCOME:
Dividends $ 3,968Dividends from affiliates (Note 3) 102,094Securities lending income (Note 2) 2,771
Total investment income 108,833EXPENSES:
Advisory fees (Note 3) 11,197Service fees (Note 2) 123
Total expenses 11,320Expense waivers (Note 3) (10,357 )
Net expenses 963Net investment income 107,870NET REALIZED AND UNREALIZED GAIN (LOSS) ON INVESTMENTS:Net realized gain (loss) from:
Investment transactions (213 )Investment transactions in affiliates (Note 3) (7,072 )Capital gain distributions from affiliates (Note 3) 145
Net realized loss (7,140 )Net increase (decrease) in unrealized appreciation/depreciation:
Investment transactions 11,990Investment transactions in affiliates (Note 3) 143,804
Net increase in unrealized appreciation/depreciation 155,794Net realized and unrealized gain on investments 148,654NET INCREASE IN NET ASSETS RESULTING FROM OPERATIONS $ 256,524
See Notes to Financial Statements.
WisdomTree Trust 123
Copyright © 2019 www.secdatabase.com. All Rights Reserved.Please Consider the Environment Before Printing This Document

Table of ContentsStatements of Changes in Net AssetsWisdomTree Trust
WisdomTree Dynamic CurrencyHedged International Equity
Fund
WisdomTree DynamicCurrency
Hedged International QualityDividend Growth Fund
WisdomTree DynamicCurrency
Hedged InternationalSmallCap
Equity Fund
For theYear Ended
June 30, 2019
For theYear Ended
June 30, 2018
For theYear Ended
June 30,2019
For theYear Ended
June 30,2018
For theYear Ended
June 30,2019
For theYear Ended
June 30,2018
INCREASE (DECREASE) IN NET ASSETS RESULTING FROM OPERATIONS:Net investment income $8,591,692 $15,718,239 $443,074 $148,962 $925,709 $361,437Net realized gain (loss) on investments, foreign
currency contracts and foreign currency relatedtransactions 15,207,638 40,493,530 276,477 56,924 (23,511 ) (664,973 )
Net increase (decrease) in unrealized appreciation/depreciation on investments, foreign currencycontracts and translation of assets and liabilitiesdenominated in foreign currencies (15,352,082 ) (21,830,092 ) (986,555 ) (310,235 ) (1,119,170 ) 105,949
Net increase (decrease) in net assets resulting fromoperations 8,447,248 34,381,677 (267,004 ) (104,349 ) (216,972 ) (197,587 )
DISTRIBUTIONS TO SHAREHOLDERS1:Distributable earnings (8,264,658 ) (10,842,896 ) (1,206,725 ) (140,290 ) (790,071 ) (290,413 )
CAPITAL SHARE TRANSACTIONS:Net proceeds from sale of shares 79,955,557 73,485,154 18,960,415 17,650,029 20,745,568 14,803,022Cost of shares redeemed (89,905,000 ) (285,859,829) (8,474,095 ) (124 ) (3,024,924 ) (129 )
Net increase (decrease) in net assets resulting fromcapital share transactions (9,949,443 ) (212,374,675) 10,486,320 17,649,905 17,720,644 14,802,893
Net Increase (Decrease) in Net Assets (9,766,853 ) (188,835,894) 9,012,591 17,405,266 16,713,601 14,314,893NET ASSETS:Beginning of year $262,128,587 $450,964,481 $19,736,364 $2,331,098 $17,327,094 $3,012,201End of year2 $252,361,734 $262,128,587 $28,748,955 $19,736,364 $34,040,695 $17,327,094SHARES CREATED AND REDEEMED:
Shares outstanding, beginning of year 9,050,000 15,950,004 800,000 100,005 550,000 100,004Shares created 2,850,000 2,450,000 800,000 700,000 700,000 450,000Shares redeemed (3,150,000 ) (9,350,004 ) (400,000 ) (5 ) (100,000 ) (4 )Shares outstanding, end of year 8,750,000 9,050,000 1,200,000 800,000 1,150,000 550,000
1 Amounts for the fiscal year ended June 30, 2018 have been reclassified to match the current fiscal year presentation which conforms to the �DisclosureUpdate and Simplification� amendments adopted by the SEC and which became effective November 5, 2018. The amounts shown for the fiscal year endedJune 30, 2018 represents a distribution from the following (See Note 7 in the Notes to Financial Statements for more information):Net investment income $(10,842,896 ) $(115,501 ) $(290,413 )Capital gains � (24,789 ) �Total dividends and distributions $(10,842,896 ) $(140,290 ) $(290,413 )
2 The �Disclosure Update and Simplification� amendments adopted by the SEC removed the requirement to disclose the amounts pertaining to undistributed(distributions in excess of) net investment income included in net assets for the current fiscal year ended June 30, 2019. The undistributed net investmentincome included in the net assets for the fiscal year ended June 30, 2018 were as follows:Undistributed net investment income included
in the net assets $734,273 $8,883 $23,574
See Notes to Financial Statements.
124 WisdomTree Trust
Copyright © 2019 www.secdatabase.com. All Rights Reserved.Please Consider the Environment Before Printing This Document

Table of ContentsStatements of Changes in Net Assets (continued)
WisdomTree Trust
WisdomTree EmergingMarkets Dividend Fund
WisdomTree EuropeMultifactor Fund
WisdomTree Globalex-Mexico Equity Fund
For theYear Ended
June 30,2019
For theYear Ended
June 30,2018
For theYear Ended
June 30,2019
For theYear Ended
June 30,2018
For theYear Ended
June 30, 2019
For theYear Ended
June 30, 2018INCREASE (DECREASE) IN NET ASSETS RESULTING FROM OPERATIONS:
Net investment income $1,527,708 $708,578 $381,844 $505,245 $1,523,621 $3,206,736Net realized gain (loss) on investments, foreign
currency contracts and foreign currency relatedtransactions (1,170,388 ) (203,417 ) (1,050,320 ) 167,705 (2,038,260 ) 9,313,535
Net increase (decrease) in unrealized appreciation/depreciation on investments, foreign currencycontracts and translation of assets and liabilitiesdenominated in foreign currencies 1,697,182 (687,191 ) 230,143 (493,753 ) 874,672 (1,087,120 )
Net increase (decrease) in net assets resulting fromoperations 2,054,502 (182,030 ) (438,333 ) 179,197 360,033 11,433,151
DISTRIBUTIONS TO SHAREHOLDERS1:Distributable earnings (1,392,048 ) (664,614 ) (723,716 ) (557,375 ) (1,681,088 ) (3,027,467 )
CAPITAL SHARE TRANSACTIONS:Net proceeds from sale of shares 15,648,445 23,003,778 � 16,863,086 8,520,804 267,784,187Cost of shares redeemed � (127 ) (2,508,781 ) (1,547,705 ) (236,792,310) (94,620,460 )
Net increase (decrease) in net assets resulting fromcapital share transactions 15,648,445 23,003,651 (2,508,781 ) 15,315,381 (228,271,506) 173,163,727
Net Increase (Decrease) in Net Assets 16,310,899 22,157,007 (3,670,830 ) 14,937,203 (229,592,561) 181,569,411NET ASSETS:Beginning of year $34,042,420 $11,885,413 $16,400,598 $1,463,395 $232,611,550 $51,042,139End of year2 $50,353,319 $34,042,420 $12,729,768 $16,400,598 $3,018,989 $232,611,550SHARES CREATED AND REDEEMED:
Shares outstanding, beginning of year 1,100,000 400,004 550,000 50,004 7,900,000 1,900,004Shares created 500,000 700,000 � 550,000 300,000 9,200,000Shares redeemed � (4 ) (100,000 ) (50,004 ) (8,100,000 ) (3,200,004 )Shares outstanding, end of year 1,600,000 1,100,000 450,000 550,000 100,000 7,900,000
1 Amounts for the fiscal year ended June 30, 2018 have been reclassified to match the current fiscal year presentation which conforms to the �DisclosureUpdate and Simplification� amendments adopted by the SEC and which became effective November 5, 2018. The amounts shown for the fiscal year endedJune 30, 2018 represents a distribution from the following (See Note 7 in the Notes to Financial Statements for more information):Net investment income $(664,614 ) $(470,215 ) $(3,027,467 )Capital gains � (87,160 ) �Total dividends and distributions $(664,614 ) $(557,375 ) $(3,027,467 )
2 The �Disclosure Update and Simplification� amendments adopted by the SEC removed the requirement to disclose the amounts pertaining to undistributed(distributions in excess of) net investment income included in net assets for the current fiscal year ended June 30, 2019. The undistributed net investmentincome included in the net assets for the fiscal year ended June 30, 2018 were as follows:Undistributed net investment income included
in the net assets $129,089 $30,453 $234,683
See Notes to Financial Statements.
WisdomTree Trust 125
Copyright © 2019 www.secdatabase.com. All Rights Reserved.Please Consider the Environment Before Printing This Document

Table of ContentsStatements of Changes in Net Assets (continued)
WisdomTree Trust
WisdomTree ICBCCSS&P China 500 Fund
WisdomTree JapanMultifactor Fund
WisdomTree Fundamental U.S.Corporate Bond Fund
For theYear Ended
June 30,2019
For thePeriod
December 21,2017* throughJune 30, 2018
For theYear Ended
June 30, 2019
For theYear Ended
June 30, 2018
For theYear Ended
June 30, 2019
For theYear Ended
June 30, 2018INCREASE (DECREASE) IN NET ASSETS RESULTING FROM OPERATIONS:
Net investment income $293,374 $90,316 $58,961 $55,778 $159,270 $149,320Net realized gain (loss) on investments, foreign
currency contracts and foreign currency relatedtransactions (929,844 ) (1,843 ) 147,482 (15,908 ) (49,131 ) (10,957 )
Net increase (decrease) in unrealized appreciation/depreciation on investments, foreign currencycontracts and translation of assets and liabilitiesdenominated in foreign currencies 382,001 (2,233,441 ) (458,527 ) 135,530 377,810 (191,214 )
Net increase (decrease) in net assets resulting fromoperations (254,469 ) (2,144,968 ) (252,084 ) 175,400 487,949 (52,851 )
DISTRIBUTIONS TO SHAREHOLDERS1:Distributable earnings (271,255 ) (46,004 ) (65,184 ) (109,141 ) (157,460 ) (155,972 )
CAPITAL SHARE TRANSACTIONS:Net proceeds from sale of shares 14,248,679 15,031,595 � 2,199,362 2,359,600 �
Cost of shares redeemed (5,715,906 ) � (1,283,639 ) (2,199,480 ) (2,359,600 ) (100 )Net increase (decrease) in net assets resulting from
capital share transactions 8,532,773 15,031,595 (1,283,639 ) (118 ) � (100 )Net Increase (Decrease) in Net Assets 8,007,049 12,840,623 (1,600,907 ) 66,141 330,489 (208,923 )NET ASSETS:Beginning of period $12,840,743 $120 $2,823,084 $2,756,943 $4,778,721 $4,987,644End of period2 $20,847,792 $12,840,743 $1,222,177 $2,823,084 $5,109,210 $4,778,721SHARES CREATED AND REDEEMED:
Shares outstanding, beginning of period 450,004 4 100,000 100,004 100,000 100,002Shares created 500,000 450,000 � 75,000 50,000 �
Shares redeemed (200,004 ) � (50,000 ) (75,004 ) (50,000 ) (2 )Shares outstanding, end of period 750,000 450,004 50,000 100,000 100,000 100,000
* Commencement of operations.1 Amounts for the fiscal year ended June 30, 2018 have been reclassified to match the current fiscal year presentation which conforms to the �Disclosure
Update and Simplification� amendments adopted by the SEC and which became effective November 5, 2018. The amounts shown for the fiscal year or periodended June 30, 2018 represents a distribution entirely from net investment income. See Note 7 in the Notes to Financial Statements for more information.
2 The �Disclosure Update and Simplification� amendments adopted by the SEC removed the requirement to disclose the amounts pertaining to undistributed(distributions in excess of) net investment income included in net assets for the current fiscal year ended June 30, 2019. The undistributed net investmentincome included in the net assets for the fiscal year ended June 30, 2018 were as follows:Undistributed net investment income included
in the net assets $75,995 $23,202 $765
See Notes to Financial Statements.
126 WisdomTree Trust
Copyright © 2019 www.secdatabase.com. All Rights Reserved.Please Consider the Environment Before Printing This Document

Table of ContentsStatements of Changes in Net Assets (continued)
WisdomTree Trust
WisdomTree FundamentalU.S. High Yield
Corporate Bond Fund
WisdomTree FundamentalU.S. Short-Term
Corporate Bond Fund
WisdomTree FundamentalU.S. Short-Term High Yield
Corporate Bond FundFor the
Year EndedJune 30,
2019
For theYear Ended
June 30, 2018
For theYear Ended
June 30, 2019
For theYear Ended
June 30, 2018
For theYear Ended
June 30,2019
For theYear Ended
June 30, 2018INCREASE (DECREASE) IN NET ASSETS RESULTING FROM OPERATIONS:
Net investment income $564,695 $290,838 $123,587 $98,029 $643,560 $238,632Net realized gain (loss) on investments (2,090 ) 2,087 (11,581 ) (6,794 ) (76,056 ) 2,894Net increase (decrease) in unrealized appreciation/
depreciation on investments 430,842 (215,445 ) 150,586 (81,351 ) 158,526 (79,530 )Net increase (decrease) in net assets resulting from
operations 993,447 77,480 262,592 9,884 726,030 161,996DISTRIBUTIONS TO SHAREHOLDERS1:
Distributable earnings (575,980 ) (328,912 ) (122,743 ) (100,702 ) (640,720 ) (309,910 )CAPITAL SHARE TRANSACTIONS:
Net proceeds from sale of shares 10,058,537 � 2,449,872 � 25,053,118 �
Cost of shares redeemed � (104 ) (2,449,872 ) (100 ) (9,948,021 ) (102 )Net increase (decrease) in net assets resulting from
capital share transactions 10,058,537 (104 ) � (100 ) 15,105,097 (102 )Net Increase (Decrease) in Net Assets 10,476,004 (251,536 ) 139,849 (90,918 ) 15,190,407 (148,016 )NET ASSETS:Beginning of year $4,977,444 $5,228,980 $4,903,339 $4,994,257 $4,990,879 $5,138,895End of year2 $15,453,448 $4,977,444 $5,043,188 $4,903,339 $20,181,286 $4,990,879SHARES CREATED AND REDEEMED:
Shares outstanding, beginning of year 100,000 100,002 100,000 100,002 100,000 100,002Shares created 200,000 � 50,000 � 500,000 �
Shares redeemed � (2 ) (50,000 ) (2 ) (200,000 ) (2 )Shares outstanding, end of year 300,000 100,000 100,000 100,000 400,000 100,000
1 Amounts for the fiscal year ended June 30, 2018 have been reclassified to match the current fiscal year presentation which conforms to the �DisclosureUpdate and Simplification� amendments adopted by the SEC and which became effective November 5, 2018. The amounts shown for the fiscal year endedJune 30, 2018 represents a distribution from the following (See Note 7 in the Notes to Financial Statements for more information):Net investment income $(288,650 ) $(100,702 ) $(238,342 )Capital gains (40,262 ) � (71,568 )Total dividends and distributions $(328,912 ) $(100,702 ) $(309,910 )
2 The �Disclosure Update and Simplification� amendments adopted by the SEC removed the requirement to disclose the amounts pertaining to undistributed(distributions in excess of) net investment income included in net assets for the current fiscal year ended June 30, 2019. The undistributed net investmentincome included in the net assets for the fiscal year ended June 30, 2018 were as follows:Undistributed net investment income included in the
net assets $5,620 $850 $1,983
See Notes to Financial Statements.
WisdomTree Trust 127
Copyright © 2019 www.secdatabase.com. All Rights Reserved.Please Consider the Environment Before Printing This Document
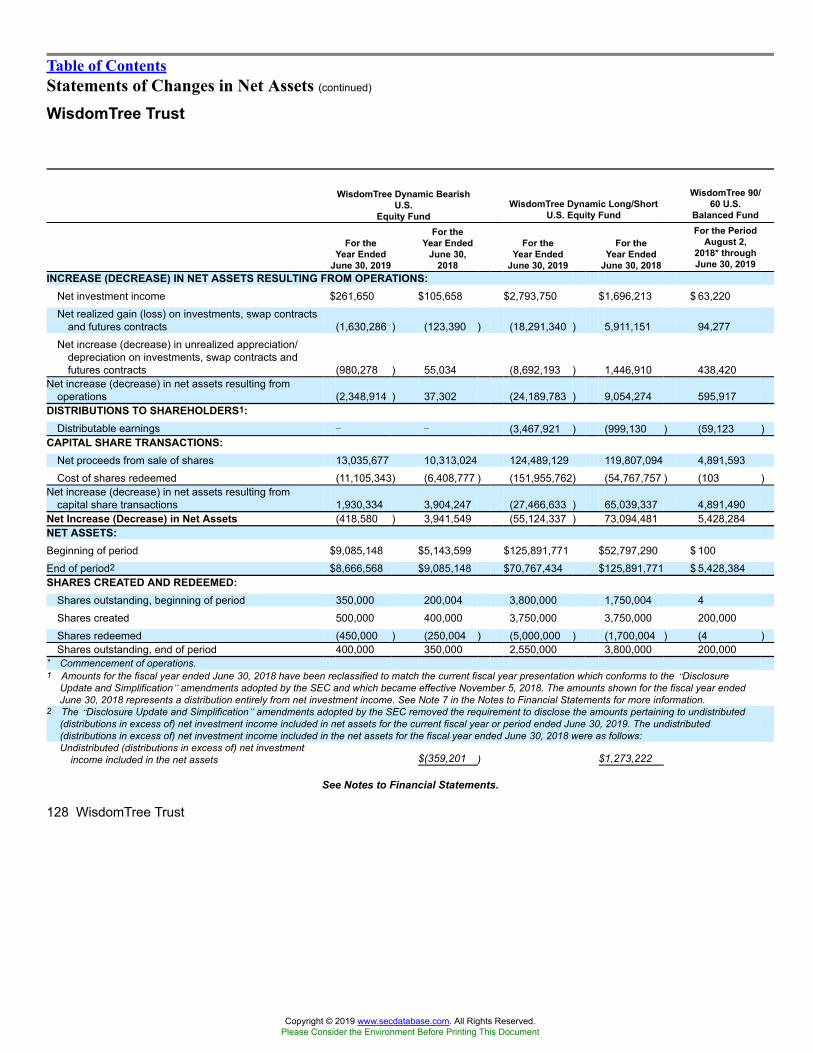
Table of ContentsStatements of Changes in Net Assets (continued)
WisdomTree Trust
WisdomTree Dynamic BearishU.S.
Equity FundWisdomTree Dynamic Long/Short
U.S. Equity Fund
WisdomTree 90/60 U.S.
Balanced Fund
For theYear Ended
June 30, 2019
For theYear Ended
June 30,2018
For theYear Ended
June 30, 2019
For theYear Ended
June 30, 2018
For the PeriodAugust 2,
2018* throughJune 30, 2019
INCREASE (DECREASE) IN NET ASSETS RESULTING FROM OPERATIONS:Net investment income $261,650 $105,658 $2,793,750 $1,696,213 $ 63,220Net realized gain (loss) on investments, swap contracts
and futures contracts (1,630,286 ) (123,390 ) (18,291,340 ) 5,911,151 94,277Net increase (decrease) in unrealized appreciation/
depreciation on investments, swap contracts andfutures contracts (980,278 ) 55,034 (8,692,193 ) 1,446,910 438,420
Net increase (decrease) in net assets resulting fromoperations (2,348,914 ) 37,302 (24,189,783 ) 9,054,274 595,917
DISTRIBUTIONS TO SHAREHOLDERS1:Distributable earnings � � (3,467,921 ) (999,130 ) (59,123 )
CAPITAL SHARE TRANSACTIONS:Net proceeds from sale of shares 13,035,677 10,313,024 124,489,129 119,807,094 4,891,593Cost of shares redeemed (11,105,343) (6,408,777 ) (151,955,762) (54,767,757 ) (103 )
Net increase (decrease) in net assets resulting fromcapital share transactions 1,930,334 3,904,247 (27,466,633 ) 65,039,337 4,891,490
Net Increase (Decrease) in Net Assets (418,580 ) 3,941,549 (55,124,337 ) 73,094,481 5,428,284NET ASSETS:Beginning of period $9,085,148 $5,143,599 $125,891,771 $52,797,290 $ 100End of period2 $8,666,568 $9,085,148 $70,767,434 $125,891,771 $ 5,428,384SHARES CREATED AND REDEEMED:
Shares outstanding, beginning of period 350,000 200,004 3,800,000 1,750,004 4Shares created 500,000 400,000 3,750,000 3,750,000 200,000Shares redeemed (450,000 ) (250,004 ) (5,000,000 ) (1,700,004 ) (4 )Shares outstanding, end of period 400,000 350,000 2,550,000 3,800,000 200,000
* Commencement of operations.1 Amounts for the fiscal year ended June 30, 2018 have been reclassified to match the current fiscal year presentation which conforms to the �Disclosure
Update and Simplification� amendments adopted by the SEC and which became effective November 5, 2018. The amounts shown for the fiscal year endedJune 30, 2018 represents a distribution entirely from net investment income. See Note 7 in the Notes to Financial Statements for more information.
2 The �Disclosure Update and Simplification� amendments adopted by the SEC removed the requirement to disclose the amounts pertaining to undistributed(distributions in excess of) net investment income included in net assets for the current fiscal year or period ended June 30, 2019. The undistributed(distributions in excess of) net investment income included in the net assets for the fiscal year ended June 30, 2018 were as follows:Undistributed (distributions in excess of) net investment
income included in the net assets $(359,201 ) $1,273,222
See Notes to Financial Statements.
128 WisdomTree Trust
Copyright © 2019 www.secdatabase.com. All Rights Reserved.Please Consider the Environment Before Printing This Document

Table of ContentsStatements of Changes in Net Assets (concluded)
WisdomTree Trust
WisdomTree BalancedIncome Fund
For theYear Ended
June 30, 2019
For the PeriodDecember 21,2017* throughJune 30, 2018
INCREASE (DECREASE) IN NET ASSETS RESULTING FROM OPERATIONS:Net investment income $107,870 $53,284Net realized loss on investments (7,140 ) (57,016 )Net increase (decrease) in unrealized appreciation/depreciation on investments 155,794 (56,577 )Net increase (decrease) in net assets resulting from operations 256,524 (60,309 )
DISTRIBUTIONS TO SHAREHOLDERS1:Distributable earnings (108,265 ) (50,801 )
CAPITAL SHARE TRANSACTIONS:Net proceeds from sale of shares 2,356,104 2,491,955Cost of shares redeemed (96 ) (1,190,424 )
Net increase in net assets resulting from capital share transactions 2,356,008 1,301,531Net Increase in Net Assets 2,504,267 1,190,421NET ASSETS:Beginning of period $1,190,521 $100End of period2 $3,694,788 $1,190,521SHARES CREATED AND REDEEMED:
Shares outstanding, beginning of period 50,004 4Shares created 100,000 100,000Shares redeemed (4 ) (50,000 )Shares outstanding, end of period 150,000 50,004
* Commencement of operations.1 Amounts for the fiscal period ended June 30, 2018 have been reclassified to match the current fiscal year presentation which conforms to the �Disclosure
Update and Simplification� amendments adopted by the SEC and which became effective November 5, 2018. The amounts shown for the fiscal period endedJune 30, 2018 represents a distribution entirely from net investment income. See Note 7 in the Notes to Financial Statements for more information.
2 The �Disclosure Update and Simplification� amendments adopted by the SEC removed the requirement to disclose the amounts pertaining to undistributed(distributions in excess of) net investment income included in net assets for the current fiscal year ended June 30, 2019. The undistributed net investmentincome included in the net assets for the fiscal period ended June 30, 2018 were as follows:Undistributed net investment income included in the net assets $2,483
See Notes to Financial Statements.
WisdomTree Trust 129
Copyright © 2019 www.secdatabase.com. All Rights Reserved.Please Consider the Environment Before Printing This Document

Table of ContentsFinancial HighlightsWisdomTree Trust
Selected data for a share of beneficial interest outstanding throughout the period is presented below:
WisdomTree Dynamic Currency HedgedInternationalEquity Fund
For theYear Ended
June 30, 2019
For theYear Ended
June 30, 2018
For theYear Ended
June 30, 2017
For the PeriodJanuary 7, 2016*
throughJune 30, 2016
Net asset value, beginning of period $ 28.96 $ 28.27 $ 24.26 $ 24.18Investment operations:
Net investment income1 1.04 1.00 0.98 0.79Net realized and unrealized gain (loss) (0.17 ) 0.70 4.32 (0.35 )
Total from investment operations 0.87 1.70 5.30 0.44Dividends and distributions to shareholders:
Net investment income (0.99 ) (1.01 ) (0.83 ) (0.36 )Capital gains � � (0.46 ) �
Total dividends and distributions to shareholders (0.99 ) (1.01 ) (1.29 ) (0.36 )Net asset value, end of period $ 28.84 $ 28.96 $ 28.27 $ 24.26
TOTAL RETURN2 3.11 % 6.04 % 22.25 % 1.82 %RATIOS/SUPPLEMENTAL DATA:Net assets, end of period (000�s omitted) $ 252,362 $ 262,129 $ 450,964 $ 243,806Ratios to average net assets of:
Expenses, net of expense waivers 0.35 % 0.35 % 0.35 % 0.35 %3Expenses, prior to expense waivers 0.40 % 0.40 % 0.40 % 0.40 %3Net investment income 3.68 % 3.33 % 3.67 % 6.79 %3
Portfolio turnover rate4 26 % 15 % 27 % 28 %
WisdomTree Dynamic Currency HedgedInternationalQuality Dividend Growth Fund
For theYear Ended
June 30, 2019
For theYear Ended
June 30, 2018
For the PeriodNovember 3, 2016*
throughJune 30, 2017
Net asset value, beginning of period $ 24.67 $ 23.31 $ 19.63Investment operations:
Net investment income1 0.49 0.71 0.32Net realized and unrealized gain 0.02 1.03 3.52
Total from investment operations 0.51 1.74 3.84Dividends and distributions to shareholders:
Net investment income (0.29 ) (0.21 ) (0.15 )Capital gains (0.93 ) (0.17 ) �
Return of capital � � (0.01 )Total dividends and distributions to shareholders (1.22 ) (0.38 ) (0.16 )Net asset value, end of period $ 23.96 $ 24.67 $ 23.31
TOTAL RETURN2 2.56 % 7.44 % 19.61 %RATIOS/SUPPLEMENTAL DATA:Net assets, end of period (000�s omitted) $ 28,749 $ 19,736 $ 2,331Ratios to average net assets5 of:
Expenses, net of expense waivers 0.10 % 0.10 % 0.10 %3Expenses, prior to expense waivers 0.58 % 0.58 % 0.58 %3Net investment income 2.10 % 2.87 % 2.23 %3
Portfolio turnover rate4 6 % 4 % 4 %* Commencement of operations.1 Based on average shares outstanding.2 Total return is calculated assuming an initial investment made at the net asset value at the beginning of the period, reinvestment of all dividends and distributions
at net asset value during the period and redemption on the last day of the period. Total return calculated for a period of less than one year is not annualized. Forthe periods in which the investment advisor waived advisory fees, the total return would have been lower if certain expenses had not been waived (Notes 2 and3).
3 Annualized.4 Portfolio turnover rate is not annualized and excludes the value of the portfolio securities received or delivered as a result of in-kind creations or redemptions of
the Fund�s capital shares. Short-term securities with maturities less than or equal to 365 days are excluded from the portfolio turnover calculation.
Copyright © 2019 www.secdatabase.com. All Rights Reserved.Please Consider the Environment Before Printing This Document

5 The ratios to average net assets do not include net investment income (loss) or expenses of other funds in which the Fund invests.
See Notes to Financial Statements.
130 WisdomTree Trust
Copyright © 2019 www.secdatabase.com. All Rights Reserved.Please Consider the Environment Before Printing This Document
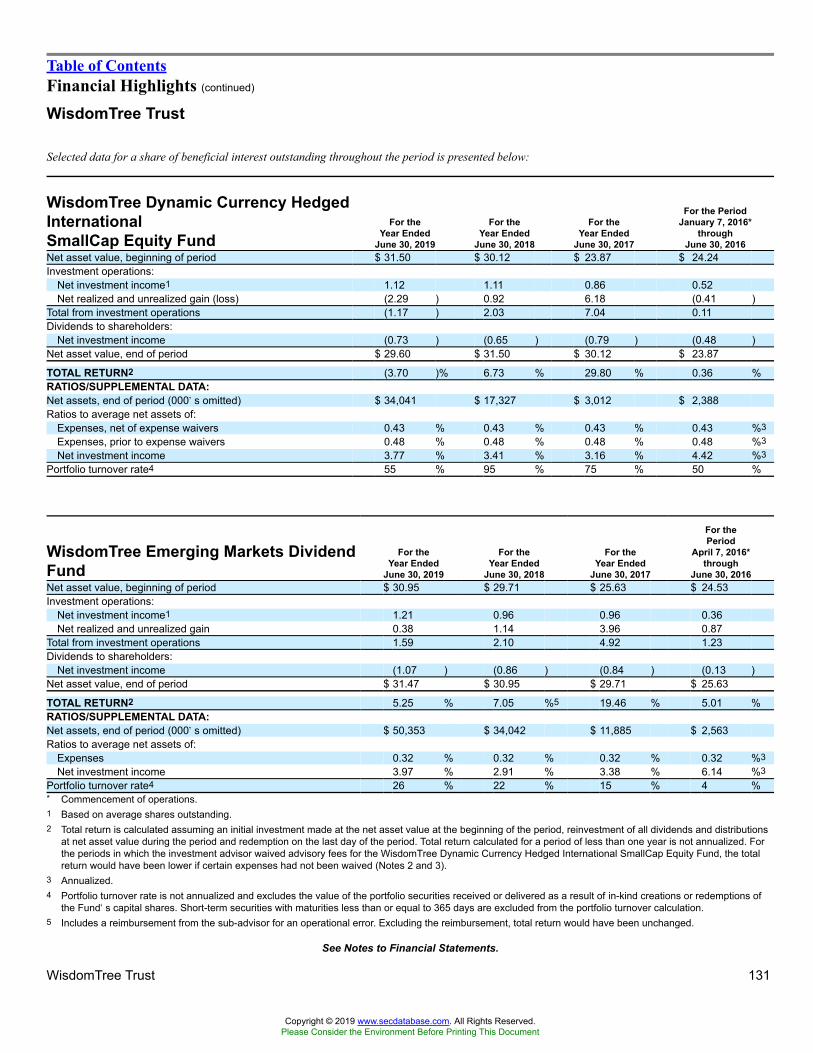
Table of ContentsFinancial Highlights (continued)
WisdomTree Trust
Selected data for a share of beneficial interest outstanding throughout the period is presented below:
WisdomTree Dynamic Currency HedgedInternationalSmallCap Equity Fund
For theYear Ended
June 30, 2019
For theYear Ended
June 30, 2018
For theYear Ended
June 30, 2017
For the PeriodJanuary 7, 2016*
throughJune 30, 2016
Net asset value, beginning of period $ 31.50 $ 30.12 $ 23.87 $ 24.24Investment operations:
Net investment income1 1.12 1.11 0.86 0.52Net realized and unrealized gain (loss) (2.29 ) 0.92 6.18 (0.41 )
Total from investment operations (1.17 ) 2.03 7.04 0.11Dividends to shareholders:
Net investment income (0.73 ) (0.65 ) (0.79 ) (0.48 )Net asset value, end of period $ 29.60 $ 31.50 $ 30.12 $ 23.87
TOTAL RETURN2 (3.70 )% 6.73 % 29.80 % 0.36 %RATIOS/SUPPLEMENTAL DATA:Net assets, end of period (000�s omitted) $ 34,041 $ 17,327 $ 3,012 $ 2,388Ratios to average net assets of:
Expenses, net of expense waivers 0.43 % 0.43 % 0.43 % 0.43 %3Expenses, prior to expense waivers 0.48 % 0.48 % 0.48 % 0.48 %3Net investment income 3.77 % 3.41 % 3.16 % 4.42 %3
Portfolio turnover rate4 55 % 95 % 75 % 50 %
WisdomTree Emerging Markets DividendFund
For theYear Ended
June 30, 2019
For theYear Ended
June 30, 2018
For theYear Ended
June 30, 2017
For thePeriod
April 7, 2016*through
June 30, 2016Net asset value, beginning of period $ 30.95 $ 29.71 $ 25.63 $ 24.53Investment operations:
Net investment income1 1.21 0.96 0.96 0.36Net realized and unrealized gain 0.38 1.14 3.96 0.87
Total from investment operations 1.59 2.10 4.92 1.23Dividends to shareholders:
Net investment income (1.07 ) (0.86 ) (0.84 ) (0.13 )Net asset value, end of period $ 31.47 $ 30.95 $ 29.71 $ 25.63
TOTAL RETURN2 5.25 % 7.05 %5 19.46 % 5.01 %RATIOS/SUPPLEMENTAL DATA:Net assets, end of period (000�s omitted) $ 50,353 $ 34,042 $ 11,885 $ 2,563Ratios to average net assets of:
Expenses 0.32 % 0.32 % 0.32 % 0.32 %3Net investment income 3.97 % 2.91 % 3.38 % 6.14 %3
Portfolio turnover rate4 26 % 22 % 15 % 4 %* Commencement of operations.1 Based on average shares outstanding.2 Total return is calculated assuming an initial investment made at the net asset value at the beginning of the period, reinvestment of all dividends and distributions
at net asset value during the period and redemption on the last day of the period. Total return calculated for a period of less than one year is not annualized. Forthe periods in which the investment advisor waived advisory fees for the WisdomTree Dynamic Currency Hedged International SmallCap Equity Fund, the totalreturn would have been lower if certain expenses had not been waived (Notes 2 and 3).
3 Annualized.4 Portfolio turnover rate is not annualized and excludes the value of the portfolio securities received or delivered as a result of in-kind creations or redemptions of
the Fund�s capital shares. Short-term securities with maturities less than or equal to 365 days are excluded from the portfolio turnover calculation.5 Includes a reimbursement from the sub-advisor for an operational error. Excluding the reimbursement, total return would have been unchanged.
See Notes to Financial Statements.
WisdomTree Trust 131
Copyright © 2019 www.secdatabase.com. All Rights Reserved.Please Consider the Environment Before Printing This Document

Table of ContentsFinancial Highlights (continued)
WisdomTree Trust
Selected data for a share of beneficial interest outstanding throughout the period is presented below:
WisdomTree Europe Multifactor FundFor the
Year EndedJune 30, 2019
For theYear Ended
June 30, 2018
For theYear Ended
June 30, 2017
For the PeriodJanuary 7, 2016*
throughJune 30, 2016
Net asset value, beginning of period $ 29.82 $ 29.27 $ 23.27 $ 24.25Investment operations:
Net investment income1 0.76 1.20 0.47 0.70Net realized and unrealized gain (loss) (0.89 ) 0.38 6.08 (1.11 )
Total from investment operations (0.13 ) 1.58 6.55 (0.41 )Dividends and distributions to shareholders:
Net investment income (0.53 ) (0.86 ) (0.44 ) (0.57 )Capital gains (0.87 ) (0.17 ) (0.11 ) �
Total dividends and distributions to shareholders (1.40 ) (1.03 ) (0.55 ) (0.57 )Net asset value, end of period $ 28.29 $ 29.82 $ 29.27 $ 23.27
TOTAL RETURN2 (0.25 )% 5.41 % 28.55 % (1.81 )%RATIOS/SUPPLEMENTAL DATA:Net assets, end of period (000�s omitted) $ 12,730 $ 16,401 $ 1,463 $ 4,655Ratios to average net assets of:
Expenses, net of expense waivers 0.43 % 0.43 % 0.43 % 0.43 %3Expenses, prior to expense waivers 0.48 % 0.48 % 0.48 % 0.48 %3Net investment income 2.68 % 3.82 % 1.86 % 6.02 %3
Portfolio turnover rate4 109 % 37 % 12 % 25 %
WisdomTree Global ex-Mexico Equity FundFor the
Year EndedJune 30, 2019
For theYear Ended
June 30, 2018
For the PeriodFebruary 10, 2017*
throughJune 30, 2017
Net asset value, beginning of period $ 29.44 $ 26.86 $ 25.22Investment operations:
Net investment income1 0.54 0.70 0.21Net realized and unrealized gain 1.22 2.45 1.50
Total from investment operations 1.76 3.15 1.71Dividends to shareholders:
Net investment income (1.01 ) (0.57 ) (0.07 )Net asset value, end of period $ 30.19 $ 29.44 $ 26.86
TOTAL RETURN2 6.44 % 11.74 % 6.79 %RATIOS/SUPPLEMENTAL DATA:Net assets, end of period (000�s omitted) $ 3,019 $ 232,612 $ 51,042Ratios to average net assets of:
Expenses, net of expense waivers 0.20 % 0.26 % 0.30 %3Expenses, prior to expense waivers 0.20 % 0.28 % 0.35 %3Net investment income 1.81 % 2.40 % 2.15 %3
Portfolio turnover rate4 18 % 13 % 2 %* Commencement of operations.1 Based on average shares outstanding.2 Total return is calculated assuming an initial investment made at the net asset value at the beginning of the period, reinvestment of all dividends and distributions
at net asset value during the period and redemption on the last day of the period. Total return calculated for a period of less than one year is not annualized. Forthe periods in which the investment advisor waived advisory fees, the total return would have been lower if certain expenses had not been waived (Notes 2 and3).
3 Annualized.4 Portfolio turnover rate is not annualized and excludes the value of the portfolio securities received or delivered as a result of in-kind creations or redemptions of
the Fund�s capital shares. Short-term securities with maturities less than or equal to 365 days are excluded from the portfolio turnover calculation.
See Notes to Financial Statements.
132 WisdomTree Trust
Copyright © 2019 www.secdatabase.com. All Rights Reserved.Please Consider the Environment Before Printing This Document
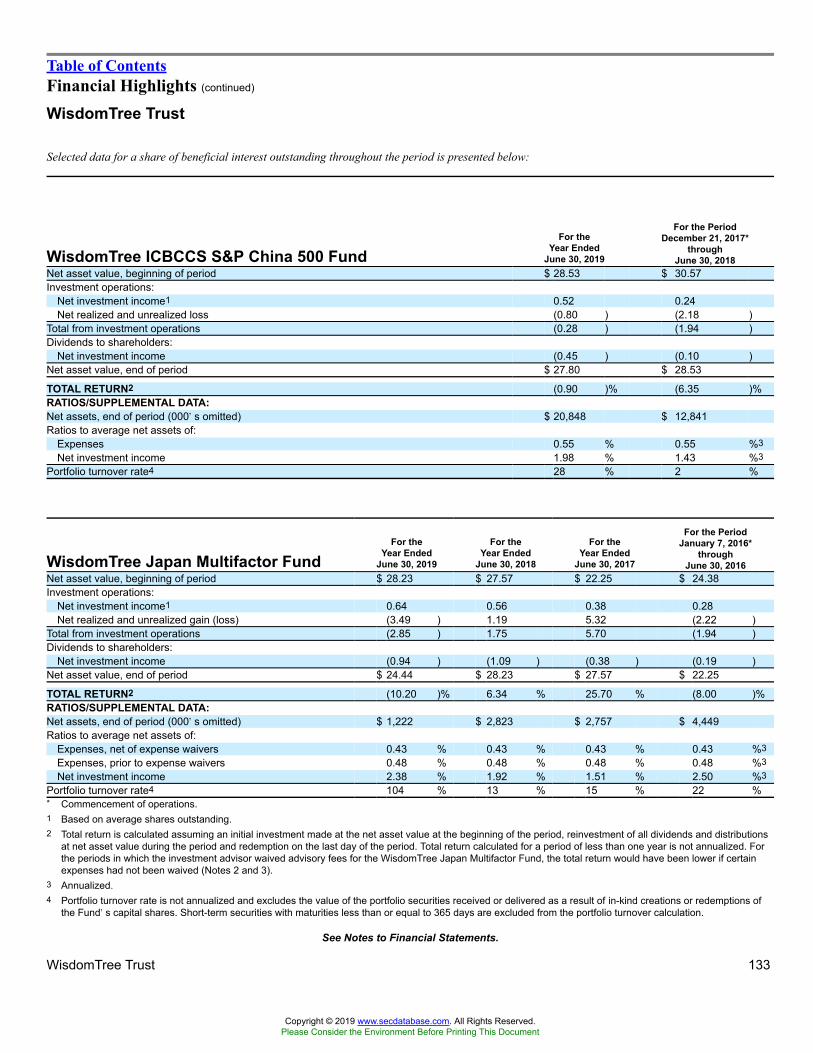
Table of ContentsFinancial Highlights (continued)
WisdomTree Trust
Selected data for a share of beneficial interest outstanding throughout the period is presented below:
WisdomTree ICBCCS S&P China 500 FundFor the
Year EndedJune 30, 2019
For the PeriodDecember 21, 2017*
throughJune 30, 2018
Net asset value, beginning of period $ 28.53 $ 30.57Investment operations:
Net investment income1 0.52 0.24Net realized and unrealized loss (0.80 ) (2.18 )
Total from investment operations (0.28 ) (1.94 )Dividends to shareholders:
Net investment income (0.45 ) (0.10 )Net asset value, end of period $ 27.80 $ 28.53
TOTAL RETURN2 (0.90 )% (6.35 )%RATIOS/SUPPLEMENTAL DATA:Net assets, end of period (000�s omitted) $ 20,848 $ 12,841Ratios to average net assets of:
Expenses 0.55 % 0.55 %3Net investment income 1.98 % 1.43 %3
Portfolio turnover rate4 28 % 2 %
WisdomTree Japan Multifactor FundFor the
Year EndedJune 30, 2019
For theYear Ended
June 30, 2018
For theYear Ended
June 30, 2017
For the PeriodJanuary 7, 2016*
throughJune 30, 2016
Net asset value, beginning of period $ 28.23 $ 27.57 $ 22.25 $ 24.38Investment operations:
Net investment income1 0.64 0.56 0.38 0.28Net realized and unrealized gain (loss) (3.49 ) 1.19 5.32 (2.22 )
Total from investment operations (2.85 ) 1.75 5.70 (1.94 )Dividends to shareholders:
Net investment income (0.94 ) (1.09 ) (0.38 ) (0.19 )Net asset value, end of period $ 24.44 $ 28.23 $ 27.57 $ 22.25
TOTAL RETURN2 (10.20 )% 6.34 % 25.70 % (8.00 )%RATIOS/SUPPLEMENTAL DATA:Net assets, end of period (000�s omitted) $ 1,222 $ 2,823 $ 2,757 $ 4,449Ratios to average net assets of:
Expenses, net of expense waivers 0.43 % 0.43 % 0.43 % 0.43 %3Expenses, prior to expense waivers 0.48 % 0.48 % 0.48 % 0.48 %3Net investment income 2.38 % 1.92 % 1.51 % 2.50 %3
Portfolio turnover rate4 104 % 13 % 15 % 22 %* Commencement of operations.1 Based on average shares outstanding.2 Total return is calculated assuming an initial investment made at the net asset value at the beginning of the period, reinvestment of all dividends and distributions
at net asset value during the period and redemption on the last day of the period. Total return calculated for a period of less than one year is not annualized. Forthe periods in which the investment advisor waived advisory fees for the WisdomTree Japan Multifactor Fund, the total return would have been lower if certainexpenses had not been waived (Notes 2 and 3).
3 Annualized.4 Portfolio turnover rate is not annualized and excludes the value of the portfolio securities received or delivered as a result of in-kind creations or redemptions of
the Fund�s capital shares. Short-term securities with maturities less than or equal to 365 days are excluded from the portfolio turnover calculation.
See Notes to Financial Statements.
WisdomTree Trust 133
Copyright © 2019 www.secdatabase.com. All Rights Reserved.Please Consider the Environment Before Printing This Document

Table of ContentsFinancial Highlights (continued)
WisdomTree Trust
Selected data for a share of beneficial interest outstanding throughout the period is presented below:
WisdomTree Fundamental U.S.Corporate Bond Fund
For theYear Ended
June 30, 2019
For theYear Ended
June 30, 2018
For theYear Ended
June 30, 2017
For the PeriodApril 27, 2016*
throughJune 30, 2016
Net asset value, beginning of period $ 47.79 $ 49.88 $ 50.69 $ 49.96Investment operations:
Net investment income1 1.59 1.49 1.36 0.22Net realized and unrealized gain (loss) 3.28 (2.02 ) (0.63 ) 0.72
Total from investment operations 4.87 (0.53 ) 0.73 0.94Dividends and distributions to shareholders:
Net investment income (1.57 ) (1.56 ) (1.30 ) (0.21 )Capital gains � � (0.24 ) �
Total dividends and distributions to shareholders (1.57 ) (1.56 ) (1.54 ) (0.21 )Net asset value, end of period $ 51.09 $ 47.79 $ 49.88 $ 50.69
TOTAL RETURN2 10.44 % (1.11 )% 1.52 % 1.89 %RATIOS/SUPPLEMENTAL DATA:Net assets, end of period (000�s omitted) $ 5,109 $ 4,779 $ 4,988 $ 5,069Ratios to average net assets of:
Expenses, net of expense waivers 0.18 % 0.18 % 0.18 % 0.18 %3Expenses, prior to expense waivers 0.28 % 0.28 % 0.28 % 0.28 %3Net investment income 3.29 % 3.02 % 2.74 % 2.50 %3
Portfolio turnover rate4 22 % 21 % 45 % 3 %
WisdomTree Fundamental U.S. HighYield CorporateBond Fund
For theYear Ended
June 30, 2019
For theYear Ended
June 30, 2018
For theYear Ended
June 30, 2017
For the PeriodApril 27, 2016*
throughJune 30, 2016
Net asset value, beginning of period $ 49.77 $ 52.29 $ 50.41 $ 50.19Investment operations:
Net investment income1 2.84 2.91 2.80 0.47Net realized and unrealized gain (loss) 1.69 (2.14 ) 2.24 0.20
Total from investment operations 4.53 0.77 5.04 0.67Dividends and distributions to shareholders:
Net investment income (2.75 ) (2.89 ) (2.79 ) (0.45 )Capital gains (0.04 ) (0.40 ) (0.37 ) �
Total dividends and distributions to shareholders (2.79 ) (3.29 ) (3.16 ) (0.45 )Net asset value, end of period $ 51.51 $ 49.77 $ 52.29 $ 50.41
TOTAL RETURN2 9.43 % 1.49 % 10.23 % 1.34 %RATIOS/SUPPLEMENTAL DATA:Net assets, end of period (000�s omitted) $ 15,453 $ 4,977 $ 5,229 $ 5,041Ratios to average net assets of:
Expenses, net of expense waivers 0.38 % 0.38 % 0.38 % 0.38 %3Expenses, prior to expense waivers 0.48 % 0.48 % 0.48 % 0.48 %3Net investment income 5.68 % 5.67 % 5.38 % 5.31 %3
Portfolio turnover rate4 14 % 35 % 51 % 0 %* Commencement of operations.1 Based on average shares outstanding.2 Total return is calculated assuming an initial investment made at the net asset value at the beginning of the period, reinvestment of all dividends and distributions
at net asset value during the period and redemption on the last day of the period. Total return calculated for a period of less than one year is not annualized. Forthe periods in which the investment advisor waived advisory fees, the total return would have been lower if certain expenses had not been waived (Notes 2 and3).
3 Annualized.4 Portfolio turnover rate is not annualized and excludes the value of the portfolio securities received or delivered as a result of in-kind creations or redemptions of
the Fund�s capital shares. Short-term securities with maturities less than or equal to 365 days are excluded from the portfolio turnover calculation.
See Notes to Financial Statements.
Copyright © 2019 www.secdatabase.com. All Rights Reserved.Please Consider the Environment Before Printing This Document

134 WisdomTree Trust
Copyright © 2019 www.secdatabase.com. All Rights Reserved.Please Consider the Environment Before Printing This Document

Table of ContentsFinancial Highlights (continued)
WisdomTree Trust
Selected data for a share of beneficial interest outstanding throughout the period is presented below:
WisdomTree Fundamental U.S. Short-Term CorporateBond Fund
For theYear Ended
June 30, 2019
For theYear Ended
June 30, 2018
For theYear Ended
June 30, 2017
For the PeriodApril 27, 2016*
throughJune 30, 2016
Net asset value, beginning of period $ 49.03 $ 49.94 $ 50.20 $ 49.98Investment operations:
Net investment income1 1.24 0.98 0.79 0.12Net realized and unrealized gain (loss) 1.39 (0.88 ) (0.28 ) 0.21
Total from investment operations 2.63 0.10 0.51 0.33Dividends to shareholders:
Net investment income (1.23 ) (1.01 ) (0.77 ) (0.11 )Net asset value, end of period $ 50.43 $ 49.03 $ 49.94 $ 50.20
TOTAL RETURN2 5.44 % 0.19 % 1.02 % 0.66 %RATIOS/SUPPLEMENTAL DATA:Net assets, end of period (000�s omitted) $ 5,043 $ 4,903 $ 4,994 $ 5,020Ratios to average net assets of:
Expenses, net of expense waivers 0.18 % 0.18 % 0.18 % 0.18 %3Expenses, prior to expense waivers 0.28 % 0.28 % 0.28 % 0.28 %3Net investment income 2.50 % 1.98 % 1.58 % 1.35 %3
Portfolio turnover rate4 28 % 41 % 38 % 14 %
WisdomTree Fundamental U.S. Short-Term High YieldCorporate Bond Fund
For theYear Ended
June 30, 2019
For theYear Ended
June 30, 2018
For theYear Ended
June 30, 2017
For the PeriodApril 27, 2016*
throughJune 30, 2016
Net asset value, beginning of period $ 49.91 $ 51.39 $ 50.32 $ 49.95Investment operations:
Net investment income1 2.66 2.39 2.43 0.51Net realized and unrealized gain (loss) 0.51 (0.77 ) 1.60 0.35
Total from investment operations 3.17 1.62 4.03 0.86Dividends and distributions to shareholders:
Net investment income (2.63 ) (2.38 ) (2.42 ) (0.49 )Capital gains � (0.72 ) (0.54 ) �
Total dividends and distributions to shareholders (2.63 ) (3.10 ) (2.96 ) (0.49 )Net asset value, end of period $ 50.45 $ 49.91 $ 51.39 $ 50.32
TOTAL RETURN2 6.54 % 3.28 % 8.19 % 1.73 %RATIOS/SUPPLEMENTAL DATA:Net assets, end of period (000�s omitted) $ 20,181 $ 4,991 $ 5,139 $ 5,032Ratios to average net assets of:
Expenses, net of expense waivers 0.38 % 0.38 % 0.38 % 0.38 %3Expenses, prior to expense waivers 0.48 % 0.48 % 0.48 % 0.48 %3Net investment income 5.34 % 4.73 % 4.72 % 5.66 %3
Portfolio turnover rate4 18 % 66 % 69 % 0 %* Commencement of operations.1 Based on average shares outstanding.2 Total return is calculated assuming an initial investment made at the net asset value at the beginning of the period, reinvestment of all dividends and distributions
at net asset value during the period and redemption on the last day of the period. Total return calculated for a period of less than one year is not annualized. Forthe periods in which the investment advisor waived advisory fees, the total return would have been lower if certain expenses had not been waived (Notes 2 and3).
3 Annualized.4 Portfolio turnover rate is not annualized and excludes the value of the portfolio securities received or delivered as a result of in-kind creations or redemptions of
the Fund�s capital shares. Short-term securities with maturities less than or equal to 365 days are excluded from the portfolio turnover calculation.
See Notes to Financial Statements.
Copyright © 2019 www.secdatabase.com. All Rights Reserved.Please Consider the Environment Before Printing This Document

WisdomTree Trust 135
Copyright © 2019 www.secdatabase.com. All Rights Reserved.Please Consider the Environment Before Printing This Document

Table of ContentsFinancial Highlights (continued)
WisdomTree Trust
Selected data for a share of beneficial interest outstanding throughout the period is presented below:
WisdomTree Dynamic Bearish U.S.Equity Fund
For theYear Ended
June 30, 2019
For theYear Ended
June 30, 2018
For theYear Ended
June 30, 2017
For the PeriodDecember 23, 2015*
throughJune 30, 2016
Net asset value, beginning of period $ 25.96 $ 25.72 $ 24.28 $ 24.30Investment operations:
Net investment income1 0.54 0.44 0.47 0.08Net realized and unrealized gain (loss) (4.83 ) (0.20 ) 0.97 (0.06 )
Total from investment operations (4.29 ) 0.24 1.44 0.02Distributions to shareholders:
Return of capital � � � (0.04 )Net asset value, end of period $ 21.67 $ 25.96 $ 25.72 $ 24.28
TOTAL RETURN2 (16.53 )% 0.93 % 5.93 % 0.06 %RATIOS/SUPPLEMENTAL DATA:Net assets, end of period (000�s omitted) $ 8,667 $ 9,085 $ 5,144 $ 10,927Ratios to average net assets of:
Expenses, net of expense waivers 0.48 % 0.48 % 0.48 % 0.48 %3Expenses, prior to expense waivers 0.53 % 0.53 % 0.53 % 0.53 %3Net investment income 2.22 % 1.70 % 1.90 % 0.60 %3
Portfolio turnover rate4 249 % 158 % 153 % 4 %
WisdomTree Dynamic Long/Short U.S.Equity Fund
For theYear Ended
June 30, 2019
For theYear Ended
June 30, 2018
For theYear Ended
June 30, 2017
For the PeriodDecember 23, 2015*
throughJune 30, 2016
Net asset value, beginning of period $ 33.13 $ 30.17 $ 26.70 $ 25.13Investment operations:
Net investment income1 0.66 0.56 0.55 0.24Net realized and unrealized gain (loss) (5.41 ) 2.72 3.47 1.49
Total from investment operations (4.75 ) 3.28 4.02 1.73Dividends to shareholders:
Net investment income (0.63 ) (0.32 ) (0.55 ) (0.16 )Net asset value, end of period $ 27.75 $ 33.13 $ 30.17 $ 26.70
TOTAL RETURN2 (14.33 )% 10.90 % 15.25 % 6.88 %RATIOS/SUPPLEMENTAL DATA:Net assets, end of period (000�s omitted) $ 70,767 $ 125,892 $ 52,797 $ 17,358Ratios to average net assets of:
Expenses, net of expense waivers 0.48 % 0.48 % 0.48 % 0.48 %3Expenses, prior to expense waivers 0.53 % 0.53 % 0.53 % 0.53 %3Net investment income 2.10 % 1.74 % 1.95 % 1.80 %3
Portfolio turnover rate4 184 % 152 % 126 % 70 %* Commencement of operations.1 Based on average shares outstanding.2 Total return is calculated assuming an initial investment made at the net asset value at the beginning of the period, reinvestment of all dividends and distributions
at net asset value during the period and redemption on the last day of the period. Total return calculated for a period of less than one year is not annualized. Forthe periods in which the investment advisor waived advisory fees, the total return would have been lower if certain expenses had not been waived (Notes 2 and3).
3 Annualized.4 Portfolio turnover rate is not annualized and excludes the value of the portfolio securities received or delivered as a result of in-kind creations or redemptions of
the Fund�s capital shares. Short-term securities with maturities less than or equal to 365 days are excluded from the portfolio turnover calculation.
See Notes to Financial Statements.
136 WisdomTree Trust
Copyright © 2019 www.secdatabase.com. All Rights Reserved.Please Consider the Environment Before Printing This Document

Table of ContentsFinancial Highlights (concluded)
WisdomTree Trust
Selected data for a share of beneficial interest outstanding throughout the period is presented below:
WisdomTree 90/60 U.S. Balanced Fund
For the PeriodAugust 2, 2018*
throughJune 30, 2019
Net asset value, beginning of period $ 25.08Investment operations:
Net investment income1 0.38Net realized and unrealized gain 2.01
Total from investment operations 2.39Dividends to shareholders:
Net investment income (0.33 )Net asset value, end of period $ 27.14
TOTAL RETURN2 9.64 %RATIOS/SUPPLEMENTAL DATA:Net assets, end of period (000�s omitted) $ 5,428Ratios to average net assets of:
Expenses 0.20 %3Net investment income 1.68 %3
Portfolio turnover rate4 11 %
WisdomTree Balanced Income FundFor the
Year EndedJune 30, 2019
For the PeriodDecember 21, 2017*
throughJune 30, 2018
Net asset value, beginning of period $ 23.81 $ 24.92Investment operations:
Net investment income1 0.92 0.53Net realized and unrealized gain (loss) 0.77 (1.13 )
Total from investment operations 1.69 (0.60 )Dividends to shareholders:
Net investment income (0.87 ) (0.51 )Net asset value, end of period $ 24.63 $ 23.81
TOTAL RETURN2 7.27 % (2.43 )%RATIOS/SUPPLEMENTAL DATA:Net assets, end of period (000�s omitted) $ 3,695 $ 1,191Ratios to average net assets5 of:
Expenses, net of expense waivers 0.03 % 0.03 %3Expenses, prior to expense waivers 0.40 % 0.40 %3Net investment income 3.85 % 4.12 %3
Portfolio turnover rate4 3 % 1 %* Commencement of operations.1 Based on average shares outstanding.2 Total return is calculated assuming an initial investment made at the net asset value at the beginning of the period, reinvestment of all dividends and distributions
at net asset value during the period and redemption on the last day of the period. Total return calculated for a period of less than one year is not annualized. Forthe periods in which the investment advisor waived advisory fees for the WisdomTree Balanced Income Fund, the total return would have been lower if certainexpenses had not been waived (Notes 2 and 3).
3 Annualized.4 Portfolio turnover rate is not annualized and excludes the value of the portfolio securities received or delivered as a result of in-kind creations or redemptions of
the Fund�s capital shares. Short-term securities with maturities less than or equal to 365 days are excluded from the portfolio turnover calculation.5 The ratios to average net assets do not include net investment income (loss) or expenses of other funds in which the Fund invests.
See Notes to Financial Statements.
WisdomTree Trust 137
Copyright © 2019 www.secdatabase.com. All Rights Reserved.Please Consider the Environment Before Printing This Document

Table of ContentsNotes to Financial Statements
1. ORGANIZATIONWisdomTree Trust (the �Trust�) is registered under the Investment Company Act of 1940, as amended (the �1940 Act�), as an open-end managementinvestment company. The Trust was established as a Delaware statutory trust on December 15, 2005. As of June 30, 2019, the Trust consisted of 78operational investment funds (each a �Fund�, collectively, the �Funds�). In accordance with Accounting Standards Update (�ASU�) 2013-08,Financial Services-Investment Companies, each Fund listed below qualifies as an investment company and is applying the accounting and reportingguidance for investment companies. These notes relate only to the Funds listed in the table below:
FundCommencement
of OperationsWisdomTree Dynamic Currency Hedged International Equity Fund (�Dynamic Currency Hedged International Equity Fund�� and
also referred to herein as ��Currency Hedged Equity Fund��) January 7, 2016WisdomTree Dynamic Currency Hedged International Quality Dividend Growth Fund (�Dynamic Currency Hedged International
Quality Dividend Growth Fund�� and also referred to herein as ��Currency Hedged Equity Fund��) November 3, 2016WisdomTree Dynamic Currency Hedged International SmallCap Equity Fund (�Dynamic Currency Hedged International
SmallCap Equity Fund�� and also referred to herein as ��Currency Hedged Equity Fund��) January 7, 2016WisdomTree Emerging Markets Dividend Fund (�Emerging Markets Dividend Fund��) April 7, 2016WisdomTree Europe Multifactor Fund (�Europe Multifactor Fund�� and also referred to herein as ��Currency Hedged Equity
Fund��) (formerly, WisdomTree Dynamic Currency Hedged Europe Equity Fund) January 7, 2016WisdomTree Global ex-Mexico Equity Fund (�Global ex-Mexico Equity Fund��) February 10, 2017WisdomTree ICBCCS S&P China 500 Fund (�ICBCCS S&P China 500 Fund��) December 21, 2017WisdomTree Japan Multifactor Fund (�Japan Multifactor Fund�� and also referred to herein as ��Currency Hedged Equity
Fund��) (formerly, WisdomTree Dynamic Currency Hedged Japan Equity Fund) January 7, 2016WisdomTree Fundamental U.S. Corporate Bond Fund (�Fundamental U.S. Corporate Bond Fund��) April 27, 2016WisdomTree Fundamental U.S. High Yield Corporate Bond Fund (�Fundamental U.S. High Yield Corporate Bond Fund��) April 27, 2016WisdomTree Fundamental U.S. Short-Term Corporate Bond Fund (�Fundamental U.S. Short-Term Corporate Bond Fund��) April 27, 2016WisdomTree Fundamental U.S. Short-Term High Yield Corporate Bond Fund (�Fundamental U.S. Short-Term High Yield
Corporate Bond Fund��) April 27, 2016WisdomTree Dynamic Bearish U.S. Equity Fund (�Dynamic Bearish U.S. Equity Fund��) December 23, 2015WisdomTree Dynamic Long/Short U.S. Equity Fund (�Dynamic Long/Short U.S. Equity Fund��) December 23, 2015WisdomTree 90/60 U.S. Balanced Fund (�90/60 U.S. Balanced Fund��) August 2, 2018WisdomTree Balanced Income Fund (�Balanced Income Fund��) December 21, 2017
Each Fund, except WisdomTree Europe Multifactor Fund and WisdomTree Japan Multifactor Fund, seeks to track the price and yield performance,before fees and expenses, of a particular index (�Index�) developed by WisdomTree Investments, Inc. (�WisdomTree Investments��) or an Indexdeveloped by a third party. As of March 29, 2019, the WisdomTree Europe Multifactor Fund and WisdomTree Japan Multifactor Fund are activelymanaged using a rules-based model approach seeking income and capital appreciation. Prior to March 29, 2019, the WisdomTree Europe MultifactorFund and WisdomTree Japan Multifactor Fund were known as the WisdomTree Dynamic Currency Hedged Europe Equity Fund and WisdomTreeDynamic Currency Hedged Japan Equity Fund, respectively, and each sought to track the price and yield performance, before fees and expenses, of aparticular index developed by WisdomTree Investments. WisdomTree Investments is the parent company of WisdomTree Asset Management, Inc.(��WTAM��), the investment adviser to each Fund and the Trust. �WisdomTree� is a registered trademark of WisdomTree Investments and has beenlicensed for use by the Trust. Each Fund described herein is considered to be non-diversified as defined under the 1940 Act.
In the normal course of business, the Funds may enter into contracts that contain a variety of representations or that provide indemnification for certainliabilities. The Funds� maximum exposure under these arrangements is unknown, as this would involve future claims that may be made against theFunds that have not yet occurred. However, the Funds have not had prior claims or losses pursuant to these contracts and believes such exposure to beremote.
2. SIGNIFICANT ACCOUNTING POLICIESThe Financial Accounting Standards Board (�FASB�) Accounting Standards Codification (the �Codification�) is the exclusive reference ofauthoritative U.S. generally accepted accounting principles (�GAAP�) recognized by the FASB to be applied by nongovernmental entities. Rules andinterpretive releases of the Securities and Exchange Commission (�SEC�) under authority of federal laws are also sources of authoritative GAAP forSEC registrants.
138 WisdomTree Trust
Copyright © 2019 www.secdatabase.com. All Rights Reserved.Please Consider the Environment Before Printing This Document
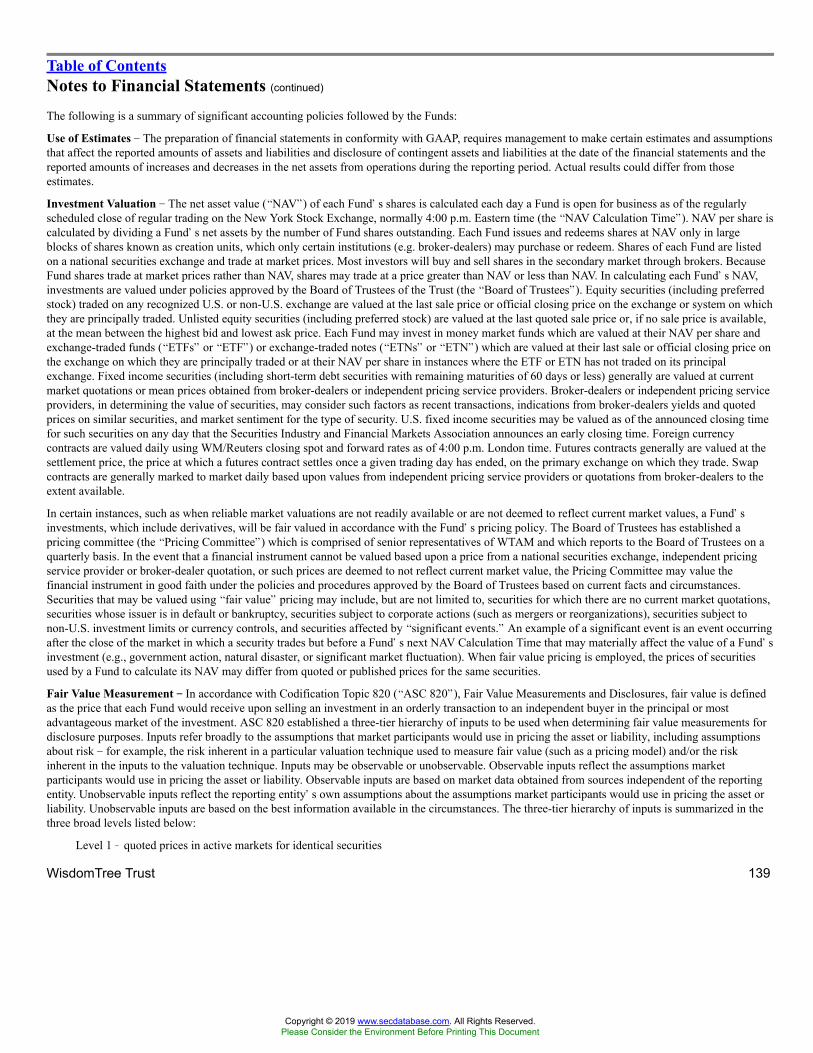
Table of ContentsNotes to Financial Statements (continued)
The following is a summary of significant accounting policies followed by the Funds:
Use of Estimates � The preparation of financial statements in conformity with GAAP, requires management to make certain estimates and assumptionsthat affect the reported amounts of assets and liabilities and disclosure of contingent assets and liabilities at the date of the financial statements and thereported amounts of increases and decreases in the net assets from operations during the reporting period. Actual results could differ from thoseestimates.
Investment Valuation � The net asset value (�NAV�) of each Fund�s shares is calculated each day a Fund is open for business as of the regularlyscheduled close of regular trading on the New York Stock Exchange, normally 4:00 p.m. Eastern time (the �NAV Calculation Time�). NAV per share iscalculated by dividing a Fund�s net assets by the number of Fund shares outstanding. Each Fund issues and redeems shares at NAV only in largeblocks of shares known as creation units, which only certain institutions (e.g. broker-dealers) may purchase or redeem. Shares of each Fund are listedon a national securities exchange and trade at market prices. Most investors will buy and sell shares in the secondary market through brokers. BecauseFund shares trade at market prices rather than NAV, shares may trade at a price greater than NAV or less than NAV. In calculating each Fund�s NAV,investments are valued under policies approved by the Board of Trustees of the Trust (the �Board of Trustees�). Equity securities (including preferredstock) traded on any recognized U.S. or non-U.S. exchange are valued at the last sale price or official closing price on the exchange or system on whichthey are principally traded. Unlisted equity securities (including preferred stock) are valued at the last quoted sale price or, if no sale price is available,at the mean between the highest bid and lowest ask price. Each Fund may invest in money market funds which are valued at their NAV per share andexchange-traded funds (�ETFs� or �ETF�) or exchange-traded notes (�ETNs� or �ETN�) which are valued at their last sale or official closing price onthe exchange on which they are principally traded or at their NAV per share in instances where the ETF or ETN has not traded on its principalexchange. Fixed income securities (including short-term debt securities with remaining maturities of 60 days or less) generally are valued at currentmarket quotations or mean prices obtained from broker-dealers or independent pricing service providers. Broker-dealers or independent pricing serviceproviders, in determining the value of securities, may consider such factors as recent transactions, indications from broker-dealers yields and quotedprices on similar securities, and market sentiment for the type of security. U.S. fixed income securities may be valued as of the announced closing timefor such securities on any day that the Securities Industry and Financial Markets Association announces an early closing time. Foreign currencycontracts are valued daily using WM/Reuters closing spot and forward rates as of 4:00 p.m. London time. Futures contracts generally are valued at thesettlement price, the price at which a futures contract settles once a given trading day has ended, on the primary exchange on which they trade. Swapcontracts are generally marked to market daily based upon values from independent pricing service providers or quotations from broker-dealers to theextent available.
In certain instances, such as when reliable market valuations are not readily available or are not deemed to reflect current market values, a Fund�sinvestments, which include derivatives, will be fair valued in accordance with the Fund�s pricing policy. The Board of Trustees has established apricing committee (the �Pricing Committee�) which is comprised of senior representatives of WTAM and which reports to the Board of Trustees on aquarterly basis. In the event that a financial instrument cannot be valued based upon a price from a national securities exchange, independent pricingservice provider or broker-dealer quotation, or such prices are deemed to not reflect current market value, the Pricing Committee may value thefinancial instrument in good faith under the policies and procedures approved by the Board of Trustees based on current facts and circumstances.Securities that may be valued using �fair value� pricing may include, but are not limited to, securities for which there are no current market quotations,securities whose issuer is in default or bankruptcy, securities subject to corporate actions (such as mergers or reorganizations), securities subject tonon-U.S. investment limits or currency controls, and securities affected by �significant events.� An example of a significant event is an event occurringafter the close of the market in which a security trades but before a Fund�s next NAV Calculation Time that may materially affect the value of a Fund�sinvestment (e.g., government action, natural disaster, or significant market fluctuation). When fair value pricing is employed, the prices of securitiesused by a Fund to calculate its NAV may differ from quoted or published prices for the same securities.
Fair Value Measurement �� In accordance with Codification Topic 820 (�ASC 820�), Fair Value Measurements and Disclosures, fair value is definedas the price that each Fund would receive upon selling an investment in an orderly transaction to an independent buyer in the principal or mostadvantageous market of the investment. ASC 820 established a three-tier hierarchy of inputs to be used when determining fair value measurements fordisclosure purposes. Inputs refer broadly to the assumptions that market participants would use in pricing the asset or liability, including assumptionsabout risk � for example, the risk inherent in a particular valuation technique used to measure fair value (such as a pricing model) and/or the riskinherent in the inputs to the valuation technique. Inputs may be observable or unobservable. Observable inputs reflect the assumptions marketparticipants would use in pricing the asset or liability. Observable inputs are based on market data obtained from sources independent of the reportingentity. Unobservable inputs reflect the reporting entity�s own assumptions about the assumptions market participants would use in pricing the asset orliability. Unobservable inputs are based on the best information available in the circumstances. The three-tier hierarchy of inputs is summarized in thethree broad levels listed below:
Level 1 � quoted prices in active markets for identical securities
WisdomTree Trust 139
Copyright © 2019 www.secdatabase.com. All Rights Reserved.Please Consider the Environment Before Printing This Document
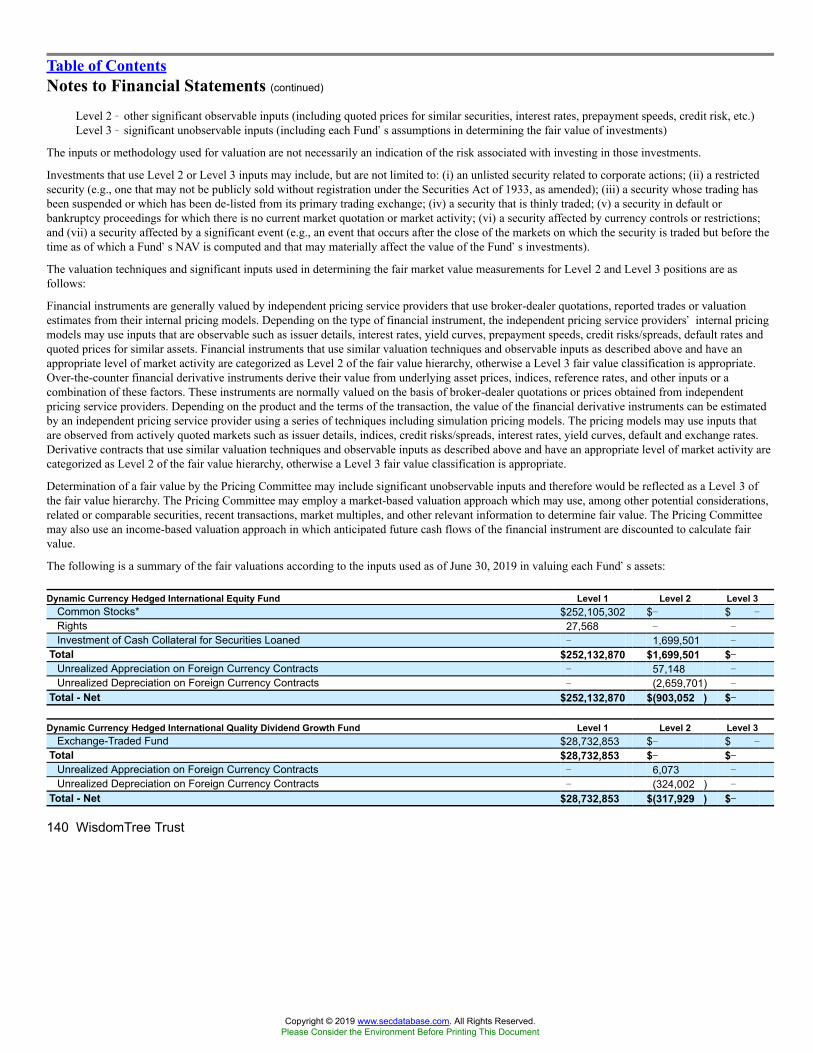
Table of ContentsNotes to Financial Statements (continued)
Level 2 � other significant observable inputs (including quoted prices for similar securities, interest rates, prepayment speeds, credit risk, etc.)Level 3 � significant unobservable inputs (including each Fund�s assumptions in determining the fair value of investments)
The inputs or methodology used for valuation are not necessarily an indication of the risk associated with investing in those investments.
Investments that use Level 2 or Level 3 inputs may include, but are not limited to: (i) an unlisted security related to corporate actions; (ii) a restrictedsecurity (e.g., one that may not be publicly sold without registration under the Securities Act of 1933, as amended); (iii) a security whose trading hasbeen suspended or which has been de-listed from its primary trading exchange; (iv) a security that is thinly traded; (v) a security in default orbankruptcy proceedings for which there is no current market quotation or market activity; (vi) a security affected by currency controls or restrictions;and (vii) a security affected by a significant event (e.g., an event that occurs after the close of the markets on which the security is traded but before thetime as of which a Fund�s NAV is computed and that may materially affect the value of the Fund�s investments).
The valuation techniques and significant inputs used in determining the fair market value measurements for Level 2 and Level 3 positions are asfollows:
Financial instruments are generally valued by independent pricing service providers that use broker-dealer quotations, reported trades or valuationestimates from their internal pricing models. Depending on the type of financial instrument, the independent pricing service providers� internal pricingmodels may use inputs that are observable such as issuer details, interest rates, yield curves, prepayment speeds, credit risks/spreads, default rates andquoted prices for similar assets. Financial instruments that use similar valuation techniques and observable inputs as described above and have anappropriate level of market activity are categorized as Level 2 of the fair value hierarchy, otherwise a Level 3 fair value classification is appropriate.Over-the-counter financial derivative instruments derive their value from underlying asset prices, indices, reference rates, and other inputs or acombination of these factors. These instruments are normally valued on the basis of broker-dealer quotations or prices obtained from independentpricing service providers. Depending on the product and the terms of the transaction, the value of the financial derivative instruments can be estimatedby an independent pricing service provider using a series of techniques including simulation pricing models. The pricing models may use inputs thatare observed from actively quoted markets such as issuer details, indices, credit risks/spreads, interest rates, yield curves, default and exchange rates.Derivative contracts that use similar valuation techniques and observable inputs as described above and have an appropriate level of market activity arecategorized as Level 2 of the fair value hierarchy, otherwise a Level 3 fair value classification is appropriate.
Determination of a fair value by the Pricing Committee may include significant unobservable inputs and therefore would be reflected as a Level 3 ofthe fair value hierarchy. The Pricing Committee may employ a market-based valuation approach which may use, among other potential considerations,related or comparable securities, recent transactions, market multiples, and other relevant information to determine fair value. The Pricing Committeemay also use an income-based valuation approach in which anticipated future cash flows of the financial instrument are discounted to calculate fairvalue.
The following is a summary of the fair valuations according to the inputs used as of June 30, 2019 in valuing each Fund�s assets:
Dynamic Currency Hedged International Equity Fund Level 1 Level 2 Level 3Common Stocks* $252,105,302 $� $ �
Rights 27,568 � �
Investment of Cash Collateral for Securities Loaned � 1,699,501 �
Total $252,132,870 $1,699,501 $��Unrealized Appreciation on Foreign Currency Contracts � 57,148 �
Unrealized Depreciation on Foreign Currency Contracts � (2,659,701) �
Total - Net $252,132,870 $(903,052 ) $��
Dynamic Currency Hedged International Quality Dividend Growth Fund Level 1 Level 2 Level 3Exchange-Traded Fund $28,732,853 $� $ �
Total $28,732,853 $�� $��Unrealized Appreciation on Foreign Currency Contracts � 6,073 �
Unrealized Depreciation on Foreign Currency Contracts � (324,002 ) �
Total - Net $28,732,853 $(317,929 ) $��
140 WisdomTree Trust
Copyright © 2019 www.secdatabase.com. All Rights Reserved.Please Consider the Environment Before Printing This Document

Table of ContentsNotes to Financial Statements (continued)
Dynamic Currency Hedged International SmallCap Equity Fund Level 1 Level 2 Level 3Common Stocks
Australia $3,471,143 $� $0 **Singapore 1,052,264 � 17,993**Other* 29,571,999 � �
Rights 892 � �
Investment of Cash Collateral for Securities Loaned � 772,019 �
Total $34,096,298 $772,019 $17,993Unrealized Appreciation on Foreign Currency Contracts � 14,511 �
Unrealized Depreciation on Foreign Currency Contracts � (336,492) �
Total - Net $34,096,298 $450,038 $17,993
Emerging Markets Dividend Fund Level 1 Level 2 Level 3Common Stocks
South Africa $2,836,386 $� $345 **Other* 47,127,329 � �
RightsChile 2,067 � �
Hong Kong � � 0 **Warrants 122 � �
Investment of Cash Collateral for Securities Loaned � 219,327 �
Total $49,965,904 $219,327 $345
Europe Multifactor Fund Level 1 Level 2 Level 3Common Stocks* $12,785,817 $� $�Investment of Cash Collateral for Securities Loaned � 5,482 �
Total $12,785,817 $5,482 $��Unrealized Appreciation on Foreign Currency Contracts � 6,935 �
Unrealized Depreciation on Foreign Currency Contracts � (186,506) �
Total - Net $12,785,817 $(174,089) $��
Global ex-Mexico Equity Fund Level 1 Level 2 Level 3Common Stocks* $2,962,220 $� $�Rights 128 � �
Investment of Cash Collateral for Securities Loaned � 5,495 �
Total $2,962,348 $5,495 $��
ICBCCS S&P China 500 Fund Level 1 Level 2 Level 3Common Stocks* $20,637,228 $� $�Investment of Cash Collateral for Securities Loaned � 54,989 �
Total $20,637,228 $54,989 $��
WisdomTree Trust 141
Copyright © 2019 www.secdatabase.com. All Rights Reserved.Please Consider the Environment Before Printing This Document

Table of ContentsNotes to Financial Statements (continued)
Japan Multifactor Fund Level 1 Level 2 Level 3Common Stocks* $1,223,372 $� $ �
Investment of Cash Collateral for Securities Loaned � 5,686 �
Total $1,223,372 $5,686 $��Unrealized Appreciation on Foreign Currency Contracts � 37 �
Unrealized Depreciation on Foreign Currency Contracts � (3,829 ) �
Total - Net $1,223,372 $1,894 $��
Fundamental U.S. Corporate Bond Fund Level 1 Level 2 Level 3U.S. Corporate Bonds $� $4,984,111 $�Foreign Corporate Bonds � 25,252 �
U.S. Government Obligations � 10,249 �
Total $�� $5,019,612 $��
Fundamental U.S. High Yield Corporate Bond Fund Level 1 Level 2 Level 3U.S. Corporate Bonds $� $15,079,499 $�Foreign Corporate Bond � 52,125 �
Investment of Cash Collateral for Securities Loaned � 514,213 �
Total $�� $15,645,837 $��
Fundamental U.S. Short-Term Corporate Bond Fund Level 1 Level 2 Level 3U.S. Corporate Bonds $� $4,751,402 $�Foreign Corporate Bonds � 157,443 �
U.S. Government Obligations � 41,341 �
Investment of Cash Collateral for Securities Loaned � 3,098 �
Total $�� $4,953,284 $��
Fundamental U.S. Short-Term High Yield Corporate Bond Fund Level 1 Level 2 Level 3U.S. Corporate Bonds $� $19,564,023 $�Foreign Corporate Bonds � 245,610 �
Investment of Cash Collateral for Securities Loaned � 1,010,193 �
Total $�� $20,819,826 $��
Dynamic Bearish U.S. Equity Fund Level 1 Level 2 Level 3Common Stocks* $9,059,666 $� $�Investment of Cash Collateral for Securities Loaned � 105,944 �
Total $9,059,666 $105,944 $��Unrealized Depreciation on Swap Contracts � (433,504 ) �
Total - Net $9,059,666 $(327,560 ) $��
Dynamic Long/Short U.S. Equity Fund Level 1 Level 2 Level 3Common Stocks* $71,966,169 $� $ �
Investment of Cash Collateral for Securities Loaned � 280,543 �
Total $71,966,169 $280,543 $��Unrealized Depreciation on Swap Contracts � (3,413,074) �
Total - Net $71,966,169 $(3,132,531) $��
142 WisdomTree Trust
Copyright © 2019 www.secdatabase.com. All Rights Reserved.Please Consider the Environment Before Printing This Document
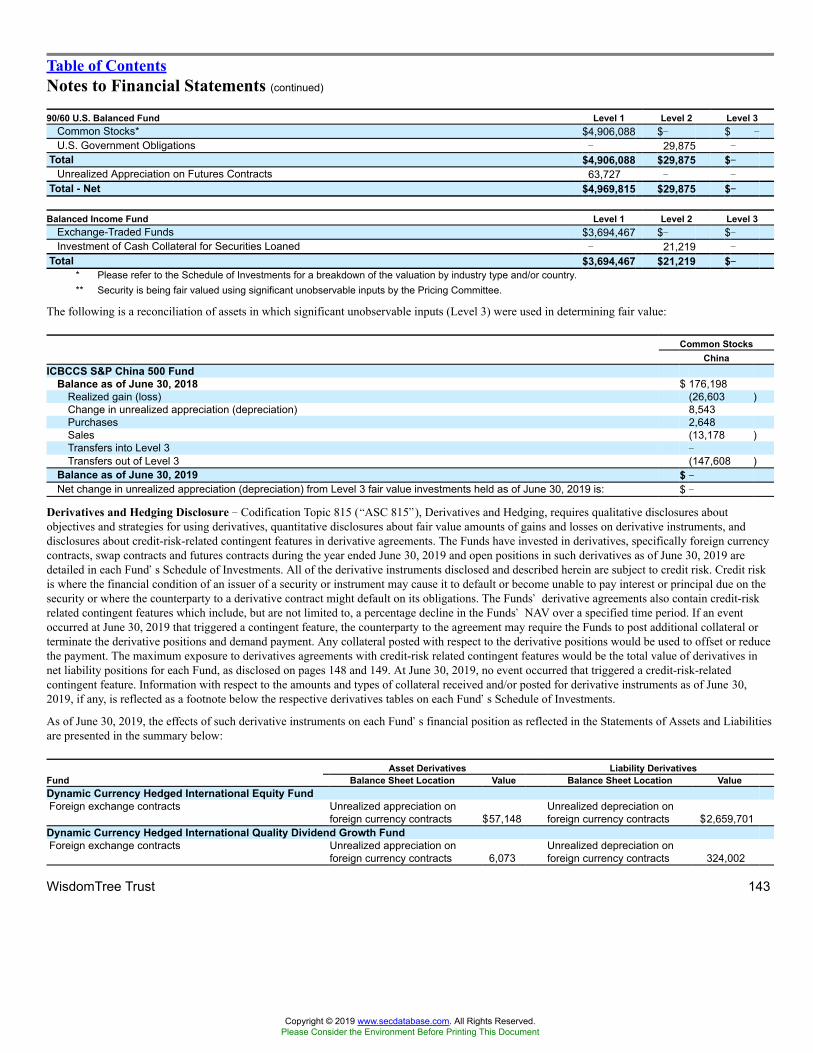
Table of ContentsNotes to Financial Statements (continued)
90/60 U.S. Balanced Fund Level 1 Level 2 Level 3Common Stocks* $4,906,088 $� $ �
U.S. Government Obligations � 29,875 �
Total $4,906,088 $29,875 $��Unrealized Appreciation on Futures Contracts 63,727 � �
Total - Net $4,969,815 $29,875 $��
Balanced Income Fund Level 1 Level 2 Level 3Exchange-Traded Funds $3,694,467 $� $�Investment of Cash Collateral for Securities Loaned � 21,219 �
Total $3,694,467 $21,219 $��* Please refer to the Schedule of Investments for a breakdown of the valuation by industry type and/or country.** Security is being fair valued using significant unobservable inputs by the Pricing Committee.
The following is a reconciliation of assets in which significant unobservable inputs (Level 3) were used in determining fair value:
Common StocksChina
ICBCCS S&P China 500 FundBalance as of June 30, 2018 $ 176,198
Realized gain (loss) (26,603 )Change in unrealized appreciation (depreciation) 8,543Purchases 2,648Sales (13,178 )Transfers into Level 3 �Transfers out of Level 3 (147,608 )
Balance as of June 30, 2019 $ ��Net change in unrealized appreciation (depreciation) from Level 3 fair value investments held as of June 30, 2019 is: $ �
Derivatives and Hedging Disclosure � Codification Topic 815 (�ASC 815�), Derivatives and Hedging, requires qualitative disclosures aboutobjectives and strategies for using derivatives, quantitative disclosures about fair value amounts of gains and losses on derivative instruments, anddisclosures about credit-risk-related contingent features in derivative agreements. The Funds have invested in derivatives, specifically foreign currencycontracts, swap contracts and futures contracts during the year ended June 30, 2019 and open positions in such derivatives as of June 30, 2019 aredetailed in each Fund�s Schedule of Investments. All of the derivative instruments disclosed and described herein are subject to credit risk. Credit riskis where the financial condition of an issuer of a security or instrument may cause it to default or become unable to pay interest or principal due on thesecurity or where the counterparty to a derivative contract might default on its obligations. The Funds� derivative agreements also contain credit-riskrelated contingent features which include, but are not limited to, a percentage decline in the Funds� NAV over a specified time period. If an eventoccurred at June 30, 2019 that triggered a contingent feature, the counterparty to the agreement may require the Funds to post additional collateral orterminate the derivative positions and demand payment. Any collateral posted with respect to the derivative positions would be used to offset or reducethe payment. The maximum exposure to derivatives agreements with credit-risk related contingent features would be the total value of derivatives innet liability positions for each Fund, as disclosed on pages 148 and 149. At June 30, 2019, no event occurred that triggered a credit-risk-relatedcontingent feature. Information with respect to the amounts and types of collateral received and/or posted for derivative instruments as of June 30,2019, if any, is reflected as a footnote below the respective derivatives tables on each Fund�s Schedule of Investments.
As of June 30, 2019, the effects of such derivative instruments on each Fund�s financial position as reflected in the Statements of Assets and Liabilitiesare presented in the summary below:
Asset Derivatives Liability DerivativesFund Balance Sheet Location Value Balance Sheet Location ValueDynamic Currency Hedged International Equity FundForeign exchange contracts Unrealized appreciation on
foreign currency contracts $57,148Unrealized depreciation onforeign currency contracts $2,659,701
Dynamic Currency Hedged International Quality Dividend Growth FundForeign exchange contracts Unrealized appreciation on
foreign currency contracts 6,073Unrealized depreciation onforeign currency contracts 324,002
WisdomTree Trust 143
Copyright © 2019 www.secdatabase.com. All Rights Reserved.Please Consider the Environment Before Printing This Document

Table of ContentsNotes to Financial Statements (continued)
Asset Derivatives Liability DerivativesFund Balance Sheet Location Value Balance Sheet Location ValueDynamic Currency Hedged International SmallCap Equity FundForeign exchange contracts Unrealized appreciation on
foreign currency contracts $14,511Unrealized depreciation onforeign currency contracts $336,492
Europe Multifactor FundForeign exchange contracts Unrealized appreciation on
foreign currency contracts 6,935Unrealized depreciation onforeign currency contracts 186,506
Japan Multifactor FundForeign exchange contracts Unrealized appreciation on
foreign currency contracts 37Unrealized depreciation onforeign currency contracts 3,829
Dynamic Bearish U.S. Equity FundEquity contracts Unrealized appreciation on
swap contracts �Unrealized depreciation onswap contracts 433,504
Dynamic Long/Short U.S. Equity FundEquity contracts Unrealized appreciation on
swap contracts �Unrealized depreciation onswap contracts 3,413,074
90/60 U.S. Balanced FundInterest rate contracts Unrealized appreciation on
futures contracts* 63,727Unrealized depreciation onfutures contracts* �
* Includes cumulative appreciation (depreciation) of futures contracts as reported in each Fund�s Schedule of Investments. Only current day�s variationmargin is reported within the Statements of Assets and Liabilities. Please see Note 2 (Futures Contracts) on pages 146-147 for additional informationregarding balance sheet location of balances associated with futures contracts.
For the fiscal year or period ended June 30, 2019, the effects of derivative instruments on each Fund�s financial performance as reflected in theStatements of Operations are presented in the summary below:
Fund
Amount of Realized Gainor (Loss) on Derivatives
Recognized1
Change in UnrealizedAppreciation or
(Depreciation) onDerivatives Recognized2
Dynamic Currency Hedged International Equity FundForeign exchange contracts $ 10,400,406 $ (4,399,047 )Dynamic Currency Hedged International Quality Dividend Growth FundForeign exchange contracts 1,056,066 (481,563 )Dynamic Currency Hedged International SmallCap Equity FundForeign exchange contracts 895,383 (484,365 )Emerging Markets Dividend FundForeign exchange contracts 7,863 �
Europe Multifactor FundForeign exchange contracts 887,840 (199,070 )Global ex-Mexico Equity FundForeign exchange contracts 10,835 �
ICBCCS S&P China 500 FundForeign exchange contracts (1,209 ) �
Japan Multifactor FundForeign exchange contracts 28,247 (33,956 )Dynamic Bearish U.S. Equity FundEquity contracts (432,125 ) (520,602 )Dynamic Long/Short U.S. Equity FundEquity contracts (18,808,766 ) (3,413,074 )90/60 U.S. Balanced Fund3Interest rate contracts 125,372 63,727
1 Realized gains (losses) on derivatives are located on the Statements of Operations as follows:Foreign exchange contracts Net realized gain (loss) from foreign currency contractsEquity contracts Net realized gain (loss) from swap contractsInterest rate contracts Net realized gain (loss) from futures contracts
144 WisdomTree Trust
Copyright © 2019 www.secdatabase.com. All Rights Reserved.Please Consider the Environment Before Printing This Document

Table of ContentsNotes to Financial Statements (continued)
2 Change in unrealized appreciation (depreciation) is located on the Statements of Operations as follows:Foreign exchange contracts Net increase (decrease) in unrealized appreciation/depreciation from foreign currency contractsEquity contracts Net increase (decrease) in unrealized appreciation/depreciation from swap contractsInterest rate contracts Net increase (decrease) in unrealized appreciation/depreciation from futures contracts
3 For the period August 2, 2018 (commencement of operations) through June 30, 2019.
During the fiscal year or period ended June 30, 2019, the volume of derivative activity (based on the average of month-end balances, except wherefootnoted) for each Fund was as follows:
Average Notional
Fund
Foreigncurrencycontracts(to deliver
USD)
Foreigncurrencycontracts(to receive
USD)
Swapcontracts
(short)
Futurescontracts
(long)Dynamic Currency Hedged International Equity FundForeign exchange contracts $171,260,917 $335,076,888 $� $�Dynamic Currency Hedged International Quality Dividend Growth FundForeign exchange contracts 15,884,457 30,895,462 � �
Dynamic Currency Hedged International SmallCap Equity FundForeign exchange contracts 17,481,779 34,543,658 � �
Emerging Markets Dividend FundForeign exchange contracts 53,088 6,526 � �
Europe Multifactor FundForeign exchange contracts 9,877,041 19,184,661 � �
Global ex-Mexico Equity FundForeign exchange contracts 1,303 1,358 � �
ICBCCS S&P China 500 Fund1Foreign exchange contracts 377,522 1,034,537 � �
Japan Multifactor FundForeign exchange contracts 1,719,051 3,484,682 � �
Dynamic Bearish U.S. Equity FundEquity contracts � � 9,364,949 �
Dynamic Long/Short U.S. Equity FundEquity contracts � � 23,790,349 �
90/60 U.S. Balanced Fund2Interest rate contracts � � � 2,573,134
1 The volume of derivative activity for the period is based on intra-month balances.2 For the period August 2, 2018 (commencement of operations) through June 30, 2019.
Investment Transactions and Investment Income � Investment transactions are recorded as of the date that the securities are purchased or sold (tradedate). Realized gains and losses on sales of portfolio securities are calculated using the identified-cost method. Dividend income (net of foreign taxeswithheld, if any) is recognized on the ex-dividend date or as soon as practicable after the existence of a dividend declaration has been determined.Non-cash dividend income is recognized at the fair value of securities received on the ex-dividend date or as soon as practicable after the existence of adividend declaration has been determined. Interest income (including amortization of premiums and accretion of discounts), net of any foreign taxeswithheld, is accrued daily. Generally, amortization of premiums and accretion of discounts are recognized daily using the effective interest method(also known as the scientific amortization method). Income earned from securities lending activities (i.e. Securities lending income), net of feespayable to the securities borrower and/or securities lending agent, is accrued daily.
Foreign Currency Translation � The accounting records of the Funds are maintained in U.S. dollars. Foreign currencies, as well as investmentsecurities and other assets and liabilities denominated in foreign currencies, are translated into U.S. dollars using exchange rates prevailing on therespective dates of such transactions that are deemed appropriate by WTAM. Realized and unrealized foreign exchange gains and losses on investmentsare included as a component of net realized gain (loss) from investment transactions and net increase (decrease) in unrealized appreciation(depreciation) from investment transactions, respectively, on the Statements of Operations. Realized and unrealized foreign exchange gains or lossesfrom foreign currency contracts are included in net realized gain (loss) from foreign currency contracts and net increase (decrease) in unrealizedappreciation/depreciation from foreign currency contracts, respectively, on the Statements of Operations. Realized and unrealized foreign exchangegains or losses arising from sales of foreign currencies, currency gains or losses recognized between the trade and settlement dates on investmenttransactions, and the difference between the amounts of dividends and foreign withholding taxes recorded on the Funds� books and the U.S. dollarequivalent of the amounts actually received or paid are included in net realized gain (loss) from foreign currency related transactions and/or
WisdomTree Trust 145
Copyright © 2019 www.secdatabase.com. All Rights Reserved.Please Consider the Environment Before Printing This Document
Table of ContentsNotes to Financial Statements (continued)
increase (decrease) in unrealized appreciation (depreciation) from translation of assets and liabilities denominated in foreign currencies in theStatements of Operations. Certain foreign exchange gains and losses included in realized and unrealized gains or losses are included in, or are areduction of, ordinary income in accordance with U.S. Federal income tax regulations.
Expenses/Reimbursements � Under the investment advisory agreement for each Fund, WTAM has agreed to pay all expenses of the Trust, except for:(i) brokerage expenses and other fees, charges, taxes, levies or expenses (such as stamp taxes) incurred in connection with the execution of portfoliotransactions or in connection with creation and redemption transactions (including without limitation any fees, charges, taxes, levies or expenses relatedto the purchase or sale of an amount of any currency, or the partition or repatriation of any security or other asset, related to the execution of portfoliotransactions or any creation or redemption transactions); (ii) legal fees or expenses in connection with any arbitration, litigation or pending orthreatened arbitration or litigation, including any settlements in connection therewith; (iii) compensation and expenses of trustees who are notinterested persons of the Funds (��Independent Trustees��); (iv) compensation and expenses of counsel to the Independent Trustees; (v) compensationand expenses of the Trust�s Chief Compliance Officer (��CCO��); (vi) extraordinary expenses (in each case as determined by a majority of theIndependent Trustees); (vii) distribution fees and expenses paid by the Trust under any distribution plan adopted pursuant to Rule 12b-1 under the 1940Act; (viii) interest and taxes of any kind or nature (including, but not limited to, income, excise, transfer and withholding taxes); (ix) fees and expensesrelated to the provision of securities lending services; and (x) the advisory fee payable to WTAM.
Acquired fund fees and expenses (�AFFEs�) (which are fees and expenses incurred indirectly by a Fund through its investments in certain underlyinginvestment companies) are not operating expenses of the Funds and are not paid by WTAM.
Pursuant to a separate contractual arrangement, WTAM arranges for the provision of CCO services with respect to each Fund, and is liable andresponsible for, and administers, payments to the CCO, the Independent Trustees and counsel to the Independent Trustees. WTAM receives a fee, asshown on the Statements of Operations under �Service fees�, of up to 0.0044% per annum of each Fund�s average daily net assets for providing suchservices and paying such expenses. WTAM provides CCO services to the Trust.
Foreign minimum reserve funds � In order to mitigate the risk of failed trades in the onshore China equity market, the China Securities Depositoryand Clearing Corporation Limited (�CSDCC�) requires investors to maintain minimum reserve funds in one of the CDSCC�s designated cash clearingbanks. At June 30, 2019, the ICBCCS S&P China 500 Fund, held foreign currency in such a CSDCC designated clearing bank having a U.S. dollarequivalent value equal to $4,077.
Currency Transactions � The Funds may enter into foreign currency contracts to facilitate local securities settlements or to protect against currencyexposure. The Funds, other than the Currency Hedged Equity Funds, do not expect to engage in currency transactions for the purpose of hedgingagainst declines in the value of the Fund�s assets that are denominated in one or more foreign currencies. The Funds may not enter into such contractsfor speculative purposes.
Forward Foreign Currency Contracts � The Currency Hedged Equity Funds utilized forward foreign currency contracts (��Forward Contract��) todynamically obtain either a net long or net short exposure to foreign currencies consistent with each Fund�s investment strategy. The EmergingMarkets Dividend Fund, Global ex-Mexico Equity Fund and the ICBCCS S&P China 500 Fund utilized Forward Contracts to facilitate foreign securitysettlements. A Forward Contract involves an obligation to purchase or sell a specific currency at a future date, which may be any fixed number of daysfrom the date of the contract agreed upon by the parties, at a price set at the time of the contract. These contracts are principally traded in the inter-bankmarket conducted directly between currency traders (usually large, commercial banks) and their customers. A Forward Contract generally does notrequire an initial margin deposit and no commissions are charged at any stage for trades. However, if a Fund is in an unrealized loss position on aForward Contract, it may be required to pledge collateral (or additional collateral) to the counterparty. If a Fund is in an unrealized gain position on aForward Contract, it may receive collateral from the counterparty.
Risks may arise upon entering into Forward Contracts from the potential inability of counterparties to meet the terms of their contracts and fromunanticipated movements in the value of foreign currencies relative to the U.S. dollar or each other.
Fluctuations in the value of open Forward Contracts are recorded for book purposes as unrealized gains or losses on Forward Contracts by the Fundsand included in net increase (decrease) in unrealized appreciation (depreciation) from foreign currency contracts on the Statements of Operations.Realized gains and losses on Forward Contracts include net gains or losses recognized by the Funds on contracts which have settled are included in netrealized gain (loss) from foreign currency contracts on the Statements of Operations.
Futures Contracts �� The 90/60 U.S. Balanced Fund utilized futures contracts to obtain long exposure to U.S. Treasury obligations consistent with itsinvestment strategy. When a Fund purchases a listed futures contract, it agrees to purchase a specified reference asset (e.g., commodity, currency orTreasury security) at a specified future date. When a Fund sells a listed futures contract, it agrees to sell a specified reference asset (e.g., commodity,currency or Treasury security) at a specified future date. The price at which the purchase and sale will take place is fixed when the Fund enters into thecontract. The exchange clearing corporation is the ultimate counterparty for all exchange-listed contracts, so credit risk is limited to thecreditworthiness of the exchange�s clearing corporation.
146 WisdomTree Trust
Copyright © 2019 www.secdatabase.com. All Rights Reserved.Please Consider the Environment Before Printing This Document

Table of ContentsNotes to Financial Statements (continued)
Upon entering into a futures contract, a Fund is required to deliver to a broker an amount of cash and/or government securities equal to a certainpercentage of the contract amount. This amount is known as the �initial margin�. Subsequent payments, known as �variation margin�, generally aremade or received by the Fund each day or at other agreed-upon time periods depending on the fluctuations in the value of the underlying futurescontracts, except that in the case of certain futures contracts payments may be made or received at settlement. Such variation margin is recorded forfinancial statement purposes on a daily basis as an unrealized gain or loss on futures until the financial futures contract is closed, at which time the netgain or loss is reclassified to realized gain or loss on futures. When a Fund purchases or sells a futures contract, the Fund is required to �cover� itsposition in order to limit the risk associated with the use of leverage and other related risks. To cover its position, a Fund will segregate assetsconsisting of, or take other measures with respect to, cash or liquid securities that, when added to any amounts deposited with a futures commissionmerchant as margin, will �cover� its position in a manner consistent with the 1940 Act or the rules and SEC interpretations thereunder. This willfunction as a practical limit on the amount of leverage which a Fund may undertake and on the potential increase in the speculative character of aFund�s outstanding portfolio securities.
Total Return Swap Contracts �� The Dynamic Bearish U.S. Equity Fund and the Dynamic Long/Short U.S. Equity Fund utilized total return swapcontracts to obtain short exposure to the S&P 500 Index. Total return swap contracts are agreements between counterparties to exchange the return of agiven underlying reference asset/index, including income and any appreciation/depreciation in value of the reference asset/index, in exchange forpayments equal to a rate of interest on another reference asset. During the term of the outstanding swap agreement, changes in the underlying value ofthe swap are recorded as unrealized gains and losses and the periodic payments received or made on the swap are recorded as realized gains or losses.Swap agreements may be used to achieve exposure to, for example, currencies, interest rates, indexes and money market securities without actuallypurchasing such currencies or securities. A Fund may use swap agreements to invest in a market without owning or taking physical custody of theunderlying securities in circumstances in which direct investment is restricted for legal reasons or is otherwise impractical. Swap agreements will tendto shift a Fund�s investment exposure from one type of investment to another or from one payment stream to another. Depending on their structure,swap agreements may increase or decrease a Fund�s exposure to long- or short-term interest rates (in the United States or abroad), foreign currencies,corporate borrowing rates, or other factors, and may increase or decrease the overall volatility of a Fund�s investments and its share price. Total returnswaps are exposed to the market risk factor of the specific underlying reference asset/index such as unanticipated movements in the value of theexchange rates, interest rates, securities, or the reference asset/index. Additional risks to a Fund include the possibility that there is no liquid market forthese agreements or that the swap counterparty may default on its obligation to perform. A Fund�s maximum loss from counterparty risk is the fairvalue of the contract.
Securities Lending � Each Fund may lend portfolio securities to certain creditworthy borrowers, including the Funds� securities lending agent. It isthe Funds� policy that, at origination, all loans are secured by collateral of at least 102% of the value of U.S. securities loaned and 105% of the value offoreign securities loaned. Collateral in the form of cash and/or high-grade debt obligations, equivalent to at least 100% of the market value ofsecurities, is maintained at all times. The cash collateral can be invested in certain money market mutual funds which also have exposure to thefluctuations of the market. The values of the investments of cash collateral for securities on loan along with the obligations to return such collateral areincluded on the Statements of Assets and Liabilities. The total value of securities received as collateral for securities on loan is included in a footnotefollowing each Schedule of Investments, but is not included within the Statements of Assets and Liabilities because the receiving Fund does not havethe right to sell or repledge the securities received as collateral. Each Fund receives compensation for lending its securities from interest or dividendsearned on the cash or U.S. government securities held as collateral, net of fee rebates paid to the borrower plus reasonable administrative and custodyfees, all of which are included in the securities lending income earned by the Funds and disclosed on the Statements of Operations. The dividend andinterest income earned on the securities loaned is accounted for in the same manner as other dividend and interest income. The borrower pays to theFunds an amount equal to any dividends or interest received on loaned securities. Dividends received while a security is out on loan are not consideredQualified Dividend Income (�QDI�) under the specific criteria issued by the Internal Revenue Service and are subject to taxation at the shareholder�sordinary income tax rate instead of the lower long-term capital gains tax rate. Lending portfolio securities could result in a loss or delay in recoveringeach Fund�s securities if the borrower defaults. In the event of a borrower default with respect to the failure to return to each Fund some or all of thesecurities loaned, the securities lending agent shall indemnify each Fund against the failure of the borrower.
Master Netting Arrangements � ASU No. 2011-11 �Disclosures about Offsetting Assets and Liabilities� (�ASU 2011-11�) is generally intended to(i) help investors and other financial statement users to better assess the effect or potential effect of offsetting arrangements on a company�s financialposition, (ii) improve transparency in the reporting of how companies mitigate credit risk, and (iii) facilitate comparisons between those entities thatprepare their financial statements on the basis of GAAP and those entities that prepare their financial statements on the basis of international financialreporting standards. ASU 2011-11 requires entities to disclose (i) gross and net information about both instruments and transactions eligible for offsetin the financial statements, and (ii) instruments and transactions subject to an agreement similar to a master netting agreement. ASU 2011-11 is limitedin scope to
WisdomTree Trust 147
Copyright © 2019 www.secdatabase.com. All Rights Reserved.Please Consider the Environment Before Printing This Document

Table of ContentsNotes to Financial Statements (continued)
the following financial instruments, to the extent they are offset in the financial statements or subject to an enforceable master netting arrangement orsimilar agreement: (i) recognized derivative instruments accounted for under ASC 815 (Derivatives and Hedging); (ii) repurchase agreements andreverse repurchase agreements; and (iii) securities borrowing and securities lending transactions.
In order to better define its contractual rights and to secure rights that will help a Fund mitigate its counterparty risk, a Fund may enter into anInternational Swaps and Derivatives Association, Inc. Master Agreement (�ISDA Master Agreement�) or similar agreement with its counterparties. AnISDA Master Agreement is a bilateral agreement between a Fund and a counterparty that governs over-the-counter derivatives (�OTC�), such as totalreturn swap contracts and Forward Contracts, and typically contains, among other things, collateral posting terms, netting and rights of set-offprovisions in the event of a default and/or termination event. Under an ISDA Master Agreement, a Fund may, under certain circumstances, offset withthe counterparty certain derivative financial instruments� payables and receivables to create a single net payment. The provisions of the ISDA MasterAgreement typically permit a single net payment in the event of a default (close-out netting) or similar event, including the bankruptcy or insolvency ofthe counterparty.
Collateral requirements generally differ by type of derivative. Collateral terms are contract-specific for OTC derivatives (e.g. foreign exchangecontracts, options and certain swaps). Generally, for transactions traded under an ISDA Master Agreement, the collateral requirements are calculated bynetting the marked to market amount for each transaction under such agreement and comparing that amount to the value of any collateral currentlypledged by a Fund and the counterparty. Generally, the amount of collateral due from or to a counterparty must exceed a minimum transfer amountthreshold before a transfer is required to be made. To the extent amounts due to a Fund from its derivatives counterparties are not fully collateralized,contractually or otherwise, the Fund bears the risk of loss from a counterparty�s non-performance.
The Funds� security lending activities are governed by a Securities Lending Authorization Agreement (�Lending Agreement�) between the Funds andthe lending agent. The Lending Agreement authorizes the lending agent to lend qualifying U.S. and foreign securities held by a Fund to approvedborrowers (each a �Borrower�). To mitigate borrower risk, a Fund typically receives from a Borrower collateral in the form of U.S. dollar cash and/orsecurities issued or guaranteed by the U.S. government or its agencies in excess of the market value of the securities loaned. Under the provisions ofthe Lending Agreement, a Fund shall have, as to the collateral, all of the rights and remedies of a secured party under applicable law. A Fund isexposed to risk of loss if a Borrower defaults on its obligation to return borrowed securities and the value of the collateral a Fund received isinsufficient to cover the market value of the securities loaned. Also, the lending agent is permitted to invest the cash collateral it receives from aBorrower into a money market fund which is subject to market fluctuation. Therefore, a Fund is exposed to risk of loss if the value of invested cashcollateral is insufficient to satisfy the Fund�s obligation to return the full amount owed to such Borrower.
The Funds� futures contracts are all exchange traded and are not subject to master netting arrangements. Therefore, all futures contracts are excludedfrom the netting table below.
For financial reporting purposes, the Funds elect to not offset assets and liabilities subject to an ISDA Master Agreement or Lending Agreement, if any,in the Statements of Assets and Liabilities. Therefore, all qualifying transactions are presented on a gross basis in the Statements of Assets andLiabilities. As of June 30, 2019, the impact of netting of assets and liabilities and the offsetting of collateral pledged or received based on contractualnetting/set-off provisions in the ISDA Master Agreement and the Lending Agreement are detailed in the following table:
Assets LiabilitiesGross Amounts Not Offset
in the Statements ofAssets and Liabilities
Gross Amounts Not Offsetin the Statements of
Assets and Liabilities
Fund
Gross Amountsin the
Statements ofAssets andLiabilities
FinancialInstruments
CollateralReceived Net Amount
Gross Amountsin the
Statements ofAssets andLiabilities
FinancialInstruments
CollateralPosted Net Amount
Dynamic CurrencyHedged InternationalEquity Fund
Securities Lending $ 3,138,822 $� $(3,138,822 )1 $ � $ � $ � $ � $�Foreign Currency
Contracts 57,148 (57,148 ) � � 2,659,701 (57,148 ) � 2,602,553Dynamic Currency
Hedged InternationalQuality DividendGrowth Fund
Foreign CurrencyContracts 6,073 (6,073 ) � � 324,002 (6,073 ) � 317,929
Dynamic CurrencyHedged InternationalSmallCap Equity Fund
Securities Lending 1,231,011 � (1,231,011 )1 � � � � �
Foreign CurrencyContracts 14,511 (14,511 ) � � 336,492 (14,511 ) � 321,981
148 WisdomTree Trust
Copyright © 2019 www.secdatabase.com. All Rights Reserved.Please Consider the Environment Before Printing This Document
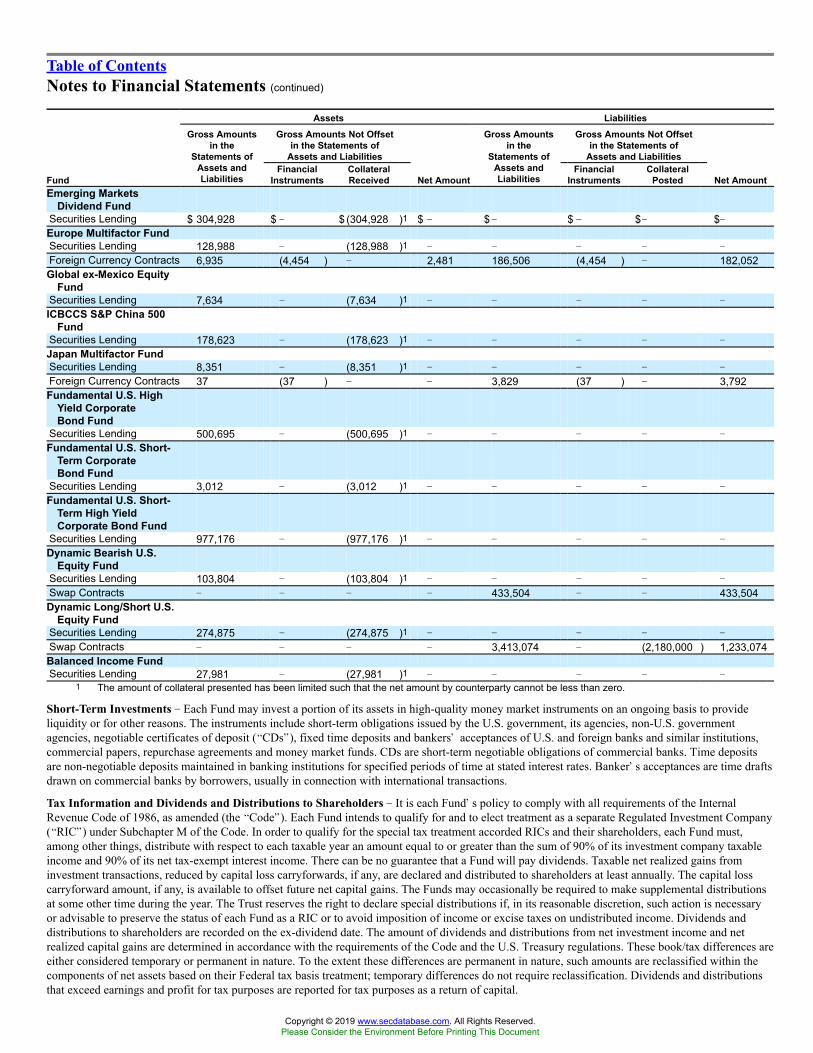
Table of ContentsNotes to Financial Statements (continued)
Assets LiabilitiesGross Amounts Not Offset
in the Statements ofAssets and Liabilities
Gross Amounts Not Offsetin the Statements of
Assets and Liabilities
Fund
Gross Amountsin the
Statements ofAssets andLiabilities
FinancialInstruments
CollateralReceived Net Amount
Gross Amountsin the
Statements ofAssets andLiabilities
FinancialInstruments
CollateralPosted Net Amount
Emerging MarketsDividend Fund
Securities Lending $ 304,928 $ � $ (304,928 )1 $ � $ � $ � $� $�Europe Multifactor FundSecurities Lending 128,988 � (128,988 )1 � � � � �
Foreign Currency Contracts 6,935 (4,454 ) � 2,481 186,506 (4,454 ) � 182,052Global ex-Mexico Equity
FundSecurities Lending 7,634 � (7,634 )1 � � � � �
ICBCCS S&P China 500Fund
Securities Lending 178,623 � (178,623 )1 � � � � �
Japan Multifactor FundSecurities Lending 8,351 � (8,351 )1 � � � � �
Foreign Currency Contracts 37 (37 ) � � 3,829 (37 ) � 3,792Fundamental U.S. High
Yield CorporateBond Fund
Securities Lending 500,695 � (500,695 )1 � � � � �
Fundamental U.S. Short-Term CorporateBond Fund
Securities Lending 3,012 � (3,012 )1 � � � � �
Fundamental U.S. Short-Term High YieldCorporate Bond Fund
Securities Lending 977,176 � (977,176 )1 � � � � �
Dynamic Bearish U.S.Equity Fund
Securities Lending 103,804 � (103,804 )1 � � � � �
Swap Contracts � � � � 433,504 � � 433,504Dynamic Long/Short U.S.
Equity FundSecurities Lending 274,875 � (274,875 )1 � � � � �
Swap Contracts � � � � 3,413,074 � (2,180,000 ) 1,233,074Balanced Income FundSecurities Lending 27,981 � (27,981 )1 � � � � �
1 The amount of collateral presented has been limited such that the net amount by counterparty cannot be less than zero.
Short-Term Investments � Each Fund may invest a portion of its assets in high-quality money market instruments on an ongoing basis to provideliquidity or for other reasons. The instruments include short-term obligations issued by the U.S. government, its agencies, non-U.S. governmentagencies, negotiable certificates of deposit (�CDs�), fixed time deposits and bankers� acceptances of U.S. and foreign banks and similar institutions,commercial papers, repurchase agreements and money market funds. CDs are short-term negotiable obligations of commercial banks. Time depositsare non-negotiable deposits maintained in banking institutions for specified periods of time at stated interest rates. Banker�s acceptances are time draftsdrawn on commercial banks by borrowers, usually in connection with international transactions.
Tax Information and Dividends and Distributions to Shareholders � It is each Fund�s policy to comply with all requirements of the InternalRevenue Code of 1986, as amended (the �Code�). Each Fund intends to qualify for and to elect treatment as a separate Regulated Investment Company(�RIC�) under Subchapter M of the Code. In order to qualify for the special tax treatment accorded RICs and their shareholders, each Fund must,among other things, distribute with respect to each taxable year an amount equal to or greater than the sum of 90% of its investment company taxableincome and 90% of its net tax-exempt interest income. There can be no guarantee that a Fund will pay dividends. Taxable net realized gains frominvestment transactions, reduced by capital loss carryforwards, if any, are declared and distributed to shareholders at least annually. The capital losscarryforward amount, if any, is available to offset future net capital gains. The Funds may occasionally be required to make supplemental distributionsat some other time during the year. The Trust reserves the right to declare special distributions if, in its reasonable discretion, such action is necessaryor advisable to preserve the status of each Fund as a RIC or to avoid imposition of income or excise taxes on undistributed income. Dividends anddistributions to shareholders are recorded on the ex-dividend date. The amount of dividends and distributions from net investment income and netrealized capital gains are determined in accordance with the requirements of the Code and the U.S. Treasury regulations. These book/tax differences areeither considered temporary or permanent in nature. To the extent these differences are permanent in nature, such amounts are reclassified within thecomponents of net assets based on their Federal tax basis treatment; temporary differences do not require reclassification. Dividends and distributionsthat exceed earnings and profit for tax purposes are reported for tax purposes as a return of capital.
Copyright © 2019 www.secdatabase.com. All Rights Reserved.Please Consider the Environment Before Printing This Document

WisdomTree Trust 149
Copyright © 2019 www.secdatabase.com. All Rights Reserved.Please Consider the Environment Before Printing This Document
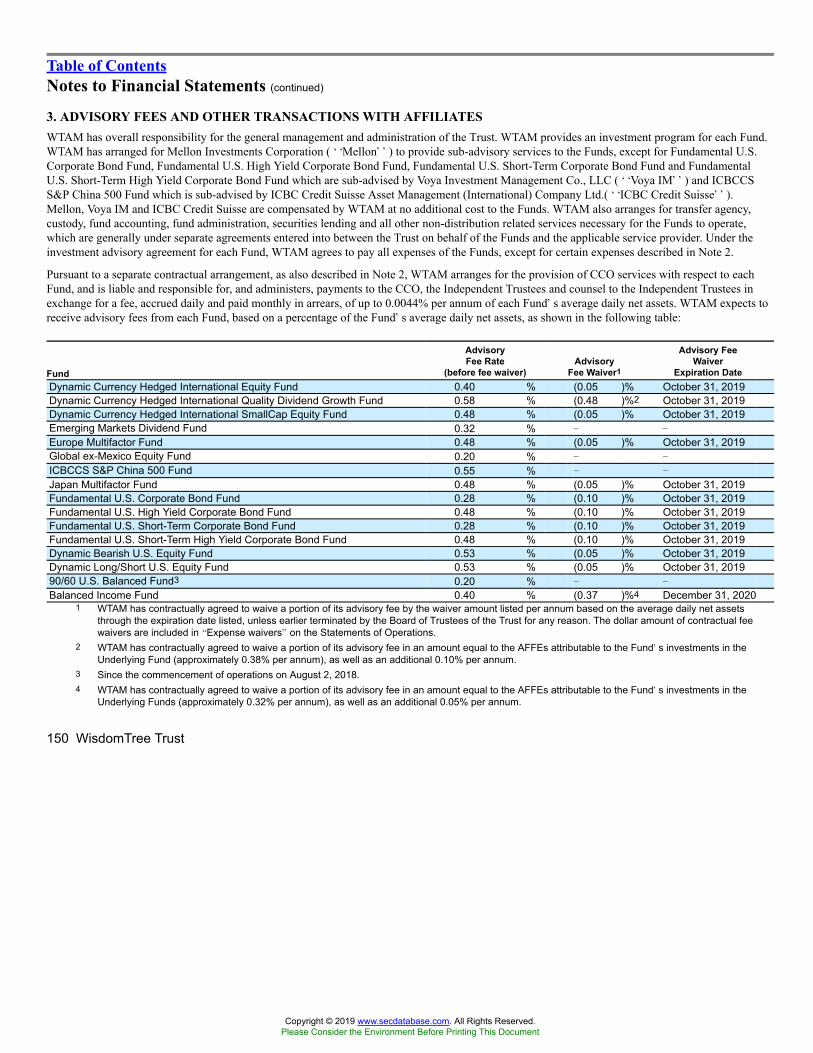
Table of ContentsNotes to Financial Statements (continued)
3. ADVISORY FEES AND OTHER TRANSACTIONS WITH AFFILIATESWTAM has overall responsibility for the general management and administration of the Trust. WTAM provides an investment program for each Fund.WTAM has arranged for Mellon Investments Corporation (��Mellon��) to provide sub-advisory services to the Funds, except for Fundamental U.S.Corporate Bond Fund, Fundamental U.S. High Yield Corporate Bond Fund, Fundamental U.S. Short-Term Corporate Bond Fund and FundamentalU.S. Short-Term High Yield Corporate Bond Fund which are sub-advised by Voya Investment Management Co., LLC (��Voya IM��) and ICBCCSS&P China 500 Fund which is sub-advised by ICBC Credit Suisse Asset Management (International) Company Ltd.(��ICBC Credit Suisse��).Mellon, Voya IM and ICBC Credit Suisse are compensated by WTAM at no additional cost to the Funds. WTAM also arranges for transfer agency,custody, fund accounting, fund administration, securities lending and all other non-distribution related services necessary for the Funds to operate,which are generally under separate agreements entered into between the Trust on behalf of the Funds and the applicable service provider. Under theinvestment advisory agreement for each Fund, WTAM agrees to pay all expenses of the Funds, except for certain expenses described in Note 2.
Pursuant to a separate contractual arrangement, as also described in Note 2, WTAM arranges for the provision of CCO services with respect to eachFund, and is liable and responsible for, and administers, payments to the CCO, the Independent Trustees and counsel to the Independent Trustees inexchange for a fee, accrued daily and paid monthly in arrears, of up to 0.0044% per annum of each Fund�s average daily net assets. WTAM expects toreceive advisory fees from each Fund, based on a percentage of the Fund�s average daily net assets, as shown in the following table:
Fund
AdvisoryFee Rate
(before fee waiver)Advisory
Fee Waiver1
Advisory FeeWaiver
Expiration DateDynamic Currency Hedged International Equity Fund 0.40 % (0.05 )% October 31, 2019Dynamic Currency Hedged International Quality Dividend Growth Fund 0.58 % (0.48 )%2 October 31, 2019Dynamic Currency Hedged International SmallCap Equity Fund 0.48 % (0.05 )% October 31, 2019Emerging Markets Dividend Fund 0.32 % � �
Europe Multifactor Fund 0.48 % (0.05 )% October 31, 2019Global ex-Mexico Equity Fund 0.20 % � �
ICBCCS S&P China 500 Fund 0.55 % � �
Japan Multifactor Fund 0.48 % (0.05 )% October 31, 2019Fundamental U.S. Corporate Bond Fund 0.28 % (0.10 )% October 31, 2019Fundamental U.S. High Yield Corporate Bond Fund 0.48 % (0.10 )% October 31, 2019Fundamental U.S. Short-Term Corporate Bond Fund 0.28 % (0.10 )% October 31, 2019Fundamental U.S. Short-Term High Yield Corporate Bond Fund 0.48 % (0.10 )% October 31, 2019Dynamic Bearish U.S. Equity Fund 0.53 % (0.05 )% October 31, 2019Dynamic Long/Short U.S. Equity Fund 0.53 % (0.05 )% October 31, 201990/60 U.S. Balanced Fund3 0.20 % � �
Balanced Income Fund 0.40 % (0.37 )%4 December 31, 20201 WTAM has contractually agreed to waive a portion of its advisory fee by the waiver amount listed per annum based on the average daily net assets
through the expiration date listed, unless earlier terminated by the Board of Trustees of the Trust for any reason. The dollar amount of contractual feewaivers are included in �Expense waivers� on the Statements of Operations.
2 WTAM has contractually agreed to waive a portion of its advisory fee in an amount equal to the AFFEs attributable to the Fund�s investments in theUnderlying Fund (approximately 0.38% per annum), as well as an additional 0.10% per annum.
3 Since the commencement of operations on August 2, 2018.4 WTAM has contractually agreed to waive a portion of its advisory fee in an amount equal to the AFFEs attributable to the Fund�s investments in the
Underlying Funds (approximately 0.32% per annum), as well as an additional 0.05% per annum.
150 WisdomTree Trust
Copyright © 2019 www.secdatabase.com. All Rights Reserved.Please Consider the Environment Before Printing This Document

Table of ContentsNotes to Financial Statements (continued)
Affiliated holdings are funds which are managed by, or an affiliate of, WTAM. Transactions with affiliated funds during the fiscal year ended June 30,2019 are as follows:
FundValue at
6/30/2018Purchases/Additions
Sales/Reductions
RealizedGain/(Loss)
Change inUnrealized
Appreciation/Depreciation
Value at6/30/2019
DividendIncome
CapitalGain
DistributionDynamic Currency Hedged International
Quality Dividend Growth FundWisdomTree International Quality Dividend
Growth Fund $19,718,373 $20,194,745 $9,895,642 $(779,589) $ (505,034 ) $28,732,853 $465,146 $ �Balanced Income Fund
Dynamic Currency Hedged InternationalEquity Fund $118,584 $225,234 $14,942 $(1,859 ) $10,050 $337,067 $10,210 $ �
Emerging Markets Dividend Fund 87,301 166,885 17,530 (1,896 ) 11,059 245,819 6,668 �
Fundamental U.S. Corporate Bond Fund 65,352 132,726 5,957 (269 ) 14,813 206,665 5,144 �
WisdomTree Emerging Markets Local DebtFund 37,049 93,659 2,343 (338 ) 5,808 133,835 5,471 �
WisdomTree Interest Rate Hedged HighYield Bond Fund 67,789 134,613 8,505 (315 ) (3,046 ) 190,536 8,690 145
WisdomTree International High DividendFund 148,171 284,679 8,927 (1,277 ) 2,499 425,145 15,923 �
WisdomTree U.S. High Dividend Fund 240,384 533,073 8,419 (360 ) 33,464 798,142 21,984 �
WisdomTree U.S. LargeCap Dividend Fund 122,419 265,451 3,926 (174 ) 29,799 413,569 8,903 �
WisdomTree Yield Enhanced U.S.Aggregate Bond Fund 238,569 480,113 16,065 (584 ) 39,358 741,391 19,101 �
Total Balanced Income Fund $1,125,618 $2,316,433 $86,614 $(7,072 ) $143,804 $3,492,169 $102,094 $ 145
During the fiscal year ended June 30, 2019, certain Funds engaged in purchase and sale transactions with funds that have a common investmentadviser, WTAM. These interfund purchase and sale transactions were effected in accordance with Rule 17a-7 under the 1940 Act. For the fiscal yearended June 30, 2019, the cost of purchases, proceeds from sales and the net realized gain or loss recognized upon the disposal of securities resultingfrom interfund transactions are shown in the following table:
Fund Purchases SalesNet Realized
LossDynamic Currency Hedged International Equity Fund $14,735,669 $9,979,520 $(1,241,398)Dynamic Currency Hedged International SmallCap Equity Fund 1,865,584 1,258,477 (157,050 )
Related Party Transactions � WTAM or its affiliates may from time to time own shares of a Fund. As of June 30, 2019, WTAM held shares of thefollowing Funds which were purchased through an unaffiliated broker in ordinary brokerage transactions in the secondary market in which the Funds�shares trade:
FundFund Shares
held by WTAM
Market Value ofFund Shares
held by WTAM
Dividends andDistributions paid to
WTAM onFund Shares
held by WTAMDynamic Currency Hedged International Equity Fund 2,197 $ 63,735 $ 2,113Emerging Markets Dividend Fund 557 17,586 647Japan Multifactor Fund 25,000 612,500 27,138Fundamental U.S. Corporate Bond Fund 191 9,775 27,141Fundamental U.S. High Yield Corporate Bond Fund 331 16,982 619Fundamental U.S. Short-Term Corporate Bond Fund 40,124 2,026,262 21,813Fundamental U.S. Short-Term High Yield Corporate Bond Fund 58 2,934 116Dynamic Bearish U.S. Equity Fund 191 4,128 �
Dynamic Long/Short U.S. Equity Fund 141 3,903 103
4. CAPITAL SHARE TRANSACTIONSAs of June 30, 2019, there were an unlimited number of $0.001 par value shares of beneficial interest authorized by the Trust. Shares are issued andredeemed by each Fund only in creation units or multiples thereof. Except when aggregated in creation units, shares of each Fund are not redeemable.Transactions in shares for each Fund are disclosed in detail in the Statements of Changes in Net Assets. The consideration for the purchase of creationunits of a Fund generally consists of the in-kind contribution of a basket of securities and/or an amount of cash. Investors purchasing and redeemingcreation units may be charged a purchase transaction fee and a redemption transaction fee to offset transfer and other transaction costs associated withthe issuance and redemption of creation units.
WisdomTree Trust 151
Copyright © 2019 www.secdatabase.com. All Rights Reserved.Please Consider the Environment Before Printing This Document

Table of ContentsNotes to Financial Statements (continued)
5. INVESTMENT PORTFOLIO TRANSACTIONSPurchases and sales of investments (excluding purchases and sales resulting from in-kind capital share transactions and short-term investments) and thecost of purchases and the proceeds from sales resulting from in-kind capital share transactions (excluding short-term investments) for the fiscal yearended June 30, 2019 are shown in the following table. Realized gains and losses on sales resulting from in-kind capital share redemptions, as shown onthe Statements of Operations, are not recognized by the Funds for tax purposes.
In-kind Capital Share TransactionsFund Purchases Sales Purchases SalesDynamic Currency Hedged International Equity Fund $72,600,349 $60,694,785 $71,050,953 $85,268,952Dynamic Currency Hedged International Quality Dividend Growth Fund 1,258,993 1,426,776 18,935,751 8,468,865Dynamic Currency Hedged International SmallCap Equity Fund 16,589,854 13,594,031 18,060,936 2,525,089Emerging Markets Dividend Fund 18,009,207 10,346,443 7,937,212 �
Europe Multifactor Fund 15,890,696 15,464,076 � 2,510,839Global ex-Mexico Equity Fund 16,157,080 23,786,147 5,317,155 225,558,204ICBCCS S&P China 500 Fund 14,845,723 4,267,273 701,520 2,837,187Japan Multifactor Fund 2,712,089 2,566,947 � 1,418,247Fundamental U.S. Corporate Bond Fund 1,052,980 1,060,656 � �
Fundamental U.S. High Yield Corporate Bond Fund 1,396,409 1,393,739 9,910,236 �
Fundamental U.S. Short-Term Corporate Bond Fund 1,356,799 1,360,039 � �
Fundamental U.S. Short-Term High Yield Corporate Bond Fund 2,109,545 6,755,354 24,574,844 5,002,927Dynamic Bearish U.S. Equity Fund 21,143,854 23,208,253 11,295,260 7,437,219Dynamic Long/Short U.S. Equity Fund 239,100,671 257,646,110 123,321,481 153,005,15690/60 U.S. Balanced Fund1 648,527 434,041 4,369,034 �
Balanced Income Fund 96,189 92,101 2,350,814 �1 For the period August 2, 2018 (commencement of operations) through June 30, 2019.
6. FEDERAL INCOME TAXESAt June 30, 2019, the cost of investments (including securities on loan and derivatives) for Federal income tax purposes was as follows:
Investments in Long Securities Investments in Financial Derivatives1
Fund Tax Cost
GrossUnrealized
Appreciation
GrossUnrealized
Depreciation
NetUnrealized
Appreciation/(Depreciation)
GrossUnrealized
Appreciation
GrossUnrealized
Depreciation
NetUnrealized
Appreciation/(Depreciation)
Total NetUnrealized
Appreciation/(Depreciation)
Dynamic Currency HedgedInternational Equity Fund $253,845,622 $16,103,232 $(16,116,483) $(13,251 ) $ 1,120 $ (79,550 ) $ (78,430 ) $(91,681 )
Dynamic Currency HedgedInternational QualityDividend Growth Fund 29,407,118 � (674,265 ) (674,265 ) 1,246 (40,206 ) (38,960 ) (713,225 )
Dynamic Currency HedgedInternational SmallCapEquity Fund 35,587,416 1,522,421 (2,223,527 ) (701,106 ) 270 (13,923 ) (13,653 ) (714,759 )
Emerging Markets DividendFund 48,382,827 4,336,687 (2,533,938 ) 1,802,749 � � � 1,802,749
Europe Multifactor Fund 12,699,836 446,552 (355,089 ) 91,463 82 (6,162 ) (6,080 ) 85,383Global ex-Mexico Equity
Fund 3,105,062 178,700 (315,919 ) (137,219 ) � � � (137,219 )ICBCCS S&P China 500
Fund 23,130,872 708,812 (3,147,467 ) (2,438,655 ) � � � (2,438,655 )Japan Multifactor Fund 1,247,424 35,129 (53,495 ) (18,366 ) � � � (18,366 )Fundamental U.S. Corporate
Bond Fund 4,845,475 182,990 (8,853 ) 174,137 � � � 174,137Fundamental U.S. High
Yield Corporate Bond Fund 15,249,537 495,380 (99,080 ) 396,300 � � � 396,300Fundamental U.S. Short-
Term Corporate BondFund 4,891,264 65,216 (3,196 ) 62,020 � � � 62,020
152 WisdomTree Trust
Copyright © 2019 www.secdatabase.com. All Rights Reserved.Please Consider the Environment Before Printing This Document

Table of ContentsNotes to Financial Statements (continued)
Investments in Long Securities Investments in Financial Derivatives1
Fund Tax Cost
GrossUnrealized
Appreciation
GrossUnrealized
Depreciation
NetUnrealized
Appreciation/(Depreciation)
GrossUnrealized
Appreciation
GrossUnrealized
Depreciation
NetUnrealized
Appreciation/(Depreciation)
Total NetUnrealized
Appreciation/(Depreciation)
Fundamental U.S. Short-TermHigh Yield Corporate BondFund $20,666,522 $301,139 $(147,835 ) $153,304 $ � $ � $ � $153,304
Dynamic Bearish U.S. EquityFund 9,408,238 281,898 (524,526 ) (242,628 ) � � � (242,628 )
Dynamic Long/Short U.S. EquityFund 73,512,689 3,191,592 (4,457,569) (1,265,977 ) � � � (1,265,977 )
90/60 U.S. Balanced Fund 4,561,978 492,474 (118,489 ) 373,985 � � � 373,985Balanced Income Fund 3,617,391 109,635 (11,340 ) 98,295 � � � 98,295
1 Certain financial derivatives may be considered section 1256 contracts under the Code. Each section 1256 contract held at the close of a taxable yearshall be treated as sold for its fair market value on the last business day of such taxable year (and any realized gain and loss shall be taken into accountfor the taxable year). As such, the unrealized appreciation/(depreciation) for financial derivatives on a tax basis may not correspond to the unrealizedappreciation/(depreciation) on a GAAP basis. The unrealized appreciation/(depreciation) for financial derivatives on a GAAP basis is located in therespective financial derivatives tables in each Fund�s Schedule of Investments.
At June 30, 2019, the components of accumulated earnings/(loss) on a tax-basis were as follows:
FundUndistributed
Ordinary Income
UndistributedCapital and
Other Gains/(Losses)
Net UnrealizedAppreciation/(Depreciation)
Currency andOther Unrealized
Appreciation/(Depreciation)
Total AccumulatedEarnings/(Losses)
Dynamic Currency Hedged International EquityFund $ 475,898 $(10,316,504) $(91,681 ) $ 3,106 $ (9,929,181 )
Dynamic Currency Hedged International QualityDividend Growth Fund � (102,480 ) (713,225 ) 5 (815,700 )
Dynamic Currency Hedged InternationalSmallCap Equity Fund 99,040 (1,265,469 ) (714,759 ) 283 (1,880,905 )
Emerging Markets Dividend Fund 286,351 (1,312,844 ) 1,802,749 784 777,040Europe Multifactor Fund 39,781 (1,628,552 ) 85,383 (224 ) (1,503,612 )Global ex-Mexico Equity Fund 39,795 (3,584,301 ) (137,219 ) (1,896 ) (3,683,621 )ICBCCS S&P China 500 Fund 98,337 (438,505 ) (2,438,655 ) 133 (2,778,690 )Japan Multifactor Fund 4,250 (141,180 ) (18,366 ) 59 (155,237 )Fundamental U.S. Corporate Bond Fund 2,575 (66,105 ) 174,137 � 110,607Fundamental U.S. High Yield Corporate Bond
Fund 1,838 (2,090 ) 396,300 � 396,048Fundamental U.S. Short-Term Corporate Bond
Fund 1,694 (21,217 ) 62,020 � 42,497Fundamental U.S. Short-Term High Yield
Corporate Bond Fund 4,823 (93,597 ) 153,304 � 64,530Dynamic Bearish U.S. Equity Fund � (3,690,856 ) (242,628 ) � (3,933,484 )Dynamic Long/Short U.S. Equity Fund � (36,033,374) (1,265,977 ) � (37,299,351 )90/60 U.S. Balanced Fund 49,215 113,594 373,985 � 536,794Balanced Income Fund 2,088 (7,072 ) 98,295 � 93,311
WisdomTree Trust 153
Copyright © 2019 www.secdatabase.com. All Rights Reserved.Please Consider the Environment Before Printing This Document
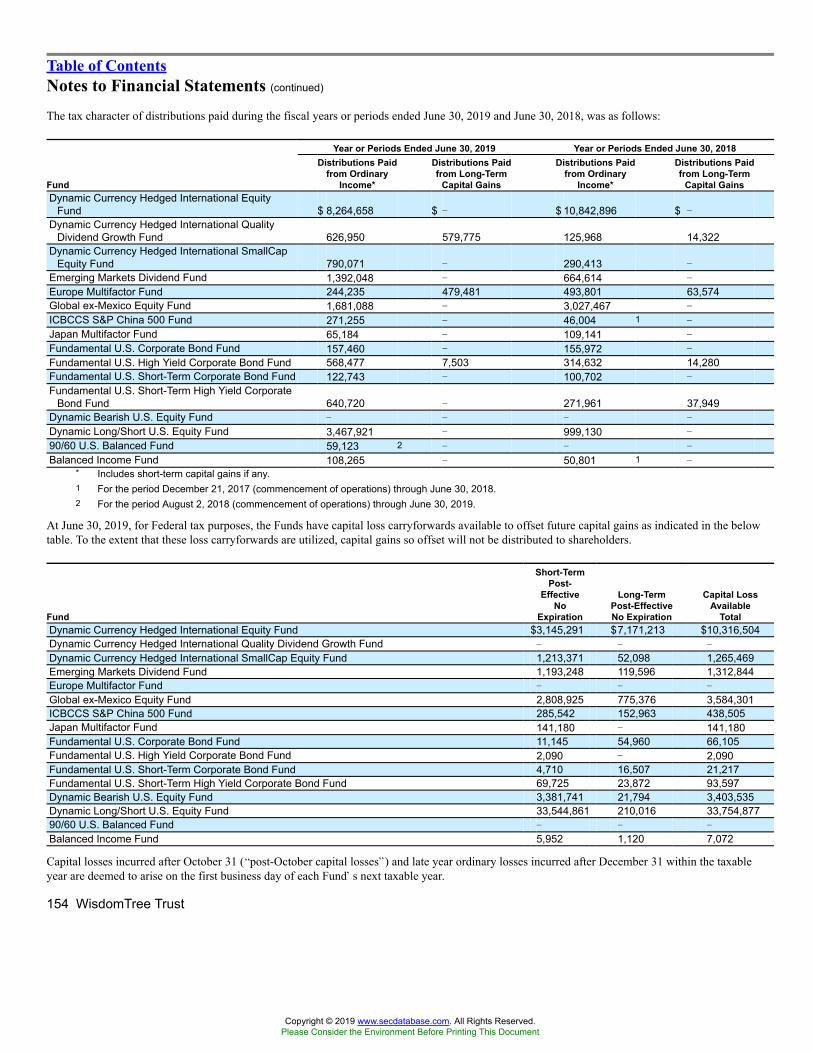
Table of ContentsNotes to Financial Statements (continued)
The tax character of distributions paid during the fiscal years or periods ended June 30, 2019 and June 30, 2018, was as follows:
Year or Periods Ended June 30, 2019 Year or Periods Ended June 30, 2018
Fund
Distributions Paidfrom Ordinary
Income*
Distributions Paidfrom Long-Term
Capital Gains
Distributions Paidfrom Ordinary
Income*
Distributions Paidfrom Long-Term
Capital GainsDynamic Currency Hedged International Equity
Fund $ 8,264,658 $ � $ 10,842,896 $ �Dynamic Currency Hedged International Quality
Dividend Growth Fund 626,950 579,775 125,968 14,322Dynamic Currency Hedged International SmallCap
Equity Fund 790,071 � 290,413 �
Emerging Markets Dividend Fund 1,392,048 � 664,614 �
Europe Multifactor Fund 244,235 479,481 493,801 63,574Global ex-Mexico Equity Fund 1,681,088 � 3,027,467 �
ICBCCS S&P China 500 Fund 271,255 � 46,004 1 �
Japan Multifactor Fund 65,184 � 109,141 �
Fundamental U.S. Corporate Bond Fund 157,460 � 155,972 �
Fundamental U.S. High Yield Corporate Bond Fund 568,477 7,503 314,632 14,280Fundamental U.S. Short-Term Corporate Bond Fund 122,743 � 100,702 �
Fundamental U.S. Short-Term High Yield CorporateBond Fund 640,720 � 271,961 37,949
Dynamic Bearish U.S. Equity Fund � � � �
Dynamic Long/Short U.S. Equity Fund 3,467,921 � 999,130 �
90/60 U.S. Balanced Fund 59,123 2 � � �
Balanced Income Fund 108,265 � 50,801 1 �* Includes short-term capital gains if any.1 For the period December 21, 2017 (commencement of operations) through June 30, 2018.2 For the period August 2, 2018 (commencement of operations) through June 30, 2019.
At June 30, 2019, for Federal tax purposes, the Funds have capital loss carryforwards available to offset future capital gains as indicated in the belowtable. To the extent that these loss carryforwards are utilized, capital gains so offset will not be distributed to shareholders.
Fund
Short-TermPost-
EffectiveNo
Expiration
Long-TermPost-EffectiveNo Expiration
Capital LossAvailable
TotalDynamic Currency Hedged International Equity Fund $3,145,291 $7,171,213 $10,316,504Dynamic Currency Hedged International Quality Dividend Growth Fund � � �
Dynamic Currency Hedged International SmallCap Equity Fund 1,213,371 52,098 1,265,469Emerging Markets Dividend Fund 1,193,248 119,596 1,312,844Europe Multifactor Fund � � �
Global ex-Mexico Equity Fund 2,808,925 775,376 3,584,301ICBCCS S&P China 500 Fund 285,542 152,963 438,505Japan Multifactor Fund 141,180 � 141,180Fundamental U.S. Corporate Bond Fund 11,145 54,960 66,105Fundamental U.S. High Yield Corporate Bond Fund 2,090 � 2,090Fundamental U.S. Short-Term Corporate Bond Fund 4,710 16,507 21,217Fundamental U.S. Short-Term High Yield Corporate Bond Fund 69,725 23,872 93,597Dynamic Bearish U.S. Equity Fund 3,381,741 21,794 3,403,535Dynamic Long/Short U.S. Equity Fund 33,544,861 210,016 33,754,87790/60 U.S. Balanced Fund � � �
Balanced Income Fund 5,952 1,120 7,072
Capital losses incurred after October 31 (�post-October capital losses�) and late year ordinary losses incurred after December 31 within the taxableyear are deemed to arise on the first business day of each Fund�s next taxable year.
154 WisdomTree Trust
Copyright © 2019 www.secdatabase.com. All Rights Reserved.Please Consider the Environment Before Printing This Document
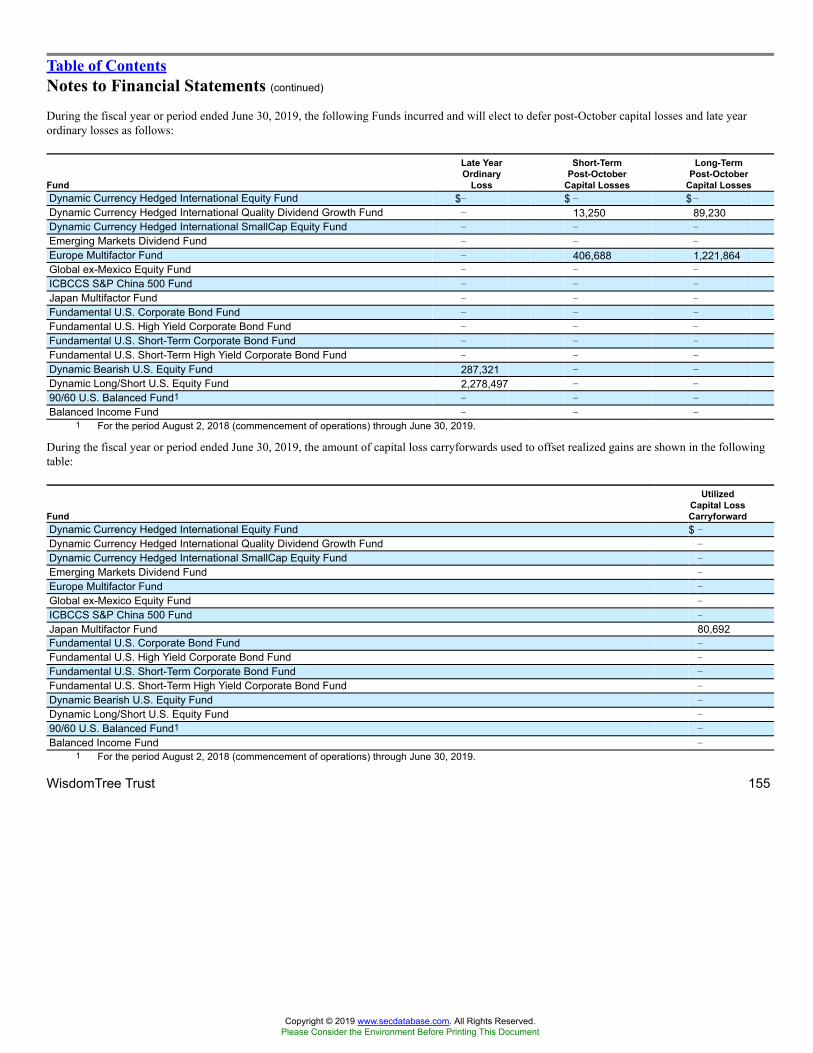
Table of ContentsNotes to Financial Statements (continued)
During the fiscal year or period ended June 30, 2019, the following Funds incurred and will elect to defer post-October capital losses and late yearordinary losses as follows:
Fund
Late YearOrdinary
Loss
Short-TermPost-October
Capital Losses
Long-TermPost-October
Capital LossesDynamic Currency Hedged International Equity Fund $� $ � $�Dynamic Currency Hedged International Quality Dividend Growth Fund � 13,250 89,230Dynamic Currency Hedged International SmallCap Equity Fund � � �
Emerging Markets Dividend Fund � � �
Europe Multifactor Fund � 406,688 1,221,864Global ex-Mexico Equity Fund � � �
ICBCCS S&P China 500 Fund � � �
Japan Multifactor Fund � � �
Fundamental U.S. Corporate Bond Fund � � �
Fundamental U.S. High Yield Corporate Bond Fund � � �
Fundamental U.S. Short-Term Corporate Bond Fund � � �
Fundamental U.S. Short-Term High Yield Corporate Bond Fund � � �
Dynamic Bearish U.S. Equity Fund 287,321 � �
Dynamic Long/Short U.S. Equity Fund 2,278,497 � �
90/60 U.S. Balanced Fund1 � � �
Balanced Income Fund � � �1 For the period August 2, 2018 (commencement of operations) through June 30, 2019.
During the fiscal year or period ended June 30, 2019, the amount of capital loss carryforwards used to offset realized gains are shown in the followingtable:
Fund
UtilizedCapital LossCarryforward
Dynamic Currency Hedged International Equity Fund $ �Dynamic Currency Hedged International Quality Dividend Growth Fund �
Dynamic Currency Hedged International SmallCap Equity Fund �
Emerging Markets Dividend Fund �
Europe Multifactor Fund �
Global ex-Mexico Equity Fund �
ICBCCS S&P China 500 Fund �
Japan Multifactor Fund 80,692Fundamental U.S. Corporate Bond Fund �
Fundamental U.S. High Yield Corporate Bond Fund �
Fundamental U.S. Short-Term Corporate Bond Fund �
Fundamental U.S. Short-Term High Yield Corporate Bond Fund �
Dynamic Bearish U.S. Equity Fund �
Dynamic Long/Short U.S. Equity Fund �
90/60 U.S. Balanced Fund1 �
Balanced Income Fund �1 For the period August 2, 2018 (commencement of operations) through June 30, 2019.
WisdomTree Trust 155
Copyright © 2019 www.secdatabase.com. All Rights Reserved.Please Consider the Environment Before Printing This Document

Table of ContentsNotes to Financial Statements (continued)
At June 30, 2019, the effect of permanent �book/tax� reclassifications resulted in increases (decreases) to the components of net assets as follows:
FundTotal Distributable
Earnings (Loss)Paid-inCapital
Dynamic Currency Hedged International Equity Fund $ (12,228,481 ) $12,228,481Dynamic Currency Hedged International Quality Dividend Growth Fund 561,259 (561,259 )Dynamic Currency Hedged International SmallCap Equity Fund (619,075 ) 619,075Emerging Markets Dividend Fund (1 ) 1Europe Multifactor Fund 203,998 (203,998 )Global ex-Mexico Equity Fund (572,509 ) 572,509ICBCCS S&P China 500 Fund (61,994 ) 61,994Japan Multifactor Fund (48,426 ) 48,426Fundamental U.S. Corporate Bond Fund � �
Fundamental U.S. High Yield Corporate Bond Fund � �
Fundamental U.S. Short-Term Corporate Bond Fund � �
Fundamental U.S. Short-Term High Yield Corporate Bond Fund (11,803 ) 11,803Dynamic Bearish U.S. Equity Fund (405,261 ) 405,261Dynamic Long/Short U.S. Equity Fund (11,491,451 ) 11,491,45190/60 U.S. Balanced Fund � �
Balanced Income Fund � �
These differences are primarily due to redemptions-in-kind.
GAAP provides guidance on tax provisions that prescribe a minimum threshold for financial statement recognition of the benefit of a tax position takenor expected to be taken in a tax return. Foreign taxes are provided for based on each Fund�s understanding of the tax rules and rates that exist in theforeign markets in which it invests. Taxes are accrued and applied to net investment income, net realized capital gains and net unrealized appreciation,as applicable, as the income is earned or capital gains are recorded. As of and during the fiscal year or period ended June 30, 2019, the Funds did nothave any liabilities for unrecognized tax benefits relating to uncertain income tax positions they have taken or expect to take in the future. If applicable,the Funds will recognize interest accrued related to unrecognized tax benefits in interest expense and penalties in �Other� expenses on the Statementsof Operations. The Funds file tax returns with the Internal Revenue Service, the State of New York, and various other states. Generally, each of the taxyears in the four-year period ended June 30, 2019, remains subject to examination by taxing authorities.
7. RECENT ACCOUNTING PRONOUNCEMENTSOn August 17, 2018, the SEC voted to adopt �Disclosure Update and Simplification� amendments to certain of its disclosure requirements that havebecome redundant, duplicative, overlapping, outdated, or superseded, in light of other SEC disclosure requirements, GAAP, or changes in theinformation environment. The SEC will also be referring certain SEC disclosure requirements that overlap with, but require information incremental to,GAAP to the FASB for potential incorporation into GAAP. The amendments are intended to facilitate the disclosure of information to investors andsimplify compliance without significantly altering the total mix of information provided to investors. These amendments became effective onNovember 5, 2018. WTAM has evaluated these amendments and determined that there is no significant impact on the Trust�s financial statements andrelated disclosures. The specific amendments incorporated into the Trust�s financial statements pertain to (i) the amendment requiring the presentationof the distributable earnings in total on the Statements of Assets and Liabilities, rather than showing the 3 components of distributable earnings (i.e., (1)undistributed (distributions in excess of) net investment income, (2) accumulated net realized gain (loss) on investments and (3) net unrealizedappreciation (depreciation) on investments, and (ii) the amendment requiring the presentation of distributions to shareholders in total on the Statementsof Changes in Net Assets, except for tax return of capital distributions, which shall continue to disclosed separately.On August 28, 2018, the FASB issued ASU 2018-13, Fair Value Measurement (Topic 820): Disclosure Framework � Changes to the DisclosureRequirements for Fair Value Measurement. ASU 2018-13 includes removals, additions and modifications to the disclosure requirements for fair valuemeasurements that are intended to improve the effectiveness of disclosures in the notes to financial statements. The amendments in ASU 2018-13 areeffective for all entities for fiscal years, and interim periods within those fiscal years, beginning after December 15, 2019. An entity is permitted toearly adopt any removed or modified disclosures upon issuance of this ASU and delay adoption of the additional disclosures until their effective date.WTAM has evaluated ASU 2018-13 and has adopted the disclosure framework for the Trust�s financial statements and the impact to the Trust�sfinancial statements was immaterial.
156 WisdomTree Trust
Copyright © 2019 www.secdatabase.com. All Rights Reserved.Please Consider the Environment Before Printing This Document

Table of ContentsNotes to Financial Statements (concluded)
8. ADDITIONAL INFORMATIONAt a meeting of the Board of Trustees of the Trust held on June 10-11, 2019, the Board of Trustees approved name changes for the WisdomTreeFundamental U.S. Corporate Bond Fund, WisdomTree Fundamental U.S. High Yield Corporate Bond Fund, WisdomTree Fundamental U.S. Short-Term Corporate Bond Fund, and the WisdomTree Fundamental U.S. Short-Term High Yield Corporate Bond Fund (the �Affected Funds�). Effectiveon or around September 30, 2019, the word �Fundamental� will be removed from each Affected Fund�s name and, thereafter, the respective AffectedFunds will be known as the WisdomTree U.S. Corporate Bond Fund, WisdomTree U.S. High Yield Corporate Bond Fund, WisdomTree U.S. Short-Term Corporate Bond Fund, and the WisdomTree U.S. Short-Term High Yield Corporate Bond Fund. There will be no change to the investmentobjectives, policies and/or strategies of any of the Affected Funds as a result of the name change.
WisdomTree Trust 157
Copyright © 2019 www.secdatabase.com. All Rights Reserved.Please Consider the Environment Before Printing This Document
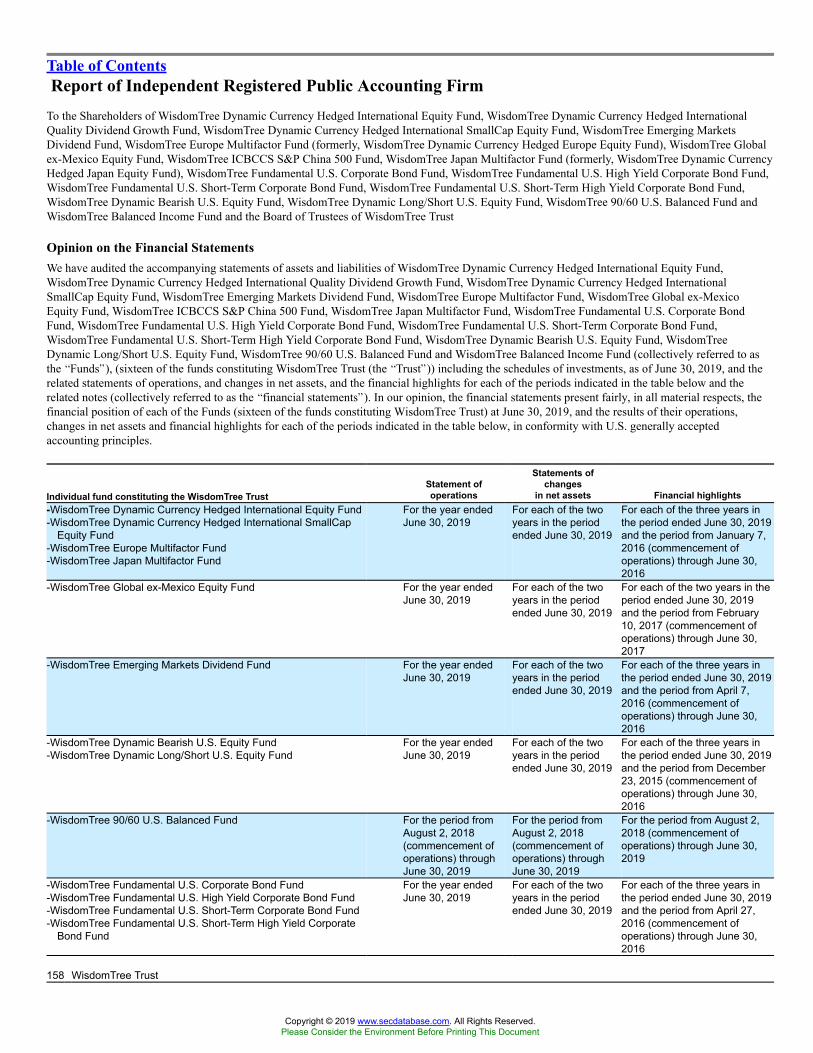
Table of ContentsReport of Independent Registered Public Accounting Firm
To the Shareholders of WisdomTree Dynamic Currency Hedged International Equity Fund, WisdomTree Dynamic Currency Hedged InternationalQuality Dividend Growth Fund, WisdomTree Dynamic Currency Hedged International SmallCap Equity Fund, WisdomTree Emerging MarketsDividend Fund, WisdomTree Europe Multifactor Fund (formerly, WisdomTree Dynamic Currency Hedged Europe Equity Fund), WisdomTree Globalex-Mexico Equity Fund, WisdomTree ICBCCS S&P China 500 Fund, WisdomTree Japan Multifactor Fund (formerly, WisdomTree Dynamic CurrencyHedged Japan Equity Fund), WisdomTree Fundamental U.S. Corporate Bond Fund, WisdomTree Fundamental U.S. High Yield Corporate Bond Fund,WisdomTree Fundamental U.S. Short-Term Corporate Bond Fund, WisdomTree Fundamental U.S. Short-Term High Yield Corporate Bond Fund,WisdomTree Dynamic Bearish U.S. Equity Fund, WisdomTree Dynamic Long/Short U.S. Equity Fund, WisdomTree 90/60 U.S. Balanced Fund andWisdomTree Balanced Income Fund and the Board of Trustees of WisdomTree Trust
Opinion on the Financial StatementsWe have audited the accompanying statements of assets and liabilities of WisdomTree Dynamic Currency Hedged International Equity Fund,WisdomTree Dynamic Currency Hedged International Quality Dividend Growth Fund, WisdomTree Dynamic Currency Hedged InternationalSmallCap Equity Fund, WisdomTree Emerging Markets Dividend Fund, WisdomTree Europe Multifactor Fund, WisdomTree Global ex-MexicoEquity Fund, WisdomTree ICBCCS S&P China 500 Fund, WisdomTree Japan Multifactor Fund, WisdomTree Fundamental U.S. Corporate BondFund, WisdomTree Fundamental U.S. High Yield Corporate Bond Fund, WisdomTree Fundamental U.S. Short-Term Corporate Bond Fund,WisdomTree Fundamental U.S. Short-Term High Yield Corporate Bond Fund, WisdomTree Dynamic Bearish U.S. Equity Fund, WisdomTreeDynamic Long/Short U.S. Equity Fund, WisdomTree 90/60 U.S. Balanced Fund and WisdomTree Balanced Income Fund (collectively referred to asthe �Funds�), (sixteen of the funds constituting WisdomTree Trust (the �Trust�)) including the schedules of investments, as of June 30, 2019, and therelated statements of operations, and changes in net assets, and the financial highlights for each of the periods indicated in the table below and therelated notes (collectively referred to as the �financial statements�). In our opinion, the financial statements present fairly, in all material respects, thefinancial position of each of the Funds (sixteen of the funds constituting WisdomTree Trust) at June 30, 2019, and the results of their operations,changes in net assets and financial highlights for each of the periods indicated in the table below, in conformity with U.S. generally acceptedaccounting principles.
Individual fund constituting the WisdomTree TrustStatement ofoperations
Statements ofchanges
in net assets Financial highlights-WisdomTree Dynamic Currency Hedged International Equity Fund-WisdomTree Dynamic Currency Hedged International SmallCap
Equity Fund-WisdomTree Europe Multifactor Fund-WisdomTree Japan Multifactor Fund
For the year endedJune 30, 2019
For each of the twoyears in the periodended June 30, 2019
For each of the three years inthe period ended June 30, 2019and the period from January 7,2016 (commencement ofoperations) through June 30,2016
-WisdomTree Global ex-Mexico Equity Fund For the year endedJune 30, 2019
For each of the twoyears in the periodended June 30, 2019
For each of the two years in theperiod ended June 30, 2019and the period from February10, 2017 (commencement ofoperations) through June 30,2017
-WisdomTree Emerging Markets Dividend Fund For the year endedJune 30, 2019
For each of the twoyears in the periodended June 30, 2019
For each of the three years inthe period ended June 30, 2019and the period from April 7,2016 (commencement ofoperations) through June 30,2016
-WisdomTree Dynamic Bearish U.S. Equity Fund-WisdomTree Dynamic Long/Short U.S. Equity Fund
For the year endedJune 30, 2019
For each of the twoyears in the periodended June 30, 2019
For each of the three years inthe period ended June 30, 2019and the period from December23, 2015 (commencement ofoperations) through June 30,2016
-WisdomTree 90/60 U.S. Balanced Fund For the period fromAugust 2, 2018(commencement ofoperations) throughJune 30, 2019
For the period fromAugust 2, 2018(commencement ofoperations) throughJune 30, 2019
For the period from August 2,2018 (commencement ofoperations) through June 30,2019
-WisdomTree Fundamental U.S. Corporate Bond Fund-WisdomTree Fundamental U.S. High Yield Corporate Bond Fund-WisdomTree Fundamental U.S. Short-Term Corporate Bond Fund-WisdomTree Fundamental U.S. Short-Term High Yield Corporate
Bond Fund
For the year endedJune 30, 2019
For each of the twoyears in the periodended June 30, 2019
For each of the three years inthe period ended June 30, 2019and the period from April 27,2016 (commencement ofoperations) through June 30,2016
158 WisdomTree Trust
Copyright © 2019 www.secdatabase.com. All Rights Reserved.Please Consider the Environment Before Printing This Document

Table of ContentsReport of Independent Registered Public Accounting Firm (concluded)
Individual fund constituting the WisdomTree TrustStatement ofoperations
Statements ofchanges
in net assets Financial highlights-WisdomTree Dynamic Currency Hedged International Quality
Dividend Growth FundFor the year endedJune 30, 2019
For each of the twoyears in the periodended June 30, 2019
For each of the two years in theperiod ended June 30, 2019and the period from November3, 2016 (commencement ofoperations) through June 30,2017
-WisdomTree Balanced Income Fund-WisdomTree ICBCCS S&P China 500 Fund
For the year endedJune 30, 2019
For the year endedJune 30, 2019 andthe period fromDecember 21, 2017(commencement ofoperations) throughJune 30, 2018
For the year ended June 30,2019 and the period fromDecember 21, 2017(commencement of operations)through June 30, 2018
Basis for OpinionThese financial statements are the responsibility of the Trust�s management. Our responsibility is to express an opinion on each of the Funds� financialstatements based on our audits. We are a public accounting firm registered with the Public Company Accounting Oversight Board (United States)(�PCAOB�) and are required to be independent with respect to the Trust in accordance with the U.S. federal securities laws and the applicable rulesand regulations of the Securities and Exchange Commission and the PCAOB.
We conducted our audits in accordance with the standards of the PCAOB. Those standards require that we plan and perform the audit to obtainreasonable assurance about whether the financial statements are free of material misstatement, whether due to error or fraud. The Trust is not requiredto have, nor were we engaged to perform, an audit of the Trust�s internal control over financial reporting. As part of our audits, we are required toobtain an understanding of internal control over financial reporting, but not for the purpose of expressing an opinion on the effectiveness of the Trust�sinternal control over financial reporting. Accordingly, we express no such opinion.
Our audits included performing procedures to assess the risks of material misstatement of the financial statements, whether due to error or fraud, andperforming procedures that respond to those risks. Such procedures included examining, on a test basis, evidence regarding the amounts anddisclosures in the financial statements. Our procedures included confirmation of securities owned as of June 30, 2019, by correspondence with thecustodian and brokers or by other appropriate auditing procedures where replies from brokers were not received. Our audits also included evaluatingthe accounting principles used and significant estimates made by management, as well as evaluating the overall presentation of the financial statements.We believe that our audits provide a reasonable basis for our opinion.
We have served as the auditor of one or more WisdomTree investment companies since 2006.
New York, NYAugust 22, 2019
WisdomTree Trust 159
Copyright © 2019 www.secdatabase.com. All Rights Reserved.Please Consider the Environment Before Printing This Document

Table of ContentsApproval of Investment Advisory and Sub-Advisory Agreements (unaudited)
Consideration of the Renewal of Investment Advisory and Sub-Investment Advisory Agreements(except the WisdomTree 90/60 U.S. Balanced Income Fund)
At a meeting of the Board of Trustees (the �Board� or the �Trustees�) of the WisdomTree Trust (the �Trust�) held on September 24-25, 2018 (the�Meeting�), the Trustees, including those Trustees who are not �interested persons� (as defined in the Investment Company Act of 1940, as amended)of the Trust (the �Independent Trustees�), considered the renewal of the Investment Advisory Agreements between WisdomTree Asset Management,Inc. (�WTAM�) and the Trust, on behalf of its series (each, a �Fund,� and, collectively, the �Funds�), pursuant to which WTAM provides the Fundswith investment advisory services (the �Advisory Agreements�), the Sub-Advisory Agreement (the �Mellon Investments Corporation Sub-AdvisoryAgreement�), pursuant to which Mellon Investments Corporation (�Mellon�) coordinates the investment and reinvestment of the assets of theapplicable Funds, and the Investment Sub-Advisory Agreement (together with the Mellon Sub-Advisory Agreement, the �Sub-Advisory Agreements,�and, collectively with the Advisory Agreements and the Mellon Sub-Advisory Agreement, the �Agreements�), pursuant to which Voya InvestmentManagement Co. LLC (�Voya�) and ICBC Credit Suisse Asset Management (International) Company Ltd. (�ICBC,� and, together with Mellon, the�Sub-Advisers�) coordinates the investment and reinvestment of the assets of the applicable Funds.
The Trustees requested, and WTAM provided, such information as the Trustees, with advice from counsel to the Trust and independent legal counsel,deemed reasonably necessary to evaluate the Agreements. At a meeting of a committee of Independent Trustees (the �Contracts Review Committee�)held on August 2, 2018, representatives from WTAM presented preliminary information to the Trustees relating to the continuance of the Agreements,and the Trustees, including the Independent Trustees, reviewed and discussed such information. Further information was presented at the Board�srequest at the Meeting.
The Independent Trustees were assisted in their review by independent legal counsel and met with counsel in executive session separate from WTAMrepresentatives and the Sub-Advisers. In considering the renewal of the Agreements, the Board considered all factors that it believed to be relevant,including those discussed below. The Board did not identify any one factor as dispositive, and each Trustee may have attributed different weights to thefactors considered.
Analysis of Nature, Extent, and Quality of Services Provided to the Funds. The Board considered information provided to them at the Meeting and inprevious presentations throughout the year from WTAM representatives regarding the nature, extent, and quality of the services provided to the Funds,recognizing WTAM�s and the Sub-Advisers� operational capabilities and resources. The Board also discussed the role of WisdomTree Investments,Inc. (�WTI�), the parent of WTAM, as index provider to certain Funds, which comprise the substantial majority of assets in the WisdomTree fundcomplex. The Board noted that the strategies represented by those Funds tracking affiliated WTI indexes are unique, based on WTI�s intellectualproperty and are only available for use by applicable Funds through WTAM. The Board noted WTAM�s belief that shareholders have invested in suchFunds on the strength of WTI�s intellectual property and WTAM�s industry standing and reputation and with the expectation that WTAM will have acontinuing role in providing advisory services to the Funds based on the WTI indexes. The Board also noted the extensive responsibilities that WTAMhas as investment adviser to the Funds, including: the selection of, and supervisory responsibilities and activities over, the Sub-Advisers, includingoversight of the Sub-Advisers� adherence to each Fund�s investment strategy and restrictions, monitoring of the Sub-Advisers� buying and selling ofsecurities and derivatives transactions, review of Sub-Adviser performance, review of proxies voted by the Sub-Advisers and oversight of, and theprovision of consultation to, the Sub-Advisers with respect to the creation of custom creation or redemption baskets for authorized participants;oversight of the daily valuation of the Funds� portfolio holdings; oversight of general Fund compliance with federal and state laws; andimplementation of Board directives as they relate to the Funds. The Board also considered research support available to, and management capabilitiesof, the Funds� management personnel and that WTAM provides oversight of day-to-day Fund operations, including fund accounting, tax matters,administration and legal assistance in meeting disclosure and regulatory requirements. Based on management�s representations, the Board expectedthat there would be no reduction in the scope of services required by or provided by WTAM and the Sub-Advisers under the relevant Agreements. TheBoard noted that WTAM has continued to commit significant resources toward the fund complex and has made substantial investments to improve theservices offered by WTAM, which benefit Fund shareholders.
Based on review of this information and the other factors considered at the Meeting, the Board concluded that the nature, extent and quality of servicesprovided by WTAM and the Sub-Advisers under the Advisory Agreements and Sub-Advisory Agreements, respectively, are adequate and appropriateand supported the Board�s approval of the renewal of the Agreements.
Comparative Analysis of the Funds� Performance and Management Fee and Expense Ratio. The Board reviewed reports prepared by BroadridgeFinancial Solutions, Inc. (�Broadridge�), an independent provider of investment company data, which included information (1) measuring each indexFund�s performance by how well it tracked the relevant benchmark index and (2) comparing each Fund�s actual management fees and total expenseswith those of a group of comparable funds (the �Expense Group�) and, with respect to total expenses, with a broader group of funds (the �ExpenseUniverse�), the information for which was derived in part from fund financial statements available to Broadridge as of the date of its analysis. TheContracts Review Committee and the Independent Trustees previously had reviewed and discussed the methodology Broadridge used to select theExpense Groups and Expense Universes. The Board noted that the Expense Groups and Expense Universes included only pure-index and index-based
160 WisdomTree Trust
Copyright © 2019 www.secdatabase.com. All Rights Reserved.Please Consider the Environment Before Printing This Document
Table of ContentsApproval of Investment Advisory and Sub-Advisory Agreements (unaudited) (continued)
exchange traded funds (�ETFs�) as comparison funds. The Board also noted that due to the special characteristics of certain Funds, there arelimitations in providing comparable funds in the Expense Groups and Expense Universes, and the information in the Broadridge reports may or maynot provide meaningful direct comparisons to the Funds. The Board also reviewed reports prepared by WTAM presenting performance data for Fundswith ten years of performance history and for WisdomTree indexes with at least three years of performance history that are tracked by an index Fund.
The Board discussed the index Funds� performance, noting that the substantial majority of index Funds seek to track their own WisdomTreebenchmark index. During the prior year, the Board received periodic reports on the Funds� performance in comparison to their relevant benchmarkindexes. In response to questions from the Independent Trustees, WTAM representatives discussed the relative performance of the Funds and thefactors affecting such performance. On that basis, the Board determined to monitor carefully in the coming year disparities in performance � bothpositive and negative � but did not believe that the disparities in the past reflected any characteristics requiring immediate action by WTAM or aSub-Adviser.
The Board also reviewed the range of actual management fees and total expenses of the Expense Group funds and, with respect to total expenses,Expense Universe funds, as well as the advisory fees and total expenses of certain funds not included in the Broadridge reports that WTAM considersto be significant competitors of the Funds, and discussed the results of the comparisons. With respect to comparisons of actual management fees, theBoard noted the Funds� unitary fee structure and that the Expense Groups and Expense Universes generally included both ETFs with and without aunitary fee structure. The Board also noted that certain comparison funds in certain Expense Groups and Expense Universes benefited from waivers ofall or a portion of their management fees and reimbursement of certain operating expenses. The Board noted that the total expenses of many of theFunds were within five basis points of the median or average total expenses of the funds in the Funds� respective Expense Groups. In those specificinstances where a Fund�s total expenses departed more significantly from comparative funds, the Independent Trustees sought explanations fromWTAM, which generally attributed the disparities to the limitations within peer data and/or the unique attributes of a Fund.
The Board considered the fees to the Sub-Advisers in relation to the fees paid to WTAM by the Funds and the respective services provided by theSub-Advisers and WTAM. The Board also noted that the Sub-Advisers� fees are paid by WTAM (out of its fee paid by the relevant Funds) and not theFunds. The Board considered the meaningful differences in the services that WTAM provides to the Funds as compared to the Sub-Advisers, includingthat the role of a Sub-Adviser in making investment recommendations with respect to a Fund tracking an index is a rules-based function, with oversightby WTAM in seeking to ensure compliance with such rules. The Board also considered the entrepreneurial and expense risk borne by WTAM that isassociated with Funds� unitary fee structure, which frequently includes minimum fees (such as those to a Sub-Adviser), regardless of whether the assetsize of a Fund has grown to a sufficient size.
Based on this review and the other factors considered at the Meeting, the Board concluded that, with respect to each Fund, the Fund�s performance, thefees paid to WTAM and the relevant Sub-Adviser and the Fund�s total expenses supported the Board�s approval of the renewal of the relevantAgreements.
Analysis of Profitability and Economies of Scale. WTAM representatives reviewed the expenses allocated and profit received by WTAM and theresulting profitability percentage for managing each Fund and the aggregate profitability percentage to WTAM for managing the WisdomTree fundcomplex, and the method used to determine the expenses and profit.
The Board considered the profitability analysis (1) as part of its evaluation of whether the fees under the Agreements bear a reasonable relationship tothe mix of services provided by WTAM and the Sub-Advisers, including the nature, extent and quality of such services, and (2) in light of the relevantcircumstances for each Fund and the extent to which economies of scale would be realized if the Fund grows and whether fee levels reflect theseeconomies of scale for the benefit of Fund shareholders. WTAM representatives noted that a discussion of economies of scale is predicated on a Fundhaving achieved a substantial size and that, if a Fund�s assets had been decreasing, the possibility that WTAM may have realized material economiesof scale would be less. WTAM representatives also noted that, as a result of shared and allocated costs among the WisdomTree funds, the extent ofeconomies of scale could depend substantially on the level of assets in the fund complex as a whole and the relative size and asset size changes amongthe Funds. The Board noted that certain Funds had grown rapidly over a relatively short period of time after longer periods of slow or no growth,during which there were years of losses for WTAM in managing such Funds that had only recently turned profitable and years of substantialcumulative losses to WTAM in managing the fund complex as a whole. WTAM representatives stated that there has been significant volatility in theassets of individual Funds and in the fund complex as a whole over time (including volatility in profitability) and that it was not clear that current assetlevels will be maintained. WTAM representatives noted that assets in certain Funds have diminished at times at a rapid rate (including during the lastyear) and could continue to do so. WTAM representatives also noted that economies of scale currently are shared with the Funds by way of the unitaryfee structure of the Trust, as well as through additional investment in the WisdomTree business. The Board noted that the Contracts Review Committeehad focused on the issue of economies of scale during its meetings. The Board also noted that it would continue to monitor the sharing of economies ofscale, focusing in particular on Funds that have experienced significant asset growth, to
WisdomTree Trust 161
Copyright © 2019 www.secdatabase.com. All Rights Reserved.Please Consider the Environment Before Printing This Document

Table of ContentsApproval of Investment Advisory and Sub-Advisory Agreements (unaudited) (concluded)
determine the appropriateness of adding breakpoints in the future. The Board also considered potential benefits to WTAM and the Sub-Advisers fromacting as investment adviser and sub-investment advisers, respectively, and noted that there were no soft dollar arrangements in effect for trading theFunds� investments. Based on this review, the Board concluded that the profitability results were consistent with the services rendered and servicelevels provided by WTAM and the entrepreneurial risk WTAM has undertaken over time.
* * * * * *
At the conclusion of these discussions, the Board agreed that it had been furnished with sufficient information to make an informed business decisionwith respect to the renewal of the Agreements. In evaluating the Agreements, the Board considered the conclusions and determinations discussed aboveand also relied on its previous knowledge, gained through meetings and other interactions with WTAM and the Sub-Advisers, of the Funds and theservices provided to the Funds by WTAM and the Sub-Advisers. The Board also relied on information received on a routine and regular basisthroughout the year relating to the operations of the Funds and the investment advisory and other services provided under the Agreements. In light ofthe foregoing, the Board, including a majority of the Independent Trustees, determined to approve the renewal of the Agreements.
162 WisdomTree Trust
Copyright © 2019 www.secdatabase.com. All Rights Reserved.Please Consider the Environment Before Printing This Document

Table of ContentsTrustees and Officers Information (unaudited)
The Board of Trustees is responsible for overseeing the management and affairs of the Funds and the Trust. The Board of Trustees elects the officers ofthe Trust who are responsible for administering the Trust�s day-to-day operations. Each Trustee serves until his or her successor is duly elected orappointed and qualified.
The address of each Trustee and Officer is c/o WisdomTree Asset Management, Inc., 245 Park Avenue, 35th Floor, New York, NY 10167.
Independent Trustees
Nameand Year of Birthof Trustee/Officer
Position(s) Held withthe Trust, Term ofOffice and Length
of Time ServedPrincipal Occupation(s)During the Past 5 Years
Number of Portfoliosin Fund Complex
Overseen by Trustee/Officer*
OtherDirectorships
Held by TrusteeDuring the Past
5 YearsDavid G. Chrencik^(1948)
Trustee, 2014-present
Chief Financial Officer of Sarus Indochina SelectLP (hedge fund) since 2012; Chief FinancialOfficer of GeoGreen BioFuels, Inc. (biodieselfuel producer) from 2010 to 2014; Audit Partnerat PricewaterhouseCoopers LLP (publicaccounting firm) from 1972 to 2009 (includespositions prior to becoming Audit Partner andpredecessor firms).
78 Trustee,VericimetryFunds (2011 to2014).
Joel Goldberg#�(1945)
Trustee, 2012-present
Attorney, Partner, Stroock & Stroock & LavanLLP from 2010 to 2018; Attorney, Partner atWillkie Farr & Gallagher LLP from 2006 to 2010.
78 Director, BetterBusiness Bureau(MetropolitanNew York, LongIsland and theMid-HudsonRegion).
Toni Massaro�(1955)
Trustee, 2006-present
Dean Emerita at the University of Arizona JamesE. Rogers College of Law (�Rogers College ofLaw�) since 2009 (distinguished Emerita in July2009); Dean at the Rogers College of Law from1999 to 2009; Regents� Professor since 2006;Milton O. Riepe Chair in Constitutional Lawsince 1997; Professor at the Rogers College ofLaw since 1990.
78 None
Melinda A. Raso Kirstein�(1955)
Trustee, 2014-present
Retired since 2004, Merrill Lynch InvestmentManagement, Vice President; Senior PortfolioManager, Fixed Income Management; Director,Tax Exempt Fund Management.
78 AssociateAlumnae ofDouglassCollege, Chairof InvestmentCommittee.
Victor Ugolyn(1947)
Trustee, 2006-present; Chairmanof the Board ofTrustees,2006-present
Private Investor, 2005 to present; President andChief Executive Officer of William D. Witter, Inc.from 2005 to 2006; Consultant to AXA Enterprisein 2004; Chairman, President and Chief ExecutiveOfficer of Enterprise Capital Management(subsidiary of The MONY Group, Inc.) andEnterprise Group of Funds, Chairman of MONYSecurities Corporation, and Chairman of the FundBoard of Enterprise Group of Funds from 1991 to2004.
78 Member of theBoard ofGovernors ofNaismithMemorialBasketball Hallof Fame(2001- 2016).
* As of June 30, 2019.^ Chair of the Audit Committee.# Chair of the Contracts Review Committee.� Co-Chair of the Governance, Nominating and Compliance Committee.� Chair of the Investment Committee.
WisdomTree Trust 163
Copyright © 2019 www.secdatabase.com. All Rights Reserved.Please Consider the Environment Before Printing This Document

Table of ContentsTrustees and Officers Information (unaudited) (concluded)
Interested Trustee and Officers
Nameand Year of Birthof Trustee/Officer
Position(s) Held withthe Trust, Term ofOffice and Length
of Time ServedPrincipal Occupation(s)During the Past 5 Years
Number of Portfoliosin Fund Complex
Overseen by Trustee/Officer*
OtherDirectorships
Held by Trustee/Officer
During the Past5 Years
Jonathan Steinberg**(1964)
Trustee, 2005-present; President,2005- present
President, WisdomTree Investments, Inc. andWisdomTree Asset Management, Inc. since 2012;Chief Executive Officer, WisdomTreeInvestments, Inc. and WisdomTree AssetManagement, Inc. since 2005.
78 Director,WisdomTreeInvestments,Inc. andWisdomTreeAssetManagement,Inc.
David Castano**(1971)
Treasurer, 2013-present
Director of Fund Accounting & Administration,WisdomTree Asset Management, Inc., since 2011.
78 None
Terry Jane Feld**(1960)
Chief ComplianceOfficer, 2012-present
Chief Compliance Officer, WisdomTree AssetManagement, Inc. since 2012; Senior ComplianceOfficer, WisdomTree Asset Management since2011.
78 None
Ryan Louvar**(1972)
Secretary and ChiefLegal Officer,2013- present
General Counsel, WisdomTree AssetManagement, Inc. since 2013; Vice President andSenior Managing Counsel, State Street, 2005 to2013.
78 None
Joanne Antico**(1975)
Assistant Secretary,2018- present
Assistant General Counsel, WisdomTree AssetManagement, Inc. since 2016; Executive Directorand Assistant Secretary, Morgan StanleyInvestment Management Inc., 2005 to 2016.
78 None
Clint Martin**(1977)
Assistant Treasurer,2015- present
Fund Manager, Fund Accounting &Administration, WisdomTree Asset Management,Inc., since 2012.
78 None
* As of June 30, 2019.** Elected by and serves at the pleasure of the Board.
164 WisdomTree Trust
Copyright © 2019 www.secdatabase.com. All Rights Reserved.Please Consider the Environment Before Printing This Document
Table of ContentsSupplemental Information (unaudited)
Federal Income Tax InformationThe following Federal tax information related to the Funds� fiscal year or period ended June 30, 2019, is provided for information purposes only andshould not be used for reporting to federal or state revenue agencies. Federal tax information for the calendar year will be reported to you on Form1099-DIV in January 2020.
Certain dividends paid by the Funds may be subject to a maximum tax rate of 15%, as provided by the Jobs and Growth Tax Relief Reconciliation Actof 2003. Of the distributions paid during the fiscal year or period ended June 30, 2019, the following represents the maximum amount of ordinaryincome distributions that may be considered qualified dividend income:
FundQualified Dividend
IncomeDynamic Currency Hedged International Equity Fund $ 7,781,170Dynamic Currency Hedged International Quality Dividend Growth Fund 465,146Dynamic Currency Hedged International SmallCap Equity Fund 790,071Emerging Markets Dividend Fund 1,163,495Europe Multifactor Fund 244,231Global ex-Mexico Equity Fund 1,500,861ICBCCS S&P China 500 Fund 271,255Japan Multifactor Fund 65,184Fundamental U.S. Corporate Bond Fund �
Fundamental U.S. High Yield Corporate Bond Fund �
Fundamental U.S. Short-Term Corporate Bond Fund �
Fundamental U.S. Short-Term High Yield Corporate Bond Fund �
Dynamic Bearish U.S. Equity Fund �
Dynamic Long/Short U.S. Equity Fund 2,974,91690/60 U.S. Balanced Fund1 59,123Balanced Income Fund 57,214
1 For the period August 2, 2018 (commencement of operations) through June 30, 2019.
The Funds designate the following amount of ordinary income distributions paid during the fiscal year or period ended June 30, 2019 from qualifiedshort-term gains and qualified interest income:
FundQualified Short-
Term GainsQualified Interest
IncomeDynamic Currency Hedged International Equity Fund 0.00 % 0.00 %Dynamic Currency Hedged International Quality Dividend Growth Fund 100.00 % 0.00 %Dynamic Currency Hedged International SmallCap Equity Fund 0.00 % 0.00 %Emerging Markets Dividend Fund 0.00 % 0.00 %Europe Multifactor Fund 0.00 % 0.00 %Global ex-Mexico Equity Fund 0.00 % 0.00 %ICBCCS S&P China 500 Fund 0.00 % 0.00 %Japan Multifactor Fund 0.00 % 0.00 %Fundamental U.S. Corporate Bond Fund 0.00 % 100.00 %Fundamental U.S. High Yield Corporate Bond Fund 0.00 % 100.00 %Fundamental U.S. Short-Term Corporate Bond Fund 0.00 % 100.00 %Fundamental U.S. Short-Term High Yield Corporate Bond Fund 0.00 % 100.00 %Dynamic Bearish U.S. Equity Fund 0.00 % 0.00 %Dynamic Long/Short U.S. Equity Fund 0.00 % 0.00 %90/60 U.S. Balanced Fund1 0.00 % 0.00 %Balanced Income Fund 0.00 % 0.00 %
1 For the period August 2, 2018 (commencement of operations) through June 30, 2019.
WisdomTree Trust 165
Copyright © 2019 www.secdatabase.com. All Rights Reserved.Please Consider the Environment Before Printing This Document
Table of ContentsSupplemental Information (unaudited) (concluded)
The following represents the percentage of dividends paid during the fiscal year or period ended June 30, 2019, that qualify for the 70% dividendsreceived deduction for corporate shareholders:
FundDividends-Received
DeductionDynamic Currency Hedged International Equity Fund �
Dynamic Currency Hedged International Quality Dividend Growth Fund �
Dynamic Currency Hedged International SmallCap Equity Fund �
Emerging Markets Dividend Fund �
Europe Multifactor Fund �
Global ex-Mexico Equity Fund 53.32 %ICBCCS S&P China 500 Fund 0.29 %Japan Multifactor Fund �
Fundamental U.S. Corporate Bond Fund �
Fundamental U.S. High Yield Corporate Bond Fund �
Fundamental U.S. Short-Term Corporate Bond Fund �
Fundamental U.S. Short-Term High Yield Corporate Bond Fund �
Dynamic Bearish U.S. Equity Fund �
Dynamic Long/Short U.S. Equity Fund 91.23 %90/60 U.S. Balanced Fund1 54.57 %Balanced Income Fund 26.59 %
1 For the period August 2, 2018 (commencement of operations) through June 30, 2019.
The Funds intend to elect to pass through to shareholders the credit for taxes paid to foreign countries during the fiscal year or period ended June 30,2019. The gross foreign source income and foreign taxes paid are as follows:
FundGross Foreign
Income
ForeignTaxesPaid
Dynamic Currency Hedged International Equity Fund $9,356,505 $645,831Dynamic Currency Hedged International Quality Dividend Growth Fund 154,433 12,107Dynamic Currency Hedged International SmallCap Equity Fund 1,014,111 91,484Emerging Markets Dividend Fund 1,752,761 217,207Europe Multifactor Fund 435,800 44,659Global ex-Mexico Equity Fund � �
ICBCCS S&P China 500 Fund 324,440 35,273Japan Multifactor Fund 66,424 7,475Fundamental U.S. Corporate Bond Fund � �
Fundamental U.S. High Yield Corporate Bond Fund � �
Fundamental U.S. Short-Term Corporate Bond Fund � �
Fundamental U.S. Short-Term High Yield Corporate Bond Fund � �
Dynamic Bearish U.S. Equity Fund � �
Dynamic Long/Short U.S. Equity Fund � �
90/60 U.S. Balanced Fund1 � �
Balanced Income Fund 11,623 1,5351 For the period August 2, 2018 (commencement of operations) through June 30, 2019.
166 WisdomTree Trust
Copyright © 2019 www.secdatabase.com. All Rights Reserved.Please Consider the Environment Before Printing This Document

Table of ContentsGeneral Information (unaudited)
Proxy Voting Policies, Procedures and RecordA complete copy of the Proxy Voting Policy may be obtained upon request, at no charge, by calling 1-866-909-WISE (9473) or writing to:WisdomTree Trust, c/o Foreside Fund Services, LLC, Three Canal Plaza Suite 100, Portland, ME, 04101.
The Trust is required to disclose annually the Funds� complete proxy voting record on Form N-PX covering the most recent12-month period ended June 30 and to file Form N-PX with the SEC no later than August 31 of each year. The current Form N-PX for the Funds isavailable at no charge upon request by calling 1-866-909-WISE (9473) or through the Trust�s website at www.wisdomtree.com. The Funds� FormN-PX is also available on the SEC�s website at www.sec.gov.
Shareholder Reports and Quarterly Portfolio DisclosureThe Funds are required to file their complete schedule of portfolio holdings with the SEC for their first and third fiscal quarters on Form N-Q.Beginning in April 2019, the Funds will cease filing Form N-Q and will commence filing Form N-PORT. Part F of each Fund�s Form N-PORT filingsfor the first and third fiscal quarters will contain the complete schedule of portfolio holdings in the same manner as previously filed on Form N-Q.Copies of the filings are available, without charge, on the SEC�s website at www.sec.gov and are also available by calling the Trust at1-866-909-WISE (9473). Copies of the filings may also be obtained, after paying a duplicating fee, by electronic request at the following E-mailaddress: [email protected].
Information about each Fund�s portfolio holdings is available daily, without charge, at www.wisdomtree.com.
The Statement of Additional Information (�SAI�) has additional information about the Funds� Trustees and Officers and is available without chargeupon request. Contact your financial representative for a free prospectus or SAI.
Frequency Distribution of Discounts & PremiumsInformation about differences between the per share net asset value of each Fund and the market trading price of shares of each Fund are available,without charge, at www.wisdomtree.com.
WisdomTree Trust 167
Copyright © 2019 www.secdatabase.com. All Rights Reserved.Please Consider the Environment Before Printing This Document

Table of ContentsThe WisdomTree Funds are exchange traded funds (�ETFs�) registered with the United States Securities and Exchange Commission asseparate series (�Funds�) of WisdomTree Trust (�Trust�). WisdomTree Asset Management, Inc., a wholly owned subsidiary ofWisdomTree Investments, Inc., serves as the investment adviser to the Trust. None of the WisdomTree entities are affiliated withForeside Fund Services, LLC, the Funds� distributor. WisdomTree Investments, its affiliates and their independent providers are not liablefor any informational errors, incompleteness, delays, or for any actions taken in reliance on information contained herein.
Investors should consider the investment objectives, risks, charges and expenses of the Funds carefully before investing. Aprospectus, containing this and other information, is available at www.wisdomtree.com, or by calling 1-866-909-WISE (9473).Investors should read the prospectus carefully before investing. There are risks associated with investing, including possibleloss of principal. Past performance does not guarantee future results. Indexes are unmanaged and you cannot invest directly inan index.
There are risks associated with investing including possible loss of principal. Foreign investing involves special risks, such asrisk of loss from currency fluctuation or political or economic uncertainty. Investments in real estate involve additional specialrisks, such as credit risk, interest rate fluctuations and the effect of varied economic conditions. Funds that focus theirinvestments in one country or region may be significantly impacted by events and developments associated with the regionwhich can adversely affect performance. Funds focusing on a single sector and/or smaller companies generally experiencegreater price volatility. Investments in emerging, offshore or frontier markets are generally less liquid and less efficient thaninvestments in developed markets and are subject to additional risks, such as risks of adverse governmental regulation andintervention or political developments. Fixed income investments are subject to interest rate risk; their value will normallydecline as interest rates rise. In addition, when interest rates fall income may decline. Fixed income investments are alsosubject to credit risk, the risk that the issuer of a bond will fail to pay interest and principal in a timely manner, or that negativeperceptions of the issuer��s ability to make such payments will cause the price of that bond to decline. High-yield or ��junk��bonds have lower credit ratings and involve a greater risk to principal. While the Fundamental Fixed Income Funds attempt tolimit credit and counterparty exposure, the value of an investment in the Funds may change quickly and without warning inresponse to issuer or counterparty defaults and changes in the credit ratings of the Fund��s portfolio investments. Investmentsin currency involve additional special risks, such as credit risk and interest rate fluctuations. Derivative investments can bevolatile and these investments may be less liquid than other securities, and more sensitive to the effect of varied economicconditions. As these Funds can have a high concentration in some issuers the Funds can be adversely impacted by changesaffecting such issuers. Due to the investment strategy of certain Funds they may make higher capital gain distributions thanother ETFs. Please read the Fund��s prospectus for specific details regarding the Fund��s risk profile.
Transactions in Fund shares will result in brokerage commissions and will generate tax consequences. Shares may be soldthrough brokerage accounts, but may be redeemed from the Funds only by Authorized Participants in large creation unit sizesof shares.
Copyright © 2019 www.secdatabase.com. All Rights Reserved.Please Consider the Environment Before Printing This Document

Table of ContentsWisdomTree Trust245 Park Avenue, 35th FloorNew York, NY 10167
WisdomTree Fund shares are distributed by Foreside Fund Services, LLC, in the U.S. only.
WTGM - 2717
Copyright © 2019 www.secdatabase.com. All Rights Reserved.Please Consider the Environment Before Printing This Document

Table of ContentsItem 2. Code of Ethics.
(a) The registrant, as of the end of the period covered by this report, has adopted a code of ethics that applies to the registrant�sprincipal executive officer, principal financial officer, principal accounting officer or controller, or persons performingsimilar functions, regardless of whether these individuals are employed by the registrant or a third party.
(c) There have been no amendments, during the period covered by this report, to a provision of the code of ethics that applies tothe registrant�s principal executive officer, principal financial officer, principal accounting officer or controller, or personsperforming similar functions, regardless of whether these individuals are employed by the registrant or a third party, andthat relates to any element of the code of ethics description.
(d) The registrant has not granted any waivers, including an implicit waiver, from a provision of the code of ethics that appliesto the registrant�s principal executive officer, principal financial officer, principal accounting officer or controller, orpersons performing similar functions, regardless of whether these individuals are employed by the registrant or a third party,that relates to one or more of the items set forth in paragraph (b) of this item�s instructions.
(f) The code of ethics is attached hereto as exhibit 13(a)(1).
Item 3. Audit Committee Financial Expert.
The Registrant�s Board of Trustees has determined that the Registrant has one audit committee financial expert, as that term is definedunder Item 3(b) and 3(c), serving on its audit committee. The audit committee financial expert serving on the Registrant�s auditcommittee is David Chrencik, who is an independent Trustee of the Trust, as that term is defined under Item 3(a) (2).
Item 4. Principal Accountant Fees and Services.
Audit Fees
(a) The aggregate fees billed for each of the last two fiscal years for professional services rendered by the principal accountantfor the audit of the registrant�s annual financial statements or services that are normally provided by the accountant inconnection with statutory and regulatory filings or engagements for those fiscal years were $374,142 for 2019 and $459,860for 2018.
Audit-Related Fees
(b) The aggregate fees billed for each of the last two fiscal years for assurance and related services by the principal accountantthat are reasonably related to the performance of the audit of the registrant�s financial statements and are not reported underparagraph (a) of this Item were $0 for 2019 and $0 for 2018.
Copyright © 2019 www.secdatabase.com. All Rights Reserved.Please Consider the Environment Before Printing This Document

Table of ContentsTax Fees
(c) The aggregate fees billed for each of the last two fiscal years for professional services rendered by the principal accountantfor tax compliance, tax advice, and tax planning were $149,895 for 2019 and $153,745 for 2018.
All Other Fees
(d) The aggregate fees billed for each of the last two fiscal years for products and services provided by the principal accountant,other than the services reported in paragraphs (a) through (c) of this Item were $0 for 2019 and $0 for 2018.
(e)(1) Disclose the audit committee�s pre-approval policies and procedures described in paragraph (c)(7) of Rule 2-01 ofRegulation S-X.
Per Rule 2-01(c) (7) (A), the Registrant�s audit committee charter provides that the audit committee shall select andapprove in advance the retention of independent accountants to annually audit and provide their opinion on the Registrant�sfinancial statements. The audit committee must also approve prior to appointment the engagement of the principalaccountant to provide other audit services to the Registrant or to provide non-audit services to the Registrant, its investmentadviser, or any entity controlling, controlled by, or under common control with its investment adviser (�adviser/affiliate�)that provides ongoing services to the Registrant, if the engagement by the investment adviser or adviser affiliate relatesdirectly to the operations and financial reporting of the Registrant. The audit committee must also, prior to appointment ofthe engagement of the principal accountant, review and approve the fees proposed to be charged to the Registrant by theauditors for each audit and non-audit service. The audit committee must also consider whether non-audit services providedby the Registrant�s principal accountant to the Registrant�s investment adviser, or adviser/affiliate that provides ongoingservices to the Trust are compatible with maintaining the auditor�s independence.
(e)(2) The Registrant�s audit committee has approved 100% of services described in each of Items 4(b) through (d) pursuant toparagraph (c)(7)(i)(C) of Rule 2-01 of Regulation S-X.
(f) The percentage of hours expended on the principal accountant�s engagement to audit the registrant�s financial statementsfor the most recent fiscal year that were attributed to work performed by persons other than the principal accountant�s full-time, permanent employees was 0%.
(g) The aggregate non-audit fees billed by the registrant�s accountant for services rendered to the registrant, and rendered to theregistrant�s investment adviser (not including any sub-adviser whose role is primarily portfolio management and issubcontracted with or overseen by another investment adviser), and any entity controlling, controlled by, or under commoncontrol with the adviser that provides ongoing services to the registrant for each of the last two fiscal years were $149,895for 2019 and $153,745 for 2018.
(h) Not applicable.
Item 5. Audit Committee of Listed Registrants.
The Registrant is an issuer as defined in Rule 10A-3 under the Exchange Act and has a separately-designated standing audit committeeestablished in accordance with Section 3(a) (58)A of the Exchange Act. The Registrant�s audit committee members are DavidChrencik, Melinda Raso Kirstein and Victor Ugolyn.
Item 6. Investments.
(a) Schedule of Investments in securities of unaffiliated issuers as of the close of the reporting period is included as part of the reportto shareholders filed under Item 1 of this form.
(b) Not applicable.
Copyright © 2019 www.secdatabase.com. All Rights Reserved.Please Consider the Environment Before Printing This Document

Table of ContentsItem 7. Disclosure of Proxy Voting Policies and Procedures for Closed-End Management Investment Companies.
Not applicable.
Item 8. Portfolio Managers of Closed-End Management Investment Companies.
Not applicable.
Item 9. Purchases of Equity Securities by Closed-End Management Investment Company and Affiliated Purchasers.
Not applicable.
Item 10. Submission of Matters to a Vote of Security Holders.
There have been no material changes to the procedures by which the shareholders may recommend nominees to the registrant�s boardof trustees, where those changes were implemented after the registrant last provided disclosure in response to the requirements of Item407(c)(2)(iv) of Regulation S-K (17 CFR 229.407) (as required by Item 22(b)(15) of Schedule 14A (17 CFR 240.14a-101)), or thisItem.
Item 11. Controls and Procedures.
(a) The registrant�s principal executive and principal financial officers, or persons performing similar functions, haveconcluded that the registrant�s disclosure controls and procedures (as defined in Rule 30a-3(c) under the InvestmentCompany Act of 1940, as amended (the �1940 Act�) (17 CFR 270.30a-3(c))) are effective, as of a date within 90 days ofthe filing date of the report that includes the disclosure required by this paragraph, based on their evaluation of thesecontrols and procedures required by Rule 30a-3(b) under the 1940 Act (17 CFR 270.30a-3(b)) and Rules 13a-15(b) or15d-15(b) under the Securities Exchange Act of 1934, as amended (17 CFR 240.13a-15(b) or 240.15d-15(b)).
(b) There were no changes in the registrant�s internal control over financial reporting (as defined in Rule 30a-3(d) under the1940 Act (17 CFR 270.30a-3(d)) that occurred during the period covered by this report that has materially affected, or isreasonably likely to materially affect, the registrant�s internal control over financial reporting.
Item 12. Disclosure of Securities Lending Activities for Closed-End Management Investment Companies.
Not applicable.
Item 13. Exhibits.
(a)(1) Code of ethics, or any amendment thereto, that is the subject of disclosure required by Item 2 is attached hereto.
Copyright © 2019 www.secdatabase.com. All Rights Reserved.Please Consider the Environment Before Printing This Document

Table of Contents(a)(2) Certifications pursuant to Rule 30a-2(a) under the 1940 Act and Section 302 of the Sarbanes-Oxley Act of 2002 are
attached hereto.
(a)(3) Not applicable.
(a)(4) Not applicable.
(b) Certifications pursuant to Rule 30a-2(b) under the 1940 Act and Section 906 of the Sarbanes-Oxley Act of 2002 areattached hereto.
Copyright © 2019 www.secdatabase.com. All Rights Reserved.Please Consider the Environment Before Printing This Document

Table of ContentsSIGNATURES
Pursuant to the requirements of the Securities Exchange Act of 1934 and the Investment Company Act of 1940, the registrant has dulycaused this report to be signed on its behalf by the undersigned, thereunto duly authorized.
(Registrant) WisdomTree Trust
By (Signature and Title) /s/ Jonathan SteinbergJonathan L. Steinberg, President(principal executive officer)
Date: September 3, 2019
Pursuant to the requirements of the Securities Exchange Act of 1934 and the Investment Company Act of 1940, this report has beensigned below by the following persons on behalf of the registrant and in the capacities and on the dates indicated.
By (Signature and Title) /s/ Jonathan SteinbergJonathan L. Steinberg, President(principal executive officer)
Date: September 3, 2019
By (Signature and Title) /s/ David CastanoDavid Castano, Treasurer(principal financial officer)
Date: September 3, 2019
Copyright © 2019 www.secdatabase.com. All Rights Reserved.Please Consider the Environment Before Printing This Document
EX-99.CODE ETH
WISDOMTREE TRUSTCODE OF ETHICS
FOR PRINCIPAL EXECUTIVE AND FINANCIAL OFFICERS
I. PURPOSE OF THE CODE
The WisdomTree Trust (the �Trust�) Code of Ethics for Principal Executive and Financial Officers (this �Code�) is intended toserve as the code of ethics described in Section 406 of the Sarbanes-Oxley Act of 2002 and Item 2 of Form N-CSR. This Code shall bethe sole code of ethics adopted by the Trust for purposes of Section 406 of the Sarbanes-Oxley Act and the rules and forms applicable toregistered investment companies thereunder. Insofar as other policies or procedures of the Trust, the Trust�s adviser, principalunderwriter, or other service providers govern or purport to govern the behavior or activities of the Covered Officers, as defined herein,who are subject to this Code, they are superseded by this Code to the extent that they overlap or conflict with the provisions of thisCode. The Trust�s and its investment adviser�s, and principal underwriter�s codes of ethics pursuant to Rule 17j-1 under the InvestmentCompany Act of 1940 (the �1940 Act�) are separate requirements applying to the Covered Officers and others, and are not part of thisCode.
All Covered Officers must become familiar and fully comply with this Code. Because this Code cannot and does not cover everyapplicable law or provide answers to all questions that might arise, all Covered Officers are expected to use common sense about whatis right and wrong, including a sense of when it is proper to seek guidance from others on the appropriate course of conduct.
The purpose of this Code is to set standards for the Covered Officers that are reasonably designed to deter wrongdoing and topromote:
� honest and ethical conduct, including the ethical handling of actual or apparent conflicts of interest between personal andprofessional relationships;
� full, fair, accurate, timely, and understandable disclosure in reports and documents that the Trust files with, or submits to,the Securities and Exchange Commission (the �SEC�) and in any other public communications by the Trust;
� compliance with applicable governmental laws, rules and regulations;
� the prompt internal reporting of violations of the Code to the appropriate persons as set forth in the Code; and
� accountability for adherence to the Code.
Copyright © 2019 www.secdatabase.com. All Rights Reserved.Please Consider the Environment Before Printing This Document

II. COVERED PERSONS
This Code applies to the Trust�s Principal Executive Officers and Principal Financial Officers, or any persons performing similarfunctions on behalf of the Trust (the �Covered Officers�). Each Covered Person should adhere to a high standard of business ethics andshould be sensitive to situations that may give rise to actual as well as apparent conflicts of interest. Covered Officers are expected to actin accordance with the standards set forth in this Code.
III. HONEST AND ETHICAL CONDUCT
A. Honesty, Diligence and Professional Responsibility
Covered Officers are expected to observe both the form and the spirit of the ethical principles contained in this Code. CoveredOfficers must perform their duties and responsibilities for the Trust:
� with honesty, diligence, and a commitment to professional and ethical responsibility;
� carefully, thoroughly and in a timely manner; and
� in conformity with applicable professional and technical standards.
Covered Officers who are certified public accountants are expected to carry out their duties and responsibilities in a mannerconsistent with the principles governing the accounting profession, including any guidelines or principles issued by the Public CompanyAccounting Oversight Board or the American Institute of Certified Public Accountants from time to time.
B. Objectivity/Avoidance of Undisclosed Conflicts of Interest
Covered Officers are expected to maintain objectivity and avoid undisclosed conflicts of interest. In the performance of their dutiesand responsibilities for the Trust, Covered Officers must not subordinate their judgment to personal gain and advantage, or be undulyinfluenced by their own interests or by the interests of others. Covered Officers must avoid participation in any activity or relationshipthat constitutes a conflict of interest unless that conflict has been completely disclosed to affected parties and waived by the Trustees onbehalf of the Trust. Further, Covered Officers should avoid participation in any activity or relationship that could create the appearanceof a conflict of interest.
A conflict of interest would generally arise if, for instance, a Covered Officer directly or indirectly participates in any investment,interest, association, activity or relationship that may impair or appear to impair the Covered Officer�s objectivity or interfere with theinterests of, or the Covered Officer�s service to, the Trust.
2
Copyright © 2019 www.secdatabase.com. All Rights Reserved.Please Consider the Environment Before Printing This Document

Any Covered Officer who may be involved in a situation or activity that might be a conflict of interest or give the appearance of aconflict of interest must report such situation or activity using the reporting procedures set forth in Section VI of this Code.
Each Covered Officer must not:
� use his or her personal influence or personal relationships improperly to influence investment decisions or financialreporting by the Trust whereby the Covered Officer would benefit personally to the detriment of the Trust;
� cause the Trust to take action, or fail to take actions, for the individual personal benefit of the Covered Officer rather thanthe benefit of the Trust; or
� use material non-public knowledge of portfolio transactions made or contemplated for the Trust to trade personally or causeothers to trade personally in contemplation of the market effect of such transactions.
Each Covered Officer is responsible for his or her compliance with this conflict of interest policy.
C. Preparation of Financial Statements
Covered Officers must not knowingly make any misrepresentations regarding the Trust�s financial statements or any facts in thepreparation of the Trust�s financial statements, and must comply with all applicable laws, standards, principles, guidelines, rules andregulations in the preparation of the Trust�s financial statements. This section is intended to prohibit:
� making, or permitting or directing another to make, materially false or misleading entries in the Trust�s financial statementsor records;
� failing to correct the Trust�s financial statements or records that are materially false or misleading when he or she has theauthority to record an entry; and
� signing, or permitting or directing another to sign, a document containing materially false or misleading financialinformation.
Covered Officers must be scrupulous in their application of generally accepted accounting principles. No Covered Officer may(i) express an opinion or state affirmatively that the financial statements or other financial data of the Trust are presented in conformitywith generally accepted accounting principles, or (ii) state that he or she is not aware of any material modifications that should be madeto such statements or data in order for them to be in conformity with generally accepted accounting principles, if such statements or datacontain any departure from generally accepted accounting principles then in effect in the United States.
3
Copyright © 2019 www.secdatabase.com. All Rights Reserved.Please Consider the Environment Before Printing This Document
Covered Officers must follow the laws, standards, principles, guidelines, rules and regulations established by all applicablegovernmental bodies, commissions or other regulatory agencies in the preparation of financial statements, records and relatedinformation. If a Covered Officer prepares financial statements, records or related information for purposes of reporting to such bodies,commissions or regulatory agencies, the Covered Officer must follow the requirements of such organizations in addition to generallyaccepted accounting principles.
If a Covered Officer and his or her supervisor have a disagreement or dispute relating to the preparation of financial statements orthe recording of transactions, the Covered Officer should take the following steps to ensure that the situation does not constitute animpermissible subordination of judgment:
� The Covered Officer should consider whether (i) the entry or the failure to record a transaction in the records, or (ii) thefinancial statement presentation or the nature or omission of disclosure in the financial statements, as proposed by thesupervisor, represents the use of an acceptable alternative and does not materially misrepresent the facts or result in anomission of a material fact. If, after appropriate research or consultation, the Covered Officer concludes that the matter hasauthoritative support and/or does not result in a material misrepresentation, the Covered Officer need do nothing further.
� If the Covered Officer concludes that the financial statements or records could be materially misstated as a result of thesupervisor�s determination, the Covered Officer should follow the reporting procedures set forth in Section VI of this Code.
D. Obligations to the Independent Auditor of the Trust
In dealing with the Trust�s independent auditor, Covered Officers must be candid and not knowingly misrepresent facts orknowingly fail to disclose material facts, and must respond to specific inquiries and requests by the Trust�s independent auditor.
Covered Officers must not take any action, or direct any person to take any action, to fraudulently influence, coerce, manipulate ormislead the Trust�s independent auditor in the performance of an audit of the Trust�s financial statements for the purpose of renderingsuch financial statements materially misleading.
IV. FULL, FAIR, ACCURATE, TIMELY AND UNDERSTANDABLE DISCLOSURE
It is the Trust�s policy to provide full, fair, accurate, timely, and understandable disclosure in reports and documents that the Trustfiles with, or submits to, the SEC and in any other public communications by the Trust. The Trust has designed and implementedDisclosure Controls and Procedures to carry out this policy.
Covered Officers are expected to familiarize themselves with the disclosure requirements generally applicable to the Trust, and touse their best efforts to promote, facilitate, and prepare full, fair, accurate, timely, and understandable disclosure in all reports anddocuments that the Trust files with, or submits to, the SEC and in any other public communications by the Trust.
4
Copyright © 2019 www.secdatabase.com. All Rights Reserved.Please Consider the Environment Before Printing This Document
Covered Officers must review the Trust�s Disclosure Controls and Procedures to ensure they are aware of and carry out theirduties and responsibilities in accordance with the Disclosure Controls and Procedures and the disclosure obligations of the Trust.Covered Officers are responsible for monitoring the integrity and effectiveness of the Trust�s Disclosure Controls and Procedures.
V. COMPLIANCE WITH APPLICABLE LAWS, RULES AND REGULATIONS
Covered Officers are expected to know, respect and comply with all laws, rules and regulations applicable to the conduct of theTrust�s business. If a Covered Officer is in doubt about the legality or propriety of an action, business practice or policy, the CoveredOfficer should seek advice from the Covered Officer�s supervisor or the Trust�s legal counsel.
In the performance of their work, Covered Officers must not knowingly be a party to any illegal activity or engage in acts that arediscreditable to the Trust.
Covered Officers are expected to promote the Trust�s compliance with applicable laws, rules and regulations. To promote suchcompliance, Covered Officers may establish and maintain mechanisms to educate employees carrying out the finance and compliancefunctions of the Trust about any applicable laws, rules or regulations that affect the operation of the finance and compliance functionsand the Trust generally.
VI. REPORTING AND ACCOUNTABILITY
All Covered Officers will be held accountable for adherence to this Code. Each Covered Officer must, upon the Trust�s adoptionof this Code (or thereafter as applicable, upon becoming a Covered Officer), affirm in writing to the Board that he/she has received,read, and understands this Code by signing the Acknowledgement Form attached hereto as Appendix A. Thereafter, each CoveredOfficer, on an annual basis, must affirm to the Board that he/she has complied with the requirements of this Code.
Covered Officers may not retaliate against any other Covered Officer of the Trust or their affiliated persons for reports of potentialviolations that are made in good faith.
The Trust will follow these procedures in investigating and enforcing this Code:
A. Any Covered Officer who knows of any violation of this Code or who questions whether a situation, activity or practice isacceptable must immediately report such practice to the Trust�s Audit Committee. The Audit Committee shall takeappropriate action to investigate any reported potential violations. If, after such investigation, the Audit Committee believesthat no violation has occurred, the Audit Committee is not required to take any further action. Any matter that the AuditCommittee believes is a violation will be reported to the Chairman of the Board of Trustees. The Audit Committee shallrespond to the Covered Officer within a reasonable period of time.
5
Copyright © 2019 www.secdatabase.com. All Rights Reserved.Please Consider the Environment Before Printing This Document

B. If the Covered Officer is not satisfied with the response of the Audit Committee, the Covered Officer shall report the matterto the Chairman of the Board of Trustees. If the Chairman is unavailable, the Covered Officer may report the matter to anyother member of the Board of Trustees. The person receiving the report shall consider the matter, refer it to the full Board ofTrustees if he or she deems appropriate, and respond to the Covered Officer within a reasonable amount of time. If theBoard of Trustees concurs that a violation has occurred, it will consider appropriate action, which may include review ofand appropriate modifications to applicable policies and procedures or notification to appropriate personnel of theinvestment adviser or its board.
C. If the Board of Trustees determines that a Covered Officer violated this Code, failed to report a known or suspectedviolation of this Code, or provided intentionally false or malicious information in connection with an alleged violation ofthis Code, the Board of Trustees may take disciplinary action against any such Covered Officer to the extent the Board ofTrustees deems appropriate. No Covered Officer will be disciplined for reporting a concern in good faith.
To the extent possible and as allowed by law, reports will be treated as confidential. The Trust may report violations of the law tothe appropriate authorities.
VII. DISCLOSURE OF THIS CODE
This Code shall be disclosed to the public by at least one of the following methods in the manner prescribed by the SEC, unlessotherwise required by law:
� Filing a copy of this Code as an exhibit to the Trust�s annual report on Form N- CSR;
� Posting the text of this Code on the Trust�s Internet website and disclosing, in its most recent report on Form N-CSR, itsInternet address and the fact that it has posted this Code on its Internet website; or
� Providing an undertaking in the Trust�s most recent report on Form N-CSR to provide a copy of this Code to any personwithout charge upon request, and explaining the manner in which such a request may be made.
VIII. WAIVERS
Any waiver of this Code, including an implicit waiver, granted to a Covered Officer may be made only by the Board of Trustees ora committee of the Board to which such responsibility has been delegated, and must be disclosed by the Trust in the manner prescribedby law and as set forth above in Section VII (Disclosure of this Code).
6
Copyright © 2019 www.secdatabase.com. All Rights Reserved.Please Consider the Environment Before Printing This Document
IX. AMENDMENTS
This Code may be amended by the affirmative vote of a majority of the Board of Trustees, including a majority of the independentTrustees. Any amendment of this Code must be disclosed by the Trust in the manner prescribed by law and as set forth above in SectionVII (Disclosure of this Code), unless such amendment is deemed to be technical, administrative, or otherwise non-substantive. Anyamendments to this Code will be provided to the Covered Officers.
X. CONFIDENTIALITY
All reports and records prepared or maintained pursuant to this Code will be considered confidential and shall be maintained andprotected accordingly. Except as otherwise required by law or this Code, such matters shall not be disclosed to anyone other than theBoard of Trustees of the Trust, the Audit Committee, the legal counsel to the Trust, legal counsel to the independent trustees and suchother persons as a majority of the Board of Trustees, including a majority of the independent Trustees, shall determine to be appropriate.
Adopted: February 2007
7
Copyright © 2019 www.secdatabase.com. All Rights Reserved.Please Consider the Environment Before Printing This Document

Appendix A
WISDOMTREE TRUST
Certification and Acknowledgment of Receipt of Code of Ethics for Principal Executive Officers and Principal Financial Officers
I acknowledge and certify that I have received a copy of the WisdomTree Trust�s Code of Ethics for Principal Executive Officers andPrincipal Financial Officers (the �Code�). I understand and agree that it is my responsibility to read and familiarize myself with thepolicies and procedures contained in the Code and to abide by those policies and procedures.
I acknowledge and certify that I have read and understand the Code.
Officer Name (Please Print) Officer Signature
Date
Copyright © 2019 www.secdatabase.com. All Rights Reserved.Please Consider the Environment Before Printing This Document
Certification Pursuant to Rule 30a-2(a) under the 1940 Act andSection 302 of the Sarbanes-Oxley Act
I, Jonathan L. Steinberg, certify that:
1. I have reviewed this report on Form N-CSR of the WisdomTree Trust;
2. Based on my knowledge, this report does not contain any untrue statement of a material fact or omit to state a material factnecessary to make the statements made, in light of the circumstances under which such statements were made, not misleading withrespect to the period covered by this report;
3. Based on my knowledge, the financial statements, and other financial information included in this report, fairly present in allmaterial respects the financial condition, results of operations, changes in net assets, and cash flows (if the financial statements arerequired to include a statement of cash flows) of the registrant as of, and for, the periods presented in this report;
4. The registrant�s other certifying officer(s) and I are responsible for establishing and maintaining disclosure controls andprocedures (as defined in Rule 30a-3(c) under the Investment Company Act of 1940) and internal control over financial reporting(as defined in Rule 30a-3(d) under the Investment Company Act of 1940) for the registrant and have:
(a) Designed such disclosure controls and procedures, or caused such disclosure controls and procedures to be designed underour supervision, to ensure that material information relating to the registrant, including its consolidated subsidiaries, is madeknown to us by others within those entities, particularly during the period in which this report is being prepared;
(b) Designed such internal control over financial reporting, or caused such internal control over financial reporting to bedesigned under our supervision, to provide reasonable assurance regarding the reliability of financial reporting and thepreparation of financial statements for external purposes in accordance with generally accepted accounting principles;
(c) Evaluated the effectiveness of the registrant�s disclosure controls and procedures and presented in this report ourconclusions about the effectiveness of the disclosure controls and procedures, as of a date within 90 days prior to the filingdate of this report based on such evaluation; and
(d) Disclosed in this report any change in the registrant�s internal control over financial reporting that occurred during theperiod covered by this report that has materially affected, or is reasonably likely to materially affect, the registrant�sinternal control over financial reporting; and
5. The registrant�s other certifying officer(s) and I have disclosed to the registrant�s auditors and the audit committee of theregistrant�s board of directors (or persons performing the equivalent functions):
(a) All significant deficiencies and material weaknesses in the design or operation of internal control over financial reportingwhich are reasonably likely to adversely affect the registrant�s ability to record, process, summarize, and report financialinformation; and
(b) Any fraud, whether or not material, that involves management or other employees who have a significant role in theregistrant�s internal control over financial reporting.
Date: September 3, 2019 /s/ Jonathan SteinbergJonathan L. Steinberg, President(principal executive officer)
Copyright © 2019 www.secdatabase.com. All Rights Reserved.Please Consider the Environment Before Printing This Document

Certification Pursuant to Rule 30a-2(a) under the 1940 Act andSection 302 of the Sarbanes-Oxley Act
I, David Castano, certify that:
1. I have reviewed this report on Form N-CSR of the WisdomTree Trust;
2. Based on my knowledge, this report does not contain any untrue statement of a material fact or omit to state a material factnecessary to make the statements made, in light of the circumstances under which such statements were made, not misleading withrespect to the period covered by this report;
3. Based on my knowledge, the financial statements, and other financial information included in this report, fairly present in allmaterial respects the financial condition, results of operations, changes in net assets, and cash flows (if the financial statements arerequired to include a statement of cash flows) of the registrant as of, and for, the periods presented in this report;
4. The registrant�s other certifying officer(s) and I are responsible for establishing and maintaining disclosure controls andprocedures (as defined in Rule 30a-3(c) under the Investment Company Act of 1940) and internal control over financial reporting(as defined in Rule 30a-3(d) under the Investment Company Act of 1940) for the registrant and have:
(a) Designed such disclosure controls and procedures, or caused such disclosure controls and procedures to be designed underour supervision, to ensure that material information relating to the registrant, including its consolidated subsidiaries, is madeknown to us by others within those entities, particularly during the period in which this report is being prepared;
(b) Designed such internal control over financial reporting, or caused such internal control over financial reporting to bedesigned under our supervision, to provide reasonable assurance regarding the reliability of financial reporting and thepreparation of financial statements for external purposes in accordance with generally accepted accounting principles;
(c) Evaluated the effectiveness of the registrant�s disclosure controls and procedures and presented in this report ourconclusions about the effectiveness of the disclosure controls and procedures, as of a date within 90 days prior to the filingdate of this report based on such evaluation; and
(d) Disclosed in this report any change in the registrant�s internal control over financial reporting that occurred during theperiod covered by this report that has materially affected, or is reasonably likely to materially affect, the registrant�sinternal control over financial reporting; and
5. The registrant�s other certifying officer(s) and I have disclosed to the registrant�s auditors and the audit committee of theregistrant�s board of directors (or persons performing the equivalent functions):
(a) All significant deficiencies and material weaknesses in the design or operation of internal control over financial reportingwhich are reasonably likely to adversely affect the registrant�s ability to record, process, summarize, and report financialinformation; and
(b) Any fraud, whether or not material, that involves management or other employees who have a significant role in theregistrant�s internal control over financial reporting.
Date: September 3, 2019 /s/ David CastanoDavid Castano, Treasurer(principal financial officer)
Copyright © 2019 www.secdatabase.com. All Rights Reserved.Please Consider the Environment Before Printing This Document
Certification Pursuant to Rule 30a-2(b) under the 1940 Actand Section 906 of the Sarbanes-Oxley Act
I, Jonathan L. Steinberg, President of the WisdomTree Trust (the �Registrant�), certify that:
1. The Form N-CSR of the Registrant (the �Report�) fully complies with the requirements of Section 13(a) or 15(d) of theSecurities Exchange Act of 1934, as amended; and
2. The information contained in the Report fairly presents, in all material respects, the financial condition and results ofoperations of the Registrant.
Date: September 3, 2019 /s/ Jonathan SteinbergJonathan L. Steinberg, President(principal executive officer)
I, David Castano, Treasurer of the WisdomTree Trust (the �Registrant�), certify that:
1. The Form N-CSR of the Registrant (the �Report�) fully complies with the requirements of Section 13(a) or 15(d) of theSecurities Exchange Act of 1934, as amended; and
2. The information contained in the Report fairly presents, in all material respects, the financial condition and results ofoperations of the Registrant.
Date: September 3, 2019 /s/ David CastanoDavid Castano, Treasurer(principal financial officer)
Copyright © 2019 www.secdatabase.com. All Rights Reserved.Please Consider the Environment Before Printing This Document