Wintertime buoyancy forcing, changing seawater properties, and two different circulation systems...
58
1 Wintertime buoyancy forcing, changing seawater properties and two different circulation systems produced in the Adriatic Mirko Orlić 1 , Vlado Dadić 2 , Branka Grbec 2 , Nenad Leder 3 , Antun Marki 1 , Frano Matić 2 , Hrvoje Mihanović 3 , Gordana Beg Paklar 2 , Miroslava Pasarić 1 , Zoran Pasarić 1 and Ivica Vilibić 2 1 Andrija Mohorovičić Geophysical Institute, Faculty of Science, University of Zagreb, Horvatovac bb, 10000 Zagreb, Croatia 2 Institute of Oceanography and Fisheries, Šetalište I. Meštrovića 63, 21000 Split, Croatia 3 Hydrographic Institute of the Republic of Croatia, Zrinsko-Frankopanska 161, 21000 Split, Croatia
-
Upload
independent -
Category
Documents
-
view
3 -
download
0
Transcript of Wintertime buoyancy forcing, changing seawater properties, and two different circulation systems...

1
Wintertime buoyancy forcing, changing seawater properties and two different
circulation systems produced in the Adriatic
Mirko Orlić1, Vlado Dadić2, Branka Grbec2, Nenad Leder3, Antun Marki1, Frano Matić2,
Hrvoje Mihanović3, Gordana Beg Paklar2, Miroslava Pasarić1, Zoran Pasarić1 and Ivica
Vilibić2
1Andrija Mohorovičić Geophysical Institute, Faculty of Science, University of Zagreb,
Horvatovac bb, 10000 Zagreb, Croatia
2Institute of Oceanography and Fisheries, Šetalište I. Meštrovića 63, 21000 Split, Croatia
3Hydrographic Institute of the Republic of Croatia, Zrinsko-Frankopanska 161, 21000 Split,
Croatia

2
Abstract
Measurements performed in winter 2002/2003 and spring 2003 off the east Adriatic coast
showed that the East Adriatic Current (EAC) peaked in January/February (as expected from
previous findings) and again in May (not expected). The first maximum corresponded with
the considerable cross-shore variability of seawater properties, the colder, fresher water
prevailing close to the coast, the warmer, saltier water dominating the open sea. The second
maximum coincided with the massive intrusion of warm, saline water from the south
Adriatic. Meteorological and hydrologic forcing was anomalous over the measurement
interval: during winter 2002/2003 the cooling and river outflows were strong, during spring
2003 the pronounced warming coincided with exceptional dryness. In order to interpret the
two EAC maxima a simple numerical model reproducing response of the Adriatic-
Mediterranean system to the wintertime forcing was developed. It was found that the first
maximum could be related to the coastal freshwater input and offshore evaporation in the
Adriatic area, and that the second maximum was probably due to the wintertime surface
cooling of the Adriatic while warmer conditions prevailed above the Mediterranean. The
resulting horizontal density gradients supported two different circulation systems, one
within the Adriatic, the other between the Adriatic and east Mediterranean, and they
differed not only in spatial but also in temporal scales, therefore supporting the occurrence
of two distinctive EAC maxima.

3
1. Introduction
In the years 2002 and 2003 intensive multidisciplinary studies were organized in the north
Adriatic [Lee et al., 2005]. They comprised meteorological sampling from a variety of
platforms as well as half-year measurements of currents at numerous locations, extensive
drifter deployments, continuous operation of high-frequency radars, regular hydrographic
surveys, high-resolution towed profiler campaigns, microstructure measurements and
remote sensing. The present paper is based on data collected in the framework of one of the
projects contributing to this effort, named ‘East Adriatic Coastal Experiment (EACE)’. The
project concentrated on the current that flows into the north Adriatic off the east, Croatian
coast and thus influences to a considerable degree processes there.
Previously, the surface current along the east coast was seldom investigated per se, but was
often considered as a branch of the general circulation system in the Adriatic. It was known
already to Voss [1677] that ‘in the Adriatick Sea the Waters move along the Shores of
Dalmatia and Croatia, even to the bottom of the Gulph of Venice’ and that ‘from thence by
a contrary motion they wash the coast of Italy until they return to the place from whence
they came’. On the basis of temperature and salinity data collected during several summer
seasons Wolf and Luksch [1887] concluded that inflow along the east coast and outflow
along the west coast are connected not just by recirculation in the northernmost part of the
Adriatic but also by cross-basin currents flowing south of Istria and close to Palagruža. The
next important step was made by Zore [1956]: by computing geostrophic currents for a
series of cruises over a few-year interval she concluded that the inflow is more pronounced
in winter, the outflow in summer. Hendershott and Rizzoli [1976] considered dense water
formation on the Adriatic shelf during winter and noticed that the related cyclonic flow may

4
be isolated from flow in the south Adriatic. Artegiani et al. [1997], by analyzing
geostrophic currents computed from climatological temperature and salinity data, arrived at
the conclusion that the inflow is better developed in the colder part of the year, the outflow
in the warmer part. Poulain [2001] utilized data provided by satellite-tracked drifters and
found that the Adriatic cyclonic circulation is more pronounced during summer and
autumn; in winter he detected the outflow similar to the inflow. It would thus appear that
there is a consensus on the existence of the East Adriatic Current (EAC) but that there are
also differing findings on its season-to-season variability. Still, prevalent is the opinion that
at the sea surface the EAC culminates in winter.
Investigation of the Adriatic intermediate and bottom circulations has also a long tradition.
Using an early hydrographic data set Nielsen [1912] concluded that the Adriatic is a site of
dense water formation during winter, implying an inflow in the surface and intermediate
layers, an outflow in the bottom layer. Schott [1915] considered some additional
hydrographic data, and arrived at the conclusion that during summer there is an outflow in
the surface and bottom layers, an inflow in the intermediate layer. Zore-Armanda [1963]
defined the Adriatic water masses and discussed their spreading; for winter she clearly
distinguished water masses being generated on the shelf from those originating in the
deeper part of the basin, for both winter and summer she considered year-to-year variability
of seawater properties and related flows. Still on the basis of hydrographic data Artegiani
and Salusti [1987] followed dense water formed during winter in the north Adriatic as it
flows along the Italian coast in the bottom layer, partially sinks to the Jabuka Pit and
partially overflows the Palagruža Sill and sinks to the South Adriatic Pit. Kovačević et al.
[1999] utilized long-term Eulerian current measurements to demonstrate that in the Otranto
Strait inflow in the intermediate layer is found on the east side, outflow in the bottom layer

5
on the west side. Performing least-squares tracer analysis of water masses Vilibić and Orlić
[2001] showed that the intermediate layer inflow to the Adriatic peaked in the years 1968-
1971, 1980 and 1987-1989 and that it was weaker in between. Manca et al. [2002] used
long-term ADCP measurements to demonstrate that the bottom outflow from the Adriatic
attains maximum in March and April, with the transport depending on the Adriatic surface
buoyancy forcing and dense water generation during the previous winter. Finally, Vilibić
[2003] considered long-term hydrographic data collected at the bottom of the Jabuka Pit
and correlated them with the surface fluxes and Po River discharge; he showed that a month
is needed for dense water to arrive to the Jabuka Pit after being generated in the north
Adriatic. The overall picture emerging from these studies is of a cyclonic gyre in both the
intermediate and bottom layers, with the inflow prevailing in the intermediate layer,
outflow dominating the bottom layer. This would imply that the EAC occupies the whole
water column, but no direct observations of the deep flow, or of its temporal variability,
were previously available.
The present meteorological, CTD and ADCP measurements, designed so as to document
air-sea fluxes, seawater properties and variability of the EAC, will be described in the
second section, along with some routinely performed observations. In the next three
sections the data collected will be analyzed. As will transpire from the sections, the main
finding of the project is that the EAC may peak in winter and again in spring. A simple
numerical model of the Adriatic/Mediterranean system will be developed in the sixth
section in order to interpret this finding. In the final seventh section importance of the
finding for an understanding of the Adriatic general circulation will be briefly discussed.

6
2. Data
With the aim of documenting meteorological conditions in our measurement area, we have
mounted Automatic Meteo-Oceanographic Station (AMOS) on the Veli Rat lighthouse
(Fig. 1). The station was equipped with sensors, produced by Aanderaa Instruments,
measuring solar and net radiation, air and sea temperature, air pressure, wind direction,
speed and gustiness, air humidity and precipitation. All sensors except the rain, air pressure
and sea temperature gauges were placed on the top of the lighthouse, 49 meters above sea
level. They were thus exposed to winds from all directions, the surrounding terrain being
almost flat. Air pressure and precipitation were recorded in front of the lighthouse, at a 4 m
height, whereas sea temperature was measured off the nearby coast, at a 0.5 m depth. For
the wind speed and direction mean values at 10 min intervals were recorded, for the wind
gusts maximum speeds over 10 min intervals were taken. Precipitation, solar and net
radiation were registered as sums at 10 min intervals. All the other parameters were
measured continuously and sampled every 10 min.
AMOS was set in operating mode on 2 November 2002 and it collected data until 27 June
2003. The measured data were transferred in real time from the station to the Institute of
Oceanography and Fisheries and have been stored there as a raw data set. Due to some
technical problems (primarily with power supply unit), two large gaps occurred in all the
time series (from 10:00 to 13:10 EMT on 25 November 2002 and from 16:00 EMT on 15
March 2003 to 11:00 EMT on 23 March 2003). Additionally, in the beginning of the
measurement period (i.e. until 14:40 EMT on 12 December 2002) no precipitation data
were recorded due to the break of electric cable. Likewise, no sea temperature data were
collected between 20:30 EMT on 11 November 2002 and 23:50 EMT on 25 January 2003

7
and between 11:10 EMT on 28 January 2003 and 12:20 EMT on 9 February 2003, because
the sensor was broken twice while being exposed to extreme wave conditions. Finally, there
were some smaller gaps in the time series, which could be bridged by interpolation.
All AMOS data were quality controlled following three steps: (1) visual inspection of
plotted time series, (2) check of homogeneity of time series, and (3) comparison with data
simultaneously recorded at Zadar (meteorological parameters except solar and net
radiation), Split (solar and net radiation) and Mali Lošinj (sea surface temperature). The
Zadar and Mali Lošinj stations are part of the permanent network supervised by the
Hydrologic and Meteorological Service of the Republic of Croatia, whereas the Split station
is owned by the Institute of Oceanography and Fisheries; their position is shown in Fig. 1.
Values missing from the Veli Rat time series were interpolated by regressing available Veli
Rat data on those simultaneously collected at Zadar (daily values of standard
meteorological parameters, r=0.81-0.99), Split (daily values of solar radiation, r=0.93) and
Mali Lošinj (three readings of sea surface temperature per day, r=0.78).
CTD measurements were performed on the network of 21 stations off Veli Rat (Fig. 1)
during seven cruises (30 November – 2 December 2002, 14 – 15 January 2003, 20 – 21
February 2003, 28 March 2003, 24 April 2003, 19 – 20 May 2003 and 14 June 2003).
Three probes (SBE9, SBE25A and SBE25B), having accuracy of at least 0.002oC in
temperature, 0.0003 S/m in conductivity and 0.1% of the full-scale range in pressure, were
used in the experiment. The data collected were preprocessed and averaged along the
vertical every 1 m. The last two probes were purchased right before the measurements, after
being calibrated by the manufacturer in August and September 2002, respectively. They
were again calibrated in 2004 and 2005, which demonstrated stability of the sensors. An

8
intercomparison of the probes was carried out during the cruises. It showed perfect
agreement of various sensors except for a slight offset of salinity recorded by the first
probe; this has been taken into account in the analysis.
Currents were measured at stations 9 (depth 71 meters) and 13 (depth 61 meters, Fig. 1) in
the interval extending from 30 November 2002 to 14 June 2003, using RDI Workhorse
Sentinel ADCPs operating at 300 kHz. Sampling interval was 15 minutes, bin size 2
meters, and width of the contaminated layer about 4 meters. Consequently, ADCPs
provided valuable data for 32 layers at station 9 and for 28 layers at station 13. Quality
check of the data was performed following the procedure proposed by the
Intergovernmental Oceanographic Commission [UNESCO, 1993]. The instruments were
mounted on the sea bottom using trawl-safe barny frames as described by Perkins et al.
[2000]. The frames enabled current measurements to be continuously performed over more
than six months. Previous time series, collected with the aid of classical current meters
deployed on moorings, did not extend beyond 1-2 months due to a heavy fishing activity in
the area.
Simultaneously with the currents some other parameters were measured as well: bottom
temperature at stations 9 and 13 by Pt100 resistors mounted together with ADCPs inside
the barny protecting cases, and bottom pressure at station 9 by a SBE26 wave and tide
recorder deployed in the same way. The latter data set could be related to tide-gauge record
collected at the Zadar station (Fig. 1), which belongs to the permanent network maintained
by the Hydrographic Institute.

9
Freshwater input by rivers, prior to and during the present experiment, was documented by
the discharge or water level data originating from eight major rivers that are distributed
along the Croatian coast of the Adriatic. Daily time series of river discharge, extending
from 1 September 2002 to 31 August 2003, were obtained for Mirna, Raša, Krka, Jadro and
Žrnovnica, while for Cetina and Neretva only water levels were available. All the river
mouths are indicated in Fig. 1. The respective stations belong to the standard network
supervised by the Hydrologic and Meteorological Service of the Republic of Croatia. The
data for Zrmanja, the major river in vicinity of the measurement site, were not available for
the interval mentioned. Consequently, the discharge of Zrmanja was estimated from the
Krka data, using linear relationship (r = 0.91) previously established from simultaneous
time series for the two rivers.
3. Meteorological and hydrologic conditions
Daily values of various parameters measured at Veli Rat are shown in Fig. 2. As is usually
the case in the Adriatic, meteorological conditions could most easily be interpreted if
related to the winds blowing at the time [Penzar et al., 2001]. According to our data,
between November 2002 and June 2003 an interchange of the sirocco (SE wind) and bora
(NE wind) episodes prevailed and these were stronger and more frequent in winter than in
spring. Most often, sirocco brought warm, humid air to the Adriatic area and was
accompanied by precipitation. Bora, on the other hand, usually implied advection of cold,
dry air and it coincided with clear-sky conditions. There were, however, some exceptions to
this pattern. Thus, on 25 November 2002 and 30 April 2003 sirocco episodes were not
visible in precipitation data. They represented so-called ‘dry sirocco’ events, being related
to an anticyclone over the southeast Europe rather than to a cyclone over the north Italy

10
[Deutscher Wetterdienst, 2002, 2003]. On 2 December 2002 bora was accompanied by
precipitation. This was the so-called ‘dark bora’ since it was influenced not just by an
anticyclone over the northeast Europe but also by a cyclone over the south Adriatic
[Deutscher Wetterdienst, 2002].
From the daily time series collected at Veli Rat surface fluxes of heat and water were
computed. Downward heat flux was determined from measured solar radiation, taking into
account the sea albedo computed by Payne [1972]. Components of upward heat flux were
determined through parameterization schemes for the longwave radiation [Bignami et al.,
1995] and for the sensible and latent heat fluxes, the latter two supplemented by the often-
used turbulent exchange coefficients [Rosati and Miyakoda, 1988]. Because cloud cover
information was not available for Veli Rat, daily cloud fraction was obtained by dividing
the measured solar radiation with the estimated clear sky radiation. Finally, surface water
flux was determined from the latent heat flux and precipitation data. All the fluxes are
shown in Fig. 3. Although computed from data that were mostly collected on the top of the
lighthouse, they showed better agreement with fluxes determined for the nearby open-sea
area [Dorman et al., 2006, their Fig. 15] than fluxes computed from data scaled to the
standard height, presumably due to the onshore-offshore wind strengthening being similar
to the vertical wind speed increase. Episodes of the strongest surface heat loss were related
to the bora wind, as marked in the figure. An apparent exception was the event of 7 January
2003, but even in this case sirocco rapidly gave way to bora, the latter being then
responsible for the upward heat flux. Episodes of the strongest surface water gain are also
marked in the figure. They are somewhat more complex, and include – besides the simple
sirocco events – the case of dark bora of 2 December 2002 as well as the cases of sirocco
turning to bora on 7 January and 3 March 2003.

11
From the surface heat and water fluxes determined on a daily time scale monthly mean
values were computed and were supplemented by the surface buoyancy flux [obtained
following Phillips, 1966]. These are in Fig. 4 compared with the corresponding averages
determined for station Mali Lošinj over a 27 year interval [1966-1992; Supić and Orlić,
1999]. The procedure is supported by findings of Dorman et al. [2006], which imply that
Veli Rat and Mali Lošinj belong to a similar surface-forcing regime. Obviously, January
and February 2003 were characterized by strong cooling, subsequent spring by strong
heating. Mean heat loss in January and February 2003 was about 170 W/m2, double than
the average for the area. In contrast, heat gains in May and June 2003 surpassed the average
values by 60%. Surface water flux was close to the average from November 2002 to
January 2003, and it was anomalously directed upwards during the following months. Mean
water flux between February and June 2003 was -2.5 mm/day, totally opposite to the
average (+1.0 mm/day). In winter 2002/2003 (i.e. until the end of February 2003) surface
buoyancy loss was considerably stronger than is typical for this part of the year, thus
reflecting the intensive heat loss. In spring 2003 (i.e. from the beginning of March 2003)
surface buoyancy gain was much more pronounced than the averages would suggest,
obviously due to the heat gain controlling it more strongly than the water loss.
Time series of monthly mean river discharge and water level are shown in Fig. 5 and are
compared there with the long-term climatology supplied by the Hydrologic and
Meteorological Service of the Republic of Croatia. All the rivers that still have a
predominantly natural flow regime (Mirna, Raša, Zrmanja, Krka, Jadro and Žrnovnica) had
a significantly increased discharge prior to or at the beginning of our measurement
program, i.e. in November 2002 and January 2003. In February 2003 discharge did not

12
depart significantly from climatological values; Jadro and Žrnovnica still had a somewhat
increased discharge, while discharge of Istrian rivers (Mirna and Raša) was slightly below
the long-term average. However, in March 2003 a long-lasting dry period started: until the
end of the experiment river discharges remained one standard deviation below
climatological values. The autumn/winter positive and the spring negative anomaly was not
that pronounced on the southernmost rivers, Cetina and Neretva, since the flow of Cetina is
entirely controlled by power plants and Neretva is also heavily influenced by human
activity.
4. Seawater properties
Our CTD sampling was performed with along-transect resolution of ca. 5 km and an even
coarser cross-transect resolution, once per month. This opens the question of errors due to
aliasing in space and time. To analyze aliasing in space we have used underway
temperature and conductivity data taken by RV Knorr at a 5 m depth while passing over our
measurement area on 4 June 2003 [C. M. Lee, personal communication]. The data were
averaged and recorded at a 1 min time interval along the ship path, which – with the typical
cruising speed of 8 knots – gave the sampling interval of ca. 250 m. The analysis of aliasing
followed the procedure developed by Pasarić et al. [2006]. Temperature, salinity and
density-anomaly sequences were first linearly interpolated every 100 m, thus obtaining
regularly sampled series. Direct comparison revealed that no spurious data were introduced
by this operation. The series were then sub-sampled with space steps of ∆s = 1, 2, 5, 10 km,
the sub-sampled series were linearly interpolated back to 100 m intervals, and the squared
differences were calculated. The starting point for sub-sampling was systematically varied
within the first ∆s kilometers of the sequence (with a step of 100 m), and squared

13
differences thus obtained were averaged. Finally, 5 km averages were calculated and square
root was taken. The obtained root mean square (RMS) error was found to reach at most
0.2°C, 0.06 and 0.07 kg/m3 for temperature, salinity and density anomaly, respectively.
The aliasing in time was analyzed using time series of bottom temperature measured at
stations 9 and 13 over six months with a 15 min sampling interval. The procedure is
analogous to the case of aliasing in space: Sub-sampling was performed with various time
steps (∆t = 1, 5, 15, 30 days), the sub-sampled series were linearly interpolated back to 15
min intervals, and the squared differences were calculated between this and the original
series. The starting point for sub-sampling was systematically varied within the first ∆t days
of the sequence (with a 1 h step) and squared differences thus obtained were averaged.
Finally, 5 day averages were calculated for all the four series of mean squared differences,
whereupon the square root was taken, giving overall RMS error. The results show that the
error due to the monthly sampling may reach 0.3°C.
Having in mind these errors, we could consider changes of water properties in our
measurement area. Data collected at the transect extending from station 8 to station 14
illustrate salient points of this variability. In February 2003 (Fig. 6, left) colder, fresher
water was advected from the coast, warmer, saltier water was dominating the open sea. In
the outer part of the transect an intrusion of colder water could be noticed close to the
bottom, probably representing the North Adriatic Dense Water [NAdDW, Zore-Armanda,
1963, Artegiani and Salusti, 1987] that was generated in early winter in the north Adriatic
and then spread towards the middle Adriatic. In May 2003 (Fig. 6, right) stratification was
well developed, with warmer, saltier water occupying the surface layer, colder, fresher
water the bottom layer. An intrusion of warm, saline water was detected in the intermediate

14
layer at stations 12-14, probably related to the Levantine Intermediate Water [LIW, Zore-
Armanda, 1963, Vilibić and Orlić, 2001] inflowing from the southeast.
Temporal variability could be considered in some detail using the time-depth plots
constructed for the outer station 7 and the inner station 14 (Fig. 7). At the inner station
temperature was lowest close to the sea surface in February 2003, whereas at the outer
station it achieved minimum in the bottom layer in March/April 2003. Warming in spring
reached to a greater depth at the inner station than at the outer station. Considerable cross-
shore salinity gradients were observed throughout winter, whereas similar values were
recorded at the two stations in spring. This again shows that in winter colder, fresher coastal
water interacted with warmer, saltier open-sea water, the latter being somewhat modified
by dense water descending from the north Adriatic. In spring vertical stratification was well
developed, as was an inflow of warmer, saltier water from the south Adriatic.
CTD data collected at stations 15-18 in the surface (0-10 m), intermediate (20-30 m) and
bottom (> 50 m) layers were compared to corresponding climatological values. The latter
were determined from data collected between 1904 and 1982 and stored in Marine
Environmental Database of the Adriatic Sea (MEDAS) that had been organized by the
Institute of Oceanography and Fisheries. Figure 8, when related to Fig. 4 illustrating the
surface forcing, reveals that due to strong cooling in January and February 2003
temperature decreased from about 17oC observed during our first cruise (1oC above long-
term average near the bottom) to approximately 12oC during the third cruise (close to the
average). After that, the intermediate and bottom temperatures stayed below average with
the maximum anomaly occurring in May 2003 (1oC below the average). On the contrary,
the surface temperature in June 2003 surpassed average values by more than 2oC, because

15
the surface heating was pronounced in May and June 2003. Throughout the experiment
salinity was more uniform along the vertical than climatological averages would suggest:
the difference between the surface and bottom salinity did not surpass 0.06 (Fig. 8). Due to
extremely dry conditions prevailing between February and June 2003 (Figs. 4 and 5) the
surface salinity minimum, which usually occurs in May after river runoffs are at the
maximum, could not be seen at all. In fact, salinity increased during the experiment, by
about 0.2 in the surface layer and 0.1 in the bottom layer.
5. Currents
Our ADCP measurements documented processes extending over a broad frequency range.
Small temporal scales (diurnal or smaller) are to a considerable degree influenced by tides.
Hence, tidal currents have been extracted from the data using MATLAB tidal package,
which follows the Foreman [1978] method and had been evaluated by Pawlowicz et al.
[2002]. Harmonic analysis was performed on the original current time series, allowing for
seven major tidal constituents (M2, S2, N2, K2, K1, O1, P1) to obtain parameters that
describe current ellipses: length of the major and minor axes and inclination of the axes.
The ellipses for each tidal constituent are drawn in Fig. 9 as a function of depth, with the
clockwise and anticlockwise rotations being clearly distinguished. Obviously, tidal currents
are almost linearly polarized in our measurement area and are aligned with the coast, as
already found by numerical modelers [Cushman-Roisin and Naimie, 2002]. Bottom friction
manifests itself in the well-known veering at semidiurnal periods [e.g. Sverdrup, 1927] and
a different behavior at diurnal periods, in the layer extending to about 10 m above the
bottom.

16
The harmonic constants obtained were used to eliminate tidal signal from the original time
series. The six-month series of detided currents were submitted to spectral analysis in order
to investigate the existence of possible periodic motions. The power density spectra were
determined by the Welch method using Hanning non-overlapping windows of 21.3-day
length, thus implying 76 degrees of freedom [Press et al., 2001] and ensuring optimum
balance between frequency resolution and statistical stability. The spectra for the along-
basin (L) and cross-basin (T) current components at different depths are presented in Fig.
10 as contours of power density. On the upper axes two characteristic periods are shown,
the local inertial period (17.2 h) and the period of the fundamental Adriatic seiche (21.2 h).
The former was much more pronounced at station 9, the latter was similar at both stations.
Inertial signal appeared in both current components, and it is interesting that the signal
occurred at the period somewhat exceeding the local inertial period – probably due to the
internal Poincaré wave being Doppler-shifted by the EAC [see also Orlić, 1987]. Currents
related to the Adriatic seiche were aligned with the coast, and they were clearly visible
since the length of our time series made efficient detiding possible; the only previous study
of such currents concentrated on an exceptionally strong episode [Leder and Orlić, 2004].
The current variability at time scales longer than a day is illustrated by Fig. 11, for February
and May 2003. The vectors represent currents submitted to a low-pass digital filter having
the cut-off frequency of 1/48 h-1 and the filter half-length equal to 168 h or 7 days [e.g.
Emery and Thomson, 1997] and then sampled with a one-day interval. At these time scales
the Adriatic is to a great extent influenced by the wind episodes associated with synoptic
atmospheric disturbances that last a few days [e.g. Orlić et al., 1994, Beg Paklar et al.,
2001, Pullen et al., 2003, and references cited therein]. Consequently, on the top of the
figure time series of the wind, measured at the Veli Rat station, is shown as well; the wind

17
was processed in the same way as the currents. The current variability generally
corresponded to the wind changes, although in spring there were some events in the sea that
were not related to the local wind. Both in winter and spring response of the currents to the
wind forcing appeared to be stronger at station 13 than at station 9. The response was
barotropic in winter, baroclinic in spring, due to different stratification and, hence, stability
conditions.
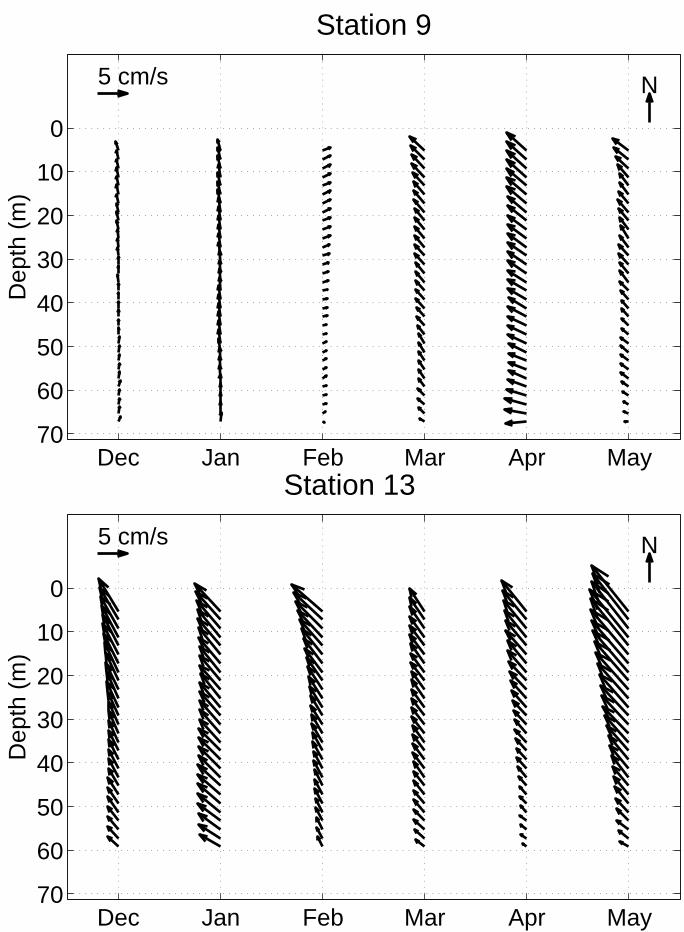
In order to get an insight into the seasonal variability of the current field, monthly mean
currents have been calculated. The original 15 min data were averaged over complete
months only. The time series of monthly mean currents at different depths, registered at the
two stations, are shown in Fig. 12. An inflow prevailed at station 13 throughout the six-
month interval, whereas currents were weaker at station 9 and did not indicate an inflow
during December 2002 and January and February 2003. Obviously, station 13 was
positioned closer to the EAC core than station 9. The currents were of almost uniform
direction along the vertical. Temporal variability of the currents did not follow expected
pattern, since at station 13 the inflow was strongest in January/February 2003 and again in
May 2003, whereas at station 9 it was actually better developed in spring than in winter. It
may be concluded that in January/February 2003 the EAC was concentrated close to the
Croatian coast, in May 2003 it was distributed more widely. On both occasions there was
some variability of the inflow along the vertical, but reversal never occurred. Transport
across the transect extending from station 8 to station 14, roughly estimated from data
collected at stations 9 and 13, peaked in January 2003 (0.123 Sv) and in May 2003 (0.120
Sv).

18
To what extent were these monthly mean currents influenced by the wind? In order to
answer this question we had removed all hourly data, corresponding to winds exceeding 7
m/s at Veli Rat, from the recorded current time series, and have then computed monthly
mean values from the reduced data set. The procedure is supported by the well-known fact
that the Adriatic currents lag only slightly behind the wind [e.g. Orlić et al., 1994]. The
new monthly mean values are shown in Fig. 13. Although the winter current maximum at
station 13 is somewhat reduced with respect to that shown in Fig. 12, it is still clearly
separated from the spring one. It would thus appear that the winds are not of particular
importance for the EAC variability at monthly time scales, and that the EAC may be
interpreted primarily as a branch of some thermohaline circulation system.
Let us also briefly consider along-shore variability of the EAC. The currents recorded along
Senigallia-Susak transect in the scope of the Adriatic Circulation Experiment [ACE, J. W.
Book, personal communication] could be used for the purpose. The EAC was well
developed at station SS9, positioned to the northwest of our station 13 (Fig. 1). The time
series at the two stations were not collected over a same interval, but they did overlap
between December 2002 and April 2003. Thus, differences of monthly mean currents could
be computed between stations SS9 and 13. They show that in January/February 2003 the
EAC was much stronger at station 13 than at station SS9. The data for April 2003 suggest
the same relationship, but it could not be properly verified for the second EAC maximum
since ACE current meters were recovered in the beginning of May 2003 and, therefore, did
not document inflow along the Croatian coast in that month.
The most surprising result of our ADCP measurements is the second maximum of EAC. In
order to check this finding, we have determined surface geostrophic currents from the

19
cross-basin sea level slope. For such a computation we had at disposal sea levels routinely
recorded at Zadar as well as bottom pressures measured at station 9 (Fig. 1). The latter data
set could be used to compute sea levels by assuming hydrostatic balance along the vertical,
by utilizing vertical density profiles from our cruises and linearly interpolating them
between the cruises, and by taking air pressures recorded at Veli Rat into account. The
computed geostrophic currents represent average surface flow in the whole area extending
from station 9 to Zadar and thus encompass channels and inlets which may have dynamics
differing from that in our measurement area. In spite of this, the computed currents were
successfully compared to the measured ones – to the northwest currents recorded at a 4 m
depth and averaged for stations 9 and 13. Assuming that the six-month averages of the
measured and computed surface currents are equal, one can easily calculate absolute sea
levels at station 9. Both sea level series, together with the computed and measured surface
currents, smoothed by a 30 day running average, are displayed in Fig. 14. The agreement of
the computed and measured surface currents is good. Slow change, with a period of about
three months, can be observed in the series, with the currents peaking in January/February
2003 and again in May 2003. Thus, the occurrence of the second EAC maximum has been
confirmed by an independent data set, and therefore had to be interpreted with care.
6. Discussion
The present analysis has shown that meteorological and hydrologic forcing was anomalous
in winter 2002/2003 and spring 2003: during winter the cooling and river outflows were
strong, during spring the pronounced warming was combined with exceptional dryness. In
winter considerable cross-shore variability of hydrographic properties was observed, with
the colder, fresher water prevailing close to the coast, the warmer, saltier water dominating

20
the open sea. In spring massive intrusion of the warmer, saltier water was detected along
the east Adriatic coast. Different hydrographic conditions corresponded to distinctive
maxima of the EAC: in January/February 2003 and in May 2003. The EAC was
concentrated close to the coast in winter whereas it was more widespread in spring, and it
stretched over the whole water column throughout the two seasons considered.
Whereas the first EAC maximum reflects the previous findings on the Adriatic circulation,
the second represents the novel result of the present study. We hypothesize that the first
EAC maximum was related to coastal freshwater input and offshore evaporation in the
Adriatic area, and that the second EAC maximum was due to wintertime surface cooling of
the Adriatic while warmer conditions prevailed above the east Mediterranean. Thus, two
circulation systems could develop in response to the wintertime forcing, one haline, the
other thermal, and since they probably differed in spatial scales (100 km vs. 1000 km) it is
reasonable to expect that they also differed in temporal scales. In order to test this
hypothesis, we have developed a simple numerical model of the Adriatic-Mediterranean
system.
Numerical experiments have been performed using Princeton Ocean Model (POM) – a
three-dimensional primitive equation model with complete hydro- and thermodynamics
[Blumberg and Mellor, 1987]. Model equations are traditional equations for the
conservation of mass, momentum, heat and salt coupled with the equation of state [Mellor,
1991]. In the present application three simplifications were used: the hydrostatic,
Boussinesq and 'f-plane' approximations. The model has a second order turbulence closure
submodel described by Mellor and Yamada [1982], which provides two prognostic
equations for the turbulent kinetic energy and turbulent macroscale. The horizontal

21
viscosity and diffusivity coefficients are obtained using Smagorinsky diffusion formulation
adapted to sigma coordinate system [Mellor and Blumberg, 1985].
Experiments were made for an idealized basin, which mimics the Adriatic and east
Mediterranean Seas (Fig. 15a). The Adriatic is approximated by a rectangular basin 800 km
long and 200 km wide, having depth equal to 200 m. It is connected to another rectangular
basin representing the east Mediterranean, which is 800 km long, 2100 km wide and 1500
m deep. Horizontal resolution in the experiments was 10 km. Along the vertical 16
unequally distributed sigma layers were used, with a better resolution in the surface and
bottom layers. Courant-Friedrichs-Lewy criterion was satisfied with external time step of
24 s and internal time step of 480 s. Duration of numerical experiments was 150 days. In all
experiments it was assumed that the background vertical viscosity/diffusivity (umol) equals
10-6 m2/s, and that the coefficient controlling the horizontal mixing (horcon) amounts to 1
m2/s [Mellor, 2003].
Initial conditions for all the experiments were uniform temperature and salinity fields with
values of 150C and 38, respectively, and the state of rest. Numerical experiments have been
organized so as to illustrate the effects of separate thermal and haline forcing and of
combined thermohaline forcing. In the experiment with haline forcing river discharges were
assumed to be equally distributed along the Adriatic coasts while horizontally uniform
evaporative flux was distributed over the whole Adriatic. At each sea point along the
Adriatic coasts a river having a 90 m3/s discharge was imposed in the top model layer. The
river was introduced as a source term in the continuity equation [Kourafalou et al., 1996],
and was therefore modeled as a volume of zero salinity water in the form of a coastal
'mound'. Coastal salinity in the immediate vicinity of the source was then determined by

22
model mixing. To equilibrate the fresh water inflow, evaporative loss of 10-7 m/s was
assumed at each grid point in the small rectangular basin approximating the Adriatic. The
water loss was introduced in the equation of salt conservation as its surface condition. In
the experiment with thermal forcing surface heat loss of 1000 W/m2 was assumed over the
entire Adriatic. The thermal forcing was imposed via surface condition in the equation of
heat conservation. In the experiment with thermohaline forcing the surface heat and water
fluxes and river inflows were applied simultaneously.
In all the experiments forcing was imposed on the Adriatic basin only, and it was multiplied
by a bell-shaped function tracing its variability over a 30 day winter interval (Fig. 15b). As
illustrated by Figs. 4 and 5, surface water loss and coastal water gain peaked in the
beginning of 2003, and were thus reasonably well approximated by the function. At a first
glance, the approximation was not so good for the surface heat loss, because the cooling
lasted from October 2002 to February 2003 (Fig. 4), i.e. much longer than assumed in the
numerical experiments. It should be taken into account, however, that in the beginning of
the cooling season about 109 J has to be removed from the sea per square meter of the sea
surface in order to reduce the temperature of the surface layer and to destroy the
thermocline. It therefore takes about three months to homogenize the water column,
whereupon convection may extend to the bottom. Rather than simulating the former
process, we have initialized numerical experiments with the uniform temperature field and
have allowed for intense cooling and consequent occurrence of horizontal temperature
gradients in the beginning of 2003. The simulations were designed with the aim of
interpreting events in the year 2003, and – in particular – the lack of forcing after the initial
30 day interval is atypical. But, as will be discussed in the concluding section, the
anomalies of the year 2003 were in fact advantageous, since they enabled the two

23
circulation systems that occur in response to the wintertime forcing to be analyzed, without
having to consider the third system that develops when the springtime forcing is
pronounced. Thus, the model reproduces – in a grossly simplified way – processes in a
particular, anomalous year, but secures an insight that may be used to interpret conditions
in a typical year.
Surface along-shore currents, simulated at section N stretching across the ‘north Adriatic’
basin (Fig. 15), are shown in Fig. 16 as a function of cross-basin distance (counted from
‘Italian’ side) and time. Currents obtained in the experiment with haline forcing indicate
formation of a cyclonic circulation in the surface layer soon after the forcing attains
maximum (Fig. 16a). They reach 10 cm/s and are concentrated in a narrow area off both
coasts, especially between 10th and 40th day. After 40 days, with the forcing being
switched off, dissipation in the current field could be observed, and after 120 days the
initial structure disappears. In contrast to this, currents following from the experiment with
thermal forcing are weak during the first 60 days, i.e. throughout the forcing episode and
some 30 days after its cessation (Fig. 16b). After that incoming current appears off
‘Croatian’ coast and after 100 days outgoing current emerges off ‘Italian’ coast, indicating
gradual development of cyclonic gyre in the surface layer of the ‘north Adriatic’ basin. The
currents reach 20 cm/s, with significant speeds being confined to the coasts, although the
coastal flows are broader than in the experiment with haline forcing. By adding the currents
obtained under the separate haline and thermal forcing (Fig. 16c) it is shown that the two
may be easily distinguished since they are widely separated in time. Currents resulting from
thermohaline forcing (Fig. 16d) somewhat differ from currents produced by thermal-cum-
haline forcing, as illustrated by the difference between them (Fig. 16e). Despite these
nonlinear effects, the two circulation systems are still clearly visible, one characterized by a

24
rapid response to the forcing, the other by a delayed one. In all experiments currents in the
bottom layer (not shown) are opposed to those in the surface layer and are much weaker.
Numerical modeling has strongly supported interpretation according to which the EAC
maximum in January/February 2003 was related to haline circulation that occurred within
the Adriatic, whereas the EAC maximum in May 2003 represented a branch of thermal
circulation that developed in the Adriatic-Mediterranean system. According to the model,
the difference in temporal scales of the two circulation systems is considerable, which may
explain the occurrence of two distinctive maxima. Moreover, the observed difference in
width of the inflow – with a narrow current recorded in January/February 2003 and a
broader current detected in May 2003 – also corresponds with the modeling results. Of
course, there are also some discrepancies between the experimental and modeling findings,
most notable being uniformity/reversal of flow along the vertical. It seems that the vertical
distribution of currents could be sensitively dependent on mixing conditions and variable
bottom topography, but numerical simulation of such effects falls beyond the scope of the
present work.
7. Summary and concluding remarks
Our meteorological measurements have shown that in winter 2002/2003 an interchange of
the sirocco and bora episodes prevailed, spring 2003 was much more quiet. Most often,
sirocco resulted in pronounced water gain by the sea, bora in strong heat loss, although
there were some exceptions to this pattern related to ‘dry sirocco’ and ‘dark bora’ events.
Overall, winter was characterized by unusually strong cooling, spring by exceptional
heating. Surface water flux was close to the average in winter, but was anomalously

25
directed upwards in spring. River outflows to the Adriatic were also atypical, thus reflecting
prevailing meteorological conditions. Most rivers had a considerably increased discharge in
late 2002 and early 2003. In February 2003 the discharges did not depart significantly from
climatological values. However, in March 2003 a long-lasting dry period started: river
discharges remained one standard deviation below climatological values until the end of the
experiment.
The sea responded promptly to the forcing. The winter cooling resulted in lower-than-
average temperatures, which persisted in the intermediate and bottom layers throughout the
spring season. Surface temperatures gradually became greater than long-term averages, due
to intensive spring heating. Salinities were close to the averages during winter, but
surpassed them during spring thus reflecting anomalously dry conditions. In winter colder,
fresher water was advected from the coast, warmer, saltier water was dominating the open
sea and was somewhat modified by dense water descending from the north Adriatic. In
spring vertical stratification was well developed, as was an inflow of warmer, saltier water
from the south Adriatic.
The current measurements revealed a variety of high-frequency phenomena – tides, seiches,
inertial oscillations, wind-driven flows. The most interesting finding, however, resulted
from an analysis of month-to-month variability: the EAC attained maximum in
January/February 2003 and again in May 2003. In the former case the EAC was
concentrated close to the coast, reflecting cross-basin variability of salinity at the time. In
the latter case it was distributed more widely, in concurrence with the observed massive
intrusion of warm water from the southeast. On both occasions there was some variability
of the inflow along the vertical, but reversal never occurred. Comparison with some other

26
data showed that the current diminished in a northwestward direction. Its temporal
variability was confirmed by computing geostrophic flow from the cross-basin sea level
slope.
Using a simple numerical model reproducing response of the Adriatic-Mediterranean
system to wintertime forcing we have successfully tested a possible interpretation of the
observed current variability. We thus propose that the first EAC maximum was related to
coastal freshwater input and offshore evaporation in the Adriatic area, and that the second
EAC maximum was due to wintertime surface cooling of the Adriatic while warmer
conditions prevailed above the east Mediterranean. Since in the two situations buoyancy
sources and sinks operated over different distances, two circulation systems developed: one
of them was haline, with the corresponding thermal contribution opposing it because the
river inflows were colder than the open Adriatic, the other was thermal, with the related
haline contribution acting in the opposite sense due to the positive Mediterranean-to-
Adriatic salinity difference. They differed in both spatial and temporal scales, therefore
supporting the occurrence of two distinctive EAC maxima.
The two circulation systems were previously modeled on several occasions. Haline
circulation developing within the Adriatic was considered theoretically by Hendershott and
Rizzoli [1976] and Orlić [1996], thermally driven interchange between the basins
resembling the Adriatic and east Mediterranean by Spall [2003, 2004]. The models,
however, were based on the steady-state assumption or were integrated until a statistical
equilibrium was achieved. Consequently, temporal variability of the currents was not of
primary concern. Both haline and thermal circulations may be expected to be reproduced by
numerical models of the Adriatic, which (1) allow for the air-sea heat and water fluxes, (2)

27
take the river inflows into account, and (3) are nested into a wider Mediterranean model. By
a rare modeling effort that satisfied these criteria Zavatarelli and Pinardi [2003] produced
realistic wintertime currents. Yet, the simulated currents were averaged over a four month
interval (January-April) and therefore haline and thermal contributions could not be
considered separately.
Previous theoretical studies indicate that haline circulation occurs within the Adriatic
(marginal-sea circulation) whereas thermal circulation develops between the Adriatic and
east Mediterranean (negative inter-basin circulation, implying an outflow from the Adriatic
in the bottom layer compensated by an inflow from the Mediterranean in the layers above).
Our data and model suggest that marginal-sea circulation is a proper winter phenomenon,
and that negative inter-basin circulation starts in winter but may persist in spring and thus
could interfere with other processes that are characteristic for the warmer part of the year.
Most important of these is positive inter-basin (or estuarine-type) circulation, which usually
occurs in spring when the Adriatic rivers discharge into the stratified sea and are
transported outwards in the surface layer thus supporting an inflow from the Mediterranean
in the deeper layers. In spring 2003, however, the latter circulation system was weakly
developed, due to anomalous meteorological and hydrologic conditions, and thus we have
observed negative inter-basin circulation in an almost pure form. It may be expected that in
a more typical year surface outflow related to positive inter-basin circulation would oppose
surface inflow due to negative inter-basin circulation and that the EAC would peak only in
winter – in agreement with the prevalent views on the Adriatic dynamics.
It is of some interest to reconsider here the main ideas on the Adriatic circulation. As
already mentioned, Nielsen [1912] was probably the first to describe negative inter-basin

28
circulation, Schott [1915] pioneered the study of positive inter-basin circulation. Their
findings were combined by Zore-Armanda [1963] in a paradigm stating, basically, that
negative inter-basin circulation occurs in winter, positive inter-basin circulation in summer,
transitions in spring and autumn. Subsequently, Hendershott and Rizzoli [1976] provided
evidence on marginal-sea circulation in the Adriatic. This resulted in a modification of the
old paradigm, implying that marginal-sea and negative inter-basin circulations develop on
similar time scales and that both occur in winter and at the same time retaining the earlier
interpretation of dynamics that controls the rest of the year [Franco et al., 1982, Orlić et al.,
1992, Cushman-Roisin et al., 2001]. The time now seems ripe for a new paradigm, which
would allow for marginal-sea and negative inter-basin circulations being separated in time.
There would be several consequences of the new paradigm. Thus, for example, the
widespread practice of computing seasonally averaged currents in the Adriatic should be
abandoned in favor of averaging over one month intervals. Whereas the new filter may
sometimes be too demanding for experimentalists, it should be readily acceptable to
modelers. The new paradigm may also help to explain the apparent discrepancy between
the findings of Zore [1956] and Artegiani et al. [1997] (who showed that the EAC is better
developed than the WAC in winter) and the results published by Poulain [2001] (who
found the EAC similar to the WAC in winter). Wintertime surface currents considered by
Zore were related to February/March, those by Artegiani et al. to January-April, currents by
Poulain to January-March. Probably, the results obtained by Poulain were mostly
controlled by marginal-sea circulation forming within the Adriatic whereas the findings
published by Zore and Artegiani et al. were additionally influenced by negative inter-basin
circulation developing between the Adriatic and east Mediterranean.

29
Acknowledgements:
We thank the masters and crews of RVs Bios, Hidra and Palagruža for taking part in the
East Adriatic Coastal Experiment (EACE) and for their professional and efficient
contributions to its field-work phase. We are also indebted to Damir Ivanković and Zlatko
Radman for participating in deployment and recovery of instruments in a highly competent
and motivated manner. We sincerely thank Craig M. Lee (University of Washington,
Seattle, WA, USA) for providing underway temperature and salinity data taken while RV
Knorr traversed our measurement area on 4 June 2003, and Jeff W. Book (Naval Research
Laboratory, Stennis Space Center, MS, USA) for supplying processed current data
collected in the framework of the Adriatic Circulation Experiment. Hydrologic and
Meteorological Service of the Republic of Croatia kindly provided meteorological data
collected at Zadar, sea surface temperatures recorded at Mali Lošinj as well as discharges
and water levels originating from the east Adriatic rivers. Comments offered by two
anonymous reviewers helped to improve the original manuscript. EACE was supported by
the USA Office of Naval Research (through the grant No. 493264 administrated by the
University of Washington, Seattle, WA, USA) and the Croatian Ministry of Science,
Education and Sports.

30
References:
Artegiani, A., and E. Salusti (1987), Field observation of the flow of dense water on the
bottom of the Adriatic Sea during the winter of 1981, Oceanol. Acta 10, 387-391.
Artegiani, A., D. Bregant, E. Paschini, N. Pinardi, F. Raicich, and A. Russo (1997), The
Adriatic Sea general circulation – Part II – Baroclinic circulation structure, J. Phys.
Oceanogr. 27, 1515-1532.
Beg Paklar, G., V. Isakov, D. Koračin, V. Kourafalou, and M. Orlić (2001), A case study of
bora-driven flow and density changes on the Adriatic shelf (January 1987), Cont. Shelf Res.
21, 1751-1783.
Bignami, F., S. Marullo, R. Santoleri, and M. E. Schiano (1995), Longwave radiation
budget in the Mediterranean Sea, J. Geophys. Res. 100, 2501-2514.
Blumberg, A. F., and G. L. Mellor (1987), A description of a three-dimensional coastal
ocean circulation model, in Three Dimensional Coastal Ocean Models, Coastal and
Estuarine Sciences 4, Edited by N. S. Heaps, 16 pp, AGU, Washington D.C.
Cushman-Roisin, B., and C. E. Naimie (2002), A 3D finite-element model of the Adriatic
tides, J. Mar. Syst. 37, 279-297.
Cushman-Roisin, B., M. Gačić, P.-M. Poulain, and A. Artegiani (Eds.) (2001), Physical
Oceanography of the Adriatic Sea, 304 pp, Kluwer, Dordrecht.

31
Deutscher Wetterdienst (2002), Europaeischer Wetterbericht – fuer das Jahr 2002, [CD-
ROMs], Offenbach am Main.
Deutscher Wetterdienst (2003), Europaeischer Wetterbericht – fuer das Jahr 2003, [CD-
ROMs], Offenbach am Main.
Dorman, C. E., S. Carniel, L. Cavaleri, M. Sclavo, J. Chiggiato, J. Doyle, T. Haack, J.
Pullen, B. Grbec, I. Vilibić, I. Janeković, C. Lee, V. Malačič, M. Orlić, E. Paschini, and A.
Russo (2006), Winter 2003 marine atmospheric conditions and the bora over the Northern
Adriatic, J. Geophys. Res., this issue.
Emery, W. J., and R. E. Thomson (1997), Data Analysis Methods in Physical
Oceanography, 634 pp, Pergamon, Oxford.
Foreman, M. G. (1978), Manual for Tidal Current Analysis and Prediction, 57 pp, Pacific
Marine Science Report 78-6, Institute of Ocean Sciences, Patricia Bay, Sydney, BC.
Franco, P., Lj. Jeftić, P. Malanotte Rizzoli, A. Michelato, and M. Orlić (1982), Descriptive
model of the Northern Adriatic, Oceanol. Acta 5, 379-389.
Hendershott, M. C., and P. Rizzoli (1976), The winter circulation of the Adriatic Sea, Deep-
Sea Res. 23, 353-370.

32
Kourafalou, V., L. Oey, J. D. Wang, and T. N. Lee (1996), The fate of river discharge on
the continental shelf: 1. modeling the river plume and the inner shelf coastal current, J.
Geophys. Res. 101, 3415-3434.
Kovačević, V., M. Gačić, and P.-M. Poulain (1999), Eulerian current measurements in the
Strait of Otranto and in the Southern Adriatic, J. Mar. Syst. 20, 255-278.
Leder, N., and M. Orlić (2004), Fundamental Adriatic seiche recorded by current meters,
Ann. Geophys. 22, 1449-1464.
Lee, C. M., F. Askari, J. Book, S. Carniel, B. Cushman-Roisin, C. Dorman, J. Doyle, P.
Flament, C. K. Harris, B. H. Jones, M. Kuzmić, P. Martin, A. Ogston, M. Orlić, H. Perkins,
P.-M. Poulain, J. Pullen, A. Russo, C. Sherwood, R. P. Signell, and D. Thaler (2005),
Northern Adriatic response to a wintertime bora wind event, Eos Trans. AGU 86(16), 157-
165.
Manca, B. B., V. Kovačević, M. Gačić, and D. Viezzoli (2002), Dense water formation in
the Southern Adriatic Sea and spreading into the Ionian Sea in the period 1997-1999, J.
Mar. Syst. 33-34, 133-154.
Mellor, G. L. (1991), An equation of state for numerical models of ocean and estuaries, J.
Atmos. Oceanic Technol. 8, 609-611.
Mellor, G. L. (2003), Users Guide for a Three-Dimensional Primitive Equation Numerical
Model, 53 pp, AOS Program, Princeton University, Princeton.

33
Mellor, G. L., and A. F. Blumberg (1985), Modeling vertical and horizontal diffusivities
with the sigma coordinate system, Mon. Weather Rev. 113, 1379-1383.
Mellor, G. L., and T. Yamada (1982), Development of turbulent closure models for
geophysical fluid problems, Rev. Geophys. Space Phys. 20, 851-875.
Nielsen, J. N. (1912), Hydrography of the Mediterranean and adjacent waters, in Report on
the Danish Oceanographical Expeditions 1908-1910, Vol. 1, Edited by J. Schmidt, pp. 79-
191, A. F. Host & Son, Copenhagen.
Orlić, M. (1987), Oscillations of the inertia period on the Adriatic Sea shelf, Cont. Shelf
Res. 7, 577-598.
Orlić, M. (1996), An elementary model of density distribution, thermohaline circulation and
quasigeostrophic flow in land-locked seas, Geofizika 13, 61-80.
Orlić, M., M. Gačić, and P. E. La Violette (1992), The currents and circulation of the
Adriatic Sea, Oceanol. Acta 15, 109-124.
Orlić, M, M. Kuzmić, and Z. Pasarić (1994), Response of the Adriatic Sea to the bora and
sirocco forcing, Cont. Shelf Res. 14, 91- 116.
Pasarić, Z., M. Orlić, and C. M. Lee (2006), Aliasing due to sampling of the Adriatic
temperature, salinity and density in space, Estuar. Coast. Shelf Sci. 69, in press.

34
Pawlowicz, R., R. Beardsley, and S. Lentz (2002), Classical tidal harmonic analysis
including error estimates in MATLAB using T_TIDE, Comp. Geosci. 28, 929-937.
Payne, R. E. (1972), Albedo of the sea surface, J. Atmos. Sci.29, 959-970.
Penzar, B., I. Penzar, and M. Orlić (2001), Weather and Climate of the Croatian Adriatic
(in Croatian), 258 pp, Feletar, Zagreb.
Perkins, H. T., F. de Strobel, and L. Gualdesi (2000), The barny sentinel trawl-resistant
ADCP bottom mount: design, testing and application, IEEE J. Oceanic Eng. 25, 430-436.
Phillips, O. M. (1966), On turbulent convection currents and the circulation of the Red Sea,
Deep-Sea Res. 13, 1149-1160.
Poulain, P.-M. (2001), Adriatic Sea surface circulation as derived from drifter data between
1990 and 1999, J. Mar. Syst. 29, 3-32.
Press, W. H., S. A. Teukolsky, W. T. Vetterling, and B. P. Flannery (2001), Numerical
Recipes in Fortran 77: The Art of Scientific Computing, Volume 1 of Fortran Numerical
Recipes, 933 pp, University Press, Cambridge.
Pullen, J., J. D. Doyle, R. Hordur, A. Ogston, J. W. Book, H. Perkins, and R. Signell
(2003), Coupled ocean-atmosphere nested modeling of the Adriatic Sea during winter and
spring 2001, J. Geophys. Res., 108, doi: 10.1029/2003JC001780.

35
Rosati, A., and K. Miyakoda (1988), General circulation model for upper ocean simulation,
J. Phys. Oceanogr. 18, 1601-1626.
Schott, G. (1915), Die Gewaesser des Mittelmeeres, Vorzugsweise nach den Arbeiten des
daenischen Forschungsdampfers ‚Thor’ 1908-1910, Ann. Hydrogr. Mar. Meteorol. 43, 1-
18, 63-79.
Spall, M. A. (2003), On the thermohaline circulation in flat bottom marginal seas, J. Mar.
Res. 61, 1-25.
Spall, M. A. (2004), Boundary currents and watermass transformation in marginal seas, J.
Phys. Oceanogr. 34, 1197-1213.
Supić, N., and M. Orlić (1999), Seasonal and interannual variability of the northern
Adriatic surface fluxes, J. Mar. Syst. 20, 205-229.
Sverdrup, H. U. (1927), Dynamic of tides on the North Siberian shelf, Geofys. Publ. 4(5),
1-75.
UNESCO (1993), Manual of Quality Control Procedures for Validation of Oceanographic
Data, 436 pp, IOC, Paris.
Vilibić, I. (2003), An analysis of dense water production on the north Adriatic shelf, Estuar.
Coast. Shelf Sci. 56, 697-707.

36
Vilibić, I., and M. Orlić (2001), Least-squares tracer analysis of water masses in the South
Adriatic (1967-1990), Deep-Sea Res. I 48, 2297-2330.
Voss, I. (1677), A Treatise Concerning the Motion of the Seas and Winds, 189 pp, H.
Brome, London.
Wolf, J., and J. Luksch (1887), Physikalische Untersuchungen in der Adria, 22 pp, Druck
und Commissionsverlag von Carl Gerold’s Sohn, Wien.
Zavatarelli, M., and N. Pinardi (2003), The Adriatic Sea modelling system: a nested
approach, Ann. Geophys. 21, 345-364.
Zore, M. (1956), On gradient currents in the Adriatic Sea, Acta Adriat. 8(6), 1-38.
Zore-Armanda, M. (1963), Les masses d’eau de la mer Adriatique, Acta Adriat. 10(3), 5-
88.

37
Figure captions
Figure 1. Position and topography of the measurement area. Also indicated is location of
meteorological (Veli Rat, Mali Lošinj, Zadar, Split), CTD (1-21) and ADCP (9, 13, SS9)
stations, of the Zadar tide gauge, and of the rivers inflowing to the east Adriatic.
Figure 2. Daily values of solar radiation, air and sea temperature, air pressure, wind speed,
wind direction, air humidity and precipitation recorded at Veli Rat between 2 November
2002 and 27 June 2003. B indicates a bora episode, S stands for a sirocco episode. The last
wind speed maximum, recorded on 22 May 2003, was due to the wind blowing from the
northwest, and therefore it departed from the simple bora-sirocco pattern.
Figure 3. Daily values of the surface heat (up) and water (down) fluxes computed from data
that were recorded at Veli Rat between 2 November 2002 and 27 June 2003. Positive
values imply that the sea gains heat or water. B indicates a bora episode, S stands for a
sirocco episode.
Figure 4. Monthly mean values of the surface heat (up), water (middle) and buoyancy
(down) fluxes determined for Veli Rat over an eight-month interval extending from
November 2002 to June 2003 (full line). Also shown are climatological values for Mali
Lošinj (dashed line).

38
Figure 5. Monthly mean values of discharge and water level documenting east Adriatic
river outflows between September 2002 and August 2003 (full line), compared with the
long-term monthly means (dashed line) and corresponding standard deviations (dotted
lines).
Figure 6. Vertical profiles of temperature, salinity and sigma-t value measured at the
transect extending from station 8 to station 14 in February 2003 (left) and May 2003 (right).
Figure 7. Time-depth distribution of temperature, salinity and sigma-t value at the outer
station 7 (left) and the inner station 14 (right). Dashed lines denote the times of CTD casts.
Figure 8. Temperature (up) and salinity (down) climatological averages computed for the
northeastern part of the measurement area over the 1904-1982 interval (lines), compared
with the values taken at stations 15-18 between November 2002 and June 2003 (symbols
and lines). The data were collected in the surface (0-10 m, full lines), intermediate (20-30
m, dashed lines) and bottom (>50 m, dotted lines) layers.
Figure 9. Tidal ellipses for seven major constituents recorded at various depths of stations 9
and 13. Thin (thick) symbols denote the clockwise (anticlockwise) rotation of tidal current
vectors.
Figure 10. Power density spectra of detided current components (L – along-basin, directed
northwestward, T – cross-basin, directed northeastward) determined as a function of depth

39
for stations 9 and 13. Also indicated is the local inertial period (17.2 h) and the period of
the fundamental Adriatic seiche (21.2 h).
Figure 11a. Wind measured at Veli Rat and currents recorded along the vertical at stations 9
(up) and 13 (down) during February 2003. Variability at subdiurnal time scales was
eliminated by a low-pass digital filter. Depiction of wind and currents follows the same
convention.
Figure 11b. As in Fig. 11a, except for May 2003.
Figure 12. Monthly mean currents recorded throughout the water column of stations 9 and
13 between December 2002 and May 2003.
Figure 13. As in Fig. 12, except that the currents related to hourly wind speeds exceeding 7
m/s at Veli Rat were excluded from the analysis.
Figure 14. Up: sea levels at stations 9 (full line) and Zadar (dashed line). Down: computed
(full line) and measured (dashed line) northwestward surface currents averaged over the
measurement area. All time series were smoothed by a 30 day running average.
Figure 15a. Numerical model domain. Also shown is position of section N for which
modeling results are discussed in some detail.

40
Figure 15b. Bell-shaped function, determining temporal variability of the forcing during 30
days that initiated numerical simulations.
Figure 16. Temporal evolution of the along-basin surface current at section N extending
from ‘Italian’ (0 km) to ‘Croatian’ (200 km) coast. Positive speeds imply an inflow to the
‘Adriatic’, with the contouring interval being 4 cm/s. Dashed line denotes culmination of
the forcing (15th day). The figures show (a) simulation obtained under haline forcing, (b)
simulation resulting from thermal forcing, (c) sum of (a) and (b), (d) simulation controlled
by thermohaline forcing, and (e) difference between (d) and (c).


0
100200300400
W/m
2
0
10
20
OC
AirSea
1000
1020
hPa
0
10
20
m/s
B B B B B B B B B B B S S S S S S
0
90
180
270
deg
25
50
75
%
02/11 02/12 01/01 31/01 02/03 01/04 01/05 31/05 0
20
40 S S B S/B S/B
mm
/day


−200
−100
0
100
200
300H
eat f
lux
(W/m
2 )
−6
−4
−2
0
2
Wat
er fl
ux(m
m/d
ay)
9 101112 1 2 3 4 5 6 7 8−20
−10
0
10
20
Buo
yanc
y flu
x(1
0−8 m
2 /s3 )
Month

0
10
20
30D
isch
arge
(m
3 /s) Mirna
0
1
2
3
4
5 Rasa
0
20
40
60
80
100
Dis
char
ge (
m3 /s
)
Zrmanja
0
50
100
150 Krka
0
5
10
15
20
Dis
char
ge (
m3 /s
)
Jadro
0
1
2
3
4
5
6 Zrnovnica
9 101112 1 2 3 4 5 6 7 80
50
100
150
Month
Wat
er le
vel (
cm)
Cetina
9 101112 1 2 3 4 5 6 7 80
50
100
150
200
Month
Neretva


O1 P1 K1 N2 M2 S2 K2
0
10
20
30
40
50
60
70
Dep
th (
m)
Station 9
3 cm/s N
O1 P1 K1 N2 M2 S2 K2
0
10
20
30
40
50
60
70
Dep
th (
m)
Tidal components
Station 13
3 cm/s N

Dep
th (
m)
17.2 h21.2 h
T−component
0 0.02 0.04 0.06 0.08
6050403020100
17.2 h21.2 h
L−component Station 9
0 0.02 0.04 0.06 0.08
6050403020100
Frequency (cph)
Dep
th (
m)
17.2 h21.2 h
0 0.02 0.04 0.06 0.08
6050403020100
Frequency (cph)
17.2 h21.2 h
Station 13
0 0.02 0.04 0.06 0.08
6050403020100
Log10
(Power density)2 3 4 5

1 6 11 16 21 26
0
10
20
30
40
50
60
70
Dep
th (
m)
Station 9
8 cm/s
8 m/s
N
Feb2003
1 6 11 16 21 26
0
10
20
30
40
50
60
70
Dep
th (
m)
Station 13
8 cm/s
8 m/s
N
Feb2003

1 6 11 16 21 26 31
0
10
20
30
40
50
60
70
Dep
th (
m)
Station 9
8 cm/s
8 m/s
N
May2003
1 6 11 16 21 26 31
0
10
20
30
40
50
60
70
Dep
th (
m)
Station 13
8 cm/s
8 m/s
N
May2003

Dec Jan Feb Mar Apr May
0
10
20
30
40
50
60
70
Dep
th (
m)
Station 9
5 cm/s N
Dec Jan Feb Mar Apr May
0
10
20
30
40
50
60
70
Dep
th (
m)
Station 13
5 cm/s N
Dec Jan Feb Mar Apr May
0
10
20
30
40
50
60
70
Dep
th (
m)
Station 9
5 cm/s N
Dec Jan Feb Mar Apr May
0
10
20
30
40
50
60
70
Dep
th (
m)
Station 13
5 cm/s N

−20
0
20
40 S
ea le
vel (
cm)
01/01 31/01 02/03 01/04 01/05 0
5
10
NW
cur
rent
(cm
/s)


0 5 10 15 20 25 300
0.2
0.4
0.6
0.8
1
Days
For
cing

days
a(x
10 k
m)
20 40 60 80 100 120 140
5
10
15
20
days
b
(x10
km
)
20 40 60 80 100 120 140
5
10
15
20
days
c
(x10
km
)
20 40 60 80 100 120 140
5
10
15
20
days
d
(x10
km
)
20 40 60 80 100 120 140
5
10
15
20
days
e
(x10
km
)
20 40 60 80 100 120 140
5
10
15
20
Alongshore currents (cm/s)−20 −15 −10 −5 0 5 10 15 20
Cro
ss−
basi
n di
stan
ce