The Hearts and Minds project: towards a theatre of cultural ...

Centre forEconomicand FinancialResearchatNew Economic School
Winning Hearts and Minds throughDevelopment Aid:Evidence from a Field Experimentin Afghanistan
Andrew Beath
Fotini Christia
Ruben Enikolopov
Working Paper �o 166
CEFIR / �ES Working Paper series
October 2011

1
Winning Hearts and Minds through Development Aid:
Evidence from a Field Experiment in Afghanistan1
Andrew Beath! Fotini Christia† Ruben Enikolopov‡
This version: 10 October 2011
First version: 28 October 2010
Abstract:
Development programs have been increasingly used not only as an instrument for economic and
political development, but also as a tool for counterinsurgency. Using a large-scale randomized field
experiment we test this approach by examining the effect of the largest development program in
Afghanistan. We find that the introduction of this program leads to significant improvement in
villagers’ economic wellbeing as well as in their attitudes towards government. The program also
leads to an improved security situation in the long run. These positive effects on attitudes and
security, however, are not observed in districts with high levels of initial violence.
1 We are indebted to Chad Hazlett for excellent research assistance and to Jason Lyall for generously sharing the data on security incidents. We would also like to thank Rex Douglas as well as seminar participants at Georgetown University, MIT, NYU, and Princeton University’s NMACPIR conference for helpful comments. The findings, interpretations, and conclusions expressed in this paper are entirely those of the authors and should not be attributed in any manner to the World Bank, to its affiliated organizations, or to members of its Board of Executive Directors, or the countries they represent. The World Bank does not guarantee the accuracy of the data included in this publication and accepts no responsibility for any consequence of their use. ! Department of Government, Harvard University, and the World Bank ([email protected]) † Department of Political Science, Massachusetts Institute of Technology ([email protected]) ‡ New Economic School ([email protected])

2
I. Introduction
Development programs have long been used to promote economic and political development. In
recent years, however, they have assumed yet another role: they have been used to promote security
in countries fighting raging insurgencies, such as Afghanistan and Iraq. The approach contends that
such projects, which are commonly used by the domestic government and allied entities to provide
basic services and infrastructure, improve economic outcomes, build support for the government,
and ultimately reduce violence as population sympathies for the insurgency wane. The idea of using
development projects as a counter-insurgency strategy is becoming more and more influential and
now constitutes a major component of the new U.S. counterinsurgency doctrine (U.S. Army /
Marine Corps, 2006).
Despite the popularity of the strategy, there is limited empirical evidence on the effectiveness of
development projects as a weapon in counter-insurgencies. In this paper we use results from a large-
scale randomized field experiment involving Afghanistan’s largest development program – the
National Solidarity Program (NSP) - to test the mechanisms by which development projects can
potentially affect counter-insurgency outcomes. NSP is found to improve economic well-being,
attitudes towards the government, and security. The effect on attitudes and security, however, is
limited to regions with moderate levels of initial violence.
Internal armed conflicts are central to many development problems. Between 1960 and 2010 more
than half of the world’s countries were affected by civil conflict, 20 percent of which had been at
war for at least ten years (Blattman and Miguel, 2010). Civil conflicts result not only in loss of lives
and physical destruction, but also have in significant deterioration in investment in physical (Collier,
1999) and human (Sánchez, 2010) capital. Thus, development programs that help to prevent or at
least ameliorate civil conflicts have a major effect on improving people’s lives that goes far beyond
the provision of basic services.
Insurgencies are a specific subset of civil conflicts that are largely irregular, asymmetrically-fought,
yet prolonged attempts by anti-government elements to overthrow the government or win
autonomy for a specific region or territory (Iyengar and Monten, 2008).2 Counterinsurgency, in turn,
2 Alternative but closely related definitions of insurgency can be found in Fearon and Laitin (2003) or in the US counterinsurgency manual (U.S. Army/Marine Corps, 2006).

3
refers to all economic, political, and military steps taken by the government and allied entities to
defeat the insurgency.
According to the theories of civil conflict, the strength of an insurgency, and the attendant levels of
violence, depends primarily on its level of popular support, since such support determines the ease
by which insurgents can recruit additional members and the degree to which the general population
is willing to share intelligence with government agents. Development projects can form part of a
counter-insurgency strategy if they are able to increase support for the government and weaken
support for the insurgents. Effectiveness of this approach will depend on projects being able to
deliver tangible benefits to the population and thus improve people’s perceptions of their economic
well-being, as well as the population giving credit to the government for the projects.
One of the main challenges in identifying the impact of development projects on counter-insurgency
outcomes is the non-random assignment of projects, which lead to spurious correlations if the
project placement is dependent on local security conditions, as is often the case. Two recent studies,
which address the question, use two different empirical strategies to overcome selection bias and
arrive at different results. Berman, Shapiro and Felter (2009) examine development projects
undertaken by the U.S. military in Iraq and, after controlling for region-specific characteristics and
pre-existing trends, find that projects reduced violence, although only after a significant increase in
troop strength in 2007. Crost and Johnston (2010) employ a regression discontinuity design to
examine the effect of development projects in the Philippines and find that the projects exacerbated
violence in the short-run, and had no effect in the long run.
Our study differs from these existing works in two important ways. First, we use a randomized field
experiment to resolve the problem of selection bias. Specifically, of 500 villages in our sample, half
were randomly assigned to receive NSP in 2007, with the other half receiving NSP in late 2011.
Second, in addition to events data on security incidents, we use survey data collected in the field,
which measures perceptions and attitudes of the civilian population. This allows us to test the
specific mechanisms through which development programs affect the underlying security situation.
Our findings indicate that NSP has a strong positive effect on people’s economic wellbeing and on
their attitudes towards the Afghan government (both on the central and local level). NSP also
appears to improve the attitudes toward NGOs and, to some extent, coalition forces on the ground.
These changes in attitudes and perceptions point to a positive direction in the battle for hearts and

4
minds. The results also indicate that villagers have more positive perceptions about security in NSP
villages. There is also evidence that the program reduces the number of security incidents recorded
by coalition forces in the long run (more than a year after the start of the program). There is no
evidence, however, that the program affects the number of security incidents recorded by NATO
coalition forces (International Security Assistance Force-ISAF) in the short run or the number of
security incidents reported by villagers in the survey. Notably, in the two eastern districts in which
the level of violence is considerably higher as compared with the other eight districts included in the
study, we don’t observe those markedly positive results on attitudes toward the government and on
security, despite a strong positive effect on economic wellbeing. Thus, our results suggest that
buying “hearts and minds” through development programs can be successful in preventing the
spread of violence, but is less successful in reducing violence in regions that already suffer from high
levels of insecurity.
Empirical results provide evidence in favor of theories of civil conflict that treat insurgents as
rational actors that respond to economic incentives, rather than fanatics whose motivation is
determined solely by ethnic, religious or ideological bonds. In this framework the level of violence to
a large extent depends on popular support for the insurgency, since it determines both the number
of people willing to join the insurgency, and the amount of information about the insurgency that
the general population is willing to share with government agents. Our results prove fully consistent
with the “hearts and minds” theory that presumes that popular support is determined by the
successful provision of public goods. Our results, however, are not consistent with theories that
focus on the amount of material resources to be captured as the main determinant of violence and
only partially consistent with the opportunity cost theory of conflict that emphasizes the costs of
joining the insurgency as the main determinant of violence.
The paper is divided into eight sections. Section II describes the relevant literature. Section III
provides a description of NSP and the randomized impact evaluation of the program. Section IV
presents the relevant hypotheses. Section V presents the data sources. Section VI describes the
methodology and results of the empirical analysis, which are then further discussed in Section VII.
Section VIII concludes.

5
II. Literature Review
The recent wars in Iraq and Afghanistan have led to a surge in the study of counter-insurgency.
Contributions to the growing body of literature have examined levels of mechanization (Lyall and
Wilson, 2009), force strength (Friedman, 2010), violence (Lyall, 2009; Kalyvas, 2006), the role of
ethnicity (Lyall, 2010), interaction of strategies between state and insurgents (Arreguin-Toft, 2001),
in-state counterinsurgency campaigns (Lalwani, 2010), and the use of foreign military aid (Dube and
Naidu, 2010). Findings suggest that force strength is not a decisive determinant of counter-
insurgency outcomes and that mechanization of counter-insurgencies has an adverse affect; that co-
ethnics help more than external forces; and that foreign military assistance may strengthen anti-
government elements. Findings diverge on whether indiscriminate use of violence by the
government increases or decreases insurgent attacks.
Recent discussions on counterinsurgency both in policy and academia have been influenced by the
U.S. counterinsurgency manual (U.S. Army / Marine Corps, 2006). Largely informed by doctrines
developed to address communist or anti-colonialist revolutionary movements (Kalyvas, 2008), its
conclusions rest upon specific assumptions about the type of insurgency and the relationship
between the domestic government and foreign forces. Specifically, the government is seen as a
legitimate actor that represents the well-being of the state’s population and needs to be bolstered by
foreign forces. It also presumes that basic security and the provision of public goods can cause
populations to withdraw support for the insurgency (Kalyvas, 2008).
II.1. Theories of Civil Conflict
There are two broad groups of theories of civil conflict (Blattman and Miguel, 2010). The first group
treats parties to the conflict as unitary actors, whereas the second looks at the incentives of
individual agents to join and support different parties during the conflict. The latter group is the
most relevant for the analysis of counter-insurgency, as it directly concerns the factors that affect the
willingness of populations to support either the insurgents or the government. Within this group,
several theoretical models explore the micro-foundations of insurgency, each focusing on different
motivations of agents and thus making different predictions on how development projects impact
insurgent violence.
According to the “greed” theory of conflict (e.g. Collier and Hoeffler 1998, 2004; Grossman, 1999)
insurgents are motivated by personal economic gain and seek to appropriate material resources
6
controlled by the government. According to this approach an increase in the amount of contested
resources increases the risk of conflict, since it offers stronger incentives for the insurgents to fight.
Thus, the greed theory would predict that an infusion of development projects would increase
violence by increasing the potential rewards for insurgents of displacing government authority.
The “bargaining model” approach (Fearon, 1995; Powell 2004, 2006) builds upon the greed theory
by assuming that material gain is the primary motivation for insurgent activity, but contend that
violence occurs only when conflicting parties fail to negotiate a peaceful division of resources. Thus,
information asymmetries caused by power shifts among conflicting parties and changes in the value
of contested resources can provoke conflict. Development projects may affect both the balance of
power and value of contested resources and thus, according to the bargaining models approach,
could increase violence. However, the effect is likely to be observed only in the short-run while the
conflicting parties seek to negotiate a new bargain (Crost and Johnston, 2010).
“Opportunity-cost” theories of conflict (e.g. Grossman, 1991; Fearon, 2008) also ascribe economic
motivations to conflicting agents, but place emphasis on the costs, rather than the benefits, of
participation in conflict. According to this approach, an increase in the income of the population
raises the opportunity cost of participating in conflict. Development projects that reduce
unemployment and increase the income of potential insurgents should thus reduce violence.
The “grievance” approach (Posen, 1993; Gurr 1994; Petersen, 2002) asserts that civil conflict is
fueled primarily by a failure to peacefully resolve political grievances, ordinarily caused by ethnic or
social cleavages that are held by a sub-section of the population. Economic factors can still have an
important effect on insurgency by fueling these grievances, but only indirectly. Grievance theories
generally predict that development projects should not have any effect on violence in so far as they
do not affect underlying social or ethnic tensions or contribute to the resolution of the resulting
grievances.
Finally, the “hearts and minds” theory (Berman et al, 2009) asserts that the level of violence is, in
part, determined by the attitudes of the general population toward the government. Increased
support for the government makes it more difficult for insurgents to recruit additional members and
procure resources, thereby tightening insurgents’ labor constraints (Condra et al., 2010), while also
making it easier for the government to gather intelligence which enables them to more effectively
disrupt insurgent activities. These two effects both contribute to a reduction in violence, but differ

7
in timing, with the information-sharing effect almost immediately apparent, but the recruitment
effect taking more time to come into effect. Thus, according to the hearts and minds theory,
development projects which increase support for the government are expected to reduce violence.
II.2. Empirical Evidence
Recent research has attempted to empirically test the aforementioned theories of conflict with
respect to on-going insurgencies in Afghanistan, Iraq, and the Philippines. A number of these
studies are reviewed below.
Berman, Felter, and Shapiro (2009) test the “opportunity cost” theory, examining the correlation
between unemployment rates and insurgent attacks in Iraq and the Philippines. Contrary to the
predictions of opportunity cost theory, they observe a negative relationship between unemployment
and attacks against the government and allied forces and no significant relationship between
unemployment and insurgent attacks that result in civilian fatalities.
Condra et. al. (2010) provide evidence related to the “grievance” approach by analyzing the effect of
civilian casualties on insurgent violence. They find that in both Afghanistan and Iraq, civilian
casualties lead to increased insurgent violence. In Afghanistan the effect is observed only in the long
run, indicating that events which result in civilian casualties increase the number of willing
combatants, which in turn reinforces insurgent strength. In Iraq, however, the effect is observed
only in the short-run, which suggests that civilian casualty events result in a reduced willingness
among the population to share information with the government, which in turn results in increased
insurgent violence.
Berman, Shapiro and Felter (2009) and Crost and Johnston (2010) directly address the question of
how development projects affect insurgent violence in Iraq and the Philippines respectively. While
Berman, Shapiro and Felter (2009) provides support for the “hearts and minds” theory, Crost and
Johnston (2010) reinforces the conclusion of the “bargaining” model. The difference in the results
of these two studies can be attributed to the differences in the nature of the conflicts and
characteristics of the development projects studied. While the war in Iraq is relatively recent,
nationwide, and dominated by foreign forces, the civil conflict in the Philippines is over four
decades old, localized, and involves related limited engagement by foreign forces. The types of
projects studied are also different, with those in Iraq consisting of small-scale projects implemented

8
by U.S. forces, while those in the Philippines falling under the aegis of KALAHI-CIDSS, the biggest
development program in the country, which is implemented by the government.
III. Description of the Experiment
III.1. National Solidarity Programme
NSP was devised in 2002 as a means to deliver services and infrastructure to the rural population
and to build representative institutions for village governance. NSP has now been implemented in
over 29,000 villages across 361 of Afghanistan’s 398 districts at a cost of $1 billion, making it the
largest single development program in Afghanistan. The program is structured around two major
interventions at the village level: (i) the creation of the Community Development Council (CDC);
and (ii) the disbursement of block grants to support project implementation.
In order to facilitate the creation of representative institutions for village governance, NSP mandates
the creation of gender-balanced CDCs through a secret-ballot, universal suffrage election. Once
CDCs are formed, NSP disburses block grants, valued at $200 per household up to a village
maximum of $60,000, to support the implementation of projects selected by the CDC in
consultation with the village community. Projects are ordinarily focused on either the construction
or rehabilitation of infrastructure, such as drinking water facilities, irrigation canals, roads and
bridges, or electrical generators; or the provision of human capital development, such as training and
literacy courses.
III.2. Sample
The field experiment described in this paper was conducted as part of an impact evaluation of the
second stage of NSP that have started in 2007 in the regions that were not covered during the first
stage of NSP in 2003-2006. Implementation of NSP was randomized across 500 villages spanning
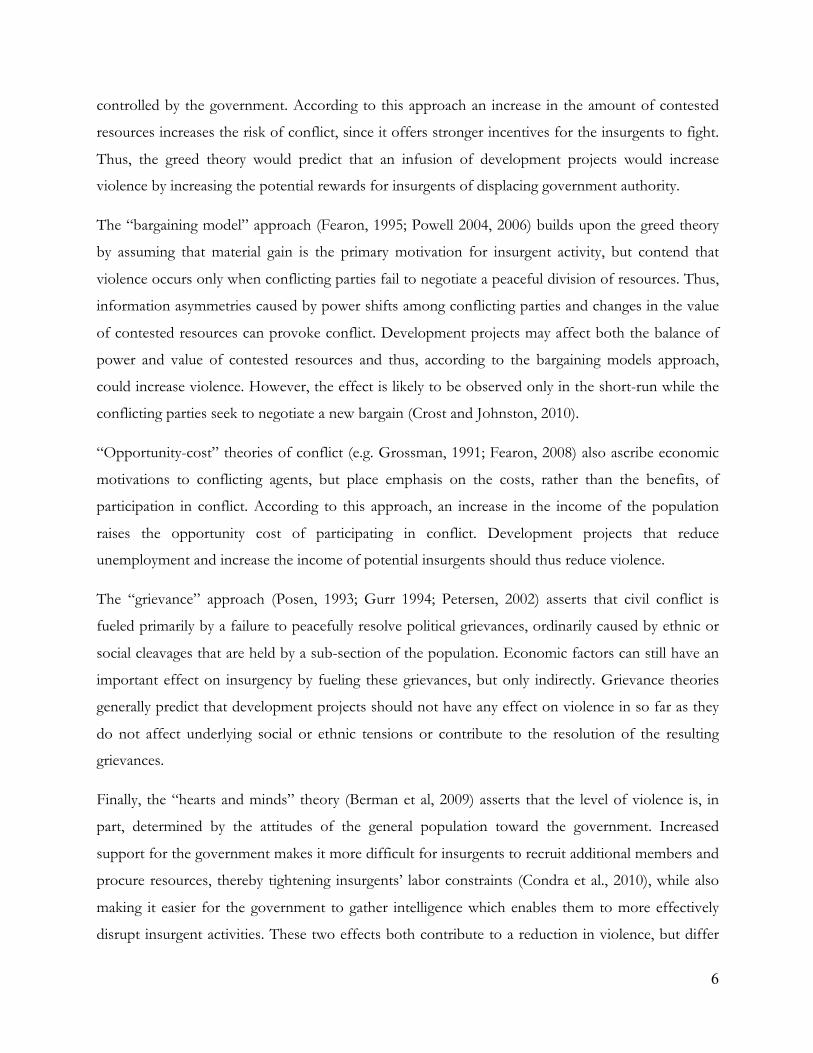
10 rural districts. Although not a random sample, these 10 districts are representative of the
country’s geographic, ethnic, and economic diversity and cover the western, central highlands,
northern, north-eastern, and eastern regions of the country (see Figure 1). Security conditions in the
10 districts are also generally representative of those across the country, with the exception of the
south. As shown in Figure 2, the rate of security incidents between January 2006 and February 2010
are similar for the area around the evaluation villages and for the whole Afghanistan excluding the
south, with those in the southern provinces being noticeably higher.

9
Among the 10 districts, two districts in the eastern province of Nangarhar have significantly higher
levels of violence. These two districts thus provide a basis for inference over the potential effects of
NSP on the reduction of violence in already insecure regions, whereas the other eight districts
represent ‘marginal’ areas which may be at risk of increased violence subject to local and national
developments. Collectively, the sample thus provides insights into the effect of NSP on violence in
areas which have already succumbed to the insurgency and in areas which are at risk of doing so.
In each of the 10 districts, 50 villages were selected to be included in the study,3 25 of which were
then selected as treatment villages using a matched-pair randomization procedure, which also
clustered proximate villages to limit potential for spillovers between treated and untreated units.
These villages received NSP following the administration of a baseline survey in September 2007,
with the remaining 250 control villages assigned to not receive NSP until late 2011.
At the household level, the sample also appears to be broadly representative of the population of
rural Afghanistan, though somewhat biased towards more rural and more remote communities. A
comparison of key characteristics of household respondents for the first follow-up survey of the
NSP impact evaluation and those of rural areas in the 2007–08 National Risk and Vulnerability
Assessment (NRVA), administered to a random stratified sample of the population of Afghanistan,
reveals only small differences between the two samples. The only difference is that households in
the evaluation village are more likely to be engaged in production activities related to agriculture (see
Table A1 in the Appendix). Though there is no significant difference in the age of respondents, they
do appear to be more resource--constrained and to have worse access to medical services, and
slightly better access to electricity, although the magnitude of the differences is quite small.4
III.3. Assignment of Treatment
To improve statistical balance between villages in the control and the treatment groups, a matched-
pair cluster randomization procedure was applied. The procedure proceeded in four stages.
1. Village Clusters. To minimize potential for spill-overs between treated and untreated units,
villages located within 1 kilometer were grouped in village clusters. Of the 500 sample
3 In each district NGOs chose another 15 communities that received NSP and were not included in the experiment. These villages were usually the most easily accessible from the district center, which farther shifts the sample towards more remote villages. 4 The differences are likely to be driven by the fact that the villages that are located closer to big cities and provincial centers received NSP between 2003 and 2007, i.e. before the start of the impact evaluation and, are thus, excluded from the analysis.

10
villages, 107 were assigned to 41 village clusters. The number of villages in each village
cluster ranged from two to six.
2. Matched Pairs. In each district, the 50 sample villages were paired into 25 groups of two using
an optimal greedy matching algorithm, which matched villages to ensure similarity based on
background characteristics provided that the villages were not in the same village cluster.
The matching was based on the information available before the baseline survey and used
such background characteristics as the size of the village (based on the data collected a few
years earlier by the Central Statistics Organization) and geographic variables (distance to
river, distance to major road, altitude, average slope).
3. Assignment of Treatment. In each matched pair one village was randomly assigned to receive
NSP, such that the clusters of villages were assigned the same treatment status.5 The
assignment was performed after the baseline survey was conducted, but before the data was
processed.
4. Violations of Clustering Restrictions. In a few districts, the large number of clustered villages
precluded the co-assignment of all the villages in the same village cluster to the same
treatment status. For cases in which assignment of treatment status without a violation of
the clustering restriction was not possible, the number of violations was minimized through
a simulation approach.6
As expected, the randomization procedure was successful in ensuring statistical balance between
treatment and control groups. Table 1 below presents means, normalized differences,7 and t-statistics
for several important variables using pre-treatment data and shows that, among the variables listed,
mean differences are always smaller than 13 percent of the standard deviation.
5 The experiment also introduced variation in the method of election of the Community Development Council and in the method of selection of the projects. All the treatment villages were randomly assigned one of the two election methods and one of the two selection methods. The results of this intervention are described in Beath, Christia and Enikolopov (2011a, 2011b). For the purposes of this study, however, we do not separate treatment villages into different groups. 6 The clustering restriction was violated in 17 village clusters (covering 44 villages). 7 Per Imbens and Wooldridge (2009), normalized differences are differences divided by pooled standard errors.
11
IV. Hypotheses
The main goal of the paper is to test the “hearts and minds” theory of counter-insurgency, which
posits that development projects increase economic welfare, improves attitudes towards
government, and reduce insurgent violence. The three hypotheses below formalize these predictions:
Hypothesis 1: Levels of economic well-being are higher among people living villages that have
received a development project.
The “hearts and minds” approach places a particular focus on attitude-driven behavior. Accordingly,
subjective perceptions of the economic situation are as important as objective economic outcomes.
Thus, to test this hypothesis, we look both at objective measures of economic well-being and
subjective perceptions of economic well-being, such as whether people report that their economic
situation has improved in the past year and whether they expect it to improve in the future. The first
hypothesis is consistent not only with the “hearts and minds” theory, but also that of “opportunity
cost”, since an increase in income and in employment raises the costs of participation in the
insurgency.
Hypothesis 2: Attitudes towards the government and allied entities are more positive among
people in villages that have received a development project.
This hypothesis asserts that economic benefits arising from development projects will translate into
improved attitudes toward the government. Since NSP is managed by the government of
Afghanistan, but is funded by international donors and implemented by NGOs, we are also
interested in the effect on levels of support for these entities. The second hypothesis is important
for distinguishing between different theories, since the “hearts and minds” approach is the only one
that predicts that development projects will result in improvement in attitudes toward government.
Hypothesis 3: The security situation is better in villages that have received a development
program.
According to the “hearts and minds” theory, improved attitudes towards the government should
decrease support for the insurgents, which should in turn lead to a decrease in security incidents.
Hypothesis 3 is also consistent with the “opportunity cost” theory, but is inconsistent with the
“greed” theory and the “bargaining” theory, both of which predict that the existence of a
development program would lead to an increase in insecurity at least in the short run.

12
V. Data
Data for this paper come from three sources: a baseline survey, a follow-up survey, and ISAF data
on security incidents.
V.1. Baseline Survey
Data from the baseline survey was collected during August and September 2007 and prior to the
implementation of NSP in any of the 250 treatment villages. The survey consisted of four different
instruments: (a) a male household questionnaire administered to ten randomly-selected male heads-
of household in each village; (b) a male focus group questionnaire administered to a group of village
leaders in each village; (c) a female focus group questionnaire administered to a group of important
women who tended to overwhelmingly be wives or other relatives of the village leaders; (d) a female
individual questionnaire. In total, the survey covered 13,899 male and female villagers and village
leaders across the 500 sample villages
V.2. Follow-Up Survey
Data from the follow-up survey was collected between May and October 2009. The follow-up
survey was administered following CDC elections and project selection, but before all projects were
fully completed. The follow-up survey drew upon many of the same questions from the baseline
survey, but changed the sample for the female individual questionnaire from female focus group
participants to wives of male household questionnaire respondents.8 Detailed information on the
coverage of the baseline and follow-up surveys can be found in Table A2 in the Appendix.
Enumerators administering the male household questionnaire were instructed to locate and
interview the same households and, whenever possible, the same villagers who participated in the
baseline survey. Enumerators were able to successfully locate such respondents in 65 percent of
households in which male respondents were interviewed during the baseline survey.9
8 During our baseline survey, an individual survey was administered only to female elites because of logistical constraints. During our follow-up survey potential panel data on individual responses of the female elites was sacrificed in order to measure attitudes of the ordinary female villagers. 9 The predominant reason for enumerators not being able to interview baseline respondents was that the person was away from home on the day that the survey team visited the village as it was the time of harvest. Differences between treatment and control groups in individual-level attrition are not statistically significant.

13
V.3. Security Incidents
Data on security incidents comes from the International Security Assistance Forces (ISAF)
Combined Information Data Network Exchange (CIDNE) database, which includes declassified
fields such as date, time, location, and type of attack. The data contains information on all security
incidents in the 10 districts between March 2003 and March 2010. Overall, there were 535 security
incidents prior to the start of NSP mobilization in October 2007 and 688 such incidents after.
Almost all the incidents are related to Improvised Explosive Devices (IED), with 45 percent of
incidents being IED explosions and 53 percent incidents in which an IED was found and cleared.
The remaining two percent of incidents were related to mine strikes.
The data was used to construct dummy variables that indicate whether there was at least one security
incident starting from October 2007 within one, three, or ten kilometers of a particular village. To
measure the level of violence before the start of the program and to separate between short-run and
long-run effects, indicators were constructed separately for three time periods: between March 2003
and September 2007 (to measure the existing level of violence), between October 2007 and
December 2008 (which is considered the short run) and for the period between January 2009 and
March 2010 (which is considered the longer run).
There is a notable difference in the levels of violence in the two Nangarhar districts and the other
eight districts. The share of villages in these two districts for which at least one security incident
occurred within one, three or ten kilometers before the start of the program were 8, 20, and 50
percent respectively, while for the remaining districts, the respective shares were 0, 4 and 13 percent.
VI. Results
All hypotheses are tested by regressing the measures relevant for each hypothesis on a treatment
indicator variable using the following OLS model:
!!" ! ! ! ! ! !! ! ! ! !! ! !"#$! ! !! ! !!" (1)
where !!" is the outcome of interest for household i in village v, !! is the village treatment dummy
(i.e. whether this is an NSP village or not), !"#$! is the dummy for villages from the two eastern
districts, !! is the village-pair fixed effect, and !!! is the error term.
Following Bruhn and McKenzie (2009), we include village-pair fixed effects to account for the
allocation of treatment to villages using pair-wise matching. Standard errors are clustered at the

14
village cluster level, to account for correlation between residuals within clusters of villages due to the
non-independence of treatment assignment. Some indicators are constructed on the village level,
rather that the individual level, so that the outcome is captured as !! rather than !!".
To be able to draw general conclusions and to improve statistical power, in addition to individual
measures, whenever we have multiple measures for the same concept, we also use a summary index
similar to the one used in Kling, Leibman and Katz (2007). The summary index is defined to be the
equally weighted average of z-scores of the nine individual attitudinal measures.10
Hypothesis 1
To test Hypothesis 1, we examine the effects of NSP on objective and subjective measures of
economic well-being. Objective measures are captured by annual household income and
consumption, whether the household head is either unemployed or employed in subsistence
agriculture, and net migration rates. Subjective measures are captured by the proportion of
respondents who report that the economic situation of the household has improved in the past year
and by the proportion of respondents who report that the economic situation of the village will
improve in the forthcoming year.
Results in Panel A in Table 2 indicated show that the general average treatment effect on household
income, consumption, and unemployment is not statistically significant, whereas involvement in
subsistence agriculture is lower in treatment villages by 3 percent. The effect in the two Nangarhar
districts is significantly higher for income, which in the eastern districts increases by 9 percent, and
for the share of unemployed, which decreases by 2 percentage points. The effect of the program in
the two eastern districts on consumption and on the share of villagers involved in subsistence
agriculture and husbandry is not statistically different for the average treatment effect. Results in
Panel C of Table 2 indicate that the average effect on net migration is not statistically significant in
non-eastern districts, but is significant in the two eastern districts, with average net migration higher
by almost 30 families per year as compared to control villages.
As results in Panel B in Table 2 show, NSP has a strong positive impact on subjective economic
outcomes. Both male and female respondents in NSP villages are more likely to report that the
10 The z-scores are calculated by subtracting the control group mean from the treatment groups mean, and dividing by the control group standard deviation. Thus, each component of the index has a mean equal to 0 and a standard deviation equal to 1 for the control group.

15
economic situation in their household has improved from last year and are more likely to indicate
that they expect the economic situation in the village to improve in the next year. For all measures,
the proportion of respondents that perceive their economic situation in a positive light is
approximately 5 percentage points higher in NSP villages, which corresponds to an increase of 11 to
18 percent depending on the measure. In the two Nangarhar districts, the results are generally the
same.
Overall, the program has a clear positive effect on the economic situation of the villagers and is
especially strong in the two eastern districts. Thus, the results provide strong support for Hypothesis
1.
Hypothesis 2
Hypothesis 2 is tested through examination of the effects of the program on villagers’ attitudes
toward different government bodies and allied entities. Results in Table 3 indicate that respondents
in NSP villages have significantly more positive attitudes toward government figures at almost all
levels, including district and provincial governors, central government officials, the President of
Afghanistan, Members of Parliament and government judges. Magnitudes of effects vary from
between 8 percentage points for Members of Parliament to 4 percentage points for the national
police. There is also a positive effect of NSP on the attitudes of the villagers toward NGOs and
ISAF soldiers. The results for the summary measure indicate that NSPs improves villagers’ attitudes
by 13 percent of a standard deviation. Results for the two eastern districts, however, are completely
different. There is no positive effect of NSP on attitudes toward any government bodies, ISAF
soldiers, or NGOs, and the effect on attitudes towards many figures is, in fact, significantly negative.
Overall, the results indicate that on average the program improves people’s attitudes toward all levels
of government (except for the national police), NGOs and ISAF military forces. This provides
strong support for Hypothesis 2. However, there is no positive effect on attitudes in the districts
with high levels of initial violence.
Hypothesis 3
Hypothesis 3 is tested using data from the follow-up survey on male and female villagers’ security
perceptions and data on security incidents based both on the information from the survey of
villagers and from ISAF data.

16
As reported in Table 4, NSP results in a statistically significant improvement in villagers’ perceptions
of security. The proportion of male respondents in NSP villages who report an improvement in the
security situation in the past two years is 6 percentage points higher, whereas the proportion of
respondents who think that the security situation has deteriorated is 3 percentage points lower.11
Among females, the proportion of respondents who think that women and girls feel safer compared
to two years ago is higher in NSP villages by 5 and 4 percentage points respectively, while the
number of respondents who think that women and girls feel less safe is lower in NSP villages by 4
percentage points in both cases. The summary measure indicates that NSP improves villagers’
perception of the security situation by 10 percent of a standard deviation. The average treatment
effect of NSP on the perception of security in the two Nangarhar districts is not statistically
significant from those in the other eight districts, although the effect for the individual indicators is
not statistically significant for any of the measures.
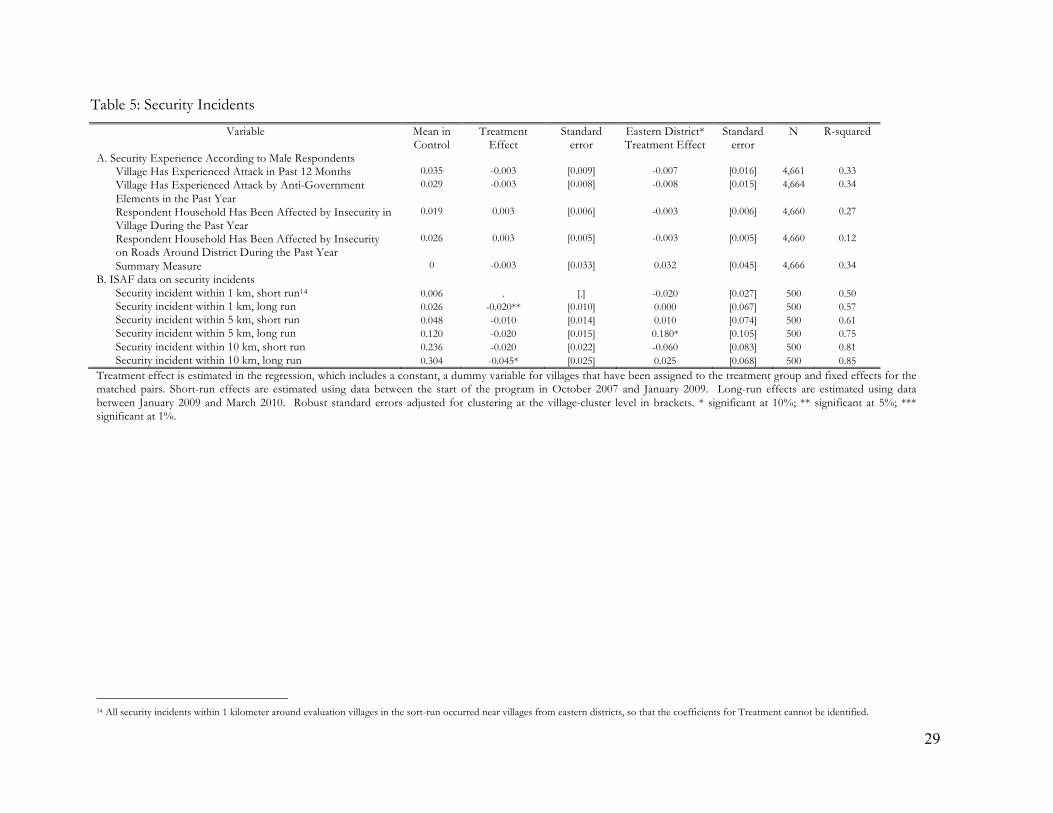
Table 5 reports estimates of the effect of NSP on reported security incidents. As shown in Panel A,
the program has no significant effect on security incidents in or around villages as reported by
villagers. In both treatment and control villages approximately 3 percent of respondents indicate that
their village experienced an attack in the past year and that they themselves were affected by
insecurity in the village or on roads around the district. In the two eastern districts, the results are
similar.
In order to distinguish between short (first 15 months after start of NSP implementation) and long
run (next 15 months) effects of NSP on security incidences, the data on ISAF-reported security
incidents – which unlike the villager-reported data are dated - are split into two samples. The results
indicate that, in the short-run, NSP does not affect the probability of security incidents,12 but, NSP
does reduce the probability of security incidents. For the one and ten kilometer radii, the probability
of incidents is 2 and 4 percentage points smaller in treatment villages. For the three kilometer radius,
the probability is lower by 2 percentage points, but not statistically significant. In the Nangarhar
11 Note that the three pairs of questions on improvement / deterioration of the security situation are not independent, since each pair is based on one question on the changes in the situation with three possible answers – the situation has improved, the situation have not changed, and the situation has deteriorated. We construct two dummy variables for improvement / deterioration of the security situation based on these questions to provide a meaningful comparison of the averages between the treatment and control villages. Since the measures are not independent we do not combine them using summary indices. 12 This applies only to the measures for three and ten kilometer radii. As there were no security incidents in the short-run within one kilometer radius of the villages outside of the two Nangarhar districts, the effect cannot be estimated.

17
districts, the short run effect is similar to the average effect, but there are no statistically significant
differences between treatment and control villages in long run effects.
Overall, there is strong evidence that the perception of security situation is better in villages
mobilized by NSP. There is no noticeable effect of NSP on the security situation as measured by the
number of security incidents reported by survey respondents, but the number of security incidents
recorded by ISAF is lower around treatment villages, although only in the long-run. Thus, the results
provide support for Hypothesis 3. The positive effect of the program on security, however, is not
observed in the two eastern districts, which are characterized by high levels of initial violence.
Robustness of Results
To check the robustness of the results, we include baseline responses to the same (or most closely
related) question from the baseline as additional controls. The results prove to be robust to the
addition of such control, although a small number of results lose their significance individual-level
controls are added due to the reduction in the sample size caused by individual-level attrition (see
Table A3).
An important characteristic of the two Nangarhar districts is that they are predominantly Pashtun.
To check whether the difference in the results for the eastern districts is driven by ethnic
composition, rather than the level of violence, we also examine whether the effect is different in the
other two predominantly Pashtun districts in our sample (Balkh and Farsi). The results indicate that
there is only a small difference in the effect of the program in Pashtun regions as compared with
other districts (see Table A4).
VII. Discussion of Results
The results lend support to the “hearts and minds” theory. NSP positively impacts subjective
measures of economic well-being, improves attitudes towards the government and allied entities and
has a positive effect on the security situation. Both men and women in the treatment villages are
more likely to report that the security situation in and around villages has improved and there is also
evidence that NSP reduces the number of incidents around villages in the long run.
The results on the positive effect of the program on economic and security outcomes are consistent
not only with the “hearts and minds”, but also with an “opportunity cost” interpretation, although
the latter does not predict changes in attitudes toward the government (though these changes are

18
not inherently contradictory with the opportunity-cost theory). The results are not consistent with
the “grievance” explanation, which would predict no effect on attitudes and security, since the
program is not affecting fundamental social or ethnic conflicts in Afghan society. The results are
also not consistent with the “greed” or “bargaining” models, both of which predict an increase in
violence. Thus, even if the effects on violence described in the “greed” and “bargaining” models are
operating, they are dominated by the opposite effects described in the “hearts and minds” and
“opportunity cost” approaches.
Our results indicate that the positive effect of the program on attitudes towards the government is
not observed in the two eastern districts with the highest level of security problems, although the
positive effect on economic even stronger in these districts. These results are not consistent with the
“opportunity cost” theory, which presumes that economic improvement and decrease in
unemployment rate should lead to a decrease in violence. This suggests that development programs
might be more effective in preventing the spread of violence in relatively secure regions, but are
considerably less effective in reducing the violence in regions in which the violence is already high.
In relatively secure regions the population is primarily concerned with harsh economic conditions,
so that government attempts to improve their material wellbeing are likely to have a strong effect on
people’s attitudes toward the government in turn reducing their willingness to join the insurgency. In
regions with high levels of violence, security is likely to be the main concern on people’s mind, so
that improvements in economic outcomes are not enough to change people’s attitudes toward the
government as long as insecurity is raging strong. Thus, these results suggest that development
programs are more effective in preventing the spread of violence, rather than in reducing the level of
violence. These results are consistent with findings in Bearman et al (2009) that development
programs in Iraq improved security only after a significant increase in the number of troops in 2007.
The fact that we observe reduction in violence only in the long run suggests, that in Afghanistan the
level of violence is affected primarily by people’s willingness to join the insurgency, rather than by
their willingness to share information, which is consistent with findings in Condra et al (2010).
Unfortunately, we do not have data on whether the villagers actually provide information to
counterinsurgency efforts nor do we have the data on who is joining the insurgency. Thus, we do
not have direct evidence on the mechanisms that link increased government support with a
reduction in violence, although indirect evidence suggests that the willingness to join the insurgency
plays a more important role in Afghanistan.

19
An important methodological issue on the effect of the program on security has to do with
externalities between villages that can bias the results downward. An increase in government support
in a particular village is likely to reduce violence not only near the village itself, but also in
neighboring villages.13 This is especially true if the program reduces the number of people willing to
join the insurgency, since the insurgents do not necessarily operate close to the place where they
have been recruited. Such positive spillovers from treatment to control villages will reduce the
estimated effect of the program. The clustering of neighboring villages, which was aimed at reducing
such inter-village spillovers, might not be enough to address this issue as long as these positive
externalities on security are sufficiently strong. In this case, a single village might not be the proper
unit of analysis, and we should be comparing bigger geographical units, such as districts.
Unfortunately, we cannot perform such an analysis in the context of this field experiment, since the
choice of the district could not be randomized. However since this problem induces a downward
bias in our estimates, it ensure our estimated treatment effects are conservative, under-estimates.
In generalizing the results to other settings it is important to bear in mind that NSP, although
funded by international donors, is managed by the Afghan government. Thus, these results cannot
be easily extended to programs in which development projects are delivered by a foreign military
power (e.g. CERP in Iraq or Afghanistan), as in that case it is not entirely clear how these programs
are perceived by the local population and whether such programs would improve the attitudes
toward the government of the country where the program is implemented.
VIII. Conclusion
In this paper we analyze the effect of the National Solidarity Program— the largest development
program in Afghanistan—on counterinsurgency outcomes. Specifically, we look at the effect of the
program on people’s economic welfare, their attitudes towards government and level of security.
Random assignment of the program across 500 evaluation villages allows us to estimate the
program’s causal effects. Our results indicate that the program has a significant positive effect on the
economic wellbeing of the villagers and their attitude toward all levels of government, as well as
NGOs. There is also evidence of a weak positive effect on their attitudes toward ISAF soldiers. We
also identify a positive effect of development aid on the security situation in the long run, but not in
13 Note, however, that the opposite effect can also take place. A decrease in violence in villages that have received development program can increase the violence in the neighboring villages if insurgents move their operations near those places that are more supportive to them.

20
the short run. Notably, the effect of the program on attitudes toward the government and security is
observed only in regions with moderate levels of violence. In regions with higher levels of violence
there is no such effect, despite a stronger positive effect on economic outcomes.
Overall, the empirical evidence supports the different line of mechanisms underlying the strategy of
winning “hearts and minds” through the provision of development projects. The development
program improves the attitudes of the civilian population toward the government and makes them
more likely to think that the government is working in their best interest, which in turn makes them
less likely to support the insurgents. The fact that we observe the effect on security only in the long
run suggests that support for the government reduces the violence mainly by reducing the number
of people willing to join the insurgents, rather than by increasing the population’s willingness to
share information with the government. The results also suggest that development programs can
prevent the spread of violence in relatively secure regions, but they are not effective in reducing the
violence in regions that are already experiencing significant security problems.
The results overall suggest that the benefits of development programs are not limited to the
provision of direct economic and social benefits. They can also contribute to long-term sustained
development by preventing the spread of violent internal conflicts, which are at the core of
problems in many developing countries.

21
References
Beath, Andrew, Christia, Fotini, and Ruben Enikolopov (2010a). “Elite Capture of Local
Institutions: Evidence from a Field Experiment in Afghanistan” . Working Paper.
Beath, Andrew, Christia, Fotini, and Ruben Enikolopov (2010b). “Do Electoral Rules Affect Who
Gets Elected?: Evidence from a Field Experiment in Afghanistan”. Working Paper.
Berman, Eli, Felter, Joseph H. and Jacob N. Shapiro (2009) “Do Working Men Rebel? Insurgency
and Unemployment in Iraq and the Philippines.” NBER Working paper 15547.
Berman, Eli, Shapiro, Jacob N., and Joseph H. Felter (2009) “Can Hearts and Minds Be Bought?
The Economics of Counterinsurgency in Iraq”. NBER Working paper 14606.
Biddle, Stephen (2008) “The New U.S. Army/Marine Corps Counterinsurgency Field Manual as
Political Science and Political Praxis,”Review Symposium, Perspectives on Politics, 6:2, 347-350.
Blattman, Christopher and Edward Miguel (2010) “Civil War,” Journal of Economic Literature, 48 (1),
3–57.
Bullock, Will, Kosuke Imai and Jacob N. Shapiro (2010) “Measuring Political Support and
Issue Ownership Using Endorsement Experiments, with Application to Militant Groups in
Pakistan,” Working Paper.
Collier, Paul (1999) “On the Economic Consequences of Civil War,” Oxford Economic Papers, 51,
168–183.
Collier, Paul, and Anke Hoeffler (1998) “On Economic Causes of Civil War.” Oxford Economic
Papers, 50(4): 563–73.
Collier, Paul, and Anke Hoeffler (2004) “Greed and Grievance in Civil War.” Oxford Economic Papers,
56(4): 563–95.
Collier, Paul, and Anke Hoeffler (2007) “Civil War.” In Handbook of Defense Economics, Volume 2,
Defense in a Globalized World, ed. Todd Sandler, and Keith Hartley, 711–40. Amsterdam and
Oxford: Elsevier, North-Holland.
Condra, Luke N., Felter, Joseph H., Iyengar, Radha K., and Jacob N. Shapiro (2010) “The Effect
Of Civilian Casualties In Afghanistan And Iraq,” NBER Working paper 16152.

22
Crost, Benjamin and Patrick B. Johnston (2010) “Aiding War? Development Programs and Civil
Conflict in the Philippines,” Working paper.
Downes, Alexander, Targeting Civilians in War. Ithaca, NY: Cornell University Press, 2008.
Dube, Oeindrila and Suresh Naidu (2010) “Bases, Bullets, and Ballots: The Effect of U.S. Military
Aid on Political Conflict in Colombia,” Center for Global Development Working Paper 197.
Fearon, James D. (1995) “Rationalist Explanations for War.” International Organization, 49(3):
379–414.
Fearon, James D. (2004) “Why Do Some Civil Wars Last So Much Longer than Others?”
Journal of Peace Research, 41(3): 275–301.
Fearon, James D., and David D. Laitin (2003) “Ethnicity, Insurgency, and Civil War.” American
Political Science Review, 97(1): 75–90.
James D. Fearon and David D. Laitin (2008), “Civil war termination,” Working Paper, Stanford
University.
Friedman, Jeffrey A. (2010) “Boots on the Ground: The Significance of Manpower in
Counterinsurgency,” Working Paper, Harvard University.
Grossman, Herschel I. (1991) “A General Equilibrium Model of Insurrections.” American Economic
Review, 81(4): 912 –21.
Grossman, Herschel I. (1999) “Kleptocracy and Revolutions.” Oxford Economic Papers, 51(2), 267–83.
Gurr, Ted and Harff Barbara. 1994. Ethnic Conflict in World Politics. Boulder, Colorado: Westview
Press.
Iyengar, Radha, and Jonathan Monten (2008) “Is There an ‘Emboldenment’ Effect? Evidence
from the Insurgency in Iraq.” NBER Working Paper 13839.
Lalwani, Sameer (2010), “Selecting Strategy: Explaining Variations in States’ Counterinsurgency Campaigns,” Working Paper, MIT. Lyall, Jason (2010) “Are Co-Ethnics More Effective Counter-Insurgents? Evidence from the Second
Chechen War.” American Political Science Review, 104:1, 1-20.
Lyall, Jason and Isaiah Wilson III (2009) “Rage Against the Machines: Explaining Outcomes in
Counterinsurgency Wars,” International Organization, 63:1, 67-106.

23
Kalyvas, Stathis (2006) The Logic of Violence in Civil War. Cambridge and New York: Cambridge
University Press.
Kalyvas, Stathis (2008) “The New U.S. Army/Marine Corps Counterinsurgency Field Manual as
Political Science and Political Praxis,” Review Symposium, Perspectives on Politics, 6:2, 350-353.
Kling, Jeffrey, Jeffrey Liebman, and Lawrence Katz (2004) “Experimental Analysis of
Neighborhood Effects.” Econometrica, 75, pp. 83-119.
Petersen, Roger.2002. Understanding Ethnic Violence: Fear, Hatred, Resentment in Twentieth Century Eastern
Europe, New York: Cambridge University Press.
Posen, Barry "The Security Dilemma and Ethnic Conflict" Survival, vol. 35, no. 1, Spring 1993, pp.
27-47.
Powell, Robert (2002) “Bargaining Theory and International Conflict.” Annual Review of Political
Science, 5: 1–30.
Powell, Robert (2006) “War as a Commitment Problem.” International Organization, 60(1): 169–
203.
Sánchez, Alan (2010) “Transitory shocks and long-term human capital accumulation: the impact of
conflict on physical health in Peru” working paper.
Toft, Ivan Arreguin. 2005. How the Weak Win Wars. New York: Cambridge University Press. Toft, Monica Duffy. "Ending Civil Wars: A Case for Rebel Victory?" International Security 34.4 (Spring 2010): 7-36. U.S. Army/Marine Corps (2006) “Counterinsurgency Field Manual,” U.S. Army FM 3-24 and
Marine Corps Warfighting Publication No. 3-33.5.
Walter, Barbara F. (1997) “The Critical Barrier to Civil War Settlement.” International Organization,
51(3): 335–64.
Weinstein, Jeremy M. (2007) Inside Rebellion: The Politics of Insurgent Violence. Cambridge and New
York: Cambridge University Press.

24
Figure 1. Ten Sample Districts
Gulran
Adraskan Farsi
Chisht-e Sharif
Daulina Sang Takht
Balkh Khost Wa Firing
Hisarak
Sherzad

25
Figure 2. Average Number of Incidents per District
Note: The southern region includes the provinces of Helmand, Kandahar, Urozgan, Zabol, Nimruz, and Day Kundi.
!"
#"
$"
%"
&"
'!"
'#"
'$"
()*+!%"
,)-+!%"
,).+!%"
(/0+!
%"123+!%"
456+!%"
()*+!7"
,)-+!7"
,).+!7"
(/0+!
7"123+!7"
456+!7"
()*+!&"
,)-+!&"
,).+!&"
(/0+!
&"123+!&"
456+!&"
()*+!8"
,)-+!8"
,).+!8"
(/0+!
8"123+!8"
456+!8"
()*+'!"
!"#$%&"'()*&+)%$('+$#')
9:;0/<=*>"15/?@" 15/?@"5*0." A=?@=*"#!BC"5D"26)0/)E5*"6=00)>2F"

26
Table 1: Statistical Balance between Treatment and Control Groups
Variable Mean Level in Control Group
Mean Level in Treatment Group
Normalized Difference t-Statistics
Number of Households in Village 103.02 109.76 0.07 0.76
Number of People in Household 9.87 9.76 - 0.02 - 0.42
Age of Respondent 43.30 43.80 0.04 1.10
Respondent Speaks Dari as Mother Tongue 0.69 0.70 0.04 0.45
Respondent Received no Formal Education 0.71 0.71 0.01 0.18
Household Has Access to Electricity 0.13 0.15 0.04 0.59
Male Health Worker is Available to Treat Villagers 0.10 0.13 0.12 1.32
Female Health Worker is Available to Treat Villagers 0.08 0.10 0.10 1.07
Main Source of Drinking Water is Unprotected Spring 0.27 0.27 - 0.00 - 0.02
Dispute among Villagers Occurred in Past Year 0.37 0.36 - 0.03 - 0.36
No Problems are Experienced in Meeting Household Food Needs 0.45 0.45 0.02 0.38
Household Borrowed Money in Past Year 0.48 0.47 - 0.02 -0.36
Respondent Reports Attending Meeting of Village Council in Past Year 0.30 0.31 0.03 0.59
Expenditures on Weddings in Past Year (Afghanis) 11,676 10,380 - 0.03 - 0.73
Expenditures on Food in Past Month (Afghanis) 3,644 3,566 - 0.04 - 0.68
Respondent Believes that Women Should be Members of Council 0.41 0.43 0.05 0.92
Views of Women are not Considered in Resolving Disputes 0.51 0.48 - 0.06 - 1.64
Assets 0.00 -0.01 - 0.02 - 0.52
Natural Log of Income 8.67 8.63 - 0.07 - 1.15 Security incident within 1 km of the village between 2004 and start of NSP 0.02 0.02 0.00 0.00 Security incident within 5 km of the village between 2004 and start of NSP 0.14 0.12 -0.06 -0.66 Security incident within 10 km of the village between 2004 and start of NSP 0.20 0.21 0.03 0.33

27
Table 2: Economic Outcomes Variable Mean in
Control Treatment
Effect Standard
error Eastern District* Treatment Effect
Standard error
N R-squared
A. Income, Consumption, and Employment Ln(Annual Household Income) 7.077 0.027 [0.020] 0.061** [0.029] 4,578 0.15 Ln(Annual Household Consumption) 7.509 0.004 [0.019] 0.030 [0.034] 4,315 0.22 Respondent is Unemployed 0.065 0.005 [0.007] -0.024** [0.011] 4,621 0.08 Respondent is Employed in Subsistence Agriculture and Husbandry
0.554 -0.032** [0.014] 0.025 [0.038] 4,621 0.16
Summary Index 0 0.026** [0.013] 0.011 [0.025] 4,665 0.18 B. Perceptions of Economic Situation by Male Respondents
Respondent Perceives Household's Situation Has Improved in the Past Year
0.406 0.044*** [0.014] 0.016 [0.032] 4,662 0.21
Respondent Expects Economic Welfare of Villagers to Improve Next Year
0.302 0.053*** [0.013] -0.006 [0.029] 4,633 0.11
C. Perceptions of Economic Situation by Female Respondents Respondent Perceives Household's Situation Has Improved in the Past Year
0.287 0.044*** [0.016] 0.079*** [0.027] 4,227 0.23
Respondent Expects Economic Welfare of Villagers to Improve Next Year
0.377 0.042*** [0.016] 0.024 [0.036] 4,213 0.18
D. Migration according to village leaders Net Number of Families Migrating to the Village 4.377 1.346 [1.634] 28.381* [14.753] 460 0.66
Treatment effect is estimated in the regression, which includes a constant, a dummy variable for villages that have been assigned to the treatment group and fixed effects for the matched pairs. Robust standard errors adjusted for clustering at the village-cluster level in brackets. * significant at 10%; ** significant at 5%; *** significant at 1%.
Table 3: Perceptions of Government, Civil Society, and ISAF Soldiers
Variable Mean in Control
Treatment Effect
Standard error
Eastern District* Treatment Effect
Standard error
N R-squared
District Governor Acts For the Benefit of All Villagers 0.654 0.061*** [0.014] -0.018 [0.046] 4,414 0.28 Provincial Governor Acts For the Benefit of All Villagers 0.707 0.077*** [0.014] -0.115*** [0.038] 4,148 0.26 Central Government Officials Act For the Benefit of All Villagers 0.688 0.061*** [0.015] -0.080** [0.036] 4,256 0.22 President of Afghanistan Act For the Benefit of All Villagers 0.801 0.057*** [0.012] -0.097*** [0.023] 4,490 0.22 Members of Parliament Act For the Benefit of All Villagers 0.557 0.079*** [0.014] -0.099*** [0.036] 4,409 0.24 Government Judges Act For the Benefit of All Villagers 0.512 0.063*** [0.017] -0.067* [0.040] 4,491 0.20 National Police Act For the Benefit of All Villagers 0.725 0.038*** [0.014] -0.129*** [0.035] 4,556 0.22 NGO Employees Act For the Benefit of All Villagers 0.684 0.063*** [0.014] -0.096*** [0.037] 4,472 0.17 ISAF Soldiers Act For the Benefit of All Villagers 0.289 0.042** [0.016] -0.030 [0.023] 4,062 0.18 Summary Measure 0 0.128*** [0.022] -0.177*** [0.049] 4,660 0.28 Treatment effect is estimated in the regression, which includes a constant, a dummy variable for villages that have been assigned to the treatment group and fixed effects for the matched pairs. All the measures are based on the responses of male villagers. Robust standard errors adjusted for clustering at the village-cluster level in brackets. * significant at 10%; ** significant at 5%; *** significant at 1%.

28
Table 4: Perceptions of Security
Variable Mean in Control
Treatment Effect
Standard error
Eastern District* Treatment Effect
Standard error
N R-squared
A. Security Perception by Male Respondents Respondent Believes Security In and Around Village Has Improved in Past Two Years
0.655 0.058*** [0.015] -0.042 [0.032] 4,661 0.28
Respondent Believes Security In and Around Village Has Deteriorated in Past Two Years
0.121 -0.026** [0.010] 0.041* [0.021] 4,661 0.22
Summary Measure 0 0.099*** [0.027] -0.106** [0.051] 4,661 0.29 B. Security Perception by Female Respondents
Respondent Believes that compared to two years ago women feel more safe in working for NGOs or the government or attending training courses
0.292 0.049*** [0.018] -0.054 [0.038] 4,063 0.29
Respondent Believes that compared to two years ago women feel less safe in working for NGOs or the government or attending training courses
0.171 -0.039** [0.016] 0.013 [0.032] 4,063 0.32
Respondent Believes that compared to two years ago teenage girls feel more safe when traveling to and from school or when socializing with other girls
0.294 0.044** [0.018] -0.069 [0.043] 4,020 0.27
Respondent Believes that compared to two years ago teenage girls feel less safe when traveling to and from school or when socializing with other girls
0.213 -0.037** [0.017] 0.009 [0.055] 4,020 0.31
Summary Measure 0 0.098*** [0.034] -0.084 [0.059] 4,102 0.29 Treatment effect is estimated in the regression, which includes a constant, a dummy variable for villages that have been assigned to the treatment group and fixed effects for the matched pairs. Robust standard errors adjusted for clustering at the village-cluster level in brackets. * significant at 10%; ** significant at 5%; *** significant at 1%.
29
Table 5: Security Incidents
Variable Mean in Control
Treatment Effect
Standard error
Eastern District* Treatment Effect
Standard error
N R-squared
A. Security Experience According to Male Respondents Village Has Experienced Attack in Past 12 Months 0.035 -0.003 [0.009] -0.007 [0.016] 4,661 0.33 Village Has Experienced Attack by Anti-Government Elements in the Past Year
0.029 -0.003 [0.008] -0.008 [0.015] 4,664 0.34
Respondent Household Has Been Affected by Insecurity in Village During the Past Year
0.019 0.003 [0.006] -0.003 [0.006] 4,660 0.27
Respondent Household Has Been Affected by Insecurity on Roads Around District During the Past Year
0.026 0.003 [0.005] -0.003 [0.005] 4,660 0.12
Summary Measure 0 -0.003 [0.033] 0.032 [0.045] 4,666 0.34 B. ISAF data on security incidents
Security incident within 1 km, short run14 0.006 . [.] -0.020 [0.027] 500 0.50 Security incident within 1 km, long run 0.026 -0.020** [0.010] 0.000 [0.067] 500 0.57 Security incident within 5 km, short run 0.048 -0.010 [0.014] 0.010 [0.074] 500 0.61 Security incident within 5 km, long run 0.120 -0.020 [0.015] 0.180* [0.105] 500 0.75 Security incident within 10 km, short run 0.236 -0.020 [0.022] -0.060 [0.083] 500 0.81 Security incident within 10 km, long run 0.304 -0.045* [0.025] 0.025 [0.068] 500 0.85
Treatment effect is estimated in the regression, which includes a constant, a dummy variable for villages that have been assigned to the treatment group and fixed effects for the matched pairs. Short-run effects are estimated using data between the start of the program in October 2007 and January 2009. Long-run effects are estimated using data between January 2009 and March 2010. Robust standard errors adjusted for clustering at the village-cluster level in brackets. * significant at 10%; ** significant at 5%; *** significant at 1%.
14 All security incidents within 1 kilometer around evaluation villages in the sort-run occurred near villages from eastern districts, so that the coefficients for Treatment cannot be identified.

30
Appendix Table A1. Comparison of NSP Evaluation Sample with Representative Sample of Afghanistan’s Rural Population
Indicator NRVA (Rural Households) NSP Follow-up Survey
t-statistics Mean S.E. Obs. Mean S.E. Obs.
Age of Male Respondent 43.04 0.12 16,143 42.68 0.23 4,660 1.381
Income from Primary Source (Afghanis) 60,950 468 16,065 58,618 1155 4,554 1.872
Household Engaged in Agriculture 0.661 0.004 16,143 0.723 0.007 4,625 -7.950
Access to Electricity 0.280 0.004 16,121 0.304 0.007 4,656 -3.065
Last Child Born is Alive 0.994 0.001 9,861 0.975 0.004 1,736 4.938
Last Birth Delivered at Home 0.871 0.004 9,817 0.892 0.007 1,744 -2.541
Last Birth Delivered in Hospital 0.065 0.003 9,817 0.036 0.004 1,744 5.625
Table A2: Composition and Coverage of NSP Impact Evaluation Surveys
Baseline Survey Follow –up Survey
(September 2007) (May -October 2009)
Male Head-of-Household Questionnaire 4,895 in 500 villages 4,666 in 474 villages
Male Focus Group Questionnaire 5,334 participants in 500 villages 3,197 in 469 villages
Female Focus Group Questionnaire 3,670 participants in 406 villages 2,792 in 424 villages
Female Household Questionnaire Not Conducted 4,234 in 431 villages
Female Individual Questionnaire 3,398 in 406 villages Not Conducted
Due to deterioration in security conditions affecting 11 treatment and 15 control villages, located primarily in the districts of Sherzad and Daulina could not be surveyed during the first follow-up survey. Cultural sensitivities precluded the administration of female household and female focus group questionnaires in an additional 21 control and 22 treatment villages spread across Sherzad, Daulina, Adraskan, and Chisht-e Sharif. In both cases the attrition was not related to the treatment status of the villages and differences between treatment and control groups in village-level attrition are not statistically significant.

31
Table A3. Treatment Effect, Controlling for Baseline Values Variable Baseline Control Level of
aggregation for baseline measures
Treatment Effect
Std. Error
East* Treatment
Std. Error
N
A. Income, Consumption, and Employment Ln(Annual Household Income) Ln(Annual Household Income) Village 0.027 [0.020] 0.071** [0.032] 4,578
Individual 0.009 [0.029] 0.024 [0.043] 2,565 Ln(Annual Household Consumption) Ln(Annual Household Consumption) Village 0.008 [0.019] 0.042 [0.034] 4,315
Individual -0.037 [0.028] 0.111** [0.043] 2,462 Male Respondent is Unemployed Male Respondent is Unemployed Village 0.006 [0.007] -0.024** [0.011] 4,621
Individual 0.015 [0.011] -0.025* [0.014] 2,636 Male Respondent is Employed in Subsistence Agriculture and Husbandry
Male Respondent is Employed in Subsistence Agriculture and Husbandry
Village -0.032** [0.014] 0.032 [0.038] 4,621 Individual -0.036* [0.019] 0.049 [0.045] 2,636
B. Perceptions of Economic Situation by Male Respondents Respondent Perceives Household's Situation Has Improved in the Past Year
Respondent Perceives Household's Situation Has Improved in the Past Year
Village 0.044*** [0.013] 0.013 [0.031] 4,662 Individual 0.045** [0.018] 0.017 [0.037] 2,644
Respondent Expects Economic Welfare of Villagers to Improve Next Year
Respondent Perceives Household's Situation Has Improved in the Past Year
Village 0.054*** [0.013] -0.011 [0.028] 4,633 Individual 0.032* [0.018] 0.005 [0.037] 2,627
C. Perceptions of Economic Situation by Female Respondents Respondent Perceives Household's Situation Has Improved in the Past Year
Respondent Perceives Household's Situation Has Improved in the Past Year (Male Respondents)
Village 0.044*** [0.016] 0.072*** [0.028] 4,227
Individual 0.069*** [0.021] 0.068* [0.035] 2,362
Respondent Expects Economic Welfare of Villagers to Improve Next Year
Respondent Perceives Household's Situation Has Improved in the Past Year (Male Respondents)
Village 0.042*** [0.016] 0.028 [0.037] 4,213
Individual 0.054** [0.022] -0.026 [0.049] 2,355
D. Migration according to village leaders Net Number of Families Migrating to the Village
Net Number of Families Migrating to the Village
Village 2.014 [1.765] 26.298** [12.651] 460
E. Perceptions of Government, Civil Society, and ISAF Soldiers by Male Respondents
District Governor Acts For the Benefit of All Villagers
District Governor Acts For the Benefit of All Villagers
Village 0.061*** [0.013] -0.013 [0.046] 4,414 Individual 0.046** [0.018] 0.015 [0.050] 2,507
Provincial Governor Acts For the Benefit of All Villagers
Provincial Governor Acts For the Benefit of All Villagers
Village 0.076*** [0.014] -0.113*** [0.038] 4,148 Individual 0.080*** [0.019] -0.107*** [0.041] 2,297
Central Government Officials Act For the Benefit of All Villagers
Central Government Officials Act For the Benefit of All Villagers
Village 0.061*** [0.015] -0.079** [0.036] 4,256 Individual 0.071*** [0.020] -0.069 [0.044] 2,346
President of Afghanistan Act For the Benefit of All Villagers
President of Afghanistan Act For the Benefit of All Villagers
Village 0.057*** [0.012] -0.098*** [0.023] 4,490 Individual 0.069*** [0.018] -0.100*** [0.026] 2,460
Members of Parliament Act For the Benefit of All Villagers
Members of Parliament Act For the Benefit of All Villagers
Village 0.079*** [0.014] -0.100*** [0.037] 4,409 Individual 0.087*** [0.020] -0.098** [0.046] 2,432
NGO Employees Act For the Benefit of All Villagers
NGO Employees Act For the Benefit of All Villagers
Village 0.064*** [0.014] -0.104*** [0.036] 4,472 Individual 0.073*** [0.019] -0.073* [0.040] 2,429
F. Security Perception by Male Respondents
Respondent Believes Security In and Household has been affected by war and Village 0.058*** [0.015] -0.045 [0.032] 4,661

32
Variable Baseline Control Level of aggregation for baseline measures
Treatment Effect
Std. Error
East* Treatment
Std. Error
N
Around Village Has Improved in Past Two Years
insecurity in Past 12 Months Individual 0.051** [0.021] -0.046 [0.042] 2,646
Respondent Believes Security In and Around Village Has Deteriorated in Past Two Years
Household has been affected by war and insecurity in Past 12 Months
Village -0.026*** [0.010] 0.041* [0.022] 4,661
Individual -0.034*** [0.013] 0.042* [0.023] 2,646
G. Security Perception by Female Respondents
Respondent Believes that compared to two years ago women feel more safe in working for NGOs or the government or attending training courses
Household has been affected by war and insecurity in Past 12 Months (Male respondents)
Village 0.049*** [0.018] -0.054 [0.037] 4,063
Individual 0.086*** [0.024] -0.091* [0.047] 2,263
Respondent Believes that compared to two years ago women feel less safe in working for NGOs or the government or attending training courses
Household has been affected by war and insecurity in Past 12 Months (Male respondents)
Village -0.042*** [0.016] 0.011 [0.032] 4,063
Individual -0.038** [0.018] -0.005 [0.035] 2,263
Respondent Believes that compared to two years ago teenage girls feel more safe when traveling to and from school or when socializing with other girls
Household has been affected by war and insecurity in Past 12 Months (Male respondents)
Village 0.046** [0.018] -0.067* [0.040] 4,020
Individual 0.077*** [0.023] -0.136*** [0.045] 2,247
Respondent Believes that compared to two years ago teenage girls feel less safe when traveling to and from school or when socializing with other girls
Household has been affected by war and insecurity in Past 12 Months (Male respondents)
Village -0.041** [0.017] 0.006 [0.053] 4,020
Individual -0.020 [0.020] -0.027 [0.069] 2,247
H. Security Experience According to Male Respondents
Village Has Experienced Attack in Past 12 Months
Household has been affected by war and insecurity in Past 12 Months
Village -0.003 [0.009] -0.008 [0.016] 4,661 Individual -0.010 [0.013] 0.009 [0.016] 2,644
Village Has Experienced Attack by Anti-Government Elements in the Past Year
Household has been affected by war and insecurity in Past 12 Months
Village -0.003 [0.009] -0.008 [0.016] 4,661 Individual -0.008 [0.012] 0.008 [0.014] 2,647
Respondent Household Has Been Affected by Insecurity in Village During the Past Year
Household has been affected by war and insecurity in Past 12 Months
Village 0.003 [0.006] -0.003 [0.006] 4,660
Individual 0.001 [0.007] -0.005 [0.008] 2,645
Respondent Household Has Been Affected by Insecurity on Roads Around District During the Past Year
Household has been affected by war and insecurity in Past 12 Months
Village 0.003 [0.005] -0.004 [0.005] 4,660
Individual 0.008 [0.007] -0.012 [0.007] 2,645

33
Variable Baseline Control Level of aggregation for baseline measures
Treatment Effect
Std. Error
East* Treatment
Std. Error
N
I. ISAF data on security incidents Security incident within 1 km, short run15
Security incident within 1 km Village . [.] -0.020 [0.030] 500
Security incident within 1 km, long run Security incident within 1 km Village -0.020** [0.010] 0.000 [0.067] 500 Security incident within 3 km, short run Security incident within 3 km Village -0.008 [0.014] 0.002 [0.071] 500 Security incident within 3 km, long run Security incident within 3 km Village -0.017 [0.015] 0.164 [0.105] 500 Security incident within 10 km, short run
Security incident within 10 km Village -0.016 [0.023] -0.064 [0.083] 500
Security incident within 10 km, long run Security incident within 10 km Village -0.050** [0.024] 0.030 [0.068] 500
15 All security incidents within 1 kilometer around evaluation villages in the sort-run occurred near villages from eastern districts, so that the coefficients for Treatment and Treatment*East cannot be identified.

34
Table A4. Treatment Effect in Pashtun Regions
Variable Treatment Effect
Std. Error Pashtun* Treatment
Std. Error East* Treatment
Std. Error N R-squared
A. Income, Consumption, and Employment Ln(Annual Household Income) 0.056** [0.022] -0.109** [0.050] 0.032 [0.031] 4,578 0.15 Ln(Annual Household Consumption) 0.017 [0.022] -0.051 [0.042] 0.017 [0.036] 4,315 0.22 Male Respondent is Unemployed 0.008 [0.008] -0.01 [0.015] -0.027** [0.011] 4,621 0.08 Male Respondent is Employed in Subsistence Agriculture and Husbandry
-0.044*** [0.016] 0.047 [0.033] 0.037 [0.038] 4,621 0.16
Summary Index 0.044*** [0.014] -0.070** [0.030] -0.007 [0.026] 4,665 0.18 B. Perceptions of Economic Situation by Male Respondents
Respondent Perceives Household's Situation Has Improved in the Past Year
0.038** [0.017] 0.022 [0.027] 0.022 [0.033] 4,662 0.21
Respondent Expects Economic Welfare of Villagers to Improve Next Year
0.046*** [0.014] 0.026 [0.031] 0.001 [0.029] 4,633 0.11
C. Perceptions of Economic Situation by Female Respondents
Respondent Perceives Household's Situation Has Improved in the Past Year
0.038** [0.017] 0.019 [0.040] 0.085*** [0.028] 4,227 0.23
Respondent Expects Economic Welfare of Villagers to Improve Next Year
0.051*** [0.018] -0.031 [0.034] 0.015 [0.037] 4,213 0.18
D. Migration according to village leaders Net Number of Families Migrating to the Village 2.75 [1.917] -5.11 [3.593] 26.977* [14.821] 460 0.66
E. Perceptions of Government, Civil Society, and ISAF Soldiers by Male Respondents
District Governor Acts For the Benefit of All Villagers 0.057*** [0.017] 0.015 [0.027] -0.014 [0.047] 4,414 0.28 Provincial Governor Acts For the Benefit of All Villagers
0.081*** [0.018] -0.014 [0.027] -0.119*** [0.039] 4,148 0.26
Central Government Officials Act For the Benefit of All Villagers
0.061*** [0.018] 0.000 [0.031] -0.080** [0.037] 4,256 0.22
President of Afghanistan Act For the Benefit of All Villagers
0.070*** [0.015] -0.045* [0.024] -0.110*** [0.025] 4,490 0.22
Members of Parliament Act For the Benefit of All Villagers
0.090*** [0.017] -0.04 [0.033] -0.110*** [0.037] 4,409 0.24
Government Judges Act For the Benefit of All Villagers
0.077*** [0.018] -0.053 [0.043] -0.081** [0.041] 4,491 0.20
National Police Act For the Benefit of All Villagers 0.033** [0.016] 0.02 [0.029] -0.124*** [0.036] 4,556 0.22 NGO Employees Act For the Benefit of All Villagers 0.058*** [0.016] 0.017 [0.032] -0.092** [0.038] 4,472 0.17 ISAF Soldiers Act For the Benefit of All Villagers 0.055*** [0.017] -0.051 [0.042] -0.043* [0.024] 4,062 0.18 Summary Measure 0.134*** [0.026] -0.024 [0.050] -0.183*** [0.051] 4,660 0.28

35
Variable Treatment Effect
Std. Error Pashtun* Treatment
Std. Error East* Treatment
Std. Error N R-squared
F. Security Perception by Male Respondents Respondent Believes Security In and Around Village Has Improved in Past Two Years
0.053*** [0.019] 0.017 [0.032] -0.038 [0.034] 4,661 0.28
Respondent Believes Security In and Around Village Has Deteriorated in Past Two Years
-0.024** [0.012] -0.007 [0.022] 0.039* [0.022] 4,661 0.22
Summary Measure 0.091*** [0.033] 0.028 [0.056] -0.099* [0.055] 4,661 0.29 G. Security Perception by Female Respondents
Respondent Believes that compared to two years ago women feel more safe in working for NGOs or the government or attending training courses
0.060*** [0.022] -0.04 [0.038] -0.066* [0.039] 4,063 0.29
Respondent Believes that compared to two years ago women feel less safe in working for NGOs or the government or attending training courses
-0.063*** [0.016] 0.084** [0.041] 0.037 [0.032] 4,063 0.33
Respondent Believes that compared to two years ago teenage girls feel more safe when traveling to and from school or when socializing with other girls
0.046** [0.021] -0.01 [0.040] -0.071 [0.044] 4,020 0.27
Respondent Believes that compared to two years ago teenage girls feel less safe when traveling to and from school or when socializing with other girls
-0.058*** [0.017] 0.073 [0.046] 0.03 [0.055] 4,020 0.31
Summary Measure 0.132*** [0.034] -0.116 [0.087] -0.119** [0.059] 4,102 0.29 H. Security Experience According to Male Respondents
Village Has Experienced Attack in Past 12 Months -0.01 [0.011] 0.027 [0.021] 0.000 [0.016] 4,661 0.33 Village Has Experienced Attack by Anti-Government Elements in the Past Year
-0.012 [0.010] 0.035** [0.015] 0.001 [0.016] 4,664 0.34
Respondent Household Has Been Affected by Insecurity in Village During the Past Year
-0.001 [0.007] 0.012 [0.012] 0.001 [0.007] 4,660 0.27
Respondent Household Has Been Affected by Insecurity on Roads Around District During the Past Year
0.007 [0.005] -0.014 [0.010] -0.007 [0.005] 4,660 0.12
Summary Measure 0.019 [0.040] -0.084 [0.066] 0.01 [0.050] 4,666 0.34 I. ISAF data on security incidents
Security incident within 1 km, short run16 0.000 [.] -0.020 [0.027] 0.000 [.] 500 0.50 Security incident within 1 km, long run -0.006 [0.006] -0.014 [0.067] -0.114* [0.066] 500 0.58 Security incident within 3 km, short run -0.011 [0.016] 0.011 [0.074] 0.011 [0.016] 500 0.61 Security incident within 3 km, long run 0.006 [0.010] 0.154 [0.105] -0.206** [0.086] 500 0.76 Security incident within 10 km, short run -0.029 [0.022] -0.051 [0.083] 0.069 [0.092] 500 0.81 Security incident within 10 km, long run -0.040 [0.025] 0.020 [0.068] -0.040 [0.108] 500 0.85
16 All security incidents within 1 kilometer around evaluation villages in the sort-run occurred near villages from eastern districts, so that the coefficients for Treatment and Treatment*East cannot be identified.
Copyright © 2022 FDOKUMEN