winning a deal in private equity: do educational networks ...
43
Electronic copy available at: https://ssrn.com/abstract=2787578 WINNING A DEAL IN PRIVATE EQUITY: DO EDUCATIONAL NETWORKS MATTER? FLORIAN FUCHS ROLAND FÜSS TIM JENKINSON STEFAN MORKOETTER WORKING PAPERS ON FINANCE NO. 2017/15 SWISS INSTITUTE OF BANKING AND FINANCE (S/BF – HSG) DECEMBER 2017
-
Upload
khangminh22 -
Category
Documents
-
view
0 -
download
0
Transcript of winning a deal in private equity: do educational networks ...

Electronic copy available at: https://ssrn.com/abstract=2787578
WINNING A DEAL IN PRIVATE EQUITY: DO EDUCATIONAL NETWORKS MATTER?
FLORIAN FUCHS ROLAND FÜSS TIM JENKINSON STEFAN MORKOETTER
WORKING PAPERS ON FINANCE NO. 2017/15
SWISS INSTITUTE OF BANKING AND FINANCE (S/BF – HSG)
DECEMBER 2017
Electronic copy available at: https://ssrn.com/abstract=2787578
Winning a Deal in Private Equity:Do Educational Networks Matter?
Florian Fuchs a
University of St.Gallen
Roland Füss b
University of St.Gallen
Tim Jenkinson c
University of Oxford
Stefan Morkoetter d
University of St.Gallen
December 2017(First version: June 2016)
Abstract
In this paper, we investigate the role of educational networks in private equity. Networkties between fund managers and CEOs of target companies could play a role in sourcingproprietary deals and winning competitive transactions. We find that educational tiesbetween the management teams of acquiring funds and the target company are frequent,and increase the odds of winning a deal. In competitive transactions, exclusivity ofnetworks tends to matter more than the university from which it derives. In addition,educational ties also mitigate prevailing local bias. However, the evidence that suchnetwork deals produce higher returns for investors is limited at best.
Keywords: Investment Choice, Deal Sourcing, Networks, Social Ties, BuyoutJEL Codes: G11, G15, G24, G34
a [email protected] b [email protected] c [email protected] [email protected]
We thank PitchBook and an anonymous investor for providing access to their data. We are grateful toSridhar Arcot, Martin Brown, Georg Gebhardt, Andre Güttler, Gunter Löffler, Brian M. Lucey, DanielMurphy, Per Östberg, Angelo Ranaldo, Christine Scheef, Markus Schmid, and Thomas Zellweger as wellas to the discussants and participants of the IFABS Asia Brunei Conference 2016, the 4th Paris FinancialManagement Conference 2016, the 14th Paris December Finance Meeting 2016, the PhD Seminar at theUniversity of St.Gallen 2017, the 15th INFINITI Conference on International Finance 2017, the ResearchSeminar at Ulm University 2017, the 1st Annual Private Markets Research Conference at Lausanne 2017,and the 44th Annual Meeting of the European Finance Association 2017 for their helpful comments.
Electronic copy available at: https://ssrn.com/abstract=2787578
Winning a Deal in Private Equity:Do Educational Networks Matter?
December 2017
Abstract
In this paper, we investigate the role of educational networks in private equity. Networkties between fund managers and CEOs of target companies could play a role in sourcingproprietary deals and winning competitive transactions. We find that educational tiesbetween the management teams of acquiring funds and the target company are frequent,and increase the odds of winning a deal. In competitive transactions, exclusivity ofnetworks tends to matter more than the university from which it derives. In addition,educational ties also mitigate prevailing local bias. However, the evidence that suchnetwork deals produce higher returns for investors is limited at best.
Keywords: Investment Choice, Deal Sourcing, Networks, Social Ties, BuyoutJEL Codes: G11, G15, G24, G34
1 Introduction
Investors commit capital to private equity funds in order to gain access to valuable
investment opportunities that may not be available to them through other channels. As
the private equity sector has matured there is increasing competition for deals, with
many transactions using a formal auction process, run by an intermediary. However,
private equity funds also search for “proprietary” deals. In this paper, we explore the
importance of one potential source of competitive advantage – educational networks – in
both identifying and winning deals. However, the expected effect of educational ties is
not obvious as they can both provide access to private information and potentially bias a
decision maker (e.g., Engelberg et al. (2012), Rousseau and Stroup (2015)). The value of
these networks to investors ultimately depends on whether they result in better returns,
which we also analyze.
We focus on university networks and construct ties between one or more of the
private equity fund partners and the CEO of the target company. We do not limit our
attention to contemporaneous attendance at university, but at the potential impact of
sharing an alumni network. We analyze the importance of educational ties created by
undergraduate, graduate and, separately, MBA degrees. Since we do not require such
ties to involve direct interactions they could work through many alternative channels,
from homophily (“birds of a feather flock together”) to commonalities among the group
of people attracted to an institution (Ishii and Xuan (2014)). Cohen and Malloy (2010)
highlight that alumni networks are a particularly effective kind of social network that
allows one to amass information about other graduates and common acquaintances due
to people’s self-selection into programs, which generates both a higher level of interaction
and longer-lived relationships.
There is evidence that such ties are valuable in public markets: mutual funds use
them in their investment choices and generate higher performance with such holdings
(Cohen et al. (2008)), and there is evidence that security analysts, CEOs, and bankers all
1
benefit from networks related to their previous educational attainments (e.g., Cohen et al.
(2010), Butler and Gurun (2012), Engelberg et al. (2012)). More generally, personal and
professional networks have been suggested as a powerful source of deal flow generation
(e.g., Fenn et al. (1997), Teten and Farmer (2010), and Gompers et al. (2016a)), and
research in the economic and sociological literature stresses the value of acquaintances or
“weak ties” (Granovetter (1973, 1983)) especially for individuals in management positions
(e.g., Wegener (1991), Brown et al. (2012)). Previous research has analyzed the importance
of repeated business relationships for venture capital in the form of syndication networks
(e.g., Sorensen and Stuart (2001, 2008), Hochberg et al. (2007, 2010), Hochberg et al.
(2015)). However, the deal sourcing networks of buyout funds are of a different kind.
While educational ties in venture capital proxy for similarities between the actors (e.g.,
Sunesson (2009), Bengtsson and Hsu (2015)), for buyout investors they more likely help
to identify, and gain access to, potential target firms. Furthermore, in the case of start-up
companies, the founding entrepreneurs actively reach out to funds, whereas in the case of
buyout funds it is typically the fund partner that approaches potential target firms.
To measure the network effect, we employ a novel data set, which comprises the
educational and professional histories of partners who manage private equity funds and
CEOs of the target firms at the time of acquisition. Buyout funds and acquisition targets
are primarily located in the United States and Western Europe, which are the two largest
buyout markets. An important feature of the data is the allocation of partners at the
fund rather than investment firm (General Partner) level. Management teams in private
equity comprise a small number of experienced professionals who are highly incentivized
by their own financial commitments and their compensation arrangements. Observing
the allocation directly at the fund level reduces noise related to larger organizations that
manage multiple lines and sequences in parallel. Our analysis focuses on traditional
buyout and growth deals, excluding add-on and venture capital transactions due to their
different dynamics. Target firms are public and private enterprises from various industry
sectors and countries. Lastly, we focus on investments up to 2010 to allow for sufficient
2

time to measure subsequent performance. This leaves us with a final sample of 3,051
investments comprising 2,606 companies (with 2,599 unique CEOs). A total of 1,757
buyout funds from 904 unique firms compete for these investments (with 3,939 unique
partners).
Our main findings are as follows. First, we find that educational ties frequently
exist – in 15% of buyout deals – and that they significantly improve the odds of a fund
winning a deal (by 79%). The effect is strong for acquisitions of private firms but not
for public-to-private deals. Second, we document that a higher degree of exclusivity (i.e.,
lower competition among funds with the same educational ties) increases the odds of a
fund winning a deal significantly. Thus, it is not necessarily just the largest and widest
network, nor just the one that produces the highest number of CEOs that is of value for
the fund. Instead, the evidence suggests the value of a network in competitive settings
is greatly elevated by the exclusivity of its ties. Third, we show that proximity to the
acquired firm matters, which we measure as the geographic distance between the closest
fund office and the company’s headquarters. In this context, we interpret proximity as a
local network. However, we also show that educational ties reduce a potential local bias
in transactions by up to a fifth. Therefore, educational networks can substitute, to some
extent, with local networks of professionals.
Finally, we analyze the relevance of these networks for investors by evaluating whether
transactions with a pre-existing educational tie generate higher returns. The evidence
suggests that the deal sourcing channel is not a systematic driver for post-deal performance
per se. This is not surprising, as it could imply that private equity funds are able to
pay consistently less (or more) for companies where they had network ties. Instead, we
confirm the relevance of market timing, namely the length and the prevailing market
return during the holding period. It seems that while buyout funds use educational ties
for investment generation, post-deal returns are still primarily driven by market timing as
well as the financial and operational value-enhancing measures that the funds implement
during the lifetime of the investment.
3

These results withstand several robustness tests. In particular, they remain robust
controlling for previous experience of the partners in professional services firms and banks,
where other networks are likely to arise. Furthermore, they hold when controlling for fund
characteristics, such as size and sequence, and for various plausible restrictions on deal
and fund attributes.
The remainder is organized as follows. Section 2 discusses the institutional background
and data we use, and our counterfactual approach. Section 3 provides the main results.
Section 4 presents a number of robustness checks, and Section 5 investigates whether deals
sourced from educational networks perform better, or worse, than other deals. Section 6
concludes.
2 Institutional background and data
2.1 Deal sourcing in the buyout industry
The private equity industry has become an important asset class with more than $2.4
trillion in assets under management, of which two-thirds are related to buyout and growth
activity.1 Funds are typically set up as a limited liability partnership with a fixed lifetime
of 10-12 years. The private equity manager acts as the general partner (GP) to the fund,
and receives an annual management fee as well as a share of the profits. While private
equity managers can raise and manage more than one fund at a time, they usually assign
one or more partners to a specific fund. These partners are then responsible for the fund’s
deal sourcing activities as well as the management of its investments. The ability to
identify, and acquire, good investment opportunities is one of the key capabilities of a
successful private equity fund.
Differences in the approach to deal sourcing are an important performance driver.
Fenn et al. (1997) outline that GPs compete with intermediaries (such as investment
banks and deal brokers) to identify potential target firms. Intermediated deals tend to be1Source: Preqin, Private Equity Spotlight, September 2016 (data as of 31st December 2015).
4
less attractive as they are run as open auctions, and can involve significant costs in terms
of due diligence. In a related study, Teten and Farmer (2010) conclude that top-quartile
funds have substantial scale in deal origination and a focus outside the most competitive
markets. They report that personal and professional relationships provide half of the
internal deal flow, followed by word-of-mouth and cold calls. More recently, Gompers
et al. (2016a) survey a broad sample of GPs and name proprietary deals, where the fund
acts as an exclusive buyer, an important determinant of value creation. A third of deals
are “proactively self-generated”, 5-10% originate from each the management’s and the
investor’s executive network, and the remaining come from agents and other private equity
firms. However, despite the frequent notion of the importance of active deal sourcing
and the role of networks across different studies, empirical evidence on the nature and
influence of these relationships remains sparse.
The importance of deal sourcing has likely increased as the industry has grown
and matured, and an increasing number of funds compete for the same investments.
Metrick and Yasuda (2011) name the level of competition among funds as the main factor
influencing performance, followed by financing conditions. In addition, competition for
investment targets also originates from strategic acquirers that constantly monitor the
market. This has different implications for the funds, namely that it affects their deal
sourcing efforts. Some authors report a recent decline in performance persistence (e.g.,
Harris et al. (2014), Braun et al. (2016)) indicating that it becomes more challenging
to source promising investments. Other studies document a countercyclical relationship
of capital and deal flow to fund performance (e.g., Phalippou (2007), Ljungqvist et al.
(2009)). This likely drives funds to broaden deal sources and increasingly tap upon their
own networks to close deals early on. Finally, Ishii and Xuan (2014) call for an extension
of the traditional target centered view by the acquirer-target relationship. In their study
of corporate takeovers, the authors record that social ties influence both decision making
and subsequent merger performance.
5

2.2 The role of educational networks
There is a growing literature on networks in finance (see Allen and Babus (2009) for
an overview). In particular, social and educational ties between the top management
teams of different organizations or interest groups prove valuable across disciplines.2 For
example, company outsiders, such as sell-side analysts, use them to initiate relationships
with the senior management of (public) firms (Cohen et al. (2010)). Information transfer
via ties allows banks and corporates to establish trust and reduce contracting frictions
(Engelberg et al. (2012)). On the other hand, they can also induce favoritism and introduce
governance problems (e.g., Fracassi and Tate (2012), Butler and Gurun (2012)).
In terms of value, Engelberg et al. (2013) report that university connections are about
four times more valuable than professional and other social ties. Furthermore, the authors
do not find a significant difference between local and remote connections. Networks can
likewise enlarge geographic exposure for their members (Cumming and Dai (2010)), and
act as a barrier to enter a local market (Hochberg et al. (2010)).
In the public takeover market, Cai and Sevilir (2012) and Renneboog and Zhao (2014)
find that board relationships influence transaction likelihood and performance alike. Ishii
and Xuan (2014) extend the evidence to social ties. Using educational networks, Cohen
et al. (2008) note mutual fund managers invest heavily in firms to which they are connected,
while Sunesson (2009) reports an increased likelihood of matching a venture capitalist with
an entrepreneur as well as with another venture capitalist.3 Bengtsson and Hsu (2015)
find co-ethnicity to increase investment likelihood in venture capital, while Gompers et al.
(2016b) investigate ethnic, educational, and career background for syndication. Lastly,
Jääskeläinen and Maula (2014) report indirect ties to promote investment identification,
while direct ties ease the investor’s quality assessment.2In general, social networks serve three purposes: flow and quality of information, source of reward
and punishment, and “trust” that others will do the “right” thing (Granovetter (2005)). Therefore, theyhelp to overcome asymmetric information, moral hazard, and costly search (Kuhnen (2009)).
3Besides social ties, the venture capital literature documents the value of economic ties (prior co-investments) and the role of spatial distance with regard to syndication networks. We refer to Sorensenand Stuart (2001, 2008), Hochberg et al. (2007, 2010), Chen et al. (2010), and Hochberg et al. (2015).
6

Evidence on the existence and value of social ties in the buyout industry is scarce.
Stuart and Yim (2010) show that board networks influence the likelihood of becoming
a target in a going-private transaction, while Wu (2011) finds that MBA networks
transfer information among co-investors in syndication. Siming (2014) reports that
past employment of managers in financial advisers provides access to profitable business
opportunities. However, the relevance of educational networks for investment generation
of buyout funds has, to the best of our knowledge, not been investigated so far. Such
networks can give the fund a competitive advantage over other investors through easier
target identification and reduced contracting frictions throughout the deal negotiation
process. However, whether such networks ultimately generate value for funds depends on
the extent of competition. We separately test for the impact of network connections on
the likelihood of doing a deal and the impact on fund returns.
There are also important differences between buyout funds and other asset classes
that allow us to add to the general interpretation of such networks. First, buyout funds
focus on identification and access to potential target firms, while educational ties in
other markets proxy for similarity between actors (Sørensen (2007) call the matching
in venture capital “two-sided”). Second, in general, buyout funds initiate the process,
whereas entrepreneurs actively reach out to venture capitalists for funding. Third, buyout
partners have to convince senior managers at target companies, who act as agents for
shareholders. Buyout funds typically acquire majority stakes in companies with a proven
business model and in a number of cases replace the management team to resolve prior
governance issues (e.g., Gompers et al. (2016a)).
Finally, to be of relevance for the deal origination, it is not only the fund partners who
need to be active network participants but the target firm management is also open to
such approaches. However, there should be little doubt about the connectedness of CEOs
as they are owners of powerful networks themselves (e.g., Gottesman and Morey (2006a),
Kirchmaier and Stathopoulos (2008), Brown et al. (2012), Liu (2014)). Overall, we expect
educational networks to support the fund managers in their deal sourcing efforts.
7

2.3 Data on funds and transactions
The data is sourced from PitchBook, a database for global M&A, Private Equity and
Venture Capital transactions.4 We split the following discussion into the four components:
funds, partners, acquisition target firms and CEOs, and deal performance.
First, we start with buyout funds for which we can identify their management teams
and for which fund size, sequence, and location is non-missing. This yields 1,757 funds
from 904 unique firms (General Partners) spanning vintage years from 1984 to 2010.5
We limit the sample period up to the vintage year 2010 to allow for sufficient time for
subsequent measurement of performance. Table 1 breaks the fund sample down by vintage
year. The average fund manages USD 794 million in capital (median: 316) and is the 4.5th
fund of the general partner (median: 2.0). A quarter of funds are first-timers and around
two-thirds are based in the United States. Roughly a half of funds provide performance
information as an internal rate of return (IRR) and/or money multiple (TVPI) as a last
reported figure.6 The average fund provides investors with an IRR of 13.3% (median:
12.0%) and a total value of 1.62 times the paid-in capital (median: 1.54).
Table 1 about here: Buyout fund sample by vintage year
Second, the database lists 4,333 unique individuals for the management teams of these
funds (some are associated with multiple funds). An important feature of the data is4PitchBook (www.pitchbook.com) obtains data from filings, press releases, and websites. Research
teams collect, verify, and integrate the information and survey companies, advisers, investors, and lendersto cross-validate collected data. In a recent study, Brown et al. (2015) compare commercial privateequity data sets of PitchBook, Preqin, Cambridge Associates, and Burgiss. They conclude that for NorthAmerica all provide similar performance signals while outside coverage varies substantially. Harris et al.(2016) find the performance data of Burgiss and Pitchbook qualitatively and quantitatively similar.
5A buyout defines a transaction where a fund acquires a significant amount of equity in a business,whereas vintage indicates the year that a fund held its final close and/or began making investments.In total, the database lists 3,837 buyout funds (up to vintage year 2010). Our main restriction is onmanagement teams that provide at least one partner’s biography and education (passed by 2,005 funds).Requiring fund size, sequence, and location leaves 1,884 funds. Lastly, we remove 127 funds from thesample that do not pass our restrictions as potential matches in the counterfactual approach describedbelow (i.e. they do not have at least one other investment in the industry and geographic region clustersor are not anymore in investment period). This results in a final sample of 1,757 funds.
6The internal rate of return (IRR) is the rate at which the net present value of all cash flows equalszero. Total value to paid-In (TVPI), also called investment or money multiple, represents the moneyreturned to investors plus the unrealized investments relative to the capital contributed to the partnership.
8

the classification of individuals at the fund rather than the general partner level. The
database sources this information from regulatory filings, fundraising information, investor
websites and surveys, and complements it with the person’s role and position within
the firm, e.g., their appearance as lead partner or as a board member of portfolio firms.
We follow the classification with a few exceptions where the partner carries an obvious
non-managing title (e.g., Analyst, Associate), and refer to them collectively as partners
of the fund.7 Our data also includes partners who have historically been involved even
though the partner has left the fund in the meantime. The average management team
in our sample consists of 3.5 partners (median: 3.0). For 3,939 partners or 91% of the
sample, a textual biography and educational background is available (we require at least
the name of the academic institution).
Third, we compile a sample of investments of these buyout funds for which the target
company CEO profile can be identified. The database is filtered based on the following
criteria: (i) We include only buyout and growth/expansion transactions (this covers
around 85% of initial deals and excludes venture capital). (ii) We include only companies
that both identify the CEO at the time of the deal and list biography and education
(around a third of transactions). (iii) As we only include funds up to vintage year 2010
we cannot fully model the competitive situation in the years after and, thus, exclude
investments from subsequent years.8 (iv) We exclude add-on transactions, which typically
support a prior acquisition in a buy-and-build strategy and follow their own dynamics
and determinants. For example, the management of the acquiring portfolio company
is actively involved and firms differ particularly in terms of firm size, profitability, and
leverage (e.g., Morkoetter and Wetzer (2015)). (v) We require non-missing values on deal
date, company location and industry sector, and include only the first time a fund invests7Their actual job titles comprise a variety of titles, e.g., Founding Partner, Managing Partner, Partner,
Managing Director, Senior Partner, Investment Director, Director, Operating Partner, Managing Principal,Principal, or General Partner (list not exhaustive).
8For example, when a fund with vintage year 2010 acquires a company during 2012 it is likely thatalso funds with vintage year 2011 compete for it. However, these are excluded from the sample due tothe required time lag on performance. While this essentially excludes the majority of investments fromfunds in the last years of the sample, it is a necessary condition to fully reflect the competitive situation.
9

in a company in order to determine the initial contact point. (vi) We require investments
to take place within five years following the vintage year of the fund. This is enforced for
consistency with the counterfactual approach (see description in Subsection 2.5).
This leaves us with a final sample of 3,051 transactions comprising 2,606 companies
and 2,599 individual CEOs (some firms are involved in multiple deals and within one
transaction several funds can invest).9 Table 2 presents a break-down of the investments
by geography, industry sector, deal type, and year. Around two-thirds of transactions
are in North American based companies with almost all the remaining being European-
based. The industry split exhibits a high concentration on business and consumer services,
followed by the information technology and healthcare sectors. In terms of transaction
type, we observe that the minority of investments represent a traditional delisting of a
public company. Furthermore, around 12% of deals are classified as management buyout/in
and 13% as secondary buyouts. Investment years range from 1987 up to 2010 yet most of
our investments take place in the post-2000 period.
Table 2 about here: Characteristics of investment sample
Fourth, we add deal-level returns to the investment sample. However, it is important
to note that the availability of deal-level data in private equity is limited at present, with
most information only being available at the fund level. The data that we construct, is
sourced from PitchBook and Preqin and complemented with data from one anonymous
limited partner. This approach yields a total of 535 deal-level IRRs (mean: 29%, median:
20%) and 624 TVPI multiples (mean: 3.0x, median: 2.4x).10 The average holding duration
is 6 years and the deal sample covers around 250 different funds, 55% are U.S. based
and less than 10% are first-timers, from approximately 150 unique general partners.11
9The database lists a total of 24,506 buyout and growth/expansion transactions from 19,866 companiesfor our sample of buyout funds. The major restrictions are the requirement on CEO data and theexclusion of add-on transactions and investments after 2010 (combined 85% of excluded deals).
10The variables are winsorized at the 1% tail.11Braun et al. (2016) recently presented a broad sample of deal-level returns in their investigation of
performance persistence. Their data shows a median multiple of 1.9 for realized investments and highermultiples for the 2000-2004 period (median of 2.0) compared to the 2005-2013 period (median of 1.5).
10

While this data can give only a glimpse into the deal return structure of buyout funds,
it still provides us with insights into the role of educational networks for subsequent
investment performance. Ideally, one would also complement these ex-post returns with
an analysis of entry valuations to test the role of educational ties for information transfer
purposes. However, we have not been able to source such data for a sufficient coverage of
our investment sample. Finally, as the performance data is not available for the complete
data set, we will address concerns about a possible introduction of selection bias into our
results in our later discussion of robustness checks.
2.4 Biographies of partners and CEOs
The information on each individual in the database comprises the name, a textual
biography, and a list of educational achievements. The latter split the degree institutions
by name, type, field, and year.12 Table 3 presents the most frequently observed institutions
for both partners and the target company CEOs. A majority of managers graduated
from well-known institutions and most are represented with more than one academic
degree. The fund partners are more likely to have graduate and MBA degrees compared
to their corporate counterparts. They are also much more concentrated on a selected
number of institutions and this concentration is even more pronounced for MBA degrees.
Harvard, especially, enjoys a significant presence, heading both lists with the highest
number of graduates. These findings are consistent with earlier studies on senior managers
in mutual funds and venture capital funds (e.g., Cohen et al. (2008, 2010), Sunesson
(2009), Zarutskie (2010)). We want to stress this point as our analysis requires the fund
partners and target firm CEOs to graduate from the same academic institution in order
to create an educational tie.
Table 3 about here: Degree institutions of partners and CEOs12Graduation year is only available for half of the degrees and the textual biography does not allow
to determine the manager’s age or origin. We omit gender and ethnicity in the analysis since the largemajority of partners and CEOs are male and we do not expect a significant effect from cultural differences.
11
The value of the educational attainment for deal sourcing may also depend on the part-
ner’s previous professional experience. To account for this, we examine the (relationship-
oriented) work history of the partners with regard to professional services firms and
banks. Specifically, we parse experience in management/strategy consulting, with a major
accounting firm, and with an (investment) bank.13 We observe more than half of funds
have at least one partner with prior banking experience, a quarter with a consulting firm,
and a fifth with a major accounting firm (team means are 33%, 11%, and 7%, respectively).
2.5 Counterfactual approach
Under perfect information we would be able to identify all funds that evaluated a target
firm and subsequently joined the bidding (if existing). As the data does not provide us
with such information, we use a counterfactual approach. We identify funds with a suitable
profile that could have invested in the target firm as well and that act as competitors to
the winning fund. This approach follows the literature on social, board and syndication
ties (e.g., Gompers and Xuan (2009), Sunesson (2009), Stuart and Yim (2010), Siming
(2014), Bengtsson and Hsu (2015), Gompers et al. (2016b)).14 To assess the value of
educational networks, we determine whether ties between the management teams of the
fund and the target firm give the fund an edge over other potential bidders during this
deal generation process.
We create our set of counterfactual investments similar to Bengtsson and Hsu (2015)
and set out the following three criteria: (i) the fund is at the point of time the deal takes
place in its investment period, which we define as the 5-year period following the vintage13Consulting includes McKinsey & Co, BCG, Bain & Co, Oliver Wyman, Roland Berger,
Booz/Strategy&, and L.E.K., whereas accounting comprises PwC, Deloitte, KPMG, EY, and ArthurAnderson. Banking is based on a list of 50 global banks compiled by “The Banker” as well as majorinvestment banks such as Lehman Brothers, Bear Stearns, Lazard, Rothschild (list not exhaustive).
14Gompers and Xuan (2009) investigates the likelihood of becoming the acquisition target of a publiccompany, while Sunesson (2009) uses a cross-section from 2002 to investigate the matching behaviorbetween venture capitals with entrepreneurs as well as with other venture capitalists. Stuart and Yim(2010) relate board interlocks with the probability of going private transaction. Siming (2014) simulatesthe mandates of financial advisers by private equity firms. Bengtsson and Hsu (2015) analyze ethnicmatching between entrepreneurial founders and venture capital partners in the U.S., and Gompers et al.(2016b) the syndication likelihood among venture capital partners.
12

year15, (ii) the fund makes at least one other investment in the same geographic region,
and (iii) at least one other investment in the same industry sector (we validate with data
up to 2015).16 The criteria are deliberately defined in a broad sense as we include various
controls and matching procedures in the following analysis to account for differences
between the funds.17 This procedure leaves us with a set of around 750,000 counterfactual
bidders and an average competition ratio of 247 from other funds (median: 243). While
this number appears high, it is important to consider carefully what it measures. It
represent all the funds that in principle could have identified the same target firm and
invested as well. However, it is not saying that every fund has actually evaluated the
company and/or competed in a bidding process.18 The goal is to explain the access the
winning fund has to the target via the use of a network measure. To mitigate potential
concerns about a high counterfactual investment ratio we present a variety of robustness
checks on model specification, including several fixed effects settings, and confirm our
main results for both a random draw and propensity score matching (see Subsection 4.1).
Finally, when assessing the competition level over time, we note an increase in the
number of potential investors per deal. This is consistent with the growth of the buyout
industry and indicates that deal sourcing has likely become more competitive for the
funds over the years. Yet, a comparable increase in the number of competing funds that
also have an educational tie cannot be detected. Thus, if the hypothesis that educational
ties increase the likelihood of winning an investment is true, then its importance should
also increase with more competition.15Private equity funds usually have a lifetime of 10-12 years and invest in the first five years after
initiation (e.g., Metrick and Yasuda (2010)).16The definitions follow the classification in the database and allow for a wide range of competition
as we expect the educational ties to bridge across borders (e.g., country). Geographic region splits intoAfrica, Americas, Asia, and Europe. Industry sector differentiates between Business Products and Services(B2B), Consumer Products and Services (B2C), Energy, Financial Services, Healthcare, InformationTechnology, and Materials and Resources. We refer to Table 2 for related statistics.
17Outlining the difficulty to define criteria for generating a control group, Stuart and Yim (2010) evenuse an unrestricted comparison sample (based on all public firms in their case).
18Fenn et al. (1997) note that some investment banks actively distribute their offering memorandumsto up to 100 potential investors, while Gompers et al. (2016a) report that buyout managers consider onaverage 100 opportunities for every 3.6 closed deals (median: 3.0).
13

If educational ties are indeed an important driver for deal generation, we should
observe this case more frequently than expected. Table 4 shows a cross-tabulation of
actual versus counterfactual fund investments for educational ties (Panel A) and MBA
ties (Panel B). Out of the 3,051 investments in our sample, 453 have an educational tie,
whereas 130 have a tie based on an MBA degree. From these descriptive statistics we can
see that the share of ties is two times as high for the actual investments (14.9%) compared
to the counterfactual sample (7.4%). Similarly, when we perform the analysis based on
common MBA degrees the resulting ratio for ties is more than 1.5 times as high for actual
investments (4.3% compared to 2.4%). This gives a first indication that educational
networks may play a role for buyout funds when they source their investments.
Table 4 about here: Investment generation and educational ties
3 Empirical results
3.1 Educational ties in deal sourcing
We first test whether the university background of the private equity managers matters
in terms of winning a deal via educational links to the CEO.19 Let index j refer to the
deals in the investment sample and index i to the buyout funds that compete for each
transaction. We define a multivariate logistic regression model with a binary response
variable Yi,j, which is set to one if fund i wins deal j (actual investment) and to zero
otherwise (counterfactual investment), and probability πij. The odds are then defined as
the ratio of probability πij to its complement 1 − πij , and the logit transformation gives19We do not expect endogeneity concerns in this relationship due to simultaneity since the educational
ties are formed many years before the individuals become partners (i.e., there is a clear timeline).
14

the expected log of the odds as
ln
(πi,j
1 − πi,j
)= α + β Educational T iei,j + (1)
ψDistancei,j + δ Experiencei +
γ Fundi + λFEj(Y ear, Region, Industry) .
Since we focus on target firms that are actually taken over, we model the relative
probabilities among bidding funds. Thus, we do not need to worry about the overall
probability that the firm is acquired (Rousseau and Stroup (2015) use a similar setup
for director movement). The variable of interest is the Educational T iei,j between the
partners of fund i and the CEO of target firm j. As the competitive situation is relative
to the point of time a deal is made, the model is cross-sectional and, thus, does not
need a time index. Control variables include the Distancei between the target firm’s
headquarters and the closest fund office (see Subsection 3.3 for more details), the partners’
previous professional experience, and fund characteristics.20 The vector Experiencei
measures the partner’s exposure to consulting, accounting, and banking prior to joining
the fund as a fraction of the management team. Such experience may have opened up
alternative networks to the partners. Another vector, Fundi, comprises committed capital
and sequence number to capture organizational factors, which correlate with assets under
management and institutional networks, and indicator variables for first-time and U.S.
based funds. The former can incorporate team size, support functions, and investment
strategies. Finally, fixed effects add investment year, geographic region, and industry
sector, which allows us to address concerns about endogeneity due to an omitted variables
bias.21 For example, fund-firm pairs with educational ties may also have close ties in
terms of industry specialization or geographic location.
Table 5 reports our results. We find that funds with an educational tie to the target20We do not know the seller’s identity in the deal to control for different types (e.g., blockholders).21We refer to Table 8 for alternative specifications of fixed effects (including target firms and investors).
15

company CEO increase their odds of winning the deal by 79% compared to other funds
active in the same market at the same time (Column (1)).22 This is in line with the
univariate evidence and represents an economically significant effect. Restricting ties to
the same degree type, graduation period or both remain significant (Columns (2) to (4)).
In particular, graduation time strongly increases the odds extending evidence from mutual
funds and their investments in public companies (Cohen et al. (2008)). Such ties likely
incorporate direct social interaction and individuals of similar age. In addition, business
school ties show slightly lower coefficients compared to other degree types (Column (5)).
MBA degrees are frequently observed in top management teams including the buyout
fund partners in this study. Educational studies regularly describe the wide network of
alumni and organizations such a degree opens up as a pure side-benefit (Baruch and
Peiperl (2000)), while our findings provide empirical evidence on their actual value.23
Table 5 about here: Educational ties and the odds of winning a deal
With regard to control variables, we see a strong negative effect associated with
the geographic distance between the fund and the target firm, which we will discuss in
more detail in Subsection 3.3. The professional experience variables for the management
team, which measure the relative share of fund partners with previous experience in the
consulting, accounting, and banking industry, show limited influence except for a slightly
positive effect from consulting. Fund teams with a stronger focus on these sectors could
have built alternative networks over time or developed other approaches based on their
specific experience (e.g., Siming (2014) reports that past employment at a financial adviser
is beneficial for future mandates). In particular, partners who have spent their previous
professional life in a consulting firm may still enjoy access to the wide industry networks22Exponentiating the regression coefficient of 0.583 results in an odds ratio of 1.79.23The literature on mutual funds and corporate managers primarily associates MBA degrees with
superior skills and management performance (e.g., Gottesman and Morey (2006a,b)) while the venturecapital literature tends to use them as a proxy for business and management education (e.g., Dimov andShepherd (2005), Patzelt et al. (2009), Zarutskie (2010), Cai et al. (2013), Cai et al. (2016)).
16

and alumni connections established through their prior employer. Controlling for these
alternative networks supports our evidence on education.
Lastly, regarding fund-level controls we see strong significance on fund size and sequence
number as well as on the indicator variable for first-time funds. This is not surprising since
larger funds typically also make more investments and may have built larger organizations
to support deal sourcing, while first time funds likely lack the latter. Larger fund teams
are also more likely to have more diversified backgrounds with regard to educational
history, and thus access to a broader network (we control for team size in Section 3.2). On
the other hand, we do not find any differential effect for U.S. based funds (the robustness
checks in Section 4.2 confirm that educational ties in both geographic sub-samples remain
significant).
3.2 The exclusivity of educational ties
After confirming the value of educational ties for the deal sourcing process in general, we
seek to understand the features that make them most useful and the relevance of the
competitive setting the funds operate in. We start by investigating the exclusivity of the
tie within the team and the potential relationship to the available team capacity. Evidence
from CEO networks suggests that redundant ties do not provide much additional value
(Engelberg et al. (2013)). On the other hand, larger teams generally have more exposure to
potential deal sources as well as more managerial capacity for the deal sourcing process. In
addition, we split the educational ties into different subsets based on the school’s position
in academic rankings. We use the Times Higher Education (THE) World University
Rankings of 2010 and argue that a university’s position in the rankings is positively
correlated with the magnitude and quality of its network.24 We interpret magnitude and
quality in this context not with regard to the education offered but by the number of
alumni in CEO positions that the fund partner can access.24We verify our findings with the Academic Ranking of World Universities (ARWU) from the Center
for World-Class Universities at Shanghai Jiao Tong University (also as of 2010).
17

Our findings are reported in Panel A of Table 6. First, we evaluate the strength of
an individual tie by the incremental value of a redundant tie and show that the odds
increase even more in their presence (Column (2)). This is contrary to evidence on social
ties in non-competitive environments and indicates that the ties provide value to the
fund aside from a pure identification purpose. Second, although team size is positively
related to deal sourcing success, its interaction term with the educational tie is negative
(Column (3)). We interpret team size as the overall capacity of the fund’s management to
pursue deal sourcing efforts. It seems that the existence of educational networks eases
the effort. Third, the ranking split shows that not only the ties from high-ranked schools
matter. The relatively rarer ties from low-ranked schools also exert an influence on the
success rate whenever they exist (Column (4)). When we split the ties into several ranking
classes, the increase in the odds ranges from 30% for top-10 schools to above 300% for
non-top 100 schools. This finding may be driven by a lower level of competing funds that
have access to the same network, which we investigate next.
Table 6 about here: Educational ties and the relevance of exclusivity
We standardize the Educational T iei,j variable by its degree of exclusivity among
the competing funds. Specifically, we divide the indicator variables by the number of
counterfactual bidders that have an educational tie as well to arrive at the following scaled
version of educational ties
ScaledEducational T iei,j = Educational T iei,j∑ni=1 Educational T iei,j
. (2)
This effectively transforms the binary variables into a probability (values are bounded
between zero and one). The scaled educational ties for transactions where the winning
fund has a tie from a top-10 school has an average of only 1.8% (median: 1.2%), while
non-top 100 schools have an average of 26.5% (median: 14.3%). The overall sample mean
is 10.3% (median: 2.9%). We re-estimate Equation (1) and present results in Panel B
18

of Table 6. It follows that the funds ultimately winning the deal have up to ten times
higher odds of doing so when their tie is more unique (Column (1)). The remaining results
highlight one notable difference: the top-10 ranking group becomes insignificant indicating
that the edge a tie provides to the fund diminishes if this is no longer a differentiating
factor to competing funds (Column (4)).25 This uncovers another benefit of networks:
it is not necessarily only the largest and widest network, not the one producing the
highest number of CEOs that is of value to the fund partners. Yet, the ties with the
highest exclusivity seem to drive the results the most. Since CEOs graduate from many
more different universities than the fund partners, less-represented schools appear to be
important for the deal generation.
3.3 Educational versus local networks
In earlier results we saw that geographic distance negatively impacts the deal sourcing
success. This is consistent with the literature that reports a “home bias” for various
kinds of investment funds (e.g., Sorensen and Stuart (2001, 2008), Chen et al. (2010), and
Cumming and Dai (2010) for venture capital firms). Does the presence of educational
networks help to overcome such biases? The educational network literature provides
evidence on the existence of such distant ties (e.g., Hall (2011)). We interpret proximity
to a target firm’s headquarters, and thus the company’s top management, as a component
of local networks.26 When target firms are located close to the fund’s office, identification
may play less of a role than for remote target firms. Thus, we suppose that information
transfer plays a larger role in these latter cases. Fund partners may use their regional
business and social relationships (e.g., country clubs) to sweet-talk a CEO and win the25Using the ARWU ranking the top 10 variable is weakly significant at the 10% level, while all other
ranking classes remain highly significant and still exhibit increasing coefficients along the groups.26The data only provides us with the investment office where the partner is based. Ideally, we would
also be able to control for the partner’s hometown in case it represents a different location to the office.
19

transaction. We calculate geographical proximity as
Distancei,j = min (Haversine (Headquarter j, Officei,k ) ) , (3)
which calculates the minimum geographical distance (in km) between the headquarters of
the target company involved in deal j and the investment offices (index k) where at least
one of the partners of fund i is located.27
Table 7 presents our results. Geographic distance has a strong, negative relationship to
the odds of winning a deal (Column (1)). However, the interaction effect on educational
ties is positive and significant, making the net effect positive if an educational tie exists.
Thus, it seems that fund managers can use their educational networks to mitigate the lack
of a local network. This evidence is similar to Jääskeläinen and Maula (2014) who find
networks of financial intermediaries to reduce local bias and cross-border venture capital
deals.
Table 7 about here: Educational ties and geographic distance
Finally, we distinguish between different degrees of distance (Columns (2) to (4)).
While the main effect on distance remains strongly negative, the interaction term becomes
insignificant only for long distances (above 1,000 km). In addition, interaction effects from
unreported regressions suggest that educational ties are more important for European
transactions in general (see also Subsection 4.2). To better understand these differences,
we look at the investment direction of transatlantic deals (Column (5)). We find an effect
for U.S. funds that invest overseas (in Europe), but not in the opposite direction (i.e.,
foreign funds acquiring American firms). Following our findings on the exclusivity and
location of networks, U.S.-related educational ties may be more exclusive in European
deals, where the majority of managers are expected to be educated locally. This is likely27Distance is expressed in log kilometers in the regressions and calculated according to the Haversine
method assuming a spherical earth and ignoring ellipsoidal effects (radius of the earth 6,378,137 meter).
20

not true the other way around since the educational history of CEOs and fund partners is
largely dominated by degrees from U.S. universities.
4 Robustness
4.1 Model specification
It could be that the results from our counterfactual approach are biased by the applied
selection procedure. Therefore, to test the robustness of our results, we use different sets
of fixed effects to ease concerns about omitted variables and different model specifications.
We follow Bengtsson and Hsu (2015) who validate their findings with a similar approach
while focusing on ethnic matches in venture capital.
Table 8 presents our results. We split models between the full sample (Columns (1)
to (4)) and a one-for-one random draw to counter the chance that results are driven by
a high counterfactual ratio (Columns (5) to (8)). The latter is tested by Bengtsson and
Hsu (2015) for the same reasons.28 The first specification in each block follows the same
logistic regression formula of deal generation success on educational ties from the main
empirical results (see Equation (1)). The second model estimates an OLS model instead
but leaves everything else constant. Finally, the remaining two specifications change the
fixed effects to the company and the investor level, respectively. While the educational tie
remains highly significant, we observe a slightly better model fit using these fixed effects.
This indicates that our previous results are rather conservative and the actual economic
effects may be even higher. We use two-way cluster-robust standard errors on investor
and company level for the OLS models and cluster standard errors on the investor level
for the logistic regressions. The coefficients on educational ties (Panel A) and MBA ties
(Panel B) are highly significant across all specifications.
28The creation of random simulation groups is also employed in Renneboog and Zhao (2014). Inunreported results, we implemented a propensity score matching approach (which, for example, is used inSiming (2014)), based on the set of control variables and nearest neighbor to control for similarity in thecharacteristics between actual and counterfactual fund investments and obtain similar results.
21

Table 8 about here: Robustness of model specification
4.2 Sub-sample robustness
In order to test how robust our main results are, we present educational and MBA ties
for various sub-samples in Table 9. We split the sample based on deal characteristics
(geography and deal type) and fund attributes (e.g., vintage, size, performance). Each
row in the table reports the coefficients and standard errors from two separate regressions,
one for the educational ties (Column (1)) and one for the MBA ties compared to other
types of academic degrees (Column (2)). Our results do not seem to be driven by the
selection strategy as the influence of ties remains intact.
Table 9 about here: Robustness of sample selection
In particular, we show that the effect persists when analyzing the competition among
funds considering only investments that took place in Europe and North America, respec-
tively. Results confirm the value of educational ties for both regional markets individually.
We also differentiate among deal categories, where we find strong evidence for manage-
ment buyouts/-ins and secondary buyouts. On the contrary, there is no effect on going
private transactions where the need for identification and information asymmetry is of less
importance compared to private companies. These results seem intuitive given a higher
personal relevance for the management team in the former, whereas the latter is more
transparent given the listing of the company. In a secondary buyout, one fund sells its
portfolio company to another fund (Degeorge et al. (2016)). In the event the CEO of the
portfolio company and a partner of the acquiring fund share the same alma mater, the
deal likelihood increases. This may indicate that the fund manager and/or CEO reaches
out to the network partner in order to facilitate the transaction. Interestingly, it appears
that the CEO has an active role in selecting its new owner, whereas normally the fund
would be expected to be in the driving seat.
22

With regard to fund attributes, we investigate pre-2001 and post-2000 vintage years yet
find the effect to persist during both time periods. In recent years performance persistence
has been reported to be lower than in earlier periods due to a maturing industry as
well as the movement of individuals and knowledge between the investors (Braun et al.
(2016)). The results also do not seem to be driven by U.S. funds or first time funds as
both sub-samples reveal consistent findings. This also shows that we do not find a pure
U.S. effect. Lastly, we split the fund sample between large and small funds as well as high
and low performers (in terms of IRR and TVPI) to increase confidence in the general
interpretation of our results. While this information is not available upfront when the
deal decision is made, it allows us to give an indication whether funds tend to win deals
by over-paying (and subsequently have low return measures). However, the educational
and MBA ties remain significant in all specifications.29
5 Educational ties and performance
Having established that educational networks have a significant influence on success in
winning deals, in this section, we investigate the relevance of our results for investors
by investigating whether the performance of deals sourced from educational networks is
better, or worse, than other deals.
On the one hand, networks could be harmful to the vendor if fund partners receive a
financial favor from the CEO by lowering the price and increasing returns. However, this
is unlikely since the board of directors of the target firm has to approve the deal. They in
turn are liable to shareholders and hence will ensure a competitive price. On the other
hand, partners could be blinded by the existing relationship to the CEO and overpay.
Such a conflict of interest is also unlikely since they are incentivized via carried interest
structures. Finally, the deal sourcing channel may not impact deal-level performance at
all due to (i) the bargaining power of the vendor, which ensures market prices even when29In unreported regressions, we confirm that also interaction terms on performance are not significant.
23

selling to a network-related party, and (ii) the primary relevance of other value-adding
pillars for returns, i.e., leveraging, multiple expansion, and operational levers, which only
take place after deal closing. Only the multiple expansion would be impacted by a lower
entry valuation and price.
Univariate evidence suggests that performance is not statistically different for deals
with and without a tie (average IRR of 18.9% versus 19.7%, TVPI of 3.03x versus 2.98x).
While both sub-samples have slightly higher ratios of educational ties (18.9% and 19.1%),
we also confirm that the findings on the impact of educational ties to win the deal hold
in the subsamples (in unreported regressions based on the specifications from Table 8).
In addition, we use a Heckman selection model to reduce a potential bias from the
sampling approach. While performance may only be reported for well-performing deals in
commercial databases, data from the investor is conditional on a particular investment
strategy. The selection equation contains the same independent variables, except for the
educational tie and, in addition, fixed effects for deal year, geographic region, and industry
sector. We estimate the impact on performance from OLS on the following cross-sectional
specification
Performancej = α + β Educational T iej + δ Experiencej + (4)
γ Fundj + ξ Investmentj + λY earj + εj .
Each observation represents one deal and the dependent variable Performancej is the
IRR and the TVPI multiple, respectively. The variable of interest is once more the
Educational T iei. Control variables are identical to previous specifications with the
addition of two investment related variables, namely the holding period and the prevailing
market return. The former measures time between entry and exit and the latter is a total
return index over the lifetime of the investment.30 Finally, we add deal year fixed effects
to account for performance differences related to the deal origination period.30 For North American deals, we use the MSCI North America, for European deals the MSCI Europe,
and for the remaining investments the MSCI World (all retrieved from Thomson Reuters in USD).
24

First empirical evidence on the impact of network structures on deal-level returns is
given in Table 10. Our findings do not show a significant effect for the educational ties
supporting the argument that networks are only useful to close a transaction but neutral
with regard to performance. Controlling for the length of the holding period and the
market return during the former shows negative and positive evidence, respectively. Due
to the time sensitivity of investments, the negative (positive) impact of holding period
(market return) is not surprising as private equity exits are highly driven by the overall
economic environment. This complements recent investigations on the drivers of deal level
performance (e.g., Achleitner et al. (2010), Acharya et al. (2013), and Braun et al. (2016)).
While our results suggest that educational ties do not matter for investment performance,
the analysis is limited by the sparse availability of performance data. Ideally, one would
test the effect with a much larger sample and also integrate entry-level valuations as well
as controls for post-deal performance, e.g., through the use of detailed cash-flow data, into
the analysis. However, such data is not available to us and thus we leave a final judgment
on performance open to future research.
Table 10 about here: Educational ties and subsequent investment performance
6 Concluding remarks
We build on the literature on the relevance of social ties using a novel data set based on the
profiles of private equity fund managers and their target firm’s management. Our analysis
reveals that educational networks matter for the investment choice of buyout funds. During
their competitive sourcing process, the existence of such ties eases identification and access
to potential acquisition targets. This confirms earlier notions in the literature that personal
and professional networks are an important channel for investors to identify target firms.
It also stresses the general importance of social ties to overcome organizational boundaries
25

and, especially, confirms the role of weak ties (“acquaintances”) for senior managers
documented in the sociological literature.
In addition, we find that the impact of an educational tie is higher when it gives (more)
exclusivity to the acquiring fund relative to the degree of competition in the market. As
academic degrees of senior managers in the private equity industry are concentrated in
a small set of schools, the existence of educational ties is an important differentiating
factor. Furthermore, we show that educational ties can help bridge geographic distances
between the investor and the target company. Geographic concentration in the investment
portfolios of fund managers is a widely-observed characteristic that spans multiple asset
classes. Our findings suggest that social ties can help to overcome localness, expand the
manager’s networks, and open additional investment opportunities to them. However, the
evidence also suggests that the deal sourcing channel is not sufficient to predict post-deal
performance.
26

ReferencesAcharya, V. V., Gottschalg, O. F., Hahn, M. and Kehoe, C. (2013). Corporate Governance
and Value Creation: Evidence from Private Equity. Review of Financial Studies, 26 (2),368–402.
Achleitner, A.-K., Braun, R., Engel, N., Figge, C. and Tappeiner, F. (2010). Value CreationDrivers in Private Equity Buyouts: Empirical Evidence from Europe. The Journal ofPrivate Equity, 13 (2), 17–27.
Allen, F. and Babus, A. (2009). Networks in Finance. In The network challenge: Strategy,profit, and risk in an interlinked world (Chap. 21, pp. 367–382). Wharton SchoolPublishing.
Baruch, Y. and Peiperl, M. (2000). The impact of an MBA on graduate careers. HumanResource Management Journal, 10 (2), 69–90.
Bengtsson, O. and Hsu, D. H. (2015). Ethnic matching in the U.S. venture capital market.Journal of Business Venturing, 30 (2), 338–354.
Braun, R., Jenkinson, T. and Stoff, I. (2016). How persistent is private equity performance?Evidence from deal-level data. Journal of Financial Economics, 123 (2), 273–291.
Brown, G. W., Harris, R. S., Jenkinson, T., Kaplan, S. N. and Robinson, D. (2015).What Do Different Commercial Data Sets Tell Us About Private Equity Performance?Working Paper.
Brown, R., Gao, N., Lee, E. and Stathopoulos, K. (2012). What Are Friends for? CEONetworks, Pay and Corporate Governance. In Corporate governance (pp. 287–307).Springer-Verlag Berlin Heidelberg.
Butler, A. W. and Gurun, U. G. (2012). Educational networks, mutual fund votingpatterns, and CEO compensation. Review of Financial Studies, 25 (8), 2533–2562.
Cai, Y., Gantchev, N. and Sevilir, M. (2016). Business School Networks and VC-backedStartups. Working Paper.
Cai, Y. and Sevilir, M. (2012). Board connections and M&A transactions. Journal ofFinancial Economics, 103 (2), 327–349.
Cai, Y., Sevilir, M. and Tian, X. (2013). Do Entrepreneurs Make Good VCs? WorkingPaper, AFA 2013 San Diego Meetings Paper.
Chen, H., Gompers, P., Kovner, A. and Lerner, J. (2010). Buy local? The geography ofventure capital. Journal of Urban Economics, 67 (1), 90–102.
Cohen, L., Frazzini, A. and Malloy, C. (2008). The Small World of Investing: BoardConnections and Mutual Fund Returns. Journal of Political Economy, 116 (5), 951–979.
27

Cohen, L., Frazzini, A. and Malloy, C. (2010). Sell-side school ties. Journal of Finance,65 (4), 1409–1437.
Cohen, L. and Malloy, C. J. (2010). The power of Alumni Networks. Harvard BusinessReview, 88 (10), 34.
Cumming, D. and Dai, N. (2010). Local bias in venture capital investments. Journal ofEmpirical Finance, 17 (3), 362–380.
Degeorge, F., Martin, J. and Phalippou, L. (2016). On Secondary Buyouts. Journal ofFinancial Economics, 120 (1), 124–145.
Dimov, D. and Shepherd, D. A. (2005). Human capital theory and venture capital firms:Exploring “home runs” and “strike outs”. Journal of Business Venturing, 20 (1), 1–21.
Engelberg, J., Gao, P. and Parsons, C. A. (2012). Friends with money. Journal of FinancialEconomics, 103 (1), 169–188.
Engelberg, J., Gao, P. and Parsons, C. A. (2013). The price of a CEO’s rolodex. Reviewof Financial Studies, 26 (1), 79–114.
Fenn, G. W., Liang, N. and Prowse, S. (1997). The Private Equity Market: An Overview.Financial Markets, Institutions and Instruments, 6 (4), 1–106.
Fracassi, C. and Tate, G. (2012). External networking and internal firm governance.Journal of Finance, 67 (1), 153–194.
Gompers, P. A., Kaplan, S. N. and Mukharlyamov, V. (2016a). What Do Private EquityFirms Say They Do? Journal of Financial Economics, 121 (3), 449–476.
Gompers, P. A., Mukharlyamov, V. and Xuan, Y. (2016b). The Cost of Friendship. Journalof Financial Economics, 119 (3), 626–644.
Gompers, P. A. and Xuan, Y. (2009). Bridge Building in Venture Capital-Backed Acquisi-tions. Working Paper.
Gottesman, A. A. and Morey, M. R. (2006a). Does a better education make for bettermanagers? An empirical examination of CEO educational quality and firm performance.Working Paper.
Gottesman, A. A. and Morey, M. R. (2006b). Manager education and mutual fundperformance. Journal of Empirical Finance, 13 (2), 145–182.
Granovetter, M. S. (1973). The Strength of Weak Ties. American Journal of Sociology,78 (6), 1360–1380.
Granovetter, M. S. (1983). The Strength of Weak Ties: A Network Theory Revisited.Sociological Theory, 1, 201–233.
28

Granovetter, M. S. (2005). The impact of social structure on economic outcomes. TheJournal of Economic Perspectives, 19 (1), 33–50.
Hall, S. (2011). Educational ties, social capital and the translocal (re)production of MBAalumni networks. Global Networks, 11 (1), 118–138.
Harris, R. S., Jenkinson, T. and Kaplan, S. N. (2016). How Do Private Equity InvestmentsPerform Compared to Public Equity? Journal of Investment Management, 14 (3), 14–37.
Harris, R. S., Jenkinson, T., Kaplan, S. N. and Stucke, R. (2014). Has persistence persistedin private equity? Evidence from buyout and venture capital funds. Working Paper.
Hochberg, Y. V., Lindsey, L. A. and Westerfield, M. M. (2015). Resource accumulationthrough economic ties: Evidence from venture capital. Journal of Financial Economics,118 (2), 245–267.
Hochberg, Y. V., Ljungqvist, A. and Lu, Y. (2007). Whom You Know Matters: VentureCapital Networks and Investment Performance. Journal of Finance, 62 (1), 251–301.
Hochberg, Y. V., Ljungqvist, A. and Lu, Y. (2010). Networking as a barrier to entry andthe competitive supply of venture capital. Journal of Finance, 65 (3), 829–859.
Ishii, J. and Xuan, Y. (2014). Acquirer-target social ties and merger outcomes. Journal ofFinancial Economics, 112 (3), 344–363.
Jääskeläinen, M. and Maula, M. (2014). Do networks of financial intermediaries helpreduce local bias? Evidence from cross-border venture capital exits. Journal of BusinessVenturing, 29 (5), 704–721.
Kirchmaier, T. and Stathopoulos, K. (2008). From fiction to fact: the impact of CEOsocial networks. Working Paper, No. 537, Manchester Business School.
Kuhnen, C. M. (2009). Business Networks, Corporate Governance, and Contracting inthe Mutual Fund Industry. Journal of Finance, 64 (5), 2185–2220.
Liu, Y. (2014). Outside options and CEO turnover: The network effect. Journal ofCorporate Finance, 28, 201–217.
Ljungqvist, A., Richardson, M. and Wolfenzon, D. (2009). The Investment Behavior ofBuyout Funds: Theory and Evidence. Working Paper.
Metrick, A. and Yasuda, A. (2010). The Economics of Private Equity Funds. Review ofFinancial Studies, 23 (6), 2303–2341.
Metrick, A. and Yasuda, A. (2011). Venture Capital and Other Private Equity: A Survey.European Financial Management, 17 (4), 619–654.
29

Morkoetter, S. and Wetzer, T. (2015). Private Equity Performance in M&A Transactions:Empirical Evidence from the Buy and Sell Side. Working Paper, No. 2015/22, SwissInstitute of Banking and Finance.
Patzelt, H., zu Knyphausen-Aufseß, D. and Fischer, H. T. (2009). Upper echelons andportfolio strategies of venture capital firms. Journal of Business Venturing, 24 (6),558–572.
Phalippou, L. (2007). Investing in Private Equity Funds: A Survey. The Research Founda-tion of CFA Institute.
Renneboog, L. and Zhao, Y. (2014). Director networks and takeovers. Journal of CorporateFinance, 28, 218–234.
Rousseau, P. L. and Stroup, C. (2015). Director Histories and the Pattern of Acquisitions.Journal of Financial and Quantitative Analysis, 50 (4), 671–698.
Siming, L. (2014). Your former employees matter: Private equity firms and their financialadvisors. Review of Finance, 18 (1), 109–146.
Sørensen, M. (2007). How Smart Is Smart Money? A Two Sided Matching Model ofVenture Capital. Journal of Finance, 62 (6), 2725–2762.
Sorensen, O. and Stuart, T. E. (2001). Syndication Networks and the Spatial Distributionof Venture Capital Investments. American Journal of Sociology, 106 (6), 1546–1588.
Sorensen, O. and Stuart, T. E. (2008). Bringing the Context Back in: Settings and theSearch for Syndicate Partners in Venture Capital Investment Networks. AdministrativeScience Quarterly, 53 (2), 266–294.
Stuart, T. E. and Yim, S. (2010). Board interlocks and the propensity to be targeted inprivate equity transactions. Journal of Financial Economics, 97 (1), 174–189.
Sunesson, D. T. (2009). Alma Mater Matters: The Value of School Ties in the VentureCapital Industry. Working Paper.
Teten, D. and Farmer, C. (2010). Where Are the Deals? Private Equity and VentureCapital Funds’ Best Practices in Sourcing New Investments. The Journal of PrivateEquity, 14 (1), 32–53.
Wegener, B. (1991). Job Mobility and Social Ties: Social Resources, Prior Job, and StatusAttainment. American Sociological Review, 56 (1), 60–71.
Wu, B. ( (2011). Shall We Dance? Syndication, Social Network, and Performance: Evidencefrom Leveraged Buyout Investments. Working Paper, Yonsei University.
Zarutskie, R. (2010). The role of top management team human capital in venture capitalmarkets: Evidence from first-time funds. Journal of Business Venturing, 25 (1), 155–172.
30

Tables
Table 1: Breakdown of buyout fund sample by vintage yearThe table shows for each vintage year descriptive statistics on the buyout funds available in the PitchBook database (upto vintage year 2010). The sample is restricted to funds for which the management team can be identified, size, sequence,and location is non-missing, and includes only closed, fully invested and liquidated funds. Fund count reports a total countof funds and on the ones for which an IRR and a TVPI multiple is available, respectively. Fund profile lists the averagenumber of investments and partners tagged to the fund as well as the average and median size. The count of investmentsincludes all types of investments (incl. venture and add-on transactions) and is not restricted to the set of buyout andgrowth transactions used in the empirical part of the study. Fund performance depicts the average and median IRR andTVPI multiple for each vintage year. Performance and capital variables are winsorized at the 1% level. A split betweenU.S. based funds and international funds is provided at the bottom.
Fund Count Fund Profile Fund Performance
Vintage Total w/ w/ Avg Avg Avg Med Avg Med Avg MedYear Funds IRR TVPI Partn. Invest Size Size IRR IRR TVPI TVPI
# # # # # $m $m % % x x
1984 2 0 0 1.0 3.5 48 481985 1 0 0 1.0 1.0 16 161986 4 0 0 1.8 4.2 76 821987 8 7 4 1.2 9.1 1126 112 20.1 18.9 2.41 2.491989 6 4 3 2.2 6.3 603 242 22.4 20.0 3.05 2.381990 4 0 0 2.0 7.8 126 1081991 4 3 3 1.0 5.8 205 196 22.6 33.8 2.40 2.671992 7 4 3 1.4 5.4 347 114 9.9 24.6 1.77 1.391993 12 9 7 1.7 10.8 567 332 25.5 25.6 2.45 2.121994 16 7 7 1.8 10.8 381 162 23.1 24.0 2.99 3.001995 22 8 8 2.2 9.7 369 208 26.6 26.6 2.45 2.371996 36 19 16 1.9 12.1 486 240 11.7 10.4 1.53 1.301997 54 22 27 1.9 9.4 687 278 7.8 9.1 1.44 1.401998 76 42 36 2.5 13.6 569 286 8.2 8.8 1.61 1.461999 85 45 44 2.6 14.0 593 305 13.4 13.1 1.72 1.692000 117 61 62 3.0 18.4 893 327 14.7 12.7 1.85 1.782001 74 40 40 3.8 17.7 739 266 24.5 24.3 2.15 2.132002 78 30 32 3.0 14.6 612 208 19.2 17.1 1.79 1.742003 70 34 39 3.8 17.8 799 300 21.2 17.8 1.85 1.712004 98 40 43 2.8 15.2 589 297 14.7 12.4 1.86 1.722005 152 72 90 4.3 20.0 953 362 9.4 9.1 1.51 1.442006 211 99 121 4.1 17.2 1044 421 8.9 8.9 1.49 1.502007 227 108 129 4.2 18.4 920 327 11.5 10.5 1.50 1.462008 188 81 102 4.0 16.1 937 325 11.6 12.0 1.42 1.442009 104 47 57 3.8 15.8 865 300 15.8 14.3 1.47 1.422010 101 44 62 4.1 14.3 488 333 9.6 9.5 1.35 1.27
Total 1757 826 935 3.5 16.1 794 316 13.3 12.0 1.62 1.54
U.S. 1115 608 666 3.6 17.3 791 319 13.5 12.5 1.63 1.58Other 642 218 269 3.4 13.9 800 313 12.6 10.4 1.60 1.44
31

Table 2: Characteristics of the investment sampleThe table presents descriptive statistics on buyout and growth transactions where a buyout fund invests for the first time inthe target company. Add-on transactions and investments after 2010 are excluded. Educational background of at least onepartner of the investing fund and the target company CEO must be available to be included. Transactions without a dateor missing information on the company’s location and industry as well as funds with missing location or size are excluded.In addition, only deals where the investment took place within the five year period following the fund’s vintage year areconsidered for comparability with the counterfactual investment sample. Headquarter region, industry sector, investmentyear, and transaction type are based on classifications in the database. Geographic distance is the distance between thefirm’s headquarters and the closest partner of the acquiring fund.
N %
Total 3051
Panel A: Headquarter Region
North America 2065 67.68Western Europe 551 18.06Northern Europe 187 6.13Eastern/Southern Europe 130 4.26Other 118 3.87
Panel B: Geographic Distance
Distance ≤ 100 km 730 23.93Distance 100-500 km 633 20.75Distance 500-1000 km 458 15.01Distance 1000-2500 km 709 23.24Distance ≥ 2500 km 521 17.08
Panel C: Primary Industry Sector
Business Products and Services (B2B) 1000 32.78Consumer Products and Services (B2C) 730 23.93Energy 119 3.90Financial Services 259 8.49Healthcare 352 11.54Information Technology 461 15.11Materials and Resources 130 4.26
Panel D: Transaction Type
Buyout/LBO 916 30.02Divestiture/Carveout 269 8.82Management Buyout/-in 363 11.90Growth/Expansion 578 18.94Going Private 208 6.82Recapitalization/Acquisition Financing 320 10.49Secondary Buyout 397 13.01
Panel E: Investment Year
1987 - 1994 27 0.881995 - 2000 340 11.142001 - 2002 201 6.592003 - 2004 387 12.682005 - 2006 664 21.762007 - 2008 777 25.472009 - 2010 655 21.47
32
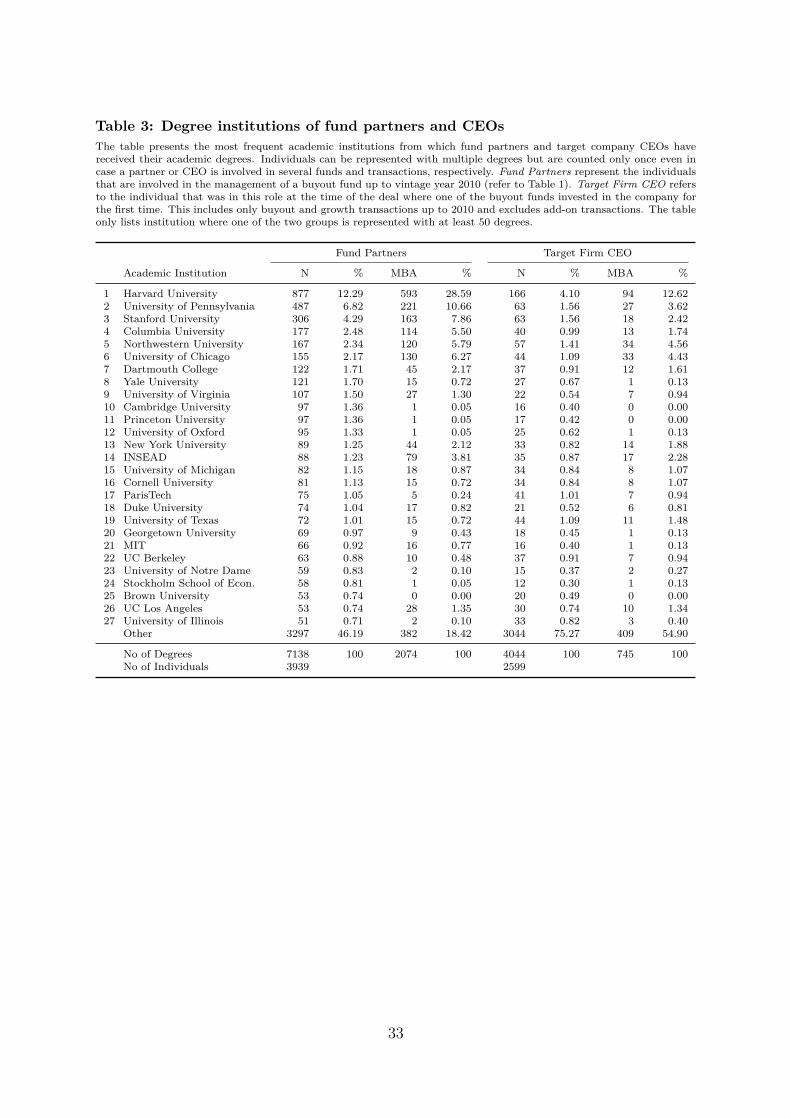
Table 3: Degree institutions of fund partners and CEOsThe table presents the most frequent academic institutions from which fund partners and target company CEOs havereceived their academic degrees. Individuals can be represented with multiple degrees but are counted only once even incase a partner or CEO is involved in several funds and transactions, respectively. Fund Partners represent the individualsthat are involved in the management of a buyout fund up to vintage year 2010 (refer to Table 1). Target Firm CEO refersto the individual that was in this role at the time of the deal where one of the buyout funds invested in the company forthe first time. This includes only buyout and growth transactions up to 2010 and excludes add-on transactions. The tableonly lists institution where one of the two groups is represented with at least 50 degrees.
Fund Partners Target Firm CEO
Academic Institution N % MBA % N % MBA %
1 Harvard University 877 12.29 593 28.59 166 4.10 94 12.622 University of Pennsylvania 487 6.82 221 10.66 63 1.56 27 3.623 Stanford University 306 4.29 163 7.86 63 1.56 18 2.424 Columbia University 177 2.48 114 5.50 40 0.99 13 1.745 Northwestern University 167 2.34 120 5.79 57 1.41 34 4.566 University of Chicago 155 2.17 130 6.27 44 1.09 33 4.437 Dartmouth College 122 1.71 45 2.17 37 0.91 12 1.618 Yale University 121 1.70 15 0.72 27 0.67 1 0.139 University of Virginia 107 1.50 27 1.30 22 0.54 7 0.9410 Cambridge University 97 1.36 1 0.05 16 0.40 0 0.0011 Princeton University 97 1.36 1 0.05 17 0.42 0 0.0012 University of Oxford 95 1.33 1 0.05 25 0.62 1 0.1313 New York University 89 1.25 44 2.12 33 0.82 14 1.8814 INSEAD 88 1.23 79 3.81 35 0.87 17 2.2815 University of Michigan 82 1.15 18 0.87 34 0.84 8 1.0716 Cornell University 81 1.13 15 0.72 34 0.84 8 1.0717 ParisTech 75 1.05 5 0.24 41 1.01 7 0.9418 Duke University 74 1.04 17 0.82 21 0.52 6 0.8119 University of Texas 72 1.01 15 0.72 44 1.09 11 1.4820 Georgetown University 69 0.97 9 0.43 18 0.45 1 0.1321 MIT 66 0.92 16 0.77 16 0.40 1 0.1322 UC Berkeley 63 0.88 10 0.48 37 0.91 7 0.9423 University of Notre Dame 59 0.83 2 0.10 15 0.37 2 0.2724 Stockholm School of Econ. 58 0.81 1 0.05 12 0.30 1 0.1325 Brown University 53 0.74 0 0.00 20 0.49 0 0.0026 UC Los Angeles 53 0.74 28 1.35 30 0.74 10 1.3427 University of Illinois 51 0.71 2 0.10 33 0.82 3 0.40
Other 3297 46.19 382 18.42 3044 75.27 409 54.90
No of Degrees 7138 100 2074 100 4044 100 745 100No of Individuals 3939 2599
33
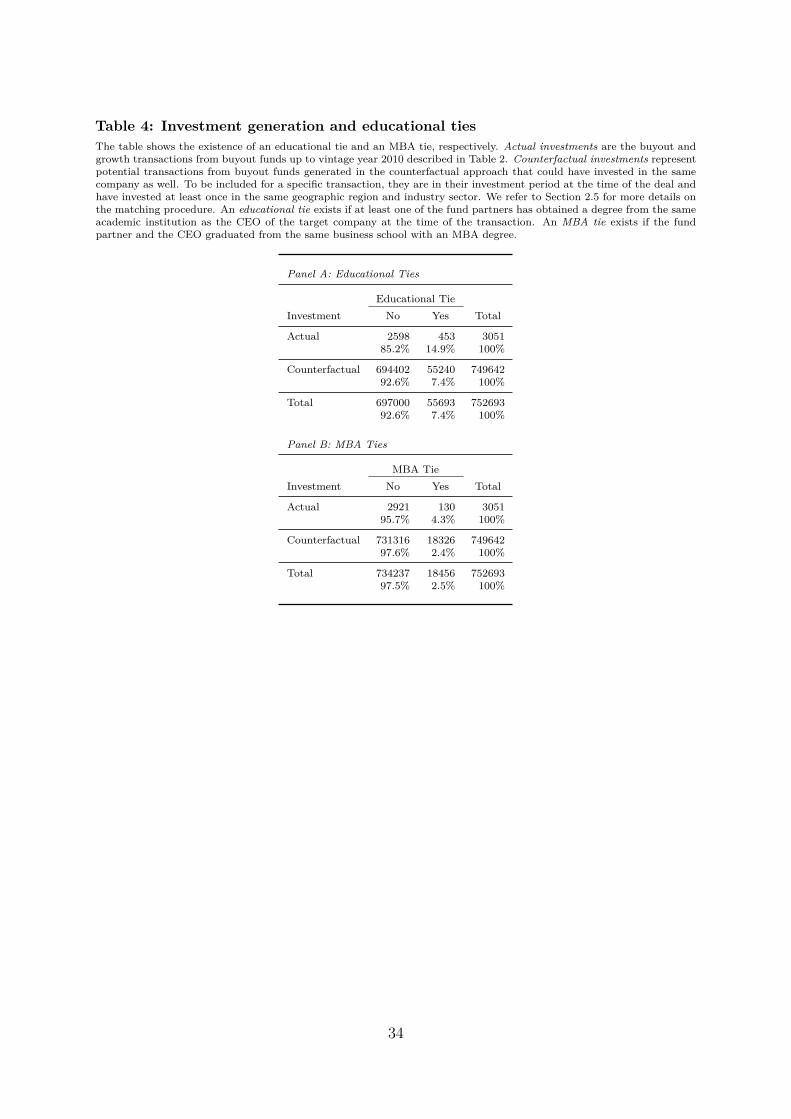
Table 4: Investment generation and educational tiesThe table shows the existence of an educational tie and an MBA tie, respectively. Actual investments are the buyout andgrowth transactions from buyout funds up to vintage year 2010 described in Table 2. Counterfactual investments representpotential transactions from buyout funds generated in the counterfactual approach that could have invested in the samecompany as well. To be included for a specific transaction, they are in their investment period at the time of the deal andhave invested at least once in the same geographic region and industry sector. We refer to Section 2.5 for more details onthe matching procedure. An educational tie exists if at least one of the fund partners has obtained a degree from the sameacademic institution as the CEO of the target company at the time of the transaction. An MBA tie exists if the fundpartner and the CEO graduated from the same business school with an MBA degree.
Panel A: Educational Ties
Educational TieInvestment No Yes Total
Actual 2598 453 305185.2% 14.9% 100%
Counterfactual 694402 55240 74964292.6% 7.4% 100%
Total 697000 55693 75269392.6% 7.4% 100%
Panel B: MBA Ties
MBA TieInvestment No Yes Total
Actual 2921 130 305195.7% 4.3% 100%
Counterfactual 731316 18326 74964297.6% 2.4% 100%
Total 734237 18456 75269397.5% 2.5% 100%
34

Table 5: Educational ties and the odds of winning a dealThe table shows the results for cross-sectional regressions of a binary investment indicator on the existence of educationalties according to Equation (1). The response variable equals one for actual and zero for counterfactual investments. Thelatter include for each transaction the buyout funds that are in investment period at the time of the deal and that haveinvested at least once in the same geographic region and industry sector. Educational ties are set to one when at leastone of the fund partners graduated from the same academic institution as the CEO of the target firm and zero otherwise.Same type refers to an overlap in the academic degree (undergraduate, graduate, MBA, etc.) and Same time to a threeyear window relative to the graduation year. An MBA tie exists if the partner and the CEO graduated from the samebusiness school, while Non-MBA ties are the residual degrees. Geographic distance is measured between the headquartersof the target company and the nearest investment office, where a partner is based, and transformed to its logarithmic base.Consulting, Accounting, and Banking measure the share of partners with prior work experience in the respective industry.Fund size is the natural logarithm of the fund’s committed capital and the sequence number is the natural logarithm onthe number of funds the respective investor has already raised including the current one. First fund and U.S. fund areindicator variables that equal to one if the fund is the first fund for the investor and if the fund is based in the U.S.,respectively. Each presented model includes vintage fixed effects on the investment’s year, geographic region, and industrysector. Coefficients are estimated from a logit model and standard errors are clustered on investor level (in brackets).
Dependent variable: Investment Indicator(1) (2) (3) (4) (5)
Educational tie 0.583∗∗∗(0.060)
Educational tie (same type) 0.534∗∗∗(0.063)
Educational tie (same time) 1.003∗∗∗(0.144)
Educational tie (type, time) 0.959∗∗∗(0.154)
MBA tie 0.539∗∗∗(0.092)
Non-MBA tie 0.601∗∗∗(0.068)
Geo. Distance (log) −0.252∗∗∗ −0.255∗∗∗ −0.260∗∗∗ −0.260∗∗∗ −0.252∗∗∗(0.011) (0.011) (0.011) (0.011) (0.011)
Accounting (%) −0.066 −0.065 −0.066 −0.066 −0.067(0.148) (0.147) (0.146) (0.146) (0.148)
Banking (%) −0.006 −0.008 −0.010 −0.010 −0.006(0.067) (0.067) (0.067) (0.067) (0.067)
Consulting (%) 0.164∗ 0.169∗ 0.178∗∗ 0.179∗∗ 0.165∗(0.089) (0.089) (0.090) (0.090) (0.089)
Fund Size (log) 0.070∗∗∗ 0.071∗∗∗ 0.075∗∗∗ 0.076∗∗∗ 0.070∗∗∗(0.022) (0.022) (0.022) (0.022) (0.022)
Fund Seq. (log) −0.103∗∗ −0.104∗∗ −0.097∗∗ −0.097∗∗ −0.103∗∗(0.041) (0.041) (0.041) (0.041) (0.041)
First Fund (d) −0.205∗∗∗ −0.205∗∗∗ −0.202∗∗∗ −0.203∗∗∗ −0.205∗∗∗(0.065) (0.065) (0.065) (0.065) (0.065)
U.S. Fund (d) −0.089 −0.091 −0.079 −0.080 −0.089(0.057) (0.057) (0.057) (0.057) (0.057)
F.E. Deal Year Yes Yes Yes Yes YesF.E. Region Yes Yes Yes Yes YesF.E. Industry Yes Yes Yes Yes Yes
Observations 752,693 752,693 752,693 752,693 752,693Pseudo R2 0.066 0.065 0.065 0.064 0.066
Note: ∗p<0.1; ∗∗p<0.05; ∗∗∗p<0.01
35

Table 6: Educational ties and the relevance of exclusivityThe table extends the cross-sectional regressions of a binary investment indicator on the existence of educational ties fromTable 5. A redundant tie indicates that more than one educational tie between the fund partners and the target firm CEOexists, while team size counts the partners in the fund’s mangement team. Top-X indicates the university’s position inacademic rankings (refer to Section 3.2 for more details). Panel A shows evidence related to binary educational ties, whichare set to one when at least one of the fund partners graduated from the same academic institution as the CEO of thetarget company and to zero otherwise. Panel B normalizes the tie variables with the number of competing funds that havethe same tie (refer to Equation (2)). We refer to Table 5 for the list of control variables. Each model includes vintage fixedeffects on the investment’s year, geographic region, and industry sector. Coefficients are estimated from a logit model andstandard errors are clustered on investor level (in brackets).
Dependent variable: Investment Indicator(1) (2) (3) (4)
Panel A: Binary educational tie
Educational tie 0.583∗∗∗ 0.437∗∗∗ 0.693∗∗∗(0.060) (0.073) (0.081)
Redundant tie 0.388∗∗∗(0.099)
Team size 0.016∗∗∗(0.005)
Team size ∗ Educational tie −0.018∗∗(0.009)
Educational tie (top-10) 0.270∗∗∗(0.081)
Educational tie (top-11-30) 0.433∗∗∗(0.114)
Educational tie (top-31-100) 0.826∗∗∗(0.116)
Educational tie (above 100) 1.229∗∗∗(0.106)
Panel B: Scaled educational tie (by number of funds with similar tie)
Educational tie 2.340∗∗∗ 2.082∗∗∗ 2.769∗∗∗(0.194) (0.231) (0.265)
Redundant tie 2.573∗∗∗(0.898)
Team size 0.015∗∗∗(0.004)
Team size ∗ Educational tie −0.080∗∗∗(0.028)
Educational tie (top 10) −0.007(0.943)
Educational tie (top-11-30) 2.233∗∗∗(0.637)
Educational tie (top-31-100) 2.178∗∗∗(0.431)
Educational tie (above 100) 2.438∗∗∗(0.216)
Control variables Yes Yes Yes Yes
F.E. Deal Year Yes Yes Yes YesF.E. Region Yes Yes Yes YesF.E. Industry Yes Yes Yes Yes
Observations 752,693 752,693 752,693 752,693
Note: ∗p<0.1; ∗∗p<0.05; ∗∗∗p<0.01
36

Table 7: Educational ties and geographic distanceThe table extends the cross-sectional regressions of a binary investment indicator on the existence of educational ties fromTable 5. Educational ties are set to one when at least one of the fund partners graduated from the same academic institutionas the CEO of the target company and to zero otherwise. Geographic distance is measured between the headquarters ofthe target company and the nearest investment office where a partner is based. U.S fund indicates that the fund is basedin the United States whereas Europe and North America (NA) deals refer to the target firm headquarters. We refer toTable 5 for the list of control variables. Each model includes vintage fixed effects on the investment’s year, geographicregion, and industry sector. Coefficients are estimated from a logit model and standard errors are clustered on investorlevel (in brackets).
Dependent variable: Investment Indicator(1) (2) (3) (4) (5)
Educational tie 0.297∗∗∗ 0.450∗∗∗ 0.544∗∗∗ 0.680∗∗∗ 0.611∗∗∗(0.101) (0.090) (0.081) (0.074) (0.060)
∗ Geo. Distance (log) 0.055∗∗∗(0.017)
∗ Geo. Distance >100 km (d) 0.272∗∗(0.111)
∗ Geo. Distance >500 km (d) 0.212∗∗(0.107)
∗ Geo. Distance >1,000 km (d) 0.038(0.106)
∗ U.S. fund / Europe deal (d) 0.575∗∗(0.271)
∗ Non-U.S. fund / NA deal (d) 0.098(0.383)
Geo. Distance (log) −0.262∗∗∗(0.011)
Geo. Distance >100 km (d) −1.403∗∗∗(0.071)
Geo. Distance >500 km (d) −1.116∗∗∗(0.061)
Geo. Distance >1,000 km (d) −0.919∗∗∗(0.053)
U.S. fund / Europe deal (d) −0.902∗∗∗(0.105)
Non-U.S. fund / NA deal (d) −1.162∗∗∗(0.131)
Control variables Yes Yes Yes Yes Yes
F.E. Deal Year Yes Yes Yes Yes YesF.E. Region Yes Yes Yes Yes NoF.E. Industry Yes Yes Yes Yes Yes
Observations 752,693 752,693 752,693 752,693 752,693
Note: ∗p<0.1; ∗∗p<0.05; ∗∗∗p<0.01
37

Table 8: Robustness of model specificationThe table shows different variations of the regression setting of a binary investment indicator on the existence of educationalties according to Equation (1). The response variable equals one for actual and zero for counterfactual investments. Thelatter include for each transaction the buyout funds that are in investment period at the time of the deal and that haveinvested at least once in the same geographic region and industry sector. Models 1 to 4 show results based on the fullsample, while Models 5 to 8 use a one-for-one random draw on the counterfactual pairs. An educational tie exists if at leastone of the partners graduated from the same university as the CEO of the target company. An MBA tie exists if both haveobtained an MBA degree from the same business school. Non-MBA ties are the residual degrees. We refer to Table 5 forthe definition of control variables. The table shows coefficient estimates and standard errors (in brackets). Models 1 and 5show results from a logit model, the remaining models use Ordinary Least Squares (OLS) regressions with varying sets offixed effects. Standard errors in the logistic model are clustered on the investor level, while the OLS models use two-waycluster-robust standard errors on investors and companies.
Dependent variable: Investment IndicatorFull Sample Random draw
(1) (2) (3) (4) (5) (6) (7) (8)Logit OLS OLS OLS Logit OLS OLS OLS
Panel A: Academic degrees
Educational tie 0.583∗∗∗ 0.003∗∗∗ 0.005∗∗∗ 0.003∗∗∗ 0.677∗∗∗ 0.142∗∗∗ 0.267∗∗∗ 0.147∗∗∗
(0.060) (0.0004) (0.001) (0.0004) (0.096) (0.017) (0.047) (0.021)
Geo. Distance −0.252∗∗∗ −0.002∗∗∗ −0.002∗∗∗ −0.002∗∗∗ −0.331∗∗∗ −0.068∗∗∗ −0.123∗∗∗ −0.064∗∗∗
(0.011) (0.0001) (0.0001) (0.0001) (0.021) (0.003) (0.006) (0.004)
Accounting (%) −0.079 −0.0004 −0.001 −0.002 −0.315 −0.066 −0.118 −0.141(0.150) (0.001) (0.001) (0.001) (0.201) (0.044) (0.085) (0.102)
Banking (%) −0.007 −0.0001 −0.0001 −0.0001 −0.049 −0.011 −0.024 −0.046(0.067) (0.0003) (0.0003) (0.001) (0.095) (0.021) (0.044) (0.046)
Consulting (%) 0.163∗ 0.001∗∗ 0.001∗∗ 0.001 0.124 0.028 0.054 0.023(0.089) (0.0004) (0.0004) (0.001) (0.129) (0.029) (0.060) (0.055)
Fund Size (log) 0.070∗∗∗ 0.0003∗∗∗ 0.0003∗∗∗ 0.001∗∗∗ 0.130∗∗∗ 0.029∗∗∗ 0.051∗∗∗ 0.067∗∗∗
(0.022) (0.0001) (0.0001) (0.0002) (0.027) (0.006) (0.012) (0.013)
Fund Seq. (log) −0.103∗∗ −0.0005∗∗ −0.001∗∗∗ 0.003∗∗∗ −0.106∗∗ −0.023∗∗ −0.042∗ 0.167∗∗∗
(0.041) (0.0002) (0.0002) (0.001) (0.049) (0.011) (0.023) (0.039)
First Fund (d) −0.205∗∗∗ −0.001∗∗∗ −0.001∗∗∗ 0.0004 −0.358∗∗∗ −0.079∗∗∗ −0.120∗∗∗ −0.00003(0.065) (0.0003) (0.0003) (0.001) (0.092) (0.021) (0.044) (0.037)
U.S. Fund (d) −0.089 −0.001∗∗∗ −0.001∗∗∗ −0.001 −0.053 −0.011 −0.008 −0.088∗
(0.057) (0.0002) (0.0002) (0.001) (0.084) (0.019) (0.038) (0.052)
F.E. Deal Year Yes Yes Yes Yes Yes Yes Yes YesF.E. Region Yes Yes n/a Yes Yes Yes n/a YesF.E. Industry Yes Yes n/a Yes Yes Yes n/a YesF.E. Company No No Yes No No No Yes NoF.E. Investor No No No Yes No No No Yes
Observations 752,693 752,693 752,693 752,693 6,102 6,102 6,102 6,102R2 0.066 0.005 0.007 0.009 0.151 0.109 0.197 0.255
Panel B: MBA versus other degrees
MBA tie 0.539∗∗∗ 0.003∗∗∗ 0.004∗∗∗ 0.003∗∗∗ 0.606∗∗∗ 0.135∗∗∗ 0.325∗∗∗ 0.143∗∗∗
(0.092) (0.001) (0.001) (0.001) (0.146) (0.027) (0.089) (0.033)
Non-MBA tie 0.601∗∗∗ 0.004∗∗∗ 0.005∗∗∗ 0.004∗∗∗ 0.723∗∗∗ 0.154∗∗∗ 0.277∗∗∗ 0.154∗∗∗
(0.068) (0.001) (0.001) (0.001) (0.116) (0.021) (0.052) (0.024)
Control variables Yes Yes Yes Yes Yes Yes Yes Yes
Fixed Effects Yes Yes Yes Yes Yes Yes Yes Yes
Observations 752,693 752,693 752,693 752,693 6,102 6,102 6,102 6,102R2 0.066 0.005 0.007 0.009 0.130 0.094 0.178 0.239
Note: R2 for Logit models reports Nagelkerke’s measure. ∗p<0.1; ∗∗p<0.05; ∗∗∗p<0.01
38

Table 9: Robustness of sample selectionThe table shows the results for cross-sectional regressions of a binary investment indicator on the existence of educationalties according to Equation (1) for various subsets of the deal data set. The dependent variable is an indicator that equalsone for actual and zero for counterfactual investments. The latter include for each transaction the buyout funds thathave been in investment period at the time of deal and that have invested at least once in the same geographic regionand industry sector. Each cell represents a separate regression under the full model specification but only reports thecoefficients for the educational ties and MBA ties, respectively. An educational tie exists if at least one of the partnersgraduated from the same academic institution as the CEO of the target company. An MBA tie exists if the fund partnerand the CEO graduated from the same business school with an MBA. Control variables and fixed effects are used as in theoriginal specifications (we refer to Table 5, Specifications (1) and (5), respectively). The table depicts coefficients estimatedfrom a logit model and standard errors clustered on investors (in brackets).
Dependent variable:Investment Indicator
Educational tie MBA tie
Baseline model 0.583∗∗∗ 0.539∗∗∗(0.060) (0.092)
Deal characteristics
Deals in North America 0.428∗∗∗ 0.477∗∗∗(0.072) (0.099)
Deals in Europe 0.872∗∗∗ 0.754∗∗∗(0.111) (0.256)
MBO/MBI deals 0.947∗∗∗ 0.385(0.163) (0.480)
Secondary buyouts 0.770∗∗∗ 0.528∗∗(0.144) (0.255)
Public to Private 0.090 0.206(0.241) (0.309)
Fund characteristics
Post-2000 vintage 0.612∗∗∗ 0.556∗∗∗(0.068) (0.106)
Pre-2001 vintage 0.473∗∗∗ 0.488∗∗(0.122) (0.194)
U.S. based 0.444∗∗∗ 0.518∗∗∗(0.071) (0.099)
Non-U.S. based 0.782∗∗∗ 0.458∗(0.109) (0.257)
First timer 0.737∗∗∗ 0.845∗∗∗(0.143) (0.228)
Non-first timer 0.562∗∗∗ 0.484∗∗∗(0.064) (0.100)
Large fund† 0.581∗∗∗ 0.538∗∗∗(0.065) (0.099)
Small fund† 0.606∗∗∗ 0.519∗∗(0.149) (0.264)
High IRR† 0.509∗∗∗ 0.395∗∗∗(0.097) (0.150)
Low IRR† 0.582∗∗∗ 0.613∗∗∗(0.090) (0.151)
High TVPI† 0.536∗∗∗ 0.402∗∗∗(0.091) (0.136)
Low TVPI† 0.519∗∗∗ 0.680∗∗∗(0.110) (0.167)
† Above/below median value based on all buyoutfunds where the respective metric is available.
∗p<0.1; ∗∗p<0.05; ∗∗∗p<0.01
39
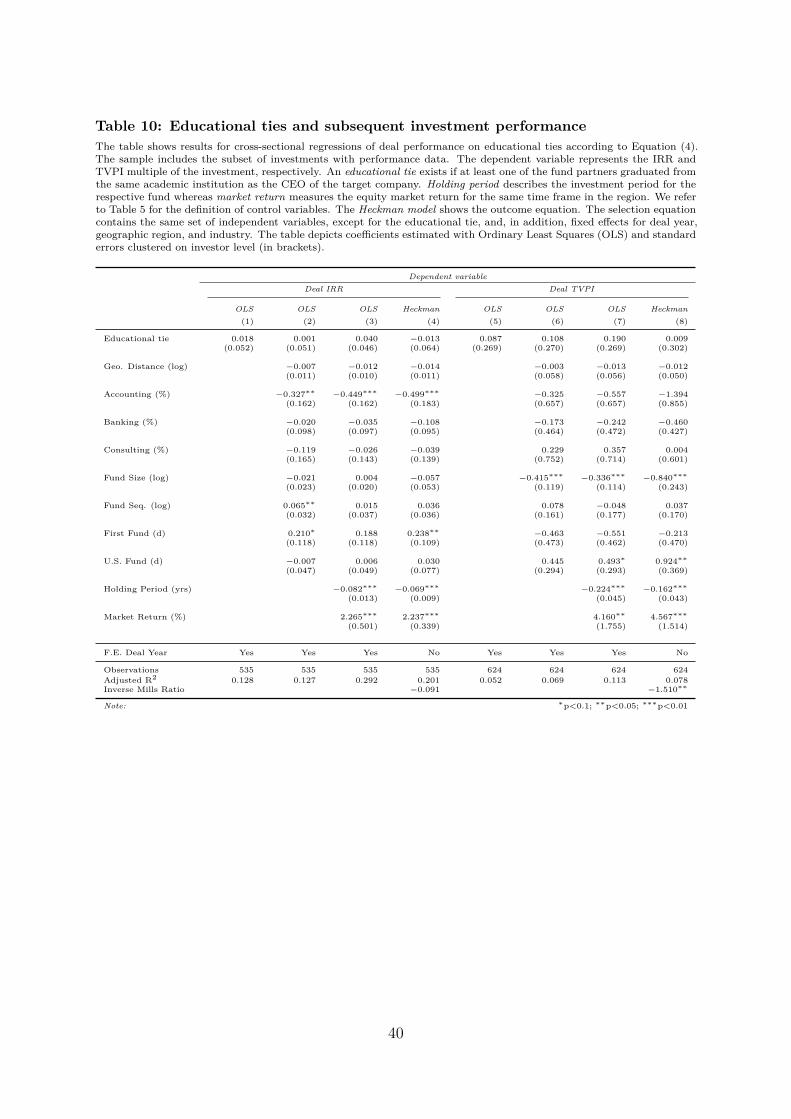
Table 10: Educational ties and subsequent investment performanceThe table shows results for cross-sectional regressions of deal performance on educational ties according to Equation (4).The sample includes the subset of investments with performance data. The dependent variable represents the IRR andTVPI multiple of the investment, respectively. An educational tie exists if at least one of the fund partners graduated fromthe same academic institution as the CEO of the target company. Holding period describes the investment period for therespective fund whereas market return measures the equity market return for the same time frame in the region. We referto Table 5 for the definition of control variables. The Heckman model shows the outcome equation. The selection equationcontains the same set of independent variables, except for the educational tie, and, in addition, fixed effects for deal year,geographic region, and industry. The table depicts coefficients estimated with Ordinary Least Squares (OLS) and standarderrors clustered on investor level (in brackets).
Dependent variableDeal IRR Deal TVPI
OLS OLS OLS Heckman OLS OLS OLS Heckman(1) (2) (3) (4) (5) (6) (7) (8)
Educational tie 0.018 0.001 0.040 −0.013 0.087 0.108 0.190 0.009(0.052) (0.051) (0.046) (0.064) (0.269) (0.270) (0.269) (0.302)
Geo. Distance (log) −0.007 −0.012 −0.014 −0.003 −0.013 −0.012(0.011) (0.010) (0.011) (0.058) (0.056) (0.050)
Accounting (%) −0.327∗∗ −0.449∗∗∗ −0.499∗∗∗ −0.325 −0.557 −1.394(0.162) (0.162) (0.183) (0.657) (0.657) (0.855)
Banking (%) −0.020 −0.035 −0.108 −0.173 −0.242 −0.460(0.098) (0.097) (0.095) (0.464) (0.472) (0.427)
Consulting (%) −0.119 −0.026 −0.039 0.229 0.357 0.004(0.165) (0.143) (0.139) (0.752) (0.714) (0.601)
Fund Size (log) −0.021 0.004 −0.057 −0.415∗∗∗ −0.336∗∗∗ −0.840∗∗∗
(0.023) (0.020) (0.053) (0.119) (0.114) (0.243)
Fund Seq. (log) 0.065∗∗ 0.015 0.036 0.078 −0.048 0.037(0.032) (0.037) (0.036) (0.161) (0.177) (0.170)
First Fund (d) 0.210∗ 0.188 0.238∗∗ −0.463 −0.551 −0.213(0.118) (0.118) (0.109) (0.473) (0.462) (0.470)
U.S. Fund (d) −0.007 0.006 0.030 0.445 0.493∗ 0.924∗∗
(0.047) (0.049) (0.077) (0.294) (0.293) (0.369)
Holding Period (yrs) −0.082∗∗∗ −0.069∗∗∗ −0.224∗∗∗ −0.162∗∗∗
(0.013) (0.009) (0.045) (0.043)
Market Return (%) 2.265∗∗∗ 2.237∗∗∗ 4.160∗∗ 4.567∗∗∗
(0.501) (0.339) (1.755) (1.514)
F.E. Deal Year Yes Yes Yes No Yes Yes Yes No
Observations 535 535 535 535 624 624 624 624Adjusted R2 0.128 0.127 0.292 0.201 0.052 0.069 0.113 0.078Inverse Mills Ratio −0.091 −1.510∗∗
Note: ∗p<0.1; ∗∗p<0.05; ∗∗∗p<0.01
40