Winnard, Andrew (2016) Rehabilitation from lumbopelvic ...
343
Citation: Winnard, Andrew (2016) Rehabilitation from lumbopelvic deconditioning on earth and in space. Doctoral thesis, Northumbria University. This version was downloaded from Northumbria Research Link: http://nrl.northumbria.ac.uk/36016/ Northumbria University has developed Northumbria Research Link (NRL) to enable users to access the University’s research output. Copyright © and moral rights for items on NRL are retained by the individual author(s) and/or other copyright owners. Single copies of full items can be reproduced, displayed or performed, and given to third parties in any format or medium for personal research or study, educational, or not-for-profit purposes without prior permission or charge, provided the authors, title and full bibliographic details are given, as well as a hyperlink and/or URL to the original metadata page. The content must not be changed in any way. Full items must not be sold commercially in any format or medium without formal permission of the copyright holder. The full policy is available online: http://nrl.northumbria.ac.uk/policies.html
-
Upload
khangminh22 -
Category
Documents
-
view
1 -
download
0
Transcript of Winnard, Andrew (2016) Rehabilitation from lumbopelvic ...

Citation: Winnard, Andrew (2016) Rehabilitation from lumbopelvic deconditioning on earth and in space. Doctoral thesis, Northumbria University.
This version was downloaded from Northumbria Research Link: http://nrl.northumbria.ac.uk/36016/
Northumbria University has developed Northumbria Research Link (NRL) to enable users to access the University’s research output. Copyright © and moral rights for items on NRL are retained by the individual author(s) and/or other copyright owners. Single copies of full items can be reproduced, displayed or performed, and given to third parties in any format or medium for personal research or study, educational, or not-for-profit purposes without prior permission or charge, provided the authors, title and full bibliographic details are given, as well as a hyperlink and/or URL to the original metadata page. The content must not be changed in any way. Full items must not be sold commercially in any format or medium without formal permission of the copyright holder. The full policy is available online: http://nrl.northumbria.ac.uk/policies.html

Rehabilitation from Lumbopelvic Deconditioning on Earth and in Space
A J Winnard
PhD
July 2016

2
Rehabilitation from Lumbopelvic Deconditioning on Earth and in Space
ANDREW JAMES WINNARD MSc, BSc, BSc, MCSP
A thesis submitted in partial fulfilment of the requirements of the University of
Northumbria at Newcastle for the degree of Doctor of Philosophy
Research undertaken in the Faculty of Health and Life Sciences
School of Sport, Exercise and Rehabilitation
Northumbria University Newcastle-upon-Tyne
July 2016

3

4
i. Abstract
Astronauts experience low back pain (LBP) and heightened spinal injury risk
due to lumbopelvic deconditioning following spaceflight. Atrophy and reduced
control of the lumbar multifidus (LM) and transversus abdominis (TrA) muscles
have been linked with LBP, and are commonly found in astronauts, as well as
individuals with LBP in the general population. Many people have difficulty
voluntarily recruiting LM and TrA, presenting a rehabilitation challenge.
Previously, it was found that LM and TrA are recruited automatically during
Functional Readaptive Exercise Device (FRED) exercise, and that the recruitment
is tonic, which is the most effective way to train these muscles, suggesting it could
be suitable for use post spaceflight and in LBP populations. However, the
mechanisms underpinning the effect that FRED exercise has on LM and TrA
needed to be investigated before clinical trialling the device to determine:
1. What current interventions are used to prevent or rehabilitate
lumbopelvic deconditioning and what are their effects?
2. Do the underlying mechanisms of FRED exercise indicate that it may
be a useful intervention to trial in the rehabilitation of lumbopelvic
deconditioning resulting from microgravity exposure in astronauts and a
sedentary lifestyle in the general population?
3. What are the requirements for a standard and progressive training
protocol using the FRED?
Interventions preventing lumbopelvic deconditioning in human spaceflight
simulation studies were systematically reviewed regarding effectiveness and
future needs. Countermeasures during microgravity exposure were found
ineffective for maintaining lumbopelvic health, presenting an immediate
rehabilitation need, and future countermeasure refinement within the human

5
spaceflight community. Rehabilitation to recover lumbar lordosis and train LM and
TrA was suggested as beneficial.
Recruitment of the LM and TrA muscles and movement variability was
measured during FRED exercise using all available foot movement amplitudes on
the device. Both muscles were recruited in all settings, and the challenge to the
muscle and movement control was increased in larger amplitudes.
Four chapters measured lumbopelvic kinematics and movement variability.
Assessment was made of kinematic effects, the usefulness of FRED generated
visual exercise feedback, the exercise familiarisation time and the effect of using
the device handle bars in people with and without LBP.
The FRED promotes increased lumbar extension and anterior pelvic tilt
compared to over ground walking.
Increasing crank amplitude increased movement variability, ΔTrAmax,
ΔLMmax and TrA muscle recruitment. There was more variation away from the
target exercise frequency when visual feedback was not provided. It took 170
seconds for asymptomatic individuals to familiarise to FRED exercise and155 for
those with LBP. Spinal positioning became more flexed with reduced movement
variability when the handles were used during exercise.
There is now sufficient evidence that FRED exercise promotes beneficial
lumbopelvic posture and deep muscle activity to justify a clinical trial of the device
in astronaut and general deconditioned LBP populations. Following an eighty
second familiarisation period, training should begin in the smallest exercise
amplitude and increase in one amplitude setting intervals once FRED users can
maintain a consistent movement speed, using visual feedback, but without using
the handle bars.

6
Contents
i. Abstract ..................................................................................................... 4
Contents ............................................................................................................... 6 ii. Acknowledgments ................................................................................... 11 iii. Declaration .............................................................................................. 14 List of Tables ...................................................................................................... 15 List of Figures .................................................................................................... 19
1. Chapter One: Introduction ....................................................................... 25 1.1. How low back pain is linked with segmental spinal stability and
upright sagittal spinal motor control ............................................................... 27
1.1.1. Deep and superficial lumbopelvic muscles in spinal stability ...... 28
1.1.2. Spinal stabilising system and motor control ............................... 29
1.1.3. Segmental Stability and the Neutral Zone .................................. 30
1.2. Theory linking low back injury with altered motor control and low back pain 32
1.3. Management of low back pain using motor control interventions for segmental spinal stability .............................................................................. 35
1.4. Evidence based management of low back pain including use of motor control interventions in a wider context with a multi-lateral approach .. 37
1.5. Defining neutral posture for low back pain interventions ............... 41
1.6. Motor control with the biopsychosocial model ............................... 42
1.7. Summary ....................................................................................... 42
1.8. Populations that are expected to benefit from spinal motor control exercises 42
1.8.1. Astronauts and Bed-Rest Study Participants ............................. 43
1.8.2. Older Populations and Falls ....................................................... 44
1.8.3. Knowledge transfer between populations and levels of indirectness ................................................................................................... 45
1.9. The Functional Readaptive Exercise Device (FRED) .................... 46
1.10. Thesis Aim and Research Questions ......................................... 50
2. Chapter Two: Systematic Review of Countermeasures and Rehabilitation Interventions to Minimise Physiological Changes and Risk of Injury to the Lumbopelvic Area Following Long-Term Microgravity Exposure ................... 52
2.1. Introduction .................................................................................... 53
2.2. Methods ......................................................................................... 56
2.2.1. Scoping ...................................................................................... 56
2.2.2. Search strategy .......................................................................... 57
2.2.3. Eligibility criteria and rationale .................................................... 59
2.2.4. Study selection & data extraction ............................................... 60
2.2.5. Quality Assessment ................................................................... 60
2.2.6. Rating the level of indirectness of the simulated space studies (bed-rest studies) .......................................................................................... 61
2.2.7. Data analysis .............................................................................. 62
7
2.2.7.1. Magnitude based inferences ..................................................... 64
2.3. Results .......................................................................................... 65
2.3.1. Characteristics of included studies ............................................. 66
2.3.2. Quality Scoring ........................................................................... 72
2.3.3. PEDro Scores ............................................................................ 72
2.3.4. The Cochrane Collaboration Risk of Bias................................... 72
2.3.5. Bed-rest Methodological Quality ................................................ 72
2.3.6. Lumbopelvic Changes Observed when no intervention used ..... 75
2.3.7. Outcomes assessed ................................................................... 80
2.3.8. Interventions and outcomes with magnitude based inference results 82
2.3.9. Effect of countermeasures on muscle changes .......................... 84
2.3.10. Effect of countermeasures on spinal morphology changes ....... 91
2.3.11. Effect of rehabilitation on muscle and spinal morphology changes 98
2.4. Discussion ................................................................................... 102
2.4.1. Lumbopelvic changes expected with no treatment ................... 102
2.4.2. Interventions and effectiveness ................................................ 102
2.4.3. Countermeasures – muscle changes ....................................... 102
2.4.3.1. Countermeasures - spinal morphology changes .................... 104
2.4.3.2. Countermeasures – overview ................................................. 106
2.4.4. Rehabilitation ........................................................................... 107
2.4.5. Human Space Flight ................................................................. 109
2.4.6. Current intervention evidence base .......................................... 112
2.4.7. Conclusions .............................................................................. 113
2.4.8. Limitations of the systematic review ......................................... 114
3. Chapter Three: Investigation of Recruitment of Lumbar Multifidus and Transversus Abdominis, Control of Movement Variability and Participant Perceived Comfort While Exercising in Various Settings Using the Functional Readaptive Exercise Device .................................................................................. 115
3.1. Introduction .................................................................................. 116
3.1.1. Aim and Objectives .................................................................. 120
3.2. Methods ....................................................................................... 120
3.2.1. Recruitment .............................................................................. 120
3.2.2. Experimental Protocol and Data Collection .............................. 122
3.2.3. Outcome Measures .................................................................. 124
3.2.4. Muscle Recruitment ................................................................. 124
3.2.5. Muscle Recruitment Variation .................................................. 129
3.2.6. Movement Variability at the Feet .............................................. 129
3.2.7. Comfort .................................................................................... 130
3.2.8. Reliability and Validity of Outcome Measures .......................... 132
3.2.8.1. Muscle Recruitment ................................................................ 132

8
3.2.8.2. Movement Variability .............................................................. 135
3.2.8.3. Comfort ................................................................................... 135
3.2.9. Ethics ....................................................................................... 135
3.2.10. Data Analysis ........................................................................... 136
3.3. Results ........................................................................................ 139
3.3.1. Demographics .......................................................................... 139
3.3.2. Reliability Results and Typical Error Calculation ...................... 139
3.3.3. Raw Data for all Conditions ...................................................... 141
3.3.4. Magnitude Based Inference Comparisons ............................... 147
3.3.1. Effect size analysis between crank amplitudes ........................ 161
3.4. Discussion ................................................................................... 165
3.4.1. Comparison of Individual Exercise Conditions ......................... 166
3.4.2. Comparison of Crank and Footplate Positions ......................... 167
3.4.3. Development of a Training Protocol ......................................... 168
3.4.4. Reliability .................................................................................. 170
3.4.5. Limitations ................................................................................ 171
3.4.6. Conclusion ............................................................................... 173
4. Chapter Four: Investigation of Lumbopelvic Kinematics and FRED Measured Outcomes in a Large Population Including Participants With Back Pain.175
4.1. Introduction .................................................................................. 176
4.1.1. Sagittal lumbar posture and LBP .............................................. 176
4.1.2. Link between LM, TrA and sagittal spinal posture .................... 177
4.1.3. Aim and Objectives .................................................................. 183
4.2. Methods ....................................................................................... 184
4.2.1. Recruitment .............................................................................. 184
4.2.2. Back pain screening ................................................................. 185
4.2.3. Experimental Protocol and Data Collection .............................. 187
4.2.4. Measures ................................................................................. 187
4.2.5. Motion capture system and calibration ..................................... 188
4.2.5.1. Kinematic Data Collected ....................................................... 193
4.2.5.2. Centre of mass estimation ...................................................... 193
4.2.6. Movement variability and frequency of Movement ................... 194
4.2.7. Use of XSens during FRED exercise ....................................... 194
4.2.8. Reliability and Validity of XSens ............................................... 195
4.2.9. Minimal worthwhile change ...................................................... 195
4.2.10. Ethics ....................................................................................... 196
4.2.11. Data Analysis ........................................................................... 197
4.3. Results ........................................................................................ 200
4.3.1. Participants and dropouts ......................................................... 200
4.4. Discussion ................................................................................... 208

9
4.4.1. Limitations ................................................................................ 212
4.4.2. Conclusion ............................................................................... 213
5. Chapter Five: Feedback vs No Feedback ............................................. 214 5.1. Introduction .................................................................................. 215
5.1.1. Aim and Objectives .................................................................. 217
5.2. Methods ....................................................................................... 218
5.3. Results ........................................................................................ 219
5.4. Discussion ................................................................................... 227
5.4.1. Limitations ................................................................................ 229
5.5. Conclusion ................................................................................... 229
6. Chapter Six: Investigation of Effect of Time on FRED Exercise, in a Large Population, Including Participants with Back Pain. ...................................... 231
6.1. Introduction .................................................................................. 232
6.1.1. Aim and Objectives .................................................................. 233
6.2. Methods ....................................................................................... 235
6.2.1. Recruitment .............................................................................. 235
6.2.2. Screening and Demographics .................................................. 237
6.2.3. Experimental Protocol and Data Collection .............................. 239
6.2.4. Kinematic and FRED Measures ............................................... 240
6.2.5. Data Analysis ........................................................................... 241
6.2.5.1. Demographics......................................................................... 241
6.2.5.2. Kinematic and FRED measures.............................................. 241
6.2.6. Ethics ....................................................................................... 243
6.3. Results ........................................................................................ 244
6.3.1. Demographics .......................................................................... 244
6.3.2. Measures ................................................................................. 244
6.3.3. FRED sampling error................................................................ 252
6.3.4. Summary of results .................................................................. 253
6.4. Discussion ................................................................................... 253
6.4.1. Familiarisation in no-LBP individuals ........................................ 254
6.4.2. Differences in familiarisation in individuals with LBP ................ 256
6.4.3. Limitations ................................................................................ 257
6.4.4. Conclusion ............................................................................... 258
7. Chapter Seven: Investigation of Effect of Using Handles, on Lumbopelvic Kinematics, During FRED Exercise .................................................. 259
7.1. Introduction .................................................................................. 260
7.1.1. Aim and Objectives .................................................................. 262
7.1.2. Methods ................................................................................... 264
7.2. Results ........................................................................................ 265
7.2.1. Results summary ..................................................................... 273
7.3. Discussion ................................................................................... 274

10
7.3.1. Familiarisation time .................................................................. 274
7.3.2. Mean difference across entire trial in all measures .................. 275
7.3.3. Limitations ................................................................................ 276
7.4. Conclusion ................................................................................... 276
8. Conclusion ............................................................................................ 278 8.1. Introduction .................................................................................. 279
8.2. Original experimental findings and implications ........................... 280
8.3. Methodological contributions ....................................................... 286
8.4. Theoretical implications ............................................................... 287
8.5. Policy implications ....................................................................... 287
8.6. Limitations of study ...................................................................... 288
8.7. Recommendations for future research ........................................ 290
8.8. Conclusion ................................................................................... 291
References .................................................................................................... 293
Appendix ....................................................................................................... 305
A. Chapter three participant information sheet .......................................... 305
B. Chapter three informed consent form.................................................... 310 C. Chapter four and five participant information sheet ............................... 311
D. Chapter four and five informed consent form ........................................ 315 E. Chapter five and six participant information sheet ................................ 316
F. Chapter five and six informed consent form .......................................... 319 G. Data filtering results for chapters 6 and 7 .............................................. 320
H. Familiarisation figures for chapter 6 ...................................................... 322 I. Familiarisation figures for chapter 7 ...................................................... 331 J. Ethics approval notifications .................................................................. 340

11
ii. Acknowledgments
The following acknowledgements and thanks are given to those who have
made contributions to the work undertaken within this thesis:
The research supervisors, Dr Nick Caplan, for many productive discussions,
mentoring on academic writing and helping prepare several papers for publication.
Dr Dorothee Debuse for allowing this PhD to study the FRED, sharing extensive
knowledge of LM and TrA rehabilitation theory and for excellent companionship
on several ferry trips to Cologne. Dr Mick Wilkinson, for introducing and teaching
the use of magnitude based inference, demystifying several statistical methods
and helping refine all of the study designs.
Northumbria University for creating an opportunity to undertake a PhD in
space life and biomedical sciences within the UK and for funding the stipend
which enabled the full time study.
The European Space Agency topical team for post flight exercise rehab for
allowing the systematic review to form a significant output of the topical team and
include sections of the text in its final report. Special acknowledgement is made
to Dr Julie Hides and Professor Maria Stokes who made many specific
contributions to the systematic review, LM and TrA ultrasound imaging methods
and inputting to several theoretical debates throughout.
Dr Simon Evetts for continuing mentorship and guidance in working an
aerospace career, contributions to the systematic review and creating
opportunities for significant career development and relevant paid part time work
alongside the PhD studies.
Dr Mona Nasser from the Cochrane Collaboration, for guiding the systematic
review, advising on methodological debates throughout the studies and continuing

12
to strongly support long term proposals for an aerospace medicine systematic
review group.
Gunda Lambrecht and Nora Petersen from the European Space Agency for
sharing information on operational astronaut rehabilitation and providing feedback
on various aspects of the thesis text that related to operational human spaceflight.
Dr Daniel Barry, NASA Astronaut and Dr Andre Kuipers, ESA Astronaut, for
providing feedback on the systematic review and elements of the wider text that
related to operational human spaceflight. Dr Mike Barrat, NASA Astronaut, for
discussing concepts of LBP in space.
The management and floor staff at the Newcastle Life Science Centre for
collaborating with this project and enabling the public studies to take place as part
of the “Meet the Scientisit” programme. It was this collaboration then allowed the
high participant numbers of several studies to be attained.
To the numerous “research side-kicks” who became involved with this PhD
through linked internships, MSc projects and undergraduate placements; Leon
Samson, Robin Bayat, Jamie Williams, Arran Parmar, Thomas Schuren, Joe
Bulmer and Carla Armstrong.
The Northumbria University Technicians, in particular David Taylor and Ruth
Steinberg for helping resolve many technical problems and for excellent
operational support throughout all off site research studies.
Jeffrey Sventek, the Aerospace Medicine Association and the Aerospace
Medicine Resident and Student Organisation for awarding a $1000 scholarship to
present the early PhD studies at the 2015 AsMA annual meeting in Florida, USA.
Also the Student European Low Gravity Research Association for also
contributing to the same trip and for the opportunity to serve on the Management

13
Committee for the last three years. The UK Space Environments Association
Operations Team for the opportunity to serve as the Coordinator for the last three
years and providing opportunities to gain experience in leading conference
organisation at two events.
It has been said that a PhD journey can be lonely, however the long list of
acknowledgments is evidence that this one involved much companionship and
collaboration. A final acknowledgement is made to those who stand to benefit
from this work, LBP patients on Earth and those who carry our hopes and
aspirations into space.
Ex astris, Scientia. Per aspera per audacia ad astra

14
iii. Declaration
The work for this thesis was undertaken at Northumbria University and the Newcastle Life Science Centre between October 2013 and July 2016. No material contained in this thesis has been used in any other submission for an academic award. Excepting where clearly identified and referenced, no material contained in this thesis has been published elsewhere (to be edited if works are accepted for publication by submission). All procedures for ethical approval have been followed throughout. Approval has been sought and granted by the Faculty Ethics Committee for all studies included in this thesis. The number of words contained in the thesis excluding table titles, figure legends, reference list and appendices is declared to be 44,396. Signed: Date: Andrew J Winnard

15
List of Tables Table 1-1 Potential primary mechanisms in FRED training ............................. 48
Table 1-2 Additional potential mechanisms in FRED training of use to Relevant Rehabilitation Populations .................................................................................... 49
Table 2-1 Search term construction ................................................................ 58 Table 2-2 Bed-rest methodological quality assessment .................................. 62
Table 2-3 – Characteristics of included studies ............................................... 68 Table 2-4 Results of all quality control assessments performed across all
included studies, ticks show condition was met, crosses show condition not met, up arrows show high risk of bias, down arrows show low risk of bias, question marks show unclear result. ................................................................................... 74
Table 2-5 - Lumbopelvic muscle changes reported across all studies, method of measure and observed change in inactive control groups................................ 76
Table 2-6 - Lumbopelvic spinal morphology changes reported across all studies, method of measure and observed change in inactive control groups ..... 78
Table 2-7 Indication of which interventions were assessed against the various outcomes used across all studies ......................................................................... 81
Table 2-8 Effects of interventions on muscle changes showing direction of change with no interventions, intervention effect size, probability of true effect and the raw change in the intervention group expressed as a percentage of the control group indicating how far off baseline the intervention group was in relation to controls. ................................................................................................................ 86
Table 2-9 Effects of interventions on spinal morphology change .................... 93
Table 2-10 – Effects of rehabilitation interventions on muscle and spinal morphology changes ............................................................................................ 99
Table 3-1 Possible Exercise settings – Ticks Indicate Possible Combinations, Crosses Indicate Unusable Combinations Which Would Damage the Device ... 118
Table 3-2 Participant Demographics (GPPAQ is General Practice Physical Activity Questionnaire)........................................................................................ 122
Table 3-3 Exercise Conditions – crank position 1 being the largest amplitude and footplate position 1 being the furthest forwards ........................................... 123
Table 3-4 Newcastle Comfort Scale .............................................................. 131
Table 3-5 Typical Error results ...................................................................... 140 Table 3-6 Summary of Raw Data For all Test Conditions ............................. 141 Table 3-7 Results of Newcastle Comfort Score Averaging for All Participants
During and After Exercise................................................................................... 142
Table 3-8 Difference in LM muscle thickness (mm) in each exercise condition compared with the rest, control and ground standing. Threshold for inferences set at typical error for LM thickness of 1.1mm. ......................................................... 148
Table 3-9 Difference in TrA muscle thickness (mm) in each Exercise Condition compared with the rest control and ground standing. Calculated with a threshold for inferences set at typical error for TrA thickness of 1.04mm. .......................... 150
Table 3-10 Groupings of FRED conditions by Crank and Footplate Positions ........................................................................................................................... 152
Table 3-11 Difference in muscle recruitment and motor control outcomes in each crank Position, all in footplate position one. Calculated with threshold for inferences set at typical error for LM thickness of 1.1mm, for ΔLMMAX thickness of 0.8mm, for movement variability of 0.46%, for TrA thickness of 1.04mm and for ΔTrAmax thickness of 0.48mm ............................................................................ 153
Table 3-12 Difference in muscle recruitment between each footplate position, all in crank position five. Calculated with threshold for inferences set at typical error for LM thickness of1.1mm, for ΔLMmax thickness of 0.8mm, for TrA thickness 1.04mm and for ΔTrAmax thickness of 0.48mm ................................................. 157

16
Table 3-13 Difference in movement variability between each footplate position, all in crank position five. Calculated with threshold for inferences set at typical error for movement variability of 0.46%. ............................................................. 158
Table 3-14 Difference in TrA muscle thickness between each crank position, and each position compared to rest, calculated with threshold for inference of effect size at least 0.2, 1 indicates inference threshold of 0.6. ............................ 162
Table 3-15 Difference in max-min LM muscle thickness between each crank position, calculated with threshold for inference of at least effect size 0.2, 1
indicates inference threshold of 0.6 and 2 of 1.2 ................................................. 163 Table 3-16 Difference in ΔTrAmax between each crank position, calculated with
threshold for inference of at least effect size 0.2, 1 indicates inference threshold of 0.6 ...................................................................................................................... 164
Table 3-17 Difference in movement variability between each crank position, calculated with threshold for inference of at least effect size 0.2, 1 indicates inference threshold of 0.6 ................................................................................... 165
Table 3-18 FRED training Progression and Effect on Outcomes .................. 170 Table 4-1 Participant Demographics and chance that any group differences
are trivial using an inference threshold of effect size 0.6. ................................... 200
Table 4-2 Low-back pain screening scale and numbers screened to each category.............................................................................................................. 200
Table 4-3. Difference in lower spinal sagittal extension angles for all comparisons, calculated with threshold for inferences of effect size 0.2. ........... 202
Table 4-4. Difference in anterior pelvic tilt for all comparisons, calculated with threshold for inferences of effect size 0.2. 1 indicates threshold for inferences was set to effect size 0.6. .......................................................................................... 203
Table 4-5. Difference in centre of mass variation for all comparisons, calculated with threshold for inferences of effect size 0.2. 1 indicates threshold for inferences was set to effect size 0.6. .................................................................. 204
Table 4-6. Difference in anterior pelvic tilt for all comparisons, calculated with threshold for inferences of effect size 0.2. 1 indicates threshold for inferences was set to effect size 0.6. .......................................................................................... 206
Table 5-1 Participant demographics with change that difference between groups is trivial using threshold for inferences of effect size 0.6. ........................ 220
Table 5-2. Difference in lower spinal sagittal extension angles for all comparisons, calculated with threshold for inferences of effect size 0.2. 1 indicates threshold for inferences was set to effect size 0.6. .............................. 221
Table 5-3. Difference in anterior pelvic tilt for all comparisons, calculated with threshold for inferences of effect size 0.2. 2 indicates threshold for inferences was set to effect size 1.2. .......................................................................................... 222
Table 5-4. Difference in centre of mass variation for all comparisons, calculated with threshold for inferences of effect size 0.2. 1 indicates threshold for inferences was set to effect size 0.6. .................................................................. 223
Table 5-5. Difference in frequency and movement variability, calculated with threshold for inferences of effect size 0.2. 1 indicates threshold for inferences was set to effect size 0.6 and 2 indicates effect size 1.2. ........................................... 224
Table 5-6 mean and standard deviation (SD) for frequency and movement variability outcome measures ............................................................................. 226
Table 6-1 Participant demographics with Xsens exclusions accounted for ... 239
Table 6-2 Participant demographics with Xsens exclusions accounted for ... 244 Table 6-3. Differences in L5/S1 flexion angle, pre and post familiarisation
point. Threshold for inferences using mean SEM, were 0.3 degrees in the no-LBP and LBP group ................................................................................................... 247

17
Table 6-4. Differences in L3/L4 flexion angle, pre and post familiarisation point. Threshold for inferences using mean SEM, were 0.1 degrees in the no-LBP and LBP group ................................................................................................... 247
Table 6-5. Differences in T12/L1 flexion angle, pre and post familiarisation point. Threshold for inferences using mean SEM, were 0.1 degrees in the no-LBP and LBP group ................................................................................................... 247
Table 6-6. Differences in T8/T9 flexion angle, pre and post familiarisation point. Threshold for inferences using mean SEM, were 0.1 degrees in the no-LBP group and LBP group ......................................................................................... 247
Table 6-7. Differences in anterior pelvic tilt, pre and post familiarisation point. Threshold for inferences using mean SEM, were 0.5 degrees in the no-LBP and LBP group .......................................................................................................... 248
Table 6-8. Differences in anteroposterior centre of mass variation, pre and post familiarisation point. Threshold for inferences using mean familiarised range SEM, were 0.2 cm in the no-LBP group and LBP group .................................... 249
Table 6-9. Differences in mediolateral centre of mass variation, pre and post familiarisation and loss point. Threshold for inferences using mean SEM, were 0.05cm in the no-LBP group and 0.1 cm in the LBP group ................................ 249
Table 6-10. Differences in exercise frequency, pre and post familiarisation and loss point. Threshold for inferences using mean SEM, were 0.014 Hz in both the no-LBP and LBP group ...................................................................................... 251
Table 6-11. Differences in movement variability, pre and post familiarisation point. Threshold for inferences using mean SEM, were 1.5% in the no-LBP group and 1.6% in the LBP group ................................................................................. 251
Table 6-12 Time to familiarisation for each variable. Times in bold show that the inferences, based on the chance of the true mean change being mechanistically different between pre and post familiarisation times, are at least a likely difference. .................................................................................................. 253
Table 7-1 group demographics and chance of differences being trivial with kinematic data exclusions taken into account ..................................................... 265
Table 7-2 group demographics and chance of differences being trivial with frequency and movement varation data exclusions taken into account .............. 266
Table 7-3 Differences in L5/S1 flexion angle, pre and post familiarisation point. Threshold for inferences using mean SEM, were 0.3 degrees in the no-holding group and 0.5 degrees in the holding group ....................................................... 267
Table 7-4 Differences in L3/L4 flexion angle, pre and post familiarisation point. Threshold for inferences using mean SEM, were 0.1 degrees in the no-holding group and 0.2 degrees in the holding group ....................................................... 268
Table 7-5 Differences in T12/L1 flexion angle, pre and post familiarisation point. Threshold for inferences using mean SEM, were 0.1 degrees in the no-holding group and 0.2 degrees in the holding group .......................................... 268
Table 7-6 Differences in T8/T9 flexion angle, pre and post familiarisation point. Threshold for inferences using mean SEM, were 0.1 degrees in the no-holding group and 0.1 degrees in the holding group ....................................................... 268
Table 7-7 Differences in anterior pelvic tilt, pre and post familiarisation point. Threshold for inferences using mean SEM, were 0.5 degrees in the no-holding group and 1.8 degrees in the holding group ....................................................... 269
Table 7-8 Differences in anteroposterior centre of mass variation, pre and post familiarisation point. Threshold for inferences using mean SEM, were 0.2 cm in the no-holding group and 0.6 cm in the holding group ....................................... 270
Table 7-9 Differences in mediolateral centre of mass variation, pre and post familiarisation and loss point. Threshold for inferences using mean SEM, were 0.05cm in the no-holding group and 0.1 cm in the holding group ....................... 270

18
Table 7-10 Differences in exercise frequency, pre and post familiarisation and loss point. Threshold for inferences using mean SEM, were 0.014 Hz1 in the no-holding group and 0.021 Hz in the holding group ............................................... 272
Table 7-11 Differences in movement variability, pre and post familiarisation point. Threshold for inferences using mean SEM, were 1.5% in the no-holding group and 1.7% in the holding group .................................................................. 272
Table 7-12 Summary of familiarisation times across all measures ............... 273 Table 7-13 Comparisons of all measures across the full 600 second trials for
all comparing the holding with the no-holding group, using the corresponding no-holding group SEM as the minimal worthwhile change threshold for MBI, all in raw unites (flexion angle and pelvic tilt: degrees, centre of mass: cm, frequency: Hz and movement variability: %) ............................................................................. 273

19
List of Figures Figure 1-1 The Spinal stabilising system from Panjabi 2003 ........................... 29
Figure 1-2 Load displacement curve of spinal segments (left) and a visual representation of the neutral zone (right) (Panjabi, 2003) .................................... 30
Figure 1-3 Varying degrees of spinal stability and neutral zone size represented using the ball in bowl analogy, high stability on the left, low stability on the right (Panjabi, 2003) .................................................................................. 31
Figure 1-4 Pain free spinal range with neutral zone within pain free range (top), exceeding pain free range (middle) and after stabilising intervention (bottom) (Panjabi, 2003) ..................................................................................................... 31
Figure 1-5 Graphical representation of pathway towards chronic back pain (Panjabi, 2003) ..................................................................................................... 33
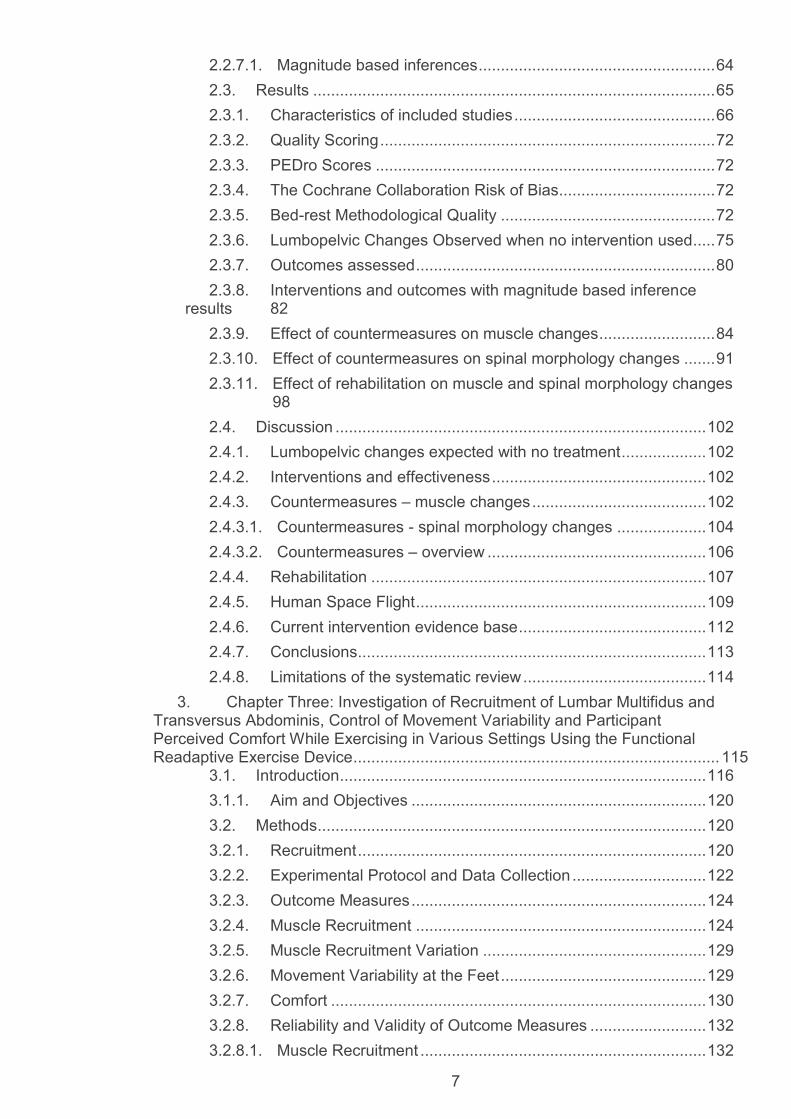
Figure 1-6 A more detailed graphical representation of possible mechanisms for changes in trunk muscles within the motor control concept (Hodges, Cholewicki and Van Dieen 2013) ......................................................................... 34
Figure 1-7 Graphical representation of deep muscle system (LMS) motor relearning (O'Sullivan, 2000) ................................................................................ 36
Figure 1-8 Effect of motor control exercise on pain, disability and quality of life outcomes for LBP and cervical pain. (Ferreira et al. 2006)). SSE = specific stabilisation exercises based on motor control approach defined earlier, SMT = spinal manipulative therapy, PT = conventional physiotherapy, med man = medical management and tails on the graph show 95% confidence intervals. ..... 38
Figure 1-9 Effect of specific stabilisation exercise on risk of recurrence after acute episode of LBP. (Ferreira, et al., 2006). SSE = specific stabilisation exercises based on the motor control approach defined earlier, med man = medical management and tails on the graph show 95% confidence intervals. ..... 38
Figure 1-10 Effect of specific stabilisation exercise on pain, disability and quality of life outcomes for chronic LBP. (Ferreira, et al., 2006). SSE = specific stabilisation exercises based on the motor control approach defined earlier, SMT = spinal manipulative therapy and tails on the graph show 95% confidence intervals. ............................................................................................................... 39
Figure 1-11 Effect of motor control exercise vs usual care on pain and disability outcomes for LBP. (Ferreira, et al. 2006). SSE = specific stabilisation exercises based on the motor control approach defined earlier, SMT = spinal manipulative therapy, and tails on the graph show 95% confidence intervals. ..... 39
Figure 1-12 Latencies of LM (in ms) reflex to sudden loading, triangle represents older people and circle young from Hwang et al. (2008). ................... 45
Figure 1-13 Current Prototype Functional Readaptive Exercise Device (European Space Agency image) ......................................................................... 47
Figure 2-1 Postural adaptation to microgravity, showing loss of normal spinal curvature and increased flexion of the spinal column, reproduced from (Buckey 2006), with permission ......................................................................................... 55
Figure 2-2 Search and screening results shown in PRISMA flow diagram standard ............................................................................................................... 66
Figure 2-3 Muscle changes where positive effects favour interventions – as occurs in cases where no intervention causes a decrease in the outcome measures Shaded area represents 0.2 effect size (at least small), dashed line represents 0.6 effect size (at least moderate). Tails are 90% confidence interval. ............................................................................................................................. 89
Figure 2-4 Muscle changes where negative effect favours intervention – as occurs in cases where no intervention causes an increase in the outcome measures. Shaded area represents 0.2 effect size (at least small), dashed line represents 0.6 effect size (at least moderate). Tails are 90% confidence interval. ............................................................................................................................. 90

20
Figure 2-5 Spinal morphology changes where negative effects favour interventions – as occurs in cases where no intervention causes a increase in the outcome measures. Shaded area represents 0.2 effect size (at least small), dashed line represents 0.6 effect size (at least moderate). Tails are 90% confidence interval ............................................................................................... 96
Figure 2-6 Spinal morphology changes where positive effects favour interventions – as occurs in cases where no intervention causes a decrease in the outcome measures. Shaded area represents 0.2 effect size (at least small), dashed line represents 0.6 effect size (at least moderate). Tails are 90% confidence interval ............................................................................................... 97
Figure 2-7 Specific motor control rehab vs trunk and general strengthening (control). Shaded area represents 0.2 effect size (at least small), dashed line represents 0.6 effect size (at least moderate). Tails are 90% confidence interval ........................................................................................................................... 101
Figure 2-8 Specific motor control rehab vs trunk and general strengthening (control). Shaded area represents 0.2 effect size (at least small), dashed line represents 0.6 effect size (at least moderate). Tails are 90% confidence interval ........................................................................................................................... 101
Figure 3-1The FRED with the adjustable crank highlighted by white arrows the footplates shown in the blue circle ...................................................................... 117
Figure 3-2 A close up view of the adjustable footplate (image from FRED operating instructions) ........................................................................................ 117
Figure 3-3 Computer model plots of expected crank (upper plot) and footplate (lower plot) position effect on exercise movement (Lindenroth 2013) ................ 119
Figure 3-4 Shows a screen shot from a typical LM USI video; the probe, Sacrum, L5/S1 and L4/L5 facet joints are labelled. The white rectangle shows the location where the area of interest was positioned for automatic edge detection. ........................................................................................................................... 127
Figure 3-5 Shows a screen shot from a typical TrA USI video; the probe, TrA, internal oblique (IO) and external oblique (EO) muscles are labelled. The white rectangle shows the location where the area of interest was positioned for automatic edge detection. .................................................................................. 127
Figure 3-6 Probe holder with ultrasound transducer ..................................... 128
Figure 3-7 Muscle thickness for LM in each exercise condition as A. absolute thickness, B. mean normalised thickness and C. ΔLMmax difference per FRED cycle ................................................................................................................... 144
Figure 3-8 Muscle thickness for TrA in each exercise condition as A. absolute thickness, B. mean normalised thickness and C. ΔTrAmax difference per FRED cycle ................................................................................................................... 145
Figure 3-9 A. Mean movement variability across all exercise conditions, B. Mean NCS rating across all exercise conditions and C. Mean NCS rating after all exercise conditions ............................................................................................. 146
Figure 3-10 Results of MBI comparisons for mean change in LM thickness compared with A. rest, B. control and C. ground standing . The tails show 90% confidence intervals and the shaded area represents the inference threshold of 1.1mm ................................................................................................................ 149
Figure 3-11 Results of MBI comparisons for mean change in TrA thickness compared with A. rest, B. control and C. ground standing . The tails show 90% confidence intervals and the shaded area represents the inference threshold of 1.04mm .............................................................................................................. 151
Figure 3-12 Results of MBI comparisons for mean change in LM outcomes between each crank position for A. LM thickness with shaded area representing the inference threshold of 1.1mm and B. ΔLMmax with shaded area showing

21
inference threshold of 0.8mm. All tails show 90% confidence intervals. All comparisons were in footplate position one........................................................ 154
Figure 3-13 Results of MBI comparisons for mean change in TrA outcomes between each crank position for A. TrA thickness with shaded area representing the inference threshold of 1.04mm and B. ΔTrAmax with shaded area showing inference threshold of 0.48mm. All tails show 90% confidence intervals. All comparisons were in footplate position one........................................................ 155
Figure 3-14 Results of MBI comparisons for mean change in Movement variability between each crank position with shaded area showing inference threshold of 0.46%. All tails show 90% confidence intervals. All comparisons were in footplate position one. ............................................................................ 155
Figure 3-15 Results of MBI comparisons for mean change in LM outcomes between each footplate position for A. LM thickness with shaded area representing the inference threshold of 1.1mm and B. ΔLMmax with shaded area showing inference threshold of 0.8mm. All tails show 90% confidence intervals. All comparisons were in crank position five. ....................................................... 159
Figure 3-16 Results of MBI comparisons for mean change in TrA outcomes between each footplate position for A. TrA thickness with shaded area representing the inference threshold of 1.04mm and B. ΔTrAmax with shaded area showing inference threshold of 0.48mm. All tails show 90% confidence intervals. All comparisons were in crank position five. ....................................... 160
Figure 3-17 Results of MBI comparisons for mean change in movement variability between each footplate position with shaded area showing inference threshold of 0.46%. All tails show 90% confidence intervals. All comparisons were in crank position five. ................................................................................. 160
Figure 3-18 TrA muscle thickness as a function of amplitude and at rest. .... 162 Figure 3-19 ΔLMmax as a function of amplitude. ............................................ 163 Figure 3-20 ΔTrAmax as a function of amplitude. ........................................... 164
Figure 3-21 Movement variability as a function of amplitude ........................ 165 Figure 4-1 Diagram of LM fibres in the sagittal plane from Macintosh (1986),
illustrating how some fibres are likely to have a role in maintaining lumbar lordosis ........................................................................................................................... 178
Figure 4-2 Photograph of lumbar segmental instability patient from O'Sullivan 2000, demonstrating lumbar posture typical of a flexion pattern ........................ 179
Figure 4-3 Photograph of lumbar segmental instability patient from O'Sullivan 2000, demonstrating lumbar posture typical of an extension pattern ................. 179
Figure 4-4 Graph from O'Sullivan et al. (2006) of muscle activity determined with EMG in various sagittal postures. ............................................................... 180
Figure 4-5 Various sagittal plane posture diagrams from Kendall (2005) ..... 181 Figure 4-6 Photograph from XSens MVN user manual (2012) showing tracker
and neoprene band locations ............................................................................. 188
Figure 4-7 XSens kinematic model show in T-Pose front view from the XSens MVN user manual (2012 with labels added to sections relevant to this study) ... 189
Figure 4-8XSens kinematic model shown in T-Pose from rear rotated view from the XSens MVN user manual (2012) .......................................................... 190
Figure 4-9 Custom made wooden XSens calibration platform (top) and in use during a calibration (bottom) ............................................................................... 192
Figure 4-10 The 4.8m long motion capture track marked on the floor of the testing area with two white parallel lines - marks within the track related to other studies running in parallel ................................................................................... 193
Figure 4-11. Raw change in lower spinal sagittal extension angles comparing walking and FRED exercise in the LBP and no-LBP groups individually and comparing the no-LBP and LBP groups for each joint angle. ............................. 202

22
Figure 4-12. Raw change anterior pelvic tilt comparing walking and FRED exercise in the LBP and no-LBP groups individually and comparing the no-LBP and LBP groups for each joint angle. ................................................................. 203
Figure 4-13. Raw change centre of mass variation comparing walking and FRED exercise in the LBP and no-LBP groups individually and comparing the no-LBP and LBP groups. ......................................................................................... 204
Figure 4-14 Illustrates the mean difference with standard deviation for a. exercise frequency (Hz) and b. movement variability between the no-LBP and LBP groups. ........................................................................................................ 205
Figure 4-15 MBI results for all comparisons. Squares show effect size for FRED vs walking comparisons, triangles show LBP vs no LBP comparisons, tails show 90% confidence interval, shaded error represents inference threshold of effect size 0.2. .................................................................................................... 207
Figure 5-1 FRED control unit display showing FB with movement variability graph on left with live and target frequency dial (50% FTU) on the right, image shows display with FRED stopped, participants try to keep the graph and frequency dial within the green zones. ............................................................... 216
Figure 5-2. Raw change in lower spinal sagittal extension angles comparing walking and FRED exercise in the FB and no-FB groups individually and to each other. .................................................................................................................. 221
Figure 5-3. Raw change anterior pelvic tilt comparing walking and FRED exercise in the FB and no-FB groups individually and to each other. ................. 222
Figure 5-4. Raw change centre of mass variation comparing walking and FRED exercise in the FB and no-FB groups individually and to each other. ...... 223
Figure 5-5 Illustrates the mean difference with standard deviation in raw units for frequency and movement variability between the FB and no-FB groups. ..... 224
Figure 5-6 MBI results for all comparisons. Squares show effect size for walking vs FRED comparisons triangles show FB vs no-FB comparisons, tails show 90% confidence interval, shaded error represents inference threshold effect size of 0.2 and dashed line 0.6. .......................................................................... 225
Figure 6-1 The entire "Meet the Scientist" area, with the FRED study area in the background and the children’s astronaut training activity section in the foreground. ......................................................................................................... 236
Figure 6-2 The FRED study section of the "Meet the Scientist" area showing the author wearing the XSens motion capture suit and exercising on the FRED. The live avatar can be seen on the screen to the left, while the screen to the right shows a space video .......................................................................................... 236
Figure 6-3 Data filtering options (green line) compared to original data (grey line) tested using mean L5/S1 flexion angle as a function of time, with moving average period of 401. ....................................................................................... 245
Figure 6-4 Mean L5/S1 flexion angle across all participants throughout the 600 second trial in; a. the no-LBP group and b. the LBP group. Familiarisation range shown on plots between dashed lines is no-LBP group: 2.7±0.3, LBP group: 3.4±0.3 (degrees). .............................................................................................. 246
Figure 7-1 Exercise on FRED prototype three not using the handles ........... 261 Figure 7-2 Mean L5/S1 flexion angle across all participants throughout the 600
second trial in; a. the no-holding group and b. the holding group. Familiarisation range shown on plots between dashed lines is 2.7 ± 0.3 in the no-holding group and 3.5 ± 0.5 in the holding group (degrees). ..................................................... 267
Figure H-1 Mean L5/S1 flexion angle across all participants throughout the 600 second trial in; a. the no-LBP group and b. the LBP group. Familiarisation range shown on plots between dashed lines is no-LBP group: 2.7±0.3, LBP group: 3.4±0.3 (degrees). .............................................................................................. 322

23
Figure H-2 Mean L3/L4 flexion angle across all participants throughout the 600 second trial in; .................................................................................................... 323
Figure H-3 Mean T12/L1 flexion angle across all participants throughout the 600 second trial in; a. the no-LBP group and b. the LBP group. Familiarisation ranges shown on plots between dashed lines is no-LBP group: 1.2±0.1, LBP group: 1.5±0.1 (degrees) .................................................................................... 324
Figure H-4 Mean T9/T8 flexion angle across all participants throughout the 600 second trial in; .................................................................................................... 325
Figure H-5 Mean sagittal plane (anterior) pelvic tilt across all participants throughout the 600 second trial in; a. the no-LBP group and b. the LBP group. Familiarisation ranges shown on plots between dashed lines is no-LBP group: 0.5±0.5 LBP group: -0.3±0.5 (degrees) .............................................................. 326
Figure H-6 Mean anteroposterior centre of mass variation across all participants throughout the 600 second trial in; a. the no-LBP group and b. the LBP group. Familiarisation ranges shown on plots between dashed lines is no-LBP group: 2.9±0.2,LBP group: 2.9±.0.2 (cm) .................................................... 327
Figure H-7 Mean mediolateral centre of mass variation across all participants throughout the 600 second trial in; a. the no-LBP group and b. the LBP group. Familiarisation ranges shown on plots between dashed lines is no-LBP group: 0.5±0.05, LBP group: 0.5±0.1 (cm) .................................................................... 328
Figure H-8 Mean exercise frequency (f) across all participants throughout the 600 second trial in; ............................................................................................. 329
Figure H-9 Mean FRED movement variability across all participants throughout the 600 second trial in; a. the no-LBP group and b. the LBP group. Familiarisation ranges shown on plots between dashed lines is no-LBP group is: 9.1±1.5 LBP group: 9.0±1.6 (%) .............................................................................................. 330
Figure I-1 Mean L5/S1 flexion angle across all participants throughout the 600 second trial in; a. the no-holding group and b. the holding group. Familiarisation range shown on plots between dashed lines is 2.7 ± 0.3 in the no-holding group and 3.5 ± 0.5 in the holding group (degrees). ..................................................... 331
Figure I-2 Mean L3/L4 flexion angle across all participants throughout the 600 second trial in; a. the no-holding group and b. the holding group. Familiarisation ranges shown on plots between dashed lines is 1.2 ± 0.1 in the no-holding group and 1.5 ± 0.2 in the holding group (degrees) ...................................................... 332
Figure I-3 Mean T12/L1 flexion angle across all participants throughout the 600 second trial in; a. the no-holding group and b. the holding group. Familiarisation ranges shown on plots between dashed lines is 1.2 ± 0.1 in the no-holding group and 1.5 ± 0.2 in the holding group (degrees) .............................. 333
Figure I-4 Mean T8/T9 flexion angle across all participants throughout the 600 second trial in; a. the no-holding group and b. the holding group. Familiarisation ranges shown on plots between dashed lines is 0.9 ± 0.1 for the no-holding group and 1.1 ± 0.1 for the holding group (degrees) .................................................... 334
Figure I-5 Mean sagittal plane (anterior) pelvic tilt across all participants throughout the 600 second trial in; a. the no-holding group and b. the holding group. Familiarisation ranges shown on plots between dashed lines is 0.5 ± 0.5 in the no-holding group and -2.1 ± 1.8 in the holding group (degrees) ................... 335
Figure I-6 Mean anteroposterior centre of mass variation across all participants throughout the 600 second trial in; a. the no-holding group and b. the holding group. Familiarisation ranges shown on plots between dashed lines is 2.9 ± 0.2 for the no-holding group and 4.7 ± 0.6 (cm) ....................................................... 336
Figure I-7 mean mediolateral centre of mass variation across all participants throughout the 600 second trial in; a. the no-holding group and b. the holding group. Familiarisation ranges shown on plots between dashed lines is 0.5 ± 0.05 in the no-holding group and 0.7 ± 0.1 in the holding group (cm) ........................ 337

24
Figure I-8 Mean exercise frequency (f) across all participants throughout the 600 second trial in; a. the no-holding group and b. the holding group. Familiarisation ranges shown on plots between dashed lines is 0.478 ± 0.014 Hz in the no-holding group and 0.481 ± 0.021 Hz in the holding group. .................. 338
Figure I-9 Mean FRED movement variability across all participants throughout the 600 second trial in; a. the no-holding group and b. the holding group. Familiarisation ranges shown on plots between dashed lines is 9.1 ± 1.5 in the no-holding group and 5.8 ± 1.7 in the holding group (%) ......................................... 339

25
1. Chapter One: Introduction

26
Physical inactivity and lumbopelvic deconditioning have been linked to
increased incidence of non-specific LBP and spinal injury in those exposed to
microgravity (e.g. Astronauts and long term bed rest) (Pavy-Le Traon et al. 2007),
and in the general population (Verbunt, Smeets and Wittink 2010). Astronauts
have been reported to have a 53-68% risk of experiencing moderate to severe
LBP during microgravity exposure (Wing et al. 1991) and a four-fold increased risk
of herniated intervertebral discs within one year following spaceflight (Johnston et
al. 2010). The direct costs of non-specific LBP in the general population was
estimated as £1 billion per year (NICE 2009), alongside the human costs of
distress, pain, injury, loss of independence and potentially mortality in extreme
cases. These costs justify the need to develop evidence based, economical and
effective preventative and rehabilitation strategies. Understanding the underlying
mechanisms of LBP and spinal changes during microgravity and sedentary
lifestyle related deconditioning, and developing an effective rehabilitation
programme to address these, is therefore required.
Atrophy and reduced motor control of the LM and TrA muscles resulting from
periods of deconditioning is linked to non-specific LBP and spinal injury risk in
both post flight astronauts and general populations (Hides et al. 1994; Hodges
and Richardson 1996; Hides et al. 2007; Hides et al. 2015). Hides et al. 2016
also highlighted the parallels in muscular adaptation between astronauts and low
back pain patients, suggesting LBP patients as a good ground based model for
lumbopelvic deconditioning relevant to astronauts. However, voluntary
recruitment of these two key muscles is difficult and presents a rehabilitation
challenge (Van, Hides and Richardson 2006). A new Functional Readaptive
Exercise Device (FRED) is being developed that shows potential to activate the
LM and TrA muscles automatically and in a tonic fashion (Debuse et al. 2013;
Caplan et al. 2014). This thesis therefore set out to investigate the mechanisms

27
of the FRED within a lumbopelvic deconditioning and non-specific LBP context,
relevant to rehabilitation of both astronaut and general sedentary lifestyle
populations.
1.1. How low back pain is linked with segmental spinal stability and
upright sagittal spinal motor control
Non-specific LBP is experienced in the lower region of the spine and is not
attributable to a known cause or specific pathology such as infection, systemic
disease, fracture or cauda equina (Balague et al. 2012). The nature of non-
specific LBP makes it complex and often multi factorial in relation to its cause,
diagnosis and interventions. This is recognised in the hypothesis of Panjabi
(2006), who suggested abnormal spinal mechanics may be a commonly reported
factor in back pain patients, but suggests several potential triggers and causes of
abnormal mechanics including: inflammation, biochemical and nutritional
changes, immunological factors, structural changes in discs and endplates,
adverse psycho-social factors and changes in neural structures.
Linked with the common symptom of altered mechanics is atrophy (Hides et al.
2008; Danneels et al. 2000; Hodges et al. 2006; Hodges and Richardson 1996;
Ferreira, and Hodges 2004) and altered motor-control (Hodges & Richardson
1996) of the lumbar multifidus (LM) and transversus abdominis (TrA) muscles.
Both muscles have a substantial body of evidence linking their dysfunction and
atrophy with LBP (Hides et al. 2015; Hides et al. 2011b; Hodges and Moseley
2003; Hodges and Richardson 1996; Macdonald, Moseley and Hodges 2009;
Saunders, Coppieters and Hodges 2004; Wallwork et al. 2009) and following
microgravity exposure (Hides et al. 2015; Belavy et al. 2015; Evetts 2015; Hides
et al. 2007).

28
1.1.1. Deep and superficial lumbopelvic muscles in spinal stability
The paraspinal muscles can be divided into deep and superficial muscles
based on a structural model of the spine provided by Bergmark (1989) who
provided the following definitions. Deep muscles all have their origin or insertion
at the vertebrae and have an action that includes controlling the curvature and/or
structural stiffness of spine. Deep muscles include the LM and TrA muscles. The
LM muscle controls and stabilises lumbar lordosis (Claus et al. 2009) during force
transfer through the spine (Macintosh et al. 1986; Moseley, Hodges and Gandevia
2002) and provides segmental stiffness (Panjabi 1992a; Kiefer, Shirazi-Adl and
Parnianpur 1998). The TrA muscle provides a transverse force, therefore
increasing stiffness and extrinsic stability of the spine (Hodges and Richardson
1996) by increasing intra-abdominal pressure (Hodges 2004; Hides et al. 2011b).
Superficial muscles control the large spinal movements and transfer loads
between the thorax and pelvis, they do not directly increase stiffness or stability of
the spine at the segmental level (Bergmark 1989), but can increase global trunk
stability (Hodges, Cholewicki and Van Dieen 2013). Superficial muscles include,
superficial Erector Spinae, Internal and External Obliques, Rectus Abdominis,
Quadratus Lumborum and Psoas. Bergmark (1989) also defined stability in
engineering terms, as the ability of a loaded structure to maintain its equilibrium
under loading. This definition was then extended to define clinical spinal stability
as the ability of the spine, under physiological loads, to limit structural
displacement in order to prevent damage to spinal structures including the discs,
ligaments and neural structures. The spine gains passive stability from the bones,
ligaments, tendons and fascia while it is suggested that active stability is provided
by deep muscles (Bergmark 1989). Studies using in vitro cadaveric specimens of
human spinal segments found that the specimens became mechanically unstable
at loads much less than those experienced by in vivo spines (Panjabi 1992a).

29
This finding highlighted the importance of the stabilising force provided by the LM
and TrA muscles in allowing the spine to function under everyday loading.
1.1.2. Spinal stabilising system and motor control
To achieve spinal stability requires the deep muscles be controlled by precise
coordination of deep muscle activation and timing. The complete spinal stabilising
system was, therefore, conceptualised by Panjabi (2003) as a neural control
element, passive spinal column(and ligaments) and an active system of deep
muscles. The control system assesses and directs the deep muscles to provide
varying levels of extrinsic stability while the passive elements of the spinal column
provide intrinsic stability (Figure 1-1). To successfully provide control, actions are
based on feedback from both the active and passive components.
Mechanoreceptors in the passive structures indicate levels of force and stress,
while feedback on muscle activation patterns and stretch are provided by the
active system.
Figure 1-1 The Spinal stabilising system from Panjabi 2003
It is also theorised that once a successful motor control strategy of trunk
muscle activiation has been learned, an anticipatory feed forward mechanism of
activating an appropriate muscle response pattern ahead of movements can
occur (Hodges, Cholewicki and Van Dieen 2013).

30
1.1.3. Segmental Stability and the Neutral Zone
During dynamic loads into spinal flexion and extension, there is displacement
of each vertebra which provides flexibility. At low loads the spine was observed to
be highly flexible and then stiffening as loads increased. A neutral zone was
defined as the range of segmental displacement within which there is minimal
resistance to the displacement (Panjabi 2003). This is represented graphically in
Figure 1-2 with the neutral zone being represented by a ball in a bowl. The
motion of the ball represents the displacement motion of the vertebral segment,
while the steepness of the sides represents varying stability with steeper sides
demonstrating increased resistance to displacement.
Figure 1-2 Load displacement curve of spinal segments (left) and a visual representation of the neutral zone (right) (Panjabi, 2003)
As segmental spinal stability increases, the neutral zone becomes smaller,
demonstrated by placing the ball in a wine glass. As segmental spinal stability
decreases the neutral zone gets larger, demonstrated by placing the ball in flat
bowl, see Figure 1-3.

31
Figure 1-3 Varying degrees of spinal stability and neutral zone size represented using the ball in bowl analogy, high stability on the left, low stability on the right (Panjabi, 2003)
It was hypothesised that decreased stability may be caused either by damage
to the passive stability system and/or abnormal activity or control of the active
system that leads to a larger neutral zone. An increase in the neutral zone is
likely to be associated with increased stress on spinal structures and so result in
pain. Therefore, interventions were suggested for unstable painful spines which
aimed at reducing the neutral zone through retraining control of the active stability
system or through use of spinal fusion (Panjabi 2003). This theory is represented
graphically in Figure 1-4, again using the ball in a bowl analogy.
Figure 1-4 Pain free spinal range with neutral zone within pain free range (top), exceeding pain free range (middle) and after stabilising intervention (bottom) (Panjabi, 2003)

32
1.2. Theory linking low back injury with altered motor control and low
back pain
More recently the theory for how LBP starts has been updated. It is still
suggested the common feature is altered mechanics but with a deeper
explanation for how this may arise. It was summarised by Panjabi (2006) as
follows, with graphical representation in Figure 1-5:
1. Initial trauma occurs to spinal structures such as ligaments. This can be
either a long term build-up of microtrauma or an acute injury.
2. During dynamic loading of the injured spine, mechanoreceptor signals sent
to the neural control system, produced by the injured tissue are now
corrupted due to injury.
3. The control unit finds a mismatch between expected signals and those
actually being received. This causes control unit output to the active
stability system in response to dynamic loading to also become corrupted.
4. Corrupted output from the control unit leads to the changes in the activation
of the deep muscles in response to the dynamic load. These changes
lead to abnormal activation and timing of the active stabilising deep
muscles – LM and TrA. This then causes altered spinal mechanics.
5. Abnormal activation patterns of the deep muscles causes their returning
feedback to also become corrupted, causing further mismatch in signals
being received by the control unit.
6. Increased corruption of control unit output occurs in response to continued
dynamic loading. This has great potential to lead to segmental instability,
increased segmental neutral zone and higher stresses on spinal structures.
7. Inflammation of stressed spinal tissues around unstable segments is then
likely to occur and nociceptive pain signals produced.

33
8. If left unchecked chronic non-specific LBP may develop.
Figure 1-5 Graphical representation of pathway towards chronic back pain (Panjabi, 2003)
A more detailed synthesis of mechanisms and pathways that can lead to
muscle changes within the motor control concept by Hodges, Cholewicki and Van
Dieen (2013) is also provided in figure 1-6.
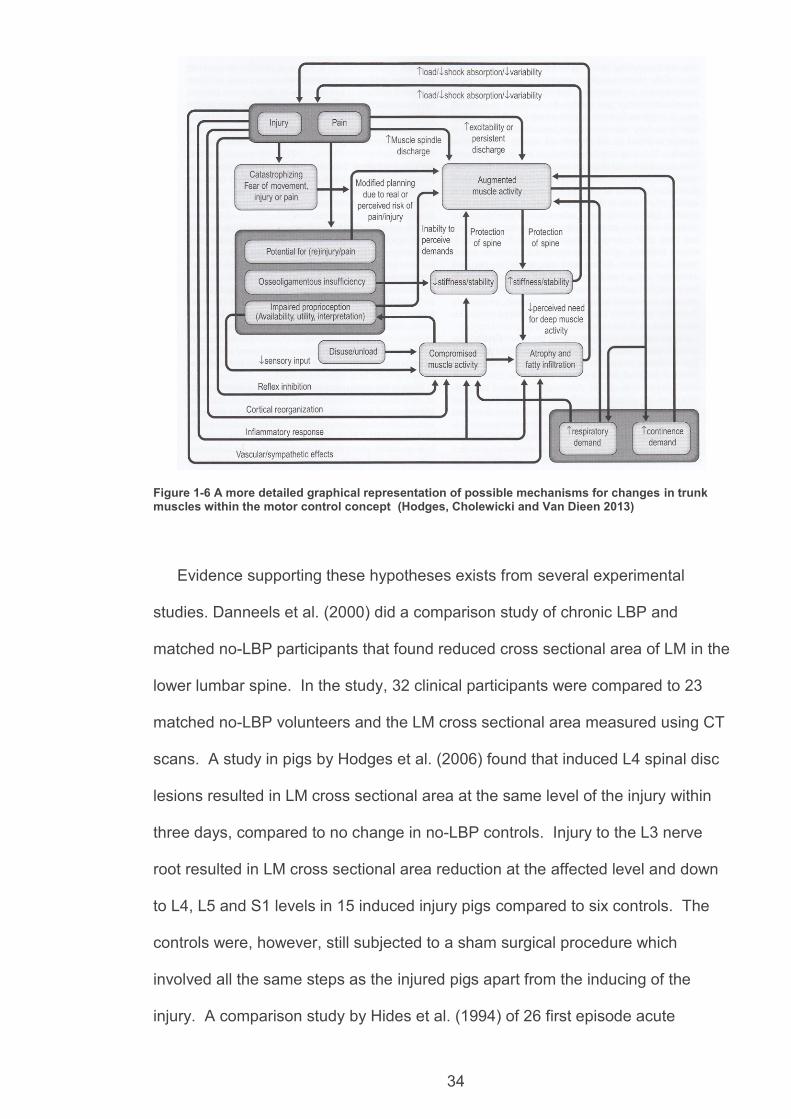
34
Figure 1-6 A more detailed graphical representation of possible mechanisms for changes in trunk muscles within the motor control concept (Hodges, Cholewicki and Van Dieen 2013)
Evidence supporting these hypotheses exists from several experimental
studies. Danneels et al. (2000) did a comparison study of chronic LBP and
matched no-LBP participants that found reduced cross sectional area of LM in the
lower lumbar spine. In the study, 32 clinical participants were compared to 23
matched no-LBP volunteers and the LM cross sectional area measured using CT
scans. A study in pigs by Hodges et al. (2006) found that induced L4 spinal disc
lesions resulted in LM cross sectional area at the same level of the injury within
three days, compared to no change in no-LBP controls. Injury to the L3 nerve
root resulted in LM cross sectional area reduction at the affected level and down
to L4, L5 and S1 levels in 15 induced injury pigs compared to six controls. The
controls were, however, still subjected to a sham surgical procedure which
involved all the same steps as the injured pigs apart from the inducing of the
injury. A comparison study by Hides et al. (1994) of 26 first episode acute

35
unilateral low back patients with 51 health controls, found LM asymmetry in the
back pain patients, isolated to the symptomatic level compared to symmetrical LM
muscles in the no-LBP controls.
A comparison study by Hodges and Richardson (1996) of 15 LBP patients with
15 no-LBP matched controls used electromyography to assess the activation and
timing of TrA in response to upper limb movements. It was observed that TrA
activation was consistently delayed in the back pain patients. A comparison study
by Ferreira and Hodges (2004), of ten low back patients with ten health matched
controls found consistently reduced changes in TrA thickness in the back pain
group during lower limb exercises measured using ultrasound imaging.
1.3. Management of low back pain using motor control interventions
for segmental spinal stability
Management of segmental instability using specific motor control exercises
aimed at normalising the recruitment patterns of the deep muscles was
summarised by O’Sullivan (2000). The first stage of training is learning to isolate
and correctly voluntarily contract the deep muscle system. The voluntary
contractions are intended to be low level and at 30-40% maximal voluntary
contraction. Contractions are taught in postures such as supine, prone and four-
point-kneeling while patients are asked to perform abdominal drawing in using TrA
while maintaining a neutral lumbar lordosis. In addition to this, patients are
taught:
Differentiation of lumbar, pelvic and hip movements.
Diaphragmatic breathing and maintenance of neutral lordosis in different
postural sets such as sitting and standing.

36
Live biofeedback with use of palpation, ultrasound imaging or possibly
electromyography can be included to help isolate TrA and LM activation (Hides et
al. 2008). Treatment is then progressed to the second stage where the deep
muscle recruitment learned in stage one is incorporated into functional and
previously faulty movement patterns. Patients are taught movements such as sit
to stand, walking, bending and twisting while maintaining activation of deep
muscles and keeping neutral lordosis. The third and final stage of training is for
patients to carry the newly learned and stable functional movements into their
activities of daily life. Further advice, practice and biofeedback may be given to
facilitate this process. These stages of rehabilitation are represented graphically
in Figure 1-7
Figure 1-7 Graphical representation of deep muscle system (LMS) motor relearning (O'Sullivan, 2000)
A study was undertaken by Hides at al. (2008) to assess LM size in athletes
with LBP and determine the effectiveness of a motor control intervention. Ten
participants with back pain underwent a six week intervention programme of
learning to correctly activate TrA and LM. Live biofeedback using ultrasound
imaging was used during muscle activation teaching. Abdominal drawing in
exercises were used to teach recruitment of the TrA while maintaining a normal,
relaxed, breathing pattern, followed by participants attempting to swell the LM

37
muscle while holding a breath out and keeping the spine still with a neutral lumbar
lordosis. Initially, activation was taught in lying and then progressed to upright
sitting and standing, all while maintaining neutral lumbar lordosis. Further
progression to functional movements was then performed. By the end of the
programme pain scores had dropped from an average of 4.3 to 2.3 (p<0.05).
Before treatment, asymmetry had been observed in LM cross sectional area,
which also significantly decreased, while overall muscle size increased. This is
evidence that suggests motor control exercises including recruitment of deep
muscles can improve clinical outcomes.
1.4. Evidence based management of low back pain including use of
motor control interventions in a wider context with a multi-lateral
approach
A good quality systematic review by Ferriera et al. (2006) summarised a large
portion of the remaining evidence surrounding motor control exercises for the
treatment of spinal and pelvic pain. Motor control exercises were defined as those
which retrain control of the deep muscles in the lumbopelvic region by specifically
recruiting those muscles while gradually reducing over activity in superficial spinal
muscles (Ferreira et al. 2006). Progression of motor control exercises involved
recruitment of deep muscles during functional activities (Ferreira et al. 2006).
Twelve discreet studies were identified and assessed for quality using PEDro
scoring before the results were pooled and illustrated graphically as in Figure 1-8
to 1-11. All of the studies scored at least 4 out of 10 on PEDro.

38
Figure 1-8 Effect of motor control exercise on pain, disability and quality of life outcomes for LBP and cervical pain. (Ferreira et al. 2006)). SSE = specific stabilisation exercises based on motor control approach defined earlier, SMT = spinal manipulative therapy, PT = conventional physiotherapy, med man = medical management and tails on the graph show 95% confidence intervals.
Figure 1-9 Effect of specific stabilisation exercise on risk of recurrence after acute episode of LBP. (Ferreira, et al., 2006). SSE = specific stabilisation exercises based on the motor control approach defined earlier, med man = medical management and tails on the graph show 95% confidence intervals.

39
Figure 1-10 Effect of specific stabilisation exercise on pain, disability and quality of life outcomes for chronic LBP. (Ferreira, et al., 2006). SSE = specific stabilisation exercises based on the motor control approach defined earlier, SMT = spinal manipulative therapy and tails on the graph show 95% confidence intervals.
Figure 1-11 Effect of motor control exercise vs usual care on pain and disability outcomes for LBP. (Ferreira, et al. 2006). SSE = specific stabilisation exercises based on the motor control approach defined earlier, SMT = spinal manipulative therapy, and tails on the graph show 95% confidence intervals.
The overall evidence presented in the review shows that intervention
programmes that include motor control exercises appear to be effective at
improving back pain outcomes across much of the evidence. One study provided
evidence that motor control exercises also improve long term outcomes in LBP
patients compared to manual therapy approaches. However, motor control

40
exercises alone did not show much more improvement on immediate outcomes
over manual therapy. The approaches that showed the best outcome
improvements were motor control exercises in combination with conventional
physiotherapy or manipulative therapy. It is possible that using a multi-lateral
approach to treating LBP could fit into the previously presented theory from
Panjabi et al. (2006). Having a motor control exercise would target the abnormal
deep muscle patterns and normalise the corrupted feedback being sent to the
control unit. Meanwhile the traditional physiotherapy, which included manual
therapy, stretching and healing process education (which many of the
physiotherapy control interventions included in Ferreira et al. (2006)), may
promote soft tissue healing and normal spinal range of movement and so also
normalise corrupted feedback from ligament or soft tissue mechanoreceptors.
Combined with teaching correct neural control system output by isolating and
relearning correct LM and TrA activation, this sort of multi-lateral approach targets
most of the problem areas highlighted in Panjabi et al. (2006). However. it has
long been established that LBP is heterogenic with respect to potential causes
and that subgrouping to address specific issues is more likely to aid clinical
diagnosis and selection of most appropriate treatments (Bouter, van Tulder and
Koes 1998; Hancock, Herbert and Maher 2009). Therefore the combination
approaches might have been treating more subgroups than individual treatments
and the same effectiveness might be found if LBP patients had been sub grouped
based on good assessment and received problem-based treatments.
In addition to this, it was suggested by Hodges, Cholewikci and Van Dieen
(2013) that functional training is likely to have better carry-over of muscle
activation into other functional movements used in daily activities. The implication
being that improved activation in every day functional movements will be of higher
benefit to patients. Additionally, new exercises such as using the FRED may have

41
potential to automatically recruit LM and TrA (Debuse et al. 2013; Caplan et al.
2014), which is a clinical challenge at present (Van, Hides and Richardson 2006).
1.5. Defining neutral posture for low back pain interventions
Maintaining a neutral spinal posture during movements and functional tasks is
part of many spinal stability intervention programmes. As lordosis is an element
of sagittal plane posture, it is necessary to define a neutral upright sagittal
posture. Postures which include the following sagittal plane elements were
considered to be well balanced in a large X-ray imaging study (Roussouly et al.
2005)
An anteriorly tilted pelvis resulting in a sacral slope of 35 to 45 degrees.
The thoracolumbar (T12L1) junction being the inflection point between
lumbar lordosis and thoracic kyphosis.
The inflection point being vertically aligned with the anterior superior edge
of the S1 vertebrae.
An electromyography study by Claus et al. (2009) additionally found that sitting
with a spinal posture very similar to the well-balanced posture defined in the x-ray
study also impacts LM and TrA activity. An inflection point located at the
thoracolumbar junction with lumbar lordosis also created the highest LM and TrA
activity compared to long lordotic, flat back and slumped postures (Claus et al.
2009). Clinically, it is often not possible to assess sacral slope, due to the lack of
sufficient imaging equipment. However, significant correlation was found between
anterior pelvic tilt and both the location of the spinal inflection point and alignment
of the inflection point with the S1 vertebrae (Roussouly et al. 2005). Therefore, it
may be possible to clinically suggest correct posture has been achieved if there is
a degree of anterior pelvic tilt to the extent that a lumbar lordosis exists throughout
the lumbar vertebrae up to the thoracolumbar junction. This suggestion would

42
have more confidence if evidence of LM and TrA activation was also found
concurrently.
1.6. Motor control with the biopsychosocial model
O’Sullivan (2005) identified many treatment options for LBP that only target a
single potential causative element and suggested it is better to assess all potential
biopsychosocial causes of back pain before selecting treatment options that
address the range of potential underlying problems. Additionally, the high quality
systematic review by Ferreira et al. (2006) found larger effect sizes with tailored
multi-treatment LBP interventions such as treating LM and TrA and addressing
psycho-social problems. Therefore, while this PhD considers LM and TrA
interventions in detail, it is acknowledged they should be used as part of a
biopsychosocial approach.
1.7. Summary
There is evidence linking atrophy and poor control of deep muscles to poor
spinal mechanics and nonspecific LBP. Interventions that activate these muscles
in functional positions and movements, while simultaneously promoting balanced
upright sagittal postures, often called motor control exercises, are suggested to be
beneficial. This is especially so when used as part of a multi-lateral approach.
1.8. Populations that are expected to benefit from spinal motor control
exercises
Previous sections of the introduction have explained how injury to the spine
and disuse atrophy of the LM and TrA can lead to motor control problems in the
general population. Therefore it is clear that motor control interventions are likely
to be of benefit in the general population who experience LBP due to a spinal
motor control deficit. However, the focus of this research was astronauts that

43
experience the same deep spinal muscle and spinal motor control changes and
have many parallels with the general population. There is also potential that this
research could also benefit falls prevention rehabilitation in older adults. These
additional populations are explained below.
1.8.1. Astronauts and Bed-Rest Study Participants
Astronauts returning from long duration space missions (~6-months duration)
(Buckey 2006) and participants following bed-rest studies, which are commonly
used to simulate microgravity exposure (Pavy-Le Traon et al. 2007), suffer a
range of muscular and postural problems. These problems include decreased
balance and proprioception, decreased muscle mass, force and power with
increased loss of technique (specifically affecting lower limb antigravity muscles
and lumbopelvic segmental control muscles) (Buckey 2006), decreased ability to
control posture - specifically the ability to achieve balanced pelvic tilt and spinal
curves in the sagittal plane (as defined in section 1.5), increased risk of spinal
injury from poor spinal positioning during every-day activities - especially involving
trunk flexion, and increased chance of poor global movement patterns and risk of
injury from musculoskeletal weakness and atrophy (Hides et al. 2011; Hides et al.
2007; Belavy et al. 2011c; Belavy et al. 2015). Those in microgravity also
experience lengthening of the spine due to swelling of the intervertebral discs
which in turn become deconditioned resulting in increased risk of disc injury
(Belavy et al. 2015). To date, the full list of musculoskeletal changes reported to
occur during microgravity exposure and the effectiveness of in-flight
countermeasures and post flight rehabilitation to prevent and reverse changes is
unknown. An element of this PhD will be to establish a list of changes that occur
due to microgravity exposure and review the effectiveness of relevant current
interventions.

44
1.8.2. Older Populations and Falls
An etiological study of aging and muscle dysfunction stated that falls are the
most common cause of accidental injury in older people with muscle weakness
being a commonly found feature (Fiatarone and Evans 1993). The reasons given
in the study for muscle weakness were: natural musculoskeletal changes due to
age, increased prevalence of chronic diseases, increased use of medications,
sedentary lifestyle leading to atrophy, and poor nutrition. Natural aging changes
included reduced maximal contraction strength, decreased muscle mass,
biochemical changes leading to reduced energy available to muscles and
decreased neural recruitment capacity. Increased use of medications such as
steroids due to higher prevalence of chronic disease in older people also
contributes to muscle wasting. When this high incidence of muscle loss is
combined with periods of immobility from bed-rest, wheelchair use or casting due
to either acute or chronic illness, the overall loss of muscle and functional ability
can accelerate (Fiatarone and Evans 1993).
A systematic review by Granacher et al. (2013) into falls prevention highlighted
that historically balance and lower limb strength training have been used as
interventions against falls in older people. While such training has improved
outcomes related to strength testing, improvements in functional outcomes and
ability to complete activities of daily living safely have been limited (Granacher et
al. 2013). Based on the research being done on the role of motor control and
deep muscles in spinal stability theories, it was suggested a similar approach may
also be useful in falls prevention (Hwang et al. 2008). It was hypothesised that
the effects of aging on the deep muscles and neural control system may
compromise an older person’s ability to stabilise the spine, particularly in response
to sudden trunk loading and lower limb movements. To assess this, Hwang et al.
(2008) conducted a comparison study of 23 young (<30 years age) individuals

45
with 15 healthy older (>60 years age) controls. Surface electromyography was
used to investigate activation of LM in response to sudden expected and
unexpected upper limb loading. LM activation was seen to be significantly later in
the older individuals for both expected and unexpected loads, the difference was
increased for expected loads (Figure 1-12).
Figure 1-12 Latencies of LM (in ms) reflex to sudden loading, triangle represents older people and circle young from Hwang et al. (2008).
The systematic review by Granacher et al. (2013) also highlighted a correlation
between increasingly flexed spinal postures in older people and falls. As it has
already been shown that LM controls lordosis (extension) and is active in
response to balanced sagittal posture including lordosis, flexed postures may also
negatively impact on deep muscle activity. The conclusion of the systematic
review was that stability was important for older people to successfully perform
activities of daily living and that functional stability interventions are also likely to
show improvements in falls relevant outcomes. It recommended including
functional stability training in programmes for older people alongside traditional
strength training.
1.8.3. Knowledge transfer between populations and levels of
indirectness
46
The three main populations identified as being likely to benefit from motor
control interventions are astronauts and bed rest (microgravity exposure), general
population LBP due to deconditioning similar to that found in microgravity
exposure and potentially older adults. Knowledge transfer between these groups
is therefore recommended and is already being performed (Stokes, Evetts and
Hides 2016). It has already been shown that LBP in the general population and
those entering microgravity have the highest comparability and are therefore
expected to have the lowest level of indirectness for knowledge transfer (Hides et
al. 2007; Pool-Goudzwaard et al. 2015), with spinal lengthening due to
intervertebral disc swelling being the only key difference other than from gravity
loading. Techniques for motor control exercises are already being transferred
successfully between general low back pain and microgravity populations (Hides
et al. 2011; Evetts et al. 2014). Therefore this thesis applies to and recruits data
from general LBP and astronaut populations and applies the results to both of
these populations. However, in the thesis conclusion, areas where knowledge
transfer could also apply to older adults are still highlighted.
1.9. The Functional Readaptive Exercise Device (FRED)
Many people have difficulty recruiting LM, in particular, voluntarily (Van et al.
2006), which presents a challenge to physiotherapists involved in motor control
exercises.
Debuse et al. (2013) investigated a new exercise device, the FRED (Figure 1-
13), that aims to recruit the LM and TrA muscles. FRED exercise constitutes a
combination of weight-bearing, an unstable base of support (at the feet), an
upright posture with a relatively stable lumbopelvic area, functional lower limb
movement and real-time visual feedback of performance. This requires the
participants’ rearward leg to work to control the downward movement of the

47
forward leg, in order to achieve a smooth, controlled cyclical motion. Exercise on
the FRED was shown to recruit LM and TrA automatically (i.e. with no conscious
effort by participants) and to recruit them differentially (Debuse et al. 2013). More
recently, FRED exercise has been shown to promote tonic activity of LM and TrA
(Caplan et al. 2014), which is considered the most effective type of activity for
retraining the stability function of these muscles (Richardson & Jull 1995). The
FRED was also found to reduce lumbopelvic movement when compared to over-
ground walking (Gibbon, Debuse & Caplan 2013).
It is hypothesised that the device uses several mechanisms in combination, to
produce rehabilitation effects on several of the problems found in spinal instability
simultaneously within one intervention (Table 1-1). Additional, potential,
mechanisms also result from training on the FRED, which are also likely to be
useful to relevant clinical populations are outlined in Table 1-2.
Figure 1-13 Current Prototype Functional Readaptive Exercise Device (European Space Agency image)

Table 1-1 Potential primary mechanisms in FRED training
Problem FRED Mechanism
Poor lumbopelvic motor control of deep spinal muscles
1. a. Exercising using a pattern of moving the feet in a quasi-elliptical path in antiphase with minimal resistance from the
device or support from the upper limbs b. Exercising while maintaining a stable pelvis and upright trunk while having to maintain an even speed within one
revolution.
The above points create a need for greater control of the lower limbs and pelvis during an unstable dynamic movement. Greater control is particularly needed in resisting a fast descent of the foot in the forward-most position of the cycle. The movement is functional and similar to over ground walking. Therefore, muscle activation training is learned in a functional movement, hoped to produce carry over into other functional daily activities. 2. Clinical observations seem to indicate that relatively greater rear foot loading in standing results in greater recruitment of
LM whereas relatively greater front foot loading in standing has a deactivating effect on LM. It is hypothesised that correct exercise on FRED results in reduced front foot loading. REF?
3. FRED provides visual feedback which encourages users to exercise at a constant, controlled speed and frequency ratio which is hypothetically the most energy efficient movement (Taylor, Budds and Thomas 2003). Additional feedback encourages users to maintain even movements throughout the exercise, training control of the lumbopelvic area and lower limbs during dynamic, functional movements. It is thought that efficient and smooth controlled movement on FRED may improve LM and TrA neuro-motor control.
The exercise has already been shown to activate LM and TRA without the need to consciously trigger the activation in non-symptomatic populations (Debuse et al. 2013). In addition to this, LM was shown to have constant tonic activity throughout exercise cycle on the device in an electromyography study. The muscle was active for more time than during over ground walking (Caplan et al. 2014).
Reduced ability to control spinal posture and balance
Previous kinematic research has shown FRED exercise promotes an increased degree of anterior pelvic tilt during upright posture (Gibbon, Debuse and Caplan 2013). Increased anterior pelvic tilt, within a range where the thoracolumbar junction remains the inflection point between lumbar lordosis and thoracic kyphosis, has been shown to create a well-balanced sagittal spinal posture (Roussouly et al. 2005). Electromyography data has also shown that this type of posture produces highest LM and TRA recruitment (Claus et al. 2009), though this study investigated sitting postures. Additionally, users of the device are required to exercise in an upright posture. It is hoped that these elements together mean FRED exercise promotes a balanced upright sagittal posture (defined in section 1.4) with recruitment of LM and TrA. Having improved control of balanced posture is also hoped to improve overall balance.

49
Table 1-2 Additional potential mechanisms in FRED training of use to Relevant Rehabilitation Populations
Atrophy of spinal extensors
EMG data from FRED exercise shows it promotes increased activation of spinal extensors over flexors (Caplan et al. 2014). This may be relevant to the rehabilitation of astronauts who show increased flexion postures when in space (Buckey 2006)
Weakness of lower limb anti-gravity muscles
Previous kinematic research shows FRED exercise involves constant hip and knee flexion in a dynamic and gravity loaded exercise, therefore, constantly loading lower limb extensor muscles (Gibbon, Debuse and Caplan 2013). This loading is expected to improve strength in the lower limb extensors which is a common aim of traditional older people falls risk interventions (Granacher et al. 2013)

The mechanisms show how the FRED has already demonstrated the ability to
automatically activate both LM and TrA in an asymptomatic population without
need for conscious muscle recruitment. This might have potential to solve the LM
and TrA conscious recruitment difficulties found in traditional rehabilitation (Van,
Hides and Richardson 2006). The exercise is dynamic, functional, weight-
bearing, in an upright posture and relevant to common daily activities such as
walking. These are all elements of motor control exercises covered in section 1.7.
It appears, therefore, that the device might be a useful intervention to train the LM
and TrA muscles and segmental spinal stability.
As the device is a prototype and its underlying mechanisms require
investigation, a series of studies were planned to test the mechanisms and build
the evidence base underpinning them. It was also decided to include relevant
back pain populations in these studies. While the current rehab approaches in
back pain are well documented and reviewed, this is not so for post spaceflight
rehabilitation. Therefore, a review of the rehabilitation in this population was also
included to establish current interventions and benchmark against the
effectiveness of the new device.
1.10. Thesis Aim and Research Questions
The aim of this thesis was to investigate the FRED to assess it mechanistic
effects within the field of motor control interventions for spinal stability in both
astronaut and terrestrial populations. The following chapters of this thesis attempt
to answer the following key questions: Do the underlying mechanisms of FRED
exercise indicate that it may be a useful intervention to trial in the rehabilitation of
lumbopelvic deconditioning resulting from microgravity exposure in astronauts and
a sedentary lifestyle in the general population? What are the requirements for a
standard and progressive training protocol using the FRED? What current

51
inventions are used to treat and rehabilitate lumbopelvic deconditioning and what
are their effects? Chapter two systematically reviews the space research within
the field of spinal stability. Chapter three assesses the activation of the LM and
TrA muscles in all device settings to inform a training protocol. Chapter four
compares sagittal plane kinematics during exercise on the FRED with walking in
both a low back pain and asymptomatic population. Chapter five highlights the
effects of using visual back during FRED exercise to inform the training protocol.
Chapter six determines the time required to familiarise with the device. Chapter
seven investigates the effect of using the handle bars during exercise to also
inform the training protocol and chapter eight contains the concluding text.
Chapter two deals with microgravity populations whereas all remaining chapters
deal with LBP populations and results are discussed in a motor control context
that is transferable between both of these populations, as discussed in section
1.8.3.

52
2. Chapter Two: Systematic Review of Countermeasures and Rehabilitation Interventions to Minimise Physiological Changes and Risk of Injury to the Lumbopelvic Area Following Long-Term Microgravity Exposure

53
2.1. Introduction
Human spaceflight results in exposure to an altered gravity state, mostly
eliminating weight bearing and axial loads, resulting in physiological changes and
potentially increased injury risk (Gernand 2004; di Prampero and Narici 2003;
Buckey 2006). Buckey (2006) grouped changes into broad themes allowing them
to be listed briefly as: bone loss, psychosocial, radiation biological, muscle loss,
balance and postural control, cardiovascular and nutritional.
Gernand (2004) reported the implications of these physiological changes on
subsequent safe functioning on return to a gravity loaded environment,
highlighting the need for both countermeasure interventions during spaceflight
and rapid and effective rehabilitation following spaceflight. For longer duration
spaceflight of around six months, Gernand (2004) noted significant bone and
muscle loss, as well as altered postural control, leaving the body susceptible to
bone fracture, muscle injury and the potential to develop osteoporosis. Muscle
atrophy and altered motor control have been specifically observed in the
lumbopelvic region (Sayson and Hargens 2008).
A European Space Agency (ESA) report by Snijders et al. (2011) reported LBP
in 12 out of 20 astronauts during spaceflight. The report highlighted the
importance of maintaining spinal movements, as end range flexion and extension
exercises were anecdotally noted as being employed to ease pain during
spaceflight. A relationship was also highlighted between LBP and atrophy of deep
spinal muscles, particularly LM, during bed-rest studies (Pool-Goudzwaard et al.
2015).
Wing et al. (1991) reported that 53-68% of astronauts experienced moderate
to severe back pain when in space. On landing after a shuttle mission, a US
astronaut reported severe LBP which was later linked with a herniated nucleus

54
pulposus at the L4-5 intervertebral (IV) disc and required surgical intervention
(Johnston et al. 2010). Johnston et al. (2010) also reported that astronauts had a
more than four-fold increased risk of herniated disc pulposus within the first year
following spaceflight, compared with controls. Sayson and Hargens (2008)
suggested that this back pain and disc injury could be caused by a range of
factors linked to spinal lengthening and reduced loading. A review by Belavy et
al. (2015) supported this, suggesting the increased lumbar IV disc herniation risk
in the astronaut population was most likely caused by long term disc tissue
deconditioning resulting from swelling of the discs due to unloading during
spaceflight. However, the review only considered IV discs in isolation and does
not refer to any potential predisposing factors such as spinal motor control.
Lumbopelvic adaptations to microgravity include adoption of a flexed posture
(Figure 2-1) (Buckey 2006), spinal lengthening, increased intervertebral disc
height and disc deconditioning, altered spinal curvatures (Sayson and Hargens
2008) and atrophy of the lumbopelvic musculature. A general pattern of selective
extensor muscle atrophy over flexors has been seen throughout the body
(Edgerton et al. 2001; Widrick et al. 2001). Spinal extensor volume decreases
have been reported as greater than hip flexor (Psoas muscle) decline in
astronauts (LeBlanc 1995). Anecdotal accounts also appear to show selective
atrophy of trunk extensor muscles concomitant with improved flexor muscle
performance immediately post mission (Evetts 2015). Hides et al. (2011)
suggested that deep spinal muscle changes such as atrophy of LM and TrA
muscles, along with selective hypertrophy of spinal flexors over extensors (Hides
et al. 2007), may impact on the ability of the spine to distribute loads appropriately
shortly after spaceflight simulation via bed-rest. Selective atrophy of spinal
extensors without corresponding atrophy of the Psoas muscle was also seen in
terrestrial individuals with LBP compared to no-LBP controls by Danneels et al.

55
(2000). Atrophy and motor control changes in the LM muscle have been linked
with LBP (Hides et al. 1994; Hides et al. 2008) and development of poor
intersegmental control of the lumbar spine (Bergmark 1989; Hodges 2004;
Hodges and Cholewicki 2007; Hodges and Moseley 2003) which can potentially
cause increased stress on spinal structures, resulting in pain (Panjabi 1992a;
Panjabi 1992b; Panjabi 2003).
Figure 2-1 Postural adaptation to microgravity, showing loss of normal spinal curvature and increased flexion of the spinal column, reproduced from (Buckey 2006), with permission
Humans exposed to sustained microgravity develop a risk of significant spinal
injury as a result of microgravity-induced poor intersegmental control of the lumbar
spine combined with loaded activities such as, extra-vehicular activity, physically
demanding medical procedures, landing and return to a g-loaded environment,
which have the potential to be at least as demanding as those undertaken in
normal Earth gravity (Gernand 2004). It is necessary, therefore, to know what
physiological changes occur that could lead to increased injury risk, and which

56
interventions, both countermanding and rehabilitative, can be used to minimise
and effectively rehabilitate physiological compromise. The current evidence also
suggests that interventions to address lumbopelvic physiological adaptations are
likely to be a required element of any rehabilitation programme following exposure
to microgravity. While Evetts et al. (2014) indicated that European post-flight
rehabilitation includes specific training for lumbopelvic posture and spinal muscles
involved in intersegmental control of the lumbar spine, they highlighted a need to
compare the effectiveness of interventions to advance the treatments given to
astronauts. Such improvements are also likely to aid terrestrial healthcare with
more effective interventions for people with LBP and post bed-rest rehabilitation
(Evetts et al. 2014).
The aim of this systematic review was, therefore, to determine what
interventions are effective at counteracting or rehabilitating changes, and reducing
injury risks to the lumbopelvic region, following exposure to microgravity in
humans. Specifically, this systematic review focussed on the lumbopelvic region
due to its vital role in the maintenance of lumbar posture, intersegmental control of
the lumbar spine and the link with LBP (Snijders et al. 2011; Hides et al. 2011;
Panjabi 2003).
2.2. Methods
2.2.1. Scoping
An initial general search found no eligible studies conducted in spaceflight
populations. Therefore, the scope of this review was expanded to allow inclusion
of bed-rest study populations within studies designed to simulate axial unloading
due to spaceflight. Due to the inherent difficulty in studying spaceflight
populations (e.g. cost and small sample size) ground based simulations are often
used. Several ground-based models exist, including bed-rest, limb immobilisation

57
and unilateral lower limb suspension. It has been reported that bed-rest is the
most valid ground based model for simulating axial unloading caused by
spaceflight, especially for studying postural and lower limb muscle changes
(Adams, Caiozzo and Baldwin 2003; Pavy-Le Traon et al. 2007). However, bed-
rest studies have limitations, as spaceflight nullifies both the Gz and Gx vectors,
whereas bed-rest moves Gz into Gx, eliminating Gz, yet failing to cancel out Gx
(Pavy-Le Traon et al. 2007).
2.2.2. Search strategy
A range of terms were used in various combinations to search the following
databases: Pubmed, CINAHL, Web of Science, Science Direct, and The
Cochrane Collaboration Library. The literature search was performed according
to the search strategy shown in Table 2-1 during November 2014.

58
Table 2-1 Search term construction
Search number
Term Key words in Boolean search format Reason
1 Rehabilitation rehabilitate OR rehabilitation OR recover* OR recovery
Locate studies which consider rehabilitation
2 Spaceflight /analogues spaceflight OR space* OR space flight OR astronaut* OR microgravity OR micro gravity OR bed-rest OR bedrest OR weightless*
To find studies using spaceflight or simulating microgravity terrestrially using bed-rest.
3 Musculoskeletal muscle* OR bone* OR skeletal OR musculoskeletal OR neuromusculoskeletal
Limiting search to musculoskeletal area
4 Intervention intervention* OR treat OR treatment* OR physio OR physiotherapy OR physical therapy OR therapy OR exercise OR program* OR exercise program*
To find research which considered actual interventions
5 Lumbopelvic lumb* OR pelv* OR low back OR lower back Limiting search to interventions for the lumbopelvic region
6 Countermeasures countermeasure* OR counter* OR protect* OR maintain OR prevent* OR train*
Locate studies which consider countermeasures
7 Combined rehab search
1 AND 2 AND 3 AND 4 AND 5 Search for musculoskeletal rehabilitation interventions for lumbopelvic region linked to spaceflight or bed-rest
8 Combined countermeasures search
2 AND 3 AND 4 AND 5 AND 6 Search for musculoskeletal countermeasure interventions for lumbopelvic region linked to spaceflight or bed bed-restrest
9 1 AND 2 AND 3 Less specific combination 10 4 AND 2 AND 3 Less specific combination 11 1 AND 2 AND 5 Less specific combination 12 4 AND 2 AND 5 Less specific combination 13 6 AND 2 AND 3 Less specific combination 14 6 AND 2 AND 5 Less specific combination 15 7 OR 8 OR 9 OR 10 OR 11 OR 12 Increased sensitivity search to check for
any missed studies

59
2.2.3. Eligibility criteria and rationale
Inclusion criteria:
The following inclusion criteria (PICOS) were applied to studies for inclusion in
the review:
Population – Astronauts (during or post spaceflight) or bed-rest (spaceflight
axial unloading simulation) study participants.
Interventions/Comparisons – Countermeasures or rehabilitation strategies
tested against each other or against no intervention or placebo/sham
intervention.
Outcomes – Although it is preferable to have patient relevant outcomes
(e.g. quality of life, ability to walk and function after space flight), studies in
this field measure biomedical (surrogate) outcomes. Studies meeting the P,
I and C were included but prioritised for surrogate measures relating to
lumbopelvic health.
Study designs: Randomised controlled trials (RCT), controlled clinical trials
(CT), interrupted time series and before and after studies.
Exclusion criteria:
Any studies that did not meet the inclusion criteria e.g. all (non-human) animal
research, were excluded. No restrictions on length of follow up, language, and
publication date or status were applied.

60
2.2.4. Study selection & data extraction
Studies were screened by the lead author of this review (AW) using the
Rayyan Software (http://rayyan.qcri.org/). Any uncertainty of study inclusion was
discussed with two other co-authors (Dr Dorothee Debuse and Dr Nick Caplan,
supervisors of this PhD). Initial screening was performed using abstracts and
titles. Where an inclusion decision was unclear from initial screening, the full text
was obtained. Studies that matched the inclusion criteria are listed in the results
section. The numbers of studies excluded during full text screening are also
reported in the results section, with reason for exclusion. An adapted version of
The Cochrane Collaboration “Data collection form for intervention reviews: RCTs
only” version 3, April 2014, (Cochrane 2015) was used to extract data from each
paper. An additional author (Dr Mona Nasser, from The Cochrane Collaboration)
advised and assisted with extraction of data from each study and disagreements
were discussed to reach consensus.
2.2.5. Quality Assessment
Two quality assessment tools were used: the Physiotherapy Evidence
Database scale (PEDro 1999) and The Cochrane Collaboration risk of bias
analysis for randomised trials (Higgins, Altman and Sterne 2011). Two authors
(Andrew Winnard and Dr Mona Nasser) independently assessed each study, and
any disagreements were discussed to reach consensus. For quality assessment,
if consensus was not possible, a third author (Dr Dorothee Debuse) was
consulted. PEDro includes other quality items that are not risk of bias but it is a
common tool used in systematic reviews of rehabilitation research.

61
2.2.6. Rating the level of indirectness of the simulated space studies
(bed-rest studies)
There is limited high quality research in the form of randomised controlled trials
in astronauts due to logistical limitations and small sample size. Bed-rest is
commonly used to simulate axial unloading which occurs during spaceflight
(Morey-Holton 2000) and can be designed with various and potentially differing
elements which may affect its quality as a simulation (Mulder 2014). There are
currently no tools for assessing bed-rest methodological quality. For this review,
therefore, a methodological tool was developed to assess how the bed-rest
studies compared to an “ideal design” study simulating unloading experienced in
the space environment (Table 2-2). The key features of an ideal bed-rest study
were based on literature review and consultation with experts (Pavy-Le Traon et
al. 2007; Morey-Holton 2000; Adams, Caiozzo and Baldwin 2003). This included
information on the aspects of ESA bed-rest protocols provided by the German
Aerospace Centre (Mulder 2014). The use of this tool was piloted in the present
study by two of the authors (Andrew Winnard and Dr Mona Nasser) for its
readability, clarity and usefulness; however, no further empirical studies on its
validity and reliability were performed at this stage. While this tool is useful to
highlight which studies may have simulated a spaceflight environment with greater
rigour, it is important to consider that the tool is not validated and is built on
currently perceived knowledge of appropriate spaceflight simulation study
characteristics. Evidence does not exist to assess assumptions of what
constitutes appropriate bed-rest study methodology. The duration of bed-rest is
required as simulation studies can only relate to spaceflight of similar duration and
shorter bed-rest studies are unlikely to model longer-term space missions.

62
Two authors (Andrew Winnard and Dr Mona Nasser) independently rated
studies with the bed-rest methodology tool and any disagreements were
discussed to reach consensus. If consensus was not reached, a third author (Dr
Dorothee Debuse) was consulted.
Table 2-2 Bed-rest methodological quality assessment
Point Criteria
1 Was the bed-rest six degree head down tilt to simulate cephlad fluid shift?
2 Was diet individualised and controlled? 3 Was the daily routine fixed – with set wake – sleep times and same
routines for all? 4 Are all phases of bed-rest standardised for all participants – same
baseline data collection period, same bed-rest time and same recovery phase?
5 Was the bed-rest ‘horizontal posture’ maintained except for when the test condition required it? I.e. personal hygiene, bowel movements, urination should all occur in bed, no visitors should be allowed and knees should not be flexed?
6 Was sunlight exposure prohibited and participants supplemented with vitamin D?
7 8
Were all measurements scheduled the same for all participants and done at the same time of day? Was the duration of bed-rest stated?
2.2.7. Data analysis
For the countermeasure studies, the raw change across all outcome
measures in the inactive control groups from baseline to end of bed-rest was
extracted. The effect size that existed between the changes seen in the
intervention and control groups provided an indication of the effectiveness of each
treatment. Data were pooled across the same outcomes within each intervention
when they were tested at multiple spinal levels and had effects of similar size, with
changes in the same direction.
All the studies identified used spaceflight related axial unloading simulation
during bed-rest and measured surrogate outcomes. The assumption with the
outcome measures in the included studies is that any change in the control group

63
is an “undesirable effect” and success is evaluated by the ability of an intervention
to demonstrate changes in the opposite direction, creating a “desirable effect”. In
the comparison between intervention and control group during bed-rest, four
scenarios were defined and used to judge interventions as effective, neutral or
ineffective based on both the size and direction of calculated effect:
1. Training effect: changes in “desirable” direction beyond baseline.
2. Full protective effect: changes reduced completely back to baseline.
3. Partially protective effect: changes in “desirable” direction but not
reaching baseline.
4. Worsening effect: further changes in “undesirable direction”.
To quantify the amount by which the interventions altered the change relating
to baseline, the intervention difference was expressed as a percentage of the
change recorded in the inactive control groups.
𝐼𝑛𝑡𝑒𝑟𝑣𝑒𝑛𝑡𝑖𝑜𝑛 𝑎𝑏𝑖𝑙𝑖𝑡𝑦 𝑡𝑜 𝑟𝑒𝑠𝑡𝑜𝑟𝑒 𝑐ℎ𝑎𝑛𝑔𝑒 𝑡𝑜 𝑏𝑎𝑠𝑒𝑙𝑖𝑛𝑒 (%) = 𝑥𝑖
𝑥𝑐× 100
Where 𝑥𝑖 is the difference in the intervention group between baseline and end
of bed-rest/spaceflight and 𝑥𝑐 is the same difference in the control group. For a
rehabilitation study the differences for 𝑥𝑖 and 𝑥𝑐 were between pre bed-rest
baseline and end of rehabilitation.
The percentages are reported as negative where the intervention partially
prevented the change and by how much (% off baseline), and positive where the
intervention caused a training effect. A negative percentage of more than 100%
shows the intervention making the change worse than having no treatment.

64
Where data from a single study were pooled across vertebral levels a standard
deviation is presented with this value.
For the rehabilitation study analysis, which did not have an inactive control
group, specific motor control (SMC) was considered the test intervention and trunk
and general strengthening (TFS) an active control. The effect size compares
each intervention’s change from baseline to the end of the rehabilitation period
(90 days after bed-rest in the included study) and assumed a closer return to
baseline was a more effective result. Therefore, the effects compare the two
interventions for ability to restore changes back to baseline values rather than
comparing to an inactive control.
2.2.7.1. Magnitude based inferences
All calculated effects were presented graphically with 90% confidence
intervals, with indication of favouring intervention or control (Figures 3-8). To add
further meaning to the effect sizes, a magnitude based inference approach was
used to calculate the probability (%) of the true effect being positive or negative
(Hopkins 2007). This was done in relation to a smallest worthwhile change of 0.2
(small change) and 0.6 (moderate change) effect size.

65
2.3. Results
A total of 3147 titles were identified in the full search results, which reduced to
2104 after duplicates were removed. All 2104 studies were screened on title and
abstract for eligibility, resulting in 2094 further exclusions. The ten remaining titles
were acquired in full text and two further exclusions made from the full text
assessments (Figure 2-2). A total of eight papers were included in the final
review. The reference lists of the eight studies included were then screened to
identify further relevant studies, which may not have been found in the searches,
but no further eligible papers were found.

66
2.3.1. Characteristics of included studies
The characteristics of included studies are outlined in chronological order in
Table 2-3. Seven of the eight included studies shared the RCT design. One study
was a two-group intervention comparison and treated as an RCT, with one group
being an active control, in this review. All eight quantitative studies, from which
Figure 2-2 Search and screening results shown in PRISMA flow diagram standard
67
required data could be extracted, were included in the quantitative synthesis. All
studies used bed-rest as an analogue for axial unloading during spaceflight; no
actual astronaut population studies were found by the search strategy.
Interventions included resistance exercise (RE), vibration stimulation, lower body
negative pressure (LBNP) treadmill exercise, and specific motor control (SMC)
rehabilitation. Four studies shared two common samples meaning some of the
samples reported in Table 2-3 are not independent. Belavy et al. (2010) and
Hides et al. (2011) both utilised the second Berlin Bed-rest study population.
Belavy et al. (2010) studied a countermeasure during bed-rest while Hides et al.
(2011) was a post bed-rest rehabilitation analysis. Belavy et al. (2008) and
Belavy et al. (2012) both used the first Berlin Bed-rest study population to assess
the same countermeasure but with different outcome measures. Belavy et al.
(2008) had one less participant than Belavy et al. (2012) due to one individual’s
MRI data being unavailable. Seven studies involved countermeasure
interventions during the bed-rest period and had inactive control groups. One
study (Hides et al. 2011) involved post-bed-rest rehabilitation and had an active
control group. The number of participants for analysis is also shown in Table 2-3.

68
Table 2-3 – Characteristics of included studies
Study Design Population Interventions Control Outcomes Measures
Cao et al. (2005)
Randomised controlled trial
Twelve sets of identical twins. One twin randomly assigned to control and other to the intervention group during 28 days of six degree head down tilt bed-rest.
Test group (n=12) exercising in a lower body negative pressure treadmill in a supine suspended position for 40mins 6 days per week. Loaded to one body weight.
All % are of VO2 max (maximal Oxygen uptake): 7mins warm up at 40%, 3mins at 60%, 2mins at 40%, 3mins at 70%, 2mins at 50%, 3mins at 80%, 2mins at 60%, 3mins at 80%, 2mins at 50%, 3mins at 70%, 2mins at 40%, 3mins at 60% and 5mins cool down at 50%.
Control group (n=12); no intervention during bed-rest
MRI measures of: spinal length, lumbar disc heights, lumbar intervertebral angle, cross sectional area of Psoas and Erector Spinae muscles.
Marcias et al. (2007)
Randomised controlled trial
Fifteen sets of identical twins. One twin randomly assigned to control and the other to the intervention group. In six degree head down tilt bed-rest for 30 days.
Test group (n=15) exercise using a lower body negative pressure treadmill in a supine suspended position. 40min exercise period at 40-80% peak oxygen consumption 6 days a week for 30 days. Loaded to one body weight.
Control group (n=15);no intervention during bed-rest
MRI 1 day before bed-rest, on day 28 of bed-rest. MRI measures of: Spinal length, spinal compressibility, disc height. Lumbar strength pre and post bed-rest determined with lumbar extension dynamometer.

69
Study Design Population Interventions Control Outcomes Measures
Belavy et al. (2008) BBR 1
Randomised controlled trial.
Nineteen healthy males during 56 days of head down tilt bed-rest. One test group and one control group.
Test group (n=9) Two RVE sessions daily, lasting 5-10 minutes each. RVE: Squat, heel raise and toe raise. In morning session also did explosive kick (full force knee extension). Resistance set greater than body weight. Whole body vibration set at 19-26Hz frequency and 3.5-4mm amplitude. Loaded to 1.2-1.9 times body weight.
Control group (n=10); no intervention during bed-rest.
MRI on day one of bed-rest and then at two week periods during bed-rest. Follow up scans at recovery days 4, 14, 28, 90 and 180. MRI measures of: Lumbar spine length, disc area, and height, intervertebral angles, cross sections of Lumbar Multifidus, Erector Spinae, Quadratus Lumborum, Psoas, Rectus Abdominis, External and Internal Oblique and Transversus Abdominialis muscles.
Holguin et al. (2009)
Randomised controlled trial
Twenty nine healthy volunteers during 90 days of supine bed-rest One test group and one control group.
Test group (n=18) low magnitude vibration exercise at 30Hz delivered at the feet while loaded to 60% of their body mass using a harness system for 10mins each day. Knees straight but not locked out during the stimulation.
Control group (n=11); no intervention during bed-rest
MRI at start of bed-rest, day 60 and 90 and 7 days post bed-rest at the S1-L1 area. MRI Disc volume and convexity and spinal length L1-S1. CT scan of intrinsic back muscle volume.

70
Study Design Population Interventions Control Outcomes Measures
Belavy et al. (2010) BBR 2
Randomised controlled trial.
Twenty four healthy males during 60 days of six degrees head down tilt bed-rest. Two test groups and one control group.
Test group one (n=7) RE only. Test group two (n=8) RVE. Exercise performed three days per week. RE: Bilateral squat, single leg heel raise, double leg heel raise, back and toe raise. Resistance set greater than body weight. RVE: Same as RE with whole body vibration of 24Hz frequency and 3.5-4mm amplitude. Loaded to 1.3-1.5 times body weight
Control group (n=9); no intervention during bed-rest.
MRI pre bed-rest and on bed-rest days 27/28 and 55/56: Spine length L1-S1, disk volume, disk height, lumbar lordosis angle. MRI measures of: Cross sectional areas of Lumbar Multifidus, Erector Spinae, Quadratus Lumborum and Psoas muscles. LBP questionnaire pre bed-rest, every day during first two weeks, then weekly throughout remaining bed-rest period.
Belavy et al. (2011)
Randomised controlled trial.
Twenty five healthy males during 90 days of six degrees head down tilt bed-rest. Two test groups and one control group.
Test group one (n=8) fly wheel exercise sessions every third day during bed-rest. Supine squat and calf press. Test group two (n=7) spinal mobility exercises, by performing large amplitude low load slow trunk movements of the frontal, sagittal and longitudinal plane five times daily. Spinal mobility exercises were done as a self-mobilisation exercise.
Control group (n=9); no intervention during bed-rest.
MRI 17 days prior to bed-rest and on day 89 of bed-rest and either 13 or 90 days after bed-rest. MRI measures of: Disc heights, disc CSA, lumbar lordosis angle. Cross section of Multifidus, Erector Spinae, Quadratus, Psoas and Iliacus muscles.

71
Study Design Population Interventions Control Outcomes Measures
Hides et al. (2011) Following BBR 2
Randomised two group comparison
Twenty one health males, following 60 days of six degree head down tilt bed-rest. Followed on from BBR2 and Belavy et al. (2010) with participants assigned to this post bed-rest rehabilitation study.
Test group (n=10) specific motor control exercise voluntarily contracting multifidus and deep abdominal muscles with ultrasound feedback followed by functional training in an upright position. Initially daily sessions, then two physiotherapy appointments and a home exercise plan (15 appointments over 90 days).
Comparison group (n=11); trunk and general strength exercise programme in supine position. Lifting the trunk and lower limbs off the floor, sit ups, diagonal sit ups, resistance created using Theraband. Progressed with more repetitions. Seen at same time intervals as intervention group.
MRI pre bed-rest, post bed-rest, recovery 14 and recovery 90. MRI measures of: Spinal length L1-S1, lordosis angle L1-S1, posterior and anterior disc height L1-S1, disc volume L1-S1, cross sectional area of Psoas, Lumbar Multfidus, Erector Spinae and Quadratus Lumborum muscles.
Belavy et al. (2012) BBR 1
Randomised controlled trial.
Twenty healthy males, aged 20-45 years, during 56 days of six degree head down tilt bed-rest.
One test group and one control group.
Test group (n=10) RVE sessions daily, lasting 5-10 minutes each.
Squat, heel raise, toe raise and explosive kicks (knee extension) with whole body vibration at 19-26Hz frequency and 4mm amplitude. Loaded to 1.2-1.9 times body weight.
Control group (n=10); no intervention during bed-rest
Electromyography of Erector Spinae, Internal and External Oblique, Gluteus Maximus and Lumbar Multifidus muscles. Specifically measured: lumbopelvic extensor-flexor co-contraction ratio, change in muscles tonic activity and extensor-flexor activity ratio.
Abbreviations: RVE; resistance vibration exercise, RE; resistance exercise, BBR; Berlin Bed-rest Study

72
2.3.2. Quality Scoring
A summary of the overall quality scores for all studies across all quality
assessments is presented in Table 2-4.
2.3.3. PEDro Scores
All studies failed to conceal group allocations and blind participants and
therapists. This made the highest score eight, which was attained by Belavy et
al. (2010), Belavy et al. (2008) and Hides et al. (2011). Cao et al. (2005), Holguin
et al. (2009) and Marcias et al. (2007) all failed to blind assessors, scoring seven.
Belavy et al. (2011) failed to take measures from at least 85% of participants and
did not perform intention to treat analysis, scoring six. Belavy et al. (2012) also
failed to take measures from at least 85% of participants and did not perform
intention to treat analysis, scoring five.
2.3.4. The Cochrane Collaboration Risk of Bias
All of the studies had at least one area where there was a high risk of bias
and were classed as having a high overall risk of bias. The risks were mostly
performance and measurement bias due to not concealing group allocation and
failing to blind participants and assessors. No papers reported a clear
randomisation method, despite saying that participants were randomised. The
overall risks were similar across all the studies except for Holguin et al. (2009)
which had high or unclear risks for all points except for selective reporting.
2.3.5. Bed-rest Methodological Quality
The study which satisfied most of the bed-rest methodology criteria was
Belavy et al. (2010), which only failed to clearly state if sunlight exposure was
prohibited. However, no studies clearly indicated fulfilling the sunlight criteria. All

73
the other studies scored between three and five except for Cao et al. (2005) which
only scored two, although for most criteria it was unclear if elements had been met
rather than definitely not met. While all studies indicated the days on which
measures were taken, none specified that the measures were taken at the same
time of day for all participants. While six-degree head down tilt bed-rest was
satisfied in 6 of the 8 studies, the protocols did allow participants to raise the head
on occasions, such as for eating. Two studies marked with asterisks in Table 2-4
specifically mentioned allowing participants to raise the head up to thirty degrees
for “daytime activities”.

74
Table 2-4 Results of all quality control assessments performed across all included studies, ticks show condition was met, crosses show condition not met, up arrows show high risk of bias, down arrows show low risk of bias, question marks show unclear result.
Bela
vy
et
al.
(201
0)
Bela
vy
et
al.
(200
8)
Bela
vy
et
al.
(201
1)
Bela
vy
et
al
(201
2)
Cao
et
al.
(20
05
)
Hid
es
et
al.
(20
11
)
Ho
lgu
in e
t
al.
(200
9)
Ma
rcia
s e
t
al.
(200
7)
PEDro criteria (short description)
Eligibility criteria specified
Random allocation
Concealed allocation
Similar baseline groups
Blinding of participants
Blinding of therapists
Blinding of assessors
Measures obtained from 85% of participants
All participants received treatment or intention to treat analysis performed
Between groups statistics
Point and variability measures
Total score 8 8 6 5 7 8 7 7
Risk of bias criteria (short description)
Random sequence generation ? ? ? ? ? ? ? ?
Allocation concealment ↑ ↑ ? ↑ ↑ ↑ ↑ ↑
Blinding of participants and assessors ↑ ↑ ↑ ↑ ↑ ↑ ↑ ↑
Blinding of outcome assessment ↓ ↓ ↓ ↑ ↑ ↓ ↑ ↑
Incomplete outcome data ↓ ↓ ? ? ↓ ↓ ↑ ↓
Selective reporting ↓ ↓ ↓ ↓ ↓ ↓ ↓ ↓
Total score ↑ ↑ ↑ ↑ ↑ ↑ ↑ ↑
Bed-rest criteria (short description)
Six degree head down tilt ?* ?*
Individualised and controlled diet ? ?
Set daily routine with fixed wake/seep time ? ? ? ? ? ?
Bed-rest phases standardised for all participants ?
Uninterrupted bed-rest except for test condition ? ? ? ? ?
Sunlight exposure prohibited ? ? ? ? ? ? ? ?
All measures taken same day and time ?
Bed-rest duration (days) 60 56 90 60 28 60 90 28
Total points met 6 4 3 5 2 5 3 2
*Participants were allowed to raise trunk to 30 degrees tilt during day activities

75
2.3.6. Lumbopelvic Changes Observed when no intervention used
The lumbopelvic changes that have been observed across the studies when
no intervention was used are listed in Table 2-5 for muscle changes and Table 2-6
for spinal morphology changes. This provides a reference for what can be
expected to occur in the lumbopelvic region of individuals exposed to axial
unloading simulation via bed-rest when countermeasure interventions are not
undertaken.

76
Table 2-5 - Lumbopelvic muscle changes reported across all studies, method of measure and observed change in inactive control groups
Change Measured Method of measure Reference(s) Change observed in controls
Multifdus muscle CSA at L1 MRI (% change) Belavy et al. (2010) Decrease 6% CSA at L2 MRI (% change) Belavy et al. (2010) Decrease 4% CSA at L3 MRI (% change) Belavy et al. (2010) Decrease 7% CSA at L4 MRI (% change) Belavy et al. (2010)
Belavy et al. (2008) Decrease 7% Decrease 21%
CSA at L5 MRI (% change) Belavy et al. (2010) Decrease 12.2% Volume at L1-S1 MRI (% change) Belavy et al. (2011) Decrease 10% Erector Spinae muscle CSA at L1 MRI (% change) Belavy et al. (2010) Decrease 13.2% CSA at L2 MRI (% change) Belavy et al. (2010) Decrease 11.3% CSA at L3 MRI (% change) Belavy et al. (2010) Decrease 9.6% CSA at L4 MRI (% change)
MRI (mm2 change) Belavy et al. (2010) Cao et al. (2005)
Decrease 8.8% Decrease 468mm2
CSA at L5 MRI (% change) Belavy et al. (2010) Decrease 8.4% Volume at L1-S1 MRI (% change) Belavy et al. (2011) Decrease 10% Max tonic activity change with lower limb movement. Lumbar region
EMG (%change) Belavy et al. (2012) Increase 15%*
Max tonic activity change with lower limb movement. Thoracic region
EMG (%change) Belavy et al. (2012) Increase 5%*
Psoas muscle CSA at L1 MRI (% change) Belavy et al. (2010) Increase 13% CSA at L2 MRI (% change) Belavy et al. (2010) Increase 7.5% CSA at L3 MRI (% change) Belavy et al. (2010) Increase 5% CSA at L4 MRI (% change) Belavy et al. (2010)
Belavy et al. (2008) Increase 3% Increase 7%
CSA at L5 MRI (% change) Belavy et al. (2010) Increase 1.2% Volume at L1-S1 MRI (% change) Belavy et al. (2011) Increase 2.5%* Quadratus Lumborum muscle CSA at L1 MRI (% change) Belavy et al. (2010) Decrease 5% CSA at L2 MRI (% change) Belavy et al. (2010) Decrease 6.3% CSA at L3 MRI (% change) Belavy et al. (2010) Decrease 11.7%

77
Change Measured Method of measure Reference(s) Change observed in controls
CSA at L4 MRI (% change) Belavy et al. (2010) Decease 8.9% Volume at L1-S1 MRI (% change) Belavy et al. (2011) Decrease 3%* EMG ratios Lumbopelvic extensor-flexor co-contraction EMG (%change) Belavy et al. (2012) Decrease 2.5%* Lumbopelvic extensor-flexor activity EMG (%change) Belavy et al. (2012) Increase 3%* Tonic activity Inferior Gluteus Maximus EMG (%change) Belavy et al. (2012) Decrease 14%* Internal Oblique EMG (%change) Belavy et al. (2012) Increase 7.5%* External Oblique EMG (%change) Belavy et al. (2012) Decrease 3.5%* Trunk strength Isokinetic extension dynamometer (%
change) Belavy et al. (2012) Decrease 34.9%
Isokinetic flexion dynamometer (% change)
Belavy et al. (2012) Decrease 9.6%
Lumbar strength at various flexion angles Nm Marcias et al. (2007) Decrease 32Nm
* - values of change were estimated from figures as raw data were not available. CSA: cross sectional area

78
Table 2-6 - Lumbopelvic spinal morphology changes reported across all studies, method of measure and observed change in inactive control groups
Change Measured Method of measure Reference(s) Change observed in controls
Lordosis angle
L1-S1 MRI (% change)
Belavy et al. (2010) Belavy et al. (2011) Cao et al. (2005)
Decrease 2.5% Increase 5.2% Decrease 3.3%
with 50% body weight load L1-S1 MRI(degrees) Marcias et al. (2007) No change
Lumbar spine compressibility with 50% body weight load L1-S1
MRI (mm) Marcias et al. (2007) Decrease 1mm
Intervertebral disc Volume L1-S1 pooled MRI (% change) Belavy et al. (2011)
Belavy et al. (2010) Increase 5% Increase 6%
Anterior-posterior diameter L1-S1 pooled MRI (% change) Belavy et al. (2011) Increase 0.2% Transverse diameter L1-S1 pooled MRI (% change) Belavy et al. (2011) Decrease 0.3% Axial CSA L1-S1 pooled MRI (% change) Belavy et al. (2011) Decrease 0.1% Sagittal CSA L1-S1 pooled MRI (% change)
MRI (mm2 change) Belavy et al. (2011) Belavy et al. (2008)
Increase 2.4% Increase 22mm2
Nuclei Pulposi volume L1L2 MRI (cm3 change) Holguin et al. (2009) Increase 0.4 cm3 Nuclei Pulposi volume L2L3 MRI (cm3 change) Holguin et al. (2009) Increase 0.8 cm3 Nuclei Pulposi volume L3L4 MRI (cm3 change) Holguin et al. (2009) Increase 1.6 cm3 Nuclei Pulposi volume L4L5 MRI (cm3 change) Holguin et al. (2009) Increase 1 cm3 Nuclei Pulposi volume L5S1 MRI (cm3 change) Holguin et al. (2009) Increase 1.1 cm3 Volume L1L2 MRI (cm3 change) Holguin et al. (2009) Increase 1 cm3 Volume L2L3 MRI (cm3 change) Holguin et al. (2009) Increase 1.9 cm3 Volume L3L4 MRI (cm3 change) Holguin et al. (2009) Increase 2.1 cm3 Volume L4L5 MRI (cm3 change) Holguin et al. (2009) Increase 2.4 cm3 Volume L5S1 MRI (cm3 change) Holguin et al. (2009) Increase 2.2 cm3 Convexity L1L2 MRI (10-1 change) Holguin et al. (2009) Decrease 1.4 10-1 Convexity L2L3 MRI (10-1 change) Holguin et al. (2009) Decrease 1.2 10-1 Convexity L3L4 MRI (10-1 change) Holguin et al. (2009) Decrease 0.8 10-1

79
Change Measured Method of measure Reference(s) Change observed in controls
Convexity L4L5 MRI (10-1 change) Holguin et al. (2009) Decrease 0.9 10-1 Convexity L5S1 MRI (10-1 change) Holguin et al. (2009) Decrease 1.3 10-1 Posterior height L1-S1 pooled MRI (% change)
Belavy et al. (2010) Belavy et al. (2011)
Increase 8.2% Increase 3%
Anterior height L1-S1 pooled MRI (% change) Belavy et al. (2010) Belavy et al. (2011)
Increase 4.6% Increase 6.1%
Spinal length between L1-S1 MRI (% change) Belavy et al. (2010) Belavy et al. (2008) Belavy et al. (2011) Holguin et al. (2009)
Increase 2.8% Increase 2.6%* Increase 1.2% Increase 5%

80
2.3.7. Outcomes assessed
Table 2-7 shows which interventions were tested for each outcome. The table
highlights the reason why decisions about which interventions were most effective
is difficult to reach based on current research. Very few interventions have been
consistently tested against the same outcomes. The only outcomes where good
comparability existed were lordosis angle, disc volume and spinal length. Overall
resistive vibration exercise (RVE) was the most frequently tested intervention,
although spinal mobility exercises and flywheel exercise were tested against the
most spinal morphology outcomes.

81
Table 2-7 Indication of which interventions were assessed against the various outcomes used across all studies
Outcomes RVE Flywheel Spinal mobs LBNP treadmill LMMS RE SMC Multifidus muscle CSA L1-L5 averaged Multifidus muscle CSA at L4 Multifidus muscle volume L1-S1 Erector Spinae muscle CSA L1-L5 averaged Erector Spinae muscle CSA at L4 Erector Spinae muscle volume L1-S1 Erector Spinae muscle lumbar tonic activity Erector Spinae muscle thoracic tonic activity Psoas muscle cross sectional area L1-L5 averaged Psoas muscle volume L1-S1 Quadratus Lumborum muscle CSA L1-L4 averaged
Quadratus Lumborum muscle volume L1-S1 Lumbopelvic extensor-flexor co-contraction Lumbopelvic extensor-flexor activity Inferior Gluteus muscle Maximus tonic activity External Oblique muscle tonic activity Internal Oblique muscle tonic activity Isokinetic strength trunk extension Isokinetic strength trunk flexion Lordosis angle L1-S1 Lordosis angle with 50% body weight Lumbar spine compressibility with 50% body weight Lumbar spine extension strength at various flexion angles IV disc volume L1-S1 IV disc anterior-posterior diameter L1-S1 IV disc transverse diameter L1-S1 IV disc axial CSA L1-S1 IV disc sagittal CSA L1-S1 IV disc nucleus pulposa volume L1-S1 averaged IV disc convexity L1-S1 averaged Posterior IV disc height Anterior IV disc height Spinal length L1-S1
RVE: resistive vibration exercise, RE: resistive exercise, IV: intervertebral, CSA: cross sectional area, L# and S# refer to lumbar and sacral spinal regions, LMMS: low magnitude mechanical stimulation, SMC: specific motor control.

82
2.3.8. Interventions and outcomes with magnitude based inference
results
There were six different countermeasures investigated during bed-rest in
seven of the studies, including RVE, RE, flywheel exercise, spinal mobility
exercises, LBNP treadmill and low magnitude mechanical signals (LMMS).
Details of the interventions and the prescriptions are in section 2.3.1 Table 2-3.
Resistance vibration exercise involved supine lower limb, close-chain exercise
with the feet placed on a suspended vibrating platform, with resistance generated
by elastics between the vibrating platform and a pelvic belt and shoulder straps
(Belavy et al. 2008; Belavy et al. 2012). Although initially developed as
countermeasure against bone loss during spaceflight, vibration stimulation as
used in both RVE and LMMS has been shown to improve lumbosacral
proprioception (Fontana, Richardson and Stanton 2005) and promote a tonic
vibration reflex in muscles subjected to the stimulation (Ribot-Cisca, Butler and
Thomas 2003). The RE was the same as the RVE but without the vibrating
platform (Belavy et al. 2010). Resistive loading between feet and shoulder straps
in RVE and RE was expected to load the spine axially (Belavy et al. 2012) and
may be part of the mechanism for preventing changes that occur during axial
unloading.
Supine LBNP treadmill training resulted in cardiovascular demands, and
produced ground reaction forces, similar to upright walking (Boda et al. 2000).
One body weight ground reaction force is produced during the treadmill exercise
by combination of the LBNP suction around an elastic waist seal and axial loading
from shoulder straps attached to the waist seal (Cao et al. 2005). It was
hypothesised that loading during the exercise may maintain spinal curvature and
muscle strength (Marcias et al. 2007).

83
The flywheel exercise device was developed to provide resistance during
lower limb, knee extension based exercises, in microgravity, using the inertia of a
rotating flywheel (Alkner and Tesch 2004). Exercise on the flywheel device
involves resting on a backrest attached with wheels to a fixed girder. Shoulders
and hips are kept in place using pads, handles and a waist belt, while the feet are
attached to a footplate. A band attaches the backrest to the flywheel which is
located by the footplate. Inertia from the flywheel resists moving into knee
extension while pushing down on the footplate, followed by the returning to a
flexed knee position while resisting the inertia force pulling the backrest back to
the start position (Alkner and Tesch 2004). While this is a lower limb global
exercise device, it was hypothesised that this type of exercise would also produce
axial loading and reduce spinal extensor muscle atrophy (Belavy et al. 2011).
Spinal mobility exercises involved low-load spinal movements intended to
reduce LBP. The movements were initiated and controlled by the participants
independently and involved active slow, large amplitude and low load spinal
movements in the frontal, sagittal and longitudinal plane, five times daily (Belavy
et al. 2011).
One study (Hides et al. 2011) examined the effects of post bed-rest
rehabilitation on recovery, comparing two types of intervention: SMC rehabilitation
and TFS rehabilitation. Specific motor control was designed to restore lumbar
spine intersegmental control and normal lordotic posture, targeting LM, TrA and
spinal extensor muscles, whereas TFS was a general strengthening programme
for the superficial trunk muscles (Hides et al. 2011).
In Tables 2-8 and 2-9 the data source is included as a reference number to
allow effects to be considered with the quality score of the corresponding paper.
84
The reference numbering system used is as follows: 1= Belavy et al. (2010), 2 =
Belavy et al. (2008), 3 = Hides et al. (2011), 4= Belavy et al. (2011), 5= Cao et al.
(2005). 6 = Belavy et al. (2012) 7= Marcias et al. (2007) and 8 = Holguin et al.
(2009).
2.3.9. Effect of countermeasures on muscle changes
Table 2-8 shows the effects of all muscle related changes assessed across all
eight studies.
Resistance vibration exercise had training effects for tonic activity in the
lumbar Erector Spinae muscle, Lumbopelvic extensor-flexor co-contraction ratio,
Lumbopelvic extensor-flexor activity ratio and External Oblique muscle tonic
activity. The intervention was able to partially protect LM muscle CSA L1-L5,
Erector Spinae muscle CSA L1-L5, Quadratus Lumborum muscle CSA L1-L4,
Inferior Gluteus Maximus muscle tonic activity and Internal Oblique muscle tonic
activity. The RVE programme worsened Erector Spinae muscle thoracic tonic
activity and Psoas CSA L1-L5.
Flywheel exercise had no observed training effects, partially protected LM
muscle volume L1-S1, Erector Spinae muscle volume L1-S1, Psoas muscle
volume L1-S1 and Isokinetic trunk extension strength. The intervention worsened
Quadratus Lumborum muscle volume L1-S1 and Isokinetic strength trunk flexion.
Spinal mobility exercises had no observed training effects. It partially
protected LM muscle volume L1-S1, Psoas muscle volume L1-S1 (although it is
unclear what the true effect is), isokinetic trunk extension strength and isokinetic
trunk flexion strength. It worsened Erector Spinae muscle volume L1-S1 and
Quadratus Lumborum muscle volume L1-S1.

85
Lower body negative pressure treadmill was only tested for one muscle
change and was able to partially protect Erector Spinae muscle CSA at L4.
Resistance exercise had no observed training effects, partially protected
Multifidus muscle CSA L1-S1, Erector Spinae muscle CSA L1-S1 and Quadratus
Lumborum muscle CSA L1-L4, and worsened Psoas muscle CSA L1-L5.

86
Table 2-8 Effects of interventions on muscle changes showing direction of change with no interventions, intervention effect size, probability of true effect and the raw change in the intervention group expressed as a percentage of the control group indicating how far off baseline the intervention group was in relation to controls.
n
Increase/ decrease in inactive controls
Effect size ±90% CI
Probability of true effect being mechanistically (±SD when pooled)
% recovered off baseline
Small Moderate (±SD when pooled)
Resistance Vibration Exercise
Multifidus muscle CSA L1-L5 pooled 16 ↓ 0.9±0.8 1 86.8±18.2%↑ 80.3±15.8%↑ -36±30%
Multifidus muscle CSA at L4 19 ↓ 2.7±1.0 2 100%↑ 100%↑ -30%
Erector Spinae muscle CSA L1-L5 pooled
16 ↓ 0.6±0.9 1 86±9.5 %↑ 77.1±13.4%↑ -65±14%
Erector Spinae muscle lumbar tonic activity
20 ↑ -2.9±1.1 6 100%↓ 100%↓ +20% (training)
Erector Spinae muscle thoracic tonic activity
20 ↑ 0.6±0.8 6 89.2%↑ 80.5%↑ -220%
Psoas muscle cross sectional area L1-L5 pooled
16 ↑ 0.7±0.9 1 89.5±19.3%↑ 84.9±24.9%↑ -280±144%
Quadratus Lumborum muscle CSA L1-L4 pooled
16 ↓ 0.7±0.9 1 85.3±17.5%↑ 78±23.9%↑ -31±21%
Lumbopelvic extensor-flexor co-contraction
20 ↓ 4.3±1.3 6 100%↑ 100%↑ +80% (training)
Lumbopelvic extensor-flexor activity 20 ↑ -3.0±1.0 6 100%↓ 100%↓ +433% (training)
Inferior Gluteus Maximus muscle tonic activity
20 ↓ 2.6±1.0 6 100%↑ 100%↑ -3.60%
External Oblique muscle tonic activity 20 ↓ 2.7±1.0 6 100%↑ 100%↑ +200% (training)
Internal Oblique muscle tonic activity 20 ↑ -1.1±0.8 6 98.7%↓ 97.1%↓ -13%
Flywheel Exercise
Multifidus muscle volume L1-S1 17 ↓ 0.3±0.8 4 68.1%↑ 52.8%↑ -80%
Erector Spinae muscle volume L1-S1 17 ↓ 0.4±0.8 4 71.2%↑ 56.7%↑ -70%
Psoas muscle volume L1-S1 17 ↑ -0.3±0.8 4 68.2%↓ 53.1%↓ -40%
Quadratus Lumborum volume L1-S1 17 ↑ -0.2±0.8 4 61.3%↓ 46.5%↓ -183%
Isokinetic strength trunk extension 17 ↓ 0.2±0.8 4 58.1%↑ 42.9%↑ -80%

87
Isokinetic strength trunk flexion 17 ↓ -1.0±0.8 4 96%↓ 92%↓ -184%
Spinal mobility exercises
Multifidus muscle volume L1-S1 16 ↓ 0.3±0.8 4 67.1%↑ 52.5%↑ -85%
Erector Spinae muscle volume L1-S1 16 ↓ -0.1±0.8 4 48.3%↓ 32.1%↓ -110%
Psoas muscle volume L1-S1 16
0.0±0.8 4 Unclear Unclear -96%
Quadratus Lumborum muscle volume L1-S1
16 ↓ -0.4±0.8 4 72.4%↓ 59.4%↓ -250%
Isokinetic strength trunk extension 16 ↓ 0.4±0.8 4 70.3%↑ 56.5%↑ -60%
Isokinetic strength trunk flexion 16 ↓ 1.1±0.9 4 97%↑ 94%↑ -14%
Lower Body Negative Pressure Treadmill
Erector Spinae muscle CSA at L4 24 ↓ 1.0±0.8 5 97.5%↑ 94.7%↑ -79.49±14%
Resistance Exercise
Multifidus muscle CSA L1-L5 pooled 16 ↓ 0.6±0.8 1 80.3±15.8%↑ 70.3±21.8%↑ -56±15%
Erector Spinae muscle CSA L1-L5 pooled
16 ↓ 1.3±0.9 1 98.2±1.3%↑ 96.2±2.6%↑ -33±16%
Psoas muscle cross sectional area L1-L5 pooled
16 ↑ 0.5±0.8 1 84±33.3%↑ 81.2±37.3%↑ -257±172%
Quadratus Lumborum muscle CSA L1-L4 pooled
16 ↓ 1.0±0.8 1 93±9%↑ 88.1±14%↑ -6±6%

88
Figures 2-3 and 2-4 show the effect size and 90% confidence interval for the
interventions assessed with muscle related outcomes. Where two interventions
were assessed against the same outcome, the effect sizes are plotted adjacent to
allow comparison. Minimal mechanistic worthwhile change ranges of 0.2 and 0.6
for at least small and moderate sized effects respectively are shown.
Resistance vibration exercise had a larger effect than RE for protecting LM
and Psoas muscle CSA. However, RE had a larger effect than RVE for lumbar
Erector Spinae and Quadratus Lumborum muscle CSA. Resistance vibration
exercise also had large effect sizes for protecting against changes in LM muscle
CSA at L4, lumbopelvic extensor-flexor co-contraction and activity ratio, inferior
Gluteus Maximus, internal and External Oblique and lumbar Erector Spinae
muscle tonic activities, but no data exists to compare these effects with other
interventions. Flywheel and spinal mobility exercises showed very similar effects
which were either small or unclear, except for spinal mobility exercises which was
more effective and had moderate effect size for protecting isokinetic trunk flexion
strength. Resistance vibration exercise and RE both worsened Psoas muscle
CSA changes in the lumbar region and there was little difference between them in
the size of this effect. Lower body negative pressure treadmill training had a
similar sized effect for protecting Erector Spinae muscle CSA at L4 as RVE and
RE did between L1 and S1.
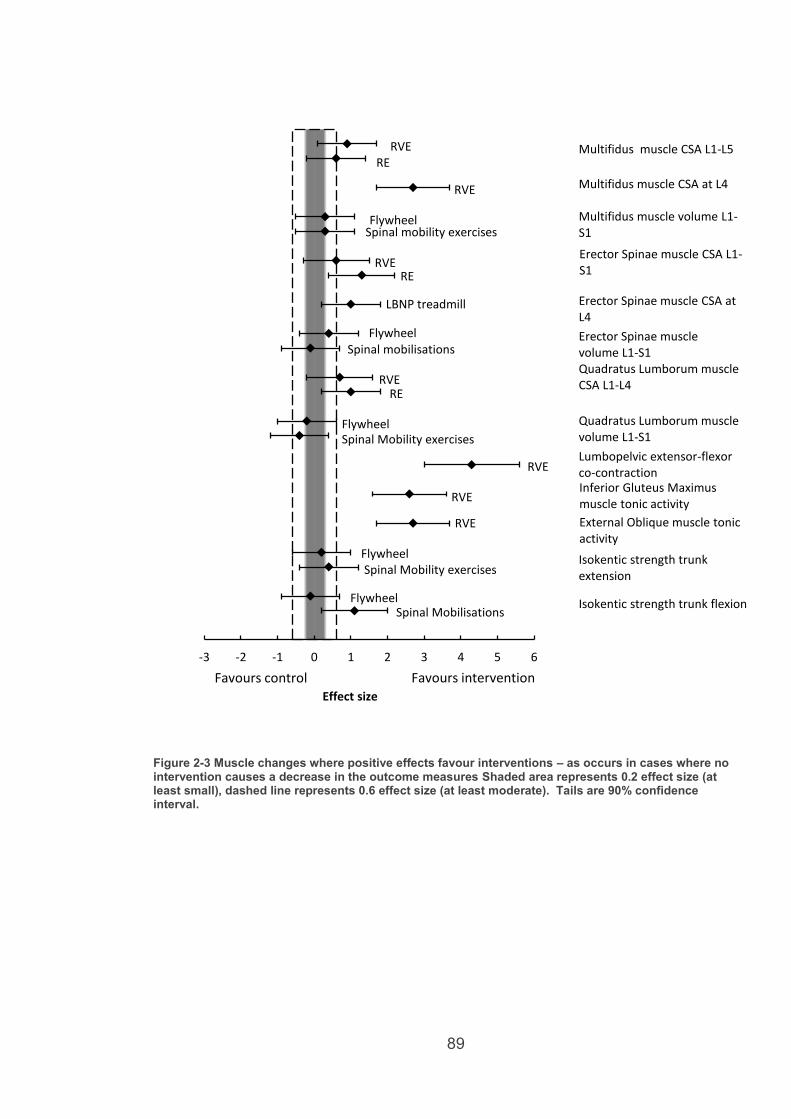
89
Figure 2-3 Muscle changes where positive effects favour interventions – as occurs in cases where no intervention causes a decrease in the outcome measures Shaded area represents 0.2 effect size (at least small), dashed line represents 0.6 effect size (at least moderate). Tails are 90% confidence interval.
-3 -2 -1 0 1 2 3 4 5 6
Effect size
Favours intervention Favours control
Multifidus muscle CSA L1-L5 RVE RE
Multifidus muscle CSA at L4 RVE
Multifidus muscle volume L1-S1
Flywheel Spinal mobility exercises
Erector Spinae muscle CSA L1-S1
RVE RE
Erector Spinae muscle CSA at L4
LBNP treadmill
Flywheel Spinal mobilisations
Erector Spinae muscle volume L1-S1 Quadratus Lumborum muscle CSA L1-L4 RVE
RE
Quadratus Lumborum muscle volume L1-S1
Flywheel Spinal Mobility exercises
Lumbopelvic extensor-flexor co-contraction Inferior Gluteus Maximus muscle tonic activity
RVE
RVE
External Oblique muscle tonic activity
RVE
Isokentic strength trunk extension
Flywheel Spinal Mobility exercises
Isokentic strength trunk flexion Flywheel Spinal Mobilisations

90
Figure 2-4 Muscle changes where negative effect favours intervention – as occurs in cases where no intervention causes an increase in the outcome measures. Shaded area represents 0.2 effect size (at least small), dashed line represents 0.6 effect size (at least moderate). Tails are 90% confidence interval.
-4 -3 -2 -1 0 1 2 3
Effect size
Favours intervention Favours control
RVE
Flywheel
RVE
Lumbo-pelvic extensor-flexor activity
RVE
Internal Oblique muscle tonic activity
RVE
Erector Spinae muscle lumbar tonic activity
RVE
Psoas muscle volume L1-S1
RVE Erector Spinae muscle thoracic tonic activity
Spinal Mobiliity exercises
Psoas muscle CSA L1-L5 RE
RVE
RVE

91
2.3.10. Effect of countermeasures on spinal morphology
changes
Table 2-9 shows the effects of interventions on spinal morphology changes
across all studies. For spinal morphology the word intervertebral is abbreviated to
IV.
Resistance vibration exercise did not have any training effect. It partially
protected IV disc volume L1-S1, IV disc sagittal CSA L1-S1, Posterior IV disc
height L1-S1 and Spinal length L1-S1. It failed to prevent, and worsened,
Lordosis angle L1-S1 and Anterior IV disc height L1-S1.
Flywheel exercise had training effects for IV disc anterior-posterior diameter
L1-S1 and IV disc sagittal CSA L1-S1. It partially protected anterior IV disc height
L1-S1 and lordosis angle and worsened IV disc transverse diameter L1-S1, IV
disc axial CSA L1-S1, Posterior IV disc height L1-S1 and Spinal length L1-S1.
Spinal mobility exercises had training effects for IV disc anterior-posterior
diameter L1-S1 and IV disc sagittal CSA L1-S1. The intervention partially
protected IV disc volume L1-S1 and Anterior IV disc height L1-S1, and worsened
lordosis angle L1-S1, IV disc transverse diameter L1-S1, IV disc axial CSA L1-S1,
Posterior IV disc height L1-S1 and Spinal Length L1-S1.
Lower body negative pressure treadmill had training effects for lumbar
spine compressibility with 50% body weight and partially protected lordosis angle
L1-S1, lumbar spine extension strength at various flexion angles and spinal length
L1-S1.

92
Low magnitude mechanical signals had no observed training effects and
partially protected IV disc volume L1-S1, IV disc nuclei pulposi volume L1-S1, IV
disc convexity L1-S1 and spinal length L1-S1.
Resistance exercise had no observed training effects. The intervention was
able to partially protect lordosis angle L1-S1, posterior IV disc height L1-S1,
anterior IV disc height L1-S1 and spinal length L1-S1, and worsened IV disc
volume L1-S1.

93
Table 2-9 Effects of interventions on spinal morphology change
n Increase/
decrease in inactive controls
Effect size ±90% CI
Probability of true effect being mechanistically
% recovery off baseline
Small Moderate
Resistance Vibration Exercise
Lordosis angle L1-S1 16 ↓ -0.1±0.8 1 52.7%↓ 37.5%↓ -124%
IV disc volume L1-S1 16 ↑ -0.36±0.8 1 71%↓ 56.6%↓ -73%
IV disc sagittal CSA L1-S1 19 ↑ -2.9±1.1 2 100%↓ 100%↓ -9%
Posterior IV disc height L1-S1 16 ↑ -0.1±0.8 1 52.1%↓ 37.1%↓ 95%
Anterior IV disc height L1-S1 16 ↑ 0.4±0.8 1 75.2%↑ 61.5%↑ -126%
Spinal length L1-S1 16 ↑ -1.1±0.91 81.5±26.1%↓ 73.8±37%↓ -60±41%
Flywheel Exercise
Lordosis angle L1-S1 17 ↑ -0.2±0.8 4 57.3%↓ 41.8%↓ -62%
IV disc volume L1-S1 17 ↑ -0.5±0.8 4 79.2%↓ 66.4%↓ -56.%
IV disc anterior-posterior diameter L1-S1 17
↑ -1.4±0.9 4 99.2%↓ 85.5%↓ +550% (training)
IV disc transverse diameter L1-S1 17 ↓ -1.8±0.9 4 99.9%↓ 99.8%↓ -600%
IV disc axial CSA L1-S1 17 ↓ -1.9±1.0 4 99.9%↓ 93.9%↓ -2900%
IV disc sagittal CSA L1-S1 17
↑ -1.0±0.9 4 95.8%↓ 91.6%↓ +117% (training)
Posterior IV disc height L1-S1 17 ↑ 0.7±0.8 4 88.5%↑ 79.6%↑ -260%
Anterior IV disc height L1-S1 17 ↑ -0.2±0.8 4 56.2%↓ 40.6%↓ -87%
Spinal length L1-S1 17 ↑ 0.1±0.8 4 51%↑ 36%↑ -108%
Spinal mobility exercises
Lordosis angle L1-S1 16 ↑ 0.4±0.8 4 71.2%↑ 57%↑ -171%
IV disc volume L1-S1 16 ↑ -0.1±0.8 4 51.1%↓ 36.1%↓ -92%
IV disc anterior-posterior diameter L1-S1 16
↑ -0.6±0.9 4 98.3%↓ 75.5%↓ +200% (training)
IV disc transverse diameter L1-S1 16 ↓ -1.8±1.0 4 99.7%↓ 99.6%↓ -600%
IV disc axial CSA L1-S1 16 ↓ -0.9±0.9 4 99.8%↓ 88.2%↓ -1400%

94
IV disc sagittal CSA L1-S1 16
↑ -0.7±0.9 4 87%↓ 78.1%↓ +33% (training)
Posterior IV disc height L1-S1 16 ↑ 0.9±0.9 4 93.6%↑ 88.1%↑ -283%
Anterior IV disc height L1-S1 16 ↑ -0.2±0.8 4 60.6%↓ 46.1%↓ -85%
Spinal length L1-S1 16 ↑ 0.2±0.8 4 53.9%↑ 37.8%↑ -117%
Lower Body Negative Pressure Treadmill
Lordosis angle L1-S1 24 ↓ 1.2±0.7 5 99.4%↑ 98.7%↑ -58%
Lordosis angle with 50% body weight
30
- -0.7±0.7 7 95.1%↓ 90%↓
No change in inactive bed-rest to compare
Lumbar spine compressibility with 50% body weight
30 ↓ 3.2±0.9 7 100%↑ 100%↑
+20% (training)
Lumbar spine extension strength at various flexion angles
30 ↓ 1.4±0.7 7 99.9%↑ 99.8%↑ -28%
Spinal length L1-S1 24 ↑ -2.7±0.95 100%↓ 100%↓ -65%
Low Magnitude Mechanical Signals
IV disc volume L1-S1 24
↑ -0.1±0.7 8 51±8.21%↓ 34.6±6.2%↓ -82.1±18.4%
IV disc nucleusi pulposi volume L1-S1 pooled
24 ↑ At L1, 2, 4 0.1±0.7 8
At L1, 2, 4 47.5±5%↑
At L1, 2, 4 32.1±6%↑
-90±54%
At L3, 5 -0.3±0.7 8
At L3, 5 66.9±12%↓
At L3, 5 49.5±11%↓
IV disc convexity L1-S1 pooled 24 ↓ 1.2±0.8 8 96.8±3.5%↑ 92.8±7.2%↑ -10±25% Spinal length L1-S1 24 ↑ -0.3±0.78 66.5%↓ 48.9%↓ -58%
Resistance Exercise
Lordosis angle L1-S1 16 ↓ 0.1±0.8 1 50.9%↑ 35.3%↑ -76%
IV disc volume L1-S1 16 ↑ 0.1±0.8 1 47.5%↑ 32.1%↑ -104%
Posterior IV disc height L1-S1 16 ↑ -0.1±0.8 1 52.1%↓ 36.8%↓ -95%
Anterior IV disc height L1-S1 16 ↑ -0.1±0.8 1 54.8%↓ 39.3%↓ -91% Spinal length L1-S1 24 ↑ -0.6±0.8 85.7%↓ 75.5%↓ -75%

95
Figures 2-5 and 2-6 show the effect size and 90% confidence interval for the
interventions tested against spinal morphology related outcomes. As with muscle
changes, where two interventions were assessed against the same outcome, the
effect sizes are plotted adjacent to allow comparison. Minimal mechanistic
worthwhile change thresholds of 0.2 and 0.6 for at least small and moderate sized
effects, respectively, are shown.
Resistance vibration exercise, flywheel, spinal mobility exercises, LMMS and
RE were all assessed for protecting lumbar IV disc volume in the lumbar spine.
Only RVE and Flywheel had clear, but small, effects for protecting this (Figure 2-
5). Flywheel had a larger effect than spinal mobility exercises protecting lumbar
IV disc anterior-posterior diameter. Resistance vibration exercise was clearly
more effective than either flywheel or spinal mobility exercises for protecting
lumbar IV disc sagittal CSA. The effect of RVE and RE in protecting lumbar IV
disc posterior height was unclear, however, flywheel and spinal mobility exercises
had small worsening effects. Flywheel, spinal mobility exercises and RE had no
clear effect on lumbar IV disc anterior height, whereas RVE had a small
worsening effect (Figure 6). Lower body negative pressure treadmill had a large
effect preventing spinal length increase in the lumbar spine and was clearly more
effective than RVE, flywheel, spinal mobility exercises, LMMS and RE.
Resistance vibration exercise, LMMS and RE had small effects for preventing
spinal length with RVE being slightly more effective than RE, and LMMS.
Flywheel and spinal mobility exercises had no clear effect for preventing lumbar
spinal length increase. Flywheel and spinal mobility exercises both made lumbar
IV disc transverse diameter and axial CSA worse.
Lordosis angle appears on both figures showing both positive and negative
effect sizes as favouring the interventions. This is due to a conflicting finding from

96
Belavy at al. (2011) of lordosis angle increasing in bed-rest, whereas all other
studies found it to decrease.
Figure 2-5 Spinal morphology changes where negative effects favour interventions – as occurs in cases where no intervention causes a increase in the outcome measures. Shaded area represents 0.2 effect size (at least small), dashed line represents 0.6 effect size (at least moderate). Tails are 90% confidence interval
-4 -3 -2 -1 0 1 2 3
Effect size
Favours intervention Favours control
IV disc volume L1-S1
RVE
IV disc NP volume L1-S1
RVE
IV disc AP diameter L1-S1 Flywheel Spinal mobility exercises
IV disc sagittal CSA L1-S1 RVE Flywheel
IV disc posterior height L1-S1
RE
Spinal length L1-S1
LMMS
Flywheel Spinal mobility exercises
LMMS RE
Spinal mobility exercises
LMMS L1, 2, 4
Flywheel Spinal mobility exercises
IV disc anterior height L1-S1
RVE
RE
Flywheel Spinal mobility exercises
RVE
RE
Flywheel Spinal mobility exercises
LBNP treadmill
LMMS L3, 5

97
Figure 2-6 Spinal morphology changes where positive effects favour interventions – as occurs in cases where no intervention causes a decrease in the outcome measures. Shaded area represents 0.2 effect size (at least small), dashed line represents 0.6 effect size (at least moderate). Tails are 90% confidence interval
-4 -3 -2 -1 0 1 2 3
Effect size
Favours intervention Favours control
IV disc transverse diameter L1-S1
IV disc axial CSA L1-S1
Flywheel
IV disc convexity L1-S1 LMMS
Spinal mobility exercises
Spinal mobility exercises
Flywheel
Lordosis angle
RVE
Flywheel
Spinal mobility exercises
LBNP treadmill

98
2.3.11. Effect of rehabilitation on muscle and spinal
morphology changes
Table 2-10 shows the effects of the rehabilitation interventions on muscle and
spinal morphology changes in the one included rehabilitation study. Specific
motor control exercise was compared with TFS as a control group for calculating
effect sizes.
Specific motor control had a training effect for Erector Spinae muscle CSA at
L5 only, was able to partially protect against changes in LM muscle CSA L1-L5,
Erector Spinae muscle CSA L1-L4, Psoas muscle CSA L1-L5, lordosis angle L1-
S1, Posterior IV height L1-S1 and spinal length L1-S1. It caused no change in
anterior IV disc height L1-S1. It had a worsening effect on change in Quadratus
Lumborum muscle CSA L1-L4.
Trunk and general strengthening had a training effect for LM muscle CSA
L1-L5 and Erector Spinae muscle CSA L1-L5 and fully protected lordosis angle
L1-S1. It was able to partially protect against changes in Psoas muscle CSA L1-
L5, Quadratus Lumborum muscle CSA L1-L4, IV disc volume L1-S1, posterior IV
disc height L1-S1, anterior disc height L1-S1 and spinal length L1-S1.

99
Table 2-10 – Effects of rehabilitation interventions on muscle and spinal morphology changes
n Direction of change in bed-rest
Effect size of SMC vs TFS ±90% CI
Probability of true effect being mechanistically % recovery off baseline
Small Moderate SMC TFS
Multifidus muscle CSA L1-L5 pooled
21 ↓ -1.4±0.8 3 52.7%↓ 37.5%↓ -6±17% +70% (training)
Erector Spinae muscle CSA L1-L5 pooled
21 ↓ L1-L4 pooled -0.2±0.7 3
L5: 0.1±0.7 3
L1-L4 pooled 74.6±25%↓ L5: 55.2%↑
L1-L4 pooled 64.8±33%↓ L5: 39.7%↑
L1-L4: -19±6% L5: +59% (training)
L1-L4: +7±11% (training) L5: +29% (training)
Psoas muscle CSA L1-L5 pooled
21 ↑ L1-L2: -0.5±0.7 3 L3-L5: 0.5±0.7 3
L1-L2: 80±17.2%↓ L3-L5: 86.4±3.7%↑
L1-L2: 85.2±22.8%↓ L3-L5: 76.1±5.5%↑
L1-L2: 0±1% L3-L5 -32±4%
L1-L2: -55±55% L3-L5 -1±26%
Quadratus Lumborum muscle CSA L1-L4 pooled
21 ↓ -0.5±0.7 3 74.5±21.8%↓ 63.5±26.5%↓ -110±40% -10±134%
Lordosis angle L1-S1 21 ↓ -0.3±0.7 3 68.6%↓ 53.4%↓ -28% +0% (fully protected)
IV disc volume L1-S1 21 ↑ 0.7±0.7 3 90.4%↑ 82.7%↑ -100% -67%
Posterior IV disc height L1-S1
21 ↑ 0.8±0.7 3 93.5%↓ 87.5%↓ -40% -67%
Anterior IV disc height L1-S1
21 ↑ 0.0±0.7 3 50%↓↑ 50%↓↑ -100% -57%
Spinal length L1-S1 21 ↑ -0.1±0.7 3 50.5%↓ 35%↓ -43% -44%
100
The effect sizes show SMC exercises were more effective at rehabilitating
changes in Erector Spinae muscle CSA but only at the L5 level, Psoas muscle
CSA at the L3, L4 and L5 levels and Posterior IV disc height L1-S1. TFS was
more effective for rehabilitating changes in LM muscle CSA L1-L5, Erector Spinae
muscle CSA at the L1-L4 levels, Psoas muscle CSA at the L1 and L2 levels,
Quadratus Lumborum muscle CSA L1-L4, Lordosis angle L1-S1 and IV disc
volume L1-S1. It was unclear which intervention was more effective at preventing
anterior IV disc height and spinal length increases from the effect sizes; both
interventions partially protected spinal length to a similar percentage of baseline,
however SMC left anterior disc height unchanged whereas TFS took it back to
around 57% off the pre bed-rest baseline. Figures 2-7 and 2-8 show these effect
sizes graphically.

101
Figure 2-7 Specific motor control rehab vs trunk and general strengthening (control). Shaded area represents 0.2 effect size (at least small), dashed line represents 0.6 effect size (at least moderate). Tails are 90% confidence interval
Figure 2-8 Specific motor control rehab vs trunk and general strengthening (control). Shaded area represents 0.2 effect size (at least small), dashed line represents 0.6 effect size (at least moderate). Tails are 90% confidence interval
-2 -1 0 1 2
Effect size
Psoas muscle CSA L1-L2
IV disc posterior height L1-S1
IV disc volume L1-S1
IV disc anterior height L1-S1
Spinal length L1-S1
Favours intervention Favours control
Psoas muscle CSA L3-L5
-2.5 -1.5 -0.5 0.5 1.5 2.5Effect size
Multifidus muscle CSA L1-L2
Quadratus Lumborum muscle CSA L1-L4
Erector Spinae muscle CSA L5
Lordosis angle
Favours intervention Favours control
Erector Spinae muscle CSA L1-L4

102
2.4. Discussion
Only bed-rest spaceflight analogue studies were found for inclusion. Of the
eight included studies, seven considered during bed-rest countermeasures and
one studied post bed-rest rehabilitation.
2.4.1. Lumbopelvic changes expected with no treatment
The lumbopelvic changes occurring in response to spaceflight simulation via
bed-rest without countermeasures, across the included studies, are reported.
Lumbar Multifidus, Erector Spinae and Quadratus Lumborum muscles all reduce
in size, while the Psoas muscle increases. Inferior Gluteus Maximus and External
Oblique muscle activity decreases while Internal Oblique activity increases. Trunk
isokinetic strength decreases in flexion and extension movements. Trunk
extensor activity and extensor-flexor co-contraction ratio both decrease. Postural
changes include reduced lumbar lordosis angle (one study, (Belavy et al. 2011)
conflicts with this finding) and increased spinal length. The IV discs are affected,
increasing in volume, height and sagittal CSA while losing convexity, axial CSA
and transverse diameter. These findings agree with those reported previously by
Sayson and Hargens (2008), Gernand (2004) and Buckey (2006). The full list of
quantified changes reported in this study may be used by future clinical trials,
assessing the same outcomes, for comparison of treatment group results.
2.4.2. Interventions and effectiveness
The full list of interventions and details is available in Table 2-3. No
countermeasure was able to prevent all lumbopelvic changes.
2.4.3. Countermeasures – muscle changes
The most effective countermeasure appeared to be RVE, being the only one to
have training effects, increasing External Oblique and Lumbar Erector Spinae

103
muscle tonic activity during lower limb movements. Resistance vibration exercise
also had larger effect sizes compared with RE for protecting against decreases in
the size of the LM muscle. Resistance exercse alone had slightly larger effects
than RVE for preventing decreases in Quadratus Lumborum and Lumbar Erector
Spinae muscle CSA. However, preventing LM muscle atrophy may be
considered more important for mitigating spinal pain and damage risk as this
muscle has been linked to LBP and injury (Hides et al. 1994; Hides et al. 2008;
Bergmark 1989; Panjabi 2003). Flywheel and spinal mobility exercises had small
or unclear effect sizes for protecting against all muscle changes for which they
were assessed, except for spinal mobility exercises partially preventing trunk
flexion strength loss. Spinal mobilisation’s effect on trunk strength may have been
a result of the nature in which the spinal mobility exercises were performed, being
large amplitude active spinal movements in three planes (Belavy et al. 2011).
Lower body negative pressure treadmill was only trialled for preventing decreases
in Erector Spinae muscle CSA at L4, for which it had a moderate effect. However,
as stated, Erector Spinae muscle CSA may not be as relevant to lumbopelvic
injury and pain prevention as LM muscle atrophy. While RVE appears to be the
most effective countermeasure for protecting against muscle changes, both RVE
and RE can, however, cause further increases in Psoas muscle CSA, and RVE
can cause additional increases in thoracic Erector Spinae muscle activity, all
above the magnitude of change seen with no treatment. Psoas muscle
hypertrophy may increase imbalances in the trunk flexion-extension strength ratio
with greater flexion bias. Hypertrophy of the lumbopelvic flexors coupled with
atrophy of the lumbopelvic extensors has been reported during inactive axial
unloading simulation via bed-rest (Belavy, et al., 2008), and such an imbalance
has been linked as a risk factor in LBP terrestrially (Lee et al. 1999).

104
Resistance vibration exercise was assessed against 12 out of 19 muscle
outcomes compared with four for spinal mobility exercises and flywheel and only
one for LBNP treadmill. Lack of direct intervention comparability limits the quality
of comparison conclusions.
2.4.3.1. Countermeasures - spinal morphology changes
Lower body negative pressure treadmill exercise appeared to be most
successful in protecting against spinal morphology changes as it was the only
intervention able to fully prevent loss of lumbar lordosis and increased spinal
length. Chronic and maintained increased spinal length may be particularly
relevant to injury and pain risk, having been linked to disc degeneration through
interruption of the diurnal cycle of disc compression and expansion (Sayson and
Hargens 2008). A diurnal disc cycle is needed for normal fluid and nutrition
turnover observed during typical terrestrial sleep-wake/loading-unloading cycles,
which become disrupted in bed-rest and spaceflight (Sayson and Hargens 2008;
Johnston et al. 2010; Belavy et al. 2015). Decreased lordosis angle may also be
a key outcome, as prolonged periods of flexed lumbar posture have been linked to
tissue creep in discs and posterior spinal ligaments and disc prolapse on
subsequent axial loading (Adams and Hutton 1982). However, LBNP treadmill
has not been assessed for preventing any intervertebral disc changes specifically.
Prolonged increases in disc volume due to lack of axially loaded compression
periods are also considered to be a key risk factor for disc degeneration (Sayson
and Hargens 2008). Moreover, Adams and Hutton (1982) have suggested that
the differences in anterior and posterior disc heights may be relevant to both lack
of compression periods and prolonged flexion postures causing tissue creep.
Assessing LBNP treadmill against these outcomes would be useful to further
assess its effectiveness.

105
Resistance vibration exercise was found to be partially effective for preventing
increases in lumbar disc volume and spinal length. While it further increased the
loss of lumbar lordosis, it simultaneously further increased anterior disc height,
over the amount of change seen with no intervention. While increasing anterior
disc height may be useful for reducing the posterior tissue creep caused by
prolonged flexed posture, increased loss of lumbar lordosis could be an
aggravating factor for posterior tissue creep, therefore maintaining stress on the
IV discs. Consequently, these conflicting results leave the effectiveness of
resistance vibration exercise on spinal morphology unclear and potentially
questionable. Low magnitude mechanical signals, partially protected lordosis
angle, spinal length and disc volume. However, the LMMS effect sizes were very
small and sometimes unclear, resulting in low effectiveness compared with RE
and RVE. Resistance exercise partially protected lordosis angle, spinal length
and anterior and posterior disc heights, however it worsened disc volume and its
protective effects were all small, being potentially mechanistically trivial, and less
than RVE for protecting spinal length.
Exercise on the flywheel apparatus and spinal mobility exercises were able to
fully prevent some of the disc area and diameter changes. They both resulted in
increased spinal length and posterior disc height compared to controls, which
could increase risks of disc damage. Flywheel exercise was able to reduce
anterior disc height, however, it increased posterior disc height, possibly due to
the flexed posture adopted in the exercise. Considering that flexed postures have
been linked to tissue creep and disc prolapse (Adams and Hutton 1982), this
would appear to make flywheel an inappropriate countermeasure for the
lumbopelvic region.

106
2.4.3.2. Countermeasures – overview
Use of the lower body negative pressure treadmill appeared to be the most
effective overall countermeasure, with RVE the most effective for muscle changes
but appearing to have a risk of worsening some changes in spinal morphology
compared to controls. The treadmill exercise should be trialled using
intervertebral disc height and volume and LM muscle size outcomes to further
assess its effectiveness for spinal pain and injury risk prevention. It is not clear
whether the treadmill or low pressure element both contribute to the effect and
these aspects could be trialled individually. Due to the potential value of RVE for
protecting muscle changes, it may be worth investigating if it could be performed
in a way that maintains the muscle effects while eliminating the changes it
currently causes to spinal morphology. Repetitive axially loaded flexion and
extension has been linked to increased risk of intervertebral disc herniation
(Callaghan and McGill 2001). Axially loaded squat exercise, as used in the RE
and RVE programmes, were found to be commonly performed incorrectly by
Durral and Manske (2005), most often due to inclusion of lumbar flexion. It was
recommended that axially loaded squats be performed in a neutral spinal position,
requiring pre-exercise teaching and peri-exercise visual assessment to train and
verify adequate performance (Durral and Manske 2005). Additionally, it was
suggested that pre-assessment of intersegmental control of the lumbar spine and
pre-training of any deficiencies, such as poor LM muscle activity, may help
mitigate spinal damage risk during RE (Durral and Manske 2005). Posture
training, pre-assessment of intersegmental control of the lumbar spine and visual
assessment of lumbar spine posture ensuring lordosis during exercise were not
reported in the RVE or RE programmes. Such elements could be included and
assessed for potential reduction of negative spinal morphology outcomes in future
RE and RVE studies.

107
2.4.4. Rehabilitation
It is unclear which rehabilitation intervention was more effective based on
effect size results alone. Results favoured SMC for restoring spinal length and
posterior disc height, suggesting it may reduce the risk of prolapse or disc
damage during rehabilitation. However, TFS was favoured for training LM muscle
and restoring lordosis angle and overall disc volume. The authors of the
rehabilitation study suggested that SMC is favourable over TFS. The reason for
this is that SMC is expected to place less force on the discs and is associated with
the lower rate of disc volume and anterior height changes (Hides et al. 2011).
Lower forces on the discs during rehabilitation, at a time when the discs may be
deconditioned and vulnerable to injury, may help restore posture and motor
control with reduced risk of damage to the discs during the process. Therefore, a
training programme starting with SMC when disc injury risk is high, then
progressing to general trunk strengthening once lumbar postural control is
restored may be indicated. Other rehabilitation methods which train the LM
muscle and maintain lordosis angle, without high axial loading, would also be
worth investigating.
Debate exists within terrestrial based rehabilitation literature comparing
effectiveness of SMC exercises to other interventions for treating LBP and spinal
injury. A recent systematic review found SMC was more effective than general
exercise, manual therapy and minimal interventions for disability and pain
outcomes at short and long term (Bystrom, Rasmussen-Barr and Grooten 2013).
However spinal mobility exercises were found more effective than motor control,
general exercise, manual therapy and minimal intervention for pain outcomes
(Bystrom, Rasmussen-Barr and Grooten 2013). An earlier review by Macedo et
al. (2009) found SMC effective only when compared with minimal interventions,
but not general exercise. However Bystrom, Rassmuss-Bar and Grooten (2013)

108
utilised more recent research, and different review methodology, specifically
isolating effects of SMC compared with other treatments, even when used in
multiple intervention approaches. A systematic review by Wong et al. (2014)
reported temporal changes in TrA muscle thickness during contraction was
unrelated to temporal changes in patient reported LBP or disability scores. The
same review found conflicting evidence for the same relationship but with the LM
muscle rather than TrA muscle. Another systematic review by Laird et al. (2012)
reported that interventions aiming to restore normal lumbopelvic movements were
infrequently able to change observable movements, or improve pain, or activity
limitation, outcome measures. Wong et al. (2014) suggested common clinical
outcomes such as ultrasound imaging to assess the muscle activity, may have
poor validity and reliability for research, resulting in variation and correlation
attenuation. Wong et al. (2014), therefore, recommended relying more on
electromyographic studies in the future. Another systematic review of specific
spinal stabilisation exercises for LBP by Hauggaard and Persson (2007) agreed
with Bystrom, Rassmuss-Bar and Grooten (2013) on the existence of evidence
supporting the effectiveness of SMC for LBP, however, heterogeneity of outcomes
across studies limited intervention comparability, adding to calls for
standardisation of outcome measures.
European guidelines show chronic LBP and increased risk of spinal injury
have several varied potential causes (Airaksinen et al. 2004). Therefore
selection of outcomes and determination of clinically worthwhile variation within
them is difficult. Attempting to find a single approach in a phenomenon with multi-
dimensional causes may be self-limiting and a potential cause of conflicting
results. O’Sullivan (2005) advocated sub-grouping spinal problems based on
signs and symptoms, each with specific clinical definitions to resolve definition and
diagnosis difficulties. Based on the subgroups, bed-rest induced changes in

109
spinal posture, atrophy and reduced activity in LM and TrA muscles fit into the
motor control subgroup, whereas superficial muscle loss is attributable to the
signs and symptoms domain. Therefore, an approach beginning with SMC to
correct the spinal positioning and deep muscle control, progressing to functional
positions and then rehabilitating the superficial muscles to support larger scale
and demanding movements may be justified. This argument is supported by
another systematic review which found multiple intervention approaches the most
effective for LBP outcomes (Ferreira et al. 2006). A multiple countermeasure
approach including LBNP treadmill and RVE (provided RVE associated spinal
morphology risks can be mitigated) may have the best chance of being effective.
Research into new interventions combining elements required to prevent or
rehabilitate lumbopelvic changes, caused by axial unloading, may also be useful.
For example, deep muscle training with functional movements, and promotion of a
normal upright spinal posture, based on the work of Debuse et al. (2013), Gibbon
et al. (2013) and Caplan et al. (2014) may be worth trialling following actual
spaceflight or simulation via bed-rest.
2.4.5. Human Space Flight
Current in-flight countermeasures include combination prescriptions of RE,
treadmill training with axial loading via a harness and cycle ergometer exercise
(Ploutz-Snyder 2013; Loerch 2010). The RE and treadmill training do not prevent
all expected lumbopelvic changes. Addition of vibration to the RE component
may improve its effect on muscle changes but risk worsening spinal morphology
changes. The power demand and potential for vibration to impact space vehicle
structure would need to be considered. However the current International Space
Station treadmill and resistance exercise device are vibration isolated from the
main structure (Loerch 2010) so it may be feasible to also isolate a vibration
platform. As the effect of treadmill training without LBNP in bed-rest is unknown,

110
it is not clear whether LBNP adds effectiveness to treadmill training. LBNP
devices may also be limited by potential difficulties in donning and doffing the
required equipment in microgravity and potential participant discomfort during use
(Barry 2015). This is an area that requires further research. Cycle ergometer
exercise has not been trialled for preventing lumbopelvic changes; therefore its
effects are unknown in this context.
Due to current countermeasures failing to protect against all changes, post
flight rehabilitation is very likely to be required. The European model for post
spaceflight rehabilitation already focuses on correcting lumbopelvic muscle
imbalance and reversing atrophy of LM and TrA muscles using the SMC approach
(Evetts et al. 2014). Astronauts are trained to voluntarily contract LM and TrA
muscles using live ultrasound imaging feedback. Following this, functional and
weight bearing positions are used targeting the LM muscle activity over Psoas
muscle to address any muscle imbalances (Evetts et al. 2014). The programme
then integrates strength training, endurance and proprioceptive retraining
programme tailored to individual’s needs (Lambrecht 2015). A rehabilitation
programme, like the European model of SMC followed by general trunk
strengthening may be the advocated method based on this review. However, this
is based on a single bed-rest rehabilitation paper and systematic review of
previous terrestrial LBP research. Further studies in relevant populations and
ideally an astronaut study, including population relevant and reported outcome
measures rather than relying solely on surrogate measures, would be required to
generate evidence determining if the SMC followed by TFS approach is effective
for post spaceflight use. It would also be useful to establish minimal worthwhile
changes in the relevant population reported outcome measures, in order to show
interventions are effective at producing beneficial and patient centred outcomes.

111
A trial comparing the current in flight countermeasure programme with a LBNP
treadmill element, possibly including vibration within the resistance element, on
prevention of lumbopelvic changes may be useful. Such a trial could assess each
intervention for the sub groups of lumbopelvic problems they specifically address,
along with overall treatment programme effectiveness. Including elements such
as pre-assessment and training of intersegmental control of the lumbar spine,
alongside ensuring RE/RVE is performed in a neutral lumbopelvic position, could
also be assessed for ability to mitigate spinal morphology related injury risks
associated with axially loaded RE. A similar approach could be taken for a
combined rehabilitation programme of SMC followed by general trunk
strengthening. This would provide valuable information as to what specific
domains are effectively dealt with and guide research to additional or new
treatment elements. Further systematic review at that point could inform updated
overall treatment programme recommendations and monitor progress in treating
lumbopelvic changes caused by axial unloading.
Interventions for the lumbopelvic region should not negatively impact the wider
physiological changes caused by spaceflight or bed-rest simulation. Treatment
effectiveness data could be combined from further systematic reviews, similar to
this one, conducted across all physiological areas affected by unloading due to
spaceflight or bed-rest. Resistance exercise, for example, may be required for
maintenance of global lower limb muscles (Pavy-Le Traon et al. 2007; Ferrando et
al. 1997). Therefore, suggesting ways to modify axially loaded RE to reduce any
increased risk of causing lumbopelvic damage, while still being effective outside
the lumbopelvic region, may be preferable. An overall appraisal may be required
to deal with conflicting recommendations from individual studies should differing
effects be reported at various physiological regions in isolation. Guidance could
also be provided for future research, by highlighting treatment programme

112
sections with poor effectiveness or conflicts between interventions. Large
numbers of participants are needed for RCTs, so these will not be feasible for
inflight studies and other study designs will need to be considered to provide
sufficient evidence and validated against spaceflight populations.
2.4.6. Current intervention evidence base
Six countermeasure interventions and two rehabilitation interventions for the
lumbopelvic region have been trialled across eight published bed-rest studies.
Two studies utilised the First Berlin Bed-rest Study, while another two used the
second Berlin Bed-rest Study, resulting in six distinct trial populations.
Comparability between interventions is limited due to outcome heterogeneity
across the studies. The rehabilitation interventions were assessed in a single
study, without an inactive control group, due to ethical reasons (Hides 2015).
Consequently, the quality of intervention recommendations for clinical use is
restricted. Further research is advocated in this area, especially in rehabilitation,
as countermeasure interventions have been shown unable to fully protect against
many of the changes. Standardisation of outcome measures in the research
community is recommended. None of the studies attempted to blind participants,
resulting in performance bias. While blinding participants in exercise intervention
trials is acknowledged as being difficult due to potentially obvious sham
interventions, potential methods to counter this, within back pain exercise therapy
trials, have been suggested (Helmhout et al. 2008).
No population reported outcome measures were used in the included studies.
There is a risk of mismatch between clinician reported outcomes and population
reported outcomes regarding how effectively interventions meet the population’s
needs and preferences (Nelson et al. 2015). Additionally, there are no reported
minimal worthwhile changes for lumbopelvic outcome measures. Missing patient

113
reported outcomes and known minimal clinically significant changes make it
difficult to establish the clinical and patient relevant effectiveness of interventions.
In effect, the research performed in this area to date, has only shown that
mechanistic and statistically relevant changes can be achieved through use of the
tested interventions. However, it remains unknown if the reported changes in
surrogate outcome measures are ones which astronauts consider relevant to their
quality of life or if the intervention effects are clinically meaningful. It is
recommended that future research attempt to establish clinically meaningful
differences in lumbopelvic outcome measures and make use of population
reported outcome measures such as quality of life, activity scores and return to
normal activity measures.
2.4.7. Conclusions
The results of this systematic review suggest that LBNP treadmill exercise is
the most effective countermeasure against lumbopelvic changes caused by
spaceflight simulation via bed-rest, with RVE effective for preventing muscle
changes but having an increased chance of worsening spinal morphology related
injury risks. Suggestions were made for potential injury risk mitigation steps which
could be tested in RVE.
Current countermeasures are unlikely to fully protect against all lumbopelvic
changes occurring due to microgravity exposure, creating a rehabilitation
requirement. Specific motor control followed by general trunk strengthening (once
posture and deep lumbopelvic muscles are restored) was be the most effective
rehabilitation approach found in the available literature. This suggestion should
be treated with caution as it is based on only one rehabilitation study performed to
date and the general trunk strengthening was treated as a control. More research

114
is required into interventions which may further improve overall effectiveness,
preferably with standardised outcome measures.
2.4.8. Limitations of the systematic review
The small evidence base and heterogeneity of outcomes across the studies
limits conclusions; more research is required, especially in rehabilitation. No true
spaceflight population trials have been conducted, meaning conclusions are all
based on simulation via bed-rest. Clear data to determine if mechanisms of back
pain and spinal injury are the same between bed-rest and spaceflight populations
do not yet exist. Without data to compare bed-rest and astronaut populations,
with large enough representative populations, it is unknown if the effectiveness
seen in analogue research will be the same in astronauts. Included studies
utilised only surrogate and clinician reported outcome measures. Gaining access
to patient views and the use of patient reported outcome measures relating to
quality of life, and ability to perform population relevant functions post spaceflight,
may also help drive intervention recommendations which are more clearly relevant
to patient preferences and needs (Nelson et al. 2015).
The duration of bed-rest across the included studies varied, two used 28 days,
one used 56 days, three used 60 days and two used 90 days. The variation in
the lengths impacts the comparability between studies. Additionally, the results
reported from the bed-rest studies can be assumed as valid only for space flight of
similar duration (Mulder 2014). Therefore the LBNP treadmill exercise results
may only relate well to shorter duration spaceflight missions of around 28days.
RE, RVE, LMMS, flywheel and spinal mobility exercises may relate more to longer
duration spaceflight missions of 60-90 days.

115
3. Chapter Three: Investigation of Recruitment of Lumbar Multifidus and Transversus Abdominis, Control of Movement Variability and Participant Perceived Comfort While Exercising in Various Settings Using the Functional Readaptive Exercise Device

116
3.1. Introduction
Management of poor lumbopelvic motor control and lumbar segmental
instability, using motor control exercises, aimed at normalising the recruitment
patterns of LM and TrA, was summarised in the thesis introduction using an
overview by O’Sullivan (2000). Traditional LM and TrA training interventions
recommend a progressive training protocol of, isolating muscle activation through
biofeedback (Hides et al. 2008), training control of muscle activation, developing
activation in functional activities and finally, building endurance of LM and TrA
(O'Sullivan 2000; Hides et al. 2008). It has already been shown that the FRED,
which is being assessed for potential use as an intervention in this field, recruits
the LM and TrA without need for conscious muscle activation (Debuse et al.
2013). Therefore, FRED exercise is likely to be of use from the initial training
stage of isolating contraction. However, it is not yet clear how a FRED
intervention could be developed as part of a progressive training protocol.
The third prototype of the device, which was in use at the time of this study,
incorporates easily adjustable crank and footplate positions. This allows use of
five crank amplitudes (Figure 3-1) and five footplate positions (Figure 3-2), which
combine to produce a total of 15 different exercise conditions (Table 3-1). The
crank positions alter the amplitude of the movement, with 1 being the largest
amplitude and 5 the smallest, while the footplate positions adjust the position of
the device user forwards and backwards.

117
Figure 3-1The FRED with the adjustable crank highlighted by white arrows the footplates shown in the blue circle
Figure 3-2 A close up view of the adjustable footplate (image from FRED operating instructions)

118
Table 3-1 Possible Exercise settings – Ticks Indicate Possible Combinations, Crosses Indicate Unusable Combinations Which Would Damage the Device
Foot Plate Positions Crank Amplitude 5 4 3 2 1
5 0.2m
4 0.28m
3 0.36m
2 0.425m
1 0.5m
It was expected that resultant different foot paths during exercise on the
device may have a differing effect on relevant motor control outcomes. This gives
potential for a graduated training protocol to be developed which progressively
challenges users of the device. Understanding the effects of footplate position
and amplitude may allow formulation of a progressive training protocol, to allow
greater use of the device as a rehabilitation intervention, and inform settings for
use in future research studies.
A computer model of the device was used to visually illustrate the likely effect
of the various amplitude and footplate positions on the movement pattern at the
feet (Lindenroth 2013) (Figure 3-3).

119
The computer model plots show the predicted movement pathways of the feet
during exercise in each amplitude (labelled crank in the figure) and footplate
position. It can be seen that as the amplitude increases the movement pathway
increases both vertically and horizontally. Adjusting the footplate position is likely
to move the user forwards and backwards during exercise, but does not appear to
alter the shape of the movement pathway. This suggests that amplitude may be
the more important element in modulating the challenge of FRED exercise. The
hypothesis for this being that a larger foot movement may be more difficult to
Figure 3-3 Computer model plots of expected crank (upper plot) and footplate (lower plot) position effect on exercise movement (Lindenroth 2013)

120
control. Whereas moving forwards and backwards with the same size and shape
movement pattern is not expected to vary movement control demands.
In order to develop the FRED as an intervention, beyond proof-of-concept
investigations, this chapter intended to determine the influence of the various
FRED settings on deep spinal muscle activity and movement control to inform the
development of a progressive rehabilitation programme.
3.1.1. Aim and Objectives
The aim of this study was to develop a feasible and effective progressive
exercise protocol using the new prototype device. The objectives were:
1. To investigate the differences between the various exercise settings across
several relevant outcome measures of motor control and participant
perceived comfort.
2. To develop understanding and evidence of differences between the
exercise settings.
3. To use the data gathered to recommend a graduated and progressively
demanding training protocol using the various device settings.
3.2. Methods
A random order within participant design was used to investigate the full
range of device settings. The study received ethics approval from the Faculty of
Health and Life Sciences Ethics Committee at Northumbria University (see
appendix J).
3.2.1. Recruitment
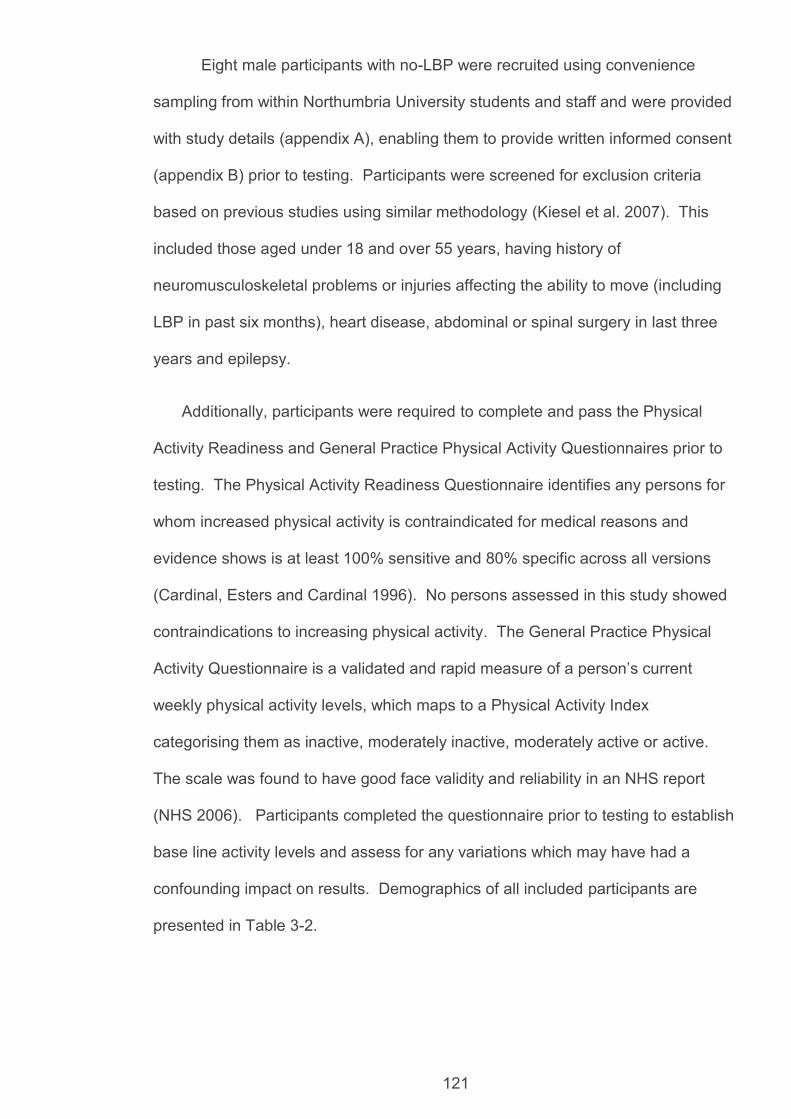
121
Eight male participants with no-LBP were recruited using convenience
sampling from within Northumbria University students and staff and were provided
with study details (appendix A), enabling them to provide written informed consent
(appendix B) prior to testing. Participants were screened for exclusion criteria
based on previous studies using similar methodology (Kiesel et al. 2007). This
included those aged under 18 and over 55 years, having history of
neuromusculoskeletal problems or injuries affecting the ability to move (including
LBP in past six months), heart disease, abdominal or spinal surgery in last three
years and epilepsy.
Additionally, participants were required to complete and pass the Physical
Activity Readiness and General Practice Physical Activity Questionnaires prior to
testing. The Physical Activity Readiness Questionnaire identifies any persons for
whom increased physical activity is contraindicated for medical reasons and
evidence shows is at least 100% sensitive and 80% specific across all versions
(Cardinal, Esters and Cardinal 1996). No persons assessed in this study showed
contraindications to increasing physical activity. The General Practice Physical
Activity Questionnaire is a validated and rapid measure of a person’s current
weekly physical activity levels, which maps to a Physical Activity Index
categorising them as inactive, moderately inactive, moderately active or active.
The scale was found to have good face validity and reliability in an NHS report
(NHS 2006). Participants completed the questionnaire prior to testing to establish
base line activity levels and assess for any variations which may have had a
confounding impact on results. Demographics of all included participants are
presented in Table 3-2.

122
Table 3-2 Participant Demographics (GPPAQ is General Practice Physical Activity Questionnaire)
Participant Gender Age (yrs)
Mass (kg)
Stature (m)
BMI GPPAQ
001 Male 31 85 1.87 24 Active
002 Male 19 63.8 1.71 22 Active 003 Male 20 71.1 1.86 21 Active 004 Male 19 79.2 1.75 26 Active 005 Male 18 73.5 1.80 23 Active 006 Male 22 72.0 1.71 25 Active 007 Male 33 81.6 1.80 25 Moderately Active 008 Male 19 81.3 1.85 24 Active
Mean - 23 75.9 1.79 24 - Standard Deviation
- 5.9 7.0 0.07 1.8 -
3.2.2. Experimental Protocol and Data Collection
The FRED prototype version three was used throughout this study. The 15
possible combinations of footplate and amplitude settings were allocated
numbered exercise conditions as per Table 3-3.

123
Table 3-3 Exercise Conditions – crank position 1 being the largest amplitude and footplate position 1 being the furthest forwards
Exercise condition
Crank Position
Footplate position
1 1 1 2 2 1 3 2 2 4 3 1 5 3 2 6 3 3 7 4 1 8 4 2 9 4 3 10 4 4 11 5 1 12 5 2 13 5 3 14 5 4 15 5 5
Participants exercised in all conditions except for condition one (largest crank
and feet furthest forward) which was removed for safety reasons, due to it being
considered too hard to control for first-time device users during pilot studies. The
order of exercise conditions was randomised for each participant using a Latin
Square random sequence grid generator (hamsterandwheel.com). Testing was
split across two sessions over two consecutive days, with half the conditions
tested on each day to prevent any training or loss of technique effects
confounding results. Rest, ground standing and control conditions were also
assessed for comparison.
Rest was defined as participants lying, fully supported on a plinth in a relaxed
state. For LM measures this was prone, with a pillow placed under the abdomen,
if needed, to reduce excessive lumbar lordosis. For TrA measures this was
supine crook lying with the knees visually observed to be in 90 degrees flexion.
Control was defined as standing in an upright static posture on the device with the
footplate and crank set to the mid positions (3 and 3), holding the footplates so the
dominant foot was in the furthest forward position, with both footplates held in

124
horizontal alignment. Ground standing involved standing in a static upright
posture on stable and even ground (the lab floor).
In all vertical conditions participants were instructed to maintain an upright
neutral posture, looking forwards with arms relaxed by their sides. Rest and
control were assessed at the start of the initial participant test session, followed by
seven random exercise conditions, while ground standing was assessed at the
start of the second visit followed by the remaining seven randomised exercise
conditions. At the initial testing visit, participants were given a five-minute
familiarisation period exercising on the device. Explanation was given of the
feedback which the device provides to help users maintain a steady speed and
even movement. When FRED settings were altered, participants undertook an
additional one-minute re-familiarisation period for the new movement setting.
Testing was performed in a temperature and humidity controlled laboratory with a
constant temperature of 23 degrees throughout.
3.2.3. Outcome Measures
The outcome measures assessed included several measures of motor
control and participant’s perceived comfort of each exercise setting. The motor
control outcomes included LM and TrA muscle recruitment, variability of LM and
TrA muscle recruitment per foot cycle and movement variability at the feet.
Comfort was assessed using a tailor made comfort scale.
3.2.4. Muscle Recruitment
The exercise conditions which showed the highest recruitment of LM and TrA
may be considered best for a potential training programme. Muscle thickness
change was measured using ultrasound imaging (USI) to assess recruitment.
This is as a common and validated outcome measure for assessment of low

125
levels of muscle activation associated with postural control (Koppenhaver et al.
2009).
All USI data were collected in B mode using a digital ultrasound imager with 2-
7MHz curvilinear transducer (Technos, Esaote, Genoa, Italy). Frequency, gain,
brightness and focus were set to ensure optimum visualisation of the muscles
during acquisition for each participant. All USI measurements were taken on
participants’ dominant side.
Thickness of LM was assessed with the transducer placed longitudinally along
the spine with the image midpoint at the facet joint level of interest. Thickness
was taken as the distance from the echogenic tip of the facet joint to the
subcutaneous fascia based on methods from Kiesel et al. (2007). Imaging was
performed at the L5/S1 facet joint. This imaging location was chosen as it
produced the best quality USI video for automatic measurement using edge
detection during pilot studies. Imaging further up the spine resulted in artefacts
appearing in the muscle, which the automatic edge detection was unable to
resolve, and reduced ability to visualise all required structures throughout the
FRED cycle. Therefore, L5/S1 had the highest data rate for analysis.
Thickness of TrA was measured with the transducer placed transversely
against the anterolateral abdominal wall in line with the navel and the muscle belly
positioned centrally on the image. Thickness was taken as the distance between
the upper and lower muscle fascia at a point at least 0.5 mm lateral from where
the muscle tip joined the abdominal aponeurosis, based on methods described by
Koppenhaver et al. (2009).
Periods of ultrasound data were captured at 25 frames per second using a
Lenovo, Windows 8 PC connected to the ultrasound imager using a PC-to-TV
splitter (SA235, Kworld, California, USA) and Terratec G5 converted to digital PC

126
input (G5, Terratec, Alsdorf, Germany). Video editing software (MAGIX Video
Easy version 3.0.1.5, Terratec, Alsdorf, Germany) recorded the USI video data in
720x480 pixels at 25 frames per second. For all exercise conditions, a minimum
of six complete FRED cycles of data were recorded and for all static control
conditions five seconds worth of data were recorded. All USI video data were
converted from mpg to mov format using transcode software (DLR, Germany).
Muscle thickness data were then measured using automatic edge detection
software (Vasculometer 1.2, DLR, Germany) designed for analysing distances
between parallel edges in USI (Bremser et al. 2012). The following edge
detection software settings were used: horizontal smoothing 3.5 and vertical
smoothing 10, near and far wall settings were adjusted to select the facet joint tip
and subcutaneous fascia for LM (Figure 3-4) and the near and far muscle fascia
for TrA (Figure 3-5). The smoothing settings refer to a system of reducing noise
to create a clear image and with defined structure edges for automatic detection
and measurement. Smoothing overlays frames and calculates a mean from the
overlay to create a single clearer image. Higher smoothing results in more
reliable edge detection, but reduces accuracy due to averaging across more
frames. Therefore the setting chosen was the highest required for edge detection
but at the lowest necessary for that. The settings were kept the same throughout
all data collection to prevent changes from potentially confounding results. Any
sections of video which did not allow adequate visualisation of the muscles were
masked and therefore discarded from analysis.

127
Figure 3-4 Shows a screen shot from a typical LM USI video; the probe, Sacrum, L5/S1 and L4/L5 facet joints are labelled. The white rectangle shows the location where the area of interest was positioned for automatic edge detection.
Figure 3-5 Shows a screen shot from a typical TrA USI video; the probe, TrA, internal oblique (IO) and external oblique (EO) muscles are labelled. The white rectangle shows the location where the area of interest was positioned for automatic edge detection.

128
During pilot studies it was found difficult to keep a steady video image of LM as
the ultrasound transducer did not move with participants’ exercise movements
when imaging during exercise. To resolve this, an ultrasound transducer holder
(Figure 3-7) was developed to steady the transducer and enabling generation of
stable LM USI video data. The holder consisted of a foam block with a
rectangular slit into which the transducer fitted, fixed onto the participants using
two adjustable material straps. This allowed the transducer to move with
participants’ natural movements. Two larger holes either side of the rectangular
one allowed additional ultrasound gel to be inserted without needing to remove
the holder or transducer.
Figure 3-6 Probe holder with ultrasound transducer
For LM, thickness was measured automatically in the edge detection software
as the area of interest for analysis was stable throughout the video. In TrA
analysis, the normal lateral movement of the muscle during its activation
prevented automatic analysis as the software was unable to laterally track the
area of interest. To compensate for this, TrA thickness was measured manually
every five frames throughout all video data. All muscle thickness data were then
imported into Microsoft Excel 2010 for analysis.

129
A research assistant operated the ultrasound video capture and exercise
device software. The second individual observed the number of FRED cycles
recorded and made a mark on the USI data to show when each cycle occurred.
Marks were generated by pressing the menu button on the ultrasound device
which left a visual mark on the lower portion of the videos, while having no effect
on the USI itself. The points were visually estimated to be the point at which
participant’s left feet were in the highest point of the exercise cycle.
3.2.5. Muscle Recruitment Variation
During initial analysis it was observed that in some participants there was
increased variation in muscle thickness. It was hypothesised that an individual
with good motor control, exercising on the device would have a relatively tonic
muscle contraction of LM and TrA with low variability in muscle recruitment.
Therefore a consistently high muscle recruitment variation during exercise may be
an indicator of poor motor control or a more challenging device setting for
consideration in a progressive training programme. Similarly, an increased
variability in certain device settings could be indicative of ones that challenged the
participant’s motor control more.
To assess this, the difference in muscle recruitment variation (maximum
change in muscle thickness during each cycle, ΔLMmax or ΔTrAmax) per FRED
cycle was calculated from the muscle recruitment data and the average of cycles
reported as the ΔLMmax or ΔTrAmax in each device setting.
3.2.6. Movement Variability at the Feet
It was hypothesised that an individual with good motor control, exercising on
the device would produce an even movement throughout. Conversely, an
individual with poor motor control would likely produce uneven movements with

130
rapidly varying movement velocities. The current device prototype was the first
one designed to record data on movement variability. The angular velocity of the
FRED crank wheel was measured using a integral rotary encoder (RP6010, ifm
Electronic GmbH, Essen, Germany). The data output was analysed live using a
PC connected to the FRED within bespoke software (Mazur Automation, Munich,
Germany). Movement variability was quantified as the difference (%) between the
live speed of exercise movement and the average speed over the previous
second. This was recorded as a negative change if the live speed was slowing
and positive if it was increasing. Movement variability data were then converted to
an absolute number for analysis. Therefore, a high movement variability result
was indicative of an uneven movement while a movement variability of zero
represented a perfectly even movement. A high movement variability result may
be an indicator of poor motor control or a more challenging device setting for
consideration in a progressive training protocol. The movement variability data
were recorded live from the device on a second Lenovo, Windows 8 PC running
custom created FRED software (Mazur Automation, Germany) which was
connected directly to the exercise device. The data were then imported into
Microsoft Excel 2010 for analysis.
3.2.7. Comfort
It was felt that participants’ individual feeling of comfort during exercise in each
condition would also impact where it should be placed in a training protocol. If a
particular condition was reported to be extremely uncomfortable during first-time
exercise on the device, then it was considered inappropriate to recommend it as
an initial training point. Participants’ perceived comfort during exercise in each
exercise condition was, therefore, assessed using a custom made scale designed
specifically for FRED studies: the Newcastle Comfort Scale (Table 3-4). The
scale asked participants to score their comfort on a numerical scale from zero to

131
five. Participants were shown the comfort scale prior to each day’s testing period
and had the statements read and shown to them at each testing point. The
comfort rating was recording during and immediately after each individual test
condition and 24 hours after each visit to the laboratory. The 24 hour post
exercise measurement was to ascertain if any delayed onset muscle aches or
discomfort was reported.
Table 3-4 Newcastle Comfort Scale
Are you:
0 Aware of exercising but not aching at all 1 Aching a little 2 Aching 3 Aching a lot 4 Aching so much you want a break 5 Aching so much you want to stop exercising altogether

132
3.2.8. Reliability and Validity of Outcome Measures
3.2.8.1. Muscle Recruitment
The use of USI for measuring the thickness change of LM and TrA in order to
estimate recruitment has previously been assessed for reliability and validity.
Ultrasound imaging measurements of LM recruitment were validated by Kiesel
et al. (2007) against fine wire electromyography, which is a recognised method of
assessing muscle activity (Koppenhaver et al. 2009; McMeeken et al. 2004) but is
an invasive technique compared to USI. The study assessed the relationship
between measured thickness changes using USI and muscle activity determined
by electromyography during 19-34% maximal voluntary contractions. Although
only done in a small population of five participants, the linear correlation between
LM muscle activation measured using fine wire electromyography and thickness
measures using USI was high (r=0.79, P<0.001).
A similar study was performed on TrA in thirteen mixed gender volunteers by
McMeeken et al. (2004). The study compared fine wire EMG change in activation
with thickness change measured using USI. A linear correlation was again found
up to 80% maximal voluntary contraction (r=0.87, p<0.001). A study by Hodges et
al. (2003), also comparing fine wire electromyography with TrA thickness change
on USI suggested that correlations weaken beyond low level contractions in the
range of up ~23% of maximal voluntary contraction. Therefore, validity of USI
thickness measures may be questionable when used to assess exercises or
movements which produce strong contractions of the muscles. Many of the
movements used to set the 100% maximal voluntary contraction reference in the
electromyography studies include prone spinal extension with maximally loaded
upper limbs (Kiesel et al. 2007), the Valsalva manoeuvre and maximal abdominal
hollowing (McMeeken et al. 2004). The postures and exercises in this study are

133
all aimed at recruiting the muscles within their normal functional range, without the
addition of loading or resistance. Therefore, the level of recruitment is likely to
remain within the range commonly validated for using USI.
Between and within day reliability of contracted LM USI thickness
measurements have previously been shown to be good, with an intraclass
correlation of 0.97 and 0.99, respectively (Koppenhaver et al. 2009). Between
and within-day reliability of contracted TrA USI thickness measures were also
shown to be good with intraclass correlations of 0.87 and 0.97, respectively
(Koppenhaver et al. 2009). To ensure reliability in this study, all ultrasound
images were taken by the same individual to maintain consistency between
participants and test days. The imager had previous experience of USI studies of
LM and TrA and underwent training in USI generation. The training included
basic fundamentals of USI generation and lessons in specifically imaging LM and
TrA. Additionally, a single rater, repeat measures, consecutive day reliability
analysis was undertaken using typical error analysis (details in section 3.2.10).
Two participants had repeat single measures taken in exercise conditions two and
eleven on each day. These two conditions provided the extremes of crank
amplitude. The results of the reliability study are reported in section 3.3.2 with
discussion in section 3.4.4.
The edge detection software is a recently developed method, designed and
validated by the German Aerospace Agency (DLR) for measuring diameters of
blood vessels with USI (Bremser et al. 2012). A region of interest in the USI data
must be defined by the operator, using knowledge and experience of the
structures for analysis, to give best results. Images are then analysed frame by
frame. A first derivative Gaussian filter was applied to filter and reduce noise in
the image by averaging regions of pixel brightness. The images were then
skeletonised, so edges appear as lines with thinner edge sections excluded from

134
analysis. Horizontal lines were computed and a classification step selected the
most likely edges of the structure based on length, edge strength, linear
regression coefficient and distance to the centre of the region of interest. Both the
region of interest and the distance to the centre of it were defined by the operator
to assist in the selection of the correct horizontal lines for analysis. The distance
between the two edges was then calculated by counting and averaging the
vertical lines of pixels between the two horizontal edges. As this is new
technology and the first time it has been used in this type of analysis, some
limitation existed in applying this method to muscle thickness of TrA and LM. The
TrA muscle tends to translate laterally across the USI during contraction; the
region of interest in the software is unable to track this and, therefore, had to be
set manually, frame by frame, for TrA images. Additionally TrA is not always able
to be positioned horizontally on USI and the software assumes horizontal lines
should not be tilted more than 5 degrees. For both LM and TrA there can also be
echogenic muscle fascia or other horizontal line artefacts on the image that can
affect the edge detection process. Frames where such artefacts prevented
correct measurement were masked and removed from the analysis to prevent
interference in results. Bremser et al. (2012) found this method valid for
measuring diameter of blood vessels, but no studies using this type of analysis
were found measuring muscle thickness.
To validate this system several frames of USI video data were also measured
using ImageJ (v1.44) image analysis software and comparison made between the
measurements of both results were found to be in agreement. ImageJ analysis is
consistent with thickness measure methods used in FRED studies (Debuse et al.
2013).

135
3.2.8.2. Movement Variability
Movement variability was a novel outcome measure specific to the FRED.
Therefore, no previous evidence of its validity and reliability as an outcome
measure of motor control existed. As the device records movement variability
automatically and mechanically itself it was expected to have high validity and
reliability to measure speed fluctuations during movement. No human error
component existed and the device sensors were considered fit for purpose.
However, as with the muscle thickness measurements, a single rater, repeat
measures, consecutive day reliability analysis was undertaken using typical error
(details in section 3.2.10). Two participants had repeat single measures taken in
exercise conditions two and eleven on each day for this purpose.
3.2.8.3. Comfort
The Newcastle Comfort Scale is also a novel outcome measure specific to
this study. No evidence currently exists to comment on its validity or reliability,
however, it was designed by the creator of the exercise device based on long
term experience of work and previous studies with the FRED.
3.2.9. Ethics
The study recruited human participants and their dignity, wellbeing and
rights were protected at all times. A risk analysis was performed prior to any
testing and steps to ensure health and safety were implemented. No lasting
effects of the exercise were expected for any participants. Informed consent was
provided in writing by all participants and they were informed they could withdraw
from the study and remove their data at any time. No incentives or money for
travel costs were provided to participants. The testing environment was made
private as participants had to partially undress to expose the lower back and

136
anterolateral abdominal region for the USI images to be taken. Ultrasound gel
was applied to participants, which can be uncomfortable due to being cold on
initial skin contact, participants were informed of this and warned again at each
application. The ultrasound gel was removed as soon it was no longer required.
Participant data were stored in a secure location in a site folder at all times and
will be destroyed after a maximum of three years following study completion.
3.2.10. Data Analysis
Magnitude based inference (MBI) statistics were used to run multiple-
pairwise comparisons between the various combinations of exercise and control
conditions. These statistics provide the probability for each comparison that the
true (population) change is positive, negative or trivial with reference to a pre-
determined minimal worthwhile change. This method allows an inference on how
meaningful any population difference is (Batterham and Hopkins 2006). It is
useful to have a previously reported and validated minimal clinically meaningful
change on which to base inferences. However, clinically relevant differences
have yet to be determined for the outcomes assessed in this study. This was in
part due to the current prototype being a recent development and the use of
several novel outcome measures. Therefore, the test-retest typical error of
measurement in each outcome was set as the worthwhile change on which to
base inferences. This allowed comparisons to be assessed and commented on
based on the probability of a true measurable change occurring which was equal
to, or more than, the typical error of measurement.
Magnitude based inference was chosen instead of using traditional null
hypothesis testing for several reasons. In this case, a null hypothesis would have
stated that no difference existed between comparisons. The probability of the
observed data occurring if the null were true would then be calculated and a

137
decision would be made to retain or reject the null using a common, yet arbitrary,
cut off of ≤5% chance that any observed difference was due to random sampling
error. This would not have provided information on the direction or magnitude of
the changes and would not have compared the change to an actual minimal
worthwhile change (Sterne and Smith 2001). It would also have resulted in a high
risk of type one errors occurring due to the large numbers of comparisons
planned, or would have necessitated a much larger sample of the population to
allow for correcting of the significance testing cut off point to compensate for the
high number of comparisons.
The typical error of measurement for all outcomes was calculated by
recording data from two identical exercise conditions in the same participants on
two consecutive days. The conditions chosen to be tested for typical error were
two (crank 2, footplate 1) and eleven (crank 5, footplate 1), which keep the
footplate in the same position but give a range of all crank positions tested. The
difference scores between measurements in each condition were calculated by
subtracting the first day’s measurements from the second.
𝑇𝑦𝑝𝑖𝑐𝑎𝑙 𝐸𝑟𝑟𝑜𝑟 =𝑆𝐷 (𝐷𝑖𝑓𝑓𝑒𝑟𝑒𝑛𝑐𝑒 𝑆𝑐𝑜𝑟𝑒𝑠)
√2
Differences greater than this error were taken as the minimal worthwhile
change. The mean change, 90% confidence intervals and probabilities (%) that
the true values were mechanistically positive, trivial or negative were then
reported and qualitatively defined by the following scale defined by Hopkins et al.
(2008), where <0.5% is “most unlikely”, <5% is “very unlikely”, <25% is “unlikely”,
25-75% is “possible”, >75% is “likely”, >95% is “very likely”, and >99.5% is “most
likely”.
The following comparisons were made using Magnitude Based Inferences:

138
All device settings compared to rest, ground standing and control for
muscle recruitment.
Device settings grouped by crank and footplate position compared to each
other for muscle recruitment, muscle recruitment variation and movement
variability.
Trends in the Newcastle Comfort Scale were assessed in the raw data and
graphically. Absolute muscle thickness values were also normalised to resting
using the following equation:
𝑇ℎ𝑖𝑐𝑘𝑛𝑒𝑠𝑠 𝐶ℎ𝑎𝑛𝑔𝑒 (%) = 𝑇ℎ𝑖𝑐𝑘𝑛𝑒𝑠𝑠(𝑒𝑥) − 𝑇ℎ𝑖𝑐𝑘𝑛𝑒𝑠𝑠(𝑟𝑒𝑠𝑡)
𝑇ℎ𝑖𝑐𝑘𝑛𝑒𝑠𝑠(𝑟𝑒𝑠𝑡)𝑥100
By grouping settings together by crank and footplate, the overall number of
comparisons being analysed was reduced and trends specific to the crank and
footplate position exercise conditions could be isolated without the other
confounding them. Only footplate data collected in crank amplitude position 5
was used to compare the effect of different footplate positions and only data
collected in footplate positions 1 was used to compare all crank positions.
During analysis, small trends were found in the raw results between amplitude
positions and weakly supported by the typical error based MBI statistics. Using
the typical error as the threshold for MBI was considered conservative as it used
the highest level of variation found in all the tested FRED conditions. While a
conservative statistic makes the comparisons more rigorous and is useful for
comparing all settings with the rest, control and ground standing conditions, it may
miss small, yet worthwhile effects existing between settings such as between the
various amplitudes. Therefore, the weak trends between the amplitude settings
were also assessed using the effect size (Cohen’s d), which was calculated
between each amplitude setting.

139
𝑑 =𝑠𝑎𝑚𝑝𝑙𝑒 𝑚𝑒𝑎𝑛1 + 𝑠𝑚𝑎𝑝𝑙𝑒 𝑚𝑒𝑎𝑛2
𝑝𝑜𝑜𝑙𝑒𝑑 𝑠𝑡𝑎𝑛𝑑𝑎𝑟𝑑 𝑑𝑒𝑣𝑖𝑎𝑡𝑖𝑜𝑛 𝑜𝑓 𝑠𝑎𝑚𝑝𝑙𝑒 1 𝑎𝑛𝑑 2
A effect size of 0.2 (at least a small effect) was set as the minimal worthwhile
change on which to base inferences as showing at least a small effect size
existed (Hopkins et al. 2008). In comparisons where participant variation made
small effects unclear, the minimal worthwhile change threshold was increased to
the lowest level which produced a clear result, of either 0.6 or 1.2, which show at
least moderate and large effects, respectively (Hopkins et al. 2008). Any
worthwhile change threshold variations were highlighted in the results. The effect
size and MBI statistics were then presented with 90% confidence intervals and
probabilities (%) that the true change was mechanistically positive, trivial or
negative, as before, using the same methods from Hopkins et al. (2008).
3.3. Results
3.3.1. Demographics
Eight participants, all male, participated in the study and their
demographics were presented in Table 3-2 in section 3.2.1. The average age
was 23±5.9 years and the average BMI was 24±1.8. All participants were
classed as either moderately active or active in the week prior to testing with the
General Practice Physical Activity Questionnaire. No outlier values were recorded
in the demographics. No dropouts occurred and all planned measurements were
taken for all participants.
3.3.2. Reliability Results and Typical Error Calculation
Table 3-5 illustrates the typical error of measurement for all variables. The
condition with the highest variability in difference scores was used to determine

140
the typical error for use as the inference threshold in MBI. The typical errors were
calculated as, 1.1 mm for absolute LM thickness, 1.04 mm for absolute TrA
thickness, 0.82 mm for ΔLMmax, 0.48 mm for ΔTrAmax and 0.46% for movement
variability.
Table 3-5 Typical Error results
condition participant average difference Scores
day 1 day2
Absolute LM thickness (mm)
2 8 44.28 44.53 0.25
7 33.15 33.15 0.00
11 8 44.95 43.66 1.29
7 33.57 34.50 0.93
Absolute TrA thickness (mm)
2 8 4.07 3.98 0.09
7 3.65 3.62 0.02
11 8 3.63 4.25 -0.61
7 4.46 2.99 1.47
ΔLMmax (mm)
2 8 2.98 1.66 1.32
7 1.66 1.97 -0.32
11 8 1.44 0.95 0.49
7 1.04 0.83 0.21
ΔTrAmax (mm)
2 8 1.28 1.24 0.04
7 2.44 1.43 1.01
11 8 0.58 1.10 0.52
7 1.12 0.78 0.34
Movement variability (%) per cycle
2 8 8.25 7.66 0.59
7 9.27 7.76 1.52
11 8 6.72 6.64 0.08
7 5.29 4.14 1.15

141
3.3.3. Raw Data for all Conditions
Table 3-6 presents a summary of all the raw data for all the test conditions across six cycles of FRED exercise for both LM,
TrA and movement variability. Table 3-7 shows the results of the Newcastle Comfort Scale during and after exercise across all
exercise conditions.
Table 3-6 Summary of Raw Data For all Test Conditions
Exercise conditions 2-15, Ground Standing (GS), Control (Cntl) and Rest
2 3 4 5 6 7 8 9 10 11 12 13 14 15 GS Cntl
Rest
LM
Thickness (mm) 31.3
31.6
31.1
31.0
31.3
30.9
31.1
31.7
31.5
31.2
31.3
31.6
31.7
31.1
32.4
31.3
26.2
SD 7.1 6.6 6.8 7.2 6.9 7.3 7.1 7.0 7.3 7.6 7.1 7.1 6.7 7.2 6.5 7.2 7.1
Normalised thickness to rest (%)
20.8
22.4
20.2
19.0
21.1
19.2
19.9
22.4
21.2
19.8
20.8
21.8
22.5
19.9
25.3
20.2
0.0
SD 12.2
10.7
10.2
6.6 10.7
10.7
10.4
9.3 8.6 8.1 11.7
8.7 10.1
9.8 10.1
9.8 0.0
ΔLMmax (mm) 2.4 1.7 1.7 2.0 1.6 1.8 1.4 1.2 1.6 1.1 1.5 1.4 1.0 1.3 0.9 1.3 0.7
SD 2.1 0.4 0.6 1.2 0.9 0.9 0.4 0.2 0.6 0.4 0.5 1.0 0.5 0.4 0.3 0.7 0.4
TrA
Thickness (mm) 4.8 4.3 4.7 4.6 4.2 4.3 4.2 4.0 4.4 4.1 4.3 4.3 4.1 4.4 4.0 4.0 3.0
SD 1.7 1.4 1.2 1.2 1.3 1.1 1.0 1.0 1.3 1.0 1.0 1.3 1.1 1.1 1.2 1.8 1.0
Normalised thickness to rest (%)
48.4
34.5
48.6
45.0
29.8
34.3
33.2
25.9
36.1
29.1
34.0
33.0
29.1
38.6
22.6
20.9
0.0
SD 40.3
19.8
20.8
20.9
20.3
14.7
16.3
15.8
19.9
14.7
15.3
15.2
13.2
16.3
9.8 10.6
6.5
ΔTrAmax (mm) 1.9 1.6 1.6 1.8 1.7 1.3 1.2 1.3 1.6 1.0 1.1 1.2 0.9 1.2 0.9 1.4 0.7
SD 0.6 0.4 0.5 0.3 0.5 0.2 0.3 0.3 0.4 0.3 0.3 0.2 0.3 0.2 0.2 0.7 0.5
Movement variability
mean 8.7 8.8 9.2 7.5 7.2 6.4 5.2 4.8 6.3 5.2 5.9 4.6 5.0 4.4
SD 1.9 1.3 3.0 2.6 2.3 1.6 1.1 1.6 1.9 0.9 2.7 1.0 0.9 1.7

142
Table 3-7 Results of Newcastle Comfort Score Averaging for All Participants During and After Exercise
Condition 2 3 4 5 6 7 8 9 10 11 12 13 14 15 24 hours after visit:
During exercise:
mean 0.5 0.1 0.9 0.4 0.5 0.1 0.8 0.3 1.0 0.0 0.0 0.0 0.0 0.0
SD 0.5 0.4 1.1 0.7 0.5 0.4 0.7 0.5 0.7 0.4 0.5 0.4 0.7 0.4
After exercise: 1 2
mean 0.1 0.9 0.4 0.5 0.1 0.8 0.3 1.0 0.0 0.0 0.0 0.0 0.0 0.0 0.0 0.0
SD 0.4 1.1 0.7 0.5 0.4 0.7 0.5 0.7 0.4 0.5 0.4 0.7 0.4 0.5 0.4 0.7

143
The raw results from Tables 3-6 and 3-7 are presented graphically in Figures
3-8 to 3-10. It appeared from the figures that LM and TrA absolute thickness
increased from rest in all conditions but did not appear to change from the control
and ground standing positions. However, ΔLMmax, ΔTrAmax and movement
variability appeared to be higher in larger amplitude settings. No trends in NCS
were evident.
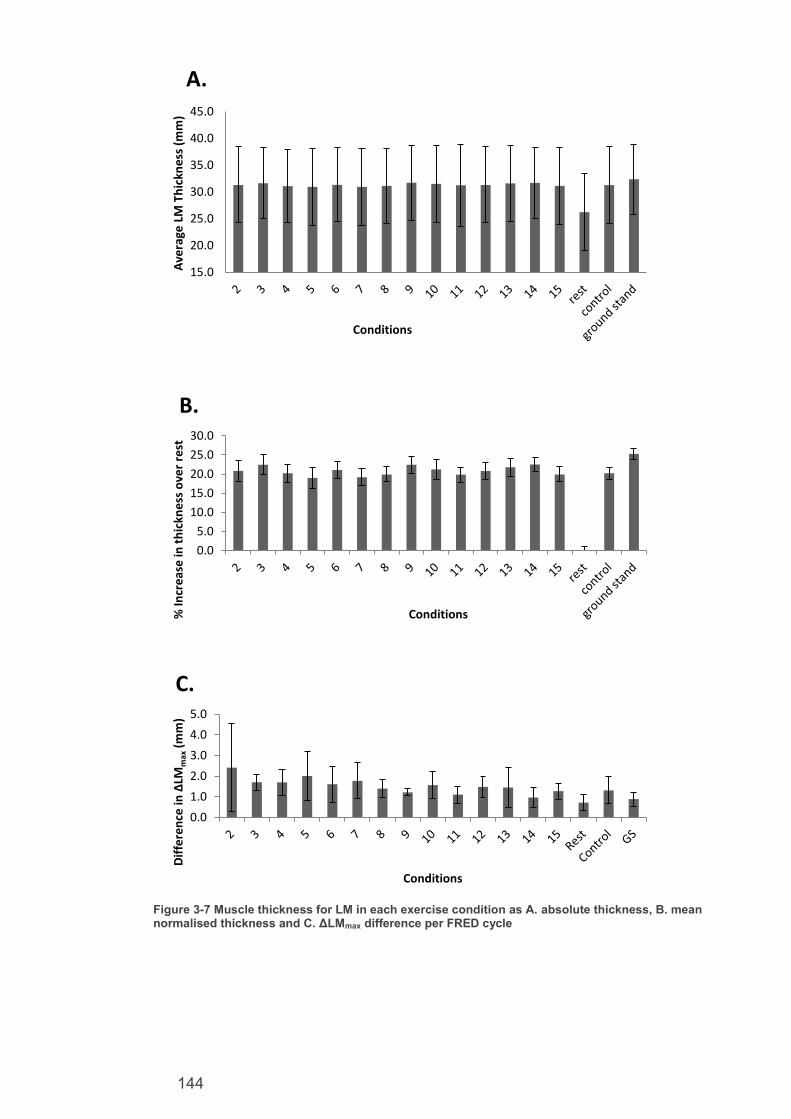
144
Figure 3-7 Muscle thickness for LM in each exercise condition as A. absolute thickness, B. mean normalised thickness and C. ΔLMmax difference per FRED cycle
15.0
20.0
25.0
30.0
35.0
40.0
45.0
Ave
rage
LM
Th
ickn
ess
(m
m)
Conditions
A.
0.0
5.0
10.0
15.0
20.0
25.0
30.0
% In
cre
ase
in t
hic
kne
ss o
ver
rest
Conditions
B.
0.0
1.0
2.0
3.0
4.0
5.0
Dif
fere
nce
in ΔLM
max
(m
m)
Conditions
C.

145
Figure 3-8 Muscle thickness for TrA in each exercise condition as A. absolute thickness, B. mean normalised thickness and C. ΔTrAmax difference per FRED cycle
0.01.02.03.04.05.06.07.0
Ave
rage
TrA
Th
ickn
ess
(m
m)
Conditions
A.
0.0
20.0
40.0
60.0
80.0
100.0
% In
cre
ase
in t
hic
kne
ss o
ver
rest
Conditions
B.
0.0
0.5
1.0
1.5
2.0
2.5
3.0
Dif
fere
ncf
e in
ΔTrA
max
(m
m)
Conditions
C.

146
Figure 3-9 A. Mean movement variability across all exercise conditions, B. Mean NCS rating across all exercise conditions and C. Mean NCS rating after all exercise conditions
0.0
2.0
4.0
6.0
8.0
10.0
12.0
14.0
2 3 4 5 6 7 8 9 10 11 12 13 14 15
Mo
vem
en
t va
riab
ility
(%
)
Conditions
A.
0.0
1.0
2.0
3.0
4.0
5.0
1 2 3 4 5 6 7 8 9 10 11 12 13 14 15
NC
S Sc
ale
Condition
B.
0.0
1.0
2.0
3.0
4.0
5.0
2 3 4 5 6 7 8 9 10 11 12 13 14 15 1 2
24 hoursafter visit
NC
S Sc
ale
Condition
C.

147
3.3.4. Magnitude Based Inference Comparisons
Table 3-8 presents the results of MBI comparisons made between each
exercise condition and rest, control and ground standing for LM thickness. Figure
3-11 presents these results graphically. It was most likely that all exercise
conditions recruited LM more than rest. The thickness change increase observed
in this study was 4.7±1.4 mm to 5.5±1.7 mm. It was possible that all exercise
conditions recruit LM less than ground standing. The thickness change decrease
observed in this study was between 0.7±1 mm and 1.4±1.1 mm. Table 3-9
presents the results of MBI comparisons made between each exercise condition
and rest, control and ground standing for TrA thickness. Figure 3-12 presents
these results graphically. It was at least possible that all exercise conditions
recruited TrA more than rest. The thickness change increase was between
0.9±0.5 mm and 1.7±0.9 mm. It was very likely that all exercise conditions did not
recruit TrA more or less than ground standing except for an unlikely decrease in
recruitment in conditions 2 (crank 2, footplate1), 4 (crank 3, footplate 1) and 5
(crank 3, footplate 2). It was unlikely that any exercise conditions recruit LM or
TrA more or less than the control condition. There were no obvious trends or
differences in NCS score between conditions.

148
Table 3-8 Difference in LM muscle thickness (mm) in each exercise condition compared with the rest, control and ground standing. Threshold for inferences set at typical error for LM thickness of 1.1mm.
Condition Mean change
90%Confidence limits Mechanistic inference
Compared to rest 2 (crank 2 footplate 1) 5.1 3.4 6.7 most likely +ive 3(crank 2 footplate 2) 5.4 4.2 6.6 most likely +ive
4(crank 3 footplate 1) 4.9 3.7 6.0 most likely +ive 5(crank 3 footplate 2) 4.7 3.9 5.5 most likely +ive
6(crank 3 footplate 3) 5.1 3.9 6.3 most likely +ive 7(crank 4 footplate 1) 4.7 3.3 6.1 most likely +ive
8(crank 4 footplate 2) 4.9 3.5 6.2 most likely +ive 9(crank 4 footplate 3) 5.5 4.5 6.5 most likely +ive
10(crank 4 footplate 4) 5.3 4.2 6.3 most likely +ive 11(crank 5 footplate 1) 5.0 3.8 6.1 most likely +ive
12(crank 5 footplate 2) 5.1 3.6 6.6 most likely +ive 13(crank 5 footplate 3) 5.4 4.2 6.5 most likely +ive
14(crank 5 footplate 4) 5.4 4.4 6.5 most likely +ive 15(crank 5 footplate 5) 4.9 3.7 6.1 most likely +ive
Compared to control 2 (crank 2 footplate 1) 0.0 -1.1 1.2 Unclear 3(crank 2 footplate 2) 0.4 -0.8 1.5 unlikely +ive 4(crank 3 footplate 1) -0.2 -1.5 1.1 unclear 5(crank 3 footplate 2) -0.3 -1.3 0.6 unlikely –ive 6(crank 3 footplate 3) 0.1 -1.0 1.1 unlikely +ive 7(crank 4 footplate 1) -0.3 -1.7 1.0 unlikely –ive 8(crank 4 footplate 2) -0.2 -0.8 0.4 very likely trivial 9(crank 4 footplate 3) 0.4 -0.7 1.5 unlikely +ive 10(crank 4 footplate 4) 0.2 -0.7 1.1 unlikely +ive 11(crank 5 footplate 1) 0.0 -0.8 0.7 very likely trivial 12(crank 5 footplate 2) 0.0 -1.1 1.2 unclear 13(crank 5 footplate 3) 0.3 -0.3 1.0 very likely trivial 14(crank 5 footplate 4) 0.4 -0.6 1.5 unlikely +ive 15(crank 5 footplate 5) -0.2 -1.4 1.1 unlikely –ive
Compared to ground standing 2 (crank 2 footplate 1) -1.1 -0.7 -1.3 possibly –ive 3(crank 2 footplate 2) -2.6 -1.7 -2.4 possibly –ive 4(crank 3 footplate 1) 0.5 0.2 -0.2 possibly –ive 5(crank 3 footplate 2) -1.1 -0.7 -1.3 possibly –ive 6(crank 3 footplate 3) -2.6 -1.7 -2.4 possibly –ive 7(crank 4 footplate 1) 0.5 0.2 -0.2 possibly –ive 8(crank 4 footplate 2) -1.1 -0.7 -1.3 possibly –ive 9(crank 4 footplate 3) -2.6 -1.7 -2.4 unlikely –ive 10(crank 4 footplate 4) 0.5 0.2 -0.2 possibly –ive 11(crank 5 footplate 1) -1.1 -0.7 -1.3 possibly –ive 12(crank 5 footplate 2) -2.6 -1.7 -2.4 possibly –ive 13(crank 5 footplate 3) 0.5 0.2 -0.2 possibly –ive 14(crank 5 footplate 4) -1.1 -0.7 -1.3 unlikely –ive 15(crank 5 footplate 5) -2.6 -1.7 -2.4 possibly –ive

149
Figure 3-10 Results of MBI comparisons for mean change in LM thickness compared with A. rest, B. control and C. ground standing . The tails show 90% confidence intervals and the shaded area represents the inference threshold of 1.1mm
0.0
2.2
4.4
6.6
8.8
2 3 4 5 6 7 8 9 10 11 12 13 14 15
Ch
ange
in t
hic
kne
ss (
mm
)
Conditions
A.
-2.2
0.0
2.2
2 3 4 5 6 7 8 9 10 11 12 13 14 15
Ch
ange
in t
hic
kne
ss (
mm
)
Conditions
B.
-4.4
-2.2
0.0
2.2
4.4
2 3 4 5 6 7 8 9 10 11 12 13 14 15
Ch
ange
in t
hic
kne
ss (
mm
)
Conditions
C.

150
Table 3-9 Difference in TrA muscle thickness (mm) in each Exercise Condition compared with the rest control and ground standing. Calculated with a threshold for inferences set at typical error for TrA thickness of 1.04mm.
Condition Mean change
90%Confidence limits Mechanistic inference
Compared to rest 2 (crank 2 footplate 1) 1.7 0.8 2.6 likely +ive
3(crank 2 footplate 2) 1.2 0.4 2.0 possibly +ive 4(crank 3 footplate 1) 1.6 0.9 2.4 likely +ive
5(crank 3 footplate 2) 1.6 0.9 2.2 likely +ive 6(crank 3 footplate 3) 1.1 0.4 1.8 possibly +ive
7(crank 4 footplate 1) 1.2 0.6 1.8 possibly +ive 8(crank 4 footplate 2) 1.1 0.5 1.8 possibly +ive
9(crank 4 footplate 3) 0.9 0.4 1.5 possibly +ive 10(crank 4 footplate 4) 1.3 0.6 2.0 likely +ive
11(crank 5 footplate 1) 1.0 0.5 1.6 possibly +ive 12(crank 5 footplate 2) 1.2 0.6 1.8 possibly +ive
13(crank 5 footplate 3) 1.3 0.8 1.8 likely +ive 14(crank 5 footplate 4) 1.1 0.5 1.7 possibly +ive
15(crank 5 footplate 5) 1.3 0.6 2.0 possibly +ive
Compared to control 2 (crank 2 footplate 1) 0.8 0.2 1.3 unlikely +ive 3(crank 2 footplate 2) 0.3 -0.6 1.1 unlikely +ive 4(crank 3 footplate 1) 0.7 0.2 1.3 unlikely +ive 5(crank 3 footplate 2) 0.6 0.0 1.3 unlikely +ive 6(crank 3 footplate 3) 0.2 -0.7 1.1 unlikely +ive 7(crank 4 footplate 1) 0.3 -0.6 1.1 unlikely +ive 8(crank 4 footplate 2) 0.2 -0.7 1.2 unlikely +ive 9(crank 4 footplate 3) 0.0 -0.8 0.8 very likely trivial 10(crank 4 footplate 4) 0.4 -0.1 0.9 very likely trivial 11(crank 5 footplate 1) 0.1 -0.6 0.9 very likely trivial 12(crank 5 footplate 2) 0.3 -0.5 1.1 unlikely +ive 13(crank 5 footplate 3) 0.4 -0.2 0.9 very likely trivial 14(crank 5 footplate 4) 0.2 -0.4 0.7 very likely trivial 15(crank 5 footplate 5) 0.4 -0.5 1.3 unlikely +ive
Compared to ground standing 2 (crank 2 footplate 1) -1.1 -2.6 0.5 unlikely +ive 3(crank 2 footplate 2) -0.7 -1.7 0.2 very likely trivial 4(crank 3 footplate 1) -1.3 -2.4 -0.2 unlikely +ive 5(crank 3 footplate 2) -1.4 -2.5 -0.3 unlikely +ive 6(crank 3 footplate 3) -1.0 -2.3 0.3 very likely trivial 7(crank 4 footplate 1) -1.4 -2.7 -0.1 very likely trivial 8(crank 4 footplate 2) -1.3 -2.5 0.0 very likely trivial 9(crank 4 footplate 3) -0.7 -1.8 0.5 most likely trivial 10(crank 4 footplate 4) -0.9 -1.9 0.1 very likely trivial 11(crank 5 footplate 1) -1.1 -2.5 0.3 most likely trivial 12(crank 5 footplate 2) -1.1 -2.3 0.1 most likely trivial 13(crank 5 footplate 3) -0.8 -2.0 0.5 most likely trivial 14(crank 5 footplate 4) -0.7 -1.7 0.3 most likely trivial 15(crank 5 footplate 5) -1.3 -2.3 -0.2 very likely trivial
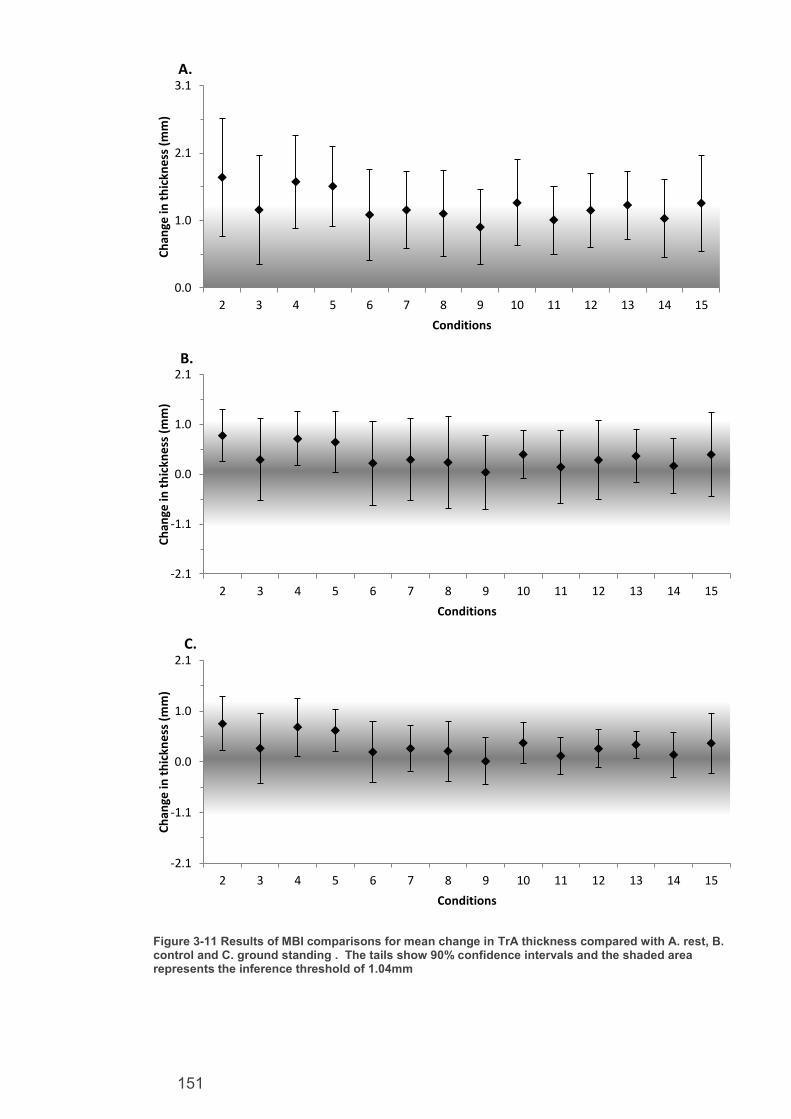
151
Figure 3-11 Results of MBI comparisons for mean change in TrA thickness compared with A. rest, B. control and C. ground standing . The tails show 90% confidence intervals and the shaded area represents the inference threshold of 1.04mm
0.0
1.0
2.1
3.1
2 3 4 5 6 7 8 9 10 11 12 13 14 15
Ch
ange
in t
hic
kne
ss (
mm
)
Conditions
A.
-2.1
-1.1
0.0
1.0
2.1
2 3 4 5 6 7 8 9 10 11 12 13 14 15
Ch
ange
in t
hic
kne
ss (
mm
)
Conditions
B.
-2.1
-1.1
0.0
1.0
2.1
2 3 4 5 6 7 8 9 10 11 12 13 14 15
Ch
ange
in t
hic
kne
ss (
mm
)
Conditions
C.

152
To test for differences between the various crank amplitude and footplate
positions, the exercise conditions were grouped by each amplitude and footplate
setting. The groupings of exercise conditions to device settings are illustrated in
Table 3-10.
Table 3-10 Groupings of FRED conditions by Crank and Footplate Positions
Table 3-11 presents the MBI comparisons between crank amplitudes using the
typical error inference thresholds for all variables. The table shows at best, only
trivial differences between the amplitudes on LM absolute muscle thickness, either
trivial or an unlikely reduction in TrA muscle thickness in smaller amplitudes, an
unlikely reduction in ΔLMmax muscle thickness in smaller amplitudes (however,
this trend was not always clear), a possible reduction in ΔTrAmax muscle
thickness in the smallest compared to largest crank amplitude and a most likely
reduction in movement variability in the smallest compared to largest crank
amplitude. The movement variability trend continues to be at least very likely
between every larger and smaller crank amplitude comparison except for between
crank amplitude positions 3 and 2 where it becomes unclear.
Crank Positions
1 2 3 4 5
FR
ED
Con
ditio
ns - 2 4 7 11
3 5 8 12
6 9 13
10 14
15
Footplate Positions
1 2 3 4 5
FR
ED
Con
ditio
ns 2 3 6 10 15
4 5 9 14
7 8 13
11 12

153
Table 3-11 Difference in muscle recruitment and motor control outcomes in each crank Position, all in footplate position one. Calculated with threshold for inferences set at typical error for LM thickness of 1.1mm, for ΔLMMAX thickness of 0.8mm, for movement variability of 0.46%, for TrA thickness of 1.04mm and for ΔTrAmax thickness of 0.48mm
Crank Positions Mean change
90%Confidence limits Mechanistic inference
Difference in LM thickness between crank positions (mm) 3-2 -0.4 -1.3 0.5 unlikely –ive 4-2 -0.4 -1.1 0.4 unlikely –ive 5-2 -0.1 -1.0 0.9 likely trivial 4-3 0.1 -0.3 0.6 very likely trivial 5-3 0.1 -0.9 1.2 unlikely +ive 5-4 0.1 -0.9 1.1 unlikely +ive
Difference in ΔLMmax thickness change per cycle between crank positions (mm) 3-2 -0.2 -1.2 0.8 unclear 4-2 -0.4 -1.1 0.4 unlikely –ive 5-2 -0.1 -1.0 0.9 unclear 4-3 -0.2 -1.0 0.6 unlikely –ive 5-3 0.1 -0.9 1.2 unclear 5-4 0.3 -0.8 1.4 unlikely +ive
Difference in TrA thickness between crank positions (mm) 3-2 -0.1 -0.7 0.5 very likely trivial 4-2 -0.5 -1.1 0.1 unlikely –ive 5-2 -0.7 -1.3 0.0 unlikely –ive 4-3 -0.4 -1.0 0.1 very likely trivial 5-3 -0.6 -1.2 0.0 unlikely –ive 5-4 -0.2 -0.6 0.3 most likely trivial
Difference in ΔTrAmax thickness change per cycle between crank positions (mm) 3-2 -0.2 -0.7 0.2 very likely trivial 4-2 -0.6 -1.0 -0.1 very likely trivial 5-2 -0.9 -1.3 -0.5 possibly –ive 4-3 -0.3 -0.7 0.0 most likely trivial 5-3 -0.6 -1.0 -0.3 very likely trivial 5-4 -0.2 -0.4 0.0 most likely trivial
Difference in movement variability between crank positions (from minimum seven cycles)
3-2 -0.8 -2.3 0.7 unclear 4-2 -3.1 -4.4 -1.8 very likely –ive 5-2 -3.7 -4.9 -2.6 most likely –ive 4-3 -2.3 -3.9 -0.8 very likely –ive 5-3 -3.0 -4.7 -1.3 very likely –ive 5-4 -0.6 -1.5 0.2 possibly –ive
Figure 3-13 presents the results of comparisons between crank comparisons
for LM outcomes. Figure 3-14 presents the results of the same comparisons for
TrA outcomes and Figure 3-15 for movement variability outcomes.

154
Figure 3-12 Results of MBI comparisons for mean change in LM outcomes between each crank position for A. LM thickness with shaded area representing the inference threshold of 1.1mm and B. ΔLMmax with shaded area showing inference threshold of 0.8mm. All tails show 90% confidence intervals. All comparisons were in footplate position one.
-2.2
0.0
2.2
3-2 4-2 5-2 4-3 5-3 5-4
Ch
ange
in t
hic
kne
ss (
mm
)
Crank Positions
A.
-1.6
0.0
1.6
3-2 4-2 5-2 4-3 5-3 5-4
Ch
ange
in t
hic
kne
ss (
mm
)
Crank postions
B.

155
Figure 3-13 Results of MBI comparisons for mean change in TrA outcomes between each crank position for A. TrA thickness with shaded area representing the inference threshold of 1.04mm and B. ΔTrAmax with shaded area showing inference threshold of 0.48mm. All tails show 90% confidence intervals. All comparisons were in footplate position one.
Figure 3-14 Results of MBI comparisons for mean change in Movement variability between each crank position with shaded area showing inference threshold of 0.46%. All tails show 90% confidence intervals. All comparisons were in footplate position one.
-2.2
0.0
2.2
3-2 4-2 5-2 4-3 5-3 5-4
Ch
ange
in t
hic
kne
ss (
mm
)
Crank positions
A.
-1.5
-0.5
0.5
1.5
3-2 4-2 5-2 4-3 5-3 5-4
Ch
ange
in t
hic
kne
ss (
mm
)
Crank positions
B.
-8.8
-6.6
-4.4
-2.2
0
2.2
4.4
6.6
8.8
3-2 4-2 5-2 4-3 5-3 5-4
Mo
vem
en
t va
riab
ility
(%
)
Crank postions

156
Table 3-12 illustrates the results of comparisons between each footplate
position for muscle recruitment measures. Table 3-13 presents the same results
for the movement variability. The results show that it was unlikely that any
difference in muscle recruitment, muscle recruitment variability or movement
variability was found between any footplate positions. Therefore, the results
would appear to show that footplate position did not affect muscle recruitment or
motor control.

157
Table 3-12 Difference in muscle recruitment between each footplate position, all in crank position five. Calculated with threshold for inferences set at typical error for LM thickness of1.1mm, for ΔLMmax thickness of 0.8mm, for TrA thickness 1.04mm and for ΔTrAmax thickness of 0.48mm
Footplate Positions Mean change
90%Confidence limits Mechanistic inference
Difference in LM thickness between footplate positions (mm)
2-1 0.1 -1.1 1.2 unclear; get more data
3-1 0.4 -0.1 0.9 very likely trivial
4-1 0.4 -0.5 1.4 unlikely +ive
5-1 -0.1 -1.2 1.0 unlikely –ive
3-2 0.3 -0.9 1.6 unlikely +ive
4-2 0.4 -0.2 1.0 very likely trivial
5-2 -0.2 -0.8 0.4 very likely trivial
4-3 0.1 -0.9 1.0 likely trivial
5-3 -0.5 -1.7 0.7 unlikely –ive
5-4 -0.6 -1.1 0.0 unlikely –ive
Difference in ΔLMmax thickness change per cycle between footplate positions (mm)
2-1 0.3 -0.1 0.7 very likely trivial
3-1 0.3 -0.3 0.9 unlikely +ive
4-1 0.0 -0.2 0.2 most likely trivial
5-1 0.1 -0.2 0.4 most likely trivial
3-2 0.1 -0.7 0.8 unlikely +ive
4-2 -0.5 -1.0 0.0 unlikely –ive
5-2 -0.2 -0.6 0.2 very likely trivial
4-3 -0.4 -0.9 0.2 unlikely –ive
5-3 -0.2 -1.0 0.6 unlikely –ive
5-4 0.3 -0.1 0.7 very likely trivial
Difference in TrA thickness between footplate positions (mm)
2-1 0.1 -0.3 0.6 most likely trivial
3-1 0.2 -0.2 0.7 very likely trivial
4-1 0.0 -0.5 0.6 very likely trivial
5-1 0.3 -0.4 0.9 very likely trivial
3-2 0.1 -0.4 0.6 very likely trivial
4-2 -0.1 -0.5 0.3 most likely trivial
5-2 0.1 -0.3 0.5 most likely trivial
4-3 -0.2 -0.7 0.3 very likely trivial
5-3 0.0 -0.7 0.8 very likely trivial
5-4 0.1 -0.3 0.5 most likely trivial
Difference in ΔTrAmax thickness change per cycle between footplate positions (mm)
2-1 0.0 -0.2 0.3 very likely trivial
3-1 0.1 -0.1 0.3 very likely trivial
4-1 -0.1 -0.3 0.2 very likely trivial
5-1 0.2 -0.1 0.4 very likely trivial
3-2 0.1 0.0 0.2 most likely trivial
4-2 -0.2 -0.4 0.1 very likely trivial
5-2 0.1 -0.1 0.3 very likely trivial
4-3 -0.2 -0.4 0.0 very likely trivial
5-3 0.1 -0.2 0.3 very likely trivial
5-4 0.3 0.1 0.5 unlikely +ive

158
Table 3-13 Difference in movement variability between each footplate position, all in crank position five. Calculated with threshold for inferences set at typical error for movement variability of 0.46%.
Footplate Postisions Mean change
90%Confidence limits Mechanistic inference
Difference in movement variability between footplate positions (from min seven cycles)
2-1 0.9 -1.8 3.7 Unclear 3-1 -0.6 -1.6 0.4 possibly –ive 4-1 -0.2 -0.6 0.3 unlikely –ive 5-1 -0.8 -2.9 1.3 Unclear 3-2 -1.2 -3.5 1.1 Unclear 4-2 -0.9 -3.4 1.6 Unclear 5-2 -1.5 -4.3 1.4 Unclear 4-3 0.2 -0.6 1.0 Unclear 5-3 -0.2 -2.4 2.1 Unclear 5-4 -0.5 -2.3 1.4 Unclear
Figure 3-16 presents the results of comparisons between footplate
comparisons for LM outcomes. Figure 3-17 presents the results of the same
comparisons for TrA outcomes and Figure 3-18 for movement variability
outcomes.
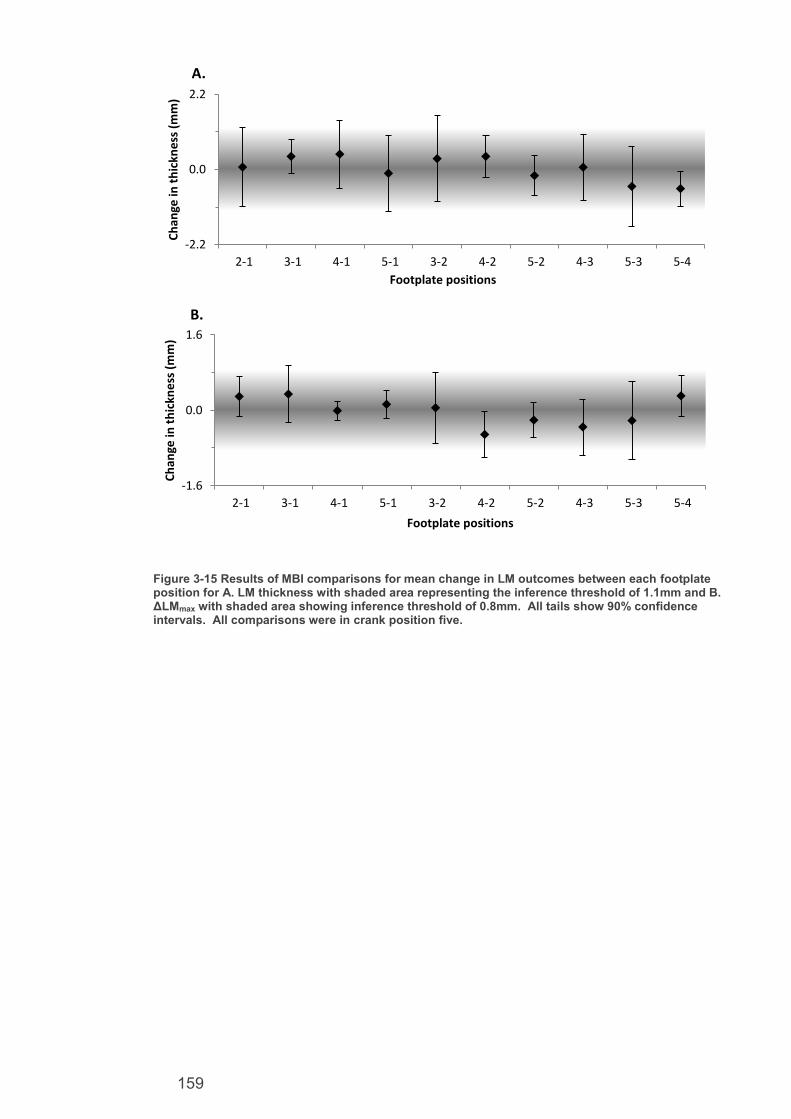
159
Figure 3-15 Results of MBI comparisons for mean change in LM outcomes between each footplate position for A. LM thickness with shaded area representing the inference threshold of 1.1mm and B. ΔLMmax with shaded area showing inference threshold of 0.8mm. All tails show 90% confidence intervals. All comparisons were in crank position five.
-2.2
0.0
2.2
2-1 3-1 4-1 5-1 3-2 4-2 5-2 4-3 5-3 5-4
Ch
ange
in t
hic
kne
ss (
mm
)
Footplate positions
A.
-1.6
0.0
1.6
2-1 3-1 4-1 5-1 3-2 4-2 5-2 4-3 5-3 5-4
Ch
ange
in t
hic
kne
ss (
mm
)
Footplate positions
B.

160
Figure 3-16 Results of MBI comparisons for mean change in TrA outcomes between each footplate position for A. TrA thickness with shaded area representing the inference threshold of 1.04mm and B. ΔTrAmax with shaded area showing inference threshold of 0.48mm. All tails show 90% confidence intervals. All comparisons were in crank position five.
Figure 3-17 Results of MBI comparisons for mean change in movement variability between each footplate position with shaded area showing inference threshold of 0.46%. All tails show 90% confidence intervals. All comparisons were in crank position five.
-2.2
0.0
2.2
2-1 3-1 4-1 5-1 3-2 4-2 5-2 4-3 5-3 5-4
Ch
ange
in t
hic
kne
ss (
mm
)
Footplate positions
A.
-1.0
0.0
1.0
2-1 3-1 4-1 5-1 3-2 4-2 5-2 4-3 5-3 5-4
Ch
ange
in t
hic
kne
ss (
mm
)
Footplate positions
B.
-5.0-4.0-3.0-2.0-1.00.01.02.03.04.05.0
2-1 3-1 4-1 5-1 3-2 4-2 5-2 4-3 5-3 5-4
Ch
ange
in m
ove
me
nt
vari
abiit
y (%
)
Footplate positions

161
3.3.1. Effect size analysis between crank amplitudes
Some weak trends were apparent between the crank amplitudes for absolute
TrA thickness, ΔLMmax, ΔTrAmax and movement variability. Therefore, effect size
analysis was performed on these variables to assess for any worthwhile effects
which may have been missed by the deliberately conservative typical error
statistics. Figures 3-19 to 3-23 illustrate the raw change between each crank
amplitude across these variables. Tables 3-14 to 3-17 present the corresponding
effect size comparisons with MBI statistics. For this analysis the amplitudes were
labelled as distance of the foot plate arm attachment away from the crank axle.
Therefore, labels were 0.2 m (setting 5) 0.28 m (setting 4), 0.36 m (setting 3) and
0.425 m (setting 2). This labelling better illustrates the effect size in relation to
amplitude change in meters.
Transversus abdominis muscle thickness
In the smallest amplitude, TrA thickness was 4.1±1.0 mm, and increased to
4.8±1.7 mm in the largest amplitude. Figure 3-19 appears to show a trend of
increased TrA thickness as the amplitude increased in size. Table 3-14 shows
that increasing the amplitude was likely to increase TrA thickness between the two
largest and the smallest amplitudes. However the trend is only possible between
the other amplitudes and becomes very likely trivial between both the two largest
and two smallest amplitudes.

162
Figure 3-18 TrA muscle thickness as a function of amplitude and at rest.
Table 3-14 Difference in TrA muscle thickness between each crank position, and each position compared to rest, calculated with threshold for inference of effect size at least 0.2,
1 indicates
inference threshold of 0.6.
Crank amplitude
(m) effect size 90% Confidence
limits Mechanistic inference
0.425-0.36 0.0 -0.2 0.4 Very likely trivial 1
0.425-0.28 0.3 0.0 0.6 Possibly +ve
0.425-0.2 0.4 0.0 0.8 Likely +ve
0.36-0.28 0.4 -0.1 0.8 Possibly +ve
0.36-0.2 0.5 0.0 1.0 Likely +ve
0.28-0.2 0.1 -0.2 0.5 Very likely trivial 1
Lumbar multifidus muscle thickness variability
In the smallest amplitude, ΔLMmax was 1.1±0.4 mm, and increased to 2.5±2.1
mm in the largest amplitude (Figure 3-20). Table 3-15 shows high levels of
variation across participants resulting in few clear inferences at the 0.2 effect size
level. Larger amplitudes were at least likely to result in increased ΔLMmax
compared to the smallest. However, this trend was only possible between the

163
other amplitudes, and was trivial, between 0.36 m and 0.28 m
Figure 3-19 ΔLMmax as a function of amplitude.
Table 3-15 Difference in max-min LM muscle thickness between each crank position, calculated with threshold for inference of at least effect size 0.2,
1 indicates inference threshold of 0.6 and
2 of 1.2
Crank positions Effect size
90% Confidence limits Mechanistic inference
0.425-0.36 0.4 -0.5 1.3 Possibly positive 1
0.425-0.28 0.4 -0.3 1.0 Possibly positive 1
0.425-0.2 0.4 -0.1 0.8 Likely positive
0.36-0.28 -0.1 -0.9 0.7 Very likely trivial 2
0.36-0.2 1.0 0.3 1.7 Very likely positive
0.28-0.2 0.8 0.0 1.6 Likely positive
Transversus abdominis muscle thickness variability
In the smallest amplitude, ΔTrAmax was 1.0±0.3 mm, and increased to 1.9±0.6
mm in the largest amplitude condition (Figure 3-21). Table 3-16 shows that it was
at least likely that larger amplitudes resulted in increased ΔTrAmax except for
between the two largest amplitudes where the trend was only possible.

164
Figure 3-20 ΔTrAmax as a function of amplitude.
Table 3-16 Difference in ΔTrAmax between each crank position, calculated with threshold for inference of at least effect size 0.2,
1 indicates inference threshold of 0.6
Crank positions Effect size
90% Confidence limits Mechanistic inference
0.425-0.36 0.5 -0.4 1.3 Possibly positive 1 0.425-0.28 1.3 0.5 2.1 Very likely positive 0.425-0.2 1.6 0.9 2.3 Most likely positive
0.36-0.28 0.9 0.1 1.7 Likely positive 0.36-0.2 1.4 0.6 2.3 Very likely positive 0.28-0.2 0.8 0.0 1.6 Likely positive
Movement variability
In the smallest amplitude, movement variability was 5.2±0.9%, and increased
in all amplitudes to 9.2±3% at 0.36 m, dropping to 8.7± 1.9% at 0.425 m (Figure 3-
22). Table 3-17 shows that it was at least likely that larger amplitudes caused
increased movement variability. However, the change was unlikely between the
largest two amplitudes.

165
Figure 3-21 Movement variability as a function of amplitude
Table 3-17 Difference in movement variability between each crank position, calculated with threshold for inference of at least effect size 0.2,
1 indicates inference threshold of 0.6
Crank positions Effect size
90% Confidence limits Mechanistic inference
0.425-0.36 -0.2 -0.7 0.4 Unlikely -ve 1 0.425-0.28 1.1 -0.1 2.2 Likely +ve 0.425-0.2 1.9 0.7 3.1 Very likely +ve 0.36-0.28 0.9 -0.2 2.0 Likely +ve 0.36-0.2 1.5 0.2 2.7 likely +ve 0.28-0.2 0.7 -0.1 1.5 Likely +ve
3.4. Discussion
The main finding of this chapter was that all FRED settings increased muscle
thickness of LM and TrA compared to rest, which validates previous findings of
Debuse et al. (2013) that FRED exercise appears to recruit both muscles
automatically, and demonstrates that all settings are useful for training. It was
also found that increasing the amplitude of foot movement while exercising on the
FRED elicited increased movement variability at the feet, which was linked to
trends in increased ΔTrAmax, ΔLMmax and TrA muscle recruitment. This suggests
larger amplitudes increase the challenge placed on the motor control system.

166
3.4.1. Comparison of Individual Exercise Conditions
It is clear from the results that all exercise conditions increase recruitment
of both LM and TrA compared to rest. This adds to the evidence that exercise on
the device recruits these muscles without conscious need to trigger that activation
as reported in previous studies on the device (Debuse et al. 2013). Debuse et al.
(2013) reported mean thickness changes between rest and exercise of 7 mm for
LM and 2.5 mm for TrA, which were larger differences than seen in this study.
Debuse et al. (2013) measured thickness change at a single point of the device
cycle, estimated to be where thickness was highest, therefore reporting the
maximal difference that could be expected in muscle thickness between exercise
and rest. This study is more representative of the true mean difference
throughout a full cycle of FRED exercise averaged over six complete cycles
compared to rest. Therefore, the recruitment reported here takes into account
potential variations in muscle thickness, evident in the ΔTrAmax and ΔLMmax
results, throughout a period of training and provides a more representative
estimate of mean muscle recruitment of the full FRED cycle. There may also be a
very small risk that subtle differences between the prototypes impacted on muscle
recruitment, however, this is unlikely due to similarities in their design.
No measurable difference was recorded between the exercise conditions and
standing still on the device. This may indicate that muscle recruitment is not due
to the movement during exercise and so may instead be a result of one of the
other device mechanisms, such as standing on and controlling the movement of
the unstable footplates or the posture adapted on the device. However, the
importance of using a functional movement in the rehabilitation of LM and TrA has
been highlighted previously (O'Sullivan 2000), and FRED exercise facilitates
dynamic movement of the legs over a stationary trunk (Debuse et al. 2013;
Gibbon, Debuse and Caplan 2013; Caplan et al. 2014)

167
It was also most likely that there was no difference in LM and TrA recruitment
between ground standing and all FRED conditions. This would suggest that
upright posture was the main mechanism resulting in muscle recruitment. There
is a low probability that LM activity was slightly less on the FRED than in ground
standing by up to 2.1 mm. This may be due to variations in muscle recruitment
when exercising or standing on the FRED with an increased challenge to motor
control, rather than potentially more constant and tonic recruitment in static
ground standing.
The lack of observed change between all the conditions involving upright
posture may also be a result of the population tested. It is possible that in healthy,
young populations without LBP, the muscles automatically recruit in response to
upright postures which can be considered a normal response to control the
upright sagittal spinal and pelvic posture against gravity (Claus et al. 2009;
O'Sullivan et al. 2006). Therefore, very little difference between standing and
walking on a stable surface, and exercising on the device may be expected in no-
LBP populations. The difference may then become larger when tested in a
clinical population, if the device is effective as a clinical intervention for deep
lumbopelvic muscle recruitment. The device has yet to be shown as being able to
automatically activate LM and TrA in a population with proven prior impairment in
recruitment. The evidence generated thus far strongly shows the device is able to
recruit the muscles and should be used to justify future trials in clinical populations
to test its effectiveness as a clinical intervention.
3.4.2. Comparison of Crank and Footplate Positions
The results of the typical error analysis showed weak trends that increasing
crank amplitude resulted in increased TrA muscle activation, ΔTrAmax, ΔLMmax and
movement variability. There were no trends found between the various footplate

168
positions. This agreed with the computer model illustrated in Figure 3-3 and
further illustrates that it is the crank amplitude position which changes the exercise
movement and impacts on motor control outcomes rather than the footplate
positions. Overall, this suggests that larger crank amplitudes present more of a
challenge and may result in slightly increased muscle recruitment and less even
movements.
The trends seen in the typical error analysis between crank amplitudes were
confirmed by the effect size analysis comparing amplitudes. Effects were found
showing that increasing the amplitude of foot movement while exercising on the
FRED elicited an increased movement variability at the feet which was linked to
increased ΔTrAmax, ΔLMmax and TrA muscle recruitment. When combined with the
typical error analysis and computer plots showing the differences between the
amplitudes, this strongly suggests larger crank amplitudes increase the challenge
placed on the motor control of the spine. This trend may be caused by larger
amplitude cranks resulting in an increased vertical distance throughout which the
front foot drop must be controlled. This has the effect of increasing both the
height and the time during which the front foot drop occurs, both of which may be
factors in increasing the demands on the deep spinal muscles and general motor
control of the entire movement. This may be similar to the mechanisms were
increased stride length in walking and running have previously been shown to
lead to increased leg muscle activity (Patla, Armstrong and Silveira 1989).
3.4.3. Development of a Training Protocol
Traditional LM and TrA training interventions recommend progressive
training, starting by isolating muscle recruitment, to recruitment during upright
functional positions while maintaining lumbar lordosis and thoracic kyphosis and
then gaining endurance of the LM and TrA muscles (Hides et al. 2008; O'Sullivan

169
2000). Previous evidence (Debuse et al. 2013) and the rest comparisons suggest
recruitment of LM and TrA occurs automatically during FRED exercise. The same
evidence and rest comparisons also demonstrate the exercise can be performed
correctly in an upright functional position from first use, in healthy first-time FRED
users. This agrees with other research investigating the learning of challenging
balance exercises in upright posture that demonstrated healthy individuals could
perform stilt walking safely on first attempt, but that technique refinement then
occurs over time, with multiple practice sessions (Akram and Frank 2011).
Therefore, a progressive training protocol using the FRED is likely to begin with
recruiting the muscles while maintaining lumbar lordosis and thoracic kyphosis
during upright functional movements and advance to muscle endurance.
As the results showed crank amplitude was the main element of the FRED
settings which affects recruitment and motor control outcomes while the footplate
had very small, if any, effect, it is recommended to use FRED conditions 2, 4, 7
and 11. These four conditions use all crank amplitude positions (two to five
respectively) without needing to alter the footplate position, which remains in
position one throughout. In addition, this footplate setting places device users in
the forward most position possible and closest to the handle bars of the device
should they be required during exercise for safety reasons. Traditional LM and
TrA training progresses the functional movement stage by reducing base of
support, increasing movement size or using physical loads such as holding
weights in the upper limbs (O'Sullivan 2000; Hides et al. 2008). As the results of
this study show that increasing crank amplitude settings resulted in reduced ability
to maintain smooth movements and increased ΔLMmax and ΔTrAmax, it appears
that FRED progression can be based on increasing amplitude size to increase the
motor control demand. It is, therefore, suggested that users begin in the lowest

170
amplitude setting and increase by one setting once they can consistently minimise
movement variability. Over a period of training, the exercise can be progressed
and the user is able to control a larger amplitude setting with an increased motor
control challenge. The progression and expected differences in outcomes
between them based on the evidence of this study are presented in Table 3-18.
Table 3-18 FRED training Progression and Effect on Outcomes
Progression FRED condition
Muscle recruitment (thickness)
Movement and muscle recruitment variability
2
(crank 2 footplate 1)
4 (crank 3
footplate 1)
7
(crank4 footplate 1)
11
(crank 5 footplate 1)
3.4.4. Reliability
The typical error analysis provided conservative estimates of intra-rater
between day measurable changes that can be detected using this type of
methodology. For contracted lumbopelvic muscle thickness, a change of 1.1 mm
could be measured in LM and 1.04 mm in TrA. These are comparable to the
standard error of measurement results previously reported by Koppenhaver et al.
(2009) of 1.1 mm for LM, but higher than the 0.5 mm reported for TrA. This
suggests the methodology used in this study has similar reliability for LM but lower
reliability for TrA. This may be due to the small amount of data used in the typical
error calculations in this study and that the highest varying participant and
condition was used to ensure a conservative typical error estimate. The typical
Increases in LM and TrA thickness. Potential thickness increase of 0.5±0.6mm to 0.7±0.6mm All are expected to recruit LM and TrA more than rest. Potential thickness increase over rest of 4.7±1.4mm to 5.5±1.7mm for LM and 0.9±0.5mm and 1.7±0.9mm for TrA
Increased movement variability,
ΔLMmax, and
ΔTrAmax.

171
errors reported here are smaller than minimal detectable changes reported by
Koppenhaver et al. (2009), of 3.1 mm for contracted LM and 1.3 mm for
contracted TrA for intra-rater between-day measures. However, the minimal
detectable change shows the difference that must occur to be 95% confident of a
true change. This is more conservative than what is needed for the MBI approach
used in this study and risks masking smaller but still potentially useful changes,
especially in small sample studies such as this (Shakespear 2001).
Conservative examples of intra-rater between-day measurable changes for the
novel outcome measures used in this study were a variation of 0.82 mm for LM
recruitment, 0.48 mm for TrA and 0.46% for movement variability. As these
outcomes are novel and specific to the FRED, there was no previous literature to
compare to. However, the good between-day reliability results found in the
muscle thickness measures suggest measures were assessed rigorously
throughout the study. The reliability estimates reported for the novel outcomes
here may also act as a benchmark to compare to for future studies which use
these outcome measures. As studies of the device develop towards clinical trials,
it may be useful to establish the validity and reliability of the common outcome
measures used in these studies and evidence of clinically relevant, minimal
worthwhile changes in relevant populations.
3.4.5. Limitations
Only the ultrasound outcome measure had previous evidence showing it to
be valid and reliable with previous data to compare to. Outcomes of ΔLMmax,
ΔTrAmax movement variability and comfort were novel. Their validity and reliability
may, therefore, be questioned. ΔLMmax, ΔTrAmax and movement recruitment
variability did show measurable changes suggesting they may be valid if tested
and conservative estimates were provided for their reliability from this study,

172
although calculated from a very small population and, therefore, should be treated
with some caution. The Newcastle Comfort Scale was unable to detect any
changes between any of the conditions it was used in and so consequently was
not tested for reliability or used in any MBI statistics. This may suggest that all
settings were equally comfortable or it may be the scale is not valid or sensitive to
the changes in comfort caused by the FRED. Future studies should either
validate the scale before its use or implement an alternative outcome measure
that has already been shown to be both a valid and reliable outcome measure for
the purpose.
The results of this study were only able to show mechanistic changes
reported in all the outcome measures. They do not show if these changes are
meaningful to clinical populations, or if they are of sufficient magnitude to be
effective as a LBP intervention. Minimal clinically worthwhile changes in
populations where the device could be used as an intervention need to be
established in order to make inferences and conclusions about the clinical
relevance of the device. Correlating validated clinical, and device relevant,
outcomes or constructs (potentially pain or disability outcomes would be
appropriate), to changes in muscle thickness, recruitment variation and movement
variability could be a way in which to establish such minimal clinically worthwhile
changes. Once established they could be used to set the thresholds for MBI to
produce meaningful insights into the ability of the device to generate clinically
worthwhile changes in the relevant outcomes. This would be useful in studies
wanting to test whether the device is effective in a clinical population.
A study into TrA and internal and external oblique thickness changes
linking them to clinical outcomes of pain and Roland Morris disability
questionnaire showed thickness change was a poor indicator of clinical outcomes
(Mannion et al. 2012). However, the study only considered baseline and end of

173
nine-weeks therapy, so a ceiling effect may have been reached earlier on and
been unnoticed. It also only considered TrA and internal and external oblique
muscles, without giving consideration to LM. Additionally they used M mode USI
with Doppler imaging which is different approach to assessing recruitment with
USI, and so their conclusions may not be transferable to this context. A fine wire
electromyography study comparing activation of LM and TrA to clinical outcomes
could be used to establish minimal clinically relevant changes in the muscle
recruitment outcome.
For LM, a study was done measuring cross sectional area and back pain in
elite cricketers over a 13 week training camp, where the cross sectional area was
seen to increase with a decrease in pain (Hides et al. 2008). This shows LM
cross sectional area may be a more suitable outcome to use during a clinical trial
over a period of time and a minimally clinically worthwhile change may be
determined linking with outcomes such as pain.
The ground standing measures were taken at the beginning of the second
day of testing. It is possible they were influenced by training effects from
exercising on the device 24 hours earlier. Although a training effect of FRED
exercise has not been documented to date, other training protocols for LM and
TrA recruitment have been shown to increase the muscle sizes over time (Hides
et al. 2008).
3.4.6. Conclusion
The exercise device clearly recruits TrA and LM more than rest. However,
in this study, the recruitment was not observed to be more than standing on stable
or unstable ground in a small healthy population with no-LBP. It was most
probable that the footplate positions did not change any of the measured
outcomes. The larger crank positions resulted in a greater challenge to

174
movement and muscle recruitment variability for both LM and TrA muscles as well
as increased TrA recruitment. Based on this, it is recommended to train in the
foremost footplate position, labelled as number one. The crank position should
then be set to the largest amplitude in which the user can maintain an even
movement based on assessment by a certified FRED operator. Exercise can be
done in lower amplitudes to regress the exercise to the position where the user
demonstrates adequate motor control to exercise with low movement variability.
The evidence that the device recruits muscles and affects motor control
outcomes can be used to justify trialling the device in clinical populations.
However, it would be useful to establish minimally clinically worthwhile changes in
outcome measures used in such a trial. Additionally, the biomechanical
mechanisms of the device within the lumbopelvic region should be investigated to
assess the posture promoted by the device, based on the finding that muscle
recruitment may be caused more by the posture adopted during exercise, than the
movement.

175
4. Chapter Four: Investigation of Lumbopelvic Kinematics and FRED Measured Outcomes in a Large Population Including Participants With Back Pain.

176
4.1. Introduction
Chapters one and three established the background and justification for
investigating the mechanisms of FRED exercise as a potential rehabilitation
intervention for the LM and TrA muscles. The same chapters also explained that
this type of rehabilitation involves training the recruitment and endurance of the
LM and TrA muscles. Chapter three went on to conclude that the posture
promoted during FRED exercise may be a possible mechanism resulting in the
LM and TrA activity found during exercise on the FRED. While non-specific LBP
has no specific causative factor, altered spinal mechanics have been reported as
a common element (Panjabi 2006) and previously linked to atrophy (Hides et al.
2008; Danneels et al. 2000; Hodges et al. 2006; Hodges and Richardson 1996;
Ferreira, and Hodges 2004) and altered motor control (Hodges and Richardson
1996) of the LM and TrA muscle. Changes and loading, specifically in sagittal
plane spinal positions have already been linked with LBP (Videman, Nurminen
and Troup 1990; McGill 1997; Wormersley and May 2006) and were therefore,
investigated.
4.1.1. Sagittal lumbar posture and LBP
Videman, Nurminen and Troup (1990) assessed the epidemiology of LBP
in relation to occupation, spinal loading and lumbar spine pathology within
cadaveric studies of 149 males. Degenerative lumbar changes were compared
with reports of back pain in the years preceding death and the type of work and
spinal loading performed over the years prior. It was found that work involving
heavy lifting or driving correlated to higher levels of reported LBP and post
mortem lumbar degenerative changes, followed by sedentary deskwork.
Conversely, occupations involving a mix of tasks and postures resulted in reduced
back pain incidence and the lowest reported levels of lumbar degenerative

177
changes (Videman, Nurminen and Troup 1990). This evidence suggested a link
between heavy lifting, or prolonged, flexed spinal sitting postures, and higher
incidence of back pain and lumbar spine degenerative changes. McGill (1997)
also found that it was more common for spinal injuries to be the result of
cumulative effects of several repeated, or sustained, low level tissue failures, or
long term poor sagittal spinal postures, over time. A study by Wormersley and
May (2006) also observed increased incidence of sagittal spinal flexion in a group
of young volunteers complaining of backache compared to a second group who
spent less time with a flexed spine in the sagittal plane. Maintaining a normal
lumbar lordosis and minimising spinal flexion during lifting postures has also been
found to greatly decrease the risk of injury to the spine and LBP (McGill 1997).
4.1.2. Link between LM, TrA and sagittal spinal posture
In the lumbar spine, the Multifidus muscle originates from mammillary
processes of the vertebrae, inserting onto the spinous processes of vertebrae 2-4
segment levels superior (Musculino 2005). It also originates from the posterior
sacrum, posterior superior iliac spine and posterior sacroiliac ligament (Musculino
2005). A detailed analysis of LM anatomy was performed by Macintosh et al.
(1986), who observed that the superficial LM fibres extend for longer distances
and tend to attach to the sacrum and ilia (Figure 4-1). The deeper LM fibres tend
to run shorter distances, staying between the vertebral segments. It was
suggested, therefore, that superficial LM fibres have a role in controlling lumbar
spine lordosis (Macintosh et al. 1986). A fine wire EMG study of both superficial
and deep fibres in eight participants by Mosely, Hodges and Gandevia (2002)
validated the finding that superficial fibres control lumbar orientation while
activation of deep fibres contribute to control and reduction of inter-segmental
movements. Deep fibres were recruited in anticipation of any direction of single
arm movements, whereas superficial fibres were only recruited in anticipation of

178
shoulder flexion. It was theorised that shoulder flexion produced larger vertebral
reaction forces in a sagittal plane requiring control of the lordosis and therefore
activating superficial fibres (Moseley, Hodges and Gandevia 2002). The
orientation of and forces produced by the LM also suggest it is the strongest
stabiliser of the lumbar spine (Kim et al. 2007)
Figure 4-1 Diagram of LM fibres in the sagittal plane from Macintosh (1986), illustrating how some fibres are likely to have a role in maintaining lumbar lordosis
Additionally, O’Sullivan (2000) observed loss of lordosis control in clinical
patients with LBP, within which he also observed symptoms of lumbar segmental
instability. Loss of lordosis control occurred in these patients in one of three

179
patterns: a flexion pattern with hypolordotic lumbar spine and posteriorly rotated
pelvis, (Figure 4-2). An extension pattern with hyperlordotic lumbar spine and
hyper-active erector spinae, compensating for reduced ability to isolate deep
muscle contraction, (Figure 4-3), and in unilateral back pain, a lateral pattern was
observed with shift of the lumbar spine in the coronal plane.
Figure 4-2 Photograph of lumbar segmental instability patient from O'Sullivan 2000, demonstrating lumbar posture typical of a flexion pattern
Figure 4-3 Photograph of lumbar segmental instability patient from O'Sullivan 2000, demonstrating lumbar posture typical of an extension pattern

180
O’Sullivan et al. (2006) examined the activation of LM and erector spinae in
various postures and found most activity in a posture termed ‘lumbopelvic’
compared to ‘thoracic’ and ‘slumped’ postures (Figure 4-4). Lumbopelvic posture
was defined as neutral pelvis, lordosis confined to lumbar spine and relaxed
thoracic musculature. Thoracic posture had a long lumbar lordosis which
extended into the lower thoracic spine. Slumped posture occurred when back
muscles were generally relaxed with sagittal spinal posture becoming flexed and
the pelvis becoming posteriorly tilted.
Figure 4-4 Graph from O'Sullivan et al. (2006) of muscle activity determined with EMG in various sagittal postures.
These findings were validated in a separate study using fine wire
electromyography by Claus et al. (2009), who found the lumbopelvic posture also
activated TrA, although this study was done in sitting. Overall, these findings
suggest LM and TrA have a role in controlling sagittal lumbopelvic posture in
addition to providing segmental stability. It appears that activity of deep muscles
increases with steadily increasing anterior pelvic tilt accompanied by a lumbar
lordosis which remains within the lumbar vertebrae, up to the thoracolumbar
junction. At the point of lordosis extending into the thoracic spine, increasing
superficial muscle recruitment (mostly erector spinae) occurs alongside,

181
decreasing LM and TrA muscle activity (Claus et al. 2009; O'Sullivan et al. 2006).
The variation in spinal curves between the differing sagittal spinal postures is also
well illustrated in Figure 4-5 from Kendall (2005).
Figure 4-5 Various sagittal plane posture diagrams from Kendall (2005)
Atrophy of LM and TrA has also been associated with loss of lordosis,
development of back pain and spinal injury, following periods of low activity and
disuse of spinal muscles (Buckey 2006; Hides et al. 2011; Sayson and Hargens
2008). Loss of lordosis and atrophy of the LM muscle was also listed in chapter
two as a physiological change resulting from periods of deconditioning during
bedrest based space simulation studies.
Ideal
Posture
“Flat” with reduced lumbar lordosis
“Lordotic” with excess lumbar lordosis, extending to thoracic region

182
The sum of the evidence presented above supports the definition of neutral
posture for LBP interventions presented in section 1.8, which was based on an x-
ray study of standing lumbopelvic posture across 160 participants by Roussouly et
al. (2005). That definition stated that a balanced lumbopelvic posture exists
when there is a degree of anterior pelvic tilt to the extent that the lumbar lordosis
exists throughout the lumbar vertebrae up to the thoracolumbar junction. It
appears, therefore, that poor motor control can lead to loss of balanced sagittal
plane spinal kinematics resulting in hyper or hypo –lordotic lumbar spine postures.
Therefore, rehabilitative interventions for lumbopelvic deconditioning should
promote a sagittal plane pelvic tilt resulting in lumbar lordosis from L5 to the
thoracolumbar inflection point and combined with deep muscle activity. This type
of posture is also well linked to increased LM and TrA activity, which is considered
an important element of motor control exercises. Traditional LM and TrA
rehabilitation interventions involved progressive training, beginning with isolating
muscle recruitment, followed by recruitment during upright functional positions
while maintaining lumbar lordosis and thoracic kyphosis (Hides et al. 2008;
O'Sullivan 2000).
Traditional training required conscious effort by the patient in order to recruit
LM and TrA and maintain the required posture. FRED exercise has already been
shown to automatically recruit both LM and TrA (Debuse et al. 2013) in a tonic
contraction (Caplan et al. 2014) with no conscious input by the participants, as
well increasing lumbopelvic stability when compared to over ground walking
(Gibbon, Debuse and Caplan 2013). However, the effect of FRED exercise on
promotion of ideal lumbopelvic kinematics for LM and TrA training has not been
investigated, nor has the effect of FRED exercise on spinal kinematics in people
with LBP.

183
Therefore, the lumbopelvic posture adopted by those using the device was
assessed in this study. Comparison of lumbopelvic posture between
asymptomatic individuals and a population with back pain was also conducted to
highlight any potential differences. At the time of this study, the device had yet to
be tested in any of the potentially relevant clinical populations. This study,
therefore, was the first to consider the effect of exercise on the FRED in
symptomatic individuals compared with no-LBP controls.
4.1.3. Aim and Objectives
This study aimed to determine the influence of FRED exercise on lumbopelvic
kinematics in people with and without LBP. It was hypothesised that the device
would automatically promote a sagittal plane lumbopelvic posture, which is
consciously trained in traditional motor control interventions, and is linked to
recruitment of LM and TrA muscles, and that similar kinematic postures would be
facilitated in people with and without LBP. The objectives were as follows.
1. To observe participants’ sagittal plane lumbopelvic posture during
walking which is a similar functional movement to FRED exercise.
2. To observe participants’ sagittal plane lumbopelvic posture during
exercise on the device.
3. To assess any changes in the lumbopelvic posture between the two
activities and between no-LBP and LBP participants.
4. To determine if exercise on the device promotes lumbopelvic postural
changes compared with walking in both no-LBP and LBP populations.
5. To observe any differences in participants’ ability to exercise in a slow
and steady movement between LBP and no-LBP populations, and
comment on any differences in lumbopelvic posture or exercise ability in
the context of deep muscle activity and rehabilitation for lumbopelvic
instability.

184
4.2. Methods
A within participant and two group, between group comparison study was
used to investigate postural kinematics during over ground walking and exercise
on the device. The study received ethics approval from the Faculty of Health and
Life Sciences Ethics Committee at Northumbria University (see appendix J).
4.2.1. Recruitment
Data collection occurred at the Life Science Centre, Newcastle upon Tyne,
as part of a “Meet the Scientist” programme, open to the general public.
Participation was open to any members of the public attending the Centre over a
four week period during July and August 2014. A data collection area titled “Meet
the Scientist” was set up in the entrance to the “Body Worlds” anatomy exhibition
already taking place at the centre. Meet the Scientist, European Space Agency
and Northumbria University banners were displayed outside the data collection
area. A screen displaying a repeating PowerPoint presentation displayed
information about the study and invited people into the area. A cordoned space
for the public to observe data collection activities was set up. Posters and
information about the study were displayed within the cordoned area and
indicated that volunteers, from the public, were being sought as participants. A
large screen behind the research area showed the observing public either a live
3D kinematic avatar representation of study participants during data collection
periods, or information on the FRED at all other times. Members of the data
collection team were on hand and available to discuss the study with those
observing. Participant information sheets (appendix C) detailing the study, and
requirements to be a participant, as well as informed consent forms (appendix D)
were readily available within the area.

185
Individuals volunteering to participate were screened for exclusion criteria
based on previous FRED studies (Debuse et al. 2013). This included those aged
under 18 and over 55 years, having history of neurological or
neuromusculoskeletal problems or injuries resulting in scoliosis or inability to
exercise safely on the device, heart disease, abdominal or spinal surgery in last
three years, pregnancy and epilepsy.
Additionally, participants were required to complete and ‘pass’ the Physical
Activity Readiness Questionnaire prior to being accepted. The Physical Activity
Readiness Questionnaire identifies any persons for whom increased physical
activity is contraindicated for medical reasons. The questionnaire has been shown
to be 100% sensitive and 80% specific across all versions (Cardinal, Esters and
Cardinal 1996). Those not having any exclusion criteria and passing the Physical
Activity Readiness Questionnaire were accepted into the study.
4.2.2. Back pain screening
All included participants were screened for LBP on entry to the study to allow
grouping of data into LBP and no-LBP populations for analysis. Questions 7 and
8 from the SF-36, standard, US version 2 (QualityMetric 2000) were used for this
screening. The wording of the questions was edited to read “back pain” rather
than “bodily pain”, as follows:
“How much back pain have you had during the past 4 weeks? 1 – None, 2 –
Very mild, 3 – Mild, 4 – Moderate, 5 – Severe, 6 – Very Severe”
Data from all participants who indicated a back pain score of two or above in
the first question were later analysed as a LBP group. Remaining participants’
data were analysed as a no-LBP group. To assess the impact any reported LBP

186
had on participants’ activities, all those who indicated LBP were also asked to rate
its impact on function using the following scale:
“During the past 4 weeks, how much did back pain interfere with your normal
work (including both work outside the home and housework)? 1 – Not at all, 2 a
little bit, 3- moderately, 4 Quite a bit, 5 – extremely”.
This wording of this question was deliberately made similar to the back pain
question and so is also based on the SF-36, standard US version 2.
To establish demographics, participants’ gender, age, mass and height were
recorded and they were asked to rate their normal activity levels on the following
scale:
“Over the past 4 weeks, how active have you been?
1. Sedentary – General activities are confined to a few rooms. Slow
walking pace and no running during the week. Most activity involves
sitting.
2. Limited – Activities involve mostly walking or some slow running.
Less than 10mins running per week. Less than 20mins brisk
walking per week.
3. Moderate – Activities include golf, tennis, sailing, pleasure
swimming, dancing, skiing etc. 10-30mins of running per week OR
20-24mins of walking at least three times a week.
4. Active – More than 30mins of sustained activity like jogging,
swimming, football or tennis more than three times a week. 45-
60mins of brisk walking at least three times a week.

187
5. Very active – At least 1.5hours of vigourous activity like competitive
sports, weight training, mountain climbing etc. four times or more per
week.
Demographics were recorded for gender, age, mass, height, BMI and activity
score. Statistical differences between the LBP and no-LBP group demographics
were assessed using MBI in relation to a minimal worthwhile change threshold of
a 0.6 effect size. This threshold detected if any differences in demographics
produced moderate effects between the groups (Hopkins et al. 2008), (see
section 4.2.9).
4.2.3. Experimental Protocol and Data Collection
The FRED prototype version three was used throughout this study. The
device was set in crank amplitude position 5 (smallest) and footplate position 1
(furthest forward) throughout. This setting was shown to be the least challenging
in chapter three, therefore allowing participants to learn the movement skill
required to exercise on the device quickly. This minimised the risk of varying
levels of skill potentially confounding the results.
4.2.4. Measures
Kinematic data were recorded for anterior pelvic tilt, sagittal plane angles
between spinal segments, measured as the angle between each segment at
L5/S1, L3/L4, T12/L1, T8/T9 and centre of mass during walking and exercise on
the device. Movement variability and frequency of the FRED exercise were also
recorded.

188
4.2.5. Motion capture system and calibration
Kinematics were assessed using a wearable 3D motion capture system (MVN,
XSens, Enschede) and MVN studio version 3.1 (XSens 2012). The motion
capture suit consisted of seventeen inertial and magnetic sensors fixed to specific
locations on all body segments (hands, forearm, upper arm, head, shoulder
blades, pelvis, upper leg, lower leg and feet) with neoprene bands and Velcro
(Figure 4-6).
Figure 4-6 Photograph from XSens MVN user manual (2012) showing tracker and neoprene band locations
The sensors contain accelerometers to determine direction of travel, 3D
gyroscopes for determining orientation and magnetometers to sense the direction
of the Earth’s magnetic field as a reference for orientation to minimise drift errors
(Rotenberg, Luinge and Slycke 2013). Data from each component combine to
provide movement data. The sensors were placed over participant’s clothing.
However, jumpers and coats were removed prior to the placing of trackers to

189
avoid artefact noise from movement of multiple layers of clothing. Two packs
were attached to the back to provide synchronised sensor sampling, battery
power and a wireless link from the suit to a nearby computer. Data from the
sensors were applied to a computer-generated 3D anatomical model to estimate
full body kinematic data. The model assumes a participant’s body is formed of 23
segments linked by joints (pelvis, L5, L3, T12, T8, neck, head, shoulders, arms,
hands, legs, feet, toes) (Figure 4-7 and 4-8) (Roetenberg, Luinge and Slycke
2013).
Figure 4-7 XSens kinematic model show in T-Pose front view from the XSens MVN user manual (2012 with labels added to sections relevant to this study)

190
Figure 4-8XSens kinematic model shown in T-Pose from rear rotated view from the XSens MVN user manual (2012)
Full body kinematic data were collected at 120 Hz, using the default full body
model and Kinematic Coupling Algorithm (KiC) fusion engine setting, without
magnetometer data. Magnetometer data were not selected due to high potential
for magnetic disturbance around the feet caused by a metal structural beam under
the test area.
Calibration was performed in the same location for all participants, which was
determined during pre-test mapping as having the lowest risk of magnetic
disruption. Additionally, calibration was performed with participants standing on a

191
custom-made raised wooden platform (Figure 9) to further reduce risks of
magnetic interference. Participant height and foot size were entered into the
model to set avatar proportions. Two static calibration poses, T (arms out to the
side in 90 degrees shoulder abduction) followed by N (arms by sides) pose, were
then used to calibrate the system. Following calibration, participants were
instructed to walk around the testing area to activate magnetic filters prior to data
collection. In the event of any tracker drift being observed following calibration, a
reset was performed to remove accelerometer data since calibration. If a reset
failed to resolve any drift then repeat calibrations were performed.

192
Figure 4-9 Custom made wooden XSens calibration platform (top) and in use during a calibration (bottom)

193
4.2.5.1. Kinematic Data Collected
Kinematic data were collected during normal walking along a straight and level
walkway 4.8m in length (Figure 4-10), allowing a minimum of two complete gait
cycles to be captured. Twenty seconds of FRED exercise were collected, during
which a minimum of five complete FRED cycles occurred. Data collection
commenced following a five minute FRED exercise familiarisation period.
Figure 4-10 The 4.8m long motion capture track marked on the floor of the testing area with two white parallel lines - marks within the track related to other studies running in parallel
4.2.5.2. Centre of mass estimation
XSens calculates centre of mass from segment positions and orientations
using a body mass distribution model (Roetenberg, Luinge and Slycke 2013).
Data on the centre of mass are exported by MVN studio as an X,Y,Z vector
relative to the origin (where calibration occurred). To make these data more
meaningful, the X,Y,Z position of the pelvic midline relative to the origin was also
exported. The difference between the pelvis segment and centre of mass vectors

194
was taken as the distance of the centre of mass from a midpoint segment of the
avatar. This provides an estimate of the centre of mass relative to the pelvic
midline in both anterior-posterior and lateral directions.
4.2.6. Movement variability and frequency of Movement
The FRED records data on the movement variability within one revolution of a
foot plate per full FRED cycle, quantified as the difference (%) between the live
angular speed of crank wheel during exercise and the average angular speed
over the previous second. These data were collected using the same methods
described in chapter three section 3.2.6. The FRED also records the frequency at
which participants complete one rotation of the crank wheel.
The movement variability and frequency data were recorded live from the
device on a Lenovo, Windows 8 PC running custom-created FRED software
(Mazur Automation, Germany) which was connected directly to the exercise
device. The data were then imported into Microsoft Excel 2010 for analysis.
4.2.7. Use of XSens during FRED exercise
XSens uses predicted contact points of the avatar with the floor to minimise
drift of the avatar as a whole (Rotenberg, Luinge and Slycke 2013). During FRED
exercise the model assumed the participant was performing the movement on a
stable floor. This caused errors in the model resulting in dislocation of ankles and
hips. To correct for this, contact point data for FRED exercise were ignored in
post processing. While this resulted in restoration of accurate joint kinematics, the
avatar as a whole drifted over time. The drift is constant for all avatar segments
and, therefore, had no effect on joint angles, segment orientation or centre of
mass data.

195
4.2.8. Reliability and Validity of XSens
The XSens setup used was reported as having up to two degrees error for
dynamic accuracy in roll, pitch and heading, linked to centre of mass and pelvic tilt
data, and an angular resolution, for joint angle estimation, of 0.05 degrees (Lebel
et al. 2013). The system has been validated previously against VICON for
measuring kinematic data (Rotenberg, Luinge and Slycke 2013). The model uses
sections of the spine which span several vertebrae, the data for the spinal
movements come from trackers on the sacrum, scapulae and head, which is then
averaged across the biomechanical model (XSens 2012). It is unable therefore,
to report individual spinal segment kinematics, and instead, averages data across
the spine from the sacral, scapulae and head trackers.
Movement variability and exercise frequency are novel outcome measures
specific to the FRED. Therefore, no previous evidence of their validity and
reliability as outcome measures of motor control existed. The data are recorded
within the device using a rotary encoder (RP6010, ifm Electronic GmbH, Essen,
Germany) which records angular velocity for analysis as movement variability and
frequency using bespoke FRED software (Mazur Automation, Munich, Germany).
No human error component exists and the device sensors are considered fit for
purpose.
4.2.9. Minimal worthwhile change
To date, there is no reported valid minimal worthwhile change in the outcome
measures which is clinically worthwhile. Therefore, mechanistic (physical) change
in all variables was reported. To infer if the change was worthwhile a MBI
approach was used. An effect size between comparisons of at least 0.2 was
considered worthwhile as this shows that at least a small effect size existed
between the two comparison groups (Batterham and Hopkins 2006). This

196
approach was chosen over traditional significance testing as it allows the direction
of any change and the size of that change relative to the designated minimal
worthwhile change to be reported. Traditional significance testing can miss small
changes and does not provide information about the direction of change
(Batterham and Hopkins 2006).
It was hypothesised that an individual with good motor control, exercising on
the device would produce an even movement throughout. Conversely, an
individual with poor motor control would likely produce uneven movements with
rapidly varying movement velocities. Therefore, it was expected to see a low
movement variability score in those with better motor control.
It was theorised that participants with good motor control and stability will be
able to exercise at the target frequency without large variation, although this
remains to be confirmed. Therefore, the mean variation of exercise frequency is
also reported.
4.2.10. Ethics
The study recruited human participants, and their dignity, wellbeing and
rights were protected at all times. A risk assessment was performed prior to any
testing and steps to ensure appropriate health and safety were implemented. No
lasting effects of the exercise were expected for any participants. Informed
consent was provided in writing by all participants and they were informed they
could withdraw from the study and remove their data at any time. No incentives or
money for travel costs were provided to participants. Participant data were stored
in a secure location in a site folder at all times and used solely for the purpose of
this study. Any personal information will be destroyed after a maximum of three
years following study completion. During data collection the site folder was kept in
padlocked box with other sensitive equipment at the Life Science Centre,

197
following data collection and was moved to a filing cabinet in a swipe card access
laboratory at Northumbria University.
4.2.11. Data Analysis
The mean change and standard deviation in raw units were calculated and
presented for each comparison. Magnitude based inference statistics were then
used to run multiple-pairwise comparisons of variables between the groups.
These statistics provide the probability for each comparison that the true
(population) change is positive, negative or trivial with reference to a pre-
determined minimal worthwhile change. This method allows meaningful
inferences about group difference to be made based on the measured effect sizes
between the groups (Batterham and Hopkins 2006). It is useful to have a
previously reported and validated minimal clinically meaningful change on which
to base inferences. However, clinically relevant differences have yet to be
determined and validated for the outcome measures assessed in this study,
related to intersegmental spinal instability. This is in part due to the use of novel
outcome measures determined by the device itself, which is still a prototype under
development. Therefore, in line with Batterham and Hopkins’ (2006)
recommendations, an effect size of at least 0.2 was set as the minimal worthwhile
change on which to base inferences, which shows the reported effect is at least
small. Raw units were converted to standardised units (Cohen’s D) for effect size
using the following equation:
𝑑 =𝑚𝑒𝑎𝑛 𝑐ℎ𝑎𝑛𝑔𝑒
𝑠𝑡𝑎𝑛𝑑𝑎𝑟𝑑 𝑑𝑒𝑣𝑖𝑎𝑡𝑖𝑜𝑛 𝑜𝑓 𝑡ℎ𝑒 𝑑𝑎𝑡𝑎

198
The effect size, 90% confidence intervals and probabilities (%) that the true
values were mechanistically positive, trivial or negative were then calculated and
qualitatively defined by Hopkins et al. (2008) as <0.5% is “most unlikely”, <5% is
“very unlikely”, <25% is “unlikely”, 25-75% is “possible”, >75% is “likely”, >95% is
“very likely”, and >99.5% is “most likely”.
The following comparisons were made between over ground walking and the
FRED within each group, and between the LBP and no-LBP groups:
Differences in the angles between the XSens model’s spinal segments in
the sagittal plane, at L5-S1, L3-L4, T12-L1 AND T8-T9 positions;
Differences in pelvic tilt (sagittal plane);
Differences in centre of mass position;
Differences in FRED reported outcomes of frequency (f) and movement
variability.
The results are, therefore, reported as raw mean change with standard
deviation and chance (%) that the true effect is greater than the smallest
worthwhile change threshold. The 90% confidence interval of the effect size is
reported in the results tables and presented graphically.
For Exercise frequency results, the variance within each group was calculated
as follows:
𝑉𝑎𝑟𝑖𝑎𝑛𝑐𝑒 =∑(𝑥 − 𝑚𝑒𝑎𝑛 𝑥2)
(n − 1)
Where x is the point measure and mean x is the sample mean and n is the
sample size.

199
XSens exports orientation using quaternions, based in a rotation matrix that is
used to prevent singularities and gimbal lock errors in the orientation data and
model animations (Kuipers 1998). Unfortunately, XSens fails to export these
data as Euler angles in X, Y, Z vectors, essential for kinematic analysis in
degrees. Therefore, pelvic orientation data were manually converted to Euler
using the following 3x3 matrix from the XSens manual (XSens 2012):
XSens does not provide details on the conversion used by the system to go
from the rotation matrix to Euler, therefore a mathematician (Lower 2014) was
consulted to complete the conversion step using the following formulas.
With the 3x3 rotation matrix referenced as follows, and X being
anterior/posterior tilt, Y being lateral tilt and Z being the direction vector:
𝑚(0,0) 𝑚(0,1) 𝑚(0,2)
𝑚(1,0) 𝑚(1,1) 𝑚(1,2)
𝑚(2,0) 𝑚(2,1) 𝑚(2,2)
The conversion is therefore:
𝑥 = 𝑎𝑡𝑎𝑛2(𝑚(0,0), −𝑚(2,0))
𝑦 = −𝑎𝑡𝑎𝑛2(𝑚(2,1), 𝑚(2,2))
𝑧 = 𝑎𝑠𝑖𝑛(𝑚1,0))

200
The conversion steps were all solved in MS Excel 2010. A sample of the
curves produced was visually checked against the Euler curves in XSens studio
as validation.
4.3. Results
4.3.1. Participants and dropouts
A total of 130 participants volunteered to join the study and provided data. All
differences between group demographics were found to be mechanistically trivial
(Table 4-1). The number of LBP in each category is presented in Table 4-2.
Table 4-1 Participant Demographics and chance that any group differences are trivial using an inference threshold of effect size 0.6.
Mean:
Group n Gender Age Mass (kg)
Height (m)
BMI Activity Score
Entire population
130 62male / 68 female 35.2 76.8 1.72 25.5 3.6
LBP 56 30 male / 26 female
35.4 78.9 1.75 25.8 3.4
No-LBP 74 33 male / 41 female
35.2 74.7 1.72 25.3 3.7
Chance (%) that difference between groups is trivial
100% 99% 99% 100% 92%
Table 4-2 Low-back pain screening scale and numbers screened to each category Question: “How much back pain have you had during the past 4 weeks?
n
1 None 74 2 Very mild 17 3 Mild 16 4 Moderate 17 5 Severe 4 6 Very severe 2
Figures 4-11 to 4-14 illustrate the raw change between walking and FRED
exercise for the no-LBP and LBP groups individually and between the no-LBP and
LBP groups, for lower spinal joint angles, sagittal pelvic tilt, centre of mass and
FRED variables respectively. Tables 4-3 to 4-6 present the corresponding MBI

201
statistics using the effect size for each comparison and 90% confidence intervals.
All tested differences in means use the smallest effect size (0.2, 0.6 or 1.2) which
resulted in a clear inference, and is reported in all MBI table captions, as the
threshold for a worthwhile change.
Lower spinal joint angles
Figure 4-11 shows that FRED exercise increased extension at all spinal joint
angles compared to walking, with the highest increase occurring at the L5/S1
level. The increase in extension was 0.9-1.2 degrees at L5/S1 and 0.3-0.4
degrees at T8/T9. There was also a weak trend that the extension was less in the
no-LBP group, by 0.3 degrees at L5/S1 and 0.1 degrees at T8/T9. Table 4-3
shows it was very likely that the mean extension angle during FRED exercise was
positive compared to the mean during walking, at all spinal levels. It was at best
possible that the mean extension angle in the no-LBP group was negative
compared to the LBP group.

202
Figure 4-11. Raw change in lower spinal sagittal extension angles comparing walking and FRED exercise in the LBP and no-LBP groups individually and comparing the no-LBP and LBP groups for each joint angle. Table 4-3. Difference in lower spinal sagittal extension angles for all comparisons, calculated with threshold for inferences of effect size 0.2.
Joint angle Comparison Effect size
90% Confidence limits
Mechanistic inference
L5-S1 FRED vs walking, no-LBP 0.4 0.2 0.6 Very likely +ve FRED vs walking, LBP 0.6 0.3 0.8 Most likely +ve
No-LBP vs LBP -0.1 -0.4 0.2 Possibly -ve
L3-L4 FRED vs walking, no-LBP 0.4 0.2 0.6 Very likely +ve
FRED vs walking, LBP 0.6 0.3 0.8 Most likely +ve
No-LBP vs LBP -0.17 -0.5 0.2 Possibly -ve T12-L1 FRED vs walking, no-LBP 0.4 0.2 0.6 Very likely +ve
FRED vs walking, LBP 0.5 0.3 0.7 Very likely +ve
No-LBP vs LBP -0.2 -0.5 0.2 Possibly -ve T8-T9 FRED vs walking, no-LBP 0.4 0.2 0.6 Very likely +ve
FRED vs walking, LBP 0.6 0.3 0.8 Most likely +ve
No-LBP vs LBP -0.2 -0.5 0.2 Possibly -ve
Anterior pelvic tilt
Figure 4-12 shows that FRED exercise resulted in increased anterior pelvic tilt
compared to walking, with the increase being 8.7 degrees in both the LBP and no-
LBP groups. Table 4-4 shows it was most likely that the mean anterior pelvic tilt

203
angle was positive in both groups compared to the mean in walking and that any
difference between the LBP and no-LBP group was trivial.
Figure 4-12. Raw change anterior pelvic tilt comparing walking and FRED exercise in the LBP and no-LBP groups individually and comparing the no-LBP and LBP groups for each joint angle. Table 4-4. Difference in anterior pelvic tilt for all comparisons, calculated with threshold for inferences of effect size 0.2.
1 indicates threshold for inferences was set to effect size 0.6.
Comparison Effect size
90% Confidence limits
Mechanistic inference
FRED vs walking, no-LBP 2.2 2.0 2.4 Most likely +ve
FRED vs walking, LBP 1.8 1.5 2.0 Most likely +ve
No-LBP vs LBP 0.0 -0.3 0.3 Most likely trivial1
Centre of mass variability
Figure 4-13 shows that FRED exercise resulted in greater centre of mass
variability in both anteroposterior and lateral directions, with more variation in the
lateral direction. The increase was by 0.7cm anteroposteriorly and 1 cm to 1.2 cm
laterally. There may be a small trend suggesting that the LBP group had less
lateral variability by 0.2 cm compared to the no-LBP group. Table 4-5 shows it
was most likely that the mean centre of mass variability during FRED exercise

204
was positive compared to the mean during walking, in both directions. Any
difference between the no-LBP and LBP groups was trivial in the anteroposterior
direction, however, it was possible that the lateral variability mean was negative in
the no-LBP group compared to the LBP group.
Figure 4-13. Raw change centre of mass variation comparing walking and FRED exercise in the LBP and no-LBP groups individually and comparing the no-LBP and LBP groups. Table 4-5. Difference in centre of mass variation for all comparisons, calculated with threshold for inferences of effect size 0.2.
1 indicates threshold for inferences was set to effect size 0.6.
Direction Comparison Effect size
90% Confidence limits
Mechanistic inference
Antero-posterior
FRED vs walking, no-LBP 0.9 0.7 1.2 Most likely +ve FRED vs walking, LBP 0.8 0.5 1.0 Most likely +ve
No-LBP vs LBP 0.0 -0.3 0.4 Most likely trivial1 Lateral FRED vs walking, no-LBP 1.2 1.0 1.4 Most likely +ve
FRED vs walking, LBP 1.2 1.0 1.4 Most likely +ve
No-LBP vs LBP -0.2 -0.5 0.2 Possibly -ve

205
Frequency and movement variability
Figure 4-14 shows that the no-LBP group had slightly decreased frequency
while movement variability increased. The decrease in frequency was ~-0.5 and
~-0.011 Hz respectively and the increase in movement variability was ~4.9%.
Table 4-6 shows that it was at best possible that the mean frequency was
negative and the mean movement variability was positive in the no-LBP group
compared to the means in the LBP group.
Figure 4-14 Illustrates the mean difference with standard deviation for a. exercise frequency (Hz) and b. movement variability between the no-LBP and LBP groups.
a. b.

206
Table 4-6. Difference in anterior pelvic tilt for all comparisons, calculated with threshold for inferences of effect size 0.2.
1 indicates threshold for inferences was set to effect size 0.6.
Variable Effect size
90% Confidence limits
Mechanistic inference
Frequency (f) -0.2 -0.6 0.2 Possibly -ve Movement variability 0.3 0.0 0.6 Possibly +ve
Figure 4-15 illustrates the results of all the MBI statistics for all comparisons
and shows how pelvic tilt had the largest change compared to walking and all of
the LBP vs no-LBP comparisons are trivial or small.

207
Figure 4-15 MBI results for all comparisons. Squares show effect size for FRED vs walking comparisons, triangles show LBP vs no LBP comparisons, tails show 90% confidence interval, shaded error represents inference threshold of effect size 0.2.
208
4.4. Discussion
The main finding of this study was that FRED exercise results in increased
anterior pelvic tilt and spinal extension compared to over ground walking. Spinal
extension is most increased in the lower lumbar spine around L5 and is increased
by approximately 0.5 to 1 degree. The increase was slightly more (0.1-0.3
degrees) in the LBP group. FRED exercise also caused increased movement of
the centre of mass away from pelvic midline in both the anteroposterior and lateral
directions compared to walking with slightly more lateral movement in the LBP
group. No instructions or information regarding pelvic tilt or spinal curves during
exercise were given. Therefore the kinematic effects measured during FRED
exercise occurred automatically, without participants consciously altering their
posture.
The results showed that anterior tilt increased, along with spinal segment
angles shifting towards increased extension at L5/S1, L3/L4 T12/L1 and T8/T9
joint angles. While the effect sizes were similar at all spinal angles, the raw
change was 0.9-1.2 degrees in the lower lumbar spine, 0.4-0.6 in the upper
lumbar spine 0.3-0.4 degrees in the lower thoracic spine. A shift of spinal
segments towards being held in more extension, seen mostly in the lower lumbar
spine, suggests lordosis angle was increasing and may have slightly reduced
lower thoracic kyphosis. A shift of sagittal spine joint angles towards extension,
seen mostly in the lower lumbar spine, suggests lordosis angle was increasing.
O’Sullivan et al. (2006) and Claus et al. (2009), have reported this type of postural
change as being associated with increased LM activity, provided the lumbar
lordosis does not extend into the thoracic spine.

209
It is unknown from this study if an ideal posture of lordosis up to thoracolumbar
junction occurred as the motion capture system used does not measure absolute
position of the joints or relative to a normal or vertical reference. Small extension
increases were seen in in the lower thoracic joints which may have resulted in a
hyperlordotic posture. However, Debuse et al. (2013) previously demonstrated
that FRED exercise recruits LM and TrA. Postures that increase anterior pelvic tilt
and have increased lordosis, extending no further than the thoracolumbar
junction, have been linked to increased LM and TrA recruitment (O'Sullivan et al.
2006; Roussouly et al. 2005). Additionally, hyperlordotic postures extending
lordosis beyond the thoracolumbar junction have been shown to decrease LM and
TrA activity (Claus et al. 2009). Therefore, the lordosis increase seen in FRED
exercise is likely to be within the range that facilitates LM and TrA activation and is
unlikely to have resulted in hyperlordosis. The small amount of increase in
lordosis (0.5-1 degree), and it being mostly in the lower lumbar spine, further
suggests the postural change was within the range required for LM and TrA to be
active. Additionally, a small shift towards increasing lordosis may be a better
result than a large shift, as larger shifts may be more likely to result in lordosis
going beyond the lumbar into the thoracic spine.
Caplan et al. (2014) reported that LM activity during FRED exercise was tonic
throughout the exercise, whereas walking resulted in peaks of activity during a
phasic recruitment pattern. A continuous LM contraction in FRED exercise
compared to phasic in walking may also partly explain why increased lordosis and
anterior pelvic tilt was found throughout FRED exercise.
Training LM and TrA, while maintaining lumbar lordosis and thoracic kyphosis,
is an element of traditional specific motor control intervention programmes (Hides
et al. 2008; O'Sullivan 2000). FRED exercise has already been shown to
automatically recruit LM and TrA, and this study suggests it also automatically

210
promotes a lumbopelvic posture beneficial to specific motor control training in
people both with and without LBP. The ability of FRED exercise to automatically
promote increased lordosis, therefore, suggests it may be a useful intervention for
both training LM and TrA as part of a specific motor control programme and for
improving lumbopelvic posture, including recovery of lumbar lordosis. The
increase in lordosis in the LBP group was slightly higher than in the no-LBP
group. This may indicate the device was producing a slightly larger effect in the
LBP group which could occur if they had more varied spinal mechanics as is often
found in populations with back pain (Panjabi 2006). While this may be an
indication of device effectiveness as an intervention, the change was very small
and this study was unable to assess absolute spinal postures.
Additionally, it is known that spaceflight results in a flexed posture (Buckey
2006; Pavy-Le Traon et al. 2007). Lordosis angle has also been seen to be lost in
bed-rest study participants (Belavy et al 2010; Belavy et al 2011; Cao et al. 2005
and Maricias et al 2007, chapter two). Therefore, evidence of a shift towards
increased lordosis being an acute effect of FRED exercise is further indication of
its potential value in post spaceflight rehabilitation. This is seen alongside loss of
cross sectional area and volume of LM (Belavy et al 2010; Belavy et al, 2008;
Belavy et al 2011). This shows the potential for FRED exercise to aid with
retraining spinal posture following long term deconditioning. These results show
that FRED exercise may be a more suitable training modality for promoting deep
muscle activity and increased lordosis angle than walking. A clinical trial would be
needed to confirm this, and having evidence of acute effects which appear to
beneficial will be useful for planning and applying for future research opportunities
in spaceflight analogues, for example in bed-rest studies.

211
The results also show that centre of mass variability was greater in FRED
exercise than during walking. While it is not possible to comment on the clinical
relevance of this result, it may be part of the acute effects of FRED exercise. An
increased variation of the centre of mass may be an element of challenging
participants’ balance and stability. Traditional motor control exercises often
include reducing base of support as a part of training progression (Hides et al.
2008; O'Sullivan 2000).
This study also analysed movement variability of the feet, which showed a
trend towards the no-LBP group exercising slightly slower with more uneven
movements. However, the probability of the change in the true population was
not high and the raw changes very small and therefore unlikely to be clinically
relevant. However, these results were analysed in more detail by calculating the
frequency variation across participants as within the no-LBP group was 0.47Hz in
the no-LBP group and 0.53Hz in the LBP group. This additional analysis showed
that while the LBP group was able to exercise with a more even movement, they
had more variation away from the target frequency. Therefore, it appears that
both no-LBP and LBP populations can exercise with an even movement on FRED
during an initial short period of exercise. However, the LBP group was less able
to achieve the target frequency. It might be found that as the groups exercise for
longer, someone with LBP and segmental instability, who may not be used to
activating the deep muscles and may have atrophied deep muscles (Hides et al.
2008), will possibly be unable to maintain these even movements for as long a
period as the no-LBP group. This may be worth investigating in a future study as
movement variability might then be a useful outcome for goal setting during
clinical FRED training.

212
4.4.1. Limitations
XSens only provides data on the change from calibration pose, not from a
reference “normal” posture, so it is also unknown if participants had poor posture
and changed toward an improved one or not in this study. It was only possible to
draw conclusions on the acute effects of FRED exercise compared to walking.
Having a method of quantifying participants’ spinal posture to a normal reference
would be useful for future studies as would the development of validated
definitions of instability linked to valid and reliable outcomes. Additionally, the
XSens model averages the spinal segment kinematics from sensors on the
sacrum, both shoulder blades and the head. The movement data from the spinal
reference sensors is applied to the kinematic model which then moves the spine
appropriately, based on assumed joint angle stiffness (XSens 2015). It may be
that this method results in a degree of averaging kinematics taking place across
the spine, rather than reporting specifically within each segment.
This may also be a reason why small increases in extension where seen at all
spinal segments rather than just in the lower lumbar region which would be the
expected pattern based on the expected muscle activity. A study which validates
the ability of XSens specificity to spinal levels producing the change may be
useful. Also a future study of FRED exercise could assess lordosis with
diagnostic imaging such as MRI as done by Belavy et al. (2010).
This study only considered the acute effects of FRED exercise and this may
have been why no changes were seen between the LBP and no-LBP groups. It
may be that during initial periods of exercise on the device individuals with back
pain and potential instability can achieve as good a technique as their no-LBP
counterparts. However over time, those with pain may not be able to sustain the

213
technique for as long a period. This is something that may be worth investigating
in future studies.
4.4.2. Conclusion
It is expected that an acute effect of FRED exercise, compared to walking, is
increased anterior pelvic tilt and lumbar extension. While no validated clinical
worthwhile changes or cut offs for these variables exist to determine if these
changes are clinically meaningful, the change does fit with patterns previously
reported (Claus et al. 2009) (O'Sullivan et al. 2006) suggesting the posture
promoted during exercise on the device correlates to the well balanced
lumbopelvic type defined by Roussouly et al. (2005). This posture type is
additionally most associated with activation of deep spinal muscles (Claus et al.
2009; O'Sullivan et al. 2006). This observation is strengthened when the overall
pattern of posture change and deep muscle activity from previous research is
considered together. The small increase in extension may also be part of the
mechanism behind the LM and TrA muscle activation seen in previous FRED
research (Debuse et al. 2013) into acute effects. The posture assumed on the
FRED did not require any conscious trigger. Therefore, as with LM and TrA
training, the device shows an ability to automatically promote elements which
required conscious triggers in traditional specific stabilising exercises and can be
a clinical challenge (Van, Hides and Richardson 2006).
It appears that all the reported acute effects of FRED exercise occur in both
LBP and no-LBP populations. It may be worth observing if these acute effects
remain the same between the groups over a longer period of FRED training.

214
5. Chapter Five: Feedback vs No Feedback

215
5.1. Introduction
The current FRED prototype (version 3) is the first to incorporate a visual
feedback (FB) system which encourages users to exercise at an optimum
frequency with minimal movement variability at the feet. The visual FB is
presented throughout exercise and is comprised of two sections, a dial showing
the current and target exercise frequency (Figure 5-1 right side) and a line graph
showing changes in frequency in the live speed compared to the mean speed
over the previous second, which has been termed “movement variability” in this
thesis (Figure 5-1 left side). The angular velocity of the FRED crank wheel is
measured using an integral rotary encoder (RP6010, ifm Electronic GmbH, Essen,
Germany). The data output is analysed live using a PC connected to the FRED
within bespoke software (Mazur Automation, Munich, Germany). Movement
variability is calculated as the difference (%) between the live speed and the
average speed of the previous second and frequency is the number of crank
cycles in Hz. A movement variability result of 0% therefore indicates the device
user is producing exercise movements at a constant speed and a frequency of
1Hz shows one crank revolution per second. It was assumed that a high
movement variability result was an indicator of poor motor control. This
assumption was supported by chapter three which found that more challenging
device settings increased movement variability. Therefore, a user with good
motor control during exercise is more likely to perform the exercise at a steady
frequency and therefore have a low movement variability score. During exercise
on the FRED, the movement variability is fed back to users as a line plot, showing
the movement variability from -45% to +45% over the last 5 seconds of exercise.
Increases and decreases in movement variability are represented by peaks and
troughs in the plot. This FB is intended to help users maintain a level plot without
any peaks and troughs by maintaining an even movement. A target frequency for

216
exercise is then set which deliberately creates a slow movement. Slow
movements are more likely to be energy efficient (Taylor, Budds and Thomas
2003) and so preferentially recruit LM and TrA (Bergmark 1989). The target
frequency was 0.42Hz as it has been shown that FRED exercise activates LM and
TrA frequencies at less than 1 Hz (Debuse et al. 2013) and at 0.42 Hz (Weber et
al. 2016). Version 3 of the FRED shows the target frequency as a “FRED Training
Unit” or “FTU”. The target frequency is reached when the FTU result is 50 and the
dial visible in Figure 5-1 is at 50%. As the FB has high sensitivity any point
between 25 and 75% was considered to be acceptable.
Figure 5-1 FRED control unit display showing FB with movement variability graph on left with live and target frequency dial (50% FTU) on the right, image shows display with FRED stopped, participants try to keep the graph and frequency dial within the green zones.
A review by Balzer et al. (1989) presented theories and initial research
showing FB which provides live information on tasks being performed, while
simultaneously linking this information with user’s current achievement, and an
ideal level of achievement, improves psychological elements of judgement and
decision making relating to the performance of the task. More recently, computer-
based sports training with effective feedback has been determined as a key
strategy in motor skill learning (Iskander, Lester and Wills 2009). Feedback
contents for motor skill learning should include speed and movement accuracy
and reaction time via an appropriate interface (Iskander, Lester and Wills 2009).

217
Systems for improving rowing technique that included motor skill visual feedback
on handle position have been shown to improve exercise technique by reducing
speed variations, improving handle trajectory to be more energetically optimal and
maintaining consistently good technique (Fothergill 2010; Ruffaldi et al. 2009). It
was expected that similar principles applied to FRED feedback. As the FRED
visual FB includes live information on both current and ideal task achievement,
the evidence would suggest FRED users who have FB will make better
judgements and decisions on their speed and movement variability improving their
ability to perform the exercise correctly. This is further supported by a recent
study into the use of visual FB to improve exercise technique during
physiotherapy rehabilitation which found that patients who had FB were able to
perform exercises more accurately and with better timing (Doyle et al. 2011). As
the aim of FRED exercise is to train deep lumbopelvic muscles, which contract at
lower power than superficial muscles and motor control of the lumbopelvic region
during upright, weight baring, functional movement. It was therefore, expected
that providing visual FB on user’s speed and movement variability would improve
FRED exercise performance by facilitating even movements, at a correct speed
for deep muscle recruitment. This hypothesis was tested by creating two
randomly assigned groups of participants exercising on FRED, one group
exercising using the visual FB and the other without. The two groups were then
compared for any measurable differences in variability and frequency of
movement, lumbopelvic kinematics, and centre of mass position between the two
groups.
5.1.1. Aim and Objectives
The aim of this study was to investigate the effect of FRED-generated visual
FB on control of movement based exercise frequency, movement variability,

218
centre of mass variability and sagittal plane lumbopelvic position during exercise.
The objectives were as follows.
1. To measure lumbopelvic kinematic data and assess if FB promotes postures
linked to LM and TrA training as found in chapter four.
2. To measure movement variability and exercise frequency to assess if FB is
needed to achieve even movements at the target frequency during exercise.
3. To assess centre of mass variation to determine the effect of FB on upright
posture and balance during exercise.
5.2. Methods
This study was done in parallel with that described in chapter four, which
documented the kinematics of the lumbopelvic region and variation of movement
during FRED exercise compared to walking and compared no-LBP and LBP
populations. Both studies used similar methods allowing data from participants
without LBP who exercised on FRED, while receiving FB, in chapter four, to be
compared with a small group of additional participants who exercised without FB.
Therefore, participant recruitment, experimental protocol, outcome measure
details for FRED recording measures, kinematics using the XSens MVN system
and magnitude based inference statistics details are the same in both studies and
can be read in detail in chapter four.
The differences in methods for this study are as follows. Participants entering
the study in chapter four who did not have back pain were randomised, using a
Microsoft Excel random number generator, into FB or no-FB groups until a no-FB
group, totalling 18 participants, was acheived. The measures taken from the no-
FB group were then compared with those assessed using the 74 participants from
chapter four who had access to full visual FB and also indicated having no LBP.
The no-FB group performed the same experimental protocol as that used in

219
chapter four, except that during FRED exercise, the visual FB was made not
visible to the participants. All participants were shown how to perform FRED
exercise including a live demonstration, as part of ensuring all individuals
exercised in a safe way. The no-FB group was given a standardised set of verbal
instructions explaining how to perform the exercise comprised of the following
statements: “Exercise in upright posture”, “bend your hips and knees to help keep
your trunk stable”, “fix your eyes on a point at eye level in front of you”, “try to
keep your trunk stable”, “exercise at a slow and steady pace” and “keep the
movement within one revolution as even as possible”. No other instructions or FB
on exercise performance was provided.
Magnitude based inferences were used, in the same way as in chapter four
comparing pain and no pain groups, to compare any differences between the FB
and no-FB groups. For differences between tested outcome measures, a small
effect size (at least 0.2) was set as the minimal worthwhile change, but increased
to 0.6 or 1.2 if smaller effect size results were unclear, as per chapter four. The
magnitude based inferences calculate the probability (%) of the true effect being
at least the set effect size using 90% confidence intervals. This analysis method
detects minimal worthwhile mechanistic differences. Participant demographics
were tested for moderate effect sizes (at least effect size 0.6) existing between
groups to check for any differences potentially confounding results. The study
received ethics approval from the Faculty of Health and Life Sciences ethics
committee at Northumbria University (see appendix J).
5.3. Results
Eighteen participants were successfully recruited to the no-FB group and
compared to the 74 participants who had no back pain and exercised while
receiving FB from chapter four. Group demographics are shown in Table 5-2.

220
Any differences between the groups were trivial for mass, height and activity
score. The no-FB group appeared consistently two years older, however, a two-
year age difference is not likely to have any clinical significance.
Table 5-1 Participant demographics with change that difference between groups is trivial using threshold for inferences of effect size 0.6.
Mean:
Group n Gender Age Mass (kg)
Height (m)
BMI Activity Score
FB 74 33 male / 41 female
35.2 74.7 1.72 25.3 3.7
No-FB 18 10male / 8 female 37.1 84.7 174.1 27.9 3.7 Chance (%) that difference between groups is trivial
48
90
98 85
83
No dropouts occurred and all planned measurements were taken. Data from
one of the FB participants could not be calculated for pelvic tilt due to
unresolvable singularities occurring in the data when converted to Euler vectors.
All tested differences in means were determined using the smallest effect size
(0.2, 0.6 or 1.2) which resulted in a clear inference, which are reported in all MBI
table captions, as the threshold for a worthwhile change.
Lower spinal joint angles
Figure 5-2 shows that FRED exercise increased extension at all spinal joint
angles compared to walking in both the FB and no-FB groups. There was also a
weak trend of extension being greater in the no-FB group, by 0.5±0.6 degrees at
L5/S1 and 0.2±0.1 degrees at T8/T9. Table 5-3 shows it was at least likely that
the mean extension angle was positive during FRED exercise compared to the
mean during walking, in both the FB and no-FB groups. However, the weak trend
of increased extension when no-FB was provided was, at best, unlikely, and the
highest probability was for any change between the groups to be trivial.

221
Figure 5-2. Raw change in lower spinal sagittal extension angles comparing walking and FRED exercise in the FB and no-FB groups individually and to each other. Table 5-2. Difference in lower spinal sagittal extension angles for all comparisons, calculated with threshold for inferences of effect size 0.2.
1 indicates threshold for inferences was set to effect size
0.6.
Joint angle Comparison Effect size
90% Confidence limits
Mechanistic inference
L5/S1 No-FB 0.5 0.1 0.9 Likely +ve
FB 0.4 0.2 0.6 Very likely +ve
No-FB vs FB 0.1 -0.6 0.8 Unlikely +ve1
L3/L4 No-FB 0.5 0.1 0.9 Likely +ve
FB 0.4 0.2 0.6 Very likely +ve
No-FB vs FB 0.1 -0.6 0.8 Unlikely +ve1 T12/L1 No-FB 0.5 0.1 0.9 Likely +ve
FB 0.4 0.2 0.6 Very likely +ve
No-FB vs FB 0.1 -0.6 0.8 Unlikely +ve1 T8/T9 No-FB 0.5 0.1 0.9 Likely +ve
FB 0.4 0.2 0.6 Very likely +ve
No-FB vs FB 0.1 -0.6 0.8 Unlikely +ve1
Anterior pelvic tilt
Figure 5-3 shows that FRED exercise resulted in increased anterior pelvic tilt
compared to walking, in both the FB and no-FB groups. There did not appear to
be any change in pelvic tilt between the two groups. Table 5-4 shows it was most
likely that the mean anterior tilt was positive both groups compared to the mean

222
during walking and showed any change between the groups to be very likely
trivial.
Figure 5-3. Raw change anterior pelvic tilt comparing walking and FRED exercise in the FB and no-FB groups individually and to each other.
Table 5-3. Difference in anterior pelvic tilt for all comparisons, calculated with threshold for inferences of effect size 0.2.
2 indicates threshold for inferences was set to effect size 1.2.
Comparison Effect size
90% Confidence limits
Mechanistic inference
No-FB 1.5 1.2 1.8 Most likely +ve
FB 2.2 2.0 2.4 Most likely +ve
No-FB vs FB 0.0 -0.6 0.7 Very likely trivial2
Centre of mass variability
Figure 5-4 shows that FRED exercise resulted in increased centre of mass
variation compared to walking in anteroposterior and lateral directions in both the
FB and no-FB groups. There was a trend towards slightly less anteroposterior
variability by 0.1±0.1 cm, and slightly more lateral variability by 0.3±0.2 cm, in the
no-FB group. Table 5-5 shows the mean centre of mass variability during FRED
exercise was at least very likely positive compared to the mean during walking in
both groups. However, the trends between groups showed the mean variability in
the no-FB group was unlikely negative anteroposteriorly, and likely positive
mediolaterally, compared to the mean in the no-FB group.

223
Figure 5-4. Raw change centre of mass variation comparing walking and FRED exercise in the FB and no-FB groups individually and to each other. Table 5-4. Difference in centre of mass variation for all comparisons, calculated with threshold for inferences of effect size 0.2.
1 indicates threshold for inferences was set to effect size 0.6.
Direction Comparison Effect size
90% Confidence limits
Mechanistic inference
Anteroposterior No-FB 0.5 0.2 0.9 Very likely +ve
FB 0.9 0.7 1.2 Most likely +ve
No-FB vs FB 0.2 -0.5 0.9 Unlikely +ve1
Mediolateral No-FB 1.0 0.6 1.5 Most likely +ve
FB 1.2 1.0 1.4 Most likely +ve
No-FB vs FB 0.6 0.0 1.2 Likely +ve
Frequency and movement variability
Figure 5-5 shows that the no-FB group had an increase in frequency by
0.021±0.015 Hz and decrease in movement variability by -0.6±0.4%, compared to
the FB group. Table 5-6 shows these between group changes to be trivial for
frequency and at best unlikely for movement variability.

224
Figure 5-5 Illustrates the mean difference with standard deviation in raw units for frequency and movement variability between the FB and no-FB groups. Table 5-5. Difference in frequency and movement variability, calculated with threshold for inferences of effect size 0.2.
1 indicates threshold for inferences was set to effect size 0.6 and
2 indicates effect
size 1.2.
Variable Effect size
90% Confidence limits
Mechanistic inference
Frequency (f) 0.0 -0.7 0.7 Very likely trivial2
Movement variability -0.3 -0.9 0.3 Unlikely –ve1
The effect size and 90% confidence interval for each of the FB vs no-FB group
comparisons was plotted in Figure 5- 6, with reference ranges indicating the 0.2
and 0.6 effect size minimal worthwhile change levels. The figure illustrates the
large confidence intervals found in many of the between group comparisons which
made inferences unclear using the 0.2 effect size threshold.

225
Figure 5-6 MBI results for all comparisons. Squares show effect size for walking vs FRED comparisons triangles show FB vs no-FB comparisons, tails show 90% confidence interval, shaded error represents inference threshold effect size of 0.2 and dashed line 0.6.

226
During analysis the frequency and movement variability standard deviations
appeared to be consistently larger in the no-FB group. These values are not
reported individually in the MBI results, therefore, individual group means and
variation statistics for these measures are reported below. Table 5-6 illustrates
that the variation, indicated by the standard deviation, was higher in the no-FB
group for frequency and consistent between the groups for movement variability.
In addition the FB group was able to exercise closer to the target frequency of
0.42 Hz
Table 5-6 mean and standard deviation (SD) for frequency and movement variability outcome measures
Group
Frequency (Hz)
Movement variability (%)
Mean SD Mean SD FB 0.47 0.07 9.79 3.76 No-FB 0.50 0.12 9.16 3.75

227
5.4. Discussion
The main findings of this study were that lower spinal joint angles, anterior
pelvic tilt and centre of mass variation remained increased regardless of whether
FB was provided. It was unlikely to see any differences in sagittal lumbopelvic
position, centre of mass variation, frequency and movement variability whether FB
is provided or not, except for mediolateral centre of mass variation which was
increased in the no-FB group. However, frequency variation was higher in the no-
FB group who also exercised at a mean frequency that 0.13Hz quicker than the
FB group.
These results suggest that the posture adopted by FRED users during
exercise and the frequency and movement variability is not affected by the visual
FB. It appears that a demonstration and the standardised set of instructions
resulted in similar sagittal plan lumbopelvic position, centre of mass variation,
exercise frequency and movement variability. It may be that having had a
demonstration of FRED exercise by a member of the research team who was
already very familiar with how to exercise at the target frequency caused the no-
FB group to adopt a similar exercise posture and frequency to the FB group.
However, higher variation in mediolateral centre of mass was found in the no-FB
group, which may indicate that device users were not maintaining a stable body
position and demonstrated increased lateral position displacement, when FB was
not provided.
The standard deviation of the frequency and movement variability data was
consistently higher in the no-FB group. This suggests that while all participants
exercised with even movements, the no-FB group were exercising at a much
greater range of frequencies away from the target promoted by the FB. The
range was 0.38-0.62 Hz in the no-FB group and 0.4-0.54 Hz in the FB group. In

228
addition the no-FB group also adopted a mean frequency that was 0.13 Hz faster.
It appears, therefore, that the visual FB is useful for ensuring all participants
exercise at the target frequency with minimal variation. It might be that the no-FB
participants were focused on exercising in an even movement from the verbal
instructions and maintained this. However, without a reference frequency
provided by the FRED, the no-FB group had much greater frequency variation .
This finding agrees with previous research (Fothergill 2010; Ruffaldi et al. 2009)
that indicated motor skill visual feedback improves by reducing exercise speed
variation as part of learning movement error correction. This explains why the
frequency variation was a larger effect of having no-FB than the overall change in
mean. This also links into the concept that having live FB during activities
improves judgement within decisions of how to perform the task well (Balzer,
Doherty and Raymond 1989). These findings also add evidence to support the
framework for pedagogical feedback in the motor skill domain that states feedback
elements should include speed and movement accuracy (Iskander, Lester and
Wills 2009). As the results of this study show, these elements appeared to be
more affected by the visual FB provided by the FRED than the kinematic
measures, except for lateral centre of mass variation. However, the centre of
mass result might be more specific to FRED and LM and TrA training principles
than wider motor control learning theory which is not specific to deep spinal
muscles.
Traditional training protocols for LM and TrA aim to promote low level, tonic
contraction (O'Sullivan 2000; Richardson and Jull 1995). Exercising too fast may
result in recruitment of superficial muscles, that have been shown to cause trunk
movements, rather than recruiting deep muscles needed for segmental stability
(Richardson and Jull 1995). Exercising too slowly on the FRED increases the
time over which the front foot must be controlled vertically, as it drops throughout

229
the forward portion of the FRED cycle. Chapter three found that increasing the
front foot drop time by increasing the amplitude resulted in a greater challenge to
motor control. Going too slowly may have the same effect and could also result in
too great a challenge and cause unstable trunk motion. The increase in lateral
centre of mass variation found in the no-FB group may be a result of an increased
motor control challenge from exercising at too low a frequency or from superficial
muscle recruitment causing trunk movements when exercising too fast. However,
both of these possibilities would need further investigation to be confirmed.
5.4.1. Limitations
This chapter shares some limitations discussed in chapter four section 4.4.1,
including XSens not providing an absolute spinal position or one relative to a
normal or vertical reference. Therefore, conclusions on the effect of the exercise,
with and without FB, on exact spinal positioning and postural element such as
lordosis angle are difficult to make.
The participants were given a demonstration of the FRED for safety purposes,
which might have provided them with knowledge of the posture and frequency to
assume while also showing that the movement should be consistent. This may
explain why the technique was so comparable between the groups for many of
the measures. However, speed did vary more within the no-FB group which might
have affected trunk muscle recruitment patterns. It would be useful to assess this
with ultrasound imaging or electromyography to test these theories.
5.5. Conclusion
Participants using FRED are able to perform even movements in the same
posture whether they have FB or not, however, they exercise with less variation
away from the target frequency and with a smaller amount of lateral body
230
displacement, when FB is provided. The lumbopelvic positioning of increased
anterior pelvic tilt and lower spinal extension are similar to that in chapter four,
which linked to LM and TrA activity. Therefore the deep muscles may still be
active at the slow and fast frequencies, however, the exercise might lose its
specificity to the deep muscles.
The visual FB provided during FRED exercise is required for users to achieve
the correct frequency during exercise with less variation away from the target
provided by the FRED visually. While those not provided with FB can exercise
safely and adopt the same lumbopelvic posture, increased lateral centre of mass
variation occurred, which might have been caused by superficial muscle
recruitment. Should superficial muscles be recruited, the exercise would no
longer be specific to the deep muscles. It is, therefore, recommended that visual
FB be provided during exercise to aid participants in exercising at the correct
frequency and refine their technique. These findings are in agreement with
previous evidence determining the importance of, and recommended design of,
visual feedback for motor skill learning.

231
6. Chapter Six: Investigation of Effect of Time on FRED Exercise, in a Large Population, Including Participants with Back Pain.

232
6.1. Introduction
To date, FRED studies have included exercise familiarisation periods of two to
three minutes (Debuse et al. 2013), or five minutes (Caplan et al. 2014; Gibbon,
Debuse and Caplan 2013). In chapters four and five, a five-minute familiarisation
period was used. Familiarisation periods have been intended to give users time
to understand the exercise and develop a good technique. All previous
familiarisation periods have been arbitrary and it remains unknown if a
quantifiable familiarisation period exists. As part of the series of studies to
establish and document the underlying mechanisms of the FRED as an
intervention, it was felt useful to attempt to quantify a standard familiarisation
period. There has also been no investigation of how long first-time device users
can maintain good technique during exercise. While fatigue is unlikely to occur
due to physical effort, as FRED exercise is very low resistance, the high demand
for coordination and balance to generate quality movements, linked to training
motor control, might cause users to tire and loose technique. Generating evidence
of familiarisation and also potential loss of technique points allows evidence-
based training schedules to be developed for intervention trials based on
empirical data. It was, therefore, considered useful to assess familiarisation and
loss of technique periods and, if possible, recommend a standard time required to
familiarise to FRED exercise.
Correct FRED exercise technique requires upright posture and a relatively
stable lumbopelvic region, during slow and smoothly controlled lower limb
functional movements (Debuse et al. 2013). Poor exercise technique may,
therefore, be defined as movement, lumbopelvic kinematic and centre of mass
variation, beyond the standard variation recorded once good technique has been
attained. The standard variation for technique relevant measures can be
determined from periods of familiarised exercise from previous studies. Any

233
mechanistic differences, greater than the familiarised variation, during exercise,
indicate periods within which device users are either not familiarised or have lost
technique. Periods of changing technique can then be used to infer familiarisation
and loss of technique points.
As the device is expected to be used clinically in the rehabilitation of those with
LBP and poor intersegmental control, which has been linked to increased
incidence of LBP in space (Sayson and Hargens 2008; Pavy-Le Traon et al. 2007;
Hides et al. 2007; Gernand 2004) and terrestrial populations (Panjabi 2006;
Danneels et al. 2000; Hodges and Moseley 2003), it was also felt useful to test for
any differences in potential familiarisation and loss of technique points between
individuals with and without LBP.
6.1.1. Aim and Objectives
The aim was to observe the effect of time, during FRED exercise, on kinematic
and device reported measures of exercise technique, to establish the time
required for familiarisation to the exercise and observe for potential loss of
technique, within a 600 second exercise period.
The objectives were as follows for first-time device users:
1. Determine if there is a familiarisation period during which poor exercise
technique occurs while using the device.
2. Determine if there is loss of technique time when exercise technique on the
device becomes poor. This will be observed for up to 600 seconds of exercise
time.

234
3. Filter results by participants who indicated having LBP or not, to establish if
any difference in times are found in objectives 1 and 2, between an
asymptomatic and those with LBP.
4. Recommend a standard familiarisation time period for future FRED studies.

235
6.2. Methods
A within-participant, two group comparison design was used to investigate how
postural kinematics and exercise control vary over a 600 second period of FRED
exercise and determine the time required to familiarise with device use. The study
received ethics approval from the Faculty of Health and Life Sciences ethics
committee at Northumbria University (see appendix J).
6.2.1. Recruitment
The study was part of a “Meet the Scientist” outreach event at the Newcastle
Life Science Centre, located in the Centre for Life Village in central Newcastle
upon Tyne. Participants were recruited from the general public entering the Life
Science Centre section of the village during a four-week period in summer 2015.
The recruitment strategy was designed to find participants aged between 18
and 55 years which are representative of the wider population and include
individuals that are both asymptomatic and experience LBP (as a clinically
relevant population). A dedicated study area was set up that included large
screens to allow the public to observe live data collection. The live data collection
screen showed the full body 3D avatar representation of the current participant or
pre-recorded avatar movements between data collection periods. A large touch
screen displayed an interactive PowerPoint that participants could use to
independently learn about the study or watch informative videos about space
medicine, astronaut training and life aboard the International Space Station. A
separate section within the study area was setup to conduct an astronaut training
themed exercise session for children, which provided a supervised and relevant
activity, allowing accompanying adults to more easily participate in the study.
Figures 6-1 shows the entire “Meet the Scientist” area and the FRED study

236
section, including the two large screens which can been seen in the background
of Figure 6-2.
Figure 6-1 The entire "Meet the Scientist" area, with the FRED study area in the background and the children’s astronaut training activity section in the foreground.
Figure 6-2 The FRED study section of the "Meet the Scientist" area showing the author wearing the XSens motion capture suit and exercising on the FRED. The live avatar can be seen on the screen to the left, while the screen to the right shows a space video

237
Individuals indicating an interest in participating in the study were given a
participant information sheet (appendix E) to enable them to make an informed
decision regarding participation. Those choosing to join the study were screened
for exclusion criteria and LBP. Participants’ demographics and normal activity
levels were also noted. To ensure all participants were fit to engage in exercise,
the Physical Activity Readiness Questionnaire (PARQ) (section 10) was
completed by all individuals. Participants who answered no to all PARQ section
10 questions were considered fit and safe to participate. Any individual who
answered yes to any question in the PARQ were excluded from the study, unless
they had written evidence that a medical doctor had declared them safe to
participate in gentle, upright exercise similar to walking for a period of up to 600
seconds. Other exclusion criteria were based on previous FRED studies
(Debuse et al. 2013) and earlier chapters, including:
Being below 18 or above 55 years of age.
History of musculoskeletal or neurological problems/injuries affecting participants’ ability to move.
Heart disease.
History of abdominal or spinal surgery within the previous three years.
Epilepsy.
Pregnancy.
Diagnosed spinal scoliosis or other structural postural changes which may affect correct calibration of Xsens motion tracking software.
6.2.2. Screening and Demographics
Participants were screened on entry to the study for LBP using the same
system as in chapter four (section 2.2 for details). Screening resulted in the
creation of two groups, a LBP and no-LBP group. Data were analysed based on

238
this screening to establish the familiarisation time for both groups and identify any
differences. Following screening a rating scale was used to record participants’
physical activity over the previous four weeks. Physical activity data were
required to monitor and correct for any potential confounding effects caused by
variation in participants’ normal activity. Physical activity ratings were collected
using the same methods detailed in chapter four section 2.2. All participants
were required to sign a consent form if they chose to participate (appendix F).
Additional demographic data were also collected including gender, age and mass
(to calculate BMI), as well as height and foot length required for equipment
calibration. The number of participants screened into each category on the LBP
scale is also indicated in Table 6-1, which shows there were 70 with LBP and 78
without.

239
Table 6-1 Participant demographics with Xsens exclusions accounted for
LBP screening question: “How much back pain have you had during the past 4 weeks?
n
1 None 78
2 Very mild 29
3 Mild 21
4 Moderate 14
5 Severe 4
6 Very severe 2
6.2.3. Experimental Protocol and Data Collection
The XSens MVN portable motion tracking system was used to collect
kinematic data and the FRED prototype version three was used to collect exercise
frequency and movement variability data. Six hundred seconds of kinematic and
FRED data were simultaneously collected from the moment participants began
exercising on the device until the end of the trial period. The FRED was set in
crank amplitude position 5 (smallest) and footplate position 1 (furthest forward) to
maintain similarity with, and comparability to, previous chapters. Chapter three
also reported this device setting to be the least challenging to first-time users and
recommended it as the initial setting in a progressive training protocol. This
setting is therefore, likely to be the setting used by first-time device users and in
the initial period of an intervention study. Participants were instructed on the
correct use of the FRED device including the visual feedback it provides on
exercise performance. During exercise, the following standardised verbal
instructions were given which are required for safe use of the device:
Exercise in an upright posture.
Bend your hips and knees to help keep your trunk stable.
Fix your eyes on a point at eye level, directly in front of you where you can see feedback on your performance.
Try to keep the trunk stable.
Exercise at a very slow and steady pace

240
Try to keep the movement within one revolution as even as possible.
6.2.4. Kinematic and FRED Measures
Kinematic data were exported from the XSens full body kinematic avatar for
anterior pelvic tilt, sagittal plane angles between spinal segments measured as
the angle between each segment at L5-S1, L3-L4, T12-L1 and T8-T9 and centre
of mass during exercise on the device. The XSens system information and
calibration process was the same as that described in chapter four section 2.5.
The only difference in this study was that full body kinematic data were collected
at 80Hz for 600 seconds. The reduced frame rate used in this study enabled the
large data files created during 600 seconds trials to be manipulated with the
analysis software, as pilot studies demonstrated higher frame rates resulted in
data files that were too large for the analysis software to process.
Methodological issues of using XSens during FRED exercise were dealt with as
per descriptions in chapter four section 2.8 and the reliability and validity of XSens
is detailed in chapter four section 2.9. Movement variability and frequency of the
FRED exercise were exported from the device control unit. Movement variability
and frequency of movement were recorded using the same methods as detailed
in chapter four section 2.7. Participants were allowed to hold on to the FRED
handles during exercise while they felt they needed to, but were encouraged to let
go as soon as possible and safe to do so. At the moment they stopped using the
handles, they were instructed not use them again unless they felt unsafe or were
about to fall. At least one FRED operator supervised participants closely
throughout the exercise trial to ensure safety. The time at which participants
stopped using the handles was determined visually from the kinematic avatar
during data analysis to establish the average time at which participants felt able to
let go. To facilitate observing the time point when the handles were no longer
used during exercise from the avatar, participants were instructed to place their

241
hands by their sides once they felt safe to do so. The time at which this arm
movement was completed by the avatar, using end of elbow extension as a
reference, was determined to be point at which participants no longer needed to
use the handles.
6.2.5. Data Analysis
All analysis was performed using Microsoft Excel 2010. Kinematic data were
captured and exported using MVN studio 3.4.1 (MVN, XSens, Enschede). FRED
data were captured and exported using the standard FRED software for device
prototype three (Mazur Automation, Munich, Germany).
6.2.5.1. Demographics
Statistical differences between the LBP and no-LBP group demographics were
assessed using magnitude based inferences. The mean difference with 90%
confidence interval between the groups for each demographic was calculated.
Magnitude based inferences were then used to investigate any differences
between the groups in relation to a standardised minimal worthwhile change of
effect size 0.6 (Cohen units), which shows if a moderate difference exists
(Hopkins et al. 2008). Magnitude based inferences provide the probability (%) of
the true population difference being more than the minimal worthwhile change.
For identifying differences in demographics it was felt acceptable to set the
minimal worthwhile change to the moderate, 0.6 level as smaller changes are not
likely to confound the results.
6.2.5.2. Kinematic and FRED measures
For all measures, the mean and standard error of the mean (SEM), across
each group’s participants, were calculated for every data point. The mean ± SEM
range was plotted as a function of time for angle of flexion at L5/S1, L4/L3, L1/T12

242
and T8/T9, anterior pelvic tilt, anteroposterior and mediolateral centre of mass,
exercise frequency and movement variability.
𝑆𝑡𝑎𝑛𝑑𝑎𝑟𝑑 𝑒𝑟𝑟𝑜𝑟 𝑜𝑓 𝑡ℎ𝑒 𝑚𝑒𝑎𝑛 =𝑆𝐷 (𝑠𝑎𝑚𝑝𝑙𝑒)
√𝑛
All data were filtered to reduce noise before analysis. A moving average filter
was used so that each data point was recalculated as the mean of 26 data points
either side of it. To ensure the level of filtering enabled clear analysis, without
losing the overall pattern, several filtering options were assessed. The smallest
moving average which reduced noise sufficiently to allow clear analysis to be
made was selected.
All data appeared to have plateaued, indicating familiarisation by 150 seconds,
and remained stable until at least 270 seconds, showing no loss of technique
within this period. Therefore, the mean of each measure between 150 and 270
seconds was used as a familiarised reference. As the SEM is the smallest
measurable change, any difference from the familiarised reference greater the
mean SEM of the familiarised reference was considered to be familiarisation or
loss of technique periods. These periods were determined to be familiarisation if
they occurred before, or loss of technique if occurring after, reaching the
familiarised reference. Therefore, the familiarised reference mean ± the mean
SEM of each measure between 150 and 270 seconds was plotted on the graph as
the measureable range beyond which data were considered familiarised or having
lost technique.
Familiarisation and any loss points were determined in the data to the nearest
5 second interval and visually confirmed using the plots of the mean and SEM of
each measure against time. Familiarisation was determined as the point at which
mean ± SEM across all participants fully entered within the familiarisation

243
reference range. Loss points occurred if the mean ± SEM went fully outside of the
familiarised reference, after the initial familiarisation point. Magnitude based
inference was used to determine if a true worthwhile difference of at least the
familiarised reference SEM existed before and after the estimated familiarisation
and loss points. For all estimated familiarisation and loss points, the effect size,
90% confidence intervals and probabilities (%) that the true values of the statistic
were mechanistically positive, trivial or negative based on the smallest worthwhile
change (familiarisation reference SEM) were reported and qualitatively defined by
the following scale recommended by Hopkins, et al. (2008) as <0.5% is “most
unlikely”, <5% is “very unlikely”, <25% is “unlikely”, 25-75% is “possible”, >75% is
“likely”, >95% is “very likely”, and >99.5% is “most likely”. All inferences which
were at least likely (>75%) were highlighted in results. All mechanistic inferences
were based on threshold changes of 5% for substantial magnitudes.
6.2.6. Ethics
The study recruited human participants, and their dignity, wellbeing and
rights were protected at all times. A risk assessment was performed prior to any
testing to ensure health and safety of all individuals involved in the study. No
lasting effects of the exercise were expected for any participants. Informed
consent was provided in writing by all participants and they were informed they
could withdraw from the study and remove their data at any time. No incentives or
money for travel costs were provided to participants. Participant data were stored
in a secure location in a site folder at all times and used solely for the purpose of
this study. During data collection the site folder was kept in a padlocked box, in
a locked cupboard, with other sensitive equipment at the Life Science Centre.
Following data collection the site folder was moved to a locking filing cabinet in a
swipe card access laboratory at Northumbria University.

244
6.3. Results
6.3.1. Demographics
Table 6-2 presents the LBP and no-LBP group demographics. Four
participants’ kinematic data and seven sets of FRED data were excluded due to
errors during testing. The group demographics and any differences found with
MBI are therefore presented taking these exclusions into account. Table 6-2
shows that any differences between the groups were trivial.
Table 6-2 Participant demographics with Xsens exclusions accounted for
n
Gender (M/F)
Age (years)
Mass (kg)
Height (m) BMI
Activity Score
Kinematic data
All participants 144 73/71 36.5 77.8 1.72 26.3 3.7
LBP 67 33/34 37.6 80.3 1.72 27.1 3.3
No-LBP 77 40/37 35.7 75.6 1.72 25.6 3.8 Chance (%) that difference between LBP and no-LBP groups is trivial 100 97 100 100 97
FRED data All participants 141 71/70 36.8 78.4 1.72 26.3 3.7 LBP 67 33/34 37.6 81.1 1.72 27.2 3.6
No-LBP 74 38/36 36.1 75.9 1.72 25.6 3.7
Chance (%) that difference between LBP and no-LBP groups is trivial 100 94 100 98 98
6.3.2. Measures
Filtering was performed on one kinematic set of data using a moving average
period of 161, 241, 401 and 805 data points. As kinematic data were recorded at
80Hz this represents averaging data across 2, 3, 5 and 10 seconds respectively.
Appendix E shows the resultant plots of each filtering option compared to the
original data. A moving average of 401 data points or 5 seconds (2.5 seconds
either side of the data point) for kinematic data, was considered to reduce noise
sufficiently for analysis, without losing the overall pattern of the original data and
was, therefore, used throughout the analysis (Figure 6-3). The FRED data were
also filtered to reduce noise using the same time interval of 5 seconds. As the

245
FRED records at 5Hz, the moving average data point period was set to 26 data
points.
Figure 6-3 Data filtering options (green line) compared to original data (grey line) tested using mean L5/S1 flexion angle as a function of time, with moving average period of 401.
a.

246
Figure 6-4 illustrates the Mean L5/S1 flexion angle across all participants
throughout the 600 second trial, compared to the familiarised reference ranges, in
both the LBP and no-LBP groups, as an example of variable. Familiarisation and
loss of technique points are marked with vertical dotted lines on the plots. All
other familiarisation figures can be found in appendix H. Tables 6-3 to 6-11
present the change in mean and 90% confidence limits of each measure, pre and
post the estimated familiarisation and loss of technique points, and MBI. All
tested differences in means use the SEM of the respective familiarised range as
the threshold for a worthwhile change.
Figure 6-4 Mean L5/S1 flexion angle across all participants throughout the 600 second trial in; a. the no-LBP group and b. the LBP group. Familiarisation range shown on plots between dashed lines is no-LBP group: 2.7±0.3, LBP group: 3.4±0.3 (degrees).
a.
b.

247
Spinal flexion angles
Spinal positioning appeared familiarised by 40 seconds, in the no-LBP group
and 45 seconds in the LBP group, and decreased during the familiarisation period
in both groups. Tables 6-3 to 6-6 shows it was likely that the mean flexion angle
before the estimated familiarisation points, were positive in both groups,
compared to afterwards. No loss of technique points occurred.
Table 6-3. Differences in L5/S1 flexion angle, pre and post familiarisation point. Threshold for inferences using mean SEM, were 0.3 degrees in the no-LBP and LBP group
Comparison Raw change in mean
(degrees)
90% confidence
limits
Mechanistic inference
No-LBP pre and post 40 s
0.4 0.6 0.2 Likely +ve
LBP pre and post 45 s
0.4 0.6 0.2 Likely +ve
Table 6-4. Differences in L3/L4 flexion angle, pre and post familiarisation point. Threshold for inferences using mean SEM, were 0.1 degrees in the no-LBP and LBP group
Comparison Raw change in mean
(degrees)
90% confidence
limits
Mechanistic inference
No-LBP pre and post 40 s
0.2 0.3 0.1 Likely +ve
LBP pre and post 45 s
0.2 0.3 0.1 Likely +ve
Table 6-5. Differences in T12/L1 flexion angle, pre and post familiarisation point. Threshold for inferences using mean SEM, were 0.1 degrees in the no-LBP and LBP group
Comparison Raw change in mean
(degrees)
90% confidence
limits
Mechanistic inference
No-LBP pre and post 40 s
0.2 0.3 0.1 Likely +ve
LBP pre and post 45 s
0.2 0.3 0.1 Likely +ve
Table 6-6. Differences in T8/T9 flexion angle, pre and post familiarisation point. Threshold for inferences using mean SEM, were 0.1 degrees in the no-LBP group and LBP group
Comparison Raw change in mean
(degrees)
90% confidence
limits
Mechanistic inference
No-LBP pre and post 40 s
0.1 0.2 0.0 Likely +ve
LBP pre and post 45 s
0.2 0.2 0.1 Likely +ve

248
Anterior pelvic tilt
Anterior pelvic tilt appeared familiarised by 105 seconds in the no-LBP group
and 110 seconds in the LBP group, decreasing during the familiarisation period in
the no-LBP group and increasing in the LBP group. However, Table 6-7 shows
that it was unlikely that the mean anterior pelvic tilt before the estimated
familiarisation points was positive in the no-LBP group and negative in the LBP
group compared to afterwards. No loss of technique points occurred.
Table 6-7. Differences in anterior pelvic tilt, pre and post familiarisation point. Threshold for inferences using mean SEM, were 0.5 degrees in the no-LBP and LBP group
Comparison Raw change in mean
(degrees)
90% confidence
limits
Mechanistic inference
No-LBP pre and post 105 s
0.4 0.4 0.0 Unlikely +ve
LBP pre and post 110 s
-0.4 0.1 -0.9 Unlikely -ve
Centre of mass variation
Anteroposterior
Anteroposterior centre of mass variation appeared familiarised by 60 seconds
in the no-LBP group and 40 seconds in the LBP group and decreased during the
familiarisation period in both groups. Table 6-8 shows it was most likely that
mean centre of mass variation before the familiarisation point was positive
compared to aferwards. No loss of technique points occurred.
Mediolateral
Mediolateral centre of mass variation appeared familiarised by 80 seconds in
the no-LBP group and 15 seconds in the LBP group. The variation decreased
during the familiarisation period in both the no-LBP and LBP groups. Table 6-9
shows it was, at best, unlikely that the mean centre of mass variation before the
familiarisation point was positive compared to the mean afterwards in the no-LBP

249
group. In the LBP group there was only a trivial difference before and after the
familiarisation point
Loss of technique appeared to occur at 325 seconds in the no-LBP group and
480 seconds in the LBP group. The centre of mass variation increased after the
loss of technique point. Table 6-9 shows it was most likely that the mean centre
of mass variation before the loss of technique point was negative compared to
afterwards in the no-LBP group, and likely negative in the LBP group.
Table 6-8. Differences in anteroposterior centre of mass variation, pre and post familiarisation point. Threshold for inferences using mean familiarised range SEM, were 0.2 cm in the no-LBP group and LBP group
Comparison Raw change in mean (cm)
90% confidence
limits
Mechanistic inference
No-LBP pre and post 60 s
0.7 0.9 0.5 Most likely +ve
LBP pre and post 40 s
0.9 1.1 0.7 Most likely +ve
Table 6-9. Differences in mediolateral centre of mass variation, pre and post familiarisation and loss point. Threshold for inferences using mean SEM, were 0.05cm in the no-LBP group and 0.1 cm in the LBP group
Comparison Raw change in mean (cm)
90% confidence
limits
Mechanistic inference
No-LBP pre and post 80 s
0.02 0.08 -0.03 Unlikely +ve
No-LBP pre and post 325 s
-0.11 -0.08 -0.15 Most likely –ve
LBP pre and post 15 s
0.03 0.09 -0.03 Very likely trivial
LBP pre and post 480 s
-0.13 -0.09 -0.17 Likely -ve
Frequency and movement variability
Exercise frequency appeared familiarised by 70 seconds in the no-LBP group
and 15 seconds in the LBP group. Frequency decreased during the
familiarisation period in the no-LBP group and increased in the LBP group. Table
6-10 shows it was likely that the mean frequency before the familiarisation point in

250
the no-LBP group was positive compared to afterwards. However, before the
familiarisation point in the LBP group, it was only possible that the mean
frequency was negative compared to afterwards.
Loss of technique appeared to occur at 580 seconds in the no-LBP group and
595 seconds LBP group with frequency increasing after the loss of technique
point. Table 6-10 shows it was most likely that the mean frequency was negative
before the loss of technique point compared to afterwards in the no-LBP group,
but only possibly negative before the loss of technique point in LBP group.
Movement variability appeared familiarised by 130 seconds of exercise in the
no-LBP group and 155 seconds in the LBP group. Movement variability
decreased during the familiarisation period in both the no-LBP and LBP groups.
Table 6-11 shows it was most likely that the mean movement variability was
positive before familiarisation points in the no-LBP and LBP groups compared to
afterwards. No loss of technique point occurred in the LBP group.
Loss of technique appeared to occur at 590 seconds in the no-LBP group.
Movement variability decreased after the loss of technique point. Table 4 shows it
was most likely that the mean movement variability was positive before the loss of
technique point compared to afterwards.
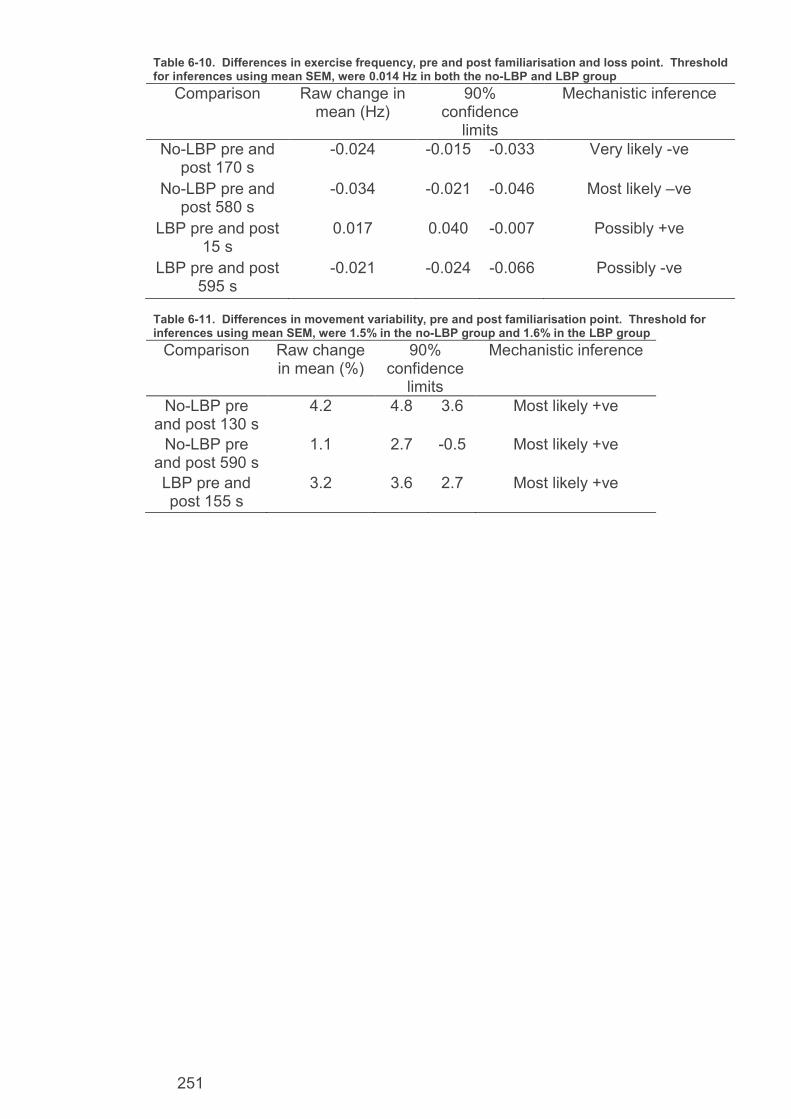
251
Table 6-10. Differences in exercise frequency, pre and post familiarisation and loss point. Threshold for inferences using mean SEM, were 0.014 Hz in both the no-LBP and LBP group
Comparison Raw change in mean (Hz)
90% confidence
limits
Mechanistic inference
No-LBP pre and post 170 s
-0.024 -0.015 -0.033 Very likely -ve
No-LBP pre and post 580 s
-0.034 -0.021 -0.046 Most likely –ve
LBP pre and post 15 s
0.017 0.040 -0.007 Possibly +ve
LBP pre and post 595 s
-0.021 -0.024 -0.066 Possibly -ve
Table 6-11. Differences in movement variability, pre and post familiarisation point. Threshold for inferences using mean SEM, were 1.5% in the no-LBP group and 1.6% in the LBP group
Comparison Raw change in mean (%)
90% confidence
limits
Mechanistic inference
No-LBP pre and post 130 s
4.2 4.8 3.6 Most likely +ve
No-LBP pre and post 590 s
1.1 2.7 -0.5 Most likely +ve
LBP pre and post 155 s
3.2 3.6 2.7 Most likely +ve

252
6.3.3. FRED sampling error
During data analysis, it was observed that the FRED does not have a
consistent sampling rate. Although the error is very small and therefore, was not
observed during the 30 second trials from previous chapters, it amplifies across
longer trials such as the 600 second sampling periods used in this study. The
FRED frame rate is not set or reported live or recorded in the data, meaning it was
not known what the frame rate was during each collection period. During analysis
it was noted that the FRED data sets were smaller than the XSens sets and that
variation was present in the lengths of the sets. Therefore, the sampling rate was
calculated for each participant’s FRED data set during the analysis, after the error
was suspected. Across all data sets in this and chapter seven (including
individuals which were recruited to chapter seven which shared data collection
with this chapter) the average frame rate of FRED collection was 4.7fps with a
standard deviation of 0.29fps. In seven participant’s data the frame rate dropped
below 4.5fps and four dropped below 4fps with the lowest frame rate calculated to
be 2.5fps. During analysis all the data were tabulated in columns, for each
participant, against time before being averaged during the analysis to plot the
graphs and for copying to MBI spreadsheets. Therefore, the frame rates need to
be closely matched between participants to be accurately representative of each
time point in the analysis tables. The standard deviation was calculated with the
four data sets with a frame rate less than 4fps excluded and then for all seven
where it fell below 4.5fps. With only less than 4fps data excluded the standard
deviation was still greater than 0.1 and resulted in a small error effecting the final
50 seconds of data. Therefore the full seven participants worth of data where the
frame rate dropped below 4.5fps were excluded from the analysis. All the
participants were in the no FB group, three had LBP and four did not. As the
sample sizes of these groups was large and there was an even spread of

253
exclusions in both, this was considered to be an acceptable number of exclusions.
The average sampling rate with all seven exclusions was 4.8Hz with a standard
deviation of 0.06Hz. The remaining included data sets varied in length by a
maximum of 8 seconds on the 600-second time scale used in the plots. Any
findings from the final 8 seconds of the trials may, therefore, not be representative
of the entire study population. Therefore caution must be taken when forming any
conclusions based on changes in data during the final 8 seconds of the FRED
data.
6.3.4. Summary of results
The average time taken to let go of the handles was 32±38 seconds in the no-
LBP group and 35±24 seconds in the LBP group. Familiarisation and any loss of
technique times are shown in Table 6-12 with bold times indicating a probability of
the true mean difference between pre and post time points was at least likely.
Table 6-12 Time to familiarisation for each variable. Times in bold show that the inferences, based on the chance of the true mean change being mechanistically different between pre and post familiarisation times, are at least a likely difference.
6.4. Discussion
The main finding of this chapter was that it took 170 seconds to familiarise to
FRED exercise and this changed to 155 seconds in those with LBP. There was
no loss of technique point at which loss of technique occurred at all measures.
However, there was an increase in mediolateral centre of mass variation at 325
seconds, exercise frequency at 580 seconds and movement variability at 590
Outcome Sag L5S1
Sag L3L4
Sag T12L1
Sag T8T9
CoM X
CoM Y
Pelv tilt
FRED f
Movement variability
Time (s) familiarised in no-LBP group
40 40 40 40 60 80 105 170 130
Time (s) familiarised in LBP group
45 45 45 45 40 15 110 15 155

254
seconds in the no-LBP group. The only loss of technique in the LBP group was
an increase in mediolateral centre of mass at 480 seconds.
6.4.1. Familiarisation in no-LBP individuals
In no-LBP individuals, full familiarisation happened by 170 seconds of
exercise. Spinal posture was the first element to familiarise followed by
anteroposterior centre of mass variation, movement variability, and finally exercise
frequency. Spinal positioning started in a more flexed position and gradually
extended for all segment angles while centre of mass variation, exercise
frequency and movement variability all gradually decreased during familiarisation.
No measurable change in pelvic tilt occurred throughout the 600-second trials. It
is known from the chapter four results and Gibbon et al. (2013) that FRED
exercise places the pelvis into increased anterior tilt compared to walking. The
results of this study would seem to indicate that this pelvic positioning occurs
immediately on initiating exercise. No loss of technique occurred within 600
seconds, however, there was a small increase in mediolateral centre of mass
variation of 0.1cm at 325 seconds and an increase of 0.034Hz in exercise
frequency at 580 seconds and a decrease of 1.1% in movement variability at 590
seconds. The change in mediolateral centre of mass was very small and
happened 255 seconds before frequency and movement variability changed.
Therefore, this is not considered an overall exercise loss of technique point.
Changes in exercise frequency and movement variability were the only other
measures which the no-LBP group lost technique. The FRED data error which
might have affected data in the final 8 seconds may explain this variation in
exercise frequency. While it is possible that increasing frequency could be the
first sign of onset loss of technique, it might also be a result of participants
possibly increasing exercise frequency in anticipation of the end of the training.
Most pacing strategies in exercise involve an end spurt (Abbiss and Laursen

255
2008; Tucker, Lambert and Noakes 2006) and so it is possible that enough
participants adopted a pacing strategy including this feature, which would appear
as loss of technique point in the final few seconds. Increased movement
variability is assumed to increase as technique is lost. Therefore, a decrease is
unlikely to be linked to a loss of technique point and suggests this change was
more likely due to the FRED data error. It is not clear from the overall results why
frequency increased in the final 20 seconds, however, participants were aware
how much training time remained and so it might be linked to the potential end
spurt.
It is known from chapter three that the LM and TrA muscles were more active
during FRED exercise compared to rest. It is also known that LM has a role in
spinal positioning with increasing activity when the lumbar spine extends into a
lordotic curve below thoracolumbar junction (Claus et al. 2009; O'Sullivan et al.
2006; Roussouly et al. 2005). Chapter four found that FRED exercise promotes
this type of posture more than walking. The pelvic and spinal kinematics were all
familiarised and stable, having gone into a small amount of lumbar extension, by
40 seconds. It can therefore be assumed that LM activation had occurred and
resulted in lumbopelvic position familiarisation by 40 seconds of exercise. The
remaining familiarisation time then appears to be attempting to reduce movement
variability and exercise at a steady frequency, most likely at the target frequency
provided by the FRED visual feedback. Movement variability familiarised by 130
seconds followed by exercise frequency 40 seconds later. This suggests that
device users focus first on achieving an even movement followed by doing this at
the correct frequency. Therefore, it appears that FRED exercise places users into
anterior pelvic tilt immediately, deep muscles appear to have activated by 40
seconds in order to achieve spinal positioning, after which it takes another 90
seconds to develop sufficient movement control to achieve controlled and even

256
movements, after which the target frequency is reached 40 seconds later. At this
point, 170 seconds after initiating exercise, all measures were considered
familiarised.
6.4.2. Differences in familiarisation in individuals with LBP
In individuals experiencing LBP full familiarisation occurred by 155 seconds of
exercise, which was 15 seconds earlier than those without LBP. Spinal
positioning was the second element to familiarise, by 45 seconds which was 5
seconds slower than the no-LBP group. Similarly to the no-LBP group pelvic tilt
did not have a familiarisation point and, therefore, also appears to reach its
exercise position immediately. Anteroposterior centre of mass variation
familiarised 20 seconds quicker in the LBP group, by 40 seconds, becoming the
first element to familiarise. There was no likely familiarisation point for exercise
frequency, meaning participants appeared to reach a steady exercise frequency
from initiating movement. However, full movement control was not reached until
155 seconds when movement variability familiarised which was the final element
to familiarise. Similarly to the no-LBP group, mediolateral centre of mass variation
did not have a familiarisation point, but did have a loss of technique point at 480
seconds which was 155 seconds later than in the no-LBP group. The patterns of
change of all variables were the same in both the LBP and no-LBP groups with
spinal positioning extending while centre of mass variation and movement
variability decreased, whilst exercise frequency produced no measurable change
throughout the 600 second trial, in the LBP group. The target frequency
provided by the feedback was 0.42 Hz. The familiarised frequency ranges were
found to be 0.48±0.01 Hz for the no-LBP group and 0.50±0.01 Hz for the LBP
group. The no-LBP group were, therefore, able to exercise closer to the target
frequency, whereas the LBP group had a frequency that was 0.12 Hz faster. This
finding might suggest that those with no LBP had better motor control.

257
Additionally, despite the much quicker frequency familiarisation time which led to a
faster overall familiarisation time, the LBP group took 25 seconds longer to
develop sufficient motor control to reach familiarised movement variability. As
people with LBP often have reduced motor control of deep lumbopelvic muscles
including LM (Hides et al. 1994; Hodges and Moseley 2003; Hodges and
Richardson 1996; Macdonald, Moseley and Hodges 2009; Panjabi 2006), it is not
an unexpected finding that they took more time to develop the motor control
required to control the movement, and showed reduced ability to exercise at the
target exercise frequency. This finding may also support the potential use of the
FRED as an intervention for challenging and training lumbopelvic motor control in
people with LBP.
6.4.3. Limitations
Limitations of this study are similar to those of chapter four discussed in
section 4.1. This includes the use of a generic LBP population which may include
LBP caused by a multitude of factors. O’sullivan (2005) and Hodges, Cholewicki
and Van Dieen (2013) advocate sub grouping LBP participants into groups which
share common features. Failing to use subgrouping risks the heterogeneity of
LBP features masking differences between the LBP and no-LBP group. FRED
exercise is particularly relevant to the motor control sub group. Therefore, a
system to recruit LBP individuals from that sub group may create a symptomatic
group which is more representative of the target FRED clinical population. Also
similar to chapter four limitations is the continued lack of clinically relevant minimal
worthwhile changes and still only being able to report mechanistic differences in
means which may not be clinically meaningful.
The LBP group consisted mostly of individuals who indicated experiencing
very mild to moderate back pain. However, only six participants indicated

258
experiencing severe or very severe pain. Therefore, the LBP results are mostly
representative of populations with very mild to moderate back pain and should be
treated with caution in populations with severe or worse pain.
The low sampling rate available from the FRED to record movement variability
suggests that the movement variability results should be treated with some
caution. In future developments of the device, it would be useful to increase the
sampling rate of FRED at which movement variability is recorded. Minimal
clinically worthwhile changes in relevant outcome measures would also be useful
to ascertain to use with MBI if FRED is trialled clinically.
6.4.4. Conclusion
First-time no-LBP users of the FRED in crank position 5 and footplate position
1 took 170 seconds to familiarise to the exercise in terms of pelvic and spinal
positioning, centre of mass variation, frequency and movement variability. Overall
familiarisation occurred 15 seconds earlier in the study participants with LBP as
they moved at the target slow speed from initiating exercise. However, those with
back pain took 20 seconds longer to develop sufficient motor control to make
controlled movements and demonstrated less ability to modulate exercise
frequency, suggesting the intervention might be useful as a motor control
intervention. It is therefore recommended that future FRED studies include a
familiarisation period of at least 170 seconds to allow correct lumbopelvic
positioning and control of the movement to be reached. Loss of technique,
including changes in lumbopelvic kinematics, frequency and movement variability,
does not appear to occur in the first 600 seconds of FRED exercise.

259
7. Chapter Seven: Investigation of Effect of Using Handles, on Lumbopelvic Kinematics, During FRED Exercise

260
7.1. Introduction
The FRED currently being investigated as a possible intervention for training
intersegmental control of the lumber spine and lumbopelvic stability, includes
adjustable handles for users to steady themselves with. The handles can be seen
in Figure 7-1. The FRED operating instructions (version 20131030) state that the
handles are intended to enable safe mounting and dismounting and for steadying
users during exercise if required. However, no specific guidance is available on
the effect of handle use during exercise on intervention mechanisms and potential
impact on exercise effectiveness or confounding of study results.
Chapters one and two highlighted that activity of the LM muscle is a key
component of intersegmental control interventions. Increasing LM activity has
been reported when progressively reducing base of support, challenging balance
and loading the upper limbs, using surface electromyography (Calatayud et al.
2015). It is expected that use of FRED handles during exercise will aid balance
and support the weight of the upper limbs. Therefore, holding on is likely to lower
LM activity and reduce the effectiveness of the FRED exercise as an
intersegmental control training intervention. Reduced intersegmental control
training and balance challenge is also likely to affect FRED exercise technique.
Lumbopelvic positioning during exercise may be changed due to the role of LM in
lordosis maintenance (Macintosh et al. 1986; Musculino 2005) and centre of mass
variation may decreased with reduced challenge to balance (Winter 1995). The
effect of handle use during FRED exercise should, therefore, be investigated as
part of studying the mechanisms of the exercise.
Previous studies investigating the FRED have varied regarding whether they
allowed participants to use the FRED handles during exercise. Some studies
have allowed participants to rest their hands lightly on the handles if required
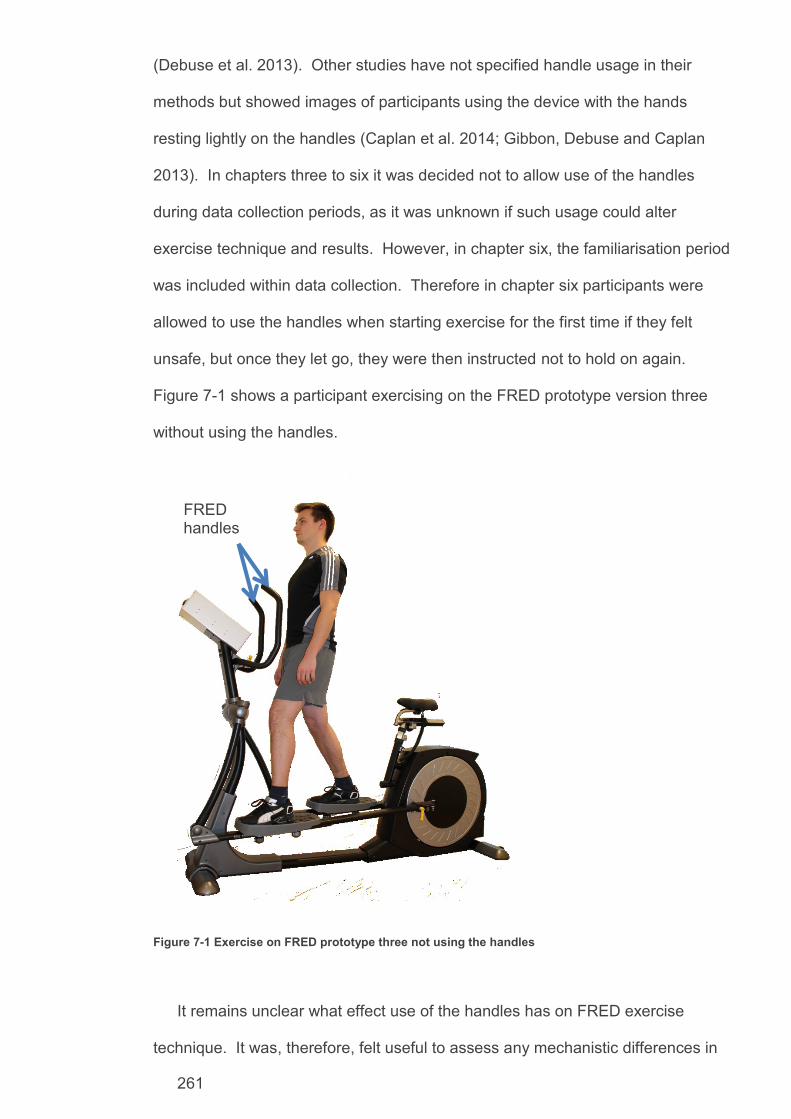
261
(Debuse et al. 2013). Other studies have not specified handle usage in their
methods but showed images of participants using the device with the hands
resting lightly on the handles (Caplan et al. 2014; Gibbon, Debuse and Caplan
2013). In chapters three to six it was decided not to allow use of the handles
during data collection periods, as it was unknown if such usage could alter
exercise technique and results. However, in chapter six, the familiarisation period
was included within data collection. Therefore in chapter six participants were
allowed to use the handles when starting exercise for the first time if they felt
unsafe, but once they let go, they were then instructed not to hold on again.
Figure 7-1 shows a participant exercising on the FRED prototype version three
without using the handles.
Figure 7-1 Exercise on FRED prototype three not using the handles
It remains unclear what effect use of the handles has on FRED exercise
technique. It was, therefore, felt useful to assess any mechanistic differences in
FRED handles

262
technique between participants using and not using the handles during exercise.
To investigate this, a parallel study using a small additional group of participants
was conducted during the data collection period of chapter six. As chapter six
was assessing technique over time, it was possible to compare the technique of
the no-LBP group from that chapter who did not use the handles once
familiarised, with another no-LBP group which did hold on throughout a full, 600
second, comparable trial. This comparison, therefore, allowed assessment of
familiarisation and loss of technique point differences when using the handles and
testing of any differences in technique relevant measures, throughout the trials,
between the holding and no-holding groups. This study also forms part of the
series of studies to establish the mechanisms of using the FRED as a complex
intervention. Determining if use of the handles affects exercise technique will also
allow evidence-based decisions to be made on handle usage during intervention
studies using the device.
7.1.1. Aim and Objectives
The aim was to observe the effect of handle use during FRED exercise on
technique relevant measures of movement variability, lumbopelvic posture and
centre of mass and make recommendations on handle usage for future
intervention studies using the device.
The objectives were for first-time no-LBP device users:
1. Determine if there is a difference in the exercise familiarisation period between
groups using and not using handles during exercise.
2. Determine if there is a difference in the exercise technique relevant measures
between groups using and not using handles during exercise.

263
3. Report any changes in exercise technique that occur if participants use the
handles during exercise and make recommendations regarding handle usage
for future studies.

264
7.1.2. Methods
The data collection for this study was done in parallel with chapter six which
was investigating exercise technique changes over time in an asymptomatic and
LBP population. This study used the same general methodology as chapter six
with a relatively smaller group of additional no-LBP participants who exercised for
the 600-second trial using the FRED handles throughout. The XSens MVN
portable motion tracking system was used to collect kinematic data and the FRED
prototype version three used to collect exercise frequency and movement
variability data. See chapter six, section 2, for details of participant recruitment,
experimental protocol, measures of exercise technique and magnitude based
inference statistics. The study received ethics approval from the Faculty of Health
and Life Sciences ethics committee at Northumbria University (see appendix J).
Participants entering the study in chapter six who were screened to the no-
LBP group, were randomised using a Microsoft Excel random number generator
into a holding or no-holding group until the holding group had 16 participants.
From that point on remaining no-LBP participants were all assigned to the study
reported in chapter six. The only protocol difference from chapter six was that the
holding on group was instructed to use the FRED handles at all times throughout
the exercise trial and not let go. The same analysis as used in chapter six was
performed to determine familiarisation and loss of technique points using the
same moving average settings to filter the data.
Additional analysis performed in this chapter included direct comparisons
using magnitude based inference to compare the mean of all measures across
the entire trial period between the holding and no-holding groups. This additional
analysis identified if any measurable changes existed between the holding and
no-holding groups. For all magnitude based inference calculations the mean

265
standard error of the mean across the full 600 seconds of all the holding group
participants was used as the smallest worthwhile change.
𝑆𝑡𝑎𝑛𝑑𝑎𝑟𝑑 𝑒𝑟𝑟𝑜𝑟 𝑜𝑓 𝑡ℎ𝑒 𝑚𝑒𝑎𝑛 =𝑆𝐷 (𝑠𝑎𝑚𝑝𝑙𝑒)
√𝑛
The holding group SEM was used to make conservative comparisons. As
there were less in the holding group resulting in the SEM of this group being the
largest as these values are inversely proportional. Therefore, any difference of at
least the holding group SEM, would also exist using the smaller SEM of the no-
holding group, with its higher number of participants.
7.2. Results
Tables 7-1 and 7-2 present the holding and no-holding group demographics.
One participant’s kinematic data were excluded from analysis due to problems
with the equipment or electromagnetic interference resulting in poor quality data.
Four sets of FRED recorded data (frequency and movement variation) from the
no-holding groups were excluded due to a frame rate error during FRED data
collection discussed in chapter six section 6.3.3. The group demographics and
any differences found with MBI are therefore presented taking these exclusions
into account. The no-holding group had a slightly higher activity score of 3.8
compared to 3.3 in the holding group. Although this was a consistent difference, it
is likely to be small enough not to confound results.
Table 7-1 group demographics and chance of differences being trivial with kinematic data exclusions taken into account
n Gender (M/F)
Mass(kg)
Height (cm)
BMI Activity score
Age (years)
All participants 93 50/43 76.8 172.6 25.7 3.7 36.7 No-holding group 77 40/37 75.6 1.72 26.6 3.8 35.7 Holding group 16 10/6 82.5 174.9 26.8 3.3 41.6 Chance (%) that difference between the groups is trivial
87 81 79 67 68

266
Table 7-2 group demographics and chance of differences being trivial with frequency and movement varation data exclusions taken into account
n Gender Mass (kg)
Height (cm)
BMI Activity score
Age (years)
All participants 90 48/42 77.1 172.5 25.7 3.7 37.1
No-holding group
74 38/36 75.9 172.0 25.6 3.7 36.1
Holding group 16 10 /6 82.5 174.9 26.8 3.3 41.6 Chance (%) that difference between the groups is trivial
83 85 79 49 74
Figure 7-2 shows the mean L5/S1 flexion angle across all participants
throughout the 600 second trial for the holding and no-holding groups, as an
example variable. All other familiarisation figures can be found in appendix I.
Familiarisation and loss of technique points were identified in the data, confirmed
on the plots and marked accordingly. The corresponding MBI results are
presented in Tables 7-3 to 7-11. The familiarised reference ranges are also
displayed on the plots. The dark lines on the plots show the mean and light lines
show the SEM range. All tested differences in means use the SEM of the
respective familiarised range as the threshold for a worthwhile change.
Spinal flexion angles
All spinal positioning appeared familiarised by 40 seconds in the no-holding
group and between 170 -205 seconds in the holding group. Flexion decreased
during the familiarisation period in the no-holding group and decreased before
increasing back to baseline values in the holding group. Tables 7-3 to 7-6 shows
it was likely that the mean flexion angles before the familiarisation point, were
positive compared to afterwards in the no-holding group. However, the pre-
familiarisation point means were only possibly negative in the holding group. No
loss of technique point occurred.

267
Figure 7-2 Mean L5/S1 flexion angle across all participants throughout the 600 second trial in; a. the no-holding group and b. the holding group. Familiarisation range shown on plots between dashed lines is 2.7 ± 0.3 in the no-holding group and 3.5 ± 0.5 in the holding group (degrees). Table 7-3 Differences in L5/S1 flexion angle, pre and post familiarisation point. Threshold for inferences using mean SEM, were 0.3 degrees in the no-holding group and 0.5 degrees in the holding group Comparison Raw change
in mean (degrees)
90% confidence limits
Mechanistic inference
No-holding pre and post 40 s
0.4 0.6 0.2 Likely +ve
Holding pre and post 170s
-0.5 0.0 -0.9 Possibly -ve
a
.
b
.

268
Table 7-4 Differences in L3/L4 flexion angle, pre and post familiarisation point. Threshold for inferences using mean SEM, were 0.1 degrees in the no-holding group and 0.2 degrees in the holding group
Comparison Raw change in mean
(degrees)
90% confidence
limits
Mechanistic inference
No pain pre and post 40 s
0.2 0.3 0.1 Likely +ve
Pain pre and post 185 s
-0.2 0.0 -0.4 Possibly -ve
Table 7-5 Differences in T12/L1 flexion angle, pre and post familiarisation point. Threshold for inferences using mean SEM, were 0.1 degrees in the no-holding group and 0.2 degrees in the holding group
Comparison Raw change in mean
(degrees)
90% confidence
limits
Mechanistic inference
No pain pre and post 40 s
0.2 0.3 0.1 Likely +ve
Pain pre and post 185 s
-0.2 0.0 -0.4 Possibly -ve
Table 7-6 Differences in T8/T9 flexion angle, pre and post familiarisation point. Threshold for inferences using mean SEM, were 0.1 degrees in the no-holding group and 0.1 degrees in the holding group
Comparison Raw change in mean (degrees)
90% confidence
limits
Mechanistic inference
No-holding pre and post 40 s
0.1 0.2 0.0 Likely +ve
Holding pre and post 205 s
-0.1 0.0 -0.3 Possibly -ve

269
Anterior pelvic tilt
Anterior pelvic tilt appeared familiarised by 100 seconds in both the holding
and no-holding group, decreasing during the familiarisation period in both groups.
However, Table 7-7 shows the mean anterior pelvic tilt before the familiarisation
point was at best unlikely positive in the no holding group compared to afterwards
and possibly positive in the holding group. No loss of technique point occurred.
Table 7-7 Differences in anterior pelvic tilt, pre and post familiarisation point. Threshold for inferences using mean SEM, were 0.5 degrees in the no-holding group and 1.8 degrees in the holding group
Comparison Raw change in mean
(degrees)
90% confidence
limits
Mechanistic inference
No-holding pre and post 105 s
0.4 0.4 0.0 Unlikely +ve
Holding pre and post 100 s
1.7 3.0 0.3 Possibly +ve
Anteroposterior centre of mass variation
Anteroposterior centre of mass variation appeared familiarised by 60 seconds
in the no-holding group and that no familiarisation point was estimated in the
holding group. Table 7-8 shows it was most likely that the mean centre of mass
variation was positive compared to afterwards in the no-holding group. To confirm
no change occurred in the holding group, the first and second 300 seconds were
compared and any change was most likely trivial. No loss of technique point
occurred.
Mediolateral centre of mass variation
Mediolateral centre of mass variation appeared familiarised by 75 seconds in
the no-holding group and by 60 seconds in the holding group. The variation
decreased during the familiarisation period in the holding group and fluctuated
without clear direction of change in the holding group. Table 7-9 shows that the
mean centre of mass variation before the familiarisation point was possibly

270
positive in the no-holding group and possibly negative in the holding group,
compared to afterwards.
Loss of technique appeared to occur at 325 seconds in the no-holding group
and 570 seconds in the holding group. The centre of mass variation increased
after the loss of technique point in both groups. Table 8 shows it was most likely
that the mean centre of mass variation before loss technique centre of mass
variation was negative in the no-holding group, and likely negative in the holding
group.
Table 7-8 Differences in anteroposterior centre of mass variation, pre and post familiarisation point. Threshold for inferences using mean SEM, were 0.2 cm in the no-holding group and 0.6 cm in the holding group
Comparison Raw change in mean (cm)
90% confidence
limits
Mechanistic inference
No-holding pre and post 60 s
0.7 0.9 0.5 Most likely +ve
Holding pre and post 300 s
0.0 0.0 0.0 Most likely trivial
Table 7-9 Differences in mediolateral centre of mass variation, pre and post familiarisation and loss point. Threshold for inferences using mean SEM, were 0.05cm in the no-holding group and 0.1 cm in the holding group
Comparison Raw change in mean (cm)
90% confidence
limits
Mechanistic inference
No-holding pre and post 75 s
0.05 0.11 0 Possibly +ve
No-holding pre and post 325 s
-0.11 -0.08 -0.15 Most likely –ve
Holding pre and post 60 s
-0.1 0.1 -0.3 Possibly -ve
Holding pre and post 570 s
-0.2 -0.1 -0.4 Likely -ve

271
Frequency and movement variability
Exercise frequency appeared familiarised by 170 seconds in the no-holding
group and 70 seconds in the holding group. Frequency increased during the
familiarisation period in the no-holding group and decreased in the holding group.
Table 7-10 shows it was likely that the mean frequency before the familiarisation
point was negative compared to afterwards in the no-holding group and possibly
positive in the holding group.
Loss of technique appeared to occur at 580 seconds in the no-holding group
and at 350 seconds in the holding group with frequency increasing after the loss
of technique point in both groups. Table 8 shows it was most likely that the mean
frequency was negative before the loss of technique point compared to afterwards
in the no-holding group but only possibly negative in the holding group.
Movement variability appeared familiarised by 130 seconds of exercise in the
no-holding group and 60 seconds in the holding group. Movement variability
decreased during the familiarisation period in both groups. Table 7-11 shows it
was at least very likely that the mean movement variability was positive before the
familiarisation point, compared to afterwards in both groups.
Loss of technique appeared to occur only in the no-holding group at 590
seconds with movement variability decreasing after the loss of technique point.
Table 7-11 shows it was most likely that the mean movement variability was
positive before the loss of technique point compared to afterwards.
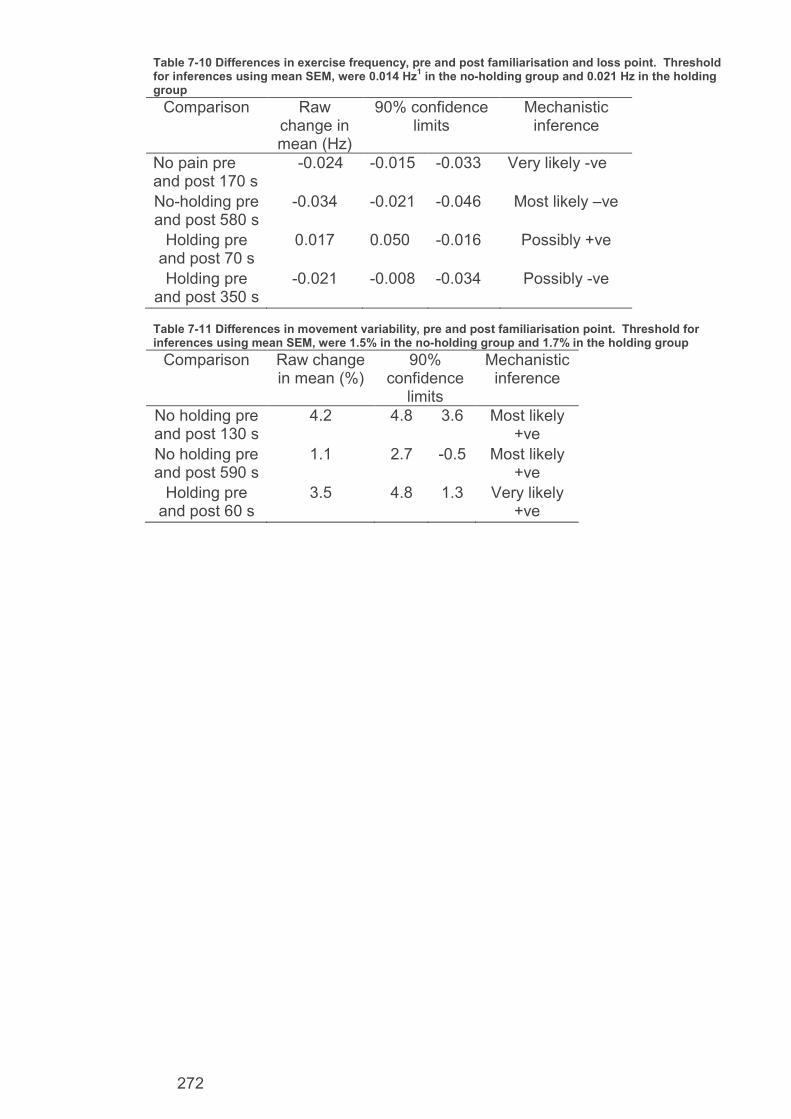
272
Table 7-10 Differences in exercise frequency, pre and post familiarisation and loss point. Threshold for inferences using mean SEM, were 0.014 Hz
1 in the no-holding group and 0.021 Hz in the holding
group
Comparison Raw change in mean (Hz)
90% confidence limits
Mechanistic inference
No pain pre and post 170 s
-0.024 -0.015 -0.033 Very likely -ve
No-holding pre and post 580 s
-0.034 -0.021 -0.046 Most likely –ve
Holding pre and post 70 s
0.017 0.050 -0.016 Possibly +ve
Holding pre and post 350 s
-0.021 -0.008 -0.034 Possibly -ve
Table 7-11 Differences in movement variability, pre and post familiarisation point. Threshold for inferences using mean SEM, were 1.5% in the no-holding group and 1.7% in the holding group
Comparison Raw change in mean (%)
90% confidence
limits
Mechanistic inference
No holding pre and post 130 s
4.2 4.8 3.6 Most likely +ve
No holding pre and post 590 s
1.1 2.7 -0.5 Most likely +ve
Holding pre and post 60 s
3.5 4.8 1.3 Very likely +ve

273
7.2.1. Results summary
Table 7-12 shows the estimated times taken to familiarise from each plot. Bold
entries in the table show when the probability of the true difference between the
time points being changed by more than smallest worthwhile amount was at least
likely (≥75%).
Table 7-12 Summary of familiarisation times across all measures
Table 7-13 shows the mean difference in each variable between the holding
and no-holding groups across the entire 600 second trials. Results where the
magnitude of true change was at least likely (≥75%) to be the smallest worthwhile
change are again shown in bold.
Table 7-13 Comparisons of all measures across the full 600 second trials for all comparing the holding with the no-holding group, using the corresponding no-holding group SEM as the minimal worthwhile change threshold for MBI, all in raw unites (flexion angle and pelvic tilt: degrees, centre of mass: cm, frequency: Hz and movement variability: %)
Outcome Raw change
90% confidence intervals
Inference
L5/S1 flexion angle 1.2 0.1 2.3 Likely +ve
L3/L4 flexion angle 0.5 0.0 1.0 Likely +ve
T12/L1 flexion angle 0.5 0.1 1.0 Likely +ve
T8/T9 flexion angle 0.4 0.0 0.7 Likely +ve
Anteroposterior centre of mass 1.6 0.4 2.7 Likely +ve
Mediolateral centre of mass -0.2 -0.4 0.0 Unclear Anterior pelvic tilt 3.3 -0.7 7.4 Unclear Frequency -0.003 0.03 -0.02 Unclear Movement variability -2.2 -3.6 -0.9 Likely -ve
Outcome Sag L5S1
Sag L3L4
Sag T12L1
Sag T8T9
CoM X
CoM Y
Pelv tilt
f Movement variability
Time (s) familiarised in no holding group
40 40 40 40 60 80 105 170 130
Time (s) familiarised in holding group
170 185 185 205 0 60 100 70 60

274
7.3. Discussion
The main findings of this chapter were that there is no likely familiarisation
period when holding on. Individuals who exercised holding on were also likely to
have a more flexed spinal position, increased variation in anteroposterior centre of
mass and lower movement variability score.
7.3.1. Familiarisation time
The details of familiarisation in the no-holding group are detailed in chapter six
section 6.4.1. In summary, familiarisation had begun by 40 seconds of exercise
and took a further 130 seconds to complete across all measures, with full
familiarisation reached by 170 seconds of exercise. Spinal mechanics familiarised
first and exercise frequency last.
Holding on during FRED exercise results in no likely worthwhile change
existing between the pre and post estimated familiarisation periods in all
measures, except for movement variability which familiarised by 60 seconds. It
therefore appears that the holding on group did not have, and therefore need, an
overall familiarisation period. A 60 second period is still required to develop
enough motor control to successfully manage movement variability. However, the
following familiarisation points were still possible. Spinal position was no longer
the first element to familiarise and became the final element to do so with
familiarisation occurring after 170 seconds at L5/S1, 185 seconds at L3/L4 and
T12/L1, and 205 seconds at T8/T9. Movement variability became the first
element to familiarise after 60 seconds of exercise. Mediolateral centre of mass
and exercise frequency were the second and third elements to possibly familiarise
after 60 and 70 seconds of exercise, respectively. Pelvic tilt familiarised at 100
seconds, before spinal positioning began familiarising at 170 seconds. There was

275
a 100% probability that any change in anteroposterior centre of mass variation
between the first and second half of the trial was trivial. Therefore, while it is not
like likely that a familiarisation period longer than 60 is required to reach the target
frequency while exercising holding on, it is possible that some variation in exercise
may be present until as late as 205 seconds. However, the probability of this
variation beyond 60 seconds is not great enough to warrant a familiarisation time
recommendation.
7.3.2. Mean difference across entire trial in all measures
It appears that the spine is held in a more flexed position, the movement
variability score lower (resulting in smoother movements) and variation in
anteroposterior centre of mass increased, when holding on. Although the 90%
confidence interval shows there could be a small decrease in anterior pelvic tilt,
most of the interval showed an increase. While the potential to increase and
decrease makes the magnitude based inference result unclear, when taken
alongside the increasingly flexed spinal angles, it appears that participants using
the handles positioned their entire trunk in a more forward flexed and forward
leaning position. A possible reason for this is that the handles are positioned
anteriorly to device users. Therefore, participants might have been leaning
towards the handles in order to hold them and reduce the need to reach far with
the arms.
Lumbar spinal extension that does not place the inflection point above
thoracolumbar junction is associated with increased LM activity (Claus et al. 2009;
O'Sullivan et al. 2006; Roussouly et al. 2005). Therefore, the shift towards flexed
spinal angles suggests the LM muscle activity was decreased when holding on. It
is also known that the LM muscle has a role in controlling and maintaining lumbar
276
lordosis (Macintosh et al. 1986; Moseley, Hodges and Gandevia 2002).
Therefore, increasing lumbar flexion which in turn decreases lumbar lordosis, is
also likely to be associated with decreased activity of the LM muscle. Ultrasound
imaging or electromyography could be used to test this theory. The reduced
movement variability also suggests that use of handles during exercise results in a
reduced challenge to motor control as it appears participants were more easily
able to exercise with smoother movement. It is possible that this might be due to
trunk stability being gained passively through the arms, using the support of the
handles rather than actively through use of the LM and TrA muscles. Although
increased anteroposterior centre of mass variation from midline could indicate an
increased balance challenge when holding on, it is more likely that the centre of
mass was moved anteriorly due to the increased flexed and anteriorly positioning
trunk. It has also been shown that decreasing support results in increased
challenge to balance (Winter 1995). Therefore, it is also unlikely that balance
would be challenged more when a participant is able to steady themselves with
stable handles during the exercise.
7.3.3. Limitations
As the methodology of this chapter is based on that from chapter six, the
limitations are also the same. Therefore, please see chapter six section 4.3 for
the limitations of this methodology.
7.4. Conclusion
It appears that holding on during FRED exercise resulted in a more flexed
spine with increased anterior pelvic tilt, suggesting a more anteriorly slanted and
leaning trunk/pelvis orientation. There also appears to be a reduced challenge to
motor control as device uses are able to exercise with smoother and more

277
controlled movements with less variation. Holding on also resulted in device
users no longer having a likely familiarisation period, except for requiring 60
seconds to establish a smooth movement pattern. These changes are likely to
result in reduced demands for motor control and less LM muscle activity. As
FRED is intended to train both these elements, it is suggest that use of the
handles during exercise is likely to make the exercise a less effective intervention.
It is recommended that intervention studies do not allow participants to hold on to
the handles except for mounting/dismounting, breaking a possible fall and during
the familiarisation period established in chapter six.

278
8. Conclusion

279
8.1. Introduction
This thesis explored the underlying mechanisms of FRED exercise from the
perspective of its potential as a future intervention in the rehabilitation of
lumbopelvic deconditioning, which often results in LBP linked with LM and TrA
muscle atrophy and control deficiencies, both on Earth and following human
spaceflight. The overarching aim was to develop evidence that informs a decision
on whether a clinical trial of the FRED is justified in both terrestrial and human
spaceflight simulation settings. The study began by synthesising the evidence for
effectiveness of interventions for lumbopelvic deconditioning during and after
microgravity exposure, to inform future research and enable comparison of
emerging interventions, such as FRED exercise, with current practice. Such
synthesis, while common in terrestrial medicine, was lacking within aerospace
medicine. The mechanistic kinematic and motor control effects caused by FRED
exercise, compared to walking, were determined in participants with and without
LBP, to assess the exercise mechanisms in relation to current LM and TrA
rehabilitation theory. Additional mechanistic studies identified the effect of
altering FRED settings on motor control and key muscle recruitment, established
the time needed to familiarise with the exercise in LBP and asymptomatic groups,
and assessed the impact of visual feedback and handle use, on kinematics and
motor control during exercise, to inform the future creation of a standardised and
evidence based exercise protocol for use in a clinical trial. The thesis sought to
answer three key questions: Do the underlying mechanisms of FRED exercise
indicate that it may be a useful intervention to trial in the rehabilitation of
lumbopelvic deconditioning resulting from microgravity exposure in astronauts and
a sedentary lifestyle in the general population? What are the requirements for a
standard and progressive training protocol using the FRED? What current

280
inventions are used to treat and rehabilitate lumbopelvic deconditioning in a
spaceflight context and what are their effects?
8.2. Original experimental findings and implications
The main experimental findings are chapter specific and are summarised in
the opening discussion paragraph of chapters three through seven. In this
section, the findings are synthesised in relation to how they answer the main three
research questions.
1. Do the underlying mechanisms of FRED exercise indicate that it may be a
useful intervention to trial in the rehabilitation of lumbopelvic deconditioning
resulting from microgravity exposure in astronauts and a sedentary lifestyle in the
general population?
a. The FRED automatically recruits LM and TrA automatically and more than
rest: All of the FRED version 3 settings were tested and recruited LM and TrA
automatically. A large body of evidence has linked these muscles to lumbopelvic
deconditioning and LBP (Panjabi 2006; Danneels et al. 2000; Hodges et al. 2006;
Hides et al. 1994; Hodges and Richardson 1996). These muscles are difficult to
recruit consciously (Van, Hides and Richardson 2006) and so their apparent
automatic recruitment during FRED exercise would appear to be particularly
beneficial over current practice.
b. The FRED promotes increased lumbar extension, mostly in the lumbar
region, and anterior pelvic tilt compared to over ground walking: Attaining a
lordosis throughout the lumbar spine below the thoracolumbar junction is a
common goal of current interventions (O'Sullivan 2000) and is the sagittal spinal
position where LM tends to be most active (Claus et al. 2009; Moseley, Hodges

281
and Gandevia 2002; O'Sullivan et al. 2006). Although this finding alone does not
indicate that the correct lordosis is promoted by FRED exercise, when combined
with finding a. there is increased likelihood that the spinal position promoted
during FRED exercise is more conducive to LM recruitment than walking. A
clinical trial including imaging of the lumbar spine to accurately determine lordosis
change, with methods similar to Roussouly et al. (2005) or Belavy et al. (2010)
which are likely to have better accuracy than surface measurements, and could
correlate lordosis changes with a patient reported and clinically relevant outcome
such as a pain score, is needed to test if these mechanisms will be effective at
normalising lumbopelvic position in a LBP population.
c. The FRED causes increased anteroposterior and mediolateral centre of
mass variation compared to walking: This suggests an increased challenge to
balance and, therefore, control of the FRED exercise movement. This may form
part of the motor control mechanism of FRED exercise which promotes the
increased LM and TrA activity and lumbar lordosis found in finding b. This adds to
the overall evidence that the FRED works in line with current motor control
interventions and when combined with the automatic recruitment in finding a. adds
weight to the justification for a clinical trial.
Overall, the experimental findings of this thesis validated previous findings
that FRED exercise recruits LM and TrA automatically and may be very beneficial
in people with LBP. The mechanisms underpinning this effect are now
understood to be the upright lumbopelvic posture, including increased lumbar
lordosis, which FRED exercise promotes, alongside an increased balance
challenge compared to walking, which is a similar upright functional exercise.
These findings support an argument that FRED exercise appears to have
potential to be beneficial in the rehabilitation of lumbopelvic deconditioning and,

282
therefore, should be trialled as an intervention for those with LBP terrestrially
and/or following microgravity exposure, to determine the clinical effects which
result from these mechanistic findings.
Alongside the mechanistic justification for a clinical trial of the FRED,
chapter two reviewed the current evidence base for effectiveness of interventions
used in, and after, microgravity exposure. The lack of any current
countermeasure effectively preventing lumbopelvic deconditioning during
microgravity, and only one trial assessing rehabilitation, demonstrates a clear
need for additional research to find better countermeasure interventions and
assess post exposure interventions effectiveness to inform clinical guidelines for
microgravity operations.
2. What are the requirements for a standard and progressive training protocol
using the FRED?
a. Increasing crank amplitude increases movement variability, ΔTrAmax,
ΔLMmax and TrA muscle recruitment: These outcomes are all measures of
motor control of either the global movement or muscle recruitment. Increasing the
crank amplitude increased the motor control demand, which can be considered a
more difficult setting and therefore a progression of the exercise.
b. There is more variation away from the target exercise frequency if visual
feedback is not provided: The target frequency of FRED exercise was chosen
as it is expected to preferentially recruit deep lumbopelvic muscles rather than
superficial, as explained in the introduction to chapter five. Therefore, achieving
the target frequency is considered important in the potential role of FRED exercise
as an intervention to train these muscles and should form part of a standard
exercise protocol.

283
b. It took 170 seconds for asymptomatic individuals to familiarise to FRED
exercise and 155 for those with LBP: The main reason for the difference was
that those with LBP exercised at the target frequency from initiating movement. It
was recommended to use at least the upper limit of familiarisation time, 170
seconds, as the standard familiarisation period for those with and without LBP, as
this ensures the majority of users will be familiarised. A short additional period
could be considered to allow for some natural variation.
c. There was no likely familiarisation period and spinal positioning become
more flexed with reduced movement variability when the handles were used
during exercise: These findings strongly suggest that the lumbopelvic posture
promoted by the FRED which likely links to LM and TrA recruitment is disrupted
when the handles are used. Increased lumbar flexion is opposite to the posture
promoted when not holding on that is expected to be linked to increased LM and
TrA activity. This is combined with reduced movement variability that suggests
there was also reduced challenge to motor control when holding on. The changes
seen when holding on are all ones that are likely to reduce the effectiveness of
FRED exercise as an intervention to recruit LM and TrA and challenge motor
control.
These findings result in a recommendation that a standard FRED training protocol
include a 170 second familiarisation time, include visual feedback of the live and
target exercise frequency and that the handles should not be used once device
users are safe to let go. These findings provide evidence to inform creation of an
evidence-based standardised training protocol that can be used within future
FRED studies.

284
What current interventions are used to treat lumbopelvic deconditioning and what
are their effects?
The literature review in chapter one explored the current interventions and
reported effectiveness of terrestrial interventions. Synthesis of the terrestrial
evidence had already been performed through use of systematic review and
showed that motor control theory had effects in LBP when used within a wider
biopsychosocial model and with subgrouping of clinical patients, that also
considered and treated wider problems including those beyond the basic
musculoskeletal model. However, synthesis was lacking in the field of clinical
operational spaceflight and so chapter two performed this for lumbopelvic
deconditioning.
a. Current countermeasures are unlikely to fully protect against all
lumbopelvic changes occurring due to microgravity exposure: This finding
demonstrates a need for further research into new interventions to better protect
the spine during microgravity exposure. It might be possible to translate ground-
based interventions into new countermeasures or develop new ones based on the
current lumbopelvic deconditioning rehabilitation theory. Any new interventions
will need testing in ground based microgravity simulations before incurring costs
associated with actual spaceflight testing. Lower body negative pressure treadmill
was the most effective currently researched countermeasure against lumbopelvic
deconditioning. As this countermeasure is not yet used in operational spaceflight
and no countermeasure is fully effective, there remains a need for rehabilitation.
b. Research into post microgravity rehabilitation interventions for
lumbopelvic deconditioning is lacking: From the research that is available from
trials of rehabilitation following human spaceflight, specific motor control followed

285
by general trunk strengthening appears to be the most effective rehabilitation
intervention. However, with this being based on only one rehabilitation trial, with
no other trials exploring other rehabilitation interventions, this finding must be
treated with caution. However, the fact that motor control exercise has shown
effects in post spaceflight and in terrestrial rehabilitation, combined with FRED
exercise automatically recruiting key muscles, provides justification for proposing
the device be considered for operational use. A recommendation for operational
use could also only occur following a clinical trial showing it to be safe and
effective.
The systematic review provided the required synthesis of current evidence
of effectiveness of interventions for treating lumbopelvic deconditioning in
microgravity exposure. It found that more research into this area is required.
The review can be used to benchmark emerging interventions, such as FRED
exercise, against current interventions. This will however, require new research to
use at least some of the same outcome measures as the studies in the review.
One of the other findings was a lack of patient reported outcome measures in
microgravity exposure research. Therefore it is recommended that future trials
use a combination of both comparable measures to previously synthesised
research to enable direct comparison of effect, and include patient reported
outcomes. This combination would enable operational decisions regarding
intervention use by having direct evidence of comparable effectiveness with
previous interventions and evidence for new interventions at least, of clinical
worthwhile effects as reported by patients. If a clinical trial of FRED exercise
occurs terrestrially, and it appears effective as an intervention for lumbopelvic
deconditioning, then a trial using terrestrially simulated microgravity exposure,
such as using a bed-rest study is recommended to assess the effects of the

286
device for informing operational decisions on its potential use in rehabilitation
following human spaceflight. In the longer term, initial investigations could begin
to consider if FRED exercise theory and mechanisms could be utilised as a
countermeasure during microgravity exposure. Initially this could be through
computer modelling, as already begun by Lindenroth et al. (2015), potentially
followed by suspension studies which could use similar methods to Cao et al.
(2005) and Marcias et al. (2007) who used a vertically aligned treadmill and
participant suspension systems to eliminate the normal gravity vector for ground
based studies.
8.3. Methodological contributions
The use of a local science museum within which to conduct a study including
participation being open to the public has proven itself to enable large population
studies that include a clinical group. While such a method will only work with short
duration participant involvement protocols, it should be considered useful for
creating a high study power and for enabling quick and easy clinical population
recruitment, for any condition which has high incidence such as LBP, which the
NHS reports as affecting one third of the UK adult population each year (NICE
2009).
Systematic reviews in aerospace medicine were found to be lacking in chapter
two. This resulted in the need to create novel quality scoring tools and statistical
tests for this field or review. These tools, should they be shown to be valid and
reliable, could make original contributions to future aerospace medicine system
review teams. It has since been acknowledged by both the European Space
Agency’s Medical Operations Office and the Aerospace Medicine Association that

287
it would be useful to consider developing an aerospace systematic review group
in the future, to build on the tools and methods developed in this thesis.
8.4. Theoretical implications
Due to the mechanistic nature of this thesis, being very specific to FRED
exercise, the wider theoretical implications are limited. However, the FRED has
been conceived as a specific motor control intervention to promote intersegmental
stability in lumbopelvic deconditioning, and initial trials successfully showed it has
potential in this area (Debuse et al. 2013). Therefore, the findings that FRED
exercise, recruits LM and TrA, appears to promote lordosis consistent with
recruitment of these key muscles and challenges balance and control of
movement, can be compared with current theory relating to if these elements
should be present in such interventions. The muscle recruitment finding is
consistent with current motor control theory commonly presented in the literature
both in terrestrial environments (Hodges and Richardson 1996; Hides et al. 1994;
Hodges and Cholewicki 2007; Hides, Richardson and Jull 1996; Panjabi 2006)
and following human spaceflight (Evetts 2015; Hides et al. 2015; Hides et al.
2011). Therefore, the studies may give a small level of limited validation to the
theories. However, the theoretical implications are far more useful when
transferred from the literature to FRED exercise, in that it shows that the device
mechanisms appear to link very well to current motor control theory. Using the
theoretical implications in this way adds support that FRED exercise appears
suitable for clinical trial as a motor control intervention.
8.5. Policy implications
The majority of this thesis is again limited in its wider policy implication due to
the mechanistic and specific to FRED nature of the studies. However, the

288
methodological contributions may already be showing potential to impact policy
regarding synthesis of aerospace medicine research. The systematic review
showed that both synthesis and use of patient reported outcome measures are
both lacking in aerospace medicine. These findings have been included in
European Space Agency report by the Topical Team for Post Flight
Reconditioning with recommendations for inclusion of patient reported outcomes
in future research and for additional aerospace medicine research synthesis in the
future. An initial proposal has also been drafted to form a systematic review group
for aerospace medicine which will collect current and develop future review tools
and methods for this field, in order to guide and encourage high standards of
synthesis in the future. This proposal, while still draft, has been viewed positively
by the Aerospace Medical Association, European and UK Space Agencies and
experts from the Cochrane Collaboration. Should this proposal develop further, it
could result in a significant contribution to the future of aerospace medicine
research synthesis.
8.6. Limitations of study
The mechanistic nature of the studies within this thesis, while able to highlight
the underlying mechanisms and show the potential effectiveness of FRED
exercise as a LBP intervention, are unable to provide any estimate or measure of
the true effectiveness. Therefore, while the effects found in these studies support
the argument that sufficient mechanistic study of FRED exercise has been
completed to show it is likely to have beneficial effects, the effectiveness of FRED
exercise has yet to be examined in people with LBP and/or in relationship to
current rehabilitation interventions. The FRED is a large piece of equipment and
some have argued that interventions should not require large or expensive
equipment (Airaksinen et al. 2004), and therefore the FRED will need to

289
demonstrate clear effectiveness over traditional exercises if it is to become a
mainstream intervention. Should future evidence show this effectiveness, then
having a wide body of additional evidence of beneficial mechanisms that underpin
the exercise will be helpful in promoting use of the device. No clinically
meaningful changes in any outcomes were used in the studies undertaken as part
of this PhD, due to the short nature of participant engagement time and again, the
mechanistic nature of the studies. For a clinical trial, including minimal worthwhile
changes over time, such as a change of at least 2 points on a ten point pain
numerical rating scale (Salaffi et al. 2004) would be useful to generate evidence
relating to the clinical worth of the device.
The LBP population in the studies expressed LBP as a symptom, but was not
verified as having LM or TrA deconditioning, and in all studies was formed
predominantly from those with mild to moderate pain. Therefore, the findings
must be treated with caution for LBP populations whose symptoms are severe or
worse. It has long been established that LBP is a heterogenic with respect to
potential causes and that subgrouping is likely to aid clinical diagnosis and
selection of most appropriate treatments (Bouter, van Tulder and Koes 1998;
Hancock, Herbert and Maher 2009). It has been argued that considering LBP as
a homogenous symptom itself is too simplistic an approach to a condition often
labelled non-specific by nature and when applying a biopsychosocial approach to
practice (O'Sullivan 2005). This is a view further supported by a systematic
review that found individual treatments have limited effect compared to multi-
lateral approaches with combinations of interventions (Ferreira et al. 2006).
However, Hides et al. (1994) found LM atrophy in a study of 26 LBP patients
compared to asymptomatic controls and validated this finding in a further study of
21 LBP patients (Hides, Richardson and Jull 1996). Therefore, those expressing

290
LBP may be considered likely to have LM deconditioning and so may allow LBP to
be considered without sub grouping during initial mechanistic studies, as done in
this thesis. It will be useful in future studies to use LBP subgrouping strategies
such as proposed by Brennan et al. (2006) which included a stabilisation group, or
specifically screen for, and recruit, those with LBP and known LM or TrA changes
as reported previously (Hides et al. 1994; Danneels et al. 2000; Ferreira, and
Hodges 2004; Hides et al. 2007). Sub-grouping in this manner is a method which
has been advocated by those who argue for more multi-lateral approaches to LBP
(O'Sullivan 2012).
8.7. Recommendations for future research
A clinical trial of the effectiveness of FRED exercise, in both terrestrial LBP
patients who have deconditioning of LM or TrA and in humans that are
deconditioned following exposure to microgravity, is justified based on the
mechanistic studies reported in this thesis and previously that show that FRED
exercise has potential to be of benefit. Such a trial should consider sub-grouping
of LBP in its recruitment strategy as mentioned in section 8.6. Comparable
outcome measures to current interventions, reported in chapter two, should be
included for direct benchmark comparisons, as well as outcomes that are both
patient reported or have known minimally clinically worthwhile changes. A future
trial is also likely to be assessed for quality in future synthesis using similar tools
to those used in chapter two, including tools such as Cochrane Risk of Bias
(Higgins, Altman and Sterne 2011) and PEDro scores (PEDro 1999). Many of the
intervention studies assessed in chapter two failed in blinding, resulting in
automatic loss of three points out of the eleven available from PEDro and being
considered to have high overall risk of bias on the Cochrane tool. Assessor
blinding might be achieved through coding of data and removal of all identifying

291
elements, which would then be analysed without knowing which participant data
belongs to. A sham exercise could take the form of normal elliptical training
exercise with resistance at a faster frequency than promoted with the FRED.
Participants, who agreed to join blind study testing function upright exercise for
LBP rehabilitation, would be assigned randomly to each exercise, producing
blinding. A cross over design could also be used to ensure all patients had
access to the potentially beneficial FRED intervention and retain ability to
compare the randomly assigned groups. Therapist blinding would still be a
challenge to overcome, but this method would at least allow blinding of
participants and assessors, blinding of outcome assessment, random sequence
generation and allocation concealment. Provided other criteria which were
commonly met by most included studies in chapter two, were also fulfilled, PEDro
scores as high as 10 and low risk of bias results might be achievable.
Early development stage computer modelling or basic suspension studies to
begin evaluating the FRED as a countermeasure for lumbopelvic deconditioning
during microgravity exposure could also be considered. More widely, additional
synthesis of aerospace medicine research is also recommended.
8.8. Conclusion
In agreement with initial studies (Debuse et al. 2013; Caplan et al. 2014;
Gibbon, Debuse and Caplan 2013) which suggested that FRED exercise may be
beneficial in the rehabilitation of LM and TrA in those with lumbopelvic
deconditioning, the underlying mechanisms of FRED exercise have been
validated, agreed with and provided further evidence in support of the original
suggestion. The underlying mechanisms of FRED exercise have shown that it
automatically recruits LM and TrA, promotes correct lordosis and challenges

292
motor control. The body of evidence in existence is considered sufficient to justify
a clinical trial of FRED exercise to establish its effectiveness in relevant clinical
populations both terrestrially and following microgravity exposure.

293
References
In Sheffield Hallam Harvard 2014 format.
ABBISS, Chris R. and LAURSEN, Paul B. (2008). Describing and Understanding Pacing
Strategies during Athletic Competition. Sports Medicine, 38 (3), 239-252.
ADAMS, Gregory R., CAIOZZO, Vincent J. and BALDWIN, Kenneth M. (2003). Skeletal
muscle unweighting: spaceflight and ground-based models. Journal of Applied
Physiology, 95, 2185-2201.
ADAMS, M.A. and HUTTON, W.C. (1982). Prolapsed Intervertebral Disc - A Hyperflexion
Injury. SPINE, 7 (3), 184-191.
AIRAKSINEN, O, et al. (2004). European Guidelines for the Management of Chronic Non-
Specific Low Back Pain. European Guidelines,.
AKRAM, Sakineh B. and FRANK, James S. (2011). Stilt walking: How do we learn those first
steps. Ergonomics, 52 (9), 1119-1127.
ALKNER, B.A. and TESCH, P.A. (2004). Efficacy of a gravity-independent resistance
exercise device as a countermeasure to muscle atrophy during 29-day bed rest. Acta
physiologica Scandinavica, 181 (3), 345-357.
BALAGUE, Federico, et al. (2012). Non-specific low back pain. Lancet, 379, 482-91.
BALZER, William K., DOHERTY, Michael, E. and RAYMOND, O'Conneror (1989). Effects of
Cognitive Feedback on Performance. American Psychological Association, 106 (3), 410-
433.
BARRY, Daniel (2015). Potential limiations of LBNP countermeasure devices. Personal
Communication,.
BATTERHAM, Alan M and HOPKINS, William G (2006). Making Meaningful Inferences
About Magnitudes. International Journal of Sports Physiology and Performance, 1, 50-57.
BELAVY, Daniel L., et al. (2015). Disc herniations in astronauts: What causes them, and
what does it tell us about herniation on earth? European Spine Journal, 24 (251),.
BELAVY, Daniel L., et al. (2010). Countermeasures against lumbar spine deconditioning in
prolonged bed rest: resistive exercise with and without whole body vibration. Applied
physiology, 109, 1801-1811.
BELAVY, Daniel L., et al. (2011c). Muscle Atrophy and Changes in Spinal Morphology, Is
the Lumbar Spine Vulnerable After Prolonged Bed-Rest? Spine, 36 (2), 132-145.

294
BELAVY, Danie L.l, et al. (2008). Resistive Simulated Weightbearing Exercise with Whole
Body Vibration Reduces Lumbar Spine Deconditioning in Bed-Rest. Spine, 33 (5), 121-131.
BELAVY, Daniel L., et al. (2011). Limited effect of fly-wheel and spinal mobilisation
exercise countermeasures on lumbar spine decondtioning during 90 d bed-rest in the
Toulouse LTBR study. Acta Astronautica, 69, 406-419.
BELAVY, Daniel L., et al. (2012). Resistive vibration exercise during bed-rest reduces
motor control changes in the lumbo-pelvic musculature. Electromyography and
kineisology, 22, 21-30.
BERGMARK, Anders (1989). Stability of the lumbar spine - A study in mechanical
engineering. Copenhagen, Department of Solid Mechanics, Lund Institute of Technology.
BODA, Wanda L, et al. (2000). Supine lower body negative pressure exercise simulates
metabolic and kinetic features of upright exercise. Journal of Applied Physiology, 89 (2),
649.
BOUTER, Lex M., VAN TULDER, Maurits W. and KOES, Bart W. (1998). Methodlogical
Issues in Low Back Pain Reseacr in Primary Care. SPINE, 23 (18), 2014-2020.
BREMSER, Matthias, et al. (2012). Diamter Measurement of Vascular Structure in
Ultrasound Video Sequences. Informaktik Akutell, Bildverabeitung fur die Medizin, 165-
170.
BRENNAN, Gerad P., et al. (2006). Identifying Subgroups of Patients With Acute/Subacute
"Nonspecific" Low Back Pain. SPINE, 31 (6), 623-631.
BUCKEY, Jay C. (2006). Space Physiology. 1st ed., New York, Oxford University Press.
BUNCE, Steve M, HOUGH, Alan D. and MOORE, Ann P. (2004). Measurement of
abdominal muscle thickness using M-mode ultrasound imaging during functional
activities. Manual Therapy, 9, 41-44.
BYSTROM, Martin Gustaf, RASMUSSEN-BARR, Eva and GROOTEN, Wilhelmus (2013).
Motor Control Exercises Redues Pain and Disability in Chronic and Recurrent Low Back
Pain. Spine, 38 (6), 350-358.
CALATAYUD, Joaquin, et al. (2015). Core muscle activity in a series of balance exercises
with different stability conditions. Gait & Posture, 42, 186-192.
CALLAGHAN, Jack and MCGILL, Stuart (2001). Intervetebral disc herniation: studies on a
porcine model exposed to highly repetitive flexion/extension motion with compressive
force. Clinical Biomechanics, 16, 28-37.
CAO, Peihong, et al. (2005). Exercise within lower body negative pressure partially
counteracts lumbar spine deconditioning associated with 28-day bed rest. Journal of
applied physiology, 99, 39-44.

295
CAPLAN, N, et al. (2014). Phasic-to-tonic shift in tunk muscle activity during low-impact
weight bearing exercise. Acta Astronautica, 104, 388-395.
CARDINAL, Bradley J, ESTERS, Jacqueline and CARDINAL, Marita, K. (1996). Evaluation of
the Revised Physical Activity Readiness Questionnaire in older adults. Medicine & Scinece
in Sports & Exercise, 28 (4), 468-472.
CLAUS, Andrew P., et al. (2009). Different Ways to Balance the Spine. SPINE, 34, 208-214.
COCHRANE, Collaboration (2015). Data collection form for intervention reviews: RCTs
only. The Cochrane Collaboration, community.cochrane.org, version 3.1 April 2014.
DANNEELS, Lieven A., et al. (2000). CT imaging of trunk muscles in chronic low back pain
patients and healthy control subjects. European Spine Journal, 9, 266-272.
DANNEELS, Lieven A, et al. (2000). CT imaging of trunk muscles in chronic low back pain
patients and health control subjects. European Spine Journal, 9, 266-272.
DEBUSE, Dorothee, et al. (2013). Low impact weight-bearing exercise in an upright
posture increases the activation of two key local muscles of the lumbo-pelvic region.
Physiotherapy Theory and Practice, 29 (1), 51-60.
DEBUSE, Dorothee, et al. (2013). Low impact weight-bearing exercise in an upright
posture increases the activation of two key local muscles of the lumbo-pelvic region.
Physiotherapy Theory and Practice, 29 (1), 51-60.
DI PRAMPERO, Pietro E. and NARICI, Marco V. (2003). Muscles in microgravity: from
fibres to human motion. Journal of Biomechanics, 36, 403-412.
DOYLE, Julie, et al. (2011). Effects of Visual Feedback in Therapeutic Exergaming Motor
Task Accuracy. International Conference on Virtual Rehabilitation.
DURRAL, Christopher and MANSKE, Robert (2005). Avoiding Lumbar Spine Injury During
Resistance Training. Strength and Conditioning Journal, 24 (4), 64.
EDGERTON, V.R., et al. (2001). Sensorimotor adaptations to microgravity in humans. The
Journal of Experimental Biology, 204, 3217-3224.
EL-KHOURY, Fabienne, et al. (2013). The effect of fall prevention exercise programmes on
fall induced injuries in community dwelling older adults: systematic review and meta-
analysis of randomised controlled trials. BMJ, 347, 13.
EVETTS, Simon (2015). Anecdotal accounts of selective atrophy of trunk extensors over
flexors in an astronaut population. personal communication,.
EVETTS, SN, et al. (2014). Post Space Mission Lumbo-Pelvic Neuromuscular
Reconditioning: A European Perspective. Aviation, Space and Environmental Medicine, 85
(7), 764-765.

296
FERRANDO, Arny, et al. (1997). Resistance exercise maintains skeletal muscle protein
synthesis during bed rest. Journal of Applied Physiology, 82, 807-810.
FERREIRA, Paulo H., et al. (2006). Specific stabilisation exercise for spinal and pelvic pain:
A systematic review. Australian Journal of Physiotherapy, 52, 79-88.
FERREIRA, Paulo H, ferreira, Manuela L. and HODGES, Paul W. (2004). Changes in
Recuitment of the Abdominal Muscles in People with Low Back Pain. SPINE, 29 (22),
2560-2566.
FIATARONE, Maria A. and EVANS, William J. (1993). The Etiology and Reversibibility of
Muscle Dysfunction in the Aged. Journal of Gerontology, 48, 77-83.
FONTANA, TL, RICHARDSON, CA and STANTON, WR (2005). The effect of weight-bearing
exercise with low frequency, whole body vibration on lumbosacral proprioception: a pilot
study on normal subjects. Australian Journal of Physiotherapy, 51 (4), 259 - 63.
FOTHERGILL, Simon (2010). Examining the effect of real-time visual feedback on the
quality of rowing technique. Procedia Engineering, 2, 3038-3088.
GERNAND, Jeremny M. (2004). Risk Assessment and Control Through Countermeasure
System Implementation For Long-Term Crew Exposure to Microgravity. IMECE.
GIBBON, K.C., DEBUSE, D. and CAPLAN, N (2013). Low impact weight-bearing exercise in
an upright posture achieves greater lumbopelvic stability than overground walking.
Journal of Bodywork & Movement Therapies, 17, 462-468.
GIBBON, K.C., DEBUSE, D and CAPLAN, N (2013). Low impact weight-bearing exercise in
an upright posture achieves greater lumbopelvic stability than overground walking.
Journal of Bodywork & Movement Therapies, 17, 462-468.
GRANACHER, Urs, et al. (2013). The Importance of Trunk Muscle Strength for Balance,
Functional Performance, and Fall Prevention in Seniors: A Systematic Review. Sports
Medicine, 43, 627-641.
HANCOCK, Mark, HERBERT, Robert D. and MAHER, Christopher, G. (2009). A Guide to
Interpretation of Studies Investigating Subgroups of Responders to Physical Therapy
Interventions. Physical Therapy, 89 (7), 698-704.
HAUGGAARD, Annika and PERSSON, Ann (2007). Specific spinal stabilisation exercises in
patients with low back pain - a systematic review. Physical Therapy Reviews, 12, 233-348.
HELMHOUT, Pieter H., et al. (2008). Exercise Therapy and Low Back Pain Insights and
Proppsals to Improve the Design, Conduct and Reporting of Clinical Trials. Spine, 33 (16),
1782-1788.
HIDES, Julie, et al. (2016). Parallels between astronauts and terrestrial patients - Taking physiotherapy rehabilitation "To infinity and beyond". Musculoskeletal Science and Practice, (in press) xx 1-6

297
HIDES, Julie (2014). Clinical observations of foot loading linked to LM and TrA activity.
Peronsal Communication,.
HIDES, Julie (2015). Methodology of bedrest rehabilitation study. Personal
Communication,.
HIDES, Julie A, et al. (2007). Magnetic Resonance Imaging Assessment of Trunk Muscles
During Prolonged Bed Rest. SPINE, 32 (15), 1687-1692.
HIDES, Julie, et al. (2008). Multifidus size and symmetry among chronic LBP and healthy
asymptomatic subjects. Manual Therapy, 13, 43-49.
HIDES, Julie A., et al. (2011). The effects of rehabilitation on the muscles of the trunk
following prolonged bed rest. European Spine Journal, 20, 808-818.
HIDES, J., et al. (2015). Changes in multifidus and abdominal muscle size in response to
microgravity: possible implications for low back pain research. European Spine Journal,
pre publication.
HIDES, Julie A., RICHARDSON, Carolyn and JULL, Gwedolen A. (1996). Multifidus Muscle
Recovery Is Not Automatic After Resolution of Acute, First-Episode Low Back Pain. Spine,
21 (23), 2763-2769.
HIDES, Julie, et al. (2008). Effect of Stabilisation Training on Multifidus Muscle Cross-
sectional Area AMong Young Elite Cricketers With Low Back Pain. Journal of Orthopaedic
& Sports Physical Therapy, 38 (3), 101-108.
HIDES, J., et al. (2011b). The relationship of transversus abdominis and lumbar multifidus
clinical muscle tests in patients with chronic low back pain. Manual Therapy, 16 (6), 573-
577.
HIDES, J.A., et al. (1994). Evidence of Lumbar Multifidus Muscle Wasting Ipsilateral to
Symptoms in Patients with Acute/Subacute Low Back Pain. Spine, 19 (2), 165-172.
HIGGINS, JPT, ALTMAN, DG and STERNE, JAC (2011). Chapter 8: Assessing risk of bias in
included studies. In: Higgins JPT, Green A. (editors) Cochrane Handbook for Systematic
Reviews of Interventions Version 5.1.0. The Cochrane Collbaboration.
HODGES, P (2004). Lumbopelvic stability: A functional model of the biomechanics and
motor control. In:. Richardson C, Hodges P, and Hides J (eds) Therapuetic Exercise for
Lumbopelvic Stabilization. Edinburgh, Churchull Livingston, 13-28.
HODGES, P and CHOLEWICKI, J (2007). Functional control of the spine. In: In Vleeming A,
Mooney V and Stoeckart R(eds). Edinburgh, Churchill Livingstone, 489-512.
HODGES, Paul, CHOLEWICKI, Jackek and VAN DIEEN, Jaap (2013). Spinal Control: The
Rehabilitation of Back Pain State of the Art and Science. 1st ed., Churchill Livingstone,
Elsevier.

298
HODGES, Paul, et al. (2006). Rapid Atophy of the Lumbar Multifidus Follows Experimental
Disc or Nerve Root Injury. SPINE, 25, 2926-2988.
HODGES, P and MOSELEY, G (2003). Pain and motor control of the lumbopelvic region:
Effect and possible mechanisms. Journal of Electromyography and Kinesiology, 13, 361-
370.
HODGES, P.W., et al. (2003). Measurement of muscle contraction with ultrasound
imaging. Muscle Nerve, 27, 682-692.
HODGES, Pau W.l and RICHARDSON, Carolyn A. (1996). Inefficient Muscular Stabilization
of the Lumbar Spine Associated With Low Back Pain: A Motor Control Evaluation of
Transversus Abdominis. Spine, 21 (22), 2640-2650.
HODGES, P. and RICHARDSON, C. (1996). Inefficient Muscular Stabilization of the Lumbar
Spine Associated With Low Back Pain: A Motor Control Evaluation of Transversus
Abdominis. Spine, 21 (22), 2640-2650.
HOLGUIN, Nilsson, et al. (2009). Short applications of very low-magnitude vibrations
attenuate expansion of the intervertrbral disc during extended bed rest. The Spine
Journal, 9, 470-477.
HOPKINS, Will G (2007). A Spreadsheet for Deriving a Confidence Interval, Mechanistic
Inference and Clinical Inference from a P Value. Sportscience, 11, 16-20.
HOPKINS, William G, et al. (2008). Progressive Statistics for Studies in Sports Medicine
and Exercise Science. Medicine & Science in Sports & Exercise, 41 (1), 3-12.
HWANG, Ji Hye, et al. (2008). Age affects the latency of the erector spinae response to
sudden loading. Clinical Biomechanics, 23, 23-29.
ISKANDER, Hanum P., LESTER, Gilbert and WILLS, Gary B (2009). A Framework for
Pedagogical Feedback in the Motor Skill Domain. In: The 9th IEE International Conference
on Advanced Learning Technologies, Riga, Latvia, July 15-17 2009. IEEE Computer Society
Publications, 37-39.
JOHNSTON, SL, et al. (2010). Risk of hernated nucleus pulposus among US astronauts.
Aviation, Space and Environments Medicine, 81 (6), 566-574.
KENDALL, Florence Peterson (2005). Muscles: testing and function with posture and pain.
5th ed., Baltimore, Lippincott Williams & Wilkins.
KENT, Michael (2006). The Oxford Dictionay of Sports Science & Medicine. 3rd ed.,
Oxford.
KENYON, Karen and KENYON, Jonathon (2009). The Physiotherapist's Pocketbook. 2nd
ed., Elsevier.

299
KIEFER, A., SHIRAZI-ADL, A. and PARNIANPUR, M. (1998). Synergy of the Human Spine in
neutral postures. European Spine Journal, 7 (6), 471-479.
KIESEL, Kyle B, et al. (2007). Measurement of lumbar multifidus muscle contraction with
rehabilitative ultrasound imaging. Manual Therapy, 12, 161-166.
KIM, Choll, et al. (2007). The Lumbar Multifidus is the Strongest Stabilzer of the Lumbar
Spine. Proceedings of the NASS 22nd Annual Meeting / The Spine Journal, 7, 1S-163S.
KOPPENHAVER, Shane L, et al. (2009). Reliability of Rehabilitative Ultrasound Imaging of
the Transversus Abdominis and Lumbar Multifidus Muscles. Archives of Physical medicine
and Rehabilitation, 90, 87-94.
KUIPERS, Jack B (1998). Quaternions and rotation sequences: a primer with applications
to orbits, aerospace and virtual reality. 5th ed., New Jersey, Princeton University Press.
LAIRD, Robert A, KENT, Peter and KEATING, Jennifer (2012). Modifying patterns of
movement in people with low back pain - does it help? A systematic review. BMC
Musculoskeltal disorders, 13, 169.
LAMBRECHT, Gunda (2015). ESA post flight training protocol details. Personal
Communication,.
LEBEL, Karina, et al. (2013). Inertial Measure of Motion for Clinical Biomechanics:
Comparative Assessment of Accuracy under Controlled Conditions - Effect of velocity.
PLOS One, 8 (11),.
LEBLANC, A, Rowe, R, Schneider, V, Evans, H,Hedrick, T. (1995). Regional muscle loss after
short duration spaceflight. Aviation, Space, and Environmental Medicine, 66 (12), 1151.
LEE, Joon-Hee, et al. (1999). Trunk Muscle Weakness as a Risk Factor for Low Back Pain -
A 5 Year Prospective Study. SPINE, 24 (1), 54-57.
LINDENROTH, Lukas (2013). Footplate and Crank Motion Tracks. Cologne, ESA.
LINDENROTH, Lukas, et al. (2015). A novel approach to activate deep spinal muscles in
space - Results of a biomechanical model. Acta Astronautica, 116, 202-210.
LOERCH, Linda (2010). Candidate Exercise Technologies and Prescriptions. NASA Johnson
Space Centre,.
LOWER, Claire (2014). Quaternion to Euler conversion..
MACDONALD, D., MOSELEY, L. and HODGES, P. (2009). Why do some patients keep
hurting their back? Evidence of ongoing back muscle dysfunction during remission from
recurrent back pain. Pain, 142 (3), 183-188.

300
MACEDO, Luciana, MAHER, Christopher and LATIMER, Jane (2009). Motor Control Exercie
for Persistent, Nonspecific Low Back Pain: A Systematic Review. Physical Therapy, 89, 9-
25.
MACEDO, Luciana G, et al. (2009). Motor Control Exercise for Peristent, Nonspecific Low
Back Pain: A Systematic Review. Physical Therapy, 89 (1), 9-25.
MACINTOSH, JE, et al. (1986). The morphology of the human lumbar multifdus. Clinical
Biomechanics, 1 (4), 196-204.
MANNION, A.F., et al. (2012). Spine stabilsation exercises in the treatment of chronic low
back pain: a good clinical outcome is not associated with improved abdominal muscle
function. European Spine Journal, 21, 1301-1310.
MARCIAS, Brandon R., et al. (2007). LBNP treadmill exercise maintains spine function and
muscle strength in identical twins during 28-day simulated microgravity. Journal of
applied physiology, 102, 2274-2278.
MCGILL, Stuart M (1997). The Biomechanics of low back injury: implications on current
practive in industry and the clinic. Journal of Biomechanics, 30 (5), 465-475.
MCMEEKEN, J.M., et al. (2004). The relationship between EMG and change in thickness of
transversus abdominis. Clinical Biomechanics, 19, 337-342.
MOREY-HOLTON, Emily R. (2000). Ground-Based Models for Studying Adaptation to
Altered Gravity. NASA Ames Research Centre Report - Moffet Field, CA,.
MOSELEY, Lorimer, HODGES, Paul and GANDEVIA, Simon (2002). Deep and Superficial
Fibers of the Lumbar Multifidus Muscle Are Differentially Active During Voluntary Arm
Movements. SPINE, 27 (2), 29-136.
MULDER, Edwin (2014). Bed rest protocols. Personal Communication,.
MUSCULINO, Joseph E. (2005). The Muscular System Manual. 2nd ed., St Lewis, Missouri,
Elsevier.
NELSON, Eugene, et al. (2015). Patient reported outcome measures in practice. British
Medical Journal (BMJ), 350, 7818.
NHS (2006). The General Practice Physical Activity Questionnaire. National Health Service.
NICE (2013). Assessment and prevention of falls in older people. Manchester, National
Institue for Health and Care Excellence.
NICE (2009). Low Back Pain. Early management of persistent non-specific low bac pain.
NHS NICE website, Last accessed 21st Febuary 2014 at www.nice.org.uk,.

301
O'SULLIVAN (2005). Diagnosis and classification of chronic low back pain disorders:
Maladaptive movement and motor control impairments as underlying mechanism.
Manual Therapy, 10, 242-255.
O'SULLIVAN, Peter (2012). It's time for a change with the management of non-specific
chronic low back pain. British Journal of Sports Medicine, 46, 224-227.
O'SULLIVAN, P.B. (2000). Lumbar segmental "instability": clinical presentation and
specific stabilizing exercise management. Manual Therapy, 5 (1), 2 - 12.
O'SULLIVAN, Peter B., et al. (2006). Effect of Different Upright Sitting Postures on Spinal
Pelvic Curvature and Trunk Muscle Activation in a Pain-Free Population. SPINE, 31 (19),
707-712.
PANJABI, Manohar M. (2006). A hypothesis of chronic back pain: ligament subfailure
injuries lead to muscle control dysfunction. European Spine Journal, 15, 668-676.
PANJABI, Manohar M. (2003). Clinical spinal instabiilty and low back pain. Journal of
Electromyography and Kinesiology, 13, 371 - 379.
PANJABI, Manohar M. (1992a). The Stabilizing System of the Spine. Part 1. Function,
Dysfunction, Adaptation, and Enhancment. Journal of Spinal Disorders & Techniques, 5
(4), 383 - 289.
PANJABI, Manohar M. (1992b). The Stabilizing System of the Spine. Part 2. Neutral Zone
and Instability Hypothesis. Journal of Spinal Disorders, 5 (4), 390 - 397.
PANJABI, M., et al. (1989). Spinal stability and intersegmental muscle forces. A
biomechanical model. Spine, 14 (2), 194-200.
PATLA, Atfab E., ARMSTRONG, Crystal, J. and SILVEIRA, Joseph M. (1989). Adaptation of
the muscle activity patterns to transitory increase in stride length during treadmill
locomotion in humans. Human Movement Science, 8, 45-66.
PAVY-LE TRAON, A., et al. (2007). From space to Earth: advances in human physiology
from 20 years of bed rest studies (1986-2006). European Journal of Applied Physiology,
191, 143-194.
PAVY-LE TRAON, A., et al. (2007). From space to Earth: advances in human physiology
from 20 years of bed rest studies (1986-2006). European Journal of Applied Physiology,
191, 143-194.
PEDRO (1999). PEDro scale. [online].
http://www.pedro.org.au/english/downloads/pedro-scale/
PLOUTZ-SNYDER, Lori (2013). An Evidence Based Approach to Exercise Prescriptions on
ISS. Universities Space Research Association,.

302
POOL-GOUDZWAARD, Annelies L., et al. (2015). Differences in Low Back Pain in
microgravity between healthy subjects and astronauts with a history of back complaints.
pre release,.
QUALITYMETRIC (2000). SF-36v2 Health Survey. http://www.sf-36.org/, Medical
Outcomes Trust.
RIBOT-CISCA, Edithr, BUTLER, Jane E. and THOMAS, Christine K. (2003). Facilitation of
triceps brachii muscle contraction by tendon vibration after chronic cervical spinal cord
injury. Journal of Applied Physiology, 94 (6), 2358 - 2367.
RICHARDSON, C.A. and JULL, G.A. (1995). Muscle control - pain control. What exercises
would you prescribe. Manual Therapy, 1, 2-10.
ROETENBERG, Daniel, LUINGE, Henk and SLYCKE, Per (2013). Xsens MVN: Full 6DOF
Human Motion Tracking Using Miniature Intertial Sensors. XSENS TECHNOLOGIES, 3, 1-9.
ROTENBERG, Daniel, LUINGE, Henk and SLYCKE, Per (2013). Xsens MVN: Full 6DOF
Human Motion Tracking Using Miniature Inertial Sensors. XSENS TECHNOLOGIES, 1-9.
ROUSSOULY, Pierre, et al. (2005). Classfication of the Normal Variation in the Sagittal
Alignment of the Human Lumbar Spine and Pelvis in the Standing Postition. SPINE, 30 (3),
346-353.
RUBENSTEIN (2006). Falls in older people: epidemiology, risk factors and strategies for
prevention. Age and Ageing, 35 (S2), ii37-ii41.
RUFFALDI, Emanuele, et al. (2009). Vibrotactile perception Assessment for a Rowing
Training System. In: Third Joint Eurohaptics Conference and Symposium on Haptic
Interfaces for Virtual Environment and Teleoperator Systems, Salt Lake City, March 18020
2009. , 350-355.
SALAFFI, Fausto, et al. (2004). Minimal clinically important changes in chronic
musculoskeletal pain intesnity measured on a numerical rating scale. European Journal of
Pain, 8, 283-291.
SAUNDERS, S., COPPIETERS, M. and HODGES, P. (2004). Reduced tonic activity of the
deep trunk muscle during locomotion in people with low back pain. In: World Congress of
Low Back Pain and Pelvic Pain, Melbourne,.
SAUNDERS, Steven W., et al. (2005). Changes in three dimensional lumbo-pelvic
kinematics and trunk muscle activity with speed and mode of location. Clinical
Biomechanics, 20, 784-793.
SAYSON, JV and HARGENS, AR (2008). Pathophysiology of Low Back Pain during Exposure
to Microgravity. Aviation, Space and Environmental Medicine, 79, 365-373.
303
SHAKESPEAR, Thomas P, Gebski, Val J, Veness, Michael J, Simes, John (2001). Improving
interpretation of clinical studies by use of confidence levels, clinical significance curves,
and risk-benefit contours. The Lancet, 357, 1349-53.
SNIJDERS, Chris J., et al. (2011). Low Back Pain during Flight - 1 Year Post-Flight Science
Report. European Space Agency Report, ESA Proposal number 2003-DSM-MUS-100,.
STERNE, Jonathan AC and SMITH, George Davey (2001). Sifting the evidence - what's
wrong with significance tests? British Medical Journal, 322, 226-231.
TAYLOR, Graham K., BUDDS, Robert L. and THOMAS, Adrian L.R. (2003). Flying and
swimming animals cruise at a Strouhal number tuned for high power efficiency. Nature,
425, 707-711.
TUCKER, Ross, LAMBERT, Michael L. and NOAKES, Timothy D. (2006). An Analysis of
Pacing Strategies During Men's World-Record Performances in Track Athletics.
International Journal of Sports Physiology and Performance, 1 (3), 233-245.
VAN, K., HIDES, J. and RICHARDSON, C. (2006). The use of real-time ultrasound imaging
for biofeedback of lumbar multifidus muscle contraction in healthy subjects. The Journal
of orthopaedic and sports physical therpay, 36 (12), 920-925.
VERBUNT, Jeanine A, SMEETS, Rob J and WITTINK, Harriet M (2010). Cause of effect?
Deconditioning and chronic low back pain. PAIN, 149, 428-430.
VIDEMAN, Tapio, NURMINEN, Markku and TROUP, J.D.G. (1990). Lumbar Spine Pathology
in Cadaveric Material in Relation to History of Back Pain, Occupation, and Physical
Loading. Spine, 15 (8), 728-740.
WALLWORK, T., et al. (2009). The effect of chronic low back pain on size and contraction
of the lumbar multifidus muscle. Manual Therapy, 14 (5), 496-500.
WEBER, Tobias, et al. (2016). Trunk muscle activation and cardiorespiratory demand
during exercise with a new device for lumbo-levic reconditioning. pre-release,.
WIDRICK, J.J., et al. (2001). Functional properties of slow and fast gastrocnemius muscle
fibers after a 17-day spaceflight. Journal of Applied Physiology, 90, 2203-2211.
WING, PC, et al. (1991). Back pain and spinal changes in microgravity. Orthopedic Clinics
of North America, 22 (2), 255-262.
WINTER, D. A (1995). Human balance and posture control during standing and walking.
Gait & Posture, 3, 193-214.
WONG, Arnold, et al. (2014). Do changes in transversus Abdominis and Lumbar
Multifidus During Conservative Treatment Explain Changes in Clinical Outcomes Related
to Nonspecific Low Back Pain? American Pain Socieity, 15 (4), 377e1-377e35.

304
WORMERSLEY, L. and MAY, S (2006). Sitting posture of subjects with postural backache.
Journal of Manipulative and Physiological Therapeutics, 29, 213-218.
XSENS, Enschede (2015). Joint angle based on joint stiffness assumptions. Personal
communication.
XSENS (2012). MVN User Manual. Enschede, NL, XSens.
SHU Havard 2014 reference style guide available to view at this link:
http://libguides.shu.ac.uk/referencing

305
Appendix
A. Chapter three participant information sheet

306
Participant Information Sheet
Project Title: Development of an exercise intervention for low back pain –
Phase 1
Principal Investigator: Dr Dorothée Debuse Investigator contact details: Telephone: 0191 215 6292 Email: dorothé[email protected]
1. What is the purpose of the project?
The purpose of the study is to assess the effect of 14 different combinations of movement amplitude and foot position when using a new exercise device. This exercise device was developed to train key muscles that provide spinal stability in the lower back and pelvis. Based on the results from our initial studies we are confident that the new exercise device could be a very useful tool in the rehabilitation of people with muscle atrophy and dysfunction in the lower back area, including those with low back pain, astronauts and people following long-term bed rest.
However, to date we have not yet investigated which of the possible combinations of exercise parameters (amplitude and foot position) is the most effective at recruiting these muscles. We also want to find out more about the forces that act on the body during exercise on the new device in different combinations of exercise parameters and how people feel about using the exercise device. Therefore, we need to undertake this study, in order to develop an effective and feasible and evidence-based exercise intervention using the new exercise device. This study will be the first in a series of studies which are funded by the European Space Agency.
2. Why am I invited to take part? You have been invited because you are likely to meet the inclusion criteria for
the study which are being fit and healthy, and between 18 and 55 years of age. Unfortunately, we cannot offer you any financial incentives or reimburse your travel expenses to take part in this study.
3. Do I have to take part, and can I withdraw from the project later? It is up to you whether or not you take part. You can also leave the study at
any time without need for explanation or justification, and this will not affect your future studies or employment at Northumbria University. If you do want to withdraw your data from this project at any time, simply contact the principal investigator by telephone, email or in person and let her know.
4. What does taking part involve?
You will be asked to visit one of our laboratories at City Campus for no more than two hours on two consecutive days. During the first visit you will be asked to

307
fill in a brief questionnaire about your general health and fitness, including how often you exercise.
For all exercise sessions reflective markers will be applied to your body in key areas on your legs and trunk, so that your movement during exercise can be captured by our VICON movement analysis system.
During each of your visits you will be asked to exercise on the new device in seven different combinations of amplitude of movement and foot position. In each of these seven combinations (14 overall), at rest, and in one control position, your transversus abdominis and lumbar multifidus muscle thickness will be measured using ultrasound imaging (see Table 1). We will take three images of your transversus abdominis (on the side of your abdominal wall) during each of these conditions and six images (at two different spinal levels) of your lumbar multifidus (in your back).
Rest = You will be asked to
lie on a standard physiotherapy examination bench.
Control = Standing on the exercise device, but not moving.
Ultrasound imaging uses sound waves to produce an image of the tissues
beneath the skin. This is a safe technique and used on a daily basis worldwide. The technology is identical to that which is used for checking on the development of foetuses within the womb during pregnancy.
The actual exercise will be at a very low intensity, and you can have a rest
between the different conditions if you like. The total anticipated exercise duration is expected to be less than 70 minutes, with individual exercise conditions lasting no more than 8 minutes. We will ask you to rate your level of comfort in each condition, and we will not ask you to exercise beyond what you are comfortable with.
Exercise sessions will be arranged to take place over two consecutive days.
We will also assess your comfort level 24hours after exercise, to check how you are feeling after exercise. We can check these face to face when you attend your second visit. Twenty for hours after the second visit we will contact you via email or telephone, whichever you prefer, to assess your comfort level after the second visit. The comfort level allows us to find out how you are feeling following the sessions, so we can get a sense of whether you have any after-exercise muscle soreness.
5. What are the exclusion criteria, i.e. are there any reasons why I should
not take part?
Being below 18 or above 55 years of age
History of musculoskeletal or neurological problems/injuries affecting your ability to move normally or exercise, including low back pain
History of abdominal or spinal surgery within the last three years
Table 1:
Session Conditions
rest control Exs. conditions
1 7
2 - - Another 7

308
Any heart conditions that would affect your ability to exercise safely
Epilepsy
Pregnancy
6. Will my participation involve any physical discomfort? Ultrasound transmission gel will be applied to your flank and on your lower
back during each of the combinations of parameters. The gel tends to feel cold initially, but soon you’ll not notice it any more. Surplus gel will be removed using alcohol free tissue.
The exercise is designed to be gentle and will not involve any range of movement beyond what you are likely to experience in your normal daily activities. However, as you are not likely to be used to working your muscles in quite this way, you may experience a slight ache in your leg and/or tummy muscles during the exercise and/or on the day or two after. However, the level of exercise activity is not likely to be above what you are likely to experience during everyday activities. We will not ask you to exercise for any longer than you are comfortable with, and you can stop exercising if you wish.
7. Will my participation involve any psychological discomfort or
embarrassment? For us to be able to access the relevant areas on your flank and back to
capture your movement and take the ultrasound images, we will ask you to expose your skin and to wear shorts and a crop top (if applicable) for the occasion. Nobody other than the researchers will have access to the lab where the ultrasound imaging is done, and screens will be placed around the exercise device to ensure privacy. The researchers will treat you with dignity and respect at all times.
8. How will confidentiality be assured? You will be allocated a participant ID code that will always be used to identify
any data that you provide. Your name or other personal details will not be associated with your data; for example, the consent form that you sign will be kept separate from your data.
Only the research team will have access to any identifiable information; and all identifiable information (other than the consent forms which are legally required to keep for the duration of the study) will be destroyed as soon as an ID code has been assigned to you. Paper records will be stored in a locked filing cabinet and electronic information will be stored on a password-protected computer. All data will be treated in accordance with the Data Protection Act.
9. Who will have access to the information that I provide? Information you provide and the data we collect will be seen only by the
principal investigator, Dr Dorothée Debuse and her research team. All records will be kept confidential except for potential auditing (that the correct procedures have been followed) by Northumbria University Ethics Committee and/or regulatory authorities.
10. How will my information be stored / used in the future?

309
Your information will be stored on a password-protected computer or in a locked filling cabinet. Any personal information will be destroyed after 3 years. Data may be published in peer-reviewed journals or presented as posters/abstracts at conferences; however all data will be anonymised and any personal information will not be referred to at any time.
11. Has this investigation received appropriate ethical clearance? The study has received full ethical approval from the Faculty of Health and Life
Sciences Ethics Committee. If you require confirmation about this, please contact the chair of the committee, stating the title of the research project and the name of the principal investigator:
Dr Nick Neave, Chair of the Faculty of Health and Life Sciences Ethics Committee, Northumberland Building, Northumbria University, Newcastle Upon Tyne, NE1 8ST
[email protected] You can also contact him if you would like to discuss the study with somebody
other than the principal investigator or if you want to register an official complaint about the study.
12. If I want any further information who should I contact and how? If you have any further questions, please feel free to contact the principal
investigator: Dr Dorothée Debuse,
Senior Lecturer in Physiotherapy, Department of Sport, Exercise and Rehabilitation
Northumbria University Newcastle-upon-Tyne
NE7 7XA E:mail: [email protected]
13. What happens next? If, after reading this information sheet, you decide that you would like to take
part, please get in touch with Andrew Winnard, PhD student, via e-mail at [email protected]. He will then contact you to answer any further questions you may have about the study and arrange a convenient time for you to come to the lab. Before the start of testing, you will be asked to sign a consent form. A copy of the consent form and this information sheet are yours to keep.
Many thanks for taking the time to read this information sheet.

310
B. Chapter three informed consent form

311
C. Chapter four and five participant information sheet

312

313

314

315
D. Chapter four and five informed consent form

316
E. Chapter five and six participant information sheet

317

318

319
F. Chapter five and six informed consent form

320
G. Data filtering results for chapters 6 and 7
a.
b.

321
Figures showing various data filtering options (green lines) compared to original data (grey lines) tested using mean L5/S1 flexion angle as a function of time, with moving average periods of; a. 161, b. 241, c. 401 and d. 801.
c.
d.

322
H. Familiarisation figures for chapter 6
Figure H-1 Mean L5/S1 flexion angle across all participants throughout the 600 second trial in; a. the no-LBP group and b. the LBP group. Familiarisation range shown on plots between dashed lines is no-LBP group: 2.7±0.3, LBP group: 3.4±0.3 (degrees).
a.
b.

323
Figure H-2 Mean L3/L4 flexion angle across all participants throughout the 600 second trial in; a. the no-LBP group and b. the LBP group. Familiarisation ranges shown on plots between dashed lines is no-LBP group: 1.2±0.1, LBP group: 1.5±0.1 (degrees)
a.
b.

324
Figure H-3 Mean T12/L1 flexion angle across all participants throughout the 600 second trial in; a. the no-LBP group and b. the LBP group. Familiarisation ranges shown on plots between dashed lines is no-LBP group: 1.2±0.1, LBP group: 1.5±0.1 (degrees)
a.
b.

325
Figure H-4 Mean T9/T8 flexion angle across all participants throughout the 600 second trial in; a. the no-LBP group and b. the LBP group. Familiarisation ranges shown on plots between dashed lines is no-LBP group: 0.9±0.1, LBP group: 1.1±0.1 (degrees)
a.
b.

326
Figure H-5 Mean sagittal plane (anterior) pelvic tilt across all participants throughout the 600 second trial in; a. the no-LBP group and b. the LBP group. Familiarisation ranges shown on plots between dashed lines is no-LBP group: 0.5±0.5 LBP group: -0.3±0.5 (degrees)
a.
b.

327
Figure H-6 Mean anteroposterior centre of mass variation across all participants throughout the 600 second trial in; a. the no-LBP group and b. the LBP group. Familiarisation ranges shown on plots between dashed lines is no-LBP group: 2.9±0.2,LBP group: 2.9±.0.2 (cm)
a.
b.

328
Figure H-7 Mean mediolateral centre of mass variation across all participants throughout the 600 second trial in; a. the no-LBP group and b. the LBP group. Familiarisation ranges shown on plots between dashed lines is no-LBP group: 0.5±0.05, LBP group: 0.5±0.1 (cm)
a.
b.

329
Figure H-8 Mean exercise frequency (f) across all participants throughout the 600 second trial in; a. the no-LBP group and b. the LBP group. Familiarisation ranges shown on plots between dashed
lines is: no-LBP group: 0.478±0.014, LBP group: 0.495±0.014 (Hz)
a.
b.

330
Figure H-9 Mean FRED movement variability across all participants throughout the 600 second trial in; a. the no-LBP group and b. the LBP group. Familiarisation ranges shown on plots between dashed lines is no-LBP group is: 9.1±1.5 LBP group: 9.0±1.6 (%)
a.
b.

331
I. Familiarisation figures for chapter 7
Figure I-1 Mean L5/S1 flexion angle across all participants throughout the 600 second trial in; a. the no-holding group and b. the holding group. Familiarisation range shown on plots between dashed lines is 2.7 ± 0.3 in the no-holding group and 3.5 ± 0.5 in the holding group (degrees).
a
.
b
.

332
Figure I-2 Mean L3/L4 flexion angle across all participants throughout the 600 second trial in; a. the no-holding group and b. the holding group. Familiarisation ranges shown on plots between dashed lines is 1.2 ± 0.1 in the no-holding group and 1.5 ± 0.2 in the holding group (degrees)
a
.
b
.

333
Figure I-3 Mean T12/L1 flexion angle across all participants throughout the 600 second trial in; a. the no-holding group and b. the holding group. Familiarisation ranges shown on plots between dashed lines is 1.2 ± 0.1 in the no-holding group and 1.5 ± 0.2 in the holding group (degrees)
a
.
b
.
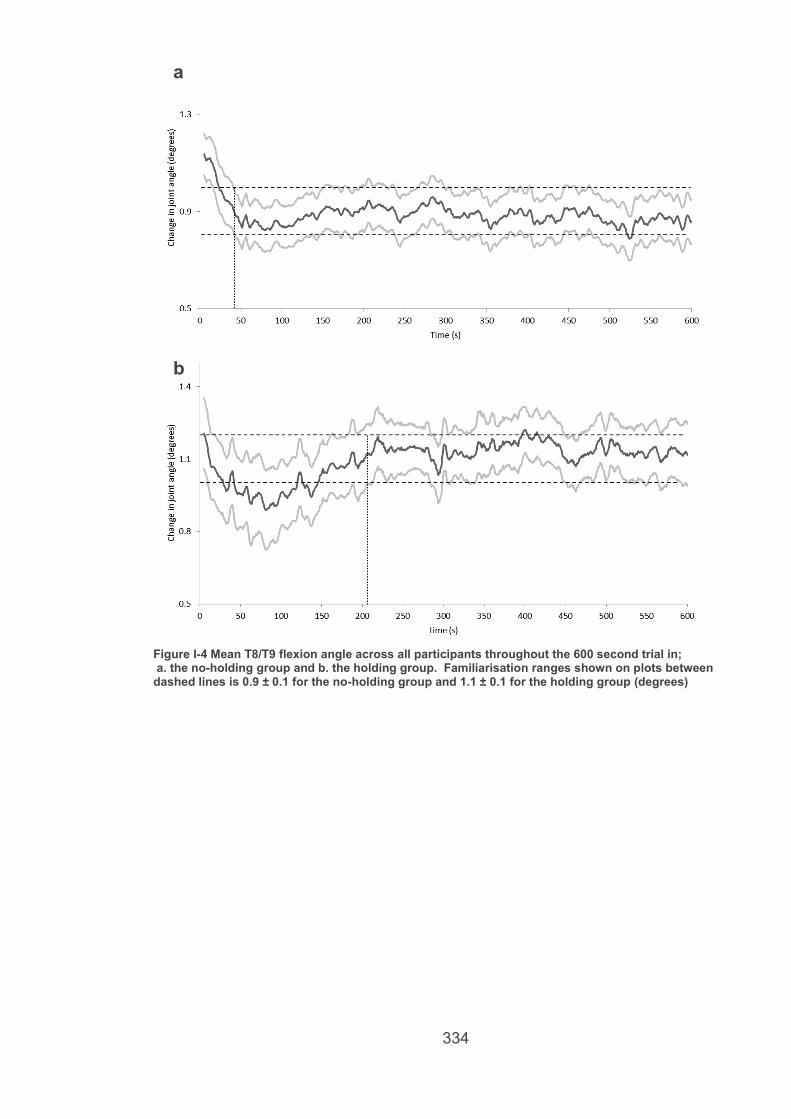
334
Figure I-4 Mean T8/T9 flexion angle across all participants throughout the 600 second trial in; a. the no-holding group and b. the holding group. Familiarisation ranges shown on plots between dashed lines is 0.9 ± 0.1 for the no-holding group and 1.1 ± 0.1 for the holding group (degrees)
a
.
b
.

335
Figure I-5 Mean sagittal plane (anterior) pelvic tilt across all participants throughout the 600 second trial in; a. the no-holding group and b. the holding group. Familiarisation ranges shown on plots between dashed lines is 0.5 ± 0.5 in the no-holding group and -2.1 ± 1.8 in the holding group (degrees)
a.
b.

336
Figure I-6 Mean anteroposterior centre of mass variation across all participants throughout the 600 second trial in; a. the no-holding group and b. the holding group. Familiarisation ranges shown on plots between dashed lines is 2.9 ± 0.2 for the no-holding group and 4.7 ± 0.6 (cm)
a
.
b
.

337
Figure I-7 mean mediolateral centre of mass variation across all participants throughout the 600 second trial in; a. the no-holding group and b. the holding group. Familiarisation ranges shown on plots between dashed lines is 0.5 ± 0.05 in the no-holding group and 0.7 ± 0.1 in the holding group (cm)
a.
b.

338
Figure I-8 Mean exercise frequency (f) across all participants throughout the 600 second trial in; a. the no-holding group and b. the holding group. Familiarisation ranges shown on plots between dashed lines is 0.478 ± 0.014 Hz in the no-holding group and 0.481 ± 0.021 Hz in the holding group.
a.
b.

339
Figure I-9 Mean FRED movement variability across all participants throughout the 600 second trial in; a. the no-holding group and b. the holding group. Familiarisation ranges shown on plots between dashed lines is 9.1 ± 1.5 in the no-holding group and 5.8 ± 1.7 in the holding group (%)
a.
b.

340
J. Ethics approval notifications
For the study in chapter three, the ethical approval process was handled by
PhD supervisor Dr Dorothee Debuse and notification sent via emails as below

341
For the studies in chapters four and five:
Staff/PGR research ethics review
Project title: Study of the effect of visual feedback on posture and control of movement during exercise on the FRED exercise device
Investigator name:
Andrew Winnard
Ethics code: RE-HLS-13-140226-530daf3adf083
General
Project risk level: Amber
Decision: APPROVED WITH MINOR AMENDMENTS: There are some minor ethical issues to be addressed. These have been outlined in attached review

342
For the studies in chapters six and seven:
from: Mic Wilkinson
to:
"Andrew Winnard ([email protected])
date: 30 April 2015 at 11:29
subject: Ethics decision
mailed-by: northumbria.ac.uk
Hi Andrew,
The project listed below has now
received approval. Please keep this
message for your records.
best wishes,
Mick
HLSAW130415 Effect of time on functional
readaptive exercise device training Mick Wilkinson, PhD Senior Lecturer Sport, Exercise and Rehabilitation Northumbria University Newcastle-upon-Tyne England NE1 8ST [email protected] Tel: 0191 243 7097