Wind loading of trees: influence of tree size and competition
17
1 23 European Journal of Forest Research ISSN 1612-4669 Volume 131 Number 1 Eur J Forest Res (2011) 131:203-217 DOI 10.1007/s10342-010-0448-2 Wind loading of trees: influence of tree size and competition Sophie E. Hale, Barry A. Gardiner, Axel Wellpott, Bruce C. Nicoll & Alexis Achim
Transcript of Wind loading of trees: influence of tree size and competition
1 23
European Journal of Forest Research ISSN 1612-4669Volume 131Number 1 Eur J Forest Res (2011) 131:203-217DOI 10.1007/s10342-010-0448-2
Wind loading of trees: influence of tree sizeand competition
Sophie E. Hale, Barry A. Gardiner,Axel Wellpott, Bruce C. Nicoll & AlexisAchim

1 23
Your article is protected by copyright and all
rights are held exclusively by UK Crown. This
e-offprint is for personal use only and shall
not be self-archived in electronic repositories.
If you wish to self-archive your work, please
use the accepted author’s version for posting
to your own website or your institution’s
repository. You may further deposit the
accepted author’s version on a funder’s
repository at a funder’s request, provided it is
not made publicly available until 12 months
after publication.
ORIGINAL PAPER
Wind loading of trees: influence of tree size and competition
Sophie E. Hale • Barry A. Gardiner •
Axel Wellpott • Bruce C. Nicoll • Alexis Achim
Received: 25 February 2010 / Revised: 31 August 2010 / Accepted: 20 October 2010 / Published online: 23 November 2010
� UK Crown 2010
Abstract Wind damage to forests is an important eco-
logical disturbance factor. At the same time, it can have
serious economic consequences due to a reduction in tim-
ber production. Current models for predicting the risk of
wind damage are useful, but generally only focus on the
‘‘mean’’ tree within uniform stands. This paper presents
measurements made of wind loading on trees of different
sizes within four forest stands of different structure and
management history, but all well-acclimated to current
wind conditions. Each tree demonstrated a linear relation-
ship between the maximum hourly turning moment and the
square of the average hourly wind speed at the canopy top;
we defined this ratio (the gradient of the line Mmax vs. u2)
as the turning moment coefficient (TC). TC was correlated
with tree size, in a relationship that differed little between
the four forest sites despite the differences between the
stands. The relationship between TC and individual tree
competition within each stand was investigated, using both
distance-independent and distance-dependent competition
indices. All sites showed decreasing TC with increasing
competition. However, the relationships differed between
sites and would also be expected to change through time
for a single site. The distance-dependent indices offered no
improvement over the simpler, non-spatial indices that
required only a diameter distribution. We suggest how,
subject to further work, the results presented could be
applied to calculate the risk of wind damage to trees of
different sizes within a forest stand, and how the risk of
wind damage to individual trees might change in response
to thinning.
Keywords Wind damage � Risk � Competition indices �Wind loading � Picea sitchensis (Bong.) Carr. �Larix decidua Mill
Introduction
Wind is a major natural disturbance factor throughout
many forested parts of the world (Putz et al. 1983; Schaetzl
et al. 1989; Ennos 1997). From an ecological perspective,
wind is an important agent for creating environments for
natural regeneration, and for increasing diversity in forest
stands (Quine 2001; Ruel and Pineau 2002). For the forest
industry, however, wind throw (wind-induced damage e.g.
stem breakage or uprooting) reduces profitability of timber
production, through reduced economic value of wind
blown timber (Savill 1983; Nieuwenhuis and Fitzpatrick
2002) and increased costs of harvesting (Quine et al. 1995).
Harvesting stands before the age of optimum economic
return to reduce the risk of wind throw also reduces the
economic return (Gardiner and Quine 2000).
Access to tools that predict the risk of wind damage
would enable forest managers to plan fellings or thinnings
This article belongs to the special issue ‘Wind Effects on Trees’.
Communicated by J. Bauhus.
S. E. Hale (&) � B. A. Gardiner � A. Wellpott �B. C. Nicoll � A. Achim
Forest Research, Northern Research Station, Roslin,
Midlothian EH25 9SY, UK
e-mail: [email protected]
A. Wellpott
Facility for Airborne Atmospheric Measurements,
Cranfield University, Cranfield, Bedford MK43 0AL, UK
A. Achim
Faculte de foresterie et de geomatique, Universite Laval,
Quebec G1V 0A6, Canada
123
Eur J Forest Res (2012) 131:203–217
DOI 10.1007/s10342-010-0448-2
Author's personal copy
in order to avoid or minimise wind damage to a stand.
Gardiner et al. (2008) synthesised the current status of
mechanistic modelling tools for the prediction of wind
damage risk. The modelling effort to date has generally
been at stand level, predicting risk of damage to the mean
tree in a stand (for example HWIND; Peltola et al. 1999,
and ForestGALES; Gardiner et al. 2000; 2004). Some
attempts have been made to model wind risk to individual
trees within stands (Ancelin et al. 2004; Cucchi et al. 2005;
Schelhaas et al. 2007), but in reality, these are stand-level
models applied to individual trees, rather than true indi-
vidual tree risk models. In Britain, where the predominant
silvicultural system has been clear-fell and replant, For-
estGALES was developed as a tool to enable forest man-
agers to assess and manage the risk of wind damage in
uniform even-aged stands (Gardiner et al. 2000; 2004).
However, even in ‘‘uniform’’ even-aged stands, there is a
distribution of tree sizes. Furthermore, in Britain, there has
been a policy shift at a national level (Anonymous 2004)
and at a country level in both Scotland (Anonymous 2006)
and Wales (Anonymous 2009) towards alternative methods
of forest management, broadly termed continuous cover
forestry, which involve maintaining the forest canopy at
one or more levels while regenerating the stand (Mason
et al. 1999; Mason and Kerr 2004). This will result in an
increased number of forest stands in Britain with a wide
range of tree sizes, in either a simple (one or two layer) or
complex (three or more layers) structure (Mason and Kerr
2004). Such forest types are much more common in central
European forestry (Hart 1985) and are regarded as being
closer to natural forest stands. Therefore, increasingly,
there is a requirement for wind risk models that can predict
the risk of wind damage to all trees in any structure of
stand, whether for forest management or for understanding
ecological processes in natural forests.
All of the models described by Gardiner et al. (2008)
contain some empirical relationships. A key empiricism is
the method used to relate the maximum turning moment to
the mean turning moment that occurs in response to the
mean wind speed. This relationship is poorly parameter-
ised, yet model output is very sensitive to it (Gardiner et al.
2000). If it was possible to quantify the relationship
between maximum turning moment (or bending moment)
and mean wind speed for individual trees, there would be
no need to convert between mean and extreme wind
loading.1 The critical turning moment required to break or
overturn a tree can be calculated from the physical prop-
erties of the tree and site (Gardiner et al. 2000; Nicoll et al.
2006). If we know how the maximum turning moment
changes with mean wind speed, it enables the critical wind
speed (the mean hourly wind speed at which damaging
gusts occur, i.e. the wind speed at which the critical turning
moment is reached) to be calculated.
In general, the turning moment experienced by large
trees at a given wind speed will be higher than for a smaller
tree because of the larger crown (increased ‘‘sail’’ area) and
increased moment arm (wind loading is at a higher effec-
tive height). However, two identical trees might be
expected to respond differently to the same wind speed
depending on how much shelter they receive from neigh-
bouring trees in the stand. A tree of height H, surrounded
by trees taller than H, might be expected to experience a
lower turning moment than the same tree surrounded by
trees smaller than H. Similarly, if neighbours are removed
from around a particular tree during a thinning, the tree will
become more exposed to the wind and would be expected
to bend more at a given wind speed than prior to thinning.
Wind throw is common at a newly created windward-
facing edge, or in an excessively thinned stand, as the trees
are not yet acclimated to their new wind environment
(Gardiner et al. 2005; Lanquaye-Opoku and Mitchell 2005;
Scott and Mitchell 2005). Trees may take several years to
acclimate to an altered wind environment (Urban et al.
1994) and regain their mechanical stability. This process
requires an altered allocation of assimilates within the tree
to strengthen parts that now experience the largest
mechanical stress, such as the lower stem and structural
roots (Stokes et al. 1997; Nicoll and Gardiner 2006).
The concept of local shelter as an influence on wind
environment has parallels with forest growth modelling,
where competition indices are widely used to determine the
growth of individual trees (e.g. Courbaud et al. 2001;
Pretzsch et al. 2002; Stadt et al. 2007; Kiernan et al. 2008).
There are many approaches of varying complexity,
including stand-level indices; individual-tree non-spatial
indices that essentially use the size rank of each tree in the
stand; and individual-tree spatial indices, based on the
proximity and relative size of each tree and its neighbours.
Several papers exist reviewing and comparing different
indices (e.g. Biging and Dobbertin 1992, 1995). In practice,
the competition index chosen for a given application will
largely be influenced by the data available. In this paper,
we investigate the idea that the competition experienced by
a tree, as well as influencing tree growth, is likely to reflect
how much that tree is sheltered from the effects of the
wind. Studying the turning moment of different trees in
response to wind loading will allow us to improve the
existing approach to wind risk modelling, by quantifying
the risk to all trees within a forest stand of any structure.
1 The assumption in all wind damage risk modelling to date is that
the extreme (maximum) wind loading in any particular storm is the
key factor in determining whether damage occurs. However, this has
never been verified in field experiments due to the lack of
measurements during damaging storms, and it is possible that root
fatiguing (Rogers et al. 1995) from a number of storms could actually
be more important.
204 Eur J Forest Res (2012) 131:203–217
123
Author's personal copy
Linking this to local competition has the potential to enable
us to model the immediate effects of thinning on the risk of
wind damage and will also facilitate the integration of wind
risk modelling within forest growth models.
In summary, the aims of the work reported were to
investigate: (i) if individual trees within a stand showed a
systematic change in maximum turning moment in
response to wind loading at different wind speeds; (ii) if
this response varied systematically for trees of different
sizes within a stand, and specifically in relation to their
local competition; and (iii) if the response varied system-
atically for different forest stands; and finally, (iv) to
suggest a method for modelling risk of wind damage to
trees of different sizes within a stand, including changes
that might occur as a stand is thinned.
Materials and methods
Extensive measurements of wind speed and tree turning
moment were taken at three sites, and a small additional
data set was available for comparison from a fourth site.
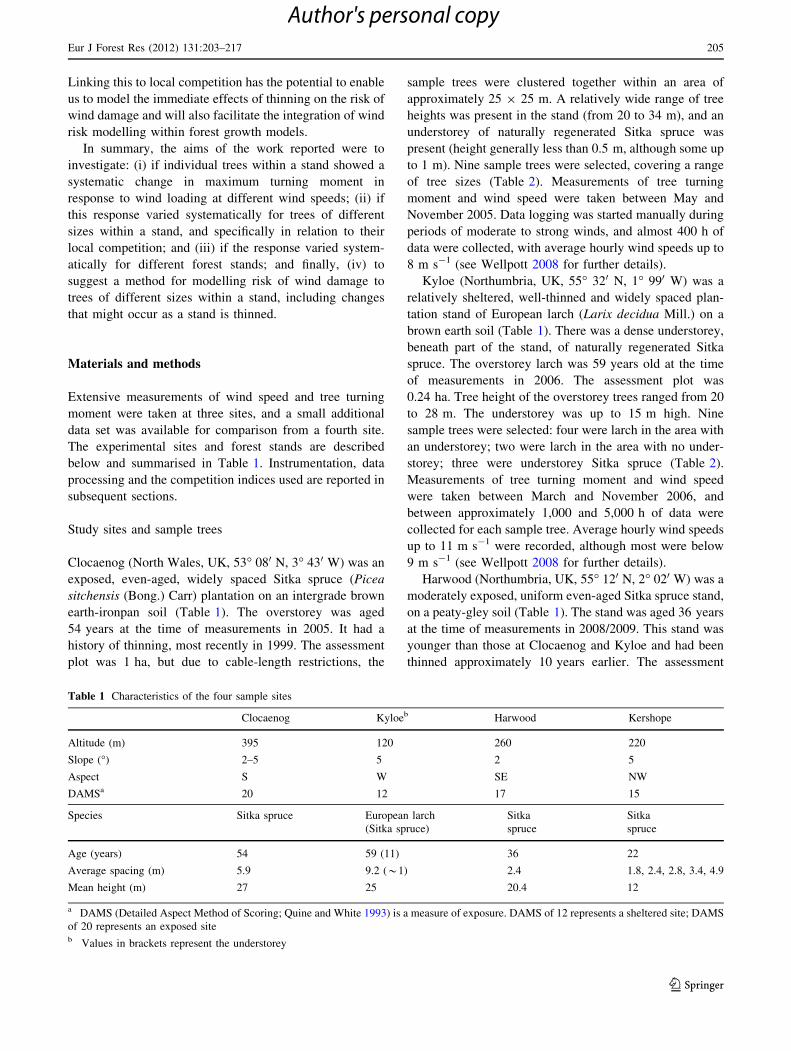
The experimental sites and forest stands are described
below and summarised in Table 1. Instrumentation, data
processing and the competition indices used are reported in
subsequent sections.
Study sites and sample trees
Clocaenog (North Wales, UK, 53� 080 N, 3� 430 W) was an
exposed, even-aged, widely spaced Sitka spruce (Picea
sitchensis (Bong.) Carr) plantation on an intergrade brown
earth-ironpan soil (Table 1). The overstorey was aged
54 years at the time of measurements in 2005. It had a
history of thinning, most recently in 1999. The assessment
plot was 1 ha, but due to cable-length restrictions, the
sample trees were clustered together within an area of
approximately 25 9 25 m. A relatively wide range of tree
heights was present in the stand (from 20 to 34 m), and an
understorey of naturally regenerated Sitka spruce was
present (height generally less than 0.5 m, although some up
to 1 m). Nine sample trees were selected, covering a range
of tree sizes (Table 2). Measurements of tree turning
moment and wind speed were taken between May and
November 2005. Data logging was started manually during
periods of moderate to strong winds, and almost 400 h of
data were collected, with average hourly wind speeds up to
8 m s-1 (see Wellpott 2008 for further details).
Kyloe (Northumbria, UK, 55� 320 N, 1� 990 W) was a
relatively sheltered, well-thinned and widely spaced plan-
tation stand of European larch (Larix decidua Mill.) on a
brown earth soil (Table 1). There was a dense understorey,
beneath part of the stand, of naturally regenerated Sitka
spruce. The overstorey larch was 59 years old at the time
of measurements in 2006. The assessment plot was
0.24 ha. Tree height of the overstorey trees ranged from 20
to 28 m. The understorey was up to 15 m high. Nine
sample trees were selected: four were larch in the area with
an understorey; two were larch in the area with no under-
storey; three were understorey Sitka spruce (Table 2).
Measurements of tree turning moment and wind speed
were taken between March and November 2006, and
between approximately 1,000 and 5,000 h of data were
collected for each sample tree. Average hourly wind speeds
up to 11 m s-1 were recorded, although most were below
9 m s-1 (see Wellpott 2008 for further details).
Harwood (Northumbria, UK, 55� 120 N, 2� 020 W) was a
moderately exposed, uniform even-aged Sitka spruce stand,
on a peaty-gley soil (Table 1). The stand was aged 36 years
at the time of measurements in 2008/2009. This stand was
younger than those at Clocaenog and Kyloe and had been
thinned approximately 10 years earlier. The assessment
Table 1 Characteristics of the four sample sites
Clocaenog Kyloeb Harwood Kershope
Altitude (m) 395 120 260 220
Slope (�) 2–5 5 2 5
Aspect S W SE NW
DAMSa 20 12 17 15
Species Sitka spruce European larch
(Sitka spruce)
Sitka
spruce
Sitka
spruce
Age (years) 54 59 (11) 36 22
Average spacing (m) 5.9 9.2 (*1) 2.4 1.8, 2.4, 2.8, 3.4, 4.9
Mean height (m) 27 25 20.4 12
a DAMS (Detailed Aspect Method of Scoring; Quine and White 1993) is a measure of exposure. DAMS of 12 represents a sheltered site; DAMS
of 20 represents an exposed siteb Values in brackets represent the understorey
Eur J Forest Res (2012) 131:203–217 205
123
Author's personal copy
plot was 0.02 ha, although trees outside this were measured
if they were neighbours of a sample tree. Vertical differ-
entiation was less well-developed than at Clocaenog and
Kyloe. Sixteen sample trees were selected to cover the
range of tree heights within the study area (18–25 m;
Table 2). Measurements of tree turning moment and wind
speed were taken between September 2008 and October
2009, and over 8000 h of data were collected. Average
hourly wind speeds rarely exceeded 6 m s-1.
Kershope (Northumbria, UK, 55� 080 N, 2� 420 W) was a
moderately exposed, uniform even-aged Sitka spruce
plantation on a peaty-gley soil (Table 1). The stand was
aged 22 years at the time of measurements in 1989.
Originally planted at 1.8 9 1.7 m spacing, it was respaced
at canopy closure in 1975 to five different spacing treat-
ments (Table 1). Each assessment plot was approximately
0.06 ha. Eleven trees were sampled: two in each treatment,
plus an additional ‘‘reference’’ tree in the unthinned plot
(Table 2). For the reference tree, 13 h of data were
obtained; for the remaining trees, between 1 and 4 h of data
were obtained. This site and experiment are described in
detail in Gardiner et al. (1997). In the results, data from all
trees at Kershope are presented together, although unlike
data from the other forests, they are not representative of a
single stand because of the distinct treatment differences
(see Gardiner et al. 1997), which produced systematic
differences in terms of, e.g., stem taper and crown shape.
Tree characteristics measured and definition
of neighbours
At all sites, position and stem diameter at 1.3 m (D1.3 in
cm) of all trees in the assessment plot were recorded.
Additionally, height (H in m) was recorded for sample trees
(Table 2). At Clocaenog, crown width was also obtained
for all trees, calculated as the average crown width based
on measurement of maximum crown radius in eight
directions.
Voronoi polygons, which are commonly used in studies
of spatial distributions of forest canopies and competition
for resources (e.g. Goudie et al. 2009), were used as an
objective method for defining neighbours for each sample
tree for use in distance-dependent competition indices.
Using the Voronoi algorithm in the open-source statistical
package R (R Development Core Team 2008), a polygon
was drawn around each tree such that all points within that
polygon were closer to that tree than to any other tree. Two
trees with a common polygon side were designated as
neighbours. The sample trees in the sites studied here had
between four and nine neighbours. At Kyloe, the under-
storey trees were not included when defining the polygons
for the overstorey trees. Otherwise, a small understorey
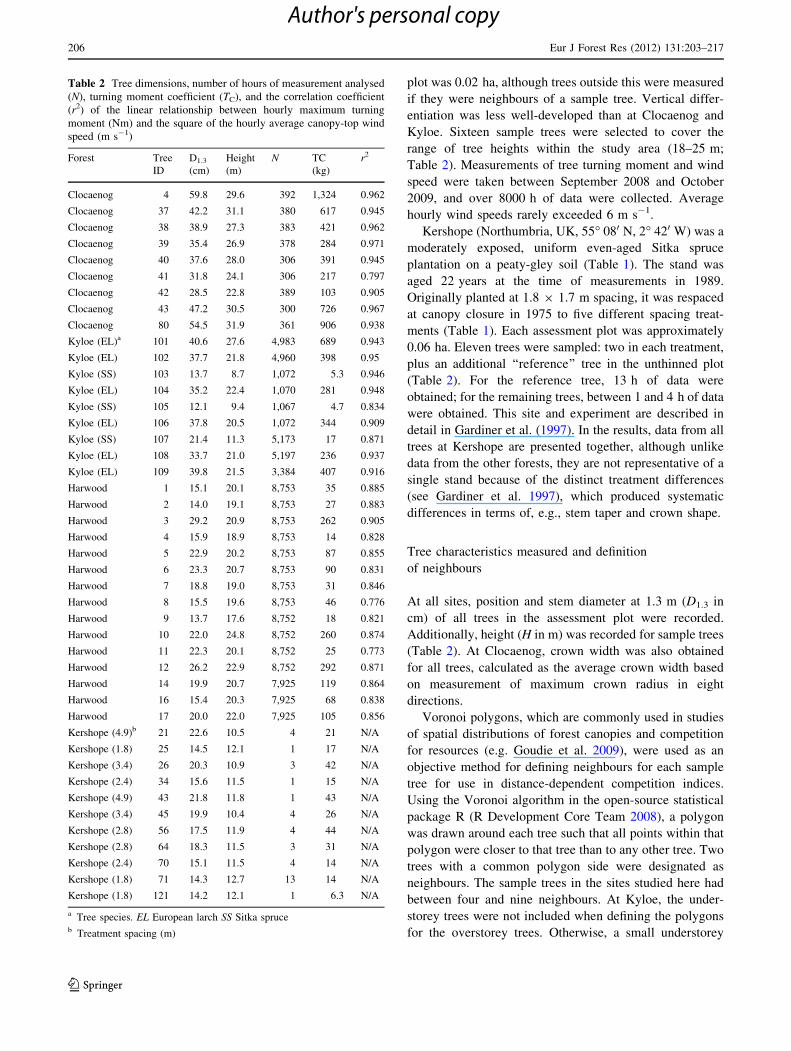
Table 2 Tree dimensions, number of hours of measurement analysed
(N), turning moment coefficient (TC), and the correlation coefficient
(r2) of the linear relationship between hourly maximum turning
moment (Nm) and the square of the hourly average canopy-top wind
speed (m s-1)
Forest Tree
ID
D1.3
(cm)
Height
(m)
N TC
(kg)
r2
Clocaenog 4 59.8 29.6 392 1,324 0.962
Clocaenog 37 42.2 31.1 380 617 0.945
Clocaenog 38 38.9 27.3 383 421 0.962
Clocaenog 39 35.4 26.9 378 284 0.971
Clocaenog 40 37.6 28.0 306 391 0.945
Clocaenog 41 31.8 24.1 306 217 0.797
Clocaenog 42 28.5 22.8 389 103 0.905
Clocaenog 43 47.2 30.5 300 726 0.967
Clocaenog 80 54.5 31.9 361 906 0.938
Kyloe (EL)a 101 40.6 27.6 4,983 689 0.943
Kyloe (EL) 102 37.7 21.8 4,960 398 0.95
Kyloe (SS) 103 13.7 8.7 1,072 5.3 0.946
Kyloe (EL) 104 35.2 22.4 1,070 281 0.948
Kyloe (SS) 105 12.1 9.4 1,067 4.7 0.834
Kyloe (EL) 106 37.8 20.5 1,072 344 0.909
Kyloe (SS) 107 21.4 11.3 5,173 17 0.871
Kyloe (EL) 108 33.7 21.0 5,197 236 0.937
Kyloe (EL) 109 39.8 21.5 3,384 407 0.916
Harwood 1 15.1 20.1 8,753 35 0.885
Harwood 2 14.0 19.1 8,753 27 0.883
Harwood 3 29.2 20.9 8,753 262 0.905
Harwood 4 15.9 18.9 8,753 14 0.828
Harwood 5 22.9 20.2 8,753 87 0.855
Harwood 6 23.3 20.7 8,753 90 0.831
Harwood 7 18.8 19.0 8,753 31 0.846
Harwood 8 15.5 19.6 8,753 46 0.776
Harwood 9 13.7 17.6 8,752 18 0.821
Harwood 10 22.0 24.8 8,752 260 0.874
Harwood 11 22.3 20.1 8,752 25 0.773
Harwood 12 26.2 22.9 8,752 292 0.871
Harwood 14 19.9 20.7 7,925 119 0.864
Harwood 16 15.4 20.3 7,925 68 0.838
Harwood 17 20.0 22.0 7,925 105 0.856
Kershope (4.9)b 21 22.6 10.5 4 21 N/A
Kershope (1.8) 25 14.5 12.1 1 17 N/A
Kershope (3.4) 26 20.3 10.9 3 42 N/A
Kershope (2.4) 34 15.6 11.5 1 15 N/A
Kershope (4.9) 43 21.8 11.8 1 43 N/A
Kershope (3.4) 45 19.9 10.4 4 26 N/A
Kershope (2.8) 56 17.5 11.9 4 44 N/A
Kershope (2.8) 64 18.3 11.5 3 31 N/A
Kershope (2.4) 70 15.1 11.5 4 14 N/A
Kershope (1.8) 71 14.3 12.7 13 14 N/A
Kershope (1.8) 121 14.2 12.1 1 6.3 N/A
a Tree species. EL European larch SS Sitka spruceb Treatment spacing (m)
206 Eur J Forest Res (2012) 131:203–217
123
Author's personal copy
tree (e.g. 12 m tall) could effectively block the inclusion of
an overstorey tree (e.g. 25 m tall) in the calculation of
competition index.
All trees classified as neighbours were measured (D1.3)
and mapped with the exceptions detailed below, which
arose because only at Harwood was the experimental
design specifically set up to study competition indices. At
Kyloe, Tree 108 lay at the edge of the assessment area, and
its neighbours outside this area were not mapped or mea-
sured. At Kershope, Trees 25 and 56 lay at the edge of the
assessment areas within two plots. The very regular layout
of the trees within and around the assessment plots at
Kershope enabled the positions of the one unmapped
neighbour for each of these trees to be approximated. The
diameters of these two neighbours were estimated as the
average of the diameters of the remaining neighbours for
each of Tree 25 and 56. Finally, Tree 121 at Kershope was
missing a diameter measurement for one of its neighbours.
Again, this was estimated as the average of the diameters
of the remaining neighbours. There was no evidence of
inconsistency in the results from these trees compared with
other trees at this site.
Instrumentation
Wind speed and direction
Wind speed and direction were measured at or near the top
of the canopy at each site. Table 3 gives details of instru-
mentation and data loggers used for this. The cup ane-
mometer data were all recorded at 3 Hz and subsequently
processed to obtain average hourly wind speed. At Clo-
caenog, the upper anemometer was at the limit using the
tower available; it was slightly below the height of the
tallest trees. To be consistent across all sites for the height
of the wind speed measurement relative to the top of the
canopy, we used data from the anemometer at 27 m for
Kyloe; at Kershope, we interpolated to 13 m, and at
Harwood used the cup anemometer installed at 23 m. All
wind speeds used in the analysis were therefore for the
height as close as possible to that of the maximum tree
height.
Measurement of turning moment
Turning moment at Clocaenog, Kyloe and Harwood was
measured using strain transducers, which are described in
detail elsewhere (Blackburn 1997; Moore et al. 2005).
Each transducer is screwed into the tree at two points. Tree
bending causes this distance to increase or decrease and
causes a change in electrical resistance of the strain gauge
within the instrument. Strain (e) is defined as:
e ¼ DL=L
where DL is change in distance between attachment points,
and L is total distance. To enable the strain output to be
converted into turning moment, each sample tree was cali-
brated in two directions by applying a known load (measured
with a load cell) at a known height (generally 0.4–0.6 9 tree
height). The load was applied incrementally in four to six
stages and then released in stages. The load was converted to
turning moment, and a regression of turning moment against
output from the strain gauge provided a calibration coeffi-
cient for each strain transducer in situ. Further details of the
methodology can be found in Gardiner et al. (1997);
Blackburn (1997) and Wellpott (2008).
At Clocaenog, Kyloe and Harwood, two strain trans-
ducers were mounted orthogonally on the north and east
sides of each sample tree (to minimise the potential heating
effects of direct sunlight, which would cause differential
heating of the wood and metal), at approximately 1.3 m
above the ground. Output was logged at 4 Hz using three
CR10s at Clocaenog, a CR23X at Kyloe and four CR1000s
at Harwood (all loggers from Campbell Scientific, Logan,
USA). At Kyloe, a multiplexer (AM416, Campbell Scien-
tific, Logan, USA) was used for four of the sample trees;
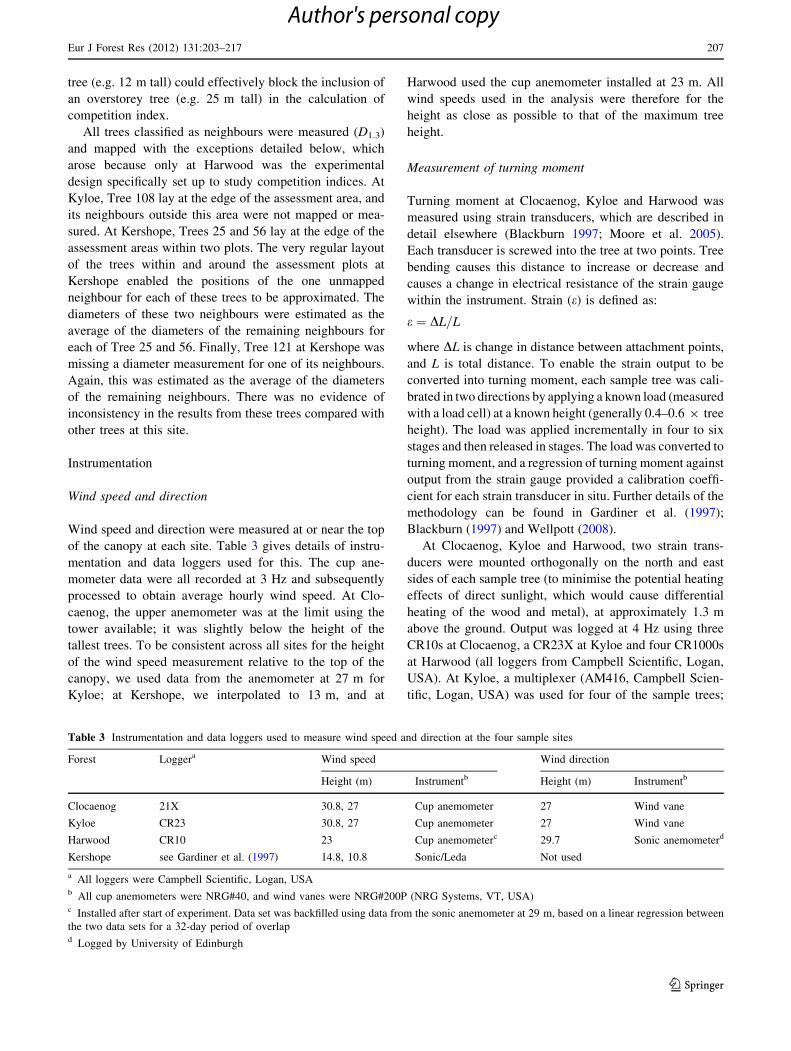
Table 3 Instrumentation and data loggers used to measure wind speed and direction at the four sample sites
Forest Loggera Wind speed Wind direction
Height (m) Instrumentb Height (m) Instrumentb
Clocaenog 21X 30.8, 27 Cup anemometer 27 Wind vane
Kyloe CR23 30.8, 27 Cup anemometer 27 Wind vane
Harwood CR10 23 Cup anemometerc 29.7 Sonic anemometerd
Kershope see Gardiner et al. (1997) 14.8, 10.8 Sonic/Leda Not used
a All loggers were Campbell Scientific, Logan, USAb All cup anemometers were NRG#40, and wind vanes were NRG#200P (NRG Systems, VT, USA)c Installed after start of experiment. Data set was backfilled using data from the sonic anemometer at 29 m, based on a linear regression between
the two data sets for a 32-day period of overlapd Logged by University of Edinburgh
Eur J Forest Res (2012) 131:203–217 207
123
Author's personal copy
these were activated only when wind speed above the
canopy exceeded 7 m s-1. At Kershope, LVDT (linear
variable differential transformer) transducers were used to
measure strain (Gardiner et al. 1997). The basic set-up and
calibration of these transducers on the individual trees was
the same as that used for the other three sites. Output was
recorded at 10 Hz, but data were extracted at 5 Hz for this
analysis to be more closely comparable with information
from the other three sites.
Data processing
Strain output from the two strain transducers (or LVDTs at
Kershope) on each sample tree was converted to turning
moment using the individual calibration coefficient for
each transducer derived from the pulling calibration. The
orthogonal turning moments were then combined to pro-
duce a single turning moment. The maximum turning
moment for each hour was obtained using the Gumbel
method (Cook 1985): each hour-long section of the time
series was divided into 20 periods of equal length (3 min),
and the maximum absolute turning moment for each period
was identified. The mode of these 20 values was taken as
the maximum turning moment for the hour. This is a robust
method that gives the most probable extreme value that
will be experienced during an hourly period. For each tree,
the relationship was investigated between the maximum
hourly turning moment and the average hourly wind speed.
All statistics were done using the open-source statistical
package R (R Development Core Team 2008) and Genstat
(Payne et al. 2008).
Competition indices
To investigate whether the bending response of trees to
wind loading was related to their position or status within
the stand, three distance-independent and five distance-
dependent competition indices were calculated for the
sample trees (Table 4). Distance-independent indices have
the advantage that individual tree positions are not
required, so they can be calculated from only a stand
diameter distribution, using all of the trees in each
assessment plot. These indices were scaled for differences
in plot size. The distance-dependent indices were calcu-
lated using the neighbours derived from the Voronoi
polygons.
The distance-independent indices were (i) sum of basal
area of trees larger than the subject tree (CBAL); (ii) sum of
diameter ratio of neighbour and subject trees (CDR); and
(iii) as for CDR but only for trees larger than the subject tree
(CDRL). These were calculated for all sample trees at all
sites. The first three distance-dependent indices (Table 4)
were calculated for all sites, using proximity in conjunction
with diameter ratios of neighbour and subject trees. The
first of these (CHegyi) was originally presented by Hegyi
(1974). C11 and C12 (numbered after Rouvinen and
Kuuluvainen 1997) are based on CHegyi, but place more
weight on proximity and diameter ratio, respectively.
These three indices were not calculated for Kyloe Tree
108, as its neighbours were not all mapped. At Clocaenog,
where crown information was available, two additional
distance-dependent indices, requiring crown characteris-
tics, were calculated for the sample trees (Table 4). The
first of these (CCWR) used proximity, and ratio of crown
width of competitor and subject trees (Bruchert 2003). The
most data-demanding index was developed by Schutz
(1989) to take into account differences in crown shape in
mixed-species stands. It uses tree height in addition to
crown radius and proximity (CSchutz).
Results
Turning moment coefficient
For each individual tree at Clocaenog, Kyloe and Harwood,
there was a linear relationship between the hourly maxi-
mum turning moment (Mmax) and the square of the hourly
mean wind speed at the canopy top; all regressions were
forced through zero (correlation coefficients are shown in
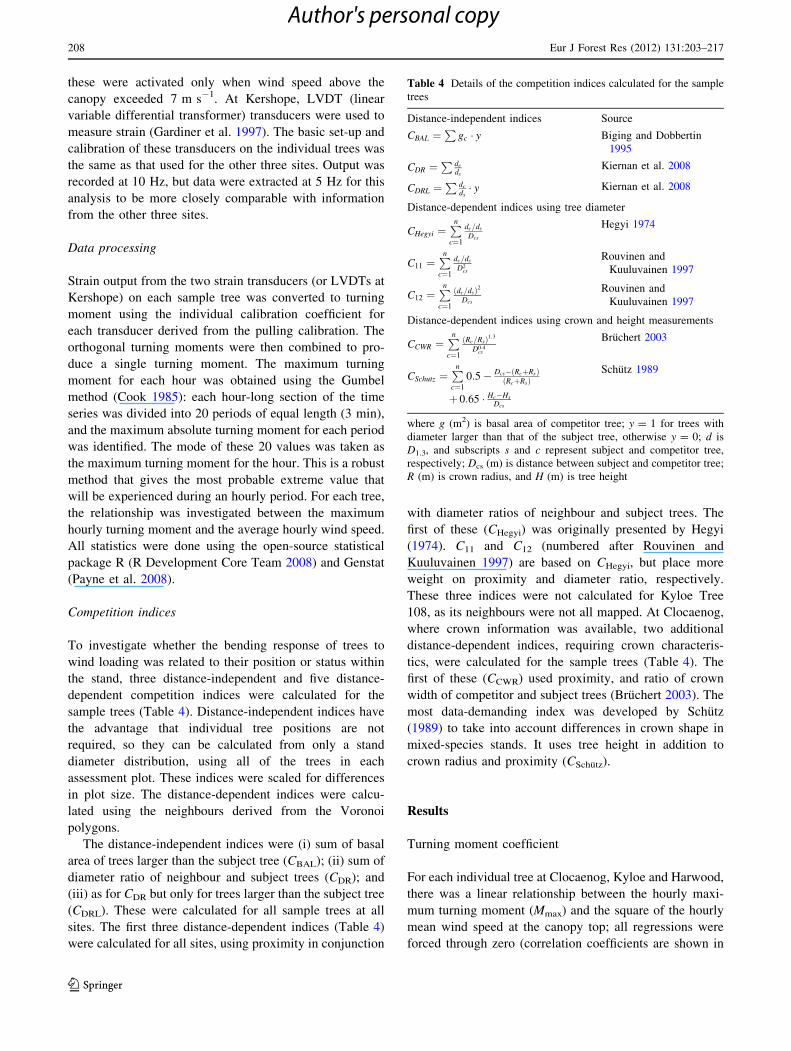
Table 4 Details of the competition indices calculated for the sample
trees
Distance-independent indices Source
CBAL ¼P
gc � y Biging and Dobbertin
1995
CDR ¼P dc
dsKiernan et al. 2008
CDRL ¼P dc
ds� y Kiernan et al. 2008
Distance-dependent indices using tree diameter
CHegyi ¼Pn
c¼1
dc=ds
Dcs
Hegyi 1974
C11 ¼Pn
c¼1
dc=ds
D2cs
Rouvinen and
Kuuluvainen 1997
C12 ¼Pn
c¼1
dc=dsð Þ2Dcs
Rouvinen and
Kuuluvainen 1997
Distance-dependent indices using crown and height measurements
CCWR ¼Pn
c¼1
Rc=Rsð Þ1:3D0:4
cs
Bruchert 2003
CSchutz ¼Pn
c¼1
0:5� Dcs� RcþRsð ÞRcþRsð Þ
þ 0:65 � Hc�Hs
Dcs
Schutz 1989
where g (m2) is basal area of competitor tree; y = 1 for trees with
diameter larger than that of the subject tree, otherwise y = 0; d is
D1.3, and subscripts s and c represent subject and competitor tree,
respectively; Dcs (m) is distance between subject and competitor tree;
R (m) is crown radius, and H (m) is tree height
208 Eur J Forest Res (2012) 131:203–217
123
Author's personal copy
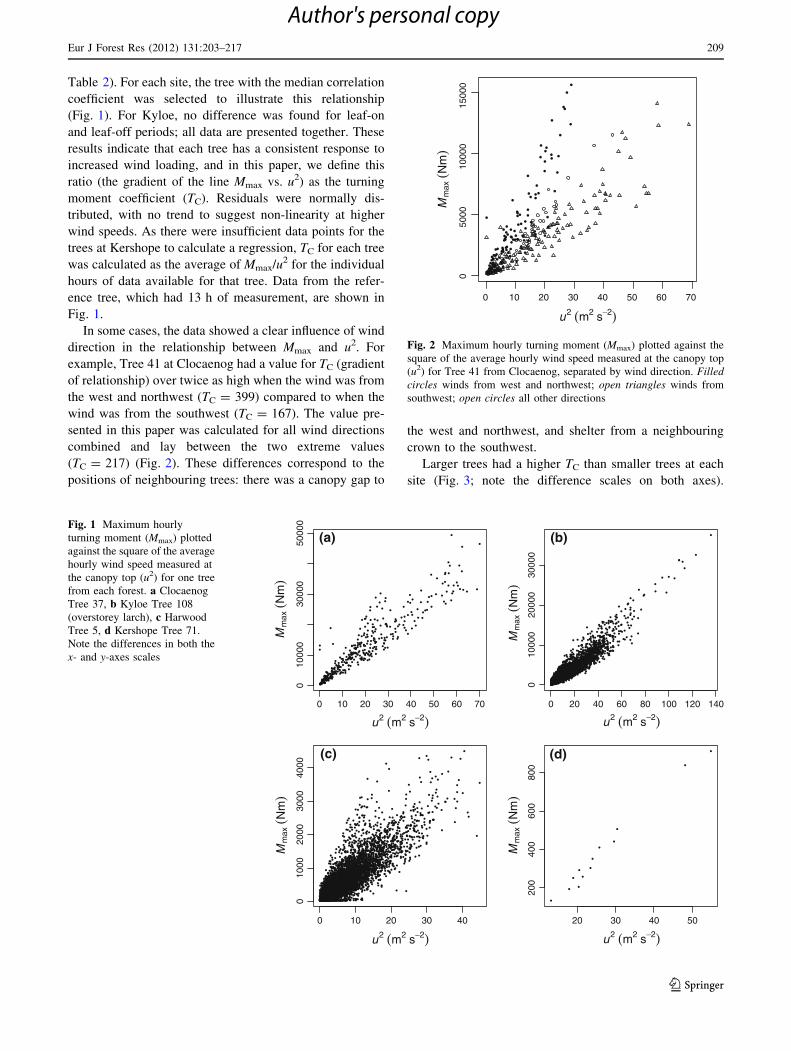
Table 2). For each site, the tree with the median correlation
coefficient was selected to illustrate this relationship
(Fig. 1). For Kyloe, no difference was found for leaf-on
and leaf-off periods; all data are presented together. These
results indicate that each tree has a consistent response to
increased wind loading, and in this paper, we define this
ratio (the gradient of the line Mmax vs. u2) as the turning
moment coefficient (TC). Residuals were normally dis-
tributed, with no trend to suggest non-linearity at higher
wind speeds. As there were insufficient data points for the
trees at Kershope to calculate a regression, TC for each tree
was calculated as the average of Mmax/u2 for the individual
hours of data available for that tree. Data from the refer-
ence tree, which had 13 h of measurement, are shown in
Fig. 1.
In some cases, the data showed a clear influence of wind
direction in the relationship between Mmax and u2. For
example, Tree 41 at Clocaenog had a value for TC (gradient
of relationship) over twice as high when the wind was from
the west and northwest (TC = 399) compared to when the
wind was from the southwest (TC = 167). The value pre-
sented in this paper was calculated for all wind directions
combined and lay between the two extreme values
(TC = 217) (Fig. 2). These differences correspond to the
positions of neighbouring trees: there was a canopy gap to
the west and northwest, and shelter from a neighbouring
crown to the southwest.
Larger trees had a higher TC than smaller trees at each
site (Fig. 3; note the difference scales on both axes).
0 10 20 30 40 50 60 70
010
000
3000
050
000
u2 (m2 s−2)
Mm
ax(N
m)
(a)
0 20 40 60 80 100 120 140
010
000
2000
030
000
u2 (m2 s−2)
Mm
ax(N
m)
(b)
0 10 20 30 40
010
0020
0030
0040
00
u2 (m2 s−2)
Mm
ax(N
m)
(c)
20 30 40 50
200
400
600
800
u2 (m2 s−2)
Mm
ax(N
m)
(d)
Fig. 1 Maximum hourly
turning moment (Mmax) plotted
against the square of the average
hourly wind speed measured at
the canopy top (u2) for one tree
from each forest. a Clocaenog
Tree 37, b Kyloe Tree 108
(overstorey larch), c Harwood
Tree 5, d Kershope Tree 71.
Note the differences in both the
x- and y-axes scales
0 10 20 30 40 50 60 70
050
0010
000
1500
0
u2 (m2 s−2)
Mm
ax(N
m)
Fig. 2 Maximum hourly turning moment (Mmax) plotted against the
square of the average hourly wind speed measured at the canopy top
(u2) for Tree 41 from Clocaenog, separated by wind direction. Filledcircles winds from west and northwest; open triangles winds from
southwest; open circles all other directions
Eur J Forest Res (2012) 131:203–217 209
123
Author's personal copy
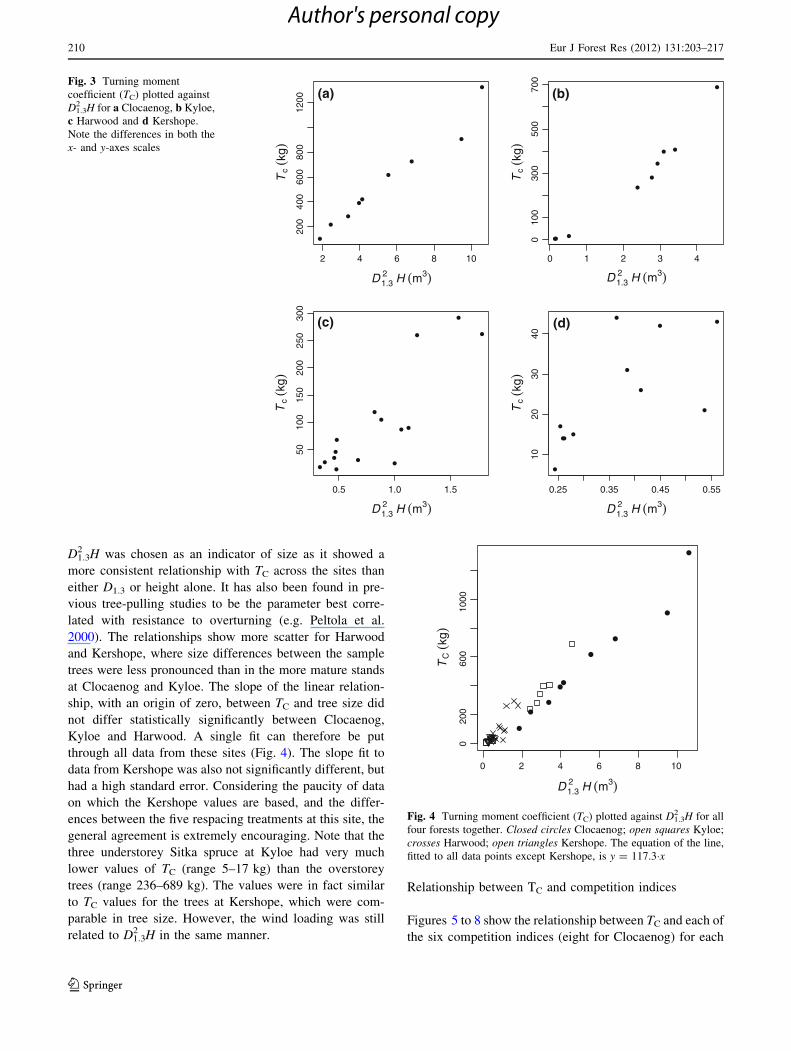
D1.32 H was chosen as an indicator of size as it showed a
more consistent relationship with TC across the sites than
either D1.3 or height alone. It has also been found in pre-
vious tree-pulling studies to be the parameter best corre-
lated with resistance to overturning (e.g. Peltola et al.
2000). The relationships show more scatter for Harwood
and Kershope, where size differences between the sample
trees were less pronounced than in the more mature stands
at Clocaenog and Kyloe. The slope of the linear relation-
ship, with an origin of zero, between TC and tree size did
not differ statistically significantly between Clocaenog,
Kyloe and Harwood. A single fit can therefore be put
through all data from these sites (Fig. 4). The slope fit to
data from Kershope was also not significantly different, but
had a high standard error. Considering the paucity of data
on which the Kershope values are based, and the differ-
ences between the five respacing treatments at this site, the
general agreement is extremely encouraging. Note that the
three understorey Sitka spruce at Kyloe had very much
lower values of TC (range 5–17 kg) than the overstorey
trees (range 236–689 kg). The values were in fact similar
to TC values for the trees at Kershope, which were com-
parable in tree size. However, the wind loading was still
related to D1.32 H in the same manner.
Relationship between TC and competition indices
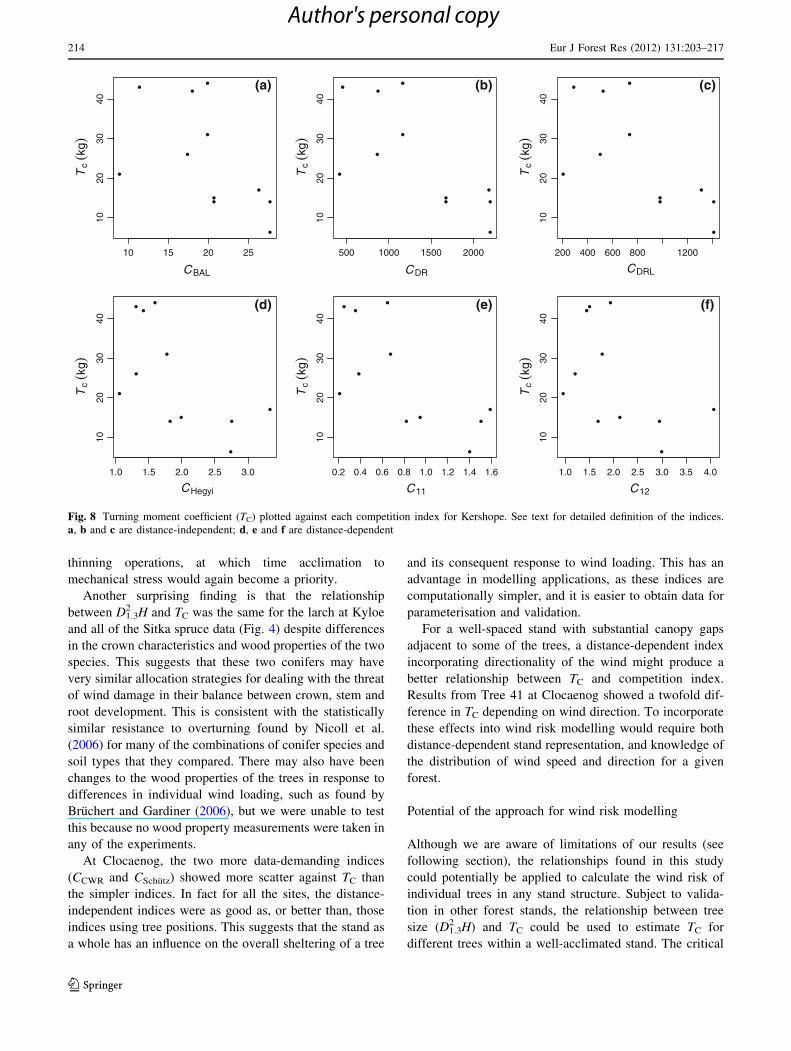
Figures 5 to 8 show the relationship between TC and each of
the six competition indices (eight for Clocaenog) for each
2 4 6 8 10
200
400
600
800
1200
D1.32 H (m3)
Tc
(kg)
(a)
0 1 2 3 4
010
030
050
070
0
D1.32 H (m3)
Tc
( kg)
(b)
0.5 1.0 1.5
5010
015
020
025
030
0
D1.32 H (m3)
Tc
( kg)
(c)
0.25 0.35 0.45 0.55
1020
3040
D1.32 H (m3)
Tc(k
g)
(d)
Fig. 3 Turning moment
coefficient (TC) plotted against
D1.32 H for a Clocaenog, b Kyloe,
c Harwood and d Kershope.
Note the differences in both the
x- and y-axes scales
0 2 4 6 8 10
020
060
010
00
D1.32 H (m3)
TC
( kg)
Fig. 4 Turning moment coefficient (TC) plotted against D1.32 H for all
four forests together. Closed circles Clocaenog; open squares Kyloe;
crosses Harwood; open triangles Kershope. The equation of the line,
fitted to all data points except Kershope, is y = 117.3�x
210 Eur J Forest Res (2012) 131:203–217
123
Author's personal copy
site. Regardless of site, all indices show a decrease in TC
with increasing competition. It is important to note that for
each competition index, the relationship differs between
sites, e.g. if TC was plotted against CBAL for all sites toge-
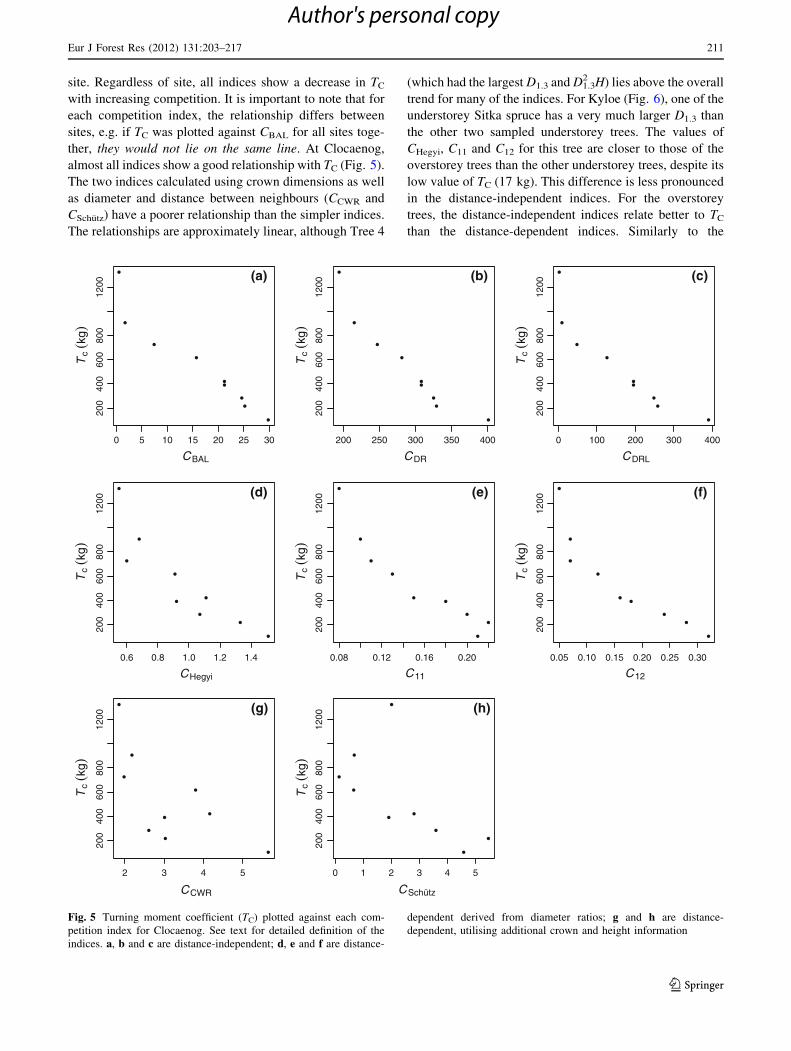
ther, they would not lie on the same line. At Clocaenog,
almost all indices show a good relationship with TC (Fig. 5).
The two indices calculated using crown dimensions as well
as diameter and distance between neighbours (CCWR and
CSchutz) have a poorer relationship than the simpler indices.
The relationships are approximately linear, although Tree 4
(which had the largest D1.3 and D1.32 H) lies above the overall
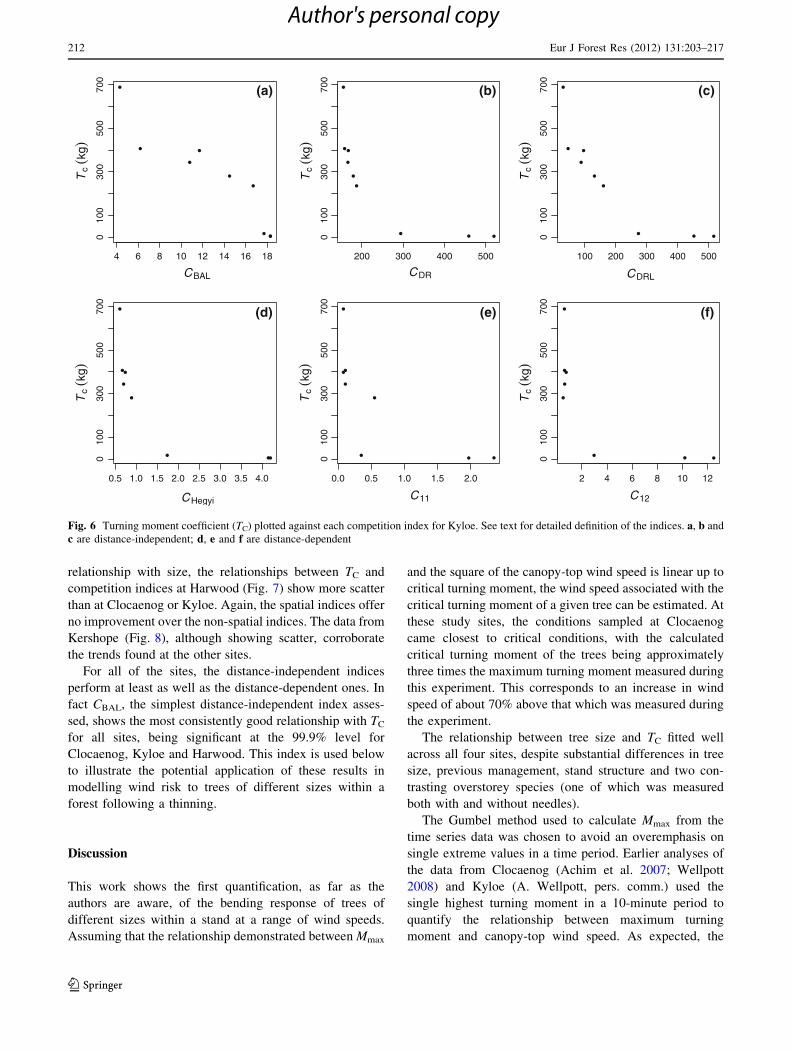
trend for many of the indices. For Kyloe (Fig. 6), one of the
understorey Sitka spruce has a very much larger D1.3 than
the other two sampled understorey trees. The values of
CHegyi, C11 and C12 for this tree are closer to those of the
overstorey trees than the other understorey trees, despite its
low value of TC (17 kg). This difference is less pronounced
in the distance-independent indices. For the overstorey
trees, the distance-independent indices relate better to TC
than the distance-dependent indices. Similarly to the
0 5 10 15 20 25 30
200
400
600
800
1200
CBAL
Tc(k
g)
(a)
200 250 300 350 400
200
400
600
800
1200
CDR
Tc(k
g )(b)
0 100 200 300 400
200
400
600
800
1200
CDRL
Tc(k
g)
(c)
0.6 0.8 1.0 1.2 1.4
200
400
600
800
1200
CHegyi
Tc
(kg )
(d)
0.08 0.12 0.16 0.20
200
400
600
800
1200
C11
Tc(k
g )
(e)
0.05 0.10 0.15 0.20 0.25 0.30
200
400
600
800
1200
C12
Tc(k
g)
(f)
2 3 4 5
200
400
600
800
1200
CCWR
Tc
(kg)
(g)
0 1 2 3 4 5
200
400
600
800
1200
CSchütz
Tc(k
g)
(h)
Fig. 5 Turning moment coefficient (TC) plotted against each com-
petition index for Clocaenog. See text for detailed definition of the
indices. a, b and c are distance-independent; d, e and f are distance-
dependent derived from diameter ratios; g and h are distance-
dependent, utilising additional crown and height information
Eur J Forest Res (2012) 131:203–217 211
123
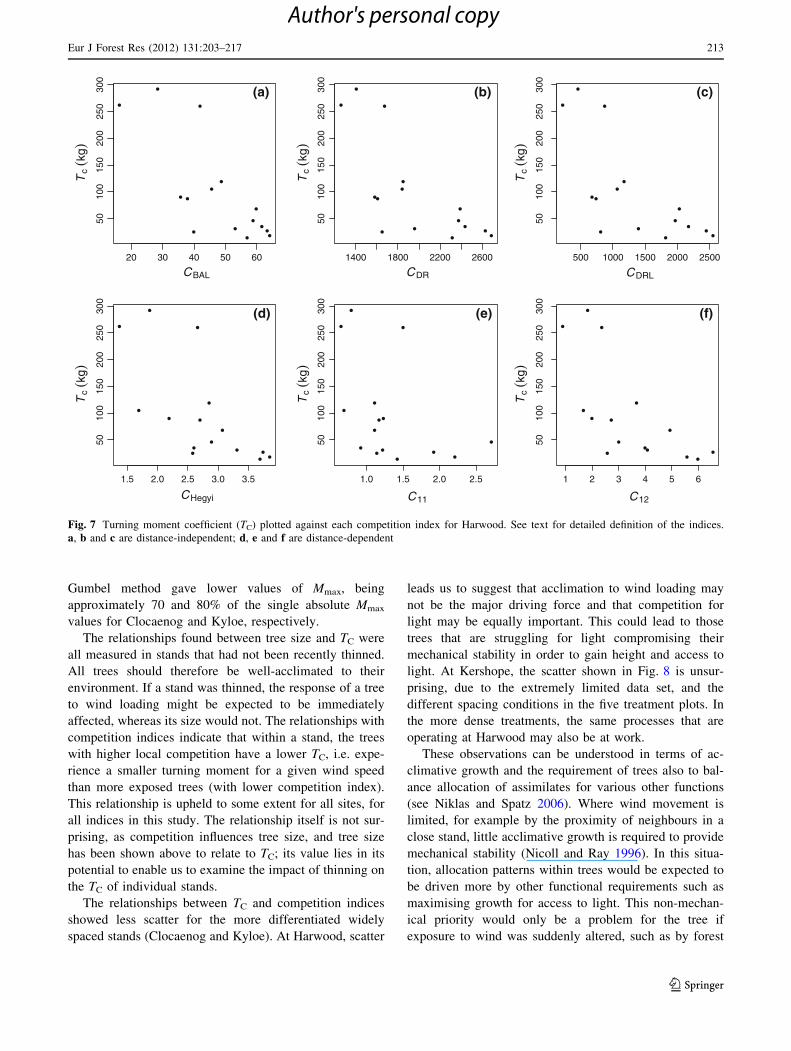
Author's personal copy
relationship with size, the relationships between TC and
competition indices at Harwood (Fig. 7) show more scatter
than at Clocaenog or Kyloe. Again, the spatial indices offer
no improvement over the non-spatial indices. The data from
Kershope (Fig. 8), although showing scatter, corroborate
the trends found at the other sites.
For all of the sites, the distance-independent indices
perform at least as well as the distance-dependent ones. In
fact CBAL, the simplest distance-independent index asses-
sed, shows the most consistently good relationship with TC
for all sites, being significant at the 99.9% level for
Clocaenog, Kyloe and Harwood. This index is used below
to illustrate the potential application of these results in
modelling wind risk to trees of different sizes within a
forest following a thinning.
Discussion
This work shows the first quantification, as far as the
authors are aware, of the bending response of trees of
different sizes within a stand at a range of wind speeds.
Assuming that the relationship demonstrated between Mmax
and the square of the canopy-top wind speed is linear up to
critical turning moment, the wind speed associated with the
critical turning moment of a given tree can be estimated. At
these study sites, the conditions sampled at Clocaenog
came closest to critical conditions, with the calculated
critical turning moment of the trees being approximately
three times the maximum turning moment measured during
this experiment. This corresponds to an increase in wind
speed of about 70% above that which was measured during
the experiment.
The relationship between tree size and TC fitted well
across all four sites, despite substantial differences in tree
size, previous management, stand structure and two con-
trasting overstorey species (one of which was measured
both with and without needles).
The Gumbel method used to calculate Mmax from the
time series data was chosen to avoid an overemphasis on
single extreme values in a time period. Earlier analyses of
the data from Clocaenog (Achim et al. 2007; Wellpott
2008) and Kyloe (A. Wellpott, pers. comm.) used the
single highest turning moment in a 10-minute period to
quantify the relationship between maximum turning
moment and canopy-top wind speed. As expected, the
4 6 8 10 12 14 16 18
010
030
050
070
0
CBAL
Tc
(kg)
(a)
200 300 400 500
010
030
050
070
0
CDR
Tc(k
g )
(b)
100 200 300 400 500
010
030
050
070
0
CDRL
Tc(k
g)
(c)
0.5 1.0 1.5 2.0 2.5 3.0 3.5 4.0
010
030
050
070
0
CHegyi
Tc( k
g)
(d)
0.0 0.5 1.0 1.5 2.0
010
030
050
070
0
C11
Tc(k
g)(e)
2 4 6 8 10 12
010
030
050
070
0
C12
Tc(k
g)
(f)
Fig. 6 Turning moment coefficient (TC) plotted against each competition index for Kyloe. See text for detailed definition of the indices. a, b and
c are distance-independent; d, e and f are distance-dependent
212 Eur J Forest Res (2012) 131:203–217
123
Author's personal copy
Gumbel method gave lower values of Mmax, being
approximately 70 and 80% of the single absolute Mmax
values for Clocaenog and Kyloe, respectively.
The relationships found between tree size and TC were
all measured in stands that had not been recently thinned.
All trees should therefore be well-acclimated to their
environment. If a stand was thinned, the response of a tree
to wind loading might be expected to be immediately
affected, whereas its size would not. The relationships with
competition indices indicate that within a stand, the trees
with higher local competition have a lower TC, i.e. expe-
rience a smaller turning moment for a given wind speed
than more exposed trees (with lower competition index).
This relationship is upheld to some extent for all sites, for
all indices in this study. The relationship itself is not sur-
prising, as competition influences tree size, and tree size
has been shown above to relate to TC; its value lies in its
potential to enable us to examine the impact of thinning on
the TC of individual stands.
The relationships between TC and competition indices
showed less scatter for the more differentiated widely
spaced stands (Clocaenog and Kyloe). At Harwood, scatter
leads us to suggest that acclimation to wind loading may
not be the major driving force and that competition for
light may be equally important. This could lead to those
trees that are struggling for light compromising their
mechanical stability in order to gain height and access to
light. At Kershope, the scatter shown in Fig. 8 is unsur-
prising, due to the extremely limited data set, and the
different spacing conditions in the five treatment plots. In
the more dense treatments, the same processes that are
operating at Harwood may also be at work.
These observations can be understood in terms of ac-
climative growth and the requirement of trees also to bal-
ance allocation of assimilates for various other functions
(see Niklas and Spatz 2006). Where wind movement is
limited, for example by the proximity of neighbours in a
close stand, little acclimative growth is required to provide
mechanical stability (Nicoll and Ray 1996). In this situa-
tion, allocation patterns within trees would be expected to
be driven more by other functional requirements such as
maximising growth for access to light. This non-mechan-
ical priority would only be a problem for the tree if
exposure to wind was suddenly altered, such as by forest
20 30 40 50 60
5010
015
020
025
030
0
CBAL
Tc(k
g)(a)
1400 1800 2200 2600
5010
015
020
025
030
0
CDR
Tc( k
g)
(b)
500 1000 1500 2000 2500
5010
015
020
025
030
0
CDRL
Tc(k
g)
(c)
1.5 2.0 2.5 3.0 3.5
5010
015
020
025
030
0
CHegyi
Tc
(kg )
(d)
1.0 1.5 2.0 2.5
5010
015
020
025
030
0
C11
Tc(k
g )(e)
1 2 3 4 5 6
5010
015
020
025
030
0
C12
Tc(k
g )
(f)
Fig. 7 Turning moment coefficient (TC) plotted against each competition index for Harwood. See text for detailed definition of the indices.
a, b and c are distance-independent; d, e and f are distance-dependent
Eur J Forest Res (2012) 131:203–217 213
123
Author's personal copy
thinning operations, at which time acclimation to
mechanical stress would again become a priority.
Another surprising finding is that the relationship
between D1.32 H and TC was the same for the larch at Kyloe
and all of the Sitka spruce data (Fig. 4) despite differences
in the crown characteristics and wood properties of the two
species. This suggests that these two conifers may have
very similar allocation strategies for dealing with the threat
of wind damage in their balance between crown, stem and
root development. This is consistent with the statistically
similar resistance to overturning found by Nicoll et al.
(2006) for many of the combinations of conifer species and
soil types that they compared. There may also have been
changes to the wood properties of the trees in response to
differences in individual wind loading, such as found by
Bruchert and Gardiner (2006), but we were unable to test
this because no wood property measurements were taken in
any of the experiments.
At Clocaenog, the two more data-demanding indices
(CCWR and CSchutz) showed more scatter against TC than
the simpler indices. In fact for all the sites, the distance-
independent indices were as good as, or better than, those
indices using tree positions. This suggests that the stand as
a whole has an influence on the overall sheltering of a tree
and its consequent response to wind loading. This has an
advantage in modelling applications, as these indices are
computationally simpler, and it is easier to obtain data for
parameterisation and validation.
For a well-spaced stand with substantial canopy gaps
adjacent to some of the trees, a distance-dependent index
incorporating directionality of the wind might produce a
better relationship between TC and competition index.
Results from Tree 41 at Clocaenog showed a twofold dif-
ference in TC depending on wind direction. To incorporate
these effects into wind risk modelling would require both
distance-dependent stand representation, and knowledge of
the distribution of wind speed and direction for a given
forest.
Potential of the approach for wind risk modelling
Although we are aware of limitations of our results (see
following section), the relationships found in this study
could potentially be applied to calculate the wind risk of
individual trees in any stand structure. Subject to valida-
tion in other forest stands, the relationship between tree
size (D1.32 H) and TC could be used to estimate TC for
different trees within a well-acclimated stand. The critical
10 15 20 25
1020
3040
CBAL
Tc(k
g)(a)
500 1000 1500 2000
1020
3040
CDR
Tc(k
g )
(b)
200 400 600 800 1200
1020
3040
CDRL
Tc(k
g)
(c)
1.0 1.5 2.0 2.5 3.0
1020
3040
CHegyi
Tc
( kg)
(d)
0.2 0.4 0.6 0.8 1.0 1.2 1.4 1.6
1020
3040
C11
Tc(k
g)(e)
1.0 1.5 2.0 2.5 3.0 3.5 4.0
1020
3040
C12
Tc(k
g)
(f)
Fig. 8 Turning moment coefficient (TC) plotted against each competition index for Kershope. See text for detailed definition of the indices.
a, b and c are distance-independent; d, e and f are distance-dependent
214 Eur J Forest Res (2012) 131:203–217
123
Author's personal copy
wind speed for each tree could then be calculated, based
on individual tree values of critical turning moment. All
else being equal, as the trees grow, D1.32 H will increase,
and TC of each tree will increase correspondingly. Cou-
pled with information about the wind climate at that site,
this will allow a distribution of risk within the stand to be
generated.
However, if the stand is thinned, the response of an
individual tree might be expected to change as its neigh-
bours are removed. Using D1.32 H will not account for this
immediate change in local sheltering effect, because tree
size will not change immediately but local shelter will.
Prior to thinning, it would be necessary to calculate a
competition index, e.g. CBAL, for each tree, which would
allow derivation of the TC versus CBAL relationship for that
stand. After a thinning, the trees will be the same size as
before, but generally have a lower CBAL. Assuming that the
individual trees remain on the line representing this rela-
tionship after thinning, the new CBAL values can be used to
estimate new TC values, and therefore a revised wind risk
distribution for the stand immediately after thinning.
If the relationship between size and TC remains the same
for acclimated trees as a stand grows, it follows that the
relationship between TC and competition index will change
with time. Tree size will increase with time, indicating an
increase in TC. If the relationship between TC and com-
petition index was to remain the same, then this increase in
TC would be met with a decrease in competition index.
However, assuming for illustrative purposes that all trees
experience the same percentage growth, then CBAL would
increase for each tree, and those indices based on diameter
ratios would remain the same. Crucially, in general, the
competition indices would not decrease. The relationship
between TC and competition index can therefore be used
only to indicate the immediate change in TC after a thin-
ning. It will not indicate how TC changes as the tree
acclimates to the new environment.
Limitations and future work
The values of TC for individual trees within a stand depend
on the wind speed at the canopy top. Wind speed can
change rapidly with height in this region, so small differ-
ences in height of the wind speed measurement potentially
have a large effect on the resulting TC values. Further, the
requirement for wind speed in parameterising the response
of individual trees to wind loading is onerous, as the
installation of a mast to raise an anemometer to canopy top
requires investment both in equipment and experimental
set-up time. Ideally, wind speed would have been measured
further above the forest canopy. However, at Clocaenog,
this was not possible with the equipment available.
In this study, measurements were taken on well-accli-
mated trees at four sites. The experiment needs to be
repeated in a range of different forest stands, including
stands with complex structure, to test the relationships
found, particularly the relationship between TC and tree
size and how it changes through time as a stand grows. TC
and competition indices need to be quantified before and
after a thinning, to confirm that individual trees within a
stand lie on the same TC versus competition index line
immediately after intervention. Instrumentation of trees
and monitoring them for a period of years following a
thinning or the creation of a new edge would provide
valuable information on the rate at which trees adapt to
changes in wind conditions, and on how the relationship
between TC and competition indices changes as the stand
grows.
The application of the relationship between Mmax and
wind speed at the canopy top to calculate critical wind
speed is based on the assumption that this relationship
remains linear at higher wind speeds than were recorded in
this study. Although there is no evidence from the residuals
for each tree that the form of the relationship changes at
high wind speeds, further measurements would be required
to validate this.
Conclusions
This study has quantified the relationship between hourly
maximum turning moment and hourly average canopy-top
wind speed for trees of different sizes in four forest stands.
At all sites, each tree showed a strong linear relationship
between maximum hourly turning moment and the square
of the average hourly wind speed measured at the canopy
top, characterising the turning response of an individual
tree at a given wind speed. This response (the gradient of
the line Mmax vs. u2), termed here TC, was found to be
correlated with tree size (D1.32 H), in a relationship that
differed little between the sites studied and indicated a
consistent acclimation to wind loading for trees of varying
size and social status within the stand. TC directly related
the maximum turning moment to the mean wind speed,
thereby offering a potential improvement on current
methods within wind risk models, which require an
adjustment from mean to extreme wind loading. At each
site studied, there was also a relationship between TC and
competition indices, with a decrease in TC with increasing
competition. Distance-independent indices performed bet-
ter than distance-dependent indices. The relationships dif-
fered for each site, and logically, they would also vary with
time for a given forest stand. Use of these relationships has
potential for modelling the immediate change in TC for
individual trees following a thinning. However, further
Eur J Forest Res (2012) 131:203–217 215
123
Author's personal copy

work needs to be carried out to explore these relationships
before incorporating them into the next generation of forest
wind risk models, which will be able to calculate the wind
risk to individual trees, the distribution of risk within
stands, and how these risks change over time.
Acknowledgments All work presented in this paper was funded by
the G.B. Forestry Commission. We would also like to thank the
following people for assistance with this work: Dave Brooks, John
Strachan and Jim Nicholl for technical help with the logging systems;
Arne Pommerening and the Tyfiant Coed team (Bangor University)
for access to, and data from, Clocaenog; Peter Hale (Hale Associa-
tion) and Ian Robinson (Scottish Woodland), for allowing us to
conduct an experiment within Kyloe Wood; Sigrid Dengel (Univer-
sity of Edinburgh) for providing wind speed and direction data for
Harwood; Carl Foster, Brian Jones, Dai Evans, Shaun Mochan, Justin
Chappell, Sophie Bertin and Colin Gordon for assistance with field
work; Cynthia Moore for data processing and Tom Connolly for
statistical analysis. Thanks also Victoria Stokes and two anonymous
reviewers for helpful comments on this manuscript.
Conflict of interest The authors declare that they have no conflict
of interest
References
Achim A, Wellpott A, Gardiner B (2007) Competition indices as a
measure of wind loading on individual trees, International
conference on wind and trees, 5–9 August 2007. University of
British Columbia, Vancouver
Ancelin P, Courbaud B, Fourcaud T (2004) Development of an
individual tree-based mechanical model to predict wind damage
within forest stands. For Ecol Manage 203:101–121
Anonymous (2004) The UK forestry standard—the government’s
approach to sustainable forestry. Forestry Commission,
Edinburgh
Anonymous (2006) The Scottish forestry strategy. Forestry Commis-
sion, Edinburgh
Anonymous (2009) Woodlands for wales. Forestry Commission,
Wales
Biging GS, Dobbertin M (1992) A comparison of distance-dependent
competition measures for height and basal area growth of
individual conifer trees. For Sci 38:695–720
Biging GS, Dobbertin M (1995) Evaluation of competition indices in
individual tree growth models. For Sci 41:360–377
Blackburn GRA (1997) The growth and mechanical response to trees
to wind loading. PhD Thesis, University of Manchester
Bruchert F (2003) The effect of growth space characteristics on the
tree growth response with respect to tree mechanics and internal
stem properties. In: Ruck B, Kottmeier C, Mattheck C, Quine
CP, Wilhelm DG (eds) International Conference ‘‘wind effects
on trees’’, Sept. 16–18, 2003. Karlsruhe, Germany, pp 369–375
Bruchert F, Gardiner B (2006) The effect of wind exposure on the tree
aerial architecture and biomechanics of Sitka spruce (Piceasitchensis Bong.). Amer J Bot 93:1512–1521
Cook NJ (1985) The designer’s guide to wind loading of building
structures. Butterworths, London
Courbaud B, Goreaud F, Dreyfus P, Bonnet FR (2001) Evaluating
thinning strategies using a tree distant dependent growth model:
some examples based on the CAPSIS software ‘‘uneven-aged
spruce forests’’ module. For Ecol Manage 145:15–28
Cucchi V, Meredieu C, Stokes A, de Coligny F, Suarez J, Gardiner B
(2005) Modelling the windthrow risk for simulated forest stands
of maritime pine (Pinus pinaster Ait.). For Ecol Manage
213:184–196
Ennos AR (1997) Wind as an ecological factor. Trends Ecol Evol
12:108–111
Gardiner BA, Quine CP (2000) Management of forests to reduce the
risk of abiotic damage—a review with particular reference to the
effects of strong winds. For Ecol Manage 135:261–277
Gardiner BA, Stacey GR, Belcher RE, Wood CJ (1997) Field and
wind tunnel assessments of the implications of respacing and
thinning for tree stability. Forestry 70:233–252
Gardiner BA, Peltola H, Kellomaki S (2000) Comparison of two
models for predicting the critical wind speeds required to
damage coniferous trees. Ecol Model 129:1–23
Gardiner BA, Suarez J, Achim A, Hale SE, Nicoll BC (2004)
ForestGALES 2—A PC-based wind risk model for British
forests—User guide. Forestry Commission, Edinburgh
Gardiner BA, Marshall BJ, Achim A, Belcher RE, Wood CJ (2005)
The stability of different silvicultural systems: a wind-tunnel
investigation. Forestry 78:471–484
Gardiner BA, Byrne K, Hale SE, Kamimura K, Mitchell S, Peltola H,
Ruel J-C (2008) A review of mechanistic modelling of wind
damage risk to forests. Forestry 81:447–463
Goudie JW, Polsson KR, Ott OK (2009) An empirical model of crown
shyness for lodgepole pine (Pinus contorta var. latifolia [Engl.]
Critch.) in British Columbia. For Ecol Manage 257:321–331
Hart C (1985) Alternative silvicultural systems to clear cutting in
Britain: a review. Bulletin 115. Forestry Commission, London
Hegyi F (1974) A simulation model for managing jack pine stands. In:
Fries J (ed) Growth models for tree and stand simulation. Royal
College of Forestry, Stockholm, pp 74–90
Kiernan DH, Bevilacqua E, Nyland RD (2008) Individual-tree
diameter growth model for sugar maple trees in uneven-aged
northern hardwood stands under selection. For Ecol Manage
256:1579–1586
Lanquaye-Opoku N, Mitchell SJ (2005) Portability of stand-level
empirical windthrow risk models. For Ecol Manage 216:
134–148
Mason WL, Kerr G (2004) Transforming even-aged conifer stands to
continuous cover management. Forestry Commission Informa-
tion Note 40 (Revised), Edinburgh
Mason WL, Kerr G, Simpson J (1999) What is continuous cover
forestry. Forestry Commission Information Note 29, Edinburgh
Moore JR, Gardiner BA, Blackburn GRA, Brickman A, Maguire DA
(2005) An inexpensive instrument to measure the dynamic
response of standing trees to wind loading. Agric For Meteorol
132:78–83
Nicoll BC, Gardiner BA (2006) The effects of increased wind action
on the radial growth of tree stems and structural roots. In:
Salmen L (ed) Proceedings of the fifth plant biomechanics
conference, Aug. 28–Sept. 1, 2006. Stockholm, Sweden,
pp 281–286
Nicoll BC, Ray D (1996) Adaptive growth of tree root systems in
response to wind action and site conditions. Tree Physiol 11:
891–898
Nicoll BC, Gardiner BA, Rayner B, Peace AJ (2006) Anchorage of
coniferous trees in relation to species, soil type, and rooting
depth. Can J For Res 36:1871–1883
Nieuwenhuis M, Fitzpatrick PJ (2002) An assessment of stem
breakage and the reduction in timber volume and value resulting
from a catastrophic storm: an Irish case study. Forestry 75:
513–523
Niklas KJ, Spatz H-C (2006) Allometric theory and the mechanical
stability of large trees: proof and conjecture. Amer J Bot
93:824–826
216 Eur J Forest Res (2012) 131:203–217
123
Author's personal copy
Payne RW, Murray DA, Harding SA, Baird DB, Soutar DM (2008)
GenStat for windows: introduction, 11th edn. VSN International,
Hemel Hempstead
Peltola H, Kellomaki S, Vaisanen H, Ikonen V-P (1999) A
mechanistic model for assessing the risk of wind and snow
damage to single trees and stands of Scots pine, Norway spruce
and birch. Can J For Res 29:647–661
Peltola H, Kellomaki S, Hassinen A, Granander M (2000) Mechanical
stability of Scots pine, Norway spruce and birch: an analysis of
tree pulling experiments in Finland. For Ecol Manage 135:
143–153
Pretzsch H, Biber P, Dursky J (2002) The single tree-based stand
simulator SILVA: construction, application and evaluation. For
Ecol Manage 162:3–21
Putz FE, Coley PD, Lu K, Montalvo A, Aiello A (1983) Uprooting
and snapping of trees: structural determinants and ecological
consequences. Can J For Res 13:1011–1020
Quine CP (2001) A preliminary survey of regeneration of Sitka spruce
in wind-formed gaps in British planted forests. For Ecol Manage
151:37–42
Quine CP, White IMS (1993) Revised windiness scores for the
windthrow hazard classification: the revised scoring method.
Forestry Commission, Edinburgh
Quine CP, Coutts MP, Gardiner BA, Pyatt DG (1995) Forests and
wind: management to minimise damage. Forestry Commission
Bulletin, HMSO, London, p 114
R Core Development Team (2008) R: a language and environment for
statistical computing. R Foundation for Statistical Computing,
Vienna, Austria. ISBN 3-900051-07-0, URL http://www.R-
project.org
Rogers M, Casey A, McMenamin C, Hendrick E (1995) An
experimental investigation of the effects of dynamic wind
loading on coniferous trees planted on wet mineral soils. In:
Coutts MP, Grace J (eds) Wind and trees. Cambridge University
Press, Cambridge, UK, pp 204–219
Rouvinen S, Kuuluvainen T (1997) Structure and asymmetry of tree
crowns in relation to local competition in a natural mature Scots
pine forest. Can J For Res 27:890–902
Ruel J-C, Pineau M (2002) Windthrow as an important process for
white spruce regeneration. For Chron 78:732–738
Savill PS (1983) Silviculture in windy climates. For Abstr 44:
473–488
Schaetzl RJ, Johnson DL, Burns SF, Small TW (1989) Tree
uprooting: review of terminology, process and environmental
implications. Can J For Res 19:1–11
Schelhaas MJ, Kramer K, Peltola H, van der Werf DC, Wijdeven SMJ
(2007) Introducing tree interactions in wind damage simulation.
Ecol Model 207:197–209
Schutz J-P (1989) Zum problem der Konkurrenz in Mischbestanen.
Schweiz Z Forstwes 140:1069–1083
Scott RE, Mitchell SJ (2005) Empirical modelling of windthrow risk
in partially harvested stands using tree, neighbourhood and stand
attributes. For Ecol Manage 218:193–209
Stadt KJ, Huston C, Coates KD, Feng Z, Dale MRT, Lieffers VJ
(2007) Evaluation of competition and light estimation indices for
predicting diameter growth in mature boreal mixed forests. Ann
For Sci 64:477–490
Stokes A, Nicoll BC, Coutts MP, Fitter AH (1997) Responses of
young Sitka spruce clones to mechanical perturbation and
nutrition: effects on biomass allocation, root development, and
resistance to bending. Can J For Res 27:1049–1057
Urban ST, Lieffers VJ, MacDonald SE (1994) Release in radial
growth in the trunk and structural roots of white spruce as
measured by dendrochronology. Can J For Res 24:1550–1556
Wellpott A (2008) The stability of continuous cover forests. PhD
Thesis, University of Edinburgh
Eur J Forest Res (2012) 131:203–217 217
123
Author's personal copy