Williams, John Delane Measures of School Integration ... - ERIC
23
DOCUMENT RESUME ED 242 793 TM 840 223 AUTHOR Mercil, Steven Bray; Williams, John Delane TITLE Measures of School Integration: Comparing Coleman's Index to Measures of Species Diversity. . PUB DATE Apr 84 NOTE 23p.; Paper presented at the Annual Meeting of the American Educational Research Association (68th, New Orleans, LA, April 23-27, 1984). PUB TYPE Speeches/Conference Papers (150) -- Reports Research-Technical (143) EDRS PRICE MF01/PC01 Plus Postage. DESCRIPTORS *Comparative Analysis; Data Analysis; Elementary Secondary Education; Mathematical Formulas; *Measurement Techniques; Private Schools; Public Schools; *Racial Integration; Racial Relations; Research Problems; *School Desegregation IDENTIFIERS *Coleman II ABSTRACT This study used species diversity indices developed in ecology as a measure of socioethnic diversity, and compared them to Coleman's Index of Segregation. The twelve indices were Simpson's Concentration Index ("ell"), Simpson's Index of Diversity, Hurlbert's Probability of Interspecific Encounter (PIE), Simpson's Probability of Individual Interspecific Encounter, the complement to Simpson's Concentration Index (1-"elI"), McIntosh's Index, the Shannon-Weiner Diversity Index, Number of Species (and its complement), and Importance Values (relative importance, unrelative importance, and equitabiIity). Intercorrelation matrices were formed for racial and ethnic segregation and diversity measures_. Coleman's segregation index and its expected value do not correlate strongly with each other or any of the diversity measures. Correlations approaching unity do exist between many of the racial and ethnic diversity measures. The indices using evenness, equitability, and importance of racial and ethnic characteristics to measure similarity-dissimilarity were the most effective measures of racial and ethnic diversity of schools. All the measures except Coleman's index showed public schools to be more racially and ethnically diverse than private schools. (BW) *********************************************************************** * Reproductions supplied by EDRS are the best that can be made * * from the original document. * ***********************************************************************
-
Upload
khangminh22 -
Category
Documents
-
view
0 -
download
0
Transcript of Williams, John Delane Measures of School Integration ... - ERIC
DOCUMENT RESUME
ED 242 793 TM 840 223
AUTHOR Mercil, Steven Bray; Williams, John DelaneTITLE Measures of School Integration: Comparing Coleman's
Index to Measures of Species Diversity. .
PUB DATE Apr 84NOTE 23p.; Paper presented at the Annual Meeting of the
American Educational Research Association (68th, NewOrleans, LA, April 23-27, 1984).
PUB TYPE Speeches/Conference Papers (150) -- ReportsResearch-Technical (143)
EDRS PRICE MF01/PC01 Plus Postage.DESCRIPTORS *Comparative Analysis; Data Analysis; Elementary
Secondary Education; Mathematical Formulas;*Measurement Techniques; Private Schools; PublicSchools; *Racial Integration; Racial Relations;Research Problems; *School Desegregation
IDENTIFIERS *Coleman II
ABSTRACTThis study used species diversity indices developed
in ecology as a measure of socioethnic diversity, and compared themto Coleman's Index of Segregation. The twelve indices were Simpson'sConcentration Index ("ell"), Simpson's Index of Diversity, Hurlbert'sProbability of Interspecific Encounter (PIE), Simpson's Probabilityof Individual Interspecific Encounter, the complement to Simpson'sConcentration Index (1-"elI"), McIntosh's Index, the Shannon-WeinerDiversity Index, Number of Species (and its complement), andImportance Values (relative importance, unrelative importance, andequitabiIity). Intercorrelation matrices were formed for racial andethnic segregation and diversity measures_. Coleman's segregationindex and its expected value do not correlate strongly with eachother or any of the diversity measures. Correlations approachingunity do exist between many of the racial and ethnic diversitymeasures. The indices using evenness, equitability, and importance ofracial and ethnic characteristics to measure similarity-dissimilaritywere the most effective measures of racial and ethnic diversity ofschools. All the measures except Coleman's index showed publicschools to be more racially and ethnically diverse than privateschools. (BW)
************************************************************************ Reproductions supplied by EDRS are the best that can be made *
* from the original document. *
***********************************************************************

"PERMISSION TO REPRODUCE:MISMATERIAL HAS BEEN GRANTED BY
/
re\Measures of School Integration: Comparing Coleman's
CT Index to Measures of Species Diversity TO THE EDUCATIONAL RESOURCESINFORMATION CENTER (ERIC)."
Steven Bray Merril and:John Delane Williams=4- University of North DakotaCNJ
tdCM
In a highly OUblitiZed study, Coleman; Hoffman and Kilgore (1981) con-
cluded thdt public SthbOlt were "less effective" than either Catholic or
private SthOtilt. Indeed, they claimed that private schools were slightly
leSS segregated thah public schools. This latter finding seems to fly
in the fate of minute minority, and particularly black; enrollments in
0,1vate schools. Such an interpretation calls for a close inspection of
their methodology and their choice of an index to measure segregation.
Additionally, their interpretation brings into focus the controversy4
regarding measures of segregation.
The responsibility of school systems in the United States to provide
quality education to all students underscores the need to develop unam=
biguous measures of integration. A review of the educational literature
reveals a collage of definitions and methods used to describe integration.
Taeuben and Taeuben (1969) provided a detailed analysis of segregation
indices. The Index of Dissimilarity presented by Duncan and Duncan
(1955) became the most popular measure of segregation. This index
uses the Lorenz curve to measure the unevenness of distribution of
two groups. Dissimilarity indices are affected by the size of the
analysis unit and the group composition of the aggregate (Cortese,
Falk and Cohen, 1976). This affect can cause and observed dissimilarity
index value to be misinterpreted. Based on information theory Theil
and Finizza (1971) developed an index that measures race entrophy, a
measure of the contribution a school district's racial composition
2
-U.S. DEPARTMENT OF EDUCATIONNATIONAL INSTITUTE OF EDUCATION
EDUCATIONAL RESOURCES INFORMATIONCENTER (ERIC/
This document has been reproduced asreceived from the person or organizationoryonattng st.Minor changes have been made to improvereproduction quality.
Points of view or opinions stated M this documerit do not necessarily represent official NIEposition or policy.

2
makes to segregation throughout the whole system (Zoloth, 1976). The diffi-
culty with this measurement is that the results do not provide easy direct
interpretation. Coleman (1981) describes his index of segregation as a
"variance" measure. Page (1981) criticizes this index with favoring the
private sector by emphasizing the within-sector variance and suggests an
"Index of Integration".
Ecologists use the concept of species number, richness, equitability
or evenness, and importance to measure similarity-dissimilarity in
biological communities. Peet (1975) provides a review of species diversity
concepts regarding species number and distribution. Similar concepts
appear in several biological; physical and social sciences (Patil and
Taille; 1982). Whether measuring segregation of schools or species
diversity of biological communities it is difficult to understand the
complex phenomena that affect diversity; This has led to various inter-
pretations of the diversity concept. As a result, diversity is largely
defined by the instrument used to measure it. The lack of universal
agreement on the concept of diversity prevents the scientific community
ifrom clarifying controversial issues for the public.
iThis study uses species diversity indices developed in ecology as
a measure of cocioethnic diversity, comparing these to Coleman's Index
of Segregation.
Coleman's Index
Coleman, Kelly and Moore (1975) measure between-school-sector segre-
gation as a function of interacial contact and measures within-school-sector
segregation by standardizing the interacial contact. The measure of
interacial contact (Sij
) is a measure of the average proportion of a

3
student's schoolmates who are from another group. it is constructed as
follows for any groups i and j:
E PS. =
k ki kj, where
£k k
= number of students inki group i in school k
J= proportion of students in
group i in school k
Schools in the sector are numbered 1; . . . . k, . . . n.
Segregation (r ) within a sector is constructed by standardizing
the measure of interacial contact by the proportion of studerts of the
other group in the sector:
P.rij = j
P,3
P. = proportion of students in group j.
where (1)
Themeasureofinteracialcontact(S.)is affected by the degree of
segregation between groups of students in the sector and by the overall
proportion of each group of students. The segregation index (rij) is
affected by the distribution of students among the schools within a
sector. Coleman (1981) concluded public schools have higher proportions
of blacks and are less interacially segregated than private schools but
are more internally segregated within the sector than private schools;
The lesser degree of segregation within the private sector counteracts
the higher degree of interacial contact and overall private schools con-
tribute slightly less to segregation. Coleman concluded that these two
tendencies would cancel each other out if the private school students
were absorbed into public schools with exactly the same distribution
among schools that is currently found in public schools.
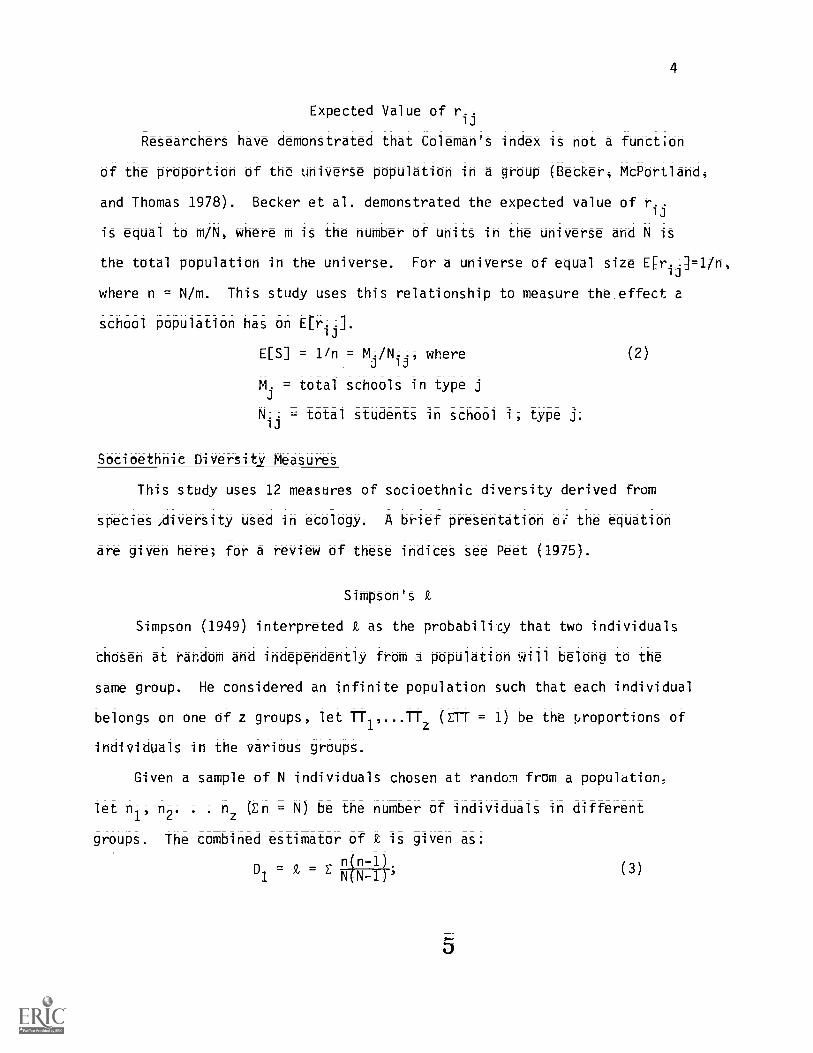
Expected Value of rid
Researchers have demonstrated that Coleman's index is not a function
Of the proportion of the universe population in a group (Becker, McPortland,
and Thomas 1978). Becker et al. demonstrated the expected value of rij
is equal to m/N, where m is the number of units in the universe and N iS
the total population in the universe. For a universe of equal size ED-ij
where n = N/m. This study uses this relationship to measure the effect a
school population has on E[r..].
E[S] = 1/n = Mj/Nii, where (2)
Mj
= total schools in type
N.;13
= total students in school type j.
Socioethnic Diversity Measures
This study uses 12 measures of socioethnic diversity derived from
species,diversity used in ecology. A brief presentation or the equation
are given here; for a review of these indices see Peet (1975).
Simpson's 2.
Simpson (1949) interpreted 2. as the probability that two individuals
chosen at random and independently from a population will belong to the
same group. He considered an infinite population such that each individual
belongs on one of z groups, let TT1,...TT± (ETT = 1) be the proportions of
individuals in the various groups.
Given a sample of N individuals chosen at random from a population;
let n1; n2. . . n2 (En = N) be the number of individuals in different
groups. The combined estimator of Q is given as:
D_ _ 601=1).1 N(N.=-1)'
(3)
5
=1/n,

since 1/2 N(N-1) is the number of pairs in the sample and 1/2 En(n-1 is
the number cf pairs drawn from the same groups.
This index is inversely proportional to diversity. For a community
consisting of cne group with nine individuals and a second group with one
individual the index would be .8 For a community with two groups each
having five individuals the index would equal .44. Simpson calls this
statistic a measurement of concentration and treats it synonymously with
diversity.
Simpson's Index of Diversity
Cox (1976) referred to Simpson's index as corresponding to the number
of randomly selected pairs of individuals that must be drawn from a com-
munity in order to have an even chance of obtaining a.pair with both
individuals of the same species; This index is calculated by the following
equation:
D2 'n(n-1)
(4)
This index is proportional to diversity. A careful inspection shows that
D2 = 1/D1. For a community of two groups containing nine and one indivi-
duals the index would equal 1.25. A community of two groups each containing
five individuals would equal 2;25; This index can have values between
one and infinity.
Hurlbert's Probability of Interspecific Encounter (PIE)
Hurlbert (1971) criticized ecologists for advancing the diversity
concept into a nonconcept. unrelated to meaningful biological properties.
He proposed ecologists develop meaningful biological properties using
species composition parameters; the probability of interspecific encounter
6
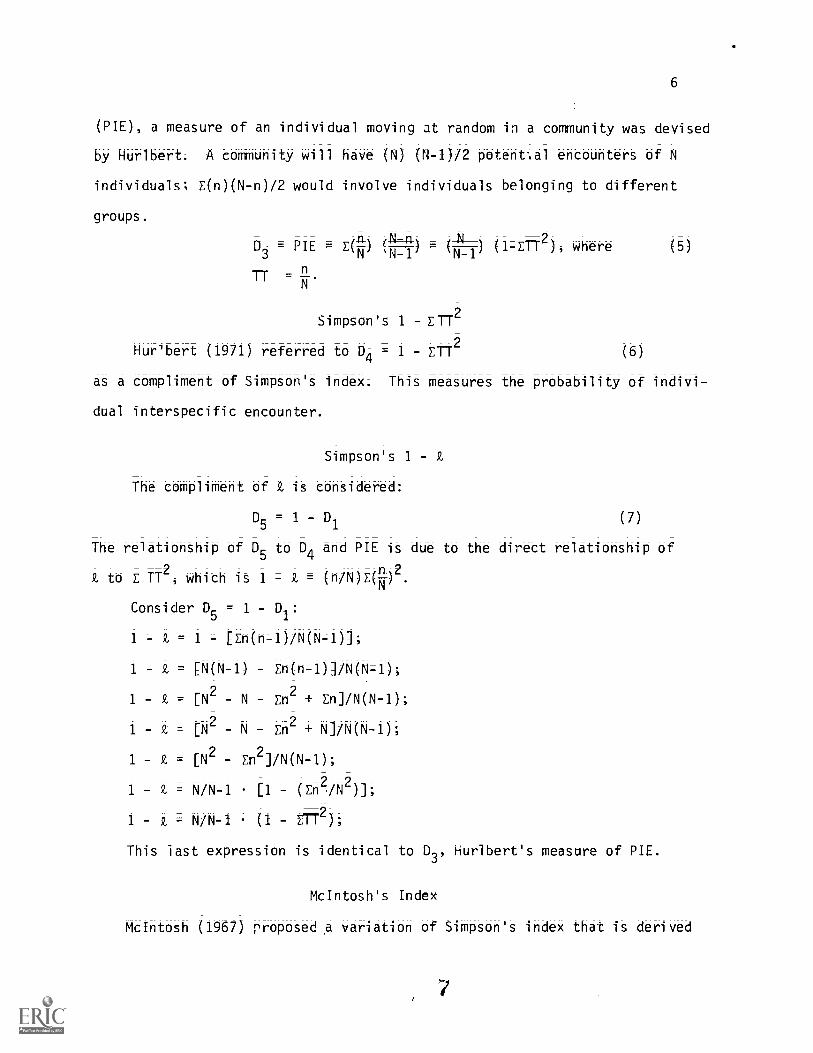
(PIE); a measure of an individual moving at random in a community was devised
by Hurlbert. A community will have (N) (N-1)/2 potential encounters of N
individuals; E(n)(N-n)/2 would involve individuals belonging to different
groups.
N-1D3
. PIE = E(N) tN
) (
N- 1) (1-ETT
'
mN
Simpson's 1 ETT2
Hur'bert (1971) referred to D4 = 1 ETT2
; where (5)
(6)
as a compliment of Simpson's index; This measures the probability of indivi-
dual interspecific encounter.
Simpson's 1 - t
The compliment of 9, is considered:
D8 = - Di (7)
The relationship of Ds to D4 and PIE is due to the direct relationship of
2 n 2to E TT ; which is 1 = Q = (n/N)E(--) .
Consider Ds = 1 -7- Di:
1 = Q = 1 = [En(n-1)/N(N=1)];
1 Q = [N(N-1) Eb(b-1)]/N(N=1);
1 - Q = [N2 N - En2 + En]/N(N-1);
1 - Q = [N2 - N - En2 + N]/N(N-1);
1 - k = [N2 - En2]/N(N-1);
1 - N/N-1 [1 - (En2 /N2)];)];
1 Q = N/N-1 (1 - 572);
This last expression is identical to DJ; Hurlbert's measure of PIE.
McIntosh's Index
McIntosh (1967) rroposed a variation of Simpson's index that is derived

from a distance measure. This index is given by:
D- (N -127)/(N -17) (8)
Distance is a measure of the ecological relationship suggested by the
similarity of two communities or samples. Two communities in which
three groups are represented appear as points in a three-dimensional
space. The equation is valid beyond three dimensions in an n-dimensional
space. Each group is theoretically represented by an axis in such a
hypothetical space. The similarity of a set of communities is represented
by the matrix of distance values between the communities.
Shannon-Weiner Diversity Index
The Shannon-Weiner Index uses information about the degree of uncer-
tainty in choosing the group membership of an individual drawn at random
(Shannon and Weaver; 1949). The uncertainty increases both as the number
of groups increases and as the individuals are distributed more equitably
among the group already present: The index is given by:
D7 = -E (ti) l (if);
Number of Species
(9)
Species number is a fundamental concept of diversity used to define
the functional relation of species-abundance to estimate species richness
and equitability of a community. Mork (1967) used a second degree poly-
nominal to show a strong relation between the Shannon-Weiner Index and
number of species. This study used D7 = S. where S = the number of groups
(groups are analogous to species) and D8 = 1 -1- as a measure of diversity. (11)
Importance Values
Whittaker (1972) examined diversity patterns based on the slope of
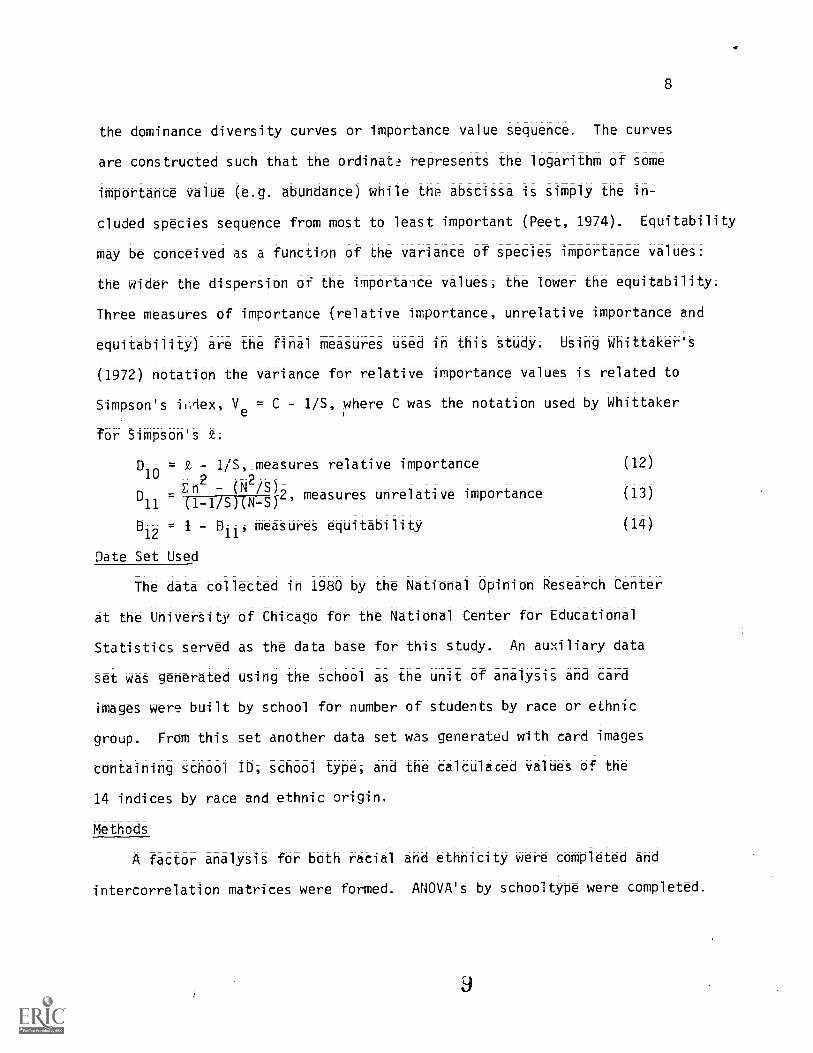
the doMinanCe diversity curves or importance value sequenc6. The curves
are constructed such that the ordinate represents the logarithm of some
importance value (e.g. abundance) while the abscissa is simply the in-
cluded species sequence from most to least important (Peet; 1974). Equitability
may be conceived as a function of the variance of species importance values:
the wider the dispersion of the importance values; the lower the equitability;
Three measures of importance (relative importance; unrelative importance and
equitability) are the final measures used in this study. Using Whittaker'S
(1972) notation the variance for relative importance values is related to
Simpson's ifflex; Ve = C - 1/Si where C was the notation used by Whittaker
for Simpson's Z;
D10 = 1/S;_measures relative importance (12)
2 2/S)
11 (1-1/S) ( N-S)En (N 2, measures unrelative importance= (13)
D121 DII, measures eqUitability (14)
Date Set Used
The data collected in 1980 by the National Opinion Research Center
at the University of ChiCaq0 for the National Center for Educational
StatittiCt served as the data base for this study. An auxiliary data
Set was generated using the school as the unit of analysis and card
images were built by school for number of students by race or ethnic
group. From this set another data set was generated with card images
containing school ID, school type; and the calculaced values of the
14 indices by race and ethnic origin.
Methods
A factor analysis for both racial and ethnicity were completed and
intercorrelation matrices were forthed. ANOVA's by schooltype were completed.

Results
Intercorrelation matrices were formed for racial and ethnic segregation
and diversity measures (Table 1). Coleman's segregation index and E[S] do
not correlate strongly with each other or any of the racial or ethnic diversity
measures. Correlations approaching unity do exist between many of the race
and ethnic diversity measures; Racial diversity measures: Simpson's (Di),
2Simpson's Index of Diversity (D2), PIE (D3), Simpson's 1-ETT (D4), bimpson's
1-Z (D5), McIntosh's Index (D6), and Shannon-Weiner's Diversity Index (07) all
correlate strongly, the lowest absolute correlation value of this set being
;9112: Ethrlicdiversityilleasuresp1 throughala'ko are strongly correlated.
Of the 21 possible correlations for this set of seven indices six are between
the absolute values of .672 and .768. The other 15 have absolute values above
.922. The number of groups measured by S (D8) correlates strongly with 1-1/S
(D9). These two measures correlate moderately with measures D1 through D.
Among this set co' correlations the lowest absolute value occurs between D9
and D2. Relative importance; St.-1/5 (Dia), does not correlate strongly with
any of the racial diversity measures but does correlate with ethnic diversity
measures. Correlations approaching unity occur with Din involving Di, 08i D4i 05
D6'
D7'
D11'
and D. The absolute value of the correlations of unrelative
importance (D--11 ) and eguitability (D12
) approach unity with all racial
diversity measures except D8, D9, and Dio. Ethnic diversity measures Dii
and 012 approach unity with Di, D3, D4, D5, D6, D7, and D10.
Factor analyses were used to examine these correlations further.
principle components solution with a varimax rotation was conducted using
the 14 measures. For racial data the measurements leaded in three factors.
These factors accounted for 92.2 percent of the total variance in the data,
70;2 percent by Factor 1, 14.6 percent by Factor 11, and 7.5 percent by
10

10
Factor III. Only Coleman's Index E[S]; S(%); 1-15(D9 ) and 9-1/S(D1o) do
not load substantially on Factor 1. Coleman's index and E[S] load partially
on Factor 1 but more highly on Factor III. The racial diversity indices DA;
D9, and D10
load highly on Factor 11.
For ethnic data the measurements loaded only on two factors. Factor 1,
b2ing the most significant factor; accounted for 71.2 percent of the total
variance in the data. Similar to the race data all variables loaded highly
on Factor I; except for Coleman's index; E[S] loaded evenly on both factors
but in the same direction as Coleman's index; S(D8) and 1-1/S(D9) load evenly
across both factors.
ANOVA's by sector were completed for each measure of racial and ethnic
diversity (Tables 4 and 5); As a measure of racial segregation Coleman's
index and 9,-1/S (D--10 ) are not significantly different by sector. All other
measures show public schools to be more racially diverse (Table 4). Ethnic
diversity doesn't differ significantly between public; private and catholic
school:. except as measuremext by E[S]; S(98), 1-1/S(D9), and 9,--1/S(D30).
Means for each sector for each measure are shown in Tables 6 and 7.
Discussion
Coleman's Index of segregation (rid) using the school as the unit of
analysis is a variance measure of the proportion of students in a group
within a sector. In this case S,-ij
is not a measure of interacial contact
because the number of students in group 1 divide out of the equation. This
results in = Pkj, the proportion of students in group j and school k.
Coleman's index measures school deviation from the overall proportion of a
group in a sector. Coleman's index (rii) is not significantly different
11

11
between sectors (Tables 4 and 5); therefore white students are distributed with-
in sectors. Because white students arse "somewhat" evenly distributed
within sectors; the within sector distribution of non-white students would
have to vary significantly to arrive at Coleman's conclusion that the
within segregation was higher in public schools. Under the above conditions
the relationship between Coleman's index (rid) and E[S] no longer exists
E[S] measures the size of the unit in a sector in terms of the number of
students in a school; Although E[S] and r,-ij
don't correlate strongly
they are the only measurements that load high on Factor III. Since E[S]
is only affected by the number of students in a school Factor III is
likely a measure of students ( 1) in a school. If the number of schools
are held constant in a sector, only shifts in ni would affect E[5];
Several measures of diversity are combinations of other measures;
These include; D1,
D2 1' 3=1/D D-=PIE=D
5' 4 ' 5 1D:=1-YTT
2D-=1-D-; In addition
to these indices, D6=McIntosh's Index, D 7 =Shannon-Weiner Index; D11 and
D12all load significantly on Factor I for race and ethnic data (Tables
2 and 3). The calculations using these measurements all involve the manipula-
tion of the number of individuals in a group and the total population. Based
on correlations and factor loading the concept of diversity is measured by
these indices. The measurements involving the number of groups present,
5(%), I9 =1-1/S and Dio=Z:- 1/S all load strongly on Factor II. This suggests
Factor II measures; race and ethnic membership.
The concept of racial and ethnic diversity of schools appear to be best
measured by D1, D2, D3, D4, D5, D6, D7, Di, and D12. These indices use even-
ness, equitability and importance of racial and ethnic characteristics to
measure similarity-dissimilarity; Coleman's index is strongly influenced by
the proportion of one group; It does not account for the race and ethnic
12

12
characteristics of all other groups. Coleman's index is the only index in
this study that allows the conclusion that public schools and private schools
are equally diverse. All other measures show public schools to be more
racially and ethnically diverse. In fact, if the question, what sector
allows the highest interacial interaction, then the PIE measure of racial
diversity would appropriately best answer that question. The public and
Catholic sectors are approximately equal in PIE, with probabilities of .251
and .261 respectively. However, the private sector is significantly less
diverse (integrated); the PIE for the private sector is .160. These outcomes
are more consonent with the common sense notion that those schools that have
the highest proportions of minorities will have the highest degree of
diversity.
Further, if social class is considered (see Table 8) public schools
enroll far more low income (social status) students than do either the
Catholic schools or the private schools. The contrast of public to private
schools is 31.72 percent to 6.96 percent in terms of low status students.
In light of these findings, Coleman's interpretation of the data together
with his measure of so-called "integration" are not just ironic; they are
so misleading to be better be described as being tragic.
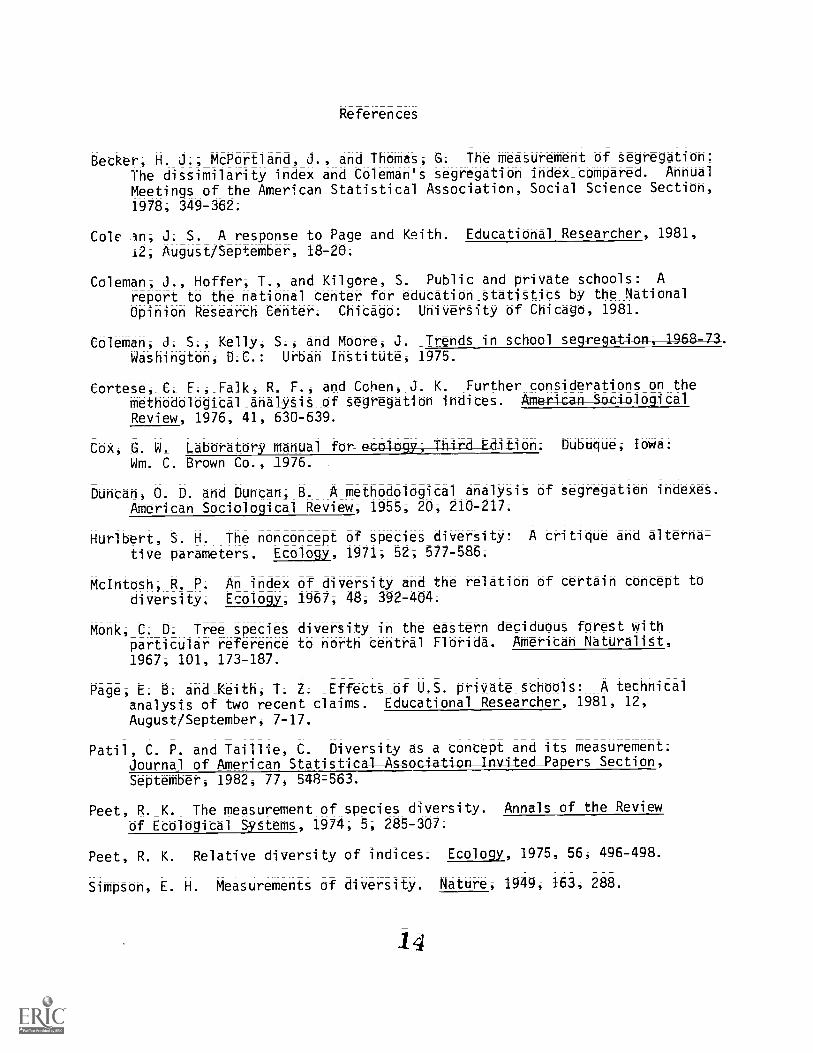
References
Becker; H. J., McPortland, J., and Thomas, G. The measurement of segregation:The dissimilarity index and Coleman's segregation index_compared. Annual
Meetings of the American Statistical Association, Social Science Section,1978; 349-362.
Cole in, J. S. A response to Page and Keith. Educational Researcher, 1981,
12, August/September, 18-20.
Coleman, J., Hoffer, T., and Kilgore, S. Public and private schools: A
report to the national center for education statistics by the NationalOpinion Research Center. Chicago: University of Chicago, 1981.
Coleman, J. S., Kelly, S., and_Moore, J. Trends in school segregation-, 1968-73.
Washington, D.C.: Urban Institute, 1975.
Cortese, C. F., Falk, R. F., and Cohen, J. K. Further considerations on themethodological analysis of segregation indices. American Sociological
Review, 1976, 41, 630=639.
COX, G. W. Laboratory manual forecoloy_ThindEclition. Dubuque; Iowa:
WM. C. Brown Co., 1976.
Duncan, O. D. and Duncan, B. A methodological analysis of segregation indexes.American Sociological Review, 1955, 20, 210-217.
Hurlbert, S. H. The nonconcept of species diversity: A critique and alterna
tive parameters. Ecology, 1971, 52, 577-586.
McIntosh, R. P. An index of diversity and the relation of certain concept todiversity. Ecology, 1967, 48, 392-404.
Monk, C. D. Tree species diversity in the eastern deciduous forest withparticular reference to north central Florida. American Naturalist,
1967, 101, 173-187.
Page, E. B. and Keith, T. Z. Effects of U.S. private schools: A technical
analysis of two recent claims. Educational Researcher, 1981, 12,
August/September, 7=17.
Patil, C. P. and Taillie, C. Diversity as a concept and its measurement.Journal of American StatisticalAssed_Papers Section,
September, 1982, 77, 548-563.
Peet, R. K. The measurement of species diversity. Annals of the Review
of Ecological Systems, 1974, 5, 285-307.
Peet, R. K. Relative diversity of indices. Ecology, 1975, 56, 496-498.
Simpson, E. H. Measurements of diversity. Nature, 1949, 163, 288.
14
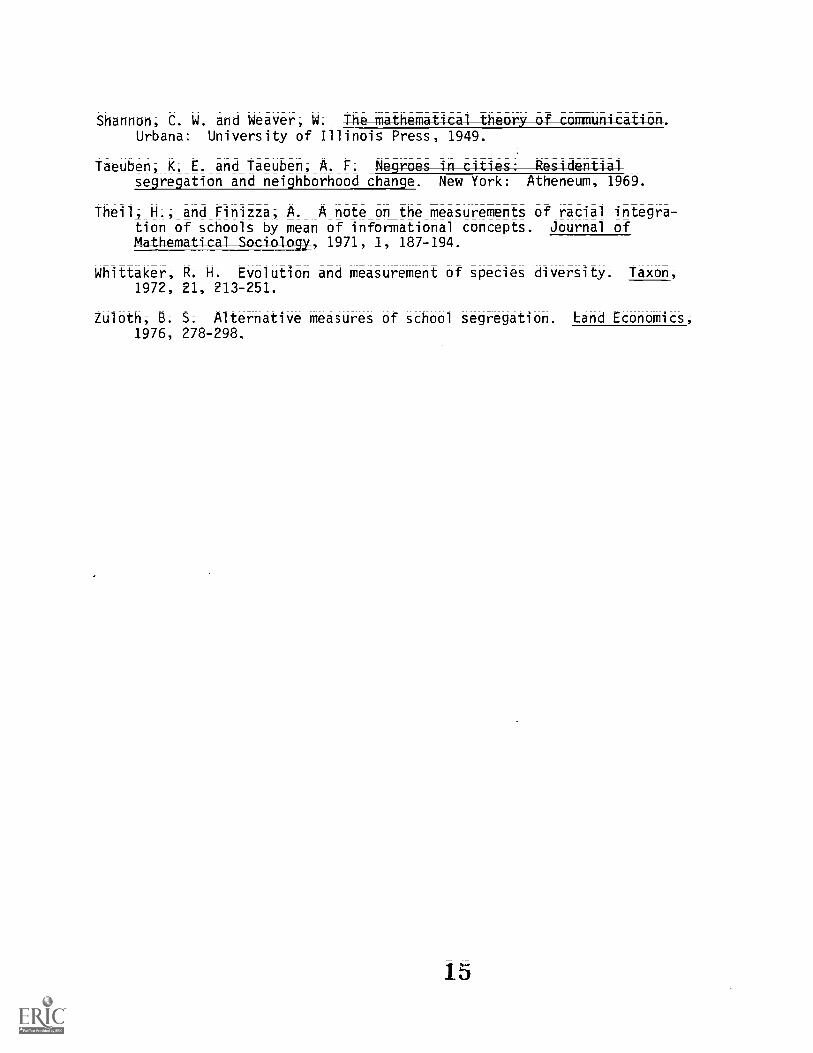
Shannon, C. W. and Weaver, W. The mathematical heory of communication.Urbana: University of Illinois Press, 1949.
Taeuben, K. E. and Taeuben, A. F. Negroes in cities: ResidentialNew York: Atheneum, 1969.-a m as 11- Gana Allem ..11
Theil, H., and Finizza, A. A note on the measurements of racial integra-tion of schools by mean of informational concepts. Journal of
, 1971, 1, 187-194.U. _ G al
Whittaker, R. H. Evolution and measurement of species diversity. Taxon,1972, 21, 213-251.
Zuloth, B. S. Alternative measures of school segregation. Land Economics,1976, 278-298.

Table 1
Correlation Among_14 Measures vf_Socioethnic al-verS-WEthhitity Correlations Above Main Diagonal_;_Racial
Correlations Below Main Diagonal (M=1015)
rij .086 .228 ;.251 ,-.243 -.248 -.243 -.256 -.293 -.268 -.227 .191 .208 -.208
.086 E[S] -.158 .105 .160 .126 .160 .191 .071 -.075 -.087 -.248 -.079 .079
-.375.179 Di -.676 -.975 -.971 -.975 -.963 .922 -.676 -.567 .944 .911 -.911
.385 -.181 -.951 D 2 .672 .672 .678 .768 .761 .615 .393 -.657 ;.544 .544
.375 -.179 -1.00 .951 D3 .996' 1.00 .980 .939 .687 .668 -.923 -.88.8 .888
.374 =.183 -1.00 .950 1.00 D4
.996 .968 .952 .717 .696 -.904 =.899 .899
.375 -.179 -1.00 .951 '1.00 1.00 08 .928 .939 .687 .668 -.923 -.888 .888
.383 -.172 =.996 .971 .996 .994 .996 06
.942 .681 .59D -.938 -.867 .867
.362 -.185 -.985 .942 .985 .986 .985 .980 07
.868 .712 -.832 -.834 .834
.174 -.187 =.656 .659 .656 .659 .656 .f37 .754 D8 .713 -.503 -.572 .572
.153 - ;177 -.597 .489 .597 .600 .597 .569 .669 .883 09 -.331 -.4Z5 .475
-.223 -.014 .373 -.446 -.373 -.370 -.373 -.401 -.275 .323 .521 D10
.881 =.881
-.370 .174 .956 .898 .956 -.957 -.956 -.950 =.903 -.453 -.448 .500 011 -1.000
.370 -.174 .956 .898 .956 .957 .956 .950 .903 .453 .448 -.500 -1.000 Dig
1'43 = Coleman's Index;
E[S] . The Expected Value of Coleman's Index
D7= Shannon-Weiner Index;
D8 = S (Number of Groups);
Di = Simpson's L; 09= 1-15;
02 = SiMOSOn Index Of Divetsity=1/D1; Dio = 1-1/S;
D3 Hurlbert's PIE=D3 5' D11
unrelative importance
2_= Simpson'S 1=ETT ; Dir04 = 1-
= Simpson's 1-2408
D- = MtIntosh's Index;
16

Table 2
Varimax- Y
Indices Factor
.39655
Factor 11
-.00707
Factor III
.69287
E[S] .21943 -.06304 .85079
D1 -.98150 -.17912 -.03114
D2 .95823 .08507 .08177
D3 .98150 ;17911 .93114
D4 .98092 .18240 .02722
D5 .98150 .17911 .03114
D6 .98417 .14956 .0393Li
D7 .94748 .29345 .02703
U8 .52641 .78915 -.03241
9.44751 .88018 -.02865
D10.52671 .82756 -.06629
D11-.97507 .01636 -.02113
Dig.97508 -.01637 .02113
17

Table
Varimax Rotated Factor Matrix for Ethnic Dive -rs-i -t
Indices
rij
E[S]
3
4
D-5
D6
D7
D8
D9
D10
Di'
Da
Factor I
F=.17845
.30477
-.97228
.70983
.97486
.96747
.97486
.97765
.91792
.64466
.54719
=.95862
=.91045
.91045
Factor II
-.49602
-.71969
-.12170
.19624
.17223
;21368
;17223
.13540
.34848
.56886
.60002
.09097
=.09480
.09480
18

Table 4
Summary af OnPway ANOVA's; Racial Diversity by Sector1
Indices dfb dfw
SSA
SSw
MS-A
MSw
F
rij
2 1012 .036 138.810 .018 .137 .134
E[S] 2 1012 13566.00 52185.699 6783.066 51.566 131.539
D1
2 1012 .315 46.317 .157 .045 3.448
D2
2 1012 1.949 317.225 .974 .313 3.110
D3
2 1012 .315 46.316 .517 .045 3.444
D4 2 1012 .336 44.129 .168 .043 3.859
D5 2 1012 .315 46.310 .157 .045 3.444
D6
2 1012 .128 22.720 .064 .022 2.861
D7 2 1012 .194 23.327 .096 .023 4.196
D8 2 1012 15.975 1205.002 7.987 1.190 6.708
09 1012 .328 54.799 .164 .054 3.030
010 1012 .118 41.059 .059 .040 1.460
Dl} 2 1012 .778 97.714 .389 .096 4.030
122 1012 .778 97.714 .389 .096 4.030
1sectors-public schools; catholic schools, privete schools
19

Table 5
Summary of Oneway ANOVA's, Ethnic_Diversity by Sector'
Indices dfb
dfw
SSA SSW MS-A
MSw
F
r1J.. 2 1012 .036 138.810 .018 .137 .134
E[S] 2 1012 13566.136 52185.699 6783.06 51.566 131.566
D1 2 1012 .046 19.506 .023 .019 1.203
D-2
2 1012 18.602 13664.901 9.301 13.502 .689
32 1012 .007 20.118 .003 .019 .193
2 1012 .001 19.266 .004 .019 .047
D-5
2 1012 .007 20.118 .003 .019 .193
D6
2 1012 .038 21.472 .109 .021 .900
D7
2 1012 .033 36.967 .0168 .036 .461
08 2 1012 85.917 9638.228 42.958 9.523 4.511
D9 2 1012 .058 3.279 .029 .003 8.900
0 101012 .096 12.414 .048 .012 3.946
Dll 2 1012 .007 32.810 .003 .032 .114
0121012 .007 32.810 .003 .032 .114
1sectors-public schools, catholic schools, private schools
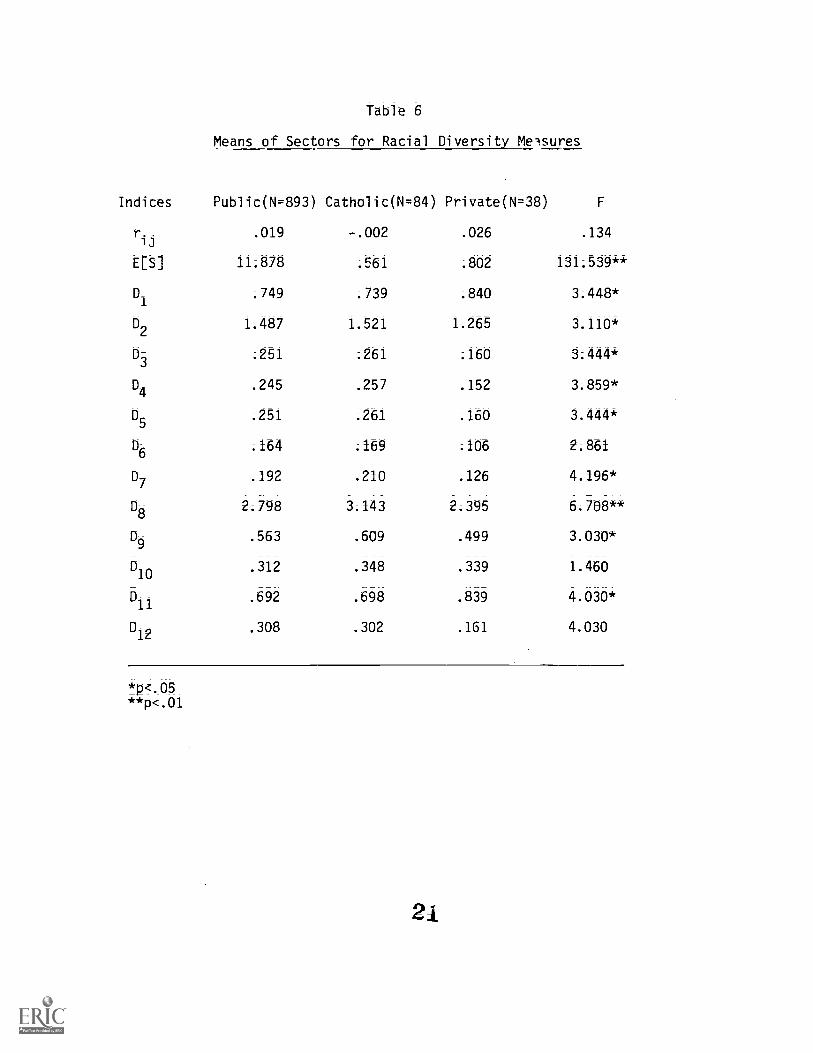
Table 6
Means of Sectors for Racial -Diversity -Mels-ures-
Indices Public(N=893) Catholic(N=84) Private(N =38) F
r..ij
.019 -.002 .026 .134
E[S] 11.878 .561 .802 131.539**
DI .749 .739 .840 3.448*
D-2
1.487 1.521 1.265 3.110*
D33
.261 .160 3.444*
D4
.245 .257 .152 3.859*
D5
.251 .261 .160 3.444*
D6
.164 .169 .106 2.861
D7
.192 .210 .126 4.196*
D8 2.798 3.143 2.395 6.708**
D9
.563 .609 .499 3.030*
D10.312 .348 .339 1.460
D11.692 .698 .839 4.030*
12.308 .302 .161 4.030
*p.05* *p <.01

Table 7
Means of Sectors for Ethnic Diversity Measures
Indices Public(N,-483) Catholic (N .=84) rivate(N =38)
r..13
.019 =.002 .026 .134
E[S] 11.878 .561 .802 131.566**
Dl .214 .222 .161 1.203
D2 6.342 5.858 6.176 .689
D3 .786 .777 .792 .193
04 .768 .764 .764 .047
D5
.786 .777 .792 .193 ,
06 .629 .611 .647 .900
D7 .820 .822 .790 .461
D8 11.222 11.789 9.974 4.511*
09 .900 .909 .863 8.900**
D10
.114 .131 .070 3.946*
D11
.251 .247 .238 .114
D12
.749 .753 .762 .114
*p<.05**v.01
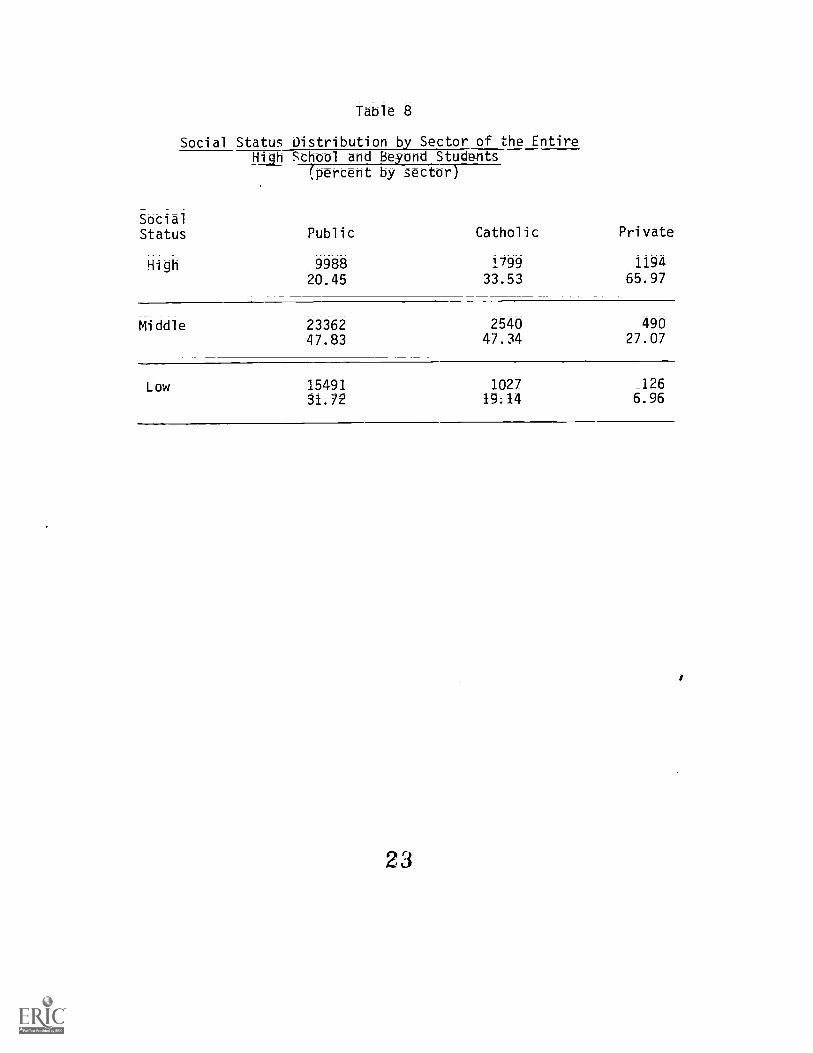
Table 8
Social Status Distribution by Sector of the Ent -ireHigh School and Beyond Stude-n ts
(percent by sector)
SocialStatus Public Catholic Private
High 9988 1799 1194
20.45 33.53 65.97
Middle 23362 2540 49047.83 47.34 27.07
Low 15491 1027 126
31.72 19.14 6.96
23