WILL TESLA CRASH THE LOS ANGELES GRID? - Homeland ...
99
NAVAL POSTGRADUATE SCHOOL MONTEREY, CALIFORNIA THESIS HITTING THE ACCELERATOR: WILL TESLA CRASH THE LOS ANGELES GRID? by Marilee Orr September 2019 Co-Advisors: Theodore G. Lewis (contractor) Rodrigo Nieto-Gomez Approved for public release. Distribution is unlimited.
-
Upload
khangminh22 -
Category
Documents
-
view
0 -
download
0
Transcript of WILL TESLA CRASH THE LOS ANGELES GRID? - Homeland ...
NAVAL POSTGRADUATE
SCHOOL
MONTEREY, CALIFORNIA
THESIS
HITTING THE ACCELERATOR: WILL TESLA CRASH THE LOS ANGELES GRID?
by
Marilee Orr
September 2019
Co-Advisors: Theodore G. Lewis (contractor) Rodrigo Nieto-Gomez
Approved for public release. Distribution is unlimited.

THIS PAGE INTENTIONALLY LEFT BLANK
REPORT DOCUMENTATION PAGE Form Approved OMB No. 0704-0188
Public reporting burden for this collection of information is estimated to average 1 hour per response, including the time for reviewing instruction, searching existing data sources, gathering and maintaining the data needed, and completing and reviewing the collection of information. Send comments regarding this burden estimate or any other aspect of this collection of information, including suggestions for reducing this burden, to Washington headquarters Services, Directorate for Information Operations and Reports, 1215 Jefferson Davis Highway, Suite 1204, Arlington, VA 22202-4302, and to the Office of Management and Budget, Paperwork Reduction Project (0704-0188) Washington, DC 20503. 1. AGENCY USE ONLY (Leave blank) 2. REPORT DATE
September 2019 3. REPORT TYPE AND DATES COVERED Master's thesis
4. TITLE AND SUBTITLE HITTING THE ACCELERATOR: WILL TESLA CRASH THE LOS ANGELES GRID?
5. FUNDING NUMBERS
6. AUTHOR(S) Marilee Orr
7. PERFORMING ORGANIZATION NAME(S) AND ADDRESS(ES) Naval Postgraduate School Monterey, CA 93943-5000
8. PERFORMING ORGANIZATION REPORT NUMBER
9. SPONSORING / MONITORING AGENCY NAME(S) AND ADDRESS(ES) N/A
10. SPONSORING / MONITORING AGENCY REPORT NUMBER
11. SUPPLEMENTARY NOTES The views expressed in this thesis are those of the author and do not reflect the official policy or position of the Department of Defense or the U.S. Government. 12a. DISTRIBUTION / AVAILABILITY STATEMENT Approved for public release. Distribution is unlimited. 12b. DISTRIBUTION CODE
A 13. ABSTRACT (maximum 200 words) How many Teslas will it take to crash the Los Angeles, California, grid? This thesis conducts a thought experiment to explore whether rapid adoption of electric vehicles (EVs) in Los Angeles will reduce the reliability of electric power in the Los Angeles Department of Water and Power (LADWP) service territory. Federal and state regulations are encouraging the shift to electric transportation in support of policy priorities that include reducing greenhouse gas emissions and reducing dependence on foreign energy sources. However, high market penetration by EVs will change the patterns of electricity use, especially in urban areas. Under some scenarios, EVs could pose a risk to the reliability and resilience of the electric grid serving these areas. To explore this issue, I developed a model that projects the impact of EVs on the peak power load in Los Angeles in 2030 under different scenarios of EV market penetration and constraints on demand for vehicle charging (e.g., time-of-day pricing). I found that even with moderate EV penetration, if vehicle charging is unconstrained, the load placed on the LADWP grid will exceed the established reserve margin in 2030. Only by adopting some form of incentives for EV drivers to shift their power demands from the normal end-of-day charging routine will the LADWP be able to maintain the reliability and resilience of the power grid.
14. SUBJECT TERMS EV, BEV, electric vehicles, resource adequacy, electric power, grid, reliability, LADWP, Los Angeles, charging
15. NUMBER OF PAGES 99 16. PRICE CODE
17. SECURITY CLASSIFICATION OF REPORT Unclassified
18. SECURITY CLASSIFICATION OF THIS PAGE Unclassified
19. SECURITY CLASSIFICATION OF ABSTRACT Unclassified
20. LIMITATION OF ABSTRACT UU
NSN 7540-01-280-5500 Standard Form 298 (Rev. 2-89) Prescribed by ANSI Std. 239-18
i

THIS PAGE INTENTIONALLY LEFT BLANK
ii
Approved for public release. Distribution is unlimited.
HITTING THE ACCELERATOR: WILL TESLA CRASH THE LOS ANGELES GRID?
Marilee Orr Senior Infrastructure Analyst, Cybersecurity and Infrastructure Security Agency,
Department of Homeland Security BS, Duke University, 1987
Submitted in partial fulfillment of the requirements for the degree of
MASTER OF ARTS IN SECURITY STUDIES (HOMELAND SECURITY AND DEFENSE)
from the
NAVAL POSTGRADUATE SCHOOL September 2019
Approved by: Theodore G. Lewis Co-Advisor
Rodrigo Nieto-Gomez Co-Advisor
Erik J. Dahl Associate Chair for Instruction Department of National Security Affairs
iii

THIS PAGE INTENTIONALLY LEFT BLANK
iv
ABSTRACT
How many Teslas will it take to crash the Los Angeles, California, grid? This
thesis conducts a thought experiment to explore whether rapid adoption of electric
vehicles (EVs) in Los Angeles will reduce the reliability of electric power in the Los
Angeles Department of Water and Power (LADWP) service territory. Federal and state
regulations are encouraging the shift to electric transportation in support of policy
priorities that include reducing greenhouse gas emissions and reducing dependence on
foreign energy sources. However, high market penetration by EVs will change the
patterns of electricity use, especially in urban areas. Under some scenarios, EVs could
pose a risk to the reliability and resilience of the electric grid serving these areas. To
explore this issue, I developed a model that projects the impact of EVs on the peak power
load in Los Angeles in 2030 under different scenarios of EV market penetration and
constraints on demand for vehicle charging (e.g., time-of-day pricing). I found that even
with moderate EV penetration, if vehicle charging is unconstrained, the load placed on
the LADWP grid will exceed the established reserve margin in 2030. Only by adopting
some form of incentives for EV drivers to shift their power demands from the normal
end-of-day charging routine will the LADWP be able to maintain the reliability and
resilience of the power grid.
v

THIS PAGE INTENTIONALLY LEFT BLANK
vi
vii
TABLE OF CONTENTS
I. INTRODUCTION..................................................................................................1 A. THESIS QUESTION .................................................................................1 B. CHARGING AHEAD: PROBLEM STATEMENT ...............................1 C. ENOUGH HORSEPOWER: RESOURCE ADEQUACY
LITERATURE REVIEW .........................................................................3 D. UNDER THE HOOD: ANALYTIC METHOD ......................................5
II. STOP AND GO: HISTORY AND FUTURE OF ELECTRIC VEHICLES .............................................................................................................9 A. IN THE REAR VIEW MIRROR: EARLY EVs .....................................9 B. GEARING UP: MODERN EVs .............................................................10 C. OUTRACING EXPECTATIONS: ELECTRIC VEHICLE
ADOPTION ..............................................................................................14 D. CURVES AHEAD: TECHNOLOGICAL DIFFUSION ......................16
1. Regulatory Requirements ...........................................................19 2. Consumer Incentives ...................................................................20 3. Infrastructure Development .......................................................21 4. Technological Improvements ......................................................22
III. WHERE THE RUBBER MEETS THE ROAD: EVs IN LOS ANGELES ............................................................................................................25 A. OUT IN FRONT: EV ADOPTION ........................................................25 B. SHIFTING GEARS: CHANGING ELECTRIC POWER
SYSTEMS .................................................................................................28 C. NO SHOULDER: CONSTRAINTS ON POWER IN THE
LAWP AREA ...........................................................................................31 D. BALANCING ACT: LOS ANGELES IN FOCUS ...............................34
IV. MOVING PARTS: ASSUMPTIONS AND ANALYSIS ..................................37 A. SCENARIO CONSTRUCTION .............................................................38
1. Supply and Demand of Electricity in Los Angeles ....................38 2. EV Energy Requirements............................................................42 3. EV Market Penetration ...............................................................42 4. EV Driver Travel .........................................................................43 5. EV Charging Patterns .................................................................45 6. EV Penetration .............................................................................49
B. ASSESSING EV CONTRIBUTION TO PEAK DEMAND ................51 C. RESULTS .................................................................................................53
viii
V. NAVIGATING THE FUTURE: CONCLUSIONS AND IMPLICATIONS .................................................................................................57 A. READING THE MAP: IMPLICATIONS OF THE RESULTS .........57 B. ALTERNATIVE ROUTES: OPTIONS FOR MANAGING EV
CHARGING .............................................................................................58 C. DOWN THE ROAD: VEHICLE TO GRID INTEGRATION............61 D. ONE FOR THE ROAD: RESEARCH GAPS AND FINAL
THOUGHTS .............................................................................................63
LIST OF REFERENCES ................................................................................................65
INITIAL DISTRIBUTION LIST ...................................................................................77
ix
LIST OF FIGURES
Figure 1. Scenarios Analyzed. .....................................................................................6
Figure 2. Tesla Model 3 First Year Production Ramp. .............................................13
Figure 3. PEV Sales and Market Share in the United States .....................................15
Figure 4. Historical and Projected Cumulative ZEV Sales, Accounting for Vehicle Scrappage Rates for 2025 Goal ....................................................16
Figure 5. Evolution of Global EV Stock 2013–2017 (All BEVs and PEVs in Service) ......................................................................................................17
Figure 6. Number of EVs in the United States by Year ............................................17
Figure 7. Analytical Structure of the Bass Technology Diffusion Mode. .................19
Figure 8. Evolution of Battery Energy Density and Cost..........................................23
Figure 9. PEV Sales by State (January 2011–June 2018) .........................................26
Figure 10. PEV Sales (2016–2017) and Projections (2018–2025) .............................27
Figure 11. California’s Energy Mix by Source, 1983–2017 .......................................30
Figure 12. LADWP’s Projected Energy Mix through 2036 ........................................31
Figure 13. Overview of the LADWP Power System ..................................................33
Figure 14. LADWP Balancing Area. ..........................................................................35
Figure 15. Scenario Combinations of EV Penetration and Charging Behavior for 2030 ......................................................................................................37
Figure 16. LADWP Average Hourly Demand for Summer (June 1–August 31) .......41
Figure 17. Travel Time Variability, an Indication of Traffic Congestion, for Los Angeles ......................................................................................................46
Figure 18. Conceptual Diagram of Sequential Driving, Starting, and Ending Charging Time Distributions .....................................................................47
Figure 19. Reserve Margin at Peak under Each Analytic Scenario ............................53

x
THIS PAGE INTENTIONALLY LEFT BLANK
xi
LIST OF ACRONYMS AND ABBREVIATIONS
A amp BEV battery electric vehicle CAFE Corporate Average Fuel Economy CARB California Air Resources Board CEC California Energy Commission DOE U.S. Department of Energy EPA U.S. Environmental Protection Agency EV electric vehicle FCEV fuel cell electric vehicle FCV fuel cell vehicle FERC Federal Energy Regulatory Commission GM General Motors GWh gigawatt-hours HFC hydrogen fuel cell IRP integrated resource plans kW kilowatts kWh kilowatt hours LA Los Angeles LADWP Los Angeles Department of Water and Power LF load factor MPGe miles per gallon equivalent mph miles per hour MW megawatt MWh megawatt hours NERC North American Electric Reliability Corporation NHTSA National Highway Traffic Safety Administration NREL National Renewable Energy Laboratory ORNL Oak Ridge National Laboratory PEV plug-in electric vehicle PG&E Pacific Gas and Electric
xii
PHEV plug-in hybrid electric vehicle POU publicly owned utilities SLTRP Power Strategic Long-term Resource Plan SONGS San Onofre Nuclear Generating Station TOU time-of-use TZEV transitional zero-emissions vehicles V volt V2G vehicle-to-grid V2H vehicle-to-house V2V vehicle-to-vehicle VER variable energy resources ZEV zero-emissions vehicle
xiii
EXECUTIVE SUMMARY
How many Teslas will it take to crash the Los Angeles, California, power grid?
This thesis conducts a thought experiment to explore whether rapid adoption of electric
vehicles (EVs) in Los Angeles (LA) will reduce the reliability of electric power in the Los
Angeles Department of Water and Power (LADWP) service territory.
Electric cars, once a novelty, are beginning a sprint into the market. In January
2018, California Governor Edmund G. Brown issued an Executive Order setting a
statewide goal of 5 million zero-emissions vehicles (ZEVs, mostly plug-in electric cars) on
the road by 2030. This ambitious goal will create additional demand for electricity and test
the resilience of California’s electric power resources, especially in its major metropolitan
areas. In Los Angeles, a leading area for EV adoption, the most recent strategic power plan
was based on projections of about half this level of EV market penetration.1 In this thesis,
I will use scenario analysis to look at whether meeting the governor’s goal will reduce the
reliability of the Los Angeles power grid at times of peak demand.
At first glance, there is plenty of excess capacity in the system. Because electric
infrastructure is designed to meet the expected peak demand with a safety margin, at non-
peak times (about 95 percent of the time), there is excess, idle generation capacity in the
system. However, instead of using idle capacity, uncontrolled charging of EVs could easily
add to the peak demand, as consumers would simply plug in their cars on arriving home
after work, when power usage is the highest, but after solar energy has begun to decline.
The analysis presented here uses scenarios to explore the question of where a
tipping point might exist for grid stability under rapid adoption of fully EVs. California’s
new Executive Order, the popularity of Tesla’s Model 3, and Los Angeles’ leading role in
EV adoption create ideal conditions for a thought experiment: how many Model 3s,
introduced how fast, would it take to endanger the reliability of the electric grid in Los
1 Los Angeles Department of Water and Power, 2017 Power Strategic Long-Term Resource Plan (Los
Angeles: Los Angeles Department of Water and Power, 2017), ES-10, https://www.ladwp.com/cs/idcplg? IdcService=GET_FILE&dDocName=OPLADWPCCB655007&RevisionSelectionMethod=LatestReleased.
xiv
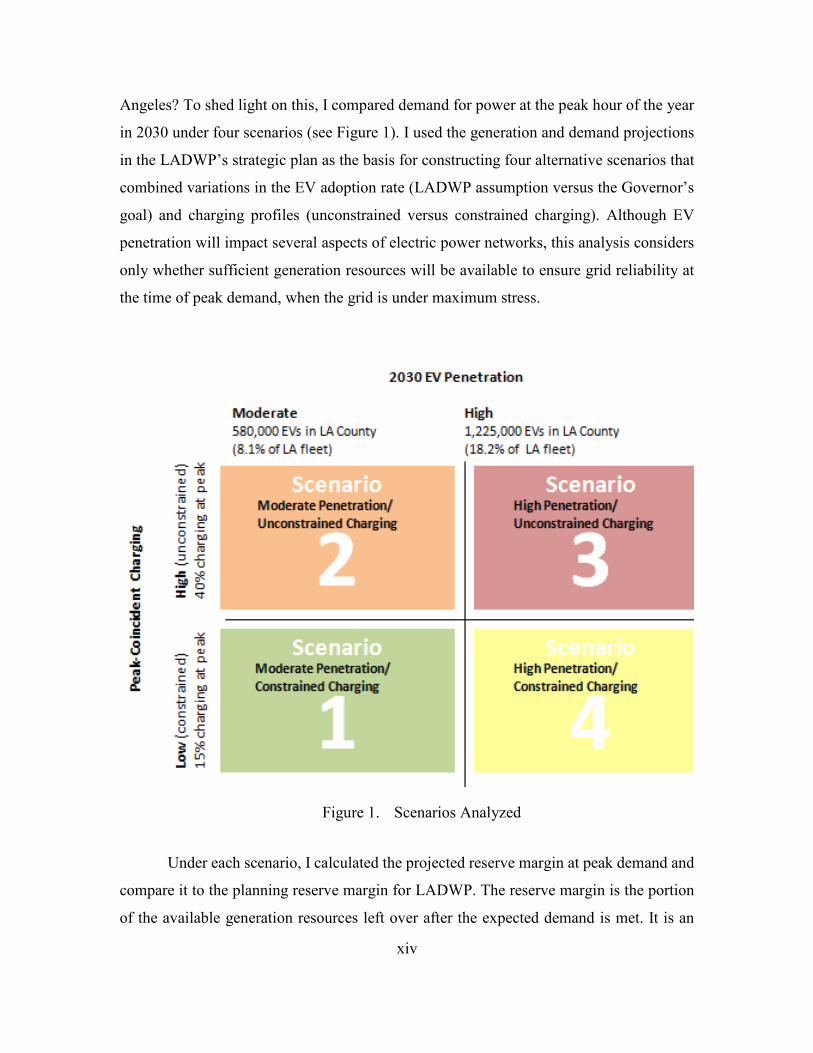
Angeles? To shed light on this, I compared demand for power at the peak hour of the year
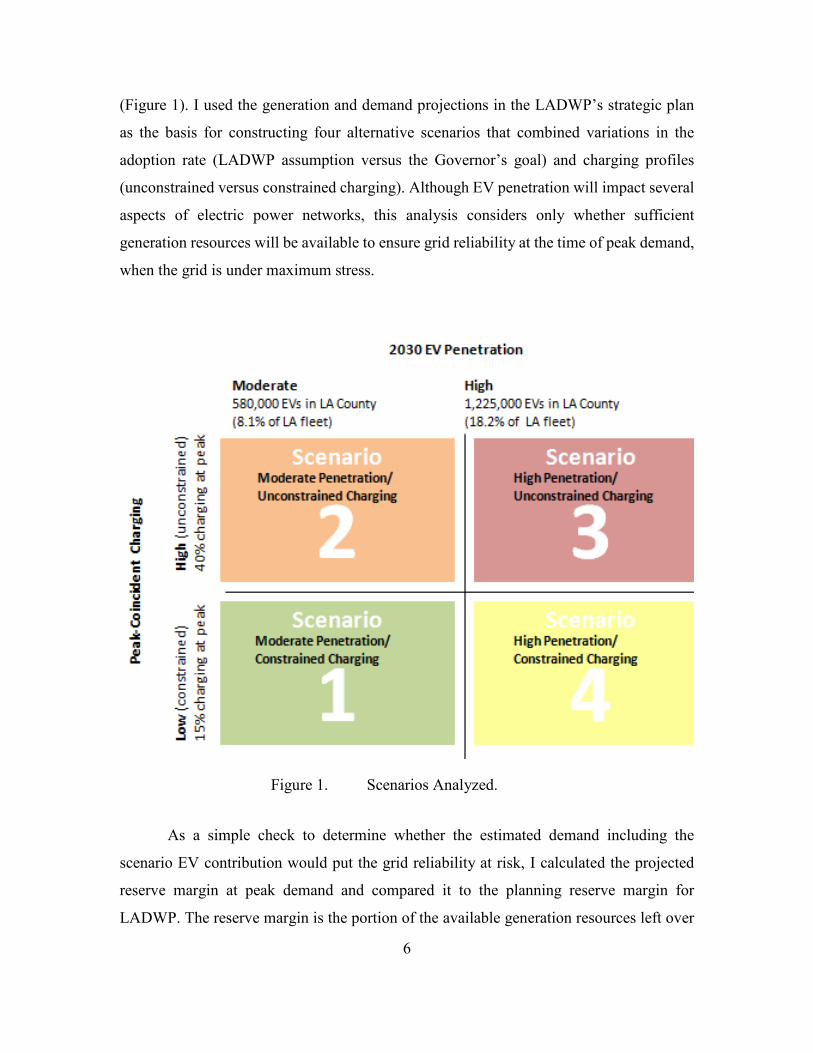
in 2030 under four scenarios (see Figure 1). I used the generation and demand projections
in the LADWP’s strategic plan as the basis for constructing four alternative scenarios that
combined variations in the EV adoption rate (LADWP assumption versus the Governor’s
goal) and charging profiles (unconstrained versus constrained charging). Although EV
penetration will impact several aspects of electric power networks, this analysis considers
only whether sufficient generation resources will be available to ensure grid reliability at
the time of peak demand, when the grid is under maximum stress.
Figure 1. Scenarios Analyzed
Under each scenario, I calculated the projected reserve margin at peak demand and
compare it to the planning reserve margin for LADWP. The reserve margin is the portion
of the available generation resources left over after the expected demand is met. It is an
xv
indicator of system reliability, because the higher the reserve margin, the more resources
are available to mitigate any unforeseen generation shortfalls that arise. This calculation is
based on LADWP’s estimate of how much power will reliably be available at the time of
peak demand in 2030.2 For the LADWP area, which experiences its heaviest demand in
summer, the summer planning reserve margin standard is 16 percent. If the reserve margin
for a scenario is less than the 16 percent planning reserve margin, I concluded that grid
reliability could be compromised.
The principal factors affecting resource adequacy with respect to EV adoption are
• Non-EV supply and demand for electricity in the Los Angeles area
• EV energy requirements
• EV market penetration
• EV driver travel and
• EV charging patterns
I used LADWP’s 2017 Power Strategic Long-term Resource Plan and the
California Energy Commission’s 2017 Integrated Energy Policy Report to project non-EV
supply and demand for electricity by time of day in 2030. Based on these data, I selected
6:30 p.m. as the time of instantaneous peak summer demand for the purpose of estimating
the contribution of EV charging to demand.
For the purposes of this analysis, I used the Tesla Model 3 with its standard battery
pack to represent EV energy requirements. (This is intended as a convenient benchmark
for analysis, not a prediction that Tesla will displace all competitors.) The scenarios in this
analysis consider two alternative scenarios of EV market penetration. The moderate
penetration scenarios use the assumption from LADWP’s recommended strategic case,
which is that there will be 580,000 EVs on the road in Los Angeles by 2030.3 The high
penetration scenarios assume that California will meet the governor’s target of five million
ZEVs on the road in California by 2030.
2 Los Angeles Department of Water and Power, 2017 Power Strategic Long-Term Resource Plan, 166. 3 Los Angeles Department of Water and Power, 2017 Power Strategic Long-Term Resource Plan, ES-
10.
xvi
The number of miles driven per day will determine the total amount of electricity
used by EVs, and therefore, the total time that each car draws power from the grid each
day. According to the latest available data published by the California Department of
Transportation, an average of 34.2 miles are driven daily in Los Angeles County for every
vehicle registered in the county.4
I assume that, absent any constraints or incentives, drivers will tend to plug in their
cars when they arrive home from work and begin to draw power immediately.
Unfortunately, this means that in the unconstrained scenarios EV power demand would be
concentrated in a few hours at the end of the workday, which also coincide with peak
demand from other users. I estimate the unconstrained load on the system from the data on
energy requirements and EV penetration described above, along with data on time-of-day
traffic patterns in Los Angeles from the U.S. Department of Transportation Federal
Highway Administration.5 In the constrained demand scenarios, I assume that time-of-day
pricing incentives or direct controls are used to spread demand out more evenly over the
night.
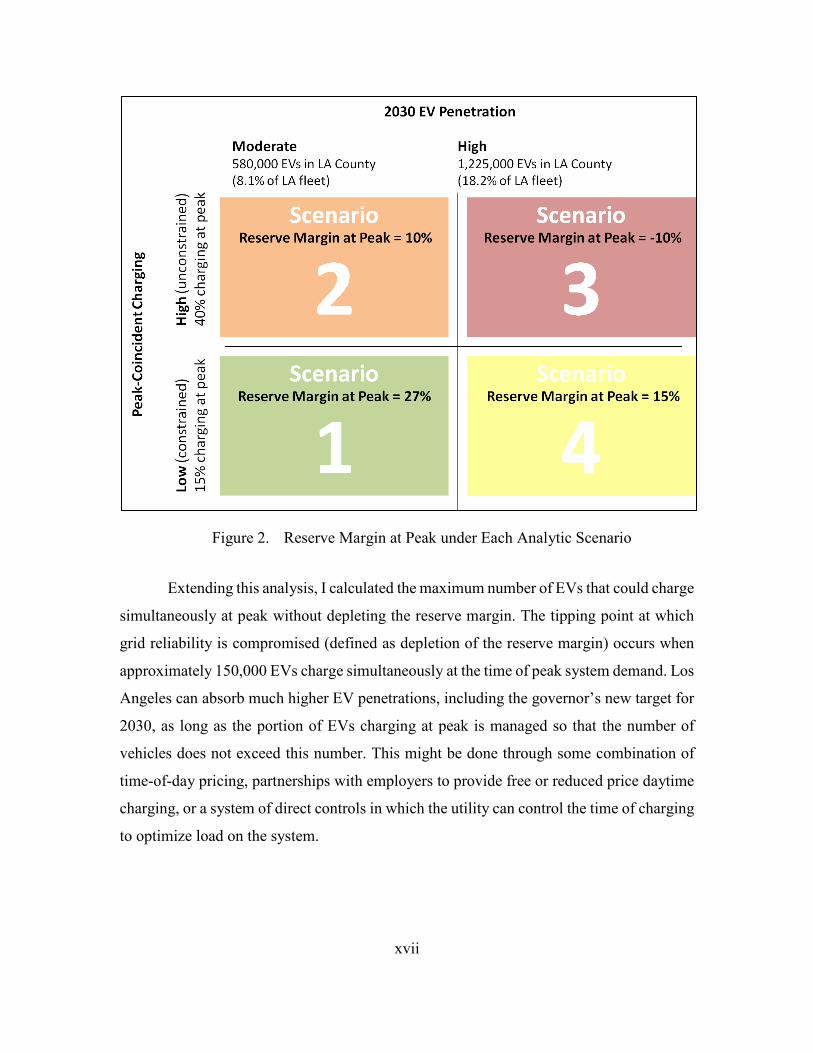
The overall results of the analysis are shown in Figure 2. As can be seen, relative
to an established reserve margin of 16 percent of capacity, only Scenario 1, with moderate
EV penetration and constrained demand, does not fall below the established standard. With
even moderate EV penetration, if vehicle charging is unconstrained the load placed on the
LADWP grid will exceed the established reserve margin in 2030. Only by adopting some
form of incentives for EV drivers to shift their power demands from the normal end-of-day
charging routine will LADWP be able to maintain the reliability and resilience of the power
grid.
4 “Vehicle Registrations in Los Angeles County, California,” Los Angeles Almanac, 2018, http://www.
laalmanac.com/transport/tr02.php. 5 “Travel Time Reliability: Making It There on Time, All the Time,” U.S. Department of
Transportation Federal Highway Administration, February 1, 2017, https://ops.fhwa.dot.gov/publications/ tt_reliability/long_descriptions/Figure4.htm.
xvii
Figure 2. Reserve Margin at Peak under Each Analytic Scenario
Extending this analysis, I calculated the maximum number of EVs that could charge
simultaneously at peak without depleting the reserve margin. The tipping point at which
grid reliability is compromised (defined as depletion of the reserve margin) occurs when
approximately 150,000 EVs charge simultaneously at the time of peak system demand. Los
Angeles can absorb much higher EV penetrations, including the governor’s new target for
2030, as long as the portion of EVs charging at peak is managed so that the number of
vehicles does not exceed this number. This might be done through some combination of
time-of-day pricing, partnerships with employers to provide free or reduced price daytime
charging, or a system of direct controls in which the utility can control the time of charging
to optimize load on the system.

xviii
THIS PAGE INTENTIONALLY LEFT BLANK
xix
ACKNOWLEDGMENTS
It would be impossible to put into words how grateful I am to my advisors,
Professors Rodrigo Nieto-Gomez and Ted Lewis, and to my family for their support and
encouragement throughout the writing of this thesis. Conversations with my advisors; my
partners, George and Pam; and my father, all helped to move my thinking forward on this
topic, and I am grateful for their patience during endless discussions of Teslas and reserve
margins. It is perhaps a testament to the pervasiveness of this discussion that my father
now drives a Tesla.
I am also grateful for the opportunity to earn my master’s degree at the Center for
Homeland Defense and Security, which was made possible by funding from the U.S.
Department of Homeland Security. The incredible intellectual environment fostered by an
amazing faculty renewed my commitment to the mission of advancing homeland security.
Professor Christopher Bellavita, in particular, will always be with me as the voice in my
head telling me to inquire more deeply into wicked problems.

xx
THIS PAGE INTENTIONALLY LEFT BLANK
1
I. INTRODUCTION
A. THESIS QUESTION
How many Teslas will it take to crash the Los Angeles, California, grid? This thesis
conducts a thought experiment to explore whether rapid adoption of electric vehicles (EVs)
in Los Angeles (LA) will reduce the reliability of electric power in the Los Angeles
Department of Water and Power (LADWP) service territory.
B. CHARGING AHEAD: PROBLEM STATEMENT
Electric cars, once a novelty, are beginning a sprint into the market. In January
2018, California Governor Edmund G. Brown issued an Executive Order setting a
statewide goal of five million zero-emissions vehicles (ZEVs, mostly plug-in electric cars)
on the road by 2030.1 This ambitious goal will create additional demand for electricity and
test the resilience of California’s electric power resources, especially in its major
metropolitan areas. In Los Angeles, a leading area for EV adoption, the most recent
strategic power plan was based on projections of about half this level of EV market
penetration. In this thesis, I will use scenario analysis to look at whether meeting the
governor’s goal will reduce the reliability of the Los Angeles power grid at times of peak
demand.
Federal and state regulations are encouraging the shift to electric transportation, in
support of policy priorities that include reducing greenhouse gas emissions and reducing
dependence on foreign energy sources. However, high market penetration by EVs will
change the patterns of electricity use, especially in urban areas. Under some scenarios, EVs
could pose a risk to the reliability and resilience of the electric grid serving these areas. The
current electric power system was not designed to handle electric transportation, which will
1 “Governor Brown Takes Action to Increase Zero-Emission Vehicles, Fund New Climate
Investments,” Office of the Governor, Governor Edmund G. Brown Jr., January 26, 2018, https://www. ca.gov/archive/gov39/2018/01/26/governor-brown-takes-action-to-increase-zero-emission-vehicles-fund-new-climate-investments/index.html.
2
reshape where and when consumers use power.2 Widespread adoption of battery electric
vehicles (BEVs) or plug-in hybrid electric vehicles (PHEVs) could negatively affect the
electric grid in several ways, including increasing peak power requirements and shortening
the life of distribution infrastructure.
Electric power planning takes place at scales ranging from hourly to decadal, but
major infrastructure changes occur slowly. Planning for expensive changes to generation
or transmission capacity is based on meticulous forecasting and analysis of alternatives,
cost-benefit ratios, and impacts. Any changes are carefully considered, since costs will be
passed on to utility customers. To ensure that there will be enough electric power
generation capacity to meet future demand, regional planners make long-term projections
of electricity supply and demand, based on trends in economic growth and development,
technological shifts, policy goals, and planned capacity projects, usually including a variety
of scenarios for each factor to help account for uncertainty. Despite the sophistication of
these plans, conditions may not unfold as the planners anticipate. The long planning cycle
and the natural tendency to change forecasts incrementally mean that a rapid rise in EV
adoption could overtake planning.
A rapid shift to fully EVs, such as the Tesla Model 3, could expose vulnerabilities
in the electric power system. Demand will be mobile—because consumers can charge their
vehicles at work, at home, or on the road—and peak charging times may not match the
peak supply of renewable energy sources, such as wind and solar.3 This analysis uses the
Tesla Model 3 to assess the capacity of the LA power network to accommodate rapid
adoption of plug-in electric vehicle (PEV) technology. It is important to examine the
2 Ahmed M. A. Haidar, Kashem M. Muttaqi, and Danny Sutanto, “Technical Challenges for Electric
Power Industries Due to Grid-Integrated Electric Vehicles in Low Voltage Distributions: A Review,” Energy Conversion and Management 86 (October 2014): 689–700, https://doi.org/10.1016/j.enconman. 2014.06.025.
3 For many areas, power available from wind peaks at about 5:00 p.m., while power demand peaks at about 7:00 p.m. Sherif F. Abdelsamad, Walid G. Morsi, and Tarlochan S. Sidhu, “Impact of Wind-Based Distributed Generation on Electric Energy in Distribution Systems Embedded with Electric Vehicles,” IEEE Transactions on Sustainable Energy 6, no. 1 (January 2015): 79–87, https://doi.org/10.1109/TSTE. 2014.2356551.
3
possible impacts of EV adoption on Los Angeles’ electric power supplies, because it will
likely be one of the first areas to encounter any potential issues.
C. ENOUGH HORSEPOWER: RESOURCE ADEQUACY LITERATURE REVIEW
The fundamental question that concerns us in this analysis is whether existing and
planned power generation resources can provide enough power for high rates of EV
adoption at times when demand for other uses is peaking. This is the question of resource
adequacy. The answer depends on a variety of factors, including how much energy EVs
draw (based on travel patterns, charging configurations, and number of vehicles), as well
as where and when EV owners charge their vehicles. Secondarily, the charging patterns
will determine which power resources are used to supply EV demand, with implications
for the amount of emissions produced and the cost of power. For example, if EVs charge
in the middle of the day, they will draw power at a time when the grid relies on plentiful
solar resources. If most charging is done at night, when solar is unavailable and wind
energy is reduced, they will increase demand on more conventional power plants, and the
power mix will have higher greenhouse gas emissions overall.4
Existing research related to regional resource adequacy for transportation
electrification lays out possible concerns. Some of the work described here (especially the
older studies) specifically considered PHEVs rather than BEVs. This work is relevant—
despite the technological differences between the car types—because in terms of grid
impacts, the only difference between the types of PEVs is the amount of power drawn from
the grid. Research carried out in other countries is also included because the issues arising
from similar grid technology and globally-marketed vehicles can be expected to be similar.
At first glance, there is plenty of excess capacity in the system. Because electric
infrastructure is designed to meet the expected peak demand with a safety margin, at non-
peak times (about 95 percent of the time), there is excess, idle generation capacity in the
4 Jae D. Kim and Mansour Rahimi, “Future Energy Loads for a Large-Scale Adoption of Electric
Vehicles in the City of Los Angeles: Impacts on Greenhouse Gas (GHG) Emissions,” Energy Policy 73 (2014): 620–30.

4
system. For most U.S. systems, including Los Angeles, peak demand occurs in summer,
due to the use of air conditioning, and is generally in the late afternoon hours. An early
study conducted at Pacific Northwest National Laboratory for the U.S. Department of
Energy (DOE) estimated that the existing electric power infrastructure could support
electrification of 84 percent of the country’s cars, trucks and sport utility vehicles,
assuming that all charging would be done at off-peak times. The researchers found that this
level of EV penetration would cut U.S. oil imports by more than 50 percent.5 A companion
paper rather optimistically looked at the economic impacts of “downward pressure on
[electric utility customer] rates as revenues increase in the absence of new investments for
generation, transmission, and distribution.”6
However, instead of using idle capacity, uncontrolled charging of EVs could easily
add to the peak demand, as consumers would simply plug in their cars on arriving home
after work, when power usage is the highest, but after solar energy has begun to decline.7
In the absence of other motivations, this would be the most convenient for drivers, as they
are already at the vehicle and they will want to have the vehicle sufficiently charged for
any unplanned evening trips.
A study conducted at Oak Ridge National Laboratory (ORNL) looked at resource
adequacy for each of the 13 North American Electric Reliability Corporation (NERC)
regions. Researchers found that regional impacts for a fleet penetration of 25 percent by
2020 varied; with unconstrained charging, they found that California, Florida, and part of
the southwest United States could have generation shortfalls. In addition, the different fuel
sources used in different regions (referred to as the region’s “energy mix”) resulted in
different resources being dispatched at peak and off-peak times to serve load, which in
5 Michael Kintner-Meyer, Kevin Schneider, and Robert Pratt, Impacts Assessment of Plug-in Hybrid
Vehicles on Electric Utilities and Regional U.S. Power Grids Part 1: Technical Analysis (Richland, WA: Pacific Northwest National Laboratory, 2007), 1, http://citeseerx.ist.psu.edu/viewdoc/summary?doi=10.1.1. 574.6257.
6 Kintner-Meyer, Schneider, and Pratt; describing findings from Michael J. Scott et al., Impacts Assessment of Plug-in Hybrid Vehicles on Electric Utilities and Regional U.S. Power Grids: Part 2: Economic Assessment (Richland, WA: Pacific Northwest National Laboratory, 2007), 1–39, http://energy environment.pnnl.gov/ei/pdf/PHEV_Economic_Analysis_Part2_Final.pdf.
7 Claire Weiller, “Plug-in Hybrid Electric Vehicle Impacts on Hourly Electricity Demand in the United States,” Energy Policy 39, no. 6 (June 2011): 3766–78, https://doi.org/10.1016/j.enpol.2011.04.005.
5
turn, affected costs and emissions.8 Although the ORNL study did not consider possible
utility responses, such as expanding capacity, increasing imports, or implementing
programs to manage demand, it clearly demonstrates the importance of regional analysis.
In Australia, researchers used a suite of models to represent EV uptake, travel
patterns, household electricity demand and the charging or discharging of EVs in Victoria
to generate spatial-temporal profiles for EV energy use. They found that although peak
demand increased by less than 10 percent in most places under their scenarios, some areas
could face resource constraints on days with particularly high demand.9
Assuming extremely fast charging rates (well beyond those possible today) and
simultaneous charging, analysts have estimate that as few as 60,000 EVs in Texas (about
0.25 percent of the cars currently registered in Texas) could equal all of today’s peak
electricity demand for the region. When added to normal demand from other users, this
would far exceed today’s power supply.10 This hypothetical case is unrealistic, but
illustrates the potential for EV power demand to affect resource adequacy.
D. UNDER THE HOOD: ANALYTIC METHOD
This analysis uses scenarios to explore the question of where a tipping point might
exist for grid stability under rapid adoption of fully EVs. California’s new Executive Order,
the popularity of Tesla’s Model 3, and Los Angeles’ leading role in EV adoption create
ideal conditions for a thought experiment: how many Model 3s, introduced how fast, would
it take to endanger the reliability of the electric grid in Los Angeles? To shed light on this,
I compared demand for power at the peak hour of the year in 2030 under four scenarios
8 Stanton W. Hadley, Impact of Plug-in Hybrid Vehicles on the Electric Grid (Oak Ridge, TN: Oak
Ridge National Laboratory, 2006), 1, http://web.ornl.gov/info/ornlreview/v40_2_07/2007_plug-in_paper.pdf.
9 Phillip Paevere et al., “Spatio-Temporal Modelling of Electric Vehicle Charging Demand and Impacts on Peak Household Electrical Load,” Sustainability Science 9, no. 1 (January 2014): 61–76, https://doi.org/10.1007/s11625-013-0235-3.
10 Analysis by Wood Mackenzie, “The Rise of the Electric Car: How Will it Impact Oil, Power and Metals?,” GreenTech Media, December 2017, https://www.greentechmedia.com/research/report/the-rise-of-the-electric-car-how-will-it-impact-oil-power-and-metals#gs.owJcKBE, as described by Jason Deign, “How Electric Vehicles Could Sink the Texas Grid,” GreenTech Media, December 19, 2017, https://www. greentechmedia.com/articles/read/how-electric-cars-could-sink-the-texas-grid.
6
(Figure 1). I used the generation and demand projections in the LADWP’s strategic plan
as the basis for constructing four alternative scenarios that combined variations in the
adoption rate (LADWP assumption versus the Governor’s goal) and charging profiles
(unconstrained versus constrained charging). Although EV penetration will impact several
aspects of electric power networks, this analysis considers only whether sufficient
generation resources will be available to ensure grid reliability at the time of peak demand,
when the grid is under maximum stress.
Figure 1. Scenarios Analyzed.
As a simple check to determine whether the estimated demand including the
scenario EV contribution would put the grid reliability at risk, I calculated the projected
reserve margin at peak demand and compared it to the planning reserve margin for
LADWP. The reserve margin is the portion of the available generation resources left over
7
after the expected demand is met. It is an indicator of system reliability, because the higher
the reserve margin, the more resources are available to mitigate any unforeseen generation
shortfalls that arise. This calculation is based on LADWP’s estimate of how much power
will reliably be available at the time of peak demand (called dependable resources) in
2030.11
The planning reserve margin is the target percentage of resources expected to
remain after expected demand is met. Planning reserve margins are designed to help system
planners ensure that there will be enough power available to handle unplanned outages or
unexpectedly high demand situations (such as a heat wave), while still maintaining power
quality. For the LADWP area, which experiences its heaviest demand in summer, the
summer planning reserve margin standard is 16.16 percent.12 If the reserve margin for a
scenario is less than the 16 percent planning reserve margin, I conclude that grid reliability
could be compromised.
11 “Dependable resources” represent only a portion of the generating capacity theoretically available to
account for unplanned outages and variability in generation from variable sources, such as solar, wind, and hydroelectric. In 2030, the LADWP forecast for dependable resources includes power imported from other regions, as well as power generated within the area. Los Angeles Department of Water and Power, 2017 Power Strategic Long-Term Resource Plan (Los Angeles: Los Angeles Department of Water and Power, 2017), 158–159, https://www.ladwp.com/cs/idcplg?IdcService=GET_FILE&dDocName=OPLADWPCC B655007&RevisionSelectionMethod=LatestReleased.
12 WECC Staff, 2016 Power Supply Assessment (Salt Lake City, UT: WECC, 2016), 3, https://www. wecc.org/Reliability/2016PSA_Final.pdf.

8
THIS PAGE INTENTIONALLY LEFT BLANK
9
II. STOP AND GO: HISTORY AND FUTURE OF ELECTRIC VEHICLES
Past and present socio-technological environments provide important context for
today’s EV development and diffusion. This chapter provides background on EV evolution
from the earliest vehicles to the present, including a discussion of the barriers to and drivers
of widespread adoption. It concludes with a discussion of the possible future market growth
for EVs.
A. IN THE REAR VIEW MIRROR: EARLY EVs
EVs have had more than one false start before gaining traction. Some of the earliest
automobiles were electric, and their proponents extolled their quieter performance and lack
of exhaust. In fact, the Electric Vehicle Company, founded in 1897 as a holding company
for several manufacturers of electric automobiles, pioneered electric taxicabs and charging
infrastructure in New York, starting with a fleet of 12 cabs.13 The company built several
hundred cars between 1897 and 1899.14 By 1900, approximately one-third of the cars on
city streets—the only place automobiles were practical before paving was common—were
electric.15
However, these early EVs were soon displaced. Internal combustion engines began
to dominate the market with the advent of the Ford Model T at the start of the 20th century.
Compared to an electric car costing $1,750 in 1912, Ford’s car was far more economical
at $680, and it could travel farther on a single “fill-up.”16 Affordability transformed the
automobile from novelty to necessity. Range also became an increasingly important factor,
13 David A. Kirsch, “The Electric Car and the Burden of History: Studies in the Automotive Systems
Rivalry in America, 1890–1996,” Business and Economic History 26 (Winter 1997): 304, https://thebhc. org/sites/default/files/beh/BEHprint/v026n2/p0304-p0310.pdf.
14 Beverly Rae Kimes, Standard Catalog of American Cars, 1805–1942, 3rd ed. (Iola, WI: Krause Publications, 1996), 357.
15 Leandra Poindexter Cooper, “Electric Vehicle Diffusion and Adoption. An Examination of the Major Factors of Influence over Time in the U.S. Market” (master’s thesis, University of Iceland, 2014), 13, https://skemman.is/bitstream/1946/17028/1/Cooper_thesis_final.pdf.
16 Rebecca Matulka, “The History of the Electric Car,” U.S. Department of Energy, September 15, 2014, http://energy.gov/articles/history-electric-car.
10
as more roads suitable for cars were built in the 20th century. The early price edge of
internal combustion engines became an entrenched dominance, and gasoline filling stations
proliferated along new highways as the century passed.
B. GEARING UP: MODERN EVs
Despite occasional resurgences of interest, the limitations of EVs from the
beginning have included cost, battery range, and poor engine performance. Over time,
however, increasing concerns about gasoline supply and harmful pollutants from
automobile exhaust began to offset the advantages of internal combustion. For this reason,
federal, state, and local governments’ policies have been important in overcoming the
barriers to EV adoption.
In California, where policy makers were particularly concerned about public health
impacts from air pollution, legislators passed the first Zero-Emissions Mandate in 1990,
requiring major car makers doing business in California to include in their fleets a
percentage of vehicles that produce no harmful emissions.17
Largely in response to these policy directives, car manufacturers began to revisit
electric vehicle technology in the late twentieth century.18 Some cars were modified from
existing gasoline vehicles, but General Motors (GM) produced the first modern purpose-
designed, all-electric model, the EV-1, between 1996 and 1999.19 The EV-1 was available
for lease only, and when California relaxed its laws to accommodate so-called transitional
zero-emissions vehicles (TZEVs, which operated at least part of the time without
emissions), GM scrapped the EV-1. Over the protests of the car’s fans, all 1,100 EV-1s
were reclaimed and nearly all were destroyed.20
17 “Zero-Emission Vehicle Legal and Regulatory Activities,” Air Resources Board, October 27, 2014,
https://www.arb.ca.gov/msprog/zevprog/zevregs/zevregs.htm#background. 18 Matulka, “The History of the Electric Car.” 19 Owen Edwards, “The Death of the EV-1,” Smithsonian Magazine, June 2006, http://www.smithson
ianmag.com/science-nature/the-death-of-the-ev-1-118595941/?no-ist. 20 Edwards.
11
Possibly because they are more compatible with the way consumers are used to
driving and fueling their cars, TZEV gas-electric hybrid cars, such as the Honda Insight
and Toyota Prius have been far more popular than battery electric models to date.21 In
2016, there were 3.57 million gas-electric hybrids on the road in the United States, making
up about 2.9 percent of the total fleet of cars.22 Gas-electric hybrids still employ internal
combustion engines, but are supported by electric drive to improve gas mileage and
decrease emissions. Their electric batteries are charged while driving and braking, so there
is no need for owners to plug them into the electric grid to charge them. PHEVs extend the
all-electric range of the hybrids by adding the ability to charge their batteries through a
connection to the grid.
Despite the relaxation for TZEVs, the ZEV requirement in California will continue
to become more stringent over time. The federal government, California, other states, and
major cities have also implemented policies designed to encourage EV adoption, including
providing rebates, offering free or subsidized public charging, permitting individual access
to carpool lanes, and building charging infrastructure.23 For these reasons, auto
manufacturers have continued to dedicate some level of effort to the development of ZEVs,
including PEVs. There are now more than 40 models of PEVs (including 17 battery-only
models) on the market, ranging in base price from $24,000 to well over $100,000.24 As
manufacturers overcome the key barriers to ownership (cost, range, convenience, and
image), BEVs are becoming more attractive to the public.
21 According to Rogers’ Theory of Innovation Diffusion, there are five major factors in successful
diffusion of innovation: relative advantage, compatibility with existing practices and norms, complexity, observability, and trialability. Pure electric vehicles and hybrids are similar along most of these dimensions, but EVs require changes in both driver behavior (to accommodate lengthy charging) and supporting infrastructure (charging infrastructure). Rogers’ theory was first laid out in Everett M. Rogers, Diffusion of Innovations, 1st ed. (New York: Free Press of Glencoe, 1962).
22 “Annual Energy Outlook 2018: Table 40 Light-Duty Vehicle Stock by Technology Type,” U.S. Energy Information Administration, 40, February 6, 2018, https://www.eia.gov/outlooks/aeo/data/brow ser/#/?id=49-AEO2018®ion=0-0&cases=ref2018&start=2016&end=2050&f=A&linechart=ref2018-d121317a.4-49-AEO2018~ref2018-d121317a.6-49-AEO2018&ctype=linechart&sourcekey=0.
23 J. R. DeShazo et al., State of the States’ Plug-in Electric Vehicle Policies (Los Angeles, CA: University of California-Los Angeles, Luskin School of Public Affairs, Luskin Center for Innovation, 2015), 1–29, http://innovation.luskin.ucla.edu/sites/default/files/EV_State_Policy.pdf.
24 “Compare Electric Cars and Plug-in Hybrids—List of Features, Price, Range, Model,” PluginCars, 2018, http://www.plugincars.com/cars.
12
In 2006, the co-founder and chief executive officer of Tesla Motors Elon Musk
published his “master plan” for catalyzing the electrification of transportation, which he
believes is essential to a sustainable future. As Musk explained it, “The strategy of Tesla
is to enter at the high end of the market, where customers are prepared to pay a premium,
and then drive down market as fast as possible to higher unit volume and lower prices with
each successive model.”25 In other words, where EVs were once out-competed and left
behind by more affordable internal combustion engines, Musk plans to use the sale of
luxury cars to finance the development of mainstream electric cars, catalyzing the
electrification of transportation. Because Tesla is the only automobile manufacturer
focusing exclusively on ZEVs, it has been able to sell its excess ZEV credits to supplement
its revenue stream.26
In contrast to the marketing strategy of other auto manufacturers, who have been
content to produce “compliance” vehicles that were the Birkenstocks of the automotive
world, Tesla challenged existing assumptions about BEVs with its first stylish, high-
performance, luxury Roadsters in 2008. The Roadster had a range of more than 200 miles
on its pioneering lithium-ion batteries, as well as highly-acclaimed driving performance.27
Tesla followed up with a luxury sedan (Model S) and a sport utility/crossover design
(Model X). The 2017 Tesla S has a five-star rating from the automotive reviewers at Car
and Driver, who rated it first in the Luxury Hybrid and Electric Vehicles, above vehicles
from BMW and Cadillac. With a top speed of 155 miles per hour (mph) and taking only
2.8 seconds to accelerate from zero to 60 mph, the Model S’s performance is impressive
for any sedan.28 Moreover, the National Highway Traffic Safety Administration (NHTSA),
which conducts independent safety evaluations of all automobile models, gave the Model
25 Elon Musk, “The Secret Tesla Motors Master Plan (Just between You and Me),” Tesla, August 2,
2006, https://www.tesla.com/blog/secret-tesla-motors-master-plan-just-between-you-and-me. 26 Matthew DeBord, “Critics Are Wrong—Tesla Should Be Selling ZEV Credits,” Business Insider,
October 27, 2016, http://www.businessinsider.com/tesla-zev-credits-ok-2016-10. 27 “Tesla Roadster Review—Research New & Used Tesla Roadster Models,” Edmunds, accessed July
24, 2019, http://www.edmunds.com/tesla/roadster/. 28 Joseph Capparella, “Tesla Model S-Car and Driver,” CarandDriver, April 2016, http://www.carand
driver.com/tesla/model-s.

13
S five stars in every testing subcategory, putting it in the top one percent of models tested.
The Model S’s actual NHTSA safety score was the highest ever issued by the agency.29
The announcement of the first mid-priced Tesla in March 2016, the Model 3,
generated unprecedented interest, as more than 325,000 customers pre-ordered cars in the
first week, even though the cars would not be delivered until July 2017.30 Belying early
skeptics, the company has managed to pull off a steep ramp in production, cutting delivery
times for many versions to two to three months after orders are placed.31 Figure 2 shows
Tesla’s Model 3 production (cumulative and by week).
Figure 2. Tesla Model 3 First Year Production Ramp.32
29 “Tesla Model S Achieves Best Safety Rating of Any Car Ever Tested,” Tesla, August 19, 2013,
https://www.tesla.com/blog/tesla-model-s-achieves-best-safety-rating-any-car-ever-tested?redirect=no. 30 Brooke Crothers, “With Tesla Model 3 Orders Nearing 400,000, Chevy Bolt Feels Heat of Tesla
Brand,” Forbes, April 15, 2016, http://www.forbes.com/sites/brookecrothers/2016/04/15/with-tesla-model-3-orders-nearing-400000-chevy-bolt-feels-heat-of-tesla-brand/#66bca5d25349.
31 Fred Lambert, “Tesla Accelerates Model 3 Delivery Timelines on New Orders,” Electrek (blog), July 14, 2018, https://electrek.co/2018/07/14/tesla-model-3-delivery-timelines-new-orders/.
32 Source: Tom Randall and Dean Halford, “We Set Out to Crack Tesla’s Biggest Mystery: How Many Model 3s It’s Making,” Bloomberg, August 14, 2018, https://www.bloomberg.com/graphics/2018-tesla-tracker/.
14
Tesla expects to produce 10,000 cars per week in 2019.33 This number of cars alone
will not revolutionize transportation, in a nation of over 248 million cars and light-duty
trucks, but it has sparked media and cultural interest in EVs; arguably helping EVs more
generally turn the corner to mainstream adoption.
C. OUTRACING EXPECTATIONS: ELECTRIC VEHICLE ADOPTION
Just a few years ago, most projections were that EV market growth would be about
20 percent annually.34 In 2016, one analysis projected 30 percent annual growth; at that
rate, by 2040, one-quarter of the vehicles on the road would be electric, and they will
consume 11 percent of the total quantity of electricity that was generated worldwide in
2015.35 Also in 2016, one market research firm increased its estimates of EV and hybrid
sales for the year 2020 to 17 million, up from the previous year’s estimate of 12 million.36
Year-over-year sales growth was 36 percent between 2015 and 2016, 27 percent between
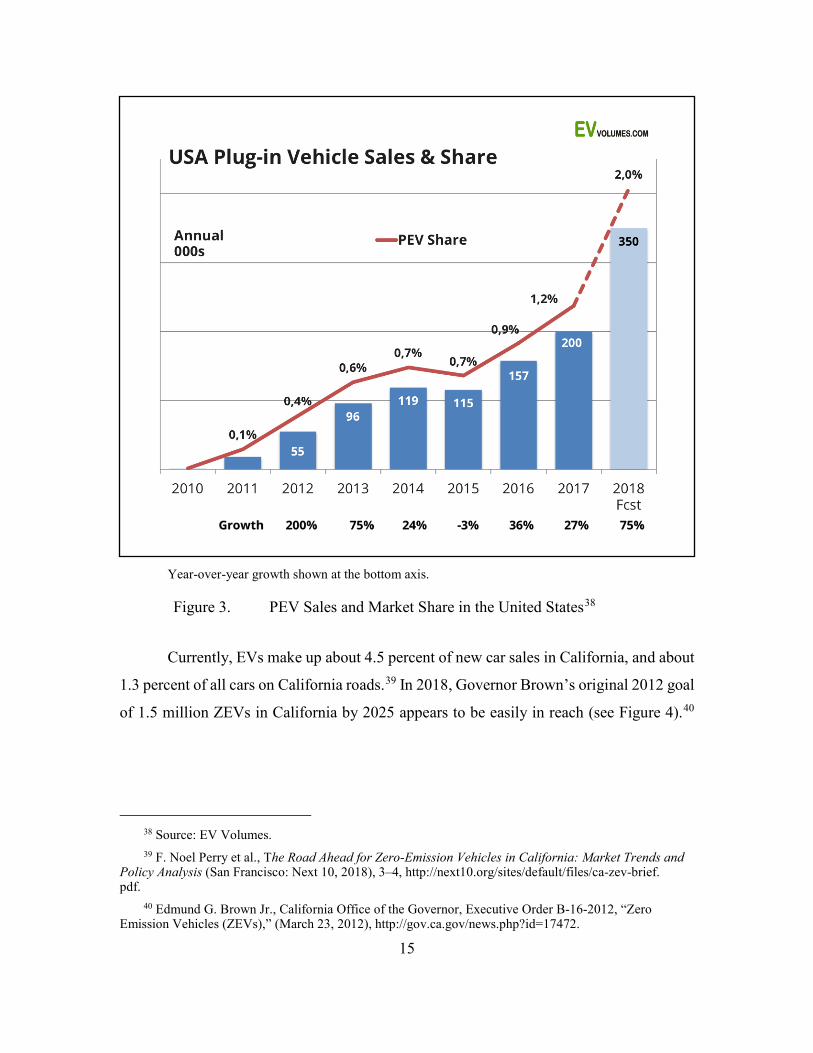
2016 and 2017, and is expected to leap 75 percent above 2017 in 2018 (see Figure 3).37
33 Mark Matousek, “Tesla Expects to Make 6,000 Model 3s per Week by the End of August,” Business
Insider, August 1, 2018, https://www.businessinsider.com/tesla-model-3-production-to-hit-6000-per-week-by-end-of-august-2018-8.
34 David Block and John Harrison, Electric Vehicle Sales and Future Projections (Cocoa, FL: Electric Vehicle Transportation Center, University of Central Florida, 2014), 7, http://evtc.fsec.ucf.edu/reports/EV TC-RR-01-14.pdf.
35 “Electric Vehicles to Be 35% of Global New Car Sales by 2040,” Bloomberg New Energy Finance, February 25, 2016, http://about.bnef.com/press-releases/electric-vehicles-to-be-35-of-global-new-car-sales-by-2040/.
36 “Hybrid and Electric Vehicle Sales to Exceed 17 Million by 2020 as ‘Range Anxiety’ Lessens,” Juniper Research, March 8, 2016, https://www.juniperresearch.com/press/press-releases/hybrid-and-electric-vehicle-sales-to-exceed-17m?utm_source=cisionpr&utm_medium=email&utm_campaign=Hybrid_ Electric_16_PR1.
37 “EV-Volumes—The Electric Vehicle World Sales Database,” EV Volumes, July 2018, http://www. ev-volumes.com/country/usa/.
15
Year-over-year growth shown at the bottom axis.
Figure 3. PEV Sales and Market Share in the United States38
Currently, EVs make up about 4.5 percent of new car sales in California, and about
1.3 percent of all cars on California roads.39 In 2018, Governor Brown’s original 2012 goal
of 1.5 million ZEVs in California by 2025 appears to be easily in reach (see Figure 4).40
38 Source: EV Volumes. 39 F. Noel Perry et al., The Road Ahead for Zero-Emission Vehicles in California: Market Trends and
Policy Analysis (San Francisco: Next 10, 2018), 3–4, http://next10.org/sites/default/files/ca-zev-brief. pdf.
40 Edmund G. Brown Jr., California Office of the Governor, Executive Order B-16-2012, “Zero Emission Vehicles (ZEVs),” (March 23, 2012), http://gov.ca.gov/news.php?id=17472.
16
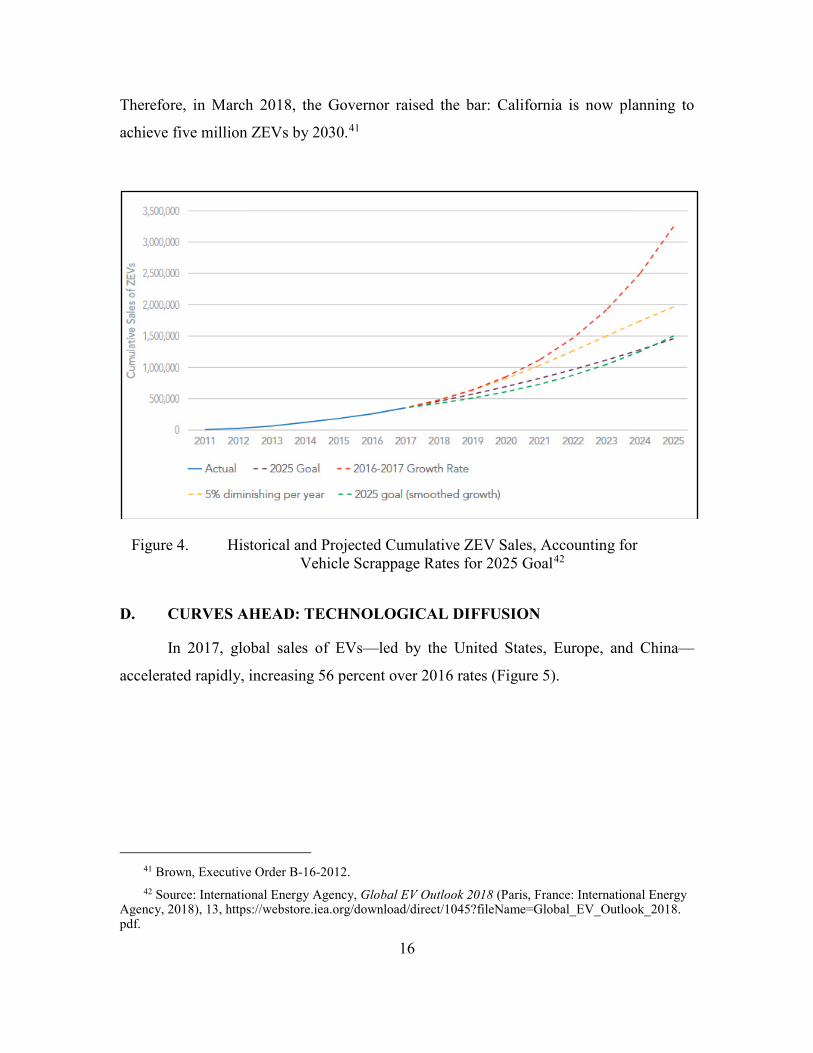
Therefore, in March 2018, the Governor raised the bar: California is now planning to
achieve five million ZEVs by 2030.41
Figure 4. Historical and Projected Cumulative ZEV Sales, Accounting for Vehicle Scrappage Rates for 2025 Goal42
D. CURVES AHEAD: TECHNOLOGICAL DIFFUSION
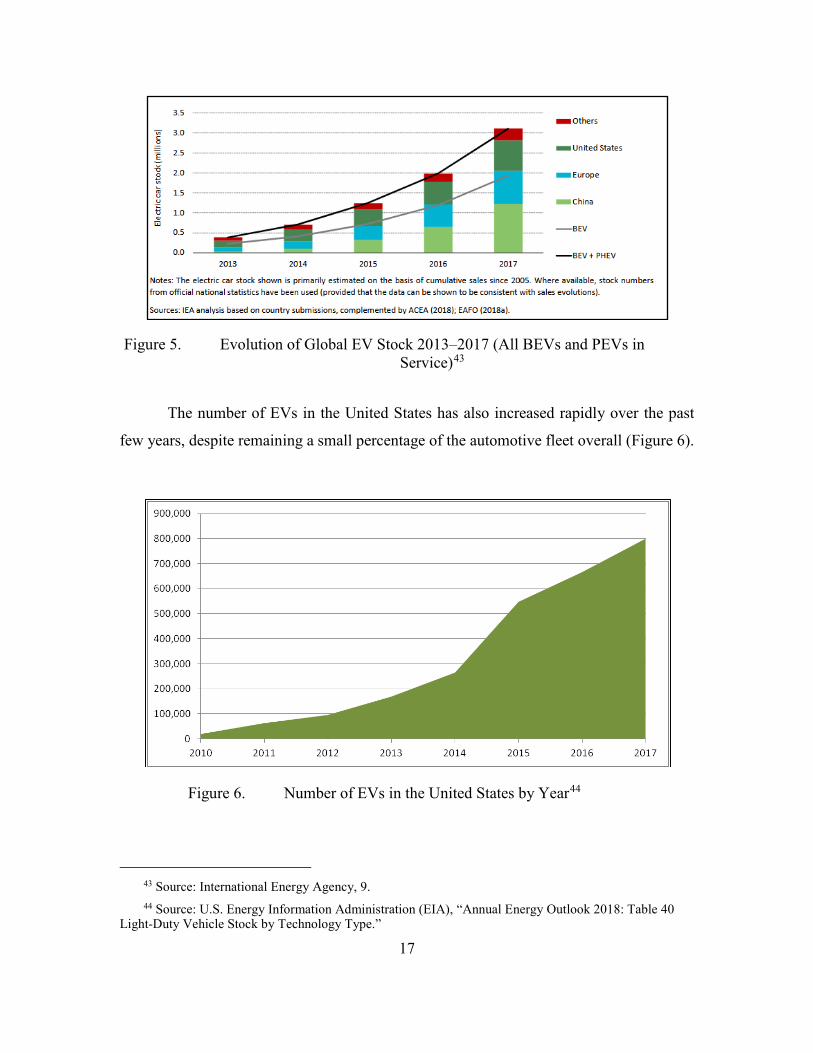
In 2017, global sales of EVs—led by the United States, Europe, and China—
accelerated rapidly, increasing 56 percent over 2016 rates (Figure 5).
41 Brown, Executive Order B-16-2012. 42 Source: International Energy Agency, Global EV Outlook 2018 (Paris, France: International Energy
Agency, 2018), 13, https://webstore.iea.org/download/direct/1045?fileName=Global_EV_Outlook_2018. pdf.
17
Figure 5. Evolution of Global EV Stock 2013–2017 (All BEVs and PEVs in Service)43
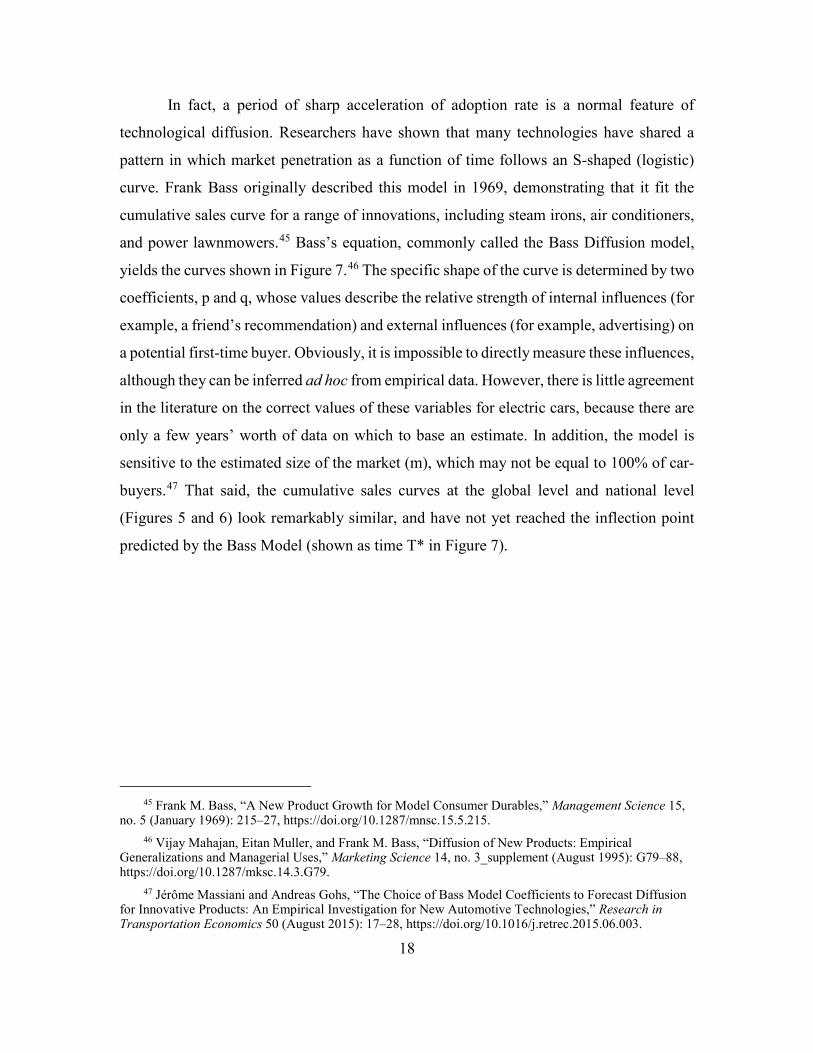
The number of EVs in the United States has also increased rapidly over the past
few years, despite remaining a small percentage of the automotive fleet overall (Figure 6).
Figure 6. Number of EVs in the United States by Year44
43 Source: International Energy Agency, 9. 44 Source: U.S. Energy Information Administration (EIA), “Annual Energy Outlook 2018: Table 40
Light-Duty Vehicle Stock by Technology Type.”
18
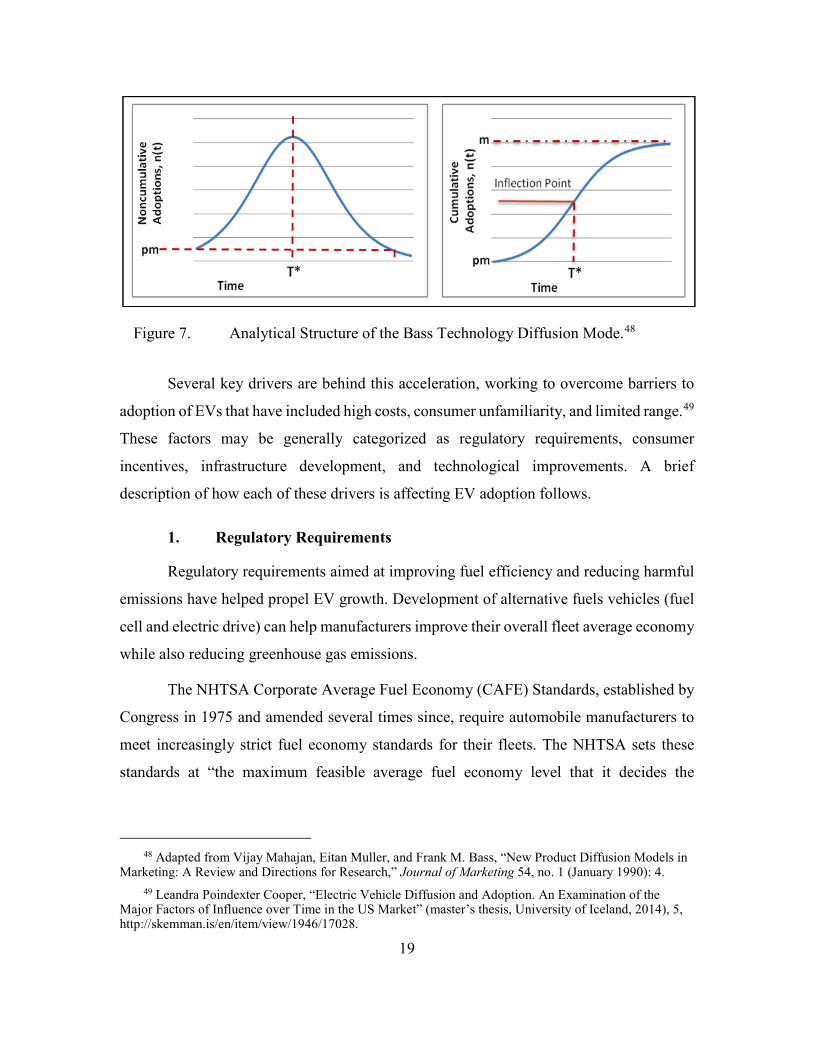
In fact, a period of sharp acceleration of adoption rate is a normal feature of
technological diffusion. Researchers have shown that many technologies have shared a
pattern in which market penetration as a function of time follows an S-shaped (logistic)
curve. Frank Bass originally described this model in 1969, demonstrating that it fit the
cumulative sales curve for a range of innovations, including steam irons, air conditioners,
and power lawnmowers.45 Bass’s equation, commonly called the Bass Diffusion model,
yields the curves shown in Figure 7.46 The specific shape of the curve is determined by two
coefficients, p and q, whose values describe the relative strength of internal influences (for
example, a friend’s recommendation) and external influences (for example, advertising) on
a potential first-time buyer. Obviously, it is impossible to directly measure these influences,
although they can be inferred ad hoc from empirical data. However, there is little agreement
in the literature on the correct values of these variables for electric cars, because there are
only a few years’ worth of data on which to base an estimate. In addition, the model is
sensitive to the estimated size of the market (m), which may not be equal to 100% of car-
buyers.47 That said, the cumulative sales curves at the global level and national level
(Figures 5 and 6) look remarkably similar, and have not yet reached the inflection point
predicted by the Bass Model (shown as time T* in Figure 7).
45 Frank M. Bass, “A New Product Growth for Model Consumer Durables,” Management Science 15,
no. 5 (January 1969): 215–27, https://doi.org/10.1287/mnsc.15.5.215. 46 Vijay Mahajan, Eitan Muller, and Frank M. Bass, “Diffusion of New Products: Empirical
Generalizations and Managerial Uses,” Marketing Science 14, no. 3_supplement (August 1995): G79–88, https://doi.org/10.1287/mksc.14.3.G79.
47 Jérôme Massiani and Andreas Gohs, “The Choice of Bass Model Coefficients to Forecast Diffusion for Innovative Products: An Empirical Investigation for New Automotive Technologies,” Research in Transportation Economics 50 (August 2015): 17–28, https://doi.org/10.1016/j.retrec.2015.06.003.
19
Figure 7. Analytical Structure of the Bass Technology Diffusion Mode.48
Several key drivers are behind this acceleration, working to overcome barriers to
adoption of EVs that have included high costs, consumer unfamiliarity, and limited range.49
These factors may be generally categorized as regulatory requirements, consumer
incentives, infrastructure development, and technological improvements. A brief
description of how each of these drivers is affecting EV adoption follows.
1. Regulatory Requirements
Regulatory requirements aimed at improving fuel efficiency and reducing harmful
emissions have helped propel EV growth. Development of alternative fuels vehicles (fuel
cell and electric drive) can help manufacturers improve their overall fleet average economy
while also reducing greenhouse gas emissions.
The NHTSA Corporate Average Fuel Economy (CAFE) Standards, established by
Congress in 1975 and amended several times since, require automobile manufacturers to
meet increasingly strict fuel economy standards for their fleets. The NHTSA sets these
standards at “the maximum feasible average fuel economy level that it decides the
48 Adapted from Vijay Mahajan, Eitan Muller, and Frank M. Bass, “New Product Diffusion Models in
Marketing: A Review and Directions for Research,” Journal of Marketing 54, no. 1 (January 1990): 4. 49 Leandra Poindexter Cooper, “Electric Vehicle Diffusion and Adoption. An Examination of the
Major Factors of Influence over Time in the US Market” (master’s thesis, University of Iceland, 2014), 5, http://skemman.is/en/item/view/1946/17028.
20
manufacturers can achieve in each year.”50 Together with the U.S. Environmental
Protection Agency (EPA), the NHTSA in 2012 published combined standards for fuel
economy and reduction of carbon dioxide emissions that also includes an “incentive
multiplier” for PHEVs, BEVs, and FCVs in the model years 2017 to 2025.The current
NHTSA standards call for the industry fleet average to reach 40 to 41 mpg fuel efficiency
in model year 2021, while the EPA greenhouse gas emission policies call for a reduction
in carbon dioxide emissions that would be equivalent to 54.7 mpg if accomplished through
fuel economy alone.51 By comparison, the 2018 Tesla models received EPA fuel economy
ratings of 116–130 miles per gallon equivalent (MPGe), depending on model and options.52
In addition, California pioneered state-level legislation requiring that car makers
who sell cars produce a percentage of alternative fuel vehicles, referred to as ZEVs. Nine
other states have adopted similar requirements. These rules are pushing auto manufacturers
to develop and market a broader range of EV models, which in turn, raises consumer
awareness and meets a wider range of customer requirements.53
2. Consumer Incentives
Federal, state, and local policies that provide consumer incentives, such as tax
credits, rebates, sales tax exemptions, free parking, subsidized charging, and carpool lane
access, are helping to offset the EV price premium.54 At the federal level, PEV purchasers
are eligible for tax credits of up to $7,500 (subject to a 200,000-vehicle cap per
50 Interestingly, at least one analysis has shown that there is no statistically significant correlation
between gasoline prices and EV sales. Richard Kelly, “Do Gas Prices Correlate with Plug-in Vehicle Sales?,” PlugInAmerica, December 15, 2014, https://pluginamerica.org/do-gas-prices-correlate-plug-vehicle-sales/..
51 “CAFE Public Information Center,” U.S. National Highway Traffic Safety Administration, accessed July 24, 2019, http://www.nhtsa.gov/CAFE_PIC/CAFE_PIC_Home.htm.
52 “Gas Mileage of 2018 Vehicles by Tesla,” Fueleconomy, accessed July 24, 2019, https://www. fueleconomy.gov/feg/bymake/Tesla2018.shtml.
53 “Gas Mileage of 2016 Vehicles by Tesla,” Fueleconomy, accessed August 29, 2016, https://www. fueleconomy.gov/feg/bymake/Tesla2016.shtml.
54 DeShazo et al., State of the States’ Plug-in Electric Vehicle Policies, 1–29.
21
manufacturer). A number of states, including California, have additional tax incentives for
EV purchase and installation of charging infrastructure.55
In California, single-occupant access to carpool lanes for PEVs has proved to be
especially important. Researchers at the University of California Los Angeles found that
approximately 25 percent of PEV registrations in California between 2010 and 2013 were
attributable to this benefit.56 Carpool-lane access is estimated to be worth about $2,300
over the lifetime of a vehicle for residents of Los Angeles.57
3. Infrastructure Development
Policy influences on electric vehicle adoption also include funding for public and
private charging infrastructure. The availability of charging infrastructure is an important
influence on the uptake of EVs because it reduces customer anxiety about the limited range
of EVs. Using funding appropriated under the 2009 American Recovery and Reinvestment
Act, DOE has contributed significantly to the development of charging infrastructure in the
United States. According to the Alternative Fuels Data Center, there are now more than
22,000 charging stations in the United States, not including private stations, such as the
Tesla “Supercharger” stations; California alone now has more than 5,700 public charging
stations.58
For cities like Los Angeles that include a high proportion of residents living in
multi-family housing, installing charging infrastructure in the parking facilities of multi-
55 Nic Lutsey et al., Assessment of Leading Electric Vehicle Promotion Activities in United States
Cities (Washington, DC: International Council on Clean Transportation, 2015), 9, http://www.theicct.org/ sites/default/files/publications/ICCT_EV-promotion-US-cities_20150729.pdf.
56 Tamara L. Sheldon and J. R. DeShazo, How Does the Presence of HOV Lanes Affect Plug-in Electric Vehicle Adoption in California? A Generalized Propensity Score Approach (Los Angeles: UCLA Luskin School of Public Affairs, Luskin Center for Innovation, 2016), 1.
57 “Plug-In Electric Drive Vehicle Credit (IRC 30D),” U.S. Internal Revenue Service, February 9, 2016, https://www.irs.gov/businesses/plug-in-electric-vehicle-credit-irc-30-and-irc-30d.
58 “Alternative Fuels Data Center: Electric Vehicle Charging Station Locations,” U.S. Department of Energy, Energy Efficiency and Renewable Energy, accessed July 25, 2019, https://afdc.energy.gov/fuels/ electricity_locations.html#/find/nearest?fuel=ELEC&country=US.
22
unit dwellings makes EV ownership feasible for and attractive to this population.59
Workplace charging is also important, as a consumer convenience and because it can help
shift EV charging away from the peak demand time in the early evening. Los Angeles has
developed partnerships with ten employers to support the deployment of charging
infrastructure at workplaces, the most of any major city in the United States. About 80
percent of the workplace installations funded under DOE’s Workplace Charging Challenge
provide free electricity, creating an additional financial benefit for EV owners.60
4. Technological Improvements
Advances in battery technology are improving both vehicle range and affordability.
Vehicle range is a function of the amount of energy in kilowatt-hours (kWh) that can be
stored in the vehicle’s onboard batteries. Because batteries are expensive and heavy, there
is a tradeoff between the amount of energy that can be stored and the energy efficiency and
cost of the vehicle. However, the amount of power that can be stored (energy density) has
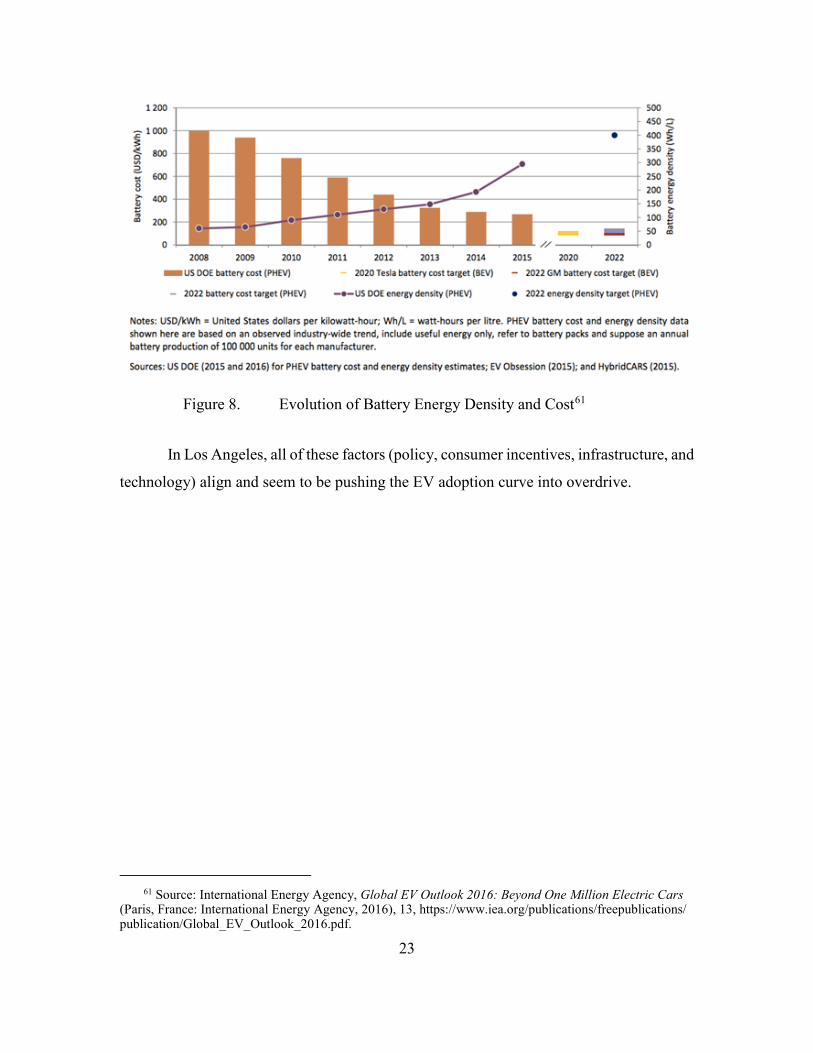
been increasing rapidly while the cost of the battery packs has been dropping (see Figure
8). Economies of scale are expected to further reduce the price differential between EVs
and conventional internal combustion vehicles.
59 Recognizing this, California has passes legislation dedicated to removing obstacles to installing
charging infrastructure in multi-unit dwellings. Legislative Counsel, California Senate Bill Number 880, Chapter 6 (Sacramento: CA: Legislative Counsel, 2012), 93, http://www.leginfo.ca.gov/pub/11-12/bill/sen/sb_0851-0900/sb_880_bill_20120229_chaptered.pdf.
60 Lutsey et al., Assessment of Leading Electric Vehicle Promotion Activities in United States Cities, 15.
23
Figure 8. Evolution of Battery Energy Density and Cost61
In Los Angeles, all of these factors (policy, consumer incentives, infrastructure, and
technology) align and seem to be pushing the EV adoption curve into overdrive.
61 Source: International Energy Agency, Global EV Outlook 2016: Beyond One Million Electric Cars
(Paris, France: International Energy Agency, 2016), 13, https://www.iea.org/publications/freepublications/ publication/Global_EV_Outlook_2016.pdf.

24
THIS PAGE INTENTIONALLY LEFT BLANK
25
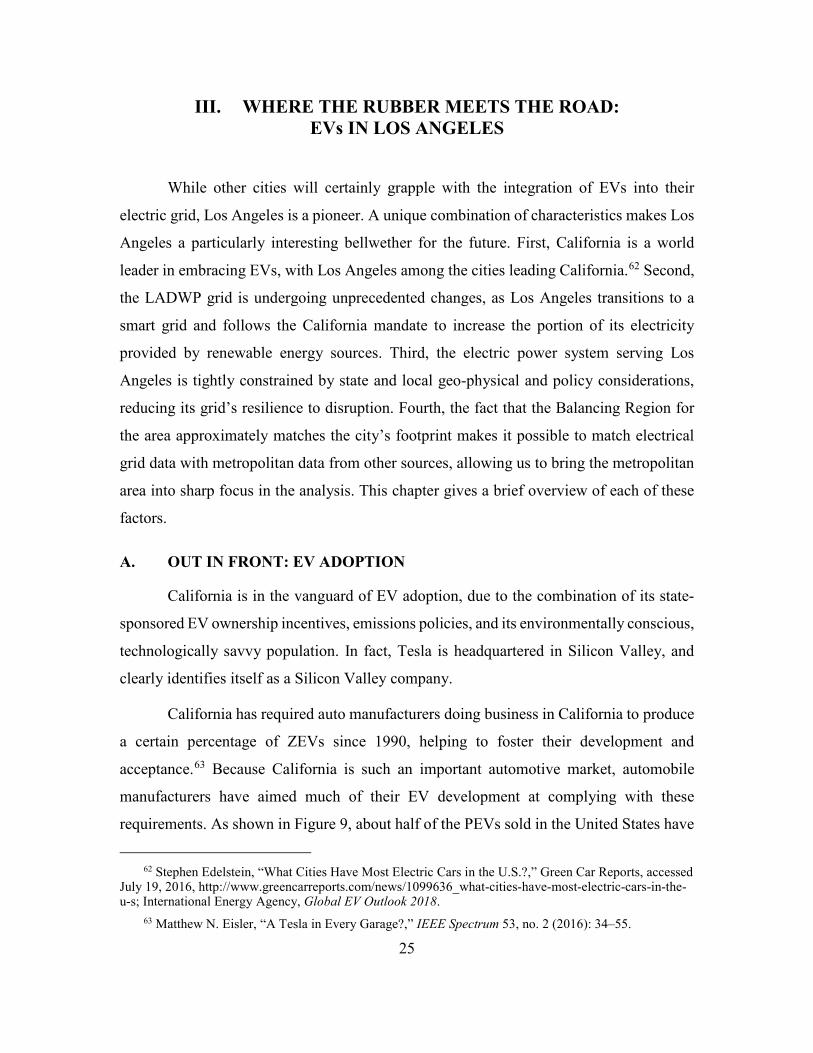
III. WHERE THE RUBBER MEETS THE ROAD: EVs IN LOS ANGELES
While other cities will certainly grapple with the integration of EVs into their
electric grid, Los Angeles is a pioneer. A unique combination of characteristics makes Los
Angeles a particularly interesting bellwether for the future. First, California is a world
leader in embracing EVs, with Los Angeles among the cities leading California.62 Second,
the LADWP grid is undergoing unprecedented changes, as Los Angeles transitions to a
smart grid and follows the California mandate to increase the portion of its electricity
provided by renewable energy sources. Third, the electric power system serving Los
Angeles is tightly constrained by state and local geo-physical and policy considerations,
reducing its grid’s resilience to disruption. Fourth, the fact that the Balancing Region for
the area approximately matches the city’s footprint makes it possible to match electrical
grid data with metropolitan data from other sources, allowing us to bring the metropolitan
area into sharp focus in the analysis. This chapter gives a brief overview of each of these
factors.
A. OUT IN FRONT: EV ADOPTION
California is in the vanguard of EV adoption, due to the combination of its state-
sponsored EV ownership incentives, emissions policies, and its environmentally conscious,
technologically savvy population. In fact, Tesla is headquartered in Silicon Valley, and
clearly identifies itself as a Silicon Valley company.
California has required auto manufacturers doing business in California to produce
a certain percentage of ZEVs since 1990, helping to foster their development and
acceptance.63 Because California is such an important automotive market, automobile
manufacturers have aimed much of their EV development at complying with these
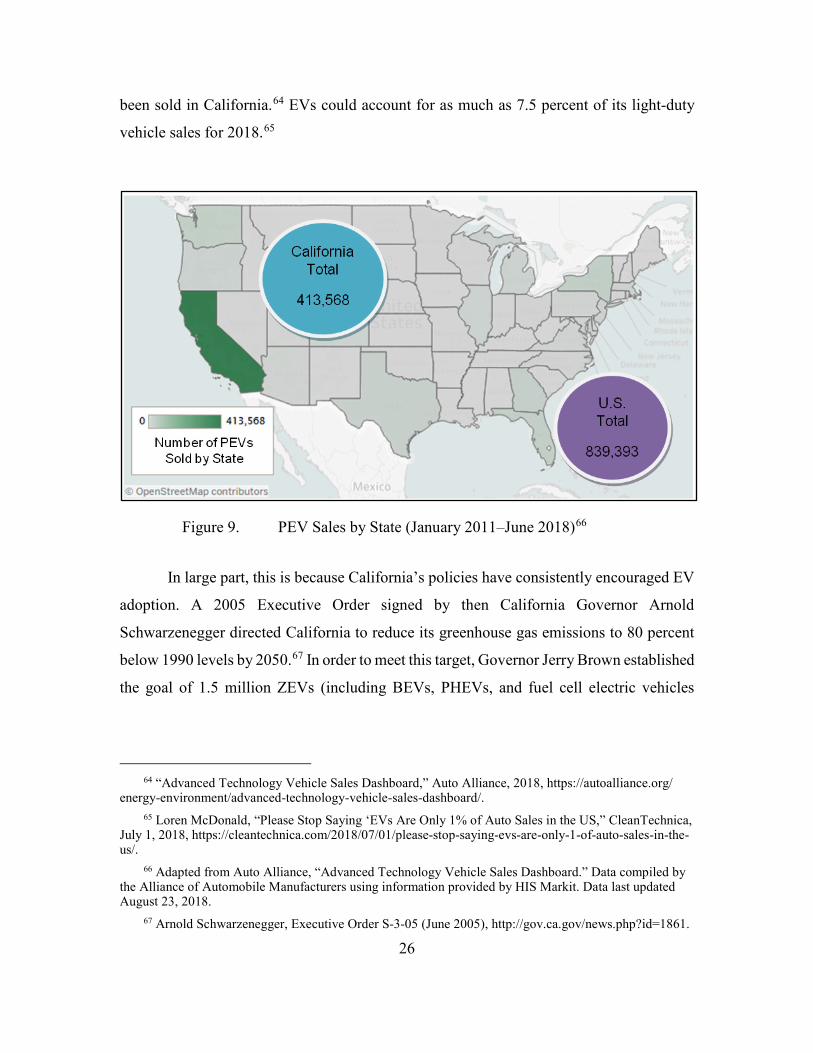
requirements. As shown in Figure 9, about half of the PEVs sold in the United States have
62 Stephen Edelstein, “What Cities Have Most Electric Cars in the U.S.?,” Green Car Reports, accessed
July 19, 2016, http://www.greencarreports.com/news/1099636_what-cities-have-most-electric-cars-in-the-u-s; International Energy Agency, Global EV Outlook 2018.
63 Matthew N. Eisler, “A Tesla in Every Garage?,” IEEE Spectrum 53, no. 2 (2016): 34–55.
26
been sold in California.64 EVs could account for as much as 7.5 percent of its light-duty
vehicle sales for 2018.65
Figure 9. PEV Sales by State (January 2011–June 2018)66
In large part, this is because California’s policies have consistently encouraged EV
adoption. A 2005 Executive Order signed by then California Governor Arnold
Schwarzenegger directed California to reduce its greenhouse gas emissions to 80 percent
below 1990 levels by 2050.67 In order to meet this target, Governor Jerry Brown established
the goal of 1.5 million ZEVs (including BEVs, PHEVs, and fuel cell electric vehicles
64 “Advanced Technology Vehicle Sales Dashboard,” Auto Alliance, 2018, https://autoalliance.org/
energy-environment/advanced-technology-vehicle-sales-dashboard/. 65 Loren McDonald, “Please Stop Saying ‘EVs Are Only 1% of Auto Sales in the US,” CleanTechnica,
July 1, 2018, https://cleantechnica.com/2018/07/01/please-stop-saying-evs-are-only-1-of-auto-sales-in-the-us/.
66 Adapted from Auto Alliance, “Advanced Technology Vehicle Sales Dashboard.” Data compiled by the Alliance of Automobile Manufacturers using information provided by HIS Markit. Data last updated August 23, 2018.
67 Arnold Schwarzenegger, Executive Order S-3-05 (June 2005), http://gov.ca.gov/news.php?id=1861.
27
[FCEVs]) by 2025 by Executive Order issued in 2012.68 The Charge Ahead California
Initiative, passed by the California legislature in September 2014, added an interim goal of
1 million ZEVs in service by 2023.69 According to an analysis carried out by the National
Renewable Energy Laboratory (NREL) for the California Energy Commission (CEC), this
goal translates into approximately 420,000 BEVs (such as the Tesla models) in California
by 2025.70 Most recently, Governor Jerry Brown increased the target for ZEVs in service
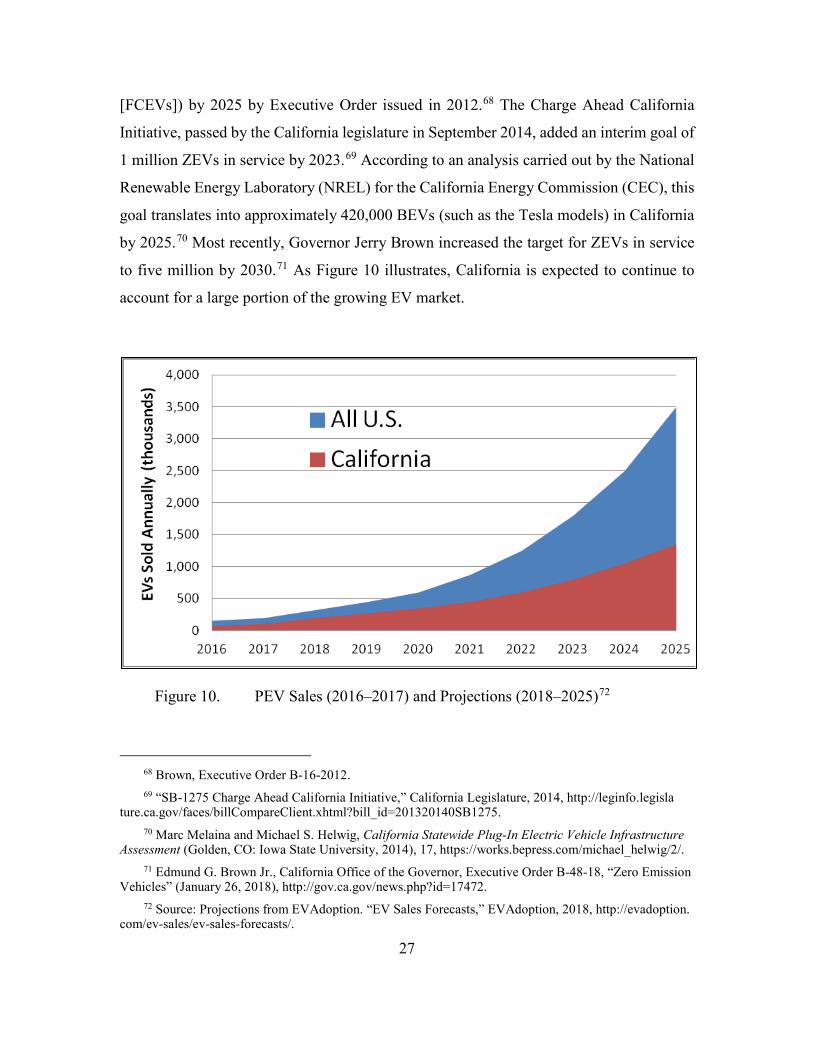
to five million by 2030.71 As Figure 10 illustrates, California is expected to continue to
account for a large portion of the growing EV market.
Figure 10. PEV Sales (2016–2017) and Projections (2018–2025)72
68 Brown, Executive Order B-16-2012. 69 “SB-1275 Charge Ahead California Initiative,” California Legislature, 2014, http://leginfo.legisla
ture.ca.gov/faces/billCompareClient.xhtml?bill_id=201320140SB1275. 70 Marc Melaina and Michael S. Helwig, California Statewide Plug-In Electric Vehicle Infrastructure
Assessment (Golden, CO: Iowa State University, 2014), 17, https://works.bepress.com/michael_helwig/2/. 71 Edmund G. Brown Jr., California Office of the Governor, Executive Order B-48-18, “Zero Emission
Vehicles” (January 26, 2018), http://gov.ca.gov/news.php?id=17472. 72 Source: Projections from EVAdoption. “EV Sales Forecasts,” EVAdoption, 2018, http://evadoption.
com/ev-sales/ev-sales-forecasts/.
28
At a finer scale, the major cities in California are driving electric vehicle adoption
by providing additional incentives, such as access to restricted commuting lanes, and by
fostering charging infrastructure development. Among these, the San Francisco and Los
Angeles metropolitan areas are at the forefront of electric vehicle adoption. In 2015, Los
Angeles accounted for nine percent of all EV sales (second only to San Francisco for total
sales).73 Los Angeles is ranked as one of the most conducive cities in the United States for
EVs, suggesting that the EV market in Los Angeles will continue to grow.74
LADWP is actively promoting the shift to EVs, in order to build its revenue stream
and help it manage the integration of more renewable energy sources. In addition to the
federal and state incentives to EV owners, LADWP is offering rebates of up to $4,000 per
installed charger to large and small businesses and multi-family residences. It has already
installed more than 400 public charging stations in Los Angeles, and it is piloting a program
to deploy additional chargers on utility poles.75 It also has a multi-tiered and time-of-use
(TOU) rate structure designed to encourage users to conserve energy and shift energy use
away from peak times (1:00 p.m. to 5:00 p.m. Monday through Friday).76
B. SHIFTING GEARS: CHANGING ELECTRIC POWER SYSTEMS
In addition to its leadership in EV adoption, California, like other electric power
systems across the United States, is in the throes of organizational and technological
changes, collectively referred to as “grid modernization.” At the heart of this modernization
73 “The Future Is Electric—The World Is on the Verge of an Automotive Revolution: CURRENT Is
Helping Los Angeles Customers Find the Right EV for Their Lifestyle,” CURRENT (blog), January 19, 2016, http://currentev.com/blog/future-electric-%E2%80%93-world-verge-automotive-revolution-current-helping-los-angeles-customers.
74 Kyle Clark-Sutton et al., “Plug-in Electric Vehicle Readiness: Rating Cities in the United States,” The Electricity Journal 29, no. 1 (January 2016): 30–40, https://doi.org/10.1016/j.tej.2015.12.006.
75 Los Angeles Department of Water and Power, Los Angeles Department of Water and Power Briefing Book 2017–2018 (Los Angeles: Los Angeles Department of Water and Power, 2017), 21, https:// s3-us-west-2.amazonaws.com/ladwp-jtti/wp-content/uploads/sites/3/2017/09/08143247/Briefing-Book-Rol ling-PDF.pdf.
76 “Electric Rates,” Los Angeles Department of Water and Power, accessed August 5, 2019, https:// www.ladwp.com/ladwp/faces/ladwp/residential/r-customerservices/r-cs-understandingyourrates/r-cs-ur-electricrates?_afrLoop=551686086234012&_afrWindowMode=0&_afrWindowId=18f8hpkcrz_1#%40%3F_afrWindowId%3D18f8hpkcrz_1%26_afrLoop%3D551686086234012%26_afrWindowMode%3D0%26_adf.ctrl-state%3D6jxwheeb9_4.
29
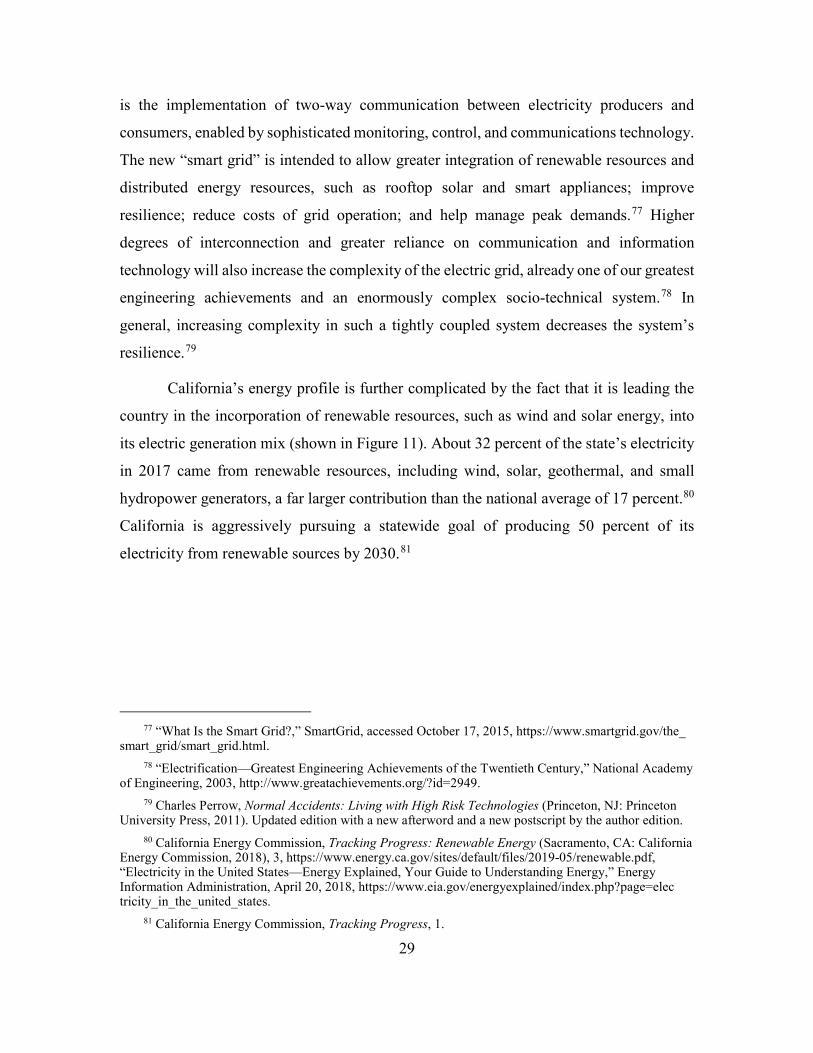
is the implementation of two-way communication between electricity producers and
consumers, enabled by sophisticated monitoring, control, and communications technology.
The new “smart grid” is intended to allow greater integration of renewable resources and
distributed energy resources, such as rooftop solar and smart appliances; improve
resilience; reduce costs of grid operation; and help manage peak demands.77 Higher
degrees of interconnection and greater reliance on communication and information
technology will also increase the complexity of the electric grid, already one of our greatest
engineering achievements and an enormously complex socio-technical system.78 In
general, increasing complexity in such a tightly coupled system decreases the system’s
resilience.79
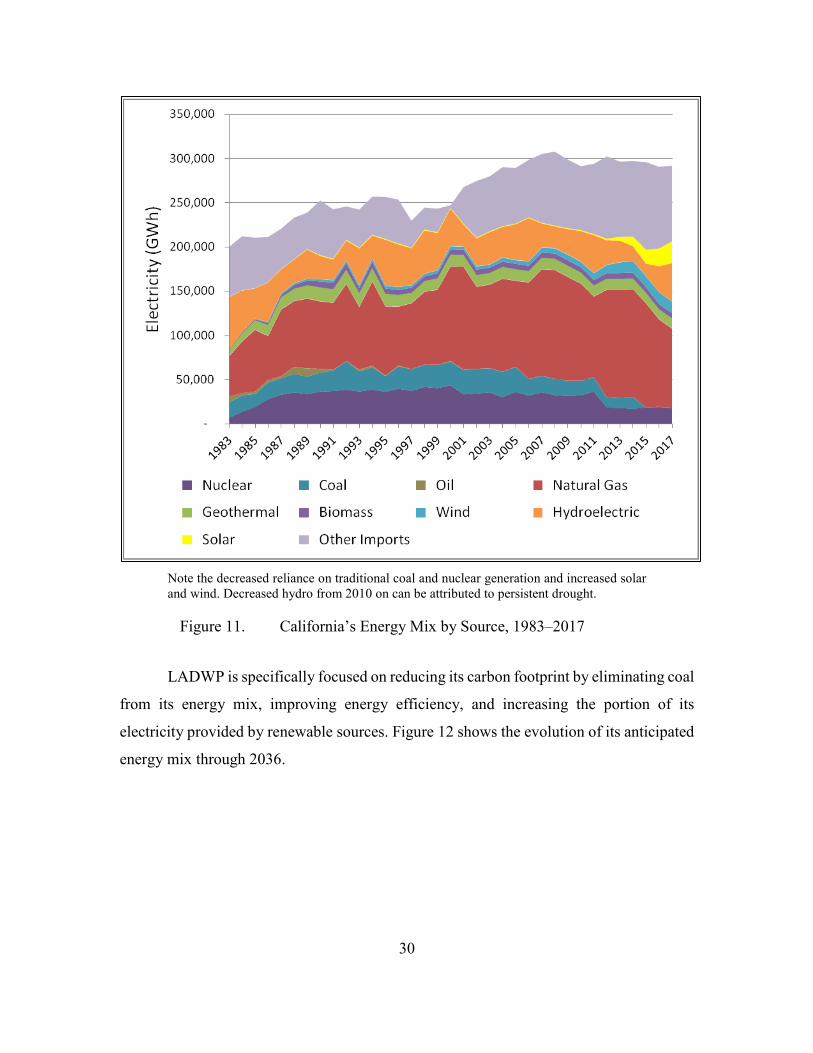
California’s energy profile is further complicated by the fact that it is leading the
country in the incorporation of renewable resources, such as wind and solar energy, into
its electric generation mix (shown in Figure 11). About 32 percent of the state’s electricity
in 2017 came from renewable resources, including wind, solar, geothermal, and small
hydropower generators, a far larger contribution than the national average of 17 percent.80
California is aggressively pursuing a statewide goal of producing 50 percent of its
electricity from renewable sources by 2030.81
77 “What Is the Smart Grid?,” SmartGrid, accessed October 17, 2015, https://www.smartgrid.gov/the_
smart_grid/smart_grid.html. 78 “Electrification—Greatest Engineering Achievements of the Twentieth Century,” National Academy
of Engineering, 2003, http://www.greatachievements.org/?id=2949. 79 Charles Perrow, Normal Accidents: Living with High Risk Technologies (Princeton, NJ: Princeton
University Press, 2011). Updated edition with a new afterword and a new postscript by the author edition. 80 California Energy Commission, Tracking Progress: Renewable Energy (Sacramento, CA: California
Energy Commission, 2018), 3, https://www.energy.ca.gov/sites/default/files/2019-05/renewable.pdf, “Electricity in the United States—Energy Explained, Your Guide to Understanding Energy,” Energy Information Administration, April 20, 2018, https://www.eia.gov/energyexplained/index.php?page=elec tricity_in_the_united_states.
81 California Energy Commission, Tracking Progress, 1.
30
Note the decreased reliance on traditional coal and nuclear generation and increased solar and wind. Decreased hydro from 2010 on can be attributed to persistent drought.
Figure 11. California’s Energy Mix by Source, 1983–2017
LADWP is specifically focused on reducing its carbon footprint by eliminating coal
from its energy mix, improving energy efficiency, and increasing the portion of its
electricity provided by renewable sources. Figure 12 shows the evolution of its anticipated
energy mix through 2036.

31
LADWP plans to eliminate coal from its generation mix, replacing it with increased reliance on renewable energy.
Figure 12. LADWP’s Projected Energy Mix through 203682
However, some of these resources (notably, wind and solar) cannot be called up or
increased by system operators to follow load (meet variations in demand). Such energy
sources are referred to as variable energy resources (VERs). The challenge of managing
higher levels of VER integration is spurring innovations in grid management, including the
development of energy storage technology and “smart market”-based solutions to help
ensure reliable operations.83
C. NO SHOULDER: CONSTRAINTS ON POWER IN THE LAWP AREA
California imports a significant proportion of its electricity from outside the state,
to support its large population and bustling economy, the fifth largest in the world.84 The
electric power transmission network is especially constrained in the LADWP area. The
82 Source: Los Angeles Department of Water and Power, Los Angeles Department of Water and Power
Briefing Book 2017–2018, 9. 83 See for example Executive Office of the President of the United States, Incorporating Renewables
into the Electric Grid: Expanding Opportunities for Smart Markets and Energy Storage (Washington, DC: Executive Office of the President of the United, 2016), 1–140, https://obamawhitehouse.archives.gov/sites/ default/files/page/files/20160616_cea_renewables_electricgrid.pdf.
84 Benjy Egel, “California Now World’s Fifth-Largest Economy, Bigger than Britain,” The Sacramento Bee, May 4, 2018, https://www.sacbee.com/news/business/article210466514.html.
32
unexpected but permanent closure of the San Onofre Nuclear Generating Station (SONGS,
located between Los Angeles and San Diego) in 2012, exacerbated an already-tight
generation situation in Southern California. SONGS supplied about eight percent of the
electricity generated in California; its closure shifted that load to other in-state generation
sources, principally those burning natural gas.85 Pacific Gas and Electric (PG&E) plans to
phase out California’s remaining nuclear power station, Diablo Canyon, near San Luis
Obispo, by 2025. PG&E plans to replace Diablo Canyon’s energy output with energy from
renewable sources.86 LADWP imports power from outside the state via a few high-voltage,
direct-current ties, creating a potential transmission bottleneck (see Figure 13).
85 Lucas Davis and Catherine Hausman, “Market Impacts of a Nuclear Power Plant Closure,”
American Economic Journal: Applied Economics 8, no. 2 (April 2016): 92–122, https://doi.org/10.1257/ app.20140473.
86 “In Step With California’s Evolving Energy Policy, PG&E, Labor and Environmental Groups Announce Proposal to Increase Energy Efficiency, Renewables and Storage While Phasing Out Nuclear Power over the Next Decade,” Pacific Gas and Electric, June 21, 2016, http://www.pge.com/en/about/ newsroom/newsdetails/index.page?title=20160621_in_step_with_californias_evolving_energy_policy_pge_labor_and_environmental_groups_announce_proposal_to_increase_energy_efficiency_renewables_and_storage_while_phasing_out_nuclear_power_over_the_next_decade.
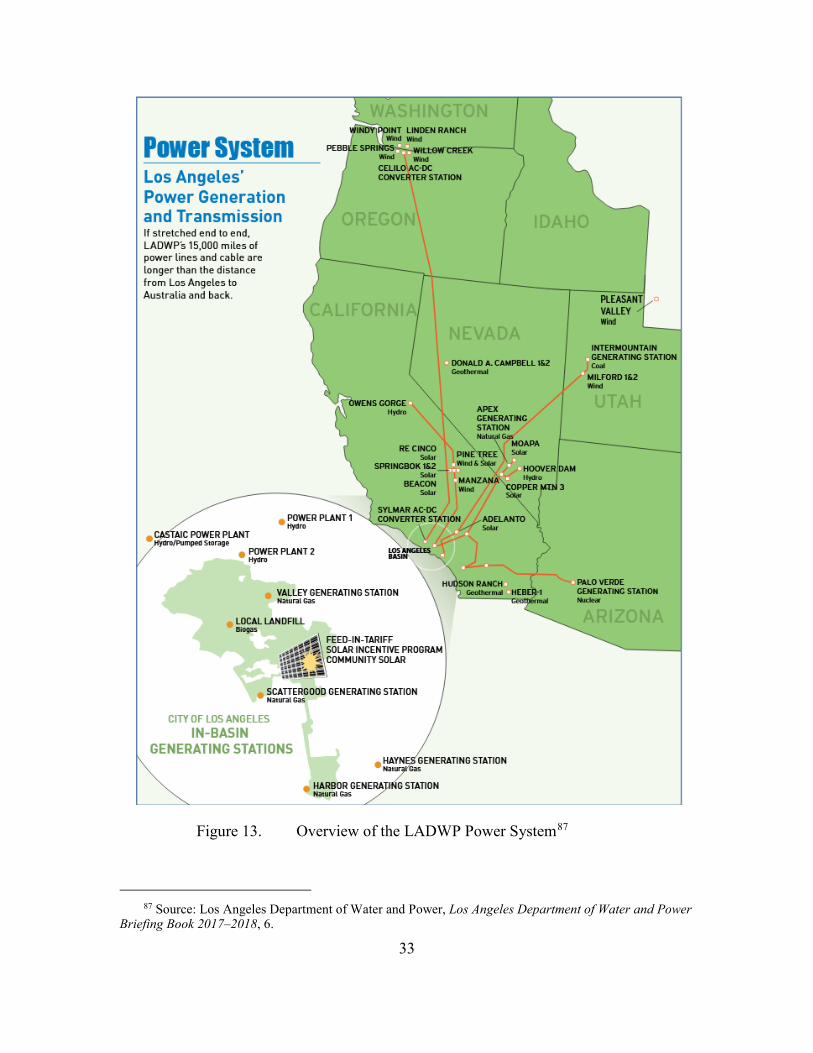
33
Figure 13. Overview of the LADWP Power System87
87 Source: Los Angeles Department of Water and Power, Los Angeles Department of Water and Power
Briefing Book 2017–2018, 6.
34
The fragility of the LA area electric power system was made abundantly clear by
two recent examples: First, the major natural gas leak that occurred outside of LA at the
Aliso Canyon Natural Gas Storage Facility on October 23, 2015, reducing LADWP’s
ability to rely on natural gas generators. Analysis in the spring of 2016 suggested that the
additional stress could result in up to 14 days of blackouts in Los Angeles during the
summer of 2016.88 Although no load shedding (blackouts) occurred in 2016 or 2017,
LADWP received a variance during a heat wave in June 2016 allowing it to burn diesel
fuel in several generation plants that normally use natural gas, expressly in order to avoid
load shedding.89
Second, on July 6, 2018, record temperatures caused electricity demand in Los
Angeles to reach an hourly peak of 6,979 megawatt hours (MWh). LADPW called on
additional gas-fired generation plants and imports from outside the region, but in this
instance was unable to meet the demand. Thousands of customers experienced power
outages.90
D. BALANCING ACT: LOS ANGELES IN FOCUS
LADWP manages and supplies the third largest California electric market,
consuming more than 27,000 gigawatt-hours (GWh) of electricity in 2015. LADWP is a
municipal utility, part of the city government of Los Angeles, and is responsible for
meeting the electric and water needs of approximately 1.5 million customers (about four
million people) in Los Angeles. Its service area (shown in Figure 14) covers most of the
greater Los Angeles metropolitan area.
88 Staff of the California Public Utilities Commission, Aliso Canyon Action Plan to Preserve Gas and
Electric Reliability for the Los Angeles Basin (Sacramento, CA: California Energy Commission, the California Independent System Operator, and the Los Angeles Department of Water and Power, 2016), 3, http://www.energy.ca.gov/2016_energypolicy/documents/2016-04-08_joint_agency_workshop/Aliso_ Canyon_Action_Plan_to_Preserve_Gas_and_Electric_Reliability_for_the_Los_Angeles_Basin.pdf.
89 Dana Bartholemew, “Heat Wave Could Bring More Diesel Pollution from SoCal Power Plants,” Los Angeles Daily News, June 17, 2016.
90 “Southern California Daily Energy Report: Record Daily-High Temperatures in Southern California Lead to High Electricity Demand and Power Outages,” Energy Information Administration, July 13, 2018, https://www.eia.gov/special/disruptions/socal/summer/#commentary.

35
LADWP service area in light blue; the LADWP balancing area also includes a discontinuous area in Inyo County, California.
Figure 14. LADWP Balancing Area.91
LADWP does not fall under the jurisdiction of the CEC. However, LADWP does
coordinate its forecasts with the CEC and submits system information to FERC as a
transmission system operator. As with any complex analysis, assumptions are necessary,
but given the close correlation of the service territory with Los Angeles County, there is
sufficient data to analyze and draw conclusions regarding the impact of EVs in Los
Angeles. The physical and policy constraints on the system make it an ideal case study for
the impacts of EV adoption on grid reliability.
As the largest publicly-owned utility in California, LADWP is also an ideal test bed
for policy and technological solutions to potential issues related to EV adoption. Publicly-
owned utilities are not regulated by the California Public Utility Commission; the utility is
91 Source: California Energy Commission, California Electric Utility Service Areas (Sacramento, CA:
California Energy Commission, 2015), 1, http://www.energy.ca.gov/maps/serviceareas/Electric_Service_ Areas_Detail.pdf.
36
instead managed by the local government, which sets customer rates and utility policy.92
LADWP is governed by the Mayor and City Council of Los Angeles, through a board of
five commissioners appointed by the Mayor.93 This relatively flat management structure
means that the city can more easily implement energy management policies tailored to its
specific situation.
92 “Differences between Publicly and Investor-Owned Utilities,” California Energy Commission, 2019,
https://www.energy.ca.gov/pou_reporting/background/difference_pou_iou.html. 93 “Who We Are,” Los Angeles Department of Water and Power, 2013, https://www.ladwp.com/
ladwp/faces/ladwp/aboutus/a-whoweare;jsessionid=LxsqcdcBR85TXzhvR3qRmwSx3rTSWcKWX0ncyn PpX70f1yMQ0d5v!-674362223?_afrLoop=147074180102173&_afrWindowMode=0&_afrWindowId= null#%40%3F_afrWindowId%3Dnull%26_afrLoop%3D147074180102173%26_afrWindowMode%3D0%26_adf.ctrl-state%3D47a02xjjm_4.

37
IV. MOVING PARTS: ASSUMPTIONS AND ANALYSIS
As described in Chapter I, Introduction, in order to examine the impacts to resource
adequacy of various levels of EV penetration combined with different charging paradigms,
I constructed four scenarios (Figure 15). I calculated the power demand at peak time due
to EV charging in each scenario and evaluated the total demand against the LADWP
dependable capacity at peak to determine whether LADWP would be able to maintain an
adequate reserve margin. If the reserve margin fell below the standard planning reserve
margin of 16 percent, I conclude that the scenario would reduce grid reliability.
Figure 15. Scenario Combinations of EV Penetration and Charging Behavior for 2030
38
A. SCENARIO CONSTRUCTION
The scenarios are the combinations of Moderate and High degrees of EV
penetration with Low and High Levels of Peak-Coincident Charging (as shown in Figure
15). The following sections provide more detail on the data and assumptions used to
construct the scenarios and describe the analytic method.
The principal factors affecting resource adequacy with respect to EV adoption are:
• Supply and demand for electricity in the Los Angeles area
• EV energy requirements
• EV market penetration
• EV driver travel
• EV charging patterns
The following subsections describe the data, methods, and assumptions used to
address each of these factors.
1. Supply and Demand of Electricity in Los Angeles
In addition to being at the leading edge of EV adoption and therefore the likely
destination for many Tesla Model 3s, the Los Angeles area is unique in California in that
the electric power service area managed by LADWP roughly conforms to the metropolitan
statistical area, so data from LADWP reports, projections, and filings with the Federal
Energy Regulatory Commission (FERC) can be used to understand the current electric
power situation in the city.94 The LADWP’s 2017 Power Strategic Long-term Resource
Plan (SLTRP) and the California Energy Commission’s 2017 Integrated Energy Policy
Report are the most important sources for this information.
94 The LADWP balancing area also includes a non-contiguous portion of California’s Inyo County, the
site of the Owens River Valley (an important water impoundment for LADWP) and Death Valley National Park. Inyo County has a total population of 18,546 according to the 2010 census. Therefore, this portion of the county is assumed to have negligible contribution to total demand within the LADWP region. “United States QuickFacts from the United States Census Bureau,” United States Census Bureau, 2010, http://www. census.gov/quickfacts/.
39
The SLTRP provides long-term projections of electricity supply and demand, based
on trends in economic growth and development, technological shifts, policy goals, and
planned capacity projects, usually including a variety of scenarios for each factor to help
account for uncertainty. It meets the California requirement for publicly owned utilities
(POUs) to submit integrated resource plans (IRP) to the CEC every five years. According
to the CEC, “IRPs are electricity system planning documents intended to ensure that POUs
lay out the resource needs, policy goals, physical and operational constraints, and general
priorities or proposed resource choices of an electric utility, including customer-side
preferred resources. These plans will provide a framework to evaluate how utilities have
chosen to align with greenhouse gas emission reduction targets as well as energy and other
policy goals.”95
a. Supply
Notably, the LADWP SLTRP projects a generation shortfall starting in 2024 under
its recommended strategy. This means that—despite LADWP’s policy that it has an
obligation to “be self-sufficient in supplying native load and not rely on external energy
markets”96—meeting the peak demand for the system will require buying power from
outside the balancing area, from sources outside of LADWP’s control. Buying power on
the market like this is common, and a reasonable solution compared to building new power
plants that might only be used a few hours per year. However, because there are only a few
transmission pathways into the LADWP grid, there are limits on how much power can be
imported.
b. Demand
In addition to publishing its resource plans, LADWP must file an Electric Balancing
Area and Planning Area Report (FERC Form 714) annually, and these forms are publicly
95 “Publicly Owned Utility Integrated Resource Plans,” California Energy Commission, 2019,
https://ww2.energy.ca.gov/sb350/IRPs/. 96 Los Angeles Department of Water and Power, 2017 Power Strategic Long-Term Resource, A–4.
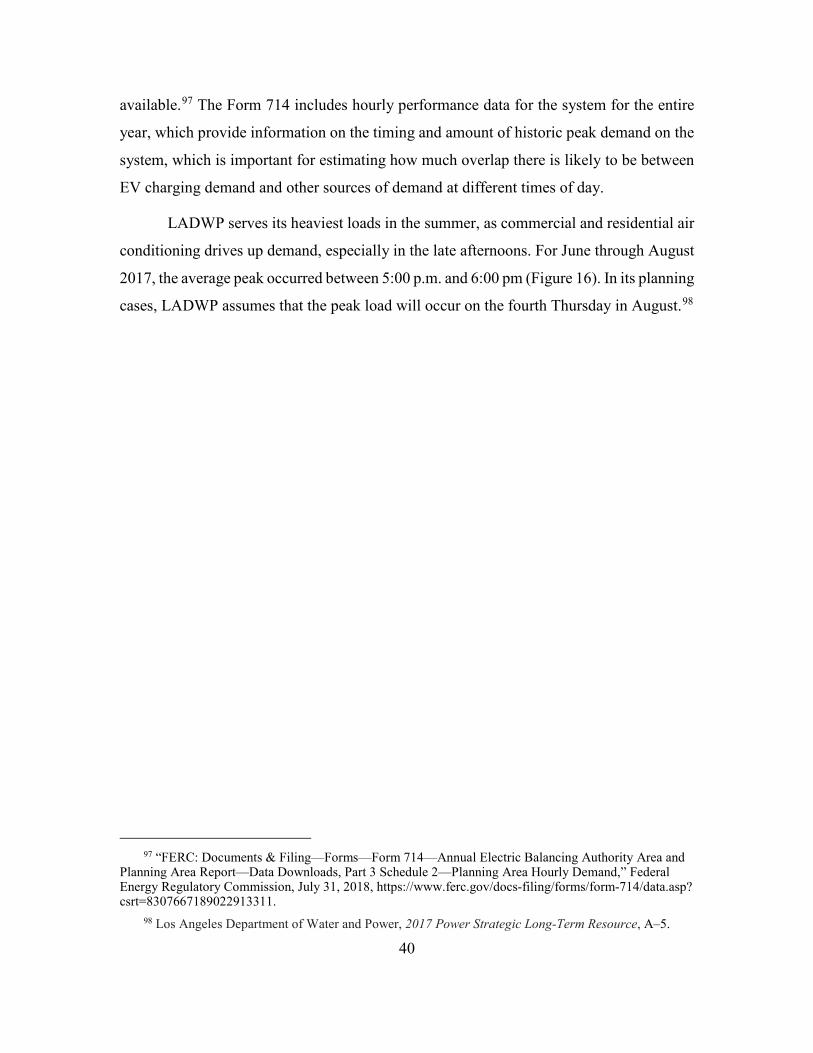
40
available.97 The Form 714 includes hourly performance data for the system for the entire
year, which provide information on the timing and amount of historic peak demand on the
system, which is important for estimating how much overlap there is likely to be between
EV charging demand and other sources of demand at different times of day.
LADWP serves its heaviest loads in the summer, as commercial and residential air
conditioning drives up demand, especially in the late afternoons. For June through August
2017, the average peak occurred between 5:00 p.m. and 6:00 pm (Figure 16). In its planning
cases, LADWP assumes that the peak load will occur on the fourth Thursday in August.98
97 “FERC: Documents & Filing—Forms—Form 714—Annual Electric Balancing Authority Area and
Planning Area Report—Data Downloads, Part 3 Schedule 2—Planning Area Hourly Demand,” Federal Energy Regulatory Commission, July 31, 2018, https://www.ferc.gov/docs-filing/forms/form-714/data.asp? csrt=8307667189022913311.
98 Los Angeles Department of Water and Power, 2017 Power Strategic Long-Term Resource, A–5.
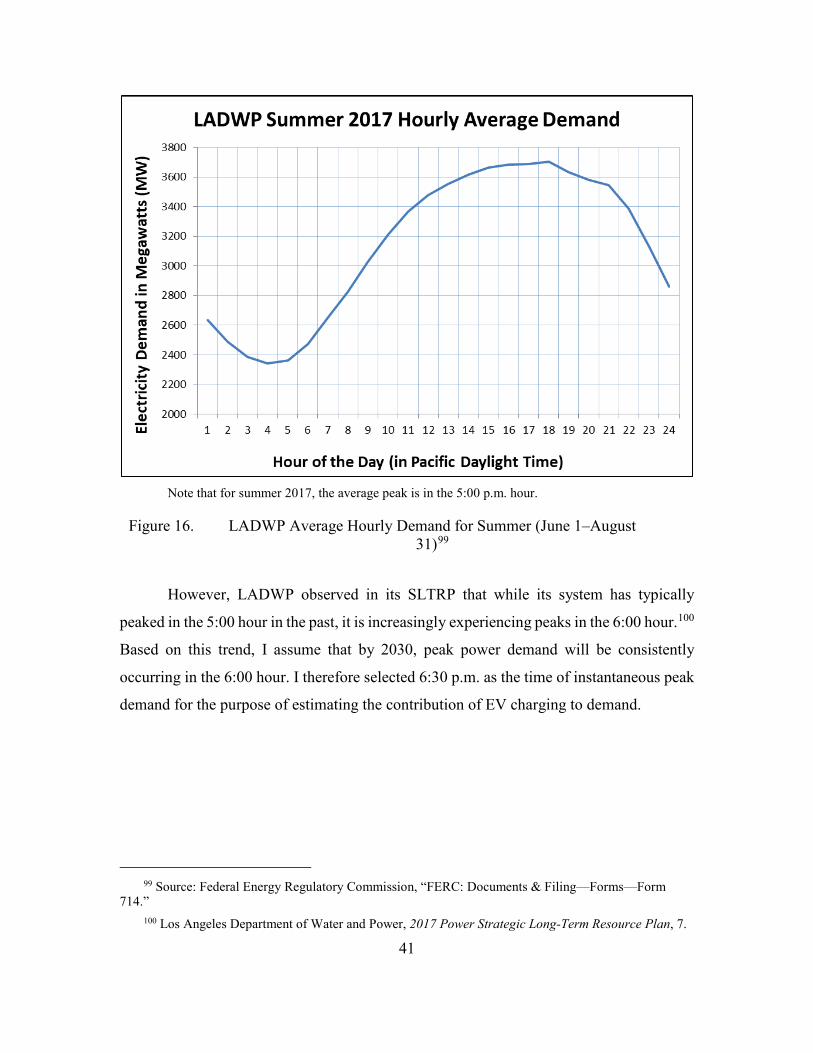
41
Note that for summer 2017, the average peak is in the 5:00 p.m. hour.
Figure 16. LADWP Average Hourly Demand for Summer (June 1–August 31)99
However, LADWP observed in its SLTRP that while its system has typically
peaked in the 5:00 hour in the past, it is increasingly experiencing peaks in the 6:00 hour.100
Based on this trend, I assume that by 2030, peak power demand will be consistently
occurring in the 6:00 hour. I therefore selected 6:30 p.m. as the time of instantaneous peak
demand for the purpose of estimating the contribution of EV charging to demand.
99 Source: Federal Energy Regulatory Commission, “FERC: Documents & Filing—Forms—Form
714.” 100 Los Angeles Department of Water and Power, 2017 Power Strategic Long-Term Resource Plan, 7.
42
2. EV Energy Requirements
Different electric car models have somewhat different energy requirements, but for
the purposes of this analysis, I used the Tesla Model 3 with its standard battery pack to
represent a typical BEV. I selected the Model 3 as a representative unit because its sales
have surged past its competition, and its charging configuration is the current state of the
art.101 (This is a convenient starting place for analysis, not a prediction that Tesla will
displace all competitors.) I expect the results to be generally applicable to a broad range of
EVs, although differences in model characteristics and fleet makeup could have minor
effects.
The standard battery pack in the base Model 3 has a capacity of approximately 50
kWh, which gives it a range of about 220 miles between charges.102 Using a 240-volt (V)
charger on a home 30-amp (A) circuit (called Level 2 charging apparatus), each EV will
draw 7.2 kilowatts (kW) (instantaneous demand) from the grid. A variety of additional
factors affect how quickly the battery will charge, including the age of the battery and
whether it is relatively full or depleted; estimates in the literature range from nine to 52
miles of range per hour of charging time.103 For the purposes of this analysis, I will assume
that owners get an average of 15 miles of range per hour of charging time.104
3. EV Market Penetration
The scenarios in this analysis include two possible levels of EV market penetration.
The moderate penetration scenarios use the assumption from LADWP’s recommended
101 Bruce Brown, “Tesla Model 3 Sales Rev up in First Quarter, Outpace Other Electric Cars in U.S.,”
Digital Trends, April 7, 2018, https://www.digitaltrends.com/cars/tesla-model-3-best-selling-electric-car/. 102 “Tesla Model 3,” Tesla, accessed April 13, 2018, https://www.tesla.com/model3. 103 See, for example, Vanja Kljaic, “Charging Your Tesla Model 3 with Just A Wall Outlet—Is It
Possible?,” InsideEVs, June 26, 2018, https://insideevs.com/charging-your-tesla-model-3-with-just-a-wall-outlet-is-it-possible/; “Electric Vehicle Charging: Types, Time, Cost and Savings,” Union of Concerned Scientists, March 9, 2018, https://www.ucsusa.org/clean-vehicles/electric-vehicles/car-charging-time-type-cost; Fred Lambert, “A Look at Tesla Model 3 Charging Options,” Electrek (blog), August 2, 2017, https:// electrek.co/2017/08/02/tesla-model-3-charging-options/.
104 This is consistent with Lambert, “A Look at Tesla Model 3 Charging Options.”

43
strategic case, which is that there will be 580,000 EVs on the road in Los Angeles by
2030.105
The high penetration scenarios assume that California will meet the governor’s
target of five million ZEVs on the road in California by 2030. To determine how many of
these will be EVs registered in Los Angeles, I assumed that the current proportion of
California cars registered in Los Angeles County (25 percent) will remain constant,
resulting in a total of 1.25 million ZEVs registered in Los Angeles County in 2030.106 ZEVs
include both EVs and FCVs. Although today FCVs are a negligible proportion of the ZEV
population, their share is expected to grow. In order to estimate the contribution of FCVs
to the total ZEV count, I used projections developed by the California Air Resources Board
(CARB) based on its survey of auto manufacturers, along with the CARB data on Los
Angeles share of the total FCVs fleet (32 percent).107 Since the CARB projections only
extend through 2023, I fit a polynomial curve to the points provided and extrapolated to
2030, giving an expected total of 78,000 FCVs on the road in California in 2030.108 The
net number of EVs in Los Angeles, then, would be 1,225,040 (1.25 million minus 32
percent of 78,000) under the high penetration scenarios.
4. EV Driver Travel
The number of miles driven per day will determine the total amount of electricity
used by EVs. It will also determine the total time that each car draws power from the grid,
105 This is actually the “high transportation electrification” assumption for LADWP. As evidence of
how quickly EV uptake projections are accelerating, it is double the projection from the California Energy Commission. California Energy Commission, 2013 Integrated Energy Policy Report, CEC-100-2013-001-CM (Sacramento, CA: California Energy Commission, 201), 21–27, https://ww2.energy.ca.gov/2013pub lications/CEC-100-2013-001/CEC-100-2013-001-CMF.pdf; Los Angeles Department of Water and Power, 2017 Power Strategic Long-Term Resource Plan, 139.
106 Number of automobiles in California from California Department of Motor Vehicles. “State of California Department of Motor Vehicles Statistics for Publication January through December 2017,” California Department of Motor Vehicles, March 2018, https://www.dmv.ca.gov/portal/wcm/connect/ 5aa16cd3-39a5-402f-9453-0d353706cc9a/official.pdf?MOD=AJPERES; “Vehicle Registrations in Los Angeles County, California,” Los Angeles Almanac, 2018, http://www.laalmanac.com/transport/tr02.php.
107 California Air Resources Board, 2017 Annual Evaluation Fuel Cell Electric Vehicle Deployment and Hydrogen Fuel Station Network Development (Sacramento, CA: California Air Resources Board, 2017), 24, 67, https://www.arb.ca.gov/msprog/zevprog/ab8/ab8_report_2017.pdf.
108 Polynomial fit with R2 = 0.99.
44
because cars will stop drawing power once the battery is full, even though they may remain
plugged in until driven again. The time of day that most trips are made will also affect
when vehicles draw charge from the grid, because most charging will immediately follow
the return home or to a public charging site (such as while parked at work), unless drivers
explicitly program their cars to charge later, in order to take advantage of any power pricing
incentives.
As the range and driving characteristics of EVs increasingly resemble those of
conventional automobiles, this analysis assumes that the travel patterns of EV drivers are,
and will continue to be, similar to the travel patterns of the general population for the Los
Angeles area. Further, it assumes that the same general travel patterns (trip timing and
average miles per day by car) that are observed in the present will continue in 2030.
According to statistical information derived from the Highway Performance Monitoring
System in 2016 (latest available data, published by the California Department of
Transportation (Caltrans)), an average of 34.2 miles are driven daily in Los Angeles County
for every vehicle registered in the county.109 Of course, some vehicles from outside the
county will drive into LA and some LA drivers will travel outside the county, but I assume
there is a negligible net difference. This assumption is supported by other sources of
information on driving patterns, which give similar estimates of average daily vehicle miles
traveled.110 Based on the Tesla 3 charging characteristics, this translates to approximately
two hours of charge used per day if the vehicle is charged at home using 240 V charging
equipment (see EV Energy Requirements section for Tesla Model 3 charging
specifications). To simplify this analysis, I assume that all EVs will charge at this rate and
for this period on the day relevant to the analysis, the peak energy demand day for LADWP.
109 Los Angeles Almanac, “Vehicle Registrations in Los Angeles County, California”; California
Department of Transportation, California Public Road Data 2016 (Sacramento, CA: California Department of Transportation, 2018), 54, table 6, https://dot.ca.gov/-/media/dot-media/programs/research-innovation-system-information/documents/california-public-road-data/prd20161-a11y.pdf.
110 Although there is not necessarily a one-to-one relationship between drivers and vehicles, the national average is 29 miles per day per driver, according to studies by the U.S. Department of Transportation and AAA. “National Household Travel Survey Daily Travel Quick Facts,” Bureau of Transportation Statistics, May 2017, https://www.bts.gov/statistical-products/surveys/national-household-travel-survey-daily-travel-quick-facts; Tamra Johnson, “New Study Reveals When, Where and How Much Motorists Drive,” AAA NewsRoom, April 16, 2015, https://newsroom.aaa.com/2015/04/new-study-revea ls-much-motorists-drive/.
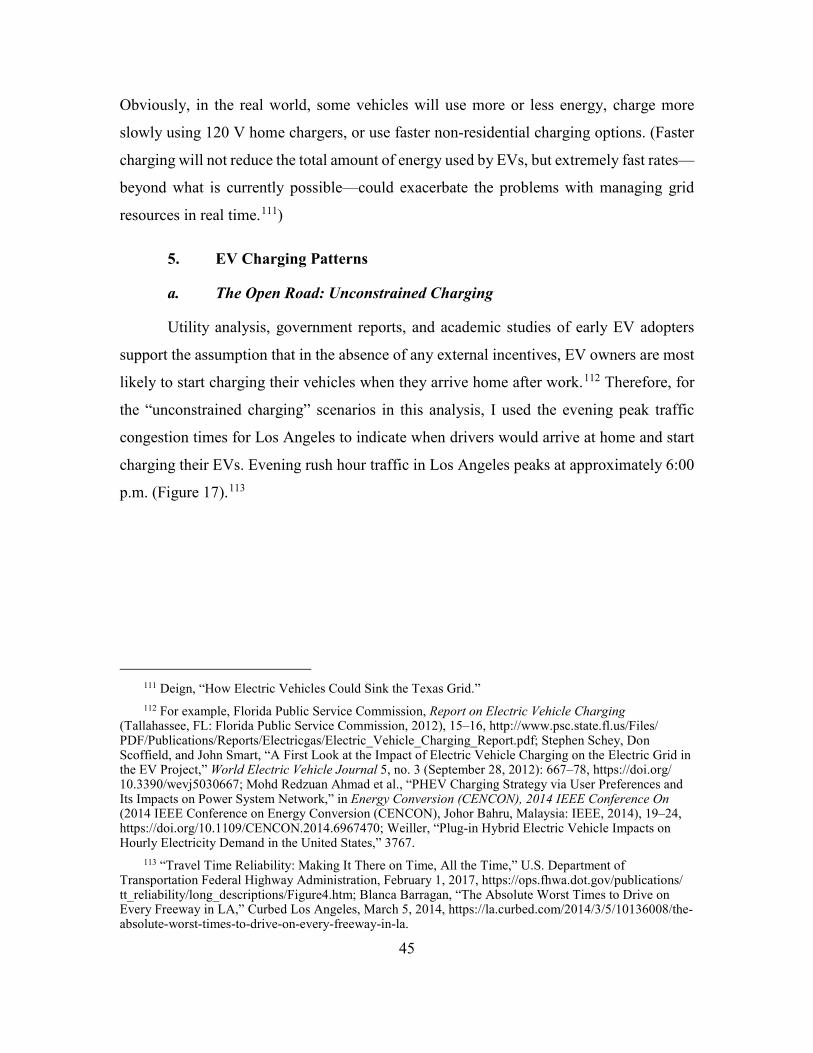
45
Obviously, in the real world, some vehicles will use more or less energy, charge more
slowly using 120 V home chargers, or use faster non-residential charging options. (Faster
charging will not reduce the total amount of energy used by EVs, but extremely fast rates—
beyond what is currently possible—could exacerbate the problems with managing grid
resources in real time.111)
5. EV Charging Patterns
a. The Open Road: Unconstrained Charging
Utility analysis, government reports, and academic studies of early EV adopters
support the assumption that in the absence of any external incentives, EV owners are most
likely to start charging their vehicles when they arrive home after work.112 Therefore, for
the “unconstrained charging” scenarios in this analysis, I used the evening peak traffic
congestion times for Los Angeles to indicate when drivers would arrive at home and start
charging their EVs. Evening rush hour traffic in Los Angeles peaks at approximately 6:00
p.m. (Figure 17).113
111 Deign, “How Electric Vehicles Could Sink the Texas Grid.” 112 For example, Florida Public Service Commission, Report on Electric Vehicle Charging
(Tallahassee, FL: Florida Public Service Commission, 2012), 15–16, http://www.psc.state.fl.us/Files/ PDF/Publications/Reports/Electricgas/Electric_Vehicle_Charging_Report.pdf; Stephen Schey, Don Scoffield, and John Smart, “A First Look at the Impact of Electric Vehicle Charging on the Electric Grid in the EV Project,” World Electric Vehicle Journal 5, no. 3 (September 28, 2012): 667–78, https://doi.org/ 10.3390/wevj5030667; Mohd Redzuan Ahmad et al., “PHEV Charging Strategy via User Preferences and Its Impacts on Power System Network,” in Energy Conversion (CENCON), 2014 IEEE Conference On (2014 IEEE Conference on Energy Conversion (CENCON), Johor Bahru, Malaysia: IEEE, 2014), 19–24, https://doi.org/10.1109/CENCON.2014.6967470; Weiller, “Plug-in Hybrid Electric Vehicle Impacts on Hourly Electricity Demand in the United States,” 3767.
113 “Travel Time Reliability: Making It There on Time, All the Time,” U.S. Department of Transportation Federal Highway Administration, February 1, 2017, https://ops.fhwa.dot.gov/publications/ tt_reliability/long_descriptions/Figure4.htm; Blanca Barragan, “The Absolute Worst Times to Drive on Every Freeway in LA,” Curbed Los Angeles, March 5, 2014, https://la.curbed.com/2014/3/5/10136008/the-absolute-worst-times-to-drive-on-every-freeway-in-la.
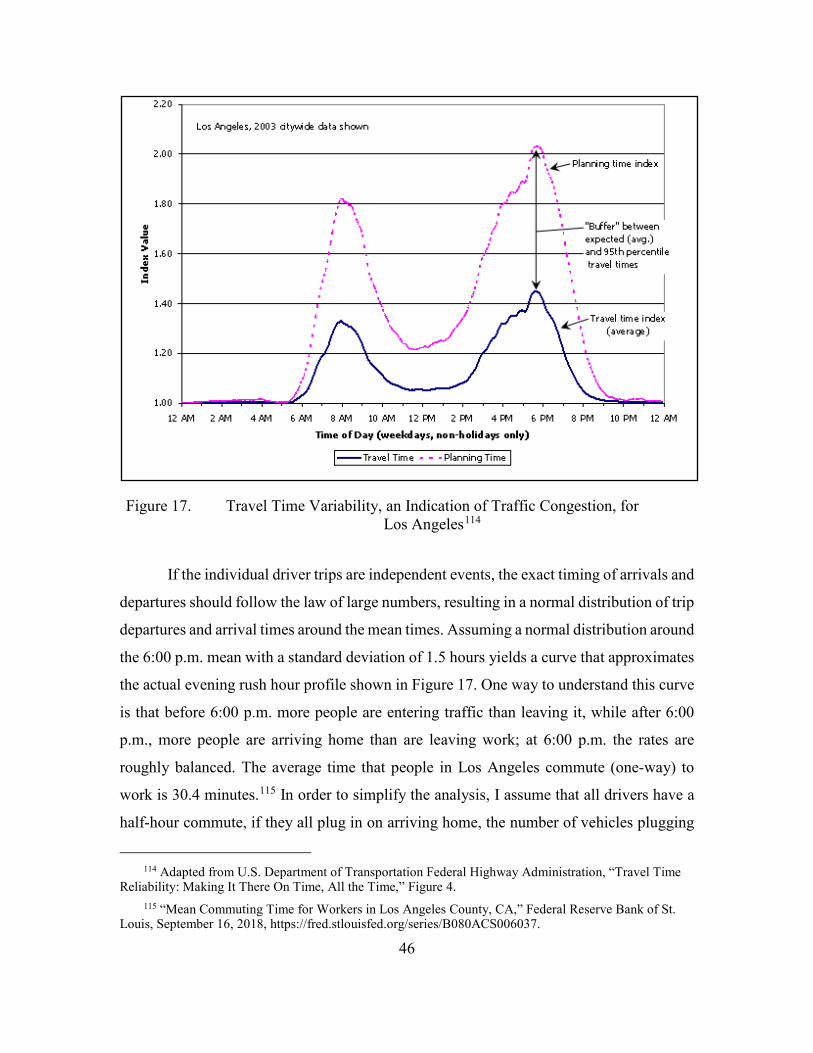
46
Figure 17. Travel Time Variability, an Indication of Traffic Congestion, for Los Angeles114
If the individual driver trips are independent events, the exact timing of arrivals and
departures should follow the law of large numbers, resulting in a normal distribution of trip
departures and arrival times around the mean times. Assuming a normal distribution around
the 6:00 p.m. mean with a standard deviation of 1.5 hours yields a curve that approximates
the actual evening rush hour profile shown in Figure 17. One way to understand this curve
is that before 6:00 p.m. more people are entering traffic than leaving it, while after 6:00
p.m., more people are arriving home than are leaving work; at 6:00 p.m. the rates are
roughly balanced. The average time that people in Los Angeles commute (one-way) to
work is 30.4 minutes.115 In order to simplify the analysis, I assume that all drivers have a
half-hour commute, if they all plug in on arriving home, the number of vehicles plugging
114 Adapted from U.S. Department of Transportation Federal Highway Administration, “Travel Time
Reliability: Making It There On Time, All the Time,” Figure 4. 115 “Mean Commuting Time for Workers in Los Angeles County, CA,” Federal Reserve Bank of St.
Louis, September 16, 2018, https://fred.stlouisfed.org/series/B080ACS006037.
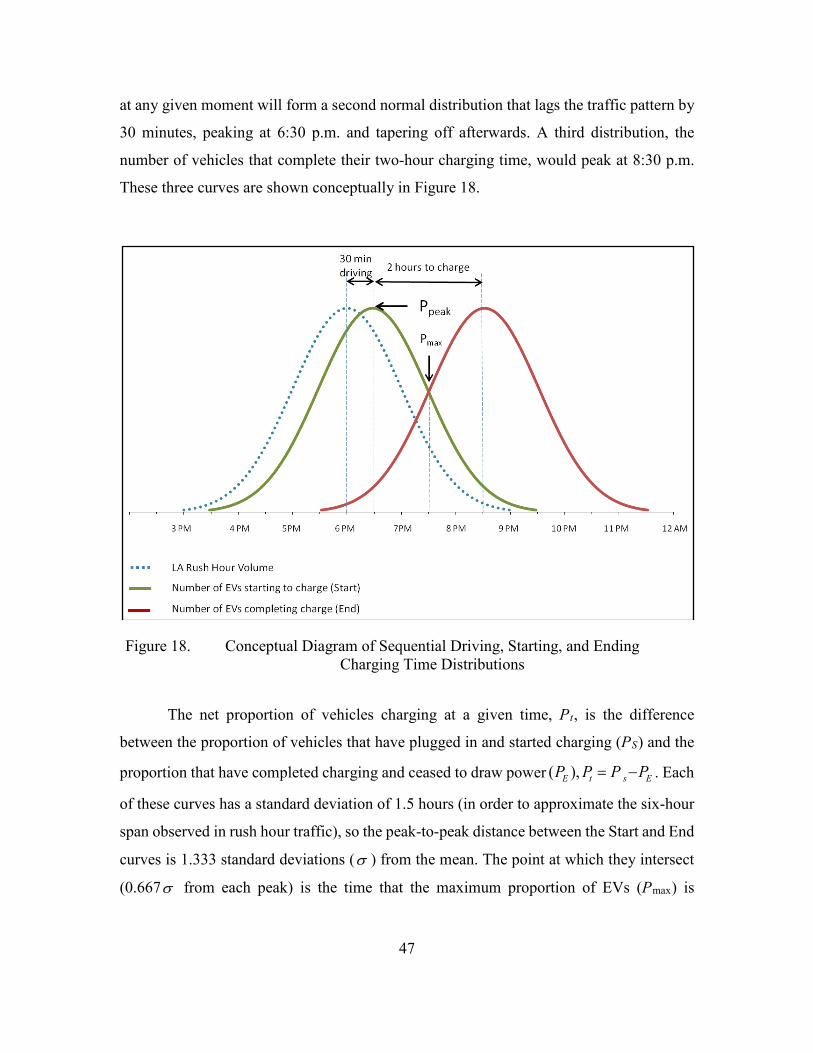
47
at any given moment will form a second normal distribution that lags the traffic pattern by
30 minutes, peaking at 6:30 p.m. and tapering off afterwards. A third distribution, the
number of vehicles that complete their two-hour charging time, would peak at 8:30 p.m.
These three curves are shown conceptually in Figure 18.
Figure 18. Conceptual Diagram of Sequential Driving, Starting, and Ending Charging Time Distributions
The net proportion of vehicles charging at a given time, Pt, is the difference
between the proportion of vehicles that have plugged in and started charging (PS) and the
proportion that have completed charging and ceased to draw power ( ),E t s EP P P P= − . Each
of these curves has a standard deviation of 1.5 hours (in order to approximate the six-hour
span observed in rush hour traffic), so the peak-to-peak distance between the Start and End
curves is 1.333 standard deviations (σ ) from the mean. The point at which they intersect
(0.667σ from each peak) is the time that the maximum proportion of EVs (Pmax) is
48
drawing current from the grid.116 I can solve for Pmax at this time (7:30 p.m.) as follows
using standard error tables for the normal curve:117
max (0.67 ) ( 0.67 ) 0.748 0.252 0.496.S EP P Pσ σ−= − = − =
The maximum percentage of the total EV fleet that would draw current
simultaneously under this scenario is thus 49.6 percent, at 7:30 p.m.
However, the focus of this analysis is on the contribution of EVs to electric demand
at the time of peak demand from other users. As described in the previous section Supply
and Demand of Electricity in Los Angeles, I assume that the peak demand hour for the
LADWP system in 2030 will be 6:00 p.m. to 7:00 p.m., and I selected 6:30 p.m. as the time
of interest. This time is indicated on the Start curve in Figure 18 as Ppeak. Using the
approach outlined above, the proportion of the EV fleet charging at the time of peak
demand on the LADWP system (Ppeak) is 40.1 percent:
(0 ) ( 0.67 ) 0.5000 0.0918 0.4082.peak S EP P Pσ σ−= − = − =
b. Speed Limits: Constrained Charging
Utilities have strong incentives to find ways to manage how drivers charge their
EVs. In a utility-ideal scenario, no EVs would be charging at the peak hour; they would
instead be charging in the mid-day to absorb over-generation from solar power sources and
at night to fill the “valley” in demand, thereby maximizing the utilization of generation
resources.118 However, it is highly unlikely that all consumers will cooperate with a regime
116 This can be easily understood with the following logic: before the point of intersection, more
drivers are starting to charge than are ending their charge, so the number charging is rising; after this point, more drivers are ending their charge than starting, so the number charging is falling. Therefore, the maximum charging must be at the point of intersection.
117 Charles D. Hodgman, ed., C.R.C. Standard Mathematical Tables, 11th ed. (Cleveland, OH: Chemical Rubber Publishing Company, 1957), 238, “Normal Curve of Error Table.”
118 Such an ideal scenario is presented in Kintner-Meyer, Schneider, and Pratt, Impacts Assessment of Plug-in Hybrid Vehicles on Electric Utilities and Regional U.S. Power Grids Part 1: Technical Analysis.
49
that causes them inconvenience or anxiety about whether their EV will have sufficient
charge when they need it, even in the face of economic incentives or altruistic appeals.
LADWP has found, for example, that while consumers are willing to curtail overall energy
use in exchange for favorable rates, this only works up to a point. In extremely hot weather,
consumers still prioritize their health and comfort above the available incentives.119
Therefore, while the ideal distribution of charging—from LADWP’s perspective—
would include no charging during periods of high demand (valley-filling only), this seems
unrealistic. It is difficult to predict, based solely on the few limited studies of early adopters,
how well various pricing structures and other strategies will work to shift demand, given
the variations between locations and the fact that early adopters are likely to have different
demographic characteristics and motivations from those who come later.120 This is an area
of active research for utilities and municipalities, but their approaches to managing the
problem (and perhaps their results) will probably vary widely. If EV charging were evenly
distributed across the day as a constant demand, about eight percent of the total fleet would
be charging at one time (each EV charging for two of the 24 hours). For this analysis, I
have chosen 15 percent of the fleet as a plausible level for the constrained-charging
scenarios.
6. EV Penetration
In its 2017 SLTRP, LADWP used EV adoption forecasts from the California
Energy Commission’s 2013 Integrated Energy Policy Report.121 In the base analysis case,
the CEC forecast that Los Angeles will have 290,000 PEVs by 2030; the LADWP SLTRP
recommends providing incentives to reach 580,000 PEVs by 2030. In this analysis, I use
the LADWP recommendation as the “moderate EV penetration” case.
119 Los Angeles Department of Water and Power, 2017 Power Strategic Long-Term Resource Plan, 7. 120 According to the theory proposed by Everett Rogers, there are five distinct categories of adopter,
each with unique priorities and interests. These groups drive technological diffusion at different stages of the diffusion process. Rogers, Diffusion of Innovations. It is also logical that as EVs evolve and the price barrier is reduced, customers who waited for a more affordable car will also be willing to defer charging by a few hours in order to save money on their electric bill.
121 Los Angeles Department of Water and Power, 2017 Power Strategic Long-Term Resource Plan, 70.
50
However, the governor’s 2018 Zero-Emission Vehicle Executive Order (EO-B-48-
18) set a goal for California to have five million ZEVs by 2030.122 Currently, 25 percent
of California’s registered vehicles are in Los Angeles County.123 Assuming this percentage
remains unchanged and that the ZEVs are evenly distributed throughout the state, meeting
this goal would mean that 1,250,000 ZEVs would be in Los Angeles County; almost twice
the number expected under the LADWP recommended case. Given LA’s leadership in EV
adoption, its aggressive incentive programs, and its entrenched car-centric culture, a higher
percentage of EVs will probably be focused in LA in reality, so this assumption is
conservative.
ZEVs include both PEVs and hydrogen fuel cell (HFC) cars. PEVs make up 99
percent of the current ZEV stock in Los Angeles, but the HFC share is projected to grow.124
The CARB has projected growth for HFC cars through 2023.125 Extrapolating the CARB
projections out to 2030, I estimate there would be 78,000 HFC cars in Los Angeles
County.126 This projection may be low, given that the CARB forecasts were prepared
before the ZEV Executive Order increased the total ZEV target, and they therefore do not
account for any additional policy incentives for adoption. In the absence of better
information, subtracting 78,000 HFC cars from the total 1,250,000 ZEVs gives us
1,117,000 PEVs in Los Angeles in 2030. This a reasonable upper bound for the PEV
component of the total ZEV inventory in Los Angeles, and therefore this number of
vehicles provides the “high EV penetration” case.
122 Brown, Executive Order B-48-18. 123 California Department of Motor Vehicles, “State of California Department of Motor Vehicles
Statistics for Publication January through December 2017.” 124 “Fuel Type by County as of 1/1/2018,” California Department of Motor Vehicles, accessed August
7, 2018, https://www.dmv.ca.gov/portal/wcm/connect/2156a052-c137-4fad-9d4f-db658c11c5c9/Motor VehicleFuelTypes_County.pdf?MOD=AJPERES&CVID=.
125 California Air Resources Board, 2017 Annual Evaluation Fuel Cell Electric Vehicle Deployment and Hydrogen Fuel Station Network Development, 27.
126 Extrapolation via best-fit polynomial curve (r2=.996).
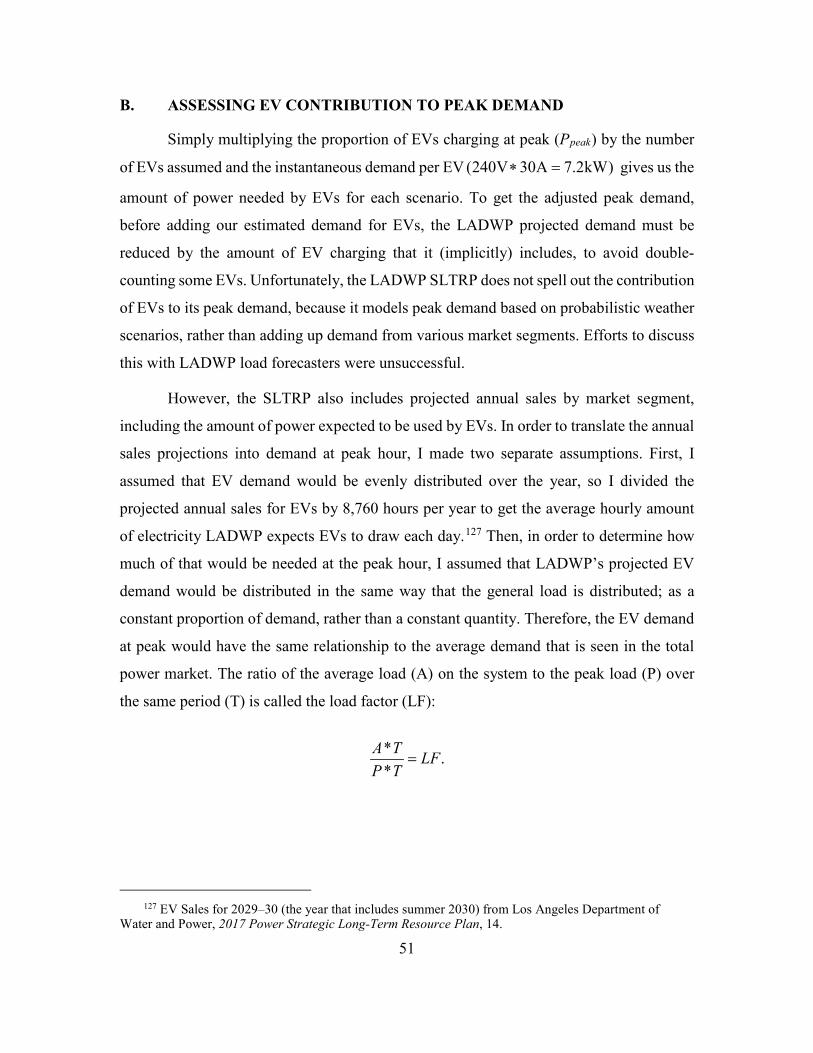
51
B. ASSESSING EV CONTRIBUTION TO PEAK DEMAND
Simply multiplying the proportion of EVs charging at peak (Ppeak) by the number
of EVs assumed and the instantaneous demand per EV (240V 30A 7.2kW)∗ = gives us the
amount of power needed by EVs for each scenario. To get the adjusted peak demand,
before adding our estimated demand for EVs, the LADWP projected demand must be
reduced by the amount of EV charging that it (implicitly) includes, to avoid double-
counting some EVs. Unfortunately, the LADWP SLTRP does not spell out the contribution
of EVs to its peak demand, because it models peak demand based on probabilistic weather
scenarios, rather than adding up demand from various market segments. Efforts to discuss
this with LADWP load forecasters were unsuccessful.
However, the SLTRP also includes projected annual sales by market segment,
including the amount of power expected to be used by EVs. In order to translate the annual
sales projections into demand at peak hour, I made two separate assumptions. First, I
assumed that EV demand would be evenly distributed over the year, so I divided the
projected annual sales for EVs by 8,760 hours per year to get the average hourly amount
of electricity LADWP expects EVs to draw each day.127 Then, in order to determine how
much of that would be needed at the peak hour, I assumed that LADWP’s projected EV
demand would be distributed in the same way that the general load is distributed; as a
constant proportion of demand, rather than a constant quantity. Therefore, the EV demand
at peak would have the same relationship to the average demand that is seen in the total
power market. The ratio of the average load (A) on the system to the peak load (P) over
the same period (T) is called the load factor (LF):
* .*
A T LFP T
=
127 EV Sales for 2029–30 (the year that includes summer 2030) from Los Angeles Department of
Water and Power, 2017 Power Strategic Long-Term Resource Plan, 14.
52
Under these assumptions, the EV load will have the same load factor as the entire
system load. LADWP has provided the data for the total sales and EV sales, as well as the
total peak demand data for 2030, so all that remains is to solve for PEV in the following:
EV S
EV S
A AP P
= .
By substituting LF for AP
, this can also be stated as:
EV
EVS
APLF
= .
Carrying out the calculation yields an estimated contribution from EVs implicit in
the LADWP forecast of 253 megawatt (MW), so the adjusted peak demand is the LADWP
forecast (6,727 MW) minus 253 MW, or 6,474 MW.128 (It is worth pointing out that
LADWP’s load factor is trending downward, indicating sharper peaks on the system,
although the forecasts in the SLTRP show a constant load factor through 2030.129 Sharper
peaks require the operators to ramp up generation more quickly and create additional stress
on the system.)
A new peak demand can then be calculated for each scenario, using the assumptions
that define each scenario. Subtracting the scenario peak demand from LADWP’s estimated
dependable capacity at peak (9,000 MW) gives the number of MW remaining to act as a
reserve margin. If the reserve margin is greater than or equal to 16 percent of the total peak
demand, LADWP will meet its planning reserve margin standard. If the reserve margin is
less than 16 percent, I conclude that the scenario poses a risk to grid stability.
128 Peak demand total for 2029–30 (the year that includes summer 2030) from Los Angeles Department
of Water and Power, 2017 Power Strategic Long-Term Resource Plan, 14. 129 Los Angeles Department of Water and Power, 7; load factor calculated for future years from data
on page 14.
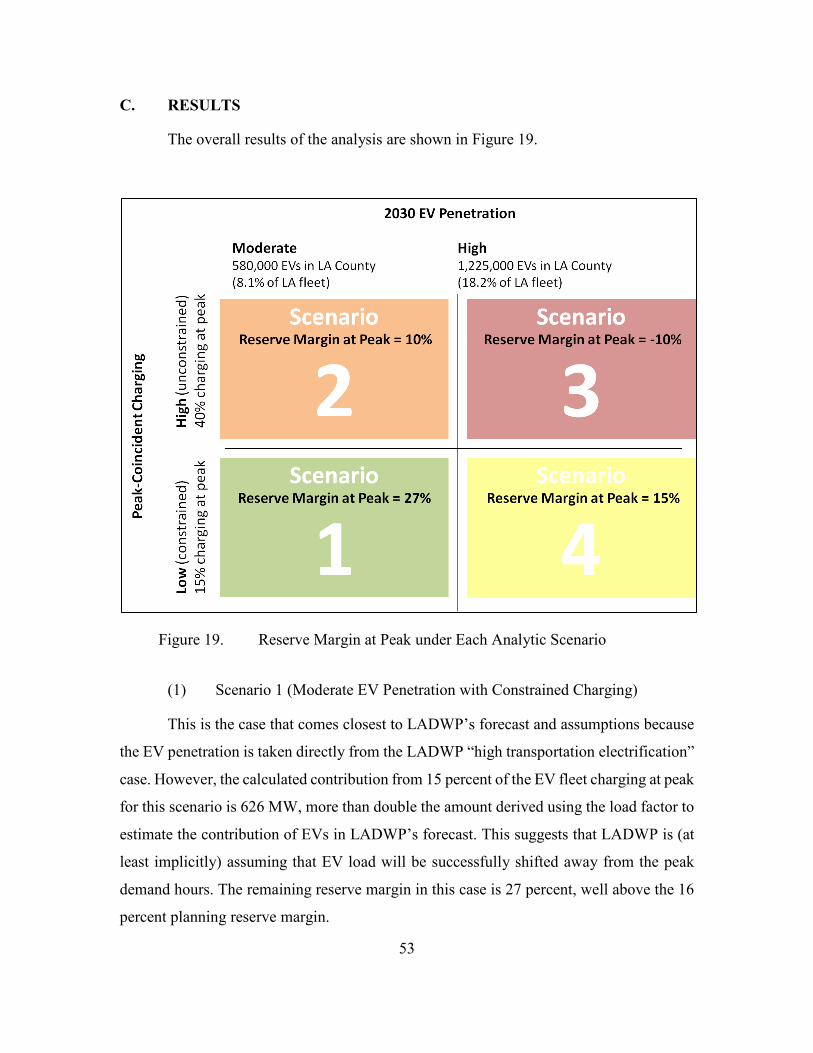
53
C. RESULTS
The overall results of the analysis are shown in Figure 19.
Figure 19. Reserve Margin at Peak under Each Analytic Scenario
(1) Scenario 1 (Moderate EV Penetration with Constrained Charging)
This is the case that comes closest to LADWP’s forecast and assumptions because
the EV penetration is taken directly from the LADWP “high transportation electrification”
case. However, the calculated contribution from 15 percent of the EV fleet charging at peak
for this scenario is 626 MW, more than double the amount derived using the load factor to
estimate the contribution of EVs in LADWP’s forecast. This suggests that LADWP is (at
least implicitly) assuming that EV load will be successfully shifted away from the peak
demand hours. The remaining reserve margin in this case is 27 percent, well above the 16
percent planning reserve margin.
54
(2) Scenario 2 (Moderate EV Penetration with Unconstrained Charging)
This case uses the moderate EV penetration level taken from the LADPW “high
transportation electrification” case with 40 percent of the EV fleet charging at the time of
peak demand (unconstrained charging). The remaining reserve margin in this case is 10
percent, less than the 16 percent planning reserve margin.
(3) Scenario 3 (High EV Penetration with Unconstrained Charging)
This case combines the number of EVs in Los Angeles in 2030 if the governor’s
goal is met (high EV penetration) with assumed 40 percent of the EV fleet charging at the
time of peak demand (unconstrained charging). In this case, dependable capacity estimated
by LADWP will fall short of demand by 10 percent. There is no remaining reserve margin.
(4) Scenario 4 (High EV Penetration with Constrained Charging)
This case combines the number of EVs in Los Angeles in 2030 if the governor’s
goal is met (high EV penetration) with an assumed 15 percent of the EV fleet charging at
peak (constrained charging). The remaining reserve margin in this case is 15 percent, near
the 16 percent planning reserve margin.
(5) Maximum Number of Cars that Can Charge at Peak
Extending this analysis, I calculated the maximum number of EVs that could charge
simultaneously at peak without exceeding 87 percent of the dependable capacity. The
maximum amount of available electricity available for EVs at peak that is consistent with
a 16 percent reserve margin would be 87 percent of the dependable capacity, minus the
quantity needed for other demand:
(0.87*9,000MW) 6,727MW 1,103MW.− =
Dividing this amount by the instantaneous demand per EV gives:
1,500MW 153,194EVs.0.0072MW / EV
=
55
Thus, the maximum number of EVs that can charge simultaneously under the
combination of assumptions without endangering the reliability of the LADWP grid is
153,194. This number of cars would be about 2.2 percent of the entire automotive fleet
expected in Los Angeles in 2030.130
130 Based on the current number of automobiles per capita in Los Angeles and the projected population
of Los Angeles in 2030. “Demographic Projections,” State of California Department of Finance, 2016, http://www.dof.ca.gov/Forecasting/Demographics/Projections/; California Department of Motor Vehicles, “State of California Department of Motor Vehicles Statistics for Publication January through December 2017.”

56
THIS PAGE INTENTIONALLY LEFT BLANK
57
V. NAVIGATING THE FUTURE: CONCLUSIONS AND IMPLICATIONS
The results of this analysis demonstrate how crucial it will be for LADWP to
manage the hourly load from EV charging in order to ensure reliable power at peak times.
As larger numbers of EVs depend on the LADWP grid, LADWP should avail itself of as
many as possible of the available tools to manage charging. If successfully managed, EVs
have the potential to provide benefits to the grid without compromising reliability.
Research gaps remain, especially around the comparative effectiveness and general
applicability of strategies for influencing consumer behavior. This chapter discusses the
implications of the analytic results and alternative policy options to manage any mismatch
between demand and capacity; describes some potential futures for vehicle-to-grid
interactions; and points out areas that might benefit from additional modeling and analysis.
A. READING THE MAP: IMPLICATIONS OF THE RESULTS
The tipping point at which grid reliability is compromised (defined as depletion of
the reserve margin) occurs when approximately 150,000 EVs charge simultaneously at the
time of peak system demand. Los Angeles can absorb much higher EV penetrations,
including the governor’s new target for 2030, as long as the portion of EVs charging at
peak is managed so that the number of vehicles does not exceed this number.
Of the four scenarios analyzed, two result in little to no risk to reliability to the grid.
Scenario 1 (Moderate EV Penetration with Constrained Charging) results in a comfortable
reserve margin and Scenario 4 (High EV Penetration with Constrained Charging) is just
below the planning reserve margin. Scenario 1 clearly presents no risk to the grid
reliability, and Scenario 4 is probably acceptable, given the uncertainties built into all
planning assumptions.
On the other hand, the two scenarios with unconstrained charging result in
unacceptable reserve margins, with Scenario 3 actually exceeding the dependable capacity
by 10 percent. Scenario 2 (Moderate EV Penetration with Unconstrained Charging)
presents a clear risk to grid stability, while Scenario 3 (High EV Penetration with

58
Unconstrained Charging) would certainly result in unmet power demand, either through
load curtailment (turning off power to customers whose contracts specifically allow the
utility to curtail their power to reduce demand) or load shedding (blackouts).
B. ALTERNATIVE ROUTES: OPTIONS FOR MANAGING EV CHARGING
In theory, the risk to resource adequacy could be addressed either by adding
additional generation capacity (for example, by building additional power plants) or by
reducing the use of power when demand is at its greatest. In practice, it is prohibitively
expensive to build capacity that would only be used a few hours per year, so utilities seek
to manage potential shortfalls by shifting charging to off-peak times.131 When the extra
demand from EVs is shifted to off-peak times, it can be met using more efficient generation
resources, because the most expensive generation sources are dispatched last, entering the
mix only at peak times. Reducing the nighttime drop in demand (valley-filling) would also
ensure more consistent utilization of these resources. Admittedly, pushing EV loads to the
lowest-demand hours (nighttime) does tend to offset some of the reductions in greenhouse
gas emissions that have been a driver of EV policy. This is because at night, power is
provided by a different mix of generation sources; solar power is not an option, so
(depending on the specific generation mix for the local grid) more energy may be provided
by conventional natural gas and coal-fired generation, which emits more greenhouse
gases.132
131 C. Farmer et al., “Modeling the Impact of Increasing PHEV Loads on the Distribution
Infrastructure,” in 2010 43rd Hawaii International Conference on System Sciences, 2010, 1–10, https://doi.org/10.1109/HICSS.2010.277; Stanton W. Hadley, “Evaluating the Impact of Plug-in Hybrid Electric Vehicles on Regional Electricity Supplies,” in 2007 IREP Symposium—Bulk Power System Dynamics and Control—VII. Revitalizing Operational Reliability (Charleston, SC: IEEE, 2007), 1–12, https://doi.org/10.1109/IREP.2007.4410538; Anamika Dubey and Surya Santoso, “Electric Vehicle Charging on Residential Distribution Systems: Impacts and Mitigations,” IEEE Access 3 (2015): 1871–93, https://doi.org/10.1109/ACCESS.2015.2476996.
132 Kim and Rahimi, “Future Energy Loads for a Large-Scale Adoption of Electric Vehicles in the City of Los Angeles”; Brian Tarroja et al., “The Effectiveness of Plug-in Hybrid Electric Vehicles and Renewable Power in Support of Holistic Environmental Goals: Part 2—Design and Operation Implications for Load-Balancing Resources on the Electric Grid,” Journal of Power Sources 278 (March 2015): 782–93, https://doi.org/10.1016/j.jpowsour.2014.06.169; Hadley, “Evaluating the Impact of Plug-in Hybrid Electric Vehicles on Regional Electricity Supplies.”
59
A number of researchers have studied ways to optimize the coordination of
charging.133 Some of the options for managing demand depend on technological solutions,
while others seek to influence consumer behavior through pricing incentives (leveraging
automated metering infrastructure). Technological solutions may be described as direct (in
which charging is centrally controlled by the utility or a third-party aggregator) or
decentralized, in which the vehicles “negotiate” an optimal solution.134
Each type of solution has some drawbacks, since technological solutions increase
the complexity of the system and may fail to satisfy consumer needs, while pricing
incentives may not be effective for the comparatively well-off consumers expected to be
the early adopters of EVs.135 Direct optimization by the utility seems unlikely to be
accepted by consumers unless it fully accounts for the convenience of the customers.
Customers’ concern that their vehicles may not be charged and available when they need
them is essentially a variation on range anxiety; it will tend to dampen enthusiasm for EVs.
LADWP is a municipal utility, part of the city government of Los Angeles. Publicly
owned utilities are not regulated by the California Public Utility Commission; the utility is
instead managed by the local government, which sets customer rates and utility policy.
Therefore, the City of Los Angeles, through the LAPWD, has broad discretion to set rates
and rules intended to manage the peak load generated by EVs.
133 See for example Zahra Darabi and Mehdi Ferdowsi, “Aggregated Impact of Plug-in Hybrid Electric
Vehicles on Electricity Demand Profile,” IEEE Transactions on Sustainable Energy 2, no. 4 (October 2011): 501–8, https://doi.org/10.1109/TSTE.2011.2158123; Moayed Moghbel, Mohammad A. S. Masoum, and Alireza Fereidouni, “Decentralize Coordinated Charging of Plug-In Electric Vehicles in Unbalanced Residential Networks to Control Distribution Transformer Loading, Voltage Profile and Current Unbalance,” Intelligent Industrial Systems 1, no. 2 (August 2015): 141–51, https://doi.org/10.1007/s40903-015-0008-7; Li Zhang et al., “Coordinating Plug-in Electric Vehicle Charging with Electric Grid: Valley Filling and Target Load Following,” Journal of Power Sources 267 (December 2014): 584–97, https://doi. org/10.1016/j.jpowsour.2014.04.078.
134 For an example of a direct strategy, see Mahnoosh Alizadeh, Anna Scaglione, and Robert J. Thomas, “Direct Load Management of Electric Vehicles,” in 2011 IEEE International Conference on Acoustics, Speech and Signal Processing (ICASSP), 5964–67, 2011, https://doi.org/10.1109/ICASSP.2011. 5947720; Moghbel, Masoum, and Fereidouni, “Decentralize Coordinated Charging of Plug-In Electric Vehicles in Unbalanced Residential Networks to Control Distribution Transformer Loading, Voltage Profile and Current Unbalance”; Zhang et al., “Coordinating Plug-in Electric Vehicle Charging with Electric Grid.”
135 Jim Gorzelany, “Electric-Car Buyers Younger and Richer than Hybrid Owners,” Forbes, April 22, 2014, http://www.forbes.com/sites/jimgorzelany/2014/04/22/electric-car-buyers-younger-and-richer-than-hybrid-owners/#3887ee05ad32.

60
LADWP began its exploration of TOU pricing in 1975, with a five-year experiment
that demonstrated the value of peak-pricing in reducing peak power use.136 At this writing,
customers can choose between two pricing structures, selecting either TOU rates or a tiered
pricing schedule that encourages overall energy conservation.137 Customers who elect
TOU pricing for EV charging and install a separate meter for their EV chargers receive an
additional EV discount.138 LADWP also offers its customers rebates on the purchase of
residential charging equipment. In addition to continuing these proven strategies, Los
Angeles should continue to expand its downtown charging infrastructure in public parking
and workplace garages, in order to encourage charging during the day and accelerate EV
adoption.139
In the future, LADWP may also wish to explore cooperative scheduling of EV
charging facilitated by a third party. Such an arrangement might follow the pattern
established to manage residential rooftop solar electric generation, in which an
“aggregator” serves as a third party that provides the software and services necessary to
monitor rooftop generation and manage its bulk sale to the utility. Such an arrangement
would offer customers options among vendors and facilitate utility grid management.140
136 Bridger M. Mitchell and Jan Paul Acton, The Effect of Time-of-Use Rates in the Los Angeles
Electricity Study (Santa, Monica, CA: RAND Corporation for the Los Angeles Department of Power and Water and the John A. Hartford Foundation, 1980), 1–29, http://www.rand.org/content/dam/rand/pubs/ notes/2007/N1533.pdf.
137 Los Angeles Department of Water and Power, “Electric Rates.” 138 “Electric Vehicle Incentives,” Los Angeles Department of Water and Power, 2013, https://www.
ladwp.com/ladwp/faces/ladwp/residential/r-gogreen/r-gg-driveelectric/r-gg-de-evncentives?_afrWindow Id=null&_afrLoop=168072590378703&_afrWindowMode=0&_adf.ctrl-state=bj6j0m1nd_4#%40%3F_afr WindowId%3Dnull%26_afrLoop%3D168072590378703%26_afrWindowMode%3D0%26_adf.ctrl-state %3Dqrjejscgp_4.
139 James Di Filippo et al., Prioritizing Workplace EV Charging Stations Investments in Los Angeles County (Los Angeles: UCLA Luskin School of Public Affairs, Luskin Center for Innovation, 2017), 34–35, https://innovation.luskin.ucla.edu/wp-content/uploads/2019/03/Prioritizing_Workplace_EV_Charging_ Stations_Investments_in_LA.pdf.
140 Fereidoon Sioshansi, “How Aggregators Will Alter Fundamentals of Electricity Business,” Energy Post (blog), April 9, 2018, https://energypost.eu/how-aggregators-will-alter-fundamentals-of-electricity-business/.
61
C. DOWN THE ROAD: VEHICLE TO GRID INTEGRATION
Moving EV charging away from the peak times when the grid is under the greatest
stress has other benefits. By charging at off-peak times, EVs would help with valley-filling,
smoothing out load curves and reducing the problems associated with rapid ramping of
generation resources to meet steep increases in load. At some point in the future, they may
also be able to improve grid functioning in more subtle ways.
In 1997, when EVs were mounting their second wave with the ill-fated GM EV-1,
Willett Kempton and Steven Letendre made the then-novel proposal that BEVs could be
used to store power for the electric grid. Kempton and Letendre went so far as to suggest
that vehicles with alternative fuel sources, such as hydrogen cells, could actually supply
power to the grid, noting that the U.S. vehicle fleet has 10 times the mechanical power of
all the generation plants and is unused 95 percent of the time. Their paper expressed the
view that utilities would benefit from subsidizing BEVs or at least the batteries for the
vehicles, in return for the right to control the charging and discharging of the batteries,
within parameters set by the drivers.141
A specific application of vehicle-to-grid (V2G) integration is the use of EV
batteries to help grid operators manage the variability of generation when a high proportion
of power is provided by VERs, such as wind and solar power. Excess power generated by
these resources could be stored in EV batteries and withdrawn at peak use times. Several
researchers have looked at the potential to use EVs in this way.142
The benefits identified by Kempton and Letendre, and other researchers since, fall
into the category of “ancillary services” to utilities. The FERC defines ancillary services
as “Those services necessary to support the transmission of electric power from seller to
purchaser… to maintain reliable operations of the interconnected transmission system.
141 Willett Kempton and Steven E. Letendre, “Electric Vehicles as a New Power Source for Electric
Utilities,” Transportation Research Part D: Transport and Environment 2, no. 3 (September 1997): 157–75, https://doi.org/10.1016/S1361-9209(97)00001-1.
142 Jianhui Wang et al., “Impact of Plug-in Hybrid Electric Vehicles on Power Systems with Demand Response and Wind Power,” Energy Policy 39, no. 7 (July 2011): 4016–21, https://doi.org/10.1016/j.enpol. 2011.01.042; Abdelsamad, Morsi, and Sidhu, “Impact of Wind-Based Distributed Generation on Electric Energy in Distribution Systems Embedded with Electric Vehicles.”

62
Ancillary services supplied with generation include load following, reactive power-voltage
regulation, system protective services, loss compensation service, system control, load
dispatch services, and energy imbalance services.”143 In other words, they are the services
that help ensure power quality and reliability, as well as system efficiency. Under normal
grid operations, EV batteries can in theory reduce peak demand (a service called peak-
shaving) either by discharging to the grid or by curtailing charging to reduce demand. For
example, an Australian team found that EVs could potentially shave about five percent
from peak loads.144 EVs could also provide the more subtle benefits of grid regulation and
reactive power compensation. In emergencies, they could act as spinning reserves for the
grid or backup generators for homes and facilities, power supplies that can be brought
online quickly to replace unexpected losses.145
The idea that EVs can provide value when interconnected and integrated into grid
operations is now expressed in several shorthand abbreviations for different types of
integrations, depending on the linkages: V2G, vehicle-to-house (V2H), and vehicle-to-
vehicle (V2V). All of these forms of integration require that the EVs and grid operators
can communicate; some (such as curtailing EV charging at peak times) would require only
one-way control, by grid operators sending commands to EVs, but others (such as
coordinating charging to smoothly fill demand valleys) will require two-way
communications to optimize. Therefore, the deployment of V2G technology will dovetail
with the grid modernization initiatives that are incorporating sensors and communications
technology to improve grid operations.
Analysis performed by Kempton et al. for the CARB and LADWP concluded that
selling ancillary services to the grid would be more valuable for EV owners in the
California electric power market (specifically, grid regulation and spinning reserves) than
143 “FERC: Guide to Market Oversight—Glossary,” Federal Energy Regulatory Commission, March
15, 2016, https://www.ferc.gov/market-oversight/guide/glossary.asp. 144 Paevere et al., “Spatio-Temporal Modelling of Electric Vehicle Charging Demand and Impacts on
Peak Household Electrical Load.” 145 Kang Miao Tan, Vigna K. Ramachandaramurthy, and Jia Ying Yong, “Integration of Electric
Vehicles in Smart Grid: A Review on Vehicle to Grid Technologies and Optimization Techniques,” Renewable and Sustainable Energy Reviews 53 (January 2016): 720–32, https://doi.org/10.1016/j.rser. 2015.09.012.
63
to discharge power and sell it at peak times. Grid regulation services in particular are
valuable to utilities because using EVs would give grid operators an improved ability to
fine-tune power management. For EV owners, selling this service is attractive because the
charge/discharge cycles would be very shallow, creating less potential inconvenience and
wear and tear on the battery pack.146
In the future, it may even be possible to wirelessly charge EVs while driving on
specially-designed electrified roads. Electrifying roads would remove range restrictions of
EVs and potentially add to the fuel savings possible with EVs and PHEVs, if implemented
on a large scale. Researchers estimate that 25 percent of all miles traveled are on one
percent of the nation’s roads, so electrifying these high-volume roadways could displace
up to 25 percent of the fuel used by a fleet of appropriately equipped vehicles.147
D. ONE FOR THE ROAD: RESEARCH GAPS AND FINAL THOUGHTS
This analysis contained a number of necessary simplifying assumptions, and a more
nuanced picture could be developed using more sophisticated techniques to model the
scenario space. However, the results make it clear that managing the resource adequacy
issues related to EV charging will be primarily a matter of effectively influencing EV
owner behavior. With options ranging from providing free public charging near workplaces
to encourage midday charging to direct charge/discharge control of EVs by utilities, the
most urgent policy need is to understand the tradeoffs and effectiveness associated with the
various strategies. This problem is complicated by the fact that governments tend to employ
combinations of strategies, making the results of any single strategy difficult to quantify,
and the fact that different areas have unique policy, cultural, geographical, and
demographic characteristics that may mean that a successful solution in one area is not
applicable to another. Large-scale, randomized trials across multiple markets would be the
146 Willett Kempton et al., Vehicle-to-Grid Power: Battery, Hybrid, and Fuel Cell Vehicles as
Resources for Distributed Electric Power in California (Davis, CA: Institution of Transportation Studies, University of California-Davis, 2001), 166–167, http://www1.udel.edu/V2G/docs/V2G-Cal-2001.pdf.
147 Eric Burton et al., Fuel Savings from Future In-Motion Wireless Power Transfer (WPT) (Park City, UT: Conference on Electric Roads & Vehicles, 2015), slide 2, http://www.nrel.gov/docs/fy15osti/63758. pdf.
64
ideal approach to evaluate the merits of various policy approaches. Policies that could be
tested in this way include alternative time-of-day pricing regimes for consumers, utility-
employer partnerships to provide free or reduced price daytime charging, and/or direct
control of EV charging, either by the utility or by a third-party “aggregator” serving as an
intermediary between the consumer and the utility.
In the longer term, an agenda of technological research needs to be pursued, if
futuristic ideas like electrified roads are to become a reality. Along with solving the
technical problems of such innovations, careful attention must be given to their likely costs
and benefits.
Introducing EVs into Los Angeles’ complex and fragile power system brings both
risks and opportunities. Demand from EVs is a welcome revenue stream for utilities like
LADWP that have been actively promoting energy efficiency and coping with trends that
tend to reduce electric demand, including rooftop solar installations and “green buildings.”
In addition, utilities, including LADWP, see the potential for incentivizing EV charging in
order to smooth out their load profiles, solving problems ranging from mid-day over-
generation from solar plants to nighttime idling of conventional plants. Integration of EVs
into the grid through sophisticated communications and management could even improve
power quality for other customers. Whether these advantages will be realized in spite of
the risks remains to be seen, but it is clear that Los Angeles is at an important turning point-
-at the intersection of transportation and electrification.
65
LIST OF REFERENCES
Abdelsamad, Sherif F., Walid G. Morsi, and Tarlochan S. Sidhu. “Impact of Wind-Based Distributed Generation on Electric Energy in Distribution Systems Embedded with Electric Vehicles.” IEEE Transactions on Sustainable Energy 6, no. 1 (January 2015): 79–87. https://doi.org/10.1109/TSTE.2014.2356551.
Ahmad, Mohd Redzuan, Ismail Musirin, Muhamad Murtadha Othman, and Nur Azzammudin Rahmat. “PHEV Charging Strategy via User Preferences and Its Impacts on Power System Network.” In Energy Conversion (CENCON), 2014 IEEE Conference On (2014 IEEE Conference on Energy Conversion (CENCON), 19–24. Johor Bahru, Malaysia: IEEE, 2014. https://doi.org/10.1109/CENCON. 2014.6967470.
Air Resources Board. “Zero-Emission Vehicle Legal and Regulatory Activities.” October 27, 2014. https://www.arb.ca.gov/msprog/zevprog/zevregs/zevregs.htm#backgro und.
Alizadeh, Mahnoosh, Anna Scaglione, and Robert J. Thomas. “Direct Load Management of Electric Vehicles.” In 2011 IEEE International Conference on Acoustics, Speech and Signal Processing (ICASSP), 5964–67. 2011. https://doi.org/10.1109/ ICASSP.2011.5947720.
Auto Alliance. “Advanced Technology Vehicle Sales Dashboard.” 2018. https://autoallia nce.org/energy-environment/advanced-technology-vehicle-sales-dashboard/.
Barragan, Blanca. “The Absolute Worst Times to Drive on Every Freeway in LA.” Curbed Los Angeles, March 5, 2014. https://la.curbed.com/2014/3/5/10136008/ the-absolute-worst-times-to-drive-on-every-freeway-in-la.
Bartholemew, Dana. “Heat Wave Could Bring More Diesel Pollution from SoCal Power Plants.” Los Angeles Daily News, June 17, 2016.
Bass, Frank M. “A New Product Growth for Model Consumer Durables.” Management Science 15, no. 5 (January 1969): 215–27. https://doi.org/10.1287/mnsc.15.5.215.
Block, David, and John Harrison. Electric Vehicle Sales and Future Projections. Cocoa, FL: Electric Vehicle Transportation Center, University of Central Florida, 2014. http://evtc.fsec.ucf.edu/reports/EVTC-RR-01-14.pdf.
Bloomberg New Energy Finance. “Electric Vehicles to Be 35% of Global New Car Sales by 2040.” February 25, 2016. http://about.bnef.com/press-releases/electric-vehic les-to-be-35-of-global-new-car-sales-by-2040/.
66
Brown, Bruce. “Tesla Model 3 Sales Rev up in First Quarter, Outpace Other Electric Cars in U.S.” Digital Trends, April 7, 2018. https://www.digitaltrends.com/cars/ tesla-model-3-best-selling-electric-car/.
Brown, Edmund G. Jr. California Office of the Governor. Executive Order B-16-2012. “Zero Emission Vehicles (ZEVs).” (March 23, 2012). http://gov.ca.gov/news. php?id=17472.
Bureau of Transportation Statistics. “National Household Travel Survey Daily Travel Quick Facts.” May 2017. https://www.bts.gov/statistical-products/surveys/na tional-household-travel-survey-daily-travel-quick-facts.
Burton, Eric, Lijuan Wang, Jeffrey Gonder, Aaron Brooker, and Arnaud Konan. Fuel Savings from Future In-Motion Wireless Power Transfer (WPT). Park City, UT: Conference on Electric Roads & Vehicles, 2015. http://www.nrel.gov/docs/fy15 osti/63758.pdf.
California Air Resources Board. 2017 Annual Evaluation Fuel Cell Electric Vehicle Deployment and Hydrogen Fuel Station Network Development. Sacramento, CA: California Air Resources Board, 2017. https://www.arb.ca.gov/msprog/zevprog/ ab8/ab8_report_2017.pdf.
California Department of Motor Vehicles. “Fuel Type by County as of 1/1/2018.” Accessed August 7, 2018. https://www.dmv.ca.gov/portal/wcm/connect/2156 a052-c137-4fad-9d4f-db658c11c5c9/MotorVehicleFuelTypes_County.pdf? MOD=AJPERES&CVID=.
———. “State of California Department of Motor Vehicles Statistics for Publication January through December 2017.” March 2018. https://www.dmv.ca.gov/portal/ wcm/connect/5aa16cd3-39a5-402f-9453-0d353706cc9a/official.pdf?MOD=AJ PERES.
California Department of Transportation. California Public Road Data 2016. Sacramento, CA: California Department of Transportation, 2018. https://dot.ca. gov/-/media/dot-media/programs/research-innovation-system-information/docu ments/california-public-road-data/prd20161-a11y.pdf.
California Energy Commission. 2013 Integrated Energy Policy Report. CEC-100-2013-001-CM. Sacramento, CA: California Energy Commission, 2013. https://ww2. energy.ca.gov/2013publications/CEC-100-2013-001/CEC-100-2013-001-CMF. pdf.
———. California Electric Utility Service Areas. Sacramento, CA: California Energy Commission, 2015. http://www.energy.ca.gov/maps/serviceareas/Electric_Ser vice_Areas_Detail.pdf.

67
———. “Differences between Publicly and Investor-Owned Utilities.” 2019. https:// www.energy.ca.gov/pou_reporting/background/difference_pou_iou.html.
———. “Publicly Owned Utility Integrated Resource Plans.” 2019. https://ww2.ener gy.ca.gov/sb350/IRPs/.
———. Tracking Progress: Renewable Energy. Sacramento, CA: California Energy Commission, 2018. https://www.energy.ca.gov/renewables/tracking_progress/ documents/renewable.pdf.
California Legislature. “SB-1275 Charge Ahead California Initiative.” 2014. http://legin fo.legislature.ca.gov/faces/billCompareClient.xhtml?bill_id=201320140SB1275.
Capparella, Joseph. “Tesla Model S-Car and Driver.” CarandDriver, April 2016. http:// www.caranddriver.com/tesla/model-s.
Clark-Sutton, Kyle, Saba Siddiki, Sanya Carley, Celeste Wanner, John Rupp, and John D. Graham. “Plug-in Electric Vehicle Readiness: Rating Cities in the United States.” The Electricity Journal 29, no. 1 (January 2016): 30–40. https://doi.org/ 10.1016/j.tej.2015.12.006.
Cooper, Leandra Poindexter. “Electric Vehicle Diffusion and Adoption. An Examination of the Major Factors of Influence over Time in the U.S. Market.” Master’s thesis, University of Iceland, 2014. https://skemman.is/bitstream/1946/17028/1/Cooper_ thesis_final.pdf.
Crothers, Brooke. “With Tesla Model 3 Orders Nearing 400,000, Chevy Bolt Feels Heat of Tesla Brand.” Forbes, April 15, 2016. http://www.forbes.com/sites/brookecro thers/2016/04/15/with-tesla-model-3-orders-nearing-400000-chevy-bolt-feels-heat-of-tesla-brand/#66bca5d25349.
Darabi, Zahra, and Mehdi Ferdowsi. “Aggregated Impact of Plug-in Hybrid Electric Vehicles on Electricity Demand Profile.” IEEE Transactions on Sustainable Energy 2, no. 4 (October 2011): 501–8. https://doi.org/10.1109/TSTE.2011. 2158123.
Davis, Lucas, and Catherine Hausman. “Market Impacts of a Nuclear Power Plant Closure.” American Economic Journal: Applied Economics 8, no. 2 (April 2016): 92–122. https://doi.org/10.1257/app.20140473.
DeBord, Matthew. “Critics Are Wrong—Tesla Should Be Selling ZEV Credits.” Business Insider, October 27, 2016. http://www.businessinsider.com/tesla-zev-credits-ok-2016-10.
Deign, Jason. “How Electric Vehicles Could Sink the Texas Grid.” GreenTech Media, December 19, 2017. https://www.greentechmedia.com/articles/read/how-electric-cars-could-sink-the-texas-grid.
68
DeShazo, J. R., CC Song, Michale Sin, and Thomas Gariffo. State of the States’ Plug-in Electric Vehicle Policies. Los Angeles, CA: University of California-Los Angeles, Luskin School of Public Affairs, Luskin Center for Innovation, 2015. http://innovation.luskin.ucla.edu/sites/default/files/EV_State_Policy.pdf.
Di Filippo, James, Mahito Moriyama, Toru Terai, Kelly Trumbull, and Jianhui Zhang. Prioritizing Workplace EV Charging Stations Investments in Los Angeles County. Los Angeles: UCLA Luskin School of Public Affairs, Luskin Center for Innovation, 2017. https://innovation.luskin.ucla.edu/wp-content/uploads/2019/03/ Prioritizing_Workplace_EV_Charging_Stations_Investments_in_LA.pdf.
Dubey, Anamika, and Surya Santoso. “Electric Vehicle Charging on Residential Distribution Systems: Impacts and Mitigations.” IEEE Access 3 (2015): 1871–93. https://doi.org/10.1109/ACCESS.2015.2476996.
Edelstein, Stephen. “What Cities Have Most Electric Cars in the U.S.?.” Green Car Reports. Accessed July 19, 2016. http://www.greencarreports.com/news/1099 636_what-cities-have-most-electric-cars-in-the-u-s; International Energy Agency, Global EV Outlook 2018.
Edmunds. “Tesla Roadster Review—Research New & Used Tesla Roadster Models.” Accessed July 24, 2019. http://www.edmunds.com/tesla/roadster/.
Edwards, Owen. “The Death of the EV-1.” Smithsonian Magazine, June 2006. http://www.smithsonianmag.com/science-nature/the-death-of-the-ev-1-118595941/?no-ist.
Egel, Benjy. “California Now World’s Fifth-Largest Economy, Bigger than Britain.” The Sacramento Bee, May 4, 2018. https://www.sacbee.com/news/business/article 210466514.html.
Eisler, Matthew N. “A Tesla in Every Garage?.” IEEE Spectrum 53, no. 2 (2016): 34–55.
Energy Information Administration. “Electricity in the United States—Energy Explained, Your Guide to Understanding Energy.” April 20, 2018. https://www.eia.gov/ener gyexplained/index.php?page=electricity_in_the_united_states.
———. “Southern California Daily Energy Report: Record Daily-High Temperatures in Southern California Lead to High Electricity Demand and Power Outages.” July 13, 2018. https://www.eia.gov/special/disruptions/socal/summer/#commentary.
EV Volumes. “EV-Volumes—The Electric Vehicle World Sales Database.” July 2018. http://www.ev-volumes.com/country/usa/.
EVAdoption. “EV Sales Forecasts.” 2018. http://evadoption.com/ev-sales/ev-sales-forecasts/.
69
Executive Office of the President of the United States. Incorporating Renewables into the Electric Grid: Expanding Opportunities for Smart Markets and Energy Storage. Washington, DC: Executive Office of the President of the United, 2016. https:// obamawhitehouse.archives.gov/sites/default/files/page/files/20160616_cea_renewables_electricgrid.pdf.
F. Perry, Noel, Colleen Kredell, Marcia E. Perry, and Stephanie Leonard. The Road Ahead for Zero-Emission Vehicles in California: Market Trends and Policy Analysis. San Francisco: Next 10, 2018. http://next10.org/sites/default/files/ca-zev-brief.pdf.
Farmer, C., P. Hines, J. Dowds, and S. Blumsack. “Modeling the Impact of Increasing PHEV Loads on the Distribution Infrastructure.” In 2010 43rd Hawaii International Conference on System Sciences, 2010. https://doi.org/10.1109/ HICSS.2010.277.
Federal Energy Regulatory Commission. “FERC: Documents & Filing—Forms—Form 714—Annual Electric Balancing Authority Area and Planning Area Report—Data Downloads, Part 3 Schedule 2—Planning Area Hourly Demand.” July 31, 2018. https://www.ferc.gov/docs-filing/forms/form-714/data.asp?csrt=83076671890229 13311.
———. “FERC: Guide to Market Oversight—Glossary.” March 15, 2016. https://www. ferc.gov/market-oversight/guide/glossary.asp.
Federal Reserve Bank of St. Louis. “Mean Commuting Time for Workers in Los Angeles County, CA.” September 16, 2018. https://fred.stlouisfed.org/series/B080ACS00 6037.
Florida Public Service Commission. Report on Electric Vehicle Charging. Tallahassee, FL: Florida Public Service Commission, 2012. http://www.psc.state.fl.us/Files/ PDF/Publications/Reports/Electricgas/Electric_Vehicle_Charging_Report.pdf.
Fueleconomy. “Gas Mileage of 2016 Vehicles by Tesla.” Accessed August 29, 2016. https://www.fueleconomy.gov/feg/bymake/Tesla2016.shtml.
———. “Gas Mileage of 2018 Vehicles by Tesla.” Accessed July 24, 2019. https://www. fueleconomy.gov/feg/bymake/Tesla2018.shtml.
Gorzelany, Jim. “Electric-Car Buyers Younger and Richer than Hybrid Owners.” Forbes, April 22, 2014. http://www.forbes.com/sites/jimgorzelany/2014/04/22/electric-car-buyers-younger-and-richer-than-hybrid-owners/#3887ee05ad32.
Hadley, Stanton W. “Evaluating the Impact of Plug-in Hybrid Electric Vehicles on Regional Electricity Supplies.” In 2007 iREP Symposium—Bulk Power System Dynamics and Control—VII. Revitalizing Operational Reliability, 1–12. Charleston, SC, IEEE, 2007. https://doi.org/10.1109/IREP.2007.4410538.
70
Hadley, Stanton W. Impact of Plug-in Hybrid Vehicles on the Electric Grid. Oak Ridge, TN: Oak Ridge National Laboratory, 2006. http://web.ornl.gov/info/ornlreview/ v40_2_07/2007_plug-in_paper.pdf.
Haidar, Ahmed M. A., Kashem M. Muttaqi, and Danny Sutanto. “Technical Challenges for Electric Power Industries Due to Grid-Integrated Electric Vehicles in Low Voltage Distributions: A Review.” Energy Conversion and Management 86 (October 2014): 689–700. https://doi.org/10.1016/j.enconman.2014.06.025.
Hodgman, Charles D., ed. C.R.C. Standard Mathematical Tables, 11th ed. Cleveland, OH: Chemical Rubber Publishing Company, 1957.
International Energy Agency. Global EV Outlook 2016: Beyond One Million Electric Cars. Paris, France: International Energy Agency, 2016. https://www.iea.org/ publications/freepublications/publication/Global_EV_Outlook_2016.pdf.
———. Global EV Outlook 2018. Paris, France: International Energy Agency, 2018. https://webstore.iea.org/download/direct/1045?fileName=Global_EV_Outlook_2018.pdf.
Johnson, Tamra. “New Study Reveals When, Where and How Much Motorists Drive.” AAA NewsRoom, April 16, 2015. https://newsroom.aaa.com/2015/04/new-study-reveals-much-motorists-drive/.
Juniper Research. “Hybrid and Electric Vehicle Sales to Exceed 17 Million by 2020 as ‘Range Anxiety’ Lessens.” March 8, 2016. https://www.juniperresearch.com/ press/press-releases/hybrid-and-electric-vehicle-sales-to-exceed-17m?utm_sou rce=cisionpr&utm_medium=email&utm_campaign=Hybrid_Electric_16_PR1.
Kelly, Richard. “Do Gas Prices Correlate with Plug-in Vehicle Sales?.” PlugInAmerica, December 15, 2014. https://pluginamerica.org/do-gas-prices-correlate-plug-vehicle-sales/.
Kempton, Willett, and Steven E. Letendre. “Electric Vehicles as a New Power Source for Electric Utilities.” Transportation Research Part D: Transport and Environment 2, no. 3 (September 1997): 157–75. https://doi.org/10.1016/S1361-9209(97)000 01-1.
Kempton, Willett, Jasna Tomic, Steven E. Letendre, and Timothy Lipman. Vehicle-to-Grid Power: Battery, Hybrid, and Fuel Cell Vehicles as Resources for Distributed Electric Power in California. Davis, CA: Institution of Transportation Studies, University of California-Davis, 2001. http://www1.udel.edu/V2G/docs/V2G-Cal-2001.pdf.
Kim, Jae D., and Mansour Rahimi. “Future Energy Loads for a Large-Scale Adoption of Electric Vehicles in the City of Los Angeles: Impacts on Greenhouse Gas (GHG) Emissions.” Energy Policy 73 (2014): 620–30.
71
Kimes, Beverly Rae. Standard Catalog of American Cars, 1805–1942. 3rd ed. Iola, WI: Krause Publications, 1996.
Kintner-Meyer, Michael, Kevin Schneider, and Robert Pratt. Impacts Assessment of Plug-in Hybrid Vehicles on Electric Utilities and Regional U.S. Power Grids Part 1: Technical Analysis. Richland, WA: Pacific Northwest National Laboratory, 2007. http://citeseerx.ist.psu.edu/viewdoc/summary?doi=10.1.1.574.6257.
Kirsch, David A. “The Electric Car and the Burden of History: Studies in the Automotive Systems Rivalry in America, 1890–1996.” Business and Economic History 26 (Winter 1997): 304–310. https://thebhc.org/sites/default/files/beh/BEHprint/v026 n2/p0304-p0310.pdf.
Kljaic, Vanja. “Charging Your Tesla Model 3 with Just A Wall Outlet—Is It Possible?.” InsideEVs, June 26, 2018. https://insideevs.com/charging-your-tesla-model-3-with-just-a-wall-outlet-is-it-possible/.
Lambert, Fred. “A Look at Tesla Model 3 Charging Options.” Electrek (blog), August 2, 2017. https://electrek.co/2017/08/02/tesla-model-3-charging-options/.
———. “Tesla Accelerates Model 3 Delivery Timelines on New Orders.” Electrek (blog), July 14, 2018. https://electrek.co/2018/07/14/tesla-model-3-delivery-time lines-new-orders/.
Legislative Counsel. California Senate Bill Number 880, Chapter 6. Sacramento: CA: Legislative Counsel, 2012. http://www.leginfo.ca.gov/pub/11-12/bill/sen/sb_ 0851-0900/sb_880_bill_20120229_chaptered.pdf.
Los Angeles Almanac. “Vehicle Registrations in Los Angeles County, California.” 2018. http://www.laalmanac.com/transport/tr02.php.
Los Angeles Department of Water and Power. “2017 Power Strategic Long-Term Resource Plan.” December 2017. https://www.ladwp.com/cs/idcplg?IdcService= GET_FILE&dDocName=OPLADWPCCB655007&RevisionSelectionMethod=LatestReleased.
———. “Electric Rates.” Accessed August 5, 2019. https://www.ladwp.com/ladwp/ faces/ladwp/residential/r-customerservices/r-cs-understandingyourrates/r-cs-ur-electricrates?_afrLoop=551686086234012&_afrWindowMode=0&_afrWindowId=18f8hpkcrz_1#%40%3F_afrWindowId%3D18f8hpkcrz_1%26_afrLoop%3D551686086234012%26_afrWindowMode%3D0%26_adf.ctrl-state%3D6jxwheeb9_4.
———. “Electric Vehicle Incentives.” 2013. https://www.ladwp.com/ladwp/faces/ladwp/ residential/r-gogreen/r-gg-driveelectric/r-gg-de-evncentives?_afrWindowId= null&_afrLoop=168072590378703&_afrWindowMode=0&_adf.ctrl-state=bj6j0 m1nd_4#%40%3F_afrWindowId%3Dnull%26_afrLoop%3D168072590378703%26_afrWindowMode%3D0%26_adf.ctrl-state%3Dqrjejscgp_4.
72
———. Los Angeles Department of Water and Power Briefing Book 2017–2018. Los Angeles: Los Angeles Department of Water and Power, 2017. https://s3-us-west-2.amazonaws.com/ladwp-jtti/wp-content/uploads/sites/3/2017/09/08143247/Brief ing-Book-Rolling-PDF.pdf.
———. “Who We Are.” 2013. https://www.ladwp.com/ladwp/faces/ladwp/aboutus/a-whoweare;jsessionid=LxsqcdcBR85TXzhvR3qRmwSx3rTSWcKWX0ncynPpX70f1yMQ0d5v!-674362223?_afrLoop=147074180102173&_afrWindowMode= 0&_afrWindowId=null#%40%3F_afrWindowId%3Dnull%26_afrLoop%3D147074180102173%26_afrWindowMode%3D0%26_adf.ctrl-state%3D47a02xjjm_4.
Lutsey, Nick, Stephanie Searle, Sarah Chambliss, and Anup Bandivadekar. Assessment of Leading Electric Vehicle Promotion Activities in United States Cities. Washington, DC: International Council on Clean Transportation, 2015. http:// www.theicct.org/sites/default/files/publications/ICCT_EV-promotion-US-cities_20150729.pdf.
Mackenzie, Wood. “The Rise of the Electric Car: How Will it Impact Oil, Power and Metals?.” GreenTech Media, December 2017. https://www.greentechmedia.com/ research/report/the-rise-of-the-electric-car-how-will-it-impact-oil-power-and-metals#gs.owJcKBE.
Mahajan, Vijay, Eitan Muller, and Frank M. Bass. “Diffusion of New Products: Empirical Generalizations and Managerial Uses.” Marketing Science 14, no. 3_supplement (August 1995): G79–88. https://doi.org/10.1287/mksc.14.3.G79.
———. “New Product Diffusion Models in Marketing: A Review and Directions for Research.” Journal of Marketing 54, no. 1 (January 1990): 4.
Massiani, Jérôme, and Andreas Gohs. “The Choice of Bass Model Coefficients to Forecast Diffusion for Innovative Products: An Empirical Investigation for New Automotive Technologies.” Research in Transportation Economics 50 (August 2015): 17–28. https://doi.org/10.1016/j.retrec.2015.06.003.
Matousek, Mark. “Tesla Expects to Make 6,000 Model 3s per Week by the End of August.” Business Insider, August 1, 2018. https://www.businessinsider.com/ tesla-model-3-production-to-hit-6000-per-week-by-end-of-august-2018-8.
Matulka, Rebecca. “The History of the Electric Car.” U.S. Department of Energy, September 15, 2014. http://energy.gov/articles/history-electric-car.
McDonald, Loren. “Please Stop Saying ‘EVs Are Only 1% of Auto Sales in the US.” CleanTechnica, July 1, 2018. https://cleantechnica.com/2018/07/01/please-stop-saying-evs-are-only-1-of-auto-sales-in-the-us/.
73
Melaina, Marc, and Michael S. Helwig. California Statewide Plug-In Electric Vehicle Infrastructure Assessment. Golden, CO: Iowa State University, 2014. https:// works.bepress.com/michael_helwig/2/.
Mitchell, Bridger M., and Jan Paul Acton. The Effect of Time-of-Use Rates in the Los Angeles Electricity Study. Santa, Monica, CA: RAND Corporation for the Los Angeles Department of Power and Water and the John A. Hartford Foundation, 1980. http://www.rand.org/content/dam/rand/pubs/notes/2007/N1533.pdf.
Moghbel, Moayed, Mohammad A. S. Masoum, and Alireza Fereidouni. “Decentralize Coordinated Charging of Plug-In Electric Vehicles in Unbalanced Residential Networks to Control Distribution Transformer Loading, Voltage Profile and Current Unbalance.” Intelligent Industrial Systems 1, no. 2 (August 2015): 141–51. https://doi.org/10.1007/s40903-015-0008-7.
Musk, Elon. “The Secret Tesla Motors Master Plan (Just between You and Me).” Tesla, August 2, 2006. https://www.tesla.com/blog/secret-tesla-motors-master-plan-just-between-you-and-me.
National Academy of Engineering. “Electrification—Greatest Engineering Achievements of the Twentieth Century.” 2003. http://www.greatachievements.org/?id=2949.
Office of the Governor, Governor Edmund G. Brown Jr. “Governor Brown Takes Action to Increase Zero-Emission Vehicles, Fund New Climate Investments.” January 26, 2018. https://www.ca.gov/archive/gov39/2018/01/26/governor-brown-takes-action-to-increase-zero-emission-vehicles-fund-new-climate-investments/index. html.
Pacific Gas and Electric. “In Step With California’s Evolving Energy Policy, PG&E, Labor and Environmental Groups Announce Proposal to Increase Energy Efficiency, Renewables and Storage While Phasing Out Nuclear Power over the Next Decade.” June 21, 2016. http://www.pge.com/en/about/newsroom/newsdeta ils/index.page?title=20160621_in_step_with_californias_evolving_energy_policy_pge_labor_and_environmental_groups_announce_proposal_to_increase_energy_efficiency_renewables_and_storage_while_phasing_out_nuclear_power_over_the_next_decade.
Paevere, Phillip, Andrew Higgins, Zhengen Ren, Mark Horn, George Grozev, and Cheryl McNamara. “Spatio-Temporal Modelling of Electric Vehicle Charging Demand and Impacts on Peak Household Electrical Load.” Sustainability Science 9, no. 1 (January 2014): 61–76. https://doi.org/10.1007/s11625-013-0235-3.
Perrow, Charles. Normal Accidents: Living with High Risk Technologies. Princeton, NJ: Princeton University Press, 2011.
PluginCars. “Compare Electric Cars and Plug-in Hybrids—List of Features, Price, Range, Model.” 2018. http://www.plugincars.com/cars.
74
Randall, Tom, and Dean Halford. “We Set Out to Crack Tesla’s Biggest Mystery: How Many Model 3s It’s Making.” Bloomberg, August 14, 2018. https://www.bloom berg.com/graphics/2018-tesla-tracker/.
Rogers, Everett M. Diffusion of Innovations. 1st ed. New York: Free Press of Glencoe, 1962.
Schey, Stephen, Don Scoffield, and John Smart. “A First Look at the Impact of Electric Vehicle Charging on the Electric Grid in the EV Project.” World Electric Vehicle Journal 5, no. 3 (September 28, 2012): 667–78. https://doi.org/10.3390/wevj503 0667.
Schwarzenegger, Arnold. Executive Order S-3-05 (June 2005). http://gov.ca.gov/news. php?id=1861.
Scott, Michael J., Michael Kintner-Meyer, Douglas B. Elliott, and William M. Warwick. Impacts Assessment of Plug-in Hybrid Vehicles on Electric Utilities and Regional U.S. Power Grids: Part 2: Economic Assessment. Richland, WA: Pacific Northwest National Laboratory, 2007. http://energyenvironment.pnnl.gov/ei/pdf/ PHEV_Economic_Analysis_Part2_Final.pdf.
Sheldon, Tamara L., and J. R. DeShazo. How Does the Presence of HOV Lanes Affect Plug-in Electric Vehicle Adoption in California? A Generalized Propensity Score Approach. Los Angeles: UCLA Luskin School of Public Affairs, Luskin Center for Innovation, 2016.
Sioshansi, Fereidoon. “How Aggregators Will Alter Fundamentals of Electricity Business.” Energy Post (blog), April 9, 2018. https://energypost.eu/how-aggr egators-will-alter-fundamentals-of-electricity-business/.
SmartGrid. “What Is the Smart Grid?.” Accessed October 17, 2015. https://www.smart grid.gov/the_smart_grid/smart_grid.html.
Staff of the California Public Utilities Commission. Aliso Canyon Action Plan to Preserve Gas and Electric Reliability for the Los Angeles Basin. Sacramento, CA: California Energy Commission, the California Independent System Operator, and the Los Angeles Department of Water and Power, 2016. http://www.energy.ca. gov/2016_energypolicy/documents/2016-04-08_joint_agency_workshop/Aliso_ Canyon_Action_Plan_to_Preserve_Gas_and_Electric_Reliability_for_the_Los_Angeles_Basin.pdf.
State of California Department of Finance. “Demographic Projections.” 2016. http:// www.dof.ca.gov/Forecasting/Demographics/Projections/.
75
Tan, Kang Miao, Vigna K. Ramachandaramurthy, and Jia Ying Yong. “Integration of Electric Vehicles in Smart Grid: A Review on Vehicle to Grid Technologies and Optimization Techniques.” Renewable and Sustainable Energy Reviews 53 (January 2016): 720–32. https://doi.org/10.1016/j.rser.2015.09.012.
Tarroja, Brian, Joshua D. Eichman, Li Zhang, Tim M. Brown, and Scott Samuelsen. “The Effectiveness of Plug-in Hybrid Electric Vehicles and Renewable Power in Support of Holistic Environmental Goals: Part 2—Design and Operation Implications for Load-Balancing Resources on the Electric Grid.” Journal of Power Sources 278 (March 2015): 782–93. https://doi.org/10.1016/j.jpowsour. 2014.06.169.
Tesla. “Tesla Model 3.” Accessed April 13, 2018. https://www.tesla.com/model3.
———. “Tesla Model S Achieves Best Safety Rating of Any Car Ever Tested.” August 19, 2013. https://www.tesla.com/blog/tesla-model-s-achieves-best-safety-rating-any-car-ever-tested?redirect=no.
“The Future Is Electric—The World Is on the Verge of an Automotive Revolution: CURRENT Is Helping Los Angeles Customers Find the Right EV for Their Lifestyle.” CURRENT (blog), January 19, 2016. http://currentev.com/blog/future-electric-%E2%80%93-world-verge-automotive-revolution-current-helping-los-angeles-customers.
U.S. Department of Energy, Energy Efficiency and Renewable Energy. “Alternative Fuels Data Center: Electric Vehicle Charging Station Locations.” Accessed July 25, 2019. https://afdc.energy.gov/fuels/electricity_locations.html#/find/nearest? fuel=ELEC&country=US.
U.S. Department of Transportation Federal Highway Administration. “Travel Time Reliability: Making It There on Time, All the Time.” February 1, 2017. https:// ops.fhwa.dot.gov/publications/tt_reliability/long_descriptions/Figure4.htm.
U.S. Energy Information Administration. “Annual Energy Outlook 2018: Table 40 Light-Duty Vehicle Stock by Technology Type.” February 6, 2018. https://www.eia. gov/outlooks/aeo/data/browser/#/?id=49-AEO2018®ion=0-0&cases=ref20 18&start=2016&end=2050&f=A&linechart=ref2018-d121317a.4-49-AEO2018~ ref2018-d121317a.6-49-AEO2018&ctype=linechart&sourcekey=0.
U.S. Internal Revenue Service. “Plug-In Electric Drive Vehicle Credit (IRC 30D).” February 9, 2016. https://www.irs.gov/businesses/plug-in-electric-vehicle-credit-irc-30-and-irc-30d.
U.S. National Highway Traffic Safety Administration. “CAFE Public Information Center.” Accessed July 24, 2019. http://www.nhtsa.gov/CAFE_PIC/CAFE_ PIC_Home.htm.

76
Union of Concerned Scientists. “Electric Vehicle Charging: Types, Time, Cost and Savings.” March 9, 2018. https://www.ucsusa.org/clean-vehicles/electric-vehicles/car-charging-time-type-cost.
United States Census Bureau. “United States QuickFacts from the United States Census Bureau.” 2010. http://www.census.gov/quickfacts/.
Wang, Jianhui, Cong Liu, Dan Ton, Yan Zhou, Jinho Kim, and Anantray Vyas. “Impact of Plug-in Hybrid Electric Vehicles on Power Systems with Demand Response and Wind Power.” Energy Policy 39, no. 7 (July 2011): 4016–21. https://doi.org/ 10.1016/j.enpol.2011.01.042.
WECC Staff. 2016 Power Supply Assessment. Salt Lake City, UT: WECC, 2016. https:// www.wecc.org/Reliability/2016PSA_Final.pdf.
Weiller, Claire. “Plug-in Hybrid Electric Vehicle Impacts on Hourly Electricity Demand in the United States.” Energy Policy 39, no. 6 (June 2011): 3766–78. https://doi. org/10.1016/j.enpol.2011.04.005.
Zhang, Li, Faryar Jabbari, Tim Brown, and Scott Samuelsen. “Coordinating Plug-in Electric Vehicle Charging with Electric Grid: Valley Filling and Target Load Following.” Journal of Power Sources 267 (December 2014): 584–97. https://doi. org/10.1016/j.jpowsour.2014.04.078.
77
INITIAL DISTRIBUTION LIST
1. Defense Technical Information Center Ft. Belvoir, Virginia 2. Dudley Knox Library Naval Postgraduate School Monterey, California