thesis - Homeland Security Digital Library
86
NAVAL POSTGRADUATE SCHOOL MONTEREY, CALIFORNIA THESIS Approved for public release; distribution is unlimited ENDING AMERICA’S ENERGY INSECURITY: HOW ELECTRIC VEHICLES CAN DRIVE THE SOLUTION TO ENERGY INDEPENDENCE by Fredrick Stein December 2011 Thesis Advisor: Tom Mackin Second Reader: Ted Lewis
-
Upload
khangminh22 -
Category
Documents
-
view
1 -
download
0
Transcript of thesis - Homeland Security Digital Library

NAVAL
POSTGRADUATE SCHOOL
MONTEREY, CALIFORNIA
THESIS
Approved for public release; distribution is unlimited
ENDING AMERICA’S ENERGY INSECURITY: HOW ELECTRIC VEHICLES CAN DRIVE THE
SOLUTION TO ENERGY INDEPENDENCE
by
Fredrick Stein
December 2011
Thesis Advisor: Tom Mackin Second Reader: Ted Lewis

THIS PAGE INTENTIONALLY LEFT BLANK
i
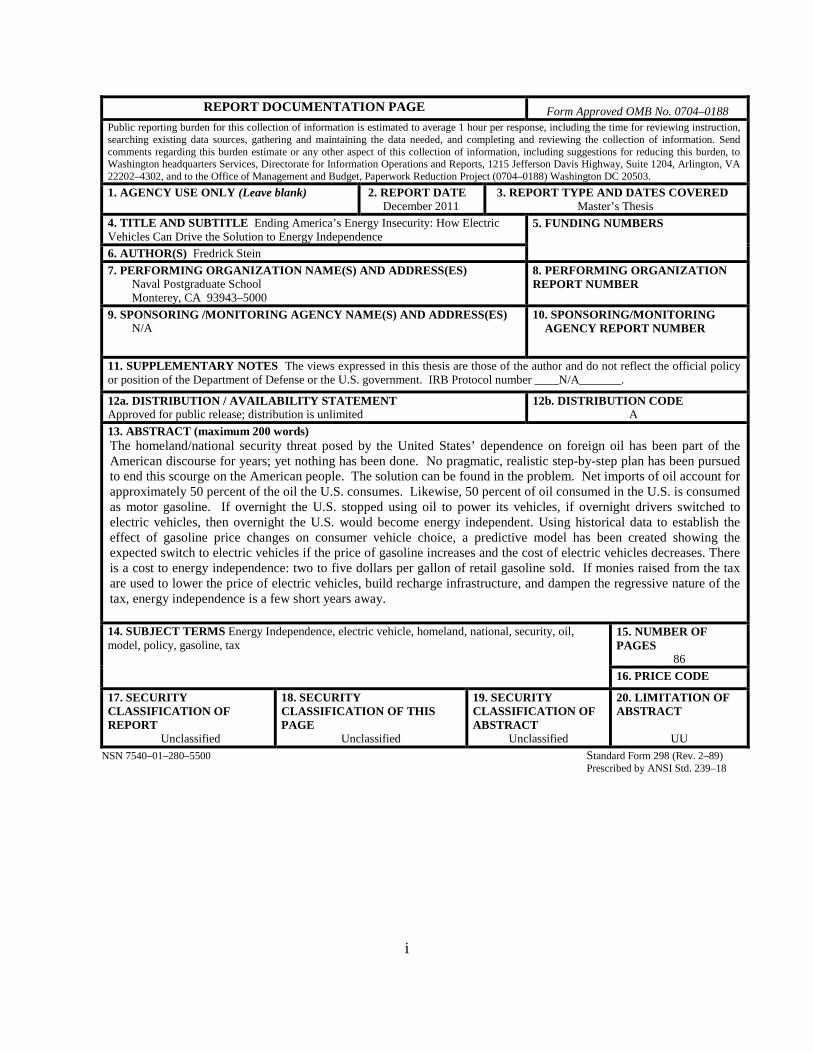
REPORT DOCUMENTATION PAGE Form Approved OMB No. 0704–0188 Public reporting burden for this collection of information is estimated to average 1 hour per response, including the time for reviewing instruction, searching existing data sources, gathering and maintaining the data needed, and completing and reviewing the collection of information. Send comments regarding this burden estimate or any other aspect of this collection of information, including suggestions for reducing this burden, to Washington headquarters Services, Directorate for Information Operations and Reports, 1215 Jefferson Davis Highway, Suite 1204, Arlington, VA 22202–4302, and to the Office of Management and Budget, Paperwork Reduction Project (0704–0188) Washington DC 20503. 1. AGENCY USE ONLY (Leave blank)
2. REPORT DATE December 2011
3. REPORT TYPE AND DATES COVERED Master’s Thesis
4. TITLE AND SUBTITLE Ending America’s Energy Insecurity: How Electric Vehicles Can Drive the Solution to Energy Independence
5. FUNDING NUMBERS
6. AUTHOR(S) Fredrick Stein 7. PERFORMING ORGANIZATION NAME(S) AND ADDRESS(ES)
Naval Postgraduate School Monterey, CA 93943–5000
8. PERFORMING ORGANIZATION REPORT NUMBER
9. SPONSORING /MONITORING AGENCY NAME(S) AND ADDRESS(ES) N/A
10. SPONSORING/MONITORING AGENCY REPORT NUMBER
11. SUPPLEMENTARY NOTES The views expressed in this thesis are those of the author and do not reflect the official policy or position of the Department of Defense or the U.S. government. IRB Protocol number ____N/A_______.
12a. DISTRIBUTION / AVAILABILITY STATEMENT Approved for public release; distribution is unlimited
12b. DISTRIBUTION CODE A
13. ABSTRACT (maximum 200 words) The homeland/national security threat posed by the United States’ dependence on foreign oil has been part of the American discourse for years; yet nothing has been done. No pragmatic, realistic step-by-step plan has been pursued to end this scourge on the American people. The solution can be found in the problem. Net imports of oil account for approximately 50 percent of the oil the U.S. consumes. Likewise, 50 percent of oil consumed in the U.S. is consumed as motor gasoline. If overnight the U.S. stopped using oil to power its vehicles, if overnight drivers switched to electric vehicles, then overnight the U.S. would become energy independent. Using historical data to establish the effect of gasoline price changes on consumer vehicle choice, a predictive model has been created showing the expected switch to electric vehicles if the price of gasoline increases and the cost of electric vehicles decreases. There is a cost to energy independence: two to five dollars per gallon of retail gasoline sold. If monies raised from the tax are used to lower the price of electric vehicles, build recharge infrastructure, and dampen the regressive nature of the tax, energy independence is a few short years away. 14. SUBJECT TERMS Energy Independence, electric vehicle, homeland, national, security, oil, model, policy, gasoline, tax
15. NUMBER OF PAGES
86 16. PRICE CODE
17. SECURITY CLASSIFICATION OF REPORT
Unclassified
18. SECURITY CLASSIFICATION OF THIS PAGE
Unclassified
19. SECURITY CLASSIFICATION OF ABSTRACT
Unclassified
20. LIMITATION OF ABSTRACT
UU NSN 7540–01–280–5500 Standard Form 298 (Rev. 2–89) Prescribed by ANSI Std. 239–18

ii
THIS PAGE INTENTIONALLY LEFT BLANK

iii
Approved for public release; distribution is unlimited
ENDING AMERICA’S ENERGY INSECURITY HOW ELECTRIC VEHICLES CAN DRIVE THE SOLUTION TO ENERGY INDEPENDENCE
Fredrick Stein Transportation Security Administration, Field Counsel
B.S., Florida State University, 1996 J.D., University of Virginia, 1999
Submitted in partial fulfillment of the
requirements for the degree of
MASTER OF ARTS IN SECURITY STUDIES (HOMELAND SECURITY AND DEFENSE)
from the
NAVAL POSTGRADUATE SCHOOL December 2011
Author: Fredrick Stein
Approved by: Tom Mackin Thesis Advisor
Ted Lewis Second Reader
Daniel J. Moran Chair, Department of National Security Affairs

iv
THIS PAGE INTENTIONALLY LEFT BLANK

v
ABSTRACT
The homeland/national security threat posed by the United States’ dependence on foreign
oil has been part of the American discourse for years; yet nothing has been done. No
pragmatic, realistic step-by-step plan has been pursued to end this scourge on the
American people. The solution can be found in the problem. Net imports of oil account
for approximately 50 percent of the oil the U.S. consumes. Likewise, 50 percent of oil
consumed in the U.S. is consumed as motor gasoline. If overnight the U.S. stopped using
oil to power its vehicles, if overnight drivers switched to electric vehicles, then overnight
the U.S. would become energy independent. Using historical data to establish the effect
of gasoline price changes on consumer vehicle choice, a predictive model has been
created showing the expected switch to electric vehicles if the price of gasoline increases
and the cost of electric vehicles decreases. There is a cost to energy independence: two to
five dollars per gallon of retail gasoline sold. If monies raised from the tax are used to
lower the price of electric vehicles, build recharge infrastructure, and dampen the
regressive nature of the tax, energy independence is a few short years away.

vi
THIS PAGE INTENTIONALLY LEFT BLANK
vii
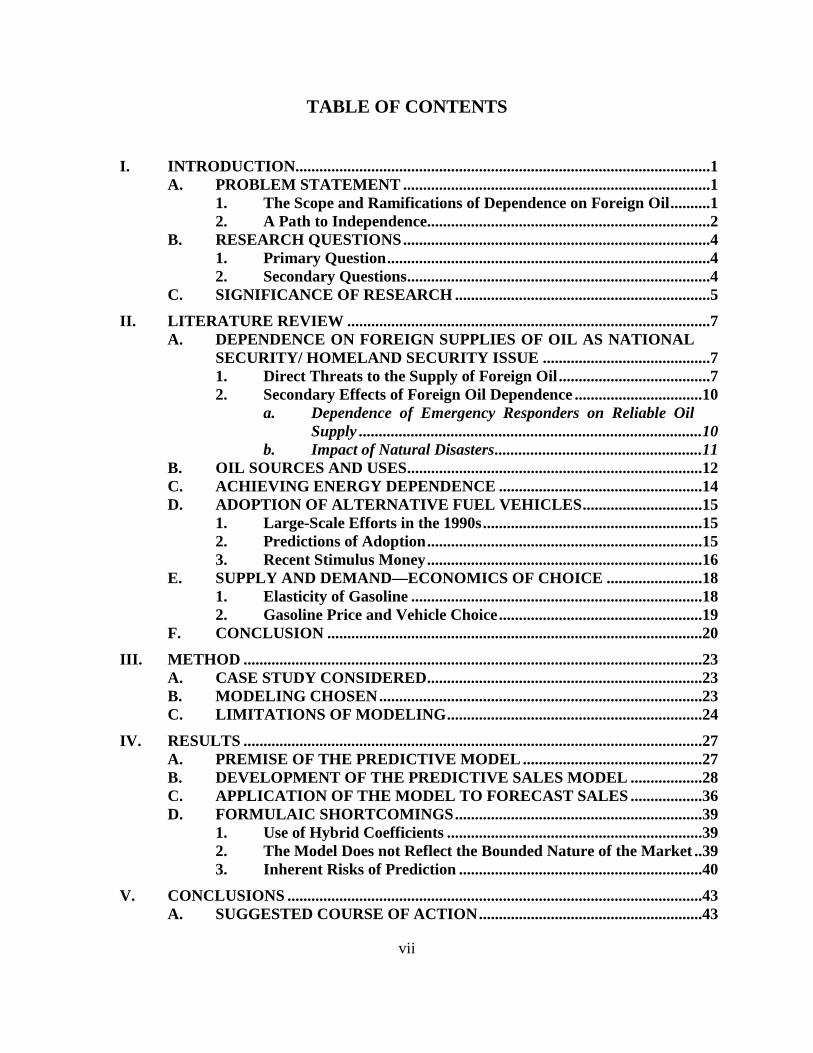
TABLE OF CONTENTS
I. INTRODUCTION........................................................................................................1 A. PROBLEM STATEMENT .............................................................................1
1. The Scope and Ramifications of Dependence on Foreign Oil ..........1 2. A Path to Independence.......................................................................2
B. RESEARCH QUESTIONS .............................................................................4 1. Primary Question .................................................................................4 2. Secondary Questions ............................................................................4
C. SIGNIFICANCE OF RESEARCH ................................................................5
II. LITERATURE REVIEW ...........................................................................................7 A. DEPENDENCE ON FOREIGN SUPPLIES OF OIL AS NATIONAL
SECURITY/ HOMELAND SECURITY ISSUE ..........................................7 1. Direct Threats to the Supply of Foreign Oil ......................................7 2. Secondary Effects of Foreign Oil Dependence ................................10
a. Dependence of Emergency Responders on Reliable Oil Supply ......................................................................................10
b. Impact of Natural Disasters ....................................................11 B. OIL SOURCES AND USES ..........................................................................12 C. ACHIEVING ENERGY DEPENDENCE ...................................................14 D. ADOPTION OF ALTERNATIVE FUEL VEHICLES ..............................15
1. Large-Scale Efforts in the 1990s .......................................................15 2. Predictions of Adoption .....................................................................15 3. Recent Stimulus Money .....................................................................16
E. SUPPLY AND DEMAND—ECONOMICS OF CHOICE ........................18 1. Elasticity of Gasoline .........................................................................18 2. Gasoline Price and Vehicle Choice ...................................................19
F. CONCLUSION ..............................................................................................20
III. METHOD ...................................................................................................................23 A. CASE STUDY CONSIDERED .....................................................................23 B. MODELING CHOSEN .................................................................................23 C. LIMITATIONS OF MODELING ................................................................24
IV. RESULTS ...................................................................................................................27 A. PREMISE OF THE PREDICTIVE MODEL .............................................27 B. DEVELOPMENT OF THE PREDICTIVE SALES MODEL ..................28 C. APPLICATION OF THE MODEL TO FORECAST SALES ..................36 D. FORMULAIC SHORTCOMINGS ..............................................................39
1. Use of Hybrid Coefficients ................................................................39 2. The Model Does not Reflect the Bounded Nature of the Market ..39 3. Inherent Risks of Prediction .............................................................40
V. CONCLUSIONS ........................................................................................................43 A. SUGGESTED COURSE OF ACTION ........................................................43

viii
1. Excise Tax on Retail Gasoline Purchases ........................................43 2. Recharge Infrastructure ....................................................................44 3. New Power Stations and Infrastructure ..........................................45
B. CRITICAL SECONDARY CONCERNS ....................................................46 1. Public Support Financially ...............................................................46 2. Public Support Politically..................................................................48 3. Source of Energy Storage Materials ................................................48
C. UNINTENDED CONSEQUENCES AND SECONDARY CONCERNS ...................................................................................................49 1. Fungible Nature of the Oil Market ...................................................49 2. A Regressive Excise Tax ....................................................................50 3. Risk Increasing Cost of Goods / Inflation ........................................51 4. Significant Drop in the Price of Oil ..................................................51
D. FOLLOW-ON RESEARCH .........................................................................52 1. A More Complex Version of the Present Model .............................52 2. A More Complex Modeling System..................................................52 3. Determine Coefficients for EVs Independently ..............................53 4. Determining the Cost of Energy Dependence .................................53 5. Infrastructure Questions ...................................................................53
E. CONCLUSION ..............................................................................................54
LIST OF REFERENCES ......................................................................................................55
INITIAL DISTRIBUTION LIST .........................................................................................67

ix
LIST OF FIGURES
Figure 1. Oil Imports, Consumption and Amounts Used for Motor Gasoline (After EIA, 2010a, pp. 128, 148) ..................................................................................3
Figure 2. Uses of Oil (EIA, 2010a, p. 148) .....................................................................13 Figure 3. Recharge Levels and Time to Charge (From Dickerman, 2010) .....................17 Figure 4. Comparison of the Variation of ln(Shy) with Year of Sale as Derived by
Model (blue) with Historic Data (red). ............................................................35 Figure 5. Comparison of the Variation of ln(SSUV) with Year of Sale as Derived by
Model (blue) with Historic Data (red) .............................................................35 Figure 6. Predicted EV Sales for the Period 2011–2018 in Response to Taxation and
Subsidy Policies as Projected by the Model ....................................................38

x
THIS PAGE INTENTIONALLY LEFT BLANK

xi
LIST OF TABLES
Table 1. Historical Data for SUVs and Hybrid Vehicles ...............................................33 Table 2. Coefficients of the Sales Volume Models (Eqns. 7 and 8) of Hybrid and
SUV Vehicles as Derived by Fitting These Equations to Historical Sales Data (Table 1) ..................................................................................................35
Table 3. Excise Tax Collected .......................................................................................39

xii
THIS PAGE INTENTIONALLY LEFT BLANK

xiii
LIST OF ACRONYMS AND ABBREVIATIONS
ASCM Anti-Ship Cruise Missile
CBO Congressional Budget Office
CAFE Corporate Average Fuel Economy
DOE United States Department of Energy
EV Electric Vehicle
EIA United States Energy Information Administration
FTC Federal Trade Commission
IAFC International Association of Fire Chiefs
MSRP Manufacturer’s Suggested Retail Price
PHEV Plug-in Hybrid Electric Vehicle
TEPCO Tokyo Electric Power Company

xiv
THIS PAGE INTENTIONALLY LEFT BLANK

xv
ACKNOWLEDGMENTS
To my wife, Tammar, all my love and thanks. You supported me from the
moment I mentioned the master’s program; you supported the family through all my trips
to Shepherdstown and during all my disappearing acts on the weekend. Had you simply
agreed to the sacrifices of the program, it would have been enough. Had you merely sent
me off with your love and the knowledge that our family was well during my absences, it
would have been enough. Yet you encouraged me when I faltered, advised me when I
deliberated and led the celebration as I succeeded.
To my father-in-law Gaby Laufer, I do not exaggerate when I say that without
your assistance this particular thesis would not exist. I had an idea and concept but
lacked the means to give it true academic rigor. The predictive model in this thesis bears
your sweat, your brilliance, and perhaps most importantly, your patience. You will
always have my gratitude and love.
Rarely does anyone achieve anything really worthwhile alone. That was never
truer than with this thesis and the master’s degree itself. Together with my classmates
and instructors, NPS CHDS Cohorts 1003/1004, I was never alone. The experience and
wisdom of the group was humbling. The willingness of everyone to give of themselves
in aid of all our classmates was inspiring. This thesis was only possible because I learned
to think differently and to view the world from a different perspective. That profound
insight did not come from any of our readings, papers or quizzes. It came from all of
you, my CHDS family.
At times it seemed as though this particular thesis was never meant to be. To
borrow from General McAuliffe, my interpretation of Dr. Bellavita’s response to all the
naysayers can be summed up in one word. Nuts! Dr. Bellavita’s belief in my ability to
write this thesis was contagious.
Months of research and a multitude of false starts had left me with grand ideas
and a mountain of papers, but nothing resembling a thesis. I had lost sight of the forest.
Dr. Pelfrey, Jr. has a singular ability to take something complex and not only make it

xvi
simple, but make it simple for everyone else. With his invaluable assistance, my ideas
and my mountain of research fit together almost effortlessly. Instead of a mass of
unorganized data, ideas and citations, I have a thesis. Thank you, Dr. Pelfrey.
The idea of simultaneously working through my classes, writing a thesis and
attending classes while keeping up with my work at the Transportation Security
Administration seemed impossible. If not for the support of my Office of Chief Counsel
brethren, in particular, Brandon Straus, Ron Kilroy and Richard DiGiacomo it would
have been impossible. I am in your debt.
No paper becomes a thesis without the direction, support and wisdom of thesis
advisors, and this thesis is no different. Tom Mackin and Ted Lewis not only guided
prodded and forced me to turn over stones I might have chosen to leave unturned, but
they did it with excitement and verve. I believe I am better off for it, and I know my
thesis is stronger and deeper thanks to their unwavering guidance.

xvii
THIS PAGE INTENTIONALLY LEFT BLANK

1
I. INTRODUCTION
A. PROBLEM STATEMENT
Dependence on foreign oil presents a growing threat to U.S. national and
homeland security. This threat manifests itself in several ways: it places unhealthy
restraints on U.S. and allied nations’ policy choices; it weakens the nation economically
by adding to the trade deficit; it forces our military to protect vital oil trade routes; and it
strengthens our adversaries by providing funding for their activities. Given that the
amount of oil imported by the country is roughly equal to the amount of oil used in the
U.S. to power automobile transportation, a shift to alternative transportation technologies
could dramatically improve our national and homeland security. Electric vehicles (EVs)
provide the most promising path toward ending our dependence on foreign oil.
For purposes of this thesis, “dependence on foreign oil” is the situation where the
domestic demand for oil exceeds the available domestic supply. When the domestic
supply is insufficient, some domestic consumption of oil must be satisfied by sources that
originate in locations other than the states, territories and possessions of the United
States. With this definition in mind, net importation of oil is more relevant than total
importation numbers though much of the literature relies on total importation data.
1. The Scope and Ramifications of Dependence on Foreign Oil
In 1973/1974, the U.S. imported approximately 28 percent of the oil that it
consumed (U.S. Energy Information Administration [EIA], 1998). At only 28 percent,
the six-month long 1973/1974 oil embargo caused gas prices to triple and long lines at
gas stations (Leotta, 2006, p. 4). Today, the United States imports approximately 50
percent of the oil that it consumes (EIA, 2011d). Imagine what would happen should a
similar disruption occur, now that the degree of dependence on foreign oil has markedly
increased.
The economic cost of dependence on foreign oil is staggering. The United States
has an oil trade deficit of approximately $1,000,000,000 per day, larger than our trade
deficit with China (Powers, 2010), which in 2010 was approximately $748,000,000 per

2
day (U. S. Census, 2011). Oil consumption represents 40 percent of America’s energy
needs, with 20 percent of the oil the U.S. consumes coming from the Persian Gulf Region
(Cohen, 2007). The cost to the United States is compounded. Not only do we send one
billion dollars out of our economy every day, but much of that same money is then used
in a manner that directly threatens our security. Time and again, the U.S. military and
national security leaders have warned of the substantial risk this outflow of capital poses
to the security of the United States. For example, Vice Admiral Dennis McGinn has
cautioned that the oil trade deficit, much of it enriching nations that wish us harm, is an
unsustainable transfer of wealth that has us literally funding both sides of the conflict in
the “war on terror” (Powers, 2010). Former national security adviser Robert McFarlane
and former CIA director R. James Woolsey, have recently described our dependence on
foreign oil as, “the well from which our enemies draw their political strength and
financial power: the strategic importance of oil, which provides the wherewithal for a
generational war against us” (McFarlane, 2011). When asked about the most important
area of research for aiding those under his command, Marine General James Mattis
responded by imploring that the country, “Unleash us from the tether of fuel” (Powers,
2010). Similarly, a panel of 11 former generals and admirals testified that “dependence
on foreign oil leaves us more vulnerable to hostile regimes and terrorists” (Powers,
2010).
The restraints from oil dependence on U.S. foreign policy decisions are untenable.
For example, as the nation struggles to blunt Iran’s drive towards nuclear weapons,
administration officials are wary of enacting sanctions on Iranian oil exports. They fear
that it might drive up oil prices when the United States and European economies are
weak. As they consider the probable impacts, they are forced to conclude that in the end,
they simply cannot predict what would happen (Sanger, 2011).
2. A Path to Independence
Energy dependence is a product of the United States’ importation of oil. Though
the U.S. is the third largest producer of oil in the world (EIA, 2010b; EIA, 2011d), it still
imports roughly 60 percent of the total oil it consumes (Brooker, 2010). Since the U.S.
3
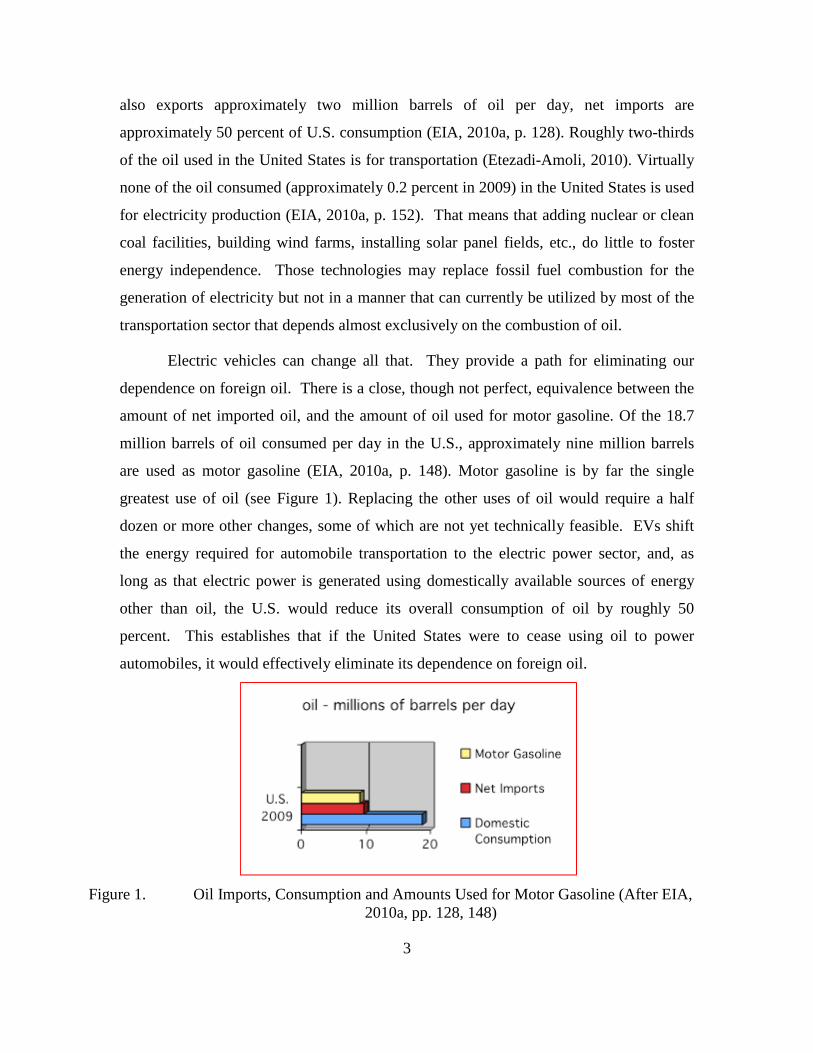
also exports approximately two million barrels of oil per day, net imports are
approximately 50 percent of U.S. consumption (EIA, 2010a, p. 128). Roughly two-thirds
of the oil used in the United States is for transportation (Etezadi-Amoli, 2010). Virtually
none of the oil consumed (approximately 0.2 percent in 2009) in the United States is used
for electricity production (EIA, 2010a, p. 152). That means that adding nuclear or clean
coal facilities, building wind farms, installing solar panel fields, etc., do little to foster
energy independence. Those technologies may replace fossil fuel combustion for the
generation of electricity but not in a manner that can currently be utilized by most of the
transportation sector that depends almost exclusively on the combustion of oil.
Electric vehicles can change all that. They provide a path for eliminating our
dependence on foreign oil. There is a close, though not perfect, equivalence between the
amount of net imported oil, and the amount of oil used for motor gasoline. Of the 18.7
million barrels of oil consumed per day in the U.S., approximately nine million barrels
are used as motor gasoline (EIA, 2010a, p. 148). Motor gasoline is by far the single
greatest use of oil (see Figure 1). Replacing the other uses of oil would require a half
dozen or more other changes, some of which are not yet technically feasible. EVs shift
the energy required for automobile transportation to the electric power sector, and, as
long as that electric power is generated using domestically available sources of energy
other than oil, the U.S. would reduce its overall consumption of oil by roughly 50
percent. This establishes that if the United States were to cease using oil to power
automobiles, it would effectively eliminate its dependence on foreign oil.
Figure 1. Oil Imports, Consumption and Amounts Used for Motor Gasoline (After EIA,
2010a, pp. 128, 148)

4
There is analysis of recent historical fluctuations in gasoline prices that looks
beyond simple supply and demand. It shows that with long-term price increases in the
cost of gasoline, people will reduce their consumption of gasoline, at least partially, by
moving to more fuel-efficient vehicles (Congressional, 2008).
EVs provide the best means of eliminating the use of petroleum products to power
automobiles in the United States. By moving to EVs (provided the increased electricity
demands are not met through the use of petroleum), the yellow bar in Figure 1 can be
eliminated, ending the need for the oil represented by the red bar, net imports of oil. It is
important to note, however, that this transformation will require upgrades to and
expansion of the nation’s electric power infrastructure, thereby requiring infrastructure
investments. More details on that issue are discussed in Chapter V.
Although the move to EVs is likely to occur slowly in response to market forces
alone (Hensley, 2009), given the urgency of the security threat posed by dependence on
foreign oil, there is a dearth of policy designed to increase the pace of transformation to
an EV fleet. While there are many discussions of the effect of EVs on the environment,
there are no policies that look to speed up this transformation from a national or
homeland security perspective. Speeding up EV adoption depends on several factors,
including: improving battery efficiencies and capacities to increase range; bringing the
total cost of EV ownership in line with or below the total cost of gasoline powered
vehicles; increasing the pace of EV infrastructure development (e.g., recharge/refuel
facilities); and increasing consumer adoption of EVs (Hensley, 2009).
B. RESEARCH QUESTIONS
1. Primary Question
How can various policy choices affect consumer adoption of electric vehicles to
move the United States from internal combustion vehicles to electric vehicles?
2. Secondary Questions
1. Which policy choices would lower the demand for gasoline powered automobiles?
5
2. Which policy choices would raise demand for electric vehicles? Although this question is related to secondary question 1, there may well be policies that lower the demand for internal combustion vehicles without specifically increasing the demand for EVs.
3. What are the potential unintended consequences of policy choices favoring electric vehicle adoption?
C. SIGNIFICANCE OF RESEARCH
This thesis will fill the void in the literature looking at EV adoption as a
national/homeland security concern. There is ample analysis of EV adoption from an
environmental and purely economic perspective, but there seems to be no literature that
gives serious consideration to adopting EVs as a potential solution to the security
vulnerability created by energy dependence. Additionally, there does not appear to be a
comprehensive look at how various policy choices might be used specifically to bring
about the speedy adoption of EVs. This thesis will assimilate the available literature and
data to establish (1) that EVs have the potential to solve the security vulnerability
inherent in energy dependence and, (2) what policies can be implemented to bring about
the speedier adoption of EVs in the United States.

6
THIS PAGE INTENTIONALLY LEFT BLANK

7
II. LITERATURE REVIEW
Oil is often the topic of public debate, political discourse and academic research.
A great deal of time and resources are spent discussing the sources of oil, the
environmental and geopolitical effects of oil and dependence on foreign sources for oil
and how the nation might reduce its use of oil/foreign oil. There is also literature
discussing the national/homeland security implications of energy dependence; however,
there is an absence of literature either discussing how EV adoption might solve that
security threat or describing what policy choices can be used to speed up EV adoption.
A. DEPENDENCE ON FOREIGN SUPPLIES OF OIL AS NATIONAL SECURITY/ HOMELAND SECURITY ISSUE
1. Direct Threats to the Supply of Foreign Oil
There is ample material establishing the existence of the security threat posed by
dependence upon foreign sources of oil. At the surface, rhetorical level, there exists a
robust record of high visibility proclamations that energy dependence is a critical security
issue for the United States (for example, see CNN, 2010). Additionally, for decades the
nation’s leaders have recognized the security importance of energy independence,
espousing its centrality to national security. Video clips of every U.S. president from
Richard Nixon to the current President capture each of them discussing the importance of
ending the United States’ dependence on foreign oil (Stewart, 2010). There is also ample
media coverage of the rhetoric of nations hostile towards the U.S. describing how they
are willing to cut off the United States’ supply of oil. This is primarily centered on oil
producing countries from the Middle East and Venezuela. This literature tends to be
sound bites without much meat, but the advantage is that it is designed for public
consumption, helping to socialize the idea of energy dependence. President Obama
recently announced that for “geopolitical and economic reasons,” the nation needed to
reduce its reliance on imported oil by about 30 percent over the next 10 years (Broder,
2011).

8
A more in depth body of literature examining energy dependence also exists. The
1973/1974 oil embargo provides historical precedence for foreign nations using oil as a
lever to affect U.S. national policy (Paust, 1974). In 1973/1974, the U.S. imported
approximately 28 percent of the oil that it consumed (EIA, 1998). The embargo,
sometimes referred to as “Energy Pearl Harbor Day” (Light, 1976), was sufficiently
severe to serve as the catalyst for legislative action concerning the use of fuel. Gas
shortages were significant enough that, along with a tripling of world oil prices, gasoline
consumption in the U.S. actually decreased by 2 percent in response to the embargo
(Leotta, 2006, p. 4). The situation was so severe that naval oil reserves were tapped for
emergency civilian supplies (Light, 1976).
Literature has addressed the present threat from state actors. Hugo Chavez,
president of Venezuela, has threatened to cut the supply of oil to the U.S., not because of
the threat of a U.S. invasion, but as leverage to prevent Colombia from invading
Venezuela (CNN, 2010). Similarly, Russia has shown it may be willing to take military
action to control the supply of oil flowing to the West. The invasion of Georgia may
have been more about the Baku-Tbilisi-Ceyhan pipeline (a conduit of oil to the West
owned by U.S. and British energy firms) than about support of the separatists in South
Ossetia (Kimery, 2008).
Similar threats have come from non-state actors like Osama bin Laden and
Ayman al-Zawahiri, who have called for attacks on economic assets, especially energy
sources (Cohen, 2007). In a tape aired by Al-Jazeera in February 2006, Zawahiri said, “I
call on the mujahedeen to concentrate their attacks on Muslims’ stolen oil, most of the
revenues of which go to the enemies of Islam while most of what they leave is seized by
the thieves who rule our countries” (Cohen, 2007). The non-state threats are broader than
just Al Qaeda with groups specifically attempting to wreak havoc in international markets
(Worth, 2010).
These attacks have real consequences, and the world oil market recognizes the
risk posed by these attacks. In February of 2005, a failed Al Qaeda attack on the Aramco
facility in Abqaiq, Saudi Arabia, caused the price of oil on international markets to jump
nearly two dollars per barrel (Cohen, 2007).

9
As grave as those threats are, perhaps the single greatest threat comes from Iran.
The literature on this subject includes Congressional investigation of the risk. Some
members of Congress feel that in response to any attack, Iran would retaliate by
attempting to shut off the supplies of Middle East oil (Chairman, 2007). Those feelings
are supported both by the public expressions of intent from Iranian officials, and by the
capabilities of the Iranian military (Berman 2006; Cohen 2007). These are not idle
threats. If Iran retaliated and shut down the Strait of Hormuz, it would mean the
temporary loss of more than 15 million barrels of oil a day (Cohen 2007). Cohen goes on
to describe just how effectively Iran has built a military arsenal with this capability in
mind.
Iran boasts an arsenal of Iranian-built missiles based on Russian and Chinese designs that are difficult to counter both before and after launch. Of particular concern are reports that Iran has purchased the SS-N-22 Moskit/Sunburn anti-ship missile. The supersonic Sunburn is specifically designed “to reduce the target’s time to deploy self- defense weapons” and “to strike ships with the Aegis command and weapon control system and the SM-2 surface-to-air missile.” 12 Iran is also well stocked with older Chinese HY-1 Seersucker and HY-2 Silkworm missiles and the more modern C-802 anti-ship cruise missile (ASCM)—designs that Iran has successfully adapted into their own Ra’ad ad Noor ASCMs.
Iran has a large supply of anti-ship mines, including modern mines that are far superior to the simple World War I–style contact mines that Iran used in the 1980s. They include the Chinese- designed EM-52 “rocket” mine, which remains stationary on the sea floor and fires a homing rocket when a ship passes overhead. In the deep waters in the Strait of Hormuz, such a weapon could destroy ships entering or exiting the Persian Gulf. According to one expert, Iran “can deploy mines or torpedoes from its Kilo-class submarines, which would be effectively immune to detection when running silent and remaining stationary on a shallow bottom justoutsidetheStraitofHormuz.”13 Iran could also deploy mines by helicopter or small boats disguised as fishing vessels.
Mines are only one of a host of potential Iranian threats to shipping in the Persian Gulf. The naval commandos of Iran’s Revolutionary Guards are trained to attack using fast attack boats, mini-sub- marines, and even jet skis. The Revolutionary Guards also have underwater demolition teams that are trained to attack offshore oil platforms and other facilities. (Cohen 2007)

10
Even with the United States’ extensive military power, U.S. intelligence estimates
that Iran’s military rearmament has given it the ability to shut off the flow of oil from the
Persian Gulf temporarily (Berman, 2006).
Literature has examined the fungible nature of oil as an asset and how that
increases the threat to the United States. Although the United States imports much of its
foreign oil from friendly nations like Canada and Mexico (EIA, 2011a), the entire world
supply would be impacted by a significant disruption anywhere in the oil market
(Chairman, 2007). Should Iran or another actor temporarily interrupt the world wide flow
of oil, if the United States chooses to respond, for example to open the Straits of Hormuz,
the government will be forced to make very difficult choices. According to Thomas,
“Reserve stores of petroleum and petroleum-based fuels would dwindle quickly—
particularly during wartime operations—leaving the U.S. military unable to obtain
suitable alternative fuels and rendering it virtually immobile” (2010).
2. Secondary Effects of Foreign Oil Dependence
This body of literature tends to focus on the importance of oil in general. There is
no real discussion of the distinction between foreign and domestic oil supplies. It is
necessary to consider this body of literature, in concert with the prior literature, in order
to understand the secondary ramifications posed by dependence on foreign oil.
a. Dependence of Emergency Responders on Reliable Oil Supply
Of course, if the military is demanding all available petroleum resources,
that leaves fire, police and ambulance services in short supply in the United States.
Other, non-critical, demands for petroleum would be left completely unfulfilled (e.g.,
commuters, truckers and the airline industry). Emergency services in the U.S. are
delivered via fire trucks, ambulances and police cars; all of those vehicles depend on
access to gasoline or diesel fuel. So delivery of emergency services in the United States
depends on oil. Additionally, during catastrophic events, when emergency services are
most in need, the services’ reliance on gasoline or diesel fuel increases significantly as
they turn to generators to supply power in order to provide many of their services.

11
Disruptions are inevitable for any number of reasons, including geopolitical or terrorist
attacks on critical energy infrastructure (Leotta, 2006).
On August 14, 2003, over 9,300 square miles, covering eight states and
portions of Canada lost electrical power with virtually no warning (International
Association of Fire Chiefs [IAFC], 2003). In New York City alone, emergency services
responded to 91,000 9–1–1 calls during the outage (IAFC, 2003). Even in their reduced
capacity, emergency services were called on to perform more than 30 distinct tasks: inter
alia, elevator rescue, subway rescue, fire suppression, hazard calls, traffic accidents,
welfare checks at hospitals, senior citizen homes, day care centers and prisons, providing
power to critical care facilities, distributing water, opening emergency shelters for the
elderly and helping the elderly up and down stairs (IAFC, 2003).
The firefighters were able to perform these actions because they had fuel
in their vehicles and because most of their 911 dispatch centers and many fire stations
had emergency power (IAFC, 2003). Of course, oil fueled those backup power systems.
Emergency generators were the only means of pumping water to fight fires in some areas.
Many stations relied on mutual aid agreements. Cleveland had an almost total loss of
water, but by activating a statewide assistance plan, tankers and personnel saw them
through (IAFC, 2003). Should the crises impact the U.S. broadly, this reciprocation of
coverage would not be possible, incapacitating many first responders.
b. Impact of Natural Disasters
The effects of Hurricanes Katrina and Rita on the regionally impacted
populations have been well documented. The second order effects further establish the
homeland security implications of reliance on oil. The effects of these storms went far
beyond the areas where the storm itself hit (Leotta, 2006). The storms showed the
vulnerability of the oil supply chain well beyond the coasts directly hit by the storms.
Nearly 1.6 million barrels a day of crude oil (between seven and eight percent of U.S. oil
consumption) was produced by Gulf of Mexico federal offshore sites before the
hurricanes struck (Leotta, 2006). Production was virtually halted in the wake of both
storms, as production facilities were evacuated and wells were closed. By September 1,

12
at least one county in North Carolina was faced with 60 percent of its gas stations out of
fuel (Leotta, 2006). The shortage was occurring hundreds of miles from the storm.
Though the energy crisis was severe, it was not expected to last long. Nonetheless, it
became necessary for the state energy office to convene all major agencies and require
each to prepare a list of how they might curtail fuel consumption; agencies had to
prioritize their fuel consuming activities (Leotta, 2006). The situation was sufficiently
short lived to avoid a state of emergency.
Had the fuel shortages persisted or worsened, the state would have been
unable to provide the National Guard, who obtains its fuel through the state, with fuel for
very long (Leotta, 2006). North Carolina was fortunate that it did not need to rely on the
services of its National Guard during this crisis. One of the proposed solutions was to
have first responders and other critical users enter into firm contracts for fuel (Leotta,
2006). Unfortunately, such an arrangement only works if there is sufficient fuel. If fuel
supplies were limited, states would be forced to choose which of their vital operations,
which critical needs of their populations, to forego.
While this body of literature looks at unintended disruptions to the supply
of oil (e.g., hurricanes and accidental blackouts) there is no reason to believe the impacts
would be diminished if the disruptions were intentional. Moreover, though not discussed
in any literature, it is not difficult to imagine the magnification of devastation were an
intentional disruption of the foreign supply of oil to coincide with a natural disaster.
B. OIL SOURCES AND USES
There exists a robust cataloging and compiling of both the various uses of oil in
the United States as well as a breakdown of the sources of the oil used in United States.
The U.S. Energy Information Administration (EIA) collects, organizes and makes
available to the general public a cornucopia of data relating to oil consumption and
production. All manner of data is tracked, including total oil used, oil imports, OPEC
versus non-OPEC imports, by country OPEC imports, etc. For 2009, EIA data shows
that the United States had net imports of 9.7 million barrels of crude oil per day (EIA,
2010a). The 9.7 million barrels of crude oil imported per day was from a total of 18.7

13
million barrels of crude oil used per day (EIA, 2010a). During the same year, 13.3
million barrels of oil were used per day for transportation purposes in the United States,
with nine million barrels per day specifically used for motor gasoline (EIA, 2010a). The
nine million barrels used every day for motor gasoline represented 48 percent of all U.S.
petroleum consumption (EIA, 2009). The relative numbers have held fairly constant. In
2010, the U.S. consumed 19.1 million barrels of oil per day (EIA, 2011d), with nine
million barrels per day used for motor gasoline (EIA, 2011e). In 2010, net imports
accounted for 49 percent of U.S. oil consumption (EIA, 2011d). For a more detailed
description of the uses of oil, see Figure 2.
1 Liquefied petroleum gases. 2 Asphalt and road oil, aviation gasoline, kerosene, lubricants, naphtha-type jet fuel, pentanes plus, petrochemical feedstocks, special naphthas, still gas (refinery gas), waxes, miscellaneous products, and crude oil burned as fuel.
Figure 2. Uses of Oil (EIA, 2010a, p. 148)
There is no significant body of literature challenging the veracity of the data
provided by the EIA. There is, however, secondary literature that seeks to analyze the
available data. For example, there is literature that focuses on comparing the amount of
oil imported by the United States with its overall use of oil. In writing for the Truman
National Security Project, Jonathan Powers (2010) uses the statistics provided by EIA to
demonstrate the breadth of the national security hazards from dependence on fossil fuels,
most specifically oil. Other authors have utilized the same EIA data to demonstrate the
need and benefits that could result from switching to plug-in hybrid electric vehicles

14
(PHEV) (Brooker, 2010). Though not always with attribution, the media seems also to
rely on the data provided by EIA. The Wall Street Journal ran an article discussing why
an alternative-energy future may be far away and explained that one cause was the
amount of fuel used for transportation1 (Totty, 2010). The literature describing the
sources and uses of oil in the United States is relatively complete and settled.
C. ACHIEVING ENERGY DEPENDENCE
Notwithstanding the difficulties created by dependence on foreign sources of oil,
illustrated by history and decried repeatedly by political and military leaders, there has
been little literature focused on achieving independence from a security perspective.
There are some signs that might be changing. Recent practitioner based scholarly work
has emerged that looks directly at the problem of ending U.S. dependence on foreign oil
or oil outside of North American sources (Cowden, 2008; Thomas, 2010). These papers
describe very broad frameworks for developing energy independence, but they do not
discuss nut and bolt practicalities of how the country might arrive there from its present
state.
There are also environmentally focused papers that discuss “green energy,” that
give passing reference to the security implications in order to bolster the strength of their
arguments (for example see Hensley, 2009). Some of the “green energy” literature
describes the various policy considerations as they relate to exploring and/or encouraging
alternative sources of energy for vehicles (Whoriskey, 2009). Whether vehicle specific,
or energy use in general, the solutions involving “green energy” generally embrace local
sources of energy, consequentially reducing dependence on foreign sources of energy.
There is also analysis of policies concerning corn based ethanol (Hauser, 2007),
geothermal energy (Sweet 2010) and electric vehicle infrastructure (Cote´, 2010).
However, there is no real move in this literature to embrace security as a driver of change
and to include that focus in their analysis. Therefore, the authors fail to leverage a view
1 Totty refers to 3.3 billion barrels of gasoline used for transportation in 2009. That is not accurate, but would be consistent with the nine million barrels of oil used for motor gasoline (13.3 million barrels for total transportation) in the U.S. per day. At 365 days per year, that would roughly equate to 3.3 billion barrels of oil used for motor gasoline in 2009 per USEIA (EIA, 2010).
15
that could provide significant sources of political will. Furthermore, the literature that
focuses on energy production largely misses the mark. Since only about 0.2 percent of
the oil used in the United States is used for electricity production (EIA, 2010a, p. 152),
absent some manner of translating that energy into a form usable by the transportation
sector “green” sources of electricity production will not displace oil.
D. ADOPTION OF ALTERNATIVE FUEL VEHICLES
1. Large-Scale Efforts in the 1990s
There have been efforts in the past to bring about the adoption of EVs or other
zero-emissions vehicles. There is some literature available that looks at and analyzes
these past efforts. For example, in the 1990s, California, in a somewhat adversarial
process, enacted a series of policies, including the requirement that a small percentage of
new vehicles sold in California be zero-emissions vehicles (Calef, 2007). As time
progressed towards the deadlines set by California, it became apparent that the industry
was not going to meet the standards and therefore California shifted to an emphasis on
low-emissions vehicles (Boyd, 1996). Also in the 1990s, with little public discussion,
France engaged in a nonadversarial effort at bringing about the adoption of EVs (Calef,
2007). For a range of reasons, including technology that was not yet ready, the efforts
failed in both France (Calef, 2007) and in California (Bedsworth, 2007; Calef, 2007).
This body of literature is helpful in that it documents potential pitfalls. However,
especially because technology plays an integral role in the analysis, these case studies are
somewhat out of date.
2. Predictions of Adoption
The literature is replete with predictions of when EVs will or should encompass a
certain percentage of the automobile market share. Al Gore concluded that it is possible
to completely eliminate the internal combustion engine over a 10-year period if a
concerted effort is made to do so (Gore, 1992). Most analysis focuses on a given market
share based on the cost of oil or based on the cost of the EV batteries. One study
determined that lithium ion batteries will drop in price from $720/kWh to between
$405/kWh and $445/kWh by 2020, resulting $510 million in sales of EVs if oil trades at

16
$70 per barrel and $9 billion in EV sales if oil trades at $200 per barrel (Haldis, 2009).
Another, more optimistic analysis by automotive market research company CSM,
predicted that by 2020, battery prices will cost only 20 percent of what they cost in 2009
(Hammerschmidt, 2009). Another study by UC Berkely predicted that EVs could make
up as much as 64 percent of the new-car market share by 2030 (Peckham, 2009).
There has even been discussion of what it might take to meet President Obama’s
target of one million EVs on the road by 2015 (Daigneau, 2011). A study by Credit
Suisse, a financial services company, anticipates a faster development of the market,
predicting that there will be five million EVs on the road by 2020 (Sherman, 2011). This
body of literature offers predictions of where the country might end up with some general
explanations of the factors that impact which future materializes, but it fails to provide
sufficient analysis of the interplay of those factors and does not adequately describe how
those factors can be utilized purposefully to achieve the wide scale adoption of EVs.
3. Recent Stimulus Money
One effort at increasing the market share of EVs was the recent stimulus package;
$2.4 billion in Recovery and Investment Act money was dedicated to advances in EV
batteries, building the domestic EV industry, and building charging stations2 (Lee, 2010).
Data has been collected capturing the amount of investment and in some cases the
specific returns or anticipated returns.
One area that has received significant attention is recharge infrastructure. Though
EVs can be charged at home, many EVs currently have limited range compared to their
internal combustion counterparts. For example, the Nissan Leaf can travel approximately
73 miles3 on a single charge (DOE, 2011a), though some models of the Tesla Roadster
can travel 300 miles on a single charge (Tesla, n.d.). The phenomena known as “range
anxiety” can diminish utilization of EVs, with use well below the actual range of the EV,
2 These funds are separate from the funds used to give $7,500 in tax rebates to customers who purchase EVs (U.S Department of Energy [DOE], 2011a).
3 It is not uncommon to see articles discussing the Leaf describe it as achieving 100 miles to the charge. Though under certain conditions, Nissan claims this to be true, what is probably being cited is the miles per gallon equivalency of the Leaf, which has been calculated to be the equivalent of 99 mpg (DOE, 2011a).

17
making a recharge infrastructure critical (Botsford, 2009). There are various types of
recharge facilities. The cost of the slow charge facilities is significantly cheaper than for
fast charge. In fact, some EVs can slow charge without any change to a standard
electrical outlet (Dickerman, 2010; German, 2010). As shown in Figure 3, as the speed of
the charge goes up, so does the required voltage/amperage output, which necessitates
more expensive facilities.
Figure 3. Recharge Levels and Time to Charge (From Dickerman, 2010)
One estimate of the cost4 of recharging stations can be taken from a project
underway in Portland, Oregon. Oregon is using a two million dollar federal grant
(stimulus money) to build 42 “quick charge” stations along the I-5 corridor, ensuring no
gap greater than 50 miles (Oregon, 2010). That averages out to $47,619 federal dollars
per station. These stations are designed to charge an EV battery to 80 percent capacity in
a 20 to 30 minute period (Oregon, 2010).
A project funded in part by the U.S. Department of Energy (DOE) provides an
estimate for the cost of building slow charge stations. Given the total cost of $230
million (of federal money) to build 15,000 charging stations, each station costs
approximately $15,333; however, that also includes 310 quick charging stations (Read,
2010), which are more expensive. Assuming the quick charging stations cost $47,619
each, the cost per station of the ordinary charging stations would be approximately
$14,652 federal dollars.
4 The cost described here, is the cost to the federal government. In order to receive the stimulus funds,
the recipients had to match the funds dollar for dollar from private or state/local government sources (Lee, 2010). Therefore, the total cost is actually twice that represented here, but the cost to the federal government is accurately described.

18
The DOE has released its analysis of the Recovery and Investment Act stimulus
funds. In its estimation, it is on track to meet President Obama’s goal of one million EVs
by 2015 (DOE, 2011b). The scientific community has taken note of the anticipated
benefits from the stimulus fund, highlighting certain DOE predictions. One such
prediction is that a battery capable of powering a vehicle 100 miles, which costs $33,000
today, will cost just $16,000 by the end of 2013 because of those stimulus fund
investments (Stimulus, 2010).
This body of literature is fairly thin. It consists mostly of the documentation of
data, without much analysis. It is sufficient to provide a qualitative assessment of the
bang for the buck in estimating the expense of building a recharge infrastructure to
support EVs. The research does not attempt to extrapolate forces like economies of scale
that might reduce the cost of infrastructure development. It also fails to analyze whether
or not the recharge facilities can be expected to be or become economically self-
sustaining and thus whether pure commercial forces can be relied upon in the future to
build the recharge infrastructure. The creation of recharge infrastructure and an in-depth
description of range anxiety are addressed in more detail in Chapter V.
E. SUPPLY AND DEMAND—ECONOMICS OF CHOICE
1. Elasticity of Gasoline
Academics and the federal government have both examined the elasticity of
gasoline. That is, what happens to the amount of gasoline sold when the price of gasoline
goes up or down. There are a multitude of studies on this topic; however, two papers have
looked at many of the gasoline elasticity studies conducted over the past few decades in
an effort to summarize the field. These meta-studies essentially conclude that gasoline
elasticity is two pronged. There is a short-term affect that is particularly small and then a
long-term affect that is somewhat larger (Espey, 1996; Goodwin, 2003). The study by
Espey focuses on elasticity in the United States, while Goodwin’s study is focused on the
United Kingdom. Goodwin’s study also looks at the reduction in traffic volume from an
increase in gasoline price. Morris (2007) has also described this understanding of the
elasticity. Speaking at an EIA conference, he described the same two-phased elasticity.
19
In the short run, elasticity was between zero and -0.5, and in the long run, it was between
-0.5 and -1.5. Put another way, in the short run, a gasoline price increase of 10 percent
will reduce the quantity demanded by two percent. In the long run, a sustained 10
percent increase in the price of gasoline will result in a six percent decrease in
consumption (Federal Trade Commission [FTC], 2005).
The elasticity of gasoline is well documented. What this body of literature does
not address is the effect, if any, that gasoline prices have on consumer vehicle choices.
2. Gasoline Price and Vehicle Choice
Around the turn of the millennium, carbon tax and other policy discussions about
global warming brought the question of gasoline elasticity into sharp focus (Kayser,
2000). Rather than look just at more traditional measures of elasticity, the literature
evolved in an effort to account for income disparities, miles driven and, ultimately,
vehicle choice. Gasoline demand and the demand for automobiles were modeled as a
joint decision (Kayser, 2000). By also accounting for income, it emerged that there was
not a uniform elasticity measure, but rather elasticity varied across the income
distribution (Kayser 2000). Importantly, it was also determined that gasoline demand
responds to changes in the price of gasoline in large part by modifying the fuel efficiency
of the car fleet rather than through an adjustment of miles traveled (Jeihani & Sibdari,
2010; Kayser, 2000). In fact, it has been determined that the number of miles driven
bears almost no relation to gas price changes (Jeihani & Sibdari, 2010).
The federal government has also explored this topic and come to similar
conclusions. Looking at the period from 2003 through 2007, the Congressional Budget
Office (CBO) determined that the 100 percent increase in gasoline prices had induced
motorists to adjust the types of vehicles they purchased (CBO, 2008). They note that in
response to consumer demand, the fuel economy of new cars increased in nearly every
new model year since 2000, despite a slightly larger annual price increase for more fuel-
efficient vehicles (CBO, 2008). The report specifically notes the potential policy
advantages that tax increases on the price of gasoline have over increasing the federal
corporate average fuel economy (CAFE) standards. That advantage stems from more

20
direct alignment with market forces (CBO, 2008). The literature also notes that in order
for elasticity to strengthen, consumers must have substitutes that are easy to switch to
(FTC, 2005).
Another government sponsored review of vehicle electrification focused on the
different economic effects of various choices (e.g., plug-in hybrids or pure EVs),
opportunity charging versus charging at night versus dynamic charging as the vehicles
drive along stretches of road, etc (Brooker, 2010). That analysis concluded that the most
economic future lay in dynamic charging, but the study ignored infrastructure costs, used
an exceptionally conservative estimate of only a three percent reduction per year in
battery cost, and, while allowing other factors to change over time, used a fixed gasoline
price based on the average cost of gasoline in 2008 (Brooker, 2010).
As with pure elasticity, hard numbers have been developed in this body of
literature. If gas price increases by 10 percent, the demand for SUVs will decrease by
13.7 percent and the demand for hybrid cars will increase by 9.1 percent (Jeihani &
Sibdari, 2010).
This body of literature is relatively new and to some degree at risk of becoming
stale due to fast-paced changes. The availability of alternative vehicles, EVs versus
hybrids for example, quickly shifts the dynamic, especially if economies of scale are
reached. However, the demonstrated principle of changes in consumers’ choice of vehicle
adds significant value by providing a reasoned model to enhance the predictive process.
What remains absent is both a focus on the risks and costs of energy independence
(though it is often mentioned in passing) and an analysis of specific targeted policy
choices and how they might bring about change—policies that raise the price of gasoline,
lower the price of EVs, and otherwise promote the adoption of EVs.
F. CONCLUSION
Existing literature provides ample support establishing the extent of and threat
posed by the United States’ dependence on foreign oil. Current literature sufficiently
describes the various uses petroleum is put to in the United States. There is some
discussion focused on alleviating the dependence on foreign oil by encouraging

21
alternative energy and alternative energy vehicle adoption, but there is a glaring
omission. The focus of the literature is really on economic and environmental factors and
benefits. It does not look at EV adoption with an eye truly focused on U.S. security. The
existing literature also fails to use that security perspective to consider specific policy
choices that might be made to increase the pace of EV adoption in order to bring about
energy independence.

22
THIS PAGE INTENTIONALLY LEFT BLANK

23
III. METHOD
A. CASE STUDY CONSIDERED
The case study method is one potential method to assess how policy choices can
be used to bring about the shift to EVs. There is data available and have been studies
made of the efforts of California and France to move toward zero-emissions vehicles in
the 1990s (Bedsworth, 2007; Calef, 2007). There are limitations to this method that
make it less than ideal. In the first instance, the adoption of EVs is connected to the
current state of technology. California’s program had to be redirected to low emissions
vehicles rather than zero emissions, precisely because of technology limitations (Boyd,
1996). Those efforts were before the advent of the Tesla Roadster, Nissan Leaf, Chevy
Volt and other market ready EVs. The technology of the 1990s does not resemble present
day EV technology. For that reason, the case study method is not an ideal choice.
B. MODELING CHOSEN
This thesis will utilize predictive modeling to examine the effect different policy
choices would have on the adoption of an EV fleet in the United States, which would
bring about U.S. energy independence. Predictive modeling provides a mechanism for
policymakers to visualize the likely effect of policy choices as an aid in determining the
most effective combination of policy choices to bring about EV adoption and thereby
achieve energy independence.
The thesis will utilize inductive modeling based on historical socio-economic and
vehicle data. A model, based on the concept presented by Jeihani and Sibdari (2010), will
be created to predict the trend of increased sales of EVs that would result from varying
levels of increased gasoline prices and decreased EV prices. The system of vehicle
choice is extremely complex. There is no expectation that the model will produce
numbers that predict future sales with exact precision. Rather, the model is expected to be
sufficiently accurate to establish turning points. On a graph showing sales, the model
should be able to show the “hockey stick” affect accurately, the point where the rate of
sales increases dramatically. The model can then be used by anyone, inputting different

24
assumptions about the future and accounting for different policy choices intended to
speed up the adoption of EV sales. Specifically, the model will allow the policymaker to
view a predicted affect from a near limitless number of variations of gasoline excise tax
decisions that feed into a rebate, lowering the cost of EVs.
C. LIMITATIONS OF MODELING
As every mutual fund prospectus warns, past performance is no guarantee of
future success. Predictive modeling has the same inherent risk. The modeling method
utilizes past data results to predict future results. It is inevitable that there are other,
unaccounted for, contributors to the observed historical behavior. What is not known is
how significant those other forces are. It is also possible that people will simply decide to
behave differently. For example, if the issue becomes politicized and people modify their
behavior accordingly, or groups with opposing financial interests flood the discussion
with information that is either untrue or misleading, a model relying on past behaviors
may lose its efficacy. Finally, it is possible that the historical data is accurate, but only
within the ranges that have historically occurred. For example, assuming the largest
gasoline price increase accounted for in creating the model is X, when a model used to
predict the results that would occur for a gasoline price increase of 2X, it is possible the
model loses its efficacy.
Though predictive modeling entails risks, those risks are somewhat mitigated by
the breadth of the data reviewed and by the range of factors considered. The Jeihani and
Sibdari (2010) concept incorporates far more than just the change in demand resulting
from a gasoline price increase; it incorporates vehicle type and fuel efficiency, household
disposable income and unemployment rates as well. In fact, by use of a stand-alone
catchall constant, to some degree it incorporates all factors affecting choice, even where
those factors are indeterminable. By including these additional criteria, the formula
reduces the chance there is some other factor being overlooked.

25
Predictive modeling provides a tool for policymakers, giving them a logical
framework for assessing the most likely outcome of their decisions. Though not perfect,
use of historical factual data greatly improves upon gut instinct, or other haphazard
efforts at predicting the outcome of policy decisions.

26
THIS PAGE INTENTIONALLY LEFT BLANK

27
IV. RESULTS
A. PREMISE OF THE PREDICTIVE MODEL
The goal of this research is to provide a rigorous basis for federal policies that
would accelerate the nation’s transition from gasoline internal combustion engines to a
national fleet of EVs. By eliminating the demand for motor gasoline, the overall daily
demand for oil in the U.S. would approximately equate to the amount of oil the U.S.
produces each day. The primary levers of any federal policy are likely to be the price of
gasoline and the price of EVs.
In this chapter, an effort is made to model the influences on vehicle choice,
focusing on the consumer’s decision to purchase a more fuel-efficient vehicle. The
model looks at the basic costs of vehicle ownership as well as the more complex factors
of vehicle choice. The methodology will provide a model that is accurate at lower
volumes of sales, recognizing that given the overall complexities of the system, it cannot
predict precise sales numbers. The model will also create a general methodology where
the practitioner can incorporate additional factors, or utilize different assumptions, and
have a grounded basis to predict the results flowing from those choices.
The model developed by Jeihani and Sibdari (2010) provides the conceptual basis
for development of a predictive model. They utilize a binary vehicle choice model in
order to provide a quantitative framework to assess the various factors that might
influence consumer transition choices (Jeihani & Sibdari, 2010). In their work, the
relative probability, P, of choosing one type of car, denoted by the subscript e, to another
type of car, denoted by the subscript c, for any given household, i, is captured by the
following formula:
(1)
Where A, B, and C are constants, K represents the characteristics of the buyer, and
L represents the characteristics of the car. The constant A in Equation (Eqn.) 1 can be
related to the type of car that, in effect, represents a bias that a consumer might have

28
towards a vehicle. For instance, range anxiety might well make a consumer wary of an
EV and this may be captured in the constant A, driving down the probability of choosing
an electric car. Likewise, styling, or fuel economy might well have an influence, as could
environmental considerations.
Though Jeihani and Sibdari (2010) used only one standalone constant, A, one
could imagine including a great many such constants in an attempt to capture a greater
range of consumer biases. One could imagine developing an input to the car
characteristics that would include a national defense cost per vehicle, where that cost
reflects the investment made by the DoD to maintain shipping lanes, providing support to
governments that are critical for oil imports, etc. Those costs would then appear as a
price per vehicle, which could be denoted as a national defense cost, ND, that is weighted
by the fuel efficiency of a particular vehicle. Likewise, one could attempt to capture the
economic costs of the oil trade deficit to the nation, the approximately one billion dollar
daily deficit. Those costs could also appear as a price per vehicle and, denoted as a trade
imbalance cost, TI, would also be weighted by a vehicle’s fuel efficiency.
The constant B weights the characteristics of the buyer towards certain car types,
while the constant C weights the vehicle characteristics.
The constant Ki captures household characteristics including both employment
status and income while L captures the initial vehicle cost and the cost per mile for
vehicle locomotion.
B. DEVELOPMENT OF THE PREDICTIVE SALES MODEL
Rather than calculating the relative probability of choosing one car over another,
the model presented in this section solves for sales volume of a particular vehicle class.
In all, three vehicle classes are looked at, SUV, hybrid, and EV. Historical data on both
SUV and hybrid vehicles is used to establish coefficients that allow a least squares fit on
that model to that historical data. Where specific vehicle averages are necessary, for
example average sales price of the class of vehicle, a representative vehicle was chosen.
The Ford Explorer represents the SUV class of vehicles, and the Toyota Prius represents
the hybrid class of vehicles.
29
This approach allows the assignment of consumer coefficients from sales data and
presumes that these coefficients will remain the same for the foreseeable future. As there
is insufficient data for a meaningful historical analysis of EV sales, the coefficients
derived for hybrid vehicles are used as a proxy in predicting EV sales, assuming the two
are closely related. Those coefficients are then used in the model to predict future sales
of EVs.
Notably, Jeihani and Sibdari (2010) did not adjust for inflation when analyzing
historical data they collected. Adjusting the historical data used herein was considered;
however, the model is designed to reflect people’s choices at a fixed point in time. When
consumers go to purchase a vehicle they are considering what the price of gasoline
currently is, what their income currently is, etc. They may also be considering what they
expect the value of those items to be in the future, but they are concerned with absolute
amounts. The model shows fixed choices from moment to moment. If high levels of
inflation were anticipated going forward, that could influence consumer purchasing
decisions in general (e.g., buy assets rather than hold onto money), but none of the
purchase periods analyzed in this thesis took place during periods where inflation was
particularly high. From 1991 through 2010, no calendar year saw inflation greater than
4.2 percent (U.S. Department of Labor, 2011). In fact, adjusting for inflation would
flatten the changes in the economic data. Rather than reflecting reality, it would actually
skew the reality that the consumer faced at the time of their purchase decision.
Assuming a linear relationship between the change in the number of hybrid
vehicles sold in any year, ΔShy, and any of the influencing parameters, as was the basis
for the Jehani and Sibdari (2010) model, the number of hybrid vehicles sold in any year,
Shy, can be modeled and the model be used to project future sales. Future sales depends
on many economic and perception factors. Among the national economic parameters the
Jehani and Sibdari (2010) model included were: the median household income I, in the
modeled year, the unemployment level U, and the price of gasoline G. For the vehicular
economic parameters the model included the gas mileage, Mhy, as represented by the
number of miles the vehicle can travel per gallon of gasoline and the hybrid vehicle price
Phy. Finally, all parameters associated with customer perception such as comfort,

30
reliability, social appearance, environmental stewardship, etc. were lumped into a single
coefficient Ahy. In essence, the coefficient represents the total combination of factors the
consumer is considering that have not been specifically accounted for elsewhere in the
equation.
Another way to look at the effect of policy choices is by examining the fraction of
new sales, ΔSannual, in any year relative to the total sales Sannual. This fraction is the sales
strain, and is represented by:
(2)
A linear relationship between the sales strain and any influencing parameter is the
simplest approach to modeling the sales figures. For example, the effect of household
income, I, on the sales strain of hybrid vehicles when isolated from other parameters that
influence sales, would be:
(3)
Where ΔSIhy is the change in the sales figures of hybrid vehicles due to the change
in household income. As the overall sales figure Shy increases so does the change in that
figure due changes in any parameter such as I. The fundamental assumption in Eqn. (3)
is that ΔSIhy varies linearly both with I and Shy. The coefficient Bhy is a proportionality
factor to be derived empirically using historic data.
The effect of the price of gasoline, G, and vehicle mileage can be combined to
provide the cost per mile driven CPMhy where:
hy
hy MGCPM = (4)
Dependences similar to Eqn. 3 for the effects of U, CPMhy and Phy on the sales
figures can be derived to provide ΔSUhy, ΔSCPMhy
hy and ΔSPhyhy, which are the change in
the sales figures when each of the representative parameters is isolated from the others.
The proportionality coefficients to be assigned to these dependences are Chy, Dhy and Ehy
respectively. All three coefficients need to be determined empirically using historic data.

31
The combined effect of all these parameters on the annual sales figures of hybrid
vehicles can be obtained by superposition or a simple addition:
hyhyhyhyhyhyhyhy SPECPMDUCIBS )( +++=∆ (5)
Eqn. 5 can now be integrated for Shy, then adding Ahy, the integration coefficient,
which is described above, to provide:
)exp( hyhyhyhyhyhyhyhy PECPMDUCIBAS ++++= (6)
Notably, this approach results in an exponential relationship between sales
volume and income, unemployment, fuel costs and purchase price. Taking the natural
log of this equation yields:
hyhyhyhyhyhyhyhy PECPMDUCIBAS ++++=)ln( (7)
Note that Eqn. 7 is the immediate result of the integration of Eqn. 5. However,
Equation 6 was shown first to show the relationship between this derivation and the
model presented by Jehani and Sibdari (2010). This expresses the relationship between
the various parameters that are likely to influence the sales volume and the sales volume
itself. Actual numerical values can be determined after obtaining the values of the
coefficients Bhy, Chy, Dhy and Ehy, with an offset factor given by Ahy. To derive the five
empirical coefficients of Eqn. (7), one needs to obtain historical data concerning
household income, unemployment, price of gasoline, gas mileage and car prices for at
least five years. To the extent data is available, a similar equation can be derived for each
vehicle model or model group.
The equation representing the sales figures of SUV vehicles was derived similarly
to Eqn. (7) to yield:
SUVSUVSUVSUVSUVSUVSUVSUV PECPMDUCIBAS ++++=)ln( (8)
Again, the coefficients ASUV, BSUV, CSUV, DSUV, and ESUV are empirical
coefficients. Similar to those of the hybrid vehicle, they are to be derived using at least
five years of historical data.
Unlike SUVs and hybrid vehicles, the available historic data on the sales volume
of EVs is inconsistent with extremely small numbers. Consequently, those figures were

32
not considered reliable for the purpose of projecting future sales of EVs and the potential
response to market-changing policies. Instead, the coefficients derived for the hybrid
vehicle using historical data were retained as proxies for the EV sales volume model. It
is reasonable to presume that factors influencing people’s decision to purchase hybrid
vehicles will similarly influence their decision to purchase EVs. As with hybrids, it is
likely that the first consumers to purchase EVs do so for a myriad of concerns (e.g.,
environmental, status). As sales of hybrids grew, economic forces such as declining
vehicle price and increase in gasoline would have become the dominant market drivers.
The same is presumed to be true with EVs. Therefore, only one parameter from the
hybrid model Eqn. 7 was replaced. CPMhy was replaced with CPMEV, which was derived
using the representative cost of electricity per kWhr and the number of miles driven by
the EV per kWhr. Accordingly, the model describing the sales volume of electric vehicle
is represented by:
( ) ( ) ( ) ( ) ( )EVhyEVhyhyhyhyEV PEPMDUCIBAS ×+×+×+×+=ln (9)
The coefficients representing the sales volume of hybrids (Eqn. 7), and
consequently EVs, and SUVs (Eqn. 8) were derived using historic data. Table 1 contains
the historic data used, encompassing the years 1991 to 2010 for SUVs and 2000–2010 for
hybrids. More than five years of data was available for each vehicle group. With only
five years available, the five coefficients of each model (Eqns. 7 and 8) could be
determined by solving five algebraic equations. With additional years available, the
coefficients could be determined by fitting ln(Shy) and ln(SSUV), as determined by Eqns. 7
and 8 respectively, to the sales volumes as shown in Table 1, through adjustment of the
coefficients of these equations until the overlap between the historic data and the analytic
data is optimized.
Figures 4 and 5 graphically represent the outcome of the optimal fit between the
actual sales figures and the modeled figures. Optimization was achieved by minimization
of the root mean square of the differences between actual and modeled figures. Table 2
shows the coefficients of the two models as derived through this analysis.

33
As previously explained:
• Ahy = all consumer preferences and choice factors not specifically addressed elsewhere in the equation,
• Shy = the sales volume of hybrids,
• Bhy = weight factor for societal annual income,
• I = societal average annual income,
• Chy = weight factor for unemployment,
• U= total unemployment,
• Dhy = cost of locomotion factor,
• PMhy = price per mile for locomotion,
• Ehy = weight factor for price of hybrid,
• Phy = price of hybrid vehicle
Table 1. Historical Data for SUVs and Hybrid Vehicles
year income $ ^^^
Gas Price $/gallon **
SUV Sales ***
Hybrid Sales ^
Total Un-employment ^^
SUV Price $ †
Hybrid Price $ ††
Hybrid MPG †††
SUV MPG §
1991 30,126 1.098 1,095,000 8628000 15,747 16 1992 30,636 1.087 1,003,000 9613000 16,692 16 1993 31,241 1.067 1,311,000 8940000 17,550 17 1994 32,264 1.072 1,623,000 7996000 18,860 16 1995 34,076 1.103 1,816,000 7404000 22,305 16 1996 35,492 1.192 1,890,000 7236000 21,170 16 1997 37,005 1.189 2,450,000 6739000 21,485 16 1998 38,885 1.017 2,581,000 6210000 21,560 16 1999 40,696 1.116 2,831,000 5880000 22,070 16 2000 41,990 1.462 3,143,000 9,350 5692000 23,480 19,995 41 16 2001 42,228 1.384 3,450,000 20,282 6801000 25,210 19,995 41 17 2002 42,409 1.313 4,191,000 36,035 8378000 24,585 19,995 41 16 2003 43,318 1.516 4,118,000 47,600 8774000 26,285 19,995 41 15 2004 44,334 1.812 4,713,000 84,199 8149000 26,600 20,295 46 15 2005 46,326 2.24 4,084,000 209,711 7591000 27,165 21,275 46 16 2006 48,201 2.533 3,757,000 252,636 7001000 26,530 16,213* 46 16 2007 50,233 2.7 4,231,000 352,274 7078000 25,370 20,601* 46 16 2008 50,303 3.26 3,987,000 312,386 8924000 26,495 21,500 46 16 2009 49,777 2.36 2,296,000 290,271 14265000 28,470 22,000 46 16 2010 50,000 2.79 3,000,000 274,210 14825000 29,280 22,800 50 17 *Includes weighted average of rebate that was offered during some or all of the year.
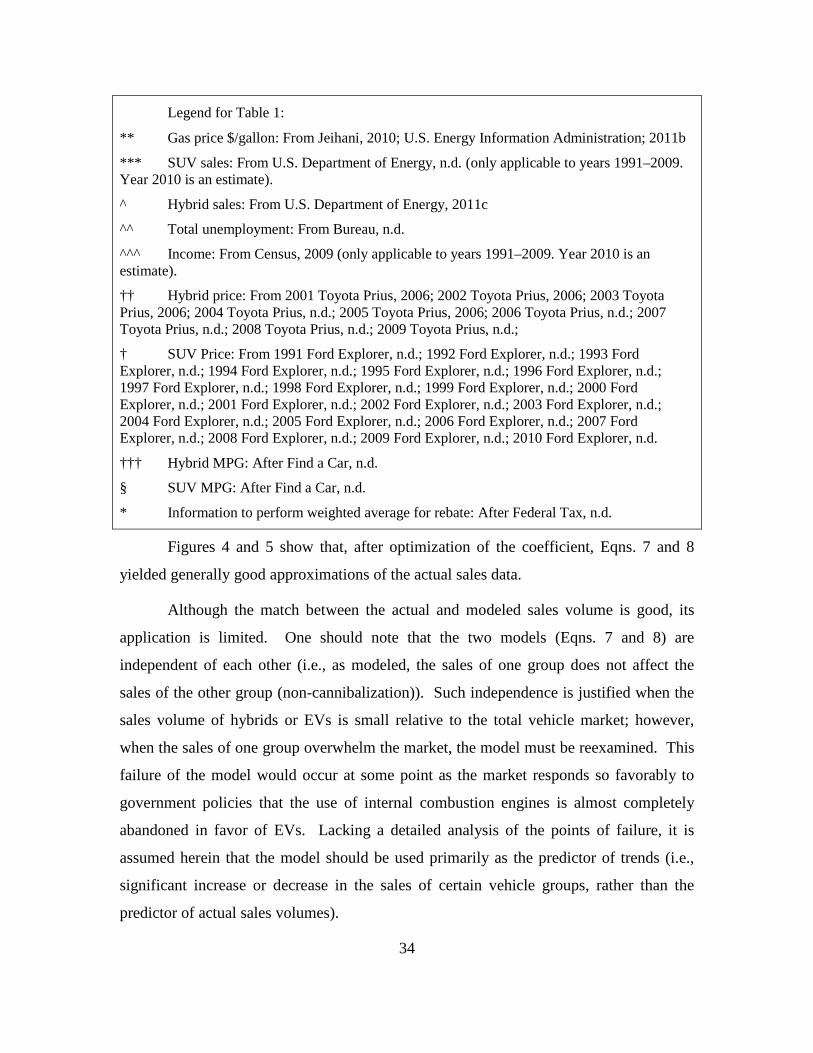
34
Legend for Table 1:
** Gas price $/gallon: From Jeihani, 2010; U.S. Energy Information Administration; 2011b
*** SUV sales: From U.S. Department of Energy, n.d. (only applicable to years 1991–2009. Year 2010 is an estimate).
^ Hybrid sales: From U.S. Department of Energy, 2011c
^^ Total unemployment: From Bureau, n.d.
^^^ Income: From Census, 2009 (only applicable to years 1991–2009. Year 2010 is an estimate).
†† Hybrid price: From 2001 Toyota Prius, 2006; 2002 Toyota Prius, 2006; 2003 Toyota Prius, 2006; 2004 Toyota Prius, n.d.; 2005 Toyota Prius, 2006; 2006 Toyota Prius, n.d.; 2007 Toyota Prius, n.d.; 2008 Toyota Prius, n.d.; 2009 Toyota Prius, n.d.;
† SUV Price: From 1991 Ford Explorer, n.d.; 1992 Ford Explorer, n.d.; 1993 Ford Explorer, n.d.; 1994 Ford Explorer, n.d.; 1995 Ford Explorer, n.d.; 1996 Ford Explorer, n.d.; 1997 Ford Explorer, n.d.; 1998 Ford Explorer, n.d.; 1999 Ford Explorer, n.d.; 2000 Ford Explorer, n.d.; 2001 Ford Explorer, n.d.; 2002 Ford Explorer, n.d.; 2003 Ford Explorer, n.d.; 2004 Ford Explorer, n.d.; 2005 Ford Explorer, n.d.; 2006 Ford Explorer, n.d.; 2007 Ford Explorer, n.d.; 2008 Ford Explorer, n.d.; 2009 Ford Explorer, n.d.; 2010 Ford Explorer, n.d.
††† Hybrid MPG: After Find a Car, n.d.
§ SUV MPG: After Find a Car, n.d.
* Information to perform weighted average for rebate: After Federal Tax, n.d.
Figures 4 and 5 show that, after optimization of the coefficient, Eqns. 7 and 8
yielded generally good approximations of the actual sales data.
Although the match between the actual and modeled sales volume is good, its
application is limited. One should note that the two models (Eqns. 7 and 8) are
independent of each other (i.e., as modeled, the sales of one group does not affect the
sales of the other group (non-cannibalization)). Such independence is justified when the
sales volume of hybrids or EVs is small relative to the total vehicle market; however,
when the sales of one group overwhelm the market, the model must be reexamined. This
failure of the model would occur at some point as the market responds so favorably to
government policies that the use of internal combustion engines is almost completely
abandoned in favor of EVs. Lacking a detailed analysis of the points of failure, it is
assumed herein that the model should be used primarily as the predictor of trends (i.e.,
significant increase or decrease in the sales of certain vehicle groups, rather than the
predictor of actual sales volumes).

35
Figure 4. Comparison of the Variation of ln(Shy) with Year of Sale as Derived by Model
(blue) with Historic Data (red).
Figure 5. Comparison of the Variation of ln(SSUV) with Year of Sale as Derived by
Model (blue) with Historic Data (red)
The resulting coefficients are contained in Table 2.
Table 2. Coefficients of the Sales Volume Models (Eqns. 7 and 8) of Hybrid and SUV Vehicles as Derived by Fitting These Equations to Historical Sales Data (Table 1)
A B C D E Hybrid/electric 3.6 2.16*10–4 -1*10–13 31.1 -1.66*10–4
SUV 13.36 2.01*10–4 -1.4*10–7 -10.8 -1.97*10–4

36
Note that Dhy, which represents the response of the hybrid vehicle sales figures to
gas prices, is positive whereas DSUV is negative. This is intuitively plausible and
represents the expected fact that higher gas prices provide an incentive for the purchase
of hybrid or electric vehicles whereas they provide a disincentive to the purchase (or
ownership) of SUVs. This is the basis for the government policy to be proposed below.
C. APPLICATION OF THE MODEL TO FORECAST SALES
The hybrid vehicle sales volume model (Eqn. 7) was used to project future sales
volumes of EVs and the response to various government policies. To this end, the
various columns of Table 1 were filled using projected data (e.g., expectations of future
median household income or unemployment levels). The government policy choices, the
gasoline excise tax per gallon and the rebate to the buyers of EVs, are parameters that can
be adjusted by the user to achieve a desired result (e.g., rapid growth in the sales of EV or
rapid decline in the use of gasoline).
Although the model was tested using a wide variety of parameters, the following
parameters were ultimately selected as representing a good balance of the positive and
negative effects of available policy choices and conservative assumptions about future
economic conditions. The assumptions used herein are as follows:
• The gasoline excise tax is $2 per gallon in 2012, $4 the following year, and $5 in 2014 through 2018. (The use of funds collected through the tax, for example, offsetting the expense of the tax for low income individuals, is discussed in detail in Chapter V.)
• The EV price for 2011 uses the Manufacturer’s Suggested Retail Price (MSRP) of the entry-level 2012 model year Nissan Leaf, $35,200 (Nissan) and a three percent annual decrease in price thereafter. The expected MSRP does not include the government subsidy described below. This decrease is a conservative number considering the anticipated rapid change in volume, which will create economies of scale. However, this reflects a similar conservative determination made by Brooker, that the price of EV batteries will decrease by three percent per year (2010).
• Though soon after publication of this work, actual 2011 sales volumes may be available for EVs, the 2011 sales volume used here was obtained from the predictive model. The 2010 EV sales were estimated as 10 percent of the hybrid vehicles sales volume of 274,210 (DOE, 2011c).

37
• The 2011 total sales cost of the EV reduces the MSRP described above by the $7,500 tax rebate that is currently available for purchase of an all-electric vehicle. Beginning in 2012 and thereafter, the total cost of the EV begins with the MSRP price described above and further reduces it by $15,000, the amount of tax rebate used for this particular predictive analysis.
• Beginning in 2008 with an EV cost per mile of three cents (Electric, 2007), the model assumes a three percent annual increase in the price per mile for the EV. This presumes the cost of electricity will increase with increased demand, though this could be offset if batteries become more efficient at recharging or otherwise become more efficient.
• Gallons of gas sold per year begins with the actual gallons sold at retail in 2009, 18,176,124,000 gallons (EIA, n.d. a.), leaves the amount constant for 2010 and 2011, and assumes a five percent decrease in 2012, the first year a gasoline tax is imposed in this model. The five percent decrease assumes that imposition of the two dollar tax will induce a decrease in the demand for gasoline. Each year beyond 2012, the decrease in gasoline sales is determined by multiplying the number of EVs sold the prior year by 490 gallons. The average driver drives 13,476 miles per year (Federal Highway Administration, 2011). Current CAFE standards provide for an average vehicle gas mileage of 27.5 mpg (National Highway Traffic Safety Administration, n.d.). Therefore, multiplication of these two figures provides an estimate of the gallons of gasoline used by each vehicle per year. Assuming that each EV sold the previous year will reduce sales of gasoline-powered vehicles by one that equates to 490 fewer gallons of gasoline sold in the current year for each EV sold the prior year. In fact, the decrease is likely higher due to drivers who purchase EVs throughout the year and other factors, but this is the estimate used in the model. A further benefit of this assumption is that it indirectly introduces a coupling between the sales volume of EVs and sales of other vehicles. It assumes that sales of EVs will cannibalize sales of all other vehicles; however, this is an incomplete and very partial coupling that does not overcome the weakness of the model as indicated above.
• The unemployment factor begins in 2010 with the published total unemployment figure of 14,825,000 (Bureau of Labor Statistics, n.d.) and assumes a one percent reduction each year.
• The income factor uses the 2009 median annual income of $49,777 (Census Bureau, 2009) and assumes a one percent increase each year.
• The base price of gasoline, prior to the introduction of the excise tax, begins with an average price of three dollars per gallon in 2011 and

38
increases the price by five percent per year. That assumes that the world oil market will continue to see an increase in demand even as demand in the U.S. declines.
Applying the policy and economic assumptions above to Eqn. 7, taken together
with the coefficients from Table 2, provides the projections of sales of EV (Figure 6)
between 2011–2018.
Figure 6. Predicted EV Sales for the Period 2011–2018 in Response to Taxation and Subsidy Policies as Projected by the Model
Figure 6 shows that electric vehicle sales will begin rising rapidly in a “hockey
stick” manner once, the policies choices listed above are introduced in 2012. A rebate of
$15,000 to each EV buyer is expected to induce this “hockey stick” effect. In this
scenario, the source of the rebate is the revenue generated from the gasoline excise tax.
Table 3 shows the annual excise taxes predicted to be collected each year through
2018, the amounts to be distributed as rebates for EV purchases, and the remaining sums
to be used to implement other EV adoption policies (e.g., refunds to low-income families
and recharge infrastructure build out incentives). Note that until 2017, the incentive
rebates represent less than 25 percent of the collected tax.

39
Table 3. Excise Tax Collected
Year Total Gasoline Excise Tax Collected
Tax Used For EV Rebates
Gas Tax Net of EV Rebate
2012 $34,534,635,600 $3,982,118,284 $30,552,517,316 2013 $68,548,941,078 $5,438,617,192 $63,110,323,885 2014 $84,797,868,872 $7,405,192,521 $77,392,676,352 2015 $83,588,354,094 $10,054,056,083 $73,534,298,011 2016 $81,946,191,600 $13,613,986,738 $68,332,204,863 2017 $79,722,573,766 $18,388,609,526 $61,333,964,241 2018 $76,719,100,877 $24,780,556,145 $51,938,544,732
D. FORMULAIC SHORTCOMINGS
1. Use of Hybrid Coefficients
The coefficients for the EV model were transferred from the coefficients for the
hybrid model, as there is insufficient historical data to solve for the EV model
coefficients independently. However, in order to make that change, the cost of
locomotion for EVs was adjusted to reflect the cost of electricity used to recharge EVs,
versus the price of gasoline that influenced the cost of locomotion for the hybrid vehicle.
That means that the EV predictive model is somewhat untethered from the cost of
gasoline. The catchall coefficient may still capture the psychological influence of the
price of gasoline, but the economic consequences are no longer directly a part of the EV
predictive model. However, the economic effect of changes to the price of gasoline still
impacts the predicted sales for SUVs (Eqn. 8). If that model were run to predict future
sales, higher gasoline prices would result in fewer sales of SUVs, but, as constructed, the
EV model may not sufficiently account for the positive influence on EV sales attributable
to increases in the price of gasoline. The likely result is that the model under predicts the
increase in EV sales as the price of gasoline increases.
2. The Model Does not Reflect the Bounded Nature of the Market
A fundamental reality, reflected in most in depth economic analyses, is that most
markets are finite. Consequently, although the total vehicle market may experience year-
to-year growth, the total number of vehicles sold in any year is finite. Thus, if a new
make, model or entirely new type of vehicle is introduced, its sales volume generally

40
comes at the expense of another group or groups of vehicles. A detailed analysis that
intended to predict sales volumes with accuracy and precision at all sales levels must
account for this zero sum game. Unfortunately, such an analysis is exceptionally
complex. It is beyond the scope and purpose of this work to develop a model of that
complexity.
The EV predictive formula (Eqn. 9) does not assume a zero sum game. In other-
words, there is no limit on the total sales of vehicles of all classes combined. Increased
sales of EVs do not automatically result in the loss of sales for any other category of
vehicles. While the factors that tend to increase EV sales are likely to decrease other
vehicle sales if their predictive models were run with the same assumptions, there is a
less than perfect link. Fortunately, when the sales volume of any group is small, its effect
on the sales volume of other groups is negligibly small. Consequently, a model
projecting its variation under the effects of certain market drivers can be decoupled from
other groups without introducing an unduly large error. This was the underlying
assumption for the Jehani and Sibdari (2010) model and is the basis for the model used
herein.
The consequence of this assumption is that the model can be a good predictor of
the onset of certain trends (e.g., the “bend” of a “hockey stick” type growth), which
occurs while the sales volume is still small. It will fail to project the actual sales or their
impact on other segments of the market (e.g., sales of gasoline), once those sales have
grown to a level that is significant relative to the rest of the market. At the low end of the
changes in sales, that is probably not significant, but it reinforces the premise, especially
at higher volumes of sales, that the model is designed to demonstrate trends, movement
and changes from various policy choices. It will identify the “hockey stick” turning point
seen on the graph where the rate of sales dramatically increases. It is not intended to
predict actual specific sales numbers.
3. Inherent Risks of Prediction
As mentioned previously, past performance is no guarantee of future success.
The model is based on historical data of the effects of gasoline price increases and other

41
factors on consumer vehicle preference. Furthermore, there is no real world data to
review an increase in the price of gasoline of the magnitude suggested herein. As
gasoline prices reach high levels, other consequences will almost certainly emerge. For
example, consumers may attempt to move closer to work and walk or bike, foregoing a
motor vehicle all together. Though this would still diminish the nation’s overall use of
oil, it might also diminish EV sales.

42
THIS PAGE INTENTIONALLY LEFT BLANK

43
V. CONCLUSIONS
A. SUGGESTED COURSE OF ACTION
The modeling results demonstrate that it is possible to alter consumer behavior
significantly in favor of EV purchases by using an excise tax to raise the price of gasoline
and using those funds in part to bring down the cost of EVs. Each step in lowering the
use of gasoline by automobiles is a step towards energy independence and greater
national and homeland security. Therefore, in a program announced significantly ahead
of time, the federal government should implement an excise tax on retail gasoline
purchases. The funds raised should go directly towards a tax credit or point of purchase
credit for the purchase of EVs. The additional funds raised should be used to offset the
effect of the tax on the lowest income segment in the population. That concern is
addressed in more detail later in this chapter. Additionally, it is important to use those
funds as incentive to propel the creation of a recharging infrastructure in the United
States. The ultimate goal is an all EV automobile market and the end of the internal
combustion automobile engine, without diminishment of the U.S. driving experience.
1. Excise Tax on Retail Gasoline Purchases
A tax on the sale of retail gasoline should be implemented. As was demonstrated
by the model, an excise tax of between two and five dollars raises more funds than is
required for rebates, even where the rebate is $15,000, double the current rebate on new
EV purchases. In order to allow consumers to prepare for the economic consequences of
the excise tax, and with the goal of seeing change at the beginning of implementation, it
is important that the policy be announced ahead of time. It takes one to two years of
gasoline price increases before there are real shifts in purchase behaviors (Goodwin,
2004; Jeihani & Sibdari, 2010).
Phasing in the tax serves two purposes. First, though announcing the increase
ahead of time should allow for a more immediate response to the price increases, there
are inevitably consumers who cannot or will not react immediately. A phase in allows
some of those consumers to adjust before the full tax is in place. Additionally, a phase in
44
would allow any unanticipated consequences to occur in a more controlled manner,
diminishing their magnitude and allowing more time to respond appropriately.
Eventually, economies of scale should bring down the price of EVs so that they
are sufficiently competitive without government rebates. According to the DOE, just the
creation of battery manufacturing plants, spurred by recovery act matching funds, is
lowering battery prices through economies of scale (Stimulus, 2010). As demand
increases and production rises to meet the demand, prices should fall allowing market
forces to drive the price reductions.
2. Recharge Infrastructure
If EVs are to be adopted nationwide, a well-designed and widely distributed
network of charging stations is imperative (Electric, 2010). A portion of the funds
collected by the excise tax net of EV rebates should be used to assist in the creation of
this infrastructure. Column four of Table 3 illustrates the additional monies that will be
available to policymakers. A portion of those funds will be required to offset the
economic hardship the gasoline tax may create for low-income families. That issue is
discussed in more detail below.
Range anxiety is a phenomenon not present with hybrid vehicles and, therefore,
not captured by the coefficients developed from hybrid vehicle historical data. Range
anxiety is particularly troublesome because it is more than a reflection of the ability of a
driver to go from point A to point B. It reflects that a driver may not try to go from point
A to point B even when the EV is fully capable of traveling that distance. Bostford and
Szczepanek describe this phenomenon well (2009). They describe range anxiety using an
anecdote from the Tokyo Electric Power Company (TEPCO). In 2007, TEPCO
introduced electric service vehicles and tracked employee usage of the vehicles over an 8
X 15 km service area. Initially, overnight charging was the only option. A few months
into the program they realized that EV drivers were only covering a small portion of the
service area. TEPCO responded by adding a fast charge station that could be used any
time of the day. After its installation, EV drivers accessed the service area in a similar
manner to conventional vehicle drivers. Most interestingly, the fast charger was rarely

45
used (Bostford & Szczepanek, 2009). The point is that the fast charger was not necessary
to meet the actual needs of the EVs, it was necessary to meet the psychological needs of
the EV drivers. It was necessary to counter range anxiety. If range anxiety is not
addressed, it may have a significant deleterious effect on the accuracy of the EV model.
Fortunately, recent stimulus funds have established the efficacy of dollar for
dollar grants in establishing a recharge infrastructure. As described previously, with two
million dollars of stimulus funds Oregon has created a recharge infrastructure covering
all of Interstate 5 that runs through the state. The facilities are spaced so that a driver is
never more than 50 miles between recharge locations (Oregon, 2010). It is not expected
that funds will be required to incentivize all recharge stations. As EV sales increase,
market forces may lead to the development of the infrastructure as well. Already some
retail establishments have determined that it is in their interest to put in recharge parking
spaces (DeLong, 2011). Nevertheless, especially given the concerns of range anxiety, to
truly jump start U.S. energy independence, significant investment should be put into
creating a recharge infrastructure, paid for by the retail gasoline excise tax.
3. New Power Stations and Infrastructure
EVs use far more energy than may be obvious. In fact, adding an EV to a
neighborhood, will increase the demand for electricity to the same or greater extent of
adding a new house to the neighborhood. For example, the Tesla Roadster contains a 56
kWh battery (Roadster Innovations, n.d.) that allows the vehicle to go 245 miles on a
single charge (Roadster Features, n.d.). By comparison, consumption by residential
utility customers averaged 908 kWh per month (How, 2011), meaning that the average
house uses about 30 kWh per day. The energy currently provided by gasoline will have
to come from power stations. This means the U.S. will need additional stations but also
additional transmission infrastructure as the current infrastructure is not sufficient
(Electric, 2010; Lewis, 2010).
Fortunately, power companies are largely financially successful (Gilbert, 2010). If
the regulatory obstacles are diminished, private industry should take over to build the
generation and transmission capabilities to meet the demand created by EVs (Gold 2009);
46
however, it takes time to build power stations and the transmission infrastructure to
support it. If the regulatory obstacles are removed, and the government’s plan to
encourage EV adoption is transparent, unambiguous, communicated and publicized one
to two years before it goes into effect, that will allow market forces to begin responding
so they are prepared to meet the rise in demand.
B. CRITICAL SECONDARY CONCERNS
1. Public Support Financially
Will the U.S. citizenry accept a substantial tax on the sale of gasoline? There is a
historical basis to believe they might, if citizens accept the security implications that are
alleviated by the tax. A parallel can be drawn to economic events during and after
WWII. Between the purchase of government war bonds, and the substantial federal
income tax paid by Americans, federal revenues were raised to never before seen
amounts, “$98.3 billion by 1945, nearly half the war-swollen GDP” (Sparrow, 2008).
Though the government’s propaganda campaign centered on the ethical imperative to
counter the Axis tyranny, combined with the self-interest realized by investing in war
bonds, research has shown that the government missed the mark. The real reason citizens
accepted the fiscal hardships was not for abstract ideals, rather it was when people were
faced with helping someone they could identify with (Sparrow, 2008). The idealized all-
American GI, the boy next door, is who they were helping. By paying taxes and buying
bonds, people saw themselves putting a gun and bullets directly in the hands of a GI.
This allowed for a sort of indirect participation in the war itself (Sparrow, 2008).
A similar view of the same social/psychological phenomena has been referred to
as the post-tragedy opportunity bubble (Breckenridge & Moghaddam, 2011). In their
paper, Breckenridge and Moghaddam look at the psychological similarities between the
attacks of 9/11 and the attack on Pearl Harbor (2011). They describe the fleeting moment
of opportunity where the populace rallies around its leaders, trusts them more, and,
because they are looking for a specific way to help, can be directed in a manner not
usually possible (Breckenridge & Moghaddam, 2011).

47
In the first State of the Union Address after 9/11, President Bush called on
Americans to give at least two years over the course of their lifetimes to the service of
their neighbors and nation (Bush, 2002). Unfortunately, that message did not resonate
with Americans in a way likely to make them feel like part of the fight against those who
attacked us. The success of fiscal participation during WWII turned on personalizing the
response, allowing the citizenry to feel it was truly participating in defeating the great
evil. The urgent desire to participate was given outlet in a contemporaneous ability to aid
in the defeat of the enemy. The outlet was immediate and direct, not an ephemeral and
vague channeling of that desire to some general purpose, at some undetermined time in
the future.
In reviewing the post 9/11 response, Breckenridge and Moghaddam (2011) show
that the government’s failure to provide meaningful participation resulted in a failure to
capture the public’s long-term engagement and support. There was no mechanism for the
citizenry to help defeat the great evil. Furthermore, the opportunity to harness the public
sentiment is fleeting. Once the bubble pops, the opportunity is essentially lost
(Breckenridge & Moghaddam, 2011).
Taken together, these examples show an uphill, though not impossible, task of
moving the citizenry of the United States to accept the sacrifice of a significant tax on
gasoline. A simple and straightforward message needs to make the case that there is an
ongoing and real evil threatening the nation, caused by dependence on foreign oil. In
countering this threat, the link must be clear in the minds of the citizenry; money spent at
the pump is buying back the very guns and bombs that are killing Americans. Secondly,
a personal and clear image must be established between the money paid and the lives
saved. While paying the tax may not put a gun in the hand of a GI, it can be shown to
take a gun out of the hands of the enemy. No more traumatic head injuries, no more
amputees, no more sophisticated plots to attack America.
Right now the country may not be ready to view the threat of dependence on
foreign oil in the same concrete terms as the bombing of Pearl Harbor or the events of
9/11. If that is the case, the government should nonetheless begin building the
framework. With so many enemies funded by oil sales, it is unfortunately only a matter

48
of time before another tragic event disrupts the landscape of the United States. When that
happens, leadership should be ready to ask for the participation of the citizenry, to ask for
their shared sacrifice as a direct and meaningful way to participate in defeating those who
seek to do us harm.
2. Public Support Politically
By using EVs as the mechanism to end energy dependence, this thesis promotes a
solution that both the political right (energy dependence) and the political left (EVs) have
vocally supported in the past. Though this paper is solely focused on the detrimental
effects energy dependence has on U.S. security, proposing a solution that is agreeable to
both sides of the political spectrum should ease adoption by the political system that must
choose whether or not and how to implement the plan.
3. Source of Energy Storage Materials
The current technology of choice for powering EVs is the lithium ion battery
(Forero, 2010; Tahil, 2006). There are several problems with reliance on lithium for
energy storage. In the first instance, there is disagreement with just how much
economically available lithium there is in the world, with some experts saying supplies
are quite limited (Tahil, 2006; Meridian, 2008) and others saying there is quite a bit
available (Evans, 2008). More troubling for national and homeland security is the
location of the largest known deposits of lithium. They are not in the United States. The
Andes Mountains in South America, specifically the area where the borders of Chile,
Bolivia and Argentina meet, contain a large majority of the world’s usable lithium
(Forero, 2010; Meridian, 2008), with Bolivia containing the largest known deposits in the
world (Risen, 2010). Recent discoveries in Afghanistan suggest that it too may possess
significant deposits of lithium (Risen, 2010). Additionally, current battery technology
relies on magnets of a type that depends on rare earth metals like neodymium, 95 percent
of which are produced in China (Ramsey, 2011).
It defeats the goal of energy independence if the U.S. simply trades one energy
dependency for another. As has been said, “We know that Bolivia can become the Saudi
Arabia of Lithium” (Romero, 2009). Policymakers must be mindful of this potential

49
development, but there are reasons to believe it is avoidable. In the first instance, unlike
reliance on oil, where the resource is consumed with each trip, with EVs, locally
produced electricity is consumed with each trip where additional lithium is only required
when the battery is replaced or a new vehicle is purchased.
There are also other potential sources of lithium. The Institute of Ocean Energy
at Saga University in Japan has described the research being conducted by Japan and
South Korea to enable harvesting of the 230 billion tons of lithium present in seawater
(Institute, n.d.).
Finally, there is reason to believe that lithium may not be the one and only source
of energy for EV batteries. The history of the EV battery shows a progression every few
years to a different source material (Chan, 2004). EV batteries have gone from
predominantly lead acid to nickel metal hydride and now to lithium-ion (Chan, 2004).
Development is constantly progressing on a variety of alternatives like aluminum air
batteries. Some research has shown reason to believe that metal air batteries—where the
cathode of the battery is air—could provide up to 11 times the energy density of the best
lithium-ion batteries currently available (Hamilton, 2009). Variety should be strongly
encouraged, with appropriate nudges (Thaler, 2008) to help orient the market’s focus
towards resources available within the U.S.
C. UNINTENDED CONSEQUENCES AND SECONDARY CONCERNS
1. Fungible Nature of the Oil Market
As described earlier in this thesis, oil is part of a fungible world market
(Chairman, 2007). That means that reducing oil to levels where the United States is
capable of providing all its petroleum needs, does not necessarily mean that the oil used
in the United States will be 100 percent domestically produced. As it stands currently,
the United States exports two million barrels of oil per day (EIA, 2010a, p. 128). As U.S.
demand decreases with the roll out of EVs, the U.S. may begin to export more of its oil.
As a fungible product, domestic oil prices will not necessarily be protected from the
effects of international disruption of oil supplies. However, if the United States is

50
capable of supplying its own oil requirements, then with proper planning it can ensure a
relatively uninterrupted supply of oil regardless of international supply disruptions.
For example, in considering what first responders can do in the event of localized
fuel shortages, it has been suggested that they should enter into firm contracts for fuel
(Leotta, 2006). At present, firm contracts would not solve the problem for the country as
a whole. If the world supply were disrupted, domestic sources could not fulfill the
contracts, because there simply would not be enough fuel to go around. However, once
energy independence is achieved, firm contracts with domestic suppliers could all be
fulfilled. Those portions of the government or private sector who wish to hedge against
supply disruptions could enter into futures contracts, or other contractual arrangements to
ensure a given supply at a given price.
2. A Regressive Excise Tax
A tax is regressive when it causes lower-income families to pay a higher
percentage of their income to the tax (Internal Revenue Service, n.d.). By adding a cost
per gallon of gasoline, the financial impact could have a disproportionate impact on
lower-income families. A simple way to lessen the impact would be in the form of a tax
credit that is phased out over a particular income level. To avoid bureaucratic expenses,
a national or regional average of both the price of gasoline and of the average gallons
consumed can be used. The credit will not precisely match the expense incurred, but can
be sufficiently harmonized to minimize the harm to lower-income families.
For example, in 2009, there were 8.8 million families living below the poverty
line. For an idea of what that measures for a family of four, made up of two adults and
two children, the poverty line was $21,756 (DeNavas-Walt, 2010). For purposes of this
example, assume that each of those families had one vehicle. As explained in Chapter
IV, the average driver uses 490 gallons of gasoline a year. Assuming policymakers felt
that all families below the poverty line should receive a rebate then in a year where the
gasoline excise tax was two dollars, 8.8 million families would receive a rebate of $980.
That would be a total rebate to those families of $8.624 billion. If the rebate was phased
out incrementally for families above the poverty line, even assuming another $8.624
51
billion was returned to those families, Table 3 shows that there would still be $13.3
billion left to use to promote recharge infrastructure growth ($30.55 billion left after EV
rebates, minus $8.624 billion times two).
3. Risk Increasing Cost of Goods / Inflation
Recent gasoline price increases have caused a corresponding increase in the cost
of goods, and may diminish consumers’ savings (CBO, 2008; Republican, 2010). Rising
gasoline prices can contribute to higher transportation costs, thereby raising expenses at
all stages of production (Republican, 2010). The proposed course of action in this thesis
minimizes that threat in a number of ways. In the first instance, the excise fee is only
levied on motor fuel. This does not include diesel fuel. In 2009, in the U.S., there was
approximately 16,878,000 gallons of diesel fuel sold per day (EIA, n.d. b) compared to
approximately 49,798,000 gallons of retail unleaded gasoline sold per day (EIA, n.d. a).
Furthermore, the 49,798,000 gallons of retail gasoline subject to the excise tax is only
about one sixth of the motor gasoline sales each day. The other categories of motor
gasoline sold each day are DTW, rack, and bulk (EIA, n.d. a). Therefore, governments
and businesses that obtain their gasoline in bulk would not be subject to the excise tax
under the implementation proposed in this thesis.
4. Significant Drop in the Price of Oil
The program may also be a victim of its own success. With sufficient numbers of
EVs on the roads, the demand for gasoline will take a measurable decline. Should a
sufficient number of other nations follow a similar course, the worldwide demand for
gasoline may drop significantly, thereby reducing the price of oil. As the price of oil and
therefore gasoline drops, the effect of the program may also decline. This can be
remedied by determining an appropriate floor for the price of gasoline and automatically
increasing the excise fee to maintain that floor.

52
D. FOLLOW-ON RESEARCH
1. A More Complex Version of the Present Model
Any number of factors can be added to the model. As long as there is historical
data measuring a particular factor, limitless terms can be added to the equation and the
coefficients solved for anew, using a least squares mean approach. For example, it would
be possible to separate out gasoline price as its own variable rather than simply have it
wrapped up in vehicle fuel efficiency. As part of fuel efficiency, it is really an economic
view of the relationship of gasoline price to vehicle choice. To the extent there is a
psychological impact from gasoline price and to allow gasoline effects to be more
specifically accounted for in the model, gasoline price could be included as an
independent factor. Though this psychological factor should be included in the catchall
term for the hybrid, and, therefore for the electric, vehicles, it may be possible to capture
the effect more directly. If a more complex model were developed for hybrid vehicles,
and the terms included appeared logically connected to the sale of EVs, then the more
complex model could be used, adopting the hybrid vehicle coefficients, to predict future
EV sales.
2. A More Complex Modeling System
One of the earlier described limits on the predictive model used in this thesis is
that the model is unbounded. In other-words, it does not envision a world where vehicle
purchases are essentially a zero sum game; however, the real world is essentially
bounded. The vast majority of consumers cannot purchase an EV and a gas-powered
vehicle. In the main, when it is time to go new car shopping, buyers are in the market to
purchase a single vehicle. This break with the reality of the marketplace means that
predictions of sales, especially at large volumes, develop obvious inaccuracies. If run far
enough into the future, the model will eventually predict sales of EVs that exceeds any
reasonable expectation of total vehicle sales for that year. It may be possible to create a
model that incorporates the linear relationship concept presented here, but that does so in
a way that bounds the universe of total vehicle sales.
53
3. Determine Coefficients for EVs Independently
As time marches forwarded and EV sales become a reality of the marketplace, it
may be possible to solve for the coefficients in the EV formula independently, rather than
borrowing from the hybrid equation. In the present model, there are five coefficients.
That means that there must be a minimum of five years of data in order to solve for the
coefficients. Once it is possible to do so, it should lead to an even more accurate EV
model.
4. Determining the Cost of Energy Dependence
Though the ramifications of energy dependence were discussed at great length,
this thesis did not attempt to put a dollar figure on the nation’s reliance on foreign oil.
Certainly the oil trade deficit is described in dollars, but the actual cost of securing the
flow of oil and of other policy choices the nation makes due to its dependence have not
been determined. Doing so may provide additional understanding to support policy
choices. If the cost were determined and then averaged over the various uses of that oil,
the true cost of oil being consumed could be established.
5. Infrastructure Questions
Though it is clear that additional recharge infrastructure is needed, and this thesis
suggests that monies raised from the excise tax should be used to spur the creation of the
infrastructure, further research would be helpful. It would be useful to determine the
ideal recharge locations to achieve the best bang for the buck. It would be useful to study
range anxiety so the recharge infrastructure met the psychological needs of consumers,
not just the physical needs of the EVs.
Similarly, it is clear that additional power generation will be required to meet the
increased demands on electricity from the growth of the EV market. Precisely how much
and where remains to be determined. Some of the demand may be met without
increasing actual power plant production. For example, smart meters that encourage non-

54
peak time charging can be installed. Some households might recharge using their own
solar or wind micro power generators. Whatever the need, it will be better met if it is
studied and well planned, rather than done haphazardly.
E. CONCLUSION
For 40 years, every president of the United States has proclaimed the critical
importance of energy independence. Time and again, the chains of foreign oil have
shackled the decisions of American officials; yet, nothing has been done. No pragmatic,
realistic step-by-step plan has been pursued to end this scourge on the American people.
This thesis proscribes the means whereby America can break free of those artificially
imposed restraints. There is a cost to achieving energy independence, and as shown
herein, that cost is two to five dollars on each gallon of retail gasoline sold. With
conviction, determination and selfless leadership, the United States can achieve energy
independence in a few short years.

55
LIST OF REFERENCES
1991 Ford Explorer. (n.d.). Retrieved November 20, 2011, from http://www.autotrader.com/1991-Ford-Explorer.jsp?modelId=11378
1992 Ford Explorer. (n.d.). Retrieved November 20, 2011, from
http://www.autotrader.com/1992-Ford-Explorer.jsp?modelId=11378 1993 Ford Explorer. (n.d.). Retrieved November 20, 2011, from
http://www.autotrader.com/1993-Ford-Explorer.jsp?modelId=11378 1994 Ford Explorer. (n.d.). Retrieved November 20, 2011, from
http://www.autotrader.com/1994-Ford-Explorer.jsp?modelId=11378 1995 Ford Explorer. (n.d.). Retrieved November 20, 2011, from
http://www.autotrader.com/1995-Ford-Explorer.jsp?modelId=11378 1996 Ford Explorer. (n.d.). Retrieved November 20, 2011, from
http://www.autotrader.com/1996-Ford-Explorer.jsp?modelId=11378 1997 Ford Explorer. (n.d.). Retrieved November 20, 2011, from
http://www.autotrader.com/1997-Ford-Explorer.jsp?modelId=11378 1998 Ford Explorer. (n.d.). Retrieved November 20, 2011, from
http://www.autotrader.com/1998-Ford-Explorer.jsp?modelId=11378 1999 Ford Explorer. (n.d.). Retrieved November 20, 2011, from
http://www.autotrader.com/1999-Ford-Explorer.jsp?modelId=11378 2000 Ford Explorer. (n.d.). Retrieved November 20, 2011, from
http://www.autotrader.com/2000-Ford-Explorer.jsp?modelId=11378 2001 Ford Explorer. (n.d.). Retrieved November 20, 2011, from
http://www.autotrader.com/2001-Ford-Explorer.jsp?modelId=11378 2001 Toyota Prius. (2006, January). Retrieved November 20, 2011, from
http://www.epinions.com/specs/auto_Make-2001_Toyota_Prius 2002 Ford Explorer. (n.d.). Retrieved November 20, 2011, from
http://www.autotrader.com/2002-Ford-Explorer.jsp?modelId=11378 2002 Toyota Prius. (2006, January). Retrieved November 20, 2011, from
http://www.epinions.com/specs/auto_Make-2001_Toyota_Prius
56
2003 Ford Explorer. (n.d.). Retrieved November 20, 2011, from http://www.autotrader.com/2003-Ford-Explorer.jsp?modelId=11378
2003 Toyota Prius. (2006, January). Retrieved November 20, 2011, from
http://www.epinions.com/specs/auto_Make-2001_Toyota_Prius 2004 Ford Explorer. (n.d.). Retrieved November 20, 2011, from
http://www.autotrader.com/2004-Ford-Explorer.jsp?modelId=11378 2004 Toyota Prius. (n.d.). Retrieved November 20, 2011, from
http://consumerguideauto.howstuffworks.com/2004-toyota-prius.htm 2005 Ford Explorer. (n.d.). Retrieved November 20, 2011, from
http://www.autotrader.com/2005-Ford-Explorer.jsp?modelId=11378 2005 Toyota Prius. (2006, January). Retrieved November 20, 2011, from
http://www.epinions.com/specs/auto_Make-2005_Toyota_Prius 2006 Ford Explorer. (n.d.). Retrieved November 20, 2011, from
http://www.autotrader.com/2006-Ford-Explorer.jsp?modelId=11378 2006 Toyota Prius used cars for sale. (n.d.). Retrieved November 20, 2011, from
http://www.web2carz.com/toyota/prius/2006 2007 Ford Explorer. (n.d.). Retrieved November 20, 2011, from
http://www.autotrader.com/2007-Ford-Explorer.jsp?modelId=11378 2007 Toyota Prius used cars for sale. (n.d.). Retrieved November 20, 2011, from
http://www.web2carz.com/toyota/prius/2007 2008 Ford Explorer. (n.d.). Retrieved November 20, 2011, from
http://www.autotrader.com/2008-Ford-Explorer.jsp?modelId=11378 2008 Toyota Prius used cars for sale. (n.d.). Retrieved November 20, 2011, from
http://www.web2carz.com/toyota/prius/2008 2009 Ford Explorer. (n.d.). Retrieved November 20, 2011, from
http://www.autotrader.com/2009-Ford-Explorer.jsp?modelId=11378 2009 Toyota Prius used cars for sale. (n.d.). Retrieved November 20, 2011, from
http://www.web2carz.com/toyota/prius/2009 2010 Ford Explorer. (n.d.). Retrieved November 20, 2011, from
http://www.autotrader.com/2010-Ford-Explorer.jsp?modelId=11378

57
2010 Toyota Prius used cars for sale. (n.d.). Retrieved November 20, 2011, from http://www.web2carz.com/toyota/prius/2010
Bedsworth, L. & Taylor, M. (2007). Learning from California’s zero-emission vehicle
program. California Economic Policy, 3(4). Berman, I. (2006, Jul 25). The economics of confronting Iran, Statement before the Joint
Economic Committee of the United States Congress. Retrieved September 20, 2010, from www.afpc.org/files/getContentPostAttachment/24
Botsford, C. & Szczepanek, A. (2009, May 13–16). Fast charging vs. slow charging:
pros and cons for the new age of electric vehicles. Presented at EVS24 International Battery, Hybrid and Fuel Cell Electric Vehicle Symposium, Stavanger, Norway.
Boyd, J. (1996). Notice of Public Hearing to consider amendments to the zero-emission
vehicle requirements for passenger cars and light-duty trucks. Retrieved September 9, 2011, from http://www.arb.ca.gov/board/books/010628/01–5–1.pdf
Breckenridge, J. N. & Moghaddam F. L. (September 2011). The post-tragedy
‘opportunity-bubble’ and the prospect of citizen engagement [The 9/11 Essays]. Homeland Security Affairs, 7. Retrieved September 9, 2011, from http://www.hsaj.org/?article=7.2.2
Broder, J. (2011, March 30). Obama sets goal of one-third cut in oil imports. New York
Times [on-line]. Retrieved March 31, 2011, from http://www.nytimes.com/2011/03/31/science/earth/31energy.html
Brooker, A., Thornton, M., & Rugh, J. (2010, January). Technology improvement
pathways to cost-effective vehicle electrification. National Renewable Energy Laboratory.
Bureau of Labor Statistics. (n.d.). Household data annual averages. Retrieved July 8,
2011, from http://www.bls.gov/cps/cpsaat1.pdf Bush, G. (2002, January, 29). State of the Union Address. Retrieved October 23, 2011,
from http://articles.cnn.com/2002–01–29/politics/bush.speech.txt_1_firefighter-returns-terrorist-training-camps-interim-leader?_s=PM:ALLPOLITICS
Calef, D. & Goble, R. (2007). The allure of technology: How France and California
promoted electric and hybrid vehicles to reduce urban air pollution. Policy Sci, 40, 1–34.

58
Census Bureau. (2009). Median household income by state: 1984 to 2009. Retrieved October 5, 2011, from http://www.census.gov/hhes/www/income/data/historical/household/H08_2009.xls
Chairman Lantos and ranking Republican Ros-Lehtinen, House of Representatives
Committee on Foreign Affairs, Foreign Policy and National Security Implications of Oil Dependence, (2007, March 22). Retrieved August 1, 2010 from http://internationalrelations.house.gov/110/34241.pdf
Chan, C.C. & Wong, Y.S. (2004, November/December). Electric vehicles charge
forward. IEEE Power and Energy Magazine. CNN Wire Staff. (2010, July 25). Chavez threatens to cut off oil to U.S. Retrieved August
1, 2010, from http://www.cnn.com/2010/WORLD/americas/07/25/venezuela.chavez.us/index.html
Cohen, A. (2007, March 2007). The national security consequences of oil dependency.
Heritage Lectures. Retrieved August 1, 2010, from www.heritage.org/research/nationalsecurity/hl1021.cfm
Congressional Budget Office. (2008). Effects of gasoline prices on driving behavior and
vehicle markets. Washington, DC; author. Retrieved December 24, 2010 from http://www.cbo.gov/ftpdocs/88xx/doc8893/01–14-GasolinePrices.pdf
Cote´, J. (2010, October 27). Electric cars to get boost from Bay Area grants. San
Francisco Chronicle [on-line]. Retrieved October 27, 2010, from http://articles.sfgate.com/2010–10–27/bay-area/24223494_1_nissan-leaf-electric-cars-chevrolet-volt
Cowden, D. (2008, summer). A brief inquiry into one of the technologies to achieve U.S.
energy security. Monterey, CA: Naval Postgraduate School. Daigneau, E. (2011, June). Planning for plug-ins. Governing. DeLong, J. (2011, January 18). Retail outlets adding electric car charging stations. USA
Today. Retrieved October 5, 2011, from http://www.usatoday.com/tech/news/2011–01–14-electric-car-charging-stations_N.htm
DeNavas-Walt, C., Proctor, B., Smith, J. (2010, September). Income, Poverty, and Health
Insurance Coverage in the United States: 2009. Retrieved October 5, 2011 from http://www.census.gov/prod/2010pubs/p60–238.pdf

59
Dickerman, L. & Harrison, J. (2010, March/April). A new car, a new grid. IEEE Power & Energy Magazine.
Electrical Construction & Maintenance. (2010, September). Electric vehicles. Retrieved
December 27, 2010, from http://ecmweb.com/market_trends/electric-vehicle-questions-answered-20100901/
Espey, M. (1996). Explaining the variation in elasticity estimates of gasoline demand in
the United States. Energy Journal, 17(3), 49. Etezadi-Amoli, M. (2010, July). Rapid-charge electric-vehicle stations. IEEE
Transactions on Power Deliver, 25(3). Electric Vehicle News. (2010, November 15). German driver logs 65,000 km in one year
in his Tesla Roadster. Retrieved November 15, 2010, from http://electric-vehicles-cars-bikes.blogspot.com/2010/11/german-driver-logs-65000-km-in-one-year.html
Electric Vehicles of Washington. (2007). EV conversions. Retrieved October 4, 2011,
from http://www.electricvehicleswa.com/electric-vehicle-hybrid-conversions.php Federal Emergency Management Agency. (2004). Lessons learned information sharing,
Department of Homeland Security: Continuity of operations: coordinating backup power and fuel supply. Washington, DC: author.
Federal Highway Administration. (2011, April 4). Average annual miles per driver by
age group. Retrieved October 3, 2011, from http://www.fhwa.dot.gov/ohim/onh00/bar8.htm
Federal tax credits for hybrids. (n.d.). Retrieved November 20, 2011, from
http://www.fueleconomy.gov/feg/tax_hybrid.shtml Find a Car. (n.d.). Retrieved November 20, 2011, from
http://www.fueleconomy.gov/feg/findacar.htm Forero, J. (2010, December 17). S. American mountains hold key to electric car’s future:
lithium for batteries. Washington Post. Retrieved December 20, 2010, from http://www.washingtonpost.com/wp-dyn/content/article/2010/12/17/AR2010121703351_pf.html
Federal Trade Commission. (2005). Gasoline price changes: The dynamic of supply,
demand, and competition. Retrieved December 24, 2010, from http://www.ftc.gov/reports/gasprices05/050705gaspricesrpt.pdf

60
Gilbert, J. (2010, September 13). Most profitable utilities by recurring EBITDA margin. Retrieved January 17, 2011, from http://www.snl.com/InteractiveX/ArticleAbstract.aspx?id=11690702
Gold, J. (2009, April 27). A modern electric grid: The new highway system? National Public Radio. Retrieved December 24, 2010, from http://www.npr.org/templates/story/story.php?storyId=103349614
Goodwin, P., Dargay, J. & Hanly, M. (2004, May). Elasticities of road traffic and fuel
consumption with respect to price and income: A review. Transport Reviews, 24(3), 275–292.
Gore, A. (1992). Earth in balance: Ecology and the human spirit. Boston, MA:
Houghton Mifflin. Haldis, P. & Franco, J. (2009). Analysts question financial attractiveness of PHEVs,
electric vehicles. Global Refining and Fuels Today, 1(77), 15. Hamilton, T. (2009, November 5). Betting on a metal-air battery breakthrough.
Technology Review. Retrieved November 14, 2010, from http://www.technologyreview.com/printer_friendly_article.aspx?id=23877
Hauser, R. (2007). Corn-based ethanol in Illinois and the U.S.: A report from the
Department of Agricultural and Consumer Economics. Champaign, IL: Department of Agricultural and Consumer Economics, University of Illinois.
Hammerschmidt, C. (2009, September 22). E-car battery price on rapid declining curve,
expert predicts. Retrieved July 10, 2011, from http://www.eetimes.com/electronics-news/4084603/E-car-battery-price-on-rapid-declining-curve-expert-predicts
Hensley, R., Knupfer, S., & Pinner, D. (2009, June). Electrifying cars: How three
industries will evolve. McKinsey Quarterly. Institute of Ocean Energy Saga University. (n.d.). Lithium—Recovery from seawater.
Retrieved July 13, 2011, from http://www.ioes.saga-u.ac.jp/ioes-study/li/recovery/seawater.html
Internal Revenue Service. (n.d.). Whys of taxes theme 3: Fairness in taxes lesson 2:
Regressive Taxes. Retrieved July 8, 2011, from http://www.irs.gov/app/understandingTaxes/student/whys_thm03_les02.jsp
International Association of Fire Chiefs. (2003). Performance of the fire service during the 2003 northeast blackout and the implications for critical infrastructure protection. Fairfax, VA: author.

61
Jeihani, M. & Sibdari, S. (2010). The impact of gas price trends on vehicle type choice. Journal of Economics and Economic Education Research, 11(2).
Kayser, H. (2000). Gasoline demand and car choice: estimating gasoline demand using
household information. Energy Economics, 22, 3331–3348. Kimery, A. (2008, August 18). Oil disruptions threaten national security. The Kimery
Report Blog. Retrieved April 11, 2011, from http://www.hstoday.us/blogs/the-kimery-report/blog/oil-disruptions-threaten-national-security/94c2f1e00a48f4dadf2cfb9734f72e88.html
Lee, J. (2010, July 15). Electric vehicles, advanced batteries, and American jobs:
Another piece of the puzzle in Holland, Michigan. White House Blog. Retrieved July 5, 2011, from http://www.whitehouse.gov/blog/2010/07/15/electric-vehicles-advanced-batteries-and-american-jobs-another-piece-puzzle-holland-
Lewis, T. (2010, February 23). How to create a resilient infrastructure in 20 years for 1 trillion dollars, create millions of jobs, transition to green transportation, and do all of this at no cost to government. Homeland Security Watch. Retrieved October 5, 2011, from http://www.hlswatch.com/2010/02/23/how-to-create-a-resilient-infrastructure-in-20-years-for-1-trillion-dollars-create-millions-of-jobs-transition-to-green-transportation-and-do-all-of-this-at-no-cost-to-government/
Leotta, K. (2006). Fuel price, availability, and mobility: What we can learn from North
Carolina in the aftermath of Hurricane Katrina, and oil shocks of the 1970s and early 1980s. Seattle, WA: Parsons Brinkerhoff.
Light, A. (1976, winter). Federalism and the energy crisis: A view from the States.
Journal of Federalism. McFarlane, R. & Woolsey, R. J. (2011, September 21). How to weaken the power of
foreign oil. New York Times, A31. Meridian International Research. (2008). Trouble with lithium 2. Retrieved November
14, 2010, from www.meridian-int-res.com/Projects/Lithium_Microscope.pdf Morris, M. (2007, March 28). Short-run motor gasoline demand model. Presented at
EIA Modeling and Data Conference, Washington, D.C. Retrieved December 20, 2010, from www.eia.gov/oiaf/aeo/conf/pdf/morris.ppt
National Highway Traffic Safety Administration. (n.d.). CAFE Overview—Frequently
asked questions. Retrieved October 5, 2011, from http://www.nhtsa.gov/cars/rules/CAFE/overview.htm

62
Nissan Leaf packages and features. (n.d.). Retrieved October 1, 2011, from http://www.nissanusa.com/leaf-electric-car/feature/pricing_information#/leaf-electric-car/feature/pricing_information
Paust, J. & Blaustein, A. (1974). The Arab oil weapon: A threat to International Peace.
American Journal of International Law, 68(410). Peckham, J. (2009). Electric cars seen taking 64% of U.S. car market by 2030. Diesel
Fuel News, 13(15), 25. Powers, J. (2010). Oil addiction: Fueling our enemies. Washington, DC: Truman
Project. Ramsey, M. (2011, February 14). Toyota tries to break reliance on China. Wall Street
Journal. Retrieved July 13, 2011, from http://online.wsj.com/article/SB10001424052748703583404576080213245888864.html
Republican Staff Commentary. (2010, December 16). Federal gasoline tax targeted for
new revenues Retrieved December 24, 2010, from http://jec.senate.gov/republicans/public/?a=Files.Serve&File_id=56428350-ebb5–48de-9b15-e7aa54d11588
Risen, James U.S. Identifies Vast Mineral Riches in Afghanistan New York Times on-
line (June 13, 2010) available at http://www.nytimes.com/2010/06/14/world/asia/14minerals.html (accessed on 11/14/2010)
Roadster/features and specs. (n.d.). Retrieved July 13, 2011, from
http://www.teslamotors.com/roadster/specs Roadster innovations/battery. (n.d.). Retrieved July 13, 2011, from
http://www.teslamotors.com/roadster/technology/battery Romero, S. (2009, February 3). In Bolivia: Untapped bounty meets nationalism. New
York Times. Retrieved November 14, 2010, from http://www.nytimes.com/2009/02/03/world/americas/03lithium.html
Sanger, D. & Landler, M. (2011, October 16). To isolate Iran: U.S. presses inspectors on
nuclear data. New York Times, A1.
http://jec.senate.gov/republicans/public/?a=Files.Serve&File_id=56428350-ebb5-48de-9b15-e7aa54d11588

63
Sherman, D. (2011, January). Electric propulsion: Clean, green, high-efficiency machines are finally ready for the road. Automobile. Retrieved March 7, 2011, from http://www.automobilemag.com/features/awards/1101_2011_technology_of_the_year_electric_propulsion/index.html
Sparrow, J. (2008). Buying our boys back: The mass foundations of fiscal citizenship in
World War II. Journal of Policy History, 20(2). Stewart, J. (2010, June 6). An energy independent future. The Dailey Show. Retrieved
November 14, 2010, from, http://www.thedailyshow.com/watch/wed-june-16–2010/an-energy-independent-future
Sweet, C. Not just a lot of hot air (2010, September 13). Wall Street Journal. Retrieved
November 7, 2010, from http://online.wsj.com/article/SB10001424052748704133804575198362283533710.html
Stimulus funds charged U.S. battery industry. (2010, July 20). Physics Today. Retrieved
March 18, 2011, from http://blogs.physicstoday.org/politics/2010/07/stimulus-funds-charged-us-batt.html
Tesla builds its cars around the driver. (n.d.). Retrieved December 26, 2010, from
http://www.teslamotors.com/goelectric Tahil, W. (2007, January). The trouble with lithium, implications of future PHEV
production for lithium demand. Retrieved November 14, 2010, from http://www.meridian-int-res.com/Projects/Lithium_Problem_2.pdf
Thaler, R. & Sunstein, C. (2008). Nudge: Improving decisions about health, wealth and
happiness. New Haven, CT: Yale University Press. Thomas, S. & Kerner, D. (2010, August). Defense energy resilience: Lessons from
ecology. The Letort Papers. Retrieved December 24, 2010, from http://www.strategicstudiesinstitute.army.mil/pubs/download.cfm?q=1011
Totty, M. (2010, February 22). The long road to an alternative-energy future. The Wall
Street Journal. Retrieved November 7, 2010, from http://online.wsj.com/article/SB10001424052748704757904575077312569582760.html
U.S. Census Bureau. (2011). Trade in goods with China. Retrieved October 2, 2011,
from http://www.census.gov/foreign-trade/balance/c5700.html

64
U.S. Department of Energy. (n.d.). New Light-Duty Vehicles Sold in U.S. Retrieved July 10, 2011, from www.afdc.energy.gov/afdc/data/docs/ldv_sales.xls
U.S. Department of Energy. (2011a). 2011–12 electric vehicles. Retrieved October 1,
2011, from http://www.fueleconomy.gov/feg/evsbs.shtml U. S. Department of Energy. (2011b, February 8). DOE releases new analysis showing
significant advances in electric vehicle deployment. Retrieved March 18, 2011, from http://www.energy.gov/news/10057.htm
U.S. Department of Energy. (2011c, September 30). Hybrid electric vehicle (HEV) sales
by model. Retrieved October 4, 2011, from http://www.afdc.energy.gov/afdc/data/vehicles.html#afv_hev
U.S. Department of Labor. (2011). Consumer price index, all urban consumers.
Retrieved October 17, 2011, from ftp://ftp.bls.gov/pub/special.requests/cpi/cpiai.txt
U.S. Energy Information Administration. (n.d. a). Refiner motor gasoline sales volume.
Retrieved July 8, 2011, from http://www.eia.gov/dnav/pet/pet_cons_refmg_d_nus_VTR_mgalpd_a.htm
U.S. Energy Information Administration. (n.d. b). Refiner sales volumes of other
petroleum products. Retrieved July 8, 2011, from http://www.eia.gov/dnav/pet/pet_cons_refoth_d_nus_VTR_mgalpd_a.htm
U.S. Energy Information Administration. (2002). Petroleum chronology of events 1970–
2000. Retrieved May 15, 2010, from ftp://ftp.eia.doe.gov/pub/oil_gas/petroleum/analysis_publications/chronology/petroleumchronology2000.htm
U.S. Energy Information Administration. (2008), Imported Oil as a Percent of Total
U.S. Consumption. Retrieved May 15, 2011, from http://www.eia.doe.gov/emeu/25opec/sld002.htm
U.S. Energy Information Administration. (2009). Use of oil: Energy explained, your guide to understanding energy. Retrieved December 24, 2010, from http://www.eia.gov/energyexplained/index.cfm?page=oil_use
U.S. Energy Information Administration. (2010a, August). Annual energy review 2009.
Retrieved October 2, 2011, from http://www.eia.gov/totalenergy/data/annual/pdf/aer.pdf

65
U.S. Energy Information Administration. (2010b). How dependent are we on foreign oil? Retrieved December 20, 2010, from http://tonto.eia.doe.gov/energy_in_brief/foreign_oil_dependence.cfm
U.S. Energy Information Administration. (2011a, February 25). Crude oil and total
petroleum imports top 15 countries. Retrieved March 7, 2011, from http://www.eia.doe.gov/pub/oil_gas/petroleum/data_publications/company_level_imports/current/import.html
U.S. Energy Information Administration. (2011b). Data 1: All grades conventional EIA
[Worksheet]. Retrieved October 6, 2011, from http://www.eia.gov/oog/ftparea/wogirs/xls/pswrgvwag.xls
U.S. Energy Information Administration. (2011c, June 1). How much electricity does an
American home use? Retrieved July 13, 2011, from http://www.eia.gov/tools/faqs/faq.cfm?id=97&t=3
U.S. Energy Information Administration. (2011d, June). Oil imports and exports.
Retrieved October 2, 2011, from http://www.eia.gov/energyexplained/index.cfm?page=oil_imports
U.S. Energy Information Administration. (2011e). Oil: Crude and petroleum products
explained use of oil. Retrieved July 4, 2011, from http://www.eia.gov/energyexplained/index.cfm?page=oil_use
Whoriskey, P. (2009, October 16). The hydrogen car gets its fuel back. Washington
Post. Retrieved November 11, 2011, from http://www.washingtonpost.com/wp-dyn/content/article/2009/10/16/AR2009101601002_pf.html
Worth, R. (2010, August, 6). Tanker damage caused by attack: Inquiry finds. Retrieved
October 23, 2011, from http://www.nytimes.com/2010/08/07/world/middleeast/07tanker.html

66
THIS PAGE INTENTIONALLY LEFT BLANK

67
INITIAL DISTRIBUTION LIST
1. Defense Technical Information Center Ft. Belvoir, VA
2. Dudley Knox Library Naval Postgraduate School Monterey, CA
3. Francine Kerner Transportation Security Administration Arlington, VA
4. Gabriel Laufer University of Virginia Charlottesville, VA