What prevents firms from access to finance? A case study of OIC countries
29
Journal of Economic Cooperation and Development, 35, 1 (2014), 103-132 What Prevents Firms from Access to Finance? A Case Study of OIC Countries Majid Kermani 1 and Elvin Afandi In this paper, micro survey data from a sample of over 13,000 firms from 30 OIC countries is used to address two primary questions: (a) what are the firm- level and country-specific predictors of financing obstacles in the OIC countries, and (b) how similar are those determinants across the least developed countries (LDCs) and developing OIC countries. It is found that the number and firm-specific characteristics that predict financing obstacles are more diverse in the LDCs when compared with the developing OIC countries. Age, size, sectoral origin, export status and ownership status of firms appear to be the most significant determinants of access to finance for firms in LDCs while only a few of these determinants are found to be statistically significant for developing OIC countries when compared to LDCs. The results also suggest that country-level indicators which measure financial infrastructure and economic development are strongly associated with obstacles to financing for firms in both groups of countries. 1. Introduction An empirical study conducted by Ayyagari, Demirgüç-Kunt, and Maksimovic (2008) has found that only obstacles related to finance, crime, and political stability are linked directly to the level of growth of firms. Further sensitivity tests used by the authors have revealed that access to finance is the only significant factor affecting the performance of firms. At a macro level, a number of other theoretical and empirical findings within the literature confirm the importance of financial inclusion for long-term economic development. Countries with better financial inclusion grow faster, resulting in lower levels of income inequality and the incidence of poverty. According to Beck, Demirgüç- Kunt, and Levine (2007), almost 30 percent of the cross-country 1 Islamic Corporation for the Development of the Private Sector (ICD), Islamic Development Bank Group, E-mail: [email protected]
-
Upload
independent -
Category
Documents
-
view
0 -
download
0
Transcript of What prevents firms from access to finance? A case study of OIC countries

Journal of Economic Cooperation and Development, 35, 1 (2014), 103-132
What Prevents Firms from Access to Finance? A Case Study of OIC Countries
Majid Kermani1 and Elvin Afandi
In this paper, micro survey data from a sample of over 13,000 firms from 30 OIC countries is used to address two primary questions: (a) what are the firm-level and country-specific predictors of financing obstacles in the OIC countries, and (b) how similar are those determinants across the least developed countries (LDCs) and developing OIC countries. It is found that the number and firm-specific characteristics that predict financing obstacles are more diverse in the LDCs when compared with the developing OIC countries. Age, size, sectoral origin, export status and ownership status of firms appear to be the most significant determinants of access to finance for firms in LDCs while only a few of these determinants are found to be statistically significant for developing OIC countries when compared to LDCs. The results also suggest that country-level indicators which measure financial infrastructure and economic development are strongly associated with obstacles to financing for firms in both groups of countries. 1. Introduction
An empirical study conducted by Ayyagari, Demirgüç-Kunt, and Maksimovic (2008) has found that only obstacles related to finance, crime, and political stability are linked directly to the level of growth of firms. Further sensitivity tests used by the authors have revealed that access to finance is the only significant factor affecting the performance of firms. At a macro level, a number of other theoretical and empirical findings within the literature confirm the importance of financial inclusion for long-term economic development. Countries with better financial inclusion grow faster, resulting in lower levels of income inequality and the incidence of poverty. According to Beck, Demirgüç-Kunt, and Levine (2007), almost 30 percent of the cross-country
1 Islamic Corporation for the Development of the Private Sector (ICD), Islamic Development Bank Group, E-mail: [email protected]

104 What Prevents Firms from Access to Finance? A Case Study of OIC Countries
variation in changing poverty rates can be explained by variation in financial development. Furthermore, access to finance remains a key constraint to the growth of the private sector, especially in developing and least developed countries (LDC). The World Bank (2004) indicates a high degree of severity with regard to the financial obstacles faced by poor countries. Lack of Access to finance is disproportionally present for firms in LDCs, with 41 percent of Small and Medium Enterprises (SMEs) in LDCs reporting access to finance as one of the major constraints to their growth and development, as opposed to 30 percent of firms in middle-income countries. The same figure stands at only 15 percent in high-income countries (IFC, 2011). Some empirical studies which suggest positive effects with respect to financial inclusion on firms’ growth include those conducted by Demirgüç-Kunt and Maksimovic (1998) and Rajan and Zingales (1998). In this paper, a firm-level data survey is used to focus on the following questions. First, what are the firm-level and country-specific predictors of financing obstacles in the Organization of Islamic Conference (OIC) countries? Second, how similar are those determinants among the LDCs versus those of the developing countries within the OIC. The current paper contributes to the existing discussion on financing obstacles in several ways. First, in contrast to previous studies which have focused primarily on all developing countries, the present study focuses on a sub-set of these countries that belongs to a particular grouping, namely, the Islamic countries. This group of countries has a significant share of the population within the developing world and also has its own specificities. For example, 57 member countries of the OIC account for 22.5 percent of the world’s population, 7.2 percent of the world’s total output, and 25 percent of the global land area (SESRIC, 2011). Nevertheless, the average labor force participation rate in OIC countries is lower than the world average. Only 30 percent of the population in OIC countries had access to financial services in the mid 2000s. This is in contrast with 41 percent in non-OIC developing countries, and 90 percent in developed countries.

Journal of Economic Cooperation and Development 105
Second, the study utilizes a unique firm-level data base which contains responses collected from 13,300 firms. More importantly, the sample selected contains a very high proportion of private firms. Third, the model uses is a binary probit regression that is estimated for both the least developed and developing OIC countries, and assumes that the determinants of financing obstacles are different for both categories. The present study departs from the existing studies in that the variables with respect to financing obstacles are not homogenous across LDCs and developing OIC countries. The results suggest that the firm-level characteristics tend to be more diverse and statistically significant in the OIC LDCs when compared with those of the developing countries. For example, older, larger, manufacturing-focused, externally audited and foreign-owned firms report less financing obstacles in LDCs when compared with other OIC countries. The results also suggest that country-level variables such as GDP per capita, private credit and institutional development provide significant forces in explaining obstacles to financing. However, due to multicollinearity and causal relationship, institutional development is found to be economically insignificant when controlled for country-level variables on economic development and financial intermediation. The rest of the paper is organized as follows. Section II presents the related literature and the background for the study. Section III describes the data and empirical methodology. Section IV presents a statistical summary and descriptive analysis of the raw data. Section V explores firm as well as country-level characteristics that predict financing difficulties in the OIC countries, and finally, Section VI concludes the paper. 2. Literature Review
Financial inclusion is found to be a key determinant of a firm’s ability to operate and expand. For example, a recent study conducted by Kinda, Plane and Veganzones-Varoudakis (2011) using a sample of developing countries confirms that satisfactory access to financing is an important factor contributing to the productive performance of an enterprise. In general, better access to financing is associated with the ability of enterprises to finance their expansion projects and to allocate resources

106 What Prevents Firms from Access to Finance? A Case Study of OIC Countries
to their most profitable projects (Levine, 2005). In both between and within-country regressions, Carlin, Schaffer and Seabright (2006) find a negative impact with respect to the high cost of financing on a firm’s output. Since the seminal study by Fazzari, Hubbard and Petersen (1988), a number of new methodologies have been suggested, and a large body of empirical literature has emerged through which to analyze the obstacles to financing faced by firms. These works largely appear to focus on the main predictors of financing constraints including (i) country level determinants of financial exclusion, and (ii) firm-level characteristics of financing obstacles. At the country-level, Demirgüç-Kunt and Maksimovic (1998) found that financing constraints are lower in countries with more efficient legal systems. After controlling for all other variables, the efficiency of a country’s legal system appeared to be important predictor of financing constraints of firms. Another study conducted by Beck, Demirgüç-Kunt and Maksimovic (2005) provides a similar conclusion, suggesting that country-level financial and institutional development indicators are very important in overcoming the constraining effect of financing obstacles. According to the Beck, Demirgüç-Kunt, Laeven and Maksimovic (2006), overall institutional development tends to be a prominent country-level predictor of a firm’s obstacles to financing. According to Leaven (2003), financial liberalization relaxes the obstacles to the financing of firms. Combining the responses of firms from 35 developing countries, Clarke, Cull and Pería (2006) found that the participation of foreign banks improves accessibility to external financing for firms. Their results suggest that enterprises face fewer challenges in countries where foreign banks have higher levels of presence. Furthermore, according to Kuntchev, Ramalho, Rodríguez-Meza and Yang (2012), in countries with high private credit to GDP ratios, firms are less likely to be credit constrained. At the firm-level, characteristics including a firm’s size, age, shareholders, legal status, sectoral origin etc. have been commonly used as predictors for constraints to financing (Devereux and Schiantarelli, 1990; Oliner and Rudebusch, 1992; Hoshi, Kashyap, and Scharfstein, 1991). For example, Devereux and Schiantarelli (1990), and Oliner and

Journal of Economic Cooperation and Development 107
Rudebusch (1992) have used age and size as the two main predictors of financing constraints. As well, according to another study, perceived obstacles to financing are higher for small firms than for large firms (Schiffer and Weder, 2001). Moreover, according to the existing literature, the ownership structure of a firm could be used to explain variances in financing obstacles, and as such, multinational or foreign-owned firms may have easier access to various external (international) sources of financing (Sembenelli and Schiantarelli, 1996; Harrison and McMillan, 2003). The literature also suggests that state-owned firms are expected to report lower financing constraints since in many countries they receive direct budgetary support from the government (Harrison and McMillan, 2003). The age of the firms was considered another factor through which to distinguish firms which were financially constrained versus those that were not (Oliner and Rudebusch, 1992). Some studies suggest that younger firms are more financially challenged because of information asymmetries associated with creditors’ access to relevant information which could help build long-term relationships. The size of firms appears to be yet another determinant of access to finance, meaning that small and medium sized businesses are more likely to be credit-constrained than are large firms (Kuntchev, Ramalho, Rodríguez-Meza and Yang, 2012). Hallward-Driemeier and Aterido (2007), in particular, find that smaller firms have significantly less access to the financial system and tend to finance a smaller share of their investment through formal credit. This finding is also reflected in a study by Schiffer and Weder (2001), where it was found that smaller firms hold higher perceptions of financing obstacles than do larger firms. Additionally, whether or not a firm has an affiliation with a business group(s) or if it has a stock market listing is also found to be correlated with its level of financing constraint. According to Hoshi, Kashyap, and Scharfstein (1991), firms that belong to a business group(s) are expected to face lower financing obstacles. The literature underlines the two main reasons of this: (i) business-group affiliation renders firms more likely to have access to the internal cash flows, and (ii) the firms with business-group affiliation are found to have close ties with banks. Furthermore,

108 What Prevents Firms from Access to Finance? A Case Study of OIC Countries
firms that are listed on a stock exchange are also expected to face lower financing obstacles due to lower levels of information asymmetries which stem from the listing and reporting requirements of stock exchanges (Oliner and Rudebusch, 1992). Through a firm-level analysis conducted in a number of developing countries, Dollar, Hallward-Driemeier and Mengistae (2006) explore the link between access to finance and the likelihood of being an exporter. In their study, they find a positive association between a firm’s export status and its access to finance. 3. Data and Methodology
3.1. Data
The data source of this study comes from the Enterprise Surveys (ES) conducted by the World Bank. This survey contains the responses of over 130,000 firms in 135 countries, of which 113 of these countries have been surveyed following the standardized methodology. The ES covers a representative sample of non-agricultural, formal, private economies, and examines a variety of topics such as firm characteristics (i.e. a firm’s age, size, owner, legal status), access to infrastructure (i.e. electricity, transportation, water), government relations (i.e. regulations, tax administration, corruption, construction permits), labor (i.e. number of temporary employees, permanent jobs), firm performance (i.e. capacity utilization, sales, export), access to finance (i.e. saving accounts, sources of investment financing), and business obstacles (i.e. ranking of the most important 15 obstacles to business). The standard strata for every economy surveyed are sector of activity, firm size, and geographical location. The primary sampling unit of every ES is the establishment and firm size is stratified into: small (5-19 employees), medium (20 to 99 employees), and large (100 and more employees). So far, a number of studies have been conducted using this database (see http://www.enterprisesurveys.org/Research). Nevertheless, one must be careful when employing and interpreting the results of the ES. First, issues concerning corruption and questionable accounting conducted by firms may produce flawed results with regard to the data, thus possibly leading to misguided interpretations. There is also measurement error

Journal of Economic Cooperation and Development 109
associated with these questions since they are sometimes intentionally underreported due to fears of repercussions and due to the sensitive nature of the question. Second, there is also a coverage bias associated with the survey’s data due to either outdated or unclean information obtained from firms. Although the most updated and complete sampling frames were used for each economy, some ineligible elements are practically impossible to identify mechanically due to incomplete or missing fields, outdated firm level information etc. For this study, 13,300 firms were surveyed in 30 OIC economies between 2006 and 2010. The survey does not cover some of the countries of the Middle East and North Africa (MENA) and the Asian OIC countries due to either a lack of coverage or lack of adherence to the ES standard methodology. Table A.1 in the appendix reports the name of the countries in the sample and the number of firms surveyed in each country. The table also shows the year in which the survey was conducted in each OIC country. For the sake of the analysis and based on factors such as per capita income, level of human resource development, and degree of economic vulnerability, all OIC countries have been classified into the two groups of either LDCs, or developing OIC countries. Accordingly, the sample included 16 LDCs and 14 developing countries of the OIC. 3.2. Methodology
The methodology of our study has primarily been inspired by a study conducted by Beck, Demirgüç-Kunt, Laeven and Maksimovic (2006). Given that the obstacle of financing is a binary dependent variable, a binary probit maximum likelihood estimation model is used in the study. Alternatively, we could also have used a logit model. It is very difficult to justify the preference of one against the other, given that the two models usually provide very similar results (Greene, 1997). However, one reason for the popularity of probit models over logit models is that the former type of model assumes a normal distribution of error term which is not the case with the latter type of models (Wooldridge, 2002). In general, the model assumes that the firm’s underlying response can be described by the following equation:

110 What Prevents Firms from Access to Finance? A Case Study of OIC Countries
𝒀𝒊,𝒌 = 𝜶 + 𝑭(𝑿′𝜷) + 𝑪(𝒁′𝜸) + 𝒖 where 𝒀𝒊 - underlying probability that firm 𝒊 in country k, considers access to finance to be major or very severe. 𝑭(𝑿′𝜷) - is the vector of firm-level independent variables. 𝑪(𝒁′𝜸) - is the vector of country-specific explanatory variables. 𝒖 – is a disturbance parameter and it is assumed that the parameter has a normal distribution. Outcome variable Using the finance section of the ES questionnaire, it is assumed that the dependent variable reflects the financing obstacles of firms during the fiscal year referenced in each survey. In order to construct a new variable for financing obstacles, the following question on the survey was used: “How problematic is financing for the operation and growth of your business?”Answers vary between 0 (no obstacle), 1 (minor obstacle), 2 (moderate obstacle), 3 (major obstacle), and 4 (very severe obstacle). Based on these answers, the dependent variable, which is a new binary variable, is assigned 1 if a firm considers financing as a “major” or “very severe” obstacle, and 0 otherwise. Nevertheless, as argued by Beck, Demirgüç-Kunt and Maksimovic (2005), it is possible that while some firms may report financing obstacles, they may not actually be constrained by them, and their perceived exclusion from financing may be largely related to their growth rates, in the sense that firms that report financing obstacles tend to be growth-constrained. Therefore, one must be cautious in interpreting the results and as such, it is suggested that readers not automatically associate perceived financing constraint with the absolute constraint of firms.

Journal of Economic Cooperation and Development 111
Independent Variables A. Firm-level Age – the age of firms is measured according to the log of the number of years since the company has been established. Size – the size of firms is measured by dummy variables indicating whether the firm is small, medium or large. Small firms are characterized by having 5 to 19 employees, medium firms by having 20 to 99 employees, and large enterprises by having over 99 employees. As suggested by Kuntchev, Ramalho, Rodríguez-Meza and Yang (2012), we avoided obtaining a measurement of firm size by their sales volume since sales contain the price effect and cannot be used as a proxy for size in cross country analyses. Sector – there are two dummy variables generated in order to measure the sectoral origin of firms. The first dummy indicates whether or not the firm belongs within the manufacturing sector (1- yes and 0 - no) while the second variable indicates whether or not the firm is from within the retail trade sector (1 – yes and 0 - no). Other sectors are not included due to the sectoral stratification limitations of the ES. Ownership – the ownership status of firms is measured by two dummy variables: foreign ownership and government ownership. If the share belonging to the main owner (foreign resident or government) is more 50 percent then it takes the value 1, and 0 otherwise. Export status – a firm is considered to be an exporter if they sell more than half their products and services in foreign markets. The dummy variable takes 1 if it is mainly an exporter, otherwise it takes 0. External audit –the external auditing status of a firm is measured by the dummy variable (1 – if yes, 0 – if no), and reflects whether or not a firm was audited in the last year. Country fixed effects – country dummies are also used to capture unobserved country-specific factors that might drive firms’ responses. Since omitted country characteristics might cause error terms to be correlated for firms within countries, clustered error terms are allowed.
112 What Prevents Firms from Access to Finance? A Case Study of OIC Countries
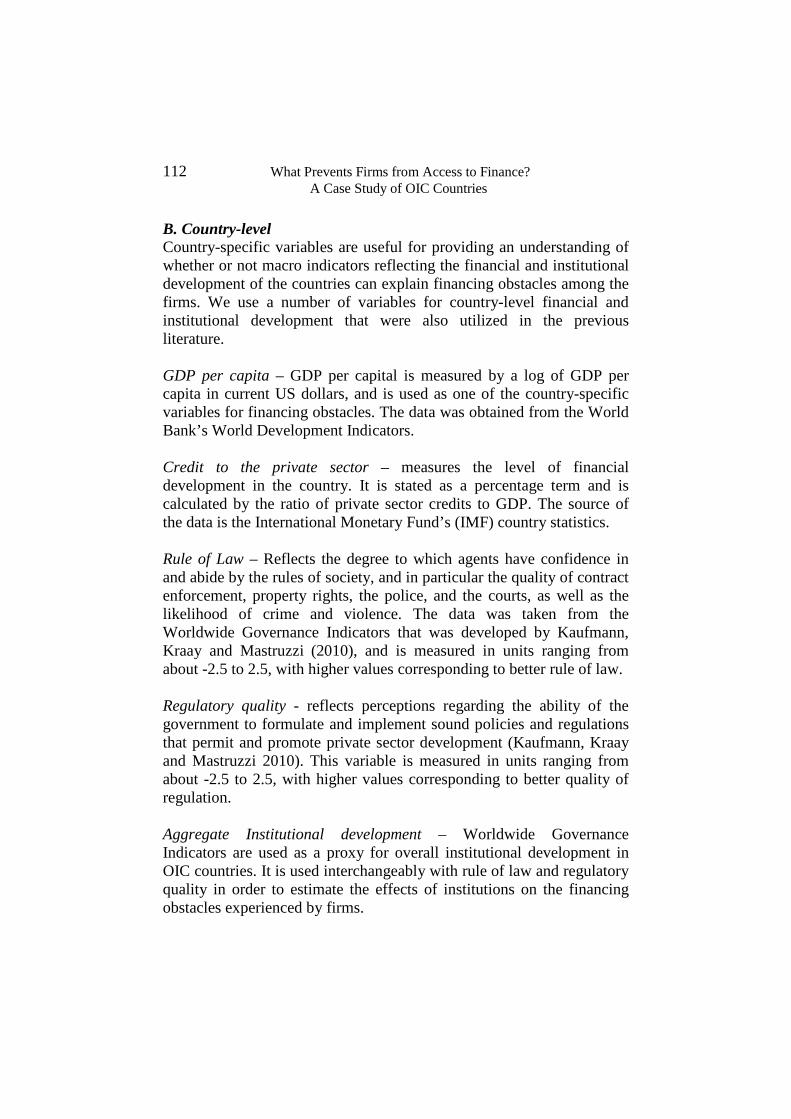
B. Country-level Country-specific variables are useful for providing an understanding of whether or not macro indicators reflecting the financial and institutional development of the countries can explain financing obstacles among the firms. We use a number of variables for country-level financial and institutional development that were also utilized in the previous literature. GDP per capita – GDP per capital is measured by a log of GDP per capita in current US dollars, and is used as one of the country-specific variables for financing obstacles. The data was obtained from the World Bank’s World Development Indicators. Credit to the private sector – measures the level of financial development in the country. It is stated as a percentage term and is calculated by the ratio of private sector credits to GDP. The source of the data is the International Monetary Fund’s (IMF) country statistics. Rule of Law – Reflects the degree to which agents have confidence in and abide by the rules of society, and in particular the quality of contract enforcement, property rights, the police, and the courts, as well as the likelihood of crime and violence. The data was taken from the Worldwide Governance Indicators that was developed by Kaufmann, Kraay and Mastruzzi (2010), and is measured in units ranging from about -2.5 to 2.5, with higher values corresponding to better rule of law. Regulatory quality - reflects perceptions regarding the ability of the government to formulate and implement sound policies and regulations that permit and promote private sector development (Kaufmann, Kraay and Mastruzzi 2010). This variable is measured in units ranging from about -2.5 to 2.5, with higher values corresponding to better quality of regulation. Aggregate Institutional development – Worldwide Governance Indicators are used as a proxy for overall institutional development in OIC countries. It is used interchangeably with rule of law and regulatory quality in order to estimate the effects of institutions on the financing obstacles experienced by firms.

Journal of Economic Cooperation and Development 113
4. Descriptive Analysis
Figure 1 illustrates the responses of firms with respect to the severity of financing challenges in the countries of OIC. The figure reveals an interesting pattern. On average, access to finance tends to be a major problem for 20 percent of firms, and a very severe challenge for 14 percent of firms in the total sample. When broken down according to development status, the composition of responses changes dramatically. In this case, 44 percent of enterprises in LDCs report access to finance as a major or severe problem. In the developing OIC countries, the number of firms which reported no, minor or moderate financing obstacles are much higher than those which reported major and severe constraints with respect to financing. Generally, in comparison to firms in LDCs, it appears that the distribution of financing obstacles for firms in developing OIC countries is skewed more towards left (ie. less financing constraint).
In Table 1, we report financing obstacles for firms in each of 30 countries. The results of the table indicate that access to finance differs widely across firms in OIC countries. For example, compared to other economies, firms from most of the OIC countries belonging to Sub-Saharan Africa generally report higher levels of financing obstacles. Forty eight percent of firms in Guinea Bissau, and 39 percent of companies in Cameroon and the Ivory Coast report financing obstacles
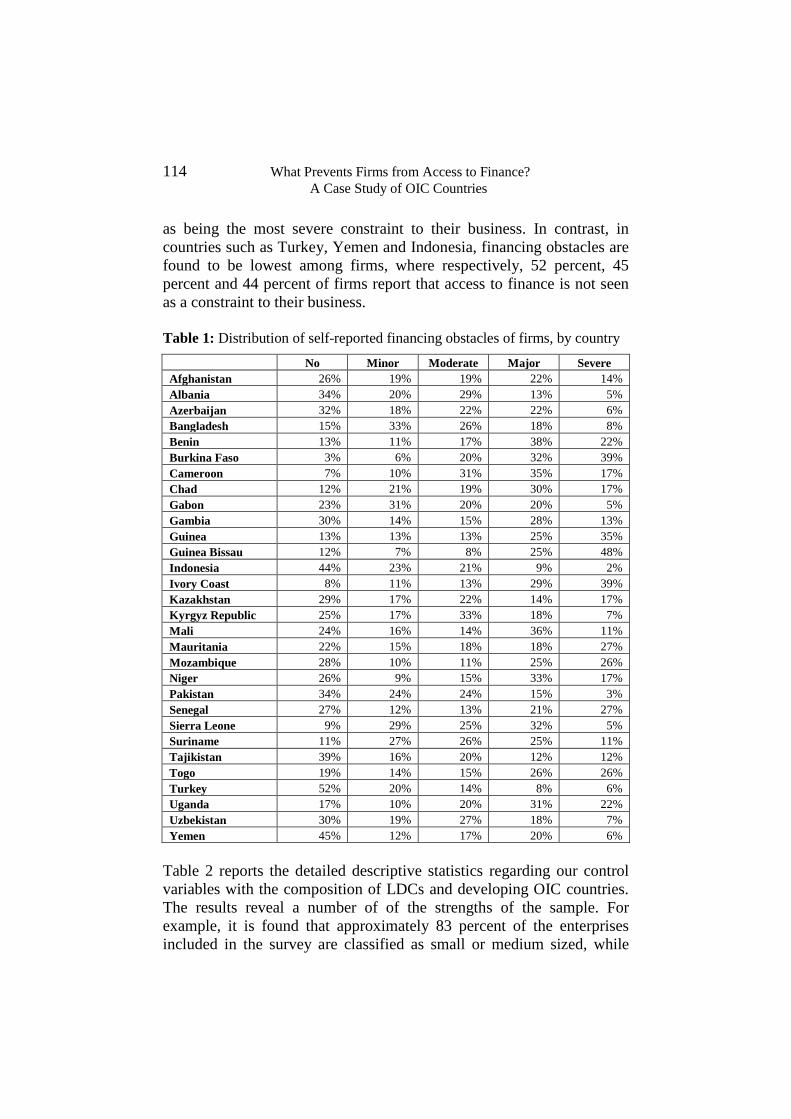
114 What Prevents Firms from Access to Finance? A Case Study of OIC Countries
as being the most severe constraint to their business. In contrast, in countries such as Turkey, Yemen and Indonesia, financing obstacles are found to be lowest among firms, where respectively, 52 percent, 45 percent and 44 percent of firms report that access to finance is not seen as a constraint to their business. Table 1: Distribution of self-reported financing obstacles of firms, by country
No Minor Moderate Major Severe Afghanistan 26% 19% 19% 22% 14% Albania 34% 20% 29% 13% 5% Azerbaijan 32% 18% 22% 22% 6% Bangladesh 15% 33% 26% 18% 8% Benin 13% 11% 17% 38% 22% Burkina Faso 3% 6% 20% 32% 39% Cameroon 7% 10% 31% 35% 17% Chad 12% 21% 19% 30% 17% Gabon 23% 31% 20% 20% 5% Gambia 30% 14% 15% 28% 13% Guinea 13% 13% 13% 25% 35% Guinea Bissau 12% 7% 8% 25% 48% Indonesia 44% 23% 21% 9% 2% Ivory Coast 8% 11% 13% 29% 39% Kazakhstan 29% 17% 22% 14% 17% Kyrgyz Republic 25% 17% 33% 18% 7% Mali 24% 16% 14% 36% 11% Mauritania 22% 15% 18% 18% 27% Mozambique 28% 10% 11% 25% 26% Niger 26% 9% 15% 33% 17% Pakistan 34% 24% 24% 15% 3% Senegal 27% 12% 13% 21% 27% Sierra Leone 9% 29% 25% 32% 5% Suriname 11% 27% 26% 25% 11% Tajikistan 39% 16% 20% 12% 12% Togo 19% 14% 15% 26% 26% Turkey 52% 20% 14% 8% 6% Uganda 17% 10% 20% 31% 22% Uzbekistan 30% 19% 27% 18% 7% Yemen 45% 12% 17% 20% 6%
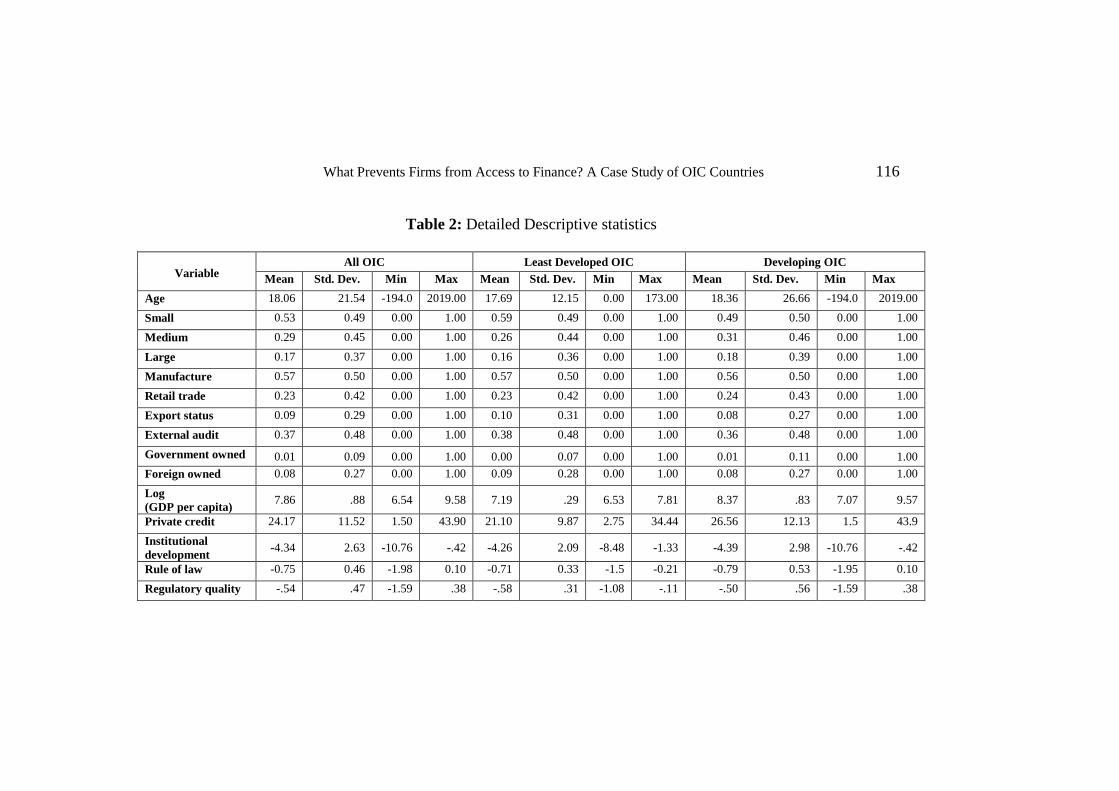
Table 2 reports the detailed descriptive statistics regarding our control variables with the composition of LDCs and developing OIC countries. The results reveal a number of of the strengths of the sample. For example, it is found that approximately 83 percent of the enterprises included in the survey are classified as small or medium sized, while

Journal of Economic Cooperation and Development 115
only 17 percent are classified as large firms. The manufacturing sector accounts for the majority of the sample (57 percent) and is distributed evenly across LDCs and developing OIC countries. Around 9 percent of firms in the sample were found to be exporters while this figure stands at 10 and 8 percent for the LDCs and the developing countries respectively. Nearly 37 percent of enterprises responded that their accounts had been externally audited in the past year. Among all firms in the sample, 8 percent were owned primarily by foreigners, while the majority of foreign shareholders accounted for 10 percent of enterprises in LDCs when compared with 8 percent in developing OIC countries.
What Prevents Firms from Access to Finance? A Case Study of OIC Countries 116
Table 2: Detailed Descriptive statistics
Variable
All OIC Least Developed OIC Developing OIC Mean Std. Dev. Min Max Mean Std. Dev. Min Max Mean Std. Dev. Min Max
Age 18.06 21.54 -194.0 2019.00 17.69 12.15 0.00 173.00 18.36 26.66 -194.0 2019.00
Small 0.53 0.49 0.00 1.00 0.59 0.49 0.00 1.00 0.49 0.50 0.00 1.00
Medium 0.29 0.45 0.00 1.00 0.26 0.44 0.00 1.00 0.31 0.46 0.00 1.00
Large 0.17 0.37 0.00 1.00 0.16 0.36 0.00 1.00 0.18 0.39 0.00 1.00
Manufacture 0.57 0.50 0.00 1.00 0.57 0.50 0.00 1.00 0.56 0.50 0.00 1.00
Retail trade 0.23 0.42 0.00 1.00 0.23 0.42 0.00 1.00 0.24 0.43 0.00 1.00
Export status 0.09 0.29 0.00 1.00 0.10 0.31 0.00 1.00 0.08 0.27 0.00 1.00
External audit 0.37 0.48 0.00 1.00 0.38 0.48 0.00 1.00 0.36 0.48 0.00 1.00
Government owned 0.01 0.09 0.00 1.00 0.00 0.07 0.00 1.00 0.01 0.11 0.00 1.00 Foreign owned 0.08 0.27 0.00 1.00 0.09 0.28 0.00 1.00 0.08 0.27 0.00 1.00
Log (GDP per capita) 7.86 .88 6.54 9.58 7.19 .29 6.53 7.81 8.37 .83 7.07 9.57
Private credit 24.17 11.52 1.50 43.90 21.10 9.87 2.75 34.44 26.56 12.13 1.5 43.9
Institutional development -4.34 2.63 -10.76 -.42 -4.26 2.09 -8.48 -1.33 -4.39 2.98 -10.76 -.42
Rule of law -0.75 0.46 -1.98 0.10 -0.71 0.33 -1.5 -0.21 -0.79 0.53 -1.95 0.10
Regulatory quality -.54 .47 -1.59 .38 -.58 .31 -1.08 -.11 -.50 .56 -1.59 .38
What Prevents Firms from Access to Finance? A Case Study of OIC Countries 117
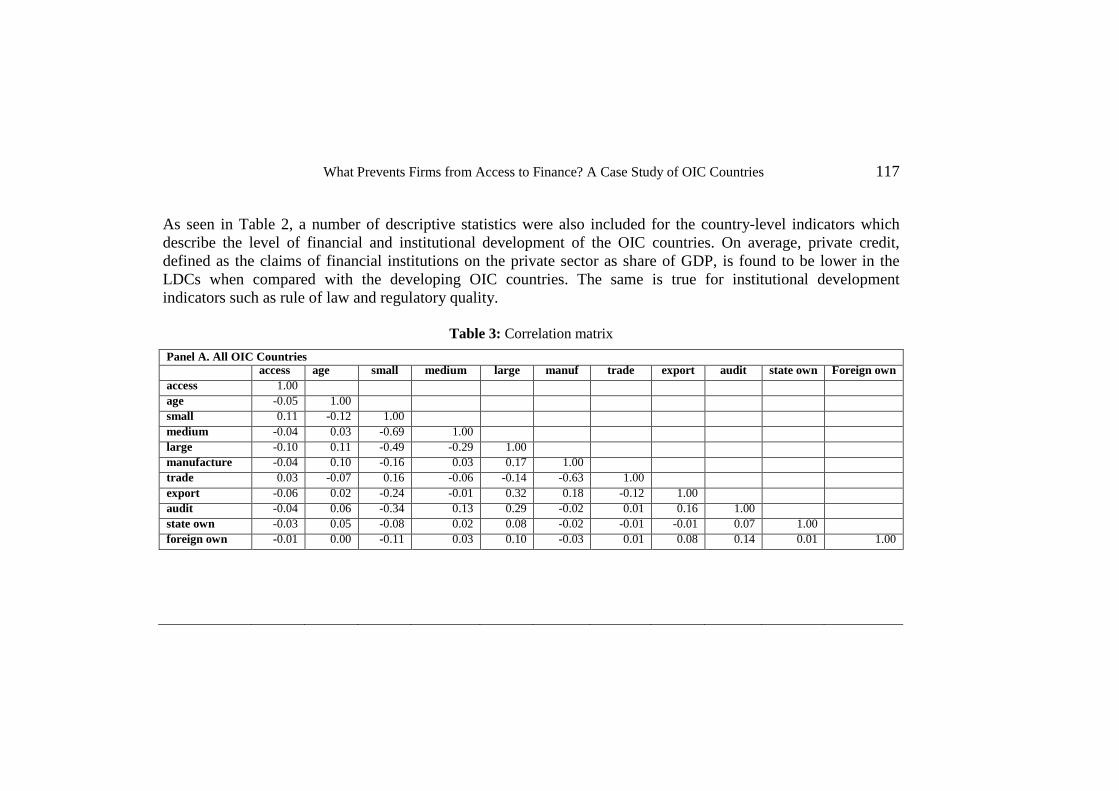
As seen in Table 2, a number of descriptive statistics were also included for the country-level indicators which describe the level of financial and institutional development of the OIC countries. On average, private credit, defined as the claims of financial institutions on the private sector as share of GDP, is found to be lower in the LDCs when compared with the developing OIC countries. The same is true for institutional development indicators such as rule of law and regulatory quality.
Table 3: Correlation matrix
Panel A. All OIC Countries access age small medium large manuf trade export audit state own Foreign own access 1.00 age -0.05 1.00 small 0.11 -0.12 1.00 medium -0.04 0.03 -0.69 1.00 large -0.10 0.11 -0.49 -0.29 1.00 manufacture -0.04 0.10 -0.16 0.03 0.17 1.00 trade 0.03 -0.07 0.16 -0.06 -0.14 -0.63 1.00 export -0.06 0.02 -0.24 -0.01 0.32 0.18 -0.12 1.00 audit -0.04 0.06 -0.34 0.13 0.29 -0.02 0.01 0.16 1.00 state own -0.03 0.05 -0.08 0.02 0.08 -0.02 -0.01 -0.01 0.07 1.00 foreign own -0.01 0.00 -0.11 0.03 0.10 -0.03 0.01 0.08 0.14 0.01 1.00

What Prevents Firms from Access to Finance? A Case Study of OIC Countries 118
.Cont’d..
Panel B. Least Developed OIC Countries access age small medium large manuf trade export Audit stown frown access 1.00 age -0.08 1.00 small 0.16 -0.22 1.00 medium -0.06 0.12 -0.70 1.00 large -0.15 0.15 -0.51 -0.25 1.00 manufacture -0.01 0.13 -0.19 0.03 0.22 1.00 trade 0.05 -0.07 0.19 -0.08 -0.16 -0.62 1.00 export -0.11 0.05 -0.31 -0.05 0.48 0.21 -0.14 1.00 audit -0.08 0.11 -0.37 0.16 0.31 -0.02 0.02 0.19 1.00 state own -0.03 0.09 -0.06 0.04 0.04 0.01 -0.02 -0.02 0.06 1.00 foreign own -0.04 0.00 -0.11 0.07 0.06 -0.06 0.04 0.04 0.16 -0.01 1.00 Panel C. Developing OIC Countries access age small medium large manuf trade export Audit stown frown access 1.00 age -0.03 1.00 small 0.05 -0.09 1.00 medium -0.01 0.01 -0.67 1.00 large -0.05 0.10 -0.48 -0.33 1.00 manufacture -0.07 0.11 -0.13 0.03 0.13 1.00 trade -0.02 -0.07 0.14 -0.05 -0.13 -0.64 1.00 export -0.03 0.01 -0.19 0.03 0.21 0.16 -0.11 1.00 audit -0.01 0.05 -0.31 0.11 0.27 -0.02 -0.01 0.12 1.00 state own -0.02 0.05 -0.09 0.01 0.10 -0.03 -0.01 0.00 0.08 1.00 foreign own -0.01 0.00 -0.11 0.00 0.14 -0.01 -0.01 0.11 0.12 0.02 1.00

Journal of Economic Cooperation and Development 119
Table 3 describes the correlation between financing obstacles and different firm characteristics. According to this table, small and medium sized firms report more financing obstacles, while access to finance seems to decrease as firms age. Among LDCs, enterprises operating in the manufacturing sector report less financing obstacles, while those in the retail trade sector report obstacles to financing to be more of a challenge. This trend runs opposite in developing countries where trade sector enterprises report less financing obstacles. Furthermore, obstacles are found to be significantly lower for exporting firms and for externally audited firms. In terms of ownership status, both foreign and government-owned enterprises face lower levels of obstacles to financing. In contrast, Table 3 describes high correlation among some of the characteristics of firms. For example, large enterprises in the manufacturing sector are found to be primarily externally audited firms. Furthermore, manufacturing firms appear primarily to be exporters, and small firms tend to be younger and mostly involved in the retail trade sector. The next section is devoted to a quantitative assessment of the determinants of obstacles with respect to financing through the application of standard maximum likelihood estimation models. 5. Regression Analysis
Seven series of maximum likelihood regression models were estimated sequentially, and the results are reported in Table 4, Table 5 and Table 6. Table 4 presents the results of the first three models (benchmark models) according to the order in which firm-level characteristics are estimated for the entire sample (Model 1), for LDCs (Model 2), and for developing OIC countries (Model 3). Table 5 reports the outcomes of two models where country-specific dummies for LDCs (Model 4) and developing OIC countries (Model 5) are estimated in conjunction with the firm-specific variables. Table 6 presents the results of the benchmark models in which firm-level variables are estimated together with country-level development variables for LDCs (Model 6) and developing OIC countries (Model 7) separately.
120 What Prevents Firms from Access to Finance? A Case Study of OIC Countries
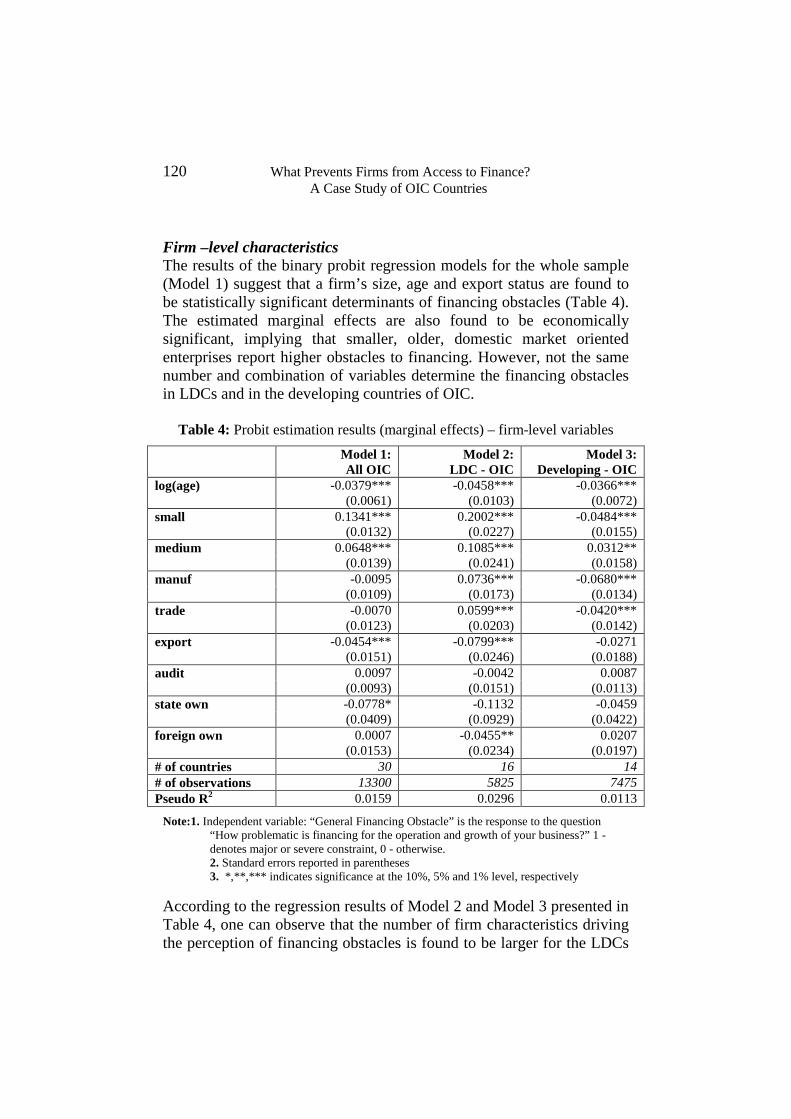
Firm –level characteristics The results of the binary probit regression models for the whole sample (Model 1) suggest that a firm’s size, age and export status are found to be statistically significant determinants of financing obstacles (Table 4). The estimated marginal effects are also found to be economically significant, implying that smaller, older, domestic market oriented enterprises report higher obstacles to financing. However, not the same number and combination of variables determine the financing obstacles in LDCs and in the developing countries of OIC.
Table 4: Probit estimation results (marginal effects) – firm-level variables
Model 1: All OIC
Model 2: LDC - OIC
Model 3: Developing - OIC
log(age) -0.0379*** -0.0458*** -0.0366*** (0.0061) (0.0103) (0.0072) small 0.1341*** 0.2002*** -0.0484*** (0.0132) (0.0227) (0.0155) medium 0.0648*** 0.1085*** 0.0312** (0.0139) (0.0241) (0.0158) manuf -0.0095 0.0736*** -0.0680*** (0.0109) (0.0173) (0.0134) trade -0.0070 0.0599*** -0.0420*** (0.0123) (0.0203) (0.0142) export -0.0454*** -0.0799*** -0.0271 (0.0151) (0.0246) (0.0188) audit 0.0097 -0.0042 0.0087 (0.0093) (0.0151) (0.0113) state own -0.0778* -0.1132 -0.0459 (0.0409) (0.0929) (0.0422) foreign own 0.0007 -0.0455** 0.0207 (0.0153) (0.0234) (0.0197) # of countries 30 16 14 # of observations 13300 5825 7475 Pseudo R2 0.0159 0.0296 0.0113
Note:1. Independent variable: “General Financing Obstacle” is the response to the question “How problematic is financing for the operation and growth of your business?” 1 - denotes major or severe constraint, 0 - otherwise. 2. Standard errors reported in parentheses 3. *,**,*** indicates significance at the 10%, 5% and 1% level, respectively
According to the regression results of Model 2 and Model 3 presented in Table 4, one can observe that the number of firm characteristics driving the perception of financing obstacles is found to be larger for the LDCs

Journal of Economic Cooperation and Development 121
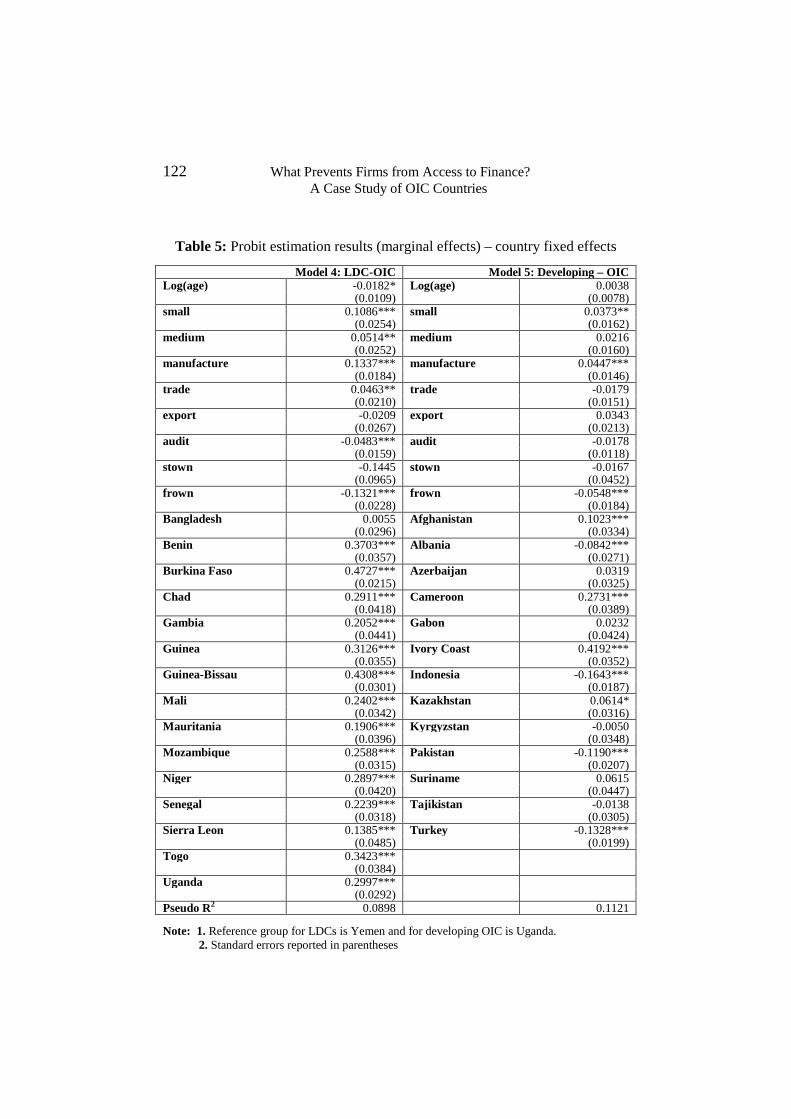
in comparison with those of the developing countries of OIC. The regression results of Model 2 described in the Table 4 indicate that age, size, sectoral origin, export status, and foreign ownership are significant predictors of financing obstacles in LDCs. However, export, ownership status and the external auditing of firms do not appear to be significant in the developing countries of the OIC (Model 3). Firms in LDCs are found to be affected unevenly across the sample with respect to challenge in financing, since almost all firm-specific characteristics of enterprises in these countries appear to be statistically significant. This may also suggest that, on the one hand, due to overall shortages in the supply of financial resources and on the other, the huge demand on financial products, entire financial systems in LDCs (including both the formal and informal sectors) seems to be very selective and risk-aversive towards firms with certain characteristics. Firm age drives the severity of concern regarding access to finance in LDCs. The marginal effects of age are both negative and statistically significant at the 1 percent level. This result suggests that younger firms in LDCs tend to face more restrictive conditions in terms of their level of access to finance. Small and medium sized firms display higher levels of concern regarding obstacles to financing when compared to large enterprises. The results also reveal that after controlling for other explanatory variables, export orientation decreases the probability that a firm rates access to finance as a serious constraint. Foreign firms complain less about access to finance than do domestic enterprises. Finally, government ownership does not appear to be statistically significant in predicting financing obstacles in the LDCs. Country-specific dummies The firm-level characteristics hold true even after controlling for country dummies as the fixed effects in the regressions. If firms are responding to country-specific differences in access to finance, differences should simply appear as fixed effects at the country level (Table 5). The number of firm-level coefficients that appear significant even after controlling for country fixed effects suggest that there is a high level of dispersion, or inequality, among firms in the LDCs (Model 4).
122 What Prevents Firms from Access to Finance? A Case Study of OIC Countries
Table 5: Probit estimation results (marginal effects) – country fixed effects
Model 4: LDC-OIC Model 5: Developing – OIC Log(age) -0.0182* Log(age) 0.0038 (0.0109) (0.0078) small 0.1086*** small 0.0373** (0.0254) (0.0162) medium 0.0514** medium 0.0216 (0.0252) (0.0160) manufacture 0.1337*** manufacture 0.0447*** (0.0184) (0.0146) trade 0.0463** trade -0.0179 (0.0210) (0.0151) export -0.0209 export 0.0343 (0.0267) (0.0213) audit -0.0483*** audit -0.0178 (0.0159) (0.0118) stown -0.1445 stown -0.0167 (0.0965) (0.0452) frown -0.1321*** frown -0.0548*** (0.0228) (0.0184) Bangladesh 0.0055 Afghanistan 0.1023*** (0.0296) (0.0334) Benin 0.3703*** Albania -0.0842*** (0.0357) (0.0271) Burkina Faso 0.4727*** Azerbaijan 0.0319 (0.0215) (0.0325) Chad 0.2911*** Cameroon 0.2731*** (0.0418) (0.0389) Gambia 0.2052*** Gabon 0.0232 (0.0441) (0.0424) Guinea 0.3126*** Ivory Coast 0.4192*** (0.0355) (0.0352) Guinea-Bissau 0.4308*** Indonesia -0.1643*** (0.0301) (0.0187) Mali 0.2402*** Kazakhstan 0.0614* (0.0342) (0.0316) Mauritania 0.1906*** Kyrgyzstan -0.0050 (0.0396) (0.0348) Mozambique 0.2588*** Pakistan -0.1190*** (0.0315) (0.0207) Niger 0.2897*** Suriname 0.0615 (0.0420) (0.0447) Senegal 0.2239*** Tajikistan -0.0138 (0.0318) (0.0305) Sierra Leon 0.1385*** Turkey -0.1328*** (0.0485) (0.0199) Togo 0.3423*** (0.0384) Uganda 0.2997*** (0.0292) Pseudo R2 0.0898 0.1121 Note: 1. Reference group for LDCs is Yemen and for developing OIC is Uganda. 2. Standard errors reported in parentheses

Journal of Economic Cooperation and Development 123
3. *,**,*** indicates significance at the 10%, 5% and 1% level, respectively In the case of developing OIC countries, the outcomes of the regressions are quite similar, but they hold less explanatory powers (Table 5). The results of Model 5 show that in the developing countries, firm-level characteristics do not adequately explain financing obstacles regardless of their size, export and auditing statuses. However, only two firm-level variables (foreign ownership and sectoral origin) are significant at the 1 percent level if controlled for country fixed effects. As the results of Table 5 suggest, the marginal effects of the variables are found to be smaller in developing countries when compared with the LDCs. For example, being a small firm increases the probability of experiencing obstacles in financing by 10 percent in LDCs versus about by 4 percent in the developing countries. Operating within the manufacturing sector decreases the perceived access to finance by 14 percent in LDCs when compared with only 5 percent in the developing OIC countries. The final point that is important to mention is with respect to the results of Table 4 and Table 5 in terms of the pseudo R-squares of the estimations. Since the dependent variables in the models involve binary responses, it is suggested that McFadden's pseudo R-square estimates as an analogous to the R-square measure for OLS regressions is used (Wooldridge, 2002). Table 4 shows that firm-level variables explain 3 percent of the variance in the financing obstacles of LDCs while this figure stands at 1 percent in developing countries. When the country dummies are entered after the firm-level variables, the pseudo R-square becomes higher for developing countries when compared with LDCs. Table 5 indicates that country dummies explain 6 percent (0.0898-0.0296) of the variance in the dependent variable of LDCs, while these dummies explain 10 percent (0.1121-0.0113) of the variance in the financing obstacles experienced by firms in developing countries. This again shows that country dummies provide the highest marginal contribution to pseudo R-square in developing countries, confirming that unobserved country differences hold the greatest explanatory power in these countries compared with the LDCs, where firm-specific variables are found to be significant determinants of the financing obstacles of firms.
124 What Prevents Firms from Access to Finance? A Case Study of OIC Countries
Country-level determinants So far, we have focused our consideration on firm-specific predictors and their effects on obstacles to financing. As described in the literature review, previous research has indicated that financial and institutional development in countries also alleviates financing obstacles. In Table 6 country-level variables were included to allow for the testing of the effects of specific country characteristics on the financing obstacles experienced by firms. These regressions also constitute a robustness test for the firm-level regressions that only controlled for country-level effects, but not for country specific determinants. According to the results of Model 6 and Model 7 in Table 6, all country level variables are found to be statistically significant in predicting financing obstacles in both groups of countries. Except for the institutional development status of a country, which is not found to be economically significant for LDCs, all other variables appear to have similar effects in both LDCs and in developing OIC countries. The firms in countries with higher levels of GDP per capita, financial intermediary and institutional development report lower financing obstacles. GDP per capita, private credit and institutional development (except for LDCs) turned out to be negative and significant at the 1 percent level. When the three variables are included simultaneously, only institutional development does not enter negatively, while GDP per capita and private credit enter negatively and significantly at the 1 percent level. These results may be due to the high correlation between the country-variables and the multicollinearity which resulted from the change in the sign of the institutional development variable.

Journal of Economic Cooperation and Development 125
Table 6: Probit estimation results (marginal effects) – country-level variables
Model 6: LDC-OIC Model 7: Developing-OIC Log(age) -0.0395*** -0.0397*** -0.0425*** -0.0328*** -0.0324*** -0.0314*** -0.0313*** -0.0320*** (0.0104) (0.0104) (0.0104) (0.0105) (0.0072) (0.0072) (0.0072) (0.0072) small 0.1880*** 0.1674*** 0.1788*** 0.1445*** 0.0211 0.0134 0.0302* 0.0091 (0.0229) (0.0235) (0.0232) (0.0240) (0.0157) (0.0157) (0.0156) (0.0158) medium 0.0956*** 0.0849*** 0.0931*** 0.0656*** 0.0258 0.0073 0.0272 0.0189 (0.0242) (0.0244) (0.0243) (0.0246) (0.0158) (0.0157) (0.0158) (0.0158) manufacture 0.0748*** 0.0849*** 0.0795*** 0.0891*** -0.0406*** -0.0246* -0.0307** -0.0337** (0.0174) (0.0174) (0.0174) (0.0175) (0.0134) (0.0137) (0.0137) (0.0139) trade 0.0556*** 0.0515** 0.0577*** 0.0475** -0.0211 -0.0129 -0.0220 -0.0138 (0.0204) (0.0204) (0.0204) (0.0205) (0.0141) (0.0148) (0.0146) (0.0149) export -0.0794*** -0.0484* -0.0669*** -0.0416 -0.0111 -0.0111 -0.0137 -0.0086 (0.0247) (0.0255) (0.0250) (0.0258) (0.0194) (0.0194) (0.0193) (0.0195) audit -0.0164 -0.0178 -0.0221 -0.0395*** 0.0135 0.0002 0.0080 0.0075 (0.0152) (0.0152) (0.0153) (0.0154) (0.0114) (0.0113) (0.0113) (0.0114) state own -0.1021 -0.1392 -0.0886 -0.1100 -0.0584 -0.0481 -0.0719* -0.0438 (0.0955) (0.0902) (0.0965) (0.0956) (0.0400) (0.0415) (0.0386) (0.0419) foreign own -0.0783*** -0.0659*** -0.0592** -0.0987*** 0.0162 -0.0147 0.0163 -0.0047 (0.0232) (0.0233) (0.0233( (0.02300 (0.0197) (0.0187) (0.0197) (0.0193) Log (GDP p.c.) -0.2288*** -0.1746*** -0.0874*** -0.0799*** (0.0227) (0.0235) (0.0062) (0.0113) Credit -0.0056*** -0.0050*** -0.0058*** -0.0041*** (0.0007) (0.0008) (0.0004) (0.0007) Institutional development -0.0296*** 0.0224*** -0.0206*** 0.0113*** (0.0032) (0.0033) (0.0017) (0.0038) Pseudo R2 0.0425 0.0367 0.0402 0.0539 0.0349 0.0321 0.0276 0.0385 Note: 1. Independent variable: “General Financing Obstacle” is the response to the question “How problematic is financing for the operation and growth of your business?”
1 - denotes major or severe constraint, 0 - otherwise. 2. Standard errors reported in parentheses 3. *,**,*** indicates significance at the 10%, 5% and 1% level, respectively

126 What Prevents Firms from Access to Finance? A Case Study of OIC Countries
Another interesting result of the regressions with country-level variables is that there are only two firm-specific variables, namely age and sectoral origin, of the firms which were found to be significant in predicting financing obstacles in developing OIC countries (Model 7). However, seven out of nine firm-level characteristics hold significance in the LDCs (Model 6). When country-level variables are included, the firm characteristics that were previously found to be significant continued to enter as statistically and economically significant in LDCs, while foreign ownership status, which was a significant predictor of financing obstacles in Table 4 and Table 5, turned out to be insignificant for the developing OIC countries. 6. Conclusions
According to the literature, access to finance has been found to be one of the most binding obstacles for firm growth. This study’s aim was to reveal the firm-level and country-specific predictors of financing obstacles in both LDCs and in developing OIC countries. Overall, age, size, external auditing status and foreign ownership predict financing obstacles in OIC countries. The results reveal that the number and content of firm-level characteristics that predict obstacles to financing in LDCs and developing OIC countries are not the same. A separate analysis of LDCs and developing OIC countries indicates that firm-level characteristics predict more of the financing obstacles in the LDCs when compared with developing OIC countries. Categorizing firms by their age, size, sectoral origin, world trade integration and ownership is found to be more useful when considering the financing obstacles in LDCs. Thus, when controlled for country fixed effects, financing inequality among firms appears to be even more prominent in LDCs when compared with the developing countries. Younger, smaller, manufacturing, domestic market-oriented and domestically owned firms report higher levels of financing obstacles in LDCs. The results also indicate that broad economic development and financial deepening are important factors in alleviating firms’ financing obstacles in OIC countries. The analysis of the regression models suggests that firms in countries with higher economic development, deeper financial intermediation, and better institutional development report lower

Journal of Economic Cooperation and Development 127
financing obstacles. Nevertheless, the findings suggest that it is hard to distinguish the effects of institutional development from the effects of financial and overall economic development in the OIC countries when we estimate the effects of these country-level variables simultaneously. Furthermore, in the developing countries of the OIC, if country-specific development variables were controlled for, it was found that access to finance seems to be independent of some firm-level characteristics such as size, export status, external auditing and ownership. However, all these firm characteristics (except export status) appear to be significant predictors of financing obstacles in the firms of LDCs.
128 What Prevents Firms from Access to Finance? A Case Study of OIC Countries
References
Ayyagari, M., A. Demirgüç-Kunt, and V. Maksimovic (2008), “How Important Are Financing Constraints? The Role of Finance in the Business Environment.”, World Bank Economic Review. Available from https://openknowledge.worldbank.org/bitstream/handle/10986/4489/wber_22_3_483.pdf?sequence=1. Beck, T., A. Demirgüç-Kunt, and V. Maksimovic (2005), “Financial and Legal Constraints to Firm Growth: Does Firm Size Matter?”, Journal of Finance Vol 60, No.1. Beck, T., A. Demirgüç-Kunt, L. Laeven and V. Maksimovic (2006), “The Determinants of Financing Obstacles.”, Journal of International Money & Finance Vol. 25 (6). Beck, T., A. Demirgüç-Kunt, and R. Levine (2007), “Finance, Inequality and the Poor: Cross-Country Evidence.”, Journal of Economic Growth 12(1):27–49. Carlin, W., M. Schaffer, and P. Seabright (2006), “Where Are the Real Bottlenecks? A Langrangian Approach to Identifying Constraints on Growth from Subjective Survey Data .”, CERT Discussion Paper no. 2006/04. Edinburgh: Center for Economic Reform and Transformation. Demirgüç-Kunt, A., and V. Maksimovic (1998), “Law, Finance, and Firm Growth.”, Journal of Finance 53(6): 2107–2137. Devereux, M., and F. Schiantarelli (1990), “Investment, Financial Factors and Cash Flow from U.K. Panel Data.”, in: G. Hubbard (ed.) Information, Capital Markets and Investment, Chicago, IL: University of Chicago Press. Dollar, D., M. Hallward-Driemeier and T. Mengistae (2006), “Investment Climate and International Integration.” World Development 34, no. 9: 1498-1516. Fazzari, S., G. Hubbard and B. Petersen (1988), “Financing Constraints and Corporate Investment.”, Brookings Papers on Economic Activity 1, 141-195.

Journal of Economic Cooperation and Development 129
George, C., R. Cull and M. Martínez Pería (2006), “Foreign bank participation and access to credit across firms in developing countries.”, Journal of Comparative Economics 34, 774-795. Greene, W. (1997), Econometric Analysis, Third Edition, Upper Saddle River, New Jersey: Prentice Hall. Hallward-Driemeier, M. and R. Aterido (2007), “Impact of Access to Finance, Corruption and Infrastructure on Employment Growth: Putting Africa in a Global Context.”, Policy Research Working Paper no. 4792. Available from http://www.businessenvironment.org/dyn/be/docs/158/Hallward-Driemeier.pdf Harrison, A. and M. McMillan (2003), “Does Direct Foreign Investment Affect Domestic Firm Credit Constraints?”, Journal of International Economics 61(1), 73-100. Hoshi, T., A. Kashyap, and D. Scharfstein (1991), “Corporate Structure, Liquidity and Investment: Evidence from Japanese Industrial Groups.”, Quarterly Journal of Economics 106(1), 33-60. International Finance Corporation (IFC) (2011), SME Finance Policy Guide. Washington, D.C: International Finance Corporation. Kaufmann, D., A. Kraay and M. Mastruzzi (2010), “The Worldwide Governance Indicators: Methodology and Analytical Issues.”, Draft Policy Research Working Paper no. 5430. Available from http://papers.ssrn.com/sol3/papers.cfm?abstract_id=1682130&download=yes Kinda, T., P. Plane And M. Veganzones-Varoudakis (2011), “Firm Productivity And Investment Climate In Developing Countries: How Does Middle East and North Africa Manufacturing Perform?”, The Developing Economies 49, no 4, 429-462. Laeven, L. (2003), “Does Financial Liberalization Reduce Financing Constraints?”, Financial Management 32(1), 5-34.
130 What Prevents Firms from Access to Finance? A Case Study of OIC Countries
Levine, R. (2005), “Finance and Growth: Theory and Evidence.” In Handbook of Economic Growth, Vol. 1A, ed. P. Aghion and Steven S. Durlauf. Amsterdam: North Holland. Oliner, D., and G. Rudebusch (1992), “Sources of the Financing Hierarchy for Business Investment.”, Review of Economics and Statistics 74(2), 643-654. Rajan, R., and L. Zingales (1998), “Financial Dependence and Growth.”, American Economic Review 88(3): 559–587. Schiffer, M. and B. Weder (2001), “Firm Size and the Business Environment: Worldwide Survey Results.”, Discussion Paper No. 43, International Finance Corporation. Sembenelli, A., and F. Schiantarelli (1996), “Form of Ownership and Financial Constraints.”, Working Paper No. 1629, World Bank. Statistical Economic and Social Research and Training Centre for Islamic Countries (SESRIC) (2011), SWOT Outlook on OIC Member Countries. Ankara: SESRIC. Kuntchev, V., R. Ramalho, J. Rodríguez-Meza and J. Yang (2012), “What have we learned from the Enterprise Surveys regarding access to finance by SMEs?”, Working Paper: World Bank. Wooldridge, J. (2002), Econometric Analysis of Cross-Section and Panel Data. Cambridge, MA: MIT Press. World Bank (WB) (2004), World Development Report 2005: A Better Business Climate for Everyone. New York: Oxford University Press.

Journal of Economic Cooperation and Development 131
APPENDIX 1
Table A.1: Country sample statistics
Year of the Survey
Number of Observations
1 Afghanistan 2008 535 2 Albania 2007 304 3 Azerbaijan 2009 380 4 Bangladesh 2007 1,504 5 Benin 2009 150 6 Burkina Faso 2009 394 7 Cameroon 2009 363 8 Chad 2009 150 9 Gabon 2009 179
10 Gambia 2006 174 11 Guinea 2006 223 12 Guinea-Bissau 2006 159 13 Indonesia 2009 1,444 14 Ivory Coast 2009 526 15 Kazakhstan 2009 544 16 Kyrgyz Republic 2009 235 17 Mali 2010 360 18 Mauritania 2006 237 19 Mozambique 2007 473 20 Niger 2009 150 21 Pakistan 2007 935 22 Senegal 2007 506 23 Sierra Leone 2009 150 24 Suriname 2010 152 25 Tajikistan 2008 360 26 Togo 2009 155 27 Turkey 2008 1,152 28 Uganda 2006 563 29 Uzbekistan 2008 366 30 Yemen 2010 477 Total - 13,300