what lessons for other regions? The case of Latin America
51
WORKING PAPER NO 185 EUROPEAN INTEGRATION: WHAT LESSONS FOR OTHER REGIONS? THE CASE OF LATIN AMERICA BY ETTORE DORRUCCI, STEFANO FIRPO, MARCEL FRATZSCHER AND FRANCESCO PAOLO MONGELLI October 2002 EUROPEAN CENTRAL BANK WORKING PAPER SERIES
-
Upload
khangminh22 -
Category
Documents
-
view
3 -
download
0
Transcript of what lessons for other regions? The case of Latin America

��������������� ��
���������������������������������������
�����������������������������
�������������������������������
���������������������������������������
�� !"#$�%&&%
� � � � � � � � � � � � � � � � � �
�����������������

��������������� ��
���������������������������������������
������������������������������
���������������������������������
�����������������������������������������
�� !"#$�%&&%� ������������������ ����������������������� �������������������� �����������������������������������������
��������������������������������������� �����!��� ������"�����#������##�"����#$$#%&���������������������� �������������'�(����)���������������*������������+�)�������,����'������-����"�)����!�������"�++� ���'�������"�������*� ����*�����++��������(�������������������������������������� ����������&���������������������������������(�� �����(��.�����&����������������� ��������������������& ������������/����������������� ����������������������������������������� ����������������� ���&
# ������������� ���0 *���'�����1"1
� � � � � � � � � � � � � � � � � �
�����������������

� ������������ ��������
������� ���������������
���������������� !��
"�� �#
$���� ������� $�����%&������
���������������� !��
"�� �#
'� ��&�� ()�����))�
*����� &���+,,---.�%/.��
��0 ()�����))����
'� �0 )���))�%/�
��������������
����������������������������������������������������������������������������������������������
��������������������������������������������������������������������������
�����������

������������ �������������������������� �
��������
��������
�� ����������������� �
�� ������������ �
�� ������������������������������������������������������� ���!����"��������#������� $��� #���������� $��� %�����������������������������������������������������������������&���
�������������� "' (��� ����!!�������������������������#������� �)
�� *��!������������������������������ ���!������+������������ ����� #����������������������������� ����� ,�����-���!�������������������������������� ���!������+������������
�-������� ������� .-��-��& ������� /��������-������������������������-���������� �$
� *��!��������������������������������������������0������������������� �)�� #���������� �)�� ,������������������������������������������������������� ��
���� 1��������������� " ������ 1�����������+������������ ��
�� ���������������&������������������������������������������0�����������������+���������������������� ���!������!������� ��
�� *���������������2� ��
1��������� �(
�!!������� ��
���!����*�������3��2�&��2����!�!��������� �

������������ ��������������������������
Abstract
This paper tests for the hypothesis that institutional integration interacts with economic integration atthe regional level. In particular, we ask what lessons can be drawn from the European experience withregional integration for Latin America. Several indicators of institutional and economic integration forboth the EU and Latin America are presented. We find that Latin America is currently lesseconomically integrated not only than the European Union today, but in some cases even than the EUat the beginning of its regional integration process. A cluster analysis illustrates that the link betweeninstitutional and economic integration has worked both ways throughout the whole EU experience.The more institutional integration went beyond the creation of a customs union and moved towards acommon market and an economic and monetary union, the deeper economic integration turned out.Increasing economic integration in turn corroborated and sustained the process of institutionalintegration.
JEL classification: [E42, F15, F33 and F41]Keywords: Regional integration in Europe and Latin America, intra-regional exchange rate variability

������������ �������������������������� �
Non-Technical Summary
Latin American countries are currently confronted with two main options concerning theirprospects for regional integration. The first option relates to the choice of partners. Costs and benefitsof so-called “South-South” arrangements – i.e., intra-regional arrangements such as the CommonMarket of the South (Mercosur) – need to be compared with those of “North-South” arrangements -i.e., inter-regional arrangements such as the Free Trade Area of the Americas (FTAA). The secondoption, not mutually exclusive with the first, regards the depth of integration: the desirability of freetrade arrangements has to be weighed vis-à-vis deeper forms of integration, such as a common marketor even a monetary union at some point in time, which is likely to be more complex.
Assuming that deeper regional integration is one of the possible scenarios for Latin America,this paper asks what lessons can be drawn from the European experience that started in the 1950s. Wecontribute to this growing debate by testing the hypothesis that institutional integration has interactedwith economic integration at a regional level. An original measure of institutional integration isdeveloped and presented here. It comprises five main institutional stages: free trade area, customunions, common market, economic union and total economic integration (in which some economicpolicies are conducted at the supranational level). Economic integration is captured by severalmeasures of real, financial and monetary integration as also suggested by the optimum currency area(OCA) theory. They include measures of the synchronisation of the business cycle, convergence ofinflation rates, exchange rate variability, trade openness and integration, convergence of interest rates,and income convergence.
The paper finds that Latin America currently fulfils these OCA criteria to a lesser extent thanthe European Union (EU) today, but in most cases even to a lesser extent than the EU in the 1960s and1970s. By means of a cluster analysis the paper shows that the link between institutional and economicintegration has worked both ways throughout the whole EU experience. The more institutionalintegration went beyond the creation of a customs union and moved towards a common market and aneconomic and monetary union, the deeper economic integration turned out. Increasing economicintegration, in turn, corroborated and sustained the process of institutional integration.
The key lesson from the European experience that this paper draws for Latin America is,therefore, that intensifying regional institutional integration indeed plays an important role indeepening and accelerating the process of regional economic integration. The importance of deepeninginstitutional integration for economic integration in Europe can be taken as a valuable example for thefuture path of integration in Latin America. However, it should be emphasised that each process ofregional integration towards ever-advanced stages takes time and entails a strong, and sustained,political commitment. For example, monetary unification among several European countries hasrequired more than 25 years from the first efforts of exchange rate stabilisation in the 1970s. Anequally important lesson is that, while deeper economic integration calls for an effective institutionalframework, the institutional development is in turn feasible only if the process of economic integrationsustains it.
While the analysis in the paper may be extended in several ways, a few policy implicationscan already be drawn from the results of this paper. In particular, the European experience suggeststhat the currently modest level of economic integration in Latin America could be interpreted as anearly stage of a process of deepening regional integration. In particular, such integration would bemore likely to succeed in Latin America to the extent that realistic objectives are set in line with thecurrent regional economic conditions and the prevailing level of political commitment. In this regard,the European experience shows that a concerted effort towards regional integration in Latin Americamay help create a sustainable, virtuous circle between deeper institutional and economic integration atthe regional level.

������������ ���������������������������
1. Introduction
Latin American countries are currently confronted with two main options concerning theirprospects for regional integration. The first option relates to the choice of partners. Costs and benefitsof so-called “South-South” arrangements – i.e., intra-regional arrangements such as the CommonMarket of the South (Mercosur) – need to be compared with those of “North-South” arrangements –i.e., inter-regional arrangements such as the Free Trade Area of the Americas (FTAA). The secondoption regards the depth of integration: the desirability of free trade arrangements has to be weighedvis-à-vis deeper forms of integration, which are likely to be more costly and lengthy to undertake.
These two options -- i.e., the choice of partner and the depth of integration -- are not mutuallyexclusive, but may complement each other over time. As argued, for instance, in World Bank (2000)and Scandizzo (2002), North-South arrangements may be preferable if their objective is only theestablishment of a free trade area1, whereas South-South arrangements may bring substantial benefitsprovided that they pursue the liberalisation of factor movement, policy harmonisation and policy co-ordination.2 For Latin America this would imply that, first, developing relations with partners in theregion can go hand in hand with trade liberalisation vis-à-vis other parts of the world; and second, thatregional integration could go beyond, or much beyond, trade liberalisation.3
The main goal of this paper is to test for the hypothesis that institutional integration interactswith economic integration at the regional level. In particular, we ask what lessons can be drawn fromthe European experience with regional integration for Latin America. We proceed by first measuringand comparing several indicators of institutional and economic integration for both the EU and LatinAmerica. Institutional integration can be defined as the outcome of joint policy decisions designed toaffect the depth and breadth of regional integration over time. The paper develops and presents anoriginal measure of institutional integration, based on the classification of regional integrationdeveloped by Balassa (1961). Economic integration is captured by several measures of real, financialand monetary integration in a given region. In particular, we look at a number of variables suggestedby the optimum currency area (OCA) theory. These include measures of the synchronisation of thebusiness cycle, convergence of inflation rates, exchange rate variability, trade openness andintegration, convergence of interest rates, and income convergence.
By employing a cluster analysis the paper then tackles a series of inter-related questions. Howintegrated are the economies within Europe and within Latin America? Can one identify homogenousgroups of countries within regions? And if so, what makes countries within groups similar? How didreal and nominal economic integration proceed over time?
To our knowledge, this approach -- based on the analysis of the relationship betweeninstitutional and economic integration -- is a rather novel one.4 In recent years a rich literature hasexamined different aspects of economic policies in the Latin American region. Calvo and Mendoza(1997) and Milesi-Ferretti and Razin (1997) have examined the sustainability of current accountsimbalances and fiscal policies in Latin American countries. Another branch of literature has focussedon the choice of exchange rate arrangements and the timing of monetary union in Latin America: seefor example Eichengreen (1998), Berg, Borensztein and Mauro (2000), and Fratianni and Hauskrecht(2002). Alberola, Busián and Fernández de Lis (2002) discuss the links between economic integration,macroeconomic stability and structural reforms. García Herrero and Santillán (2002) assess andcompare the degree of financial sector development across Latin American countries. Hochreiter,
1 South-South free trade arrangements would in fact entail trade diversion from more efficient exporters outside the region to
less efficient regional producers.2 South-South arrangements may benefit from deeper regional integration in terms of economies of scale, competition effects
and improved resource allocation.3 This view is currently mirrored both in Latin American countries’ interest in pursuing trade agreements with the NAFTA
and the EU, and in the final objectives of the various Latin American sub-regional arrangements.4 Ben-David (1993) uses quite a similar approach, but he only focuses on the link between the timing of trade reform and
income convergence among countries.

������������ �������������������������� $
Schmidt-Hebbel and Winkler (2002) discuss the issue of the long-run sustainability of a monetaryunion in Latin America vis-à-vis the European experience.
As one would have expected, Latin America currently fulfils the optimum currency area(OCA) criteria to a lesser extent not only than the European Union (EU) today, but ins some caseseven than the EU at the beginning of its regional integration process.5 The cluster analysis shows thatthe link between institutional and economic integration has worked both ways throughout the wholeEU experience. The more institutional integration went beyond the creation of a customs union andmoved towards a common market and an economic and monetary union, the deeper economicintegration turned out. Increasing economic integration in turn corroborated and sustained the processof institutional integration.
The paper is organised as follows. Section 2 presents the index of institutional regionalintegration describing, which describes the main stages of institutional co-operation among selectedsub-groups of European and Latin American countries, each taken as a whole. Section 3 presentssome selected indicators of economic integration, including some measures of exchange ratevariability in the two regions. Section 4 conducts a cluster analysis addressing the questions spelledout above. Section 5 presents some concluding remarks.
2. An institutional index of regional integration for the European Union and Mercosur
We trace here the main stages of institutional integration by constructing an index ofinstitutional regional integration for the EU. We then apply this index also to Mercosur.6 Afterexplaining our methodology (in Section 2.1, but see also Appendix 1 for greater detail), we review themain indications that can be drawn from the progression of this index within the EU and Mercosurover time (Sections 2.2 and 2.3, respectively).
2.1 Methodology
In his seminal contribution, Balassa (1961) identified five main stages of regional integration7.Such stages can here be defined as the outcome of policy decisions taken by regionalintergovernmental fora and/or supranational institutions in order to affect the depth and breadth ofregional integration. In this section such decisions are considered per se, i.e. without analysing theiractual impact on the degree of integration as measured by a number of economic variables. The indexis then used in Section 4 to test for the hypothesis that institutional integration interacts with economicinterdependence at regional level. Using examples drawn both from current regional arrangements inthe world and from the EU experience, the five stages can be rephrased as in Table 1.
For the purposes of this paper, the overall degree of institutional integration achieved within aregional arrangement at a given point in time can be quantified by assigning values (“scores”) to thelevel of integration recorded, for each of these five stages, throughout the relevant period (in our case,1957-2001 for the EU and 1991-2001 for Mercosur). This allows us to measure, and thereforecompare, the EU and Mercosur in a relatively homogeneous way, although with some unavoidabledegree of discretion and judgement, which should be taken into account as a general caveat.
Table 1. The five “Balassa” stages of regional integration
5 Fiscal dominance, insufficient trade integration and business cycle synchronisation, and weaknesses in the financial system
are usually listed as crucial deficiencies. This type of conclusion can be found in most of the literature: among others,Bayoumi and Eichengreen (1994), Eichengreen (1998), Berg, Borensztein and Mauro (2000), and Belke and Gros (2002).
6 Mercosur members are Argentina, Brazil, Paraguay and Uruguay.7 An ultimate step, which goes beyond the five stages identified in the Balassa’s contribution and is not discussed in this
paper, is Political Union.

������������ ��������������������������4
THE FIVE STAGESOF REGIONALINTEGRATION
DEFINITION SOME EXAMPLES
1. Free Trade Area(FTA)
An area where tariffs andquotas are abolished for importsfrom area members, which,however, retain national tariffsand quotas against thirdcountries
- In 1992 ASEAN countries launched the ASEANFree Trade Area (AFTA) plan. On 1 January2002 six out of ten ASEAN countries reducedinternal tariffs on most goods (so-called“Inclusion List”) to levels ranging between zeroand five percent. The whole ASEAN area isscheduled to become a fully-fledged free tradearea in the coming years.
- The USA, Canada and Mexico are in the processof completing a North-American FTA(NAFTA): many tariffs were eliminated alreadyin 1994, with others being phased out overperiods of 5 to 15 years
2. Customs Union(CU)
A FTA setting up commontariffs and quotas (if any) fortrade with non-members
- European Economic Community since 1968- The MERCOSUR aims at becoming a fully-
fledged CU by 20063. Common Market(CM)
A CU abolishing non-tariffbarriers to trade (product andservices markets integration) aswell as restrictions on factormovement (factor marketintegration)
- European Community since 1993 (establishmentof the European Single Market). The CM wasalready set up as an objective under the Treatyof Rome
- The Andean Community aims at becoming acommon market by 2005
4. Economic Union(EUN)
A CM with a significant degreeof co-ordination of nationaleconomic policies and/orharmonisation of relevantdomestic laws
- European Union nowadays
5. Total EconomicIntegration (TEI)
An EUN with all relevanteconomic policies conducted atthe supranational level, possiblyin compliance with theprinciple of subsidiarity. To thisaim, both supranationalauthorities and supranationallaws need to be in place
- The euro area (i.e., 12 out of 15 countries of theEuropean Union) can be currently classifiedsomewhere between an EUN and a TEI.Supranational authorities and rule making wereestablished already with the Treaty of Rome in1957, and subsequently enhanced
We assign scores from 0 to 25 to the degree of regional integration achieved over time in thedevelopment of, respectively, a Free Trade Area/Customs Union (FTA/CU, considered jointly), aCommon Market (CM), an Economic Union (EUN), and an area with Total Economic Integration(TEI). By summing up the scores achieved in each moment in time (we use monthly data), an index ofinstitutional regional integration is obtained which can range between 0 (no economic integration atall) and 100 (full economic integration, including monetary and financial integration). Scores areassigned on the basis of the specific indicators and criteria presented in Appendix 1. Two generalcriteria should be here borne in mind. First, to the extent possible scores are not assigned on the basisof the year when a certain decision was taken (e.g. Treaty of Rome in 1957), but rather the year andmonth when such a decision started being actually implemented (e.g. lowering of EU-6 internal tariffsbetween 1959 and 1968). This implies that those projects which were never implemented (e.g. WernerPlan) are not taken into account. Second, especially in the European experience some Balassa stagestend to develop in parallel, which implies that in this case the term “stage” could be misleading. Forinstance, when it became a customs union (1968), EU-6 had already one fundamental characteristic ofTEI, i.e. a number of supranational institutions and the structuring of integration through Communitylaw. This entails that numbers can be assigned in parallel to each of the five stages (see Appendix 1).

������������ �������������������������� (
The institutional index of regional integration is constructed for:(i) the EU-6 founding Member States taken as a whole (see Figure 1 and, for greater detail,
Appendix 1);(ii) Mercosur taken as a whole (Figure 2 and Appendix 1).
The reason why we prefer using the composite index only for EU-6 instead of EU-15 is thatthe path followed by individual EU Member States in joining the EU has been quite heterogeneousover time.8 Each of these groupings or individual countries proceeded with its own speed and path inthe process of integration with other partner countries9. This implies that a composite index for theEU-15, though feasible, would be more difficult to interpret than for EU-6.
The methodology used to build up the composite index for EU-6 is described in Appendix 1,where the criteria and indicators used to assign scores to each of the Balassa stages are illustrated.Appendix 1 also reports the specific scores given to each event in the process of regional integration(see Table A1.1), and, what is more important, summarises the analysis in a table providing anhistorical perspective (Table A1.2). This allows showing how the institutional index of regionalintegration evolved in the EU-6 area between 1957 and 2001 in a more analytical way than as shownin Figure 1. The same methodology has been used, mutatis mutandis, to construct the index forMercosur taken as a whole (Table A1.3).
2.2 What does the institutional index of regional integration tell us with regard to the EU?
Figure 1, and also Table A1.2 in Appendix 1, outline the evolution of the composite index ofinstitutional regional integration for EU-6 from 1957 to 2001. Two main features of the Europeanprocess of integration emerge.
First, the EU/euro area10 obtains a score as high as 86 out of 100 at the end of 2001 (see Figure1). The EU/euro area can indeed claim to have achieved, at the same time, a developed commonmarket, strong policy co-ordination, a single monetary and exchange rate policy, and – which can beseen as a major requirement for the aforementioned achievements – supranational institutions andsupranational laws enforced by the courts. If one used the EU as a yardstick to measure regionalintegration processes around the world, it would be expected that the other existing arrangementsobtain a much lower score (see Section 2.3 as far as Mercosur is concerned). Nevertheless, even using,as we do, a model of integration both based on the principle of subsidiarity and not considering theultimate stage of Political Union, the EU does not obtain the highest score possible. Further steps inthe deepening of European regional integration can be envisaged especially in the areas of labourmobility, harmonisation of national structural policies (e.g. in the area of labour market flexibility),further deepening of integration in European capital markets, and co-ordination of thosemacroeconomic policies which are not unified.
Second, using EU-6 as the benchmark, we can distinguish three sub-periods in the process ofregional integration (Figure 1). The first period, characterised by faster integration, proceeds fromMarch 1957 (Treaty of Rome) to July 1968 (completion of the customs union). By that time more than
8 One should in fact distinguish among these country groupings or individual countries: EU-6 (i.e., BE, GE, FR, IT, LU, NL);
Ireland (IE), which joined the EU in 1973; Denmark and United Kingdom (DK, UK), which also joined the EU in 1973;Greece (GR), which joined the EU in 1981; Spain and Portugal (ES, PT), which joined the EU in 1986; Austria and Finland(AU, FI), which joined the EU in 1995; and Sweden (SE), which also joined the EU in 1995.
9 EU-6 countries followed a relatively homogeneous path. As regards the 9 remaining EU Member States, IE hadimplemented all measures to participate in the CU already by 1977, and became a member of the euro area in 1999. DKand UK also entered the customs union in 1977, but do not participate in EMU. DK, however, participates in the ERM II,which is not the case of UK. GR accomplished the transition to the CU in 1986, and adopted the euro in 2001. ES and PTbecame EU members in 1986, entered the CU only in 1995, and EMU in 1999. AU and FI became members of both the EUand the CU in the same year (1995), and adopted the euro in 1999. Finally, SE differs from AU and FI as it is does notparticipate in EMU, but differently from DK and UK does not have an “opting-out” clause.
10 It should be noted that, since the adoption of the euro in 1999 (2001 for Greece), all 12 euro area Member States havereached the same level and follow the same path of institutional integration. This implies that since 1999 the groupings“EU-6” and “euro area” are equivalent in terms of score in Figure 1.

������������ ���������������������������)
half of the overall institutional integration process had been already completed. In July 1968 the EUwas indeed much more than a customs union, since it already had some genuine characteristics ofsubsequent Balassa stages (see Appendix 1, Table A1.2). The second period can be identified betweenthe start of the 1970s and the mid-1980s, and is characterised by sluggish integration (so-called “euro-scepticism”), with the noteworthy exception of the EMS start in March 1979. Finally, in the third,most recent period a new, considerable acceleration in regional integration can be observed: as aresult, the EU/euro area can currently be classified somewhere between an EUN and a TEI.
If the core proposition discussed in this paper is true – i.e., the proposition that regionalinstitutional integration interacts with regional economic integration – one would expect that trends inEU economic integration between 1957 and 2001 follow a path similar to that we have tracked forinstitutional integration. This will be discussed in Section 4.
Figure 1
N.B.: (1) EU-6 is here taken as a whole (2) 1957 = 0 (3) Highest score possible for regional integration: 100
2.3 An application of the index to Mercosur
Since the early 1990s, a process of revitalisation and renewal of Latin American sub-regionalintegration11 has accompanied the structural economic reforms being implemented in the countries ofthe region. Mercosur, created in 1991 by Argentina, Brazil, Paraguay and Uruguay, soon came toprominence for the economic area being developed in the Southern Cone of South America, with apopulation of over 220 million and a GDP in excess of USD 900 billion. Mercosur’s final objectives 11 The process of regional integration in Latin America does not, in fact, start in the 1990s. Examples of regional integration
in the earlier periods are the Cartagena Agreement founding the Andean Group (1969) and the Chaguaramas Treatyfounding the Caribbean Community (1973).
INSTITUTIONAL INDEX OF INTEGRATION FOR EU-6 (BE, DE, FR, LU, IT, NL) (1957- 2001)
0
10
20
30
40
50
60
70
80
90
100
1957
1958
1959
1960
1961
1962
1963
1964
1965
1966
1967
1968
1969
1970
1971
1972
1973
1974
1975
1976
1977
1978
1979
1980
1981
1982
1983
1984
1985
1986
1987
1988
1989
1990
1991
1992
1993
1994
1995
1996
1997
1998
1999
2000
2001
Customs Union (1968)
Monetary Union (1999)
Common Market (1993)
EMS (1979)
CAP (1962)

������������ �������������������������� ��
are ambitious: to create a common market and to co-ordinate the economic policies of its membercountries. Equally striking was the single-mindedness with which Mercosur pursued its objectives inthe first half of the 1990s, which led to the satisfactory conclusion in December 1994 of what wasknown as the transition phase (see Appendix 1, Table A1.3). Partly as a result of these institutionaldevelopments (see Eichengreen (1998) for other explaining factors), the share of intra-regional trade inaggregate Mercosur exports rose throughout the decade, from 9% in 1990 to 25% in 1998 (see Section3 for greater detail). Despite the uncertainty in and setbacks to the process of integration caused by the1999 devaluation of the Brazilian real and the Argentine crisis since end-2000, Mercosur remains thecore sub-regional arrangement in Latin America. It might be revitalised and deepened in the comingyears, also as a result of a new wave of initiatives in the aftermath of the Argentine crisis.
Figure 2
N.B.: (1) The four Mercosur member States and EU-6 are here taken as a whole (2) 1957 = 0 (3) Highest score possible for regional integration: 100
Despite its achievements, Mercosur ranks much lower than the EU in terms of degree ofregional integration, with an index accounting for 23 out of 100 at the end of 2001 (i.e., a scorecomparable to that achieved by EU-6 already in the mid-1960s). Using the EU as a yardstick, theindex of institutional regional integration for Mercosur accounts for only one quarter of the EU indexat the end of 2001 (see Figure 2 and Appendix 1, Table A1.3). This can be attributed not only to the“quantity” of integration – i.e., the fact that Mercosur obtains high scores only as a free trade area anda customs union – but also to its “quality”.
It is in the latter field – i.e., how the free trade area and customs union are actuallyimplemented – that Mercosur might consider drawing some lessons from the European experience.First, differently from the EU, Mercosur countries not only can still keep their own tariffs for a list ofexempted goods, but are empowered to withdraw from their commitments as both the Brazilian andArgentine experiences confirm. This reversibility is among the main reason why Mercosur still ranksbelow the EU of 1968 as a FTA/CU. Second, the Mercosur treaty is intergovernmental in nature, notsupranational (see for instance Laird (1997)). As a result, Mercosur’s decisions have no force as suchand need to be implemented by corresponding national measures, with no obligation for Member
0
10
20
30
40
50
60
70
80
90
100
Mar
-57
Mar
-60
Mar
-63
Mar
-66
Mar
-69
Mar
-72
Mar
-75
Mar
-78
Mar
-81
Mar
-84
Mar
-87
Mar
-90
Mar
-93
Mar
-96
Mar
-99
MercosurEU-6
Institutional index of regional integration for Mercosur (1991-2001) as compared to EU-6 (1957-2001)

������������ ����������������������������
States to comply with common market rules. There is indeed no supranational court through whicheither a member country or the Mercosur Secretariat can enforce treaty provisions on another memberor a private party. This implies that the existence of several Mercosur bodies cannot be weighed asmuch as for EU bodies.
3. Comparing economic integration in Europe and Latin America
We now turn to the issue of economic integration and how economic integration has developedover time in both Europe and Latin America. An obvious starting point is the optimum currency area(OCA) theory, which was first developed by Mundell (1961), McKinnon (1963), and Kenen (1969). 12
In essence, OCA theory analyses whether the pre-conditions exist for establishing a monetary unionwith a common currency and a common monetary policy among different countries. The question ofwhether countries are sufficiently integrated in order to form a monetary union is not the one we areaddressing in this paper. However, OCA theory can be a useful tool for helping us define and measureeconomic integration.
3.1 Measuring economic integration
To measure economic integration, we look at variables of economic integration suggested bythe OCA theory, as well as some other variables that have not been explicitly mentioned within thisframework but which help complement a more comprehensive definition of economic integration.Most of the employed variables are commonly used in the empirical analysis of OCA criteria. Thissub-section outlines the definition of and rationale for including them in our analysis.
Synchronisation of the business cycle
A high degree of synchronisation of the business cycle across two countries indicates that thebusiness cycle in each country is driven largely by common external shocks, or that the economies ofthe two countries are highly interdependent (Artis and Zhang, 1998a and 1998b). The highersynchronisation, the lower is the cost of pursuing common policies and deepening integration.Following Baxter and Stockman (1989), we use the cross-correlation of monthly industrial production�������� ��������� ��� ���� �� ��������������� ������ ����� � �� ������� �� ���� ��� ��� ������� ��synchronisation of the business cycle.
Convergence of inflation rates
Deepening institutional integration is most beneficial if inflation rates are already reasonablysimilar among the member states participating in the regional arrangement. Inflation convergence, forinstance, is a key element of the Maastricht Treaty for the creation of a single European currency. Wemeasure the convergence of inflation as the difference of the 12-month percentage changes in theconsumer price indices, and alternatively as the correlation coefficient, for each country with theregion’s average.
Exchange rate variability
Some authors see a low level of exchange rate variability as a corollary of the OCA propertyon convergence/similarity of inflation rates. The terms of trade should indeed exhibit narrowfluctuations between countries pursuing intra-regional exchange rate stability or even planning toshare a single currency (see for example Eichengreen 1990). If real exchange rate variability is lowand currencies are stable vis-à-vis each other, the cost of abandoning exchange rate flexibility or evenadopting a common currency is lower. For the European country groupings we take, as our measure ofintra-regional exchange rate variability, the “region” average of each country’s moving average
12 For a recent survey of the OCA theory see Tavlas (1993), DeGrauwe (2000), McKinnon (2001), Mongelli (2002).

������������ �������������������������� ��
variance of the log difference of the real/nominal bilateral exchange rate vis-à-vis the de facto anchorcurrency, the Deutsche Mark. For Latin America, being not able to identify an anchor country, we takethe same measure using each country’s average bilateral exchange rates variability vis-à-vis all otherregional currencies.
Trade openness and integration
OCA theory implies that different countries can benefit more from reducing or eveneliminating exchange rate variability if they already trade strongly with each other. We employ twotypes of measures on the trade side. First, we measure the degree of regional trade integration as theratio of intra-regional trade to total trade. The potential drawback of this measure is that this ratio maynot increase even if intra-regional trade rises strongly because of an even higher growth rate in extra-regional trade. We therefore use as an alternative measure the ratio of intra-regional trade to GDP asan indicator of trade openness.
Financial market integration
One important area that has not been sufficiently discussed in the OCA literature is the degreeof financial market integration. Countries may benefit from financial market integration by allocatingresources more efficiently and reducing transaction costs. Financial market integration permits also tocushion temporary adverse disturbances through capital inflows – e.g. by borrowing from surplusareas or de-cumulating net foreign assets that can be reverted when the shock is over. Under a highdegree of financial integration even modest changes in interest rates would elicit equilibrating capitalmovements across partner countries. This would reduce differences in interest rates, easing thefinancing of external imbalances. In this paper we employ two proxies for financial market integration.The first is the correlation of monthly equity market returns across countries. We also investigate thedegree of financial market openness, which is defined as the ratio of equity market capitalisation toGDP for each country.
Convergence of interest rates
The convergence of interest rates is used as a measure of financial market integration but alsoof the degree of similarity of the monetary policy stance across countries. The rationale for using thismeasure is that the higher the initial similarity of interest rates, the less is the cost for each country bymoving to a common monetary policy. We test in the analysis both the correlation of nominal short-term interest rates and of short-term real interest rates, using CPI inflation rates as deflator.
Income convergence
More economic integration should also enhance the convergence of income across countriesand regions. Again, we refer to an argument of resource allocation in this regard: more integration andopenness should lead to more mobility of factors of production, which may result in convergence ofincome levels. As a proxy, we use the real GDP per capita percentage difference to the region’saverage. The real GDP per capita numbers were obtained from the Summers and Heston (1988)database and interpolated for the past few years.
3.2 The development of economic integration in Europe and Latin America over time
3.2.1 Overview
As a starting point, it is necessary to specify the country groupings and time periods we arefocusing on. As for the index of institutional regional integration, we look at EU-6 and Mercosurcountries. In addition, for Europe we also look at the euro area, and for Latin America at a large subsetof countries which we call “Latin America 11”13. For Europe, we consider the period 1957-2001 andthe following six sub-periods:
13 For the purposes of this paper, Latin America 11 includes Mercosur countries, the members of the Andean Community
(Bolivia, Colombia, Ecuador, Peru and Venezuela), Chile and Mexico.

������������ ���������������������������
Sub-period Main characteristics
March 1957 – August 1971 Bretton Woods system of fixed exchange ratesSeptember 1971 – February1979
Very volatile exchange rates; failed attempt to establish an exchange ratemechanism (the “Snake”); major recession in 1973-75
March 1979 – August 1987 “Soft ERM”: introduction of EMS with frequent realignments, especiallyuntil 1983
September 1987 – December1992
“Hard ERM”: no realignments (apart from a realignment associated to thelira entering the narrow ERM bad in January 1990) until the EMS crisis inSeptember 1992; integration of factor markets, culminating in theestablishment of the European Single Market on 1 January 1993
January 1993 – December1998
“Pre-EMU”: Enhanced nominal convergence and run-up to monetary union
January 1999 onwards European Monetary Union (EMU)
Due to data availability, we can instead look only at a shorter time period (1980-2000) forLatin America. We chose the following three sub-periods for the purpose of analysing the timechanges of economic integration:
Sub-period Main characteristics
January 1980 – December 1986 Latin American debt crisis; relatively moderate nominal volatilityJanuary 1987 – December 1993 Highly volatile exchange rates, and high rates of inflation or hyperinflation
for several Latin American countriesJanuary 1994 – December 2000 Re-structuring and stabilisation programmes in several economies;
strengthening of the process of regional integration
Table 2 shows the list of the eleven above-described indicators of economic integration for thesix sub-periods for Europe and the three sub-periods for Latin America. Figure 3 provides moredetailed examples of the time dynamics of integration. This figure compares the EU-6 countries withMercosur countries, and show 5-year moving averages for some of the selected indicators of regionaleconomic integration.
As expected, both EU-6 and the euro area are generally a much more integrated economic areathan Latin America over time (not only than the selected 11 Latin American countries, but also thanMercosur countries). Overall, comparing the levels of economic integration emerging from the abovetables and figures, one can conclude that the degree of economic integration in Latin America isroughly close to that in Europe in the 1960s and 1970s.
As Table 2 illustrates, exchange rate variability in Latin America has been substantiallyhigher than in Europe (even with respect to the 1970s, a period characterised by high exchange ratevariability in Europe as well). Since changes in the exchange rate arrangement have been of keyimportance for understanding the integration process in Europe, in the next sub-section 3.2.2 weprovide a more detailed discussion on the development of exchange rates. Regional trade integrationand openness are in Europe much larger than in Latin America on average. The interest rates andinflation rates show a much higher degree of co-movement in Europe than in Latin America. Inparticular, the correlation of nominal interest rates has been around 60% within the euro area duringthe pre-EMU period, but only around 30% for the Latin American countries. Finally, the higher degreeof economic integration is also reflected in the integration of financial markets. Equity market returncorrelations in Europe are at around 50% or higher, which is around twice as high as the correlation inLatin America.
As Figure 3 shows, business cycle correlation, inflation convergence, real interest ratecorrelation and financial market integration have all been persistently higher within the EU-6 area thanamong the Mercosur countries, despite some degree of variability in the variables. Similarly, EU-6countries have also a substantially higher degree of real per capita GDP convergence and tradeopenness than Mercosur.

������������ �������������������������� ��
Tab
le 2
Sele
cted
indi
cato
rs o
f ec
onom
ic in
tegr
atio
n in
Eur
ope
and
Lat
in A
mer
ica
Bus
ines
scy
cle
corr
elat
ion
Rea
l pe
rca
pita
GD
P%
diff
eren
ce
Infla
tion
% r
ate
corr
elat
ion
Rea
l in
tere
stra
teco
rrel
atio
n
Nom
inal
inte
rest
rat
eco
rrel
atio
n
Rea
lex
ch.
rate
vola
tility
Nom
inal
exch
. ra
tevo
latil
ity
Tra
dein
tegr
atio
nT
rade
open
ness
Fin
anci
alm
arke
tin
tegr
atio
n
Fin
anci
alm
arke
top
enne
ss
1957
- 7
00.
212
23.3
380.
209
0.33
40.
537
9.08
34.
633
61.0
8026
.990
NA
NA
1971
- 7
80.
533
19.8
450.
470
0.32
00.
240
18.8
7816
.629
63.2
1132
.976
0.18
97.
354
Eu
ro a
rea
1979
- 8
70.
298
18.7
150.
705
0.24
20.
273
12.4
6210
.868
63.0
1237
.724
0.14
09.
466
1988
- 9
20.
309
17.1
130.
353
0.36
10.
482
10.2
397.
704
70.6
0242
.039
0.46
615
.625
1993
- 9
80.
417
15.2
130.
335
0.51
20.
596
10.4
709.
075
66.1
1340
.399
0.63
331
.419
1999
- 2
001
0.33
414
.073
0.69
20.
483
1.0
4.23
50.
060
.426
45.5
240.
486
81.6
29
1957
- 7
00.
282
7.61
20.
256
0.46
20.
669
7.21
93.
937
62.3
8130
.442
NA
NA
1971
- 7
80.
791
6.42
30.
508
0.34
30.
473
14.9
2314
.066
65.7
4939
.062
0.51
48.
931
EU
619
79 -
87
0.51
35.
168
0.88
90.
228
0.72
38.
344
7.55
764
.765
44.4
850.
336
11.4
5619
88 -
92
0.36
85.
172
0.36
80.
443
0.74
47.
605
5.52
569
.865
47.2
910.
698
20.2
3719
93 -
98
0.51
54.
887
0.53
90.
654
0.80
48.
220
6.74
665
.790
42.8
990.
727
37.3
5319
99 -
200
10.
576
4.72
20.
817
0.49
91.
03.
096
0.0
60.5
0350
.956
0.59
985
.552
LA
TIN
1980
- 8
60.
469
32.0
910.
194
0.07
70.
093
106.
0590
.35
17.0
266.
236
NA
NA
AM
ER
ICA
1987
- 9
30.
240
30.1
540.
204
-0.0
150.
003
78.2
475
.62
19.7
767.
844
0.20
0N
A11
1994
- 2
000
0.32
032
.955
0.31
1-0
.014
0.32
931
.89
33.3
327
.630
10.2
000.
350
NA
ME
RC
O-
1980
- 8
60.
687
23.8
660.
321
0.18
50.
094
78.3
067
.36
13.4
583.
709
NA
NA
SU
R19
87 -
93
0.42
721
.876
0.27
9-0
.008
0.01
091
.88
92.6
817
.382
5.92
40.
202
NA
1994
- 2
000
0.45
825
.825
0.43
3-0
.015
0.29
523
.42
22.1
530
.311
8.41
20.
384
NA
Not
e: C
orre
latio
n an
d di
ffere
nce
mea
sure
s ar
e re
lativ
e to
reg
ion
aver
age.
See
tex
t fo
r de
finiti
on o
f va
riabl
es.

������������ ����������������������������
Fig
ure 3
Co
mp
arin
g E
co
no
mic
In
teg
ra
tion
in
La
tin
Am
eric
a a
nd
Eu
rop
e
Rea
l in
tere
st r
ate
corr
elat
ion
An
nu
al m
ovi
ng
ave
rag
es
-0.10
0.1
0.2
0.3
0.4
0.5
0.6
1960
1963
1966
1969
1972
1975
1978
1981
1984
1987
1990
1993
1996
1999
EU
6M
erco
sur
Infl
atio
n c
on
verg
ence
An
nu
al m
ovi
ng
ave
rag
es
0
0.1
0.2
0.3
0.4
0.5
0.6
0.7
1960
1963
1966
1969
1972
1975
1978
1981
1984
1987
1990
1993
1996
1999
EU
6M
erco
sur
Rea
l GD
P p
er c
apit
a co
nve
rgen
ce
0
0.1
0.2
0.3
0.4
0.5
1960
1963
1966
1969
1972
1975
1978
1981
1984
1987
1990
1993
1996
1999
EU
6M
erco
sur
Bu
sin
ess
cycl
e co
rrel
atio
nA
nn
ual
mo
vin
g a
vera
ges
0
0.1
0.2
0.3
0.4
0.5
0.6
1960
1963
1966
1969
1972
1975
1978
1981
1984
1987
1990
1993
1996
1999
EU
6M
erco
sur
Tra
de
op
enn
ess,
An
nu
al a
vera
ges
0
0.02
0.04
0.06
0.080.
1
0.12
0.14
1960
1963
1966
1969
1972
1975
1978
1981
1984
1987
1990
1993
1996
1999
intra-EU trade to GDP
EU
6M
erco
sur
Fin
anci
al m
arke
t in
teg
rati
on
An
nu
al m
ovi
ng
ave
rag
es
0
0.1
0.2
0.3
0.4
0.5
0.6
0.7
0.8
1960
1963
1966
1969
1972
1975
1978
1981
1984
1987
1990
1993
1996
1999
EU
6M
erco
sur

������������ �������������������������� �$
3.2.2 Further evidence on exchange rate variability
Changes in the exchange rate arrangement have been very important forunderstanding the institutional integration process in Europe. The measure of nominal andreal exchange variability briefly outlined in section 3.1 and Table 2 provide a useful insight inthis respect. In this sub-section we provide a more detailed discussion of the development ofexchange rates dynamics using a more elaborated indicator of exchange rate variability,which has been extensively used in the literature14.
Bilateral exchange rate variability between currency i and j (σ ij) is defined here asthe moving sample standard deviation of the growth rate of the bilateral exchange rate (firstdifferences of the logarithmic exchange rate or exchange rate percentage change):
5.0
2
1
)(1
−= ∑
=−
n
ktkt
ij een
σ
where e is the monthly change in nominal/real bilateral exchange rate while n is the order ofthe moving standard deviation. In the computation n has been set at 4 in order not toexcessively smooth the monthly exchange rate variability. In order to have an indicator of theexchange rate variability within EU or Latin American country groupings, we construct aweighted average (using trade weights) of the above measures using each bilateral variability.For example, in the case of the euro area country grouping, the real (or nominal) exchangerate variability indicator (EVI) is constructed as follows15:
∑=≠
=55
1,ijji
ijt
ijtt wEVI σ
Table 3. Indicator of nominal and Real Exchange Rate Variability in the EU
CountryGroup
Whole
period
19572001
Bretton
Woods
1957:31971:7
Post BW
pre ERM
1971:81979:2
Soft ERM
1979:31987:8
Hard ERM
1987:91992:12
Pre
EMU
1993:11998:12
EMU
1999:12001-5
EU 6RealNominal
0.00960.0074
0.00870.0048
0.01560.0146
0.00890.0081
0.00790.0063
0.00920.0078
0.00320.0000
Euro AreaRealNominal
0.01050.0080
0.00950.0050
0.01650.0151
0.01000.0090
0.00910.0072
0.01020.0088
0.00330.0003
EURealNominal
0.01630.0100
0.01380.0046
0.02260.0161
0.01770.0131
0.01460.0101
0.01630.0119
0.00980.0066
Table 3 and Figure 4.a present the indicators of nominal and real exchange ratevariability for the euro area.16 A visual inspection of Figure 4.a reveals that between 1957and 1998 real exchange rate variability has always exceeded nominal exchange ratevariability. This is indicative of the fact that in the EU an effort to pursue nominalconvergence (i.e., one major requirement for successful regional integration) was in place.Although with different levels of commitment and different paths over time, EU MemberStates with higher inflation rates accepted swings in, and an appreciation of, their real
14 See Kenen and Rodrik (1986), Koray and Lastrapes (1989), Chowdhury (1993) and Arize (1996 and 1999).15 In the euro area example there are 12 countries but i and j goes from 1 to 11 because Belgium and Luxembourg
represent just one country, so there are 55 bilateral real exchange rates and trade weights.16 Note that Table 3 also includes the EU-6 and EU-15 while Figure 4 only presents the exchange rate variability
for the euro area.

������������ ���������������������������4
effective exchange rate. This served as an instrument to pursue disinflation and re-structuredomestic industry exposed to international competition. Sometimes this led to unsustainabletrends in the real exchange rates, which in the ERM experience were then adjusted – thoughusually only partially and ex-post – by means of so-called “realignments” of the nominalexchange rates.
Besides this general indication, we can distinguish a few sub-periods. A strikingfeature of fixed but adjustable exchange rates under the Bretton Woods system is that it didnot shield European countries from some “occasional” adjustments in exchange rate paritiesand from some significant real exchange rate variability. The subsequent sub-period,following the demise of Bretton Woods and prior to the ERM experience, is characterised bythe highest overall nominal and real exchange rate variability. During the subsequent two sub-periods – i.e. the “soft-and the hard-ERM” – variability declined albeit unevenly and with avery sizeable swing back in the run-up to the 1992-ERM crisis and its aftermath. Nominalexchange rate variability then disappeared with the introduction of the euro in January 1999,while real exchange rate variability has thus far declined to its lowest levels ever.
Table 4 focuses on real exchange rate variability in Latin America, distinguishingbetween Mercosur, Mercosur and its associate members (Chile and Bolivia), and LatinAmerica 11 (the latter is also represented in Figure 4.b). The Table illustrates that in theperiod 1980-2001 real exchange rate variability in Mercosur was almost 7 times higher thanin EU-6, while nominal exchange rate variability was nearly 10 times higher. During times ofcrisis such variability rose to much higher levels, but such episodes are not discussed in thispaper. The more recent episode of exchange rate instability in the region is also excludedfrom our sample. An important difference with respect to Europe is that in Latin Americanominal exchange rate variability generally exceeds real exchange rate variability. This isindicative of the fact that in Latin America there was no systematic effort to pursue nominalconvergence over time.
Table 4. Indicator of nominal and Real Exchange Rate Variability in Mercosur and
Latin America
CountryGroup
Whole period
1980:12001:2
1980:1
1983:3
1983:4
1988:12
1989:1
1992:1
1992:2
1998:10
1998:11
2001:2
MercosurRealNominal
0.06240.0673
0.15060.838
0.04370.0522
0.18840.1988
0.01140.0153
0.05980.0585
Mercosur andassociatemembersRealNominal
0.06530.0880
0.12140.0803
0.14330.0767
0.14770.1742
0.01160.0122
0.04740.0261
Latin America(11 countries)RealNominal
0.06140.0661
0.06350.0616
0.06790.0758
0.13370.1494
0.02430.0263
0.05170.0503
Table 4 also shows that exchange rate variability in Mercosur displays some verymarked changes between sub-periods. In particular there are two “tranquil periods” – such asfrom April 1983 to December 1988, and from February 1992 to October 1998 - during whichvariability was remarkably lower than in the other “crises periods.” In particular, the levels ofboth nominal and real exchange rate variability during the second “tranquil period” – i.e., theperiod when regional integration proceeded at the fastest speed within Mercosur – are close tothe European levels.

������������ �������������������������� �(
The latter observation indicates that high exchange rate variability is not necessarilyembedded in the Latin American economic and financial system. There were in fact twoperiods in which successful stabilisation was achieved and maintained for some time.However, a climate of sustained low exchange rate variability also requires supportingpolicies in diverse areas and institutional choices: an issue that will be discussed in the nextsections.
Figures 4.a, 4.b
������������������ ����������������������������������������������������
0
0.005
0.01
0.015
0.02
0.025
0.03
0.035
0.04
0.045
Aug
-58
Feb
-60
Aug
-61
Feb
-63
Aug
-64
Feb
-66
Aug
-67
Feb
-69
Aug
-70
Feb
-72
Aug
-73
Feb
-75
Aug
-76
Feb
-78
Aug
-79
Feb
-81
Aug
-82
Feb
-84
Aug
-85
Feb
-87
Aug
-88
Feb
-90
Aug
-91
Feb
-93
Aug
-94
Feb
-96
Aug
-97
Feb
-99
Aug
-00
������������� ������������ ��������� ������������
������������������ ���������������������������� �������������������!������
0
0.05
0.1
0.15
0.2
0.25
0.3
0.35
0.4
0.45
Jan-80
Jan-81
Jan-82
Jan-83
Jan-84
Jan-85
Jan-86
Jan-87
Jan-88
Jan-89
Jan-90
Jan-91
Jan-92
Jan-93
Jan-94
Jan-95
Jan-96
Jan-97
Jan-98
Jan-99
Jan-00
Jan-01
��������� ������������� ������������ �������������

������������ ���������������������������)
4. Comparing institutional and economic integration: a cluster analysis
We can now turn to the main question of this paper: testing the hypothesis thatinstitutional integration interacts with economic interdependence at the regional levels. Weexamine and compare the degree and dynamics of integration in both Europe and in LatinAmerica.
After explaining the methodology in Section 4.1, we address three types of questions.A first question is: how really integrated are the countries within Europe and Latin Americafrom an economic viewpoint? Can one identify homogenous groups of countries withinregions? And, if so, what makes countries within groups similar? Second, by looking at arelatively long time horizon (from 1957 onwards for Europe and from 1980 onwards for LatinAmerica) we investigate the dynamics of the process of economic integration within bothregions. Which periods have experienced a particularly strong increase in economicintegration? While these questions are addressed in Section 4.2, in Section 4.3 we analyse thelink between institutional integration, as described in Section 2 above, and economicintegration in Europe in comparison with Latin America.
4.1 Methodology
The purpose of the cluster analysis is to detect natural groupings, or “clusters”,among countries. The way the cluster analysis is detecting such groupings is by measuring thedissimilarity among the countries and assigning each country to a particular group by using adistance metric. The distant metric we employ in this analysis is the Euclidean distance
( ) ∑=
−=p
kkjki xxjiD
1
2)(, (3)
where D(i,j) measures the dissimilarity between country i and country j for all economicintegration characteristics k.
There are two different methods of forming the clusters or groupings. First, one canpartition the countries into a predetermined number of clusters. This implies that each countryis assigned by iteration to that group to which it is most similar. The second alternative is thehierarchical clustering method.17 We use this second alternative, more precisely an“agglomerative” hierarchical clustering method. In essence, this method starts by creating anumber of clusters N that is equal to the number of countries in the sample. The methodproceeds by first combining those two countries that are most similar, and then continuing inthe same fashion till all countries belong to the same group or to a single group out of a pre-specified number of groups. We use the average of each group when comparing the Euclideandistance of two different groups. This ensures that the shape of the clusters is reasonablycompact.
A further relevant issue is the normalisation of the data. As a starting point, we wishto give equal weight to each of the economic integration variables k. Under the assumptionthat the variables are each distributed normally, we need to transform the data to have thesame mean and standard deviation. We chose a mean of zero and a standard deviation ofunity.
17 See Kaufman and Rousseeuw (1990) and Gordon (1999) for a detailed analysis of cluster analysis
methodology and the different underlying choices a modeller has to take.

������������ �������������������������� ��
4.2 The degree and dynamics of regional economic integration
4.2.1 Results for the EU
Figure A2.1 in Appendix 2 shows the cluster analysis dendrograms for the fifteen EUcountries and the six sub-periods specified in Section 3.2.1. The dendrograms show in whichorder and at what degree of dissimilarity countries have merged together.
The dendrograms allows us to identify a trend since the 1950s. First, the degree ofeconomic heterogeneity was generally much higher in Europe between the 1950s and 1970s.This can be seen from the size of the Euclidean distance on the vertical axis. It is also lessclear-cut to identify clusters in the earlier periods than in the later periods.
A second interesting result is that the countries forming clusters have changed overtime, in some cases drastically. More specifically, between the 1950s and the end of the 1970sintegration seems to have been strongly related to the geographic location and distance of thecountries to each other. This point is clearly illustrated for the period 1971-79. In this period,the country pairs that were most integrated with each other were usually direct geographicneighbours: Austria, Germany and Denmark; Belgium and the Netherlands; Spain andPortugal; and Greece and Italy. By contrast, since the 1980s clusters correspond more closelyto institutional arrangements, in particular the participation in the ERM and EMU, than togeographic location.
This suggests that EU countries have become increasingly homogenous over time,while the forming of clusters has gradually more been based on institutional factors than ongeographic factors.
Figure 5. Real Integration versus Nominal Integration in Europe, 1957-2000
N.B.: The lower the values on the axes, the higher integration. Core EMU refers to EU-6 founding Member States. Other EMU-6 comprises the other euro
area Member States. Non-EMU countries are Denmark, Sweden and UK.
To investigate these general findings in greater detail, Table 5 shows the degree ofeconomic integration for various country groups and clusters. The table shows the average
1.0
2.0
3.0
4.0
5.0
6.01.52.02.53.03.54.0
real integration
no
min
al in
teg
rati
on
Core EMU Other EMU 6 Non-EMU 3
1971-78
1998-00
1993-981987-92
1979-86
1971-781957-70
1957-70
1957-70
1998-00
1998-00
1993-98
1993-98
1979-86
1987-92

������������ ����������������������������
dissimilarity, based on the normalised Euclidean distance, for each group of countries withthe EU average. A smaller number implies a lower degree of dissimilarity and, therefore, ahigher degree of integration.
Table 5. Measuring Economic Integration in Europe
First, core EMU countries (core EMU6 cluster) have always been the most integratedand also further deepened their integration over time. By contrast, the non-EMU cluster hasnot managed to intensify its degree of integration over time. The most interesting case may bethe “other” EMU6 cluster of countries that joined the integration process somewhat later. Thiscluster includes geographically diverse countries that had the lowest degree of integration inthe 1950s and 1960s. However, since the 1970s these countries showed the fastest rate ofintegration.
A second important finding is that the degree of nominal economic integration hasbeen significantly faster than real integration in Europe over the past 50 years (see Table 5
EU15 Core Other Non-EMUEMU 61 EMU 62 cluster3
Total economic integration4
1957 - 70 4.85 3.65 6.12 5.681971 - 78 5.12 3.85 6.45 6.001979 - 87 5.15 3.90 6.00 6.641988 - 92 4.67 3.23 5.49 6.261993 - 98 4.34 2.56 4.91 6.481999 - 2001 4.02 2.64 4.04 6.40
Real economic integration5
1957 - 70 3.08 2.25 3.63 4.001971 - 78 2.95 2.48 3.43 3.561979 - 87 2.74 1.78 3.46 3.471988 - 92 2.88 2.00 3.51 3.691993 - 98 3.02 1.83 3.71 4.091999 - 2001 2.80 1.86 3.11 4.05
Nominal economic integration6
1957 - 70 3.84 3.05 5.07 4.041971 - 78 4.23 2.95 5.60 4.851979 - 87 4.32 3.35 4.95 5.581988 - 92 3.63 2.33 4.35 4.931993 - 98 3.33 1.93 3.71 5.101999 - 2001 2.62 1.38 2.57 4.59
Notes:
As explained in the text, integration is measured as the average of the normalised Euclidean distance of the
variables. Therefore, a smaller number indicates less dissimialrity and hence higher integration.
1 Core EMU6 are: Belgium/Luxemburg, France, Germany, Italy, Netherlands2 Other EMU6 are: Austria, Finland, Greece, Ireland, Italy, Portugal, Spain3 Non-EMU cluster are: Denmark, Sweden, UK4 includes 7 variables: business cycle convergence, inflation difference, real interest rate convergence,
real exchange rate volatility, trade integration, financial market integration, real per capita GDP convergence5 includes 3 variables: business cycle convergence, trade integration, real per capita GDP convergence6 includes 4 variables: inflation difference, real interest rate convergence, real exchange rate volatility,
financial market integration

������������ �������������������������� ��
and Figure 5). EMU countries were initially more similar with regard to real economicvariables than to their nominal counterparts. Real integration progressed and reached a highlevel by the late 1970s and since then the deepening has slowed. By contrast, nominalvolatilities increased and nominal integration fell during the 1970s with the breakdown of theBretton Woods System. However, the economic integration process in Europe in the 1980sand 1990s has then mainly been driven by stronger integration among inflation rates, interestrates, exchange rates and financial markets.
These findings strongly point at institutional factors as the driving force of Europeaneconomic integration: countries at the centre of the institutional integration process have alsobeen those that have integrated most strongly economically.
4.2.2 Results for Latin America
Looking at the dendrograms of the cluster analysis (Figure A.2.2 in Appendix 2)reveals that economic integration in Latin America takes still place along geographic lines.The countries most integrated with each other are (i) Argentina, Uruguay and Chile; (ii)Brazil, Paraguay and Peru; (iii) Colombia and Venezuela.
Mexico, Bolivia, and Ecuador are among the least economically integrated countriesin Latin America. This is likely to be partly explained by the specific economic characteristicsof some of these countries, and also partly by their geographic location. Mexico stands out inparticular. It is intuitively convincing that Mexico is one of the least integrated as it is moreintegrated with the US economy than with the rest of Latin America.
Figure 6. Real Integration versus Nominal Integration in Latin America, 1980-2000
N.B.: The lower the values on the axes, the higher integration.
Turning to the Euclidean measure of integration gives an interesting picture about thetime dynamics of the economic integration process in Latin America. Table 6 shows themeasure of integration for all Latin America 11 countries as well as for the six countries ofMercosur plus associates. The most interesting information we obtain from this table is thatthe deepening of economic integration has been driven by integration of the nominal
0.90
1.10
1.30
1.50
1.70
1.900.901.001.101.201.30
real integration
no
min
al in
teg
rati
on
Latin America 11 Mercosur
1994-2000
1994-2000
1980-86
1980-86
1987-93
1987-93

������������ ���������������������������
economic variables, such as less nominal and real exchange rate variability, more inflationand interest rate convergence and a higher degree of financial market integration. Realintegration through the intensification of business cycle co-movements and trade has beenmarkedly slower. This point is also illustrated in Figure 6, which graphs the nominalintegration measure against the real one.
Moreover, economic integration among the four Mercosur countries plus twoassociate countries has reached a higher level than in Latin America as a whole. The period1987-93 also deserves a special mention in this context. Table 6 shows that the integrationprocess came to a temporary halt during this period as none of the integration measuresdeepened throughout these seven years. This most likely is explained by the difficulteconomic conditions present during that time as numerous Latin American countries sufferedunder high inflation rates, slow growth and substantial exchange rate variability.
Table 6. Measuring Economic Integration in Latin America
On the whole, the findings of the cluster analysis show that both Latin America andEurope have become more integrated over time. In particular, the integration process of realvariables (business cycle, trade and income) is generally much slower than the integrationprocess of nominal variables (exchange rates, inflation, interest rates, and financial markets).This is a result that one would expect, given the fact that the real integration process ofeconomies is generally much slower as it partly requires the mobility and built-up of physicalfactors of production. It is relatively more feasible for policy-makers to achieve a
Latin America Mercosur11 countries1 countries2
Total economic integration3
1980 - 86 2.44 2.131987 - 93 2.29 2.111994 - 2000 1.87 1.64
Real economic integration4
1980 - 86 1.19 0.981987 - 93 1.21 1.101994 - 2000 1.12 0.95
Nominal economic integration5
1980 - 86 1.86 1.631987 - 93 1.86 1.661994 - 2000 1.28 0.98
Notes:
As explained in the text, integration is measured as the average of the normalised Euclidean distance of the
variables. Therefore, a smaller number indicates less dissimialrity and hence higher integration.
1 Latin America 11 are: Argentina, Bolivia, Brazil, Chile, Colombia, Ecuador, Mexico, Paraguay,
Peru, Uruguay, Venezuela2 Mercosur are: Argentina, Brazil, Paraguay, Uruguay3 includes 6 variables: business cycle convergence, inflation convergence real interest rate convergence,
real exchange rate volatility, trade integration, financial market integration4 includes 2 variables: business cycle convergence, trade integration5 includes 4 variables: inflation difference, real interest rate convergence, real exchange rate volatility,
financial market integration

������������ �������������������������� ��
convergence of inflation rates and interest rates across countries than to achieve a closer co-movement of business cycles and trade.
4.3 Interaction between institutional and economic integration: some lessons for Latin
America from the European experience
A compelling finding of the analysis conducted in the previous section is thateconomic integration in Europe occurred along geographic lines in the earlier periods,whereas it took place mainly along institutional lines since the 1980s. Countries that weremost closely committed to European institutional co-operation also integrated more quicklythan those joining the various stages of the institutional process (e.g. ERM and monetaryunion) only later or not at all.
This suggests that institutional integration indeed had an important impact oneconomic integration in Europe. This is confirmed by Figure 7, which uses the institutionalindex of regional integration constructed in Section 3 for EU-6 countries and shows thateconomic integration was slower or even halted during periods, such as the 1970s, whenprogress in institutional integration was slow. By contrast, economic integration was fasterwhen institutional integration deepened significantly, for instance in the late 1980s and 1990s.For the Mercosur countries (Figure 8), the degree of institutional integration is still muchlower than in Europe, although some progress was made in the 1990s.
One of the key lessons from the European experience for Latin America is thereforethat intensifying institutional integration, such as for instance through the creation of acommon market and the co-operation of monetary and exchange rate policies, indeed plays animportant role in deepening and accelerating the process of regional economic integration.The importance of deepening institutional integration for economic integration in Europe cantherefore be taken as a valuable example for the future path of integration in Latin America.
Figure 7
Institutional versus economic integration in Europe, 1957-2000
4 0 . 0
5 0 . 0
6 0 . 0
7 0 . 0
8 0 . 0
9 0 . 0
1 0 0 . 0
2.42.83.23.64.0
economic integration
inst
itu
tio
nal
inte
gra
tio
n
1993-98
1998-2000
1971-78
1987-92
1979-86
1957-70
100.0
90.0
50.0
60.0
70.0
80.0
40.0

������������ ����������������������������
Figure 8
Institutional Integration versus Economic Integration in Mercosur countries, 1980-2000
N.B.: The lower the values in Figures 7 and 8, the higher the degree of economic integration.
5. Concluding remarks
A distinctive feature of European regional integration has been a systematic andincremental approach to institutional integration. This is clearly measured by the newindicator developed in this paper. An ever-larger group of European countries haveprogressed along the five Balassa stages of regional integration. This has entailed, amongother things, a transfer of sovereignty and responsibilities in an increasing number of areas.As our indicator of institutional integration shows for EU-6 countries, the cases of reversal inthe process of institutional integration were just a few, and limited to relatively short periods.In comparison, institutional integration has thus far been modest in Latin America.
Europe and Latin America have also performed very differently in terms of someselected, and illustrative, indicators of economic integration. Historically, even excludingfrom our sample period the most recent episode of exchange rate instability, real (nominal)exchange rate variability has been 7 (10) times higher in Mercosur than in EU-6 countries.The current level of economic integration, as measured by a large number of OCA-basedindicators, is in Latin America by and large comparable to that of European countries in the1960-1970s.
While we have not explicitly tested for the direction of causality between institutionaland economic integration, we have found a strong correlation between them: following eachinstitutional stage economic integration deepened, enhancing welfare and efficiency for theparticipating countries and justifying the subsequent institutional stage. The cluster analysisused in this paper also shows that, between the 1950s and 1970s, economic integration inEurope primarily occurred among geographically close countries. However, since the early1980s the economic integration process occurred mainly along institutional lines. In otherwords, countries that participated most strongly in the institutional integration process in
0 . 0
5 . 0
1 0 . 0
1 5 . 0
2 0 . 0
2 5 . 0
3 0 . 0
1.51.71.92.12.3
economic integration
inst
itu
tio
nal
inte
gra
tio
n
1980-86
1987-93
1994-2000
25.0
20.0
30.0
10.0
5.0
15.0
0

������������ �������������������������� �$
Europe also integrated more strongly with each other, whereas countries less involved in theinstitutional process also integrated less in economic terms. Finally, the cluster analysis findsthat the monetary integration process in Europe, culminating in EMU at the beginning of1999, has been the main driving force of European economic integration since the 1980s.
One key lesson from the European experience for Latin America is, therefore, thatintensifying institutional integration, for instance through the creation of a common marketand the co-ordination of monetary and exchange rate policies, might indeed play an importantrole in deepening and accelerating the process of regional economic integration. Theimportance of deepening institutional integration for economic integration in Europe can betaken as a valuable example for the future path of integration in Latin America. However, itshould be emphasised that the process of regional integration, and in particular of monetaryunification, is a lengthy and complex one. Its successful implementation takes time andrequires a strong, sustained political commitment. Another important lesson for LatinAmerica is that, while the deepening of economic integration calls for an effectiveinstitutional framework, further advancements in institutional integration are in turn feasibleonly if economic integration supports them as well.
To what extent, however, can Latin America follow the footprint of Europe? Afterall, Latin America currently fulfils the OCA criteria that we have reviewed to a lesser extentnot only than the EU today, but sometimes even than the EU at the beginning of its regionalintegration process. As a group, Latin American countries display a lack of persistent fiscaldiscipline, low trade and financial integration, and modest business cycle synchronisation. Isthis necessarily problematic? A possible, although partial, reply to this question can be foundin the hypothesis of “endogeneity” of OCA, which has been discussed quite extensively in theeconomic literature in recent years.18 The basic intuition behind the endogeneity hypothesis isthat monetary integration reduces trading costs much beyond the elimination of the costsarising from exchange rate variability (that can be to some extent hedged). A commoncurrency among partner countries is seen as “a much more serious and durable commitment”(McCallum (1995)).19 The ultimate implications of this hypothesis is that a group of countriesadopting a single currency might develop into an OCA ex-post even if this group does notconstitute an OCA ex-ante (Rose (2000) and Frankel and Rose (1997, 2000)). Hence, theOCA characteristics of a regional arrangement are not given once and for all.
This justifies in turn a number of questions that would need to be fully addressed in afuture extension of this paper. Would the present modest level of economic integrationnecessarily rule out the option of further deepening regional integration in Latin America? Orwould it rather suggest that the process(es) of (sub)regional integration will succeed in LatinAmerica to the extent that realistic objectives are set in line with regional economicconditions and the prevailing level of political commitment? After all, the experience of theEU seems more in line with this second line of reasoning, and the European process ofintegration has always had strong political roots, motivations and purposes. The politicalcommitment has permitted the process to move forward through increasingly advancedinstitutional stages.
Over time the EU has, in fact, experienced a dynamic interaction between the processof institutional integration and the fulfilment of certain OCA criteria. While this result is
18 For some qualifications, and explanations, of the “endogeneity” of OCA studies see Quah (2000), van Wincoop(2000), De Grauwe (2000), Gaspar and Mongelli (2002), and Mongelli (2002).
19 Amongst others, sharing a single currency precludes future competitive devaluation, fosters trade and financialintegration, facilitates foreign direct investment and the building of long-term relationships, and might overtime encourage forms of political integration. This will in turn promote economic and financial integrationand even business cycle synchronisation among the countries sharing the single currency. This could resultfrom the increasing propensity of partner countries to import from each other, from productivity shocksspilling over via trade, or the disciplining effect of a monetary or exchange rate arrangement.

������������ ���������������������������4
consistent with the hypothesis of OCA endogeneity, it does not mean that OCA criteria areentirely endogenous to the policy decisions affecting regional integration. There is indeed no“automatic pilot” ensuring that a strengthening in institutional integration will bring about, forinstance, higher intra-regional trade, more synchronised business cycles, financial marketintegration and nominal convergence. Rather it means that, if the analysis becomes dynamicand forward-looking, a virtuous circle may be identified between institutional and economicintegration at the regional level.
The analysis in this paper and, in general, tests of the hypothesis that institutionalintegration interacts with economic integration at the regional level, will need to be extendedin a number of ways. Amongst others, the variables taken into consideration will need to bebroadened and additional tests of the interaction between institutional and economicintegration are required to corroborate our preliminary findings. An aspect that will requiredue consideration is that in Europe a strong nominal anchor presented itself “attracting” overtime other surrounding partner countries, fostering better standards for policy making (seee.g., Goodhart (1989) and Rogoff (1996)). Latin America has not yet found a solution to thistype of problem.

������������ �������������������������� �(
References
Alberola, E., A. Busián and F. de Lis, 2002, “The Quest for Nominal and Real ConvergenceThrough Integration in Europe and Latin America,” Banco de España, Working Paper 0213.
Anderton, R. and F. Skudelny, 2001, Exchange Rate Volatility and Euro Area Imports, ECBWP 64, May.
Arize, A. 1996. Real Exchange Variability and Trade Flows: the Experience of eight EuropeanCountries, International Review of Economics and Finance, 5/2, 187-205.
Arize, A., Osang, T. and Slottje, D.J. 1999. Real Exchange Volatility in Latin America and itsImpact on Foreign Trade, Unpublished paper.
Artis, M. and W. Zhang. 1998a. Core and Periphery in EMU: A Cluster Analysis. EUI RSCWorking Paper 98/37. Florence: European University Institute.
Artis, M. and W. Zhang. 1998b. Membership of EMU: A Fuzzy Clustering Analysis ofAlternative Criteria. EUI RSC Working Paper 98/52. Florence: European University Institute.
Atkeson, A. and T. Bayoumi, 1993, Do Private Capital Markets Insure Regional Risk? Evidencefrom the United States and Europe, Open Economies Review 4: 303-324.
Balassa, B. 1961. The Theory of Economic Integration. Irwin, Homewood, Illinois.
Bayoumi, T. and B. Eichengreen. 1993. Shocking Aspects of European Monetary Integration.In F. Torres and F. Giavazzi. (eds.) Adjustment and Growth in the European Monetary Union.Cambridge: Cambridge University Press.
Bayoumi, T. and B. Eichengreen. 1997. Ever Closer to Heaven? An Optimal Currency Index ofEuropean Countries. European Economic Review. 41: 760-70.
Baxter, M. and A.C. Stockman. 1989. Business Cycles and the Exchange-Rate Regime. Journalof Monetary Economics, 27: 377-400.
Ben-David, B. 1993. Equalizing Exchange: Trade Liberalization and Income Equalization.Quarterly Journal of Economics, 108, 653-679.
Berg, A., Borensztein, E, and Mauro, P. (2000): An Evaluation of Monetary Regime Optionsfor Latin America. Paper presented at the seminar “Monetary Union: Theory, EMU Experience,and Prospects for Latin America” (Vienna)
Canzoneri, M., J. Valles and J. Vinals. 1996. Do Exchange Rates Move to AddressInternational Macroeconomic Imbalances? CEPR Discussion Papers 1498. London: CEPR.
Caramazza, Ricci and Salgado, 2000 “Trade and Financial Contagion in Currency Crisess,”International Monetary Fund, mimeo.
Chowdhury, A.R. 1993. Does Exchange Rate Volatility Depress Trade Flows? Evidence fromError Correction Models. Review of Economics and Statistics, 75, 700-706.

������������ ���������������������������)
Christiano, L., M. Eichenbaum and C. Evans, 1999, Monetary Policy Shocks: What Have WeLearned and To What End? In John Taylor and Michael Woodford (eds.), Handbook ofMacroeconomics, North-Holland, Amsterdam.
Corden, W. M. 1972, "Monetary Integration, Essays in International Finance," InternationalFinance Section No. 93, Princeton University, Department of Economics.
Cushman, D. 1988. U.S.Bilateral Trade Flows and Exchange Rate Risk during the FloatingPeriod, Journal of International Economics, 24, 317-330.
Dell’Ariccia, G. 1999. Exchange rate Fluctuations and Trade Flows: Evidence from the EuropeanUnion, IMF Staff Paper 46/3, 315-334.
De Grauwe, P. and Verfaille, G. 1988. Exchange Rate Variability, misalignment and theEuropean Monetary System, in R.C. Marston ed., Misalignment of Exchange Rates: Effects onTrade and Industry. University of Chicago Press, 77-103.
Eichengreen, B. 1990, "One Money for Europe? Lessons from The U. S. Currency Union,"Economic Policy: a European Forum, Vol. 5, No. 1 pp. 118-187, April.
------------------------------ 1998. “Does Mercosur Need a Single Currency?”. NBER WorkingPaper no. 6821, 1998.
European Central Bank, 1999, “Inflation Differentials in a Monetary Union,” European CentralBank, Frankfurt Germany, Monthly Bulletin, October.
------------------------------ 2001, The Monetary Policy of the ECB, European Central Bank,Frankfurt.
Emerson, M., D. Gros A. Italianer, J. Pisani-Ferry, H. Reichenbach, 1992, One Market, OneMoney, Oxford University Press, Oxford.
Everitt, B.S. 1993. Cluster Analysis. 3rd ed. London: Edward Arnold.
Flam, H. and Jansson, P. 2000. EMU Effects on International Trade and Investment. Institutefor International Economic Studies Seminar Paper 683, Stockholm University.
Fleming. J. Marcus, 1971 “On Exchange Rate Unification,” The Economic Journal, Vol. 81, pp.467-88.
Forbes and Rigobon, 2000 “Measuting Contagion: Conceptual and Empirical Issues,” MIT-Sloan School of Management, mimeo.
Frankel, J. and A.K. Rose. 1997. IS EMU more Justifiable Ex-post than Ex-ante? EuropeanEconomic Review. 41: 753-60.
Fratianni M. and A. Hauskrecht. 2002. A Centralised Monetary Union for Mercosur: Lessonsfrom EMU, paper presented at the Conference on “Euro and Dollarization: Forms of MonetaryUnion in Integrated Regions” Fordham University and CEPR, New York, April 5-6, 2002.
Frankel, J. and A.K. Rose. 1998. The Endogeneity of the Optimum Currency Area Criteria.Economic Journal. 108: 1009-1025.
Frankel, J. and Wei, S. 1993. Trade Blocs and Currency Blocs. NBER Working Paper 4335,Cambridge, MA.

������������ �������������������������� ��
Fratzscher (2000) “On Currency Crises and Contagion” Institute for International EconomicsWorking Paper, Washington D.C.
García Herrero, A and J. Santillán, 2002, “Latin American Financial Development inPerspective,” Banco de España, Working Paper 0216.
Gaspar Vítor and Francesco Paolo Mongelli, 2002, “European Monetary Unification and theSingle Market,” forthcoming in “Economic Convergence and Divergence in Europe: Growth andRegional Development in an Enlarged European Union,” edited by Gertrude Tumpel-Gugerelland Peter Moslechner, Edward Elgar.
Gordon, A.D. 1999. Classification. 2nd ed. Boca Raton, FL: CRC Press.
Hochreiter E., K. Schmidt-Hebbel and G. Winkler, 2002, Monetary Union: European Lessons,Latin American Prosopects, paper presented at the Conference “Monetary Union: Theory, EMUexperience, and prospects for Latin America” co-organised by the Oesterreichische Nationalbankon 15-16 April 2002.
Ingram, J.C. 1973, "The Case for the European Monetary Integration." Princeton University,Essays in International Finance, No. 98.
Issing, Otmar, 1996, “Europe: Political Union Through Common Money?” The Institute ofEconomic Affairs.
-----------------------, 2001, “Economic and Monetary Union in Europe: political priority versuseconomic integration?” Paper for the Conference 2001 of the European Society for the History ofEconomic Thought, February 2001.
Kaufman, L. and P.J. Rousseeuw. 1990. Finding Groups in Data. New York: John Wiley &Sons.
Kenen, P.B. 1969. The Theory of Optimal Currency Areas: An Eclectic View, in R.A.
Laird, S. 1997. “Mercosur: Objectives and Achievements”. World Bank, Economic Notes No. 22(June)
McKinnon, Ronald I, 2001 “Optimum Currency Areas Revisited,” Stanford University, mimeo.
Milesi-Ferretti, Gian Maria, and Assaf Razin, 1996 “Current Account Sustainability.”Princeton Studies in International Finance No. 81. Princeton, NT: Princeton University Press.
Mongelli, Francesco Paolo, 2002, ““New” Views on the Optimum Currency Area Theory: Whatis EMU Telling Us?” European Central Bank, Working Paper No. 138.
Mundell R. and A.K. Swoboda (eds.) Monetary Problems of the International Economy,Chicago: University of Chicago Press. What Year???
Mundell R., 1973 “Uncommon Arguments for Common Currencies”, in H.G. Johnson and A.K.Swoboda, The Economics of Common Currencies, Allen and Unwin, pp.114-32.
Kenen, P. and Rodrik, D. 1986. Measuring and analyzing the Effects of short-term Variability inReal Exchange Rates. Review of Economics and Statistics, 68, 311-319.

������������ ����������������������������
Koray, F. and Lastrapes. 1989. Real Exchange Volatility and US Bilateral Trade: a VARapproach. Review of Economics and Statistics, 71, 708-712.
Masson Paul, 2000 “Multiple Equilibria, Contagion, and the Emerging Market Crises,” IMFWorking Paper WP/99/164.
McKinnon, R.I. 1963. Optimum Currency Areas. American Economic Review, 53:717-25.
Mundell, R.A. 1961. A Theory of Optimal Currency Areas. American Economic Review, 51:105-46.
Obstfeld M. and K. Rogoff, 2000, The Six Major Puzzles in International Macroeconomics: IsThere a Common Cause? NBER Working Paper 7777.
Padoa-Schioppa, Tommaso, 1982, “Capital Mobility: Why is the Treaty not Implemented”, re-printed in “The Road to Monetary Union in Europe: the Emperor, the Kings and the Genies”,Oxford University Press, Oxford, 2000.
-------------------------------, (2000), “The European Union and the Nation State,” The HumeLecture 2000, Hume Occasional Paper no. 58.
Quah, D., 2000, Discussion of A. Rose, One money, one market: the effect of commoncurrencies on trade, Economic Policy, April.
Rose, A., 2000, One money, one market: the effect of common currencies on trade, EconomicPolicy, April.
Rose, A., 2001, Currency Unions and Trade: the Effect is Large, Economic Policy, October.
Scandizzo, S., 2002, "Options for Monetary Integration in the Andean Community", CorporaciónAndina de Fomento, mimeo.
Sims, C, 1980. Macroeconomics and Reality. Econometrica, 48, 1-48.
Summers, R. and Heston, A. 1988. A New Set of International Comparisons of Real Productand Price Levels Estimates for 130 Countries, 1950-1985. Review of Income and Wealth, 34, 1-25.
Tavlas, G. S. 1993, “The ‘New’ Theory of Optimum Currency Areas”, The World Economy, pp663-685.
----------------, 1994, “The Theory of Monetary Integration,” Open Economies Review, Vol. 5 no. 2,pp 211-230.
Van Rijckeghem and Weder 1999 “Sources of Contagion: Finance or Trade?” IMF WorkingPaper WP/99/146, October.
Werner Report, 1970, “Report to the Council and the Commission on the Realisation by Stagesof Economic and Monetary Union in the Community,” Supplement to Bulletin 11 – 1970,Luxembourg.
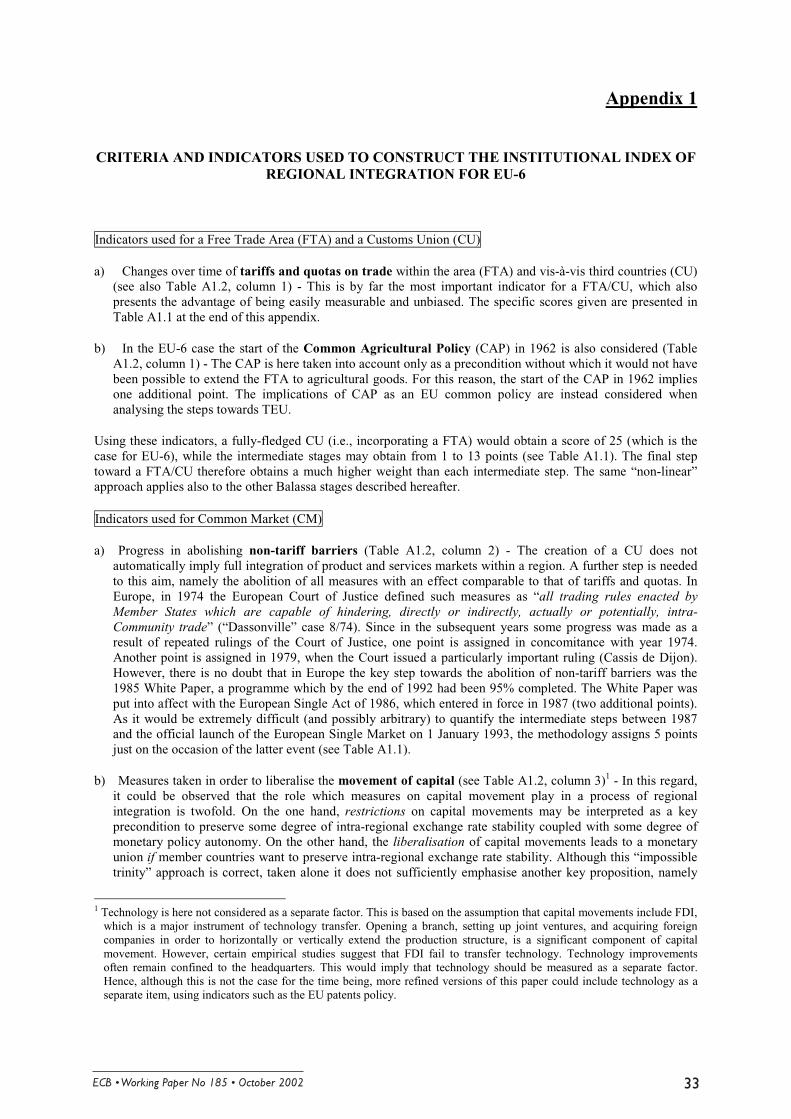
������������ �������������������������� ��
Appendix 1
CRITERIA AND INDICATORS USED TO CONSTRUCT THE INSTITUTIONAL INDEX OF
REGIONAL INTEGRATION FOR EU-6
Indicators used for a Free Trade Area (FTA) and a Customs Union (CU)
a) Changes over time of tariffs and quotas on trade within the area (FTA) and vis-à-vis third countries (CU)(see also Table A1.2, column 1) - This is by far the most important indicator for a FTA/CU, which alsopresents the advantage of being easily measurable and unbiased. The specific scores given are presented inTable A1.1 at the end of this appendix.
b) In the EU-6 case the start of the Common Agricultural Policy (CAP) in 1962 is also considered (TableA1.2, column 1) - The CAP is here taken into account only as a precondition without which it would not havebeen possible to extend the FTA to agricultural goods. For this reason, the start of the CAP in 1962 impliesone additional point. The implications of CAP as an EU common policy are instead considered whenanalysing the steps towards TEU.
Using these indicators, a fully-fledged CU (i.e., incorporating a FTA) would obtain a score of 25 (which is thecase for EU-6), while the intermediate stages may obtain from 1 to 13 points (see Table A1.1). The final steptoward a FTA/CU therefore obtains a much higher weight than each intermediate step. The same “non-linear”approach applies also to the other Balassa stages described hereafter.
Indicators used for Common Market (CM)
a) Progress in abolishing non-tariff barriers (Table A1.2, column 2) - The creation of a CU does notautomatically imply full integration of product and services markets within a region. A further step is neededto this aim, namely the abolition of all measures with an effect comparable to that of tariffs and quotas. InEurope, in 1974 the European Court of Justice defined such measures as “all trading rules enacted byMember States which are capable of hindering, directly or indirectly, actually or potentially, intra-Community trade” (“Dassonville” case 8/74). Since in the subsequent years some progress was made as aresult of repeated rulings of the Court of Justice, one point is assigned in concomitance with year 1974.Another point is assigned in 1979, when the Court issued a particularly important ruling (Cassis de Dijon).However, there is no doubt that in Europe the key step towards the abolition of non-tariff barriers was the1985 White Paper, a programme which by the end of 1992 had been 95% completed. The White Paper wasput into affect with the European Single Act of 1986, which entered in force in 1987 (two additional points).As it would be extremely difficult (and possibly arbitrary) to quantify the intermediate steps between 1987and the official launch of the European Single Market on 1 January 1993, the methodology assigns 5 pointsjust on the occasion of the latter event (see Table A1.1).
b) Measures taken in order to liberalise the movement of capital (see Table A1.2, column 3)1 - In this regard,it could be observed that the role which measures on capital movement play in a process of regionalintegration is twofold. On the one hand, restrictions on capital movements may be interpreted as a keyprecondition to preserve some degree of intra-regional exchange rate stability coupled with some degree ofmonetary policy autonomy. On the other hand, the liberalisation of capital movements leads to a monetaryunion if member countries want to preserve intra-regional exchange rate stability. Although this “impossibletrinity” approach is correct, taken alone it does not sufficiently emphasise another key proposition, namely
1 Technology is here not considered as a separate factor. This is based on the assumption that capital movements include FDI,
which is a major instrument of technology transfer. Opening a branch, setting up joint ventures, and acquiring foreigncompanies in order to horizontally or vertically extend the production structure, is a significant component of capitalmovement. However, certain empirical studies suggest that FDI fail to transfer technology. Technology improvementsoften remain confined to the headquarters. This would imply that technology should be measured as a separate factor.Hence, although this is not the case for the time being, more refined versions of this paper could include technology as aseparate item, using indicators such as the EU patents policy.

������������ ���������������������������
that the decisive and ultimate precondition for intra-regional exchange rate stability is intra-regionaleconomic convergence. This means that capital flow restrictions can well play a role to preserve exchangerate stability for some time, but in the longer run they jeopardise such stability since they allow policymakers postponing measures designed to convergence towards best performing countries. On the contrary, asthe European experience of the early 1990s clearly illustrates, free capital movement is a key factorexplaining the increasing weight of economic convergence as core goal of economic policy. Consequently, inTable A1.1 all steps towards the liberalisation of capital movements obtain a positive score, whereas allrestrictive measures receive a negative one. Emphasis is given to those measures which were taken at theregional level, since liberalisation in one individual country does not per se imply increased integration.
c) Measures taken to liberalise the movement of workers (Table A1.2, column 4) - This is another keyindicator, in line with Mundell’s seminal paper (Mundell (1961)). However, achieving a single labour marketis far more demanding than integrating product, services and financial capital markets.
In the Treaty of Rome, this objective was pursued by entitling workers to accept job offers within the internalmarket and by abolishing any discrimination based on nationality between workers (Art. 48). By 1968 thisrule was, at least in principle, already enforced (one point). However, this approach to labour mobility wasclearly insufficient, as it did not address the key issue of the actual possibility (i.e., disincentives) to moveacross the borders of countries participating in the regional arrangement. Such an issue would involve that anumber of supplementary measures be taken at the regional level, such as promoting the mobility of pensionrights, making information on cross-border job opportunities transparent, recognising professionalqualifications across different countries, and harmonising national labour market regulations. Although since1993 the EU is supposed to have an internal market for labour, these measures are far from having been fullyimplemented. Also for that reason2, less than 2% of the working age population of the EU consists of peoplefrom one Member State working in another. This explains why the maximum score possible for this indicator(8) cannot be given to EU countries in this field. Three further steps have been however selected, eachimplying an additional point: a directive of 1989 on mutual recognition of higher education diplomas; the factthat, following the Amsterdam meeting of the European Council in 1997 and the Action Plan elaborated bythe Commission the same year, policies in the area of labour mobility have gained momentum; and the fullimplementation in the EU-6 area, since 1998, of the Schengen convention of 1990 on free circulation ofpeople.
On the whole, a CM as such (i.e, without considering the other stages of regional integration) would obtain 25points (Table A1.1). The score assigned to EU-6 is 21, in order to signal that much has still to be done in the areaof labour mobility.
Indicators used for an Economic Union (EUN)
a) The degree of co-ordination of national macroeconomic policies (i.e., fiscal, exchange rate and monetarypolicies) (see Table A1.2, column 5) - How to incorporate regional macroeconomic policies in the index ofregional integration is a complex issue, open to discussion. Such policies, in fact, cannot be considered asindependent of the need for regional exchange rate stability, but they are largely endogenous. For instance,the establishment of the EMS in 1979 is clearly intertwined with the need for exchange rate stability in theregion, so that it is impossible to find a direction of causality between regional integration and need forexchange rate stability (as it might still be the case, for instance, for the establishment of the CU or the CM).
Two avenues can be followed to tackle this problem.
The first avenue is that followed in this paper. According to this approach, the degree of co-ordination of allregional macroeconomic policies should become an integral part of the index (see Table A1.2, column 5).The rationale for this approach is that not only in the case of macroeconomic policies, but also moregenerally it is impossible to disentangle the sense of causality between a process of regional integration andthe need for exchange rate stability as illustrated by the OCA variables. As already mentioned in theIntroduction, the main objective of the analysis is not that of identifying a direction of causality, but, moresimply, that of identifying a possible strong correlation between the variables.
2 There are of course factors explaining scarce labour mobility which is very difficult – if not even impossible – for policy
makers to deal with (e.g. differences in language, life style, housing markets).

������������ �������������������������� ��
Along with an alternative avenue, macroeconomic policies should not be taken into account, in order tocircumscribe the problem of circular causation. This avenue is not followed in this paper.
b) The implementation, at the regional level alongside the national level, of those microeconomic policies
which are most likely to affect the need for regional exchange rate stability (Table A1.2, column 6) -The latter policies are mainly: (b.1) competition policy (i.e., measures designed to forbid subsidies andregulations that favour domestic producers); (b.2) transport policy; (b.3) harmonisation of VAT on trade ofgoods and services; and b.4) harmonisation of other national structural (in particular, labour market)policies in order to increase price (in particular, labour cost) flexibility within the region. The successfulimplementation of these four policies (see Table A1.1 for the events considered and scores assigned to eachevent) is likely to increase the cross-border price elasticity of demand for similar products produced indifferent countries participating in the regional arrangement. The higher the elasticity, the more a swing inthe exchange rate can heavily shift competitive advantages within the area, thus producing strong effects onprofitability and triggering political reactions. Conversely, the link between the need for regional exchangerate stability and other microeconomic policies (e.g. R&D policy and environmental policy) seems uncertainand in any case more indirect. The latter policies are therefore not taken into account.
On the whole, an EUN as such (i.e, without considering the other stages of regional integration) would obtain 25points. The score assigned to EU-6 is 23, in order to signal that there is still room for improvement in the area ofharmonisation of structural policies.
Indicators used for Total Economic Integration (TEI)
a) The set-up of supranational institutions and decision-making processes, as well as the structuring of the
process of regional integration through laws issued and enforced at the supranational level (TableA1.2, column 7) - Of course, the use of this indicator only with regard to TEI is somewhat arbitrary.Supranational institutions and laws can indeed play a crucial role also when building up, for instance, a FTAor a CM. It is equally true, however, that, when pursuing total economic integration, supranationalinstitutions and laws become not only a desirable but also a necessary condition.
In the EU-6 experience, supranational institutions and laws were set up from the very onset of the process.Although they were strengthened over time, there is little doubt that the basic supranational framework wasalready available with the Treaty of Rome. This implies the assignment of 4 points already in 1958, when theTreaty of Rome went into force. Out of several subsequent developments, three events have been selected,each implying one additional point: (i) the establishment in 1974 of the European Council as a permanentforum providing political impulse; (ii) the involvement of citizens in the election of the European Parliamentin 1979; and (iii) the Treaty of Amsterdam, which entered into force in 1999 and introduced, among otherthings, an extension of qualified majority voting. As a result, the score assigned at the end of the periodconsidered is 7. The highest possible score is, however, 9, in order to signal that – apart from any discussionon political union, which falls outside the scope of the paper – even in the EU there is a clear case forstrengthening the institutional supranational aspects of the process of regional economic integration.
b) The concrete steps towards, and the conduction of, macroeconomic policies at the supranational level (seeTable A1.2, column 5) - We are of course referring to the achievement of a single monetary and exchangerate policy in 1999, with the establishment of the Eurosystem and the European Central Bank (fiveadditional points). This event was prepared in the course of the 1990s with a process sanctioned by theMaastricht Treaty. The most important step in this process was the so-called Stage II, which started in 1994(one point). The score assigned at the end of the period considered is, therefore, 6. The highest possiblescore is, however, 9, in order to signal that fiscal policies are already conducted at the national level,although within the context of the Stability and Growth Pact.
c) Those microeconomic policies which are conducted only or mostly at a supranational level and are most
likely to affect the need for regional exchange rate stability (Table A1.2, column 6). In the Europeanexperience (the only relevant thus far), such policies are, in our view: (2.i) the CAP; (2.ii) the use of the EU
general budget to strengthen the process of catching up in member countries such as Greece, Ireland,Portugal and Spain (EU structural funds). The CAP is here included due to its role as first Europeancommon policy. Given the analytical purposes of the paper, no attention is paid to the shortcomings anddistortions related to the CAP, which is just considered in its nature as common policy (three points, ofwhich one in 1962 when the CAP started and two in 1964 when it was strengthened). EU transfers ofstructural funds to poorer member countries are included since they may have fostered the catching-up

������������ ����������������������������
process in these countries, thus reducing their need for exchange rate adjustment. However, within EU-6these transfers play a less important role than within EU-15. They therefore obtain 1 point in 1988, whenstructural fund expenditure in the EU budget is doubled and reformed. The score assigned at the end of theperiod considered is 4. The highest possible score is, however, 7, in order to signal that a TEI would involvefurther unification of microeconomic policies. However, such a highest score is lower than that envisagedfor macroeconomic policies in order to signal that, in line with the principle of subsidiarity, the case forunification of microeconomic policies is weaker than that for unification of macroeconomic policies.
On the whole, an EUN as such (i.e, without considering the other stages of regional integration) would obtain 25points. The score assigned to EU-6 is 17.
Table A1.1
INDEX OF REGIONAL INTEGRATION FOR EU-6 COUNTRIES:
SCORES GIVEN TO EACH EVENT
(N.B.: Scores envisaged by the methodology but not actually assigned to EU-6 are highlighted in italics)
Stages in the process of regional integration, and events selected
Scores for
each
intermediate
step
Maximum
score
possible
Free trade area (FTA) and customs union (CU) (considered jointly)
a) FTA:
(i) each additional reduction of tariffs by (at least) 20% implies one additionalpoint. However, the final step towards a FTA is weighed differently (see (iii))
(ii) quota abolition (possible intermediate stages are not considered)
(iii) the completion of the FTA (brings as many points as is the difference between15 and the score achieved prior to completion (6 points, in the case of EU-6)).
(iv) the start of the CAP in 1962 (see this Appendix, main text for anexplanation)
b) CU
(i) each additional reduction by (at least) 20% in the difference betweenaverage external tariffs in individual countries and the Common ExternalTariffs (CETs) implies one additional point. However, the final step towardsa CU is weighed differently (see (ii))
(ii) the completion of the CU (brings as many points as is the differencebetween 9 and the score achieved prior to completion (6 points, in the caseof EU-6))
4=1*4
4
6
1
4=1*4
6
25 (given bythe sum of thescores below)
15
10
Common market (CM)
a) Progress in abolishing non-tariff barriers:
(i) “Dassonville” ruling of the Court of Justice (1974)
(ii) Cassis de Dijon ruling of the Court of Justice (1979)
1
1
25 (given bythe sum of thescores below)9

������������ �������������������������� �$
(iii) European Single Act (1986; entered in force in 1987)
(iv) official launch of the European Single Market (January 1993)
b) Steps in the liberalisation of the movement of capital:
(i) restoration of currency convertibility in 1958 to allow the settlement ofcurrent account transactions
(ii) directive of 11 May 1960, which promotes the liberalisation of certaincapital flows and prevents member countries from introducing newrestrictions
(iii) directive of 18 December 1962, which widens the scope for liberalisation
(iv) directive of 21 March 1972, which goes in the opposite direction byallowing countries to re-introduce restrictions in order to tackle the turmoilassociated with the collapse of the Bretton Woods system
(v) directive of 17 November 1986, which, coupled with a less importantdirective of 1985, gives new impetus to the liberalisation process
(vi) directive of 24 June 1988, which for the first time requires the fullliberalisation of capital movements within the EU by 1 July 1990 (in 1990the implementation of the directive is completed in the two EU-6 countries(FR, IT) which maintained residual restrictions)
c) Measures taken to liberalise the movement of workers:
(i) entitlement of workers to accept job offers within the internal market andabolition of any discrimination based on nationality between workers;
(ii) directive of 1989 on mutual recognition of higher education diplomas;
(iii) following the Action Plan elaborated by the Commission in 1997, policies inthe area of labour mobility have gained momentum;
(iv) full implementation in the EU-6 area, since 1998, of the Schengenconvention of 1990 on free circulation of people;
(v) other possible future measures (N.B.: not yet implemented. This implies thatthe actual total score obtained by item (c) at the end of the period is 4instead of 8).
2
5
1
1
1
-2
2
5
1
1
1
1
4
8
8
Economic union (EUN)
a) The degree of co-ordination of national macroeconomic policies:
(i) establishment in 1958 of the Monetary Committee;
(ii) establishment in 1964 of the Committee of Governors;
(iii) launch of the “snake” in 1972;
(iv) crisis of the snake since 1973;
(v) launch of the EMS in 1979;
1
1
1
-1
4
25
13

������������ ���������������������������4
(vi) strengthening of the EMS in 1987, with the Basle-Nyborg agreements;
(vii) convergence criteria laid down in the Maastricht Treaty3;
(viii) adoption of the Stability and Growth Pact in 1997 (+3).
b) The implementation, at the regional level alongside the national level, of thosemicroeconomic policies which are most likely to affect the need for regional
exchange rate stability
(i) competition policy: attribution in 1962 of strong powers to the Commissionfor competition policy;
(ii) transport policy: Commission's Action Programme on Transport Policy,published in 1962 in order to remove obstacles on trade;
(iii) harmonisation of VAT on trade of goods and services: the adoption of theVAT on trade of goods and services in April 1967 (First Council DirectiveNo. 67/227/EEC on the harmonisation of legislation of Member Statesconcerning turnover taxes/VAT on trade of goods and services), which startsthe process of harmonisation;
(iv) harmonisation of other national structural (in particular, labour market)policies in order to increase price (in particular, labour cost) flexibilitywithin the region: start of the process of monitoring of structural reforms,agreed by the European Council in Cardiff in June 1998. (N.B.: While eachof the events from (i) to (iii) brings about an actual increase in the score bythree points, the last event brings only one additional point. As a result, thetotal score obtained since 1998 (10) is lower than the highest possible for anEUN as far as microeconomic policies are concerned (12). This indicatesthat, although in the EU the degree of regional integration in terms of policyharmonisation and co-ordination is very high, some room for improvementis still left especially in the area of structural policies harmonisation.)
1
3
3
3
3
3
3=1 (i.e., Cardiffprocess)+2 (i.e., otherfuturemeasures)
12
3 The 1992-93 crisis as such does not add or subtract any points to the index of regional integration. The rationale for that is
that exchange rate stability in the EU was mainly pursued via foreign exchange intervention, mutual financial assistanceand so-called “credibility” of central banks prior to the crisis; and through enhanced efforts to achieve convergingfundamentals following the crisis. Differently from the snake crisis, the process of regional integration is not discontinuedin 1992-93. It is not by chance that a major adjustment of the Italian budget in September 1992 was approved a week after,and not a week before, the lira started its fluctuation outside the ERM. This explains why the ratification of the MaastrichtTreaty in 1993 and the related approval of legally binding convergence criteria imply an higher score for that year (+3)despite the enlargement of the ERM fluctuation band to +/-15%.

������������ �������������������������� �(
Total economic integration (TEI)
a) The set-up of supranational institutions and decision-making processes, as wellas the structuring of the process of regional integration through laws issued and
enforced at the supranational level:
(i) basic supranational framework already available with the Treaty of Rome (1957;entered in force in 1958);
(ii) establishment in 1974 of the European Council as a permanent forum providingpolitical impulse;
(iii) involvement of citizens in the election of the European Parliament in 1979;
(iv) Treaty of Amsterdam, which entered into force in 1999 and introduced, amongother things, an extension of qualified majority voting.
(v) Other possible future measures (N.B. The actual score assigned at the end of theperiod considered is 7. The highest possible score is, however, 9, in order tosignal that – apart from any discussion on political union, which falls outside thescope of the paper – even in the EU there is a clear case for strengthening theinstitutional supranational aspects of the process of regional economicintegration).
b) The concrete steps towards, and the conduction of, macroeconomic policies at the
supranational level:
(i) Achievement of a single monetary and exchange rate policy in 1999, withthe establishment of the Eurosystem and the European Central Bank;
(ii) Event (i) was prepared in the course of the 1990s with a process sanctioned by theMaastricht Treaty. The most important step in this process was the so-called StageII, which started in 1994
(iii) other possible future measures (N.B.: the actual score assigned at the end of theperiod considered is 6. The highest possible score is, however, 9, in order tosignal that fiscal policies are already conducted at the national level, althoughwithin the context of the Stability and Growth Pact).
c) Those microeconomic policies which are conducted only or mostly at a
supranational level and are most likely to affect the need for regional exchange
rate stability
(i) the start of the CAP in 1962
and
the strengthening of CAP in 1964 (see above for an explanation);
(ii) use of the EU general budget to strengthen the process of catching up in
member countries (EU structural funds): structural fund expenditure in theEU budget was doubled and reformed in 1988;
(iii) Other possible future measures (N.B. The highest possible score for c) is 7,while the actual score at the end of the period is 4. This signals that a TEIwould involve further unification of microeconomic policies).
4
1
1
1
2
5
1
3
1
2
1
3
25
9
9
7

������������ ��������������������������)
TABLE A1.2
TRADE SUPRANATIONALITY
1) Tariffs and quotas2) Non-tariff
barriers
3) Capital
movement
4) Labour
mobility
5)
Macroeconomic
policies
6) Microeconomic
policies
7) Institutional
developmentsFTA CU CM EU TEI TOTAL
1957 0 0 0 0 0 0
1958
Restoration of currency convertibility (December)
Establishment of the Monetary Committee (January)
EEC Treaty of Rome and EURATOM Treaty enter in force. A number of objectives and supranational institutions are set up. Integration starts being structured through Community law (January)
0 0 1 1 4 6
1959
The transition period for eliminating the internal tariffs starts. Intra-EU6 tariffs are reduced by 10%. They will be progressively eliminated between 1.1.59 and 1.7.68.
0 0 1 1 4 6
1960 Intra-EU6 tariffs reduced by 10% (July)
Directive of 11 May 1960, which promotes the liberalisation of certain capital flows
1 0 2 1 4 8
1961
Quota restrictions lifted at the end of the year, with a few exceptions. Intra-EU6 tariffs reduced by 10% (January)
5 0 2 1 4 12
1962
Intra-EU6 tariffs reduced by 20% (10% January, 10% July). In January the difference between average external tariffs in individual countries and the Common External Tariffs (CETs) is reduced by 30% (both agriculture and industrial products; for the latter, reduction had taken place already in 1961). Start of Common Agricultural Policy
Directive of 18 December 1962, which widens the scope for capital flow liberalisation
Start in April of Common Agricultural Policy (CAP). Strong Commission powers for competition policy. The Commission's Action Programme on Transport Policy is published in order to remove obstacles on trade (January)
7 1 3 7 5 23
1963 Intra-EU6 tariffs reduced by 10% (June) 8 1 3 7 5 24
1964
Establishment of the Committee of Governors of the Central Banks of the Member Countries of the European Community
Strengthening of CAP 8 1 3 8 7 27
1965Intra-EU6 tariffs reduced by 10% (January)
8 1 3 8 7 27
1966
Intra-EU6 tariffs reduced by 10%. The difference between average external tariffs in individual countries and the Common External Tariffs (CETs) is further reduced by 30% (both agriculture and industrial products; for the latter, reduction had taken place already in 1963) (January)
9 3 3 8 7 30
1967 Intra-EU6 tariffs reduced by 10% (July)
Directive of 11 April 1967 on the harmonisation of legislation of Member States concerning turnover taxes/VAT on trade of goods and services
9 3 3 11 7 33
1968
Customs union completed on 1 July: all remaining internal tariffs abolished; national customs duties in trade with the rest of the world replaced by the Common External Tariffs (CETs)
Workers are entitled to accept job offers within the internal market. Any discrimination based on nationality between workers is, in principle, abolished
15 10 4 11 7 47
1972
Directive of 21 March 1972, which allows countries to re-introduce certain restrictions
With the Basle agreement, the snake enters into force (April)
15 10 2 12 7 46
1973Italy withdraws from the snake (February)
15 10 2 11 7 45
1974
The European Court starts the process of removal of non-tariff barriers on trade (Dassonville case; July)
France withdraws from the snake (January)
The European Council is formally established (December)
15 10 3 11 8 47
1975France re-enters the snake (July)
15 10 3 11 8 47
1976
France withdraws again from the snake (March)
15 10 3 11 8 47
1978 15 10 3 11 8 47
CO-ORDINATED OR COMMON POLICIES
INDEX OF REGIONAL
INTEGRATION (score at the end of
each yeear)
INTEGRATION OF PRODUCT, SERVICES AND
FACTOR MARKETS
Index of regional integration FOR EU-6 countries (1957 - 1978)

������������ �������������������������� �
TRADE SUPRANATIONALITY
1) Tariffs
and
quotas
2) Non-tariff
barriers
3) Capital
movement
4) Labour
mobility
5) Macroeconomic
policies
6) Microeconomic
policies
7) Institutional
developmentsFTA CU CM EU TEI TOTAL
1979
Cassis de Dijon ruling by the European Court of Justice (principle of mutual recognition of national laws affecting trade if such laws are de facto equivalent) (February)
The European Monetary System (EMS) becomes operational (March)
European Parliament elected by the Community citizens directly (June)
15 10 4 15 9 53
1985EC-1992 White Paper programme
Schengen initial agreement on removal of border controls for EU-6 (excluding Italy)
15 10 4 15 9 53
1986
Directive of 17 November 1986, which gives new impetus to the liberalisation process
15 10 6 15 9 55
1987European Single Act in force (July)
Strengthening of the EMS through the Basle-Nyborg Agreement (September)
15 10 8 16 9 58
1988
Directive of 24 June 1988, which completes the liberalisation of capital movement from 1 July 1990 onwards
Doubling and reform of structural fund expenditure in the EU budget
15 10 8 16 10 59
1989
Directive No. 89/48/EEC on mutual recognition of higher education diplomas. However, this directive has not proved sufficiently effective (December)
15 10 9 16 10 60
1990
France completes liberalisation in January, Italy in May. From July onwards free capital movement is compulsory. No EU-6 country will re-introduce restrictions afterwards
Schengen convention on removal of border controls for EU-6 (excluding Italy) (June)
Start of Stage I of EMU. Italy enters the narrow (+/-2.25) band within the Exchange Rate Mechanism (ERM) of the EMS
Ex-GDR in the EU as a result of German reunification
15 10 14 16 10 65
1992EMS crisis. Italy abandons the ERM (September)
Re-doubling of structural fund expenditure in the EU budget. Ceiling to EU budget set at 1.27% of Union EU GDP, to be possibly increased only by a unanimous vote. Reform of Common Agricultural Policy
15 10 14 16 10 65
1993
Widening of the ERM band to +/-15%. However, with the ratification of the Maastricht Treaty in November, nominal convergence starts being enhanced in line with standardised and legally binding convergence criteria
The Treaty on European Union, signed in Maastricht in 1992, enters into force. Among other things, a monetary union shall be established by 1.1.1999
15 10 19 19 10 73
1994
Start of Stage II of EMU. The European Monetary Institute is set up (January)
15 10 19 19 11 74
1995
Schengen convention enters into force (excluding Italy)
15 10 19 19 11 74
1996 Italy re-joins ERM 15 10 19 19 11 74
1997
Commission's Action Plan for free movement of workers (June)
Approval by the European Council of the Pact for Stability and Growth (December)
15 10 20 22 11 78
1998
Since 31 March the Schengen convention is fully in force in all EU-6 countries, including Italy
Establishment of the European Central Bank (June)
Process of monitoring of national structural reforms, agreed by the European Council in Cardiff (June)
15 10 21 23 11 80
1999
11 EU countries (including EU-6) start a monetary union (January)
The Amsterdam Treaty, signed in 1997, enters into force (extension of qualified majority voting, etc.) (January)
15 10 21 23 17 86
2001 15 10 21 23 17 86
TABLE A1.2 (continuation)
INTEGRATION OF PRODUCT, SERVICES AND FACTOR
MARKETS
INDEX OF REGIONAL INTEGRATION
(score at the end of each yeear)
The European Single Market is established on 1 January. To a very large extent, restrictions on factor movements are abolished. The process is completed by dismantlement of non-tariff barriers (e.g. on market access, competitive conditions and market functioning)
CO-ORDINATED OR COMMON POLICIES
Index of regional integration FOR EU-6 countries (1979 - 2001)

������������ ���������������������������
TR
AD
E
1)
Tarif
fs, q
uota
s an
d n
on
-tarif
f b
arrie
rs
2)
No
n-t
arif
f b
arrie
rs
3)
Cap
ital
movem
ent
4)
Lab
ou
r m
ob
ilit
y6)
Inst
itu
tion
al
develo
pm
en
tsF
TA
CU
CM
EU
TE
IT
OT
AL
1991
FTA
: Tra
de L
iber
alis
atio
n Pr
ogra
mm
e ba
sed
on tw
o gu
idel
ines
: (1
) se
mia
nnua
l, pr
ogre
ssiv
e, li
near
and
aut
omat
ic ta
riff
red
uctio
ns; (
2) li
sts
of p
rodu
cts
tem
pora
rily
exc
lude
d fr
om s
uch
redu
ctio
ns, t
o be
red
uced
by
the
end
of e
ach
year
; (3)
pro
gres
sive
elim
inat
ion
of n
on-t
arif
f re
stri
ctio
ns o
r eq
uiva
lent
mea
sure
s. A
s re
gard
s (1
), a
47%
tari
ff r
educ
tion
is c
ompl
eted
in J
une
1991
, and
7%
dec
reas
es a
re p
lann
ed e
very
si
x m
onth
s in
ord
er to
obt
ain
100%
by
Janu
ary
1995
.
The
Tre
aty
of A
sunc
ión
ente
rs in
to f
orce
in N
ovem
ber.
T
he T
reat
y se
ts f
orth
the
mai
n fi
nal o
bjec
tives
of
inte
grat
ion:
1)
the
prog
ress
ive
esta
blis
hmen
t of
a FT
A,
CU
and
, as
a fi
nal o
bjec
tive,
a C
M; 2
) co
-ord
inat
ion
of
mac
roec
onom
ic p
olic
ies
and
mic
roec
onom
ic s
ecto
ral
polic
ies.
The
initi
al in
stitu
tiona
l str
uctu
re is
set
up.
20
10
14
1994
The
ME
RC
OSU
R T
rade
Com
mis
sion
is e
stab
lishe
d by
the
Prot
ocol
of
Our
o Pr
eto
(Dec
embe
r). T
he T
rade
Com
mis
sion
adm
inis
trat
es
trad
ing
rela
tions
bet
wee
n th
e m
embe
rs a
nd a
cts
as a
for
um o
f fi
rst i
nsta
nce
for
the
settl
emen
t of
trad
e di
sput
es.
The
Tre
aty
of A
sunc
ión
is f
orm
ally
am
ende
d in
the
so-
calle
d "P
roto
col o
f O
uro
Pret
o", s
igne
d in
Dec
embe
r 19
94. T
he P
roto
col c
once
rns
inst
itutio
nal i
ssue
s su
ch a
s th
e de
fini
tive
Com
mon
Mar
ket i
nstit
utio
nal f
ram
ewor
k an
d di
sput
e se
ttlem
ent.
It a
lso
conf
ers
on M
ER
CO
SUR
a
dist
inct
inte
rnat
iona
l leg
al p
erso
nalit
y.
30
10
26
1995
FTA
: An
"im
perf
ect"
FT
A is
est
ablis
hed
in J
anua
ry 1
995
betw
een
Arg
entin
a, B
razi
l, Pa
ragu
ay a
nd U
rugu
ay. T
he F
TA
doe
s no
t cov
er th
e en
tire
tari
ff u
nive
rse.
For
the
rem
aini
ng p
rodu
cts,
the
so-c
alle
d "R
egim
e fo
r Fi
nal A
djus
tmen
t to
the
Cus
tom
s U
nion
" st
arts
for
Bra
zil a
nd
Arg
entin
a. A
list
is d
efin
ed f
or w
hich
intr
a-re
gion
al im
port
tari
ffs
mus
t be
subj
ect t
o an
nual
, lin
ear
and
auto
mat
ic r
educ
tions
unt
il re
achi
ng
0% b
y Ja
nuar
y 1,
199
9. T
he s
tage
s of
this
pro
cess
res
pond
to th
e fo
llow
ing
tari
ff r
educ
tion
timet
able
: 19
96 2
5 %
; 199
7 50
%; 1
998
75 %
; 19
99 1
00%
.
C
U: T
he C
omm
on E
xter
nal T
arif
f (C
ET
) on
impo
rts
from
thir
d co
untr
ies
is s
et a
t 11
diff
eren
t lev
els
rang
ing
from
0 to
20%
, with
exc
eptio
n lis
ts f
or e
ach
ME
RC
OSU
R m
embe
r (u
p to
300
tari
ff it
ems
for
Arg
entin
a, B
razi
l and
Uru
guay
unt
il 20
01, a
nd 3
99 it
ems
for
Para
guay
unt
il 20
06).
For
all
thes
e ex
cept
ions
a c
onve
rgin
g pr
oces
s to
war
ds th
e C
ET
is e
nvis
aged
.
105
20
219
1996
The
"R
egim
e fo
r Fi
nal A
djus
tmen
t to
the
Cus
tom
s U
nion
" (s
ee u
nder
"19
95")
sta
rts
in P
arag
uay
and
Uru
guay
. It h
as to
be
com
plet
ed b
y Ja
nuar
y 1,
200
0.
106
20
220
1997
In D
ecem
ber
Bra
zil i
mpo
ses
a sy
stem
of
disc
retio
nary
lice
nses
for
som
e im
port
s, s
uch
as d
airy
pro
duct
s, f
uel,
frui
ts, c
erta
in c
hem
ical
pr
oduc
ts a
nd m
achi
nery
.
In D
ecem
ber
Mem
ber
Stat
es s
ign
the
Prot
ocol
of
Mon
tevi
deo,
whi
ch
stip
ulat
es th
e ph
asin
g ou
t of
bar
rier
s on
trad
e in
se
rvic
es w
ithin
ten
year
s.
96
20
219
1998
The
Bra
zilia
n re
stri
ctio
ns s
tart
ed in
Dec
embe
r 19
97 a
re f
urth
er ti
ghte
ned.
Res
ista
nce
to th
e m
easu
re f
rom
the
ME
RC
OSU
R p
artn
ers
lead
s to
th
e cr
eatio
n of
a tr
ibun
al to
set
tle th
e di
sput
e. T
he tr
ibun
al r
ules
that
the
regi
me
mus
t be
dism
antle
d no
late
r th
an th
e en
d of
199
9. T
his
is
the
the
firs
t tim
e th
at th
e M
ER
CO
SUR
cou
ntri
es u
se th
eir
disp
ute-
settl
emen
t mec
hani
sm s
ince
the
appr
oval
of
the
Prot
ocol
of
Bra
silia
in
1994
.
Follo
win
g th
e Pr
otoc
ol o
f M
onte
vide
o (s
ee u
nder
"1
997"
), f
orm
al
nego
tiatio
ns s
tart
in th
e se
cond
hal
f of
199
8.
106
30
221
1999
FTA
: Som
e se
nsiti
ve g
oods
, whi
ch w
ere
excl
uded
fro
m th
e FT
A a
nd g
radu
ally
inco
rpor
ated
(se
e un
der
"199
5"),
bec
ome
in D
ecem
ber
part
of
the
FTA
for
Arg
entin
a an
d B
razi
l. E
xcep
tions
are
stil
l allo
wed
for
Par
agua
y an
d U
rugu
ay. H
owev
er, s
peci
al r
egim
es r
emai
n fo
r se
ctor
s su
ch a
s th
e au
tom
otiv
e an
d su
gar
indu
stri
es, w
ith a
long
er p
erio
d of
tran
sitio
n to
war
ds f
ree
trad
e. M
oreo
ver,
the
deva
luat
ion
of th
e B
razi
lian
curr
ency
in J
anua
ry o
f 19
99 b
ring
s ab
out s
erio
us e
cono
mic
pro
blem
s fo
r M
ER
CO
SUR
mem
ber
coun
trie
s, w
hich
ori
gina
te te
mpo
rary
trad
e re
stri
ctio
ns.
C
U: i
n 19
99
the
CE
T d
oes
not y
et c
over
cap
ital g
oods
, com
pute
rs a
nd s
oftw
are,
and
tele
com
mun
icat
ion
equi
pmen
t. A
s a
resu
lt, e
ach
ME
RC
OSU
R
coun
try
appl
ies
its o
wn
leve
l of
tari
ff to
thos
e go
ods.
Tar
iffs
on
capi
tal g
oods
are
pla
nned
to c
onve
rge
at 1
4 pe
r ce
nt b
y Ja
nuar
y 20
01 in
the
case
s of
Arg
entin
a an
d B
razi
l and
by
Janu
ary
2006
for
Par
agua
y an
d U
rugu
ay. F
or c
ompu
ters
and
sof
twar
e an
d te
leco
mm
unic
atio
n eq
uipm
ent,
the
tari
ffs
are
plan
ned
to c
onve
rge
at 1
6 pe
r ce
nt in
200
6.
117
31
224
2000
FTA
: Som
e se
nsiti
ve g
oods
, whi
ch w
ere
excl
uded
fro
m th
e FT
A a
nd g
radu
ally
inco
rpor
ated
(se
e "1
996"
), b
ecom
e in
Dec
embe
r pa
rt o
f th
e FT
A a
lso
for
Para
guay
and
Uru
guay
127
31
225
2001
Arg
entin
a pa
rtly
aba
ndon
s th
e M
ER
CO
SUR
CE
T s
yste
m b
y el
imin
atin
g ta
riff
s on
Arg
entin
e im
port
s of
cap
ital g
oods
and
rai
sing
tari
ffs
on
cons
umpt
ion
good
s to
35%
. The
tem
pora
ry s
hift
of
Arg
entin
a to
a d
ual c
urre
ncy
curr
ency
boa
rd f
or c
urre
nt a
ccou
nt tr
ansa
ctio
ns im
ping
es
on tr
ade
with
ME
RC
OSU
R p
artn
ers.
11
63
12
23
5)
Po
licy
co
-ord
ina
tio
n
One
wor
king
gro
up is
cre
ated
in J
une
1999
, ca
lled
Mac
roec
onom
ic C
o-or
dina
tion
Com
mitt
ee. T
he C
omm
ittee
: a)
is r
espo
nsib
le
for
exam
inin
g th
e ec
onom
ic p
olic
ies
of
ME
RC
OSU
R m
embe
r co
untr
ies
and
for
draf
ting
new
mac
roec
onom
ic c
o-or
dina
tion
prop
osal
s,
incl
udin
g an
act
ion
prog
ram
me
for
grea
ter
mac
roec
onom
ic c
onve
rgen
ce; b
) ex
plor
es
mec
hani
sms
both
for
the
harm
onis
atio
n of
st
atis
tical
dat
a an
d to
iden
tify
met
hodo
logi
cal
crite
ria
used
by
som
e m
embe
r co
untr
ies
to
prep
are
thei
r ec
onom
ic in
dica
tors
. Mor
eove
r, in
th
e sa
me
year
the
ME
RC
OSU
R H
eads
of
Stat
e en
dors
e th
e id
ea o
f el
abor
atin
g a
"min
i-M
aast
rich
t Agr
eem
ent"
for
sec
urin
g fi
scal
ba
lanc
e w
ithin
the
grou
p as
a f
irst
ste
p to
war
ds
the
poss
ible
cre
atio
n of
a m
onet
ary
unio
n.
With
the
esta
blis
hmen
t of
the
inte
rgov
ernm
enta
l Com
mon
Mar
ket G
roup
-
the
mai
n ex
ecut
ive
body
of
ME
RC
OSU
R -
a n
umbe
r of
wor
king
gro
ups
are
esta
blis
hed
to s
tudy
issu
es r
elat
ed to
the
esta
blis
hmen
t of
a co
mm
on
mar
ket.
The
se g
roup
s ca
n on
ly m
ake
reco
mm
enda
tions
to th
e C
omm
on
Mar
ket G
roup
for
con
side
ratio
n an
d/or
impl
emen
tatio
n.
Und
er R
esol
utio
n N
o. 9
0/95
, a n
ew s
truc
ture
is e
stab
lishe
d fo
r w
orki
ng
grou
ps u
nder
the
Com
mon
Mar
ket G
roup
. The
se w
orki
ng g
roup
s de
al w
ith
issu
es s
uch
as c
omm
unic
atio
n, f
inan
cial
mat
ters
, tra
nspo
rt a
nd
infr
astr
uctu
re, e
nvir
onm
ent,
indu
stry
, agr
ecul
ture
, ene
rgy,
and
labo
ur a
nd
soci
al s
ecur
ity. T
his
fram
ewor
k, h
owev
er, r
emai
ns b
ased
on
an in
ter-
gove
rnm
enta
l str
uctu
re.
TA
BL
E A
1.3
INT
EG
RA
TIO
N O
F S
ER
VIC
ES
AN
D F
AC
TO
R M
AR
KE
TS
IND
EX
OF
RE
GIO
NA
L
INT
EG
RA
TIO
N (
score a
t th
e e
nd
of
each
yeear)
Ind
ex
of
reg
ion
al
inte
gra
tio
n f
or M
ER
CO
SU
R c
ou
ntr
ies
(19
91
- 2
00
1)

������������ �������������������������� �
AP
PE
ND
IX 2
Fig
ure A
2.1
: C
lust
er A
na
lysi
s D
en
dro
gra
ms
for E
U1
5
Hie
rarc
hica
l clu
ster
ing
Clu
ster
Ana
lysi
s: In
tegr
atio
n in
Eur
ope,
195
7-70
L2 dissimilarity measure
0
6.2
5183
AT
FR
UK
DK
FI
PT
SE
DE
BE
IEN
DE
SG
RIT
Hie
rarc
hica
l clu
ster
ing
Clu
ster
Ana
lysi
s: In
tegr
atio
n in
Eur
ope,
197
1-79
L2 dissimilarity measure
0
5.6
2908
AT
DE
DK
SE
BE
ND
FR
UK
IEE
SP
TF
IG
RIT
Hie
rarc
hica
l clu
ster
ing
Clu
ster
Ana
lysi
s: In
tegr
atio
n in
Eur
ope,
198
0-87
L2 dissimilarity measure
0
6.0
7125
AT
BE
IEN
DD
EF
RIT
DK
SE
ES
FI
UK
GR
PT
Hie
rarc
hica
l clu
ster
ing
Clu
ster
Ana
lysi
s: In
tegr
atio
n in
Eur
ope,
198
8-92
L2 dissimilarity measure
0
6.6
245
AT
FR
ITS
EF
IB
EIE
DE
DK
ND
ES
UK
GR
PT

������������ ��������������������������
Fig
ure A
2.1
: C
lust
er A
naly
sis
Den
dro
gram
s fo
r E
U1
5 (
co
nt.
)
Hie
rarc
hica
l clu
ster
ing
Clu
ster
Ana
lysi
s: In
tegr
atio
n in
Eur
ope,
199
3-98
L2 dissimilarity measure
0
6.5
3442
AT
DE
DK
FR
BE
ND
ES
PT
FI
ITIE
SE
GR
UK
Den
drog
ram
for
a1t6
clu
ster
ana
lysi
s
Clu
ster
Ana
lysi
s: In
tegr
atio
n in
Eur
ope,
199
9-20
01
L2 dissimilarity measure
0
4.4
9478
AT
DE
DK
FI
ITE
SF
RB
EN
DS
EG
RIE
PT
UK

������������ �������������������������� �
Fig
ure A
2.2
: C
lust
er A
naly
sis
Den
dro
gram
s fo
r L
ati
n A
meric
a 1
1
Hie
rarc
hica
l sin
gle
clus
terin
g m
etho
d
Clu
ster
Ana
lysi
s: In
tegr
atio
n in
Lat
in A
mer
ica
11, 1
980-
93
L2 dissimilarity measure
0
4.0
234
ME
XB
OL
EC
UC
OL
AR
GC
HL
BR
AP
AR
PE
RU
RU
VE
N
Hie
rarc
hica
l sin
gle
clus
terin
g m
etho
d
Clu
ster
Ana
lysi
s: In
tegr
atio
n in
Lat
in A
mer
ica
11, 1
980-
86
L2 dissimilarity measure
0
4.0
3469
ME
XB
OL
EC
UA
RG
CH
LP
AR
BR
AP
ER
UR
UC
OL
VE
N
Hie
rarc
hica
l sin
gle
clus
terin
g m
etho
d
Clu
ster
Ana
lysi
s: In
tegr
atio
n in
Lat
in A
mer
ica
11, 1
987-
93
L2 dissimilarity measure
0
3.5
0511
ME
XB
OL
PA
RE
CU
BR
AP
ER
CH
LA
RG
CO
LU
RU
VE
N
Hie
rarc
hica
l sin
gle
clus
terin
g m
etho
d
Clu
ster
Ana
lysi
s: In
tegr
atio
n in
Lat
in A
mer
ica
11, 1
994-
2000
L2 dissimilarity measure
0
3.4
9081
EC
UM
EX
BO
LP
AR
BR
AP
ER
AR
GC
HL
UR
UC
OL
VE
N

������������ ���������������������������
�������������� ���������������������
�������� ���� ���������������������� ������������������� ���� ������������!��"������#����$%%"""&���&���'&
((� )������ �������������������������������������������$��������� ������������ ������ �������*�����&������+&�,�������-&�.��� � ��+����/00/&
((1 )2�����������������������������$�"�������"������3*����4&�5��� �����5&�-������&�2�6�����&�7� �88�����+����/00/&
((9 )2�������� ����� �������������������� ���������� ����$�� ��"����������������*���5&�:�����������������/00(&
((; )<�������������������������������=�����(>?9����(>>?*����+&�@�����������&�-�8&�+����/00/&
((� )@�������������������"������������������$��������������"��� ��������������*���:&��� ������&�A� � ��+����/00/&
((? )��� ������������������B������C� ���������$����� ����������������� ����������4� ���(>??D(>>?*����=&�2&�7�����+����/00/&
((> )2�������� ����������������������������������*����.&����� �����&�2���+����/00/&
(/0 ),���������� �����������������"���������������������*����E&�@������6����-&�2���+����/00/&
(/( ).�� ����������*����5&���������<&��&�5&������������/00/&
(// ).�"������� ���������������� ������"���������������*�����&�A�6�� ����<&�5 ����������/00/&
(/� )5� ��������������������� ��� ���������������������������� �������������*�����&�7�������5&�A������������/00/&
(/1 )2�������� ������B�����������������������*����=&��&�� ������E&�@������6�������/00/&
(/9 )�������� � ������� � �� �����������������*����E&�2���� ���������/00/&
(/; ):���� ������������������������ ������� �������������� *�����&�2���������&�F��������������/00/&
(/� )��������������������� ����"��������� ����� ��������������*����E&�@������6���-&�2����������/00/&
(/? ):�������������������B������������D������������������� ���*�����&�E�������<&���������������/00/&

������������ �������������������������� $
(/> ).��D���������� ����� ������������������"���������������������C�� ����*���5&� D.�"�������,&�E�����2���/00/&
(�0 )@����8�������B�������������������$�������������� �����������*�����&����"���2���/00/&
(�( )2��������������������@4��$�"������"�����"�����"������"�������������"3*���2&�5&�����������&�<��G���8D� ��8�� ��2���/00/&
(�/ )4�� ������������������ ���� �������������������������$��)��"�-�������*�������� �*����:&�5���� ���&�<��G���8D� ��8�� �����&�7�������2���/00/&
(�� )������������������������������� ��������������������� �=�����"��3*���5&�2�����������2&�<����2���/00/&
(�1 )7������������� ���������������������.���� �����(>>/D(>>>*�����&��������+&�A��� ����2���/00/&
(�9 )7�������� ���B�����B����������������������������������*�����&������������&�7� ����5�� �/00/&
(�; )<��� �������������������D������$�������"�� ������������������� � � *���=&�����������5�� �/00/&
(�� )�C�� ������������������������������!��������������������*����H&�������� ��5�� /00/&
(�? ).�"*� ��"�������������������������������$�"�������2H��� ������3*����&��&�2���� ���5�� �/00/&
(�> ):��������������������������*����2&���8������5�� �/00/&
(10 )�������������������������D������������������� ����*����2&�������2��/00/&
(1( )5������������������ �� ����*�����&��������������,&�E�����������2��/00/&
(1/ )2��� ���������� ������������������ �����������������B��������� �C��������������������������������� ����*�����5&�������=&����D2����8��5&�@���������&�.�����2��/00/&
(1� )5����D����������������� �������"������*�����4&��"�����2��/00/&
(11 )5��� �������������������������� ����$���� ���������������������������B���������������������*�����2&�E� �����E&�@� ���2��/00/&
(19 )7�"������"�� ��"��������������������� ������*�����2&���8��������2&���������2��/00/&
(1; )������������������� ����I�"��!������� ������������3*������&�� ���������&�@�����2��/00/&

������������ ��������������������������4
(1� )7���D��D��� ��������������������������������"���������8��������������� ����2&�������2��/00/&
(1? )7����������� ����������� ���� ��*����A&����������2��/00/&
(1> )7���E������� ������������E��D�� ��D����������� *����5&���������5&��� ����2�/00/&
(90 )�C���������������������� ���� ������������������������� ���*����<&�=����+&�A�� ����=&�A� �����+����/00/&
(9( )=D����� ������������*�����&���� ��+����/00/&
(9/ )E���D��������������������� ��� ���������� ���*����=&����D2����8����5&�,����+���/00/&
(9� )����������������������������������� �������$������ �������������������*���5&��� ����+����/00/&
(91 )7�������� ���������� �� ��������������� ��$���"��������������� ��������������������B���������� �B��� ���������������������������"� �3*����2&���8������+����/00/&
(99 )J���������� ��������������:���$������������������� �������������������������������������������*����+&��&�+����������&�<������8D� ��8�� ��+����/00/&
(9; )4�������������������������� ��� ����� ���������������������� �*����+&�+&����8�����&�@�������+� ��/00/&
(9� )����������������������������������$�� ���������������������������������*���-&�=&�.������H&�������� ����4&�5&�E���� � ��+� ��/00/&
(9? )F�������������������7����� ���� ������*�����&�E�� �������&�+&��� �����+� ��/00/&
(9> ):���� ���� ��������*�����&�2�������+� ��/00/&
(;0 )2��� �������������������C�� ������ ����������� �������� �������B��������*����&���������5&���������+&�@������&�2�������&�E������+� ��/00/&
(;( )7�������� � ���������������������������������*����,&�E�����+� ��/00/&
(;/ )��� �����������������$����������������B�����������������������������H����*���E&�-��������5������/00/&
(;� )7������� ���������������!���� ������B���������$��� ��D������ ������������������*����2&����� �����=&�-������5������/00/&
(;1 )��������������������������������$������������ �� ������*����=&����������5������/00/&

������������ �������������������������� (
(;9 )7������������������������������� ����������������*����=&������������&�E�����5������/00/&
(;; )2������������� ��� �����������������������D������������ �����������������*���<&�2&�&+&�����������@&�+�������5������/00/&
(;� )4����������������������������������� ���������������B�����������������������C�������K����+&�������+&@&�<�������&�E"��������+&@&��������5������/00/&
(;? )����������������������������� ��� �������:������������*����<&���������5������/00/&
(;> )2��� �������� ����������*����5&�:���������.&��� �����5������/00/&
(�0 )���������������� ��������� ������� ���������3*����=&�2���"����<&�<����5������/00/&
(�( )5�������������������������������� ��C�� ���������� �������������*�����&�E�������<&���������5������/00/&
(�/ )������������C� ���D�6������������������$������������������������������������������� �*����.&�+������E��������/00/&
(�� ):������������C�� ��������������������������������� ��*�����&�����������L&�,����E��������/00/&
(�1 )4�������� ���������� ������������������������ ���������������*���5&�E���� ����E��������/00/&
(�9 )2�������� ����������������� ���� ��������������������*����E&�=� ������+&:&�@�� �����@&�-������E��������/00/&
(�; )2������������������������ ������������������*����=&������������,&����� �E��������/00/&
(�� )5��������������������������������������������� ����*�����&������������&� �����������E��������/00/&
(�? )4�� ������������������������ ���������� ����������������*�����&�����������+&�&�,M��8DE �����E��������/00/&
(�> ):���� ���������� ����"������� ��������D��� �������*�����&+&��������5&7&�,� ����E��������/00/&
(?0 )<����� ���� ���������������������$����� ��� ���� �&��������� �*����2&��������5&,&��� ����E��������/00/&
(?( )4�� ������������������������� � ������$������ ��������H������E������������������+��*����=&�����������A&���� ����E��������/00/&
(?/ )7������������������������� D����������������������������� ������������������*����=&�<N��� ���E��������/00/&

������������ ���������������������������)
(?� )2�������� ��������"� ��"������������������� ��������*�����&�����:������/00/&
(?1 )�������������������� ��� �������������������������*�����&�@� ���������+&D�&�<�������:������/00/&
(?9 )����������������$�"��� ���������������������3�7����������,����5����*����&���������E&�������2&���8���������&��&�2���� ���:������/00/&