What do Americans Think About Federal Tax Options to Support Public Transit, Highways, and Local...
118
What do Americans Think About Federal Tax Options to Support Public Transit, Highways, and Local Streets and Roads? Results from Year Five of a National Survey MTI Report 12-36 MTI What do Americans Think About Federal Transportation Tax Options? MTI Report 12-36 June 2014
Transcript of What do Americans Think About Federal Tax Options to Support Public Transit, Highways, and Local...

What do Americans Think About Federal Tax Options to Support Public Transit, Highways, and Local Streets and Roads? Results from Year Five of a National Survey
MTI Report 12-36
Funded by U.S. Department of Transportation and California Department of Transportation
MT
IW
hat do Am
ericans Think A
bout Federal Transportation T
ax Options?
MT
I Report 12-36June 2014
The Norman Y. Mineta International Institute for Surface Transportation Policy Studies was established by Congress in the Intermodal Surface Transportation Efficiency Act of 1991 (ISTEA). The Institute’s Board of Trustees revised the name to Mineta Transportation Institute (MTI) in 1996. Reauthorized in 1998, MTI was selected by the U.S. Department of Transportation through a competitive process in 2002 as a national “Center of Excellence.” The Institute is funded by Congress through the United States Department of Transportation’s Research and Innovative Technology Administration, the California Legislature through the Department of Transportation (Caltrans), and by private grants and donations.
The Institute receives oversight from an internationally respected Board of Trustees whose members represent all major surface transportation modes. MTI’s focus on policy and management resulted from a Board assessment of the industry’s unmet needs and led directly to the choice of the San José State University College of Business as the Institute’s home. The Board provides policy direction, assists with needs assessment, and connects the Institute and its programs with the international transportation community.
MTI’s transportation policy work is centered on three primary responsibilities:
MINETA TRANSPORTATION INSTITUTE
Research MTI works to provide policy-oriented research for all levels of government and the private sector to foster the development of optimum surface transportation systems. Research areas in-clude: transportation security; planning and policy development; interrelationships among transportation, land use, and the environment; transportation finance; and collaborative labor-management relations. Certified Research Associates conduct the research. Certification requires an advanced degree, gener-ally a Ph.D., a record of academic publications, and profession-al references. Research projects culminate in a peer-reviewed publication, available both in hardcopy and on TransWeb, the MTI website (http://transweb.sjsu.edu).
Education The educational goal of the Institute is to provide graduate-lev-el education to students seeking a career in the development and operation of surface transportation programs. MTI, through San José State University, offers an AACSB-accredited Master of Science in Transportation Management and a graduate Certifi-cate in Transportation Management that serve to prepare the na-tion’s transportation managers for the 21st century. The master’s degree is the highest conferred by the California State Uni-versity system. With the active assistance of the California
Department of Transportation, MTI delivers its classes over a state-of-the-art videoconference network throughout the state of California and via webcasting beyond, allowing working transportation professionals to pursue an advanced degree regardless of their location. To meet the needs of employers seeking a diverse workforce, MTI’s education program promotes enrollment to under-represented groups.
Information and Technology Transfer MTI promotes the availability of completed research to professional organizations and journals and works to integrate the research findings into the graduate education program. In addition to publishing the studies, the Institute also sponsors symposia to disseminate research results to transportation professionals and encourages Research Associates to present their findings at conferences. The World in Motion, MTI’s quarterly newsletter, covers innovation in the Institute’s research and education pro-grams. MTI’s extensive collection of transportation-related publications is integrated into San José State University’s world-class Martin Luther King, Jr. Library.
The contents of this report reflect the views of the authors, who are responsible for the facts and accuracy of the information presented herein. This document is disseminated under the sponsorship of the U.S. Department of Transportation, University Transportation Centers Program and the California Department of Transportation, in the interest of information exchange. This report does not necessarily reflect the official views or policies of the U.S. government, State of California, or the Mineta Transportation Institute, who assume no liability for the contents or use thereof. This report does not constitute a standard specification, design standard, or regulation.
DISCLAIMER
MTI FOUNDER Hon. Norman Y. Mineta
MTI BOARD OF TRUSTEESFounder, Honorable Norman Mineta (Ex-Officio)Secretary (ret.), US Department of TransportationVice ChairHill & Knowlton, Inc.
Honorary Chair, Honorable Bill Shuster (Ex-Officio)ChairHouse Transportation and Infrastructure CommitteeUnited States House of Representatives
Honorary Co-Chair, Honorable Nick Rahall (Ex-Officio)Vice ChairHouse Transportation and Infrastructure CommitteeUnited States House of Representatives
Chair, Steve Heminger (TE 2015)Executive DirectorMetropolitan Transportation Commission
Vice Chair, Stephanie Pinson (TE 2015)President/COOGilbert Tweed Associates, Inc.
Executive Director, Rod Diridon* (Ex-Officio)Mineta Transportation InstituteSan José State University
Thomas Barron (TE 2015)Executive Vice PresidentStrategic InitiativesParsons Group
Joseph Boardman (Ex-Officio)Chief Executive OfficerAmtrak
Donald Camph (TE 2016)PresidentAldaron, Inc.
Anne Canby (TE 2014)DirectorOneRail Coalition
Grace Crunican (TE 2016)General ManagerBay Area Rapid Transit District
Julie Cunningham (TE 2015)President/CEOConference of Minority Transportation Officials
William Dorey (TE 2014)Board of DirectorsGranite Construction, Inc.
Malcolm Dougherty (Ex-Officio)DirectorCalifornia Department of Transportation
Mortimer Downey* (TE 2015)Senior AdvisorParsons Brinckerhoff
Nuria Fernandez (TE 2014)General Manager/CEOValley Transportation Authority
Rose Guilbault (TE 2014)Vice President (ret.)American Automobile Association
Ed Hamberger (Ex-Officio)President/CEOAssociation of American Railroads
Diane Woodend Jones (TE 2016)Principal and Chair of BoardLea+Elliot, Inc.
Will Kempton (TE 2016)Executive DirectorTransportation California
Jean-Pierre Loubinoux (Ex-Officio)Director GeneralInternational Union of Railways (UIC)
Michael Melaniphy (Ex-Officio)President & CEOAmerican Public Transportation Association (APTA)
Jeff Morales (TE 2016)CEOCalifornia High-Speed Rail Authority
Beverley Swaim-Staley (TE 2016)PresidentUnion Station Redevelopment Corporation
Dr. David Steele (Ex-Officio)Dean, College of BusinessSan José State University
Michael Townes* (TE 2014)Senior Vice PresidentNational Transit Services LeaderCDM Smith
Bud Wright (Ex-Officio)Executive DirectorAmerican Association of State Highway and Transportation Officials (AASHTO)
Edward Wytkind (Ex-Officio)PresidentTransportation Trades Dept., AFL-CIO
(TE) = Term Expiration or Ex-Officio* = Past Chair, Board of Trustee
Hon. Rod Diridon, Sr.Executive Director
Karen Philbrick, Ph.D.Deputy Executive Director andResearch Director
Peter Haas, Ph.D.Education Director
Donna MaurilloCommunications Director
Brian Michael JenkinsNational Transportation Safety and Security Center
Asha Weinstein Agrawal, Ph.D.National Transportation Finance Center
Asha Weinstein Agrawal, Ph.D.Urban and Regional Planning San José State University
Jan Botha, Ph.D.Civil & Environmental EngineeringSan José State University
Katherine Kao Cushing, Ph.D.Enviromental Science San José State University
Dave Czerwinski, Ph.D.Marketing and Decision Science San José State University
Frances Edwards, Ph.D.Political Science San José State University
Taeho Park, Ph.D.Organization and Management San José State University
Diana WuMartin Luther King, Jr. LibrarySan José State University
Directors Research Associates Policy Oversight Committee
A publication of
Mineta Transportation InstituteCreated by Congress in 1991
College of BusinessSan José State UniversitySan José, CA 95192-0219
REPORT 12-36
WHAT DO AMERICANS THINK ABOUT FEDERAL TAX OPTIONS TO SUPPORT PUBLIC TRANSIT, HIGHWAYS, AND LOCAL STREETS AND ROADS? RESULTS FROM
YEAR FIVE OF A NATIONAL SURVEY
Asha Weinstein Agrawal, Ph.D.Hilary Nixon, Ph.D.
June 2014
TECHNICAL REPORT DOCUMENTATION PAGE
1. Report No. 2. Government Accession No. 3. Recipient’s Catalog No.
4. Title and Subtitle 5. Report Date
6. Performing Organization Code
7. Authors 8. Performing Organization Report
9. Performing Organization Name and Address 10. Work Unit No.
11. Contract or Grant No.
12. Sponsoring Agency Name and Address 13. Type of Report and Period Covered
14. Sponsoring Agency Code
15. Supplemental Notes
16. Abstract
17. Key Words 18. Distribution Statement
19. Security Classif. (of this report) 20. Security Classif. (of this page) 21. No. of Pages 22. Price
Form DOT F 1700.7 (8-72)
102
CA-MTI-14-1328
What Do Americans Think About Federal Tax Options to Support Public Transit, Highways, and Local Streets and Roads? Results from Year Five of a National Survey
June 2014
MTI Report 12-36Asha Weinstein Agrawal, Ph.D. and Hilary Nixon, Ph.D.
Mineta Transportation Institute College of Business San José State University San José, CA 95192-0219
California Department of TransportationOffice of Research—MS42P.O. Box 942873Sacramento, CA 94273-0001
U.S. Department of TransportationResearch & Innovative Technology Admin.1200 New Jersey Avenue, SEWashington, DC 20590
Final Report
UnclassifiedUnclassified
No restrictions. This document is available to the public through The National Technical Information Service, Springfield, VA 22161
DTRT12-G-UTC21
$15.00
Gasoline tax; Mileage fees; Highway user taxation; Public transit; Public opinion
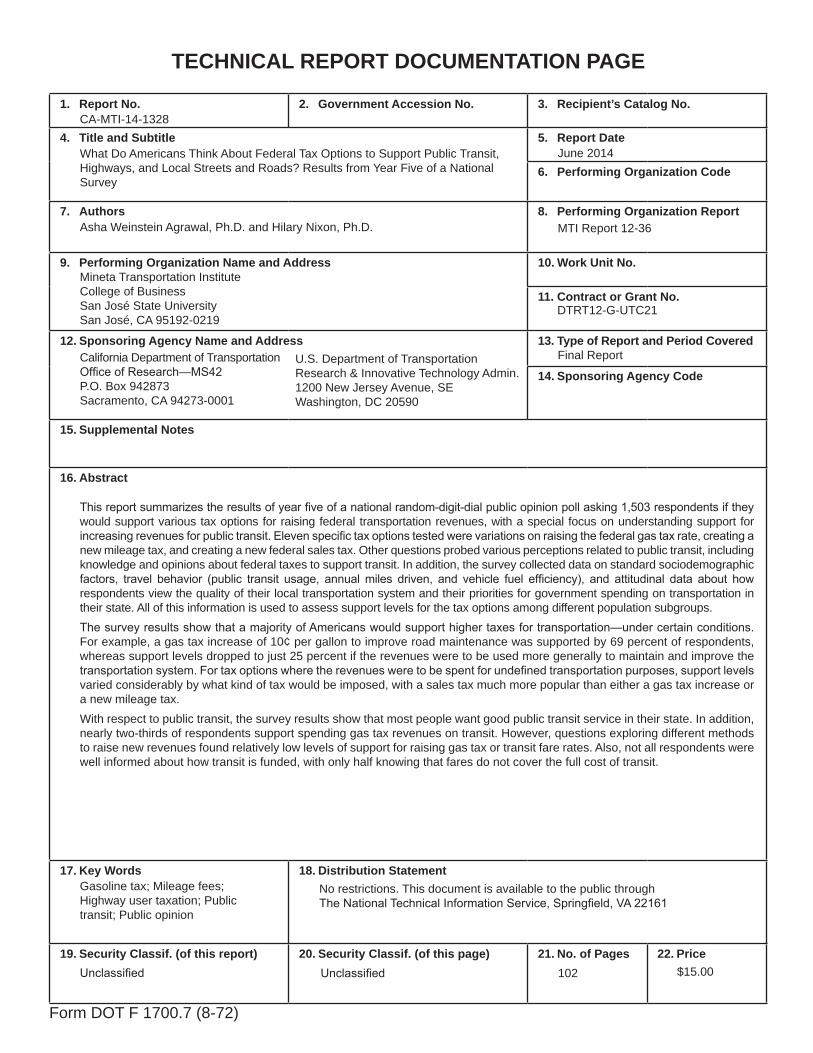
This report summarizes the results of year five of a national random-digit-dial public opinion poll asking 1,503 respondents if they would support various tax options for raising federal transportation revenues, with a special focus on understanding support for increasing revenues for public transit. Eleven specific tax options tested were variations on raising the federal gas tax rate, creating a new mileage tax, and creating a new federal sales tax. Other questions probed various perceptions related to public transit, including knowledge and opinions about federal taxes to support transit. In addition, the survey collected data on standard sociodemographic factors, travel behavior (public transit usage, annual miles driven, and vehicle fuel efficiency), and attitudinal data about how respondents view the quality of their local transportation system and their priorities for government spending on transportation in their state. All of this information is used to assess support levels for the tax options among different population subgroups.The survey results show that a majority of Americans would support higher taxes for transportation—under certain conditions. For example, a gas tax increase of 10¢ per gallon to improve road maintenance was supported by 69 percent of respondents, whereas support levels dropped to just 25 percent if the revenues were to be used more generally to maintain and improve the transportation system. For tax options where the revenues were to be spent for undefined transportation purposes, support levels varied considerably by what kind of tax would be imposed, with a sales tax much more popular than either a gas tax increase or a new mileage tax.With respect to public transit, the survey results show that most people want good public transit service in their state. In addition, nearly two-thirds of respondents support spending gas tax revenues on transit. However, questions exploring different methods to raise new revenues found relatively low levels of support for raising gas tax or transit fare rates. Also, not all respondents were well informed about how transit is funded, with only half knowing that fares do not cover the full cost of transit.

To order this publication, please contact:
Mineta Transportation Institute College of Business
San José State University San José, CA 95192-0219
Tel: (408) 924-7560 Fax: (408) 924-7565
Email: [email protected]
transweb.sjsu.edu
by Mineta Transportation Institute All rights reserved
Library of Congress Catalog Card Number:
Copyright © 2014
2014943486
061914

Mineta Transportat ion Inst i tute
iv

Mineta Transportat ion Inst i tute
v
ACKNOWLEDGMENTS
The authors would like to acknowledge and thank the following people for their important contributions to this project:
• Stephen Granger-Bevan, who provided research and data analysis assistance.
• Laura Gil-Trejo, Director of the Social Science Research Center (SSRC) at California State University, Fullerton, who managed the survey implementation, as well as her staff at SSRC.
• The 1,503 individuals who responded to the survey.
• The Mineta Transportation Institute staff, including Research Director Karen Philbrick, Ph.D.; Director of Communications and Technology Transfer Donna Maurillo; Research Support Manager Joey Mercado; and Webmaster Frances Cherman, who also provided additional editorial and publication support.

Mineta Transportat ion Inst i tute
vi Acknowledgments

Mineta Transportat ion Inst i tute
vii
TABLE OF CONTENTS
I. Introduction 1
II. A Review of Polling on Gas, Mileage, and Sales Taxes for Transportation Purposes 3
Gas Taxes 3Mileage Taxes 3Sales Taxes 4
III. Survey Design and Administration 5Questionnaire Design 5Survey Implementation 6
IV. Findings on Support for the Taxes 9Survey Respondents 9Overall Support Levels for the Transportation Tax Options 11Support by Population Subgroups 13Support for Different Versions of the Mileage and Gas Taxes 23Trends in Support over Time (2010 – 2014) 32
V. Findings Related to Opinions on Public Transit 37
VI. Conclusions 57Summary of Key Findings 57
Appendix A: Survey Questionnaire and Results 61
Appendix B: Opinion Polls Reviewed 71
Endnotes 89
Bibliography 91
About the Authors 101

Mineta Transportat ion Inst i tute
viii Table of Contents

Mineta Transportat ion Inst i tute
ix
LIST OF FIGURES
1. Support Levels for the Tax Options Surveyed (2014) 12
2. Relative Increases in Support for Variations of the Base-Case Gas Tax
and Mileage Tax Concepts (2014) 24
3. Trends in Support for the Tax Options (2010 – 2014) 33
4. Changes over Time for the Relative Increases in Support for Variations of the Base-Case Gas Tax and Mileage Tax Concepts (2010 – 2014) 36
5. Respondents’ Belief about Whether Transit Fares Cover the Full Cost of Transit (2013 and 2014) 39
6. Knowledge among All Respondents about which Government Entities Pay for Public Transit around the U.S. (2013 and 2014) 40
7. Support for Three Ways Congress Could Pay for Expanding and Improving Public Transportation (2012 – 2014) 49
Mineta Transportat ion Inst i tute
x List of Figures

Mineta Transportat ion Inst i tute
xi
LIST OF TABLES
1. Comparison of Survey Respondents to the Adult U.S. Population by Census Region and Sociodemographic Characteristics (2014) 10
2. Support for the Tax Options, by Census Region and Sociodemographic Characteristics (2014) 14
3. Support for the Tax Options, by Political Characteristics (2014) 17
4. Support for the Tax Options, by Travel Behavior (2014) 19
5. Support for the Tax Options, by Opinions of the Transportation System (2014) 21
6. Percentage-Point Increases in Support for Variants of the Mileage Tax and Gas Tax over Support for the Base-Case Versions of Those Taxes, by Census Region and Sociodemographic Categories (2014) 26
7. Percentage-Point Increases in Support for Variants of the Mileage Tax and Gas Tax over Support for the Base-Case Versions of Those Taxes, by Political Affiliation (2014) 28
8. Percentage-Point Increases in Support for Variants of the Mileage Tax and Gas Tax over Support for the Base-Case Versions of Those Taxes, by Opinions of the Transportation System (2014) 29
9. Percentage-Point Increases in Support for Variants of the Mileage Tax and Gas Tax over Support for the Base-Case Versions of Those Taxes, by Travel Behavior (2014) 31
10. Trends in Support for the Tax Options (2010 – 2014) 34
11. Priority Placed on Ways that Government Could Improve the Transportation System for Everyone in the Respondent’s State (2012 – 2014) 38
12. Opinions on Whether Fares Cover the Full Cost of Transit Service, by Subgroup (2014) 41
13. Knowledge of Which Levels of Government Pay for Transit, by Subgroup (2014) 43
14. Opinion on Whether Gas Taxes Should Be Spent on Public Transit in Addition to Roads and Highways, by Subgroup (2014) 46
15. Attitudes about Three Ways Congress Could Pay for Expanding and Improving Public Transportation (2012 – 2014) 48

Mineta Transportat ion Inst i tute
xii List of Tables
16. Preferred Alternative among Three Ways Congress Could Pay for Expanding and Improving Public Transportation (2012 – 2014) 49
17. Support for Three Ways Congress Could Pay for Expanding and Improving Public Transportation, by Subgroup (2014) 51
18. Respondents’ Preferred Method to Expand and Improve Public Transportation, by Subgroup (2014) 54
19. Public Opinion Polling on Gas Tax Increases 72
20. Public Opinion Polling on Gas Tax Increases Linked to Environmental Benefits 80
21. Public Opinion Polling on Mileage Taxes 82
22. Public Opinion Polling on Sales Taxes 84

Mineta Transportat ion Inst i tute
1
I. INTRODUCTION
Over the past several decades, the transportation revenues available from state and federal gas taxes have fallen significantly, especially in terms of inflation-adjusted dollars per mile traveled. At the same time, the transportation system requires critical—and expensive—system upgrades. Among other needs, a large portion of the national highway system needs major rehabilitation, and there is growing desire at all levels of government to substantially upgrade and expand infrastructure to support public transit, walking, and bicycling, modes that have been relatively neglected in the past 50 years.
This dilemma of growing needs and shrinking revenues can be resolved in only two ways: either the nation must dramatically lower its goals for system preservation and enhancement, or new revenues must be raised. If the latter is to happen, legislators must be convinced that increasing taxes or fees is politically feasible. One portion of the political calculus that legislators make when deciding whether or not to raise new revenues is, of course, considering likely public support for—or opposition to—raising different kinds of taxes.
This report contributes to the understanding of current public sentiment about increasing transportation taxes by presenting the results from the fifth year of an annual telephone survey investigating public opinion about a variety of transportation tax options at the federal level. The specific taxes tested were 10 variations on raising the federal gas tax rate or creating a new mileage tax, as well as 1 option for creating a new federal sales tax. In addition, the survey collected standard sociodemographic data, some travel behavior data, and attitudinal data about how respondents view the quality of their local transportation system and their priorities for government spending on transportation in their state. All of this information is used to assess support levels for the tax options among different population subgroups.
The survey questionnaire described the various tax proposals in only general terms, so the study results cannot be assumed to reflect support for any actual proposal put forward. Nevertheless, the results show likely patterns of support and, more important, the public’s likely relative preferences among different transportation tax options.
An important emphasis added in 2012 (the third year) was to understand perceptions related to public transit, including knowledge and opinions about federal taxes to support transit. Several new transit-related questions were added to explore respondents’ knowledge of whether different levels of government help to pay for transit, their opinion about whether gas tax revenues should be spent on transit, and their support for different Congressional options to raise additional revenues to support improved and expanded transit.
Because the survey is the fifth year of a project to assess how public support for federal transportation taxes may change over time, most of the questions asked are identical to those in the earlier surveys carried out in the four prior years.1 This report compares the results of the five surveys to establish how public views may have shifted over the past years.
The remaining chapters of the report contain the following material. Chapter 2 describes findings from other polling on similar transportation taxes to provide context for understanding

Mineta Transportat ion Inst i tute
2 Introduction
this survey’s results. Chapter 3 describes the survey methodology and presents an overview of the questionnaire and details of the implementation procedure. Detailed discussion of the survey findings on the different tax options and the transit-related questions follow in Chapters 4 and 5. Chapter 6 summarizes key findings and suggests some implications of those findings for policymakers.
Mineta Transportat ion Inst i tute
3
II. A REVIEW OF POLLING ON GAS, MILEAGE, AND SALES TAXES FOR TRANSPORTATION PURPOSES
To provide context for interpreting the survey results presented in this report, Chapter 2 reviews the results from 92 other public opinion polls that asked about support for gas, mileage, and sales taxes whose revenues would be used for transportation purposes. Almost all surveys are from the past eight years.
The surveys were identified through a search of the Internet-based archives of popular pollsters and aggregators of public opinion polls, including the Pew Center for the People and the Press, the Roper Center for Public Opinion Research, Rasmussen Reports, SurveyUSA, and PollingReport.com. This work was supplemented by searching Google and newspaper databases to find mainstream media coverage on polls about transportation taxes.2 Complete survey results were obtained directly from the survey sponsors’ websites or through personal contact with the sponsors.
Most of the surveys reviewed here were conducted by public agencies, advocacy groups, popular pollsters, or news media, with a few others conducted by academics or research-oriented nonprofits.
GAS TAXES
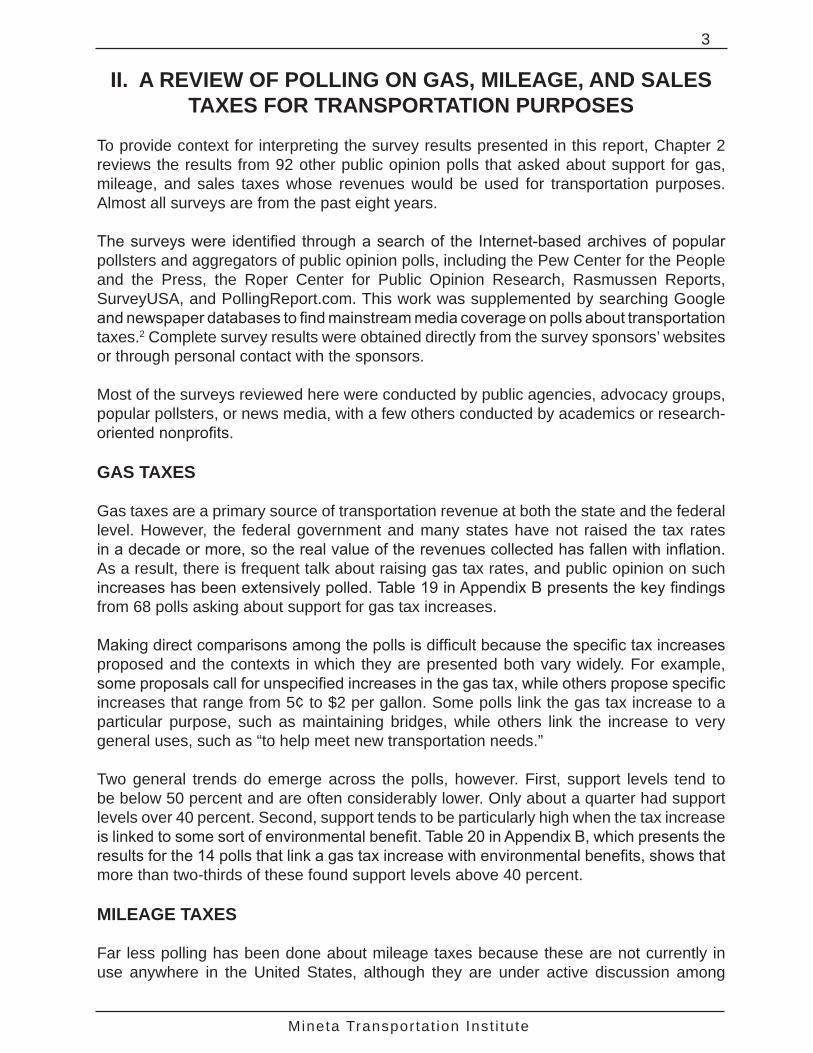
Gas taxes are a primary source of transportation revenue at both the state and the federal level. However, the federal government and many states have not raised the tax rates in a decade or more, so the real value of the revenues collected has fallen with inflation. As a result, there is frequent talk about raising gas tax rates, and public opinion on such increases has been extensively polled. Table 19 in Appendix B presents the key findings from 68 polls asking about support for gas tax increases.
Making direct comparisons among the polls is difficult because the specific tax increases proposed and the contexts in which they are presented both vary widely. For example, some proposals call for unspecified increases in the gas tax, while others propose specific increases that range from 5¢ to $2 per gallon. Some polls link the gas tax increase to a particular purpose, such as maintaining bridges, while others link the increase to very general uses, such as “to help meet new transportation needs.”
Two general trends do emerge across the polls, however. First, support levels tend to be below 50 percent and are often considerably lower. Only about a quarter had support levels over 40 percent. Second, support tends to be particularly high when the tax increase is linked to some sort of environmental benefit. Table 20 in Appendix B, which presents the results for the 14 polls that link a gas tax increase with environmental benefits, shows that more than two-thirds of these found support levels above 40 percent.
MILEAGE TAXES
Far less polling has been done about mileage taxes because these are not currently in use anywhere in the United States, although they are under active discussion among

Mineta Transportat ion Inst i tute
4 A Review of Polling on Gas, Mileage, and Sales Taxes for Transportation
transportation policymakers and researchers. A review of 17 polls shows that support is not especially strong but can be strengthened when the taxes are linked to environmental benefits (see Table 21 in Appendix B). The six polls linking a mileage tax to environmental benefits found support levels ranging from 33 percent to 50 percent, but the other eleven polls without that environmental link found support levels no higher than 39 percent.
SALES TAXES
Public opinion about local sales taxes to fund transportation programs has been extensively tested. However, very little polling has been done to test public support for a national sales tax to support transportation, most likely because the federal government does not collect sales taxes, leaving them for state and local governments to use as a revenue tool. (If the federal government were to consider imposing its own sales tax, there would likely be a very strong backlash from state and local officials.)
For more than a decade, sales taxes have been one of the most popular methods used by local governments to raise revenue for transportation purposes. In almost all cases, the taxes were placed on the ballot for voter approval, so the election results provide one clear picture of the level of public support. And in fact, many of these local sales taxes have passed, especially in California where the great majority of the population currently lives in counties whose voters have approved local sales taxes for transportation by two-thirds majorities. In addition to the evidence from election results, considerable public polling has been done prior to elections to assess the appeal of sales tax increases.
Table 22 in Appendix B summarizes a sampling of 30 polls testing public opinion on sales taxes. Overall support levels were quite high: 16 of the polls showed support at 50 percent or higher.

Mineta Transportat ion Inst i tute
5
III. SURVEY DESIGN AND ADMINISTRATION
QUESTIONNAIRE DESIGN
The survey questionnaire was designed to test public support for three types of taxes: an increase in the federal gas tax, a new national mileage tax, and a new national sales tax. In all cases, respondents were told that the revenue raised would be spent only for transportation purposes.
To make these hypothetical taxes easier for respondents to understand, the survey gave specific amounts for each. The amounts were selected to be simple numbers within the range of mainstream current policy discussion.
Because a gas tax and a mileage tax are revenue options likely to receive considerable policy scrutiny in coming years, the survey tested support for these concepts when the taxes were presented in different forms. Overall, 11 different tax options were tested—8 variants of a gas tax increase, 2 variants of a new mileage tax, and 1 new sales tax option.
Gas tax increases. All variants of a federal gas tax increase involved raising the existing 18¢ per gallon tax3 to 28¢ per gallon, but each included a different set of information for respondents to consider. The eight variations were:
• A base-case 10¢ increase in the gas tax without further stipulations.
• A 10¢ increase in the gas tax that would be phased in over five years, increasing by 2¢ per year.
• A 10¢ increase in the gas tax, with the revenues to be spent only for projects to reduce local air pollution caused by the transportation system.
• A 10¢ increase in the gas tax, with the revenues to be spent only on projects to reduce the transportation system’s contribution to global warming.
• A 10¢ increase in the gas tax, with the revenues to be spent only on projects to maintain streets, roads, and highways.
• A 10¢ increase in the gas tax, with the revenues to be spent only on projects to reduce accidents and improve safety.
• A 10¢ increase in the gas tax, with the revenues to be spent only on projects to add more modern, technologically advanced systems like real-time travel alerts, longer lasting pavements, and better-timed traffic lights.
• A 10¢ increase in the gas tax, with respondents informed of the annual tax burden for a typical driver under both the current and increased tax rates. Respondents were told that the tax burden would increase from an average of $100 a year to

Mineta Transportat ion Inst i tute
6 Survey Design and Administration
$150 a year for someone driving 10,000 miles a year in a car with a fuel economy of 20 miles per gallon.
New mileage taxes. Two variants of the mileage tax were presented, both of which involved levying a new tax per mile driven, with electronic meters being used to track miles driven and drivers being billed when they buy gas. The two variants, which differed only in the rate structure, were:
• A base-case 1¢-per-mile tax, with every car taxed at the same rate.
• A variable-rate mileage tax for which the average rate would be 1¢ per mile, but vehicles that pollute less would be charged less and vehicles that pollute more would be charged more.
A new national sales tax. In this option, the federal government would levy a new 0.5 percent sales tax.
A new feature of the survey project introduced in 2012 was a special focus on understanding support for raising revenues to pay for public transportation. Respondents were asked if they knew whether different entities help to pay for transit (transit riders, plus government at the local, state, and federal levels), their opinion about whether or not gas tax revenues should be spent on public transit, and their support for, and preference among, different Congressional options to find additional revenues to support improved and expanded transit.
In addition to testing population-wide support levels for the tax options and opinions about public transit, the survey was designed to assess how responses to the questions might vary by respondents’ opinions about their local and state transportation systems, sociodemographic factors, and travel behavior characteristics. Introductory questions asked respondents to rate the quality of roads and highways and transit service in their community and to indicate the priority they thought government should place on various options for improving the transportation system for everyone in their state. The questionnaire concluded with a standard set of sociodemographic questions on such factors as age, race and ethnicity, and income. To assess travel behavior, the survey included one question asking how many miles the respondent drove in the previous year and another question asking if the respondent had used any form of public transit within the past 30 days. Respondents were also asked the average fuel efficiency of the vehicle they drove most often for personal use.
The exact wording used for all questions can be found in Appendix A, which reproduces the survey questionnaire.
SURVEY IMPLEMENTATION
The Social Science Survey Center at California State University, Fullerton, conducted the survey on behalf of the Mineta Transportation Institute’s National Transportation Finance Center. The interviewing was completed in two phases, from March 4 – April 7 and April 23 – April 30, 2014. A total of 1,503 adults nationwide were interviewed by telephone in either English or Spanish, with 33 (2 percent) of the interviews conducted in Spanish.

Mineta Transportat ion Inst i tute
7Survey Design and Administration
Telephone numbers included in this sample were randomly generated, and survey respondents were reached by both cell phone (N = 352) and landline phone (N = 1,151).
The margin of error for the total sample is ± 2.53 percentage points at the 95 percent confidence level. Smaller subgroups have larger margins of error.
Unless otherwise indicated, all results are weighted to match the Census Bureau’s 2012 American Community Survey one-year estimates with respect to gender, race, Hispanic ethnicity, education level, annual household income, and age.4

Mineta Transportat ion Inst i tute
8 Survey Design and Administration

Mineta Transportat ion Inst i tute
9
IV. FINDINGS ON SUPPORT FOR THE TAXES
This chapter presents highlights of the survey results. It first describes the survey respondents and then presents the support for the tax options among all respondents and also among population subgroups. The chapter concludes with findings on how support for the base-case 10¢ gas tax increase and new flat-rate mileage tax compares with support for variants on these options. (Appendix A presents the complete results of the survey.)
SURVEY RESPONDENTS
The 1,503 adult survey respondents were generally representative of the U.S. population in terms of region and sociodemographic characteristics (see Table 1). The sample’s divergence from the national population was greatest (from 5 to 12 percentage points) along a few dimensions of ethnicity, race, education, and age. With respect to ethnicity, the unweighted sample contained fewer people of Hispanic or Latino origin or descent, while in terms of race the sample had more whites and fewer African-Americans. Our sample had fewer people whose formal education ended before or upon graduation from high school, and more people with a graduate degree. Finally, the sample included fewer adults aged 18 to 39, but more adults aged 60 to 79 years old.

Mineta Transportat ion Inst i tute
10 Findings on Support for the Taxes
Table 1. Comparison of Survey Respondents to the Adult U.S. Population by Census Region and Sociodemographic Characteristics (2014)
RDD sample (%)
Cell sample (%)
Total sample, unweighted (%)
U.S. adultsa (%)
Census regionb
Northeast 21 14 19 18Midwest 24 21 23 21South 34 39 35 37West 21 26 22 23
GenderMale 42 55 45 49Female 58 45 55 51
Of Hispanic/Latino origin/descent 7 15 9 17Race
White 81 71 79 74Black/African-American 7 10 8 13Asian/Asian-American 3 5 3 5Other 9 13 10 9
EducationLess than high school graduate 5 6 5 14High school graduate 18 16 18 28Some college 26 34 28 24College graduate 27 23 26 25Some grad school 2 3 2 --Graduate degree 5 19 20 10
Income (annual household)$0 - $25,000 22 20 21 24$25,001 - $50,000 24 21 23 25$50,001 - $75,000 20 17 19 18$75,001 - $100,000 11 13 12 12$100,001 - $150,000 14 20 15 12$150,001+ 10 9 10 9
Age18 – 29 4 30 10 2230 – 39 9 16 11 1740 – 49 14 15 14 1850 – 59 21 19 21 1860 – 69 26 13 23 1370 – 79 17 7 14 780+ 10 1 8 5
a All data are for adults 18 years and older, with the exception of household income, which is for all U.S. households. The U.S. population estimates are from U.S. Census Bureau, “2012 American Community Survey 1-Year Estimates” (no date), http://factfinder2.census.gov/faces/nav/jsf/pages/index.xhtml (accessed May 19, 2014).
b Census regions are defined at U.S. Census Bureau, “Census Regions and Divisions of the United States” (no date), http://www.census.gov/geo/maps-data/maps/pdfs/reference/us_regdiv.pdf (accessed May 19, 2014).
Note: Some percentages do not sum to 100% due to rounding.

Mineta Transportat ion Inst i tute
11Findings on Support for the Taxes
OVERALL SUPPORT LEVELS FOR THE TRANSPORTATION TAX OPTIONS
The survey results show that a majority of Americans would support higher taxes for transportation—under certain conditions (see Figure 1). For example, a gas tax increase of 10¢ per gallon to improve road maintenance was supported by 69 percent of respondents, whereas support levels dropped to 25 percent if the revenues were to be used more generally to maintain and improve the transportation system. The only other variant on a gas tax that received at least 60 percent support in 2014 was an increase of 10¢ per gallon with the revenues dedicated to reducing accidents and improving safety. However, support for several other tax options was still above 50 percent, a healthy showing of support for a tax increase of any kind.
For tax options where the revenues were to be spent for undefined transportation purposes, support levels varied considerably by what kind of tax would be imposed, with a new national sales tax roughly twice as popular as either the 10¢ per gallon gas tax increase a or new mileage tax with a flat rate of 1¢ per mile.

Mineta Transportat ion Inst i tute
12 Findings on Support for the Taxes
19
25
41
42
43
49
51
54
57
63
69
0 10 20 30 40 50 60 70Respondent support (%)
Gas tax: 10¢ increase with revenuespent to maintain streets,
roads, and highways
Gas tax: 10¢ increase with revenuespent on projects to reduce
accidents and improve safety
Gas tax: 10¢ increase with revenuespent to add more modern,
technologically advanced systems
Gas tax: 10¢ increase with revenuespent to reduce local air pollution
0.5¢ sales tax
Gas tax: 10¢ increase with revenuespent to reduce global warming
Gas tax: 2¢ increase
Gas tax: 10¢ increase with informationon average driver's annual cost
Mileage tax: rate varies by vehicle’spollution level (average 1¢ per mile)
Gas tax: 10¢ increase
Mileage tax: flat rate of 1¢ per mile
Figure 1. Supporta Levels for the Tax Options Surveyed (2014)a “Support” is the sum of those who said that they “strongly” or “somewhat” support the tax option.

Mineta Transportat ion Inst i tute
13Findings on Support for the Taxes
SUPPORT BY POPULATION SUBGROUPS
We also examined support levels for the different tax options by subgroups within the population. The statistical test of two proportions was used to check whether differences among subgroups (e.g., men versus women) are statistically significant at the 95 percent and 99 percent confidence levels. Results are presented in Tables 2 through 5 below. In each case, the first subgroup listed in a table for that set of population categories is the base case against which all the other subgroups are compared.
The following discussion focuses on those differences among subgroups where the patterns are clearest. A pattern is defined as “clear” when (1) the variation in support is statistically significant across at least five of the tax options, and (2) the average magnitude of the difference between the groups across all 11 tax options is at least 7 percentage points or more. Readers should note that the variations described below are not necessarily the only important ones that may exist. Rather, the variations discussed are those that could be identified by the particular statistical tests used and also fell within the cutoff points selected.
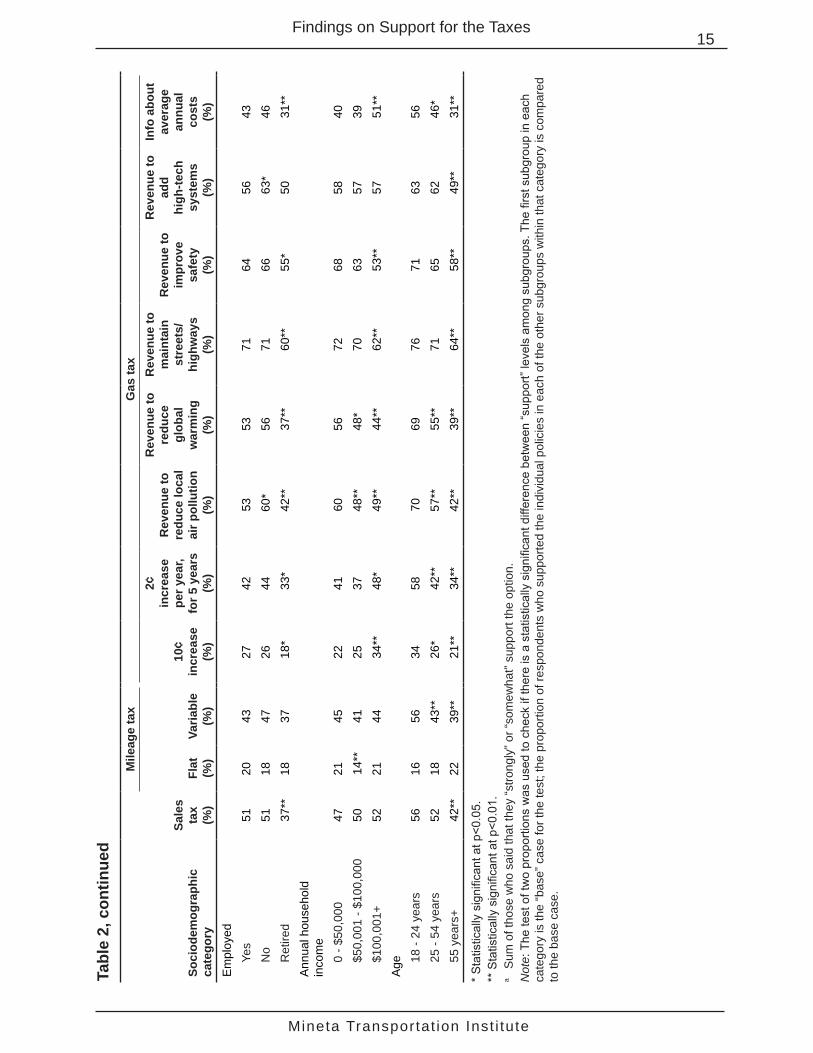
Table 2 shows support for the taxes when the respondents are broken into subgroups by sociodemographic categories and U.S. Census region. The clear patterns that emerge are linked to race, employment status, and age. With respect to race, Asians/Asian-Americans were, on average, 17 percentage points more likely to support each tax than whites. Similarly, African-Americans were on average 10 percentage points more likely to support each tax than were whites. As for age, respondents in the youngest group (18- to 24-year olds) were more likely to support virtually all of the taxes than respondents in the two older groups, especially as compared to the oldest group (55 years and older). The average difference in support for the taxes was 17 percentage points for the youngest group as compared to the oldest group. Finally, employed respondents were more supportive of the taxes than retirees, mirroring the differences in support by age.

Mineta Transportat ion Inst i tute
14 Findings on Support for the Taxes
Tabl
e 2.
Su
ppor
ta for
the
Tax
Opt
ions
, by
Cen
sus
Reg
ion
and
Soci
odem
ogra
phic
Cha
ract
eris
tics
(201
4)M
ileag
e ta
xG
as ta
x
Soci
odem
ogra
phic
ca
tego
ry
Sale
s ta
x
(%)
Flat
(%)
Varia
ble
(%)
10¢
incr
ease
(%)
2¢
incr
ease
pe
r yea
r, fo
r 5 y
ears
(%)
Rev
enue
to
redu
ce lo
cal
air p
ollu
tion
(%)
Rev
enue
to
redu
ce
glob
al
war
min
g
(%)
Rev
enue
to
mai
ntai
n st
reet
s/
high
way
s(%
)
Rev
enue
to
impr
ove
safe
ty(%
)
Rev
enue
to
add
high
-tech
sy
stem
s(%
)
Info
abo
ut
aver
age
annu
al
cost
s
(%)
All
resp
onde
nts
4919
4325
4154
5169
6357
42C
ensu
s re
gion
Nor
thea
st
5318
4927
3955
5069
6557
42M
idw
est
4618
36**
2340
4743
7356
*55
38S
outh
48
2144
3143
5759
*71
6859
47W
est
5719
4621
4554
5367
6157
44G
ende
rM
ale
4717
4231
4251
5167
5960
45Fe
mal
e51
2145
20**
4157
*52
7168
**55
39*
Rac
e Whi
te48
1742
2440
4845
6860
5639
Bla
ck/A
frica
n-
Am
eric
an51
26**
4632
*40
67**
68**
79**
70*
67**
46
Asi
an/A
sian
- A
mer
ican
67**
1948
35*
66**
73**
74**
7282
**67
75**
Oth
er46
27**
4919
4269
**65
**68
70*
5244
Of H
ispa
nic/
Latin
o or
igin
/des
cent
Yes
4826
5422
4064
6171
7055
47N
o49
18**
41**
2642
52**
50**
6962
*58
41E
duca
tion
Hig
h sc
hool
gr
adua
te o
r les
s45
2040
2438
5752
7468
6039
Mor
e th
an h
igh
scho
ol51
*19
46*
2644
*51
*51
66**
60**
5545
*
Mineta Transportat ion Inst i tute
15Findings on Support for the Taxes
Mile
age
tax
Gas
tax
Soci
odem
ogra
phic
ca
tego
ry
Sale
s ta
x
(%)
Flat
(%)
Varia
ble
(%)
10¢
incr
ease
(%)
2¢
incr
ease
pe
r yea
r, fo
r 5 y
ears
(%)
Rev
enue
to
redu
ce lo
cal
air p
ollu
tion
(%)
Rev
enue
to
redu
ce
glob
al
war
min
g
(%)
Rev
enue
to
mai
ntai
n st
reet
s/
high
way
s(%
)
Rev
enue
to
impr
ove
safe
ty(%
)
Rev
enue
to
add
high
-tech
sy
stem
s(%
)
Info
abo
ut
aver
age
annu
al
cost
s
(%)
Em
ploy
edYe
s51
2043
2742
5353
7164
5643
No
5118
4726
4460
*56
7166
63*
46R
etire
d37
**18
3718
*33
*42
**37
**60
**55
*50
31**
Ann
ual h
ouse
hold
in
com
e0
- $50
,000
4721
4522
4160
5672
6858
40$5
0,00
1 - $
100,
000
5014
**41
2537
48**
48*
7063
5739
$100
,001
+52
2144
34**
48*
49**
44**
62**
53**
5751
**A
ge 18 -
24 y
ears
5616
5634
5870
6976
7163
5625
- 54
yea
rs52
1843
**26
*42
**57
**55
**71
6562
46*
55 y
ears
+ 42
**22
39**
21**
34**
42**
39**
64**
58**
49**
31**
* S
tatis
tical
ly s
igni
fican
t at p
<0.0
5.**
Sta
tistic
ally
sig
nific
ant a
t p<0
.01.
a S
um o
f tho
se w
ho s
aid
that
they
“stro
ngly
” or “
som
ewha
t” su
ppor
t the
opt
ion.
Not
e: T
he te
st o
f tw
o pr
opor
tions
was
use
d to
che
ck if
ther
e is
a s
tatis
tical
ly s
igni
fican
t diff
eren
ce b
etw
een
“sup
port”
leve
ls a
mon
g su
bgro
ups.
The
firs
t sub
grou
p in
eac
h ca
tego
ry is
the
“bas
e” c
ase
for t
he te
st; t
he p
ropo
rtion
of r
espo
nden
ts w
ho s
uppo
rted
the
indi
vidu
al p
olic
ies
in e
ach
of th
e ot
her s
ubgr
oups
with
in th
at c
ateg
ory
is c
ompa
red
to th
e ba
se c
ase.
Tabl
e 2,
con
tinue
d

Mineta Transportat ion Inst i tute
16 Findings on Support for the Taxes
Except for those noted above, Table 2 reveals few other clear patterns of statistical significance. For example, there are no clear patterns showing consistent variation in support for the taxes by region of the country, gender, educational attainment, or income.5
Table 3 shows support levels by political characteristics. Political party affiliation played a strong role, with support for all of the taxes more likely among registered Democrats than among registered Republicans, voters registered with other parties, or registered voters who are party-independent. The level of support differed for registered Democrats and registered Republicans by an average of 19 percentage points across the 11 tax options. In addition, people who were not registered to vote were more likely to support most of the taxes than were registered voters, with an average support difference of 7 percentage points across all the taxes.

Mineta Transportat ion Inst i tute
17Findings on Support for the Taxes
Tabl
e 3.
Su
ppor
ta for
the
Tax
Opt
ions
, by
Polit
ical
Cha
ract
eris
tics
(201
4)M
ileag
e ta
xG
as ta
x
Sale
s ta
x
(%)
Flat
(%)
Varia
ble
(%)
10¢
incr
ease
(%)
2¢
incr
ease
pe
r yea
r, fo
r 5 y
ears
(%)
Rev
enue
to
redu
ce lo
cal
air p
ollu
tion
(%)
Rev
enue
to
redu
ce
glob
al
war
min
g
(%)
Rev
enue
to
mai
ntai
n st
reet
s /
high
way
s(%
)
Rev
enue
to
impr
ove
safe
ty(%
)
Rev
enue
to
add
high
-tech
sy
stem
s(%
)
Info
ab
out
aver
age
annu
al
cost
s
(%)
All
resp
onde
nts
4919
4325
4154
5169
6357
42R
egis
tere
d vo
ter
Yes
4819
4226
4051
4969
6056
41N
o58
**17
51**
2447
*63
**61
**73
74**
65**
50**
Like
ly v
oter
b
Yes
4718
4025
4047
4465
5854
37N
o52
2049
**26
4464
**63
**75
**71
**63
**49
**P
oliti
cal a
ffilia
tion
for
regi
ster
ed v
oter
sD
emoc
rat
6222
4834
4860
6676
6865
48R
epub
lican
37**
15*
36**
13**
34**
41**
30**
62**
56**
43**
25**
Inde
pend
entc
45**
1941
2937
*46
**42
**63
**57
*52
**45
Oth
erd
41**
2032
**19
**24
**52
47**
6952
**56
39
* S
tatis
tical
ly s
igni
fican
t at p
<0.0
5.**
Sta
tistic
ally
sig
nific
ant a
t p<0
.01.
a S
um o
f tho
se w
ho s
aid
that
they
“stro
ngly
” or “
som
ewha
t” su
ppor
t the
opt
ion.
b Li
kely
vot
ers
are
thos
e re
spon
dent
s w
ho s
aid
that
they
are
regi
ster
ed v
oter
s an
d th
at th
ey v
ote
“all
of th
e tim
e” o
r “m
ost o
f the
tim
e.”
c R
egis
tere
d, b
ut d
eclin
ed to
sta
te a
par
ty.
d R
egis
tere
d m
embe
r of a
ny o
ther
par
ty, i
nclu
ding
the
Am
eric
an In
depe
nden
t Par
ty.
Not
e: T
he te
st o
f tw
o pr
opor
tions
was
use
d to
che
ck if
ther
e is
a s
tatis
tical
ly s
igni
fican
t diff
eren
ce b
etw
een
“sup
port”
leve
ls a
mon
g su
bgro
ups.
The
firs
t sub
grou
p lis
ted
in
each
cat
egor
y is
the
“bas
e” c
ase
for t
he te
st; t
he p
ropo
rtion
of r
espo
nden
ts w
ho s
uppo
rted
the
indi
vidu
al p
olic
ies
in e
ach
of th
e ot
her s
ubgr
oups
with
in th
at c
ateg
ory
is
com
pare
d to
the
base
cas
e.

Mineta Transportat ion Inst i tute
18 Findings on Support for the Taxes
The survey asked three questions about travel behavior and personal vehicle mileage in order to examine whether support for the tax options varied by these factors (Table 4). Respondents who reported driving from 1 to 7,500 miles annually were more likely to support the taxes than people who reported driving more than 12,500 miles annually, but they were less likely to support the taxes than people who said they did not drive at all. Also, respondents who said that they had taken public transit within the previous 30 days were more likely to support the tax options than respondents who said that they had not.

Mineta Transportat ion Inst i tute
19Findings on Support for the Taxes
Tabl
e 4.
Su
ppor
ta for
the
Tax
Opt
ions
, by
Trav
el B
ehav
ior (
2014
)M
ileag
e ta
xG
as ta
x
Sale
s ta
x
(%)
Flat
(%)
Varia
ble
(%)
10¢
incr
ease
(%)
2¢
incr
ease
pe
r yea
r, fo
r 5 y
ears
(%)
Rev
enue
to
redu
ce
loca
l air
pollu
tion
(%)
Rev
enue
to
redu
ce
glob
al
war
min
g
(%)
Rev
enue
to
mai
ntai
n st
reet
s/
high
way
s(%
)
Rev
enue
to
impr
ove
safe
ty(%
)
Rev
enue
to
add
hi
gh-te
ch
syst
ems
(%)
Info
ab
out
aver
age
annu
al
cost
s
(%)
All
resp
onde
nts
4919
4325
4154
5169
6357
42A
nnua
l mile
s dr
iven
1 - 7
,500
5318
4129
4256
5669
6458
427,
501
- 12,
500
5015
4225
4343
**41
**64
56*
5746
12,5
01+
44*
12*
3522
*37
41**
42**
6555
*51
36D
on’t
know
4823
53**
2638
6356
7368
5538
Don
’t dr
ive
4837
**56
**19
*49
75**
70**
82**
79**
71**
52*
Mile
s pe
r gal
lonb
≤ 24
5014
3221
4045
4467
5858
3925
- 38
5215
50**
28*
4454
**52
*67
6353
4139
+c 4
1 2
4 5
4**
48*
* 4
2 4
4 4
9 6
4 5
5 5
4 5
4 Ta
ken
trans
it in
last
30
days
Yes
5526
5531
4967
6769
6761
54N
o47
*17
**40
**23
**39
**50
**46
**69
6256
38**
* S
tatis
tical
ly s
igni
fican
t at p
<0.0
5.**
Sta
tistic
ally
sig
nific
ant a
t p<0
.01.
a S
um o
f tho
se w
ho s
aid
that
they
“stro
ngly
” or “
som
ewha
t” su
ppor
t the
opt
ion.
b C
ateg
orie
s co
rres
pond
to th
e E
PA’s
“Sm
artW
ay” v
ehic
le ra
ting
syst
em (U
.S. E
nviro
nmen
tal P
rote
ctio
n A
genc
y, “V
ehic
le R
atin
g S
yste
m a
nd S
mar
tWay
Thr
esho
lds,
M
Y 20
11 &
MY
2012
” (no
dat
e), h
ttp://
ofm
pub.
epa.
gov/
gree
nveh
icle
s/S
mar
tWay
_201
2.pd
f (ac
cess
ed M
ay 3
1, 2
012)
).c
The
sam
ple
size
for t
his
subg
roup
is <
50. A
lthou
gh th
e sa
mpl
e si
ze is
larg
e en
ough
to c
ondu
ct s
tatis
tical
test
ing,
resu
lts s
houl
d be
inte
rpre
ted
with
par
ticul
ar c
autio
n,
whi
ch is
why
this
row
of n
umbe
rs h
as a
stri
keth
roug
h.N
ote:
The
test
of t
wo
prop
ortio
ns w
as u
sed
to c
heck
if th
ere
is a
sta
tistic
ally
sig
nific
ant d
iffer
ence
bet
wee
n “s
uppo
rt” le
vels
am
ong
subg
roup
s. T
he fi
rst s
ubgr
oup
liste
d in
eac
h ca
tego
ry is
the
“bas
e” c
ase
for t
he te
st; t
he p
ropo
rtion
of r
espo
nden
ts w
ho s
uppo
rt th
e in
divi
dual
pol
icie
s in
eac
h of
the
othe
r sub
grou
ps w
ithin
that
cat
egor
y is
co
mpa
red
to th
e ba
se c
ase.
Mineta Transportat ion Inst i tute
20 Findings on Support for the Taxes
Another set of analyses examined how support for the different tax options correlates with respondents’ opinions about the transportation system (Table 5). Respondents’ opinions about road and transit services in their local community are not clearly correlated with support for the taxes, but the quality of local public transit is. Respondents who rated the quality of public transit service in their community as very good were more likely to support the taxes than those who said they had no public transit service at all in their communities. Another set of questions asked respondents about their priorities for how governments might spend transportation revenues: reducing traffic congestion; maintaining streets, roads, and highways; expanding and improving local public transit service; reducing accidents and improving safety; and increasing the use of modern technologies. Not surprisingly, respondents who placed a high priority on these goals were more likely to support almost every tax option than were those who assigned them a low priority.6 The differences were, on average, very large—over 20 percentage points in three cases. In addition, respondents who placed a high priority on the goals of improving public transit service and increasing the use of modern technology were more supportive of the taxes than those who had assigned those goals a “medium” priority.

Mineta Transportat ion Inst i tute
21Findings on Support for the Taxes
Tabl
e 5.
Su
ppor
ta for
the
Tax
Opt
ions
, by
Opi
nion
s of
the
Tran
spor
tatio
n Sy
stem
(201
4)M
ileag
e ta
xG
as ta
x
Sale
s ta
x
(%)
Flat
(%)
Varia
ble
(%)
10¢
incr
ease
(%)
2¢
incr
ease
pe
r yea
r, fo
r 5 y
ears
(%)
Rev
enue
to
redu
ce
loca
l air
pollu
tion
(%)
Rev
enue
to
redu
ce
glob
al
war
min
g
(%)
Rev
enue
to
mai
ntai
n st
reet
s/
high
way
s (%
)
Rev
enue
to
impr
ove
safe
ty
(%)
Rev
enue
to
add
hi
gh-te
ch
syst
ems
(%)
Info
abo
ut
aver
age
annu
al
cost
s
(%)
All
resp
onde
nts
4919
4325
4154
5169
6357
42O
pini
on o
n co
nditi
on o
f roa
ds a
nd h
ighw
ays
in lo
cal c
omm
unity
Very
goo
d55
1846
2943
5344
6361
5248
Som
ewha
t goo
d50
1844
2644
5655
**70
*65
59*
42B
ad43
**20
3921
*34
*48
4773
**61
5837
**O
pini
on o
n pu
blic
tran
sit s
ervi
ce in
loca
l com
mun
ityVe
ry g
ood
6326
5430
4863
5772
7260
50S
omew
hat g
ood
46**
19*
41**
2846
5756
6962
**59
43P
oor
49**
2148
2645
50**
5073
61*
6351
No
serv
ice
43**
14**
36**
16**
27**
45**
43**
61**
58**
47**
25**
Rol
e of
gov
ernm
ent i
n re
duci
ng tr
affic
con
gest
ion
Hig
h pr
iorit
y55
2147
2746
5756
7268
6245
Med
ium
prio
rity
48*
1946
2943
5752
6762
*56
42Lo
w p
riorit
y34
**12
**31
**16
**30
**39
**40
**63
*50
**45
**32
**R
ole
of g
over
nmen
t in
mai
ntai
ning
stre
ets,
road
s, a
nd h
ighw
ays
Hig
h pr
iorit
y50
1944
2544
5452
7165
5944
Med
ium
prio
rity
4817
4527
33**
5352
60**
56**
5435
*
Low
prio
rity
30**
9b
29*
b 15
25**
39*
39b
6449
* 4
1*b
26**
Rol
e of
gov
ernm
ent i
n ex
pand
ing
and
impr
ovin
g lo
cal p
ublic
tran
sit s
ervi
ceH
igh
prio
rity
6023
5031
5262
6272
6863
50M
ediu
m p
riorit
y46
**18
*45
22**
38**
53**
51**
7064
57*
39**
Low
prio
rity
32**
12**
27**
19**
27**
40**
30**
63*
52**
45**
31**
Rol
e of
gov
ernm
ent i
n re
duci
ng a
ccid
ents
and
impr
ovin
g sa
fety
Hig
h pr
iorit
y55
2048
2746
5856
7372
6146
Med
ium
prio
rity
42**
2041
*27
38*
49**
5065
*48
**57
38*
Low
prio
rity
27**
6**
24**
14**
21**
36**
28**
54**
36**
40**
27**

Mineta Transportat ion Inst i tute
22 Findings on Support for the Taxes
Mile
age
tax
Gas
tax
Sale
s ta
x
(%)
Flat
(%)
Varia
ble
(%)
10¢
incr
ease
(%)
2¢
incr
ease
pe
r yea
r, fo
r 5 y
ears
(%)
Rev
enue
to
redu
ce
loca
l air
pollu
tion
(%)
Rev
enue
to
redu
ce
glob
al
war
min
g
(%)
Rev
enue
to
mai
ntai
n st
reet
s/
high
way
s (%
)
Rev
enue
to
impr
ove
safe
ty
(%)
Rev
enue
to
add
hi
gh-te
ch
syst
ems
(%)
Info
abo
ut
aver
age
annu
al
cost
s
(%)
Rol
e of
gov
ernm
ent i
n us
ing
mod
ern
tech
nolo
gyH
igh
prio
rity
5823
4528
4859
5774
6970
48M
ediu
m p
riorit
y44
**17
*45
2640
**54
5268
*62
*52
**41
*Lo
w p
riorit
y33
**11
**35
*16
**23
**34
**35
**56
**46
**27
**27
**
* S
tatis
tical
ly s
igni
fican
t at p
<0.0
5.**
Sta
tistic
ally
sig
nific
ant a
t p<0
.01.
a S
um o
f tho
se w
ho s
aid
that
they
“stro
ngly
” or “
som
ewha
t” su
ppor
t the
opt
ion.
b Th
e sa
mpl
e si
ze fo
r thi
s su
bgro
up is
<50
. Alth
ough
the
sam
ple
size
is la
rge
enou
gh to
con
duct
sta
tistic
al te
stin
g, th
is re
sult
shou
ld b
e in
terp
rete
d w
ith p
artic
ular
cau
tion,
w
hich
is w
hy th
e nu
mbe
r has
a s
trike
thro
ugh.
Not
e: T
he te
st o
f tw
o pr
opor
tions
was
use
d to
che
ck if
ther
e is
a s
tatis
tical
ly s
igni
fican
t diff
eren
ce b
etw
een
“sup
port”
leve
ls a
mon
g su
bgro
ups.
The
firs
t sub
grou
p lis
ted
in
each
cat
egor
y is
the
“bas
e” c
ase
for t
he te
st; t
he p
ropo
rtion
of r
espo
nden
ts w
ho s
uppo
rted
the
indi
vidu
al p
olic
ies
in e
ach
of th
e ot
her s
ubgr
oups
with
in th
at c
ateg
ory
is
com
pare
d to
the
base
cas
e.
Tabl
e 5,
con
tinue
d

Mineta Transportat ion Inst i tute
23Findings on Support for the Taxes
SUPPORT FOR DIFFERENT VERSIONS OF THE MILEAGE AND GAS TAXES
A central goal of the survey was to test how public support varied for different mileage and gas tax proposals. In this study, the base-case proposals for each type of tax were the flat-rate mileage tax of 1¢ per mile and the 10¢ gas tax increase without any additional detail. For comparative purposes, respondents were also asked about a single variant of the mileage tax (a variable tax based on how much pollution a vehicle produces) and a series of variants on the gas tax (several proposals that dedicate additional revenues to specific purposes, a phased-in tax increase, and a proposal that informs respondents of the typical annual cost). Figure 2 shows how variants on the tax proposals increased support in comparison to the base-case tax options. For both tax types, the base-case version had the lowest support level, and applying the test of two proportions confirmed that in all cases the increase in support is statistically significant.

Mineta Transportat ion Inst i tute
24 Findings on Support for the Taxes
25
16
17
26
28
32
38
44
0 10 20 30 40 50Percentage-point increase in support for
the variant compared with the base-case tax option
Gas tax: 10¢ increase with revenuespent to maintain streets,
roads, and highways
Gas tax: 10¢ increase with revenuespent on projects to reduce
accidents and improve safety
Gas tax: 10¢ increase with revenuespent to add more modern,
technologically advanced systems
Gas tax: 10¢ increase with revenuespent to reduce local air pollution
Gas tax: 10¢ increase with revenuespent to reduce global warming
Gas tax: 10¢ increase with informationon average driver's annual cost
Gas tax: 2¢ increaseper year for 5 years
Mileage tax: rate varies by vehicle’spollution level (average 1¢ per mile)
Figure 2. Relative Increases in Supporta for Variations of the Base-Caseb Gas Tax
and Mileage Tax Concepts (2014)a “Support” is the sum of those who said they “strongly” or “somewhat” support the tax option.b The base-case proposals were a new flat-rate mileage tax of 1¢ per mile and a 10¢ per gallon gas tax increase,
without any additional detail.

Mineta Transportat ion Inst i tute
25Findings on Support for the Taxes
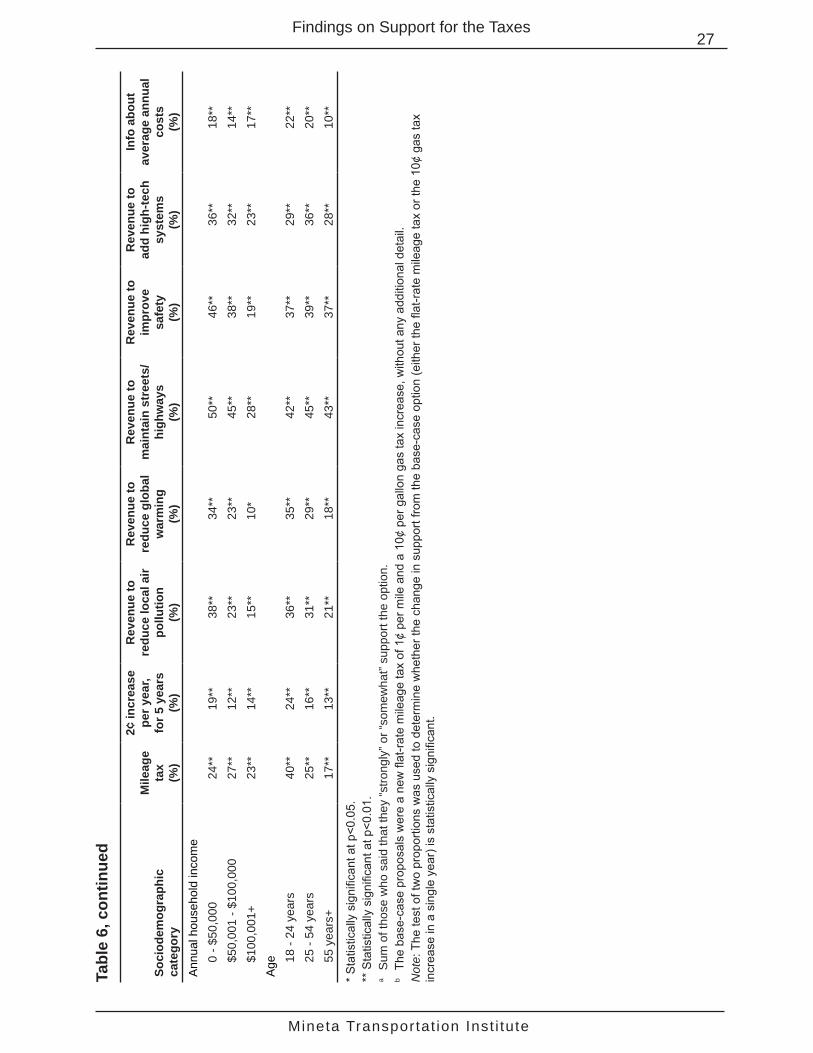
Tables 6 through 9 present the change in support levels for each tax variant by respondent subgroups that are defined by census region, sociodemographic and political characteristics, travel behavior characteristics, and opinions about the transportation system. Collectively, the tables include 63 population subgroups, for each of which there are 8 tax comparisons, resulting in a total of 504 cases examined.
The overall pattern of increased support for the variants holds for the subgroups, just as for the respondent pool as a whole. Across all 504 cases examined, the tax variants improved support in all but one case (and this one case was for a subgroup with fewer than 50 respondents). The increase in support for the variants as compared to the base cases was statistically significant for 93 percent of cases. Further, the increases were very large:
• At least 10 percentage points for 97 percent of cases
• At least 20 percentage points for 74 percent of cases
• At least 30 percentage points for 42 percent of cases
• At least 40 percentage points for 17 percent of cases

Mineta Transportat ion Inst i tute
26 Findings on Support for the Taxes
Tabl
e 6.
Pe
rcen
tage
-Poi
nt In
crea
ses
in S
uppo
rta f
or V
aria
nts
of th
e M
ileag
e Ta
x an
d G
as T
ax o
ver S
uppo
rt fo
r the
B
ase-
Cas
eb Ver
sion
s of
Tho
se T
axes
, by
Cen
sus
Reg
ion
and
Soci
odem
ogra
phic
Cat
egor
ies
(201
4)
Soci
odem
ogra
phic
ca
tego
ry
Mile
age
tax
(%)
2¢ in
crea
se
per y
ear,
for 5
yea
rs
(%)
Rev
enue
to
redu
ce lo
cal a
ir po
llutio
n
(%)
Rev
enue
to
redu
ce g
loba
l w
arm
ing
(%)
Rev
enue
to
mai
ntai
n st
reet
s/
high
way
s(%
)
Rev
enue
to
impr
ove
safe
ty(%
)
Rev
enue
to
add
high
-tech
sy
stem
s(%
)
Info
abo
ut
aver
age
annu
al
cost
s
(%)
All
resp
onde
nts
2516
2826
4438
3217
Cen
sus
regi
ons
Nor
thea
st
31**
12**
28**
23**
42**
38**
30**
15**
Mid
wes
t 18
**17
**24
**20
**50
**33
**32
**15
**S
outh
23
**12
**26
**28
**40
**37
**28
**16
**W
est
27**
24**
33**
32**
46**
40**
36**
23**
Gen
der
Mal
e25
**11
**20
**20
**36
**28
**29
**14
**Fe
mal
e24
**21
**37
**32
**51
**48
**35
**19
**R
ace Whi
te25
**16
**24
**21
**44
**36
**32
**15
**B
lack
/Afri
can-
Am
eric
an20
**8
35**
36**
47**
38**
35**
14**
Asi
an/A
sian
-Am
eric
an29
**31
**38
**39
**37
**47
**32
**40
**O
ther
22**
23**
50**
46**
49**
51**
33**
25**
Of H
ispa
nic/
Latin
o or
igin
/des
cent
No
28**
18**
42**
39**
49**
48**
33**
25**
Yes
23**
16**
26**
24**
43**
36**
32**
15**
Edu
catio
nH
igh
scho
ol
grad
uate
or l
ess
20**
14**
33**
28**
50**
44**
36**
15**
Mor
e th
an h
igh
scho
ol27
**18
**25
**25
**40
**34
**29
**19
**E
mpl
oyed
Yes
23**
15**
26**
26**
44**
37**
29**
16**
No
29**
18**
34**
30**
45**
40**
37**
20**
Ret
ired
19**
15**
24**
19**
42**
37**
32**
13**
Mineta Transportat ion Inst i tute
27Findings on Support for the Taxes
Soci
odem
ogra
phic
ca
tego
ry
Mile
age
tax
(%)
2¢ in
crea
se
per y
ear,
for 5
yea
rs
(%)
Rev
enue
to
redu
ce lo
cal a
ir po
llutio
n
(%)
Rev
enue
to
redu
ce g
loba
l w
arm
ing
(%)
Rev
enue
to
mai
ntai
n st
reet
s/
high
way
s(%
)
Rev
enue
to
impr
ove
safe
ty(%
)
Rev
enue
to
add
high
-tech
sy
stem
s(%
)
Info
abo
ut
aver
age
annu
al
cost
s
(%)
Ann
ual h
ouse
hold
inco
me
0 - $
50,0
0024
**19
**38
**34
**50
**46
**36
**18
**$5
0,00
1 - $
100,
000
27**
12**
23**
23**
45**
38**
32**
14**
$100
,001
+ 23
**14
**15
**10
*28
**19
**23
**17
**A
ge 18 -
24 y
ears
40**
24**
36**
35**
42**
37**
29**
22**
25 -
54 y
ears
25**
16**
31**
29**
45**
39**
36**
20**
55 y
ears
+ 17
**13
**21
**18
**43
**37
**28
**10
**
* S
tatis
tical
ly s
igni
fican
t at p
<0.0
5.**
Sta
tistic
ally
sig
nific
ant a
t p<0
.01.
a S
um o
f tho
se w
ho s
aid
that
they
“stro
ngly
” or “
som
ewha
t” su
ppor
t the
opt
ion.
b Th
e ba
se-c
ase
prop
osal
s w
ere
a ne
w fl
at-r
ate
mile
age
tax
of 1
¢ pe
r mile
and
a 1
0¢ p
er g
allo
n ga
s ta
x in
crea
se, w
ithou
t any
add
ition
al d
etai
l.N
ote:
The
test
of t
wo
prop
ortio
ns w
as u
sed
to d
eter
min
e w
heth
er th
e ch
ange
in s
uppo
rt fro
m th
e ba
se-c
ase
optio
n (e
ither
the
flat-r
ate
mile
age
tax
or th
e 10
¢ ga
s ta
x in
crea
se in
a s
ingl
e ye
ar) i
s st
atis
tical
ly s
igni
fican
t.
Tabl
e 6,
con
tinue
d

Mineta Transportat ion Inst i tute
28 Findings on Support for the Taxes
Tabl
e 7.
Pe
rcen
tage
-Poi
nt In
crea
ses
in S
uppo
rta f
or V
aria
nts
of th
e M
ileag
e Ta
x an
d G
as T
ax o
ver S
uppo
rt fo
r the
B
ase-
Cas
eb Ver
sion
s of
Tho
se T
axes
, by
Polit
ical
Affi
liatio
n (2
014)
Gas
tax
Mile
age
tax
(%)
2¢ in
crea
se p
er
year
, for
5 y
ears
(%)
Rev
enue
to
redu
ce
loca
l air
pollu
tion
(%)
Rev
enue
to
redu
ce
glob
al
war
min
g
(%)
Rev
enue
to
mai
ntai
n st
reet
s/
high
way
s (%
)
Rev
enue
to
impr
ove
safe
ty
(%)
Rev
enue
to
add
hi
gh-te
ch
syst
ems
(%)
Info
abo
ut
aver
age
annu
al
cost
s
(%)
All
resp
onde
nts
2516
2826
4438
3217
Reg
iste
red
vote
rYe
s23
**19
4223
**43
**34
**30
**15
**N
o34
**17
51**
37**
49**
50**
41**
26**
Like
ly v
oter
c
Yes
22**
1840
19**
40**
33**
29**
12**
No
29**
2049
**37
**49
**45
**37
**23
**P
oliti
cal a
ffilia
tion
for r
egis
tere
d vo
ters
Dem
ocra
t26
**22
4832
**42
**34
**31
**14
**R
epub
lican
21**
15*
36**
17**
49**
43**
30**
12**
Inde
pend
entd
22**
1941
13*
34**
28**
23**
16**
Oth
ere
1220
32**
28**
50**
33**
37**
20**
* S
tatis
tical
ly s
igni
fican
t at p
<0.0
5.**
Sta
tistic
ally
sig
nific
ant a
t p<0
.01.
a S
um o
f tho
se w
ho s
aid
that
they
“stro
ngly
” or “
som
ewha
t” su
ppor
t the
opt
ion.
b Th
e ba
se-c
ase
prop
osal
s w
ere
a ne
w fl
at-r
ate
mile
age
tax
of 1
¢ pe
r mile
and
a 1
0¢ p
er g
allo
n ga
s ta
x in
crea
se, w
ithou
t add
ition
al d
etai
ls.
c Li
kely
vot
ers
are
thos
e re
spon
dent
s w
ho s
aid
that
they
are
regi
ster
ed v
oter
s an
d th
at th
ey v
ote
“all
of th
e tim
e” o
r “m
ost o
f the
tim
e.”
d R
egis
tere
d, b
ut d
eclin
ed to
sta
te a
par
ty.
e R
egis
tere
d m
embe
r of a
ny o
ther
par
ty, i
nclu
ding
the
Am
eric
an In
depe
nden
t Par
ty.
Not
e: T
he te
st o
f tw
o pr
opor
tions
was
use
d to
det
erm
ine
whe
ther
the
chan
ge in
sup
port
from
the
base
-cas
e op
tion
(eith
er th
e fla
t-rat
e m
ileag
e ta
x or
the
10¢
gas-
tax
incr
ease
in a
sin
gle
year
) is
stat
istic
ally
sig
nific
ant.

Mineta Transportat ion Inst i tute
29Findings on Support for the Taxes
Tabl
e 8.
Pe
rcen
tage
-Poi
nt In
crea
ses
in S
uppo
rta f
or V
aria
nts
of th
e M
ileag
e Ta
x an
d G
as T
ax o
ver S
uppo
rt fo
r the
B
ase-
Cas
eb Ver
sion
s of
Tho
se T
axes
, by
Opi
nion
s of
the
Tran
spor
tatio
n Sy
stem
(201
4)G
as ta
x
Mile
age
tax
(%)
2¢ in
crea
se
per y
ear,
for 5
yea
rs
(%)
Rev
enue
to
redu
ce
loca
l air
pollu
tion
(%)
Rev
enue
to
redu
ce
glob
al
war
min
g (%
)
Rev
enue
to
mai
ntai
n st
reet
s/
high
way
s(%
)
Rev
enue
to
impr
ove
safe
ty(%
)
Rev
enue
to
add
hi
gh-te
ch
syst
ems
(%)
Info
abo
ut
aver
age
annu
al
cost
s (%
)A
ll re
spon
dent
s25
1628
2644
3832
17O
pini
on o
n co
nditi
on o
f roa
ds a
nd h
ighw
ays
in lo
cal c
omm
unity
Very
goo
d28
**14
**24
**15
**34
**32
**23
**19
**S
omew
hat g
ood
26**
18**
30**
29**
44**
39**
33**
16**
Bad
19**
13**
27**
26**
52**
40**
37**
16**
Opi
nion
on
publ
ic tr
ansi
t ser
vice
in lo
cal c
omm
unity
Very
goo
d 28
**18
**33
**27
**42
**42
**30
**20
**S
omew
hat g
ood
22**
18**
29**
28**
41**
34**
31**
15**
Poo
r27
**19
**24
**24
**47
**35
**37
**25
**N
o se
rvic
e22
**11
**29
**27
**45
**42
**31
**9*
Rol
e of
gov
ernm
ent i
n re
duci
ng tr
affic
con
gest
ion
Hig
h pr
iorit
y26
**19
**30
**29
**45
**41
**35
**18
**M
ediu
m p
riorit
y27
**14
**28
**23
**38
**33
**27
**13
**Lo
w p
riorit
y19
**14
**23
**24
**47
**34
**29
**16
**R
ole
of g
over
nmen
t in
mai
ntai
ning
stre
ets,
road
s, a
nd h
ighw
ays
Hig
h pr
iorit
y25
**19
**29
**27
**46
**40
**34
**19
**M
ediu
m p
riorit
y28
**6
26**
25**
33**
29**
27**
8Lo
w p
riorit
y 2
0*c
1024
** 2
4**c
49**
34**
26*
*c 11
Rol
e of
gov
ernm
ent i
n ex
pand
ing
and
impr
ovin
g lo
cal p
ublic
tran
sit s
ervi
ceH
igh
prio
rity
27**
21**
31**
31**
41**
37**
32**
19**
Med
ium
prio
rity
27**
16**
31**
29**
48**
42**
35**
17**
Low
prio
rity
15**
8*21
**11
**44
**33
**26
**12
**

Mineta Transportat ion Inst i tute
30 Findings on Support for the Taxes
Gas
tax
Mile
age
tax
(%)
2¢ in
crea
se
per y
ear,
for 5
yea
rs
(%)
Rev
enue
to
redu
ce
loca
l air
pollu
tion
(%)
Rev
enue
to
redu
ce
glob
al
war
min
g (%
)
Rev
enue
to
mai
ntai
n st
reet
s/
high
way
s(%
)
Rev
enue
to
impr
ove
safe
ty(%
)
Rev
enue
to
add
hi
gh-te
ch
syst
ems
(%)
Info
abo
ut
aver
age
annu
al
cost
s (%
)R
ole
of g
over
nmen
t on
redu
cing
acc
iden
ts a
nd im
prov
ing
safe
tyH
igh
prio
rity
28**
19**
31**
29**
46**
45**
34**
19**
Med
ium
prio
rity
21**
11**
22**
23**
38**
21**
30**
11**
Low
prio
rity
18**
722
**14
**40
**22
**26
**13
**R
ole
of g
over
nmen
t in
usin
g m
oder
n te
chno
logy
Hig
h pr
iorit
y22
**20
**31
**29
**46
**41
**42
**20
**M
ediu
m p
riorit
y28
**14
**28
**26
**42
**36
**26
**15
**Lo
w p
riorit
y24
**7
18**
19**
40**
30**
11*
11*
* S
tatis
tical
ly s
igni
fican
t at p
<0.0
5.**
Sta
tistic
ally
sig
nific
ant a
t p<0
.01.
a S
um o
f tho
se w
ho s
aid
that
they
“stro
ngly
” or “
som
ewha
t” su
ppor
t the
opt
ion.
b
The
base
-cas
e pr
opos
als
wer
e a
new
flat
-rat
e m
ileag
e ta
x of
1¢
per m
ile a
nd a
10¢
per
gal
lon
gas
tax
incr
ease
, with
out a
ny a
dditi
onal
det
ail.
c Th
e sa
mpl
e si
ze fo
r thi
s su
bgro
up is
<50
. Alth
ough
the
sam
ple
size
is la
rge
enou
gh to
con
duct
sta
tistic
al te
stin
g, th
is re
sult
shou
ld b
e in
terp
rete
d w
ith p
artic
ular
cau
tion,
w
hich
is w
hy th
is n
umbe
r has
a s
trike
thro
ugh.
Not
e: T
he te
st o
f tw
o pr
opor
tions
was
use
d to
det
erm
ine
whe
ther
the
chan
ge in
sup
port
from
the
base
-cas
e op
tion
(eith
er th
e fla
t-rat
e m
ileag
e ta
x or
the
10¢
gas-
tax
incr
ease
in a
sin
gle
year
) is
stat
istic
ally
sig
nific
ant.
Tabl
e 8,
con
tinue
d

Mineta Transportat ion Inst i tute
31Findings on Support for the Taxes
Tabl
e 9.
Pe
rcen
tage
-Poi
nt In
crea
ses
in S
uppo
rta f
or V
aria
nts
of th
e M
ileag
e Ta
x an
d G
as T
ax o
ver S
uppo
rt fo
r the
B
ase-
Cas
eb Ver
sion
s of
Tho
se T
axes
, by
Trav
el B
ehav
ior (
2014
)G
as ta
x
Mile
age
tax
(%)
2¢ in
crea
se
per y
ear,
for 5
yea
rs
(%)
Rev
enue
to
redu
ce lo
cal
air p
ollu
tion
(%)
Rev
enue
to
redu
ce
glob
al
war
min
g
(%)
Rev
enue
to
mai
ntai
n st
reet
s/
high
way
s(%
)
Rev
enue
to
impr
ove
safe
ty(%
)
Rev
enue
to
add
hi
gh-te
ch
syst
ems
(%)
Info
abo
ut
aver
age
annu
al
cost
s
(%)
All
resp
onde
nts
2516
2826
4438
3217
Ann
ual m
iles
driv
en1
- 7,5
0023
**13
**27
**27
**40
**35
**29
**13
**7,
501
- 12,
500
27**
18**
18**
16**
39**
31**
32**
21**
12,5
01+
23**
15**
19**
20**
43**
33**
29**
14**
Don
’t kn
ow30
**12
**37
**30
**47
**42
**29
**12
**D
on’t
driv
e19
**30
**56
**51
**63
**60
**52
**33
**M
iles
per g
allo
n≤
2418
**19
**24
**23
**46
**37
**37
**18
**25
- 38
35**
16**
26**
24**
39**
35**
25**
13**
39+c
30*
* -6
-4
1
1
6 7
6
6
Ta
ken
trans
it in
last
30
days
Yes
29**
18**
36**
36**
38**
36**
30**
23**
No
23**
16**
27**
23**
46**
39**
33**
15**
* S
tatis
tical
ly s
igni
fican
t at p
<0.0
5.**
Sta
tistic
ally
sig
nific
ant a
t p<0
.01.
a S
um o
f tho
se w
ho s
aid
that
they
“stro
ngly
” or “
som
ewha
t” su
ppor
t the
opt
ion.
b Th
e ba
se-c
ase
prop
osal
s w
ere
a ne
w fl
at-r
ate
mile
age
tax
of 1
¢ pe
r mile
and
a 1
0¢ p
er g
allo
n ga
s ta
x in
crea
se, w
ithou
t any
add
ition
al d
etai
l.c
The
sam
ple
size
for t
his
subg
roup
is <
50. A
lthou
gh th
e sa
mpl
e si
ze is
larg
e en
ough
to c
ondu
ct s
tatis
tical
test
ing,
resu
lts m
ay n
ot b
e ge
nera
lizab
le to
the
popu
latio
n fo
r th
is s
ubgr
oup,
whi
ch is
why
this
row
of n
umbe
rs h
as a
stri
keth
roug
h.N
ote:
The
test
of t
wo
prop
ortio
ns w
as u
sed
to d
eter
min
e w
heth
er th
e ch
ange
in s
uppo
rt fro
m th
e ba
se-c
ase
optio
n (e
ither
the
flat-r
ate
mile
age
tax
or th
e 10
¢ ga
s-ta
x in
crea
se in
a s
ingl
e ye
ar) i
s st
atis
tical
ly s
igni
fican
t.

Mineta Transportat ion Inst i tute
32 Findings on Support for the Taxes
TRENDS IN SUPPORT OVER TIME (2010 – 2014)
Most of the survey questions replicate those in the four surveys previously administered in this series, so it is possible to look at trends in support over time.7 The trend analysis shows that support levels have changed only a little over the five surveys (see Figure 3 and Table 10). In most cases the support for a tax varied by 5 or fewer percentage points from 2010 to 2011 to 2012, a change too small to suggest a meaningful change in support. However, Americans were modestly more willing to support most of the tax increases in 2013 and 2014 than they were in the previous three years. In 2014, support levels were at their highest ever for 7 of the tax options tested.

Mineta Transportat ion Inst i tute
33Findings on Support for the Taxes
21
23
39
32
33
42
42
30
22
24
39
36
36
45
45
48
50
56
62
21
20
39
31
41
49
41
41
46
54
58
19
23
42
40
39
51
50
53
58
62
67
19
25
41
42
43
49
51
54
57
63
69
0 10 20 30 40 50 60 70Respondent support (%)
20142013201220112010
Gas tax: 10¢ increase with revenuespent to maintain streets,
roads, and highways
Gas tax: 10¢ increase with revenuespent on projects to reduce
accidents and improve safety
Gas tax: 10¢ increase with revenuespent to add more modern,
technologically advanced systems
Gas tax: 10¢ increase with revenuespent to reduce local air pollution
Gas tax: 10¢ increase with revenuespent to reduce global warming
0.5¢ sales tax
Mileage tax: rate varies by vehicle’spollution level (average 1¢ per mile)
Gas tax: 10¢ increase with informationon average driver's annual cost
Gas tax: 2¢ increaseper year for 5 years
Gas tax: 10¢ increase
Mileage tax: flat rate of 1¢ per mile
Figure 3. Trends in Supporta for the Tax Options (2010 – 2014)a “Support” is the sum of those who said that they “strongly” or “somewhat” support the tax option.

Mineta Transportat ion Inst i tute
34 Findings on Support for the Taxes
Tabl
e 10
. Tr
ends
in S
uppo
rta f
or th
e Ta
x O
ptio
ns (2
010
– 20
14)
Tax
optio
n20
10(%
)20
11(%
)20
12(%
)20
13
(%)
2014
(%)
Diff
eren
ce
2014
-201
0 (%
)
Diff
eren
ce
2014
-201
1 (%
)
Diff
eren
ce
2014
-201
2 (%
)
Diff
eren
ce
2014
-201
3 (%
)G
as ta
x10
¢ in
crea
se23
2420
2325
21
5**
210
¢ in
crea
se, p
hase
d in
ove
r 5 y
ears
at 2
¢ pe
r yea
r39
3939
4241
22
2-1
10¢
incr
ease
, rev
enue
s sp
ent t
o re
duce
loca
l air
pollu
tion
3048
4153
5424
**6*
*13
**1
10¢
incr
ease
, rev
enue
s sp
ent t
o re
duce
glo
bal w
arm
ing
4245
4150
519*
*6*
*10
**1
10¢
incr
ease
, rev
enue
s sp
ent t
o m
aint
ain
stre
ets,
road
s, a
nd
high
way
s--b
6258
6769
--7*
*11
**2
10¢
incr
ease
, rev
enue
s sp
ent t
o re
duce
acc
iden
ts a
nd
impr
ove
safe
ty--
b56
5462
63--
7**
9**
1
10¢
incr
ease
, rev
enue
s sp
ent t
o ad
d m
ore
mod
ern,
te
chno
logi
cally
adv
ance
d sy
stem
s--
b50
4658
57--
7**
11**
-1
10¢
incr
ease
, res
pond
ents
info
rmed
of t
he a
nnua
l tax
bur
den
for t
he ty
pica
l driv
er32
3631
4042
10**
6**
11**
2
Mile
age
tax
1¢ p
er m
ile21
2221
1919
-2-3
*-2
01¢
per
mile
ave
rage
, but
veh
icle
s th
at p
ollu
te m
ore
pay
mor
e an
d ve
hicl
es th
at p
ollu
te le
ss p
ay le
ss33
3641
3943
10**
7**
24*
Nat
iona
l 0.5
% s
ales
tax
4345
4951
496*
*4*
0-2
* S
tatis
tical
ly s
igni
fican
t at p
<0.0
5.**
Sta
tistic
ally
sig
nific
ant a
t p<0
.01.
a S
um o
f tho
se w
ho s
aid
that
they
“stro
ngly
” or “
som
ewha
t” su
ppor
t the
opt
ion.
b Th
ese
optio
ns w
ere
not i
nclu
ded
in th
e 20
10 s
urve
y.N
ote:
The
test
of t
wo
prop
ortio
ns w
as u
sed
to c
heck
if th
ere
is a
sta
tistic
ally
sig
nific
ant d
iffer
ence
in s
uppo
rt fo
r the
diff
eren
t tax
opt
ions
from
201
4 to
201
0, 2
014
to 2
011,
20
14 to
201
2, a
nd 2
014
to 2
013.

Mineta Transportat ion Inst i tute
35Findings on Support for the Taxes
The one striking exception to the trend of fairly similar support levels across all the taxes for all five surveys is the gas tax increase with revenues dedicated to projects that reduce air pollution. Here, support has varied considerably from year to year, with a low of 30 percent support in 2010 to a high of 54 percent support in 2014.
We also found that a few population subgroups were clearly more likely to support the taxes across all five surveys:8
• Asians/Asian-Americans and blacks/African-Americans (compared to whites)
• Younger people (compared to people in both older age groups)
• Democrats (compared to Republicans and Independents)
• People who drove the fewest miles per year (compared to people who did not know how many miles per year they drove or who did not drive)
• People who had used transit in the previous 30 days (compared to people who did not)
• People who think government should place a high priority on expanding and improving local public transit service, maintaining streets and roads, reducing accidents and improving safety, and using modern technology (compared with people who think government should place a low priority on these goals)
Our analysis of how the tax variations boosted support over the base cases shows relatively little change from 2010 to 2014 (see Figure 4). In every case, the variations had higher support levels than the base-case options, and the boosts in support were fairly similar each year the questions were asked. The gas tax variant with the most consistent boost has been the option to phase in the tax increase over five years. The increase in support for this variant has remained within a 4 percentage point range across all survey years. The boosts for the other gas tax variants have fluctuated a little more but still within a range of 9 points or fewer, except for the gas tax linked to projects that would reduce local air pollution. This variant received a small boost in support in 2010 but then received relatively large boosts since then (between 21 and 30 percentage points). Additionally, there has been a gradual but steady increase in support for the mileage tax with variable rates based on vehicle emissions. For that tax variant, the boost has climbed from 12 percentage points in 2010 to 25 percentage points in 2014.
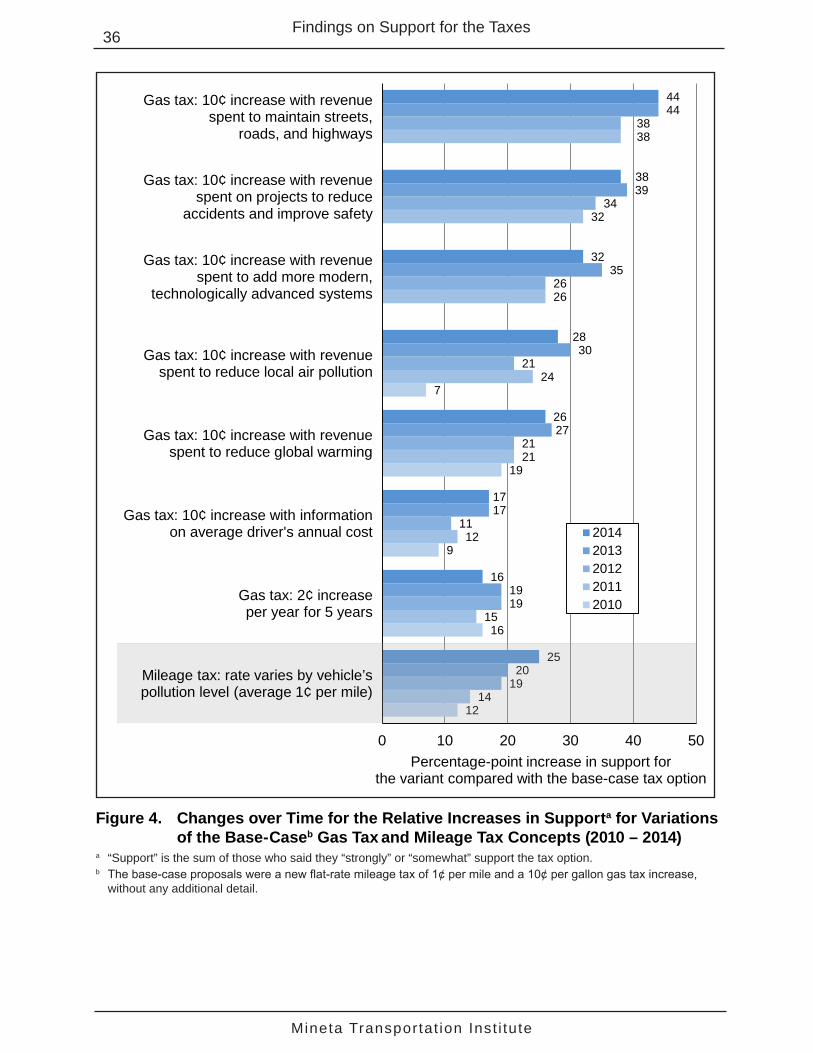
Mineta Transportat ion Inst i tute
36 Findings on Support for the Taxes
12
16
9
19
7
14
15
12
21
24
26
32
38
19
19
11
21
21
26
34
38
20
19
17
27
30
35
39
44
25
16
17
26
28
32
38
44
0 10 20 30 40 50Percentage-point increase in support for
the variant compared with the base-case tax option
20142013201220112010
Gas tax: 10¢ increase with revenuespent to maintain streets,
roads, and highways
Gas tax: 10¢ increase with revenuespent on projects to reduce
accidents and improve safety
Gas tax: 10¢ increase with revenuespent to add more modern,
technologically advanced systems
Gas tax: 10¢ increase with revenuespent to reduce local air pollution
Gas tax: 10¢ increase with revenuespent to reduce global warming
Gas tax: 10¢ increase with informationon average driver's annual cost
Gas tax: 2¢ increaseper year for 5 years
Mileage tax: rate varies by vehicle’spollution level (average 1¢ per mile)
Figure 4. Changes over Time for the Relative Increases in Supporta for Variations of the Base-Caseb Gas Tax and Mileage Tax Concepts (2010 – 2014)
a “Support” is the sum of those who said they “strongly” or “somewhat” support the tax option.b The base-case proposals were a new flat-rate mileage tax of 1¢ per mile and a 10¢ per gallon gas tax increase,
without any additional detail.
Mineta Transportat ion Inst i tute
37
V. FINDINGS RELATED TO OPINIONS ON PUBLIC TRANSIT
For 2012, 2013, and 2014 a new emphasis in the survey project was to understand various perceptions related to public transit, including knowledge and opinions about federal taxes to support transit. This chapter pulls together the different pieces of the survey to highlight all findings related to transit.
A question early in the survey asked respondents their opinion on the quality of public transit in their community. The majority of respondents (57 percent) said that it is very or somewhat good, 15 percent said that it is poor, and 28 percent said either that there is no service in their community or that they do not know about transit quality. These values are very close to those from identical questions asked in all four prior surveys. (To compare the responses from all five surveys, see Q2 in Appendix A.)
Another early series of questions in the survey asked respondents how highly they would prioritize various things “government could do to improve the transportation system for everyone in the state where you live” (see Table 11). One of the priorities tested was expanding and improving local public transit service. Public transit was a high priority for close to half of respondents (44 percent), though this was the lowest percentage among the five priorities tested. However, when looking at those who felt transit was either a high or medium priority, transit rated not so differently from the other options—79 percent of respondents felt this way, compared to the other options that ranged from a low of 80 percent to a high of 95 percent. The two most popular priorities were road maintenance and improving safety.
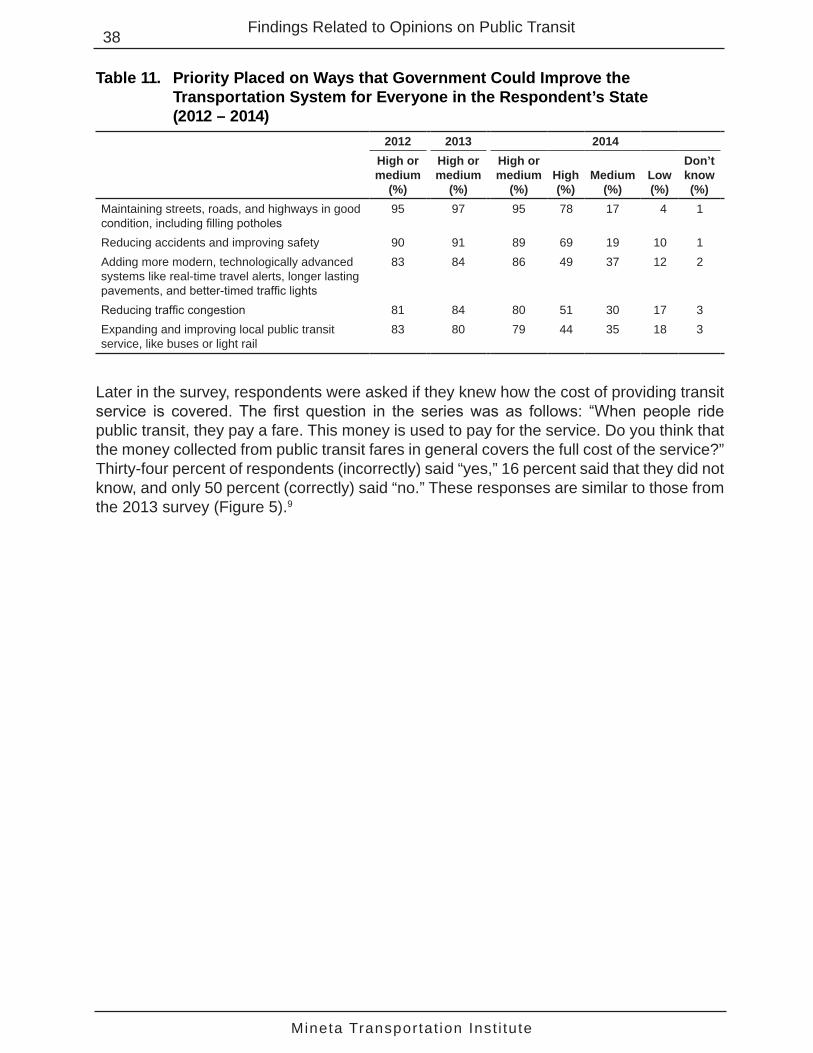
Mineta Transportat ion Inst i tute
38 Findings Related to Opinions on Public Transit
Table 11. Priority Placed on Ways that Government Could Improve the Transportation System for Everyone in the Respondent’s State (2012 – 2014)
2012 2013 2014High or medium
(%)
High or medium
(%)
High or medium
(%)High (%)
Medium (%)
Low (%)
Don’t know (%)
Maintaining streets, roads, and highways in good condition, including filling potholes
95 97 95 78 17 4 1
Reducing accidents and improving safety 90 91 89 69 19 10 1Adding more modern, technologically advanced systems like real-time travel alerts, longer lasting pavements, and better-timed traffic lights
83 84 86 49 37 12 2
Reducing traffic congestion 81 84 80 51 30 17 3Expanding and improving local public transit service, like buses or light rail
83 80 79 44 35 18 3
Later in the survey, respondents were asked if they knew how the cost of providing transit service is covered. The first question in the series was as follows: “When people ride public transit, they pay a fare. This money is used to pay for the service. Do you think that the money collected from public transit fares in general covers the full cost of the service?” Thirty-four percent of respondents (incorrectly) said “yes,” 16 percent said that they did not know, and only 50 percent (correctly) said “no.” These responses are similar to those from the 2013 survey (Figure 5).9

Mineta Transportat ion Inst i tute
39Findings Related to Opinions on Public Transit
15
55
30
16
50
34
0 10 20 30 40 50 60
Don’t know
No
Yes
Question response (%)
20142013
Figure 5. Respondents’ Belief about Whether Transit Fares Cover the Full Cost of Transit (2013 and 2014)
Those respondents who did not think that fares cover the full costs of transit were asked some follow-up questions. First, they were asked, “In general, what percent of the full cost of public transit services do you think the fares cover?” Twenty-eight percent said that fares cover 1 to 33 percent of the full cost, 38 percent said that fares cover 34 to 66 percent of the full cost, 17 percent said that fares cover 67 to 100 percent of the full cost, and 18 percent said that they did not know.
For those respondents who did not think that fares cover all transit costs, the survey asked if they thought the federal, state, and local government also “helps to pay for public transit services around the country.” Slightly more than half (55 percent) knew that the federal government helps pay for transit, with more respondents aware of the local contribution (64 percent) and the state contribution (76 percent). An alternative way to think about the survey findings on this topic is in terms of the percent of all respondents who were aware of the role each government entity plays in funding. Calculating the numbers this way, 36 percent of all respondents knew the federal government pays for transit, 42 percent knew of the local government role, and 50 percent knew of the state government role (Figure 6).

Mineta Transportat ion Inst i tute
40 Findings Related to Opinions on Public Transit
48
53
46
42
50
36
0 10 20 30 40 50 60
Local government
State government
Federal government
Respondents who knew of federal/state/localgovernment's role in funding transit (%)
2014
2013
Figure 6. Knowledge among All Respondents about which Government Entities Pay for Public Transit around the U.S. (2013 and 2014)
Knowledge of whether or not fares cover transit and which government entities pay for transit varies considerably among many subgroups. Table 12 shows that quite a few subgroups are more than 15 percentage points more likely than the others in that category to incorrectly think that fares cover all transit costs. These respondents were:
• Black/African-American (compared to white respondents)
• Not of Latino or Hispanic descent (compared to those of Latino or Hispanic descent)
• Within the lowest income group (compared to people with household incomes over $50,000 per year)
• In the youngest group (compared to the two older age groups)
• Not registered to vote or unlikely to vote (compared to those registered and likely to vote)
• Unaware of their annual mileage or were non-drivers (compared to those who did know their annual mileage)

Mineta Transportat ion Inst i tute
41Findings Related to Opinions on Public Transit
Table 12. Opinions on Whether Fares Cover the Full Cost of Transit Service, by Subgroup (2014)
Yes (%)
No (%)
Don’t know (%)
All respondents 34 50 16Census region
Northeast 31 53 15Midwest 31 56 13South 34 47 19West 37 50 14
GenderMale 34 51 15Female 34 48 17
RaceWhite 30 52 18Black/African-American 46** 42* 12Asian/Asian-American 39 52 9Other 44** 42* 14
Of Hispanic/Latino origin/descentNo 48 41 10Yes 31** 52** 17**
EducationHigh school graduate or less 42 38 20More than high school 29** 58** 13**
EmployedYes 33 53 14No 39 44** 18Retired 27 52 21*
Annual household income0 - $50,000 42 41 17$50,001 - $100,000 24** 60** 16$100,001+ 30** 56** 15
Age18 - 24 years 41 45 1325 - 54 years 35 51 1455 years+ 29** 50 20*
Registered voterYes 29 55 16No 53** 30** 17
Likely votera
Yes 28 56 16No 43** 41** 16
Political affiliation for registered votersDemocrat 36 50 14Republican 27* 51 22**Independentb 21** 65** 14Otherc 20** 64* 16

Mineta Transportat ion Inst i tute
42 Findings Related to Opinions on Public Transit
Yes (%)
No (%)
Don’t know (%)
Annual miles driven1 - 7,500 35 47 187,501 - 12,500 25** 59** 1712,501+ 26** 59** 15Don’t know 38 47 16Don’t drive 56** 30** 14
Miles per gallond
≤ 24 mpg 33 49 1825 - 38 mpg 25** 58** 1739+ mpge 24 64* 11
Taken transit in last 30 daysYes 43 49 8No 31** 50 19**
Transit service in communityHas transit service 35 52 13No transit service 32 47 21**
* Statistically significant at p<0.05.** Statistically significant at p<0.01.a Likely voters are those respondents who said that they are registered voters and that they vote “all of the time” or
“most of the time.”b Registered, but declined to state a party.c Registered member of any other party, including the American Independent Party.d Categories correspond to the EPA’s “SmartWay” vehicle rating system (U.S. Environmental Protection Agency,
“SmartWay Vehicle Thresholds, MY 2011 & MY 2012” EPA-420-B-13-015 (January 2010), http://www.epa.gov/greenvehicles/documents/420b13015.pdf (accessed May 20, 2014)).
e The sample size for this subgroup is <50. Although the sample size is large enough to conduct statistical testing, results should be interpreted with particular caution, which is why this row of numbers has a strikethrough.
Note: The test of two proportions was used to check if there is a statistically significant difference between responses among subgroups. The first subgroup in each category is the “base” case for the test; it is compared to the proportion of respondents in each of the other subgroups within that category who chose the same response.
With respect to knowledge of which government entities fund transit, the most variation occurs in knowledge about federal funding (Table 13). The subgroups that are at least 10 percentage points less likely to know about federal funding are people with no education beyond high school, people in the youngest age group (compared to people in the oldest age group), and people who don’t drive. Asians/Asian-Americans are 10 percentage points more likely to know about federal funding than any other race.
The only subgroups at least 10 percentage points more likely to know about state government funding were employed people (compared to retired people) and people aged 25-54 years old (compared to people over 55).
Subgroups that were at least 10 percentage points more likely to know about local government funding were those living in the South and West (compared to those living in the Midwest and Northeast), whites and Asian/Asian-Americans (compared to black/African-Americans), voters registered with political parties other than the Democratic and
Table 12, continued

Mineta Transportat ion Inst i tute
43Findings Related to Opinions on Public Transit
Republican parties, people who drive more than 7,500 miles per year (compared to non-drivers), and those living in communities with transit services.
Table 13. Knowledge of Which Levels of Government Pay for Transit, by Subgroup (2014)a
Federal gov’t (%)
State gov’t (%)
Local gov’t (%)
All respondents asked the questiona 62 82 72Census region
Northeast 63 90 67Midwest 69 86 67South 63 87 79*West 71 91 81**
GenderMale 69 88 78Female 62* 89 71*
RaceWhite 66 88 76Black/African-American 62 86 66Asian/Asian-American 76 91 76Other 64 86 69
Of Hispanic/Latino origin/descentNo 58 92 79Yes 67 88 74
EducationHigh school graduate or less 59 86 72More than high school 69* 89 76
EmployedYes 66 91 75No 64 87 75Retired 68 79** 71
Annual household income0 - $50,000 62 83 70$50,001 - $100,000 66 92** 79*$100,001+ 70 91** 74
Age18 - 24 years 57 91 7425 - 54 years 65 92 7855 years+ 69* 82* 70
Registered voterYes 65 88 75No 59 85 69
Likely voterb
Yes 68 87 75No 61 89 74

Mineta Transportat ion Inst i tute
44 Findings Related to Opinions on Public Transit
Federal gov’t (%)
State gov’t (%)
Local gov’t (%)
Political affiliation for registered votersDemocrat 64 87 74Republican 66 87 78Independentc 61 90 75Otherd 68 92 85
Annual miles driven1 - 7,500 68 86 707,501 - 12,500 65 89 79*12,501+ 67 90 76Don’t know 63 88 78Don’t drive 57 84e 67e
Miles per gallonf
≤ 24 mpg 66 89 7225 - 38 mpg 65 87 79*39+ mpge 77 84 71
Taken transit in last 30 daysYes 73 89 75No 63* 88 74
Transit service in communityHas transit service 68 89 76No transit service 60* 85 65**
* Statistically significant at p<0.05.** Statistically significant at p<0.01.a This question was asked of only those respondents who, when asked if transit fares cover the full cost of transit,
responded “no” or “don’t know.”b Likely voters are those respondents who said that they are registered voters and that they vote “all of the time” or
“most of the time.”c Registered, but declined to state a party.d Registered member of any other party, including the American Independent Party.e The sample size for this subgroup is <50. Although the sample size is large enough to conduct statistical testing,
results should be interpreted with particular caution, which is why this row of numbers has a strikethrough.f Categories correspond to the EPA’s “SmartWay” vehicle rating system (U.S. Environmental Protection Agency,
“SmartWay Vehicle Thresholds, MY 2011 & MY 2012” EPA-420-B-13-015 (January 2010), http://www.epa.gov/greenvehicles/documents/420b13015.pdf (accessed May 20, 2014)).
Note: The test of two proportions was used to check if there is a statistically significant difference between responses among subgroups. The first subgroup listed in each category is the “base” case for the test; it is compared to the proportion of respondents who responded that the different entities “do” pay for transit in each of the other subgroups within that category.
Table 13, continued
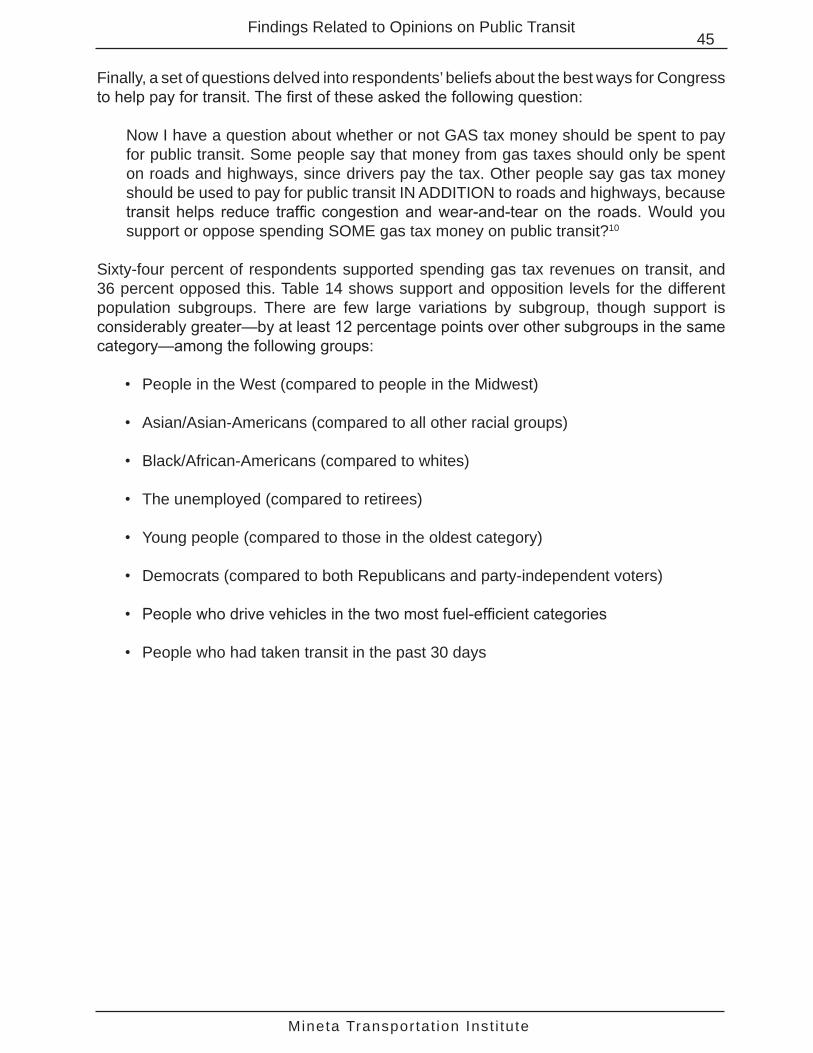
Mineta Transportat ion Inst i tute
45Findings Related to Opinions on Public Transit
Finally, a set of questions delved into respondents’ beliefs about the best ways for Congress to help pay for transit. The first of these asked the following question:
Now I have a question about whether or not GAS tax money should be spent to pay for public transit. Some people say that money from gas taxes should only be spent on roads and highways, since drivers pay the tax. Other people say gas tax money should be used to pay for public transit IN ADDITION to roads and highways, because transit helps reduce traffic congestion and wear-and-tear on the roads. Would you support or oppose spending SOME gas tax money on public transit?10
Sixty-four percent of respondents supported spending gas tax revenues on transit, and 36 percent opposed this. Table 14 shows support and opposition levels for the different population subgroups. There are few large variations by subgroup, though support is considerably greater—by at least 12 percentage points over other subgroups in the same category—among the following groups:
• People in the West (compared to people in the Midwest)
• Asian/Asian-Americans (compared to all other racial groups)
• Black/African-Americans (compared to whites)
• The unemployed (compared to retirees)
• Young people (compared to those in the oldest category)
• Democrats (compared to both Republicans and party-independent voters)
• People who drive vehicles in the two most fuel-efficient categories
• People who had taken transit in the past 30 days

Mineta Transportat ion Inst i tute
46 Findings Related to Opinions on Public Transit
Table 14. Opinion on Whether Gas Taxes Should Be Spent on Public Transit in Addition to Roads and Highways, by Subgroup (2014)
Support (%) Oppose (%)All respondents 64 36Census region
Northeast 65 35Midwest 57 43South 64 36West 69 31
GenderMale 65 35Female 63 37
RaceWhite 60 40Black/African-American 72** 28**Asian/Asian-American 91** 9**Other 69 31
Of Hispanic/Latino origin/descentNo 67 33Yes 63 37
EducationHigh school graduate or less 62 38More than high school 65 35
EmployedYes 63 37No 68 32Retired 55 45
Annual household income0 - $50,000 66 34$50,001 - $100,000 59* 41*$100,001+ 65 35
Age18 - 24 years 72 2825 - 54 years 64* 36*55 years+ 59** 41**
Registered voterYes 63 37No 70* 30*
Likely votera
Yes 61 39No 68** 32**
Political affiliation for registered votersDemocrat 75 25Republican 48** 52**Independentb 59** 41**Otherc 66 34

Mineta Transportat ion Inst i tute
47Findings Related to Opinions on Public Transit
Support (%) Oppose (%)Annual miles driven
1 - 7,500 66 347,501 - 12,500 59* 41*12,501+ 62 38Don’t know 65 35Don’t drive 64 36
Miles per gallond
≤ 24 mpg 56 4425 - 38 mpg 71** 29**39+ mpge 70 30
Taken transit in last 30 daysYes 77 23No 59** 41**
Transit service in communityHas transit service 66 34No transit service 56** 44**
* Statistically significant at p<0.05.** Statistically significant at p<0.01.a Likely voters are those respondents who said that they are registered voters and that they vote “all of the time” or
“most of the time.”b Registered, but declined to state a party.c Registered member of any other party, including the American Independent Party.d Categories correspond to the EPA’s “SmartWay” vehicle rating system (U.S. Environmental Protection Agency,
“SmartWay Vehicle Thresholds, MY 2011 & MY 2012” EPA-420-B-13-015 (January 2010), http://www.epa.gov/greenvehicles/documents/420b13015.pdf (accessed May 20, 2014)).
e The sample size for this subgroup is <50. Although the sample size is large enough to conduct statistical testing, results for this subgroup should be interpreted with particular caution, which is why the numbers in the row have a strikethrough.
Note: The test of two proportions was used to check if there is a statistically significant difference between responses among subgroups. The first subgroup listed in each category is the “base” case for the test; it is compared to the proportion of respondents who supported or opposed using gas taxes to pay for transit in each of the other subgroups within that category.
Table 14, continued

Mineta Transportat ion Inst i tute
48 Findings Related to Opinions on Public Transit
A multipart question then posed the scenario that Congress had decided to spend more money on public transit but had not decided how to pay for this. Respondents were first asked whether they would support each of the following three options to pay for expanding and improving public transportation: reducing spending on other federal programs, raising transit fares, or raising the federal gas tax. In 2014, reducing federal spending on other programs received the most support (60 percent), followed by raising transit fares (52 percent), and trailed by raising the federal gas tax (36 percent). (See Table 15 and Figure 7.) When respondents were asked which of the three choices they preferred, the same hierarchy emerged: 48 percent preferred reducing spending on other programs, 24 percent preferred raising transit fares, and 17 percent preferred raising the federal gas tax (Table 16).
Across the three years of surveying, there was a statistically significant increase in support for each individual option from 2012 to 2014: four percentage points more support for reducing federal spending, seven points more support for raising transit fares, and eight points more support for raising the federal gas tax (Table 15). However, the percent of respondents choosing each option as their preferred alternative remained almost the same from year to year (Table 16).
Table 15. Attitudes about Three Ways Congress Could Pay for Expanding and Improving Public Transportation (2012 – 2014)
2012 2013 2014
Supporta
(%)Opposeb
(%)
Don’t knowc
(%)Supporta
(%)Opposeb
(%)
Don’t knowc
(%)Supporta
(%)Opposeb
(%)
Don’t knowc
(%)Reduce spending on other federal programs
56 35 9 57 37 6 60 32 8
Raise transit fares 45 48 7 56 41 3 52 42 6Raise the federal gas tax
28 69 3 32 66 1 36 62 2
a Sum of respondents who “strongly support” or “somewhat support” each method to raise funds for public transportation.
b Sum of respondents who “strongly oppose” or “somewhat oppose” each method to raise funds for public transportation.
c Some respondents volunteered this answer, which was not an option presented in the questionnaire.

Mineta Transportat ion Inst i tute
49Findings Related to Opinions on Public Transit
56
45
28
57
56
32
60
52
36
0 10 20 30 40 50 60 70Support for each funding option (%)
201420132012
Raise the federal gas tax
Raise transit fares
Reduce spending onother federal programs
Figure 7. Supporta for Three Ways Congress Could Pay for Expanding and Improving Public Transportation (2012 – 2014)
a Percent of respondents who said that they “strongly” support or “support” each method to raise funds for public transportation.
Table 16. Preferred Alternative among Three Ways Congress Could Pay for Expanding and Improving Public Transportation (2012 – 2014)
2012a 2013b 2014c
Reduce spending on other federal programs 48 48 48Raise transit fares 27 27 24Raise the federal gas tax 14 17 17
a An additional 10 percent declined to choose a preferred alternative and instead volunteered an answer (don’t know, equally oppose all three, or equally support all three).
b An additional 7 percent didn’t know, equally opposed all three, or equally supported all three.c An additional 11 percent didn’t know, equally opposed all three, or equally supported all three.Note: Some percentages do not sum to 100% due to rounding.

Mineta Transportat ion Inst i tute
50 Findings Related to Opinions on Public Transit
Investigating how the respondent subgroups responded to each of the three options for raising more federal money for transit shows a few clear differences by subgroup (Table 17), with the most clearly supportive subgroups defined as those showing at least 10 percentage points more support than one or more subgroups within the category. For each policy option, the most supportive subgroups were as follows:
• The subgroups that showed the most support for raising the federal gas tax contained people who: lived in the Northeast (compared to the Midwest), were Asian/Asian-American, had annual household incomes over $100,000, were employed (compared to retired respondents), were in one of the two youngest age groups (as opposed to the oldest age group), were registered Democrats (compared to registered Republicans or those who had not registered a party preference), drove the most fuel-efficient cars,11 had taken transit within the previous 30 days, and reported having transit service in their community.
• Those most supportive of reducing spending on other government programs fell into one of the following subgroups: men, those with household incomes over $50,000 per year, independent voters (compared to Democrats), those who reported driving any mileage at all (compared to those who don’t drive or don’t know their annual mileage), and those driving the most fuel-efficient cars.12
• Those most supportive of raising transit fares were respondents who: identified as Asian/Asian-American or white (as compared to black/African-American or other race), are of Hispanic or Latino descent, had completed more years of schooling than high school, were employed (compared to unemployed respondents), had annual household incomes over $50,000, were registered voters and likely voters, had not taken transit in the previous 30 days, or drove more than 7,500 miles per year (compared to those who didn’t drive or didn’t know their annual mileage). Those who didn’t drive were notably less supportive of raising transit fares.
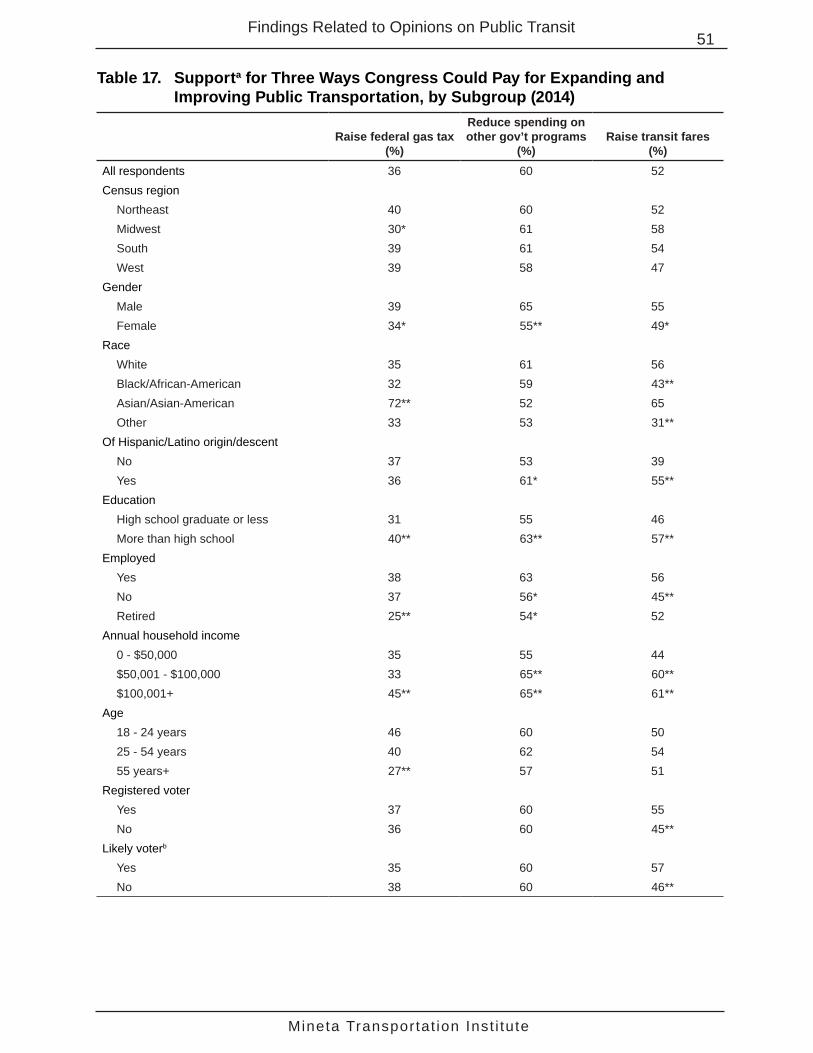
Mineta Transportat ion Inst i tute
51Findings Related to Opinions on Public Transit
Table 17. Supporta for Three Ways Congress Could Pay for Expanding and Improving Public Transportation, by Subgroup (2014)
Raise federal gas tax (%)
Reduce spending on other gov’t programs
(%)Raise transit fares
(%)All respondents 36 60 52Census region
Northeast 40 60 52Midwest 30* 61 58South 39 61 54West 39 58 47
GenderMale 39 65 55Female 34* 55** 49*
RaceWhite 35 61 56Black/African-American 32 59 43**Asian/Asian-American 72** 52 65Other 33 53 31**
Of Hispanic/Latino origin/descentNo 37 53 39Yes 36 61* 55**
EducationHigh school graduate or less 31 55 46More than high school 40** 63** 57**
EmployedYes 38 63 56No 37 56* 45**Retired 25** 54* 52
Annual household income0 - $50,000 35 55 44$50,001 - $100,000 33 65** 60**$100,001+ 45** 65** 61**
Age18 - 24 years 46 60 5025 - 54 years 40 62 5455 years+ 27** 57 51
Registered voterYes 37 60 55No 36 60 45**
Likely voterb
Yes 35 60 57No 38 60 46**

Mineta Transportat ion Inst i tute
52 Findings Related to Opinions on Public Transit
Raise federal gas tax (%)
Reduce spending on other gov’t programs
(%)Raise transit fares
(%)Political affiliation for registered voters
Democrat 44 55 56Republican 27** 62* 52Independentc 38 71** 60Otherd 30* 61 51
Annual miles driven1 - 7,500 35 61 527,501 - 12,500 36 65 62**12,501+ 33 66 60*Don’t know 42 50** 49Don’t drive 36 51* 30**
Miles per gallone
≤ 24 mpg 32 62 5325 - 38 mpg 37 64 6039+ mpgf 51** 44* 58
Taken transit in last 30 daysYes 46 55 41No 33** 61* 56**
Transit service in communityHas transit service 40 59 52No transit service 26** 63 53
* Statistically significant at p<0.05.** Statistically significant at p<0.01.a Percent of respondents who “strongly support” or “somewhat support” each method to raise funds for public
transportation.b Likely voters are those respondents who said that they are registered voters and that they vote “all of the time” or
“most of the time.”c Registered, but declined to state a party.d Registered member of any other party, including the American Independent Party.e Categories correspond to the EPA’s “SmartWay” vehicle rating system (U.S. Environmental Protection Agency,
“SmartWay Vehicle Thresholds, MY 2011 & MY 2012” EPA-420-B-13-015 (January 2010), http://www.epa.gov/greenvehicles/documents/420b13015.pdf (accessed May 20, 2014)).
f The sample size for this subgroup is <50. Although the sample size is large enough to conduct statistical testing, results should be interpreted with particular caution, which is why this row of numbers has a strikethrough.
Notes: The test of two proportions was used to check if there was a statistically significant difference between responses among subgroups. The first subgroup listed in each category is the “base” case for the test; it is compared to the proportion of respondents who “supported” using each method for raising funds to pay for transit in each of the other subgroups within that category. As detailed in Table 15, up to 8 percent of respondents responded “don’t know” rather than support/oppose; these people are excluded from this analysis.
Table 17, continued

Mineta Transportat ion Inst i tute
53Findings Related to Opinions on Public Transit
When respondents were asked which of the three options they preferred, some but not all of the same subgroups were at least 10 percentage points more supportive than other subgroups within the same category (Table 18). For each preferred policy option, the most supportive subgroups were as follows:
• Those most likely to prefer raising the federal gas tax were respondents who fell into any one of the following subgroups: Asian/Asian-Americans, registered Democrats (compared to registered Republicans), or drivers of the least fuel- efficient vehicles.13
• Those most likely to prefer reducing spending on other government programs were respondents who fell into any one of the following subgroups: those living in the Northeast (compared to the Midwest or Northeast); black/African-Americans (compared to white or “other” race respondents); those of Hispanic or Latino descent; those not educated beyond high school; those living in households with an annual income below $50,000; those unlikely to vote; registered voters who did not indicate a party preference or chose a party other than Democrat; or drivers of the least fuel-efficient vehicles (as compared to drivers of the most fuel-efficient vehicles).14
• Those most likely to prefer raising transit fares were respondents who fell into one any one of the following subgroups: those living in the Midwest (compared to those in the Northeast and West); black/African-Americans or whites (compared to Asian/Asian-Americans); registered voters (compared to respondents not registered to vote); voters registered as Democrat, Republican, or party-independent (compared to “Other” voters); drivers (compared to non-drivers); or those who had not taken transit within the last 30 days.

Mineta Transportat ion Inst i tute
54 Findings Related to Opinions on Public Transit
Table 18. Respondents’ Preferred Method to Expand and Improve Public Transportation, by Subgroup (2014)
Raise federal gas tax
(%)
Reduce spending on other gov’t
programs (%)
Raise transit fares (%)
Equally oppose all three
(%)
Equally support all three
(%)All respondents 18 50 25 5 2Census region
Northeast 20 56 18 4 1Midwest 13* 45* 35** 4 3South 20 48 26* 4 2West 17 52 23 6 2
GenderMale 20 49 23 5 2Female 15** 51 27 5 2
RaceWhite 17 49 28 4 2Black/African-American 12 60* 19* 7 2Asian/Asian-American 37** 51 9** 1 1Other 18 50 20 11** 2
Of Hispanic/Latino origin/descentNo 22 42 24 9 2Yes 17* 52* 25 4** 2
EducationHigh school graduate or less 13 59 21 5 2More than high school 20** 44** 28** 5 2
EmployedYes 19 48 25 6 2No 18 54 25 3* 1Retired 11* 50 28 7 3
Annual household income0 - $50,000 15 56 22 6 1$50,001 - $100,000 17 45** 30** 4 3$100,001+ 23** 44** 25 5 3*
Age18 - 24 years 17 56 23 2 225 - 54 years 21 47* 26 5 255 years+ 13 53 25 6* 3
Registered voterYes 17 48 29 5 2No 21 56* 16** 5 2
Likely votera
Yes 19 46 29 5 2No 16 57** 20** 5 2
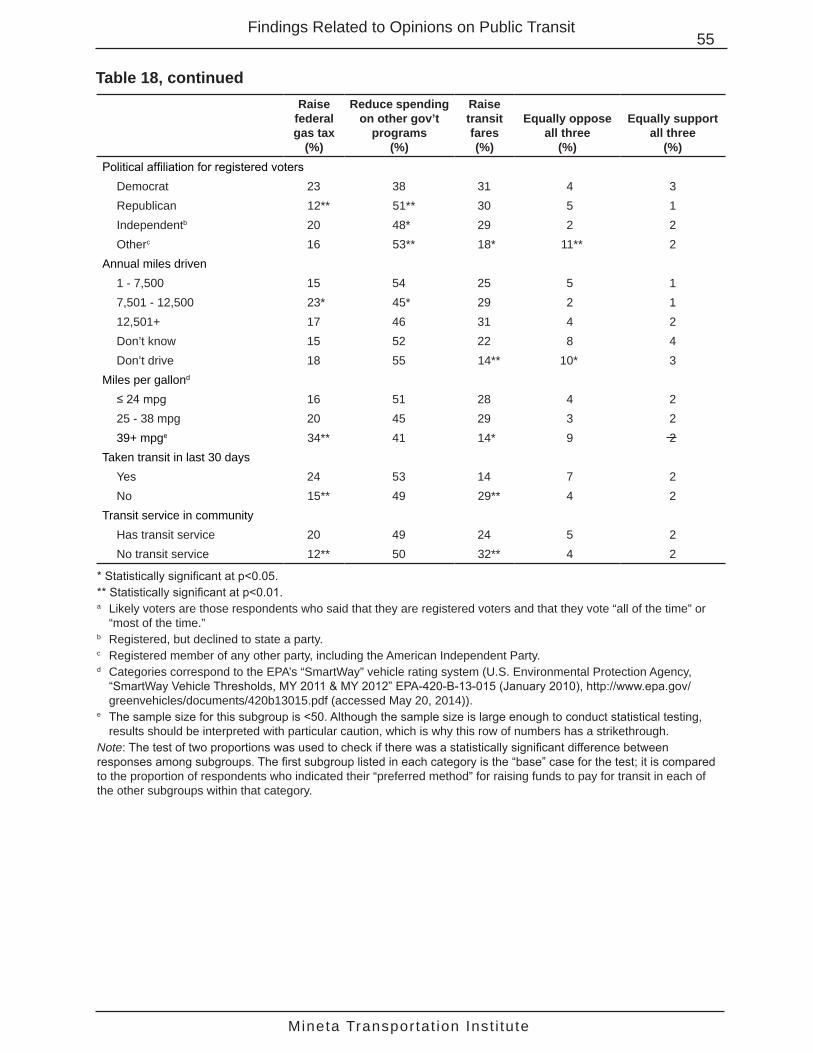
Mineta Transportat ion Inst i tute
55Findings Related to Opinions on Public Transit
Raise federal gas tax
(%)
Reduce spending on other gov’t
programs (%)
Raise transit fares (%)
Equally oppose all three
(%)
Equally support all three
(%)Political affiliation for registered voters
Democrat 23 38 31 4 3Republican 12** 51** 30 5 1Independentb 20 48* 29 2 2Otherc 16 53** 18* 11** 2
Annual miles driven1 - 7,500 15 54 25 5 17,501 - 12,500 23* 45* 29 2 112,501+ 17 46 31 4 2Don’t know 15 52 22 8 4Don’t drive 18 55 14** 10* 3
Miles per gallond
≤ 24 mpg 16 51 28 4 225 - 38 mpg 20 45 29 3 239+ mpge 34** 41 14* 9 2
Taken transit in last 30 daysYes 24 53 14 7 2No 15** 49 29** 4 2
Transit service in communityHas transit service 20 49 24 5 2No transit service 12** 50 32** 4 2
* Statistically significant at p<0.05.** Statistically significant at p<0.01.a Likely voters are those respondents who said that they are registered voters and that they vote “all of the time” or
“most of the time.”b Registered, but declined to state a party.c Registered member of any other party, including the American Independent Party.d Categories correspond to the EPA’s “SmartWay” vehicle rating system (U.S. Environmental Protection Agency,
“SmartWay Vehicle Thresholds, MY 2011 & MY 2012” EPA-420-B-13-015 (January 2010), http://www.epa.gov/greenvehicles/documents/420b13015.pdf (accessed May 20, 2014)).
e The sample size for this subgroup is <50. Although the sample size is large enough to conduct statistical testing, results should be interpreted with particular caution, which is why this row of numbers has a strikethrough.
Note: The test of two proportions was used to check if there was a statistically significant difference between responses among subgroups. The first subgroup listed in each category is the “base” case for the test; it is compared to the proportion of respondents who indicated their “preferred method” for raising funds to pay for transit in each of the other subgroups within that category.
Table 18, continued

Mineta Transportat ion Inst i tute
56 Findings Related to Opinions on Public Transit

Mineta Transportat ion Inst i tute
57
VI. CONCLUSIONS
SUMMARY OF KEY FINDINGS
Overall Support Levels for the Eleven Tax Options in 2014
The survey results show that a majority of Americans would support higher taxes for transportation—under certain conditions. For example, a gas tax increase of 10¢ per gallon to improve road maintenance was supported by 69 percent of respondents, whereas support levels dropped to 51 percent if the revenues were to be devoted to reducing global warming, or only 25 percent if the revenues were to support undefined transportation purposes. As for tax options where the revenues were to be spent for undefined transportation purposes, support levels varied considerably by the kind of tax that would be imposed, with a sales tax much more popular (49 percent) than either a gas tax increase (25 percent) or a new mileage tax (19 percent).
A central goal of the survey was to compare public support for two alternative versions of the mileage tax and eight versions of a gas tax increase. Variations on the two taxes increased support substantially over that for the base case of each (a flat-rate mileage tax of 1¢ per mile and a 10¢ gas tax increase proposed without any additional detail). Those boosts in support ranged from a low of 16 percentage points to a high of 44 points.
When interpreting the survey results, it is important to keep in mind that the questionnaire described the various tax proposals in only general terms, so the results cannot be assumed to reflect support for any actual proposal put forward. Nevertheless, the results show likely patterns of support and, more important, the public’s likely relative preferences among different transportation tax options.
Support Levels among Population Subgroups for the Tax Options in 2014
In addition to examining support for the different tax options among the overall population, we examined support by subgroups within the population. Breaking the population into subgroups by sociodemographic categories reveals only a few links with support for the taxes. Subgroups showing clearly higher levels of support compared to other subgroups in the same category are respondents who are Asian/Asian-American, black/African-American, in the youngest age group, and employed (as opposed to retired). In terms of politics, party affiliation played a clear role, with Democrats significantly more likely than Republicans or party-independent respondents to support every one of the taxes. Respondents not registered to vote were also more likely supporters.
Breaking the respondents into subgroups according to their travel behavior and perceptions of the transportation system reveals only a few clear correlations with support for the tax options. However, support for many of the taxes is clearly higher among respondents who stated that they did not drive at all within the past year or did not know their mileage, drove the least (1 to 7,500 miles per year), or had taken public transit within the previous 30 days. Also, support was clearly higher among respondents who rated transit service in their community as very good compared with residents who said they have no transit
Mineta Transportat ion Inst i tute
58 Conclusions
service in their community. Finally, support is clearly much higher among respondents who place a high priority on having government reduce traffic congestion; maintain streets, roads, and highways; expand and improve local public transit service; reduce accidents and improve safety; and increase use of modern technologies.
When comparing support by population subgroup for the gas tax and mileage tax variations to the base-case versions, the overall picture that emerges is simple and clear: the base-case taxes were less popular than the alternative tax options for virtually every subgroup. Further, that boost in support for the variants is generally quite large. We examined 504 cases (8 tax variants for each of 63 subgroups) and found that the boost in support for the variant was at least 30 percentage points for 42 percent of the cases.
Changes in Support for the Eleven Tax Options, 2010 - 2014
Our surveys indicate that American public opinion about the federal transportation tax options tested has changed very little since 2010. The 2014 survey found approximately the same support for the tax increases as in the previous four years, though support levels have generally risen a bit over the five-year period and were the highest ever in 2014 for seven of the tax options. In addition, the analysis of how the variations on the gas and mileage taxes boosted support over the base cases for each shows very little change from one year to the next. The only truly notable change over time is the continued rise in support for a variable-rate mileage tax based on vehicle pollution levels. The boost in support for this tax option has risen from 12 percentage points in 2010 to 25 points in 2014.
The fact that all five surveys generally show such similar results suggests that the views expressed are indeed generally representative of the American public and are not aberrations caused by an unusual and unrepresentative sample in any year of the survey.
Knowledge and Preferences Related to Public Transit in 2014
The questions that focused on public transit revealed that a very high percentage of people (79 percent) place a high or medium priority on improving and expanding public transit in their state, though other priorities have even higher support levels.
Most respondents were not knowledgeable about how public transit is funded. For example, 34 percent incorrectly thought that fares cover the full cost of the service. In addition, only 36 percent knew the federal government pays for transit, 42 percent knew of the local government role, and 50 percent knew of the state government role.
Several questions looked at different aspects of support for various methods the federal government could use to generate revenues for improving transit service. Sixty-four percent of respondents supported the concept of spending gas tax revenues on transit. However, when asked about each of three mechanisms the federal government could use to raise new revenues to expand and improve transit, raising the gas tax was supported by the fewest respondents (36 percent). Both of the other options presented to respondents—raising transit fares or cutting spending on other government programs—had majority support at 52 percent and 60 percent, respectively.

Mineta Transportat ion Inst i tute
59Conclusions
When respondents were asked which of the three choices for raising new revenues they preferred, a clear hierarchy emerged: 48 percent preferred reducing spending on other programs, 24 percent preferred raising the federal gas tax, and 17 percent preferred raising transit fares.
Policy Implications for Transportation Professionals and Policymakers
The results of the five surveys suggest several key implications for policymakers who wish to craft transportation revenue increases that will be more appealing—or at least less objectionable—to the public:
The basic concept of a gas tax increase is not popular, but there are ways to structure such an increase that would significantly boost its acceptability.
The survey results from all five years show that while support for a one-time gas tax increase can be very low, support could be increased by modifying the way the tax is implemented or described. Dedicating the revenue to purposes that are popular with the public, spreading out the increase over several years, and providing information about how much the increase will cost drivers annually are all options for improving support levels.
The basic concept of a mileage tax is not popular, but there are ways to structure such a tax that would increase its acceptability.
The survey results from all five years show that while a new mileage fee may be very unpopular, support could be increased by modifying the tax structure so that the rate varies according to the vehicle’s environmental performance (defined in this survey as the vehicle’s pollution level). The survey did not test any other variations on the mileage tax, but it is likely that there are others that would also have support levels above the very low 19 percent support for a flat 1¢-per-mile tax.
Linking a transportation tax to environmental benefits can increase public support.
Linking a transportation tax increase to environmental benefits can increase support, a trend found among other public opinion polls as well. In all years of our survey, support improved notably for both the gas tax increase and the mileage tax increase when they were linked to environmental benefits. For the mileage tax, the pollution-linked variant boosted support as compared to the flat-rate version a few more percentage points each year, from a 12-percentage-point boost in 2010 to a 25-point boost in 2014. The boost crossed political party lines, too, though the magnitude of increased support was greater among Democrats than people with other political affiliations.
Demographic change in the US population may increase support for transportation taxes.
The surveys found that the youngest respondents were much more supportive of the tax options than older respondents. If this variation reflects a true generational shift rather than different views at different life-stages, then these opinions would persist as those currently
Mineta Transportat ion Inst i tute
60 Conclusions
young respondents age and might also hold with the age cohorts behind them who soon become adults.
Transit is a popular concept, but it will face the same challenges as other transportation programs in finding new revenues.
The survey results from all five years show that most people want good public transit service in their state. However, the 2014 questions exploring different methods to raise new revenues found relatively low levels of support for all of them. Policymakers seeking new funding for transit will likely find that their programs are similarly popular to more traditional priorities like reducing traffic congestion, but nevertheless face the same obstacles as other transportation programs in finding new tax revenue sources. One strategy to increase support for transit relative to other transportation programs may be to stress transit’s environmental benefits. Another may be to focus on local tax measures in those communities that have existing transit networks, given the survey finding that people in communities with no transit service are less supportive of funding it.

Mineta Transportat ion Inst i tute
61
APPENDIX A: SURVEY QUESTIONNAIRE AND RESULTS
This appendix presents the results of the 2014 survey described above, comparing these to the results from similar surveys conducted by MTI in 2010, 2011, 2012, and 2013.15
Note that in the tables below, some categories do not sum to 100 percent due to rounding.
The data labeled as “weighted” have been weighted by gender, race, Hispanic ethnicity, education level, and imputed income values, and age to match the U.S. population estimates from the Census Bureau’s American Community Survey 1-year estimates for 2012.16
For the tables in this appendix, we removed missing and refused responses from the dataset before calculating the response rates.
* * *
Hello, I’m calling from the Social Science Research Center at Cal State University, Fullerton. We’re conducting an important research study on people’s thoughts about transportation in the US. May we please have a few minutes of your time for this study?
We are interested in your opinions about the transportation system. When I talk about the transportation system, I mean local streets and roads, highways, and public transit services like buses, light rail, and trains.
Ok. Here’s my first question.
Q1. In the community where you live, would you say that roads and highways are in very good condition, somewhat good condition, or bad condition?
2010 2011 2012 2013 2014Weighted
(%)Weighted
(%)Weighted
(%)Weighted
(%)Weighted
(%)Unweighted
(%)Very good condition 25 19 20 23 19 20Somewhat good condition 54 62 64 60 57 57Bad condition 20 19 16 16 23 23Don’t know (volunteered) <1 <1 1 1 1 1
Q2. Does your community offer very good public transit service, somewhat good public transit service, poor public transit service, or no public transit service at all?
2010 2011 2012 2013 2014Weighted
(%)Weighted
(%)Weighted
(%)Weighted
(%)Weighted
(%)Unweighted
(%)Very good 17 16 19 19 20 18Somewhat good 38 38 41 41 38 36Poor 15 19 16 13 15 16No service 23 21 17 21 20 22Don’t know (volunteered) 7 7 7 5 8 8

Mineta Transportat ion Inst i tute
62 Appendix A: Survey Questionnaire and Results
Now, please think about what the government could do to improve the transportation system for EVERYONE in the state where you live. I’m going to read you several options. For each one, tell me whether you think government should make that a high priority, medium priority, or low priority.
[Q3-Q7 RANDOMIZED]
Q3. How about reducing traffic congestion? Should government make that a high, medium, or low priority?
2010 2011 2012 2013 2014Weighted
(%)Weighted
(%)Weighted
(%)Weighted
(%)Weighted
(%)Unweighted
(%)High priority 47 49 47 49 51 51Medium priority 35 36 33 35 30 30Low priority 15 14 17 15 17 17Don’t know (volunteered) 4 2 2 1 3 3
Q4. How about maintaining streets, roads, and highways in good condition, including filling potholes? Should government make that a high, medium, or low priority?
2010 2011 2012 2013 2014Weighted
(%)Weighted
(%)Weighted
(%)Weighted
(%)Weighted
(%)Unweighted
(%)High priority 68 73 68 75 78 78Medium priority 26 23 27 22 17 17Low priority 5 4 5 2 4 5Don’t know (volunteered) 1 <1 1 <1 1 <1
Q5. How about expanding and improving local public transit service, like buses or light rail? Should government make that a high, medium or low priority?
2010 2011 2012 2013 2014Weighted
(%)Weighted
(%)Weighted
(%)Weighted
(%)Weighted
(%)Unweighted
(%)High priority 47 47 45 43 44 44Medium priority 36 33 37 38 35 34Low priority 14 17 16 18 18 19Don’t know (volunteered) 4 3 2 2 3 3
Q6. How about reducing accidents and improving safety? Should government make that a high, medium, or low priority?
2010 2011 2012 2013 2014Weighted
(%)Weighted
(%)Weighted
(%)Weighted
(%)Weighted
(%)Unweighted
(%)High priority n.a. 65 68 71 69 68Medium priority n.a. 26 22 20 19 21Low priority n.a. 7 9 8 10 9Don’t know (volunteered) n.a. 1 2 1 1 2
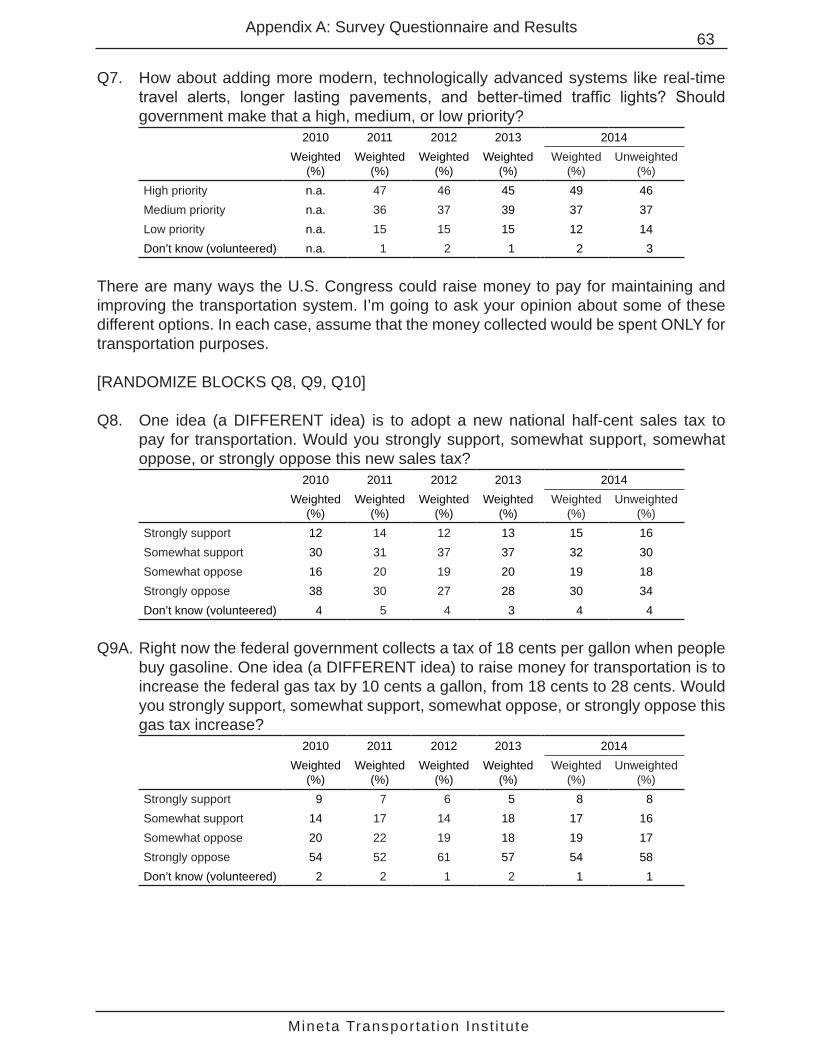
Mineta Transportat ion Inst i tute
63Appendix A: Survey Questionnaire and Results
Q7. How about adding more modern, technologically advanced systems like real-time travel alerts, longer lasting pavements, and better-timed traffic lights? Should government make that a high, medium, or low priority?
2010 2011 2012 2013 2014Weighted
(%)Weighted
(%)Weighted
(%)Weighted
(%)Weighted
(%)Unweighted
(%)High priority n.a. 47 46 45 49 46Medium priority n.a. 36 37 39 37 37Low priority n.a. 15 15 15 12 14Don’t know (volunteered) n.a. 1 2 1 2 3
There are many ways the U.S. Congress could raise money to pay for maintaining and improving the transportation system. I’m going to ask your opinion about some of these different options. In each case, assume that the money collected would be spent ONLY for transportation purposes.
[RANDOMIZE BLOCKS Q8, Q9, Q10]
Q8. One idea (a DIFFERENT idea) is to adopt a new national half-cent sales tax to pay for transportation. Would you strongly support, somewhat support, somewhat oppose, or strongly oppose this new sales tax?
2010 2011 2012 2013 2014Weighted
(%)Weighted
(%)Weighted
(%)Weighted
(%)Weighted
(%)Unweighted
(%)Strongly support 12 14 12 13 15 16Somewhat support 30 31 37 37 32 30Somewhat oppose 16 20 19 20 19 18Strongly oppose 38 30 27 28 30 34Don’t know (volunteered) 4 5 4 3 4 4
Q9A. Right now the federal government collects a tax of 18 cents per gallon when people buy gasoline. One idea (a DIFFERENT idea) to raise money for transportation is to increase the federal gas tax by 10 cents a gallon, from 18 cents to 28 cents. Would you strongly support, somewhat support, somewhat oppose, or strongly oppose this gas tax increase?
2010 2011 2012 2013 2014Weighted
(%)Weighted
(%)Weighted
(%)Weighted
(%)Weighted
(%)Unweighted
(%)Strongly support 9 7 6 5 8 8Somewhat support 14 17 14 18 17 16Somewhat oppose 20 22 19 18 19 17Strongly oppose 54 52 61 57 54 58Don’t know (volunteered) 2 2 1 2 1 1

Mineta Transportat ion Inst i tute
64 Appendix A: Survey Questionnaire and Results
Q9B. A VARIATION on the idea of raising the gas tax by 10 cents AT ONE TIME would be to spread the increase over 5 years. The tax would go up by 2 cents a year for each of the five years. Would you strongly support, somewhat support, somewhat oppose, or strongly oppose THIS gas tax increase?
2010 2011 2012 2013 2014Weighted
(%)Weighted
(%)Weighted
(%)Weighted
(%)Weighted
(%)Unweighted
(%)Strongly support 14 13 10 14 14 14Somewhat support 25 25 29 28 26 25Somewhat oppose 21 20 18 20 19 18Strongly oppose 36 39 43 38 38 41Don’t know (volunteered) 3 2 1 1 3 2
Q10A. One idea (a DIFFERENT idea) is to adopt a new tax based on the number of miles a person drives. Each driver would pay a tax of one cent for every mile driven. For example, someone driving one hundred miles would pay a tax of one dollar. Vehicles would have an electronic meter to keep track of the miles driven, and the tax would be paid each time drivers buy gas. Would you strongly support, somewhat support, somewhat oppose, or strongly oppose this new mileage tax?
2010 2011 2012 2013 2014Weighted
(%)Weighted
(%)Weighted
(%)Weighted
(%)Weighted
(%)Unweighted
(%)Strongly support 9 6 6 5 6 6Somewhat support 12 16 15 13 12 12Somewhat oppose 15 17 17 16 20 18Strongly oppose 61 58 60 64 59 62Don’t know (volunteered) 3 2 3 2 3 2
Q10B. A VARIATION on the mileage tax just described is to have the tax rate VARY depending upon how much the vehicle pollutes. On average, vehicles would be charged one cent per mile, but vehicles that pollute less would be charged less, and vehicles that pollute more would be charged more. Would you strongly support, somewhat support, somewhat oppose, or strongly oppose THIS new mileage tax?
2010 2011 2012 2013 2014Weighted
(%)Weighted
(%)Weighted
(%)Weighted
(%)Weighted
(%)Unweighted
(%)Strongly support 14 14 17 16 17 17Somewhat support 19 22 24 23 26 23Somewhat oppose 18 18 17 18 19 16Strongly oppose 46 42 40 42 37 41Don’t know (volunteered) 3 4 2 2 2 3
Now, imagine that the US Congress decided that the best option to raise money for transportation is to increase the federal gas tax by ten cents per gallon. I’m going to read you several different options for how the money is spent. For each, please tell me if you would strongly support, somewhat support, somewhat oppose, or strongly oppose the gas tax increase.

Mineta Transportat ion Inst i tute
65Appendix A: Survey Questionnaire and Results
[RANDOMIZE BLOCKS Q11 TO Q15]
Q11. Would you support the gas tax increase if the new money were spent ONLY on projects to reduce LOCAL AIR POLLUTION caused by the transportation system?
2010 2011 2012 2013 2014Weighted
(%)Weighted
(%)Weighted
(%)Weighted
(%)Weighted
(%)Unweighted
(%)Strongly support 9 14 14 18 19 17Somewhat support 21 33 27 35 33 29Somewhat oppose 23 16 16 19 19 20Strongly oppose 42 33 41 28 26 32Don’t know (volunteered) 6 3 2 2 2 3
Q12. Would you support the gas tax increase if the money were spent ONLY on projects to reduce the transportation system’s contribution to GLOBAL WARMING?
2010 2011 2012 2013 2014Weighted
(%)Weighted
(%)Weighted
(%)Weighted
(%)Weighted
(%)Unweighted
(%)Strongly support 12 14 14 19 20 18Somewhat support 30 32 26 30 29 26Somewhat oppose 19 15 14 17 17 18Strongly oppose 36 34 41 32 30 35Don’t know (volunteered) 3 6 4 2 3 4
Q13. Would you support the gas tax increase if the money were spent ONLY on projects to MAINTAIN streets, roads, and highways?
2010 2011 2012 2013 2014Weighted
(%)Weighted
(%)Weighted
(%)Weighted
(%)Weighted
(%)Unweighted
(%)Strongly support n.a. 26 23 33 33 28Somewhat support n.a. 36 35 34 36 35Somewhat oppose n.a. 12 10 12 13 14Strongly oppose n.a. 22 31 20 17 22Don’t know (volunteered) n.a. 4 2 1 1 1
Q14. Would you support the gas tax increase if the money were spent ONLY on projects to reduce accidents and improve safety?
2010 2011 2012 2013 2014Weighted
(%)Weighted
(%)Weighted
(%)Weighted
(%)Weighted
(%)Unweighted
(%)Strongly support n.a. 23 25 27 27 22Somewhat support n.a. 34 29 35 35 34Somewhat oppose n.a. 15 12 17 16 17Strongly oppose n.a. 24 31 21 21 26Don’t know (volunteered) n.a. 5 3 1 1 2
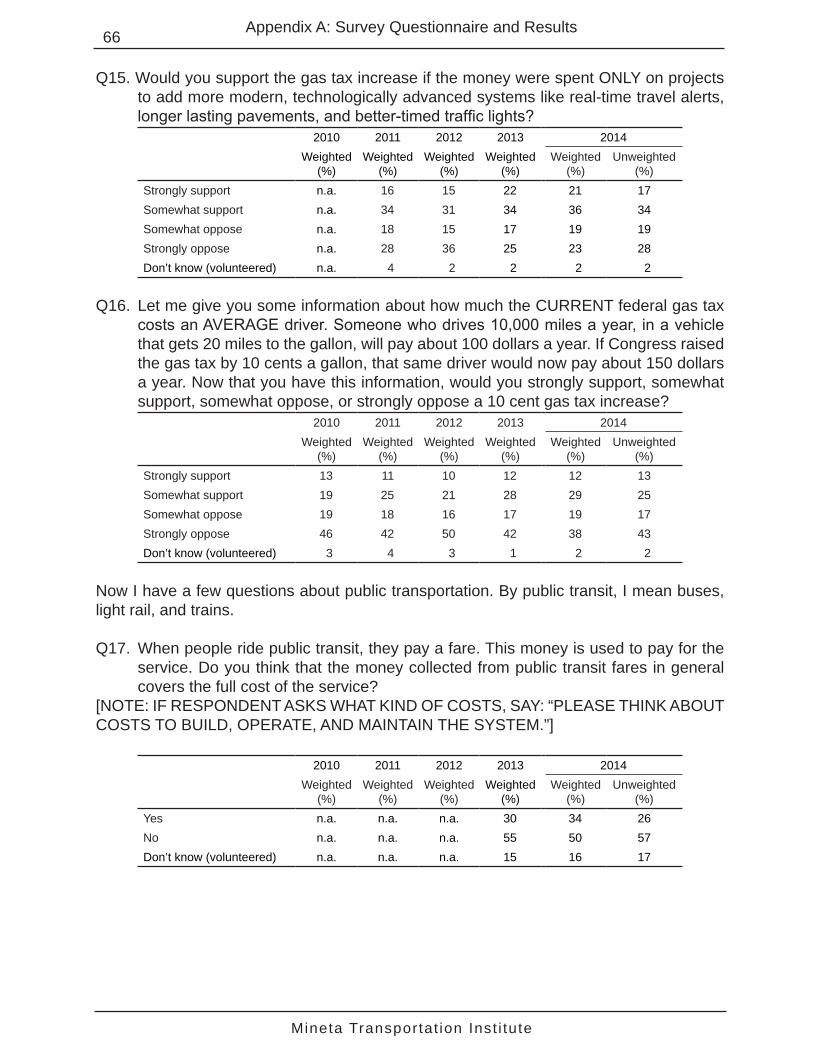
Mineta Transportat ion Inst i tute
66 Appendix A: Survey Questionnaire and Results
Q15. Would you support the gas tax increase if the money were spent ONLY on projects to add more modern, technologically advanced systems like real-time travel alerts, longer lasting pavements, and better-timed traffic lights?
2010 2011 2012 2013 2014Weighted
(%)Weighted
(%)Weighted
(%)Weighted
(%)Weighted
(%)Unweighted
(%)Strongly support n.a. 16 15 22 21 17Somewhat support n.a. 34 31 34 36 34Somewhat oppose n.a. 18 15 17 19 19Strongly oppose n.a. 28 36 25 23 28Don’t know (volunteered) n.a. 4 2 2 2 2
Q16. Let me give you some information about how much the CURRENT federal gas tax costs an AVERAGE driver. Someone who drives 10,000 miles a year, in a vehicle that gets 20 miles to the gallon, will pay about 100 dollars a year. If Congress raised the gas tax by 10 cents a gallon, that same driver would now pay about 150 dollars a year. Now that you have this information, would you strongly support, somewhat support, somewhat oppose, or strongly oppose a 10 cent gas tax increase?
2010 2011 2012 2013 2014Weighted
(%)Weighted
(%)Weighted
(%)Weighted
(%)Weighted
(%)Unweighted
(%)Strongly support 13 11 10 12 12 13Somewhat support 19 25 21 28 29 25Somewhat oppose 19 18 16 17 19 17Strongly oppose 46 42 50 42 38 43Don’t know (volunteered) 3 4 3 1 2 2
Now I have a few questions about public transportation. By public transit, I mean buses, light rail, and trains.
Q17. When people ride public transit, they pay a fare. This money is used to pay for the service. Do you think that the money collected from public transit fares in general covers the full cost of the service?
[NOTE: IF RESPONDENT ASKS WHAT KIND OF COSTS, SAY: “PLEASE THINK ABOUT COSTS TO BUILD, OPERATE, AND MAINTAIN THE SYSTEM.”]
2010 2011 2012 2013 2014Weighted
(%)Weighted
(%)Weighted
(%)Weighted
(%)Weighted
(%)Unweighted
(%)Yes n.a. n.a. n.a. 30 34 26No n.a. n.a. n.a. 55 50 57Don’t know (volunteered) n.a. n.a. n.a. 15 16 17

Mineta Transportat ion Inst i tute
67Appendix A: Survey Questionnaire and Results
Note: Questions Q17A-D were not asked of respondents who answered “yes” to Q17.
Q17A. In general, what percent of the full cost of public transit services do you think the fares cover?
2010 2011 2012 2013 2014*Weighted
(%)Weighted
(%)Weighted
(%)Weighted
(%)Weighted
(%)Unweighted
(%)1 to 33% n.a. n.a. n.a. 21 28 2534 to 66% n.a. n.a. n.a. 35 38 4267 to 100% n.a. n.a. n.a. 16 17 15Don’t know (volunteered)
n.a. n.a. n.a. 29 18 18
*Respondents could select any percentage from 0-100. The mean percent was 46%, with a standard deviation of 21% (weighted) and 20% (unweighted).
I’m going to read you a list of potential funding sources. For each, please tell me if you think it helps to pay for public transit services.
[NOTE: IF THE RESPONDENT ASKS ABOUT THE DEFINITION OF LOCAL GOVERNMENT, SAY “EITHER CITIES, COUNTIES, PARISHES, OR BOROUGHS.”]
Q17B. Who helps pay for public transit around the country? The federal government.2010 2011 2012 2013 2014
Weighted (%)
Weighted (%)
Weighted (%)
Weighted (%)
Weighted (%)
Unweighted (%)
Does pay n.a. n.a. 42 65 55 60Does not pay n.a. n.a. 22 26 29 26Don’t know (volunteered)
n.a. n.a. 36 10 17 15
Q17C. Who helps pay for public transit around the country? State governments.2010 2011 2012 2013 2014
Weighted (%)
Weighted (%)
Weighted (%)
Weighted (%)
Weighted (%)
Unweighted (%)
Does pay n.a. n.a. 56 76 76 75Does not pay n.a. n.a. 12 14 10 12Don’t know (volunteered)
n.a. n.a. 32 10 14 13
Q17D. Who helps pay for public transit around the country? Local governments.2010 2011 2012 2013 2014
Weighted (%)
Weighted (%)
Weighted (%)
Weighted (%)
Weighted (%)
Unweighted (%)
Does pay n.a. n.a. 51 68 64 65Does not pay n.a. n.a. 16 20 22 22Don’t know (volunteered)
n.a. n.a. 33 12 14 12

Mineta Transportat ion Inst i tute
68 Appendix A: Survey Questionnaire and Results
Q18. Now I have a question about whether or not GAS tax money should be spent to pay for public transit. Some people say that money from gas taxes should only be spent on roads and highways, since drivers pay the tax. Other people say gas tax money should be used to pay for public transit IN ADDITION to roads and highways, because transit helps reduce traffic congestion and wear-and-tear on the roads. Would you support or oppose spending SOME gas tax money on public transit?
2010 2011 2012 2013 2014Weighted
(%)Weighted
(%)Weighted
(%)Weighted
(%)Weighted
(%)Unweighted
(%)Support n.a. n.a. n.a. 64 61 60Oppose n.a. n.a. n.a. 33 35 36Don’t know (volunteered) n.a. n.a. n.a. 2 4 4
*Half the sample received the question with this wording, and the other half received the question with the options presented in reverse order, i.e., “Some people say gas tax money should be used to pay for public transit IN ADDITION to roads and highways, because transit helps reduce traffic congestion and wear-and-tear on the roads. Other people say that money from gas taxes should only be spent on roads and highways, since drivers pay the tax. Would you support or oppose spending SOME gas tax money on public transit.”
Q19. Suppose Congress has voted to spend more money to expand and improve public transit around the country but has NOT yet decided how to pay for the improvements. Would you strongly support, somewhat support, somewhat oppose, or strongly oppose each of the following ways to raise money for public transit?
[RANDOMIZE LIST A – C]
Q19A. Raise the federal gas tax2010 2011 2012 2013 2014
Weighted (%)
Weighted (%)
Weighted (%)
Weighted (%)
Weighted (%)
Unweighted (%)
Strongly support n.a. n.a. 9 9 10 11Somewhat support n.a. n.a. 19 24 26 23Somewhat oppose n.a. n.a. 16 19 16 16Strongly oppose n.a. n.a. 53 48 45 48Don’t know (volunteered) n.a. n.a. 3 1 2 2
Q19B. Reduce spending on other federal programs2010 2011 2012 2013 2014
Weighted (%)
Weighted (%)
Weighted (%)
Weighted (%)
Weighted (%)
Unweighted (%)
Strongly support n.a. n.a. 25 27 28 30Somewhat support n.a. n.a. 31 30 32 31Somewhat oppose n.a. n.a. 18 18 17 15Strongly oppose n.a. n.a. 18 18 15 16Don’t know (volunteered) n.a. n.a. 9 6 8 8
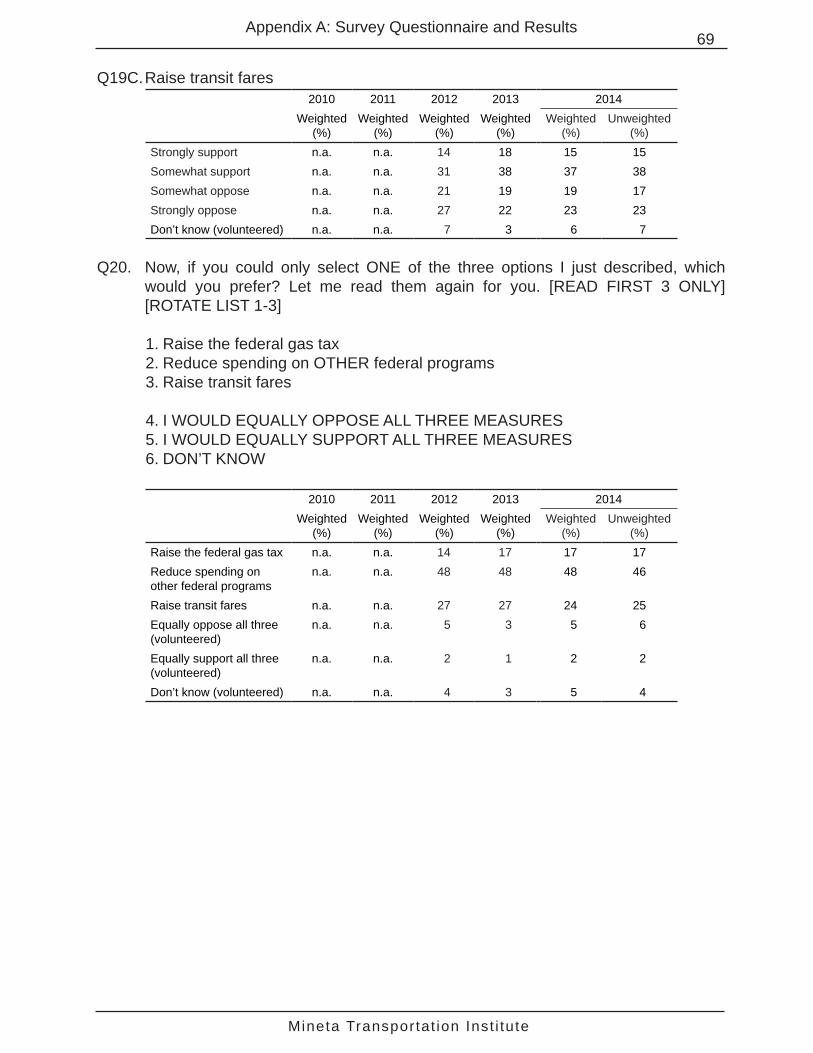
Mineta Transportat ion Inst i tute
69Appendix A: Survey Questionnaire and Results
Q19C. Raise transit fares2010 2011 2012 2013 2014
Weighted (%)
Weighted (%)
Weighted (%)
Weighted (%)
Weighted (%)
Unweighted (%)
Strongly support n.a. n.a. 14 18 15 15Somewhat support n.a. n.a. 31 38 37 38Somewhat oppose n.a. n.a. 21 19 19 17Strongly oppose n.a. n.a. 27 22 23 23Don’t know (volunteered) n.a. n.a. 7 3 6 7
Q20. Now, if you could only select ONE of the three options I just described, which would you prefer? Let me read them again for you. [READ FIRST 3 ONLY] [ROTATE LIST 1-3]
1. Raise the federal gas tax2. Reduce spending on OTHER federal programs3. Raise transit fares
4. I WOULD EQUALLY OPPOSE ALL THREE MEASURES5. I WOULD EQUALLY SUPPORT ALL THREE MEASURES6. DON’T KNOW
2010 2011 2012 2013 2014Weighted
(%)Weighted
(%)Weighted
(%)Weighted
(%)Weighted
(%)Unweighted
(%)Raise the federal gas tax n.a. n.a. 14 17 17 17Reduce spending on other federal programs
n.a. n.a. 48 48 48 46
Raise transit fares n.a. n.a. 27 27 24 25Equally oppose all three (volunteered)
n.a. n.a. 5 3 5 6
Equally support all three (volunteered)
n.a. n.a. 2 1 2 2
Don’t know (volunteered) n.a. n.a. 4 3 5 4
Mineta Transportat ion Inst i tute
70 Appendix A: Survey Questionnaire and Results

Mineta Transportat ion Inst i tute
71
APPENDIX B: OPINION POLLS REVIEWED
The tables in this appendix summarize key findings from a sampling of recent public opinion polls asking respondents about their support for taxes to raise transportation revenues. Table 19 and Table 20 present responses to gas tax proposals; Table 21 presents responses to mileage tax proposals; and Table 22 presents responses to sales tax proposals. Complete source citations for all items in the tables are given in the bibliography.

Mineta Transportat ion Inst i tute
72 Appendix B: Opinion Polls Reviewed
Tabl
e 19
. Pu
blic
Opi
nion
Pol
ling
on G
as T
ax In
crea
ses
Spon
sor (
and
auth
or,
if di
ffere
nt)
Surv
ey d
ate
Sam
plin
g fr
ame
Find
ings
Bos
ton
Glo
be (S
mith
)20
08M
assa
chus
etts
resi
dent
s77
% “w
ould
be
will
ing
to in
crea
se” t
he g
as ta
x 5¢
or m
ore,
“kno
win
g th
at m
aint
aini
ng ro
ads
and
brid
ges
is e
xpen
sive
.” 40
% w
ould
“fav
or” i
ncre
asin
g th
e ga
s ta
x to
redu
ce to
lls o
r sta
te d
ebt.
Nat
iona
l Hig
hway
Use
rs
Ass
ocia
tion
(Fab
rizio
M
cLau
ghlin
& A
ssoc
iate
s)
2008
U.S
. lik
ely
vote
rs71
% o
f res
pond
ents
“sup
porte
d” s
ome
form
of u
nspe
cifie
d in
crea
se in
the
gas
tax
“to p
ay fo
r ne
eded
tran
spor
tatio
n pr
ojec
ts” w
hen
the
ques
tion
follo
wed
a s
erie
s of
info
rmat
ive
ques
tions
on
the
valu
es o
f inv
estin
g in
road
s an
d br
idge
s. In
itial
ly, 5
7% o
f res
pond
ents
had
sup
porte
d th
e in
crea
se. I
n bo
th c
ases
, res
pond
ents
wer
e in
form
ed a
bout
the
curr
ent l
evel
of t
he ta
x an
d ho
w
long
it h
as b
een
set a
t its
cur
rent
leve
l.C
BS
/ New
Yor
k Ti
mes
2007
U.S
. res
iden
ts64
% o
f res
pond
ents
“wou
ld b
e w
illin
g to
pay
” an
unsp
ecifi
ed in
crea
se in
the
gas
tax
if pr
ocee
ds
wer
e us
ed to
rese
arch
rene
wab
le e
nerg
y so
urce
s, w
hile
38%
wou
ld “f
avor
” an
incr
ease
to
prom
ote
cons
erva
tion
and
redu
ce g
loba
l war
min
g.
Mas
s In
c. P
ollin
g G
roup
2013
Mas
sach
uset
ts
regi
ster
ed v
oter
s61
% o
f res
pond
ents
“sup
port”
incr
easi
ng th
e st
ate
gas
tax
“if th
e m
oney
wer
e sp
ent O
NLY
on
proj
ects
to M
AIN
TAIN
stre
ets,
road
s, a
nd h
ighw
ays?
” Low
er p
erce
ntag
es s
uppo
rted
a ga
s ta
x
ncre
ase
for o
ther
tran
spor
tatio
n pu
rpos
es.
New
Yor
k Ti
mes
/CB
S
New
s20
06U
.S. r
esid
ents
59%
of r
espo
nden
ts “f
avor
ed” a
n un
spec
ified
incr
ease
in th
e ga
s ta
x if
it “w
ould
cut
dow
n on
en
ergy
con
sum
ptio
n an
d re
duce
glo
bal w
arm
ing.
” 55%
als
o fa
vore
d th
e in
crea
se if
it “w
ould
re
duce
the
Uni
ted
Sta
tes’
dep
ende
nce
on fo
reig
n oi
l.” T
his
drop
ped
to 2
8% if
the
tax
incr
ease
re
duce
d ot
her t
axes
, 24%
if it
hel
ped
pay
for t
he w
ar o
n te
rror
, and
12%
if n
o re
ason
was
giv
en.
17%
of r
espo
nden
ts c
ontin
ued
to “f
avor
” the
tax
incr
ease
whe
n it
was
spe
cifie
d as
a $
2 pe
r gal
lon
incr
ease
.R
utge
rs E
agle
ton
Inst
itute
of
Pol
itics
(Eag
leto
n C
ente
r for
Pub
lic In
tere
st
Pol
ling)
2014
(Apr
il)
New
Jer
sey
adul
t re
side
nts
58%
of N
ew J
erse
yans
wou
ld s
uppo
rt in
crea
sing
the
gas
tax
whe
n to
ld th
at th
e (r
ecen
tly
prop
osed
) inc
reas
e “w
ould
be
five
cent
s pe
r yea
r ove
r thr
ee y
ears
, rai
sing
an
addi
tiona
l $25
0 m
illio
n pe
r yea
r for
road
and
brid
ge re
pairs
” and
that
“giv
en c
urre
nt p
rices
, thi
s w
ould
incr
ease
ga
s co
sts
by a
bout
one
and
one
hal
f per
cent
per
yea
r.” T
his
repr
esen
ts a
n in
crea
se fr
om a
48%
ap
prov
al ra
te w
hen
the
ques
tion
did
not e
xpla
in th
e pe
rcen
tage
incr
ease
in th
e pr
ice
of g
as a
nd a
31
% a
ppro
val r
ate
whe
n th
e qu
estio
n m
erel
y st
ated
that
“any
incr
ease
wou
ld b
e de
dica
ted
to p
ay
for r
oad
mai
nten
ance
and
impr
ovem
ents
.”M
etro
polit
an
Tran
spor
tatio
n C
omm
issi
on (B
W
Res
earc
h P
artn
ersh
ip)
2007
San
Fra
ncis
co B
ay A
rea
resi
dent
s56
% o
f res
pond
ents
wou
ld “s
uppo
rt” a
n un
spec
ified
incr
ease
in th
e co
st o
f gas
olin
e to
eith
er
redu
ce p
ublic
tran
sit f
ares
or i
ncre
ase
trans
it se
rvic
e. 5
7% s
uppo
rted
the
incr
ease
for p
rovi
ding
in
cent
ives
for c
arpo
olin
g, b
ut o
nly
47%
sup
porte
d th
e in
crea
se to
pay
for b
ike
lane
s an
d si
dew
alks
. 46%
, 28%
, and
17%
wer
e “w
illin
g to
pay
” 25¢
, 50¢
, or $
1 m
ore
per g
allo
n of
gas
, re
spec
tivel
y, w
hen
thes
e am
ount
s w
ere
calle
d ou
t. A
ll qu
estio
ns fr
amed
incr
ease
d ga
s co
sts
as a
w
ay to
redu
ce g
reen
hous
e-ga
s em
issi
ons
or g
loba
l war
min
g.
HN
TB (K
elto
n R
esea
rch)
2011
(Mar
ch)
U.S
. res
iden
ts57
% o
f res
pond
ents
agr
ee “t
hat t
he g
as ta
x sh
ould
be
incr
ease
d an
d de
crea
sed
with
infla
tion.
”

Mineta Transportat ion Inst i tute
73Appendix B: Opinion Polls Reviewed
Spon
sor (
and
auth
or,
if di
ffere
nt)
Surv
ey d
ate
Sam
plin
g fr
ame
Find
ings
Min
neso
ta P
ublic
Rad
io
(Pug
mire
)20
07M
inne
sota
regi
ster
ed
vote
rs51
% o
f res
pond
ents
sup
porte
d a
5¢ p
er g
allo
n in
crea
se in
the
stat
e ga
s ta
x “to
pay
for
impr
ovem
ents
to ro
ads
and
brid
ges.
” Thi
s w
as a
follo
w-u
p qu
estio
n re
gard
ing
a 10
¢ pe
r gal
lon
incr
ease
for w
hich
sup
port
was
onl
y 37
%. T
he p
oll w
as c
ondu
cted
two
mon
ths
afte
r a b
ridge
co
llaps
ed in
Min
neso
ta.
Was
hing
ton
Pos
t (A
bt-S
RB
I, In
c)20
12M
aryl
and
resi
dent
s48
% o
f res
pond
ents
“fav
ored
” a 5
¢ pe
r gal
lon
incr
ease
in th
e st
ate
gas
tax
“if th
e m
oney
is u
sed
for t
rans
porta
tion
proj
ects
.” Fo
llow
-up
ques
tions
for 1
0¢ a
nd 1
5¢ in
crea
ses
wer
e “fa
vore
d” b
y 26
% a
nd 2
5% o
f res
pond
ents
resp
ectiv
ely.
Was
hing
ton
Pos
t (M
orin
an
d G
insb
erg)
2005
Was
hing
ton,
DC
, are
a re
side
nts
48%
of r
espo
nden
ts “s
uppo
rted”
a g
as-ta
x in
crea
se if
the
mon
ey w
as u
sed
for “
trans
porta
tion
proj
ects
suc
h as
bui
ldin
g ro
ads,
traf
fic m
anag
emen
t, or
pub
lic tr
ansp
orta
tion.
” Thi
s qu
estio
n w
as
aske
d af
ter a
ser
ies
of q
uest
ions
on
cong
estio
n-re
duct
ion
stra
tegi
es.
NC
PP
R (W
ilson
Res
earc
h S
trate
gies
)20
08U
.S. l
ikel
y vo
ters
47%
of r
espo
nden
ts “w
ould
be
will
ing
to p
ay” s
ome
leve
l of i
ncre
ased
gas
tax
as a
way
to
prom
ote
cons
erva
tion
and
redu
ce g
reen
hous
e-ga
s em
issi
ons.
62%
repo
rted
that
they
wou
ld b
e le
ss li
kely
to a
ccep
t suc
h an
incr
ease
if A
mer
ican
s’ tr
ansp
orta
tion
emis
sion
s w
ere
show
n to
be
“a
smal
l fra
ctio
n of
a p
erce
ntag
e po
int”
of a
ll gr
eenh
ouse
-gas
em
issi
ons.
Was
hing
ton
Sta
te
Tran
spor
tatio
n C
omm
issi
on
(EM
C R
esea
rch)
2012
Was
hing
ton
Sta
te
resi
dent
s46
% o
f res
pond
ents
thou
ght t
hat t
he s
tate
gas
tax
was
“defi
nite
ly” o
r “pr
obab
ly” a
“goo
d w
ay to
fu
nd in
crea
sed
trans
porta
tion
inve
stm
ent.”
Add
ition
ally,
41%
of r
espo
nden
ts “s
uppo
rted”
allo
win
g th
e ga
s ta
x to
“ris
e w
ith th
e ra
te o
f infl
atio
n so
it p
rovi
des
a m
ore
stab
le fu
ndin
g so
urce
.”
Pub
lic A
gend
a (B
ittle
et a
l.)20
09U
.S. r
esid
ents
45%
of r
espo
nden
ts “f
avor
ed” a
40¢
per
gal
lon
gas
tax
“to s
uppo
rt de
velo
pmen
t of c
lean
re
new
able
ene
rgy
sour
ces”
whe
n pr
esen
ted
in a
ser
ies
of e
nerg
y-re
late
d pr
opos
als.
Lev
els
of
favo
r for
oth
er g
as-ta
x pr
opos
als
incl
uded
40%
for a
40¢
tax
“to h
elp
achi
eve
ener
gy
inde
pend
ence
,” 38
% fo
r a 4
0¢ ta
x “to
impr
ove
road
s, b
ridge
s, tu
nnel
s, a
nd o
ther
pub
lic w
orks
,” an
d 25
% fo
r a fe
dera
l $4
per g
allo
n fix
ed p
rice
on g
asol
ine
to “e
ncou
rage
the
deve
lopm
ent o
f al
tern
ativ
e fu
els.
”M
etro
polit
an
Tran
spor
tatio
n C
omm
issi
on
(EM
C R
esea
rch)
2012
San
Fra
ncis
co B
ay A
rea
likel
y vo
ters
43%
of r
espo
nden
ts “a
ppro
ved”
a 1
0¢ p
er g
allo
n ga
s ta
x in
crea
se a
cros
s th
e re
gion
“for
no
long
er
than
20
year
s w
ith e
xpen
ditu
res
subj
ect t
o st
rict c
itize
n ov
ersi
ght a
nd re
quiri
ng th
at a
t lea
st 9
5 pe
rcen
t of r
even
ue g
ener
ated
by
each
cou
nty
be s
pent
on
bene
fits
for t
hat c
ount
y” a
fter
men
tioni
ng s
ome
pote
ntia
l im
prov
emen
ts. 3
6% o
f res
pond
ents
“agr
eed”
to s
uppo
rt th
e in
crea
se
with
out a
dditi
onal
info
rmat
ion,
alth
ough
follo
w-u
p qu
estio
ns o
n 5¢
and
2¢
incr
ease
s ga
rner
ed
51%
and
66%
agr
eem
ent.
44%
of r
espo
nden
ts “a
gree
d” to
sup
port
the
10¢
incr
ease
“onl
y fo
r ro
ad im
prov
emen
ts,”
whi
le 4
1% “a
gree
d” to
sup
port
the
incr
ease
“onl
y fo
r tra
nsit
impr
ovem
ents
.”U
nive
rsity
of T
exas
, Aus
tin
(Mus
ti et
al.)
2010
Aus
tin, T
exas
, are
a re
side
nts
43%
of r
espo
nden
ts “s
uppo
rted”
a $
1 pe
r gal
lon
incr
ease
in th
e ga
s ta
x “to
com
bat c
limat
e ch
ange
.” 62
% o
f res
pond
ents
“sup
porte
d” e
nerg
y ta
xes
with
this
sam
e pu
rpos
e --
a $
50 ta
x pe
r to
n of
gre
enho
use
gas
emis
sion
s “p
rodu
ced
by e
lect
ricity
gen
erat
ion
and
mot
or fu
el u
se” w
as
give
n as
an
exam
ple
of s
uch
a ta
x.
Tabl
e 19
, con
tinue
d

Mineta Transportat ion Inst i tute
74 Appendix B: Opinion Polls Reviewed
Spon
sor (
and
auth
or,
if di
ffere
nt)
Surv
ey d
ate
Sam
plin
g fr
ame
Find
ings
CB
S N
ews/
New
Yor
k Ti
mes
2009
U.S
. res
iden
ts43
% o
f res
pond
ents
“fav
ored
” an
unsp
ecifi
ed in
crea
se to
the
fede
ral g
as ta
x “if
it w
ould
redu
ce
U.S
. dep
ende
nce
on fo
reig
n oi
l.”M
inet
a Tr
ansp
orta
tion
Inst
itute
(Wei
nste
in, e
t al.)
2006
Cal
iforn
ia li
kely
vot
ers
43%
of r
espo
nden
ts “w
ould
vot
e fo
r” a
1¢
per g
allo
n in
crea
se in
the
stat
e ga
s ta
x du
ring
each
of
the
next
10
year
s. 2
8% o
f res
pond
ents
“wou
ld v
ote
for”
inde
the
stat
e ga
s ta
x to
infla
tion
whe
n th
e qu
estio
n pr
ompt
ed th
at s
uch
an in
crea
se w
ould
hav
e be
en 0
.5¢
per g
allo
n in
the
prev
ious
yea
r.A
BC
New
s/Ti
me
Mag
azin
e/W
ashi
ngto
n P
ost (
Lang
er)
2005
U.S
. res
iden
ts42
% o
f res
pond
ents
wer
e “w
illin
g to
pay
” som
e hi
gher
leve
l of g
as ta
x “to
fund
tran
spor
tatio
n pr
ojec
ts.”
32%
of r
espo
nden
ts “s
uppo
rted”
hig
her g
as ta
xes
for b
uild
ing
road
s, p
ublic
tra
nspo
rtatio
n, o
r man
agin
g tra
ffic.
Nat
iona
l Ass
ocia
tion
of
Rea
ltors
(Har
t Res
earc
h A
ssoc
iate
s)
2009
U.S
. reg
iste
red
vote
rs40
% o
f res
pond
ents
favo
red
a 5¢
per
gal
lon
gas-
tax
incr
ease
“to
pay
for t
rans
porta
tion
proj
ects
an
d cr
eate
jobs
.” S
uppo
rt fe
ll to
23%
for a
10¢
incr
ease
.
Ala
med
a C
ount
y Tr
ansp
orta
tion
Com
mis
sion
(E
MC
Res
earc
h)
2011
(M
arch
)A
lam
eda
Cou
nty,
C
alifo
rnia
, reg
iste
red
vote
rs
39%
of r
espo
nden
ts w
ere
“like
ly to
vot
e ye
s” fo
r a 1
0¢ p
er g
allo
n in
crea
se in
gas
taxe
s fo
r the
su
rrou
ndin
g re
gion
to “p
ay fo
r mai
nten
ance
of l
ocal
stre
ets
and
road
s as
wel
l as
impr
ovem
ents
to
publ
ic tr
ansp
orta
tion.
” App
rova
l dro
pped
to 3
8% w
hen
mor
e in
form
atio
n w
as p
rovi
ded.
In
cont
rast
, 71%
of r
espo
nden
ts “w
ere
likel
y to
vot
e ye
s” fo
r an
exte
nsio
n of
a 0
.5¢
coun
ty s
ales
tax
“to a
ddre
ss a
n up
date
d pl
an fo
r the
cou
nty’
s cu
rren
t and
futu
re tr
ansp
orta
tion
need
s” a
fter b
eing
in
form
ed th
at “m
oney
from
this
mea
sure
cou
ld o
nly
be s
pent
on
the
vote
r-ap
prov
ed e
xpen
ditu
re
plan
… a
nd c
ould
not
be
take
n by
the
stat
e.”
Rut
gers
Eag
leto
n In
stitu
te o
f Pol
itics
(E
agle
ton
Cen
ter f
or P
ublic
In
tere
st P
ollin
g)
2014
(Mar
ch)
New
Jer
sey
resi
dent
s38
% o
f New
Jer
seya
ns s
uppo
rted
rais
ing
the
gas
tax
whe
n th
ey w
ere
info
rmed
that
it ‘i
s cu
rren
tly
the
third
low
est i
n th
e na
tion
and
has
not b
een
rais
ed in
twen
ty y
ears
.” Th
is ra
te o
f sup
port
is
high
er th
an th
e 27
% o
f New
Jer
seya
ns w
ho s
uppo
rted
the
rais
ing
the
gas
tax
whe
n no
t giv
en th
e ad
ditio
nal i
nfor
mat
ion.
Was
hing
ton
Pos
t20
07M
aryl
and
resi
dent
s38
% o
f res
pond
ents
“fav
ored
” a 1
0¢ p
er g
allo
n in
crea
se in
the
stat
e ga
s ta
x “if
the
mon
ey is
use
d fo
r tra
nspo
rtatio
n pr
ojec
ts s
uch
as b
uild
ing
road
s, tr
affic
man
agem
ent,
or p
ublic
tran
spor
tatio
n.”
Qui
nnip
iac
Uni
vers
ity
Pol
ling
Inst
itute
2009
New
Jer
sey
vote
rs37
% o
f res
pond
ents
“sup
porte
d” a
n un
spec
ified
gas
tax
incr
ease
“to
help
fina
nce
road
im
prov
emen
ts a
nd m
ass
trans
porta
tion.
”Q
uinn
ipia
c U
nive
rsity
P
ollin
g In
stitu
te20
05C
onne
ctic
ut re
gist
ered
vo
ters
37%
of r
espo
nden
ts “s
uppo
rted”
a 6
¢ pe
r gal
lon
gas-
tax
incr
ease
to p
ay fo
r “tra
nspo
rtatio
n im
prov
emen
t pro
ject
s to
redu
ce tr
affic
con
gest
ion.
”H
NTB
Cor
pora
tion
(Kel
ton
Res
earc
h)20
11U
.S. r
esid
ents
36%
of r
espo
nden
ts a
gree
d th
at th
ey “w
ould
sup
port”
a 1
0¢ p
er g
allo
n ga
s ta
x in
crea
se “n
ow th
at
the
econ
omy
has
impr
oved
” afte
r bei
ng in
form
ed th
at th
e ta
x ha
d no
t ris
en s
ince
199
3 an
d th
at it
no
long
er “c
olle
cts
enou
gh fu
nds
to fu
lly s
uppo
rt cu
rren
t or f
utur
e fe
dera
l hig
hway
and
tran
sit
prog
ram
s.” I
n a
follo
w-u
p qu
estio
n, 5
8% o
f res
pond
ents
agr
eed
that
the
gas
tax
“sho
uld
rise
and
fall
alon
g w
ith th
e ra
te o
f infl
atio
n.”
Tabl
e 19
, con
tinue
d

Mineta Transportat ion Inst i tute
75Appendix B: Opinion Polls Reviewed
Spon
sor (
and
auth
or,
if di
ffere
nt)
Surv
ey d
ate
Sam
plin
g fr
ame
Find
ings
Sel
zer a
nd C
ompa
ny20
13Io
wa
adul
ts35
% o
f res
pond
ents
“fav
ored
” rai
sing
the
gas
tax
“by
arou
nd 1
0 ce
nts
a ga
llon
to p
ay fo
r roa
d an
d br
idge
repa
irs.”
Indi
an N
atio
ns C
ounc
il of
G
over
nmen
ts
(Col
lect
ive
Stre
ngth
)
2010
Tuls
a (O
klah
oma)
regi
on
resi
dent
s34
% o
f Tul
sa re
side
nts
wer
e so
mew
hat o
r ver
y w
illin
g “to
use
. . .
“slig
ht in
crea
se in
the
gas
and
dies
el ta
x” to
“hel
p fu
nd p
ublic
tran
spor
tatio
n im
prov
emen
ts.”
HN
TB C
orpo
ratio
n (K
elto
n R
esea
rch)
2009
U.S
. res
iden
ts35
% o
f res
pond
ents
“wou
ld s
uppo
rt” a
10¢
per
gal
lon
gas-
tax
incr
ease
“onc
e th
e ec
onom
y im
prov
es.”
The
ques
tion
info
rmed
resp
onde
nts
abou
t the
leve
l of t
he fe
dera
l gas
tax,
whe
n it
was
se
t, an
d th
e re
ason
s w
hy it
is n
o lo
nger
suf
ficie
nt. E
arlie
r in
the
poll,
57%
of r
espo
nden
ts a
gree
d th
at c
urre
nt g
as ta
xes
“are
no
long
er s
uffic
ient
to p
rope
rly m
aint
ain
our r
oads
and
brid
ges.
”Q
uinn
ipia
c U
nive
rsity
2014
(Apr
il)
New
Jer
sey
vote
rs33
% o
f res
pond
ents
sup
porte
d an
incr
ease
in th
e ga
solin
e ta
x to
bal
ance
the
New
Jer
sey
stat
e bu
dget
.
HN
TB (K
elto
n R
esea
rch)
2013
(Sep
tem
ber)
U.S
. res
iden
ts33
% o
f res
pond
ents
sup
porte
d an
uns
peci
fied
incr
ease
in th
e ga
s ta
x to
fund
hig
hway
im
prov
emen
ts. S
uppo
rt fo
r usi
ng in
crea
ses
in th
e ga
s ta
x to
fund
oth
er tr
ansp
orta
tion
impr
ovem
ents
was
low
er.
CN
N (B
ursk
)20
07U
.S. r
esid
ents
33%
of r
espo
nden
ts “f
avor
ed” a
n un
spec
ified
incr
ease
in th
e fe
dera
l gas
tax
to p
ay fo
r add
ition
al
“insp
ectio
n an
d re
pair
of b
ridge
s ac
ross
the
coun
try.”
The
poll
was
con
duct
ed o
ne w
eek
afte
r a
brid
ge c
olla
psed
in M
inne
sota
.Q
uinn
ipia
c U
nive
rsity
2012
Virg
inia
vot
ers
32%
of r
espo
nden
ts w
ould
rath
er h
ave
high
er g
as ta
xes
than
tolls
to ra
ise
mon
ey fo
r roa
d im
prov
emen
ts.
AB
C N
ews/
Was
hing
ton
Pos
t/Sta
nfor
d U
nive
rsity
(K
rosn
ick)
2007
U.S
. res
iden
ts32
% o
f res
pond
ents
“fav
ored
” an
unsp
ecifi
ed in
crea
se in
gas
taxe
s to
pro
mot
e fu
el-e
ffici
ent
vehi
cles
and
con
serv
atio
n. T
his
ques
tion
was
ask
ed a
s pa
rt of
a s
erie
s of
que
stio
ns o
n st
rate
gies
to
redu
ce g
loba
l war
min
g.Ju
dy F
ord
Wat
son
Cen
ter
for P
ublic
Pol
icy
2013
Virg
inia
regi
ster
ed v
oter
s31
% o
f res
pond
ents
wou
ld “s
uppo
rt” a
n in
crea
se in
the
stat
e ga
s ta
x in
ord
er to
fund
the
stat
e’s
“tran
spor
tatio
n ne
eds,
incl
udin
g bu
ildin
g ne
w ro
ads
and
brid
ges
and
mai
ntai
ning
cur
rent
road
s an
d br
idge
s.”
Fisc
al R
esea
rch
Cen
ter,
And
rew
You
ng S
choo
l of
Pol
icy
Stu
dies
, Geo
rgia
S
tate
Uni
vers
ity (E
llen,
S
joqu
ist,
and
Sto
yche
va)
2012
Geo
rgia
adu
lt dr
iver
s31
% o
f res
pond
ents
wou
ld “s
uppo
rt” a
gas
tax
incr
ease
of 1
0 ce
nts
per g
allo
n to
fund
tra
nspo
rtatio
n. 2
3% o
f res
pond
ents
wou
ld “s
uppo
rt” a
gas
tax
incr
ease
of 1
5 ce
nts
per g
allo
n.
21%
of r
espo
nden
ts w
ould
“sup
port”
a g
as ta
x in
crea
se o
f 25
cent
s pe
r gal
lon.
Des
Moi
nes
Reg
iste
r (S
elze
r & c
o.)
2012
Iow
a re
side
nts
31%
of r
espo
nden
ts “f
avor
ed” r
aisi
ng th
e st
ate
gas
tax
“8 to
10
cent
s a
gallo
n to
pay
for r
oad
and
brid
ge re
pairs
.”
Tabl
e 19
, con
tinue
d

Mineta Transportat ion Inst i tute
76 Appendix B: Opinion Polls Reviewed
Spon
sor (
and
auth
or,
if di
ffere
nt)
Surv
ey d
ate
Sam
plin
g fr
ame
Find
ings
Met
ropo
litan
Was
hing
ton
Cou
ncil
of G
over
nmen
ts20
13W
ashi
ngto
n, D
C-a
rea
parti
cipa
nts
in fo
rum
s on
co
nges
tion
pric
ing
29%
of r
espo
nden
ts “s
trong
ly a
gree
” tha
t the
gas
tax
shou
ld b
e ra
ised
to p
ay fo
r tra
nspo
rtatio
n (th
is w
as a
fter a
n in
form
atio
nal p
rese
ntat
ion)
. Bef
ore
the
pres
enta
tion,
onl
y 13
% o
f res
pond
ents
“s
trong
ly a
gree
d” w
ith th
is p
ropo
sal.
Gal
lup
(Bro
wn)
2013
Nat
iona
l pho
ne s
urve
y29
% o
f res
pond
ents
wou
ld “v
ote
for”
a “l
aw in
you
r sta
te th
at w
ould
incr
ease
the
gas
tax
up to
20
cent
s a
gallo
n, w
ith th
e ne
w g
as ta
x m
oney
goi
ng to
impr
ove
road
s an
d br
idge
s an
d bu
ild m
ore
mas
s tra
nspo
rtatio
n in
you
r sta
te.”
Roa
noke
Col
lege
2013
Virg
inia
resi
dent
s29
% o
f res
pond
ents
“fav
ored
” lin
king
the
gas
tax
to in
flatio
n in
ord
er to
rais
e re
venu
es fo
r tra
nspo
rtatio
n. 2
4% o
f res
pond
ents
sai
d th
at ra
isin
g ta
xes
and
desi
gnat
ing
them
for r
oads
is
“clo
sest
to th
eir v
iew
” poi
nt.
Yale
Pro
ject
on
Clim
ate
Cha
nge
Com
mun
icat
ion
(Lei
sero
witz
, et a
l)
2013
U.S
. adu
lts29
% o
f res
pond
ents
stro
ngly
or s
omew
hat s
uppo
rt a
polic
y to
“inc
reas
e ta
xes
on g
asol
ine
by 2
5 ce
nts
per g
allo
n an
d re
turn
the
reve
nues
to ta
xpay
ers
by re
duci
ng th
e Fe
dera
l inc
ome
tax.
”
The
Wal
l Stre
et J
ourn
al20
12R
eade
rs o
f the
pap
er’s
bl
og w
ho re
spon
ded
to
an in
vita
tion
to v
ote
28%
sai
d th
e ga
s ta
x sh
ould
be
“incr
ease
d.” 1
6% s
aid
that
the
gas
tax
shou
ld b
e in
dexe
d to
in
flatio
n.
Qui
nnip
iac
Uni
vers
ity
Pol
ling
Inst
itute
(Bro
wn)
2011
Virg
inia
regi
ster
ed v
oter
s28
% o
f res
pond
ents
“wou
ld ra
ther
hav
e…a
high
er g
as ta
x to
rais
e m
oney
for r
oad
impr
ovem
ent”
whe
n as
ked
to c
hoos
e be
twee
n ga
s ta
xes
and
tolls
. In
cont
rast
, 60%
“wou
ld ra
ther
hav
e hi
ghw
ay
tolls
.”M
arqu
ette
Law
Sch
ool
2013
Wis
cons
in v
oter
s28
% o
f res
pond
ents
wer
e “w
illin
g” to
“rai
se g
as ta
xes
and
vehi
cle
regi
stra
tion
fees
for h
ighw
ay
proj
ects
.” E
lway
Res
earc
h20
13W
ashi
ngto
n S
tate
re
gist
ered
vot
ers
28%
of r
espo
nden
ts w
ould
“fav
or” o
r “ac
cept
” a g
as ta
x in
crea
se a
s a
trans
porta
tion
fund
ing
optio
n.
The
Roc
kefe
ller
Foun
datio
n (H
art
Res
earc
h A
ssoc
iate
s)
2011
U.S
. reg
iste
red
vote
rs27
% o
f res
pond
ents
foun
d it
“acc
epta
ble”
to in
crea
se th
e fe
dera
l gas
tax
an u
nspe
cifie
d am
ount
in
ord
er to
“pro
vide
add
ition
al fu
ndin
g fo
r tra
nspo
rtatio
n pr
ojec
ts” a
fter b
eing
info
rmed
that
the
tax
had
not i
ncre
ased
sin
ce 1
993.
Gon
zale
s R
esea
rch
Mar
ketin
g S
trate
gies
2013
Mar
ylan
d re
gist
ered
vo
ters
who
vot
e re
gula
rly27
% o
f res
pond
ents
wou
ld “f
avor
” a “1
0 ce
nt p
er g
allo
n in
crea
se in
Mar
ylan
d’s
gas
tax
rate
to b
e us
ed fo
r tra
nspo
rtatio
n pr
ojec
ts.”
Was
hing
ton
Pos
t20
13M
aryl
and
resi
dent
s26
% o
f res
pond
ents
wou
ld “f
avor
” a “n
ew 3
per
cent
sal
es ta
x on
gas
olin
e, if
the
mon
ey w
ere
used
fo
r tra
nspo
rtatio
n pr
ojec
ts s
uch
as b
uild
ing
road
s, tr
affic
man
agem
ent o
r pub
lic tr
ansp
orta
tion.
” O
ld D
omin
ion
Uni
vers
ity20
12H
ampt
on R
oads
, Virg
inia
, re
side
nts
25%
of r
espo
nden
ts w
ould
“sup
port”
incr
easi
ng th
e st
ate
fuel
tax
“if a
dditi
onal
fund
s ar
e ne
eded
to
mai
ntai
n or
exp
and
the
road
, hig
hway
, and
brid
ge s
yste
ms
in H
ampt
on R
oads
.”
Tabl
e 19
, con
tinue
d
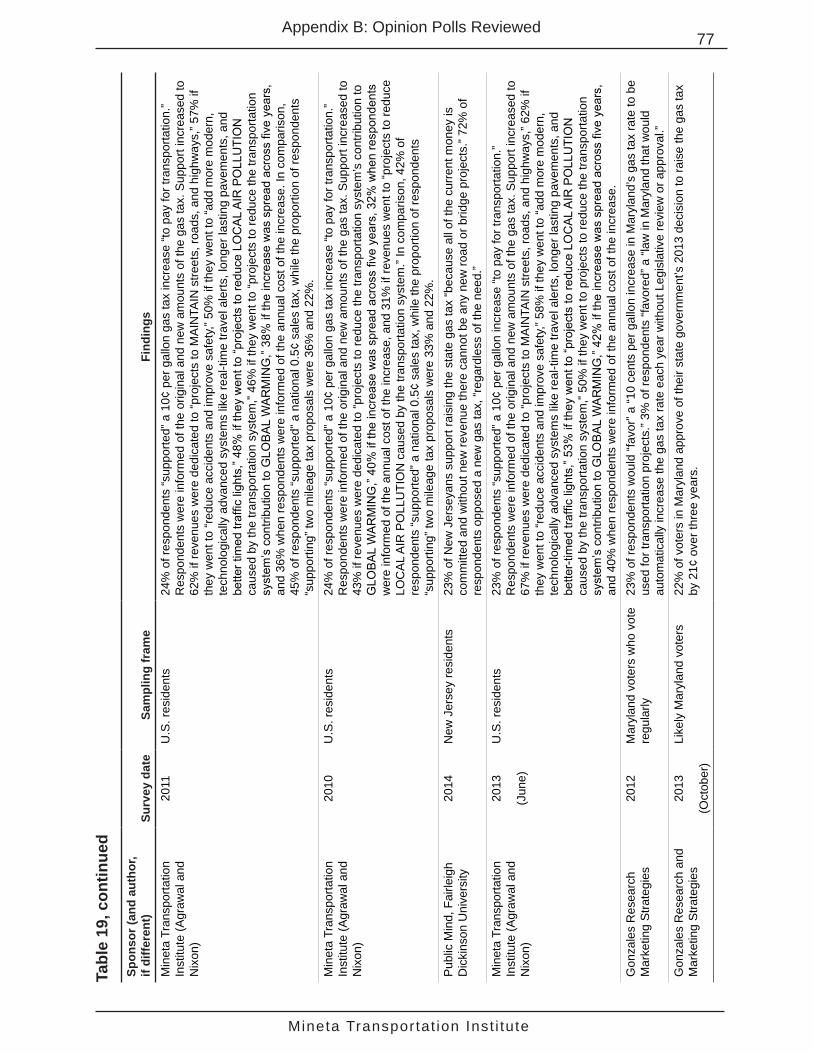
Mineta Transportat ion Inst i tute
77Appendix B: Opinion Polls Reviewed
Spon
sor (
and
auth
or,
if di
ffere
nt)
Surv
ey d
ate
Sam
plin
g fr
ame
Find
ings
Min
eta
Tran
spor
tatio
n In
stitu
te (A
graw
al a
nd
Nix
on)
2011
U.S
. res
iden
ts24
% o
f res
pond
ents
“sup
porte
d” a
10¢
per
gal
lon
gas
tax
incr
ease
“to
pay
for t
rans
porta
tion.
” R
espo
nden
ts w
ere
info
rmed
of t
he o
rigin
al a
nd n
ew a
mou
nts
of th
e ga
s ta
x. S
uppo
rt in
crea
sed
to
62%
if re
venu
es w
ere
dedi
cate
d to
“pro
ject
s to
MA
INTA
IN s
treet
s, ro
ads,
and
hig
hway
s,” 5
7% if
th
ey w
ent t
o “r
educ
e ac
cide
nts
and
impr
ove
safe
ty,”
50%
if th
ey w
ent t
o “a
dd m
ore
mod
ern,
te
chno
logi
cally
adv
ance
d sy
stem
s lik
e re
al-ti
me
trave
l ale
rts, l
onge
r las
ting
pave
men
ts, a
nd
bette
r tim
ed tr
affic
ligh
ts,”
48%
if th
ey w
ent t
o “p
roje
cts
to re
duce
LO
CA
L A
IR P
OLL
UTI
ON
ca
used
by
the
trans
porta
tion
syst
em,”
46%
if th
ey w
ent t
o “p
roje
cts
to re
duce
the
trans
porta
tion
syst
em’s
con
tribu
tion
to G
LOB
AL
WA
RM
ING
,” 38
% if
the
incr
ease
was
spr
ead
acro
ss fi
ve y
ears
, an
d 36
% w
hen
resp
onde
nts
wer
e in
form
ed o
f the
ann
ual c
ost o
f the
incr
ease
. In
com
paris
on,
45%
of r
espo
nden
ts “s
uppo
rted”
a n
atio
nal 0
.5¢
sale
s ta
x, w
hile
the
prop
ortio
n of
resp
onde
nts
“sup
porti
ng” t
wo
mile
age
tax
prop
osal
s w
ere
36%
and
22%
.M
inet
a Tr
ansp
orta
tion
Inst
itute
(Agr
awal
and
N
ixon
)
2010
U.S
. res
iden
ts24
% o
f res
pond
ents
“sup
porte
d” a
10¢
per
gal
lon
gas
tax
incr
ease
“to
pay
for t
rans
porta
tion.
” R
espo
nden
ts w
ere
info
rmed
of t
he o
rigin
al a
nd n
ew a
mou
nts
of th
e ga
s ta
x. S
uppo
rt in
crea
sed
to
43%
if re
venu
es w
ere
dedi
cate
d to
“pro
ject
s to
redu
ce th
e tra
nspo
rtatio
n sy
stem
’s c
ontri
butio
n to
G
LOB
AL
WA
RM
ING
,” 40
% if
the
incr
ease
was
spr
ead
acro
ss fi
ve y
ears
, 32%
whe
n re
spon
dent
s w
ere
info
rmed
of t
he a
nnua
l cos
t of t
he in
crea
se, a
nd 3
1% if
reve
nues
wen
t to
“pro
ject
s to
redu
ce
LOC
AL
AIR
PO
LLU
TIO
N c
ause
d by
the
trans
porta
tion
syst
em.”
In c
ompa
rison
, 42%
of
resp
onde
nts
“sup
porte
d” a
nat
iona
l 0.5
¢ sa
les
tax,
whi
le th
e pr
opor
tion
of re
spon
dent
s “s
uppo
rting
” tw
o m
ileag
e ta
x pr
opos
als
wer
e 33
% a
nd 2
2%.
Pub
lic M
ind,
Fai
rleig
h D
icki
nson
Uni
vers
ity20
14N
ew J
erse
y re
side
nts
23%
of N
ew J
erse
yans
sup
port
rais
ing
the
stat
e ga
s ta
x “b
ecau
se a
ll of
the
curr
ent m
oney
is
com
mitt
ed a
nd w
ithou
t new
reve
nue
ther
e ca
nnot
be
any
new
road
or b
ridge
pro
ject
s.” 7
2% o
f re
spon
dent
s op
pose
d a
new
gas
tax,
“reg
ardl
ess
of th
e ne
ed.”
Min
eta
Tran
spor
tatio
n In
stitu
te (A
graw
al a
nd
Nix
on)
2013
(Jun
e)
U.S
. res
iden
ts23
% o
f res
pond
ents
“sup
porte
d” a
10¢
per
gal
lon
incr
ease
“to
pay
for t
rans
porta
tion.
” R
espo
nden
ts w
ere
info
rmed
of t
he o
rigin
al a
nd n
ew a
mou
nts
of th
e ga
s ta
x. S
uppo
rt in
crea
sed
to
67%
if re
venu
es w
ere
dedi
cate
d to
“pro
ject
s to
MA
INTA
IN s
treet
s, ro
ads,
and
hig
hway
s,” 6
2% if
th
ey w
ent t
o “r
educ
e ac
cide
nts
and
impr
ove
safe
ty,”
58%
if th
ey w
ent t
o “a
dd m
ore
mod
ern,
te
chno
logi
cally
adv
ance
d sy
stem
s lik
e re
al-ti
me
trave
l ale
rts, l
onge
r las
ting
pave
men
ts, a
nd
bette
r-tim
ed tr
affic
ligh
ts,”
53%
if th
ey w
ent t
o “p
roje
cts
to re
duce
LO
CA
L A
IR P
OLL
UTI
ON
ca
used
by
the
trans
porta
tion
syst
em,”
50%
if th
ey w
ent t
o pr
ojec
ts to
redu
ce th
e tra
nspo
rtatio
n sy
stem
’s c
ontri
butio
n to
GLO
BA
L W
AR
MIN
G,”
42%
if th
e in
crea
se w
as s
prea
d ac
ross
five
yea
rs,
and
40%
whe
n re
spon
dent
s w
ere
info
rmed
of t
he a
nnua
l cos
t of t
he in
crea
se.
Gon
zale
s R
esea
rch
Mar
ketin
g S
trate
gies
2012
Mar
ylan
d vo
ters
who
vot
e re
gula
rly23
% o
f res
pond
ents
wou
ld “f
avor
” a “1
0 ce
nts
per g
allo
n in
crea
se in
Mar
ylan
d’s
gas
tax
rate
to b
e us
ed fo
r tra
nspo
rtatio
n pr
ojec
ts.”
3% o
f res
pond
ents
“fav
ored
” a “l
aw in
Mar
ylan
d th
at w
ould
au
tom
atic
ally
incr
ease
the
gas
tax
rate
eac
h ye
ar w
ithou
t Leg
isla
tive
revi
ew o
r app
rova
l.”G
onza
les
Res
earc
h an
d M
arke
ting
Stra
tegi
es20
13
(Oct
ober
)
Like
ly M
aryl
and
vote
rs22
% o
f vot
ers
in M
aryl
and
appr
ove
of th
eir s
tate
gov
ernm
ent’s
201
3 de
cisi
on to
rais
e th
e ga
s ta
x by
21¢
ove
r thr
ee y
ears
.
Tabl
e 19
, con
tinue
d

Mineta Transportat ion Inst i tute
78 Appendix B: Opinion Polls Reviewed
Spon
sor (
and
auth
or,
if di
ffere
nt)
Surv
ey d
ate
Sam
plin
g fr
ame
Find
ings
Pew
Res
earc
h C
ente
r20
10U
.S. r
esid
ents
22%
of r
espo
nden
ts “a
ppro
ved”
of a
n un
spec
ified
incr
ease
to th
e na
tiona
l gas
olin
e ta
x w
hen
“thin
king
abo
ut w
ays
to re
duce
the
fede
ral b
udge
t defi
cit.”
Ras
mus
sen
Rep
orts
2009
U.S
. res
iden
ts22
% p
refe
rred
rais
ing
the
gas
tax
an u
nspe
cifie
d am
ount
to “c
uttin
g ba
ck n
atio
nally
on
trans
porta
tion
proj
ects
.” 15
% o
f res
pond
ents
agr
eed
that
the
fede
ral g
over
nmen
t sho
uld
incr
ease
ga
s ta
xes
“to h
elp
mee
t new
tran
spor
tatio
n ne
eds.
”P
ew R
esea
rch
Cen
ter
2008
U.S
. res
iden
ts22
% o
f res
pond
ents
“fav
ored
” an
unsp
ecifi
ed in
crea
se in
the
gas
tax
“to e
ncou
rage
car
pool
ing
and
cons
erva
tion.
” Thi
s w
as in
resp
onse
to a
ser
ies
of q
uest
ions
on
polic
ies
that
“add
ress
A
mer
ica’
s en
ergy
sup
ply.
”Vi
rgin
ia T
rans
porta
tion
Con
stru
ctio
n A
llian
ce
(Pub
lic O
pini
on S
trate
gies
)
2013
Virg
inia
like
ly v
oter
s21
% o
f res
pond
ents
sai
d th
at th
e fo
llow
ing
prop
osal
to in
crea
se tr
ansp
orta
tion
fund
ing
was
“c
lose
st” t
o th
eir o
pini
on: “
in o
rder
to in
crea
se tr
ansp
orta
tion
fund
ing,
the
curr
ent g
as ta
x of
se
vent
een
poin
t five
cen
ts p
er g
allo
n sh
ould
be
incr
ease
d by
ten
cent
s to
twen
ty s
even
poi
nt fi
ve
cent
s pe
r gal
lon.
The
gas
tax
wou
ld a
lso
be in
dexe
d to
infla
tion
so th
at it
wou
ld in
crea
se a
t the
sa
me
rate
as
infla
tion.
” (Th
e al
tern
ativ
e pr
esen
ted
was
to e
limin
ate
the
gas
tax
and
incr
ease
the
stat
e sa
les
tax.
)M
inet
a Tr
ansp
orta
tion
Inst
itute
(Agr
awal
, Nix
on,
and
Mur
thy)
2012
U.S
. res
iden
ts20
% o
f res
pond
ents
“sup
porte
d” a
10¢
per
gal
lon
gas
tax
incr
ease
“to
pay
for t
rans
porta
tion.
” R
espo
nden
ts w
ere
info
rmed
of t
he o
rigin
al a
nd n
ew a
mou
nts
of th
e ga
s ta
x. S
uppo
rt in
crea
sed
to
58%
if re
venu
es w
ere
dedi
cate
d to
“pro
ject
s to
MA
INTA
IN s
treet
s, ro
ads,
and
hig
hway
s,” 5
4% if
th
ey w
ent t
o “r
educ
e ac
cide
nts
and
impr
ove
safe
ty,”
46%
if th
ey w
ent t
o “a
dd m
ore
mod
ern,
te
chno
logi
cally
adv
ance
d sy
stem
s lik
e re
al-ti
me
trave
l ale
rts, l
onge
r las
ting
pave
men
ts, a
nd
bette
r-tim
ed tr
affic
ligh
ts,”
41%
if th
ey w
ent t
o “p
roje
cts
to re
duce
LO
CA
L A
IR P
OLL
UTI
ON
ca
used
by
the
trans
porta
tion
syst
em,”
41%
if th
ey w
ent t
o “p
roje
cts
to re
duce
the
trans
porta
tion
syst
em’s
con
tribu
tion
to G
LOB
AL
WA
RM
ING
,” 39
% if
the
incr
ease
was
spr
ead
acro
ss fi
ve y
ears
, an
d 36
% w
hen
resp
onde
nts
wer
e in
form
ed o
f the
ann
ual c
ost o
f the
incr
ease
.R
easo
n Fo
unda
tion
2011
U.S
. res
iden
ts19
% o
f res
pond
ents
“fav
ored
” an
unsp
ecifi
ed in
crea
se in
the
gas
tax.
Res
pond
ents
wer
e in
form
ed
that
the
tax
pays
for h
ighw
ays
and
trans
it, a
nd w
ere
give
n th
e fo
llow
ing
oppo
sing
vie
wpo
ints
: “R
oads
and
tran
sit s
yste
ms
are
crum
blin
g an
d ne
ed m
ore
fund
ing”
and
“The
gov
ernm
ent w
aste
s a
lot o
f the
gas
mon
ey it
alre
ady
rece
ives
.”R
asm
usse
n R
epor
ts
(Pul
se O
pini
on R
esea
rch)
2012
U.S
. res
iden
ts18
% o
f res
pond
ents
agr
eed
that
the
gove
rnm
ent s
houl
d “r
aise
the
gas
tax
to h
elp
mee
t new
tra
nspo
rtatio
n ne
eds.
” 48%
of r
espo
nden
ts a
gree
d th
at th
e go
vern
men
t sho
uld
“elim
inat
e th
e fe
dera
l gas
olin
e ta
x un
til g
as p
rices
com
e do
wn.
”Q
uinn
ipia
c U
nive
rsity
2009
(Jan
uary
)
New
Yor
k st
ate
regi
ster
ed
vote
rs18
% o
f res
pond
ents
sup
porte
d in
crea
sing
the
gaso
line
tax
by a
n un
spec
ified
am
ount
Qui
nnip
iac
Uni
vers
ity20
11
(Mar
ch)
Con
nect
icut
regi
ster
ed
vote
rs17
% o
f res
pond
ents
sup
porte
d in
crea
sing
the
gaso
line
tax
by 3
¢ pe
r gal
lon
Tabl
e 19
, con
tinue
d

Mineta Transportat ion Inst i tute
79Appendix B: Opinion Polls Reviewed
Spon
sor (
and
auth
or,
if di
ffere
nt)
Surv
ey d
ate
Sam
plin
g fr
ame
Find
ings
HN
TB C
orpo
ratio
n (K
elto
n R
esea
rch)
2012
U.S
. res
iden
ts17
% o
f res
pond
ents
sta
ted
they
wou
ld b
e “w
illin
g to
spe
nd m
ore
mon
ey o
n” th
e ga
s ta
x “if
it w
as
allo
cate
d to
long
-term
inte
rsta
te im
prov
emen
ts in
[the
ir] a
rea.
”H
NTB
Cor
pora
tion
(Kel
ton
Res
earc
h)20
12U
.S. r
esid
ents
16%
of r
espo
nden
ts w
ould
“pre
fer”
that
“the
Uni
ted
Sta
tes
get f
undi
ng fo
r the
nat
ion’
s in
ters
tate
pr
ojec
ts” t
hrou
gh a
n “in
crea
sed
fede
ral g
as ta
x” (a
s co
mpa
red
to to
lls o
r a m
iles
driv
en u
ser f
ee).
Ras
mus
sen
Rep
orts
2009
U.S
. res
iden
ts10
% o
f res
pond
ents
“fav
ored
” a fe
dera
l gov
ernm
ent p
olic
y to
incr
ease
gas
taxe
s “a
larg
e am
ount
” to
enc
oura
ge th
e pu
rcha
se o
f fue
l-effi
cien
t car
s.D
uke
Nic
hola
s In
stitu
te20
13U
.S. a
dults
8% o
f res
pond
ents
“stro
ngly
sup
port”
“[i]n
crea
sing
taxe
s on
all
foss
il fu
els
(gas
olin
e, c
oal,
and
natu
ral g
as) t
o en
cour
age
cons
erva
tion
and
use
of a
ltern
ativ
e en
ergy
sou
rces
.” Th
e nu
mbe
r of
indi
vidu
als
who
“stro
ngly
sup
port”
the
tax
incr
ease
d to
10%
if th
e in
crea
se in
taxe
s on
foss
il fu
els
prov
ided
“eac
h pe
rson
with
a $
500
ener
gy re
bate
on
thei
r tax
retu
rn.”
Tabl
e 19
, con
tinue
d
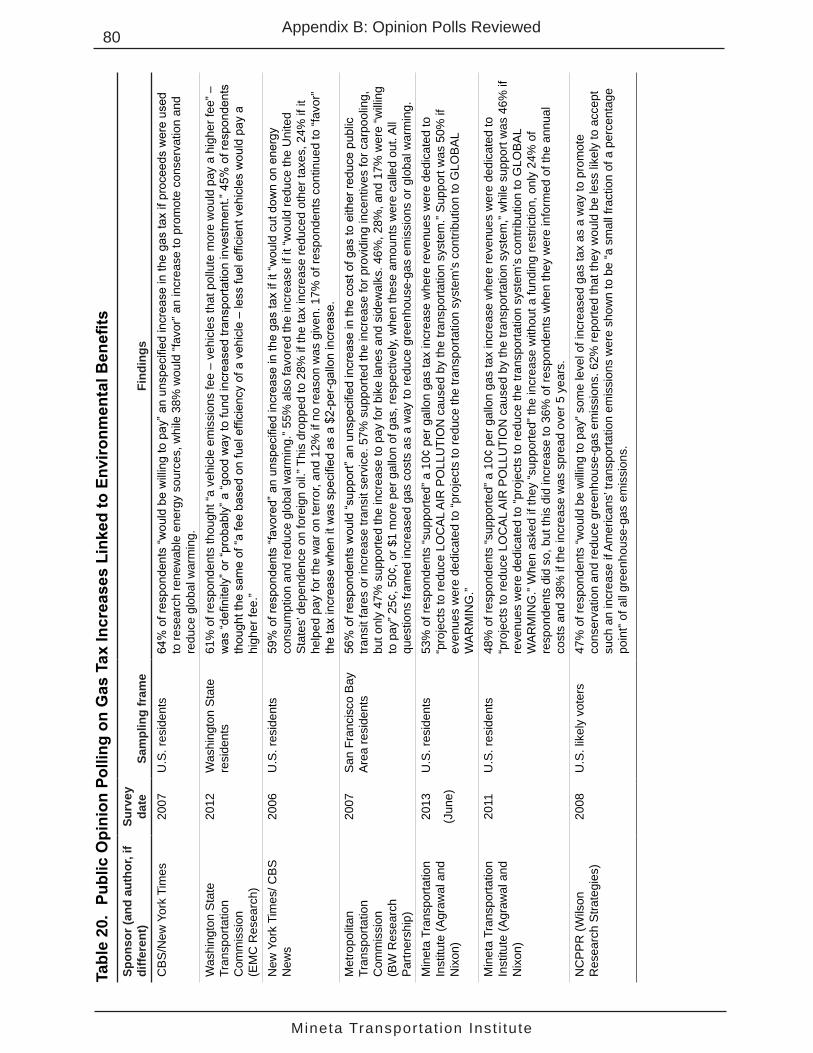
Mineta Transportat ion Inst i tute
80 Appendix B: Opinion Polls Reviewed
Tabl
e 20
. Pu
blic
Opi
nion
Pol
ling
on G
as T
ax In
crea
ses
Link
ed to
Env
ironm
enta
l Ben
efits
Spon
sor (
and
auth
or, i
f di
ffere
nt)
Surv
ey
date
Sam
plin
g fr
ame
Find
ings
CB
S/N
ew Y
ork
Tim
es20
07U
.S. r
esid
ents
64%
of r
espo
nden
ts “w
ould
be
will
ing
to p
ay” a
n un
spec
ified
incr
ease
in th
e ga
s ta
x if
proc
eeds
wer
e us
ed
to re
sear
ch re
new
able
ene
rgy
sour
ces,
whi
le 3
8% w
ould
“fav
or” a
n in
crea
se to
pro
mot
e co
nser
vatio
n an
d re
duce
glo
bal w
arm
ing.
W
ashi
ngto
n S
tate
Tr
ansp
orta
tion
Com
mis
sion
(E
MC
Res
earc
h)
2012
Was
hing
ton
Sta
te
resi
dent
s61
% o
f res
pond
ents
thou
ght “
a ve
hicl
e em
issi
ons
fee
– ve
hicl
es th
at p
ollu
te m
ore
wou
ld p
ay a
hig
her f
ee” –
w
as “d
efini
tely
” or “
prob
ably
” a “g
ood
way
to fu
nd in
crea
sed
trans
porta
tion
inve
stm
ent.”
45%
of r
espo
nden
ts
thou
ght t
he s
ame
of “a
fee
base
d on
fuel
effi
cien
cy o
f a v
ehic
le –
less
fuel
effi
cien
t veh
icle
s w
ould
pay
a
high
er fe
e.”
New
Yor
k Ti
mes
/ CB
S
New
s20
06U
.S. r
esid
ents
59%
of r
espo
nden
ts “f
avor
ed” a
n un
spec
ified
incr
ease
in th
e ga
s ta
x if
it “w
ould
cut
dow
n on
ene
rgy
cons
umpt
ion
and
redu
ce g
loba
l war
min
g.” 5
5% a
lso
favo
red
the
incr
ease
if it
“wou
ld re
duce
the
Uni
ted
Sta
tes’
dep
ende
nce
on fo
reig
n oi
l.” T
his
drop
ped
to 2
8% if
the
tax
incr
ease
redu
ced
othe
r tax
es, 2
4% if
it
help
ed p
ay fo
r the
war
on
terr
or, a
nd 1
2% if
no
reas
on w
as g
iven
. 17%
of r
espo
nden
ts c
ontin
ued
to “f
avor
” th
e ta
x in
crea
se w
hen
it w
as s
peci
fied
as a
$2-
per-
gallo
n in
crea
se.
Met
ropo
litan
Tr
ansp
orta
tion
Com
mis
sion
(B
W R
esea
rch
Par
tner
ship
)
2007
San
Fra
ncis
co B
ay
Are
a re
side
nts
56%
of r
espo
nden
ts w
ould
“sup
port”
an
unsp
ecifi
ed in
crea
se in
the
cost
of g
as to
eith
er re
duce
pub
lic
trans
it fa
res
or in
crea
se tr
ansi
t ser
vice
. 57%
sup
porte
d th
e in
crea
se fo
r pro
vidi
ng in
cent
ives
for c
arpo
olin
g,
but o
nly
47%
sup
porte
d th
e in
crea
se to
pay
for b
ike
lane
s an
d si
dew
alks
. 46%
, 28%
, and
17%
wer
e “w
illin
g to
pay
” 25¢
, 50¢
, or $
1 m
ore
per g
allo
n of
gas
, res
pect
ivel
y, w
hen
thes
e am
ount
s w
ere
calle
d ou
t. A
ll qu
estio
ns fr
amed
incr
ease
d ga
s co
sts
as a
way
to re
duce
gre
enho
use-
gas
emis
sion
s or
glo
bal w
arm
ing.
M
inet
a Tr
ansp
orta
tion
Inst
itute
(Agr
awal
and
N
ixon
)
2013
(Jun
e)
U.S
. res
iden
ts53
% o
f res
pond
ents
“sup
porte
d” a
10¢
per
gal
lon
gas
tax
incr
ease
whe
re re
venu
es w
ere
dedi
cate
d to
“p
roje
cts
to re
duce
LO
CA
L A
IR P
OLL
UTI
ON
cau
sed
by th
e tra
nspo
rtatio
n sy
stem
.” S
uppo
rt w
as 5
0% if
ev
enue
s w
ere
dedi
cate
d to
“pro
ject
s to
redu
ce th
e tra
nspo
rtatio
n sy
stem
’s c
ontri
butio
n to
GLO
BA
L W
AR
MIN
G.”
Min
eta
Tran
spor
tatio
n In
stitu
te (A
graw
al a
nd
Nix
on)
2011
U.S
. res
iden
ts48
% o
f res
pond
ents
“sup
porte
d” a
10¢
per
gal
lon
gas
tax
incr
ease
whe
re re
venu
es w
ere
dedi
cate
d to
“p
roje
cts
to re
duce
LO
CA
L A
IR P
OLL
UTI
ON
cau
sed
by th
e tra
nspo
rtatio
n sy
stem
,” w
hile
sup
port
was
46%
if
reve
nues
wer
e de
dica
ted
to “p
roje
cts
to re
duce
the
trans
porta
tion
syst
em’s
con
tribu
tion
to G
LOB
AL
WA
RM
ING
.” W
hen
aske
d if
they
“sup
porte
d” th
e in
crea
se w
ithou
t a fu
ndin
g re
stric
tion,
onl
y 24
% o
f re
spon
dent
s di
d so
, but
this
did
incr
ease
to 3
6% o
f res
pond
ents
whe
n th
ey w
ere
info
rmed
of t
he a
nnua
l co
sts
and
38%
if th
e in
crea
se w
as s
prea
d ov
er 5
yea
rs.
NC
PP
R (W
ilson
R
esea
rch
Stra
tegi
es)
2008
U.S
. lik
ely
vote
rs47
% o
f res
pond
ents
“wou
ld b
e w
illin
g to
pay
” som
e le
vel o
f inc
reas
ed g
as ta
x as
a w
ay to
pro
mot
e co
nser
vatio
n an
d re
duce
gre
enho
use-
gas
emis
sion
s. 6
2% re
porte
d th
at th
ey w
ould
be
less
like
ly to
acc
ept
such
an
incr
ease
if A
mer
ican
s’ tr
ansp
orta
tion
emis
sion
s w
ere
show
n to
be
“a s
mal
l fra
ctio
n of
a p
erce
ntag
e po
int”
of a
ll gr
eenh
ouse
-gas
em
issi
ons.
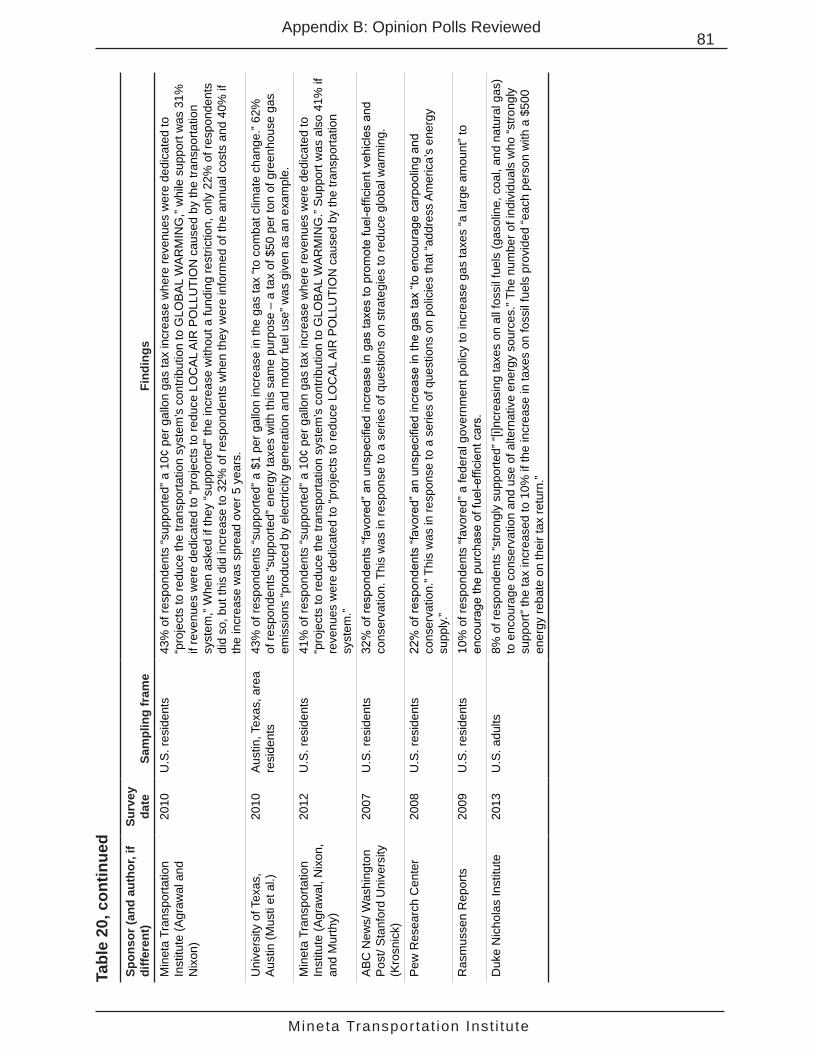
Mineta Transportat ion Inst i tute
81Appendix B: Opinion Polls Reviewed
Spon
sor (
and
auth
or, i
f di
ffere
nt)
Surv
ey
date
Sam
plin
g fr
ame
Find
ings
Min
eta
Tran
spor
tatio
n In
stitu
te (A
graw
al a
nd
Nix
on)
2010
U.S
. res
iden
ts43
% o
f res
pond
ents
“sup
porte
d” a
10¢
per
gal
lon
gas
tax
incr
ease
whe
re re
venu
es w
ere
dedi
cate
d to
“p
roje
cts
to re
duce
the
trans
porta
tion
syst
em’s
con
tribu
tion
to G
LOB
AL
WA
RM
ING
,” w
hile
sup
port
was
31%
if
reve
nues
wer
e de
dica
ted
to “p
roje
cts
to re
duce
LO
CA
L A
IR P
OLL
UTI
ON
cau
sed
by th
e tra
nspo
rtatio
n sy
stem
,” W
hen
aske
d if
they
“sup
porte
d” th
e in
crea
se w
ithou
t a fu
ndin
g re
stric
tion,
onl
y 22
% o
f res
pond
ents
di
d so
, but
this
did
incr
ease
to 3
2% o
f res
pond
ents
whe
n th
ey w
ere
info
rmed
of t
he a
nnua
l cos
ts a
nd 4
0% if
th
e in
crea
se w
as s
prea
d ov
er 5
yea
rs.
Uni
vers
ity o
f Tex
as,
Aus
tin (M
usti
et a
l.)20
10A
ustin
, Tex
as, a
rea
resi
dent
s43
% o
f res
pond
ents
“sup
porte
d” a
$1
per g
allo
n in
crea
se in
the
gas
tax
“to c
omba
t clim
ate
chan
ge.”
62%
of
resp
onde
nts
“sup
porte
d” e
nerg
y ta
xes
with
this
sam
e pu
rpos
e –
a ta
x of
$50
per
ton
of g
reen
hous
e ga
s em
issi
ons
“pro
duce
d by
ele
ctric
ity g
ener
atio
n an
d m
otor
fuel
use
” was
giv
en a
s an
exa
mpl
e.
Min
eta
Tran
spor
tatio
n In
stitu
te (A
graw
al, N
ixon
, an
d M
urth
y)
2012
U.S
. res
iden
ts41
% o
f res
pond
ents
“sup
porte
d” a
10¢
per
gal
lon
gas
tax
incr
ease
whe
re re
venu
es w
ere
dedi
cate
d to
“p
roje
cts
to re
duce
the
trans
porta
tion
syst
em’s
con
tribu
tion
to G
LOB
AL
WA
RM
ING
.” S
uppo
rt w
as a
lso
41%
if
reve
nues
wer
e de
dica
ted
to “p
roje
cts
to re
duce
LO
CA
L A
IR P
OLL
UTI
ON
cau
sed
by th
e tra
nspo
rtatio
n sy
stem
.”A
BC
New
s/ W
ashi
ngto
n P
ost/
Sta
nfor
d U
nive
rsity
(K
rosn
ick)
2007
U.S
. res
iden
ts32
% o
f res
pond
ents
“fav
ored
” an
unsp
ecifi
ed in
crea
se in
gas
taxe
s to
pro
mot
e fu
el-e
ffici
ent v
ehic
les
and
cons
erva
tion.
Thi
s w
as in
resp
onse
to a
ser
ies
of q
uest
ions
on
stra
tegi
es to
redu
ce g
loba
l war
min
g.
Pew
Res
earc
h C
ente
r20
08U
.S. r
esid
ents
22%
of r
espo
nden
ts “f
avor
ed” a
n un
spec
ified
incr
ease
in th
e ga
s ta
x “to
enc
oura
ge c
arpo
olin
g an
d co
nser
vatio
n.” T
his
was
in re
spon
se to
a s
erie
s of
que
stio
ns o
n po
licie
s th
at “a
ddre
ss A
mer
ica’
s en
ergy
su
pply.
”R
asm
usse
n R
epor
ts20
09U
.S. r
esid
ents
10%
of r
espo
nden
ts “f
avor
ed” a
fede
ral g
over
nmen
t pol
icy
to in
crea
se g
as ta
xes
“a la
rge
amou
nt” t
o en
cour
age
the
purc
hase
of f
uel-e
ffici
ent c
ars.
Duk
e N
icho
las
Inst
itute
2013
U.S
. adu
lts8%
of r
espo
nden
ts “s
trong
ly s
uppo
rted”
“[i]n
crea
sing
taxe
s on
all
foss
il fu
els
(gas
olin
e, c
oal,
and
natu
ral g
as)
to e
ncou
rage
con
serv
atio
n an
d us
e of
alte
rnat
ive
ener
gy s
ourc
es.”
The
num
ber o
f ind
ivid
uals
who
“stro
ngly
su
ppor
t” th
e ta
x in
crea
sed
to 1
0% if
the
incr
ease
in ta
xes
on fo
ssil
fuel
s pr
ovid
ed “e
ach
pers
on w
ith a
$50
0 en
ergy
reba
te o
n th
eir t
ax re
turn
.”
Tabl
e 20
, con
tinue
d

Mineta Transportat ion Inst i tute
82 Appendix B: Opinion Polls Reviewed
Tabl
e 21
. Pu
blic
Opi
nion
Pol
ling
on M
ileag
e Ta
xes
Spon
sor (
and
auth
or,
if di
ffere
nt)
Surv
ey d
ate
Sam
plin
g fr
ame
Find
ings
Min
eta
Tran
spor
tatio
n In
stitu
te
(Agr
awal
et a
l.)
2009
Cal
iforn
ia re
side
nts
50%
of r
espo
nden
ts “s
uppo
rted”
repl
acin
g th
e st
ate
gas
tax
with
a fe
e av
erag
ing
1¢ p
er m
ile fo
r ev
ery
mile
driv
en w
ithin
the
stat
e, w
ith th
e fe
e ra
te v
aryi
ng b
y ho
w m
uch
the
vehi
cle
pollu
tes
so th
at
“veh
icle
s th
at p
ollu
te th
e le
ast w
ould
pay
less
, and
veh
icle
s th
at p
ollu
te th
e m
ost w
ould
pay
mor
e pe
r mile
.” R
espo
nden
ts w
ere
info
rmed
that
“veh
icle
s w
ould
be
equi
pped
with
an
elec
troni
c m
eans
to
keep
trac
k of
mile
s dr
iven
, and
the
fee
wou
ld b
e pa
id w
hen
driv
ers
buy
gas.
” Sup
port
for t
he
prop
osal
was
onl
y 28
% fo
r a v
aria
tion
in w
hich
all
vehi
cles
pai
d th
e sa
me
1¢ p
er m
ile ra
te.
Was
hing
ton
Sta
te
Tran
spor
tatio
n C
omm
issi
on
(EM
C R
esea
rch)
2012
Was
hing
ton
stat
e re
side
nts
44%
of r
espo
nden
ts th
ough
t tha
t “a
fee
base
d on
the
num
ber o
f mile
s dr
iven
– p
eopl
e w
ho u
sed
the
syst
em m
ore
wou
ld p
ay a
hig
her f
ee” w
as “d
efini
tely
” or “
prob
ably
” a “g
ood
way
to fu
nd in
crea
sed
trans
porta
tion
inve
stm
ent.”
Min
eta
Tran
spor
tatio
n In
stitu
te (A
graw
al, N
ixon
, an
d M
urth
y)
2012
U.S
. res
iden
ts41
% o
f res
pond
ents
“sup
porte
d” a
tax
whe
re “v
ehic
les
wou
ld b
e ch
arge
d on
e ce
nt p
er m
ile, b
ut
vehi
cles
that
pol
lute
less
wou
ld b
e ch
arge
d le
ss, a
nd v
ehic
les
that
pol
lute
mor
e w
ould
be
char
ged
mor
e. .
. . .V
ehic
les
wou
ld h
ave
an e
lect
roni
c m
eter
to k
eep
track
of t
he m
iles
driv
en, a
nd th
e ta
x w
ould
be
paid
eac
h tim
e dr
iver
s bu
y ga
s.”
Min
eta
Tran
spor
tatio
n In
stitu
te (A
graw
al a
nd
Nix
on)
2013
U.S
. res
iden
ts39
% o
f res
pond
ents
a ta
x w
here
“veh
icle
s w
ould
be
char
ged
one
cent
per
mile
, but
veh
icle
s th
at
pollu
te le
ss w
ould
be
char
ged
less
, and
veh
icle
s th
at p
ollu
te m
ore
wou
ld b
e ch
arge
d m
ore.
” Sup
port
decr
ease
d to
19%
of r
espo
nden
ts w
hen
all v
ehic
les
paid
the
sam
e fla
t fee
of o
ne c
ent p
er m
ile.
Fisc
al R
esea
rch
Cen
ter,
And
rew
You
ng S
choo
l of
Pol
icy
Stu
dies
, Geo
rgia
S
tate
Uni
vers
ity (E
llen,
S
joqu
ist,
and
Sto
yche
va)
2012
Geo
rgia
adu
lt dr
iver
s39
% o
f res
pond
ents
wou
ld “s
uppo
rt” a
VM
T ta
x of
1.6
0 ce
nts
per m
ile. T
hey
surv
ey d
escr
ibed
the
tax
“as
a re
plac
emen
t for
the
curr
ent g
as ta
x w
ithou
t des
crib
ing
the
mec
hani
sm b
y w
hich
mile
s w
ould
be
dete
rmin
ed. R
espo
nden
ts w
ere
aske
d to
imag
ine
that
, ins
tead
of p
ayin
g a
stat
e ga
s ta
x,
they
cou
ld p
ay a
t the
gas
pum
p a
tax
base
d so
lely
on
the
num
ber o
f mile
s th
e ve
hicl
e w
as d
riven
in
Geo
rgia
sin
ce it
was
last
refu
eled
.” 36
% o
f res
pond
ents
wou
ld “s
uppo
rt” a
VM
T ta
x of
2.1
0 ce
nts
per m
ile “a
s a
repl
acem
ent f
or th
e cu
rren
t gas
tax
with
out d
escr
ibin
g th
e m
echa
nism
by
whi
ch m
iles
wou
ld b
e de
term
ined
. 33%
of r
espo
nden
ts w
ould
“sup
port”
a V
MT
tax
of 1
.35
cent
s pe
r mile
“as
a re
plac
emen
t for
the
curr
ent g
as ta
x w
ithou
t des
crib
ing
the
mec
hani
sm b
y w
hich
mile
s w
ould
be
dete
rmin
ed.
HN
TB C
orpo
ratio
n (K
elto
n R
esea
rch)
2010
U.S
. res
iden
ts39
% o
f res
pond
ents
agr
eed
with
the
stat
emen
t “th
e U
.S. s
houl
d try
to re
duce
tran
spor
tatio
n gr
eenh
ouse
-gas
em
issi
ons
by re
duci
ng th
e nu
mbe
r of m
iles
that
veh
icle
s tra
vel t
hrou
gh a
mile
age
use
tax.
”M
inet
a Tr
ansp
orta
tion
Inst
itute
(Agr
awal
and
N
ixon
)
2011
U.S
. res
iden
ts36
% o
f res
pond
ents
“sup
porte
d” a
tax
whe
re “v
ehic
les
wou
ld b
e ch
arge
d on
e ce
nt p
er m
ile, b
ut
vehi
cles
that
pol
lute
less
wou
ld b
e ch
arge
d le
ss, a
nd v
ehic
les
that
pol
lute
mor
e w
ould
be
char
ged
mor
e. .
. . .V
ehic
les
wou
ld h
ave
an e
lect
roni
c m
eter
to k
eep
track
of t
he m
iles
driv
en, a
nd th
e ta
x w
ould
be
paid
eac
h tim
e dr
iver
s bu
y ga
s.” S
uppo
rt de
crea
sed
to 2
2% o
f res
pond
ents
whe
n al
l ve
hicl
es p
aid
the
sam
e fla
t fee
of o
ne c
ent p
er m
ile.
The
Roc
kefe
ller
Foun
datio
n (H
art R
esea
rch
Ass
ocia
tes)
2011
U.S
. reg
iste
red
vote
rs34
% o
f res
pond
ents
foun
d it
“acc
epta
ble”
to re
plac
e th
e fe
dera
l gas
tax
with
“a fe
e ba
sed
on th
e nu
mbe
r of m
iles
driv
en p
er y
ear.”
40%
of r
espo
nden
ts “f
avor
ed” d
evel
opin
g a
pilo
t pro
gram
in “s
elec
t st
ates
and
loca
litie
s” to
test
suc
h a
repl
acem
ent.

Mineta Transportat ion Inst i tute
83Appendix B: Opinion Polls Reviewed
Spon
sor (
and
auth
or,
if di
ffere
nt)
Surv
ey d
ate
Sam
plin
g fr
ame
Find
ings
Indi
an N
atio
ns C
ounc
il of
G
over
nmen
ts
(Col
lect
ive
Stre
ngth
)
2010
Tuls
a (O
klah
oma)
re
gion
resi
dent
s33
% o
f Tul
sa re
side
nts
wer
e so
mew
hat o
r ver
y w
illin
g to
pay
“a s
mal
l use
r tax
that
wou
ld b
e ba
sed
on th
e nu
mbe
r of m
iles
a ve
hicl
e is
driv
en e
ach
year
” to
“hel
p fu
nd p
ublic
tran
spor
tatio
n im
prov
emen
ts.”
Min
eta
Tran
spor
tatio
n In
stitu
te (A
graw
al a
nd
Nix
on)
2010
U.S
. res
iden
ts33
% o
f res
pond
ents
“sup
porte
d” a
tax
whe
re “v
ehic
les
wou
ld b
e ch
arge
d on
e ce
nt p
er m
ile, b
ut
vehi
cles
that
pol
lute
less
wou
ld b
e ch
arge
d le
ss, a
nd v
ehic
les
that
pol
lute
mor
e w
ould
be
char
ged
mor
e. .
. . .V
ehic
les
wou
ld h
ave
an e
lect
roni
c m
eter
to k
eep
track
of t
he m
iles
driv
en, a
nd th
e ta
x w
ould
be
paid
eac
h tim
e dr
iver
s bu
y ga
s.” S
uppo
rt de
crea
sed
to 2
2% o
f res
pond
ents
whe
n al
l ve
hicl
es p
aid
the
sam
e fla
t fee
of o
ne c
ent p
er m
ile.
Wal
l Stre
et J
ourn
al20
12R
eade
rs o
f the
pap
er’s
bl
og w
ho re
spon
ded
to
an in
vita
tion
to v
ote
28%
of r
espo
nden
ts s
aid
that
in p
lace
of t
he g
as ta
x th
ere
shou
ld b
e a
“tax
inst
ead
by m
iles
driv
en.”
HN
TB C
orpo
ratio
n (K
elto
n R
esea
rch)
2012
U.S
. res
iden
ts23
% o
f res
pond
ents
wou
ld “m
ost p
refe
r” a
“veh
icle
mile
s dr
iven
use
r fee
” whe
n as
ked
to c
hoos
e w
heth
er th
ey w
ould
“mos
t pre
fer”
as
a w
ay to
“get
fund
ing
for t
he n
atio
n’s
inte
rsta
te p
roje
cts.
” (Th
e al
tern
ativ
es w
ere
tolls
or a
n in
crea
sed
fede
ral g
as ta
x.)
Min
eta
Tran
spor
tatio
n In
stitu
te (W
eins
tein
et a
l.)20
06C
alifo
rnia
like
ly v
oter
s23
% o
f res
pond
ents
“wou
ld v
ote
for”
repl
acin
g th
e st
ate
gas
tax
with
a m
ileag
e fe
e w
here
“eac
h dr
iver
wou
ld p
ay a
fee
of 1
¢ pe
r mile
for e
very
mile
driv
en w
ithin
the
stat
e.” R
espo
nden
ts w
ere
in-
form
ed th
at “v
ehic
les
wou
ld b
e eq
uipp
ed w
ith a
n el
ectro
nic
mea
ns to
kee
p tra
ck o
f mile
s dr
iven
, and
th
e fe
e w
ould
be
paid
whe
n dr
iver
s bu
y ga
s.”
Ras
mus
sen
Rep
orts
2009
U.S
. res
iden
ts18
% o
f res
pond
ents
“fav
ored
” som
e fo
rm o
f mile
age
tax
“to h
elp
fund
the
build
ing
and
repa
ir of
ro
ads
and
brid
ges.
”M
assI
NC
Pol
ling
Gro
up20
13M
assa
chus
etts
re
gist
ered
vot
ers
17%
of r
espo
nden
ts w
ould
“sup
port”
the
stat
e ad
optin
g “a
new
tax
base
d on
the
num
ber o
f mile
s a
pers
on d
rives
. Eac
h dr
iver
wou
ld p
ay a
tax
for e
very
mile
driv
en. T
he c
ar’s
mile
age
wou
ld b
e re
ad
durin
g an
nual
veh
icle
insp
ectio
ns, a
nd th
e ta
x w
ould
be
paid
at t
hat t
ime.
”R
asm
usse
n R
epor
ts
(Pul
se O
pini
on R
esea
rch)
2012
U.S
. res
iden
ts12
% o
f res
pond
ents
“fav
ored
” a m
ileag
e ta
x w
hen
it w
as p
rese
nted
as
“a g
ood
way
to ra
ise
fund
s fo
r hi
ghw
ay m
aint
enan
ce.”
Civ
itas
Inst
itute
2009
Nor
th C
arol
ina
regi
ster
ed v
oter
s12
% o
f res
pond
ents
“wou
ld v
iew
favo
rabl
y” a
sw
itch
to “a
pla
n th
at w
ould
cha
rge
all d
river
s ba
sed
on th
e nu
mbe
r of m
iles
they
driv
e in
Nor
th C
arol
ina.
” (Th
e qu
estio
n di
d no
t spe
cify
wha
t the
“cur
rent
sy
stem
” was
.)
Tabl
e 21
, con
tinue
d

Mineta Transportat ion Inst i tute
84 Appendix B: Opinion Polls Reviewed
Tabl
e 22
. Pu
blic
Opi
nion
Pol
ling
on S
ales
Tax
esSp
onso
r (an
d au
thor
, if
diffe
rent
)Su
rvey
dat
eSa
mpl
ing
fram
eFi
ndin
gsS
an B
erna
rdin
o C
ount
y,
CA
and
Riv
ersi
de C
ount
y,
CA
2002
Riv
ersi
de C
ount
y an
d S
an B
erna
rdin
o C
ount
y,
(Cal
iforn
ia) r
esid
ents
72.2
% o
f Riv
ersi
de C
ount
y re
side
nts
and
75.8
% o
f San
Ber
nard
ino
Cou
nty
resi
dent
s sa
id th
at
they
wou
ld s
uppo
rt lo
cal s
ales
tax
mea
sure
s in
upc
omin
g re
fere
ndum
s (in
200
2). A
naly
sis
of th
e su
rvey
dat
a sh
owed
that
the
mea
sure
s w
ere
supp
orte
d co
nsis
tent
ly a
cros
s a
varie
ty o
f sub
grou
ps
(inco
me
leve
l, ra
cial
iden
tity,
vot
er re
gist
ratio
n st
atus
, and
like
lihoo
d of
vot
ing)
. All
grou
ps e
xcep
t bl
ack/
Afri
can-
Am
eric
ans
in R
iver
side
Cou
nty
show
ed m
ore
than
69%
sup
port
for t
he m
easu
res.
Ala
med
a C
ount
y Tr
ansp
orta
tion
Com
mis
sion
(E
MC
Res
earc
h)
2011
(M
arch
)A
lam
eda
Cou
nty,
C
alifo
rnia
, reg
iste
red
vote
rs
71%
of r
espo
nden
ts w
ere
“like
ly to
vot
e ye
s to
app
rove
” an
exte
nsio
n of
a 0
.5¢
coun
ty s
ales
tax
“to a
ddre
ss a
n up
date
d pl
an fo
r the
cou
nty’
s cu
rren
t and
futu
re tr
ansp
orta
tion
need
s.”
Res
pond
ents
wer
e in
form
ed a
bout
the
fact
that
the
tax
pass
ed tw
elve
yea
rs p
revi
ousl
y an
d th
at
“mon
ey fr
om th
is m
easu
re c
ould
onl
y be
spe
nt o
n th
e vo
ter-
appr
oved
exp
endi
ture
pla
n, a
nd a
ll m
oney
from
this
mea
sure
wou
ld s
tay
in A
lam
eda
Cou
nty
and
coul
d no
t be
take
n by
the
stat
e.” I
n se
para
te q
uest
ions
, res
pond
ents
sho
wed
a p
refe
renc
e fo
r mak
ing
the
tax
perm
anen
t with
vot
es
on th
e sp
endi
ng p
lan
ever
y 20
yea
rs to
just
ext
endi
ng th
e ta
x 20
yea
rs (5
4% to
29%
) and
m
aint
aini
ng th
e ta
x at
its
curr
ent r
ate
rath
er th
an in
crea
sing
it b
y 0.
25¢
(45%
to 3
9%).
Virg
inia
Tra
nspo
rtatio
n C
onst
ruct
ion
Alli
ance
(P
ublic
Opi
nion
Stra
tegi
es)
2013
Virg
inia
like
ly v
oter
s69
% o
f res
pond
ents
sai
d th
at th
e fo
llow
ing
prop
osal
to in
crea
se tr
ansp
orta
tion
fund
ing
was
“c
lose
st” t
o th
eir o
pini
on: “
in o
rder
to in
crea
se tr
ansp
orta
tion
fund
ing,
the
curr
ent g
as ta
x of
se
vent
een
poin
t five
cen
ts p
er g
allo
n sh
ould
be
elim
inat
ed a
nd re
plac
ed w
ith a
n ei
ght t
enth
s of
a
penn
y in
crea
se in
the
stat
e sa
les
tax.
The
add
ition
al re
venu
e fro
m th
e st
ate
sale
s ta
x in
crea
se
wou
ld b
e de
dica
ted
entir
ely
to tr
ansp
orta
tion
and
Virg
inia
’s s
tate
sal
es ta
x w
ould
stil
l be
the
low
est i
n th
e re
gion
.” (T
he a
ltern
ativ
e pr
esen
ted
was
to ra
ise
the
stat
e pe
r-ga
llon
gas
tax
and
also
inde
x th
e ra
te to
infla
tion.
)A
lam
eda
Cou
nty
Tran
spor
tatio
n C
omm
issi
on
(EM
C R
esea
rch)
2011
(O
ctob
er)
Ala
med
a C
ount
y,
Cal
iforn
ia, r
egis
tere
d vo
ters
69%
of o
ne g
roup
of r
espo
nden
ts w
ere
“like
ly to
vot
e ye
s to
app
rove
” a m
easu
re “e
xten
ding
the
exis
ting
trans
porta
tion
sale
s ta
x an
d in
crea
sing
it b
y on
e ha
lf ce
nt.”
59%
of a
sec
ond
grou
p of
re
spon
dent
s w
ere
“like
ly to
vot
e ye
s to
app
rove
” a m
easu
re th
at “a
utho
rizes
a o
ne h
alf c
ent
trans
porta
tion
sale
s ta
x.” I
n bo
th c
ases
, res
pond
ents
wer
e in
form
ed th
at th
e m
easu
re w
ould
“a
ddre
ss th
e C
ount
y’s
curr
ent a
nd fu
ture
tran
spor
tatio
n ne
eds,
” wou
ld re
quire
“vot
er a
ppro
val
ever
y 20
yea
rs o
n a
new
exp
endi
ture
pla
n, w
ith c
itize
n ov
ersi
ght a
nd a
loca
l job
s cr
eatio
n pr
ogra
m” a
nd th
at “n
o m
oney
can
be
take
n by
the
stat
e.”
Judy
For
d W
atso
n C
ente
r fo
r Pub
lic P
olic
y20
13Vi
rgin
ia re
gist
ered
vot
ers
63%
of r
espo
nden
ts s
aid
they
wou
ld “s
uppo
rt re
plac
ing
the
gas
tax
with
an
incr
ease
d sa
les
tax.
” 45
% o
f res
pond
ents
sai
d th
ey w
ould
sup
port
an “i
ncre
ase
the
stat
e sa
les
tax”
in o
rder
to fu
nd
“tran
spor
tatio
n ne
eds,
incl
udin
g bu
ildin
g ne
w ro
ads
and
brid
ges
and
mai
ntai
ning
cur
rent
road
s an
d br
idge
s.”
Reg
iona
l Tra
nspo
rtatio
n A
llian
ce (F
allo
n R
esea
rch)
2012
Ora
nge
Cou
nty,
Nor
th
Car
olin
a, re
gist
ered
vo
ters
60%
of r
espo
nden
ts “w
ould
vot
e fo
r” a
0.5
¢ lo
cal s
ales
tax
“to p
ay fo
r new
or e
xpan
ded
publ
ic
trans
porta
tion.
” Exe
mpt
ing
“food
, med
icin
e, u
tiliti
es, a
nd g
asol
ine”
from
the
tax
incr
ease
d su
ppor
t fo
r the
mea
sure
(41%
sai
d th
ey w
ere
“mor
e lik
ely”
to v
ote
for t
he m
easu
re v
s. 7
% “l
ess
likel
y”),
as
did
a sc
enar
io w
here
gas
pric
es ro
se to
$5/
gallo
n (2
7% “m
ore
likel
y” to
14%
“les
s lik
ely”
). A
scen
ario
whe
re “f
undi
ng w
as u
sed
just
for m
ore
bus
rout
es a
nd s
ervi
ces,
and
did
not
incl
ude
any
rail
syst
ems”
redu
ced
supp
ort f
or th
e m
easu
re (8
% “m
ore
likel
y” to
35%
“les
s lik
ely”
).

Mineta Transportat ion Inst i tute
85Appendix B: Opinion Polls Reviewed
Spon
sor (
and
auth
or,
if di
ffere
nt)
Surv
ey d
ate
Sam
plin
g fr
ame
Find
ings
Tria
ngle
Tra
nspo
rtatio
n A
utho
rity
(Fal
lon
Res
earc
h)
2010
Dur
ham
, Ora
nge,
and
W
ake
Cou
ntie
s, N
orth
C
arol
ina,
regi
ster
ed
vote
rs
58%
of r
espo
nden
ts “w
ould
vot
e fo
r” a
0.5
¢ sa
les-
tax
incr
ease
“to
pay
for n
ew o
r exp
ande
d pu
blic
tra
nspo
rtatio
n.” 5
3% o
f a s
egm
ent o
f res
pond
ents
“wou
ld v
ote
for”
a 0
.75¢
cou
nty
sale
s ta
x to
fu
nd “n
ew o
r exp
ande
d pu
blic
tran
spor
tatio
n, n
ew s
choo
l con
stru
ctio
n, a
nd th
e pu
rcha
se o
f ope
n sp
ace
for p
rese
rvat
ion.
”Lo
s A
ngel
es M
etro
(F
airb
ank
Mas
lin M
aulli
n)20
07Lo
s A
ngel
es C
ount
y,
Cal
iforn
ia, r
egis
tere
d vo
ters
56%
of r
espo
nden
ts “w
ould
vot
e ye
s in
favo
r” o
f a 0
.5¢
coun
ty s
ales
tax
for t
rans
porta
tion
proj
ects
“with
loca
l con
trol,
requ
ired
annu
al in
depe
nden
t fina
ncia
l aud
its, a
nd n
o fu
nds
to b
e us
ed
for a
dmin
istra
tors
’ sal
arie
s.” R
espo
nden
ts w
ere
pres
ente
d w
ith th
e ty
pes
of p
roje
cts
that
wou
ld b
e fu
nded
with
the
tax.
57%
of r
espo
nden
ts “w
ould
vot
e ye
s in
favo
r” o
f the
sam
e m
easu
re if
the
tax
was
set
at 0
.25¢
.C
ente
r for
the
Stu
dy o
f Lo
s A
ngel
es, L
oyol
a M
arym
ount
Uni
vers
ity
2012
Los
Ang
eles
, Cal
iforn
ia,
regi
ster
ed v
oter
s54
% o
f res
pond
ents
“wou
ld v
ote
yes”
to e
xten
d a
0.5¢
cou
nty
sale
s ta
x “fo
r tra
nspo
rtatio
n-re
late
d pr
ojec
ts, l
ike
the
met
ro ra
il.” R
espo
nden
ts w
ere
info
rmed
abo
ut th
e fa
ct th
at th
e ta
x w
as p
asse
d fo
ur y
ears
pre
viou
sly
and
was
goi
ng to
last
a to
tal o
f thi
rty y
ears
, and
that
thei
r vot
e w
ould
be
to
exte
nd th
e ta
x an
othe
r thi
rty y
ears
.U
nive
rsity
of A
rkan
sas
(Par
ry)
2012
Ark
ansa
s ad
ult r
esid
ents
53%
of r
espo
nden
ts “f
avor
” a m
easu
re th
at w
ould
“inc
reas
e th
e st
atew
ide
sale
s ta
x fro
m 6
pe
rcen
t to
6.5
perc
ent f
or th
e ne
xt 1
0 ye
ars
in o
rder
to g
ener
ate
mon
ey fo
r Ark
ansa
s hi
ghw
ays
and
othe
r roa
d co
nstru
ctio
n pr
ojec
ts. T
he in
crea
se w
ould
not
app
ly to
gro
cerie
s.”
Min
eta
Tran
spor
tatio
n In
stitu
te (A
graw
al, N
ixon
)20
11U
.S. r
esid
ents
51%
of r
espo
nden
ts “s
uppo
rted”
a 0
.5¢
natio
nal s
ales
tax
“to p
ay fo
r tra
nspo
rtatio
n.”
Den
ver R
TD
(The
Ken
ney
Gro
up)
2010
Met
ro D
enve
r and
B
ould
er C
ount
y,
Col
orad
o, li
kely
vot
ers
51%
of r
espo
nden
ts “w
ould
vot
e fo
r” a
0.4
¢ in
crea
se in
cou
nty
sale
s ta
xes
devo
ted
to a
set
of
regi
onal
tran
spor
tatio
n pr
ojec
ts. E
arlie
r in
the
surv
ey, 4
8% o
f res
pond
ents
agr
eed
that
“we
shou
ld
doub
le th
e sa
les
tax
from
four
pen
nies
on
ten
dolla
rs to
a to
tal o
f eig
ht p
enni
es o
n te
n do
llars
” in
orde
r to
com
plet
e th
e se
t of p
roje
cts
“on
time
in 2
017.
”A
tlant
a Jo
urna
l- C
onst
itutio
n an
d C
hann
el 2
A
ctio
n N
ews
(Mas
on-D
ixon
P
ollin
g &
Res
earc
h, In
c.)
2011
Atla
nta,
Geo
rgia
, are
a re
gist
ered
vot
ers
51%
of r
espo
nden
ts “w
ould
vot
e ye
s, in
favo
r” o
f a 1
¢ lo
cal s
ales
tax
to “f
und
trans
porta
tion
proj
ects
in th
e [lo
cal]
spec
ial t
rans
porta
tion
dist
rict.”
Res
pond
ents
wer
e in
form
ed th
at “p
roje
cts
to
be fu
nded
wou
ld b
e re
ques
ted
by e
ach
coun
ty a
nd th
en s
elec
ted
by a
regi
onal
gro
up o
f ele
cted
of
ficia
ls.”
Reg
iona
l Tra
nspo
rtatio
n A
llian
ce (F
allo
n R
esea
rch)
2012
Wak
e C
ount
y, N
orth
C
arol
ina,
regi
ster
ed
vote
rs
50%
of r
espo
nden
ts “w
ould
vot
e fo
r” a
0.5
¢ lo
cal s
ales
tax
“to p
ay fo
r new
or e
xpan
ded
publ
ic
trans
porta
tion.
” Exe
mpt
ing
“food
, med
icin
e, u
tiliti
es, a
nd g
asol
ine”
from
the
tax
incr
ease
d su
ppor
t fo
r the
mea
sure
(44%
sai
d th
ey w
ere
“mor
e lik
ely”
to v
ote
for t
he m
easu
re v
s. 9
% “l
ess
likel
y”),
as
did
a sc
enar
io w
here
gas
pric
es ro
se to
$5/
gallo
n (2
3% “m
ore
likel
y” to
20%
“les
s lik
ely”
). A
scen
ario
whe
re “f
undi
ng w
as u
sed
just
for m
ore
bus
rout
es a
nd s
ervi
ces,
and
did
not
incl
ude
any
rail
syst
ems”
redu
ced
supp
ort f
or th
e m
easu
re (1
2% “m
ore
likel
y” to
40%
“les
s lik
ely”
).M
inet
a Tr
ansp
orta
tion
Inst
itute
(Agr
awal
, Nix
on,
and
Mur
thy)
2012
U.S
. res
iden
ts49
% o
f res
pond
ents
“sup
porte
d” a
0.5
¢ na
tiona
l sal
es ta
x “to
pay
for t
rans
porta
tion.
”
Tabl
e 22
, con
tinue
d

Mineta Transportat ion Inst i tute
86 Appendix B: Opinion Polls Reviewed
Spon
sor (
and
auth
or,
if di
ffere
nt)
Surv
ey d
ate
Sam
plin
g fr
ame
Find
ings
Pub
lic P
olic
y In
stitu
te o
f C
alifo
rnia
(Bal
dass
are)
2005
Los
Ang
eles
Cou
nty,
C
alifo
rnia
, res
iden
ts47
% o
f res
pond
ents
“wou
ld v
ote
yes”
for a
0.5
¢ lo
cal s
ales
tax
“for l
ocal
tran
spor
tatio
n pr
ojec
ts.”
Min
eta
Tran
spor
tatio
n In
stitu
te (A
graw
al a
nd
Nix
on)
2011
U.S
. res
iden
ts45
% o
f res
pond
ents
“sup
porte
d” a
0.5
¢ na
tiona
l sal
es ta
x “to
pay
for t
rans
porta
tion.
”
Min
eta
Tran
spor
tatio
n In
stitu
te (A
graw
al a
nd
Nix
on)
2010
U.S
. res
iden
ts42
% o
f res
pond
ents
“sup
porte
d” a
0.5
¢ na
tiona
l sal
es ta
x “to
pay
for t
rans
porta
tion.
”
Talk
busi
ness
.net
(Bro
ck)
2012
Ark
ansa
s lik
ely
vote
rs42
% o
f res
pond
ents
“wou
ld v
ote
for”
a 0
.5¢
stat
ewid
e sa
les
tax
incr
ease
that
“wou
ld b
e us
ed to
pa
y fo
r a fo
ur-la
ne h
ighw
ay s
yste
m s
tate
wid
e.”
Min
eta
Tran
spor
tatio
n In
stitu
te (W
eins
tein
et a
l.)20
06C
alifo
rnia
like
ly v
oter
s41
% o
f res
pond
ents
wou
ld “s
uppo
rt” a
0.5
¢ in
crea
se in
the
stat
e sa
les
tax
“for t
rans
porta
tion
purp
oses
, suc
h as
mai
ntai
ning
and
impr
ovin
g lo
cal s
treet
s, h
ighw
ays,
and
mas
s tra
nsit.
”S
urve
yUS
A20
07S
eattl
e-Ta
com
a M
SA
resi
dent
s38
% o
f res
pond
ents
“wou
ld s
uppo
rt” ra
isin
g th
e sa
les
tax
by 0
.6¢
“in o
rder
to p
ay fo
r tra
nspo
rtatio
n pr
ojec
ts.”
Als
o, 2
5% o
f res
pond
ents
“wou
ld s
uppo
rt” th
e sa
les-
tax
incr
ease
in
conc
ert w
ith a
n in
crea
sed
“car
lice
nse
tab
tax”
to p
ay fo
r “a
com
bina
tion
of ro
ad, h
ighw
ay, a
nd
mas
s tra
nsit
impr
ovem
ents
” in
the
surv
ey a
rea.
Sur
veyU
SA
2012
Atla
nta,
Geo
rgia
, are
a lik
ely
vote
rs36
% o
f res
pond
ents
wer
e “c
erta
in to
vot
e ye
s” o
n a
1¢ s
ales
tax
incr
ease
“to
fund
regi
onal
tra
nspo
rtatio
n pr
ojec
ts.”
Roa
noke
Col
lege
2013
Virg
inia
resi
dent
s33
% “f
avor
” a p
ropo
sal t
hat “
[t]he
gas
tax
wou
ld b
e el
imin
ated
, but
the
sale
s ta
x w
ould
be
incr
ease
d. V
ehic
le re
gist
ratio
n fe
es w
ould
als
o in
crea
se. T
he a
dditi
onal
fund
s fro
m th
e sa
les
tax
wou
ld g
o to
tran
spor
tatio
n an
d a
high
er p
erce
ntag
e of
the
exis
ting
sale
s ta
x re
venu
e w
ould
go
to
trans
porta
tion
as w
ell.”
20/2
0 In
sigh
t Pol
ling
2011
Atla
nta,
Geo
rgia
, are
a re
gist
ered
vot
ers
33%
of r
espo
nden
ts “f
avor
ed” a
mea
sure
“to
incr
ease
thei
r loc
al s
ales
tax
by o
ne c
ent f
or e
very
do
llar s
pent
” if “
the
mon
ey ra
ised
…w
ill b
e us
ed s
olel
y fo
r tra
nspo
rtatio
n pr
ojec
ts o
n a
list
appr
oved
by
regi
onal
lead
ers.
”U
SC
Sol
Pric
e S
choo
l of
Pub
lic P
olic
y (M
4 S
trate
gies
and
Ben
son
Stra
tegy
Gro
up)
2013
City
of L
os A
ngel
es,
Cal
iforn
ia, l
ikel
y vo
ters
30%
of r
espo
nden
ts w
ould
vot
e “d
efini
tely
yes
” on
Pro
posi
tion
A w
hich
“wou
ld e
nact
a o
ne-h
alf
cent
sal
es ta
x in
ord
er to
offs
et s
ever
e an
d re
peat
ed s
tate
cut
s an
d pr
ovid
e lo
cal f
undi
ng fo
r: 91
1 em
erge
ncy
resp
onse
ser
vice
s; m
aint
aini
ng fi
refig
hter
, par
amed
ic, a
nd p
olic
e of
ficer
sta
ffing
le
vels
; con
tinui
ng c
omm
unity
pol
icin
g, s
enio
r ser
vice
s, a
fter-
scho
ol g
ang
and
drug
pre
vent
ion
prog
ram
s; re
pairi
ng p
otho
les
and
side
wal
ks; a
nd o
ther
gen
eral
mun
icip
al s
ervi
ces.
”W
ashi
ngto
n S
tate
Tr
ansp
orta
tion
Com
mis
sion
(E
MC
Res
earc
h)
2012
Was
hing
ton
stat
e re
side
nts
30%
of r
espo
nden
ts th
ough
t tha
t “ad
ding
the
sale
s ta
x to
gas
pur
chas
es” w
as “d
efini
tely
” or
“pro
babl
y” a
“goo
d w
ay to
fund
incr
ease
d tra
nspo
rtatio
n in
vest
men
t.
Tabl
e 22
, con
tinue
d
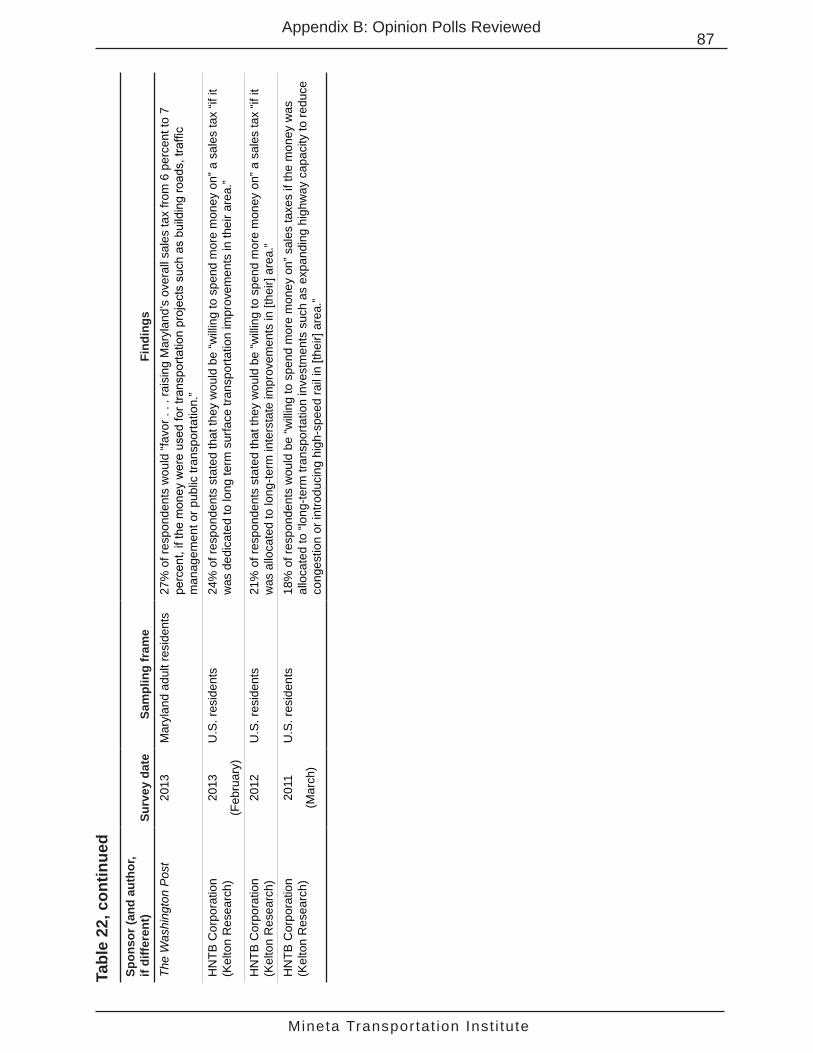
Mineta Transportat ion Inst i tute
87Appendix B: Opinion Polls Reviewed
Spon
sor (
and
auth
or,
if di
ffere
nt)
Surv
ey d
ate
Sam
plin
g fr
ame
Find
ings
The
Was
hing
ton
Pos
t20
13M
aryl
and
adul
t res
iden
ts
27%
of r
espo
nden
ts w
ould
“fav
or .
. . ra
isin
g M
aryl
and’
s ov
eral
l sal
es ta
x fro
m 6
per
cent
to 7
pe
rcen
t, if
the
mon
ey w
ere
used
for t
rans
porta
tion
proj
ects
suc
h as
bui
ldin
g ro
ads,
traf
fic
man
agem
ent o
r pub
lic tr
ansp
orta
tion.
”H
NTB
Cor
pora
tion
(Kel
ton
Res
earc
h)20
13
(Feb
ruar
y)
U.S
. res
iden
ts24
% o
f res
pond
ents
sta
ted
that
they
wou
ld b
e “w
illin
g to
spe
nd m
ore
mon
ey o
n” a
sal
es ta
x “if
it
was
ded
icat
ed to
long
term
sur
face
tran
spor
tatio
n im
prov
emen
ts in
thei
r are
a.”
HN
TB C
orpo
ratio
n (K
elto
n R
esea
rch)
2012
U.S
. res
iden
ts21
% o
f res
pond
ents
sta
ted
that
they
wou
ld b
e “w
illin
g to
spe
nd m
ore
mon
ey o
n” a
sal
es ta
x “if
it
was
allo
cate
d to
long
-term
inte
rsta
te im
prov
emen
ts in
[the
ir] a
rea.
”H
NTB
Cor
pora
tion
(Kel
ton
Res
earc
h)20
11
(Mar
ch)
U.S
. res
iden
ts18
% o
f res
pond
ents
wou
ld b
e “w
illin
g to
spe
nd m
ore
mon
ey o
n” s
ales
taxe
s if
the
mon
ey w
as
allo
cate
d to
“lon
g-te
rm tr
ansp
orta
tion
inve
stm
ents
suc
h as
exp
andi
ng h
ighw
ay c
apac
ity to
redu
ce
cong
estio
n or
intro
duci
ng h
igh-
spee
d ra
il in
[the
ir] a
rea.
”
Tabl
e 22
, con
tinue
d

Mineta Transportat ion Inst i tute
88 Appendix B: Opinion Polls Reviewed
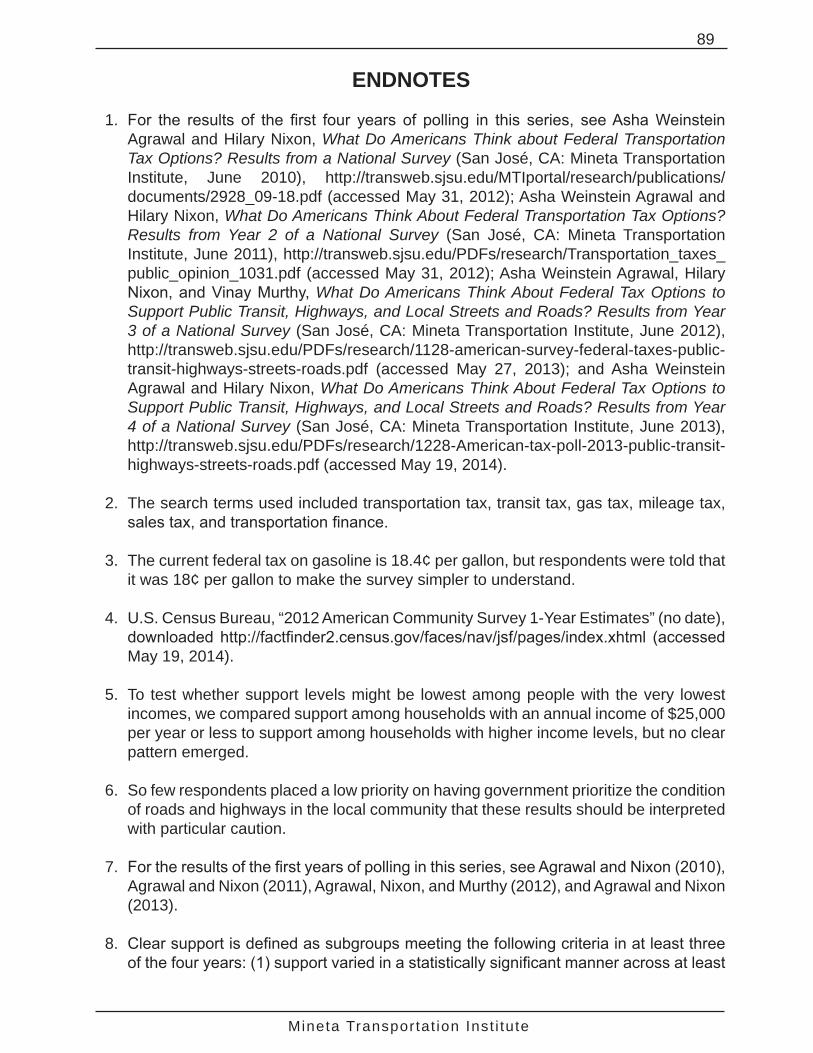
Mineta Transportat ion Inst i tute
89
ENDNOTES
1. For the results of the first four years of polling in this series, see Asha Weinstein Agrawal and Hilary Nixon, What Do Americans Think about Federal Transportation Tax Options? Results from a National Survey (San José, CA: Mineta Transportation Institute, June 2010), http://transweb.sjsu.edu/MTIportal/research/publications/documents/2928_09-18.pdf (accessed May 31, 2012); Asha Weinstein Agrawal and Hilary Nixon, What Do Americans Think About Federal Transportation Tax Options? Results from Year 2 of a National Survey (San José, CA: Mineta Transportation Institute, June 2011), http://transweb.sjsu.edu/PDFs/research/Transportation_taxes_public_opinion_1031.pdf (accessed May 31, 2012); Asha Weinstein Agrawal, Hilary Nixon, and Vinay Murthy, What Do Americans Think About Federal Tax Options to Support Public Transit, Highways, and Local Streets and Roads? Results from Year 3 of a National Survey (San José, CA: Mineta Transportation Institute, June 2012), http://transweb.sjsu.edu/PDFs/research/1128-american-survey-federal-taxes-public-transit-highways-streets-roads.pdf (accessed May 27, 2013); and Asha Weinstein Agrawal and Hilary Nixon, What Do Americans Think About Federal Tax Options to Support Public Transit, Highways, and Local Streets and Roads? Results from Year 4 of a National Survey (San José, CA: Mineta Transportation Institute, June 2013), http://transweb.sjsu.edu/PDFs/research/1228-American-tax-poll-2013-public-transit-highways-streets-roads.pdf (accessed May 19, 2014).
2. The search terms used included transportation tax, transit tax, gas tax, mileage tax, sales tax, and transportation finance.
3. The current federal tax on gasoline is 18.4¢ per gallon, but respondents were told that it was 18¢ per gallon to make the survey simpler to understand.
4. U.S. Census Bureau, “2012 American Community Survey 1-Year Estimates” (no date), downloaded http://factfinder2.census.gov/faces/nav/jsf/pages/index.xhtml (accessed May 19, 2014).
5. To test whether support levels might be lowest among people with the very lowest incomes, we compared support among households with an annual income of $25,000 per year or less to support among households with higher income levels, but no clear pattern emerged.
6. So few respondents placed a low priority on having government prioritize the condition of roads and highways in the local community that these results should be interpreted with particular caution.
7. For the results of the first years of polling in this series, see Agrawal and Nixon (2010), Agrawal and Nixon (2011), Agrawal, Nixon, and Murthy (2012), and Agrawal and Nixon (2013).
8. Clear support is defined as subgroups meeting the following criteria in at least three of the four years: (1) support varied in a statistically significant manner across at least

Mineta Transportat ion Inst i tute
90 Endnotes
5 of the tax options, and (2) the average magnitude of the difference between the groups across all 11 tax options was at least 8 percentage points or more.
9. The 2012 survey asked a similar question, but the authors determined from the responses that respondents had misunderstood the question. Therefore, the 2012 results are not presented here for comparison.
10. Half of respondents were asked the question this way, while the other half were asked the question with the two arguments presented in reverse order: “Now I have a question about whether or not GAS tax money should be spent to pay for public transit. Some people say gas tax money should be used to pay for public transit IN ADDITION to roads and highways, because transit helps reduce traffic congestion and wear-and-tear on the roads. Other people say that money from gas taxes should only be spent on roads and highways, since drivers pay the tax. Would you support or oppose spending SOME gas tax money on public transit?”
11. This last subgroup, drivers of the most fuel-efficient vehicles, had so few respondents that the results should be interpreted with particular caution.
12. This last subgroup, drivers of the most fuel-efficient vehicles, had so few respondents that the results should be interpreted with particular caution.
13. This last subgroup, drivers of the most fuel-efficient vehicles, had so few respondents that the results should be interpreted with particular caution.
14. This last subgroup, drivers of the most fuel-efficient vehicles, had so few respondents that the results should be interpreted with particular caution.
15. For the complete 2010, 2011, 2012, and 2013 results, see Agrawal and Nixon (2010), Agrawal and Nixon (2011), Agrawal, Nixon, and Murthy (2012), and Agrawal and Nixon (2013).
16. U.S. Census Bureau, “2012 American Community Survey 1-Year Estimates” (no date), downloaded from http://factfinder2.census.gov/faces/nav/jsf/pages/index.xhtml (accessed May 19, 2014).

Mineta Transportat ion Inst i tute
91
BIBLIOGRAPHY
20/20 Insight Polling. “New Poll Shows Trouble for Transportation Tax in Metro Atlanta.” 20/20 Insight Polling Blog. June 22, 2011. http://2020insight.blogspot.com/2011/06/new-poll-show-trouble-for.html (accessed March 5, 2012).
Abt-SRBI, Inc. “Maryland Politics Poll.” The Washington Post. January 29, 2012. http://www.washingtonpost.com/wp-srv/special/local/maryland-politics-poll/ (accessed April 11, 2012).
Agrawal, Asha, Jennifer Dill, and Hilary Nixon. “Green” Transportation Taxes and Fees: A Survey of Californians. San José, CA: Mineta Transportation Institute, June 2009. http://transweb.sjsu.edu/MTIportal/research/publications/documents/green_transportation_taxes_fees.pdf (accessed June 11, 2011).
Agrawal, Asha Weinstein, and Hilary Nixon. What Do Americans Think About Federal Transportation Tax Options? Results from a National Survey. San José, CA: Mineta Transportation Institute, June 2010. http://transweb.sjsu.edu/MTIportal/research/publications/documents/2928_09-18.pdf (accessed June 1, 2012).
———. What Do American Think About Federal Transportation Tax Options? Results from Year 2 of a National Survey. San José, CA: Mineta Transportation Institute, June 2011. http://transweb.sjsu.edu/PDFs/research/Transportation_taxes_public_opinion_1031.pdf (accessed February 28, 2012).
———. What Do Americans Think About Federal Transportation Tax Options? Results from Year 4 of a National Survey. San José, CA: Mineta Transportation Institute, June 2013. http://transweb.sjsu.edu/PDFs/research/1228-American-tax-poll-2013-public-transit-highways-streets-roads.pdf (accessed June 2, 2014).
Agrawal, Asha, Hilary Nixon, and Vinay Murthy. What Do American Think About Federal Transportation Tax Options? Results from Year 3 of a National Survey. San José, CA: Mineta Transportation Institute, June 2012. http://transweb.sjsu.edu/PDFs/research/1128-american-survey-federal-taxes-public-transit-highways-streets-roads.pdf (accessed May 21, 2013).
Baldassare, Mark. Statewide Survey: Special Survey of Los Angeles. San Francisco, CA: Public Policy Institute of California, 2005.
Bittle, Scott, Jonathan Rochkind, and Amber Ott. The Energy Learning Curve. Public Agenda, January 2009. http://www.publicagenda.org/pages/energy-learning-curve (accessed June 1, 2010).
Brock, Roby. “Differing Results for Three Major Ballot Issues.” TalkBusiness.Net. April 2, 2012. http://talkbusiness.net/2012/04/differing-results-for-three-major-ballot-issues/ (accessed April 12, 2012).
Mineta Transportat ion Inst i tute
92 Bibliography
Brown, Alyssa. “In U.S., Most Oppose State Gas Tax Hike to Fund Repairs.” Gallup, April 22, 2013. http://www.gallup.com/poll/161990/oppose-state-gas-tax-hike-fund-repairs.aspx (accessed April 30, 2013).
Brown, Peter. “Virginia Voters Satisfied with State, But Not U.S., Quinnipiac University Poll Finds; Voters Support Nuclear Plants, Oppose I-95 Tolls.” Quinnipiac University Polling Institute. October 11, 2011. http://www.quinnipiac.edu/images/polling/va/va10122011.doc (accessed March 5, 2012).
Bursk, Steve. “Poll: Americans Worried but Reject Higher Taxes to Fix Bridges.” CNN. August 10, 2007. http://www.cnn.com/2007/POLITICS/08/09/bridges.poll/index.html (accessed May 28, 2010).
BW Research Partnership. “MTC – RTP 2035 – Visioning Resident Survey Toplines.” October 2007. http://www.mtc.ca.gov/planning/2035_plan/poll.htm (accessed July 3, 2008).
CBS News/New York Times. “Barack Obama/George Bush Presidency/Finances.” January 2009. USCBSNYT2009-01A. http://webapps.ropercenter.uconn.edu/CFIDE/cf/action/catalog/ (accessed May 27, 2010).
Center for the Study of Los Angeles. “LA Riots Anniversary Study.” Los Angeles: Loyola Marymount University, April 18, 2012. http://www.lmu.edu/Assets/Colleges+Schools/BCLA/Center+for+the+Study+of+Los+Angeles/measure_r.pdf (accessed April 19, 2012).
Civitas Institute. “Decision Maker Poll.” Raleigh, NC: Civitas Institute, January 2009. http://www.nccivitas.org/files/January percent202009 percent20Poll.pdf (accessed April 27, 2010).
Collective Strength. “Tulsa Transportation Research Findings.” Tulsa, OK: Indian Nation Council of Governments, January 2010.
Duke Nicholas Institute. “Poll: Americans Back Climate Change Regulation, Not Taxes” [poll conducted Jan. 16-22, 2013]. Durham, NC: Duke University, no date. http://nicholasinstitute.duke.edu/sites/default/files/publications/topline_results.pdf (accessed June 6, 2013).
Eagleton Center for Public Interest Polling. “New Jerseyans Express Limited Support for Gas Tax Hike: Support Varies Depending on How Tax Is Explained.” New Brunswick, NJ: Rutgers Eagleton Institute of Politics, March 10, 2014. http://www.rci.rutgers.edu/~redlawsk/EP/Tables2014/NJGasTaxMarch2014.pdf (accessed June 2, 2014).
———. “Strong Opposition to Higher Gas Tax Decreases as New Jerseyans Learn Why More Revenue is Needed.” New Brunswick, NJ: Rutgers Eagleton Institute of Politics, April 17, 2014. http://www.rci.rutgers.edu/~redlawsk/EP/Tables2014/NJGasTaxApril2014.pdf (accessed June 2, 2014).

Mineta Transportat ion Inst i tute
93Bibliography
Ellen, Pam Scholder, David L. Sjoquist, and Rayna Stoycheva. Measuring Preferences for and Responses to Alternative Revenue Sources for Transportation. Atlanta, Georgia: Fiscal Research Center, Andrew Young School of Policy Studies, Georgia State University, June 2012. http://frc.gsu.edu/sites/default/files/documents/Rpt_244FIN(1).pdf (accessed March 14, 2013).
Elway Research, Inc. “Tough Road Ahead for Transportation Package.” The Elway Poll, March 4, 2013. http://seattletimes.wpengine.netdna-cdn.com/politicsnorthwest/files/2013/03/Elway-Poll-030413-Transportation.pdf (accessed March 14, 2013).
EMC Research. “EMC #11-4407: Telephone Survey of Alameda County Voters Conducted for Alameda County Transportation Commission (ACTC).” Oakland, CA: EMC Research, March 14, 2011.
———. “EMC #11-4453: Telephone survey of Alameda County voters conducted for Alameda County Transportation Commission (ACTC).” Oakland, CA: EMC Research, October 9, 2011.
———. Statewide Transportation Survey: Report on Findings. Olympia, WA: Washington State Transportation Commission. January 2012. http://www.wstc.wa.gov/StudiesSurveys/StatewideTransportationSurvey/documents/2012_0209_WSTCSurveyReport.pdf (accessed February 24, 2012).
———. “Telephone Survey of Bay Area Likely November 2012 Voters.” Oakland, CA: Metropolitan Transportation Commission, April 11, 2012.
Fabrizio McLaughlin & Associates. “American Highway Users Alliance National Survey of Likely Voters.” Washington, DC: American Highway Users Alliance, April 2008. http://www.highways.org/pdfs/survey.pdf (accessed June 1, 2010).
Fairbank, Maslin, Maullin and Associates. “Los Angeles County Transportation Ballot Measure Survey 2007.” November 2007.
Fallon Research. “2010 Triangle Transportation Survey (Durham, Orange, and Wake Counties, North Carolina).” Regional Transportation Alliance. March 23, 2010. http://www.letsgetmoving.org/images/uploads/RTAtransitcompositeresults-Mr percent2710.pdf (accessed June 1, 2010).
———. “2012 Triangle Transit Survey: Orange County, North Carolina.” Regional Transportation Alliance. May 15, 2012. http://www.letsgetmoving.org/images/uploads/pages/RTAtransitOrange-May’12.pdf (accessed May 25, 2012).
———. “2012 Triangle Transportation Survey: Wake County, NC.” Regional Transportation Alliance. May 15, 2012. http://www.letsgetmoving.org/images/uploads/pages/RTAtransitWake-May’12.pdf (accessed May 25, 2012).
File, Thom, and Sarah Crissey. “Voting and Registration in the Election of November

Mineta Transportat ion Inst i tute
94 Bibliography
2008: Population Characteristics.” Washington, DC: U.S. Census Bureau, Economic Statistics Bureau, May 2010. http://www.census.gov/prod/2010pubs/p20-562.pdf (accessed June 10, 2010).
Gonzales Research & Marketing Strategies, Inc. Maryland Poll. Gonzalez Research & Marketing Strategies, Inc., January 2013. http://www.gonzalesresearch.com/polls/Maryland%20Poll%20January%202013.pdf (accessed June 6, 2013).
———. Maryland Poll. Gonzalez Research & Marketing Strategies, Inc., October 2013. http://www.gonzalesresearch.com/polls/Maryland%20Poll%20October%202013.pdf (accessed June 2, 2014).
———. [Poll Conducted for] Mid-Atlantic Petroleum Distributors Association. January 2012. http://mapda.com/pdf/Report_-_MAPDA_January_2012.pdf (accessed June 6, 2013).
Green, Andrew D., Max Neiman, Shel Bockman, and Barbara Sirotnik. “Public Support for Transportation Sales Taxes in California: A Two County Assessment.” California Journal of Politics and Policy 5, no. 4 (2013): 645-670.
Hart Research Associates. “NAR/SGA Survey: Final.” National Association of Realtors, January 2009. http://www.realtor.org/wps/wcm/connect/a974a4804d3d185ba091b ea1d5758593/Topline+Survey+Results+Jan+2009.doc?MOD=AJPERES&CACHEID=a974a4804d3d185ba091bea1d5758593 (accessed April 27, 2010).
Hart Research Associates/Public Opinion Strategies. “Study #10177: The Rockefeller Foundation Transportation Survey: January/February 2011.” New York: The Rockefeller Foundation, February 2011. http://www.rockefellerfoundation.org/uploads/files/8095e806-a876-41a6-9f35-7485287cf0d2.pdf (accessed May 31, 2011).
Judy Ford Watson Center for Public Policy, Christopher Newport University. “Virginia Survey: 2013 General Assembly Session, Strong Support for McDonnell’s Transportation Plan.” Newport News, VA: Christopher Newport University, January 24, 2013. http://www.cnu.edu/cpp/pdf/Jan_24_General_Assembly_Report.pdf (accessed March 15, 2013).
Kelton Research. “America THINKS 2012 Highway Survey.” HNTB, 2012. http://news.hntb.com/images/bulk_media_upload/docs/AThinks_Highway_factsheet_0612.pdf (accessed April 11, 2013).
———. “America THINKS 2013: Use of Tolls for Transportation Funding.” Kansas City, MO: HNTB Corporation, February 2013.
———. “DOT and Tolling Survey 1: Breakout Report.” Kansas City, MO: HNTB, April 2012.

Mineta Transportat ion Inst i tute
95Bibliography
———. “HNTB Q1 Survey.” Kansas City, MO: HNTB Corporation, March 2011.
———. “Public Transit Survey: Topline Report.” Kansas City, MO: HNTB Corporation, February 2011.
———. “Surface Transportation Survey: America THINKS 2009 Infrastructure Survey.” Kansas City, MO: HNTB Corporation, August 2009.
———. “Sustainability Survey: America THINKS 2010 Sustainability Survey.” Kansas City, MO: HNTB Corporation, April 2010.
Krosnick, Jon A. “ABC News/Washington Post/Stanford University Poll.” Stanford, CA: Woods Institute for the Environment at Stanford University, April 20, 2007. http://woods.stanford.edu/docs/surveys/GW_2007_ABC_News_Release.pdf (accessed April 27, 2010).
Langer, Gary. “A Look Under the Hood of a Nation on Wheels: ABC News/Time Magazine/Washington Post Poll.” ABC News/Time Magazine /Washington Post, February 13, 2005.
Leiserowitz, Anthony, et al. Public Support for Climate & Energy Policies in April 2013. New Haven, CT: Yale Project on Climate Change Communication, 2013. http://environment.yale.edu/climate-communication/files/Climate-Policy-Support-April-2013.pdf (accessed May 27, 2013).
M4 Strategies and Benson Strategy Group. USC Sol Price School of Public Policy/LA Times Los Angeles City Primary Poll. February 2013. http://www.mfour.com/docs/2/poll/USC%20Sol%20Price%20School%20of%20Public%20Policy_LA%20Times%20Los%20Angeles%20City%20Primary%20Poll_Topline_PHONE_FINAL%20ms.pdf (accessed June 6, 2013).
Marquette Law School. “Marquette Law School Poll Toplines, March 11-14, 2013.” Milwaukee, WI: Marquette Law School, 2013. https://law.marquette.edu/poll/wp-content/uploads/2013/03/MLSP15CompleteToplines.pdf (accessed March 22, 2013).
Mason-Dixon Polling & Research, Inc. “Atlanta Metro Transit Poll.” Atlanta, GA: Atlanta Journal-Constitution and Channel 2 Action News, September 26, 2011.
MassINC Polling Group. “Massachusetts Statewide Poll of 1,506 Registered Voters Field Dates: February 4-11, 2013.” No date. http://031d482.netsolhost.com/WordPress/wp-content/uploads/2013/03/Crosstabs-02-13-Transportation-Poll.pdf (accessed June 6, 2013).
Mineta Transportat ion Inst i tute
96 Bibliography
Metropolitan Washington Council of Governments. Keypad Polling Results -- Cumulative Total -- Final. Washington, D.C.: Metropolitan Washington Council of Governments, no date. http://www.mwcog.org/transportation/activities/congestionpricing/materials/Appendices/KeypadVoting_PricingForums2011-2012.pdf (accessed April 14, 2013).
Morin, Richard, and Steven Ginsberg. “Painful Commutes Don’t Stop Drivers.” The Washington Post, February 13, 2005. http://www.washingtonpost.com/wp-dyn/articles/A19884-2005Feb12.html (accessed June 13, 2010).
Musti, Sashank, Katherine Kortum, and Kara M. Kockelman. “Household Energy Use and Travel: Opportunities for Behavioral Change.” Transportation Research Part D: Transport and Environment 16, no. 1 (January 2011): 49–56.
New York Times/CBS News. “New York Times/CBS News Poll, February 22–26, 2006.” The New York Times. February 28, 2006. http://www.nytimes.com/packages/pdf/national/20060228_poll_results.pdf (accessed April 27, 2010).
Old Dominion University Social Science Research Center. How is Life in the Hampton Roads? 2012 Report for the 3rd Annual Life in Hampton Roads Survey. Norfolk, VA: Social Science Research Center, Old Dominion University, no date. http://images.bimedia.net/documents/odu_lifestyle_study.pdf (accessed March 14, 2013).
Parry, Janine A. The Arkansas Poll, 2012 Summary Report. Fayetteville: University of Arkansas, 2012. http://www.uark.edu/depts/plscinfo/partners/arkpoll/12/2012_Arkansas_Poll_Summary_Report.pdf (accessed April 14, 2013).
Pew Research Center for the People and the Press. “Consensus in Principle, Resistance in Practice: Deficit Solutions Meet with Public Skepticism.” Washington, DC: Pew Research Center for the People and the Press, December 9, 2010. http://pewresearch.org/pubs/1824/poll-federal-budget-deficit-reductions-tax-spend-specifics-opposed-obama-trust (accessed May 31, 2011).
———. “Public Sends Mixed Signals on Energy Policy.” Washington, DC: Pew Research Center for the People and the Press, March 6, 2008. http://people-press.org/report/400/public-sends-mixed-signals-on-energy-policy (accessed May 18, 2010).
Public Mind, Fairleigh Dickinson University. “Disapproval for Middle Class Tax Hikes.” Hackensack, NJ: Fairleigh Dickinson University, March 17, 2014. http://publicmind.fdu.edu/2014/taxattack/final.pdf (accessed June 2, 2014).
Public Opinion Strategies. “Virginia Statewide: Key Findings from a Statewide Survey of 500 Likely Voters in Virginia, with 125 Cell Phone Interviews, Conducted January 19-21, 2012.” Richmond: Virginia Transportation Construction Alliance, January 24, 2013. http://www.vtca.org/images/uploads/VTCA_Press_Release_1-24-13.pdf (accessed June 6, 2013).

Mineta Transportat ion Inst i tute
97Bibliography
Pugmire, Tim. “MPR Poll on Gas Tax: Five Cents. . . Maybe.” Saint Paul, MN: Minnesota Public Radio News, May 11, 2007. http://minnesota.publicradio.org/display/web/2007/05/11/gastax/ (accessed June 1, 2010).
Pulse Opinion Research, LLC. “Toplines - Mileage Tax - March 24-25, 2012.” Rasmussen Reports. March 27, 2012. http://www.rasmussenreports.com/platinum/econ_crosstabs/march_2012/toplines/toplines_mileage_tax_march_24_25_201 (accessed April 11, 2012).
Quinnipiac University Polling Institute. “Connecticut Gov Hits New High in Midst of Gun Debate, Quinnipiac University Poll Finds; Voters Back Tolls to Repair Roads, Reduce Gas Tax.” Hamden, CT: Quinnipiac University, 2013. http://www.quinnipiac.edu/images/polling/ct/ct03122013.pdf/ (accessed June 6, 2013).
———. “Connecticut Gov. Rell’s Approval Slips, Quinnipiac University Poll Finds; Voters Say No to Gas Tax, Yes to Beer, Cigarette Tax.” Hamden, CT: Quinnipiac University, February 18, 2005. http://www.quinnipiac.edu/x1296.xml?ReleaseID=651 (accessed April 27, 2010).
———. “New Jersey Voters Back Wage Freeze, Nix Gas Tax Hike, Quinnipiac University Poll Finds; Voters Split on Recreational Marijuana.” Hamden, CT: Quinnipiac University, April 10, 2014. http://www.quinnipiac.edu/news-and-events/quinnipiac-university-poll/new-jersey/release-detail?ReleaseID=2031 (accessed June 2, 2014).
———. “New Jersey Voters Say 3–1 Freeze State Worker Wages, Quinnipiac University Poll Finds; Voters Back Layoffs Almost 2–1.” Hamden, CT: Quinnipiac University, November 24, 2009. http://www.quinnipiac.edu/x1299.xml?ReleaseID=1399 (accessed April 27, 2010).
———. “No Honeymoon For Connecticut’s New Governor, Quinnipiac University Poll Finds; Voters Say Budget Plan Taxes Too Much, Unfair to Them.” Hamden, CT: Quinnipiac University, March 9, 2011. http://www.quinnipiac.edu/news-and-events/quinnipiac-university-poll/connecticut/release-detail?ReleaseID=1565 (accessed June 2, 2014).
———. “Opposition to New York Fat Tax Gets Fatter, Quinnipiac University Poll Finds; Statewide Opposition to East River Tolls is Narrow.” Hamden, CT: Quinnipiac University, January 15, 2009. http://www.quinnipiac.edu/news-and-events/quinnipiac-university-poll/new-york-state/release-detail?ReleaseID=1247 (accessed June 2, 2014).
———. “Women, Young Voters Like Virginia’s Republican Gov, Quinnipiac University Poll Finds; Year-Round School is a Bad Idea, Voters Say.” Hamden, CT: Quinnipiac University, November 15, 2012. http://www.quinnipiac.edu/institutes-centers/polling-institute/virginia/release-detail/?ReleaseID=1814 (accessed June 6, 2013).
Mineta Transportat ion Inst i tute
98 Bibliography
Rasmussen Reports. “73 percent Steer Clear of Mileage Tax.” Rasmussen Reports. February 23, 2009. http://www.rasmussenreports.com/public_content/business/taxes/february_2009/ 73_steer_clear_of_mileage_tax (accessed April 27, 2010).
———. “81 percent Oppose Gas Tax Hike to Encourage Sales of More Efficient Cars.” Rasmussen Reports. May 11, 2009. http://www.rasmussenreports.com/public_content/business/gas_oil/may_2009/ 81_oppose_gas_tax_hike_to_encourage_sales_of_more_efficient_cars (accessed April 27, 2010).
———. “Just 15 percent Favor Higher Gas Tax to Fund More Transportation Projects.” Rasmussen Reports. December 7, 2009. http://www.rasmussenreports.com/ public_content/business/taxes/december_2009/just_15_favor_higher_gas_tax_to_fund_more_transportation_projects (accessed April 27, 2010).
Reason Foundation. “Reason-RUPE Public Opinion Survey: Winter 2011 Topline Results.” No date. http://reason.org/files/reason_rupe_transportation_poll.pdf (accessed June 6, 2013).
Roanoke College. “Roanoke College Poll, 2013 General Assembly, January 24, 2013.” Salem, VA: Roanoke College, 2013. http://roanoke.edu/Documents/polls/Jan%202013%20Qs%20Part%201.pdf (accessed June 6, 2013).
Selzer & Company. “The Iowa Poll.” DesMoinesRegister.com, February 15, 2013. http://www.desmoinesregister.com/article/20130215/NEWS/302150077/Iowa-Poll-63-oppose-raising-state-gas-tax (accessed June 6, 2013).
Selzer & Company. “The Iowa Poll: Study #2040.” Des Moines, IA: Des Moines Register, February 12–15, 2012.
Smith, Andrew E. “Boston Globe Poll #20: Transportation Issues in MA.” Durham, NH: The Survey Center, University of New Hampshire, December 2008. http://www.unh.edu/survey-center/news/pdf/bg_2008-dec21.pdf (accessed January 7, 2009).
SurveyUSA of Clifton, NJ. “Results of SurveyUSA News Poll #12214.” SurveyUSA. May 31, 2007. http://www.surveyusa.com/client/PollReportEmail.aspx?g=d19736e9-c3a8-44b5-9612-28b2af3e96ff (accessed June 4, 2010).
———. “Georgia Voters Say Roads, Not Mass Transit, Should Be Transportation Funding Priority; Outcome of T-SPLOST Uncertain.” SurveyUSA. February 27, 2012. http://www.surveyusa.com/client/PollReport.aspx?g=89931e1a-e757-41ef-a92e-beaffd3801e0 (accessed April 11, 2012).
The Kenney Group. “Survey of Likely Voters in RTD District.” Denver, CO: Coalition for Smart Transit, March 2010. http://www.rtd-fastracks.com/media/uploads/main/ FasTrack_survey_March_2010_RTD_summary.pdf (accessed June 4, 2010).

Mineta Transportat ion Inst i tute
99Bibliography
Wall Street Journal. “Vote: What Should Happen to the Gas Tax?” August 30, 2012. http://blogs.wsj.com/drivers-seat/2012/08/30/vote-what-should-happen-to-the-gas-tax/ (accessed March 4, 2013).
Washington Post. “Maryland Residents Reject Gas Tax Hikes, Support Wind Power in Washington Post Poll.” March 2, 2013. http://www.washingtonpost.com/politics/polling/maryland-residents-reject-gas-tax-hikes/2013/03/02/5c282fc2-80cf-11e2-a671-0307392de8de_print.html (accessed June 6, 2013).
———. “Maryland Poll—State Politics and Finances.” October 2007. USWASH2007-160464. http://webapps.ropercenter.uconn.edu/CFIDE/cf/action/catalog/ (accessed May 27, 2010).
U.S. Census Bureau. “2011 American Community Survey 1-Year Estimates.” No date. Downloaded from http://factfinder2.census.gov/faces/nav/jsf/pages/searchresults.xhtml?refresh=t (accessed May 21, 2013).
U.S. Census Bureau. “Census Regions and Divisions of the United States.” No date. https://www.census.gov/geo/www/us_regdiv.pdf (accessed May 21, 2013).
U.S. Environmental Protection Agency. “Vehicle Rating System and SmartWay Thresholds, MY 2011 & MY 2012” (EPA-420-B-13-015). January 2010. http://ofmpub.epa.gov/greenvehicles/SmartWay_2012.pdf (accessed May 31, 2012). http://www.epa.gov/greenvehicles/documents/420b13015.pdf (accessed May 20, 2014).
Weinstein, Asha, et al. Transportation Financing Opportunities for the State of California. San José, CA: Mineta Transportation Institute, October 2006. http://transweb.sjsu.edu/mtiportal/research/publications/documents/06-01/TransportFinanceOpps5_020107.pdf (accessed June 13, 2011).
Wilson Research Strategies. “NCPPR Global Warming Poll.” National Center for Public Policy Research. February 26, 2008. http://www.nationalcenter.org/ NCPPR_Global_Warming_Poll_Questions_0208.pdf (accessed February 26, 2008).

Mineta Transportat ion Inst i tute
100 Bibliography

Mineta Transportat ion Inst i tute
101
ABOUT THE AUTHORS
ASHA WEINSTEIN AGRAWAL, PH.D.
Dr. Agrawal is the Director of the MTI National Transportation Finance Center and also an Associate Professor of Urban and Regional Planning at San José State University. Her research and teaching interests in transportation policy and planning include transportation finance, pedestrian planning, and urban street design. She also works in the area of planning and transportation history. She has a B.A. from Harvard University in Folklore and Mythology, an M.Sc. from the London School of Economics and Political Science in Urban and Regional Planning, and a Ph.D. from the University of California, Berkeley, in City and Regional Planning.
HILARY NIXON, PH.D.
Dr. Nixon is an Associate Professor of Urban and Regional Planning at San José State University. Her research and teaching interests in environmental planning and policy focus on the relationship between environmental attitudes and behavior, particularly with respect to waste management and linkages between transportation and the environment. She holds a B.A. from the University of Rochester in Environmental Management and a Ph.D. in Planning, Policy, and Design from the University of California, Irvine.

Mineta Transportat ion Inst i tute
102 About the Authors

The Norman Y. Mineta International Institute for Surface Transportation Policy Studies was established by Congress in the Intermodal Surface Transportation Efficiency Act of 1991 (ISTEA). The Institute’s Board of Trustees revised the name to Mineta Transportation Institute (MTI) in 1996. Reauthorized in 1998, MTI was selected by the U.S. Department of Transportation through a competitive process in 2002 as a national “Center of Excellence.” The Institute is funded by Congress through the United States Department of Transportation’s Research and Innovative Technology Administration, the California Legislature through the Department of Transportation (Caltrans), and by private grants and donations.
The Institute receives oversight from an internationally respected Board of Trustees whose members represent all major surface transportation modes. MTI’s focus on policy and management resulted from a Board assessment of the industry’s unmet needs and led directly to the choice of the San José State University College of Business as the Institute’s home. The Board provides policy direction, assists with needs assessment, and connects the Institute and its programs with the international transportation community.
MTI’s transportation policy work is centered on three primary responsibilities:
MINETA TRANSPORTATION INSTITUTE
Research MTI works to provide policy-oriented research for all levels of government and the private sector to foster the development of optimum surface transportation systems. Research areas in-clude: transportation security; planning and policy development; interrelationships among transportation, land use, and the environment; transportation finance; and collaborative labor-management relations. Certified Research Associates conduct the research. Certification requires an advanced degree, gener-ally a Ph.D., a record of academic publications, and profession-al references. Research projects culminate in a peer-reviewed publication, available both in hardcopy and on TransWeb, the MTI website (http://transweb.sjsu.edu).
Education The educational goal of the Institute is to provide graduate-lev-el education to students seeking a career in the development and operation of surface transportation programs. MTI, through San José State University, offers an AACSB-accredited Master of Science in Transportation Management and a graduate Certifi-cate in Transportation Management that serve to prepare the na-tion’s transportation managers for the 21st century. The master’s degree is the highest conferred by the California State Uni-versity system. With the active assistance of the California
Department of Transportation, MTI delivers its classes over a state-of-the-art videoconference network throughout the state of California and via webcasting beyond, allowing working transportation professionals to pursue an advanced degree regardless of their location. To meet the needs of employers seeking a diverse workforce, MTI’s education program promotes enrollment to under-represented groups.
Information and Technology Transfer MTI promotes the availability of completed research to professional organizations and journals and works to integrate the research findings into the graduate education program. In addition to publishing the studies, the Institute also sponsors symposia to disseminate research results to transportation professionals and encourages Research Associates to present their findings at conferences. The World in Motion, MTI’s quarterly newsletter, covers innovation in the Institute’s research and education pro-grams. MTI’s extensive collection of transportation-related publications is integrated into San José State University’s world-class Martin Luther King, Jr. Library.
The contents of this report reflect the views of the authors, who are responsible for the facts and accuracy of the information presented herein. This document is disseminated under the sponsorship of the U.S. Department of Transportation, University Transportation Centers Program and the California Department of Transportation, in the interest of information exchange. This report does not necessarily reflect the official views or policies of the U.S. government, State of California, or the Mineta Transportation Institute, who assume no liability for the contents or use thereof. This report does not constitute a standard specification, design standard, or regulation.
DISCLAIMER
MTI FOUNDER Hon. Norman Y. Mineta
MTI BOARD OF TRUSTEESFounder, Honorable Norman Mineta (Ex-Officio)Secretary (ret.), US Department of TransportationVice ChairHill & Knowlton, Inc.
Honorary Chair, Honorable Bill Shuster (Ex-Officio)ChairHouse Transportation and Infrastructure CommitteeUnited States House of Representatives
Honorary Co-Chair, Honorable Nick Rahall (Ex-Officio)Vice ChairHouse Transportation and Infrastructure CommitteeUnited States House of Representatives
Chair, Steve Heminger (TE 2015)Executive DirectorMetropolitan Transportation Commission
Vice Chair, Stephanie Pinson (TE 2015)President/COOGilbert Tweed Associates, Inc.
Executive Director, Rod Diridon* (Ex-Officio)Mineta Transportation InstituteSan José State University
Thomas Barron (TE 2015)Executive Vice PresidentStrategic InitiativesParsons Group
Joseph Boardman (Ex-Officio)Chief Executive OfficerAmtrak
Donald Camph (TE 2016)PresidentAldaron, Inc.
Anne Canby (TE 2014)DirectorOneRail Coalition
Grace Crunican (TE 2016)General ManagerBay Area Rapid Transit District
Julie Cunningham (TE 2015)President/CEOConference of Minority Transportation Officials
William Dorey (TE 2014)Board of DirectorsGranite Construction, Inc.
Malcolm Dougherty (Ex-Officio)DirectorCalifornia Department of Transportation
Mortimer Downey* (TE 2015)Senior AdvisorParsons Brinckerhoff
Nuria Fernandez (TE 2014)General Manager/CEOValley Transportation Authority
Rose Guilbault (TE 2014)Vice President (ret.)American Automobile Association
Ed Hamberger (Ex-Officio)President/CEOAssociation of American Railroads
Diane Woodend Jones (TE 2016)Principal and Chair of BoardLea+Elliot, Inc.
Will Kempton (TE 2016)Executive DirectorTransportation California
Jean-Pierre Loubinoux (Ex-Officio)Director GeneralInternational Union of Railways (UIC)
Michael Melaniphy (Ex-Officio)President & CEOAmerican Public Transportation Association (APTA)
Jeff Morales (TE 2016)CEOCalifornia High-Speed Rail Authority
Beverley Swaim-Staley (TE 2016)PresidentUnion Station Redevelopment Corporation
Dr. David Steele (Ex-Officio)Dean, College of BusinessSan José State University
Michael Townes* (TE 2014)Senior Vice PresidentNational Transit Services LeaderCDM Smith
Bud Wright (Ex-Officio)Executive DirectorAmerican Association of State Highway and Transportation Officials (AASHTO)
Edward Wytkind (Ex-Officio)PresidentTransportation Trades Dept., AFL-CIO
(TE) = Term Expiration or Ex-Officio* = Past Chair, Board of Trustee
Hon. Rod Diridon, Sr.Executive Director
Karen Philbrick, Ph.D.Deputy Executive Director andResearch Director
Peter Haas, Ph.D.Education Director
Donna MaurilloCommunications Director
Brian Michael JenkinsNational Transportation Safety and Security Center
Asha Weinstein Agrawal, Ph.D.National Transportation Finance Center
Asha Weinstein Agrawal, Ph.D.Urban and Regional Planning San José State University
Jan Botha, Ph.D.Civil & Environmental EngineeringSan José State University
Katherine Kao Cushing, Ph.D.Enviromental Science San José State University
Dave Czerwinski, Ph.D.Marketing and Decision Science San José State University
Frances Edwards, Ph.D.Political Science San José State University
Taeho Park, Ph.D.Organization and Management San José State University
Diana WuMartin Luther King, Jr. LibrarySan José State University
Directors Research Associates Policy Oversight Committee
What do Americans Think About Federal Tax Options to Support Public Transit, Highways, and Local Streets and Roads? Results from Year Five of a National Survey
MTI Report 12-36
Funded by U.S. Department of Transportation and California Department of Transportation
MT
IW
hat do Am
ericans Think A
bout Federal Transportation T
ax Options?
MT
I Report 12-36June 2014