Western Section American Society of Animal Science
368
Western Section American Society of Animal Science June 23-26, 2015
-
Upload
khangminh22 -
Category
Documents
-
view
0 -
download
0
Transcript of Western Section American Society of Animal Science

Western Section American Society of
Animal Science
June 23-26, 2015

2015 Western Section Proceedings Sponsors
Meeting Sponsors
Boehringer Ingelheim National Cattleman's Beef Association
New Mexico Beef Council New Mexico Department of Agriculture
New Mexico State University University of Arizona, College of Agriculture and Life Sciences Cooperative Extension
Elanco Animal Health Zoetis
Zinpro Corporation
Award and Recognition Donors
Distinguished Service Award Elanco Animal Health
Western Section, American Society of Animal Science
Distinguished Teaching Award Elanco Animal Health
Western Section, American Society of Animal Science
Extension Award Elanco Animal Health
Western Section, American Society of Animal Science
Young Scientist Award Western Section, American Society of Animal Science
Graduate Student Institution Award Zinpro Corporation
Young Scholars Recognition Recipients Zinpro Corporation
First Place Recipient of the Applied Animal Science Awards
Western Section, American Society of Animal Science

i
TABLE OF CONTENTS
WSASAS Committees .................................................................................................................................................. vii Minutes of the 2014 Western section Business meeting ..................................................................................................... viii
Distinguished Service Award Sheep Happens.
T. T. Ross .......................................................................................................................................................................... 1 Young Scholars Recognition Program Effects of supplementation of acyl-homoserine lactones on in vitro true digestibility of a forage diet.
K. Marchetti, A. Garza, E. J. Scholljegerdes, and S. L. Lodge-Ivey ................................................................................ 5 Effects of feeding ground juniper to gestating ewes on pre- and postpartum ewe performance, serum biochemistry and hormones, milk fatty acid composition and progeny preweaning performance.
W. C. Stewart, T. R. Whitney, E. J. Scholljegerdes, D. M. Hallford, S. A. Soto-Navarro, H. D. Naumann .................... 10 Oral Presentations
Graduate Student Paper Competition Effects of organic or inorganic Co, Cu, Mn, and Zn supplementation to late-gestating beef cows on productive and physiological responses of the offspring.
R. Marques, R. F. Cooke, M. C. Rodrigues, T. A. Guarnieri, B. I. Cappellozza, P. Moriel, D. W. Bohnert .................... 17 Effect of maternal mid- to late gestational energy source on expression of angiogenic factors in fetal lamb jejunal tissue.
H. C. Cunningham, K. J. Austin, K. M. Cammack, M. A. Berg, A. E. Radunz, A. M. Meyer........................................ 22 Influence of dried distiller's grains with solubles on ram lamb growth and reproductive traits.
A. R. Crane, R. R. Redden, M. S. Crouse, J. D. Kirsch, J. E. Held, C. S. Schauer ...................................................... 27
Effects of nose flap devices applied to calves on cow body condition, calf performance, and calf humoral immune response.
K. D. Lippolis, R. J. Callan, C. E. Mayo, M. Fischer, J. K. Ahola ................................................................................... 33 An evaluation of biofuel coproducts in feedlot diets: cattle growth performance, carcass characteristics, apparent nutrient digestibility, and water use assessment of feedstock sources.
T. L. Opheim, P. R. B. Campanili, B. J. M. Lemos, L. A. Ovinge, J. O. Baggerman, K. C. McCuistion, J. Dwyer, M. L. Galyean, J. O. Sarturi, S. J. Trojan ................................................................................................................................... 38
Nutrient transporters in bovine utero-placental tissues on days 16 to 50 of gestation.
M. S. Crouse, K. J. McLean, L. P. Reynolds, C. R. Dahlen, B. W. Neville, P. P. Borowicz, J. S. Caton ........................ 44
Effect of chronic administration of oxytocin on corpus luteum function in cycling mares. K. C. Parkinson, D. K. Vanderwall, J. Rigas, A. Sweat ................................................................................................... 48
Inhibition of chemokine receptor four (CXCR4) signaling in vivo suppresses trophoblast invasion during early gestation in sheep.
K. E. Quinn, S. Z. Prosser, R. L. Ashley .................................................................................................................................. 52 Intrauterine transfer of autologous interferon tau-primed peripheral blood mononuclear cells increases pregnancy rates after embryo transfer in cattle.
J. L. Chase, J. A. Hernandez Gifford, D. M. Hallford, T. L. Ott, C. A. Gifford ........................................................................... 58

ii
IGF-1 attenuates WNT inhibition on FSH target genes and estradiol production in granulosa cells. B. I. Gomez, C. A. Gifford, D. M. Hallford, J. A. Hernandez Gifford ............................................................................. 63
Meloxicam as an alternative to alleviate inflammatory and acute-phase reactions in beef cattle upon lipopolysaccharide administration or vaccination
M. C. Rodrigues, R. F. Cooke, R. Marques, S. Arispe, D. H. Keisler, D. W. Bohnert ..................................................... 67
Performance of beef-cattle as influenced by controlled and uncontrolled populations of horn flies (Diptera: Muscidae) B. G. Smythe, M. E. Wise, E. J. Scholljegerdes, M. Fletcher .......................................................................................... 72
Carcass characteristics and body composition of lambs selected for divergent residual feed intake. K. A. Perz, M. R. Whitmore, A. F. Williams, A. R. Hicks-Lynch, M. R. Herrygers, J. A. Boles, J. G. Berardinelli, J. M. Thomson ........................................................................................................................................................................... 77
Late gestation supplementation of corn dried distiller’s grains plus solubles to beef cows fed a low-quality forage: Impacts on mammary gland blood flow, colostrum and milk production, and calf weights.
V. C. Kennedy, B. Mordhorst, J. J. Gaspers, G. L. Stokka, M. L. Bauer, K. C. Swanson, K. A. Vonnahme................... 81
Comparison of titanium dioxide vs. chromic oxide as an external marker to estimate fecal output in horses. T. D. Morgan, A. L. Salazar, F. R. Melgar, E. J. Scholljegerdes, C. A. Loest, L. M. White, K. Marchetti, S. A. Soto-Navarro, K. M. Winsco, S. L. Ivey ................................................................................................................................... 85
Chemokine ligand twelve and T-helper 1 cytokines increase in corpus luteum during implantation in sheep.
S. Z. Prosser, K. E. Quinn, R. L. Ashley ......................................................................................................................... 88
Behavior
Validation of the Beef Quality Assurance Feedyard Assessment for cattle handling. R. Woiwode, T. Grandin, B. Hl. Kirch, J. A. Paterson ..................................................................................................... 92
Ram reproductive behavior and serum Testosterone of white faced rams during the early and mid-breeding season and out of season.
J. L. Wyatt, K. J. Austin, K. C. Otto, B. M. Alexander .................................................................................................... 96 Breeding and Genetics
Relationship of pulmonary arterial pressure and terrain use of beef cows grazing high-altitude foothill rangelands.
D. W. Bailey, M. G. Thomas, T. N. Holt, M. B. Stephenson, R. M. Enns, S. E. Speidel ................................................. 99
SNP query in candidate genes that affect puberty in Bos indicus-influenced heifers. M. M. Dias, A. Cánovas, C. Mantilla-Rojas, D. Riley, P. Luna, S. E. Speidel, M. Enns, I. D. P. S. Diaz, F. R. P. de Souza, J. F. Medrano, H. N. de Oliveira, M. G. Thomas ............................................................................................................. 104
Variance components for genetic evaluation of body condition score in beef cattle.
R. J. Boldt, S. E. Speidel, M. G. Thomas, R. M. Enns ..................................................................................................... 108
Effects of beef cow milk production levels on longevity from Colorado State University's Beef Improvement Center. M. M. Culbertson, S. E. Speidel, M. G. Thomas, R. M. Enns .......................................................................................... 111
Genotypes within the prolactin and GH-IGF1 pathways association with 305 d milk yield in heat stressed lactating Holstein cows in Sonora, Mexico.
A. I. Hernández, M. A. Sánchez, R. Zamorano-Algandar, P. Luna-Nevárez, G. Rincón, J. F. Medrano, S. E. Speidel, R. M. Enns, M. G. Thomas ................................................................................................................................................... 114
Angus cattle at high altitude: Relationship between age and pulmonary arterial pressure.
X. Zeng, T. N. Holt, R. M. Enns, S. E. Speidel, M. G. Thomas ....................................................................................... 119
iii
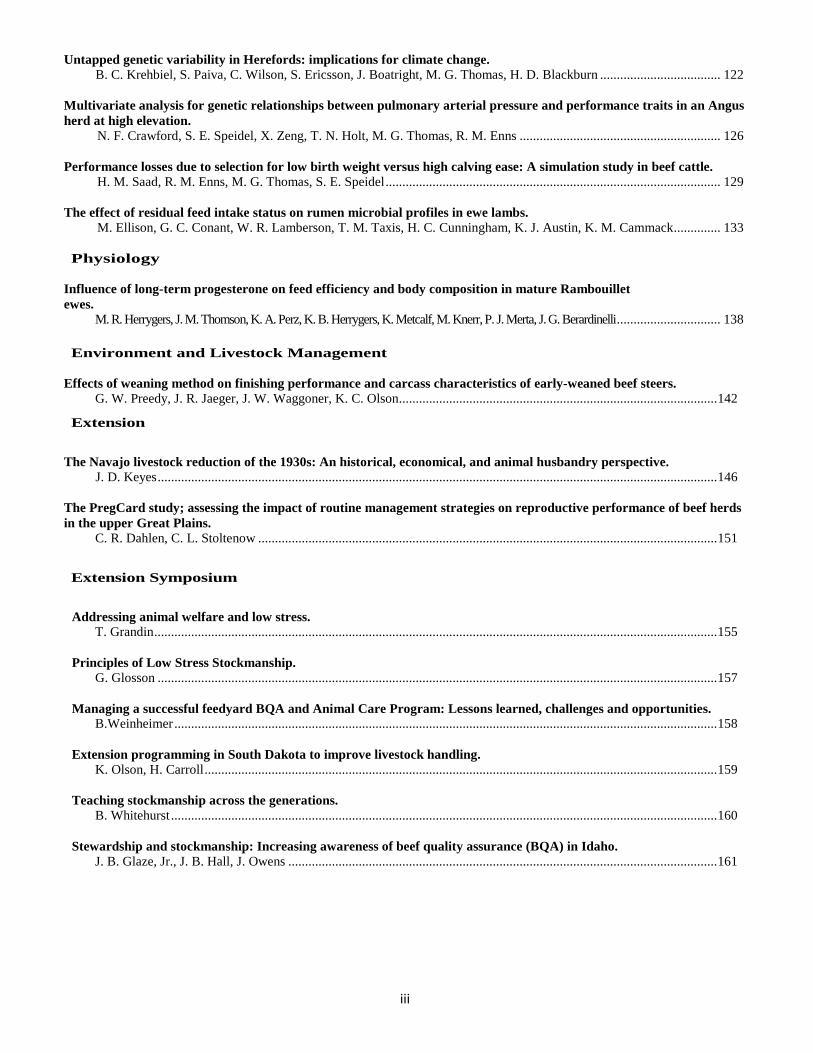
Untapped genetic variability in Herefords: implications for climate change. B. C. Krehbiel, S. Paiva, C. Wilson, S. Ericsson, J. Boatright, M. G. Thomas, H. D. Blackburn .................................... 122
Multivariate analysis for genetic relationships between pulmonary arterial pressure and performance traits in an Angus herd at high elevation. N. F. Crawford, S. E. Speidel, X. Zeng, T. N. Holt, M. G. Thomas, R. M. Enns ............................................................ 126 Performance losses due to selection for low birth weight versus high calving ease: A simulation study in beef cattle. H. M. Saad, R. M. Enns, M. G. Thomas, S. E. Speidel .................................................................................................... 129 The effect of residual feed intake status on rumen microbial profiles in ewe lambs. M. Ellison, G. C. Conant, W. R. Lamberson, T. M. Taxis, H. C. Cunningham, K. J. Austin, K. M. Cammack .............. 133 Physiology
Influence of long-term progesterone on feed efficiency and body composition in mature Rambouillet ewes.
M. R. Herrygers, J. M. Thomson, K. A. Perz, K. B. Herrygers, K. Metcalf, M. Knerr, P. J. Merta, J. G. Berardinelli ............................... 138 Environment and Livestock Management
Effects of weaning method on finishing performance and carcass characteristics of early-weaned beef steers. G. W. Preedy, J. R. Jaeger, J. W. Waggoner, K. C. Olson ............................................................................................... 142
Extension
The Navajo livestock reduction of the 1930s: An historical, economical, and animal husbandry perspective.
J. D. Keyes ....................................................................................................................................................................... 146
The PregCard study; assessing the impact of routine management strategies on reproductive performance of beef herds in the upper Great Plains.
C. R. Dahlen, C. L. Stoltenow ......................................................................................................................................... 151
Extension Symposium
Addressing animal welfare and low stress.
T. Grandin ........................................................................................................................................................................ 155
Principles of Low Stress Stockmanship. G. Glosson ....................................................................................................................................................................... 157
Managing a successful feedyard BQA and Animal Care Program: Lessons learned, challenges and opportunities. B.Weinheimer .................................................................................................................................................................. 158
Extension programming in South Dakota to improve livestock handling. K. Olson, H. Carroll ......................................................................................................................................................... 159
Teaching stockmanship across the generations. B. Whitehurst ................................................................................................................................................................... 160
Stewardship and stockmanship: Increasing awareness of beef quality assurance (BQA) in Idaho. J. B. Glaze, Jr., J. B. Hall, J. Owens ................................................................................................................................ 161
iv
Pastures and Forages
Effects of intensive late-season grazing following early-season steer grazing on population dynamics of sericea lespedeza in the Kansas Flint Hills. J. Lemmon, W. H. Fick, J. A. Alexander, A. G. Lemmon, D. C. Shaw, G. W. Preedy, C. A. Gurule, K. C. Olson ..... 166 Effects of growing-season prescribed burning on vigor of the noxious weed sericea lespedeza (Lespedeza cuneata) in the Kansas Flint Hills. C. A. Gurule, J. A. Alexander, W. H. Fick, J. Lemmon, A. G. Lemmon, G. W. Preedy, K. C. Olson .......................... 173 Effect of corn residue stocking rate on cattle performance and subsequent grain yield. A.Stalker, H. Blanco-Canqui, J. A. Gigax, A. L. McGee, T. M. Shaver, S. J. van Donk .............................................. 177
Ruminant Nutrition
Effects of feeding ground juniper to gestating ewes on pre- and postpartum ewe performance, serum metabolites, and progeny preweaning performance.
W. C. Stewart, T. R. Whitney, E. J. Scholljegerdes, D. M. Hallford, S. A. Soto-Navarro, and H. D. Naumann ............. 180 Effect of inorganic or amino acid complexed trace mineral supplementation on growth performance, carcass characteristics and prevention of digital dermatitis of growingñfinishing beef cattle in a southern Alberta feedlot.
J. Van Donkersgoed, M. T. Socha, C. K. Larson, M. E. Branine ..................................................................................... 185 Effects of high-tannin substrate, dietary tannin adaptation, antibiotic inclusion, and animal species on mean gas pressures, ammonia concentrations, and total volatile fatty acid concentrations following a 48-h in vitro incubation.
A.N. McKiearnan, M. D. Miesner, E. C. Titgemeyer, T. G. Nagaraja, J. S. Drouillard, K. C. Olson .............................. 189
Effects of high-tannin substrate, dietary tannin adaptation, antibiotic inclusion, and animal species on individual volatile fatty acid concentrations following a 48-h in vitro incubation.
A. N. McKiearnan, T. G. Nagaraja, E. C. Titgemeyer, J. S. Drouillard, M. D. Miesner, K. C. Olson ............................ 195
Influence of sampling time on carbon dioxide and methane emission by grazing cattle. S. A. Gunter, J. A. Bradford ............................................................................................................................................ 201
Effects of using ground woody plants in kid goat feedlot diets on growth performance. J. L. Glasscock, T. R. Whitney, J. R. Roper, A. R. Holmes, S. G. Marrs, N. M. Cherry, J. P. Muir, W. C. Stewart, E. Scholljegerdes .................................................................................................................................................................. 204
Performance of beef replacement heifers supplemented with dried distillers grains or a mixture of soybean meal and ground sorghum grain.
C. J. McMullen, J. R. Jaeger, K. R. Harmoney, J. W. Waggoner, K. C. Olson .............................................................. 209
Effects of altering supplementation frequency during the pre-partum period of beef cows. C. J. McMullen*1, J. R. Jaeger, J. W. Waggoner, K. R. Harmoney, K. C. Olson ........................................................... 213
Health, performance, and ovalbumin-specific immunoglobulin titers of feedlot receiving calves in response to intranasal or subcutaneous vaccination programs.
E. R. Oosthuysen, M. Hubbert, J. R. Graves, A. K. Ashley, C. A. Löest ........................................................................ 217
Intake and grazing activity of mature range cows on Arizona rangelands. C. W. Knight, D. W. Bailey, D. Faulkner, D. W. Schafer ............................................................................................... 222
The effect of dry-rolled corn particle size on feed efficiency in feedlot finishing diets containing wet distiller's grains. E. F. Schwandt, D. U. Thomson, S. J. Bartle, T. E. Engle, J. J. Wagner, C. D. Reinhardt .............................................. 225
Impact of maternal protein restriction in first-calf heifers during mid- to late-gestation on dam and suckling calf performance through weaning.
J. J. Kincheloe, K. C. Olson, A. D. Blair, K. R. Underwood, M. G. Gonda, A. A. Harty1, R. N. Funston ..................... 231
v
Assessment of supplemental trace mineral level and source on liver and serum mineral concentrations after feeding cattle a diet deficient in trace minerals.
M. Garcia, E. R. Oosthuysen, M. Hubbert, M. E. Branine, C. K. Larson, C. A. Löest, E. J. Scholljegerdes .................. 235
Poster Presentations Behavior
Fate of free ferulic acid and ethyl ferulate in beef cattle.
C. González-Plascencia, D. Domínguez, G. Villalobos, F. Castillo Rangel, J. A. Ortega ............................................... 240
Breeding and Genetics
Effect of high sulfate water on rumen microbial populations in lambs. C. J. Clarkson, A. N. Abrams, K. J. Austin, M. Ellison, H. C. Cunningham, G. C. Conant, W. R. Lamberson, T. M. Taxis, K. M. Cammack .............................................................................................................................................................. 244
Candidate gene molecular breeding value prediction of reproductive performance in Holstein dairy cows managed under heat stress conditions from southern Sonora in Mexico.
R. Zamorano-Algandar, A. Correa-Calderón, M. Sánchez-Castro, G. Rincón, J. F. Medrano, A. I. Hernandez, G. Luna-Nevárez, R. M. Enns, S. E. Speidel, M. G. Thomas, P. Luna-Nevárez .............................................. 249
Environment and Livestock Management
Short and long-term forensic evaluation of cattle brand burn scar healing. D. R. Tolleson, D. W. Schafer .......................................................................................................................................... 253
Non-invasive detection of external parasites on free-ranging cattle in the Edwards Plateau region of Texas. D. R. Tolleson, P. D. Teel, O. F. Strey, S. D. Prince, J. P. Angerer, C. A. Taylor Jr. ..................................................... 258
Comparison between the birth weight crosses native cattle as an alternative to European breeding to fight global warming in México.
J. Espinoza, O. Roacho, R. M. Quintana, D. Domínguez ................................................................................................ 262 Pastures and Forages Validation of fecal microhistology for assessing dietary botanical composition of beef-cattle using diets of fixed composition.
C. J. McMullen, J. Lemmon, K. C. Olson ....................................................................................................................... 265
Interseeding cool-season forages into corn to increase yield and quality of residue grazed in the fallpastures in Rondônia-Brazil
L. A. Villalobos, Brummer .............................................................................................................................................. 268
Physiology Relationship among feed efficiency traits and reproduction in heifers.
J. B. Hall, J. B. Glaze, Jr., W. K. Smith, M. C. Roberts .................................................................................................. 272 Effects of arginine supplementation in adult exercising horses on heart rate and blood metabolites.
L. R. Owensby, L. M. White, B. Housewright, E. J. Scholljegerdes, K. W. Walter ........................................................ 277
RUMINANT AND NON-RUMINANT NUTRITION
Effect of supplementing spring-calving beef cows grazing barley crop residue with canola meal and wheat-based dry distillers' grains with solubles on beef cow performance, and reproductive efficiency.
D. Damiran, H. Lardner, J. J. McKinnon ......................................................................................................................... 282

vi
Phenotypic relationships of residual feed intake with growth, feeding behavior, and reproductive performance of beef heifers.
D. Damiran, G. B. Penner, K. Larson, H. Lardner ........................................................................................................... 286
Effects of maternal nutrition and rumen-protected arginine supplementation on circulating hormone and metabolite concentrations in both ewes and lambs.
J.L. Peine, K.E. Chilcoat, M.S. Crouse, M. Kapphahn, S.T. O'Rourke, D.M. Hallford, L.P. Reynolds, J.S. Caton ........ 291
Impact of dietary forage quality on ruminal by-pass of calcium salts of long-chain omega-3 fatty acids in beef heifers when provided in dried molasses lick tubs.
D. C. Rule, P. A. Ludden, T. D. Draney, K. M. Cammack .............................................................................................. 295 Evaluation of implant strategies in Angus-sired steers with high and low genetic potential for marbling and gain.
D. N. Black, B. W. Neville, M. R. Crosswhite, C. R. Dahlen ................................................................................................... 299 Effect of dietary level of oregano essential oil and monensin on ruminal fermentation of hair lambs.
G. Flores, D. Domínguez, G. Villalobos, F. Castillo, L. Carlos, L. A. Durán, J. A. Ortega, R. Silva-Vázquez .............. 303 Effect of ferulic acid supplementation on animal performance of preconditioning calves.
J. P. Flores Campos, G. Villalobos, D. Domínguez, R. A. Loya-Rodríguez, J. A. Ortega-Gutiérrez, F. Castillo ........... 307
Dry matter intake, ruminal pH and plasma glucose of beef heifers fed finishing feedlot diet and ferulic acid. L. F. Soto-Casas, I. García-Roque, D. Domínguez, G. Villalobos, J. A. Ortega, F. Castillo ......................................................... 310
Efffect of processing conditions onnutrient disappearance of cold-pressed and hexane-extracted camelina and carinata meals in vitro.
A. Sackey, E. E. Grings, D. W. Brake, K. Muthukumarappan ........................................................................................ 314 Performance in rabbits fed diets supplemented with conjugated linoleic acid (CLA).
S. Ramírez, J. Espinoza, A. Trejo, V. M. Meza, J. Abad, C. M. Antonio........................................................................ 319
Author index ............................................................................................................................................................................. 322
vii
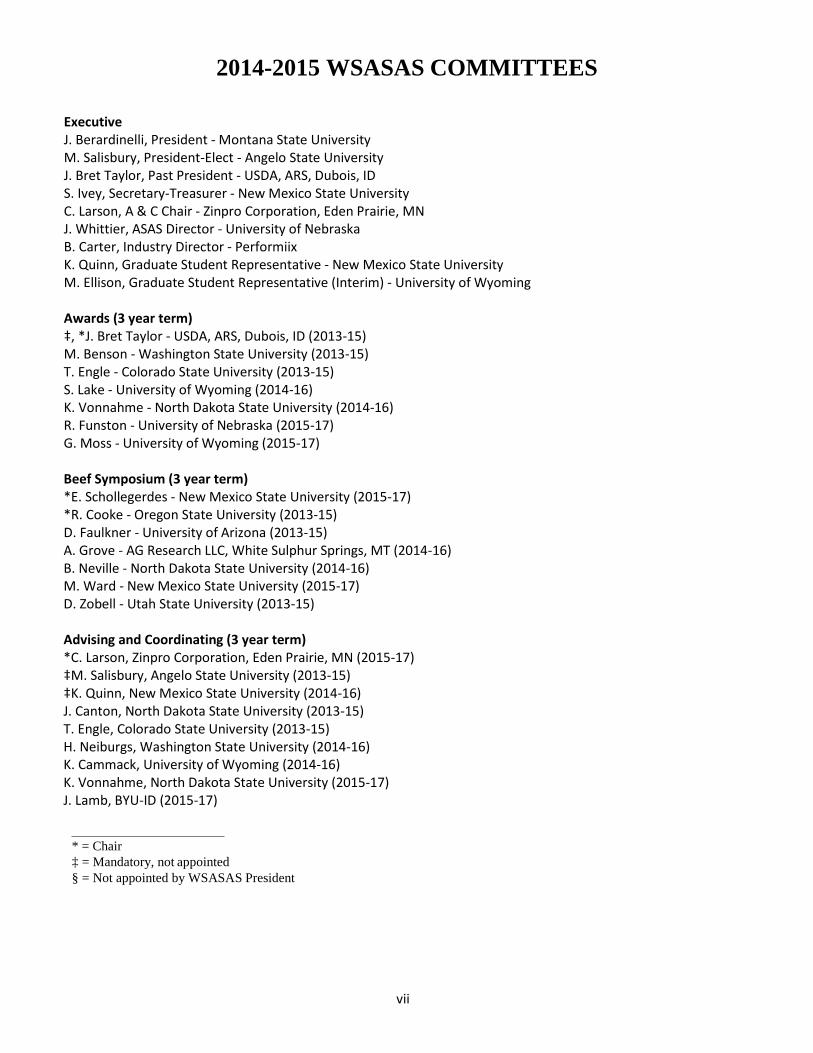
2014-2015 WSASAS COMMITTEES Executive J. Berardinelli, President - Montana State University M. Salisbury, President-Elect - Angelo State University J. Bret Taylor, Past President - USDA, ARS, Dubois, ID S. Ivey, Secretary-Treasurer - New Mexico State University C. Larson, A & C Chair - Zinpro Corporation, Eden Prairie, MN J. Whittier, ASAS Director - University of Nebraska B. Carter, Industry Director - Performiix K. Quinn, Graduate Student Representative - New Mexico State University M. Ellison, Graduate Student Representative (Interim) - University of Wyoming Awards (3 year term) ‡, *J. Bret Taylor - USDA, ARS, Dubois, ID (2013-15) M. Benson - Washington State University (2013-15) T. Engle - Colorado State University (2013-15) S. Lake - University of Wyoming (2014-16) K. Vonnahme - North Dakota State University (2014-16) R. Funston - University of Nebraska (2015-17) G. Moss - University of Wyoming (2015-17) Beef Symposium (3 year term) *E. Schollegerdes - New Mexico State University (2015-17) *R. Cooke - Oregon State University (2013-15) D. Faulkner - University of Arizona (2013-15) A. Grove - AG Research LLC, White Sulphur Springs, MT (2014-16) B. Neville - North Dakota State University (2014-16) M. Ward - New Mexico State University (2015-17) D. Zobell - Utah State University (2013-15) Advising and Coordinating (3 year term) *C. Larson, Zinpro Corporation, Eden Prairie, MN (2015-17) ‡M. Salisbury, Angelo State University (2013-15) ‡K. Quinn, New Mexico State University (2014-16) J. Canton, North Dakota State University (2013-15) T. Engle, Colorado State University (2013-15) H. Neiburgs, Washington State University (2014-16) K. Cammack, University of Wyoming (2014-16) K. Vonnahme, North Dakota State University (2015-17) J. Lamb, BYU-ID (2015-17)
* = Chair ‡ = Mandatory, not appointed § = Not appointed by WSASAS President

viii
Minutes of the WSASAS Annual Business Meeting June 27, 2014 • Angelo State University Prepared by Michael Salisbury, Secretary-Treasurer

ix
The Annual Business Meeting of the General Membership, Executive Committee and the ASAS Executive Staff was held at Angelo State University, San Angelo, TX in room 100 of the University Center building to report, discuss and make decisions and recommendations of the agenda items listed below and other business of the Western Society of the American Society of Animal Science.
Call to Order The meeting was called to order by Bret Taylor, President, at 07:35 am (CST).
Members present 35 members were in attendance.
Approval of the Agenda Agenda was approved with revisions for Bret giving the Awards report and a line added for the Undergraduate Poster Competition Report. Motion: Tim Ross/Chris Schaur.
Approval of the Minutes Modification of the Andy Roberts’ statement at end of Graduate Student report. Statement was completed. Approved by general consent. 2014 Financial Report Jacelyn gave an overview of the financial (appendix) and that the section was in extremely good financial status. The current meeting is trending on track with last year on expected revenues.
2014 WSASAS Meeting Report
M. Salisbury provided numbers from the current meeting: Registrations: 167 Professional: 81 Graduate: 50 Undergraduate: 35 Retired: 1 Beef Symposium: 83 Opening Reception: 93 Graduate Student Lunch and Learn: 39 Awards: 107 Proceedings: 63
Bret discussed submission numbers and explained that the numbers were in line with a prediction model of the last 20 years’ submissions. He also explained that he hoped that would be part of the strategic plan to increase paper submissions at the annual meetings.
ASAS Report: Greg Lardy provided a report of the activities at the national office. A full transcript of his report is in the appendix. Bret Discussed the change in submission format for abstract and proceedings at the same time. Some early confusion but it seemed work out okay. Modifications to the online process have been made to smooth the process a bit. Academic Quadrathlon Committee Report Dan Rule was not present so Hannah Cunningham presented the report prepared by Dan (Appendix). There are concerns with the AQ when it is held in locations that are not the easiest to get to because of the expense. There was discussion about moving the AQ back to times during the school year. The report details the concerns and requests action by the board to allowing some changes. Advisory and coordinating committee report Shanna Ivey reported that the A&C committee was responsible for establishing submission guidelines and procedures (appendix). 2015 Meeting Report: Shanna Ivey reported that the plans for the 2015 meeting are to hold the meeting at the Lodge of Sierra Blanca, Symposia at the Corona Range and Livestock Research Center, potentially the AQ at Corona but if not at on NMSU campus, and Awards Banquet with the Fly J Wranglers. Discussion occurred about the location of the 2017 meeting being in Fargo.
John Hall asked why we were going to locations that were not affiliated with the section and how that relates to travel and expense. David Bohnert asked why we were going to non-Western Section locations and how the decision was made? Ken Olson/Pat Hatfield/Andy Roberts discussed how they chose locations when they were president. They all three stated that they would look at who had not hosted the meetings in quite sometime and call departs to ask if they were willing to host. The frustrations was that most locations, with the exception of the core two or three would turn them down. Therefore, they went to the locations that came to them

x
asking to host (Angelo State University, North Dakota State University) look at logistics. If we are to stay within the normal section boundaries, the institutions will have to step up and do their part. Andy Roberts discussed the idea that some locations within the sections really don’t make since and don’t fit with the activities of the section. He gave the example of locations in California not fitting. He asked why we shouldn’t look at locations around the border of the section that do work that fits in the West. Benton Glaze asked what happened to the passed normal rotation of meeting locations and several (past presidents) spoke up and said that would be fine if they would start hosting again but nobody is willing to take on the job. It is hard to host when nobody is will to take on the task.
Bret Taylor mentioned that there should be more transparency in the process but there must also be willingness to get involved and be productive members of the section when it comes to hosting. Graduate Student Competition Committee Report Ryan Ashley discussed the graduate student competition (report in appendix). The question came up about terms and term rotations. Bret explained that it lost some continuity several years back and since has been corrected and should get to the structure terms as outlined in the by-laws. Necrology Committee Report Bret Taylor presented the report and reported that the only person associated with sections that passed away during the 2013-2014 year was Denny Cruz, Colorado State University. He served in all official positions within the section.
Nominating Committee Report Bret Taylor reported for Glen Duff that Connie Larson would be appointed to the A&C Committee as the chair and Shanna was elected as the next secretary. The question was asked about Connie serving on two boards and it was clarified that she would not be in a conflict and would be leaving one as she began the current post.
Young Scholars Recognition Connie Larson gave a report and reported on the old business of the program. She also reported that he strategic plan was slightly delayed but is moving forward and will establish committees/subcommittees by the end of the meeting to handle the development of the plan. Old Business: The motion on the table from last year from Mark Peterson will remain on the table until the completion of the strategic plan and implementation of the amendments. New Business:
Constitutional amendments to clarify elections and voting were voted on. Motion was made by Dennis Hallford and seconded by Tim Ross. Discussion to clarify everyone’s understanding of the amendment. The motion passed unanimously. Undergraduate Paper Competition Kasey Deatley reported on the undergraduate paper completion and it success in the first year with recommendations to improve the visibility of the poster section and ways to increase participation. She also requested that a permanent committee be established to advise and manage the program. Jim B. made the motion to establish the committee and Andy R. seconded and it passed. Full report in the appendix. Jacelyn Presented the budget as a new way to help with meetings as we move forward. Motion to accept was made by Kim and seconded by Rachel, motion carried. Adjournment
Adjourned: 9:20 Rachel/Dennis.

xi
Appendix 1 Business Meeting Agenda
Western Section, American Society of Animal Science June 27, 2014
University Center Room 100; Angelo State University Call to Order – B. Taylor
Approval of the Agenda – B. Taylor
Approval of the 2013 WSASAS Business Meeting minutes – M. Salisbury
Reports - 2014 Financials – J. Hemmelgarn, M. Salisbury - 2014 Annual WSASAS Meeting – J. Berardinelli - ASAS President – G. Lardy - WSASAS President – B. Taylor - WSASAS Committees
o Academic Quadrathlon – D. Rule o Advising and Coordinating – S. Ivey o Awards – G. Duff o Beef Symposium – R. Cooke o Graduate Student Paper Competition – R. Ashley o Necrology – G. Duff o Nominating – G. Duff o Undergraduate Student Poster Competition (ad hoc) – K. DeAtley o Young Scholars Program – C. Larson
Old Business - Motion on the table: M. Petersen, “All complete and eligible submissions [abstracts and
proceedings] to the Graduate Student Paper Competition cannot be rejected.” - Strategic Planning
New Business - Constitutional Amendments – Organization, selection, and function of the Executive Committee - 2015 Budget - Proceedings publications – quality and integrity
Transfer of the Gavel
Announcements - 2016 Grazing Livestock Nutrition Conference
Adjourn
xii
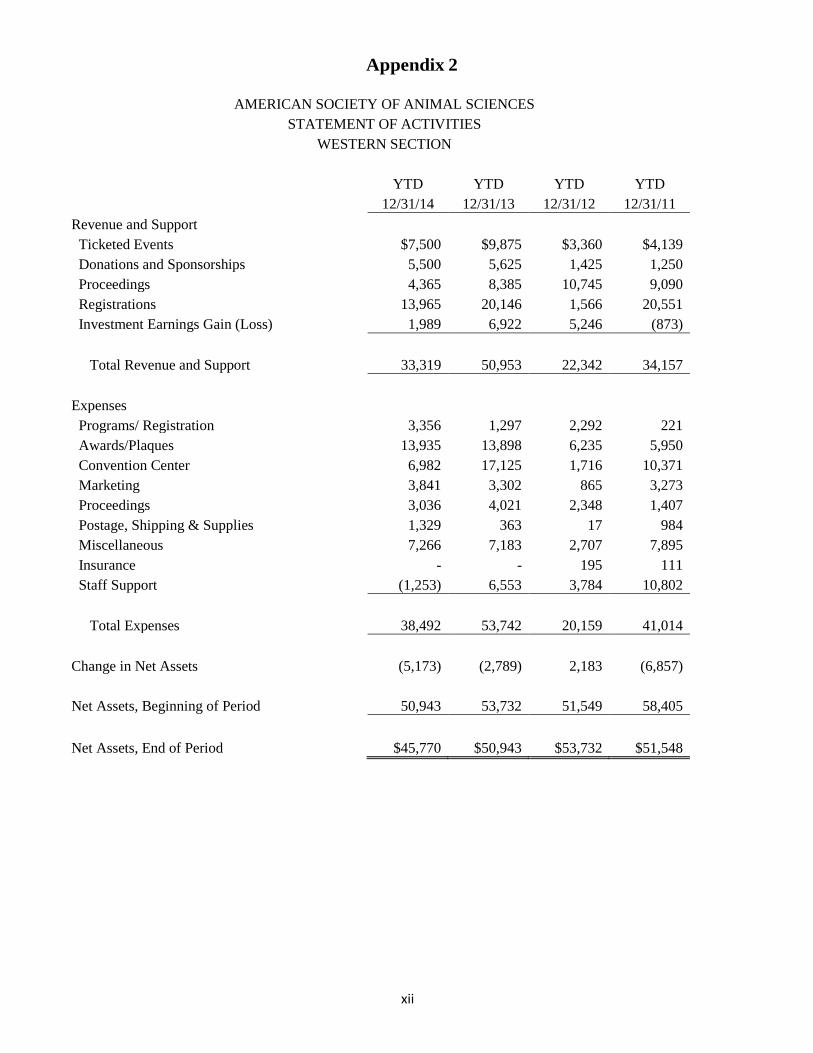
Appendix 2
AMERICAN SOCIETY OF ANIMAL SCIENCES STATEMENT OF ACTIVITIES
WESTERN SECTION
YTD YTD YTD YTD
12/31/14 12/31/13 12/31/12 12/31/11
Revenue and Support Ticketed Events $7,500 $9,875 $3,360 $4,139
Donations and Sponsorships 5,500 5,625 1,425 1,250 Proceedings 4,365 8,385 10,745 9,090 Registrations 13,965 20,146 1,566 20,551 Investment Earnings Gain (Loss) 1,989 6,922 5,246 (873)
Total Revenue and Support 33,319 50,953 22,342 34,157
Expenses Programs/ Registration 3,356 1,297 2,292 221
Awards/Plaques 13,935 13,898 6,235 5,950 Convention Center 6,982 17,125 1,716 10,371 Marketing 3,841 3,302 865 3,273 Proceedings 3,036 4,021 2,348 1,407 Postage, Shipping & Supplies 1,329 363 17 984 Miscellaneous 7,266 7,183 2,707 7,895 Insurance - - 195 111 Staff Support (1,253) 6,553 3,784 10,802
Total Expenses 38,492 53,742 20,159 41,014
Change in Net Assets (5,173) (2,789) 2,183 (6,857)
Net Assets, Beginning of Period 50,943 53,732 51,549 58,405
Net Assets, End of Period $45,770 $50,943 $53,732 $51,548
xiii
Appendix 3 2014 WSASAS Beef Symposium
Committee Report The 2014 Beef Symposium was held from 8:00 am to 5:00 pm on June 25, and was divided into a ranch tour (morning session) and invited presentations (afternoon session). Nearly 90 WSASAS attendees participated in the Beef Symposium. During the morning session, the group toured two locations within the Rocking Chair Ranch, located 20 miles SE of San Angelo. After the tour, the group returned to the Angelo State University - Management, Instruction and Research (MIR) Center where lunch was served. After lunch, 4 invited presentations were offered:
1- Managerial considerations in drought conditions a. Dr. Clay Mathis King Ranch Institute for Range Management, Kingsville, TX
2- Supplementation strategies in arid environments a. Dr. Dave Bohnert, EOARC, Oregon State University, Burns
3- Stressed calves a. Dr. Jeff Carroll, USDA, ARS, Livestock Issues Research Unit, Lubbock, TX
4- Impacts of DMI on reproductive performance a. Andy J. Roberts, USDA, ARS, Fort Keogh LARRL, Miles City, MT
The Symposium was adjourned at 5:00 pm.
xiv
Appendix 4 2014 Undergraduate Poster Competition Committee
Report Western Section American Society of Animal Science 86th Annual Meeting Angelo State University San Angelo, Texas June 25-27, 2014 The first annual undergraduate poster competition was conducted on Thursday, June 26, 2014 at Angelo State University. A total of eight undergraduates submitted abstracts for the poster session. Institutions represented included Montana State University, New Mexico State University, and California State University, Chico. Ad hoc committee members served as judges and included Dr. Chad Muller, Dr. Pat Hatfield, and Dr. Kasey DeAtley (chair). Winners of the poster session were: 1st Place: F. R. Melgar, New Mexico State University 2nd Place: N. S. Sanchez, New Mexico State University 3rd Place: M. Crouse, New Mexico State University
Monetary awards included $150 for 1st Place, $100 for 2nd Place, and $75 for 3rd place. Committee members are seeking additional sponsors for the 2015 contest and will be editing poster score sheet and procedures. Respectfully submitted, Kasey DeAtley, Chair
xv
Appendix 5 Applied Animal Science Award Report
June 13, 2013 Chair: Connie K Larson, Industry Director
Committee Members: Mark Branine Zinpro Boone Carter Performix Nutrition (new member) Dan Dhuyvetter Ridley Block Kristy Dorton Diamond V Allison Grove AG Research, LLC Kim Hagar CHS Jim Killen Killen Corporation Jeremy Martin Great Plains Consulting Trey Patterson Padlock Ranches Sonda Killen Killen Corporation Steve Stafford Vigortone Marshall Streeter Merck Kelcey Swyers Ranchway Feeds There were eight submissions for the Applied Animal Science Award: Oregon State University 2 New Mexico State University 2 Kansas State University 1 Texas A & M University 1 CITA-Aragon, Spain 1 UC Davis, U of Chile, U of Georgia 1 Based on the Rankings of the committee reviewers, results are as follows 31 Effects of meloxicam administration on
physiological and performance responses of transported feeder cattle T. A. Guarnieri Filho,1,2 R. F. Cooke,1 B. I. Cappellozza,1 M. M. Reis,1 R. S. Marques,1 and D. W. Bohnert1 Oregon State University - Eastern Oregon Agricultural Research Center, Burns, OR 1 Faculdade de Medicina Veterinária e Zootecnia, UNESP – Univ. Estadual Paulista, Brazil 2
15 Incorporation of sexed semen into reproductive management of cow-calf operations
R. S. Marques1, R. F. Cooke1, D. W. Bohnert1,
B. I. Cappellozza1, T. DelCurto2, and C. J.
Mueller2
Oregon State University - Eastern Oregon
Agricultural Research Center, Burns, OR 1
Oregon State University - Eastern Oregon
Agricultural Research Center, Union, OR 2
11 Performance of pregnant beef cows limit-fed
diets containing wheat straw treated with two rates of anhydrous ammonia and wet distiller’s grain
J. W. Waggoner and J. R. Jaeger
Western Kansas Agricultural Research Center, Kansas State University, Hays, KS 67601
Committee member contributions was a total of $1050.00. The recipients will receive the following monetary awards: 1st Place $500 2nd Place $300 3rd Place $200. Additional funds will be available for next year. The Chair would like to acknowledge the time, effort and contributions of all Committee Members who make this award possible. There was some confusion with the change in Abstract/Proceedings submission. Announcements were placed on the website and emails were sent to clarify the submission process.
xvi
Appendix 6 Young Scholar Recognition Program (YSRP) Committee Report
Chair: Connie Larson, Zinpro Committee Members: M. MacNeil, USDA, ARS (retired), Miles City, MT (14) G. Lardy, NDSU, (14) J. Whittier, CSU, (15) G. Moss, U of WY (15) R. Ashley, NMSU (16) P. Hatfield, MSU (16) This year there were three PhD Candidates (NDSU, OSU and WSU) and five MS Candidates (U of ID, NDSU, U of WY, OSU and UC Davis). In reviewing the submissions, there were two committee members who withdrew due to conflict of interest. Drs. Terry Engle (CSU) and Mark Petersen (USDA, Fort Keogh) graciously agreed to fill those two vacancies. We would like to thank them for their time and effort to review applications and provide their rankings. As the committee agreed at our meeting in Bozeman, MT during the WSASAS meeting, one PhD and two MS Candidates would be selected to receive the Young Scholar Recognition (YSR). The committee also decided the monetary award would be greater for the PhD recipient, but that the dollar amount should not exceed other awards. For 2014 recipients, the PhD YSR will receive $500 and the two MS YSRs will receive $300 each. 2014 Young Scholar Recognition Recipients: PhD Leticia Camacho (NDSU) nominated by Dr. Kim Vonnahme MS Hannah Cunningham (U of WY) nominated by Dr. Allison Meyer MS Bryan Welly (UC Davis) nominated by Dr. Alison Van Eenennaam As sponsorship of the YSRP, Zinpro Corporation provides $2000.00 annually to pay the cost of the awards, placques, registration for the students and publishing of the papers. As the second year for this new recognition, members agreed that it was success. Many comments have been made in regards to the presentations and that the quality was excellent. The committee recommends
that YSRP presentation remain as the event just prior to the Opening Reception. The presentations were well attended this year. The only challenge was for those people who attended the Beef Symposium, as their return was at another location. For future reference, planning may consider the departure and return location to be coordinated with the location of the YSRP presentations. The application process and review process had an improved flow for the second year. The time allowed for review by the committee was only one week. While all members and temporary reviewers were able to complete the review, a two-week time frame will be implemented in the coming years. The committee suggested that the chairman compile a list of willing reviewers that could fill in if a conflict should arise. It was suggested that people to consider could include members of the Western Executive Committee and former PhD YSR. The committee discussed the issue of viewing submissions that indicated the student was not a member of the Western Section. Jacelyn Hemmelgarn informed the committee that she always verifies membership before sending out the compiled information for review. For future reviews, committee members are to recognize that all nominees for the recognition have been verified. Committee members also decided that there should not be default winners. For reviewers, they must indicate that individual nominee should be given consideration for the award. If in the event that an application is unsuitable, the reviewer will be given the directions as to how to rank that application. In order to provide additional guidance on the application process, the committee members agreed that the scoring guide provided to reviewers, should be posted on the website YSRP section. As final discussion, the members talked about how important it is for the recipients to send a hand written thank you note to Sponsors of awards. I would like to thank Drs. Greg Lardy and Mike MacNeil for their service on this committee as their terms are completed in 2014.
xvii
The Committee would like to see the website information improved as well as more “user friendly” access to the information. Ideas that were generated in the discussion are as follows:
1. Tabs that can easily take you to the YSRP information.
2. Including a link to the YSRP information included in the “reminder emails” regarding requests for award nominations.
3. List of important dates.
4. Photos and bios of the current year award winners in order to bring a more personal touch to the information and to highlight the recipients from the previous year. Also include instant access to the Invited Proceedings Papers
5. More detailed communication on the expectations for each component of the nomination package.
6. Scoring guide.
There had been confusion with the process during this first year as to whether the nominator completed all components of the nomination process or whether it was a combined effort with the student. The committee agreed that it should be a combined effort and more specific directions were needed. The three components of the nomination process that generated discussion among the committee included nomination letters, essay and the abstract. The committee agreed to revise these three components.
1. Nomination letters. One letter to be submitted by the nominator and a second letter of recommendation to be determined by the nominator. The second letter is no longer required to be from the Department Head.
2. Essay. The essay will be more of a personal statement written by the student.
3. Abstract. The abstract will be more of an extended abstract that reflects the contents of the Invited Proceedings Paper.
To improve directions and information regarding the YSRP committee members agreed to work on assignments. Kelsey Quinn and James Graves will work on providing the guidelines for the essay. Pat Hatfield and Connie Larson will determine the guidelines for the extended abstract. Once these two components are completed and all committee members are in agreement, Jack Whittier and Ryan Ashley will evaluate the scoring guidelines and make any necessary adjustments.

xviii
Appendix 7
2014 WSASAS Graduate Student Paper Competition Report Chair: Ryan Ashley (NMSU) Committee Members: Jason Ahola (CSU) Kris Johnson (WSU) Michelle Mousel (USDA-ARS, Pullman, WA) Benton Glaze (UI) Brenda Alexander (UW) Chris Schauer (NDSU) Jennifer Thomson (MSU) The 2014 WSASAS graduate student paper competition was held on Thursday, June 26, 2014 at Angelo State University in San Angelo, TX. We had a total of 13 graduate students provide platform presentations at the competition representing OSU, NMSU, CSU, UW, and NDSU. Judges present at the meeting included, Brenda Alexander, Chris Schauer, Benton Glaze, Jennifer Thomson, and Ryan Ashley. The 2015 competition will be chaired by Brenda Alexander (UW). The 2014 winners were: 1st: Kendal Samuelson, New Mexico State University. Effects of dietary urea concentration and zilpaterol hydrochloride on performance and carcass characteristics of finishing steers. K. L. Samuelson*1, M. E. Hubbert2, and C. A. Loest1, 1New Mexico State University, Las Cruces, 2New Mexico State University, Clayton.
2nd: Kelsey Quinn, New Mexico State University. Chemokine ligand twelve (CXCL12) protein in ovine placenta increases during early gestation: Role in maternal-fetal crosstalk? K. E. Quinn*1, L. P. Reynolds2, A. Grazul-Bilska2, P. P. Borowicz2, S. T. Dorsam2, and R. L. Ashley1, 1New Mexico State University, Las Cruces, 2North Dakota State University, Fargo. 3rd: B. Cappellozza, Oregon State University. Supplementation based on protein or energy ingredients to beef cattle consuming low-quality cool-season forages: I. Performance, reproductive, and metabolic responses of replacement heifers. B. I. Cappellozza*1, R. F. Cooke1, M. M. Reis1, P. Moriel2, D. H. Keisler3, and D. W. Bohnert1, 1Oregon State University - EOARC Burns, Burns, 2North Carolina State University- Mountain Research Station, Waynesville, 3University of Missouri-Division of Animal Sciences, Columbia. The 2014 institutional award went to NMSU. Thanks are extended to all the judges for their time and effort completing the evaluations of the proceedings and oral presentations and to the students for their hard work

xix
Appendix 8 2014 Western Section, American Society of Animal Science
Academic Quadrathlon Committee Report The 2014 Western Section ASAS Academic Quadrathlon was held on June 23 and 24 at Angelo State University. Teams participating included: Oregon State University; Montana State University; BYU-Idaho; University of Wyoming; Chico State University, California; and New Mexico State University. Notable absences included Colorado State University, Utah State University, and University of Arizona. The outcome of the contest was as follows: Written exam: New Mexico State University Oral Presentation: Montana State University Lab Practicum: Montana State University Quiz Bowl: University of Wyoming Overall: Montana State University
Second overall was a tie between Chico State and University of Wyoming
The committee wishes to recognize the hard work and organization that Corey Owens provided to put this contest on. Additionally the committee wishes to thank Priefert Ranch Supply and McCoy Building Supply companies for sponsoring the AQ dinner Tuesday night at the Village Café in San Angelo. The AQ committee advisor meeting included discussion of issues of relevance to the future Western Section AQ events. Involvement of AQ with Western Section meetings is a particular hard ship when the Western Section ASAS meetings are held outside of the common Western Section region, when meetings are held at remote locations, and when Western Section and National Meetings are held concomitantly. Advisors agreed that the 2015 Western Section AQ can be held in Las Cruces but splitting the event between Las Cruces and Ruidoso will add financial hardship to departments and job/internship constraints to students because of the added time for travel and extended stay at the remote location. The AQ committee requests Board approval for the following change: That the Western Section AQ be conducted at a Western Section institution determined by the AQ committee and separate from the Western Section conference when: The Western Section ASAS meetings are out side of the typical Western Section region The Western Section ASAS meetings occur at a remote location from the host institution where the AQ facilities are located.
When the National ASAS meetings are held in the Western Section and combined with the Western Section meetings. Additional discussion regarding amending the written exam and quiz bowl questions to add questions of current relevance resulted in subcommittee assignments and time lines to insure revised questions for the 2015 contest. Discussion of financial issues resulted in the following request for Board approval: The Western Section AQ committee requests that in lieu of the current $600 reimbursement from ASAS that ASAS pay for motel costs for teams participating in the Western Section AQ contest. Alleviating this cost to participating schools will further insure participation and departmental support for AQ. Final discussion of the advisors meeting focused on Western Section committee chair assignment. Dan Rule, current Western Section AQ committee chair requested support by the committee to step down as chair. Dan will submit a letter to the President elect regarding this request. The committee requests Board approval to establish a new protocol for assigning Western Section AQ leadership. The committee recommends nomination of a chair and vice-chair for a 3-year term. At the end of each term the chair will rotate off, the vice-chair becomes the chair, and a new vice-chair is nominated from the current AQ committee. The Western Section AQ committee requests support by the Board for acceptance of this 3-year chair and vice-chair rotation policy. The AQ committee nominated Rachel Endecott (MSU) as Western Section AQ committee chair and Matt Kennedy (OSU) as vice-chair. The committee requests Board approval of these nominations. This discussion concluded the meeting. Respectfully submitted, Dan Rule, Western Section, ASAS Academic Quadrathlon Chari

xx
Appendix 9 Advising and Coordinating Committee Report Shanna Ivey, Chair Advising and Coordinating Committee members: J. Graves, NMSU, (14) J. Berardinelli, MSU (14) R. Waterman, USDA, ARS, Miles City, MT (14) A. Ahmadzadeh, UI, (14) T. Engle, CSU, (15) J. Caton, NDSU, (15) H. Neibergs, WSU, (16) K. Cammack, UW, (16) This year the A and C committee was tasked with assisting in the revision of documents for the graduate student competition. We were also asked to review the constitutional amendments prior to review by the membership. Also, approval of the scoresheet and instructions for the undergraduate poster competition was completed.

DISTINGUISHED SERVICE AWARD
ABSTRACT: Our domesticated sheep, Ovis aries,
were not indigenous to the United States. However, no other livestock species with the exception of the horse has contributed more to building a nation than sheep. Sheep were introduced into the ‘New World’ and what became the United States at several times and locations. Sheep reached the shores of the Dominican Republic in 1493 with Columbus’ second voyage. This initial colonization led to the eventual introduction of the Spanish sheep, Churros, into New Spain (Mexico) in 1519-1521 via Cuba and the Dominican Republic. Later, sheep from Cuba reached the shores of Florida. Mutton sheep arrived on the east coast with the English pilgrims in 1607-1609. Following the Revolutionary War, the finewool breeds, Merino and Rambouillet, were purchased and brought to the United States. It will be about 40 years for the improved British breeds and the finewools to reach the western sheep flocks and begin the improvement of the Spanish Churros of the west. So, how did these ‘woolies’ have such a huge impact on the growth and development of a nation? Key words: history, sheep, United States, wool
INTRODUCTION
Sheep were first introduced into the ‘New World’ by
Christopher Columbus on his second voyage in 1493 (Wentworth, 1948). Columbus landed in what he called Espanola (Santo Domingo, Dominican Republic). The sheep included on the voyage were the Spanish sheep called Churro (Carman et al., 1892 and Wentworth, 1948). Sheep eventually reached the coast of Florida in 1565 and the east coast of what would become the United States in 1607 and 1609 (Carman et al., 1892 and Wentworth, 1948). During the next 200 years, the Churro sheep of the west met the British and finewools sheep of the east to form an industry that affected a nation.
THE BEGINNING
In 1493, Columbus took on provisions including sheep and other livestock at the Spanish settlements on the Canary Islands. The sheep were small sheep will a light weight fleece. The sheep were said to be hardy and could adapt to varied environments. These were the Churro. Columbus landed in Espanola, now Santo Domingo, Dominican Republic where he off-loaded part of his supplies for the settlement and then continued on to Isabella, Cuba establishing the first Christian village of the New World (Carman et al., 1892 and Wentworth, 1948). Permanent flocks were established at each
location and it wasn’t until 1519 and 1521 that Hernando Cortez set sail to conquer and create a sheep industry in New Spain (Mexico). Even though, he reached his destination, it was not until 1530 before he accomplished his goal of establishing a sheep industry on the continent. Cortez became the pioneer rancher in the Americas building large ranches in the region of Oaxaca and southern Mexico (Carman et al., 1892 and Wentworth, 1948).
Wentworth (1948) in his book, ‘American Sheep Trails’ describes the movement of sheep from southern New Spain north to the New Mexico territory. In 1540, Francisco Coronado with an expedition of over 1000 men, 5000 sheep, 500 cattle and an unknown number of swine left southern Mexico in search of the seven cities of Cibola. By the time he reached the northern border of Mexico, he had only 24 lambs and 4 muttons remaining. He reported that the feed resources for the livestock was sparse and the rough rocky terrain wore their hooves to nothing. Winifred Kupper (1945), in her book ‘The Golden Hoof’ writes about a conversation she had with her sheep herder in 1917. He said “I myself have driven sheep, ten thousand of ‘em, from California to Texas and from Texas to Wyoming without losing a single ‘lambe’s hoove’ along the way. Coronado just wasn’t much of a sheepman”. Coronado returned to Mexico a failure. However, some reports (Wentworth, 1948) suggest that Coronado made it to the plains called Quivira. He reportedly left two friars behind with a small flock near Pecos, NM to establish a mission and convert the natives to Christianity. Both were killed but the sheep could have survived (Wentworth, 1948) maybe in a feral state. Another expedition from Mexico in 1582- 1583 traveled to the territory of Arizona and reported seeing Hopi women tending flocks in the area mountains some 300 miles away from Coronado’s trail.
It wasn’t until 1595 that sheep took a permanent foot-hold in what would become the United States. Don Juan de Onate was given the contract to colonize along Coronado’s trek (Wentworth, 1948). He crossed into the United States near what is now Presidio, Texas and followed the Rio Grande to El Paso del Norte. His force included 3000 sheep for wool, 1000 muttons, and 1000 cattle with numerous horses, mules and oxen. He continued to follow the Rio Grande until he reached the northern mountains of New Mexico near Chama in 1598. In 1609, Onate’s successor, Peralto, founded Santa Fe. The industry is now established in the southwest.
Admiral Menendez was contracted by King Phillip II of Spain to conquer and colonize what is now Florida.
1
After turning back French ships, Menendez landed 500 men, each with a slave, 600 sheep and lambs, 200 cattle, 400 hogs and 200 horses. He established St. Augustine, which is reported to be the first Christian settlement in the United States (Wentworth, 1948).
Following the colonization of the Rio Grande valley of New Mexico, New Spain turned their interests east. In 1674, Fernando del Bosque crossed the Rio Grande at what is now Eagle Pass, Texas and continued north to the hill country of Texas, Edwards County (Wentworth, 1948). Two years later the Tejas Indians requested help from the Spanish colonists and Catholic priests established missions and stocked them with livestock especially sheep. Martin de Alacon built missions at San Antonio de Bexar as well as San Antonio Valera which became known as the ‘The Alamo’ (Wentworth, 1948). Sheep became the primary industry of that region. During the next 20 years, many missions were established in the area and all maintained significant sheep flocks.
About the time of Coronado’s and Onate’s excursions into the New Mexico territory, sheep traveled with Jesuit pioneers into the lower California (Baha California). Since this was over land, the expedition would have traveled through the Sonora region. Sheep were also shipped across the Gulf of California (Sea of Cortez) into lower California in 1697 (Carman et al., 1892 and Wentworth, 1948). In 1768, four expeditions left lower California for the regions of upper California, two by sea and 2 by land. They met at San Diego Alcala. Soon after, an expedition left San Diego Alcala north and eventually discovered San Francisco Bay.
So, by the close of the 18th century, sheep were permanently embedded into the southwest from Texas to California. Eventually, sheep trails were established which crossed the southwest allowing sheep trading and sales between Texas, New Mexico, Arizona and California.
THE MERINO CRAZE
The first Merino sheep to reach the United States
were smuggled from Spain in 1793 by William Foster. Foster was recalled to France and gave the sheep to his friend Andrew Craize as a gift. Craize, not knowing what he had with regards to potential breeding value, ate the sheep (Carman et al.,1892). So, the first Merino to legally enter the United States for breeding purposes occurred in 1801 (Pursell, 1959). E.I. du Pont, a Frenchman, purchased the first Merinos to be shipped to the U.S. Of the four sheep purchased, only one ram survived the voyage and he was named Don Pedro and was housed on du Pont’s farm in Delaware. Don Pedro was exposed to as many ewes as possible for the next 9 years. He is credited as being the foundation Merino ram for the American Merinos. ‘Merino Mania’ began with Don Pedro and continued for the next 10 years (Pursell, 1962). As France and Spain restricted the sale of additional Merinos and Rambouillet outside of their respective countries, demand soared and the offspring of Don Pedro could fetch large sums of money. Recognizing the potential of Merino sheep on domestic wool production,
du Pont wrote to President Jefferson, imploring him to encourage the U.S. Ambassador to France to arrange purchase and shipment of French Merino (Rambouillet) sheep to the U.S. He even suggested that the President be listed as the purchaser hoping that this would influence the French government to release the sheep for sale. The sale did not happen. However, when Napoleon invaded Spain, the local juntas made Spanish Merinos available for sale and about 5000 Merinos were shipped to the U.S. in two separate sales. However, the flood gates were open and by 1811, 20,000 Merinos had entered the U.S. thus bring ‘Merino Mania’ to a close. Instead of Merino selling for $1000 or more each, the price dropped to a more respectable $350/head or less (Pursell, 1962). Even though ‘Merino Mania’ was over, the Merino had established itself the breed of major influence on the sheep and wool industry and would alter the sheep and wool industry for decades to come. At the end of the War of 1812, relations between the U.S. and the United Kingdom returned to normal. So, as trade was reestablished, the United Kingdom dumped their wool surplus onto the U.S. market driving the price of wool down as well as the value of the Merino sheep. However, the pioneers began moving west carrying their livestock with them. So, sheep moved from Delaware, Maryland and other coastal states through New York, Pennsylvania to Ohio and beyond (Wentworth, 1948).
WEST MEETS EAST
Mean while, back in Texas, Steven F. Austin
inherited from his father an impresario grant to locate 300 American families on land between the Colorado and Brazos rivers. Following some difficulty with the Mexican government honoring the grant, in 1821 American families began to move onto the land grant. Following the Texas Revolution and the death of Austin in 1836, the American settlers sent back to Vermont for Merino sheep to be crossed on the Churro sheep of the missions to begin improvement of the wool clip (Wentworth, 1948). In 1845, German colonists brought sheep to Indianola, Texas and established a sheep and wool industry along the Guadalupe River. These sheep were British mutton breeds along with Merinos. By 1890, Texas was home to 5,135,585 sheep with wool production at 30 million pounds (Carman, 1892).
New Mexico was considered the center of the sheep industry in the southwest and influencing industries in many western states. Carman et al, (1892) referred to New Mexico as the “mother of the industry of the Rocky Mountains and the great plains”. During 1852 – 1860, an estimated 551,000 sheep and lambs were driven from New Mexico to California (Carman et al., 1892). Merinos reached the New Mexico territory in 1859 from Kentucky. However, sheep continued to be shipped out of the territory primarily for meat to surrounding states (Carman et al., 1892). From 1876 to 1878, 350,000 sheep were driven annually from New Mexico to Wyoming, Kansas, and Nebraska (Carman et al., 1892). Between 1883 and 1885 a million head per year were driven to Texas. During the late 1880,s many New Mexico saw
2
more profit in cattle, so many sold their sheep and stocked cattle. By 1890, New Mexico sheep flock had grown to over 2 million head with large numbers located in the northern counties (Carlson, 1969). However, in the territories accurate estimations of livestock numbers was a ‘best guess’ so the numbers could be much larger than reported. In 1890, New Mexico marketed 9 million pounds of wool. If you assume that each sheep produced 3 pounds of wool (average for sheep in New Mexico) then sheep numbers would be about 3 million head (Carman et al., 1892). This estimation probably did not include sheep and wool on the Navajo Nations.
Sheep had been in California nearly as long as New Mexico. In 1832, an estimated 155,000 sheep were located on missions in the state. Captain Sutter had 12,000 – 15,000 delivered to Sutter’s Mill to feed the minors following discovery of gold. Drives continued from New Mexico by western personalities like Kit Carson and Uncle Dick Wootten (Carlson, 1969 and Wentworth, 1948). The first Merinos introduced into California were a purchase of 7 purebred sheep at a cost of $1000 in 1856 (Carman, 1892). Thomas McConnell who purchased the sheep wrote in 1892 “It is needless to say to you that this shipment has been worth millions to the California sheep-raisers.” As reported by Carman et al. (1892) McConnell went on to write “I think all changes profitable to be made should be by selection. I remember a time when it was thought to be a large fleece from a ram to shear 14 pounds and a ewe 8 pounds. Now ewes shear from 10 to 20 pounds and rams from 15 to 30 pounds.’ By 1890, an estimated 2.7 million sheep inhabited California from a high of 6.4 million in 1876 (Carman, 1892). In California late in the 19th century, sheep grazing public domain and forest lands was restricted (Carman et al.,1892). An advocate of sheep grazing these lands, McConnell wrote that he had grazed sheep in the Sierra Nevada Mountains and indicated that fewer fires occurred when the grass and undergrowth was removed by grazing. About the same time of McConnell’s purchase, Parker Whitney purchased 350 Merino for $50 each from Australia but only 120 survived the voyage. With this base, he built a flock of 12,000 to 15,000 sheep (Carman et al.,1892). In a letter he wrote in 1892, he estimated that the Australian Merinos earned him $8000 to $10,000 each. He used his flock to clear 20,000 acres of land that he subdivided and sold for $150 to $350 per acre.
The first sheep reportedly to reach Oregon was in 1843 with the destination in Willamette Valley by the Hudson Bay Company. The sheep were the Churro type and were to be used for food. According to Carman et al. (1892), the first Merinos to reach Oregon were sheep owned by Hiram Smith in 1851 which originated from Ohio. This led to rapid growth of the sheep industry with sheep numbers reaching 1.7 million head in 1885. Between 1885 and 1891, farming increased in popularity and removed lands from grazing resulting in a drop in sheep numbers of 500,000 (Carman et al.,1892). The use of lambing sheds was a common practice in the coastal regions of Oregon (Wentworth, 1948).
Permanent flocks were established in Utah by the members of the Mormon Church in 1847 (Wentworth, 1948). These flocks were increased through sheep purchased out of New Mexico. However, the founding fathers emphasized the need for flock improvement and encourage flock managers to select superior rams. In 1853, 266 Spanish Merino were purchased and used extensively until French Merinos (Rambouillet) were introduced in 1860. An additional introduction of Merino rams was made in 1873 which seemed to greatly influence the quality of wool produced by the Utah flocks. The industry began to grow and the sheep numbers reached 2.8 million by 1892 (Carman et al., 1892). However, overgrazing occurred in the late 1890’s and the turn of the century and flock numbers was significantly reduced (Wentworth, 1948).
The first permanent flocks in Wyoming were established in 1846 when Jim Bridger brought New Mexico sheep and goats to his fort on the Green River (Wentworth, 1948). The sheep industry was just beginning in the western states when the U.S. Commissioner of Agriculture reported that the western states could produce sheep and wool at half the cost in the eastern states. So, sheep numbers grew rapidly throughout the west and the decade of the 1870’s was a boom for the western sheep industry. Certainly, Wyoming, Colorado and Montana became benefactors of the growth. Some historians disagree on who was the first large sheep producer in Wyoming. Wentworth (1948) reports that M.E. Post increased hi flock by 5000 head in the Pole Creek area. Samuel Western writing for the Wyoming State Historical Society cited a report of the Wyoming Surveyor General in 1871 that Edward Creighton ran 10,000 head of sheep in southeast Wyoming. Regardless, the sheep industry grew with the primary sheep being the wool breeds. In his essay, Western (2015) mentions that the Wyoming environment is a natural home for sheep. By 1891, Wyoming had 1.25 million sheep and a strong wool industry.
Sheep were introduced into Montana either in 1859 or 1867 (Carman et al., 1892). Regardless, the sheep entering Montana were heavily influenced by Merino breeding and originated from California and Oregon. Unlike many of the other western states, very little Churro breeding was found in the Montana sheep flocks. In 1885, a strong advocate for genetic improvement in sheep stated “The wool growers of Montana can congratulate themselves on the splendid position which their wools have gained among manufacturers” (Carman et al. 1892). By 1890, the sheep population had grown to over 1.5 million head. In 1883, H.M. Martin wrote a paper regarding Montana Wool (Carman et al.,1892) in which he stated the sheep raisers should cull their coarse wooled sheep and produce fine and medium fine staple wools. In the same paper, he stated that if producers paid attention to ensure that their fleeces were properly tied and packaged, they would add to the already outstanding reputation of Montana wools.
Introduction of sheep into Colorado was by New Mexican herders utilizing some of the southern mountains for summer grazing. It was not until 1852 that sheep
3

raisers established a strong foothold in Southern Colorado in the San Luis valley (Wentworth, 1948). The early sheep ranches were established by New Mexicans bringing with them the Churro type sheep. By 1870, the sheep industry was beginning to shift to the eastern slope of the Rockies and on the eastern plains. Carman et al. (1892) said in regards to the shift “Picturesque mountains make poor sheep pastures.” In 1873, a carload of Merinos were purchased from growers in Vermont and traveled by rail to Cheyenne, WY and then trailed to the Fort Collins area. By 1878, the sheep numbers had grown to 75,000 head (Wentworth, 1948). However, the sheep ranchers were soon crowed out of the eastern plains by the farmers and the irrigation systems built to support the farming activities. So, the industry shifted back to the south, and to the north central part of the state (Wentworth, 1948). The 1891 census form the USDA estimated 1.8 million sheep in Colorado. Writing about the sheep industry in Colorado, Carman et al. (1892) stated “With good breeding, good feeding and watering combined with eternal vigilance and good business-sense, the sheep industry is profitable to the producer.”
RISE AND FALL
During the last half of the 19th century, the sheep industry shifted from the east to western states. Sheep could be grown more cheaply through inexpensive grazing lands and the opportunity to graze public lands. After the introduction of the Merino type sheep, the industry shifted from production of mutton to wool production which suited the western states. Sheep numbers continued to increase through the turn of the 20th century. By 1900, an estimated 48 million sheep inhabited the U.S (USDA, 2015). In 1946, sheep numbers peaked at an estimated 56 million (USDA, 2015). Since, the numbers have dramatically dropped. In the 69 years between the peak and current status, the domestic sheep population has declined by 88%. In 2008, the National research Council (NRC, 2008) published ‘Changes in the Sheep Industry in the United States: Making the Transition from Tradition’ in which the committee reviewed the development and current situation of the sheep industries as well as offering opportunities to sustain and grow the sheep industry of today. The report identified several factors contributing to the free fall of the sheep industry in the United States. These included labor issues, low consumer acceptance and consumption of the lamb and wool, regulations and issues with the endangered species act, predation, and loss of the National Wool Act and Incentive payments as well as competition from other meats, fibers and countries. To overcome the obstacles, the NRC (2008) provided some opportunities for the industry such as continued research into efficient production practices, develop new methods of processing and marketing the less desirable cuts of the carcass, build partnerships with wildlife professionals to
control predation of both domestic and wild grazing ungulates, work with our government officials to reduce the impact of regulations on grazing public lands and the endangered species act, develop new markets for our products and even develop new products such as milk and cheese, and investigate the efficacy of different breeds of sheep and alternate production systems. To take a phrase from the NRC (2008) report, let’s not think of the sheep industry as a failing industry but as and industry in transition much like our forbearers in the early 1800’swhen they changed the sheep industry and in so doing affected a nation.
LITERATURE CITED
Carlson, A.W. 1969. New Mexico’s sheep industry, 1850 – 1900: It’s role in the history of the territory. New Mexico Historical Review. 44:25 – 49.
Carman, E.A., H.A. Heath, and J. Minto. 1892. Special Report on the History and Present Condition of the Sheep Industry of the United States. Government Printing Office, Washington, DC.
Kupper, W. 1945. The golden Hoof, the Story of the Sheep of the Southwest. Alfred a. Knopf, Inc., New York.
NRC. 2008. Changes in the Sheep Industry in the United States: Making the Transition from Tradition. Natl. Acad. Press, Washington, DC.
Pursell, C.W. 1962. E.I. du Pont and the Merino Mania in Delaware, 1805 – 1815. The Journal. 36(2): 91 – 100.
Pursell, C.W. 1959. E.I. du Pont, don Pedro, and the introduction of Merino sheep into the United States, 1801: A document. The Journal. 33(2): 86 -88.
USDA. 2015. quickstats.nass.usda.gov (accessed 10 March 2015).
Wentworth, E.N. 1948. American sheep Trails History and Personalities. The Iowa State college Press, Ames, Iowa.
Western, Samuel. 2015. The Wyoming sheep Business. http://www.wyohistory.org/essays/wyoming-sheep-business (accessed 10 March 2015).
4
YOUNG SCHOLAR RECOGNITION
Proceedings, Western Section, American Society of Animal Science
Vol. 66, 2015
Effects of supplementation of acyl-homoserine lactones on in vitro true digestibility of a forage diet
K. H. Marchetti, A. Garza, E. J. Scholljegerdes, and S. L. Lodge-Ivey
New Mexico State University, Las Cruces, NM 88003
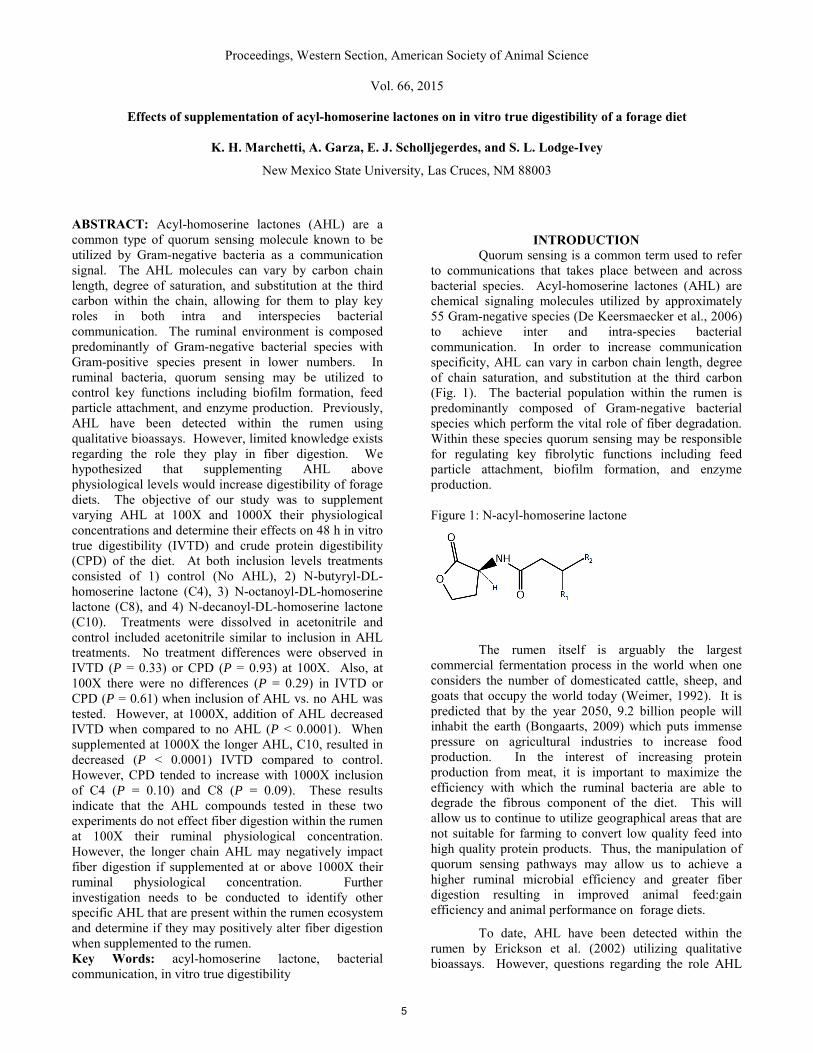
ABSTRACT: Acyl-homoserine lactones (AHL) are a common type of quorum sensing molecule known to be utilized by Gram-negative bacteria as a communication signal. The AHL molecules can vary by carbon chain length, degree of saturation, and substitution at the third carbon within the chain, allowing for them to play key roles in both intra and interspecies bacterial communication. The ruminal environment is composed predominantly of Gram-negative bacterial species with Gram-positive species present in lower numbers. In ruminal bacteria, quorum sensing may be utilized to control key functions including biofilm formation, feed particle attachment, and enzyme production. Previously, AHL have been detected within the rumen using qualitative bioassays. However, limited knowledge exists regarding the role they play in fiber digestion. We hypothesized that supplementing AHL above physiological levels would increase digestibility of forage diets. The objective of our study was to supplement varying AHL at 100X and 1000X their physiological concentrations and determine their effects on 48 h in vitro true digestibility (IVTD) and crude protein digestibility (CPD) of the diet. At both inclusion levels treatments consisted of 1) control (No AHL), 2) N-butyryl-DL-homoserine lactone (C4), 3) N-octanoyl-DL-homoserine lactone (C8), and 4) N-decanoyl-DL-homoserine lactone (C10). Treatments were dissolved in acetonitrile and control included acetonitrile similar to inclusion in AHL treatments. No treatment differences were observed in IVTD (P = 0.33) or CPD (P = 0.93) at 100X. Also, at 100X there were no differences (P = 0.29) in IVTD or CPD (P = 0.61) when inclusion of AHL vs. no AHL was tested. However, at 1000X, addition of AHL decreased IVTD when compared to no AHL (P < 0.0001). When supplemented at 1000X the longer AHL, C10, resulted in decreased (P < 0.0001) IVTD compared to control. However, CPD tended to increase with 1000X inclusion of C4 (P = 0.10) and C8 (P = 0.09). These results indicate that the AHL compounds tested in these two experiments do not effect fiber digestion within the rumen at 100X their ruminal physiological concentration. However, the longer chain AHL may negatively impact fiber digestion if supplemented at or above 1000X their ruminal physiological concentration. Further investigation needs to be conducted to identify other specific AHL that are present within the rumen ecosystem and determine if they may positively alter fiber digestion when supplemented to the rumen. Key Words: acyl-homoserine lactone, bacterial communication, in vitro true digestibility
INTRODUCTION
Quorum sensing is a common term used to refer to communications that takes place between and across bacterial species. Acyl-homoserine lactones (AHL) are chemical signaling molecules utilized by approximately 55 Gram-negative species (De Keersmaecker et al., 2006) to achieve inter and intra-species bacterial communication. In order to increase communication specificity, AHL can vary in carbon chain length, degree of chain saturation, and substitution at the third carbon (Fig. 1). The bacterial population within the rumen is predominantly composed of Gram-negative bacterial species which perform the vital role of fiber degradation. Within these species quorum sensing may be responsible for regulating key fibrolytic functions including feed particle attachment, biofilm formation, and enzyme production.
Figure 1: N-acyl-homoserine lactone
The rumen itself is arguably the largest commercial fermentation process in the world when one considers the number of domesticated cattle, sheep, and goats that occupy the world today (Weimer, 1992). It is predicted that by the year 2050, 9.2 billion people will inhabit the earth (Bongaarts, 2009) which puts immense pressure on agricultural industries to increase food production. In the interest of increasing protein production from meat, it is important to maximize the efficiency with which the ruminal bacteria are able to degrade the fibrous component of the diet. This will allow us to continue to utilize geographical areas that are not suitable for farming to convert low quality feed into high quality protein products. Thus, the manipulation of quorum sensing pathways may allow us to achieve a higher ruminal microbial efficiency and greater fiber digestion resulting in improved animal feed:gain efficiency and animal performance on forage diets.
To date, AHL have been detected within the rumen by Erickson et al. (2002) utilizing qualitative bioassays. However, questions regarding the role AHL
5

play within the rumen and fiber digestion still remain. We hypothesized that supplementing AHL would increase digestibility of a forage diet. Therefore, the objective of this study was to supplement varying AHL at 100X and 1000X their estimated physiological concentration in the rumen and measure their effects on 48 h in vitro true digestibility (IVTD) of a forage diet.
MATERIALS AND METHODS
All procedures were approved by the New Mexico State University Institutional Animal Care and Use Committee.
Experimental design and treatments
A DaisyII incubator (ANKOM Technology) was utilized to evaluate the effect of AHL on IVTD of Sorghum sudan hay (65.5% NDF, 12.6% CP; DM basis) that was ground to pass through a 2mm screen using a Wiley Mill (Thomas Wiley Model 4, Swedesboro, NJ). The hay was weighed out into F57 ANKOM filter bags that were rinsed, labeled, and weighed prior to being heat sealed according to the DaisyII protocol (ANKOM Technology Method 3). Ten bags were placed in each jar with pre-heated Daisy buffer solution (pH 6.8) 30 minutes prior to beginning incubation with ruminal fluid. Approximately 3 h post feeding, 0.75 L of ruminal fluid was collected into a pre-heated thermos from each of 3 ruminally cannulated heifers and combined. Ruminal fluid was homogenized and strained through 4 layers of cheesecloth before 400 mL were added to each DaisyII jar. Jars were purged of O2 with CO2 and the incubation was initiated approximately 30 min from the time of ruminal fluid collection. Within the incubator each treatment was represented. Treatments included 1) control (No AHL); 2) N-butyryl-DL-homoserine lactone (C4) (Fig. 2); 3) N-octanoyl-DL-homoserine lactone (C8) (Fig. 3); and 4) N-decanoyl-DL-homoserine lactone (C10) (Fig. 4) and were designated by jar. The AHL were dissolved in acetonitrile and control treatment included acetonitrile at a similar inclusion level to AHL treatments. After incubating for 48 h, bags were first rinsed gently with water and frozen at -20°C until further analyses could be conducted. To determine IVTD, bags were thawed and rinsed in neutral detergent fiber (NDF) solution for 75 minutes following the NDF protocol (ANKOM Technology Method 6) in order to achieve removal of any microbial attachment to the bags. Bags were then dried at 110°C and final weights were recorded. In order to determine protein digestibility, nitrogen content of feed and remaining residue, a Leco FP-528 (St. Joseph, MI) analyzer was utilized.
Figure 2: N-butyryl-DL-homoserine lactone (C4)
Figure 3: N-octanoyl-DL-homoserine lactone (C8)
Figure 4: N-decanoyl-DL-homoserine lactone (C10)
Calculations and statistical analysis
Forty-eight hour IVTD was calculated based on the disappearance of dry matter from the bags using the following equation: %𝐼𝑉𝑇𝐷𝐷𝑀 = 100−𝑊3−(𝑊1 𝑥 𝐶1)
𝑊2 𝑋 100.
Where W1 = bag tare weight; W2 = sample weight; W3 = final bag weight after in vitro and sequential NDF treatment; and C1 = blank bag correction (final oven dried weight/original blank bag weight). Utilizing the same equation, CP digestibility (CPD) was determined by applying the % CP of the feed and remaining residue to the W2 and W3 terms respectively.
Data were analyzed using the GLM procedure of SAS version 9.4 (SAS Inst. Inc., Cary, NC). Bag was the experimental unit; treatments represented effects and random error was accounted for in the error term. Means were calculated using LSMEANS. Treatment effect was considered significant when the probability of a greater F was < 0.05 and a tendency when F was < 0.10. When F-tests were significant, mean separations were performed using the PDIFF procedure. Single degree of freedom orthogonal contrasts were used to compare effects of AHL to no AHL.
RESULTS AND DISCUSSION
Results are summarized in Table 1. No treatment differences in IVTD (P = 0.33) or CPD (P = 0.93) at 100X were observed. Also, at 100X, there was no difference in IVTD (P = 0.29) or CPD (P = 0.61) when inclusion of AHL vs. no AHL was tested. Crude protein digestibility tended to increase with the inclusion of C4 (P = 0.10) and C8 (P = 0.09) at 1000X. Similarly, at 1000X, overall CPD tended to increase when AHL vs. no AHL was tested (P = 0.10). However, the addition of AHL decreased overall IVTD when compared to no AHL (P < 0.0001) at 1000X. Furthermore, when supplemented at 1000X the longer chain AHL, C10, decreased (P < 0.0001) IVTD compared to control.
Achieving consistent improvements in fiber degradation within the rumen has been the goal of microbiologists and nutritionists alike for the past 100
6
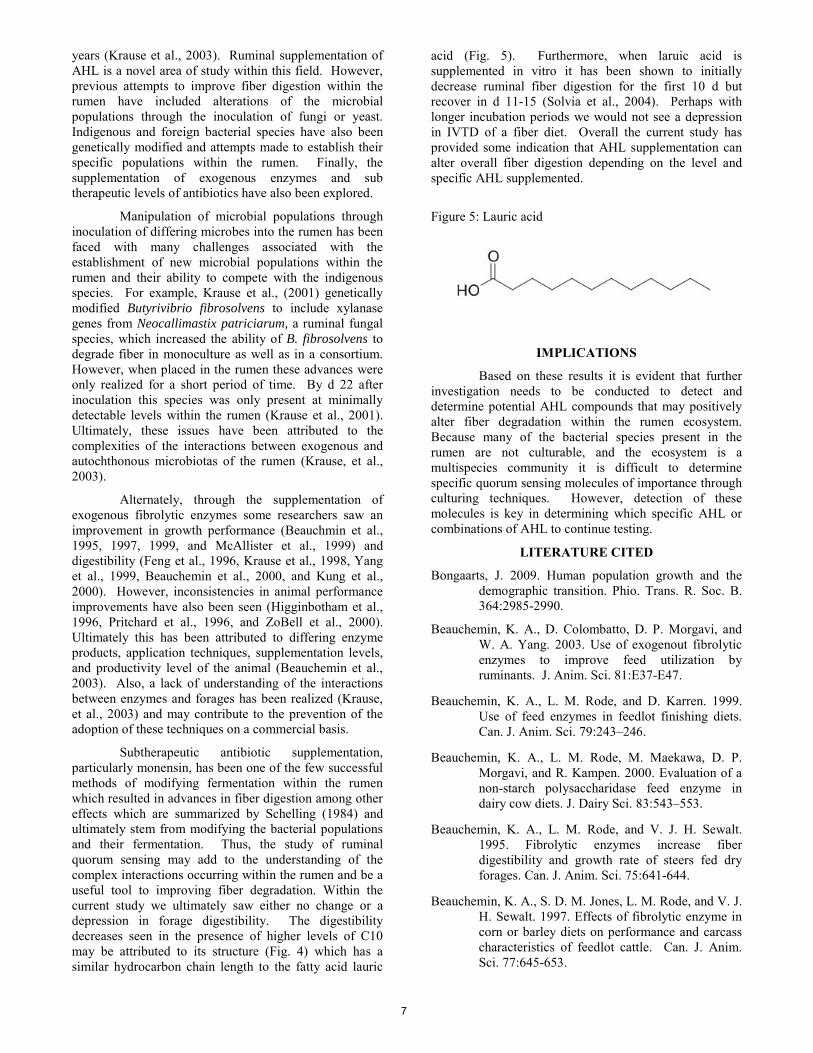
years (Krause et al., 2003). Ruminal supplementation of AHL is a novel area of study within this field. However, previous attempts to improve fiber digestion within the rumen have included alterations of the microbial populations through the inoculation of fungi or yeast. Indigenous and foreign bacterial species have also been genetically modified and attempts made to establish their specific populations within the rumen. Finally, the supplementation of exogenous enzymes and sub therapeutic levels of antibiotics have also been explored.
Manipulation of microbial populations through inoculation of differing microbes into the rumen has been faced with many challenges associated with the establishment of new microbial populations within the rumen and their ability to compete with the indigenous species. For example, Krause et al., (2001) genetically modified Butyrivibrio fibrosolvens to include xylanase genes from Neocallimastix patriciarum, a ruminal fungal species, which increased the ability of B. fibrosolvens to degrade fiber in monoculture as well as in a consortium. However, when placed in the rumen these advances were only realized for a short period of time. By d 22 after inoculation this species was only present at minimally detectable levels within the rumen (Krause et al., 2001). Ultimately, these issues have been attributed to the complexities of the interactions between exogenous and autochthonous microbiotas of the rumen (Krause, et al., 2003).
Alternately, through the supplementation of exogenous fibrolytic enzymes some researchers saw an improvement in growth performance (Beauchmin et al., 1995, 1997, 1999, and McAllister et al., 1999) and digestibility (Feng et al., 1996, Krause et al., 1998, Yang et al., 1999, Beauchemin et al., 2000, and Kung et al., 2000). However, inconsistencies in animal performance improvements have also been seen (Higginbotham et al., 1996, Pritchard et al., 1996, and ZoBell et al., 2000). Ultimately this has been attributed to differing enzyme products, application techniques, supplementation levels, and productivity level of the animal (Beauchemin et al., 2003). Also, a lack of understanding of the interactions between enzymes and forages has been realized (Krause, et al., 2003) and may contribute to the prevention of the adoption of these techniques on a commercial basis.
Subtherapeutic antibiotic supplementation, particularly monensin, has been one of the few successful methods of modifying fermentation within the rumen which resulted in advances in fiber digestion among other effects which are summarized by Schelling (1984) and ultimately stem from modifying the bacterial populations and their fermentation. Thus, the study of ruminal quorum sensing may add to the understanding of the complex interactions occurring within the rumen and be a useful tool to improving fiber degradation. Within the current study we ultimately saw either no change or a depression in forage digestibility. The digestibility decreases seen in the presence of higher levels of C10 may be attributed to its structure (Fig. 4) which has a similar hydrocarbon chain length to the fatty acid lauric
acid (Fig. 5). Furthermore, when laruic acid is supplemented in vitro it has been shown to initially decrease ruminal fiber digestion for the first 10 d but recover in d 11-15 (Solvia et al., 2004). Perhaps with longer incubation periods we would not see a depression in IVTD of a fiber diet. Overall the current study has provided some indication that AHL supplementation can alter overall fiber digestion depending on the level and specific AHL supplemented.
Figure 5: Lauric acid
IMPLICATIONS
Based on these results it is evident that further investigation needs to be conducted to detect and determine potential AHL compounds that may positively alter fiber degradation within the rumen ecosystem. Because many of the bacterial species present in the rumen are not culturable, and the ecosystem is a multispecies community it is difficult to determine specific quorum sensing molecules of importance through culturing techniques. However, detection of these molecules is key in determining which specific AHL or combinations of AHL to continue testing.
LITERATURE CITED
Bongaarts, J. 2009. Human population growth and the demographic transition. Phio. Trans. R. Soc. B. 364:2985-2990.
Beauchemin, K. A., D. Colombatto, D. P. Morgavi, and W. A. Yang. 2003. Use of exogenout fibrolytic enzymes to improve feed utilization by ruminants. J. Anim. Sci. 81:E37-E47.
Beauchemin, K. A., L. M. Rode, and D. Karren. 1999. Use of feed enzymes in feedlot finishing diets. Can. J. Anim. Sci. 79:243–246.
Beauchemin, K. A., L. M. Rode, M. Maekawa, D. P. Morgavi, and R. Kampen. 2000. Evaluation of a non-starch polysaccharidase feed enzyme in dairy cow diets. J. Dairy Sci. 83:543–553.
Beauchemin, K. A., L. M. Rode, and V. J. H. Sewalt. 1995. Fibrolytic enzymes increase fiber digestibility and growth rate of steers fed dry forages. Can. J. Anim. Sci. 75:641-644.
Beauchemin, K. A., S. D. M. Jones, L. M. Rode, and V. J. H. Sewalt. 1997. Effects of fibrolytic enzyme in corn or barley diets on performance and carcass characteristics of feedlot cattle. Can. J. Anim. Sci. 77:645-653.
7

De Keersmaecker, S. C. J., K. Sonck, and J. Vanderleyden. 2006. Let LuxS speak up in AI-2 signalling. Trends Microbiol. 14:114-119.
Erickson, D. L., V. L. Nsereko, D. P. Morgavi, L. B. Selinger, L. M. Rode, and K. A. Beauchemin. 2002. Evidence of quorum sensing in the rumen ecosystem: detection of N-acyl homoserine lactone autoinducers in ruminal contents. Can. J. Microbiol. 48:374-378.
Feng, P. C. W. Hunt, G. T. Pritchard, and W. E. Julien. 1996. Effect of enzyme preparations on in situ and in vitro degradation and in vivo digestive characteristics of mature cool-season grass forage in beef steers. J. Anim. Sci. 74:1349-1357
Higginbotham, G. E., E. J. dePetters, S. L. Berry, and A. Ahmadi. 1996. Effect of adding a cell wall degrading enzyme to a total mixed ration for lactating dairy cows. Prof. Anim. Sci. 12:81–85.
Kung, L., Jr., R. J. Treacher, G. A. Nauman, A. M. Smagala, K. M. Endres, and M. A Cohen. 2000. The effect of treating forages with fibrolytic enzymes on its nutritive value and lactation performance of dairy cows. J. Dairy Sci. 83:115–122.
Krause, D. O., R. J. Bunch, N. D. Darylmple, D. S. Gobius, W. J. Smith, X. P. Xue, and C. S. McSweeney. 2001. Expression of a modified Neocallimastix patricicarum xylanase in Butyvibrio fibrosolvens digests more fibre but cannot effectively compete with highly fibrolytic bacteria in the rumen. J. Appl. Microbiol. 90:388-396.
Krause, D. O., S. E. Denman, R. I. Mackie, M. Morrison, A. L. Rae, G. T. Attwood, C. S. McSweeney. 2003. Opportunities to improve fiber degradation in the rumen: microbiology, ecology, and genomics. FEMS Microbiol. Rev. 27:663-693.
Krause, M., K. A. Beauchemin, L. M. Rode, B. I. Farr, and P. Nørgaard. 1998. Fibrolytic enzyme treatment of barley grain and source of forage in high-grain diets fed to growing cattle. J. Anim. Sci. 96:1010–1015
McAllister, T. A., S. J. Oosting, J. D. Popp, Z. Mir, L. J. Yanke, A. N. Hristov, R. J. Treacher, and K.-J. Cheng. 1999. Effect of exogenous enzymes on digestibility of barley silage and growth performance of feedlot cattle. Can. J. Anim. Sci. 79:353–360.
Pritchard, G., C. Hunt, A. Allen, and R. Treacher. 1996. Effect of direct-fed fibrolytic enzymes on digestion and growth performance in beef cattle. J. Anim. Sci. 74(Suppl. 1):296. (Abstr.)
Rode, L. M., W. Z. Yang, and K. A Beauchemin. 1999. Fibrolytic enzyme supplements for dairy cows in early lactation. J. Dairy Sci. 82:2121–2126.
Shelling, G. T. 1984. Monensin mode of action in the rumen. J. Anim. Sci. 58:1518-1527.
Solvia, C. R., L. Meile, A. Cieslak, M. Kreuzer, and A. Machmuller. 2004. Brit. J. Nutr. 92:689-700.
Weimer, P. J. 1992. Cellulose degradation by ruminal microorganisms. Crit. Rev. Biotechnol. 12:189-223
Yang, W. Z., K. A. Beauchemin, and L. M Rode. 1999. Effects of enzyme feed additives on extent of digestion and milk production of lactating dairy cows. J. Dairy Sci. 82:391–403.
ZoBell, D. R., R. D. Weidmeier, K. C. Olson, and R. J. Treacher. 2000. The effect of an exogenous enzyme treatment on production and carcass characteristics of growing and finishing steers. Anim. Feed Sci. Technol. 87:279–285
8
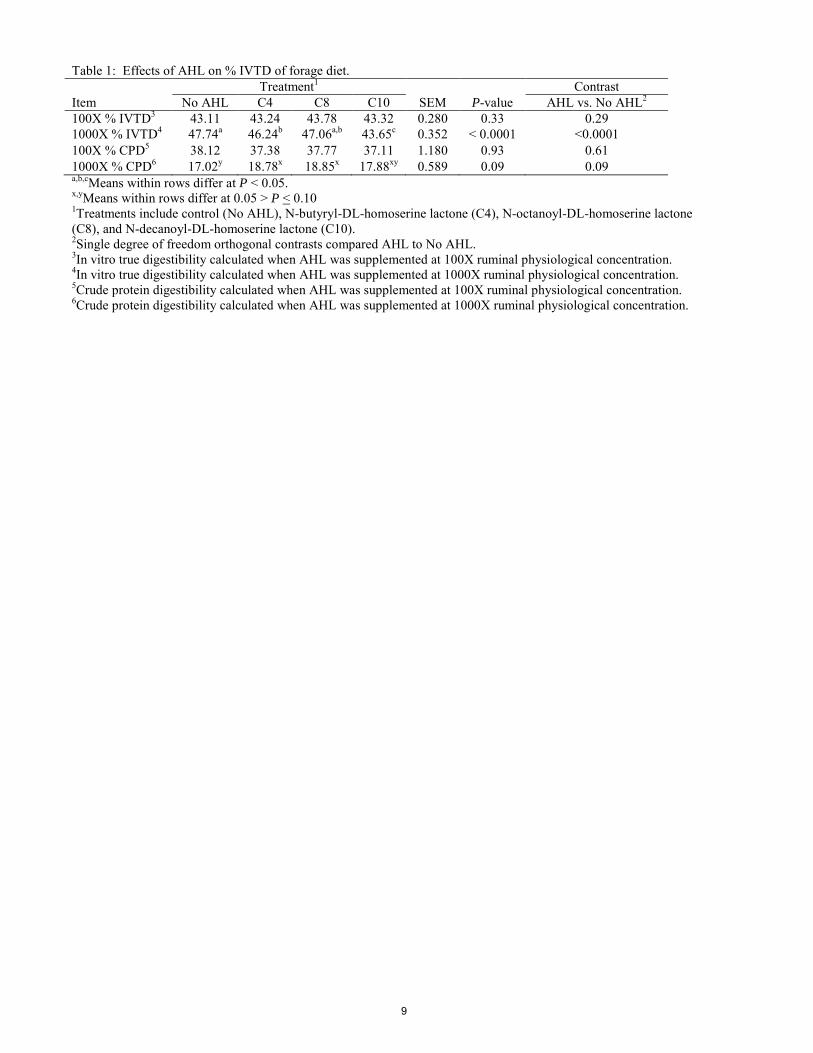
Table 1: Effects of AHL on % IVTD of forage diet. Treatment1 Contrast
Item No AHL C4 C8 C10 SEM P-value AHL vs. No AHL2
100X % IVTD3 43.11 43.24 43.78 43.32 0.280 0.33 0.29 1000X % IVTD4 47.74a 46.24b 47.06a,b 43.65c 0.352 < 0.0001 <0.0001 100X % CPD5 38.12 37.38 37.77 37.11 1.180 0.93 0.61 1000X % CPD6 17.02y 18.78x 18.85x 17.88xy 0.589 0.09 0.09 a,b,cMeans within rows differ at P < 0.05. x,yMeans within rows differ at 0.05 > P < 0.10 1Treatments include control (No AHL), N-butyryl-DL-homoserine lactone (C4), N-octanoyl-DL-homoserine lactone (C8), and N-decanoyl-DL-homoserine lactone (C10). 2Single degree of freedom orthogonal contrasts compared AHL to No AHL. 3In vitro true digestibility calculated when AHL was supplemented at 100X ruminal physiological concentration. 4In vitro true digestibility calculated when AHL was supplemented at 1000X ruminal physiological concentration. 5Crude protein digestibility calculated when AHL was supplemented at 100X ruminal physiological concentration. 6Crude protein digestibility calculated when AHL was supplemented at 1000X ruminal physiological concentration.
9
Proceedings, Western Section, American Society of Animal Science
Vol. 66, 2015
Effects of feeding ground juniper to gestating ewes on pre- and postpartum ewe performance, serum biochemistry and hormones, milk fatty acid composition and progeny preweaning performance
W. C. Stewart*†, T. R. Whitney*, E. J. Scholljegerdes†, D. M. Hallford†, S. S. Soto-Navarro†, and H. D. Naumann
*Texas A&M AgriLife Research, San Angelo, TX 76901; †Animal and Range Sciences Department, New Mexico State University, Las Cruces NM, 88003; #Texas AgriLife Research, Stephenville, TX 76401; ‖Division of Plant Sciences,
University of Missouri, Columbia MO, 65211
ABSTRACT: The objective of this research was to evaluate effects of feeding ground juniper to pregnant ewes on pre- and postpartum growth performance, serum biochemistry, and hormone concentrations, milk fatty acid composition and progeny performance. Forty commercial Rambouillet ewes (initial BW = 65.6 ± 1.6 kg) were used in a completely randomized design and assigned to 1 of 4 supplements replacing 0% (CNTL; n = 10), 33% (18JUN; n = 10), 66% (36JUN; n = 10) or 100% (54JUN; n = 10) of the ground sorghum × sudan grass hay component with ground juniper (J. pinchotii). Ewes were individually fed supplements from d 38 ± 4 of gestation to 2 d postpartum. Afterwards, all ewes and lambs were maintained in a dry lot and offered ad libitum access to ground sorghum × sudan hay and allowed access to pasture for 50 d, at which time lambs were weaned. Ewe supplement and hay intake (g/kg of BW) were similar (P ≥ 0.24) throughout the duration of the study between ewes receiving no juniper to those receiving increasing concentrations of juniper. Ewe BW and BCS were also similar (P ≥ 0.13) across treatments. Overall, serum IGF-1 decreased linearly (P = 0.02) as concentration of juniper increased in the diet. No differences (P ≥ 0.25) in progesterone concentrations were detected. Serum biochemical concentrations were not significantly altered (P > 0.06) by juniper consumption and were within normal clinical ranges. Ewe milk fatty acid composition was similar across treatment groups with the exception of arachidonic acid being (C20:4n6) greater (P < 0.02) in 54JUN vs. CNTL. Lamb birth weight was not affected (P = 0.13) by maternal juniper consumption. However, lamb ADG tended to differ (quadratic, P = 0.06) from d 0 to 14 with 18JUN being the lowest. At weaning, BW tended (linear, P = 0.09) to decrease in lambs born to ewes consuming increasing levels of juniper, however, no differences were detected (P = 0.29) when compared to CNTL lambs. Lamb survival from birth to weaning tended to be greatest (P = 0.10) when juniper was fed. These results indicate that ground juniper is a suitable feed ingredient for pregnant ewes and does not appear to negatively affect the ewe or subsequent progeny.
Key words: ground juniper, pregnant sheep, ewe and progeny performance, SUN.
INTRODUCTION
Drought-induced feed shortages, rising feed costs, and woody plant encroachment threaten the sustainability of sheep production systems in arid ecosystems. Underutilized feed resources such as the invasive woody plant juniperus is an abundant feed alternative in the
southwestern U.S., consumed as browse (Malachek and Leinweber, 1972), and more recently as a ground roughage component in complete growing and finishing diets for lambs (Whitney et al., 2014). Nutritional and plant secondary compound composition of the entire mature plant biomass (i.e., condensed tannins, terpenes, and terpenoids) have been recently characterized (Stewart et al., 2014), however feeding of ground juniper has been limited to leaves (Whitney and Muir, 2010) or leaves plus small stems (Whitney et al., 2014). Additional studies have shown redberry juniper-based diets can reduce Haemonchus contortus infection and increase ivermectin efficiency in lambs (Whitney et al., 2013). Yet, effects of feeding this novel feed source from early gestation to parturition and the subsequent effects on pre- and postpartum ewe performance, and lamb pre- and post-natal growth have not been evaluated. Therefore, we hypothesized that replacing sorghum × sudan grass hay with increasing levels of ground juniper in gestation diets would not negatively impact ewe or progeny performance. Objectives were to determine effects of feeding ground red berry juniper as an alternative roughage, replacing the hay component during early gestation to parturition on ewe pre-partum performance, pre- and postpartum serum biochemistry and hormones, and pre-weaning lamb performance.
MATERIALS AND METHODS
Animals and Diets
The experimental protocol was approved by the Texas A&M University Institutional Animal Care and Use Committee. Commercial unshorn pregnant Rambouillet ewes (n = 40; age = 3 to 5 yr of age; initial BW = 65.2 ± 1.6 kg), were weighed at the beginning of the study, stratified by BW, and assigned to a treatment (n = 10/treatment). Ewes were randomly assigned to individual pens and 1 of 4 supplements that contained either 0% juniper (CNTL), 33% (18JUN), 66% (36JUN) or 100% (54JUN) juniper as a replacement of the sorghum × sudan hay component of the supplement. Ewes were fed the supplement at 1% of BW until d 64 (103 ± 4 d gestation), then 1.15% of BW was fed until 2 d postpartum. Additionally, ewes were fed long-stem sorghum × sudan at 2.1% of BW until d 64 (103 ± 4 d gestation), and ad libitum thereafter until parturition. Diets were formulated to meet or exceed nutrients for all phases of gestation according to NRC (2007). Hay intake data from d 64 to parturition was not recorded. Ewes were weighed at d 0,
10
34, 64, and 2 d postpartum and body condition scored (1 = emaciated; 5 = obese; ASIA, 2002).
Juniper Harvesting Feed Collection and Analysis.
During the fall, mature J. pinchotti trees were harvested, mechanically chipped and air-dried approximately 8 days to approximately 80% DM. This material was then fine-ground in a hammermill to pass a 4.76-mm sieve. Once roughages were hammermilled, diets were immediately mixed (Table 1) and pelleted without steam. Diet composition and nutrient composition is reported in Table 1. All nutrients and plant secondary compounds were analyzed as described by Stewart et al. (2014). A 10-mL blood sample was collected 4 h after feeding from each ewe via jugular venipuncture using a vacutainer collection tube at study initiation 0 d (39 ± 4 d gestation), 34 d (73 ± 4 d gestation), 64 d (103 ± 4 d gestation) and 2 d post-parturition. Serum was frozen at –20 °C until analyzed. The serum biochemistry panel was analyzed by Texas A&M Veterinary Diagnostic Laboratory (Amarillo, TX) according to standard procedures. Serum IGF-1 and progesterone concentrations were determined by RIA. Lamb birth weights were recorded within 12 h postpartum. Lamb vigor and suckling criteria was adapted according to Matheson et al. (2011). To assess lamb performance, lambs were weighed at 13 ± 1 d and 49 ± 1 d (weaning) of age and were adjusted for lamb age (14 and 50 d) and sex using the American Sheep Industry Association formulas (ASIA, 2002).
At two days post-partum lambs were removed from their dams (a.m.) for 3 h and allowed to suckle until satisfied. Ewes and lambs were separated an additional 3 h at which time milk samples were collected. Frozen samples were stored at –80 °C. until fatty acid analysis. Samples were lyophilized (Lyotroll; SP Scientific., Warminster, PA) and then analyzed via direct transesterification (Whitney et al., 1999) with an alkaline catalyst (KOH), as described by Murrieta et al. (2003). Separation of fatty acid methyl esters was achieved by GLC (Agilent 7890; Agilent Technologies, Inc., Santa Clara, CA) with a 100 m × 0.25 mm (i.d.) × 0.2 μm (film thickness) capillary column (SP-2560, Supelco, Bellefonte, PA) and H2 gas as the carrier at 1.5 mL/min. The initial oven temperature was maintained at 120°C for 2 min, increased to 210°C at 6°C/min, and then increased to 250°C at 5°C/min. The injector temperature was 260°C and the flame ionization detector temperature was 300°C. Identification of peaks was accomplished using purified fatty acid standards (Sigma-Aldrich, St. Louis, MO; Nu-Chek Prep, Elysian, MN; Matreya, Pleasant Gap, PA). One milligram of methyl tridecanoic acid (13:0) was used as an internal standard.
Statistical Analysis
Twelve ewes were removed from study analysis for reasons unrelated to experimental treatments. Ewe DMI, BW, ADG, BCS, and all serum data were analyzed using the MIXED procedure of SAS (SAS Inst. Inc., Cary NC) with individual ewe as the experimental unit. Model statement included treatment, time, and treatment × time interaction. The GENMOD procedure was used to
analyze binomial data (lamb survival %). To test the effect of the treatment diets on ewe lamb and progeny response variables, orthogonal contrasts were constructed using the CONTRAST statement in PROC MIXED. Specifically, effects of the juniper-containing diets (CNTL vs. average of juniper-based diets: 18JUN, 36JUN, 54JUN) and linear and quadratic effects to treatments CNTL, 18JUN, 36JUN, 54JUN. Data are reported as least squares means.
RESULTS AND DISCUSSION
Pre- and Postpartum Ewe Performance
The primary objective was to determine if feeding amounts of ground redberry juniper would alter ewe performance throughout gestation, and subsequent progeny performance. No treatment by period interactions (P > 0.05) were detected for ewe BW, BCS, ADG, or DMI, thus main effects of treatment within time are presented in Table 2. Overall, average daily DMI was unaffected (P > 0.05) by increasing amounts of ground juniper in the diet. Supplement intake was not different throughout the study when comparing CNTL vs. Juniper treatments, which, considering increasing plant secondary compound composition and indigestible fiber (Table 1) is noteworthy as these factors did not significantly reduce intake. Positive associated effects of mixing the ground juniper with another roughage source (oat hay) on improved growth performance has been previously observed (Whitney et al., 2014).
Crude protein content of supplements decreased with increasing juniper levels (Table 1). Consequently, calculated CP intake from d 0 to 64 linearly decreased (P < 0.001) in ewes consuming increasing amounts of juniper. Furthermore, increased ADF concentration and reduced tIVDMD as juniper levels increased (Table 1) in supplements resulted in CNTL ewes consuming greater ME g/kg of BW (P = 0.013). One of the initial concerns with feeding juniper is the potential reduction in DMI due to plant secondary compounds (volatile oil and CT). Ewes consuming 18JUN, 36JUN, and 54JUN supplement ingested approximately 1.5, 2.6, and 4.8 g/d of volatile oil, respectively (DM basis; calculated from Table 1). Volatile oil was primarily composed of elemol (16%), terpinen-4-ol (15%), eudesmol (13%), sabinene (9%), and camphor (7%).
Overall, serum biochemistry was unaffected (P > 0.10) by juniper consumption throughout gestation (Table 3), and were within normal clinical ranges (Kaneko et al., 2008). Treatment × time interactions were observed for aspartate amino transferase (AST; P < 0.01), and gamma glutamyl transferase (GGT; P < 0.01). Differences in AST concentrations were only greatest (P < 0.01) in CNTL vs Juniper at 2 d post-partum. Serum Na concentrations declined linearly (P < 0.05). Phosphorus concentrations were greater (P < 0.01) in CNTL vs. Juniper (linear, P < 0.002) likely due to greater dietary P. Overall lack of differences across treatments in serum biochemistry parameters is noteworthy considering plant secondary compounds in the juniper groups were consumed over a period of approximately 110 d. Overall reductions in volatile oil as a result of processing (Stewart et al., 2014)
11
may minimize the biological activity of plant secondary compounds fed in the current study.
No treatment × period interactions (P > 0.05) were detected for ewe IGF-1, or progesterone. Ewes consuming CNTL, 18JUN, 36JUN, and 54JUN supplement consumed approximately 2.5, 10.4, 12.1, 14.5 g/d of CT respectively (DM basis; calculated from Table 1). Biological activity of CT-containing diets can reduce proteolytic bacteria in the rumen (Min et al., 2014) and increase protein supply to the small intestine by precipitating protein in the rumen (Kariuki and Norton, 2008), which may have contributed to a linear reduction (d 64; P < 0.003) in SUN in ewes consuming greater amounts of juniper. Acharya et al. (2015) observed reduced blood urea nitrogen in lambs grazing sericea lespedeza (4% CT, DM basis) compared to controls but only during the first 42 days on CT -containing diets. Biological activity (protein binding ability) of CT was quantified on treatment supplements and appears to have been altered as a result of the process of pelleting treatment supplements. The unpelleted ground juniper (3.5% CT) exhibited moderate biological activity (70.6 g protein precipitated/kg ground juniper) whereas 0.4, 1.5, 2.1, and 2.5% CT pelleted supplements did not exhibit biological activity in the protein precipitation assay (data not shown).
A tendency for greater IGF-1 concentrations were observed (P = 0.06) in CNTL vs. 18, 36, 54JUN treatment groups, and an overall linear decrease (P = 0.01) in ewes consuming increasing amounts of juniper in supplements. Values in the current study fall within acceptable ranges for pregnant ewes (Camacho et al., 2012). Nutritional status significantly affects serum IGF-1 concentrations (Wallace et al., 1997). Elevated circulating IGF-1 concentrations can increase anabolic effects on feto-placental protein metabolism, thereby regulating fetal growth in response to nutrient supply of the maternal diet (Harding et al., 1994). No differences (P > 0.05) in progesterone concentrations were detected throughout the duration of the study. These results are meaningful because the 18, 36, and 54JUN supplements contained, 0.02, 0.07 and 0.08 % DM labdane acids, respectively. Labdane acids such as isocupressic acid found in pine needles have been implicated as abortifacient agents in cattle (Gardner et al., 2009). It is suspected that labdane acids inhibit progesterone signaling needed for the maintenance of pregnancy by inhibition of steroidogenic enzymes (Wu et al., 2002). Trace amounts of the labdane acids consumed in treatment supplements in the current study did not affect progesterone concentrations in ewe serum.
Milk Fatty Acid Composition
Milk fatty acid composition is reported in Table 5. Juniper consumed throughout pregnancy did not alter (P > 0.05) total fat composition of lyophilized ewe milk collected at 2 d postpartum. Arachidonic acid (C20:4n-6) was greatest (P < 0.02) in 54JUN vs. CNTL ewe milk. Docosahexaenoic acid (C22:6n-3) was greatest in ewe milk from 54JUN (0.15 g/100g) but was not found in CNTL or
36JUN. A greater (P < 0.05) ratio of C16:1 to C16:0 was detected in the 36JUN vs. CNTL or 18JUN ewe milk but was not observed in C18:1 to C18:0 ratios. It’s unlikely the increase in C20:4n-6 is a result of increased linoleic acid composition in the juniper as previously measured by Whitney et al. (2011). Increasing percentage of dried juniper leaves in diet increased myristic acid, CLA cis-9, trans-11, palmitoleic acid, in lamb loin (Whitney et al., 2011). Condensed tannins from quebracho bark have been shown to reduce biohydrogenation in the rumen and consequently increase PUFA in ewe milk (Buccioni et al., 2015). Toral et al. (2013) reported that quebracho tannins tended to increase C18:1 trans-10 content in milk fat over time. The potential of CT from juniper to modify biohydrogenation and the subsequent fatty acid profile of milk and meat products warrants additional investigation.
Progeny Pre-weaning Performance
Lamb response variables are displayed in Table 4.The specific aim of the current research was to determine potential effects of feeding increasing amounts of ground juniper to ewes during gestation on lamb performance from birth to weaning. No treatment effects (P = 0.17) were detected for lamb BW at birth or day 14 or 50. Crude protein consumption from mid- to late gestation greatly influences fetal growth (Ocak et al., 2005). Radunz et al. (2011) reported decreased lamb birth weights (5.4 vs. 6.1 kg) in ewes consuming 170 g CP/d compared to 201 g CP/d from d 80 to 115 of gestation. However, subtle differences in nutrient intake across treatment supplements in the current study did not appear to affect lamb birth weight. Overall, pre-weaning lamb growth performance from birth to weaning did not differ (P = 0.73). Birth suckling scores were greatest (P < 0.03) in CNTL vs. juniper lambs.
IMPLICATIONS
We accept our initial hypothesis that feeding juniper in a maternal diet would not negatively affect prepartum ewe performance, serum metabolites, or pre-weaning lamb growth performance. Ewes consuming ground juniper had less total feed cost per day (CNTL, $0.36; 18JUN, $0.33; 36JUN, $0.29; 54JUN, $0.28). Combined savings in feed costs added to the calculated market value $4.84/lb of lambs based on 50-d weaning weights across treatment groups, would generate $98.47, $100.89, $100.37 and $98.36 in lambs from CNTL, 18JUN, 36JUN, and 54JUN groups, respectively (Table 4). During times of drought induced feed shortages and elevated feed costs, livestock producers might be more predisposed to utilize alternative feeds such as ground juniper due to their ability to reduce overall feed costs while to reducing woody plant encroachment.
LITERATURE CITED
Acharya, M., J. M. Burke, K. P. Coffey, E. B. Kegley, J. E. Miller, G. R. Huff, E. Smith, T. H. Terrill, J. A. Mosjidis, and C. Rosenkrans, Jr. 2015. Changes in hematology, serum biochemistry, and gastrointestinal nematode infection in lambs fed sericea lespedeza with or without dietary sodium molybdate. J. Anim. Sci. doi:10.2527/jas2014−8584.
12

Buccioni, A. M., M. Pauselli, C. Viti, S. Minieri, G. Pallara, V. Roscini, S. Rapaccini, M. Trabalza Marinucci, P. Lupi, G. Conte, and M. Mele. 2015. Milk fatty acid composition in response to diets rich in linoleic acid supplemented with chestnut or quebracho tannins in dairy ewes. J. Dairy Sci. 98:1145–1156.
Gardner, D. R., K. E. Panter, and B. L. Stegelmeier. 2009. Implication of agathic acid from Utah juniper bark as an abortifacient compound in cattle. J. Appl. Toxicol. 30:115–119.
Harding, J. E., L. Liu, P. C. Evans, and P. D. Gluckman. 1994. Insulin-like growth factor-1 alters feto-placental protein and carbohydrate metabolism in fetal sheep. Endocrinology. 134:1509–1514.
Kariuki, I. W., and B.W. Norton. 2008. The digestion of dietary protein bound by condensed tannins in the gastro-intestinal tract of sheep. Anim. Feed. Sci. Technol. 142:197−209.
Matheson, S. M., J. A. Rooke, K. McIlvaney, M. Jack, S. Ison, L. Bünger, and C. M. Dwyer. 2011. Development and validation of on-farm behavioural scoring systems to assess birth assistance and lamb vigour. Animal. 5:776–783.
Min, B. R., S. Solaiman, R. Shange, and J. S. Eun. 2014. Gastrointestinal bacterial and methanogenic archaea diversity dynamics associated with condensed tannin-containing pine bark diet in goats using 16S rDNA amplicon pyrosequencing. Int. J. Microbiol. 1:1–14.
Malachek, J. C., and C. L. Leinweber. 1972. Forage selectivity by goats on lightly and heavily grazed ranges. J. Range. Manage. 25:105–111.
Murrieta, C. M., B. W. Hess, and D. C. Rule. 2003. Comparison of acidic and alkaline catalysts for preparation of fatty acid methyl esters from ovine muscle with emphasis on conjugated linoleic acid. Meat Sci. 65:523–529.
Ocak, N., M. A. Cam, and M. Kuran. 2005. The effect of high dietary protein levels during late gestation on colostrum yield and lamb survival rate in singleton-bearing ewes. Small Rumin. Res. 56:89–94.
Radunz, A. E., F. L. Fluharty, H. N. Zerby, and S. C. Loerch. 2011. Winter-feeding systems for gestating sheep I. Effects on pre-and postpartum ewe performance and lamb progeny preweaning performance. J. Anim. Sci. 89:467–477.
Stewart W. C., T. R. Whitney, E. J. Scholljegerdes, H. D. Naumann, N. M Cherry, J. P. Muir, B. D. Lambert, R. P. Adams, K. D. Welch, and D. R. Gardner. Effects of juniper species and stage of maturity on nutritional, digestive, and plant secondary compound characteristics. 2014. Proc. West. Sect. Am. Soc. Anim. Sci. 65:59− 63.
Toral, P. G., G. Hervas, E. Bichi, A. Belenguer, and P. Fruitos. 2013. Effect of the inclusion of quebracho tannins in diet rich in linoleic acid on milk fatty acid composition in dairy ewes. J. Dairy Sci. 96:431–439.
Wallace, J. M., P. Da Silva, R. P. Aitken, and M. A. Cruickshank. 1997. Maternal endocrine status in relation to pregnancy outcome in rapidly growing adolescent sheep. J. Endocrinol. 155:359–368.
Whitney, M. B., B. W. Hess, J. E. Kaltenbach, H. J. Harlow, and D. C. Rule. 1999. Direct transesterification of lipids from feedstuffs and ruminal bacteria. Can. J. Anim. Sci. 79:247–249.
Whitney, T. R., C. J. Lupton, S. B. Smith. 2011. Redberry juniper as a roughage source in lamb feedlot rations: Wool and carcass characteristics, meat fatty acid profiles, and sensory panel traits. Meat Sci. 89:160–165.
Whitney, T. R., S. Wildeus, and A. M. Zajac. 2013. The use of redberry juniper (Juniperus pinchotii) to reduce Haemonchus contortus fecal egg counts and increase ivermectin efficacy. Vet. Parasitol. 197:182–188.
Whitney, T. R., C. J. Lupton, J. P. Muir, R. P. Adams, and W. C. Stewart. 2014. Effects of using ground redberry juniper and dried distillers grains with solubles in lamb feedlot diets: Growth, blood serum, fecal, and wool characteristics. J. Anim. Sci. 92:1119−1132.
Wu, L. S., J. C. Chen, S. Y. Sheu, C. C. Huang, Y. H. Kuo, C. H. Chiu, and J. H. Lin. 2002. Isocupressic acid blocks progesterone production from bovine luteal cells. American J. Chinese Med. 30:533−541.
13

Table 1. Chemical composition and digestibility (% DM basis) of sorghum × sudan grass hay, ground juniper, and supplements
Item3
Diet1 Ingredient2
CNTL 18JUN
36JUN 54JUN
Hay
Juniper Ground juniper ‒ 18.0 36.0 54.0 ‒ ‒ Sorghum × sudan hay 54.0 36.0 18.0 ‒ ‒ ‒ DDGS 30.0 30.0 30.0 30.0 ‒ ‒ Sorghum grain 6.0 6.0 6.0 6.0 ‒ ‒ Cottonseed meal 3.0 3.0 3.0 3.0 ‒ ‒ Molasses 4.0 4.0 4.0 4.0 ‒ ‒ Salt 1.0 1.0 1.0 1.0 ‒ ‒ Mineral Premix 1.5 1.5 1.5 1.5 ‒ ‒ Ammonium chloride 0.5 0.5 0.5 0.5 ‒ ‒ Nutrient composition, % DM 92.3 91.8 91.1 90.6 90.5 93.1 CP 16.1 16.0 15.7 14.4 6.4 4.1 NDF 36.1 38.5 41.3 42.3 53.5 64.1 ADF 20.0 24.2 30.4 35.0 31.2 61.0 Ash 9.7 9.5 7.9 7.3 10.4 5.9 tIVDMD 73.3 74.2 66.7 50.3 62.5 26.2 Cost/t feed $228 $209 $190 $172 $108 $90 Volatile oil ND 0.1 0.2 0.35 - 0.6 CT 0.37 1.5 2.1 2.4 0.74 3.5
1Treatment diets were agglomerated and contained ground juniper that replaced 0% (CNTL), 33% (18JUN), 66% (36JUN) or 100% (54JUN) of the sorghum-sudan hay component.
2DDGS = dried distillers grains with solubles; Cost/t of feed was calculated using ingredient prices based on local markets and the price of juniper ($100/dry t) was based on estimated harvesting, drying, and processing costs, after consulting with local brush control specialists; transportation costs were not included for any ingredient.
Table 2. Effects of replacing sorghum × sudan grass hay with ground juniper on pre- and postpartum BW, BCS, ADG, and DMI
Diet¹ P-value2
Item3 CNTL 18JUN 36JUN 54JUN SEM CNTL vs.
JUN Linear Quadratic BW, kg
d 0 66.1 68.8 59.5 62.7 3.10 0.49 0.17 0.92 2 d postpartum 77.9 78.8 70.7 72.9 4.19 0.45 0.22 0.88
BCS d 0 3.3 3.4 3.0 3.2 0.2 0.66 0.38 0.86 2 d postpartum 3.3 3.3 3.3 3.2 0.12 0.95 0.75 0.68
Overall Supplement DMI, g/kg BW 9.6 9.7 9.5 9.5 0.12 0.68 0.38 0.92 Overall Hay DMI, g/kg BW 17.4 17.0 18.6 17.8 0.40 0.35 0.10 0.61 Overall Total DMI, g/kg BW 26.31 26.02 27.54 26.66 0.40 0.36 0.15 0.45
1Treatment diets were agglomerated containing ground juniper that replaced 0% (CNTL), 33% (18JUN), 66% (36JUN) or 100% (54JUN) of the sorghum-sudan hay component. The remainder of ingredients consisted of 30% DDGS, 6% milo, 3% cottonseed meal, 4% molasses, 1.5% mineral premix, 1% salt, 0.50% ammonium chloride. .
2Orthogonal contrasts. CNTL vs. Juniper = CNTL vs. average of juniper-based supplements (18JUN, 36JUN, and 54JUN). Linear and quadratic contrasts of CNTL, 18JUN, 36JUN, 54JUN.
3BCS= Body Condition Score, scale of 1 to 5 with half point increments utilized. ADG= average daily gain. Day 0 = first day treatment diet offered (39 ± 4 d gestation). Day 34 = 0 to 34 d on treatment supplements (38 to 73 ± 4 d gestation). Day 64 = 34 to 64 d on treatment supplements (73 to 103 ± 4 d gestation).
14
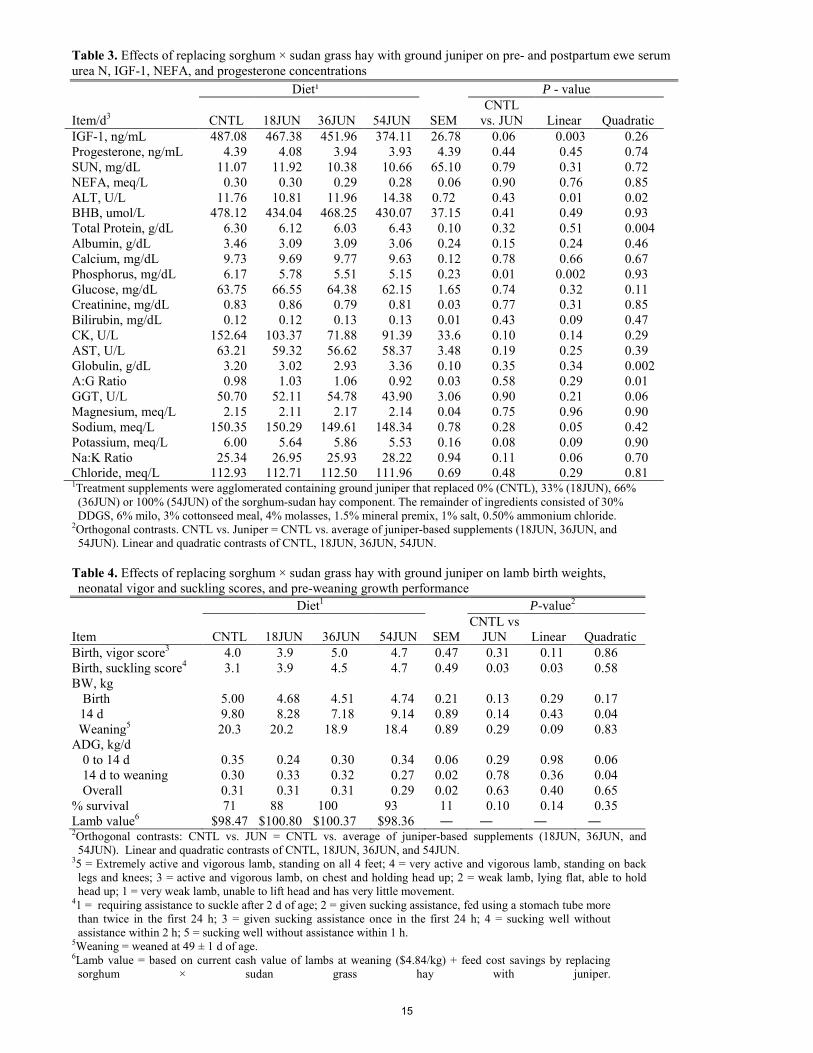
Table 3. Effects of replacing sorghum × sudan grass hay with ground juniper on pre- and postpartum ewe serum urea N, IGF-1, NEFA, and progesterone concentrations Diet¹ P - value
Item/d3 CNTL 18JUN 36JUN 54JUN SEM CNTL
vs. JUN Linear Quadratic IGF-1, ng/mL 487.08 467.38 451.96 374.11 26.78 0.06 0.003 0.26 Progesterone, ng/mL 4.39 4.08 3.94 3.93 4.39 0.44 0.45 0.74 SUN, mg/dL 11.07 11.92 10.38 10.66 65.10 0.79 0.31 0.72 NEFA, meq/L 0.30 0.30 0.29 0.28 0.06 0.90 0.76 0.85 ALT, U/L 11.76 10.81 11.96 14.38 0.72 0.43 0.01 0.02 BHB, umol/L 478.12 434.04 468.25 430.07 37.15 0.41 0.49 0.93 Total Protein, g/dL 6.30 6.12 6.03 6.43 0.10 0.32 0.51 0.004 Albumin, g/dL 3.46 3.09 3.09 3.06 0.24 0.15 0.24 0.46 Calcium, mg/dL 9.73 9.69 9.77 9.63 0.12 0.78 0.66 0.67 Phosphorus, mg/dL 6.17 5.78 5.51 5.15 0.23 0.01 0.002 0.93 Glucose, mg/dL 63.75 66.55 64.38 62.15 1.65 0.74 0.32 0.11 Creatinine, mg/dL 0.83 0.86 0.79 0.81 0.03 0.77 0.31 0.85 Bilirubin, mg/dL 0.12 0.12 0.13 0.13 0.01 0.43 0.09 0.47 CK, U/L 152.64 103.37 71.88 91.39 33.6 0.10 0.14 0.29 AST, U/L 63.21 59.32 56.62 58.37 3.48 0.19 0.25 0.39 Globulin, g/dL 3.20 3.02 2.93 3.36 0.10 0.35 0.34 0.002 A:G Ratio 0.98 1.03 1.06 0.92 0.03 0.58 0.29 0.01 GGT, U/L 50.70 52.11 54.78 43.90 3.06 0.90 0.21 0.06 Magnesium, meq/L 2.15 2.11 2.17 2.14 0.04 0.75 0.96 0.90 Sodium, meq/L 150.35 150.29 149.61 148.34 0.78 0.28 0.05 0.42 Potassium, meq/L 6.00 5.64 5.86 5.53 0.16 0.08 0.09 0.90 Na:K Ratio 25.34 26.95 25.93 28.22 0.94 0.11 0.06 0.70 Chloride, meq/L 112.93 112.71 112.50 111.96 0.69 0.48 0.29 0.81 1Treatment supplements were agglomerated containing ground juniper that replaced 0% (CNTL), 33% (18JUN), 66%
(36JUN) or 100% (54JUN) of the sorghum-sudan hay component. The remainder of ingredients consisted of 30% DDGS, 6% milo, 3% cottonseed meal, 4% molasses, 1.5% mineral premix, 1% salt, 0.50% ammonium chloride.
2Orthogonal contrasts. CNTL vs. Juniper = CNTL vs. average of juniper-based supplements (18JUN, 36JUN, and 54JUN). Linear and quadratic contrasts of CNTL, 18JUN, 36JUN, 54JUN.
Table 4. Effects of replacing sorghum × sudan grass hay with ground juniper on lamb birth weights, neonatal vigor and suckling scores, and pre-weaning growth performance
Diet1 P-value2
Item CNTL 18JUN 36JUN 54JUN SEM CNTL vs
JUN Linear Quadratic Birth, vigor score3 4.0 3.9 5.0 4.7 0.47 0.31 0.11 0.86 Birth, suckling score4 3.1 3.9 4.5 4.7 0.49 0.03 0.03 0.58 BW, kg
Birth 5.00 4.68 4.51 4.74 0.21 0.13 0.29 0.17 14 d 9.80 8.28 7.18 9.14 0.89 0.14 0.43 0.04
Weaning5 20.3 20.2 18.9 18.4 0.89 0.29 0.09 0.83 ADG, kg/d
0 to 14 d 0.35 0.24 0.30 0.34 0.06 0.29 0.98 0.06 14 d to weaning 0.30 0.33 0.32 0.27 0.02 0.78 0.36 0.04 Overall 0.31 0.31 0.31 0.29 0.02 0.63 0.40 0.65
% survival 71 88 100 93 11 0.10 0.14 0.35 Lamb value6 $98.47 $100.80 $100.37 $98.36 ― ― ― ― 2Orthogonal contrasts: CNTL vs. JUN = CNTL vs. average of juniper-based supplements (18JUN, 36JUN, and
54JUN). Linear and quadratic contrasts of CNTL, 18JUN, 36JUN, and 54JUN. 35 = Extremely active and vigorous lamb, standing on all 4 feet; 4 = very active and vigorous lamb, standing on back
legs and knees; 3 = active and vigorous lamb, on chest and holding head up; 2 = weak lamb, lying flat, able to hold head up; 1 = very weak lamb, unable to lift head and has very little movement.
41 = requiring assistance to suckle after 2 d of age; 2 = given sucking assistance, fed using a stomach tube more than twice in the first 24 h; 3 = given sucking assistance once in the first 24 h; 4 = sucking well without assistance within 2 h; 5 = sucking well without assistance within 1 h.
5Weaning = weaned at 49 ± 1 d of age. 6Lamb value = based on current cash value of lambs at weaning ($4.84/kg) + feed cost savings by replacing
sorghum × sudan grass hay with juniper.
15
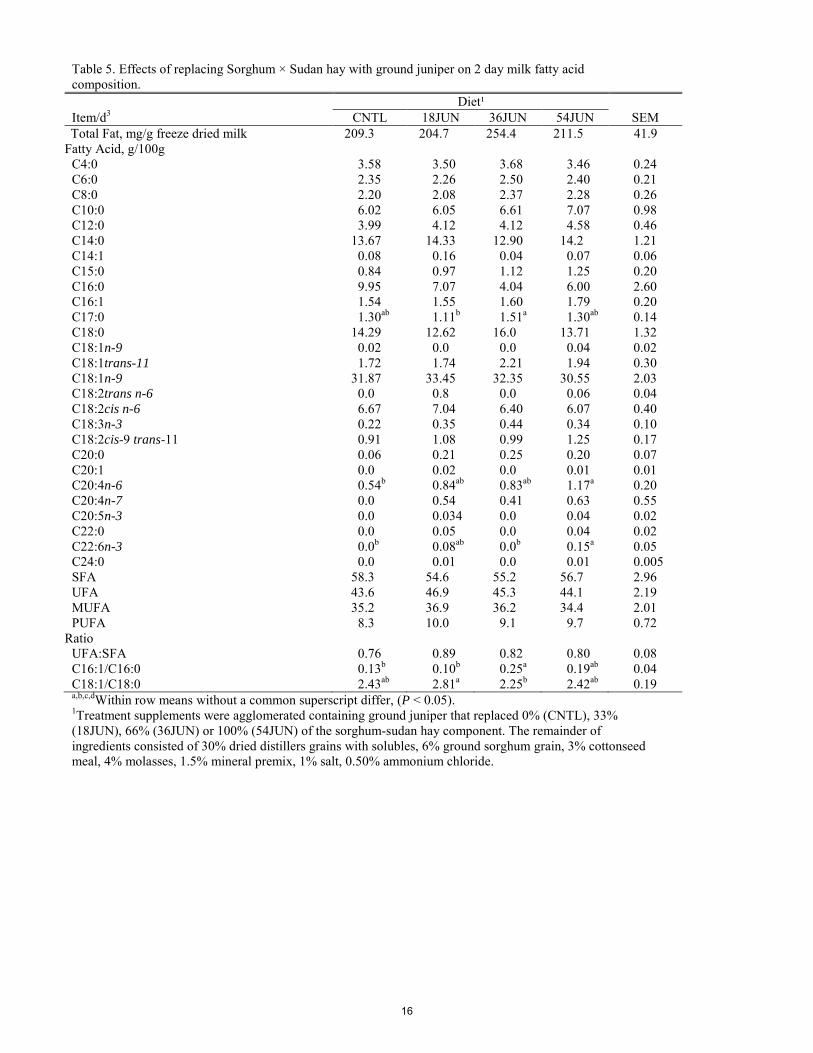
Table 5. Effects of replacing Sorghum × Sudan hay with ground juniper on 2 day milk fatty acid composition. Diet¹ Item/d3 CNTL 18JUN 36JUN 54JUN SEM Total Fat, mg/g freeze dried milk 209.3 204.7 254.4 211.5 41.9
Fatty Acid, g/100g C4:0 3.58 3.50 3.68 3.46 0.24 C6:0 2.35 2.26 2.50 2.40 0.21 C8:0 2.20 2.08 2.37 2.28 0.26 C10:0 6.02 6.05 6.61 7.07 0.98 C12:0 3.99 4.12 4.12 4.58 0.46 C14:0 13.67 14.33 12.90 14.2 1.21 C14:1 0.08 0.16 0.04 0.07 0.06 C15:0 0.84 0.97 1.12 1.25 0.20 C16:0 9.95 7.07 4.04 6.00 2.60 C16:1 1.54 1.55 1.60 1.79 0.20 C17:0 1.30ab 1.11b 1.51a 1.30ab 0.14 C18:0 14.29 12.62 16.0 13.71 1.32 C18:1n-9 0.02 0.0 0.0 0.04 0.02 C18:1trans-11 1.72 1.74 2.21 1.94 0.30 C18:1n-9 31.87 33.45 32.35 30.55 2.03 C18:2trans n-6 0.0 0.8 0.0 0.06 0.04 C18:2cis n-6 6.67 7.04 6.40 6.07 0.40 C18:3n-3 0.22 0.35 0.44 0.34 0.10 C18:2cis-9 trans-11 0.91 1.08 0.99 1.25 0.17 C20:0 0.06 0.21 0.25 0.20 0.07 C20:1 0.0 0.02 0.0 0.01 0.01 C20:4n-6 0.54b 0.84ab 0.83ab 1.17a 0.20 C20:4n-7 0.0 0.54 0.41 0.63 0.55 C20:5n-3 0.0 0.034 0.0 0.04 0.02 C22:0 0.0 0.05 0.0 0.04 0.02 C22:6n-3 0.0b 0.08ab 0.0b 0.15a 0.05 C24:0 0.0 0.01 0.0 0.01 0.005 SFA 58.3 54.6 55.2 56.7 2.96 UFA 43.6 46.9 45.3 44.1 2.19 MUFA 35.2 36.9 36.2 34.4 2.01 PUFA 8.3 10.0 9.1 9.7 0.72
Ratio UFA:SFA 0.76 0.89 0.82 0.80 0.08 C16:1/C16:0 0.13b 0.10b 0.25a 0.19ab 0.04 C18:1/C18:0 2.43ab 2.81a 2.25b 2.42ab 0.19 a,b,c,dWithin row means without a common superscript differ, (P < 0.05). 1Treatment supplements were agglomerated containing ground juniper that replaced 0% (CNTL), 33% (18JUN), 66% (36JUN) or 100% (54JUN) of the sorghum-sudan hay component. The remainder of ingredients consisted of 30% dried distillers grains with solubles, 6% ground sorghum grain, 3% cottonseed meal, 4% molasses, 1.5% mineral premix, 1% salt, 0.50% ammonium chloride.
16

ORAL PRESENTATIONS

GRADUATE STUDENT PAPER COMPETITON
Proceedings, Western Section, American Society of Animal Science
Vol. 66, 2015 Effects of Organic or Inorganic Co, Cu, Mn, and Zn Supplementation to Late-Gestating Beef Cows on Productive and
Physiological Responses of the Offspring
R. S. Marques1, R. F. Cooke1, M. Rodrigues1,2, T. A. Guarnieri1,2, B. I. Cappellozza1, P. Moriel2, and D. W. Bohnert1
Oregon State University - Eastern Oregon Agricultural Research Center, Burns, OR 1
UNESP - Faculdade de Medicina Veterinária e Zootecnia, Botucatu, Brazil 2 North Carolina State University – Mountain Research Station, Waynesville, NC 3
Abstract text: Eighty-four pregnant Angus × Hereford cows were ranked by BW and BCS, and allocated to 21 drylot pens at the end of their 2nd trimester of gestation (d 0). Pens were assigned to receive: 1) diet supplemented with sulfate sources of Cu, Co, Mn, and Zn (INR), 2) diet supplemented with an organic source of Cu, Mn, Co, and Zn (ORG), and 3) no Cu, Co, Mn, and Zn supplementation (CON). From d 0 until calving, cows were offered a forage-based diet formulated to meet requirements for energy, protein, macrominerals, Se, I, and vitamins. The INR and ORG diets were formulated to provide the same daily amount of Cu, Co, Mn, and Zn. Cow BCS was recorded, and liver samples were collected on d -10 and 2 wk (d 75) before the calving season. Within 3h after calving, calf BW was recorded, liver samples were collected, and the placenta was retrieved for cotyledon collection. All liver and cotyledon samples were analyzed for Cu, Co, Mn, and Zn. After calving, cow-calf pairs were assigned to the general management of the herd that included inorganic mineral supplementation. Calves were weaned a 6 mo of age and preconditioned for 45 d. Cows receiving CON had less (P≤0.05) BCS gain during the last trimester of gestation compared with INR and ORG cows, although cows from all treatments had similar (P=0.61) and adequate pre-calving BCS. On d 75, liver concentrations of Co, Cu, and Zn were greater (P≤0.05) for INR and ORG compared with CON, whereas INR cows had reduced (P=0.04) liver Co but greater (P=0.03) liver Cu compared with ORG cows. In the cotyledons, Co concentrations were greater (P≤0.05) in ORG and INR compared with CON cows, whereas Cu concentrations were increased (P=0.05) in ORG compared with CON cows. Calves from INR and ORG cows had greater (P<0.01) liver Co concentrations compared with calves from CON cows. Liver Cu and Zn concentrations were also greater (P≤0.05) for calves from ORG cows compared with cohorts from CON cows. Calf BW and value at weaning and upon preconditioning were greater (P≤0.04) for calves from ORG cows compared with calves from CON cows, and similar (P≥0.18) between calves from INR cows compared with the other treatments. Therefore, supplementing late-gestating beef cows with organic Co, Cu, Zn, and Mn is an alternative to enhance offspring productivity and economic returns in cow-calf systems. Keywords: beef cows, minerals, offspring, pregnancy
INTRODUCTION
Energy and protein intake of beef cows during late-gestation influence performance responses of the offspring (Bohnert et al., 2013). However, little is known about the impacts of trace mineral status of late-gestating cows, which are essential for fetal development in livestock species (Hostetler et al., 2003), on offspring productivity.
The fetus depends completely on the dam for proper supply of trace minerals to support metabolic processes required for fetal growth (Hidiroglou and Knipfel, 1981). If maternal supply is inadequate, fetal development and postnatal performance can be impaired (Weiss et al., 1983). As examples, Zn, Cu, Mn, and Co (as component of vitamin B12; NRC, 2000) are required for adequate development of the fetal nervous, reproductive, and immune systems (Hostetler et al., 2003; Pepper, 2011). Moreover, Cu concentrations in bovine fetal liver are greater than maternal liver Cu concentrations, suggesting that the maternal system shunts Cu to support fetal development (Gooneratne and Christensen, 1989). Therefore, we hypothesized that supplementing Cu, Mn, Zn, and Co to late-gestating cows is indispensable for optimal offspring productivity. One strategy to enhance trace mineral status in cattle is to feed organic sources (Spears, 1996). Hostetler et al. (2003) reported that Cu, Mn, and Zn concentrations in tissues of fetuses collected from sows supplemented with organic sources of these elements were greater compared with fetuses from sows supplemented with inorganic sources, which translated into reduced fetal degeneration. Hence, we also theorized that supplementing organic sources of Cu, Mn, Zn, and Co to beef cows during late gestation is an alternative to further optimize postnatal offspring productivity.
Based these hypotheses, the objective of this experiment was to evaluate the effects of organic and inorganic Cu, Mn, Zn, and Co supplementation to beef cows during late gestation on productive and physiological responses of the offspring.
MATERIALS AND METHODS
Animals and treatments. Eighty-four multiparous, non-lactating, pregnant Angus × Hereford cows (BW 512 ± 6 kg, age = 5.8 ± 0.3 yr, BCS = 5.11 ± 0.04 according to Wagner et al., 1988) were assigned to the experiment at the end of their 2nd trimester of gestation. Cows were pregnant to AI using semen from a single Angus sire (n = 56) or
17
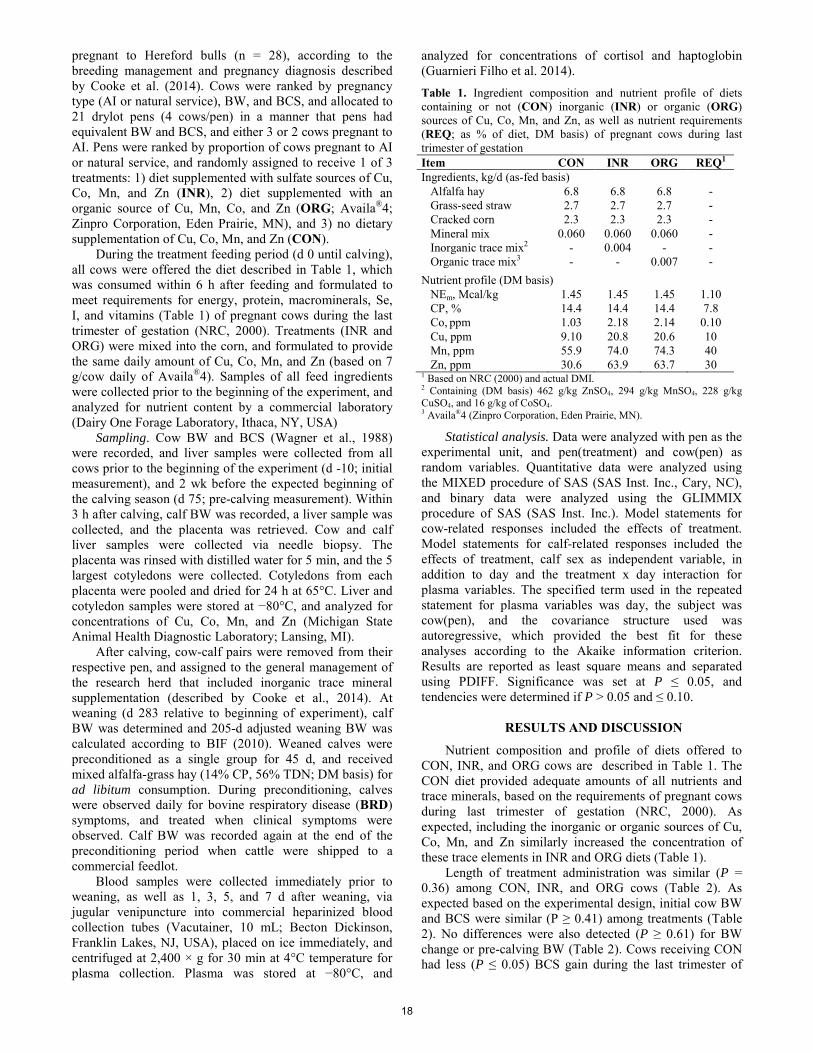
pregnant to Hereford bulls (n = 28), according to the breeding management and pregnancy diagnosis described by Cooke et al. (2014). Cows were ranked by pregnancy type (AI or natural service), BW, and BCS, and allocated to 21 drylot pens (4 cows/pen) in a manner that pens had equivalent BW and BCS, and either 3 or 2 cows pregnant to AI. Pens were ranked by proportion of cows pregnant to AI or natural service, and randomly assigned to receive 1 of 3 treatments: 1) diet supplemented with sulfate sources of Cu, Co, Mn, and Zn (INR), 2) diet supplemented with an organic source of Cu, Mn, Co, and Zn (ORG; Availa®4; Zinpro Corporation, Eden Prairie, MN), and 3) no dietary supplementation of Cu, Co, Mn, and Zn (CON).
During the treatment feeding period (d 0 until calving), all cows were offered the diet described in Table 1, which was consumed within 6 h after feeding and formulated to meet requirements for energy, protein, macrominerals, Se, I, and vitamins (Table 1) of pregnant cows during the last trimester of gestation (NRC, 2000). Treatments (INR and ORG) were mixed into the corn, and formulated to provide the same daily amount of Cu, Co, Mn, and Zn (based on 7 g/cow daily of Availa®4). Samples of all feed ingredients were collected prior to the beginning of the experiment, and analyzed for nutrient content by a commercial laboratory (Dairy One Forage Laboratory, Ithaca, NY, USA)
Sampling. Cow BW and BCS (Wagner et al., 1988) were recorded, and liver samples were collected from all cows prior to the beginning of the experiment (d -10; initial measurement), and 2 wk before the expected beginning of the calving season (d 75; pre-calving measurement). Within 3 h after calving, calf BW was recorded, a liver sample was collected, and the placenta was retrieved. Cow and calf liver samples were collected via needle biopsy. The placenta was rinsed with distilled water for 5 min, and the 5 largest cotyledons were collected. Cotyledons from each placenta were pooled and dried for 24 h at 65°C. Liver and cotyledon samples were stored at −80°C, and analyzed for concentrations of Cu, Co, Mn, and Zn (Michigan State Animal Health Diagnostic Laboratory; Lansing, MI).
After calving, cow-calf pairs were removed from their respective pen, and assigned to the general management of the research herd that included inorganic trace mineral supplementation (described by Cooke et al., 2014). At weaning (d 283 relative to beginning of experiment), calf BW was determined and 205-d adjusted weaning BW was calculated according to BIF (2010). Weaned calves were preconditioned as a single group for 45 d, and received mixed alfalfa-grass hay (14% CP, 56% TDN; DM basis) for ad libitum consumption. During preconditioning, calves were observed daily for bovine respiratory disease (BRD) symptoms, and treated when clinical symptoms were observed. Calf BW was recorded again at the end of the preconditioning period when cattle were shipped to a commercial feedlot.
Blood samples were collected immediately prior to weaning, as well as 1, 3, 5, and 7 d after weaning, via jugular venipuncture into commercial heparinized blood collection tubes (Vacutainer, 10 mL; Becton Dickinson, Franklin Lakes, NJ, USA), placed on ice immediately, and centrifuged at 2,400 × g for 30 min at 4°C temperature for plasma collection. Plasma was stored at −80°C, and
analyzed for concentrations of cortisol and haptoglobin (Guarnieri Filho et al. 2014).
Table 1. Ingredient composition and nutrient profile of diets containing or not (CON) inorganic (INR) or organic (ORG) sources of Cu, Co, Mn, and Zn, as well as nutrient requirements (REQ; as % of diet, DM basis) of pregnant cows during last trimester of gestation Item CON INR ORG REQ1 Ingredients, kg/d (as-fed basis) Alfalfa hay 6.8 6.8 6.8 - Grass-seed straw 2.7 2.7 2.7 - Cracked corn 2.3 2.3 2.3 - Mineral mix 0.060 0.060 0.060 - Inorganic trace mix2 - 0.004 - - Organic trace mix3 - - 0.007 -
Nutrient profile (DM basis) NEm, Mcal/kg 1.45 1.45 1.45 1.10 CP, % 14.4 14.4 14.4 7.8 Co, ppm 1.03 2.18 2.14 0.10 Cu, ppm 9.10 20.8 20.6 10 Mn, ppm 55.9 74.0 74.3 40 Zn, ppm 30.6 63.9 63.7 30 1 Based on NRC (2000) and actual DMI. 2 Containing (DM basis) 462 g/kg ZnSO4, 294 g/kg MnSO4, 228 g/kg CuSO4, and 16 g/kg of CoSO4. 3 Availa®4 (Zinpro Corporation, Eden Prairie, MN).
Statistical analysis. Data were analyzed with pen as the experimental unit, and pen(treatment) and cow(pen) as random variables. Quantitative data were analyzed using the MIXED procedure of SAS (SAS Inst. Inc., Cary, NC), and binary data were analyzed using the GLIMMIX procedure of SAS (SAS Inst. Inc.). Model statements for cow-related responses included the effects of treatment. Model statements for calf-related responses included the effects of treatment, calf sex as independent variable, in addition to day and the treatment x day interaction for plasma variables. The specified term used in the repeated statement for plasma variables was day, the subject was cow(pen), and the covariance structure used was autoregressive, which provided the best fit for these analyses according to the Akaike information criterion. Results are reported as least square means and separated using PDIFF. Significance was set at P ≤ 0.05, and tendencies were determined if P > 0.05 and ≤ 0.10.
RESULTS AND DISCUSSION
Nutrient composition and profile of diets offered to CON, INR, and ORG cows are described in Table 1. The CON diet provided adequate amounts of all nutrients and trace minerals, based on the requirements of pregnant cows during last trimester of gestation (NRC, 2000). As expected, including the inorganic or organic sources of Cu, Co, Mn, and Zn similarly increased the concentration of these trace elements in INR and ORG diets (Table 1).
Length of treatment administration was similar (P = 0.36) among CON, INR, and ORG cows (Table 2). As expected based on the experimental design, initial cow BW and BCS were similar (P ≥ 0.41) among treatments (Table 2). No differences were also detected (P ≥ 0.61) for BW change or pre-calving BW (Table 2). Cows receiving CON had less (P ≤ 0.05) BCS gain during the last trimester of
18
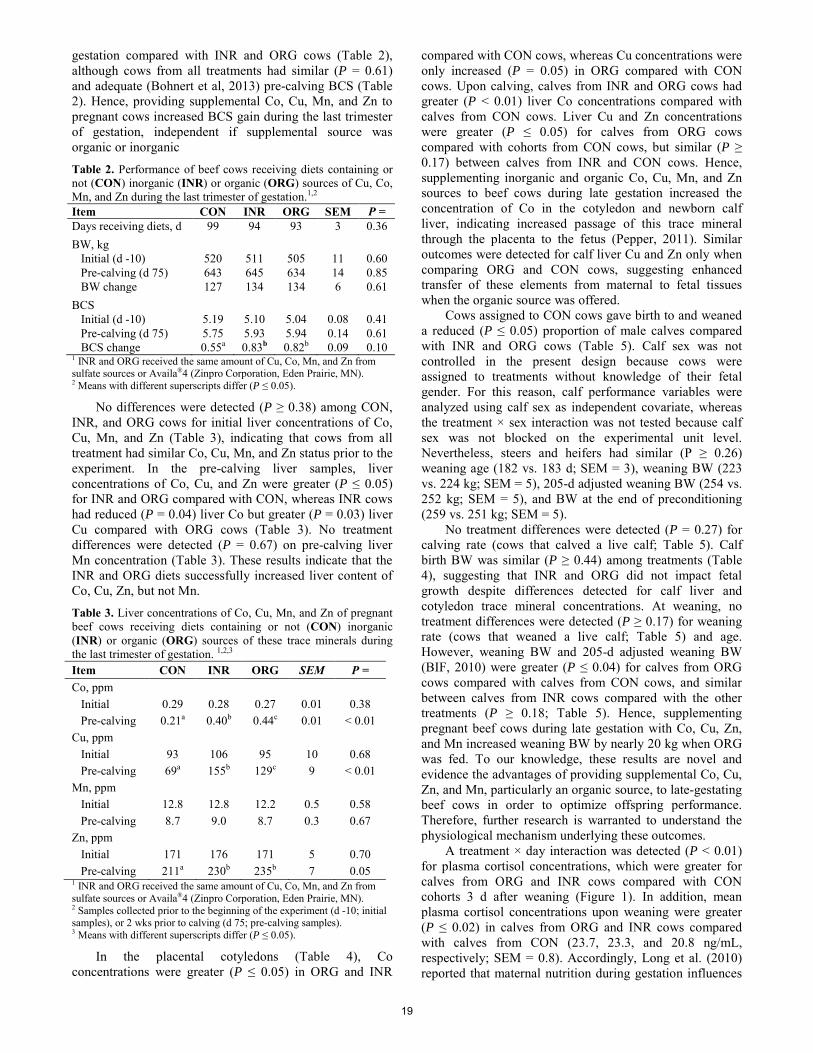
gestation compared with INR and ORG cows (Table 2), although cows from all treatments had similar (P = 0.61) and adequate (Bohnert et al, 2013) pre-calving BCS (Table 2). Hence, providing supplemental Co, Cu, Mn, and Zn to pregnant cows increased BCS gain during the last trimester of gestation, independent if supplemental source was organic or inorganic
Table 2. Performance of beef cows receiving diets containing or not (CON) inorganic (INR) or organic (ORG) sources of Cu, Co, Mn, and Zn during the last trimester of gestation.1,2 Item CON INR ORG SEM P = Days receiving diets, d 99 94 93 3 0.36
BW, kg Initial (d -10) 520 511 505 11 0.60 Pre-calving (d 75) 643 645 634 14 0.85 BW change 127 134 134 6 0.61
BCS Initial (d -10) 5.19 5.10 5.04 0.08 0.41 Pre-calving (d 75) 5.75 5.93 5.94 0.14 0.61 BCS change 0.55a 0.83b 0.82b 0.09 0.10 1 INR and ORG received the same amount of Cu, Co, Mn, and Zn from sulfate sources or Availa®4 (Zinpro Corporation, Eden Prairie, MN). 2 Means with different superscripts differ (P ≤ 0.05).
No differences were detected (P ≥ 0.38) among CON, INR, and ORG cows for initial liver concentrations of Co, Cu, Mn, and Zn (Table 3), indicating that cows from all treatment had similar Co, Cu, Mn, and Zn status prior to the experiment. In the pre-calving liver samples, liver concentrations of Co, Cu, and Zn were greater (P ≤ 0.05) for INR and ORG compared with CON, whereas INR cows had reduced (P = 0.04) liver Co but greater (P = 0.03) liver Cu compared with ORG cows (Table 3). No treatment differences were detected (P = 0.67) on pre-calving liver Mn concentration (Table 3). These results indicate that the INR and ORG diets successfully increased liver content of Co, Cu, Zn, but not Mn.
Table 3. Liver concentrations of Co, Cu, Mn, and Zn of pregnant beef cows receiving diets containing or not (CON) inorganic (INR) or organic (ORG) sources of these trace minerals during the last trimester of gestation. 1,2,3
Item CON INR ORG SEM P = Co, ppm Initial 0.29 0.28 0.27 0.01 0.38 Pre-calving 0.21a 0.40b 0.44c 0.01 < 0.01 Cu, ppm Initial 93 106 95 10 0.68 Pre-calving 69a 155b 129c 9 < 0.01 Mn, ppm Initial 12.8 12.8 12.2 0.5 0.58 Pre-calving 8.7 9.0 8.7 0.3 0.67 Zn, ppm Initial 171 176 171 5 0.70 Pre-calving 211a 230b 235b 7 0.05 1 INR and ORG received the same amount of Cu, Co, Mn, and Zn from sulfate sources or Availa®4 (Zinpro Corporation, Eden Prairie, MN). 2 Samples collected prior to the beginning of the experiment (d -10; initial samples), or 2 wks prior to calving (d 75; pre-calving samples). 3 Means with different superscripts differ (P ≤ 0.05).
In the placental cotyledons (Table 4), Co concentrations were greater (P ≤ 0.05) in ORG and INR
compared with CON cows, whereas Cu concentrations were only increased (P = 0.05) in ORG compared with CON cows. Upon calving, calves from INR and ORG cows had greater (P < 0.01) liver Co concentrations compared with calves from CON cows. Liver Cu and Zn concentrations were greater (P ≤ 0.05) for calves from ORG cows compared with cohorts from CON cows, but similar (P ≥ 0.17) between calves from INR and CON cows. Hence, supplementing inorganic and organic Co, Cu, Mn, and Zn sources to beef cows during late gestation increased the concentration of Co in the cotyledon and newborn calf liver, indicating increased passage of this trace mineral through the placenta to the fetus (Pepper, 2011). Similar outcomes were detected for calf liver Cu and Zn only when comparing ORG and CON cows, suggesting enhanced transfer of these elements from maternal to fetal tissues when the organic source was offered.
Cows assigned to CON cows gave birth to and weaned a reduced (P ≤ 0.05) proportion of male calves compared with INR and ORG cows (Table 5). Calf sex was not controlled in the present design because cows were assigned to treatments without knowledge of their fetal gender. For this reason, calf performance variables were analyzed using calf sex as independent covariate, whereas the treatment × sex interaction was not tested because calf sex was not blocked on the experimental unit level. Nevertheless, steers and heifers had similar (P ≥ 0.26) weaning age (182 vs. 183 d; SEM = 3), weaning BW (223 vs. 224 kg; SEM = 5), 205-d adjusted weaning BW (254 vs. 252 kg; SEM = 5), and BW at the end of preconditioning (259 vs. 251 kg; SEM = 5).
No treatment differences were detected (P = 0.27) for calving rate (cows that calved a live calf; Table 5). Calf birth BW was similar (P ≥ 0.44) among treatments (Table 4), suggesting that INR and ORG did not impact fetal growth despite differences detected for calf liver and cotyledon trace mineral concentrations. At weaning, no treatment differences were detected (P ≥ 0.17) for weaning rate (cows that weaned a live calf; Table 5) and age. However, weaning BW and 205-d adjusted weaning BW (BIF, 2010) were greater (P ≤ 0.04) for calves from ORG cows compared with calves from CON cows, and similar between calves from INR cows compared with the other treatments (P ≥ 0.18; Table 5). Hence, supplementing pregnant beef cows during late gestation with Co, Cu, Zn, and Mn increased weaning BW by nearly 20 kg when ORG was fed. To our knowledge, these results are novel and evidence the advantages of providing supplemental Co, Cu, Zn, and Mn, particularly an organic source, to late-gestating beef cows in order to optimize offspring performance. Therefore, further research is warranted to understand the physiological mechanism underlying these outcomes.
A treatment × day interaction was detected (P < 0.01) for plasma cortisol concentrations, which were greater for calves from ORG and INR cows compared with CON cohorts 3 d after weaning (Figure 1). In addition, mean plasma cortisol concentrations upon weaning were greater (P ≤ 0.02) in calves from ORG and INR cows compared with calves from CON (23.7, 23.3, and 20.8 ng/mL, respectively; SEM = 0.8). Accordingly, Long et al. (2010) reported that maternal nutrition during gestation influences
19
adrenal steroidogeneses and health-related stress reactions of the offspring. No treatment effects were detected for plasma haptoglobin concentrations (Figure 1), which sharply increased for all treatment upon weaning (day effect; P < 0.01). Collectively, these results suggest that Co, Cu, Zn, and Mn supplementation to late-gestating cows impacts the steroidogenesis required to cope with the weaning stress in the offspring, without impacting the resultant haptoglobin response (Carroll et al., 2007)
During the 45-d preconditioning, no treatment effects were detected (P ≥ 0.42) for incidence of calves that required treatment for BRD, mortality rates, and ADG (Table 5), suggesting that treatment differences detected for plasma cortisol (Figure 1) did not influence preconditioning performance and health parameters. At the end of preconditioning, BW was still greater (P = 0.03) for calves from ORG cows compared with calves from CON cows, and similar between calves from INR cows compared with the other treatments (P ≥ 0.25). These outcomes further corroborate that supplementing an organic source of Co, Cu, Zn, and Mn to late-gestating beef cows enhance offspring performance. Nevertheless, kg of preconditioning calf produced/cow assigned to the experiment were similar (P = 0.35) among treatments, which can be attributed, at least in part, to the unexpected numerical increase (P = 0.27) in overall calf loss of INR cows (Table 5).
Based on the 2013-2014 U.S. average for weaned cattle prices (US$ 3.1/kg of BW across genders, USDA-Agricultural Marketing Service, 2015), differences in actual weaning BW would result in $32 value increase per calf born from INR cows, or $70 value increase per calf born from ORG cows when compared to calves from CON cows, although only the ORG vs. CON comparison was statistically significant (P = 0.01; Table 5). A similar outcome was detected for calf value at the end of preconditioning (P = 0.01; Table 5). Based on actual feed prices, the INR source cost was $12.81/kg and the ORG source was $4.73/kg. According to cow DMI (Table 1) and feeding days (Table 2), the INR treatment increased total feeding cost by $4.81/cow, and the ORG treatment by $3.08/cow. These feeding costs, associated with the increase in calf BW and value upon weaning and preconditioning (Table 5) suggests an economical advantage of providing supplemental Co, Cu, Mn, and Zn, particularly an organic source, to late-gestating beef cows. Yet, economical return based on preconditioned calf value/cow assigned to the experiment were similar between treatments, which can also be associated with the numerical increase (P = 0.27) in calf loss of INR cows (Table 5).
IMPLICATIONS
Supplementing beef cows during late gestation with Co, Cu, Zn, and Mn increased concentrations of these trace minerals in the placental cotyledon as well as maternal and newborn calf liver, particularly when an organic source of Co, Cu, Zn, and Mn was offered. However, calf BW and calf value upon weaning and following a 45-d preconditioning were only increased when late-gestating cows were supplemented with an organic source of Co, Cu, Zn, and Mn. Hence, supplementing late-gestating beef cows
with an organic Co, Cu, Zn, and Mn is an alternative to optimize offspring productivity and economic returns in cow-calf systems.
LITERATURE CITED
BIF (Beef Improvement Federation), 2010. Guidelines for Uniform Beef Improvement Programs. 9th ed. BIF, North Carolina State University, Raleigh, NC, USA.
Bohnert, D. W., L. A. Stalker, R. R. Mills, A. Nyman, S. J. Falck, and R. F. Cooke. 2013. Late gestation supplementation of beef cows differing in BCS: Effects on cow and calf performance. J. Anim. Sci. 91:5485-5491.
Carroll, J. A., and N. E. Forsberg. 2007. Influence of stress and nutrition on cattle immunity. Vet. Clin. Food. Anim. 23:105-149.
Cooke, R. F., D. W. Bohnert, B. I. Cappellozza, R. S. Marques, T. DelCurto, and C. J. Mueller. 2014. Incorporation of sexed semen into reproductive management of range cow-calf operations. Livest. Sci. 163:165-171.
Gooneratne, S. R., and D. A. Christensen. 1989. A survey of maternal copper status and fetal tissue concentrations in Saskatchewan bovine. Can. J. Anim. Sci. 69:141-150.
Guarnieri Filho, T. A., R. F. Cooke, B. I. Cappellozza, M. M. Reis, R. S. Marques, and D. W. Bohnert. 2014. Effects of meloxicam administration on physiological and performance responses of transported feeder cattle. J. Anim. Sci. 92:4137-4144.
Hidiroglou, M., and J. E. Knipfel. 1981. Maternal fetal relationships of copper, manganese and sulfur in ruminants. A review. J. Dairy Sci. 64:1637-1647.
Hostetler, C. E., R. L. Kincaid, and M. A. Mirando. 2003. The role of essential trace elements in embryonic and fetal development in livestock. The Veterinary Journal 166:125–139.
Long, N. M., M. J. Nijland, P. W. Nathanielsz, and S. P. Ford. 2010. The effect of early to mid-gestational nutrient restriction on female offspring fertility and hypothalamic-pituitary-adrenal axis response to stress. J. Anim. Sci. 88:2029-2037.
NRC. 2000. Nutrient Requirements of Beef Cattle. 7th rev. ed. Natl. Acad. Press, Washington, DC.
Pepper, M. R., and M. M. Black. 2011. B12 in fetal development. Semin. Cell. Dev. Biol. 22:619– 623.
Spears, J. W. 1996. Organic trace minerals in ruminant nutrition. Anim. Feed Sci. Tech. 58, 151-163.
USDA-Agricultural Marketing Service, 2015. Livestock, poultry, and grain market news. Washington, DC. http://www.ams.usda.gov/. Accessed March 1, 2015.
Wagner, J. J., Lusby, K. S., Oltjen, J. W., Rakestraw, J., Wettemann, R. P., Walters, L. E., 1988. Carcass composition in mature Hereford cows: Estimation and effect on daily metabolizable energy requirement during winter. J. Anim. Sci. 66, 603–612.
Weiss, W.P., V. F. Colendrander, M. D. Cunningham, and C. J. Callahan. 1983. Selenium/vitamin E: role in disease prevention and weight gain of neonatal calves. J. Dairy Sci. 66:1101-1107.
20

Table 4. Cotyledon and calf liver concentrations of Co, Cu, Mn, and Zn from beef cows receiving diets containing or not (CON) inorganic (INR) or organic (ORG) sources of these trace minerals during the last trimester of gestation.1,2,3
Item CON INR ORG SEM P = Co, ppm Cotyledon 0.13a 0.20b 0.24b 0.03 0.02 Calf 0.09a 0.12b 0.13b 0.01 < 0.01
Cu, ppm Cotyledon 3.88a 4.75ab 5.11b 0.39 0.10 Calf 362a 428ab 450b 33 0.18
Mn, ppm Cotyledon 22.0 18.2 22.9 4.5 0.73 Calf 5.82 5.22 5.83 0.36 0.43
Zn, ppm Cotyledon 65 66 68 4 0.87 Calf 456a 562ab 660b 57 0.01
1 INR and ORG received the same amount of Cu, Co, Mn, and Zn from sulfate sources or Availa®4 (Zinpro Corporation, Eden Prairie, MN). 2 Cotyledon and calf liver samples were collected within 3 h after calving. 3 Means with different superscripts differ (P ≤ 0.05).
Figure 1. Concentration (ng/mL) of plasma cortisol (1A) and haptoglobin (1B) in calves weaned (d 283 of the experiment) from beef cows receiving diets containing or not (CON) inorganic (INR) or organic (ORG) sources of Cu, Co, Mn, and Zn during the last trimester of gestation. A treatment × day interaction was detected (P < 0.01) for cortisol, whereas a day effect was detected for haptoglobin (P < 0.01) Within days, letters indicate treatment differences (P < 0.01); a = INR vs. CON, b = ORG vs. CON.
Table 5. Calving, weaning, and preconditioning outcomes from beef cows receiving diets containing or not (CON) inorganic (INR) or organic (ORG) sources of Cu, Co, Mn, and Zn during the last trimester of gestation.1,2
Item CON INR ORG SEM P = Calving results Calving rate, % 95.5 84.6 95.5 5.4 0.27 Calf birth BW, kg 42.1 43.0 41.7 1.0 0.68 % of male calves born 25.9a 61.6b 48.2b 9.5 0.05
Weaning results Weaning rate, % 92.9 82.1 89.3 6.2 0.46 % of male calves weaned 23.1a 58.3b 52.0b 9.4 0.02 Calf weaning age, d 178 183 186 3 0.17 Calf weaning BW, kg 212a 223ab 236c 6 0.04 Calf value,3 US$ 660a 692ab 730b 20 0.04 Calf 205-d adjusted weaning BW, 4 kg 244a 252ab 263b 5 0.05 Calf value,3 US$ 757a 781ab 815b 18 0.09
Preconditioning results Preconditioning ADG, kg/d 0.59 0.51 0.55 0.05 0.49 Treated for bovine respiratory disease symptoms, % 34.9 36.4 31.5 11.7 0.95 Mortality rate, % 0.0 7.5 0.0 4.5 0.42 End of preconditioning BW, kg 245a 255b 265c 6 0.05 Calf value,3 US$ 756a 793ab 822b 19 0.05
Overall calf loss, % 7.1 21.4 10.7 6.4 0.27 Kg of preconditioned calf produced /cow assigned to experiment5 226 202 236 18 0.35 Value of preconditioned calf/cow assigned to experiment,3 US$ 702 582 734 55 0.15
1 INR and ORG received the same amount of Cu, Co, Mn, and Zn from sulfate sources or Availa®4 (Zinpro Corporation, Eden Prairie, MN). 2 Means with different superscripts differ (P ≤ 0.05). 3 Calculated based on the latest U.S. average for weaned cattle prices (US$ 3.1/kg of BW, 2103 and 2014; USDA-Agricultural Marketing Service, 2015). 4 Calculated according to BIF (2010). 5 Calculated based on shipping rate (% of live calves that were transferred to feedlot) and calf BW at the end of preconditioning
15
20
25
30
35
0 1 3 5 7
ORG CON INOR
0.0
0.5
1.0
1.5
0 1 3 5 7Day relative to weaning (d 283 of the experiment)
ORG CON INR
(1A)
(1B)
a b
21
Proceedings, Western Section, American Society of Animal Science
Vol. 66, 2015
Effect of maternal mid- to late gestational energy source on expression of angiogenic factors in fetal lamb jejunal tissue
H. C. Cunningham*, K. J. Austin*, K. M. Cammack*, M. A. Berg†, A. E. Radunz‡, and A. M. Meyer§
*Department of Animal Science, University of Wyoming, Laramie, WY † Department of Animal Sciences, University of Wisconsin-Madison, Madison, WI
‡ Department of Animal and Food Science, University of Wisconsin-River Falls, River Falls, WI § Division of Animal Sciences, University of Missouri, Columbia, MO
ABSTRACT: Small intestinal growth and function greatly impact animal performance and can be influenced early by maternal nutrition during gestation. We hypothesized that functional aspects of the fetal small intestine would be altered by maternal energy source during gestation. The objective was to investigate jejunal angiogenic factor mRNA in fetuses from ewes fed 1 of 3 energy sources during late gestation. Mature Polypay ewes (n = 14; carrying either single or twin fetuses) were allocated to receive 1 of 3 diets (3.52 Mcal ME/d) with different primary energy sources from d 67 ± 3 of gestation: ad libitum alfalfa haylage (HL), limit-fed whole shelled corn (CN), or limit-fed corn dried distillers grain plus solubles (DG). Ewes fed the CN and DG diets were given trace minerals, vitamins, and additional CP (CN only) to meet or exceed NRC recommendations due to a restriction of DMI. Haylage (12.2% of the diet, DM basis) and lasalosid (27 mg/kg of dietary DM) were also fed to minimize rumen health problems in ewes fed DG and CN. On d 130 of gestation, non-survival surgeries took place and the fetuses were removed for necropsy. The fetal small intestine was dissected and jejunal mucosa samples were collected. Real-time RT-PCR was performed to determine jejunal expression of genes of the VEGF and NOS systems, including vascular endothelial growth factor (VEGF), VEGF receptors (FLT1 and KDR), endothelial nitric oxide synthase 3 (NOS3), and soluble guanylate cyclase (GUCY1B3). Data were analyzed with the MIXED procedure of SAS for fixed effects of treatment, fetal number, and sex. Means were separated using LSD and considered different when P ≤ 0.05. Jejunal mRNA of VEGF and NOS systems was unaffected (P ≥ 0.40) by maternal energy source during late gestation. The lack of differences in angiogenic factor expression in fetal jejunal tissues is concordant with a lack of differences in organ mass previously reported. Expression of VEGF and NOS system genes appear to be unaffected by maternal energy source during gestation. Key words: angiogenic factors, developmental programming, small intestine
INTRODUCTION
Research in the field of developmental programming in livestock species has made major advances in recent years, yet mechanisms associated with gestational perturbations potentially driving changes in postnatal offspring performance remain largely unknown. Previous research
has demonstrated the impact of maternal plane of nutrition on offspring development and lifetime performance (Caton and Hess, 2010; Funston et al., 2010). Data suggest that fetal organogenesis, and subsequently organ mass, is affected by gestational nutrition (Fowden et al., 2006; Luther et al., 2007; Reed et al., 2007; Vonnahme et al., 2003; Meyer et al., 2013). Gestational nutrition, specifically maternal energy source, not only affects offspring prenatally, but can additionally have lasting effects postnatally (Radunz et al., 2011a, b, 2012).
Expression of angiogenic factors, which regulate angiogenesis or the formation of new blood vessels from pre-existing blood vessels, in various organ systems have also been responsive to gestational nutrition (Vonnahme et al., 2007; Neville et al., 2010, Meyer et al., 2012b). Vascular endothelial growth factor (VEGF) regulates angiogenesis and stimulates endothelial cell survival, proliferation, and migration in conjunction with its receptors (KDR and FLT1; Klagsbrun and D’Amore, 1996). Nitric oxide (NO) induces vasodilation and thus increases blood flow. Endothelial nitric oxide synthase 3 (NOS3) produces NO, and soluble guanylate cyclase (GUCY1B3) is a receptor for NO that contributes to its actions (Martin et al., 2001). Not only does NO act as a vasodilator, but it also stimulates VEGF production which in turn promotes angiogenesis (Roy et al., 2006). It has been reported that offspring of nutrient-restricted dams with a ruminally undegradable protein supplement had greater jejunal expression of GUCY1B3 (Meyer et al., 2014).
Because the small intestine is the main site of nutrient absorption and could thus impact overall animal performance and efficiency, we hypothesized that fetal small intestinal development could be responsible, in part, for the whole animal responses associated with gestational energy source. The objective was to investigate jejunal mRNA of angiogenic factors in fetuses from ewes fed various primary energy sources during gestation.
MATERIALS AND METHODS
All animal procedures were approved by the University of Wisconsin-Madison (UW) Research Animal Resource Committee. Detailed descriptions of ewe management and non-survival surgeries have been previously described by Berg (2012). Animal Management and Diets
22
Mature Polypay ewes (n = 15; BW = 74.7 ± 2.50 kg) from the UW Sheep Research unit were used in a randomized complete block design for this study. Ewes were synchronized for estrus using controlled internal drug release (CIDR; Eazi-breed CIDR, West Ryde, NSW) devices containing 300 mg of progesterone and then naturally bred to a common sire. Ewes were managed as a single contemporary group before and after breeding and received ad libitum alfalfa haylage. Transabdominal ultrasonography was used to determine pregnancy status at 26 d post-breeding and fetal number at 33 and 37 d post-breeding.
On d 50 of gestation, ewes were transported 32.5 km to the UW Livestock Laboratory where ewes were placed in individual pens (1.2 x 2.4 m) on metal slats. Ewes were randomly assigned to 1 of 2 rooms and stratified among treatments by BW (74.7 ± 2.50 kg), BCS (3.5 ± 0.36), ewe age (3.7 ± 0.91 yr), fetal age (67 ± 3.4 d), and fetal count (1.7 ± 0.49). On d 67 ± 3 of gestation, treatments were initiated and ewes were assigned to 1 of 3 diets (Table 1) initially formulated to meet or exceed NRC (2007) nutrient requirements for mid-gestation at 3.52 Mcal ME/d. These dietary treatments consisted of 1 of 3 primary energy sources; ad libitum alfalfa haylage (HL), limit-fed whole shell corn (CN), or limit-fed corn dried distillers grains plus solubles (DG). Limit feeding was utilized for CN and DG to ensure isoenergetic intake across all treatments. Haylage (12.2% of diet on DM basis) and lasalosid (27 mg/kg of dietary DM; Alpharma, LLC, Bridgewater, NJ) were provided with the CN and DG diets to minimize rumen health problems. Diets were fed once daily at 0630 h. Ewe BW and BCS were collected weekly during the test period and DMI was adjusted to maintain similar BW gain for ewes fed CN and DG versus HL. From d 116 until the end of the experiment, ewes fed the HL diet were fed corn gluten feed at 10.36% of diet on DM basis to account for the increased energy needs of fetal development during late-gestation.
On d 130 ± 1 of gestation, all ewes were transported 2.3 km to the UW-Madison Department of Obstetrics and Gynecology, Perinatal Research Laboratories for non-survival surgeries (NSS). The NSS procedure was similar to that described by Magness et al. (1998) and Reynolds et al. (1984). After completion of the NSS, each fetus was removed and the small intestine was dissected according to methods described by Meyer et al. (2013). Briefly, the mesenteric-ileocecal vein juncture was located and a point on the jejunum was marked after moving 3 branches along the mesenteric vein. From this point a 10-cm sample of the jejunum was collected, trimmed of fat and rinsed of digesta using warm PBS. The sample was then cut into smaller pieces and frozen in liquid N2 and stored at -80°C. Fetal tissue was only analyzed from ewes with singleton or twins resulting in 14 ewes and 23 fetuses. Angiogenic Factor mRNA Expression
Fetal jejunal mucosal expression of VEGF, VEGF
receptors (FLT1 and KDR), NOS3, and GUCY1B3 genes was determined by semi-quantitative real-time RT-PCR (Austin et al., 2011). Frozen mucosal scrape (95-100 mg)
was placed in 1 mL of TRI reagent (Sigma Chemical Co., St Louis, MO) and homogenized using an electron tissue grinder (IKA Laboratories; Wilmington, NC). Chloroform (200 µL) was added to aid phase separation and isopropanol (500 µL) was added to the aqueous layer to precipitate the RNA pellet that was then resuspended in 100 µL RNase-free water and further purified using the RNeasy kit (Qiagen, Santa Clarita, CA). The purified RNA was quantified using a NanoDrop Spectrophotometer (Thermo Fisher Scientific, Denver, CO).
Next, cDNA was synthesized by adding 4 µL reverse transcription buffer (5X) and 1 µL of IScript reverse transcriptase (Bio-Rad Laboratories, Richmond, CA) to 2 µg RNA (in 15 µL nuclease-free water). This mixture was placed in a thermocycler for 5 min at 25°C, 30 min at 42°C, 5 min at 85°C, and held at 4°C. The cDNA was diluted with 100 µL nuclease-free water and stored at -20°C until semi-quantitative real-time PCR was performed. Primers used were those previously reported in ovine and bovine small intestinal studies (Clarkson et al., 2013; Cunningham et al., 2013; Garrison et al., 2013), and are shown in Table 2. Real-time PCR was performed by mixing 10 µL of diluted cDNA with 12.5 µL of SYBR green Supermix (Bio-Rad Laboratories, Inc., Hercules, CA), 500 pmol each of forward and reverse primer, and 0.5 µL of nuclease-free water in each well of a 96-well plate. Amplification was performed using the iQ5 and 40 cycles of 95°C for 30 sec and 60°C for 30 sec. Melting curve analysis was performed post-amplification to ensure the quality of PCR products as noted by the presence of a single peak. Briefly, the PCR plate was heated to 95°C for 3 min and cooled to 55°C, and then the temperature was increased by 0.5°C/sec up to 95°C. Bovine glyceraldehydes 3-phosphate dehydrogenase (GAPDH) was used as the reference gene, and all gene expression levels were quantified and reported relative to GAPDH expression using the 2-ΔΔCT method (Livak and Schmittgen, 2001). Real-time PCR was performed in duplicate for each sample/primer set. Statistical Analysis
Data were analyzed for fixed effects of treatment, fetal
number, and sex using the MIXED procedure of SAS 9.2 (SAS Inst., Inc., Cary, NC). Means were separated using LSD and differences were considered significant when P ≤ 0.05. Ewe was considered the experimental unit.
RESULTS AND DISCUSSION
Expression of fetal small intestinal VEGF, FLT1, KDR, NOS3, or GUCY1B3 was not affected (P ≥ 0.40) by maternal energy source, fetal number, or sex in this study (Table 3). It was reported previously that relative fetal small intestinal mass (% BW) tended to be affected by maternal energy source where fetuses from DG ewes had greater relative mass than CN fed ewes (Larson et al., 2015). Proliferation of the fetal small intestine also tended to be affected by maternal energy source (Larson et al., 2015), where fetuses from DG fed ewes tended to have greater proliferation than those of HY fed ewes. Despite this, fetal BW and major fetal organ masses were unaffected by
23

maternal treatment (Cretney et al., 2012). Previous research suggests that maternal gestational
nutrition can impact offspring performance and body composition. For example, lambs born to ewes limit-fed dried distillers grain with solubles and limit-fed corn tended to have greater final BW at slaughter than those fed haylage, but lambs born to ewes limit-fed dried distillers grain with solubles had a decreased dressing percentage (Radunz et al., 2011b). Additionally, it has been reported in beef cows that differences in prepartum dietary energy source resulted in changes in birth weights where calves born to cows limit-fed dried corn distillers grain with solubles and limit-fed corn were heavier than those born to cows fed hay (Radunz et al., 2012).
Because the small intestine is the main site of post-ruminal nutrient absorption, potential impacts of maternal nutrition on small intestinal development and function of offspring are important. Small intestinal mass can be affected by feed intake (Meyer et al., 2013; Cunningham et al., 2014) as well as by maternal plane of nutrition (Reed et al., 2007; Caton et al., 2009). The blood supply to the small intestine is responsible for the transport of nutrients and therefore may impact whole animal efficiency and performance. Investigation of the intestinal blood supply and variables that may be influencing these properties including angiogenesis is critical. The VEGF and NOS systems have been reported to be affected by intake (Meyer et al., 2012a; Cunningham et al., 2013), feed efficiency classification (Clarkson et al., 2013), and maternal plane of nutrition with Se supplementation (Neville et al., 2010; Meyer et al., 2010, 2012b). The jejunal expression of the VEGF and NOS systems genes as well as small intestinal proliferation was also evaluated in the dams of the fetuses in the current study. There was no effect of gestational energy source on jejunal expression of VEGF, FLT1, KDR, NOS3, or GUCY1B3 genes (Garrison et al., 2013). Also, there were no differences in ewe small intestinal proliferation (Larson et al., 2015).
The lack of differences in organ mass in the current study suggests that differences in maternal energy source may not affect organ mass in ewes or organogenesis in fetuses. This could be because the 3 treatments were provided at isoenergetic levels that met the nutritional requirements of mid- to late gestating ewes. Because adequate energy was supplied to the ewe and fetus, perhaps differences in mass were not induced and thus blood supply to those organs was not altered. While angiogenesis was not affected in this study, proliferation of fetal tissue was previously reported to be affected by maternal energy source. Therefore differences in small intestinal physiology and function, such as absorptive capacity, may exist as a result of maternal energy source and warrants further research.
IMPLICATIONS
These results suggest that angiogenic factor mRNA in
fetal small intestinal tissue is not affected by maternal energy source during late gestation. Because feed quality and quantity are often limited during mid- to late gestation in sheep and cattle, supplementation is a common practice
to achieve adequate nutrition during gestation. A better understanding of how nutrition during gestation affects fetal development could lead to targeted supplementation and feeding strategies that limit effects of gestational nutrition deficiencies or optimize development.
LITERATURE CITED
Austin, K. J., R. R. Cockrum, A. M. Jons, B. M. Alexander, and K. M. Cammack. 2011. Renin mRNA is upregulated in testes and testicular cells in response to treatment with aflatoxin B1. Theriogenology. 77:331-337. doi:10.1016/j.theriogenology.2001.08.004.
Berg, M. A. 2012. Effects of maternal dietary energy source during mid- to late-gestation on maternal plasma characteristics, glucose tolerance and uterine blood low in sheep. M. S. Thesis. Univ. of Wisconsin, Madison.
Caton, J. S., J. J. Reed, R. P. Aitken, J. S. Milne, P. P. Borowicz, L. P. Reynolds, D. A. Redmer, and J. M. Wallace. 2009. Effects of maternal nutrition and stage of gestation on body weight, visceral organ mass, and on indices of jejunal cellularity, proliferation, and vascularity in pregnant ewe lambs. J. Anim. Sci.87:222-235. doi:10.2527/jas.2008-1043.
Caton, J. S. and B. W. Hess. 2010. Maternal plane of nutrition: Impacts on fetal outcomes and postnatal offspring responses. In: B. W. Hess, T. DelCurto, J. G. P. Bowman and R. C. Waterman (eds.) Proc. 4th Grazing Livestock Nutrition Conference. p 104-122. West. Sect. Am. Soc. Anim. Sci., Champaign, IL.
Clarkson, C. J., H. C. Cunningham, M. J. Ellison, K. J. Austin, K. M. Cammack, and A. M. Meyer. 2013. Effects of diet and feed efficiency on small intestinal gene expression of angiogenic factors in growing lambs. Proc. West. Sect. Amer. Soc. Anim. Sci. 64:In press.
Cunningham, H. C., R. D. Yunusova, B. W. Hess, J. S. Caton, and A. M. Meyer. 2013. Correlation of jejunal vascularity with feed efficiency and angiogenic factor mRNA expression in calves from a gestational nutrient restriction model. J. Anim. Sci. 91:In press. (Abstr.).
Cunningham, H. C., K. J. Austin, S. I. Paisley, J. C. Gatlin, K. M. Cammack, and A. M. Meyer. 2014. The relationship of feed efficiency with small intestinal biology in finishing cattle. Proc. West. Sect. Amer. Soc. Anim. Sci. 65:In press.
Cretney, E. J., J. S. Luther, M. A. Berg, R. L. Burgett, R. R. Magness, J. Susko-Parrish, and A. E. Radunz. 2012. Effects of maternal dietary energy source during mid-to late-gestation on fetal organ and adipose tissue growth in sheep. J. Anim. Sci. 90 (Suppl. 2):129 (Abstr.)
Fowden, A. L., D. A. Giussani, and A. J. Forhead. 2006. Intrauterine programming of physiological systems: Causes and consequences. Physiology 21:29-37. doi:10.1152/physiol.0050.2005.
Funston, R. N., D. M. Larson, and K. A. Vonnahme. 2010. Effects of maternal nutrition on conceptus growth and offspring performance: Implications for beef cattle production. J. Anim. Sci. 88(E. Suppl.):E205-E215. doi:10.2527/jas.2009-2351.
24
Garrison, J. D., K. J. Austin, H. C. Cunningham, M. A. Berg, A. E. Radunz, and A. M. Meyer. 2013. Effects of mid- to late gestational energy source on jejunal mucosal angiogenic factor mRNA expression in mature ewes. Proc. West Sect. Amer. Soc. Anim. Sci. 64:In press.
Klagsbrun, M. and P. A. D’Amore. 1996. Vascular endothelial growth factor and its receptors. Cytokine Growth Factor Rev. 7:259-270.
Larson, J. M., A. R. Smith, M. A. Berg, A. E. Radunz, and A. M. Meyer. 2015. Effects of mid- to late gestational energy source on jejunal crypt cell proliferation in the ewe and fetus. Midwest Sect. Amer. Soc. Anim. Sci. In press.
Livak, K. J. and T. D. Schmittgen. 2001. Analysis of relative gene expression data using real-time quantitative PCR and the 2-∆∆CT method. Methods 25:402-408. doi:10.1006/meth.2001.1262.
Luther, J., R. Aitken, J. Milne, M. Matsuzaki, L. Reynolds, D. Redmer, and J. Wallace. 2007. Maternal and fetal growth, body composition, endocrinology, and metabolic status in undernourished adolescent sheep. Biol. Reprod. 77:343-350. doi:10.1095/biolreprod.107.061440.
Magness, R. M., T. M. Phernetton and J. Zheng. 1998. Systemic and uterine blood flow distribution during prolonged infusion of 17 β-estradiol. Am. J. Physiol. 275:H731-H743.
Martin, M. J., M. D. Jimenez, and V. Motilva. 2001. New issues about nitric oxide and its effects on the gastrointestinal tract. Curr. Pharm. Des. 7:881-908. doi:10.2174/1381612013397645.
Meyer, A. M., J. J. Reed, T. L. Neville, J. B Taylor, C. J. Hammer, L. P. Reynolds, D. A. Redmer, K. A. Vonnahme, and J. S. Caton. 2010. Effect of plane of nutrition and selenium supply during gestation on ewe and neonatal offspring performance, body composition, and serum selenium. J. Anim. Sci. 88:1786-1800. doi:10.2527/jas.2009-2435.
Meyer, A. M., K. M. Cammack, K. J. Austin, J. M. Kern, M. Du, J. S. Caton, and B. W. Hess. 2012a. Correlation of feed intake and efficiency with small intestinal angiogenic factor and receptor expression in finishing cattle born to dams fed varying levels of nutrients during early to mid-gestation. Proc. West. Sect. Amer. Soc. Anim. Sci. 63:193-197.
Meyer, A. M., K. M. Cammack, S. I. Paisley, P. Moriel, W. J. Means, M. Du, J. S. Caton, and B. W. Hess. 2012b. Correlation of feed efficiency and small intestinal growth in finishing cattle born to dams fed varying levels of nutrients during early to mid-gestation. J. Anim. Sci. 90 (Suppl. 2):70 (Abstr.).
Meyer, A. M., K. W. Christenson, W. J. Means, S. L. Lake, and S. I. Paisley. 2013. Small intestinal, stomach complex, and total gastrointestinal tract masses are decreased relative to body weight in high efficiency steers. Proc. Int. Symp. Energy Prot. Metab. In Press.
Meyer, A. M., B. W. Hess, S. I. Paisley, M. Du, and J. S. Caton. 2014. Small intestinal growth measures are correlated with feed efficiency in market weight cattle, despite minimal effects of maternal nutrition during
early to midgestation. J. Anim. Sci. 92:3855-3867. doi:10.2527/jas.2014-7646.
Neville, T. L., D. A. Redmer, P. P. Borowicz, J. J. Reed, M. A. Ward, M. L. Johnson, J. B. Taylor, S. A. Soto-Navarro, K. A. Vonnahme, L. P. Reynolds, and J. S. Caton. 2010. Maternal dietary restriction and selenium supply alters mRNA expression of angiogenic factors in maternal intestine, mammary gland, and fetal jejunal tissues during late gestation in pregnant ewe lambs. J. Anim. Sci. 88: 2692-2702. doi:10.2527/jas.2009-2706.
NRC. 2007. Nutrient Requirements of Small Ruminants: Sheep, Goats, Cervids, and New World Camelids. Natl. Acad. Press. Washington, DC.
Radunz, A. E., F. L. Fluharty, H. N. Zerby, and S. C. Loerch. 2011a. Winter-feeding systems for gestating sheep I: Effects on pre- and postpartum ewe performance and lamb progeny preweaning performance. J. Anim. Sci. 89:467–477. doi:10.2527/jas.2010-3035.
Radunz, A. E., F. L. Fluharty, I. Susin, T. L. Felix, H. N. Zerby, and S. C. Loerch. 2011b. Winter-feeding systems for gestation sheep II: Effects on feedlot performance, glucose tolerance, and carcass composition of lamb progeny. J. Anim. Sci. 89:478–488. doi:10.2527/jas.2010-3037.
Radunz, A. E., F. L. Fluharty, A.E. Relling, T. L. Felix, L. M. Shoup, H. N. Zerby, and S. C. Loerch. 2012. Prepartum dietary energy source fed to beef cows: II. Effects on progeny postnatal growth, glucose tolerance, and carcass composition. J. Anim. Sci. 90:4962-4974. doi:10.2527/jas.2012-5098.
Reed, J. J., M. A. Ward, K. A. Vonnahme, T. L. Neville, S. L. Julius, P. P. Borowicz, J. B. Taylor, D. A. Redmer, A. T. Grazul-Bilska, L. P. Reynolds, and J. S. Caton. 2007. Effects of selenium supply and dietary restriction on maternal and fetal body weight, visceral organ mass and cellularity estimates, and jejunal vascularity in pregnant ewe lambs. J. Anim. Sci. 85:2721-2733. doi:10.2527/jas.2006-785.
Reynolds, L. P., R. R. Magness, and S. P. Ford. 1984. Uterine blood flow during early pregnancy in ewes: interaction between the conceptus and the ovary bearing the corpus luteum. J. Anim. Sci. 58:423-429.
Roy, H., S. Bhardwaj, and S. Yla-Herttuala. 2006. Biology of vascular endothelial growth factors. FEBS Letters 580:2879-2887. doi:10.1016/j.febslet.2006.03.087.
Vonnahme, K. A., B. W. Hess, T. R. Hansen, R. J. McCormick, D. C. Rule, G. E. Moss, W. J. Murdoch, M. J. Nijland, D. C. Skinner, P. W. Nathanielsz, and S. P. Ford. 2003. Maternal undernutrition from early- to mid-gestation leads to growth retardation, cardiac ventricular hypertrophy, and increased liver weight in the fetal sheep. Biol. Reprod. 69:133-140. doi:10.1095/biolreprod.102.012120.
Vonnahme K. A., M. J. Zhu, P. P. Borowicz, T. W. Geary, B. W. Hess, L. P. Reynolds, J. S. Caton, W. J. Means, and S. P. Ford. 2007. Effect of early gestational undernutrition on angiogenic factor expression and vascularity in the bovine placentome. J. Anim. Sci. 85:2464-2472. doi:10.2527/jas.2006-805.
25

Table 1. Ingredient and nutrient composition of mid and late-gestation ewe diets Treatment1 Item HL CN DG Ingredient, %, DM basis
Alfalfa haylage 100.00 12.12 12.19 Whole shelled corn - 63.64 - DDGS2 - - 60.93 Supplement
Ground corn - 16.97 - DDGS - - 24.37 Soybean meal - 4.85 - Limestone - 1.15 1.52 Monocalcium phosphate - 0.12 - Mineral & vitamin mixture3 - 0.97 0.97 Lasalocid4 - 0.02 0.02
Analyzed nutrient composition, % CP 18.23 11.14 26.38 NDF 47.05 16.12 42.90 ADF 32.00 6.06 14.55 Ether extract 5.15 7.64 9.89 Ash 10.41 4.79 7.42 Ca 1.10 0.81 0.89 P 0.40 0.56 1.02 S 0.21 0.14 0.67
1HL = ad libitum fed alfalfa haylage and provided ad libitum access to a mineral and vitamin mixture (Sheep Mineral Plus, Vita Plus Corporation, Madison, WI); CN = limit-fed whole shell corn; DG = limit-fed corn dried distillers grains. 2Corn dried distillers grains plus solubles. 3Contained 56% NaCl, 9.5% Ca, 5.0% P, 1.5% Mg, 0.75% Zn, 0.40% Mn, 0.02% I, 0.005% Se, 0.0025% Co, 440,920 IU/kg vitamin A, 110,230 IU/kg vitamin D3, 1,764 IU/kg vitamin E. 4Provided 27 mg of lasalocid (Alpharma, LLC, Bridgewater, NJ)/kg of dietary DM. Table 2. Sequence of primers used for ovine angiogenic factors and receptors Gene of interest Description Forward Primer Reverse Primer VEGF Vascular endothelial growth factor TGAGACCCTGGTGGACATCT TATGTGCTGGCTTTGGTGAG FLT11 VEGF receptor 1 GTATCACTGCAAAGCCAGCA AGCGTTAACAGGAGCCAGAA KDR VEGF receptor 2 AGCCGTTTGTTGCTTTCAGT AGCACATGCCCACTTTAAC
NOS3 Endothelial nitric oxide (NO) synthase GTGGAGATCAACCTGGCTGT GACCATCTCCTGGTGGAAGA
GUCY1B31 Soluble guanylate cyclase, binds NO GAGGATGCCTCGCTACTGTC CTGCTCCGTTTCCTCTGTTC
1Indicates that a bovine primer set was used. Table 3. Effects of maternal energy source, fetal number, and sex on relative jejunal angiogenic factor mRNA in fetal lambs Maternal energy source2 P–value Gene of interest1 CN DG HL SEM Treatment Fetal
Number Sex
VEGF 2.23 2.04 2.25 0.54 0.93 0.52 0.97 FLT1 2.21 2.00 1.97 0.51 0.82 0.76 0.24 KDR 7.63 5.07 6.24 1.44 0.40 0.78 0.31 NOS3 3.67 4.23 3.16 1.73 0.88 0.44 0.20 GUCY1B3 2.00 3.32 4.94 0.80 0.48 0.86 0.76 1VEGF = vascular endothelial growth factor, FLT1 = VEGF receptor-1, KDR = VEGF receptor-2, NOS3 = endothelial nitric oxide synthase 3, and GUCY1B3 = soluble guanylate cyclase. 2 CN = limit-fed whole shell corn; DG = limit-fed corn dried distillers grains; HL = ad libitum fed alfalfa haylage.
26

Proceedings, Western Section, American Society of Animal Science
Vol. 66, 2015
Influence of dried distiller’s grains with solubles on ram lamb growth and reproductive traits1
A. R. Crane, *‡ R. R. Redden, ‡ M. S. Crouse, ‡ J. D. Kirsch, ‡ J. E. Held, † and C. S. Schauer*2 *Hettinger Research Extension Center, Hettinger, ND 58639
‡Department of Animal Sciences, North Dakota State University, Fargo, ND 58108 †Department of Animal Sciences, South Dakota State University, Brookings, SD 57007
1The authors would like to thank the ND SBARE for the partial funding of this trial. 2Corresponding author’s email address: [email protected].
27
ABSTRACT: The inclusion of dried distiller’s grains (DDGS) at 15%, 30%, and 45% of the ration was hypothesized to have a decreasing linear effect on semen quality of ram lambs, while having no negative effects on growth. Following the removal of DDGS from the ration, we hypothesized that the ram lambs would recover and become reproductively sound, independent of treatment. To test this hypothesis, Suffolk and Hampshire ram lambs (n =112) were allocated to four treatments (n = 4 pens/treatment; 7 rams/pen) in a completely random design. Dietary treatments were 60% corn, 25% oats, and 15% commercial market lamb pellet (CON), 15% of the ration as DDGS substituted for corn (% DM basis; 15DDGS), 30% of the ration as DDGS substituted for corn (% DM basis; 30DDGS) and 45% of the ration as DDGS substituted for corn (% DM basis; 45DDGS). Rams were fed to d 112 on their respective treatment (PHASE 1), after which rams were placed on the CON ration until d 168 (PHASE 2). Rams were weighed on consecutive days at the beginning (d 0 and 1) and end (d 167 and 168) of the trial. Scrotal circumference was measured on all rams on d 84, 112, 140, and 168. Semen samples were collected on a subset of 64 rams (4 rams/pen) to evaluate semen quality on d 84, 112, 140, and 168. Blood samples were collected on the same subset of rams every 14 d throughout the trial. A quadratic effect on PHASE 1 BW (P = 0.03), PHASE 1 and overall ADG (P = 0.02 and P = 0.02, respectively), PHASE 1 DMI (P = 0.007), and a cubic effect (P = 0.05) for overall G:F were observed. Overall and PHASE 2 scrotal circumference had linear (P = 0.04) and quadratic (P = 0.05) effects, respectively. Overall morphological abnormalities increased linearly (P = 0.04) as the concentration of DDGS in the ration increased. In PHASE 2 a linear increase in spermatozoa concentration was observed (P = 0.03). Testosterone concentrations exhibited a linear decrease (P = 0.004) as DDGS increased in the ration. The results confirm our hypothesis that increasing DDGS in the diet had no negative effects on ram feedlot performance. Additionally, spermatozoa morphology was negatively affected as DDGS increased in the ration.
Key words: dried distiller’s grains with solubles, feedlot, growth performance, rams, reproductive traits, semen quality
INTRODUCTION
Ethanol production in the United States continues to increase exponentially (Renewable Fuels Association, 2015). The byproduct of the ethanol industry, dried distiller’s grains with solubles (DDGS), provides an affordable and viable feed source for livestock, especially ruminants. Dried distiller’s grains are readily incorporated into diets for RUP, although DDGS can be high in sulfur and crude fat. Newer ethanol distilleries have decreased the variability in crude fat and protein, however mineral content can still be highly variable (Spiehs et al., 2002). With this affordable byproduct, research involving its inclusion in feedlot rations continues to increase. In feedlot lambs, DDGS have been included in the ration at rates of up
to 60% with no negative effects on performance or signs of polioencephalomalacia (PEM; Schauer et al., 2008; Neville et al., 2011). With the growing popularity of feeding DDGS by the sheep industry, research needs to expand to investigate the possible impacts of DDGS on ram reproductive traits and fertility. Van Emon et al. (2013) reported a linear decrease in spermatozoa concentration as DDGS increased in the diet. However, this is the only trial we are aware of that has evaluated DDGS in growing ram lamb rations, and its potential effect on male fertility. The current trial tested the hypothesis that ram lambs consuming increasing concentrations of DDGS in the ration would have declining reproductive traits, with feedlot performance being unaffected. We also hypothesized that ram lambs would reproductively convalesce once being removed from diets containing DDGS and being placed on the CON ration. The objectives used to test this hypothesis were to determine the influence of increasing concentrations of DDGS in ram lamb rations on ram lamb growth, reproductive traits, and serum testosterone concentration.
MATERIALS AND METHODS
All procedures were approved by the animal care and use committee of North Dakota State University (protocol # A14060). This study was conducted at the North Dakota State University Hettinger Research Extension Center in Hettinger, ND.

Feedlot Study
Ram lambs (Suffolk and Hampshire) were purchased from four producers in North and South Dakota, Minnesota, and Iowa. Prior to purchase, ram lambs were vaccinated for Clostridium perfringens types C and D and tetanus, weaned at 60 d of age, and revaccinated. At approximately 90 d of age, rams were purchased and transported to the Hettinger Research Extension Center. Ram lambs were adapted to a 60% corn, 25% oats, and 15% commercial market lamb pellet diet (DM basis) for approximately 2 weeks. The adaptation diet for all lambs was the CON diet described in Table 1. Ram lambs (n=112) were stratified by weight and breed then allocated to four treatments (n = 4 pens/treatment; 7 rams/pen) in a completely random design. Dietary treatments were 60% corn, 25% oats, and 15% commercial market lamb pellet (CON), 15% of the ration as DDGS substituted for corn (% DM basis; 15DDGS), 30% of the ration as DDGS substituted for corn (% DM basis; 30DDGS) and 45% of the ration as DDGS substituted for corn (% DM basis; 45DDGS) as described in Table 1 . Study diets were balanced to be isocaloric and to be equal to or greater than the CP and TDN requirements of a 40 kg lamb gaining 300 g/d (NRC, 2007) and to maintain a Ca:P ratio of 2:1 or greater. Rations were ground (1.25 cm screen) and mixed in a grinder-mixer (GEHL mix-all, Model 170; West Bend, WI) and provided ad libitum access via bulk feeders (70 cm bunk space/ram). Ram lambs had continuous access to clean, fresh water. Feeders
28
were checked daily and cleaned of contaminated feed (fecal contamination, wet feed due to precipitation, etc.). Ram lambs were weighed on two consecutive d at the beginning (d 0 and 1) and the end of the trial (d 167 and 168) and weighed once every 28 d (to assist in evaluation of lambs for morbidity). Ram lambs were fed their respective treatments until d 112 (PHASE 1) and on d 112 all feed was removed from self-feeders and pens were reallocated to the CON diet until d 168 (PHASE 2). One ram was removed from the trial due to a broken leg and six other rams died before the conclusion of the trial from complications not related to the trial. Necropsies concluded that the rams had normal liver, rumen, and intestines, with the majority of the ram lambs succumbing to chronic pneumonia.
Reproductive Performance Study
Scrotal circumference was measured on all ram lambs on d 84, 112, 140, and 168 of the trial (Martin et al., 1994). Sixty-four ram lambs (a subsample of the 112 ram lambs in the feedlot study described above; 4 ram lambs/pen) were chosen for semen quality and serum testosterone concentration analysis. The four ram lambs in each pen were selected based on weight and breed to provide a representative subset. Semen was collected on d 84, 112, 140, and 168 of the study via electroejaculation. Immediately post-ejaculation, volume of the ejaculate was recorded and spermatozoa characteristics were observed and recorded using techniques similar to Van Emon et al. (2013). In addition, percent morphology of the diluted spermatozoa in a nigrosin-eosin stain was determined on a pre-warmed glass slide at 40x magnification. The remaining semen sample from each individual ram was then diluted, mixed with an extender and frozen in 200 µl pellets on a block of dry ice and stored in a liquid nitrogen tank (-196˚C). The extender recipe included 30 mL of sterile distilled water, 10 mL triladyl and 10 mL of an egg yolk from a brown chicken egg.
Every 14 d throughout the duration of the trial a 10 mL blood sample was collected via jugular venipuncture with a 20 gauge x 2.54 cm vacutainer needle into serum separator 16 x 100 mm tubes. Blood samples were immediately placed on ice and cooled for 4 h at 4°C when serum was harvested postcentrifugation (3,640 × g at 15°C for 20 min). Serum was frozen at -20°C until serum testosterone analysis (IMMULITE 1000 Total Testosterone; LKTW1; Siemens Diagnostic, Los Angeles, CA).
emueller
Typewritten Text
emueller
Typewritten Text
emueller
Typewritten Text
emueller
Typewritten Text
emueller
Typewritten Text
emueller
Typewritten Text
emueller
Typewritten Text
emueller
Typewritten Text
emueller
Typewritten Text
emueller
Typewritten Text
emueller
Typewritten Text
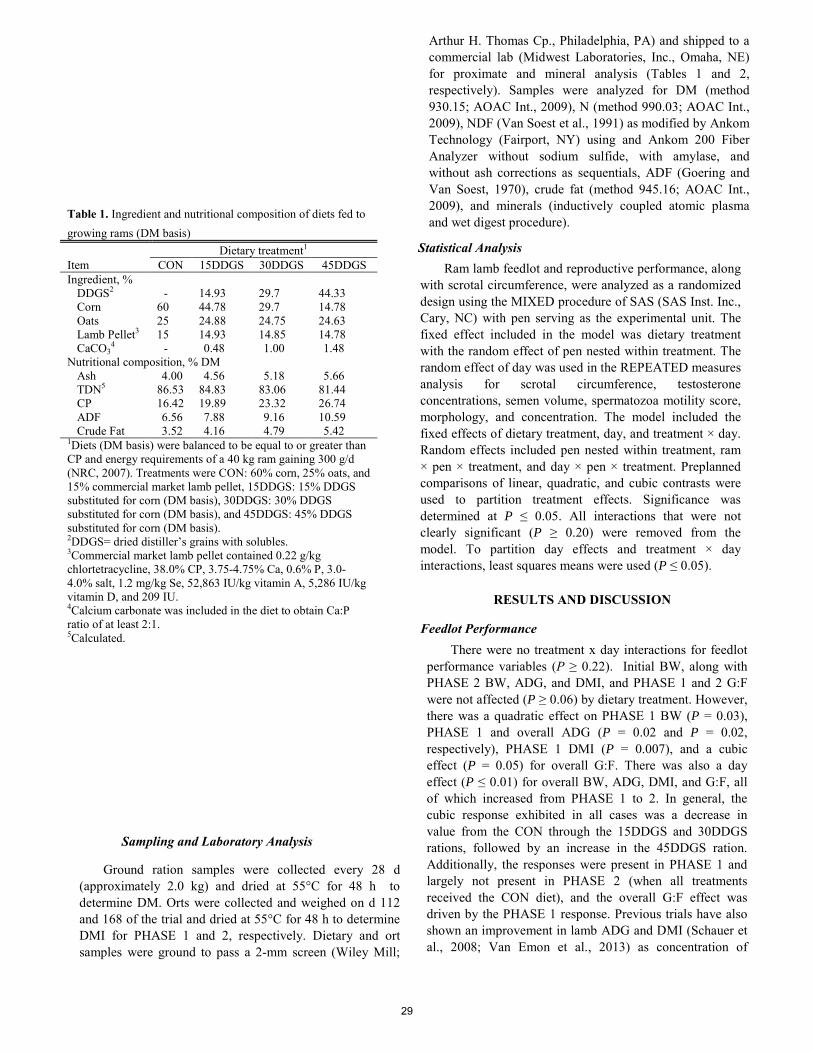
Statistical Analysis Ram lamb feedlot and reproductive performance, along
with scrotal circumference, were analyzed as a randomized design using the MIXED procedure of SAS (SAS Inst. Inc., Cary, NC) with pen serving as the experimental unit. The fixed effect included in the model was dietary treatment with the random effect of pen nested within treatment. The random effect of day was used in the REPEATED measures analysis for scrotal circumference, testosterone concentrations, semen volume, spermatozoa motility score, morphology, and concentration. The model included the fixed effects of dietary treatment, day, and treatment × day. Random effects included pen nested within treatment, ram × pen × treatment, and day × pen × treatment. Preplanned comparisons of linear, quadratic, and cubic contrasts were used to partition treatment effects. Significance was determined at P ≤ 0.05. All interactions that were not clearly significant (P ≥ 0.20) were removed from the model. To partition day effects and treatment × day interactions, least squares means were used (P ≤ 0.05).
RESULTS AND DISCUSSION
Feedlot Performance There were no treatment x day interactions for feedlot
performance variables (P ≥ 0.22). Initial BW, along with PHASE 2 BW, ADG, and DMI, and PHASE 1 and 2 G:F were not affected (P ≥ 0.06) by dietary treatment. However, there was a quadratic effect on PHASE 1 BW (P = 0.03), PHASE 1 and overall ADG (P = 0.02 and P = 0.02, respectively), PHASE 1 DMI (P = 0.007), and a cubic effect (P = 0.05) for overall G:F. There was also a day effect (P ≤ 0.01) for overall BW, ADG, DMI, and G:F, all of which increased from PHASE 1 to 2. In general, the cubic response exhibited in all cases was a decrease in value from the CON through the 15DDGS and 30DDGS rations, followed by an increase in the 45DDGS ration. Additionally, the responses were present in PHASE 1 and largely not present in PHASE 2 (when all treatments received the CON diet), and the overall G:F effect was driven by the PHASE 1 response. Previous trials have also shown an improvement in lamb ADG and DMI (Schauer et al., 2008; Van Emon et al., 2013) as concentration of
29
Table 1. Ingredient and nutritional composition of diets fed to growing rams (DM basis)
Dietary treatment1
Item CON 15DDGS 30DDGS 45DDGS Ingredient, %
DDGS2 - 14.93 29.7 44.33 Corn 60 44.78 29.7 14.78 Oats 25 24.88 24.75 24.63 Lamb Pellet3 15 14.93 14.85 14.78 CaCO3
4 - 0.48 1.00 1.48 Nutritional composition, % DM
Ash 4.00 4.56 5.18 5.66 TDN5 86.53 84.83 83.06 81.44 CP 16.42 19.89 23.32 26.74 ADF 6.56 7.88 9.16 10.59 Crude Fat 3.52 4.16 4.79 5.42
1Diets (DM basis) were balanced to be equal to or greater than CP and energy requirements of a 40 kg ram gaining 300 g/d (NRC, 2007). Treatments were CON: 60% corn, 25% oats, and 15% commercial market lamb pellet, 15DDGS: 15% DDGS substituted for corn (DM basis), 30DDGS: 30% DDGS substituted for corn (DM basis), and 45DDGS: 45% DDGS substituted for corn (DM basis). 2DDGS= dried distiller’s grains with solubles. 3Commercial market lamb pellet contained 0.22 g/kg chlortetracycline, 38.0% CP, 3.75-4.75% Ca, 0.6% P, 3.0-4.0% salt, 1.2 mg/kg Se, 52,863 IU/kg vitamin A, 5,286 IU/kg vitamin D, and 209 IU. 4Calcium carbonate was included in the diet to obtain Ca:P ratio of at least 2:1. 5Calculated.
Sampling and Laboratory Analysis
Ground ration samples were collected every 28 d (approximately 2.0 kg) and dried at 55°C for 48 h to determine DM. Orts were collected and weighed on d 112 and 168 of the trial and dried at 55°C for 48 h to determine DMI for PHASE 1 and 2, respectively. Dietary and ort samples were ground to pass a 2-mm screen (Wiley Mill;
Arthur H. Thomas Cp., Philadelphia, PA) and shipped to a commercial lab (Midwest Laboratories, Inc., Omaha, NE) for proximate and mineral analysis (Tables 1 and 2, respectively). Samples were analyzed for DM (method 930.15; AOAC Int., 2009), N (method 990.03; AOAC Int., 2009), NDF (Van Soest et al., 1991) as modified by Ankom Technology (Fairport, NY) using and Ankom 200 Fiber Analyzer without sodium sulfide, with amylase, and without ash corrections as sequentials, ADF (Goering and Van Soest, 1970), crude fat (method 945.16; AOAC Int., 2009), and minerals (inductively coupled atomic plasma and wet digest procedure).
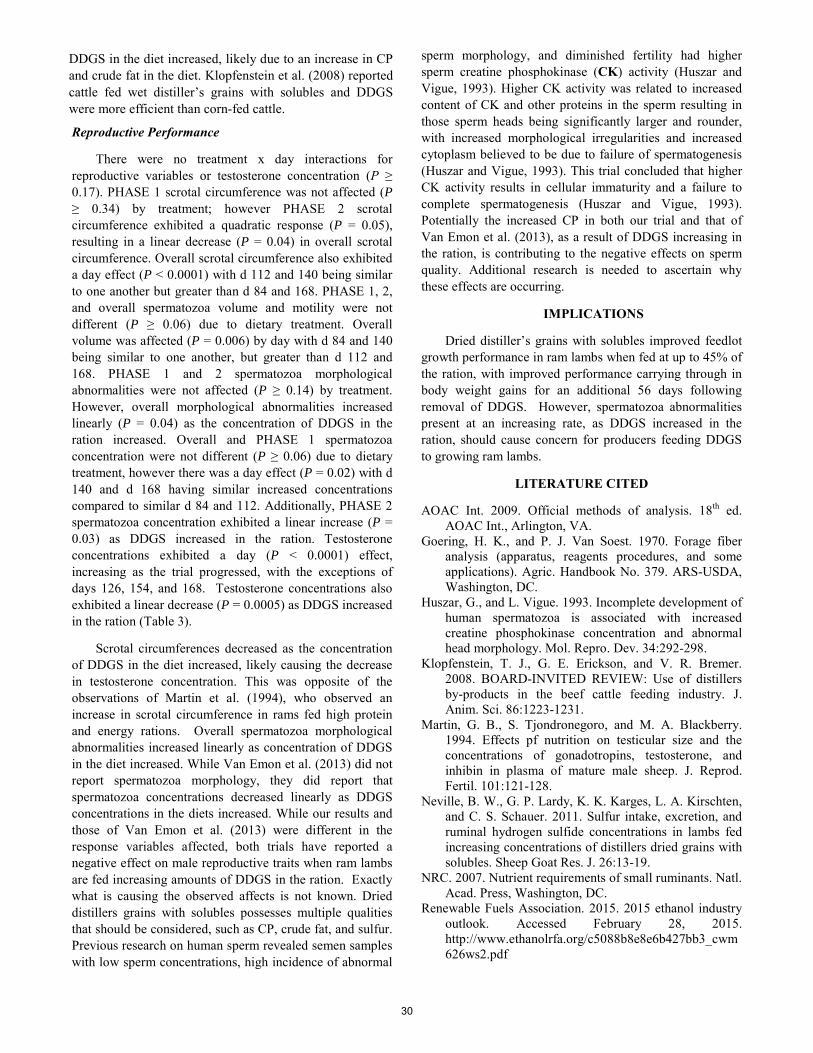
Reproductive Performance
There were no treatment x day interactions for reproductive variables or testosterone concentration (P ≥ 0.17). PHASE 1 scrotal circumference was not affected (P ≥ 0.34) by treatment; however PHASE 2 scrotal circumference exhibited a quadratic response (P = 0.05), resulting in a linear decrease (P = 0.04) in overall scrotal circumference. Overall scrotal circumference also exhibited a day effect (P < 0.0001) with d 112 and 140 being similar to one another but greater than d 84 and 168. PHASE 1, 2, and overall spermatozoa volume and motility were not different (P ≥ 0.06) due to dietary treatment. Overall volume was affected (P = 0.006) by day with d 84 and 140 being similar to one another, but greater than d 112 and 168. PHASE 1 and 2 spermatozoa morphological abnormalities were not affected (P ≥ 0.14) by treatment. However, overall morphological abnormalities increased linearly (P = 0.04) as the concentration of DDGS in the ration increased. Overall and PHASE 1 spermatozoa concentration were not different (P ≥ 0.06) due to dietary treatment, however there was a day effect (P = 0.02) with d 140 and d 168 having similar increased concentrations compared to similar d 84 and 112. Additionally, PHASE 2 spermatozoa concentration exhibited a linear increase (P = 0.03) as DDGS increased in the ration. Testosterone concentrations exhibited a day (P < 0.0001) effect, increasing as the trial progressed, with the exceptions of days 126, 154, and 168. Testosterone concentrations also exhibited a linear decrease (P = 0.0005) as DDGS increased in the ration (Table 3).
Scrotal circumferences decreased as the concentration of DDGS in the diet increased, likely causing the decrease in testosterone concentration. This was opposite of the observations of Martin et al. (1994), who observed an increase in scrotal circumference in rams fed high protein and energy rations. Overall spermatozoa morphological abnormalities increased linearly as concentration of DDGS in the diet increased. While Van Emon et al. (2013) did not report spermatozoa morphology, they did report that spermatozoa concentrations decreased linearly as DDGS concentrations in the diets increased. While our results and those of Van Emon et al. (2013) were different in the response variables affected, both trials have reported a negative effect on male reproductive traits when ram lambs are fed increasing amounts of DDGS in the ration. Exactly what is causing the observed affects is not known. Dried distillers grains with solubles possesses multiple qualities that should be considered, such as CP, crude fat, and sulfur. Previous research on human sperm revealed semen samples with low sperm concentrations, high incidence of abnormal
sperm morphology, and diminished fertility had higher sperm creatine phosphokinase (CK) activity (Huszar and Vigue, 1993). Higher CK activity was related to increased content of CK and other proteins in the sperm resulting in those sperm heads being significantly larger and rounder, with increased morphological irregularities and increased cytoplasm believed to be due to failure of spermatogenesis (Huszar and Vigue, 1993). This trial concluded that higher CK activity results in cellular immaturity and a failure to complete spermatogenesis (Huszar and Vigue, 1993). Potentially the increased CP in both our trial and that of Van Emon et al. (2013), as a result of DDGS increasing in the ration, is contributing to the negative effects on sperm quality. Additional research is needed to ascertain why these effects are occurring.
IMPLICATIONS
Dried distiller’s grains with solubles improved feedlot growth performance in ram lambs when fed at up to 45% of the ration, with improved performance carrying through in body weight gains for an additional 56 days following removal of DDGS. However, spermatozoa abnormalities present at an increasing rate, as DDGS increased in the ration, should cause concern for producers feeding DDGS to growing ram lambs.
LITERATURE CITED
AOAC Int. 2009. Official methods of analysis. 18th ed. AOAC Int., Arlington, VA.
Goering, H. K., and P. J. Van Soest. 1970. Forage fiber analysis (apparatus, reagents procedures, and some applications). Agric. Handbook No. 379. ARS-USDA, Washington, DC.
Huszar, G., and L. Vigue. 1993. Incomplete development of human spermatozoa is associated with increased creatine phosphokinase concentration and abnormal head morphology. Mol. Repro. Dev. 34:292-298.
Klopfenstein, T. J., G. E. Erickson, and V. R. Bremer. 2008. BOARD-INVITED REVIEW: Use of distillers by-products in the beef cattle feeding industry. J. Anim. Sci. 86:1223-1231.
Martin, G. B., S. Tjondronegoro, and M. A. Blackberry. 1994. Effects pf nutrition on testicular size and the concentrations of gonadotropins, testosterone, and inhibin in plasma of mature male sheep. J. Reprod. Fertil. 101:121-128.
Neville, B. W., G. P. Lardy, K. K. Karges, L. A. Kirschten, and C. S. Schauer. 2011. Sulfur intake, excretion, and ruminal hydrogen sulfide concentrations in lambs fed increasing concentrations of distillers dried grains with solubles. Sheep Goat Res. J. 26:13-19.
NRC. 2007. Nutrient requirements of small ruminants. Natl. Acad. Press, Washington, DC.
Renewable Fuels Association. 2015. 2015 ethanol industry outlook. Accessed February 28, 2015. http://www.ethanolrfa.org/c5088b8e8e6b427bb3_cwm626ws2.pdf
30
DDGS in the diet increased, likely due to an increase in CP and crude fat in the diet. Klopfenstein et al. (2008) reported cattle fed wet distiller’s grains with solubles and DDGS were more efficient than corn-fed cattle.
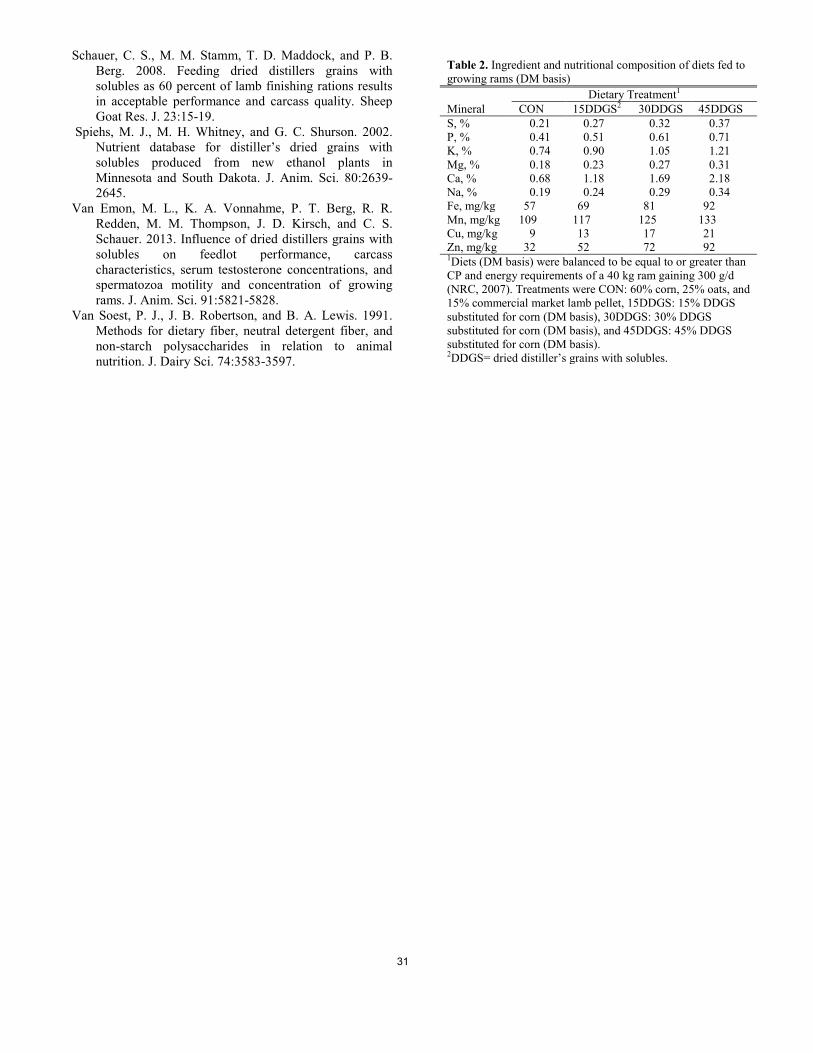
Schauer, C. S., M. M. Stamm, T. D. Maddock, and P. B. Berg. 2008. Feeding dried distillers grains with solubles as 60 percent of lamb finishing rations results in acceptable performance and carcass quality. Sheep Goat Res. J. 23:15-19.
Spiehs, M. J., M. H. Whitney, and G. C. Shurson. 2002. Nutrient database for distiller’s dried grains with solubles produced from new ethanol plants in Minnesota and South Dakota. J. Anim. Sci. 80:2639-2645.
Van Emon, M. L., K. A. Vonnahme, P. T. Berg, R. R. Redden, M. M. Thompson, J. D. Kirsch, and C. S. Schauer. 2013. Influence of dried distillers grains with solubles on feedlot performance, carcass characteristics, serum testosterone concentrations, and spermatozoa motility and concentration of growing rams. J. Anim. Sci. 91:5821-5828.
Van Soest, P. J., J. B. Robertson, and B. A. Lewis. 1991. Methods for dietary fiber, neutral detergent fiber, and non-starch polysaccharides in relation to animal nutrition. J. Dairy Sci. 74:3583-3597.
31
Table 2. Ingredient and nutritional composition of diets fed to growing rams (DM basis) Dietary Treatment1 Mineral CON 15DDGS2 30DDGS 45DDGS S, % 0.21 0.27 0.32 0.37 P, % 0.41 0.51 0.61 0.71 K, % 0.74 0.90 1.05 1.21 Mg, % 0.18 0.23 0.27 0.31 Ca, % 0.68 1.18 1.69 2.18 Na, % 0.19 0.24 0.29 0.34 Fe, mg/kg 57 69 81 92 Mn, mg/kg 109 117 125 133 Cu, mg/kg 9 13 17 21 Zn, mg/kg 32 52 72 92 1Diets (DM basis) were balanced to be equal to or greater than CP and energy requirements of a 40 kg ram gaining 300 g/d (NRC, 2007). Treatments were CON: 60% corn, 25% oats, and 15% commercial market lamb pellet, 15DDGS: 15% DDGS substituted for corn (DM basis), 30DDGS: 30% DDGS substituted for corn (DM basis), and 45DDGS: 45% DDGS substituted for corn (DM basis). 2DDGS= dried distiller’s grains with solubles.
PHASE 1 DMI 2.68 2.27 2.31 2.62 0.11 0.82 0.007 0.70 PHASE 2 DMI 2.38 2.08 2.04 1.79 0.26 0.15 0.94 0.71
Overall G:F, kg of gain/kg of DMI 0.13 0.14 0.13 0.15 0.005 0.04 0.50 0.05 PHASE 1 G:F 0.15 0.16 0.16 0.18 0.009 0.12 0.80 0.36 PHASE 2 G:F 0.06 0.07 0.06 0.06 0.02 1.00 0.79 0.76
Overall scrotal circumference, cm 37.30 36.92 36.36 36.79 0.22 0.04 0.08 0.23 PHASE 1 scrotal circumference 37.67 38.14 37.60 38.23 0.50 0.62 0.87 0.34 PHASE 2 scrotal circumference 37.52 36.55 35.66 36.27 0.36 0.01 0.05 0.39
Overall spermatozoa volume, mL 1.16 1.29 1.26 1.33 0.10 0.28 0.76 0.55 PHASE 1 volume 1.02 1.17 1.22 1.07 0.17 0.79 0.38 0.88 PHASE 2 volume 0.93 0.79 1.00 1.44 0.19 0.06 0.15 0.89
Overall spermatozoa motility5 3.05 3.26 3.38 3.47 0.17 0.07 0.72 0.92 PHASE 1 motility 3.13 3.44 3.56 3.63 0.29 0.23 0.67 0.92 PHASE 2 motility 2.81 2.92 3.00 3.81 0.41 0.12 0.40 0.69
Overall spermatozoa morphology, %6 16.00 20.44 20.56 24.87 2.79 0.04 0.98 0.50 PHASE 1 morphology 9.80 16.75 21.75 21.75 5.58 0.14 0.56 0.91 PHASE 2 morphology 19.75 21.25 18.75 19.75 4.41 0.90 0.96 0.71
Overall spermatozoa concentration7 10.98 10.33 13.84 13.17 1.17 0.06 0.99 0.12 PHASE 1 concentration8 8.11 10.73 10.03 12.22 1.71 0.16 0.90 0.43 PHASE 2 concentration 9.89 13.10 17.60 17.83 2.48 0.03 0.56 0.62
Testosterone concentration, ng/dL 665.56 592.09 571.59 546.79 24.16 0.0005 0.32 0.60 1Diets (DM basis) were balanced to be equal to or greater than CP and energy requirements of a 40 kg ram gaining 300 g/d (NRC, 2007). Treatments were CON: 60% corn, 25% oats, and 15% commercial market lamb pellet, 15DDGS: 15% DDGS substituted for corn (DM basis), 30DDGS: 30% DDGS substituted for corn (DM basis), and 45DDGS: 45% DDGS substituted for corn (DM basis). 2n = 4. 3P-value for linear, quadratic, and cubic effects of increasing dried distiller’s grains with solubles. 4PHASE 1 = treatment diets fed to respective groups of ram lambs from d 1 to 112 of trial; PHASE 2 = d 112 to 168 all ram lambs were placed on the CON ration. 5Spermatozoa motility score: 1= no forward movement, 2 = slow forward movement, 3 = moderate forward movement, 4 = fast forward movement. 6Spermatozoa morphology: percentage of morphologically damaged sperm. 7Spermatozoa concentrations were measured as billions per milliliter. The hemocytometer has a counting chamber volume of one cubic millimeter. Five large squares were counted for each ejaculate sample, the four corner squares and the middle square. To calculate the spermatozoa concentration: Total number of sperm counted × dilution factor × hemocytometer factor × conversion factor. The dilution rate was 1:200, the hemocytometer factor was 50, and the conversion factor (converted units to spermatozoa/cubic centimeter, or mL) was 1,000. 8PHASE 1 spermatozoa concentration n = 2.
32
Table 3. Effects of dried distiller’s grains with solubles (DDGS) on feedlot performance and reproductive traits of growing rams Dietary Treatment1 Contrasts3
Item4 CON 15DDGS 30DDGS 45DDGS SEM2 Linear Quadratic Cubic Initial BW, kg 48.4 48.5 49.3 48.5 0.31 0.45 0.17 0.13 Overall BW, kg 80.76 78.91 78.95 84.89 1.28 0.04 0.005 0.49
PHASE 1 BW 92.9 90.2 90.0 100.0 2.58 0.10 0.03 0.53 PHASE 2 BW 100.9 98.1 97.5 106.2 2.84 0.25 0.06 0.60
Overall ADG, kg/d 0.33 0.31 0.30 0.35 0.01 0.25 0.02 0.39 PHASE 1 ADG 0.40 0.37 0.36 0.46 0.02 0.11 0.02 0.41 PHASE 2 ADG 0.14 0.14 0.13 0.11 0.04 0.57 0.78 0.95
Overall DMI, kg • ram-1 • d-1 2.58 2.20 2.22 2.34 0.14 0.31 0.11 0.65
Proceedings, Western Section, American Society of Animal Science
Vol. 66, 2015
Effects of nose flap devices applied to calves on cow body condition, calf performance, and calf humoral immune response
K.D. Lippolis,* R.J. Callan,† C.E. Mayo,‡ M. Fischer,* and J.K. Ahola*
*Department of Animal Sciences, Colorado State University, Fort Collins 80523 †Department of Clinical Sciences, Colorado State University, Fort Collins 80523
‡Department of Microbiology, Immunology and Pathology, Colorado State University, Fort Collins 80523
ABSTRACT: The objective of this study was to examine the effect of fitting calves with nose flap (NF) devices for 21 d prior to separation from the dam on cow BCS, calf pre- and post-weaning performance, and humoral immune response to vaccination compared to traditional weaning. This study was conducted using primiparous and multiparous Angus and Hereford cows (n = 115) and their respective Angus, Hereford, and Angus × Hereford calves. Cow/calf pairs were allocated to one of two treatments in a completely randomized design: 1) NF for 21 d prior to separation from the dam (NF), or 2) no NF for 21 d prior to separation from the dam (CON). Cow BCS was measured to determine cow performance. Calf separation from the dam occurred on d 0. Calf performance was determined for the 21-d pre-weaning period and during the feedlot period (d 1 post-weaning through d 195). Vaccinations were administered on d -21 and 1. Calves were weighed on d -21, 1, 7, 14, 21, 28, and 195 and jugular blood samples were collected on d -21, 1, 14, and 28. Serum neutralization tests for bovine viral diarrhea virus type 1 (BVDV-1) and bovine herpesvirus type 1 (BHV-1) were used to measure humoral response to vaccination. Morbidity rates were measured to compare calf health across treatments. Cow BCS and change in BCS were similar across treatments (P > 0.05). There was no difference in calf BW at d 1, 7 or 28 (P > 0.05) between treatments, however CON calves tended to have higher BW on d 14 (P = 0.09), 21 (P = 0.07), and 195 (P = 0.07). Control calves had greater ADG from d -21 to 1 (P < 0.05) compared to NF calves. However, ADG from d -21 to 195 was similar between treatments (P > 0.05). There was a tendency for CON calves to have greater DMI (P = 0.08) from d 22 to 28 with no difference (P > 0.05) between treatments at remaining times or during the 28-d post-weaning period. Feed efficiency and morbidity were similar across treatments (P > 0.05). Serum neutralization tests to determine humoral response to vaccination are pending. Preliminary results indicate that NF devices did not influence calf performance, feed efficiency, or morbidity during the initial post-weaning period. More research is needed to determine long-term effects. Key words: beef calves, feedlot performance, immune response, nose flap, two-stage weaning
INTRODUCTION
Excessive stress in a beef animal associated with common husbandry practices has the potential to
compromise the animal’s immune system and affect performance throughout its lifetime. Stress in beef cattle has the ability to cause immunosuppression and increased disease susceptibility. Blecha et al. (1984) reported decreased lymphocyte blastogenic responses of the immune system in calves experiencing transportation stress. Lymphocytes increase in response to infection and help the body produce an immune response necessary to respond to a vaccination or infection (Murphy et al., 2011). Weaning has also been observed to reduce immune function through decreased lymphocytes and neutrophils (Lynch et al., 2010). Not only does increased incidence of disease and illness disrupt an animal’s well-being, it is also detrimental to the beef industry. Studies have shown that feedlot steers treated for disease have reduced performance and carcass merit (Schneider et al., 2009).
Minimizing stress associated with weaning may improve the effectiveness of vaccines. Two-stage weaning strategies may be able to serve as a low-stress weaning method by allowing the calf to begin to break the social bond with the dam before physical separation for the dam, therefore decreasing behaviors commonly associated with weaning stress (Haley et al., 2005; Lambertz et al., 2014). Typically, a calf vaccination protocol includes a vaccine administered a few weeks before weaning and a booster vaccine administered at weaning. This may serve as an opportunity to initiate a two-stage weaning protocol without processing calves an additional time. Our hypothesis was that nose flap (NF) devices used for 21 d prior to weaning are a low-stress alternative to traditional weaning that would improve vaccine effectiveness without negatively impacting post-weaning performance
MATERIALS AND METHODS
This experiment was conducted following approval by
the Colorado State University Animal Care and Use Committee.
One hundred and fifteen Angus, Hereford, and Angus × Hereford calves and primiparous and multiparous purebred Angus and Hereford dams were utilized in this experiment. Cow BCS was collected on d -21 and 56 (Table 1). Calves were vaccinated on d -21 and 1, separated from their dams on d 0, and weighed on d -21, 1, 7, 14, 21, 28, and 195. Blood was collected from all calves via jugular venipuncture on d -21, 1, 14, and 28.
33
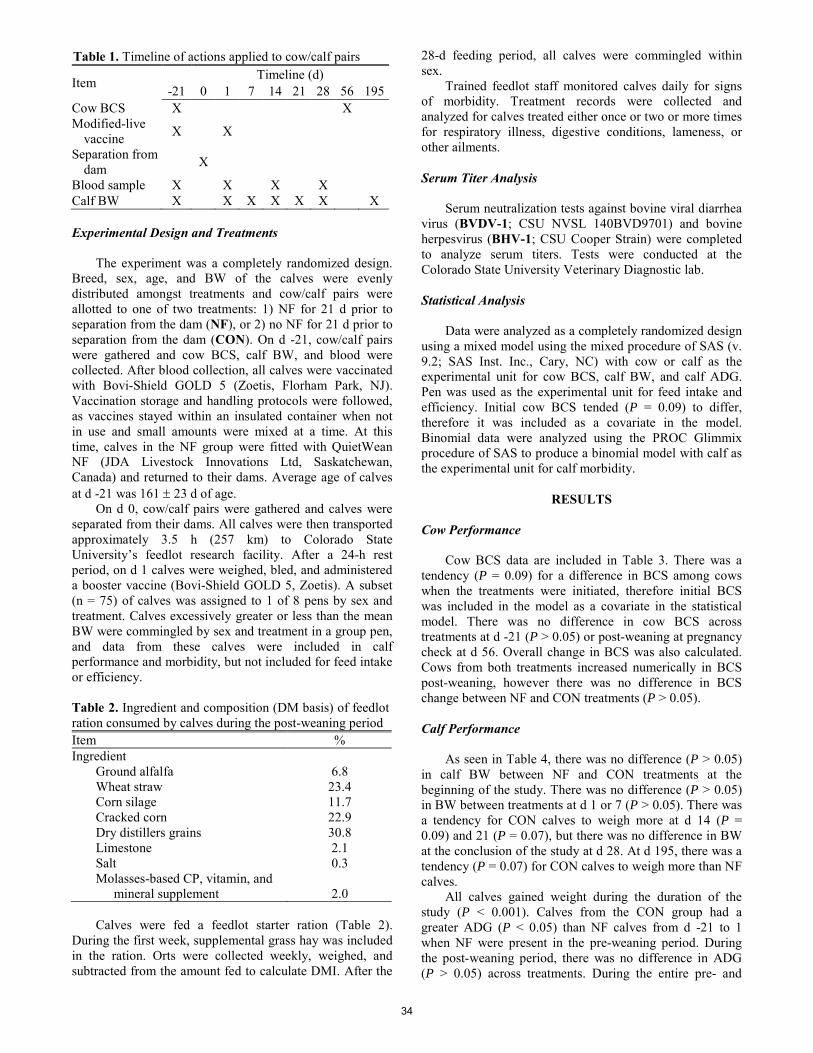
Table 1. Timeline of actions applied to cow/calf pairs
Item Timeline (d)
-21 0 1 7 14 21 28 56 195 Cow BCS X X Modified-live
vaccine X X
Separation from dam X
Blood sample X X X X Calf BW X X X X X X X Experimental Design and Treatments
The experiment was a completely randomized design. Breed, sex, age, and BW of the calves were evenly distributed amongst treatments and cow/calf pairs were allotted to one of two treatments: 1) NF for 21 d prior to separation from the dam (NF), or 2) no NF for 21 d prior to separation from the dam (CON). On d -21, cow/calf pairs were gathered and cow BCS, calf BW, and blood were collected. After blood collection, all calves were vaccinated with Bovi-Shield GOLD 5 (Zoetis, Florham Park, NJ). Vaccination storage and handling protocols were followed, as vaccines stayed within an insulated container when not in use and small amounts were mixed at a time. At this time, calves in the NF group were fitted with QuietWean NF (JDA Livestock Innovations Ltd, Saskatchewan, Canada) and returned to their dams. Average age of calves at d -21 was 161 ± 23 d of age.
On d 0, cow/calf pairs were gathered and calves were separated from their dams. All calves were then transported approximately 3.5 h (257 km) to Colorado State University’s feedlot research facility. After a 24-h rest period, on d 1 calves were weighed, bled, and administered a booster vaccine (Bovi-Shield GOLD 5, Zoetis). A subset (n = 75) of calves was assigned to 1 of 8 pens by sex and treatment. Calves excessively greater or less than the mean BW were commingled by sex and treatment in a group pen, and data from these calves were included in calf performance and morbidity, but not included for feed intake or efficiency.
Table 2. Ingredient and composition (DM basis) of feedlot ration consumed by calves during the post-weaning period Item % Ingredient
Ground alfalfa 6.8 Wheat straw 23.4 Corn silage 11.7 Cracked corn 22.9 Dry distillers grains 30.8 Limestone 2.1 Salt 0.3 Molasses-based CP, vitamin, and
mineral supplement 2.0 Calves were fed a feedlot starter ration (Table 2).
During the first week, supplemental grass hay was included in the ration. Orts were collected weekly, weighed, and subtracted from the amount fed to calculate DMI. After the
28-d feeding period, all calves were commingled within sex.
Trained feedlot staff monitored calves daily for signs of morbidity. Treatment records were collected and analyzed for calves treated either once or two or more times for respiratory illness, digestive conditions, lameness, or other ailments. Serum Titer Analysis
Serum neutralization tests against bovine viral diarrhea virus (BVDV-1; CSU NVSL 140BVD9701) and bovine herpesvirus (BHV-1; CSU Cooper Strain) were completed to analyze serum titers. Tests were conducted at the Colorado State University Veterinary Diagnostic lab. Statistical Analysis
Data were analyzed as a completely randomized design using a mixed model using the mixed procedure of SAS (v. 9.2; SAS Inst. Inc., Cary, NC) with cow or calf as the experimental unit for cow BCS, calf BW, and calf ADG. Pen was used as the experimental unit for feed intake and efficiency. Initial cow BCS tended (P = 0.09) to differ, therefore it was included as a covariate in the model. Binomial data were analyzed using the PROC Glimmix procedure of SAS to produce a binomial model with calf as the experimental unit for calf morbidity.
RESULTS Cow Performance
Cow BCS data are included in Table 3. There was a tendency (P = 0.09) for a difference in BCS among cows when the treatments were initiated, therefore initial BCS was included in the model as a covariate in the statistical model. There was no difference in cow BCS across treatments at d -21 (P > 0.05) or post-weaning at pregnancy check at d 56. Overall change in BCS was also calculated. Cows from both treatments increased numerically in BCS post-weaning, however there was no difference in BCS change between NF and CON treatments (P > 0.05). Calf Performance
As seen in Table 4, there was no difference (P > 0.05) in calf BW between NF and CON treatments at the beginning of the study. There was no difference (P > 0.05) in BW between treatments at d 1 or 7 (P > 0.05). There was a tendency for CON calves to weigh more at d 14 (P = 0.09) and 21 (P = 0.07), but there was no difference in BW at the conclusion of the study at d 28. At d 195, there was a tendency (P = 0.07) for CON calves to weigh more than NF calves.
All calves gained weight during the duration of the study (P < 0.001). Calves from the CON group had a greater ADG (P < 0.05) than NF calves from d -21 to 1 when NF were present in the pre-weaning period. During the post-weaning period, there was no difference in ADG (P > 0.05) across treatments. During the entire pre- and
34

post-weaning period, there was no difference in ADG (P > 0.05) between NF and CON calves. In addition, there was no difference (P > 0.05) in ADG from NF administration at d -21 to yearling weights at d 195. Calf Feed Efficiency
Dry matter intake and G:F were monitored and analyzed during the 28-d post-weaning period to determine feed intake and efficiency and can be found in Table 5. During this time, DMI increased in both treatments (P < 0.001) during the 28-d post-weaning period from d 1 to 7 to d 22 to 28. There was no difference (P > 0.05) in DMI between NF and CON calves from d 1 to 21. There was a tendency (P = 0.08) for CON calves to have a higher DMI than NF calves at the end of the feeding period from d 22 to 28, however there was no difference (P > 0.05) in overall DMI during the entire post-weaning period.
During the first week post-weaning from d 1 to 7, both treatments had greater G:F (P < 0.001) than in later observations. There was no difference (P > 0.05) in G:F between NF and CON calves during the weekly measurements. Over the duration of the post-weaning period from d 1 to 28, there was no difference (P > 0.05) in G:F between NF and CON calves. Morbidity and Humoral Immune Response
Observed morbidity rates can be found in Table 6. There was no difference (P > 0.05) between NF and CON calves treated for illness either once or two or more times. In calves treated once, treatments for illness did not differ (P = 0.98) between those treated for respiratory illness, digestive conditions, lameness, or other ailments. No mortalities were observed for either treatment group.
Serum samples were collected to measure humoral antibody titer response to vaccination. Serum neutralization results are pending.
DISCUSSION
During the study, cow performance did not differ across treatments. While cow BCS was not monitored at d 0, these findings contradict previous studies where BCS improved when calves were early weaned (Myers et al., 1999, Story et al., 2000). This could be due to the fact that cows were not nutritionally challenged and were at a moderate BCS. In addition, NF calves were prevented from suckling for only 21 d, which may have been too short of a time to cause a difference in cow BCS.
The decreased calf ADG for NF calves from d -21 to 1 supports previous studies (Haley et al., 2005, Burke et al., 2009). Since NF calves were effectively weaned (removed from milk intake) 21 d before CON calves and transitioned from their dam’s milk and range forage to only range forage, these results are to be expected. However, the tendency for NF calves to weigh less than CON calves contradicts a previous study that found no long-term effects of alternative weaning methods (Lambertz et al., 2014). In a study conducted by Burke et al. (2009), results indicated that while initial BW and ADG were suppressed, calves had
compensatory gain by the end of the study. In the current study, this may be due to the fact that the NF calves were removed from milk 21 d earlier than CON calves. In the future, it may be beneficial to separate and wean CON calves from their dams at the time NF are implemented to specifically evaluate the low-stress capability of NF.
Dry matter intake did not differ between treatments. This is somewhat contradictory to research conducted by Haley et al. (2005), who observed that NF calves spent more time eating during the first few days post-weaning than CON calves. Similarly, Price et al. (2003) observed fence-line weaned calves spent more time eating 7 d post-weaning than CON calves. Both studies observed CON calves spending more time walking than the low-stress weaning alternative. While behavioral effects were not monitored in the current study, weaning method did not have an effect on DMI or G:F.
Possible explanations for the lack of differences in morbidity rate could be due to the fact that calves used in the present study were not high-risk calves. Cows and calves used in this study were on a proactive vaccination program, and therefore may not have a significant difference for morbidity between treatments as calves that were considered high-risk. In addition, calves were penned according to sex and treatment with their companions rather than commingled with unfamiliar calves that may occur in a conventional feedlot setting. Serum neutralization tests will need to be analyzed to further understand the total effect of NF on calf health, morbidity, and humoral immune response.
IMPLICATIONS
Observations seen by administration of nose flaps for a 21-d period prior to weaning indicate that there is not an impact on calf performance, feed efficiency, or calf morbidity during pre- and post-weaning periods. As serum neutralization tests are pending, these results are preliminary as far as evaluating vaccine effectiveness with the use of alternative weaning methods. Also, separating control calves from the dam at the same time nose flaps were applied may provide a better model to compare growth parameters in calves. A longer post-weaning feeding period may also need to be conducted in future studies to monitor long-term effects of nose flap devices on feedlot performance and feed efficiency. Additional research is needed in this area to fully understand the interactions between weaning, transportation, and vaccine effectiveness.
LITERATURE CITED
Blecha, F., S.L. Boyles, and J.G. Riley. 1984. Shipping
suppresses lymphocyte blastogenic responses in Angus and Brahman X Angus feeder calves. J. Anim. Sci. 59:576-583.
Burke, N.C., G. Scaglia, H.T. Boland, and W.S. Swecker Jr.
2009. Influence of two-stage weaning with subsequent transport on body weight, plasma lipid peroxidation, plasma selenium, and on leukocyte glutathione
35

peroxidase and glutathione reductase activity in beef calves. Vet. Immunol. and Immunop. 127:365-370.
Haley, D.B., D.W. Bailey, and J.M. Stookey. 2005. The
effects of weaning beef calves in two stages on their behavior and growth rate. J. Anim. Sci. 83:2205-2214.
Lambertz, C., P.R. Bowen, G. Erhardt, and M. Gauly. 2014.
Effects of weaning beef cattle in two stages or by abrupt separation on nasal abrasions, behavior, and weight gain. Anim. Prod. Sci. http://dx.doi.org/10.1071/AN14097. (Accessed 10 January 2015.)
Lynch, E.M., B. Early, M. McGee, and S. Doyle. 2010.
Effect of abrupt weaning at housing on leukocyte distribution, functional activity of neutrophils, and acute phase protein response in beef calves. BMC Vet. Res. 6:39-47.
Murphy, K.M., P. Travers, and M. Walport. 2011. Janeway’s Immunobiology. 8th ed., Taylor & Francis, Inc., New York, NY.
Price, E.O., J.E. Harris, R.E. Borgwardt, M.L. Sween, and
J.M. Connor. 2003. Fenceline contact of beef calves with their dams at weaning reduces the negative effects of separation on behavior and growth rate. J. Anim. Sci. 81:116-121.
Schneider, R.G., R.G. Tait Jr., W.D. Busby, and J.M.
Reecy. 2009. An evaluation of bovine respiratory disease complex in feedlot cattle: Impact on performance and carcass traits using treatment records and lung lesion scores. J. Anim. Sci. 87:1921-1827.
Wagner, J.J., K.S. Lusby, J.W. Oltjen, J. Rakestraw, R.P.
Wettemann, and L.E. Walters. 1988. Carcass composition in mature Hereford cows: Estimation and effect on daily metabolizable energy requirement during winter. J. Anim. Sci. 66:603–612.
Table 3. Least squares means for the effect of nose flap (NF) administration in calves for 21 d prior to weaning on cow BCS1
Treatment
Item NF2 CON3 SEM P - Value Cow BCS d -21 5.62 5.55 0.09 0.44 d 56 5.64 5.69 0.11 0.56 Change in cow BCS 0.04 0.06 0.12 0.92 1BCS scale was 1 = thin, 9 = obese (Wagner et al., 1988). 2Nose flaps were administered to calves for 21 d while remaining with dams prior to calves being removed from dams on d 0 and transported to a feedyard and evaluated for 28 d. 3CON = control group; did not receive NF for 21 d while remaining with dams. Table 4. Least squares means for the effect of nose flap (NF) administration in calves for 21 d prior to weaning on calf body weight (BW) and gain
Treatment
Item NF1 CON2 SEM P - Value BW, kg d -21 177.5 181.4 6.9 0.61 d 1 190.2 200.5 6.9 0.18 d 7 206.7 218.9 6.9 0.12 d 14 211.6 224.8 6.9 0.09 d 21 229.3 243.2 6.9 0.07 d 28 231.1 243.0 6.9 0.12 d 195 402.1 416.1 6.9 0.07 ADG, kg/d d -21 to 1 0.6 0.9 0.1 0.03 d 1 to 28 1.5 1.5 0.1 0.67 d -21 to 28 1.1 1.3 0.1 0.23 d -21 to d 195 1.1 1.1 0.1 0.73 1Nose flaps were administered to calves for 21 d while remaining with dams prior to calves being removed from dams on d 0 and transported to a feedyard and evaluated for 28 d. 2CON = control group; did not receive NF for 21 d while remaining with dams.
36
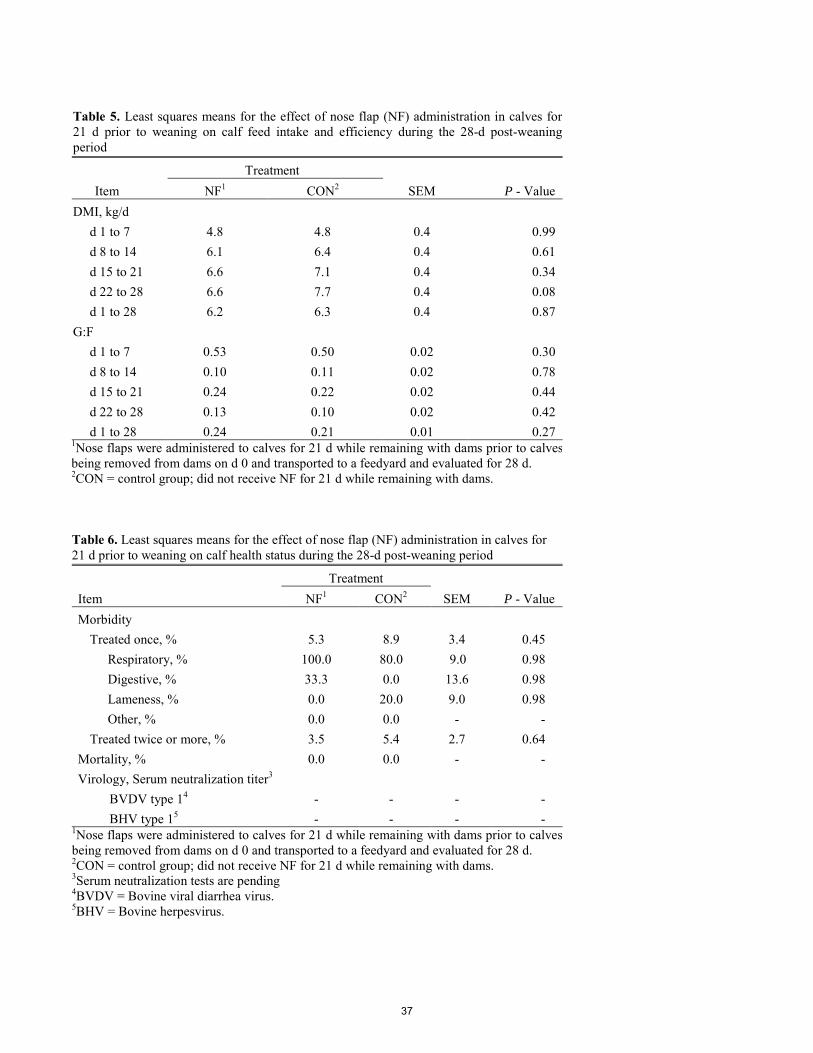
Table 5. Least squares means for the effect of nose flap (NF) administration in calves for 21 d prior to weaning on calf feed intake and efficiency during the 28-d post-weaning period
Treatment
Item NF1 CON2 SEM P - Value DMI, kg/d d 1 to 7 4.8 4.8 0.4 0.99 d 8 to 14 6.1 6.4 0.4 0.61 d 15 to 21 6.6 7.1 0.4 0.34 d 22 to 28 6.6 7.7 0.4 0.08 d 1 to 28 6.2 6.3 0.4 0.87 G:F
d 1 to 7 0.53 0.50 0.02 0.30 d 8 to 14 0.10 0.11 0.02 0.78 d 15 to 21 0.24 0.22 0.02 0.44 d 22 to 28 0.13 0.10 0.02 0.42 d 1 to 28 0.24 0.21 0.01 0.27 1Nose flaps were administered to calves for 21 d while remaining with dams prior to calves being removed from dams on d 0 and transported to a feedyard and evaluated for 28 d. 2CON = control group; did not receive NF for 21 d while remaining with dams. Table 6. Least squares means for the effect of nose flap (NF) administration in calves for 21 d prior to weaning on calf health status during the 28-d post-weaning period
Treatment Item NF1 CON2 SEM P - Value
Morbidity Treated once, % 5.3 8.9 3.4 0.45
Respiratory, % 100.0 80.0 9.0 0.98 Digestive, % 33.3 0.0 13.6 0.98 Lameness, % 0.0 20.0 9.0 0.98 Other, % 0.0 0.0 - -
Treated twice or more, % 3.5 5.4 2.7 0.64 Mortality, % 0.0 0.0 - - Virology, Serum neutralization titer3
BVDV type 14 - - - - BHV type 15 - - - -
1Nose flaps were administered to calves for 21 d while remaining with dams prior to calves being removed from dams on d 0 and transported to a feedyard and evaluated for 28 d. 2CON = control group; did not receive NF for 21 d while remaining with dams. 3Serum neutralization tests are pending 4BVDV = Bovine viral diarrhea virus. 5BHV = Bovine herpesvirus.
37

Proceedings, Western Section, American Society of Animal Science
Vol. 66, 2015
An evaluation of biofuel coproducts in feedlot diets: cattle growth performance, carcass characteristics, apparent nutrient digestibility, and water use assessment of feedstock sources1
T. L. Opheim,* P. R. B. Campanili,* B. J. M. Lemos,* L. A. Ovinge,* J. O. Baggerman,* K. C. McCuistion, † J. Dwyer, ‡
M. L. Galyean,* J. O. Sarturi,* and S. J. Trojan*2 *Department of Animal and Food Sciences, Texas Tech University, Lubbock 79409;
†Department of Animal, Rangeland, and Wildlife Sciences, Texas A&M University-Kingsville 78363; and ‡Department of Mathematics & Statistics, Texas Tech University, Lubbock 79409
1Appreciation is expressed to United Sorghum Checkoff Program, Texas Cattle Feeders Association and Conestoga Energy Partners for joint project funding, and to K. Robinson and R. Rocha at the Texas Tech University Burnett Center for research assistance. 2Corresponding author: [email protected]
38
ABSTRACT: Crossbred steers (British x Continental; n = 192; initial BW 391 ± 28 kg) were used to evaluate the effects of feeding ethanol coproducts on feedlot cattle growth performance, carcass characteristics, apparent nutrient digestibility, and the relationship between crop yield, water input and animal performance. Steers were blocked by initial BW and assigned randomly to 1 of 6 dietary treatments within block. Treatments were replicated in 8 pens with 4 steers/pen. Dietary treatments included: 1) control, steam-flaked corn-based diet (CTL); 2) corn dried distillers grains with solubles (DGS; DRY-C); 3) de-oiled corn dried DGS (DRY-CLF); 4) blended 50/50 dry corn/sorghum DGS (DRY-C/S); 5) sorghum dried DGS (DRY-S); and 6) sorghum wet DGS (WET-S). Inclusion rate for all DGS diets was 25% (DM basis); DGS diets were isonitrogenous and all diets were balanced for fat. Overall ADG (1.64 kg), and DMI (10 kg/d) did not differ (P ≥ 0.14) among treatments. Means for G:F were identical (0.153) for DRY-C and DRY-CLF, which were similar to CTL, DRY C/S, and WET-S (P ≥ 0.30). Gain efficiency was decreased 9.6% with DRY-S vs. CTL (0.142 vs. 0.157, respectively, P < 0.01), and was 7.2% less for DRY-S vs. DRY-C or DRY-CLF (P < 0.05), but tended (P = 0.06) to be 5.6% greater for WET-S vs. DRY-S. Diet did not affect HCW (400 kg) or dressing percent (62.4%; P ≥ 0.10); however, yield grade tended (P = 0.09) to be less for DRY-CLF and DRY-S vs. other treatments. Digestibility of DM and OM did not differ among CTL, DRY-C, DRY-CLF, and WET-S (P ≥ 0.30), and were least for DRY-S vs. other treatments (P < 0.01). Digestibility of DM and OM was greater for DRY-C/S vs. DRY-S (P < 0.01), and similar for DRY-C/S and DRY-C (P ≥ 0.20). Digestibility of NDF was greater (P < 0.01) for WET-S vs. other treatments and was least for DRY-S vs. other treatments (P < 0.01), but not different among DRY C/S, DRY-C, and DRY-CLF (P ≥ 0.40). Analysis of water use for corn vs. grain sorghum relative to G:F for DRY-C, DRY-S, and WET-S diets revealed a greater coefficient for steer gain relative to crop production as a function of water input with 280 mm of water for grain sorghum vs. corn. At a moderately high (25% DM basis) inclusion, blending C/S or feeding WET-S resulted in similar cattle performance to CTL and corn-based coproducts.
Key words: beef cattle, biofuel, digestibility, distillers grains
INTRODUCTION
Legislative mandates continue to drive U.S. ethanol production, with corn being the most widely used feedstock. In the Texas High Plains, an increasing number of acres are being planted to grain sorghum because of its capability to persist with limited water resources; ethanol production is one market for grain sorghum.
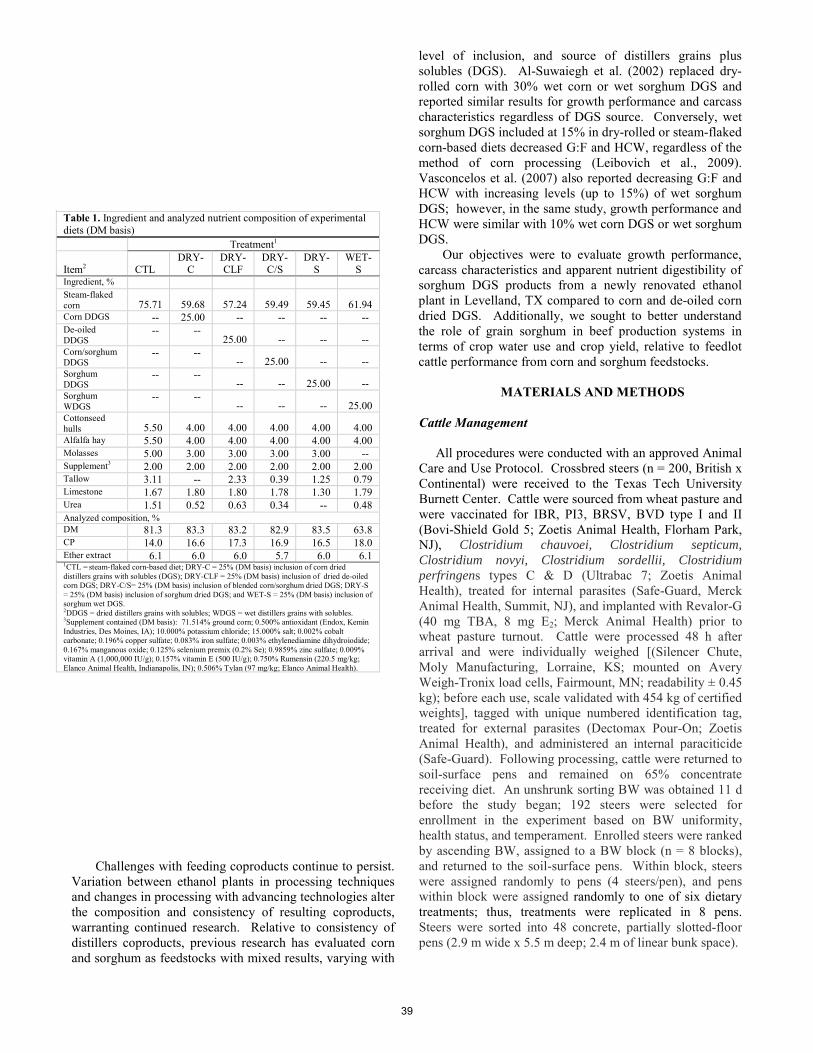
Challenges with feeding coproducts continue to persist. Variation between ethanol plants in processing techniques and changes in processing with advancing technologies alter the composition and consistency of resulting coproducts, warranting continued research. Relative to consistency of distillers coproducts, previous research has evaluated corn and sorghum as feedstocks with mixed results, varying with
level of inclusion, and source of distillers grains plus solubles (DGS). Al-Suwaiegh et al. (2002) replaced dry-rolled corn with 30% wet corn or wet sorghum DGS and reported similar results for growth performance and carcass characteristics regardless of DGS source. Conversely, wet sorghum DGS included at 15% in dry-rolled or steam-flaked corn-based diets decreased G:F and HCW, regardless of the method of corn processing (Leibovich et al., 2009). Vasconcelos et al. (2007) also reported decreasing G:F and HCW with increasing levels (up to 15%) of wet sorghum DGS; however, in the same study, growth performance and HCW were similar with 10% wet corn DGS or wet sorghum DGS.
Our objectives were to evaluate growth performance, carcass characteristics and apparent nutrient digestibility of sorghum DGS products from a newly renovated ethanol plant in Levelland, TX compared to corn and de-oiled corn dried DGS. Additionally, we sought to better understand the role of grain sorghum in beef production systems in terms of crop water use and crop yield, relative to feedlot cattle performance from corn and sorghum feedstocks.
MATERIALS AND METHODS
Cattle Management All procedures were conducted with an approved Animal Care and Use Protocol. Crossbred steers (n = 200, British x Continental) were received to the Texas Tech University Burnett Center. Cattle were sourced from wheat pasture and were vaccinated for IBR, PI3, BRSV, BVD type I and II (Bovi-Shield Gold 5; Zoetis Animal Health, Florham Park, NJ), Clostridium chauvoei, Clostridium septicum, Clostridium novyi, Clostridium sordellii, Clostridium perfringens types C & D (Ultrabac 7; Zoetis Animal Health), treated for internal parasites (Safe-Guard, Merck Animal Health, Summit, NJ), and implanted with Revalor-G (40 mg TBA, 8 mg E2; Merck Animal Health) prior to wheat pasture turnout. Cattle were processed 48 h after arrival and were individually weighed [(Silencer Chute, Moly Manufacturing, Lorraine, KS; mounted on Avery Weigh-Tronix load cells, Fairmount, MN; readability ± 0.45 kg); before each use, scale validated with 454 kg of certified weights], tagged with unique numbered identification tag, treated for external parasites (Dectomax Pour-On; Zoetis Animal Health), and administered an internal paraciticide (Safe-Guard). Following processing, cattle were returned to soil-surface pens and remained on 65% concentrate receiving diet. An unshrunk sorting BW was obtained 11 d before the study began; 192 steers were selected for enrollment in the experiment based on BW uniformity, health status, and temperament. Enrolled steers were ranked by ascending BW, assigned to a BW block (n = 8 blocks), and returned to the soil-surface pens. Within block, steers were assigned randomly to pens (4 steers/pen), and pens within block were assigned randomly to one of six dietary treatments; thus, treatments were replicated in 8 pens. Steers were sorted into 48 concrete, partially slotted-floor pens (2.9 m wide x 5.5 m deep; 2.4 m of linear bunk space).
39
Table 1. Ingredient and analyzed nutrient composition of experimental diets (DM basis) Treatment1
Item2 CTL DRY-
C DRY-CLF
DRY-C/S
DRY-S
WET-S
Ingredient, % Steam-flaked corn 75.71 59.68 57.24 59.49 59.45 61.94 Corn DDGS -- 25.00 -- -- -- -- De-oiled DDGS
-- -- 25.00 -- -- --
Corn/sorghum DDGS
-- -- -- 25.00 -- --
Sorghum DDGS
-- -- -- -- 25.00 --
Sorghum WDGS
-- -- -- -- -- 25.00
Cottonseed hulls 5.50 4.00 4.00 4.00 4.00 4.00 Alfalfa hay 5.50 4.00 4.00 4.00 4.00 4.00 Molasses 5.00 3.00 3.00 3.00 3.00 -- Supplement3 2.00 2.00 2.00 2.00 2.00 2.00 Tallow 3.11 -- 2.33 0.39 1.25 0.79 Limestone 1.67 1.80 1.80 1.78 1.30 1.79 Urea 1.51 0.52 0.63 0.34 -- 0.48 Analyzed composition, % DM 81.3 83.3 83.2 82.9 83.5 63.8 CP 14.0 16.6 17.3 16.9 16.5 18.0 Ether extract 6.1 6.0 6.0 5.7 6.0 6.1 1CTL = steam-flaked corn-based diet; DRY-C = 25% (DM basis) inclusion of corn dried distillers grains with solubles (DGS); DRY-CLF = 25% (DM basis) inclusion of dried de-oiled corn DGS; DRY-C/S= 25% (DM basis) inclusion of blended corn/sorghum dried DGS; DRY-S = 25% (DM basis) inclusion of sorghum dried DGS; and WET-S = 25% (DM basis) inclusion of sorghum wet DGS. 2DDGS = dried distillers grains with solubles; WDGS = wet distillers grains with solubles. 3Supplement contained (DM basis): 71.514% ground corn; 0.500% antioxidant (Endox, Kemin Industries, Des Moines, IA); 10.000% potassium chloride; 15.000% salt; 0.002% cobalt carbonate; 0.196% copper sulfate; 0.083% iron sulfate; 0.003% ethylenediamine dihydroiodide; 0.167% manganous oxide; 0.125% selenium premix (0.2% Se); 0.9859% zinc sulfate; 0.009% vitamin A (1,000,000 IU/g); 0.157% vitamin E (500 IU/g); 0.750% Rumensin (220.5 mg/kg; Elanco Animal Health, Indianapolis, IN); 0.506% Tylan (97 mg/kg; Elanco Animal Health).
emueller
Typewritten Text

Dietary treatments included: 1) steam-flaked corn-based control diet, (CTL); 2) corn dried DGS (DRY-C); 3) de-oiled corn dried DGS (DRY-CLF); 4) blended 50/50 dry corn/sorghum DGS (DRY C/S); 5) sorghum dried DGS (DRY-S); and 6) sorghum wet DGS (WET-S). Inclusion rate for all DGS diets was 25% (DM basis); DGS diets were isonitrogenous, whereas CTL was formulated to provide 13.5% CP, and all diets were balanced for fat. Formulated and analyzed diet compositions are provided in Table 1.
Steers were allowed 6 d for adaptation to concrete pens and then individually weighed to obtain an initial BW, and each steer was implanted with Revalor-XS (200 mg TBA, 20 mg E2, Merck Animal Health). At this time, feeding of respective experimental dietary treatments commenced, and steers were gradually transitioned from diets containing 65% concentrate to 90% concentrate over a 21-d period.
Throughout the finishing period, pen weights were collected every 28-d using a platform scale (readability ± 2.3 kg; validated before each use with 454 kg of certified weights). Feed bunks were cleaned at each weigh day, and any remaining feed was weighed and analyzed for DM content in a forced-air oven at 1000C for 24 h. Unconsumed feed was accounted for at each weigh day. Diet Sampling and Feed Delivery Feed bunks were read at 0700 to 0730 h daily to estimate the quantity of residual feed for each pen and the bunks were managed such that only traces of feed remained before the next feeding. A 1.27-m3-capacity paddle mixer (Marion Mixers, Inc., Marion, IA) was used to mix diets; a drag-chain conveyor was used to move feed from the mixer to tractor-pulled mixer/delivery unit (Roto-Mix 84-8, Roto-Mix, Dodge City, KS; scale readability of ± 0.45 kg) for delivery of feed to the bunk.
Throughout the experiment, diets were sampled each week from each of the 8 pens/treatment and composited within treatment by 28-d weigh periods. Diet composites were analyzed for nutrient composition by Servi-Tech Laboratory, Amarillo, TX. Samples of coproducts were obtained throughout the study to monitor nutrient composition, and weekly samples were obtained for analysis of DM. Samples of other dietary ingredients were obtained every other week for determination of DM in a forced-air oven for approximately 15 h at 100oC.
Diet samples were collected once daily from (d 103 to 108) from the bunk immediately after delivery; a subsample of each diet sample was frozen at -20ºC for later analyses, and the reminder of the sample was used to determine DM. Diet subsamples were composited by treatment at the end of the 5-d digestion study. From d 104 to 109 of the feeding period, orts were collected, and their weight was recorded. Approximately 10% of orts were subsampled and frozen at -20ºC. The remainder of the orts was used to determine DM; subsamples were composited by pen following the digestion period. Feces were collected from freshly voided feces on the pen surface twice daily at 0700 and 1600 from d 104 to 109 of the feeding period and frozen. On d 110, fecal samples were thawed, and a subsample (approximately 100 g) of homogenized feces from each collection was composited by pen, after which composite samples were dried at 55°C for 96 h. Diet, orts and fecal samples were ground in a Wiley mill (Thomas Scientific, Swedesboro, NJ) to pass a 1-mm screen.
Diet, orts, and fecal samples were analyzed for acid insoluble ash (AIA), DM, ash, NDF, ADF, ether extract and starch. Concentration of AIA was determined using 2N HCl analysis (Van Keulen and Young, 1977), in triplicate. All other analyses were conducted in duplicate, and corrected for laboratory DM, determined by drying samples at 100°C in a forced-air oven for 24 h. Ash was evaluated for determination of OM by burning samples at 550°C for 4 h (AOAC, 1990). Neutral detergent fiber and ADF were determined using a fiber analyzer (Ankom Technology, Macedon, NY), with the addition of sodium sulfite and α-
40
Steers within the various weight blocks were sent to a commercial slaughter facility (Tyson Fresh Meats Inc., Amarillo, TX) on 3 dates. Steers were shipped the morning of each slaughter date, with an individual BW measurement obtained before shipping. A 4% pencil shrink was used for determination of final BW.
Carcass characteristics were evaluated 24-h after slaughter by trained personnel from West Texas A&M University for the final 2 slaughter dates. Because of a logistical error, carcass data were not collected for the first slaughter group; thus, only data for 2 slaughter groups are presented.
Apparent Diet Digestibility
amylase for the NDF procedure. Crude protein was determined using a Leco CNS Nitrogen Analyzer (Leco CNS-200, St. Joseph, MI). Starch and ether extract were evaluated by a commercial laboratory (ServiTech, Amarillo, TX). Apparent total tract DM, OM, CP, NDF, ADF, ether extract, and starch digestibilities were determined from the formula: 100 - 100 x [(concentration of AIA in feed/concentration of AIA in feces) x (concentration of nutrient in feces/concentration of nutrient in feed)]. Orts were accounted for in nutrient concentration of feed by correcting nutrient concentrations by dividing the adjusted (for orts) nutrient composition of the nutrient consumed by the adjusted (for orts) quantity of DM consumed. Statistical Analyses Performance, carcass characteristics, and diet intake and digestibility data were analyzed using the MIXED procedure of SAS (SAS Inst. Inc., Cary, NC) in a randomized complete block design. Pen was the experimental unit, dietary treatment was a fixed effect and block was a random effect. Binomial proportions were used to analyze quality grade and yield grade with the Glimmix procedure (SAS Inst., Inc.), with block included as a random effect. When the P-value for the F-statistic was ≤ 0.05, least squares means were separated and reported using the LSD procedure of SAS (α = 0.05).
RESULTS AND DISCUSSION Cattle Performance and Carcass Characteristics Final BW, ADG and overall DMI (Table 2) did not differ among treatments (P ≥ 0.10). Means for G:F were identical (0.153) for DRY-C and DRY-CLF and did not differ from CTL or WET-S (P ≥ 0. 11). At a similar inclusion of DGS (25 to 30% DM basis), results for G:F are mixed; Al-Suwaiegh et al. (2002) reported an improvement compared with control, whereas others reported G:F was less than control (Depenbusch et al., 2008; May et al., 2010). Similar to our findings, Jolly et al. (2014) reported no difference in G:F for wet-corn DGS or de-oiled wet corn DGS in blended dry-rolled and high-moisture corn-based diets.
Gain efficiency (Table 2) was decreased 9.6% with DRY-S vs. CTL (0.142 vs. 0.157, respectively, P < 0.01) and was 7.2% lower for DRY-S vs. DRY-C or DRY-CLF (P < 0.05), but tended (P = 0.06) to be greater (5.6%) for WET-S vs. DRY-S (Table 2). In addition, G:F for DRY C/S tended (P = 0.08) to be 5.3% greater than DRY-S (0.150 vs. 0.142, respectively). Similar to the present results, May et al. (2010) reported improved G:F for blended wet corn/sorghum DGS vs. wet sorghum DGS. The HCW (400 kg), dressing percent (62.35%), and other carcass characteristics (Table 2) did not differ among treatments (P ≥ 0.10); however, carcasses for DRY-CLF and DRY-S tended (P = 0.09) to have a lower yield grade. Nutrient Intake and Digestibility
Intake of DM, OM, CP, and EE during the digestion phase (Table 2) was greater for DRY-C vs. other treatments (P ≤ 0.03). Intake of NDF was greater for all DGS treatments vs. CTL (P < 0.05), and starch intake was greater for CTL vs. DGS treatments (P < 0.05), which reflects the nature of the differences in chemical composition of DGS diets vs. CTL. Greater intakes of CP and EE by DRY-C were driven by greater DMI for this diet compared with other diets during the digestion phase, as well as slightly higher fat and CP contents of this diet during the collection period. Nutrient digestibility data (Table 2) complement feedlot performance results. Digestibility of DM and OM did not differ for CTL, DRY-C, DRY-CLF, and WET-S (P ≥ 0.30), and was least for DRY-S vs. other treatments (P < 0.01). Interestingly, DM and OM digestibility were greater for DRY-C/S vs. DRY-S (P < 0.01). In addition, DM and OM digestibility did not differ (P ≥ 0.20) for DRY C/S and DRY-C. The fiber fractions of WET-S were highly digestible and yielded greater digestibility coefficients than other treatments (P < 0.01). Conversely, NDF and ADF digestibility was less for DRY-S compared with other DGS diets (P < 0.01), and was 48.5% and 65.4% lower for NDF, and ADF, respectively, compared with WET-S. Interestingly, DRY-C/S resulted in similar digestibility of NDF and ADF compared to DRY-C and DRY-CLF (P ≥ 0.26).
In diets where corn-DGS was included at 25% (DM basis) to replace a portion of steam-flaked corn, May et al. (2009) found similar results to our study with no decrease in apparent DM, OM, NDF, or starch digestibility for DGS compared to control. In contrast, Uwituze et al. (2010) reported decreased apparent DM, OM, starch and CP digestibility for corn-DGS compared with control. In addition, May et al. (2010) reported no difference in nutrient digestibility between wet-corn or wet-sorghum DGS, included at 15% (DM basis), in steam-flaked corn-based diets compared to control.
When diets were balanced for fat, no differences in performance were observed for DRY-C and DRY-CLF; however, digestibility of EE was greater for DRY-CLF vs. DRY-C (P < 0.05). Digestibility of other nutrients did not differ between the 2 corn DGS products, indicating that the further processing by de-oiling did not significantly affect digestibility of nutrients with the product used in this study. Animal Performance and Crop Water Use Relationship Evaluating the relationship between crop yield as a function of total water input, relative to differences and tradeoffs in animal performance is important in better understanding the role of grain sorghum in beef production systems. Crop yield (kg/ha) as a function of total crop water (assuming rainfall + irrigation) was derived from historical production information (J. Weinheimer, National Sorghum Producers, Lubbock, TX; personal communication). The relationship between total water and respective estimated yields of grain sorghum and corn, assuming crops were grown within similar environmental and management conditions, indicates greater production of grain sorghum with limited water and greater corn yields with increased
41

availability of crop water. To combine the data for crop production in relation to water use and animal performance, we considered the following scenarios: if total crop water (rainfall + irrigation) is 254 mm, respective yields of grain sorghum and corn are 7,029 kg/ha and 6,025 kg/ha, respectively. If 7,029 kg/ha of grain sorghum at 254 mm water application is multiplied by the G:F ratio for DRY-S (0.142), the result is 998 whereas if the yield for corn (6,025 kg/ha) is multiplied by G:F for DRY-C (0.153), the result is 922. These calculations suggest greater gain (yield in relationship to animal performance) for sorghum when total crop water is 254 mm.
IMPLICATIONS
At moderately high (25% dry matter) inclusion, blending dry corn/sorghum coproducts, and a feeding wet-sorghum coproduct resulted in similar cattle performance to steam-flaked corn control diet and dry corn ethanol coproducts. Moreover, blending dry corn and sorghum coproducts allowed for greater nutrient digestibility compared with a dry-sorghum coproduct alone, potentially attributable to a dilution of decreased nutrient availability of dry sorghum coproducts compared with corn coproducts, an associative effect with the two grain types, or a combination of these two effects. Based on gain efficiency and digestibility of nutrients, the feeding value of the wet-sorghum coproduct was increased compared with the dry-sorghum coproduct. Decreased crop water requirements show the value of grain sorghum in water-limited regions relative to tradeoffs in crop yield and animal performance at low water levels compared with corn.
LITERATURE CITED
AOAC International. 1995. Official Methods of Analysis. 16th ed. AOAC Int., Arlington, VA.
Al-Suwaiegh, S., K. C. Fanning, R. J. Grant, C. T. Milton, and T. J. Klopfenstein. 2002. Utilization of distillers grains from the fermentation of sorghum or corn in diets for finishing beef and lactating dairy cattle. J. Anim. Sci. 80:1105-1111.
Depenbusch, B.E., J. S. Drouillard, E. R. Loe, J.J. Higgins, M.E. Corrigan, and M. J. Quinn. 2008. Efficacy of
monensin and tylosin in finishing diets based on steam-flaked corn with and without corn wet distillers grains with solubles. J. Anim. Sci. 86:2270-2276.
Jolly, M. L., B. L. Nuttleman, D. Burken, C. J. Schneider, T. J. Klopenstein, G. E. Erickson. 2014. Effects of increasing inclusion of wet distllers grains plus solubles with and without oil extraction on finishing performance. Nebraska Beef Rep. MP-99:81-82. Univ. of Nebraska, Lincoln.
Leibovich, J., J. T. Vasconcelos, and M. L. Galyean. 2009. Effects of corn processing method in diets containing sorghum wet distillers grain plus solubles on performance and carcass characteristics of finishing beef cattle and on in vitro fermentation of diets. J. Anim. Sci. 87:2124-2132.
May, M. L., J. C. DeClerck, M. J. Quinn, N. DiLorenzo, J. Leibovich, D. R. Smith, K. E. Hales, and M. L. Galyean. 2010. Corn or sorghum wet distillers grains with solubles in combination with steam-flaked corn: Feedlot performance, carcass characteristics, and apparent total tract digestibility. J. Anim. Sci. 88:2433-2443.
May, M. L., M. J. Quinn, C. D. Reinhardt, L. Murray, M. L. Gibson, K. K. Karges, and J. S. Drouillard. 2009. Effects of dry-rolled or steam-flaked corn finishing diets with or without twenty-five percent dried distillers grains on ruminal fermentation and apparent total tract digestion. J. Anim. Sci. 87:3630-3638.
Uwituze, S., G. L. Parsons, M. K. Shelor, B. E. Depenbusch, K. K. Karges, M. L. Gibson, C.D. Reinhardt, J. J. Higgins, and J. S. Drouillard. 2010. Evaluation of dried distillers grains and roughage source in steam-flaed corn finishing diets. J. Anim. Sci. 88:258-274.
Van Keulen, J., and B. A. Young. 1977. Evaluation of acid-insoluble ash as a natural marker in ruminant digestibility studies. J. Anim. Sci. 44:282-287.
Vasconcelos, J. T., L. M. Shaw, K. A. Lemon, N. A. Cole, and M. L. Galyean. 2007. Effects of graded levels of sorghum wet distiller’s grains and degraded intake protein supply on performance and carcass characteristics of feedlot cattle fed steam-flaked corn-based diets. Prof. Anim. Sci. 23:467-475.
42

Table 2. Effects of type of coproduct on growth performance, carcass characteristics, diet intake and digestibility of feedlot steers Treatment1
Item CTL DRY-C DRY-CLF DRY-C/S DRY-S WET-S SE P-value
Performance No. of pens 8 8 8 8 8 8 Avg. days on feed 149 149 149 149 149 149 Initial BW, kg 390 391 392 391 391 391 8.60 0.83 Final BW, kg 620 627 619 619 602 623 9.32 0.19 ADG d 0 to end, kg 1.53 1.57 1.51 1.51 1.40 1.54 0.05 0.14 DMI d 0 to end, kg 9.71 10.24 9.87 10.08 9.83 10.26 0.25 0.30 G:F d 0 to end 0.157ᵃ 0.153ᵃ 0.153ᵃ 0.150ᵃᵇ 0.142ᵇ 0.150ᵃᵇ 0.003 0.03 Carcass Characteristics No. of pens 6 6 6 6 6 6 HCW, kg 397 408 402 401 388 402 7.65 0.23 Dressing percent2 62.43 62.48 62.54 62.53 61.89 62.23 0.57 0.95 12th rib-fat, cm 1.35 1.53 1.23 1.55 1.34 1.50 0.10 0.17 LM area, cm2 86.48 87.08 86.47 84.59 89.83 84.09 2.19 0.51 KPH, % 1.92 2.00 1.93 1.93 1.95 2.03 0.05 0.43 Yield grade 3.25 3.51 3.17 3.57 3.17 3.58 0.15 0.09 Marbling score3 408 418 386 407 379 417 17.35 0.41
Intake, kg/d DM 9.32b 10.52a 9.69b 9.37b 9.42b 9.42b 0.31 0.03 OM 8.96b 9.98a 9.19b 8.96b 8.96b 8.94b 0.30 0.04 NDF 1.33c 1.85a 1.67b 1.72ab 1.66b 1.78ab 0.06 < 0.01 ADF 0.56d 0.65b 0.60cd 0.65bc 0.62bc 0.71a 0.02 < 0.01 CP 1.28c 1.80a 1.51b 1.54b 1.50b 1.70a 0.06 < 0.01 EE 0.54bc 0.64a 0.57b 0.53bc 0.54bc 0.52c 0.02 < 0.01 Starch 5.17a 4.73b 4.56b 4.56b 4.45bc 4.13c 0.14 < 0.01
Digestibility, % DM 78.7a 77.2ab 78.2ab 75.7b 68.8c 78.5a 0.95 < 0.01 OM 79.8a 78.5ab 79.5ab 76.9b 70.8c 79.7a 0.95 < 0.01 NDF 37.2cd 46.9b 44.4bc 43.8bc 32.6d 59.9a 2.73 < 0.01 ADF 27.8c 39.4b 38.8bc 35.8bc 18.9d 53.7a 3.00 < 0.01 CP 71.4a 74.5a 74.3a 65.6b 50.7c 65.9b 1.88 < 0.01 EE 93.6a 91.2b 93.5a 89.2c 86.5d 89.7bc 0.62 < 0.01 Starch 95.6ab 95.5ab 96.3a 96.1a 93.3c 94.3bc 0.56 < 0.01
1CTL = steam-flaked corn-based diet; DRY-C = 25% (DM basis) inclusion of corn dried distillers grains with solubles (DGS); DRY-CLF = 25% (DM basis) inclusion of dried de-oiled corn DGS; DRY-C/S= 25% (DM basis) inclusion of blended corn/sorghum dried DGS; DRY-S = 25% (DM basis) inclusion of sorghum dried DGS; and WET-S = 25% (DM basis) inclusion of sorghum wet DGS. 2Dressing percent = HCW/unshrunk final BW. 3100 = practically devoid00, 200 = traces00, 300 = slight00, 400 = small00, 500 = modest00, 600 = moderate00. a,b,cMeans within rows that do not have a common superscript differ, P < 0.05.
43

Nutrient transporters in bovine utero-placental tissues on days 16 to 50 of gestation1
1 Appreciation is expressed to the NDSU Animal Nutrition and Physiology Center, NDSU Animal Science Nutrition Laboratory, and Animal Science Graduate Students: Jena Bjertness, Danielle Black, Mellissa Crosswhite, and Guangqiang Jia for their assistance in completing this project.
M. S. Crouse,* K. J. McLean,* L. P. Reynolds,* C. R. Dahlen,* B. W. Neville, † P. P. Borowicz,* and J. S. Caton* *Department of Animal Sciences, Center for Nutrition and Pregnancy, North Dakota State University, Fargo 58108
†Central Grasslands Research Extension Center, Streeter ND 58483
ABSTRACT: Our hypothesis was that transporters for glucose and amino acids in utero-placental tissues would be differentially expressed across days of early pregnancy. To test this hypothesis, crossbred Angus heifers (n = 46), were synchronized, bred via AI and then ovariohysterectomized on d 16, 22, 28, 34, 40, or 50 of gestation (n = 5 to 9/d), or were not bred and ovariohysterectomized on d 16 of the synchronized estrous cycle (n = 7) to serve as nonpregnant (NP) controls. Utero-placental tissues (caruncular, CAR; intercaruncular, ICAR; and fetal membranes, FM [chorioallantois, d 22 and later]) were collected from the uterine horn of pregnancy immediately following ovariohysterectomy. For NP controls only CAR and ICAR were obtained. Relative mRNA expression of the glucose transporters GLUT1 and GLUT3 as well as cationic amino acid transporters SLC7A1, SLC7A2, and SLC7A3 was determined for each tissue from d 16 to d 50 of gestation and also for NP controls. In CAR, expression of GLUT1 was greatest (P < 0.0001) on d 16, and expression of GLUT3 was greatest (P = 0.01) on d 50 of gestation. The expression of cationic amino acid transporter SLC7A1 was greater (P ≤ 0.05) in CAR on d 28, 34, and 40 compared to NP and d 16, 22, and 50. There was no effect of day on SLC7A2 expression in CAR. Expression of SLC7A3 was greatest (P = 0.01) in CAR on d 16. In ICAR, the expression of GLUT1 was greatest (P < 0.0001) on d 16 of gestation. Relative expression of GLUT3 tended to be greater (P = 0.06) in ICAR at d 34 and 40 compared to NP. Intercaruncular expression of SLC7A1 and SLC7A2 was greatest on d 34 (P < 0.0001 and P = 0.02, respectively). Relative expression of SLC7A3 was greater (P ≤ 0.05) in ICAR on d 28, 34, and 40 compared with d 16 and 22. In FM, GLUT1 was greater (P ≤ 0.05) on d 22 compared with d 34, 40, and 50. There was no effect of day on expression of GLUT3 in FM. The expression of SLC7A1 was greatest (P = 0.0003) in FM at d 22. There was no day effect for SLC7A2 or SLC7A3 in FM. These results support our hypothesis that there is an effect of day on the expression of glucose and amino acid transporter mRNAs in utero-placental tissues of heifers during early pregnancy. Key words: cationic amino acids, early gestation, glucose, nutrient transporters, nutrition
INTRODUCTION
To meet the projected food requirements of the growing population, the world needs to significantly increase its output of meats by 2050 (Elliot, 2013). Currently, fertilization rates for first service AI are
approximately 90% in beef heifers (Bridges et al., 2013); however, by d 30 of gestation, only 50 to 60% are viable embryos. Moreover, Thatcher et al., (1994) indicated that up to 40% of all embryonic loss occurs before d 40 of gestation. We recently developed a standing, flank ovariohysterectomy procedure that allows for a detailed and accurate assessment of expression of utero-placental nutrient transporters during the early stages of gestation (NP to d 50 of gestation). The presence of nutrient transporters and nutrient flow to the growing embryo is crucial for proper development and growth. During this time, the placenta is developing and the fetus begins to utilize increasing quantities of glucose and amino acids (Gardner, 1998; Groebner et al., 2011; Bazer et al., 2014). Thus, the expression of glucose and amino acid transporters in the utero-placenta becomes essential to the viability of the conceptus. The main utero-placental glucose transporters are GLUT1 and GLUT3. The GLUT1 isoform is the main glucose transporter and is present in most tissues throughout the body and is ubiquitous across species. The GLUT3 is a specific neural and placental glucose transporter. The main cationic utero-placental amino acid transporters are SLC7A1, SLC7A2, and SLC7A3. The luminal and glandular epithelium of the endometrium have a greater prevalence of SLC7A1 and SLC7A2, with SLC7A3 being more commonly located in stromal cells (Bazer et al., 2011). The substrates for these transporters are amino acids such as arginine and lysine, which are directly linked to angiogenesis and cell proliferation. In this study, we tested the hypothesis that mRNA for glucose and amino acid transporters in utero-placental tissues is differentially expressed across days of early pregnancy.
MATERIALS AND METHODS Animals
Protocols described herein were approved by the North Dakota State University Institutional Animal Care and Use Committee. Crossbred Angus heifers (n = 46, ~15 mo of age; BW = 362.3 ± 34.7 kg) were exposed to the 5-d CO-Synch + CIDR estrus synchronization protocol. Seven heifers were not inseminated to serve as non-pregnant (NP) controls, but received ovariohysterectomy on d 16 of the synchronized estrous cycle. The remaining heifers (n = 5 to 9/d) were AI bred at 12 h after observed estrus and ovariohysterectomized at d 16, 22, 28, 34, 40, or 50 of gestation.
44
Sample Collection
Immediately following ovariohysterectomy, utero-placental tissues (caruncle, CAR; intercaruncular endometrium, ICAR, and fetal membranes, FM [chorioallantois, d 22 and later]) were obtained from the uterine horn containing the conceptus, as previously described (Grazul-Bilska et al., 2010, 2011). Fetal membranes were also collected only from d 22 and later days due to inadequate quantities of FM on d 16 and absence of FM in NP controls. Once collected, all tissues were snap frozen in liquid nitrogen cooled isopentane and stored at -80°C. Real-Time Reverse Transcription Quantitative PCR
The RNA was extracted and purified using RNeasy Mini Kit (Qiagen, Valencia, CA), and cDNA was synthesized utilizing QuantiTect Reverse Transcription Kit (Qiagen, Valencia, CA). Total quantity of RNA was determined using Take3 module of a Synergy H1 Microplate Reader (BioTek, Winooski, VT). The cDNA dilutions were determined by primer validation for each gene and tissue type across stages of gestation. For PCR, dilutions of 1:100 were utilized for GLUT1 and SLC7A1, and 1:10 for GLUT3, SLC7A2, and SLC7A3. Gene expression was quantified using a 7500 Fast Real-Time PCR System (Applied Biosystems, Grand Island, NY) with SYBR Green Master Mix (Bio-Rad Laboratories, Hercules, CA); 18µL total for GLUT1 and SLC7A1, and 15 µL total for GLUT3, SLC7A2, and SLC7A3). Statistical Analysis
Data were analyzed for day of gestation effects using the GLM procedure of SAS (SAS Inst. Inc., Cary, NY), with individual heifer serving as the experimental unit. Means were separated using the LSMEANS procedure of SAS and P-values ≤ 0.05 were considered different.
RESULTS AND DISCUSSION Maternal Caruncules (CAR)
Expression of GLUT1 was greatest at d 16, with a 7.8-fold increase (P < 0.0001) compared to NP and also exhibited a 4.3-fold increase (P < 0.05) at d 22, with the remaining days of early pregnancy being similar to NP (Table 2). Expression of GLUT3 was 13.68-fold greater (P < 0.01) at d 50 compared with NP, intermediate at d 34, and similar (P > 0.05) among NP, d 16, 22, 28, and 40 of gestation. Relative expression of SLC7A1 was greater (P < 0.05) on d 28, 34, and 40 compared with NP, d 16, 22, and 50 of gestation (Table 2). Stage of gestation did not influence SLC7A2 expression (P = 0.20). Expression of SLC7A3 was greatest at d 16 (6.89 fold greater), decreasing to 0.69-fold by d 22 and maintaining a relative expression level less than NP through d 50 of gestation (P = 0.01; Table 2).
By d 50, expression of GLUT1, SLC7A1, SLC7A2, and SLC7A3 had all returned to similar levels as observed NP
heifers. With GLUT3 being a low Km (high affinity) glucose transporter (Illsley, 1999), its linear and dramatic increase (13.7 fold by d 50; P = 0.01) in expression indicates it may play a pivotal role in supporting the increased nutrient demands of the conceptus as early pregnancy progresses. Maternal Intercaruncular Endometrium (ICAR)
Expression of GLUT1 followed a similar expression
trend in ICAR as in CAR, with d 16 being greater (P < 0.0001) than all other days measured (Table 2). At d 22, GLUT1 expression was greater than NP or d 34, 40, and 50 of gestation. Relative expression of GLUT3 tended (P = 0.06) to be greater at d 34 and 40 compared with NP. On d 34 of gestation, relative expression of SLC7A1 peaked at 16-fold greater (P < 0.0001) than NP, and on d 40 was still greater (P ≤ 0.05) than NP or d 16, 22, 28, and 50 of gestation. Expression of SLC7A2 was greatest on d 34, intermediate on d 28, and least in NP and d 16, 22, and 50 (P ≤ 0.05; Table 2). In contrast to CAR, SLC7A2 in ICAR, reached its greatest relative expression on d 34 (P = 0.02; Table 2). Expression of SLC7A3 was greater in NP, d 28, 34, and 40 (P ≤ 0.05) compared with d 16 and 22 (Table 2). Fetal Membranes (FM)
Expression of GLUT1 was greatest on d 22 and decreased to d 50, indicating a linear decline as pregnancy progressed, but still remaining at relatively high levels compared with B-actin (P = 0.009; Table 3). Expression of GLUT3 remained consistent from d 22 to 50 (P = 0.76; Table 3). Expression of SLC7A1 was greatest on d 22 (9.57) and showed a cubic pattern, decreasing by d 50 (P = 0.0003; Table 3). Relative expression of SLC7A2 and SLC7A3 was consistent throughout early gestation (~5.5 and ~11.5 and P = 0.60 and P = 0.52, respectively, compared with B-actin; Table 3).
Due to GLUT3’s known function as a placental and neural glucose transporter, it was expected that expression levels would be greater than those of GLUT1, and might even increase throughout gestation. Although neigher GLUT1 nor GLUT3 expression increased, noth were expressed at relatively high levels compared with B-actin, which suggests their key role in glucose transport to the developing fetus.
Previous work by Bazer et al. (2011) examined the location of the various nutrient transporters within the endometrium in ewes. The GLUT1, GLUT3, SLC7A1, and SLC7A2 transporters were located in the luminal and glandular epithelium of the uterus, and SLC7A3 transporter was found in the luminal and glandular epithelium as well as the stromal cells. Examining the cells or tissue compartments expressing these transporters in beef cattle could provide insight into the difference in the relative expression levels between tissue types.
Although not all transporters showed differences across all tissues, for the most part these data supported our hypothesis that there is an effect of day of early pregnancy on the mRNA expression of GLUT1, GLUT3, SLC7A1, SLC7A2, and SLC7A3 in CAR, ICAR, and FM.
45
IMPLICATIONS
We interpret these data to imply that glucose and cationic amino acid transport capacity in utero-placental tissues is changing dramatically during the first 50 d of pregnancy in beef heifers. Moreover, implications are that our model provides an effective platform for additional studies investigating a plethora of mechanisms at play during early bovine embryo development. Ultimately, new knowledge in this area will facilitate increased efficiencies associated with beef cattle production and contribute to meeting projected world food demands.
LITERATURE CITED
Bazer, F. W., G. Wu, G. A. Johnson, and X. Wang. 2014.
Environmental factors affecting pregnancy: Endocrine disrupters, nutrients and metabolic pathways. Mol. Cell. Endocrinol. Doi: 10.1016/j.mce.2014.09.007
Bazer, F. W., G. Wu, G. A. Johnson, J. Kim, and G. Song. 2011. Uterine histotroph and conceptus development: Select nutrients and secreted phosphoprotein 1 affect mechanistic target of rapamycin cell signaling in ewes. Biol. Reprod. 85: 1094-1107.
Bridges, G. A., M. L. Day, T. W. Geary, and L. H. Cruppe. 2013. Deficiencies in the uterine environment and failure to support embryonic development. J. Anim. Sci. 91:3002-3013.
Elliot, I. Meat output must double by 2050. Feedstuffs. Accessed 1/15/2013: http://feedstuffsfoodlink.com/story-meat-output-must-double-by-2050-71-66920
Gardner, D. K 1998. Changes in requirements and
utilization of nutrients during mammalian preimplantation embryo development and their significance in embryo culture. Theriogenology. 49:83-102.
Grazul-Bilska, A. T., P. P. Borowicz, M. L. Johnson, M. A. Minten, J. J. Bilski, R. Wroblewski, D. A. Redmer and L. P. Reynolds. 2010. Placental development during early pregnancy in sheep:vascular growth and expression of angiogenic factors in maternal placenta. Reproduction. 140:165-174.
Grazul-Bilska, A. T., M. L. Johnson, P. P. Borowicz, M. Minten, J. J. Bilski, R. Wroblewski, M. Velimirovich, L. R. Coupe, D. A. Redmer and L. P. Reynolds. 2011. Placental development during early pregnancy in sheep:cell proliferation, global methylation, and angiogenesis in the fetal placenta. Reproduction. 141:529-540.
Groebner, A. E., I. Rubio-Aliaga, K. Schulke, J. D. Reichenbach, H. Daniel, E. Wolfe, J. J. D. Meyer and S.E. Ulbrich 2011. Increase of essential amino acids in the bovine uterine lumen during preimplantation development. Reproduction. 141: 685-695.
Illsley, N.P. 2000. Glucose transporters in the human placenta. Placenta. 21:14-22
Thatcher, W. W., C. R. Staples, G. Danet-Desnoyers, B.
Oldick, and E. P. Schmitt. 1994. Embryo health and mortality in sheep and cattle. J. Anim. Sci. 74(Suppl 3):16-30.
46
Table 1. Primer Sets used for real-time quantitative reverse-transcription PCR
Gene1 Product size (bp) Forward primer (5'-3') Reverse Primer (5'-3')
GenBank Accession No.
GLUT1 2533 CGGCTGCCCTGGATGTC GCCTGGGCCCACTTCAAA NM_174602 GLUT3 1404 CAAGTCACAGTGCTAGAGTCTTTC GGAGAGCTGGAGCATGATAGAGAT XM_001256170 SLC7A1 695 CCGATAATCGCCACCTTAACCT ACCAGGTCCTTCAGGTCGAA DQ399522 SLC7A2 490 AAGGAAATGTGGCAAACT TTGAAAAGCAACCCATCCTC XM_865568.2 SLC7A3 473 TACCAGCCTCTTGGGCTCTA AAAGCAGTGGAATGGACCAC BC126655 1GLUT1 and GLUT3 are glucose transporter solute carrier family 2 member 1 and 3. SLC7A1, SLC7A2, and SLC7A3 are cationic amino acid transporters of arginine and lysine, solute carrier family 7 member 1, 2, and 3.
Table 3. Level of expression of nutrient transporters GLUT 1, GLUT 3, SLC7A1, SLC7A2, and SLC7A3 in fetal membranes from d 22 to 50 of gestation
Day of Gestation1
Gene of Interest2 22 28 34 40 50 SEM3 P - value4
GLUT 1
6.72c 6.35bc 5.58a 5.78ab 5.32a
0.30
0.009
GLUT 3
6.38 6.06 5.80 6.35 5.66
0.51
0.76 SLC7A1
9.57c 8.16b 7.05a 8.86bc 6.99a
0.43
0.0003
SLC7A2
6.27 5.3 5.71 4.77 5.57
0.72
0.60 SLC7A3 12.25 10.49 10.99 11.61 13.08 1.19 0.52 1Day of Gestation = number of days after insemination. Values for expression of genes are provided as ΔCt values for that gene after being normalized to B-Actin. 2Gene of Interest = GLUT1 and GLUT3- Glucose transporter solute carrier family 2 member 1 and 3. SLC7A1, SLC7A2, and SLC7A3- Cationic amino acid transporters of arginine and lysine, solute carrier family 7 member 1, 2, and 3. 3The most conservative SEM was used within gene. 4Probability values for effect of d on level of expression of individual genes. a-e Means within a row without a common superscript differ (P < 0.05).
Table 2. Level of expression of nutrient transporters GLUT 1, GLUT3, SLC7A1, SLC7A2, and SLC7A3 in CAR and ICAR tissue in no pregnant controls and from d 16 to 50 of gestation
Day of Gestation1
Tissue2 Gene of Interest3 NP 16 22 28 34 40 50 SEM4 P - value5
GLUT 1 1.00a 7.77c 4.34b 2.06a 1.38a 1.20a 1.70a
0.99
0.0001
GLUT 3 1.00a 3.89a 5.62ab 4.80ab 9.13bc 4.93ab 13.68c
2.28
0.01 CAR SLC7A1 1.00a 1.54a 1.99a 5.12b 6.82b 5.10b 0.98a
0.92
0.0001
SLC7A2 1.00 2.38 1.37 0.68 3.24 2.95 0.35
1.01
0.2
SLC7A3 1.00a 6.89b 0.69a 0.42a 0.52a 0.54a 0.14a
1.74
0.01
GLUT 1 1.00a 13.24c 6.07b 2.48ab 1.65a 1.04a 0.66a
2.22
0.0001
GLUT 3 1.00abc 0.93b 1.67ac 4.32ce 4.90de 3.51acd 0.73ab 1.65
0.06 ICAR SLC7A1 1.00a 2.03a 1.63a 6.30b 16.03d 12.02c 5.73b
2.03
0.0001
SLC7A2 1.00a 1.25a 1.23a 7.84bc 10.25c 4.08ab 2.15a
3.11
0.02 SLC7A3 1.00abc 0.50a 0.20a 1.87c 1.49bc 1.46bc 0.61ab 0.54 0.03 1Day of Gestation = number of days after insemination. Day 0 is a non-bred non pregnant control and serves as the baseline of expression for that gene. Each gene expression is given as a fold change in relation to NP level of expression. 2CAR = caruncular tissue (caruncles taken from the uterine horn containing the conceptus in pregnant heifers), ICAR = inter-caruncular tissue (endometrial tissue not including caruncles; taken from the horn containing the conceptus in pregnant heifers). 3Gene of Interest = GLUT1 and GLUT3- Glucose transporter solute carrier family 2 member 1 and 3. SLC7A1, SLC7A2, and SLC7A3- Cationic amino acid transporters of arginine and lysine, solute carrier family 7 member 1, 2, and 3. 4The most conservative SEM was used within gene. 5Probability values for effect of d on level of expression of individual genes. For those with a value 0.0001, values are <0.0001. a-e Means within a row without a common superscript differ (P < 0.05).
47

Proceedings, Western Section, American Society of Animal Science
Vol. 66, 2015
Effect of chronic administration of oxytocin on corpus luteum function in cycling mares1
K.C. Parkinson, D.K. Vanderwall,2 J. Rigas and L. Sweat
Department of Animal, Dairy, and Veterinary Sciences, Utah State University, Logan, Utah 84322 ABSTRACT: The objective of this study was to determine if administration of 60 units of oxytocin once daily for 29 days, regardless of when treatment was initiated during the estrous cycle, would induce prolonged corpus luteum (CL) function in cycling mares. Mares were randomly assigned to two groups: 1) saline-treated control (n=7) and 2) oxytocin-treated (n=9). Control mares received 3 cc saline and oxytocin-treated mares received 60 units (3 cc) of oxytocin intramuscularly for 29 consecutive days. Treatment was initiated in all mares on the same day (d 1), independent of the day of the cycle. Jugular blood samples for determination of progesterone concentration were collected three times weekly (M, W, F) for 21 days before treatment was initiated. Beginning on the first day of treatment, blood samples were collected daily for seven days, three times weekly for the remainder of the treatment period, and then three times weekly for 45 days after the last treatment. Mares were considered to have prolonged CL function if serum progesterone remained >1.0 ng/mL for at least 30 days during/after the treatment period. The proportion of mares with prolonged CL function was higher in the oxytocin-treated group compared to the saline-treated group (7/9 vs. 1/7, respectively; P<0.05). Three of the seven oxytocin-treated mares that developed prolonged CL function initially underwent luteolysis within 3 to 7 days of the start of oxytocin treatment, and then developed prolonged CL function following the subsequent ovulation during the treatment period. In the other four oxytocin-treated mares that developed prolonged CL function, progesterone remained >1.0 ng/mL throughout the treatment period and into the post-treatment period. All mares with prolonged CL function maintained elevated progesterone concentrations through at least day 56 of the study. Key words: corpus luteum, estrus, equine, luteolysis, mare, oxytocin
1This work was supported by the Utah Agricultural Experiment Station, Utah State University, Logan, Utah 84322. Appreciation is expressed to Bettina Conrad and Sherrie Petty for technical assistance. 2Corresponding author’s e-mail address: [email protected]
INTRODUCTION
A common complaint of veterinarians, horse owners and trainers is the variable behavior and performance of mares that is related to the estrous cycle (Jorgensen et al., 1996). Because of that, suppression of estrous behavior has become a common practice in performance mares and the most widely used methods include: 1) administration of exogenous progesterone/progestins and 2) extending the duration of corpus luteum (CL) function, which allows continued secretion of endogenous progesterone to block estrus (Vanderwall and Nie, 2011). Recently, administration of oxytocin has been shown to be an effective method of prolonging CL function, since administration of 60 units of oxytocin once daily on days 7 to 14 after ovulation induced prolonged CL function in over 60% of treated mares (Vanderwall et al., 2012). However, the need to know the exact day of ovulation is a drawback to the current oxytocin protocol. We hypothesized that by extending the duration of oxytocin administration, treatment could be initiated at any point during the estrous cycle (i.e., without knowing the day of ovulation) and still effectively prolong CL function. Therefore, the objective of this study was to determine if treating mares with oxytocin daily for 29 days would result in prolonged CL function.
MATERIALS AND METHODS
Animals
This study was conducted in the Northern Hemisphere under natural photoperiod using 17 Quarter Horse-type mares that were between 2 and 17 years old and weighed 300 to 500 kg. All animal procedures were approved and conducted following the guidelines of the Utah State University Institutional Animal Care and Use Committee (IACUC). The reproductive tract of each mare was examined with transrectal palpation and ultrasound in April and/or May to confirm that spontaneous seasonal ovulatory activity had commenced (i.e., a corpus luteum was identified). All of the mares had ovulated by late May. Prior to the study, no reproductive hormones were administered to any of the mares to regulate their cyclical reproductive activity (i.e., they were allowed to cycle spontaneously without hormonal manipulation). After confirming spontaneous ovulatory activity in all of the mares, no further reproductive examinations were performed for the duration of the study period.
48
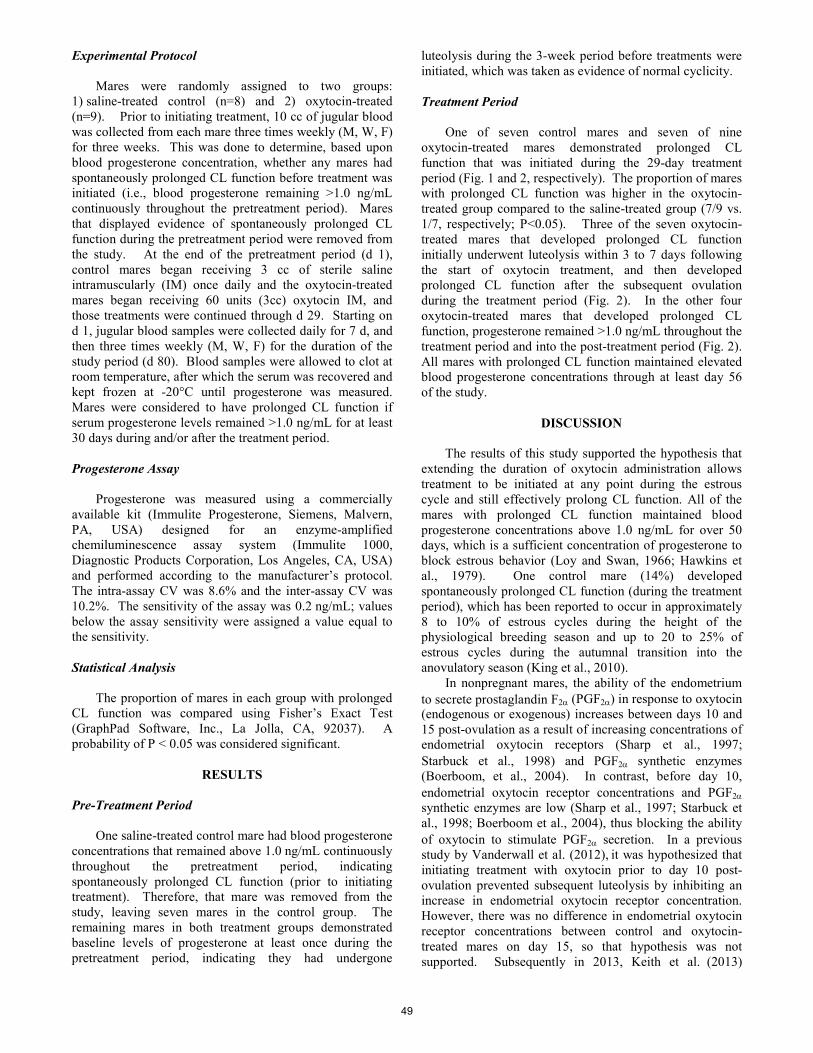
Experimental Protocol
Mares were randomly assigned to two groups: 1) saline-treated control (n=8) and 2) oxytocin-treated (n=9). Prior to initiating treatment, 10 cc of jugular blood was collected from each mare three times weekly (M, W, F) for three weeks. This was done to determine, based upon blood progesterone concentration, whether any mares had spontaneously prolonged CL function before treatment was initiated (i.e., blood progesterone remaining >1.0 ng/mL continuously throughout the pretreatment period). Mares that displayed evidence of spontaneously prolonged CL function during the pretreatment period were removed from the study. At the end of the pretreatment period (d 1), control mares began receiving 3 cc of sterile saline intramuscularly (IM) once daily and the oxytocin-treated mares began receiving 60 units (3cc) oxytocin IM, and those treatments were continued through d 29. Starting on d 1, jugular blood samples were collected daily for 7 d, and then three times weekly (M, W, F) for the duration of the study period (d 80). Blood samples were allowed to clot at room temperature, after which the serum was recovered and kept frozen at -20°C until progesterone was measured. Mares were considered to have prolonged CL function if serum progesterone levels remained >1.0 ng/mL for at least 30 days during and/or after the treatment period. Progesterone Assay
Progesterone was measured using a commercially available kit (Immulite Progesterone, Siemens, Malvern, PA, USA) designed for an enzyme-amplified chemiluminescence assay system (Immulite 1000, Diagnostic Products Corporation, Los Angeles, CA, USA) and performed according to the manufacturer’s protocol. The intra-assay CV was 8.6% and the inter-assay CV was 10.2%. The sensitivity of the assay was 0.2 ng/mL; values below the assay sensitivity were assigned a value equal to the sensitivity. Statistical Analysis
The proportion of mares in each group with prolonged CL function was compared using Fisher’s Exact Test (GraphPad Software, Inc., La Jolla, CA, 92037). A probability of P < 0.05 was considered significant.
RESULTS Pre-Treatment Period
One saline-treated control mare had blood progesterone concentrations that remained above 1.0 ng/mL continuously throughout the pretreatment period, indicating spontaneously prolonged CL function (prior to initiating treatment). Therefore, that mare was removed from the study, leaving seven mares in the control group. The remaining mares in both treatment groups demonstrated baseline levels of progesterone at least once during the pretreatment period, indicating they had undergone
luteolysis during the 3-week period before treatments were initiated, which was taken as evidence of normal cyclicity. Treatment Period
One of seven control mares and seven of nine oxytocin-treated mares demonstrated prolonged CL function that was initiated during the 29-day treatment period (Fig. 1 and 2, respectively). The proportion of mares with prolonged CL function was higher in the oxytocin-treated group compared to the saline-treated group (7/9 vs. 1/7, respectively; P<0.05). Three of the seven oxytocin-treated mares that developed prolonged CL function initially underwent luteolysis within 3 to 7 days following the start of oxytocin treatment, and then developed prolonged CL function after the subsequent ovulation during the treatment period (Fig. 2). In the other four oxytocin-treated mares that developed prolonged CL function, progesterone remained >1.0 ng/mL throughout the treatment period and into the post-treatment period (Fig. 2). All mares with prolonged CL function maintained elevated blood progesterone concentrations through at least day 56 of the study.
DISCUSSION
The results of this study supported the hypothesis that extending the duration of oxytocin administration allows treatment to be initiated at any point during the estrous cycle and still effectively prolong CL function. All of the mares with prolonged CL function maintained blood progesterone concentrations above 1.0 ng/mL for over 50 days, which is a sufficient concentration of progesterone to block estrous behavior (Loy and Swan, 1966; Hawkins et al., 1979). One control mare (14%) developed spontaneously prolonged CL function (during the treatment period), which has been reported to occur in approximately 8 to 10% of estrous cycles during the height of the physiological breeding season and up to 20 to 25% of estrous cycles during the autumnal transition into the anovulatory season (King et al., 2010).
In nonpregnant mares, the ability of the endometrium to secrete prostaglandin F2α (PGF2α) in response to oxytocin (endogenous or exogenous) increases between days 10 and 15 post-ovulation as a result of increasing concentrations of endometrial oxytocin receptors (Sharp et al., 1997; Starbuck et al., 1998) and PGF2α synthetic enzymes (Boerboom, et al., 2004). In contrast, before day 10, endometrial oxytocin receptor concentrations and PGF2α synthetic enzymes are low (Sharp et al., 1997; Starbuck et al., 1998; Boerboom et al., 2004), thus blocking the ability of oxytocin to stimulate PGF2α secretion. In a previous study by Vanderwall et al. (2012), it was hypothesized that initiating treatment with oxytocin prior to day 10 post-ovulation prevented subsequent luteolysis by inhibiting an increase in endometrial oxytocin receptor concentration. However, there was no difference in endometrial oxytocin receptor concentrations between control and oxytocin-treated mares on day 15, so that hypothesis was not supported. Subsequently in 2013, Keith et al. (2013)
49

demonstrated that initiating oxytocin treatment prior to day 10 suppresses PGF2α secretion by preventing upregulation of endometrial gene expression of cyclooxygenase-2, the key regulatory enzyme in PGF2α synthesis/secretion that otherwise would be upregulated on days 14 to 15, allowing the onset of PGF2α secretion. Therefore, the anti-luteolytic effect of exogenous oxytocin occurs “downstream” from its receptor.
In an effort to simplify the oxytocin treatment protocol by eliminating the need for detection of ovulation, we extended the treatment period to 29 days and initiated treatment randomly during the estrous cycle. This was done with the anticipation that treatment would likely be initiated in some mares on days 10 to 15, which as described above, would induce PGF2α secretion causing luteolysis to occur. Therefore, the 29-day period of treatment was designed to ensure continued treatment of mares in which luteolysis was induced for a long enough period such that after they underwent luteolysis, they would still be receiving oxytocin on the critical days (days 7 to 14) of the following cycle. As these results demonstrated, three of the seven mares that displayed prolonged luteal function initially underwent luteolysis and then subsequently developed prolonged CL function. The other four mares in the treatment group that had prolonged CL function must have received oxytocin treatments beginning prior to day 10 of their cycle, since they did not undergo luteolysis immediately following the start of oxytocin treatment.
In conclusion, the results of this study demonstrated the effectiveness of chronic oxytocin treatment, initiated randomly during the estrous cycle, for prolonging CL function CL in mares.
IMPLICATIONS
Treatment of mares with exogenous oxytocin for 29
consecutive days provides an effective method of prolonging CL function to suppress estrus in mares without the need for detection of ovulation. Therefore, horse trainers, owners, and veterinarians will benefit from this simplified method of suppressing estrus in mares.
LITERATURE CITED Atli, M. O., E. Kurar, S. A. Kayis, S. Aslan, A. Semacan, S.
Celik, and A. Guzeloglu. 2010. Evaluation of genes involved in prostaglandin action in equine endometrium during estrous cycle and early pregnancy. Anim. Reprod. Sci. 122:124-132.
Boerboom, D., K. A. Brown, D. Vaillancourt, P. Poitras, A. K. Goff, K. Watanabe, M. Dore, and J. Sirois. 2004. Expression of key prostaglandin synthases in equine endometrium during late diestrus and early pregnancy. Biol. Reprod. 70:391-399.
Ealy, A. D., M. L. Eroh, and D. C. Sharp, III. 2010. Prostaglandin H synthase Type 2 is differentially expressed in endometrium based on pregnancy status in pony mares and responds to oxytocin and conceptus secretions in explant culture. Anim. Reprod. Sci. 117:99-105.
Hawkins, D. L., D. P. Neely, and G. H. Stabenfeldt. 1979. Plasma progesterone concentrations derived from the administration of exogenous progesterone to ovariectomized mares. J. Reprod. Fertil. Suppl. 27:211-216.
Jorgensen, J. S., S. Vivrette, M. Correa, and R. A. Mansmann. 1996. Significance of the estrous cycle on athletic performance in mares. Proc. Annu. Conv. Am. Assoc. Equine Pract. 42:98-100.
Keith, L., B. A. Ball, K. Scoggin, A. Esteller-Vico, E. M. Woodward, M. H. Troedsson, and E. L. Squires. 2013. Diestrus administration of oxytocin prolongs luteal maintenance and reduces plasma PGFM concentrations and endometrial COX-2 expression in mares. Theriogenology 79:616-624.
King, S. S., B. L. Douglas, J. F. Roser, W. J. Silvia, and K. L. Jones. 2010. Differential luteolytic function between the physiological breeding season, autumn transition and persistent winter cyclicity in the mare. Anim. Reprod. Sci. 117:232-240.
King, S. S., J. F. Roser, D. L. Cross, and K. L. Jones. 2008. Dopamine antagonist affects luteal function but not cyclicity during the autumn transition. J. Equine Vet. Sci. 28:345-350.
Loy, R. G. and S. M. Swan. 1966. Effects of exogenous progestogens on reproductive phenomena in mares. J. Anim. Sci. 25:821-826.
Sharp, D. C., M. J. Thatcher, M. E. Salute, and A. R. Fuchs. 1997. Relationship between endometrial oxytocin receptors and oxytocin- induced prostaglandin F2a release during the oestrous cycle and early pregnancy in pony mares. J. Reprod. Fertil. 109:137-144.
Starbuck, G. R., T. A. Stout, G. E. Lamming, W. R. Allen, and A. P. Flint. 1998. Endometrial oxytocin receptor and uterine prostaglandin secretion in mares during the oestrous cycle and early pregnancy. J. Reprod. Fertil. 113:173-179.
Vanderwall, D. K. and G. J. Nie. 2011. Estrus Suppression. In: Equine Reproduction. A. O. McKinnon, E. L. Squires, W. E. Vaala, and D. D. Varner, eds. Wiley-Blackwell, Oxford. p. 1845-1853.
Vanderwall, D. K., D. M. Rasmussen, K. G. Carnahan, and T. L. Davis. 2012. Effect of administration of oxytocin during diestrus on corpus luteum function and endometrial oxytocin receptor concentration in cycling mares. J. Equine Vet. Sci. 32:536-541.
50
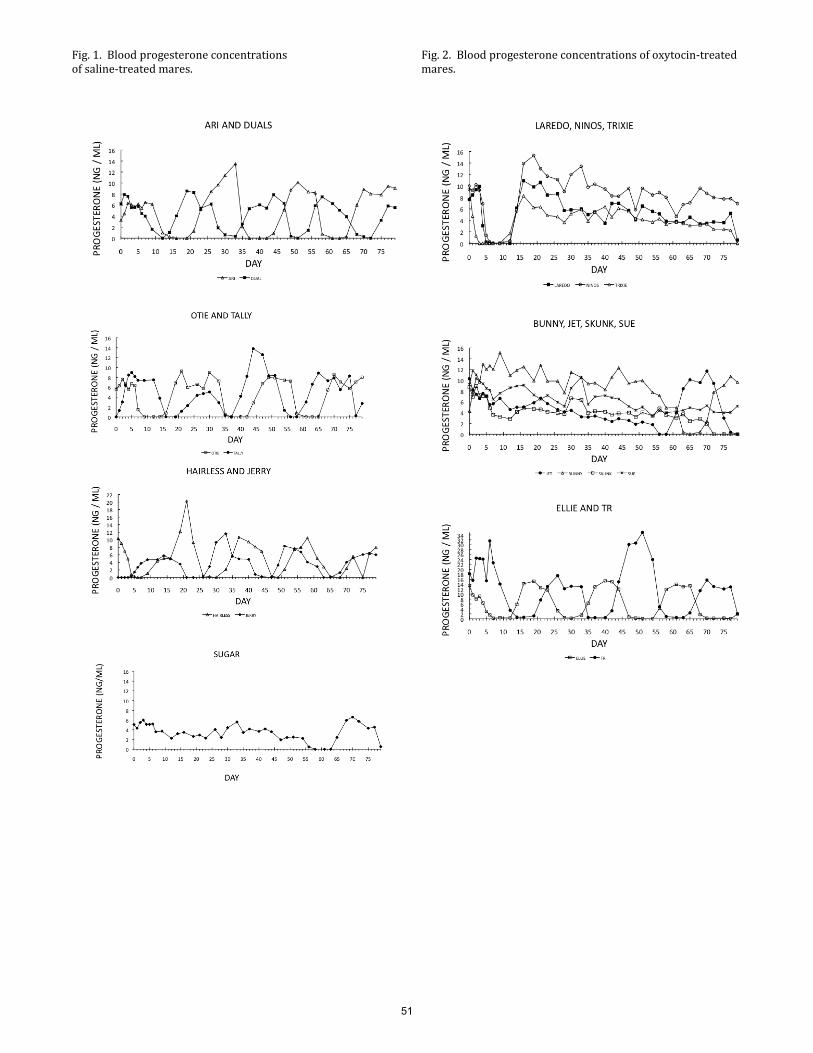
Fig. 1. Blood progesterone concentrations of saline-treated mares.
Fig. 2. Blood progesterone concentrations of oxytocin-treated mares.
51
Proceedings, Western Section, American Society of Animal Science
Vol. 66, 2015
Inhibition of chemokine receptor four (CXCR4) signaling in vivo suppresses trophoblast invasion during early gestation in sheep1
K.E. Quinn, S.Z. Prosser and R.L. Ashley2
Department of Animal and Range Sciences, New Mexico State University, Las Cruces, NM
1 Authors acknowledge ANRS graduate students and Dr. Kim Kane for assistance in tissue collection and surgical procedures 2 Corresponding author: [email protected]
52
ABSTRACT: The aim of this study was to further elucidate the roles of chemokine ligand twelve (CXCL12) and its receptor, chemokine receptor four (CXCR4) in vivo during early gestation by using the CXCR4 antagonist, AMD3100. We hypothesized inhibition of CXCR4 signaling will disrupt fetal attachment and decrease vascular endothelial growth factor (VEGF) expression in uterine tissue. Mini-osmotic pumps containing PBS (control, n = 7) or AMD3100 (treatment, n = 8) were surgically installed on d 12 of gestation and treatment was delivered directly into the lumen via a catheter. Uterine tissue was collected on d 23 of gestation and mRNA, protein, and cellular morphology changes were analyzed. In caruncle tissue, mRNA for CXCR4 decreased (P < 0.05) and VEGF had a tendency (P = 0.06) to decrease in treated ewes compared to control. Similarly, protein levels for VEGF decreased (P < 0.05) in caruncle tissue of treated ewes. In control ewes, the uterine luminal epithelium changed to squamous appearance, signifying proper cell morphology and attachment initiation during gestation. However, treated ewes had limited luminal epithelium cell morphology changes and still appeared columnar. The decrease of CXCR4 mRNA and VEGF protein in caruncle tissue of treated ewes suggests that CXCR4 plays an important role in maternal-fetal communication and possibly contributes to fetal attachment and subsequent placentation. A decrease in CXCR4 signaling may lead to poor pregnancy outcomes, such as impaired trophoblast attachment and compromised embryonic growth. A better understanding of CXCL12-CXCR4 signaling during early gestation, may lead to novel applied techniques to improve embryo survival during early gestation in livestock.
Key words: CXCL12, CXCR4, placentation, pregnancy, trophoblast, VEGF
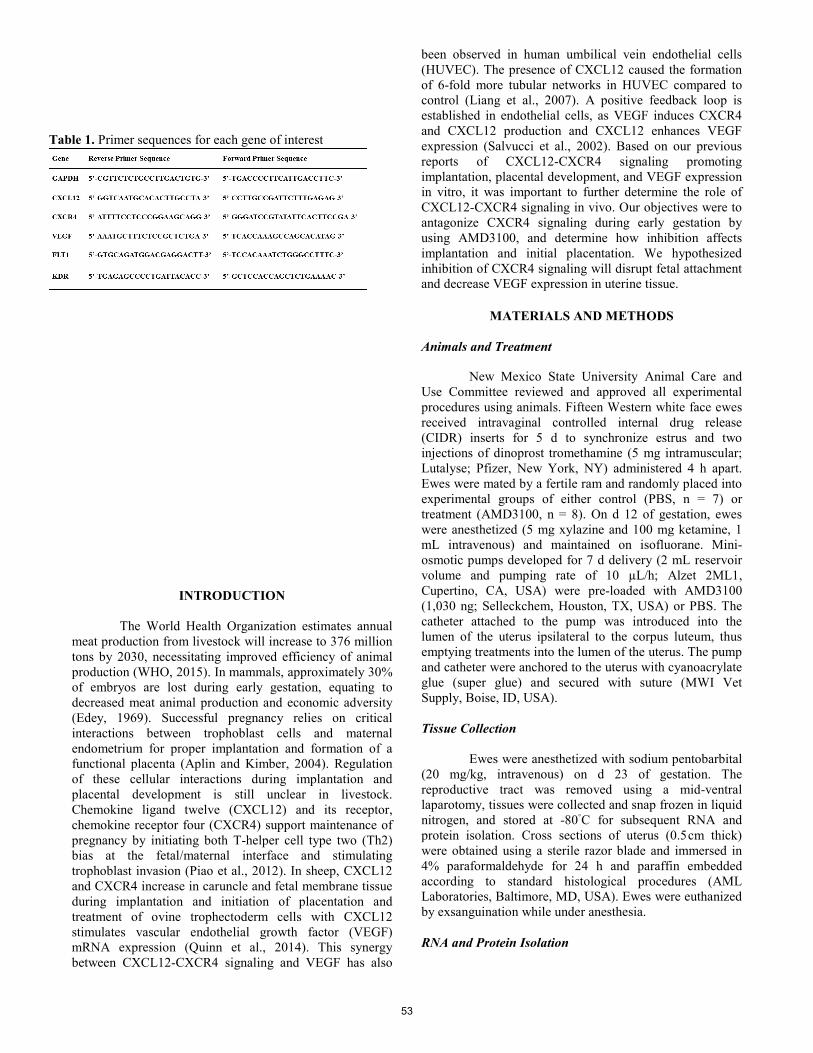
INTRODUCTION
The World Health Organization estimates annual meat production from livestock will increase to 376 million tons by 2030, necessitating improved efficiency of animal production (WHO, 2015). In mammals, approximately 30% of embryos are lost during early gestation, equating to decreased meat animal production and economic adversity (Edey, 1969). Successful pregnancy relies on critical interactions between trophoblast cells and maternal endometrium for proper implantation and formation of a functional placenta (Aplin and Kimber, 2004). Regulation of these cellular interactions during implantation and placental development is still unclear in livestock. Chemokine ligand twelve (CXCL12) and its receptor, chemokine receptor four (CXCR4) support maintenance of pregnancy by initiating both T-helper cell type two (Th2) bias at the fetal/maternal interface and stimulating trophoblast invasion (Piao et al., 2012). In sheep, CXCL12 and CXCR4 increase in caruncle and fetal membrane tissue during implantation and initiation of placentation and treatment of ovine trophectoderm cells with CXCL12 stimulates vascular endothelial growth factor (VEGF) mRNA expression (Quinn et al., 2014). This synergy between CXCL12-CXCR4 signaling and VEGF has also
been observed in human umbilical vein endothelial cells (HUVEC). The presence of CXCL12 caused the formation of 6-fold more tubular networks in HUVEC compared to control (Liang et al., 2007). A positive feedback loop is established in endothelial cells, as VEGF induces CXCR4 and CXCL12 production and CXCL12 enhances VEGF expression (Salvucci et al., 2002). Based on our previous reports of CXCL12-CXCR4 signaling promoting implantation, placental development, and VEGF expression in vitro, it was important to further determine the role of CXCL12-CXCR4 signaling in vivo. Our objectives were to antagonize CXCR4 signaling during early gestation by using AMD3100, and determine how inhibition affects implantation and initial placentation. We hypothesized inhibition of CXCR4 signaling will disrupt fetal attachment and decrease VEGF expression in uterine tissue.
MATERIALS AND METHODS
Animals and Treatment
New Mexico State University Animal Care and Use Committee reviewed and approved all experimental procedures using animals. Fifteen Western white face ewes received intravaginal controlled internal drug release (CIDR) inserts for 5 d to synchronize estrus and two injections of dinoprost tromethamine (5 mg intramuscular; Lutalyse; Pfizer, New York, NY) administered 4 h apart. Ewes were mated by a fertile ram and randomly placed into experimental groups of either control (PBS, n = 7) or treatment (AMD3100, n = 8). On d 12 of gestation, ewes were anesthetized (5 mg xylazine and 100 mg ketamine, 1 mL intravenous) and maintained on isofluorane. Mini-osmotic pumps developed for 7 d delivery (2 mL reservoir volume and pumping rate of 10 µL/h; Alzet 2ML1, Cupertino, CA, USA) were pre-loaded with AMD3100 (1,030 ng; Selleckchem, Houston, TX, USA) or PBS. The catheter attached to the pump was introduced into the lumen of the uterus ipsilateral to the corpus luteum, thus emptying treatments into the lumen of the uterus. The pump and catheter were anchored to the uterus with cyanoacrylate glue (super glue) and secured with suture (MWI Vet Supply, Boise, ID, USA). Tissue Collection
Ewes were anesthetized with sodium pentobarbital (20 mg/kg, intravenous) on d 23 of gestation. The reproductive tract was removed using a mid-ventral laparotomy, tissues were collected and snap frozen in liquid nitrogen, and stored at -80◦C for subsequent RNA and protein isolation. Cross sections of uterus (0.5 cm thick) were obtained using a sterile razor blade and immersed in 4% paraformaldehyde for 24 h and paraffin embedded according to standard histological procedures (AML Laboratories, Baltimore, MD, USA). Ewes were euthanized by exsanguination while under anesthesia. RNA and Protein Isolation
53
Table 1. Primer sequences for each gene of interest
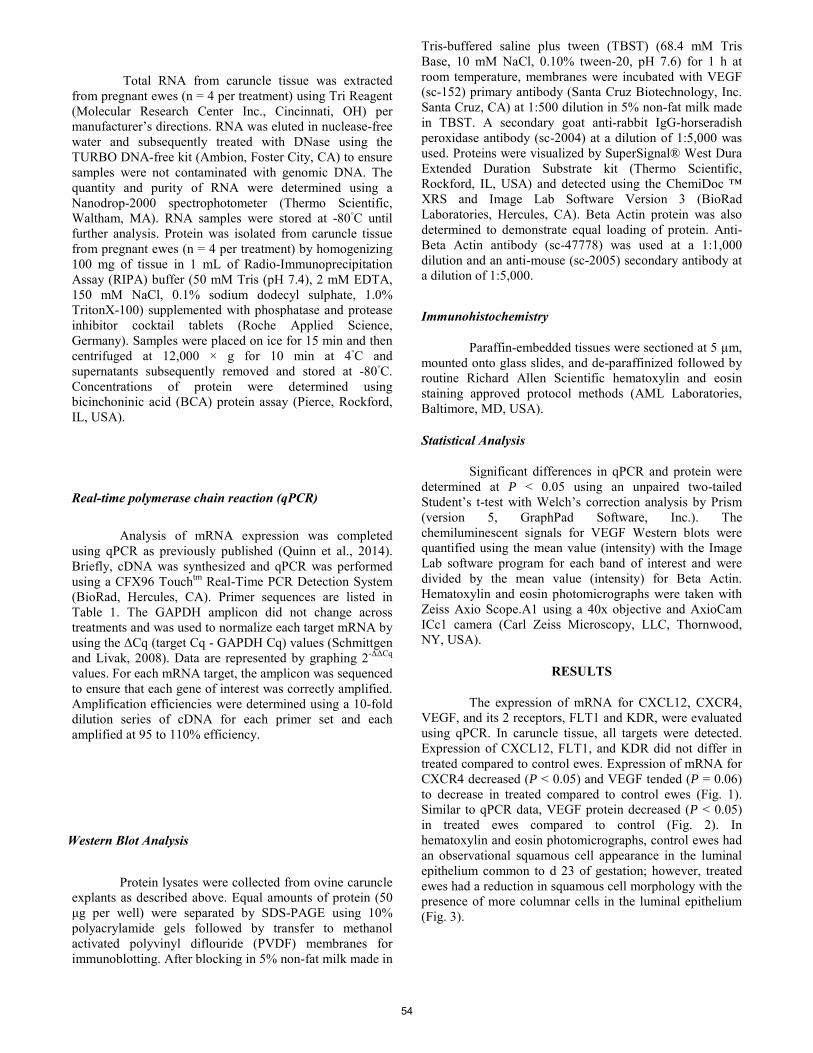
Total RNA from caruncle tissue was extracted from pregnant ewes (n = 4 per treatment) using Tri Reagent (Molecular Research Center Inc., Cincinnati, OH) per manufacturer’s directions. RNA was eluted in nuclease-free water and subsequently treated with DNase using the TURBO DNA-free kit (Ambion, Foster City, CA) to ensure samples were not contaminated with genomic DNA. The quantity and purity of RNA were determined using a Nanodrop-2000 spectrophotometer (Thermo Scientific, Waltham, MA). RNA samples were stored at -80◦C until further analysis. Protein was isolated from caruncle tissue from pregnant ewes (n = 4 per treatment) by homogenizing 100 mg of tissue in 1 mL of Radio-Immunoprecipitation Assay (RIPA) buffer (50 mM Tris (pH 7.4), 2 mM EDTA, 150 mM NaCl, 0.1% sodium dodecyl sulphate, 1.0% TritonX-100) supplemented with phosphatase and protease inhibitor cocktail tablets (Roche Applied Science, Germany). Samples were placed on ice for 15 min and then centrifuged at 12,000 × g for 10 min at 4◦C and supernatants subsequently removed and stored at -80◦C. Concentrations of protein were determined using bicinchoninic acid (BCA) protein assay (Pierce, Rockford, IL, USA).
Real-time polymerase chain reaction (qPCR)
Analysis of mRNA expression was completed using qPCR as previously published (Quinn et al., 2014). Briefly, cDNA was synthesized and qPCR was performed using a CFX96 Touchtm Real-Time PCR Detection System (BioRad, Hercules, CA). Primer sequences are listed in Table 1. The GAPDH amplicon did not change across treatments and was used to normalize each target mRNA by using the ΔCq (target Cq - GAPDH Cq) values (Schmittgen and Livak, 2008). Data are represented by graphing 2-ΔΔCq values. For each mRNA target, the amplicon was sequenced to ensure that each gene of interest was correctly amplified. Amplification efficiencies were determined using a 10-fold dilution series of cDNA for each primer set and each amplified at 95 to 110% efficiency.
Western Blot Analysis
Protein lysates were collected from ovine caruncle explants as described above. Equal amounts of protein (50 μg per well) were separated by SDS-PAGE using 10% polyacrylamide gels followed by transfer to methanol activated polyvinyl diflouride (PVDF) membranes for immunoblotting. After blocking in 5% non-fat milk made in
Tris-buffered saline plus tween (TBST) (68.4 mM Tris Base, 10 mM NaCl, 0.10% tween-20, pH 7.6) for 1 h at room temperature, membranes were incubated with VEGF (sc-152) primary antibody (Santa Cruz Biotechnology, Inc. Santa Cruz, CA) at 1:500 dilution in 5% non-fat milk made in TBST. A secondary goat anti-rabbit IgG-horseradish peroxidase antibody (sc-2004) at a dilution of 1:5,000 was used. Proteins were visualized by SuperSignal® West Dura Extended Duration Substrate kit (Thermo Scientific, Rockford, IL, USA) and detected using the ChemiDoc ™ XRS and Image Lab Software Version 3 (BioRad Laboratories, Hercules, CA). Beta Actin protein was also determined to demonstrate equal loading of protein. Anti-Beta Actin antibody (sc-47778) was used at a 1:1,000 dilution and an anti-mouse (sc-2005) secondary antibody at a dilution of 1:5,000.
Immunohistochemistry
Paraffin-embedded tissues were sectioned at 5 µm, mounted onto glass slides, and de-paraffinized followed by routine Richard Allen Scientific hematoxylin and eosin staining approved protocol methods (AML Laboratories, Baltimore, MD, USA). Statistical Analysis
Significant differences in qPCR and protein were determined at P < 0.05 using an unpaired two-tailed Student’s t-test with Welch’s correction analysis by Prism (version 5, GraphPad Software, Inc.). The chemiluminescent signals for VEGF Western blots were quantified using the mean value (intensity) with the Image Lab software program for each band of interest and were divided by the mean value (intensity) for Beta Actin. Hematoxylin and eosin photomicrographs were taken with Zeiss Axio Scope.A1 using a 40x objective and AxioCam ICc1 camera (Carl Zeiss Microscopy, LLC, Thornwood, NY, USA).
RESULTS
The expression of mRNA for CXCL12, CXCR4,
VEGF, and its 2 receptors, FLT1 and KDR, were evaluated using qPCR. In caruncle tissue, all targets were detected. Expression of CXCL12, FLT1, and KDR did not differ in treated compared to control ewes. Expression of mRNA for CXCR4 decreased (P < 0.05) and VEGF tended (P = 0.06) to decrease in treated compared to control ewes (Fig. 1). Similar to qPCR data, VEGF protein decreased (P < 0.05) in treated ewes compared to control (Fig. 2). In hematoxylin and eosin photomicrographs, control ewes had an observational squamous cell appearance in the luminal epithelium common to d 23 of gestation; however, treated ewes had a reduction in squamous cell morphology with the presence of more columnar cells in the luminal epithelium (Fig. 3).
54
emueller
Typewritten Text
emueller
Typewritten Text
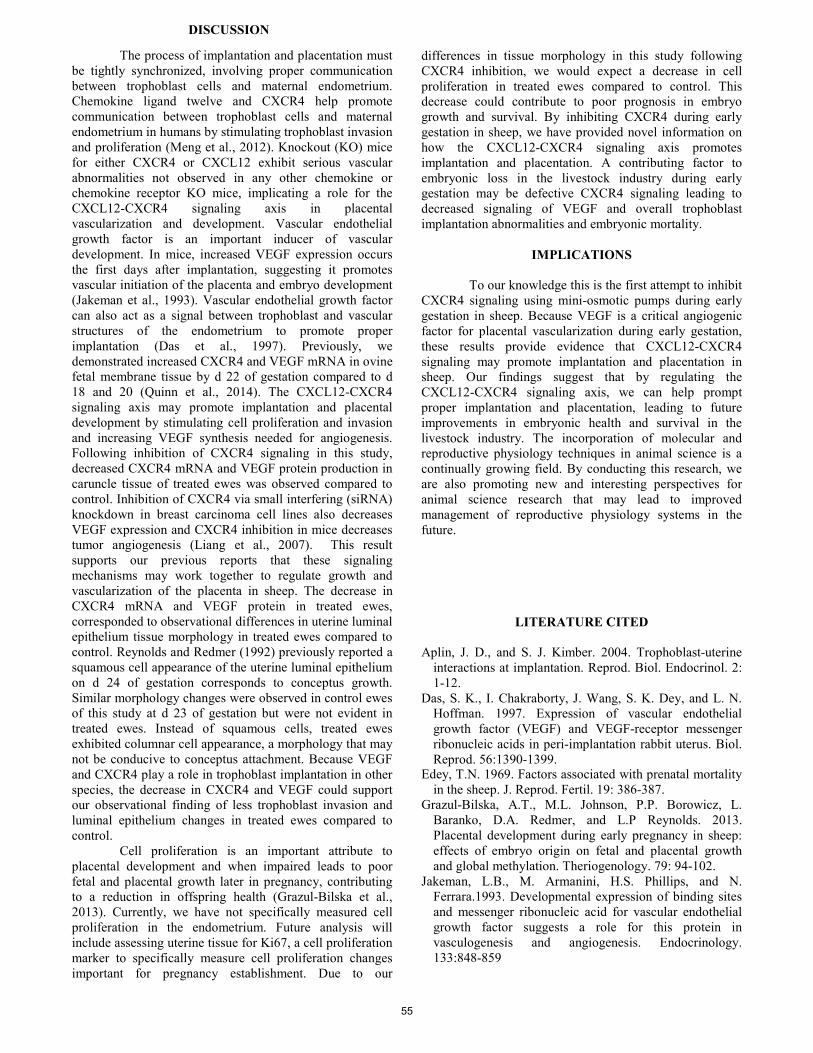
The process of implantation and placentation must be tightly synchronized, involving proper communication between trophoblast cells and maternal endometrium. Chemokine ligand twelve and CXCR4 help promote communication between trophoblast cells and maternal endometrium in humans by stimulating trophoblast invasion and proliferation (Meng et al., 2012). Knockout (KO) mice for either CXCR4 or CXCL12 exhibit serious vascular abnormalities not observed in any other chemokine or chemokine receptor KO mice, implicating a role for the CXCL12-CXCR4 signaling axis in placental vascularization and development. Vascular endothelial growth factor is an important inducer of vascular development. In mice, increased VEGF expression occurs the first days after implantation, suggesting it promotes vascular initiation of the placenta and embryo development (Jakeman et al., 1993). Vascular endothelial growth factor can also act as a signal between trophoblast and vascular structures of the endometrium to promote proper implantation (Das et al., 1997). Previously, we demonstrated increased CXCR4 and VEGF mRNA in ovine fetal membrane tissue by d 22 of gestation compared to d 18 and 20 (Quinn et al., 2014). The CXCL12-CXCR4 signaling axis may promote implantation and placental development by stimulating cell proliferation and invasion and increasing VEGF synthesis needed for angiogenesis. Following inhibition of CXCR4 signaling in this study, decreased CXCR4 mRNA and VEGF protein production in caruncle tissue of treated ewes was observed compared to control. Inhibition of CXCR4 via small interfering (siRNA) knockdown in breast carcinoma cell lines also decreases VEGF expression and CXCR4 inhibition in mice decreases tumor angiogenesis (Liang et al., 2007). This result supports our previous reports that these signaling mechanisms may work together to regulate growth and vascularization of the placenta in sheep. The decrease in CXCR4 mRNA and VEGF protein in treated ewes, corresponded to observational differences in uterine luminal epithelium tissue morphology in treated ewes compared to control. Reynolds and Redmer (1992) previously reported a squamous cell appearance of the uterine luminal epithelium on d 24 of gestation corresponds to conceptus growth. Similar morphology changes were observed in control ewes of this study at d 23 of gestation but were not evident in treated ewes. Instead of squamous cells, treated ewes exhibited columnar cell appearance, a morphology that may not be conducive to conceptus attachment. Because VEGF and CXCR4 play a role in trophoblast implantation in other species, the decrease in CXCR4 and VEGF could support our observational finding of less trophoblast invasion and luminal epithelium changes in treated ewes compared to control.
Cell proliferation is an important attribute to placental development and when impaired leads to poor fetal and placental growth later in pregnancy, contributing to a reduction in offspring health (Grazul-Bilska et al., 2013). Currently, we have not specifically measured cell proliferation in the endometrium. Future analysis will include assessing uterine tissue for Ki67, a cell proliferation marker to specifically measure cell proliferation changes important for pregnancy establishment. Due to our
differences in tissue morphology in this study following CXCR4 inhibition, we would expect a decrease in cell proliferation in treated ewes compared to control. This decrease could contribute to poor prognosis in embryo growth and survival. By inhibiting CXCR4 during early gestation in sheep, we have provided novel information on how the CXCL12-CXCR4 signaling axis promotes implantation and placentation. A contributing factor to embryonic loss in the livestock industry during early gestation may be defective CXCR4 signaling leading to decreased signaling of VEGF and overall trophoblast implantation abnormalities and embryonic mortality.
IMPLICATIONS
To our knowledge this is the first attempt to inhibit
CXCR4 signaling using mini-osmotic pumps during early gestation in sheep. Because VEGF is a critical angiogenic factor for placental vascularization during early gestation, these results provide evidence that CXCL12-CXCR4 signaling may promote implantation and placentation in sheep. Our findings suggest that by regulating the CXCL12-CXCR4 signaling axis, we can help prompt proper implantation and placentation, leading to future improvements in embryonic health and survival in the livestock industry. The incorporation of molecular and reproductive physiology techniques in animal science is a continually growing field. By conducting this research, we are also promoting new and interesting perspectives for animal science research that may lead to improved management of reproductive physiology systems in the future.
LITERATURE CITED
Aplin, J. D., and S. J. Kimber. 2004. Trophoblast-uterine interactions at implantation. Reprod. Biol. Endocrinol. 2: 1-12.
Das, S. K., I. Chakraborty, J. Wang, S. K. Dey, and L. N. Hoffman. 1997. Expression of vascular endothelial growth factor (VEGF) and VEGF-receptor messenger ribonucleic acids in peri-implantation rabbit uterus. Biol. Reprod. 56:1390-1399.
Edey, T.N. 1969. Factors associated with prenatal mortality in the sheep. J. Reprod. Fertil. 19: 386-387.
Grazul-Bilska, A.T., M.L. Johnson, P.P. Borowicz, L. Baranko, D.A. Redmer, and L.P Reynolds. 2013. Placental development during early pregnancy in sheep: effects of embryo origin on fetal and placental growth and global methylation. Theriogenology. 79: 94-102.
Jakeman, L.B., M. Armanini, H.S. Phillips, and N. Ferrara.1993. Developmental expression of binding sites and messenger ribonucleic acid for vascular endothelial growth factor suggests a role for this protein in vasculogenesis and angiogenesis. Endocrinology. 133:848-859
55
DISCUSSION
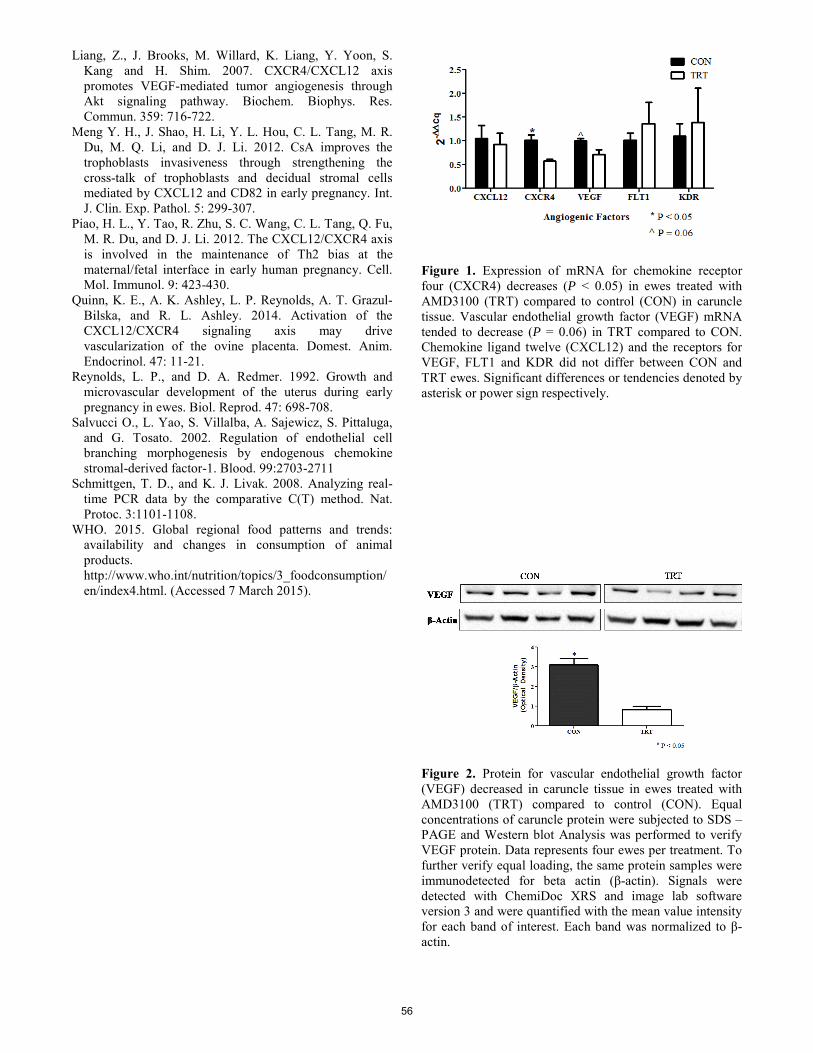
Liang, Z., J. Brooks, M. Willard, K. Liang, Y. Yoon, S. Kang and H. Shim. 2007. CXCR4/CXCL12 axis promotes VEGF-mediated tumor angiogenesis through Akt signaling pathway. Biochem. Biophys. Res. Commun. 359: 716-722.
Meng Y. H., J. Shao, H. Li, Y. L. Hou, C. L. Tang, M. R. Du, M. Q. Li, and D. J. Li. 2012. CsA improves the trophoblasts invasiveness through strengthening the cross-talk of trophoblasts and decidual stromal cells mediated by CXCL12 and CD82 in early pregnancy. Int. J. Clin. Exp. Pathol. 5: 299-307.
Piao, H. L., Y. Tao, R. Zhu, S. C. Wang, C. L. Tang, Q. Fu, M. R. Du, and D. J. Li. 2012. The CXCL12/CXCR4 axis is involved in the maintenance of Th2 bias at the maternal/fetal interface in early human pregnancy. Cell. Mol. Immunol. 9: 423-430.
Quinn, K. E., A. K. Ashley, L. P. Reynolds, A. T. Grazul-Bilska, and R. L. Ashley. 2014. Activation of the CXCL12/CXCR4 signaling axis may drive vascularization of the ovine placenta. Domest. Anim. Endocrinol. 47: 11-21.
Reynolds, L. P., and D. A. Redmer. 1992. Growth and microvascular development of the uterus during early pregnancy in ewes. Biol. Reprod. 47: 698-708.
Salvucci O., L. Yao, S. Villalba, A. Sajewicz, S. Pittaluga, and G. Tosato. 2002. Regulation of endothelial cell branching morphogenesis by endogenous chemokine stromal-derived factor-1. Blood. 99:2703-2711
Schmittgen, T. D., and K. J. Livak. 2008. Analyzing real-time PCR data by the comparative C(T) method. Nat. Protoc. 3:1101-1108.
WHO. 2015. Global regional food patterns and trends: availability and changes in consumption of animal products. http://www.who.int/nutrition/topics/3_foodconsumption/en/index4.html. (Accessed 7 March 2015).
Figure 1. Expression of mRNA for chemokine receptor four (CXCR4) decreases (P < 0.05) in ewes treated with AMD3100 (TRT) compared to control (CON) in caruncle tissue. Vascular endothelial growth factor (VEGF) mRNA tended to decrease (P = 0.06) in TRT compared to CON. Chemokine ligand twelve (CXCL12) and the receptors for VEGF, FLT1 and KDR did not differ between CON and TRT ewes. Significant differences or tendencies denoted by asterisk or power sign respectively.
Figure 2. Protein for vascular endothelial growth factor (VEGF) decreased in caruncle tissue in ewes treated with AMD3100 (TRT) compared to control (CON). Equal concentrations of caruncle protein were subjected to SDS –PAGE and Western blot Analysis was performed to verify VEGF protein. Data represents four ewes per treatment. To further verify equal loading, the same protein samples were immunodetected for beta actin (β-actin). Signals were detected with ChemiDoc XRS and image lab software version 3 and were quantified with the mean value intensity for each band of interest. Each band was normalized to β-actin.
56
Figure 3. Representative images of hematoxylin and eosin staining in uterine tissue of control (A, CON, n = 3) and treated (B, TRT, n = 3) on d 23 of gestation. A cross section of uterine tissue with fetal membrane intact was imaged at the same exposure time using Zeiss Axio Scope.A1 with a 40x objective and AxioCam ICc1 camera (Carl Zeiss Microscopy, LLC, Thornwood, NY, USA). In CON ewes, there was a squamous appearance of luminal epithelium (arrows), but this appearance is not evident in TRT ewes. Trophoblast in each image is represented by arrow heads.
57
Proceedings, Western Section, American Society of Animal Science
Vol. 66, 2015
Intrauterine transfer of autologous interferon tau-primed peripheral blood mononuclear cells increases pregnancy rates after embryo transfer in cattle
J.L. Chase*, J.A. Hernandez Gifford*, T.L. Ott†, D.M. Hallford#, and C.A. Gifford*¹
*Department of Animal Science, Oklahoma State University, Stillwater, OK 74078
†Department of Animal Science, Pennsylvania State University, University Park, PA 16802 #Department of Animal and Range Sciences, New Mexico State University, Las Cruces, NM 88003
ABSTRACT: Early embryo loss costs livestock producers billions of dollars annually. As food production expands to meet future demand, reproductive efficiency of food animals will become even more important. Reproductive technologies are a valuable tool to rapidly expand genetics from superior animals, but fertilization failure and embryonic loss limits successful implementation of progressive reproductive strategies. Interferon-tau (IFNT) is the pregnancy recognition signal in ruminants and upregulates interferon-stimulated genes (ISG) in the endometrium, corpus luteum, and peripheral immune cells during early pregnancy. To understand mechanisms of pregnancy loss, much work has focused on conceptus-endometrial interactions. However, there is an increasing body of evidence demonstrating that IFNT affects maternal peripheral blood immune cells and that these immune cells play an active role in establishing and maintaining pregnancy. In women and cattle, transfer of autologous immune cells to the uterus increases pregnancy rates. The current experiment tested the hypothesis that, intrauterine transfer of autologous, IFNT-primed, peripheral blood mononuclear cells (PBMC) will improve pregnancy rates in cattle. Blood samples were collected at d 3 and PBMC were isolated utilizing Histopaque 1077 according to manufacturer’s recommendation. Twenty to 40 million cells were cultured overnight in the presence of 500 U/mL of IFNT followed by autologous intrauterine transfer (IMMUNE; n = 71) on d 4; controls received intrauterine infusion of saline (CONT; n = 50). On d 7, serum samples were collected for hormone analysis and embryos were transferred to all animals. Pregnancy was determined on d 30 by transrectal ultrasonography, and progesterone quantified by RIA. Progesterone concentrations were similar for IMMUNE (4.1 ± 0.33 ng/mL) and CONT (3.7 ± 0.33 ng/mL) and were not different between pregnant and open cows (P > 0.05). Pregnancy rate for IMMUNE was 76% (54/71) compared with 54% (27/50) for CONT (P < 0.05). Results indicate that progesterone concentrations at d 7 did not differ between treatment groups and transfer of autologous IFNT-primed PBMC improved pregnancy rates
after embryo transfer. These results illustrate that priming the maternal immune system resulted in enhanced pregnancy rates supporting the concept that immune function at the fetal-maternal interface affects pregnancy outcome. Keywords: embryo transfer, immune, pregnancy, uterus
INTRODUCTION
Global meat demand is expected to increase dramatically in the next 35 years (Alexandratos and Bruinsma, 2012). Livestock exhibit high fertilization rates, but embryo loss remains a challenge for efficient livestock production (McMillan, 1998). With future increasing pressure on livestock industries to become even more efficient, subfertility will be even more costly. Because early pregnancy loss significantly contributes to subfertility, reducing embryonic mortality will increase profitability and sustainability of livestock enterprises.
Pregnancy requires continued secretion of progesterone (P4) by the corpus luteum (CL). In ruminants, interferon-tau (IFNT) is the pregnancy recognition signal which blocks luteolytic pulses of prostaglandin-F2α (PGF2α; reviewed by Spencer and Bazer, 2004). To prepare the uterine environment for pregnancy, IFNT initiates complex signaling events (Bazer et al., 2010). Pregnancy increases interferon stimulated genes (ISG) in circulating immune cells in sheep (Yankey et al., 2001) and cattle (Han et al., 2006; Gifford et al., 2007). Recently, IFNT was detected in uterine venous blood (Oliveira et al., 2008) suggesting that it is responsible for increased ISG in circulating immune cells (Bott et al., 2010). The physiological significance of systemic responses to early pregnancy is unclear.
Immune adaption to pregnancy is not limited to suppressing immune response to the allogenic conceptus but immune cells may play an active role in establishing pregnancy (Kosaka et al., 2003). Women and cattle undergoing embryo transfer (ET) techniques exhibited increased pregnancy rates when immune cells were transferred to the uterus prior to ET (Yoshioka et al., 2006; Ideta et al., 2010). The objective of this study was to evaluate pregnancy rates in cattle that receive autologous, IFNT-primed intrauterine immune cells prior to ET. We hypothesize that intrauterine administration of immune cells will increase pregnancy rates in cattle undergoing ET.
Appreciation is expressed to Tucker Link, Dr. Josh Walker and the Kiamichi Link Ranch for use of facilities and cattle and to Dr. Fuller Bazer, Texas A&M University, Department of Animal Science, for the gift of Interferon-tau. ¹Corresponding author’s e-mail address: [email protected]
58
MATERIAL AND METHODS
Animals
All procedures were approved by Oklahoma State University Animal Care and Use Committee (protocol AG-14-28). Experiments were conducted at the Kiamichi Link Ranch, Finley, OK. One hundred twenty one Angus cows were used as embryo recipients. All recipient cattle were heat synchronized using a CIDR protocol. With respect to estrus (d 0), the CIDR (Zoetis, 1.38 g) was inserted at d -9 and removed at d -2; prostaglandin (Zoetis, 6 mL, 5 mg/mL) injection was administered i.m. Presence of healthy CL was confirmed by palpation, and freshly collected (n = 105) or in vitro fertilization derived (n = 16) embryos were randomly assigned to cows that received intrauterine administration of saline (CONT; n = 50) or intrauterine transfer of autologous IFNT-primed PBMC (IMMUNE; n = 71). Details of PBMC isolation and administration are described below. Embryos were transferred by a professional embryologist to the uterine horn ipsilateral to the CL on d 7, and blood samples were collected and serum stored frozen for P4 analysis. Pregnancy was confirmed by transrectal ultrasonography at d 30.
For donor cows, a CIDR (Zoetis, 1.38 g) was inserted at d -12 with respect to estrus. Decreasing injections of FSH (Bioniche Animal Health, 400 mg/mL) were administered between d -8 and d -2. Either Estrumate or Lutalyse (Merck Animal Health, 2.3 mL, 250 mg/mL; Zoetis, 6 mL, 5 mg/mL) was given on d -3 and d -4; CIDR was removed d -4. Cows were inseminated, 12 to 16 h after the onset of estrus with 2 units of semen. A second service was conducted at 20 to 24 h with 1 unit of semen and an option of a third service at 30 to 36 h if cows displayed standing heat at the second service.
Peripheral Blood Mononuclear Cell Isolation and Culture Peripheral blood mononuclear cells were isolated and treated with 500 U/ml IFNT, which approximates concentrations measured in the uterine vein of early pregnant cows (Oliveira et al., 2008). To ensure culture conditions stimulated ISG, PBMC were collected and cultured as described below. Ten million PBMC were collected into 1 mL of Trizol (Life Technologies, Carlsbad, CA) before and after culture for 24 h with 500 U/mL of IFNT. Total RNA was extracted according to manufacturer’s recommendation. Steady-state mRNA abundance of interferon stimulated gene-15 (ISG15) were analyzed utilizing qRT-PCR as previously described (Gifford et al., 2007).
Three days after estrus, 20 mL of blood was collected into EDTA tubes for PBMC isolation. Blood was mixed with 20 mL of RPMI 1640 (SigmaAldrich, St. Louis, MO) medium and gently layered over 10 mL of Histopaque 1077 (SigmaAldrich, St. Louis, MO). Tubes were centrifuged at 500 x g for 45 min at room temperature and PBMC collected. Cells were then subjected to red blood cell lysis (150 mM NH4Cl, 10 mM NaHCO3, 1mM EDTA, pH 7) for 2 to 5 min at 25oC depending on red blood cell
contamination. After lysis, cells were washed with 20 mL of RPMI 1640, pelleted by centrifugation at 300 x g for 7 min. The resulting cell pellet was resuspended in 12 mL of RPMI 1640 containing 5% penicillin/streptomyocin (Gibco, Grand Island, NY) and 10% fetal bovine serum (Gibco, Grand Island, NY), with or without 500 U/mL IFNT (gift from Fuller Bazer, Texas A&M University, College Station, TX), and cultured in T75 flasks (Thermo Fisher Scientific, Waltham, MA) overnight at 35oC. On d 4, 20 to 40 million PBMC were centrifuged at 300 x g for 7 min at 4oC, washed with 9% saline solution, and resuspended in 450 uL of saline for intrauterine transfer utilizing traditional artificial insemination techniques. Data Analysis
Fold change in ISG15 mRNA abundance in immune cells after culture with IFNT for 24 h was calculated using the ΔΔCT method (Kubista et al., 2006). Effects of IFNT treatment on fold change were analyzed using the MIXED procedure in SAS (Ver 9.2; SAS Institute). Percent cows pregnant were calculated and analyzed using the GENMOD and GLIMIX procedures in SAS. Progesterone concentrations were determined by RIA and were analyzed using the GLM procedures in SAS. Significance level for all studies was set at P < 0.05.
RESULTS AND DISCUSSION As the global population increases, the demand for
meat and other animal products will also increase. It is estimated that food production will need to increase 70% by 2050 (Alexandratos and Bruinsma, 2012), and the production increase will need to be largely driven by new technologies that increase production efficiency. Reproductive technologies are tools that can rapidly expand genetics from superior animals, but successful implementation of reproductive technologies can be limited by early embryo loss (Looney et al., 2006). The negative economic impacts of early embryo loss are not limited to production practices that utilize reproductive technologies. Early embryonic loss also causes significant economic and productivity losses in current animal production operations that do not utilize reproductive technologies (Disken and Morris, 2008). Thus, reducing embryo loss would increase profitability and sustainability of current livestock operations as well as increasing the use of reproductive technologies to help meet the future global demand for animal products.
Progesterone is absolutely required for pregnancy, and pregnancy recognition requires rescue of the CL by the conceptus. Trophoblast cells of the conceptus secrete IFNT with maximal secretion on d 14 to 16 in sheep and 16 to 19 in bovine (Bartol et al., 1985; Bazer et al., 1997). In the uterus, IFNT upregulates ISG in the endometrium, and numerous ISG were shown to be spatially and temporally regulated in the endometrium during early pregnancy (Ott et al., 1998; Johnson et al., 1999; Hansen et al., 2003). Interferon stimulated gene-15 is expressed in the luminal epithelium of sheep on d 10 or 11, as well as in the stratum compactum stroma and glandular epithelium on d 13 and 14
59
of pregnancy (Johnson et al., 1999). Myxovirus resistance 1 (MX1; Ott et al., 1998) and 2’5’-oligoadenylate synthetase (OAS-1; Schmitt et al., 1993), are also increased in response to pregnancy and IFNT. Regulation of ISG is hypothesized to be important for endometrial receptivity, conceptus elongation, and implantation (Bazer et al., 2009; Hansen et al., 2010; Ott and Gifford, 2010). Although it is clear that conceptus signaling blocks luteolytic pulses of PGF2α to sustain P4 production by the CL, work by Oliveira et al. (2008) also demonstrated that IFNT escapes the uterus and exogenous IFNT directly protects the CL from PGF2α (Antoniazzi et al., 2013). Interestingly, work by Atkins et al. (2013) demonstrated that P4 concentrations at d 7, which is before the embryo secretes IFNT, impact subsequent fertility. In the current experiment, intrauterine transfer of autologous IFNT-primed immune cells did not affect P4 concentrations. For IMMUNE cows, P4 concentrations averaged 4.1 ± 0.33 ng/mL compared with 3.7 ± 0.26 ng/mL for CONT (P > 0.10; Fig. 1). Moreover, when treatments were pooled, there was no difference in P4 concentrations between pregnant (4.0 ng/mL) and open cows (3.6 ng/mL) at d 7 (P > 0.10, Fig. 2) indicating that P4 concentration at d 7 is not an indicator of subsequent fertility after ET.
It is becoming increasingly clear that IFNT that escapes the uterus, likely modulates the maternal systemic immune function. Yankey et al. (2001) first showed that the ISG, MX1, was up-regulated in peripheral blood leukocytes of pregnant ewes within 24 to 48 h of the onset of IFNT signaling. Expression of MX2 was also increased as early as d 16 and, ISG15, and MX1 were increased at d 18, and d 20 in peripheral blood leukocytes of pregnant cattle (Gifford et al., 2007). Although the functional significance of systemic immune activation is unclear, it is reasonable to speculate that conceptus regulation of the maternal immune system, both in the uterus and systemically, is an important adaptation for the mother to tolerate the allogenic conceptus.
There is a growing body of evidence to suggest that the maternal immune system plays an active role in establishing pregnancy. Attachment of BeWo-cell spheroids to endometrial epithelial cells (ECC) derived from human uteri was increased after co-culturing the ECC with PBMC (Kosaka et al., 2003), suggesting that PBMC aid in regulating endometrial receptivity. Pregnancy rates were increased in women when human chorionic gonadotropin-primed PBMC were combined with fresh PBMC and administered to the uterus 1 d prior to fresh ET (Yoshioka et al., 2006). In ET using frozen/thawed embryos and patients with 3 or more failed IVF sessions, fresh PBMC that were administered to the uterus 2 d before ET resulted in an increase in pregnancy rates (Okitsu et al., 2011). Similar to the experiment done by Yoshioka et al. (2006), when bovine PBMC were isolated from Holstein heifers at d 3 of the estrous cycle, cultured overnight, and administered to the uterine horn ipsilateral to the CL on d4 of estrus, pregnancy rates by 17% for the PBMC treated group (Ideta et al., 2010). However, Ideta et al. (2010), did not culture the PBMC with IFNT. The current experiment expanded on previous results by treating PBMC with IFNT at concentrations observed in maternal circulation during
early pregnancy. Treating PBMC with 500 U/mL increased (P < 0.01; Fig. 3) ISG15 mRNA abundance 250-fold above non-treated PBMC indicating that IFNT activates the type I IFN pathway in cultured PBMC. Intrauterine transfer of autologous IFNT-primed immune cells increased pregnancy rates in beef cattle undergoing ET procedures. For IMMUNE cows, pregnancy rate was 76% (54/71) compared with 54% (27/50) for CONT (P < 0.05). Data demonstrate that priming the maternal immune system resulted in enhanced pregnancy rates supporting the concept that immune function at the fetal-maternal interface affects pregnancy outcome.
IMPLICATIONS
Reproductive technologies have great potential for improving genetics, economics, and production efficiency. Both conventional and intensive reproductive management practices are affected by high rates of embryo loss. Results from the current study indicate that transfer of autologous interferon-tau-primed peripheral blood mononuclear cells increased success rates for embryo transfer indicating that maternal immune system plays a pivotal role in establishing pregnancy in cattle. Additionally, priming the maternal immune system during early pregnancy might be a method to decrease embryonic loss in domestic livestock.
LITERATURE CITED Alexandratos, N., and J. Bruinsma. 2012. World agriculture
towards 2030/2050: the 2012 revision. ESA Working paper No. 12-03. Rome, FAO.
Antoniazzi, A.Q., B.T. Webb, J.J. Romero, R.L. Ashley, N.P. Smirnova, L.E. Henkes, R.C. Bott, J.F. Oliveria, G.D. Niswender, F.W. Bazer, and T.R. Hansen. 2013. Endocrine delivery of interferon tau protects the corpus luteum from prostaglandin F2 alpha-induced luteolysis in ewes. Biol. Reprod. 88:144-156.
Atkins, J.A., M.F. Smith, M.D. MacNeil, E.M. Jinks, F.M. Abreu, L.J. Alexander, and T.W. Geary. 2013. Pregnancy establishment and maintenance in cattle. J.Anim. Sci. 91:722-733.
Bartol, F.F., R.M. Roberts, F.W. Bazer, G.S. Lewis, J.D. Godkin, and W.W. Thatcher. 1985. Characterization of proteins produced in vitro by periattachment bovine conceptuses. Biol. Reprod. 32:681–686.
Bazer, F.W., T.E. Spencer, and T.L. Ott. 1997. Interferon tau: a novel pregnancy recognition signal. Am. J. Reprod. Immunol. 6:412-420.
Bazer, F.W., T.E. Spencer, and G.A. Johnson. 2009. Interferons and uterine receptivity. Semin. Reprod. Med. 27:90-102.
Bazer, F.W., G. Wu, T.E. Spencer, G.A. Johnson, R.C. Burghardt, and K. Bayless. 2010. Novel pathways for implantation and establishment and maintenance of pregnancy in mammals. Mol. Hum. Reprod. 16:135-152.
Bott, R.C., R.L. Ashley, L.E. Henkes, A.Q. Antoniazzi, J.E. Bruemmer, G.D. Niswender, F.W. Bazer, T.E. Spencer, N.P. Smirnova, R.V. Anthony, and T.R. Hansen. 2010. Uterine vein infusion of interferon tau
60
(IFNT) extends luteal life span in ewes. Bio. Reprod. 82:725-735.
Diskin, M.G., and D.G. Morris. 2008. Embryonic and early fetal losses in cattle and other ruminants. Reprod. Dom. Anim. 43:260-267.
Gifford, C.A., K. Ralcot, D.S. Clark, K.J. Austin, T.R. Hansen, M.C. Lucy, C.J. Dayles, and T.L. Ott. 2007. Regulation of interferon-stimulated genes in peripheral blood leukocytes in pregnant and bred, nonpregnant dairy cows. J. Dairy. Sci. 90:274-280.
Gifford, C.A., and T.L. Ott. 2010. Effects of early conceptus signals by circulating immune cells: lessons from domestic ruminants. Am. J. Reprod. Immunol.64:245-254.
Han, H., K.J. Austin, L.A. Rempel, and T.R. Hansen. 2006. Low blood ISG15 mRNA and progesterone levels are predictive of non-pregnant dairy cows. J. Endocrinol. 191:505-512.
Hansen, T.R., M.A. Mirando, G.L. Woods, D.K. Vanderwall, and T.L. Ott. 2003. Expression of the uterine Mx protein in cyclic and pregnant cows, gilts, and mares. J. Anim. Sci. 81:1552-1561.
Hansen, T.R., L.K. Henkes, R.L. Ashley, R.C. Bott, A.Q. Antonizaai, and H. Han. 2010. Endocrine actions of interferon-tau in ruminants. Soc. Reprod. Fertil. Suppl. 67:325-340.
Ideta, A., S. Sakai, Y. Nakamura, M. Urakawa, K. Hayama, K. Tsuchiya, H. Fujiwara, and Y. Aoyagi. 2010. Administration of peripheral blood mononuclear cells into the uterine horn to improve pregnancy rate following bovine embryo transfer. Anim. Reprod. Sci. 117:18-23.
Johnson, G.A., T.E. Spencer, T.R. Hansen, K.J. Austin, R.C. Burghardt, and F.W. Bazer. 1999. Expression of interferon tau inducible ubiquitin cross-reactive protein in the ovine uterus. Biology of Reproduction. 61:312-318.
Kosaka, K., H. Fujiwara, K. Tatsumi, S. Yoskioka, T. Higuchi, Y. Sato, T. Nakayama, and S. Fuji. 2003. Human peripheral blood mononuclear cells enhance cell-cell interaction between human endometrial epithelial cells and BeWo-cell spheroids. Hum. Reprod. 18:19-25.
Kubista, M., J.M. Andrade, M. Bengtsson, A., Forootan, J. Jonak, K. Lind, R. Sindelka, R. Sjoback, B. Sjogreen, L. Strombom, A. Stahlberg, and N. Zoric. 2006. The real-time polymerase chain reaction. Mol. Aspects. Med. 27:95-125.
Looney, C.R., J.S. Nelson, H.J. Schneider, and D.W. Forrest. 2008. Improving fertility in beef cow recipients. Theriogenology. 65:201-209.
McMillian, W.H. 1998. Statistical models predicting embryo survival to term in cattle after embryo transfer. Theriogenology. 50:1053-1070.
Oliveira, J.F., L.E. Henkes, R.L. Ashley, S.H. Purcell, N.P. Smirnova, D.N. Rao Veeramachaneni, R.V. Anthony, and T.R. Hansen. 2008. Expression of interferon (IFN)-stimulated genes in extrauterine tissues during early pregnancy in sheep is the consequence of endocrine IFN-τ release from the uterine vein. Endocrinology. 149:1252-1259.
Okitsu, O., M. Kiyokawa, T. Oda, K. Miyake, Y. Sato, and H. Fujiwara. 2011. Intrauterine administration of autologous peripheral blood mononuclear cells increases clinical pregnancy rates in frozen/thawed embryo transfer cycles of patients with repeated implantation failure. J. Reprod. Immunol. 92:82-87.
Ott, T.L. J. Yin, A.A. Wiley, H.T. Kim, B. Gerami-Nani, T.E. Spencer, F.F. Bartol, R.C. Burghardt, and F.W. Bazer. 1998. Effects of the estrous cycle and early pregnancy on uterine expression of Mx protein in sheep (Ovis aries). Biol. Reprod. 59:784-794
Schmitt, R.A., R.D. Geisert, M.T. Zavy, E.C. Blai, and R.M. Blair. 1993. Uterine cellular changes in 2’, 5’-oligoadenylate synthetase activity in sheep endometrium during pregnancy, by intrauterine infusion of ovine trophoblast protein-1, and by intramuscular administration of recombinant bovine interferon αI1. J. Reprod. Fertil. 93:599-607.
Spencer, T.E., and F.W. Bazer. 2004. Conceptus signals for establishment and maintenance of pregnancy. Reprod. Biol. Endocrinol. 2:49-63.
Yankey, S.J., B.A. Hicks, K.G. Carnahan, A.M. Assiri, S.J. Sinor, K. Kodali, J. N. Stellflug, and T.L. Ott. 2001. Expression of the antiviral protein Mx in peripheral blood mononuclear cells of pregnant and bred, non-pregnant ewes. J. Endocrinol. 170:R7-1.
Yoshioka, S., H. Fujiwara, T. Nakayama, K. Kosaka, T. Mori, and S. Fuji. 2006. Intrauterine administration of autologous peripheral blood mononuclear cells promotes implantation rates in patients with repeated failure of IVF-embryo transfer. Hum. Reprod. 21:3290-3294.
61
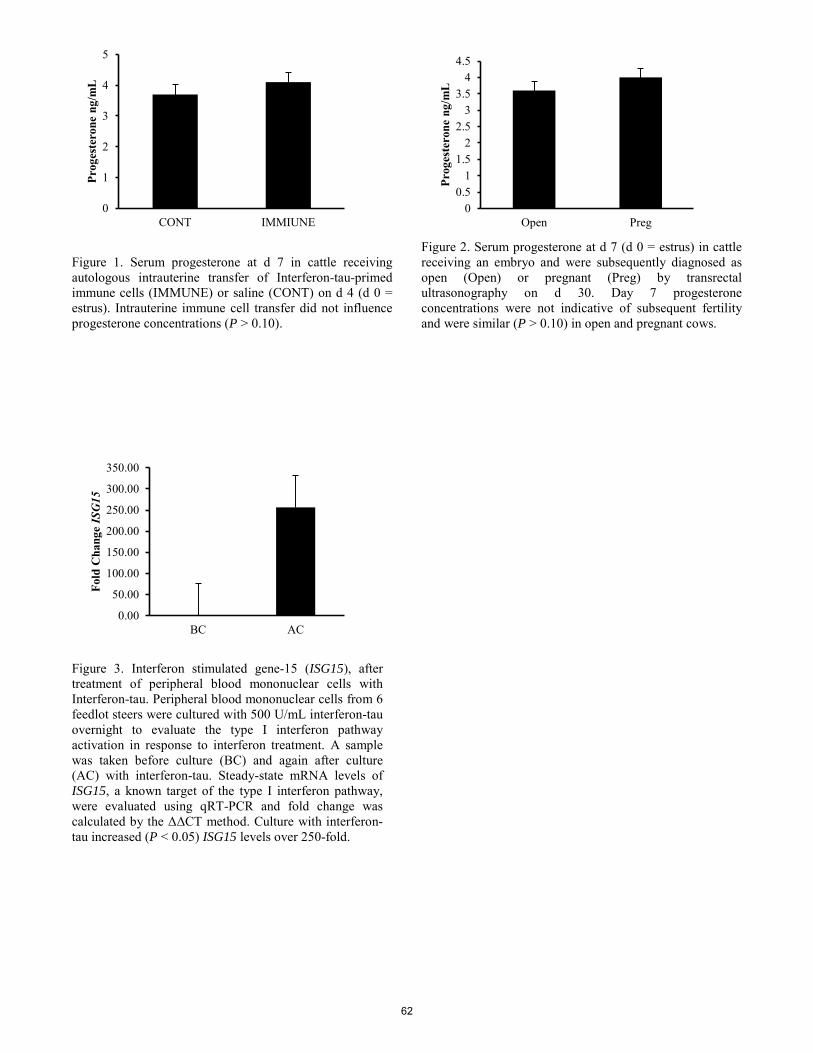
Figure 1. Serum progesterone at d 7 in cattle receiving autologous intrauterine transfer of Interferon-tau-primed immune cells (IMMUNE) or saline (CONT) on d 4 (d 0 = estrus). Intrauterine immune cell transfer did not influence progesterone concentrations (P > 0.10).
Figure 2. Serum progesterone at d 7 (d 0 = estrus) in cattle receiving an embryo and were subsequently diagnosed as open (Open) or pregnant (Preg) by transrectal ultrasonography on d 30. Day 7 progesterone concentrations were not indicative of subsequent fertility and were similar (P > 0.10) in open and pregnant cows.
Figure 3. Interferon stimulated gene-15 (ISG15), after treatment of peripheral blood mononuclear cells with Interferon-tau. Peripheral blood mononuclear cells from 6 feedlot steers were cultured with 500 U/mL interferon-tau overnight to evaluate the type I interferon pathway activation in response to interferon treatment. A sample was taken before culture (BC) and again after culture (AC) with interferon-tau. Steady-state mRNA levels of ISG15, a known target of the type I interferon pathway, were evaluated using qRT-PCR and fold change was calculated by the ΔΔCT method. Culture with interferon-tau increased (P < 0.05) ISG15 levels over 250-fold.
0
1
2
3
4
5
CONT IMMIUNE
Prog
este
rone
ng/
mL
00.5
11.5
22.5
33.5
44.5
Open Preg
Prog
este
rone
ng/
mL
0.00
50.00
100.00
150.00
200.00
250.00
300.00
350.00
BC AC
Fold
Cha
nge
ISG
15
62
Proceedings, Western Section, American Society of Animal Science
Vol. 66, 2015
IGF-1 attenuates WNT inhibition on FSH target genes and estradiol production in granulosa cells
B. I. Gomez*, C. A. Gifford*, D. M. Hallford†, and J. A. Hernandez Gifford*2 *Department of Animal Science, Oklahoma State University, Stillwater, OK 74078;
†Department of Animal and Range Sciences, New Mexico State University, Las Cruces, NM 88003
ABSTRACT: In livestock production, infertility is a major source of economic loss. Preovulatory estradiol biosynthesis relies on coordinated input from pituitary and intraovarian signaling pathways and impacts fertility of the ovulated follicle. In granulosa cells (GC), canonical wingless-type mammary tumor virus integration-site (WNT) signaling is inhibitory on FSH target genes and steroid biosynthesis indicating a role in regulation of follicle maturation and differentiation. Additionally, IGF-1 contributes to estrogen production and dominant follicles contain greater concentrations of IGF-1 and estradiol than their cohorts. The objective of this study was to investigate if IGF-1 would overcome the inhibitory effects of WNT3A on FSH-mediated steroidogenesis. To determine the effects of IGF-1 in this negative feedback system, primary cultures of rat GC were exposed to FSH (100 ng/mL) and WNT (50 ng/mL) with or without IGF-1 (50 ng/mL) for 24 h (n = 3). Activation of an aromatase (Cyp19a1) type II promoter (PII)-luciferase reporter was achieved by treatment with FSH with or without IGF-1 (P < 0.001). Inhibition of WNT3A on FSH-mediated Cyp19a1 PII activity was partially attenuated by the addition of IGF-1 to the co-treatment paradigm (P < 0.001). Granulosa cells treated with FSH+WNT3A had lower estradiol concentrations than cells treated with FSH alone (113 vs 482 ± 92 pg/mL, respectively; P = 0.01), while addition of IGF-1 in the presence of FSH+WNT3A tended to increase estradiol production (341 ± 92 pg/mL; P = 0.10). To identify the mechanism by which IGF-1 suppresses WNT3A inhibition on FSH activity, expression of Axin2, a negative regulator of WNT signaling, and β-catenin phosphorylation status were evaluated. Compared with controls, FSH treatment promoted β-catenin phosphorylation at Ser-552 and Ser-675 irrespective of co-treatments (P < 0.05). Treatment with IGF-1 did not modulate β-catenin phosphorylation at these specific C-terminal sites. Specific WNT pathway activation was demonstrated by up regulation of Axin2 (P < 0.05), and the addition of FSH, or IGF-1 alone or in combination with WNT3A regulated Axin2 expression to similar levels. These data indicate that IGF-1, contributes to FSH and WNT signaling in GC to mediate ovarian follicle maturation and
estradiol production. Future studies are necessary to identify the mechanisms by which IGF-1 is able to restore estradiol biosynthesis in the presence of WNT negative regulation on FSH signaling. Key words: aromatase, beta-catenin, estradiol, follicle-stimulating hormone, granulosa cell
INTRODUCTION Circulating estrogen concentrations prior to ovulation must remain elevated by the dominant follicle to prevent undesirable subordinate follicle maturation. Additionally, estrogen influences fertility as indicated by increased pregnancy rates in cows whose dominant follicle developed under a longer period of proestrus and increased estrogen (Bridges et al., 2010). Follicle maturation and estrogen synthesis is regulated by FSH, as well as intraovarian regulatory molecules including IGF-1 (Adashi et al., 1985b) and wingless-type mammary tumor virus integration-site (WNT) (Boyer et al., 2010). In granulosa cells (GC), FSH generates a cAMP-dependent signaling cascade to initiate transcription of cytochrome P450 enzyme aromatase (Cyp19a1) to catalyze the conversion of androgens to estrogens. The estrogenic potential of GC can be positively modulated by IGF-1 through its contributions to cell differentiation and proliferation (Zhou et al., 2013). Additionally, in cattle the largest dominant follicle has elevated IGF-1 relative to the second largest (Beg et al., 2001). Recent data indicates that IGF-1 and FSH activate protein kinase B (AKT) leading to β-catenin accumulation (unpublished data), a transcriptional co-factor required for Cyp19a1 mRNA accumulation and subsequent estrogen production (Parakh et al., 2006; Hernandez Gifford et al., 2009). Collectively, these data suggest that IGF-1 and FSH pathways converge downstream of their receptors to promote normal GC function. β-catenin activity is regulated by the canonical WNT signaling pathway in GC. Treatment with WNT3A inhibits FSH induction of Cyp19a1 and subsequent estradiol production in GC (Stapp et al., 2014). However, the mechanism by which WNT3A negatively regulates FSH signaling remains to be determined. In this study, we tested the hypothesis that IGF-1 plays a role in rescuing FSH-mediated Cyp19a1 activity and estradiol production from the inhibitory effects of WNT3A.
1The authors would like to thank NIDDK’s National Hormone & Peptide program and A.F. Parlow for supplying the FSH reagent. This work was supported by USDA National Needs Fellowship (2012-04149). 2Corresponding author’s email address: [email protected]
63
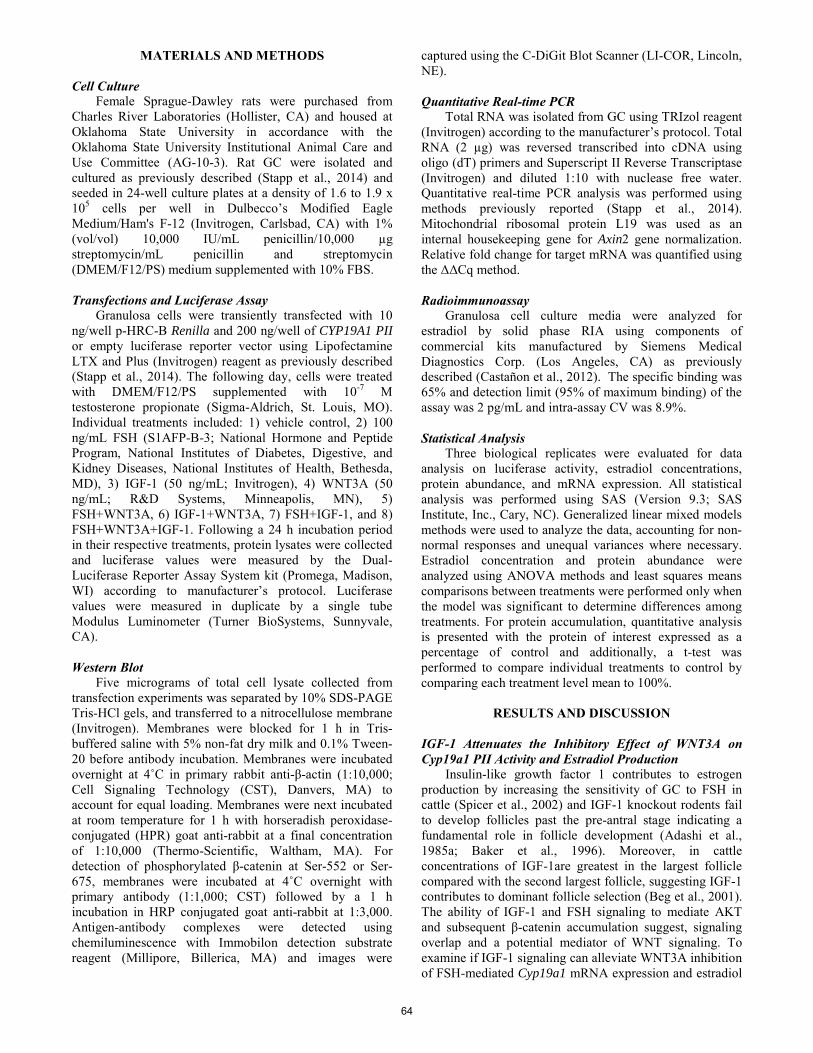
MATERIALS AND METHODS
Cell Culture Female Sprague-Dawley rats were purchased from Charles River Laboratories (Hollister, CA) and housed at Oklahoma State University in accordance with the Oklahoma State University Institutional Animal Care and Use Committee (AG-10-3). Rat GC were isolated and cultured as previously described (Stapp et al., 2014) and seeded in 24-well culture plates at a density of 1.6 to 1.9 x 10⁵ cells per well in Dulbecco’s Modified Eagle Medium/Ham's F-12 (Invitrogen, Carlsbad, CA) with 1% (vol/vol) 10,000 IU/mL penicillin/10,000 µg streptomycin/mL penicillin and streptomycin (DMEM/F12/PS) medium supplemented with 10% FBS. Transfections and Luciferase Assay Granulosa cells were transiently transfected with 10 ng/well p-HRC-B Renilla and 200 ng/well of CYP19A1 PII or empty luciferase reporter vector using Lipofectamine LTX and Plus (Invitrogen) reagent as previously described (Stapp et al., 2014). The following day, cells were treated with DMEM/F12/PS supplemented with 10-7 M testosterone propionate (Sigma-Aldrich, St. Louis, MO). Individual treatments included: 1) vehicle control, 2) 100 ng/mL FSH (S1AFP-B-3; National Hormone and Peptide Program, National Institutes of Diabetes, Digestive, and Kidney Diseases, National Institutes of Health, Bethesda, MD), 3) IGF-1 (50 ng/mL; Invitrogen), 4) WNT3A (50 ng/mL; R&D Systems, Minneapolis, MN), 5) FSH+WNT3A, 6) IGF-1+WNT3A, 7) FSH+IGF-1, and 8) FSH+WNT3A+IGF-1. Following a 24 h incubation period in their respective treatments, protein lysates were collected and luciferase values were measured by the Dual-Luciferase Reporter Assay System kit (Promega, Madison, WI) according to manufacturer’s protocol. Luciferase values were measured in duplicate by a single tube Modulus Luminometer (Turner BioSystems, Sunnyvale, CA). Western Blot Five micrograms of total cell lysate collected from transfection experiments was separated by 10% SDS-PAGE Tris-HCl gels, and transferred to a nitrocellulose membrane (Invitrogen). Membranes were blocked for 1 h in Tris-buffered saline with 5% non-fat dry milk and 0.1% Tween-20 before antibody incubation. Membranes were incubated overnight at 4˚C in primary rabbit anti-β-actin (1:10,000; Cell Signaling Technology (CST), Danvers, MA) to account for equal loading. Membranes were next incubated at room temperature for 1 h with horseradish peroxidase-conjugated (HPR) goat anti-rabbit at a final concentration of 1:10,000 (Thermo-Scientific, Waltham, MA). For detection of phosphorylated β-catenin at Ser-552 or Ser-675, membranes were incubated at 4˚C overnight with primary antibody (1:1,000; CST) followed by a 1 h incubation in HRP conjugated goat anti-rabbit at 1:3,000. Antigen-antibody complexes were detected using chemiluminescence with Immobilon detection substrate reagent (Millipore, Billerica, MA) and images were
captured using the C-DiGit Blot Scanner (LI-COR, Lincoln, NE). Quantitative Real-time PCR Total RNA was isolated from GC using TRIzol reagent (Invitrogen) according to the manufacturer’s protocol. Total RNA (2 µg) was reversed transcribed into cDNA using oligo (dT) primers and Superscript II Reverse Transcriptase (Invitrogen) and diluted 1:10 with nuclease free water. Quantitative real-time PCR analysis was performed using methods previously reported (Stapp et al., 2014). Mitochondrial ribosomal protein L19 was used as an internal housekeeping gene for Axin2 gene normalization. Relative fold change for target mRNA was quantified using the ΔΔCq method. Radioimmunoassay Granulosa cell culture media were analyzed for estradiol by solid phase RIA using components of commercial kits manufactured by Siemens Medical Diagnostics Corp. (Los Angeles, CA) as previously described (Castañon et al., 2012). The specific binding was 65% and detection limit (95% of maximum binding) of the assay was 2 pg/mL and intra-assay CV was 8.9%. Statistical Analysis Three biological replicates were evaluated for data analysis on luciferase activity, estradiol concentrations, protein abundance, and mRNA expression. All statistical analysis was performed using SAS (Version 9.3; SAS Institute, Inc., Cary, NC). Generalized linear mixed models methods were used to analyze the data, accounting for non-normal responses and unequal variances where necessary. Estradiol concentration and protein abundance were analyzed using ANOVA methods and least squares means comparisons between treatments were performed only when the model was significant to determine differences among treatments. For protein accumulation, quantitative analysis is presented with the protein of interest expressed as a percentage of control and additionally, a t-test was performed to compare individual treatments to control by comparing each treatment level mean to 100%.
RESULTS AND DISCUSSION
IGF-1 Attenuates the Inhibitory Effect of WNT3A on Cyp19a1 PII Activity and Estradiol Production Insulin-like growth factor 1 contributes to estrogen production by increasing the sensitivity of GC to FSH in cattle (Spicer et al., 2002) and IGF-1 knockout rodents fail to develop follicles past the pre-antral stage indicating a fundamental role in follicle development (Adashi et al., 1985a; Baker et al., 1996). Moreover, in cattle concentrations of IGF-1are greatest in the largest follicle compared with the second largest follicle, suggesting IGF-1 contributes to dominant follicle selection (Beg et al., 2001). The ability of IGF-1 and FSH signaling to mediate AKT and subsequent β-catenin accumulation suggest, signaling overlap and a potential mediator of WNT signaling. To examine if IGF-1 signaling can alleviate WNT3A inhibition of FSH-mediated Cyp19a1 mRNA expression and estradiol
64

production, rat GC were treated with FSH, WNT3A, IGF-1 or a combination of the treatments. As expected FSH treatment induced a 36-fold change in luciferase Cyp19a1 PII activity above controls (P < 0.001: Fig. 1A), and consistent with our previous studies, WNT3A inhibited (P < 0.001) FSH-mediated Cyp19a1PII activity (Stapp et al., 2014). Interestingly, the addition of IGF-1 to FSH+WNT3A increased (P < 0.02) Cyp19a1 PII activity from 36 relative light units in FSH+WNT3A treated cells to 55 relative light units in FSH+WNT3A+IGF-1 treated cells. Media concentrations of estradiol followed a parallel response to Cyp19a1 PII activity (Fig. 1B). Following FSH treatment, estradiol concentration increased (P < 0.01) when compared with vehicle controls (482 vs. 14 ± 92 pg/mL). Co-treatment of FSH with WNT3A reduced estradiol concentrations, while the addition of IGF-1 to the FSH+WNT3A treatment group increased (P < 0.10) estradiol in medium from 113 to 341 ± 92 pg/mL, respectively. β-catenin Phosphorylation and Axin2 is not Modulated by IGF-1 Phosphorylation of β-catenin at Ser-552 and Ser-675 are mediated by FSH and found to associate with T-cell factor on FSH target gene promoters (Law et al., 2013). Therefore, these transcriptionally active forms of β-catenin were measured to evaluate if IGF-1 rescues WNT3A inhibition of FSH-target genes by modulating β-catenin phosphorylation status. Treatment with FSH consistently induced phosphorylation of β-catenin at Ser-552 and Ser-675 accumulation when compared with controls (P < 0.05) irrespective of treatment. However, FSH co-treated with IGF-1 or WNT3A had no effect on phosphorylation of β-catenin at Ser-552 or Ser-675 (Fig. 2A). These results demonstrate IGF-1 did not affect FSH’s ability to phosphorylate β-catenin at these specific sites. A negative regulator of downstream WNT signaling components is Axin2 (Bernkopf et al., 2014), which was induced in cells treated with exogenous WNT3A (P < 0.005; Fig. 2B) compared with cells that did not receive WNT3A treatment. Co-treatment of WNT3A with FSH, IGF-1 or the combination of did not differentially regulate Axin2 mRNA expression therefore eliminating this as a possible mechanism in which IGF-1 suppresses WNT3A inhibition. Data herein support previous studies in which WNT3A is inhibitory on FSH-mediated estradiol biosynthesis (Stapp et al., 2014). Moreover, the endogenous intraovarian signaling molecule, IGF-1 partially rescues Cyp19a1 promoter activity from WNT3A inhibition resulting in increased estradiol concentrations.
IMPLICATIONS
In cattle estrogen concentrations are critical in fertility and dominant follicle selection however, the mechanisms responsible are diverse and remain unclear. These results indicate FSH, IGF-1, and wingless-type mammary tumor virus integration-site contribute to regulate estrogen in granulosa cells. Data herein demonstrate that IGF-1 is capable of overriding a negative feedback system set up by wingless-type mammary tumor virus integration-site
signaling on FSH target genes that may be necessary to keep follicle maturation and estrogen production from going unregulated.
LITERATURE CITED
Adashi, E. Y., C. E. Resnick, A. M. Brodie, M. E. Svoboda, and J. J. Van Wyk. 1985a. Somatomedin-C-mediated potentiation of follicle-stimulating hormone-induced aromatase activity of cultured rat granulosa cells. Endocrinology 117:2313-2320.
Adashi, E. Y., C. E. Resnick, A. J. D'Ercole, M. E. Svoboda, and J. J. Van Wyk. 1985b. Insulin-like growth factors as intraovarian regulators of granulosa cell growth and function. Endocr. Rev. 6:400-420.
Baker, J., M. P. Hardy, J. Zhou, C. Bondy, F. Lupu, A. R. Bellve, and A. Efstratiadis. 1996. Effects of an Igf1 gene null mutation on mouse reproduction. Mol. Endocrinol. 10:903-918.
Beg, M. A., D. R. Bergfelt, K. Kot, M. C. Wiltbank, and O. J. Ginther. 2001. Follicular-fluid factors and granulosa-cell gene expression associated with follicle deviation in cattle. Biol. Reprod. 64:432-441.
Bernkopf, D. B., M. V. Hadjihannas, and J. Behrens. 2014. Negative feedback regulation of the Wnt pathway by conductin/axin2 involves insensitivity to upstream signalling. J. Cell Sci.
Boyer, A., A. K. Goff, and D. Boerboom. 2010. WNT signaling in ovarian follicle biology and tumorigenesis. Trends. Endocrinol. Metab. 21:25-32.
Bridges, G. A., M. L. Mussard, C. R. Burke, and M. L. Day. 2010. Influence of the length of proestrus on fertility and endocrine function in female cattle. Anim. Reprod. Sci. 117:208-215.
Castañon, B. I., A. D. Stapp, C. A. Gifford, L. J. Spicer, D. M. Hallford, and J. A. Hernandez Gifford. 2012. Follicle-stimulating hormone regulation of estradiol production: possible involvement of WNT2 and beta-catenin in bovine granulosa cells. J. Anim. Sci. 90:3789-3797.
Hernandez Gifford, J. A., M. E. Hunzicker-Dunn, and J. H. Nilson. 2009. Conditional deletion of beta-catenin mediated by Amhr2cre in mice causes female infertility. Biol. Reprod. 80:1282-1292.
Parakh, T. N., J. A. Hernandez, J. C. Grammer, J. Weck, M. Hunzicker-Dunn, A. J. Zeleznik, and J. H. Nilson. 2006. Follicle-stimulating hormone/cAMP regulation of aromatase gene expression requires beta-catenin. Proc. Natl. Acad. Sci. U. S. A. 103:12435-12440.
Spicer, L. J., C. S. Chamberlain, and S. M. Maciel. 2002. Influence of gonadotropins on insulin- and insulin-like growth factor-I (IGF-I)-induced steroid production by bovine granulosa cells. Domest. Anim. Endocrinol. 22:237-254.
Stapp, A. D., B. I. Gomez, C. A. Gifford, D. M. Hallford, and J. A. Hernandez Gifford. 2014. Canonical WNT signaling inhibits follicle stimulating hormone mediated steroidogenesis in primary cultures of rat granulosa cells. PLoS ONE 9:e86432.
Zhou, P., S. C. Baumgarten, Y. Wu, J. Bennett, N. Winston, J. Hirshfeld-Cytron, and C. Stocco. 2013. IGF-I signaling is essential for FSH stimulation of AKT and steroidogenic genes in granulosa cells. Mol. Endocrinol. 27:511-523.
65
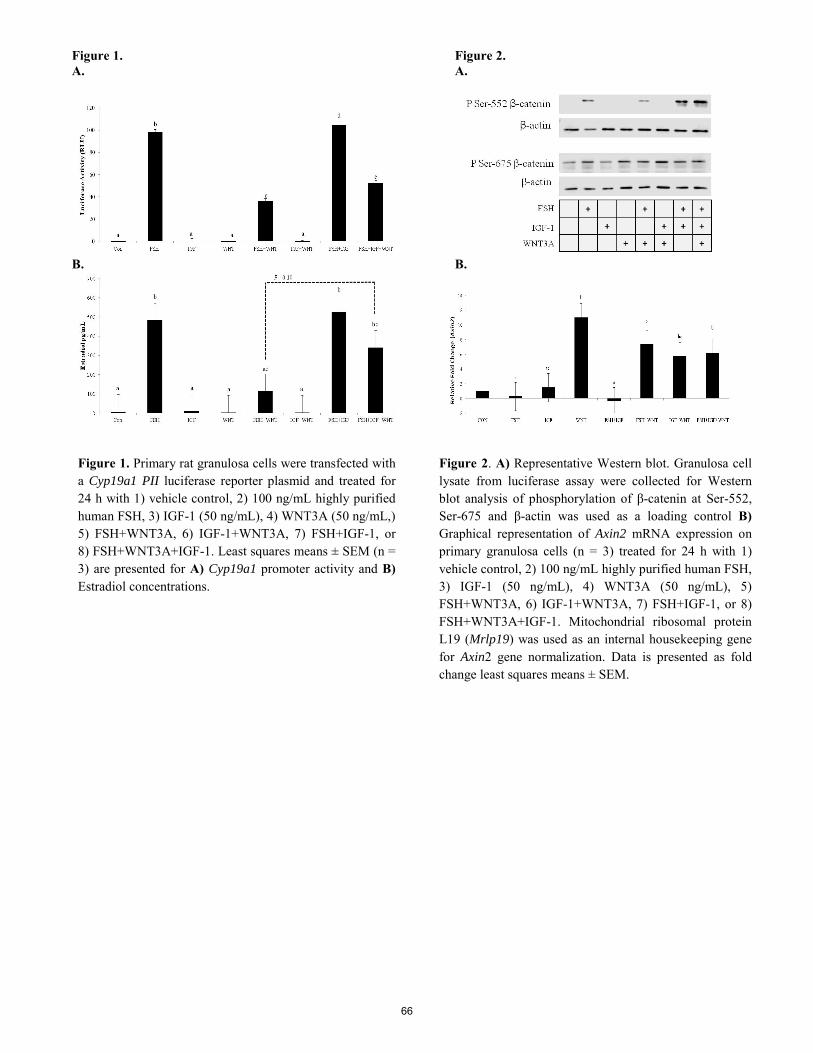
Figure 1. Figure 2. A. A.
B. B.
Figure 1. Primary rat granulosa cells were transfected with a Cyp19a1 PII luciferase reporter plasmid and treated for 24 h with 1) vehicle control, 2) 100 ng/mL highly purified human FSH, 3) IGF-1 (50 ng/mL), 4) WNT3A (50 ng/mL,) 5) FSH+WNT3A, 6) IGF-1+WNT3A, 7) FSH+IGF-1, or 8) FSH+WNT3A+IGF-1. Least squares means ± SEM (n = 3) are presented for A) Cyp19a1 promoter activity and B) Estradiol concentrations.
Figure 2. A) Representative Western blot. Granulosa cell lysate from luciferase assay were collected for Western blot analysis of phosphorylation of β-catenin at Ser-552, Ser-675 and β-actin was used as a loading control B) Graphical representation of Axin2 mRNA expression on primary granulosa cells (n = 3) treated for 24 h with 1) vehicle control, 2) 100 ng/mL highly purified human FSH, 3) IGF-1 (50 ng/mL), 4) WNT3A (50 ng/mL), 5) FSH+WNT3A, 6) IGF-1+WNT3A, 7) FSH+IGF-1, or 8) FSH+WNT3A+IGF-1. Mitochondrial ribosomal protein L19 (Mrlp19) was used as an internal housekeeping gene for Axin2 gene normalization. Data is presented as fold change least squares means ± SEM.
66

Proceedings, Western Section, American Society of Animal Science
Vol. 66, 2015
Meloxicam as an Alternative to Alleviate Inflammatory and Acute-Phase Reactions in Beef Cattle Upon Lipopolysaccharide Administration or Vaccination
M. C. Rodrigues1,2, R. F. Cooke1, R. S. Marques1, S. Arispe3, D. H. Keisler4, and D. W. Bohnert1
Oregon State University - Eastern Oregon Agricultural Research Center, Burns, OR 1
UNESP - Faculdade de Medicina Veterinária e Zootecnia, Botucatu, Brazil 2
Oregon State University – Malheur County Extension, Ontario, OR 3
University of Missouri - Division of Animal Sciences, Columbia, MO 4
Abstract text: Twenty-one Angus steers (n = 11) and heifers (n = 10) were assigned to Exp. 1 (d -1 to 6) and Exp. 2 (d 6 to 20). On d -10, cattle were housed in individual pens and offered free-choice water, mineral-vitamin mix, and hay until d 20. In Exp. 1, calves were ranked on d -1 by gender and BW, and assigned to: 1) oral meloxicam administration (1 mg/kg of BW daily) from day -1 to 6 (MEL7), 2) oral meloxicam administration (1 mg/kg of BW) on d 0, and oral lactose monohydrate administration (1 mg/kg of BW) on d -1 and from d 1 to 6 (MEL1), and 3) oral lactose monohydrate administration (1 mg/kg of BW daily) from d -1 to 6 (CON). On d 0, all cattle received an intravenous lipopolysaccharide bolus (0.5 μg/kg of BW). From d -2 to d 6, cattle BW and hay DMI were recorded daily. Rectal temperature was assessed and blood samples collected every 2 h from -2 to 8 h, every 6 h from 12 to 72 h, and every 24 h from 96 to 144 h relative to lipopolysaccharide administration. Calves receiving MEL7 had greater (P = 0.03) hay DMI (kg/d) compared with MEL1 and CON. When DMI was evaluated as % of BW, MEL7 had greater (P = 0.05) hay DMI compared with CON. No treatment effects were detected (P = 0.90) for rectal temperature, plasma cortisol, insulin, leptin, haptoglobin and serum NEFA, although temperature and plasma variables increased after LPS administration (time effects; P < 0.01). For Exp. 2, calves were maintained and received the same treatments as in Exp. 1 from d 6 to 12. On d 7, cattle were vaccinated against respiratory pathogens. Cattle BW was recorded at the beginning (d 6 and 7) and end (d 20 and 21) of Exp. 2, whereas hay DMI was recorded daily. Rectal temperature was assessed and blood samples collected as in Exp. 1, in addition to 168, 240, and 336 h relative to vaccination. No treatment effects were detected (P ≥ 0.15), although hay DMI decreased, plasma concentrations of cortisol, insulin, leptin, and haptoglobin increased, and serum antibodies against respiratory pathogens also increased (time effects, P < 0.01) after vaccination. Hence, meloxicam failed to modulate the physiological, inflammatory, and acute-phase protein reactions associated with lipopolysaccharide administration and vaccination in beef cattle. Keywords: cattle, lipopolysaccharide, meloxicam, vaccination
INTRODUCTION
Oral meloxicam administration to feeder cattle alleviated the acute-phase protein reaction and prevented the decrease in receiving ADG, DMI, and G:F caused by transport and feedlot entry (Guarnieri Filho et al., 2014), indicating that meloxicam is an alternative to mitigate inflammatory reactions and performance losses elicited by stressful events. Nevertheless, research is still required to further understand the role of meloxicam during acute-phase and inflammatory reactions (Van Engen et al., 2014) to biologically support its benefits to highly-stressed beef cattle. One alternative to characterize the effects of meloxicam on the bovine innate immune system is through a bacterial lipopolysaccharide (LPS) challenge and subsequent evaluation of physiological and acute-phase variables (Carroll et al., 2009).
Vaccination is another stressful and mandatory procedure in cattle operations (Carroll and Forsberg, 2007). As an example, vaccination against Mannheimia haemolytica, the main bacterium isolated from bovine respiratory disease (BRD) in feedlot cattle (Rice et al., 2007), stimulated an acute-phase protein reaction and reduced ADG, DMI, and G:F during the 2 wk subsequent to vaccination (Arthington et al., 2013; Marques et al., 2014). Hence, research to develop management interventions that benefit vaccine-induced immune protection and cattle performance is warranted (Arthington et al., 2013). Based on the benefits of meloxicam administration to highly-stressed cattle (Guarnieri Filho et al., 2014; Van Engen et al., 2014) it can be hypothesized that oral meloxicam will alleviate the acute-phase response and prevent the decrease in performance caused by vaccination.
Based on this rationale, the objective of this experiment was to evaluate the effects of oral meloxicam administration on performance, inflammatory, and acute-phase parameters of beef cattle assigned to a bacterial LPS challenge (Exp. 1), or vaccinated against the BRD complex (Exp. 2).
MATERIALS AND METHODS
Twenty-one Angus halter-trained steers (n = 11) and heifers (n = 10) were assigned to the Exp. 1 (d -1 to 6) and subsequently to Exp. 2 (d 6 to 20). Cattle were weaned at 6 mo of age on d -33, and exposed daily to halter-training techniques until d -1. At weaning, cattle were vaccinated
67
against clostridial diseases, infectious bovine rhinotracheitis, bovine viral diarrhea complex, pneumonia, and M. haemolytica (One Shot Ultra 7, Bovi-Shield Gold One Shot, and TSV-2; Zoetis, Florham Park, NJ), and administered an anthelmintic (Dectomax; Zoetis). On d -10, cattle were housed in individual pens contained within an enclosed barn, and offered free choice water, mineral-vitamin mix, and mixed alfalfa-grass hay until the end of Exp. 2 (d 20).
Experiment 1 Animals and treatments. On d -1, calves were ranked
by gender and BW (avg. BW = 232 ± 4 kg), and assigned to 1 of 3 treatments: 1) oral meloxicam administration (1 mg/kg of BW daily; Carlsbad Technologies, Inc., Carlsbad, CA) from day -1 to 6 (MEL7), 2) oral meloxicam administration (1 mg/kg of BW; Carlsbad Technologies, Inc.) on d 0, and oral lactose monohydrate administration (1 mg/kg of BW, excipient used in the manufacture of meloxicam tablets; Avantor Performance Materials, Center Valley, PA) on d -1 and from d 1 to 6 (MEL1), and 3) oral lactose monohydrate administration (1 mg/kg of BW daily; Avantor Performance Materials) from d -1 to 6 (CON).
Meloxicam was originally presented in 15 mg tablets, which were ground daily using a commercial food processor (Soho Food Processor; West Bend Housewares, West Bend, WI) to ensure that cattle received their exact dose. Lactose monohydrate was administered to account for potential placebo effects. Meloxicam or lactose monohydrate were manually mixed with 50 mL of 0.9% saline and administered individually to cattle via oral drench. The MEL7 and CON treatments are based on Guarnieri Filho et al. (2014), which also suggested that different lengths meloxicam administration should be investigated. Accordingly, the MEL1 treatment was included to determine if a single meloxicam administration can mitigate the inflammatory and acute-phase responses elicited by the LPS challenge, which occur within 24 h challenge (Carroll et al., 2009).
On d 0, all cattle received an intravenous bolus dose of bacterial LPS (0.5 μg/kg of BW, Escherichia coli 0111:B4, Sigma-Aldrich, St. Louis, MO) concurrently with treatment administration (Carroll et al., 2009). Bacterial LPS was dissolved into 10 mL of 0.9% saline immediately before administration.
Sampling. From d -2 to d 6, cattle were weighed daily. Hay DMI was evaluated daily from d -2 to 6 from each pen by collecting and weighing refusals daily. Samples of the offered and non-consumed feed were collected daily from each pen and dried for 96 h at 50°C in forced-air ovens for DM calculation.
Steer rectal temperature was assessed with a GLA M750 digital thermometer (GLA Agricultural Electronics, San Luis Obispo, CA) every 2 h from -2 to 8 h, every 6 h from 12 to 72 h, and every 24 h from 96 to 144 h relative to LPS administration. Blood samples were collected concurrently with rectal temperature assessment via jugular venipuncture into commercial blood collection tubes (Vacutainer, 10 mL; Becton Dickinson, Franklin Lakes, NJ) with or without freeze-dried sodium heparin for plasma and serum collection, respectively. Blood samples were placed
immediately on ice, centrifuged (2,500 × g for 30 min; 4°C) for plasma or serum harvest, and stored at -80°C on the same day of collection. All plasma samples were analyzed for plasma haptoglobin concentrations (Guarnieri Filho et al., 2014). Samples collected from -2 to 48 h relative to LPS administration were analyzed for concentrations of serum NEFA, plasma cortisol, insulin, and leptin (Delavaud et al., 2000; Guarnieri Filho et al., 2014).
Experiment 2 Animals and treatments. Immediately after the last
sampling of Exp. 1 on d 6, cattle (avg. BW = 228 ± 4 kg) were assigned to the same treatment scheme received in Exp. 1. Treatments (MEL7, MEL1, and CON) were administered from d 6 to d 12.
On d 7, cattle were re-vaccinated against infectious bovine rhinotracheitis, bovine viral diarrhea complex, pneumonia, and M. haemolytica (Bovi-Shield Gold One Shot; Zoetis) concurrently with treatment administration. As in Exp. 1, the MEL7 and CON treatments are based on Guarnieri Filho et al. (2014). Given that leukocytes responsible for inflammatory and acute-phase responses are directly involved with antigen presentation to T cells (Durum and Muegge. 1996), excessive meloxicam administration may impair the innate immune responses required for proper vaccine efficacy. Therefore, MEL1 was included to determine if a single meloxicam administration concurrently with handling for vaccination can mitigate the resultant inflammatory and acute-phase responses (Marques et al., 2014) without impairing vaccine efficacy.
Sampling. Cattle full BW was recorded at the beginning (d 6 and 7) and end (d 20 and 21) of the experiment. Hay DMI was recorded daily from d 5 to 20 as in Exp. 1, whereas G:F was calculated based on total BW gain and hay DMI during the experimental period. Rectal temperature was assessed and blood samples collected as in Exp. 1, with additional collected at 168, 240, and 336 h relative to vaccination for analysis of plasma haptoglobin (Guarnieri Filho et al., 2014). Plasma samples collected immediately prior (0 h) and at 168, 240, and 336 h following vaccination were also analyzed for concentrations of antibodies against M. haemolytica (Confer et al., 2009), as well as titers against bovine respiratory syncytial virus (BRSV), bovine herpesvirus-1 (BHV-1), bovine viral diarrhea virus-1 (BVD-1), and parainfluenza 3 virus (PI3) at the Oklahoma Animal Disease Diagnostic Laboratory (Stillwater, OK).
Statistical analysis Data from both experiments were analyzed using the
MIXED procedure of SAS (SAS Inst., Inc., Cary, NC) and Satterthwaite approximation to determine the denominator df for the tests of fixed effects. Animal was considered the experimental unit. The model statements contained the effects of treatment, time, gender, and all resultant interaction. Hay DMI was analyzed using values obtained on d -2 and -1 (Exp. 1) or d 5 and 6 (Exp. 2) as covariates. Animal(treatment × gender) was used as random variable. The specified term for the repeated statement was time, animal(treatment × gender) was included as subject, and the covariance structure utilized was autoregressive, which provided the lowest Akaike information criterion and
68
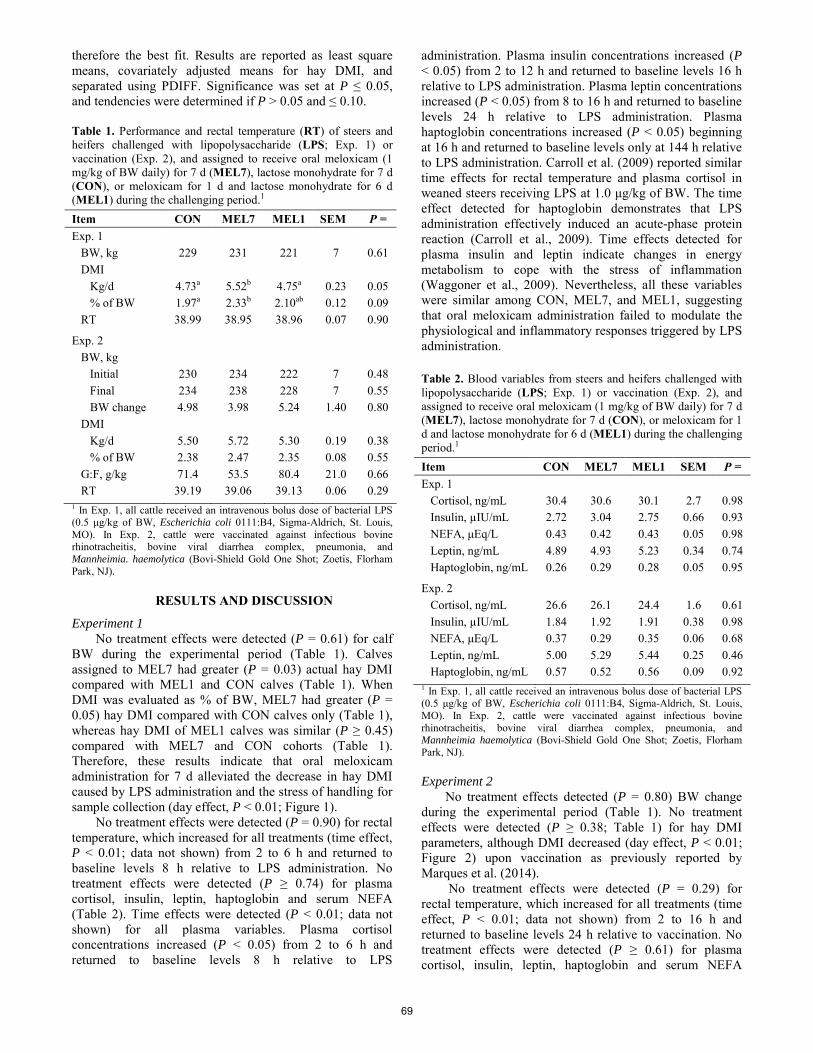
therefore the best fit. Results are reported as least square means, covariately adjusted means for hay DMI, and separated using PDIFF. Significance was set at P ≤ 0.05, and tendencies were determined if P > 0.05 and ≤ 0.10.
Table 1. Performance and rectal temperature (RT) of steers and heifers challenged with lipopolysaccharide (LPS; Exp. 1) or vaccination (Exp. 2), and assigned to receive oral meloxicam (1 mg/kg of BW daily) for 7 d (MEL7), lactose monohydrate for 7 d (CON), or meloxicam for 1 d and lactose monohydrate for 6 d (MEL1) during the challenging period.1
Item CON MEL7 MEL1 SEM P = Exp. 1 BW, kg 229 231 221 7 0.61 DMI Kg/d 4.73a 5.52b 4.75a 0.23 0.05 % of BW 1.97a 2.33b 2.10ab 0.12 0.09 RT 38.99 38.95 38.96 0.07 0.90
Exp. 2 BW, kg Initial 230 234 222 7 0.48 Final 234 238 228 7 0.55 BW change 4.98 3.98 5.24 1.40 0.80 DMI Kg/d 5.50 5.72 5.30 0.19 0.38 % of BW 2.38 2.47 2.35 0.08 0.55 G:F, g/kg 71.4 53.5 80.4 21.0 0.66 RT 39.19 39.06 39.13 0.06 0.29
1 In Exp. 1, all cattle received an intravenous bolus dose of bacterial LPS (0.5 μg/kg of BW, Escherichia coli 0111:B4, Sigma-Aldrich, St. Louis, MO). In Exp. 2, cattle were vaccinated against infectious bovine rhinotracheitis, bovine viral diarrhea complex, pneumonia, and Mannheimia. haemolytica (Bovi-Shield Gold One Shot; Zoetis, Florham Park, NJ).
RESULTS AND DISCUSSION
Experiment 1 No treatment effects were detected (P = 0.61) for calf
BW during the experimental period (Table 1). Calves assigned to MEL7 had greater (P = 0.03) actual hay DMI compared with MEL1 and CON calves (Table 1). When DMI was evaluated as % of BW, MEL7 had greater (P = 0.05) hay DMI compared with CON calves only (Table 1), whereas hay DMI of MEL1 calves was similar (P ≥ 0.45) compared with MEL7 and CON cohorts (Table 1). Therefore, these results indicate that oral meloxicam administration for 7 d alleviated the decrease in hay DMI caused by LPS administration and the stress of handling for sample collection (day effect, P < 0.01; Figure 1).
No treatment effects were detected (P = 0.90) for rectal temperature, which increased for all treatments (time effect, P < 0.01; data not shown) from 2 to 6 h and returned to baseline levels 8 h relative to LPS administration. No treatment effects were detected (P ≥ 0.74) for plasma cortisol, insulin, leptin, haptoglobin and serum NEFA (Table 2). Time effects were detected (P < 0.01; data not shown) for all plasma variables. Plasma cortisol concentrations increased (P < 0.05) from 2 to 6 h and returned to baseline levels 8 h relative to LPS
administration. Plasma insulin concentrations increased (P < 0.05) from 2 to 12 h and returned to baseline levels 16 h relative to LPS administration. Plasma leptin concentrations increased (P < 0.05) from 8 to 16 h and returned to baseline levels 24 h relative to LPS administration. Plasma haptoglobin concentrations increased (P < 0.05) beginning at 16 h and returned to baseline levels only at 144 h relative to LPS administration. Carroll et al. (2009) reported similar time effects for rectal temperature and plasma cortisol in weaned steers receiving LPS at 1.0 μg/kg of BW. The time effect detected for haptoglobin demonstrates that LPS administration effectively induced an acute-phase protein reaction (Carroll et al., 2009). Time effects detected for plasma insulin and leptin indicate changes in energy metabolism to cope with the stress of inflammation (Waggoner et al., 2009). Nevertheless, all these variables were similar among CON, MEL7, and MEL1, suggesting that oral meloxicam administration failed to modulate the physiological and inflammatory responses triggered by LPS administration.
Table 2. Blood variables from steers and heifers challenged with lipopolysaccharide (LPS; Exp. 1) or vaccination (Exp. 2), and assigned to receive oral meloxicam (1 mg/kg of BW daily) for 7 d (MEL7), lactose monohydrate for 7 d (CON), or meloxicam for 1 d and lactose monohydrate for 6 d (MEL1) during the challenging period.1
Item CON MEL7 MEL1 SEM P = Exp. 1 Cortisol, ng/mL 30.4 30.6 30.1 2.7 0.98 Insulin, µIU/mL 2.72 3.04 2.75 0.66 0.93 NEFA, μEq/L 0.43 0.42 0.43 0.05 0.98 Leptin, ng/mL 4.89 4.93 5.23 0.34 0.74 Haptoglobin, ng/mL 0.26 0.29 0.28 0.05 0.95
Exp. 2 Cortisol, ng/mL 26.6 26.1 24.4 1.6 0.61 Insulin, µIU/mL 1.84 1.92 1.91 0.38 0.98 NEFA, μEq/L 0.37 0.29 0.35 0.06 0.68 Leptin, ng/mL 5.00 5.29 5.44 0.25 0.46 Haptoglobin, ng/mL 0.57 0.52 0.56 0.09 0.92
1 In Exp. 1, all cattle received an intravenous bolus dose of bacterial LPS (0.5 μg/kg of BW, Escherichia coli 0111:B4, Sigma-Aldrich, St. Louis, MO). In Exp. 2, cattle were vaccinated against infectious bovine rhinotracheitis, bovine viral diarrhea complex, pneumonia, and Mannheimia haemolytica (Bovi-Shield Gold One Shot; Zoetis, Florham Park, NJ).
Experiment 2
No treatment effects detected (P = 0.80) BW change during the experimental period (Table 1). No treatment effects were detected (P ≥ 0.38; Table 1) for hay DMI parameters, although DMI decreased (day effect, P < 0.01; Figure 2) upon vaccination as previously reported by Marques et al. (2014).
No treatment effects were detected (P = 0.29) for rectal temperature, which increased for all treatments (time effect, P < 0.01; data not shown) from 2 to 16 h and returned to baseline levels 24 h relative to vaccination. No treatment effects were detected (P ≥ 0.61) for plasma cortisol, insulin, leptin, haptoglobin and serum NEFA
69

(Table 2). Time effects were detected (P < 0.01; data not shown) for all plasma variables. Plasma cortisol concentrations increased (P < 0.05) from 4 to 12 h and returned to baseline levels 16 h relative to vaccination. Plasma insulin concentrations increased (P < 0.05) from 8 to 16 h and returned to baseline levels 24 h relative to vaccination. Plasma leptin concentrations increased (P < 0.05) from 8 to 16 h and returned to baseline levels 24 h relative to vaccination. Plasma haptoglobin concentrations increased (P < 0.05) beginning at 16 h and returned to baseline levels only at 168 h relative to vaccination. Similar outcomes were reported by Marques et al. (2014), illustrating the physiological changes, including energy metabolism, inflammatory and stress reaction, caused by vaccination against BRD pathogens in beef cattle.
Table 3. Serum concentrations of antibodies against M. haemolytica (ng bound), as well as serum titers (log) against bovine respiratory syncytial virus (BRSV), bovine herpesvirus-1 (BHV-1), bovine viral diarrhea virus-1 (BVD-1), and parainfluenza 3 virus (PI3) in steers and heifers challenged with a vaccine against these pathogens and assigned to receive oral meloxicam (1 mg/kg of BW daily) for 7 d (MEL7), lactose monohydrate for 7 d (CON), or meloxicam for 1 d and lactose monohydrate for 6 d (MEL1) during the challenging period.1
Item CON MEL7 MEL1 SEM P = M. haemolytica 0.87 0.70 0.96 0.17 0.53 BRSV 1.70 1.57 1.32 0.16 0.26 BHV-1 0.79 0.66 0.75 0.22 0.90 BVD-1 1.35 1.45 1.17 0.21 0.62 PI3 1.65 1.01 1.25 0.23 0.16
1 Cattle were vaccinated against infectious bovine rhinotracheitis, bovine viral diarrhea complex, pneumonia, and Mannheimia haemolytica (Bovi-Shield Gold One Shot; Zoetis, Florham Park, NJ).
No treatment effects were detected (P ≥ 0.16) for
serum concentrations of antibodies against M. haemolytica, or serum titers against BRSV, BHV-1, BVD-1, and BVD-1. Time effects were detected (P < 0.01) for all titers but for BVD (P = 0.40), given that values increased (P ≤ 0.04) when comparing samples collected prior to and after vaccination (0.68 vs. 0.89, SEM = 0.05 for M. haemolytica, 1.03 vs. 1.70, SEM = 0.11 for BRSV, 0.22 vs. 0.90, SEM = 0.15 for BHV-1, and 0.81 vs. 1.50, SEM = 0.14 for PI3. These results indicate that vaccination induced the expected antibody response but for BVD-1, whereas meloxicam administration did not impact these outcomes.
IMPLICATIONS
Oral meloxicam administration to beef cattle for 7 consecutive d at 1 mg/kg of BW prevented the decrease in DMI caused by LPS administration, but did not alleviate the resultant inflammatory and acute-phase protein reactions. Similarly, oral meloxicam administration to beef cattle at 1 mg/kg of BW upon vaccination against the BRD complex did not prevent the vaccine-induced decrease in DMI, did not alleviate the resultant inflammatory and acute-phase protein responses, and did not impact serum concentrations of antibodies against these pathogens. Hence, meloxicam administration failed to modulate the physiological
challenges associated with LPS administration and vaccination in beef cattle.
LITERATURE CITED
Arthington, J. D., R. F. Cooke, T. D. Maddock, D. B. Araujo, P. Moriel, N. DiLorenzo, and G. C. Lamb. 2013. Effects of vaccination on the acute-phase protein response and measures of performance in growing beef calves. J. Anim. Sci. 91:1831-1837.
Carroll, J. A., and N. E. Forsberg. 2007. Influence of stress and nutrition on cattle immunity. Vet. Clin. Food. Anim. 23:105-149.
Carroll, J. A., Reuter, R.R., Chase Jr., C.C., Coleman, S.W., Riley, D.G., Spiers, D.E., Arthington, J.D. and Galyean, M.L. 2009. Profile of the bovine acute-phase response following an intravenous lipopolysaccharide challenge. Innate Immun. 15:81–89.
Confer, A. W., S. Ayalew, M. Montelongo, D. L. Step, J. H. Wray, R. D. Hansen, and R. J. Panciera. 2009. Immunity of cattle following vaccination with a Mannheimia haemolytica chimeric PlpE–LKT (SAC89) protein. Vaccine 27:1771–1776.
Delavaud, C., F. Bocquier, Y. Chilliard, D. H. Keisler, A. Gertler, and G. Kann. 2000. Plasma leptin determination in ruminants: Effect of nutritional status and body fatness on plasma leptin concentration assessed by a specific RIA in sheep. J. Endocrinol. 165:519–526.
Guarnieri Filho, T. A., R. F. Cooke, B. I. Cappellozza, M. M. Reis, R. S. Marques, and D. W. Bohnert. 2014. Effects of meloxicam administration on physiological and performance responses of transported feeder cattle. J. Anim. Sci. 92:4137-4144.
Marques, R. S., R. F. Cooke, B. I. Cappellozza, T. Guarnieri Filho, M. M. Reis, D. H. Keisler, and D. W. Bohnert. 2014. A vaccine-induced acute-phase reaction increases plasma leptin concentrations in beef cattle. J. Anim. Sci. 92(E-Suppl. 2):258.
Rice, J. A., L. Carrasco-Medina, D. C. Hodgins, and P. E. Shewen. 2007. Mannheimia haemolytica and bovine respiratory disease. Anim. Health Res. Rev. 8:117–128.
Van Engen, N. K., M. L. Stock, T. Engelken, R. C. Vann, L. W. Wulf, L. A. Karriker, W. D. Busby, J. Lakritz, A. J. Carpenter, B. J. Bradford, W. H. Hsu, C. Wang, and J. F. Coetzee. 2014. Impact of oral meloxicam on circulating physiological biomarkers of stress and inflammation in beef steers after long-distance transportation. J. Anim. Sci. 92:498–510.
Waggoner, J. W., C. A. Löest, J. L. Turner, C. P. Mathis, and D. M. Hallford. 2009. Effects of dietary protein and bacterial lipopolysaccharide infusion on nitrogen metabolism and hormonal responses of growing beef steers. J. Anim. Sci. 2009. 87:3656–3668.
70
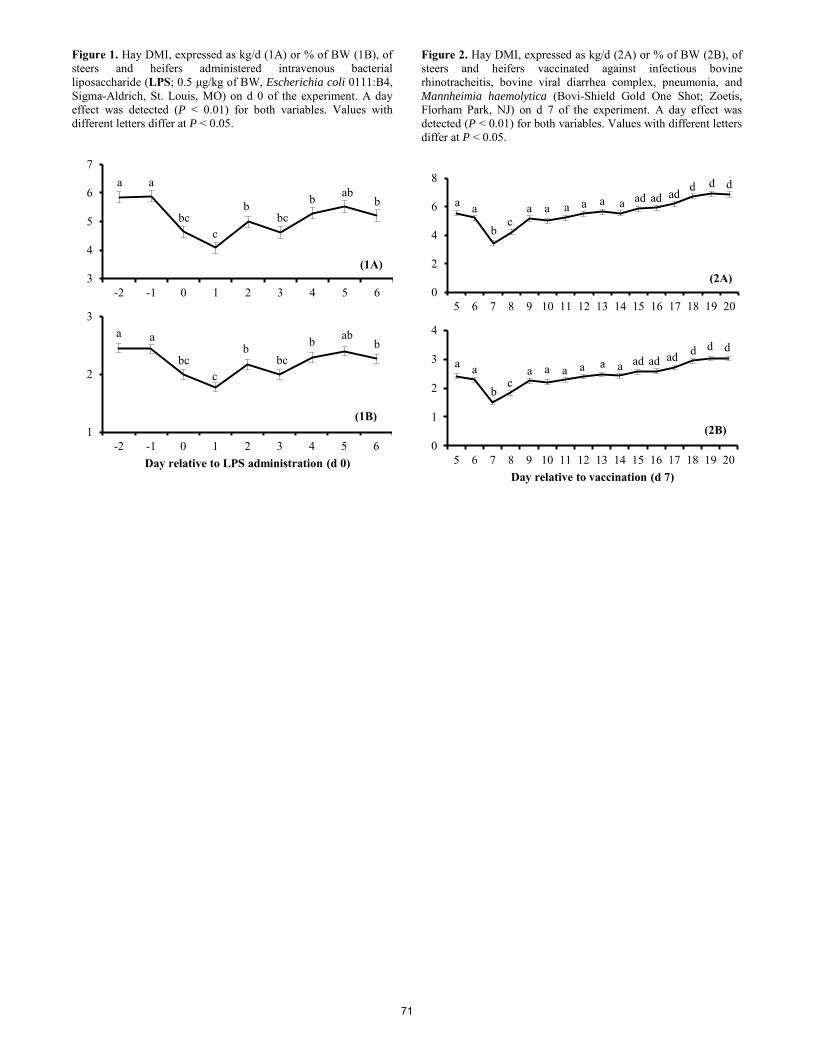
Figure 1. Hay DMI, expressed as kg/d (1A) or % of BW (1B), of steers and heifers administered intravenous bacterial liposaccharide (LPS; 0.5 μg/kg of BW, Escherichia coli 0111:B4, Sigma-Aldrich, St. Louis, MO) on d 0 of the experiment. A day effect was detected (P < 0.01) for both variables. Values with different letters differ at P < 0.05.
Figure 2. Hay DMI, expressed as kg/d (2A) or % of BW (2B), of steers and heifers vaccinated against infectious bovine rhinotracheitis, bovine viral diarrhea complex, pneumonia, and Mannheimia haemolytica (Bovi-Shield Gold One Shot; Zoetis, Florham Park, NJ) on d 7 of the experiment. A day effect was detected (P < 0.01) for both variables. Values with different letters differ at P < 0.05.
3
4
5
6
7
-2 -1 0 1 2 3 4 5 6
1
2
3
-2 -1 0 1 2 3 4 5 6Day relative to LPS administration (d 0)
0
2
4
6
8
5 6 7 8 9 10 11 12 13 14 15 16 17 18 19 20
0
1
2
3
4
5 6 7 8 9 10 11 12 13 14 15 16 17 18 19 20Day relative to vaccination (d 7)
(1B)
a a
bc c
b bc
b ab b
(1A)
a a
bc c
b bc
b ab b
(2B)
a a
b c
a
d
(2A)
a a a a a ad ad ad d d
a a
b c
a a a a a ad ad ad d d
a d
71
Proceeding, Western Section, American Society of Animal Science
Vol. 66, 2015
Performance of Beef-Cattle as influenced by controlled and uncontrolled populations of horn flies (Diptera: Muscidae)1
B.G. Smythe*, M.E. Wise*, E.J. Scholljegerdes† and M. Fletcher‡
*Center for Animal Health and Food Safety and †Department of Animal and Range Sciences, New Mexico State University, Las Cruces, NM 88003; ‡Y-Tex Corporation, Cody WY, 82414
ABSTRACT: The horn fly (Diptera: Muscidae) is commonly regarded as the most detrimental insect ectoparasite affecting rangeland cattle. This study was conducted to assess the reproductive consequences associated with cattle infested with naturally-occurring seasonal populations of horn flies in a pastured setting. Forty Angus x Hereford cow-calf pairs were randomly assigned to one of two treatments; an untreated control (UTC) herd and an insecticide treated (TRT) herd. Weekly horn fly counts were made on both animal herds throughout the duration of the study and blood serum progesterone levels were used to evaluate post-partum intervals and days to re-breeding. Initial and final body weights of cows along with calf weaning weights were collected. No differences were detected between treatment groups for length of postpartum anestrous (P = 0.61) or time to pregnancy postpartum (P = 0.57). No differences were detected in final body weight (P = 0.16) or weight gain (P = 0.14) of cattle despite notable observations. However, weaning weights of calves from TRT herd were greater (P = 0.0054) when compared to calves from the UTC herd. These results supported our hypothesis that horn fly infestation of cow would negatively impact calf growth performance. Though not statistically different, numerical differences in weight gain of cows during the late postpartum and early gestational period indicate potential biological importance and are discussed.
Key words: horn fly, ectoparasite, post-partum, weaning,progesterone
_____________________ 1 Appreciation is extended to Y-Tex Corporation for support of this project, as well as NMSU Corona Range and Livestock Research Center for their valued assistance.
INTRODUCTION
Animal health is an essential component to maximizing animal performance. In rangeland scenarios ectoparasites pose a substantial threat to animal welfare that could potentially jeopardize profit margins for producers. In fact, economic losses due to infestations of horn flies, Haematobia irritans, are responsible for over $700 million in cattle production losses annually (Drummond et al., 1981; Kunz et al., 1990). Often manifested through decreases in feed efficiency, weight gain, and milk production, the impacts of the horn fly on cattle have been well defined and described (Byford et al., 1992). However, the underlying physiological responses to this unique source of stress have not yet been clearly defined. Under controlled conditions, Schwinghammer (1986) evaluated horn fly-induced stress ultimately noting differences in heart and respiration rates, rectal temperatures, water intake, nitrogen retention, and serum cortisol concentrations. In order to properly develop and establish successful integrated pest management programs to help control this pest and minimize production losses, further research, including that of the reproductive consequences of horn fly-induced stress responses in cattle is warranted. We hypothesized that horn fly infestations would extend cattle anestrous and negatively affect calf growth performance. The objectives of this study were to assess the post-partum responses of nursing cattle grazing native range to seasonal horn fly populations as measured by time to resume estrous, postpartum interval, and cow and calf growth performance.
72
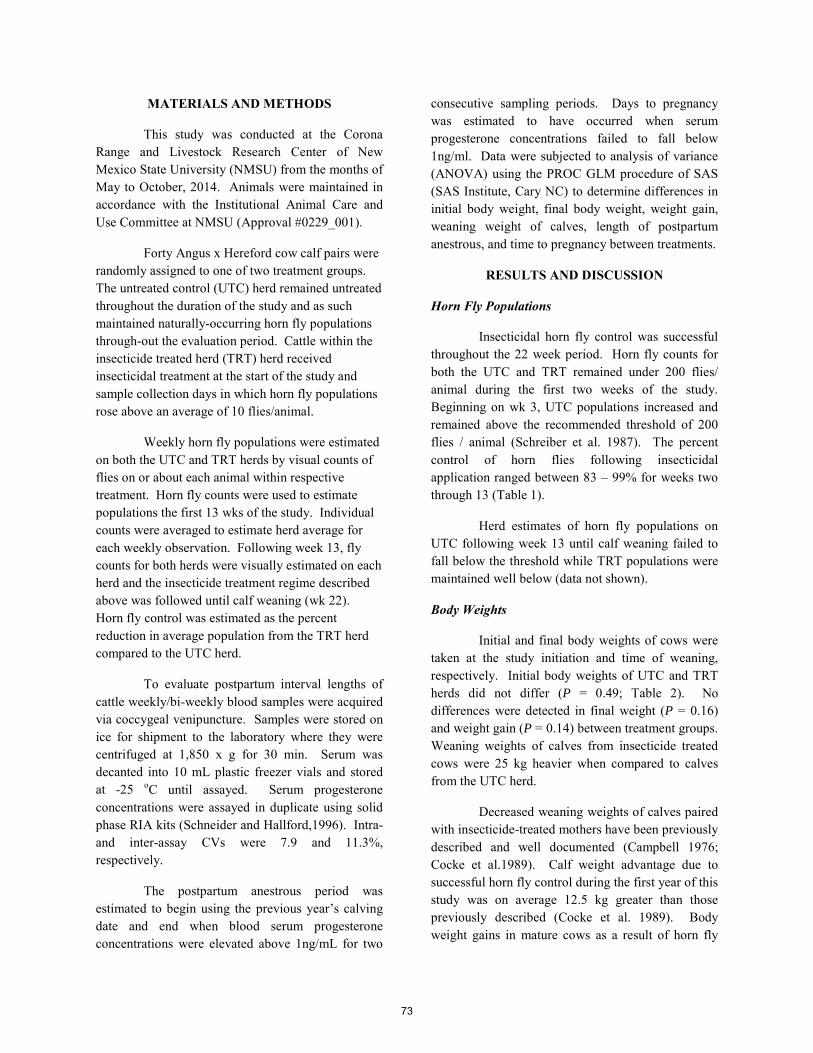
MATERIALS AND METHODS
This study was conducted at the Corona Range and Livestock Research Center of New Mexico State University (NMSU) from the months of May to October, 2014. Animals were maintained in accordance with the Institutional Animal Care and Use Committee at NMSU (Approval #0229_001).
Forty Angus x Hereford cow calf pairs were randomly assigned to one of two treatment groups. The untreated control (UTC) herd remained untreated throughout the duration of the study and as such maintained naturally-occurring horn fly populations through-out the evaluation period. Cattle within the insecticide treated herd (TRT) herd received insecticidal treatment at the start of the study and sample collection days in which horn fly populations rose above an average of 10 flies/animal.
Weekly horn fly populations were estimated on both the UTC and TRT herds by visual counts of flies on or about each animal within respective treatment. Horn fly counts were used to estimate populations the first 13 wks of the study. Individual counts were averaged to estimate herd average for each weekly observation. Following week 13, fly counts for both herds were visually estimated on each herd and the insecticide treatment regime described above was followed until calf weaning (wk 22). Horn fly control was estimated as the percent reduction in average population from the TRT herd compared to the UTC herd.
To evaluate postpartum interval lengths of cattle weekly/bi-weekly blood samples were acquired via coccygeal venipuncture. Samples were stored on ice for shipment to the laboratory where they were centrifuged at 1,850 x g for 30 min. Serum was decanted into 10 mL plastic freezer vials and stored at -25 oC until assayed. Serum progesterone concentrations were assayed in duplicate using solid phase RIA kits (Schneider and Hallford,1996). Intra- and inter-assay CVs were 7.9 and 11.3%, respectively.
The postpartum anestrous period was estimated to begin using the previous year’s calving date and end when blood serum progesterone concentrations were elevated above 1ng/mL for two
consecutive sampling periods. Days to pregnancy was estimated to have occurred when serum progesterone concentrations failed to fall below 1ng/ml. Data were subjected to analysis of variance (ANOVA) using the PROC GLM procedure of SAS (SAS Institute, Cary NC) to determine differences in initial body weight, final body weight, weight gain, weaning weight of calves, length of postpartum anestrous, and time to pregnancy between treatments.
RESULTS AND DISCUSSION
Horn Fly Populations
Insecticidal horn fly control was successful throughout the 22 week period. Horn fly counts for both the UTC and TRT remained under 200 flies/ animal during the first two weeks of the study. Beginning on wk 3, UTC populations increased and remained above the recommended threshold of 200 flies / animal (Schreiber et al. 1987). The percent control of horn flies following insecticidal application ranged between 83 – 99% for weeks two through 13 (Table 1).
Herd estimates of horn fly populations on UTC following week 13 until calf weaning failed to fall below the threshold while TRT populations were maintained well below (data not shown).
Body Weights
Initial and final body weights of cows were taken at the study initiation and time of weaning, respectively. Initial body weights of UTC and TRT herds did not differ (P = 0.49; Table 2). No differences were detected in final weight (P = 0.16) and weight gain (P = 0.14) between treatment groups. Weaning weights of calves from insecticide treated cows were 25 kg heavier when compared to calves from the UTC herd.
Decreased weaning weights of calves paired with insecticide-treated mothers have been previously described and well documented (Campbell 1976; Cocke et al.1989). Calf weight advantage due to successful horn fly control during the first year of this study was on average 12.5 kg greater than those previously described (Cocke et al. 1989). Body weight gains in mature cows as a result of horn fly
73

infestations have garnered much less attention then weaning weight of calves due to the lack of monetary value associated with mature animal weight gains. However, average daily gain (ADG) advantages of 0.16 kg by yearling steers in New Mexico have been reported (Kinzer et al. 1984). Our mature insecticide-treated cows were observed to have a 0.12 kg ADG advantage when compared to their untreated counterparts. Though not significant, numerical differences obtained in this study appear to be biologically important. Low level energy intake by cattle during the postpartum interval can decrease chances of rebreeding (Randel 1990). Differences in average daily gain between insecticide-treated and untreated control cows could influence the length of the postpartum anestrous period, particularly if cows were in poor or marginal body condition. Cows in this study were all in moderate (BCS > 5) body condition at time of weaning and thus, may not have been impacted reproductively by the differences in weight gain.
Serum Progesterone Concentrations
Cows from the UTC and TRT were on average 37.70 and 39.65 d (P = 0.3685) post-partum at the initiation of the study. Serum progesterone concentrations yielded minimum differences between treatments for post-partum interval lengths which averaged 66.55 and 68.35 d (P = 0.61) for UTC and TRT, respectively. Similarly, no differences (P = 0.57) were detected when days to pregnancy was compared between treatment groups (Table 3). Average serum progesterone concentrations throughout the duration of the sample collection period were consistent between treatment groups (Figure 1).
The consequences of various stress factors, particularly that of heat, on multiple reproductive traits in cattle have been well-defined and reviewed multiple times (Jordan 2003; Hansen, 2001). Horn fly-induced stress and associated reproductive performances of cattle have yet to be fully described. Our results would indicate that the presence of horn flies has no impact on post-partum intervals or days to pregnancy for rangeland cattle maintaining favorable body condition scores in New Mexico. More research is required to assess potential impacts
of horn fly infestations on mature cattle below optimal body condition.
IMPLICATIONS
It is important to note that these data are reported descriptively and as the first replication of a multi-year project. However, results for this year suggest an advantage seen in weaning weight for the calves of insecticide-treated cows. Slight differences in weight gains of cows between treatment groups during the late postpartum period and early breeding season indicate a potential horn fly influence. However, blood serum progesterone concentration used to estimate postpartum anestrous interval and days to pregnancy appear unaffected.
LITERATURE CITED
Byford, R. L., M. E. Craig, & B. L. Crosby. 1992. Ectoparasites and their effect on cattle production. J. Anim. Sci, 70: 597-602.
Campbell, J. B. 1976. Effect of horn fly control on cows as expressed by increased weaning weights of calves. J. Econ. Entomol. 69:711-712.
Cocke Jr, J., R. Knutson, and D. K. Lunt. 1989. Effects of horn fly control with cyhalothrin ear tags on weight gains in weaning calves in Texas. Soutwest. Entomol. 14:357-362.
Drummond, R.O. 1981. Estimated losses of livestock to pests. In D. Pimentel (Ed.). CRC Handbook of Pest Management in Agriculture. CRC Press, Boca Raton, FL.
Hansen, P. J., and Aréchiga, C. F. 1999. Strategies for managing reproduction in the heat-stressed dairy cow. J. Dairy Sci. 82(Suppl 2):36–50.
Jordan, E. R. 2003. Effects of heat stress on reproduction. J. Dairy Sci. 86:104-114.
Kunz, S. E., A. J. Miller, P. L. Sims, and D. C. Meyerhoeffer. 1984. Economics of controlling horn flies (Diptera: Muscidae) in range cattle management. J. Econ. Entomol. 77:657-660.
Kinzer, H. G., W. E. Houghton, J. M. Reeves, S. E. Kunz, J. D. Wallace, and N. S. Urquhart. 1984.
74
Influence of horn flies on weight loss in cattle, with notes on prevention of loss by insecticide treatment. Southwest. Entomol. 9:212-217.
Randel, R. D. 1990. Nutrition and postpartum rebreeding in cattle. J. Anim. Sci, 68:853-862.
Schwinghammer, K. A., F. W. Knapp, J. A. Boling, and K. K. Schillo. 1986. Physiological and nutritional response of beef steers to infestations of the horn fly (Diptera: Muscidae). J. Econ. Entomol, 79(4), 1010-1015.
Schneider, F. A., and D. M. Hallford. 1996. Use of a rapid progesterone radioimmunoassay to predict pregnancy and fetal numbers in ewes. Sheep and Goat Res. J. 12:33-38.
Schreiber, E. T., J. B. Cambpell, S. E. Kunz, D. C. Clanton, and D. B. Hudson. 1987. Effects of horn fly (Diptera: Muscidae) control on cows and gastrointestinal worm (Nematode: Trichostrongylidae) treatment for calves on cow and calf weight gains. J. Econ. Entomol, 80:451-454.
75
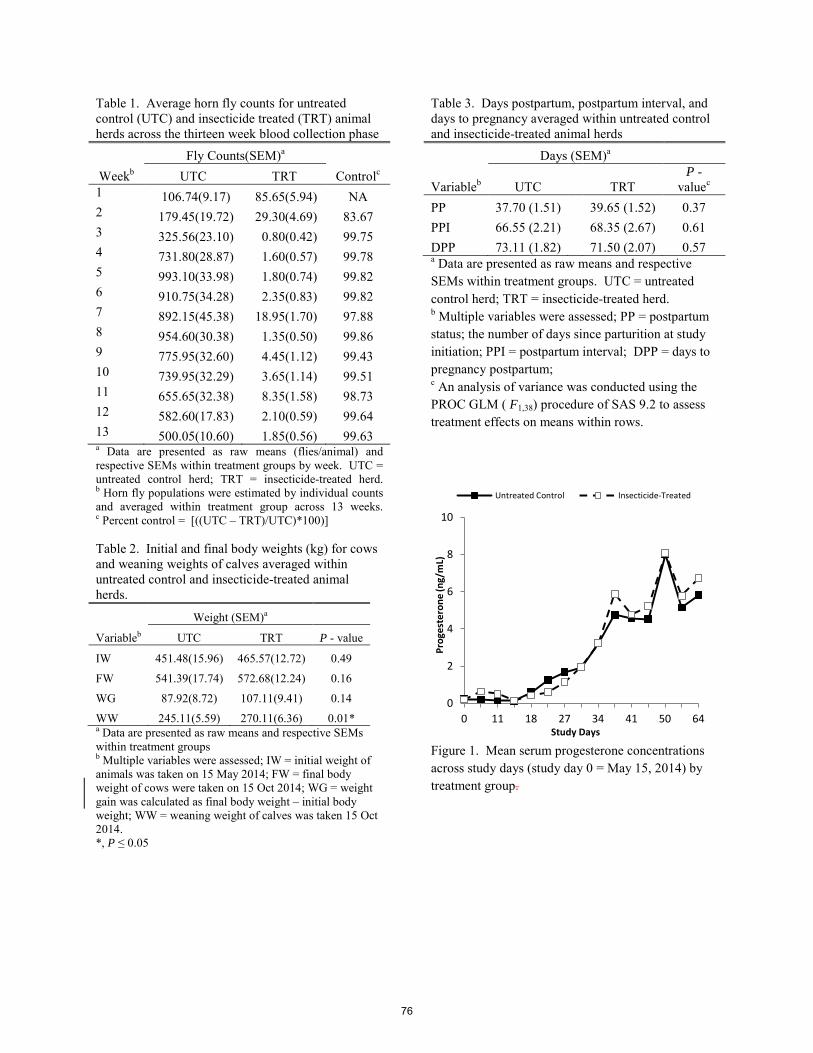
Table 1. Average horn fly counts for untreated control (UTC) and insecticide treated (TRT) animal herds across the thirteen week blood collection phase
Fly Counts(SEM)a
Weekb UTC TRT Controlc 1 106.74(9.17) 85.65(5.94) NA 2 179.45(19.72) 29.30(4.69) 83.67 3 325.56(23.10) 0.80(0.42) 99.75 4 731.80(28.87) 1.60(0.57) 99.78 5 993.10(33.98) 1.80(0.74) 99.82 6 910.75(34.28) 2.35(0.83) 99.82 7 892.15(45.38) 18.95(1.70) 97.88 8 954.60(30.38) 1.35(0.50) 99.86 9 775.95(32.60) 4.45(1.12) 99.43 10 739.95(32.29) 3.65(1.14) 99.51 11 655.65(32.38) 8.35(1.58) 98.73 12 582.60(17.83) 2.10(0.59) 99.64 13 500.05(10.60) 1.85(0.56) 99.63 a Data are presented as raw means (flies/animal) and respective SEMs within treatment groups by week. UTC = untreated control herd; TRT = insecticide-treated herd. b Horn fly populations were estimated by individual counts and averaged within treatment group across 13 weeks. c Percent control = [((UTC – TRT)/UTC)*100)] Table 2. Initial and final body weights (kg) for cows and weaning weights of calves averaged within untreated control and insecticide-treated animal herds.
Weight (SEM)a
Variableb UTC TRT P - value
IW 451.48(15.96) 465.57(12.72) 0.49
FW 541.39(17.74) 572.68(12.24) 0.16
WG 87.92(8.72) 107.11(9.41) 0.14
WW 245.11(5.59) 270.11(6.36) 0.01* a Data are presented as raw means and respective SEMs within treatment groups b Multiple variables were assessed; IW = initial weight of animals was taken on 15 May 2014; FW = final body weight of cows were taken on 15 Oct 2014; WG = weight gain was calculated as final body weight – initial body weight; WW = weaning weight of calves was taken 15 Oct 2014. *, P ≤ 0.05
Table 3. Days postpartum, postpartum interval, and days to pregnancy averaged within untreated control and insecticide-treated animal herds
Days (SEM)a
Variableb UTC
TRT P -
valuec PP 37.70 (1.51) 39.65 (1.52) 0.37 PPI 66.55 (2.21) 68.35 (2.67) 0.61 DPP 73.11 (1.82) 71.50 (2.07) 0.57 a Data are presented as raw means and respective SEMs within treatment groups. UTC = untreated control herd; TRT = insecticide-treated herd. b Multiple variables were assessed; PP = postpartum status; the number of days since parturition at study initiation; PPI = postpartum interval; DPP = days to pregnancy postpartum; c An analysis of variance was conducted using the PROC GLM ( F1,38) procedure of SAS 9.2 to assess treatment effects on means within rows.
Figure 1. Mean serum progesterone concentrations across study days (study day 0 = May 15, 2014) by treatment group.
0
2
4
6
8
10
0 11 18 27 34 41 50 64
Prog
este
rone
(ng/
mL)
Study Days
Untreated Control Insecticide-Treated
76
Proceedings, Western Section, American Society of Animal Science
Vol. 66, 2015
Carcass characteristics and body composition of lambs selected for divergent residual feed intake1
K.A. Perz, M.R. Whitmore, A.F. Williams, A.R. Hicks-Lynch, M. R. Herrygers, J.A. Boles, J.G. Berardinelli, and
J.M. Thomson2
Department of Animal and Range Sciences, Montana State University, Bozeman MT 59717
ABSTRACT: The objective of this study was to evaluate differences in growth performance measures, carcass characteristics and quality, and body composition in lambs selected for divergent residual feed intake (RFI). Mixed-breed wether lambs (n = 65), approximately 4-mo-old, were placed on trial in September of 2014. A 47-d feeding trial was conducting to get an estimate of individual lamb intake. Residual feed intake, an efficiency measurement based upon the difference in actual feed intake and expected feed intake, was calculated for each lamb. Wethers with an RFI of one standard deviation greater (HIGH; less efficient; n = 6) or lower (LOW; more efficient; n = 6) than the mean RFI (approximately 0) of the 65 wethers were used in the present study. Lambs were processed on December 15, 2014. Organ weights were collected immediately after slaughter, with the exception of gastrointestinal tract, which was chilled and evaluated 24 to 48 h after harvest. Carcass data were collected on December 16, 2014. Initial and final liveweights, as well as ADG were not affected (P > 0.05) by RFI class. Back fat thickness (BF) and yield grade (YG) were greater (P < 0.03) in HIGH carcasses than in LOW lamb carcasses. No other carcass traits differed between RFI classes. Lung and trachea weights were heavier (P < 0.03) in LOW lamb carcasses than in HIGH lamb carcasses. Regression of lung weight on hot carcass weight (HCW) indicated that lighter carcasses had heavier lungs (P < 0.02, R2=0.45); this relationship was observed in both HIGH and LOW lamb carcasses (HIGH: P < 0.04; R2 = 0.68; LOW: P < 0.04; R2 = 0.68). Rumen weight was greater (P < 0.005) for LOW lambs than for HIGH lambs. Total GIT and total viscera weights were greater (P < 0.03) for LOW lambs than in HIGH lambs. In growing lambs, selection for RFI seems to affect fat deposition and visceral organ weights, although more research is necessary to understand the relationship between lung weight, RFI, and HCW. Key words: body composition, carcass characteristics, residual feed intake ______________________ 1The authors thank Philip Merta for his excellent technical assistant during the course of this study. This study was supported by the Montana Agric. Exp. Sta., and is a contributing project to Multistate Research Project, W2010, Integrated Approach to Enhance Efficiency of Feed Utilization in Beef Production Systems. 2Corresponding author’s e-mail address: [email protected]
INTRODUCTION
The most costly resource in any livestock production system is the cost of feed (Moore et al., 2009). As feed prices continue to rise, selection for efficient animals that can gain more on less feed will become more economically important. Moreover, decreasing days on feed not only decreases production costs for producers, it also decreases the carbon footprint and increases sustainability (Capper, 2011). Residual feed intake (RFI) has been suggested as the optimal selection trait for enhancing efficiency of production in beef cattle, since it has been reported to be independent of phenotypic effects and reflects variation metabolic differences among individual animals (Carstens and Kerley, 2009).
The physiological mechanisms that cause variations in RFI are not clear or completely understood. Richardson and Herd (2004) estimated that protein turnover, tissue metabolism, and stress are related to 37% of the variation in RFI; body composition explains 5% of the variation,; activity and digestibility explain 10% of the variation; heat increment of fermentation causes 9% of variation; and, feeding patterns give rise to 2% of variation. This leaves 27% of the variation in RFI remaining to be explained. The 27% of unaccounted for variation may be problematic when using RFI as a selection tool. Due to our lack of understanding of the physiological mechanism related to this variation it may led to inadvertently selecting for undesirable traits.
The objective of this study was to investigate patterns of variation in RFI and to determine if young wethers divergently selected for RFI differed in performance traits and produced carcasses with different carcass characteristics and organ weights. Our hypothesis was that divergently selecting wethers based on RFI class would not influence performance traits, but would lead to carcasses with different carcass characteristics and organ weights.
MATERIALS AND METHODS
This experiment was conducted at the Montana State University Bozeman Agricultural Research and Teaching Farm (BARTF). Animal care, handling, and protocols used in this experiment were approved by the Montana State University Agricultural Animal Care and Use Committee.
77

Animals and Diets
Crossbred wethers (n = 65), approximately 4 mo of age, from the Montana State University flock were transported to the Fort Ellis Research Farm in Bozeman, MT in August of 2014. Following vaccination for enterotoxaemia and a 2-wk acclimation period, a 47-d RFI feeding trial began in September, 2014. Due to space constraints, lambs were separated into two groups; group 1 (n = 45) and group 2 (n = 25). Lambs were brought into a barn twice daily, 12 h apart, and individually penned to allow ad libitum access to an 80%:20% alfalfa:barley pelleted diet (Table 1) for 2 to 3 h. Feed was weighed prior to and after each feeding for calculating individual lamb intake. Lambs were penned in a drylot with unlimited access to water, but no access to forage. Body weights were recorded for each lamb on two consecutive days and averaged for BW at wk 1, 3, 4, and 6 after the adaptation period. Final BW collected at wk 6 was delayed 5 d due to extreme weather conditions.
Table 1. Nutrient composition (DM basis) of alfalfa:barley pelleted diet
Item1 Value
DM, % 89.0
CP, % 20.2
ADF, % 33.2
TDN, % 64.5
NEm, mcal/lb 0.65
NEg, mcal/lb 0.37 1Average of samples taken from each batch (n=6) of feed used
RFI Calculation and Animal Selection
Daily intakes for each wether were used to calculate ADG. Average daily gains (kg/d) of individual wethers were modeled by linear regression of BW using the PROC GLM procedure of SAS (SAS Inst., Inc., Cary, NC, USA). The regression coefficients were used to compute the ADG, initial and final BW, and mid-test metabolic BW (MBW) as described by Lancaster et al. (2009). Expected feed intake (EFI) was modeled using PROC GLM by linear regression of DMI against the modeled mid-test MBW and ADG (Koch et al., 1963). The model used to estimate EFI was: Yi = βO + β1ADGi + β2 mid-test MBWi + εi where Yi is the DMI of the ewe, β0 is the regression intercept, β1 is the partial regression coefficient of DMI on modeled ADG, β2 is the partial regression coefficient of DMI modeled on mid-test MBW, and εi is the residual error in the DMI of the wethers. Residual feed intake was calculated for each wether as the difference between DMI and EFI. Wethers with an RFI greater than (HIGH; less
efficient; n = 6) and less than (LOW; more efficient; n = 6) one standard deviation of the mean of the 65 wethers were retained and moved to the BARTF in December 2014 (Table 1). Carcass Characteristics and Body Composition
Wethers were transported to Big Timber, MT on December 15, 2014 and processed following standard industry procedures on December 16, 2014. Weights of kidneys, spleen, heart, liver, and lungs including the trachea of each lamb were taken immediately after slaughter. Gastrointestinal tracts (GIT) of each wether were emptied, transported back to Montana State University, and weighed 24 to 48 h later.
Following a 24-h chill, carcasses were transported back to the Meat Laboratory at Montana State University, where carcass data (back fat thickness, rib-eye area, maturity, leg score, conformation, flank streaking, and quality grade) were collected by a trained meat evaluator. Yield grade (YG) was calculated with the following equation: YG= [10*back fat thickness (in)] + 0.4. Statistical Analysis
Data for initial and final BW, ADG, HCW, back fat thickness (BF), rib-eye area (REA), leg score, maturity, conformation, flank streaking, quality grade, YG, and weights of heart, intestines, kidneys, liver, lungs including trachea, rumen, spleen, total GIT, and total viscera were analyzed separately with one-way ANOVA using PROC ANOVA of SAS (SAS Inst. Inc., Cary, NC). The model included only RFI class. Means from each analysis were separated using Bonferroni’s adjustment.
The relationship between lung weight and HCW was investigated by regression analysis using PROC REG of SAS.
RESULTS AND DISCUSSION Lamb Performance and Carcass Data
Initial liveweight, final liveweight, and ADG did not differ (P > 0.05) between HIGH and LOW RFI lambs (Table 2).These results are similar to those reported by Redden et al. (2011, 2013) where ADG was not affected by RFI classification in lamb and yearling ewes. Table 2. Performance of HIGH and LOW RFI Wethers RFI Classification Item HIGH LOW SEM P-value
Initial liveweight, kg 29.2 30.6 6.9 0.37 Final Liveweight, kg 45.1 46.1 9.2 0.70 ADG, kg/d 0.27 0.26 0.1 0.62 RFI 0.19 -0.28 0.02
78

Carcass characteristics except BF and YG were not affected (P < 0.03) by RFI class (Table 3). It is important to note that these lambs were on feed for a fixed period of 47 d for the feeding trial prior to being fed ad libitum for the remainder of data collection, and resulted in carcasses smaller than industry average. It is possible that if the lambs had been heavier at slaughter, these results may have been different. HIGH wethers produced carcasses with more BF and higher YG. As YG is calculated based upon BF, it was not surprising that both of these values were significant.
Table 3. Carcass characteristics and quality of wethers from divergent RFI classes RFI
Classification
Item HIGH LOW SEM P-value
HCW, kg 21.0 20.8 4.4 0.90 Backfat thickness, cm 0.6a 0.3b 0.1 0.03 Ribeye area, cm2 6.5 5.6 1.0 0.87 Leg Score 1 9.3 9.3 1.2 1.00 Maturity 2 1.67 1.8 0.5 0.55 Conformation1 9.3 9.3 1.2 1.00 Flank Streaking 3 225 245 104.1 0.75 Quality Grade1 9.3 9.2 1.9 0.88 Yield Grade 4 2.65a 1.73b 0.6 0.03 1 Utility = 7, High Good = 9, Low Choice = 10, Average Choice = 11, High Choice = 12. 2 A00 to A33 = 1, A34 to A67=2. 3 Practically devoid = 100-199, Traces = 200-299, slight = 300-399, small = 400-499. 4 YG= [10*back fat thickness (in)] + 0.4 a,b Means within a row with different superscripts differ (P ≤ 0.05).
The findings of the current study that inefficient
wethers deposited more BF supports results of those reported by Redden et al. (2013) and Perry et al.(1997) in sheep and Perry et al. (1997) for beef cattle. Basarab et al. (2003) suggested using BF in the RFI equation, as there was a small correlation between BF and RFI classification. However, the relationship between efficiency and fat deposition is not fully understood. While some suggest that there is no relationship between fat and efficiency (Castro Bulle et al., 2007), others suggest that efficient animals cannot easily conserve excess energy as fat (Perry et al., 1997). It has also been hypothesized that greater maintenance energy costs are related to protein rather than fat (Ferrell et al., 1979); if this is the case, the increased BF deposition in carcasses from HIGH wethers should not be increasing the maintenance requirements enough to be the cause of their inefficiency. It is interesting that BF differed HIGH and LOW RFI wethers at approximately 8 mo of age, even though HCW and REA did not differ between HIGH and LOW RFI wethers, This may indicate that the mechanism which causes increased deposition of external fat in inefficient animals begins at a young age and is not
simply a product of being fed to finish, or until ample fat is deposited. Basarab et al. (2003) suggested that efficient steers deposited fat more slowly than inefficient steers, and our data support this hypothesis.
HIGH and LOW wethers had different total viscera and total GIT weights (P < 0.03; Table 4). Organ weights, other than lungs and rumen weights, did not differ ( P > 0.05) between HIGH and LOW RFI wethers. However, LOW RFI wethers had heavier (P < 0.03) lungs and heavier (P < 0.005) rumens than HIGH RFI wethers. In cattle, lung weights, including the trachea, did not differ between RFI classes; yet total GIT weight was greater in high RFI cattle than in low RFI cattle (Basarab et al., 2003). The results the present study in sheep are just the opposite pattern of those for GIT weights in cattle. Small intestinal weights did not differ between RFI classes, suggesting that the difference in total GIT weight was due to differences in rumen weight. It was expected that rumen weights in efficient sheep would be lighter, not heavier, similar to that reported by Basarab et al. (2003). The disparity between the results for RFI class between sheep and cattle is not clear. It is possible that heavier rumen weight in efficient wethers is related to greater surface area of the rumen than in inefficient wethers that had lighter rumens, which would allow for increased nutrient absorption. This hypothesis requires further investigation.
Table 4. Viscera weights (g) from carcasses from HIGH and LOW RFI wethers RFI Classification Weight, g
HIGH LOW SEM P-value
Heart 348.4 372.8 96.5 0.67 Intestine 1707.5 1898.5 203.9 0.13 Kidney 181.9 159.9 37.3 0.33 Liver 894.8 921.84 121.1 0.71 Lungs and trachea 578.8a 655.7b 51.4 0.03 Rumen 1416.8a 1666.6b 120.9 0.005 Spleen 68.5 71.1 13.3 0.75 Total GI Tract 1 3124.5a 3565.1b 301.0 0.03 Total Viscera 2 5196.7a 5746.4b 388.1 003 1 Rumen weight + intestine weight. 2 Heart weight + kidney weight + liver weight + spleen weight + total GI tract weight. a,b Means within a row with different superscripts differ (P ≤ 0.05).
Further investigation of the relationship between lung
weight revealed that lung weight regressed on HCW, indicated that lighter carcasses had significantly heavier lungs as a proportion (P < 0.02, R2 = 0.45). This relationship was true for both RFI classification groups (HIGH: P < 0.04; R2 = 0.68; CWT estimate = -23.2 g lung/kg CWT; LOW: P < 0.04; R2 = 0.68, CWT estimate
79
= -19.6 g lung/kg CWT). This relationship between lung weight and carcass weight was quite unexpected, and we are not sure what is physiologically responsible for this relationship. It is not known as to whether this relationship changes with increased feed or age. Slower-growing mature sheep have been reported to yield smaller carcasses with decreased wet lung weights, lung volumes, alveolar number, and alveolar surface area (Maritz et al., 2008). In the current study, lung volumes were not measured, and cross sectional areas were not taken; however, we speculate that there might be a difference in alveolar surface area between the RFI classes. Further investigation of the relationship between lung weight, RFI, and HCW is necessary.
IMPLICATIONS
Researchers still have not reached a consensus on the
effect of RFI on carcass composition and quality, and visceral organ weights. The results in this study corroborate this fact, and suggest that more investigation, especially in young animals, is necessary to understand RFI variation.
LITERATURE CITED
Basarab, J.A., M.A. Price, J.L. Aalhus, E.K. Okine, W.M.
Snelling, and K.L. Lyle. 2003. Residual feed intake and body composition in young growing cattle. Can. J. Anim. Sci. 83:189-204. doi: 10.4141/A02-065
Capper, J.L. 2011. The environmental impact of beef production in the United States: 1977 compared with 2007. J. Anim. Sci. 89:4249-4261. doi:10.2527/jas.2010-3784
Carstens, G.E. and M.S. Kerley. 2009. Biological basis for variation in energetic efficiency in beef cattle. In: Proc. Beef Improve. Fed. 41st Annual Research Symposium, Sacramento, CA. p. 124–131.
Castro Bulle, F.C.P., P.V. Paulino, A.C. Sanches, and R.D. Sainz. 2007. Growth, carcass quality, and protein and energy metabolism in beef cattle with different growth potentials and residual feed intake. J. Anim. Sci. 85:928-936. doi:10.2527/jas.2006-373
Ferrell, C.L., J.D. Crouse, R.A. Field, and J.L. Chant. 1979. Effects of sex, diet, and stage of growth upon energy utilization by lambs. J. Anim. Sci. 49:790-801. doi:10.2134/jas1979.493790x
Koch, R.M., L.A. Swiger, D. Chambers, and K.E. Gregory. 1963. Efficiency of feed use in beef cattle. J. Anim. Sci. 22:486-494. doi:10.2134/jas1963.222486x
Maritz, G., M. Probyn, R. DeMatteo, K. Snibson, and R. Harding. 2008. Lung parenchyma at maturity is influenced by postnatal growth but not by moderate preterm birth in sheep. Neonatology. 93:28-35. doi: 10.1159/000105522
Moore, S.S., F.D. Mujibi, and E.L. Sherman. 2009. Molecular basis for residual feed intake in beef cattle. J. Anim. Sci. 87 (Suppl. 14):E41-47. doi: 10.2527/jas.2008-1418.
Perry, D., A.J. Ball, J.M. Thompson, and V.H. Oddy. 1997. The relationship between residual feed intake and body components in animals selected for divergent growth rate. Proc. Assoc. Advmt. Anim. Breed. Genet. 12:238-241.
Redden, R.R., L.M.M. Surber, B.L. Roeder, B.M. Nichols, J.A. Paterson, R.W. Kott. 2011. Residual feed efficiency established in a post-weaning growth test may not result in more efficient ewes on the range. Sm. Rum. Res. 96:155-159. doi:10.1016/j.smallrumres.2010.12.007
Redden, R.R., L.M.M. Surber, A,V. Grove, and R.W. Kott. 2013. Growth efficiency of ewe lambs classified into residual feed intake groups and pen fed a restricted amount of feed. Sm. Rum. Res. 114:214-219. doi:10.1016/j.smallrumres.2013.07.002
Richardson, E.C. and R.M. Herd. 2004. Biological basis for variation in residual feed intake in beef cattle. 2. Synthesis of results following divergent selection. Anim. Prod. Sci. 44:431-440. doi:10.1071/EA02221.
80
Proceedings, Western Section, American Society of Animal Science
Vol. 66, 2015
Late gestation supplementation of corn dried distiller’s grains plus solubles to beef cows fed a low-quality forage: Impacts on mammary gland blood flow, colostrum and milk production,
and calf weights
V.C. Kennedy§, B.R. Mordhorst‡§, J.J. Gaspers§, G.L. Stokka§, M.L. Bauer§, K.C. Swanson§, and K.A. Vonnahme§
Department of Animal Sciences, North Dakota State University, Fargo§
Department of Animal Science, University of Missouri, Columbia‡ ABSTRACT: The objectives of the present study were to investigate the effects of distiller’s grains plus solubles (DDGS) supplementation on blood flow to the mammary glands during late gestation and early lactation; colostrum and milk production; and calf weight gain during early lactation and at weaning. To test this, multiparous beef cows were divided randomly into a control group (CON; n = 15) consuming ad libitum a diet containing 90% corn stover and 10% corn silage (DM basis) and a treatment group (SUP; n = 12) consuming the same basal diet and DDGS (0.3% BW). Corn silage inclusion was increased to 30% as gestation progressed to meet increasing requirements. Mammary gland blood flow (BF) ipsilateral and contralateral to the pregnant uterine horn was measured on d 245 of gestation and d 44 of lactation. At parturition, colostrum samples were collected; calves were weighed at 0 and 24 hr and percentage BW loss was calculated. Milk production was assessed on d 44 of lactation. Calves were weighed every 2 wk from birth to d 56 and when weaned (d 205). Contralateral BF (P = 0.85) and cross sectional area (CSA; P = 0.44) did not differ on d 245 of gestation. Ipsilateral BF of SUP cows was greater than CON cows (2.76 vs. 1.76 ± 0.30 L/min, respectively; P = 0.03). Calves from CON dams tended to have a greater loss in percentage of body weight after birth than those of SUP dams (-0.43 vs. -2.75 ± 0.92%, P = 0.09). Cows carrying heifers produced more colostrum (P < 0.01) than those carrying bulls. No effect of maternal diet was observed on total mammary blood flow (P = 0.33) or other measures on d 44 of lactation. The SUP cows tended to produce more milk on d 44 (2.78 vs. 2.13 ± 0.25 kg/5 h, P = 0.07). Calves gained weight from birth to d 56 (P < 0.001) and those from SUP cows were heavier (P < 0.05) and tended to have a heavier (P = 0.06) adjusted d 205 weight at weaning than those from CON cows (309.7 vs. 292.0 ± 6.0 kg; 288.4 vs. 274.0 ± 5.4 kg, respectively). In conclusion, we accept our hypothesis that DDGS supplementation during gestation influenced mammary blood flow, milk production and calf
weights; underlying mechanisms need to be investigated. Keywords: beef cow, blood flow, mammary gland, pregnancy
Introduction
Dramatic increases in corn production in North Dakota have resulted in more corn production byproducts, such as corn stover, available to producers for use as winter feed. The byproducts of corn-based ethanol production, particularly dried distiller’s grains plus solubles (DDGS), can provide an important supplemental energy and protein source for producers in addition to winter feeds. Making use of these byproducts for pregnant beef cows during the winter offers economic benefits to cow-calf operations (Kim et al., 2008), but research is needed to elucidate the nutritional benefits of using DDGS as a supplement to cows fed low-quality forages such as corn stover. Numerous studies have explored the effects of protein supplementation as well as the use of DDGS; focusing on supplementation of DDGS during late gestation has also been investigated with promising results. Observed advantages include increased percentage calves weaned, weaning weights, and ADG (Stalker et al., 2006). In cows, mammary arterial blood flow is a vital component for milk synthesis and therefore nutrient delivery to the offspring. Arterial blood flow to the mammary glands comes through the pudendoepigastric trunk, from which branches the caudal epigastric and external pudendal arteries (Budras et al., 2011). Mammary blood flow is strongly correlated with milk yield (Götze et al, 2010). Doppler ultrasonography provides an accurate, reproducible, and less invasive tool for measuring mammary blood flow compared with other methods. In 2010, Götze et al. utilized Doppler ultrasonography to quantify mammary blood flow in dairy cows and confirmed that using the pudendoepigastric trunk was equally as effective as measuring the external pudendal artery. However, little work has been done to characterize mammary blood flow in beef cattle
81

characterize mammary blood flow in beef cattle and its influences on calf postnatal performance. In fact, there is a dearth of data for ultrasonographic mammary blood flow in beef cows.
Maternal nutrient intake during gestation can also alter systemic blood flow via changes in circulating hormones and growth factors during pregnancy that facilitate nutrient delivery to the still developing mammary gland in anticipation of colostrum and milk production (Svennersten-Sjaunja and Olsson, 2005). Additionally, differing nutritional protein and energy planes can influence milk production to varying degrees depending on timing of differences in gestational diet (Sullivan et al., 2009, McSweeney et al., 1993). Therefore, supplementation of DDGS during late gestation could positively influence arterial blood flow to the mammary glands, affecting colostrum and milk production and eventually calf growth trajectories.
The objectives of the present study were to investigate the effects of DDGS supplementation to arterial blood flow to the mammary glands during late gestation and early lactation; colostrum and milk production; and calf weight gain during early lactation and at weaning. We hypothesized that DDGS supplementation to cows fed a low quality forage would increase blood flow to the mammary glands and, therefore colostrum and milk production, ultimately resulting in an advantage in calf weight gain during early lactation and at weaning.
Materials and Methods
All procedures were approved by the North Dakota State University Animal Care and Use Committee. Animals and Management. Twenty-seven multiparous beef cows (Angus or Angus x Simmental; 674 ± 17 kg of BW; 6 ± 5 yr of age) were divided randomly into a control group (CON; n = 15) and a treatment group (SUP; n = 12). Cows were housed at the Beef Cattle Research Complex in two adjacent pens, one for each treatment group. Individual intake was monitored and controlled via RIC feeders (Insentec, B.V., Marknesse, Nederlands) beginning on d 201 of gestation for 10 wk. Each pen contained 8 Insentec feeders, with all 8 feeders in the CON pen containing the basal diet. In the SUP pen, 6 feeders contained the basal diet and 2 contained the DDGS supplement. Both pens had free access to water and trace-mineralized salt blocks (97% NaCl, 3,500 mg/kg Zn, 2,000 mg/kg Fe, 1,800 mg/kg Mn, 350 mg/kg Cu, 100 mg/kg I, 60 mg/kg Co). A basal
diet of 90% corn stover and 10% corn silage (5.0% CP of a DM basis, marginally NE deficient, DIP deficient) was fed for ad libitum intake to both groups, with SUP group supplied DDGS at 0.3% of BW (DM basis). Corn silage inclusion was increased to 20% on d 245 of gestation and again on d 260 to 30% to meet increased nutritional demands during pregnancy, while DDGS supplementation remained the same. On d 270 of gestation, close to expected parturition, all cows were fed the same lactation diet (22% DDGS, 48% corn stover, 30% corn silage (DM basis; 11.0% CP) for ad libitum intake for a period of 10 wk; DDGS supplementation ceased. Following parturition, gestation length was calculated for each cow. Ultrasonography Evaluation. To measure mammary blood flow, color Doppler ultrasonography was employed. Ipsilateral and contralateral (as confirmed with uterine blood flow measurements) mammary blood flow (BF), cross-sectional area (CSA) and pulsatility indices of each uterine artery were measured on d 245 (± 5 d) of pregnancy (based on a 283 d gestation) and d 44 of lactation (following milk collection). A 7.5 MHz fingerprobe was used transrectally to identify the bifurcation of the internal and external iliac arteries. By following the latter, the external pudendal artery was identified. The external pudendal artery, which branches through the inguinal canal and continues branching down to the udder, was measured and considered as representative of blood flow to the mammary glands (Budras et al., 2011). Doppler mode was employed to confirm measurement of the artery and not surrounding veins. Three separate cardiac cycle waveforms from 2 to 3 separate ultrasound evaluations were selected for data collection and averaged (i.e., 6 to 9 measurements per artery per cow). Resistance index (RI), pulsatility index (PI), peak systolic velocity (PSV), end diastolic velocity (EDV), flow time (FlowT), maternal heart rate (HR), mean velocity (MnV), flow volume (FV), cross-sectional area (CSA) and cross-sectional diameter (CSD) were recorded. The Doppler software was preprogrammed to calculate PI = (peak systolic velocity - end diastolic velocity)/mean velocity; RI = (peak systolic velocity - end diastolic velocity)/peak systolic velocity; and BF (mL/min) = mean velocity (cm/s) × (π/4) × cross-sectional diameter (cm2) × 60 s. Finally, total mammary BF was calculated as the sum of ipsilateral and contralateral mammary BF. Parturition, colostrum, calf weights. As previously reported (Kennedy et al., 2014) during calving cows were allowed to remain in their pens with the group until signs of labor
82
were observed. If it was possible to move the cow inside the barn without causing undue stress, she was brought inside and put in an individual pen for calving, otherwise she was allowed to calve outside with the group and the pair was then immediately brought inside using a sled for the newborn calf. Calves were weighed at parturition and 24 hours postpartum to calculate percentage loss. Additionally, dams were separated briefly from their calves to collect a colostrum sample. For each cow, the right hind quarter was milked completely to collect a colostrum sample. Colostrum density was calculated based on volume and mass of the total sample. Cows and calves were returned to their individual pen where they were monitored for general health and remained for 24 hr before returning outside to the group. Gestation length was calculated for each cow. Finally, calves were weighed every 2 wk following calving to track weight gain. Weaning weights were also obtained in the subsequent autumn (d 205). Milk Collection. On day 44 of lactation, each cow was milked completely using a single-cow portable milking machine (InterPuls, Albinea, IT) to determine individual milk production. Briefly, each cow was weighed, milked completely, kept in an individual pen for 5 hr with her normal diet and water, and then milked completely again for 5-hr milk production. Time required to completely milk each cow was recorded, total milk was weighed, and a sample was collected for DHIA milk component analysis (Dairy Lab Services, Inc., Dubuque, IA). Samples were analyzed for fat, true protein, somatic cell count, lactose, other solids, total solids, and milk urea nitrogen. Statistical Analysis. Data analysis utilized either the mixed procedure of SAS (SAS Institute Inc., Cary N.C.) with repeated measures or the general linear model procedure. Class statements included cow, maternal diet (SUP vs. CON), day of gestation or lactation, and the interaction of day and maternal diet. The effect of calf sex and the interaction of diet and calf sex were also used in separate class statements. Model statements tested the dependent variables of ultrasound indices, colostrum sample measures, milk collection measures, calf weights and placental weights. Differences between least square means were determined using the least significant difference method.
Results
On d 245 of gestation there was no effect of treatment on BF (P = 0.85) or CSA (P = 0.42) measured contralateral to the conceptus. However, on the ipsilateral side, treatment
affected (P = 0.03) BF, with SUP cows having greater BF than CON cows (2.76 vs. 1.76 ± 0.29 L/min). Average CSA did not differ (P = 0.71) between treatment groups. When totaled, BF did not differ (P = 0.12) between treatment groups but maternal heart rate did (75.42 vs. 63.71 ± 2.43 bpm, SUP vs. CON, P < 0.01). Average PI and RI also differed between treatment groups, with the CON group having greater values than the SUP group for both indices (1.84 vs. 1.53 ± 0.08, P < 0.01 and 0.77 vs. 0.73 ± 0.01, P = 0.03). As previously reported, (Kennedy et al., 2014; Kennedy et al., 2015), there was a tendency (P = 0.06) for calves born to SUP cows to be heavier than calves from CON cows (43.3 vs 40.5 ± 0.9 kg) despite no difference in gestation length (P = 0.43). When percentage BW change from 0 to 24 h postpartum was calculated, calves from CON cows tended (P = 0.09) to gain less weight than calves from SUP cows (0.43 vs. 2.75 ± 0.92%).
Treatment did not affect (P = 0.15) colostrum weight; however, cows carrying heifers gave greater (P < 0.01) colostrum volume compared to cows carrying bull calves. On day 44 of lactation, no measurement of mammary arterial hemodynamics were altered by previous gestation diet (P = 0.34). Gestational diet did influence time required to milk cows, with SUP cows taking longer than CON cows to finish milking (12.92 vs. 10.69 ± 0.76 min, P = 0.05). There was also a tendency for SUP cows to produce a heavier milk sample compared to CON cows (2.78 vs. 2.13 ± 0.25 kg/5 h; P = 0.07), resulting in a tendency for greater rate of milk production (562.70 vs. 425.57 ± 50.65 g/h, respectively, P = 0.07). No other milk production parameters were affected by maternal diet. Additionally, when included in the model, no main effect of calf sex was observed for milk production. Analysis of milk components revealed no differences between treatment groups. Calves gained weight (P < 0.01) from birth to d 56 of lactation with no difference (P = 0.68) due to maternal treatment. However, calves from SUP dams weighed more (P = 0.05) than those of the CON group (309.7 vs. 292.0v± 6.0 kg) at weaning. Finally, adjusted d 205 weaning weights tended (P = 0.06) to be greater in calves from SUP vs. CON cows (288.4 vs. 274.0 ± 5.4 kg).
Discussion While we failed to reach statistical significance in many of our results, likely due to a low number of observations, our findings are certainly of merit. During gestation, blood flow to the mammary gland on the ipsilateral side, but
83

not the contralateral side, was increased with supplementation. These observations, along with notable decreases in measurements of resistance, still indicate a potential for increased blood flow and perfusion in supplemented dams. Traditional measurements of milk production (i.e., weaning weight) were enhanced in SUP cows. Perhaps, if we had measured mammary gland blood flow more frequently throughout gestation, or closer to calving, we would have different results. Additionally, the lack of difference in BF on d 44 of lactation may have been influenced by various factors including compensatory weight gain in CON cows (Kennedy et al., 2015) or similar diets; more observations could have improved these results. The observation that calves from SUP cows lost less weight during their first 24 h, indicates that either they consumed more colostrum, or lost less body water, or both, than calves from CON cows. While we did not measure a difference in colostrum weight, we only took a sample from one quarter of the udder. So perhaps there was greater colostrum to be consumed by the neonate. Because viability of the calves did not differ as measured by time to stand and suckle (data not reported here), we assume that the ability for the calves to attain colostrum did not differ. We plan to investigate circulating hormones in neonatal blood as well, however that is currently unknown. Perhaps we impacted metabolic and endocrine factors that influenced heat production of neonatal calves. Interestingly, calf sex influenced colostrum weight. This is similar to data reported in dairy cows (Hinde et al., 2014) where cows carrying heifers had greater colostrum weight.
Milk volume and rate of production tended to be enhanced in SUP cows. While this did not impact calf weight gain during the first 56 days of life, by weaning, this did, or tended to benefit those calves from SUP cows as they were heavier. In conclusion, effects of DDGS supplementation on mammary blood flow, colostrum and milk production were not as noteworthy as other parameters we investigated, such as maternal intake behavior or uterine blood flow (Kennedy et al., 2014; Kennedy et al., 2015), however, these findings certainly warrant consideration as they still imply influences. Further investigations on how gestational diet impacts calf performance due to greater nutrient delivery, be it placental or mammary, warrant further investigation.
Literature Cited
Budras, K., R. Habel, C. Mülling, and P.
Greenough. 2011. Bovine Anatomy: An illustrated text. Die Deutsche Bibliothek, Hannover, Germany.
Götze, A., A. Honnens, G. Flachowsky, and H. Bollwein. 2010. Variability of mammary blood flow in lactation Holstein-Friesian cows during the first tweleve weeks of lactation. J. Dairy Sci. 93:38-44.
Hinde, K. A.J. Carpenter, J.S. Clay, and B.J. Bradford. 2014. Holsteins favor heifers, not bulls: Biased milk production programmed during pregnancy as a function of fetal sex. PLOS 9(2): e86169.
Kennedy, V.C., B.R. Mordhorst, M.L. Bauer, K.C. Swanson, K.A. Vonnahme. 2014. Uterine blood flow, calf, and placental weights from beef cows supplemented during late gestation. In: ASAS 2014 Joint Annual Meeting, Kansas City, Missouri. Presented.
Kennedy, V.C., M.L. Bauer, K.C. Swanson, K.A. Vonnahme. Effects of Corn Dried Distiller’s Grains plus Solubles Supplementation to Gestating Cows Fed Low-quality Forage on Cow Performance and Feeding Behavior. In: Graduate Student Oral Competition, ADSA-ASAS 2015 Midwest Meeting, Des Moines, Iowa. Accepted
Kim, Y., N.S. Mosier, R. Hendrickson, T. Ezeji, H. Blaschek, B. Dien, M. Cotta, B. Dale, and M. R. Ladisch. 2008. Composition of corn dry-grind ethanol by-products : DDGS , wet cake , and thin stillage. 99:5165–5176.
McSweeney, C.S., L.A. Fitzpatrick, M.J. D'Occhio, D. Reid, K.W. Entwistle. 1993. Reducing post-partum anoestrous interval in first-calf Bos indicus crossbred beef heifers. 1. Effects of pre- and post-partum supplementation strategies. Aust. J. Agric. Res. 44:1063–1077..
Stalker, L.A., D.C. Adams, T.J. Klopfenstein, D. M. Feuz, and R. N. Funston. 2006. Effects of pre- and postpartum nutrition on reproduction in spring calving cows and calf feedlot performance. J.Anim.Sci.84:2582–9.
Sullivan, T.M. , G.C. Micke, and V.E.A. Perry. 2009. Influences of diet during gestation on potential postpartum reprductive performance and milk production in beef heifers. Theriogenology. 72:1202-1214.
Svennersten-Sjaunja, K. and K. Olsson. 2005. Endocrinology of milk production. Dom. Anim. Endocrin. 29:241-258.
84
Proceedings, Western Section, American Society of Animal Science
Vol. 66, 2015
Comparison of titanium dioxide vs. chromic oxide as an external marker to estimate fecal output in horses
T. D. Morgan, A. L. Salazar, F. R. Melgar, E. J. Scholljegerdes, C. A. Lӧest, L. M. White, K. Marchetti, S. A. Soto-Navarro K. N. Winsco, and S. L. Ivey
Department of Animal and Range Sciences, New Mexico State University, Las Cruces, NM
ABSTRACT: We hypothesized that external markers titanium dioxide (TiO2) or chromic oxide (Cr2O3) could be used to predict fecal output and DM digestibility of a grass hay diet fed to horses. The objective of our study was to compare total fecal output and DM digestibility values obtained by total fecal collection or dosing TiO2 or Cr2O3. Twelve stock-type horses were used (average age 13.8 + 5.6 y) and housed individually in 3.7 m × 3.7 m stalls, allowed ad libitum access to water and mineral block. Horses were divided equally between 2 treatments consisting of dosing with 10 g/d of TiO2 (TI) or Cr2O3 (CR). For ease of external marker delivery, TiO2 or Cr2O3 were incorporated into a corn and molasses-based pellet. The 26 d experiment consisted of d 1 to 21 for adaptation to the basal grass hay diet (9.4% CP and 54.8% TDN; DM basis) and corn/molasses supplement without external marker, d 17 to 26 for TiO2 or Cr2O3 supplementation, and d 22 to 26 for total fecal collection with fecal bags. The basal hay diet was fed at 1.9% BW (as-fed basis) divided equally between two feeding. The corn and molasses pellet was fed at 0.9 kg/d divided equally between two feedings to deliver 10 g/d of external marker. Feed intake did not differ (P = 0.65). Fecal output and DM digestibility did not differ for TI between fecal bag collection and marker prediction (P = 0.46). Horses dosed with CR had different fecal output and DM digestibility when fecal bag collection was compared to marker prediction (P = 0.03). When TI and CR fecal output were compared, TI fecal bag and marker prediction differed and were greater than CR (P < 0.04). Digestibility of DM differed by treatment and was less for TI than CR (P < 0.0001) regardless of method. Recovery of marker differed by treatment (P = 0.04) was 104.1 and 129.4 + 10.5% for TI and CR, respectively. These results indicate that Cr2O3 does a poor job of predicting fecal output and DM digestibility when compared to fecal bag collections and TiO2 and is not recommended as an external marker for horses when fed a Bermuda grass hay diet. These results imply that further validation studies are needed with differing diets to solidify external marker recommendations for fecal output and subsequent nutrient digestibility calculations in the horse. Key words: chromic oxide, horses, titanium dioxide
INTRODUCTION
Total fecal collections are a reliable way to determine fecal output in horses (Holland et al., 1998) External markers, such as chromic oxide (Cr2O3) or titanium dioxide (TiO2), have been used to estimate fecal output and reduce time and cost associated with fecal bags, reduce stress on animals, and allow for a greater number of animals per experiment (Haenlein, et al., 1966). Use of external markers is based on the premise if the amount of DM excreted and digestibility of the food are known, then intake can be calculated from the quotient between fecal output and the coefficient of undigestibility (Ferret et al., 1999).
Chromic oxide has been used extensively for decades in digestion trials primarily with ruminants (Titgemeyer et al., 2001). However, Cr2O3 can be problematic due to concerns over potential carcinogenic properties and health hazards associated with
inhalation (Titgemeyer et al., 2001). Although variation of Cr2O3 recovery seems to be diet dependent, Cr2O3 has been utilized in previous equine studies (Haenlein, et al., 1966; Frape et al., 1982; Patterson et al., 2001; Sales, 2012).
Titanium dioxide has been used as an alternative digestibility marker to Cr2O3 in cattle and sheep (Titgemeyer et al., 2001; Myers et al., 2006; Glindemann et al., 2009), pigs (Jagger et al., 1992) and chickens (Short et al., 1996). Although TiO2 has not been validated in horses it is currently being utilized (Winsco et al., 2013).
To our knowledge little data has been published to validate the use of external markers in horses. We hypothesized that external markers, titanium dioxide (TiO2) or chromic oxide (Cr2O3) would predict DM fecal output and DM digestibility of a grass hay diet in horses similar to fecal bag collections. The objective of our study was to compare total fecal output and subsequent DM digestibility values obtained by total fecal collection or TiO2 and Cr2O3 marker calculations with a grass hay diet fed to horses at 1.9% of BW (as-fed basis).
MATERIAL AND METHODS
All procedures were approved by the New Mexico State University Institutional Animal Care and Use Committee. Experimental design and treatments
Prior to the start of the experiment horses were dewormed and had dentation checked and any abnormalities corrected. Twelve stock-type horses (average age 13.8 + 5.6 y) were used in a completely randomized design. Horses were randomly assigned into 1 of 2 groups with equal number of horses and treatments in both groups. Grouping of horses was necessary due to number of stalls available at the New Mexico State University Horse Farm for this experiment. Treatments consisted of TiO2 (TI) and Cr2O3 (CR) in a pelleted feed and fed at 10g/d. The 26-d experiment consisted of d 1 to 21 for adaptation to the basal grass hay diet (9.4% CP and 54.8% TDN; DM basis) and corn/molasses pelleted supplement without external marker, d 17 to 26 for TiO2 or Cr2O3 supplementation, and d 22 to 26 for total fecal collection with fecal bags. The basal hay diet was fed at 1.9% BW (as-fed basis) divided equally between two feeding and met or exceeded all NRC requirements for mature horses. Prior to TiO2 and Cr2O3 dosing, the pelleted supplement contained 90% fine ground corn and 10% molasses (DM basis) and a portion of the fine ground corn was replaced with TiO2 or Cr2O3. The corn and molasses pellet was fed at 0.9 kg/d divided equally between two feedings to deliver 10 g/d of external marker. Horses were allowed ad libitum access to a trace mineral block (American Stockman Big 6 Trace Mineral Salt Block, Tractor Supply, Las Cruces, NM). Horses were housed individually within 3.7 m × 3.7 m stalls in a semi-enclosed barn. Stalls were equipped with automatic water fountains and bedded with wood shavings.
Horses were fitted with a fecal collection bag during the final 5 d of each period. For each day of fecal collection, feces from each horse were collected every 6 h for 24 h. Feces from
85
each horse was weighed individually and after mixing by hand, a 10% subsample was preserved. All fecal samples were immediately frozen at -20oC prior to further analysis. Once thawed fecal samples were weighed and dried at 55oC in a forced-air oven for 7 d, allowed to air-equilibrate and weighed again. Dried samples were ground through a 2 mm screen (Wiley Mill, Thomas Scientific, New York, NY) then composited into a representative 24 h sample based on total fecal collection or hour of sampling. Fecal samples were analyzed for DM, external marker TiO2 and Cr2O3. Titanium dioxide in the feed and feces was extracted according to the wet-ash method of Myers et al. (2004) and quantified using a microtiter plate reader (BioTek Instruments Inc., Winooski, VT) at a wavelength of 410 nm. Chromic oxide in the feed and feces was analyzed by a commercial laboratory (North Dakota State University, ND)
Calculations and statistical analysis
Marker recovery and fecal output based on marker concentration were calculated according to Titgemeyer et al. (2001). Feed DM digestibility was calculated as described in Scholljegerdes et al. (2004). All data were analyzed as a completely randomized design using the MIXED model of SAS (version 9.4; SAS Inst. Inc., Cary, NC) with repeated measures for day of fecal collection. Animal was the experimental unit and animal (treatment) was the random variable. The model included treatment, day, and treatment × day. Using Akaike’s information criterion, compound symmetry was determined to be the most desirable covariance structure. Means were calculated using LSMEANS. Treatment effects were considered significant at a P ≤ 0.05. There were no treatment x day interactions (P > 0.55) observed, therefore only main effects are presented.
RESULTS AND DISCUSSION
To our knowledge external markers for the prediction of fecal output has not been thoroughly validated in horses. In our experiment TiO2 or Cr2O3 were evaluated for utility as an external marker. Each marker was fed separately to individual horses. Feed intake did not differ by treatment (P = 0.35) and was 7.8 and 7.6 + 0.31 kg/d for CR and TI, respectively.
Results for fecal output and DM digestibility are summarized in Table 1. Fecal output and DM digestibility did not differ for TI between fecal bag collection and marker prediction (P = 0.46). Chromic oxide differed for fecal output and DM digestibility when fecal bag collection was compared to marker prediction (P = 0.03). Calculated digestibility for CR was 10.8 % greater than total fecal recovery which differed from Titgemeyer et al. (2001). These authors reported that in cattle Cr2O3 estimated values of fecal output were not different (P = 0.30) compared to total fecal collections. Digestibility calculated from Cr2O3 was also not different from fecal bag collections.
When total fecal output measured with fecal bags were compared between treatments, fecal output was greater (P < 0.04) for the horses that received TI than CR. Digestibility of DM was greater for CR than TI when measured with fecal bags (P < 0.001) and when estimated with markers (P < 0.0001). Titgemeyer et al. (2001) compared TiO2 and Cr2O3 in beef cattle diets and reported differences between the two external markers for estimating fecal outputs and DM digestibility. Titanium dioxide led to greater estimates of fecal output and lower estimates of digestibility than either total fecal collections or use of Cr2O3. When TiO2 was used to calculate DM digestibility in cattle results were 1.6 to 4.3 units lower than true value of fecal collection. Fecal recovery of TiO2 averaged 90%, whereas that of Cr2O3 averaged 98% (Titgemeyer et al., 2001) which led to an underestimation of digestibility when a forage diet was fed.
Recovery of external markers should be close to 100% of what was dosed. In our study recovery of marker differed by treatment (P = 0.04) and was 104.1 and 129.4% + 10.5% for TI and CR, respectively. Recoveries greater than 100% result in an under prediction of fecal output which will then overestimate feed digestibility. Recovery rates of Cr2O3 ranging from 96.0 to 100.1% have been reported in horses (Haenlein et al., 1966). These authors speculated that diet type and particle size could impact marker flow and result in suboptimal marker recovery. Holland et al. (1998) recovered 12% more chromium than chromium dosed and agreed with our data. Although Cr2O3 has been used extensively in many digestibility experiments in a number of species, many authors have concluded that Cr2O3 output is not constant and may be influenced by frequency of dosing (Holland et al., 1998) leading to errors in the estimation of apparent digestibility with consistent underestimation of digestibility compared to those obtained by total collection (Haenlein et al., 1966; Cuddeford and Hughes, 1990; Holland et al., 1998; Titgemeyer et al., 2001).
The same inconsistencies of marker output have not been observed with TiO2. Myers et al. (2006) compared Cr2O3 and TiO2 using a sheep model fed varying levels of concentrate in their diets and concluded that TiO2 concentrations were unaffected by sampling frequency but did not report marker recovery.
In summary, chromic oxide underestimates fecal output resulting in inflated DM digestibility of Bermuda grass hay diet consumed by horses. This could result in inaccurate diet formulations.
IMPLICATIONS
Our results indicate that chromic oxide poorly predicts fecal output and DM digestibility when compared to fecal bag collections and titanium dioxide in horses. Without further research we do not recommend chromic oxide as an external marker for horses when fed a Bermuda grass hay diet. Further research is need to understand how chromic oxide and titanium dioxide behaves in the digestive tract of horses on a variety of diets before these markers can be widely recommended for use in horses.
LITERATURE CITED
Cuddeford, D., D. Hughes. 1990. A comparison between
chromium–mordanted hay and acid-insoluble ash to determine apparent digestibility of a chaffed, molasses hay / straw mixture. Equine Vet. J. 22: 122-125.
Ferret, A., J. Plaixats, G. Caja, J. Gasa, and P. Prio. 1999. Using markers to estimate apparent dry matter digestibility, faecal output, and dry matter intake in dairy ewes fed Italian ryegrass or alfalfa hay. Small Ruminant Res. 33:145-152.
Frape, D.L., M.G. Tuck, N.H. Stucliffe, and D.B. Jones. 1982. The use of inert markers for protein digestibility studies in dogs. Recent advances in Animal Nutrition in Australia. 15:5.
Glindemann, T., B.M. Tas, C. Wang, S. Alvers, and A. Susenbeth. 2009. Evaluation of titanium dioxide as an inert marker for estimating faecal excretion in grazing sheep. Anim. Feed Sci. Tech.69: 186-197.
Haenlein, G.F.W., R.C. Smith and Y.M. Yoon. 1966. Determination of the fecal excretion rate of horses with chromic oxide. J. Anim. Sci. 25:1091-1095.
Hafez, S., W. Judge, and E. Kalm. 1998. Estimation of digestibility with an indicator method in comparison to
86
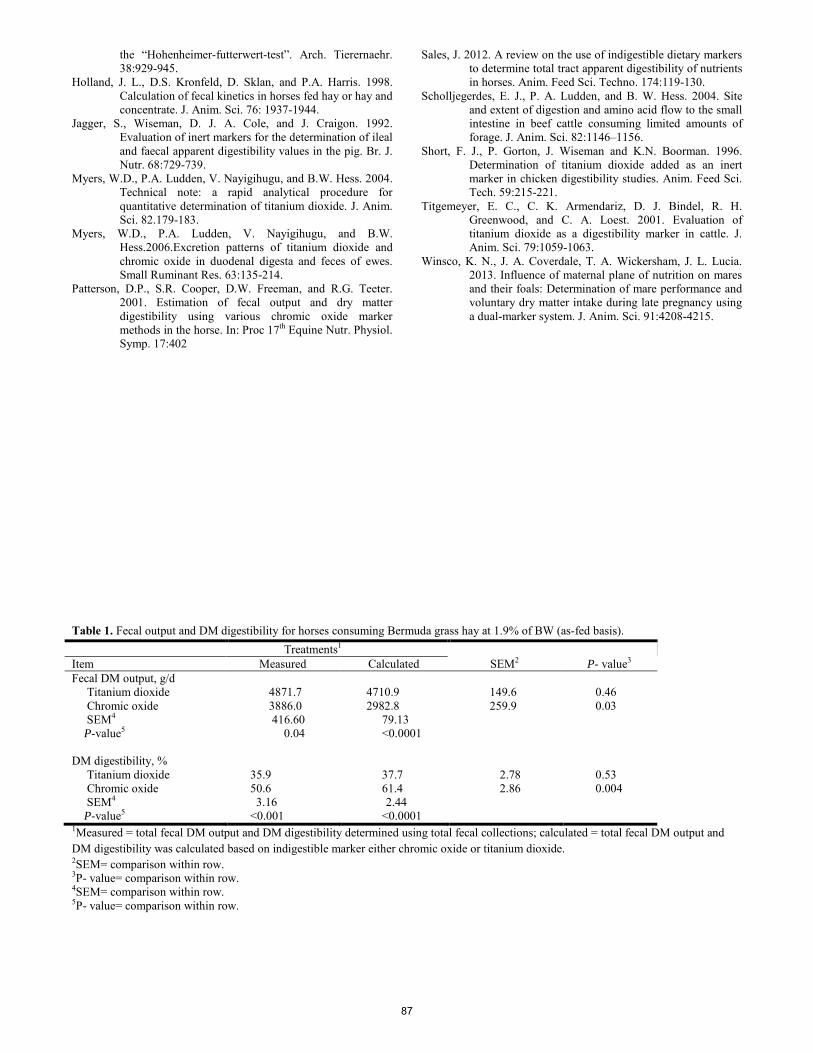
the “Hohenheimer-futterwert-test”. Arch. Tierernaehr. 38:929-945.
Holland, J. L., D.S. Kronfeld, D. Sklan, and P.A. Harris. 1998. Calculation of fecal kinetics in horses fed hay or hay and concentrate. J. Anim. Sci. 76: 1937-1944.
Jagger, S., Wiseman, D. J. A. Cole, and J. Craigon. 1992. Evaluation of inert markers for the determination of ileal and faecal apparent digestibility values in the pig. Br. J. Nutr. 68:729-739.
Myers, W.D., P.A. Ludden, V. Nayigihugu, and B.W. Hess. 2004. Technical note: a rapid analytical procedure for quantitative determination of titanium dioxide. J. Anim. Sci. 82.179-183.
Myers, W.D., P.A. Ludden, V. Nayigihugu, and B.W. Hess.2006.Excretion patterns of titanium dioxide and chromic oxide in duodenal digesta and feces of ewes. Small Ruminant Res. 63:135-214.
Patterson, D.P., S.R. Cooper, D.W. Freeman, and R.G. Teeter. 2001. Estimation of fecal output and dry matter digestibility using various chromic oxide marker methods in the horse. In: Proc 17th Equine Nutr. Physiol. Symp. 17:402
Sales, J. 2012. A review on the use of indigestible dietary markers to determine total tract apparent digestibility of nutrients in horses. Anim. Feed Sci. Techno. 174:119-130.
Scholljegerdes, E. J., P. A. Ludden, and B. W. Hess. 2004. Site and extent of digestion and amino acid flow to the small intestine in beef cattle consuming limited amounts of forage. J. Anim. Sci. 82:1146–1156.
Short, F. J., P. Gorton, J. Wiseman and K.N. Boorman. 1996. Determination of titanium dioxide added as an inert marker in chicken digestibility studies. Anim. Feed Sci. Tech. 59:215-221.
Titgemeyer, E. C., C. K. Armendariz, D. J. Bindel, R. H. Greenwood, and C. A. Loest. 2001. Evaluation of titanium dioxide as a digestibility marker in cattle. J. Anim. Sci. 79:1059-1063.
Winsco, K. N., J. A. Coverdale, T. A. Wickersham, J. L. Lucia. 2013. Influence of maternal plane of nutrition on mares and their foals: Determination of mare performance and voluntary dry matter intake during late pregnancy using a dual-marker system. J. Anim. Sci. 91:4208-4215.
Table 1. Fecal output and DM digestibility for horses consuming Bermuda grass hay at 1.9% of BW (as-fed basis). Treatments1 Item Measured Calculated SEM2 P- value3
Fecal DM output, g/d Titanium dioxide 4871.7 4710.9 149.6 0.46 Chromic oxide 3886.0 2982.8 259.9 0.03 SEM4 416.60 79.13 P-value5 0.04 <0.0001 DM digestibility, % Titanium dioxide 35.9 37.7 2.78 0.53 Chromic oxide 50.6 61.4 2.86 0.004 SEM4 3.16 2.44 P-value5 <0.001 <0.0001 1Measured = total fecal DM output and DM digestibility determined using total fecal collections; calculated = total fecal DM output and DM digestibility was calculated based on indigestible marker either chromic oxide or titanium dioxide. 2SEM= comparison within row. 3P- value= comparison within row. 4SEM= comparison within row. 5P- value= comparison within row.
87
Proceedings, Western Section, American Society of Animal Science
Vol. 66, 2015
Chemokine ligand twelve and T-helper 1 cytokines increase in corpus luteum during implantation in sheep
S. Z. Prosser, K. E. Quinn, and R. L. Ashley1 Department of Animal and Range Sciences, New Mexico State University, Las Cruces 88003
ABSTRACT: The objective of this study was to examine expression of interferon gamma (IFNγ), tumor necrosis factor alpha (TNFα), IL12, IL10, chemokine ligand twelve (CXCL12), and chemokine receptor four (CXCR4) in corpus luteum (CL) tissue from non-pregnant (NP) compared with pregnant ewes. Previous reports indicate CXCL12 promotes IL10 regulation, angiogenesis, and implantation in reproductive tissues. We hypothesized that mRNA for CXCL12 and IL10 would increase in CL tissue in pregnant ewes during early gestation. To test this hypothesis, CL tissue was collected from NP (n = 5, d 10 of the estrous cycle) and pregnant ewes on d 20 (n = 4) and 25 (n = 4) of gestation. Relative mRNA expression of CXCL12, CXCR4, Th1 (IFNγ, TNFα, and IL12) and Th2 (IL10) cytokines were determined using real-time PCR (qPCR) and analyzed using one-way ANOVA for a completely randomized design. During gestation, Th1 cytokines increased (P < 0.05) in CL from pregnant compared to NP ewes. Similarly, CXCL12 increased (P < 0.05) on d 20 of gestation in pregnant compared to NP ewes. Interleukin ten and CXCR4 were detected in CL tissue, but did not differ across d tested. The increase in Th1 cytokines and CXCL12 in CL from pregnant ewes could signify that this ligand regulates migration of Th1 populations to the CL and promotes CL function aiding in CL maintenance needed for establishment of pregnancy. Key words: Chemokine ligand 12, chemokine receptor 4, corpus luteum, cytokines, T-helper 2 bias
INTRODUCTION 1
The corpus luteum (CL) is a dynamic ovarian structure responsible for progesterone (P4) synthesis and pregnancy maintenance. Structural integrity of the CL during early pregnancy is largely dependent on immune cell and cytokine populations associated with T-helper 2 (Th2) cells. Human peripheral blood mononuclear cells stimulate luteal cell production of Th2 cytokines, IL4 and IL10, which promote production of P4 in vitro (Hashii et al., 1998). Pro-inflammatory (Th1) cytokines interferon gamma (IFNγ) and tumor necrosis factor alpha (TNFα) decrease P4 synthesis (Fairchild et al., 1991; Fukuoka et a., 1992). Regulating pro- and anti-inflammatory cytokines is crucial to CL function. Chemokine ligand twelve (CXCL12) and its receptor, chemokine receptor four (CXCR4), activate immune cell trafficking and contribute to development of a bias toward Th2 cytokines at the maternal-fetal interface in humans (Piao et al., 2012). Disrupting the CXCL12-CXCR4 signaling axis between trophoblast and decidual
1 Corresponding author: [email protected]
stromal cells compromises the Th2 bias by decreasing anti-inflammatory cytokines IL10 and IL4, and significantly increasing IFNγ and TNFα (Piao et al., 2012). Human granulosa cells express CXCR4, and CXCL12 is found in follicular fluid (Kryczek et al., 2005). Additionally, increases in CXCL12 correspond to follicular luteinization and increases in P4 concentrations (Nishigaki et al., 2013). Previously, we reported activation of the CXCL12-CXCR4 axis in ovine uterus (Ashley et al, 2011; Quinn et al., 2014), and are interested in determining CXCL12-CXCR4 signaling in the CL. Additionally, Th bias has not been fully elucidated within the CL. Therefore, our objectives were to examine expression of Th1 cytokines (IFNγ, TNFα, and IL12), Th2 cytokines (IL10), CXCL12 and CXCR4 in non-pregnant (NP) and pregnant ewes. We hypothesized that mRNA for CXCL12 and Th2 cytokines would increase in CL from pregnant ewes during early gestation.
MATERIALS AND METHODS Animals and tissue collection
New Mexico State University Animal Care and Use Committee reviewed and approved all experimental procedures using animals. Estrus was synchronized in Western white face ewes during the mid-to-late luteal phase with 2 intramuscular injections of dinoprost tromethamine (5 mg; Lutalyze; Pfizer, New York, NY) administered 4 h apart. Estrus (d 0) was detected using a vasectomized ram, and ewes were placed in experimental groups and mated to an intact ram of known fertility. Pregnancy was determined by serum P4 concentrations with the use of RIA as previously described (Coat-A-Count Siemens Medical Solutions Diagnostics, Los Angeles, CA; Schneider and Hallford, 1996). Progesterone concentration >1 ng/mL was considered as an indicator of pregnancy. The interassay and intra-assay CVs were 7.8% and 6.0%, respectively. Ewes (n = 4 to 5/d) were anesthetized with sodium pentobarbital (20 mg/kg, intravenous) on d 20 or 25 of gestation and on d 10 of the estrous cycle (NP, control ewes). The reproductive tract was removed at mid-ventral laparotomy, and CL tissue was collected with sterile techniques, snap frozen in liquid nitrogen, and stored at -80°C for subsequent RNA isolation. Ewes were euthanized by exsanguination while under anesthesia. RNA isolation
Total RNA was extracted from CL tissue using 1 mL of Tri Reagent (Molecular Research Center Inc, Cincinatti, OH, USA) per 100 mg of tissue according to
88
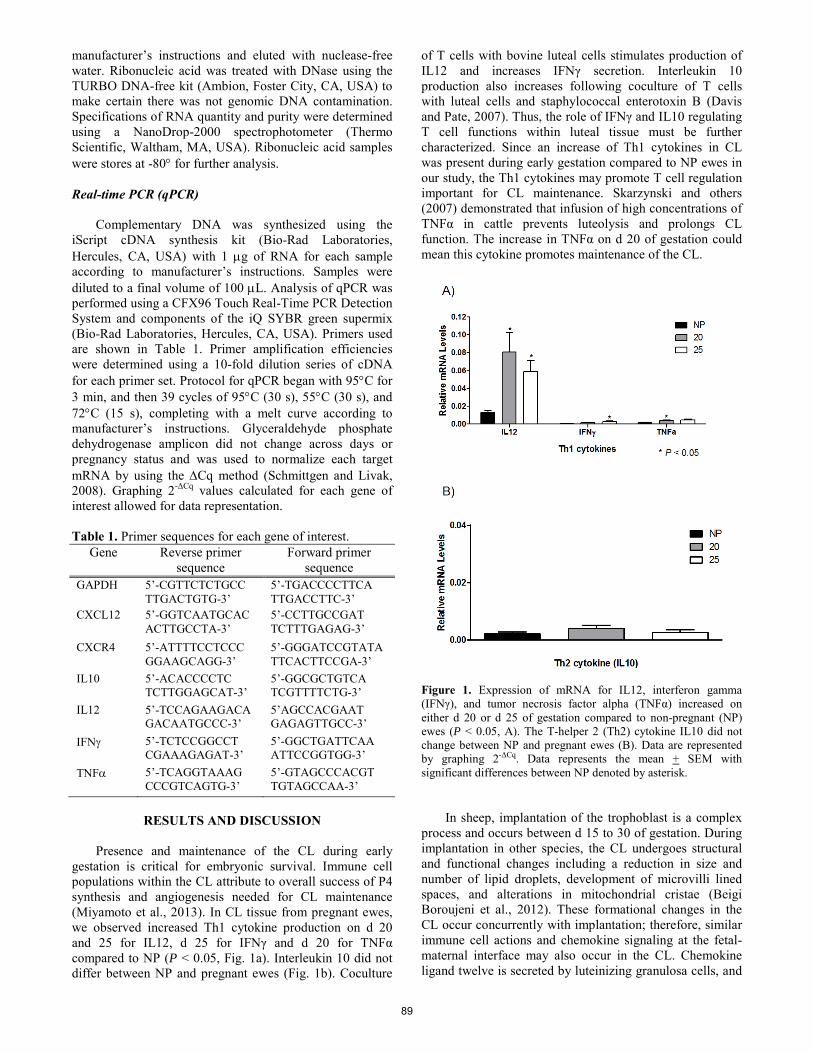
manufacturer’s instructions and eluted with nuclease-free water. Ribonucleic acid was treated with DNase using the TURBO DNA-free kit (Ambion, Foster City, CA, USA) to make certain there was not genomic DNA contamination. Specifications of RNA quantity and purity were determined using a NanoDrop-2000 spectrophotometer (Thermo Scientific, Waltham, MA, USA). Ribonucleic acid samples were stores at -80° for further analysis.
Real-time PCR (qPCR)
Complementary DNA was synthesized using the iScript cDNA synthesis kit (Bio-Rad Laboratories, Hercules, CA, USA) with 1 µg of RNA for each sample according to manufacturer’s instructions. Samples were diluted to a final volume of 100 µL. Analysis of qPCR was performed using a CFX96 Touch Real-Time PCR Detection System and components of the iQ SYBR green supermix (Bio-Rad Laboratories, Hercules, CA, USA). Primers used are shown in Table 1. Primer amplification efficiencies were determined using a 10-fold dilution series of cDNA for each primer set. Protocol for qPCR began with 95°C for 3 min, and then 39 cycles of 95°C (30 s), 55°C (30 s), and 72°C (15 s), completing with a melt curve according to manufacturer’s instructions. Glyceraldehyde phosphate dehydrogenase amplicon did not change across days or pregnancy status and was used to normalize each target mRNA by using the ∆Cq method (Schmittgen and Livak, 2008). Graphing 2-ΔCq values calculated for each gene of interest allowed for data representation. Table 1. Primer sequences for each gene of interest.
Gene Reverse primer sequence
Forward primer sequence
GAPDH 5’-CGTTCTCTGCC TTGACTGTG-3’
5’-TGACCCCTTCA TTGACCTTC-3’
CXCL12 5’-GGTCAATGCAC ACTTGCCTA-3’
5’-CCTTGCCGAT TCTTTGAGAG-3’
CXCR4 5’-ATTTTCCTCCC GGAAGCAGG-3’
5’-GGGATCCGTATA TTCACTTCCGA-3’
IL10 5’-ACACCCCTC TCTTGGAGCAT-3’
5’-GGCGCTGTCA TCGTTTTCTG-3’
IL12 5’-TCCAGAAGACA GACAATGCCC-3’
5’AGCCACGAAT GAGAGTTGCC-3’
IFNγ 5’-TCTCCGGCCT CGAAAGAGAT-3’
5’-GGCTGATTCAA ATTCCGGTGG-3’
TNFα 5’-TCAGGTAAAG CCCGTCAGTG-3’
5’-GTAGCCCACGT TGTAGCCAA-3’
RESULTS AND DISCUSSION
Presence and maintenance of the CL during early
gestation is critical for embryonic survival. Immune cell populations within the CL attribute to overall success of P4 synthesis and angiogenesis needed for CL maintenance (Miyamoto et al., 2013). In CL tissue from pregnant ewes, we observed increased Th1 cytokine production on d 20 and 25 for IL12, d 25 for IFNγ and d 20 for TNFα compared to NP (P < 0.05, Fig. 1a). Interleukin 10 did not differ between NP and pregnant ewes (Fig. 1b). Coculture
of T cells with bovine luteal cells stimulates production of IL12 and increases IFNγ secretion. Interleukin 10 production also increases following coculture of T cells with luteal cells and staphylococcal enterotoxin B (Davis and Pate, 2007). Thus, the role of IFNγ and IL10 regulating T cell functions within luteal tissue must be further characterized. Since an increase of Th1 cytokines in CL was present during early gestation compared to NP ewes in our study, the Th1 cytokines may promote T cell regulation important for CL maintenance. Skarzynski and others (2007) demonstrated that infusion of high concentrations of TNFα in cattle prevents luteolysis and prolongs CL function. The increase in TNFα on d 20 of gestation could mean this cytokine promotes maintenance of the CL.
Figure 1. Expression of mRNA for IL12, interferon gamma (IFNγ), and tumor necrosis factor alpha (TNFα) increased on either d 20 or d 25 of gestation compared to non-pregnant (NP) ewes (P < 0.05, A). The T-helper 2 (Th2) cytokine IL10 did not change between NP and pregnant ewes (B). Data are represented by graphing 2-ΔCq. Data represents the mean + SEM with significant differences between NP denoted by asterisk.
In sheep, implantation of the trophoblast is a complex process and occurs between d 15 to 30 of gestation. During implantation in other species, the CL undergoes structural and functional changes including a reduction in size and number of lipid droplets, development of microvilli lined spaces, and alterations in mitochondrial cristae (Beigi Boroujeni et al., 2012). These formational changes in the CL occur concurrently with implantation; therefore, similar immune cell actions and chemokine signaling at the fetal-maternal interface may also occur in the CL. Chemokine ligand twelve is secreted by luteinizing granulosa cells, and
89
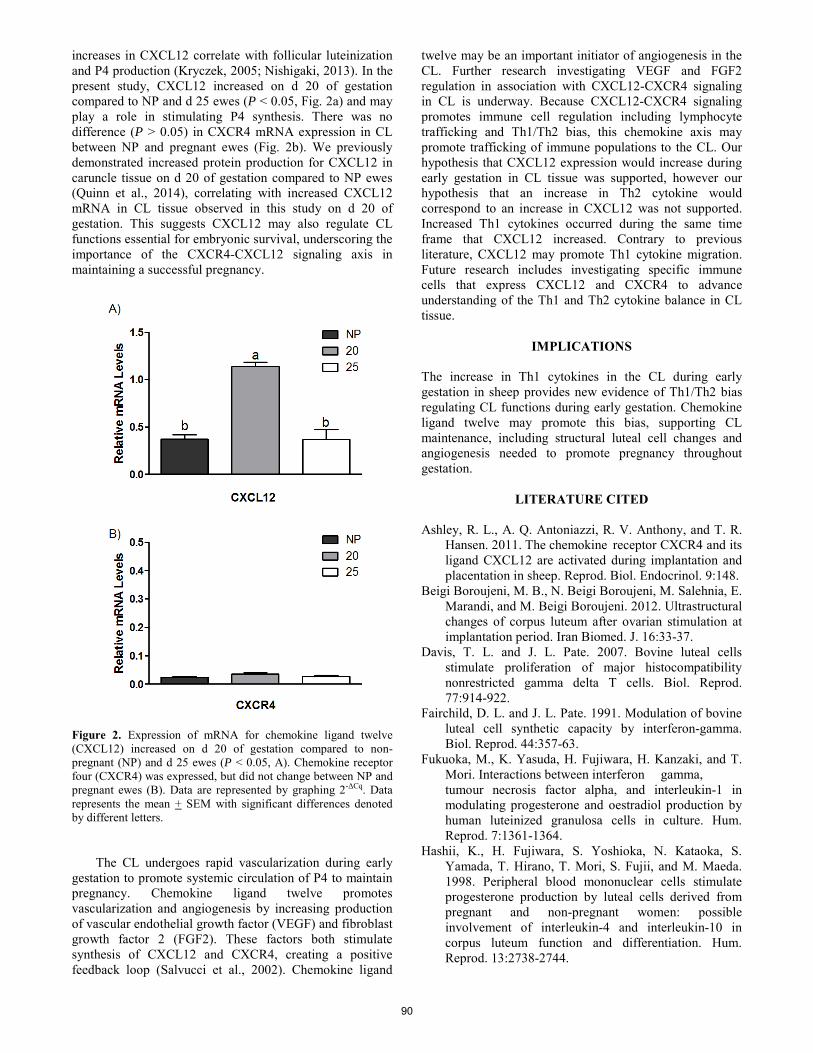
increases in CXCL12 correlate with follicular luteinization and P4 production (Kryczek, 2005; Nishigaki, 2013). In the present study, CXCL12 increased on d 20 of gestation compared to NP and d 25 ewes (P < 0.05, Fig. 2a) and may play a role in stimulating P4 synthesis. There was no difference (P > 0.05) in CXCR4 mRNA expression in CL between NP and pregnant ewes (Fig. 2b). We previously demonstrated increased protein production for CXCL12 in caruncle tissue on d 20 of gestation compared to NP ewes (Quinn et al., 2014), correlating with increased CXCL12 mRNA in CL tissue observed in this study on d 20 of gestation. This suggests CXCL12 may also regulate CL functions essential for embryonic survival, underscoring the importance of the CXCR4-CXCL12 signaling axis in maintaining a successful pregnancy.
Figure 2. Expression of mRNA for chemokine ligand twelve (CXCL12) increased on d 20 of gestation compared to non-pregnant (NP) and d 25 ewes (P < 0.05, A). Chemokine receptor four (CXCR4) was expressed, but did not change between NP and pregnant ewes (B). Data are represented by graphing 2-ΔCq. Data represents the mean + SEM with significant differences denoted by different letters.
The CL undergoes rapid vascularization during early gestation to promote systemic circulation of P4 to maintain pregnancy. Chemokine ligand twelve promotes vascularization and angiogenesis by increasing production of vascular endothelial growth factor (VEGF) and fibroblast growth factor 2 (FGF2). These factors both stimulate synthesis of CXCL12 and CXCR4, creating a positive feedback loop (Salvucci et al., 2002). Chemokine ligand
twelve may be an important initiator of angiogenesis in the CL. Further research investigating VEGF and FGF2 regulation in association with CXCL12-CXCR4 signaling in CL is underway. Because CXCL12-CXCR4 signaling promotes immune cell regulation including lymphocyte trafficking and Th1/Th2 bias, this chemokine axis may promote trafficking of immune populations to the CL. Our hypothesis that CXCL12 expression would increase during early gestation in CL tissue was supported, however our hypothesis that an increase in Th2 cytokine would correspond to an increase in CXCL12 was not supported. Increased Th1 cytokines occurred during the same time frame that CXCL12 increased. Contrary to previous literature, CXCL12 may promote Th1 cytokine migration. Future research includes investigating specific immune cells that express CXCL12 and CXCR4 to advance understanding of the Th1 and Th2 cytokine balance in CL tissue.
IMPLICATIONS
The increase in Th1 cytokines in the CL during early gestation in sheep provides new evidence of Th1/Th2 bias regulating CL functions during early gestation. Chemokine ligand twelve may promote this bias, supporting CL maintenance, including structural luteal cell changes and angiogenesis needed to promote pregnancy throughout gestation.
LITERATURE CITED Ashley, R. L., A. Q. Antoniazzi, R. V. Anthony, and T. R. Hansen. 2011. The chemokine receptor CXCR4 and its ligand CXCL12 are activated during implantation and placentation in sheep. Reprod. Biol. Endocrinol. 9:148. Beigi Boroujeni, M. B., N. Beigi Boroujeni, M. Salehnia, E. Marandi, and M. Beigi Boroujeni. 2012. Ultrastructural changes of corpus luteum after ovarian stimulation at implantation period. Iran Biomed. J. 16:33-37. Davis, T. L. and J. L. Pate. 2007. Bovine luteal cells stimulate proliferation of major histocompatibility nonrestricted gamma delta T cells. Biol. Reprod. 77:914-922. Fairchild, D. L. and J. L. Pate. 1991. Modulation of bovine luteal cell synthetic capacity by interferon-gamma. Biol. Reprod. 44:357-63. Fukuoka, M., K. Yasuda, H. Fujiwara, H. Kanzaki, and T. Mori. Interactions between interferon gamma, tumour necrosis factor alpha, and interleukin-1 in modulating progesterone and oestradiol production by human luteinized granulosa cells in culture. Hum. Reprod. 7:1361-1364. Hashii, K., H. Fujiwara, S. Yoshioka, N. Kataoka, S. Yamada, T. Hirano, T. Mori, S. Fujii, and M. Maeda. 1998. Peripheral blood mononuclear cells stimulate progesterone production by luteal cells derived from pregnant and non-pregnant women: possible involvement of interleukin-4 and interleukin-10 in corpus luteum function and differentiation. Hum. Reprod. 13:2738-2744.
90
Kryczek, I., N. Frydman, F. Gaudin, R. Krzysiek, R. Fanchin, D. Emilie, S. Chouaib, W. Zou, V. Machelon. 2005. The chemokine SDF-1/CXCL12 contributes to T lymphocyte recruitment in human pre- ovulatory follicles and coordinates with lymphocytes to increase granulosa cell survival and embryo quality. Am. J. Reprod. Immunol. 54:270-83. Miyamoto, A., K. Shirasuna, S. Haneda, T. Shimizu, and M. Matsui. 2014. CELL BIOLOGY SYMPOSIUM: perspectives: possible roles of polymorphonuclear neutrophils in angiogenesis and lymphangiogenesis in the corpus luteum during development and early pregnancy in ruminants. J. Anim. Sci. 92:1834-1839. Nishigaki, A., H. Okada, R. Okamoto, K. Shimoi, H. Miyashiro, K. Yasuda, and H. Kanzaki. 2013. The concentration of human follicular fluid stromal cell- derived factor-1 is correlated with luteinization in follicles. Gynecol. Endocrinol. 29:230-240. Piao, H., Y. Tao, R. Zhu, S. Wang, C. Tang, Q. Fu, M. Du, and D. Li. 2012. The CXCL12/CXCR4 axis is involved in the maintenance of Th2 bias at the maternal/fetal interface in early human pregnancy. Cell Mol. Immunol. 9:423-430.
Quinn, K. E., A. K. Ashley, L. P. Reynolds, A. T. Grazul- Bilska, and R. L. Ashley. 2014. Activation of the CXCL12/CXCR4 signaling axis may drive vascularization of the ovine placenta. Dom. Anim. Endocrinol. 47:11-21. Salvucci, O., L. Yao, S. Villalba, A. Sajewicz, S. Pittaluga, and G. Tosato. 2002. Regulation of endothelial cell branching morphogenesis by endogenous chemokine stromal-derived factor-1. Blood. 99:2703-2711. Schmittgen, T. D. and K. J. Livak. 2008. Analyzing real- time PCR data by the comparative CT method. Nat. Prot. 3:1101-1108. Schneider, F. A. and D. M. Hallford. 1996. Use of a rapid progesterone radioimmunoassay to predict pregnancy and fetal numbers in ewes. Sheep Goat Res. 12:33-38. Skarzynski, D. J., I. Woclawek-Potocka, A. Korzekwa, M. M. Bah, K. Piotrowska, B. Barszczewska, and K. Okuda. 2007. Infusion of exogenous tumor necrosis factor dose dependently alters the length of the luteal phase in cattle: differential responses to treatment with indomethacin and L-NAME, a nitric oxide synthase inhibitor. Biol. Reprod. 76:619-627.
91

BEHAVIOR
Proceedings, Western Section, American Society of Animal Science
Vol. 66, 2015
Validation of the Beef Quality Assurance Feedyard Assessment for cattle handling1 R. Woiwode,* 2 T. Grandin, * B. Kirch, * and J. Paterson†
*Department of Animal Sciences, Colorado State University, Fort Collins, CO 80523 National Cattlemen’s Beef Association, Centennial, CO 80112
ABSTRACT: The objective of this study was to document compliance of select feedlots with Beef Quality Assurance (BQA) guidelines for cattle handling, and to evaluate handling categories not previously documented by the National Beef Quality Audit (NBQA). Livestock producers face growing public scrutiny of practices used in raising food animals. It is important to communicate the measures producers take to ensure the well-being of farm animals. This can be accomplished by wider reporting of producer compliance with existing standards for animal management and care. One such program that has been widely adopted in the beef cattle industry is the BQA program, which is a voluntary program that can use self-assessment or third party audits to ensure compliance with the guidelines of the program. The BQA Feedyard Assessment (FA) provides guidelines for cattle handling in commercial feedlots, and is a useful tool for measuring cattle handling practices. In this study, mean scores of 28 feedlots for six current BQA categories (electric prod use, falls, stumbles, jump and run, and chute operation) were obtained. Use of electric prods was 3.8% vs. the 10% current BQA critical limit (CL). Two sites surveyed exceeded the BQA guideline for electric prod use; having 15% and 45% respective mean prod scores, whereas 42.8% of the feedlots had prod scores of 0%. For the category of falls recorded for cattle exiting the squeeze chute, no site surveyed exceeded the BQA guideline of 2%, and 20 sites had no falls; mean score was 0.6% vs. BQA CL 2%. In the category of stumbles recorded for cattle exiting the squeeze chute, 4 sites exceeded the BQA guideline of 10%, and 4 sites had 0% stumbles; mean score was 5.7% vs. BQA CL 10%. Mean score for vocalization was 1.4% vs. BQA CL 5%; for cattle that jumped or ran when exiting the squeeze chute, 52% vs. BQA CL 25%; and mean score for cattle that were improperly captured in the squeeze chute and not readjusted was 1.2%, vs. BQA CL 0%. Only one site was able to comply with the current jump or run category, which may indicate either the CL is unreasonable, or the category warrants revision. The revision of the category should be considered to include only cattle that both jump and run, which may be a better indicator of agitation. Key words: beef quality assurance, cattle handling, feedlot 1Support for this project provided by Grandin Livestock Systems, Fort Collins, CO 80526. 2Corresponding author’s email address: [email protected]
INTRODUCTION
The public is increasingly concerned about how food animals are treated (Rollin, 2004), and much of this scrutiny is focused on confinement operations. In the United States, ten to eleven million cattle are fed annually, according to recent reports (USDA, 2013a). Upon arriving at a feedyard for finishing, cattle are processed and handled a minimum of one time for routine procedures including weighing, sorting, vaccination, placement of identification tags and implants, vaccinations, and other veterinary procedures. In many cases, cattle are handled more frequently, either to treat morbidity, for replacing implants, or other procedures. Handling events can result in bruising and other stress to cattle. It is important to mitigate stress associated with handling through the use of good handling practices. Increased public scrutiny underscores the importance of documenting good handling practices at the feedlot. The Beef Quality Assurance (BQA) (NCBA, 2009a) program was developed with the collaboration of experts in industry and academia to provide a system of management for producers. The BQA program adopted the Hazard Analysis Critical Control Point (HACCP) approach to managing specific categories as critical control points (CCPs). Other segments of the cattle industry have used this approach to monitor cattle handling (Grandin, 2000; Grandin, 2005). Categories identified as CCPs, or guidelines for cattle handling in the feedlot are: driving aids, cattle falling, cattle stumbling or tripping, cattle vocalizing, cattle jumping or running, and chute operation. Each category has an associated threshold, or critical limit (CL), and in the case of the Feedyard Assessment (FA)(NCBA, 2009b), compliance with these guidelines is typically self-assessed at feedlots that participate in the voluntary BQA program. Results of these assessments provide valuable feedback for managers to identify areas of positive performance, as well as identify areas where improvement may be necessary. These results, if included in the NBQA could provide future targets for the beef industry to address its commitment to good handling practices.
MATERIALS AND METHODS
All methods described in this project were approved by the Colorado State University Animal Care and Use Committee. Data collection occurred during routine processing of cattle, and no attempt was made to modify any handling practices or procedures.
92

Feedlot Sample Three states (Colorado, Kansas, and Nebraska) were
selected for this study. The three states selected rank among the top five cattle feeding states in the nation, according to UDSA figures (USDA, 2013b). For purposes of economy, a feedlot directory, BeefSpotter (Spotterpublications, 2012), was used to locate areas where feedlots were clustered within the three states. Contact was made in alphabetic order within these clusters. Fifty-six feedlots were contacted by telephone, and an appointment was requested; requests were also made in person after a scheduled visit to other feedlots in the vicinity. Data were collected at 28 feedlots ranging in size from 5,000 to over 100,000 head. When a feedlot manager was contacted, the investigator explained that the purpose of the study was to survey industry adoption of BQA guidelines during cattle handling when processing cattle. The names and locations of all participants were kept anonymous in an effort to encourage participation rate.
Data Collection Methods
Evaluations were conducted using the BQA FA, and 100 cattle were observed during routine processing at every site when possible. Routine processing consisted of vaccinations, removal of old ear tags, placement of new ear tags, implants, and other veterinary procedures. Note was made of the procedures that were performed during the observation period, as well as weight and breed influence of cattle.
Feedyard Assessment Tool
According to BQA guidelines for handling cattle, data were collected and proportions were calculated for the following categories, according to BQA FA protocol: 1) driving aids; 2) cattle falling; 3) cattle stumbling or tripping; 4) cattle vocalizing; 5) cattle jumping or running; and 6) squeeze chute operation. In the category of driving aids, information was collected about the primary type of driving aid that was used at each site. The use of electric prod was recorded and calculated to obtain a score, or a percentage of the cattle sampled that were moved using an electric prod. Electric prod use was recorded in the single file alley and squeeze chute. Electric prod use was defined as the prod being energized while it was in contact with an animal, according to BQA guidelines.
A fall was recorded if the animal’s body (shoulders, belly, or torso) touched the ground during exit from the squeeze chute. A stumble or slip was recorded if a knee touched the ground during exit from the squeeze chute. Vocalization was scored for any audible sound emitted by the animal while entering the squeeze chute or during capture or restraint, before a procedure was performed. If the head gate was closed on the head, leg, or body of an animal, it was scored as an improper catch, and information was recorded about the nature of the incorrect catch. Per BQA guidelines, the percentage of improper catches in the squeeze chute that were not adjusted to the correct position was also recorded. Cattle received a run score when exiting the squeeze chute, assigned on a three-point scale (1=walk,
2=trot, 3=run). The tool that handlers carried in the processing area was recorded as the primary driving aid used at that site. Facility design features that were recorded were crowd pen design; type of flooring present in crowd pen, in the squeeze chute, and at the squeeze chute exit; type of squeeze chute was noted; and whether the workers were a contract crew or feedlot employee crew was documented.
Statistical Analysis
Frequencies and mean, minimum, and maximum values were calculated for each of the six current BQA CPPs. The PROCFREQ and PROCMEAN procedures of SAS (SAS Inst. Inc., Cary, NC) were used, with feedlot site considered the experimental unit. The percentage of cattle for each variable was calculated for each individual feedlot, and mean, minimum, and maximum values were calculated for each category for all feedlots.
RESULTS AND DISCUSSION
Facilities Findings
Two types of forcing pens were observed; a majority (89%) of sites used round crowd pens, and 11% used a Bud box. A woven rubber tire mat (Double D Family Mat Co.) was at the exit of the squeeze chute at 22 feedlots. Information was collected about primary driving aids, and 5 sites used electric prod as the primary driving aid; 15 sites used another tool as their primary driving aid, while handlers at 8 sites did not carry driving aids of any kind. Two categories of squeeze chutes were observed, with 50% scissor type, and 50% clamshell type. Feedlot employees handled cattle in 21feedlots, and the rest were contract crews that were not employed by the feedlot.
Feedlot Participation
Of 56 feedlots contacted, only 9 refused to participate. An additional 19 feedlots contacted were willing to participate, but due to scheduling conflicts or lack of cattle, were not included in the survey. Overall participation, compliance (or willingness to participate), and refusal rates were 50%, 16%, and 9%, respectively.
Electric Prod Use
For the 28 sites surveyed, mean electric prod use was well within the BQA critical limit (Table 1). Only two sites exceeded this critical limit, having scores of 15% and 45% respectively; 42.8% of sites surveyed had prod scores of 0%, and 93% of sites surveyed were within the BQA critical limit. Handlers at one site carried electric prods as their primary driving aid, and had a prod score of 0%. Feedlots in this study demonstrated a very high rate of compliance with the BQA guidelines for minimizing electric prod use. Little is known about feedyard compliance with current BQA guidelines; a recent study conducted in Kansas reported that a driving aid was used on 4% of cattle surveyed, though a description of the driving
93
aids used in this study was not provided (Henderson, 2013). A survey of truck unloading practices conducted at 23 packing plants that processed cows and bulls reported electric prod use on 32.4% of the truckloads, as well as aggressive use of all types of driving aids (Hultgren et al., 2014). Though our results show lower mean scores for electric prod use, no loading or unloading of trucks was observed in this study. A possible explanation for the low electric prod score in our study may be that cattle handling is more closely supervised in the processing area than in shipping or receiving areas.
Table 1. Performance on BQA feedlot cattle handling categories assessed during processing at 28 feedlots in Nebraska, Kansas, and Colorado1
All Sites
Sites (n = 28) BQA
Guideline2
Mean, %
Minimum, %
Maximum, %
Electric Prod 5 3.8 0 45
Falls 2 0.06 0 4.5
Stumbles 10 5.7 0 28
Vocalization 10 1.4 0 6
Jump or Run 25 52 22 80
Miscaught 0 1.2 0 16 1Performance in each category is reported as a mean of all feedlot scores 2Upper limit for each category described in the Beef Quality Assurance Feedyard Assessment Guide
Cattle Falling
Mean score for cattle that fell when exiting the squeeze chute was below the BQA critical limit of 2% (Table 1). In our study, 26 sites were in compliance with the CL, and only two sites slightly exceeded the CL in this category; while 20 feedlots had no cattle fall during the observation period. Recent results from a survey of cattle handling at a packing plant include similar findings of less than 1% of cattle falling (Hultgren et al., 2014), and a survey of Kansas feedlots reported cattle falling at a rate of 0.2% (Henderson, 2013). Cattle may fall due to agitation; or because of poor flooring at the squeeze chute exit. Falls may result in costly injuries or bruising. Many feedlots in this study recognized the importance of reducing slips and falls, and in an effort to minimize stumbling, providing a woven rubber mat at the exit to the squeeze chute.
Cattle Stumbling
In the category of cattle that stumbled when exiting the squeeze chute our results were higher than a recent report where cattle were scored similarly (Henderson, 2013), though these findings are still CL, and 24 feedlots were in compliance with this BQA. Stumbling may be caused by agitation or by the flooring conditions in the squeeze chute
or at the exit of the squeeze chute. Because of the relationship between slips, stumbles, falls, and injuries, many feedlots place a heavy mat constructed of woven tire tread at the exit of the squeeze chute to reduce slips and falls.
Cattle Vocalizing
Mean vocalization score for all feedlots was below the BQA CL. Only two feedlots were slightly over the BQA limit for vocalization with scores of 5.1% and 6%. Of feedlots surveyed, 27 were in compliance with the BQA CL for vocalization. Vocalization scoring is a useful tool for identifying cattle handling problems because vocalization during handling and restraint is associated with aversive events such as electric prod use or excessive pressure applied by a restraint device (Bourguet et al., 2011; Grandin, 2001; Grandin, 1998). Cattle Jumping or Running
The mean score for feedlots where cattle jumped or ran while exiting the squeeze chute exceeded the BQA CL by twofold. Only one feedlot was able to comply with BQA guidelines. Since the mean scores of feedlots for all CCPs discussed thus far were well within the current CLs, this suggests that this category may warrant revision. It may be reasonable to score cattle that both jump and run rather than the current category in the BQA FA. In the present scoring system, if cattle walk or trot, but also jump when exiting the squeeze chute, they are counted in the present jump or run category; also, cattle that do not jump, but run when exiting the squeeze chute are counted in the same category. Finally, cattle that both jump and run are also counted in the same category. Many feedlots were within BQA guidelines for every other category, and only exceeded the CL in this category. The high rate of feedlots (96.4%) that exceeded the BQA critical limit in this category suggests that the present critical limit may not be realistic. Due to the low rate of feedlots that were in compliance with the category, the category was considered suspect, and a score was calculated for cattle that performed both the jump and run behaviors. These results appear in Table 2. After these calculations, feedlot scores were within the BQA CL of 25%. These data show that it may be a more useful indicator of agitation to record cattle that both jump and run, rather than the approach previously described. Adopting this change to the present scoring system may improve the validity of this category as a CCP. There are many factors that influence jumping and running; the presence of both behaviors may suggest greater agitation.
Chute Operation
The mean score for feedlots that caught cattle improperly and did not adjust them was 1.2%, which exceeds the BQA critical limit of 0%. The BQA guidelines do not address a collective category of improper catches that are not adjusted. A total of 2% of the cattle in this study were caught improperly, and 60% of improper catches were not adjusted. Currently, there is no CCP or
94

critical limit for cattle that are improperly caught and subsequently adjusted in the head gate. It may be reasonable based on these findings to suggest 2% as a critical limit for overall improper catches. It is important to score all improper catches and subsequent adjustments. Few studies document the full effects of improper catches, but aversion to head gate restraint can result in more time and force required to move cattle through working facilities (Goonewardene et al., 1999). Cattle were more reluctant to enter the squeeze chute during handling subsequent to an aversive experience, such as an improper catch with the head gate (Grandin, 1993).
Table 2. Suggested Revisions to Beef Quality Assurance Categories
All Sites
Sites (n = 28) BQA
Guideline2
Mean, %
Minimum, %
Maximum, %
Jump & Run1 25* 16.4 1 35
Run Only1 25* 28.7 2 76 1Suggested as a more accurate scoring category for exit behavior than the present collective category of jump or run *Suggested critical limit (CL) for proposed categories
CONCLUSIONS
The mean scores for electric prod use and vocalization were superior to results in an initial survey of packing plants (Grandin, 2000), indicating an awareness of the aversive effect of excessive prod use. Packing plants have greatly improved since the mid-nineties, where the mean percentage of cattle vocalizing in the stunning area was 10%. In just five years of audits, the average percentage of cattle vocalizing dropped to 2% (Grandin, 2006). The auditing and subsequent improvements that have been documented in cattle handling practices at packing plants may provide a good model for similar evaluation of handling of feedlot cattle.
It is important to continue to collect and report data on feedlot cattle handling according to the BQA guidelines, and this information warrants inclusion in future National Beef Quality Audit. Just as the reports of the NBQA to date have been used to focus areas where attention is needed in growth, and to identify areas of positive performance, the inclusion of handling data in audits going forward could likely have similar positive impact.
LITERATURE CITED
Bourguet, C., V. Deiss, C. C. Tannugi, and E. M. C. Terlouw. 2011. Behavioural and physiological reactions of cattle in a commercial abattoir: Relationships with organisational aspects of the
abattoir and animal characteristics. Meat science 88: 158-168.
Goonewardene, L. A., M. A. Price, E. Okine, and R. T. Berg. 1999. Behavioral responses to handling and restraint in dehorned and polled cattle. Appl Anim Behav Sci 64: 159-167.
Grandin, T. 1993. Behavioral Agitation during Handling of Cattle Is Persistent over Time. Appl Anim Behav Sci 36: 1-9.
Grandin, T. 1998. The feasibility of using vocalization scoring as an indicator of poor welfare during cattle slaughter. Appl Anim Behav Sci 56: 121-128.
Grandin, T. 2000. 1999 audits of stunning and handling in federally inspected beef and pork plants. In: 2000 Conference on Animal Handling and Stunning
Grandin, T. 2001. Cattle vocalizations are associated with handling and equipment problems at beef slaughter plants. Appl Anim Behav Sci 71: 191-201.
Grandin, T. 2006. Progress and challenges in animal handling and slaughter in the U.S. Appl Anim Behav Sci 100: 129-139.
Hemsworth, P. H. et al. 2011. Human–animal interactions at abattoirs: Relationships between handling and animal stress in sheep and cattle. Appl Anim Behav Sci 135: 24-33.
Henderson, G. 2013. Tangible Evidence Cattlemen Care. Drover's Journal Accessed Date Accessed.| doi:DOI|
Hultgren, J., S. Wiberg, C. Berg, K. Cvek, and C. Lunner Kolstrup. 2014. Cattle behaviours and stockperson actions related to impaired animal welfare at Swedish slaughter plants. Appl Anim Behav Sci 152: 23-37.
NCBA. 2009a. Beef Quality Assurance National Manual. National Cattlemen’s Beef Association, Centennial, CO 80112.
NCBA. 2009b. Beef Quality Assurance Feedyard Assessment Assessor’s Guide. National Cattlemen’s Beef Association, Centennial, CO 80112.
Rollin, B. E. 2004. Annual meeting keynote address: Animal agriculture and emerging social ethics for animals. J Anim Sci 82: 955-964.
Spotter Publications. 2012. BeefSpotter. Spotter Publications, Amarillo, TX 79106.
USDA. 2013a. Cattle on Feed. Released by the National Agricultural Statistics Service (NASS), Agricultural Statistics Board, United States Department of Agriculture (USDA). Accessed Feb. 4, 2014. http://www.nass.usda.gov/Publications/Todays_Reports/reports/cofd1013.pdf
USDA. 2013b. Rank Among States. Released by the National Agricultural Statistics Service (NASS), Agricultural Statistics Board, United States Department of Agriculture (USDA). Accessed Feb. 4, 2014. http://www.nass.usda.gov/Statistics_by_State/Indiana/Publications/Annual_Statistical_Bulletin/0809/pg6.pdf
Vetters, M. D., T. E. Engle, J. K. Ahola, and T. Grandin. 2013. Comparison of flight speed and exit score as measurements of temperament in beef cattle. J Anim Sci 91: 374-381.
95

Proceedings, Western Section, American Society of Animal Science
Vol. 66, 2015
Ram reproductive behavior and serum Testosterone of white faced rams during the early and mid-breeding season and out of season
J. L. Wyatt, K. J. Austin, K. C. Otto, B. M. Alexander
Department of Animal Sciences, University of Wyoming, Laramie
ABSTRACT: The objective of this experiment was to determine how season affects expression of sexual behavior and determine if basal or induced concentrations of testosterone are responsive to season and/or expressed behavior. Rams display sexual behavior throughout the year with an increase in libido during the normal breeding season. Breeding behavior was monitored in three Rambouillet rams during two fall and winter breeding seasons and during one out-of-season summer breeding. The frequencies of key anticipatory and consummatory behaviors were recorded over five discontinuous hours during exposure to 15 estrous-induced ewes. Blood samples were collected via jugular venipuncture prior to and following exposure to ewes to determine serum concentrations of testosterone. Mounting behavior did not differ (P > 0.5) among seasons. However, sexual interest as measured by expression of investigatory behavior changed with season and tended (P = 0.06) to be decreased during the summer breeding season. In particular vocalizations and nudging behavior tended (P ≤ 0.07) to occur more frequently during the fall breeding seasons. The ratio of anticipatory to consummatory behavior was decreased (P = 0.04) during the summer out-of-season period. Basal concentrations of testosterone tended (P ≤ 0.1) to be higher during the fall exposure period and change in serum concentrations of testosterone in response to estrous ewe exposure was greater (P = 0.05) in the fall but did not differ (P = 0.4) among rams in the winter or summer. Expression of investigatory behavior may be more sensitive to serum concentrations of testosterone or alternatively, sensory input from investigatory behavior may be responsible for the increase in testosterone following exposure to estrous females. Key words: rams, sexual behavior, seasonality, testosterone
INTRODUCTION
Among domesticated ruminants, the sheep and the goat are regarded as the two most common seasonal breeders. The timing of their sexual activity is marked by a decrease in photoperiod. In the wild, seasonality ensured that offspring were born during times of optimal nutrition (Delgadillo et al., 2001) and helped guarantee the survival of both dam and offspring (Price, 1985). Rams express sexual behavior throughout the year with increases in sperm production and sexual activity during the
breeding season (Rosa and Bryant, 2003). The reproductive success of any ram is partially dependent on the intensity and expression of his courtship and copulatory behaviors. These behaviors attract estrous ewes and are an indication of his fitness as a breeder (Perkins et al., 1992b). The effect of season on the expression of specific behaviors as well as the compulsory synthesis of testosterone has not been determined, and may have implications for rams which express limited sexual behavior.
MATERIALS AND METHODS
Sexual behavior was monitored in three sexually–experienced rams (age 2-3 yr) exposed individually to a pen of estrus synchronized ewes (n = 15) during the early-, mid-breeding season and then again outside of the normal breeding season. Ewes were induced into estrous by exposure to progesterone (EAZI-BREED CIDR, Pfizer, NY) for a minimum of 14 d. For the summer exposure period ewes were treated with 500 IU pregnant mare serum gonadotropin (PMSG) at CIDR removal. Rams were placed into breeding pens at 30 hr following CIDR removal when initial expression of estrus was expected. Rams were monitored for the expression of sexual behavior for one hour. Following the observation period rams were removed and reintroduced six hours later for another hour of observation. Behavior was monitored again the following day for a total of five hours during the fall, winter and summer testing periods. Total behaviors expressed through the five hour observation periods are reported. Recorded behaviors included investigatory (vocalizations, ano-genital sniffs, flehmen, fore-leg kicks, nudges) and consummatory (mount attempts, mounts and ejaculations) behavior. Blood samples for the analysis of serum concentrations of testosterone were collected from rams via jugular venipuncture prior to and immediately following exposure to ewes in fall, winter and summer. Testosterone was analyzed via radio-immuno assay validated for sheep serum using standards in sheep serum compared to the kit standards (MP Biomedicals., Solon, OH).
96

RESULTS AND DISCUSSION
Although expression of consummatory behaviors did not differ (P > 0.5) among seasons, vocalizations and nudging behavior tended (P < 0.07) to occur more frequently during the fall breeding season. Total anticipatory behaviors (vocalizations, ano-genital sniffs, flehmen, fore-leg kicks, and nudges) tended (P = 0.06) to decrease outside of the normal breeding season (Figure 1). The ratio of anticipatory to consummatory behavior decreased (P = 0.04) during the summer out-of-season period compared to the fall breeding period (8.9 ± 3.0 vs. 14.1 ± 3.3, respectively). The ratio of anticipatory to consummatory behavior was similar (P = 0.4) in the fall (14.1 ± 3.3) and winter (9.2 ± 1.0) breeding periods. In the summer, expression of investigatory behavior was decreased even though similar mounting behavior was achieved. Baseline serum testosterone concentrations (pre-exposure) tended to be higher in the fall (P = 0.09) but did not differ (P = 0.5) between winter and summer (Figure 2). Change in testosterone in response to exposure to estrous ewes was greatest in the fall (3.4 ± 1.2 ng/mL; P = 0.05) but was stable (P = 0.4) among rams in the winter (0.1 ± 0.3 ng/mL) and summer (0.7 ± 0.5 ng/mL; Figure 2).
Figure 1. Total anticipatory behavior occurrences by season. Total anticipatory behavior tended (P = 0.06) to decrease in the summer.
Figure 2. Baseline and induced serum testosterone levels (ng/L) during the three testing periods. Baseline (P = 0.1) and change (P = 0.05) in concentrations were greater in the fall.
In the fall, the increase in serum concentrations of testosterone in response to estrous ewes was coincident with an increased incidence of investigatory behavior. Rams likely experience a testosterone surge in response to sensory stimuli received from estrous ewes. A reflexive release of testosterone is characterized by an abrupt elevation of basal concentrations of testosterone in response to external stimuli. High-, but not Low-, sexually performing rams exposed to estrous ewes for 11 hr experienced an increase in serum concentrations of LH and testosterone with the increase positively correlated to number of ejaculations (Perkins et al., 1992a). Although it was not reported, it would be expected that number of ejaculations also correlated with expression of investigatory behavior. Direct physical contact is required since an increase in testosterone was not evident in rams in visual, but not physical, contact with estrous ewes (Alexander et al., 1999; Gonzalez et al., 1988). Alternatively, investigatory behavior may only be supported in a rich testosterone environment with rudimentary reproductive function (ie sperm production and mounting behavior) supported first. The incidence of investigatory behavior increased in a dose-dependent manner in rats treated with an androgen-induced protein (Messaoudi et al., 2004). Sexual interest as measured by investigatory behavior may facilitate testosterone synthesis, or may predominantly occur when serum concentrations of testosterone are elevated. However, since the incidence of mounting behavior was unchanged even though investigatory behavior was decreased, these behaviors are clearly not required for reproductive success. Not all rams experience a reflexive release of testosterone in response to exposure to estrous ewes (Perkins et al., 1992a). One theory suggests that the degree to which a male becomes motivated to engage in sexual behavior determines the capacity to achieve a reflexive release of testosterone (James et al., 2006). This is most evident in rams with low sexual interest (Perkins et al., 1992a). In sheep, concentrations of testosterone are also influenced by season and phase of testicular growth. Low- and high-sexually performing rams both failed to achieve a rise in testosterone in response to novel females when testicular growth was minimal in late November (Perkins et al., 1992a).
IMPLICATIONS
Our data indicates that there is a positive relationship between high concentrations of testosterone and incidence of investigative behaviors. Sensory input obtained from investigatory behaviors may facilitate the synthesis and release of testosterone. Alternatively, investigatory behavior may only be facilitated by high concentrations of testosterone. This data has implications for rams which fail to or rarely display sexual behaviors.
0
100
200
300
400
500
Fall Winter Summer
97
LITERATURE CITED
Alexander, B. M., J.N. Stellflug, J.D. Rose, J.A. Fitzgerald, G.E. Moss. 1999. Behavior and endocrine changes in high-performing, low-performing, and male-oriented domestic rams following exposure to rams and ewes in estrus when copulation is precluded. J. Anim. Sci. 77:1869-1874.
Delgadillo, J.A., E. Carrillo, J. Morán, G. Duarte, P. Chemineau, and B. Malpaux. 2001. Induction of sexual activity of male creole goats in subtropical northern Mexico using long days and melatonin. J. Anim. Sci. 79:2245–2252.
Gonzalez, R., P. Crgeur and J.P. Signoret. 1988. Luteinizing hormone, testosterone and cortisol responses in rams upon presentation of estrous females in the nonbreeding season. Therio. 30:1075-1086.
James, P.J., J.G. Nyby, and G.A. Saviolakis. 2006. Sexually stimulated testosterone release in male mice (Mus musculus): Roles of genotype and sexual arousal. Horm Behav. 50:424-431.
Messaoudi, M., D. Desor, A. Nejdi, C. Rougeot. 2004. The
endogenous androgen-regulated sialorphin modulates male rat sexual behavior. Horm Behav. 46: 684-691.
Perkins, A., J.A Fitzgerald, and E. O. Price. 1992a. Luteinizing hormone and testosterone response of sexually active and inactive rams. J. Anim. Sci. 70:2086-2093.
Perkins, A., J.A. Fitzgerald, and E.O. Price. 1992b. Sexual performance of rams in serving capacity tests predicts success in pen breeding. J. Anim. Sci. 70:2722-2725.
Price, E. 1985. Sexual behavior of large domestic farm animals: an overview. J. of Anim. Sci. 61:62-74.
Rosa, H.J.D. and M.J. Bryant. 2003. Seasonality of reproduction in sheep. Small Ruminant Res. 48:155-171.
98

BREEDING AND GENETICS
Proceedings, Western Section, American Society of Animal Science
Vol. 66, 2015
Relationship of pulmonary arterial pressure and terrain use of beef cows grazing high-altitude foothill rangelands1
D. W. Bailey*, 2, M. G. Thomas,† T. N. Holt,‡ M. B. Stephenson,§ R. M. Enns,† and S. E. Speidel†
*Department of Animal and Range Sciences, New Mexico State University, Las Cruces, NM 88003
†Department of Animal Science, Colorado State University, Fort Collins, CO 80523 ‡Department of Clinical Sciences, Colorado State University, Fort Collins, CO 80523
§Panhandle Research and Extension Center, University of Nebraska-Lincoln, Scottsbluff, NE 69631
ABSTRACT: A study was conducted to evaluate the effect of pulmonary arterial pressure (PAP) on cattle grazing distribution. We hypothesized that cows with higher PAP would avoid using high elevations, steep slopes and areas far from water. During 2013 and 2014, a total of 41 mature Angus cows were tracked with global positioning system (GPS) collars for 27 and 17 days, respectively, in a 1210 ha foothill pasture with a vertical relief of 2150 to 2411 m. Pulmonary arterial pressure was measured for each cow as yearlings (yearling PAP) and before tracking (mature PAP). Yearling PAP was not correlated with the mature PAP (r = 0.23, P = 0.15). Both yearling PAP and mature PAP were only weakly correlated (P > 0.10) with the terrain use metrics (mean elevation, slope and distance from water of tracked locations). Yearling and mature PAP scores were not correlated (P > 0.50) to indices of terrain use that combined elevation and slope use (rough index) and elevation, slope and distance from water (rolling index). Yearling PAP and mature PAP were not useful predictors (P > 0.10) of terrain use in multiple regression analyses. Cows in this study were apparently adapted to high elevations and PAP had little, if any, effect on their use of foothill rangeland. In situations where elevation was higher, terrain was rougher or cattle were not adapted, results may differ from those observed in this study. Key words: high altitude disease, pulmonary arterial pressure, mountain grazing distribution, cattle INTRODUCTION
In the western United States, many ranchers graze cattle at high elevations during at least part of the year. High altitude disease or brisket disease is common problem for non-adapted cattle. Incidence of brisket disease is on the rise in the western US cattle industry despite the efforts of research scientists and veterinary clinicians (Rhoades, 2005). Ranchers in mountainous beef production systems have their breeding stock tested for pulmonary arterial _______________________ 1 Funding for this study was provided by the John E. Rouse Endowments of Colorado State University and the New Mexico Agricultural Experiment Station. 2Corresponding author’s email address: [email protected]
pressure (PAP) and use this information in genetic selection for high altitude tolerance. Holt and Callan (2007) reported that PAP is a good predictor of brisket disease because increased blood pressure results from a restriction in blood flow. The restriction in blood flow is due to an exuberant vasoconstrictive response of the pulmonary artery to hypoxia. Right ventricular hypertrophy and edema of the chest are characteristic of brisket disease and commonly results in death if the affected cattle are not moved to lower altitudes. Shirley et al. (2008) found that PAP was moderately heritable and should respond to sire selection. However, calf mortalities remain above normal in high elevation ranches despite selection for PAP for over 20 years (Neary et al., 2013).
Grazing distribution is a critical issue for cattle ranchers on extensive and rugged rangelands. Cows typically avoid steep slopes (Mueggler, 1965) and areas far from water (Valentine, 1947; Roath and Krueger, 1982). High PAP may be associated with cattle reluctance to graze steep slopes and climb to higher elevations because of the increased effort and associated increases in blood pressure required for the climb. The objective of this study was to evaluate the relationship between PAP and terrain use of beef cows grazing a high-elevation foothill rangeland pasture. We hypothesized that cows with higher PAP would avoid high elevations or steep slopes. We also expected cows with higher PAP would not travel as far from water or walk as far each day as cows with lower PAP values. MATERIALS AND METHODS
The study was conducted at the John E. Rouse Beef Improvement Center located 14 km east of Encampment, WY. Cows grazed in the US Forest Service Beaver Hills Allotment (latitude 41º 14.9’, longitude 106º 38.8’ W). This pasture consisted of 1210 ha, and the elevation ranged from 2150 to 2411 m. The average elevation was 2228 m. Slopes varied from 0 to 72% with an average slope of 12%. The average and maximum distance from water was 679 and 1755 m, respectively.
Cattle grazed and were tracked in the Beaver Hills Allotment pasture from May 19 to June 14 during 2013 and from May 19 to June 4 during 2014. Cattle were tracked with Lotek GPS 3300 collars (Newmarket,
99
Ontario, Canada). Positions were recorded at 10-min intervals.
Cattle in the study were mature Angus cows with calves. In 2013, nineteen 8 year-old cows were tracked, and in 2014, twenty-two 5-year old cows were tracked. The age groups of cows that were used in the study had wider ranges of yearling PAP scores than other age groups of mature cows in the herd. Within a selected age group, cows with similar aged calves were selected for tracking in order to minimize potential confounding of calf age and terrain use of cows. Average BW and body condition score of these cows were 552 ± 7.0 kg and 4.8 ± 0.1 (beef cattle scale of 1 to 9), respectively. A total of approximately 300 cow-calf pairs grazed the Beaver Hills Allotment pasture in both 2013 and 2014. Calves were spring born and between the ages of 2 to 4 months during the tracking period.
The PAP of all tracked cows was measured when they were approximately 12 months of age (yearling PAP) and again about 2 weeks prior to tracking (mature PAP). The PAP measures were obtained using the procedures of Holt and Callan (2007). In brief, a catheter was inserted into the jugular vein and maneuvered through the right atrium and ventricle into the pulmonary artery. Systolic, diastolic, and mean PAP pressures were measured using a heart monitor.
Terrain Use Metrics
A digital elevation model (DEM) was obtained from the USGS Seamless Data Warehouse (seamless.usgs.gov) for the Beaver Hills Allotment pasture. The DEM was used to provide an elevation for each recorded position using the Spatial Analyst Extension in ArcMap tools (ArcGIS software, Redlands, CA, www.esri.com). Similarly percent slope was derived from the DEM for each collar position. Watering point locations (spring tanks and available sections of Beaver Creek) were used to determine the distance from water for each collar position. The average elevation for each cow was calculated from all recorded positions for that cow during the tracking period. Similarly, the average slope and distance from water for each cow was calculated from all positions recorded during the tracking period.
Individual cows from each ranch were ranked by an index identified as “rough” which is a “normalized average” of elevation and slope (Bailey et al., 2015). The mean elevation of each cow was divided by average elevation use of all cows tracked at the Rouse Ranch during the study and multiplied by 100. Similarly, mean slope use of each cow was divided by the average slope use of all cows tracked at a study site and multiplied by 100. The corresponding products associated for elevation and slope for each cow were then averaged. Rough Index = ((slopek / slopel)*100) + ((elevationk / elevationl)*100) / 2 Where; k was the respective mean of a collared cow at a given ranch and l was the respective mean of all collared cows during a given tracking period.
The rough index reflected relative differences in elevation and slope use. A value of 100 indicates that the mean elevation and slope use for that cow was equivalent to the average of all tracked cows. Values less than 100 corresponded to gentler and/or lower terrain use than average, and values over 100 indicated use of steeper slopes and/or higher terrain.
An index termed “rolling” was used to evaluate a combination of elevation, slope, and distance to water (Bailey et al., 2015). Mean values of each cow for these variables were divided by corresponding averages of all tracked cattle at the study site during the entire tracking period and then multiplied by 100. These corresponding ratio variables were then averaged together. Rolling Index = ((slopek / slopel) *100) + (elevationk / elevationl)*100) + (distance from waterk / distance from waterl) / 3 Where; k was the respective mean observation of a collared cow and l was the respective mean observation of all collared cows during a given tracking period.
We used these terrain indices because a single measure of terrain use, such as slope, does not fully explain the impact of terrain on cattle grazing distribution (Bailey 2005). For example, steep slopes located near water do not reduce cattle use near as much as steep slopes that are located over 1.5 km from water or steep slopes located on high elevations (large vertical distance from water).
Distance traveled per day was calculated as the cumulative distance between successive positions when the cows were active. When cows were inactive the distances between successive positions were not included in the average. Definitions of activity were based on the criteria used by Russell et al. (2012). Cows were inactive when the distance between positions was less than 20 m, the horizontal head movement sensor was less than 50 and the vertical head movement sensor was less than 50. Ganskopp and Johnson (2007) recommend excluding periods when cattle are inactive when calculating distance traveled per day to reduce the bias that may occur from GPS error. Statistical Analyses
Analyses were executed using SAS (ver 9.4).Pearson correlation coefficients were calculated for all pairs of variables and included yearling PAP, mature PAP, average elevation, slope and distance to water during tracking, rough index, rolling index and distance traveled each day. Tracked cows were the experimental units (n = 41).
Using PROC MIXED, PAP measurements were used as continuous independent variables to predict each of the terrain use metrics. Year was also included in the model as a fixed effect. In addition, yearling PAP and mature PAP were evaluated independently to determine if there were linear, quadratic or cubic relationships with each of the terrain use response variables. In all of these models,
100
year and interactions of year and PAP (yearling or mature) were included in the model.
RESULTS
The correlation between yearling PAP and mature PAP was 0.23 (P = 0.15). Only weak correlations (P > 0.10) were observed between yearling PAP and the average elevation, slope and distance from water of positions recorded for tracked cows (Table 1). Similarly, mature PAP was only weakly correlated (P > 0.10) to the average elevation, slope and distance from water of locations of tracked cows. There was no evidence (P > 0.50) that yearling PAP and mature PAP were correlated to the rough and rolling terrain use indices (Table 1).
Using a multiple regression approach, the combination of PAP collected from the females as yearling heifers and mature cows, was not a useful predictor of any measure of terrain use (P > 0.05). Similarly, no linear, quadratic or cubic relationships were detected (P > 0.05) between yearling PAP and measures of terrain use (average elevation, slope and distance from water of recorded cow positions). Yearling PAP was not a useful predictor (P > 0.10) of the rough and rolling terrain indices. No linear, quadratic or cubic relationships were detected (P > 0.10) between mature PAP scores and average elevation, slope and distance from water of recorded cow positions. Mature PAP was not a useful predictor (P > 0.10) of the rough and rolling terrain use indices (Fig. 1).
DISCUSSION
Yearling PAP and mature PAP were only weakly correlated. This weak phenotypic correlation suggests that PAP scores measured when heifers are one year of age may be a different trait than measures obtained later in life. Pulmonary arterial pressure is a moderately heritable trait that should readily respond to sire selection (Enns et al., 1992; Shirley et al., 2008). Phenotypically, Shirley et al. (2008) found no correlation between PAP and birth weight and weaning weight, but genetically, PAP was negatively correlated to growth traits. Additional research is needed to evaluate the genetic correlation between PAP scores obtained at different ages.
Although there was variation in terrain use of tracked cows, this variability could not be explained by yearling and mature PAP scores. There was no evidence to support our hypothesis that cows with higher PAP scores would use lower elevations, gentler slopes or areas near water. Recent research by Bailey et al. (2015) suggested that cattle grazing distribution could be inherited. This study showed that up to 25% of the variation in terrain use indices (rough and rolling) could be explained by one genetic marker and multiple markers across several chromosomes could explain over 35% of the variation in terrain use. The lack of phenotypic correlations between PAP scores and terrain use suggest that producers could successfully select for both improved grazing distribution
patterns and reduced PAP scores. These breeding objectives could thereby improve the adaptability of cattle that graze high elevation mountain pastures. However, the genetic correlations between terrain use and PAP scores need to be estimated to determine the effect of selection for PAP on grazing distribution or selection for grazing distribution on PAP.
Cows in this study were adapted to high elevations. They were born and raised at the John E. Rouse Beef Improvement Center. Therefore, we conclude that cows in this study were apparently adapted to high elevations and PAP had little, if any, effect on their use of foothill rangeland. However, if the cows had originated from low elevations and then transported immediately prior to the study the results may have been quite different. High altitude disease typically occurs when cattle adapted to low elevations are transported to high elevations (Holt and Callan, 2007; Neary et al., 2013). In such cases, pulmonary and arterial issues associated with this disease may have affected a cow’s desire and ability to climb and graze high elevations and steep slopes.
IMPLICATIONS
This study did not provide evidence to support our hypothesis that terrain use was related to PAP scores. Although more research is needed, the phenotypic correlations suggest that terrain use and PAP scores are independent traits and could be both used as selection criteria for beef cattle ranchers grazing rugged, high elevation rangelands.
LITERATURE CITED Bailey, D. W. 2005. Identification and creation of
optimum habitat conditions for livestock. Rangeland Ecol. Manage. 58:109-118.
Bailey, D. W., S. Lunt, A. Lipka, M. G. Thomas, J. F. Medrano, A. Canovas, G. Rincon, M. B. Stephenson, and D. Jensen. Genetic influences on cattle grazing distribution: association of genetic markers with terrain use in cattle. Rangeland Ecol. Manage. (in press) http://dx.doi.org/10.1016/j.rama.2015.02.001
Enns, R., J. Brinks, R. Bourdon, and T. Field. 1992. Heritability of pulmonary arterial pressure in Angus cattle. Proc., West. Sec. Amer. Soc. Anim. Sci. 43:111-112.
Ganskopp, D. C., and D. D. Johnson. 2007. GPS error in studies addressing animal movements and activities. Rangeland Ecol. Manage. 60:350-358.
Holt, T. N., and R. J. Callan. 2007. Pulmonary arterial pressure testing for high mountain disease in cattle. Vet. Clinics N. Amer.: Food Anim. Pract. 23:575-596.
Mueggler, W. F. 1965. Cattle distribution on steep slopes. J. Range Manage. 18:255-257.
Neary, J. M., D. H. Gould, F. B. Garry, A. P. Knight, D. A. Dargatz, and T. N. Holt. 2013. An investigation into beef calf mortality on five high-altitude ranches that selected sires with low pulmonary arterial
101
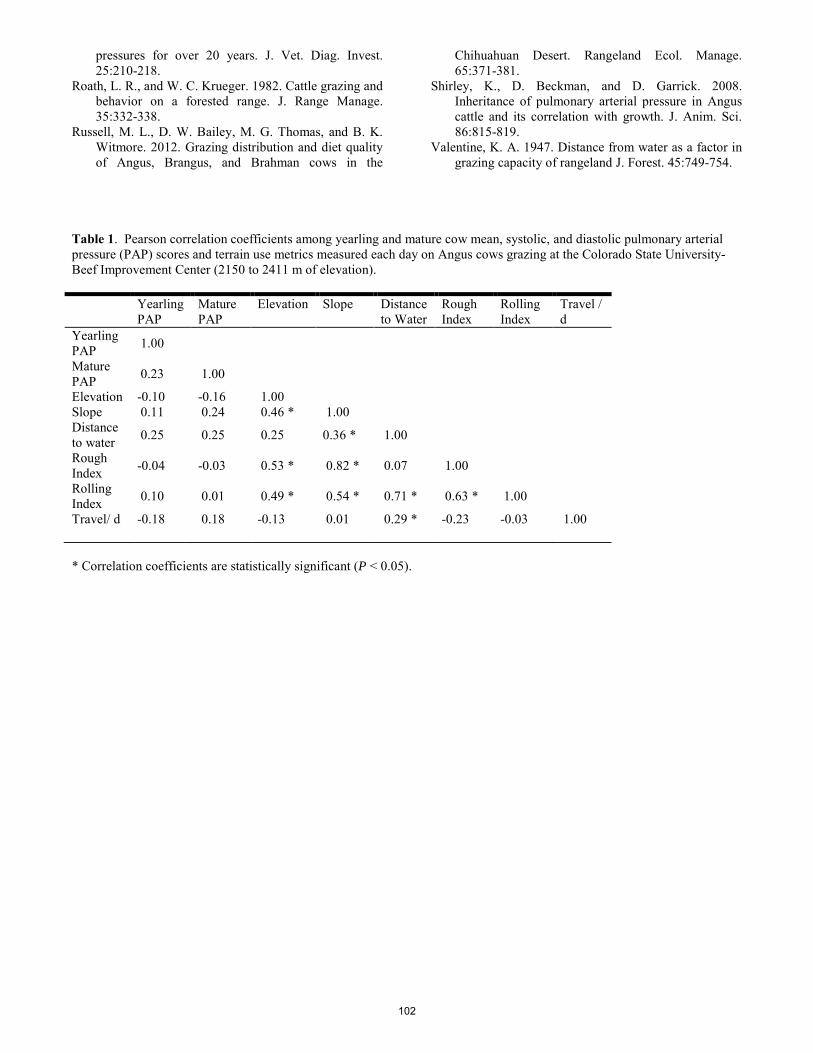
pressures for over 20 years. J. Vet. Diag. Invest. 25:210-218.
Roath, L. R., and W. C. Krueger. 1982. Cattle grazing and behavior on a forested range. J. Range Manage. 35:332-338.
Russell, M. L., D. W. Bailey, M. G. Thomas, and B. K. Witmore. 2012. Grazing distribution and diet quality of Angus, Brangus, and Brahman cows in the
Chihuahuan Desert. Rangeland Ecol. Manage. 65:371-381.
Shirley, K., D. Beckman, and D. Garrick. 2008. Inheritance of pulmonary arterial pressure in Angus cattle and its correlation with growth. J. Anim. Sci. 86:815-819.
Valentine, K. A. 1947. Distance from water as a factor in grazing capacity of rangeland J. Forest. 45:749-754.
Table 1. Pearson correlation coefficients among yearling and mature cow mean, systolic, and diastolic pulmonary arterial pressure (PAP) scores and terrain use metrics measured each day on Angus cows grazing at the Colorado State University-Beef Improvement Center (2150 to 2411 m of elevation). Yearling
PAP Mature PAP
Elevation Slope Distance to Water
Rough Index
Rolling Index
Travel / d
Yearling PAP 1.00
Mature PAP 0.23 1.00
Elevation -0.10 -0.16 1.00 Slope 0.11 0.24 0.46 * 1.00 Distance to water 0.25 0.25 0.25 0.36 * 1.00
Rough Index -0.04 -0.03 0.53 * 0.82 * 0.07 1.00
Rolling Index 0.10 0.01 0.49 * 0.54 * 0.71 * 0.63 * 1.00
Travel/ d -0.18 0.18 -0.13 0.01 0.29 * -0.23 -0.03 1.00 * Correlation coefficients are statistically significant (P < 0.05).
102
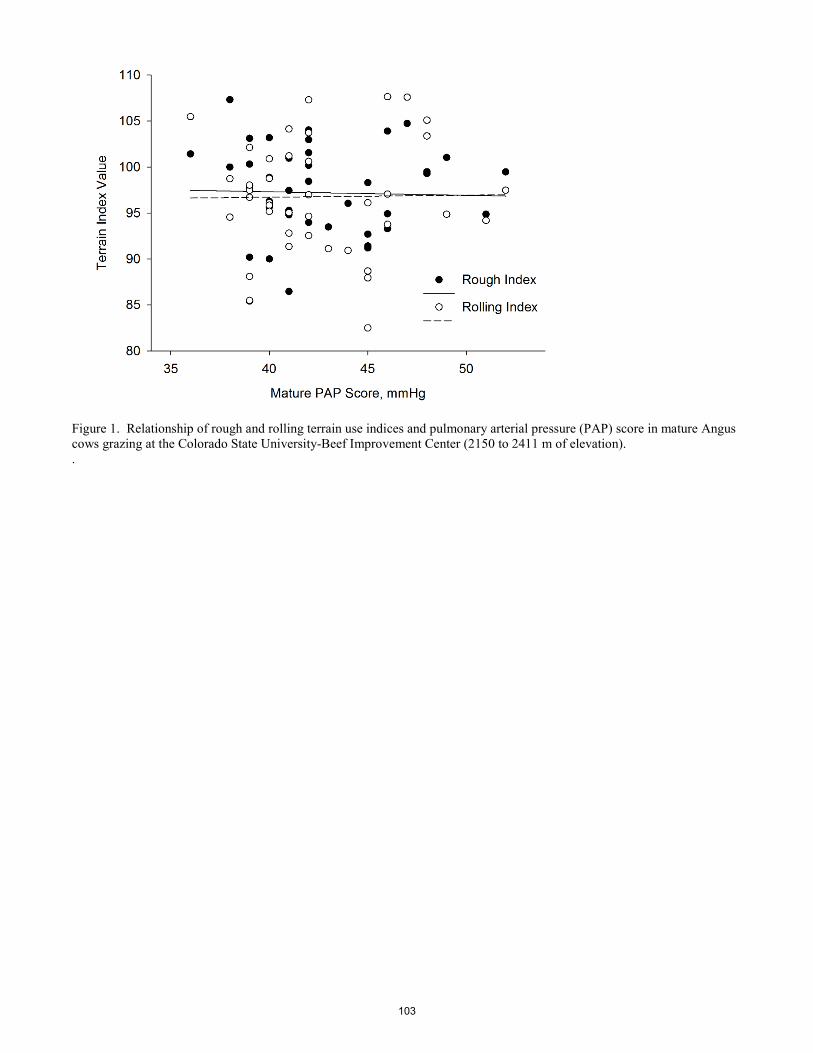
Figure 1. Relationship of rough and rolling terrain use indices and pulmonary arterial pressure (PAP) score in mature Angus cows grazing at the Colorado State University-Beef Improvement Center (2150 to 2411 m of elevation). .
103

Proceedings, Western Section, American Society of Animal Science
Vol. 66, 2015
SNP query in candidate genes that affect puberty in Bos indicus-influenced heifers
M. M. Dias*,¹, A. Cánovas §, C. Mantilla-Rojas†, D. G. Riley†, P. Luna-Nevárez‡, S. E. Speidel#, R. M. Enns#, I.S.D.P. Diaz*, F.R.P. Souza*, J. F. Medrano§, H. N. Oliveira*, and M. G. Thomas#
*Departament of Animal Science, Universidade Estadual Paulista, Jaboticabal, Brazil, 14884-900, §Department of Animal Science, University of California, Davis, CA, 95616, †Department of Animal Science, Texas A&M University,
College Station, TX, 77843, ‡Department of Agronomic Sciences and Veterinary, Instituto Tecnológico de Sonora, Obregón, SO, Mexico, 85000, ¥Department of Ecology, Zoology and Genetics, Universidade Federal de Pelotas, Pelotas,
Brazil, 96160-000, #Department of Animal Sciences, Colorado State University, Fort Collins - CO, 80523
ABSTRACT: Reproductive traits are an important component in economic selection indexes for beef cattle, even though these types of traits are typically expressed late in life and have low heritability. The aim of this research was to study genes involved in puberty in Brangus and Nellore heifers and discover SNP that may be useful in marker assisted selection. Sixty-three genes were used in this study that had been identified with multi-omics and gene network approaches (i.e., genome, transcriptome, proteome). Also, conserved regions of genes may harbor SNP useful in multibreed genetic predictions; therefore, sequences from 9 species of animals were downloaded from Ensembl (http://www.ensembl.org/). The animals were: cattle (Bos taurus), cat (Felis catus), chimpazee (Pan troglodytes), dog (Canis lupus familiaris), horse (Equus caballus), human (Homo sapiens), mouse (Mus musculus), pig (Sus scrofa), rabbit (Oryctolagus cuniculus), and sheep (Ovis aries). The coding–exon sequences from theses species were aligned with the CLC Genomics Workbench 7.0.3 (http://www.clcbio.com). Forty bp regions with ≥ 85% homology were defined as conserved. The number of exons in the 63 genes was 1,649 with 1,071 of these regions considered conserved. There were 6,874 SNP in Ensembl in these exons and 3,660 SNP were in the conserved regions. Of these SNP, 913 were synonymous and 2,747 were non-synonymous. In conclusion, there were numerous SNP queried that could be used to help develop functional genotyping assay(s). However, these SNP should be confirmed in DNA or RNA sequence resources from the populations of cattle where marker assisted selection will be applied. Key words: Bos indicus-influenced, cattle, exons, fertility, puberty, SNP _____________________ ¹Corresponding author's email address: [email protected]
INTRODUCTION
In most beef production systems, the primary breeding objective is weight gain with little emphasis on reproductive traits (Snelling et al., 2010). This is partly due to low heritability of fertility traits, expression late in life, and difficulty in measurement (Snelling et al., 2010). However, fertility demands more breeder attention because it is economically more relevant than growth performance (Brumatti et al., 2011).
Marker-assisted selection (MAS) was first proposed as a tool to eliminate or promote single locus mutations and (or) to increase accuracy of EPD. For the latter, it was proposed to use molecular markers within candidate genes that were associated with traits of economic importance. This type of selection could be of utility for traits that are of low heritability, expressed late in life, or measured in only one sex; therefore, serving as tools coupled to traditional or whole genome selection technologies (Eggen, 2012).
Fortes et al. (2014) reported SNP genotypes from transcription factors were strongly predictive of fertility traits in a multi-breed analysis involving indicine and taurine cattle. These transcription factors were discovered with gene network analyses that used data from genome-wide and transcriptome resources. Therefore, the aim of our study was to discover SNP in 63 genes associated with puberty in Brangus and Nellore cattle (DeAtley, 2012; Canovas et al., 2014). The association of these genes with fertility traits was also revealed with gene network analyses involving multi-omics data. To understand these genes, their information was queried from Ensembl. Also, since SNP from conserved gene regions and transcription factors appear to have predictive- power across breeds (Fortes et al., 2014), we selected conserved exon regions among species within each gene for SNP discovery.
MATERIALS AND METHODS
Candidate genes Sixty-three candidate genes were selected from studies of heifer puberty using whole genome (SNP-chips) and transcriptome (RNA-Seq) analyses, as well as gene network research. Sixty-one of these genes were from studies involving Brangus (3/8 Brahman x 5/8 Angus) heifers. Specifically, the candidates included 25 genes harboring SNP associated with puberty traits and also expressed in fertility tissues (Cánovas et al., 2014; DPPA4, TP63, INHA, IL22RA1, RHEBL1, LYSB, ADH6, MEPE, TECRL, LOC777593, MGC157266, C10H11ORF46, NRXN, TSHR, NEBL, MOS, PENK, ELF5, POU4F2, FAM19A4, ITIH1, CPNE5, MMD2, DKK1, SYCE1). Added to these candidates were 20 genes that were relevant transcription factors-hubs of gene networks (Cánovas et al. 2014; OVGP1, NHLH1, PITX2, PROP1, KLF1, FOXE1, FOXB2, SIX6, VAX2, CDX2, LHX4, FOXN4, MYOCD, E2F3, TSG101, DACH2,
104
VGLL1, GATA1, ELF5, POU4F2). The ELF5 and POU4F2 genes were in both of these resources. DeAltey (2012) described 18 genes that were gene-precursors of hypothalamic peptides related to reproduction and included: SST, SCG2, STMN1, TAC 1, NTS, SCG5, SGC3, POMC, PEPT-1, CBLN4, CHGB, CBLN1, CHGA, CCK, CBLN2, PCSK1N, CART, PENK. The PENK gene was present in the 25 genes harboring SNP associated with puberty traits and also in the 18 genes that were gene-precursors of hypothalamic peptides related to reproduction. The FABP4 and PPP3CA were from a study associating high-density SNP genotypes with puberty in Nellore heifers (Dias et al, 2015). Conserved regions in candidate genes To identify conserved-exon regions, coding sequences of the 63 genes were downloaded from Ensembl (http://www.ensembl.org/index.html). Specifically, sequences from 9 species were compared with cattle (Bos taurus) and included: cat (Felis catus), chimpazee (Pan troglodytes), dog (Canis lupus familiaris), horse (Equus caballus), human (Homo sapiens), mouse (Mus musculus), pig (Sus scrofa), rabbit (Oryctolagus cuniculus), and sheep (Ovis aries). Sequences were aligned with the CLC Genomics Workbench 7.0.3 (http://www.clcbio.com). Regions 40 bp in length and with ≥ 85% average homology were defined as conserved. Figure 1 is an example of these results. SNP query within candidate genes Resources of Ensembl were used to identify SNP in the following gene regions: near the 5'UTR, 5'UTR exon, 3'UTR, and near the 3'UTR exon. SNP were considered near the gene if the region was 2500 bp upstream or downstream from the 5'UTR and 3'UTR regions respectively. Since Fortes and co-workers (2014) suggested that SNP within transcription factors, which are typically conserved across species, have value in multi-breed predictions, the SNP from the conserved regions of genes were queried.
RESULTS AND DISCUSSION The genes LYSB, LOC777593, MGC15722266, and CART were not analyzed in this study because they do not have Ensembl sequences in multiple species. Also the NRXN3 gene did not have any conserved regions. Alternatively, the entire gene (i.e., all exons) of ELF5, FOXB2, SIX6, DACH2, GATA1, SST, NTS, CBLN1, CCK, and FABP4 were conserved. Descriptive statistics of conserved regions of 63 genes are in Table 1. The total of number of 40 bp regions of exons across the 63 genes was 1,649, but just 1,071 were considered conserved. From these sequences, we queried SNP in Ensembl. Our rationale for this query was based on Fortes et al (2014) reporting that SNP from transcription factors appeared to have strong genetic predictive power across cattle breeds. The total number of SNP in the exons in the genes evaluated in this study was 120,099, yet only 6,874 were in exons (Table 2). Custom
SNP chips, which contain functional genotype content, have an interesting cost–benefit relationship because they may improve genetic evaluation models (Snelling et al. 2012). However, SNP content of many of the current commercial chips are equally spaced across the genome and are not causal mutations; yet, many of these SNP are located in introns in linkage disequilibrium with a causal mutation. For this study, we only considered SNP in exons because we are interested in causal mutations. Specifically, there were 6,874 exon-SNP in Ensembl; however, only 3,660 SNP were in conserved regions which included: 913 synonymous and 2,747 non-synonymous SNP (Table 3). Synonymous mutations are normally called silent mutations, as they do not cause amino acid changes, yet they often do influence phenotype (Sauna and Kimchi-Sarfaty, 2011). Non-synonymous mutations alter amino acid sequence. When this occurs, the mutation can be classified as conservative, semi-conservative, or radical as it influences the amino acid- physicochemical properties of the protein. This information is of great interest when designing a custom-SNP genotyping panel with limited financial resources. Prior studies revealed 63 genes involved in puberty in Bos indicus-influenced heifers (DeAtley, 2012; Canovas et al., 2014 ; Dias et al., 2015). The current study exhibited that are thousands of SNP in these genes. The next step in this research will be to confirm the SNP in RNA-Sequencing from Brangus heifers and reproductive tissues. These SNP will be used to help design a physiologically-focused set of SNP for a genotype to fertility-phenotype association study in Brangus cattle.
ACKNOWLEDGEMENTS
Authors thank the CONACYT program of Mexico and Texas A&M University and John E. Rouse Endowment of Colorado State University for financial support and Programa de Doutorado Sanduíche no Exterior from Coordenação de Aperfeiçoamento de Pessoal de Nível Superior (PDSE - CAPES) for the fellowship granted to M. M. Dias. Appreciation is also expressed to Marina Fortes (University of Queensland), Antonio Reverter, Sigrid Lehnert, and Laercio Porto-Neto (CSIRO-Brisbane, AU), Warren Snelling (US-MARC; USDA-ARS) and Kasey DeAtley (California State University – Chico) for continued collaborations.
LITERATURE CITED
Brumatti, R. C., J. B. S. Ferraz, J. P. Eler, and Formigonni, I.B. 2011. Desenvolvimento de índices de seleção em gado de corte sob enfoque de um modelo bioeconômico. Arch. Zootec. 60:205-213. doi:10.4321/S0004-05922011000200005
Cánovas, A., A. Reverter, K. L. DeAtley, R. L. Ashley, M. L. Colgrave, M. R. Fortes, A. Islas-Trejo, S. Lehnert, L. Porto-Neto, G. Rincón, G. A. Silver, W. M. Snelling, J. F. Medrano, and M.G. Thomas. 2014. Multi-tissue omics analyses reveal molecular regulatory networks for puberty in composite beef
105

cattle. PLoS One; 9:e102551. doi: 10.1371/journal.pone.0102551.
DeAtley, K.L. 2012. Neuropeptidome of hypothalamus and pituitary gland of pre- and post-pubertal Brangus heifers. Ph.D. Dissertation. New Mexico State University, Las Cruces, NM.
Dias, M. M., F. R. P. Souza, L. Takada, F. L. B. Feitosa, R. B. Costa, I. D. P. S. Diaz, D. F. Cardoso, R. L. Tonussi, F. Baldi, L. G. Albuquerque, H. N. Oliveira. 2015. Study of lipid metabolism-related genes as candidate genes of sexual precocity in Nellore cattle. Genet. Mol. Res. 14:234-243. doi: 10.4238/2015.January.16.7
Eggen, A. 2012. The development and application of genomic selection as a new breeding paradigm. Anim. Front. 2:10-15. doi:10.2527/af.20112027.
Fortes, M. R. S., L. R. Porto-Neto, K. L. DeAtley, M. G. Thomas, S. S. Moore, S. A. Lehnert, and W. M. Snellig. 2014. Genetic markers in transcription factors of differentially expressed genes associated with post-partum anoestrus predict pregnancy
outcome in an independent population of beef cattle. Proc. 10th World Congr. Genet. Appl. Livest. Prod. Vancouver, Canada. https://asas.org/docs/default-source/wcgalp-proceedings-oral/250_paper_10277_manuscript_1281_0.pdf?sfvrsn=2
Sauna, Z. E., and Kimchi-Sarfaty C. 2011. Understandung the contribution of synonymouns mutations too human disease. Nat. Rev. Genet. 12:683-691.
Snelling,W. M., R. A. Cushman, M. R. S. Fortes, A. Reverter, G. L. Bennett, J. W. Keele, L. A. Kuehn, T. G. McDaneld, R. M. Thallman, and M. G. Thomas. 2012. How single nucleotide polymorphism chips will advance our knowledge of factors controlling puberty and aid in selecting replacement beef females. J. Anim. Sci. 90:1152–1165. doi: 10.2527/jas.2011-458.
Figure 1. Alignment among 10 species with 40bp in length and higher than 85% average of conservation on CLC Workbench software.
106

Tab
le 1
. Num
ber o
f con
serv
ed e
xon
in 6
3 ge
nes i
nvol
ved
in p
uber
ty in
Bos
indi
cus-
influ
ence
d he
ifers
.
Sour
ce o
f can
dida
te g
enes
C
onse
rved
Exo
ns R
egio
ns
Max
M
in
Mea
n ±
SE
Tot
al
25 g
enes
har
bori
ng S
NP
in B
rang
us¹
58
4 18
.8 ±
3.2
39
6 20
tran
scri
ptio
n fa
ctor
s in
Bra
ngus
¹ 52
4
19.4
± 2
.6
350
18 h
ypot
hala
mic
pep
tides
in B
rang
us²
44
6 17
.6 ±
2.6
28
2 2
gene
s ass
ocia
ted
with
pub
erty
in N
ello
re³
33
10
21.5
± 1
1.5
43
Tot
al
1,
071
1 DeA
tley
(201
2);
2 Cán
ovas
et a
l. (2
014)
; 3 D
ias e
t al.
(201
5)
Tab
le 2
. Num
ber o
f SN
P in
Ens
embl
in 6
3 ca
ndid
ate
gene
s inv
olve
d in
pub
erty
in B
os in
dicu
s-in
fluen
ced
heife
rs.
Sour
ces o
f can
dida
te g
enes
G
ene
Reg
ions
and
Num
ber
of S
NP
Tot
al
5' n
ear
gene
5'
UT
R
Intr
on
Exo
n 3'
UT
R
3' n
ear
gene
25 g
enes
har
bori
ng S
NP
in B
rang
us¹
2,06
9 13
1 69
,156
2,
524
407
2,04
6 76
,333
20 tr
ansc
ript
ion
fact
ors i
n B
rang
us¹
1,05
3 25
6 10
,712
2,
727
350
2,02
0 17
,118
18 h
ypot
hala
mic
pep
tides
in B
rang
us²
959
219
8,07
0 1,
456
810
1,44
8 12
,962
2 ge
nes a
ssoc
iate
d w
ith p
uber
ty in
Nel
lore
³ 15
0 19
6 12
,516
18
3 21
0 43
1 13
,686
Tot
als
4,23
1 80
2 10
0,45
4 6,
890
1,77
7 5,
945
120,
099
1 DeA
tley
(201
2);
2 Cán
ovas
et a
l. (2
014)
; 3 D
ias e
t al.
(201
5).
T
able
3. N
umbe
r of S
NP
in c
onse
rved
40
bp re
gion
s in
exon
s in
63 c
andi
date
gen
es in
volv
ed in
pub
erty
in B
os in
dicu
s-in
fluen
ced
heife
rs.
Sour
ces o
f can
dida
te g
enes
SN
P in
Con
serv
ed E
xons
T
otal
Sy
nony
mou
s N
on-s
ynon
ymou
s 25
gen
es h
arbo
ring
SN
P in
Bra
ngus
¹ 29
2 82
4 1,
116
20 tr
ansc
ript
ion
fact
ors i
n B
rang
us¹
374
1275
1,
649
18 h
ypot
hala
mic
pep
tides
in B
rang
us²
222
597
819
2 ge
nes a
ssoc
iate
d w
ith p
uber
ty in
Nel
lore
³ 25
51
76
Tot
als
913
2,74
7 3,
660
1
DeA
tley
(201
2);
2 Cáno
vas e
t al.
(201
4);
3 Dia
s et a
l. (2
015)
.
107
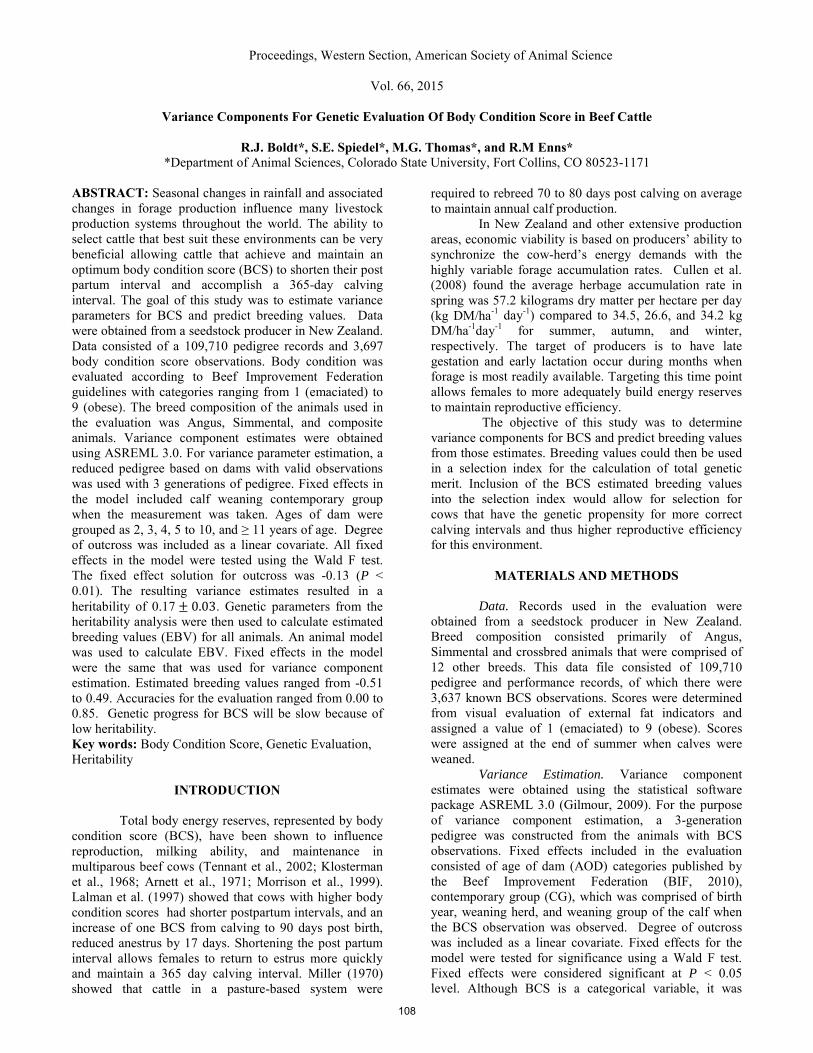
Proceedings, Western Section, American Society of Animal Science
Vol. 66, 2015
Variance Components For Genetic Evaluation Of Body Condition Score in Beef Cattle
R.J. Boldt*, S.E. Spiedel*, M.G. Thomas*, and R.M Enns* *Department of Animal Sciences, Colorado State University, Fort Collins, CO 80523-1171
ABSTRACT: Seasonal changes in rainfall and associated changes in forage production influence many livestock production systems throughout the world. The ability to select cattle that best suit these environments can be very beneficial allowing cattle that achieve and maintain an optimum body condition score (BCS) to shorten their post partum interval and accomplish a 365-day calving interval. The goal of this study was to estimate variance parameters for BCS and predict breeding values. Data were obtained from a seedstock producer in New Zealand. Data consisted of a 109,710 pedigree records and 3,697 body condition score observations. Body condition was evaluated according to Beef Improvement Federation guidelines with categories ranging from 1 (emaciated) to 9 (obese). The breed composition of the animals used in the evaluation was Angus, Simmental, and composite animals. Variance component estimates were obtained using ASREML 3.0. For variance parameter estimation, a reduced pedigree based on dams with valid observations was used with 3 generations of pedigree. Fixed effects in the model included calf weaning contemporary group when the measurement was taken. Ages of dam were grouped as 2, 3, 4, 5 to 10, and ≥ 11 years of age. Degree of outcross was included as a linear covariate. All fixed effects in the model were tested using the Wald F test. The fixed effect solution for outcross was -0.13 (P < 0.01). The resulting variance estimates resulted in a heritability of 0.17 ± 0.03. Genetic parameters from the heritability analysis were then used to calculate estimated breeding values (EBV) for all animals. An animal model was used to calculate EBV. Fixed effects in the model were the same that was used for variance component estimation. Estimated breeding values ranged from -0.51 to 0.49. Accuracies for the evaluation ranged from 0.00 to 0.85. Genetic progress for BCS will be slow because of low heritability. Key words: Body Condition Score, Genetic Evaluation, Heritability
INTRODUCTION
Total body energy reserves, represented by body condition score (BCS), have been shown to influence reproduction, milking ability, and maintenance in multiparous beef cows (Tennant et al., 2002; Klosterman et al., 1968; Arnett et al., 1971; Morrison et al., 1999). Lalman et al. (1997) showed that cows with higher body condition scores had shorter postpartum intervals, and an increase of one BCS from calving to 90 days post birth, reduced anestrus by 17 days. Shortening the post partum interval allows females to return to estrus more quickly and maintain a 365 day calving interval. Miller (1970) showed that cattle in a pasture-based system were
required to rebreed 70 to 80 days post calving on average to maintain annual calf production.
In New Zealand and other extensive production areas, economic viability is based on producers’ ability to synchronize the cow-herd’s energy demands with the highly variable forage accumulation rates. Cullen et al. (2008) found the average herbage accumulation rate in spring was 57.2 kilograms dry matter per hectare per day (kg DM/ha-1 day-1) compared to 34.5, 26.6, and 34.2 kg DM/ha-1day-1 for summer, autumn, and winter, respectively. The target of producers is to have late gestation and early lactation occur during months when forage is most readily available. Targeting this time point allows females to more adequately build energy reserves to maintain reproductive efficiency.
The objective of this study was to determine variance components for BCS and predict breeding values from those estimates. Breeding values could then be used in a selection index for the calculation of total genetic merit. Inclusion of the BCS estimated breeding values into the selection index would allow for selection for cows that have the genetic propensity for more correct calving intervals and thus higher reproductive efficiency for this environment.
MATERIALS AND METHODS
Data. Records used in the evaluation were obtained from a seedstock producer in New Zealand. Breed composition consisted primarily of Angus, Simmental and crossbred animals that were comprised of 12 other breeds. This data file consisted of 109,710 pedigree and performance records, of which there were 3,637 known BCS observations. Scores were determined from visual evaluation of external fat indicators and assigned a value of 1 (emaciated) to 9 (obese). Scores were assigned at the end of summer when calves were weaned.
Variance Estimation. Variance component estimates were obtained using the statistical software package ASREML 3.0 (Gilmour, 2009). For the purpose of variance component estimation, a 3-generation pedigree was constructed from the animals with BCS observations. Fixed effects included in the evaluation consisted of age of dam (AOD) categories published by the Beef Improvement Federation (BIF, 2010), contemporary group (CG), which was comprised of birth year, weaning herd, and weaning group of the calf when the BCS observation was observed. Degree of outcross was included as a linear covariate. Fixed effects for the model were tested for significance using a Wald F test. Fixed effects were considered significant at P < 0.05 level. Although BCS is a categorical variable, it was
108

analyzed as continuous based on the extended range of observations. Once variance parameters were estimated heritability was calculated using the parameters. Genetic Evaluation. Estimated breeding values were calculated with the Animal Breeders Toolkit (Golden et al. 1992) using the following model:
y=X𝛽+ Zu + e Where y was a vector observations, X was an incidence matrix relating observations in y to fixed effects in 𝛽 was a vector of unknown fixed effect solutions which included AOD, CG, and outcross as a linear covariate, Z was an incidence matrix relating random effects in u to observations in y, and e was a vector of residuals. Breeding values and residuals were assumed to be distributed as:
var�𝑢𝑒�= �𝐴𝜎𝑎2 0
0 𝐼𝜎𝑟2�
where A was Wright’s numerator relationship matrix, 𝜎𝑎2 represented the additive genetic variance associated with BCS, I was an identity matrix, and 𝜎𝑟2 was residual variance associated with BCS. Variance estimate were obtained using the previously described variance estimation procedure.
The full pedigree was used for the genetic evaluation to allow all animals to obtain estimates for BCS EBV. Estimated Breeding Value accuracy was obtained by inversion of the coefficient matrix to obtain prediction error variance (PEV). Accuracy was expressed as the correlation between the true and index values and was calculated using the following equation:
rTI =�1 − 𝜎𝑃𝐸𝑉2
𝜎𝑎2
rTI was the correlation between calculated merit and true merit, 𝜎𝑃𝐸𝑉2 was prediction error variance, and 𝜎𝑎2 is the additive genetic variance.
RESULTS AND DISCUSSION
Variance Estimation. Variance parameters were equal 0.041 ± 0.008 and 0.245 ± 0.006 for additive genetic variance and phenotypic variance. These estimates resulted in a heritability calculation of 0.17 ± 0.03, which is considered to be lowly heritable. However, it was consistent with the estimates reported in previous studies (Choy et. al., 2002, Nephawe et al., 2004, Arango et. al., 2002). Arango et al., (2002) found that the heritability of BCS in a crossbred beef cattle population using a repeated measures model was 0.16 ± 0.02, with a repeatability estimate of 0.30. Therefore, genetic progress in BCS will be expected to be slow due to the low heritability unless more complete data is reported on an annual basis
Previous studies have shown that repeated measure models have been more accurate for estimating BCS compared to single observation analysis. However, for this analysis, only 10 records were available as
repeated observations and would not be sufficient for estimating permanent environment variance.
Fixed effects in the model were tested in the model using the Wald F test. Age of dam, CG, and outcross significantly influence BCS (P < 0.01). The distributions of the average BCS scores for different AOD categories are presented in Table 1. Most of the data were comprised of 2-year-old dams that had the highest average BCS. This advantage may speak to the 2-year-old dams advantage of grazing on higher quality pastures in this production system to help aid in growth as well as maintaining pregnancy. The differences in the average BCS across the age groups show how this variable is significant in the evaluation (P < 0.001). The solution from the analysis for outcross was -0.13 (P < 0.01). This result shows that as outcross was increased by one percent, BCS was reduced by -0.13 %. This result is sensible when terminal cross sires are used for crossbreeding. Table 1. Body condition score summary statistics grouped by age when measurement was taken.
1AOD =Age of dam 2Min = minimum body condition score 3Max = Maximum body condition score 4𝑏 = BLUE estimates from mixed model analysis Genetic Evaluation. Table 2 summarizes the EBV calculated from the analysis. For this analysis all animals in the pedigree received an estimate. These EBVs will be included in a selection index that is calculated to help estimate total genetic merit of the individuals. Inclusion of the EBV into the index will help to select for animals with more genetic propensity to achieve higher condition scores, with higher condition scores improving the reproductive efficiency of the individuals.
Accuracy estimates were also calculated during the analysis. The mean accuracy estimate is 0.01 with a range of 0.00 to 0.85. Most accuracy estimates were low based on the limited number of observations relative to the number of animals receiving estimates. Table 2. Summary Statistics for EBV for BCS estimation in beef cattle
1All Animals n=109,698 2Sires n=7890
AOD1 n Mean SD Min2 Max3 𝑏4 2 2607 5.18 1.33 2 9 3.39 3 506 4.35 1.52 2 7 3.39 4 143 4.12 1.56 2 8 3.63
5-10 353 4.44 1.41 2 8 3.72 11+ 14 5.00 1.75 3 8 3.54 All 3623 4.95 1.41 2 9 -
All Animals1 Sires2
Mean -0.01 -0.07 SD 0.10 0.12
Minimum -0.51 -0.47 Maximum 0.46 0.46
109
IMPLICATIONS
Different management strategies require genetic
merit for different traits to be examined in beef production systems. With the drastic changes in forage accumulation that is experienced by producers in New Zealand and elsewhere, the importance of cows to effectively use the available forage to build fat reserves is vitally important for reproduction. Body condition score has shown to be negatively correlated with post partum interval and suggest that genetic selection of animals with a higher BCS EBV will be more reproductively efficient in this environment.
Literature Cited
Arango, J.A., L.V. Cundiff, and L.D. Van Vleck. 2002.
Genetic parameters for weight, weight adjusted for body condition score, and body condition score in beef cows. J. Anim. Sci. 80:3112-3122.
Arnett, D. W., G. L. Holland, and R. Totusek. 1971. Some effects of obesity in beef females. J. Anim. Sci. 33:1129–1136.
Choy, Y.H., J.S. Brinks, and R.M. Bourdon. 2002. Repeated-measure models to estimate genetic components of mature weight, hip height, and body condition score. J. Anim. Sci. 80:2071-2077.
Cullen, B.R., R.J. Eckard, M.N. Callow, I.R. Johnson, D.F. Chapman. R.P. Rawnsley, S.C. Garcia, T. White, V.O. Snow, 2008. Simulating pasture growth rate in Australian and New Zealand grazing systems. Australian Journal of Agriculture Research. 59: 761-768.
Golden, B. L., W. M. Snelling, and C. H. Mallinckrodt. 1992. Animal Breeder’s Tool Kit User’s and Reference Manual. Colorado State Univ. Agric. Exp. Stn. Tech. Bull. LTB92-2, Ft. Collins
Gilmour, A. R., Gogel, B. J., Cullis, B. R., & Thompson,
R. 2009. ASReml user guide release 3.0. VSN I nternational Ltd, Hemel Hempstead, UK. Klosterman, E. W., L.G. Sanford, and C. F. Parker. 1968.
Effect of cow size and condition and ration protein content upon maintenance requirements of mature beef cows. J. Anim. Sci. 27:242–246.
Lalman, D.L., D.H Keisler, J.E. Williams, E.J. Scholljegerdes, and D.M Mallet. 1997. Influence of postpartum weight and body condition change on duration of anestrus by undernourished suckled beef heifers. J. Anim. Sci. 75:2003-2008.
Miller, K., (1970). A review of uterine involution and ovarian activity during the postparturient period in the cow. New Zealand Veterinary Journal. 18:83-90.
Morrison, D. G., J. C. Spitzer, and J. L. Perkins. 1999. Influence of prepartum body condition score change on reproduction in multiparous beef cows calving in moderate body condition. J. Anim. Sci. 77:1048–1054.
Nephawe, K.A., L.V. Cundiff, et al., 2004. Genetic relationships between sex-specific traits in beef cattle: Mature weight, weight adjusted for body condition score, height, and body condition score of cows, and carcass traits of their steer relatives. J. Anim. Sci. 82:647-653.
Tennant, C.J., J.C. Spitzer, W.C. Bridges Jr., and J.H. Hampton. 2002. Weight Necessary to change body condition scores in Angus cows. J. Anim. Sci. 80: 2031-2035.
110
Proceedings, Western Section, American Society of Animal Science
Vol. 66, 2015
Effects of beef cow milk production levels on longevity from Colorado State University’s Beef Improvement Center
M.M. Culbertson*, S.E. Speidel*, M.G. Thomas*, and R.M. Enns* *Department of Animals Sciences, Colorado State University, Fort Collins, CO 80523-1171
ABSTRACT: In beef production systems, the ability of cows to calve and rebreed annually is critical for economic success. The study objective was to determine the effects of milk EPD on the ability of a cow to remain in a herd. We hypothesized that animals with higher milk EPD would fail to remain in the herd long enough to recoup the development cost of replacement females. Data was provided by the Colorado State University John E. Rouse Beef Improvement Center (CSU-BIC). The herd was grazed on rangeland for 2 to 3 months during early lactation and maintained on irrigated pastures with hay supplementation the remainder of the year. Herd data were used to examine the effects of genetic milk potential on longevity of the Angus based cow herd. Data were collected from 1993 to 2013 and included 8,348 calf records. The length of productive life (longevity) was regressed on linear and quadratic milk EPD of the cow. The resulting regression coefficients for milk EPD were estimated at -0.21 (linear) and 0.10 (quadratic). This positive quadratic relationship between milk EPD and longevity suggested that for milk EPD greater than 1.07 kg, the relationship between milk EPD and longevity increased. According to these results, we would reject our hypothesis that cows with milk EPD greater than 1 kg have increased probability of being culled from the herd.
Key words: beef cattle, milk, longevity
INTRODUCTION
For a cow/calf operation to be economically viable, a cow must remain in the herd long enough to recoup the cost of heifer development, cow maintenance and other females culled at young ages (Snelling et al., 2012). On average, a cow has an 80 day postpartum period to recover from calving and then conceive (assuming a 285 d average gestation length) to maintain a yearly calving interval. Cows with long postpartum interval (PPI) could fail to express estrus or resume an estrous cycle late in the breeding season. Therefore, the
length of PPI can be a determining factor in a cow’s ability to stay in the herd (Williams, 2005).
High lactation levels and associated nutritional requirements can contribute to longer PPI and consequently decrease reproductive efficiency (Short et al., 1990). Following calving, lactation requirements for a cow are high and increase her nutritional requirements needed to resume estrous. Within the dairy industry, cows with the highest milk production have the greatest incidence of infertility (Lucy, 2001). However, most cow/calf operations sell their calves at weaning where higher weaning weights are more desirable. A calf’s weaning weight is influenced by their dam’s milking ability. Calves weaned from dams with higher milk EPD are heavier at weaning when compared to calves from dams with lower milk EPD (Clutter and Nielsen, 1987). As a result, producers often select for higher milk production, which could be antagonistic to a cow’s ability to rebreed and remain in the herd.
Given the importance of both fertility and weaning weight to profitability, our objective was to evaluate the effects of the genetic potential of milking ability of beef cows on their ability to remain in the herd long enough to recoup to cost of cow maintenance and development. We hypothesized that animals with higher milk EPD (greater than 1 kg) would have shorter lengths of productive life.
MATERIALS AND METHODS
Data and animal management
Data used in the study was collected from the Colorado State University’s John E. Rouse Beef Improvement Center (CSU-BIC) to examine the effects of milking ability on longevity of the Angus based cow herd. The CSU-BIC herd is grazed on rangelands during early lactation for 2 to 3 months. The remainder of the year, the herd is maintained on pastures consisting of timothy and brome grasses with hay supplementation. Data included 8,347 calf records collected from 1993 to 2013 with dam
111

birth dates ranging from 1979 to 2011. The longevity of a cow was defined as the age when she last calved. Cows that were born after 2000 were removed from the data to prevent bias for cows that were still in production past 6 years of age. This placed a maximum limit on longevity of 13 years for cows born in 2000.
Data was comprised of 507 cows that were born from 1993 to 2000. Their longevity ranged from 2 to 16 years old with a mean and standard deviation of 7 ± 4.1 years old, respectively. The average milk EPD for cows was 1.5 kilograms, with a standard deviation of 1.9 kilograms.
Statistical Analysis
Data was analyzed with the MIXED procedure in SAS 9.3 (SAS Institute Inc., Cary, NC) using the following model:
𝑌𝑖 = 𝜇 + 𝑀𝐼𝐿𝐾𝑖 + (𝑀𝐼𝐿𝐾𝑖)2 + 𝜀𝑖
Where Yi was cow’s longevity measured in years, 𝜇 was the population mean, MILKi was the cow’s milk EPD measured in kilograms and 𝜀𝑖 was the random residual effect.
RESULTS AND DISCUSSION
Results of the regression of longevity on the cow’s milk EPD are presented in Table 1. The quadratic term for milk EPD was positive indicating a positive relationship between longevity in the upper range of milk EPD (Figure 1).
Table 1. Coefficients for the regression of longevity (length of a cow’s productive life) on milk EPD and milk EPD2.
1Estimate Standard
Error P-value
Milk EPD -0.21 0.13 0.0966
Milk EPD2 0.1 0.03 0.0036 1Estimate is the regression coefficients from the regression of longevity on milk EPD and milk EPD2.
The results from this study were supported by studies conducted with dairy cattle. These studies involving dairy cattle used stayability instead of longevity. Stayability was defined as a binary trait of either 0 or 1 for the ability of a cow to remain in a herd to a specific age. A score of 1 would indicate success and a score of 0 would indicate failure. This is in contrast to
longevity which was a numeric value ranging from 2 to 16. Everett et al. (1976), Hudson and Van Vleck (1981), and Short and Lawlor (1992) reported positive genetic correlations between milk production and stayability of 36 months to 84 months which ranged from 0.22 down to 0.09 with the range of correlations for all 3 studies decreasing as the length of stayability increased to 84 months. De Lorenzo and Everett (1982) found small but positive regression coefficients for stayability of 48 months and 72 months on milk yield (0.002 and 0.003, respectively). Since the largest reason to voluntarily cull in the dairy industry is milk production, it is a reasonable expectation for a positive relationship for stayability and milk to exist (De Lorenzo and Everett, 1982). However, all of these studies were conducted with dairy cattle housed in more confined operations relative to grazing beef cattle, which are typically managed in a more extensive approach. In addition, the dairy cattle were not maintained on rangeland and were fed diets in concentrated dairy systems.
De Lorenzo and Everett (1982) reported a negative regression coefficient for the quadratic term of milk suggesting that for upper levels of milk production, the relationship between milk and stayability decreased as milk increased in dairy cattle. This is in contrast to what was found in our study. This difference may be a result of the difference in management of beef cattle compared to dairy cattle.
There is a direct economic gain for an increase in calf weaning weights in addition to economic importance for cattle reproductive efficiency for most cow/calf operations. A dam’s milking ability has an effect on a calf’s weaning weight. The relationship between a dam’s milking ability and her reproductive efficiency has repeatedly been referred to as antagonistic. Our study revealed a positive relationship between Milk EPD above 1.07 kilograms and longevity; therefore we would reject our hypothesis that cows with high milk EPD have increased probability of being culled. Although more research would be needed, a threshold may exist where the levels of milk produced by a beef cow will make it difficult for cows to rebreed and remain in the herd. Between the years of 1993 to 2000, the CSU-BIC herd had moderate levels of milk EPD with averages of 0.77 kilograms to 2.06 kilograms, respectively, with minimum milk EPD of -5.3 kilograms and maximum milk EPD of 6.1 kilograms. It is possible that this data does not reflect high enough milk EPD to illustrate this and those thresholds have not been reached. Alternatively, selection
112

for improved milk production may be offsetting environmental constraints on longevity.
Data provided by CSU-BIC represented one herd in one environment. The CSU-BIC herd was grazed on rangeland for 2 to 3 months during lactation and maintained on pastures consisting of timothy and brome grasses with hay supplementation the remainder of the year. This may not be representative of commercial herds who are grazed on rangeland throughout the year.
IMPLICATIONS
Matching environment and genetic potential of a herd is a challenge for any cow/calf operation. Producers must find a balance when making decisions between profitability and the environmental limitations of their operation. When making genetic selection decisions producers should consider level of environment as milk production levels increase.
Figure 1. Graph of the regression of longevity on milk EPD for BIC
LITERATURE CITED Clutter, A.C. and M.K. Nielsen. 1987. Effect of level of
beef cow milk production on pre- and postweaning calf growth. J. Anim. Sci. 64:1313-1322.
De Lorenzo, M.A. and R.W. Everett. 1982. Relationships Between Milk and Fat Porduction, Type, and Stayability in Holstein Sire Evaluation. J. Dairy Sci. 65:1277-1285.
Everett, R.W., J.F. Keown and E.E. Clapp. 1976. Relationships among type, production, and staybility in Holstein cattle. J. Dairy Sci. 59:1505-1510.
Hudson, G.F.S. and L.D. VanVleck. 1981. Relationship between production and stayability in holstein catte. J.Dairy Sci. 64:2246-2250.
Lucy, M. C. 2001. Reproductive loss in high-producing dairy cattle: Where will it end? J. Dairy Sci. 84:1277-1293.
Short, T.H., R.W. Blake, R.L. Quaas and L.D. Van Vleck. 1990. Heterogeneous Within-Herd Variance. 1. Genetic Parameters for First and Second
Lactation Milk Yeilds of Grade Holstein Cows. J. Dairy Sci. 73:3312-3320.
Short, T.H.and T.J. Lawlor. 1992. Genetic parameters of conformation traits, milk yield, and herd life in Holsteins. J. Diary Sci. 75:1987-1998.
Short, R.E., R.A. Bellows, R.B. Staigmiller, J.G. Berardinelli and E.E. Custer. 1990. Pysiological mechanisms controling anestrus and infertility in postpartum beef cattle. J. Anim. Sci. 68:799-816.
Snelling, W.M., R.A. Cushman, M.R.S. Fortes, A. Reverter, G.L. Bennett, J.W. Keele, L.A. Kuehn, T.G. McDaneld, R.M. Thallman and M.G. Thomas. 2012. Physiology and endocrinology symposium: How single nucleotide polymorphism chips will advance our knowledge of factors controlling puberty and aid in selecting replacemtn beef females. J. Anim. Sci 90:1152-1165.
Williams, G.L. 2005. Physiology and management of the postpartum suckled cow for controlled breeding programs. Applied Reproductive Strategies in Beef Cattle. Beeville: Texas A&M University. http://beefrepro.unl.edu/proceedings/2005collegestation/11_tamu_postpartum_williams.pdf
0
2
4
6
8
10
12
-5 -4 -3 -2 -1 0 1 2 3 4 5 6 7
Lon
gevi
ty (y
ears
)
Milk EPD (kilograms)
BIC
113

Proceedings, Western Section, American Society of Animal Science
Vol. 66, 2015
Genotypes within the prolactin and GH-IGF1 pathways association with 305 d milk yield in heat stressed lactating Holstein cows in Sonora, Mexico
A. Hernández*, M. Sánchez-Castro†, R. Zamorano-Algandar†, P. Luna-Nevárez‡, G. Rincón§, J. F. Medrano#, S. E.
Speidel*, R. M. Enns*, M. G. Thomas*
*Department of Animal Science, Colorado State University, Fort Collins, CO, †Instituto de Ciencias Agrícolas, Universidad Autónoma de Baja California, Baja California, México, ‡Instituto Tecnológico de Sonora, Sonora, México, §Zoetis, Inc.,
Kalamazoo, MI, #University of California, Davis, CA.
ABSTRACT: One of the major challenges of dairy production in tropical and hot climates is heat stress. This leads to gene expression changes and to an altered physiological status known as acclimation. This process is largely controlled by endocrine systems. The use of DNA markers associated with endocrine pathways have the potential to be used as tools to predict milk production levels in heat stressed lactating cows. Milk production data were collected from Holstein cows (n = 659) at three dairy farms in the Yaqui Valley, Sonora, México. Cows were genotyped for 179 tag SNP within 43 genes in the prolactin and GH-IGF1 pathways. Eleven SNP were associated with 305 d milk yield and used to calculate a molecular breeding value (MBV; 2377 ± 476 kg). Two statistical models were used to predict the variation in 305 d milk yield: full model with effects of days in milk, contemporary group (farm management), number of lactations, health status, and MBV, and a reduced model only with MBV. The first model had an R2 of 45.8%, while the reduced model had an R2 of 4.5%. The small amount of variation explained by the MBV led us to postulate that the high environmental temperatures to which these cattle were exposed negated the association with the MBV.
Key words: gene pathways, heat stress, MAS.
INTRODUCTION
One of the major challenges of dairy production in tropical and hot climates is heat stress. With high ambient temperatures, high humidity and intense radiant energy, dairy cows accumulate metabolic heat, increase their body temperature and decrease food intake and therefore milk production (West, 2003). Despite the effort to minimize the negative impact of heat stress (such as use of cooling systems, shades and diet changes), the reduction in milk production remains significant during the summer (Dunshea, 2013). When heat stress persists, gene expression changes lead to an altered physiological state referred to as “acclimation”, which is a process largely controlled by endocrine systems (Collier et al., 2008).
Through the use of DNA technologies, it is possible to find DNA markers (SNP) associated with a quantitative trait loci (QTL), that contribute to variation in a phenotype. The genotypes could be used to construct molecular breeding values (MBV) to assist selection decisions, especially for phenotypes that are complex, like milk production under heat stress. Since prolactin and GH play crucial roles in the initiation and maintenance of lactation, we hypothesized that an MBV constructed with SNP genotypes within the prolactin and GH-IGF1 pathways have the potential to predict milk production traits in heat stressed Holstein cows. The objective of this study was to determine if the MBV accounts for a significant portion of the variation in the phenotype for 305 d milk yield.
MATERIALS AND METHODS
Animals Data were collected during 2012 from Holstein cows (n
= 659) at three dairy farms in the Yaqui Valley, Sonora, Mexico. Cows were progeny of 159 sires and 360 dams. Cows were housed in free stall barns, with free access to water and shade and fed twice daily with a TMR that supplied their nutritional needs according to the requirements established by the NRC (2001) for lactating Holstein cows with an average weight of 650 kg producing ~30 kg/d of milk with average composition (i.e., 3.5% fat and 3.2% true protein). In addition, cows were provided with fans and showers in the waiting shed before milking.
Milk production data was recorded monthly and adjusted to 305 days of lactation. Cows were also evaluated monthly for subclinical mastitis based on the California test (Laboratorios Sanfer, S.A. de C.V., Obregón, Mexico). Cows with clinical mastitis were removed from this study. After parturition, cows were palpated between d 20 to 25 to diagnose signs of uterine infection. The voluntary waiting period was between 40 to 50 d for cows in this study. Records of health status were obtained for all the cows and used as a categorical variable coded as 0 for no disease diagnosis and 1 for any disease diagnose.
Summary statistics for the variables used in this study were calculated and presented in Table 1.
114

Table1. Summary statistics for heat stressed Holstein cows in Sonora, Mx.
Variable N Mean SD Minimum Maximum 305d MY, kg1 589 6308 1468 636 10787 Total MY, kg1 596 6467 1907 372 13964 Age 596 5.26 1.97 1 13 Lactation number 596 3.06 1.83 1 11 SPC2 596 1.96 1.23 1 10 DIM3 595 308.03 70.44 21 716
1MY = Milk yield adjusted to 305 d of lactation 2SPC = Services per conception 3DIM = Days in milk
Temperature-Humidity Index (THI) Temperature Humidity Index (THI) was calculated
each hour of each day during this study using the equation of by Mader et al., (2006):
THI= (0.8 × T°C) + [(RH/100) x (T°C − 14.4)] + 46.4
where THI was the temperature and humidity index, T° was the temperature in Celsius degrees and RH was the relative humidity in decimals.
SNP Association study. For DNA extraction, 3 ml of blood was collected by venipuncture of the median tail vein or artery of each cow using disposable sterile syringes. This sample was spotted on nucleic acid (FTA) cards. Whole blood was eluted from the FTA cards and DNA was extracted and quantified.
Forty-three candidate genes within the prolactin and GH-IGF1 pathways were selected based on their physiological function and role in milk production (Collier et al., 2008; Lü et al., 2010). The SNP within these genes were genotyped using several multiplex SNP assays and the Sequenom MassArray platform (GeneSeek, Inc., Lincon, NE). Polymorphisms were analyzed and regions of linkage disequilibrium were identified using the software Haploview. A resulting panel of 179 tag SNP were genotyped in the 659 Holstein cows. The association analyses between single SNP genotypes and phenotypes for milk production was performed using PROC MIXED (SAS 9.4). The statistical model was:
𝑦 = 𝑋𝑏 + 𝑍𝑎 + 𝑒
where y was the vector of milk yield to 305 d of lactation, b was the vector of fixed effects, and a was the vector of random effects which include random sire effects. Fixed effects included lactation, genotypes, farm management (e.g. milking time), days of lactation and health status. X and Z were incidence matrices relating observations in y to fixed and random effects in b and a, respectively and e was the vector of random residual effects.
MBV Estimation Molecular breeding values of the individual animals
were calculated by summing the additive genotype effect for each SNP that showed a significant (P < 0.05) independent association with 305 d milk yield. The
calculation of the MBV was performed using the Animal Breeder Tool Kit (ABTK; Colorado State University, Fort Collins, CO).
Models and Parameter estimation Correlations between 305 d milk yield and continuous
variables total milk production, days in milk, age, number of AI services, lactations and MBV were calculated using PROC CORR. A regression-prediction analysis using PROC MIXED was used to estimate a full and reduced model. The full model was:
𝑌 = 𝜇 + 𝑋𝐷𝐼𝑀𝛽𝐷𝐼𝑀 + 𝑋𝑀𝐵𝑉𝛽𝑀𝐵𝑉 + 𝑋𝐿𝑎𝑐.𝑛𝛽𝐿𝑎𝑐.𝑛+ 𝑋𝐻.𝑠𝑡𝑎𝑡𝛽𝐻.𝑠𝑡𝑎𝑡 + 𝑋𝐶𝐺𝛽𝐶𝐺 + 𝑒
where Y was the dependent variable of 305 d milk yield, μ was the population mean, 𝑋𝐷𝐼𝑀 was the covariate for days in milk, 𝛽𝐷𝐼𝑀 was the slope for the variable days in milk, 𝑋𝑀𝐵𝑉 was the covariate for MBV, 𝛽𝑀𝐵𝑉 was the slope for the variable MBV, 𝑋𝐿𝑎𝑐.𝑛𝛽𝐿𝑎𝑐.𝑛, 𝑋𝐻𝑠𝑡𝑎𝑡𝛽𝐻𝑠𝑡𝑎𝑡, 𝑋𝐶𝐺𝛽𝐶𝐺 were the incidence matrixes for the categorical variables number of lactations, health status and contemporary group (farm management) with vectors for fixed effects respectively and e was the vector of residual effect or error term.
The reduced model constructed only with the dependent variable and the MBV was:
𝑌 = 𝜇 + 𝑋𝑀𝐵𝑉𝛽𝑀𝐵𝑉 + 𝑒
where Y was define as the dependent variable of 305 d milk yield, μ was the population mean, 𝑋𝑀𝐵𝑉 was the covariate for MBV and 𝛽𝑀𝐵𝑉 was the slop for the variable MBV, and e was the vector of residual effect or error term.
RESULTS AND DISCUSSION
Estimated THI values revealed that cows in this study were potentially heat stressed from March 2012 until November of 2012, varying from light (72-79 units) to moderate stress (80-89 units) (West, 2003).
SNP association Eleven SNP within nine genes were associated (P <
0.05) with 305 d milk yield (Table 2). These genes were: the arginine vasopressin receptor 1A (AVPR1A), Furin (FURIN), the insulin-like growth factor binding proteins 5
115
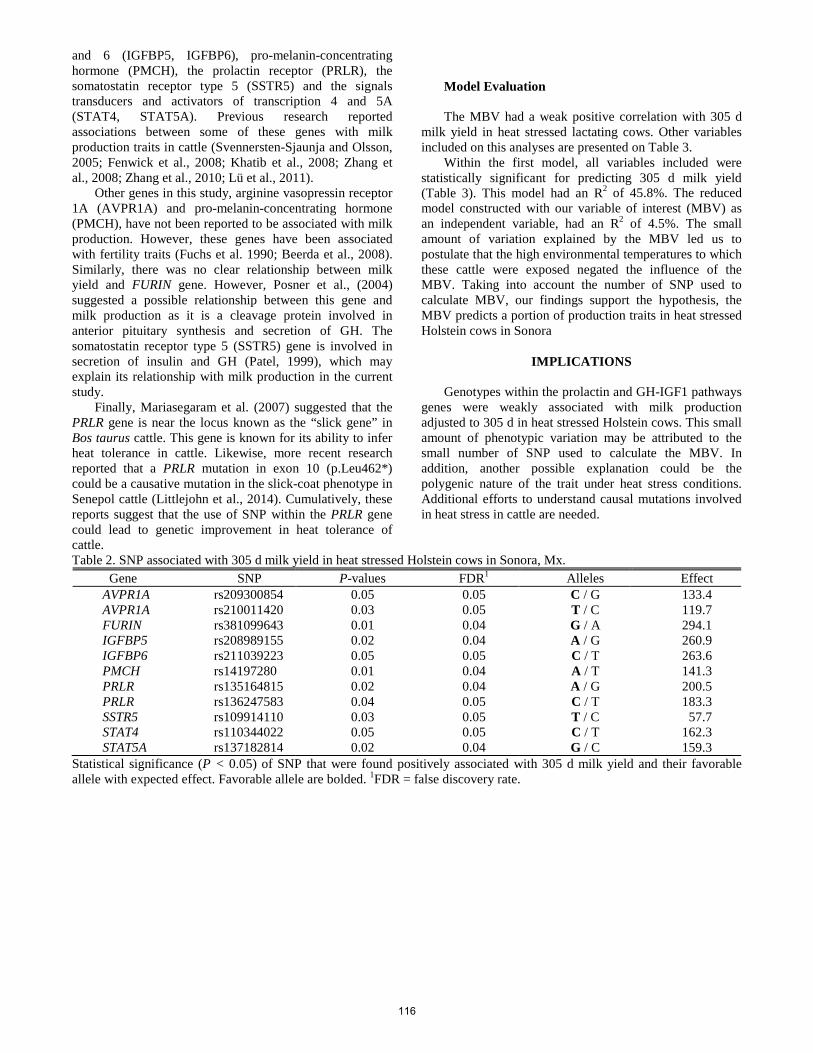
and 6 (IGFBP5, IGFBP6), pro-melanin-concentrating hormone (PMCH), the prolactin receptor (PRLR), the somatostatin receptor type 5 (SSTR5) and the signals transducers and activators of transcription 4 and 5A (STAT4, STAT5A). Previous research reported associations between some of these genes with milk production traits in cattle (Svennersten-Sjaunja and Olsson, 2005; Fenwick et al., 2008; Khatib et al., 2008; Zhang et al., 2008; Zhang et al., 2010; Lü et al., 2011).
Other genes in this study, arginine vasopressin receptor 1A (AVPR1A) and pro-melanin-concentrating hormone (PMCH), have not been reported to be associated with milk production. However, these genes have been associated with fertility traits (Fuchs et al. 1990; Beerda et al., 2008). Similarly, there was no clear relationship between milk yield and FURIN gene. However, Posner et al., (2004) suggested a possible relationship between this gene and milk production as it is a cleavage protein involved in anterior pituitary synthesis and secretion of GH. The somatostatin receptor type 5 (SSTR5) gene is involved in secretion of insulin and GH (Patel, 1999), which may explain its relationship with milk production in the current study.
Finally, Mariasegaram et al. (2007) suggested that the PRLR gene is near the locus known as the “slick gene” in Bos taurus cattle. This gene is known for its ability to infer heat tolerance in cattle. Likewise, more recent research reported that a PRLR mutation in exon 10 (p.Leu462*) could be a causative mutation in the slick-coat phenotype in Senepol cattle (Littlejohn et al., 2014). Cumulatively, these reports suggest that the use of SNP within the PRLR gene could lead to genetic improvement in heat tolerance of cattle.
Model Evaluation The MBV had a weak positive correlation with 305 d
milk yield in heat stressed lactating cows. Other variables included on this analyses are presented on Table 3.
Within the first model, all variables included were statistically significant for predicting 305 d milk yield (Table 3). This model had an R2 of 45.8%. The reduced model constructed with our variable of interest (MBV) as an independent variable, had an R2 of 4.5%. The small amount of variation explained by the MBV led us to postulate that the high environmental temperatures to which these cattle were exposed negated the influence of the MBV. Taking into account the number of SNP used to calculate MBV, our findings support the hypothesis, the MBV predicts a portion of production traits in heat stressed Holstein cows in Sonora
IMPLICATIONS
Genotypes within the prolactin and GH-IGF1 pathways genes were weakly associated with milk production adjusted to 305 d in heat stressed Holstein cows. This small amount of phenotypic variation may be attributed to the small number of SNP used to calculate the MBV. In addition, another possible explanation could be the polygenic nature of the trait under heat stress conditions. Additional efforts to understand causal mutations involved in heat stress in cattle are needed.
Table 2. SNP associated with 305 d milk yield in heat stressed Holstein cows in Sonora, Mx. Gene SNP P-values FDR1 Alleles Effect AVPR1A rs209300854 0.05 0.05 C / G 133.4 AVPR1A rs210011420 0.03 0.05 T / C 119.7 FURIN rs381099643 0.01 0.04 G / A 294.1 IGFBP5 rs208989155 0.02 0.04 A / G 260.9 IGFBP6 rs211039223 0.05 0.05 C / T 263.6 PMCH rs14197280 0.01 0.04 A / T 141.3 PRLR rs135164815 0.02 0.04 A / G 200.5 PRLR rs136247583 0.04 0.05 C / T 183.3 SSTR5 rs109914110 0.03 0.05 T / C 057.7 STAT4 rs110344022 0.05 0.05 C / T 162.3 STAT5A rs137182814 0.02 0.04 G / C 159.3
Statistical significance (P < 0.05) of SNP that were found positively associated with 305 d milk yield and their favorable allele with expected effect. Favorable allele are bolded. 1FDR = false discovery rate.
116
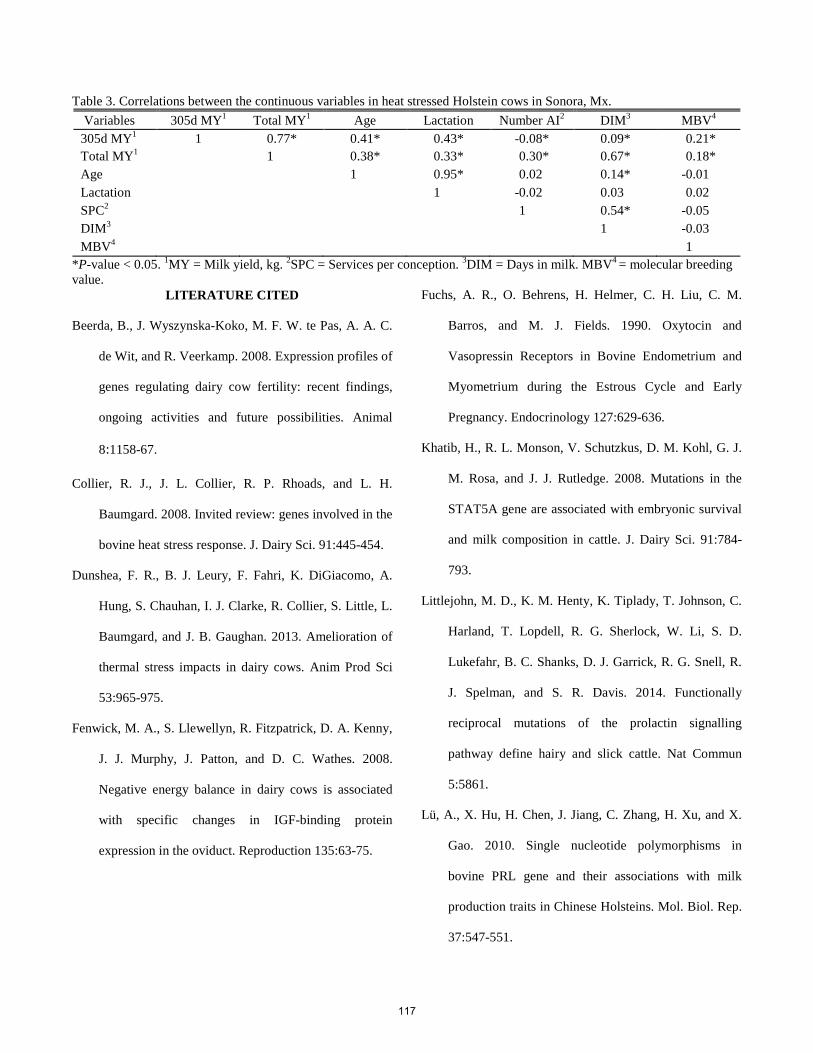
Table 3. Correlations between the continuous variables in heat stressed Holstein cows in Sonora, Mx. Variables 305d MY1 Total MY1 Age Lactation Number AI2 DIM3 MBV4
305d MY1 1 0.77* 0.41* 0.43* -0.08* 0.09* -0.21* Total MY1
1.00* 0.38* 0.33* -0.30* 0.67* -0.18*
Age
1.00* 0.95* -0.02* 0.14* -0.01* Lactation
1.00* -0.02* 0.03* -0.02*
SPC2
-1.00* 0.54* -0.05*
DIM3
1.00* -0.03*
MBV4
-1.00*
*P-value < 0.05. 1MY = Milk yield, kg. 2SPC = Services per conception. 3DIM = Days in milk. MBV4 = molecular breeding value.
LITERATURE CITED Beerda, B., J. Wyszynska-Koko, M. F. W. te Pas, A. A. C.
de Wit, and R. Veerkamp. 2008. Expression profiles of
genes regulating dairy cow fertility: recent findings,
ongoing activities and future possibilities. Animal
8:1158-67.
Collier, R. J., J. L. Collier, R. P. Rhoads, and L. H.
Baumgard. 2008. Invited review: genes involved in the
bovine heat stress response. J. Dairy Sci. 91:445-454.
Dunshea, F. R., B. J. Leury, F. Fahri, K. DiGiacomo, A.
Hung, S. Chauhan, I. J. Clarke, R. Collier, S. Little, L.
Baumgard, and J. B. Gaughan. 2013. Amelioration of
thermal stress impacts in dairy cows. Anim Prod Sci
53:965-975.
Fenwick, M. A., S. Llewellyn, R. Fitzpatrick, D. A. Kenny,
J. J. Murphy, J. Patton, and D. C. Wathes. 2008.
Negative energy balance in dairy cows is associated
with specific changes in IGF-binding protein
expression in the oviduct. Reproduction 135:63-75.
Fuchs, A. R., O. Behrens, H. Helmer, C. H. Liu, C. M.
Barros, and M. J. Fields. 1990. Oxytocin and
Vasopressin Receptors in Bovine Endometrium and
Myometrium during the Estrous Cycle and Early
Pregnancy. Endocrinology 127:629-636.
Khatib, H., R. L. Monson, V. Schutzkus, D. M. Kohl, G. J.
M. Rosa, and J. J. Rutledge. 2008. Mutations in the
STAT5A gene are associated with embryonic survival
and milk composition in cattle. J. Dairy Sci. 91:784-
793.
Littlejohn, M. D., K. M. Henty, K. Tiplady, T. Johnson, C.
Harland, T. Lopdell, R. G. Sherlock, W. Li, S. D.
Lukefahr, B. C. Shanks, D. J. Garrick, R. G. Snell, R.
J. Spelman, and S. R. Davis. 2014. Functionally
reciprocal mutations of the prolactin signalling
pathway define hairy and slick cattle. Nat Commun
5:5861.
Lü, A., X. Hu, H. Chen, J. Jiang, C. Zhang, H. Xu, and X.
Gao. 2010. Single nucleotide polymorphisms in
bovine PRL gene and their associations with milk
production traits in Chinese Holsteins. Mol. Biol. Rep.
37:547-551.
117

Lü, A., X. Hu, H. Chen, Y. Dong, Y. Zhang, and X. Wang.
2011. Novel SNPs of the bovine PRLR gene
associated with milk production traits. Biochem.
Genet. 49:177-189.
Mader, T. L., M. S. Davis, and T. Brown-Brandl. 2006.
Environmental factors influencing heat stress in
feedlot cattle. J. Anim. Sci. 84:712-719.
Mariasegaram, M., C. C. Chase, J. X. Chaparro, T. A.
Olson, R. A. Brenneman, and R. P. Niedz. 2007. The
slick hair coat locus maps to chromosome 20 in
Senepol‐derived cattle. Anim. Genet. 38:54-59.
NRC. 2001. Nutrient requirements of dairy cattle. 7th rev.
ed. Natl. Acad. Press, Washington, DC.
Patel, Y. C. 1999. Somatostatin and its receptor family.
Front Neuroendocrinol 20:157-198.
Posner, S. F., C. A. Vaslet, M. Jurofcik, A. Lee, N. G.
Seidah, and E. A. Nillni. 2004. Stepwise
posttranslational processing of progrowth hormone-
releasing hormone (proGHRH) polypeptide by furin
and PC1. Endocrine 23:199-213.
Svennersten-Sjaunja, K., and K. Olsson. 2005.
Endocrinology of milk production. Domest. Anim.
Endocrinol. 29:241-258.
West, J. W. 2003. Effects of heat-stress on production in
dairy cattle. J. Dairy Sci. 86:2131-2144.
Zhang, J., L. Zan, P. Fang, F. Zhang, G. Shen, and W. Tian.
2008. Genetic variation of PRLR gene and association
with milk performance traits in dairy cattle. Can. J.
Anim. Sci. 88:33-39.
Zhang, F., J. Huang, Q. Li, Z. Ju, J. Li, F. Shi, J. Zhong,
and C. Wang. 2010. Novel single nucleotide
polymorphisms (SNPs) of the bovine STAT4 gene and
their associations with production traits in Chinese
Holstein cattle. Afr. J. Biotechnol. 9:4003-4008.
118
Proceedings, Western Section, American Society of Animal Science
Vol. 66, 2015
Angus Cattle at High Altitude: Relationship Between Age and Pulmonary Arterial Pressure
X. Zeng*1, T. N. Holt†, R. M. Enns*, S. E. Speidel*, and M. G. Thomas*
*Department of Animal Science and †College of Veterinary Medicine and Biomedical Sciences, Colorado State University, Fort Collins CO 80526
ABSTRACT: Bovine pulmonary hypertension (BPH), resulting in right-side congestive heart failure, is a major cause of calf morbidity in beef cattle ranches and feed yards at high elevation (i.e. above 1500m). Elevated pulmonary arterial pressure (PAP) has been widely used as an indicator trait for BPH in beef cattle breeding programs, as it is physiologically related to BPH and moderately heritable. The objective of this study was to study the phenotypic and genetic relationship between age and PAP measurements. Our hypotheses were that increases in age were significantly associated with changes in PAP, and weaning PAP was a different trait than yearling PAP, genetically. For this study, PAP measurements (n = 5,062) were collected from Angus cattle of John E. Rouse Colorado State University Beef Improvement Center (CSU-BIC) at 2,340 m elevation. Data were from two categories: weaning PAP (n = 316; measured at an average age of 229.8 ± 24.5d with a average score of 41.9 ± 9.3 mmHg) and yearling PAP (n = 4,647; measured at an average age of 351.3 ± 27.6 d with an average score of 42.5 ± 10.1 mmHg). Weaning PAP and yearling PAP scores were regressed on age to evaluate the phenotypic relationship. A quadratic relationship, having a maximum point, was identified between age and weaning PAP or yearling PAP. The estimated regression coefficients of quadratic age on weaning PAP and yearling PAP were 0.0045 (P < 0.05) and 0.0004 (P < 0.05), respectively. The genetic effect of age on PAP measurement was assessed through estimating the genetic correlation between weaning PAP and yearling PAP. The estimated genetic correlation between weaning PAP and yearling PAP was 0.67 (P < 0.05), which is considered a moderate genetic relationship. Therefore, we would accept our hypotheses that the increases in age were significantly associated with changes in PAP, and weaning PAP was not the same trait as yearling PAP. Results suggest that age of measurement affects PAP scores on both phenotypic and genetic levels; and therefore, weaning PAP and yearling PAP measurements should be treated as separate traits in selection and genetic evaluation programs. Key words: age, genetic correlation, pulmonary arterial pressure, regression*
INTRODUCTION
Hypoxia-derived bovine pulmonary hypertension (BPH) causes multi-million dollars losses each year in beef herds at high altitude in the United States (Holt and Callan,
1Corresponding author’s email address: [email protected]
2007; Williams et al., 2012). Currently, the beef industry uses pulmonary arterial pressure (PAP) measurements to indicate the risk of cattle for hypoxia-derived BPH. The association of increased PAP with pulmonary hypertension, right ventricular hypertrophy, right ventricular dilation, and right heart congestive failure enables its use as an indicator of BPH risk. Besides altitude, many other factors can have an effect on PAP measurements including breed, age, and production level (Holt et al., 2007; Neary, 2014)
Will et al. (1975) reported that PAP increases with increasing age, and Neary (2014) demonstrated that, even at moderate altitude, PAP significantly increased with age among pre-weaned calves. Similarly in humans, it was reported that systolic PAP increased with age regardless of altitude, which would suggest a pulmonary vascular remodeling with increasing age (Lam et al., 2009). Holt and Callan (2007) implied that PAP measurements were likely to change greatly from younger ages to older ages, and Rhodes (2005) reported that the incident of hypoxia-induced BPH varied among different ages of cattle. Age may affect PAP at both the phenotypic and genetic levels. It is possible that the PAP measurements are not genetically identical at earlier and older ages of cattle. Therefore, the objective of this study was to study the phenotypic and genetic relationship between age and PAP measurements. We hypothesized that increases in age were significantly associated with the changes in PAP, and weaning PAP was a different trait than yearling PAP, genetically. We regressed PAP measurements on age, and subsequently estimated genetic correlation between PAP measurements at weaning and yearling ages to test the hypotheses.
METHODS AND MATERIALS
Colorado State University Institutional Animal Care
and Use Committee approved the research procedures. Data. Pulmonary arterial pressure measurements (n =
5,062) were collected from Angus cattle from 1994 to 2013 at the John E. Rouse Colorado State University Beef Improvement Center (CSU-BIC; at 2,340 m elevation). Angus calves were born in spring, and weaned in fall in this herd. The same licensed veterinarian measured PAP in mmHg for every animal over a 1 to 2 day period each year in accordance with the procedures described by Holt and Callen (2007). The PAP measurements taken on cattle at ages equal or earlier than 260 days were assigned as weaning PAP, while those taken at older than 260 days of age were recognized as yearling PAP. Cattle in the data file were AI or natural-service progeny of 245 sires and 1,454
119
dams. The pedigree file contained 10,653 individuals. Descriptive statistics of weaning PAP scores, yearling PAP scores and corresponding ages are presented in Table 1.
Regressions. Weaning PAP and yearling PAP
measurements were regressed on age to determine the phenotypic relationship between age and PAP. The model was expressed as: , where y represented weaning PAP or yearling PAP scores, age was in days, sex and age of dam (aod) were included as categorical effects, and residual e was normally distributed. The regressions were analyzed using the statistical package R (R Core Team, 2013).
Genetic relationship. The following Bivariate animal model was used to estimate genetic correlation between weaning PAP and yearling PAP.
where y1 and y2 represented weaning PAP and yearling PAP, respectively; and were two vectors of fixed effects on observation of weaning PAP and yearling PAP that included PAP date, age of dam, linear and quadratic terms of age (covariate); X1 and X2 were incident matrices relating observations in y1 and y2 to effects in and ; u1 and u2 were vectors of random additive genetic effects influencing observations in y1 and y2 ; Z1 and Z2 represented incidence matrices relating observations in y1 and y2 to additive random animal effects; e1 and e2 were vectors of random errors specific to observations in y1 and y2. The genetic (G) and residual (R) variance-covariance matrices were expressed as:
;
where A was Wright’s numerator relationship matrix,
and were additive genetic variances of weaning PAP
and yearling PAP; was genetic covariance between
weaning PAP and yearling PAP; and were residual variance of weaning PAP and yearling PAP. The residual covariance between weaning PAP and yearling PAP was assigned to zero, because no individual had both records in the dataset. It was also assumed that the genetic and residual effects followed a multivariate normal distribution with zero covariance between genetic and residual effects.
A likelihood ratio test could assess the significance of fitting weaning PAP and yearling PAP as separate traits. A similar bivariate model was parameterized to approximate the univariate model of PAP scores (including both weaning PAP and yearling PAP measurements) through the
procedure described in Shirley et al. (2006). The likelihood ratio was obtained by comparing likelihood of the two models, and the degree of freedom was the difference in number of parameters between the models. Each of these models was implemented using the statistical software package ASREML (Gilmour et al., 2009).
RESULTS AND DISCUSSION
Regressions. Table 2 presents regression coefficients
for linear and quadratic terms of age on weaning PAP and yearling PAP measurements. The results indicated that weaning PAP and yearling PAP scores were significantly related to age of calves (P < 0.05 for all coefficients). These results support previous reports that showed age had a significant impact on pulmonary hypertension, right ventricular hypertrophy and vascular smooth muscle cell hypertrophy, when studying the physiological response to hypoxia (Will et al., 1975; Rhodes, 2005; Neary, 2014). In both regression analyses, the coefficients for quadratic age were negative, while the coefficients for linear age were positive. This outcome suggested a quadratic relationship (with a maximum point) between PAP scores and ages. In each PAP category (weaning PAP or yearling PAP), as age went up, PAP score increased until reaching the maximum, at which point PAP score decreased as age increased. These maximum values of weaning PAP and yearling PAP measurements were at 224 and 363 days, respectively. Although, the authors are unaware of any literature reporting a non-linear relationship between PAP and age, Rhodes (2005) reported a potential non-linear relationship between incidence of hypoxia-induced BPH and age as the majority of hypoxia-induced pulmonary hypertension of cattle occurs between birth and 2 years of age. Therefore, we would accept our hypothesis that PAP measurements were significantly associated with age of calves. The results suggested that we should consider the effect of age when studying PAP scores.
Genetic relationship. Table 3 shows the genetic parameters estimated from the bivariate animal model. The estimated genetic correlation was moderate to high (0.67 ± 0.18). The likelihood ratio test demonstrated the significant of treating PAP as different traits (P < 0.05). This supports previous findings that inferred PAP measured at ages prior to one year was highly possibly different from that measured at older ages (Holt and Callen, 2007). This report also suggested that weaning PAP measurement are less accurate in identifying low-PAP-testing animals, and yearling PAP measurements were more accurate than weaning PAP measurements in predicting susceptibility of cattle to hypoxia-induced BPH. Therefore, we would accept our hypothesis that weaning PAP was a different trait than yearling PAP, genetically, but they are strongly genetically associated. However, likely they should be treated as different traits in breeding programs. The estimated heritabilities (Table 3) indicated that PAP was moderately or highly heritable trait. These obtained heritabilities were similar to the heritabilities reported in previous studies (0.34~0.46; Enns et al., 1992; Shirley et al., 2007). This
120

would indicate that offspring are likely to have similar PAP scores as their parents, and therefore PAP measurements of parents can be an indicator of their descents’ susceptibility to hypoxia-induced BPH.
IMPLICATIONS
Age influences an individual’s PAP measurement both phenotypically and genetically. Therefore, when evaluating PAP of an individual, the age of the testing animal should be considered, and weaning PAP and yearling PAP should be treated as different traits in genetic evaluation analyses.
LITERATURE CITIED Enns, R. M., J. S. Brinks, R. M. Bourdon, and T. G. Field.
1992. Heritability of pulmonary arterial pressure in Angus cattle. Proc. West. Sect. Am. Soc. Anim. Sci. 43:111−112.
Gilmour, A. R., B. J. Gogel, B. R. Cullis, and R. Thompson. 2009. ASReml user guide release 3.0. VSN International Ltd, Hemel Hempstead, UK.
Holt, T. N., and R. J. Callan. 2007. Pulmonary arterial pressure testing for high mountain disease in cattle. Vet. Clin. North Am. Food Anim. Pract. 23: 575−596.
Lam, C. S., B. A. Borlaug, G. C. Kane, F. T. Enders, R. J. Rodeheffer, and M. M. Redfield. 2009. Age-associated increases in pulmonary artery systolic pressure in the general population. Circulation. 119:2663−2670.
Neary, J. M. 2014. Epidemiological, physiological and genetic risk factors associated with congestive heart failure and mean pulmonary arterial pressure in cattle. PhD Diss. Colorado State Univ., Fort Collins.
Rhodes, J. 2005. Comparative physiology of hypoxic pulmonary hypertension: historical clues from brisket disease. J. Appl. Physiol. 98: 1092−1100.
Shirley, K. L., D. W. Beckman, and D. J. Garrick. 2008. Inheritance of pulmonary arterial pressure in Angus cattle and its correlation with growth. J. Anim. Sci. 86:815−819.
Will, D. H., J. F. Horrell, J. T. Reeves, and A. F. Alexander. 1975. Influence of altitude and age on pulmonary arterial pressure in cattle. Proc. Soc. Exp. Biol. Med. 150:564−567.
Williams, J. L., J. K. Bertrand, I. Misztal, and M. Łukaszewicz. 2012. Genotype by environment interaction for growth due to altitude in United States Angus cattle. J. Anim. Sci. 90:2152−2158.
Table 1. Descriptive statistics of pulmonary arterial pressure measurement and age
Trait No. Mean Minimum Maximum SD WPAP1 316 41.9 21 100 9.3 WAGE2 316 229.8 139 260 24.5 YPAP3 4,746 42.5 22 139 10.1 YAGE4 4,746 351.3 261 450 27.6
1WPAP = weaning pulmonary arterial pressure, mmHg. 2WAGE = weaning age, d. 3YPAP = yearling pulmonary arterial pressure, mmHg. 4YAGE = yearling ages, d.
Table 2. Regression coefficients of age on weaning pulmonary arterial pressure (WPAP) and yearling pulmonary arterial pressure (YPAP) measurements
Trait age, d age, d2
WPAP, mmHg 2.021 -0.00451
YPAP, mmHg 0.341 -0.00051
1Differ from 0 (P < 0.05), Student t-test. Table 3. Estimated heritability and genetic variances (on diagonal) and genetic correlation (above diagonal) and genetic covariance (below diagonal) of weaning and yearling pulmonary arterial pressure
Trait WPAP1 YPAP2
WPAP 0.56 ± 0.203
41.52 ± 17.03 0.67 ± 0.184
YPAP 24.45 ± 7.16 0.31 ± 0.03 31.82 ± 3.95
1WPAP = weaning pulmonary arterial pressure, mmHg. 2YPAP = yearling pulmonary pressure, mmHg. 3Parameters ± SE 4WPAP is a different trait than YPAP (P < 0.05), Log
likelihood ratio test; Log likelihood ratio = -2(-3975.81 + 3966.32) = 18.98, df = 4; P-value was estimated from Chi-square distribution, which equaled 0.0008.
121
Proceedings, Western Section, American Society of Animal Science
Vol. 66, 2015
Untapped genetic variability in Herefords: implications for climate change
B.C. Krehbiel,†*1 S. Paiva,§ C. Wilson,† S. Ericsson,‡ J. Boatright,‡ M.G. Thomas,* and H.D. Blackburn†2
†National Animal Germplasm Program, National Center for Genetic Resources Preservation, ARS, USDA, Fort Collins, CO 80521; §Embrapa Labex US – Secretariat International Affairs, Brasilia, DF, Brazil, 70770; *Department of Animal Sciences, Colorado State University, Fort Collins, CO 80523-117; ‡Department of Animal Sciences, Sul Ross State
University, Alpine, TX 79832
ABSTRACT: Global climate change (CC) has the potential to significantly alter US cattle productivity. As a result, the creation of genetic resources for a specific environment may be necessary, given that genetic-environmental interactions are present and may become more important. Molecular evaluation of a single breed based upon geographic location may provide insights as to the level of genetic variability for a variety of physiological and production traits that alter a population’s ability to withstand CC. We evaluated differences in SNP (single nucleotide polymorphisms) frequencies for Herefords (n=278) that came from five geographic locations designated as Cool Arid (CA) n=45; Cool Humid (CH) n=48; Transition Zone (TZ) n=76; Warm Arid (WA) n=68; and Warm Humid (WH) n=41. The SNPs were derived from commercial Bovine 50K or 770K SNP Bead Chip panels. Preliminary analysis using Bayesian analysis confirmed the validity of the five regions specified. A subset of 66 SNPs was selected for evaluation based upon literature reports that associated them to physiological or production traits that might be potentially impacted by CC. Twenty-five SNPs (associated with body weight, heat stress, milk yield, heifer conception rate, net merit, and early embryonic survival) showed departure from Hardy-Weinberg Equilibrium (HWE) (P < 0.05). Among SNPs was observed large and substantial differences between most of the regions with exception to CA and TZ. The results suggest the existence of a significant geographically substructure in the Hereford breed which can be useful in selecting animals with greater resilience to CC. Key words: animal genetic resources, Bos taurus, genetic diversity management, molecular markers
INTRODUCTION
Climate change (CC) can influence genetic-environmental interactions in animals, affecting production levels in various climates. Knowledge about allele frequencies among environments will become more important to livestock production as climates change and selection practices will require modification to improve or
maintain productivity within geographic regions. Genome wide association studies have revealed SNPs associated with specific traits affected by environment such as milk production (Lillihammer et al., 2008; Hayes et al., 2009) health, and fertility (Dikmen et al, 2013). Although current genetic selection procedures include genotyping animals to improve the accuracy of genetic predictions, environmental challenges and lack of genetic diversity could hinder genetic progress. To gain insight to genetic variability within cattle populations that might be useful in adaptation to climatic change, we have performed a fine scale genetic structure analysis in Hereford cattle distributed across the US.
MATERIALS AND METHODS
Fine genetic structure analysis was performed with 14,312 SNP markers on 571 (n) nationally sampled Herefords acquired by USDA-ARS and Sul Ross University. All SNP markers are present on the Bovine 50K and 770K SNP Bead Chips and were selected after standard quality control analysis. Initial inspection of the dataset indicated a substantial bias in the samples due to inbred Line 1 influence and migration of that population across geographic regions. In order to reduce this bias, we carried out a Bayesian analysis with STRUCTURE (Pritchard et al., 2000; Hubisz et al., 2009) and kept the individual genotypes with a posterior probability of < 0.37 in relation to Line 1. The remaining Hereford cattle (n=278) were classified into five geographic regions based on temperature and humidity and coded as: Cool Arid n=45; Cool Humid n=48; Transition Zone n=76; Warm Arid n=68; and Warm Humid n=41. To test the validity of the five geographic region classifications, we used STUCTURE with a 2,000 iteration burn in, 14,000 MCMC iterations, and K values from 1 to 9. All K values were replicated three times. Delta K as estimated indicated that five subpopulations were present (Evanno et al., 2005).
From the 14,312 SNPs, a subset of 100 SNPs were selected for evaluation based upon previous published works and their relationship to physiological and production traits (body weight, heat stress, milk yield, heifer conception rate, net merit, and early embryonic survival) that are influenced by environmental effects (Hu et al., 2013). The 100 SNP dataset was reduced to 66 SNPs because lack of genotypic information on the SNP, or duplication of the SNP. The GENALEX software program (Peakall and Smouse, 2012) was used to determine the
1Corresponding author’s email address: [email protected] 2The authors thank the American Hereford Association for their assistance.
122
allele frequencies of the SNPs in each subpopulation. To ensure correctness of individual region assignments, the population assignment option in GENALEX was used to reassign animals from the 66 SNP panel based upon genotype frequency at each locus. Table 1 shows animal reassignments in addition to the heterozygosity within each subpopulation. The ARLEQUIN software program (Excoffier and Lischer, 2010) was used to test the 66 SNPs for Hardy-Weinberg Equilibrium and their genetic differentiation among the five regions.
RESULTS
Neutral genetic structure analysis performed by 14,312 SNP markers using Bayesian statistics confirmed the validity of the five main regions based on temperature and humidity (Fig. 1 and Fig. 2). The Warm Arid region was distinct, while Cool Arid and Cool Humid had a high proportional assignment to K-3. The Transition Zone had high levels of admixture and had intermediate proportional assignments for all K. Evaluation for HWE found that 25 SNPs were not in HWE and/or were under some sort of selection pressure. Pairwise Fst were calculated for regions using the 25 loci (Table 2) and showed all subpopulations to be significantly different with the exception of the Cool Arid and Transition Zone. Allelic frequencies for a subsample of SNPs were evaluated among geographic regions (Fig. 3). Warm Arid and Warm Humid subpopulations tended to be at opposite extremes especially for SNPs associated with heat stress, while Transition Zone, Cool Arid and Cool Humid were found to be intermediate. Figure 3 demonstrates the wide range of genotypes in the evaluated SNPs, which supports our hypothesis that Herefords contain sufficient genetic variability to withstand CC.
DISCUSSION
The SNP allele frequency differences among the five regions were significant for the two panels used: 14k random spaced selected SNPs and the trait associated SNPs cited by literature. This demonstrates that Herefords have potential to further adapt to various environments as CC takes hold. In a classic study of genetic-environment interaction, Burns et al. (1979) demonstrated how Florida
and Montana Hereford cattle changed performance levels based upon environmental stressors. These findings have the potential to enhance Hereford breeding programs to balance production traits and environmental adaptation. In addition, the results showed plasticity of the cattle even though the breed has a relatively high inbreeding level (Purfield et al., 2012). Because of its intermediate proportional assignment and similarity to the Cool Arid Zone, the Transition Zone genotypes may provide the plasticity that producers need to increase genetic progress within different environments. Varying genotypes among the subpopulations could potentially change selection practices and use of reproductive technology within the industry. For example, bulls collected for AI may become more relevant in regions in which they reside. The SNPs found not to be in HWE in addition to the Fst differences between regions show evidence of regional allelic differences which industry can use. de Jong and Bijma (2002) assert that ignoring environmental effects is an unproductive strategy especially when there are large and systematic differences in phenotypes. They also point out that with large environmental differences, breeders have selectable information that affords an opportunity for selection, which can target phenotypic plasticity. Such an approach may lead to more robust livestock populations confronted with CC. The varying genotypes among the subpopulations found in this study suggest there is genetic variability which can be used to alter selection toward more plastic populations of cattle. Further work in defining effective genomic markers for adaptability is needed, however, for now we demonstrate large differences exist and can facilitate efforts to better adapt cattle to CC.
IMPLICATONS
The genetic diversity observed within the subpopulations for each ecoregion provides producers with more opportunities to select for animals that will produce better in their corresponding region. Cattle from extreme environments may provide the quickest genetic change in response to CC, but cattle found in the transition zone, with their intermediate allelic frequencies, may offer unique opportunities for selection programs.
LITERATURE CITED
Burns, W. C., M. Koger, W.T. Butts, O. F. Pahnish, and R.L. Blackwell. 1979. Genotype by environment interaction in Hereford cattle: II. birth and weaning traits. J. Anim. Sci. 49:2.
Dikmen, S., J.B. Cole, D.J. Null, and P.J. Hansen. 2013. Genome-wide association mapping for identification of quantitative trait loci for rectal temperature during heat stress in Holstein cattle. PlOS ONE 8(7): doi: 10.1371/journal.pone.0069202.
de Jong, G. and P. Bijma. 2002. Selection and phenotypic plasticity in evolutionary biology and animal breeding. Livestock Prod. Sci. 78:195-214.
Table 1. Initial and post subpopulation assignments and heterozygosity for animals within five US climate regions Assignment
Heterozygosity
Region Initial Post Initial Post Cool Arid 51 45 0.359 0.354
Cool Humid 44 48 0.338 0.340
Transition Zone 107 76 0.332 0.357
Warm Arid 52 68 0.353 0.358
Warm Humid 24 41 0.341 0.357
123
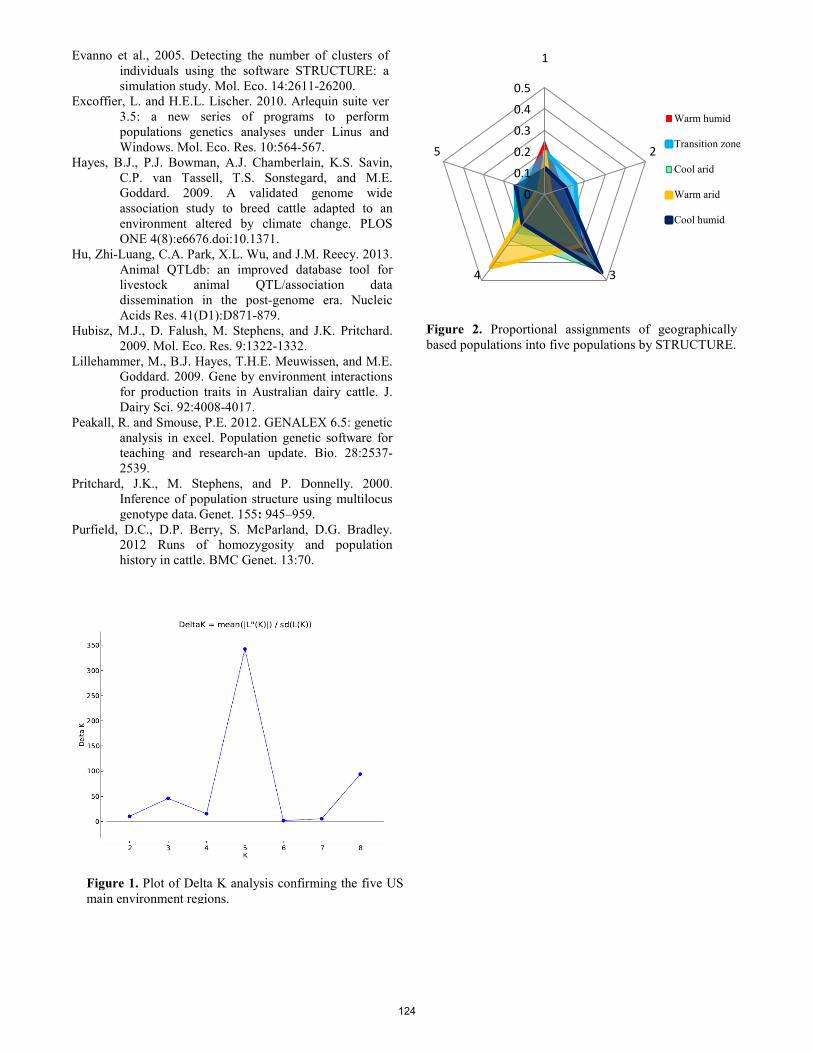
0
0.1
0.2
0.3
0.4
0.5
1
2
34
5
Warm humid
Transition zone
Cool arid
Warm arid
Cool humid
Evanno et al., 2005. Detecting the number of clusters of individuals using the software STRUCTURE: a simulation study. Mol. Eco. 14:2611-26200.
Excoffier, L. and H.E.L. Lischer. 2010. Arlequin suite ver 3.5: a new series of programs to perform populations genetics analyses under Linus and Windows. Mol. Eco. Res. 10:564-567.
Hayes, B.J., P.J. Bowman, A.J. Chamberlain, K.S. Savin, C.P. van Tassell, T.S. Sonstegard, and M.E. Goddard. 2009. A validated genome wide association study to breed cattle adapted to an environment altered by climate change. PLOS ONE 4(8):e6676.doi:10.1371.
Hu, Zhi-Luang, C.A. Park, X.L. Wu, and J.M. Reecy. 2013. Animal QTLdb: an improved database tool for livestock animal QTL/association data dissemination in the post-genome era. Nucleic Acids Res. 41(D1):D871-879.
Hubisz, M.J., D. Falush, M. Stephens, and J.K. Pritchard. 2009. Mol. Eco. Res. 9:1322-1332.
Lillehammer, M., B.J. Hayes, T.H.E. Meuwissen, and M.E. Goddard. 2009. Gene by environment interactions for production traits in Australian dairy cattle. J. Dairy Sci. 92:4008-4017.
Peakall, R. and Smouse, P.E. 2012. GENALEX 6.5: genetic analysis in excel. Population genetic software for teaching and research-an update. Bio. 28:2537-2539.
Pritchard, J.K., M. Stephens, and P. Donnelly. 2000. Inference of population structure using multilocus genotype data. Genet. 155: 945–959.
Purfield, D.C., D.P. Berry, S. McParland, D.G. Bradley. 2012 Runs of homozygosity and population history in cattle. BMC Genet. 13:70.
Figure 1. Plot of Delta K analysis confirming the five US main environment regions.
Figure 2. Proportional assignments of geographically based populations into five populations by STRUCTURE.
124
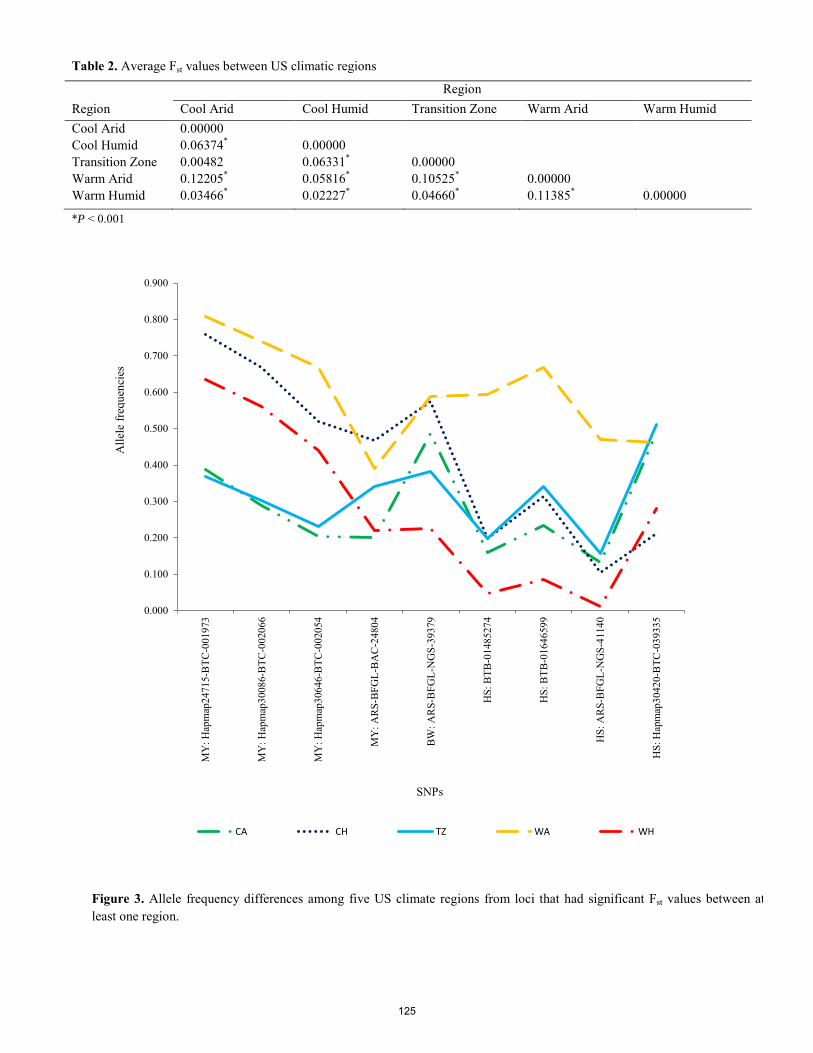
0.000
0.100
0.200
0.300
0.400
0.500
0.600
0.700
0.800
0.900
MY
: Hap
map
2471
5-B
TC-0
0197
3
MY
: Hap
map
3008
6-B
TC-0
0206
6
MY
: Hap
map
3064
6-B
TC-0
0205
4
MY
: ARS
-BFG
L-B
AC-
2480
4
BW: A
RS-B
FGL-
NG
S-39
379
HS:
BTB
-014
8527
4
HS:
BTB
-016
4659
9
HS:
ARS
-BFG
L-N
GS-
4114
0
HS:
Hap
map
3042
0-B
TC-0
3933
5
CA CH TZ WA WH
Table 2. Average Fst values between US climatic regions
Region Region Cool Arid Cool Humid Transition Zone Warm Arid Warm Humid Cool Arid 0.00000 Cool Humid 0.06374* 0.00000 Transition Zone 0.00482 0.06331* 0.00000 Warm Arid 0.12205* 0.05816* 0.10525* 0.00000 Warm Humid 0.03466* 0.02227* 0.04660* 0.11385* 0.00000
Figure 3. Allele frequency differences among five US climate regions from loci that had significant Fst values between at least one region.
SNPs
Alle
le fr
eque
ncie
s
*P < 0.001
125

Proceedings, Western Section, American Society of Animal Science
Vol. 66, 2015
Multivariate analysis of genetic relationships between pulmonary arterial pressure and performance traits in an Angus herd at high elevation1
N. F. Crawford*, S. E. Speidel*, X. Zeng*, T. N. Holt§, M. G. Thomas*, and R. M. Enns*2
*Department of Animal Science, Colorado State University, Fort Collins, §Department of Clinical Sciences, Colorado State University, Fort Collins
ABSTRACT: The objective of this study was to determine and estimate the relationship between pulmonary arterial pressure (PAP) measures and performance traits with a multivariate analysis with data from the John E. Rouse Colorado State University Beef Improvement Center (CSU-BIC) Angus herd (n = 10,561). Our hypothesis was there is small to no genetic relationships between PAP and these traits at the CSU-BIC. Typical selection for herd bulls and replacement heifers involved a PAP measure of 50 mm Hg or lower, given other selection criteria were met. Outside AI sires were not PAP tested, yet offspring from these matings were included. Performance traits included birth weight (n = 8,269), weaning weight (n = 7,584), and post-weaning gain (n = 4,448). A multivariate analysis was conducted with ASReml 3.0 software to estimate heritabilities and genetic correlations between PAP and each performance trait. The model: 𝑦 = 𝑋𝑏 + 𝑍𝑢 + 𝑒 , where y represented the n observations for each of the four traits, X was an n x pi incidence matrix of p fixed effects, b was a vector on fixed effects, Z represented a n x q incidence matrix of q random effects, u was a vector of random effects, and e a vector of residual errors. Heritabilities for PAP, BW, and WW direct appeared to be within their previously reported ranges, whereas WW maternal heritability was higher and PWG was slightly lower than what was expected based on previous reports. Results from the multivariate analysis yielded genetic correlations between PAP and birth weight, weaning weight direct, weaning weight maternal and post-weaning gain as 0.13 ± 0.06, 0.05 ± 0.08, 0.09 ± 0.08, and 0.08 ± 0.08, respectively. We accept our hypothesis; therefore the results of this study suggest that selection for lower PAP score should have minimal influence on the growth performance of cattle at the CSU-BIC. Key words: cattle, correlation, pulmonary arterial pressure 1
INTRODUCTION
A major risk of cattle at elevation is development of high altitude disease (HAD), commonly called “Brisket Disease”. According to Enns et al. (2011), HAD falls within the class of diseases associated with non-transmittable environmental challenges, more directly related to adaptability. Preventative measures are applied through the identification of high-risk individuals and culling from the
1 Appreciation is expressed to Colorado State University’s Dr. Mark Enns, Dr. Scott Speidel, Dr. Milton Thomas, and Xi Zeng for their assistance with this project. 2 Corresponding author: [email protected]
breeding program. An indicator trait, pulmonary arterial pressure (PAP), can be used to confirm the presence of pulmonary hypertension due to high altitude (Holt and Callan, 2007). Pulmonary arterial pressure is a moderately to highly heritable trait (0.22 to 0.46) and therefore can be used to make selection decisions by selecting for lower PAP (Enns et al., 1992; Shirley et al., 2008; Cockrum et al., 2014).
The objective of this research was to determine the relationship between PAP and birth weight, weaning weight, and post-weaning gain performance traits through a multivariate analysis. Our hypothesis is there is small to no genetic relationships between PAP and these traits. A better understanding of the relationship between PAP and performance traits would indicate what effect, if any, selection for PAP has had on performance of these animals.
MATERIALS AND METHODS
Animals and trait measures. Data used in this
study were queried from an existing database constructed from performance trait measures of the John E. Rouse Colorado State University Beef Improvement Center (CSU-BIC) Angus herd. The CSU-BIC is located near Saratoga, Wyoming at an elevation of approximately 2,340 m. In this study, PAP measures were collected by a state licensed veterinarian while animals were restrained in a squeeze chute with a halter controlling the animal’s head. A catheter was thread through the jugular vein and right side of the heart and into the pulmonary artery. Measurements of PAP were recorded in millimeters of mercury (mm Hg) (Holt and Callan, 2007).
The data included pedigree and performance records from 10,561 purebred Angus cattle. Performance and PAP records from 1993 to 2013 were used and are summarized in Table 1. The CSU-BIC has made breeding selection decisions based on PAP scores for 28 years in their replacement heifers and within-herd, herd bulls. Selection criteria included a PAP measure of 50 mm Hg or below to be suitable as herd bulls and replacement heifers. Outside AI sires, part of a PAP progeny test program, were not PAP tested, yet progeny were evaluated for PAP. Age of dam was calculated based on Beef Improvement Federation (BIF) guidelines (http://beefimprovement.org/library-2/bif-guidelines). The calculation for post-weaning gain (PWG) was:
𝑃𝑊𝐺 = 𝑌𝑊−𝑊𝑊𝐷𝑎𝑦𝑠 𝑏𝑒𝑡𝑤𝑒𝑒𝑛 𝑤𝑒𝑖𝑔ℎ𝑡𝑠
∗ 160. Ages at which PAP was measured averaged 345 d, ranging from 139 to 650 d with a standard deviation of 50 d.
126
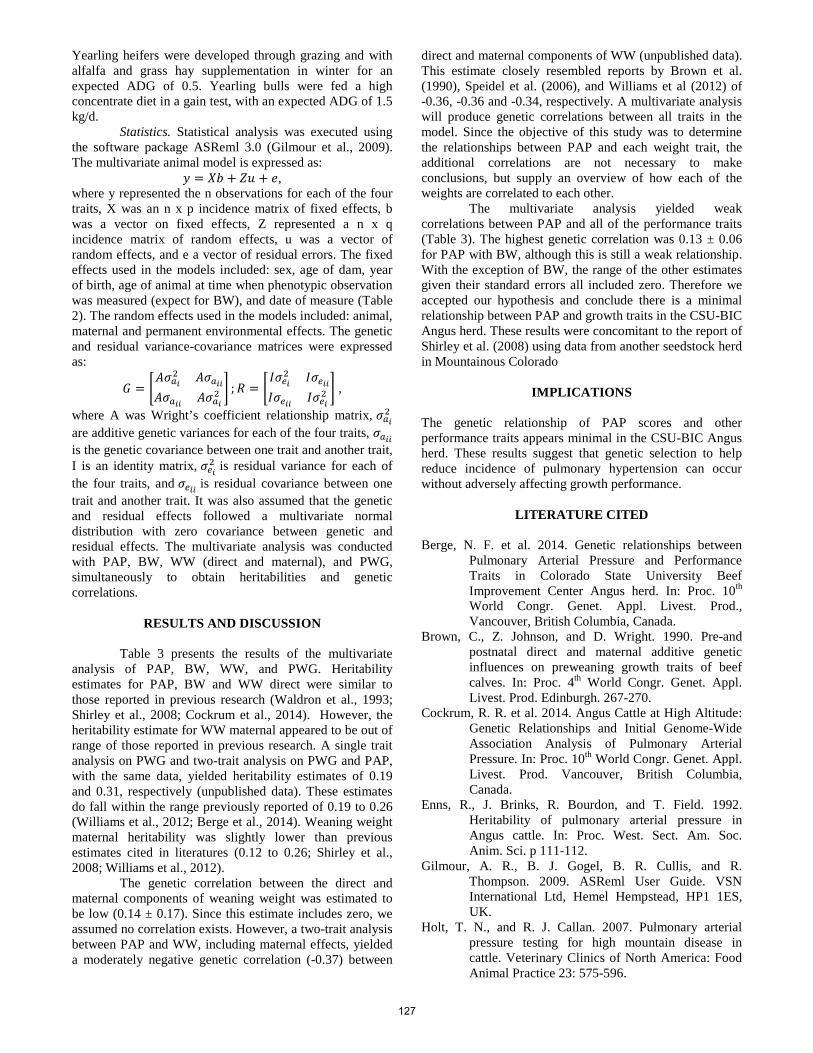
Yearling heifers were developed through grazing and with alfalfa and grass hay supplementation in winter for an expected ADG of 0.5. Yearling bulls were fed a high concentrate diet in a gain test, with an expected ADG of 1.5 kg/d.
Statistics. Statistical analysis was executed using the software package ASReml 3.0 (Gilmour et al., 2009). The multivariate animal model is expressed as:
𝑦 = 𝑋𝑏 + 𝑍𝑢 + 𝑒, where y represented the n observations for each of the four traits, X was an n x p incidence matrix of fixed effects, b was a vector on fixed effects, Z represented a n x q incidence matrix of random effects, u was a vector of random effects, and e a vector of residual errors. The fixed effects used in the models included: sex, age of dam, year of birth, age of animal at time when phenotypic observation was measured (expect for BW), and date of measure (Table 2). The random effects used in the models included: animal, maternal and permanent environmental effects. The genetic and residual variance-covariance matrices were expressed as:
𝐺 = �𝐴𝜎𝑎𝑖
2 𝐴𝜎𝑎𝑖𝑖𝐴𝜎𝑎𝑖𝑖 𝐴𝜎𝑎𝑖
2 � ;𝑅 = �𝐼𝜎𝑒𝑖
2 𝐼𝜎𝑒𝑖𝑖𝐼𝜎𝑒𝑖𝑖 𝐼𝜎𝑒𝑖
2 � ,
where A was Wright’s coefficient relationship matrix, 𝜎𝑎𝑖2
are additive genetic variances for each of the four traits, 𝜎𝑎𝑖𝑖 is the genetic covariance between one trait and another trait, I is an identity matrix, 𝜎𝑒𝑖
2 is residual variance for each of the four traits, and 𝜎𝑒𝑖𝑖 is residual covariance between one trait and another trait. It was also assumed that the genetic and residual effects followed a multivariate normal distribution with zero covariance between genetic and residual effects. The multivariate analysis was conducted with PAP, BW, WW (direct and maternal), and PWG, simultaneously to obtain heritabilities and genetic correlations.
RESULTS AND DISCUSSION
Table 3 presents the results of the multivariate
analysis of PAP, BW, WW, and PWG. Heritability estimates for PAP, BW and WW direct were similar to those reported in previous research (Waldron et al., 1993; Shirley et al., 2008; Cockrum et al., 2014). However, the heritability estimate for WW maternal appeared to be out of range of those reported in previous research. A single trait analysis on PWG and two-trait analysis on PWG and PAP, with the same data, yielded heritability estimates of 0.19 and 0.31, respectively (unpublished data). These estimates do fall within the range previously reported of 0.19 to 0.26 (Williams et al., 2012; Berge et al., 2014). Weaning weight maternal heritability was slightly lower than previous estimates cited in literatures (0.12 to 0.26; Shirley et al., 2008; Williams et al., 2012).
The genetic correlation between the direct and maternal components of weaning weight was estimated to be low (0.14 ± 0.17). Since this estimate includes zero, we assumed no correlation exists. However, a two-trait analysis between PAP and WW, including maternal effects, yielded a moderately negative genetic correlation (-0.37) between
direct and maternal components of WW (unpublished data). This estimate closely resembled reports by Brown et al. (1990), Speidel et al. (2006), and Williams et al (2012) of -0.36, -0.36 and -0.34, respectively. A multivariate analysis will produce genetic correlations between all traits in the model. Since the objective of this study was to determine the relationships between PAP and each weight trait, the additional correlations are not necessary to make conclusions, but supply an overview of how each of the weights are correlated to each other.
The multivariate analysis yielded weak correlations between PAP and all of the performance traits (Table 3). The highest genetic correlation was 0.13 ± 0.06 for PAP with BW, although this is still a weak relationship. With the exception of BW, the range of the other estimates given their standard errors all included zero. Therefore we accepted our hypothesis and conclude there is a minimal relationship between PAP and growth traits in the CSU-BIC Angus herd. These results were concomitant to the report of Shirley et al. (2008) using data from another seedstock herd in Mountainous Colorado
IMPLICATIONS
The genetic relationship of PAP scores and other performance traits appears minimal in the CSU-BIC Angus herd. These results suggest that genetic selection to help reduce incidence of pulmonary hypertension can occur without adversely affecting growth performance.
LITERATURE CITED Berge, N. F. et al. 2014. Genetic relationships between
Pulmonary Arterial Pressure and Performance Traits in Colorado State University Beef Improvement Center Angus herd. In: Proc. 10th World Congr. Genet. Appl. Livest. Prod., Vancouver, British Columbia, Canada.
Brown, C., Z. Johnson, and D. Wright. 1990. Pre-and postnatal direct and maternal additive genetic influences on preweaning growth traits of beef calves. In: Proc. 4th World Congr. Genet. Appl. Livest. Prod. Edinburgh. 267-270.
Cockrum, R. R. et al. 2014. Angus Cattle at High Altitude: Genetic Relationships and Initial Genome-Wide Association Analysis of Pulmonary Arterial Pressure. In: Proc. 10th World Congr. Genet. Appl. Livest. Prod. Vancouver, British Columbia, Canada.
Enns, R., J. Brinks, R. Bourdon, and T. Field. 1992. Heritability of pulmonary arterial pressure in Angus cattle. In: Proc. West. Sect. Am. Soc. Anim. Sci. p 111-112.
Gilmour, A. R., B. J. Gogel, B. R. Cullis, and R. Thompson. 2009. ASReml User Guide. VSN International Ltd, Hemel Hempstead, HP1 1ES, UK.
Holt, T. N., and R. J. Callan. 2007. Pulmonary arterial pressure testing for high mountain disease in cattle. Veterinary Clinics of North America: Food Animal Practice 23: 575-596.
127
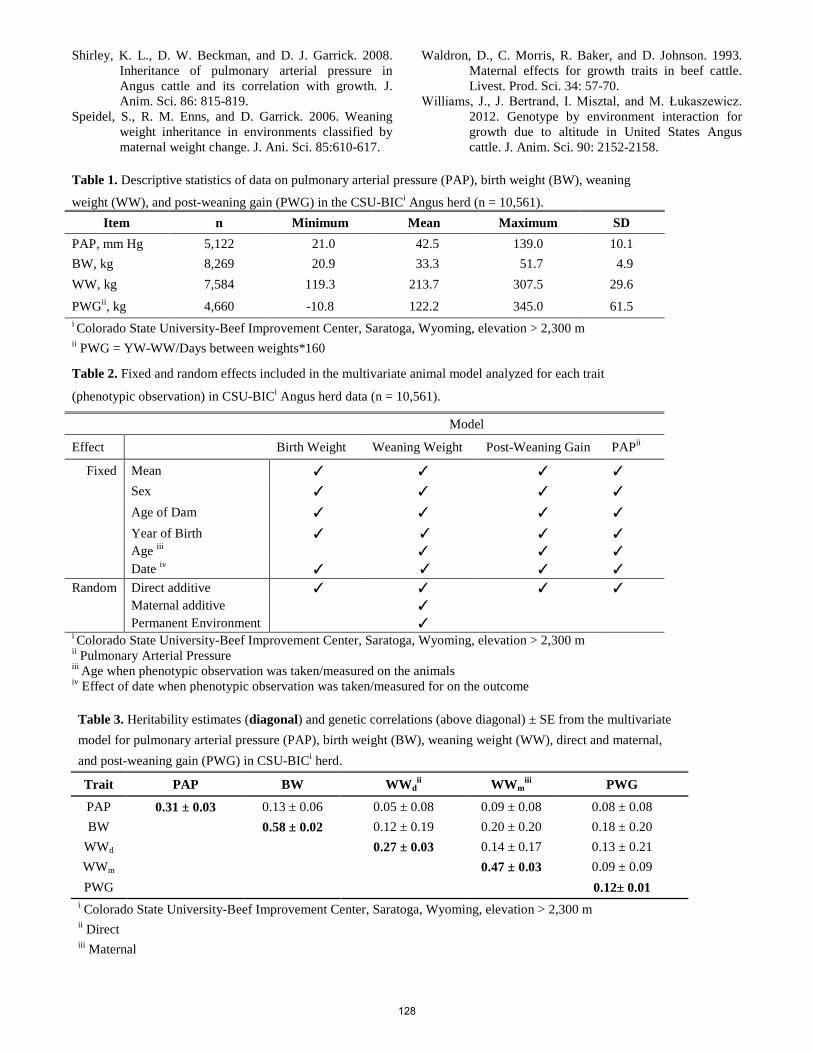
Shirley, K. L., D. W. Beckman, and D. J. Garrick. 2008. Inheritance of pulmonary arterial pressure in Angus cattle and its correlation with growth. J. Anim. Sci. 86: 815-819.
Speidel, S., R. M. Enns, and D. Garrick. 2006. Weaning weight inheritance in environments classified by maternal weight change. J. Ani. Sci. 85:610-617.
Waldron, D., C. Morris, R. Baker, and D. Johnson. 1993. Maternal effects for growth traits in beef cattle. Livest. Prod. Sci. 34: 57-70.
Williams, J., J. Bertrand, I. Misztal, and M. Łukaszewicz. 2012. Genotype by environment interaction for growth due to altitude in United States Angus cattle. J. Anim. Sci. 90: 2152-2158.
Table 1. Descriptive statistics of data on pulmonary arterial pressure (PAP), birth weight (BW), weaning
weight (WW), and post-weaning gain (PWG) in the CSU-BICi Angus herd (n = 10,561). Item n Minimum Mean Maximum SD
PAP, mm Hg 5,122 21.0 42.5 139.0 10.1 BW, kg 8,269 20.9 33.3 51.7 4.9 WW, kg 7,584 119.3 213.7 307.5 29.6
PWGii, kg 4,660 -10.8 122.2 345.0 61.5 i Colorado State University-Beef Improvement Center, Saratoga, Wyoming, elevation > 2,300 m ii PWG = YW-WW/Days between weights*160
Table 2. Fixed and random effects included in the multivariate animal model analyzed for each trait
(phenotypic observation) in CSU-BICi Angus herd data (n = 10,561).
Model
Effect Birth Weight Weaning Weight Post-Weaning Gain PAPii
Fixed Mean ✓ ✓ ✓ ✓ Sex ✓ ✓ ✓ ✓ Age of Dam ✓ ✓ ✓ ✓ Year of Birth ✓ ✓ ✓ ✓ Age iii ✓ ✓ ✓ Date iv ✓ ✓ ✓ ✓ Random Direct additive ✓ ✓ ✓ ✓ Maternal additive ✓ Permanent Environment ✓ i Colorado State University-Beef Improvement Center, Saratoga, Wyoming, elevation > 2,300 m
ii Pulmonary Arterial Pressure iii Age when phenotypic observation was taken/measured on the animals iv Effect of date when phenotypic observation was taken/measured for on the outcome Table 3. Heritability estimates (diagonal) and genetic correlations (above diagonal) ± SE from the multivariate model for pulmonary arterial pressure (PAP), birth weight (BW), weaning weight (WW), direct and maternal, and post-weaning gain (PWG) in CSU-BICi herd.
Trait PAP BW WWdii WWm
iii PWG
PAP 0.31 ± 0.03 0.13 ± 0.06 0.05 ± 0.08 0.09 ± 0.08 0.08 ± 0.08 BW 0.58 ± 0.02 0.12 ± 0.19 0.20 ± 0.20 0.18 ± 0.20
WWd 0.27 ± 0.03 0.14 ± 0.17 0.13 ± 0.21 WWm 0.47 ± 0.03 0.09 ± 0.09 PWG 0.12± 0.01
i Colorado State University-Beef Improvement Center, Saratoga, Wyoming, elevation > 2,300 m ii Direct
iii Maternal
128

Proceedings, Western Section, American Society of Animal Science
Vol. 66, 2015
Performance losses due to selection for low birth weight versus high calving ease: A simulation study in beef cattle1
H. M. Saad,*† R. M. Enns,* M. G. Thomas,* and S. E. Speidel*2
*Department of Animal Sciences, Colorado State University, Fort Collins, CO 80523; †Department of Animal Production, Omar Al-Mukhtar University, Al Bayda, Libya
ABSTRACT: Despite being an indicator trait, downward selection on birth weight is widely used as a tool to improve calving ease. However, the positive genetic correlation between birth weight and subsequent growth traits could lead to loss in performance at marketing age. The objective of this study is to assess performance losses under two scenarios in which selection for high calving ease (HCE) and selection for low birth weight (LBW) will be applied. Under these two selection scenarios, two populations with observations on calving ease (CE), birth weight (BWT), weaning weight (WWT), and postweaning gain (PWG) were simulated. Each population consisted of a base generation of 1,200 sires and 36,000 dams. First generation was produced by random mating of founders (1,200 sires and 36,000 dams). Each of the three subsequent generations were produced by selecting the top 5% and 80% sires and dams, respectively, from previous generations. Simulation was carried out using a multivariate threshold-linear model with Gibbs sampling algorithm. Fixed effects were herd (n = 120) and sex. Results showed that the rate of genetic change of CE (% unassisted calving/yr) from HCE selection scenario (1.56 ± 0.05) was significantly (P < 0.001) higher than that from LBW (1.20 ± 0.07). For yearling weight, the difference between the two scenarios was more pronounced (P < 0.001) where less losses in YWT average EPD were found in HCE selection scenario (-2.04 ± 0.10 kg/yr) versus (-3.81 ± 0.11 kg/yr) for LBW. Slope difference between both scenarios was significant (P < 0.001) for all traits. For HCE compared to LBW, the annual gained difference in CE, WWT, and YWT were 0.37%, 1.65 kg, and 1.77 kg, respectively. In conclusion, both selection scenarios increased calving ease average EPD and decreased growth traits average EPD. However, selection for high calving ease produced animals with better calving ease EPD and have higher growth rates at later ages compared to those produced by selection for low birth weight. Key words: birth weight, calving ease, genetic trend, Gibbs sampling, threshold-linear model. _______________ 1The authors acknowledge Dr. Larry Schaeffer, Department of Animal and Poultry Science, University of Guelph, Ontario, Canada, for his assistance with this study. 2Corresponding author: [email protected]
INTRODUCTION
The economic importance of calving difficulty in cattle
is well documented in literature (Wiltbank et al., 1961; Laster et al., 1973; Meijering, 1984; Dematawewa and Berger, 1997). Cost associated with extreme dystocia, i.e.,
animals with score of 3, 4, and 5, was estimated to be $96.48, $159.82, and $379.61, respectively, (Dematawewa and Berger, 1997). Amongst genetic and environmental factors that affect the incidence of calving difficulty, birth weight is considered most important (Bellows, 1993). Incidence of dystocia increases by 2.3-13% when birth weight increases by 1 kg (Laster et al., 1973; Johanson and Berger, 2003). Therefore, historically genetic improvement of calving ease relied heavily on selection of animals with low birth weight. Such a strategy could potentially reduce beef cattle efficiency in two different ways. First, given the fact that the genetic correlation between calving ease and birth weight is not one, selection for low birth weight does not necessarily improve the ease of calving. Second, selection for low birth weight can reduce growth at later ages given the unfavorable genetic relationship with those traits. Several researchers found that selection for low birth weight did not improve calving ease and they suggested that direct selection for calving ease would be more effective (Burfening et al., 1978; MacNeil et al., 1998). Compared to selection for lower birth weight, we hypothesize that direct selection for high calving ease would results in animals with lower incidence of calving difficulty and higher growth rate at later ages. The objective of this study was to investigate potential performance losses in two simulated populations; one selected for high calving ease and the other selected for low birth weight.
MATERIALS AND METHODS
Simulated data sets Two data sets were simulated using weighted means,
from 18 reviewed publications, of genetic and residual (co)variances and phenotypic averages for calving ease (CE), birth weight (BWT), weaning weight (WWT), and postweaning gain (PWG). The base population consisted of 1,200 sires randomly mated to 36,000 dams (30 dams/sire) to produce 36,000 F1 progeny. Animals were distributed within 120 herds of 300 cows/herd. To create two selected populations, cattle were selected for three generations under two selection scenarios which were 1) selection for high calving ease (HCE) 2) selection for low birth weight (LBW). For each selection scenario, the selection criteria was the true breeding values (TBV) for either calving ease on the underlying scale or birth weight where the top 5% (TBV ≤ male average TBV - 1.65SD) males across the generations were selected and randomly mated to the top 80% (TBV ≤ female average TBV + 0.85SD) females from previous generation, (i.e., 2 year old females). Summary
129
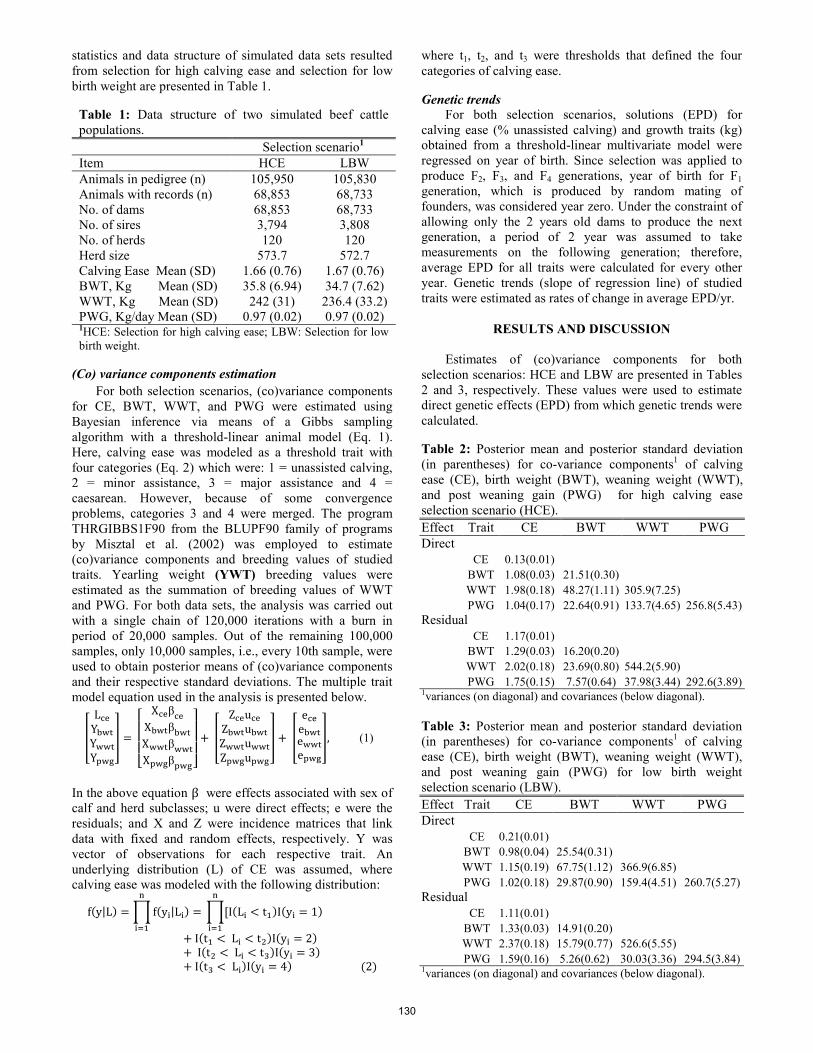
statistics and data structure of simulated data sets resulted from selection for high calving ease and selection for low birth weight are presented in Table 1.
Table 1: Data structure of two simulated beef cattle populations. Selection scenario1
Item HCE LBW Animals in pedigree (n) 105,950 105,830 Animals with records (n) 68,853 68,733 No. of dams 68,853 68,733 No. of sires 3,794 3,808 No. of herds 120 120 Herd size 573.7 572.7 Calving Ease Mean (SD) 1.66 (0.76) 1.67 (0.76) BWT, Kg Mean (SD) 35.8 (6.94) 34.7 (7.62) WWT, Kg Mean (SD) 242 (31) 236.4 (33.2) PWG, Kg/day Mean (SD) 0.97 (0.02) 0.97 (0.02) 1HCE: Selection for high calving ease; LBW: Selection for low birth weight.
(Co) variance components estimation For both selection scenarios, (co)variance components
for CE, BWT, WWT, and PWG were estimated using Bayesian inference via means of a Gibbs sampling algorithm with a threshold-linear animal model (Eq. 1). Here, calving ease was modeled as a threshold trait with four categories (Eq. 2) which were: 1 = unassisted calving, 2 = minor assistance, 3 = major assistance and 4 = caesarean. However, because of some convergence problems, categories 3 and 4 were merged. The program THRGIBBS1F90 from the BLUPF90 family of programs by Misztal et al. (2002) was employed to estimate (co)variance components and breeding values of studied traits. Yearling weight (YWT) breeding values were estimated as the summation of breeding values of WWT and PWG. For both data sets, the analysis was carried out with a single chain of 120,000 iterations with a burn in period of 20,000 samples. Out of the remaining 100,000 samples, only 10,000 samples, i.e., every 10th sample, were used to obtain posterior means of (co)variance components and their respective standard deviations. The multiple trait model equation used in the analysis is presented below.
�
LceYbwtYwwtYpwg
� =
⎣⎢⎢⎢⎡
XceβceXbwtβbwtXwwtβwwtXpwgβpwg⎦
⎥⎥⎥⎤
+ �
ZceuceZbwtubwtZwwtuwwtZpwgupwg
� + �
eceebwtewwtepwg
�, (1)
In the above equation β were effects associated with sex of calf and herd subclasses; u were direct effects; e were the residuals; and X and Z were incidence matrices that link data with fixed and random effects, respectively. Y was vector of observations for each respective trait. An underlying distribution (L) of CE was assumed, where calving ease was modeled with the following distribution:
f(y|L) = � f(yi|Li) =n
i=1
�[I(Li < t1)I(yi = 1)n
i=1+ I(t1 < Li < t2)I(yi = 2)+ I(t2 < Li < t3)I(yi = 3)+ I(t3 < Li)I(yi = 4) (2)
where t1, t2, and t3 were thresholds that defined the four categories of calving ease.
Genetic trends For both selection scenarios, solutions (EPD) for
calving ease (% unassisted calving) and growth traits (kg) obtained from a threshold-linear multivariate model were regressed on year of birth. Since selection was applied to produce F2, F3, and F4 generations, year of birth for F1 generation, which is produced by random mating of founders, was considered year zero. Under the constraint of allowing only the 2 years old dams to produce the next generation, a period of 2 year was assumed to take measurements on the following generation; therefore, average EPD for all traits were calculated for every other year. Genetic trends (slope of regression line) of studied traits were estimated as rates of change in average EPD/yr.
RESULTS AND DISCUSSION
Estimates of (co)variance components for both
selection scenarios: HCE and LBW are presented in Tables 2 and 3, respectively. These values were used to estimate direct genetic effects (EPD) from which genetic trends were calculated.
Table 2: Posterior mean and posterior standard deviation (in parentheses) for co-variance components1 of calving ease (CE), birth weight (BWT), weaning weight (WWT), and post weaning gain (PWG) for high calving ease selection scenario (HCE). Effect Trait CE BWT WWT PWG Direct
CE 0.13(0.01) BWT 1.08(0.03) 21.51(0.30) WWT 1.98(0.18) 48.27(1.11) 305.9(7.25) PWG 1.04(0.17) 22.64(0.91) 133.7(4.65) 256.8(5.43)
Residual CE 1.17(0.01) BWT 1.29(0.03) 16.20(0.20) WWT 2.02(0.18) 23.69(0.80) 544.2(5.90) PWG 1.75(0.15) 7.57(0.64) 37.98(3.44) 292.6(3.89)
1variances (on diagonal) and covariances (below diagonal). Table 3: Posterior mean and posterior standard deviation (in parentheses) for co-variance components1 of calving ease (CE), birth weight (BWT), weaning weight (WWT), and post weaning gain (PWG) for low birth weight selection scenario (LBW). Effect Trait CE BWT WWT PWG Direct
CE 0.21(0.01) BWT 0.98(0.04) 25.54(0.31) WWT 1.15(0.19) 67.75(1.12) 366.9(6.85) PWG 1.02(0.18) 29.87(0.90) 159.4(4.51) 260.7(5.27)
Residual CE 1.11(0.01) BWT 1.33(0.03) 14.91(0.20) WWT 2.37(0.18) 15.79(0.77) 526.6(5.55) PWG 1.59(0.16) 5.26(0.62) 30.03(3.36) 294.5(3.84)
1variances (on diagonal) and covariances (below diagonal).
130

Average EPD for calving ease and growth traits corresponding to four generations of selection are depicted in Fig. 1. Both selection scenarios showed increases in calving ease average EPD. However, Table 4 shows that rate of genetic change of calving ease (% unassisted calving/yr) from HCE selection scenario (1.56 ± 0.05) was significantly (P < 0.001) higher than that from LBW selection scenario (1.20 ± 0.07). Average EPD for birth weight from both selection scenarios showed decreases (Figure 1). Nevertheless, the decrease from LBW selection scenario was (P < 0.001) more severe (-1.17 ± 0.03 kg/yr) compared to (-0.86 ± 0.02 kg/yr). These results were in agreement with Bennett (2008) who reported that selection for higher calving ease has reduced birth weight and the incidence of calving difficulty and did not affect growth at later ages. For weaning weight, average EPD showed a decrease in both selection populations; however, the rate of genetic change of WWT EPD in the LBW selection scenario showed (P < 0.001) a steeper decline, -3.55 ± 0.10 kg/yr, compared to the -1.90 ± 0.09 kg/yr for HCE selection scenario. Similarly, postweaning gain average EPD from the LBW selection scenario had (P < 0.001) a faster rate of decrease at -0.25 ± 0.01 kg/yr compared to a -0.13 ± 0.01 kg/yr for PWG from HCE selection scenario. Even though both selection scenarios showed decreasing rates for yearling weight average EPD, the difference between the two scenarios was more pronounced (P < 0.001) where smaller losses in yearling weight average EPD were found in HCE selection scenario (-2.04 ± 0.10 kg/yr) versus LBW selection scenario (-3.81 ± 0.11 kg/yr).
Compared to selection for low birth weight, selection for high calving ease has significantly (P < 0.001) increased the annual genetic gain for all studied economically relevant traits. These increases in the rate genetic change, (i.e., slope differences between HCE and LBW), were 0.37%, 1.65 kg, and 1.77 kg for CE, WWT, and YWT, respectively, which correspond to 30.83, 46.47, and 46.45% annual increase for these traits. Therefore, selection for the economically relevant trait (CE) instead of its indicator trait (BWT) has reduced losses by producing animals with a lower incidence of dystocia and heavier weights at marketing age. On the other hand, in both selection scenarios, all growth-related traits showed negative genetic trends. These negative trends were a result of the single trait selection procedure applied here. Such a procedure is not practically used as means for genetic improvement; alternately, multiple trait selection programs are the preferred method to achieve selection goals. Nonetheless, the use of single trait selection in the current study is justified by the need to exclusively quantify response to selection attributed to selection for high calving ease as appose to low birth weight without selection for other traits which would cause misinterpretation of obtained results.
In conclusion, it appears that selection for high calving ease (HCE) produced animals with improved calving ease EPD and higher growth rates at later ages compared to selection for low birth weight (LBW). However, both selection scenarios resulted in negative genetic trends for growth-related traits. These results were expected because of applying single trait selection schemes. Incorporating
economically relevant traits, (e.g., weaning and yearling weights), with calving ease in a multitrait selection program would produce cattle with low incidence of dystocia and higher growth rates.
LITERATURE CITED
Bellows, R. A. 1993. Factors affecting calving difficulty. In: Range Beef Cow Symposium. p 224.
Bennett, G. L. 2008. Experimental selection for calving ease and postnatal growth in seven cattle populations. I. Changes in estimated breeding values. J. Anim. Sci. 86: 2093-2102.
Burfening, P. J., D. D. Kress, R. L. Friedrich, and D. D. Vaniman. 1978. Phenotypic and genetic relationships between calving ease, gestation length, birth weight and preweaning growth. J. Anim. Sci. 47: 595-600.
Dematawewa, C. M. B., and P. J. Berger. 1997. Effect of dystocia on yield, fertility, and cow losses and an economic evaluation of dystocia scores for Holsteins. J. Dairy Sci. 80: 754-761.
Johanson, J. M., and P. J. Berger. 2003. Birth weight as a predictor of calving ease and perinatal mortality in Holstein cattle. J. Dairy Sci. 86: 3745-3755.
Laster, D. B., H. A. Glimp, L. V. Cundiff, and K. E. Gregory. 1973. Factors affecting dystocia and effects of dystocia on subsequent reproduction in beef cattle. J. Anim. Sci. 36: 695-705.
MacNeil, M. D., J. J. Urick, and W. M. Snelling. 1998. Comparison of selection by independent culling levels for below-average birth weight and high yearling weight with mass selection for high yearling weight in line 1 Hereford cattle. J. Anim. Sci. 76: 458-467.
Meijering, A. 1984. Dystocia and stillbirth in cattle -A review of causes, relations and implications. Livest. Prod. Sci. 11: 143-177.
Misztal, I. et al. 2002. BLUPF90 and related programs (BGF90). In: Proceedings of the 7th World Congress on Genetics Applied to Livestock Production, Montpellier, France. p 1-2.
Wiltbank, J. N., B. M. Priode, E. H. Vernon, and E. J. Warwick. 1961. Factors affecting net calf crop in beef cattle. J. Anim. Sci. 20: 409-415.
131
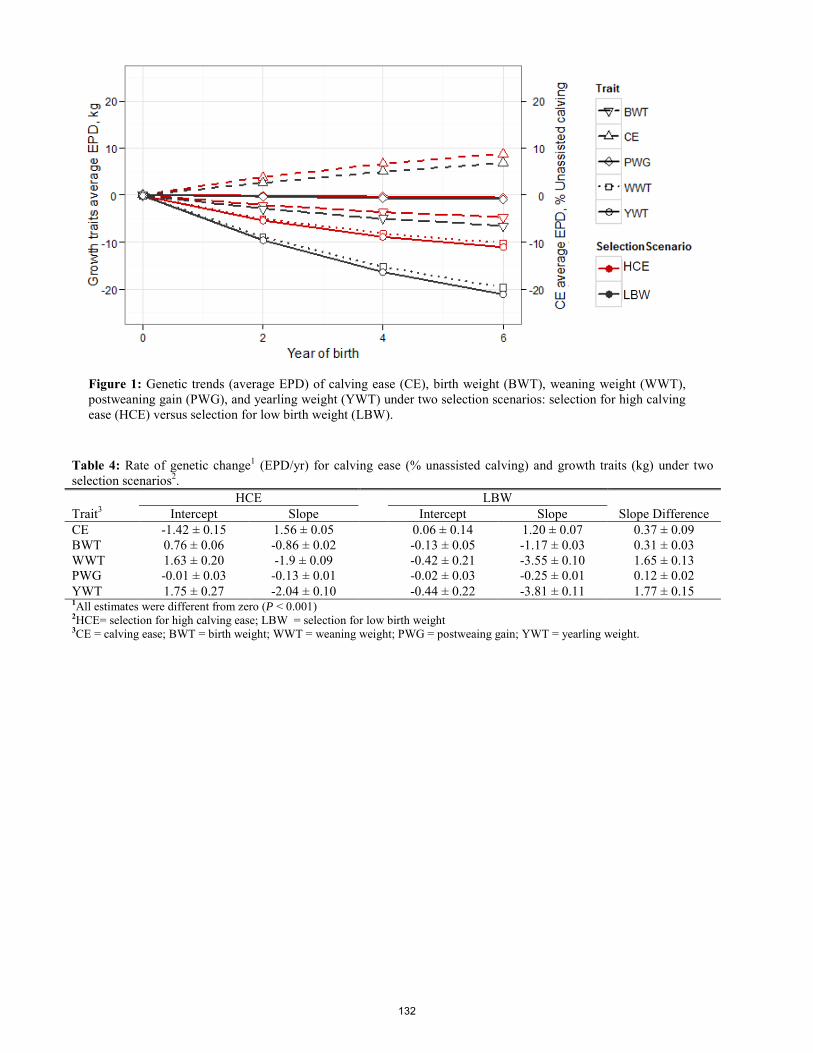
Table 4: Rate of genetic change1 (EPD/yr) for calving ease (% unassisted calving) and growth traits (kg) under two selection scenarios2. HCE LBW
Slope Difference Trait3 Intercept Slope Intercept Slope CE -1.42 ± 0.15 1.56 ± 0.05 0.06 ± 0.14 1.20 ± 0.07 0.37 ± 0.09 BWT 0.76 ± 0.06 -0.86 ± 0.02 -0.13 ± 0.05 -1.17 ± 0.03 0.31 ± 0.03 WWT 1.63 ± 0.20 -1.9 ± 0.09 -0.42 ± 0.21 -3.55 ± 0.10 1.65 ± 0.13 PWG -0.01 ± 0.03 -0.13 ± 0.01 -0.02 ± 0.03 -0.25 ± 0.01 0.12 ± 0.02 YWT 1.75 ± 0.27 -2.04 ± 0.10 -0.44 ± 0.22 -3.81 ± 0.11 1.77 ± 0.15 1All estimates were different from zero (P < 0.001) 2HCE= selection for high calving ease; LBW = selection for low birth weight 3CE = calving ease; BWT = birth weight; WWT = weaning weight; PWG = postweaing gain; YWT = yearling weight.
Figure 1: Genetic trends (average EPD) of calving ease (CE), birth weight (BWT), weaning weight (WWT), postweaning gain (PWG), and yearling weight (YWT) under two selection scenarios: selection for high calving ease (HCE) versus selection for low birth weight (LBW).
132

Proceedings, Western Section, American Society of Animal Science
Vol. 66, 2015
The effect of residual feed intake status on rumen microbial profiles in ewe lambs.
M. J. Ellison*, G. Conant†, W. R. Lamberson‡, T. M. Taxis‡, H. C. Cunningham*, K. J. Austin*, and K. M. Cammack*
*Department of Animal Science, University of Wyoming, Laramie, WY †Department of Animal Sciences, University of Missouri, Columbia, MO
‡Department of Animal Sciences, Colorado State University, Fort Collins, CO ABSTRACT: The rumen microbiome is known to play a paramount role in fermentation of consumed feedstuffs in ruminant livestock, and therefore may influence the efficiency of feed utilization. The objective of this study was to determine the effect of feed efficiency status on rumen microbial profiles in growing ewe lambs. Growing Targhee ewe lambs (initial BW = 55.7 ± 1.2 kg; n = 78) were fed a forage-based pelleted diet. Individual feed intake was measured with a GrowSafe System for 70 d and initial, mid, and final BW were recorded to allow for estimation of residual feed intake (RFI), a measure of feed efficiency. Rumen fluid samples were collected at the end of the feeding trial, and DNA was extracted for sequencing from the rumen fluid of the eight most (low RFI) and eight least efficient (high RFI) ewes. Paired-end reads were filtered, quality trimmed and compared with a database of known 16S rDNA genes. Operational taxonomic units (OTU) were defined as sequence clusters with ≥ 97% identity. There were 306 OTUs present in at least one animal. These OTUs were further evaluated for the effect of RFI status using the GENMOD procedure of SAS. Of the 19 OTUs observed to differ with RFI status, 10 were of greater (P ≤ 0.047) abundance in high RFI ewes. As expected, Prevotella ruminicola was the most abundant OTU overall and was of greater (P = 0.037) abundance in low RFI ewes. Of particular note, Methanobrevibacter smithii was in greater abundance (P < 0.001) in the low RFI ewes, which was unexpected based on its methanogenic activity. These data suggest that certain species in the rumen microbiome may contribute to variation in host feed efficiency. Key words: Microbiome, microbial sequencing, RFI, rumen
Introduction The rumen microbiome is a complex assembly of microbiota that ferment a variety of feedstuffs consumed by the ruminant animal into metabolites that can be absorbed by the host (Van Soest, 1994). The ecology of the rumen microbial system influences the maintenance, growth and performance of the host. In turn, the host provides an environment that is both anaerobic and substrate-rich in which microbes thrive. This mutualistic relationship benefits both host and microbiota. The understanding of these ruminal bacterial communities and especially how they influence host feed efficiency is in early stages.
Because feed costs for livestock are a substantial portion of production costs, feed efficiency is an important trait to reduce inputs. Residual feed intake (RFI) is a measure of feed efficiency defined as the difference between actual and predicted feed intake (Koch et al., 1963). Because RFI is moderately heritable and independent of growth and mature body size, it has become a favored measure of feed efficiency for livestock (Carberry et al., 2012). Furthermore, improved feed efficiency may be linked to lower methane production (Hegarty et al., 2007; Carberry et al., 2012). Domesticated livestock contribute 13-19% of global methane emissions, and ruminants can lose 5.5-9.0% of ingested energy through methane-production by way of eructated gases from the rumen during fermentation (Nicholson et al., 2007; Zhou et al., 2011). Determining variations in ruminal microbial species associated with divergence in feed efficiency may lead to easier, more economical methods for identifying feed efficient individuals as opposed to feed intake tests that can be expensive and time-consuming. The objective of this study was to determine the effect of feed efficiency status on rumen microbial profiles in growing ewe lambs divergent for RFI. We hypothesized that differences in feed efficiency status would be associated with differences in rumen microbial profiles.
Materials and Methods Animals and Diet. All animal procedures were approved by the University of Wyoming Animal Care and Use Committee. Growing Targhee ewe lambs (n = 78; initial BW = 55.7 ± 1.2 kg) were fed a forage-based pelleted diet (Table 1). Individual feed intake was measured using the GrowSafe System (Airdrie, Alberta, Canada) for a 70 d trial period. Two-day average initial and final BW were obtained to calculate ADG, and a mid BW to calculate metabolic mid-weight (MMWT). From these data, RFI was calculated as the deviation of true feed intake from expected feed intake. Expected feed intake was determined by regressing actual feed intake on ADG and MMWT (Cammack et al., 2005). Residual feed intake estimates were used to rank ewes on efficiency. Rumen fluid samples were collected from the eight most (low RFI; L-RFI) and eight least (high RFI; H-RFI) efficient ewes via oral lavage, allocated in triplicate into 2 mL tubes, snap-frozen , and stored at -80º C until processing.
133
DNA Extraction from Rumen Fluid. DNA was extracted from the collected rumen fluid. Zirconia (0.3 g of 0.1 mm) and silicon (0.1 g of 0.5 mm) beads and 1 mL lysis buffer were added to thawed rumen fluid samples. Samples (250 mg) were homogenized using a Mini-Beadbeater-8 at maximum speed for 3 min, incubated at 70° C for 15 min with gentle mixing every 5 min, and centrifuged at 4° C for 5 min. Supernatant was transferred to new 2 mL flat cap tubes and fresh lysis buffer (300 µL) was added to the pelleted beads. The homogenization, incubation and centrifugation steps were repeated on the remaining supernatant, and supernatants were pooled. Final purification for removal of RNA and proteins was completed using the protocol of the QIAamp DNA Stool Mini Kit (Qiagen, Santa Clarita, CA). Samples of DNA were then quantified on the NanoDrop spectrophotometer (NanoDrop, Wilmington, DE) and determined to have acceptable quality using the manufacturer prescribed standard of the A260/280 ratio ≥ 1.8. Microbial Sequencing. As previously described by Ellison et al. (2014), extracted DNA (10 µg) was sent to the University of Missouri (Columbia) DNA Core Facility for sequencing using 16 libraries on an Illumina HighSeq platform, with 4 libraries per lane. The resulting 100 base-pair, paired-end reads were filtered by truncating each read after the first run of three bases using a Phred quality score < 15, quality-trimmed by omitting reads with < 85 base pairs or a quality score of < 25, and compared with a database of 27K known 16S rDNA genes using the Bowtie reference-based assembly tool (Johns Hopkins, Baltimore, MD). Operational taxonomic units (OTUs) were defined as clusters of database sequences from which members shared pairwise sequence identity of ≥97% (see Ellison et al. 2014 for details). A read pair was considered to be an example of one of these OTUs if both reads matched to sequences from that OTU and only that OTU with ≥97% identity. For the purposes of this study, OTUs were considered to be generally equivalent to microbial species. Statistical Analysis. The MIXED procedure of SAS (SAS Inst. Inc., Cary, NC) was used to determine the effects of feed efficiency status on BW characteristics, ADFI, ADG, and G:F for RFI-selected ewes (n = 16). Least-squares means of abundance were obtained by fitting OTU abundance to a model including a fixed effect of RFI status and total number of OTU reads per lamb as a covariate in PROC MIXED of SAS. Because residuals from the MIXED procedure were not normally distributed, significance tests were obtained by fitting a similar model in a Generalized Linear Model analysis using the GENMOD procedure of SAS assuming a Poisson distribution. Raw P-values were corrected for multiple tests by using the false-discovery rate correction of Benjamini and Hochberg (1995).
Results and Discussion There were 306 OTUs present in at least one animal and 19 of those OTUs differed according to RFI status (Table 2). The H-RFI ewes had a greater (P = 0.037) abundance of Prevotella ruminicola, which was the most abundant OTU across all ewes regardless of RFI status. Prevotella ruminicola encompasses one of the most numerous groups
of rumen bacteria. These bacteria utilize a wide variety of carbohydrates and are therefore highly represented in ruminants fed a variety of different diets (Chapman and Hall, 1997). Prevotella ruminicola is a carbohydrate fermenter that can break down and utilize cellulose, hemicellulose, pectin, starches, sugars (simple and complex) and proteins (Van Soest, 1994). While this explains the high overall abundance of P. ruminicola in the rumen, it does not explain why it was of greater abundance in H-RFI ewes. Prevotella bryantii and Prevotella marshii were also of greater (P ≤ 0.018) abundance in H-RFI ewes compared with L-RFI; however, Prevotella oris, Prevotella pleuritidis and one unknown Prevotella species were more (P ≤ 0.044) abundant in L-RFI ewes. Prevotella species in general are predominant bacteria in the rumen and are very diverse because they can degrade starch, fiber, and protein (Carberry et al., 2012), which may help explain their diversity according to RFI status. Nonetheless, understanding the specific role that each Prevotella species plays in the rumen, as well as how each affects feed efficiency, has not been well documented to-date. Ruminococcus species and Clostridium species are fiber degrading bacteria and because the ewes in the current study were fed a forage-based diet, their presence was expected (Dehority, 2003; Carberry et al., 2012). Ruminococcus albus and Ruminococcus bromii were of greater (P ≤ 0.036) abundance in H-RFI ewes, while Ruminococcus callidus and Clostridium leptum were more (P ≤ 0.047) in L-RFI animals. Bacterial breakdown of fiber (cellulose) leads to the production of VFAs (especially Acetic Acid), CO2 and H2. Additionally, ruminant animals on forage-based diets tend to have greater methane production compared with ruminants on concentrate-based diets (Van Soest, 1994). Furthermore, methane is produced from CO2 and H2 by methanogenic bacteria (Thauer et al., 1993) and ruminants can lose 5.5-9.0% of their ingested energy through methane-production by way of eructated gases from the rumen during fermentation (Nicholson et al., 2007; Zhou et al., 2011). In the current study, Methanobrevibacter smithii was the only methane-producing species that differed by RFI status and was in greater (P < 0.001) abundance in L-RFI ewes. It stands to reason that a greater abundance of cellulolytic bacteria would result in greater availability of substrates for methanogenic bacteria; however, it is unclear why more efficient animals had a greater abundance of methane-producing bacteria. This is in agreement with results we previously reported in a separate group of lambs divergent for RFI (Ellison et al., 2013). Selenomonas ruminantium was of greater (P = 0.025) abundance in H-RFI ewes. Selenomonas species are starch degrading and lactate-utilizing bacteria that are able to tolerate low pH and effectively reduce acid accumulation in the rumen, especially on diets high in starch (Tajima et al., 2000; Fernando et al., 2010). While the difference in abundance according to RFI status may be ambiguous, some Selenomonas species have been reported to be able to produce hydrogen, which is used by other species in the rumen for growth and fermentation of substrate (Latham and Wolin, 1977).
134
Dialister succinatiphilus has been reported to digest glucose into succinate and acetate, while Schwartzia succinivorans is a known succinate-utilizing species (Van Gylswyk et al., 1997; Morotomi et al., 2008). Both D. succinatiphilus and S. succinivorans were of greater (P ≤ 0.015) abundance in H-RFI; however, it is difficult to speculate the role these bacteria play in RFI status, and especially to conjecture about their role in ruminants with decreased feed efficiency while there seems to be a clear symbiosis between the two species. Also, both an unknown Neisseria species and an unknown Alysiella species were of greater (P ≤ 0.047) abundance in H-RFI ewes, both of which are oral or mucosal bacterial typically observed in mammals (Dworkin et al., 2006). Oscillibacter valericigenes abundance was greater (P = 0.026) in L-RFI ewes, however, little information is available on its function or metabolic abilities.. Moreover, the proteolytic Butyrivibrio fibrisolvens was of greater (P = 0.018) abundance in L-RFI ewes, which may speak to the enhanced ability of these lambs to digest dietary protein and play a role in improving feed efficiency in their hosts (Cotta and Hespell, 1986). Finally, Treponema maltophilum was of greater (P = 0.040) abundance in L-RFI ewes compared with H-RFI ewes. Treponema species are typically found in the mouth and intestines of mammals and some species are pathogenic, but T. maltophilum is not well understood within the rumen (Willey et al., 2008).
Implications
These data suggest that key rumen microbial species may play an important role in the regulation of feed efficiency. Furthermore, prediction of feed efficiency status without the need to measure individual feed intake is a necessary step in realizing the potential of this economically important trait as a tool for genetic selection. Use of rumen microbial populations as a means of assessing feed efficiency may ultimately provide producers with an easier (i.e. one-time rumen sampling) and more affordable means of identifying feed efficient breeding stock, especially as technologies, such as DNA sequencing, continue to become less expensive. Further research is necessary to validate which species play a role in feed efficiency, and whether they are consistent across diet types, and can be influenced to both improve feed efficiency and reduce methane production.
Acknowledgements The authors would like to acknowledge the support of the University of Wyoming Agriculture Experiment Station.
Literature Cited Benjamini, Y., and Y. Hochberg. 1995. Controlling the
false discovery rate: A practical and powerful approach to multiple testing. J. Royal Statistical Society, Series B (Methodological) 57:289-300.
Cammack, K. M., K. A. Leymaster, T. G. Jenkins, and M. K. Nielsen. 2005. Estimates of genetic parameters for
feed intake, feeding behavior, and daily gain in composite ram lambs. J. Anim. Sci. 83:777-785.
Chapman and Hall. 1997. The rumen microbial ecosystem: second edition. Blackie Academic and Professional. New York City, New York. pp 14-15.
Carberry, C. A., D. A. Kenny, S. Han, M. S. McCabe, and S. M. Waters. 2012. Effect of phenotypic residual feed intake and dietary forage content on the rumen microbial community of beef cattle. Appl. Environ. Microbiol. 78(14):4949-4958.
Cotta, M. A. and R. B. Hespell. 1986. Proteolytic activity of the ruminal bacterium Butyrivibrio fibrisolvens. Appl. Environ. Microbiol. 52(1): 51-58.
Dehority, B. A. 2003. Rumen Microbiology. Nottingham University Press. Thrumpton, Nottingham.
Dworkin, M., S. Falkow, E. Rosenberg, K. H. Schleifer, and E. Stackebrandt. 2006. The prokaryotes, third edition, volume 5. Springer. New York City, New York. pp. 830-834.
Ellison, M. J., G. Conant, W. R. Lamberson, K. J. Austin, R. R. Cockrum and K. M. Cammack. 2013. The effect of diet and feed efficiency status on rumen microbial profiles in sheep. Proceedings of the Western Section American Society of Animal Science. 64: 71-73.
Ellison, M. J., G. C. Conant, R. R. Cockrum, K. J. Austin, H. Truong, M. Becchi, W. R. Lamberson, and K. M. Cammack. 2014. Diet alters both the structure and taxonomy of the Ovine gut microbial ecosystem. DNA Res. 21(2): 115–125.
Fernando, S. C., H. T. Purvis II, F. Z. Najar, L. O. Sukharnikov, C. R. Krehbiel, T. G. Nagaraja, B. A. Roe, and U. DeSilva. 2010. Rumen microbial population dynamics during adaptation to a high-grain diet. Appl. Environ. Microbiol. 76(22): 7482-7490.
Hegarty, R. S., J. P. Goopy, R. M. Herd, and B. McCorkell. 2007. Cattle selected for lower residual feed intake have reduced daily methane production. J. Anim. Sci. 85: 1479-1486.
Koch, R. M., L. A. Swiger, D. Chambers, and K. E. Gregory. 1963. Efficiency of feed use in beef cattle. J. Anim. Sci. 22:486-494.
Latham, M. J. and M. J. Wolin. 1977. Fermentation of cellulose by Ruminococcus flavefaciens in the presence and absence of Methanobacterium ruminantium. Appl. Environ. Microbiol. 34(3): 297-301.
Morotomi, M., F. nagai, H. Sakon and R. Tanaka. 2008. Dialister succinatiphilus sp. nov. and Baresiella intestinihominis sp. nov., isolated from human faeces. Int. J. Syst. Evol. Microbiol. 58: 2716-2720.
Nicholson, M. J., P. N. Evans, and K. N. Joblin. 2007. Analysis of methanogen diversity in the rumen using temporal temperature gradient gel electrophoresis: Identification of uncultured methanogens. Microbial Ecol. 54:141-150.
NRC. 2007. Nutrient Requirements of Small Ruminants: Sheep, Goats, Cervids, and New World Camelids. Natl. Acad. Press. Washington, D.C.
Tajima, K., R. I. Aminov, T. Nagamine, H. Matsui, M. Nakamura, and Y. Benno. 2001. Diet-dependent shifts in the bacterial population of the rumen revealed with
135

real-time PCR. Appl. Environ. Microbiol. 67(6):2766-2774.
Thauer, R. K., R. Hedderich, and R. Fischer. 1993. Reactions and enzymes involved in Methanogenesis from CO2 and H2. Methanogenesis; Chapman & Hall Microbiology Series. pp 209-252.
Van Gylswyk, N. O., H. Hippe, and F. A. Rainey. 1997. Schwartzia succinivorans gen. nov., sp. nov., another ruminal bacterium utilizing succinate as the sole energy source. Int. J. Syst. Bacteriol. 47(1): 155-159.
Van Soest, P. J. 1994. Nutritional ecology of the ruminant: second edition. Cornell University Press. Ithaca, New York. pp 253-280.
Willey, J. M., L. M. Sherwood, and C. J. Woolverton. 2008. Prescott, Harley, and Klein’s microbiology, seventh edition. The McGraw Hill Companies. New York City, New York. pp. 534-535.
Zhou, M., Y. H. Chung, K. A. Beauchemin, L. Holtshausen, M. Oba, T. A. McAllister, and L. L. Guan. 2011. Relationship between rumen methanogens and methane production in dairy cows fed diets supplemented with a feed enzyme additive. J. Appl. Microbiol. 111: 1148-1158.
Table 1. Composition of forage-based pelleted diet. Item Ingredient, % DM Alfalfa pellets 67.70 Corn -- Wheat middlings 27.50 Corn gluten -- Cane molasses 2.50 Salt 1.34 Calcium carbonate 0.60 Dried distillers grains with solubles -- Calcium sulfate -- Potassium chloride -- Trace minerals and vitamins1 0.34 Analyzed nutrient composition DM, % as fed 92.30 CP, % DM 16.20 NDF, % DM 36.30 ADF, % DM 25.10 ME, Mcal/kg2 2.31 Ca, % DM4 1.20 P, % DM4 0.37 1Includes Selenium 1600, Sheep TM ORG-Zn, Flavor APF-168, Vit E 20000 IU/#, and CHS/PN VT-FDLT. 2Calculated from NRC (2007) values.
136

Table 2. Microbial abundance least-squares means in lambs divergent for feed efficiency.
Feed Efficiency Status1 Bacteria H2 L3 P-value Prevotella ruminicola 387.884 316.75 0.037 Prevotella bryantii 44.13 21.25 < 0.001 Ruminococcus albus 43.25 30.88 0.002 Dialister succinatiphilus 38.13 22.00 0.015 Prevotella marshii 27.13 16.13 0.018 Schwartzia succiniborans 10.88 3.38 < 0.001 Ruminococcus bromii 4.13 1.13 0.036 Selenomonas ruminantium 2.00 0.63 0.025 Alysiella species 1.63 0.25 0.021 Neisseria species 1.63 0.63 0.047 Methanobrevibacter smithii 23.38 31.75 < 0.001 Oscillibacter valericigenes 5.00 7.13 0.026 Prevotella genomospecies 1.50 4.13 0.044 Prevotella oris 2.25 4.00 0.002 Clostridium leptum 0.88 1.88 0.026 Ruminococcus callidus 0.25 1.50 0.047 Butyrivibrio fibrisolvens 0.63 1.38 0.018 Treponema maltophilum 0.38 1.25 0.040 Prevotella pleuritidis 0.25 0.88 0.004 1Tests of significance generated using the GENMOD procedure of SAS modeled with a Poisson distribution. Treatment means were generated using the MIXED procedure are valid, but because the data were not normally distributed, standard errors are not valid and thus not included. 2H = high residual feed intake (low feed efficiency status). 3L = low residual feed intake (high feed efficiency status). 4Values in bold indicate the feed efficiency status in which the OTU was more abundant.
137

PHYSIOLOGY
Proceedings, Western Section, American Society of Animal Science
Vol. 66, 2015
Influence of long-term progesterone on feed efficiency and body composition in mature Rambouillet ewes1
M. R. Herrygers, J. M. Thomson, K. Perz, K. B. Herrygers, K. Metcalf, M. Knerr, P. Merta, and J. G. Berardinelli2 Department of Animal and Range Sciences, Montana State University, Bozeman, MT, 59717
ABSTRACT: The objectives of this study were to evaluate the effects of long-term progesterone (P4) treatment on changes in feed efficiency, BW, and body composition in mature Rambouillet ewes. Thirty, multiparous, 5- and 6-yr-old Rambouillet ewes were stratified by age and metabolic BW and assigned randomly to receive long-term P4 administration using controlled intravaginal releasing devices (CIDR) or no P4 (CIDRX; CIDR backbone only). Initially, ewes were synchronized for estrus using a 7 d CIDR and PGF2α protocol. All ewes exhibited estrus within 72 h after PGF2α. Twelve d after estrus (d = 0), each ewe received either a CIDR (n = 15) or a CIDRX (n = 15). Every 2 wk thereafter, the CIDR or CIDRX was removed from each ewe and replaced with a new CIDR or CIDRX for 112 d. Individual feed intake was recorded using the GrowSafe units beginning at d 0 following a 3-wk adaptation period. Ewes were fed a mixed grass hay diet ad libitum that met the nutrient requirements for maintenance. BW for each ewe was collected every 2 wk when CIDR or CIDRX were replaced. Back fat (BF) and rib-eye area (REA) were measured for each ewe every 28 d using ultrasonography. Data reported herein represent the first 70 d of the experiment. BW, RFI, BF, and REA did not differ (P > 0.10) between CIDR- and CIDRX-treated ewes, and averaged 58.8 ± 7 kg (± SD), -0.026 ± 0.227 kg/day, 1.93 ± 0.58 mm, and 26.6 ± 2.1 mm, respectively. Calculated estimates of muscle mass (kg), intra-muscular fat (kg), empty body weight (kg), empty body weight dry matter (%), empty body weight fat (%), empty body weight protein (%), carcass weight (kg), carcass weight dry matter (%), carcass weight fat (%), and carcass weight protein (%) did not differ (P > 0.10) between CIDR- and CIDRX-treated ewes. In conclusion, at least 70 d of long-term P4 treatment provided by a CIDR did not appear to alter feed efficiency, BW or body composition in mature Rambouillet ewes. However, exposing ewes to P4 for a longer period of time may be necessary to affect feed efficiency, BW and body composition. Key words: carcass traits, CIDR, ewe, progesterone, residual feed intake ______________________ 1Appreciation is expressed to Andrew Williams, Arianne Perlinski, and Dr. Lisa Surber for their excellent technical assistance. This study was supported by the Montana Agric. Exp. Sta., and is a contributing project to the Multistate Research Project, W2112, Reproductive Performance in Domestic Ruminants. 2Corresponding author’s e-mail address: [email protected]
INTRODUCTION
Nutrition and metabolism are known to affect reproduction in livestock. It is now established that nutrition affects reproduction not only by providing energy to develop and sustain the embryo or fetus directly, but also through regulation of hormones that control reproduction and impact development of the neonate (Robinson et al., 2006; Boland et al., 2001). Also, nutritional status of ewes has been shown to interact with systemic progesterone (P4) concentrations and influence the maintenance of pregnancy (Parr et al., 1987). Recently, Swartz et al. (2014) showed that P4 concentrations were greater in Rambouillet ewes selected for high reproductive rates (HL) than in ewes selected for low reproductive rate (LL) during pregnancy. In their study, nutrient intake and TDN did not differ between lines of ewes. However, the total kg of TDN consumed per ewe per kg of lamb born was 24% greater in LL line ewes than in HL ewes. One could hypothesize that HL ewes were more efficient in partitioning nutrients into fetal growth and development. The physiological mechanism involved in this observation is not clear, but maybe related to greater systemic concentrations of P4 between d 60 and d 120 of gestation in HL ewes than in LL ewes. Based on the results of Swartz et al. (2014) we hypothesized that long-term, systemic P4 concentrations may be related to increased feed efficiency and changes in partitioning of nutrients. Thus, the objectives of this study were to evaluate the effects of long-term P4 treatment, independent of the influence of the placenta and fetus, on changes in feed efficiency, BW, and body composition in mature Rambouillet ewes. The hypotheses tested in this experiment were that feed efficiency, BW, back fat (BF), rib-eye area (REA), and body composition do not differ between Rambouillet ewes treated with a long-term P4 regimen, maintained with controlled intravaginal releasing devices (CIDR), or ewes not treated with the long-term P4 regimen.
MATERIALS AND METHODS
This experiment was conducted at the Montana State University Bozeman Area Research and Teaching Facility. Animal care, handling, and protocols used in this experiment were approved by the Montana State University Agricultural Animal Care and Use Committee. Animals and Housing Thirty, multiparous, 5- and 6-yr-old commercial
138

Rambouillet ewes from the Montana State University, Red Bluff Research Ranch flock in Norris, Montana were used for this study. Additionally, two 2-yr-old crossbred Suffolk x Rambouillet and one 4-yr-old Rambouillet, sexually experienced, epididymectomized rams were used for detection of estrus. At the beginning of the study, each ewe received an electronic individual identification ear tag that was used to record feed intake in the GrowSafe units (GrowSafe Systems Ltd., Airdrie, AB, Canada). Ewes were housed in four open-shed pens (33 m x 11 m) each with an individual GrowSafe unit. Treatments Before the beginning of the feeding trial adaptation period, individual BW were collected on two consecutive days and averaged. The average of the BW for each ewe was used to calculate individual metabolic BW (MBW = BW0.75). At the same time, estimates of BF and REA were obtained by ultrasonography over the 12th rib of each ewe. Ewes were stratified by age and MBW, then assigned randomly to one of two treatments. Treatments were: 1) long-term P4 maintenance using CIDR (CIDR; n = 15) or 2) no long-term P4 maintenance using a CIDR backbone (CIDRX; n = 15). To make the CIDR backbone, the outer, P4-containing silastic membrane was removed by slicing down the long axis of the CIDR with a scalpel blade and peeling the membrane from the plastic T-shaped backbone. All CIDR backbones were soaked in 80% ethanol (vol/vol H2O). They were dried and coated with three layers of Flex Seal Liquid Rubber (Swift Response, Weston, FL, USA) in order to minimize the abrasive properties of the backbone on the vaginal wall of ewes. In this experiment it was necessary to normalize the length of the long-term P4 treatment to estrus of the estrous cycle of each ewe. This was accomplished using the 7-d CIDR and PGF2α protocol. Each ewe received a CIDR for 7 d. On d 7, CIDR were removed and each ewe was injected (i.m) with 12.5 mg of PGF2 α (dinoprost tromethamine; ProstaMate®, Vedico, Inc., St. Joseph, MO, USA). Ewes were then exposed to epididymectomized rams that had painted briskets to mark the rumps of any ewe that exhibited estrus. All ewes showed estrus within 72 h after PGF2α . Twelve d after estrus each CIDR-treated and CIDRX-treated ewe received a CIDR or CIDRX, respectively. This event was the beginning of the feeding trial and d 0 of the experiment. Maintenance of long-term P4 concentrations in each ewe was accomplished by replacing a CIDR every 14 d with a new CIDR. The backbones of the CIDRX-treated ewes were replaced every 14 d with fresh CIDR backbones. BW and Ultrasonography for BF and REA Body weights of each ewe were collected on two consecutive days beginning on d 0 and every 14 d associated with the replacement of either a CIDR or CIDRX. The averages of the two consecutive BW were
considered the BW for that day. Estimates of BF and REA were obtained by ultrasonography every 28 d beginning at d 0. Feeding Intake A 112-d trial was conducted in order to estimate feed efficiency of CIDR- and CIDRX-treated ewes using the GrowSafe feed intake system. Data reported herein represent the first 70 d of the experiment. Ewes were given ad libitum access to mixed grass hay, water, and mineralized salt blocks. The chemical composition is given in Table 1. The chemical composition of the mixed grass hay on an as fed basis met the NRC (NRC, 2006) nutrient requirements for maintenance of a 60 kg adult ewe. Ewes were allowed a 3-wk adaptation period where the feed bars were removed from the GrowSafe units so that multiple ewes could eat at the same time. At the beginning of the experiment feed bars were replaced to ensure accurate measurements of individual ewe feed intake.
Table 1. Chemical composition of mixed grass hay
diet1
Item Mixed Grass Hay diet Nutrient analyses
DM 86.2
CP2 7.5
TDN2 60.2 1 Ewes had free access to the mixed grass hay diet. 2 CP and TDN are based on a percentage DM basis. Residual Feed Intake Calculations Daily intakes were computed for each of the ewes from the feed intakes derived from the GrowSafe Data software. Days that had scale noise greater than 12% and with assigned feed disappearance less than 92% were not used for feed intakes. Average daily gain (kg/d) of individual ewes were modeled by linear regression of bi-weekly BW using the PROC GLM procedure of SAS (SAS Inst., Inc., Cary, NC, USA). The regression coefficients were used to compute the ADG, initial and final BW, and mid-test MBW as described by Lancaster et al. (2009). Expected feed intake (EFI) was modeled using PROC GLM by linear regression of DMI against the modeled mid-test MBW and ADG (Koch et al., 1963). The model used to estimate EFI was: Yi = βO + β1ADGi + β2 mid-test MBWi + εi
where Yi is the DMI of the ewe, βO is the regression intercept, β1 is the partial regression coefficient of DMI on modeled ADG, β2 is the partial regression coefficient of DMI modeled on mid-test MBW, and εi is the residual error in the DMI of the ewes. Residual feed intake (RFI) was calculated for each ewe as the difference between DMI and EFI.
139
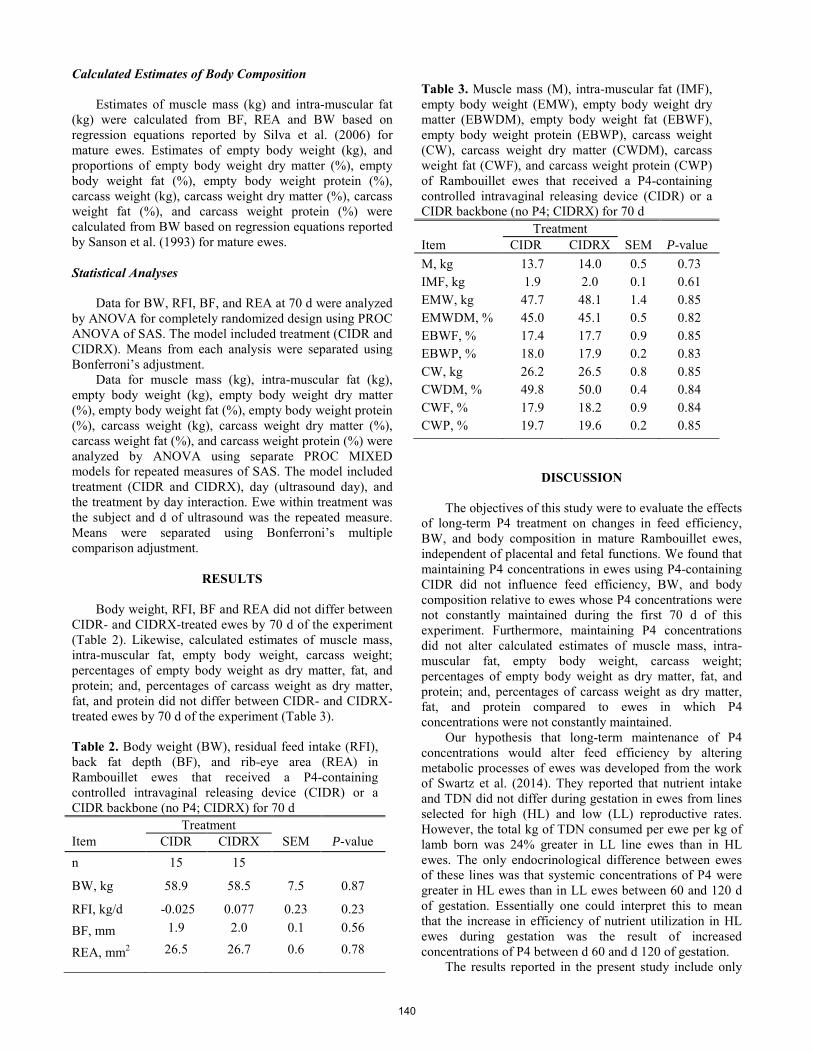
Calculated Estimates of Body Composition Estimates of muscle mass (kg) and intra-muscular fat (kg) were calculated from BF, REA and BW based on regression equations reported by Silva et al. (2006) for mature ewes. Estimates of empty body weight (kg), and proportions of empty body weight dry matter (%), empty body weight fat (%), empty body weight protein (%), carcass weight (kg), carcass weight dry matter (%), carcass weight fat (%), and carcass weight protein (%) were calculated from BW based on regression equations reported by Sanson et al. (1993) for mature ewes. Statistical Analyses Data for BW, RFI, BF, and REA at 70 d were analyzed by ANOVA for completely randomized design using PROC ANOVA of SAS. The model included treatment (CIDR and CIDRX). Means from each analysis were separated using Bonferroni’s adjustment. Data for muscle mass (kg), intra-muscular fat (kg), empty body weight (kg), empty body weight dry matter (%), empty body weight fat (%), empty body weight protein (%), carcass weight (kg), carcass weight dry matter (%), carcass weight fat (%), and carcass weight protein (%) were analyzed by ANOVA using separate PROC MIXED models for repeated measures of SAS. The model included treatment (CIDR and CIDRX), day (ultrasound day), and the treatment by day interaction. Ewe within treatment was the subject and d of ultrasound was the repeated measure. Means were separated using Bonferroni’s multiple comparison adjustment.
RESULTS
Body weight, RFI, BF and REA did not differ between CIDR- and CIDRX-treated ewes by 70 d of the experiment (Table 2). Likewise, calculated estimates of muscle mass, intra-muscular fat, empty body weight, carcass weight; percentages of empty body weight as dry matter, fat, and protein; and, percentages of carcass weight as dry matter, fat, and protein did not differ between CIDR- and CIDRX-treated ewes by 70 d of the experiment (Table 3). Table 2. Body weight (BW), residual feed intake (RFI), back fat depth (BF), and rib-eye area (REA) in Rambouillet ewes that received a P4-containing controlled intravaginal releasing device (CIDR) or a CIDR backbone (no P4; CIDRX) for 70 d Treatment Item CIDR CIDRX SEM P-value
n 15 15
BW, kg 58.9 58.5 7.5 0.87
RFI, kg/d -0.025 0.077 0.23 0.23 BF, mm 1.9 2.0 0.1 0.56
REA, mm2 26.5 26.7 0.6 0.78
Table 3. Muscle mass (M), intra-muscular fat (IMF), empty body weight (EMW), empty body weight dry matter (EBWDM), empty body weight fat (EBWF), empty body weight protein (EBWP), carcass weight (CW), carcass weight dry matter (CWDM), carcass weight fat (CWF), and carcass weight protein (CWP) of Rambouillet ewes that received a P4-containing controlled intravaginal releasing device (CIDR) or a CIDR backbone (no P4; CIDRX) for 70 d Treatment Item CIDR CIDRX SEM P-value
M, kg 13.7 14.0 0.5 0.73 IMF, kg 1.9 2.0 0.1 0.61 EMW, kg 47.7 48.1 1.4 0.85 EMWDM, % 45.0 45.1 0.5 0.82 EBWF, % 17.4 17.7 0.9 0.85 EBWP, % 18.0 17.9 0.2 0.83 CW, kg 26.2 26.5 0.8 0.85 CWDM, % 49.8 50.0 0.4 0.84 CWF, % 17.9 18.2 0.9 0.84 CWP, % 19.7 19.6 0.2 0.85
DISCUSSION The objectives of this study were to evaluate the effects of long-term P4 treatment on changes in feed efficiency, BW, and body composition in mature Rambouillet ewes, independent of placental and fetal functions. We found that maintaining P4 concentrations in ewes using P4-containing CIDR did not influence feed efficiency, BW, and body composition relative to ewes whose P4 concentrations were not constantly maintained during the first 70 d of this experiment. Furthermore, maintaining P4 concentrations did not alter calculated estimates of muscle mass, intra-muscular fat, empty body weight, carcass weight; percentages of empty body weight as dry matter, fat, and protein; and, percentages of carcass weight as dry matter, fat, and protein compared to ewes in which P4 concentrations were not constantly maintained. Our hypothesis that long-term maintenance of P4 concentrations would alter feed efficiency by altering metabolic processes of ewes was developed from the work of Swartz et al. (2014). They reported that nutrient intake and TDN did not differ during gestation in ewes from lines selected for high (HL) and low (LL) reproductive rates. However, the total kg of TDN consumed per ewe per kg of lamb born was 24% greater in LL line ewes than in HL ewes. The only endocrinological difference between ewes of these lines was that systemic concentrations of P4 were greater in HL ewes than in LL ewes between 60 and 120 d of gestation. Essentially one could interpret this to mean that the increase in efficiency of nutrient utilization in HL ewes during gestation was the result of increased concentrations of P4 between d 60 and d 120 of gestation. The results reported in the present study include only
140
70 d of maintenance of P4 concentrations. The lack of differences in feed efficiency, BW, and body composition could be related to the duration of maintenance of P4 concentrations. In this regard, one has to take into account that CIDRX ewes were exhibiting regular estrous cycles accompanied natural increases in P4 from the start of the experiment through the end of the breeding season (approximately the end of January). In the study by Sarda et al. (1973), P4 concentrations in pregnant ewes did not markedly increase until after d 80 to 90 of gestation. Furthermore, Swartz et al. (2014) reported that P4 concentrations did not differ between HL and LL ewes on d 30 and 60; a time frame that corresponds to this study for CIDR- and CIDRX- treated ewes. This may indicate that P4 concentrations must be maintained for longer than 60 to 70 d in order to cause a change in metabolism in sheep. In fact, feeding melengesterol acetate (MGA), a synthetic progestin, to beef heifers required at least 57 d to affect an increase in ADG, marbling score, and tenderness relative to these characteristics in heifers not fed MGA (Busby et al., 2002). To our knowledge this is the first study that evaluated the effects of long-term P4 treatment on feed efficiency and body composition in ewes. In conclusion, it appears that maintaining P4 concentrations for 70 d does not affect feed efficiency and body composition in ewes. Furthermore, it remains to be determined as to whether maintaining P4 concentrations for greater than 70 d up to 112 d will alter feed efficiency and body composition in ewes.
LITERATURE CITED
Boland, M. P., P. Lonergan, and D. O’Callaghan. 2001.
Effect of nutrition on endocrine parameters, ovarian physiology, and oocyte and embryo development. Theriogenology 55: 1323-1340.
Busby, D., D. Loy, and G. Rouse. 2002. Effect of MGA on performance, sexual behavior, carcass quality and tenderness in mixed-sex pens of cattle. Beef Research Report. http://lib.dr.ia.state.edu/beefreports_2001/9 (Accessed 11 March 2015).
Koch, R.M., L.A. Swiger, D. Chambers, and K.E. Gregory. 1963. Efficiency of feed use in beef cattle. J. Anim. Sci. 22: 486-494.
Lancaster, P.A., G.E. Carstens, F.R.B. Ribeiro, L.O. Tedeschi, and D.H. Crews, Jr. 2009. Characterization of feed efficiency traits and relationships with feeding behavior and ultrasound carcass traits in growing bulls. J. Anim. Sci. 87: 1528-1539.
NRC. 2006. Nutrient requirements of small ruminants. Natl. Acad. Press. Washington D.C. p. 246.
Parr, R. A., I. F. Davis, R. J. Fairclough, and M. A. Miles. 1987. Overfeeding during early pregnancy reduces peripheral progesterone concentration and pregnancy rate in sheep. J. Reprod. Fertil. 80: 317-320.
Robinson, J. J., C. J. Ashworth, J. A. Rooke, L. M. Mitchell, and T. G. McEvoy. 2006. Nutrition and fertility in ruminant livestock. Anim. Feed. Sci. Technol. 126: 259-276.
Sanson, D.W., T.R. West, W.R. Tatman, M.L. Riley, M.B. Judkins, and G.E. Moss. 1993. Relationship of body composition of mature ewes with condition score and body weight. J. Anim. Sci. 71: 1112-1116.
Sarda, I. R., H. A. Robertson, and T. C. Smeaton. 1973. Sequential changes in plasma progesterone levels in the ewe during the estrous cycle, and during pregnancy in intact and ovariectomized sheep. Can. J. Anim. Sci. 53: 25-34.
Silva, S.R., J.J. Afonso, V.A. Santos, A. Monteiro, C.M. Guedes, J.M.T. Azevedo, and A. Dias-da-Silva. 2006. In vivo estimation of sheep carcass composition using real-time ultrasound with two probes of 5 and 7.5 MHz and image analysis. J. Anim. Sci. 84: 3433-3439
Swartz, J.D., J.G. Berardinelli, J.M. Thomson, M. Lachman, K. Westveer, M.R. Herrygers, R.W. Kott, P.G. Hatfield, and C.J. Yeoman. 2014. Temporal patterns of intake, energy-related metabolites, metabolic hormones, progesterone concentrations, and lambing rates in Rambouillet ewes selected for high and low reproductive rate. Proc. West. Sect. Amer. Soc. Anim. Sci. 65: 98-101.
141

ENVIRONMENTAL & LIVESTOCK MANAGEMENT
Proceedings, Western Section, American Society of Animal Science
Vol. 66, 2015
Effects of weaning method on finishing performance and carcass characteristics of early-weaned beef steers
G. W. Preedy*, J. R. Jaeger†, J. W. Waggoner†, K. C. Olson*, 1 * Department of Animal Sciences and Industry, Kansas State University, Manhattan, KS, USA
† Western Kansas Agricultural Research Center, Kansas State University, Hays, KS, USA
ABSTRACT1: We evaluated the finishing performance and carcass characteristics of early-weaned steer calves that had previously been subject a 56-d weaning period and a subsequent 56-d feedlot receiving period. Steers (n = 239) were assigned randomly to 1 of 2 weaning treatments: drylot weaning for 56 d (DRYLOT) or pasture weaning for 56 d (PASTURE). Steers assigned to PASTURE were allowed to graze mature, native tallgrass range (89.2% DM, 6.7% CP) without supplement. Steers assigned to DRYLOT were fed a complete, concentrate-based diet for a targeted ADG of 1 kg at a DMI of 2.5% of BW (18.7% CP and 1.15 Mcal NEg/kg). Body weight after and ADG during the 56-d weaning period were greater (P ≤ 0.01) for DRYLOT than for PASTURE. After weaning, steers were transported to a feedlot, penned by treatment (n = 8 pens/treatment) and fed a common receiving diet for 56 d. Subsequently, steers were transitioned to a finishing diet over 21 d and fed to a common endpoint (11.5 mm 12th-rib fat thickness). At the beginning of the finishing period, DRYLOT steers were heavier (P < 0.01) than PASTURE steers. Finishing ADG (P < 0.01) was greater for PASTURE steers compared to DRYLOT steers. There were no differences (P = 0.50) in DOF among treatments, although HCW of PASTURE steers was 18 kg less (P < 0.01) than DRYLOT steers. Additionally, DRYLOT steers had greater DMI (P < 0.01) than PASTURE steers over the finishing phase, while PASTURE steers had greater G:F (P < 0.01) than DRYLOT steers. There were no differences (P = 0.19) between treatments in 12th-rib fat thickness, marbling score, USDA yield grade, and longissimus-muscle area. We interpreted these data to suggest that, under the conditions of our study, steers preconditioned on pasture without supplementation for 56 d were unable to fully compensate for previous nutrient restriction during finishing. Keywords: carcass, early weaning, finishing, pasture
INTRODUCTION
Weaning method affects calf weight gains during preconditioning (Bailey et al., 2012; Preedy et al., 2014). Bailey et al. (2013) found that calves weaned on pasture for 28 d before feedlot placement had reduced BW gain during the weaning and receiving periods compared to drylot-weaned calves; however, pasture-weaned steers achieved full compensation of BW and HCW at harvest with no differences in finishing DMI, DOF, or carcass quality,
1 Appreciation is expressed to Elanco Animal Health of Greenfield, IN for support of this research.
compared to drylot-weaned steers. Similarly, Mathis et al. (2008) reported that calves preconditioned on native range weighed less at the end of a 45 d preconditioning period and gained more weight during the first 75 d of finishing than calves preconditioned in a drylot. Myers et al. (1999) reduced DOF without affecting harvest BW by grazing early-weaned calves for 82 d before placement into a feedlot compared with early-weaned calves fed a high-concentrate diet from weaning to harvest. Producers who retain ownership of calves through finishing may be able to employ a low-cost, pasture-based preconditioning, while expecting similar finishing performance relative to a higher-cost, confinement-based preconditioning program. Therefore, the objective of our study was to measure performance and carcass characteristics of early-weaned steer calves that had previously been subject to a 56-d weaning period in either a pasture or a drylot environment.
MATERIALS AND METHODS
Animal care practices used in our study were approved by the Kansas State University Animal Care and Use Committee (protocol no. 2978.1).
Animals. Angus × Hereford steers originating from the commercial cow-calf herds of Kansas State University (n = 123; initial BW = 132 ± 26.4 kg; 113 ± 13 d of age; Source 1) in Manhattan, KS and the Western Kansas Agricultural Research Center (n = 116; initial BW = 194 ± 23.4 kg; 144 ± 15 d of age; Source 2) in Hays, KS were used in this study. All steers were castrated, dehorned, and vaccinated against clostridial diseases (Ultrabac® 7; Pfizer Animal Health, Exton, PA) at approximately 60 d of age. At weaning, steers were stratified by source and assigned randomly to 1 of 2 weaning treatments: drylot weaning for 56 d (DRYLOT) at the Western Kansas Agricultural Research Center or pasture weaning for 56 d (PASTURE) on native-tallgrass pastures at the Kansas State University Commercial Cow-Calf Unit.
Weaning phase. Steers from both sources were weighed individually and given initial vaccinations against respiratory pathogens (Bovi-Shield Gold® 5; Pfizer Animal Health, Exton, PA) and clostridial pathogens (Ultrabac® 7; Pfizer Animal Health, Exton, PA) as they were separated from dams. Calves were also given an injection of trace minerals (Multimin® 90; Multimin USA Inc., Fort Collins, CO), treated for internal and external parasites (Dectomax® Injectable; Zoetis Inc., Kalamazoo, MI), and given a growth-promoting implant (Ralgro®; Intervet Inc., Merck Animal Health, Summit, NJ). Steers were re-vaccinated 14 d after maternal separation.
142
After initial processing, all steers were transported via motor carrier for a common shipping duration of 4 h to their designated weaning locations.
Steers from both sources that were assigned to DRYLOT were transported to the Western Kansas Agricultural Research Center feedlot, where they were stratified by source and assigned randomly to 1 of 8 pens (minimum area = 200 m2/calf; bunk space = 0.46 m/calf).
Calves were fed a diet (18.7% CP and 1.15 Mcal NEg/kg) formulated to promote a 1-kg ADG at a DMI of 2.5% of BW during the weaning phase of the study. Feed was delivered once daily at 0700 h; bunks were evaluated each morning at 0630 h. Bunks were managed to minimize feed refusals (Pritchard and Bruns, 2003). If all feed delivered to a pen was consumed by 0630, delivery at the next feeding was increased to approximately 102% of the previous delivery. Diet samples were collected from bunks weekly and frozen (-20°C). Samples were composited at the conclusion of the experiment and submitted to a commercial laboratory (SDK Laboratories, Hutchinson, KS) for analysis of DM, CP, NDF, ADF, Ca, P, and S.
Steers from both sources assigned to PASTURE were transported to the Kansas State University Commercial Cow-Calf Unit, where they were stratified by source and assigned randomly to 1 of 8 previously-ungrazed, native-tallgrass pastures (97 ± 40 hectares). Upon arrival, steers were confined to a single earth-floor pen (minimum area = 200 m2/calf) and allowed ad libitum access to native tallgrass prairie hay (89.2% DM, 9.08% CP) via 2 ring feeders (diameter = 3 m) for 4 d. On the afternoon of d 4, steers were released into assigned pastures. Each pasture provided continual access to surface water and was stocked at 3.2 ha/steer. Additional non-study cattle of similar age and weight were added to pastures to achieve the desired stocking density. Pasture forage quality was estimated by clipping all plant material from within randomly-placed sampling frames (0.25 m2; n = 2/pasture) at a height of 1 cm (6.7% CP and 60.6% NDF).
Health. Steers assigned to both DRYLOT and PASTURE were monitored daily for symptoms of respiratory disease and conjunctivitis. Steers with clinical signs of BRD, as judged by animal caretakers, were removed from pens or pastures and evaluated. Steers were assigned a clinical-illness score (scale: 1 to 4; 1 = normal, 4 = moribund), weighed, and assessed for febrile response. Steers with a clinical illness score > 1 and a rectal temperature > 40.0°C were treated with therapeutic antibiotics according to label directions (first incidence = Baytril®, Bayer Animal Health, Shawnee Mission, KS; second incidence = Resflor Gold®, Merck Animal Health, Summit, NJ). Steers were evaluated 72 h following treatment and re-treated if clinical signs of BRD persisted.
Receiving phase. Following the 56-d weaning period, all steers were weighed at their respective weaning sites, implanted with Revalor IS® (Intervet Inc.; Merck Animal Health, Summit, NJ), and transported via motor carrier for 4 h to the Western Kansas Agricultural Research Center for a 56-d feedlot receiving period. At that time, steer calves assigned to PASTURE were stratified by source and assigned randomly to 1 of 8 pens, adjacent to those
assigned to DRYLOT (minimum area = 200 m2/calf; bunk space = 0.46 m/calf).
Steers were fed a common growing diet (17.6% CP and 1.19 Mcal NEg/kg) once daily at 0700 h. Bunks and feed delivery were managed according to procedures described for the DRYLOT treatment during the weaning phase of the study. Bunk samples were collected and analyzed as during the weaning phase of the study. Cattle health was monitored as during the weaning phase of the study.
Finishing phase. After the 56-d receiving period, steers were implanted with Component TE-IS (Elanco Animal Health) and adapted to a finishing ration over a period of 21 d (Table 1). Feeding management during finishing was handled according to the procedures described in the weaning phase. After 90 d on feed, steers were scanned by ultrasound using an Aloka 500V (Aloka Co., Ltd, Wallingford, CT) B-mode instrument equipped with a 3.5-MHz general purpose transducer array (UST 5021- 125 mm window) to determine subcutaneous fat thickness over the 12th rib. Steers were assigned to 1 of 5 harvest dates to meet an average carcass endpoint of 11.5 mm of fat depth over the 12th rib in each harvest group. Final live body weights were collected within 48 hours of harvest.
Steers were transported approximately 3 h to a commercial abattoir on their respective harvest dates. Carcasses were chilled for 48 h; subsequently, they were ribbed and graded. Carcass measurements were collected by digital imaging software and included 12th-rib fat thickness, 12th-rib loin eye area, and marbling score. Using these measurements, yield grade and quality grade were assigned according to USDA (1997).
Statistical analysis. Finishing performance and carcass characteristics were analyzed as a completely randomized design with pen as the experimental unit (PROC MIXED; SAS Inst. Inc., Cary, NC). All models included terms for treatment and location. No location × treatment interactions were detected (P ≥ 0.05); therefore, location was removed from final analysis. Pen within treatment was used as a random term.
When protected by a significant F-test (P < 0.05), Least Squares treatment means were separated using the method of Least Significant Difference. Means were considered different when P ≤ 0.05. Tendencies were discussed when 0.05 < P ≤ 0.10.
RESULTS AND DISCUSSION
Finishing performance. The ADG during the 56-d
weaning period were greater (P ≤ 0.01) for DRYLOT than for PASTURE, resulting in DRYLOT steers weighing 65 kg more than PASTURE steers at the beginning of finishing (Table 2). During finishing, PASTURE steers gained BW at a greater rate (P < 0.01) and had greater (P < 0.01) G:F than DRYLOT steers; however, harvest BW was 29 kg heavier for DRYLOT steers. Similarly, Bailey et al. (2012) reported greater BW gains for calves weaned in a drylot environment for 28 d than for calves weaned on dormant native range for 28 d; however, these researchers reported full compensation of BW during the subsequent finishing period with no differences in DOF between pasture- and drylot-weaned calves. Mathis et al. (2008) reported that
143
pasture-weaned steers had greater finishing ADG than drylot-weaned steers through the first 75 d on feed but, over the entire finishing period, there were no differences in ADG.
In our study, DRYLOT steers had greater DMI (P < 0.01) than PASTURE steers during the finishing phase (Table 2), whereas PASTURE steers had greater G:F (P < 0.01) during finishing than DRYLOT steers. The number of days on feed was not different (P = 0.50) between treatments. Myers et al. (1999) reduced DOF without affecting harvest BW by grazing early-weaned calves for 82 d before placement into a feedlot compared with early-weaned calves fed a high-concentrate diet from weaning to harvest; however pasture-weaned steers in that study gained 0.48 kg/d over the 82-d period. Mathis et al. (2009) also noted differences in final BW between steers preconditioned at either a high or low rates of gain. In our study, harvest BW of DRYLOT was greater (P < 0.01) than that of DRYLOT, when steers were harvested at a predetermined physiological endpoint based on a backfat thickness.
Carcass characteristics. Hot carcass weight was 18 kg greater (P = 0.03) for DRYLOT than for PASTURE (Table 3). Yield grade, marbling score, and 12th-rib fat thickness did not differ (P ≥ 0.23) among treatments. When finished to a common backfat thickness endpoint, it appeared that the nutritional restrictions that PASTURE steers were subject to during the 56-d weaning period did not alter carcass quality. Similarly, Hersom et al. (2004) and Sharman et al. (2010) reported that the type of growing program employed prior to finishing had minimal effects on marbling score when treatments were fed to a common 12th-rib fat thickness endpoint.
IMPLICATIONS
Steers weaned in a pasture environment for 56 d
weighed less at the beginning of finishing than steers weaned in a drylot environment and fed a concentrate-based diet for 56 d; however, pasture-weaned steers gained BW at a greater rate during finishing. Pasture-weaned steers also had improved G:F and reduced DMI through preconditioning and finishing, relative to drylot-weaned steers. There were no differences in days on feed when fed to a common degree of 12th-rib fat but HCW was 18 kg heavier for drylot-weaned steers than pasture-weaned steers. We previously reported similar results through the end of the receiving period resulting from 28-d drylot or pasture-weaning periods; however, there were no treatment differences in harvest BW, finishing DMI, finishing DOF, or carcass quality. We speculated that the compensatory effects during finishing after 28 d of nutritional restriction could not be sustained for 56 d.
LITERATURE CITED
Bailey, E. A., J. R. Jaeger, J. W. Waggoner, G. W. Preedy,
L. A. Pacheco, and K. C. Olson. 2012. Effect of weaning method on welfare and performance of beef calves during receiving. Proc. West. Sec. Amer. Soc. Anim. Sci. 63:25-29.
Bailey, E. A., J. R. Jaeger, J. W. Waggoner, L. A. Pacheco, G. W. Preedy, T. B. Schmidt, and K. C. Olson. 2013. Weaning method influences finishing performance without impacting carcass characteristics. Proc. West. Sec. Amer. Soc. Anim. Sci. 64:214-217.
Hersom, M. J., G. W. Horn, C. R. Krehbiel, and W. A. Phillips. 2004. Effect of live weight gain of steers during winter grazing: I. Feedlot performance, carcass characteristics, body composition, and energy requirements of beef steers. J. Anim Sci. 82:262-272.
Mathis, C. P., S. H. Cox, C. A. Löest, M. K. Petersen, R. L. Endecott, A. M. Encinias, and J. C. Wenzel. 2008. Comparison of low-input pasture to high-input drylot backgrounding on performance and profitability of beef calves through harvest. Prof. Anim. Sci. 24:169-174.
Mathis, C. P., S. H. Cox, C. A. Löest, M. K. Petersen, and J. T. Mulliniks. 2009. Pasture preconditioning calves at a higher rate of gain improves feedlot health but not post-weaning profit. Prof. Anim. Sci. 25:475-480.
Myers, S. E., D. B. Faulkner, T. G. Nash, L. L. Berger, D. F. Parrett, and F. K. McKeith. 1999b. Performance and carcass traits of early-weaned steers receiving either a pasture growing period or a finishing diet at weaning. J. Anim. Sci. 77:311-322.
Preedy, G. W., J. R. Jaeger, J. W. Waggoner, and K. C. Olson. 2014. Effects of weaning method on weaning-and growing-phase performance by early-weaned calves. Proc. West. Sec. Amer. Soc. Anim. Sci. 65:111-115.
Pritchard, R. H., and K. W. Bruns. 2003. Controlling variation in feed intake through bunk management. J. Anim. Sci. 81(E Suppl. 2):E133-E138.
Sharman, E. D., P. A. Lancaster, G. G. Hilton, C. R. Krehbiel, W. A. Phillips, and G. W. Horn. 2010. Effect of forage energy intake and supplementation on marbling deposition in growing beef cattle. Proc. West. Sec. Amer. Soc. Anim. Sci. 61:44-49.
144
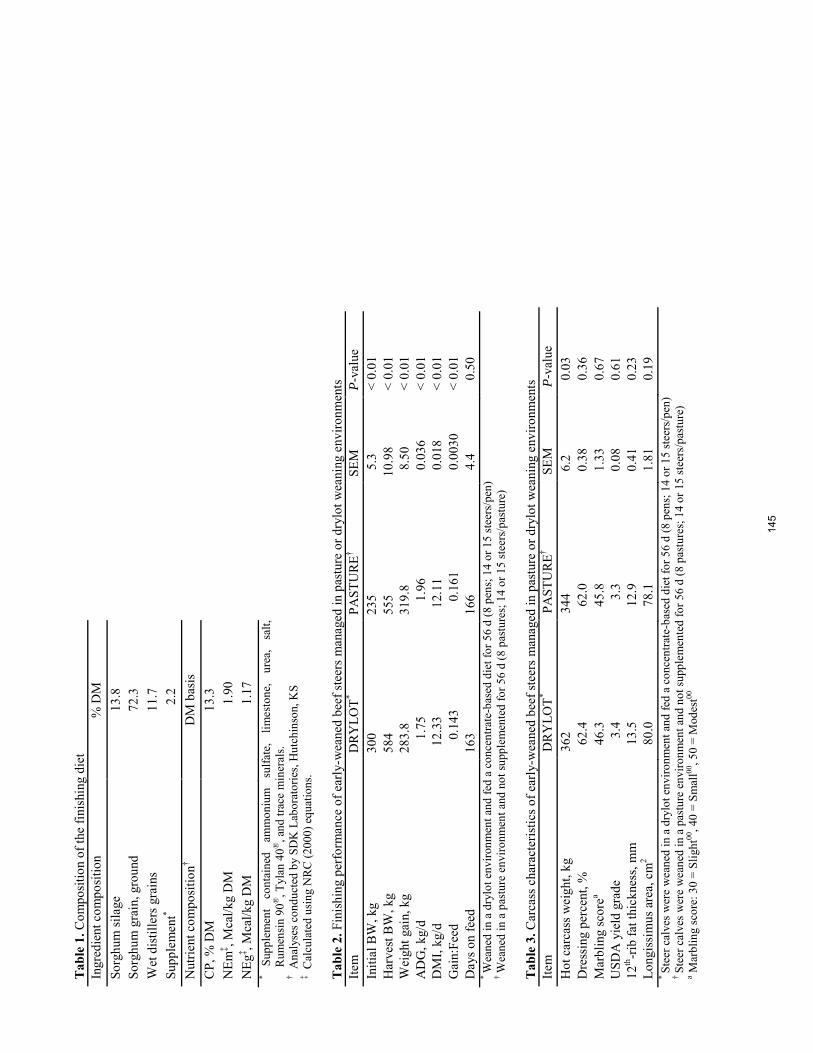
Tab
le 1
. Com
posi
tion
of th
e fin
ishi
ng d
iet
Ingr
edie
nt c
ompo
sitio
n %
DM
So
rghu
m si
lage
13
.8
Sorg
hum
gra
in, g
roun
d 72
.3
Wet
dis
tille
rs g
rain
s 11
.7
Supp
lem
ent*
2.2
N
utrie
nt c
ompo
sitio
n† D
M b
asis
C
P, %
DM
13
.3
NEm
‡ , Mca
l/kg
DM
1.9
0 N
Eg‡ , M
cal/k
g D
M
1
.17
* Su
pple
men
t co
ntai
ned
amm
oniu
m
sulfa
te,
limes
tone
, ur
ea,
salt,
R
umen
sin
90®
, Tyl
an 4
0®, a
nd tr
ace
min
eral
s.
† A
naly
ses c
ondu
cted
by
SDK
Lab
orat
orie
s, H
utch
inso
n, K
S
‡ Cal
cula
ted
usin
g N
RC
(200
0) e
quat
ions
. T
able
2. F
inis
hing
per
form
ance
of e
arly
-wea
ned
beef
stee
rs m
anag
ed in
pas
ture
or d
rylo
t wea
ning
env
ironm
ents
Ite
m
DR
YLO
T* PA
STU
RE†
SEM
P-
valu
e In
itial
BW
, kg
300
235
5.3
<
0.01
H
arve
st B
W, k
g 58
4 55
5 10
.98
< 0.
01
Wei
ght g
ain,
kg
283.
8 31
9.8
8.5
0 <
0.01
A
DG
, kg/
d
1.7
5
1.9
6 0
.036
<
0.01
D
MI,
kg/d
1
2.33
1
2.11
0
.018
<
0.01
G
ain:
Feed
0.1
43
0
.161
0
.003
0 <
0.01
D
ays o
n fe
ed
163
166
4.4
0.50
*
Wea
ned
in a
dry
lot e
nviro
nmen
t and
fed
a co
ncen
trate
-bas
ed d
iet f
or 5
6 d
(8 p
ens;
14
or 1
5 st
eers
/pen
) †
Wea
ned
in a
pas
ture
env
ironm
ent a
nd n
ot su
pple
men
ted
for 5
6 d
(8 p
astu
res;
14
or 1
5 st
eers
/pas
ture
) T
able
3. C
arca
ss c
hara
cter
istic
s of e
arly
-wea
ned
beef
stee
rs m
anag
ed in
pas
ture
or d
rylo
t wea
ning
env
ironm
ents
Ite
m
DR
YLO
T* PA
STU
RE†
SEM
P-
valu
e H
ot c
arca
ss w
eigh
t, kg
36
2 34
4 6
.2
0.0
3 D
ress
ing
perc
ent,
%
62.
4 6
2.0
0.3
8 0
.36
Mar
blin
g sc
orea
46.
3 4
5.8
1.3
3 0
.67
USD
A y
ield
gra
de
3
.4
3
.3
0.0
8 0
.61
12th
-rib
fat t
hick
ness
, mm
1
3.5
12.
9 0
.41
0.2
3 Lo
ngis
sim
us a
rea,
cm
2 8
0.0
78.
1 1
.81
0.1
9 *
Stee
r cal
ves w
ere
wea
ned
in a
dry
lot e
nviro
nmen
t and
fed
a co
ncen
trate
-bas
ed d
iet f
or 5
6 d
(8 p
ens;
14 o
r 15
stee
rs/p
en)
† St
eer c
alve
s wer
e w
eane
d in
a p
astu
re e
nviro
nmen
t and
not
supp
lem
ente
d fo
r 56
d (8
pas
ture
s; 1
4 or
15
stee
rs/p
astu
re)
a Mar
blin
g sc
ore:
30
= Sl
ight
00, 4
0 =
Smal
l00, 5
0 =
Mod
est00
145

EXTENSION

Proceedings, Western Section, American Society of Animal Science
Vo. 66, 2015
The Navajo Livestock Reduction of the 1930s: An historical, economical, and animal husbandry perspective.
J. D. Keyes Cooperative Extension, Utah State University, Monticello, UT 84535
ABSTRACT: Livestock production has been, and remains to this day, a key aspect of the history, culture, economy, and daily life of the Navajo People. Many theories exist concerning how the Dine (The People, as the Navajo refer to themselves) evolved from a mostly agrarian existence to a pastoral lifestyle. The most generally accepted of these theories is the introduction of livestock to the Dine by the early Spanish explorers by means of a conduit involving the Pueblo people of the Rio Grande Valley in New Mexico. Many historians and anthropologists adhere to the idea the Navajo People obtained both their flocks of sheep and their skill at weaving rugs, blankets, and clothing from the Zuni tribe who had contact with the early explorers. From the beginning, most animal husbandry practices were not viewed as important to the Dine. Quantity, as in herd numbers, was far more important than quality breeding practices to improve wool or meat production. In the early twentieth century, Extension and other government programs aimed at developing sheep with finer wool or larger carcasses on the Navajo Reservation failed miserably. Animals that could walk, breathe, and sustain themselves were kept in the flocks as a measure of wealth. Procedures such as castration were practiced from an early time, but neutered males remained in the flock to an advanced age because they added to the total. As the number of animals continued to grow at an unchecked pace, trouble for the Dine loomed on the horizon. Eventually the grazing resources could no longer support the massive number of animals. Erosion, coupled with invasion of undesirable plant species, caused the federal government to administer a livestock reduction program in the 1930s to stop the destruction. This reduction ended the traditional Navajo tribal economy that would never again rise to its former magnitude. The ripple effect from the reduction had serious consequences for the businesses tied to the Navajo livestock industry such as trading posts who purchased rugs, lambs, and wool. The Navajo way of life would never be the same. Key words: Navajo, sheep, reduction, wool, range management
INTRODUCTION
Since the Dine’ (The People, as Navajos refer to
themselves) began appearing in the written historical record, sheep have been linked with their very existence. Most importantly, Navajo oral tradition recounts sheep as being part of their culture from the very beginning. The Navajo Nation is bordered by four sacred mountains: Blanca Peak, Colorado on the East, Mount
Taylor, New Mexico on the South, San Francisco Peaks, Arizona on the West, and Hesperus Peak, Colorado on the North. Hesperus Peak is known by the Dine as Dibe’ Ntsaa or Big Sheep Mountain. It is believed that the mountain is made up of sheep. Medicine men will visit the peak and bring home soil they have collected. This soil protects the property of the Dine’, mainly the land and the livestock.
The Navajo creation story discusses the coming forth of human beings to this earth from previous worlds by means of a magic reed. The introduction of the first people occurred in the region around Hesperus Peak. When First Man and First Woman emerged into the Fourth or Glittering World (the one we now live in), the environment was predisposed to sustain livestock production (Nakai, 2001). Changing Woman, a key personality in the Navajo creation story, is said to have formed sheep from herbs that grew in water soaked soil. The water on the soil, sprinkled from Changing Woman’s hand, was purported to be amniotic fluid.
Motherhood is the focal point of the Navajo culture. Their society has always been matriarch in nature with women basically controlling all things important. The Franciscan Fathers at St. Michaels, Arizona noted that the sheep belong to the women and the cattle to the men (1910). There is a definite connection between motherhood and sheep in Dine traditions. Much more than the simple female ownership of the animals.
According to anthropologist Gary Witherspoon, “The Navajo have always found a conceptual relationship between sheep and motherhood” (Witherspoon, 1973). At the Sheep is Life Conference held at Dine College, Tsaile, Arizona in 1999, Percy Deal said, “Sheep are your mother, sheep are your future.” Sheep are also the Navajo Nation’s past. Livestock Introduction
Most modern archeologists, anthropologists, and historians theorize that sheep were introduced into the Southwest by Spanish explorers. Columbus, on his second voyage brought livestock to the New World in 1494 (Bailey, 1980). Vasquez De Coronado is credited with bringing the first sheep into the United States in 1540 (Hodge, et al. 1895). Bailey (1980) discusses Juan De Onate’s efforts to colonize on the banks of the Rio Grande River in 1598. He and his followers brought with them over 3,600 head of sheep and goats. Many writers point to Onate as being responsible for introducing Native Americans to livestock.
146
Onate was more than likely the originator of the western livestock industry. He and his followers organized settlements along the Rio Grande. The newcomers to the land may have found success had they not tried to force the aboriginal residents of the area into a restrictive paradigm. Conversion of the Native Americans to Catholicism was the all-consuming goal of the Spanish, but to be successful they had to build solid agricultural units (Bailey, 1980). These units were anchored by sheep, and the teaching of the people the art of shepherding. Sometimes the teaching methods of the Spanish were less than humane. In 1680 it all came to a head when the native people revolted driving the Spanish back down the Rio Grande Valley, the direction from whence they came. In the turmoil of retreat, thousands of head livestock were left for the taking. With the restrictions of the Spanish gone, a livestock economy began to develop among the tribes of the Southwest.
MATERIALS AND METHODS
Much work has been done by historians and anthropologists since the latter part of the nineteenth century to document and articulate the life and culture of the Navajo People. Volumes of information have been published on the Dine concerning everything from housekeeping to witchcraft. A thorough search of the printed record was undertaken to create the foundation of this document. Additionally, personal interviews have been conducted of elderly Navajo people who were involved directly or indirectly with the federally mandated livestock reduction. These stories and anecdotes are priceless in a project of this nature.
RESULTS AND DISCUSSION “Economy of the Sheep” – Dibe’ bee iinaa
Livestock have always been central to Navajo society and economy, but sheep have always been what mattered most. For hundreds of years everything in the Navajo economy revolved around the sheep. Since the beginning of the pastoral lifestyle, the Dine’ looked at livestock more in terms of quantity than quality. The more animals a person owned, the wealthier the family. Not only did the flock provide food and fiber, but also material for barter with other peoples. The Dine’ lived under the influence of a sheep economy. One of the most famous Navajo leaders of the nineteenth century, Narbona, was said to have 10,000 head of sheep at the time of the signing of the first treaty between the Navajos and the United States in 1846. In that same year Governor Charles Bent of the New Mexico Territory wrote a lengthy letter to Secretary of State James Buchanan. In this document he reported the Navajos as possessing 30,000 cattle, 500,000 sheep, and 10,000 horses (Iverson, 2002).
Bosque Redondo – 1864-1868 – The Fearing Time
The Navajos and the citizens of the early New Mexico Territory had always been at odds with one another. Deprecations on both sides involving murder, the slave trade and livestock rustling were common. On January 6, 1864, after decades of fighting, General James Carleton, Governor of the New Mexico Territory, launched a campaign to put an end to the Navajo conflict. Under the direction of Colonel Christopher “Kit” Carson troops marched from Fort Canby into Navajoland to subdue its residents. The policy of the campaign was “scorched earth.” Carson and his men destroyed anything and everything that belonged to the Dine’ in an effort to subjugate them. The efforts of the soldiers were stacked between two horrific bookends: a land destroying drought and a killer winter. The livestock of the Navajo suffered greatly. They were killed on sight by members of the Carson army, as well as thousands dying in the summer drought and winter snow. The Dine’ had no choice, but to surrender. By February 1, 1864 the destitute Navajos began to arrive at Forts Canby and Wingate awaiting their eventual removal to Fort Sumner in the Bosque Redondo region of New Mexico (Bailey, 1998). That same month the first 1500 Navajo prisoners were marched to Fort Sumner. At the end of the journey for this first group, Captain Joseph Berney reported that ten Navajos had perished on the road from cold, three were stolen, and two had strayed away. He also reported that the prisoner had in their possession between 300 and 400 head of sheep (Berney, 1864). Over the next two years 12,000 Navajos and 10,000 sheep would be forwarded to Bosque Redondo. By 1868 the number of sheep held by the prisoners would diminish to not more than 940 head (Bailey, 1998). In 1868 a treaty was signed between the Navajo People and the United States allowing the Dine’ to return to their homelands. Article XII, part 2 of the treaty allowed for the purchase of 15,000 sheep and goats to be distributed among the people. War Department records show that these sheep were purchased from Vincent Romero of La Cueva, Mora County, New Mexico. They were native Mexican sheep and of similar origin to the sheep which the Navajos originally had (Grandstaff, 1941). The wool of these animals was described as being coarse, long, and practically worthless as an article of commerce (Phillips, 1941). With these sheep, plus those left on the range by the Carson campaign, and a few brought back from Bosque Redondo, the Dine’ were back in the sheep business.
The Navajo People were somewhat fortunate in the treaty they signed with the U.S. Government. That is, as fortunate as a conquered people can be. Very few Native American tribes were ever allowed to return to their homelands just as they left them at the time of their surrender. The Navajos came home and began living the same lifestyle they had left, minus the raiding and plundering of other peoples. They were able to resume their
147
traditional agricultural ways. In 1870 the Navajo sheep flocks were reported at 30,000 animals. By 1930 that number had climbed to over 1.3 million (Bailey, 1980). The Dine’ were again looking at their flocks in terms of quantity and not quality. Trading post operator Will Evans recalls seeing a goat with only two legs, the other two limbs being lost to frostbite. The unfortunate animal had learned to move around, and was kept in the flock to keep the numbers up.
With limited land and grazing resources, tribulation was on the horizon. As early as the 1880’s Navajo grazing practices were receiving criticism. Indian Agent Dennis Riordan called for the number of Navajo goats and sheep to be reduced by one-half to two-thirds (Riordan, 1883). In 1930 the impression that the Dine’ were destroying their grazing lands reached a peak. Between 1930 and 1933 a series of government hearings and surveys were conducted to find a way to deal with the widespread erosion and loss of grazing that were threatening the Navajo pastoral economy. The conclusion was that the Navajo Reservation could support 500,000 sheep units. In short, the ranges were overstocked by more than 100 percent (Bailey, 1980).
Livestock Reduction – 1933-1938
Once it was concluded that the Navajo Reservation was overstocked, there was no alternative but to reduce the number of grazing animals. To make matters worse, the area had been in the grips of drought that had limited the amount of forage that was available for livestock. Basically, the plan was that money would be appropriated to purchase the livestock from the Navajo people and remove them from their grazing lands. The idea would be to establish a balance between the range and the animals. Under the direction of Commissioner of Indian Affairs, John Collier, a livestock reduction program was instituted in 1933. By 1938 over 350,000 sheep and goats had been removed from Navajoland. However, what started out as a plan with very admirable goals, turned into a national tragedy. Dr. Bob McPherson, Historian at the College of Eastern Utah San Juan Campus, calls the Navajo livestock reduction one of the two major tragedies in Navajo tribal memory. He compares it to the incarceration at Fort Sumner, describing it as a defeat, degradation, and removal from traditional lifestyle (2001). During the 1930’s the United States was in the throes of the Great Depression. This put two wrinkles into the Navajo Livestock Reduction Program. Firstly, money and markets were tight and the prices paid by the government to the livestock owners were low, ranging from $1 to $3 per head depending on the sex of the animal. Secondly, after the program commenced, it became impossible to make delivery of many of the animals to market, and consequently the animals were herded off into canyons and destroyed. The carcasses of the sheep and goats rotted in the sun. The Dine’ not only viewed this as
an unnecessary waste, but also as a horrifying loss of something sacred. Oral interviews, conducted of Navajo people who were first hand participants in the livestock reduction tell the story most effectively. Mary Cook said, “People were butchering our herd…They were slitting the goats’ throats. Pete Sheen remembered, “Many of the sheep were shot by the roadside and just fell there. Some dried bones still are visible today where the sheep were shot down. Howard Gorman served as an interpreter for the government during the reduction program. He said, “It was a terrible sight where the slaughtering took place for several days. Near what is now the trading post was a ditch where sheep intestines were dumped, and these were scattered all over. The womenfolks were crying, mourning over such a tragic scene.”(Roessel, 1974). The Navajo people were traumatized by what happened. They could not understand why the white man’s government would do something so horrendous. They did not comprehend the objectives of the program, and at the same time could not equate money received for livestock as wealth. Wealth was measured by the number of animals a person owned and not dollar bills. Tribal elders blamed the livestock reduction program for continuing the drought and preventing any new rains from coming to the land. Navajo tradition asserted that without the livestock’s prayers for rain, the whole weather cycle collapsed (McPherson, 2001). Many people claimed before the reduction grass was plentiful over the fields and hills because there was a lot of rain. Horses played along the streams (Roessel, 1974). This illustrates the blatant fact that the Anglo government implementing the plan looked at the situation in an entirely different light than the Navajo people who were the recipients. Another unfortunate outcome of this event is the blame that the Navajo people still attach to John Collier who implemented the livestock reduction program as Commissioner of Indian Affairs. He tried to ease the Navajo people into voluntarily reducing their flocks, but due to the Navajo way of thinking this could not happen. He also made great efforts to try and compensate the Dine’ for their losses. Most historians agree that Mr. Collier’s efforts were motivated by concern and a desire to help the Navajo people. Today John Collier, often referred to as John “Collie”, is remembered with hatred and anger by many Navajo people. 1935 – Present
The Navajo livestock reduction had a key effect on educational activities on the reservation. Following the reduction, individual sheep owners were running fewer head, and thereby receiving less income. Realizing the need for help, the government established objectives for Navajo sheep growers to produce a finer wool clip that was more suited to the domestic markets. The traditional Navajo sheep had little or no wool on the face, legs, and belly, and had a fleece of carpet quality (Bailey, 1980).
148
Phenotypically, the early sheep were described as lightweight and very hardy. This made officials think that producing lambs with a heavier carcass would make Navajo ranchers financially viable. Ram breeds that were intended for improvement were introduced into Navajo flocks.
On the surface, these goals made perfect sense if no consideration was given to the feed resources on the Navajo Reservation that range from limited to non-existent. Sheep breeds that flourished in many parts of the world could not endure the rigors of the American Southwest. At the same time, the finer wool needed by the woolen mills was not suited for the Navajo style of carding yarn and weaving. Fine-wooled fleeces had shorter fibers with much more crimp making it impossible to card and spin yarn using traditional Navajo techniques (Toledo, 1981). An official study in 1934 found that the wool produced by Navajo flocks had lost favorable qualities for weaving, consequently, the existence of the rug weaving industry was threatened (Lawrence, 2002). By the early to mid-twentieth century the old type Churro sheep that had been with the Dine since the beginning of their pastoral lifestyle comprised an estimated five percent of the total reservation sheep (Grandstaff, 1942).
In 1935, The Southwestern Range and Sheep Breeding Laboratory (SRSBL) was organized near Bear Springs, New Mexico. The site of the new research station had been a military establishment known as Fort Wingate. The research programs were directed at weaving wool production and the problems of overgrazing on the reservation. Throughout its existence the laboratory was the site of research and education aimed at improving the Navajo way of producing sheep. Crossbreeding programs to improve fleece and meat production were conducted as well as straight breeding of old type Navajo sheep to produce weaving wool. From its inception the lab employed Navajo weavers to weave sample rugs of the various grades of wool produced with the experimental flocks (NPS).
For thirty years data was collected, and educational programs presented by the staff of the station. The SRSBL was closed down in 1966. Land grant universities of the three states within the borders of the Navajo Reservation continue to use information from the SRSBL to educate Navajo ranchers. The main implications are still trying to provide information and help to maintain the Navajo lifestyle and culture.
In the past several decades Extension has done much to assist livestock producers with animal management workshops and programs. However, range management has been left alone. The main reason for this is the lack of control of grazing animals on the reservation. In 1936 the federal government introduced the process of using animal unit months (AUMs) to manage the capacity of grazing lands on the Navajo Reservation. The ranges were divided into grazing permits, and license to use these permits were issued to Navajo families. For the most part these regulations have been ignored. Flocks of sheep and goats, herds of cattle, and feral horses run unchecked in most areas. Much has been voiced about the problems of
uncontrolled grazing, but little has been done. In 2014 the Navajo Rangeland Improvement Act was proposed, but as of yet nothing official has been done. The grazing issue has many facets that include political, family, and economical concerns. There is no doubt that an outside organization will be required to objectively solve the multitude of problems that need to be addressed with grazing on the Navajo Reservation. Right now, it might be said that the efforts of the livestock reduction were not successful in accomplishing a strict program of range management on the reservation.
Until then, the efforts of University Extension will need to be in the area of small flock production. Very few flocks today have more than 30 head of sheep and goats. The livestock reduction program was a major factor in the Many of the up and coming generation choose not to have the responsibility of taking a flock out in the morning and bringing it back in the late afternoon. Extension’s efforts will continue, for the time, to deal with nutrition, health care, and the issues of management.
IMPLICATIONS
Today the Navajo Reservation covers over 27,000
square miles of land, and is home to 250,000 people (Navajo, 2008). Despite modernization, the livestock culture still plays an important role in tribal economics as well as individual family life. The only difference is now there are fewer flocks. Many Navajo families still live out in the open country in clusters of hoghans and small square houses referred to as a “kin.” Most of these families live without power or running water. On the outskirts of these homesteads is the ever-present sheep corral. Herders still turn their sheep and goat flocks loose in the morning and follow them as they graze throughout the day. At night the animals are returned to the corral for protection. The process differs very little from that followed by the herder’s ancestors centuries earlier. These modern flocks, smaller and fewer in numbers than a century ago, keep the Navajo livestock culture alive. Ceremonies are still held to bless the animals, and the animals are considered to bless the family. Sarah Police said that they raise the old type sheep to protect their traditions and to teach their children responsibility (Police, 2008). Is that not one of the main reasons that Navajos have always had sheep? Janet Hatathly feared that children who stray from the traditions of raising sheep will never be satisfied. They always want something new that they cannot have, and they are never happy (Hatathly, 2008).
LITERATURE CITED
Bailey, L.R. (1980). If you take my sheep: The evolution
and conflicts of Navajo pastoralism. Pasadena, CA: Westernlore Publications.
Bailey, L.R. (1998). Bosque Redondo. Tucson, AZ: Westernlore Press.
149
Benally, A. (1993). Hane’ Bee’eehaniih: With stories it is remembered. Unpublished master’s thesis, Arizona State University. Cited: Dine’. P. Iverson, 2002. P 13.
Blun, C.T. (1940). Improvement of the Navajo sheep: A Unique Breed and the Project to Improve It as developed at the Southwestern Range and
Sheep Breeding Laboratory. J Hered 1940 31: 99-112. Franciscan Fathers (1910) Ethnologic Dictionary of the
Navajo Language. (1910). St. Michaels, AZ: St. Michaels Press.
Grandstaff, J.O. (1942). Wool characteristics in relation to
Navajo weaving, Technical Bulletin No. 790 (Washington, DC: US Department of Agriculture, 1942).
Hathaly, J. (2008). Interview by author. May 21, 2008 Iverson, P (2002). Dine’, a history of the Navajos.
Albuquerque, NM: University of New Mexico Press. Lawrence, A. J. (2002). Southwest range and sheep
breeding laboratory. National Register of Historic Places. Washington, D.C.: National Park Service, May, 2002.
McPherson, R.S. (2001). Navajo land, Navajo culture: The Utah experience in the twentieth century. Norman, OK: University of Oklahoma Press.
Nakai, Willis. Interview by author. May 22, 2001
National Park Service. (2003) Southwest Range and Sheep Breeding Laboratory. http://www.nps.gov/history/nr/feature/indian/2003/sheep.htm.
Navajo Nation. (2008). Navajo Nation Government. http://navajo.org. Phillips, M.P. (1941). A study of some of the characterstics
of present and old-type Navajo wools. Unpublished master’s thesis. Utah State University.
Police, S. (2008). Interview by author. April 7, 2008. Roessel, R. and B.H. Johnson (1974). Navajo livestock
reduction: A national disgrace. Tsaile, AZ: Navajo Community College Press.
Sides, H. (2006). Blood and thunder. New York: Doubleday. Toledo, J. (1981). Interview by author. July 21, 1981. Wheat, J.B. (1994). Rio Grande, Pueblo, and Navajo:
Cross-cultural influence. Rio Grande Textiles, ed. Nora Fisher. Albuquerque, NM: Museum of New Mexico Press. Cited: Dine’. P. Iverson, 2002. p 24.
Witherspoon, G. (1973). Sheep in Navajo culture. American Anthropologist 72. Cited: Dine’, P. Iverson, 2002. p 12.
Witherspoon, G. (1975). Navajo Kinship and Marriage. University of Chicago Press. Cited: xroads.virginia.edu/~ma97/dinetah/change2.html.
150
Proceedings, Western Section, American Society of Animal Science
Vol. 66, 2015
The PregCard study; assessing the impact of routine management strategies on reproductive performance of beef herds in the upper Great Plains1
C.R. Dahlen*2 and C.L. Stoltenow*
*North Dakota State University, Fargo 58108
ABSTRACT: Over a two-year period summary data from pregnancy examinations were collected to assess the impacts of routine management decisions on reproductive performance in beef herds. Upon completion of pregnancy examination, the PregCard was completed by indicating the number of females evaluated, the number non-pregnant, female age (cows, heifers, or both), the number and age of bulls used, breeding season dates, and whether groups were exposed to AI. Data were reported by 8 veterinary clinics and included 242,967 females in 1,782 groups. Pregnancy rate, stocking rate (females/ bull), and breeding season length (last day of bull exposure – first bull exposure or AI) were calculated for each group. Each group was also assigned to categories for stocking rate (<15, 15 to 25, 26 to 36, and >35 females per bull), group size (<50, 50 to 99, 100 to 199, and 200+ females), breeding season length (<45 d, 45 to 65, 66 to 85, 86 to 105, and >105 d) and breeding bull age (yearling, mature, or mixed ages). Groups consisting of only cows (90.1%) had greater (P < 0.01) reported pregnancy rates compared with groups consisting of only heifers (86.6%). Groups with breeding seasons <45 d had poorer (P < 0.01) reported pregnancy rates compared with all other breeding season length categories. Groups with <50 females (86.1%) had poorer (P < 0.01) reported pregnancy rates compared with groups containing 50 to 99 females (88.3%), which had poorer (P < 0.01) pregnancy rates than groups with either 100 to 199 (90.0%) or 200+ females (90.4%). Stocking groups at 15 to 25 females per bull (89.7%) resulted in greater (P < 0.05) reported pregnancy rates compared with stocking females at 26 to 35 (88.3%) and >36 females per bull (88.3%), which were greater (P < 0.05) than groups stocked at <15 females per bull (82.7%). Stocking rates were greater (P < 0.01) for groups of females exposed to AI (39.2 females/bull) than for females only exposed to natural service breeding systems (24.8 females/bull). Reported pregnancy rates of groups bred by mature (88.8%) and mixed age (89.2%) bulls were greater (P < 0.01) than those of groups bred by yearling bulls (86.6%). The PregCard system provided an excellent platform to assess the impacts of routine management practices on reported pregnancy rates in beef herds in the upper Great Plains. Key words: pregnancy examination, reproductive management ______________________ 1Great appreciation is expressed to the veterinarians and staff of the 8 participating veterinary clinics that submitted pregnancy examination results for this effort, to the focus groups of veterinarians, producers, industry representatives, J.T. Seeger, and J.C. Rodgers that were all instrumental in developing the
PregCard, and to Zoetis, Inc for partial financial support of this effort. 2Corresponding Author: [email protected]
INTRODUCTION
Reproductive performance in beef herds is an area of management that is paramount to profitability. The greatest expense accrued for a beef cow per annum is the cost of feed, which accounts for over 60% of cow-calf producers’ total cost (Miller et al., 2001). The practice of pregnancy checking prior to the start of the winter feeding period to identify and remove non-pregnant females, therefore, may result in significant cost-savings. However, less than 20% of all beef herds in the United States incorporate this reproductive technology into their herd management system (NAHMS, 2009).
Each year Extension personnel, veterinarians, and others that serve in a consulting role for cow-calf producers respond to countless inquiries shortly after pregnancy examination about the possible impact of adverse events on overall beef herd reproduction. Depending on the year inquiries can include, but are certainly not limited to, the impact of extreme heat, extreme cold, record rains, extended drought, delayed pasture turnout, delayed initiation of winter feeding, noxious pasture plant proliferation, and disease concerns in the region. To respond to the inquiries many testimonials are collected from producers and veterinarians, and some responses may indicate that pregnancy rates have been impacted. However, real-time data from sentinel herds that could be used to verify testimonials are lacking.
The PregCard system was initiated in an attempt to gather real-time data at the time of pregnancy examination regarding reproductive performance of beef herds, to provide veterinary clinics with benchmarking data and summary reports for their current clients, and to determine the impacts of several routine management practices on overall beef herd reproductive performance in the upper Great Plains.
MATERIALS AND METHODS
After extensive conversation with a focus group of
veterinarians, producers, and industry representatives, the PregCard emerged as a 4 × 5 ½” pre-preprinted postage paid card that can be completed after pregnancy examination in a group of cattle. Cards were distributed to sentinel veterinary clinics for completion after pregnancy examinations occurring over a 2-yr period.
151
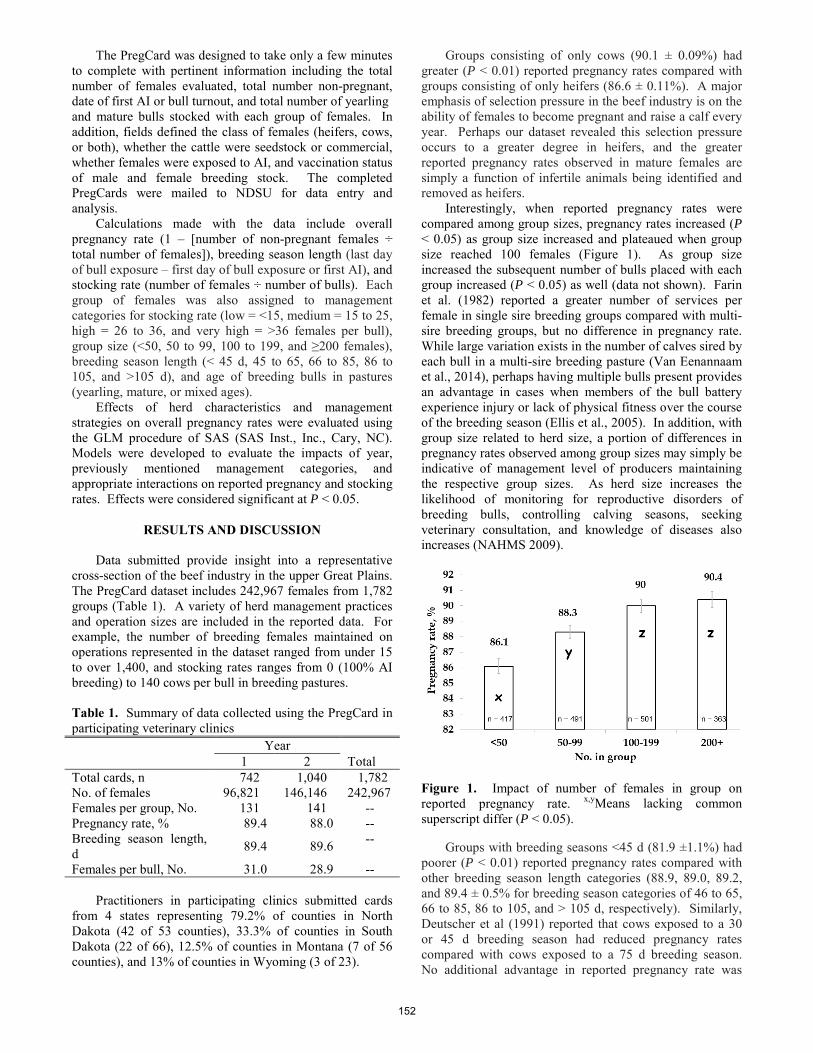
The PregCard was designed to take only a few minutes to complete with pertinent information including the total number of females evaluated, total number non-pregnant, date of first AI or bull turnout, and total number of yearling and mature bulls stocked with each group of females. In addition, fields defined the class of females (heifers, cows, or both), whether the cattle were seedstock or commercial, whether females were exposed to AI, and vaccination status of male and female breeding stock. The completed PregCards were mailed to NDSU for data entry and analysis.
Calculations made with the data include overall pregnancy rate (1 – [number of non-pregnant females ÷ total number of females]), breeding season length (last day of bull exposure – first day of bull exposure or first AI), and stocking rate (number of females ÷ number of bulls). Each group of females was also assigned to management categories for stocking rate (low = <15, medium = 15 to 25, high = 26 to 36, and very high = >36 females per bull), group size (<50, 50 to 99, 100 to 199, and ≥200 females), breeding season length (< 45 d, 45 to 65, 66 to 85, 86 to 105, and >105 d), and age of breeding bulls in pastures (yearling, mature, or mixed ages).
Effects of herd characteristics and management strategies on overall pregnancy rates were evaluated using the GLM procedure of SAS (SAS Inst., Inc., Cary, NC). Models were developed to evaluate the impacts of year, previously mentioned management categories, and appropriate interactions on reported pregnancy and stocking rates. Effects were considered significant at P < 0.05.
RESULTS AND DISCUSSION
Data submitted provide insight into a representative cross-section of the beef industry in the upper Great Plains. The PregCard dataset includes 242,967 females from 1,782 groups (Table 1). A variety of herd management practices and operation sizes are included in the reported data. For example, the number of breeding females maintained on operations represented in the dataset ranged from under 15 to over 1,400, and stocking rates ranges from 0 (100% AI breeding) to 140 cows per bull in breeding pastures. Table 1. Summary of data collected using the PregCard in participating veterinary clinics Year 1 2 Total Total cards, n 742 1,040 1,782 No. of females 96,821 146,146 242,967 Females per group, No. 131 141 -- Pregnancy rate, % 89.4 88.0 -- Breeding season length, d 89.4 89.6 --
Females per bull, No. 31.0 28.9 --
Practitioners in participating clinics submitted cards from 4 states representing 79.2% of counties in North Dakota (42 of 53 counties), 33.3% of counties in South Dakota (22 of 66), 12.5% of counties in Montana (7 of 56 counties), and 13% of counties in Wyoming (3 of 23).
Groups consisting of only cows (90.1 ± 0.09%) had greater (P < 0.01) reported pregnancy rates compared with groups consisting of only heifers (86.6 ± 0.11%). A major emphasis of selection pressure in the beef industry is on the ability of females to become pregnant and raise a calf every year. Perhaps our dataset revealed this selection pressure occurs to a greater degree in heifers, and the greater reported pregnancy rates observed in mature females are simply a function of infertile animals being identified and removed as heifers.
Interestingly, when reported pregnancy rates were compared among group sizes, pregnancy rates increased (P < 0.05) as group size increased and plateaued when group size reached 100 females (Figure 1). As group size increased the subsequent number of bulls placed with each group increased (P < 0.05) as well (data not shown). Farin et al. (1982) reported a greater number of services per female in single sire breeding groups compared with multi-sire breeding groups, but no difference in pregnancy rate. While large variation exists in the number of calves sired by each bull in a multi-sire breeding pasture (Van Eenannaam et al., 2014), perhaps having multiple bulls present provides an advantage in cases when members of the bull battery experience injury or lack of physical fitness over the course of the breeding season (Ellis et al., 2005). In addition, with group size related to herd size, a portion of differences in pregnancy rates observed among group sizes may simply be indicative of management level of producers maintaining the respective group sizes. As herd size increases the likelihood of monitoring for reproductive disorders of breeding bulls, controlling calving seasons, seeking veterinary consultation, and knowledge of diseases also increases (NAHMS 2009).
Figure 1. Impact of number of females in group on reported pregnancy rate. x,yMeans lacking common superscript differ (P < 0.05).
Groups with breeding seasons <45 d (81.9 ±1.1%) had poorer (P < 0.01) reported pregnancy rates compared with other breeding season length categories (88.9, 89.0, 89.2, and 89.4 ± 0.5% for breeding season categories of 46 to 65, 66 to 85, 86 to 105, and > 105 d, respectively). Similarly, Deutscher et al (1991) reported that cows exposed to a 30 or 45 d breeding season had reduced pregnancy rates compared with cows exposed to a 75 d breeding season. No additional advantage in reported pregnancy rate was
152
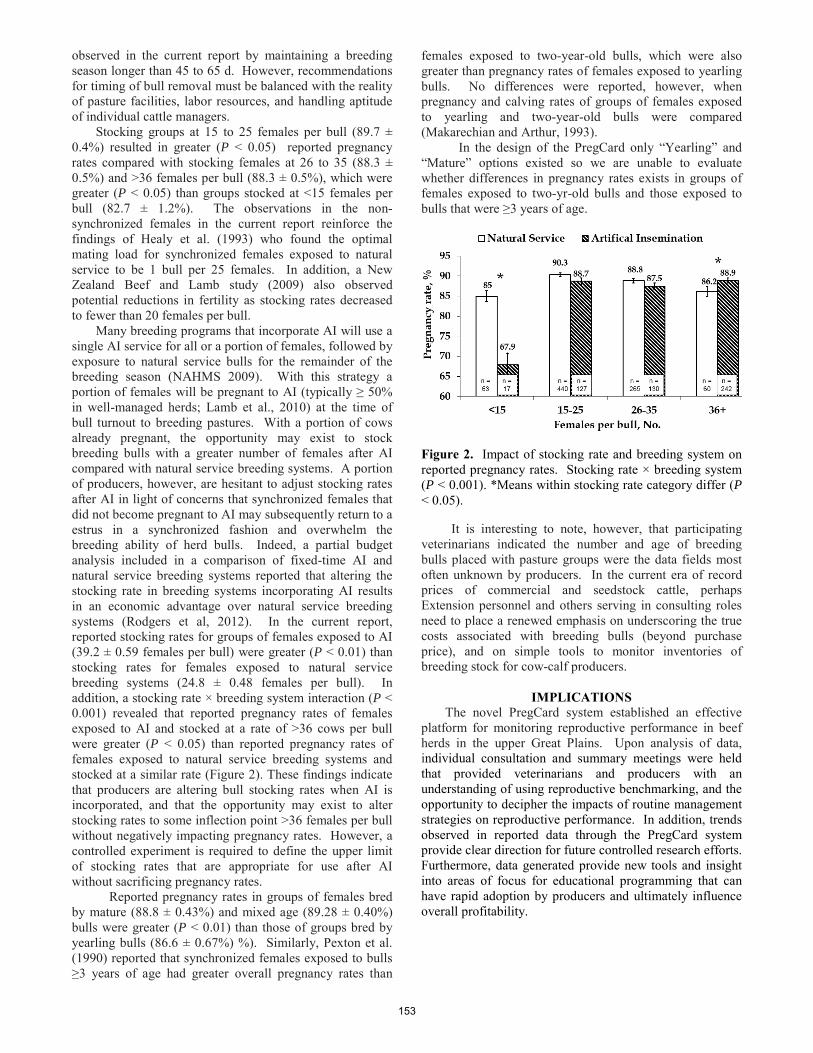
observed in the current report by maintaining a breeding season longer than 45 to 65 d. However, recommendations for timing of bull removal must be balanced with the reality of pasture facilities, labor resources, and handling aptitude of individual cattle managers.
Stocking groups at 15 to 25 females per bull (89.7 ± 0.4%) resulted in greater (P < 0.05) reported pregnancy rates compared with stocking females at 26 to 35 (88.3 ± 0.5%) and >36 females per bull (88.3 ± 0.5%), which were greater (P < 0.05) than groups stocked at <15 females per bull (82.7 ± 1.2%). The observations in the non-synchronized females in the current report reinforce the findings of Healy et al. (1993) who found the optimal mating load for synchronized females exposed to natural service to be 1 bull per 25 females. In addition, a New Zealand Beef and Lamb study (2009) also observed potential reductions in fertility as stocking rates decreased to fewer than 20 females per bull.
Many breeding programs that incorporate AI will use a single AI service for all or a portion of females, followed by exposure to natural service bulls for the remainder of the breeding season (NAHMS 2009). With this strategy a portion of females will be pregnant to AI (typically ≥ 50% in well-managed herds; Lamb et al., 2010) at the time of bull turnout to breeding pastures. With a portion of cows already pregnant, the opportunity may exist to stock breeding bulls with a greater number of females after AI compared with natural service breeding systems. A portion of producers, however, are hesitant to adjust stocking rates after AI in light of concerns that synchronized females that did not become pregnant to AI may subsequently return to a estrus in a synchronized fashion and overwhelm the breeding ability of herd bulls. Indeed, a partial budget analysis included in a comparison of fixed-time AI and natural service breeding systems reported that altering the stocking rate in breeding systems incorporating AI results in an economic advantage over natural service breeding systems (Rodgers et al, 2012). In the current report, reported stocking rates for groups of females exposed to AI (39.2 ± 0.59 females per bull) were greater (P < 0.01) than stocking rates for females exposed to natural service breeding systems (24.8 ± 0.48 females per bull). In addition, a stocking rate × breeding system interaction (P < 0.001) revealed that reported pregnancy rates of females exposed to AI and stocked at a rate of >36 cows per bull were greater (P < 0.05) than reported pregnancy rates of females exposed to natural service breeding systems and stocked at a similar rate (Figure 2). These findings indicate that producers are altering bull stocking rates when AI is incorporated, and that the opportunity may exist to alter stocking rates to some inflection point >36 females per bull without negatively impacting pregnancy rates. However, a controlled experiment is required to define the upper limit of stocking rates that are appropriate for use after AI without sacrificing pregnancy rates.
Reported pregnancy rates in groups of females bred by mature (88.8 ± 0.43%) and mixed age (89.28 ± 0.40%) bulls were greater (P < 0.01) than those of groups bred by yearling bulls (86.6 ± 0.67%) %). Similarly, Pexton et al. (1990) reported that synchronized females exposed to bulls ≥3 years of age had greater overall pregnancy rates than
females exposed to two-year-old bulls, which were also greater than pregnancy rates of females exposed to yearling bulls. No differences were reported, however, when pregnancy and calving rates of groups of females exposed to yearling and two-year-old bulls were compared (Makarechian and Arthur, 1993).
In the design of the PregCard only “Yearling” and “Mature” options existed so we are unable to evaluate whether differences in pregnancy rates exists in groups of females exposed to two-yr-old bulls and those exposed to bulls that were ≥3 years of age.
Figure 2. Impact of stocking rate and breeding system on reported pregnancy rates. Stocking rate × breeding system (P < 0.001). *Means within stocking rate category differ (P < 0.05).
It is interesting to note, however, that participating veterinarians indicated the number and age of breeding bulls placed with pasture groups were the data fields most often unknown by producers. In the current era of record prices of commercial and seedstock cattle, perhaps Extension personnel and others serving in consulting roles need to place a renewed emphasis on underscoring the true costs associated with breeding bulls (beyond purchase price), and on simple tools to monitor inventories of breeding stock for cow-calf producers.
IMPLICATIONS
The novel PregCard system established an effective platform for monitoring reproductive performance in beef herds in the upper Great Plains. Upon analysis of data, individual consultation and summary meetings were held that provided veterinarians and producers with an understanding of using reproductive benchmarking, and the opportunity to decipher the impacts of routine management strategies on reproductive performance. In addition, trends observed in reported data through the PregCard system provide clear direction for future controlled research efforts. Furthermore, data generated provide new tools and insight into areas of focus for educational programming that can have rapid adoption by producers and ultimately influence overall profitability.
153
LITERATURE CITED Ellis, R. W., G. P. Rupp, P. J. Chenoweth, L. V. Cundiff,
and D. D. Lunstra. 2005. Fertility of yearling beef bulls during mating. Theriogenology 64:657-678.
Farin, P. W., P. J. Chenoweth, E. R. Mateos, and J. E. Pexton. 1992. Beef bulls mated to estrus synchronized heifers: single- vs multi-sire breeding groups. Theriogenology 17:365-372.
Healy, V. M., G. W. Boyd, P. H. Gutierrez, R. G. Mortimer, and J. P. Piotrowski. 1993. Investigating optimal bull:heifer ratios required for estrus-synchronized heifers. J. Anim. Sci. 71:291-297.
Lamb, G. C., C. R. Dahlen, J. E. Larson, G. Marquezini, and J. S. Stevenson. 2010. Control of the estrous cycle to improve fertility for fixed-time artificial insemination in beef cattle: A review. J. Anim. Sci. 88(E. Suppl.) E181-E192.
Makarechian, M., and P. F. Arthur. 1993. A comparison of natural service fertility of yearling and two-year-old bulls on pasture. Theriogenology 39:835-845.
Miller, A. J., D. B. Faulkner, R. K. Knipe, D. R. Strohbehn, D. F. Parrett, and L. L. Berger. 2001. Critical control points for profitability in the cow-calf enterprise. Prof. Anim. Sci. 17:295-302.
NAHMS. National Animal health Monitoring System. 2009. Part II. Reference of beef cow-calf management practices in the United States, 2007-08. Fort Collins, CO. Pp. 1-48.
New Zealand Beef and Lamb. 2009. R&D Brief 140: Beef cow conception rates and influences. Available at http://www.beeflambnz.com/Documents/Farm/Beef%20cow%20conception%20rate%20and%20influences.pdf (Accessed 10 March 2014.)
Pexton, J. E., P. W. Farin, G. P. Rupp, and P. J. Chenoweth. 1990. Factors affecting mating activity and pregnancy rates with beef bulls mated to estrus synchronized females. Theriogenology. 34(6):1059-1070.
Rodgers, J. C., S. L. Bird, J. E. Larson, N. DiLorenzo, C. R. Dahlen, A. DiCostanzo and G. C. Lamb. 2012. An economic evaluation of estrous synchronization and timed artificial insemination in suckled beef cows. J. Anim. Sci. 90:4055-4062.
Van Eenennaam, A. L., K. L. Weber, and D. J. Drake. 2014. Evaluation of bull prolificacy on commercial beef cattle ranches using DNA paternity analysis. J. Anim. Sci. 92:2693-2701.
154

EXTENSION SYMPOSIUM
Proceedings, Western Section, American Society of Animal Science
Vol. 66, 2015
Addressing Animal Welfare and Low Stress Livestock Handling
Temple Grandin Dept. of Animal Science, Colorado State University
ABSTRACT: Careful quiet handling will help improve productivity. Cattle that become
agitated in the squeeze chute or run fast out of it have lower weight gains. Carefully
acclimating cattle to moving quietly through the handling facility will improve
conception rates when they are brought back into the facility for AI. Acclimating young
cattle to people walking through them will produce calmer, easier to handle adult
animals. Research has also shown that acclimating animals to both chutes and transport
lowered cortisol levels and heart rate. Animal memories are specific and acclimation to
one situation may not transfer to another situation. Practical experience in the field
clearly indicates that cattle that are completely habituated and have a small flight zone
when a person on horseback rides through them may run away when they are suddenly
confronted by a person on foot. A person on foot presents a totally different image
compared to a person on a horse. Studies by Reinaldo Cooke at Oregon State University
and Lisa Leiner and Markus Fendt in Germany show the specificity of animal habituation
to new experiences. Cattle that become acclimated to a person feeding range cubes does
not transfer to handling in a chute. Training a horse to tolerate an umbrella opening does
not transfer to a large tarpaulin canvas.
Australian researcher Paul Hemsworth has done numerous studies that clearly
show that fearful pigs and dairy cows are less productive. Fear behavior was measured
by size of the flight zone and avoidance of people. Dr. Hemsworth also found that
155
changing a person’s attitude to be more positive towards animals improved
stockmanship. Some scientists may question the use of the word fear in Dr. Hemsworth’s
work. Neuroscience research clearly shows that mammals have circuits in the brain for
perceiving fear. Handling during transport and at the slaughter plants are areas where
poor handling can compromise welfare. Quiet low stress methods will reduce costly
bruising and death losses in both cattle and pigs. During the last five minutes before
slaughter, excitement, agitation, or electric prod use will increase lactate levels which
may increase tough meat in cattle or PSE in pigs. Auditing animal handling with
numerical scoring will help prevent people form slipping back into old bad practices.
Some of the variables that can be measured are slipping, falling, running, electric prod
use, miscaught in the squeeze and vocalization during catching in the squeeze.
Key words: stockmanship, welfare, cattle, handling, low stress
156

Procedings, Western Section, American Society of Animal Science
Vol. 66, 2015
Principles of low stress stockmanship
Guy Glosson Ranch Manager, Rancher, Consultant and Trainer, Low Stress Animal Handling Instructor
Holistic Management International & Mesquite Grove Ranch, Jayton, Texas 79528 I was lucky enough to have worked with Bud Williams, famous for his work with Low Stress Animal Handling across the world, for several months back in 1990. Bud and I worked together almost every day for four months. He really worked hard at trying to get me to learn to handle the cattle in a better way. Since that time I have not only been able to better handle the cattle at Mesquite Grove Ranch but have been privileged to help people in many states in the United States and several countries in Africa. The first Low Stress Animal Handling class that I was involved in was sponsored by the Quivira Coalition of Santa Fe, New Mexico in 2000. They asked a friend, Tim McGaffic, if he could put together a Herding Clinic, and he in turn asked me; well I told him I guess “I could make something up”. So, Tim and a friend of his, Steve Allen, and I did just that, we put together a program that attempted to teach the very basics of how to handle livestock. The program was to last for 3 days; no one can learn to handle animals in three days, as it may take a lifetime. So we determined we would need to compress the course into just the very basic techniques one uses to handle cattle and then to help the folks to practice in order that they might get the “feel” of moving livestock. I prefer to teach people to handle cattle by using cattle and working on foot. I do have a bit of a presentation I do using diagrams to help folks to understand what we are trying to do and how we are going to do it. It creates a game of sorts, and folks seem to be able to pick up what I am teaching them. I teach two very basic techniques that if people will learn and practice using they can start to have success with their own animals. My feeling is that when folks are having success they will keep on learning and getting better. These techniques work on one animal or a herd of thousands. They work in a small corral, or a large pasture with no fences. They work in heavy brush infested pastures as well as fields. This is what I do, and am glad to share what little I have learned about cattle handling with others.
157
Procedings, Western Section, American Society of Animal Science
Vol. 66, 2015
Managing a successful feedyard BQA and animal care program: lessons learned, challenges and opportunities
Ben Weinheimer, P.E.
Vice President Texas Cattle Feeders Association, Amarillo, Texas 79106
Texas Cattle Feeders Association (TCFA) has worked for almost three decades to develop materials, deliver educational programs and encourage adoption and implementation of Beef Quality Assurance (BQA) principles and proper animal care and handling practices. Beginning in the mid-1980s, the key issues for BQA focused on proper placement of pharmaceuticals to prevent injection site lesions and an overall emphasis on quality—for feed and cattle inputs. In the 1990s, Hazard Analysis and Critical Control Points (HACCP) arrive on the scene for meat packers/processors. In an effort to stay ahead of the curve, cattle feeders enhanced the BQA program based on the HACCP principles, which required the development of more specific protocols for potential physical and chemical hazards. In the late 1990s, TCFA staff began conducting on-site BQA audits that also require review and verification by a nutritionist and veterinarian. Those audit procedures remain in place today. The BQA program continued to evolve in the early 2000s with additional requirements for monitoring feed inputs to verify compliance with the FDA ban on feeding of ruminant proteins. And, after several years of discussions, in 2003 the cattle industry came to agreement on Guidelines for the Care and Handling of Cattle, which were quickly incorporated into the BQA program content and audit protocols. The success of BQA throughout the supply chain continues to grow. While BQA is a high priority for cattle feeders, feedyard managers’ expectations from cow-calf and stocker operators throughout the country also continues to grow. Top priorities for beef consumers include beef safety, beef quality and assurance that animals produced for human consumption have been properly handled and cared for. In order to meet this expectation, feedyard managers expect BQA practices to be adhered to long before the cattle arrive at the feedyard. Cow-calf producers, stocker operators and feedyard managers are all obligated to provide proper nutrition, health, care and handling of cattle during each phase of production. There have been and will continue to be a number of challenges and opportunities facing cattle producers. Many of those challenges will be addressed voluntarily by industry, and may require implementation of additional protocols, practices and procedures. A strong commitment to BQA and animal care and handling will help ensure that BQA can continue to be a viable and efficient platform to address many of those challenges and opportunities.
158
Procedings, Western Section, American Society of Animal Science
Vol. 66, 2015
Extension programming in South Dakota to improve livestock handling.
K.C. Olson and H. Carroll South Dakota State University, Brookings, SD 57007
Low-stress livestock handling has regained interest in recent years because it provides a variety of advantages. A primary advantage is improved animal welfare from reduced stress. It also improves human safety, reduces human stress, and is an economic advantage because time and labor associated with animal handling decreases. SDSU Extension has provided programming on livestock handling both as stand-alone programs and incorporated into more comprehensive programs such as beef SD, a program for beginning producers. As early as 2006, Dr. Tom Noffsinger, a livestock-handling expert, was the keynote speaker at Experiment Station Field Days and local Beef Day events. In 2014, Dr. Temple Grandin was the keynote speaker for workshops entitled “Raising the Best: Livestock Husbandry and Handling for Today’s Market” that were held in Rapid City and Watertown. These workshops were highly successful with over 400 producers attending. Over 50 percent of attendees found the information new and all planned to adopt or already have adopted effective use of flight zones and the point of balance. Additionally, more than 70 percent would attend a similar workshop. Another program is the “Animal Care Wednesday Webinar”, a monthly series that is a multi-state effort with Nebraska, Iowa, Missouri, and Wyoming. To date, 3106 participants have viewed the webinars either live or via posted recording. Ninety percent of participants indicated the webinars were worth their time. Another important programming effort has been regular publication about livestock handling and stewardship on iGrow, the SDSU Extension web portal. One example of a recent iGrow article was “Challenges to Improving Animal Care: Insights from Dr. Bernard Rollin”, which was an overview of an Animal Care Wednesday Webinar. Numerous iGrow articles about animal handling have been reprinted in the livestock popular press, such as “Tips & Preparation for Safe Cattle Hauling”. SDSU Extension partners with the South Dakota Beef Industry Council to provide Beef Quality Assurance Training in South Dakota. An ongoing effort is the “Animal Well-being in South Dakota 2014-2015 Survey” that is intended to provide insight into perceptions about animal well-being by Extension clientele and determine educational resources being sought. Programming efforts have improved producer attitudes and procedures for handling their livestock. Low-stress livestock handling requires a shift in how people approach and interact with their livestock. As such, continued programming efforts will help increase producer recognition of the benefits of low-stress handling.
159

Procedings, Western Section, American Society of Animal Science
Vol. 66, 2015
Teaching stockmanship across the generations
Billy Whitehurst, PAS Montana State University Extension Agent
Madison-Jefferson Counties, Whitehall, MT 59759 In recent years, the beef industry has come under more scrutiny from a consumer population that is increasingly concerned with animal welfare. University extension has the obligation to educate cattle producers in multiple disciplines, one of which is proper cattle handling. The topic of cattle handling and stockmanship skills has become more critical. Extension is responding to the need by holding workshops specific to stockmanship. Many cattle producers have resisted implementing more low-stress methods of handling cattle. This may be due in part to perceptions that such practices may not have financial benefits, may infringe on cultural traditions, or may require a re-training of their prior methods. All of these would mean an admission of prior wrongdoing: an admission many are not yet willing to make. Since the adoption of low-stress cattle handling skills impacts the work place, traditions, societal, and cultural practices, the approach to teach and encourage implementation of better stockmanship skills has been a challenge as attendance at stockmanship clinics is often low. Low attendance can be overcome through a multi-generational approach focusing more on youth education programs such as 4-H, FFA, or through student demonstration projects. Parents often bring youth to events they would not attend themselves. Youth stockmanship clinics are usually held at ranch locations. Youth attendance at these clinics is generally increased if the clinic offers a variety of hands-on activities. These activities may include: practicing herding and processing cattle; having attendees physically walk through the facilities, including the squeeze chute as though they are cattle; and, being loaded into trailers and receiving a short ride through the ranch yards. These activities enhance the understanding of the environment as cattle may perceive them. Due to the rural nature of these events, parents remain at the event and participate. By allowing the parents to participate, the ratio of youth to adult producers has been 1:1 or even 1:4 in many instances. Adults and youth are given the opportunity to evaluate the event. Part of the evaluation is to collect data anonymously as to how many head of cattle the attendees of the event represent. One example of the success seen through a “youth” event involved only 10 youth, but had 30 adults in attendance, representing stewardship of over 15,000 head of cattle either through ownership or employment. Based on events held over the past 12 months, where the multigenerational approach was employed, the number of adults and of cattle potentially affected has increased by over 50% in some instances compared to adult-only workshops.
160
Proceedings, Western Section, American Society of Animal Science
Vol. 66, 2015
Stewardship and Stockmanship: Increasing awareness of beef quality assurance (BQA) in Idaho
J. B. Glaze, Jr.*1, J. B. Hall*2, and J. Owens3 *Department of Animal and Veterinary Science, University of Idaho, Moscow, ID 83844
1University of Idaho, Twin Falls Research and Extension Center, Twin Falls, ID 83301 2University of Idaho, Nancy M. Cummings Research, Extension & Education Center, Carmen, ID 83462
3Beef Northwest, North Powder, OR 97867
ABSTRACT: Consumers have a high regard for the safety and quality of the food they consume. Beef quality assurance (BQA) programs have been implemented to favorably impact the public’s perception of the beef industry and reduce the incidence of residues and carcass defects. Recently, BQA has evolved to include topics such as animal handling. In 2011, the Idaho BQA Program identified animal handling as one of the yearly program emphases. The objective of this work was to bring Stewardship and Stockmanship educational events to Idaho, satisfying the identified needs and desires for animal handling training. In April 2011, animal handling demonstrations were delivered to four locations around the state. The delivery of these educational events afforded the opportunity to potentially reach new audiences with BQA information, reconnect with some traditional audiences, and collect information on the knowledge and adoption of BQA principles and practices, including animal handling. Sign-in sheets at the four workshop locations showed 438 individuals attending the events. Attendees submitting evaluation forms totaled 150, resulting in an overall response rate of 34.2%. The workshop participants included cow-calf operators (78.0%), stocker/backgrounders (11.3%), and feeders (11.3%). The most highly represented (40.2%) group of cow-calf operators was small producers with herds of <100 cows. When asked about their current BQA certification status, 30.7% noted they were BQA certified, 18.0% noted they were not BQA certified but had attended a previous BQA educational event, and 49.3% were not BQA certified and had not been to a previous BQA meeting. The participants’ level of agreement to various statements related to low stress handling were gauged prior to the workshops and after the workshops. For all of the statements, the percentage of participants strongly agreeing increased from before to after the workshops. The percentage of participants strongly agreeing ranged from 30.7% to 58.6% prior to the workshops, and 49.6% to 80.7% after the workshops. Similar results were noted for the evaluation statements that were designed to gauge the frequency with which certain BQA principles and practices were being performed. As before, favorable improvements were seen for all statements. As an example, when asked how often the injection-site triangle is used for injections, 65.3% indicated always prior to the workshops and 80.6% indicated always after the workshop. Key Words: Beef Quality Assurance, Low-stress Handling, Stewardship, Stockmanship
INTRODUCTION Consumers have a high regard for the safety and quality of the food they consume. Consumers deserve and expect safe, wholesome, and high quality products from food producing industries such as the beef industry. The perception of safety and wholesomeness has a major impact on the buying decisions of health conscious consumers (NCBA, 2011). To address these expectations and maintain beef demand, the beef industry has implemented a beef quality assurance (BQA) program (NCBA, 2008). Traditionally, the BQA program has focused on the reduction and avoidance of residues and carcass defects. The BQA program has expanded to include many aspects of improving beef quality and safety including proper use of animal health products, proper record keeping, animal nutrition, and genetics. To address consumers’ increasing concerns about animal welfare, BQA programs have expanded even further and include animal handling. In 2008, Stewardship and Stockmanship was started through a collaborative effort of the National Cattlemen’s Beef Association (NCBA) and three cattle stockmanship practitioners. The goals of these efforts were to provide beef producers with the tools and information to positively impact consumers’ perception of the beef industry and increase animal performance and quality through reduced handling stress. In 2011, the Idaho BQA Program, which is a collaborative effort among University of Idaho Extension, Idaho Beef Council, Idaho Cattle Association, and allied industry representatives, identified animal handling as one of the yearly program emphases. The objective of this work was to bring Stewardship and Stockmanship educational events to Idaho, satisfying the identified needs and desires for animal handling training. This work afforded the opportunity to potentially reach new audiences with BQA information, reconnect with some traditional audiences, and collect some basic demographic information. Additionally, information related to participants knowledge and adoption of BQA principles and practices, including animal handling, was collected.
MATERIALS AND METHODS
The Idaho BQA Program results from a
collaborative arrangement among University of Idaho Extension (Specialists, Educators, and Program Coordinator), Idaho Beef Council, Idaho Cattle
161
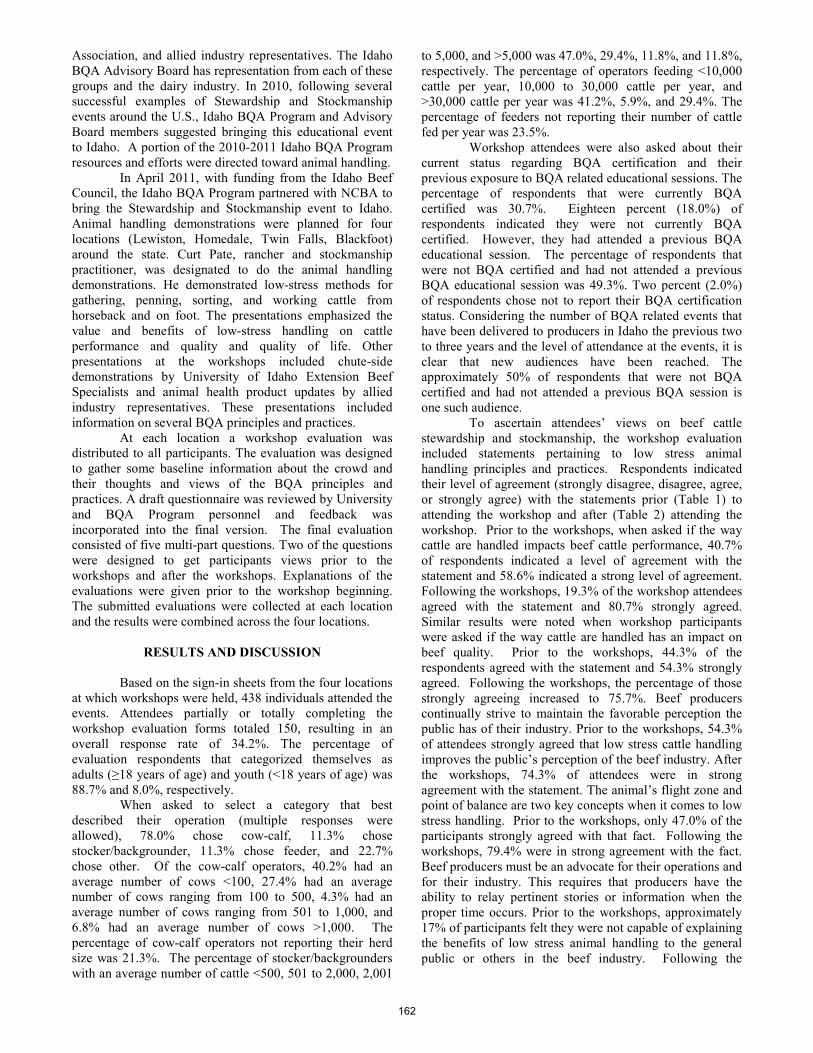
Association, and allied industry representatives. The Idaho BQA Advisory Board has representation from each of these groups and the dairy industry. In 2010, following several successful examples of Stewardship and Stockmanship events around the U.S., Idaho BQA Program and Advisory Board members suggested bringing this educational event to Idaho. A portion of the 2010-2011 Idaho BQA Program resources and efforts were directed toward animal handling.
In April 2011, with funding from the Idaho Beef Council, the Idaho BQA Program partnered with NCBA to bring the Stewardship and Stockmanship event to Idaho. Animal handling demonstrations were planned for four locations (Lewiston, Homedale, Twin Falls, Blackfoot) around the state. Curt Pate, rancher and stockmanship practitioner, was designated to do the animal handling demonstrations. He demonstrated low-stress methods for gathering, penning, sorting, and working cattle from horseback and on foot. The presentations emphasized the value and benefits of low-stress handling on cattle performance and quality and quality of life. Other presentations at the workshops included chute-side demonstrations by University of Idaho Extension Beef Specialists and animal health product updates by allied industry representatives. These presentations included information on several BQA principles and practices.
At each location a workshop evaluation was distributed to all participants. The evaluation was designed to gather some baseline information about the crowd and their thoughts and views of the BQA principles and practices. A draft questionnaire was reviewed by University and BQA Program personnel and feedback was incorporated into the final version. The final evaluation consisted of five multi-part questions. Two of the questions were designed to get participants views prior to the workshops and after the workshops. Explanations of the evaluations were given prior to the workshop beginning. The submitted evaluations were collected at each location and the results were combined across the four locations.
RESULTS AND DISCUSSION
Based on the sign-in sheets from the four locations at which workshops were held, 438 individuals attended the events. Attendees partially or totally completing the workshop evaluation forms totaled 150, resulting in an overall response rate of 34.2%. The percentage of evaluation respondents that categorized themselves as adults (≥18 years of age) and youth (<18 years of age) was 88.7% and 8.0%, respectively.
When asked to select a category that best described their operation (multiple responses were allowed), 78.0% chose cow-calf, 11.3% chose stocker/backgrounder, 11.3% chose feeder, and 22.7% chose other. Of the cow-calf operators, 40.2% had an average number of cows <100, 27.4% had an average number of cows ranging from 100 to 500, 4.3% had an average number of cows ranging from 501 to 1,000, and 6.8% had an average number of cows >1,000. The percentage of cow-calf operators not reporting their herd size was 21.3%. The percentage of stocker/backgrounders with an average number of cattle <500, 501 to 2,000, 2,001
to 5,000, and >5,000 was 47.0%, 29.4%, 11.8%, and 11.8%, respectively. The percentage of operators feeding <10,000 cattle per year, 10,000 to 30,000 cattle per year, and >30,000 cattle per year was 41.2%, 5.9%, and 29.4%. The percentage of feeders not reporting their number of cattle fed per year was 23.5%.
Workshop attendees were also asked about their current status regarding BQA certification and their previous exposure to BQA related educational sessions. The percentage of respondents that were currently BQA certified was 30.7%. Eighteen percent (18.0%) of respondents indicated they were not currently BQA certified. However, they had attended a previous BQA educational session. The percentage of respondents that were not BQA certified and had not attended a previous BQA educational session was 49.3%. Two percent (2.0%) of respondents chose not to report their BQA certification status. Considering the number of BQA related events that have been delivered to producers in Idaho the previous two to three years and the level of attendance at the events, it is clear that new audiences have been reached. The approximately 50% of respondents that were not BQA certified and had not attended a previous BQA session is one such audience.
To ascertain attendees’ views on beef cattle stewardship and stockmanship, the workshop evaluation included statements pertaining to low stress animal handling principles and practices. Respondents indicated their level of agreement (strongly disagree, disagree, agree, or strongly agree) with the statements prior (Table 1) to attending the workshop and after (Table 2) attending the workshop. Prior to the workshops, when asked if the way cattle are handled impacts beef cattle performance, 40.7% of respondents indicated a level of agreement with the statement and 58.6% indicated a strong level of agreement. Following the workshops, 19.3% of the workshop attendees agreed with the statement and 80.7% strongly agreed. Similar results were noted when workshop participants were asked if the way cattle are handled has an impact on beef quality. Prior to the workshops, 44.3% of the respondents agreed with the statement and 54.3% strongly agreed. Following the workshops, the percentage of those strongly agreeing increased to 75.7%. Beef producers continually strive to maintain the favorable perception the public has of their industry. Prior to the workshops, 54.3% of attendees strongly agreed that low stress cattle handling improves the public’s perception of the beef industry. After the workshops, 74.3% of attendees were in strong agreement with the statement. The animal’s flight zone and point of balance are two key concepts when it comes to low stress handling. Prior to the workshops, only 47.0% of the participants strongly agreed with that fact. Following the workshops, 79.4% were in strong agreement with the fact. Beef producers must be an advocate for their operations and for their industry. This requires that producers have the ability to relay pertinent stories or information when the proper time occurs. Prior to the workshops, approximately 17% of participants felt they were not capable of explaining the benefits of low stress animal handling to the general public or others in the beef industry. Following the
162
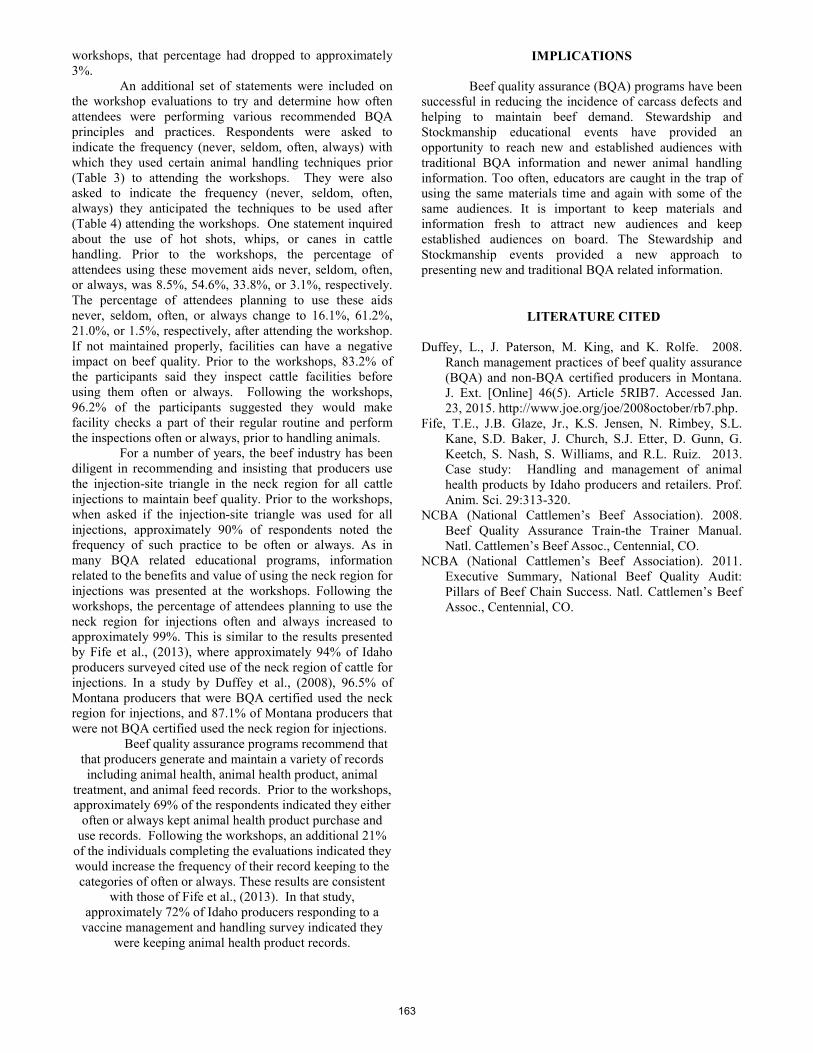
workshops, that percentage had dropped to approximately 3%.
An additional set of statements were included on the workshop evaluations to try and determine how often attendees were performing various recommended BQA principles and practices. Respondents were asked to indicate the frequency (never, seldom, often, always) with which they used certain animal handling techniques prior (Table 3) to attending the workshops. They were also asked to indicate the frequency (never, seldom, often, always) they anticipated the techniques to be used after (Table 4) attending the workshops. One statement inquired about the use of hot shots, whips, or canes in cattle handling. Prior to the workshops, the percentage of attendees using these movement aids never, seldom, often, or always, was 8.5%, 54.6%, 33.8%, or 3.1%, respectively. The percentage of attendees planning to use these aids never, seldom, often, or always change to 16.1%, 61.2%, 21.0%, or 1.5%, respectively, after attending the workshop. If not maintained properly, facilities can have a negative impact on beef quality. Prior to the workshops, 83.2% of the participants said they inspect cattle facilities before using them often or always. Following the workshops, 96.2% of the participants suggested they would make facility checks a part of their regular routine and perform the inspections often or always, prior to handling animals.
For a number of years, the beef industry has been diligent in recommending and insisting that producers use the injection-site triangle in the neck region for all cattle injections to maintain beef quality. Prior to the workshops, when asked if the injection-site triangle was used for all injections, approximately 90% of respondents noted the frequency of such practice to be often or always. As in many BQA related educational programs, information related to the benefits and value of using the neck region for injections was presented at the workshops. Following the workshops, the percentage of attendees planning to use the neck region for injections often and always increased to approximately 99%. This is similar to the results presented by Fife et al., (2013), where approximately 94% of Idaho producers surveyed cited use of the neck region of cattle for injections. In a study by Duffey et al., (2008), 96.5% of Montana producers that were BQA certified used the neck region for injections, and 87.1% of Montana producers that were not BQA certified used the neck region for injections.
Beef quality assurance programs recommend that that producers generate and maintain a variety of records including animal health, animal health product, animal
treatment, and animal feed records. Prior to the workshops, approximately 69% of the respondents indicated they either
often or always kept animal health product purchase and use records. Following the workshops, an additional 21%
of the individuals completing the evaluations indicated they would increase the frequency of their record keeping to the categories of often or always. These results are consistent
with those of Fife et al., (2013). In that study, approximately 72% of Idaho producers responding to a
vaccine management and handling survey indicated they were keeping animal health product records.
IMPLICATIONS
Beef quality assurance (BQA) programs have been successful in reducing the incidence of carcass defects and helping to maintain beef demand. Stewardship and Stockmanship educational events have provided an opportunity to reach new and established audiences with traditional BQA information and newer animal handling information. Too often, educators are caught in the trap of using the same materials time and again with some of the same audiences. It is important to keep materials and information fresh to attract new audiences and keep established audiences on board. The Stewardship and Stockmanship events provided a new approach to presenting new and traditional BQA related information.
LITERATURE CITED
Duffey, L., J. Paterson, M. King, and K. Rolfe. 2008. Ranch management practices of beef quality assurance (BQA) and non-BQA certified producers in Montana. J. Ext. [Online] 46(5). Article 5RIB7. Accessed Jan. 23, 2015. http://www.joe.org/joe/2008october/rb7.php.
Fife, T.E., J.B. Glaze, Jr., K.S. Jensen, N. Rimbey, S.L. Kane, S.D. Baker, J. Church, S.J. Etter, D. Gunn, G. Keetch, S. Nash, S. Williams, and R.L. Ruiz. 2013. Case study: Handling and management of animal health products by Idaho producers and retailers. Prof. Anim. Sci. 29:313-320.
NCBA (National Cattlemen’s Beef Association). 2008. Beef Quality Assurance Train-the Trainer Manual. Natl. Cattlemen’s Beef Assoc., Centennial, CO.
NCBA (National Cattlemen’s Beef Association). 2011. Executive Summary, National Beef Quality Audit: Pillars of Beef Chain Success. Natl. Cattlemen’s Beef Assoc., Centennial, CO.
163
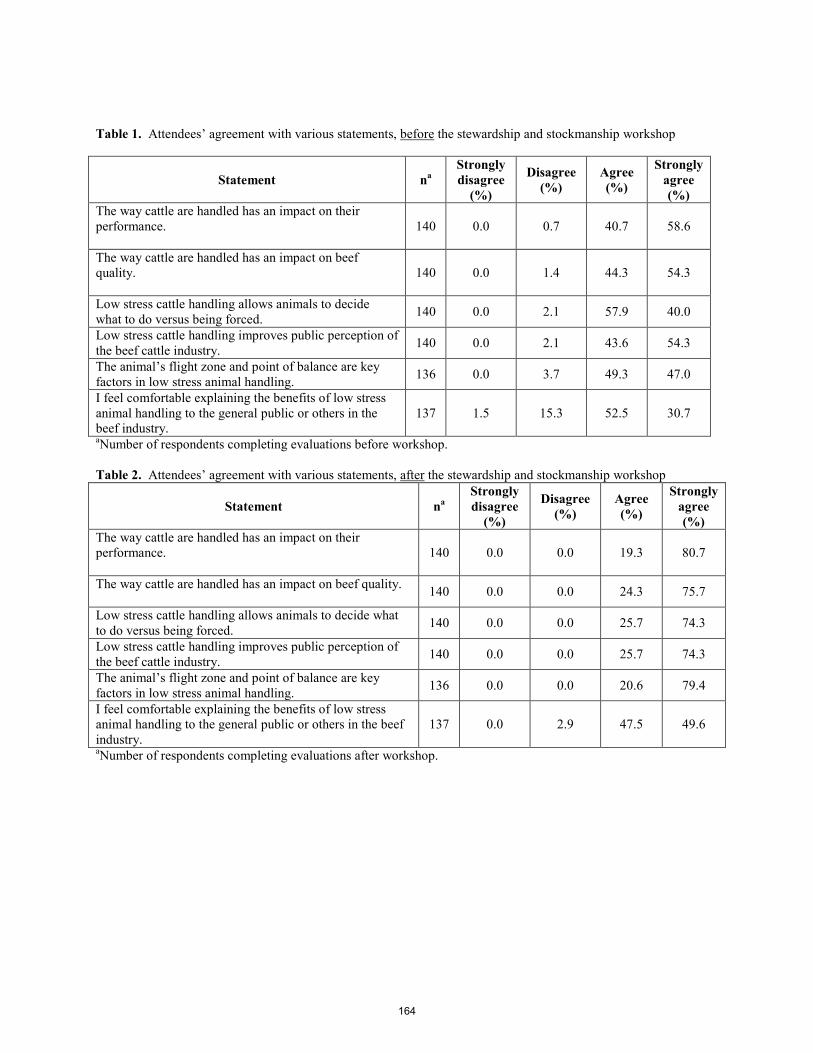
Table 1. Attendees’ agreement with various statements, before the stewardship and stockmanship workshop
aNumber of respondents completing evaluations before workshop. Table 2. Attendees’ agreement with various statements, after the stewardship and stockmanship workshop
Statement na Strongly disagree
(%)
Disagree (%)
Agree (%)
Strongly agree (%)
The way cattle are handled has an impact on their performance.
140 0.0 0.0 19.3 80.7
The way cattle are handled has an impact on beef quality. 140 0.0 0.0 24.3 75.7
Low stress cattle handling allows animals to decide what to do versus being forced. 140 0.0 0.0 25.7 74.3
Low stress cattle handling improves public perception of the beef cattle industry. 140 0.0 0.0 25.7 74.3
The animal’s flight zone and point of balance are key factors in low stress animal handling. 136 0.0 0.0 20.6 79.4
I feel comfortable explaining the benefits of low stress animal handling to the general public or others in the beef industry.
137 0.0 2.9 47.5 49.6
aNumber of respondents completing evaluations after workshop.
Statement na Strongly disagree
(%)
Disagree (%)
Agree (%)
Strongly agree (%)
The way cattle are handled has an impact on their performance.
140 0.0 0.7 40.7 58.6
The way cattle are handled has an impact on beef quality.
140 0.0 1.4 44.3 54.3
Low stress cattle handling allows animals to decide what to do versus being forced. 140 0.0 2.1 57.9 40.0
Low stress cattle handling improves public perception of the beef cattle industry. 140 0.0 2.1 43.6 54.3
The animal’s flight zone and point of balance are key factors in low stress animal handling. 136 0.0 3.7 49.3 47.0
I feel comfortable explaining the benefits of low stress animal handling to the general public or others in the beef industry.
137 1.5 15.3 52.5 30.7
164
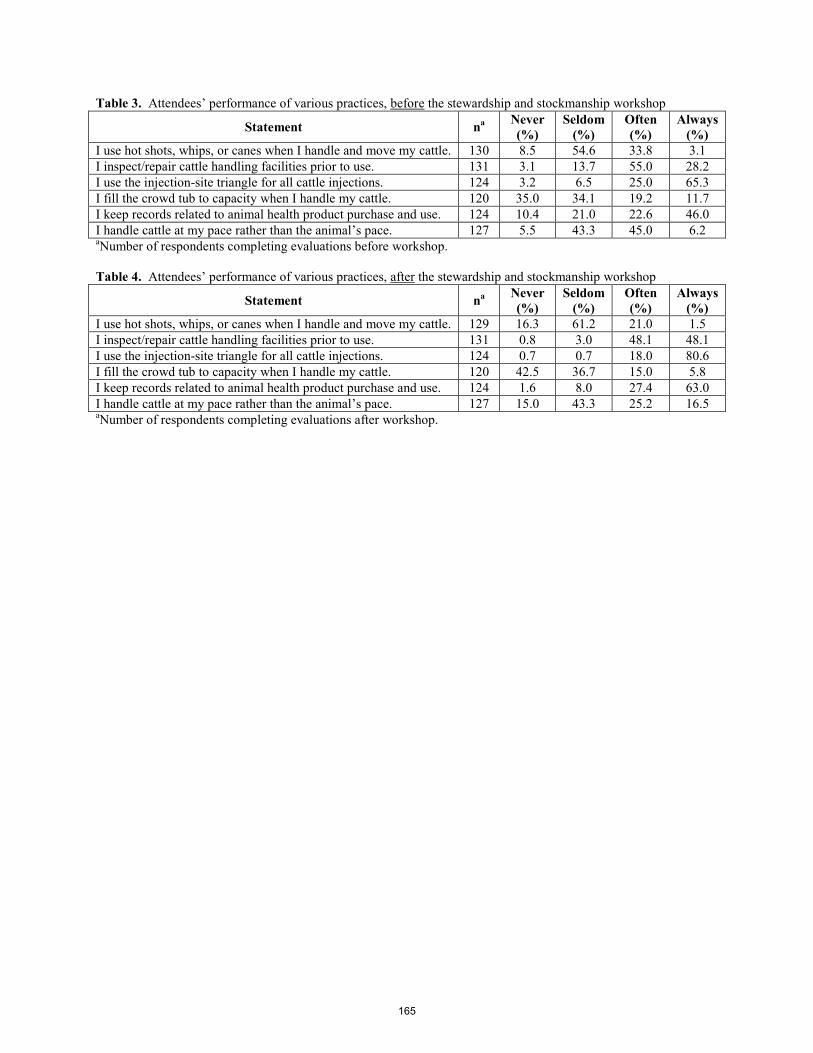
Table 3. Attendees’ performance of various practices, before the stewardship and stockmanship workshop
Statement na Never (%)
Seldom (%)
Often (%)
Always (%)
I use hot shots, whips, or canes when I handle and move my cattle. 130 8.5 54.6 33.8 3.1 I inspect/repair cattle handling facilities prior to use. 131 3.1 13.7 55.0 28.2 I use the injection-site triangle for all cattle injections. 124 3.2 6.5 25.0 65.3 I fill the crowd tub to capacity when I handle my cattle. 120 35.0 34.1 19.2 11.7 I keep records related to animal health product purchase and use. 124 10.4 21.0 22.6 46.0 I handle cattle at my pace rather than the animal’s pace. 127 5.5 43.3 45.0 6.2 aNumber of respondents completing evaluations before workshop. Table 4. Attendees’ performance of various practices, after the stewardship and stockmanship workshop
Statement na Never (%)
Seldom (%)
Often (%)
Always (%)
I use hot shots, whips, or canes when I handle and move my cattle. 129 16.3 61.2 21.0 1.5 I inspect/repair cattle handling facilities prior to use. 131 0.8 3.0 48.1 48.1 I use the injection-site triangle for all cattle injections. 124 0.7 0.7 18.0 80.6 I fill the crowd tub to capacity when I handle my cattle. 120 42.5 36.7 15.0 5.8 I keep records related to animal health product purchase and use. 124 1.6 8.0 27.4 63.0 I handle cattle at my pace rather than the animal’s pace. 127 15.0 43.3 25.2 16.5 aNumber of respondents completing evaluations after workshop.
165

PASTURES AND FORAGES

Proceedings, Western Section, American Society of Animal Science
Vol. 66, 2015
Effects of intensive late-season sheep grazing following early-season steer grazing on population dynamics of sericea lespedeza in the Kansas Flint Hills
J. Lemmon*, W. H. Fick†, J. A. Alexander*, A. G. Lemmon*,
D. C. Shaw*, G. W. Preedy*, C. A. Gurule*, K. C. Olson*, 1
*Department of Animal Sciences & Industry, Kansas State University, Manhattan, KS, USA †Department of Agronomy, Kansas State University, Manhattan, KS, USA
ABSTRACT: Mature ewes were used in a 2-yr study to evaluate effects of intensive late-season sheep grazing on vigor of sericea lespedeza (SL) in native tallgrass prairie. Pastures (n = 8; 31 ± 3.6 ha), infested with SL (initial basal frequency = 1.4%), were assigned randomly to 1 of 2 treatments: early-season beef steer grazing (1.1 ha/steer; approximate initial BW = 275 kg) from 4/15 to 7/15 followed by 60 d of rest (control; STR) or steer grazing from 4/15 to 7/15 followed by intensive grazing by mature ewes (0.2 ha/ewe; SHP) from 8/1 to 10/1. Ewes (n = 813/yr; initial BW = 67 ± 1.7 kg) were assigned randomly to graze 1 of 4 pastures; remaining pastures were not grazed from 8/1 to 10/1. Vegetation responses to treatment were measured along 4 permanent 100-m transects and in 2 permanent 5 x 5-m grazing exclosures in each pasture. Herbivory of SL was monitored weekly in each pasture from 7/21 to 10/7. Herbivory of SL in SHP and STR following steer grazing was not different (P = 0.26; 7.1 vs. 1.7% of all SL-containing canopies, respectively). In contrast, SL herbivory following sheep grazing was greater (P ≤ 0.01) in SHP than in STR (91.2 vs. 0.1% of all SL-containing canopies). Herbivory of individual SL plants was greater (P ≤ 0.01) in SHP than in STR by wk 2 of the sheep-grazing period (14.5 vs. 0.8%); moreover, herbivory of SL steadily increased (P ≤ 0.01) such that 89.4% of SL plants were grazed in SHP comparted to 2.0% in STR by wk 9 of the sheep-grazing period. Whole-plant DM weight of SL at dormancy was less (P ≤ 0.04; treatment × yr) in SHP than in STR both yr of the study. Additionally, annual seed production by SL was less (P < 0.01) in SHP than in STR (70 vs. 548 seeds / plant). Pasture forage biomass was not different (P = 0.29) between SHP and STR following the steer-grazing period. Conversely, STR had more (P ≤ 0.01) residual forage biomass than SHP at the end of the sheep-grazing period (2,838 vs. 1,770 kg DM/ha). Our results were interpreted to suggest that intense late-season grazing by sheep decreased vigor and reproductive capabilities of SL. Late-season sheep grazing decreased forage biomass by 1,068 kg DM/ha compared with late-season rest; however, residual biomass on grazed pastures was adequate to prevent soil-moisture loss and erosion. Key Words: biological weed control, grazing, Lespedeza cuneata, sheep, tallgrass prairie1
1 This research was funded by the National Fish & Wildlife Foundation (project no. 2003.12.039817).
INTRODUCTION
Sericea lespedeza (Lespedeza cuneata; SL) is a high-tannin, invasive forb in the Tallgrass Prairie ecosystem (Eckerle et al., 2010). In Kansas, SL infests ~2,530 km2 of pasture, primarily in the Flint Hills region (KDA, 2010). Sericea lespedeza infestations reduce native grass production by up to 92% through a combination of aggressive growth, prolific reproduction, canopy dominance, and allelopathy (Kalburtji and Mosjidis, 1992; Dudley et al., 2003; Eddy et al. 2003). Herbicides retard the spread of SL but application is laborious and expensive (Eddy et al., 2003); moreover, herbicides are lethal to ecologically-important, non-target plant species.
Increased grazing pressure on SL by domestic herbivores may slow its spread and facilitate some measure of biological control. Unfortunately, mature plants contain high levels of condensed tannins which are a strong deterrent to grazing by beef cattle (Jones and Mangan 1977; Eckerle et al. 2011a, 2011b, 2011c; Preedy et al., 2013). Small ruminants have greater tolerance for condensed tannins than beef cattle (Robbins et al., 1991; Hart, 2001; Pacheco et al., 2012). Sheep, in particular, appear less susceptible to certain plant toxins than beef cattle and may be useful to selectively pressure noxious weeds like SL (Ralphs et al., 1991; Henderson et al., 2012).
The predominant grazing management practice in the Flint Hills region of Kansas involves annual spring burning followed by intensive grazing with yearling beef cattle from April to August (Owensby et al. 2008). During seasonal grazing, 40 to 60% of annual graminoid production is removed and pastures remain idle for the remainder of the year. Under this prevailing management practice, invasion by SL into the tallgrass prairie biome has steadily increased (Eddy et al. 2003). Sericea lespedeza flowers and produces seed in late summer from August to September (Cope and Burns 1974; Koger et al., 2002; Eckerle et al. 2010). The absence of grazing pressure during this interval strongly promotes seed production, seed distribution, and continued invasion of the Flint Hills ecoregion by this noxious weed. Therefore the objective of our study was to evaluate the effects of late-season sheep grazing following locally-conventional steer grazing on vigor and reproductive capabilities of SL.
MATERIALS AND METHODS
This manuscript reports data from the first 2 yr of a 4 yr
study. Animal care and handling practices used herein were
166

approved by the Kansas State University Institutional Animal Care and Use Committee (protocol no. 3456).
Location. Our experiment was conducted during 2013 and 2014 at the Kansas State University Bressner Range Research Unit located in Woodson County, Kansas. Native tallgrass pastures (n = 8; 31 ± 3.6 ha) infested with sericea lespedeza (SL; initial basal frequency = 1.4%) were burned annually in early April. Pastures were assigned randomly to 1 of 2 treatments: early-season grazing with beef steers (1.1 ha/steer; approximate initial BW = 275 kg) from 4/15 to 7/15 followed by rest for the remainder of the year (control; STR) or steer grazing from 4/15 to 7/15 followed by intensive grazing by mature ewes (0.2 ha/ewe; SHP) from 8/1 to 10/1. Ewes (n = 815 in yr 1 and 811 in yr 2; mean initial BW = 67 ± 1.7 kg) were assigned randomly to graze 1 of 4 pastures; remaining pastures were not grazed from 8/1 to 10/1.
Animals. Mature ewes were obtained from 2 commercial sheep producers located in western Kansas. Ewes were transported to the site on approximately 7/30 each year. Ewes were weighed immediately before grazing began on 8/1 and immediately after grazing was halted on 10/1. Final BW of sheep averaged 72 ± 3.0 kg. Sheep were monitored daily to assure they remained in assigned pastures and that fresh water and mineral were available continually. Death loss was < 2% annually (13 sheep in yr 1 and 15 sheep in yr 2) and assumed to occur through predation or disease.
Vegetation responses. Vegetation responses to treatment were measured along 4 permanent 100-m transects (100 × 30-cm2 plot points/transect) and in 2 permanent 5 x 5-m grazing exclosures in each pasture (25 × 30-cm2 plot points/exclosure). Transects were laid out on a north-south gradient; ends were marked using steel posts. Immediately before and immediately after sheep grazing, a 100-m measuring tape was stretched from the southern end to the northern end of each transect. At 1-m intervals along each transect, biomass was measured using a visual obstruction technique (Robel et al., 1970). A 30 × 30-cm plot was projected on the eastern side of transects at each point of measurement. Within the plot, canopy type (i.e., grass- or forb-dominated) was noted, presence of SL was noted (e.g., yes or no), and evidence of herbivory was noted (i.e., obvious truncation of leaves or stems). Grazing exclosures were examined at the same times and in the same manner as transects, except that biomass, canopy type, and herbivory were evaluated in the approximate center of each m2 of the exclosure (n = 25 / exclosure). A total of 3,250 data points were collected twice annually using these procedures.
A weekly estimate of herbivory was conducted to evaluate grazing pressure on select forb species in each pasture. The species of interest were sericea lespedeza (Lespedeza cuneata), Baldwin’s ironweed (Vernonia baldwinii), and ragweed species (Ambrosia artemisiifolia, Ambrosia bidentata, and Ambrosia psilostachya). Individuals of each species or group of species (n = 100 / pasture weekly) were evaluated at temporary point transects. Point transect locations were determined randomly in control pastures. In treated pastures, point transects were located in areas where sheep grazing was observed to occur
at the time of observation. Evidence of herbivory (i.e., obvious truncation of leaves or stems) on individual plants was recorded.
Plant species composition and soil cover were assessed annually each October using a modified step-point technique (Owensby, 1973). Initial plant species composition was reported (Table 1). Pre-treatment bare ground % (44 ± 1.3% for SHP and 47 ± 7.2% for STR), litter cover % (47 ± 2.6% for SHP and 46 ± 8.0% for STR), and basal plant cover % (8.7 ± 2.82% for SHP and 7.0 ± 1.29% for STR) were not different (P ≥ 0.63) between treatments. Trends in plant species composition and soil cover will be evaluated at the end of this 4-yr study. Table 1. Initial botanical composition of native tallgrass pastures grazed by steers and sheep
Item %
Grasses 85.95 Big bluestem Andropogon gerardii 24.55 Hairy crabgrass Digitaria sanguinalis 3.90 Indiangrass Sorghastrum nutans 9.85 Little bluestem Schizachyrium scoparium 8.85 Plains lovegrass Eragrostis intermedia 6.00 Prairie threeawn Aristida oligantha 1.95 Purple lovegrass Eragrostis spectabilis 3.35 Sedge Carex spp. 8.20 Sideoats grama Bouteloua curtipendula 5.10 Switchgrass Panicum virgatum 3.70 Tall dropseed Sporobolus asper 6.65 Other grasses n = 20 3.85 Forbs 14.05 Baldwin's ironweed Vernonia baldwinii 0.82 Common ragweed Ambrosia artemisiifolia 0.41 Common yellow oxalis Oxalis stricta 0.57 Heath aster Symphyotrichum ericoides 0.38 Korean lespedeza Kummerowia stipulacea 0.75 Sericea lespedeza Lespedeza cuneata 1.38 Smoothseed wildbean Strophostyles leiosperma 0.36 Western ragweed Ambrosia psilostachya 6.00 Other forbs n = 48 2.92 Shrubs 0.44 Leadplant Amorpha canescens 0.42 Other shrubs n = 5 0.04
Seed production. A total of 100 mature SL plants were
collected adjacent to permanent line transects in each pasture immediately after the first killing frost (approximately 11/1 annually). Plants were placed into a labeled paper bag. Partial DM was measured using a forced-air oven (96 h; 55º C). Individual plants in each sample were defoliated manually; seeds, chaff, and stems were placed into a South Dakota Seed Blower (E.L. Erickson Products, Model B; 10-cm tube) to separate seeds. Cleaned seed was weighed for each sample. Seed weight was converted to seed count assuming a density of 770 seeds/g (Vermeire et al., 2007; Vandevender, 2014). Average seed production was calculated by dividing the number of seeds by the number of SL plants in each sample (n = 100).
Statistical analyses. Line transect and exclosure data were analyzed as a completely random design with repeated measures (PROC MIXED, SAS Inst. Inc., Cary, NC). Class variables included pasture, yr, time (i.e., pre-treatment or post-treatment), treatment, and transect (or exclosure). The
167
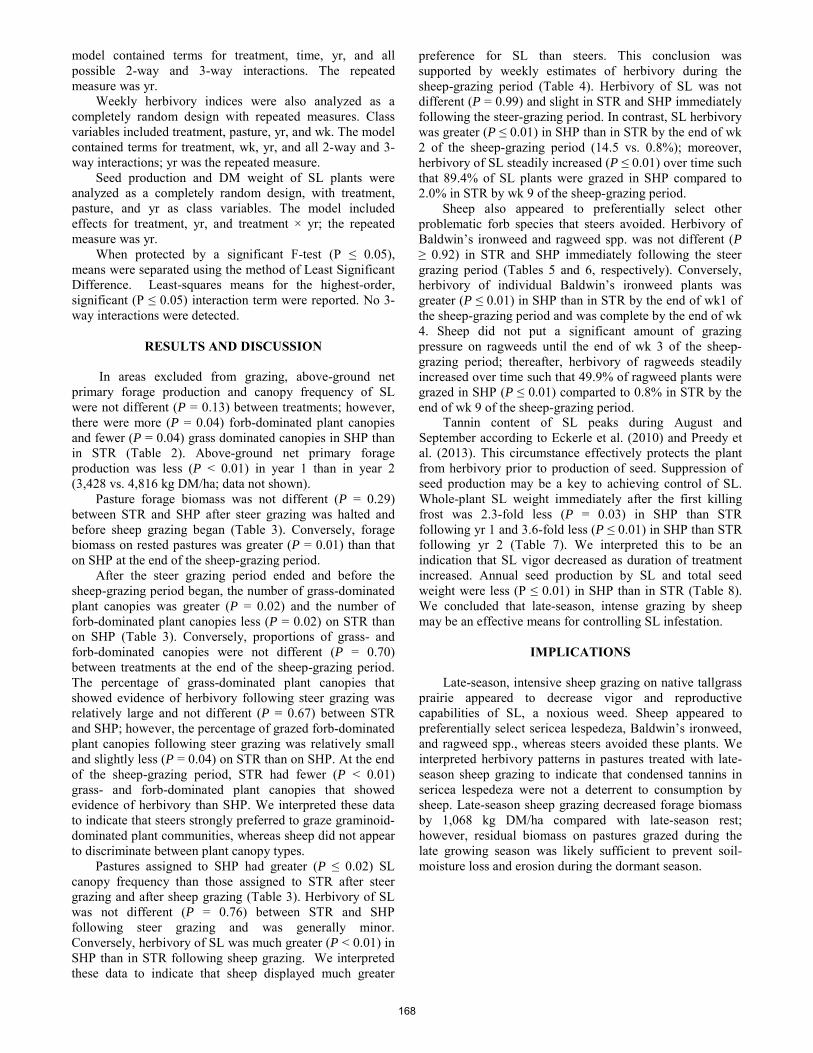
model contained terms for treatment, time, yr, and all possible 2-way and 3-way interactions. The repeated measure was yr.
Weekly herbivory indices were also analyzed as a completely random design with repeated measures. Class variables included treatment, pasture, yr, and wk. The model contained terms for treatment, wk, yr, and all 2-way and 3-way interactions; yr was the repeated measure.
Seed production and DM weight of SL plants were analyzed as a completely random design, with treatment, pasture, and yr as class variables. The model included effects for treatment, yr, and treatment × yr; the repeated measure was yr.
When protected by a significant F-test (P ≤ 0.05), means were separated using the method of Least Significant Difference. Least-squares means for the highest-order, significant (P ≤ 0.05) interaction term were reported. No 3-way interactions were detected.
RESULTS AND DISCUSSION
In areas excluded from grazing, above-ground net
primary forage production and canopy frequency of SL were not different (P = 0.13) between treatments; however, there were more (P = 0.04) forb-dominated plant canopies and fewer (P = 0.04) grass dominated canopies in SHP than in STR (Table 2). Above-ground net primary forage production was less (P < 0.01) in year 1 than in year 2 (3,428 vs. 4,816 kg DM/ha; data not shown).
Pasture forage biomass was not different (P = 0.29) between STR and SHP after steer grazing was halted and before sheep grazing began (Table 3). Conversely, forage biomass on rested pastures was greater (P = 0.01) than that on SHP at the end of the sheep-grazing period.
After the steer grazing period ended and before the sheep-grazing period began, the number of grass-dominated plant canopies was greater (P = 0.02) and the number of forb-dominated plant canopies less (P = 0.02) on STR than on SHP (Table 3). Conversely, proportions of grass- and forb-dominated canopies were not different (P = 0.70) between treatments at the end of the sheep-grazing period. The percentage of grass-dominated plant canopies that showed evidence of herbivory following steer grazing was relatively large and not different (P = 0.67) between STR and SHP; however, the percentage of grazed forb-dominated plant canopies following steer grazing was relatively small and slightly less (P = 0.04) on STR than on SHP. At the end of the sheep-grazing period, STR had fewer (P < 0.01) grass- and forb-dominated plant canopies that showed evidence of herbivory than SHP. We interpreted these data to indicate that steers strongly preferred to graze graminoid-dominated plant communities, whereas sheep did not appear to discriminate between plant canopy types.
Pastures assigned to SHP had greater (P ≤ 0.02) SL canopy frequency than those assigned to STR after steer grazing and after sheep grazing (Table 3). Herbivory of SL was not different (P = 0.76) between STR and SHP following steer grazing and was generally minor. Conversely, herbivory of SL was much greater (P < 0.01) in SHP than in STR following sheep grazing. We interpreted these data to indicate that sheep displayed much greater
preference for SL than steers. This conclusion was supported by weekly estimates of herbivory during the sheep-grazing period (Table 4). Herbivory of SL was not different (P = 0.99) and slight in STR and SHP immediately following the steer-grazing period. In contrast, SL herbivory was greater (P ≤ 0.01) in SHP than in STR by the end of wk 2 of the sheep-grazing period (14.5 vs. 0.8%); moreover, herbivory of SL steadily increased (P ≤ 0.01) over time such that 89.4% of SL plants were grazed in SHP compared to 2.0% in STR by wk 9 of the sheep-grazing period.
Sheep also appeared to preferentially select other problematic forb species that steers avoided. Herbivory of Baldwin’s ironweed and ragweed spp. was not different (P ≥ 0.92) in STR and SHP immediately following the steer grazing period (Tables 5 and 6, respectively). Conversely, herbivory of individual Baldwin’s ironweed plants was greater (P ≤ 0.01) in SHP than in STR by the end of wk1 of the sheep-grazing period and was complete by the end of wk 4. Sheep did not put a significant amount of grazing pressure on ragweeds until the end of wk 3 of the sheep-grazing period; thereafter, herbivory of ragweeds steadily increased over time such that 49.9% of ragweed plants were grazed in SHP (P ≤ 0.01) comparted to 0.8% in STR by the end of wk 9 of the sheep-grazing period.
Tannin content of SL peaks during August and September according to Eckerle et al. (2010) and Preedy et al. (2013). This circumstance effectively protects the plant from herbivory prior to production of seed. Suppression of seed production may be a key to achieving control of SL. Whole-plant SL weight immediately after the first killing frost was 2.3-fold less (P = 0.03) in SHP than STR following yr 1 and 3.6-fold less (P ≤ 0.01) in SHP than STR following yr 2 (Table 7). We interpreted this to be an indication that SL vigor decreased as duration of treatment increased. Annual seed production by SL and total seed weight were less (P ≤ 0.01) in SHP than in STR (Table 8). We concluded that late-season, intense grazing by sheep may be an effective means for controlling SL infestation.
IMPLICATIONS
Late-season, intensive sheep grazing on native tallgrass
prairie appeared to decrease vigor and reproductive capabilities of SL, a noxious weed. Sheep appeared to preferentially select sericea lespedeza, Baldwin’s ironweed, and ragweed spp., whereas steers avoided these plants. We interpreted herbivory patterns in pastures treated with late-season sheep grazing to indicate that condensed tannins in sericea lespedeza were not a deterrent to consumption by sheep. Late-season sheep grazing decreased forage biomass by 1,068 kg DM/ha compared with late-season rest; however, residual biomass on pastures grazed during the late growing season was likely sufficient to prevent soil-moisture loss and erosion during the dormant season.
168

LITERATURE CITED
Cope, W. A., and J. C. Burns. 1974. Components of forage quality in sericea lespedeza in relationship to strain, season, and cutting treatments. Agronomy Journal 66:389-394.
Dudley, D. M., and W. H. Fick. 2003. Effects of sericea lespedeza residues on selected tallgrass prairie grasses. Trans. Kansas Acad. Sci. 106:166-170.
Eckerle, G. J., K. C. Olson, J. R. Jaeger, J. L. Davidson, T. K. Kraft, and L. A. Pacheco. 2010. Effects of sun-curing and harvest maturity on concentration and protein-binding capacity of condensed tannins in sericea lespedeza (Lespedeza cuneata). Proc. West. Sec. Amer. Soc. Anim. Sci. 61:30-34.
Eckerle, G. J., K. C. Olson, J. R. Jaeger, J. W. Waggoner, J. L. Davidson and L. A. Pacheco. 2011a. High-tannin forage utilization by beef cows I. Intake and digestion of Tallgrass prairie hay contaminated with sericea lespedeza (Lespedeza cuneata). Proc. West. Sec. Amer. Soc. Anim. Sci. 62:199-202.
Eckerle, G. J., K. C. Olson, J. R. Jaeger, J. W. Waggoner, J. L. Davidson and L. A. Pacheco. 2011b. High-tannin forage utilization by beef cows II. Effects of corn steep liquor (CSL) supplementation on intake and digestion of Tallgrass prairie hay contaminated with sericea lespedeza (Lespedeza cuneata). Proc. West. Sec. Amer. Soc. Anim. Sci. 62:203-206.
Eckerle, G. J., K. C. Olson, J. R. Jaeger, J. W. Waggoner, J. L. Davidson and L. A. Pacheco. 2011c. High-tannin forage utilization by beef cows III. Effects of corn steep liquor supplementation on voluntary selection of Tallgrass prairie hay contaminated with sericea lespedeza (Lespedeza cuneata) and uncontaminated Tallgrass prairie hay. Proc. West. Sec. Amer. Soc. Anim. Sci. 62:207-210.
Eddy, T., J. Davidson, and B. Obermeyer. 2003. Invasion dynamics and biological control prospects for Sericea lespedeza in Kansas. Great Plains Research: A Journal of Natural and Social Sciences. 13:217-230.
Hart, S. P. 2001. Recent perspectives in using goats for vegetation management in the USA. J. Dairy Sci. 84(E Suppl.):E170-E176.
Henderson, S. L., T. K. Mosley, J. C. Mosley, and R. W. Kott. 2012. Spotted knapweed utilization by sequential cattle and sheep grazing. Range. Ecol. Manage. 65:286-291.
Jones, W. T., and J. L. Mangan. 1977. Complexes of the condensed tannins of sainfoin (Onobrychis viciifolia Scop.) with fraction 1 leaf protein and with submaxillary mucoprotein, and their reversal by polyethylen glycol and pH. J. Sci. Food Agric. 28:126-136.
Kalburtji, K. L., and J. A. Mosjidis. 1992. Effects of sericea lespedeza residues on warm-season grasses. J. Range Manage. 45:441-444.
KDA. 2010. Kansas Department of Agriculture, Kansas Plant Pest Alert. Sericea Lespedeza. http://agriculture.ks.gov/docs/default-source/pp-fact-sheets/sericea-lespedeza-pest-alert.pdf?sfvrsn=0. Accessed 02/23/2015.
Koger, C. H., J. F. Stritzke, and D. C. Cummings. 2002. Control of sericea lespedeza (Lespedeza cuneata) with triclopyr, fluroxypyr, and metsulfron. Weed Technol. 16:893-900.
Owensby, C.E., L.M. Auen, H.F. Berns, and K.C. Dhuyvetter. 2008. Grazing systems for yearling cattle on tallgrass prairie. Range. Ecol. Manage. 61:204-210.
Owensby, C. E. 1973. Modified step-point system for botanical composition and basal cover estimates. J. Range Manage. 26:302-303.
Pacheco, L.A., W.H. Fick, E.A. Bailey, D.L. Davis, G.W. Preedy, and K.C. Olson. 2012. Effects of co-grazing on herbivory patterns and performance by cattle and goats grazing native tallgrass rangeland infested by sericea lespedeza (Lespedeza cuneata). Proc.West. Sec. Amer. Soc. Anim. Sci. 63:169-172.
Preedy, G. W., L. W. Murray, W. H. Fick, L. A. Pacheco, E. A. Bailey, D. L. Davis, A. V. Siverson, and KC Olson. 2013. High-tannin forage utilization by beef cows V. Effects of corn steep liquor supplementation on dietary botanical composition of beef cows grazing native range infested by sericea lespedeza (Lespedeza cuneata). Proc. West. Sec. Amer. Soc. Anim. Sci. 64:310-316.
Ralphs, M. H., J. E. Bowns, and G. D. Manners. 1991. Utilization of larkspur by sheep. J. Range Manage. 44:619-622.
Robbins, C., A. E. Hagerman, P. J. Austin, C. McArthur, and T. A. Hanley. 1991. Variation in mammalian physiological responses to a condensed tannin and its ecological implications. J. Mamm. 72:480-486.
Robel, R. J., J. N. Briggs, A. D. Dalton, and L. C. Hulbert. 1970. Relationships between visual obstruction measurements and weight of grassland vegetation. J. Range Manage. 23:295-297.
Vandevender, J. 2014. Planting guide: sericea lespedeza. USDA-NRCS. Accessed at: http://www.nrcs.usda.gov/ Internet/FSE_PLANTMATERIALS/publications/wvpmcpg7034.pdf (12 December 2014).
Vermeire, L.T., T.G. Bidwell, and J. Stritzke. 2007. Ecology and management of sericea lespedeza. Oklahoma Cooperative Extension Service PSS-2874. Accessed at: http://dasnr22.dasnr.okstate.edu/ docushare/dsweb/Get/Rendition-7591/PSS-2874web%20color.pdf (12 February 2015).
169
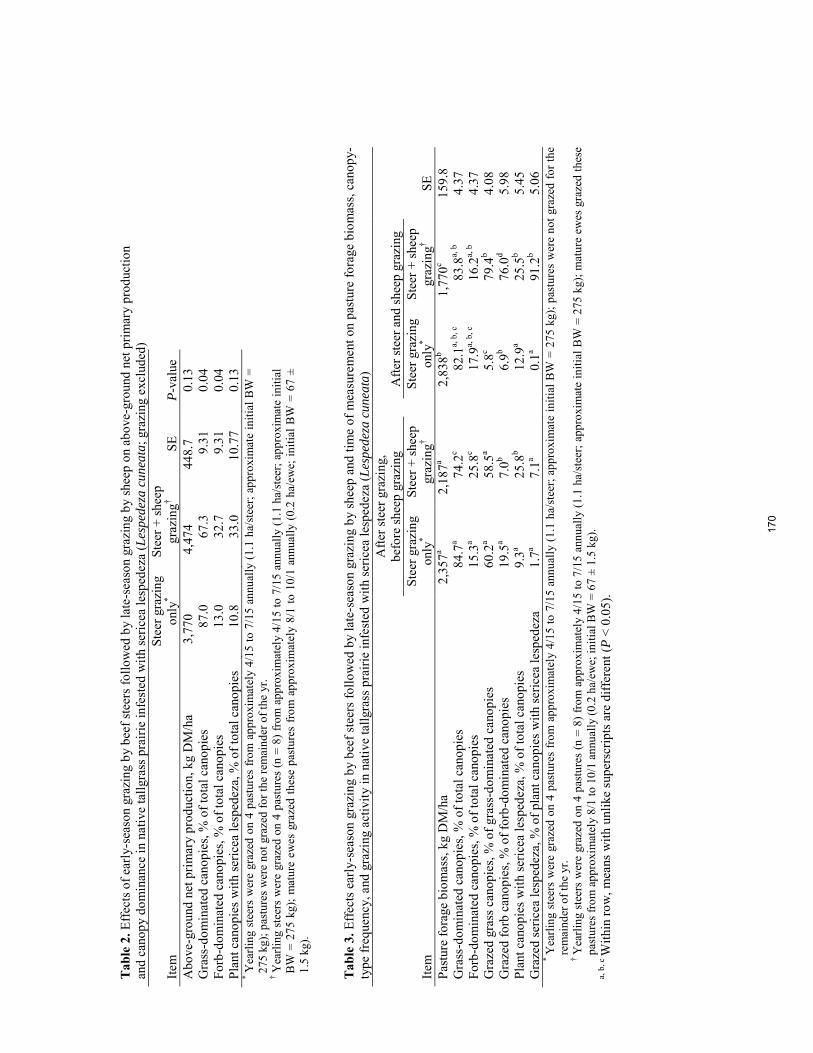
Tab
le 2
. Effe
cts o
f ear
ly-s
easo
n gr
azin
g by
bee
f ste
ers f
ollo
wed
by
late
-sea
son
graz
ing
by sh
eep
on a
bove
-gro
und
net p
rimar
y pr
oduc
tion
and
cano
py d
omin
ance
in n
ativ
e ta
llgra
ss p
rairi
e in
fest
ed w
ith se
ricea
lesp
edez
a (L
espe
deza
cun
eata
; gra
zing
exc
lude
d)
Item
St
eer g
razi
ng
only
* St
eer +
shee
p gr
azin
g† SE
P-va
lue
Abo
ve-g
roun
d ne
t prim
ary
prod
uctio
n, k
g D
M/h
a 3,
770
4,47
4 44
8.7
0.13
G
rass
-dom
inat
ed c
anop
ies,
% o
f tot
al c
anop
ies
87.0
67
.3
9.3
1 0.
04
Forb
-dom
inat
ed c
anop
ies,
% o
f tot
al c
anop
ies
13.0
32
.7
9.3
1 0.
04
Plan
t can
opie
s with
seric
ea le
sped
eza,
% o
f tot
al c
anop
ies
10.8
33
.0
10.7
7 0.
13
* Y
earli
ng s
teer
s w
ere
graz
ed o
n 4
past
ures
from
app
roxi
mat
ely
4/15
to 7
/15
annu
ally
(1.1
ha/
stee
r; ap
prox
imat
e in
itial
BW
=
275
kg);
past
ures
wer
e no
t gra
zed
for t
he re
mai
nder
of t
he y
r. †
Yea
rling
ste
ers
wer
e gr
azed
on
4 pa
stur
es (n
= 8
) fro
m a
ppro
xim
atel
y 4/
15 to
7/1
5 an
nual
ly (1
.1 h
a/st
eer;
appr
oxim
ate
initi
al
BW
= 2
75 k
g); m
atur
e ew
es g
raze
d th
ese
past
ures
from
app
roxi
mat
ely
8/1
to 1
0/1
annu
ally
(0.2
ha/
ewe;
initi
al B
W =
67
± 1.
5 kg
). T
able
3. E
ffect
s ear
ly-s
easo
n gr
azin
g by
bee
f ste
ers f
ollo
wed
by
late
-sea
son
graz
ing
by sh
eep
and
time
of m
easu
rem
ent o
n pa
stur
e fo
rage
bio
mas
s, ca
nopy
-ty
pe fr
eque
ncy,
and
gra
zing
act
ivity
in n
ativ
e ta
llgra
ss p
rairi
e in
fest
ed w
ith se
ricea
lesp
edez
a (L
espe
deza
cun
eata
)
Afte
r ste
er g
razi
ng,
befo
re sh
eep
graz
ing
Afte
r ste
er a
nd sh
eep
graz
ing
Item
St
eer g
razi
ng
only
* St
eer +
shee
p gr
azin
g†
Stee
r gra
zing
on
ly*
Stee
r + sh
eep
graz
ing†
SE
Past
ure
fora
ge b
iom
ass,
kg D
M/h
a 2,
357a
2,18
7a
2,83
8b 1,
770c
159.
8 G
rass
-dom
inat
ed c
anop
ies,
% o
f tot
al c
anop
ies
84.7
a 74
.2c
82
.1a,
b, c
83
.8a,
b
4.37
Fo
rb-d
omin
ated
can
opie
s, %
of t
otal
can
opie
s 15
.3a
25.8
c
17.9
a, b
, c
16.2
a, b
4.
37
Gra
zed
gras
s can
opie
s, %
of g
rass
-dom
inat
ed c
anop
ies
60.2
a 58
.5a
5.
8c 79
.4b
4.08
G
raze
d fo
rb c
anop
ies,
% o
f for
b-do
min
ated
can
opie
s 19
.5a
7.0b
6.
9b 76
.0d
5.98
Pl
ant c
anop
ies w
ith se
ricea
lesp
edez
a, %
of t
otal
can
opie
s 9.
3a 25
.8b
12
.9a
25.5
b 5.
45
Gra
zed
seric
ea le
sped
eza,
% o
f pla
nt c
anop
ies w
ith se
ricea
lesp
edez
a 1.
7a 7.
1a
0.1a
91.2
b 5.
06
* Y
earli
ng s
teer
s w
ere
graz
ed o
n 4
past
ures
from
app
roxi
mat
ely
4/15
to 7
/15
annu
ally
(1.1
ha/
stee
r; ap
prox
imat
e in
itial
BW
= 2
75 k
g); p
astu
res
wer
e no
t gra
zed
for t
he
rem
aind
er o
f the
yr.
† Y
earli
ng s
teer
s w
ere
graz
ed o
n 4
past
ures
(n =
8) f
rom
app
roxi
mat
ely
4/15
to 7
/15
annu
ally
(1.1
ha/
stee
r; ap
prox
imat
e in
itial
BW
= 2
75 k
g); m
atur
e ew
es g
raze
d th
ese
past
ures
from
app
roxi
mat
ely
8/1
to 1
0/1
annu
ally
(0.2
ha/
ewe;
initi
al B
W =
67
± 1.
5 kg
). a,
b, c
With
in ro
w, m
eans
with
unl
ike
supe
rscr
ipts
are
diff
eren
t (P
< 0.
05).
170
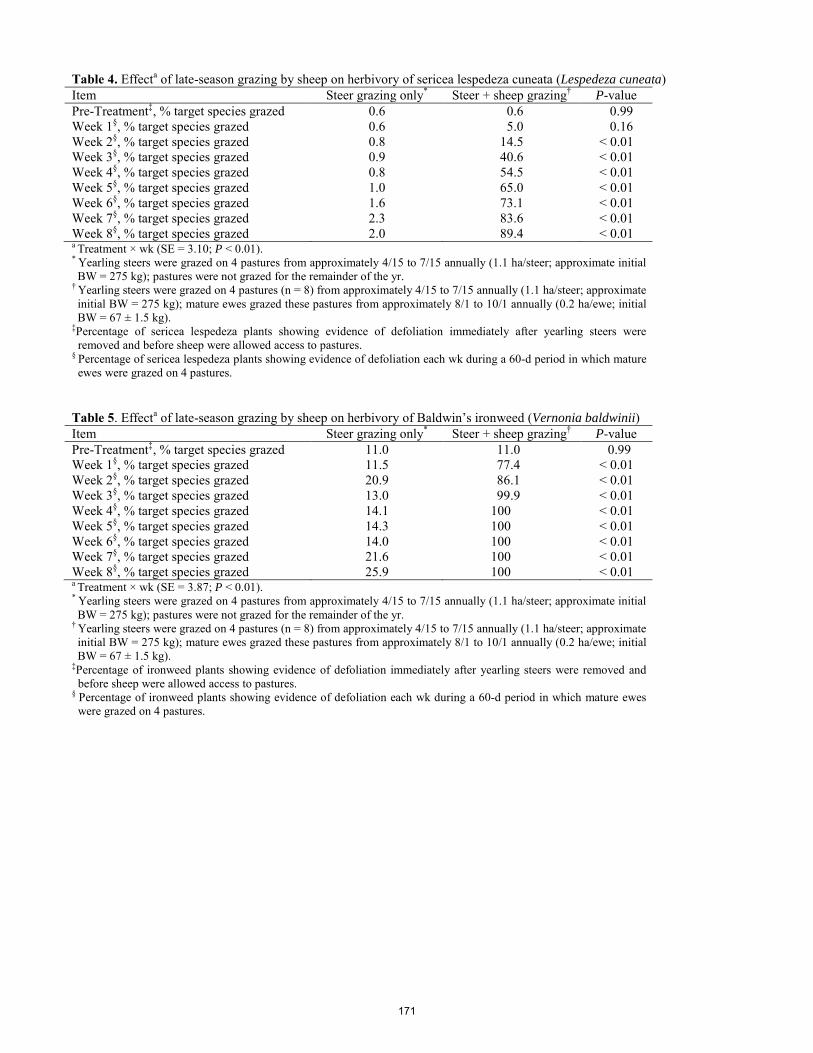
Table 4. Effecta of late-season grazing by sheep on herbivory of sericea lespedeza cuneata (Lespedeza cuneata) Item Steer grazing only* Steer + sheep grazing† P-value Pre-Treatment‡, % target species grazed 0.6 0.6 0.99 Week 1§, % target species grazed 0.6 5.0 0.16 Week 2§, % target species grazed 0.8 14.5 < 0.01 Week 3§, % target species grazed 0.9 40.6 < 0.01 Week 4§, % target species grazed 0.8 54.5 < 0.01 Week 5§, % target species grazed 1.0 65.0 < 0.01 Week 6§, % target species grazed 1.6 73.1 < 0.01 Week 7§, % target species grazed 2.3 83.6 < 0.01 Week 8§, % target species grazed 2.0 89.4 < 0.01 a Treatment × wk (SE = 3.10; P < 0.01). * Yearling steers were grazed on 4 pastures from approximately 4/15 to 7/15 annually (1.1 ha/steer; approximate initial BW = 275 kg); pastures were not grazed for the remainder of the yr.
† Yearling steers were grazed on 4 pastures (n = 8) from approximately 4/15 to 7/15 annually (1.1 ha/steer; approximate initial BW = 275 kg); mature ewes grazed these pastures from approximately 8/1 to 10/1 annually (0.2 ha/ewe; initial BW = 67 ± 1.5 kg).
‡Percentage of sericea lespedeza plants showing evidence of defoliation immediately after yearling steers were removed and before sheep were allowed access to pastures.
§ Percentage of sericea lespedeza plants showing evidence of defoliation each wk during a 60-d period in which mature ewes were grazed on 4 pastures.
Table 5. Effecta of late-season grazing by sheep on herbivory of Baldwin’s ironweed (Vernonia baldwinii) Item Steer grazing only* Steer + sheep grazing† P-value Pre-Treatment‡, % target species grazed 11.0 11.0 0.99 Week 1§, % target species grazed 11.5 77.4 < 0.01 Week 2§, % target species grazed 20.9 86.1 < 0.01 Week 3§, % target species grazed 13.0 99.9 < 0.01 Week 4§, % target species grazed 14.1 100 < 0.01 Week 5§, % target species grazed 14.3 100 < 0.01 Week 6§, % target species grazed 14.0 100 < 0.01 Week 7§, % target species grazed 21.6 100 < 0.01 Week 8§, % target species grazed 25.9 100 < 0.01 a Treatment × wk (SE = 3.87; P < 0.01). * Yearling steers were grazed on 4 pastures from approximately 4/15 to 7/15 annually (1.1 ha/steer; approximate initial BW = 275 kg); pastures were not grazed for the remainder of the yr.
† Yearling steers were grazed on 4 pastures (n = 8) from approximately 4/15 to 7/15 annually (1.1 ha/steer; approximate initial BW = 275 kg); mature ewes grazed these pastures from approximately 8/1 to 10/1 annually (0.2 ha/ewe; initial BW = 67 ± 1.5 kg).
‡Percentage of ironweed plants showing evidence of defoliation immediately after yearling steers were removed and before sheep were allowed access to pastures.
§ Percentage of ironweed plants showing evidence of defoliation each wk during a 60-d period in which mature ewes were grazed on 4 pastures.
171
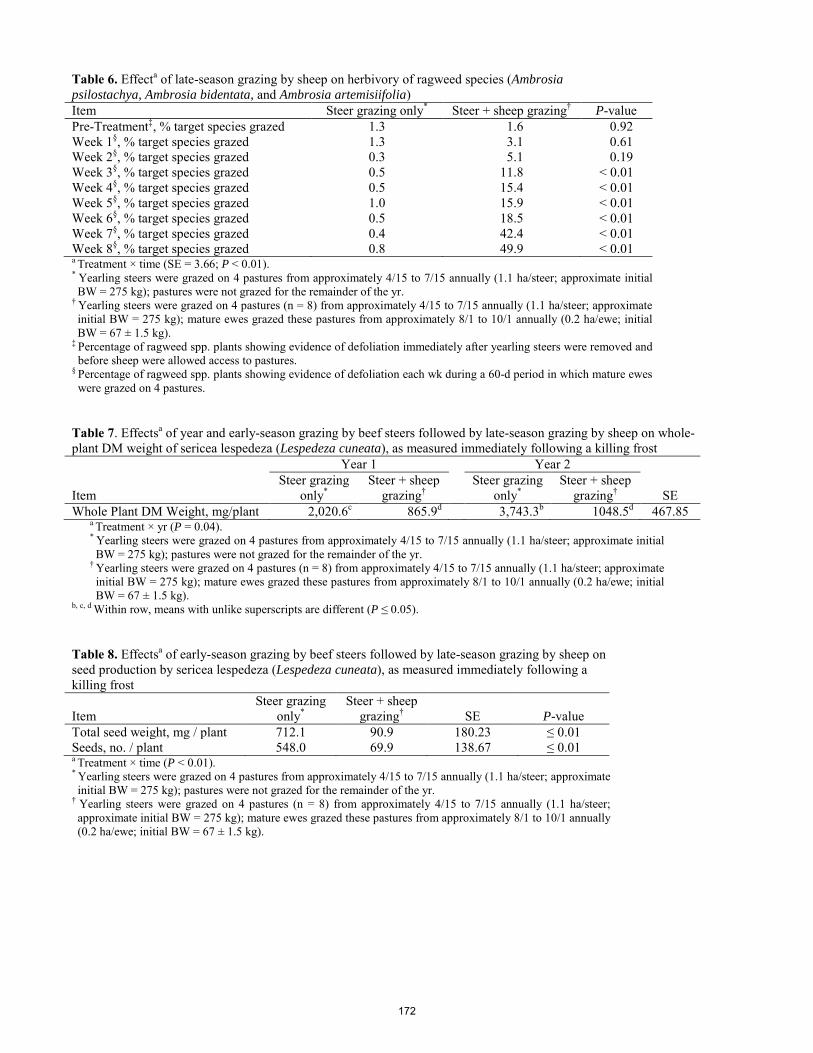
Table 6. Effecta of late-season grazing by sheep on herbivory of ragweed species (Ambrosia psilostachya, Ambrosia bidentata, and Ambrosia artemisiifolia) Item Steer grazing only* Steer + sheep grazing† P-value Pre-Treatment‡, % target species grazed 1.3 1.6 0.92 Week 1§, % target species grazed 1.3 3.1 0.61 Week 2§, % target species grazed 0.3 5.1 0.19 Week 3§, % target species grazed 0.5 11.8 < 0.01 Week 4§, % target species grazed 0.5 15.4 < 0.01 Week 5§, % target species grazed 1.0 15.9 < 0.01 Week 6§, % target species grazed 0.5 18.5 < 0.01 Week 7§, % target species grazed 0.4 42.4 < 0.01 Week 8§, % target species grazed 0.8 49.9 < 0.01 a Treatment × time (SE = 3.66; P < 0.01). * Yearling steers were grazed on 4 pastures from approximately 4/15 to 7/15 annually (1.1 ha/steer; approximate initial BW = 275 kg); pastures were not grazed for the remainder of the yr.
† Yearling steers were grazed on 4 pastures (n = 8) from approximately 4/15 to 7/15 annually (1.1 ha/steer; approximate initial BW = 275 kg); mature ewes grazed these pastures from approximately 8/1 to 10/1 annually (0.2 ha/ewe; initial BW = 67 ± 1.5 kg).
‡ Percentage of ragweed spp. plants showing evidence of defoliation immediately after yearling steers were removed and before sheep were allowed access to pastures.
§ Percentage of ragweed spp. plants showing evidence of defoliation each wk during a 60-d period in which mature ewes were grazed on 4 pastures.
Table 7. Effectsa of year and early-season grazing by beef steers followed by late-season grazing by sheep on whole-plant DM weight of sericea lespedeza (Lespedeza cuneata), as measured immediately following a killing frost Year 1 Year 2 Item
Steer grazing only*
Steer + sheep grazing†
Steer grazing only*
Steer + sheep grazing†
SE
Whole Plant DM Weight, mg/plant 2,020.6c 865.9d 3,743.3b 1048.5d 467.85 a Treatment × yr (P = 0.04). * Yearling steers were grazed on 4 pastures from approximately 4/15 to 7/15 annually (1.1 ha/steer; approximate initial BW = 275 kg); pastures were not grazed for the remainder of the yr.
† Yearling steers were grazed on 4 pastures (n = 8) from approximately 4/15 to 7/15 annually (1.1 ha/steer; approximate initial BW = 275 kg); mature ewes grazed these pastures from approximately 8/1 to 10/1 annually (0.2 ha/ewe; initial BW = 67 ± 1.5 kg).
b, c, d Within row, means with unlike superscripts are different (P ≤ 0.05). Table 8. Effectsa of early-season grazing by beef steers followed by late-season grazing by sheep on seed production by sericea lespedeza (Lespedeza cuneata), as measured immediately following a killing frost Item
Steer grazing only*
Steer + sheep grazing†
SE
P-value
Total seed weight, mg / plant 712.1 90.9 180.23 ≤ 0.01 Seeds, no. / plant 548.0 69.9 138.67 ≤ 0.01 a Treatment × time (P < 0.01). * Yearling steers were grazed on 4 pastures from approximately 4/15 to 7/15 annually (1.1 ha/steer; approximate initial BW = 275 kg); pastures were not grazed for the remainder of the yr.
† Yearling steers were grazed on 4 pastures (n = 8) from approximately 4/15 to 7/15 annually (1.1 ha/steer; approximate initial BW = 275 kg); mature ewes grazed these pastures from approximately 8/1 to 10/1 annually (0.2 ha/ewe; initial BW = 67 ± 1.5 kg).
172

Proceedings, Western Section, American Society of Animal Science
Vol. 66, 2015
Effects of growing-season prescribed burning on vigor of the noxious weed sericea lespedeza (Lespedeza cuneata) in the Kansas Flint Hills
C. A. Gurule*, J. A. Alexander*, W. H. Fick†, J. Lemmon*, A. G. Lemmon*, G. W. Preedy*, K. C. Olson*, 1
* Department of Animal Sciences & Industry, Kansas State University, Manhattan † Department of Agronomy, Kansas State University, Manhattan, KS
ABSTRACT: Prescribed, dormant-season burning is practiced commonly in the Kansas Flint Hills to improve growth performance of transient yearling cattle and to control invasion by woody-stemmed plant species. Our objective was to evaluate the effects of growing-season prescribed burning of native tallgrass range on vigor of the noxious weed sericea lespedeza (SL). A 50-ha native tallgrass pasture infested with SL (initial basal frequency = 2.02%) was divided along watershed boundaries into 9 fire-management units (5 ± 2.6 ha). Units were assigned randomly to 1 of 3 prescribed-burning times (n = 3 / treatment): early spring (4/1; CON), mid-summer (7/30; EARLY), or late summer (9/1; LATE). Forage biomass, SL frequency, and SL stem height were measured along a single, permanent 100-m transect in each pasture subunit (100 × 30-cm2 plot points/transect). Transects were read at 1-m intervals on 07/10, 08/04, 09/04, and 10/14; moreover, SL seed production was assessed on 11/04. Forage biomass was influenced by treatment and measurement date (treatment × time; P ≤ 0.01). Forage biomass was not different (P ≥ 0.77) between treatments on 7/10. On 10/14, forage biomass was greater (P < 0.01) on CON than on EARLY or LATE; however, all treatments had > 2,200 kg of forage DM/ha. Similarly, canopy frequency of SL was not different (P ≥ 0.61) between treatments on 7/10; it was decreased (P ≤ 0.04) in EARLY compared to CON and LATE on 8/4 but recovered (P = 0.78) to pre-fire levels on 10/14. Conversely, canopy frequency of SL on LATE was less (P ≤ 0.04) than CON on 9/2 and 10/14 and did not recover (P = 0.19) to pre-fire levels on 10/14. Stem height of SL was not different (P ≥ 0.62) between treatments on 7/10; however, SL stem height in EARLY and LATE was less (P ≤ 0.05) than that in CON on 10/14. Whole-plant DM weight of SL at dormancy and seed production by SL were greatly (P < 0.01) diminished in EARLY and LATE compared with CON. We interpreted these data to indicate that prescribed burning during the growing season had minor or transient effects on SL canopy frequency and stem height compared to conventional dormant-season prescribed burning. In contrast, growing-season prescribed burning had strong suppressive influences on vigor and reproductive capabilities of individual SL plants. Key words: biomass, canopy frequency, Lespedeza cuneata, prescribed fire, seed production 1 This research was funded by the National Fish & Wildlife
Foundation (project no. 2003.12.039817).
INTRODUCTION
Sericea lespedeza (SL) was introduced into the United States from Asia in the late 19th century. Early land managers recognized that SL was adaptable, tolerant of shallow, acidic or low-fertility soils, and resistant to insects and disease. This combination of traits made SL a widely-used plant for reseeding strip-mined lands, highway right-of-ways, dams, and waterways in the US for nearly a century.
Regrettably, SL is highly fecund. Individual plants are capable of producing up to 950 kg seed / ha annually (Vermeire et al. 2007). Vigorous seed production allows SL to rapidly infiltrate native grasslands that are adjacent to reseeding projects; seed can be transported great distances via the alimentary canal and hair of wild and domestic herbivores. In Kansas alone, SL has infested ~2,530 km2 of pasture, primarily in the Flint Hills region (KDA, 2010). The resulting damage to native habitats for wildlife and pasture quality for domestic herbivores has been devastating.
The predominant grazing management practice in the Kansas Flint Hills involves annual spring burning in March or April followed by intensive grazing with yearling beef cattle for a relatively short period from April to August (Owensby et al. 2008). During seasonal grazing, 40 to 60% of annual graminoid production is removed and grazing lands then remain idle for the remainder of the year. Under this prevailing management practice, invasion by SL into the tallgrass prairie biome has steadily increased (Eddy et al. 2003). Vermeire et al. (2007) speculated that dormant-season spring fires may stimulate SL growth by scarifying seeds lying on the surface of the soil. Adams et al. (1982) reported that plants with robust canopies responded more strongly to growing-season prescribed burns than to dormant-season prescribed burns. In addition, Cummings et al. (2007) reported that application of growing season fire at 3-yr intervals decreased the rate of SL invasion. Therefore, the objective of the study was to evaluate the effects of growing-season prescribed burning of native tallgrass range on vigor of sericea lespedeza.
MATERIALS AND METHODS
Study Site and Treatments. A 50-ha native tallgrass
pasture located in Geary Co., KS was used for our study. The site was historically grazed during the winter and spring by beef cattle; moreover, the infestation of sericea lespedeza on the site was problematic for the 20 yr period preceding our study (Tom Goudey, Geary Co. Noxious Weed Dept.,
173
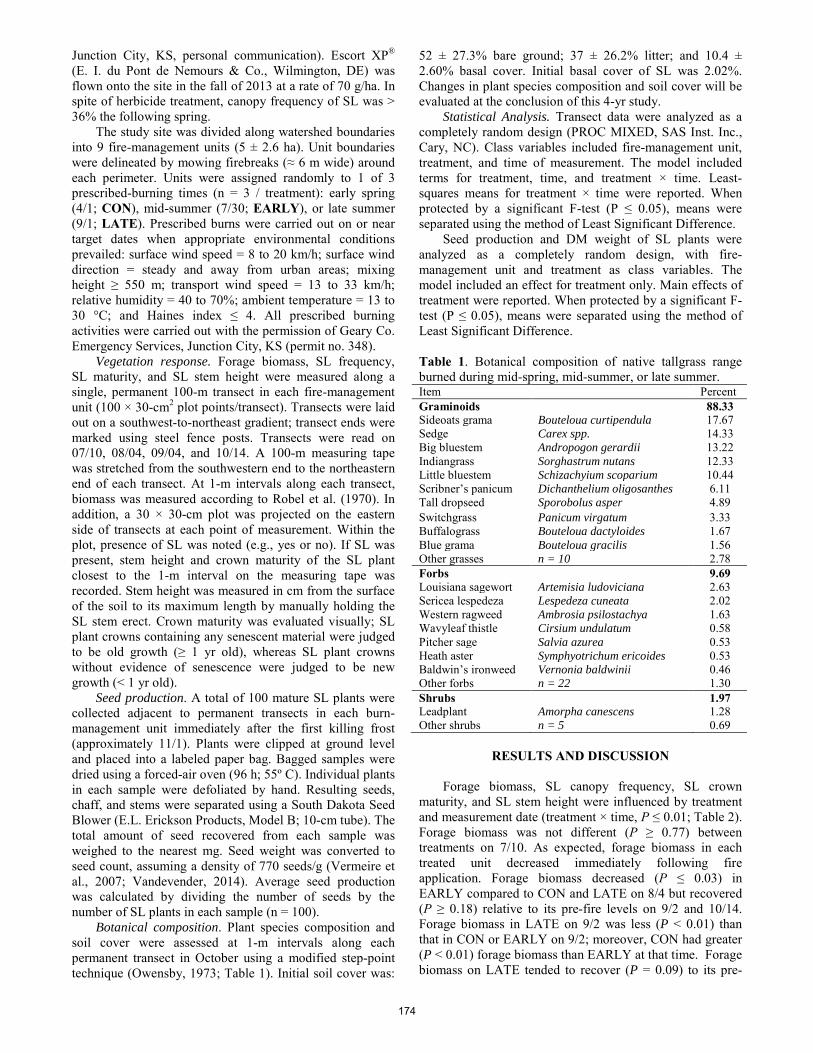
Junction City, KS, personal communication). Escort XP® (E. I. du Pont de Nemours & Co., Wilmington, DE) was flown onto the site in the fall of 2013 at a rate of 70 g/ha. In spite of herbicide treatment, canopy frequency of SL was > 36% the following spring.
The study site was divided along watershed boundaries into 9 fire-management units (5 ± 2.6 ha). Unit boundaries were delineated by mowing firebreaks (≈ 6 m wide) around each perimeter. Units were assigned randomly to 1 of 3 prescribed-burning times (n = 3 / treatment): early spring (4/1; CON), mid-summer (7/30; EARLY), or late summer (9/1; LATE). Prescribed burns were carried out on or near target dates when appropriate environmental conditions prevailed: surface wind speed = 8 to 20 km/h; surface wind direction = steady and away from urban areas; mixing height ≥ 550 m; transport wind speed = 13 to 33 km/h; relative humidity = 40 to 70%; ambient temperature = 13 to 30 °C; and Haines index ≤ 4. All prescribed burning activities were carried out with the permission of Geary Co. Emergency Services, Junction City, KS (permit no. 348).
Vegetation response. Forage biomass, SL frequency, SL maturity, and SL stem height were measured along a single, permanent 100-m transect in each fire-management unit (100 × 30-cm2 plot points/transect). Transects were laid out on a southwest-to-northeast gradient; transect ends were marked using steel fence posts. Transects were read on 07/10, 08/04, 09/04, and 10/14. A 100-m measuring tape was stretched from the southwestern end to the northeastern end of each transect. At 1-m intervals along each transect, biomass was measured according to Robel et al. (1970). In addition, a 30 × 30-cm plot was projected on the eastern side of transects at each point of measurement. Within the plot, presence of SL was noted (e.g., yes or no). If SL was present, stem height and crown maturity of the SL plant closest to the 1-m interval on the measuring tape was recorded. Stem height was measured in cm from the surface of the soil to its maximum length by manually holding the SL stem erect. Crown maturity was evaluated visually; SL plant crowns containing any senescent material were judged to be old growth (≥ 1 yr old), whereas SL plant crowns without evidence of senescence were judged to be new growth (< 1 yr old).
Seed production. A total of 100 mature SL plants were collected adjacent to permanent transects in each burn-management unit immediately after the first killing frost (approximately 11/1). Plants were clipped at ground level and placed into a labeled paper bag. Bagged samples were dried using a forced-air oven (96 h; 55º C). Individual plants in each sample were defoliated by hand. Resulting seeds, chaff, and stems were separated using a South Dakota Seed Blower (E.L. Erickson Products, Model B; 10-cm tube). The total amount of seed recovered from each sample was weighed to the nearest mg. Seed weight was converted to seed count, assuming a density of 770 seeds/g (Vermeire et al., 2007; Vandevender, 2014). Average seed production was calculated by dividing the number of seeds by the number of SL plants in each sample (n = 100).
Botanical composition. Plant species composition and soil cover were assessed at 1-m intervals along each permanent transect in October using a modified step-point technique (Owensby, 1973; Table 1). Initial soil cover was:
52 ± 27.3% bare ground; 37 ± 26.2% litter; and 10.4 ± 2.60% basal cover. Initial basal cover of SL was 2.02%. Changes in plant species composition and soil cover will be evaluated at the conclusion of this 4-yr study.
Statistical Analysis. Transect data were analyzed as a completely random design (PROC MIXED, SAS Inst. Inc., Cary, NC). Class variables included fire-management unit, treatment, and time of measurement. The model included terms for treatment, time, and treatment × time. Least-squares means for treatment × time were reported. When protected by a significant F-test (P ≤ 0.05), means were separated using the method of Least Significant Difference.
Seed production and DM weight of SL plants were analyzed as a completely random design, with fire-management unit and treatment as class variables. The model included an effect for treatment only. Main effects of treatment were reported. When protected by a significant F-test (P ≤ 0.05), means were separated using the method of Least Significant Difference.
Table 1. Botanical composition of native tallgrass range burned during mid-spring, mid-summer, or late summer. Item Percent Graminoids 88.33 Sideoats grama Bouteloua curtipendula 17.67 Sedge Carex spp. 14.33 Big bluestem Andropogon gerardii 13.22 Indiangrass Sorghastrum nutans 12.33 Little bluestem Schizachyium scoparium 10.44 Scribner’s panicum Dichanthelium oligosanthes 6.11 Tall dropseed Sporobolus asper 4.89 Switchgrass Panicum virgatum 3.33 Buffalograss Bouteloua dactyloides 1.67 Blue grama Bouteloua gracilis 1.56 Other grasses n = 10 2.78 Forbs 9.69 Louisiana sagewort Artemisia ludoviciana 2.63 Sericea lespedeza Lespedeza cuneata 2.02 Western ragweed Ambrosia psilostachya 1.63 Wavyleaf thistle Cirsium undulatum 0.58 Pitcher sage Salvia azurea 0.53 Heath aster Symphyotrichum ericoides 0.53 Baldwin’s ironweed Vernonia baldwinii 0.46 Other forbs n = 22 1.30 Shrubs 1.97 Leadplant Amorpha canescens 1.28 Other shrubs n = 5 0.69
RESULTS AND DISCUSSION
Forage biomass, SL canopy frequency, SL crown
maturity, and SL stem height were influenced by treatment and measurement date (treatment × time, P ≤ 0.01; Table 2). Forage biomass was not different (P ≥ 0.77) between treatments on 7/10. As expected, forage biomass in each treated unit decreased immediately following fire application. Forage biomass decreased (P ≤ 0.03) in EARLY compared to CON and LATE on 8/4 but recovered (P ≥ 0.18) relative to its pre-fire levels on 9/2 and 10/14. Forage biomass in LATE on 9/2 was less (P < 0.01) than that in CON or EARLY on 9/2; moreover, CON had greater (P < 0.01) forage biomass than EARLY at that time. Forage biomass on LATE tended to recover (P = 0.09) to its pre-
174
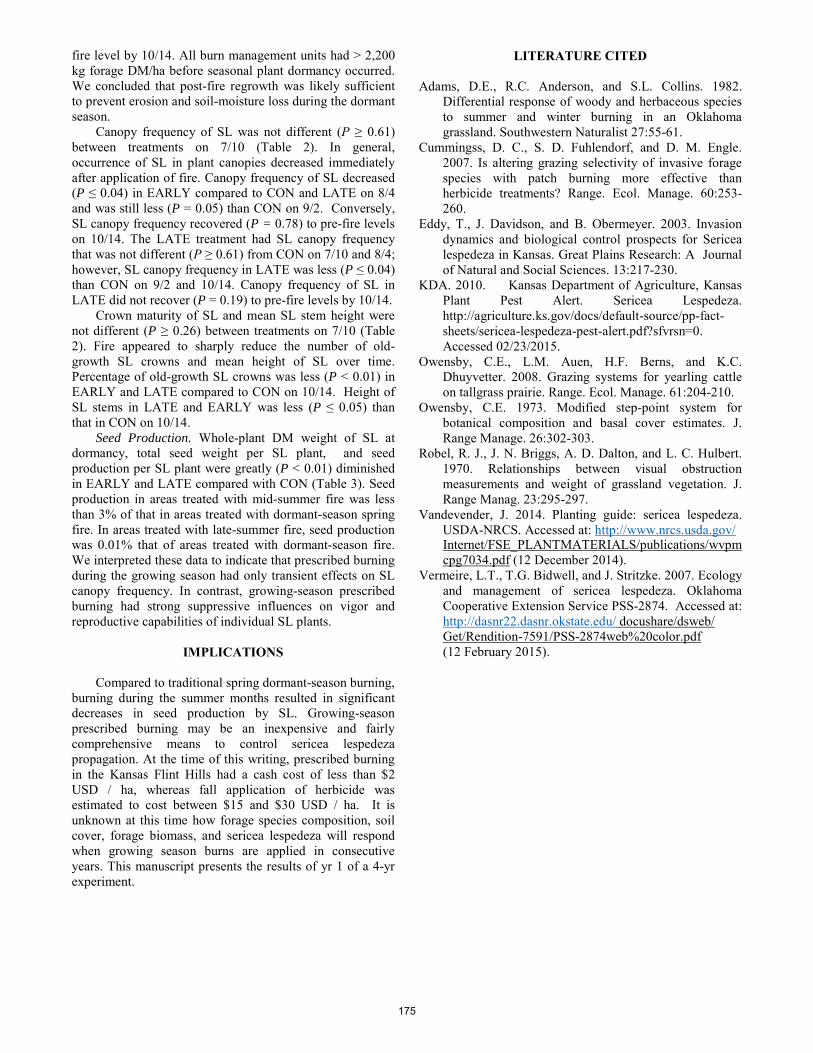
fire level by 10/14. All burn management units had > 2,200 kg forage DM/ha before seasonal plant dormancy occurred. We concluded that post-fire regrowth was likely sufficient to prevent erosion and soil-moisture loss during the dormant season.
Canopy frequency of SL was not different (P ≥ 0.61) between treatments on 7/10 (Table 2). In general, occurrence of SL in plant canopies decreased immediately after application of fire. Canopy frequency of SL decreased (P ≤ 0.04) in EARLY compared to CON and LATE on 8/4 and was still less (P = 0.05) than CON on 9/2. Conversely, SL canopy frequency recovered (P = 0.78) to pre-fire levels on 10/14. The LATE treatment had SL canopy frequency that was not different (P ≥ 0.61) from CON on 7/10 and 8/4; however, SL canopy frequency in LATE was less (P ≤ 0.04) than CON on 9/2 and 10/14. Canopy frequency of SL in LATE did not recover (P = 0.19) to pre-fire levels by 10/14.
Crown maturity of SL and mean SL stem height were not different (P ≥ 0.26) between treatments on 7/10 (Table 2). Fire appeared to sharply reduce the number of old-growth SL crowns and mean height of SL over time. Percentage of old-growth SL crowns was less (P < 0.01) in EARLY and LATE compared to CON on 10/14. Height of SL stems in LATE and EARLY was less (P ≤ 0.05) than that in CON on 10/14.
Seed Production. Whole-plant DM weight of SL at dormancy, total seed weight per SL plant, and seed production per SL plant were greatly (P < 0.01) diminished in EARLY and LATE compared with CON (Table 3). Seed production in areas treated with mid-summer fire was less than 3% of that in areas treated with dormant-season spring fire. In areas treated with late-summer fire, seed production was 0.01% that of areas treated with dormant-season fire. We interpreted these data to indicate that prescribed burning during the growing season had only transient effects on SL canopy frequency. In contrast, growing-season prescribed burning had strong suppressive influences on vigor and reproductive capabilities of individual SL plants.
IMPLICATIONS
Compared to traditional spring dormant-season burning,
burning during the summer months resulted in significant decreases in seed production by SL. Growing-season prescribed burning may be an inexpensive and fairly comprehensive means to control sericea lespedeza propagation. At the time of this writing, prescribed burning in the Kansas Flint Hills had a cash cost of less than $2 USD / ha, whereas fall application of herbicide was estimated to cost between $15 and $30 USD / ha. It is unknown at this time how forage species composition, soil cover, forage biomass, and sericea lespedeza will respond when growing season burns are applied in consecutive years. This manuscript presents the results of yr 1 of a 4-yr experiment.
LITERATURE CITED
Adams, D.E., R.C. Anderson, and S.L. Collins. 1982. Differential response of woody and herbaceous species to summer and winter burning in an Oklahoma grassland. Southwestern Naturalist 27:55-61.
Cummingss, D. C., S. D. Fuhlendorf, and D. M. Engle. 2007. Is altering grazing selectivity of invasive forage species with patch burning more effective than herbicide treatments? Range. Ecol. Manage. 60:253-260.
Eddy, T., J. Davidson, and B. Obermeyer. 2003. Invasion dynamics and biological control prospects for Sericea lespedeza in Kansas. Great Plains Research: A Journal of Natural and Social Sciences. 13:217-230.
KDA. 2010. Kansas Department of Agriculture, Kansas Plant Pest Alert. Sericea Lespedeza. http://agriculture.ks.gov/docs/default-source/pp-fact-sheets/sericea-lespedeza-pest-alert.pdf?sfvrsn=0. Accessed 02/23/2015.
Owensby, C.E., L.M. Auen, H.F. Berns, and K.C. Dhuyvetter. 2008. Grazing systems for yearling cattle on tallgrass prairie. Range. Ecol. Manage. 61:204-210.
Owensby, C.E. 1973. Modified step-point system for botanical composition and basal cover estimates. J. Range Manage. 26:302-303.
Robel, R. J., J. N. Briggs, A. D. Dalton, and L. C. Hulbert. 1970. Relationships between visual obstruction measurements and weight of grassland vegetation. J. Range Manag. 23:295-297.
Vandevender, J. 2014. Planting guide: sericea lespedeza. USDA-NRCS. Accessed at: http://www.nrcs.usda.gov/ Internet/FSE_PLANTMATERIALS/publications/wvpmcpg7034.pdf (12 December 2014).
Vermeire, L.T., T.G. Bidwell, and J. Stritzke. 2007. Ecology and management of sericea lespedeza. Oklahoma Cooperative Extension Service PSS-2874. Accessed at: http://dasnr22.dasnr.okstate.edu/ docushare/dsweb/ Get/Rendition-7591/PSS-2874web%20color.pdf (12 February 2015).
175
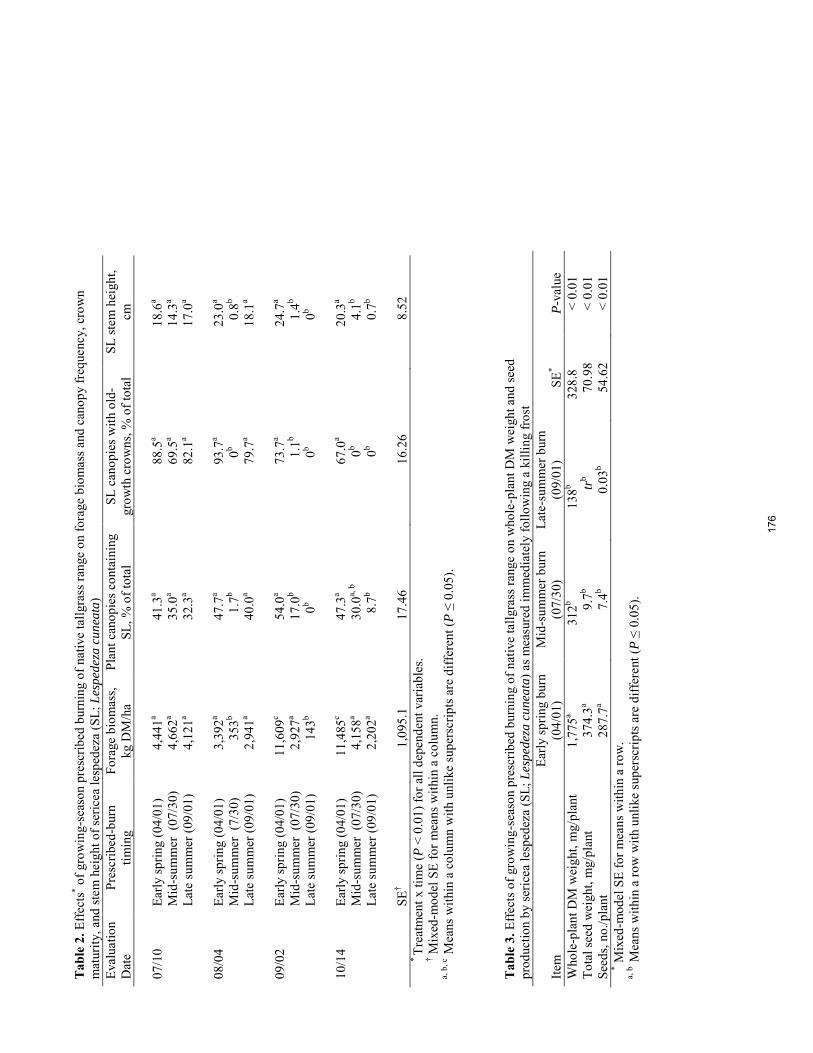
Tab
le 2
. Effe
cts* o
f gro
win
g-se
ason
pre
scrib
ed b
urni
ng o
f nat
ive
tallg
rass
rang
e on
fora
ge b
iom
ass a
nd c
anop
y fr
eque
ncy,
cro
wn
mat
urity
, and
stem
hei
ght o
f ser
icea
lesp
edez
a (S
L; L
espe
deza
cun
eata
) Ev
alua
tion
Dat
e Pr
escr
ibed
-bur
n tim
ing
Fora
ge b
iom
ass,
kg D
M/h
a Pl
ant c
anop
ies c
onta
inin
g SL
, % o
f tot
al
SL c
anop
ies w
ith o
ld-
grow
th c
row
ns, %
of t
otal
SL
stem
hei
ght,
cm
07/1
0 Ea
rly sp
ring
(04/
01)
4,44
1a 41
.3a
88.5
a 18
.6a
M
id-s
umm
er (
07/3
0)
4,66
2a 35
.0a
69.5
a 14
.3a
La
te su
mm
er (0
9/01
) 4,
121a
32.3
a 82
.1a
17.0
a
08/0
4 Ea
rly sp
ring
(04/
01)
3,39
2a 47
.7a
93.7
a 23
.0a
M
id-s
umm
er (
7/30
) 35
3b 1
.7b
0b
0.8
b
La
te su
mm
er (0
9/01
) 2,
941a
40.0
a 79
.7a
18.1
a
09/0
2 Ea
rly sp
ring
(04/
01)
11,6
09c
54.0
a 73
.7a
24.7
a
M
id-s
umm
er (
07/3
0)
2,92
7a 17
.0b
1.1
b 1
.4b
La
te su
mm
er (0
9/01
) 14
3b 0
b 0
b 0
b
10/1
4 Ea
rly sp
ring
(04/
01)
11,4
85c
47.3
a 67
.0a
20.3
a
M
id-s
umm
er (
07/3
0)
4,15
8a 30
.0a,
b
0
b 4
.1b
La
te su
mm
er (0
9/01
) 2,
202a
8.7
b
0b
0.7
b
SE
†
1
,095
.1
17.4
6 16
.26
8.5
2
*
Trea
tmen
t x ti
me
(P <
0.0
1) fo
r all
depe
nden
t var
iabl
es.
† M
ixed
-mod
el S
E fo
r mea
ns w
ithin
a c
olum
n.
a, b
, c M
eans
with
in a
col
umn
with
unl
ike
supe
rscr
ipts
are
diff
eren
t (P
≤ 0.
05).
Tab
le 3
. Effe
cts o
f gro
win
g-se
ason
pre
scrib
ed b
urni
ng o
f nat
ive
tallg
rass
rang
e on
who
le-p
lant
DM
wei
ght a
nd se
ed
prod
uctio
n by
seric
ea le
sped
eza
(SL;
Les
pede
za c
unea
ta) a
s mea
sure
d im
med
iate
ly fo
llow
ing
a ki
lling
fros
t Ite
m
Early
sprin
g bu
rn
(04/
01)
Mid
-sum
mer
bur
n
(07/
30)
Late
-sum
mer
bur
n (0
9/01
)
SE*
P-
valu
e W
hole
-pla
nt D
M w
eigh
t, m
g/pl
ant
1,7
75a
312
b
1
38b
3
28.8
<
0.01
To
tal s
eed
wei
ght,
mg/
plan
t 37
4.3a
9.7b
tr
b 70
.98
< 0.
01
Seed
s, no
./pla
nt
287.
7a 7.
4b 0.
03b
54.6
2 <
0.01
* M
ixed
-mod
el S
E fo
r mea
ns w
ithin
a ro
w.
a, b
Mea
ns w
ithin
a ro
w w
ith u
nlik
e su
pers
crip
ts a
re d
iffer
ent (
P ≤
0.05
).
176

Proceedings, Western Section, American Society of Animal Science
Vol. 66, 2015
Effect of corn residue stocking rate on cattle performance and subsequent grain yield
L. A. Stalker*, H. Blanco-Canqui†, J. A. Gigax*, A. L. McGee*, T. M. Shaver*, and S. J. van Donk*
*University of Nebraska, West Central Research and Extension Center, North Platte, 69101; †Department of Agronomy and Horticulture, University of Nebraska-Lincoln, 68583
ABSTRACT: A study conducted at the West Central Water Resources Field Laboratory, near Brule NE, investigated effects of stocking rate on cattle performance grazing corn residue and impact of residue removal on grain yield, and quality and quantity of residue. The study consisted of four removal treatments: 1) no removal, 2) grazing at 2.5 AUM/ha, 3) grazing at 5.0 AUM/ha, and 4) baling. A center pivot (53 ha) irrigated corn field was divided into 8, 6.6-ha paddocks to which replicated treatments were assigned. Cattle were stratified by BW and assigned randomly to the two grazing treatments. Samples of residue were collected at two time points (pre- and post-residue removal) using 10, 0.5-m2 quadrats per treatment replication. Residue was separated into 4 plant parts: stem, cob, leaf, and husk and analyzed for nutrient content. Esophageally fistulated cattle were used to measure diet quality. Cattle assigned to the 2.5 AUM/ha stocking rate treatment gained more BW (P < 0.01) and BCS (P < 0.01) than cattle assigned to the 5.0 AUM/ha treatment. Leaf contained the most CP (P < 0.01) and husk had the greatest in vitro organic matter disappearance (IVOMD; P < 0.01) but the CP and IVOMD of all plant parts did not differ pre- vs. post-residue removal. Residue was reduced (P < 0.05) for baling and both grazing treatments pre- vs. post-removal but was not different (P > 0.05) for control treated paddocks. Diet CP content was similar for the two grazing treatments but IVOMD was greater post-grazing in the 2.5 AUM/ha grazing treatment (P = 0.04). Subsequent grain yields were not different (P = 0.16) across all four residue removal treatments. Key Words: baling, beef cattle, corn residue, grazing
INTRODUCTION About 3.6 million hectares of corn is harvested
annually in Nebraska and yields average 11.9 Mg ha-1 on irrigated land (USDA-NASS, 2014). This results in the production of more than 10,000,000 metric tons of leaf and husk residue, the parts of the corn plant cattle prefer. Capturing this abundant resource for use in the beef industry is appealing. Increased interest in utilization of corn residue raises questions about how its removal impacts subsequent grain yield. Wilhelm (2004) cited several studies reporting differing impacts or residue removal on grain yields and attributed most of the
differences to the interaction of residue removal and tillage method. Weinhold et al. (2013) reported removal of residue in an irrigated, no till, continuous corn production system improves grain yields. However, in a rain-fed system they found a slight decrease in grain yields over a 10 year period. These differing results and the importance of grazing corn residue to the beef industry in Nebraska prompted the initiation of this study.
Objectives of this study were to determine the impact of corn residue removal either by grazing or by baling on grain yield and quality of residue and to determine the impact of stocking rate on cattle performance when grazing corn residue. A further objective was to determine the degree to which cattle utilize each plant fraction.
MATERIALS AND METHODS
This study was conducted at the West Central
Water Resources Field Laboratory near Brule, NE. A center pivot (53 ha) irrigated corn field was divided into 8, 6.6-ha paddocks starting in 2008. Four replicated treatments were assigned; light grazing (2.5 AUM/ha), heavy grazing (5.0 AUM/ha), baling, and control (no residue removal). This field is in continuous corn, no-till management. Treatments have been applied to the same paddocks each year. Mature cows in mid gestation with previous corn grazing experience grazed the paddocks from early November to early February. Cows were stratified by BW and assigned randomly to treatment each year. Cow BW and body condition score (BCS) were assessed pre- and post-grazing. Cows were stocked at 2.5 AUM/ha in the light grazing paddocks and 5.0 AUM/ha in the heavy grazing paddocks. Cattle were fed the daily equivalent of 0.45 kg/cow per day of a 32% CP supplement delivered 3 d/wk.
Pre-residue removal samples were collected in mid-October about one week prior to grain harvest at ten locations using GPS coordinates. Post-residue removal samples were collected in mid-March each year. Post-residue removal sites were located immediately adjacent to the pre-removal location resulting in contiguous sampling sites. A 0.5 m2 quadrat that was 81.6 cm by 76.2 cm was centered on the row and clipped to ground level. All residue on the ground, within the quadrat was collected and sorted into 4 plant parts: stem, cob, leaf and
177

husk. Residue in the baled treatments were raked into windrows and then baled using commercially available rake and baler.
All plant fractions except grain were composited by plant part within treatment replication, then ground using a Willey Mill and analyzed for IVOMD (Tilley and Terry, 1963), OM and CP (AOAC, 1996). Diet samples were collected using esophageally fistulated cows pre- and post-grazing. Impact of residue removal on subsequent year grain yields was determined by the grain yield reported by the yield monitor on the combine.
Data were analyzed using the Mixed procedure of SAS (v. 9.2; SAS Inst. Inc., Cary, NC) with year and residue removal treatment as fixed effects. For residue quality, the model also included the effect of removal status (pre vs. post) and its interaction with treatment.
RESULTS AND DISCUSSION
Cows in both the 2.5 and 5.0 AUM/ha stocking rate treatment gained BW (Table 1) while grazing corn residue, however cows assigned to the 2.5 AUM/ha treatment gained more (P < 0.01). Cows in the 2.5 AUM/ha treatment gained BCS while cows in the 5.0 AUM/ha treatment only maintained BCS (P < 0.01). These results agree with previous work. Russell (1993) found similar results, with cattle provided a grazing allowance of 1.64 animals/ha being the only treatment to not lose BW. Difference in animal performance based on stocking rate is a function of the large difference in the nutrient content of the different parts of the corn plant. Leaf had the greatest (P < 0.01) CP content, followed by stem, which was intermediate, and husk and cob were the lowest (Table 2). In vitro organic matter disappearance was greatest (P < 0.01) for husk, followed by leaf, cob and stem in descending order. The values found in this study are comparable to the values found in previous work. In one study, Fernandez-Rivera and Klopfenstein (1989), found CP content of leaf and husk of irrigated corn residue to be 5.6% pre-grazing and a statistically significant lower value for post-grazing of 4.8%. However, they also found in a separate trial CP content of irrigated corn residue was not different pre-grazing (4.7% and 4.9% CP) than post-grazing (5.1% and 4.7% CP) under stocking rates of 2.47 and 4.69 animals/ha respectively.
When the quantity of residue remaining following removal treatments were applied it was determined cattle ate predominantly husk and leaf while not consuming stem or cob fractions (Table 3). This is similar to what was found by Gutierrez-Ornelas and Klopfenstein (1991) and Fernandez-Rivera and Klopfenstein (1989). In the control treatment about 43% of the husks disappeared over the course of the study demonstrating the labile nature of husks. In the 2.5 AUM/ha treatment the amount of husks was reduced by 57% post grazing. In the 5.0 grazing treatment husks were reduced by 82%. In the baling treatment only 7% of husks remained. A similar pattern was observed for leaf but most stem and cob remained for both grazing treatments.
Diet nutrient values were slightly lower post-grazing compared with pre-grazing but differences were minor (Table 4). Diet IVOMD was reduced (P = 0.04) for the 5.0 AUM/ha stocking rate treatment compared with the 2.5 AUM/ha treatment.
Removing the highly palatable fractions forces cattle to either spend more time searching for leaf and husk or to start consuming more of the lower quality, less digestible plant parts. Husk is the most digestible fraction of the plant and even though cattle consume a great deal of leaf it is not a highly digestible fraction. Gutierrez-Ornelas (1991) showed that husk and grain are consumed the fastest and when the majority of the grain is gone cattle start consuming a greater amount of the leaf.
Corn grain yields were not affected (P = 0.16) by treatment and averaged 9.4 Mg/ha (Table 5). These grain yields suggest that removing corn grain residue from a fully irrigated corn residue field has no effect on the subsequent grain yield.
IMPLICATIONS
Because cattle preferentially select husk and leaf, the two most nutrient dense parts of corn residue, stocking rate plays a major role in determining animal performance while grazing corn residue. As stocking rate decreases BW and BCS would be expected to increase. Nutrient content of corn residue is stable during the winter and could therefore be utilized at any time throughout the winter. However husks are labile and might be utilized to a greater extent immediately after harvest of corn grain. Under stocking rates similar to this experiment, corn residue can be utilized without negatively impacting subsequent corn grain production.
LITERATURE CITED AOAC, 1996. Official Methods of Anaylsis, 16th ed.
Association of Official Analytical Chemist, Arlington, VA.
Fernandez-Rivera, S., T. J. Klopfenstein. 1989a. Yield and quality components of corn crop residues and utilization of these residues by grazing cattle. J. Anim. Sci. 67:597-605.
Gutierrez-Ornelas, E., T. J. Klopfenstein. 1991. Changes in availability and nutritive value of different corn residue parts as affected by early and late grazing seasons. J. Anim. Sci. 69:1741-1750.
Russell, J. R., M. R. Brasche, and A. M. Cowen. 1993. Effects of grazing allowance and system on the use of corn-crop residues by gestating beef cows. J. Anim. Sci. 71:1256-1265.
Tilley, J.M.A., Terry, R.A., 1963. A two-stage technique for the in vitro digestion of forage crops. J. Br. Grassl. Soc. 18, 104–111
Wienhold, B. J., G. E. Varvel, V. L. Jin, R. B. Mitchell, K. P. Vogel. 2013 Corn residue removal effects on subsequent yield. Nebraska Beef Cattle Report. MP98:40-41.
Wilhelm, W. W., J. M. F. Johnson, J. L. Hatfield, W. B. Voorhees, and D. R. Linden. 2004. Crop and soil
178
productivity response to corn residue removal: a literature review. Agron. J. 96:1-17.
Table 1. Cow body weight and body condition score (BCS) during 5 years (2009 – 2013) of grazing corn residue at 2.5 or 5.0 animal unit months (AUM) per hectare
Item 2.5 AUM/ha 5.0 AUM/ha SE P-value
Start BW, kg 440 443 10 0.19 End BW, kg 470 457 17 < 0.01 BW change, kg 30 14 10 < 0.01 Start BCS 5.2 5.2 0.1 0.60 End BCS 5.5 5.2 0.1 < 0.01 BCS change 0.3 0.0 0.2 < 0.01
Table 2. Crude protein and in vitro organic matter disappearance (IVOMD) of corn plant parts collected pre and post-residue removal
Leaf Husk Stem Cob SEM P-value
CP
Pre-Grazing 6.4a 3.2c 4.8b 3.2c 0.6 < 0.01 Post-Grazing 6.0a 3.9b 4.0b 3.1c 0.6 < 0.01 IVOMD
Pre-Grazing 53.5b 69.8a 37.3c 47.4d 2.3 < 0.01 Post-Grazing 52.2bc 70.0a 43.0d 48.4c 2.3 < 0.01 abcd Within a row, means lacking a common superscript letter differ (P < 0.05).
Table 3. Amount of residue (kg/ha; DMB) by plant part pre- and post-residue removal
Control 2.5 AUM/ha 5.0 AUM/ha Baled
Plant Part Pre Post Pre Post Pre Post Pre Post SE Trt Graze TxG1
Stem 3422a 3226a 3320a 3459a 3624a 3417a 3386a 1120b 264 < 0.01 < 0.01 < 0.01 Leaf 2967a 2230b 2944a 1718b 3002a 1602b 2938a 487c 234 < 0.01 < 0.01 0.01 Husk 882a 501b 820a 350b 805a 141c 757a 51c 57 < 0.01 < 0.01 0.03 Cob 1299a 926ab 1279a 1025ab 1272a 1199ab 1254a 757b 134 0.41 < 0.01 0.46 Total 8571a 6885ab 8363ab 6552c 8702a 6359c 8334ab 2416d 562 < 0.01 < 0.01 < 0.01 1 Treatment by residue removal interaction. abcd Within a row, means lacking a common superscript letter differ (P < 0.05).
Table 4. Crude protein and in vitro organic matter disappearance (IVOMD) of diet samples collected from esophageally fistulated cattle pre- and post-grazing
2.5 AUM/ha 5.0 AUM/ha SEM P-Value
CP Pre-grazing 4.0 3.3 0.4 0.06 Post-grazing 3.2 3.9 0.4 0.10 IVOMD Pre-grazing 66.4 67.8 2.6 0.48 Post-grazing 63.4 55.3 4.9 0.04
Table 5. Average corn grain yield (2009-2013) after residue removal of continuous corn production Treatment
Item Control 2.5 AUM/ha 5.0 AUM/ha Baling SE P-value
Yield, Mg/ha 9.3 9.5 9.7 9.2 7 0.16
179
RUMINANT NUTRITION
Proceedings, Western Section, American Society of Animal Science
Vol. 66, 2015
Effects of feeding ground juniper to gestating ewes on pre- and postpartum ewe performance, serum metabolites, and progeny preweaning performance
W. C. Stewart*†, T. R. Whitney*, E. J. Scholljegerdes†, D. M. Hallford†, S. S. Soto-Navarro†, and H. D. Naumann‖
*Texas A&M AgriLife Research, San Angelo, TX 76901; †Animal and Range Sciences Department, New Mexico State University, Las Cruces NM, 88003; #Texas AgriLife Research, Stephenville, TX 76401; ‖Division of Plant Sciences,
University of Missouri, Columbia MO, 65211
ABSTRACT: The objective of this research was to evaluate effects of feeding ground juniper to pregnant ewes on pre- and postpartum growth performance, serum metabolites, and hormonal concentrations and progeny performance. Commercial Rambouillet ewes (n = 40; initial BW = 65.6 ± 1.6 kg) were used in a completely randomized design and assigned to 1 of 4 supplements replacing 0% (CNTL), 33% (18JUN), 66% (36JUN) or 100% (54JUN) of the ground sorghum × sudan grass hay with ground juniper (J. pinchotii). Ewes were individually fed supplements from d 38 ± 4 of gestation to 2 d postpartum. Ewe supplement and hay intake (g/kg of BW) were similar (P ≥ 0.24) throughout the duration of the study between ewes receiving no juniper to those receiving increasing concentrations of juniper. Ewe BW and BCS were also similar (P ≥ 0.13) across treatments. Serum urea N concentrations were greater in CNTL vs. JUN on d 34 (P = 0.05) and 64 (P = 0.04), and decreased linearly (P < 0.006) with increasing concentrations of juniper. Overall, serum IGF-1 decreased linearly (P = 0.02) as concentration of juniper increased in the diet. No differences (P ≥ 0.25) in NEFA and progesterone concentrations were detected. Lamb birth weight was not affected (P = 0.13) by maternal juniper consumption. However, lamb ADG tended to differ (quadratic, P = 0.06) from d 0 to 14 with 18JUN being the lowest. At weaning BW tended (linear, P = 0.09) to decrease in lambs born to ewes consuming increasing levels of juniper, however, no differences were detected (P = 0.29) when compared to CNTL lambs. Lamb survival from birth to weaning tended to be greatest (P = 0.10) when juniper was fed. Under these experimental conditions results indicate that ground juniper is a suitable feed ingredient for pregnant ewes and does not appear to negatively affect ewe or the subsequent progeny.
Key words: ground juniper, pregnant sheep, ewe and progeny performance, SUN.
INTRODUCTION
Drought-induced feed shortages, rising feed costs, and woody plant encroachment threaten the sustainability of sheep production systems in arid ecosystems. Underutilized feed resources such as the invasive woody plant juniperus is an abundant feed alternative in the southwestern U.S., consumed as browse (Malachek and Leinweber, 1972), and more recently as a ground roughage component in complete growing and finishing diets for lambs (Whitney et al., 2014). Nutritional and plant secondary compound composition of the entire mature plant biomass (i.e., condensed tannins, terpenes, and
terpenoids) have been recently characterized (Stewart et al., 2014), however feeding of ground juniper has been limited to leaves (Whitney and Muir, 2010) or leaves plus small stems (Whitney et al., 2014). Additional studies have shown redberry juniper-based diets can reduce Haemonchus contortus infection and increase ivermectin efficiency in lambs (Whitney et al., 2013). Yet, effects of feeding this novel feed source from early gestation to parturition and the subsequent effects on pre- and postpartum ewe performance, and lamb pre- and post-natal growth have not been evaluated. Therefore, we hypothesized that replacing sorghum × sudan grass hay with increasing levels of ground juniper in gestation diets will not negatively impact ewe or progeny performance. Objectives were to determine effects of feeding ground red berry juniper as an alternative roughage, replacing the hay component during early gestation to parturition on ewe pre-partum performance, pre- and postpartum blood metabolites and hormones, and pre-weaning lamb performance.
MATERIALS AND METHODS
Animals and Diets
The experimental protocol was approved by the Texas A&M University Institutional Animal Care and Use Committee. Commercial unshorn pregnant Rambouillet ewes (n = 40; age = 3 to 5 yr of age; initial BW = 65.2 ± 1.6 kg), were weighed at the beginning of the study, stratified by BW, and assigned to a treatment (n = 10/treatment). Ewes were randomly assigned to individual pens and 1 of 4 supplements that contained either 0% juniper (CNTL), 33% (18JUN), 66% (36JUN) or 100% (54JUN) juniper as a replacement of the sorghum × sudan hay component of the supplement. Ewes were fed the supplement at 1% of BW until d 64 (103 ± 4 d gestation), then 1.15% of BW was fed until 2 d postpartum. Additionally, ewes were fed long-stem sorghum × sudan at 2.1% of BW until d 64 (103 ± 4 d gestation), and ad libitum thereafter until parturition. Diets were formulated to meet or exceed nutrients for all phases of gestation according to NRC (2007). Hay intake data from d 64 to parturition was not recorded. Ewes were weighed at d 0, 34, 64, and 2 d postpartum and body condition scored (BCS) (1 = emaciated; 5 = obese; ASIA, 2002).
Juniper Harvesting Feed Collection and Analysis.
During the fall, mature J. pinchotti trees were harvested, mechanically chipped and air-dried approximately 8 days to approximately 80% DM. This
180
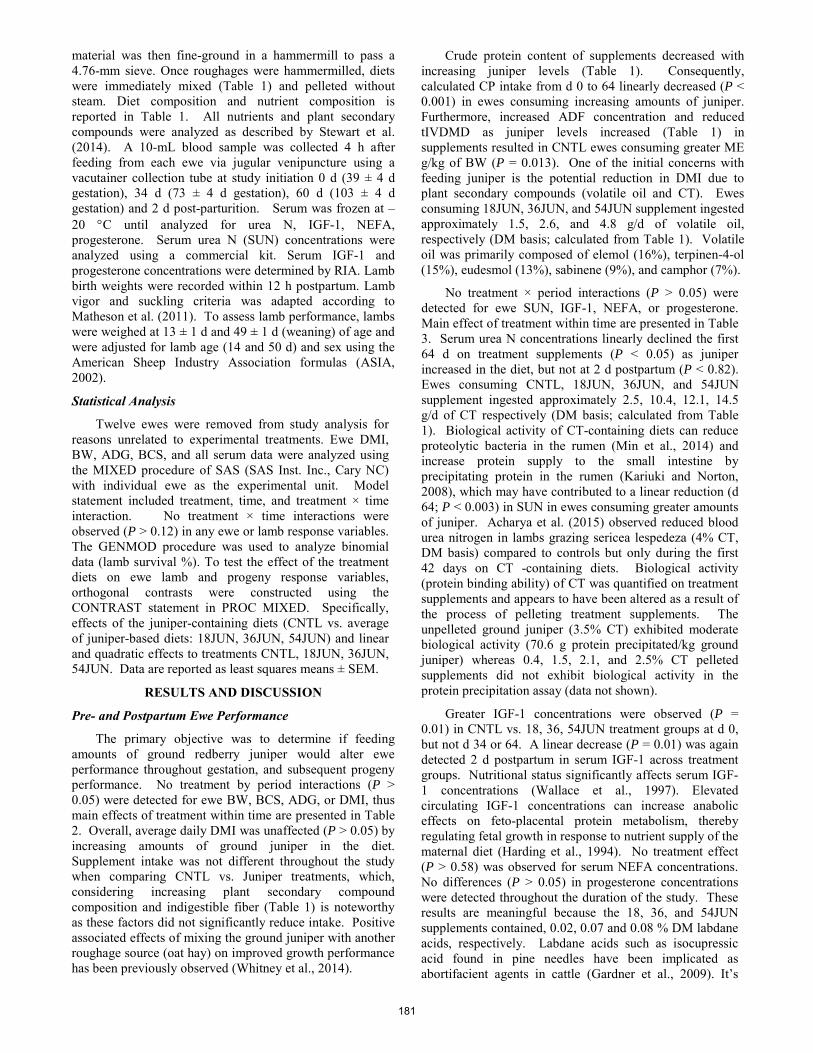
material was then fine-ground in a hammermill to pass a 4.76-mm sieve. Once roughages were hammermilled, diets were immediately mixed (Table 1) and pelleted without steam. Diet composition and nutrient composition is reported in Table 1. All nutrients and plant secondary compounds were analyzed as described by Stewart et al. (2014). A 10-mL blood sample was collected 4 h after feeding from each ewe via jugular venipuncture using a vacutainer collection tube at study initiation 0 d (39 ± 4 d gestation), 34 d (73 ± 4 d gestation), 60 d (103 ± 4 d gestation) and 2 d post-parturition. Serum was frozen at –20 °C until analyzed for urea N, IGF-1, NEFA, progesterone. Serum urea N (SUN) concentrations were analyzed using a commercial kit. Serum IGF-1 and progesterone concentrations were determined by RIA. Lamb birth weights were recorded within 12 h postpartum. Lamb vigor and suckling criteria was adapted according to Matheson et al. (2011). To assess lamb performance, lambs were weighed at 13 ± 1 d and 49 ± 1 d (weaning) of age and were adjusted for lamb age (14 and 50 d) and sex using the American Sheep Industry Association formulas (ASIA, 2002).
Statistical Analysis
Twelve ewes were removed from study analysis for reasons unrelated to experimental treatments. Ewe DMI, BW, ADG, BCS, and all serum data were analyzed using the MIXED procedure of SAS (SAS Inst. Inc., Cary NC) with individual ewe as the experimental unit. Model statement included treatment, time, and treatment × time interaction. No treatment × time interactions were observed (P > 0.12) in any ewe or lamb response variables. The GENMOD procedure was used to analyze binomial data (lamb survival %). To test the effect of the treatment diets on ewe lamb and progeny response variables, orthogonal contrasts were constructed using the CONTRAST statement in PROC MIXED. Specifically, effects of the juniper-containing diets (CNTL vs. average of juniper-based diets: 18JUN, 36JUN, 54JUN) and linear and quadratic effects to treatments CNTL, 18JUN, 36JUN, 54JUN. Data are reported as least squares means ± SEM.
RESULTS AND DISCUSSION
Pre- and Postpartum Ewe Performance
The primary objective was to determine if feeding amounts of ground redberry juniper would alter ewe performance throughout gestation, and subsequent progeny performance. No treatment by period interactions (P > 0.05) were detected for ewe BW, BCS, ADG, or DMI, thus main effects of treatment within time are presented in Table 2. Overall, average daily DMI was unaffected (P > 0.05) by increasing amounts of ground juniper in the diet. Supplement intake was not different throughout the study when comparing CNTL vs. Juniper treatments, which, considering increasing plant secondary compound composition and indigestible fiber (Table 1) is noteworthy as these factors did not significantly reduce intake. Positive associated effects of mixing the ground juniper with another roughage source (oat hay) on improved growth performance has been previously observed (Whitney et al., 2014).
Crude protein content of supplements decreased with increasing juniper levels (Table 1). Consequently, calculated CP intake from d 0 to 64 linearly decreased (P < 0.001) in ewes consuming increasing amounts of juniper. Furthermore, increased ADF concentration and reduced tIVDMD as juniper levels increased (Table 1) in supplements resulted in CNTL ewes consuming greater ME g/kg of BW (P = 0.013). One of the initial concerns with feeding juniper is the potential reduction in DMI due to plant secondary compounds (volatile oil and CT). Ewes consuming 18JUN, 36JUN, and 54JUN supplement ingested approximately 1.5, 2.6, and 4.8 g/d of volatile oil, respectively (DM basis; calculated from Table 1). Volatile oil was primarily composed of elemol (16%), terpinen-4-ol (15%), eudesmol (13%), sabinene (9%), and camphor (7%).
No treatment × period interactions (P > 0.05) were detected for ewe SUN, IGF-1, NEFA, or progesterone. Main effect of treatment within time are presented in Table 3. Serum urea N concentrations linearly declined the first 64 d on treatment supplements (P < 0.05) as juniper increased in the diet, but not at 2 d postpartum (P < 0.82). Ewes consuming CNTL, 18JUN, 36JUN, and 54JUN supplement ingested approximately 2.5, 10.4, 12.1, 14.5 g/d of CT respectively (DM basis; calculated from Table 1). Biological activity of CT-containing diets can reduce proteolytic bacteria in the rumen (Min et al., 2014) and increase protein supply to the small intestine by precipitating protein in the rumen (Kariuki and Norton, 2008), which may have contributed to a linear reduction (d 64; P < 0.003) in SUN in ewes consuming greater amounts of juniper. Acharya et al. (2015) observed reduced blood urea nitrogen in lambs grazing sericea lespedeza (4% CT, DM basis) compared to controls but only during the first 42 days on CT -containing diets. Biological activity (protein binding ability) of CT was quantified on treatment supplements and appears to have been altered as a result of the process of pelleting treatment supplements. The unpelleted ground juniper (3.5% CT) exhibited moderate biological activity (70.6 g protein precipitated/kg ground juniper) whereas 0.4, 1.5, 2.1, and 2.5% CT pelleted supplements did not exhibit biological activity in the protein precipitation assay (data not shown).
Greater IGF-1 concentrations were observed (P = 0.01) in CNTL vs. 18, 36, 54JUN treatment groups at d 0, but not d 34 or 64. A linear decrease (P = 0.01) was again detected 2 d postpartum in serum IGF-1 across treatment groups. Nutritional status significantly affects serum IGF-1 concentrations (Wallace et al., 1997). Elevated circulating IGF-1 concentrations can increase anabolic effects on feto-placental protein metabolism, thereby regulating fetal growth in response to nutrient supply of the maternal diet (Harding et al., 1994). No treatment effect (P > 0.58) was observed for serum NEFA concentrations. No differences (P > 0.05) in progesterone concentrations were detected throughout the duration of the study. These results are meaningful because the 18, 36, and 54JUN supplements contained, 0.02, 0.07 and 0.08 % DM labdane acids, respectively. Labdane acids such as isocupressic acid found in pine needles have been implicated as abortifacient agents in cattle (Gardner et al., 2009). It’s
181
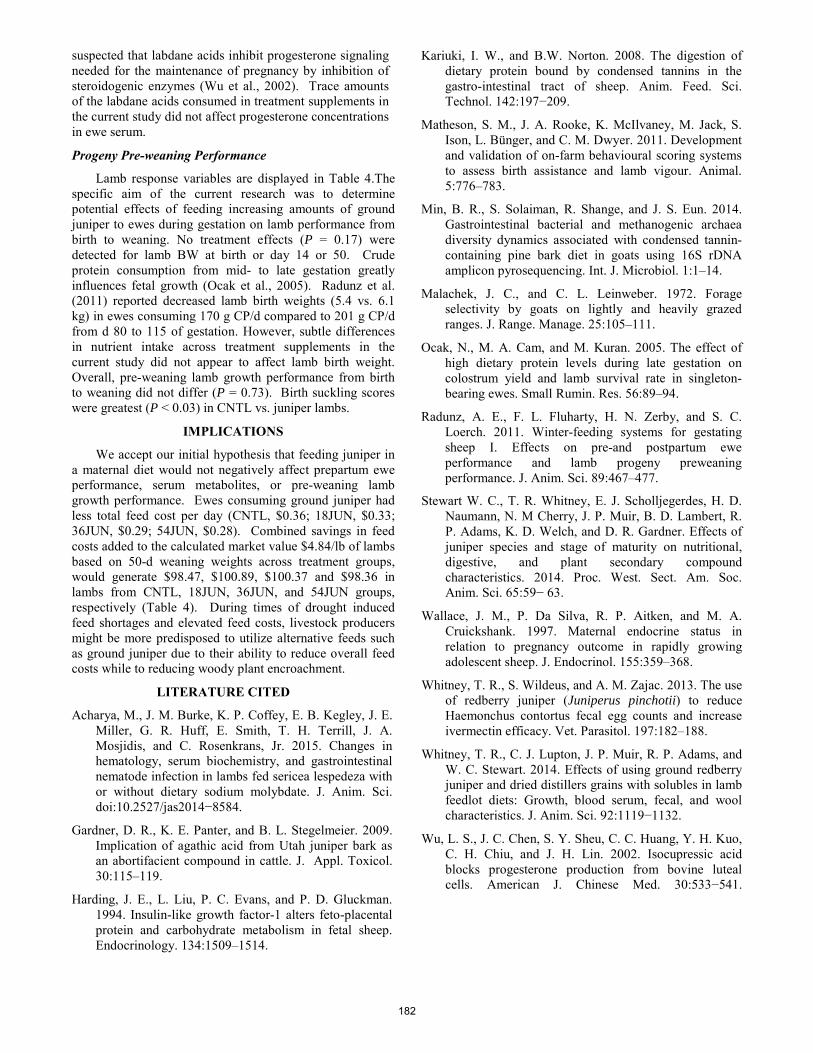
suspected that labdane acids inhibit progesterone signaling needed for the maintenance of pregnancy by inhibition of steroidogenic enzymes (Wu et al., 2002). Trace amounts of the labdane acids consumed in treatment supplements in the current study did not affect progesterone concentrations in ewe serum.
Progeny Pre-weaning Performance
Lamb response variables are displayed in Table 4.The specific aim of the current research was to determine potential effects of feeding increasing amounts of ground juniper to ewes during gestation on lamb performance from birth to weaning. No treatment effects (P = 0.17) were detected for lamb BW at birth or day 14 or 50. Crude protein consumption from mid- to late gestation greatly influences fetal growth (Ocak et al., 2005). Radunz et al. (2011) reported decreased lamb birth weights (5.4 vs. 6.1 kg) in ewes consuming 170 g CP/d compared to 201 g CP/d from d 80 to 115 of gestation. However, subtle differences in nutrient intake across treatment supplements in the current study did not appear to affect lamb birth weight. Overall, pre-weaning lamb growth performance from birth to weaning did not differ (P = 0.73). Birth suckling scores were greatest (P < 0.03) in CNTL vs. juniper lambs.
IMPLICATIONS
We accept our initial hypothesis that feeding juniper in a maternal diet would not negatively affect prepartum ewe performance, serum metabolites, or pre-weaning lamb growth performance. Ewes consuming ground juniper had less total feed cost per day (CNTL, $0.36; 18JUN, $0.33; 36JUN, $0.29; 54JUN, $0.28). Combined savings in feed costs added to the calculated market value $4.84/lb of lambs based on 50-d weaning weights across treatment groups, would generate $98.47, $100.89, $100.37 and $98.36 in lambs from CNTL, 18JUN, 36JUN, and 54JUN groups, respectively (Table 4). During times of drought induced feed shortages and elevated feed costs, livestock producers might be more predisposed to utilize alternative feeds such as ground juniper due to their ability to reduce overall feed costs while to reducing woody plant encroachment.
LITERATURE CITED
Acharya, M., J. M. Burke, K. P. Coffey, E. B. Kegley, J. E. Miller, G. R. Huff, E. Smith, T. H. Terrill, J. A. Mosjidis, and C. Rosenkrans, Jr. 2015. Changes in hematology, serum biochemistry, and gastrointestinal nematode infection in lambs fed sericea lespedeza with or without dietary sodium molybdate. J. Anim. Sci. doi:10.2527/jas2014−8584.
Gardner, D. R., K. E. Panter, and B. L. Stegelmeier. 2009. Implication of agathic acid from Utah juniper bark as an abortifacient compound in cattle. J. Appl. Toxicol. 30:115–119.
Harding, J. E., L. Liu, P. C. Evans, and P. D. Gluckman. 1994. Insulin-like growth factor-1 alters feto-placental protein and carbohydrate metabolism in fetal sheep. Endocrinology. 134:1509–1514.
Kariuki, I. W., and B.W. Norton. 2008. The digestion of dietary protein bound by condensed tannins in the gastro-intestinal tract of sheep. Anim. Feed. Sci. Technol. 142:197−209.
Matheson, S. M., J. A. Rooke, K. McIlvaney, M. Jack, S. Ison, L. Bünger, and C. M. Dwyer. 2011. Development and validation of on-farm behavioural scoring systems to assess birth assistance and lamb vigour. Animal. 5:776–783.
Min, B. R., S. Solaiman, R. Shange, and J. S. Eun. 2014. Gastrointestinal bacterial and methanogenic archaea diversity dynamics associated with condensed tannin-containing pine bark diet in goats using 16S rDNA amplicon pyrosequencing. Int. J. Microbiol. 1:1–14.
Malachek, J. C., and C. L. Leinweber. 1972. Forage selectivity by goats on lightly and heavily grazed ranges. J. Range. Manage. 25:105–111.
Ocak, N., M. A. Cam, and M. Kuran. 2005. The effect of high dietary protein levels during late gestation on colostrum yield and lamb survival rate in singleton-bearing ewes. Small Rumin. Res. 56:89–94.
Radunz, A. E., F. L. Fluharty, H. N. Zerby, and S. C. Loerch. 2011. Winter-feeding systems for gestating sheep I. Effects on pre-and postpartum ewe performance and lamb progeny preweaning performance. J. Anim. Sci. 89:467–477.
Stewart W. C., T. R. Whitney, E. J. Scholljegerdes, H. D. Naumann, N. M Cherry, J. P. Muir, B. D. Lambert, R. P. Adams, K. D. Welch, and D. R. Gardner. Effects of juniper species and stage of maturity on nutritional, digestive, and plant secondary compound characteristics. 2014. Proc. West. Sect. Am. Soc. Anim. Sci. 65:59− 63.
Wallace, J. M., P. Da Silva, R. P. Aitken, and M. A. Cruickshank. 1997. Maternal endocrine status in relation to pregnancy outcome in rapidly growing adolescent sheep. J. Endocrinol. 155:359–368.
Whitney, T. R., S. Wildeus, and A. M. Zajac. 2013. The use of redberry juniper (Juniperus pinchotii) to reduce Haemonchus contortus fecal egg counts and increase ivermectin efficacy. Vet. Parasitol. 197:182–188.
Whitney, T. R., C. J. Lupton, J. P. Muir, R. P. Adams, and W. C. Stewart. 2014. Effects of using ground redberry juniper and dried distillers grains with solubles in lamb feedlot diets: Growth, blood serum, fecal, and wool characteristics. J. Anim. Sci. 92:1119−1132.
Wu, L. S., J. C. Chen, S. Y. Sheu, C. C. Huang, Y. H. Kuo, C. H. Chiu, and J. H. Lin. 2002. Isocupressic acid blocks progesterone production from bovine luteal cells. American J. Chinese Med. 30:533−541.
182
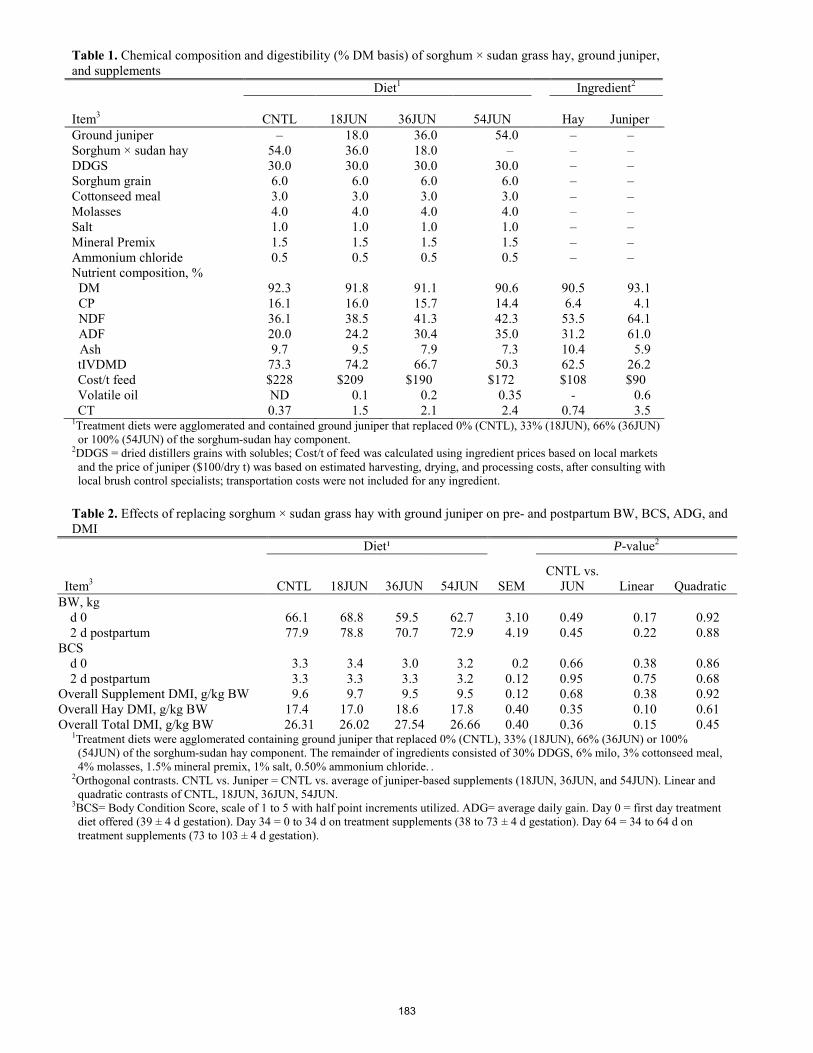
Table 1. Chemical composition and digestibility (% DM basis) of sorghum × sudan grass hay, ground juniper, and supplements
Item3
Diet1 Ingredient2
CNTL 18JUN
36JUN 54JUN
Hay
Juniper Ground juniper ‒ 18.0 36.0 54.0 ‒ ‒ Sorghum × sudan hay 54.0 36.0 18.0 ‒ ‒ ‒ DDGS 30.0 30.0 30.0 30.0 ‒ ‒ Sorghum grain 6.0 6.0 6.0 6.0 ‒ ‒ Cottonseed meal 3.0 3.0 3.0 3.0 ‒ ‒ Molasses 4.0 4.0 4.0 4.0 ‒ ‒ Salt 1.0 1.0 1.0 1.0 ‒ ‒ Mineral Premix 1.5 1.5 1.5 1.5 ‒ ‒ Ammonium chloride 0.5 0.5 0.5 0.5 ‒ ‒ Nutrient composition, % DM 92.3 91.8 91.1 90.6 90.5 93.1 CP 16.1 16.0 15.7 14.4 6.4 4.1 NDF 36.1 38.5 41.3 42.3 53.5 64.1 ADF 20.0 24.2 30.4 35.0 31.2 61.0 Ash 9.7 9.5 7.9 7.3 10.4 5.9 tIVDMD 73.3 74.2 66.7 50.3 62.5 26.2 Cost/t feed $228 $209 $190 $172 $108 $90 Volatile oil ND 0.1 0.2 0.35 - 0.6 CT 0.37 1.5 2.1 2.4 0.74 3.5
1Treatment diets were agglomerated and contained ground juniper that replaced 0% (CNTL), 33% (18JUN), 66% (36JUN) or 100% (54JUN) of the sorghum-sudan hay component.
2DDGS = dried distillers grains with solubles; Cost/t of feed was calculated using ingredient prices based on local markets and the price of juniper ($100/dry t) was based on estimated harvesting, drying, and processing costs, after consulting with local brush control specialists; transportation costs were not included for any ingredient.
Table 2. Effects of replacing sorghum × sudan grass hay with ground juniper on pre- and postpartum BW, BCS, ADG, and DMI
Diet¹ P-value2
Item3 CNTL 18JUN 36JUN 54JUN SEM CNTL vs.
JUN Linear Quadratic BW, kg
d 0 66.1 68.8 59.5 62.7 3.10 0.49 0.17 0.92 2 d postpartum 77.9 78.8 70.7 72.9 4.19 0.45 0.22 0.88
BCS d 0 3.3 3.4 3.0 3.2 0.2 0.66 0.38 0.86 2 d postpartum 3.3 3.3 3.3 3.2 0.12 0.95 0.75 0.68
Overall Supplement DMI, g/kg BW 9.6 9.7 9.5 9.5 0.12 0.68 0.38 0.92 Overall Hay DMI, g/kg BW 17.4 17.0 18.6 17.8 0.40 0.35 0.10 0.61 Overall Total DMI, g/kg BW 26.31 26.02 27.54 26.66 0.40 0.36 0.15 0.45
1Treatment diets were agglomerated containing ground juniper that replaced 0% (CNTL), 33% (18JUN), 66% (36JUN) or 100% (54JUN) of the sorghum-sudan hay component. The remainder of ingredients consisted of 30% DDGS, 6% milo, 3% cottonseed meal, 4% molasses, 1.5% mineral premix, 1% salt, 0.50% ammonium chloride. .
2Orthogonal contrasts. CNTL vs. Juniper = CNTL vs. average of juniper-based supplements (18JUN, 36JUN, and 54JUN). Linear and quadratic contrasts of CNTL, 18JUN, 36JUN, 54JUN.
3BCS= Body Condition Score, scale of 1 to 5 with half point increments utilized. ADG= average daily gain. Day 0 = first day treatment diet offered (39 ± 4 d gestation). Day 34 = 0 to 34 d on treatment supplements (38 to 73 ± 4 d gestation). Day 64 = 34 to 64 d on treatment supplements (73 to 103 ± 4 d gestation).
183

Table 3. Effects of replacing sorghum × sudan grass hay with ground juniper on pre- and postpartum ewe serum urea N, IGF-1, NEFA, and progesterone concentrations Diet¹ P - value
Item/d3 CNTL 18JUN 36JUN 54JUN SEM CNTL vs.
JUN Linear Quadratic SUN, mg/dL 10.78 11.81 10.25 10.05 0.98 0.94 0.35 0.47 IGF-1, ng/mL 484.8 469.2 450.7 372.7 31.4 0.14 0.01 0.28 NEFA, meq/L 0.24 0.31 0.32 0.31 0.05 0.18 0.25 0.36 Progesterone, ng/mL 4.15 3.36 3.94 3.93 0.53 0.50 0.97 0.43
1Treatment supplements were agglomerated containing ground juniper that replaced 0% (CNTL), 33% (18JUN), 66% (36JUN) or 100% (54JUN) of the sorghum-sudan hay component. The remainder of ingredients consisted of 30% DDGS, 6% milo, 3% cottonseed meal, 4% molasses, 1.5% mineral premix, 1% salt, 0.50% ammonium chloride.
2Orthogonal contrasts. CNTL vs. Juniper = CNTL vs. average of juniper-based supplements (18JUN, 36JUN, and 54JUN). Linear and quadratic contrasts of CNTL, 18JUN, 36JUN, 54JUN.
Table 4. Effects of replacing sorghum × sudan grass hay with ground juniper on lamb birth weights, neonatal vigor and suckling scores, and pre-weaning growth performance
Diet1 P-value2
Item CNTL 18JUN 36JUN 54JUN SEM CNTL vs
JUN Linear Quadratic Birth, vigor score3 4.0 3.9 5.0 4.7 0.47 0.31 0.11 0.86 Birth, suckling score4 3.1 3.9 4.5 4.7 0.49 0.03 0.03 0.58 BW, kg
Birth 5.00 4.68 4.51 4.74 0.21 0.13 0.29 0.17 14 d 9.80 8.28 7.18 9.14 0.89 0.14 0.43 0.04
Weaning5 20.3 20.2 18.9 18.4 0.89 0.29 0.09 0.83 ADG, kg/d
0 to 14 d 0.35 0.24 0.30 0.34 0.06 0.29 0.98 0.06 14 d to weaning 0.30 0.33 0.32 0.27 0.02 0.78 0.36 0.04 Overall 0.31 0.31 0.31 0.29 0.02 0.63 0.40 0.65
% survival 71 88 100 93 11 0.10 0.14 0.35 Lamb value6 $98.47 $100.80 $100.37 $98.36 ― ― ― ― 1Treatment supplements were agglomerated containing ground juniper that replaced 0% (CNTL), 33% (18JUN), 66%
(36JUN) or 100% (54JUN) of the sorghum-sudan hay component. The remainder of ingredients consisted of 30% dried distillers grains with solubles, 6% ground sorghum grain, 3% cottonseed meal, 4% molasses, 1.5% mineral premix, 1% salt, 0.50% ammonium chloride.
2Orthogonal contrasts: CNTL vs. JUN = CNTL vs. average of juniper-based supplements (18JUN, 36JUN, and 54JUN). Linear and quadratic contrasts of CNTL, 18JUN, 36JUN, and 54JUN.
35 = Extremely active and vigorous lamb, standing on all 4 feet; 4 = very active and vigorous lamb, standing on back legs and knees; 3 = active and vigorous lamb, on chest and holding head up; 2 = weak lamb, lying flat, able to hold head up; 1 = very weak lamb, unable to lift head and has very little movement.
41 = requiring assistance to suckle after 2 d of age; 2 = given sucking assistance, fed using a stomach tube more than twice in the first 24 h; 3 = given sucking assistance once in the first 24 h; 4 = sucking well without assistance within 2 h; 5 = sucking well without assistance within 1 h.
5Weaning = weaned at 49 ± 1 d of age. 6Lamb value = based on current cash value of lambs at weaning ($4.84/kg) + feed cost savings by replacing
sorghum × sudan grass hay with juniper.
184
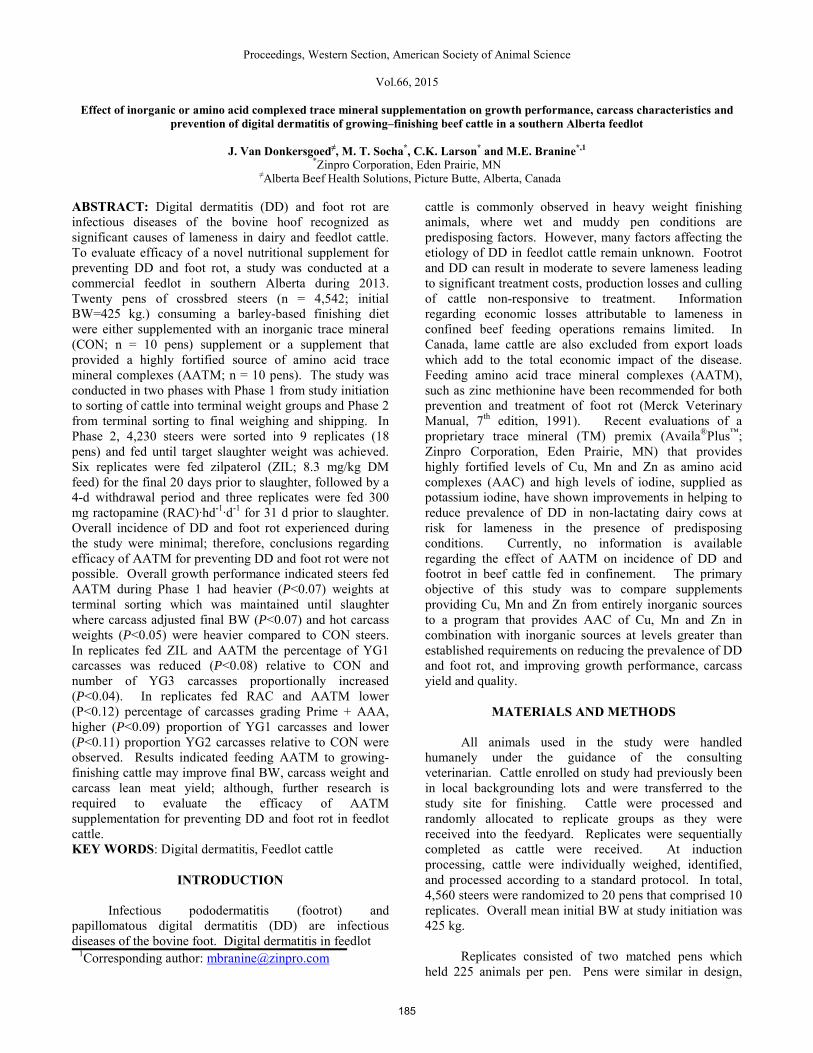
Proceedings, Western Section, American Society of Animal Science
Vol.66, 2015
Effect of inorganic or amino acid complexed trace mineral supplementation on growth performance, carcass characteristics and prevention of digital dermatitis of growing–finishing beef cattle in a southern Alberta feedlot
J. Van Donkersgoed≠, M. T. Socha*, C.K. Larson* and M.E. Branine*,1
*Zinpro Corporation, Eden Prairie, MN ≠Alberta Beef Health Solutions, Picture Butte, Alberta, Canada
ABSTRACT: Digital dermatitis (DD) and foot rot are infectious diseases of the bovine hoof recognized as significant causes of lameness in dairy and feedlot cattle. To evaluate efficacy of a novel nutritional supplement for preventing DD and foot rot, a study was conducted at a commercial feedlot in southern Alberta during 2013. Twenty pens of crossbred steers (n = 4,542; initial BW=425 kg.) consuming a barley-based finishing diet were either supplemented with an inorganic trace mineral (CON; n = 10 pens) supplement or a supplement that provided a highly fortified source of amino acid trace mineral complexes (AATM; n = 10 pens). The study was conducted in two phases with Phase 1 from study initiation to sorting of cattle into terminal weight groups and Phase 2 from terminal sorting to final weighing and shipping. In Phase 2, 4,230 steers were sorted into 9 replicates (18 pens) and fed until target slaughter weight was achieved. Six replicates were fed zilpaterol (ZIL; 8.3 mg/kg DM feed) for the final 20 days prior to slaughter, followed by a 4-d withdrawal period and three replicates were fed 300 mg ractopamine (RAC)∙hd-1∙d-1 for 31 d prior to slaughter. Overall incidence of DD and foot rot experienced during the study were minimal; therefore, conclusions regarding efficacy of AATM for preventing DD and foot rot were not possible. Overall growth performance indicated steers fed AATM during Phase 1 had heavier (P<0.07) weights at terminal sorting which was maintained until slaughter where carcass adjusted final BW (P<0.07) and hot carcass weights (P<0.05) were heavier compared to CON steers. In replicates fed ZIL and AATM the percentage of YG1 carcasses was reduced (P<0.08) relative to CON and number of YG3 carcasses proportionally increased (P<0.04). In replicates fed RAC and AATM lower (P<0.12) percentage of carcasses grading Prime + AAA, higher (P<0.09) proportion of YG1 carcasses and lower (P<0.11) proportion YG2 carcasses relative to CON were observed. Results indicated feeding AATM to growing-finishing cattle may improve final BW, carcass weight and carcass lean meat yield; although, further research is required to evaluate the efficacy of AATM supplementation for preventing DD and foot rot in feedlot cattle. KEY WORDS: Digital dermatitis, Feedlot cattle
INTRODUCTION
Infectious pododermatitis (footrot) and
papillomatous digital dermatitis (DD) are infectious diseases of the bovine foot. Digital dermatitis in feedlot
1Corresponding author: [email protected]
cattle is commonly observed in heavy weight finishing animals, where wet and muddy pen conditions are predisposing factors. However, many factors affecting the etiology of DD in feedlot cattle remain unknown. Footrot and DD can result in moderate to severe lameness leading to significant treatment costs, production losses and culling of cattle non-responsive to treatment. Information regarding economic losses attributable to lameness in confined beef feeding operations remains limited. In Canada, lame cattle are also excluded from export loads which add to the total economic impact of the disease. Feeding amino acid trace mineral complexes (AATM), such as zinc methionine have been recommended for both prevention and treatment of foot rot (Merck Veterinary Manual, 7th edition, 1991). Recent evaluations of a proprietary trace mineral (TM) premix (Availa®Plus™;
Zinpro Corporation, Eden Prairie, MN) that provides highly fortified levels of Cu, Mn and Zn as amino acid complexes (AAC) and high levels of iodine, supplied as potassium iodine, have shown improvements in helping to reduce prevalence of DD in non-lactating dairy cows at risk for lameness in the presence of predisposing conditions. Currently, no information is available regarding the effect of AATM on incidence of DD and footrot in beef cattle fed in confinement. The primary objective of this study was to compare supplements providing Cu, Mn and Zn from entirely inorganic sources to a program that provides AAC of Cu, Mn and Zn in combination with inorganic sources at levels greater than established requirements on reducing the prevalence of DD and foot rot, and improving growth performance, carcass yield and quality.
MATERIALS AND METHODS
All animals used in the study were handled
humanely under the guidance of the consulting veterinarian. Cattle enrolled on study had previously been in local backgrounding lots and were transferred to the study site for finishing. Cattle were processed and randomly allocated to replicate groups as they were received into the feedyard. Replicates were sequentially completed as cattle were received. At induction processing, cattle were individually weighed, identified, and processed according to a standard protocol. In total, 4,560 steers were randomized to 20 pens that comprised 10 replicates. Overall mean initial BW at study initiation was 425 kg.
Replicates consisted of two matched pens which
held 225 animals per pen. Pens were similar in design,
185
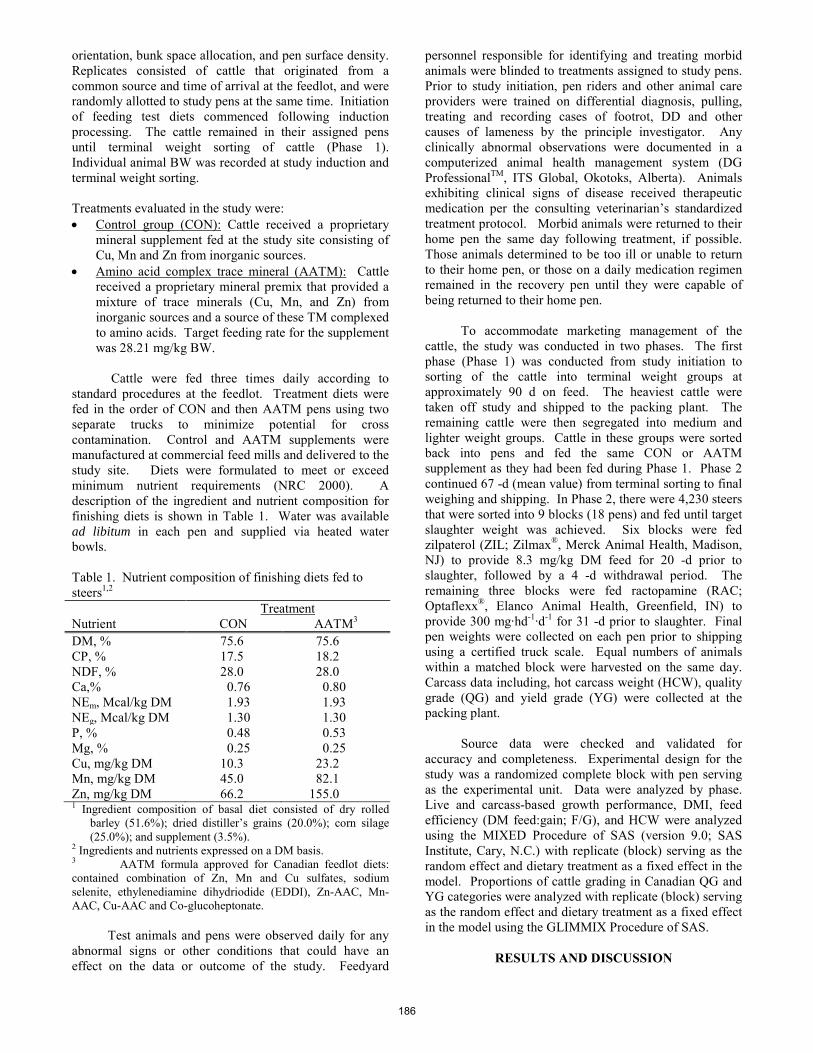
orientation, bunk space allocation, and pen surface density. Replicates consisted of cattle that originated from a common source and time of arrival at the feedlot, and were randomly allotted to study pens at the same time. Initiation of feeding test diets commenced following induction processing. The cattle remained in their assigned pens until terminal weight sorting of cattle (Phase 1). Individual animal BW was recorded at study induction and terminal weight sorting. Treatments evaluated in the study were: • Control group (CON): Cattle received a proprietary
mineral supplement fed at the study site consisting of Cu, Mn and Zn from inorganic sources.
• Amino acid complex trace mineral (AATM): Cattle received a proprietary mineral premix that provided a mixture of trace minerals (Cu, Mn, and Zn) from inorganic sources and a source of these TM complexed to amino acids. Target feeding rate for the supplement was 28.21 mg/kg BW.
Cattle were fed three times daily according to
standard procedures at the feedlot. Treatment diets were fed in the order of CON and then AATM pens using two separate trucks to minimize potential for cross contamination. Control and AATM supplements were manufactured at commercial feed mills and delivered to the study site. Diets were formulated to meet or exceed minimum nutrient requirements (NRC 2000). A description of the ingredient and nutrient composition for finishing diets is shown in Table 1. Water was available ad libitum in each pen and supplied via heated water bowls.
Table 1. Nutrient composition of finishing diets fed to steers1,2 Treatment Nutrient CON AATM3 DM, % 75.6 75.6 CP, % 17.5 18.2 NDF, % 28.0 28.0 Ca,% 0.76 0.80 NEm, Mcal/kg DM 1.93 1.93 NEg, Mcal/kg DM 1.30 1.30 P, % 0.48 0.53 Mg, % 0.25 0.25 Cu, mg/kg DM 10.3 23.2 Mn, mg/kg DM 45.0 82.1 Zn, mg/kg DM 66.2 155.0 1 Ingredient composition of basal diet consisted of dry rolled
barley (51.6%); dried distiller’s grains (20.0%); corn silage (25.0%); and supplement (3.5%).
2 Ingredients and nutrients expressed on a DM basis. 3 AATM formula approved for Canadian feedlot diets: contained combination of Zn, Mn and Cu sulfates, sodium selenite, ethylenediamine dihydriodide (EDDI), Zn-AAC, Mn-AAC, Cu-AAC and Co-glucoheptonate.
Test animals and pens were observed daily for any abnormal signs or other conditions that could have an effect on the data or outcome of the study. Feedyard
personnel responsible for identifying and treating morbid animals were blinded to treatments assigned to study pens. Prior to study initiation, pen riders and other animal care providers were trained on differential diagnosis, pulling, treating and recording cases of footrot, DD and other causes of lameness by the principle investigator. Any clinically abnormal observations were documented in a computerized animal health management system (DG ProfessionalTM, ITS Global, Okotoks, Alberta). Animals exhibiting clinical signs of disease received therapeutic medication per the consulting veterinarian’s standardized treatment protocol. Morbid animals were returned to their home pen the same day following treatment, if possible. Those animals determined to be too ill or unable to return to their home pen, or those on a daily medication regimen remained in the recovery pen until they were capable of being returned to their home pen.
To accommodate marketing management of the cattle, the study was conducted in two phases. The first phase (Phase 1) was conducted from study initiation to sorting of the cattle into terminal weight groups at approximately 90 d on feed. The heaviest cattle were taken off study and shipped to the packing plant. The remaining cattle were then segregated into medium and lighter weight groups. Cattle in these groups were sorted back into pens and fed the same CON or AATM supplement as they had been fed during Phase 1. Phase 2 continued 67 -d (mean value) from terminal sorting to final weighing and shipping. In Phase 2, there were 4,230 steers that were sorted into 9 blocks (18 pens) and fed until target slaughter weight was achieved. Six blocks were fed zilpaterol (ZIL; Zilmax®, Merck Animal Health, Madison, NJ) to provide 8.3 mg/kg DM feed for 20 -d prior to slaughter, followed by a 4 -d withdrawal period. The remaining three blocks were fed ractopamine (RAC; Optaflexx®, Elanco Animal Health, Greenfield, IN) to provide 300 mg∙hd-1∙d-1 for 31 -d prior to slaughter. Final pen weights were collected on each pen prior to shipping using a certified truck scale. Equal numbers of animals within a matched block were harvested on the same day. Carcass data including, hot carcass weight (HCW), quality grade (QG) and yield grade (YG) were collected at the packing plant.
Source data were checked and validated for accuracy and completeness. Experimental design for the study was a randomized complete block with pen serving as the experimental unit. Data were analyzed by phase. Live and carcass-based growth performance, DMI, feed efficiency (DM feed:gain; F/G), and HCW were analyzed using the MIXED Procedure of SAS (version 9.0; SAS Institute, Cary, N.C.) with replicate (block) serving as the random effect and dietary treatment as a fixed effect in the model. Proportions of cattle grading in Canadian QG and YG categories were analyzed with replicate (block) serving as the random effect and dietary treatment as a fixed effect in the model using the GLIMMIX Procedure of SAS.
RESULTS AND DISCUSSION
186
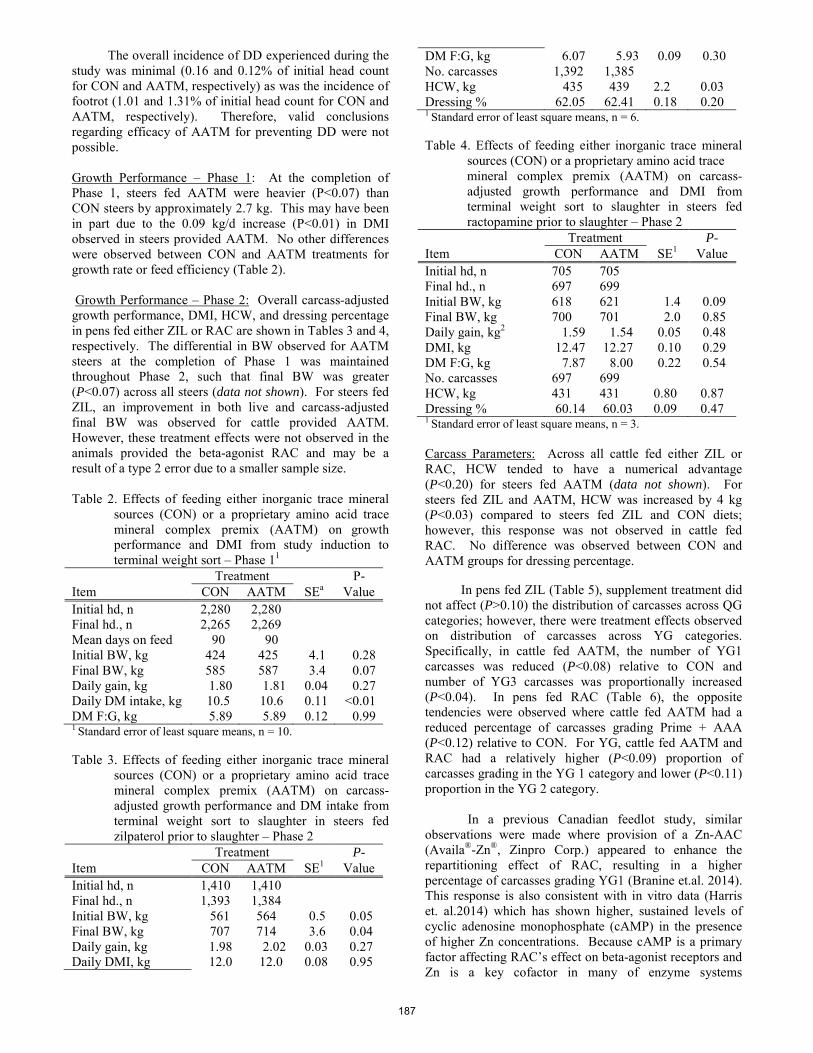
The overall incidence of DD experienced during the study was minimal (0.16 and 0.12% of initial head count for CON and AATM, respectively) as was the incidence of footrot (1.01 and 1.31% of initial head count for CON and AATM, respectively). Therefore, valid conclusions regarding efficacy of AATM for preventing DD were not possible.
Growth Performance – Phase 1: At the completion of Phase 1, steers fed AATM were heavier (P<0.07) than CON steers by approximately 2.7 kg. This may have been in part due to the 0.09 kg/d increase (P<0.01) in DMI observed in steers provided AATM. No other differences were observed between CON and AATM treatments for growth rate or feed efficiency (Table 2). Growth Performance – Phase 2: Overall carcass-adjusted growth performance, DMI, HCW, and dressing percentage in pens fed either ZIL or RAC are shown in Tables 3 and 4, respectively. The differential in BW observed for AATM steers at the completion of Phase 1 was maintained throughout Phase 2, such that final BW was greater (P<0.07) across all steers (data not shown). For steers fed ZIL, an improvement in both live and carcass-adjusted final BW was observed for cattle provided AATM. However, these treatment effects were not observed in the animals provided the beta-agonist RAC and may be a result of a type 2 error due to a smaller sample size. Table 2. Effects of feeding either inorganic trace mineral
sources (CON) or a proprietary amino acid trace mineral complex premix (AATM) on growth performance and DMI from study induction to terminal weight sort – Phase 11
Treatment P- Item CON AATM SEa Value Initial hd, n 2,280 2,280 Final hd., n 2,265 2,269 Mean days on feed 90 90 Initial BW, kg 424 425 4.1 0.28 Final BW, kg 585 587 3.4 0.07 Daily gain, kg 1.80 1.81 0.04 0.27 Daily DM intake, kg 10.5 10.6 0.11 <0.01 DM F:G, kg 5.89 5.89 0.12 0.99 1 Standard error of least square means, n = 10. Table 3. Effects of feeding either inorganic trace mineral
sources (CON) or a proprietary amino acid trace mineral complex premix (AATM) on carcass-adjusted growth performance and DM intake from terminal weight sort to slaughter in steers fed zilpaterol prior to slaughter – Phase 2
Treatment P- Item CON AATM SE1 Value Initial hd, n 1,410 1,410 Final hd., n 1,393 1,384 Initial BW, kg 561 564 0.5 0.05 Final BW, kg 707 714 3.6 0.04 Daily gain, kg 1.98 2.02 0.03 0.27 Daily DMI, kg 12.0 12.0 0.08 0.95
DM F:G, kg 6.07 5.93 0.09 0.30 No. carcasses 1,392 1,385 HCW, kg 435 439 2.2 0.03 Dressing % 62.05 62.41 0.18 0.20 1 Standard error of least square means, n = 6. Table 4. Effects of feeding either inorganic trace mineral
sources (CON) or a proprietary amino acid trace mineral complex premix (AATM) on carcass-adjusted growth performance and DMI from terminal weight sort to slaughter in steers fed ractopamine prior to slaughter – Phase 2
Treatment P- Item CON AATM SE1 Value Initial hd, n 705 705 Final hd., n 697 699 Initial BW, kg 618 621 1.4 0.09 Final BW, kg 700 701 2.0 0.85 Daily gain, kg2 1.59 1.54 0.05 0.48 DMI, kg 12.47 12.27 0.10 0.29 DM F:G, kg 7.87 8.00 0.22 0.54 No. carcasses 697 699 HCW, kg 431 431 0.80 0.87 Dressing % 60.14 60.03 0.09 0.47 1 Standard error of least square means, n = 3. Carcass Parameters: Across all cattle fed either ZIL or RAC, HCW tended to have a numerical advantage (P<0.20) for steers fed AATM (data not shown). For steers fed ZIL and AATM, HCW was increased by 4 kg (P<0.03) compared to steers fed ZIL and CON diets; however, this response was not observed in cattle fed RAC. No difference was observed between CON and AATM groups for dressing percentage.
In pens fed ZIL (Table 5), supplement treatment did not affect (P>0.10) the distribution of carcasses across QG categories; however, there were treatment effects observed on distribution of carcasses across YG categories. Specifically, in cattle fed AATM, the number of YG1 carcasses was reduced (P<0.08) relative to CON and number of YG3 carcasses was proportionally increased (P<0.04). In pens fed RAC (Table 6), the opposite tendencies were observed where cattle fed AATM had a reduced percentage of carcasses grading Prime + AAA (P<0.12) relative to CON. For YG, cattle fed AATM and RAC had a relatively higher (P<0.09) proportion of carcasses grading in the YG 1 category and lower (P<0.11) proportion in the YG 2 category.
In a previous Canadian feedlot study, similar
observations were made where provision of a Zn-AAC (Availa®-Zn®, Zinpro Corp.) appeared to enhance the repartitioning effect of RAC, resulting in a higher percentage of carcasses grading YG1 (Branine et.al. 2014). This response is also consistent with in vitro data (Harris et. al.2014) which has shown higher, sustained levels of cyclic adenosine monophosphate (cAMP) in the presence of higher Zn concentrations. Because cAMP is a primary factor affecting RAC’s effect on beta-agonist receptors and Zn is a key cofactor in many of enzyme systems
187
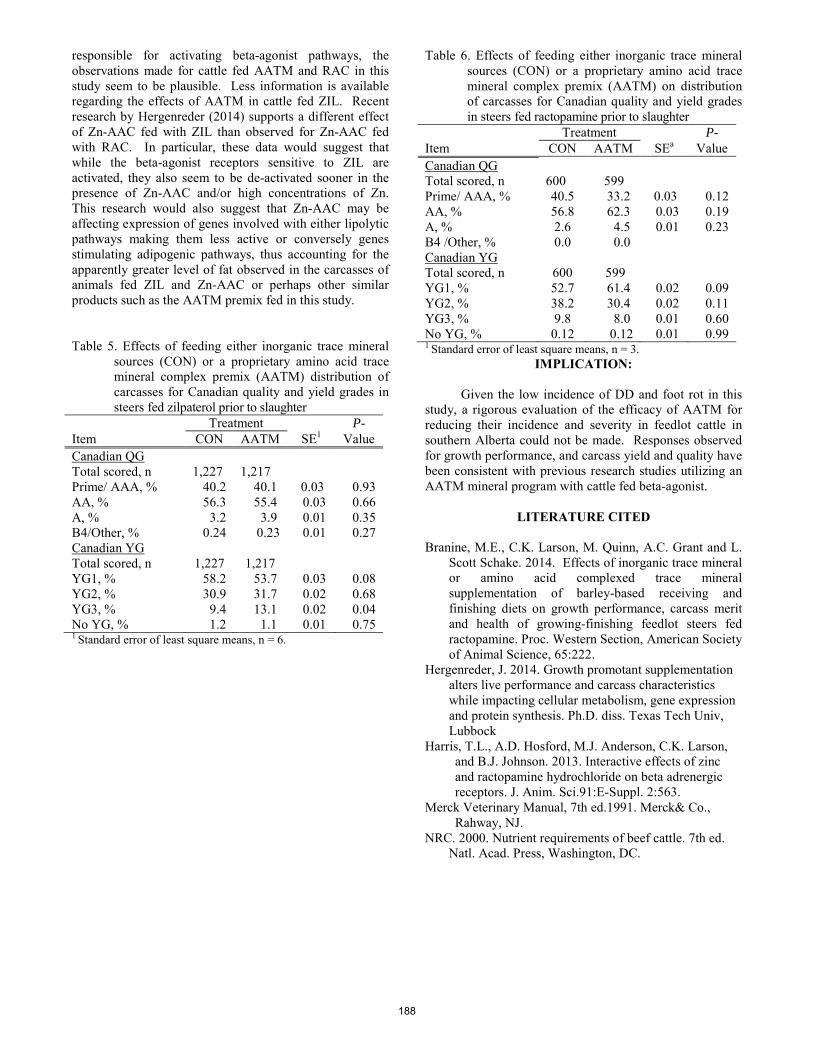
responsible for activating beta-agonist pathways, the observations made for cattle fed AATM and RAC in this study seem to be plausible. Less information is available regarding the effects of AATM in cattle fed ZIL. Recent research by Hergenreder (2014) supports a different effect of Zn-AAC fed with ZIL than observed for Zn-AAC fed with RAC. In particular, these data would suggest that while the beta-agonist receptors sensitive to ZIL are activated, they also seem to be de-activated sooner in the presence of Zn-AAC and/or high concentrations of Zn. This research would also suggest that Zn-AAC may be affecting expression of genes involved with either lipolytic pathways making them less active or conversely genes stimulating adipogenic pathways, thus accounting for the apparently greater level of fat observed in the carcasses of animals fed ZIL and Zn-AAC or perhaps other similar products such as the AATM premix fed in this study.
Table 5. Effects of feeding either inorganic trace mineral sources (CON) or a proprietary amino acid trace mineral complex premix (AATM) distribution of carcasses for Canadian quality and yield grades in steers fed zilpaterol prior to slaughter
Treatment P- Item CON AATM SE1 Value Canadian QG Total scored, n 1,227 1,217 Prime/ AAA, % 40.2 40.1 0.03 0.93 AA, % 56.3 55.4 0.03 0.66 A, % 3.2 3.9 0.01 0.35 B4/Other, % 0.24 0.23 0.01 0.27 Canadian YG Total scored, n 1,227 1,217 YG1, % 58.2 53.7 0.03 0.08 YG2, % 30.9 31.7 0.02 0.68 YG3, % 9.4 13.1 0.02 0.04 No YG, % 1.2 1.1 0.01 0.75 1 Standard error of least square means, n = 6.
Table 6. Effects of feeding either inorganic trace mineral sources (CON) or a proprietary amino acid trace mineral complex premix (AATM) on distribution of carcasses for Canadian quality and yield grades in steers fed ractopamine prior to slaughter
Treatment P- Item CON AATM SEa Value Canadian QG Total scored, n 600 599 Prime/ AAA, % 40.5 33.2 0.03 0.12 AA, % 56.8 62.3 0.03 0.19 A, % 2.6 4.5 0.01 0.23 B4 /Other, % 0.0 0.0 Canadian YG Total scored, n 600 599 YG1, % 52.7 61.4 0.02 0.09 YG2, % 38.2 30.4 0.02 0.11 YG3, % 9.8 8.0 0.01 0.60 No YG, % 0.12 0.12 0.01 0.99 1 Standard error of least square means, n = 3.
IMPLICATION:
Given the low incidence of DD and foot rot in this study, a rigorous evaluation of the efficacy of AATM for reducing their incidence and severity in feedlot cattle in southern Alberta could not be made. Responses observed for growth performance, and carcass yield and quality have been consistent with previous research studies utilizing an AATM mineral program with cattle fed beta-agonist.
LITERATURE CITED Branine, M.E., C.K. Larson, M. Quinn, A.C. Grant and L.
Scott Schake. 2014. Effects of inorganic trace mineral or amino acid complexed trace mineral supplementation of barley-based receiving and finishing diets on growth performance, carcass merit and health of growing-finishing feedlot steers fed ractopamine. Proc. Western Section, American Society of Animal Science, 65:222.
Hergenreder, J. 2014. Growth promotant supplementation alters live performance and carcass characteristics while impacting cellular metabolism, gene expression and protein synthesis. Ph.D. diss. Texas Tech Univ, Lubbock
Harris, T.L., A.D. Hosford, M.J. Anderson, C.K. Larson, and B.J. Johnson. 2013. Interactive effects of zinc and ractopamine hydrochloride on beta adrenergic receptors. J. Anim. Sci.91:E-Suppl. 2:563.
Merck Veterinary Manual, 7th ed.1991. Merck& Co., Rahway, NJ.
NRC. 2000. Nutrient requirements of beef cattle. 7th ed. Natl. Acad. Press, Washington, DC.
188
Proceedings, Western Section, American Society of Animal Science
Vol. 66, 2015
Effects of high-tannin substrate, dietary tannin adaptation, antibiotic inclusion, and animal species on mean gas pressures, ammonia concentrations, and total volatile fatty acid concentrations following a 48-h in vitro incubation
A. N. McKiearnan*, M. D. Miesner†, E. C. Titgemeyer*, T. G. Nagaraja‡, J. S. Drouillard*, K. C. Olson*
* Department of Animal Sciences & Industry, Kansas State University, Manhattan † Department of Clinical Sciences, Kansas State University, Manhattan
‡ Department of Diagnostic Medicine & Pathobiology, Kansas State University, Manhattan
ABSTRACT: Effects of dietary tannins, dietary tannin adaptation, animal species, and antibiotic inclusion on 48-h extent of in vitro fermentation were measured. Cows, sheep, and goats (n = 3 / species) were used in a 2-period, randomized complete-block experiment with a 2 × 3 × 2 × 3 factorial arrangement of treatments. Factor 1 was culture substrate: high-tannin or tannin-free. Factor 2 was inoculum-donor species: cow, sheep, or goat. Factor 3 was donor species adaptation to a high-tannin diet: non-adapted or adapted. Factor 4 was antibiotic: no antibiotic, bacterial suppression (penicillin + streptomycin), or fungal suppression (cycloheximide). Tannin-free or high-tannin substrates were incubated in vitro using ruminal fluid from animals that were either not adapted to dietary tannins (period 1) or adapted to dietary tannins (period 2). Periods consisted of an adaptation period to tannin-free (10 d) or high-tannin diets (21 d) and a 15-d period of ruminal-fluid collection via stomach tube. Effects of culture substrate on mean gas pressure were influenced (P < 0.0001) by antibiotic inclusion. Mean gas pressure was not different (LSD = 3.43) between antibiotic-free cultures and cycloheximide-spiked cultures when both were fed tannin-free substrate (30.6 and 28.6 psi, respectively). In addition, mean gas pressure was not different between antibiotic-free cultures and cycloheximide-spiked cultures when both were fed high-tannin substrate (14.3 and 14.7 psi, respectively). Ammonia concentration was greatest (P < 0.0001; LSD = 1.19) in cultures spiked with penicillin + streptomycin, less in cultures not treated with antibiotic, and least in cultures spiked with cycloheximide (20.2, 19.0, and 16.8 mmol/L, respectively). Total VFA concentration was influenced (P < 0.001; LSD = 3.43) by culture substrate and tannin-adaptation status of ruminal-fluid donors. Total VFA concentration in cultures fed tannin-free media was greater when inoculated with ruminal fluid from animals not adapted to dietary tannins (83.7 mmol/L) than when inoculated with ruminal fluid from tannin-adapted animals (79.6 mmol/L). Conversely, total VFA concentration in cultures fed high-tannin substrate was greater with tannin-adapted ruminal fluid (59.4 mmol/L) than with non-adapted ruminal fluid (52.6 mmol/L). We concluded that: 1) condensed tannins had general deleterious effects on fermentation and 2) adaptation to dietary condensed tannins attenuated some negative effects of tannins on fermentation during a 48-h batch-culture in vitro incubation.
Keywords: condensed tannins, dietary tannin adaptation, ruminal fermentation
INTRODUCTION
Condensed tannins (CT) are phenolic compounds found in a wide variety of plants and are most prevalent in legume and browse species; CT are a functional defense mechanism against diseases, stress, and herbivory (Min et al., 2003). Tannins limit DM intake, DM digestibility, and ruminal protein degradation by ruminants due to formation of CT-protein complexes in vivo (Makkar, 2003; Eckerle, 2011). Condensed tannin-protein complexes are formed during mastication when CT are released from plant cells (Min et al., 2003). These complexes are maintained under ruminal conditions and render proteins unavailable (Makkar, 2003).
Ruminal protein degradation decreased with the addition of CT in vitro (Hassanat and Bencharr, 2012) and in vivo (Al-Dobaib, 2009). Min et al. (2005) concluded also that CT reduced ruminal protein degradation; moreover, this was accompanied by suppressed growth rates in 11 select species of ruminal bacteria. Small ruminants reportedly had greater tolerance for high-tannin forages than beef cattle. Frutos et al. (2004) reported that in vitro gas production and DM disappearance were greater for goats and deer than for cattle and sheep when CT were included in culture media. Little research has focused on adaptability of various ruminant species to dietary CT. In addition, the relative susceptibilities of ruminal fungi and ruminal bacteria to dietary CT are unknown. Therefore, our objective was to evaluate simultaneously the influences of adaptation to dietary tannins in Bos taurus, Ovis aries, and Capra hircus, with and without selective antibiotic suppression of either ruminal bacteria or ruminal fungi on mean gas pressure and concentrations of total VFA and ammonia.
MATERIALS AND METHODS
Study preparation. The Kansas State University
Institutional Animal Care and Use Committee reviewed and approved all animal-handling and animal-care practices used in our research (protocol no. 3423).
Animals. Three beef cows (551 ± 30 kg BW), 3 sheep (68 ± 3 kg BW), and 3 goats (49 ± 4 kg BW) were used in this experiment. Sheep and goats were housed together in a 10 x 10 m pen and cows were housed in an adjacent 100 x 100 m pen. Smooth bromegrass hay (Bromus inermis; 87.9% DM; 9.1% CP, 76.2% NDF, and 47.0% ADF) was offered to all animals daily in round-bale feeders (diameter = 2.5 m) in amounts calculated to allow ad libitum intake (3.2% BW). One animal from each species was assigned randomly to 1 of 3 cohorts; cohorts were assigned randomly
189

to 1 of 3 sampling times during each of 2 experimental periods.
Animals were fed a single tannin-free diet during period 1 and a single high-tannin diet during period 2. Tannin-free and tannin-contaminated substrates were subject to in vitro fermentation using ruminal inoculum harvested from beef cows, sheep, and goats that were either not adapted to dietary condensed tannins (period 1) or adapted to dietary condensed tannins (period 2).
Adaptation to tannin-free diets. The timeline of our experiment was expressed relative to the first day of animal adaptation (d 1) to treatment diets. All animal cohorts were fed tannin-free smooth bromegrass hay ad libitum for 10 d to begin period 1. Ruminal fluid was collected via stomach tube from animals from d 11 to 25 for use in in vitro batch cultures. Ruminal fluid was collected from cohort 1 on d 11 and on d 19, from cohort 2 on d 14 and on d 22, and from cohort 3 on d 17 and on d 25. During the period of ruminal fluid collection, animals continued to be fed for ad libitum intake of smooth bromegrass hay, as during the adaptation phase of the experiment. All animals had unrestricted access to fresh water, a salt block (98.0% NaCl; Compass Minerals, Chicago, IL) and a mineral block (95.5% NaCl, 3500 ppm Zn, 2000 ppm Fe, 1800 ppm Mn, 280 ppm Cu, 100 ppm I, and 60 ppm Co; Compass Mineral, Chicago, IL) during period 1.
Adaptation to high-tannin diets. During period 2, animal subjects were adapted to high-tannin intake conditions by providing them with grain-byproduct supplements that were spiked with quebracho tannins. Hassanat and Benchaar (2013) reported that condensed tannins extracted from certain trees in the Anacardiaceae and Apocynaceae families, known commonly as quebracho trees, had dose-dependent effects on ruminal digestion parameters in vitro. Purified, feed-grade quebracho-tannin extract (QT) was procured from Wintersun Chemical (Ontario, CA) for use in high-tannin supplements and high-tannin culture substrates.
Immediately following period 1, animal subjects were fed tannin-free smooth bromegrass hay ad libitum for an additional 21 d. Each animal was also individually fed a supplement which contained QT at 0.1% BW, soybean hulls (SBH) at 0.2% BW and dried molasses at 0.05% BW. Soybean hulls and molasses were fed to encourage complete consumption of the prescribed dose of QT. The animals were individually penned each morning (0730) and each evening (2000) with supplement and fresh water available. They were allowed access to the supplement for 45 min at each feeding; any unconsumed supplement following the morning feeding was offered again during the evening feeding. Unconsumed supplement following the evening feeding was collected and weighed to determine DMI. Supplement consumption by sheep and goats was complete each d, whereas cows left an average of 183 ± 10 g QT unconsumed daily. Consumed QT was equivalent to only 67% of the targeted dose, underscoring the strong aversion among beef cows to dietary CT reported by Eckerle et al. (2011).
Animals were fed the tannin-containing supplement in conjunction with ad libitum tannin-free smooth bromegrass hay for 21 d before ruminal-fluid collections began. All
animal subjects had continual access to fresh water, a salt block, and a mineral block as in period 1.
Ruminal fluid was collected via stomach tube from d 22 to 37 from animals for in vitro batch cultures. Ruminal fluid was collected from cohort 1 on d 22 and on d 31, from cohort 2 on d 25 and on d 34, and from cohort 3 on d 28 and on d 37. During the period of ruminal fluid collection, animals continued to be fed for ad libitum intake of smooth bromegrass hay, as during the adaptation phase of the experiment; moreover, they continued to be fed QT-containing supplements daily.
Ruminal fluid collection. Ruminal fluid was collected orally at 0730 on the schedule designated for each animal cohort. A simple hand-made vacuum strainer was used for this purpose. Ruminal fluid was collected from each animal in a cohort in the following order: cow, sheep, and goat. Cows were restrained using a chute with a locking head gate. Sheep and goats were restrained manually. An oral speculum was inserted into the mouth (15 cm for cows and 8 cm for sheep and goats) to prevent animals from biting the collection tube, thereby halting fluid flow or damaging the tube. To prevent excessive salivary contamination, the first 200 mL of ruminal fluid collected from each animal was discarded. Approximately 700 mL of fluid was harvested from each animal at each collection; collection time was approximately 7 min / animal.
Harvested ruminal fluid from each animal was transferred immediately to a single 3-L, pre-warmed, insulated bottle for transport to laboratory facilities. Harvested ruminal fluid was strained through 8 layers of cheesecloth and poured into a separatory flask; it was allowed to separate in the flask for 30 min. The heaviest fraction, containing protozoa and other waste, was discarded.
Culture substrate preparation. During periods 1 and 2, the tannin-free substrate added to ruminal inoculum of cattle, sheep, and goats was smooth bromegrass hay (87.9% DM; 9.1% CP, 76.2% NDF, and 47.0% ADF). Hay was dried at 55°C for 48 h and ground (#4 Wiley Mill, Thomas Scientific, Swedesboro, NJ, USA) to pass a 1-mm screen before it was added to the culturing devices. The tannin-contaminated substrate added to ruminal inoculum of cattle, sheep, and goats during periods 1 and 2 was a composite of the smooth bromegrass hay used as the tannin-free substrate and condensed tannin in the form of QT. Hay and QT were blended to achieve a substrate condensed-tannin concentration of 10.2% (wt/wt). Condensed-tannin concentration in QT (71.8%, DM basis) was determined by the Friedberg Skin-Powder method (Wintersun Chemical, Ontario, CA). Composition of QT was: 92.4% DM, 1.3% CP, 0.5% NDF, and 2.7% ADF.
In order to determine the relative importance of bacterial and fungal fermentative activities in vitro, tannin-free and tannin-contaminated substrates were subject to in vitro fermentation with the addition of antimicrobial compounds to the culture (Windham and Akin, 1984). Bacterial suppression was accomplished using penicillin G (1,600 U/mg; PEN-K; Sigma-Aldrich Chemical Co., Milwaukee, WI) and streptomycin sulfate (720 IU/mg; S-6501, Sigma-Aldrich Chemical Co., Milwaukee, WI). A bacterial-suppression solution was prepared, containing 12.5
190

mg of penicillin G and 2 mg of streptomycin sulfate per mL of deionized water. One mL of this solution was added to in vitro cultures per 10 mL of ruminal fluid. Fungal suppression was accomplished by preparing a solution of 5 mg of cycloheximide (C7698; Sigma-Aldrich Chemical Co., Milwaukee, WI) per mL of deionized water. One mL of fungal-suppression solution (FS) was added to in vitro cultures per 10 mL of ruminal fluid. Unsuppressed in vitro cultures were examined concurrently for reference.
48-h batch cultures. In vitro total gas production, total VFA concentrations, and ammonia concentrations were measured using a 48-h batch-culture technique. Cultures were conducted using 250-mL glass jars equipped with ANKOM gas-production system lids (Model RF1; Ankom Technology, Macedon, NY). Nine jars were used to measure effects of treatment for each animal in each cohort in a 2 × 3 × 2 × 3 factorial arrangement of a randomized complete block design. Factor 1 was culture substrate: high-tannin or tannin-free. Factor 2 was species: cow, sheep, or goat. Factor 3 was adaptation to a high-tannin diet: non-adapted or adapted. Factor 4 was antibiotic: no antibiotic, bacterial suppression (penicillin + streptomycin), or fungal suppression (cycloheximide).
Within animal and cohort, 6 jars were assigned randomly to receive substrate, ruminal fluid, and McDougal’s artificial saliva and 3 were assigned randomly to serve as blanks, receiving ruminal fluid and McDougal’s artificial saliva only. McDougall’s artificial saliva was prepared 24 h before each ruminal-fluid collection and stored in an incubator at 39°C. Ruminal fluid and McDougall’s artificial saliva were included in the cultures at a 1:2 ratio. Blank jars were randomly assigned to receive no additive, penicillin + streptomycin sulfate, or cycloheximide. Jars containing substrate were randomly assigned to receive tannin-free substrate (3 g smooth bromegrass hay) or high-tannin substrate (3 g smooth bromegrass hay + 0.4763 g QT); within each substrate group (n = 3), jars were randomly assigned to receive no additive, penicillin + streptomycin sulfate, or cycloheximide.
Five mL of penicillin + streptomycin sulfate solution were added to designated samples and 5 mL of cycloheximide solution were added to designated samples immediately before ruminal fluid was added to culture jars (Windham and Akin, 1984). Fifty mL of ruminal fluid from each species were added to jars, including blanks, for each species. McDougall’s artificial saliva (100 mL) was added to each jar. Jars were individually gassed with N2 for 20 s and capped with an ANKOM RF1 lid. The jars were placed in an incubator (Model G25; New Brunswick Scientific Co., Inc., New Brunswick, N.J.) in random order at 39°C for 48 h. After 48 h, jars were removed and immediately placed on ice to inhibit fermentation.
Gas pressure in the headspace of each jar was recorded every 15 min during the 48-h incubation. Samples for VFA and ammonia analyses were collected by transferring 1 mL of fluid from each jar in duplicate into separate 2-mL conical vials, into which 0.25 mL of aqueous meta-phosphoric acid (25%, w/v) had been added to suspend microbial activity. Samples were frozen pending analysis.
Laboratory analyses. Sample concentrations of total VFA were measured via gas chromatography. Ammonia concentration was analyzed via uv/vis spectroscopy using a Technicon Autoanalyzer II (Technicon Industrial Systems, Tarrytown, NY) according to procedures described by Broderick and Kang (1980).
Culture substrates were analyzed for partial DM (Goering and Van Soest, 1970), DM (Goering and Van Soest, 1970), N (AOAC, 2000; 968.06) using combustion analysis (Leco TruMac N, St. Joeseph, MI), NDF (Van Soest et al., 1991; modified for the Ankom 200 fiber analyzer, Ankom Technology Corp., Macedon, NY) and ADF (AOAC, 2005; 973.18 modified for the Ankom 200 fiber analyzer, Ankom Technology Corp, Macedon, NY).
Statistical analyses. Gas pressure, ammonia concentrations, and total VFA concentrations were analyzed as a mixed model using a 2 × 3 × 2 × 3 factorial arrangement of a randomized complete block design (PROC MIXED; SAS Inst. Inc., Cary, NC). Class factors included animal species (Bos taurus, Ovis aries, or Capra hircus), culture substrate (tannin-free or high-tannin), microbial suppressant (none, penicillin + streptomycin, or cycloheximide), animal cohort (i.e., block; 1, 2, or 3), and animal adaptation to tannins (non-adapted or adapted). The model statement included terms for the fixed effects of animal species, culture substrate, microbial suppressant, animal adaptation, and all possible 2-, 3-, and 4-way interaction terms. The random statement had terms for animal cohort, cohort × species, and adaptation (cohort × species). When protected by a significant F-test (P < 0.001), means were separated using the method of Least Significant Difference. Least-squares means for the highest-order, significant (P < 0.001) interaction term were reported.
RESULTS AND DISCUSSION
Mean Gas Pressure. Effects of culture substrate on
mean gas pressures were influenced (P = 0.0002) by donor-animal adaptation to dietary CT (Table 1). Mean gas pressures were greater (LSD = 0.21) in cultures with tannin-free substrate (1.83 and 1.65 bar for non-adapted and adapted, respectively) than for cultures with high-tannin substrate (0.82 and 0.94 bar for non-adapted and adapted, respectively). Tannin-adaptation status of donor inoculum did not affect mean gas pressures, regardless of substrate type. Hassanat and Benchaar (2012) reported that gas production in cultures containing CT was reduced at doses ≥ 20 g QT / kg substrate. Tan et al. (2011) also demonstrated a dose-dependent decrease in total gas production with increasing CT. Makkar (2003) speculated that decreased gas production may be due to decreased fiber digestion in the presence of CT. In our study, adaptation to dietary tannins did not alleviate depression in mean gas pressure in vitro.
Effects of culture substrate on mean gas pressures were also affected (P < 0.0001) by antibiotic addition to 48-h in vitro batch cultures (Table 2). Mean gas pressures were not different (LSD = 0.24) between antibiotic-free cultures fed tannin-free substrate and cycloheximide-spiked cultures fed tannin-free substrate (2.11 and 1.98 bar, respectively). In addition, mean gas pressures were not different between antibiotic-free cultures fed high-tannin substrate and
191

cycloheximide-spiked cultures fed high-tannin substrate (0.99 and 1.02 bar, respectively). We interpreted these data to indicate that fermentative activities of ruminal fungi contributed little to total gas production in a 48-h batch-culture in vitro system. Mean gas pressures in tannin-free cultures that were spiked with penicillin + streptomycin (1.14 bar) were less than in tannin-free cultures without antibiotic and tannin-free cultures spiked with cycloheximide. High-tannin substrate also produced lesser gas pressures when dosed with penicillin + streptomycin (0.65 bar) than when no antibiotic was added to high-tannin cultures or when high-tannin cultures were was dosed with cycloheximide. Clearly, suppression of bacterial fermentative activities had strong negative effects on production of gas in a 48-h, batch-culture in vitro system. Windham and Akin (1984) indicated that the ruminal bacteria were responsible collectively for more fiber degradation than the ruminal fungi; therefore, bacteria may have contributed more to total gas production from a fibrous substrate in our study than fungi.
Ammonia Concentrations. Effects of antibiotic treatment on ammonia concentrations were not influenced (P ≥ 0.13) by culture substrate type, by donor animal species, by donor-animal adaptation to dietary tannins, or by any interactions between these factors; therefore, main effects of antibiotic treatment on ammonia concentrations were reported (data not shown). Ammonia concentrations were greatest (P < 0.0001; LSD = 1.19) in cultures spiked with penicillin + streptomycin, slightly less in cultures not treated with antibiotic, and least in cultures spiked with cycloheximide (20.2, 19.0, and 16.8 mmol/L, respectively). Satter and Slyter (1974) indicated that ammonia concentrations in an in vitro system were influenced by both amino-acid deamination and amino-acid synthesis by ruminal microbes. We speculated the balance between these activities was affected differentially by suppression of fungal or bacterial fermentative activities relative to the antibiotic-free control. In our study, fungal suppression may have led to greater net ammonia uptake by bacteria, whereas bacterial suppression may have led to greater net ammonia accumulation.
Ammonia concentrations were influenced (P < 0.0001) by both culture substrate and tannin-adaptation status of ruminal fluid donors (Table 1). Concentrations of ammonia were greatest (LSD = 2.05) in cultures with tannin-free substrate (19.4 and 19.9 mmol/L for non-adapted and adapted, respectively), regardless of tannin-adaptation status, and least in cultures with high-tannin substrate and inoculated with ruminal fluid from tannin-adapted animals (16.7 mmol/L). Ammonia concentrations in cultures with non-tannin adapted ruminal inoculum and high-tannin substrate were intermediate (18.5 mmol/L). Ruminal ammonia concentration was reduced in the presence of dietary CT due to decreased ruminal protein degradation (Frutos et al., 2004; Hassanat and Benchaar, 2012). We speculated that dietary adaptation to tannins may have reduced populations of microbial species that depended on free ammonia as an N source.
Total VFA Concentrations. Total VFA concentrations in 48-h in vitro batch cultures were influenced (P < 0.0001) by culture substrate and tannin-adaptation status of ruminal
fluid donors (Table 1). Total VFA concentrations were greatest (LSD = 3.43) when tannin-free media was fed to cultures inoculated with ruminal fluid from animals that were not adapted to dietary CT (83.7 mmol/L); they were slightly less in cultures fed tannin-free substrate and incubated with tannin-adapted inoculum (79.6 mmol/L). In contrast, total VFA concentrations decreased sharply in cultures with high-tannin substrate; moreover, cultures inoculated with CT-adapted ruminal fluid had greater total VFA concentrations than cultures inoculated with non-adapted ruminal fluid (59.4 and 52.6 mmol/L, respectively). Culture substrates containing CT generally depressed total VFA concentrations compared with cultures containing tannin-free substrate. Adaptation to dietary CT appeared to produce an amelioration of this depression. Condensed tannins were noted to depress total VFA concentration (Waghorn, 2008; Tan et al., 2011; Hassanat and Benchaar, 2012). We speculated that prior dietary exposure to CT may have alleviated a portion of their detrimental effects on total VFA concentrations in ruminants.
Effects of culture substrate on total VFA concentrations were influenced (P < 0.0001) by antibiotic inclusion in cultures (Table 2). Total VFA concentrations were greatest (LSD = 3.43) in cultures fed tannin-free media without antibiotic; they were slightly less for cultures fed tannin-free media and dosed with cycloheximide (96.1 and 91.6 mmol/L, respectively). Both produced significantly greater total VFA concentrations at 48 h of incubation than antibiotic-free, high-tannin substrate cultures and cycloheximide-treated, high-tannin cultures (63.6 and 62.7, mmol/L, respectively). Cultures treated with penicillin + streptomycin had lesser total VFA concentrations than other culture types. Within cultures treated with penicillin + streptomycin, tannin-free substrate produced greater total VFA concentrations than tannin-contaminated substrate (57.2 and 41.7 mmol/L, respectively). Molan et at. (2000) determined that CT concentrations > 400 ug CT / mL of ruminal fluid reduced growth of several important bacterial strains. This may have exacerbated the effects of the high-tannin substrate and penicillin + streptomycin treatment.
Effects of antibiotic treatment on total VFA concentrations were influenced (P = 0.001) by tannin-adaptation status of ruminal fluid donors (data not shown). Within antibiotic-free cultures, total VFA concentrations were not different (LSD = 8.51) between donor inoculum sources that were not adapted or adapted to dietary tannins (78.2 and 81.5 mmol/L, respectively). Total VFA concentrations were also not different between non-adapted and adapted inoculum for penicillin + streptomycin-spiked cultures (50.8 and 48.0 mmol/L, respectively) or cycloheximide cultures (75.4 and 78.9 mmol/L, respectively). Total VFA concentrations were not different between antibiotic-free cultures and cycloheximide-treated cultures; however, both had greater total VFA concentrations that cultures treated with penicillin + streptomycin. Suppression of bacterial fermentative activities had a strong negative influence on total VFA concentrations, whereas suppression of fungal fermentative activities had no influence on total VFA concentrations, relative to cultures not treated with antibiotic.
192

IMPLICATIONS
Condensed tannins had general suppressive effects on mean gas pressure, ammonia concentrations, and total VFA concentrations under the conditions of our study. This was likely due to tannin-protein interactions that decreased fermentative capacity of ruminal microbes. Dietary adaptation of ruminal-fluid donors to CT mitigated the negative effects of dietary CT to some extent. In the presence of CT, total VFA concentrations were greater in cultures with adapted-animal inoculum than in cultures with non-adapted animal inoculum. Selective suppression of bacterial fermentation in vitro intensified the negative effects of CT on mean gas pressures and total VFA concentrations. Conversely, suppression of fungal fermentation had no effect on these measures. We concluded that activities of ruminal fungi contributed little to major indices of fermentation during a 48-h in vitro incubation. Source of ruminal inoculum (Bos taurus, Ovis aries, or Capra hircus) did not influence mean gas pressures, ammonia concentrations, or total VFA concentrations regardless of CT-adaptation status, substrate type, or antibiotic treatment.
LITERATURE CITED
Al-Dobaib, S. N. 2009. Effect of different levels of
quebracho tannin on nitrogen utilization and growth performance of Najdi sheep fed alfalfa (Medicago sativa) hay as a sole diet. J. Anim. Sci. 80: 532-541.
AOAC. 2005. Official Methods of Analysis 18th Ed. Association of Official Analytical Chemist, Inc., Gaithersburg, MD.
AOAC. 2000. Official Methods of Analysis 17th Ed. Association of Official Analytical Chemist, Inc., Gaithersburg, MD.
Broderick, G. A., and J. H. Kang. 1980. Automated simultaneous determination of ammonia and total amino acids in ruminal fluid and in vitro media. J. Dairy Sci. 63:64-75.
Eckerle, G. J., K. C. Olson, J. R. Jaeger, J. W. Waggoner, J. L. Davidson, and L. A. Pacheco. 2011. High-tannin forage utilization by beef cows I. Intake and digestion of Tallgrass prairie hay contaminated with sericea lespedeza (Lespedeza cuneata). Proc. West. Sec. Amer. Soc. Anim. Sci. 62:199-202.
Frutos, P., G. Hervas, F. J. Giraldez, and A. R. Mantecon. 2004. An in vitro study on the ability of polyethylene glycol to inhibit the effect of quebracho tannins and tannic acid on rumen fermentation in sheep, goats, cows, and deer. Aust. J. Agri. Res. 55:1125-1132.
Goering, H. K. and P. J. Van Soest. 1970. Forage fiber amylases (Apparatus, reagents, procedures, and some applications). Agr. Handbook No. 379. USDA-ARS, Washington D.C.
Hassanat, F. and C. Benchaar. 2012. Assessment of the effect of condensed (acacia and quebracho) and hydrolysable (chestnut and valonea) tannins on rumen fermentation and methane production in vitro. J. Sci. Food Agric. 93: 332-339.
Markkar, H.P.S. 2003. Quantification of tannins in tree and shrub foliage: A laboratory manual. Kluwer Academic Publishers, Boston, MA.
Min, B. R., G. T. Attwood, W. C. McNabb, A. L. Molan, and T. N. Barry. 2005. The effect of condensed tannins from Lotus corniculatus on the proteolytic activities and growth of rumen bacteria. Anim. Feed Sci. Technol. 121: 45-58.
Min, B. R., T. N. Barry, G. T. Attwood, and W. C. McNabb. 2003. The effect of condensed tannins on the nutrition and health of ruminants fed fresh temperate forages: a review. Anim. Feed Sci. Technol. 106: 3-19.
Molan, A. L., G. C. Waghorn, B. R. Min, and W. C. McNabb. 2000. The effect of condensed tannins from seven herbages on Trichostrongylus colubriformis larval migration in vitro. Folia Parasit. 47: 39-44.
Satter, L. D., and L. L. Slyter. 1974. Effect of ammonia concentration on rumen microbial protein production in vitro. Br. J. Nutr. 32:199-208.
Tan, H. Y., C. C. Sieo, N. Abdullah, J. B. Liang, X. D. Huang, and Y. W. Ho. 2011. Effects of condensed tannins from Leucaena on methane production, rumen fermentation and populations of methanogens and protozoa in vitro. Anim. Feed Sci. Technol. 169:185-193.
Van Soest, P. J., J. B. Robertson, and B. A. Lewis. 1991. Methods for dietary fiber, neutral detergent fiber, and nonstarch polysaccharides in relation to animal nutrition. J. Dairy Sci. 74: 3583.
Waghorn, G. 2008. Beneficial and detrimental effects of dietary condensed tannins for sustainable sheep and goat production-progress and challenges. Anim. Feed Sci. Technol. 147:116-139.
Windham, W. R., and D. E. Akin. 1984. Rumen fungi and forage fiber degradation. Appl. Environ. Microbiol. 48:473-476.
193
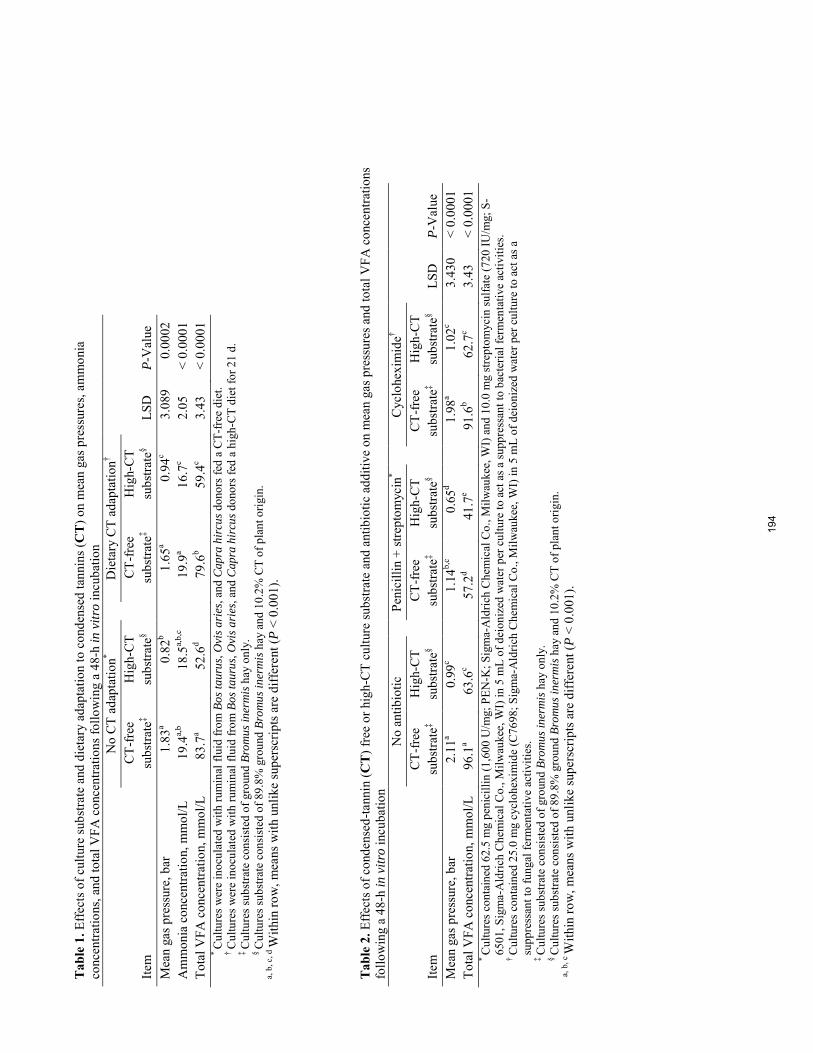
Tab
le 1
. Effe
cts o
f cul
ture
subs
trate
and
die
tary
ada
ptat
ion
to c
onde
nsed
tann
ins (
CT
) on
mea
n ga
s pre
ssur
es, a
mm
onia
co
ncen
tratio
ns, a
nd to
tal V
FA c
once
ntra
tions
follo
win
g a
48-h
in v
itro
incu
batio
n
No
CT
adap
tatio
n*
Die
tary
CT
adap
tatio
n†
Ite
m
CT-
free
su
bstra
te‡
Hig
h-C
T su
bstra
te§
C
T-fr
ee
subs
trate
‡ H
igh-
CT
subs
trate
§
LSD
P-V
alue
M
ean
gas p
ress
ure,
bar
1
.83a
0.8
2b
1.6
5a 0
.94c
3.0
89
0.00
02
Am
mon
ia c
once
ntra
tion,
mm
ol/L
19
.4a,
b 18
.5a,
b,c
19
.9a
16.7
c 2.
05
< 0.
0001
To
tal V
FA c
once
ntra
tion,
mm
ol/L
83
.7a
52.6
d
79.6
b 59
.4c
3.43
<
0.00
01
* C
ultu
res w
ere
inoc
ulat
ed w
ith ru
min
al fl
uid
from
Bos
taur
us, O
vis a
ries
, and
Cap
ra h
ircu
s don
ors f
ed a
CT-
free
die
t. †
Cul
ture
s wer
e in
ocul
ated
with
rum
inal
flui
d fro
m B
os ta
urus
, Ovi
s ari
es, a
nd C
apra
hir
cus d
onor
s fed
a h
igh-
CT
diet
for 2
1 d.
‡
Cul
ture
s sub
stra
te c
onsi
sted
of g
roun
d Br
omus
iner
mis
hay
onl
y.
§ C
ultu
res s
ubst
rate
con
sist
ed o
f 89.
8% g
roun
d Br
omus
iner
mis
hay
and
10.
2% C
T of
pla
nt o
rigin
. a,
b, c
, d W
ithin
row
, mea
ns w
ith u
nlik
e su
pers
crip
ts a
re d
iffer
ent (
P <
0.00
1).
Tab
le 2
. Effe
cts o
f con
dens
ed-ta
nnin
(CT
) fre
e or
hig
h-C
T cu
lture
subs
trate
and
ant
ibio
tic a
dditi
ve o
n m
ean
gas p
ress
ures
and
tota
l VFA
con
cent
ratio
ns
follo
win
g a
48-h
in v
itro
incu
batio
n
No
antib
iotic
Peni
cilli
n +
stre
ptom
ycin
*
Cyc
lohe
xim
ide†
Item
C
T-fr
ee
subs
trate
‡ H
igh-
CT
subs
trate
§
CT-
free
su
bstra
te‡
Hig
h-C
T su
bstra
te§
C
T-fr
ee
subs
trate
‡ H
igh-
CT
subs
trate
§
LSD
P-V
alue
M
ean
gas p
ress
ure,
bar
2.11
a
0.99
c
1.
14b,
c
0.65
d
1
.98a
1
.02c
3.4
30
< 0.
0001
To
tal V
FA c
once
ntra
tion,
mm
ol/L
9
6.1a
63.
6c
57.
2d 4
1.7e
9
1.6b
62.
7c 3.
43
< 0.
0001
*
Cul
ture
s con
tain
ed 6
2.5
mg
peni
cilli
n (1
,600
U/m
g; P
EN-K
; Sig
ma-
Ald
rich
Che
mic
al C
o., M
ilwau
kee,
WI)
and
10.
0 m
g st
rept
omyc
in su
lfate
(720
IU/m
g; S
-65
01, S
igm
a-A
ldric
h C
hem
ical
Co.
, Milw
auke
e, W
I) in
5 m
L of
dei
oniz
ed w
ater
per
cul
ture
to a
ct a
s a su
ppre
ssan
t to
bact
eria
l fer
men
tativ
e ac
tiviti
es.
† C
ultu
res c
onta
ined
25.
0 m
g cy
cloh
exim
ide
(C76
98; S
igm
a-A
ldric
h C
hem
ical
Co.
, Milw
auke
e, W
I) in
5 m
L of
dei
oniz
ed w
ater
per
cul
ture
to a
ct a
s a
supp
ress
ant t
o fu
ngal
ferm
enta
tive
activ
ities
. ‡
Cul
ture
s sub
stra
te c
onsi
sted
of g
roun
d Br
omus
iner
mis
hay
onl
y.
§ C
ultu
res s
ubst
rate
con
sist
ed o
f 89.
8% g
roun
d Br
omus
iner
mis
hay
and
10.
2% C
T of
pla
nt o
rigin
. a
, b, c
With
in ro
w, m
eans
with
unl
ike
supe
rscr
ipts
are
diff
eren
t (P
< 0.
001)
.
194

Proceedings, Western Section, American Society of Animal Science
Vol. 66, 2015
Effects of high-tannin substrate, dietary tannin adaptation, antibiotic inclusion, and animal species on individual volatile fatty acid concentrations following a 48-h in vitro incubation
A. N. McKiearnan*, T. G. Nagaraja†, E. C. Titgemeyer*, J. S. Drouillard*, M. D. Miesner‡, K. C. Olson*
* Department of Animal Sciences & Industry, Kansas State University, Manhattan † Department of Diagnostic Medicine & Pathobiology, Kansas State University, Manhattan
‡ Department of Clinical Sciences, Kansas State University, Manhattan
ABSTRACT: Effects of dietary tannins, dietary tannin adaptation, animal species, and antibiotic inclusion on individual VFA concentrations were measured during a 48-h in vitro incubation. Cows, sheep, and goats (n = 3/species) were used in a 2-period, randomized complete-block experiment with a 2 × 3 × 2 × 3 factorial treatment arrangement. Factor 1 was culture substrate: high-tannin or tannin-free. Factor 2 was inoculum-donor species: cow, sheep, or goat. Factor 3 was donor species adaptation to a high-tannin diet: non-adapted or adapted. Factor 4 was antibiotic: no antibiotic, bacterial suppression (penicillin + streptomycin), or fungal suppression (cycloheximide). Tannin-free or high-tannin substrates were incubated in vitro using ruminal fluid from animals that were either not adapted to dietary tannins (period 1) or adapted to dietary tannins (period 2). Periods consisted of a 10- to 21-d adaptation to tannin-free or high-tannin diets and a 15-d period of ruminal-fluid collection. Cultures fed high-tannin substrates had lesser (P < 0.001) acetate, propionate, butyrate, valerate, and branched-chain VFA concentrations than cultures fed tannin-free substrate. Cultures that contained penicillin + streptomycin had lesser (P < 0.001) acetate, propionate, butyrate, valerate, and total branched-chain VFA than antibiotic-free cultures or cultures spiked with cycloheximide. Effects of culture substrate on acetate concentrations were influenced (P < 0.001) by dietary tannin adaptation. Acetate concentrations after 48 h of incubation were greater (LSD = 5.89) in cultures with tannin-free substrate and no donor-animal adaptation to tannins than in cultures with tannin-free substrate with inoculum from tannin-adapted donors (57.8 and 51.3 mmol/L). The effects of culture substrate on propionate concentration were influenced (P < 0.001; LSD = 3.77) by antibiotic additive and tannin-adaptation status. Dietary tannin adaptation appeared to increase propionate. Effects of culture substrate on butyrate, valerate, and total branched-chain VFA concentrations were influenced (P < 0.001) by antibiotic additive. We concluded that: 1) condensed tannins had general detrimental effects on production of individual VFA and 2) adaptation to dietary condensed tannins alleviated some negative effects of tannins on propionate concentrations in a 48-h in vitro batch culture. Keywords: condensed tannins, dietary tannin adaptation, ruminal fermentation
INTRODUCTION
Condensed tannins (CT) are polymers of flavanoid units connected by carbon-to-carbon bonds; they have a relatively high capacity to bind to proteins and affect enzymatic activities (Waghorn, 2008). Interaction of CT with proteins and structural carbohydrates occurs via hydrogen and hydrophobic bonding, a condition which renders them unavailable to normal digestive and absorptive processes (Wroblewski et al., 2001). This interaction occurs due to the high affinity CT has for the carbonyl group of tertiary peptides (Haslam, 1989). Waghorn (2008) reported that CT decreased VFA production in ruminants. Hassant and Benchaar, 2012 demonstrated a decrease in butyrate, valerate, and total branched-chain VFA molar proportions in the presence of high levels of CT. Dietary CT decreased ruminal protein degradation in vitro (Min et al., 2005; Hassanat and Bencharr, 2012) and in vivo (Al-Dobaib, 2009). The presence of CT also suppressed growth rates in 11 select species of ruminal bacteria (Min et al., 2005). Generally, small ruminants have greater tolerance for high-tannin forages than beef cattle. In vitro gas production and DM disappearance were greater for deer and goats than for sheep and cattle in cultures containing CT (Frutos et al., 2004). Little research has focused on adaptability of various ruminant species to dietary CT. In addition, the relative susceptibilities of ruminal fungi and ruminal bacteria to dietary CT are unknown. Therefore, our objective was to evaluate simultaneously the influences of adaptation to dietary CT in Bos taurus, Ovis aries, and Capra hircus, with and without selective antibiotic suppression of either ruminal bacteria or ruminal fungi, on concentration of individual VFA in a 48-h in vitro batch cultures.
MATERIALS AND METHODS
Study preparation. The Kansas State University Institutional Animal Care and Use Committee reviewed and approved all animal-handling and animal-care practices used in this study (protocol # 3423).
Animals. Three beef cows (551 ± 30 kg BW), 3 sheep (68 ± 3 kg BW), and 3 goats (49 ± 4 kg BW) were used in this experiment. Sheep and goats were housed together in a 10 x 10 m pen and cows were housed in an adjacent 100 x 100 m pen. Smooth bromegrass hay (Bromus inermis; 87.9% DM; 9.1% CP, 76.2% NDF, and 47.0% ADF) was
195

offered to all animals daily in round-bale feeders (diameter = 2.5 m) in amounts calculated to allow ad libitum intake (3.2% BW). One animal from each species was assigned randomly to 1 of 3 cohorts; cohorts were assigned randomly to 1 of 3 sampling schedules. Animals were fed a tannin-free diet during period 1 and a high-tannin diet during period 2. Tannin-free and high-tannin substrates were subject to in vitro fermentation using ruminal inoculum harvested from Bos taurus, Ovis aries, and Capra hircus that were either not adapted to a high-CT diet (period 1) or adapted to a high-CT diet (period 2).
Adaptation to Tannin-Free Diets. The timeline of our experiment was expressed relative to the first day of animal adaptation (d 1) to treatment diets. All animal cohorts were fed tannin-free smooth bromegrass hay ad libitum for 10 d to begin period 1. Ruminal fluid was collected via stomach tube from animals from d 11 to 25 for use in in vitro batch cultures. Ruminal fluid was collected from cohort 1 on d 11 and on d 19, from cohort 2 on d 14 and on d 22, and from cohort 3 on d 17 and on d 25. During the period of ruminal-fluid collection, animals continued to be fed for ad libitum intake of smooth bromegrass hay. All animals had unrestricted access to a salt block (98.0% NaCl; Compass Minerals, Chicago, IL), a mineral block (95.5% NaCl, 3500 ppm Zn, 2000 ppm Fe, 1800 ppm Mn, 280 ppm Cu, 100 ppm I, and 60 ppm Co; Compass Mineral, Chicago, IL), and fresh water.
Adaptation to High-Tannin Diets. During period 2, animal subjects were adapted to a high-tannin diet by providing them with grain-byproduct supplements spiked with purified, feed-grade quebracho tannin (QT) extract. Hassanat and Benchaar (2013) reported that condensed tannins extracted from certain trees in the Anacardiaceae and Apocynaceae families, commonly called quebracho trees, had dose-dependent effects on ruminal digestion parameters in vitro.
Immediately following period 1, animal subjects were fed tannin-free smooth bromegrass hay ad libitum for 21 d. Each animal was also individually fed a supplement which contained QT at 0.1% BW, soybean hulls (SBH) at 0.2% BW and dried molasses at 0.05% BW. The animals were penned individually each morning (0730) and each evening (2000) with supplement and fresh water available. They were allowed access to the supplement for 45 min at each feeding. Unconsumed supplement from the morning feeding was offered again during the evening feeding. Following the evening feeding, orts were collected and weighed to determine DMI. Supplement intake by Ovis aries and Capra hircus was complete each d, whereas Bos taurus left an average of 183 ± 10 g QT (67% of the prescribed dose) unconsumed daily, emphasizing the strong aversion among Bos taurus to dietary CT reported by Eckerle et al. (2011).
Each animal was fed the tannin-containing supplement in conjunction with ad libitum tannin-free smooth bromegrass hay for 21 d before ruminal-fluid collections began. All animal subjects had unrestricted access to a salt block (98.0% NaCl; Compass Minerals, Chicago, IL), a mineral block (95.5% NaCl, 3500 ppm Zn, 2000 ppm Fe, 1800 ppm Mn, 280 ppm Cu, 100 ppm I, 60 ppm Co;
Compass Minerals, Chicago, IL), and fresh water during period 2.
Ruminal fluid was collected via stomach tube from d 22 to 37 of period 2. Ruminal fluid was collected from cohort 1 on d 22 and on d 31, from cohort 2 on d 25 and on d 34, and from cohort 3 on d 28 and on d 37. During the period of ruminal fluid collection, animals continued to be fed for ad libitum intake of smooth bromegrass hay, as during the adaptation phase of the experiment; moreover, they continued to be fed QT-containing supplements daily.
Ruminal fluid collection. Ruminal fluid was collected orally via stomach tube at 0730 on the schedule designated for each cohort. A vacuum strainer was constructed from a 2-L sidearm flask fitted with a #6 rubber stopper pre-drilled with two 1-cm holes. A 50 x 1 cm polyethylene tube was connected to the stopper via a 1-cm OD fitting that penetrated the stopper approximately 2 cm on each side. The distal end of the tube was connected to a 500-mL vacuum bottle. The vacuum bottle was connected to an electrical vacuum pump. Another polyethylene tube (300 x 1 cm) was placed in the second hole in the stopper. A copper cylinder (10 x 1 cm) was fitted to the distal end of the tube. The copper cylinder was prepared for use as a filter by drilling 0.5-cm holes at approximately 0.25-cm intervals along its length and around its circumference. When the vacuum pump was engaged, the pump operator covered the sidearm opening in the flask with a finger to create suction manually. Manual control of suction allowed for the collection device to be adjusted or cleaned rapidly during ruminal-fluid collection.
Bos taurus were restrained using a chute with a locking head gate. Ovis aries and Capra hircus were restrained manually. An oral speculum was inserted into the mouth (15 cm for Bos taurus and 8 cm for Ovis aries and Capra hircus) to prevent animals from biting the collection tube. The collection tube, detached from the sidearm flask, was inserted copper-fitting side first into the esophagus. In the rumen, the collection tube was twisted slightly to force the copper fitting below the fiber mat. The tube was then attached to the sidearm flask. The pump was turned on and fluid collection began. To prevent salivary contamination, the first 200 mL of ruminal fluid collected from each animal was discarded. Approximately 700 mL of fluid was harvested from each animal at each collection; collection time was approximately 7 min / animal. The collection tube was pulled slowly out of the esophagus upon completion and the speculum was removed.
Harvested ruminal fluid from each animal was transferred immediately to a single 3-L, pre-warmed, insulated bottle for transport to laboratory facilities. Harvested ruminal fluid was strained through 8 layers of cheesecloth and poured into a separatory flask; it was allowed to separate in the flask for 30 min. The heaviest fraction, containing protozoa and other waste, was discarded.
Culture substrate preparation. The tannin-free substrate was smooth bromegrass hay (87.9% DM; 9.1% CP, 76.2% NDF, and 47.0% ADF). Hay was dried at 55°C for 48 h and ground (#4 Wiley Mill, Thomas Scientific, Swedesboro, NJ, USA) to pass a 1-mm screen before it was added to the culturing devices. The high-tannin
196

substrate was a composite of the smooth bromegrass hay used as the tannin-free substrate and CT in the form of QT. Hay and QT were blended to achieve a substrate CT concentration of 10.2% (wt/wt). Condensed-tannin concentration in QT (71.8%, DM basis) was determined by the Friedberg Skin-Powder method (Wintersun Chemical, Ontario, CA). Composition of QT was: 92.4% DM, 1.3% CP, 0.5% NDF, and 2.7% ADF.
Bacterial suppression was accomplished using penicillin G (1,600 U/mg; PEN-K; Sigma-Aldrich Chemical Co., Milwaukee, WI) + streptomycin sulfate (720 IU/mg; S-6501, Sigma-Aldrich Chemical Co., Milwaukee, WI). A bacterial-suppression solution was prepared which contained 12.5 mg of penicillin G and 2 mg of streptomycin sulfate per mL of deionized water. One mL of bacterial-suppression solution was added to in vitro cultures per 10 mL of ruminal fluid. Fungal suppression was accomplished by preparing a solution of 5 mg of cycloheximide (C7698; Sigma-Aldrich Chemical Co., Milwaukee, WI) per mL of deionized water. One mL of fungal-suppression solution was added to in vitro cultures per 10 mL of ruminal fluid. Unsuppressed (no antibiotic) in vitro cultures were examined concurrently for reference.
48-h batch cultures. Individual VFA concentrations were measured using a 48-h batch-culture technique. Cultures were conducted using 250-mL glass jars equipped with ANKOM gas-production system lids (Model RF1; Ankom Technology, Macedon, NY). Nine jars were used to measure effects of treatment on each animal in each cohort in a 2 × 3 × 2 × 3 experimental design. Factor 1 was culture substrate: tannin-free or high-tannin. Factor 2 was inoculum-donor species: Bos taurus, Ovis aries, or Capra hircus. Factor 3 was dietary tannin adaptation (not adapted or adapted). Factor 4 was microbial suppression: no antibiotic, penicillin + streptomycin (bacterial suppression), or cycloheximide (fungal suppression). Within animal and cohort, 6 jars were assigned randomly to receive 1 of 2 substrates, ruminal fluid from 1 of 3 animal species, McDougal’s artificial saliva, and 1 of 3 microbial suppressing treatments. Three were assigned randomly to serve as blanks, receiving ruminal fluid, McDougal’s artificial saliva, and 1 of 3 microbial suppressing treatments.
Five mL of penicillin + streptomycin sulfate solution were added to designated samples and 5 mL of cycloheximide solution were added to designated samples immediately before ruminal fluid was added to culture jars (Windham and Akin, 1984). Fifty mL of ruminal fluid from each inoculum-donor species were added to jars, including blanks. McDougall’s artificial saliva (100 mL) was added to each jar. Jars were individually gassed with N2 for 20 s and capped with an ANKOM RF1 lid. The jars were placed in an incubator (Model G25; New Brunswick Scientific Co., Inc., New Brunswick, N.J.) in random order at 39°C for 48 h. Jars were swirled by hand every 10 h to ensure the substrate was well-mixed. After 48 h, jars were removed in the same order in which they were placed into the incubator and immediately placed on ice to inhibit fermentation.
After 48 h of incubation, samples for VFA analyses were collected by transferring 1 mL from each jar in
duplicate into separate 2-mL conical vials with 0.25 mL of aqueous meta-phosphoric acid (25%, w/v). Samples were frozen pending analysis.
VFA analyses. Before VFA analyses, samples were thawed for 30 min, agitated for 10 s with a vortex mixer, and centrifuged at 16,000 × g for 10 min (Eppendorf model 5415C; Brinkmann Instruments, Inc., Wesbury, NY). The supernatant from each sample was transferred to a 2-mL gas-chromatography vial. A 1.8 m x 6 mm, 4-mm i.d. glass column packed with GP 10% SP-1200 / 1% H3PO4 (Supelco #1-1965; Sigma-Aldrich) was used for analysis. Nitrogen was the carrier gas (flow rate = 80 mL/min); detection was by flame ionization (compressed air flow = 200 mL/min, H2 flow = 20 mL/min, combined flow = 200 mL/min). The injection and detector were set at 250°C and the column temperature was maintained between 120 and 140°C.
Statistical analyses. Concentrations of acetate, propionate, butyrate, valerate, and total branched-chain VFA were analyzed as a mixed model using a 2 × 3 × 2 × 3 factorial arrangement of a randomized complete-block design (PROC MIXED; SAS Inst. Inc., Cary, NC). Class factors included animal species (Bos taurus, Ovis aries, or Capra hircus), culture substrate (tannin-free or high-tannin), microbial suppressant (none, penicillin + streptomycin, or cycloheximide), animal cohort (i.e., block; 1, 2, or 3), and animal adaptation to tannins (non-adapted or adapted). The model statement included terms for the fixed effects of animal species, culture substrate, microbial suppressant, animal adaptation, and all possible 2-, 3-, and 4-way interaction terms. The random statement had terms for animal cohort, cohort × species, and adaptation (cohort × species). When protected by a significant F-test (P < 0.001), means were separated using the method of Least Significant Difference. Least-squares means for the highest-order, significant (P < 0.001) interaction term were reported.
RESULTS AND DISCUSSION
Acetate Concentrations. An interaction between
culture substrate and donor-species inoculum was detected (P < 0.001) for acetate concentrations (data not shown). Bos taurus and Capra hircus inoculum with tannin-free substrates had the greatest (LSD = 2.96) acetate concentrations after 48 h of incubation; Ovis aries inoculum with tannin-free substrate had less acetate (57.1, 55.0, and 51.6 mmol/L, respectively). Cultures with high-tannin substrate had less acetate than cultures with tannin-free substrate, across all inoculum-donor species (36.8, 35.8, 38.4 mmol/L for Bos taurus, Ovis aries, and Capra hircus, respectively). Interestingly, high-tannin substrates depressed acetate concentrations approximately 30% across inoculum-donor species compared with tannin-free substrates. Tan et al. (2011) and Hassanat and Benchaar (2012) reported no change in acetate molar proportions in the presence of CT. We speculated that CT depressed fiber degradation resulting in lesser acetate concentrations. We concluded that inoculum-donor species had little influence on acetate concentrations following a 48-h in vitro incubation under the conditions of our study.
197

A second interaction for acetate concentration was detected between culture substrate and adaptation status of donor animals (P < 0.001; data not shown). In tannin-free cultures, acetate concentrations were greatest (LSD = 5.89) in cultures with no donor-animal adaptation to tannins and less in cultures with inoculum from tannin-adapted donors (57.8 and 51.3 mmol/L, respectively). Apparently, prior tannin exposure may have depressed acetate yield, even when CT were not present in the diet. Cultures with high-tannin substrate had the least acetate concentrations; however, there was no difference among them with respect to tannin-adaptation status of donor animals (36.7 and 37.3 mmol/L for non-adapted and adapted, respectively). Under the circumstances of our study, prior tannin adaptation may have spared acetate yield.
Acetate concentrations were also influenced (P < 0.001) by a culture substrate × antibiotic treatment interaction (Table 1). In tannin-free cultures, acetate concentrations were modestly increased (LSD = 2.96) in cultures without antibiotic compared with cultures dosed with cycloheximide; both had greater acetate concentrations than cultures dosed with penicillin + streptomycin (60.5, 57.5, and 45.6 mmol/L, respectively). Cultures with tannin-free substrate had greater acetate concentrations than cultures with high-tannin substrate. Among cultures with high-tannin substrates, those with no antibiotic and those spiked with cycloheximide had marginally greater acetate concentrations that those spiked with penicillin + streptomycin (39.7, 39.2, and 32.0 mmol/L, respectively).
Propionate Concentrations. A three-way interaction effect was detected (P < 0.001) for propionate concentration following a 48-h in vitro incubation (Figure 1). Propionate concentrate was greater (LSD = 3.77) in antibiotic-free cultures with tannin-free substrate and inoculated with CT-adapted ruminal fluid (27.2 mmol/L) than in antibiotic-free and cycloheximide-spiked cultures with high-tannin substrates and CT adaptation (21.6 and 22.1 mmol/L, respectively); propionate concentration was intermediate to and not different from either of the previously-mentioned treatments in non-adapted, antibiotic-free and cycloheximide-treated cultures with tannin-free media (25.3 and 25.1 mmol/L, respectively), as well as in CT-adapted, cycloheximide-treated cultures fed tannin-free media (26.2 mmol/L). Each of the aforementioned treatments had greater propionate concentrations than non-adapted cultures fed high-tannin substrate and either not treated with antibiotic or treated with cycloheximide (14.8 and 14.9 mmol/L, respectively). In contrast, treatment with penicillin + streptomycin produced the least concentrations of propionate; substrate type and tannin adaptation had no effect on propionate yield when bacterial activities were suppressed. Tan et al. (2011) reported no change and Hassanat and Benchaar (2012) reported a slight increase in propionate molar proportions in the presence of CT compared to controls. We speculated that propionate-producing organisms in our study, most likely bacteria, may have received substantial benefit from prior exposure to dietary tannins. In addition, suppression of fungal fermentative activities had little
influence on propionate concentration following a 48-h in vitro incubation.
Butyrate Concentrations. Effects of culture substrate on butyrate concentrations were influenced (P < 0.001) by antibiotic treatment (Table 1). Within each substrate type (i.e., tannin-free or high-tannin), cultures not treated with antibiotic had the greatest (LSD = 0.389) butyrate concentrations (7.1 and 4.4 mmol/L for tannin-free and high-tannin cultures, respectively), cycloheximide-spiked cultures were intermediate (6.4 and 4.0 mmol/L for tannin-free and high-tannin cultures, respectively), and cultures spiked with penicillin + streptomycin had the least butyrate concentrations (3.6 and 2.9 mmol/L for tannin-free and high-tannin cultures, respectively). Across antibiotic treatments, cultures fed high-tannin substrate had lesser concentrations of butyrate than cultures fed tannin-free substrates. Relative to antibiotic-free cultures, butyrate concentrations were slightly reduced (< 1 mmol/L) by anti-fungal treatment and extensively reduced (1.5 to 3.5 mmol/L) by anti-bacterial treatment. We interpreted these data to indicate that both bacteria and fungi contributed to butyrate concentration; however, the magnitude of butyrate production by bacteria was larger than that of fungi. Reduction in butyrate molar proportions in the presence of high-tannin substrate was reported by Getachew et al. (2008) and Hassanat and Benchaar (2012).
Valerate Concentrations. Valerate concentrations were influenced (P < 0.001) by culture substrate and antibiotic treatment (Table 1). Within each substrate type, valerate concentrations were not different (LSD = 0.160) between antibiotic-free cultures and cultures treated with cycloheximide; however, tannin-free substrate was associated with greater valerate concentration than high-tannin substrate for these treatments (0.79 vs. 0.44 mmol/L for antibiotic-free cultures and 0.75 vs. 0.42 mmol/L for cycloheximide-spiked cultures). Valerate concentration was least in cultures treated with penicillin + streptomycin (0.22 and 0.24 mmol/L for tannin-free and high-tannin cultures, respectively). Substrate type did not influence valerate concentration within penicillin + streptomycin-treated cultures. Reduction in valerate molar proportions in the presence of CT was reported also by Getachew et al. (2008) and Hassanat and Benchaar (2012). We concluded the ruminal fungal population did not contribute significantly to valerate concentrations.
Branched-Chain VFA Concentrations. Concentrations of branched-chain VFA (isobutyrate + isovalerate; BCVFA) were influenced (P < 0.001) by culture substrate and antibiotic treatment, as well (Table 1). Within cultures fed tannin-free substrate, antibiotic-free cultures had the greatest (LSD = 0.148) BCVFA concentrations, cultures treated with cycloheximide were intermediate, and cultures treated with penicillin + streptomycin had the least BCVFA concentrations (1.55, 1.24, and 1.04 mmol/L, respectively). Cultures with high-tannin substrate had lesser BCVFA than cultures fed tannin-free substrate. Antibiotic-free cultures with high-tannin substrate had greater BCVFA than cycloheximide-treated cultures with high-tannin substrate; high-tannin cultures treated with penicillin + streptomycin were of intermediate BCVFA concentration (0.76, 0.60, and 0.73 mmol/L, respectively)
198
and not different from either antibiotic-free or cycloheximide-treated cultures fed high-tannin substrate. Compared with tannin-free substrate, BCVFA concentration was reduced approximately 50% by high-tannin substrates in antibiotic-free and in cycloheximide-treated cultures; BCVFA concentration was reduced by high-tannin substrates by less than half that magnitude in cultures treated with penicillin + streptomycin. We interpreted this to suggest that fungal production of BCVFA may have partially compensate for that by bacteria when bacterial activities are suppressed. Hassanat and Benchaar (2012) reported that BCVFA concentrations were not affected by the presence of CT at doses comparable to those used in our study.
IMPLICATIONS
Cultures fed high-tannin substrates had lesser acetate,
propionate, butyrate, valerate, and branched-chain VFA concentrations than cultures fed tannin-free substrate. Cultures that contained penicillin + streptomycin had lesser acetate, propionate, butyrate, valerate, and total branched-chain VFA than antibiotic-free cultures or cultures spiked with cycloheximide. Under the conditions of our study, bacterial suppression markedly decreased individual VFA concentrations, whereas fungal suppression produced results similar to non-suppressed cultures. We concluded that fungal contributions to individual VFA concentrations in a 48-h batch culture were minor compared to those of bacteria. Dietary adaptation of ruminal-fluid donors to CT mitigated the negative effects of dietary CT on acetate concentrations to some extent. Additionally, propionate concentration was greater in cultures with adapted-animal inoculum than in cultures with non-adapted animal inoculum in the presence of dietary CT. Source of ruminal inoculum (Bos taurus, Ovis aries, or Capra hircus) appeared to have little influence on individual VFA concentrations in vitro under the conditions of our study.
LITERATURE CITED
Al-Dobaib, S. N. 2009. Effect of different levels of quebracho tannin on nitrogen utilization and growth performance of Najdi sheep fed alfalfa (Medicago sativa) hay as a sole diet. J. Anim. Sci. 80:532-541.
Eckerle, G. J., K. C. Olson, J. R. Jaeger, J. W. Waggoner, J. L. Davidson and L. A. Pacheco. 2011. High-tannin forage utilization by beef cows I. Intake and digestion of Tallgrass prairie hay contaminated with sericea lespedeza (Lespedeza cuneata). Proc. West. Sec. Amer. Soc. Anim. Sci. 62:199-202.
Frutos, P., G. Hervas, F. J. Giraldez, and A. R. Mantecon. 2004. An in vitro study on the ability of polyethylene glycol to inhibit the effect of quebracho tannins and tannic acid on rumen fermentation in sheep, goats, cows, and deer. Aust. J. Agri. Res. 55:1125-1132.
Getachew, G., W. Pittroff, D. H. Putnam, A. Dandeker, S. Goyal, and E. J. DePeters. 2008. The influence of addition of gallic acid, tannic acid, or quebracho tannins to alfalfa hay on in vitro rumen fermentation and microbial protein synthesis. Anim. Feed Sci. Technol. 140:444-461.
Haslam, E. 1989. Plant Polyphenolspolyphenols: vegetable tannins revisited. Cambridge University Press, Cambridge, UK.
Hassanat, F. and C. Benchaar. 2012. Assessment of the effect of
condensed (acacia and quebracho) and hydrolysable (chestnut and valonea) tannins on rumen fermentation and methane production in vitro. J. Sci. Food Agric. 93: 332-339.
Min, B. R., G. T. Attwood, W. C. McNabb, A. L. Molan, and T. N. Barry. 2005. The effect of condensed tannins from Lotus corniculatus on the proteolytic activities and growth of rumen bacteria. Anim. Feed Sci. Technol. 121:45-58.
Tan, H. Y., C. C. Sieo, N. Abdullah, J. B. Liang, X. D. Huang, and Y. W. Ho. 2011. Effects of condensed tannins from Leucaena on methane production, rumen fermentation and populations of methanogens and protozoa in vitro. Anim. Feed Sci. Technol. 169:185-193.
Waghorn, G. 2008. Beneficial and detrimental effects of dietary condensed tannins for sustainable sheep and goat production-progress and challenges. Anim. Feed Sci. Technol. 147:116-139.
Windham, W.R., D.E. Akin. 1984. Rumen fungi and forage fiber degradation. Appl. Environ. Microbiol. 48:473-476.
Wroblewski, K., R. Muhandiram, A. Chakrabartty, and A. Bennick. 2001. The molecular interaction of human salivary histatins with polyphenolic compounds. Eur. J. Biochem. 268: 4384-4397.
199
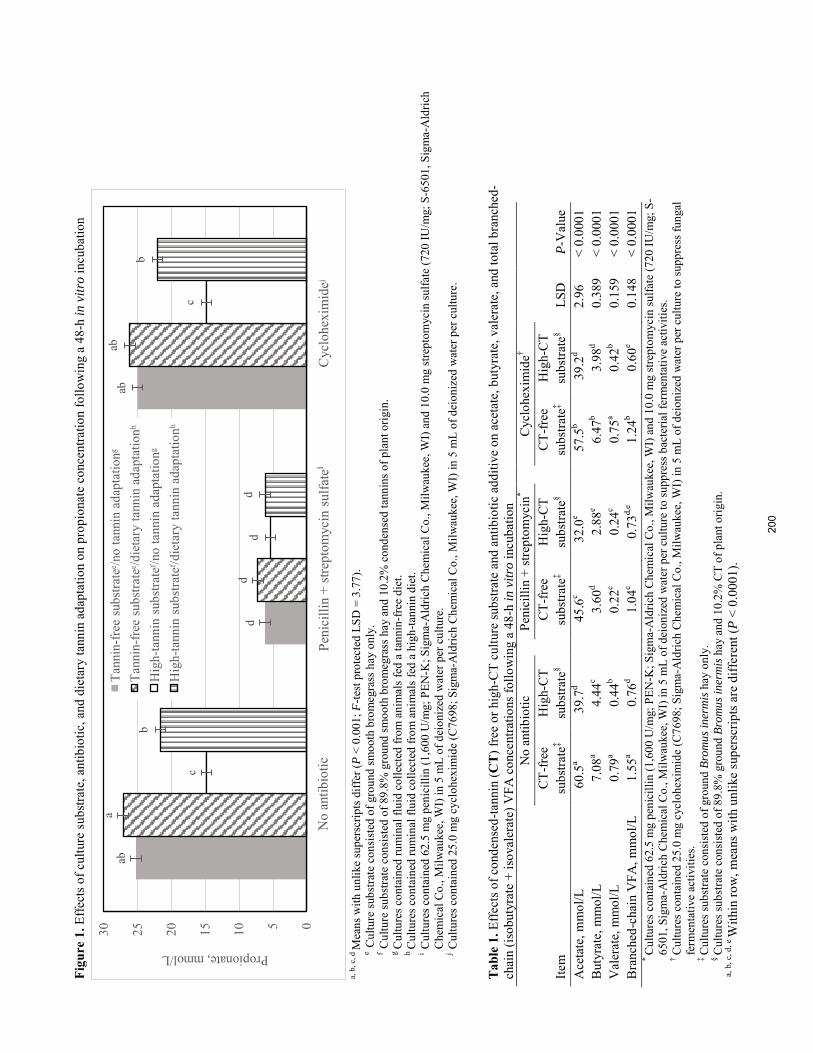
Figu
re 1
. Effe
cts o
f cul
ture
subs
trate
, ant
ibio
tic, a
nd d
ieta
ry ta
nnin
ada
ptat
ion
on p
ropi
onat
e co
ncen
tratio
n fo
llow
ing
a 48
-h in
vitr
o in
cuba
tion
a,
b, c
, d M
eans
with
unl
ike
supe
rscr
ipts
diff
er (P
< 0
.001
; F-te
st p
rote
cted
LSD
= 3
.77)
. e
Cul
ture
subs
trate
con
sist
ed o
f gro
und
smoo
th b
rom
egra
ss h
ay o
nly.
f
Cul
ture
subs
trate
con
sist
ed o
f 89.
8% g
roun
d sm
ooth
bro
meg
rass
hay
and
10.
2% c
onde
nsed
tann
ins o
f pla
nt o
rigin
. g
Cul
ture
s con
tain
ed ru
min
al fl
uid
colle
cted
from
ani
mal
s fed
a ta
nnin
-free
die
t. h C
ultu
res c
onta
ined
rum
inal
flui
d co
llect
ed fr
om a
nim
als f
ed a
hig
h-ta
nnin
die
t.
i C
ultu
res c
onta
ined
62.
5 m
g pe
nici
llin
(1,6
00 U
/mg;
PEN
-K; S
igm
a-A
ldric
h C
hem
ical
Co.
, Milw
auke
e, W
I) a
nd 1
0.0
mg
stre
ptom
ycin
sulfa
te (7
20 IU
/mg;
S-6
501,
Sig
ma-
Ald
rich
Che
mic
al C
o., M
ilwau
kee,
WI)
in 5
mL
of d
eion
ized
wat
er p
er c
ultu
re.
j C
ultu
res c
onta
ined
25.
0 m
g cy
cloh
exim
ide
(C76
98; S
igm
a-A
ldric
h C
hem
ical
Co.
, Milw
auke
e, W
I) in
5 m
L of
dei
oniz
ed w
ater
per
cul
ture
. T
able
1. E
ffect
s of c
onde
nsed
-tann
in (C
T) f
ree
or h
igh-
CT
cultu
re su
bstra
te a
nd a
ntib
iotic
add
itive
on
acet
ate,
but
yrat
e, v
aler
ate,
and
tota
l bra
nche
d-ch
ain
(isob
utyr
ate
+ is
oval
erat
e) V
FA c
once
ntra
tions
follo
win
g a
48-h
in v
itro
incu
batio
n
No
antib
iotic
Peni
cilli
n +
stre
ptom
ycin
*
Cyc
lohe
xim
ide†
Item
C
T-fr
ee
subs
trate
‡ H
igh-
CT
subs
trate
§
CT-
free
su
bstra
te‡
Hig
h-C
T su
bstra
te§
C
T-fr
ee
subs
trate
‡ H
igh-
CT
subs
trate
§
LSD
P-V
alue
A
ceta
te, m
mol
/L
60
.5a
39
.7d
45.6
c
32.0
e
57.
5b 3
9.2d
2.9
6 <
0.00
01
But
yrat
e, m
mol
/L
7.08
a 4.
44c
3.
60d
2.88
e
6.47
b 3.
98d
0.3
89
< 0.
0001
V
aler
ate,
mm
ol/L
0.
79a
0.44
b
0.22
c 0.
24c
0.
75a
0.42
b 0
.159
<
0.00
01
Bra
nche
d-ch
ain
VFA
, mm
ol/L
1.
55a
0.76
d
1.04
c 0.
73d,
e
1.24
b 0.
60e
0.1
48
< 0.
0001
*
Cul
ture
s con
tain
ed 6
2.5
mg
peni
cilli
n (1
,600
U/m
g; P
EN-K
; Sig
ma-
Ald
rich
Che
mic
al C
o., M
ilwau
kee,
WI)
and
10.
0 m
g st
rept
omyc
in su
lfate
(720
IU/m
g; S
-65
01, S
igm
a-A
ldric
h C
hem
ical
Co.
, Milw
auke
e, W
I) in
5 m
L of
dei
oniz
ed w
ater
per
cul
ture
to su
ppre
ss b
acte
rial f
erm
enta
tive
activ
ities
. †
Cul
ture
s con
tain
ed 2
5.0
mg
cycl
ohex
imid
e (C
7698
; Sig
ma-
Ald
rich
Che
mic
al C
o., M
ilwau
kee,
WI)
in 5
mL
of d
eion
ized
wat
er p
er c
ultu
re to
supp
ress
fung
al
ferm
enta
tive
activ
ities
. ‡
Cul
ture
s sub
stra
te c
onsi
sted
of g
roun
d Br
omus
iner
mis
hay
onl
y.
§ C
ultu
res s
ubst
rate
con
sist
ed o
f 89.
8% g
roun
d Br
omus
iner
mis
hay
and
10.
2% C
T of
pla
nt o
rigin
. a
, b, c
, d, e
With
in ro
w, m
eans
with
unl
ike
supe
rscr
ipts
are
diff
eren
t (P
< 0.
0001
).
ab
d
ab
a
d
ab
c
d
c
b
d
b
051015202530
No
antib
iotic
Peni
cilli
n +
stre
ptom
ycin
sul
fateⁱ
Cyc
lohe
xim
ideʲ
Propionate, mmol/L
Tann
in-fr
ee s
ubst
rate
ᵉ/no
tann
in a
dapt
atio
nᵍ
Tann
in-fr
ee s
ubst
rate
ᵉ/die
tary
tann
in a
dapt
atio
nʰ
Hig
h-ta
nnin
sub
stra
teᶠ/n
o ta
nnin
ada
ptat
ionᵍ
H
igh-
tann
in s
ubst
rate
ᶠ/die
tary
tann
in a
dapt
atio
nʰ
200
Proceedings, Western Section, American Society of Animal Science
Vol. 66, 2015
Influence of sampling time on carbon dioxide and methane emissions by grazing cattle
S. A. Gunter and J. A. Bradford* USDA, Agricultural Research Service, Southern Plains Range Research Station, Woodward, OK
ABSTRACT: A need to respond to global climate change has focused great attention towards greenhouse gases produced by domestic ruminants and the mitigation of emissions. Respiration chambers have long been the preferred method to measure CO2 and CH4 emission by cattle. With quickly advancing technology, automated head chambers are now available as a research tool that measures the CO2 and CH4 emission by cattle. Cattle are enticed to place their head in the chamber with feed and while they consume this bait the chamber collects a breath sample and analyzes CO2 and CH4. A criticism of this system is that it only makes measurements while the animal is feeding, possibly only 3 to 12 min/d. Data collected over 64-d collection period (n = 2,377) was separated into early morning (0000 to 0559), late morning (0600 to 1159), afternoon (1200 to 1759), and evening (1800 to 2359) samples. Carbon dioxide emission tended (P = 0.10) to be less when samples were collected in the late morning, but differences were small. Further, CH4 emissions did differ (P = 0.07) among periods, with later morning sampling producing the least CH4 emission (199 g/d) and evening sampling producing the greatest CH4 emission (235 g/d). In a further analysis, 3 data sets were produced with sampling occurring over the entire day (ALL), only in the MORNING (0500 to 1059), and only in the EVENING (1400 to 1959) which could occur in some research situations. Methane (P = 0.98) and CO2 (P = 0.35) emission estimates did not differ among sampling scenarios. As a result of this analysis, researchers can be confident in ‘spot sampling’ when assurances are made to collect representative samples in sufficient numbers.
Key Words: Beef, Heifers, Pastures, Rangelands, Methane
INTRODUCTION
The need to respond to global climate change has focused attention on the main sources of emissions (World Bank, 2007). This scrutiny has largely come about because developed (United Nations Framework for Climate Change, http://www.ipcc.ch/pdf/glossary/ar4-wg3.pdf) countries have committed themselves to emissions reduction (mitigation) targets that must somehow be shared among polluting industries within their jurisdictional control. Livestock production systems contribute an estimated 18% of global
anthropogenic green house gas emissions (Steinfeld et al., 2006). These emissions represent a significant proportion for some regions of the World, including North America (Herrero et al., 2013). The main sources of greenhouse gas emissions from agricultural systems are methane (CH4) from livestock (25%), carbon dioxide (CO2) from land use and its changes (32%), and nitrous oxide from manure and slurry management (31%; Steinfeld et al., 2006).
The gold standard for measuring CO2 and CH4 emission from cattle is the respiration chamber. However, these chambers are expensive to operate, the number of cattle per treatment that can be screened is limited, and they are not portable to the animal’s normal environment. Further, cattle performance cannot be measured simultaneously with gas emission. Hence, new methods have been developed to measure the CO2 and CH4 emissions by cattle. This new technology has been designed to measure the CO2 and CH4 emission by grazing cattle utilizing an automated head chamber system (Greenfeed; C-Lock, Inc., Rapid City, SD). With this system, cattle are enticed to place their head in the chamber with feed and while they consume the bait, the chamber collects a breath sample and analyzes for CO2 and CH4. One criticism of this system is that the machine only makes measurements while the animal is feeding, resulting in a fairly small sampling period each day.
The circadian variation in CH4 emission is affected by diet, feed intake, and pattern of feeding in sheep (Mathers and Walters, 1982) and cattle (Jonker et al., 2014). This later research has showed that with cattle fed a single meal each day, CH4 emission rate increased 6.3 times following feeding compared to pre-meal production. However, when these cattle were allowed continual access to feed, the circadian variation in CH4 emission rates were only 1.9 times with pre-meal production. This research leads to an important question regarding estimates of CH4 and CO2 emission with spot sampling, can CH4 and CO2 emission by grazing cattle be estimated by spot sampling for short periods each day?
The following research evaluates the CH4 and CO2 emission by grazing cattle at different times of the day and determines whether management practices that favor sampling at different times of the day bias CH4 and CO2 emission estimates.
MATERIALS AND METHODS
The following experiment was reviewed and approved by the Southern Plains Range Research Station Institutional Animal Care and Use Committee. Fourteen
1 Mention of trade names or commercial products in this article is solely for the purpose of providing specific information and does not imply recommendation or endorsement by the USDA. Corresponding author’s e-mail address: [email protected]
201
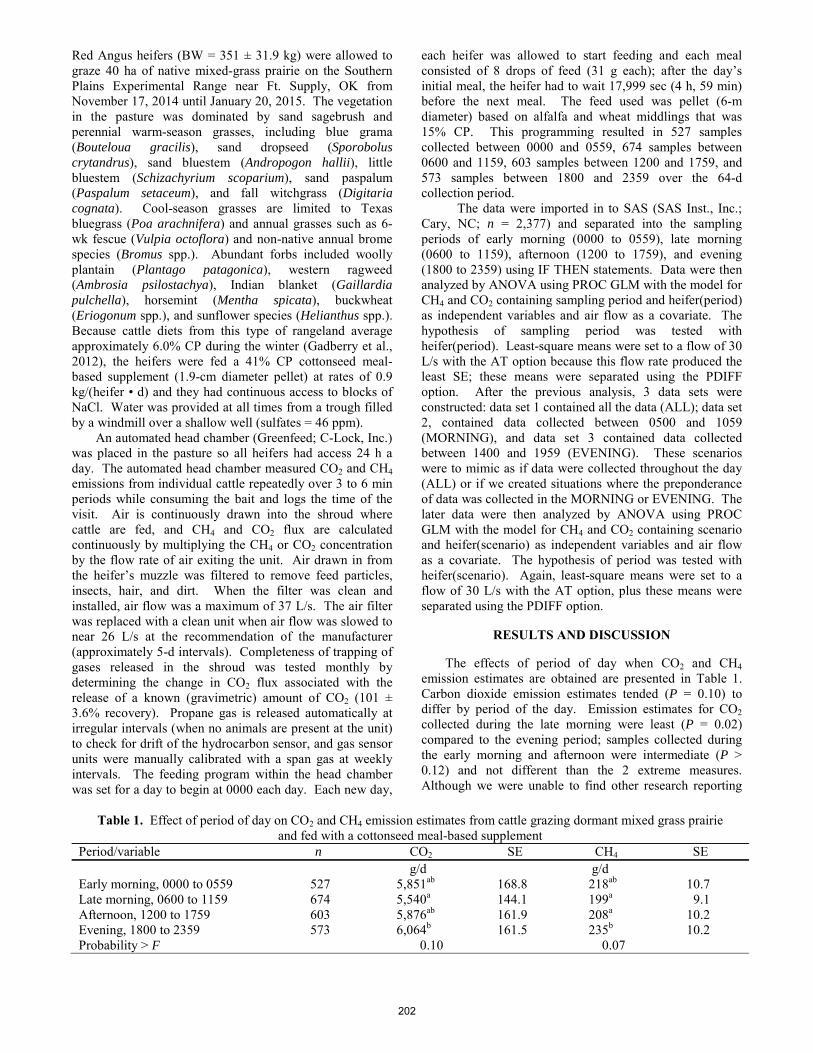
Red Angus heifers (BW = 351 ± 31.9 kg) were allowed to graze 40 ha of native mixed-grass prairie on the Southern Plains Experimental Range near Ft. Supply, OK from November 17, 2014 until January 20, 2015. The vegetation in the pasture was dominated by sand sagebrush and perennial warm-season grasses, including blue grama (Bouteloua gracilis), sand dropseed (Sporobolus crytandrus), sand bluestem (Andropogon hallii), little bluestem (Schizachyrium scoparium), sand paspalum (Paspalum setaceum), and fall witchgrass (Digitaria cognata). Cool-season grasses are limited to Texas bluegrass (Poa arachnifera) and annual grasses such as 6-wk fescue (Vulpia octoflora) and non-native annual brome species (Bromus spp.). Abundant forbs included woolly plantain (Plantago patagonica), western ragweed (Ambrosia psilostachya), Indian blanket (Gaillardia pulchella), horsemint (Mentha spicata), buckwheat (Eriogonum spp.), and sunflower species (Helianthus spp.). Because cattle diets from this type of rangeland average approximately 6.0% CP during the winter (Gadberry et al., 2012), the heifers were fed a 41% CP cottonseed meal-based supplement (1.9-cm diameter pellet) at rates of 0.9 kg/(heifer • d) and they had continuous access to blocks of NaCl. Water was provided at all times from a trough filled by a windmill over a shallow well (sulfates = 46 ppm).
An automated head chamber (Greenfeed; C-Lock, Inc.) was placed in the pasture so all heifers had access 24 h a day. The automated head chamber measured CO2 and CH4 emissions from individual cattle repeatedly over 3 to 6 min periods while consuming the bait and logs the time of the visit. Air is continuously drawn into the shroud where cattle are fed, and CH4 and CO2 flux are calculated continuously by multiplying the CH4 or CO2 concentration by the flow rate of air exiting the unit. Air drawn in from the heifer’s muzzle was filtered to remove feed particles, insects, hair, and dirt. When the filter was clean and installed, air flow was a maximum of 37 L/s. The air filter was replaced with a clean unit when air flow was slowed to near 26 L/s at the recommendation of the manufacturer (approximately 5-d intervals). Completeness of trapping of gases released in the shroud was tested monthly by determining the change in CO2 flux associated with the release of a known (gravimetric) amount of CO2 (101 ± 3.6% recovery). Propane gas is released automatically at irregular intervals (when no animals are present at the unit) to check for drift of the hydrocarbon sensor, and gas sensor units were manually calibrated with a span gas at weekly intervals. The feeding program within the head chamber was set for a day to begin at 0000 each day. Each new day,
each heifer was allowed to start feeding and each meal consisted of 8 drops of feed (31 g each); after the day’s initial meal, the heifer had to wait 17,999 sec (4 h, 59 min) before the next meal. The feed used was pellet (6-m diameter) based on alfalfa and wheat middlings that was 15% CP. This programming resulted in 527 samples collected between 0000 and 0559, 674 samples between 0600 and 1159, 603 samples between 1200 and 1759, and 573 samples between 1800 and 2359 over the 64-d collection period.
The data were imported in to SAS (SAS Inst., Inc.; Cary, NC; n = 2,377) and separated into the sampling periods of early morning (0000 to 0559), late morning (0600 to 1159), afternoon (1200 to 1759), and evening (1800 to 2359) using IF THEN statements. Data were then analyzed by ANOVA using PROC GLM with the model for CH4 and CO2 containing sampling period and heifer(period) as independent variables and air flow as a covariate. The hypothesis of sampling period was tested with heifer(period). Least-square means were set to a flow of 30 L/s with the AT option because this flow rate produced the least SE; these means were separated using the PDIFF option. After the previous analysis, 3 data sets were constructed: data set 1 contained all the data (ALL); data set 2, contained data collected between 0500 and 1059 (MORNING), and data set 3 contained data collected between 1400 and 1959 (EVENING). These scenarios were to mimic as if data were collected throughout the day (ALL) or if we created situations where the preponderance of data was collected in the MORNING or EVENING. The later data were then analyzed by ANOVA using PROC GLM with the model for CH4 and CO2 containing scenario and heifer(scenario) as independent variables and air flow as a covariate. The hypothesis of period was tested with heifer(scenario). Again, least-square means were set to a flow of 30 L/s with the AT option, plus these means were separated using the PDIFF option.
RESULTS AND DISCUSSION
The effects of period of day when CO2 and CH4 emission estimates are obtained are presented in Table 1. Carbon dioxide emission estimates tended (P = 0.10) to differ by period of the day. Emission estimates for CO2 collected during the late morning were least (P = 0.02) compared to the evening period; samples collected during the early morning and afternoon were intermediate (P > 0.12) and not different than the 2 extreme measures. Although we were unable to find other research reporting
Table 1. Effect of period of day on CO2 and CH4 emission estimates from cattle grazing dormant mixed grass prairie and fed with a cottonseed meal-based supplement
Period/variable n CO2 SE CH4 SE g/d g/d Early morning, 0000 to 0559 527 5,851ab 168.8 218ab 10.7 Late morning, 0600 to 1159 674 5,540a 144.1 199a 9.1 Afternoon, 1200 to 1759 603 5,876ab 161.9 208a 10.2 Evening, 1800 to 2359 573 6,064b 161.5 235b 10.2 Probability > F 0.10 0.07
202
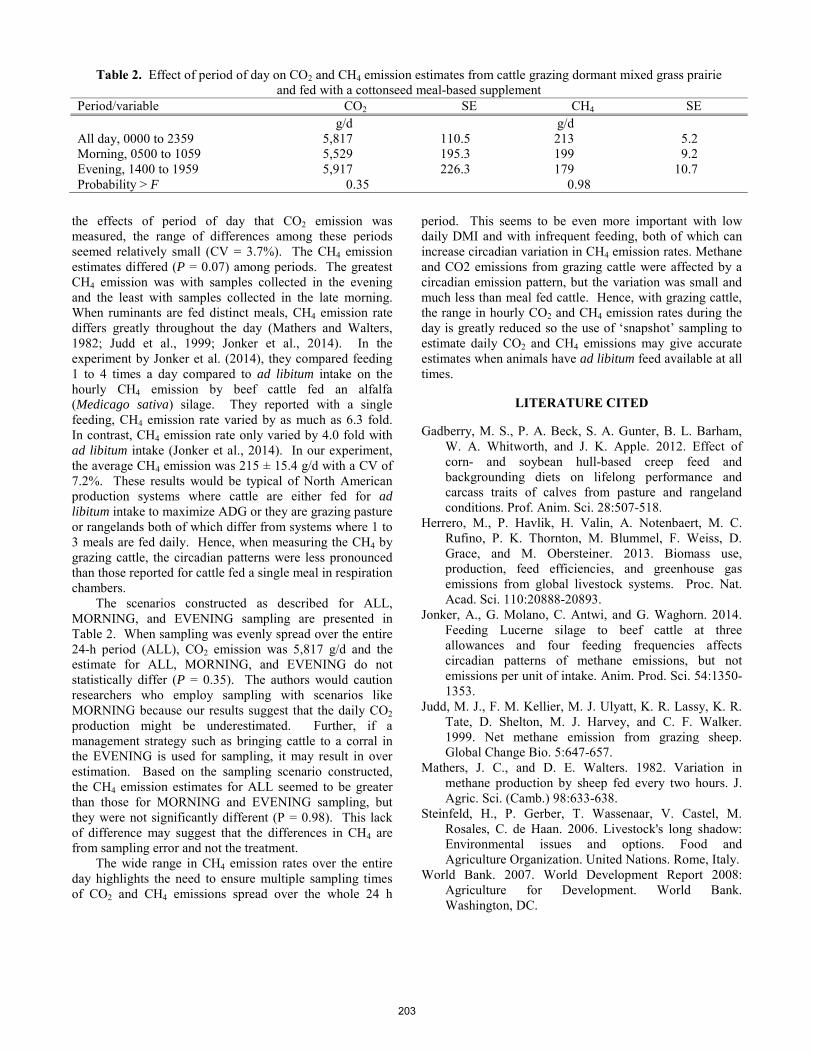
the effects of period of day that CO2 emission was measured, the range of differences among these periods seemed relatively small (CV = 3.7%). The CH4 emission estimates differed (P = 0.07) among periods. The greatest CH4 emission was with samples collected in the evening and the least with samples collected in the late morning. When ruminants are fed distinct meals, CH4 emission rate differs greatly throughout the day (Mathers and Walters, 1982; Judd et al., 1999; Jonker et al., 2014). In the experiment by Jonker et al. (2014), they compared feeding 1 to 4 times a day compared to ad libitum intake on the hourly CH4 emission by beef cattle fed an alfalfa (Medicago sativa) silage. They reported with a single feeding, CH4 emission rate varied by as much as 6.3 fold. In contrast, CH4 emission rate only varied by 4.0 fold with ad libitum intake (Jonker et al., 2014). In our experiment, the average CH4 emission was 215 ± 15.4 g/d with a CV of 7.2%. These results would be typical of North American production systems where cattle are either fed for ad libitum intake to maximize ADG or they are grazing pasture or rangelands both of which differ from systems where 1 to 3 meals are fed daily. Hence, when measuring the CH4 by grazing cattle, the circadian patterns were less pronounced than those reported for cattle fed a single meal in respiration chambers.
The scenarios constructed as described for ALL, MORNING, and EVENING sampling are presented in Table 2. When sampling was evenly spread over the entire 24-h period (ALL), CO2 emission was 5,817 g/d and the estimate for ALL, MORNING, and EVENING do not statistically differ (P = 0.35). The authors would caution researchers who employ sampling with scenarios like MORNING because our results suggest that the daily CO2 production might be underestimated. Further, if a management strategy such as bringing cattle to a corral in the EVENING is used for sampling, it may result in over estimation. Based on the sampling scenario constructed, the CH4 emission estimates for ALL seemed to be greater than those for MORNING and EVENING sampling, but they were not significantly different (P = 0.98). This lack of difference may suggest that the differences in CH4 are from sampling error and not the treatment.
The wide range in CH4 emission rates over the entire day highlights the need to ensure multiple sampling times of CO2 and CH4 emissions spread over the whole 24 h
period. This seems to be even more important with low daily DMI and with infrequent feeding, both of which can increase circadian variation in CH4 emission rates. Methane and CO2 emissions from grazing cattle were affected by a circadian emission pattern, but the variation was small and much less than meal fed cattle. Hence, with grazing cattle, the range in hourly CO2 and CH4 emission rates during the day is greatly reduced so the use of ‘snapshot’ sampling to estimate daily CO2 and CH4 emissions may give accurate estimates when animals have ad libitum feed available at all times.
LITERATURE CITED
Gadberry, M. S., P. A. Beck, S. A. Gunter, B. L. Barham, W. A. Whitworth, and J. K. Apple. 2012. Effect of corn- and soybean hull-based creep feed and backgrounding diets on lifelong performance and carcass traits of calves from pasture and rangeland conditions. Prof. Anim. Sci. 28:507-518.
Herrero, M., P. Havlik, H. Valin, A. Notenbaert, M. C. Rufino, P. K. Thornton, M. Blummel, F. Weiss, D. Grace, and M. Obersteiner. 2013. Biomass use, production, feed efficiencies, and greenhouse gas emissions from global livestock systems. Proc. Nat. Acad. Sci. 110:20888-20893.
Jonker, A., G. Molano, C. Antwi, and G. Waghorn. 2014. Feeding Lucerne silage to beef cattle at three allowances and four feeding frequencies affects circadian patterns of methane emissions, but not emissions per unit of intake. Anim. Prod. Sci. 54:1350-1353.
Judd, M. J., F. M. Kellier, M. J. Ulyatt, K. R. Lassy, K. R. Tate, D. Shelton, M. J. Harvey, and C. F. Walker. 1999. Net methane emission from grazing sheep. Global Change Bio. 5:647-657.
Mathers, J. C., and D. E. Walters. 1982. Variation in methane production by sheep fed every two hours. J. Agric. Sci. (Camb.) 98:633-638.
Steinfeld, H., P. Gerber, T. Wassenaar, V. Castel, M. Rosales, C. de Haan. 2006. Livestock's long shadow: Environmental issues and options. Food and Agriculture Organization. United Nations. Rome, Italy.
World Bank. 2007. World Development Report 2008: Agriculture for Development. World Bank. Washington, DC.
Table 2. Effect of period of day on CO2 and CH4 emission estimates from cattle grazing dormant mixed grass prairie and fed with a cottonseed meal-based supplement
Period/variable CO2 SE CH4 SE g/d g/d All day, 0000 to 2359 5,817 110.5 213 5.2 Morning, 0500 to 1059 5,529 195.3 199 9.2 Evening, 1400 to 1959 5,917 226.3 179 10.7 Probability > F 0.35 0.98
203

Proceedings, Western Section, American Society of Animal Science
Vol. 66, 2015
Effects of using ground woody plants in kid goat feedlot diets on growth performance1
J. L. Glasscock*, T. R. Whitney*1, J. R. Roper*, A. R. Holmes*, S. G. Marrs*, N. M. Cherry†, J. P. Muir†, W. C. Stewart‡, and E. J. Scholljegerdes‡
*Texas A&M AgriLife Research, San Angelo, 76901; †Texas A&M AgriLife Research, Stephenville, TX 76401; ‡Animal and Range Sciences Department, New Mexico State University, Las Cruces NM, 88003
ABSTRACT: Growth performance was evaluated for Boer × Spanish kid goats (n = 48) consuming feedlot diets which differed only by roughage source. In a randomized design study with 2 feeding periods (Period 1 = 70% concentrate, 26 d; Period 2 = 86% concentrate, 37 d), goats were individually fed a control diet containing cottonseed hulls (CSH; CNTL) as the roughage source or a diet containing ground woody products; redberry juniper (RED), blueberry juniper (BLUE), one-seed juniper (ONE), eastern red cedar (ERC), or mesquite (MESQ). Using ground wood vs. CSH as the roughage source did not affect (P > 0.34) BW at the end of Period 1 or 2, even though ADG during Period 1 was greater for goats fed CSH vs. MESQ (0.17 vs. 0.09 kg/d; P = 0.005). Goat DMI was similar (P > 0.50) during Periods 1 and 2. During Period 1, goats fed CNTL had similar (P > 0.30) G:F compared to goats fed RED, BLUE, ONE, or ERC, but greater G:F than goats fed MESQ (P = 0.03; 0.20 vs. 0.12 kg/kg). During Period 2, G:F was similar (P > 0. 59) among goats fed CNTL and goats fed ground wood as the roughage source. Results indicated that replacing all roughage source (cottonseed hulls) with ground juniper or mesquite trees in dried distillers grain-based feedlot diets is not detrimental to kid goat performance. Total feedlot costs, however, need to be further evaluated when using 30% ground mesquite wood as the roughage source during a growing period. Key words: feedlot, kid goats, juniper, mesquite, roughage
INTRODUCTION
Due to current livestock feed prices, which are exacerbated during periods of drought, alternatives to less expensive ingredients are becoming more important to the livestock industry. One alternative is the use of ground woody products as the roughage source in mixed diets. Although, woody products are currently a novel ingredient, their use is not a new concept and dates back to Maynard (1920) who stated that pine wood was useful in livestock feeds. Sawdust proved to be an effective roughage ingredient in _______________________________________ 1This study was funded in part by the National Sheep Industry Improvement Center. Appreciation is expressed to POET Nutrition (Sioux Falls, SD) for donating the dried distillers grains with solubles.
numerous trials (Morrison et al., 1922; Archibald,1926) and mesquite wood was successfully used in cattle diets (Marion et al., 1957). In 1980, ground aspen was adopted as an approved feed ingredient (AAFCO, 2011) and ground J. pinchotii and J. ashei are currently under review. Invasive Juniperus (Ansley et al., 2006) and Prosopis (Felker, 1996) plants infest millions of hectares of rangelands within the U.S.A. The negative effects of juniper encroachment on stocking rates were documented as early as 1939 (Jenkins, 1939). Woody plant encroachment is expensive to manage and can lead to a reduction in total forage production that is essential to livestock and wildlife (Scholes and Archer, 1997). Juniperus pinchotii leaves and stems (Whitney et al., 2014) are effective roughage ingredients in lamb feedlot diets without negatively effecting wool, carcass, or meat sensory characteristics. In addition, Stewart et al. (2014) reported that nutritional and digestive characteristics of various Juniperus spp. are comparable to many traditional roughage ingredients. Feeding value of ground mature trees, however, needs to be further evaluated. Therefore, the hypothesis was that mature woody plants could effectively replace cottonseed hulls in kid goat feedlot diets. If woody products can be used effectively, then potential exist to reduce feed cost while synergistically enhancing natural resources.
MATERIAL AND METHODS Animals and Management The experimental protocol was approved by the Texas A&M University Institutional Animal Care and Use Committee. Boer × Spanish kid goats (n = 48; approximate age = 6 mo; initial BW = 21.5 ± 2 kg) were stratified by BW, randomly assigned to a treatment diet (n = 8/diet) which differed only by roughage source: either cottonseed hulls (CNTL) or a ground woody product; redberry juniper (RED), blueberry juniper (BLUE), one-seed juniper (ONE), eastern red cedar (ERC), or mesquite (MESQ). Goats were placed into an individual covered pen and received an ear tag and subcutaneous clostridial vaccine. Goats were individually fed ad libitum once daily at 0800 h. A goat fed ERC died on d 46 and the veterinary diagnosis revealed a chronic duodenal ulcer
204

with fibrinous exudate. It is unlikely that death was related to the treatment diet considering that all of the other goats fed ERC remained healthy throughout the trial. In addition, a goat fed ONE was removed from Period 2 due to a fractured leg. After a 29-d transition period, goats were fed for 2 periods for a total of 64 d. During Period 1 (d 0 to 26), goats were fed a 70% concentrate diet (40% dried distillers grains with solubles [DDGS], 21.7% sorghum grain, 4% molasses, 2.2% limestone, 0.5% ammonium Cl, 0.6% salt, 1% mineral premix; approximately 18.7% CP). Goats were then transitioned over 5 d into Period 2 (d 27 to 64) onto an 86% concentrate ration (40% DDGS, 37.5% sorghum grain, 4% molasses, 2.4% limestone, 0.5% ammonium Cl, 0.6% salt, 1% mineral premix; approximately 19.4% CP). The DDGS were a byproduct of corn ethanol production. Monensin (Rumensin 90; Elanco, Indianapolis, IN) was added at the rate of 22 g/t. Goat ADG and average daily DMI were determined between days that BW was recorded; d 0, 27, 41, 55 and 64. Sample Collection and Measurements Entire above ground biomass from mature Juniperus (juniper; including leaves) and mature Prosopis (mesquite; excluding leaves) trees were harvested, chipped (Vermeer, X1500, Pella, IA), and dried for 6 hr to approximately 93% DM using a drying trailer equipped with a jet dryer. Chipped material was fine-ground through a hammermill to pass a 4.76-mm sieve, bagged and stored under cover. To evaluate nutritive value, random subsamples of mechanically dried and hammermilled (4.76-mm) juniper and mesquite, and air-dried subsamples of cottonseed hulls (CSH), sorghum grain, and DDGS were collected multiple times, individually combined, and analyzed (Table 1). Random samples of treatment diets were collected during both periods; samples were combined by Period, analyzed separately; data not shown. Samples were dried at 55°C in a forced-air oven for 48 h, ground through a 1-mm screen (Wiley mill, Arthur H. Thomas Co., Philadelphia, PA), and stored at –20°C. Nitrogen was analyzed by a standard method (AOAC Int., 2006) and CP calculated as 6.25 × N. Crude fat was analyzed by a standard ether extraction method (AOAC Int., 2006). Feed NDF and ADF were analyzed according to procedures of Van Soest et al. (1991), which were modified for an Ankom 2000 Fiber Analyzer (Ankom Technol. Corp., Fairport, NY) using α-amylase and Na sulfite. In addition, N was analyzed in residue remaining after ADF procedure and multiplied by 6.25 to determine acid detergent insoluble CP (ADICP). Ash was analyzed by a standard method (AOAC Int., 2006) and Ca, P, and S were analyzed by a Thermo Jarrell Ash IRIS
Advantage HX Inductively Coupled Plasma Radial Spectrometer (Thermo Instrument Systems, Inc., Waltham, MA). Condensed tannins in the ground juniper, mesquite, CSH, and sorghum grain were assayed for soluble, protein-bound, and fiber-bound fractions by methods described by Terrill et al. (1992); samples were oven dried and standards were prepared for each individual ingredient as recommended by Wolfe et al. (2008). In addition, part of each sample was dried to constant weight in a forced-air oven at 103°C to determine DM concentration. Statistical Analysis Data were analyzed using PROC MIXED procedure of SAS (SAS Inst. Inc., Cary, NC). Goat BW, DMI, ADG, and G:F were analyzed by period using a model that included treatment, day, and treatment × day with day as the repeated measure and goat as the subject. No treatment × day interactions were observed (P > 0.10) except for BW during Period 2 (P = 0.007). Covariance structures were compared to determine the most appropriate structure and toeplitz was used. The only comparisons that were evaluated were between the control diet vs. each of the ground woody diets. Data are reported as least squares means with greatest standard errors and P-values generated by using PDIFF procedure of SAS.
RESULTS AND DISCUSSION Chemical Composition of Individual Ingredients and Treatment Diets Chemical composition of individual ingredients and treatment diets were not statistically analyzed. Concentrations of CP in the Juniperus plants were relatively similar to CSH, but mesquite contained 39% greater CP than CSH. In general, woody plants contained less fiber (NDF and ADF) than CSH, but Juniperus plants had greater concentrations of lignin (Table 1). Nutritive values of mature woody plants reported in this trial are similar to those reported by Stewart et al. (2014) for mature Junipers plants. Furthermore, results suggest that ground woody products have similar to greater nutritive value than many traditional roughage ingredients (Ndlovu and Buchanan-Smith, 1985; NRC, 2007; Whitney and Muir, 2010). Total CT for CSH was less than all of the woody plant species, but CT was never greater than 6% (DM basis). The CT concentrations are similar to those reported by Stewart et al. (2014). Condensed tannins are naturally occurring plant polyphenols that can bind and precipitate proteins and either positively or negatively affect animal performance (Cannas, 2014).
205
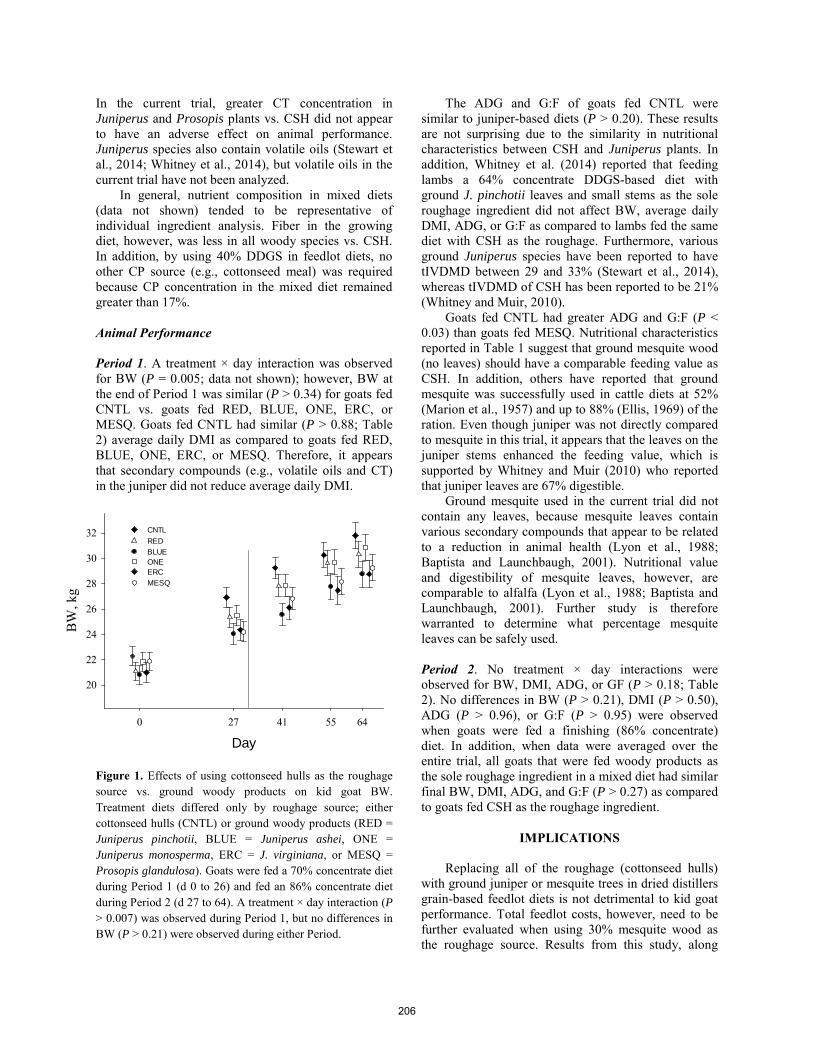
Day0 27 41 55 64
BW
, kg
20
22
24
26
28
30
32 CNTL RED BLUE ONE ERC MESQ
In the current trial, greater CT concentration in Juniperus and Prosopis plants vs. CSH did not appear to have an adverse effect on animal performance. Juniperus species also contain volatile oils (Stewart et al., 2014; Whitney et al., 2014), but volatile oils in the current trial have not been analyzed. In general, nutrient composition in mixed diets (data not shown) tended to be representative of individual ingredient analysis. Fiber in the growing diet, however, was less in all woody species vs. CSH. In addition, by using 40% DDGS in feedlot diets, no other CP source (e.g., cottonseed meal) was required because CP concentration in the mixed diet remained greater than 17%. Animal Performance Period 1. A treatment × day interaction was observed for BW (P = 0.005; data not shown); however, BW at the end of Period 1 was similar (P > 0.34) for goats fed CNTL vs. goats fed RED, BLUE, ONE, ERC, or MESQ. Goats fed CNTL had similar (P > 0.88; Table 2) average daily DMI as compared to goats fed RED, BLUE, ONE, ERC, or MESQ. Therefore, it appears that secondary compounds (e.g., volatile oils and CT) in the juniper did not reduce average daily DMI.
Figure 1. Effects of using cottonseed hulls as the roughage source vs. ground woody products on kid goat BW.
Treatment diets differed only by roughage source; either cottonseed hulls (CNTL) or ground woody products (RED = Juniperus pinchotii, BLUE = Juniperus ashei, ONE = Juniperus monosperma, ERC = J. virginiana, or MESQ = Prosopis glandulosa). Goats were fed a 70% concentrate diet during Period 1 (d 0 to 26) and fed an 86% concentrate diet during Period 2 (d 27 to 64). A treatment × day interaction (P > 0.007) was observed during Period 1, but no differences in BW (P > 0.21) were observed during either Period.
The ADG and G:F of goats fed CNTL were similar to juniper-based diets (P > 0.20). These results are not surprising due to the similarity in nutritional characteristics between CSH and Juniperus plants. In addition, Whitney et al. (2014) reported that feeding lambs a 64% concentrate DDGS-based diet with ground J. pinchotii leaves and small stems as the sole roughage ingredient did not affect BW, average daily DMI, ADG, or G:F as compared to lambs fed the same diet with CSH as the roughage. Furthermore, various ground Juniperus species have been reported to have tIVDMD between 29 and 33% (Stewart et al., 2014), whereas tIVDMD of CSH has been reported to be 21% (Whitney and Muir, 2010). Goats fed CNTL had greater ADG and G:F (P < 0.03) than goats fed MESQ. Nutritional characteristics reported in Table 1 suggest that ground mesquite wood (no leaves) should have a comparable feeding value as CSH. In addition, others have reported that ground mesquite was successfully used in cattle diets at 52% (Marion et al., 1957) and up to 88% (Ellis, 1969) of the ration. Even though juniper was not directly compared to mesquite in this trial, it appears that the leaves on the juniper stems enhanced the feeding value, which is supported by Whitney and Muir (2010) who reported that juniper leaves are 67% digestible. Ground mesquite used in the current trial did not contain any leaves, because mesquite leaves contain various secondary compounds that appear to be related to a reduction in animal health (Lyon et al., 1988; Baptista and Launchbaugh, 2001). Nutritional value and digestibility of mesquite leaves, however, are comparable to alfalfa (Lyon et al., 1988; Baptista and Launchbaugh, 2001). Further study is therefore warranted to determine what percentage mesquite leaves can be safely used. Period 2. No treatment × day interactions were observed for BW, DMI, ADG, or GF (P > 0.18; Table 2). No differences in BW (P > 0.21), DMI (P > 0.50), ADG (P > 0.96), or G:F (P > 0.95) were observed when goats were fed a finishing (86% concentrate) diet. In addition, when data were averaged over the entire trial, all goats that were fed woody products as the sole roughage ingredient in a mixed diet had similar final BW, DMI, ADG, and G:F (P > 0.27) as compared to goats fed CSH as the roughage ingredient.
IMPLICATIONS Replacing all of the roughage (cottonseed hulls) with ground juniper or mesquite trees in dried distillers grain-based feedlot diets is not detrimental to kid goat performance. Total feedlot costs, however, need to be further evaluated when using 30% mesquite wood as the roughage source. Results from this study, along
206
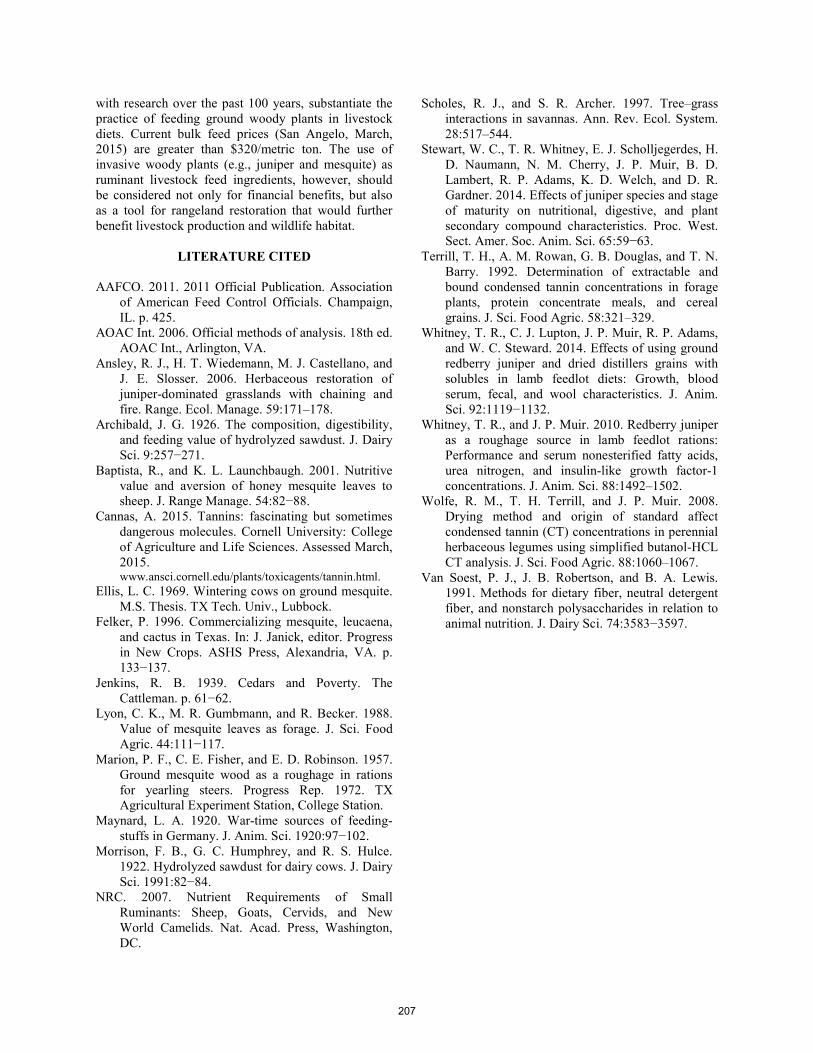
with research over the past 100 years, substantiate the practice of feeding ground woody plants in livestock diets. Current bulk feed prices (San Angelo, March, 2015) are greater than $320/metric ton. The use of invasive woody plants (e.g., juniper and mesquite) as ruminant livestock feed ingredients, however, should be considered not only for financial benefits, but also as a tool for rangeland restoration that would further benefit livestock production and wildlife habitat.
LITERATURE CITED
AAFCO. 2011. 2011 Official Publication. Association of American Feed Control Officials. Champaign, IL. p. 425.
AOAC Int. 2006. Official methods of analysis. 18th ed. AOAC Int., Arlington, VA.
Ansley, R. J., H. T. Wiedemann, M. J. Castellano, and J. E. Slosser. 2006. Herbaceous restoration of juniper-dominated grasslands with chaining and fire. Range. Ecol. Manage. 59:171–178.
Archibald, J. G. 1926. The composition, digestibility, and feeding value of hydrolyzed sawdust. J. Dairy Sci. 9:257−271.
Baptista, R., and K. L. Launchbaugh. 2001. Nutritive value and aversion of honey mesquite leaves to sheep. J. Range Manage. 54:82−88.
Cannas, A. 2015. Tannins: fascinating but sometimes dangerous molecules. Cornell University: College of Agriculture and Life Sciences. Assessed March, 2015. www.ansci.cornell.edu/plants/toxicagents/tannin.html.
Ellis, L. C. 1969. Wintering cows on ground mesquite. M.S. Thesis. TX Tech. Univ., Lubbock.
Felker, P. 1996. Commercializing mesquite, leucaena, and cactus in Texas. In: J. Janick, editor. Progress in New Crops. ASHS Press, Alexandria, VA. p. 133−137.
Jenkins, R. B. 1939. Cedars and Poverty. The Cattleman. p. 61−62.
Lyon, C. K., M. R. Gumbmann, and R. Becker. 1988. Value of mesquite leaves as forage. J. Sci. Food Agric. 44:111−117.
Marion, P. F., C. E. Fisher, and E. D. Robinson. 1957. Ground mesquite wood as a roughage in rations for yearling steers. Progress Rep. 1972. TX Agricultural Experiment Station, College Station.
Maynard, L. A. 1920. War-time sources of feeding-stuffs in Germany. J. Anim. Sci. 1920:97−102.
Morrison, F. B., G. C. Humphrey, and R. S. Hulce. 1922. Hydrolyzed sawdust for dairy cows. J. Dairy Sci. 1991:82−84.
NRC. 2007. Nutrient Requirements of Small Ruminants: Sheep, Goats, Cervids, and New World Camelids. Nat. Acad. Press, Washington, DC.
Scholes, R. J., and S. R. Archer. 1997. Tree–grass interactions in savannas. Ann. Rev. Ecol. System. 28:517–544.
Stewart, W. C., T. R. Whitney, E. J. Scholljegerdes, H. D. Naumann, N. M. Cherry, J. P. Muir, B. D. Lambert, R. P. Adams, K. D. Welch, and D. R. Gardner. 2014. Effects of juniper species and stage of maturity on nutritional, digestive, and plant secondary compound characteristics. Proc. West. Sect. Amer. Soc. Anim. Sci. 65:59−63.
Terrill, T. H., A. M. Rowan, G. B. Douglas, and T. N. Barry. 1992. Determination of extractable and bound condensed tannin concentrations in forage plants, protein concentrate meals, and cereal grains. J. Sci. Food Agric. 58:321–329.
Whitney, T. R., C. J. Lupton, J. P. Muir, R. P. Adams, and W. C. Steward. 2014. Effects of using ground redberry juniper and dried distillers grains with solubles in lamb feedlot diets: Growth, blood serum, fecal, and wool characteristics. J. Anim. Sci. 92:1119−1132.
Whitney, T. R., and J. P. Muir. 2010. Redberry juniper as a roughage source in lamb feedlot rations: Performance and serum nonesterified fatty acids, urea nitrogen, and insulin-like growth factor-1 concentrations. J. Anim. Sci. 88:1492–1502.
Wolfe, R. M., T. H. Terrill, and J. P. Muir. 2008. Drying method and origin of standard affect condensed tannin (CT) concentrations in perennial herbaceous legumes using simplified butanol-HCL CT analysis. J. Sci. Food Agric. 88:1060–1067.
Van Soest, P. J., J. B. Robertson, and B. A. Lewis. 1991. Methods for dietary fiber, neutral detergent fiber, and nonstarch polysaccharides in relation to animal nutrition. J. Dairy Sci. 74:3583−3597.
207
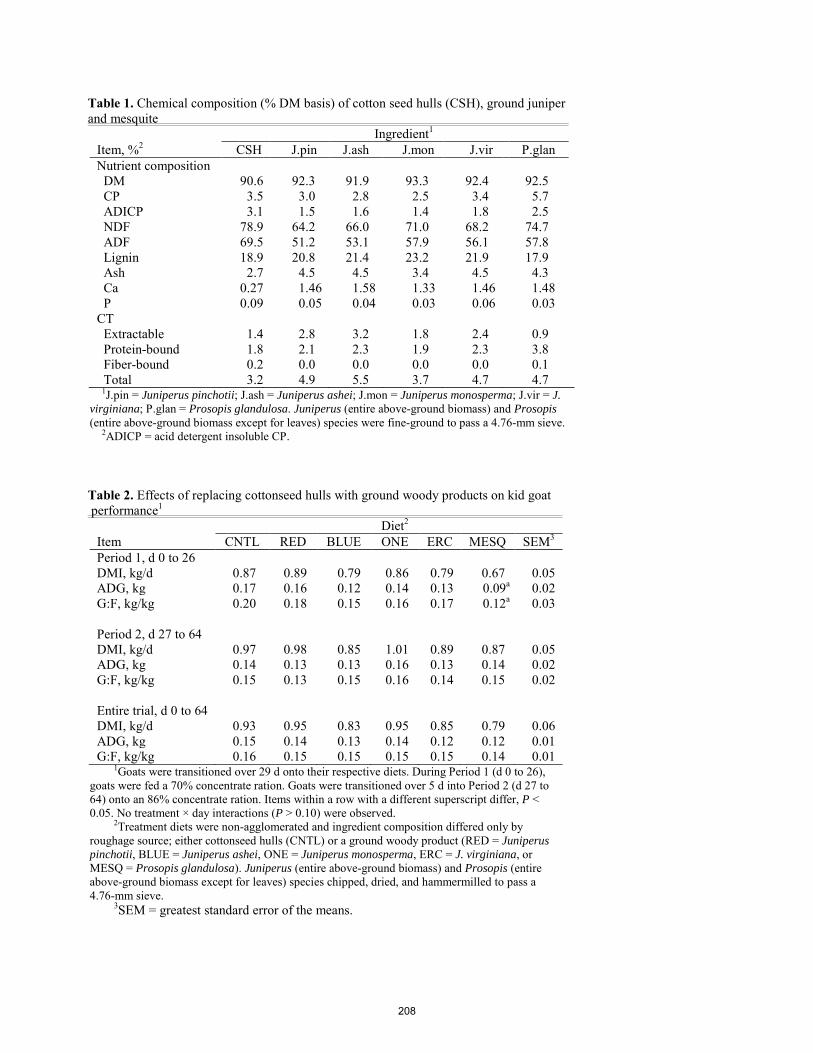
Table 1. Chemical composition (% DM basis) of cotton seed hulls (CSH), ground juniper and mesquite
Ingredient1 Item, %2 CSH J.pin J.ash J.mon J.vir P.glan Nutrient composition DM 90.6 92.3 91.9 93.3 92.4 92.5 CP 3.5 3.0 2.8 2.5 3.4 5.7 ADICP 3.1 1.5 1.6 1.4 1.8 2.5 NDF 78.9 64.2 66.0 71.0 68.2 74.7 ADF 69.5 51.2 53.1 57.9 56.1 57.8 Lignin 18.9 20.8 21.4 23.2 21.9 17.9 Ash 2.7 4.5 4.5 3.4 4.5 4.3 Ca 0.27 1.46 1.58 1.33 1.46 1.48 P 0.09 0.05 0.04 0.03 0.06 0.03 CT Extractable 1.4 2.8 3.2 1.8 2.4 0.9 Protein-bound 1.8 2.1 2.3 1.9 2.3 3.8 Fiber-bound 0.2 0.0 0.0 0.0 0.0 0.1 Total 3.2 4.9 5.5 3.7 4.7 4.7
1J.pin = Juniperus pinchotii; J.ash = Juniperus ashei; J.mon = Juniperus monosperma; J.vir = J. virginiana; P.glan = Prosopis glandulosa. Juniperus (entire above-ground biomass) and Prosopis (entire above-ground biomass except for leaves) species were fine-ground to pass a 4.76-mm sieve. 2ADICP = acid detergent insoluble CP. Table 2. Effects of replacing cottonseed hulls with ground woody products on kid goat performance1
Diet2 Item CNTL RED BLUE ONE ERC MESQ SEM3 Period 1, d 0 to 26 DMI, kg/d 0.87 0.89 0.79 0.86 0.79 0.67 0.05 ADG, kg 0.17 0.16 0.12 0.14 0.13 0.09a 0.02 G:F, kg/kg 0.20 0.18 0.15 0.16 0.17 0.12a 0.03 Period 2, d 27 to 64 DMI, kg/d 0.97 0.98 0.85 1.01 0.89 0.87 0.05 ADG, kg 0.14 0.13 0.13 0.16 0.13 0.14 0.02 G:F, kg/kg 0.15 0.13 0.15 0.16 0.14 0.15 0.02 Entire trial, d 0 to 64 DMI, kg/d 0.93 0.95 0.83 0.95 0.85 0.79 0.06 ADG, kg 0.15 0.14 0.13 0.14 0.12 0.12 0.01 G:F, kg/kg 0.16 0.15 0.15 0.15 0.15 0.14 0.01
1Goats were transitioned over 29 d onto their respective diets. During Period 1 (d 0 to 26), goats were fed a 70% concentrate ration. Goats were transitioned over 5 d into Period 2 (d 27 to 64) onto an 86% concentrate ration. Items within a row with a different superscript differ, P < 0.05. No treatment × day interactions (P > 0.10) were observed. 2Treatment diets were non-agglomerated and ingredient composition differed only by roughage source; either cottonseed hulls (CNTL) or a ground woody product (RED = Juniperus pinchotii, BLUE = Juniperus ashei, ONE = Juniperus monosperma, ERC = J. virginiana, or MESQ = Prosopis glandulosa). Juniperus (entire above-ground biomass) and Prosopis (entire above-ground biomass except for leaves) species chipped, dried, and hammermilled to pass a 4.76-mm sieve. 3SEM = greatest standard error of the means.
208
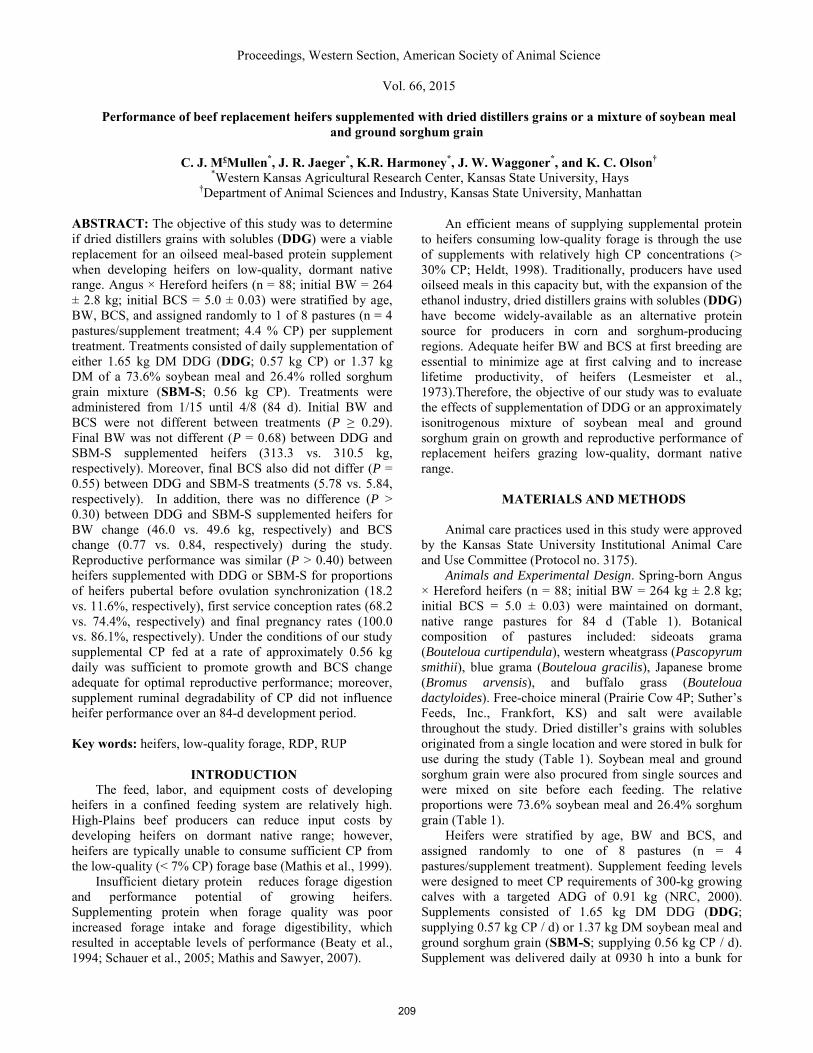
Proceedings, Western Section, American Society of Animal Science
Vol. 66, 2015
Performance of beef replacement heifers supplemented with dried distillers grains or a mixture of soybean meal and ground sorghum grain
C. J. McMullen*, J. R. Jaeger*, K.R. Harmoney*, J. W. Waggoner*, and K. C. Olson†
*Western Kansas Agricultural Research Center, Kansas State University, Hays †Department of Animal Sciences and Industry, Kansas State University, Manhattan
ABSTRACT: The objective of this study was to determine if dried distillers grains with solubles (DDG) were a viable replacement for an oilseed meal-based protein supplement when developing heifers on low-quality, dormant native range. Angus × Hereford heifers (n = 88; initial BW = 264 ± 2.8 kg; initial BCS = 5.0 ± 0.03) were stratified by age, BW, BCS, and assigned randomly to 1 of 8 pastures (n = 4 pastures/supplement treatment; 4.4 % CP) per supplement treatment. Treatments consisted of daily supplementation of either 1.65 kg DM DDG (DDG; 0.57 kg CP) or 1.37 kg DM of a 73.6% soybean meal and 26.4% rolled sorghum grain mixture (SBM-S; 0.56 kg CP). Treatments were administered from 1/15 until 4/8 (84 d). Initial BW and BCS were not different between treatments (P ≥ 0.29). Final BW was not different (P = 0.68) between DDG and SBM-S supplemented heifers (313.3 vs. 310.5 kg, respectively). Moreover, final BCS also did not differ (P = 0.55) between DDG and SBM-S treatments (5.78 vs. 5.84, respectively). In addition, there was no difference (P ˃ 0.30) between DDG and SBM-S supplemented heifers for BW change (46.0 vs. 49.6 kg, respectively) and BCS change (0.77 vs. 0.84, respectively) during the study. Reproductive performance was similar (P > 0.40) between heifers supplemented with DDG or SBM-S for proportions of heifers pubertal before ovulation synchronization (18.2 vs. 11.6%, respectively), first service conception rates (68.2 vs. 74.4%, respectively) and final pregnancy rates (100.0 vs. 86.1%, respectively). Under the conditions of our study supplemental CP fed at a rate of approximately 0.56 kg daily was sufficient to promote growth and BCS change adequate for optimal reproductive performance; moreover, supplement ruminal degradability of CP did not influence heifer performance over an 84-d development period. Key words: heifers, low-quality forage, RDP, RUP
INTRODUCTION The feed, labor, and equipment costs of developing
heifers in a confined feeding system are relatively high. High-Plains beef producers can reduce input costs by developing heifers on dormant native range; however, heifers are typically unable to consume sufficient CP from the low-quality (< 7% CP) forage base (Mathis et al., 1999).
Insufficient dietary protein reduces forage digestion and performance potential of growing heifers. Supplementing protein when forage quality was poor increased forage intake and forage digestibility, which resulted in acceptable levels of performance (Beaty et al., 1994; Schauer et al., 2005; Mathis and Sawyer, 2007).
An efficient means of supplying supplemental protein to heifers consuming low-quality forage is through the use of supplements with relatively high CP concentrations (> 30% CP; Heldt, 1998). Traditionally, producers have used oilseed meals in this capacity but, with the expansion of the ethanol industry, dried distillers grains with solubles (DDG) have become widely-available as an alternative protein source for producers in corn and sorghum-producing regions. Adequate heifer BW and BCS at first breeding are essential to minimize age at first calving and to increase lifetime productivity, of heifers (Lesmeister et al., 1973).Therefore, the objective of our study was to evaluate the effects of supplementation of DDG or an approximately isonitrogenous mixture of soybean meal and ground sorghum grain on growth and reproductive performance of replacement heifers grazing low-quality, dormant native range.
MATERIALS AND METHODS
Animal care practices used in this study were approved
by the Kansas State University Institutional Animal Care and Use Committee (Protocol no. 3175).
Animals and Experimental Design. Spring-born Angus × Hereford heifers (n = 88; initial BW = 264 kg ± 2.8 kg; initial BCS = 5.0 ± 0.03) were maintained on dormant, native range pastures for 84 d (Table 1). Botanical composition of pastures included: sideoats grama (Bouteloua curtipendula), western wheatgrass (Pascopyrum smithii), blue grama (Bouteloua gracilis), Japanese brome (Bromus arvensis), and buffalo grass (Bouteloua dactyloides). Free-choice mineral (Prairie Cow 4P; Suther’s Feeds, Inc., Frankfort, KS) and salt were available throughout the study. Dried distiller’s grains with solubles originated from a single location and were stored in bulk for use during the study (Table 1). Soybean meal and ground sorghum grain were also procured from single sources and were mixed on site before each feeding. The relative proportions were 73.6% soybean meal and 26.4% sorghum grain (Table 1).
Heifers were stratified by age, BW and BCS, and assigned randomly to one of 8 pastures (n = 4 pastures/supplement treatment). Supplement feeding levels were designed to meet CP requirements of 300-kg growing calves with a targeted ADG of 0.91 kg (NRC, 2000). Supplements consisted of 1.65 kg DM DDG (DDG; supplying 0.57 kg CP / d) or 1.37 kg DM soybean meal and ground sorghum grain (SBM-S; supplying 0.56 kg CP / d). Supplement was delivered daily at 0930 h into a bunk for
209
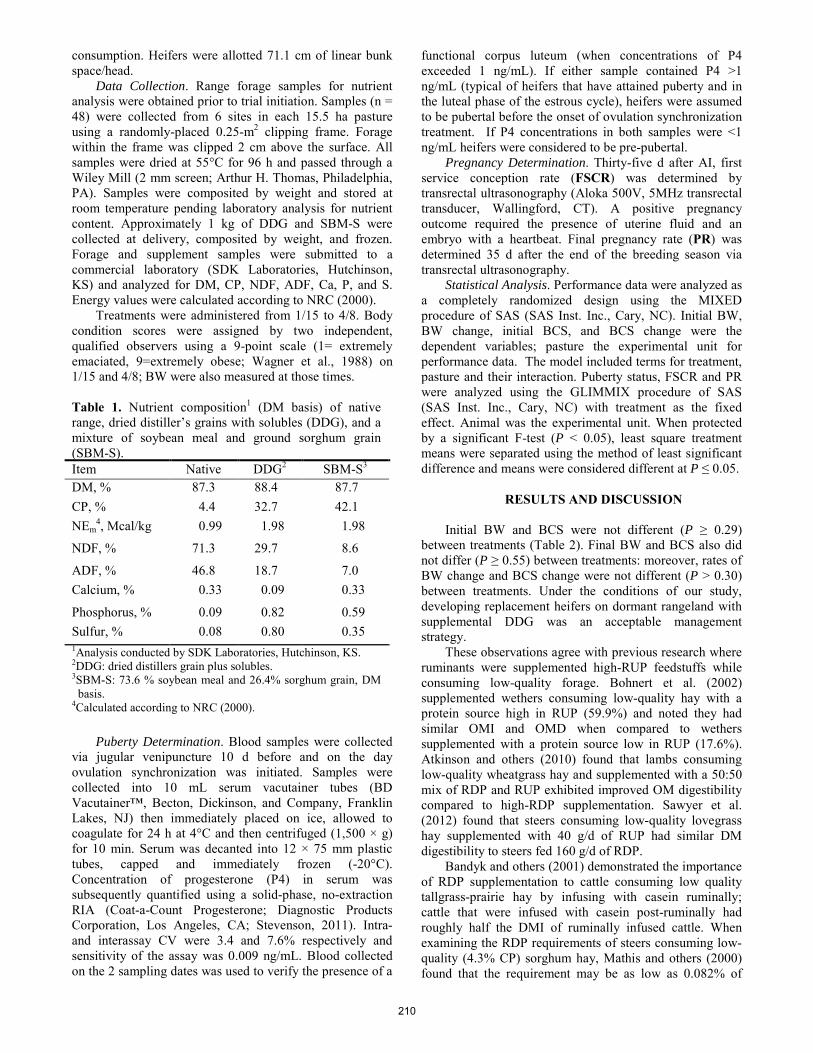
consumption. Heifers were allotted 71.1 cm of linear bunk space/head.
Data Collection. Range forage samples for nutrient analysis were obtained prior to trial initiation. Samples (n = 48) were collected from 6 sites in each 15.5 ha pasture using a randomly-placed 0.25-m2 clipping frame. Forage within the frame was clipped 2 cm above the surface. All samples were dried at 55°C for 96 h and passed through a Wiley Mill (2 mm screen; Arthur H. Thomas, Philadelphia, PA). Samples were composited by weight and stored at room temperature pending laboratory analysis for nutrient content. Approximately 1 kg of DDG and SBM-S were collected at delivery, composited by weight, and frozen. Forage and supplement samples were submitted to a commercial laboratory (SDK Laboratories, Hutchinson, KS) and analyzed for DM, CP, NDF, ADF, Ca, P, and S. Energy values were calculated according to NRC (2000).
Treatments were administered from 1/15 to 4/8. Body condition scores were assigned by two independent, qualified observers using a 9-point scale (1= extremely emaciated, 9=extremely obese; Wagner et al., 1988) on 1/15 and 4/8; BW were also measured at those times.
Puberty Determination. Blood samples were collected
via jugular venipuncture 10 d before and on the day ovulation synchronization was initiated. Samples were collected into 10 mL serum vacutainer tubes (BD Vacutainer™, Becton, Dickinson, and Company, Franklin Lakes, NJ) then immediately placed on ice, allowed to coagulate for 24 h at 4°C and then centrifuged (1,500 × g) for 10 min. Serum was decanted into 12 × 75 mm plastic tubes, capped and immediately frozen (-20°C). Concentration of progesterone (P4) in serum was subsequently quantified using a solid-phase, no-extraction RIA (Coat-a-Count Progesterone; Diagnostic Products Corporation, Los Angeles, CA; Stevenson, 2011). Intra- and interassay CV were 3.4 and 7.6% respectively and sensitivity of the assay was 0.009 ng/mL. Blood collected on the 2 sampling dates was used to verify the presence of a
functional corpus luteum (when concentrations of P4 exceeded 1 ng/mL). If either sample contained P4 >1 ng/mL (typical of heifers that have attained puberty and in the luteal phase of the estrous cycle), heifers were assumed to be pubertal before the onset of ovulation synchronization treatment. If P4 concentrations in both samples were <1 ng/mL heifers were considered to be pre-pubertal.
Pregnancy Determination. Thirty-five d after AI, first service conception rate (FSCR) was determined by transrectal ultrasonography (Aloka 500V, 5MHz transrectal transducer, Wallingford, CT). A positive pregnancy outcome required the presence of uterine fluid and an embryo with a heartbeat. Final pregnancy rate (PR) was determined 35 d after the end of the breeding season via transrectal ultrasonography.
Statistical Analysis. Performance data were analyzed as a completely randomized design using the MIXED procedure of SAS (SAS Inst. Inc., Cary, NC). Initial BW, BW change, initial BCS, and BCS change were the dependent variables; pasture the experimental unit for performance data. The model included terms for treatment, pasture and their interaction. Puberty status, FSCR and PR were analyzed using the GLIMMIX procedure of SAS (SAS Inst. Inc., Cary, NC) with treatment as the fixed effect. Animal was the experimental unit. When protected by a significant F-test (P < 0.05), least square treatment means were separated using the method of least significant difference and means were considered different at P ≤ 0.05.
RESULTS AND DISCUSSION
Initial BW and BCS were not different (P ≥ 0.29)
between treatments (Table 2). Final BW and BCS also did not differ (P ≥ 0.55) between treatments: moreover, rates of BW change and BCS change were not different (P ˃ 0.30) between treatments. Under the conditions of our study, developing replacement heifers on dormant rangeland with supplemental DDG was an acceptable management strategy.
These observations agree with previous research where ruminants were supplemented high-RUP feedstuffs while consuming low-quality forage. Bohnert et al. (2002) supplemented wethers consuming low-quality hay with a protein source high in RUP (59.9%) and noted they had similar OMI and OMD when compared to wethers supplemented with a protein source low in RUP (17.6%). Atkinson and others (2010) found that lambs consuming low-quality wheatgrass hay and supplemented with a 50:50 mix of RDP and RUP exhibited improved OM digestibility compared to high-RDP supplementation. Sawyer et al. (2012) found that steers consuming low-quality lovegrass hay supplemented with 40 g/d of RUP had similar DM digestibility to steers fed 160 g/d of RDP.
Bandyk and others (2001) demonstrated the importance of RDP supplementation to cattle consuming low quality tallgrass-prairie hay by infusing with casein ruminally; cattle that were infused with casein post-ruminally had roughly half the DMI of ruminally infused cattle. When examining the RDP requirements of steers consuming low-quality (4.3% CP) sorghum hay, Mathis and others (2000) found that the requirement may be as low as 0.082% of
Table 1. Nutrient composition1 (DM basis) of native range, dried distiller’s grains with solubles (DDG), and a mixture of soybean meal and ground sorghum grain (SBM-S). Item Native
DDG2 SBM-S3
DM, % 87.3 88.4 87.7 CP, % 4.4 32.7 42.1 NEm
4, Mcal/kg 0.99 1.98 1.98
NDF, % 71.3 29.7 8.6
ADF, % 46.8 18.7 7.0 Calcium, % 0.33 0.09 0.33
Phosphorus, % 0.09 0.82 0.59 Sulfur, % 0.08 0.80 0.35 1Analysis conducted by SDK Laboratories, Hutchinson, KS. 2DDG: dried distillers grain plus solubles. 3SBM-S: 73.6 % soybean meal and 26.4% sorghum grain, DM
basis. 4Calculated according to NRC (2000).
210

BW, suggesting only a small amount of RDP may be required to sustain microbial populations for cattle grazing low-quality forage. Based on those findings, when DDG is fed at the proper level, its RDP fraction (approximately 45% of CP; Shurson and Noll, 2005) should provide adequate N to the rumen to sustain the microbial populations.
Proportions of heifers pubertal before ovulation synchronization, FSCR, and PR were not affected (P > 0.40) by treatment (Table 3). Jaeger and others (2012) reported that heifers developed with wet distillers grains with solubles in place of soybean meal as the primary dietary protein source gained less BW and had lower proportions of pubertal heifers after 28 and 56 d of feeding; moreover, fewer wet distillers grain-supplemented heifers were pubertal at those times. Conversely, proportion of pubertal heifers was not different prior to ovulation synchronization, nor was FSCR or PR in that study. Thus, heifers in both studies sufficient growth and BCS to initiate puberty by consuming either distillers grains or soybean meal.
IMPLICATIONS
Dried distillers grains with solubles may be utilized as
an alternative to a mixture of soybean meal and ground sorghum grain without adversely affecting growth or reproductive performance of replacement heifers grazing low-quality dormant native range.
LITERATURE CITED
Atkinson, R. L., C. D. Toone, and P. A. Ludden. 2010. Effects of ruminal protein degradability and frequency of supplementation on site and extent of digestion and ruminal fermentation characteristics in lambs fed low-quality forage. J. Anim. Sci. 88:718-726.
Bandyk, C. A., R. C. Cochran, T. A. Wickersham, E. C. Titgemeyer, C. G. Farmer, and J. J. Higgins. 2001. Effect of ruminal vs postruminal administration of degradable protein on utilization of low-quality forage by beef steers. J. Anim. Sci. 79:225-231.
Beaty, J. L., R. C. Cochran, B. A. Lintzenich, E. S. Vanzant, J. L. Morrill, R. T. Brandt Jr., and D. E. Johnson. 1994. Effect of frequency of supplementation and protein concentration in supplements on performance and digestion characteristics of beef cattle consuming lowquality forages. J. Anim. Sci. 72:2475-2486.
Bohnert, D. W., C. S. Schauer, S. J. Falck, and T. DelCurto. 2002. Influence of rumen protein degradability and supplementation frequency on steers consuming low-quality forage: II. Ruminal fermentation characteristics. J. Anim. Sci. 80:2978-2988.
Heldt, J. S. 1998. Effect of various supplemental carbohydrate sources on the utilization of low- quality
tallgrass-prairie forage. PhD Diss. Kansas State University, Manhattan.
Jaeger, J. R., J. W. Waggoner, K. C. Olson, K. R. Harmoney, and J. W. Bolte. 2012. Growth and reproductive performance of beef replacement heifers fed development diets containing soybean meal or wet distillers grains. Prof. Anim. Sci. 28:300-305.
Köster, H. H., R. C. Cochran, E. C. Titgemeyer, E. S. Vanzant, I. Abdelgadir, G. St-Jean. 1996. Effect of increasing degradable intake protein on intake and digestion of low-quality tallgrass prairie forage by beef cows. J. Anim. Sci. 74:2473-2481.
Lesmeister, J. L., P. J. Burfening, and R. L. Blackwell. 1973. Date of first calving in beef cows and subsequent calf production. J. Anim. Sci. 36:1-6.
Mathis, C. P., R. C. Cochran, J. S. Heldt, B. C. Woods, I. E. O. Abdelgadir, K. C. Olson, E. C. Titgemeyer, and E. Z. Vanzant. 2000. Effects of supplemental degradable intake protein on utilization of medium- to low-quality forages. J. Anim. Sci. 78:224− 232.
Mathis, C. P., R. C. Cochran, G. L. Stokka, J. S. Heldt, B. C. Woods, and K. C. Olson. 1999. Impacts of increasing amounts of soybean meal on intake and digestion by beef steers and performance by beef cows consuming low-quality tallgrass-prairie forage. J. Anim. Sci. 77:3156-3162.
Mathis, C. P., and J. E. Sawyer. 2007. Nutritional management of grazing beef cows. Vet. Clin. North Amer. Food Anim. Pract. 23:1-19.
Sawyer, J. E., J. T. Mulliniks, R. C. Waterman, and M. K. Petersen. 2012. Influence of protein type and level on nitrogen and forage use in cows consuming low-quality forage. J. Anim. Sci. 90:2324-2330.
Schauer, C. S., D. W. Bohnert, D. C. Ganskopp, C. J. Richards, and S. J. Falok. 2005. Influence of protein supplementation frequency on cows consuming low-quality forage: Performance, grazing behavior, and variation in supplementation intake. J. Anim. Sci. 83: 1715-1725.
Shurson, J., and Noll, S. 2005. Feed and alternative uses for DDG. In: Energy from Agriculture: New Technologies, Innovative Programs & Successes Conference, Dec. 14–15, 2005. Farm Foundation, NRCS, and USDA Office of Energy Policy and New Uses, St. Louis, MO. pp. 1.
Stevenson, J. S. 2011. Alternative programs to presynchronize estrous cycles in dairy cattle before a timed artificial insemination program. J. Dairy Sci. 94:205-217.
Wagner, J. J., K. S. Lusby, J. W. Oltjen, J. Rakestraw, R. P. Wettemann, and L. E. Walters. 1988. Carcass composition in mature Hereford cows: Estimation and effect on daily metabolizable energy requirement during winter. J. Anim. Sci. 66:603-612.
211

Table 2. Growth performance of beef replacement heifers supplemented with dried distillers grains with solubles (DDG) or a mixture of soybean meal and ground sorghum grain (SBM-S).
Supplement Item DDG1 SBM-S2 SEM P-value Number of heifers 44 44 Initial BW, kg 267.2 260.8 8.6 0.29 Final BW, kg 313.0 310.7 10.12 0.68 BW change, kg 45.8 49.9 3.58 0.17 ADG, kg 0.6 0.6 0.04 0.17 Initial body condition score3 5.0 5.0 0.03 0.92 Final body condition score3 5.8 5.8 0.06 0.55 Body condition score change 0.8 0.8 0.06 0.53 1DDG: dried distillers grains with solubles. 2SBM-S: 73.6 % soybean meal and 26.4% ground sorghum grain, DM basis. 3Scale of 1 to 9; 1 = extremely emaciated, 9 = extremely obese.
Table 3. Reproductive performance of beef replacement heifers supplemented with dried distillers grains with solubles (DDG) or a mixture of soybean meal and ground sorghum grain (SBM-S)
Supplement Item DDG1 SBM-S2 P-value Estrual heifers, % 18.2 11.6 0.40 FSCR3, % 68.2 74.4 0.52 PR4, % 100.0 86.0 0.97 1DDG: dried distillers grains with solubles. 2SBM-S: 73.6% soybean meal and 26.4% ground sorghum grain, DM basis. 3FSCR: First service conception rate determined 35 d after AI. 4PR: Final pregnancy rate determined 35 d after removal of bulls.
212

Proceedings, Western Section, American Society of Animal Science
Vol. 66, 2015
Effects of altering supplementation frequency during the pre-partum period of beef cows grazing dormant native range
C. J. McMullen*, J. R. Jaeger*, J. W. Waggoner*, K.R. Harmoney*, and K. C. Olson†
*Western Kansas Agricultural Research Center, Kansas State University, Hays †Department of Animal Sciences and Industry, Kansas State University, Manhattan
ABSTRACT: A 2-yr study was conducted at the Western Kansas Agricultural Research Center, Hays to evaluate the effect of altering supplementation frequency during late gestation on performance of spring-calving cows grazing low-quality, dormant native range and supplemented with dried distillers grains with solubles (DDG). Angus × cows (n = 238; mean age = 6 ± 2.5 yr; average initial BW = 618 ± 56.2 kg; average initial BCS = 5.7 ± 0.03) were stratified by age, BW, BCS, and assigned randomly to 1 of 4 treatments: 1) DDG daily (D1); 2) DDG once every 6 d (D6); 3) DDG daily from d 1 to d 60 and then every 6 d (D1-D6); 4) DDG every 6 d from d 1 to d 60 and then daily (D6-D1). Treatments were initiated 100 d prior to expected onset of calving. Cow BW and BCS were measured every 28 d. Cows were sorted daily before supplementation at 0830 h. Supplement delivery was calculated to meet dietary CP requirements. Increasing supplementation frequency immediately prepartum negatively affected final BW and BW change from d 61-88 for the D6-D1 supplementation group (P < 0.05) compared to other supplementation groups. Cow BW change for the study (d 1-88) was also less (P < 0.02) for the D6-D1 group compared to other groups but was also affected (P < 0.01) by year. Under the conditions of our study, we concluded that increasing supplementation frequency 28 d prior to calving was not a valid means of increasing prepartum cow performance. Key words: cow performance, dried distillers grain, low-quality forage, supplementation frequency
INTRODUCTION
Spring-calving beef cattle grazing low-quality (< 7% CP) dormant forage are typically unable to meet their maintenance requirements for protein. Providing a protein supplement (>3 0% CP) is recommended to reduce BW and BCS losses that may occur (DelCurto et al., 1990; Mathis et al., 1999; Beaty et al., 1994). Nutrient supplementation when forage quality is poor or limited is one of the largest expenditures for forage-based beef cattle operations (Dhuyvetter, 2012). The expansion of the ethanol industry has afforded many producers in corn and sorghum-producing regions an alternative to traditional oilseed-based protein supplements. The availability and nutrient profile of distillers grains with solubles (DDG) has made it a popular protein supplement for beef producers supplementing cows grazing dormant low-quality forages.
Reducing supplementation frequency may reduce costs (i.e., labor and fuel) associated with winter supplementation
programs. Previously, Bennett et al. (2012) reported no difference in BW and BCS of cows supplemented with DDG daily, once every 3 d, or once every 6 d; however, the proportion of cows consuming hay 60 min post-supplementation was less on the day of supplementation for cows supplemented once every 6 d compared to cows supplemented daily. The observed reduction of ingestive behavior following supplementation events could potentially reduce OMI during late gestation. More frequent supplementation may increase OMI and increase performance during the month before parturition (Farmer et al., 2001).
Therefore, the objective of this study was to evaluate the effects of altering DDG supplementation frequency during the last 28 d of gestation on performance of spring-calving beef cows consuming low-quality dormant native range.
MATERIALS AND METHODS
Animal care practices used in this study were approved
by the Kansas State University Institutional Animal Care and Use Committee (Protocol no. 3175).
Animals and Experimental Design. Pregnant Angus × cows (n = 238; age = 6 ± 2.5 yr; initial BW = 618 ± 56.2 kg; initial BCS = 5.7 ± 0.03) were maintained on dormant native range for 88 d until the onset of calving (Table 1). Pasture botanical composition included the following species; sideoats grama (Bouteloua curtipendula), western wheatgrass (Pascopyrum smithii), blue grama (Bouteloua gracilis), Japanese brome (Bromus arvensis), and buffalograss (Bouteloua dactyloides).
Cows were stratified by age, BW, BCS, and assigned randomly to 1 of 4 treatments: 1) DDG daily (D1); 2) DDG once every 6 d (D6); 3) DDG daily from d 1 to d 60 and then every 6 d until d 88 (DD1-D6); 4) DDG every 6 d from d 1 to d 60 and then daily until d 88 (D6-D1). Treatments were initiated 100 d prior to expected onset of calving. Dried distillers grain with solubles were delivered and stored in bulk for use throughout the duration of the study (Table 1). Cows were sorted daily into treatment groups and supplement was delivered at 0830 h into a bunk for consumption. Only one set of bunks was available; therefore, on d when multiple supplement treatments were fed, each group was given 1 h to consume the supplement before being moved out of the feeding area. Cows were allotted 71.1 cm of linear bunk space/head. Supplement intake was prorated to supply 0.36 kg CP∙head-1∙day-1 (1.17 kg DDG∙head-1∙day-1, year 1; 1.18 kg DDG∙head-1∙day-1,
213

year 2, DM basis). Mineral (Prairie Cow 4P; Suther Feeds, Inc., Frankfort, KS) and salt were available continuously, during the experiment. At the onset of calving, treatments were discontinued and cows were fed forage sorghum hay at 2% of BW and supplemented 0.65 kg DDG daily in a common pasture (DM basis).
Data Collection. Forage samples for nutrient analysis were obtained prior to trial initiation. Samples (n = 24) were collected from multiple areas in each pasture using a randomly-placed 0.25-m2 clipping frame. All forage within the frame was clipped 2 cm above the surface. All samples were dried at 55°C for 96 h, passed through a Wiley Mill (2 mm screen; Arthur H. Thomas, Philadelphia, PA), and stored at room temperature for subsequent nutrient analysis.
A representative sample of DDG was collected at delivery, composited, and frozen. Forage and DDG samples were submitted to a commercial laboratory (SDK Laboratories, Hutchinson, KS) and analyzed for DM, CP, NDF, ADF, Ca, P, and S.
Cow BW and BCS were measured every 28 d at 0900 h. Supplement was withheld the morning of data collection and fed immediately after all cows had been weighed. Two independent, trained observers assigned BCS using a 9-point scale (1= extremely emaciated, 9=extremely obese; Wagner et al., 1988) on each respective weigh date. Cows that calved before the final data collection date were excluded from the data set resulting in 232 observations.
Statistical Analysis. Performance data were analyzed as a completely randomized design using the MIXED procedure of SAS (SAS Inst. Inc., Cary, NC). Initial BW, BW change, initial BCS, and BCS change were dependent variables. The model included terms for treatment, year and their interaction. Animal within treatment was used as the random term. Cow was utilized as the experimental unit. When protected by a significant F-test (P < 0.05), Least Squares treatment means were separated using the method of least significant difference. Means were considered significant at P ≤ 0.05. Tendencies were discussed when 0.05 < P ≤ 0.10.
RESULTS AND DISCUSSION
No treatment × year interactions were observed for cow BW or BCS (P > 0.05; Table 2). Cattle consuming low-quality dormant native range do not consume sufficient N to optimize ruminal fermentation, which may limit nutrient absorption. (Köster et al., 1996; Bohnert et al., 2002; Arroquy et al., 2004). Reducing supplementation frequency has been reported to have no effect on cow performance when cattle were supplemented with traditional oil seed-based protein as infrequently as once per week (Beaty et al., 1994; Huston et al., 1999; Farmer et al., 2001) or with DDG as infrequently as once every 6 d (Bennett et al., 2012). We also found no differences between the D6 and D1 supplementation groups.
Beaty et al. (1994) fed 8 mature, ruminally-fistulated steers wheat straw (3.1% CP) ad libitum while supplementing increasing levels of SBM either daily or 3 × per wk. Steers that were supplemented 3 × per wk had lesser DMI when compared to steers that were supplemented daily. We hypothesized that increasing
supplementation frequency 28 d before the onset of calving would increase DMI for the D6-D1 cows, resulting in greater nutrient intake and improved performance when compared to the D1-D6 and D6 cows. In contrast, increasing supplementation frequency had the opposite of its intended effect. Cows in the D6-D1 group had less (P = 0.04) BW and BW change at the end of the 88 d supplementation period compared to the D1, D6 and D1-D6 groups (Table 2). Likewise, BCS of D6-D1 cows tended (P = 0.09) be lower than that of cows in the D1, D6 or D1-D6 supplementation groups.
IMPLICATIONS
Under the conditions of our study, increasing supplementation frequency 28 d prior to calving from once every 6 d to daily resulted in less BW gain and lessor BCS by pregnant beef cows supplemented with DDG. Additionally, no adverse effects of reducing supplementation frequency to once every 6 d were observed in pregnant beef cows fed DDG. Reducing supplementation frequency may be a viable means of reducing supplementation costs when DDG are used as supplement.
LITERATURE CITED
Arroquy, J. J., R. C. Cochran, M. Villarreal, T. A. Wickersham, D. A. Llewellyn, E. C. Titgemeyer, T. G. Nagaraja, D.E. Johnson, and D. Gnad. 2004. Effect of level of rumen degradable protein and type of supplemental non-fiber carbohydrate on intake and digestion of low-quality grass hay by beef cattle. Anim. Feed Sci. Technol. 115 83-99.
Beaty, J. L., R. C. Cochran, B. A. Lintzenich, E. S. Vanzant, J. L. Morrill, R. T. Brandt Jr., and D. E. Johnson. 1994. Effect of frequency of supplementation and protein concentration in supplements on performance and digestion characteristics of beef cattle consuming low quality forages. J. Anim. Sci. 72:2475-2486.
Bennett, B. W., J. W. Waggoner, J. R. Jaeger, A. K. Sexten, and K. C. Olson. 2013. Effect of supplementation frequency on performance of spring-calving cows supplemented with dried distillers grain. Proc. Western Section, American society of Animal Science. Vol. 64, 2013.
Bohnert, D. W., C. S. Schauer, S. J. Falck, and T. DelCurto. 2002. Influence of rumen protein degradability and supplementation frequency on steers consuming low-quality forage: II. Ruminal fermentation characteristics. J. Anim. Sci. 80:2978-2988.
DelCurto, T., R. C. Cochran, L. R. Corah, A. A. Beharka, E. S. Vanzant, and D. E. Johnson. 1990. Supplementation of dormant tallgrass-prairie forage. II. Performance and forage utilization characteristics in grazing beef cattle receiving supplements of different protein concentration. J. Anim. Sci. 68:532-542.
Dhuyvetter, K. C. 2012. Differences between high, medium, and low profit producers: an analysis of 2007-2011 Kansas farm management association cow-calf
214
enterprise. Kansas State Univ. Department of Agricultural Economics. AM-KCD-2012.03.
Farmer, C. G., R. C. Cochran, D. D. Simms, E. A. Klevesahl, T. A. Wickersham, and D. E. Johnson. 2001. The effects of several supplementation frequencies on forage use and performance of beef cattle consuming dormant tallgrass-prairie forage. J. Anim. Sci. 79:2276-2285.
Huston, J. E., H. Lippke, T. D. Forbes, J. W. Holloway, and R. V. Machem. 1999. Effects of supplemental feeding interval on adult cows in western Texas. J. Anim. Sci. 77:3057-3067.
Köster, H. H., R. C. Cochran, E. C. Titgemeyer, E. S. Vanzant, I. Abdelgadir, G. St-Jean. 1996. Effect of increasing degradable intake protein on intake and
digestion of low-quality tallgrass prairie forage by beef cows. J. Anim. Sci. 74:2473-2481.
Mathis, C. P., R. C. Cochran, G. L. Stokka, J. S. Heldt, B. C. Woods, and K. C. Olson. 1999. Impacts of increasing amounts of soybean meal on intake and digestion by beef steers and performance by beef cows consuming low-quality tallgrass-prairie forage. J. Anim. Sci. 77:3156-3162.
NRC. 2000. Nutrient Requirements of Beef Cattle. National Academy Press, Washington, DC.
Wagner, J. J., K. S. Lusby, J. W. Oltjen, J. Rakestraw, R. P. Wettermann, and L. E. Walters. 1988. Carcass composition in mature Hereford cows: Estimation and effect on daily metabolizable energy requirement during winter. J. Anim. Sci. 66:603-612.
215
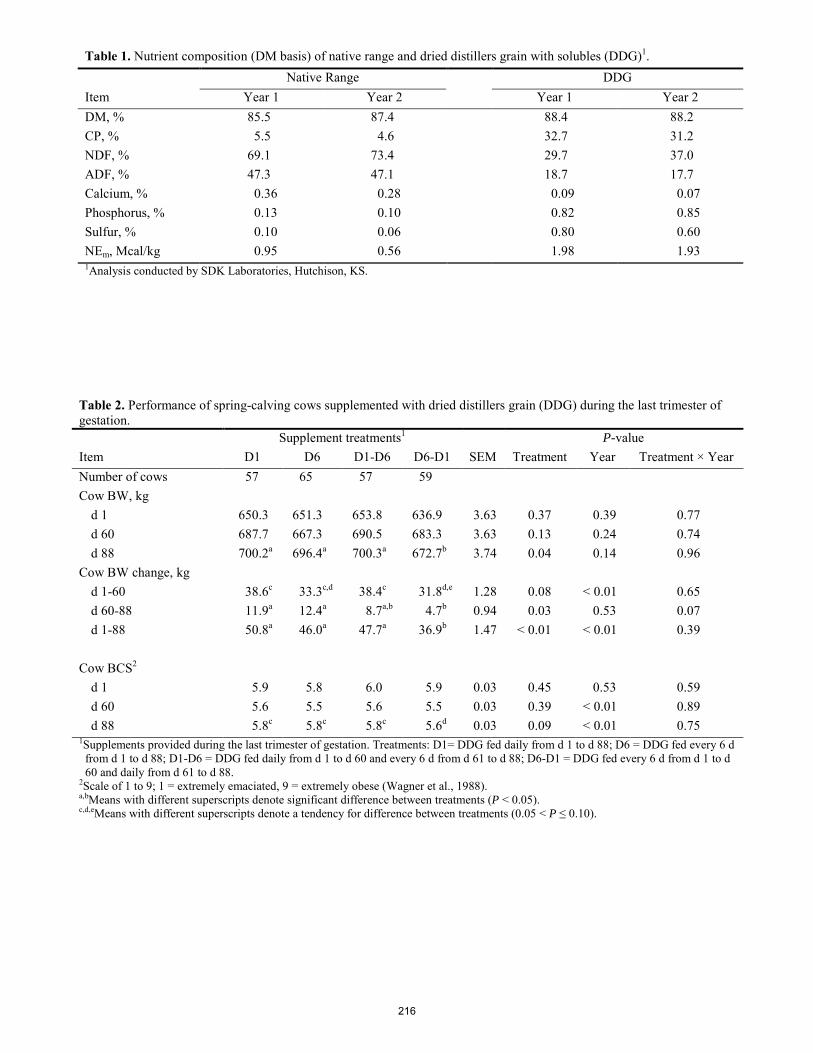
Table 1. Nutrient composition (DM basis) of native range and dried distillers grain with solubles (DDG)1. Native Range DDG
Item Year 1 Year 2 Year 1 Year 2 DM, % 85.5 87.4 88.4 88.2 CP, % 5.5 4.6 32.7 31.2 NDF, % 69.1 73.4 29.7 37.0 ADF, % 47.3 47.1 18.7 17.7 Calcium, % 0.36 0.28 0.09 0.07 Phosphorus, % 0.13 0.10 0.82 0.85 Sulfur, % 0.10 0.06 0.80 0.60 NEm, Mcal/kg 0.95 0.56 1.98 1.93 1Analysis conducted by SDK Laboratories, Hutchison, KS.
Table 2. Performance of spring-calving cows supplemented with dried distillers grain (DDG) during the last trimester of gestation. Supplement treatments1 P-value Item D1 D6 D1-D6 D6-D1 SEM Treatment Year Treatment × Year Number of cows 57 65 57 59 Cow BW, kg
d 1 650.3 651.3 653.8 636.9 3.63 0.37 0.39 0.77 d 60 687.7 667.3 690.5 683.3 3.63 0.13 0.24 0.74 d 88 700.2a 696.4a 700.3a 672.7b 3.74 0.04 0.14 0.96
Cow BW change, kg d 1-60 38.6c 33.3c,d 38.4c 31.8d,e 1.28 0.08 < 0.01 0.65 d 60-88 11.9a 12.4a 8.7a,b 4.7b 0.94 0.03 0.53 0.07 d 1-88 50.8a 46.0a 47.7a 36.9b 1.47 < 0.01 < 0.01 0.39
Cow BCS2
d 1 5.9 5.8 6.0 5.9 0.03 0.45 0.53 0.59 d 60 5.6 5.5 5.6 5.5 0.03 0.39 < 0.01 0.89 d 88 5.8c 5.8c 5.8c 5.6d 0.03 0.09 < 0.01 0.75
1Supplements provided during the last trimester of gestation. Treatments: D1= DDG fed daily from d 1 to d 88; D6 = DDG fed every 6 d from d 1 to d 88; D1-D6 = DDG fed daily from d 1 to d 60 and every 6 d from d 61 to d 88; D6-D1 = DDG fed every 6 d from d 1 to d 60 and daily from d 61 to d 88.
2Scale of 1 to 9; 1 = extremely emaciated, 9 = extremely obese (Wagner et al., 1988). a,bMeans with different superscripts denote significant difference between treatments (P < 0.05). c,d,eMeans with different superscripts denote a tendency for difference between treatments (0.05 < P ≤ 0.10).
216
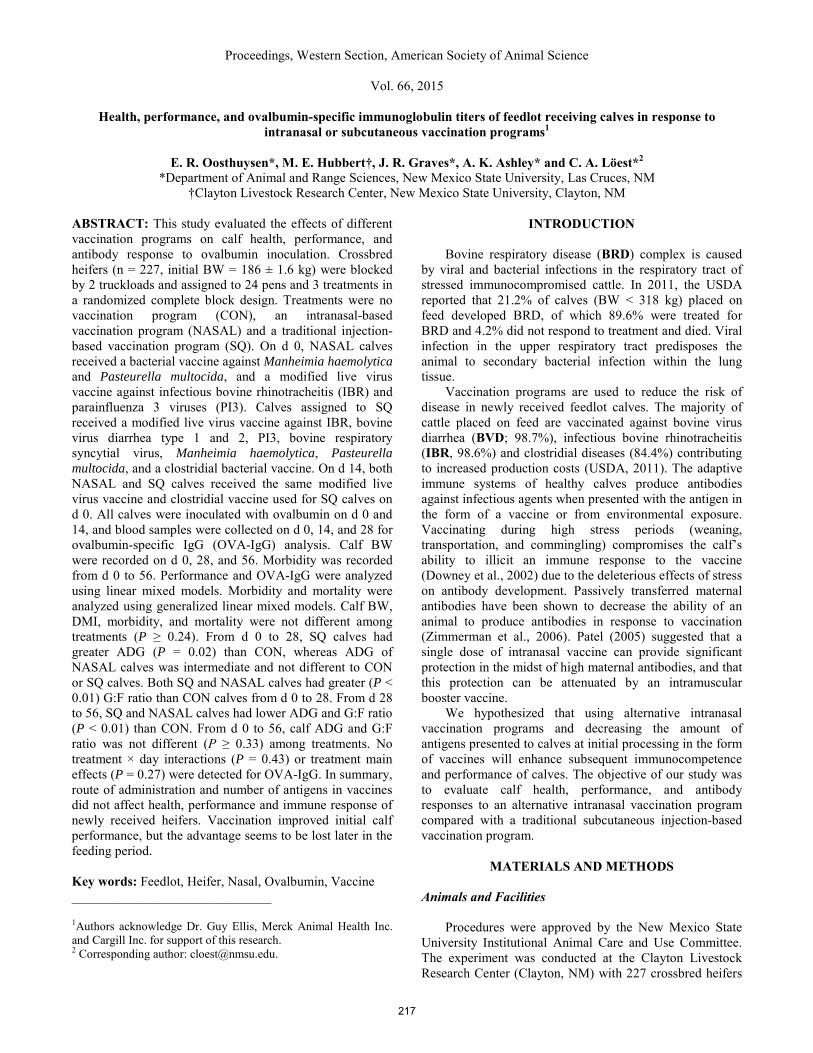
Proceedings, Western Section, American Society of Animal Science
Vol. 66, 2015
Health, performance, and ovalbumin-specific immunoglobulin titers of feedlot receiving calves in response to intranasal or subcutaneous vaccination programs1
E. R. Oosthuysen*, M. E. Hubbert†, J. R. Graves*, A. K. Ashley* and C. A. Löest*2
*Department of Animal and Range Sciences, New Mexico State University, Las Cruces, NM †Clayton Livestock Research Center, New Mexico State University, Clayton, NM
ABSTRACT: This study evaluated the effects of different vaccination programs on calf health, performance, and antibody response to ovalbumin inoculation. Crossbred heifers (n = 227, initial BW = 186 ± 1.6 kg) were blocked by 2 truckloads and assigned to 24 pens and 3 treatments in a randomized complete block design. Treatments were no vaccination program (CON), an intranasal-based vaccination program (NASAL) and a traditional injection-based vaccination program (SQ). On d 0, NASAL calves received a bacterial vaccine against Manheimia haemolytica and Pasteurella multocida, and a modified live virus vaccine against infectious bovine rhinotracheitis (IBR) and parainfluenza 3 viruses (PI3). Calves assigned to SQ received a modified live virus vaccine against IBR, bovine virus diarrhea type 1 and 2, PI3, bovine respiratory syncytial virus, Manheimia haemolytica, Pasteurella multocida, and a clostridial bacterial vaccine. On d 14, both NASAL and SQ calves received the same modified live virus vaccine and clostridial vaccine used for SQ calves on d 0. All calves were inoculated with ovalbumin on d 0 and 14, and blood samples were collected on d 0, 14, and 28 for ovalbumin-specific IgG (OVA-IgG) analysis. Calf BW were recorded on d 0, 28, and 56. Morbidity was recorded from d 0 to 56. Performance and OVA-IgG were analyzed using linear mixed models. Morbidity and mortality were analyzed using generalized linear mixed models. Calf BW, DMI, morbidity, and mortality were not different among treatments (P ≥ 0.24). From d 0 to 28, SQ calves had greater ADG (P = 0.02) than CON, whereas ADG of NASAL calves was intermediate and not different to CON or SQ calves. Both SQ and NASAL calves had greater (P < 0.01) G:F ratio than CON calves from d 0 to 28. From d 28 to 56, SQ and NASAL calves had lower ADG and G:F ratio (P < 0.01) than CON. From d 0 to 56, calf ADG and G:F ratio was not different (P ≥ 0.33) among treatments. No treatment × day interactions (P = 0.43) or treatment main effects (P = 0.27) were detected for OVA-IgG. In summary, route of administration and number of antigens in vaccines did not affect health, performance and immune response of newly received heifers. Vaccination improved initial calf performance, but the advantage seems to be lost later in the feeding period. Key words: Feedlot, Heifer, Nasal, Ovalbumin, Vaccine ______________________________ 1Authors acknowledge Dr. Guy Ellis, Merck Animal Health Inc. and Cargill Inc. for support of this research. 2 Corresponding author: [email protected].
INTRODUCTION Bovine respiratory disease (BRD) complex is caused
by viral and bacterial infections in the respiratory tract of stressed immunocompromised cattle. In 2011, the USDA reported that 21.2% of calves (BW < 318 kg) placed on feed developed BRD, of which 89.6% were treated for BRD and 4.2% did not respond to treatment and died. Viral infection in the upper respiratory tract predisposes the animal to secondary bacterial infection within the lung tissue.
Vaccination programs are used to reduce the risk of disease in newly received feedlot calves. The majority of cattle placed on feed are vaccinated against bovine virus diarrhea (BVD; 98.7%), infectious bovine rhinotracheitis (IBR, 98.6%) and clostridial diseases (84.4%) contributing to increased production costs (USDA, 2011). The adaptive immune systems of healthy calves produce antibodies against infectious agents when presented with the antigen in the form of a vaccine or from environmental exposure. Vaccinating during high stress periods (weaning, transportation, and commingling) compromises the calf’s ability to illicit an immune response to the vaccine (Downey et al., 2002) due to the deleterious effects of stress on antibody development. Passively transferred maternal antibodies have been shown to decrease the ability of an animal to produce antibodies in response to vaccination (Zimmerman et al., 2006). Patel (2005) suggested that a single dose of intranasal vaccine can provide significant protection in the midst of high maternal antibodies, and that this protection can be attenuated by an intramuscular booster vaccine.
We hypothesized that using alternative intranasal vaccination programs and decreasing the amount of antigens presented to calves at initial processing in the form of vaccines will enhance subsequent immunocompetence and performance of calves. The objective of our study was to evaluate calf health, performance, and antibody responses to an alternative intranasal vaccination program compared with a traditional subcutaneous injection-based vaccination program.
MATERIALS AND METHODS
Animals and Facilities
Procedures were approved by the New Mexico State
University Institutional Animal Care and Use Committee. The experiment was conducted at the Clayton Livestock Research Center (Clayton, NM) with 227 crossbred heifers
217

shipped from south-eastern Texas (12 h on truck; 1,159 km) in two truckloads. Upon arrival, heifers were given free access to two 132-L water fountains (CATTLEMASTER 840; Ritchie Inc., Conrad, IA), wheat hay, and 1 kg of a commercially available feedlot receiving diet (RAMP; Cargill Inc., Dalhart, TX). Heifers were allowed to drink, eat, and rest before initial processing the following morning. At initial processing, all heifers were individually weighed (Daniels Bud Box System; Model: AH-10; Ainsworth, NE), given a unique identification and pen tag, an oral de-wormer (Safe-guard; Intervet Inc.; Millsboro, DE), ovalbumin inoculant, and vaccination treatment. All heifers were housed in 24 soil-surfaced pens (12 m × 35 m) with 11 m of bunk space and a 76-L water fountain (CATTLEMASTER 480; Ritchie Inc., Conrad, IA). The average BW of heifers at initial processing was 186 ± 1.6 kg.
Experimental Design and Treatments
The experiment was a randomized complete block
design with pen as experimental unit. Heifers were blocked by truckload (2 truckloads; 111 to 116 calves per truckload). Within each block, calves were randomly assigned to 12 pens (9 to 11 calves per pen), and pens of calves were randomly assigned to 3 treatments (8 replicated pens per treatments). Treatments were no vaccination program (CON), an intranasal-based vaccination program (NASAL), and a subcutaneous injection-based vaccination program (SQ). Calves assigned to CON received no vaccines throughout the 56-d experiment. Calves assigned to NASAL received two nasal vaccines at initial processing (d 0). These nasal vaccines were a bacterial vaccine against diseases caused by Manheimia haemolytica and Pasteurella multocida, and a modified live virus vaccine to control against IBR and parainfluenza 3 viruses (PI3). Calves assigned to SQ received a modified live virus vaccine and a clostridial bacterial vaccine at initial processing. The modified live virus vaccine was active against IBR, BVD type 1 and 2, PI3, bovine respiratory syncytial virus (BRSV), Manheimia haemolytica and Pasteurella multocida. On d 14, both NASAL and SQ calves received two subcutaneous booster vaccines, a modified live virus vaccine, and a bacterial vaccine against clostridial diseases.
Wood panels were attached to fence lines separating pens of different treatment groups to prevent the cross contamination of the modified live viruses among pens of calves. All calves received 2 mL of a single-site subcutaneous ovalbumin vaccine injection on d 0, followed by a booster injection on d 14. The ovalbumin vaccine consisted of a 1:1 solution of commercially prepared aluminum hydroxide adjuvant solution (Alhydrogel 1.3%; Cat. No. A1090 S; Accurate Chemicals and Scientific Corporation, Westbury, NY) and sterile saline containing 0.6% (w/v) suspended ovalbumin (Cat. No. A5503; Sigma-Aldrich, St. Louis., MO). Vaccinating the calves with ovalbumin, a non-pathogenic antigen, will stimulate the adaptive immune system to produce antibodies against ovalbumin (OVA-IgG) for assessment of immunocompetence.
All calves were fed a commercially available feedlot receiving diet (RAMP, Cargill Inc.; Dalhart, TX) throughout the 56-d experiment (Table 1). Cattle were fed twice daily at 07:00 and 13:00 using a feed truck with six individual bins, each fitted with a horizontal auger for dispensing feed. Contents of feed bunks were evaluated at 06:30, 12:45, and 18:30 to determine the amount of feed to be delivered to the pen during the next feedings. Feed intake was managed to minimize the amount of feed refusals and build-up of orts in bunks. Trace amount of feed was allowed at the 18:30 bunk evaluation time, with no feed in bunks before the first feeding. Composite samples of each load of feed was obtained for DM analysis (100°C for 24 h) and for nutrient analysis by a commercial laboratory (Servi-Tech Laboratories, Amarillo, TX).
Management and Collections
On d 0, 14 and 28 all calves were individually
weighed, had their rectal temperature taken, and had blood samples collected via jugular venipuncture. Pen weights were obtained on d 56. Clinical assessment of animal health was performed daily by trained personnel based on depression, anorexia, respiratorion, and temperature (“DART” 3-point scale method). Calves showing signs of morbidity based on the DART criteria were removed from their home pens and taken to the handling facilities for further evaluation, where they were weighed, had their rectal temperatures taken, and given a severity score of 0 to 3 for depression and respiration. Calves warranted medical treatment if they had a negative or no weight gain since the previously recorded weight, had a severity score of 2 or higher for depression or anorexia, or had a rectal temperature of 40.5°C or higher. Calves received a combination of antibiotic (florfenicol) and a fast-acting non-steroidal anti-inflammatory (flunixin meglumine) as a single dose (Resflor Gold; Merck Animal Health, Summit, NJ) for their first medical treatment. For the second medical treatment, calves received a broad spectrum antibiotic (crystalline free acid of centioflur) active against gram-negative bacteria (Excede; Zoetis Inc.; Kalamazoo, MI). The third medical treatment consisted of an antibiotic with oxytetracycline as active component (Bio-Mycin 200: Boehringer Ingelheim Vetmedia, Inc., St. Joseph, MO). If a fourth medical treatment was warranted, the animal was permanently removed from the study and taken to the hospital pen.
Blood samples collected on d 0, 14, and 28 were analyzed for ovalbumin-specific IgG using an ELISA. Individual wells of a 96-well plate were coated with 100 μL of ovalbumin reagent consisting of 0.01 mg of ovalbumin per mL of PBS. Plates were incubated for 8 h at 4°C then washed 4 times with 200 μL of a 0.05% Tween 20 (Cat. No. M147-1L; Amresco Inc., Solon, OH) in PBS. Plates were blocked using 200 μL of 1% BSA (Cat. No. A21253-10G; Sigma-Aldrich, St. Louis, MO) in PBS for 1 h at 22°C, then plates were washed as described above. All serum samples were diluted to a 1:3,200 dilution in PBS, and 100 μL of diluted serum was added to each well except for 6 wells assigned to non-specific binding (NSB) and 6 wells for the
218

positive control. Each serum sample was assessed in triplicate. Serum was substituted for 100 μL of PBS in the NSB wells to calculate the amount of non-specific binding that would then be subtracted from all sample and positive control optical densities. A composite of d 28 serum samples was obtained and diluted to 1:3,200 in PBS to be used as positive control and substitute sample serum in wells assigned to positive control. Serum samples, positive control and NSB wells were allowed to incubate for 1 h at 22°C, and then plates were washed as escribed previously. Bovine IgG-heavy and -light chain antibody conjugated to horseradish peroxidase (Cat. NO. A10-102P, Bethyl Lab. Inc., Montgomery, TX) was diluted to 1:40,000 in PBS and used as the secondary antibody to bind OVA-IgG produced by the adaptive immune system of calves in response to the ovalbumin vaccine. Secondary antibody reagent (100 μL) was added to all 96 wells and allowed to incubate for 1 h at 22°C. After incubation, the plate was washed as previously described. The chromogenic substrate 3’5, 5, 5’ Tetramethylbenzidene (Cat. No. T8665; Sigma Aldrich St. Louis, MO) was added (100 μL) to each well and incubated for 25 min at 22°C. The reaction was stopped by adding 100 μL of 1 M HCl to each well. Optical density was measured on a plate reader (Synergy H1; BioTek Instruments Inc., Winooski, VT) at 450 nm. For each well, non-specific binding was accounted for by subtracting the mean optical density of the 6 NSB wells. Statistical Analysis
Calf BW, DMI, and performance were statistically
analyzed as continuous variables using mixed models (SAS Inst. Inc., Cary, NC). The statistical model included the effect of treatment with block being random. Ovalbumin-specific IgG was analyzed using the same model with the addition of day as repeated measures. Morbidity and mortality data were analyzed as categorical proportions using generalized linear mixed models (SAS Inst. Inc., Cary, NC). The statistical model included the effect of treatment with block being random. Differences between treatments were considered significant when P < 0.05.
RESULTS
Body weights of heifers on d 0, 28, and 56 were not different (P ≥ 0.50) among vaccination programs (Table 2). Vaccination program did not affect (P ≥ 0.64) DMI. From d 0 to 28, SQ calves had greater ADG (P = 0.02) than CON, whereas ADG of NASAL calves was intermediate and not different to CON or SQ calves. Both SQ and NASAL calves had greater (P < 0.01) G:F ratio than CON calves from d 0 to 28. From d 28 to 56, calves that received SQ and NASAL had lower ADG and G:F ratio (P < 0.01) compared with CON calves. From d 0 to 56, ADG and G:F ratio was not different (P ≥ 0.33) among treatments.
For calf morbidity, the percentage of calves receiving medical treatment was not affected (P ≥ 0.34) by vaccination program (Table 2). Calf mortality was not different (P = 0.24) among vaccination programs. Serum OVA-IgG concentration increased (P < 0.01) from the day of initial inoculation (d 0) to d 28 (Figure 1). No treatment
× day interactions (P = 0.43) were detected for OVA-IgG. Ovalbumin-specific IgG concentration was not different (P = 0.27) among vaccination programs. Table 1. Nutrient composition of the diet (DM basis)
Nutrient2 RAMP1 CP, % 19.9 ADF, % 18.6 Ca, % 1.52 P, % 0.83 ME3, Mcal/kg 2.64 NEm
3, Mcal/kg 1.72 NEg
3, Mcal/kg 1.11 1RAMP = commercial feedlot receiving diet (Cargill Inc., Minneapolis, MN) 2Analyzed by Servi-Tech Laboratories (Amarillo, TX) 3ME, Mcal/kg = 0.01×(81.81-0.48×%ADF)×4.409×0.82; NEm, Mcal/kg = 1.37×ME-0.138×ME2+0.0105×ME3-1.12; NEg, Mcal/kg = 1.42×ME-0.174×ME2+0.0122×ME3-1.65 (NRC,
2000).
DISCUSSION Morbidity and Mortality
Morbidity and mortality of calves receiving NASAL and SQ vaccines were not different to that of control calves, indicating that the vaccination programs evaluated in this study did not improve overall health during the first 56 d in the feedlot. The amount of medical treatments warranted is a subjective indication of calf health compared with mortality. Although not significantly different, 2.6% mortality rates in groups of calves receiving vaccines (NASAL and SQ) compared with 8% in CON calves might suggest that calves receiving vaccines had improved health. Animal Performance
Decreasing the amount of antigens presented to newly received feedlot heifers through the use of an alternative intranasal vaccination program did not improve health and performance when compared with a traditional subcutaneous vaccination program. Improved animal performance for SQ from d 0 to 28 could be explained by the increased number of viral antigens presented to vaccinated calves. Schunicht et al. (2003) showed improved ADG for feedlot calves on a multivalent (IBR, PI3, BVD, and BRSV) viral vaccine program compared to calves on a univalent (IBR) viral vaccine program. The lower ADG and feed efficiency from d 28 to 56 in calves receiving NASAL and SQ compared to CON could be explained by compensatory growth by initially stunted CON calves. Faber et al. (1999) showed that BRD-affected calves exhibited compensatory gain when they responded to medical treatment. These findings together with the numerically higher mortality rates in CON calves might suggest that non-vaccinated calves were more likely to be affected by BRD. This suggests that after effective medical treatment, CON calves compensated for poor ADG during the first 28 d such that overall ADG (d 0 to 56) was not different to vaccinated calves. Our results are also
219

consistent with Chirase et al. (2001) who reported no difference in ADG for calves receiving a control (saline) injection compared with a subcutaneous clostridial-based vaccination program. Immune Responses
The production of OVA-IgG in response to ovalbumin
inoculation provides a measure of immunocompetence of an animal and potentially an indication that the vaccine effectively stimulated the adaptive immune system. Consistent with Carter et al. (2011), OVA-IgG concentrations increased from d 0 to 28 with an increased response to booster vaccine at d 14. Similar antibody responses among treatments to ovalbumin vaccine suggests that the adaptive immune system of newly received calves was not overwhelmed by the amount of antigens presented in the form of vaccines, which is in contrast to what was hypothesized. High serum maternal derived antibodies have been shown to decrease antibody responses to vaccines (Zimmerman et al., 2006) and the effect was more pronounced in subcutaneous compared to intranasal vaccines (Patel, 2005). In the current study, intranasal vaccines did not improve antibody responses compared with subcutaneous vaccines. Conclusions
These results imply that route of administration and
number of antigens in vaccines did not affect health, performance and immune response of newly received feedlot heifers. Vaccinating newly received calves increased performance during the first 28 d, but the performance advantage of vaccinated calves was lost by d 56.
LITERATURE CITED
Carter, B. H., C. P. Mathis, G. C. Duff, J. B. Taylor, K. M.
Taylor, B. C. Graham, L. W. Hall, J. D. Allen, D. M. Hallford, and C. A. Löest. 2011. Supplemental branched chain amino acids improve performance and immune response of newly-received feedlot calves. Proc. Wes. Sec. Am. Soc. Anim. Sci. 62:321-324.
Chirase, N. K., L. W. Greene, G. D. Graham, and J. M. Avampato. 2001. Influence of clostridial vaccines and injection site on performance, feeding behavior, and lesion size scores of beef steers. J. Anim. Sci. 79:1409-1415.
Downey, E. D., R. G. Tait Jr., M. S. Mayes, C. A. Park, J. F. Ridpath, D. J. Garrick, and J. M. Reecy. 2013. An
evaluation of circulating bovine viral diarrhea virus type 2 maternal antibody level and response the vaccination in Angus calves. J. Anim. Sci. 91:4440-4450.
Faber, R. N., N. Hartwig, D. Busby, and R. BreDahl. 1999. The costs and predictive factors of bovine respiratory disease in standardized steer tests. Beef Res. Rep. Iowa State Univ. Press, Ames. Paper 24.
NRC. 2000. Nutrient requirements of beef cattle. 7th rev. ed. National Academy Press, Washington, DC.
Patel, J. R. 2005. Characteristics of live bovine herpesvirus-1 vaccines. Vet. J. 169:404-416.
Schunicht, O. C., C. W. Booker, G. K. Jim, P. T. Guichon, B. K. Wildman, and B. W. Hill. 2003. Comparisons of a multivalent viral vaccine program versus a univalent viral vaccine program on animal health, feedlot performance, and carcass characteristics. Can. Vet. J. 44:43-50.
USDA. 2011. Health and health management on U.S. feedlots with a capacity of 1,000 or more head. NAHMS report, Part IV. Fort Collins, CO.
Zimmerman, A. D., R. E. Boots, J. L. Valli, and C. C. L. Chase. 2006. Evaluation of protection against virulent bovine viral diarrhea virus type 2 in calves that had maternal antibodies and were vaccinated with a modified-live vaccine. J. Am. Vet. Med. Assoc. 228:1757-1761.
Figure 1. Optical density of serum ovalbumin-specific IgG in heifers receiving either no vaccination program (CON), an intranasal-based vaccination program (NASAL), or a subcutaneous injection-based vaccination program (SQ). Calves were inoculated against ovalbumin on d 0 and 14. Effects were: treatment (P = 0.27), day (P < 0.01), treatment × day interaction (P = 0.43).
-0.4
0
0.4
0.8
1.2
1.6
0 14 28
Opt
ical
Den
sity
Days After Innoculation
CON NASAL SQ
220
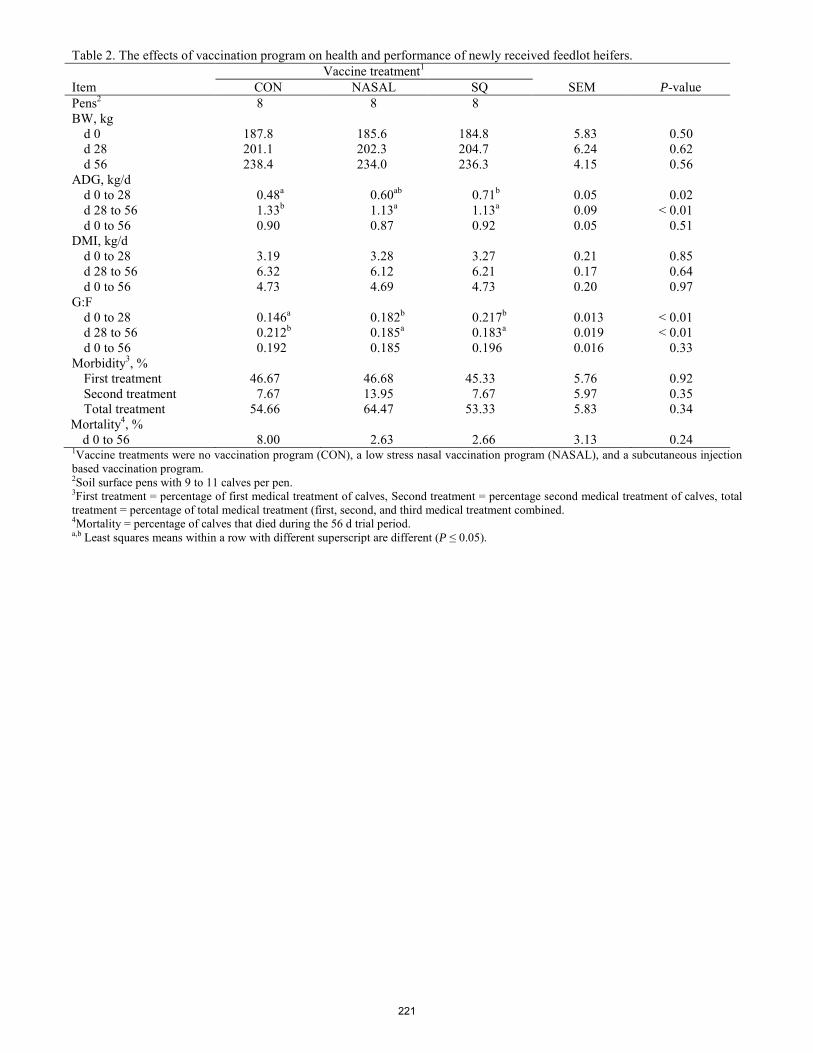
Table 2. The effects of vaccination program on health and performance of newly received feedlot heifers. Vaccine treatment1 Item CON NASAL SQ SEM P-value Pens2 8 8 8 BW, kg
d 0 187.8 185.6 184.8 5.83 0.50 d 28 201.1 202.3 204.7 6.24 0.62 d 56 238.4 234.0 236.3 4.15 0.56
ADG, kg/d d 0 to 28 0.48a 0.60ab 0.71b 0.05 0.02 d 28 to 56 1.33b 1.13a 1.13a 0.09 < 0.01 d 0 to 56 0.90 0.87 0.92 0.05 0.51
DMI, kg/d d 0 to 28 3.19 3.28 3.27 0.21 0.85 d 28 to 56 6.32 6.12 6.21 0.17 0.64 d 0 to 56 4.73 4.69 4.73 0.20 0.97
G:F d 0 to 28 0.146a 0.182b 0.217b 0.013 < 0.01 d 28 to 56 0.212b 0.185a 0.183a 0.019 < 0.01 d 0 to 56 0.192 0.185 0.196 0.016 0.33
Morbidity3, % First treatment 46.67 46.68 45.33 5.76 0.92 Second treatment 7.67 13.95 7.67 5.97 0.35 Total treatment 54.66 64.47 53.33 5.83 0.34
Mortality4, % d 0 to 56 8.00 2.63 2.66 3.13 0.24
1Vaccine treatments were no vaccination program (CON), a low stress nasal vaccination program (NASAL), and a subcutaneous injection based vaccination program. 2Soil surface pens with 9 to 11 calves per pen. 3First treatment = percentage of first medical treatment of calves, Second treatment = percentage second medical treatment of calves, total treatment = percentage of total medical treatment (first, second, and third medical treatment combined. 4Mortality = percentage of calves that died during the 56 d trial period. a,b Least squares means within a row with different superscript are different (P ≤ 0.05).
221
Proceedings, Western Section, American Society of Animal Science
Vol. 66, 2015
Intake and grazing activity of mature range cows on Arizona rangelands
C. W. Knight, D. W. Bailey,* D. Faulkner, and D. W. Schafer School of Animal and Comparative Biomedical Sciences, University of Arizona, Tucson 85721; * Department of Animal and Range Sciences, New
Mexico State University, Las Cruces 88003
ABSTRACT: Our objective was to characterize mature range cows based on intake and grazing activity. Starting in the early spring of 2013, 4 experiments were conducted. First, mature range cows (n = 137) were fitted with radio frequency identification tags (RFID) and placed in a dry-lot pen equipped with GrowSafe® technology to monitor DMI of alfalfa hay. These data were then used to assign cows a RFI value utilizing the National Research Council (1996) model to predict intake of beef cattle. Cattle with negative and positive RFI were characterized as low-intake and high-intake, respectively. In addition, the following data were also recorded: weight (kg), age (mo), days pregnant (d), and body condition score (BCS). Second, 30 mature range cattle were selected from the first trial and fitted with pedometers for 7 d to monitor activity with step counts and estimated distance traveled. Third, mature range cows (n = 19) selected from the first trial were fitted with global position system (GPS) collars, and placed on pinyon-juniper rangeland from 20 June 2014 to 19 August 2014. Forth, mature range cows (n = 28) were fitted with GPS collars, and placed on ponderosa pine rangeland from 17 September 2014 to 15 October 2014. Distance traveled, slope, distance from water, elevation data were collected from both GPS trials. Low-intake and high-intake cows consumed 9.3 and 12.2 kg/d, respectively (P <0.0001). Low-intake cattle became pregnant sooner (P =0.002) than high-intake cattle (average of 16 d sooner). Cattle age (mo) equaled 90 and 98 for low- and high-intake cows, respectively (P = 0.04). Weight, predicted DMI, and BCS did not differ between groups (P > 0.06). Step counts for low- and high-intake animals were 5839 and 5383±2089, respectively (P = 0.61), and estimated distance traveled was 5.35 and 4.31±1.66 km/d for low- and high-intake animals, respectively (P = 0.77). Low-intake cows (6.234km/d) traveled farther (P = 0.005) each day than high-intake cows (5.84 km/d) on pinyon-juniper rangelands, and high-intake cows utilized (P = 0.013) steeper slopes. No differences were detected (P ≥ 0.06) for distance traveled, distance from water, and elevation for cows grazing ponderosa pine rangeland). However, low-intake cattle preferred (P = 0.046) steeper slopes on ponderosa pine rangeland than high-intake cattle. These results indicate that low-intake animals may travel farther on some rangelands and rebreed earlier. Key Words: ADG, beef steers, genetic potential, implants, management, marbling ______________________ Authors would like to thank Keith G. and Keith O. Cannon, University of Arizona V Bar V Ranch, as well as, Ashley D. Wright and Sophia Leone, School of Animal and Comparative
Biomedical Sciences, University of Arizona for their assistance with this project
INTRODUCTION
Cow intake, on average, relates to cow size, physiological state, milk production, and cow age (NRC, Beef Cattle Requirements, 2005), but cattle express a large individual variation in intake. Koch et al. (1963) suggested a method to identify individuals that consumed more/less than expected called residual feed intake (RFI), or the difference between expected feed intake and actual feed intake. Carstens and Kerley (2009) state that RFI is phenotypically independent of production traits used to calculate intake, meaning cattle of various types and production levels can be compared. For example, Arthur et al. (2001) demonstrated that calves from parents selected for RFI differed significantly in feed intake, but were similar in body weight (BW) and production, suggesting that selecting for negative RFI could result in lower feed costs without affecting the level of production. In contrast, feed conversion ratios, such as feed:gain, are positively correlated with growth rate, increased body size, increased leaness, increased organ weights, increased heat increment, and decreased digestibility (Herd and Bishop, 2000).
Herd et al. (2004) concluded that relative feed intake is related to intake, digestion, metabolism, activity, and thermoregulation. They also proposed that approximately 10% of variation in RFI is due to physical activity in growing cattle, which can be measured using pedometers. Additionally, activity in laying hens selected for RFI has been shown to account for 29 to 54% of their total energy expenditures (Luiting et. al., 2001). Carstens and Kerley (2009) suggest these studies could merit utilizing feeding behaviors as indicator traits for RFI.
Cow intake has been estimated to be as high as 75% or more of a commercial beef cattle herd’s total feed consumption (Archer et. al, 1999). However, according to Herd and Pitchford (2011) most research is focused on growing animals, steers in particular. The objective of this study was to compare weights, BCS, breeding dates and grazing behavior of low- and high-intake cows.
MATERIALS AND METHODS
Beginning in the spring of 2013, 137 multiparous-mature cows (≥ 60 mo) born and raised on the University of Arizona’s V Bar V ranch in Rimrock, AZ were fitted with RFID and placed in a drylot equipped with Growsafe® technology. Cattle were fed alfalfa hay and intake data were recorded for at least 10 d. Hay samples were analyzed at Servi-tech Laboratories in Dodge City, KS for forage quality. In addition, weight (kg), age (mo), days pregnant (d), and body condition
222
score (BCS) data were recorded. The NRC (1996) model was then used to calculate RFI values for cows. Cattle with negative and positive RFI were characterized as low-intake and high-intake, respectively.
After RFI data were collected, cows were returned to their normal rangeland conditions. In summer 2013, all ranch cows were gathered, and synchronized for artificial insemination utilizing Eazi-Breed CIDRs® (Zoetis). While animals were worked through the chute, 15 high- and 15 low-intake cattle were fitted with Omron HJ-113® pedometers (Omron Healthcare, Inc. Vernon Hills, Il.). Pedometers were attached to the cows behind the front left shoulder utilizing Heatwatch II® estrus detection pouches (Cow Chips, LLC. Manalapan, NJ). These pedometers have the capability to store daily data for 7 consecutive days, as well as, estimate distance traveled when individual stride length is programmed into the unit. Cows were then released back on a rangeland pasture for 7 d. Attaching pedometers to animals during CIDR synchronization helps eliminate increased variation in step counts due to estrous behavior. Days animals were driven to and from the chute were not used to estimate distance traveled (km/d). Data from 24 of the 30 pedometers equipped were recovered. Six pedometers failed due to loss or pedometer malfunction.
On 20 June 2014, low-intake (n = 14) and high-intake (n = 12) cows were fitted with LOTEK® 3300 GPS collars for 60 d on pinyon-juniper rangeland. Cow location, slope, distance to water, and elevation were recorded every 10 min.
On 17 September 2014, an additional 10 high- and 9 low-intake cows were fitted with modified igotU GT-120® GPS logging collars. Cattle were then placed on ponderosa pine rangeland for 28 d. Location, slope, distance from water, and elevation were recorded every 10 min. Data were recovered from 25 of the 28 GPS collars due to loss and damage.
Latitude and longitude coordinates were converted to the Universal Transverse Mercator coordinate system to facilitate calculation of distance traveled. Elevation, slope, and distance from water data were calculated utilizing spatial analyst tools in the mapping program ArcGIS® (v. 10.2.2, Esri). Statistical Analysis
Data were analyzed as a completely random design with
RFI (low or high) as a fixed effect using the GLM procedure of SAS (v. 9.4, SAS Inst. Inc., Cary, NY). Cow served as the experimental unit. All tracking data were summarized daily for each cow, which provided the average distance traveled per day and daily elevation use, slope use and distance cows were from water. Data were analyzed using the repeated measures procedures of PROC MIXED (SAS Version 9.4, Cary, NC). Intake (low or high) was used as a fixed effect, and Julian day was used as a covariate. Linear, quadratic and cubic responses to Julian day were evaluated. The subject was the cow, and the autoregressive order 1 structure was used to model the covariance of repeated records (Littell et al., 2006). We also evaluated the interactions of intake with the linear, quadratic and cubic functions of Julian day. The interactions of intake with Julian day were not significant (P > 0.05) for any of the dependent variables, and for brevity these results are not presented.
RESULTS AND DISCUSSION
Of the 137 matures cows tested for intake, 37% were characterized as low-intake with the remaining 63% characterized as high-intake. No differences in predicted DMI intake were detected (P = 0.86) between low-intake and high-intake cows. However, actual DMI for high-intake cows (12.2 kg/d) was greater (P < 0.001) and differed from low-intake cows (9.32 kg/d). High- and low-intake cattle had mean RFI scores of +1.66 and -1.23, respectively (P < 0.001). No differences in cow weight were detected between groups (P = 0.21). Low- and high-intake cattle weighed 494 and 506 kg, respectively. Also, no differences in BCS were detected (P = 0.06) between low- (5.2 BCS) and high-take cattle (5.4 BCS). In addition, low-intake cows (217.5 days pregnant) became pregnant sooner (P = 0.0002) than high-intake cows, (201 days pregnant), indicating that low-intake cattle rebred 16d earlier than high-intake cattle. The average age of high-intake cattle was 98 mo while low-intake cattle were 90 mo (P = 0.041). However, the correlation between cow age (mo) and RFI was low (R2 = 0.076). Carstens and Kerley (2009) and Herd and Arthur (2008) both state that RFI is phenotypically independent of production characteristics used to calculate RFI, and this study is consistent with their assessment.
Physical Activity Measured with Pedometer
No differences in physical activity as measured with
pedometers were detected (P = 0.61) between low- and high-intake animals (5839 and 5383 steps/d, respectively). Estimated distance traveled for low- and high-intake cows were 5.35 and 4.31 km/d, respectively (P = 0.72). However, more numbers may have been needed to detect differences. This trial served as a pilot study to trials conducted with more expensive GPS technology. Connor et al. (2013) reported a positive correlation between pedometer readings and RFI in dairy cattle.
Physical Activity Measured with GPS
Physical activity measured with GPS on pinyon-juniper
rangeland is presented in Table 1. Differences in distance from water (P = 0.24) and elevation (P = 0.13) were not detected. Low-intake traveled 0.50 km further per day than high-intake cattle (P = 0.005), and high-intake cattle utilized (P = 0.013) steeper slopes.
Physical activity measured with GPS on ponderosa pine rangeland is presented in Table 1. Low-intake cattle spent (P = 0.046) more time on steeper slopes than high-intake cattle. Differences in distance from water (P = 0.41) and distance traveled (P = 0.8432) were not detected. Elevation differences between cattle approached significance (P = 0.057) showing a trend that low-intake cattle utilized slightly higher elevations.
The pinyon-juniper rangelands located on the V Bar V have more varied and challenging topography than the ponderosa pine rangelands. Also, the pinyon-juniper rangelands had less available forage. Average elevation for low- and high-intake cattle was not expected to differ for cattle placed on ponderosa pine rangeland because pasture elevation did not differ drastically. Distance traveled only differed significantly
223
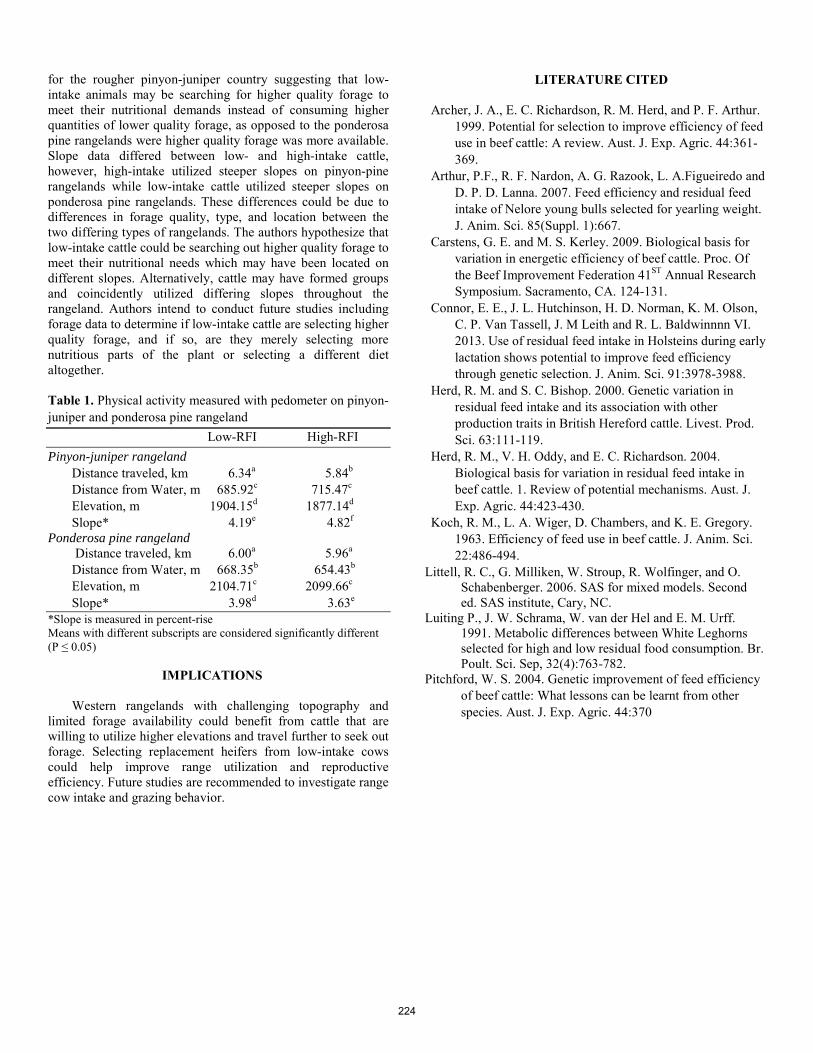
for the rougher pinyon-juniper country suggesting that low-intake animals may be searching for higher quality forage to meet their nutritional demands instead of consuming higher quantities of lower quality forage, as opposed to the ponderosa pine rangelands were higher quality forage was more available. Slope data differed between low- and high-intake cattle, however, high-intake utilized steeper slopes on pinyon-pine rangelands while low-intake cattle utilized steeper slopes on ponderosa pine rangelands. These differences could be due to differences in forage quality, type, and location between the two differing types of rangelands. The authors hypothesize that low-intake cattle could be searching out higher quality forage to meet their nutritional needs which may have been located on different slopes. Alternatively, cattle may have formed groups and coincidently utilized differing slopes throughout the rangeland. Authors intend to conduct future studies including forage data to determine if low-intake cattle are selecting higher quality forage, and if so, are they merely selecting more nutritious parts of the plant or selecting a different diet altogether. Table 1. Physical activity measured with pedometer on pinyon-juniper and ponderosa pine rangeland Low-RFI High-RFI Pinyon-juniper rangeland Distance traveled, km 6.34a 5.84b Distance from Water, m 685.92c 715.47c Elevation, m 1904.15d 1877.14d Slope* 4.19e 4.82f Ponderosa pine rangeland Distance traveled, km 6.00a 5.96a Distance from Water, m 668.35b 654.43b Elevation, m 2104.71c 2099.66c Slope* 3.98d 3.63e *Slope is measured in percent-rise Means with different subscripts are considered significantly different (P ≤ 0.05)
IMPLICATIONS
Western rangelands with challenging topography and limited forage availability could benefit from cattle that are willing to utilize higher elevations and travel further to seek out forage. Selecting replacement heifers from low-intake cows could help improve range utilization and reproductive efficiency. Future studies are recommended to investigate range cow intake and grazing behavior.
LITERATURE CITED
Archer, J. A., E. C. Richardson, R. M. Herd, and P. F. Arthur. 1999. Potential for selection to improve efficiency of feed use in beef cattle: A review. Aust. J. Exp. Agric. 44:361-369.
Arthur, P.F., R. F. Nardon, A. G. Razook, L. A.Figueiredo and D. P. D. Lanna. 2007. Feed efficiency and residual feed intake of Nelore young bulls selected for yearling weight. J. Anim. Sci. 85(Suppl. 1):667.
Carstens, G. E. and M. S. Kerley. 2009. Biological basis for variation in energetic efficiency of beef cattle. Proc. Of the Beef Improvement Federation 41ST Annual Research Symposium. Sacramento, CA. 124-131.
Connor, E. E., J. L. Hutchinson, H. D. Norman, K. M. Olson, C. P. Van Tassell, J. M Leith and R. L. Baldwinnnn VI. 2013. Use of residual feed intake in Holsteins during early lactation shows potential to improve feed efficiency through genetic selection. J. Anim. Sci. 91:3978-3988.
Herd, R. M. and S. C. Bishop. 2000. Genetic variation in residual feed intake and its association with other production traits in British Hereford cattle. Livest. Prod. Sci. 63:111-119.
Herd, R. M., V. H. Oddy, and E. C. Richardson. 2004. Biological basis for variation in residual feed intake in beef cattle. 1. Review of potential mechanisms. Aust. J. Exp. Agric. 44:423-430.
Koch, R. M., L. A. Wiger, D. Chambers, and K. E. Gregory. 1963. Efficiency of feed use in beef cattle. J. Anim. Sci. 22:486-494.
Littell, R. C., G. Milliken, W. Stroup, R. Wolfinger, and O. Schabenberger. 2006. SAS for mixed models. Second ed. SAS institute, Cary, NC.
Luiting P., J. W. Schrama, W. van der Hel and E. M. Urff. 1991. Metabolic differences between White Leghorns selected for high and low residual food consumption. Br. Poult. Sci. Sep, 32(4):763-782.
Pitchford, W. S. 2004. Genetic improvement of feed efficiency of beef cattle: What lessons can be learnt from other species. Aust. J. Exp. Agric. 44:370
224
Proceedings, Western Section, American Society of Animal Science
Vol. 66, 2015
The effect of dry-rolled corn particle size on feed efficiency in feedlot finishing diets containing wet distiller’s grains
E. F. Schwandt*, D. U. Thomson, † S. J. Bartle, † T. E. Engle,‡ J. J. Wagner, ‡ and C. D. Reinhardt*
*Department of Animal Sciences & Industry, Kansas State University, Manhattan, KS, USA †Department of Clinical Sciences, College of Veterinary Medicine, Kansas State University, Manhattan, KS, USA
‡ Department of Animal Sciences, Colorado State University, Fort Collins, CO, USA
ABSTRACT: Three hundred sixty cross-bred yearling steers (initial BW = 395 ± 33.1 kg) were used to evaluate the effects of dry-rolled corn (DRC) particle size in diets containing 20 % (DMB) wet distiller’s grains plus solubles (WDGS) on ADG and feed efficiency, carcass characteristics, and fecal starch content. Steers were utilized in a randomized complete block design and allocated to 36 pens (9 pens/treatment; 10 animals/pen). Treatments were Coarse DRC (4,882 µm; COARSE), Medium DRC (3,760 µm; MEDIUM), Fine DRC (2,359 µm; FINE), and Steam-flaked corn (SFC). Final BW and ADG were not affected by treatment. Dry matter intake and G:F increased (P < 0.05) for steers fed DRC vs. SFC. There was a linear effect (P < 0.05) of decreasing particle size with decreasing DMI in the final 5 weeks on feed. Fecal starch decreased (P < 0.01) as DRC particle size decreased. In situ starch disappearance was lower for the DRC vs SFC treatments (P < 0.05) and increased linearly (P < 0.05) with decreasing particle size at 8h and 24h. Reducing DRC particle size did not influence growth performance but reduced fecal starch and influenced DMI of cattle on finishing diets.
Key words: dry rolled corn, fecal starch, feedlot, particle size
INTRODUCTION
Dry rolling corn is a common practice in feedlots located in the Midwestern and Northern Plains regions of the U.S. Optimizing total tract starch utilization in diets containing dry rolled corn (DRC) is essential for maximizing efficiency. However, recommendations often suggest that grain be coarsely cracked to refrain from producing an excessive amount of fine material that could potentially increase the rate of fermentation, reduce rumen pH, and cause digestive disturbances (Owens et al., 1998).
In a survey conducted by Schwandt et al. (unpublished data) evaluating current practices of DRC processing in feedlots located in the Midwestern region of the U.S. (n = 31). The average geometric mean diameter (Dgw) of DRC across all feedyards was 4,534 µm.
Corrigan et al. (2009) reported that the inclusion of wet distiller’s grains in finishing diets may influence the optimal grain processing method. Loe et al. (2006) examined degree of processing for DRC in diets containing 50% as wet corn gluten feed (WCGF). Degree of processing had no impact on feedlot performance but carcass fat depth and yield grades were increased for finely (1,900 µm) rolled as compared with coarsely (3,200 µm) rolled grain.
The objective of this study was to evaluate the effect of DRC particle sizes compared to SFC on animal performance and carcass traits in feedlot finishing diets containing 20% wet distiller’s grains on a dry matter basis.
MATERIALS AND METHODS
The study was conducted in accordance with a protocol approved by Colorado State University Institutional Animal Care and Use Committee (14-5091A).
Animals. Upon arrival at the feedlot, cross-bred steers (n = 360; initial BW = 395 ± 33.1 kg) were vaccinated for viral (Bovi-Shield Gold, IBR-BVD, Zoetis Animal Health) and clostridial (Ultra Choice 7, Bacterin-Toxoid, Zoetis Animal Health) diseases and treated for parasites (Noromectin, Injectable Ivermectin; Norbrook Laboratories Limited and Safe-Guard, Fenbendazole; Merck Animal Health). Steers were implanted with Revalor XS (40 mg estradiol and 200 mg of trenbolone acetate; Merck Animal Health) administered in the right ear and were not re-
225

implanted prior to slaughter. The study was conducted as randomized block design using 9 replicates per treatment with 10 steers per pen. Dietary treatments were Coarse DRC (4,882 µm; COARSE), Medium DRC (3,760 µm; MEDIUM), Fine DRC (2,359 µm; FINE), and Steam-flaked corn ( 0.35 kg/L; SFC). All diets contained 20% wet distiller’s grains and were formulated to meet or exceed National Research Council (2000) requirements for growing-finishing beef cattle.
Diets. Steers were adjusted to the finishing diets using a series of 4 diets (Starter, Step 1, Step 2, and Finisher). Steam-flaked corn was used in the starter and step-up diets and all diet changes during the step-up program were simultaneous for all treatments. Cattle reached the finisher diet by d 24 post-arrival. Complete mixed diet and feed ingredient samples were collected weekly for DM and nutrient content determination. The finishing diet (Table 1) consisted of target diet nutrient concentrations of: 16% CP; 3% CP from NPN; 4.5% NDF from diet corn silage; 0.72% Ca; and 90 mg supplemental Zn, 20 mg supplemental Cu, and 75 mg supplemental Mn per kg DM. Rumensin and Tylan were included in all diets. Target Rumensin dosage was 22.2, 22.2, 33.3 and 44.4 g/ton (DMB) in the Starter, Step-1, Step-2, and Finisher diets, respectively. Optaflexx was fed to all treatments the final 29 d in the feedlot at 27.3 g/ton DM basis, providing approximately 300 mg•hd-1•d-1.
Table 1. Composition of finish diet to evaluate the effect of dry-rolled corn particle size in yearling steers fed diets containing 20% wet distiller’s grains (DMB).
Ingredient composition % DM Wet distiller’s grains 19.99 Corn 64.90 Corn silage 8.75 Liquid supplement 6.36
Corn Processing. A common corn supply was used for the DRC treatments. Dry-rolled corn was processed once weekly at the Agriculture Research Development & Education Center (ARDEC; Fort Collins, CO) using an electric powered single stage roller mill (R & R Machine Works, Dalhart, TX) with 2, 25.4 x 50.8 cm rolls with 20.3 corrugations per cm. Corn processed for the COARSE and MEDIUM treatments were passed through dial settings 8 and 9.5, respectively. Corn processed for the FINE treatment was initially processed using the MEDIUM setting then and returned through the roller mill to achieve the FINE particle size.
Particle size analysis was conducted on weekly DRC samples at the Kansas State University Feed Technology Innovation Center (Manhattan, KS) for particle size
distribution using a Ro-Tap Sieve Shaker (W.S. Tyler, Mentor, OH). Particle size analysis was determined using the ANSI/ASAE (2008). Particle size for COARSE, MEDIUM, and FINE DRC samples are shown in Table 2. Table 2. Least squares means illustrating the effect of dry-rolled corn particle size in yearling steers fed diets containing 20% wet distiller’s grains (DMB). Treatment Item Coarse Medium Fine SEM1 Prob. > F Dgw
2 4,882 3,760 2,359 127.6 < 0.01
Sgw3 1.54 1.72 2.00 0.053 < 0.01
1 Standard error of the least squares mean. 2 Dgw: geometric mean diameter (µm) 3 Sgw: standard deviation of the geometric mean diameter
Fecal Starch. Fecal starch was evaluated on day 63, 98, and 119 from the treatment start date. Approximately 300 g of freshly voided feces was collected from 6 individual steers per pen for all pens in the study. Samples were composited by pen within each sampling date and frozen. Fecal samples were analyzed for fecal starch content at the Kansas State University Ruminant Nutrition Laboratory using Technicon Industrial Method #SE3-0036FJ4.
In Situ. One g of SFC, COARSE, MEDIUM, and FINE corn samples were each placed into Dacron bags. Four bags per time period (0, 2, 4, 8, 12, and 24 h) per steer (n = 2) were suspended in the rumen. Corn dry matter disappearance was evaluated by measuring initial and final dry corn sample weights. Corn samples were analyzed for starch disappearance at the Kansas State University Ruminant Nutrition Laboratory using Technicon Industrial Method #SE3-0036FJ4.
Data Analysis. Dry-rolled corn particle size, fecal starch, feedlot performance and continuous carcass data were analyzed on a pen mean basis as a randomized complete block design using PROC MIXED of SAS (SAS Institute, Inc., Cary, NC). Factors included in the model as a fixed class variable included treatment (TRT). Weight block pen replicate (REP) was included in the model as a random effect. Average daily DMI for each week was evaluated using mixed model procedures. Class fixed effects included in the model were TRT, week, and TRT*week and REP was included in the model as a random class effect. Quality grade, yield grade, and liver abscess data were evaluated as categorical data using PROC GLIMMIX of SAS assuming a binomial distribution. The Link = Logit option of the model statement and the ILINK option of the LSMEANS statement was used to calculate the likelihood ± SEM that an individual within each pen qualified for a specific category. Significance was determined at P ≤ 0.05. Pen initial weight was used as a covariant in the analysis when the covariant effect was
226

significant, P ≤ 0.10. Treatment means were separated using orthogonal contrasts if the effect for TRT approached significance. Contrasts of interest were SFC vs. DRC and the linear and quadratic effects among the DRC treatments.
RESULTS AND DISCUSSION
Feedlot Performance. Least squares means showing the effect of DRC particle size on feedlot performance are shown in Table 4. At the initiation of the treatment diets BW tended (P = 0.06) to be lighter for the COARSE treatment as compared with the MEDIUM, FINE, and SFC treatments. Reasons for this result are unknown but likely due to random chance. Average daily gain (ADG) was similar (P > 0.10) for all treatments. There was a tendency (P = 0.11) for treatment to influence DMI and upon closer evaluation during the final 5 wk DMI was reduced (P = 0.02) for SFC vs the DRC treatments. This reduction in DMI resulted in (P < 0.01) improvements in gain efficiency and NE recovery (approximately 7.5% for NEg) for the SFC vs. DRC treatments. Performance differences among the DRC treatments were non-significant (P > 0.10).
The treatment-by-week interaction was significant (P < 0.05) indicating the effect of treatment on DMI depended upon which weeks of the study were considered. Intake was reduced for the SFC compared with the DRC treatments throughout most of the study. In addition, over the final 5 wk of the study, there was a linear decrease in DMI (P < 0.01) with decreasing DRC particle size.
Fecal starch was lower (P < 0.01) for the SFC vs. DRC treatments. There was a linear decrease in fecal starch with decreasing particle size (P < 0.01). Reduced fecal starch likely indicates greater starch digestion for SFC as compared with DRC. Reductions in fecal starch as particle size decreased for the DRC treatments indicates that starch digestion is also likely improved as DRC particle size is reduced.
Carcass Merit. No differences (P > 0.10) among treatments were observed for any of the carcass traits measured suggesting that corn processing method did not impact carcass merit in yearling steers fed diets containing 20% WDGS.
Figure 1. Dry matter intake on the effect of dry-rolled corn particle size on feedlot performance in yearling steers fed diets containing 20% wet distiller’s grains (DMB). Orthogonal contrasts: DRC vs. SFC (P < 0.01); DRC particle size linear (P < 0.01) from weeks 16 through 20.
Figure 2. Least squares means of in situ DM and starch disappearance of COARSE, MEDIUM, FINE DRC, and SFC from 0 to 24 h. Orthogonal Contrasts (2B): *DRC vs. SFC (P < 0.05); †DRC particle size linear (P < 0.05)
6789
1011121314
2 4 6 8 10 12 14 16 18 20
DM
I, kg
CoarseMediumFineSFC
-10
0
10
20
30
40
50
60
70
80
0 2 4 8 12 24
DM
Dis
appe
aran
ce, %
Coarse
Medium
Fine
SFC
Time, h
-10
0
10
20
30
40
50
60
70
80
0 2 4 8 12 24
Star
ch D
isapp
eara
nce,
%
CoarseMediumFineSFC
* †
*
*
*
* †
Time, h
(2A)
Week
(2B)
227
In Situ. Corn dry matter disappearance was greatest for SFC followed by FINE, MEDIUM, and COARSE DRC (Figure 2A). Starch disappearance was lower for the DRC vs SFC treatments (P < 0.05) and increased linearly (P < 0.05) with decreasing particle size at 8h and 24h (Figure 2B).
IMPLICATIONS
Reduced DMI and improved GF (6.9%) for the SFC vs DRC treatments suggests that the cost of steam flaking remains a viable investment for many cattle feeders. The treatment-by-week interaction for DMI suggest that there was mild acidosis after several weeks of exposure associated with more finely processed corn, or the greater digestibility of the finely processed corn led to marginally greater positive energy balance and negative feedback inhibition on DMI. Unfortunately, monthly BW was not measured for this study; thus GF and NE recovery during the final 5 weeks of the study cannot be computed. However, if ADG was similar among the treatments at 1.81 kg•hd-1•d-1during this time, GF may have been improved by 4.3% as particle size decreased from 4,882 to 3,760 µm and improved an additional 2.3% as particle size decreased
from 3,760 to 2,359 µm; however, this can only be speculation.
LITERATURE CITED
Corrigan, M. E., G. E. Erickson, T. J. Klopfenstein, M. K. Luebbe, K. J. Vander Pol, N. F. Meyer, C. D. Buckner, S. J. Vanness, and K. J. Hanford. 2009. Effect of corn processing method and corn wet distillers grains plus solubles inclusion level in finishing steers. J. Anim. Sci. 87:3351-3362.
Loe, E. R., M. L. Bauer, and G. P. Lardy. 2006. Grain source and processing in diets containing varying concentrations of wet corn gluten feed for finishing cattle. J. Anim. Sci. 84:986-996.
Owens, F. N., D. S. Secrist, W. J. Hill, and D. R. Gill. 1998. Acidosis in cattle: A review. J. Anim. Sci. 76:275-286.
NRC. 2000. Nutrient Requirements of Beef Cattle: 7th Rev. Edition: Update 2000. Natl. Acad. Press, Washington, D.C.
228
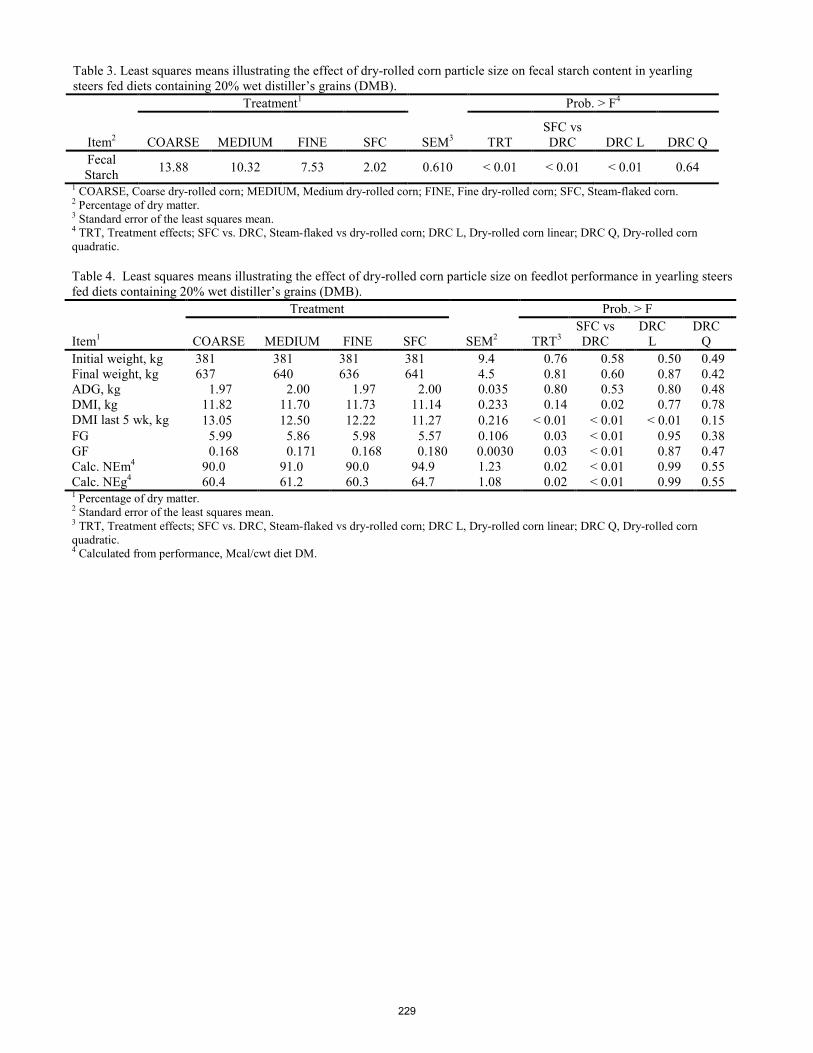
Table 3. Least squares means illustrating the effect of dry-rolled corn particle size on fecal starch content in yearling steers fed diets containing 20% wet distiller’s grains (DMB).
Treatment1 Prob. > F4
Item2 COARSE MEDIUM FINE SFC SEM3 TRT SFC vs DRC DRC L DRC Q
Fecal Starch 13.88 10.32 7.53 2.02 0.610 < 0.01 < 0.01 < 0.01 0.64
1 COARSE, Coarse dry-rolled corn; MEDIUM, Medium dry-rolled corn; FINE, Fine dry-rolled corn; SFC, Steam-flaked corn. 2 Percentage of dry matter. 3 Standard error of the least squares mean. 4 TRT, Treatment effects; SFC vs. DRC, Steam-flaked vs dry-rolled corn; DRC L, Dry-rolled corn linear; DRC Q, Dry-rolled corn quadratic. Table 4. Least squares means illustrating the effect of dry-rolled corn particle size on feedlot performance in yearling steers fed diets containing 20% wet distiller’s grains (DMB). Treatment Prob. > F Item1
COARSE
MEDIUM
FINE
SFC
SEM2
TRT3
SFC vs DRC
DRC L
DRC Q
Initial weight, kg 381 381 381 381 9.4 0.76 0.58 0.50 0.49 Final weight, kg 637 640 636 641 4.5 0.81 0.60 0.87 0.42 ADG, kg 1.97 2.00 1.97 2.00 0.035 0.80 0.53 0.80 0.48 DMI, kg 11.82 11.70 11.73 11.14 0.233 0.14 0.02 0.77 0.78 DMI last 5 wk, kg 13.05 12.50 12.22 11.27 0.216 < 0.01 < 0.01 < 0.01 0.15 FG 5.99 5.86 5.98 5.57 0.106 0.03 < 0.01 0.95 0.38 GF 0.168 0.171 0.168 0.180 0.0030 0.03 < 0.01 0.87 0.47 Calc. NEm4 90.0 91.0 90.0 94.9 1.23 0.02 < 0.01 0.99 0.55 Calc. NEg4 60.4 61.2 60.3 64.7 1.08 0.02 < 0.01 0.99 0.55 1 Percentage of dry matter. 2 Standard error of the least squares mean. 3 TRT, Treatment effects; SFC vs. DRC, Steam-flaked vs dry-rolled corn; DRC L, Dry-rolled corn linear; DRC Q, Dry-rolled corn quadratic. 4 Calculated from performance, Mcal/cwt diet DM.
229

Table 5. Least squares means illustrating the effect of dry-rolled corn particle size on carcass merit in yearling steers fed diets containing 20% wet distiller’s grains (DMB). Treatment Prob. > F
Item1 COARSE MEDIUM FINE SFC SEM2 TRT3 SFC vs DRC
DRC L
DRC Q
Hot carcass weight, kg4 419 423 420 422 3.2 0.79 0.88 0.78 0.29
Dressing percentage 65.8 66.2 66.1 65.8 0.25 0.49 0.40 0.30 0.42
Marbling score, units5 409 420 413 408 8.0 0.67 0.53 0.73 0.39
Relative marbling6 0.05 0.05 0.02 -0.14 0.125 0.66 0.25 0.86 0.95
USDA Quality grade7 10.5 10.6 10.5 10.5 0.11 0.81 0.63 0.80 0.48
12th rib fat depth, cm. 1.30 1.32 1.30 1.37 0.051 0.70 0.31 0.94 0.69
Ribeye area, sq. cm. 91.6 91.0 91.0 91.6 1.16 0.81 0.82 0.34 0.68
USDA Yield grade8 3.14 3.25 3.20 3.26 0.088 0.71 0.53 0.59 0.41
1 Least-squares treatment means unless specified otherwise. 2 Standard error of the least-squares mean. 3 TRT, Treatment effects; SFC vs. DRC, Steam-flaked vs dry-rolled corn; DRC L, Dry-rolled corn linear; DRC Q, Dry-rolled corn
quadratic. 4 Initial weight was used as a covariant in the analysis (P < 0.10). 5 Marbling score units: 400 = Small00, 500 = Modest00. 6 Relative marbling = [(Individual marbling score – Average marbling score)/Marbling standard deviation] – [(Individual yield grade –
Average yield grade)/Yield grade standard deviation]. 7 Quality grade numeric scale: 10 = Select; 11 = Low Choice, 12 = Average Choice. 8 USDA Yield grade calculated from carcass measurements.
230

Proceedings, Western Section, American Society of Animal Science
Vol. 66, 2015
Impact of maternal protein restriction in first calf heifers during mid- to late-gestation on dam and suckling calf performance through weaning1
J. J. Kincheloe2, K. C. Olson2, A. D. Blair2, K. R. Underwood3, M. Gonda3, A. A. Harty2, and R. N. Funston4
2South Dakota State University, Rapid City, SD 57702 3South Dakota State University, Brookings, SD 57007
4University of Nebraska – Lincoln, West Central Research and Extension Center, North Platte, NE 69101 ABSTRACT: Nutrient status in gestating beef cows can impact performance of the dam and offspring; however, most research is focused on a global nutrient restriction and a single gestation period. The objective of this study was to evaluate the effects of maternal protein restriction in first-calf heifers during mid- and late-gestation on dam nutrient status and performance and suckling calf performance through weaning. One hundred eight two-year-old Angus × Simmental heifers were allocated to a randomized complete block design with a 2 × 2 treatment structure. Each treatment was randomly assigned to one pen per block for a total of three pens per treatment combination, with eight to ten heifers per pen. Pens within each block were randomly assigned to CON (slightly exceeding metabolizable protein (MP) requirements) or R (providing approximately 80% of MP requirements) dietary treatments during mid- and/or late-gestation in a crossover design. Both diets were formulated to meet net energy requirements. Heifer BW, BCS, ultrasound body composition, blood metabolites, milk production and quality, calving data, and calf weaning weights were measured. There was an interaction for mid-gestation treatment × period of gestation for changes in BW and BCS during mid-gestation, with heifers on the R treatment losing 4-fold more BW than CON heifers (P = 0.002). Mid-gestation treatment did not affect BW or BCS change during late gestation (P > 0.05). In a late gestation treatment × period of gestation interaction, heifers restricted in late gestation gained almost half as much BW and lost BCS compared to CON heifers (P < 0.05). Metabolizable protein restriction did not affect changes in β-hydroxybutyrate, NEFA, BSA, glucose, blood urea nitrogen, or total protein serum concentrations (P > 0.05). There was a mid-gestation treatment × period of gestation interaction wherein heifers receiving the R treatment during mid-gestation lost over twice as much LM area (LMA) as CON heifers (P = 0.04). Mid-gestation treatment tended (P < 0.10) to affect change in % intramuscular fat (IMF) during late gestation, with an increase in % IMF in R vs. CON heifers. In a late-gestation treatment × period of gestation interaction, MP restriction in late gestation increased loss of LMA in R vs. CON heifers (P = 0.03). There was no change in 12th rib subcutaneous fat thickness (P > 0.05). Dietary treatment did not affect calf birth BW, milk production, or calf weaning BW (P > 0.05). Key words: Beef cattle, MP restriction, calf performance
INTRODUCTION
Research has indicated that the nutrient status of gestating beef cows can have various long-term implications on growth, feed intake and efficiency, and performance of offspring (Funston et al., 2012). While there appears to be a relationship between the developmental status of the fetus at the time of a nutrient deficiency and its effect on postnatal responses (Freetly et al., 2000; Morrison, et al., 1999; Wiley et al., 1991), most of the research is limited to a single period of development (e.g. early or late gestation) and involves a global nutrient restriction. To our knowledge, there are no studies that have investigated the effects of an individual nutrient deficiency such as protein across mid- and late gestation.
While the primary goal of research examining maternal nutrient levels during gestation is to evaluate lifetime performance of offspring, particularly post-weaning, the impact of a gestational nutrient restriction on performance of the dam and postnatal calf is also important. Therefore, the objective of this study was to evaluate the effect of maternal protein restriction from mid- to late- gestation in first-calf heifers on dam nutrient status and performance and suckling calf performance through weaning.
MATERIALS AND METHODS
Animals and Experimental Design. The South Dakota State University Institutional Animal Care and Use Committee approved all procedures involving animals. One hundred eight two-year-old Angus x Simmental heifers were pen-fed at the SDSU Cottonwood Range and Livestock Field Station. Heifers were synchronized and time-bred to a single sire on June 7th, 2013. Following AI, all heifers were exposed naturally to Angus bulls for 60 days. Ultrasound was conducted in mid-September to detect pregnancy and fetuses were sexed and aged. Heifers were blocked by BW as well as age and sex of the fetus at the end of the first trimester of gestation. The design resulted in three blocks, with each block containing four pens. Treatments were arranged in a 2 × 2 factorial structure with 2 levels of dietary protein provided during two stages of gestation (mid- and late-). Dietary protein levels included: control (CON; slightly exceeding MP requirements) and restricted (R; approximately 80% of MP requirements supplied based on NRC Level 2 (2000), Table 1). NRC (2000) requirements for NEm and NEg were met in both dietary treatments, and diets were formulated to be isocaloric.
1 Research supported by the South Dakota Beef Industry Council
231
Each treatment in the 2 × 2 factorial was randomly assigned to one pen per block for a total of three pen replicates per treatment combination, with eight to ten heifers per pen. At the end of mid-gestation, half of the pens on the CON treatment were reassigned to the R treatment and half of the pens on the R treatment were reassigned to the CON treatment in a crossover design. Diets were based on calcium hydroxide treated wheat straw and concentrates (Table 1). Both CON and R concentrate formulations contained ground corn, ground corn cobs, a rumen-protected fat product (Energy Booster 100, Milk Specialties Global, Eden Prairie, MN), urea, and crude glycerin. Most ingredients were chosen to be sources of energy so diets were isocaloric and met NEm and NEg requirements predicted by NRC (2000). Urea was utilized to meet bacterial N requirements and ensure that fermentation capacity would not limit energy value of the diet. The CON concentrate also contained porcine bloodmeal to slightly exceed the MP requirement. Diet formulations were adjusted throughout gestation to account for increased energy needs for the growing heifer and the developing fetus. Values provided in Table 1 represent the average of diets utilized within each gestation period.
Heifer Performance Measurements. Heifer performance data were collected at the initiation of the trial, at the time of treatment crossover, and approximately 3 weeks prior to calving. Heifer BW were recorded, and body condition scores (BCS) were determined using a 9-point scale (1 = extremely emaciated, 9 = extremely obese; Wagner et al., 1988) with observations from three trained, independent observers. Ultrasound images were recorded and analyzed to determine 12th rib subcutaneous fat thickness, percent intramuscular fat (% IMF), and longissimus muscle area (LMA) for each heifer using an Aloka 500V (Aloka, Wallingford, CT). Blood samples were collected via caudal or jugular venipuncture using 10 mL evacuated serum tubes (BD Vacutainer, Becton, Dickinson, and Company, Franklin Lakes, NJ). Blood samples were immediately placed on ice, allowed to clot, and then centrifuged at 1,500 × g for 10 minutes. Serum was decanted into 12 × 75 mm plastic tubes, capped, and immediately frozen (-20˚ C). Serum samples were subsequently shipped to the South Dakota State University Animal Disease Research and Diagnostic Laboratory and analyzed for β-hydroxybutyrate (BHB), NEFA, BSA, glucose (GLC), blood urea nitrogen (BUN), and total protein (TP) to indicate protein and energy status.
A sub-set (n = 34) of heifers from each treatment combination was randomly selected to measure milk production at d 62 ± 5 of lactation. Heifers were gathered from pasture and separated from their calves. Heifers received an IM injection of oxytocin 5 min prior to milking. A portable milking machine (Porta-Milker, The Coburn Company, Inc., Whitewater, WI) was used, followed by hand stripping until dry. Time was recorded when milking was complete and milk was discarded. Heifers remained separated from calves and the milking process was repeated approximately 4 h later. After the second milking, milk was weighed to determine production, and samples were collected and shipped to the Heart of America Dairy Herd
Improvement Association laboratory (Manhattan, KS) to be analyzed for fat, protein, somatic cell count, lactose, total solids, and milk urea nitrogen. Twenty-four hour milk yield was calculated by dividing the total weight of the second milking by time in minutes between the end of the first and second milking and multiplying by 24 hours.
Calving Data. Immediately prior to calving, heifers were removed from their respective pens and no longer received dietary treatments. Within 24 h of birth, calves were weighed and tagged, and male calves were banded using a premium castration ring plier (Neogen Corp., Lansing, MI). Calving information, cow BCS at calving, and Beef Improvement Federation (BIF) scores for calving difficulty (1= No difficulty, no assistance; 2 = Minor difficulty, some assistance (easy pull); 3 = Major difficulty, often mechanical assistance (hard pull); 4 = Caesarian section or other surgery; 5 = Abnormal presentation (i.e., breech)) and calf vigor (1= Nursed immediately, healthy; 2= Nursed on own but took time; 3= Required assistance to suckle; 4= Died shortly after birth; 5= Dead on arrival) were recorded.
Statistical Analysis. Heifer performance variables, including BW, BCS, ultrasound measures, and blood metabolites were analyzed as change in each variable during each period of gestation (e.g. final BW – initial BW). Data were analyzed as a 2 × 2 factorial treatment structure in a randomized complete block design using the MIXED procedure of SAS (SAS Institute, Cary, NC). For heifer BW, BCS, ultrasound, and blood metabolite dependent variables, period of gestation (mid or late) was also included in the model as a repeated measure, along with its interaction with dietary treatments. Pen was used as the experimental unit. Calf data were analyzed using the same model with calf sex also included.
RESULTS AND DISCUSSION
A mid-gestation treatment (CON vs. R) × period of
gestation interaction was observed for change in heifer BW (P < 0.05) and tended (P < 0.10) to affect change in BCS (Table 2). In mid-gestation, heifers on the R treatment lost over 14 kg more BW than heifers on the CON treatment (P = 0.002), despite the diets being balanced to meet energy needs. Mid-gestation treatment did not affect BW or BCS change during late gestation (Table 2), indicating that there was no carryover effect of the mid-gestation treatment into the late-gestation period. Despite equal and adequate levels of NEm and NEg based on NRC (2000) across treatments, the protein restriction reduced the capacity of the restricted heifers to maintain BW and BCS.
A late-gestation treatment (CON vs. R) × period of gestation interaction was also observed for change in heifer BW and BCS (Table 3). Surprisingly, treatment diets applied during late gestation tended (P < 0.10) to affect mid-gestation BW and BCS change, with greater mid-gestation BW and BCS loss for heifers that received the CON diet during late-gestation than heifers that received the R diet in late-gestation. These results were anomalous because late-gestation treatments had not yet been applied in mid-gestation. Although all heifers gained BW during
232
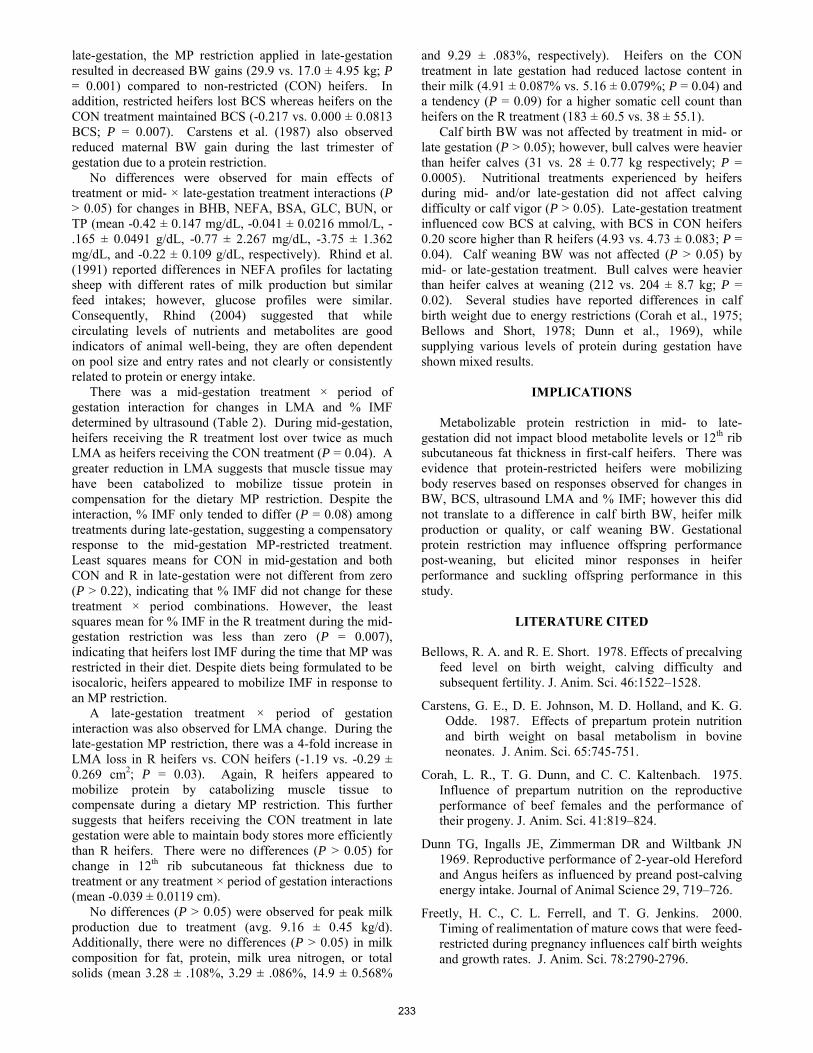
late-gestation, the MP restriction applied in late-gestation resulted in decreased BW gains (29.9 vs. 17.0 ± 4.95 kg; P = 0.001) compared to non-restricted (CON) heifers. In addition, restricted heifers lost BCS whereas heifers on the CON treatment maintained BCS (-0.217 vs. 0.000 ± 0.0813 BCS; P = 0.007). Carstens et al. (1987) also observed reduced maternal BW gain during the last trimester of gestation due to a protein restriction.
No differences were observed for main effects of treatment or mid- × late-gestation treatment interactions (P > 0.05) for changes in BHB, NEFA, BSA, GLC, BUN, or TP (mean -0.42 ± 0.147 mg/dL, -0.041 ± 0.0216 mmol/L, -.165 ± 0.0491 g/dL, -0.77 ± 2.267 mg/dL, -3.75 ± 1.362 mg/dL, and -0.22 ± 0.109 g/dL, respectively). Rhind et al. (1991) reported differences in NEFA profiles for lactating sheep with different rates of milk production but similar feed intakes; however, glucose profiles were similar. Consequently, Rhind (2004) suggested that while circulating levels of nutrients and metabolites are good indicators of animal well-being, they are often dependent on pool size and entry rates and not clearly or consistently related to protein or energy intake.
There was a mid-gestation treatment × period of gestation interaction for changes in LMA and % IMF determined by ultrasound (Table 2). During mid-gestation, heifers receiving the R treatment lost over twice as much LMA as heifers receiving the CON treatment (P = 0.04). A greater reduction in LMA suggests that muscle tissue may have been catabolized to mobilize tissue protein in compensation for the dietary MP restriction. Despite the interaction, % IMF only tended to differ (P = 0.08) among treatments during late-gestation, suggesting a compensatory response to the mid-gestation MP-restricted treatment. Least squares means for CON in mid-gestation and both CON and R in late-gestation were not different from zero (P > 0.22), indicating that % IMF did not change for these treatment × period combinations. However, the least squares mean for % IMF in the R treatment during the mid-gestation restriction was less than zero (P = 0.007), indicating that heifers lost IMF during the time that MP was restricted in their diet. Despite diets being formulated to be isocaloric, heifers appeared to mobilize IMF in response to an MP restriction.
A late-gestation treatment × period of gestation interaction was also observed for LMA change. During the late-gestation MP restriction, there was a 4-fold increase in LMA loss in R heifers vs. CON heifers (-1.19 vs. -0.29 ± 0.269 cm2; P = 0.03). Again, R heifers appeared to mobilize protein by catabolizing muscle tissue to compensate during a dietary MP restriction. This further suggests that heifers receiving the CON treatment in late gestation were able to maintain body stores more efficiently than R heifers. There were no differences (P > 0.05) for change in 12th rib subcutaneous fat thickness due to treatment or any treatment × period of gestation interactions (mean -0.039 ± 0.0119 cm).
No differences (P > 0.05) were observed for peak milk production due to treatment (avg. 9.16 ± 0.45 kg/d). Additionally, there were no differences (P > 0.05) in milk composition for fat, protein, milk urea nitrogen, or total solids (mean 3.28 ± .108%, 3.29 ± .086%, 14.9 ± 0.568%
and 9.29 ± .083%, respectively). Heifers on the CON treatment in late gestation had reduced lactose content in their milk (4.91 ± 0.087% vs. 5.16 ± 0.079%; P = 0.04) and a tendency (P = 0.09) for a higher somatic cell count than heifers on the R treatment (183 ± 60.5 vs. 38 ± 55.1).
Calf birth BW was not affected by treatment in mid- or late gestation (P > 0.05); however, bull calves were heavier than heifer calves (31 vs. 28 ± 0.77 kg respectively; P = 0.0005). Nutritional treatments experienced by heifers during mid- and/or late-gestation did not affect calving difficulty or calf vigor (P > 0.05). Late-gestation treatment influenced cow BCS at calving, with BCS in CON heifers 0.20 score higher than R heifers (4.93 vs. 4.73 ± 0.083; P = 0.04). Calf weaning BW was not affected (P > 0.05) by mid- or late-gestation treatment. Bull calves were heavier than heifer calves at weaning (212 vs. 204 ± 8.7 kg; P = 0.02). Several studies have reported differences in calf birth weight due to energy restrictions (Corah et al., 1975; Bellows and Short, 1978; Dunn et al., 1969), while supplying various levels of protein during gestation have shown mixed results.
IMPLICATIONS
Metabolizable protein restriction in mid- to late-
gestation did not impact blood metabolite levels or 12th rib subcutaneous fat thickness in first-calf heifers. There was evidence that protein-restricted heifers were mobilizing body reserves based on responses observed for changes in BW, BCS, ultrasound LMA and % IMF; however this did not translate to a difference in calf birth BW, heifer milk production or quality, or calf weaning BW. Gestational protein restriction may influence offspring performance post-weaning, but elicited minor responses in heifer performance and suckling offspring performance in this study.
LITERATURE CITED
Bellows, R. A. and R. E. Short. 1978. Effects of precalving
feed level on birth weight, calving difficulty and subsequent fertility. J. Anim. Sci. 46:1522–1528.
Carstens, G. E., D. E. Johnson, M. D. Holland, and K. G. Odde. 1987. Effects of prepartum protein nutrition and birth weight on basal metabolism in bovine neonates. J. Anim. Sci. 65:745-751.
Corah, L. R., T. G. Dunn, and C. C. Kaltenbach. 1975. Influence of prepartum nutrition on the reproductive performance of beef females and the performance of their progeny. J. Anim. Sci. 41:819–824.
Dunn TG, Ingalls JE, Zimmerman DR and Wiltbank JN 1969. Reproductive performance of 2-year-old Hereford and Angus heifers as influenced by preand post-calving energy intake. Journal of Animal Science 29, 719–726.
Freetly, H. C., C. L. Ferrell, and T. G. Jenkins. 2000. Timing of realimentation of mature cows that were feed-restricted during pregnancy influences calf birth weights and growth rates. J. Anim. Sci. 78:2790-2796.
233
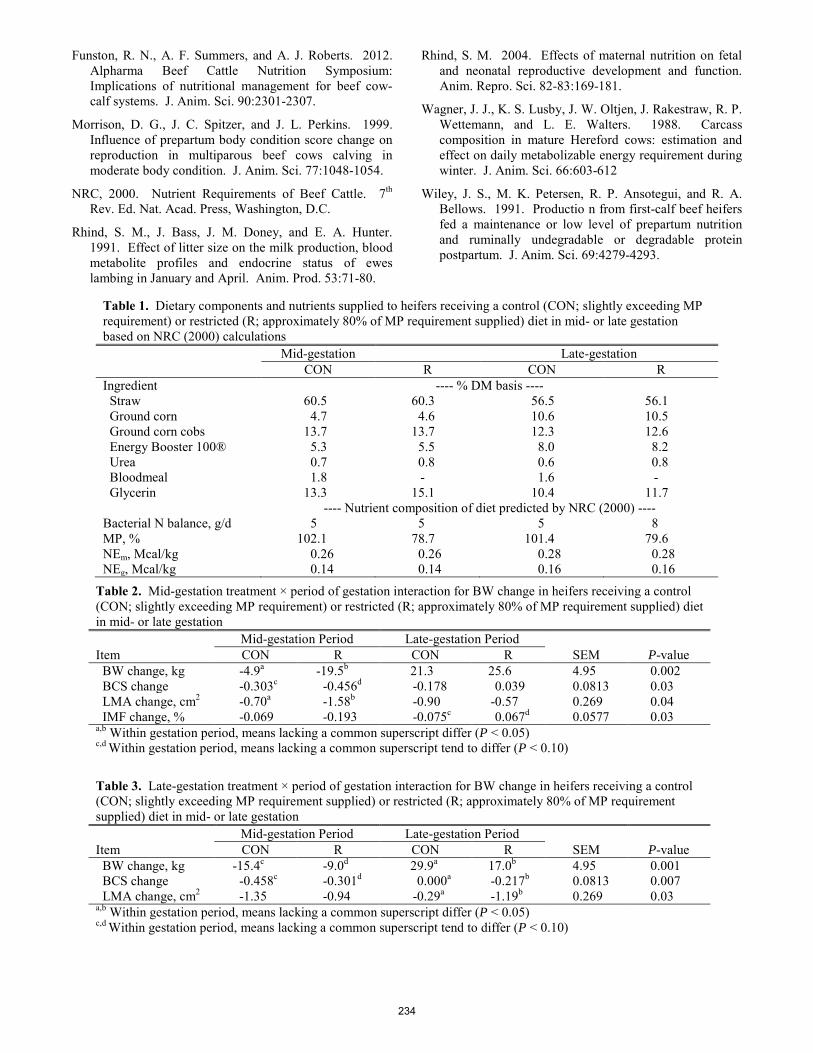
Funston, R. N., A. F. Summers, and A. J. Roberts. 2012. Alpharma Beef Cattle Nutrition Symposium: Implications of nutritional management for beef cow-calf systems. J. Anim. Sci. 90:2301-2307.
Morrison, D. G., J. C. Spitzer, and J. L. Perkins. 1999. Influence of prepartum body condition score change on reproduction in multiparous beef cows calving in moderate body condition. J. Anim. Sci. 77:1048-1054.
NRC, 2000. Nutrient Requirements of Beef Cattle. 7th Rev. Ed. Nat. Acad. Press, Washington, D.C.
Rhind, S. M., J. Bass, J. M. Doney, and E. A. Hunter. 1991. Effect of litter size on the milk production, blood metabolite profiles and endocrine status of ewes lambing in January and April. Anim. Prod. 53:71-80.
Rhind, S. M. 2004. Effects of maternal nutrition on fetal and neonatal reproductive development and function. Anim. Repro. Sci. 82-83:169-181.
Wagner, J. J., K. S. Lusby, J. W. Oltjen, J. Rakestraw, R. P. Wettemann, and L. E. Walters. 1988. Carcass composition in mature Hereford cows: estimation and effect on daily metabolizable energy requirement during winter. J. Anim. Sci. 66:603-612
Wiley, J. S., M. K. Petersen, R. P. Ansotegui, and R. A. Bellows. 1991. Productio n from first-calf beef heifers fed a maintenance or low level of prepartum nutrition and ruminally undegradable or degradable protein postpartum. J. Anim. Sci. 69:4279-4293.
Table 1. Dietary components and nutrients supplied to heifers receiving a control (CON; slightly exceeding MP requirement) or restricted (R; approximately 80% of MP requirement supplied) diet in mid- or late gestation based on NRC (2000) calculations
Mid-gestation Late-gestation CON R CON R Ingredient ---- % DM basis ---- Straw 60.5 60.3 56.5 56.1 Ground corn 4.7 4.6 10.6 10.5 Ground corn cobs 13.7 13.7 12.3 12.6 Energy Booster 100® 5.3 5.5 8.0 8.2 Urea 0.7 0.8 0.6 0.8 Bloodmeal 1.8 - 1.6 - Glycerin 13.3 15.1 10.4 11.7 ---- Nutrient composition of diet predicted by NRC (2000) ---- Bacterial N balance, g/d 5 5 5 8 MP, % 102.1 78.7 101.4 79.6 NEm, Mcal/kg 0.26 0.26 0.28 0.28 NEg, Mcal/kg 0.14 0.14 0.16 0.16
Table 3. Late-gestation treatment × period of gestation interaction for BW change in heifers receiving a control (CON; slightly exceeding MP requirement supplied) or restricted (R; approximately 80% of MP requirement supplied) diet in mid- or late gestation
Mid-gestation Period Late-gestation Period Item CON R CON R SEM P-value BW change, kg -15.4c -9.0d 29.9a 17.0b 4.95 0.001 BCS change -0.458c -0.301d 0.000a -0.217b 0.0813 0.007 LMA change, cm2 -1.35 -0.94 -0.29a -1.19b 0.269 0.03 a,b Within gestation period, means lacking a common superscript differ (P < 0.05) c,d Within gestation period, means lacking a common superscript tend to differ (P < 0.10)
Table 2. Mid-gestation treatment × period of gestation interaction for BW change in heifers receiving a control (CON; slightly exceeding MP requirement) or restricted (R; approximately 80% of MP requirement supplied) diet in mid- or late gestation
Mid-gestation Period Late-gestation Period Item CON R CON R SEM P-value BW change, kg -4.9a -19.5b 21.3 25.6 4.95 0.002 BCS change -0.303c -0.456d -0.178 0.039 0.0813 0.03 LMA change, cm2 -0.70a -1.58b -0.90 -0.57 0.269 0.04 IMF change, % -0.069 -0.193 -0.075c 0.067d 0.0577 0.03 a,b Within gestation period, means lacking a common superscript differ (P < 0.05) c,d Within gestation period, means lacking a common superscript tend to differ (P < 0.10)
234

Proceedings, Western Section, American Society of Animal Science
Vol. 66, 2015
Assessment of supplemental trace mineral level and source on liver and serum mineral concentrations after feeding cattle a diet deficient in trace minerals
M. E. Garcia*, E. R. Oosthuysen* M. E. Hubbert†, M. E. Branine§, C. K. Larson§, C. A. Löest*, and E. J. Scholljegerdes*
*Department of Animal and Range Animal Sciences, New Mexico State University, Las Cruces, NM 88003; †Clayton Livestock and Research Center, New Mexico State University, Clayton, 88415;
§Zinpro Corporation, Eden Prairie, MN 55347
ABSTRACT1: Eighteen crossbred steers (initial BW 185 ± 24.5 kg) were subjected to a 60-d depletion period, where steers were provided ad libitum access to cornstalks with no mineral supplement. Steers were then used in a completely randomized design with a 2 × 2 factorial arrangement of treatments to test the effects of supplemental Cu, Mn, and Zn level and source on liver and serum repletion. Each steer was assigned to individual pens (6.4 m × 2.4 m) and provided a basal diet (17.8% CP, NEm 1.86 Mcal/kg and NEg 1.26 Mcal/kg, DM basis) fortified with one of four mineral supplements for 60 d (repletion period). Mineral treatments were formulated to provide supplemental Cu, Mn, and Zn from inorganic sources at either 100 (INO1X) or 300% of recommended levels (INO3X); or a 50:50 blend of inorganic and organic sources of Cu, Mn, and Zn offered at the same two levels (OR1X or OR3X). Liver and serum samples were collected on d 0, 15, 30, 45, and 60 of the depletion and repletion periods. Liver concentrations of Cu, and Mn did not differ (P ≥ 0.20) during the depletion period while liver Zn concentrations increased (P < 0.001). Serum concentrations of Cu and Zn decreased (P ≤ 0.05) over time, whereas, serum Mn did not differ (P = 0.47). During the repletion period there was no source × level × d interaction (P ≥ 0.21) for liver Cu, Mn, and Zn. Source did not impact (P ≥ 0.12) liver Mn or Zn concentrations. Liver Cu concentration tended (P = 0.09) to be greater at d 30 and was greater (P < 0.01) by d 60 in steers fed inorganic sources. Because cattle were on a low plane of nutrition and lost weight during the depletion period (ADG = -0.22 kg BW • steer-1 • d-1) liver size and mass may have decreased, thereby, increasing relative mineral concentrations. Conversely, when cattle were placed on a higher plane of nutrition (NEm = 0.44 vs. 1.86 Mcal/kg) during the repletion period (ADG = 1.4 kg BW • steer-1 • d-1), liver size may have increased, thus diluting liver mineral concentrations per unit of liver mass. Nevertheless, these data would suggest that collection of liver biopsy samples during and after weight loss to assess trace mineral status may provide erroneous and misleading values regarding trace mineral status. Keywords: Level, Liver, Serum, Steers, Trace minerals
1 Corresponding author: [email protected]
INTRODUCTION Trace minerals play a vital role in supporting
biochemical processes in the body, impacting health and growth in livestock (Suttle, 2010). Stressful events such as weaning, transportation, and marketing can increase requirements for immuno-supportive nutrients such as trace minerals. During these periods cattle often experience feed deprivation resulting in the potential depletion of endogenous trace mineral reserves. Feeder cattle management through normal livestock marketing systems results in stressors that may increase the nutritional requirements of calves (Hutcheson and Cole, 1986). Therefore, increased dietary concentrations of certain trace minerals may be warranted to compensate for decrease DM intake (Duff and Galyean, 2007). Yost et al. (2002) subjected Holstein heifers fed a high-quality diet with Cu antagonists (S and Mo) to a 111-d Cu depletion period followed by a 70-d repletion period and found that liver concentrations of Cu were more influenced by level than source. However, what is not known is the time required to replete mineral stores after a period of nutrient deprivation as often observed during drought or prolonged periods of stress. Therefore, our hypothesis was that supplementing minerals from organic sources at levels above the current NRC (2000) recommendation will decrease the time to which liver mineral concentrations are repleted after a 60 d mineral depletion period. The objective of this study was to quantify the effects of supplemental Cu, Mn, and Zn originating from either inorganic or a 50:50 blend of inorganic and organic sources fed at 100 or 300% of NRC (2000) recommended levels on liver and serum trace mineral concentrations.
MATERIALS AND METHODS All procedures and protocols were approved by the New
Mexico State University Institutional Animal Care and Use Committee. Eighteen crossbred steers (initial BW 185 ± 24.5 kg) originating from a south Texas sale barn were used in a completely randomized design with a 2 × 2 factorial arrangement of treatments. Steers were transported (approximately 12 h) to the Clayton Livestock Research Center (CLRC) in Clayton, NM. Upon arrival, cattle were placed in receiving pen (18 m × 37 m) overnight with ad libitum access to water and long-stem wheat hay. Cattle
235
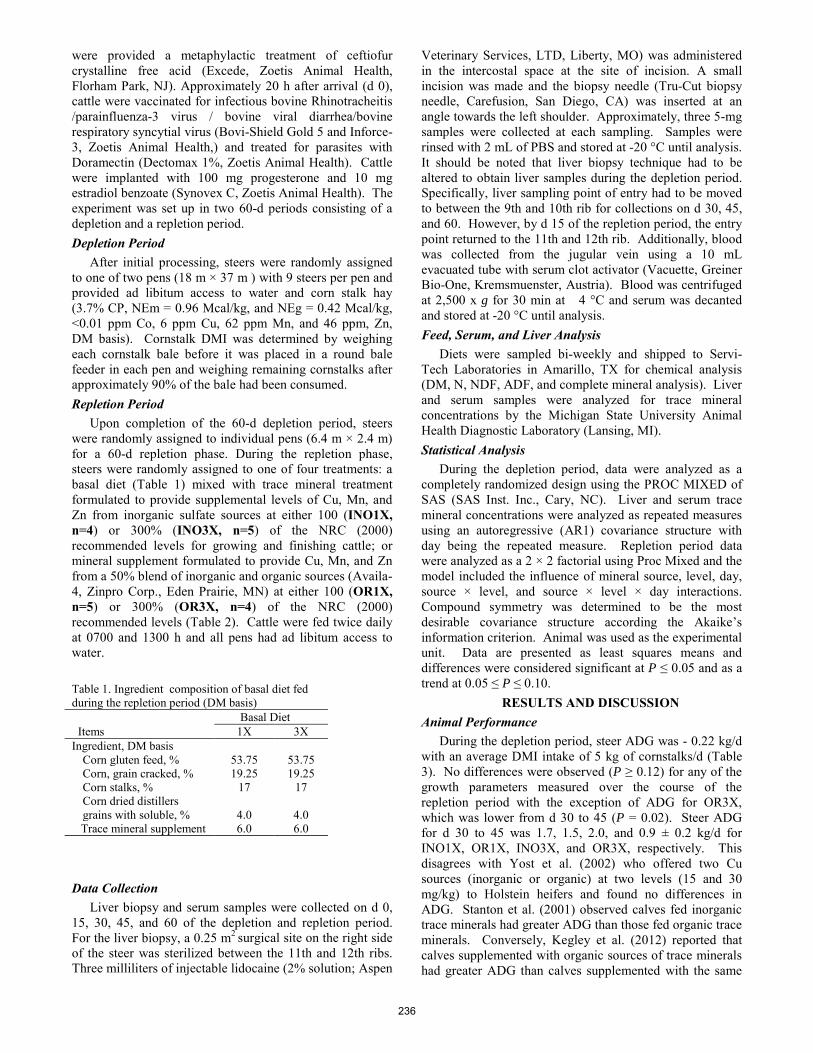
were provided a metaphylactic treatment of ceftiofur crystalline free acid (Excede, Zoetis Animal Health, Florham Park, NJ). Approximately 20 h after arrival (d 0), cattle were vaccinated for infectious bovine Rhinotracheitis /parainfluenza-3 virus / bovine viral diarrhea/bovine respiratory syncytial virus (Bovi-Shield Gold 5 and Inforce-3, Zoetis Animal Health,) and treated for parasites with Doramectin (Dectomax 1%, Zoetis Animal Health). Cattle were implanted with 100 mg progesterone and 10 mg estradiol benzoate (Synovex C, Zoetis Animal Health). The experiment was set up in two 60-d periods consisting of a depletion and a repletion period. Depletion Period
After initial processing, steers were randomly assigned to one of two pens (18 m × 37 m ) with 9 steers per pen and provided ad libitum access to water and corn stalk hay (3.7% CP, NEm = 0.96 Mcal/kg, and NEg = 0.42 Mcal/kg, <0.01 ppm Co, 6 ppm Cu, 62 ppm Mn, and 46 ppm, Zn, DM basis). Cornstalk DMI was determined by weighing each cornstalk bale before it was placed in a round bale feeder in each pen and weighing remaining cornstalks after approximately 90% of the bale had been consumed. Repletion Period
Upon completion of the 60-d depletion period, steers were randomly assigned to individual pens (6.4 m × 2.4 m) for a 60-d repletion phase. During the repletion phase, steers were randomly assigned to one of four treatments: a basal diet (Table 1) mixed with trace mineral treatment formulated to provide supplemental levels of Cu, Mn, and Zn from inorganic sulfate sources at either 100 (INO1X, n=4) or 300% (INO3X, n=5) of the NRC (2000) recommended levels for growing and finishing cattle; or mineral supplement formulated to provide Cu, Mn, and Zn from a 50% blend of inorganic and organic sources (Availa-4, Zinpro Corp., Eden Prairie, MN) at either 100 (OR1X, n=5) or 300% (OR3X, n=4) of the NRC (2000) recommended levels (Table 2). Cattle were fed twice daily at 0700 and 1300 h and all pens had ad libitum access to water.
Data Collection
Liver biopsy and serum samples were collected on d 0, 15, 30, 45, and 60 of the depletion and repletion period. For the liver biopsy, a 0.25 m2 surgical site on the right side of the steer was sterilized between the 11th and 12th ribs. Three milliliters of injectable lidocaine (2% solution; Aspen
Veterinary Services, LTD, Liberty, MO) was administered in the intercostal space at the site of incision. A small incision was made and the biopsy needle (Tru-Cut biopsy needle, Carefusion, San Diego, CA) was inserted at an angle towards the left shoulder. Approximately, three 5-mg samples were collected at each sampling. Samples were rinsed with 2 mL of PBS and stored at -20 °C until analysis. It should be noted that liver biopsy technique had to be altered to obtain liver samples during the depletion period. Specifically, liver sampling point of entry had to be moved to between the 9th and 10th rib for collections on d 30, 45, and 60. However, by d 15 of the repletion period, the entry point returned to the 11th and 12th rib. Additionally, blood was collected from the jugular vein using a 10 mL evacuated tube with serum clot activator (Vacuette, Greiner Bio-One, Kremsmuenster, Austria). Blood was centrifuged at 2,500 x g for 30 min at 4 °C and serum was decanted and stored at -20 °C until analysis. Feed, Serum, and Liver Analysis
Diets were sampled bi-weekly and shipped to Servi-Tech Laboratories in Amarillo, TX for chemical analysis (DM, N, NDF, ADF, and complete mineral analysis). Liver and serum samples were analyzed for trace mineral concentrations by the Michigan State University Animal Health Diagnostic Laboratory (Lansing, MI). Statistical Analysis
During the depletion period, data were analyzed as a completely randomized design using the PROC MIXED of SAS (SAS Inst. Inc., Cary, NC). Liver and serum trace mineral concentrations were analyzed as repeated measures using an autoregressive (AR1) covariance structure with day being the repeated measure. Repletion period data were analyzed as a 2 × 2 factorial using Proc Mixed and the model included the influence of mineral source, level, day, source × level, and source × level × day interactions. Compound symmetry was determined to be the most desirable covariance structure according the Akaike’s information criterion. Animal was used as the experimental unit. Data are presented as least squares means and differences were considered significant at P ≤ 0.05 and as a trend at 0.05 ≤ P ≤ 0.10.
RESULTS AND DISCUSSION Animal Performance
During the depletion period, steer ADG was - 0.22 kg/d with an average DMI intake of 5 kg of cornstalks/d (Table 3). No differences were observed (P ≥ 0.12) for any of the growth parameters measured over the course of the repletion period with the exception of ADG for OR3X, which was lower from d 30 to 45 (P = 0.02). Steer ADG for d 30 to 45 was 1.7, 1.5, 2.0, and 0.9 ± 0.2 kg/d for INO1X, OR1X, INO3X, and OR3X, respectively. This disagrees with Yost et al. (2002) who offered two Cu sources (inorganic or organic) at two levels (15 and 30 mg/kg) to Holstein heifers and found no differences in ADG. Stanton et al. (2001) observed calves fed inorganic trace minerals had greater ADG than those fed organic trace minerals. Conversely, Kegley et al. (2012) reported that calves supplemented with organic sources of trace minerals had greater ADG than calves supplemented with the same
Table 1. Ingredient composition of basal diet fed during the repletion period (DM basis)
Basal Diet Items 1X 3X Ingredient, DM basis
Corn gluten feed, % 53.75 53.75 Corn, grain cracked, % 19.25 19.25 Corn stalks, % 17 17 Corn dried distillers grains with soluble, % 4.0 4.0
Trace mineral supplement 6.0 6.0
236

levels of inorganic mineral sources. Dry matter intake did not differ (P = 0.35) for d 0 to 15, yet differences were observed for the remainder of the experiment (P ≤ 0.03) with OR3X having lower intake than the other treatments, which coincides with the lower ADG observed for this treatment (DMI d 0 to 15: 3.6 to 4.0 ± 0.2 kg/d; d 15 to 30 5.4 to 6.6 ± 0.4 kg/d; d 30 to 45 6.2 to 8.1 ± 0.4 kg/d; d 45 to 60: 6.4 to 8.3 ± kg/d; d 0 to 60: 5.4 to 6.8 ± 0.3 kg/d). This result was also reported in a companion paper (Garcia et al., 2014) where group fed cattle were offered the same dietary treatments as the current study. Malcolm-Callis et al. (2000) reported that high levels of dietary Zn (200 mg Zn/kg) decreased DMI, and attributed this to a decrease in palatability. However, this is greater than the highest levels fed in the current study (139 mg Zn/kg). Therefore, it is not clear as to why intake was lower for OR3X. Because DMI for INO3X was not reduced compared to 100% treatments, a palatability issue may explain the difference in DMI. Depletion Period: Liver and Serum Mineral Concentrations
Trace mineral intake for steers during the depletion period and the recommended trace mineral intake levels for stressed calves (NRC, 2000) are presented in Table 3. The justification for the use of stressed calf values was based on the fact that the depletion period occurred during the first 60 d of the receiving period when stress would be greatest for steers. Despite deficiencies in trace mineral intake, liver concentrations of Cu, and Mn did not change (P ≥ 0.23) over the course of the 60 d depletion period (Table 4). However, liver Zn concentrations changed over time (P < 0.001) with a peak concentration being observed by d 45 and a subsequent decrease by d 60 yet remained numerically above d 0 values. On d 0, liver Cu, Mn, and Zn concentrations could be classified as marginal or adequate based on values published by Kincaid (1999) and Puls (1988) and over the course of the 60 d depletion period, concentrations increased to adequate or high. This increase in liver concentration is unexpected considering the relatively low dietary supply of Cu, Mn, and Zn. In the current study, liver biopsy technique during the depletion period had to be altered to obtain liver samples. Specifically, liver samples were originally obtained between the 11th and 12th rib, but the point of entry had to be moved to between the 9th and 10th rib for collections on d 30, 45, and 60. This would suggest that the negative energy balance imposed with feeding cornstalks caused a reduction in liver size and mass. It has been well established that liver mass decreases when animals are placed on a nutrient restricted diet (Meyer et al., 2010). Although speculative, it is possible that liver size and mass reduced faster than liver trace minerals could be mobilized, which would increase liver mineral concentrations. Unfortunately, to our knowledge there is no literature to substantiate this phenomena. Furthermore, it is not fully understood why Cu, Mn, and Zn responded differently to the deficiencies imposed. It is possible that differences in the severity of each deficiency (Table 3) or body storage pools may have influenced individual mineral response to depletion (Suttle, 2010). Mills (1987) suggested that young cattle with adequate liver Cu stores (100 to 150 mg/kg) are
unable to release sufficient Cu to maintain normal plasma Cu concentrations when fed Cu deficient diets.
Nonetheless, serum trace mineral concentrations decreased as expected during the depletion period. Specifically, serum concentrations for Cu and Zn decreased (P ≤ 0.05) across the depletion period, whereas, serum Mn concentrations did not differ (P = 0.47) due to high variation among animals despite a numerical decrease. Trace mineral concentrations observed for serum appeared adequate on d 0 and declined to a deficient concentration by d 60 of the depletion period (Puls, 1988; Kincaid, 1999). Repletion Period: Liver and Serum Mineral Concentrations
There was no source × level × day interaction observed for the concentrations of Cu, Mn, and Zn in liver (P ≥ 0.21) or serum (P ≥ 0.30). Furthermore, there was no source × level interaction (P ≥ 0.13) for Cu, Mn, and Zn. Likewise there was no level or source × day interaction (P ≥ 0.23) for liver or serum mineral concentrations therefore only the effects of source (Inorganic and 50:50 Organic) and level (1X and 3X) within sampling day are presented in Table 5. Liver Cu concentrations tended to be (P = 0.09) and were greater (P = 0.01) for inorganic sources on d 30 and 60, respectively. Liver concentrations of Cu in steers fed the 300% levels were greater (P ≤ 0.04) than 100% levels on d 45 and 60. Similar results were observed by Engle and Spears (2000) whereas liver Cu concentrations were greater at 56 d in steers fed Cu supplement. Serum Cu concentrations tended (P = 0.09) to be greater for steers fed organic source of Cu on d 60. Providing organic Mn increased (P = 0.08) serum concentrations. Likewise, feeding greater levels (3X) increased (P = 0.01) serum Mn concentrations. However, source and level did not impact (P ≥ 0.12) liver or serum concentrations of Zn. A steady increase in liver mineral concentrations was expected. However, as during the depletion period, liver sampling technique during the repletion period was adjusted back to the original site of liver collection. Nonetheless, the overall lack of response of level and source in particular with the OR3X could be due to the lower DMI (source x level, P ≤ 0.03) observed for this treatment from d 15 to 60 (data not shown). Conversely, Ahola et al. (2004) did report improvements in liver Cu, Mn, and Zn concentrations with organic sources in the initial yr of a 2 yr study, but no differences in yr 2. Interestingly, by d 15, liver and serum levels had increased from d 0 (same day as d 60 of depletion) and did so to d 30, however, they declined at d 45, then increased again by d 60. Yost et al. (2002) subjected Holstein heifers to a 111 d Cu depletion period where they were fed a high-quality basal diet (55% corn, 16.3% soybean meal, 19.0% cottonseed hulls, 7.0% molasses and 2.7% mineral and vitamin premix mixture) with S and Mo added as antagonists to Cu until liver Cu concentrations were classified as deficient (15 mg/kg). Afterwards, heifers were then fed similar basal diets (without antagonists) that contained organic (chelated Cu) or inorganic Cu (CuSO4) fed at two levels (15 versus 30 mg/kg) for 70 d repletion period. These authors reported a linear increase in liver Cu concentrations over the course of the 70 d repletion period with heifers supplemented with 30
237

mg Cu/kg being greater than 15 mg/kg irrespective of source. This is in contrast to the current study where concentrations varied throughout the repletion period. The difference between the Yost et al. (2002) the current study could be related to diet quality during the depletion periods (corn-based diet versus corn stalks, respectively). Under the same supposition that liver size changed with quality of diet offered, the responses reported herein may reflect liver trace mineral concentrations increasing faster than growth of the liver when cattle switched to the repletion diet and by
d 45 liver size had stabilized and concentrations began to increase.
IMPLICATIONS Under the constraints of the current experiment, after a
period of depletion, that rate at which trace minerals were repleted was not improved with a combination of organic minerals fed at 300% of recommended levels, which may have been due to the lower intake observed for OR3X. Although speculative, the change in liver size may have negated any impact of level and source of trace minerals as measured by liver concentrations. Therefore, the interpretation of liver mineral concentrations should be used with caution in animals that are subjected to a nutrient deprived state as fluctuation in liver size and mass could provide erroneous and misleading results regarding trace minerals status. Further research is required to validate these observations.
LITERATURE CITED Ahola, J. K., D. S. Baker, P. D. Burns, R. G. Mortimer, R.
M. Enns, J. C. Whittier, T. W. Geary, and T. E. Engle. 2004. Effect of copper, zinc, and manganese supplementation on source on reproduction, mineral status, and performance in grazing beef cattle over a two-year period. J. Anim. Sci. 82:2375-2383.
Duff, G. C., and M. L. Galyean. 2007. Board-invited review: Recent advances in management of highly stressed newly received feedlot cattle. J. Anim. Sci. 85:823-840.
Engle, T. E., and J. W. Spears. 2000. Effects of dietary copper concentration and source on performance and copper status of growing and finishing steers. J. Anim. Sci. 78:2446-2451.
Garcia, M. E., E. Oosthuysen, J. R. Graves, M. E. Hubbert, M. E. Branine, C. A. Löest, and E. J. Scholljegerdes. 2014. Effects of level and source of supplemental trace minerals on growth responses of beef calves received from New Mexico ranches. West. Sect. Proc. Am. Soc. Anim. Sci. 65:91-94. Hutcheson, D. P., and N. A. Cole. 1986. Management of transit-stress syndrome in cattle: nutritional and environmental effects. J. Anim. Sci. 62:555-560. Kegley, E. B., M. R. Pass, J. C. Moore, and C. K. Larson. 2012. Supplemental trace minerals (zinc, copper, manganese, and cobalt) as Availa-4 or inorganic sources for shipping-stressed beef cattle. Prof. Anim. Sci. 28:313-318. Malcom-Callis, K. J., G. C. Duff, S. A. Gunter, E. B. Kegley, and D. A. Vermeire. 2000. Effects of supplemental zinc concentration and source on performance, carcass characteristics, and serum values in finishing beef steers. J. Anim. Sci. 78:2801-2808. Meyer A. M., J. J. Reed, K. A Vonnahme, S. A. Soto-Navarro, P. Reynolds, S. P. Ford, B. W. Hess, and J. S. Caton. 2010. Effects of stage of gestation and nutrient restriction during early to mid-gestation on maternal and fetal visceral organ mass and indices of jejunal
growth and vascularity in beef cows. J. Anim. Sci. 88:2410-2424.
Mills, C. F. 1987. Biochemical and physiological indicators of mineral status in animals: copper, cobalt, and zinc. J. Anim. Sci. 65:1702-1711.
Kincaid, R. L. 1999. Assessment of trace mineral status of ruminants: review. Proc. of Amer. Soc. Anim. Sci.
NRC. 2000 Nutrient Requirement of Beef Cattle. 7th rev. ed. Natl. Acad. Sci., Washington, D.C.
Puls, R. 1988. Mineral levels in animal health. Sherpa International. Clearbrook, B.C., Canada.
Suttle, N., 2010. Mineral Nutrition of Livestock. 4th ed. Oxfordshire: CABI.
Yost, G. P., J. D. Arthington, L. R. McDowell, F. G. Martin, N. S. Wilkinson, and C. K. Swenson. 2002. Effect of copper source and level on the rate and extent of copper repletion in Holstein heifers. J. Dairy Sci. 85:3297-3303.
Table 2 Actual nutrient composition of treatment diets (DM basis)1 Treatment Items INO1X OR1X INO3X OR3X NEm , Mcal/kg 1.80 1.88 1.81 1.82 NEg, Mcal/kg 1.18 1.24 1.18 1.18 CP,% 18.0 18.8 18.3 18.9 Ca, % 0.68 1.04 0.91 0.92 P, % 0.58 0.56 0.58 0.57 Cu, mg/kg 13.7 19.0 33.3 36.7 Mn, mg/kg 41.3 46.7 78.7 88.0 Zn, mg/kg 75 87 134 139 1= Steers were assigned to an individual pen (6.4 m × 2.4 m) and provided a basal fortified with one of four mineral supplements (repletion period). Mineral supplements were formulated to provide Cu, Mn, and Zn from inorganic sources at either 100 (INO1X) or 300% of recommended levels (INO3X); or a 50:50 blend of inorganic and organic sources of Cu, Mn, and Zn at offered at the same two levels (OR1X or OR3X).
Table 3. Daily consumption of minerals during the depletion period of cornstalks, with a comparison of NRC recommended mineral levels Item Cornstalk1 NRC Req. level2 mg • steer-1 • d-1
Co 0.05 1.0 Cu 30 75 Mn 310 350 Zn 230 500
1Based on their average DMI 5 kg/d. 2Values based on NRC (2000) predicted intake and stressed calves mineral requirements.
238
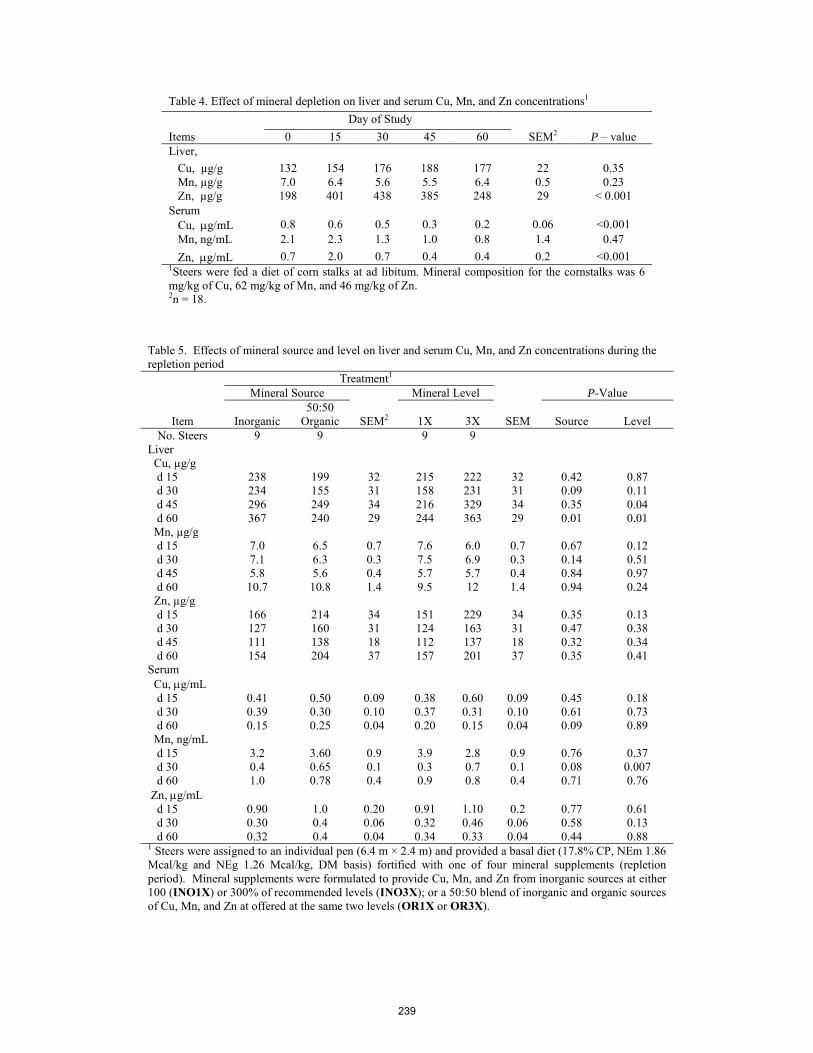
Table 4. Effect of mineral depletion on liver and serum Cu, Mn, and Zn concentrations1
Day of Study Items 0 15 30 45 60 SEM2 P – value Liver, Cu, µg/g 132 154 176 188 177 22 0.35 Mn, µg/g 7.0 6.4 5.6 5.5 6.4 0.5 0.23 Zn, µg/g 198 401 438 385 248 29 < 0.001 Serum Cu, µg/mL 0.8 0.6 0.5 0.3 0.2 0.06 <0.001 Mn, ng/mL 2.1 2.3 1.3 1.0 0.8 1.4 0.47 Zn, µg/mL 0.7 2.0 0.7 0.4 0.4 0.2 <0.001 1Steers were fed a diet of corn stalks at ad libitum. Mineral composition for the cornstalks was 6 mg/kg of Cu, 62 mg/kg of Mn, and 46 mg/kg of Zn. 2n = 18.
Table 5. Effects of mineral source and level on liver and serum Cu, Mn, and Zn concentrations during the repletion period Treatment1 Mineral Source Mineral Level P-Value
Item Inorganic 50:50
Organic SEM2 1X 3X SEM Source Level No. Steers 9 9 9 9
Liver Cu, µg/g d 15 238 199 32 215 222 32 0.42 0.87 d 30 234 155 31 158 231 31 0.09 0.11 d 45 296 249 34 216 329 34 0.35 0.04 d 60 367 240 29 244 363 29 0.01 0.01 Mn, µg/g d 15 7.0 6.5 0.7 7.6 6.0 0.7 0.67 0.12 d 30 7.1 6.3 0.3 7.5 6.9 0.3 0.14 0.51 d 45 5.8 5.6 0.4 5.7 5.7 0.4 0.84 0.97 d 60 10.7 10.8 1.4 9.5 12 1.4 0.94 0.24 Zn, µg/g d 15 166 214 34 151 229 34 0.35 0.13 d 30 127 160 31 124 163 31 0.47 0.38 d 45 111 138 18 112 137 18 0.32 0.34 d 60 154 204 37 157 201 37 0.35 0.41 Serum Cu, µg/mL d 15 0.41 0.50 0.09 0.38 0.60 0.09 0.45 0.18 d 30 0.39 0.30 0.10 0.37 0.31 0.10 0.61 0.73 d 60 0.15 0.25 0.04 0.20 0.15 0.04 0.09 0.89 Mn, ng/mL d 15 3.2 3.60 0.9 3.9 2.8 0.9 0.76 0.37 d 30 0.4 0.65 0.1 0.3 0.7 0.1 0.08 0.007 d 60 1.0 0.78 0.4 0.9 0.8 0.4 0.71 0.76 Zn, µg/mL d 15 0.90 1.0 0.20 0.91 1.10 0.2 0.77 0.61 d 30 0.30 0.4 0.06 0.32 0.46 0.06 0.58 0.13 d 60 0.32 0.4 0.04 0.34 0.33 0.04 0.44 0.88 1 Steers were assigned to an individual pen (6.4 m × 2.4 m) and provided a basal diet (17.8% CP, NEm 1.86 Mcal/kg and NEg 1.26 Mcal/kg, DM basis) fortified with one of four mineral supplements (repletion period). Mineral supplements were formulated to provide Cu, Mn, and Zn from inorganic sources at either 100 (INO1X) or 300% of recommended levels (INO3X); or a 50:50 blend of inorganic and organic sources of Cu, Mn, and Zn at offered at the same two levels (OR1X or OR3X).
239

POSTER PRESENTATIONS

BEHAVIOR

Procedings, Western Section, American Society of Animal Science
Vol. 66, 2015
Fate of free ferulic and etil ferulate in beef cattle
C. González, D. Domínguez*, G. Villalobos, F. Castillo, and J. Ortega
Facultad de Zootecnia y Ecología. Universidad Autonoma de Chihuahua. Chihuahua, México
ABSTRACT. The objective was to evaluate the fate of a single dosage of free ferulic acid and ethyl ferulate in beef cattle. Six crossbred (Hereford × Angus) heifers with a rumen fistula, averaging 12 months age and an initial body weigth of 340±10 kg were used. Animals were housed in individual pens and fed ad libitum with a feedlot diet. Treatments consisted: control (CON), ferulic acid (FA, single dosis of 85.1 g/animal) and ethyl ferulate (EF, single dosis of 85.1 g/animal). Rumen fluid, blood and urine were intensively sampled on 12, 12 and 24 h period, respectively. Concentrations of FA en EF in collected samples were determined by HPLC. Data were analyzed in a duplicate 3 × 3 Latin square. Rumen fluid FA concentration peaks at 0.5 h after dosage, then it decreased quickly until 4 h after dosage and dissapeared before 12 h after dosage. Appearance of FA and EF concentrations were immediately in the blood stream, reaching the peak at 15 m after dosage, decreaseasing rapidly and then slowly until 3.0 and 6.0 h after dosage, respectively, to return to basal levels at 12 h after dosage. Excretion of FA and EF in urine was quickly, peaking at 4 h after dosage, but returning to basal levels until 24 h after dosage. Solubilization and spread of FA and EF in rumen fluid are very quickly, being efficiently absorbed by rumen epithelium to appear immediately in blood stream, and then rapidly be excreted in urine. Key words: beef cattle, blood, ethyl ferulate, ferulic acid, rumen fluid, urine
INTRODUCTION
Chemical structure of ferulic acid (FA) is 3-4 hidroxy-3-methoxyphenyl-2-propionic. This compound is derivated from cinnamic acid, and is extremely abundant in nature (Jung and Allen, 1995), forming lignin that links to structural carbohydrates in cell wall (Gámez de León, 2006). Ferulic acid is obtained from vegetal byproducts with higher content of fibre, as hulls of oat, rice (Yu et al., 2005) and boiled maize (Navarro-Ocaña et al., 2009). Ferulic acid has shown antioxidant properties in humans (Srinivasan et al., 2007) and lab animals (Ouand y kwouk, 2004), and recently as growth promoter (Macías-Cruz et al., 2014). However, limited research is available on uptake and fate of free FA, mechanisms of action as a growth promoter and benefits on beef cattle industry. Soberon et al. (2012) evaluated the uptake and fate of free FA in lactating cows and found an increased concentration of FA after dosage, then it decreased rapidly until reached basal concentrations
in ruminal fluid, plasma and urine at 4.5, 5.5 and 10 h after dosage, respectively. Fate of free ferulic acid studies in beef cattle are necessary to explain its potential residuality, which is an important public concern. The objective was to evaluate the fate of a single dosage of free ferulic acid and ethyl ferulate in beef cattle.
MATERIALS AND METHODS
All procedures involving animals were approved by local official techniques for animal care (NOM-O51-ZOO-1995; Humanitarian care in animal movilization; NOM-059-1997: Specifications of chemical, pharmaceuticals, and biological products, as well as feeds for animal use). This study was conducted at the Facultad de Zootecnia y Ecologia of the Universidad Autónoma de Chihuahua, Chihuahua City, Mexico. Animals and treatments Six crossbred (Hereford × Angus) heifers with a rumen fistula, averaging 12 months age and an initial body weigth of 340±10 kg were used. At begining of experiment animals received ADE vitamins, 3 way clostridial vaccine, internal and external parasiticide. During the experiment heifers were housed in individual pens and fed ad libitum (0800 and 1600 h), adjusting to 5 to 10% of feed refusals and have free access to clean water. Basal diet composition (DM) was 19% triticale straw:81 % concentrate (Table 1). Heifers were randomly assigned to treatments: control (CON), ferulic acid (FA, single dosis of 85.1 g/animal; Laboratorios Minkab S.A de C.V., Guadalajara, Jalisco, México) and ethyl ferulate (EF, single dosis of 85.1 g/animal; Laboratorios Minkab S.A de C.V., Guadalajara, Jalisco, México). Sampling and analyses Length of experimental periods was 8 d, using the first one for sample collection, and the last 7 d for animal recovery. Before sampling, a urinary catheter was placed in each heifer at 0700 h, then rumen fluid, blood and urine samples were taken at 0800 h to determine basal concentrations of FA and EF. At 0830 h heifers received a single dosage of FA and EF via rumen fistula allowing for intensively sampling for the next 24 h. Rumen fluid samples were obtained from different rumen locations, every 30 m during
240

the first 3.5 h, until 12 h post dosage. Blood samples were taken by yugular puncture (heparinized vacutainer). Two blood samples were obtained every 15 m after dosage, then at 1.0, 1.5, 3, 4.5, 6, 9 and 12 h after dosage. Urine samples were collected at 2, 4, 6, 12, 16, 20 and 24 h after dosage. Rumen fluid, blood and urine samples collected were centrifuged, after that urine and plasma samples were hidrolyzed with NaOH and then frozen. Assay for FA and EF concentration was conducted on an HPLC system (Varian ProStar; Varian Inc., Palo Alto, CA) as described by Soberon et al., (2012b). Analysis of FA and EF were developed by Laboratorios Minkab S.A de C.V., Guadalajara, Jalisco, México.
Statistical analysis Data were analyzed with a MIXED procedure of SAS (2002) in a duplicate 3 × 3 Latin square. Model statement included the effect of treatment, period, repetition and hour, using heifer as random variable.
RESULTS AND DISCUSSIÓN Rumen fluid FA concentration increased linearly, reaching a máximum concentration at 0.5 h after dosage (Figure 1), then it decreased quickly until 3.5 h after dosage. After that, the reduction in FA concentration was slowly until reaching basal levels. Similar results were reported by Soberon et al., (2012b) in regard with the máximum concentration after dosage. However, the returning of FA concentration to basal levels, was between 3 and 4 h after dosage. Since FA is a highly soluble molecule in water (Soberon et al., 2012a), it spreads rapidly in rumen fluid. Rumen fluid EF concentration reached a peak at 1.0 h after dosage, then decreased steadily until 4 h after dosage, and dissapeared at 12 h. Concentration of EF at all sampling times was lower than FA, probably by higher breakdown of this molecule (Besle et al., 1995). Since EF is a phenolic compound such FA, microbial degradation has been reported (Chesson et al., 1982). No concentration of FA and EF in CON was observed. This results disagree with the fact of ruminal breakdown of ferulic acid bound to cell wall of the diet by Fibrobacter succinogenes, Butrivibrio fibrosolvens, Streptoccocus bovis, Ruminococcus albus, Ruminococcus flavefaciens and Wolinella succinogenes (Besle et al., 1995). However, in this study the forage used was triticale straw in 19% (DM) of the diet. This forage is highly lignified and probably this molecule is less fragile to microbial breakdown than lignin found in forages harvested in an earlier maturity stage, such forages used in Soberon study. Efficient absorption of FA and EF by rumen epithelium allowed the immediately appearance in the blood stream, reaching the peak at 15 m after dosage (Figure 2). After that, FA and EF concentration decreased rapidly until 3.0 h after dosage, then they decreased slowly until 6.0 and return to basal levels at 12 h after dosage. Minimum concentrations of FA and EF were observed in CON between 15 m and 1 h after dosage. A similar pattern of FA appearance in blood stream was observed by Soberon et al. (2012b), since peak plasma FA happened at 15 m after
dosage, then FA concentration decreased steadily, until it dissapeared at 5.5 h after dosage. The fast dissapeareance of FA in blood found in Soberon study could be related to the greater metabolism of dairy cow to support a high milk synthesis compared to beef cattle in feedlot conditions. Basal concentrations of FA and EF in urine were present in trace amounts even in heifers of CON treatment (Figure 3). After that, urine FA and EF concentration increased quickly, peaking at 4 h after dosage. Then, a rapidly decrease of FA and EF concentrations were observed until 8 h after dosage, and in a slowly manner until reach basal levels at 24 h. A similar pattern of FA excretion in urine was reported by Soberon et al. (2012b). In Soberon experiment, urine FA peak concentration was at 2.75 h after dosage, then if decreased very fast to reach basal levels at 10 h after dosage.
CONCLUSIONS Solubilization and spread of FA and EF in rumen fluid are very quickly. These phenolic compounds are efficiently absorbed by rumen epithelium, therefore they appear immediately in blood stream. A fast excretion of FA and EF happend via urine. Table 1.Composition of basal diet
1 The premix contains a mínimum of 12% P, 11.5% Ca, 0.6% Mg, 2,160 ppm Mn, 2,850 ppm Zn, 580 ppm Fe, 1,100 ppm Cu, 102 ppm I, 13 ppm Co, 9 ppm Se, 220,000 IU/kg Vit A, 24,500 IU/kg Vit D3 y 30 IU/kg Vit E.
LITERATURE CITED
Besle J. M., J. P. Jouany y A. Cornu. 1995. Transformations of structural phenylpropanoids during cell wall digestion. FEMS Microbiol. Rev. 16:33-52.
Chesson, A., C. S. Stewart, and R. J. Wallace. 1982. Influence of plant phenolic acids on growth and cellulolytic activity of rumen bacteria. Appl. Environ. Microbiol. 44:597–603.
Gámez de León N. y Sánchez-González M. 2006. Extracción Químico Enzimática del Ácido Ferulico Presente en Diferentes Variedades de Maíz Mexicano, Page 1, Congreso de Ciencias
Ingredients DM (%) Triticale straw 19.0 Corn flaked 67.6 Cotton seed meal 7.1 Molasses 3.0 Mineral premix1 1.0 Sodium bicarbonate 1.0 Calcium carbonate 0.8
Chemical composition (%) Dry matter (%) 89.1 Crude protein (%) 9.7 NEm (Mcal/kg DM) NEg (Mcal/kg DM)
1.919 1.272
Ca (%) P (%)
494 412
241
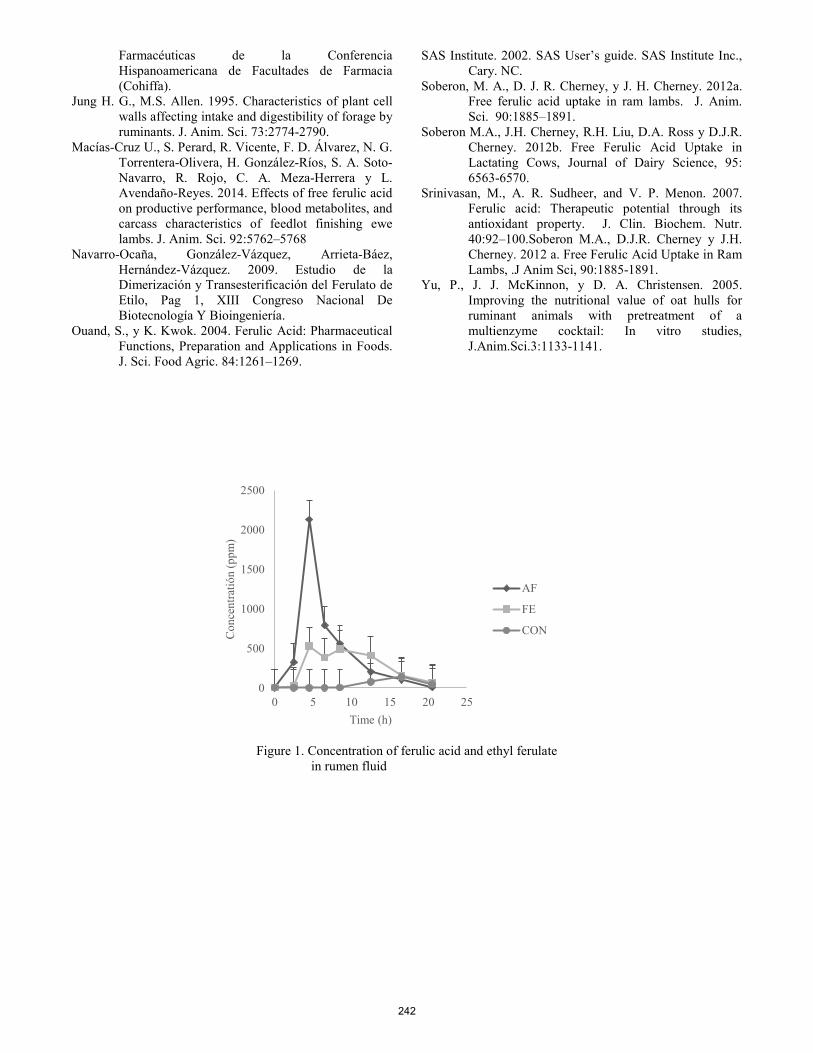
Farmacéuticas de la Conferencia Hispanoamericana de Facultades de Farmacia (Cohiffa).
Jung H. G., M.S. Allen. 1995. Characteristics of plant cell walls affecting intake and digestibility of forage by ruminants. J. Anim. Sci. 73:2774-2790.
Macías-Cruz U., S. Perard, R. Vicente, F. D. Álvarez, N. G. Torrentera-Olivera, H. González-Ríos, S. A. Soto-Navarro, R. Rojo, C. A. Meza-Herrera y L. Avendaño-Reyes. 2014. Effects of free ferulic acid on productive performance, blood metabolites, and carcass characteristics of feedlot finishing ewe lambs. J. Anim. Sci. 92:5762–5768
Navarro-Ocaña, González-Vázquez, Arrieta-Báez, Hernández-Vázquez. 2009. Estudio de la Dimerización y Transesterificación del Ferulato de Etilo, Pag 1, XIII Congreso Nacional De Biotecnología Y Bioingeniería.
Ouand, S., y K. Kwok. 2004. Ferulic Acid: Pharmaceutical Functions, Preparation and Applications in Foods. J. Sci. Food Agric. 84:1261–1269.
SAS Institute. 2002. SAS User’s guide. SAS Institute Inc., Cary. NC.
Soberon, M. A., D. J. R. Cherney, y J. H. Cherney. 2012a. Free ferulic acid uptake in ram lambs. J. Anim. Sci. 90:1885–1891.
Soberon M.A., J.H. Cherney, R.H. Liu, D.A. Ross y D.J.R. Cherney. 2012b. Free Ferulic Acid Uptake in Lactating Cows, Journal of Dairy Science, 95: 6563-6570.
Srinivasan, M., A. R. Sudheer, and V. P. Menon. 2007. Ferulic acid: Therapeutic potential through its antioxidant property. J. Clin. Biochem. Nutr. 40:92–100.Soberon M.A., D.J.R. Cherney y J.H. Cherney. 2012 a. Free Ferulic Acid Uptake in Ram Lambs, .J Anim Sci, 90:1885-1891.
Yu, P., J. J. McKinnon, y D. A. Christensen. 2005. Improving the nutritional value of oat hulls for ruminant animals with pretreatment of a multienzyme cocktail: In vitro studies, J.Anim.Sci.3:1133-1141.
Figure 1. Concentration of ferulic acid and ethyl ferulate
in rumen fluid
0
500
1000
1500
2000
2500
0 5 10 15 20 25
Con
cent
ratió
n (p
pm)
Time (h)
AF
FE
CON
242
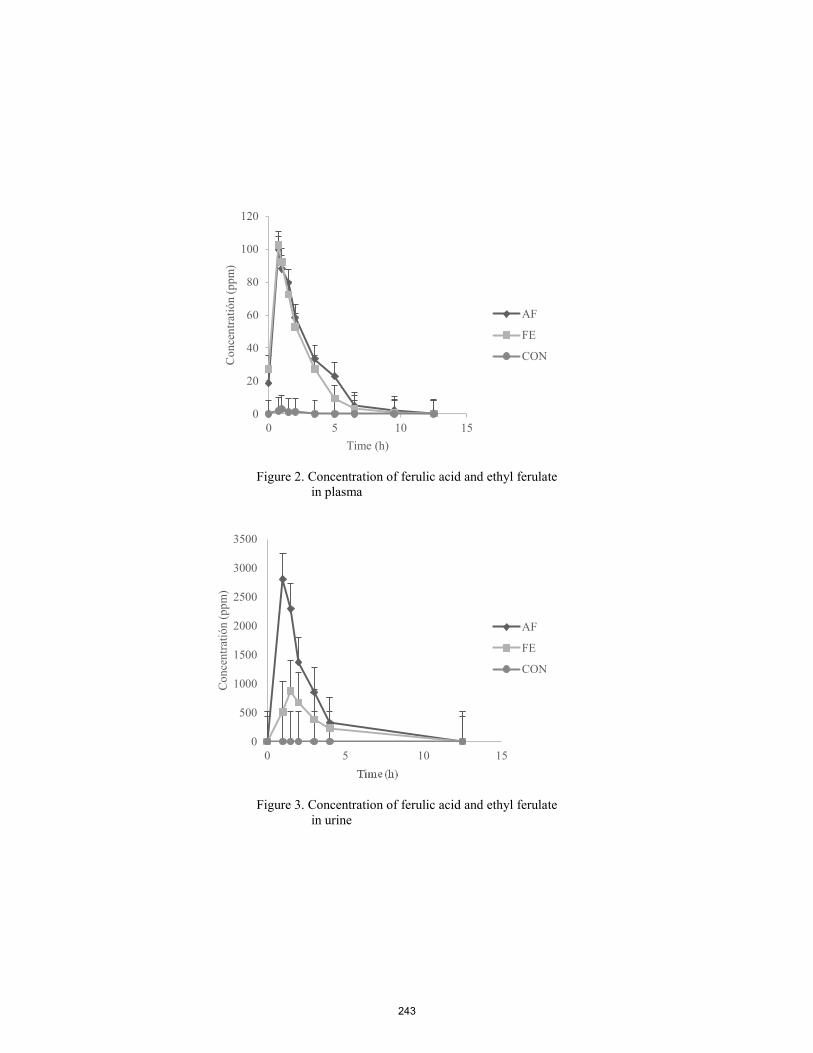
Figure 2. Concentration of ferulic acid and ethyl ferulate
in plasma
Figure 3. Concentration of ferulic acid and ethyl ferulate in urine
0
20
40
60
80
100
120
0 5 10 15
Con
cent
ratió
n (p
pm)
Time (h)
AF
FE
CON
0
500
1000
1500
2000
2500
3000
3500
0 5 10 15
Con
cent
ratió
n (p
pm)
AF
FE
CON
243
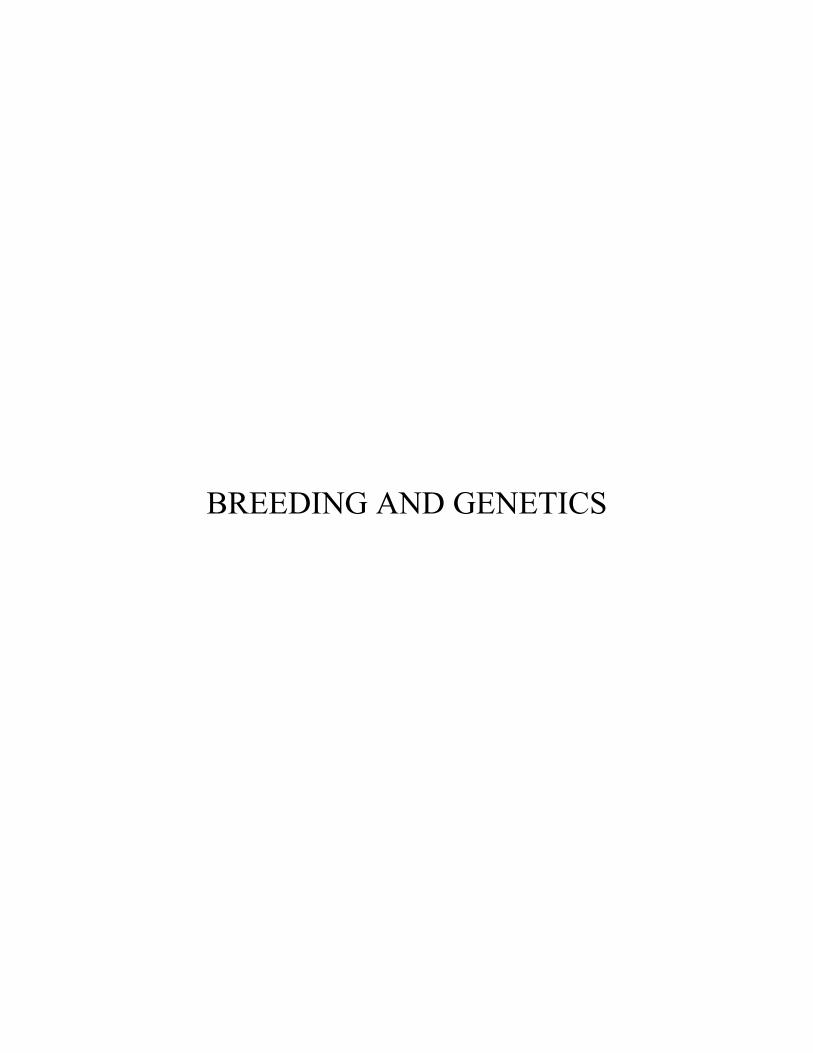
BREEDING AND GENETICS

Proceedings, Western Section, American Society of Animal Science
Vol. 66, 2015
Effect of high sulfate water on rumen microbial populations in lambs
C.J. Clarkson*, A.N. Abrams*, K.J. Austin*, M.J. Ellison*, H.C. Cunningham*, G. Conant†, W.R. Lamberson†, T. Taxis†, and K.M. Cammack*
*Department of Animal Science, University of Wyoming, Laramie, WY † Division of Animal Sciences, University of Missouri, Columbia, MO
ABSTRACT: Rumen microbes are responsible for the degradation of feedstuffs within the rumen; therefore, ruminants have a unique ability to reduce dietary SO4. We hypothesized that high sulfate (SO4) water would alter the rumen microbial population in growing lambs. Growing lambs (n = 43; female = 22, male = 21; initial BW = 48.76 ± 16.44 kg) of Hampshire and Hampshire-cross breed types were randomly allotted to individual pens and acclimated to a forage-based pelleted diet. All lambs were provided drinking water with 3,043.89 ± 746.11 mg SO4/L for a 28 d trial period. Feed and water disappearance were recorded daily. Lambs were also monitored daily for behavioral signs of S toxicity, including alertness and fecal consistency (as a measure of health), and were ranked using a daily ethogram including both behavior and water and feed intake data. Rumen samples were obtained on d 0, 7, and 28, along with BW measures. The four highest ranking lambs were considered tolerant to high S, and the four lowest ranking lambs intolerant to high S. DNA was extracted from d 0, 7, and 28 rumen samples of the tolerant and intolerant lambs and then sequenced for microbial taxa identification. Paired-end reads were filtered, quality-trimmed, and compared with a known database of 16S rDNA reads. Operational taxonomic units (OTU) were defined as sequence clusters with ≥ 97% identity and analyzed for fixed effects of tolerance status and sampling day using the GENMOD procedure of SAS. A total of 145 OTUs were found in at least 1 of the 24 total samples that were sequenced (8 lambs; 3 sampling dates). Of the 145 taxa identified, 10 were affected (P ≤ 0.01) by both tolerance class and sampling day main effects, 12 were affected (P ≤ 0.01) by tolerance class only, and 8 were affected (P ≤ 0.01) by sampling day only. Results indicate a response in the rumen microbial population associated with high SO4 water. Key words: DNA, microbes, rumen, sheep, sulfate
INTRODUCTION As the most important nutrient, water is
involved directly or indirectly in almost every physiologic process that is essential to livestock’s well-being. In the western U.S., livestock frequently only have access to water sources that are less than ideal due to a combination of competition with urbanization and mineral extraction (Raisbeck et al., 2007). Ruminants are susceptible to health problems when high S content in water sources is encountered. The production of H2S has been established as the mechanism of S toxicity, initiated by SO4-reducing bacteria (e.g., Desulfovibrio and Desulfotomaculum) which typically also use lactate and SO4 as substrates. Generation of acetate and S2- from this process can diffuse into the blood stream across the rumen wall (Campbell and Postgate, 1965); additionally, H2S gas can be eructated and re-inhaled by the animal (Gould et al., 2002). Differences in individual animal ability to tolerant high dietary S has been demonstrated in beef cattle (Cammack et al., 2010). Furthermore, it has been proposed that the bacteria responsible for SO4 reduction are capable of adaptation to changing levels of dietary S (Cummings et al., 1995). Therefore, we hypothesized that rumen microbial profiles would differ between lambs divergent for tolerance to high SO4 water. Furthermore, we hypothesized that the rumen microbial profiles would be altered over the course of a high SO4 water regimen, potentially demonstrating an adaptation by the microbes to the high S environment. A better understanding of the relationship between dietary SO4 and rumen microbial profiles could potentially benefit livestock producers by determining a way to test for S tolerance that is quick and efficient.
MATERIALS AND METHODS
Animal Care All procedures were approved by
the University of Wyoming Animal Care and Use Committee. The lamb trial occurred July 27th to August 23rd, 2013, at the University of Wyoming’s Laramie
244
Research Extension Center. Hampshire and Hampshire-cross growing lambs (n = 43; average initial BW 48.76 ± 16.44 kg) were randomly allotted to individual pens in a confinement facility for a 28 d feed and water intake trial. Lambs were acclimated to the pelleted forage diet for 23 d prior to the start of the trial to allow for diet adjustment, and within this time allowed a 2 wk period to adjust to individual pens. All animals were administered the same forage-based pelleted diet (67.7% alfalfa and 27.5% wheat middlings; 16.2% CP, 36.3% NDF, 2.31 Mcal ME/kg, DM basis). Lambs were fed once daily, ad libitum, and orts were weighed back each morning. On d 0, 7, and 28, 2-d BW were collected and averaged.
Water Sulfate Prior to the high SO4 water administration, lambs were provided water from the research facility with 67 mg SO4/L. To create the desired level of 3,000 mg SO4/L for the high S water treatment, sodium sulfate was mixed daily with water from the research facility. The water mixture was tested daily during the first 2 wk of SO4 administration at the Wyoming Department of Agriculture Analytical Services (Laramie), and then every other day for the remainder of the study; actual levels over the duration of the study averaged 3043.89 ± 746.11 mg SO4 /L. This level of SO4 was chosen as previous experiments demonstrated that a level of 2,500 mg SO4/L did not elicit significant health and performance changes in lambs (Jons, 2011). Water was provided twice daily; disappearance was measured to determine lamb water intake. Evaporation was also monitored daily.
Animal Selection Following the SO4 water treatment, “tolerant” and “intolerant” lambs were identified using a 2-tier selection process. First, an ethogram (Table 1) was used to rate daily behavior during the 28 d trial. These daily behavior scores were averaged for each lamb, and lambs were ranked accordingly. Second, same sex lambs on each tail of the behavior score distribution were considered for selection as tolerant and intolerant, respectively, based on their sex and ADG in addition to similar behavior scores, ultimately resulting in four tolerant lambs (two male; two female) and four intolerant lambs (two male; two female).
Microbial DNA Sequencing. From the rumen fluid samples, DNA was extracted using methods detailed by Yu and Morrison (2004); 5 µg of DNA was sent to the University of Missouri (Columbia) DNA Core Facility for sequencing using 16 libraries of an Illumina HighSeq platform, with 4 libraries per lane. The resulting 100 base-pair, paired-end reads were filtered by truncating each read after the first run of 3 bases using a phred quality score < 15, quality-trimmed by omitting reads with < 85 base pairs or a quality score of < 25, and compared with a database of 27K known 16S rDNA genes using the Bowtie reference-
based assembly tool (Johns Hopkins, Baltimore, MD). For the read sequence and the database sequence to match, they were required to have ≥ 97% identity. Operational taxonomic units (OTU) were defined as sequence clusters with ≥ 97% identity. Statistical Analysis. A generalized linear model was fitted using the GENMOD procedure of SAS to determine the effects of tolerance class and sampling day on OTU abundance assuming a Poisson distribution; α = 0.01 was considered statistically significant to minimize Type I errors for low count data. Raw P-values from the Poisson regression were corrected for multiple tests using the false-discovery rate correction of Benjamini and Hochberg (1995). Because means produced from the Poisson regression were non-normally distributed, treatment means were generated using the GLM procedure of SAS. Additionally, those OTU with a significant sampling day effect were further tested for linear and quadratic effects using orthogonal contrasts.
RESULTS AND DISCUSSION
A total of 145 OTUs were found in at least 1 of the 24 total samples that were sequenced (8 lambs; 3 sampling dates). Taxa with ≤ 5 counts (n = 42) for any one sample were considered to be sequencing artifacts (or potentially false positives) and eliminated. Of the remaining taxa (n = 103), 10 were affected (P ≤ 0.01) by both tolerance class and sampling day main effects (Table 2); 12 were affected (P ≤ 0.01) by tolerance class only (Table 3), and 8 were affected (P ≤ 0.01) by sampling day only (Table 4); taxa are listed in each table in order of abundance. Prevotella ruminicola was the most abundant taxa in all lambs, with a greater abundance (P ≤ 0.001) observed in tolerant lambs compared to intolerant lambs. Van Soest (1994) defined P. ruminicola as a carbohydrate fermenter that is able to utilize cellulose, hemicellulose, and pectin as well as starches, proteins, and sugars (both simple and complex) as dietary sources. As this species can utilize a wide variety of substrates, it tends to be a predominant species within the rumen (Carberry et al., 2012).
Of the multiple species of Prevotella identified in this study, P. micans, P. nanceiensis, and P. genomospecies (i.e. an unknown Prevotella species) were all affected (P ≤ 0.003) by both tolerance level and sampling day (Table 2). Of those species, both the unknown Prevotella species and P. micans demonstrated a quadratic effect (P ≤ 0.001), with abundance increasing from d 0 to d 7, but then decreasing by d 28; abundances of these Prevotella
245

were also lower in tolerant lambs. Alternatively, P. nanceiensis had a linear (P < 0.001) increase in abundance over time, and was also of greater (P < 0.001) abundance in tolerant lambs. Oscillibacter valericigenes, the microbe in greatest abundance following Prevotella ruminicola (see Table 4), was also affected by both tolerance classification (P < 0.001) and sampling day (P < 0.001). There was a linear decrease (P < 0.001) of this species over the sampling regimen, with greater (P ≤ 0.001) abundance overall in the intolerant lambs. All other species affected by both tolerance classification and sampling day had greater (P < 0.001) abundance in the tolerant lambs (Table 2).
Of those OTU affected only by tolerance classification, all but one were in greater (P ≤ 0.006) abundance in the tolerant lambs (Table 3). Of particular interest, Methanobrevibacter smithii was in greater (P = 0.001) abundance in tolerant lambs compared to intolerant lambs. Methanobrevibacter smithii is a methanogen-producing bacterium that exhibits symbiotic relationships with other rumen microbes, such as Ruminicoccus albus and R. flavefaciens (Rychlick and May, 2000). Similar to M. smithii, abundances of both R. albus (Table 2) and R. flavefaciens (Table 3) were greater (P ≤ 0.003) in tolerant lambs. Also of interest among those species affected by tolerance classification was Butyrivibrio hungatei, which was in greater (P = 0.006) abundance in tolerant lambs. This species, along with other Butyrivibrio species, has been commonly reported in ruminant literature regarding their ability to degrade cellulose (Ellison, 2013); however, its role in the response to high dietary S is difficult to speculate.
Finally, P. rumincola had a linear (P = 0.004) increase in abundance over sampling days; however, P. genomospecies and P. albensis increased in abundance only initially at d 7 (Table 4). Each Bacteroides capillosus, P. nigrescens, and Anaerovibrio lipolyticus demonstrated a quadratic effect (P ≤ 0.005). Little is understood regarding the function of these species in the rumen, and in particular their potential role in a high S environment is difficult to speculate.
IMPLICATIONS
Ruminants have a unique ability to reduce
SO4 within the rumen. Surveys of the western U.S. have demonstrated that livestock water sources frequently have SO4 in excess of 1000 mg/L, a level that can cause harm to ruminant animals through impaired health and performance. Although no
differences in S-reducing bacteria were apparent in the DNA sequencing data, the microbial differences that were observed could lead to a greater understanding of the relationship between the rumen microbiome and an individual’s ability to tolerate dietary S beyond that required for growth and maintenance. Variation in abundance of numerous microbial taxa corresponded to differences in individual S tolerance, as well as the time over which the high S water was administrated.
LITERATURE CITED
Benjamini, Y., and Y. Hochberg. 1995. Controlling the false discovery rate: A practical and powerful approach to multiple testing. J. Royal Statistical Society, Series B (Methodological) 57:289-300.
Cammack, K. M., C. L. Wright, K. J. Austin, P. S. Johnson, R. R. Cockrum, K. L. Kessler, and K. C. Olson. 2010. Effects of high-sulfur water and clinoptilolite on health and growth performance of steers fed forage-based diets. J. Anim. Sci. 88L1777-1785.
Carberry, C. A., D. A. Kenny, S. Han, M. S. McCabe, and S. M. Waters. 2012. Effect of phenotypic residual feed intake and dietary forage content on the rumen microbial community of beef cattle. Appl. Environ. Microbiol. 78(14):4949-4958.
Campbell, L. L. and J. R. Postgate. 1965. Classification of the spor-forming sulfate-reducing bacteria. Bacteriol. Rev. 29:359-363.
Cummings, B. A., D. R. Caldwell, D. H. Gould, and D. W. Hamar. 1995. Identity and interactions of rumen microbes associated with dietary sulfate-induced polioencephalomalacia in cattle. Am. J. Vet. Res. 56:1384-1389.
Ellison, M. J. 2013. Effects of diet and feed efficiency status on performance, carcass characteristics, and rumen microbial profiles in sheep. MS Thesis. University of Wyoming, Laramie.
Gould, D. H., D. A. Dargatz, F. B. Garry, D. W. Hamar, and P. F. Ross. 2002. Potentially hazardous sulfur sulfur conditions on beef cattle ranches in the United States. J. Am. Vet. Med. Assoc. 221:673-677.
Jons, A. M. 2011. Iron carbonate supplementation to prevent reduced performance and health of wethers administered high-sulfate water. MS Thesis. University of Wyoming, Laramie.
Raisbeck, M. F., S. L. Riker, C. M. Tate, R. Jackson, M. A. Smith, K. J. Reddy, and J. R. Zygmunt. 2007. A review of the literature pertaining to health effects of inorganic contaminants. Water quality for Wyoming livestock & wildlife. UW AES Bulletin B-1183.
246
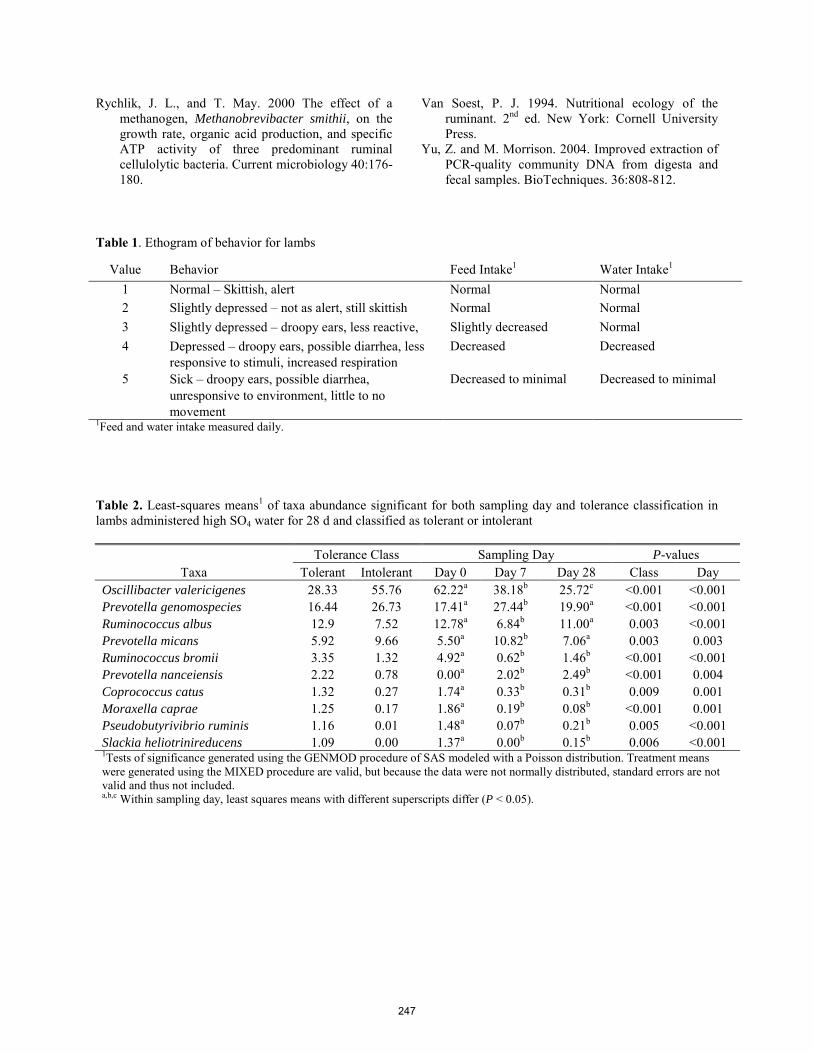
Rychlik, J. L., and T. May. 2000 The effect of a methanogen, Methanobrevibacter smithii, on the growth rate, organic acid production, and specific ATP activity of three predominant ruminal cellulolytic bacteria. Current microbiology 40:176-180.
Van Soest, P. J. 1994. Nutritional ecology of the ruminant. 2nd ed. New York: Cornell University Press.
Yu, Z. and M. Morrison. 2004. Improved extraction of PCR-quality community DNA from digesta and fecal samples. BioTechniques. 36:808-812.
Table 2. Least-squares means1 of taxa abundance significant for both sampling day and tolerance classification in lambs administered high SO4 water for 28 d and classified as tolerant or intolerant
Tolerance Class Sampling Day P-values
Taxa Tolerant Intolerant Day 0 Day 7 Day 28 Class Day Oscillibacter valericigenes 28.33 55.76 62.22a 38.18b 25.72c <0.001 <0.001 Prevotella genomospecies 16.44 26.73 17.41a 27.44b 19.90a <0.001 <0.001 Ruminococcus albus 12.9 7.52 12.78a 6.84b 11.00a 0.003 <0.001 Prevotella micans 5.92 9.66 5.50a 10.82b 7.06a 0.003 0.003 Ruminococcus bromii 3.35 1.32 4.92a 0.62b 1.46b <0.001 <0.001 Prevotella nanceiensis 2.22 0.78 0.00a 2.02b 2.49b <0.001 0.004 Coprococcus catus 1.32 0.27 1.74a 0.33b 0.31b 0.009 0.001 Moraxella caprae 1.25 0.17 1.86a 0.19b 0.08b <0.001 0.001 Pseudobutyrivibrio ruminis 1.16 0.01 1.48a 0.07b 0.21b 0.005 <0.001 Slackia heliotrinireducens 1.09 0.00 1.37a 0.00b 0.15b 0.006 <0.001 1Tests of significance generated using the GENMOD procedure of SAS modeled with a Poisson distribution. Treatment means were generated using the MIXED procedure are valid, but because the data were not normally distributed, standard errors are not valid and thus not included.
a,b,c Within sampling day, least squares means with different superscripts differ (P < 0.05).
Table 1. Ethogram of behavior for lambs
Value Behavior Feed Intake1 Water Intake1
1 Normal – Skittish, alert Normal Normal 2 Slightly depressed – not as alert, still skittish Normal Normal 3 Slightly depressed – droopy ears, less reactive,
ll Slightly decreased Normal
4 Depressed – droopy ears, possible diarrhea, less responsive to stimuli, increased respiration
Decreased Decreased
5 Sick – droopy ears, possible diarrhea, unresponsive to environment, little to no movement
Decreased to minimal Decreased to minimal
1Feed and water intake measured daily.
247

Table 3. Least-squares means1 of taxa abundance significant for tolerance classification in lambs administered high SO4 water for 28 d and classified as tolerant or intolerant Tolerance Class
Taxa Tolerant Intolerant P-values Methanobrevibacter smithii 17.76 12.40 0.001 Fibrobacter succinogenes 12.05 4.12 <0.001 Ruminococcus flavefaciens2 10.43 5.41 <0.001 Butyrivibrio hungatei 3.59 1.74 0.006 Ruminococcus bromii 3.11 1.31 0.002 Prevotella melaninogenica 3.00 0.42 <0.001 Paraprevotella clara 0.40 1.68 0.004 Olsenella uli 1.36 0.47 0.010 Ruminococcus flavefaciens2 1.40 0.18 <0.001 Ruminococcus torques 0.98 0.10 0.003 Gracilibacter thermotolerans 0.93 0.07 0.003 Roseburia intestinalis 0.74 0.10 0.001
1Tests of significance generated using the GENMOD procedure of SAS modeled with a Poisson distribution. Treatment means were generated using the MIXED procedure are valid, but because the data were not normally distributed, standard errors are not valid and thus not included. 2Microbiota with the same name are different unknown species within a genus or unknown subspecies within a species
Table 4. Least-squares means1 of taxa abundance significant for sampling day in lambs administered high SO4 water for 28 d and classified as tolerant or intolerant
Sampling Day
Taxa d 0 d 7 d 28 P-values Prevotella ruminicola 125.85a 166.96b 178.69b <0.001 Prevotella genomospecies 8.75a 13.98b 13.52b 0.001 Prevotella albensis 3.05a 5.04b 5.66b 0.004 Calycanthus floridus 5.44a 2.05b 4.63a 0.002 Bacteroides capillosus 6.17a 1.46b 2.00b <0.001 Prevotella nigrescens 1.51ab 2.33a 0.53b 0.004 Anaerovibrio lipolyticus 0.21a 2.00b 1.79b <0.001 Butyrivibrio fibrisolvens 2.08a 1.01ab 0.16b 0.001 1Tests of significance generated using the GENMOD procedure of SAS modeled with a Poisson distribution. Treatment means were generated using the MIXED procedure are valid, but because the data were not normally distributed, standard errors are not valid and thus not included. a,bLeast squares means with different superscripts differ (P < 0.05).
248
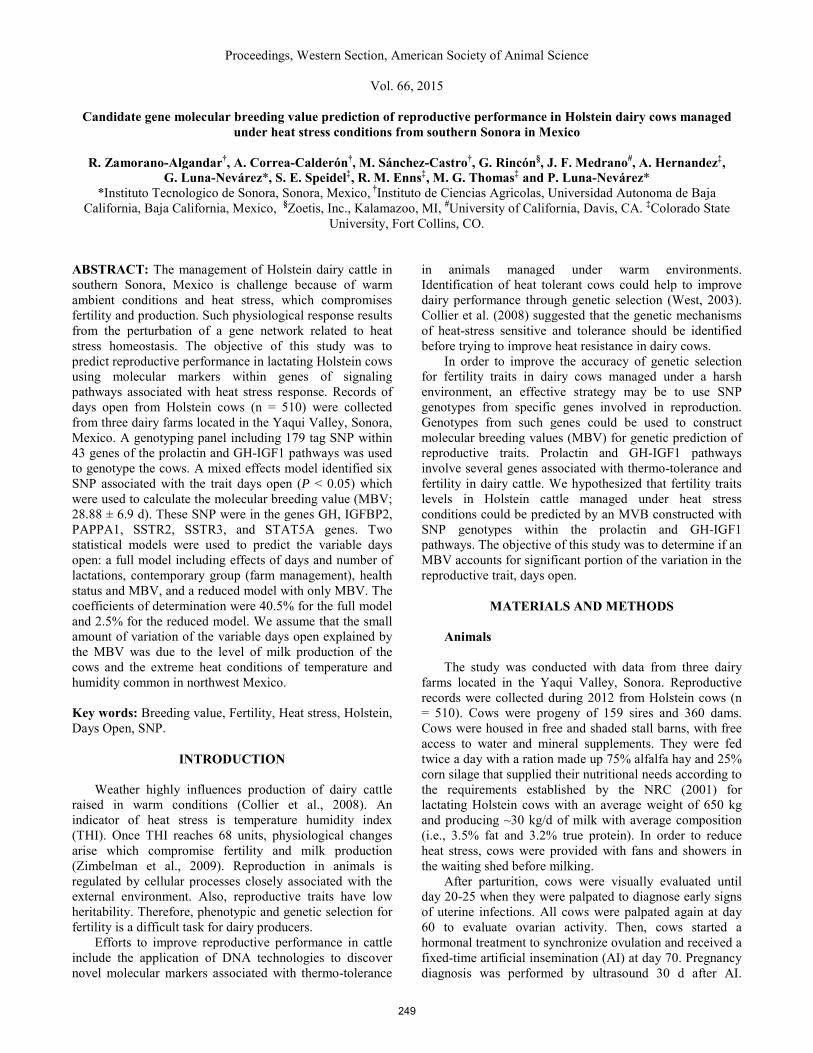
Proceedings, Western Section, American Society of Animal Science
Vol. 66, 2015
Candidate gene molecular breeding value prediction of reproductive performance in Holstein dairy cows managed under heat stress conditions from southern Sonora in Mexico
R. Zamorano-Algandar†, A. Correa-Calderón†, M. Sánchez-Castro†, G. Rincón§, J. F. Medrano#, A. Hernandez‡,
G. Luna-Nevárez*, S. E. Speidel‡, R. M. Enns‡, M. G. Thomas‡ and P. Luna-Nevárez* *Instituto Tecnologico de Sonora, Sonora, Mexico, †Instituto de Ciencias Agricolas, Universidad Autonoma de Baja
California, Baja California, Mexico, §Zoetis, Inc., Kalamazoo, MI, #University of California, Davis, CA. ‡Colorado State University, Fort Collins, CO.
ABSTRACT: The management of Holstein dairy cattle in southern Sonora, Mexico is challenge because of warm ambient conditions and heat stress, which compromises fertility and production. Such physiological response results from the perturbation of a gene network related to heat stress homeostasis. The objective of this study was to predict reproductive performance in lactating Holstein cows using molecular markers within genes of signaling pathways associated with heat stress response. Records of days open from Holstein cows (n = 510) were collected from three dairy farms located in the Yaqui Valley, Sonora, Mexico. A genotyping panel including 179 tag SNP within 43 genes of the prolactin and GH-IGF1 pathways was used to genotype the cows. A mixed effects model identified six SNP associated with the trait days open (P < 0.05) which were used to calculate the molecular breeding value (MBV; 28.88 ± 6.9 d). These SNP were in the genes GH, IGFBP2, PAPPA1, SSTR2, SSTR3, and STAT5A genes. Two statistical models were used to predict the variable days open: a full model including effects of days and number of lactations, contemporary group (farm management), health status and MBV, and a reduced model with only MBV. The coefficients of determination were 40.5% for the full model and 2.5% for the reduced model. We assume that the small amount of variation of the variable days open explained by the MBV was due to the level of milk production of the cows and the extreme heat conditions of temperature and humidity common in northwest Mexico. Key words: Breeding value, Fertility, Heat stress, Holstein, Days Open, SNP.
INTRODUCTION
Weather highly influences production of dairy cattle raised in warm conditions (Collier et al., 2008). An indicator of heat stress is temperature humidity index (THI). Once THI reaches 68 units, physiological changes arise which compromise fertility and milk production (Zimbelman et al., 2009). Reproduction in animals is regulated by cellular processes closely associated with the external environment. Also, reproductive traits have low heritability. Therefore, phenotypic and genetic selection for fertility is a difficult task for dairy producers.
Efforts to improve reproductive performance in cattle include the application of DNA technologies to discover novel molecular markers associated with thermo-tolerance
in animals managed under warm environments. Identification of heat tolerant cows could help to improve dairy performance through genetic selection (West, 2003). Collier et al. (2008) suggested that the genetic mechanisms of heat-stress sensitive and tolerance should be identified before trying to improve heat resistance in dairy cows.
In order to improve the accuracy of genetic selection for fertility traits in dairy cows managed under a harsh environment, an effective strategy may be to use SNP genotypes from specific genes involved in reproduction. Genotypes from such genes could be used to construct molecular breeding values (MBV) for genetic prediction of reproductive traits. Prolactin and GH-IGF1 pathways involve several genes associated with thermo-tolerance and fertility in dairy cattle. We hypothesized that fertility traits levels in Holstein cattle managed under heat stress conditions could be predicted by an MVB constructed with SNP genotypes within the prolactin and GH-IGF1 pathways. The objective of this study was to determine if an MBV accounts for significant portion of the variation in the reproductive trait, days open.
MATERIALS AND METHODS
Animals The study was conducted with data from three dairy
farms located in the Yaqui Valley, Sonora. Reproductive records were collected during 2012 from Holstein cows (n = 510). Cows were progeny of 159 sires and 360 dams. Cows were housed in free and shaded stall barns, with free access to water and mineral supplements. They were fed twice a day with a ration made up 75% alfalfa hay and 25% corn silage that supplied their nutritional needs according to the requirements established by the NRC (2001) for lactating Holstein cows with an average weight of 650 kg and producing ~30 kg/d of milk with average composition (i.e., 3.5% fat and 3.2% true protein). In order to reduce heat stress, cows were provided with fans and showers in the waiting shed before milking.
After parturition, cows were visually evaluated until day 20-25 when they were palpated to diagnose early signs of uterine infections. All cows were palpated again at day 60 to evaluate ovarian activity. Then, cows started a hormonal treatment to synchronize ovulation and received a fixed-time artificial insemination (AI) at day 70. Pregnancy diagnosis was performed by ultrasound 30 d after AI.
249

Calving interval was calculated as the days between two consecutive calving. A gestation period (i.e. 282 d) was subtracted from calving interval to calculate the variable days open.
The California test (Laboratorios Sanfer, S.A. de C.V., Obregon, Mexico) was used monthly to test cows for subclinical mastitis. Animals diagnosed with clinical mastitis were not included in this study. Records of health status (i.e. clinical mastitis and/or uterine infection) were collected for all the cows and used as a categorical variable coded as 0 for no diseases and 1 for any disease diagnose. Records of milk production were collected daily using an electronic system (Metatron 21, Westfalia Surge). Milk production data were adjusted to 305 days of lactation.
Ambient temperature (T, °C) and relative humidity (RH, %) data were collected from a nearby (~ 500 m) climatic station and used to calculate temperature-humidity index according to the formula described by Mader (2006). Summary statistics for the variables used in this study were calculated and presented in Table 1.
SNP Association Study Blood samples (3 mL) were collected by venipuncture
using disposable sterile syringes. Five drops of whole blood were spotted on nucleic acid (FTA) cards. Whole blood was eluted from the FTA cards and DNA was extracted and quantified at GeneSeek lab prior to genotyping assays.
As result from re-sequencing, forty-three candidate genes within the prolactin and GH-IGF1 pathways were selected based on their physiological functions related to thermos-tolerance, milk production and fertility (Collier et al., 2008). Such analyses allowed the construction of a 179 tag SNP panel. These SNP were genotyped in 510 Holstein cows using the Sequenom MassArray platform (GeneSeek, Inc., Lincoln, NE).
Genotype to phenotype association analyses were conducted using a mixed effects model (PROC MIXED; SAS 9.4). The statistical model was:
yijklm = µ + Ai + Bj + Ck + Dl + Em + Fn + eijklm
This model included phenotype (i.e. days open) as the response variable, SNP genotype, number of lactations, farm management and health status as fixed terms, lactation days as a covariate, and sire as a random term. It also included the random residual effects. Effect of the average allele substitution was calculated by regressing the phenotype on the number of copies of each significant polymorphism allele as a covariate (Falconer and Mackay, 1996).
MBV Estimation The MBV of the Holstein cows were calculated by
summing the additive genotype effect for each SNP that showed a significant (P < 0.05) association with the variable days open. The calculation of the MBV was performed using the Animal Breeder Tool Kit (ABTK) (Colorado State University, Fort Collins, CO). The model to calculate MBV was:
MBVk= ∑
m W
ik ĝi
Given a specific set of SNP from the kth validation candidate, the MBVk was computed as in which Wik and ĝi are the recoded genotype and the estimated SNP effect at the ith locus, respectively, and m is the total number of selected SNP markers (Akanno et al., 2014).
Models and Parameter Estimation The PROC CORR procedure in SAS was used to
calculate correlations between the variable open days and continuous variables including: days of lactation, number of lactations, age, number of AI services, and MBV. The PROC MIXED procedure was used to calculate a regression model which included the MBV previously calculated as a continuous variable in to the model. The model was:
𝑌 = 𝜇 + 𝑋𝐷𝐼𝑀𝛽𝐷𝐼𝑀 + 𝑋𝑀𝐵𝑉𝛽𝑀𝐵𝑉 + 𝑋𝐿𝑎𝑐.𝑛𝛽𝐿𝑎𝑐.𝑛+ 𝑋𝐻.𝑠𝑡𝑎𝑡𝛽𝐻.𝑠𝑡𝑎𝑡 + 𝑋𝐶𝐺𝛽𝐶𝐺 + 𝑒
where Y was define as the dependent variable of days open, μ was the population mean, 𝑋𝐷𝐼𝑀 was the covariate for days in milk, 𝛽𝐷𝐼𝑀 was the slope for the variable days in milk, 𝑋𝑀𝐵𝑉 was the covariate for MBV, 𝛽𝑀𝐵𝑉 was the slope for the variable MBV, 𝑋𝐿𝑎𝑐.𝑛𝛽𝐿𝑎𝑐.𝑛, 𝑋𝐻𝑠𝑡𝑎𝑡𝛽𝐻𝑠𝑡𝑎𝑡, 𝑋𝐶𝐺𝛽𝐶𝐺 were the incidence matrixes for the categorical variables number of lactations, health status and contemporary group (farm management) with vectors for fixed effects respectively and e was the vector of residual effect or error term.
A reduced model was constructed with days open as dependent variable and the MBV as an independent variable. The model was:
𝑌 = 𝜇 + 𝑋𝑀𝐵𝑉𝛽𝑀𝐵𝑉 + 𝑒 where Y was defined as the dependent variable days open, μ was the population mean, 𝑋𝑀𝐵𝑉 was the covariate for MBV and 𝛽𝑀𝐵𝑉 was the slop for the variable MBV, and e was the vector of residual effect or error term.
RESULTS AND DISCUSSION
Milk records indicated high production after calving that decreased in late spring and early summer. Values of THI indicated that the cows were potentially heat stressed since March until November of 2012, varying from mild-moderate (72-79 units) to moderate-severe stress (80-89 units) (Zimbelman et al., 2009).
SNP Association Six SNP within 5 genes resulted as predictors (P <
0.05) of days open (Table 2). These genes were growth hormone (GH), the insulin-like growth factor binding protein 2 (IGFBP-2), the pregnancy-associated plasma protein A1 (PAPP-A1), the somatostatin receptor 2 and 3
i=1
250

(SSTR2, SSTR3), and the signal transducer and activator of transcription 5A (STAT5A).
Several SNP have been associated with fertility in dairy cows. Two SNP within the GH and the GHR genes were associated to days open, calving interval and first-service pregnancy rate (Mullen et al., 2011; Waters et al., 2011), as both genes regulate hepatic synthesis and secretion of IGF1. A SNP within the PAPP-A2 gene was a predictor of reproductive traits such as days open, calving interval, and number of services per conception (Siqueiros, 2013). Three SNP within the PAPP-A2 gene were reported to be associated with fertility traits such as age at first and second calving in thermos-tolerant beef cattle breeds (Luna-Nevarez et al., 2012). Other SNP markers have been associated with fertility in dairy cows. Among these are SNP related to fertilization and sire conception rate (i.e. STAT5; Khatib et al, 2008), superovulatory response (FSHR; Yang et al., 2010), and twining rate (IGF1; Kim et al., 2009).
Other genes in this study, the somatostatin receptor type 2 and 3 (SSTR2, 3) and the insulin-like growth factor binding protein 2 (IGFBP-2), were also associated with fertility traits. Both genes are associated with IGF1 bioavailability in blood circulation that may explain its relationship to days open in the current study.
Models and Correlations The full model contained several significant predictors
of days open, and it had an r2 of 40.5%. The reduced model that only included the MBV as independent variable had an r2 of 2.5%. In the current study, the MBV had a weak positive correlation with the days open and other variables (Table 3). Cochran et al. (2013) genotyped for 434 candidate SNP using the Sequenom MassARRAY platform and they found a total of 40 SNP associated with heifer and cow pregnancy rates. They proposed that one possible way to increase the accuracy of genetic predictions for fertility traits involves more dense SNP panels that would allow identification of more causative SNP.
Our findings support the hypothesis of this study because the MBV predicted some of the variation of the variable days open in Holstein cows managed under heat stress conditions, which was influenced by the low number of SNP used to calculate the MBV. We assumed that a combined effect of cow milk production level and heat stress environmental conditions also affected the MBV.
IMPLICATIONS
Genetic selection for fertility traits in Holstein dairy
cattle managed under heat stress conditions could be improved through marker assisted selection. In this study, genotypes within the prolactin and GH-IGF1 pathways genes allowed to construct an MBV, yet it was weakly associated with days open. However, more dense SNP information will needed in order to improve the power of genetic predictions for fertility traits in lactating dairy cows managed under harsh environmental conditions.
LITERATURE CITED
Akanno, E. C., G. Plastow., B. W. Woodward., S. Bauck, H. Okut, X-L. Wu, C. Sun., J. L. Aalhus, S. S. Moore, S. P. Miller, Z. Wang, and J. A. Basarab. 2014. Reliability of molecular breeding values for Warner-Bratzler shear force and carcass traits of beef cattle - An independent validation study. J. Anim. Sci.,92:2896-2904.
Cochran, S. D., J. B. Cole, D.J. Null, and P. J. Hansen. 2013. Discovery of single nucleotide polymorphisms in candidate genes associated with fertility and production traits in Holstein cattle. Genetics 14:49-72.
Collier, R. J., J. L. Collier, R. P. Rhoads, and L. H. Baumgard. 2008. Invited Review: Genes Involved in the Bovine Heat Stress Response. J. Dairy Sci. 91:445–454.
Falconer, D. S. and T. C. F. McKay. 1996. Introduction to quantitative genetics. 4th Ed. Longman Scientific and Technical, New York, NY.
Khatib, H., R. L. Monson, V. Schutzkus, D. M. Kohl, G. J. Rosa, and J. J. Rutledge. 2008. Mutations in the STAT5A gene are associated with the embryonic survival and milk composition in cattle. J. Dairy sci. 91:784-793.
Kim, E. S., X. Shi, O. Cobanoglu, K. Weigel P. J. Berger, and B. W. Kirkpatrick. 2009. Refined mapping of twinning-rate quantitative trait loci on bovine chromosome 5 and analysis of insulin-like growth factor-1 as a positional candidate gene. J. Anim. Sci. 87:835–843.
Luna-Nevarez, P., G. Rincon, J. F. Medrano, D. G. Riley, C. C. Chase, S. W. Coleman, K. L. DeAtley, A. T. Islas, G. A. Silver, and M. G. Thomas. 2012. Identification of one polymorphism from the PAPP-A2 gene associated to fertility in Romosinuano beef heifers raised under a subtropical environment. Rev. Mex. Cienc. Pecu. 3:185-200.
Mader, T. L., M. S. Davis, and T. Brown-Brandl. 2006. Environmental factors influencing heat stress in feedlot cattle. J. Anim. Sci. 84:712–719.
Mullen, M. P., C. O. Lynch, S. M. Waters, D. J. Howard, P. O. Boyle, D. A. Kenny, F. Bickley, B. Horan, and M. G. Diskin. 2011. Single nucleotide polymorphisms in the growth hormone and insulin-like growth factor-1 genes are associated with milk production, body condition score and fertility traits in dairy cows. Gen. Mol. Res. 10:1819-1830.
Siqueiros, M. A. 2013. Association of PAPP-A2 gene to production and fertility in Holstein cows managed under warn conditions. Ms.C. Thesis. Technological Institute of Sonora, Mexico.
Waters, S. M., M. S. McCabe, D. J. Howard, L. Giblin, D. A. Magee, D. E. MacHugh, and D. P. Berry. 2011. Association between newly discovered polymorphisms in the Bos taurus growth hormone receptor gene and performance traits in Holstien-Friesian dairy cattle. Anim. Genet. 42:39-49.
West, J. W. 2003. Effects of heat-stress on production in dairy cattle. J. Dairy Sci. 86:2131-2144.
251
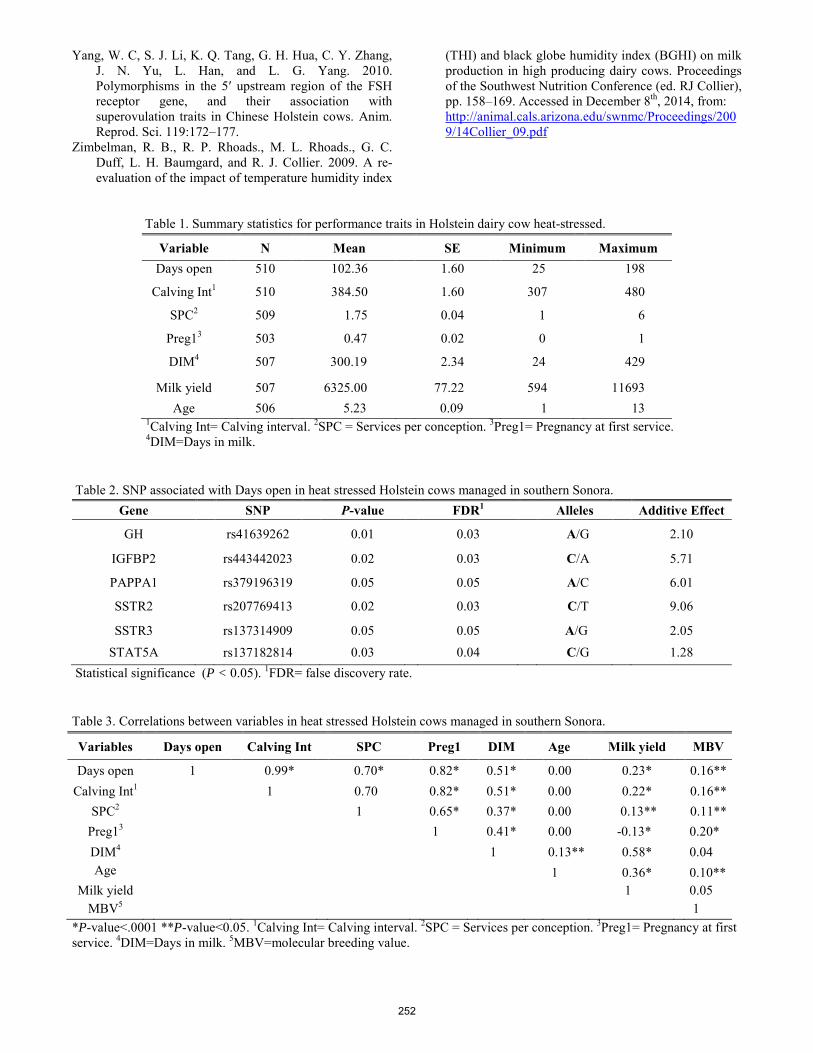
Yang, W. C, S. J. Li, K. Q. Tang, G. H. Hua, C. Y. Zhang, J. N. Yu, L. Han, and L. G. Yang. 2010. Polymorphisms in the 5′ upstream region of the FSH receptor gene, and their association with superovulation traits in Chinese Holstein cows. Anim. Reprod. Sci. 119:172–177.
Zimbelman, R. B., R. P. Rhoads., M. L. Rhoads., G. C. Duff, L. H. Baumgard, and R. J. Collier. 2009. A re-evaluation of the impact of temperature humidity index
(THI) and black globe humidity index (BGHI) on milk production in high producing dairy cows. Proceedings of the Southwest Nutrition Conference (ed. RJ Collier), pp. 158–169. Accessed in December 8th, 2014, from: http://animal.cals.arizona.edu/swnmc/Proceedings/2009/14Collier_09.pdf
Table 1. Summary statistics for performance traits in Holstein dairy cow heat-stressed.
Variable N Mean SE Minimum Maximum Days open
510
102.36
1.60
25
198
Calving Int1
510
384.50
1.60
307
480
SPC2
509
1.75
0.04
1
6
Preg13
503
0.47
0.02
0
1
DIM4
507
300.19
2.34
24
429
Milk yield 507 6325.00 77.22 594 11693 Age
506 5.23 0.09 1 13
1Calving Int= Calving interval. 2SPC = Services per conception. 3Preg1= Pregnancy at first service. 4DIM=Days in milk.
Table 2. SNP associated with Days open in heat stressed Holstein cows managed in southern Sonora.
Statistical significance (P < 0.05). 1FDR= false discovery rate. Table 3. Correlations between variables in heat stressed Holstein cows managed in southern Sonora.
*P-value<.0001 **P-value<0.05. 1Calving Int= Calving interval. 2SPC = Services per conception. 3Preg1= Pregnancy at first service. 4DIM=Days in milk. 5MBV=molecular breeding value.
Gene SNP P-value FDR1 Alleles Additive Effect GH rs41639262 0.01 0.03 A/G 2.10 IGFBP2 rs443442023 0.02 0.03 C/A 5.71 PAPPA1 rs379196319 0.05 0.05 A/C 6.01 SSTR2 rs207769413 0.02 0.03 C/T 9.06 SSTR3 rs137314909 0.05 0.05 A/G 2.05 STAT5A rs137182814 0.03 0.04 C/G 1.28
Variables Days open Calving Int SPC Preg1 DIM Age Milk yield MBV
Days open 1 0.99* 0.70* 0.82* 0.51* 0.00 0.23* 0.16** Calving Int1
1 0.70 0.82* 0.51* 0.00 0.22* 0.16** SPC2
1 0.65* 0.37* 0.00 0.13** 0.11** Preg13
1 0.41* 0.00 -0.13* 0.20* DIM4
1 0.13** 0.58* 0.04 Age
1 0.36* 0.10** Milk yield 1 0.05
MBV5 1
252
ENVIRONMENTAL & LIVESTOCK MANAGEMENT

Proceedings, Western Section, American Society of Animal Science
Vol. 66, 2015
Short and long-term forensic evaluation of cattle brand burn scar healing.
D. R. Tolleson and D. W. Schafer.
V Bar V Ranch Agriculture Experiment Station, University of Arizona, Camp Verde.
ABSTRACT: Hot-iron branding is a traditional form of permanent cattle identification in the western US. There is a need for science-based determination of cattle brand age. Near infrared reflectance spectroscopy (NIRS) has been used by medical and forensic scientists to obtain information about animal tissues and healing processes. We applied height-width allometry and NIRS to hot-iron cattle brand scars in an effort to determine if either or both of these methods can be used to non-invasively establish the interval since application of hot-iron cattle brands or segments thereof. In Trial 1 we measured the length (5.7 cm) and width (4.5 cm) of the upper half of the V Bar V brand as routinely applied to calves (~30 to 60 d old) and then obtained the same measurements on brands from 118 animals of known age (~ 2 to 8 yr old). Brand length and width increased over the original electric branding iron measurements by greater than 200% between calfhood application and 2 years of age. Brand size did not change dramatically between 2 and 6 years. In Trial 2 we collected visible and near infrared spectra (400 to 2500 nm) from 3 replicates of: a) branded b) non-clipped, non-branded, and c) clipped, non-branded, skin on 12, 25 ± 3 day-old Bos taurus calves (30 ± 4 kg) stratified by sex and coat color in May of 2014. We subsequently obtained spectra from these animals in June and October. NIRS discrimination of coat color was > 92% (P < 0.05) and > 70% for branding/clipping treatment (P < 0.05). Preliminary results indicate that brand size could be used to indicate brand age and that NIRS can discriminate between branded and non-branded tissue in cattle. More work will need to be done before the techniques can be used in real-world forensic applications. Key words: brand, cattle, near infrared spectroscopy
INTRODUCTION
Hot-iron branding is a traditional form of permanent cattle identification practiced in multiple cultures dating back centuries. In the US, approximately half of all cattle are identified in this manner and the practice is more prevalent (~80%) in the western states (USDA 2008). Although registered brands are considered to be an effective method of establishing ownership, theft can be facilitated by placing a mark on un-branded animals or by altering an existing brand. Arizona Department of Agriculture livestock inspectors (personal communication) have reported losing _________________________________________________________________________________ We would like to thank the respective staff members from the V Bar V Ranch Agriculture Experiment Station who contributed to this project. We would also like to extend appreciation to Lisa Gerber with Arizona Cooperative Extension for assistance in editing and final preparation of the manuscript.
legal cases in which visual inspection indicated that cattle brands had been altered from the original design or had been recently applied to mature cattle. In these instances, law enforcement officials did not have scientific data to document that the alleged altered portion of the brand was “newer” than the original brand or that a given brand had not grown to the size expected for mature cattle. Record high cattle prices are forecast to continue through 2022 (USDA 2013). If so, the incentive to steal animals will also continue to increase (NPR 2014).
The process of hot-iron branding results in a scar. Although it seems intuitive that a brand (scar) applied to cattle at an early age would change and grow in size with the animal, we could find no specific scientific documentation to that effect. In fact Bond et al. (2008) reported that “Despite the acknowledgment that the clinical characteristics of the scar change with time, there has been no formal description of this process in the literature.” Branding wounds take ≥ 8 wk to heal and cattle tend to show responses to wound palpation at least 10 wk after the procedure (Tucker et al. 2014).
The healing process subsequent to any disruption of cutaneous integrity involves inflammatory (1 to 3 d), proliferative (4 to 21 d), and remodeling (22 to 365 d) phases (Profyris et al. 2012). Scar maturation occurs at different rates for different ages in humans (Bond et al. 2008). Tissue hemoglobin oxygen saturation, total hemoglobin, and water content in porcine skin were all affected by burn injury and changed throughout the first 3 h post-burn (Sowa et al. 2001). Human mast cell populations change in scar tissue as it ages (Hermes et al. 2000). Rawlins et al. (2006) observed changes in collagen as burn scars mature and found an increase in the Type I/Type III collagen ratio compared to normal skin. The altered ratio is evident in a transformation of collagen from a basketweave arrangement to one of small parallel bundles. These authors also report that edema affects the orientation of collagen fibers as well and may contribute to the differences observed in young and old burn wounds. During the remodeling phase, due largely to the Type I/III collagen ratio, scar tissue becomes visibly different than normal or un-injured skin. Other contributing factors include loss of hair follicles and sebaceous glands (Profyris et al. 2012).
Rawlins et al. (2006) state that “…despite a great deal of research involving early burn wounds, few investigators have studied the histology of mature burn scars or burn scar contractures. To better understand how burn scars develop and mature with time, it would seem logical to study burn scars and burn scar contractures in their mature forms.” We agree with Rawlins et al. (2006)
253
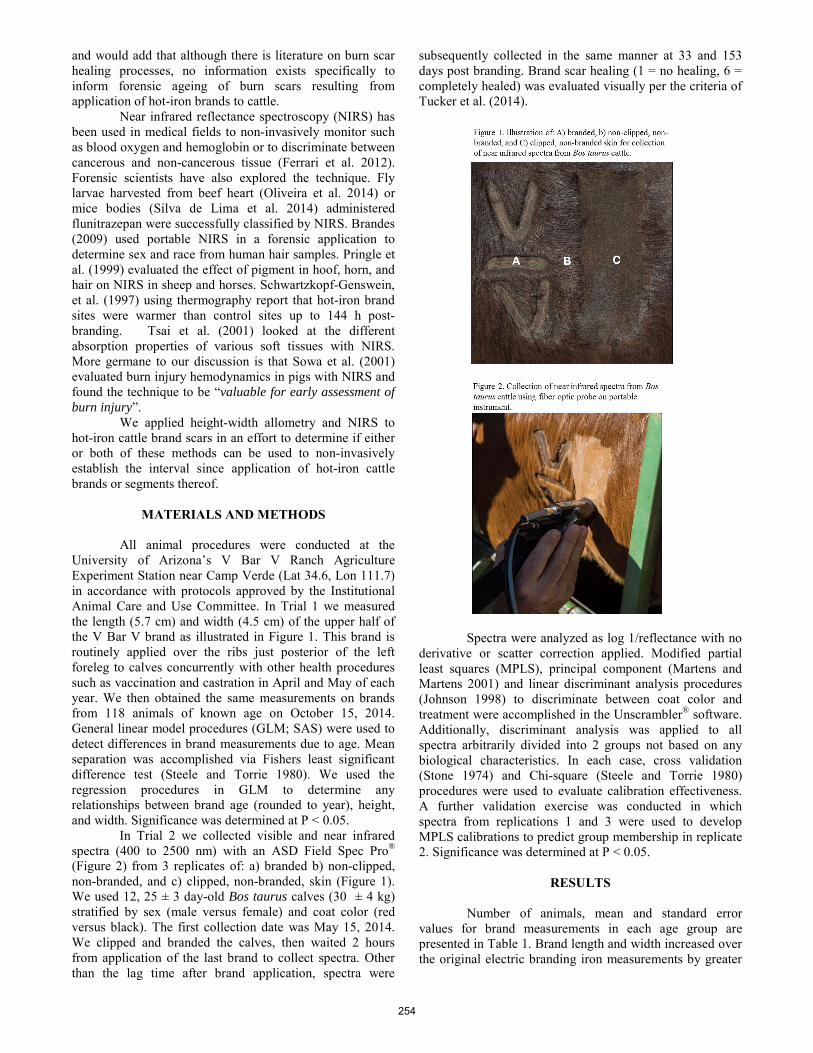
and would add that although there is literature on burn scar healing processes, no information exists specifically to inform forensic ageing of burn scars resulting from application of hot-iron brands to cattle.
Near infrared reflectance spectroscopy (NIRS) has been used in medical fields to non-invasively monitor such as blood oxygen and hemoglobin or to discriminate between cancerous and non-cancerous tissue (Ferrari et al. 2012). Forensic scientists have also explored the technique. Fly larvae harvested from beef heart (Oliveira et al. 2014) or mice bodies (Silva de Lima et al. 2014) administered flunitrazepan were successfully classified by NIRS. Brandes (2009) used portable NIRS in a forensic application to determine sex and race from human hair samples. Pringle et al. (1999) evaluated the effect of pigment in hoof, horn, and hair on NIRS in sheep and horses. Schwartzkopf-Genswein, et al. (1997) using thermography report that hot-iron brand sites were warmer than control sites up to 144 h post-branding. Tsai et al. (2001) looked at the different absorption properties of various soft tissues with NIRS. More germane to our discussion is that Sowa et al. (2001) evaluated burn injury hemodynamics in pigs with NIRS and found the technique to be “valuable for early assessment of burn injury”.
We applied height-width allometry and NIRS to hot-iron cattle brand scars in an effort to determine if either or both of these methods can be used to non-invasively establish the interval since application of hot-iron cattle brands or segments thereof.
MATERIALS AND METHODS
All animal procedures were conducted at the University of Arizona’s V Bar V Ranch Agriculture Experiment Station near Camp Verde (Lat 34.6, Lon 111.7) in accordance with protocols approved by the Institutional Animal Care and Use Committee. In Trial 1 we measured the length (5.7 cm) and width (4.5 cm) of the upper half of the V Bar V brand as illustrated in Figure 1. This brand is routinely applied over the ribs just posterior of the left foreleg to calves concurrently with other health procedures such as vaccination and castration in April and May of each year. We then obtained the same measurements on brands from 118 animals of known age on October 15, 2014. General linear model procedures (GLM; SAS) were used to detect differences in brand measurements due to age. Mean separation was accomplished via Fishers least significant difference test (Steele and Torrie 1980). We used the regression procedures in GLM to determine any relationships between brand age (rounded to year), height, and width. Significance was determined at P < 0.05.
In Trial 2 we collected visible and near infrared spectra (400 to 2500 nm) with an ASD Field Spec Pro® (Figure 2) from 3 replicates of: a) branded b) non-clipped, non-branded, and c) clipped, non-branded, skin (Figure 1). We used 12, 25 ± 3 day-old Bos taurus calves (30 ± 4 kg) stratified by sex (male versus female) and coat color (red versus black). The first collection date was May 15, 2014. We clipped and branded the calves, then waited 2 hours from application of the last brand to collect spectra. Other than the lag time after brand application, spectra were
subsequently collected in the same manner at 33 and 153 days post branding. Brand scar healing (1 = no healing, 6 = completely healed) was evaluated visually per the criteria of Tucker et al. (2014).
Spectra were analyzed as log 1/reflectance with no
derivative or scatter correction applied. Modified partial least squares (MPLS), principal component (Martens and Martens 2001) and linear discriminant analysis procedures (Johnson 1998) to discriminate between coat color and treatment were accomplished in the Unscrambler® software. Additionally, discriminant analysis was applied to all spectra arbitrarily divided into 2 groups not based on any biological characteristics. In each case, cross validation (Stone 1974) and Chi-square (Steele and Torrie 1980) procedures were used to evaluate calibration effectiveness. A further validation exercise was conducted in which spectra from replications 1 and 3 were used to develop MPLS calibrations to predict group membership in replicate 2. Significance was determined at P < 0.05.
RESULTS
Number of animals, mean and standard error values for brand measurements in each age group are presented in Table 1. Brand length and width increased over the original electric branding iron measurements by greater
254

than 200% between calfhood application and 2 years of age. Brand size did not change dramatically between 2 and 6 years, however, both height and width were significantly (P < 0.05) greater at 6 years of age. All spectra for each coat color and treatment group are presented in Figure 3. The first 3 principal component scores for each coat color and treatment group are presented in Figure 4. Differences in NIR spectra and principal component scores are visibly apparent for coat color and treatment. Percent correct group identifications from discriminant analyses are found in Table 2. Within a given date, discriminant calibrations were more successful (P < 0.05) in identifying spectra due to coat color and treatment than for arbitrary groupings. Within coat color, treatment, or the arbitrary grouping, there were no differences (P > 0.05) due to date.
The MPLS validation results are presented in Table 3. Coat color was significantly (P < 0.001) predicted with a moderate (RSQ ~0.80) degree of success. Treatment was also significantly predicted (P < 0.001) but at a lower correlation (~0.60). It is not known why results for the June collection date were different than May and October. Prediction of arbitrary grouping was unsuccessful (P > 0.1).
DISCUSSION
Our preliminary findings that brand scars increased
in size as the animals grew from calf to 2 years of age is consistent with observations in the industry. Our results also agree with Meyer et al. (2003) in which laceration scars on ostrich chicks measured at 14 months increased in size with time since injury. These authors observed that “Damage inflicted at a young age (one-month) generally resulted in larger scars at slaughter than damage inflicted at later ages, and particularly those inflicted at seven and 10 months of age. This suggests that scar development is closely linked with the overall growth of ostriches. A working hypothesis would be that scars grow in synchrony with the skin. Ostrich skin exhibits natural growth and development as the animal matures (Russel & Kohl, unpubl. report). Scar tissue on the skin will thus also exhibit growth as the animal matures, with large scars resulting from wounds inflicted at a young age. It was, however, impossible to substantiate this contention from the literature.” More observations with a greater variety of animals in a range of production and nutritional environments will be required to develop algorithms robust enough for practical forensic applications.
Burn scars change with age (Rawlins et al. 2006). In May, within hours of brand application, the overall visual brand healing score was 1. In June this had progressed to a range 3 to 5 and by October, all animals were at 6. Type III/Type I collagen ratios in undamaged human skin was 0.63 and 0.17 in mature burn scars. Near infrared spectroscopy detected hemodynamic changes in burned versus unburned porcine skin (Sowa et al. 2001). Here we demonstrate for the first time that near infrared spectra from cattle brand burn scars are different than unbranded skin through 153 days post application.
The discrimination due to coat color was as expected and provides an easily visual example of spectral differences from which to discuss the spectral differences observed for the clipping and branding treatment. Not surprising then is that these differences were maintained throughout the experiment. Coat color did not change, but some bleaching due to UV would be expected to occur in the southwestern US. There was, however, no drop off in successful coat color identifications in October.
It is also intuitive that on the day of brand application in May; spectral differences between clipped, non-clipped and branded tissue would be evident. This might be expected to be as much from the effect of physical characteristics (i.e. scatter) on the scanned areas as from biochemical (i.e. population of covalent bonds) characteristics. As the burn scars aged and healed, spectral differences, although not as dramatic as coat color, remained strong. It should be noted that the probe used in
255
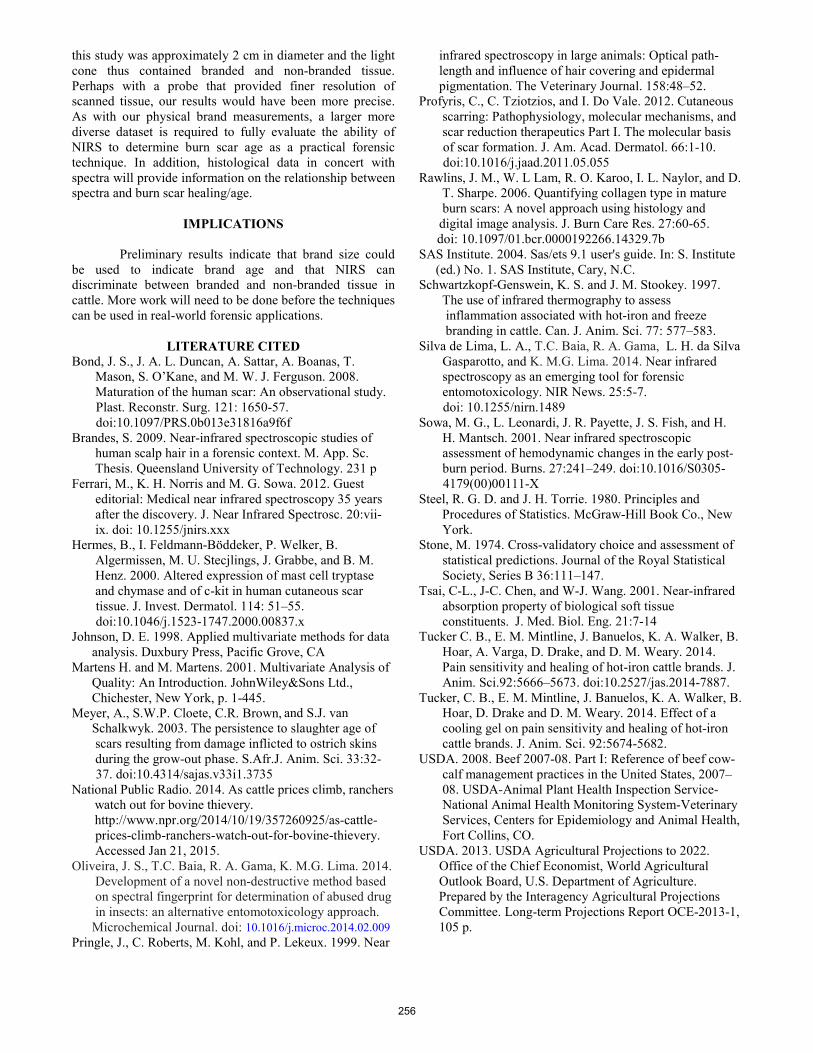
this study was approximately 2 cm in diameter and the light cone thus contained branded and non-branded tissue. Perhaps with a probe that provided finer resolution of scanned tissue, our results would have been more precise. As with our physical brand measurements, a larger more diverse dataset is required to fully evaluate the ability of NIRS to determine burn scar age as a practical forensic technique. In addition, histological data in concert with spectra will provide information on the relationship between spectra and burn scar healing/age.
IMPLICATIONS
Preliminary results indicate that brand size could
be used to indicate brand age and that NIRS can discriminate between branded and non-branded tissue in cattle. More work will need to be done before the techniques can be used in real-world forensic applications.
LITERATURE CITED
Bond, J. S., J. A. L. Duncan, A. Sattar, A. Boanas, T. Mason, S. O’Kane, and M. W. J. Ferguson. 2008. Maturation of the human scar: An observational study.
Plast. Reconstr. Surg. 121: 1650-57. doi:10.1097/PRS.0b013e31816a9f6f
Brandes, S. 2009. Near-infrared spectroscopic studies of human scalp hair in a forensic context. M. App. Sc. Thesis. Queensland University of Technology. 231 p Ferrari, M., K. H. Norris and M. G. Sowa. 2012. Guest editorial: Medical near infrared spectroscopy 35 years after the discovery. J. Near Infrared Spectrosc. 20:vii- ix. doi: 10.1255/jnirs.xxx Hermes, B., I. Feldmann-Böddeker, P. Welker, B. Algermissen, M. U. Stecjlings, J. Grabbe, and B. M. Henz. 2000. Altered expression of mast cell tryptase and chymase and of c-kit in human cutaneous scar
tissue. J. Invest. Dermatol. 114: 51–55. doi:10.1046/j.1523-1747.2000.00837.x
Johnson, D. E. 1998. Applied multivariate methods for data analysis. Duxbury Press, Pacific Grove, CA Martens H. and M. Martens. 2001. Multivariate Analysis of Quality: An Introduction. JohnWiley&Sons Ltd., Chichester, New York, p. 1-445. Meyer, A., S.W.P. Cloete, C.R. Brown,
and S.J. van
Schalkwyk. 2003. The persistence to slaughter age of scars resulting from damage inflicted to ostrich skins during the grow-out phase. S.Afr.J. Anim. Sci. 33:32-
37. doi:10.4314/sajas.v33i1.3735 National Public Radio. 2014. As cattle prices climb, ranchers watch out for bovine thievery. http://www.npr.org/2014/10/19/357260925/as-cattle- prices-climb-ranchers-watch-out-for-bovine-thievery. Accessed Jan 21, 2015. Oliveira, J. S., T.C. Baia, R. A. Gama, K. M.G. Lima. 2014. Development of a novel non-destructive method based on spectral fingerprint for determination of abused drug in insects: an alternative entomotoxicology approach. Microchemical Journal. doi: 10.1016/j.microc.2014.02.009 Pringle, J., C. Roberts, M. Kohl, and P. Lekeux. 1999. Near
infrared spectroscopy in large animals: Optical path- length and influence of hair covering and epidermal pigmentation. The Veterinary Journal. 158:48–52. Profyris, C., C. Tziotzios, and I. Do Vale. 2012. Cutaneous scarring: Pathophysiology, molecular mechanisms, and scar reduction therapeutics Part I. The molecular basis
of scar formation. J. Am. Acad. Dermatol. 66:1-10. doi:10.1016/j.jaad.2011.05.055
Rawlins, J. M., W. L Lam, R. O. Karoo, I. L. Naylor, and D. T. Sharpe. 2006. Quantifying collagen type in mature burn scars: A novel approach using histology and digital image analysis. J. Burn Care Res. 27:60-65.
doi: 10.1097/01.bcr.0000192266.14329.7b SAS Institute. 2004. Sas/ets 9.1 user's guide. In: S. Institute (ed.) No. 1. SAS Institute, Cary, N.C. Schwartzkopf-Genswein, K. S. and J. M. Stookey. 1997. The use of infrared thermography to assess inflammation associated with hot-iron and freeze branding in cattle. Can. J. Anim. Sci. 77: 577–583. Silva de Lima, L. A., T.C. Baia, R. A. Gama, L. H. da Silva Gasparotto, and K. M.G. Lima. 2014. Near infrared spectroscopy as an emerging tool for forensic entomotoxicology. NIR News. 25:5-7.
doi: 10.1255/nirn.1489 Sowa, M. G., L. Leonardi, J. R. Payette, J. S. Fish, and H. H. Mantsch. 2001. Near infrared spectroscopic assessment of hemodynamic changes in the early post- burn period. Burns. 27:241–249. doi:10.1016/S0305-
4179(00)00111-X Steel, R. G. D. and J. H. Torrie. 1980. Principles and Procedures of Statistics. McGraw-Hill Book Co., New York. Stone, M. 1974. Cross-validatory choice and assessment of statistical predictions. Journal of the Royal Statistical Society, Series B 36:111–147. Tsai, C-L., J-C. Chen, and W-J. Wang. 2001. Near-infrared absorption property of biological soft tissue constituents. J. Med. Biol. Eng. 21:7-14 Tucker C. B., E. M. Mintline, J. Banuelos, K. A. Walker, B. Hoar, A. Varga, D. Drake, and D. M. Weary. 2014. Pain sensitivity and healing of hot-iron cattle brands. J. Anim. Sci.92:5666–5673. doi:10.2527/jas.2014-7887. Tucker, C. B., E. M. Mintline, J. Banuelos, K. A. Walker, B. Hoar, D. Drake and D. M. Weary. 2014. Effect of a cooling gel on pain sensitivity and healing of hot-iron cattle brands. J. Anim. Sci. 92:5674-5682. USDA. 2008. Beef 2007-08. Part I: Reference of beef cow- calf management practices in the United States, 2007– 08. USDA-Animal Plant Health Inspection Service- National Animal Health Monitoring System-Veterinary Services, Centers for Epidemiology and Animal Health, Fort Collins, CO. USDA. 2013. USDA Agricultural Projections to 2022. Office of the Chief Economist, World Agricultural Outlook Board, U.S. Department of Agriculture. Prepared by the Interagency Agricultural Projections Committee. Long-term Projections Report OCE-2013-1, 105 p.
256

Table 1. The effect of age on size of hot-iron brands as applied to Bos taurus cattle.
Age (years) N Length (cm) Width (cm) NA NA 5.7 4.5 2 33 12.3 ± 0.2a 11.3 ± 0.3a 3 19 12.0 ± 0.3a 11.1 ± 0.3a 4 7 13.4 ± 0.7b 11.1 ± 0.6a 5 9 12.5 ± 0.7a 10.8 ± 0.7a 6 12 14.1 ± 0.5b 13.5 ± 0.9b >6 38 12.5 ± 0.3a,b 11.9 ± 0.4a,c a,b,c Means within a column with different superscripts differ, P < 0.05
Table 2. Effect of hair color, hair clipping or hot-iron branding treatment, and arbitrary grouping on discriminant
analysis using visible/near infrared spectra in Bos taurus cattle.
Percent Correct Identification
Color Treatment Arbitrary Grouping
Date Red Black Clipped Non-clipped Branded Odd Even
5/15/2014 0.96a 1.00a 0.94a 0.92a 0.92a 0.52b 0.52b
6/17/2014 0.92a 0.96a NA 0.70a 0.80a 0.47b 0.53b
10/15/2014 0.94a 0.98a 0.88a 0.82a 1.00a 0.68b 0.51b
a,b,c Values within a row with different superscripts differ, P < 0.05.
Table 3. Effect of hair color, hair clipping or hot-iron branding treatment, and arbitrary grouping on mutivariate calibration analysis applying replicates 1 and 3 to predict replicate 2 using visible/near infrared spectra in Bos taurus cattle.
Color Date RSQ SE Slope P
5/15/2014 0.82 0.21 0.85 < 0.001 6/17/2014 0.63 0.31 0.77 < 0.001 10/15/2014 0.93 0.13 0.91 < 0.001
Treatment
Date RSQ SE Slope P
5/15/2014 0.49 0.44 0.51 < 0.001 6/17/2014 0.94 0.14 1.01 < 0.001 10/15/2014 0.46 0.47 0.51 < 0.001
Arbitrary Grouping
Date RSQ SE Slope P
5/15/2014 0.04 0.12 0.04 > 0.1 6/17/2014 0.01 0.16 0.01 > 0.1 10/15/2014 0.01 0.06 0.01 > 0.1
257

Proceedings, Western Section, American Society of Animal Science
Vol. 66, 2015
Non-invasive detection of external parasites on free-ranging cattle in the Edwards Plateau region of Texas.
D. R. Tolleson*, P. D. Teel†, O. F. Strey†, S. D. Prince‡, J. P. Angerer‡, and C. A. Taylor Jr§
*School of Natural Resources and the Environment, University of Arizona, Camp Verde; †Texas A&M AgriLife Research, Department of Entomology, College Station; ‡ Texas A&M Agrilife Blackland Research and Extension Center, Temple; §
Texas A&M Agrilife Research Station, Sonora. ABSTRACT: Our objective was to evaluate the ability of fecal near infrared spectroscopy (FNIRS) as a non-invasive external parasite detection method for free-ranging cattle during central Texas winter conditions. Parasitism is a well recognized problem for the livestock industry. Documented effects include loss of animal productivity and disease transmission. Collateral effects include cost of detection, treatment, and regulatory measures. Acaricide treatment applied without regard to timing of the parasite life-cycle or level of infestation is inefficient and may contribute to drug resistance. Thirteen mature crossbred beef cows grazing native range pastures from November 2005 to March 2006 were allocated by weight, body condition and pregnancy/lactation status to either receive one topical treatment with Cylence® (20 ml per animal, n = 7) or to serve as untreated controls (n = 6). Presence of external parasites was estimated visually by an experienced technician at the time of acaricide treatment in late November and then approximately monthly thereafter. Fecal grab samples were collected at the time of parasite inspection. Infrared spectra (1100 to 2500nm) were obtained on fecal samples. Differences in total parasite counts and diet crude protein between treatment groups were detected using MIXED model procedures. Discriminant equations to determine group membership were developed using a two-block partial least squares procedure. Both groups had approximately 20 total parasites per animal at first inspection. Fewer (P < 0.05) parasites were observed subsequently and acaricide-treated animals generally had fewer (P < 0.05) parasites than controls at each sampling date thereafter. The proportion of correct treatment group identifications via FNIRS discriminant equations numerically (P > 0.1) increased post-acaricide treatment and then generally declined with time. Similarly, FNIRS discriminant equation RSQ increased then declined from November to March while SEC and SECV decreased, then increased. Fecal NIRS can be used to monitor external parasitism on free-ranging cattle and could contribute to early warning systems for Cattle Fever Ticks, Integrated Pest Treatment protocols, and as part of an overall grazing animal nutrition and health management program. ________________________________________________ We would like to thank staff members from the Grazingland Animal Nutrition Laboratory, the Tick Research Laboratory, and the Sonora Research Station of Texas A&M University. We would also like to extend appreciation to Lisa Gerber with Arizona Cooperative Extension for assistance in editing and final preparation of the manuscript.
Key words: acaricide, Edwards Plateau, external parasite burden, fecal near infrared spectroscopy, free-ranging cattle, Integrated Pest Management
INTRODUCTION
External parasitism is a well recognized problem
for the livestock industry. Documented effects on animal agriculture include loss of productivity and disease transmission. Collateral effects include cost of detection, treatment, and regulatory measures. For instance, outbreaks of cattle fever ticks (CFT; Boophilus microplus and Boophilus annulatus) occurred in Texas in 2009, resulting in the quarantine of cattle on 1.1 million acres for 2 years (Perez de Leon et al. 2012). The CFT species are responsible for carrying bovine babesiosis; historically known as “Texas Fever”. In addition to direct effects on livestock producers, economic impacts of these recent outbreaks were sustained in banking, retail, and real estate markets of south Texas communities. Regulatory costs alone exceeded $25 million. Estimated per-cow costs of a 9-month quarantine with associated treatment and prophylactic measures for a simulated outbreak in the central region of Texas were greater than the value of an individual animal (Anderson et al. 2010). Non-invasive early detection techniques would not only enhance triage efforts to more efficiently target and allocate resources during such outbreaks, but perhaps also help reduce their occurrence and severity.
Unfortunately, anti-parasite treatments are often opportunistically administered to free-ranging livestock when the animals are gathered for other routine management procedures. While this is a sound practice logistically, if done without regard to timing of the parasite life-cycle or level of infestation, such treatments may contribute to drug resistance (Whalon et al. 2008). If so, such practices are not only wasteful and ineffective, but irresponsible. Similar to the reasoning behind enhanced disease surveillance, non-invasive parasite detection methods should be developed in an effort to streamline and target the use of acaricides for both economic and environmental reasons.
Non-invasive discrimination between groups of livestock with and without a tick burden has been accomplished with near infrared spectroscopy of feces (FNIRS; Tolleson et al. 2007). Species-specific differences
258
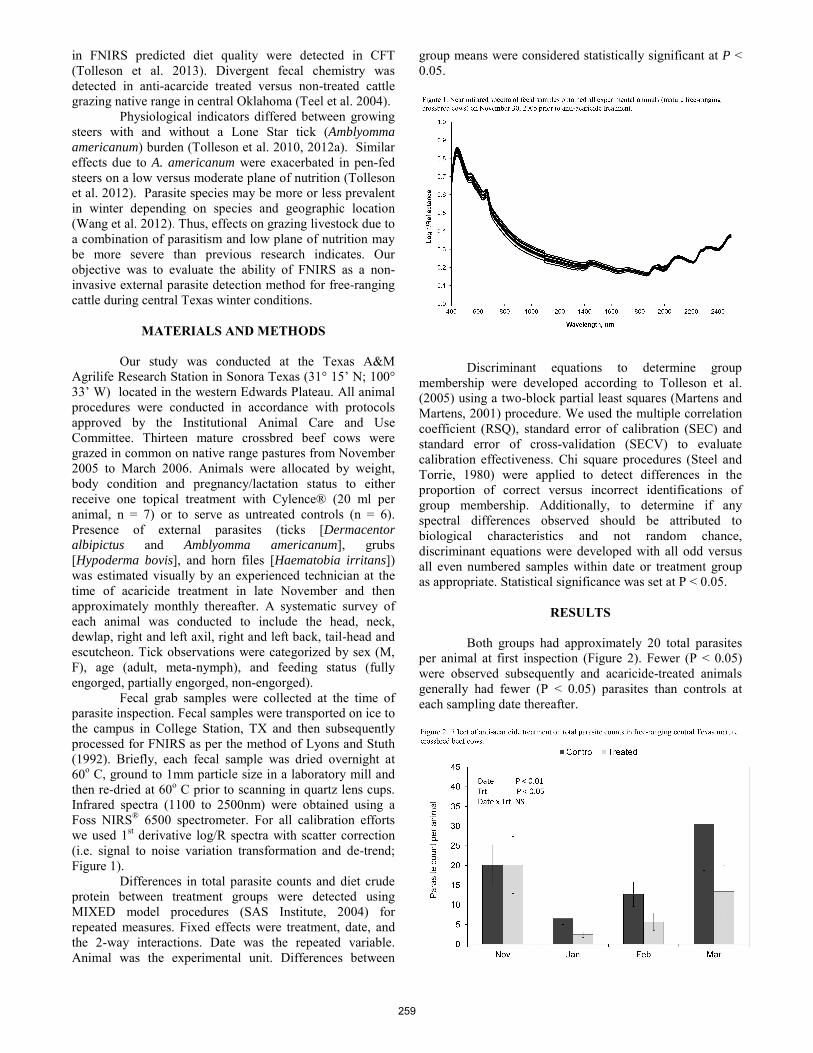
in FNIRS predicted diet quality were detected in CFT (Tolleson et al. 2013). Divergent fecal chemistry was detected in anti-acarcide treated versus non-treated cattle grazing native range in central Oklahoma (Teel et al. 2004).
Physiological indicators differed between growing steers with and without a Lone Star tick (Amblyomma americanum) burden (Tolleson et al. 2010, 2012a). Similar effects due to A. americanum were exacerbated in pen-fed steers on a low versus moderate plane of nutrition (Tolleson et al. 2012). Parasite species may be more or less prevalent in winter depending on species and geographic location (Wang et al. 2012). Thus, effects on grazing livestock due to a combination of parasitism and low plane of nutrition may be more severe than previous research indicates. Our objective was to evaluate the ability of FNIRS as a non-invasive external parasite detection method for free-ranging cattle during central Texas winter conditions.
MATERIALS AND METHODS
Our study was conducted at the Texas A&M
Agrilife Research Station in Sonora Texas (31° 15’ N; 100° 33’ W) located in the western Edwards Plateau. All animal procedures were conducted in accordance with protocols approved by the Institutional Animal Care and Use Committee. Thirteen mature crossbred beef cows were grazed in common on native range pastures from November 2005 to March 2006. Animals were allocated by weight, body condition and pregnancy/lactation status to either receive one topical treatment with Cylence® (20 ml per animal, n = 7) or to serve as untreated controls (n = 6). Presence of external parasites (ticks [Dermacentor albipictus and Amblyomma americanum], grubs [Hypoderma bovis], and horn files [Haematobia irritans]) was estimated visually by an experienced technician at the time of acaricide treatment in late November and then approximately monthly thereafter. A systematic survey of each animal was conducted to include the head, neck, dewlap, right and left axil, right and left back, tail-head and escutcheon. Tick observations were categorized by sex (M, F), age (adult, meta-nymph), and feeding status (fully engorged, partially engorged, non-engorged).
Fecal grab samples were collected at the time of parasite inspection. Fecal samples were transported on ice to the campus in College Station, TX and then subsequently processed for FNIRS as per the method of Lyons and Stuth (1992). Briefly, each fecal sample was dried overnight at 60o C, ground to 1mm particle size in a laboratory mill and then re-dried at 60o C prior to scanning in quartz lens cups. Infrared spectra (1100 to 2500nm) were obtained using a Foss NIRS® 6500 spectrometer. For all calibration efforts we used 1st derivative log/R spectra with scatter correction (i.e. signal to noise variation transformation and de-trend; Figure 1).
Differences in total parasite counts and diet crude protein between treatment groups were detected using MIXED model procedures (SAS Institute, 2004) for repeated measures. Fixed effects were treatment, date, and the 2-way interactions. Date was the repeated variable. Animal was the experimental unit. Differences between
group means were considered statistically significant at P < 0.05.
Discriminant equations to determine group
membership were developed according to Tolleson et al. (2005) using a two-block partial least squares (Martens and Martens, 2001) procedure. We used the multiple correlation coefficient (RSQ), standard error of calibration (SEC) and standard error of cross-validation (SECV) to evaluate calibration effectiveness. Chi square procedures (Steel and Torrie, 1980) were applied to detect differences in the proportion of correct versus incorrect identifications of group membership. Additionally, to determine if any spectral differences observed should be attributed to biological characteristics and not random chance, discriminant equations were developed with all odd versus all even numbered samples within date or treatment group as appropriate. Statistical significance was set at P < 0.05.
RESULTS
Both groups had approximately 20 total parasites per animal at first inspection (Figure 2). Fewer (P < 0.05) were observed subsequently and acaricide-treated animals generally had fewer (P < 0.05) parasites than controls at each sampling date thereafter.
259

The proportion of correct treatment group
identifications via FNIRS discriminant equations numerically (P > 0.1) increased post-acaricide treatment and then generally declined with time. Similarly, FNIRS discriminant equation RSQ increased then declined from November to March while SEC and SECV decreased, then increased (Table 1). No such discernable patterns were observed for equations developed with odd versus even numbered (i.e. arbitrarily grouped) samples for each collection date (Table 2).
DISCUSSION
Integrated Pest Management (IPM) strategies
require monitoring of parasite burdens to detect animal health or economic thresholds and inform tactical application of acaricides. For rangeland grazing operations, frequent gathering and inspection of animals is expensive and impractical. This cost in time and money hinders adoption of IPM programs.
Miller et al. (1999) have reported the development of acaricide resistant CFT. Surveillance for CFT is important to the US livestock industry because these species and bovine babesiosis remain endemic in northern Mexico. Human inspection for CFT is still the current method of detection (Graham and Hourrigan, 1977). Teel et al. (2003) evaluated a biophysical model containing ecological and human factors to predict tick populations and likelihood of detection.
Accurate non-invasive detection of parasites on free-ranging animals would facilitate both surveillance and IPM programs. In addition to informing targeted parasite treatments, such detection methods may function in early warning systems as one of the first lines of defense. For instance, a biophysical model could indicate that weather and ecological conditions are right for parasite infestation, spatio-temporally systematic fecal sampling could detect animals experiencing parasite stress and possibly with enough sensitivity to justify gathering and handling for inspection or treatment.
Fecal analysis techniques have long been employed in veterinary practice to diagnose internal parasites such as Ostertagia ostertagi (brown stomach worm; Kahn and Line, 2010). Fecal near infrared spectroscopy has been used for a
variety of applications with grazing animals including determination of diet quality and composition, animal age/sex/class as well as presence of tick burdens. Differences in near infrared spectra of feces from animals with or without a tick burden could be due to ingestive or digestive behavior or function, endocrine/immune/metabolic function, or hindgut microbiology (Tolleson et al. 2012b). We observed differences in fecal near infrared spectra between grazing cattle treated versus not treated with an acaricide. These results are similar to an earlier study reported by our group (Teel et al. 2004) for cattle grazing Oklahoma tallgrass prairie in the spring. In this previous study, tick counts were similar (~28 per animal) the week of acaricide treatment (W1) and were 1.6 ± 0.4 versus 21.2 ± 2.4 for acaricide treated and non-treated animals respectively, one week post treatment (W2). Discriminant RSQ increased from 0.24 to 0.98 and SECV decreased from 0.56 to 0.36 for W1 and W2 respectively. These observed trends continued through week 5. Percent correct group identifications were 80% for treated and 60% for control animals. Although the same general trend was observed, our results were less dramatic than observed in the Oklahoma study. Differences between the two studies could be due to fewer parasites, especially ticks, in the Texas study. The current study was also conducted over a longer period in a different season and drier climate. Discriminant calibrations developed using arbitrary groups yielded inconsistent predictions of group membership. These results support the biological differences observed between treated and control animals in our study.
IMPLICATIONS
Fecal NIRS can be used to monitor tick parasitism on pastured cattle and could contribute to CFT early warning systems, IPM programs, and as part of an overall grazing animal nutrition and health management protocol.
LITERATURE CITED
Anderson, D.P., A.D. Hagerman, P.D. Teel, G. G. Wagner, J.L. Outlaw, and B.K. Herbst. 2010. Economic Impact of Expanded Fever Tick Range. Agricultural & Food Policy Center, Research Report 10-2. Graham, O.H., Hourrigan, J.L., 1977. Eradication programs for the arthropod parasites of livestock. J. Med. Entomol. 6, 629–658. doi:10.1093/jmedent/13.6.629 Lyons, R. K. and J. W. Stuth. 1992. Fecal NIRS equations for predicting diet quality of free-ranging cattle. J. Range Manag. 45:238-244 Martens H. and M. Martens. 2001. Multivariate Analysis of Quality: An Introduction. JohnWiley&Sons Ltd., Chichester, New York, p. 1-445. Miller, R.J., Davey, R.B., George, J.E., 1999. Characterization of pyrethroid resistance and susceptibility to coumaphos in Mexican Boophilus microplus (Acari: Ixodidae). J. Med.Entomol. 36, 533–538. doi:10.1093/jmedent/36.5.533 538.
260

Perez de Leon, A.A., P.D. Teel, A.N. Auclair, M.T. Messenger, F.D. Guerrero, G. Schuster and R.J. Miller. 2012. Integrated strategy for sustainable cattle fever tick eradication is required to mitigate the impact of global change. Frontiers in Physiology Vol 3, Art No.195 doi: 10.3389/fphys.2012.00195 Kahn, C.M., and Line, S. (Eds.), 2010. The Merck Veterinary Manual (10th edition). John Wiley & Sons, Hoboken, NJ SAS Institute. 2004. Sas/ets 9.1 user's guide. In: S. Institute (ed.) No. 1. SAS Institute, Cary, N.C. Steel, R. G. D. and J. H. Torrie. 1980. Principles and Procedures of Statistics. McGraw-Hill Book Co., New York. Teel, P.D., O. F. Strey, R. E. Wright, L. A. Coburn, D. R. Tolleson, and J. W. Stuth. 2004. Discrimination between two levels of indigenous external parasite burden in free-ranging beef cattle via near infrared reflectance spectroscopy of feces. Journal of Animal Science 82:22 (Suppl. II). Tolleson, D. R.., R. D. Randel, J. W. Stuth, and D. A. Neuendorff. 2005. Determination of sex and species in red and fallow deer by near infrared reflectance spectroscopy of the faeces. Small Ruminant Research 57:141-50. Tolleson, D. R., P. D. Teel , J. W. Stuth, O. F. Strey, T. H. Welsh, Jr, and G. E. Carstens. 2007. Fecal NIRS: detection of tick infestations in cattle and horses. Vet. Parasitol.144:146-152. doi:10.1016/j.vetpar.2006.09.018 Tolleson, D. R., and D. W. Schafer. 2010. Monitoring diet quality and body condition in beef cows grazing Arizona
rangeland. Proceedings of the Western Section American Society of Animal Science. 61:175-178. Tolleson, D. R., P. D. Teel, J. W. Stuth, O. F. Strey, T. H. Welsh Jr, G. E. Carstens, K. K. Banik, and S. D. Prince. 2010. Effects of a Lone Star Tick (Amblyomma ameri- canum) burden on performance and metabolic indicators in growing beef steers. Vet. Parasitol. 173:99-106. Tolleson, D.R., P. D. Teel, J. W. Stuth, O. F. Strey, T. H. Welsh Jr, G. E. Carstens, K. K Banik, and S. D. Prince. 2012a. Plane of nutrition by tick burden interaction in cattle: Effect on growth and metabolism. J. Anim. Sci. 90:3442-3450. doi:10.2527/jas.2011-5066 Tolleson, D. R., P. D. Teel, G. E. Carstens, and T. H. Welsh Jr. 2012b. Chapter 1. Physiology of tick induced stress in grazing animals. In: Ticks: Management, Disease Control and the Environment. Editor: Moges Woldemeskel, pp 1-18. Nova Science Publishers, Inc.
Tolleson, D. R., P. D. Teel, O. F. Strey, S. D. Prince, R. J. Miller, and A. A. Pérez de León. 2013. The effect of tick species on fecal near infrared spectroscopy predicted diet quality of cattle. Proceedings of the Western Section American Society of Animal Science. 64:249-253.
Wang, H. H., W.E. Grant, P.D. Teel. 2012. Simulation of climate–host–parasite–landscape interactions: A spatially explicit model for ticks (Acari: Ixodidae). Ecol. Model.
243: 42– 62. doi:10.1016/j.ecolmodel.2012.06.007 Whalon, M.R., D. Mota-Sanchez and R.M. Hollingsworth. 2008. Global pesticide resistance in arthropods. Cambridge: CAB International.
Table 1. Percent correct identifications1 and accompanying discriminant calibrations accomplished via fecal near infrared spectroscopy in control versus acaricide treated groups of mature crossbred beef cows grazing Edwards Plateau rangeland.
Treatment Group Comparison Date Control Treated Combined RSQ2 SEC3 SECV4
11/30/2005 0.25 0.71 0.55 0.33 0.40 0.81 01/04/2006 0.67 0.57 0.62 0.84 0.20 0.73 02/02/2006 0.50 0.29 0.38 0.74 0.26 1.07 03/02/2006 0.50 0.57 0.54 0.24 0.43 0.55
1 All comparisons, within row or column, (P > 0.1) 2 Multiple Correlation Coefficient 3 Standard Error of Calibration 4 Standard Error of Cross Validation Table 2. Percent correct identifications1 and accompanying discriminant calibrations accomplished via fecal near infrared spectroscopy in arbitrarily assigned groups of mature crossbred beef cows grazing Edwards Plateau rangeland.
Arbitrary Group Comparison Date Group A Group B Combined RSQ2 SEC3 SECV4
11/30/2005 0.00 0.17 0.09 0.13 0.46 0.53 01/04/2006 0.50 0.57 0.54 0.32 0.41 0.62 02/02/2006 0.50 0.43 0.46 0.56 0.33 0.88 03/02/2006 0.50 0.29 0.38 0.39 0.39 0.61
1 All comparisons, within row or column, (P > 0.1) 2 Multiple Correlation Coefficient 3 Standard Error of Calibration 4 Standard Error of Cross Validation
261
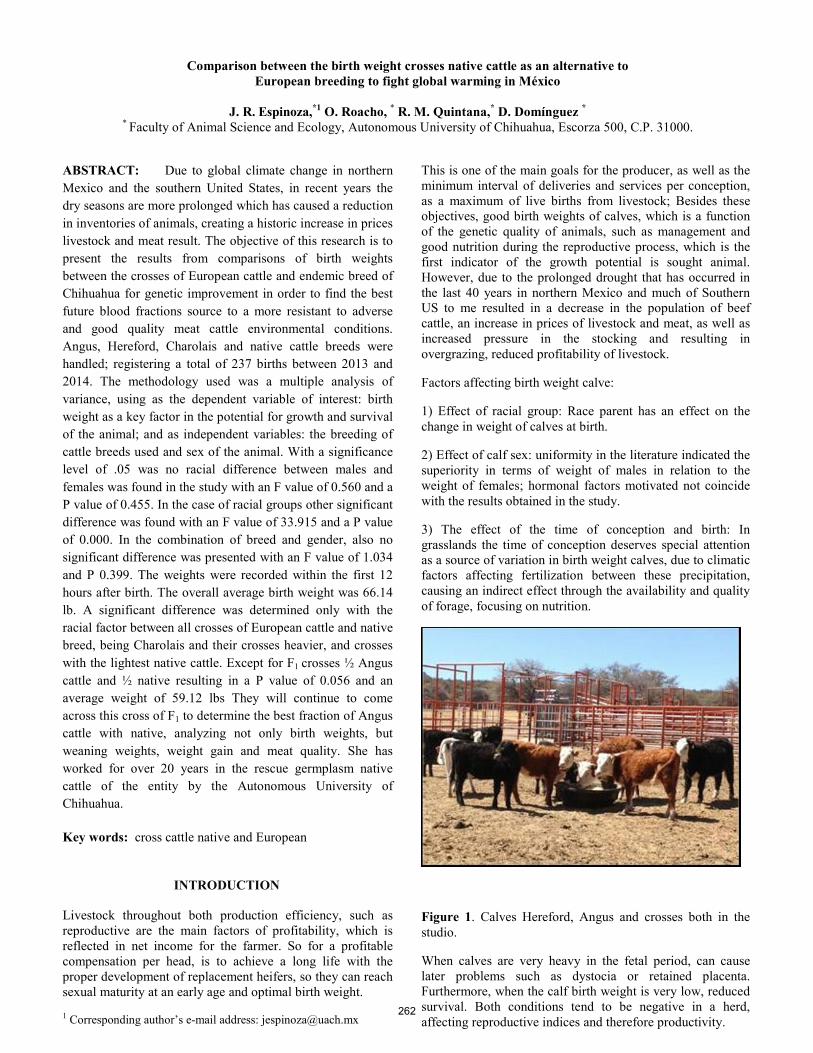
Comparison between the birth weight crosses native cattle as an alternative to
European breeding to fight global warming in México
J. R. Espinoza,*1 O. Roacho, * R. M. Quintana,* D. Domínguez * * Faculty of Animal Science and Ecology, Autonomous University of Chihuahua, Escorza 500, C.P. 31000.
ABSTRACT: Due to global climate change in northern Mexico and the southern United States, in recent years the dry seasons are more prolonged which has caused a reduction in inventories of animals, creating a historic increase in prices livestock and meat result. The objective of this research is to present the results from comparisons of birth weights between the crosses of European cattle and endemic breed of Chihuahua for genetic improvement in order to find the best future blood fractions source to a more resistant to adverse and good quality meat cattle environmental conditions. Angus, Hereford, Charolais and native cattle breeds were handled; registering a total of 237 births between 2013 and 2014. The methodology used was a multiple analysis of variance, using as the dependent variable of interest: birth weight as a key factor in the potential for growth and survival of the animal; and as independent variables: the breeding of cattle breeds used and sex of the animal. With a significance level of .05 was no racial difference between males and females was found in the study with an F value of 0.560 and a P value of 0.455. In the case of racial groups other significant difference was found with an F value of 33.915 and a P value of 0.000. In the combination of breed and gender, also no significant difference was presented with an F value of 1.034 and P 0.399. The weights were recorded within the first 12 hours after birth. The overall average birth weight was 66.14 lb. A significant difference was determined only with the racial factor between all crosses of European cattle and native breed, being Charolais and their crosses heavier, and crosses with the lightest native cattle. Except for F1 crosses ½ Angus cattle and ½ native resulting in a P value of 0.056 and an average weight of 59.12 lbs They will continue to come across this cross of F1 to determine the best fraction of Angus cattle with native, analyzing not only birth weights, but weaning weights, weight gain and meat quality. She has worked for over 20 years in the rescue germplasm native cattle of the entity by the Autonomous University of Chihuahua.
Key words: cross cattle native and European
INTRODUCTION Livestock throughout both production efficiency, such as reproductive are the main factors of profitability, which is reflected in net income for the farmer. So for a profitable compensation per head, is to achieve a long life with the proper development of replacement heifers, so they can reach sexual maturity at an early age and optimal birth weight.
1 Corresponding author’s e-mail address: [email protected]
This is one of the main goals for the producer, as well as the minimum interval of deliveries and services per conception, as a maximum of live births from livestock; Besides these objectives, good birth weights of calves, which is a function of the genetic quality of animals, such as management and good nutrition during the reproductive process, which is the first indicator of the growth potential is sought animal. However, due to the prolonged drought that has occurred in the last 40 years in northern Mexico and much of Southern US to me resulted in a decrease in the population of beef cattle, an increase in prices of livestock and meat, as well as increased pressure in the stocking and resulting in overgrazing, reduced profitability of livestock.
Factors affecting birth weight calve:
1) Effect of racial group: Race parent has an effect on the change in weight of calves at birth.
2) Effect of calf sex: uniformity in the literature indicated the superiority in terms of weight of males in relation to the weight of females; hormonal factors motivated not coincide with the results obtained in the study.
3) The effect of the time of conception and birth: In grasslands the time of conception deserves special attention as a source of variation in birth weight calves, due to climatic factors affecting fertilization between these precipitation, causing an indirect effect through the availability and quality of forage, focusing on nutrition.
Figure 1. Calves Hereford, Angus and crosses both in the studio.
When calves are very heavy in the fetal period, can cause later problems such as dystocia or retained placenta. Furthermore, when the calf birth weight is very low, reduced survival. Both conditions tend to be negative in a herd, affecting reproductive indices and therefore productivity.
262
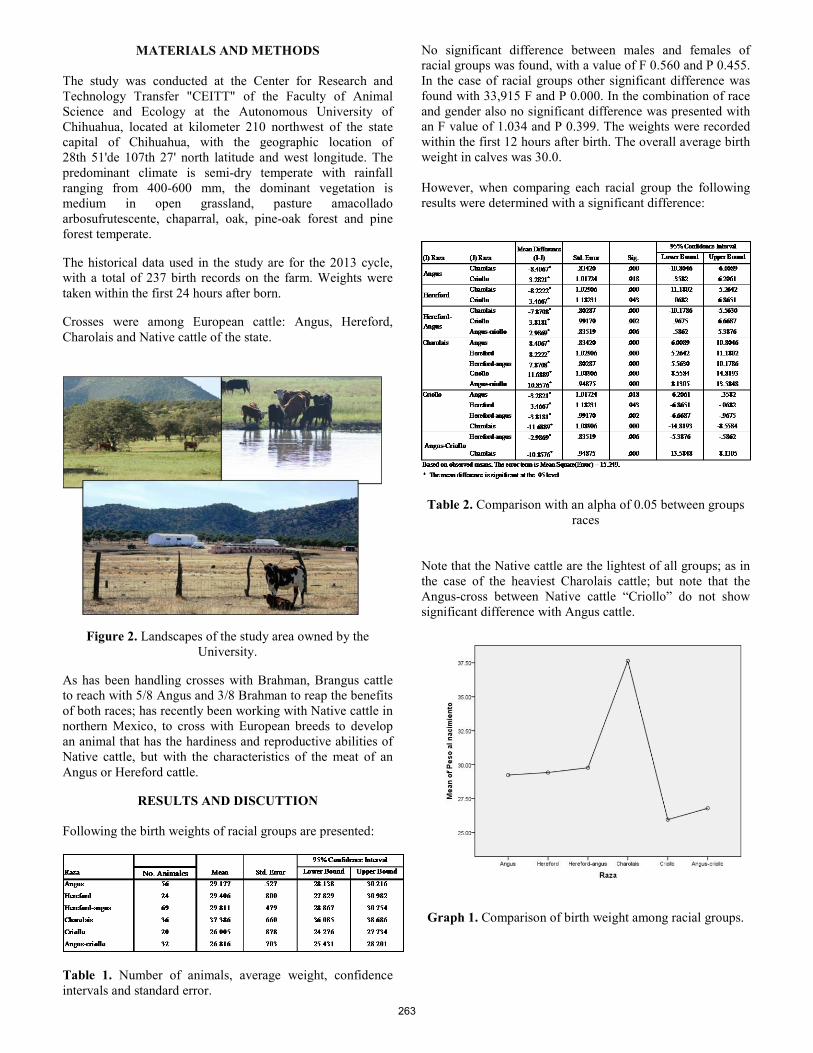
MATERIALS AND METHODS
The study was conducted at the Center for Research and Technology Transfer "CEITT" of the Faculty of Animal Science and Ecology at the Autonomous University of Chihuahua, located at kilometer 210 northwest of the state capital of Chihuahua, with the geographic location of 28th 51'de 107th 27' north latitude and west longitude. The predominant climate is semi-dry temperate with rainfall ranging from 400-600 mm, the dominant vegetation is medium in open grassland, pasture amacollado arbosufrutescente, chaparral, oak, pine-oak forest and pine forest temperate.
The historical data used in the study are for the 2013 cycle, with a total of 237 birth records on the farm. Weights were taken within the first 24 hours after born.
Crosses were among European cattle: Angus, Hereford, Charolais and Native cattle of the state.
Figure 2. Landscapes of the study area owned by the University.
As has been handling crosses with Brahman, Brangus cattle to reach with 5/8 Angus and 3/8 Brahman to reap the benefits of both races; has recently been working with Native cattle in northern Mexico, to cross with European breeds to develop an animal that has the hardiness and reproductive abilities of Native cattle, but with the characteristics of the meat of an Angus or Hereford cattle.
RESULTS AND DISCUTTION
Following the birth weights of racial groups are presented:
Table 1. Number of animals, average weight, confidence intervals and standard error.
No significant difference between males and females of racial groups was found, with a value of F 0.560 and P 0.455. In the case of racial groups other significant difference was found with 33,915 F and P 0.000. In the combination of race and gender also no significant difference was presented with an F value of 1.034 and P 0.399. The weights were recorded within the first 12 hours after birth. The overall average birth weight in calves was 30.0. However, when comparing each racial group the following results were determined with a significant difference:
Table 2. Comparison with an alpha of 0.05 between groups races
Note that the Native cattle are the lightest of all groups; as in the case of the heaviest Charolais cattle; but note that the Angus-cross between Native cattle “Criollo” do not show significant difference with Angus cattle.
Graph 1. Comparison of birth weight among racial groups.
263

Figure 3. Offspring born in 2013 during the investigation.
IMPLICATIONS In all cattle operations must be taken into account birth weight calves as it is a general indication of performance in the management and feeding the flock; individually indicative of the physical condition of both the mother and the baby. Hence the economic importance of this feature. Crosses between races always provide genetic improvement for animal production and you need to find the best mix of blood with the Native cattle, looking for their racial characteristics of rusticity, reproduction and combine it with European breeds known for their quality of meat, maternal ability as Angus or Hereford. So it is necessary to follow up on weaning weights and exports and evaluate the quality of carcass and meat; to find the blood fractions that give rise to a racial group that benefits the productivity of farms. Where mix ½ Angus - ½ Native cattle “Criollo” showed no significant difference in birth weights with Angus cattle. It is important to mention that not to have problems of difficult births with litter size at birth, especially in breeds such as Charolais, handling was performed where the male out of the Landrace and female of any European race, note that due to the precocity and the ability of local cattle in the field with rugged topography and capacity of violating fences, should be performed a very good supervision to avoid damaging the blood types of purebreds or register. It is contemplated with the F1 offspring of Native cattle and European cattle crossing them with European cattle to obtain a mixture of 6/8 and 2/8 European race landrace, seeking to assess which locks into the genetics of F2 offspring earliness and rusticity Native cattle Chihuahua, with the ability to generate high quality meat, such as maternal ability of European breeds with greater emphasis Angus cattle.
All programs are breeding and selection processes that take several years for the proposed benefits, but the contribution of livestock to the world Chihuahua contribution of germplasm or genetic bank of native cattle can have scopes that result new races for bovine meat production.
LITERATURE CITED
Alba de, J. 1964. “Reproducción Genética Animal”. Turriaba. Instituto de Ciencias Agrícolas. Page 446. Bogart, R. y Frischnecht, W. D. 1967. “Relationship of Weights Scores and Gains in Growing Cattle. Journal of Animal Science. 21. Pages 101 -107. Brinks, J.S., Olson, J. E. y Carroll, E. J. 1973. “Calving Difficulty and its Associatio with Subsequent Productivity in Herefords”Journal of Animal Science.36, Páginas 11-17. Garcia-Galicia I.A. 2010. Antioxidant content, fatty acid composition and shelf life of beef from commercial and tradition beef breeds. University of Bristol. Ph.D. Dissertation. Bristol, United Kingdom. Isselstein, J, B A Griffith, P Pradel, and S Venerus. 2007. “Effects of livestock breed agrazing intensity on biodiversity and production in grazing systems. 1. Nutritive Value of herbage and livestock performance.”Grass and Forage Science 62:145–158. Jones, C. R., E. Dransfield, M. J. Robinson, and R. A. Crosland.1985. Correlation of mechanical properties, composition and perceived texture of beef burgers. Journal of Texture Studies 16: 241-262. Lesmeister, J. L., Burfening, P. J. y Blackwell, R. L. 1973. “Date of the First Calving in Beef Cows and Subsequent Calf Production”. Journal of Animal Science. 36, Page 1-6. Osoro, K. et al. 1999. “Respuesta productiva de dos razas de ganado vacuno manejadas dos cubiertas vegetales de montaña.” ITEA Producción Animal 95:188–203. Tolhurst, S., and M. Oates. 2001. A Guide to Animal Welfare in Nature Conservation Grazing. English Nat. Peterborough: The Grazing Animals Project Retrieved. Wallis De Vries, M. F. 1998. “Habitat quality and the performance of large Herbivores Pp. 275–320 in Grazing and conservation management, edited by M. F. Wallis DeVries, J. P. Bakker, and S. E. van Wieren. Dordrecht (Netherlands): Kluwer Academic Publishers.
264
PASTURES AND FORAGES

Proceedings, Western Section, American Society of Animal Science
Vol. 66, 2015
Validation of fecal microhistology for assessing dietary botanical composition of beef-cattle using diets of fixed composition
C. J. McMullen*, J. Lemmon†, and K. C. Olson†
*Western Kansas Agricultural Research Center, Kansas State University, Hays † Department of Animal Sciences & Industry, Kansas State University, Manhattan, KS
ABSTRACT: The objective of our study was to evaluate the accuracy of visual microhistological evaluation of bovine fecal material for assessing dietary botanical composition. Five non-pregnant, non-lactating, Hereford × Angus cows (initial BW = 446 ± 37.5 kg) were used in a 5 period × 5 treatment Latin square experiment. Cows were fed 1 of 5 combinations of alfalfa (Medicago sativa) and smooth bromegrass (Bromis inermis) in pre-determined ratios: 100% alfalfa; 75% alfalfa:25% smooth bromegrass; 50% alfalfa:50% smooth bromegrass; 25% alfalfa:75% smooth bromegrass, and 100% smooth bromegrass. Total forage intake was fixed at 2.2% of BW daily (DM basis); forage consumption was complete each d. Periods were 7 d in duration. Animals were adapted to treatment diets from d 1 to 6. Fecal grab samples were collected from each cow at 6-h intervals on d 7. Fecal samples were composited by weight within animal and period; fecal composites were evaluated microhistologically for botanical composition. Results of microhistological analyses were compared with known diet compositions via regression. A total of 9,337 plant fragments were examined microscopically; species identity of less than 1% (74) was indistinguishable. Proportions of alfalfa and smooth bromegrass in beef cow diets that were estimated via visual microhistological analyses of plant fragments in fecal material closely agreed (r2 = 0.99; P < 0.01) with fixed proportions of alfalfa and smooth bromegrass that were fed to beef cows. In addition, slopes of regression lines (b = 0.99) indicated little or no bias was associated with the prediction. We concluded that the botanical composition of beef cow diets could be accurately estimated using visual microhistological analyses of plant fragments in fecal material. Key words: beef cows, dietary botanical composition, fecal microhistology, validation
INTRODUCTION
Since its introduction over 75 yr ago by Baumgartner and Martin (1939), microhistological techniques have been widely used to estimate the botanical composition of diets consumed by herbivores. Visual microhistology (VMH) is a method of identifying plant fragments in herbivore fecal material and quantitatively determining botanical composition of a voluntarily-selected diet. Visual microhistology has been used to identify the factors that influence diet selection by free-ranging herbivores including: forage quality, forage availability, learned behaviors, competition, and environmental conditions (Ellis
et al., 1976; Hodgson, 1986; Provenza and Balph, 1987; Stuth, 1991).
The technique is regarded as accurate with respect to identifying grazing preferences of free-ranging herbivores; however, the accuracy of VMH may be compromised by some of its inherent limitations. These limitations include: digestibility differences between plants, observer errors, calculation procedures, errors in sample preparation, and the presence of unidentifiable plant fragments (Stewart, 1970; Slater and Jones, 1971; Vavra et al., 1978; Vavra and Holechek, 1980; McInnis et al., 1983; Holechek et al., 1982; Holechek and Gross, 1982; Aubel et al., 2011).
Control of observer errors and errors caused by digestibility differences between plants can be achieved by standardizing the conditions under which observers are trained in VMH. The most reliable means of standardizing these conditions is to feed diets of known botanical composition. Sparks and Malechek (1968) verified the accuracy of VMH in this manner and reported a 1:1 ratio between the relative density of plant fragments recovered from feces and known percentages of plants in the diet. Plant diversity in the diets of herbivores grazing native rangeland prevents quantitative characterization of individual plant proportions in diets in the form that they are selected and consumed. Conversely, pure samples of diverse plant types can be blended with precision to produce known ratios of graminoids and forbs. Feeding diets of this type to animals maintained in confinement can be a valuable means by which to train observers in VMH and by which to evaluate errors introduced by digestibility differences between plants. Therefore, our objective was to evaluate the accuracy of VMH by feeding beef cows varying, known proportions of 2 plant species with different morphological characteristics and different inherent digestibilities.
MATERIALS AND METHODS
Animal care and handling practices used in our study
were approved by the Kansas State University Institutional Animal Care and Use Committee (protocol no. 2978.2)
Design and Treatments. Five non-pregnant, non-lactating, Hereford × Angus cows (initial BW = 446 ± 37.5 kg) were used in a 5 period × 5 treatment Latin square experiment. Cows were fed 1 of 5 combinations of alfalfa (Medicago sativa) and smooth bromegrass (Bromis inermis) in pre-determined ratios: 100% alfalfa; 75% alfalfa:25% smooth bromegrass; 50% alfalfa:50% smooth bromegrass; 25% alfalfa:75% smooth bromegrass, and 100% smooth
265
bromegrass. Cows were assigned randomly to 1 of 5 adjacent outdoor, dirt surfaced pens (5 × 10 m) where they adapted to their surroundings for 10 d prior to the experiment. Fresh water, salt, and a mineral supplement were available continually.
Alfalfa and smooth bromegrass used in our experiment were harvested from relatively pure monocultures and preserved in 1 × 2 m square bales. Forages were ground to a particle size of approximately 10 cm prior to feeding. Representative samples of both forage types were collected as they were ground (approximately 2 kg of air-dry material) and placed into a forced-air oven for 96 h at 50 °C. Samples were then ground (No. 4 Wiley mill, Thomas Scientific, Swedesboro, NJ) to pass a 1-mm screen and submitted to a commercial laboratory for analysis of OM, OM, N, NDF, ADF, Ca, and P (SDK Laboratories, Hutchinson, KS; Table 1). Table 1. Nutrient content of alfalfa hay and smooth bromegrass hay fed to beef cows (DM basis) Item Alfalfa Smooth bromegrass DM, % 91.3 91.2 OM, % 91.1 90.7 CP, % 14.3 7.3 NDF, % 45.9 59.0 ADF, % 38.4 37.6 Ca, % 1.27 0.46 P, % 0.19 0.16 1 Analysis conducted by SDK Laboratories, Hutchinson, KS.
Total forage intake was fixed at 2.2% of BW daily (DM basis); forage consumption was complete each d. Appropriate proportions of alfalfa and smooth bromegrass for each treatment diet were determined gravimetrically. Cows received each diet over the course of 5 consecutive 7-d data-collection periods. Animals were adapted to treatment diets from d 1 to 6. Fecal grab samples were collected from each cow at 6-h intervals on d 7. Fecal grab samples were frozen immediately after collection.
At the end of the experiment, fecal samples were thawed and ground (No. 4 Wiley mill, Thomas Scientific, Swedesboro, NJ) to pass a 2-mm screen. Fecal samples were composited by weight within animal and period. Fecal composites were prepared for VMH as described by Eckerle et al. (2009). Fecal samples were blended with 50% ethanol (v/v) for 30 s. The samples were agitated and then left to soak overnight for 24 h. After soaking, ethanol was decanted and samples were homogenized and washed with deionized H2O through a No. 200 US-standard sieve. Samples were then re-homogenized and strained. The sample fractions were then dried in a forced air-oven (96 h; 50°C). Dried samples were ground (#4 Wiley Mill, Thomas Scientific, Swedesboro, NJ, USA) to pass a 1-mm screen and stored in plastic bags for slide preparation (Bennett et al., 1999).
Slide Preparation. Subsamples (0.5 g) of dried, ground plant material recovered from fecal composites were soaked in deionized H2O for 1 h to soften them. Approximately 20 mL of NaOH (0.05M) was then added to each sample. Samples were incubated for 20 min at room temperature to
destroy plant pigments. Samples were rinsed with deionized H2O over a No. 200 US-standard sieve to remove NaOH.
Samples were placed on a slide, 1 to 3 drops of Hertwig’s solution was applied, and the slide was placed over a propane flame until dry. One to 2 drops of Hoyer’s solution was added to mount a cover slip. Slides were dried for 96 h in a 50°C-oven before viewing.
Slides were viewed on a compound microscope at 100 × magnification, although 400 × magnification was sometimes used for greater resolution. Twenty fields per slide were selected randomly from the entire slide view and were used to measure the frequency with which plant fragments appeared (Holechek and Vavra, 1981). Plant fragment prevalence in slide fields was assumed to be equivalent to prevalence in fecal samples and in diets on a DM basis (Sparks and Malechek, 1968).
Statistics. A simple, linear regression equation (Y = a + bX) was prepared to determine the relationships between estimated (Y) and observed (X) species occurrence in samples.
RESULTS AND DISCUSSION
Johnson et al. (1983) indicated that small fragments of
grasses and forbs were easily distinguished from one another under magnification. The lack of species diversity in our diets and the relative ease of distinguishing alfalfa and smooth bromegrass fragments created a near 1:1 ratio in estimated intake and actual intake (Table 2). Proportions of alfalfa and smooth bromegrass in beef cow diets that were estimated via VMH analyses of plant fragments in fecal material closely agreed (r2 = 0.99; P < 0.01) with fixed proportions of alfalfa and smooth bromegrass that were fed to beef cows. In addition, slopes of regression lines (b = 0.99) indicated little or no bias was associated with the prediction. Table 2. Linear regression equations using the model Y = a + bX to determine the relationships between estimated (Y) and observed (X) species proportions in beef cow diets using visual microhistological analysis of fecal material Item a b r2 n Smooth bromegrass 0.31 0.99 0.99* 25
Alfalfa 1.38 0.99 0.99* 25 * Value of r2 is significant (P < 0.01).
Sparks and Malechek (1968) conducted a similar experiment with comparatively complex blends of grasses and forbs and reported strong relationships between observed and predicted dietary botanical composition (r2 = 0.98). We interpreted this result to indicate that inherent digestibility differences between smooth bromegrass and alfalfa had minimal impact on interpretation of VMH results. Holechek et al. (1982) validated VMH using 26 different mixtures of grasses, forbs, and shrubs that contained up to 9 different species. Up to 4 different observers viewed each sample. Even though their experimental design had greater inherent variation than
266
ours, agreement between observed and predicted botanical composition was excellent (r2 = 0.95).
IMPLICATIONS
We concluded that the botanical composition of beef
cow diets could be accurately estimated using visual microhistological analyses of plant fragments in fecal material. Inherent differences in digestibility did not influence detection of smooth bromegrass or alfalfa under the conditions of our experiment. While plant diversity in the diets of herbivores grazing native rangeland prevents quantitative characterization of individual plant proportions in diets, pure samples of diverse plant types can be blended with precision to produce known dietary ratios of graminoids and forbs. Feeding diets of this type to animals maintained in confinement can be a valuable means by which to train observers in visual fecal microhistology and by which to evaluate errors introduced by digestibility differences between plants.
LITERATURE CITED
Aubel, N. A., K. C. Olson, J. R. Jaeger, G. J. Eckerle, L. A.
Pacheco, M. J. Macek, L. R. Mundell, and L. W. Murray. 2011. Botanical composition of diets grazed by mature, .lactating cows with calves and mature, non-lactating cows maintained on burned or .unburned native tall grass prairie. Proc. West. Sec. Amer. Soc. Anim. Sci. 62:222-227.
Baumgartner, L. L., and A.C. Martin. 1939. Plant histology as an aid in squirrel food-habits studies. J. Wildl. Manage. 3:266-268.
Bennett L. L., A. C. Hammond, M. J. Williams, C. C. Chase Jr., and W. E. Kunkle. 1999. Diet selection by steers using microhistological and stable carbon isotope ratio analyses. J. Anim. Sci. 77:2252-2258.
Eckerle, G. J., K. C. Olson, J. R. Jaeger, W. H. Fick, L. A. Pacheco, and K. Walburger. 2009. Microhistological characterization of the botanical composition of diets grazed by beef cows in the Kansas Flint Hills during winter. Proc. West. Sec. Am. Soc. Anim. Sci. 60:399-402.
Ellis, J. E., J. A. Weins, C. F. Rodell, and J. C. Anway. 1976. A conceptual model of diet selection as an ecosystem process. J. Theoretical Biol. 60:93-108.
Hodgson, J. 1986. Grazing behaviour and herbage intake. Pages 51–64 in Grazing. Occas. Symp. No. 19. J. Frame, ed. Br. Grassl. Soc., Reading, UK.
Holechek, J. L., M Vavra, and R. D. Pieper. 1982. Botanical composition determination of range herbivore diets: a review. J. Range Manage. 35:309-315.
Holechek, J. L., and B.D. Gross. 1982. Evaluation of diet calculation procedures for .microhistological analysis. J. Range Manage. 46:502-505.
Holechek, J. L., and M. Vavra. 1981. The effect of slide and frequency observation numbers on the precision of microhistological analysis. J. Range Manage. 34:337-338.
McInnis, M. L., Vavra, and W. C. Krueger. 1983. A
composition of four methods used to determine the diets of large herbivores. J. Range Manage. 36:302-306.
Provenza, F. D., and D. F. Balph. 1987. Diet learning by domestic ruminants: Theory, evidence and practical implications. Appl. Anim. Behav. Sci. 18:211-232.
Slater, J., and R. J. Jones. 1971. Estimation of the diets selected by grazing animals from microscopic analysis of the feces – a warning. J. Austral. Inst. Agric. Sci. 37:238-240
Sparks, D. R., and J. C. Malechek. 1968. Estimating percentage dry weight in diets using a microscope technique. J. Range Manage. 21:264-265.
Stewart, D.R.M. 1970. Survival during digestion of epidermis from plants eaten by ungulates. Rev. Zoo. Bot. Afr. 82:343-348.
Stuth J. W. 1991. Foraging behavior. In L R. K. Heitschmidt and J. W. Stuth (Eds.) Grazing Management: An Ecological Perspective. Portland, OR: Timber Press. P 65-84.
Vavra, M., and J. L. Holechek. 1980. Factors influencing microhistological analysis of herbivore diets. J. Range Manage. 33:371-374.
267
Proceedings, Western Section, American Society of Animal Science
Vol. 66, 2015
Interseeding cool-season forages into corn to increase yield and quality of residue grazed in the fall
L. Villalobos*and J.E. Brummer*1 *Department of Soil & Crop Sciences, Colorado State University, Fort Collins, CO 80523
ABSTRACT: Six forage species/mixtures were interseeded into irrigated grain corn to evaluate their yield and nutritional quality as a means of improving diets for beef cattle grazing cornstalks during the fall. Species evaluated included annual ryegrass (Lolium multiflorum), crimson clover (Trifolium incarnatum), Fridge winter triticale (X Triticosecale), a mixture of annual ryegrass plus crimson clover, a brassica mixture (Barkant turnip [Brassicas rapa], Barnapoli rape [Brassica napus], Groundhog radish [Raphanus sativus var.oleifer Strokes], and Pasja hybrid [Chinese cabbage {Brassica rapa L. chinensis} x Turnip hybrid]), and a mixture of winter triticale plus the brassica mix. The cool-season forages were interseeded at the V6 growth stage of corn on June 30, 2014. DM yield (p=0.0013), CP (p=0.0149), aNDF (p=0.0001), and in-vitro true digestibility (IVTD, p=0.0027) differed among the interseeded forages. Annual ryegrass and the brassica mix had the highest yields (596 and 790 kg ha-1, respectively). The CP content of all treatments was higher than that of cornstalks (5.2% vs. 18.3-26.1%) and had the potential to provide supplemental protein for beef cattle grazing corn residue. The fiber content of the interseeded cool-season forages was lower than cornstalks (73.5% vs. 23.4-44.2%), being particularly low in the brassica mix and the brassica mix plus winter triticale. Except for crimson clover (77.7%), all treatments had high IVTD values (89.4-92.1%), with all forages having higher values than cornstalks (57.7%). The cost per kg of DM and kg of CP of the interseeded forages varied widely because of differences in seeding rates, seed cost, DM yield, and CP content. Annual ryegrass and the brassica mix were the treatments with the lowest costs ($0.18 and $0.17 kg-1 of DM and $0.96 and $0.72 kg-1 of CP; respectively), having values similar to good quality alfalfa hay with a current market price of $154 t-1. Interseeding cool-season forages can increase the quality of biomass offered to beef cattle grazing cornstalks during the fall. This should be combined with strip grazing to maximize utilization of the high quality cool-season forages that can grow during the fall. This practice can reduce supplementation costs for producers while improving nutrient cycling through a more even spread of manure across the field.
Key words: cattle, corn, beef, forages, grazing, interseeding, protein.
INTRODUCTION
Cornstalks grazed by beef cattle, mostly cow/calf systems, represent a cheap and efficient way to utilize the
plant biomass left after grain harvest (Klopfenstein et al., 1987). The main problem with grazing cornstalks is the relatively low protein content and digestibility of the corn residue (Fernandez-Rivera and Klopfenstein, 1989) which makes supplementation, especially with protein, necessary in order to meet the nutritional requirements of cattle (NRC, 2000). Grazing cornstalks can be expanded to yearling cattle, but adequate forage quality must be available in order to maintain animal gains (Fernandez-Rivera and Klopfenstein, 1989). Such opportunities must fit economically and logistically in a farming-ranching system (Klopfenstein et al., 1987). Interseeding cool-season forage species into corn is an agronomic management practice by which producers can increase the quality of the forage offered to beef cattle. The objective of this study was to evaluate the yield and nutritional quality of cool-season forages interseeded into corn for fall grazing under Colorado growing conditions. Most studies where forages have been interseeded into corn have been conducted in the eastern United States (Scott et al., 1987; Baributsa et al., 2008). In our study, differences in yield and quality as affected by forage species/mixture were considered indicators of the potential to increase forage quality provided to beef cattle grazing cornstalks into the fall and winter.
MATERIALS AND METHODS
Study Location and Implementation This study was conducted during the summer-fall growing season of 2014 at Colorado State University’s Agricultural Research, Development and Education Center (ARDEC), located about 15 km northeast of Fort Collins, Colorado (40.39°N, 104.59°W, elevation 1555 m). Table 1. Seeding rates of species and mixtures of forages interseeded into corn. Forages (code) Seeding rate (kg ha-1) Annual ryegrass (AR) 22.5 Crimson clover (CC) 13.5 AR + CC 13.5 + 9.0 Winter triticale (WT) 112 Brassica mix (BM) 11.2 WT + BM 60.5 + 6.7 Six forage species/mixtures were interseeded into grain corn that was at the V6 growth stage on June 30, 2014 (Table 1). The species seeded included annual ryegrass (Lolium multiflorum), crimson clover (Trifolium
268
incarnatum), and Fridge winter triticale (X Triticosecale) The brassica mix was comprised of equal parts Barkant turnip (Brassicas rapa), Barnapoli rape (Brassica napus), Groundhog radish (Raphanus sativus var.oleifer Strokes), and Pasja hybrid (Chinese cabbage [Brassica rapa L. chinensis] x Turnip hybrid). To interseed the forages, a 3 m wide Gandy® box was mounted on a 3-point toolbar to meter the seeds. Three sets of 3 wavy blade coulters were attached to the toolbar to lightly disturb the soil in the strips between corn rows. The seeds were broadcasted into each tilled strip through 3 tubes that were mounted about 30 cm above the soil surface. The wavy blades were set to prepare a 40 cm wide seedbed between each row. Sprinkler irrigation was applied to the corn at a rate of 25 mm per week through mid-September. Harvesting Protocol and Laboratory Analysis Dry matter yield (DMY) was assessed on November 10, 2014, by hand clipping three, 0.75 m by 0.75 m frames per treatment to ground level, one within each interseeded row. Plant material was collected in paper bags, placed in a forced-air oven and dried at 60°C for 72 hours, and weighed. Yields were then converted to kg ha-1. The samples were later ground for nutritional analysis through a Wiley® Mill (Model 4) equipped with a 2 mm screen and then through a Foss® Tecator Cyclotec Sample Mill (Model 1093), also equipped with a 2 mm screen, to homogenize the material. The samples were analyzed using a LECO TruSpec® CN268 Elemental Combustion analyzer (St Joseph, MI, USA) to obtain the nitrogen content which was then multiplied by 6.25 to estimate crude protein (CP) content (AOAC, 1990). Neutral detergent fiber (aNDF) and in-vitro true digestibility (IVTD) (Van Soest and Robertson, 1985; Van Soest et al., 1991) were determined using an Ankom® 200 fiber analyzer (Methods 13 and 3, respectively). For the digestibility analysis, rumen fluid was collected from 2 fistulated steers that were being fed a mixed forage-corn diet. The samples were incubated for 48 hours. Statistical Methods The study was laid out using a randomized complete block design with three replicates per treatment. Dry matter yield, CP, aNDF, and IVTD were analyzed by analysis of variance using PROC GLIMMIX (SAS Inst. Inc., Cary, NC). The model included forage species/mixture as the main factor and block (replicate) as the random factor. Mean separations were estimated using the Tukey test within PROC MEANS (SAS Inst. Inc., Cary, NC). Cost Analysis The cost of interseeding cool-season annual forages into corn was estimated by using the seed cost and cost of machinery used (tractor and interseeder). The biomass yield was multiplied by a utilization factor of 75% and the total cost was then divided by the utilizable biomass of each treatment to estimate the cost per kilogram of utilizable DM. The biomass yield was then multiplied by the percent
CP to obtain the yield of protein in kilograms per hectare which was then multiplied by the utilization factor of 75%. The total cost per hectare was divided by the kilograms of utilizable protein per hectare to estimate the cost per kilogram of CP.
RESULTS AND DISCUSSION
Dry Matter Yield and Nutritional Quality Dry matter yields differed among the interseeded forage species (p=0.0013), with the annual ryegrass and brassica mixture having the highest yields whereas crimson clover and winter triticale produced much lower biomass (Table 2). The two mixtures evaluated (AR+CC and WT+BM) had intermediate levels of DMY that were higher than crimson clover and winter triticale, but still lower than the highest yields achieved. Yield of the mixtures was dominated by the annual ryegrass and brassicas and was lower than the straight treatments due to the lower seeding rate for these species in the mix (Table 1). The CP content also differed among the interseeded forage species (p=0.0149). On average, CP for the cool-season forages evaluated was four times the content of the cornstalks (Table 2). A low CP content for irrigated cornstalks has been reported as the first-limiting factor for weight gain when calves graze cornstalks (Klopfenstein et al., 1987; Fernandez-Rivera and Klopfenstein, 1989). The brassica and WT+BM mixtures were the treatments with the highest CP. Although the annual ryegrass and crimson clover had lower CP values, their content would still more than meet the requirements of beef cattle (NRC, 2000). For fiber content as measured by aNDF, the interseeded species evaluated fell into 2 groups (p=0.0001, Table 2). The brassica and WT+BM mixtures were the treatments with the lowest aNDF contents averaging 24.4%. The other species and mixtures evaluated averaged 41.6% aNDF. All the forage species in this study had an aNDF content much lower than that of the cornstalks. Fernandez-Rivera and Klopfenstein (1989) had reported NDF values of 85% and 80.7% for irrigated and dryland cornstalks, respectively. Although the treatment effect was significant for IVTD (p=0.0027), only one species, crimson clover, was significantly lower in digestibility compared to the other species and mixtures evaluated, averaging just under 78% (Table 2). All of the other cool-season forages had values of IVTD higher than 89%. Compared to the cornstalks, all of the forages evaluated had higher IVTD values. Cornstalks can only be grazed after the plants have reached physiological maturity which makes them low in digestibility (Klopfenstein et al., 1987; Fernandez-Rivera and Klopfenstein, 1989). Digestibility integrates the nutritional quality of a feedstuff and is an indicator of the potential nutrients available to livestock. The combination of cool-season forages with the cornstalks can provide high quality protein and fiber, however, the type of grazing management used could impact overall forage utilization and subsequent nutrient intake (Fernandez-Rivera and Klopfenstein, 1989). Rotation systems, in particular strip grazing with every day or every few day moves, can control
269

the tendency of animals to select for the cool-season forages while encouraging more even utilization of the cornstalks. This will result in a more uniform intake of nutrients over time and capitalize on the higher quality of the cool-season forages.
Table 2. Dry matter yield and nutritional quality of forages interseeded into corn. Forages Yield
(kg ha-1) CP (%)
aNDF (%)
IVTD (%)
Cornstalks† 6873 5.2 73.5 57.7 Annual ryegrass 596ab 18.9c 39.9a 90.7a
Crimson clover 18d 18.3c 42.9a 77.7b
AR + CC 358bc 20.1bc 39.3a 91.5a
Winter triticale 58cd 22.3abc 44.2a 90.0a
Brassica mix 790a 23.9ab 25.3b 89.4a
WT + BM 428b 26.1a 23.4b 92.1a
† Not included in statistical analysis Dry Matter and Crude Protein Costs
The cost of interseeding cool-season forages into corn varied by the seed cost and the seeding rates applied (Table 3). The cost to run the tractor with interseeder was the same for all treatments. Winter triticale was the treatment with the highest seeding rate and highest total cost. The two treatments with lower yields (i.e. crimson clover and winter triticale) resulted in the highest costs per kg of DM produced. If using good quality alfalfa (18% CP and 150 RFV) with a current market price of $154 t-1 as a supplement, the cost per kg of DM would be $0.175 after adjusting to a dry matter basis ($154/(1000 kg x 88% DM)). The brassica mix and annual ryegrass had the lowest costs per kg of DM produced which were similar to the cost for alfalfa hay.
Table 3. Costs for interseeding forages into corn and resulting cost per kilogram of dry matter (DM) yield. Forages Seed cost
($ ha-1) Total cost ($ ha-1)*
Utilizable DM cost ($ kg-1)**
Annual ryegrass 32.11 81.61 0.18 Crimson clover 48.90 98.40 7.28 AR + CC 51.87 101.37 0.37 Winter triticale 133.13 182.63 4.19 Brassica mix 52.61 102.11 0.17 WT + BM 103.44 152.94 0.47 * Tractor and interseeder operation cost used was $49.50 ha-1 ** Assuming 75% utilization by cattle Like with DM yield, annual ryegrass and the brassica mix were the treatments with the highest CP yields, followed by the WT+BM mixture which was favored by having the highest CP content of all the treatments (Table 4). The utilizable protein was assumed to be a constant value (75%) of what the cattle can consume when grazing. The cost per kg of CP produced for the cool-season forages evaluated in this study varied widely due to the combination of DMY and CP. However, similar trends to those mentioned above were evident where crimson clover
and winter triticale were the treatments with the highest costs. Annual ryegrass and the brassica mix had the lowest costs per kg of utilizable protein (Table 4). These latter values were comparable to the cost of protein from good quality alfalfa hay (18% CP, $0.97 kg-1) with the brassica mix being cheaper at $0.72 kg-1. Being a cash crop, alfalfa hay prices are variable. At the current market price of $154 t-1, interseeding cool-season forages such as annual ryegrass and brassicas can compete favorably with the common practice of feeding alfalfa hay as a supplement when grazing cornstalks. If the market price for alfalfa goes up, the economics of interseeding cool-season forages into corn will be even more favorable and can definitely help provide the nutrients required to maintain rumen microbial activity (Klopfenstein et al., 1987).
Table 4. Protein yield and resulting cost per kilogram of crude protein yield of forages interseeded into corn. Forages Protein
yield (kg ha-1)
Utilizable protein
(kg ha-1)*
Protein cost
($ kg-1) Annual ryegrass 112.80 84.60 0.96 Crimson clover 3.29 2.47 39.84 AR + CC 72.15 54.11 1.87 Winter triticale 12.95 9.71 18.80 Brassica mix 189.15 141.86 0.72 WT + BM 111.65 83.74 1.82 * Assuming 75% utilization by cattle
Interseeding cool-season forages into corn will require the use of strip grazing to achieve the most efficient utilization of the corn residue/forage combination. Livestock managers may require training in these types of grazing management techniques and there will be some labor costs associated with moving electric fences every day or every few days. The cattle may also need time to acclimate to this type of management. On the other hand, producers have the potential to save money on purchased supplements such as alfalfa hay, even at current market prices of $154 t-1. The additional labor required to move electric fences will be offset by the costs associated with the storage, hauling, and feeding of other types of protein supplements.
IMPLICATIONS
Interseeding of cool-season forages into corn can provide a higher-quality diet for beef cattle grazing cornstalks during the fall. Supplementation of harvested feeds such as alfalfa hay represents a large expense for producers that graze their cattle on cornstalks. Production costs in beef cattle systems can be reduced by interseeding cool-season forages which have the potential to meet the nutritional requirements of cows as well as growing and finishing animals. Integration of crop and livestock systems is feasible and can provide benefits to producers and to the environment. Through strip grazing, producers can optimize utilization of the cornstalks interseeded with cool-season
270
forages while more evenly spreading the manure across the entire field thus reducing the need for future fertilization.
LITERATURE CITED AOAC. 1990. Official Methods of Analysis. 15th ed,
Arlington, Virginia, USA. Baributsa, D. N., E. F. Foster, K. D. Thelen, A. N.
Kravchenko, D. R. Mutch, and M. Ngouajio. 2008. Corn and cover crop response to corn density in an interseeding system. Agron. J. 100:981-987.
Fernandez-Rivera, S., and T. J. Klopfenstein. 1989. Yield and quality components of corn crop residues and utilization of these residues by grazing cattle1. J. Anim. Sci. 67:597-605.
Klopfenstein, T., L. Roth, S. F. Rivera, and M. Lewis. 1987. Corn residues in beef production systems1,2. J. Anim. Sci. 65:1139-1148.
NRC. 2000. Nutrient Requirements of Beef Cattle: Seventh Revised Edition: Update 2000. p 248. The National Academies Press, Washington, DC.
Scott, T. W., J. Mt. Pleasant, R. F. Burt, and D. J. Otis. 1987. Contributions of ground cover, dry matter, and nitrogen from intercrops and cover crops in a corn polyculture system1. Agron. J. 79:792-798.
Van Soest, P. J., and J. B. Robertson. 1985. Analysis of forages and fibrous feeds. A laboratory manual for animal science, Cornell University, Ithaca, NY.
Van Soest, P. J., J. B. Robertson, and B. A. Lewis. 1991. Methods for dietary fiber, neutral detergent fiber, and nonstarch polysaccharides in relation to animal nutrition. J. Dairy Sci. 74:3583-3597.
271
PHYSIOLOGY
Proceedings, Western Section, American Society of Animal Science
Vol. 66, 2015
Relationship among feed efficiency traits and reproduction in heifers1 J. B. Hall*,†, J. B. Glaze, Jr.*,‡, W. K. Smith†, and M. C. Roberts†
*Department of Animal and Veterinary Sciences, University of Idaho, Moscow 83844; †UI Nancy M. Cummings Research, Extension & Education Center, Carmen 83462;
‡UI Twin Falls Research and Extension Center, Twin Falls 83301
ABSTRACT: Improving feed efficiency is important to the sustainability of cow-calf operations; however, improvements in efficiency must not compromise reproductive efficiency. The objective of the current experiment was to determine: 1) the relationship among growth and feed efficiency with AI pregnancy rates in crossbred beef heifers, and 2) changes in feed intake associated with estrus. Crossbred heifers (n = 104) were fed in a GrowSafe® system to obtain individual feed intakes. Heifers were sired by Angus, Hereford, or SimAngus bulls. A modified (49 d) residual feed intake (RFI) trial was conducted. Heifers were classified into RFI groups as efficient (≤ ½ SD below the average RFI), average, or inefficient. At the conclusion of the RFI trial, heifers were synchronized using the 5d CIDR CO-Synch protocol and inseminated with X-sorted (Sexed) or conventional (CON) semen. Pregnancy status and fetal age were determined at d 60 and d 111. The effect of breed of sire, RFI group, and their interactions on mid RFI trial weight (MidWT), ADG, DMI, metabolic BW, feed:gain (F:G), RFI, yearling wt (YWT), BCS, reproductive tract score (RTS), and pelvic area (PA) were tested by ANOVA. The effect of sire breed, semen type and RFI group on average fetal age at d 60 and 111 was examined by ANOVA as well as the relationship between pregnancy status and RFI. Breed of sire affected (P < 0.03) ADG, DMI, F:G, and RFI. Differences among RFI groups were due to reductions (P < 0.01) in DMI, but not differences in ADG. Overall ADG was great and exceeded 1.75 kg/d. Neither sire breed nor RFI group affected average d pregnant at d 60 or d 111 (P > 0.5). Heifers inseminated with SEXED had decreased (P < 0.03) pregnancy rates to AI compared to CON heifers as evidenced by decreased days pregnant at d 60 and d 111. DMI was decreased (P < 0.001) on the d of estrus compared to average DMI for the trial. We conclude that although various growth and feed efficiency traits were affected by breed of sire, there was no significant relationship between RFI and pregnancy rates to AI. Further large scale studies or meta-analysis of the relationship among feed efficiency and reproduction in heifers are warranted. Key words: residual feed intake, heifers, pregnancy rate __________________________________________ 1Research conducted by the University of Idaho presented in this manuscript was supported by the Idaho Agricultural Experiment Station, UI Department of Animal and Veterinary Science, and UI Nancy M. Cummings REEC. The authors gratefully acknowledge Zoetis Animal Health (New York, NY) for providing Lutalyse® sterile suspension, EAZI BREED CIDR® Cattle inserts, and Factrel®; ABS Global and J.R. Good for donation of semen; River Bend Angus Ranch for supplying natural service sires.
INTRODUCTION
Feed costs account for 55-70% of direct costs of a cow-calf operation. Feed efficiency can be measured by a variety of methods including feed to gain ratio, gain to feed ratio, and residual feed intake (RFI). Selection for feed conversion alone (feed to gain ratio) can result in increased mature size (Hill and Ahola, 2012). Residual feed intake attempts to account for energy used for maintenance and estimates the efficiency of utilization of nutrients above maintenance. Animals with negative values for RFI are considered more efficient.
While RFI can be used to select animals for increased feed efficiency, it is important to understand the relationship of RFI to other traits of interest such as carcass quality and reproduction. Several studies indicate limited impact of RFI to carcass traits or that –RFI animals can produce a high quality product (Hill and Ahola, 2012; Welch et al., 2012). Therefore, selection for RFI does not appear to limit feedlot performance or product quality.
Fewer experiments investigated the impacts of RFI on reproduction in cattle (Basarab et al., 2012). Comparisons of -RFI and +RFI females indicate -RFI heifers may be delayed in attaining puberty (Basarab et al., 2011). However, the impact of -RFI status on pregnancy rate is inconsistent with reports of a reduction (Arthur et al., 2005; Basarab et al., 2011) or no effect (Donoghue et al., 2011) in beef cows and heifers. Adjusting RFI values for off-test back fat and activity removed any effect of RFI on reproductive measures (Basarab et al., 2011). More information on the relationship among RFI and pregnancy rates is needed. In addition, a better understanding of the impact of estrus activity on feed intake may assist with design of RFI trials for heifers.
Therefore, we designed an experiment to determine: 1) the relationship among growth and feed efficiency with AI pregnancy rates in crossbred beef heifers, and 2) changes in feed intake associated with estrus.
MATERIALS AND METHODS
All procedures were approved by the University of Idaho Animal Care and Use Committee. Crossbred heifers (n = 104) were fed a TMR in a GrowSafe system to determine individual feed intakes and calculate RFI. Sire breeds represented included Angus (n = 60), Hereford (n = 12), and SimAngus (n = 32), and dams were predominately Angus-Hereford cross. Diets were offered ad libitum and calculated to produce daily gains of 1.2 kg per animal based
272

on the Beef NRC. Water was available at all times. Heifers were assigned to 1 of 3 pens based on yearling weights with heavy, moderate, and light weight heifers in separate pens. Growth and feed efficiency measures were collected during a modified residual feed intake (RFI) trial which lasted 49 days. Heifers were weighed at the beginning, midpoint and end of the RFI trial. Heifers remained in the GrowSafe system and in their original feeding groups for an additional 28 d.
Dry matter intake, feed:gain, and RFI were calculated for all heifers. The RFI equation regressed DMI against metabolic body weight and average daily gain. Heifers were categorized by RFI as Efficient (E), Average (A) or Inefficient (INE). Efficient heifers had RFI values ≤ ½ SD below the average RFI value whereas INE heifers had RFI values ≥ ½ SD above the average RFI value.
At the end of the RFI trial, heifers were blocked by yearling weight and reproductive tract score and assigned to be inseminated with either conventional (CON) or X-sorted semen (SEXED) from a single AI sire. All heifers were synchronized using the 5-day CO-Synch + CIDR protocol (Johnson et al., 2013; Figure 1). At CIDR removal, heat detection patches (Estrotect, Denver, CO) were applied to heifers. Estrus status was determined twice daily and at fixed-time AI (FTAI). Heifers were inseminated by FTAI at 66 h if the estrus detection patch was fully or partially activated. Heifers with an unactivated patch were given GnRH per estrus synchronization protocol, but insemination was delayed for 20 h.
Fourteen days after FTAI, heifers were placed with natural service sires for clean-up breeding. The bull to heifer ratio was 1:35. At 60 days after FTAI, pregnancy status and fetal age was determined by transrectal ultrasonography. Bulls were removed 60 days after FTAI and final pregnancy status was determined via palpation on d 111 after FTAI. Reproductive data collected included fetal age, pregnancy status at d 60 post AI (AI vs Non) and pregnancy status at d 111 (AI, natural service [NS], or Open).
To examine the effect of estrus on DMI, average intake, intake on the d before estrus (Es d-1), intake on d of estrus (Es), and intake one d after estrus (Es d+1) were measured. Average intake for all animals and RFI calculations excluded the day of estrus.
Results were analyzed by ANOVA using GLM procedures of SAS (SAS, 2010). The effect of breed of sire, RFI group, and their interactions on mid RFI trial weight (MidWT), ADG, DMI, metabolic BW, feed:gain (F:G), RFI, yearling wt (YWT), BCS, and reproductive tract score (RTS) were tested. The only significant interaction among breed of sire and RFI group was on BCS. All other interactions were removed from the model. An independent analysis of the effect of semen type (CON vs SEXED) on the above listed traits was conducted. The effect of sire breed, semen type and RFI group on average fetal age at d 60 and 111 was examined by ANOVA. The relationship between pregnancy status at d 60 and d111 and RFI value was examined by ANOVA. Differences between average intake and intake on day of estrus were analyzed using a paired t-test. Comparison among intake from Es d-
1, Es, and Es d+1 were analyzed by ANOVA with repeated measures using MIXED procedures of SAS.
RESULTS
Breed of sire affected (P < 0.03) ADG, but did not influence (P > 0.33) other growth traits measured (Table 1). However, breed of sire altered (P < 0.01) DMI, F:G, and RFI (Table 2). SimAngus sired heifers had the greatest ADG, but also consumed more feed whereas Hereford sired heifers ADG was intermediate while having the lowest DMI. Accordingly, Hereford sired heifers had the lowest RFI with SimAngus sired heifers having the highest RFI and Angus sired heifers being intermediate for RFI.
The RFI group had no effect (P > 0.5) on any of the growth traits measured (data not shown). Differences in RFI grouping were due to decreased (P < 0.001) DMI and improved (P < 0.001) F:G in E heifers compared to A or INE heifers (Table 3). For DMI and F:G the relationship was E < A < INE.
As would be expected due to blocking, all weight traits were similar (P > 0.5) among heifers inseminated with CON or SEXED semen except ADG was greater (P < 0.001) for heifers inseminated with SEXED compared to CON semen (1.85 ± 0.04 kg/d vs 1.69 ± 0.04 kg/d, respectively). Due to increased ADG, F:G was less (P < 0.01) for SEXED compared CON heifers (6.9 vs 7.4, respectively). However, there was no difference (P > 0.5) in RFI between heifers receiving SEXED and CON semen.
The RFI group did not affect (P > 0.4) RTS which averaged 3.9 ± 0.19. Reproductive tract scores were reduced (P < 0.03) in Hereford sired heifers compared to Angus and Simmental sired heifers (3.1 ± 0.3, 4.0 ± 0.1, 4.1 ± 0.2, respectively).
Pregnancy rates were not altered (P > 0.5) by sire breed or RFI group as indicated by average d pregnant (fetal age) at d 60 and d 111 (39.1 ± 4.4 d and 83.4 ± 7.5 d, respectively). Average d pregnant (fetal) was decreased (P < 0.03) in SEXED compared to CON heifers (Table 4). Pregnancy rates to AI were 67.9% and 41.8% for CON and SEXED, respectively. There was no significant relationship (P > 0.2) among RFI and pregnancy status at d 60 and d 111 (Table 5).
Dry matter intake was reduced (P < 0.001) on Es by 1.76 ± 0.19 kg compared to the average intake for the trial period. In addition, DMI was altered (P < 0.001) by day relative to estrus. Average DMI for Es d-1, Es, and Es d+1 were 14.3 kg, 11.8 kg, and 13.3 kg, respectively (pooled SE = 0.25 kg). While DMI was reduced (P < 0.001) from Es d-1 to Es, it increased (P < 0.001) from Es to Es d+1. However, DMI was still reduced (P < 0.005) on Es d+1 compared to Es d-1.
DISCUSSION
In the present experiment, differences in several growth and feed efficiency traits including RFI were detected; however, there was not an effect of RFI group or value on any measure of reproductive efficiency. Greater ADG and reduced feed efficiency for Simmental sires was not unexpected as Simmental sires were terminal type sires whereas Hereford and Angus sires were selected for
273
maternal traits. In experiments using heifers sired by bulls divergent for RFI, researchers report decreases in DMI and RFI for heifers sired by –RFI bulls or no differences among feed efficiency measures (Herd et al., 1997; Minick Bormann et al., 2010). Animals with a higher growth potential (large framed, greater ADG), such as the Simmental sired heifers, in the present study, usually have greater feed efficiency as determined by F:G (Hill and Ahola, 2012), and F:G and ADG are highly correlated. However, correlations between ADG and RFI are low to non-existent (Hill and Ahola, 2012). Accordingly, enhanced ADG in our study did not translate into improvements in RFI. In the present study, sires of heifers were not selected for RFI or EPDs related to feed efficiency. Our goal was to determine RFI of crossbred heifers from bulls unselected for RFI and then compare feed efficiency traits to reproductive measures.
Traditionally, animals used for reproductive experiments are blocked or allocated to treatments based on body weights. This allocation is considered important due to the effects of growth and body weight on reproductive performance, particularly in heifers (Schillo et al, 1992). Results from the current study, demonstrate that while accounting for BW when allocating heifers to treatment can reduce variation at the beginning of the experiment, it may not be successful in reducing variation in growth and feed intake. Fortunately, there was no difference in RFI among SEXED and CON.
Reduction in pregnancy rates to sexed semen are consistent with those observed in a variety of other experiment comparing sexed and conventional semen (Hall and Glaze, 2014). Overall, the 26% reduction in pregnancy rates to sexed semen are more drastic than normally observed. However, this discrepancy is more of a result of high pregnancy rates to the conventional semen as the 42% pregnancy rate for sexed semen is in the typical range observed in other studies.
There was no relationship between RFI and measures of reproductive efficiency. This lack of effect of RFI on reproduction agrees with several studies using heifers sired by bulls divergent for RFI which found no effect of RFI on first service conception rate, pregnancy rate or calving rate (Donoghue et al., 2011; Blair et al., 2013). In contrast, -RFI has been associated with decreased reproductive efficiency (Arthur et al., 2005; Basarab et al., 2011). Although we observed a numeric relationship between animals that became pregnant to AI having +RFI and open animals having –RFI, this was not a significant relationship like that observed by (Arthur et al, 2005). Another possibility is that the high ADG observed in all animals in this study obliterated any effects of RFI due to high availability of nutrients for reproduction (Schillo et al., 1992).
Basarab and co-workers (2011) adjusted RFI for backfat and heifer feeding activity and found no relationship between RFI and reproduction. In the current study, we did not adjust RFI for backfat, but did remove intake data from the day of estrus from the DMI calculations. The decrease in DMI during estrus, as well as differences on the d after estrus, indicate that estrus
detection and removal of data from at least the day of estrus may be important in RFI studies involving cycling females.
IMPLICATIONS
Results from the present study indicate that there was no relationship between RFI and measures of reproductive efficiency in crossbred heifers. However, the reported results are from a limited data set. Estrus detection should be included in RFI studies using cycling cattle, and DMI intake for day of estrus should be eliminated from the data set. Overall, further large scale studies or meta-analysis of the relationship among feed efficiency and reproduction in heifers are warranted.
LITERATURE CITED
Arthur, P. F., R. M. Herd, J. F. Wilkins, and J. A. Archer. 2005. Maternal productivity in Angus cows divergently selected for post-weaning residual feed intake. Aust. J. Exp. Agric. 45:985-993.
Basarab, J.A., M.G. Colazo, D.J. Ambrose, S. Novak, D. McCartney, and V.S. Baron. 2011. Residual feed intake adjusted for backfat thickness and feeding frequency is independent of fertility in beef heifers. Can. J. Anim. Sci. 91:573-584.
Barasab, J. A., C. Fitzsimmons, C. S. Whisnant, and R. P. Wettemann. 2012. Interactions with other traits: Reproduction and fertility. In: R. A. Hill, editor, Feed efficiency in the beef industry. John Wiley & Sons, Inc. Ames, IA. p. 123-144.
Blair E.E., J. Minick Bormann, D.W. Moser, and T.T. Marston. 2013. Relationship between residual feed intake and female reproductive measurements in heifers sired by high- or low- residual feed intake Angus bulls. Prof. Anim. Sci. 29:46-50.
Donoghue, K. A., P. F. Arthur, J. F. Wilkins, and R. M. Herd. 2011. Onset of puberty and early-life reproduction in Angus females divergently selected for post-weaning residual feed intake. Anim. Prod. Sci. 51: 183-190.
Hall, J. B. and J. B. Glaze, Jr. 2014. Review: System application of sexed semen in beef cattle. Prof. Anim. Sci. 30:279-284.
Herd, R. M., J. A. Archer, P. F. Arthur, E. C. Richardson, J. H. Wright, K. C. P. Dibley, and D. A. Burton. 1997. Performance of progeny of high vs. low net feed conversion efficiency cattle. Proc. Assoc. Adv. Anim. Breed. Genet. 12:742.
Hill, R.A., and J.K. Ahola. 2012. Feed efficiency interactions with other traits: Growth and product quality. In: R. A. Hill, editor, Feed efficiency in the beef industry. John Wiley & Sons, Inc. Ames, IA. p. 145-158.
Loyd, Andrea N., C.R. Long, A.W. Lewis, R.D. Randel. 2011. Effects of physiological age on residual feed intake of growing heifers. Open J. Anim. Sci. 1:89-92.
Minick Bormann, J., D.W. Moser, and T.T. Marston. 2010. CASE STUDY: Feed intake and performance of heifers sired by high- or low- residual feed intake Angus bulls. Haskell Agricultural Laboratory
274
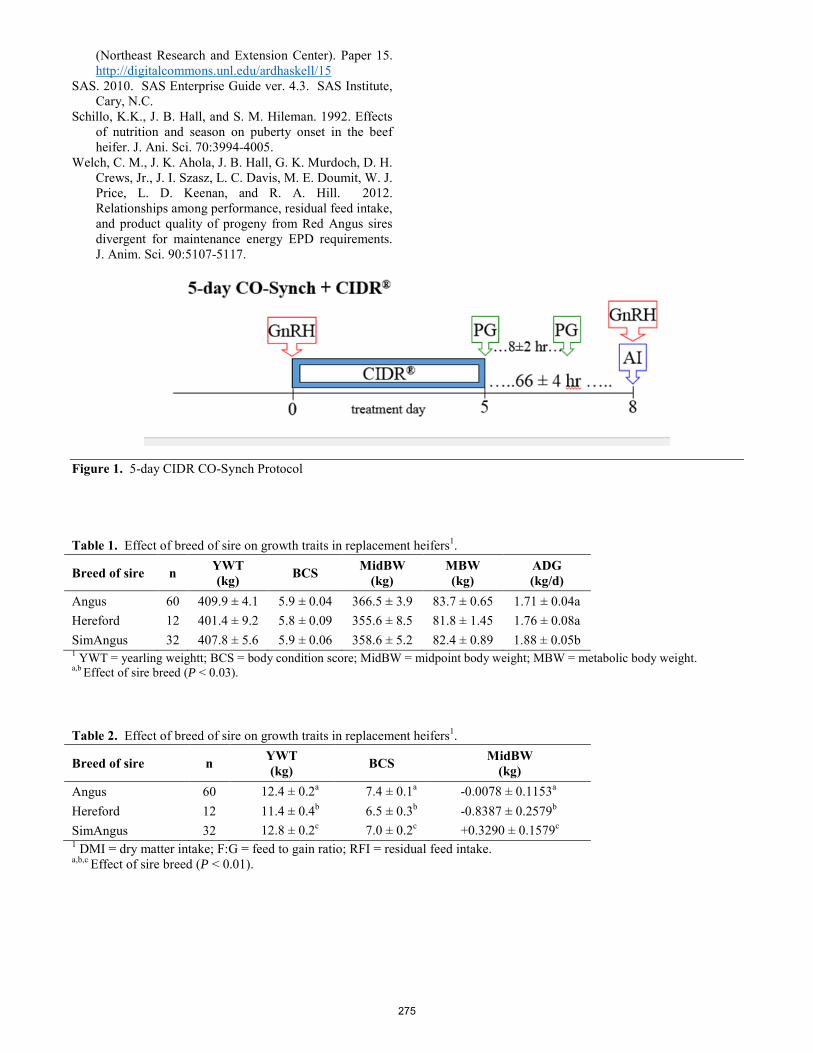
(Northeast Research and Extension Center). Paper 15. http://digitalcommons.unl.edu/ardhaskell/15
SAS. 2010. SAS Enterprise Guide ver. 4.3. SAS Institute, Cary, N.C.
Schillo, K.K., J. B. Hall, and S. M. Hileman. 1992. Effects of nutrition and season on puberty onset in the beef heifer. J. Ani. Sci. 70:3994-4005.
Welch, C. M., J. K. Ahola, J. B. Hall, G. K. Murdoch, D. H. Crews, Jr., J. I. Szasz, L. C. Davis, M. E. Doumit, W. J. Price, L. D. Keenan, and R. A. Hill. 2012. Relationships among performance, residual feed intake, and product quality of progeny from Red Angus sires divergent for maintenance energy EPD requirements. J. Anim. Sci. 90:5107-5117.
Figure 1. 5-day CIDR CO-Synch Protocol
Table 1. Effect of breed of sire on growth traits in replacement heifers1.
Breed of sire n YWT (kg) BCS MidBW
(kg) MBW (kg)
ADG (kg/d)
Angus 60 409.9 ± 4.1 5.9 ± 0.04 366.5 ± 3.9 83.7 ± 0.65 1.71 ± 0.04a Hereford 12 401.4 ± 9.2 5.8 ± 0.09 355.6 ± 8.5 81.8 ± 1.45 1.76 ± 0.08a SimAngus 32 407.8 ± 5.6 5.9 ± 0.06 358.6 ± 5.2 82.4 ± 0.89 1.88 ± 0.05b 1 YWT = yearling weightt; BCS = body condition score; MidBW = midpoint body weight; MBW = metabolic body weight. a,b Effect of sire breed (P < 0.03). Table 2. Effect of breed of sire on growth traits in replacement heifers1.
Breed of sire n YWT (kg) BCS MidBW
(kg) Angus 60 12.4 ± 0.2a 7.4 ± 0.1a -0.0078 ± 0.1153a
Hereford 12 11.4 ± 0.4b 6.5 ± 0.3b -0.8387 ± 0.2579b
SimAngus 32 12.8 ± 0.2c 7.0 ± 0.2c +0.3290 ± 0.1579c
1 DMI = dry matter intake; F:G = feed to gain ratio; RFI = residual feed intake. a,b,c Effect of sire breed (P < 0.01).
275
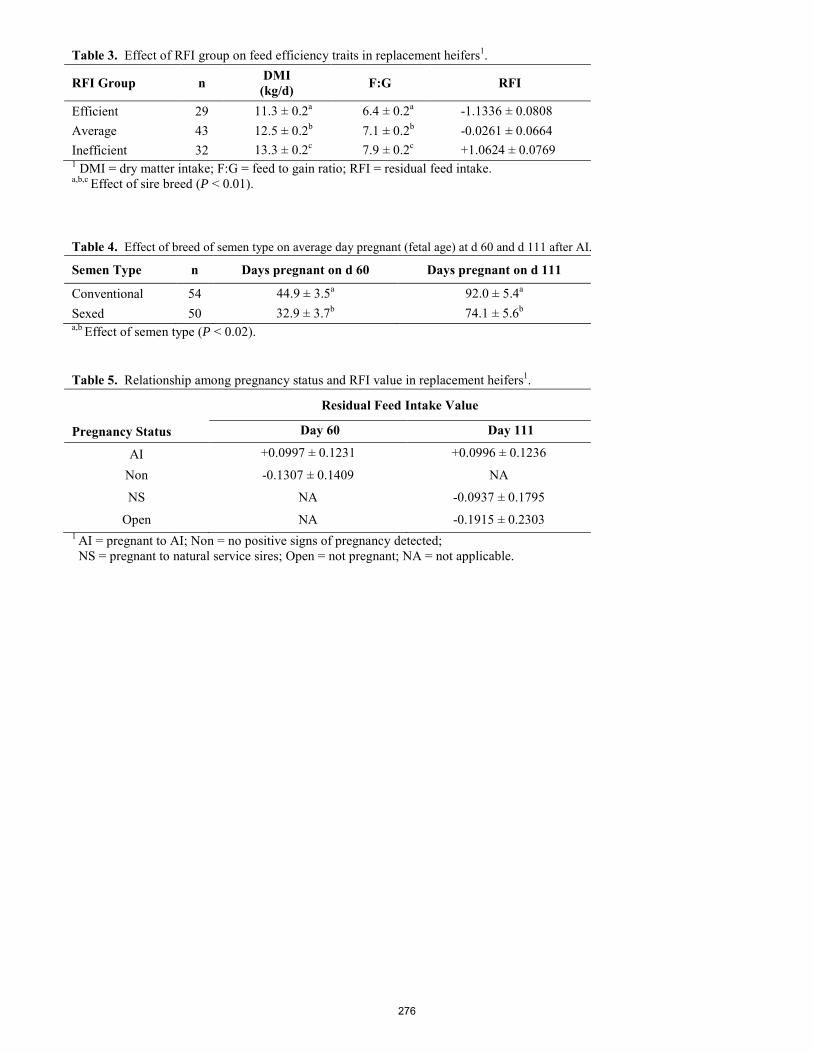
Table 3. Effect of RFI group on feed efficiency traits in replacement heifers1.
RFI Group n DMI (kg/d) F:G RFI
Efficient 29 11.3 ± 0.2a 6.4 ± 0.2a -1.1336 ± 0.0808
Average 43 12.5 ± 0.2b 7.1 ± 0.2b -0.0261 ± 0.0664
Inefficient 32 13.3 ± 0.2c 7.9 ± 0.2c +1.0624 ± 0.0769
1 DMI = dry matter intake; F:G = feed to gain ratio; RFI = residual feed intake. a,b,c Effect of sire breed (P < 0.01). Table 4. Effect of breed of semen type on average day pregnant (fetal age) at d 60 and d 111 after AI.
Semen Type n Days pregnant on d 60 Days pregnant on d 111
Conventional 54 44.9 ± 3.5a 92.0 ± 5.4a
Sexed 50 32.9 ± 3.7b 74.1 ± 5.6b
a,b Effect of semen type (P < 0.02). Table 5. Relationship among pregnancy status and RFI value in replacement heifers1.
Residual Feed Intake Value
Pregnancy Status Day 60 Day 111
AI +0.0997 ± 0.1231 +0.0996 ± 0.1236
Non -0.1307 ± 0.1409 NA
NS NA -0.0937 ± 0.1795
Open NA -0.1915 ± 0.2303 1 AI = pregnant to AI; Non = no positive signs of pregnancy detected; NS = pregnant to natural service sires; Open = not pregnant; NA = not applicable.
276
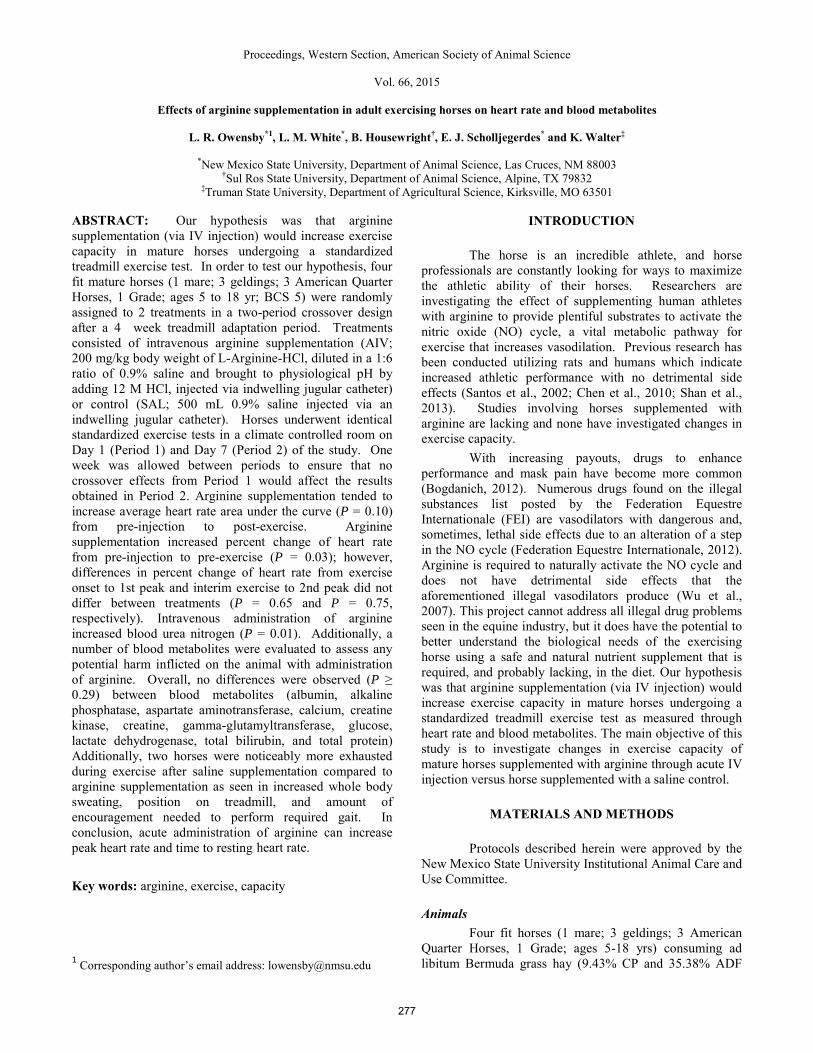
Proceedings, Western Section, American Society of Animal Science
Vol. 66, 2015
Effects of arginine supplementation in adult exercising horses on heart rate and blood metabolites
L. R. Owensby*1, L. M. White*, B. Housewright†, E. J. Scholljegerdes* and K. Walter‡
*New Mexico State University, Department of Animal Science, Las Cruces, NM 88003 †Sul Ros State University, Department of Animal Science, Alpine, TX 79832
‡Truman State University, Department of Agricultural Science, Kirksville, MO 63501 ABSTRACT: Our hypothesis was that arginine supplementation (via IV injection) would increase exercise capacity in mature horses undergoing a standardized treadmill exercise test. In order to test our hypothesis, four fit mature horses (1 mare; 3 geldings; 3 American Quarter Horses, 1 Grade; ages 5 to 18 yr; BCS 5) were randomly assigned to 2 treatments in a two-period crossover design after a 4 week treadmill adaptation period. Treatments consisted of intravenous arginine supplementation (AIV; 200 mg/kg body weight of L-Arginine-HCl, diluted in a 1:6 ratio of 0.9% saline and brought to physiological pH by adding 12 M HCl, injected via indwelling jugular catheter) or control (SAL; 500 mL 0.9% saline injected via an indwelling jugular catheter). Horses underwent identical standardized exercise tests in a climate controlled room on Day 1 (Period 1) and Day 7 (Period 2) of the study. One week was allowed between periods to ensure that no crossover effects from Period 1 would affect the results obtained in Period 2. Arginine supplementation tended to increase average heart rate area under the curve (P = 0.10) from pre-injection to post-exercise. Arginine supplementation increased percent change of heart rate from pre-injection to pre-exercise (P = 0.03); however, differences in percent change of heart rate from exercise onset to 1st peak and interim exercise to 2nd peak did not differ between treatments (P = 0.65 and P = 0.75, respectively). Intravenous administration of arginine increased blood urea nitrogen (P = 0.01). Additionally, a number of blood metabolites were evaluated to assess any potential harm inflicted on the animal with administration of arginine. Overall, no differences were observed (P ≥ 0.29) between blood metabolites (albumin, alkaline phosphatase, aspartate aminotransferase, calcium, creatine kinase, creatine, gamma-glutamyltransferase, glucose, lactate dehydrogenase, total bilirubin, and total protein) Additionally, two horses were noticeably more exhausted during exercise after saline supplementation compared to arginine supplementation as seen in increased whole body sweating, position on treadmill, and amount of encouragement needed to perform required gait. In conclusion, acute administration of arginine can increase peak heart rate and time to resting heart rate. Key words: arginine, exercise, capacity
1 Corresponding author’s email address: [email protected]
INTRODUCTION
The horse is an incredible athlete, and horse professionals are constantly looking for ways to maximize the athletic ability of their horses. Researchers are investigating the effect of supplementing human athletes with arginine to provide plentiful substrates to activate the nitric oxide (NO) cycle, a vital metabolic pathway for exercise that increases vasodilation. Previous research has been conducted utilizing rats and humans which indicate increased athletic performance with no detrimental side effects (Santos et al., 2002; Chen et al., 2010; Shan et al., 2013). Studies involving horses supplemented with arginine are lacking and none have investigated changes in exercise capacity.
With increasing payouts, drugs to enhance performance and mask pain have become more common (Bogdanich, 2012). Numerous drugs found on the illegal substances list posted by the Federation Equestre Internationale (FEI) are vasodilators with dangerous and, sometimes, lethal side effects due to an alteration of a step in the NO cycle (Federation Equestre Internationale, 2012). Arginine is required to naturally activate the NO cycle and does not have detrimental side effects that the aforementioned illegal vasodilators produce (Wu et al., 2007). This project cannot address all illegal drug problems seen in the equine industry, but it does have the potential to better understand the biological needs of the exercising horse using a safe and natural nutrient supplement that is required, and probably lacking, in the diet. Our hypothesis was that arginine supplementation (via IV injection) would increase exercise capacity in mature horses undergoing a standardized treadmill exercise test as measured through heart rate and blood metabolites. The main objective of this study is to investigate changes in exercise capacity of mature horses supplemented with arginine through acute IV injection versus horse supplemented with a saline control.
MATERIALS AND METHODS
Protocols described herein were approved by the
New Mexico State University Institutional Animal Care and Use Committee.
Animals
Four fit horses (1 mare; 3 geldings; 3 American Quarter Horses, 1 Grade; ages 5-18 yrs) consuming ad libitum Bermuda grass hay (9.43% CP and 35.38% ADF
277

dry matter basis) were exercised and acclimated to a treadmill for 4 weeks prior to the study. Treadmill acclimation included familiarizing horses to the treadmill harness and room in addition to working to become fit through a mixture of round pen and treadmill work. Horses were considered acclimated to the treadmill when they were able to walk on to and exercise on the treadmill without a drastic spike in their heart rate or show other signs of nervousness (ie. panic, sweating without exercise, increase in respiratory rate etc.) and were considered to be at a similar levels of fitness when each horse was able to work through the exercise regimen without over exertion. Prior to the study, all horses were considered unfit (having not been ridden in 6 + mo), scored a BCS of 5, and weighed and average of 439.32 ± 18.04 kg.
Experimental Design and Treatments
This experiment was run as a two-period crossover design. After the 4 week treadmill adaptation period, horses were randomly assigned to one of two treatments: intravenous arginine supplementation (AIV; 200 mg/kg body weight of L-Arginine-HCl, dissolved in a 1:6 ratio of 0.9% saline diluted in a 1:6 ratio of 0.9% saline and brought to physiological pH by adding 12 M HCl, injected via indwelling jugular catheter) or control (SAL; 500 mL 0.9% saline injected via an indwelling jugular catheter). Mills et al. (1997) utilized similar levels of arginine IV and reported a difference in skin blood flow and sweating rate in horses during variable intensity treadmill exercise. Treatments were administered 30 min prior to each exercise test (Day 1 and 7). On d 1, horses underwent a modified standardized exercise protocol described by Mills et al. (1997). The exercise protocol was as follows: walk (1.7 m/s), jog (2.6 m/s), extended trot (3.7 m/s), lope (6.0 m/s), jog (2.6 m/s), extended trot (3.7 m/s), lope (6.0 m/s), and jog (2.6 m/s) for three minutes each followed by a walk (1.7 m/s) for five minutes bringing the total time of exercise to 29 minutes. After the first exercise test, horses underwent a 1 week washout period, where they were placed on the basal ration of ad libitum Bermuda grass hay and housed in a 4.6 m × 4.6 m stall. On d 7, treatment assignments were switched and horses were subjected to the treatment protocol and exercise (Day 7).
Sample Collection
Blood Collection. Thirty minutes prior to administration of treatments horses were fitted with a 14 gauge 5.25” indwelling jugular catheter with a 5 mL extension set (Taylor et al., 1995). Blood was collected 10 minutes prior to supplementation (0 min) of ARG or SAL to determine basal levels of basic blood metabolites. Additionally, blood was drawn after supplementation, during exercise, and for 45 minutes post-exercise, or until resting heart rate (35 beats/min) was achieved, to determine any changes as a result of supplementation.
Heart Rate: Heart rate was taken as a measure of work and exercise capacity, and was measured using a Polar Equine InZone Heart Rate Monitor. Heart rate was taken before catheterization so we were able to determine
an accurate resting heart rate. Additionally, heart rate was taken 20, 10, and 5 min prior to supplementation, 10, 20, 25, and 29 min post-supplementation/pre-exercise, every min during exercise, and every min post-exercise until resting heart rate was achieved.
Exhaustion/Exertion: During exercise, the level of exhaustion was measured by noting visual amounts of whole body sweating, position of treadmill (leaning on back strap as opposed to pushing on front strap), and the amount of encouragement from the handler needed to perform required gait (Marlin and Nankervis, 2002). Sample and Statistical Analysis
Fifteen minutes post-collection, blood was spun at 1500 × g for 15 min and serum was poured off and stored at -20 °C until further analysis. To determine blood urea nitrogen, albumin, alkaline phosphatase, aspartate aminotransferase, calcium, creatine kinase, creatine, gamma-glutamyltransferase, glucose, lactate dehydrogenase, total bilirubin, and total protein, serum samples were run through a VetTest 8008 IDEXX machine. Data were analyzed as a two-period crossover using the PROC Mixed function in SAS (v. 9.4; SAS Inst. Inc., Cary, NY), where horse served as the experimental unit. For the heart rate percent change data, the model included horse and period. Area under the curve was calculated using the trapezoidal summation method. Blood metabolite analysis included horse, period, min and all appropriate interactions in the model. Means were considered significant at P ≤ 0.05 and a trend at P ≤ 0.10.
RESULTS AND DISCUSSION
Heart Rate There was a treatment × min interaction (P <
0.001) for heart rate. This result was due to differences being observed at min -1 and continuing to min 0 where arginine horses displayed a higher heart rate than the control group, and again at min 20 (peak of the second lope) where arginine supplemented horses displayed higher heart rates than the control. However, beginning at min 23 and continuing to min 28, the arginine group displayed a lower heart rate. Beginning at min 28, heart rate between groups was no longer different.
Arginine supplemented horses had greater peak heart rate during the 2nd peak of exercise (treatment × min, P < 0.05; Figure 1). Arginine supplementation tended (P = 0.10) to increase heart rate area under the curve (Table 1). Arginine supplementation resulted in increased (P = 0.03) percent change in heart rate from pre-injection to pre-exercise; however, differences in percent change of heart rate from exercise onset to 1st peak and interim exercise to 2nd peak were not significantly different between treatments (P = 0.65 and P = 0.75, respectively). This agrees with Giugliano et al. (1997) and McConell (2007) who reported that humans administered arginine had similar changes in heart rate at rest following acute IV arginine injection. This result is not surprising if one considers the role arginine plays from exercise onset to 1st peak and
278
interim exercise to 2nd peak were not significantly different between treatments (P = 0.65 and P = 0.75, respectively). This agrees with Giugliano et al. (1997) and McConell (2007) who reported that humans administered arginine had similar changes in heart rate at rest following acute IV arginine injection.
1Treatments consisted of Control= 500mL isotonic saline; and Arginine=200mg/kg BW Arginine-HCl dissolved in a 1:6 ration of isotonic saline solution and brought to physiological pH with 12 M HCl. Treatments were injected IV through a 5.24” 14 G jugular catheter 30 minutes prior to exercise. 2 HR = heart rate 3 AUC = area under the curve
This result is not surprising if one considers the role arginine plays in NO production and the resultant vasodilation; therefore, a fall in blood pressure is expected followed by an increase in heart rate in an effort to regain normal blood pressure. However, other studies have found a significant drop in blood pressure with only minor changes in heart rate (Bode-Boger et al., 1998; Nagaya et al., 2001), and others have found no change in blood pressure or heart rate under arginine infusion (Creager et al., 1992; Camic et al., 2010). Additionally, it has also been demonstrated that arginine infusion has no effect on blood pressure or heart rate during exercise (McConell, 2007). Therefore, increased blood pressure brought on by bouts of exercise naturally induce NO production through endothelial stimulation resulting in vasodilation (McConell, 2007); hence, arginine injection would be expected to have less of an effect on vasodilation when the body is already undergoing vasodilation through natural stimulus (exercise) of NO production. An exercising horse will breach the anaerobic threshold at a heart rate of 150 bpm (Marlin and Nakervis, 2002).
It was thought that if arginine supplemented horses displayed an overall lower heart rate on average during exercise that they would be able to work under aerobic conditions for a longer period of time while undergoing the same intensity of exercise as the control group, thus, an increase in exercise capacity would be seen. However, since the horses in this study never reached anaerobic threshold, further research is necessary to determine if there is a change in equine anaerobic threshold under arginine supplementation and if there is indeed an difference in exercise capacity at anaerobic threshold between arginine supplemented horses and control.
Blood Metabolites
With the exception of blood urea nitrogen (P = 0.01), there were no differences (P ≥ 0.29) between blood metabolites (Table 2), which indicates that acute arginine injection caused no internal harm to the horse. The significant difference seen in blood urea nitrogen (BUN) is expected due to the fact that treatments were not isonitrogenous, meaning that there was an increase in blood amino acid concentration in the arginine group, thus more metabolism of arginine to urea occurred in the liver. However, although the difference was significant, BUN averages for each group still fell within the normal range for a mature horse (10-24 mg/dL; Kaneko et al., 2008). The fact that there was no significant difference between any other blood metabolite measured is important as it shows that acute arginine injection of this magnitude had no detrimental internal effects on the horse. Albumin (P = 0.97), alkaline phosphatase (P = 0.65), calcium (P =0.74), creatine (P = 0.92), gama-glutamyltransferase (P = 0.95), globulin (P = 0.98), total bilirubin (P = 0.84), and total protein (P = 0.98) levels did not significantly differ between animals, yet average for each treatment fell within the normal range indicating no liver and kidney damage to the animal. Furthermore, aspartate aminotransferase (P = 0.90), and lactate dehydrogenase (P = 0.89) did not differ between treatments, but still fell within an acceptable range, indicating no arginine induced muscle damage. It should be noted, however, that creatine kinase levels (Normal levels: 2.4-23.4 U/L) were consistently elevated in all horses in all treatments. Creatine kinase is an essential enzyme for the storage and release of energy in skeletal muscle. It is responsible for catalyzing the transfer of a phosphate group between creatine phosphate and ATP, creates energy reserves in myocardial and skeletal muscle in the form of creatine phosphate, and catalyzes the transfer of a high energy phosphate group from creatine phosphate to ADP in order to form ATP (Kaneko et al., 2008). Given that information, it is logical to see elevated levels of creatine kinase in exercising horses, especially during exercise in horses that are not in peak fitness. Additionally, it should be noted that lactate levels would have been a more accurate predictor of anaerobic threshold (anaerobic threshold: 4 mmol/L lactate) and exercise capacity; however, due to machine error, that data was unable to be collected; therefore, heart rate was used as an indicator of exercise capacity for this study. Exhaustion and Exertion
Anecdotally, two horses were noticeably more exhausted during exercise after saline supplementation compared to arginine supplementation as seen in increased whole body sweating, position on treadmill, and amount of encouragement needed to perform required gait. Fatigue was measured using previously described methods (Marlin and Nakervis, 2002). Studies conducted with humans where arginine was orally supplemented over a period of time found similar results. Santos et al., (2002) reported an
Table 1. Effects of intravenous arginine supplementation on changes in equine heart rate before and during a standardized treadmill exercise regimen Treatment1 Item Control Arginine SE P-Value HR2, AUC3 193 245 18 0.10 HR, Pre-injection to Pre-exercise, % change 93 153 14 0.03
HR, Begin Exercise to 1st Peak, % change 449 469 28 0.65
HR, Interim to 2nd Peak, % change 143 139 6 0.75
279
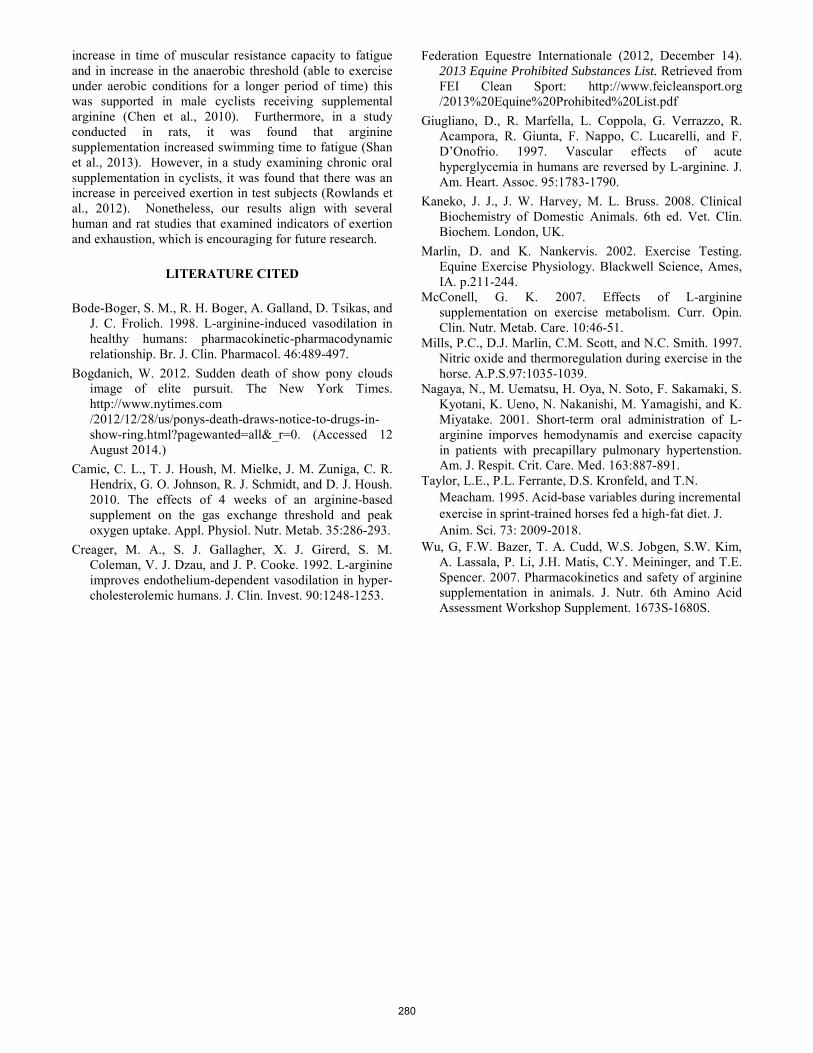
increase in time of muscular resistance capacity to fatigue and in increase in the anaerobic threshold (able to exercise under aerobic conditions for a longer period of time) this was supported in male cyclists receiving supplemental arginine (Chen et al., 2010). Furthermore, in a study conducted in rats, it was found that arginine supplementation increased swimming time to fatigue (Shan et al., 2013). However, in a study examining chronic oral supplementation in cyclists, it was found that there was an increase in perceived exertion in test subjects (Rowlands et al., 2012). Nonetheless, our results align with several human and rat studies that examined indicators of exertion and exhaustion, which is encouraging for future research.
LITERATURE CITED
Bode-Boger, S. M., R. H. Boger, A. Galland, D. Tsikas, and
J. C. Frolich. 1998. L-arginine-induced vasodilation in healthy humans: pharmacokinetic-pharmacodynamic relationship. Br. J. Clin. Pharmacol. 46:489-497.
Bogdanich, W. 2012. Sudden death of show pony clouds image of elite pursuit. The New York Times. http://www.nytimes.com /2012/12/28/us/ponys-death-draws-notice-to-drugs-in-show-ring.html?pagewanted=all&_r=0. (Accessed 12 August 2014.)
Camic, C. L., T. J. Housh, M. Mielke, J. M. Zuniga, C. R. Hendrix, G. O. Johnson, R. J. Schmidt, and D. J. Housh. 2010. The effects of 4 weeks of an arginine-based supplement on the gas exchange threshold and peak oxygen uptake. Appl. Physiol. Nutr. Metab. 35:286-293.
Creager, M. A., S. J. Gallagher, X. J. Girerd, S. M. Coleman, V. J. Dzau, and J. P. Cooke. 1992. L-arginine improves endothelium-dependent vasodilation in hyper-cholesterolemic humans. J. Clin. Invest. 90:1248-1253.
Federation Equestre Internationale (2012, December 14). 2013 Equine Prohibited Substances List. Retrieved from FEI Clean Sport: http://www.feicleansport.org /2013%20Equine%20Prohibited%20List.pdf
Giugliano, D., R. Marfella, L. Coppola, G. Verrazzo, R. Acampora, R. Giunta, F. Nappo, C. Lucarelli, and F. D’Onofrio. 1997. Vascular effects of acute hyperglycemia in humans are reversed by L-arginine. J. Am. Heart. Assoc. 95:1783-1790.
Kaneko, J. J., J. W. Harvey, M. L. Bruss. 2008. Clinical Biochemistry of Domestic Animals. 6th ed. Vet. Clin. Biochem. London, UK.
Marlin, D. and K. Nankervis. 2002. Exercise Testing. Equine Exercise Physiology. Blackwell Science, Ames, IA. p.211-244.
McConell, G. K. 2007. Effects of L-arginine supplementation on exercise metabolism. Curr. Opin. Clin. Nutr. Metab. Care. 10:46-51.
Mills, P.C., D.J. Marlin, C.M. Scott, and N.C. Smith. 1997. Nitric oxide and thermoregulation during exercise in the horse. A.P.S.97:1035-1039.
Nagaya, N., M. Uematsu, H. Oya, N. Soto, F. Sakamaki, S. Kyotani, K. Ueno, N. Nakanishi, M. Yamagishi, and K. Miyatake. 2001. Short-term oral administration of L-arginine imporves hemodynamis and exercise capacity in patients with precapillary pulmonary hypertenstion. Am. J. Respit. Crit. Care. Med. 163:887-891.
Taylor, L.E., P.L. Ferrante, D.S. Kronfeld, and T.N. Meacham. 1995. Acid-base variables during incremental exercise in sprint-trained horses fed a high-fat diet. J. Anim. Sci. 73: 2009-2018.
Wu, G, F.W. Bazer, T. A. Cudd, W.S. Jobgen, S.W. Kim, A. Lassala, P. Li, J.H. Matis, C.Y. Meininger, and T.E. Spencer. 2007. Pharmacokinetics and safety of arginine supplementation in animals. J. Nutr. 6th Amino Acid Assessment Workshop Supplement. 1673S-1680S.
280

Table 2. Effects of intravenous arginine supplementation on equine blood parameters Treatment1 Item Control Arginine SE P-Value Albumin, g/dL 2.5 2.5 0.09 0.97 Alkaline phosphatase, U/L
107.9 103.3 6.62 0.65
Aspartate aminotransferase, U/L
183.3 184.9 8.38 0.90
Blood urea nitrogen, mg/dL
13.9 16.5 0.35 0.01
Calcium, mg/dL 9.7 9.5 0.29 0.74 Creatine kinase, U/L 143.0 180.9 27.06 0.29 Creatine, mg/dL 1.3 1.3 0.06 0.92 Gamma-glutamyltrasferase, U/L
9.8 9.7 1.60 0.95
Globulin, g/dL 3.0 3.0 0.12 0.98 Glucose, mg/dL 67.6 65.5 2.65 0.62 Lactate dehydrogenase, U/L
471.2 479.9 43.6 0.89
Total bilirubin, mg/dL 0.4 0.5 0.08 0.84 Total protein, g/dL 5.5 5.5 0.20 0.98 1Treatments consisted of Control= 500mL isotonic saline; and Arginine=200mg/kg BW Arginine-HCl dissolved in a 1:6 ration of isotonic saline solution and brought to physiological pH with 12 M HCl. Treatments were injected IV through a 5.24” 14 G jugular catheter 30 minutes prior to exercise.
Figure 1: Effects of IV arginine supplementation vs control (IV saline) on average horse heart rate from pre-injection to post-exercise.
281

RUMINANT AND NON-RUMINANT NUTRITION
Proceedings, Western Section, American Society of Animal Science
Vol. 66, 2015
Effect of supplementing spring-calving beef cows grazing barley crop residue with canola meal and wheat-based dry distillers’ grains with solubles on beef cow performance, and reproductive efficiency1
D. Damiran,*† HA (Bart) Lardner,*† and J. McKinnon*2
*Department of Animal and Poultry Science, University of Saskatchewan, Saskatoon, SK, Canada, S7N 5A8 †Western Beef Development Centre, Humboldt, SK, Canada, S0K 2A0
ABSTRACT:1 A 2-yr study (2012 and 2013) was conducted to determine the effects of supplementing canola meal (CM) and wheat-based dry distillers’ grains with solubles (wDDGS) on the performance of wintering cows grazing barley straw-chaff. Each year, a 24 ha were seeded with forage barley (Hordeum vulgare, cv. Ranger) at a rate of 124 kg/ha, with nitrogen applied as fertilizer at 56 kg/ha. In fall, the mature crop was swathed and combined to collect straw-chaff crop residue (57.7% CP, 51% TDN) in 22 ± 5-kg piles. The field was divided into six 4-ha paddocks. Each year, sixty spring-calving black Angus beef cows (yr 1: BW = 641.4 ± 10.6 kg, BCS = 2.7 ± 0.1, gestation day 121 ± 2; yr 2: BW = 685.2 ± 9.1 kg, BCS = 2.6 ± 0.1, gestation day 108 ± 2) were randomly allocated to 1 of 3 supplement treatments (paddocks) (n = 2): (1) 100% wDDGS (39.2% CP, 78.8% TDN, DM basis); (2) 50% wDDGS plus 50% CM (DGCM); or (3) 100% CM (42.6% CP, 71.5% TDN, DM basis) while winter grazing (49 and 39 d for yr 1 and yr 2, respectively) on barley-straw chaff piles. The average estimated supplementation rate was 0.40% BW or 2.6 kg/d. Cows were allocated to crop-residue piles on a 3-d basis using portable electric fence. Supplementation strategy did not influence (P > 0.05) straw-chaff utilization (75.8 ± 1.9%), straw-chaff DMI (11.4 ± 0.55 kg/d), estimated total nutrient intake (DMI =14.6 ± 0.55 kg/d, CP = 1.8 ± 0.05 kg/d, TDN = 8.2 ± 0.28 kg/d), nutrient density (CP = 12.6 ± 0.39%, TDN = 56.7 ± 0.60%), cow final BW (657.8 ± 6.7 kg), BW change (-3.0 ± 1.90 kg), final BCS (2.5 ± 0.02), pre-calving BW (661.4 ± 6.63 kg) or pre-calving BCS (2.6 ± 0.04). As well, calf birth weight (41.3 ± 0.60 kg), calving interval (380 ± 2 d), calf 205d adjusted weaning weight (274.9 ± 2.80 kg), and following year pregnancy rates (91.3 ± 2.74%) were not affected by treatment. In conclusion, canola meal was equal to wDDGS as a supplement for beef cows consuming barley straw-chaff forages and can be used to meet protein requirements for wintering beef cows. Key words: Barley straw-chaff, canola meal, winter grazing, wheat-based dried distillers grains with solubles 2
1This study was funded by the Saskatchewan Agriculture Development Fund (ADF#20100176). The authors thank the staff of the Western Beef Development Centre for their assistance during this experiment. 2Corresponding author’s email address: [email protected]
INTRODUCTION
For beef producers in western Canada, meeting cow maintenance and gestation requirements economically is a challenge. Efforts to lower costs of production have led to the adoption of extensive grazing and management practices. This has subsequently led to increased use of low quality forages in beef cow diets. Grazing pregnant beef cows on stockpiled forages, bale grazing, swath grazing or grazing cereal crop residues through the winter months are the options to potentially reduce the costs of wintering beef cows (Kelln et al., 2011). Approximately half of the above-ground dry matter of cereal crops consists of crop residue (McCartney et al., 2006). Canada is the third largest barley producer in the world, with annual barley production at 7.1 million tons (Statistics Canada, 2014), which means about the same amount of barley crop residues are available for beef producers. Cereal crop residue is a mixture of chaff, grain, leaf blade, leaf sheath, internode, and node and is considered a low-quality forage because of its low protein (5.3% CP) and high fiber (54% ADF) content, hence low digestible nutrients (44.0% TDN) (McCartney et al., 2006). Therefore, when crop residue is the main forage in beef cow rations, additional energy and protein must be provided to the beef cow to meet nutrients requirement (McCartney et al., 2006). Barley grain (13.2% CP; 71% TDN; NRC, 1996) is commonly used to supplement beef cow diets in the winter (Van De Kerckhove et al., 2011). Due to the expansion of the bioethanol industry, a large supply of bioethanol co-products like wheat based dried distillers’ grains with solubles (wDDGS) has become available. Currently, the wDDGS is getting “conventional” supplementation for extensive management practices for cow/calf operation in western Canada (Van De Kerckhove et al., 2011). In parallel, Canada's 13 crushing and refining plants have the capacity to crush about 9.0 million tonnes of canola seed, and produce about 3.6 million tonnes of canola oil and 5.4 million tons of canola meal (CM; 40% CP, 69% TDN; NRC, 1996) annually (Canola Council of Canada, 2014). Thus it is expected that canola meal will become a readily available and cost effective feed ingredient for beef producers in North America. The objective of this study was to compare CM with wDDGS in terms of wintering beef cow supplementation. The specific objective was to determine the performance and reproductive efficiency of cows grazing barley straw-chaff crop residue and
282
supplemented with either CM, wDDGS, or a 50:50 blend of CM and wDDGS (DGCM).
MATERIALS AND METHODS Site and Crop Management
A 2-yr study was conducted at the Western Beef Development Centre’s Termuende Research Ranch located 8 km east of Lanigan (lat 51°51´N, long 105°02´W), Saskatchewan, Canada. Each year in June, 24 ha of barley (Hordeum vulgare, cv. Ranger) was seeded at 124 kg/ha, along with 56 kg/ha of actual nitrogen. These paddocks were swathed in September and the grain was combined shortly after to collect crop residue in 22 ± 5-kg (DM basis) piles using a wholebuncher (AJ Manufacturing, Calgary, Alberta, Canada) unit attached to the combine. Subsequently, the field was divided into six 4-ha paddocks to facilitate grazing. The same 24-ha field was used in both yrs, however, in each year, treatments were randomly assigned to each of the six 4-ha paddocks. Barley grain yield was 3.5 and 5.1 tonnes/ha for yr 1 and yr 2, respectively. Consequently, straw/chaff yield (Barley crop production tons/ha – Grain yield tonnes/ha) averaged 5.9 and 6.1 tonnes/ha, for yr 1 and yr 2, respectively. Animal Management
The 2-yr grazing study was conducted from October 26 to December 14, 2012 (yr 1; 49 d) and from October 28 to December 7, 2013 (yr 2: 39 d). Dry pregnant Black Angus cows were used in this study (initial BW = 660.8 ± 7.2 kg, BCS = 2.6 ± 0.02, gestation day 114 ± 2). The strategy was to use the same cows for the entire 2 yr of production cycle, unless culled for injury or failure to conceive. Each year, 60 cows were stratified from lightest to heaviest BW, randomly assigned within strata to 1 of 6 barley crop residue (STCH; straw + chaff) paddocks (10 cows/paddock), and the paddocks were randomly assigned to 1 of the 3 supplementation treatments including with either (1) 100% wheat DDGS (wDDGS); (2) 100% canola meal (CM); or (3) a 50:50% blend of DDGS and canola meal (DGCM). In each year, each treatment (n = 3) had 2 replicates (n = 2) and each replicate group consisted of 10 cows.
Cows were allocated to straw-chaff residue based on BW and feed nutrient density in accordance with the NRC (1996) beef model. Cow access to straw-chaff piles was controlled using portable electric fence. The crop residue was allocated for a 2 to 3 d grazing period with supplementation occurring daily. The amount of diet (STCH + supplementation) allocated was intended for maintenance of body condition, with negligible weight change except that of conceptus growth. Cows were supplemented daily at 0800 h with either CM (42.6% CP, 71.5% TDN), wDDGS (39.2% CP, 78.8% TDN) or DGCM to meet additional protein and energy requirements. The average supplementation rate was 0.4% BW or 2.6 kg/d. In addition, each cow was supplied with mineral at 70 g/d (Right Now Emerald, Cargill Animal Nutrition, Winnipeg, Manitoba, Canada). According to NRC (1996) recommendation, the calcium to phosphorus ratio was maintained at 1.5:1 by supplementing with limestone at 40 g/cow/d (15 g calcium/cow). In addition, cows of all
groups had ad libitum access to cobalt-iodized salt (Windsor, The Canadian Salt Company Ltd., Pointe-Claire, Quebec, Canada) over the course of the trial. Water was supplied in troughs and two portable wind breaks (10 × 16 m) were supplied for each replicate group of cows.
Following the trial period in January, the cows were managed as a single group and fed a diet ad libitum consisting of 50% hay (13.2% CP, 58.8% TDN) and 50% barley greenfeed (13.9% CP, 58.2% TDN). In February and March, all cows received a pre-calving pellet 2 kg/d (containing 22.00 mg/kg rumensin; 13.0% CP, 58.2% TDN) and hay (13.2% CP; 58.9% TDN). Cows were group managed during calving and breeding season until the following winter period. Animal and Diet Measurements
The animals were weighed (BW) on 2 consecutive d at the start and end of the trial and every 21 d through out the trial. Cow BW was corrected for conceptus gain according NRC (1996). The BCS was determined by a trained technician at start and end of the trial using a scale of 1 to 5 (1 = emaciated to 5 = grossly fat; Lowman et al., 1976). At calving all calves were weighed within 24 h of birth. Calving difficulty was evaluated on a 1 to 5 score; where 1 = no assistance, 2 = easy pull, 3 = mechanical pull, 4 = hard mechanical pull, and 5 = caesarean section. Calving interval was calculated for all cows. Each year, cow BW and BCS were recorded shortly after calving and all calves were weaned on October 15. All calf weaning BW were 205 d adjusted weaning weights. Forage utilization, DMI, total nutrient intake, and average total diet nutrient density were estimated according to Kelln et al. (2011) and Damiran et al. (2013). Straw-chaff was sampled at start, middle, and end of the grazing trial and supplementation samples were collected upon delivery. Sample DM, ash, CP, and crude fat were analyzed according to AOAC (1990). The ADF and NDF were analyzed according to the procedures of Van Soest et al. (1991). The TDN was calculated according to NRC dairy (2001). Statistical Analysis
Data were analyzed using the Proc Mixed Model procedure (SAS Inst. Inc., Cary, NC); each replicate group (paddock) of cows was considered an experimental unit for a total of 12 experimental units over the 2 yr study using the satterthwaite degrees of freedom method. The model used for the analysis was: Yij = µ + Ti + eij; where Yij was an observation of the dependent variable ij; µ was the population mean for the variable; Ti was the fixed effect of treatment (supplementations: wDDGS, CM, and DGCM); and eij was the random error associated with the observation ij. Year was included as a random (block) variable in all analyses. Significance was declared at P < 0.05.
RESULTS AND DISCUSSION Average DMI, Nutrient Intake, and Nutrient Density
Cow’s straw-chaff utilization was not different (P = 0.78) between groups with a mean being 75.8% (Table 1). Average barley straw-chaff intake was 12.3, 9.9, and 12.5 kg/d (averaged 11.6 kg/d; P = 0.09), or 1.9, 1.5, and 1.9% of BW per day (averaged 1.8% of BW; data not shown) for
283
wDDGS, DGCM, and CM supplemented cows, respectively. No differences (P > 0.05) were detected among the winter supplementation strategies in total DMI or nutrient intake of the cows. Total DMI was 15.3, 12.9, and 15.5 kg/d or 2.3, 1.9, and 2.4% of BW per day (averaged 2.2% of BW) for wDDGS, DGCM, and CM supplemented cows, respectively.
Based on measured DMI and dietary CP content, it was calculated that cows consumed 1.8, 1.7, and 1.9 kg/d CP; and 8.8, 7.4, and 8.5 kg/d TDN for wDDGS, DGCM, and CM treatments, respectively. According to NRC (1996), a medium framed, 658 kg, 4 month-pregnant beef cow needs TDN and CP intakes of 6.14 and 0.760 kg/d, respectively with a total DMI of 14.8 kg/d. Hence, in the current study, calculated DM and nutrient intakes of all cows were meeting NRC (1996) recommended requirements. As such, protein supplementation may have exceeded the level where forage DMI would be improved. Likewise, average diet nutrient density of all treatments was similar (P > 0.05); and met NRC (1996) recommended nutrient density requirement for beef cows with similar weight and gestation stage to animals used in current study. Cow Performance
Animal performance data are presented in Table 2. There was no difference (P > 0.05) in initial BW (660.8 ± 7.2 kg) and initial BCS (2.6 ± 0.02) among cows for the supplement strategies. Cows in the three supplementation strategies also had similar (P > 0.05) final BW (657.8 ± 6.73 kg) and BW change (-3.98 ± 1.86 kg). Cows supplemented with DG, DGCM, or CM lost or gained an average of -7.8, -2.5, or 1.5 kg per cow, respectively. These results differ from Van De Kerckove et al. (2011), who reported that cows supplemented with dried distillers’ grains with solubles or supplemented at the level of 0.7% of BW with 50% wDDGS and 50% rolled barley grain had positive BW gain.
No differences (P > 0.05; final BCS = 2.5 ± 0.02; BCS change = -0.11 ± 0.02) were observed in BCS as a result of supplementation strategies (Table 2). In general, as Selk et al. (1988) pointed out, negative effects on cow reproduction occur only when BCS drops below 2.5 during the precalving and prebreeding periods. The results in the current study indicated that cows in all supplement treatment groups performed well and were still in good BCS by the end of the study period. Cow Reproductive Performance
Cow performance at calving and reproductive data are presented in Table 3. The effect of winter system supplementation was not significant (P > 0.05) for cow BW and BCS at time of calving. Thus, from the end of the grazing trial (middle of December) to calving time (middle of April), cows previously supplemented with wDDGS, DGCM, or CM gained an average of 3.0, 5.0, or 3.9 kg per cow, respectively. Overall, by calving, the cows regained on average their fall season BW (661.4 vs. 660.8 kg) and BCS (2.6 vs 2.6).
Cows managed in the supplementation systems were not different (P > 0.05) for calf birth weight (41.4 ± 0.6 kg) or calving difficulty score (1.0). As well, 205-d adjusted weaning weight (274.9 ± 2.8 kg) did not differ (P > 0.05) between cows with different supplement strategy.
Likewise, the pregnancy rate (93 ± 3 d) and calving interval (380 ± 2 d) did not differ (P > 0.05) between cows exposed previously to the different supplementation systems.
IMPLICATIONS
The results of this study support that either wDDGS or CM or a 50:50 blend of DDGS and CM are good sources of supplemental protein for wintering beef cows. When supplemented at recommended levels their use allows cows to over winter with minimal or no BW change and have no negative effect on beef cow reproductive performance. The study further suggests that beef cows supplemented with either wDDGS or CM while grazing crop residue will result in similar performance. However, environmental conditions (i.e., snowfall, temperature, and wind speed) may limit accessibility of forage in field crop residue grazing systems. Therefore careful management must be considered when using these systems during the winter season in western Canada.
LITERATURE CITED
AOAC. 1990. Official methods of analysis. 15th ed. AOAC Inc. Arlington, Virginia.
Canola Council of Canada. 2014. Industry overview. Available:http://www.canolacouncil.org/markets-stats/industry-overview/.
Damiran, D., T. DelCurto, S. Findholt, B. Johnson, and M. Vavra. 2013. Comparison of bite-count and rumen evacuation technique to estimate diet quantity and quality in grazing cattle. Range. Ecol. and Manage. 66(1):106-109.
Kelln, M. B., H. A. Lardner, J. J. McKinnon, J. R. Campbell, K. Larson, and D. Damiran. 2011. Effect of winter feeding system on beef cow performance, reproductive efficiency and system cost. Prof. Anim. Sci. 27:410-421.
Lowman, B. G., N. A. Scott, and S. H. Sommerville. 1976. Condition scoring for cattle. East of Scotland College of Agric. Bull. No. 6. Edinburgh School of Agric., Edinburgh, UK.
McCartney, D., H. C. Block, P. L. Dubeski, and A. J. Ohama. 2006. Review: the composition and availability of straw and chaff from small grain cereals for beef cattle in western Canada. Can. J. Anim. Sci. 86:443---455.
NRC. 1996. Nutrient requirements of beef cattle. Update 2000. 7th rev. ed. Natl. Acad. Press, Washington, DC.
NRC. 2001. Nutrient requirement of dairy cattle, 7th ed. rev. ed. Natl. Acad. Press, Washington, DC.
SAS. 2003. User's Guide: Statistics (8th ed.), SAS Inst., Inc., Cary, NC.
Selk, G. E., R. P. Wettemann, K. S. Lusby, J. W. Oltjen, S. L. Mobley, R. J. Rasby, and J. C. Garmendia. 1988. Relationships among weight change, body condition and reproductive performance of range beef cows. J. Anim. Sci. 66:3153–3159.
Statistics Canada. 2014. Production of principal field crops. Available at http://www.statcan.gc.ca/daily-
284

quotidien/141204/dq141204a-eng.htm Accessed January 2015.
Van De Kerckhove, A. Y., H. A. Lardner, K. Walburger, J. J. McKinnon, and P. Yu. 2011. Effects of supplementing spring-calving beef cows grazing barley crop residue with a wheat-corn blend dried distillers grains with solubles on
animal performance and estimated dry matter intake. Prof. Anim. Sci. 27:219-227.
Van Soest, P. J., J. B. Robertson, and B. A. Lewis. 1991. Methods for dietary fiber, neutral detergent fiber, and nonstarch polysaccharides in relation to animal nutrition. J. Dairy Sci. 74:3583-3597.
Table 1. Effect of supplementing wintering beef cows in western Canada grazing barley crop residue with canola meal and/or with wheat dried distillers grains with solubles on DMI, TDN intake, and nutrient density over 2 yr1 Supplement2 Item wDDGS DGCM CM SEM P-value DMI
Forage3 utilization, % 77.9 74.9 74.6 3.59 0.78 Forage, kg/d 12.3 9.9 12.5 0.81 0.09 wDDGS, kg/d 2.6 1.3 - - - Canola meal, kg/d - 1.3 2.6 - - Barley, kg/d 0.4 0.4 0.4 0.04 1.00 Total diet, kg/d 15.3 12.9 15.5 0.83 0.11 Nutrient intake CP, kg/d 1.8 1.7 1.9 0.09 0.57 TDN, kg/d 8.8 7.4 8.5 0.41 0.09 Diet nutrient density CP, % DM 12.1 13.6 12.2 0.62 0.22 TDN, % DM 57.7 57.2 55.1 0.97 0.20 1Yr = 49 d (October 26 - December 14, 2012); yr 2 = 39 d (October 28 - December 7, 2013). The experimental unit was paddock (n = 4). 2wDDGS = cows supplemented with 100% wheat dried distillers grains with solubles; DGCM = cows supplemented with 50% wDDGS and 50% CM; CM = cows supplemented with 100% canola meal. 3Barley straw-chaff.
Table 2. Effect of supplementing wintering beef cows in western Canada grazing barley crop residue with wheat dried distillers grains with solubles and/or with canola meal and on animal performance in over 2 yr
Supplement1
Item wDDGS DGCM CM SEM P-value n, animals (paddock) 10 (4) 10 (4) 10 (4) BW, kg Initial 662.1 658.1 662.2 11.39 0.96 Final 654.3 659.4 659.7 4.87 0.69 Change -7.8 1.4 -2.5 8.98 0.78 BCS2 Initial 2.8 2.8 2.8 0.11 0.96 Final 2.6 2.5 2.6 0.04 0.60 Change -0.2 -0.3 -0.2 0.06 0.96 1wDDGS = cows supplemented with 100% wheat dried distillers grains with soluble; DGCM = cows supplemented with 50% wDDGS and 50% CM; CM = cows supplemented with 100% canola meal. 2BCS = body condition score (1 = emaciated; 5 = obese; Lowman et al., 1976).
Table 3. Effect of supplementing wintering beef cows in western Canada grazing barley crop residue with canola meal and/or wheat dried distillers grains with solubles on calving performance over 2 yr1
Supplement1
Item wDDGS DGCM CM SEM P-value Cow
BW, kg 657.3 664.7 663.3 7.76 0.78 BCS 2.6 2.7 2.6 0.11 0.64 Calving difficulty score2 1.0 1.0 1.0 - - Calf birth BW, kg 42.2 41.7 40.0 1.36 0.49 Calving interval, d 383.0 384.5 375.0 3.01 0.20 Calf 205-d adjusted weaning BW, kg 271.0 277.8 275.8 5.89 0.71 Cow 2nd yr pregnancy rate, % 84.7 96.9 92.2 4.37 0.19 1wDDGS = cows supplemented with 100% wheat dried distillers grains with solubles; CMDG = cows supplemented with 50% DG and 50% CM; CM = cows supplemented with 100% canola meal. 2Scoring system 1 to 5: 1 = no assistance, 2 = easy pull; 3 = mechanical pull; 4 = hard mechanical pull; and 5 = ceasarean section.
285
Proceedings, Western Section, American Society of Animal Science
Vol. 66, 2015
Phenotypic relationships of residual feed intake with growth, feeding behavior, and reproductive performance of beef heifers1
D. Damiran,*† G. Penner,† K. Larson,* and HA (Bart) Lardner*†2 *Western Beef Development Centre, Humboldt, SK, Canada, S0K 2A0
†Department of Animal and Poultry Science, University of Saskatchewan, Saskatoon, SK, Canada, S7N 5A8
ABSTRACT:1 The objective of this study was to compare two heifer groups with differing residual feed intake (RFI) ranking (feed efficient or low-RFI and feed inefficient or high-RFI) with a conventional industry selected (control group; CON) group of heifers for winter feeding performance, feeding behavior, and subsequent reproductive efficiency. The three heifer groups (n = 20/group; initial BW = 322 ± 2.9 kg) were fed a forage-based (90% processed grass-legume hay and 10% rolled barley) diet (14.7% CP; 53.7% TDN) for 78 d, and individual animal DMI and feeding activity were determined. The RFI was calculated for each animal using a model which included ADG, mid-metabolic BW (BW0.75), and DMI. Heifer groups did not differ (P > 0.05) in final BW (391 ± 3.5 kg), DMI (9.7 ± 0.12 kg), final BCS (2.6 ± 0.20 kg), feeding event duration (FD; 174 ± 3.8 min/d), eating rate (ER; 0.056 ± 0.001 kg/min), and feeding frequency (FF; 144 ± 3.8 events/d). As well, RFI was -0.09 ± 0.15, -0.33 ± 0.12, and 0.42 ± 0.13 kg/d for CON, low-RFI, and high-RFI groups, respectively. The low-RFI group (108.5 ± 6.2 min/d) did not differ (P > 0.05) from CON (115.5 ± 6.2 min/d), but was lower (P < 0.05) than high-RFI heifers (142.3 ± 7.9 min/d) in feeding event head-down time. While low-RFI heifers tended to have lower FD (161.7 ± 4.4 min/d; P < 0.1) than high-RFI group (190.3 ± 7.3 min/d), FD for low-RFI was similar (P > 0.05; 171 ± 6.2 min/d) to CON heifers. Low-RFI group (10.4 ± 0.32) tended to have lower (P < 0.1) feed conversion ratio (FCR) than either CON or high-FRI heifers, 11.4 ± 0.34 and 11.25 ± 0.31, respectively. The magnitude of correlation between feeding behavior and feed efficiency traits tended to differ between RFI groups; in most cases the values were greater for low-RFI group as opposed to the high-RFI group. Consumed feed (DM basis) for development period (200 d) was 1689, 1856, and 1746 kg for low-RFI, high-RFI, and CON groups, respectively. Based on first-calf pregnancy rate, the heifer groups can be ranked as follows: low-RFI (80%) < CON (93%) < high-RFI heifers (100%). In summary, feed efficient heifers with increased feed
1This project was funded by the Saskatchewan Agriculture Development Fund (ADF#2002027), and Western Beef Development Centre (WBDC; Lanigan, SK, Canada). The authors also thank the staff at the WBDC for their assistance with feeding management and data collection during this experiment. 2Corresponding author’s email address: [email protected]
efficiency may not result in improved reproductive performance, and further research is warranted. Key words: cattle, feed efficiency, feeding behavior, replacement heifer, residual feed intake
INTRODUCTION
In today’s beef industry, the long-standing rule of thumb is for heifers to be developed to reach 60 to 65% of mature BW by the onset of the breeding season (Patterson et al., 1992) and meeting maintenance and gestation nutrient requirements for heifers can increase overall development costs for beef producers (Lardner et al., 2014). Improved feed utilization and thus, reduced feed costs would improve the economic and environmental sustainability of the beef cattle industry. Feed efficiency (FE) in young, growing cattle has been measured by feed conversion ratio (FCR) or the units of feed required for each unit of gain. The FCR is shown to be influenced by body weight and average daily gain (Arthur et al., 2001). On the other hand, residual feed intake (RFI), which is the difference between the actual intake and predicted intake for a known level of performance and body weight, has been used to rank animals based on their FE. It has been demonstrated recently that animals with low RFI had similar rates of gain to animals with high RFI, even though feed intake was lower (Kelly et al., 2010; Durunna et al., 2012). Since RFI is a moderately heritable trait (Archer et al., 2002), as well as repeatable (Kelly et al., 2010), there may be a potential to improve the feed efficiency of cow-calf herds on a long-term basis by selecting females for both reproductive and feed efficiency traits at an early age. Although about 30% of heifer calves raised are developed for herd replacements, the application of RFI for use in cow-calf herds is largely unknown. It is interesting to evaluate current ranching practice for replacement heifer selection in terms of feed efficiency. As such, the validation of different RFI group animals under different environmental conditions requires further exploration, particularly in western Canada where cattle are fed forage-based diets and exposed to extreme conditions. In parallel, the feeding behavior could be used as indicator traits for feed efficiency performance (Durunna et al., 2011). However, few studies have evaluated the relationships between feed efficiency, animal performance, and feeding behavior in replacement beef heifers. Hence, the objectives of this study were to investigate performance, feeding
286

behavior, and reproductive efficiency of heifers classified as high and low feed efficiency based on RFI rankings in comparison to conventionally selected replacement heifers.
MATERIALS AND METHODS The Study Site and Experimental Design
The study was conducted at the Western Beef Development Centre’s Termuende Research Ranch located near Lanigan (lat 51°51´N, long 105°02´W), Saskatchewan, Canada. Heifers were weaned in October and selected as replacements to reach a similar target-weight and BCS at first breeding. The experimental period was divided into 2 periods: (1) period 1 (identification of low- and high-RFI heifers) and (2) period 2 (feeding study to compare 3 groups of heifers). In period 1, at weaning, 140 heifers were randomly divided in to 1 of 2 subgroups. From one of the subgroups, ~30% were selected for replacement heifers (CON; control group) in a similar manner employed for replacement selection on the ranch (phenotypic evaluation). The CON group and remaining heifers (n = 70) were fed to achieve a moderate rate of gain for 100 d (including adjustment period) (period 1; 0.64 kg/day). Following period 1, 30% of the most efficient heifers (low-RFI; n = 20) and 30% of the least efficient heifers (high-RFI; n = 20) were selected for the second feeding trial (period 2), where, CON, low-RFI and high-RFI were fed at a higher targeted gain (0.90 kg/day) for the next 100 d before start of breeding season. The first phase (period 1) was conducted from December to February 2013 (71 d), and the second phase (period 2) was conducted from March to May (78 d). Animal Management
For the current experiment, 3 drylot pens were used, each pen (50 × 120 m) was surrounded by wooden slatted fences with 20% porosity and contained an open-faced shed in one end and water was supplied to each pen in a heated waterbowl. In each of 2 pens, 8 GrowSafe Intake (GrowSafe Systems Ltd., Airdrie, Alberta, Canada) feeding troughs were installed. The remaining pen had a fenceline bunk (0.5 × 10 m) and housed the CON heifer group. Each heifer was identified with a radio frequency transponder button (half duplex RFID, Allflex USA Inc., Dallas/Ft. Worth Airport, TX) in their ear. Feeding Management
The heifer diet was formulated to provide nutrition to reach to a pre-breeding target BW of 62% (395 kg) of mature BW (637 kg). The winter feeding period from weaning to breeding for beef heifers in western Canada is reported to be ~200 d (Lardner et al., 2014). The post-wean to breeding development period can be divided in to 2 periods: period 1 = post weaning stage (d 1 to 100 of winter feeding); period 2 = pre-breeding stage (d 101 to 200 of winter feeding). The target ADG was moderate (0.6 kg/d) and high (0.9 kg/d) gain for period 1 and period 2, respectively. Heifers were adjusted to diets during a 21 d adaptation The heifers were fed a diet (14.7% CP; 53.7% TDN) that consisted of 70% brome grass/alfalfa hay (16.1% CP; 45.5% TDN) and 30% rolled barley (11.0% CP; 75.0% TDN) (DM basis) throughout the entire feeding trial.
The dietary ingredients were mixed and delivered using a Farm Aid Mixer Wagon equipped with a digital scale (model 430, Corsica, SD) and offered once daily at ~0800 h. Barley grain was dry rolled (Ross Kamp Champion, Waterloo, IA) to a processing index of 76%, and brome grass/alfalfa hay was ground through a 9.5 cm screen. During period 1, CON animals received the identical diet as low-RFI and high-RFI groups. Animals also had ad libitum access to a mineral supplement over the course of the trial.
Animal, Feed Intake, and Feeding Behaviour Measurements
All animals were weighed over 2 consecutive days at the start and end of each period, and every 21 d throughout the trial. The BCS was also determined at the start and end of the trial. The BCS was assigned on a scale of 1 to 5 (1 = emaciated to 5 = grossly fat). Feed intake was measured with the GrowSafe (GrowSafe Systems Ltd., Airdrie, Alberta, Canada) automatic feeding system, which monitors individual animal feed intake and feeding behaviors as described by Durunna et al. (2011). Feeding behavior measured included daily feeding event duration (FD, min/d), feeding event head-down time (FHD; min/d), and feeding event frequency (FF) (events/d). Based on these data the eating rate (ER, the ratio of total daily DMI to the total daily FD; kg DM/min), the head-down per feeding duration (HDD: the ratio of total daily FHD to the daily FD), and the head-down per visit (HDV; the ratio between the total daily FHD and the total daily FF) were calculated. Feed conversion ratio for each animal was calculated as the ratio of daily DMI to ADG.
Heifer Management at Breeding to Calving
Heifers were exposed to bulls for 63 d breeding period starting 1 June 2013 at a 25:1 cow:bul. Estrus was synchronized with a single 2-ml injection of cloprostenol sodium, an analogue of prostaglandin F2α (Estroplan, Parnell Technologies Pty Ltd, Alexandria, NSW, Australia) administered 5 d after bulls were placed with heifers.
During the breeding season and until pregnancy diagnosis (18 October 2013), heifers were managed as a single group on mixed crested wheatgrass (Agropyron cristatum (L.) Gaertn.) and smooth bromegrass (Bromus inermis Leyss.) pasture. For the period from pregnancy determination to calving, pregnant heifers grazed in field paddocks on swathed barley (10.8% CP; 69.3% TDN) from November 1 to February 15, followed by drylot feeding free choice grass-legume hay (86.6% DM, 9.7% CP, 58.5% TDN) with a daily supplemented range pellet (2.7 kg/d; 13.6% CP, 79.5% TDN) from February 15 to May 30.
Reproductive data collected included calf birth date (expressed in Julian date), calf birth weight, sex and calving distribution (Lardner et al., 2014). Calving began 27 March, 2014. Calving difficulty was evaluated on a 1 to 5 score; where 1 = no assistance, 2 = easy pull, 3 = mechanical pull, 4 = hard mechanical pull, and 5 = Caesarean section.
Calculations and Statistical Analysis
The RFI was calculated as described by Arthur et al. (2001) within each test period. Body weights collected
287
every 21 d were used to calculate mid test BW and ADG. Actual DMI was regressed on mid test metabolic BW and ADG to calculate an expected DMI for each heifer using the PROC REG procedure (SAS Inst. Inc., Cary, NC).
The model for expected feed intake is: yi = b0 + b1ADGi + b2MWTi + ei,
where ADGi is the ADG of animal i, MWTi is the mid test metabolic (BW0.75) BW of animal i, and ei is the uncontrolled error of the jth animal. Expected DMI was calculated within each contemporary test period. The RFI is calculated by subtracting the expected intake from the actual intake for each animal. Based on these calculations heifers were then ranked by RFI, then low (low-RFI) and high (high-RFI) RFI groups were further assigned to feed period 2 of the trial. The FCR ratio was calculated as the ratio of daily DMI to ADG.
Data were analyzed using the MIXED procedure of SAS 9.2 (SAS, 2003). The model used for the analysis was: Yij = µ + Ti + eij; where Yij was an observation of the dependent variable ij; µ was the population mean for the variable; Ti was the fixed effect of the animal RFI type (CON, low-RFI, and high-RFI group); and eij was the random error associated with the observation ij. When a significant difference was detected (P < 0.05), means were separated using the Tukey-Kramer post-test. Animal was considered an experimental unit. The correlations between the feed efficiency and feeding behavior traits of animal were calculated using the CORR procedure of SAS (2003).
RESULTS AND DISCUSSION Selecting Low-RFI and High-RFI Animals
In period 1, animals in this study had an overall mean initial BW of 260 kg (SE ± 2.61), ADG of 0.63 kg (SE ± 0.02), DMI of 7.72 kg/d (SE ± 0.13), and FCR of 9.1 kg of feed DM /kg of BW gain (SE ± 0.19). The mean of residual feed intake ranged from −0.62 (top 25% animals; with low-RFI) to 1.26 (bottom 25% animals; with high-RFI) kg of DM/d, representing a difference of 1.88 kg of DM of feed/d between the least and most efficient animals. Whereas, the mean of FCR ranged from 9.89 (top 25% animals) to 16.04 (bottom 25% animals), representing a difference of 6.15 kg of DM of feed/kg BW gain between the least and most efficient animals. From these findings the 30% most efficient heifers (low-RFI; n = 20; RFI = -0.76 ± 0.10 kg/d) and 30% least efficient heifers (high-RFI; n = 20; RFI = 0.72 ± 0.08 kg/d) were selected for the second feeding trial (period 2). Feed Intake, Heifer Performance, Feeding Behavior, and Feed Efficiency
The effects of RFI classification on heifer performance, mature size, and feeding behavior are presented in Table 1. There was no difference (P > 0.05) among the three RFI groups in initial BW (322 ± 2.9 kg), DMI (9.7 ± 0.12 kg), FD (174 ± 3.8 min/d), ER (0.056 ± 0.001 kg/min), and FF (144 ± 3.8 events/d). Likewise, final BW did not differ (P > 0.05) among heifers, averaging 391 kg (SE ± 3.5 kg) across groups, thus achieving 61.4% of the mature BW. The RFI range was -0.09 ± 0.15, -0.33 ± 0.12, and 0.42 ± 0.13 kg/d for CON, low-RFI, and high-RFI groups,
respectively. Although low-RFI heifers (108.5 ± 6.2 min/d) were similar (P > 0.05) with CON group (115.5 ± 6.2 min/d) for FHD, the low-RFI were greater (P < 0.05) than high-RFI heifers (142.3 ± 7.9 min/d) in FHD. In contrast, the low-RFI heifers tended (P = 0.07) to have lower FD than high-RFI group. Moreover, both low-RFI and high-RFI group tended (P = 0.08) to be greater than CON heifers in ADG. Collectively, the magnitude of FD, FDT, FF, as well as HDV was larger for high-RFI, intermediate for CON group, and smaller for low-RFI animals. In general, it appeared that low-RFI heifers eat faster (they consume 3 and 5 g more per min than CON and high-RFI groups, respectively), with high-RFI heifers being intermediate, and CON heifers slower in forage consumption. Thus low-RFI heifers were able to spend less time on feeding activities than either CON or high-RFI heifers. Overall, the low-RFI heifers appeared to be more efficient (~ 8% greater than CON or high-RFI group) at converting feed to muscle and fat.
For all 3 heifer groups, a strong positive relationship existed between RFI and DMI (r > 0.66; P < 0.01), although RFI was very weak or was not correlated (r < -0.24; P > 0.05) with ADG. As expected, a moderate and positive relationship (r = 0.4 to 0.6; P < 0.05) existed between RFI and FCR for all groups of heifers. The results of the current study agree with other published results (Kelly et al., 2010; Durunna et al., 2012), which suggested that animals with low-RFI had similar rates of gain to animals with high-RFI, even though feed intake for low-RFI animals was lower. As demonstrated earlier, for 2 (FHD and HDD) of the 6 major feeding behavior parameters measured, the low-RFI group spent statistically significant shorter time than high-RFI group in the current study. This result was in agreement with Durunna et al. (2012), who found that low-RFI heifers had lower (26% less) FHD than high-RFI.
The considerably greater DMI (5% greater) of animals with high-RFI in the current study, may partially be related as Nkrumah et al. (2006) noted the low metabolizability of consumed feed and the accompanying increased need to attain the levels of energy intake required for maintaining BW and supporting body protein and fat accretion. In contrast, low-RFI animals may use less energy in their feeding-associated activities (Kelly et al., 2010). Overall, in terms of feed requirements during the entire heifer pre-breeding development period, the CON heifers (1746 kg/200 d) were numerically (P > 0.05) greater than low-RFI heifers (1689 kg/200 d), but were numerically lower (P > 0.05) than high-RFI heifers (1856 kg/200 d). Hence, the advantage of developing heifers with low-RFI was the decreased stored feed requirements without dramatically affecting animal performance. Relationship between Feed Efficiency and Feeding Behavior
When, all 3 heifer groups were pooled, FD and FHD had moderate (-0.4 < r < 0.4; P < 0.05) correlations with DMI. For the low-RFI heifers, ER was significantly (P < 0.01) and moderately correlated (r = 0.47) with DMI, whereas, the relationship of FF and DMI was inverse and weak (r = -0.25; P > 0.05) as expected. The RFI was
288

moderately correlated in a positive manner with FD (r = 0.51; P < 0.05) and FHD (r = 0.47; P < 0.05) for low-RFI heifers, suggesting that more efficient heifers spent shorter time feeding. The RFI was moderately correlated with FD (r = 0.51; P < 0.05) and FF (r = 0.59; P < 0.01) for CON group as well. On the contrary, RFI was weakly associated with FD (r = 0.36; P > 0.05) and FF (r = 0.25; P > 0.05) for the high-RFI group. The FD, FHD, ER, FF, HDV, as well as HDD had weak to no correlation (-0.4 < r < 0.4; P > 0.05) with ADG and FCR. Based on this result, it could be stated that, in general, the magnitude of correlations between feeding behavior and feed efficiency traits tended to be different between RFI groups; in most cases, the values were generally greater in low-RFI as compared to high-RFI group. Heifer Reproductive Performance
Measured at pregnancy diagnosis, (18 October 2013) BW (469.4 ± 4.5 kg) and BCS (2.75 ± 0.04), calving date (Julian date; 100 ± 2), calving difficulty score (1.1 ± 0.06), and calf birth weight (34.3 ± 0.8 kg) were similar (P > 0.05) among the heifers in all three groups (Table 2) during the first reproduction cycle. Pregnancy rates were 93, 80, and 100% for CON, low-RFI, and high-RFI heifers, respectively. Arthur et al. (2005) found no difference in pregnancy rate but found that low RFI cows calved 5 d later (P = 0.07) than high RFI cows. The lower pregnancy rate in low-RFI group in the current study should be interpreted with caution given the relatively small number of animals (n = 20/RFI group), however it may be speculated that any over conditioning in low-RFI group may result in reproductive failure (Martin et al., 2008). In the current study, the average pregnancy rate was 90.8% across all heifer groups. Likewise, Lardner et al. (2014) reported a pregnancy rate of 88% for heifers developed to 62% of the mature BW in industry drylot pen system. Heifers calving early during their first calving season have a greater lifetime calf production than those calving late and are more likely to become pregnant sooner as 2 yr of age (Lardner et al., 2014). In the current study, 90, 49, and 72% of pregnant heifers from CON, low-RFI, and high-RFI groups, respectively, calved in the first 21 d of the first calving season.
Research on relationships of heifer RFI and reproductive performance is limited (Basarab et al., 2007). In conformity to the current study, recent studies of cow-calf production efficiency have also demonstrated that cows producing progeny with decreased RFI (Basarab et al., 2007) calved 5 to 6 d later in the calving season, an effect that was attributed to a delay in first estrus. Regarding calving distribution (Table 2), high-RFI heifers showed a relatively similar distribution with CON heifers rather than with low-RFI heifers. As well, 100, 93, and 100% of pregnant heifers in CON, low-RFI, and high-RFI groups, respectively, calved in the first 42 d of the first calving season, which was in agreement with other studies where heifers were exposed to bulls for a 63 d breeding season (Lardner et al., 2014).
IMPLICATIONS The results of the current study imply that animals
favorable for feed efficiency may not be desirable in terms of reproductive performance, however this factor deserves further study. Overall, the control heifers (selected by a conventional industry phenotypic manner) were intermediate in terms of feed efficiency and reproductive performance. Thus, study results suggest that even though selecting replacement heifers through traditional ranching methods may be subjective and depend on producer experience and knowledge, it is still a valuable option for beef heifer replacement selection.
LITERATURE CITED Archer, J. A., A. Reverter, R. M. Herd, D. J. Johnston, and
P. F. Arthur. 2002. Genetic variation in feed intake and efficiency of mature beef cows and relationships with postweaning measurements. Proc. 7th World Congress on Genetics Applied to Livestock Production 31:221–224.
Arthur, P. F., R. M. Herd, J. F. Wilkins and J. A. Archer. 2005. Maternal productivity for Angus cows divergently selected for post-weaning residual feed intake. Aust. J. Exp. Agric. 45:985-993.
Arthur, P. F., G. Renand, and D. Krauss 2001. Genetic and phenotypic relationships among different measures of growth and feed efficiency in young Charolaise bulls. Live. Prod. Sci. 68:131-139.
Basarab, J. A., D. McCartney, E. K. Okine, and V. S. Baron. 2007. Relationships between progeny residual feed intake and dam productivity traits. Can. J. Anim. Sci. 87:489–502.
Durunna, O. N., F. D. N. Mujibi, L. Goonewardene, E. K. Okine, J. A. Basarab, Z. Wang, and S. S. Moore, 2011. Feed efficiency differences and reranking in beef steers fed grower and finisher diets J. Anim. Sci. 2011. 89:158–167.
Durunna, O. N., M. G. Colazo, D. J. Ambrose, D. McCartney, V. S. Baron and J. A. Basarab. 2012. Evidence of residual feed intake reranking in crossbred replacement heifers. J. Anim. Sci. 90:734-741.
Kelly, A. K, M. McGee, D. H. Crews, A. G. Fahey, A. R. Wylie, and D. A. Kenny. 2010. Effect of divergence in residual feed intake on feeding behaviour, blood metabolic variables, and body composition in growing beef heifers. J. Anim. Sci. 88:109-123.
Krause, K. M., and G. R. Oetzel. 2006. Understanding and preventing subacute ruminal acidosis in dairy herds: A review. Anim. Feed Sci. Technol. 126:215–236.
Lardner, H. A., D. Damiran, S. Hendrick, K. Larson, and R. Funston. 2014. Effect of development system on growth and reproductive performance of beef heifers. J. Anim. Sc. 92:3116-3126.
Martin, J. L., K. Creighton, J. Musgrave, K. Klopfenstein, R. Clark, D. Adams, and R. Funston, 2008. Effect of prebreeding body weight or progestin exposure before breeding on beef heifer performance through the second breeding season. J. Anim. Sci. 86:451-459.
Nkrumah, J. D., E. K. Okine, G. W. Mathison, K. Schmid, C. Li, J. A. Basarab, M. A. Price, Z. Wang, and S. S.
289
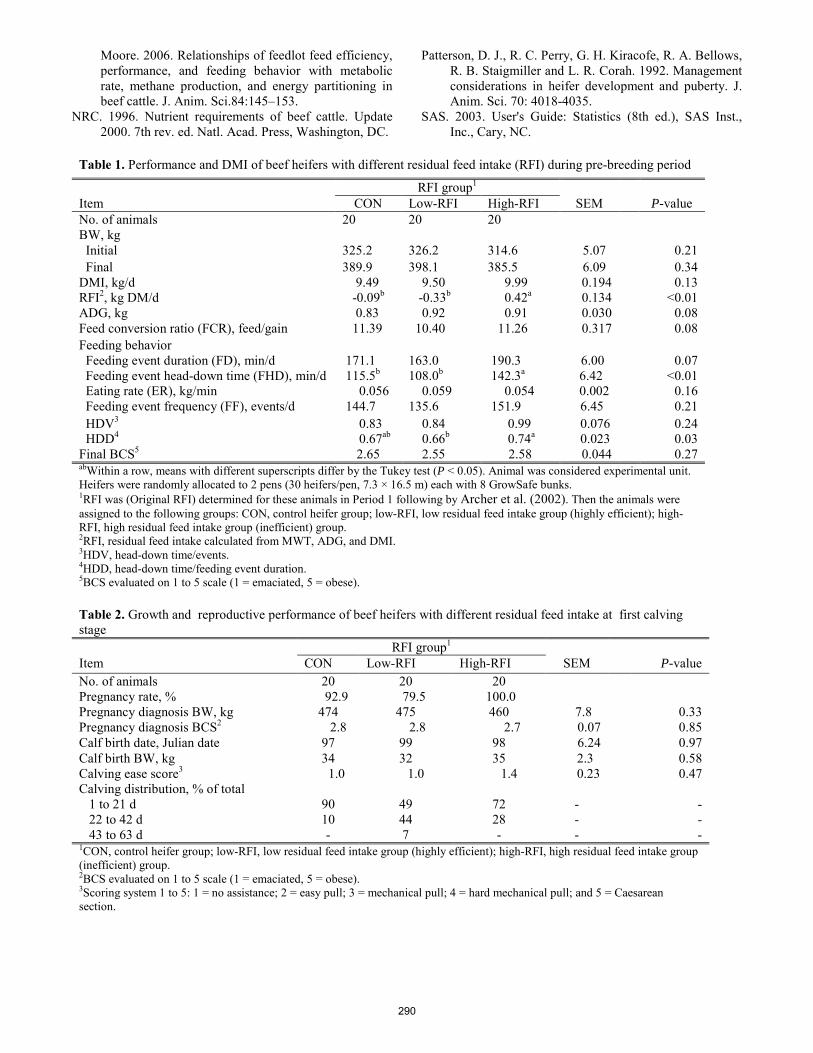
Moore. 2006. Relationships of feedlot feed efficiency, performance, and feeding behavior with metabolic rate, methane production, and energy partitioning in beef cattle. J. Anim. Sci.84:145–153.
NRC. 1996. Nutrient requirements of beef cattle. Update 2000. 7th rev. ed. Natl. Acad. Press, Washington, DC.
Patterson, D. J., R. C. Perry, G. H. Kiracofe, R. A. Bellows, R. B. Staigmiller and L. R. Corah. 1992. Management considerations in heifer development and puberty. J. Anim. Sci. 70: 4018-4035.
SAS. 2003. User's Guide: Statistics (8th ed.), SAS Inst., Inc., Cary, NC.
Table 1. Performance and DMI of beef heifers with different residual feed intake (RFI) during pre-breeding period
RFI group1
Item CON Low-RFI High-RFI SEM P-value No. of animals 20 20 20 BW, kg Initial 325.2 326.2 314.6 5.07 0.21 Final 389.9 398.1 385.5 6.09 0.34 DMI, kg/d 9.49 9.50 9.99 0.194 0.13 RFI2, kg DM/d -0.09b -0.33b 0.42a 0.134 <0.01 ADG, kg 0.83 0.92 0.91 0.030 0.08 Feed conversion ratio (FCR), feed/gain 11.39 10.40 11.26 0.317 0.08 Feeding behavior Feeding event duration (FD), min/d 171.1 163.0 190.3 6.00 0.07 Feeding event head-down time (FHD), min/d 115.5b 108.0b 142.3a 6.42 <0.01 Eating rate (ER), kg/min 0.056 0.059 0.054 0.002 0.16 Feeding event frequency (FF), events/d 144.7 135.6 151.9 6.45 0.21 HDV3 0.83 0.84 0.99 0.076 0.24 HDD4 0.67ab 0.66b 0.74a 0.023 0.03 Final BCS5 2.65 2.55 2.58 0.044 0.27 abWithin a row, means with different superscripts differ by the Tukey test (P < 0.05). Animal was considered experimental unit. Heifers were randomly allocated to 2 pens (30 heifers/pen, 7.3 × 16.5 m) each with 8 GrowSafe bunks. 1RFI was (Original RFI) determined for these animals in Period 1 following by Archer et al. (2002). Then the animals were assigned to the following groups: CON, control heifer group; low-RFI, low residual feed intake group (highly efficient); high-RFI, high residual feed intake group (inefficient) group. 2RFI, residual feed intake calculated from MWT, ADG, and DMI. 3HDV, head-down time/events. 4HDD, head-down time/feeding event duration. 5BCS evaluated on 1 to 5 scale (1 = emaciated, 5 = obese).
Table 2. Growth and reproductive performance of beef heifers with different residual feed intake at first calving stage
RFI group1
Item CON Low-RFI High-RFI SEM P-value No. of animals 20 20 20 Pregnancy rate, % 92.9 79.5 100.0 Pregnancy diagnosis BW, kg 474 475 460 7.8 0.33 Pregnancy diagnosis BCS2 2.8 2.8 2.7 0.07 0.85 Calf birth date, Julian date 97 99 98 6.24 0.97 Calf birth BW, kg 34 32 35 2.3 0.58 Calving ease score3 1.0 1.0 1.4 0.23 0.47 Calving distribution, % of total 1 to 21 d 90 49 72 - - 22 to 42 d 10 44 28 - - 43 to 63 d - 7 - - - 1CON, control heifer group; low-RFI, low residual feed intake group (highly efficient); high-RFI, high residual feed intake group (inefficient) group. 2BCS evaluated on 1 to 5 scale (1 = emaciated, 5 = obese). 3Scoring system 1 to 5: 1 = no assistance; 2 = easy pull; 3 = mechanical pull; 4 = hard mechanical pull; and 5 = Caesarean section.
290
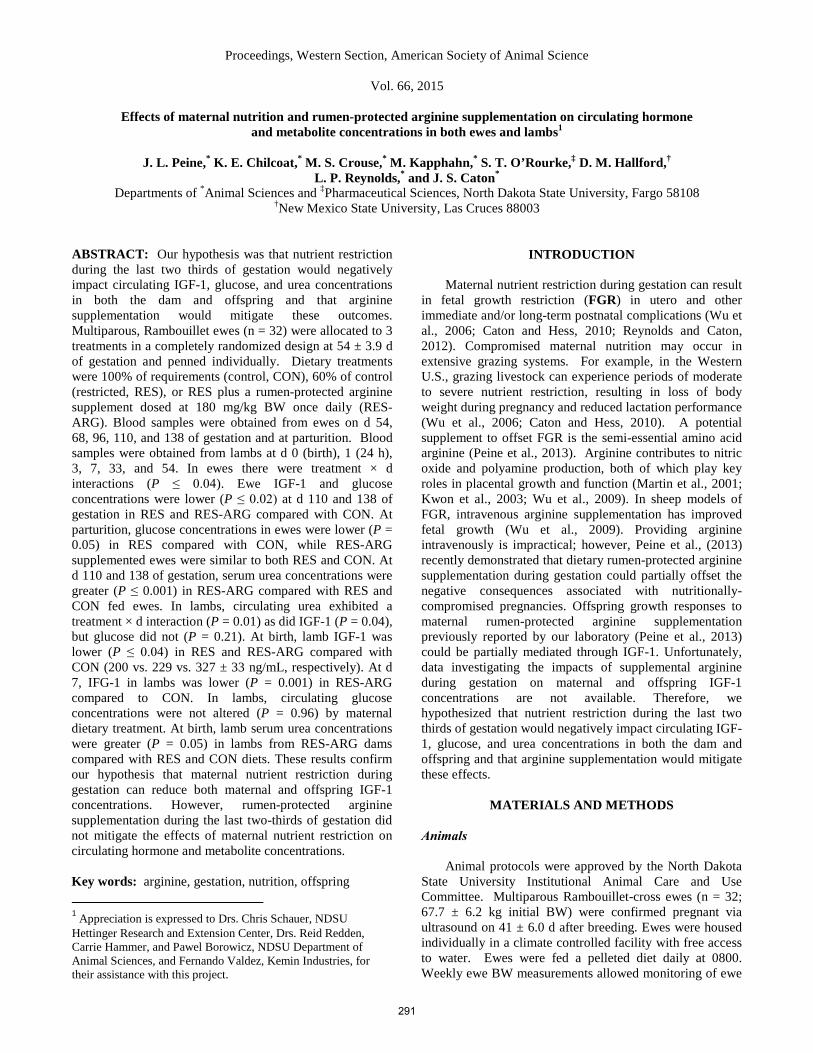
Proceedings, Western Section, American Society of Animal Science
Vol. 66, 2015
Effects of maternal nutrition and rumen-protected arginine supplementation on circulating hormone and metabolite concentrations in both ewes and lambs1
J. L. Peine,* K. E. Chilcoat,* M. S. Crouse,* M. Kapphahn,* S. T. O’Rourke,‡ D. M. Hallford,†
L. P. Reynolds,* and J. S. Caton*
Departments of *Animal Sciences and ‡Pharmaceutical Sciences, North Dakota State University, Fargo 58108 †New Mexico State University, Las Cruces 88003
ABSTRACT: Our hypothesis was that nutrient restriction during the last two thirds of gestation would negatively impact circulating IGF-1, glucose, and urea concentrations in both the dam and offspring and that arginine supplementation would mitigate these outcomes. Multiparous, Rambouillet ewes (n = 32) were allocated to 3 treatments in a completely randomized design at 54 ± 3.9 d of gestation and penned individually. Dietary treatments were 100% of requirements (control, CON), 60% of control (restricted, RES), or RES plus a rumen-protected arginine supplement dosed at 180 mg/kg BW once daily (RES-ARG). Blood samples were obtained from ewes on d 54, 68, 96, 110, and 138 of gestation and at parturition. Blood samples were obtained from lambs at d 0 (birth), 1 (24 h), 3, 7, 33, and 54. In ewes there were treatment × d interactions (P ≤ 0.04). Ewe IGF-1 and glucose concentrations were lower (P ≤ 0.02) at d 110 and 138 of gestation in RES and RES-ARG compared with CON. At parturition, glucose concentrations in ewes were lower (P = 0.05) in RES compared with CON, while RES-ARG supplemented ewes were similar to both RES and CON. At d 110 and 138 of gestation, serum urea concentrations were greater (P ≤ 0.001) in RES-ARG compared with RES and CON fed ewes. In lambs, circulating urea exhibited a treatment × d interaction (P = 0.01) as did IGF-1 (P = 0.04), but glucose did not (P = 0.21). At birth, lamb IGF-1 was lower (P ≤ 0.04) in RES and RES-ARG compared with CON (200 vs. 229 vs. 327 ± 33 ng/mL, respectively). At d 7, IFG-1 in lambs was lower (P = 0.001) in RES-ARG compared to CON. In lambs, circulating glucose concentrations were not altered (P = 0.96) by maternal dietary treatment. At birth, lamb serum urea concentrations were greater (P = 0.05) in lambs from RES-ARG dams compared with RES and CON diets. These results confirm our hypothesis that maternal nutrient restriction during gestation can reduce both maternal and offspring IGF-1 concentrations. However, rumen-protected arginine supplementation during the last two-thirds of gestation did not mitigate the effects of maternal nutrient restriction on circulating hormone and metabolite concentrations. Key words: arginine, gestation, nutrition, offspring1 1 Appreciation is expressed to Drs. Chris Schauer, NDSU Hettinger Research and Extension Center, Drs. Reid Redden, Carrie Hammer, and Pawel Borowicz, NDSU Department of Animal Sciences, and Fernando Valdez, Kemin Industries, for their assistance with this project.
INTRODUCTION
Maternal nutrient restriction during gestation can result in fetal growth restriction (FGR) in utero and other immediate and/or long-term postnatal complications (Wu et al., 2006; Caton and Hess, 2010; Reynolds and Caton, 2012). Compromised maternal nutrition may occur in extensive grazing systems. For example, in the Western U.S., grazing livestock can experience periods of moderate to severe nutrient restriction, resulting in loss of body weight during pregnancy and reduced lactation performance (Wu et al., 2006; Caton and Hess, 2010). A potential supplement to offset FGR is the semi-essential amino acid arginine (Peine et al., 2013). Arginine contributes to nitric oxide and polyamine production, both of which play key roles in placental growth and function (Martin et al., 2001; Kwon et al., 2003; Wu et al., 2009). In sheep models of FGR, intravenous arginine supplementation has improved fetal growth (Wu et al., 2009). Providing arginine intravenously is impractical; however, Peine et al., (2013) recently demonstrated that dietary rumen-protected arginine supplementation during gestation could partially offset the negative consequences associated with nutritionally-compromised pregnancies. Offspring growth responses to maternal rumen-protected arginine supplementation previously reported by our laboratory (Peine et al., 2013) could be partially mediated through IGF-1. Unfortunately, data investigating the impacts of supplemental arginine during gestation on maternal and offspring IGF-1 concentrations are not available. Therefore, we hypothesized that nutrient restriction during the last two thirds of gestation would negatively impact circulating IGF-1, glucose, and urea concentrations in both the dam and offspring and that arginine supplementation would mitigate these effects.
MATERIALS AND METHODS Animals
Animal protocols were approved by the North Dakota State University Institutional Animal Care and Use Committee. Multiparous Rambouillet-cross ewes (n = 32; 67.7 ± 6.2 kg initial BW) were confirmed pregnant via ultrasound on 41 ± 6.0 d after breeding. Ewes were housed individually in a climate controlled facility with free access to water. Ewes were fed a pelleted diet daily at 0800. Weekly ewe BW measurements allowed monitoring of ewe
291
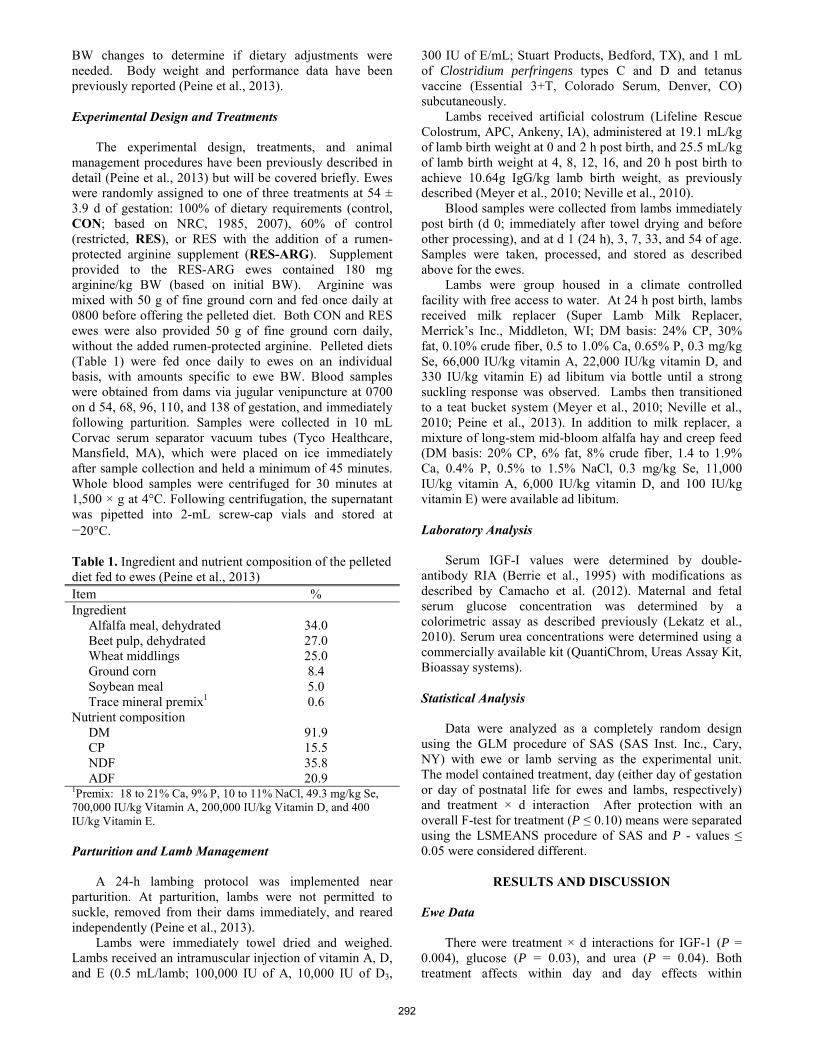
BW changes to determine if dietary adjustments were needed. Body weight and performance data have been previously reported (Peine et al., 2013).
Experimental Design and Treatments
The experimental design, treatments, and animal management procedures have been previously described in detail (Peine et al., 2013) but will be covered briefly. Ewes were randomly assigned to one of three treatments at 54 ± 3.9 d of gestation: 100% of dietary requirements (control, CON; based on NRC, 1985, 2007), 60% of control (restricted, RES), or RES with the addition of a rumen-protected arginine supplement (RES-ARG). Supplement provided to the RES-ARG ewes contained 180 mg arginine/kg BW (based on initial BW). Arginine was mixed with 50 g of fine ground corn and fed once daily at 0800 before offering the pelleted diet. Both CON and RES ewes were also provided 50 g of fine ground corn daily, without the added rumen-protected arginine. Pelleted diets (Table 1) were fed once daily to ewes on an individual basis, with amounts specific to ewe BW. Blood samples were obtained from dams via jugular venipuncture at 0700 on d 54, 68, 96, 110, and 138 of gestation, and immediately following parturition. Samples were collected in 10 mL Corvac serum separator vacuum tubes (Tyco Healthcare, Mansfield, MA), which were placed on ice immediately after sample collection and held a minimum of 45 minutes. Whole blood samples were centrifuged for 30 minutes at 1,500 × g at 4°C. Following centrifugation, the supernatant was pipetted into 2-mL screw-cap vials and stored at −20°C.
Table 1. Ingredient and nutrient composition of the pelleted diet fed to ewes (Peine et al., 2013) Item % Ingredient Alfalfa meal, dehydrated 34.0 Beet pulp, dehydrated 27.0 Wheat middlings 25.0 Ground corn 8.4 Soybean meal 5.0 Trace mineral premix1 0.6 Nutrient composition DM 91.9 CP 15.5 NDF 35.8 ADF 20.9 1Premix: 18 to 21% Ca, 9% P, 10 to 11% NaCl, 49.3 mg/kg Se, 700,000 IU/kg Vitamin A, 200,000 IU/kg Vitamin D, and 400 IU/kg Vitamin E. Parturition and Lamb Management
A 24-h lambing protocol was implemented near parturition. At parturition, lambs were not permitted to suckle, removed from their dams immediately, and reared independently (Peine et al., 2013).
Lambs were immediately towel dried and weighed. Lambs received an intramuscular injection of vitamin A, D, and E (0.5 mL/lamb; 100,000 IU of A, 10,000 IU of D3,
300 IU of E/mL; Stuart Products, Bedford, TX), and 1 mL of Clostridium perfringens types C and D and tetanus vaccine (Essential 3+T, Colorado Serum, Denver, CO) subcutaneously.
Lambs received artificial colostrum (Lifeline Rescue Colostrum, APC, Ankeny, IA), administered at 19.1 mL/kg of lamb birth weight at 0 and 2 h post birth, and 25.5 mL/kg of lamb birth weight at 4, 8, 12, 16, and 20 h post birth to achieve 10.64g IgG/kg lamb birth weight, as previously described (Meyer et al., 2010; Neville et al., 2010).
Blood samples were collected from lambs immediately post birth (d 0; immediately after towel drying and before other processing), and at d 1 (24 h), 3, 7, 33, and 54 of age. Samples were taken, processed, and stored as described above for the ewes.
Lambs were group housed in a climate controlled facility with free access to water. At 24 h post birth, lambs received milk replacer (Super Lamb Milk Replacer, Merrick’s Inc., Middleton, WI; DM basis: 24% CP, 30% fat, 0.10% crude fiber, 0.5 to 1.0% Ca, 0.65% P, 0.3 mg/kg Se, 66,000 IU/kg vitamin A, 22,000 IU/kg vitamin D, and 330 IU/kg vitamin E) ad libitum via bottle until a strong suckling response was observed. Lambs then transitioned to a teat bucket system (Meyer et al., 2010; Neville et al., 2010; Peine et al., 2013). In addition to milk replacer, a mixture of long-stem mid-bloom alfalfa hay and creep feed (DM basis: 20% CP, 6% fat, 8% crude fiber, 1.4 to 1.9% Ca, 0.4% P, 0.5% to 1.5% NaCl, 0.3 mg/kg Se, 11,000 IU/kg vitamin A, 6,000 IU/kg vitamin D, and 100 IU/kg vitamin E) were available ad libitum.
Laboratory Analysis
Serum IGF-I values were determined by double-antibody RIA (Berrie et al., 1995) with modifications as described by Camacho et al. (2012). Maternal and fetal serum glucose concentration was determined by a colorimetric assay as described previously (Lekatz et al., 2010). Serum urea concentrations were determined using a commercially available kit (QuantiChrom, Ureas Assay Kit, Bioassay systems).
Statistical Analysis
Data were analyzed as a completely random design using the GLM procedure of SAS (SAS Inst. Inc., Cary, NY) with ewe or lamb serving as the experimental unit. The model contained treatment, day (either day of gestation or day of postnatal life for ewes and lambs, respectively) and treatment × d interaction After protection with an overall F-test for treatment (P ≤ 0.10) means were separated using the LSMEANS procedure of SAS and P - values ≤ 0.05 were considered different.
RESULTS AND DISCUSSION Ewe Data
There were treatment × d interactions for IGF-1 (P = 0.004), glucose (P = 0.03), and urea (P = 0.04). Both treatment affects within day and day effects within
292
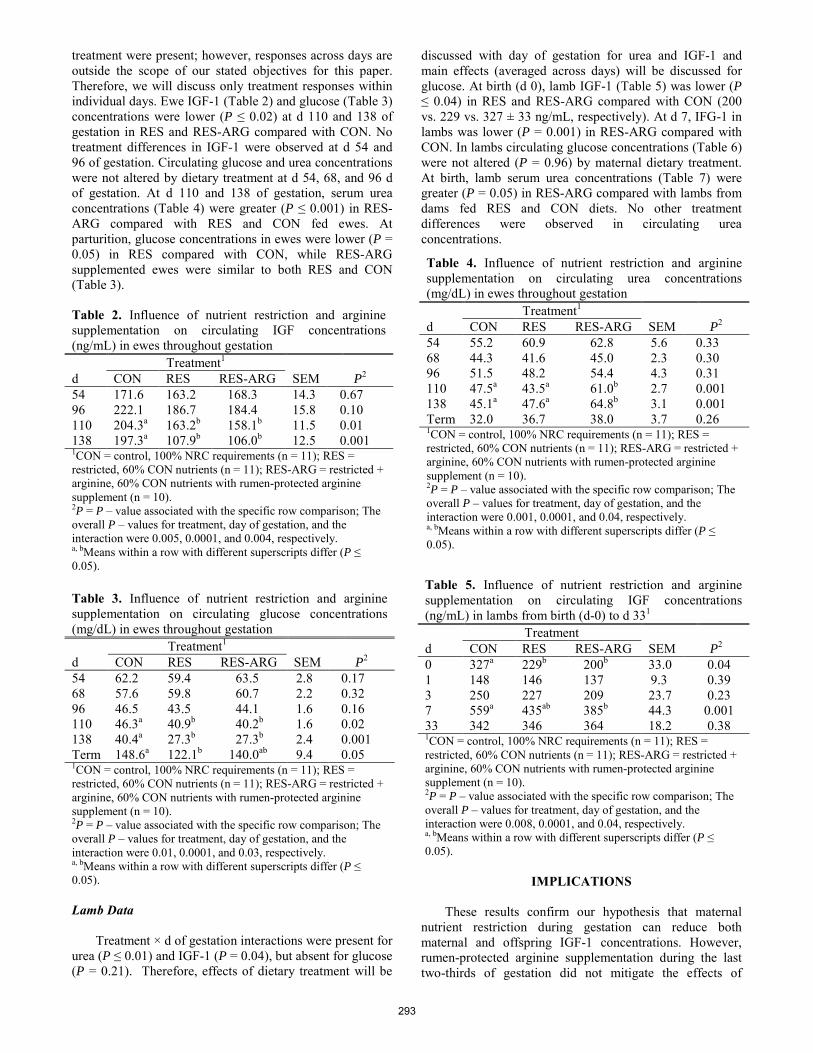
treatment were present; however, responses across days are outside the scope of our stated objectives for this paper. Therefore, we will discuss only treatment responses within individual days. Ewe IGF-1 (Table 2) and glucose (Table 3) concentrations were lower (P ≤ 0.02) at d 110 and 138 of gestation in RES and RES-ARG compared with CON. No treatment differences in IGF-1 were observed at d 54 and 96 of gestation. Circulating glucose and urea concentrations were not altered by dietary treatment at d 54, 68, and 96 d of gestation. At d 110 and 138 of gestation, serum urea concentrations (Table 4) were greater (P ≤ 0.001) in RES-ARG compared with RES and CON fed ewes. At parturition, glucose concentrations in ewes were lower (P = 0.05) in RES compared with CON, while RES-ARG supplemented ewes were similar to both RES and CON (Table 3).
Lamb Data
Treatment × d of gestation interactions were present for urea (P ≤ 0.01) and IGF-1 (P = 0.04), but absent for glucose (P = 0.21). Therefore, effects of dietary treatment will be
discussed with day of gestation for urea and IGF-1 and main effects (averaged across days) will be discussed for glucose. At birth (d 0), lamb IGF-1 (Table 5) was lower (P ≤ 0.04) in RES and RES-ARG compared with CON (200 vs. 229 vs. 327 ± 33 ng/mL, respectively). At d 7, IFG-1 in lambs was lower (P = 0.001) in RES-ARG compared with CON. In lambs circulating glucose concentrations (Table 6) were not altered (P = 0.96) by maternal dietary treatment. At birth, lamb serum urea concentrations (Table 7) were greater (P = 0.05) in RES-ARG compared with lambs from dams fed RES and CON diets. No other treatment differences were observed in circulating urea concentrations.
IMPLICATIONS
These results confirm our hypothesis that maternal
nutrient restriction during gestation can reduce both maternal and offspring IGF-1 concentrations. However, rumen-protected arginine supplementation during the last two-thirds of gestation did not mitigate the effects of
Table 2. Influence of nutrient restriction and arginine supplementation on circulating IGF concentrations (ng/mL) in ewes throughout gestation Treatment1 d CON RES RES-ARG SEM P2 54 171.6 163.2 168.3 14.3 0.67 96 222.1 186.7 184.4 15.8 0.10 110 204.3a 163.2b 158.1b 11.5 0.01 138 197.3a 107.9b 106.0b 12.5 0.001 1CON = control, 100% NRC requirements (n = 11); RES = restricted, 60% CON nutrients (n = 11); RES-ARG = restricted + arginine, 60% CON nutrients with rumen-protected arginine supplement (n = 10). 2P = P – value associated with the specific row comparison; The overall P – values for treatment, day of gestation, and the interaction were 0.005, 0.0001, and 0.004, respectively. a, bMeans within a row with different superscripts differ (P ≤ 0.05).
Table 3. Influence of nutrient restriction and arginine supplementation on circulating glucose concentrations (mg/dL) in ewes throughout gestation Treatment1 d CON RES RES-ARG SEM P2 54 62.2 59.4 63.5 2.8 0.17 68 57.6 59.8 60.7 2.2 0.32 96 46.5 43.5 44.1 1.6 0.16 110 46.3a 40.9b 40.2b 1.6 0.02 138 40.4a 27.3b 27.3b 2.4 0.001 Term 148.6a 122.1b 140.0ab 9.4 0.05 1CON = control, 100% NRC requirements (n = 11); RES = restricted, 60% CON nutrients (n = 11); RES-ARG = restricted + arginine, 60% CON nutrients with rumen-protected arginine supplement (n = 10). 2P = P – value associated with the specific row comparison; The overall P – values for treatment, day of gestation, and the interaction were 0.01, 0.0001, and 0.03, respectively. a, bMeans within a row with different superscripts differ (P ≤ 0.05).
Table 4. Influence of nutrient restriction and arginine supplementation on circulating urea concentrations (mg/dL) in ewes throughout gestation Treatment1 d CON RES RES-ARG SEM P2 54 55.2 60.9 62.8 5.6 0.33 68 44.3 41.6 45.0 2.3 0.30 96 51.5 48.2 54.4 4.3 0.31 110 47.5a 43.5a 61.0b 2.7 0.001 138 45.1a 47.6a 64.8b 3.1 0.001 Term 32.0 36.7 38.0 3.7 0.26 1CON = control, 100% NRC requirements (n = 11); RES = restricted, 60% CON nutrients (n = 11); RES-ARG = restricted + arginine, 60% CON nutrients with rumen-protected arginine supplement (n = 10). 2P = P – value associated with the specific row comparison; The overall P – values for treatment, day of gestation, and the interaction were 0.001, 0.0001, and 0.04, respectively. a, bMeans within a row with different superscripts differ (P ≤ 0.05).
Table 5. Influence of nutrient restriction and arginine supplementation on circulating IGF concentrations (ng/mL) in lambs from birth (d-0) to d 331 Treatment d CON RES RES-ARG SEM P2 0 327a 229b 200b 33.0 0.04
1 148 146 137 9.3 0.39
3 250 227 209 23.7 0.23
7 559a 435ab 385b 44.3 0.001
33 342 346 364 18.2 0.38
1CON = control, 100% NRC requirements (n = 11); RES = restricted, 60% CON nutrients (n = 11); RES-ARG = restricted + arginine, 60% CON nutrients with rumen-protected arginine supplement (n = 10). 2P = P – value associated with the specific row comparison; The overall P – values for treatment, day of gestation, and the interaction were 0.008, 0.0001, and 0.04, respectively. a, bMeans within a row with different superscripts differ (P ≤ 0.05).
293

maternal nutrient restriction during gestation on circulating IGF-1, glucose, or urea concentrations. Additional research is needed to further define the possible benefits of rumen-protected arginine supplementation during gestation on offspring physiology and performance.
LITERATURE CITED
Berrie, R. A., D. M. Hallford, and M. L. Galyean. 1995.
Effects of zinc source and level on performance, carcass characteristics, and metabolic hormone concentrations of growing and finishing lambs. Prof. Anim. Sci. 11:149–156.
Camacho, L. E., J. M. Benavidez, and D. M. Hallford. 2012. Serum hormone profiles, pregnancy rates, and offspring performance of Rambouillet ewes treated with ecombinant bovine somatotropin before breading. J. Anim. Sci. 90:2826-2835.
Caton, J. S., and B. W. Hess. 2010. Maternal plane of nutrition: Impacts on fetal outcomes and postnatal offspring responses. Invited Review. Pages 104-122 in Proc. 4th Grazing Livest. Nutr. Conference. B. W. Hess, T. Delcurto, J. G. P. Bowman, and R. C. Waterman, eds. West. Sect. Am. Soc. Anim. Sci., Champaign, IL.
Kwon, H., G. Wu, F. W. Bazer, and T. E. Spencer. 2003. Developmental changes in polyamine levels and synthesis in the ovine conceptus. Biol. Reprod. 69:1626-1634.
Lekatz, L. A., M. A. Ward, P. P. Borowicz, J. B. Taylor, D. A. Redmer, A. T. Grazul-Bilska, L. P. Reynolds, J. S. Caton, and K. A. Vonnahme. 2010b. Cotyledonary responses to maternal selenium and dietary restriction may influence alterations in fetal weight and fetal liver glycogen in sheep. Anim. Reprod. Sci. 117:216–225.
Martin, M. J., M. D. Jimenez, and V. Motilva. 2001. New issues about nitric oxide and its effects on the gastrointestinal tract. Curr. Pharm. Des. 7(10):881-908.
Meyer A. M., J. J. Reed, T. L. Neville, J. B. Taylor, C. J. Hammer, L. P. Reynolds, D. A. Redmer, K. A. Vonnahme, and J. S. Caton. 2010. Effects of plane of nutrition and selenium supply during gestation on ewe and neonatal offspring performance, body composition, and serum selenium. J. Anim. Sci. 88:1786-1800.
Neville, T. L., J. S. Caton, C. J. Hammer, J. J. Reed, J. S. Luther, J. B. Taylor, D. A. Redmer, L. P. Reynolds, and K. A. Vonnahme. 2010. Ovine offspring growth and diet digestibility are influenced by maternal selenium supplementation and nutritional intake during pregnancy despite a common postnatal diet. J. Anim. Sci. 88:3645-3656.
NRC. 1985. Nutrient Requirements of Sheep. 6th ed. Natl. Acad. Press, Washington, DC.
NRC. 2007. Nutrient Requirements of Sheep. 7th ed. Natl. Acad. Press, Washington, DC.
Peine, J. L., G. Q. Jia, M. L. Van Emon, T. L. Neville, J. D. Kirsch, C. J. Hammer, S. T. O’Rourke, L. P. Reynolds, and J. S. Caton. 2013. Effects of maternal nutrition and rumen-protected arginine supplementation on ewe and postnatal lamb performance. Proc. West. Sec. Amer. Soc. Anim. Sci. 64:80-83.
Reynolds, L. P., and J. S. Caton. 2012. Role of the pre- and post-natal environment in developmental programming of health and productivity. Invited review. Molecular and Cellular Endocrinology, Special Issue ‘Environment, Epigenetics and Reproduction,” MK Skinner (ed.) 2012; 354:54-59.
Wu, G., F. W. Bazer, T. A. Davis, S. W. Kim, P. Li, J. M. Rhoads, M. C. Satterfield, S. B. Smith, T. E. Spencer, and Y. Yin. 2009. Arginine metabolism and nutrition in growth, health and disease. Amino Acids. 37(1):153-168.
Wu, G., F. W. Bazer, J. M. Wallace, and T. E. Spencer. 2006. Board-Invited Review: Intrauterine growth retardation: implications for the animal sciences. J. Anim. Sci. 84:2316-2337.
Table 6. Influence of nutrient restriction and arginine supplementation on circulating glucose concentrations (mg/dL) in lambs from birth (d-0) to d 541 Treatment d CON RES RES-ARG SEM Mean 0 59 41 62 6.4 54
1 69 72 69 10.0 70
3 114 110 117 5.3 114
7 117 127 116 4.2 120
33 122 126 119 2.9 122
54 109 108 109 3.4 108
Mean 98 97 98 2.6 1P – value associated with the overall F-test for treatment, day, and treatment × day interaction were 0.96, 0.0001, and 0.21, respectively. CON = control, 100% NRC requirements (n = 11); RES = restricted, 60% CON nutrients (n = 11); RES-ARG = restricted + arginine, 60% CON nutrients with rumen-protected arginine supplement (n = 10).
Table 7. Influence of nutrient restriction and arginine supplementation on circulating urea concentrations (mg/dL) in lambs from birth (d-0) to d 541 Treatment d CON RES RES-ARG SEM P1 0 42a 39a 58b 2.9 0.05
1 52 52 52 2.3 0.94
3 35 36 35 3.5 0.72
7 37 39 35 2.1 0.33
33 42 39 40 2.1 0.30
54 38 36 39 2.7 0.38
1P – value associated with the overall F-test for treatment, day, and treatment × day interaction were 0.29, 0.0001, and 0.01, respectively. P = P – value associated with the specific row comparison. CON = control, 100% NRC requirements (n = 11); RES = restricted, 60% CON nutrients (n = 11); RES-ARG = restricted + arginine, 60% CON nutrients with rumen-protected arginine supplement (n = 10). a, bMeans within a row with different superscripts differ (P ≤ 0.05).
294
Proceedings, Western Section, American Society of Animal Science
Vol. 66, 2015
Impact of dietary forage quality on ruminal by-pass of calcium salts of long-chain omega-3 fatty acids in beef heifers when provided in dried molasses lick tubs
D. C. Rule, P. A. Ludden, T. D. Draney, and K. M. Cammack Department of Animal Science, University of Wyoming
ABSTRACT: Our objective was to compare three forage qualities (low, medium and high) to heifers offered dried molasses lick tubs formulated to contain 30% by weight of calcium salts of fish oil fatty acids and quantify by-pass potential by measuring changes in plasma concentrations of Eicosapentaenoic (EPA) and docosahexaenoic (DHA). We hypothesized that as forage quality increases, ruminal fermentation rate increases resulting in increased loss of by-pass potential of the calcium salts of the unsaturated fatty acids. Twenty-seven crossbred beef heifers (initial BW 308.9 ± 2.7 kg) were randomly allocated by BW to each of nine pens (three heifers per pen) in a replicated 3× 3 Latin square designed experiment with repeated measures. Pens were randomly assigned to one of three treatments based on forage type: Alfalfa hay, Brome grass hay, or a grass hay containing approximately an 80:20 ratio of Garrison creeping meadow foxtail and brome grass to represent high-, medium-, and low-quality forage (based on CP), respectively. Heifers were fed forages for 3 wk and then were provided free access lick tubs for 21 d. Treatments were re-randomized each subsequent period which included 21-d without access to lick tubs. At d-0 and every 7 d during lick tub feeding blood samples and body weights were obtained. Forage intake during washout phases or during the 21 d on lick tubs was less (P < 0.01) for Garrison than for either Alfalfa or Brome, which were similar (P ≥ 0.40). Tub intake, and thus intake of EPA and DHA were not affected by forage treatment (P ≥ 0.34). Heifers fed Alfalfa had greater ADG than both Brome (P = 0.02) or Garrison (P < 0.01), and ADG was greater (P < 0.01) for Brome than with Garrison, wherein heifers lost body weight while on Garrison. No forage treatment × day interactions were observed for plasma EPA (P = 0.26) or DHA (P = 0.19). Plasma EPA and DHA appeared to continue increasing at 21 d on Brome and Garrison but had plateaued for Alfalfa at 14 d. We conclude that plasma concentrations of EPA and DHA in beef heifers fed forage-based diets and supplemented fish oil calcium salts delivered within a dried molasses lick tub blood will peak earlier when fed higher quality forage than when fed medium or lower quality forage. Key words: Docosahexaenoic acid; Eicosapentaenoic acid; Fish oil calcium salt; Forage; Heifer; Plasma. _______________________ Appreciation is extended to Virtus Nutrition (Concord, CA) for providing the calcium salts of fish oil, and Ridley Block (White, SD) for preparing the dried molasses lick tubs used in this research. This project was supported in part by a University of Wyoming Agricultural Experiment Station Competitive Grant.
INTRODUCTION
Fish oil contains high levels of eicosapentaenoic acid (EPA) and docosahexaenoic acid (DHA), with EPA the prevalent of the two. Rule et al. (2002) and Portomingo et al. (2012) reported that omega-3 fatty acids were up to 8-fold higher in the rib-eye steak of grass-fed compared with feedlot-fed beef. Additionally, deposition of EPA and DHA into reproductive tract tissue of cows and heifers could improve female reproductive performance in cattle (Williams and Stanko, 2000). Feeding unsaturated fatty acids to ruminant livestock results in loss of many of these fatty acids because of ruminal biohydrogenation. Scollan et al. (2001) reported over 90% loss of EPA and DHA in cattle supplemented with fish oil. Rule et al. (2011) supplemented steers grown on irrigated pasture with calcium salts of fish oil, which are resistant to ruminal biohydrogenation, and observed that variation in intake of the fish oil treatment resulted in similar variation in concentrations of EPA in muscle, liver, and serum, indicating that serum concentrations reflect tissue uptake (thus rumen by-pass) of EPA and DHA. We also observed less variation in muscle concentration of EPA and DHA in cattle fed harvested forage when supplemented with fish oil calcium salts contained within dried molasses lick tubs compared with feeding as a beet pulp-based supplement (Melson et al., 2013). Greater serum EPA and DHA were observed when forage quality was decreased; thus, forage quality could impact ruminal by-pass of fish oil calcium salts. We hypothesized that as forage quality increases, ruminal fermentation rate increases resulting in increased loss of by-pass potential of the calcium salts of the unsaturated fatty acids. Our objective was to compare three forage qualities (low, medium and high) to heifers offered dried molasses lick tubs formulated to contain 30% by weight of calcium salts of fish oil fatty acids and quantify by-pass potential by measuring changes in plasma concentrations of EPA and DHA.
MATERIALS AND METHODS
Procedures with heifers were approved by the University of Wyoming Institutional Animal Care and Use Committee before any work started. Twenty-seven crossbred beef heifers (initial BW 308.9 ± 2.7 kg) were obtained from the University of Wyoming beef herd and randomly allocated by BW to each of nine pens with three heifers per pen in a replicated 3× 3 Latin square designed experiment with repeated measures. Heifers were fed brome grass hay free choice for about 1 mo before starting
295
the study. Pens were randomly assigned to one of three treatments based on forage type: Alfalfa hay, Brome grass hay, or a grass hay containing approximately an 80:20 ratio of Garrison creeping meadow foxtail and brome grass to represent high-, medium-, and low-quality forage (based on CP). Initial forage composition is shown in Table 1. Heifers were offered forage free choice for 7 d before dried molasses lick tubs that contained calcium salts of fish oil (30% by weight) were placed into each pen (35 m × 5 m). Lick tubs contained about 113 kg of dried molasses. Calcium salts of fish oil were provided by Virtus Nutrition (Concord, CA) and dried molasses lick tubs were prepared by Ridley Block (White, SD). Heifers had free access to fresh water and trace-mineral salt blocks (NaCl, 95.5%; Zinc, 3,500 ppm, Iron, 2,000 ppm; Manganese, 1,800 ppm; Copper, 420 ppm; Iodine, 100 ppm; and Cobalt, 60 ppm; American Stockman, Overland Park, KS). Lick tubs remained in the pens for 21 d after which they were removed, pens were re-allocated to forage treatment and a 3-wk washout period was allowed during which the heifers were fed the subsequent treatment forage only. At the end of the washout period lick tubs were placed back into all pens for 21 d. This process was repeated once more so that all pens received all forages with lick tubs for 21 d each. Forage was weighed each day and placed into bunks in the morning. Forage weigh backs, lick tub weights, and samples of forage and lick tub were taken every 7 d. At the end of each washout period and every 7 d during lick tub feeding blood samples and body weights were obtained. Plasma aliquots (5.0 mL) were transferred to vials, capped and stored at -20 C. Samples of each forage (about 1.0 kg) were ground to pass a 1.0 mm screen using a Wiley mill, and stored in sealable plastic bags and stored at 4°C. Sub-samples (100 g) of each ground forage were vacuum packaged and stored at -20 °C for later fatty acid analysis. At the end of trial equal amounts of each ground forage were mixed to provide a composite sample.
Forages were analyzed for DM, ash, and crude protein (AOAC, 1990); In Vitro DM Digestibility (IVDMD) via a modified Tilley and Terry (1963) protocol; ADF and NDF were determined using an ANKOM 200 fiber analyzer (ANKOM Technology, Fairport, NY); fatty acid concentration was determined using GLC for forages (Weston et al., 2008) and blood plasma (Lake et al., 2006). Blood plasma samples (5 mL) and forages were lyophilized (Genesis SQ 25 Super ES Freeze Dryer, The Virtis Co., Gardiner, NY) before methyl esters of total fatty acids were prepared for analysis by GLC.
Data were analyzed as a replicated Latin square with repeated measures using the Mixed procedure of SAS (SAS Inst. Inc., Cary, NC). The model included the autoregressive, heterogeneous criterion with day as fixed effect, treatment as random effect, and pen as the subject. Least squared means for forage treatment, day, and treatment × day interaction on EPA and DHA were reported. Within forage treatment linear and quadratic relationships between both EPA and DHA and days of lick tub supplementation were determined by using the GLM procedure of SAS.
RESULTS AND DISCUSSION
Composition of forages, forage and lick tub intake, and ADG are presented in Table 1. Crude protein content was the primary measure of forage quality. Comparison of CP values shows about 4-6 percentage unit difference between each forage with Alfalfa being greatest, Brome intermediate, and Garrison the least. The contribution of forage fatty acids to overall fatty acid consumption would have been minimal given the total fatty acid concentrations measured in each forage. In each forage the predominant fatty acid was C18:3 n-3 (48.0, 49.4, and 47.1 mg/100 mg fatty acid for Alfalfa, Brome, and Garrison, respectively). Concentrations of EPA and DHA in the dried molasses lick tubs were 23.4 and 16.1 g/kg, respectively, and the concentration of EPA and DHA in the fish oil calcium salt was 11.24 and 7.74 g/100 g fatty acids. Forage intake during washout phases or during the 21 d on lick tubs was less (P < 0.01) for Garrison than for either Alfalfa or Brome, which were similar (P ≥ 0.40). Tub intake, as well as intake of EPA and DHA were not affected by forage treatment (P ≥ 0.34). Average daily gain during the 21-d lick tub supplementation phase was greater for Alfalfa than both Brome (P = 0.02) or Garrison (P < 0.01), and ADG was greater (P < 0.01) for Brome than with Garrison, wherein heifers lost body weight while on Garrison. The changes in plasma concentrations of EPA and DHA during the 21-d supplementation phase for each forage are illustrated in Figures 1 and 2, respectively. No forage treatment × day interactions were observed for EPA (P = 0.26) or DHA (P = 0.19). Within day of lick tub supplementation, no forage treatment effects were observed for plasma EPA (P ≥ 0.70) or DHA (P ≥ 0.14). However, day effects were observed for both fatty acids (P < 0.01). For all forages, both EPA and DHA were lowest (P < 0.01) on day-0, which was expected because these fatty acids were not observed in the forages. For Alfalfa, plasma EPA was similar (P ≥ 0.30) at d-7 through 21 of supplementation. When heifers were fed Brome plasma EPA at d-7 was less than that at d-14 (P = 0.01) and d-21 (P = 0.04); EPA at d-14 and d-21 were similar (P = 0.94). Heifers fed Garrison had similar (P = 0.12) EPA concentrations at d-7 and d-14; while EPA at d-21 was greater than at d-7 (P < 0.01) or d-14 (P = 0.02). Plasma DHA concentrations were similar at 7, 14, and 21 d for Alfalfa (P ≥ 0.85) and Brome (P ≥ 0.83). When fed Garrison, DHA concentrations were similar for d-7 and d-14 (P = 0.15), as well as for d-14 and d-21 (P = 0.59), but were less (P = 0.02) at d-7 and at d-21.
The effect of days on fish oil calcium salt and plasma EPA resulted in a quadratic effect (P = 0.02) while on Alfalfa. However, when fed Brome only the linear effect (P = 0.02) was observed (quadratic effect, P = 0.37). When fed Garrison a linear effect was observed (P < 0.01); however, a trend for a quadratic effect was also observed (P = .06). For DHA a quadratic effect (P = 0.01) was observed when heifers were fed Alfalfa; whereas when fed Brome only a linear effect was noted (P = 0.02). When fed Garrison a quadratic effect (P = 0.01) was observed for DHA and days of supplementation.
296

Intake of lick tub was higher in the present study compared with lick tub intake in our previous study (Melson et al., 2013). In the current study, only three heifers were offered a single tub; whereas, in the previous study heifers and steers were group fed in larger pens and provided two tubs per pen. Smaller pens and fewer heifers per tub likely resulted in greater intake of dried molasses and fish oil calcium salts. Plasma concentrations of EPA and DHA were also higher in the present study than we reported previously (Melson et al., 2013). Greater intake of fish oil calcium salts would result in greater plasma concentration of these fatty acids (Rule et al., 2011). We hypothesized that the greater forage quality of Alfalfa would cause less EPA and DHA to be observed in the blood plasma due to greater ruminal fermentation rate decreasing ruminal pH, resulting in increased loss of by-pass potential of the calcium salts of the unsaturated fatty acids. While EPA and DHA increased in plasma as days fed the fish oil calcium salts increased, concentrations in heifers fed Alfalfa plateaued at d-14; whereas, EPA continued to increase when fed Brome and Garrison. Similarly, DHA continued to increase at d-21 when fed Brome, but this fatty acid plateaued by d-14 for Garrison. Confounding the results of Garrison further was the noted weight loss that occurred for heifers while fed this forage. We expected to observe continued increases in EPA and DHA for Garrison and possibly for Brome. However, the effect of time on fish oil calcium salts on plasma DHA concentration was not consistent with forage quality and plasma concentrations of DHA could have been affected by physiological effects associated with weight loss when Garrison was fed.
Generally, with high quality forage the concentration of EPA and DHA increased for 14 d, whereas, with lesser quality forages by 21 d the concentrations appeared to continue increasing. The time fed the fish oil calcium salts needed to allow plasma concentrations of EPA and DHA to stabilize when fed Brome or Garrison could not be determined in the present study. However, the results indicate that greater concentrations of these fatty acids in blood may occur if supplementation continues for a longer period. Ultimately, the concentration of EPA and DHA in blood plasma will be determined by daily intake (Rule et al., 2011; Melson et al., 2013). If group fed in a pasture tub
intake will likely be less because typical intakes range from 0.23 to 0.34 kg/ day depending on body weight. In the pilot study that proceeded the work reported earlier (Melson et al., 2013) we observed EPA concentrations at about 30 mg/100 mL in serum in beef cows grazing late fall pasture. Concentrations were greater in the present study than reported by Melson et al (2013); however, tub intake was five-fold greater in the present study. We conclude that plasma concentrations of EPA and DHA in beef heifers fed forage-based diets and supplemented fish oil calcium salts delivered within a dried molasses lick tub blood will peak earlier when fed higher quality forage than when fed medium or lower quality forage
LITERATURE CITED
Lake, S. L., E. J. Scholljegerdes, T. R. Weston, D. C. Rule, and B. W. Hess. 2006. Postpartum supplemental fat, but not maternal body condition score at parturition, affects plasma and adipose tissue fatty acid profiles of suckling beef calves. J. Anim. Sci. 84: 1811-1819.
Melson, E., W. J. Means, S. Paisley, and D. C. Rule. 2013. Effectiveness of a dried molasses lick tub supplement containing calcium salts of fish oil for increasing omega-3 fatty acids in muscle of forage-finished cattle. Proc. West. Sec. Amer. Soc. Anim. Sci. 64:149-153.
Portomingo, A. J., T. P. Garcia, and G. Volpi Lagreca. 2012. Effect of feeding treatment during the backgrounding phase of beef production from pasture on: Longissiums muscle proximate composition, cholesterol and fatty acids. Meat Sci. 90:947-955.
Rule, D. C., B. W. Hess, S. Paisley, W. J. Means, K. Underwood, and O. Kucuk. 2011. Supplemental rumen-protected fish oil increases concentrations of long-chain n-3 fatty acids in tissues of grass-fed beef. Proc. West. Sec. Amer. Soc. Anim. Sci. 62:390-393.
Tilley, J. M. A. and R. A. Terry. 1963. A two-stage technique for the in vitro digestion of forage crops. J. Brit. Grassland Soc. 18:104-111.
Weston, T. R., J. D. Derner, C. M. Murrieta, D. C. Rule, and B. W. Hess. 2008. Comparison of catalysts for direct transesterification of fatty acids in freeze-dried forage samples. Crop Sci. 48:1636-1641.
297
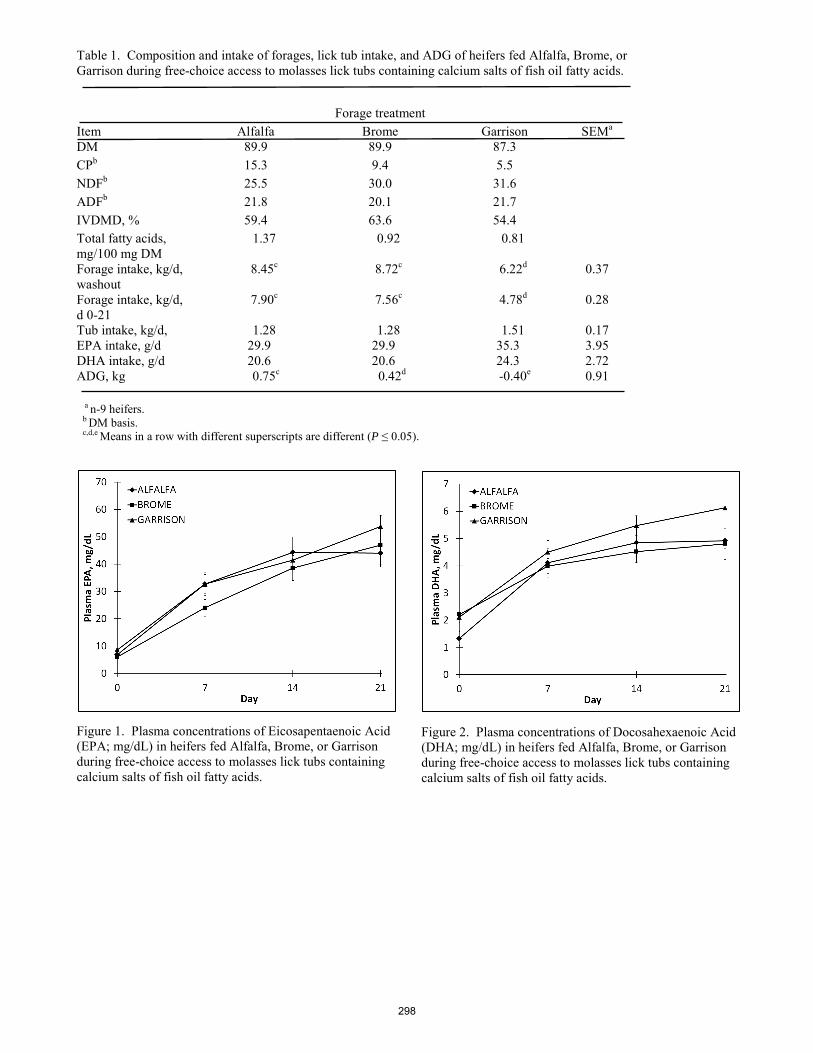
Table 1. Composition and intake of forages, lick tub intake, and ADG of heifers fed Alfalfa, Brome, or Garrison during free-choice access to molasses lick tubs containing calcium salts of fish oil fatty acids.
Forage treatment Item Alfalfa Brome Garrison SEMa
DM 89.9 89.9 87.3 CPb 15.3 9.4 5.5 NDFb 25.5 30.0 31.6 ADFb 21.8 20.1 21.7 IVDMD, % 59.4 63.6 54.4 Total fatty acids, mg/100 mg DM
1.37 0.92 0.81
Forage intake, kg/d, washout
8.45c 8.72c 6.22d 0.37
Forage intake, kg/d, d 0-21
7.90c 7.56c 4.78d 0.28
Tub intake, kg/d, 1.28 1.28 1.51 0.17 EPA intake, g/d 29.9 29.9 35.3 3.95 DHA intake, g/d 20.6 20.6 24.3 2.72 ADG, kg 0.75c 0.42d -0.40e 0.91 a n-9 heifers. b DM basis. c,d,e Means in a row with different superscripts are different (P ≤ 0.05).
Figure 1. Plasma concentrations of Eicosapentaenoic Acid (EPA; mg/dL) in heifers fed Alfalfa, Brome, or Garrison during free-choice access to molasses lick tubs containing calcium salts of fish oil fatty acids.
Figure 2. Plasma concentrations of Docosahexaenoic Acid (DHA; mg/dL) in heifers fed Alfalfa, Brome, or Garrison during free-choice access to molasses lick tubs containing calcium salts of fish oil fatty acids.
298
Proceedings, Western Section, American Society of Animal Science
Vol. 66, 2015
Evaluation of implant strategies in Angus-sired steers with high and low genetic potential for marbling and gain
D.N. Black*, B.W. Neville†, M.R. Crosswhite*, and C.R. Dahlen*1
*North Dakota State University, Fargo, ND, 58108 †Central Grasslands Research Extension Center, Streeter, ND, 58483
ABSTRACT: Sixty-nine Angus-sired steer calves (initial BW = 332.3 kg) were used to determine the effects of a moderate and aggressive implant strategy on steers of high and low genetic potential (GP) using the GeneMax (Zoetis, Florham Park, NJ) genetic profiling test. Steers were assigned to treatments in a 2 x 2 factorial design with factors of 1) composite GP score [high (HI), mean score of 86.5, n = 35 or low (LO), mean score of 25.3, n = 34]; and 2) implant strategy [aggressive (AGG) or moderate (MOD)]. All steers were given the same implant (Revalor-S, Merck Animal Health, Summit, NJ) with the AGG group implanted on d 0 and d 70 and the MOD group only on d 70. A high concentrate (84.5%) diet was fed ad-libitum, once daily. Ultrasound was used to measure body composition characteristics on d 0. Steers were harvested after 140 days on feed. On d 0, HI steers had greater (P < 0.001) percent intramuscular fat than LO steers. Over the entire 140 d feeding period, there were no differences (P ≥ 0.6) in BW, ADG, DMI, or G:F between GP groups; however AGG steers had greater (P = 0.03) ADG compared to MOD steers while still having similar (P ≥ 0.12) DMI and G:F. Marbling score tended (P = 0.06) to be impacted by a GP x implant strategy interaction (492.9, 538.3, 481.1, 463.7 for HIAGG, HIMOD, LOAGG, and LOMOD, respectively). No differences (P ≥ 0.70) were observed between GP groups for HCW, LM area, ribfat thickness, KPH, or yield grade. Steers in the MOD group had less (P = 0.003) ribfat thickness than AGG steers, but similar (P ≥ 0.14) HCW, marbling, LM area, KPH, and yield grade. Steers in the HI GP group were more likely (P = 0.03) to grade choice (100%) than LO steers (88%). Results of this study indicate that genetic potential tests, specifically GeneMax, may be indicative of marbling potential and quality grades. The overall quality grades observed indicates that it may be possible to manage cattle with poor genetic potential to achieve acceptable performance.
Key Words: ADG, beef steers, genetic potential, implants, management, marbling
INTRODUCTION
Hormone implants have been used since the 1950’s (Preston, 1999) in beef production to improve performance and lower the cost of production (Duckett et al., 1997; Wileman et al., 2009). A variety of implants are available, with varying potencies depending on their active ingredient and dosage (Montgomery et al., 2001). ______________________ 1Corresponding author: [email protected]
Elevated circulating concentrations of hormones and subsequent growth promotion occur soon after implant placement and decline as the implant dissolves (Reinhardt, 2007). To offset the decline in growth promotion, cattle can be placed on an aggressive implant regime whereby an additional implant can be applied to foster addition growth and feed efficiency (Samber et al., 1996; Parr et al., 2011). Unfortunately, aggressive implant strategies can results in decreased marbling scores compared with more moderate implant strategies (Samber et al., 1996; Duckett et al., 1997; Platter et al., 2003; Parr et al., 2011).
As our knowledge of the bovine genome expands, a larger variety of genetic tests have become available to predict an animal’s genetic potential to express economically important traits. Though DeVuyst et al. (2011) found a positive correlation between Igenity (Neogen, Lansing, MI) marbling markers and actual quality grade of feedlot steers, further evaluations of observed phenotype in animals with different genotype are needed. In addition, a paucity of information is available regarding the feedlot performance and carcass characteristics of cattle with varying genetic potential when exposed to different implant strategies. Perhaps the early indication of genetic potential for growth and marbling available via genetic testing can be paired with an optimal implant strategy to maximize feedlot profitability. This study was conducted to evaluate the effects of moderate and aggressive implant strategies in Angus-sired steers with varying genetic potentials for gain and marbling using the GeneMax test (Zoetis, Florham Park, NJ).
MATERIALS AND METHODS
All procedures were conducted within the guidelines and approval of the North Dakota State University Institutional Animal Care and Use Committee. Animals and Treatments
At the time of weaning blood samples were collected via jugular venipuncture from 114 Angus-sired steers originating from North Dakota State University’s Central Grasslands Research and Extension Center in Streeter, ND and submitted to Angus Genetics Inc (St. Joseph, MO) for determination of GeneMax score. GeneMax scores represent the genetic potential (GP) for post-weaning gain and marbling in Angus-based calves. Individual scores for gain and marbling (each reported in quintiles; 1 to 5) are used to calculate a composite score
299

ranging from 1 to 100, with 1 being the least and 100 being greatest GP.
Sixty nine steers (average age = 10 mo., initial BW = 332.3 kg), representing the greatest (HI, n = 35) and least (LO, n = 34) composite GP scores were selected from the original population and assigned to treatments in a 2×2 factorial arrangement with factors of GP and implant strategy (moderate, MOD or aggressive, AGG). Steers were paired according to composite GP and BW and pairs were assigned randomly to each of two implant treatments. The four treatment groups were as follows: 1) HI with AGG implant (HIAGG, n = 17), 2) HI with MOD implant (HIMOD, n = 18), 3) LO with an AGG implant (LOAGG, n = 18), and 4) LO with MOD implant (LOMOD, n = 16). Implants administered in all instances contained 120mg of trenbolone acetate (TBA) and 24mg of estradiol (E2) (Revalor-S, Merck Animal Health, Summit, NJ). Steers in the AGG group were implanted on d 0 and 70, whereas steers in the MOD group were only implanted on d 70.
Steers were fed individually using a Calan gate feeding system (American Calan, Northwood, NH) once daily at 0630 h and had continual access to water. The finishing diet was 85% concentrate, contained 1.25 MCal/kg NEg and 17.2% CP, and was fed ad libitum. Orts were collected weekly and analyzed for DM for determination of DMI. Start weight was the average of two consecutive days’ weights. Percentage intramuscular fat (IMF) was determined at the initiation of the experiment (d 0) using ultrasonography (Aloka 500V equipped with a 3.5-MHz, 17 cm linear array transducer, Wallingford, CT, Wall et al., 2004).
After 140 d on feed all steers were transported and processed in a commercial abattoir. After routine processing procedures, HCW was collected and carcasses chilled for 24 h (2 °C) before determining LM area, 12th rib fat depth (RF), yield grade (YG), quality grade, marbling number, and KPH. Final BW was calculated using HCW adjusted to a common dressing percent of 63.4%. All ADG and G:F calculations were made using the carcass-adjusted final weight. Statistical Analysis
The GLM procedure of SAS (SAS Inst., Inc., Cary, NC) was used to analyze all continuous data, whereas the GENMOD procedure was used for binomial data. The models contained GP group (HI or LO), implant strategy (MOD or AGG), and the respective interaction with steer being the experimental unit. Means were separated with the least significant difference procedure and were considered significant at P ≤ 0.05 and a tendency at P ≤ 0.10.
RESULTS AND DISCUSSION
Genetic Potential Scores
By design, composite GP scores for HI steers (86.5 ± 1.7) were greater (P < 0.001) than LO steers (25.3 ± 1.7). In addition, marbling score was greater (P < 0.001) for HI steers (3.7± 0.1) than LO steers (1.4 ± 0.1) and gain
scores were greater (P < 0.001) for HI steers (3.83 ± 0.2) than LO steers (2.88± 0.2). Ultrasound Intramuscular Fat
At the start of the experiment HI steers had a greater percentage IMF (P = 0.001) than LO steers (Table 1). To our knowledge there are no other reports of diverging IMF% being observed before steers of differing genetic potentials are placed onto finishing diets. Overall, 25% of steers had IMF ≥ 4% (the anticipated value needed to be considered for a choice carcass), with a greater proportion (P = 0.01) of steers in the HI group (36.8%) having IMF ≥ 4% compared with LO steers (11.8%). These observations support the concept that IMF deposition is a lifetime event (Bruns et al., 2004; Wall et al., 2004; Rhoades et al., 2009). Observation of differing IMF% between GP groups before being placed on feed may foreshadow potential differences in marbling at the conclusion of the finishing period. Feedlot Performance
No differences (P ≥ 0.60) were observed between GP groups in final BW, ADG, DMI, or G:F (Table 1) in spite of the HI steers having greater genetic potential for gain than LO steers (3.8 and 2.9 for HI and LO, respectively). DeVuyst et al. (2011) also failed to observe a phenotype effect in steer gain with different Igenity (Merial Ltd.) panel scores. Taken together, three possibilities exist; 1) genetic evaluations do not accurately separate cattle into distinct gain groups, 2) greater divergence in GP scores for gain are required to observe a phenotypic gain response, or 3) greater experimental power is required to observe a phenotypic gain response.
No differences (P ≥ 0.12) were observed in final BW, DMI, or G:F between MOD and AGG implant strategies. Guiroy et al. (2002) also did not observe a difference in feed efficiency between implant treatments when steers were given either one, delayed implant (Revalor-S) on d 90 or an implant on d 0 and 90. In the current study, steers in the AGG group had greater overall ADG (P = 0.03) than MOD steers, however this appears to be strictly a result of increased ADG during the first 70 d (data not shown) when MOD steers did not have the growth promoting benefits of an implant. The observed difference in ADG is similar to findings of Guiroy et al. (2002) who reported steers given 2 implants gained more per day than those given one delayed implant. Carcass Characteristics
No differences (P ≥ 0.28) were observed between GP groups in HCW, LM area, RF, KPH%, or YG. (Table 2). A greater proportion (P = 0.03) of steers in the HI group had choice carcasses (100%) compared with LO steers (87.8%). Interestingly, a tendency for an interaction (P ≤ 0.08) between GP and implant factors was present for marbling score and proportion of carcasses qualifying for the Certified Angus Beef (CAB) program (Table 3). Marbling score and % CAB were reduced by the AGG implant strategy in HI steers but the same effect was not present in LO steers. Previous research has reported a further reduction in marbling score when re-implanting or
300
using a more aggressive implant compared to more moderate regimens (Samber et al., 1996; Duckett et al., 1997; Platter et al., 2003). Duckett et al. (1997) reported a 2.5% reduction in marbling when implanting with a combination TBA/E2 implant rather than a single estrogen, and a 4.3% reduction when utilizing two combination implants compared to a single combination implant. DeVuyst et al. (2011) reported that greater Igenity marbling panel scores correlated with improved quality grades. Contrary to our results, Johnston and Graser (2010) did not find association between GeneSTAR (Zoetis) marbling markers and carcass marbling score. Results from the current study would indicate that cattle of differing GP may be managed differently to attain desirable quality grades. Steers with greater GP, based on GeneMax score, achieve greater marbling scores when implanted once compared to receiving two implants. Cattle of lesser GP can be given two implants to reap full benefits of an implants growth potential, without negatively impacting marbling scores.
Steers in the AGG group had thicker (P = 0.003) RF and greater (P = 0.003) yield grades than MOD steers and no differences (P ≥ 0.14) were observed in HCW, marbling, LM area, or KPH. Considerable variability exists in other reports of carcass characteristics of cattle managed under moderate and aggressive implant strategies (Duckett et al., 1997; Scaglia et al., 2004) The thicker RF seen in the AGG treatment is something not expected, as previous work reported that more aggressive implants result in thinner RF (Parr et al., 2011). In the current study all cattle were harvested on a common date. In a commercial setting where cattle are marketed at a certain degree of finish, however, the AGG steers would be market-ready before the MOD steers resulting in fewer overall days on feed. Perry et al. (1991) compared steers implanted with Revalor-S to non-implanted controls and found that when slaughtering on an individual basis, (when ultrasound predicted a small degree of marbling) implanted cattle had fewer DOF than non-implanted steers. After cattle have reached physiological maturity, caloric intake above maintenance requirements will be partitioned in the form of adipose tissue rather than protein (Andrews, 1958), at least partly explaining the greater amount of RF observed in the AGG implant group compared to the MOD implant group.
IMPLICATIONS
Results of this study indicate that commercially available predictions of genetic potential can be indicative of marbling potential and quality grades. Steers with greater genetic potential had greater % intramuscular fat before consuming high concentrate diets, and improved marbling scores and quality grade at slaughter compared with low genetic potential steers. The difference in intramuscular fat on d 0 between genetic potential groups indicates that a portion of marbling accretion occurs before steers are being fed high concentrate diets. The overall quality of carcasses in the current study indicates that producers may be able to adopt management strategies that result in acceptable performance of cattle
with poor genetic potential. More aggressive implant strategies can affect feedlot performance and carcass characteristics at different points throughout the feeding period, but carcass marbling in steers of greater genetic potential seems to be more sensitive to implant strategy than that of steers with lesser genetic potential for marbling.
LITERATURE CITED
Andrews, F. N. 1958. Fifty years of progress in animal physiology. J. Anim. Sci. 17:1064-1078.
Bruns, K. W., R. H. Pritchard, and D. L. Boggs. 2004. The relationships among body weight, body composition, and intramuscular fat content in steers. J. Anim. Sci. 82:1315-1322.
DeVuyst, J. T. Biermacher, J. L. Lusk, R. G. Mateescu, J. B. Blanton Jr., J. S. Swigert, B. J. Cook, and R. R. Reuter. 2011. Relationships between fed cattle traits and Igenity panel scores. J. Anim. Sci. 89:1260-1269.
Duckett, S. K., F. N. Owens, and J. G. Andrae. 1997. Effects of implants on performance and carcass traits of feedlot steers and heifers. Pages 63-82 in Impacts of Implants on Performance and Carcass Value of Beef Cattle Symposium. Oklahoma Agric. Exp. Stn. P-957. Tulsa, OK.
Guiroy, P. J., L. O. Tedeschi, D. G. Fox, and J. P. Hutcheson. 2002. The effects of implants strategy on finishing body weight of beef cattle. J. Anim. Sci. 80:1791-1800.
Johnston, D. J. and H.-U. Graser. 2010. Estimated gene frequencies of GeneSTAR markers and their size of effects on meat tenderness, marbling, and feed efficiency in temperate and tropical beef cattle breeds across a range of production systems. J. Anim. Sci. 88:1917-1935.
Montgomery, T. H., P. F. Dew, and M. S. Brown. 2001. Optimizing carcass value and the use of anabolic implants in beef cattle. J. Anim. Sci. 79:E296-E306.
Parr, S. L., K. Y. Chung, J. P. Hutcheson, W. T. Nichols, D. A. Yates, M. N. Streeter, R. S. Swingle, M. L. Galyean, and B. J. Johnson. 2011. Dose and release pattern of anabolic implants affects growth of finishing beef steers across days on feed. J. Anim. Sci. 89:863-873.
Perry, T. C., D. G. Fox, and D. H. Beermann. 1991. Effect of an implant of trenbolone acetate and estradiol on growth, feed efficiency, and carcass composition of Holstein and beef steers. J. Anim. Sci. 69:4696-4702.
Platter, W. J., J. D. Tatum, K. E. Belk, J. A. Scanga, and G. C. Smith. 2003. Effects of repetitive use of hormonal implants on beef carcass quality, tenderness, and consumer ratings of beef palatability. J. Anim. Sci. 81:984-996.
Preston, R. L. 1999. Hormone containing growth promoting implants in farmed livestock. Adv. Drug Deliv. Rev. 38:123-138.
Reinhardt, C. 2007. Growth-Pormotant Implant: Managing the Tools. Vet. Clin. Food Anim. 23:309-319.
Rhoades, R. D., C. H. Ponce, S. B. Smith, A. D. Herring, L. O. Tedeschi, D. K. Lunt, D. T. Dean, F. R. Ribeiro, C. W. Choi, D. G. Riley, and J. E. Sawyer. 2009. Evaluation of growth-based predictions of carcass fat and marbling at slaughter using ultrasound measurements. Professional Animal Scientist 25:434-442.
Samber, J. A., J. D. Tatum, M. I. Wray, W. T. Nichols, J. B. Morgan, and G. C. Smith. 1996. Implant program effects on performance and carcass quality of steer calves finished for 212 days. J. Anim. Sci. 74:1470-1476.
301
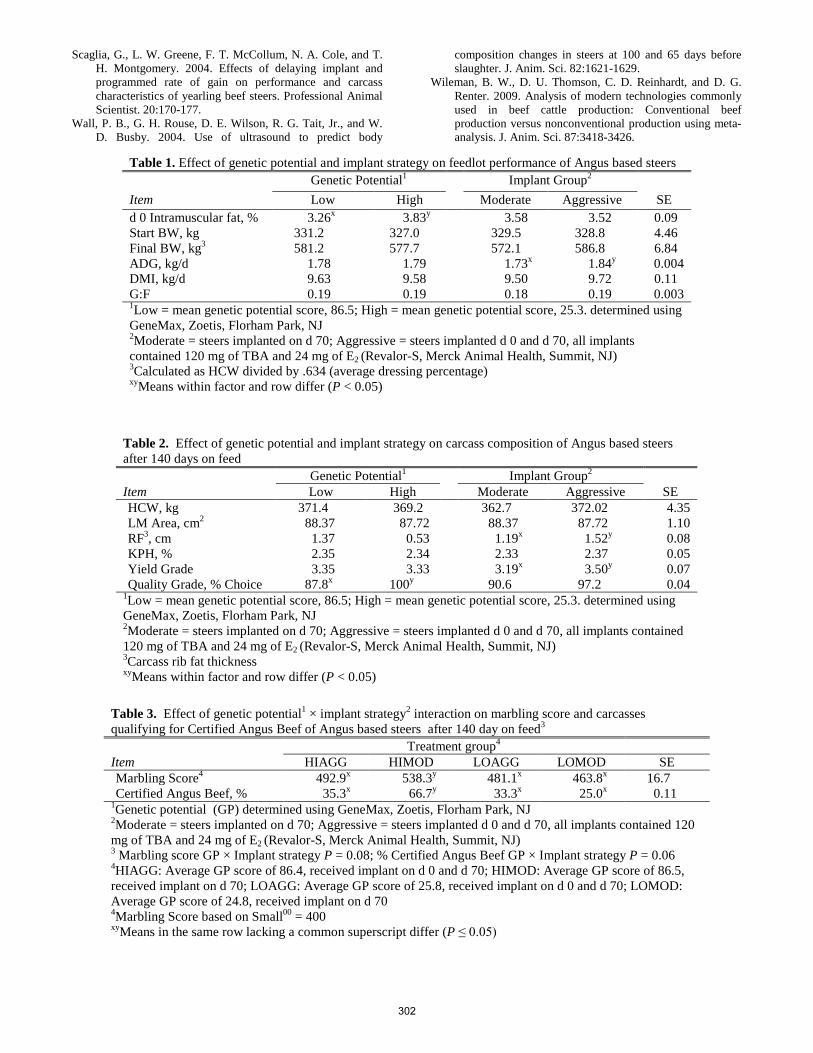
Scaglia, G., L. W. Greene, F. T. McCollum, N. A. Cole, and T. H. Montgomery. 2004. Effects of delaying implant and programmed rate of gain on performance and carcass characteristics of yearling beef steers. Professional Animal Scientist. 20:170-177.
Wall, P. B., G. H. Rouse, D. E. Wilson, R. G. Tait, Jr., and W. D. Busby. 2004. Use of ultrasound to predict body
composition changes in steers at 100 and 65 days before slaughter. J. Anim. Sci. 82:1621-1629.
Wileman, B. W., D. U. Thomson, C. D. Reinhardt, and D. G. Renter. 2009. Analysis of modern technologies commonly used in beef cattle production: Conventional beef production versus nonconventional production using meta-analysis. J. Anim. Sci. 87:3418-3426.
Table 1. Effect of genetic potential and implant strategy on feedlot performance of Angus based steers
Genetic Potential1 Implant Group2 Item Low High Moderate Aggressive SE d 0 Intramuscular fat, % 3.26x 3.83y 3.58 3.52 0.09 Start BW, kg 331.2 327.0 329.5 328.8 4.46 Final BW, kg3 581.2 577.7 572.1 586.8 6.84 ADG, kg/d 1.78 1.79 1.73x 1.84y 0.004 DMI, kg/d 9.63 9.58 9.50 9.72 0.11 G:F 0.19 0.19 0.18 0.19 0.003 1Low = mean genetic potential score, 86.5; High = mean genetic potential score, 25.3. determined using GeneMax, Zoetis, Florham Park, NJ 2Moderate = steers implanted on d 70; Aggressive = steers implanted d 0 and d 70, all implants contained 120 mg of TBA and 24 mg of E2 (Revalor-S, Merck Animal Health, Summit, NJ) 3Calculated as HCW divided by .634 (average dressing percentage) xyMeans within factor and row differ (P < 0.05)
Table 2. Effect of genetic potential and implant strategy on carcass composition of Angus based steers after 140 days on feed Genetic Potential1 Implant Group2 Item Low High Moderate Aggressive SE HCW, kg 371.4 369.2 362.7 372.02 4.35 LM Area, cm2 88.37 87.72 88.37 87.72 1.10 RF3, cm 1.37 0.53 1.19x 1.52y 0.08 KPH, % 2.35 2.34 2.33 2.37 0.05 Yield Grade 3.35 3.33 3.19x 3.50y 0.07 Quality Grade, % Choice 87.8x 100y 90.6 97.2 0.04
1Low = mean genetic potential score, 86.5; High = mean genetic potential score, 25.3. determined using GeneMax, Zoetis, Florham Park, NJ 2Moderate = steers implanted on d 70; Aggressive = steers implanted d 0 and d 70, all implants contained 120 mg of TBA and 24 mg of E2 (Revalor-S, Merck Animal Health, Summit, NJ) 3Carcass rib fat thickness xyMeans within factor and row differ (P < 0.05)
Table 3. Effect of genetic potential1 × implant strategy2 interaction on marbling score and carcasses qualifying for Certified Angus Beef of Angus based steers after 140 day on feed3 Treatment group4 Item HIAGG HIMOD LOAGG LOMOD SE Marbling Score4 492.9x 538.3y 481.1x 463.8x 16.7 Certified Angus Beef, % 35.3x 66.7y 33.3x 25.0x 0.11
1Genetic potential (GP) determined using GeneMax, Zoetis, Florham Park, NJ 2Moderate = steers implanted on d 70; Aggressive = steers implanted d 0 and d 70, all implants contained 120 mg of TBA and 24 mg of E2 (Revalor-S, Merck Animal Health, Summit, NJ) 3 Marbling score GP × Implant strategy P = 0.08; % Certified Angus Beef GP × Implant strategy P = 0.06 4HIAGG: Average GP score of 86.4, received implant on d 0 and d 70; HIMOD: Average GP score of 86.5, received implant on d 70; LOAGG: Average GP score of 25.8, received implant on d 0 and d 70; LOMOD: Average GP score of 24.8, received implant on d 70 4Marbling Score based on Small00 = 400 xyMeans in the same row lacking a common superscript differ (P ≤ 0.05)
302
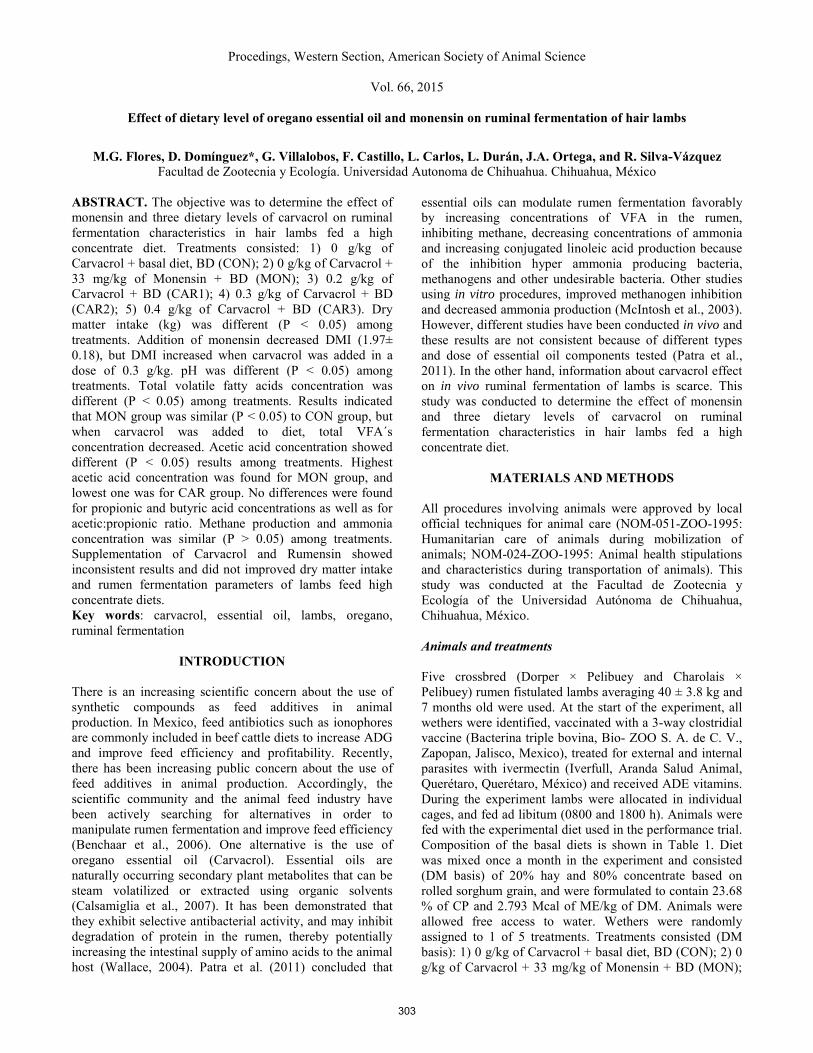
Procedings, Western Section, American Society of Animal Science
Vol. 66, 2015
Effect of dietary level of oregano essential oil and monensin on ruminal fermentation of hair lambs
M.G. Flores, D. Domínguez*, G. Villalobos, F. Castillo, L. Carlos, L. Durán, J.A. Ortega, and R. Silva-Vázquez
Facultad de Zootecnia y Ecología. Universidad Autonoma de Chihuahua. Chihuahua, México
ABSTRACT. The objective was to determine the effect of monensin and three dietary levels of carvacrol on ruminal fermentation characteristics in hair lambs fed a high concentrate diet. Treatments consisted: 1) 0 g/kg of Carvacrol + basal diet, BD (CON); 2) 0 g/kg of Carvacrol + 33 mg/kg of Monensin + BD (MON); 3) 0.2 g/kg of Carvacrol + BD (CAR1); 4) 0.3 g/kg of Carvacrol + BD (CAR2); 5) 0.4 g/kg of Carvacrol + BD (CAR3). Dry matter intake (kg) was different (P < 0.05) among treatments. Addition of monensin decreased DMI (1.97± 0.18), but DMI increased when carvacrol was added in a dose of 0.3 g/kg. pH was different (P < 0.05) among treatments. Total volatile fatty acids concentration was different (P < 0.05) among treatments. Results indicated that MON group was similar (P < 0.05) to CON group, but when carvacrol was added to diet, total VFA´s concentration decreased. Acetic acid concentration showed different (P < 0.05) results among treatments. Highest acetic acid concentration was found for MON group, and lowest one was for CAR group. No differences were found for propionic and butyric acid concentrations as well as for acetic:propionic ratio. Methane production and ammonia concentration was similar (P > 0.05) among treatments. Supplementation of Carvacrol and Rumensin showed inconsistent results and did not improved dry matter intake and rumen fermentation parameters of lambs feed high concentrate diets. Key words: carvacrol, essential oil, lambs, oregano, ruminal fermentation
INTRODUCTION
There is an increasing scientific concern about the use of synthetic compounds as feed additives in animal production. In Mexico, feed antibiotics such as ionophores are commonly included in beef cattle diets to increase ADG and improve feed efficiency and profitability. Recently, there has been increasing public concern about the use of feed additives in animal production. Accordingly, the scientific community and the animal feed industry have been actively searching for alternatives in order to manipulate rumen fermentation and improve feed efficiency (Benchaar et al., 2006). One alternative is the use of oregano essential oil (Carvacrol). Essential oils are naturally occurring secondary plant metabolites that can be steam volatilized or extracted using organic solvents (Calsamiglia et al., 2007). It has been demonstrated that they exhibit selective antibacterial activity, and may inhibit degradation of protein in the rumen, thereby potentially increasing the intestinal supply of amino acids to the animal host (Wallace, 2004). Patra et al. (2011) concluded that
essential oils can modulate rumen fermentation favorably by increasing concentrations of VFA in the rumen, inhibiting methane, decreasing concentrations of ammonia and increasing conjugated linoleic acid production because of the inhibition hyper ammonia producing bacteria, methanogens and other undesirable bacteria. Other studies using in vitro procedures, improved methanogen inhibition and decreased ammonia production (McIntosh et al., 2003). However, different studies have been conducted in vivo and these results are not consistent because of different types and dose of essential oil components tested (Patra et al., 2011). In the other hand, information about carvacrol effect on in vivo ruminal fermentation of lambs is scarce. This study was conducted to determine the effect of monensin and three dietary levels of carvacrol on ruminal fermentation characteristics in hair lambs fed a high concentrate diet.
MATERIALS AND METHODS
All procedures involving animals were approved by local official techniques for animal care (NOM-051-ZOO-1995: Humanitarian care of animals during mobilization of animals; NOM-024-ZOO-1995: Animal health stipulations and characteristics during transportation of animals). This study was conducted at the Facultad de Zootecnia y Ecología of the Universidad Autónoma de Chihuahua, Chihuahua, México. Animals and treatments Five crossbred (Dorper × Pelibuey and Charolais × Pelibuey) rumen fistulated lambs averaging 40 ± 3.8 kg and 7 months old were used. At the start of the experiment, all wethers were identified, vaccinated with a 3-way clostridial vaccine (Bacterina triple bovina, Bio- ZOO S. A. de C. V., Zapopan, Jalisco, Mexico), treated for external and internal parasites with ivermectin (Iverfull, Aranda Salud Animal, Querétaro, Querétaro, México) and received ADE vitamins. During the experiment lambs were allocated in individual cages, and fed ad libitum (0800 and 1800 h). Animals were fed with the experimental diet used in the performance trial. Composition of the basal diets is shown in Table 1. Diet was mixed once a month in the experiment and consisted (DM basis) of 20% hay and 80% concentrate based on rolled sorghum grain, and were formulated to contain 23.68 % of CP and 2.793 Mcal of ME/kg of DM. Animals were allowed free access to water. Wethers were randomly assigned to 1 of 5 treatments. Treatments consisted (DM basis): 1) 0 g/kg of Carvacrol + basal diet, BD (CON); 2) 0 g/kg of Carvacrol + 33 mg/kg of Monensin + BD (MON);
303

3) 0.2 g/kg of Carvacrol + BD (CAR1); 4) 0.3 g/kg of Carvacrol + BD (CAR2); 5) 0.4 g/kg of Carvacrol + BD (CAR3). Ruminal fermentation parameters Dry matter intake was recorded daily during the sampling period (17 d). During the first day of sampling period (day 10 of each period) a ruminal fluid sample (200 ml) was obtained (0, 1, 2, 4, 8, 12, 18, 24 h after morning fed). In the ruminal fluid sample, ruminal pH was measured immediately (UltraBASIC pH/mV Meter; Denver Instrument) and four subsamples (15 ml) of strained fluid were taken and acidified with 0.2 ml of sulphuric acid (50%) and frozen until laboratory analysis. Samples were later thawed in the refrigerator (12 h at 4° C), then centrifuged at 13800 × g for 20 min, and supernatant fraction was analyzed for ammoni (Broderick and Kang, 1980). Volatile fatty acids (acetate, propionate and butyrate) samples were prepared by centrifuging at 10000 × g during 10 min at 4° C. Supernatant fraction was filtered twice, and three subsamples were prepared with meta-phosphoric acid (5 ml of sample and 1 ml of meta-phosphoric acid) according to Galyean (1980). Volatile fatty acids were analyzed with a Varian capillary column CP-wax 58 (FFAP) (15m × 0.53 mm, 0.5 µm) by gas chromatography using a model Claurus 400 (Perkin Elmer). Methane production was estimated according to the method proposed by Wolin (1960). Statistical Analysis Data for DMI, ruminal pH, ammonia and VFA’s concentration and methane, were analyzed with a MIXED procedure of SAS (2002) in a latin square design 5 × 5. Model statement included the effect of treatment, period, repetition and hour (except for DMI) and the interaction treatment × hour.
RESULTS AND DISCUSION
Dry matter intake (kg) was different (P < 0.05) among treatments (Table 2). As expected, addition of monensin decreased DMI (1.97± 0.18), but DMI increased when carvacrol was added in a dose of 0.3 g/kg, although as carvacrol dose increased (CAR3), DMI decreased (Table 2). The increase in dry matter intake by feeding Carvacrol at dose of 0.3 g/kg of DM is not consistent with results reported in lambs and cattle experiments. Bampidis et al. (2005) found similar dry matter intake in growing lambs fed 144 to 288 mg of oregano oil/kg of DM vs. control group (1.06 and 1.09 vs. 1.12 kg DM, respectively). Similarly, Chaves et al. (2008) reported no differences in dry matter intake of growing lambs fed Carvacrol at dose of 0.2 g/kg of DM (1.22 and 1.28 kg DM). Benchaar et al. (2006) found similar dry matter intake in beef cattle fed 2 or 4 g/d of a mixture of essential oils, but feeding monensin (33 mg/ kg DM) reduced dry matter intake in 10%.
Results indicated that pH was different (P < 0.05) among treatments. Control group presented the highest pH (Table 2) and was similar to that presented by CAR1 group, but when carvacrol dose increased, ruminal pH decreased and was similar to MON group. Effects of Carvacrol on pH are level dependent. Rumen fluid pH was not affected by addition of low dose (3 to 30 mg/L) of Carvacrol (Busquet et al., 2006), but higher dose of Carvacrol (400 mg/L) increased pH (Benchaar et al., 2007), which has been associated with a reduction in total VFA concentration. The observed lower pH in rumen fluid by feeding Carvacrol at 0.3 g/kg DM could be partially explained by its potent antimicrobial activity, affecting in selective way growth of mixed ruminal bacteria. Others essential oils as Thymol, shows a selective inhibitory effect on growth of Selenomonas ruminantium but not on Streptococcus bovis at level of 90 mg/L, leading to a potential increase on lactic acid (Evans and Martin, 2000). Total volatile fatty acids concentration was different (P < 0.05) among treatments (Table 2). Results indicated that MON group was similar (P < 0.05) to CON group, but when carvacrol was added to diet, total VFA´s concentration decreased, and results were similar for all doses of carvacrol tested in the experiment. Lack of negative effects of essential oils at low dose on total concentration of volatile fatty acids has been reported (Patra et al., 2010), compared to higher levels which impaired microbial activity that decrease total concentration of volatile fatty acids (Kumar et al., 2009). The low concentration of total volatile fatty acids observed when Carvacrol was fed at 0.3 g/kg DM, compared to control and monensin treatments could be associated to a reduction on rumen fermentation, due to the antimicrobial effects of this essential oil (Fraser et al., 2007). Mc Ginn et al. (2004) did not find difference in total production of volatile fatty acids by feeding Holstein steers with monensin. Data for acetic acid concentration showed different (P < 0.05) results among treatments. Highest acetic acid concentration was found for MON group, and lowest one was for CAR treatments (Table 2). However, no difference was noted for CAR treatments and CON group. No differences were found for propionic and butyric acid concentrations as well for acetic:propionic ratio. The concentration of acetic, propionic and butyric acid, as well as acetate:propionate ratio found in our study are in agreement with other experiments. In vitro and continuous-culture systems studies (Benchaar et al., 2007; Chaves et al., 2009) indicate that rumen organic acids generally are unaffected by low dose of essential oils (Busquet et al., 2006). In vivo studies (Chaves et al., 2008) feeding lambs with Carvacrol at 0.2 g/kg DM showed similar results, since concentration of acetic, propionic, and butyric acid, as well as acetate:propionate ratio, was unaffected compared to control treatment (47.6 and 47.7%, 40.7 and 40.7%, 7.0 and 8.1%, 1.16 and 1.15, respectively). Methane production and ammonia concentration was similar (P > 0.05) among treatments. Methane and ammonia were not affected neither by carvacrol and monensin in this experiment. Inconsistent results of effects of essential oils on methane reduction have been reported in literature
304

(Beauchemin and Mc Ginn, 2006). Reduction in methane concentration by essential oils is dependent of high levels, which could impair rumen fermentation (Macheboeuf et al., 2008). Lack of effect on ammonia reduction can be explained considering that protein sources of the diet were soybean meal and corn gluten meal which have medium and low rate of rumen degradation and the inhibiting effects of essential oils on hyper ammonia producing bacteria are dependent of rapidly degraded rumen protein sources.
CONCLUSION
It was concluded that supplementation of Carvacrol and Rumensin showed inconsistent results and did not improve dry matter intake and rumen fermentation parameters of lambs feed high concentrate diets. Since ruminal fermentation response is highly related to dose of essential oil supplementation, further investigation with higher levels of Carvacrol in finishinging lambs fed with high concentrate diets is needed.
LITERATURE CITED
Bampidis, V. A., V. Christodoulou, P. Florou-Paneri, E. Chistaki, A. B. Spais, and P. S.Chatzopoulou. 2005. Effect of dietary dried oregano leaves supplementation on performance and carcass characteristics of growing lambs. Anim. Feed Sci. Technol 121: 285–295.
Beauchemin, K. A., and S. M. McGinn. 2006. Methane emissions form beef cattle: effects of fumaric acid, essential oil and canola. J. Anim. Sci. 84:1489-1496.
Benchaar, C., J. L. Duynisveld, and E. Charmley. 2006. Effects of monensin and increasing dose levels of a mixture of essential oil compounds on intake, digestion and growth performance of beef cattle. Can. J. Anim. Sci. 86: 91-96.
Benchaar, C., H. V. Petit, R. Berthiaume, D. R. Ouellet, J. Chiquette, P. Y. Chouinard. 2007. Effects of essential oils on digestion, ruminal fermentation, ruminal microbial populations, milk production and milk composition in dairy cows fed alfalfa silage or corn silage. J. Dairy Sci., 90: 886-897.
Broderick, G. A., and J. H. Kang. 1980. Automated simultaneous determination of ammonia and total amino acids in ruminal fluids and in vitro media. J. Dairy Sci. 63: 64-75.
Busquet, M., S. Calsamiglia, A. Ferret, and C. Kamel. 2006. Plant extracts affect in vitro rumen microbial fermentation. J. Dairy Sci. 89: 761–771.
Calsamiglia, S., M. Busquet, P. W. Cardozo, L. Castillejos, and A. Ferret. 2007. Essential oils as modifiers of rumen microbial fermentation. J. Dairy Sci. 90:2580-2595.
Chaves, A. V., I. Schei, Y. Wang, T. A. McAllister, and C. Benchaar. 2009. Effects of carvacrol and cinnamaldehyde on microbial fermentation when added to a barley- or corn-based diet in a
continuous-culture system. Can. J. Anim. Sci. 89:97-104
Chaves, A.V., K. Stanford, L. L. Gibson, T. A. McAllister, and C. Benchaar. 2008. Effects of carvacrol and cinnamaldehyde on intake, rumen fermentation, growth performance, and carcass characteristics of growing lambs. Anim. Feed Sci. Technol. 145: 396–408.
Evans, J. D., and S. A. Martin. 2000. Effects of thymol on ruminal microorganisms. Curr. Microbiology. 41:336-340.
Fraser, G. R., A. V. Chaves, Y. Wang, T. A. McAllister, K. A. Beauchemin, and C. Benchaar. 2007. Assesment of the effects of cinnamon leaf oil on rumen microbial fermentation using two continuous-culture system. J. Dairy Sci. 90:2315-2328.
Galyean, M. L. 1980. Laboratory procedures in animal nutrition research. Department on animal and food sciences. Texas Tech University, Lubbock, TX. USA.
Kumar, R., D. N. Kamra, N. Agrawal, and L. C.Chaudhary. 2009. Effect of eucalyptus (Eucalyptus globules) oil on in vitro methanogenesis and fermentation of fed with buffalo rumen liquor. Anim. Nutr. Feed Technol. 9:237-243.
Macheboeuf, D., D. P. Morgavi, Y. Pappon, J. L. Mousset, and M. Arturo-Schaan. 2008. Dose response effects of essential oils on in vitro fermentation activity on the rumen microbial population. Anim. Feed Sci. Technol. 145:335-350.
Mc Ginn, S. M, K. A. Beauchemin, T. Coates, and D. Colombato. 2004. Methane emissions for beef cattle: effects of monensin, sunflower oil, enzymes, yeast, and fumaric acid. J. Anim. Sci. 82:3346-3356.
McIntosh, F. M., P. Williams, R. Losa, R. J. Wallace, D. A. Beever, and C. J. Newbold. 2003. Effects of essential oils on ruminal microorganisms and their protein metabolism. Appl. Environ. Microbiol. 69:5011-5014.
Norma Oficial Mexicana NOM-024-ZOO-1995, Especificaciones y características zoosanitarias para el transporte de animales, sus productos y subproductos, productos químicos, farmacéuticos, biológicos y alimenticios para uso en animales o consumo por éstos. Publicada en el Diario Oficial de la Federación el 16 de Octubre de 1995.
Norma Oficial Mexicana NOM-051-ZOO-1995, Norma oficial para trato humanitario en la movilización de animales. Publicada en el Diario Oficial de la Federación el 23 de Marzo de 1998.
Patra, A. K. 2011. Effects of essential oils on rumen fermentation, microbial ecology and ruminant production. Asian J. Anim. Vet. Adv. 6 (5): 416-418.
SAS Institute. 2002. SAS User’s guide. SAS Institute Inc., Cary. NC.
305
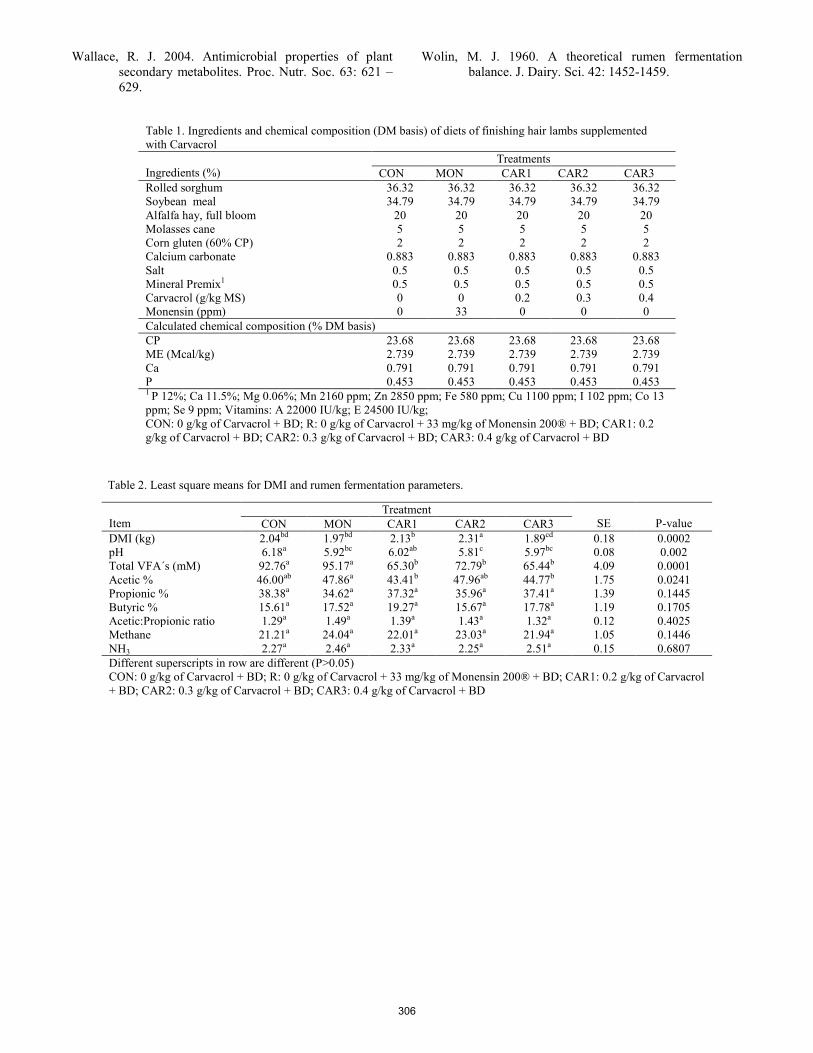
Wallace, R. J. 2004. Antimicrobial properties of plant secondary metabolites. Proc. Nutr. Soc. 63: 621 – 629.
Wolin, M. J. 1960. A theoretical rumen fermentation balance. J. Dairy. Sci. 42: 1452-1459.
Table 1. Ingredients and chemical composition (DM basis) of diets of finishing hair lambs supplemented with Carvacrol Ingredients (%)
Treatments CON MON CAR1 CAR2 CAR3
Rolled sorghum 36.32 36.32 36.32 36.32 36.32 Soybean meal 34.79 34.79 34.79 34.79 34.79 Alfalfa hay, full bloom 20 20 20 20 20 Molasses cane 5 5 5 5 5 Corn gluten (60% CP) 2 2 2 2 2 Calcium carbonate 0.883 0.883 0.883 0.883 0.883 Salt 0.5 0.5 0.5 0.5 0.5 Mineral Premix1 0.5 0.5 0.5 0.5 0.5 Carvacrol (g/kg MS) 0 0 0.2 0.3 0.4 Monensin (ppm) 0 33 0 0 0 Calculated chemical composition (% DM basis) CP 23.68 23.68 23.68 23.68 23.68 ME (Mcal/kg) 2.739 2.739 2.739 2.739 2.739 Ca 0.791 0.791 0.791 0.791 0.791 P 0.453 0.453 0.453 0.453 0.453 1 P 12%; Ca 11.5%; Mg 0.06%; Mn 2160 ppm; Zn 2850 ppm; Fe 580 ppm; Cu 1100 ppm; I 102 ppm; Co 13 ppm; Se 9 ppm; Vitamins: A 22000 IU/kg; E 24500 IU/kg; CON: 0 g/kg of Carvacrol + BD; R: 0 g/kg of Carvacrol + 33 mg/kg of Monensin 200® + BD; CAR1: 0.2 g/kg of Carvacrol + BD; CAR2: 0.3 g/kg of Carvacrol + BD; CAR3: 0.4 g/kg of Carvacrol + BD
Table 2. Least square means for DMI and rumen fermentation parameters.
Item
Treatment SE
P-value CON MON CAR1 CAR2 CAR3
DMI (kg) 2.04bd 1.97bd 2.13b 2.31a 1.89cd 0.18 0.0002 pH 6.18a 5.92bc 6.02ab 5.81c 5.97bc 0.08 0.002 Total VFA´s (mM) 92.76a 95.17a 65.30b 72.79b 65.44b 4.09 0.0001 Acetic % 46.00ab 47.86a 43.41b 47.96ab 44.77b 1.75 0.0241 Propionic % 38.38a 34.62a 37.32a 35.96a 37.41a 1.39 0.1445 Butyric % 15.61a 17.52a 19.27a 15.67a 17.78a 1.19 0.1705 Acetic:Propionic ratio 1.29a 1.49a 1.39a 1.43a 1.32a 0.12 0.4025 Methane 21.21a 24.04a 22.01a 23.03a 21.94a 1.05 0.1446 NH3 2.27a 2.46a 2.33a 2.25a 2.51a 0.15 0.6807 Different superscripts in row are different (P>0.05) CON: 0 g/kg of Carvacrol + BD; R: 0 g/kg of Carvacrol + 33 mg/kg of Monensin 200® + BD; CAR1: 0.2 g/kg of Carvacrol + BD; CAR2: 0.3 g/kg of Carvacrol + BD; CAR3: 0.4 g/kg of Carvacrol + BD
306
Proceedings, Western section, American Society of Animal science
Vol. 66, 2015
Effect of ferulic acid supplementation on animal performance of preconditioning calves
Flores Campos, J. P., G. Villalobos, D. Domínguez, R. A. Loya-Rodríguez, J. A. Ortega-Gutiérrez, and F. Castillo*. Facultad de Zootecnia y Ecología. Universidad Autónoma de Chihuahua. Chihuahua, México 31453.
*Corresponding author: [email protected]. ABSTRACT. The objective of this study was to evaluate the effect of ferulic acid on animal performance in preconditioning calves. Forty calves (Charolais × Angus, and Angus × Hereford) were used (10 heifers and 30 calves, averaging 7 mo old and 160 ± 15.6 kg of initial BW). Animals were housed in pairs (outdoors; 4.5 × 4.5 m) thus forming 20 pens. Then the twenty pens were allocated at random to one of the two dietary treatments. Thus, there were a total of 10 pens each containing two calves per treatment, and the experimental design was a complete random design. Treatments consisted: 1) no ferulic acid + basal diet, Control (0 ppm/kg of BW; CON); and 2) ferulic acid (Ácido ferúlico, Laboratorios Minkab, S. A. de C. V., Guadalajara, Jalisco, México) + basal diet (7 ppm/kg of BW; FA). Body weight was recorded initially and subsequently at 14 d intervals for a total 56 d of trial. Dry matter intake was recorded daily and analyzed in 14-d intervals. Gain efficiency was calculated for each period. Data was analyzed as a complete randomized design with repeated measures on time using the Mixed procedure of SAS. For ADG (kg/d) no differences were found (P > 0.05) among treatments (CON: 0.89 ± 0.10; FA: 0.96 ± 0.10). Dry matter intake (kg) was not different (P > 0.05) among treatments (CON: 6.33 ± 0.17; FA: 6.18 ± 0.17). Since AGD and DMI were similar, gain efficiency did not differ among treatments (CON: 9.22 ± 2.47; FA: 7.67 ± 2.53). In conclusion, ferulic acid supplementation did not improve ADG, DMI and GE ratio of calves receiving preconditioning diet. Keywords: calves, ferulic acid, preconditioning
INTRODUCTION An important problem of the Mexican cow-calf system is its low weaning weight. Generally, calves are weaned in the fall and sold with no preconditioning programs that affect profitability of cow-calf operations (Villalobos et al., 2007). Appropriate nutritional management during preconditioning is important on BW and profitability (St. Louis et al., 2003; Waggoner et al., 2005), health status (Holland et al., 2010), and to introduce calves to starch – containing diets (Waggoner et al., 2005). New natural alternatives are necessary to increase animal performance during preconditioning. Ferulic acid (FA) is a hydroxycinnamic acid classified as a phenolic compound, which exists mainly in cell walls of plants, cereal grains, and fruits (Hernanz et al., 2001). Ferulic acid is characterized as bioactive compound that provides antioxidant properties for animals (Gladine et al., 2007; Roy et al., 2014) and humans (Manach et al., 2004; Ou
and Kwok, 2004). Recent studies reported that also acts as a growth promoter in beef cattle (González-Rios et al., 2013) and pigs (Herrera et al., 2011). In fact, compared with other natural antioxidant, this metabolite has proved to be more effective to prevent lipid and protein oxidation (Rose et al., 2010). In this sense, considering the beneficial properties of FA, some studies have suggested using it as dietary additive in the feeding of domestic animals to improve productive traits (Kroon and Williamson, 1999; Karami et al., 2010). However, the greatest amount of information on use of free FA has been generated from laboratory animals. Currently, no data is available on the influence of ferulic acid on growth performance of beef cattle. The objective of this study was to evaluate the effect of ferulic acid on performance of preconditioning calves. Such data will be relevant to practical aspects of management of calves before the feedlot receiving diets.
MATERIALS AND METHODS All procedures involving animals were approved by local official techniques for animal care (NOM-051-ZOO-1995: Humanitarian care of animals during mobilization of animals; NOM-024-ZOO-1995: Animal health stipulations and characteristics during transportation of animals). This study was conducted at the Facultad de Zootecnia y Ecología of the Universidad Autónoma de Chihuahua, Chihuahua city, México. Animals and Treatments Forty calves (Charolais × Angus, and Angus × Hereford) were used (10 heifers and 30 calves, averaging 7 mo old and 160 ± 15.6 kg of initial BW). At the beginning of the experiment, all calves were identified, vaccinated with a 3 way clostridial vaccine (Bacterina triple bovina, Bio- ZOO S. A. de C. V., Zapopan, Jalisco, Mexico), treated for external and internal parasites with ivermectin (Iverfull, Aranda Salud Animal, Querétaro, Querétaro, México) and received vitamin A, D and E supplement. Calves were sorted by gender and assigned within gender to 1 of 2 treatments. Animals were housed in pairs (outdoors; 4.5 × 4.5 m) thus forming 20 pens. Then, the twenty pens were allocated at random to one of the two dietary treatments. Thus, there were a total of 10 pens each containing two calves per treatment, and the experimental design was a complete random design. Composition of the basal diet is shown in Table 1. Diet was mixed weekly, and consisted of 38.14 % corn stover
307
and 61.86% concentrate based on ground corn grain. Animals were gradually adjusted to a 61.86% concentrate diet before the trial started. Treatments consisted: 1) no ferulic acid + basal diet, Control (0 ppm/kg of BW; CON); and 2) ferulic acid (Ácido ferúlico, Laboratorios Minkab, S. A. de C. V., Guadalajara, Jalisco, México) + basal diet (7 ppm/kg of BW; FA). Diet was formulated to contain 16.0 % CP and 1.533 Mcal of ME/kg DM. The diet was offered ad libitum with the food being refreshed at 0700 and 1700 h daily; calves were allowed free access to water. During the experiment, 1 calve from FA group was removed from the study because of respiratory disease that was not related to treatment. Animal Performance Measurements Body weight was recorded initially and subsequently at 14 d intervals for a total 56 d length of trial. Feed and refusal (10%) samples were taken once weekly and composite samples were formed over 14-d intervals. Dry matter intake was recorded daily and analyzed in 14-d intervals. Gain efficiency was calculated for each period. Statistical Analysis Data of DMI, BW, ADG and GE were analyzed as a complete randomized design with repeated measures on time using the Mixed procedure of SAS (2002).
RESULTS AND DISCUSSION Dry matter intake (kg) was not different (P > 0.05) among treatments (CON: 6.33 ± 0.17; FA: 6.18 ± 0.17). Similar results (P = .59) were reported by Macías-Cruz et al. (2014) when fed high concentrate diets to ewe lambs supplemented with free FA at 0 and 0.3 g/d (1.12 vs. 1.10 kg/d, respectively). However, Soberon et al. (2012) found a quadratic effect (P < 0.01) on DMI when fed a high forage diet to ram lambs supplemented with 0, 3, 6 and 9 g/d of free FA (1.25, 1.41, 1.41 and 1.29 kg/d, respectively. The effect of phenolic compounds on DMI is not clear. Feed intake has been reported to be depressed by addition of phenolics compounds in the diet of laboratory animals, due to their toxic activity (Jung et al., 1983). Also, in vitro studies (Chesson et al., 1986) showed impairment on cellulose digestion due to the inhibitory effect of FA on rumen microbial growth. In contrast (Jung et al., 1988) reported no negative effects of FA on rumen digestion, due to the rumen microbial detoxification activity. In this sense, massive amounts supplemented of free FA (6 g/d) in lambs, did not affect DMI in Soberon experiment, which in fact allowed for the higher DMI (P = 0.03). In this study the free FA intake was approximately 1.4 g/d, which is a low dose compared to 3 or 6 g of free FA supplemented in the Soberon study. Body weight and ADG (kg/d) were unaffected (P > 0.05) by treatments (CON: 208.9 ± 4.33 kg and 0.89 ± 0.10 kg/d; FA: 214.8 ± 4.44 and 0.96 ± 0.10). In agreement, Soberon et al. (2012) found no differences in body weight and ADG of lambs fed 0, 3, 6 and 9 g/d of free FA during the 4 week length of study. Similarly, Macías-Cruz et al. (2014) found similar final BW and ADG in the whole
experiment of ewe lambs supplemented with 0 and 0.3 g/d of free FA (35.52 vs. 34.28 kg, and 0.20 vs. 0.17 kg/d, respectively). The suggested anabolic effects of FA are unclear. Preliminary studies (González-Ríos et al., 2013) reported growth promoter effects of free FA on beef cattle, similar to that of zilpaterol hydrochloride. However, results of Macías-Cruz et al. (2010) did not support this contention, speculating that may be the detoxification capacity of rumen microbios to phenolic compounds is limited under long period of supplementation, impairing rumen digestion and ADG. In this sense, length of the present study (56 d) was longer than Macías-Cruz et al. (2014) experiment (34 d). Due to the results in ADG and DMI, feed:gain ratio did not differ (P > 0.05) among treatments (CON: 9.22 ± 2.47; FA: 7.67 ± 2.53). Research conducted with lambs (Macías-Cruz et al. 2014) support this findings, since supplementation of 0 and 0.3 g/d had similar gain:feed ratio (0.18 and 0.16, respectively).
CONCLUSIONS Free ferulic acid supplementation did not improve DMI, BW, ADG and F:G ratio of preconditioning calves. Further research is granted to extend knowledge of the potential benefits of antioxidant properties of this phenolic compound on animal performance.
LITERATURE CITED
Chesson, A., C.S. Stewart, and R.J. Wallace. 1982. Influence of plant phenolic acids on growth and cellulolytic activity of rumen bacteria. Appl. Environ. Microbiol. 44:597-603.
Gladine, C., E. Rock, C. Morand, D. Bauchart, and D. Durand. 2007. Bioavailability and antioxidant capacity of plant extracts rich in polyphenol, given as a single acute dose, in sheep made highly susceptible to lipoperoxidation. Br. J. Nutr. 98:691-701.
Gonzalez-Rios, H., D. A. Gil, and A. Berrondo. 2013. Ferulic acid as feed supplement in beef cattle to promote animal growth and improve the meat quality of the carcass and the meat. US. Patent published in February 14, 2013, with number US20130041036A1. Httpwww.faqs.org/patents/app/20130041036. (Accessed May 2, 2014.)
Hernanz, D., V. Nunez, A.I. Sancho, C. B. Faulds, G. Williamson, B. Bartolome, and C. Gomez-Cordoves. 2001. Hydroxycinnamic acids and Ferulic acid dehydrodimers in barley and processed barley. J. Agric. Food Chem. 49:4884-4888.
Herrera, R., M. L. Alejo, and A.J. Assaf. 2011. Methods to accelerate muscle development, decrease fat deposits, and enhance feeding efficiency in pigs. U.S. patent published in February 24, 2011, with number 20110046224. www.faqs.org/patents/app/20110046224 (accessed may 7, 2014).
308
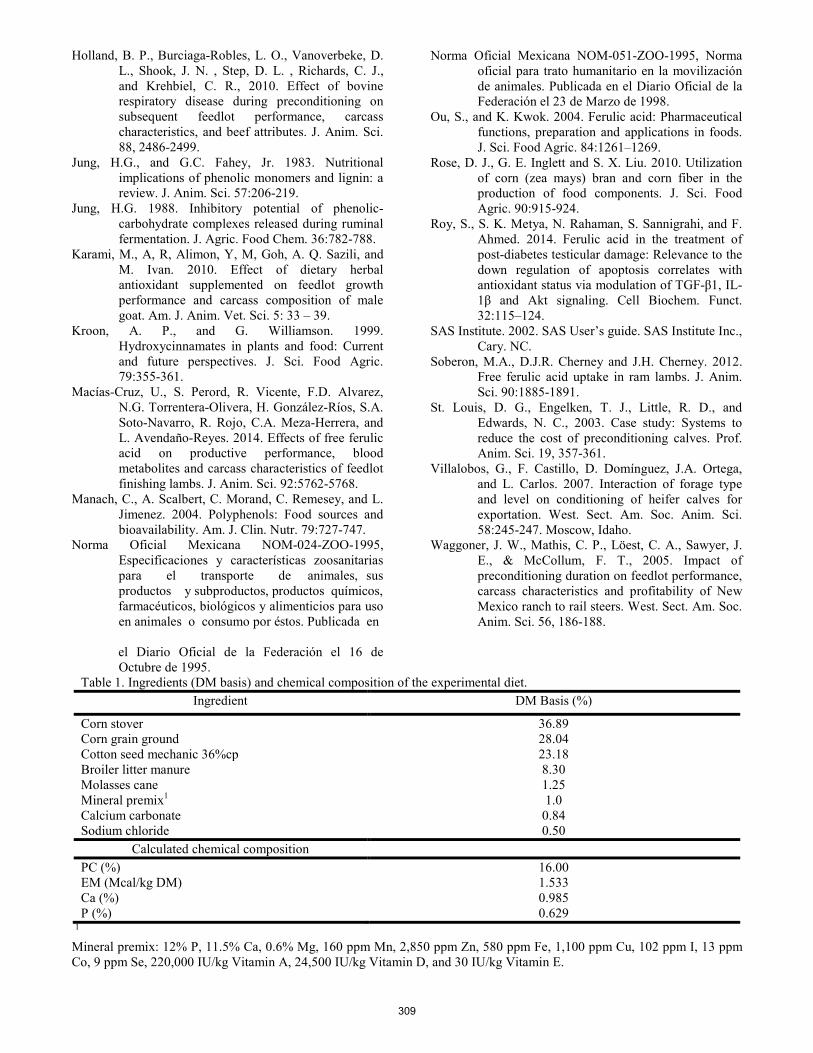
Holland, B. P., Burciaga-Robles, L. O., Vanoverbeke, D. L., Shook, J. N. , Step, D. L. , Richards, C. J., and Krehbiel, C. R., 2010. Effect of bovine respiratory disease during preconditioning on subsequent feedlot performance, carcass characteristics, and beef attributes. J. Anim. Sci. 88, 2486-2499.
Jung, H.G., and G.C. Fahey, Jr. 1983. Nutritional implications of phenolic monomers and lignin: a review. J. Anim. Sci. 57:206-219.
Jung, H.G. 1988. Inhibitory potential of phenolic-carbohydrate complexes released during ruminal fermentation. J. Agric. Food Chem. 36:782-788.
Karami, M., A, R, Alimon, Y, M, Goh, A. Q. Sazili, and M. Ivan. 2010. Effect of dietary herbal antioxidant supplemented on feedlot growth performance and carcass composition of male goat. Am. J. Anim. Vet. Sci. 5: 33 – 39.
Kroon, A. P., and G. Williamson. 1999. Hydroxycinnamates in plants and food: Current and future perspectives. J. Sci. Food Agric. 79:355-361.
Macías-Cruz, U., S. Perord, R. Vicente, F.D. Alvarez, N.G. Torrentera-Olivera, H. González-Ríos, S.A. Soto-Navarro, R. Rojo, C.A. Meza-Herrera, and L. Avendaño-Reyes. 2014. Effects of free ferulic acid on productive performance, blood metabolites and carcass characteristics of feedlot finishing lambs. J. Anim. Sci. 92:5762-5768.
Manach, C., A. Scalbert, C. Morand, C. Remesey, and L. Jimenez. 2004. Polyphenols: Food sources and bioavailability. Am. J. Clin. Nutr. 79:727-747.
Norma Oficial Mexicana NOM-024-ZOO-1995, Especificaciones y características zoosanitarias para el transporte de animales, sus productos y subproductos, productos químicos,
farmacéuticos, biológicos y alimenticios para uso en animales o consumo por éstos. Publicada en
el Diario Oficial de la Federación el 16 de
Octubre de 1995.
Norma Oficial Mexicana NOM-051-ZOO-1995, Norma oficial para trato humanitario en la movilización de animales. Publicada en el Diario Oficial de la Federación el 23 de Marzo de 1998.
Ou, S., and K. Kwok. 2004. Ferulic acid: Pharmaceutical functions, preparation and applications in foods. J. Sci. Food Agric. 84:1261–1269.
Rose, D. J., G. E. Inglett and S. X. Liu. 2010. Utilization of corn (zea mays) bran and corn fiber in the production of food components. J. Sci. Food Agric. 90:915-924.
Roy, S., S. K. Metya, N. Rahaman, S. Sannigrahi, and F. Ahmed. 2014. Ferulic acid in the treatment of post-diabetes testicular damage: Relevance to the down regulation of apoptosis correlates with antioxidant status via modulation of TGF-β1, IL-1β and Akt signaling. Cell Biochem. Funct. 32:115–124.
SAS Institute. 2002. SAS User’s guide. SAS Institute Inc., Cary. NC.
Soberon, M.A., D.J.R. Cherney and J.H. Cherney. 2012. Free ferulic acid uptake in ram lambs. J. Anim. Sci. 90:1885-1891.
St. Louis, D. G., Engelken, T. J., Little, R. D., and Edwards, N. C., 2003. Case study: Systems to reduce the cost of preconditioning calves. Prof. Anim. Sci. 19, 357-361.
Villalobos, G., F. Castillo, D. Domínguez, J.A. Ortega, and L. Carlos. 2007. Interaction of forage type and level on conditioning of heifer calves for exportation. West. Sect. Am. Soc. Anim. Sci. 58:245-247. Moscow, Idaho.
Waggoner, J. W., Mathis, C. P., Löest, C. A., Sawyer, J. E., & McCollum, F. T., 2005. Impact of preconditioning duration on feedlot performance, carcass characteristics and profitability of New Mexico ranch to rail steers. West. Sect. Am. Soc. Anim. Sci. 56, 186-188.
Table 1. Ingredients (DM basis) and chemical composition of the experimental diet. Ingredient DM Basis (%)
Corn stover 36.89 Corn grain ground 28.04 Cotton seed mechanic 36%cp 23.18 Broiler litter manure 8.30 Molasses cane 1.25 Mineral premix1 1.0 Calcium carbonate 0.84 Sodium chloride 0.50
Calculated chemical composition PC (%) 16.00 EM (Mcal/kg DM) 1.533 Ca (%) 0.985 P (%) 0.629
1
Mineral premix: 12% P, 11.5% Ca, 0.6% Mg, 160 ppm Mn, 2,850 ppm Zn, 580 ppm Fe, 1,100 ppm Cu, 102 ppm I, 13 ppm Co, 9 ppm Se, 220,000 IU/kg Vitamin A, 24,500 IU/kg Vitamin D, and 30 IU/kg Vitamin E.
309
Proceedings, Western section, American Society of Animal science
Vol. 66, 2015 Dry matter intake, ruminal pH and plasma glucose of beef heifers fed finishing feedlot diet and ferulic acid
L. F. Soto-Casas, I. García-Roque, D. Domínguez, G. Villalobos, J. A. Ortega-Gutiérrez, and F. Castillo*.
Facultad de Zootecnia y Ecología. Universidad Autónoma de Chihuahua. Chihuahua, México 31453. *Corresponding author: [email protected].
ABSTRACT. The objective of this study was to determine the effects of ferulic acid on DMI, ruminal pH and glucose plasma concentrations of heifers fed a finishing feedlot diet. Ten crossbred (Charolais × Angus and Angus × Hereford) rumen fistulated heifers averaging 494.8 ± 59.99 kg were used. During the experiment heifers were allocated in individual pens, and fed ad libitum (0800 and 1700 h). Heifers were randomly assigned to 1 of 5 treatments. Treatments consisted: 1) no ferulic acid + basal diet, Control (0 ppm/kg of BW; CON); 2) ferulic acid (3.5 ppm/kg of BW; Ácido ferúlico, Laboratorios Minkab, S. A. de C. V., Guadalajara, Jalisco, México) + basal diet (FA3.5); 3) ferulic acid (7 ppm/kg of BW) + basal diet (FA7); 4) ferulic acid (10.5 ppm/kg of BW) + basal diet (FA10.5); and 5) ferulic acid (14 ppm/kg of BW) + basal diet (FA14). Dry matter intake was evaluated daily. During the first day of sampling period a ruminal fluid sample (200 ml) was obtained and ruminal pH was measured. Four blood samples in each heifer per period were collected by jugular punction, and glucose concentration in plasma was measured. Results for DMI were different (P < 0.05) among treatments, data showed a quadratic tendency being FA7 treatment the highest (12.41 ± 0.61). Ruminal pH was different (P < 0.05) among treatments. Plasma glucose concentration was not different (P > 0.05) among treatments. It was concluded that AF7 treatment is recommended for its use in beef cattle when is fed with finishing feedlot diets. Keywords: ferulic acid, heifers, ruminal fermentation
INTRODUCTION Ferulic acid (FA) is a hydroxycinnamic acid classified as a phenolic compound, which exists mainly in cell walls of plants, cereal grains, and fruits (Hernanz et al., 2001). Bound ferulic acid is a phenolic acid that inhibits ruminal fiber digestion because of crosslink of lignin to potential digestible hemicelluloses, forming a largely indigestible lignin complex (Jung and Allen, 1995), rendering it unavailable for microbial digestion. Some microbiota such as Fibrobacter succinogenes and Butrivibrio fibrosolvens have feruloyl esterases capable of cleaving the ester linkages (Besle et al., 1995), but the process occurs inefficiently in vivo (Krause et al., 2003). Feruloyl esterase activity is greatly enhanced by the addition of xylanases, pectinases, cellulases, and other cell wall degrading enzymes (Mathew and Abraham, 2004). Researchers have released FA using multienzymatic combinations in vitro and in incubations from various feedstuffs (Faulds et al., 2002; Yu et al., 2002). Moreover,
often 10% and sometimes more than 50% of fed lignin is solubilized and may be absorbed in ruminants (Singleton and Kratzer, 1969), maybe because of low molecular weight of phenolic compounds. Recent studies reported that FA also acts as a growth promoter in beef cattle (Gonzalez Ríos et al., 2013). In this sense, considering the beneficial properties of FA, some studies have suggested using it as dietary additive in the feeding of domestic animals to improve productive traits (Kroon and Williamson, 1999; Karami et al., 2010). Gladine et al. (2007) indicated that rumen microorganisms did not inhibit the bioavailability and antioxidant properties of polyphenols, finding an increase in the total antioxidant status of sheep treated with dietary phenols. Direct effect of ferulic acid of rumen fermentation could have important implications but have not been documented in cattle. The objective of this study was to determine the effects of ferulic acid on DMI, ruminal pH and glucose plasma concentrations of heifers fed finishing feedlot diet.
MATERIALS AND METHODS All procedures involving animals were approved by local official techniques for animal care (NOM-051-ZOO-1995: Humanitarian care of animals during mobilization of animals; NOM-024-ZOO-1995: Animal health stipulations and characteristics during transportation of animals). This study was conducted at the Facultad de Zootecnia y Ecología of the Universidad Autónoma de Chihuahua, Chihuahua city, Mexico. Animals and treatments Ten crossbred (Charolais × Angus and Angus × Hereford) rumen fistulated heifers averaging 494.8 ± 59.99 kg were used. At the beginning of the experiment, all heifers were identified, vaccinated with a 3 way clostridial vaccine (Bacterina triple bovina, Bio- ZOO S. A. de C. V., Zapopan, Jalisco, Mexico), treated for external and internal parasites with ivermectin (Iverfull, Aranda Salud Animal, Querétaro, Querétaro, México) and received ADE vitamins. During the experiment heifers were allocated in individual pens, and fed ad libitum with the feed being refreshed at 0800 and 1700 h. Heifers were allowed free access to water. Composition of the basal diet is shown in Table 1. Diet was mixed once a month and consisted of 20% wheat straw, and 80 % of concentrate based on steam flaked corn grain, and was formulated to contain 9.7 % CP and 2.884 Mcal of ME/kg of DM. Heifers were randomly
310

assigned to 1 of 5 treatments, and the experimental design was a latin square repeated in line. Within treatment 2 animals were randomly assigned to 1 of 10 pens. Each treatment was applied on two experimental units per period. This procedure was performed in five periods of 17 d (10 d for adaptation to the diet, and 7 d for sampling). By this way, all the experimental units received the five ferulic acid concentrations (one per period). Treatments consisted (DM basis): 1) no ferulic acid + basal diet, Control (0 ppm/kg of BW; CON); 2) ferulic acid (3.5 ppm/kg of BW; Ácido ferúlico, Laboratorios Minkab, S. A. de C. V., Guadalajara, Jalisco, México) + basal diet (FA3.5); 3) ferulic acid (7 ppm/kg of BW) + basal diet (FA7); 4) ferulic acid (10.5 ppm/kg of BW) + basal diet (FA10.5); and 5) ferulic acid (14 ppm/kg of BW) + basal diet (FA14). Sampling Dry matter intake was evaluated daily during the sampling period (seven days). During the first day of sampling period (day 10 of each period) a ruminal fluid sample (200 ml) was obtained (0, 1, 2, 4, 8, 12, 18, 24 h after morning fed). In the ruminal fluid sample, ruminal pH was measured immediately (UltraBASIC pH/mV Meter; Denver Instrument). Four blood samples (-60, 0 120, y 330 m post feeding) were collected by jugular punction in order to determine glucose concentration in plasma (Cooke et al., 2012). Statistical analysis Data for DMI, ruminal pH, and glucose concentration in plasma were analyzed with a MIXED procedure of SAS (2002) in a latin square design 5 × 5 repeated in line. Model statement included the effect of treatment, period, repetition and hour (except for DMI) and the interaction treatment × hour. Column within repetition was considered as random effect. When significant (P < 0.05) F-statistics were noted, means were separated using linear and quadratic contrast.
RESULTS AND DISCUSSION
Results for DMI were different (P < 0.05) among treatments (Table 2). Data showed a quadratic tendency being FA7 treatment the highest (12.41 ± 0.61). Similar results have been reported by Soberón et al. (2012), they found a quadratic effect (P < 0.01) on DMI when fed a high forage diet to ram lambs supplemented with 0, 3, 6 and 9 g/d of free FA (1.25, 1.41, 1.41 and 1.29 kg/d, respectively. However, Macías-Cruz et al. (2014) did not find differences when fed high concentrate diets to ewe lambs supplemented with free FA at 0 and 0.3 g/d (1.12 vs. 1.10 kg/d, respectively). Feed intake had been reported to be depressed by addition of phenolics compounds in the diet of laboratory animals, due to their moderate toxic activity (Jung et al., 1983). The effects of phenolics compounds on DMI are not clear. By other hand, in vitro studies (Chesson et al., 1986) showed impairment on cellulose digestion due to the inhibitory effect of FA on rumen microbial growth. In contrast (Jung et al., 1988) reported no negative effects of
FA on rumen digestion, due to the rumen microbial detoxification activity. Ruminal pH was different (P < 0.05) among treatments. Ferulic acid present differences when compared with CON group. Higher doses of ferulic acid showed an increased in pH when is supplemented to beef heifers. Probably, ferulic acid may have a positive effect on ruminal fermentation when bovine are fed high concentrate diets because its antioxidant properties that are related with the microorganisms. To our knowledge, few papers have addressed the contribution of pH and substrate of fermentation to the changes in fiber digestion. Mould and Ørskov (1983) and Mould et al. (1983) concluded that pH was a major determinant of the reduction of fiber and OM degradation, with a pH threshold around 6.0. The levels used in this study did not decreased ruminal pH to 6. This is an important consideration for include ferulic acid to finishing feedlot diets. Plasma glucose concentration was not different (P > 0.05) among treatments. This suggest that acetate:propionate ratio is not affected by ferulic acid supplementation.
IMPLICATIONS
According to these results, AF7 treatment is recommended for its use in beef cattle feeding when finishing feedlot diets are provided. Further investigation is necessary in order to understand the impact that ferulic acid has on ruminal fermentation, kinetics and microflora. Appreciation is expressed to CONACyT for its economical support and to Laboratorios MINKAB for their technical and economical support. LITERATURE CITED Besle, J. M., J. P. Jouany, and A. Cornu. 1995.
Transformations of structural phenylpropanoids during cell wall digestion. FEMS Microbiol. Rev. 16:33–52.
Chesson, A., C.S. Stewart, and R.J. Wallace. 1982. Influence of plant phenolic acids on growth and cellulolytic activity of rumen bacteria. Appl. Environ. Microbiol. 44:597-603.
Cooke, R. F., B. I. Capellozza, M. M. Reis, D. W. Bonhert, and J. L. M. Vasconcelos. 2012. Plasma progesterone concentration in beef heifers receiving exogenous glucose, insulin, or bovine somatotropin. J. Anim. Sci. 90: 3266 - 3273
Faulds, C., A. Sancho, and B. Bartolome. 2002. Mono and dimeric ferulic acid release from brewer’s spent grain by fungal feruloyl esterases. Appl. Microbiol. Biotechnol. 60:489–494.
Gladine, C., E. Rock, C. Morand, D. Baucharat, and D. Durand. 2007. Bioavailability and antioxidant capacity of plant extracts rich in polyphenol, given as a single acute dose, in sheep made highly susceptible to lipoperoxidation. Br. J. Nutr. 98:691-701.
311

Gonzalez-Rios, H., D. A. Gil, and A. Berrondo. 2013. Ferulic acid as feed suplement in beef cattle to promote animal growth and improve the meat quality of the carcass and the meat. US. Patent published in February 14, 2013, with number US20130041036A1. Httpwww.faqs.org/patents/app/20130041036. (Accessed May 2, 2014.)
Hernanz, D., V. Nunez, A.I. Sancho, C. B. Faulds, G. Williamson, B. Bartolome, and C. Gomez-Cordoves.2001. Hydroxycinnamic acids and Ferulic acid dehydrodimers in barley and processed barley. J. Agric. Food Chem. 49:4884-4888.
Jung, H. G., and M. S. Allen. 1995. Characteristics of plant cell walls affecting intake and digestibility of forages by ruminants. J. Anim. Sci. 73:2774–2790.
Jung, H.G. 1988. Inhibitory potential of phenolic-carbohydrate complexes released during ruminal fermentation. J. Agric. Food Chem. 36:782-788.
Jung, H.G., and G.C. Fahey, Jr. 1983. Nutritional implications of phenolic monomers and lignin: a review. J. Anim. Sci. 57:206-219.
Karami, M., A, R, Alimon, Y, M, Goh, A. Q. Sazili, and M. Ivan. 2010. Effect of dietary herbal antioxidant supplemented on feedlot growth performance and carcass composition of male goat. Am. J. Anim. Vet. Sci. 5: 33 – 39.
Krause, D.O., S.E. Denman, R.I. Mackie, M. Morrison, A.L. Rae, G.T. Attwood, and C.S. McSweeney. 2003. Opportunities to improve fiber degradation in the rumen: microbiology, ecology, and genomics. FEMS Microbiol. Rev. 27:663–693.
Kroon, A. P., and G. Williamson. 1999. Hydroxycinnamates in plants and food: Current and future perspectives. J. Sci. Food Agric. 79:355-361
Macías-Cruz, U., S. Perord, R. Vicente, F.D. Alvarez, N.G. Torrentera-Olivera, H. González-Ríos, S.A. Soto-Navarro, R. Rojo, C.A. Meza-Herrera, and L. Avendaño-Reyes. 2014. Effects of free ferulic acid on productive performance, blood
metabolites and carcass characteristics of feedlot finishing lambs. J. Anim. Sci. 92:5762-5768.
Mathew, S., and T. E. Abraham. 2004. Ferulic acid: An anti- oxidant found naturally in plant cell walls and feruloyl esterases involved in its release and their applications. Crit. Rev. Biotechnol. 24:59–83.
Norma Oficial Mexicana NOM-024-ZOO-1995, Especificaciones y características zoosanitarias para el transporte de animales, sus productos y subproductos, productos químicos, farmacéuticos, biológicos y alimenticios para uso en animales o consumo por éstos. Publicada en el Diario Oficial de la Federación el 16 de Octubre de 1995.
Norma Oficial Mexicana NOM-051-ZOO-1995, Norma oficial para trato humanitario en la movilización de animales. Publicada en el Diario Oficial de la Federación el 23 de Marzo de 1998.
Singleton, V.L., and F.H. Kratzer. 1969. Toxicity and related physiological activity of phenolic substances of plant origin. J. Agric. Food Chem. 17:497–512.
Soberon, M.A., D.J.R. Cherney and J.H. Cherney. 2012. Free ferulic acid uptake in ram lambs. J. Anim. Sci. 90:1885-1891.
Yu, P., D. D. Maenz, J. J. McKinnon, V. J. Racz, and D. A. Christensen. 2002. Release of ferulic acid from oat hulls by Aspergillus ferulic acid esterase and Trichoderma xylanase. J. Agric. Food Chem. 50:1625–1630.
Mould, F. L., and E. R. Ørskov. 1983. Manipulation of rumen fluid pH and its influence on cellulolysis in sacco, dry matter degradation and the ruminal microflora of sheep offered either hay or concentrate. Anim. Feed Sci. Technol. 10:1–14.
Mould, F. L., E. R. Ørskov, and S. O. Mann. 1983. Associative effects of mixed feeds. I. Effect of type and level of supplementation and the influence of the rumen fluid pH on cellulolysis in vivo and dry matter digestion on various roughages. Anim. Feed Sci. Technol. 10:15–30.
312
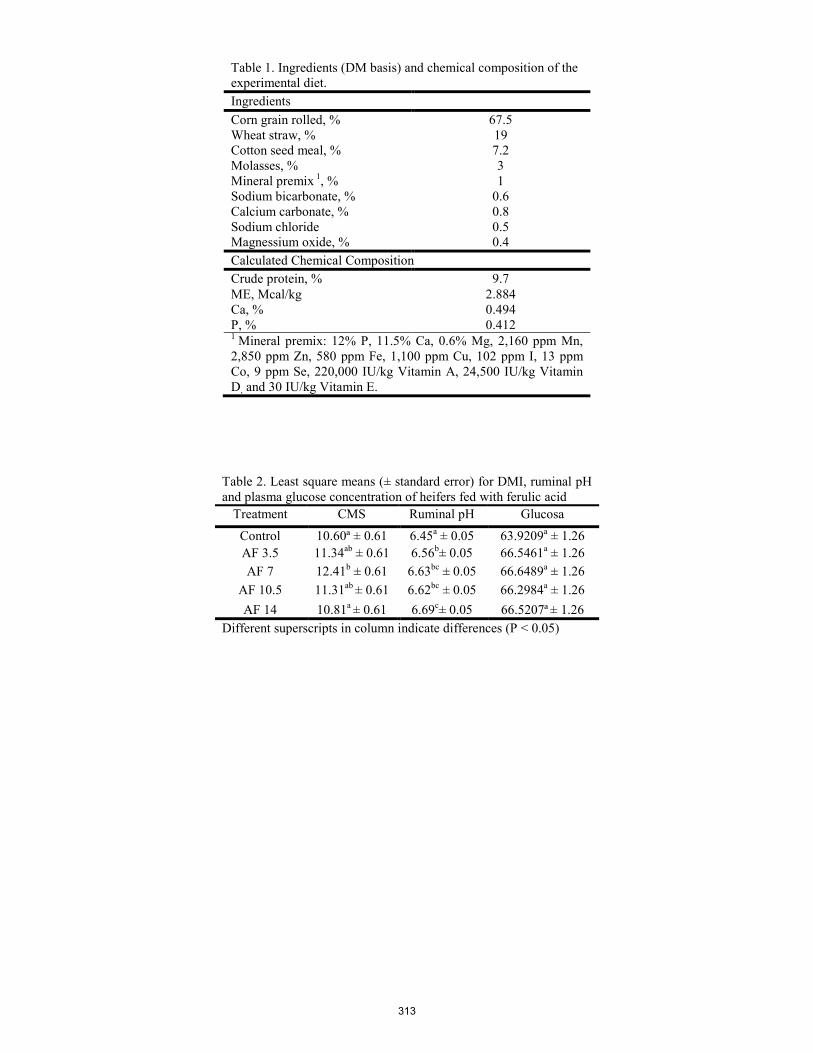
Table 1. Ingredients (DM basis) and chemical composition of the experimental diet. Ingredients Corn grain rolled, % 67.5 Wheat straw, % 19 Cotton seed meal, % 7.2 Molasses, % 3 Mineral premix 1, % 1 Sodium bicarbonate, % 0.6 Calcium carbonate, % Sodium chloride Magnessium oxide, %
0.8 0.5 0.4
Calculated Chemical Composition Crude protein, % 9.7 ME, Mcal/kg 2.884 Ca, % 0.494 P, % 0.412 1 Mineral premix: 12% P, 11.5% Ca, 0.6% Mg, 2,160 ppm Mn, 2,850 ppm Zn, 580 ppm Fe, 1,100 ppm Cu, 102 ppm I, 13 ppm Co, 9 ppm Se, 220,000 IU/kg Vitamin A, 24,500 IU/kg Vitamin D, and 30 IU/kg Vitamin E.
Table 2. Least square means (± standard error) for DMI, ruminal pH and plasma glucose concentration of heifers fed with ferulic acid
Treatment CMS Ruminal pH Glucosa
Control 10.60ª ± 0.61 6.45a ± 0.05 63.9209a ± 1.26 AF 3.5 11.34ab ± 0.61 6.56b± 0.05 66.5461a ± 1.26 AF 7 12.41b ± 0.61 6.63bc ± 0.05 66.6489a ± 1.26
AF 10.5 11.31ab ± 0.61 6.62bc ± 0.05 66.2984a ± 1.26 AF 14 10.81a ± 0.61 6.69c± 0.05 66.5207ª ± 1.26
Different superscripts in column indicate differences (P < 0.05)
313
Proceedings, Western Section, American Society of Animal Science
Vol. 66, 2015
Effect of processing conditions on nutrient disappearance of cold-pressed and hexane-extracted |camelina and carinata meals in vitro
A. Sackey1, E. E. Grings1, D. W. Brake1 and K. Muthukumarappan2
1Department of Animal Science, South Dakota State University 2Department of Agricultural and Biosystems Engineering, South Dakota State University
ABSTRACT: A series of studies were designed to determine an appropriate modification to the Tilley and Terry in vitro procedure that would generate adequate material for multiple analyses on residue of cold-pressed camelina meal without compromising IVDMD. The modified procedure was used to evaluate OM and CP disappearance of camelina and carinata meal. Meals were either cold-pressed or solvent-extracted and manufactured from 6 different processing conditions within each extraction method. In Exp. 1, cold-pressed camelina meal was evaluated for IVDMD using 35, 70, 105, 140, 175 or 210 mL of pepsin solution. In Exp. 2, sample weights were 4, 5 or 6 g of camelina meal incubated for 48 h with mixtures of buffer: ruminal fluid with a volume of 100:50 mL or 150:50 mL with urea (13.32 mM) or without urea and then in 140 mL of pepsin solution. The third experiment evaluated DM disappearance from 2.2, 3, 4 or 5 g of camelina meal using a mixture of buffer and ruminal fluid (150:50 mL) with urea (13.32 mM) or without urea and followed by 140 mL of pepsin solution. When using a 250 mL incubation vessel, fermentation was not maximized when a sample weight greater than 4 g was used. A sample weight less than 4 g did not provide adequate material for multiple analyses on residue. Data gathered from the three experiments suggest that incubating 4 g of cold-pressed camelina meal in a 150:50 mL mixture of buffer: ruminal fluid either with urea (13.32 mM) or without urea followed by 140 mL of pepsin solution was the optimal in vitro modification procedure generating enough residue for use in further nutritional analyses without compromising IVDMD. Using the modified Tilley and Terry in vitro procedure, cold-pressed and solvent-extracted camelina and carinata meal manufactured using 6 different processing conditions were evaluated to determine the effect of processing condition on OM and CP disappearance. We detected no difference (P = 0.17) in CP disappearance of camelina meal manufactured under cold-pressed extraction. In contrast, OM disappearance from cold-pressed camelina and carinata meals manufactured with different processing conditions was different (P < 0.01). Similarly, OM and CP disappearance from solvent extracted oilseed meals manufactured with different processing conditions were different (P < 0.01). Our data suggests that hexane extraction produced meals with greater OM disappearance
than cold-pressing, but there were interactions by oilseed type. Keywords: Camelina meal, Carinata meal, Oilseed processing, In vitro disappearance
INTRODUCTION
Camelina and carinata meals are byproducts of lipid extraction from camelina and carinata seeds. Camelina meal has been investigated previously and has been found to be economically efficient and a good sources of CP and polyunsaturated fatty acids (Bonjean and Le Goffic, 1999; Hurtaud and Peyraud, 2007). Carinata meal may have similar nutritional qualities but is not as widely used because of greater glucosinolate content compared to camelina meal. Knowledge of how nutrient value to ruminants differs among camelina and carinata meal manufactured with different processing conditions is limited. We evaluated OM and CP disappearance of camelina and carinata meal manufactured with different processing conditions using a modified 2-phase procedure of Tilley and Terry (1963). Our first objective was to produce adequate material for multiple analyses on in vitro residue without compromising IVDMD by testing the procedure with increased sample size, varying volume of pepsin solution and ruminal fluid to buffer ratio (with or without urea) on final residue weight . Our second objective was to use the modified Tilley and Terry in vitro procedure to evaluate meals manufactured from cold-pressed and solvent-extracted camelina and carinata seeds under 6 different processing conditions for OM and CP disappearance.
MATERIALS AND METHODS
Sample preparation
In all experiments, steers were fed 5.6 kg of bromegrass hay two times per day. To determine the in vitro procedure that would generate adequate residue for multiple analyses without compromising nutrient disappearance, ruminal fluid was collected from 1 steer 4 h after feeding and after 2 h without water and transferred into pre-warmed thermos flasks. Evacuated ruminal contents were hand-squeezed and the associated fluid was blended for 1 min and strained
314

through 4 layers of cheesecloth. Filtered ruminal fluid was maintained at 39°C under a constant flow of CO2. Prepared McDougall’s buffer with urea (13.32 mM) or without urea was similarly degassed and maintained at 39°C for use. In all the experiments, after samples were inoculated with ruminal fluid and buffer, 250 mL in vitro vessels were flushed with CO2, capped with lids equipped with a vent to allow release of gases, and incubated for 48 h. After 48 h of incubation, in vitro vessels were removed from the incubator and placed in an ice bath to stop fermentation, followed by centrifugation at 4°C for 15 min at 2,000 x g, after which supernatant was suctioned off. Pepsin solution prepared from 1.98 g of 1:10000 pepsin dissolved in 100 mL 1 N HCl and topped to 1 L with deionized water was added to each vessel and incubated for 48 h at 39°C. In vitro tubes were again centrifuged for 15 min at 2,000 x g at 4°C and supernatant suctioned off. Samples were lyophilized and weighed to determine DM disappearance.
Exp. 1
To determine the volume of pepsin solution to be used, 21 mL of ruminal fluid was transferred into 18 in vitro vessels, each containing 2.2 g cold-pressed camelina meal and 84 mL of degassed buffer without urea. After the initial incubation and centrifugation, vessels were filled with either 35, 70, 105, 140, 175 or 210 mL of pepsin solution and treated as previously described.
Exp. 2
To determine effect of amount of sample, the addition of urea in buffer, and the ratio of buffer to ruminal fluid on IVDMD, 4, 5 and 6 g of camelina meal were evaluated for DM disappearance. Replicates were incubated in a mixture of buffer: ruminal fluid volume of 100:50 mL or 150:50 mL with (13.32 mM) or without urea. After the initial incubation, all vessels were filled with 140 mL of pepsin solution (1:10000) and treated as previously described.
Exp. 3
To determine the combination of sample weight and McDougall’s buffer with or without urea that would generate enough residue for use in further nutritional analyses, 2.2, 3, 4 and 5 g of camelina meal in triplicate were evaluated for DM disappearance. Samples were initially incubated in either a mixture of buffer: ruminal fluid volume of 150:50 mL with or without urea followed by 140 mL of pepsin solution (1:10000).
Exp 4
To address our second objective, meals from cold-pressed and hexane-extracted camelina and carinata obtained from the same source and manufactured using 6 different processing conditions were analyzed for OM and CP disappearance. Cold-pressed extraction conditions evaluated for each meal varied by die nozzle size and screw speed: 0.56 cm at 15 Hz, 0.56 cm at 20 Hz, 0.56 cm at 25 Hz, 0.64 cm at 15 Hz, 0.64 cm at 20 Hz and 0.64 cm at 25 Hz, respectively. Hexane extraction conditions evaluated varied
by temperature and duration of extraction: 80°C for 90 min, 100°C for 65 min, 100°C for 90 min, 120°C for 40 min, 120°C for 65 min and 120°C for 90 min, respectively. Ruminal fluid (50 mL) from 2 steers accustomed to being feed hay twice daily was processed as previously described and transferred into separate 250 mL in vitro vessels in duplicate, each containing 4 g of sample and 150 mL of degassed buffer without urea. Dry matter and OM disappearance was determined after 48 h of incubation in McDougall’s buffer and ruminal fluid, followed by a 48 h pepsin digestion. Lyophilized residue was also analyzed for N by combustion (AOAC, 1990) and CP disappearance was calculated (N × 6.25).
Statistical analysis
Data from Exp. 1 were analyzed using the general liner model procedure of SAS (SAS Inst. Inc., Cary, NC) using a completely random design to test for the effect of pepsin volume. Data from Exp. 2 and 3 were analyzed with the Mixed model procedure of SAS using a model that included weight of sample, buffer: ruminal fluid ratio, inclusion or exclusion of urea and the interaction among them (Exp. 2); or weight of sample, inclusion or exclusion of urea and the interaction among them (Exp. 3). In vitro vessel was considered random. Differences were declared at P ≤ 0.05.
Data from Exp. 4 were analyzed using the Mixed procedure of SAS. Initially, effects of processing condition on in vitro OM and CP disappearance were analyzed with a model that included oilseed and processing condition and the interactions between them. A second analysis was conducted separately for each extraction method using a model that included oilseed and processing conditions. Steer was considered random and differences were considered significant at P ≤ 0.05.
RESULTS AND DISCUSSION
Exp. 1
Incubation with 35 mL of pepsin solution resulted in the least IVDMD (P < 0.01; Table 1). We observed no differences (P = 0.30) in IVDMD of sample incubated in 70, 140 and 175 mL of pepsin solution. Incubation under 70 mL also resulted in IVDMD that did not differ (P = 0.09) from that observed under 105 and 140 mL of pepsin incubation. Incubation under 210 mL resulted in in vitro DM disappearance that only compared to 105 mL of pepsin incubation. Exp.2
There was no effect of relative volume of McDougall’s buffer to ruminal fluid on IVDMD (P = 0.68) (Table 2). However, we observed a tendency for amount of material (P = 0.06) to cause an effect. Sample weight interacted with buffer condition such that the IVDMD was greater (P = 0.06) for the 4 g sample size compared with the 5 or 6 g when urea was added. However, no differences among sample sizes were observed when no urea was added.
315
Exp. 3
We observed differences (P = 0.01) in IVDMD due to sample weight. Buffer (with or without urea) incubation, however, did not affect (P = 0.41) IVDMD. Incubation of 5 g of sample without urea in buffer resulted in the least IVDMD. On average, addition of urea produced lesser DM disappearance than inclusion of urea (67.3 vs 68.7 %; SEM 0.44%; P < 0.01). Even though we observed no difference (P < 0.01) in IVDMD using 2.2 or 3 g (with or without urea) and 4 g (without urea), the procedure did not generate enough residue for use in further nutritional analyses when 2.2 and 3g were used. In addition, IVOMD was decreased when more than 4 g was used, therefore 4 g incubated in 150 mL of buffer without urea and 50 mL of ruminal fluid was chosen for further analysis of the oilseed meals. Exp. 4
Hexane extraction processing conditions produced the greatest CP and OM disappearance in both oilseed types (P < 0.05). Carinata meal had greater CP and OM disappearance than camelina meal (P < 0.05). However, we observed an interaction (P < 0.05) between oilseeds and processing condition for both OM and CP disappearance.
Hexane extraction processing conditions
Differences in CP and OM disappearance in both oilseed types due to hexane extraction processing conditions were noted (Table 3). We observed differences (P = 0.01) in OM disappearance of camelina meal between hexane extraction processing condition of 120°C for 65 min and 120°C 90 min, but the 120°C for 65 min processing condition was not different from any other processing conditions.
Hexane extraction performed under 80°C for 90 min produced camelina meal with the greatest CP disappearance (P = 0.13), whereas a temperature of 120°C for 65 min resulted in meals with the least CP disappearance. Hexane extraction performed under temperature and time combinations of 100°C for 65 min, 100°C for 90 min, 120°C for 40 min and 120°C for 90 min, however, did not differ in CP disappearance. We noted no difference in OM disappearance of hexane extracted carinata meal between 80°C for 90 min and 100°C for 65 min. Similarly, processing condition at 100°C for 90 min resulted in OM disappearance of hexane extracted carinata meal that only compares with processing at 120°C for 65 min. Similar OM disappearance of hexane extracted carinata meal was observed between processing at 120°C for 90 min and 120°C for 40 min.
Crude protein disappearance of carinata meal manufactured under a hexane extraction processing temperature of 100°C for 90 min was significantly greater than all other hexane processing conditions except processing at 120°C for 65 min. Disappearance of CP of carinata meals manufactured at a temperature of 120°C for 65 min also did not differ from that produced at 100°C for
65 min and 120°C for 40 min. No difference in the CP disappearance of hexane extracted carinata meals was observed among meals manufactured under 80°C for 90 min, 100°C for 65 min, 120°C for 40 min and 120°C for 90 min.
Cold-press processing conditions
Organic matter disappearance of cold pressed camelina meal observed under a die nozzle of 0.56 cm and screw speed of 20 Hz was significantly greater than (P = 0.10) that of 0.64 cm die nozzle and either a 20 or 25 Hz screw speed (P ≤ 0.01); Table 4). No significant differences in the OM disappearance of cold-pressed camelina meal were, however, detected when processing conditions of die nozzle and screw size of 0.56 cm at 15 Hz, 0.56 cm at 20 Hz, 0.56 cm at 25Hz and 0.64 cm at 15 Hz, respectively were used. A die nozzle of 0.64 cm with a screw speed of 25 Hz resulted in the lowest OM disappearance of cold pressed camelina meal. No significant differences in CP disappearance among cold-pressed camelina meals were noted.
Cold-pressed extraction performed under a die nozzle and screw size of 0.56 cm at 15 Hz resulted in the greatest (P = 0.01) OM disappearance of carinata meal, whereas a die nozzle and screw speed of 0.56 cm at 20 Hz or 0.64 cm at either or 25 Hz and resulted in meals with the lowest OM disappearance. No differences in OM disappearance of carinata meals manufactured under cold-pressed processing conditions of 0.56 cm at 25 Hz and 0.64 cm at 15 Hz were noted.
Crude protein disappearance was not different when cold-pressed carinata meals were manufactured under a die nozzle and screw speed of 0.56 cm at 20 Hz or 0.64 cm at 25 Hz. Observed CP disappearance among these 2 processing conditions, however, differed (P = 0.01) from 0.56 cm at 15 Hz. Crude protein disappearance of carinata meals manufactured under a cold-pressed processing conditions of 0.56 cm at 15 Hz, and 0.56 cm at 25 Hz and 0.64 cm at 15 Hz were not different. Observed CP disappearance of carinata meal processed under a processing condition of 0.56 cm at 15 Hz was, however, significantly greater (P = 0.04) than carinata meal manufactured under a processing conditions of 0.64 cm at 20 Hz. Implications
Our data suggest that initially incubating 4 g of sample in a mixture of buffer: ruminal fluid volume of 150:50 mL either with urea (13.32 mM) or without urea and followed by digestion in 140 mL pepsin is the optimal in vitro modification that generates enough residue for use in further nutritional analyses without compromising IVDMD, when using a 250 mL incubation vessel.
Data from our modified Tilley and Terry in vitro procedure suggest that hexane extraction performed under a temperature of 80°C for 90 min will result in camelina meals with the greatest CP disappearance, whereas a temperature of 120°C for 65 min will result in camelina meal with the lowest CP disappearance. Cold-press
316
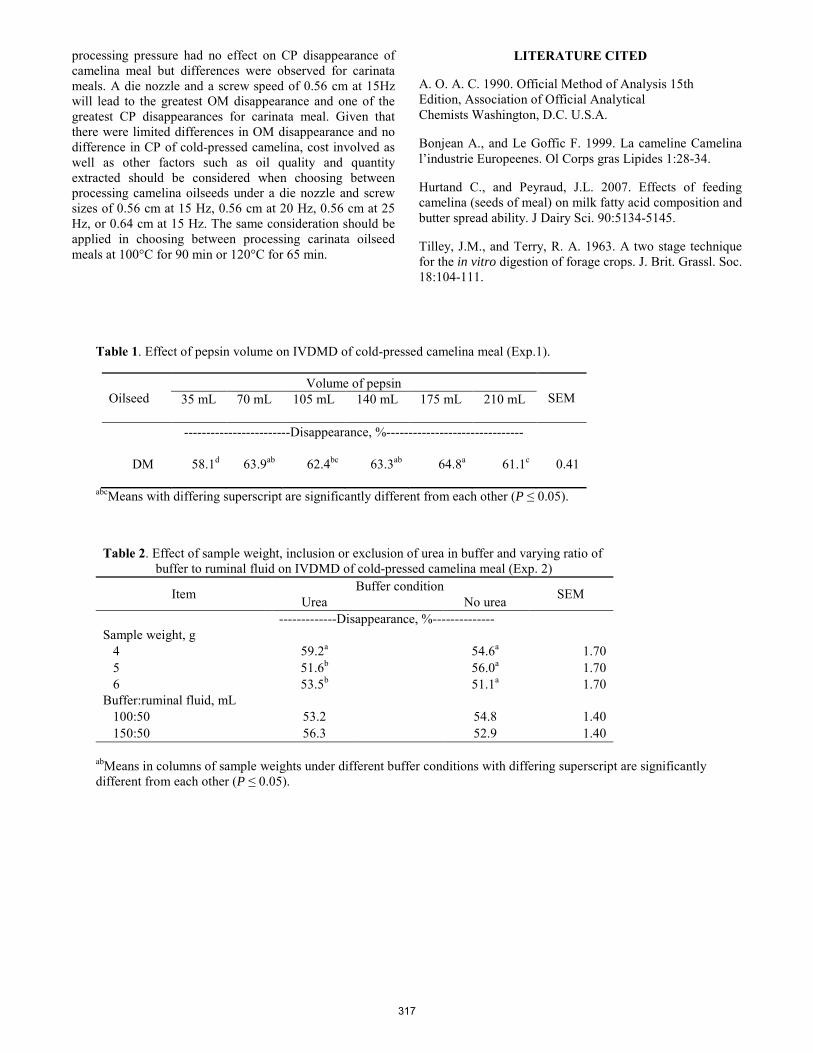
processing pressure had no effect on CP disappearance of camelina meal but differences were observed for carinata meals. A die nozzle and a screw speed of 0.56 cm at 15Hz will lead to the greatest OM disappearance and one of the greatest CP disappearances for carinata meal. Given that there were limited differences in OM disappearance and no difference in CP of cold-pressed camelina, cost involved as well as other factors such as oil quality and quantity extracted should be considered when choosing between processing camelina oilseeds under a die nozzle and screw sizes of 0.56 cm at 15 Hz, 0.56 cm at 20 Hz, 0.56 cm at 25 Hz, or 0.64 cm at 15 Hz. The same consideration should be applied in choosing between processing carinata oilseed meals at 100°C for 90 min or 120°C for 65 min.
LITERATURE CITED
A. O. A. C. 1990. Official Method of Analysis 15th Edition, Association of Official Analytical Chemists Washington, D.C. U.S.A.
Bonjean A., and Le Goffic F. 1999. La cameline Camelina l’industrie Europeenes. Ol Corps gras Lipides 1:28-34.
Hurtand C., and Peyraud, J.L. 2007. Effects of feeding camelina (seeds of meal) on milk fatty acid composition and butter spread ability. J Dairy Sci. 90:5134-5145.
Tilley, J.M., and Terry, R. A. 1963. A two stage technique for the in vitro digestion of forage crops. J. Brit. Grassl. Soc. 18:104-111.
Table 1. Effect of pepsin volume on IVDMD of cold-pressed camelina meal (Exp.1).
Oilseed Volume of pepsin
SEM 35 mL
70 mL
105 mL
140 mL
175 mL
210 mL
------------------------Disappearance, %-------------------------------
DM 58.1d 63.9ab 62.4bc 63.3ab 64.8a 61.1c 0.41
abcMeans with differing superscript are significantly different from each other (P ≤ 0.05).
Table 2. Effect of sample weight, inclusion or exclusion of urea in buffer and varying ratio of buffer to ruminal fluid on IVDMD of cold-pressed camelina meal (Exp. 2)
Item Buffer condition SEM Urea No urea
-------------Disappearance, %--------------
Sample weight, g 4 59.2a 54.6a 1.70 5 51.6b 56.0a 1.70 6 53.5b 51.1a 1.70 Buffer:ruminal fluid, mL
100:50 53.2 54.8 1.40 150:50 56.3 52.9 1.40
abMeans in columns of sample weights under different buffer conditions with differing superscript are significantly different from each other (P ≤ 0.05).
317
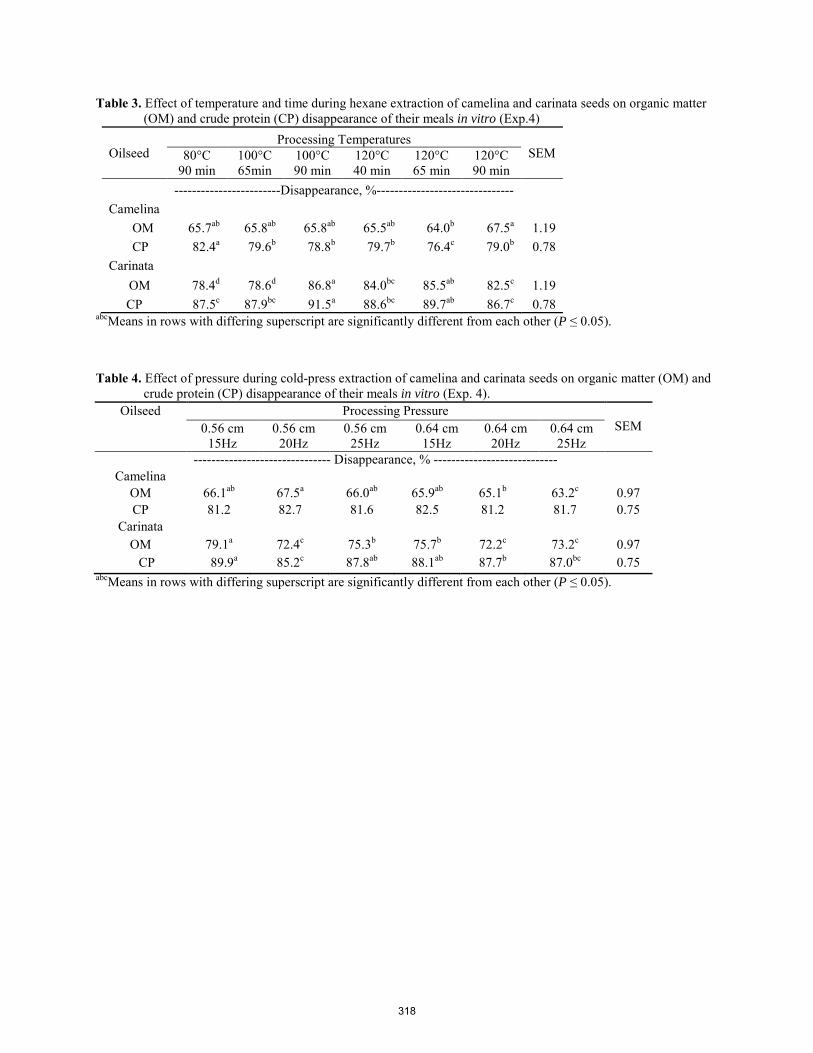
Table 3. Effect of temperature and time during hexane extraction of camelina and carinata seeds on organic matter (OM) and crude protein (CP) disappearance of their meals in vitro (Exp.4)
Oilseed Processing Temperatures
SEM 80°C 90 min
100°C 65min
100°C 90 min
120°C 40 min
120°C 65 min
120°C 90 min
------------------------Disappearance, %-------------------------------
Camelina OM 65.7ab 65.8ab 65.8ab 65.5ab 64.0b 67.5a 1.19 CP 82.4a 79.6b 78.8b 79.7b 76.4c 79.0b 0.78 Carinata
OM 78.4d 78.6d 86.8a 84.0bc 85.5ab 82.5c 1.19 CP 87.5c 87.9bc 91.5a 88.6bc 89.7ab 86.7c 0.78
abcMeans in rows with differing superscript are significantly different from each other (P ≤ 0.05).
Table 4. Effect of pressure during cold-press extraction of camelina and carinata seeds on organic matter (OM) and crude protein (CP) disappearance of their meals in vitro (Exp. 4).
Oilseed Processing Pressure SEM 0.56 cm
15Hz 0.56 cm
20Hz 0.56 cm
25Hz 0.64 cm
15Hz 0.64 cm
20Hz 0.64 cm
25Hz ------------------------------- Disappearance, % ----------------------------
Camelina OM 66.1ab 67.5a 66.0ab 65.9ab 65.1b 63.2c 0.97 CP 81.2 82.7 81.6 82.5 81.2 81.7 0.75
Carinata OM 79.1a 72.4c 75.3b 75.7b 72.2c 73.2c 0.97
CP 89.9a 85.2c 87.8ab 88.1ab 87.7b 87.0bc 0.75 abcMeans in rows with differing superscript are significantly different from each other (P ≤ 0.05).
318
Proceedings, Western Section, American Society of Animal Science
Vol. 66, 2015
Performance in rabbits fed diets supplemented with conjugated linoleic acid (CLA)
S. Ramírez*1, J. Espinoza1, A. Trejo2, V. M. Meza1, J. Abad1, C. M. Antonio 1University of Papaloapan, Loma Bonita, Oax., Mexico
2Autonomous Metropolitan University-Iztapalapa, Mexico ABSTRACT: Our hypothesis was that conjugated linoleic acid (CLA) supplementation would improve feed intake, growth, feed conversion, and carcass yield and quality of rabbits. To test this hypothesis New Zeland White female rabbits (n=30) were individually housing in stainless mesh cage. The rabbits with 1106±146 gr initial BW, were randomly assigned to one of three dietary treatments (n=10 per treatment): control, without CLA (CLA 0%), 0.25% (CLA 0.25%) and 0.50% (CLA 0.50%). Feeding, consumption and refuse of feed were measured daily. Animals were weighed weekly and seven weights were recorded. Carcass yield and pH in Longissimus dorsi muscle were measured in hot carcass (HC) and chilled carcass (CC). Perirenal fat was measured in cold carcass. One-way analysis of variance was done to evaluate the effect of supplement on feed intake, growth, average daily gain (ADG), feed conversion and carcass yield and quality of rabbits. No differences (P > 0.05) were observed among the three dietary groups for feed intake, growth, ADG, or feed conversion. CLA 0% showed the lowest (P < 0.05) carcass weight, while it was similar among CLA 0.25% or CLA 0.50%. There was observed a tendency (P = 0.07) in HC weight and CC weight, the second one was reduced 5.6%. The pH carcass was similar (P > 0.05) among treatments, and was lowest (P < 0.05) in CC. CLA supplementation did not significantly affect the pH muscle. Perirenal fat was 4.8±5, 8.9±1 and 9.6±3 gr for CLA 0, 0.25 or 0.50%, respectively, however, this differences were not significant (P = 0.08). These results reject our hypothesis, since conjugated linoleic acid supplementation, did not affect intake, growth, feed conversion and carcass yield and quality when feeding New Zeland White female rabbits. Key words: conjugated linoleic acid, meat quality, rabbits. ____________________ We thank the Professional Development Program for Teachers (PRODEP) for the financial support to carry out this investigation through the project PROMEP/103.5/13/7356. *Corresponding author’s e-mail address: [email protected]
INTRODUCTION
Conjugated linoleic acid (CLA) is a collective name for positional and geometric conjugated isomers of octadecadicnoic acid (C 18:2). Many health benefits has been attributed to CLA in animal experiments (Belury, 2002), e.g. on cancer, cardiovascular disease and diabeties Effects of dietary CLA in farm animals show its potential to improve performance and decrease body fat mass. In pigs, CLA had increased rate of gain, improved feed efficiency (Lauridsen et al., 2005) and reduced backfat thickness (Wiegand et al., 2001). In broilers, dietary supplementation with 1% of CLA had positive effect on meat quality, antioxidant capacity, and fatty acid composition, but it had no significant effect on growth performance (Jiang et al., 2014). In rabbits slaughtered at 2.8 kg, CLA reduced carcass fats, produced lower concentrations of serum triglycerides and cholesterol and higher concentration of leptin, but it had no effect for growth, feed intake, or feed efficiency (Corino et al., 2002). This fatty acid (FA) is largely found in foods such as beef (1.2-10.0 mg/gr fat) and mutton (4.3-19.0 mg/g fat), and in dairy products containing milk fat. On the contrary, the CLA content is low in pork and chicken (1.0 mg/g fat) (Schmid et al., 2006). Rabbits meat is rich in linoleic acid (LA) because it represents about 22% of whole FAs (Li et al., 2012). From economical points of view, rabbits are good model to study the effect of CLA on performance and meat quality. The aim was to investigate the effect of CLA supplementation in the diets on performance and carcass yield and quality of rabbits.
MATERIALS AND METHODS
In July 04, 2014, in the Rabbit Production Unit of University of Papaloapan, Loma Bonita, Oax., Mex., New Zeland White female rabbits (n=30), weaned at 28 days of age (992±141 gr of BW), were housed in stainless mesh cages, one per cage, thus a rabbit was the experimental unit. Once labeled, rabbits were weighing for initial BW (1106±146 gr) and randomly assigned in groups of 10 animals to one of three dietary treatments: without CLA (CLA 0%), 0.25% (CLA 0.25%) and 0.50% (CLA 0.50%). The rabbits had ad libitum access to feed and fresh water daily. Ingredients and nutrients composition of diets are show in Table 1. Control rabbits were feed the basal diets
319
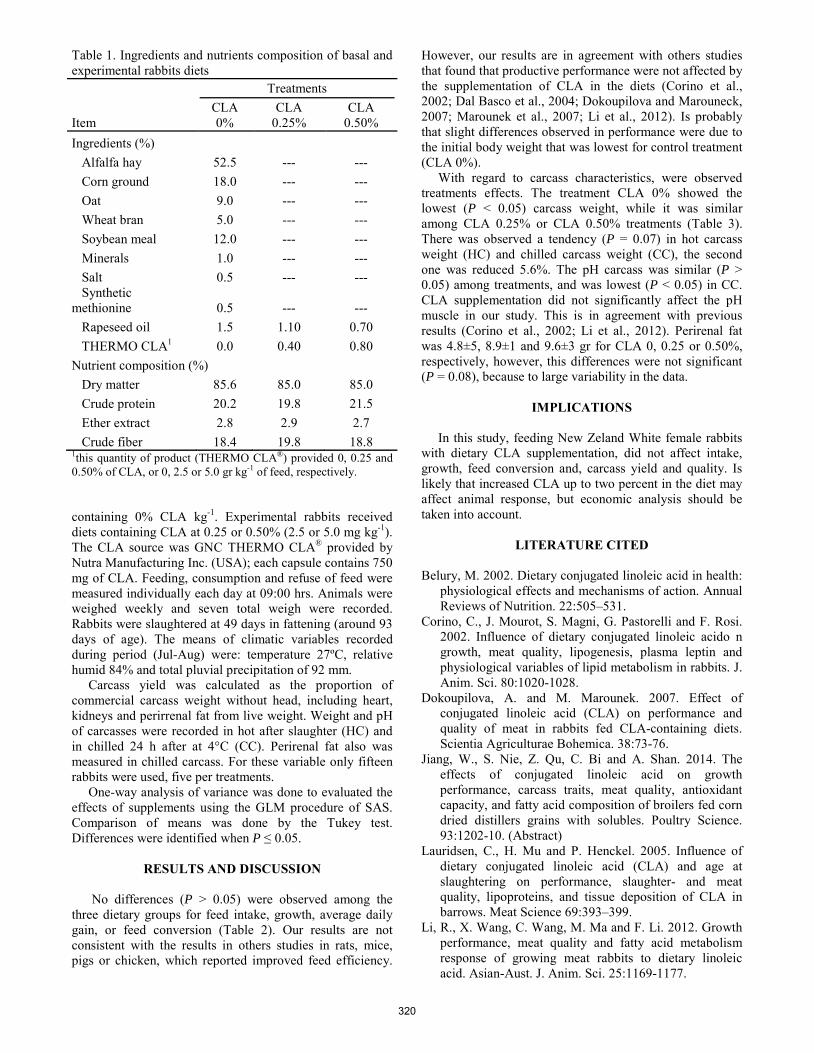
Table 1. Ingredients and nutrients composition of basal and experimental rabbits diets
Item
Treatments CLA 0%
CLA 0.25%
CLA 0.50%
Ingredients (%) Alfalfa hay 52.5 --- --- Corn ground 18.0 --- --- Oat 9.0 --- --- Wheat bran 5.0 --- --- Soybean meal 12.0 --- --- Minerals 1.0 --- --- Salt 0.5 --- --- Synthetic methionine 0.5 --- --- Rapeseed oil 1.5 1.10 0.70 THERMO CLA1 0.0 0.40 0.80 Nutrient composition (%) Dry matter 85.6 85.0 85.0 Crude protein 20.2 19.8 21.5 Ether extract 2.8 2.9 2.7 Crude fiber 18.4 19.8 18.8 1this quantity of product (THERMO CLA®) provided 0, 0.25 and 0.50% of CLA, or 0, 2.5 or 5.0 gr kg-1 of feed, respectively. containing 0% CLA kg-1. Experimental rabbits received diets containing CLA at 0.25 or 0.50% (2.5 or 5.0 mg kg-1). The CLA source was GNC THERMO CLA® provided by Nutra Manufacturing Inc. (USA); each capsule contains 750 mg of CLA. Feeding, consumption and refuse of feed were measured individually each day at 09:00 hrs. Animals were weighed weekly and seven total weigh were recorded. Rabbits were slaughtered at 49 days in fattening (around 93 days of age). The means of climatic variables recorded during period (Jul-Aug) were: temperature 27ºC, relative humid 84% and total pluvial precipitation of 92 mm. Carcass yield was calculated as the proportion of commercial carcass weight without head, including heart, kidneys and perirrenal fat from live weight. Weight and pH of carcasses were recorded in hot after slaughter (HC) and in chilled 24 h after at 4°C (CC). Perirenal fat also was measured in chilled carcass. For these variable only fifteen rabbits were used, five per treatments. One-way analysis of variance was done to evaluated the effects of supplements using the GLM procedure of SAS. Comparison of means was done by the Tukey test. Differences were identified when P ≤ 0.05.
RESULTS AND DISCUSSION
No differences (P > 0.05) were observed among the three dietary groups for feed intake, growth, average daily gain, or feed conversion (Table 2). Our results are not consistent with the results in others studies in rats, mice, pigs or chicken, which reported improved feed efficiency.
However, our results are in agreement with others studies that found that productive performance were not affected by the supplementation of CLA in the diets (Corino et al., 2002; Dal Basco et al., 2004; Dokoupilova and Marouneck, 2007; Marounek et al., 2007; Li et al., 2012). Is probably that slight differences observed in performance were due to the initial body weight that was lowest for control treatment (CLA 0%). With regard to carcass characteristics, were observed treatments effects. The treatment CLA 0% showed the lowest (P < 0.05) carcass weight, while it was similar among CLA 0.25% or CLA 0.50% treatments (Table 3). There was observed a tendency (P = 0.07) in hot carcass weight (HC) and chilled carcass weight (CC), the second one was reduced 5.6%. The pH carcass was similar (P > 0.05) among treatments, and was lowest (P < 0.05) in CC. CLA supplementation did not significantly affect the pH muscle in our study. This is in agreement with previous results (Corino et al., 2002; Li et al., 2012). Perirenal fat was 4.8±5, 8.9±1 and 9.6±3 gr for CLA 0, 0.25 or 0.50%, respectively, however, this differences were not significant (P = 0.08), because to large variability in the data.
IMPLICATIONS In this study, feeding New Zeland White female rabbits with dietary CLA supplementation, did not affect intake, growth, feed conversion and, carcass yield and quality. Is likely that increased CLA up to two percent in the diet may affect animal response, but economic analysis should be taken into account.
LITERATURE CITED Belury, M. 2002. Dietary conjugated linoleic acid in health:
physiological effects and mechanisms of action. Annual Reviews of Nutrition. 22:505–531.
Corino, C., J. Mourot, S. Magni, G. Pastorelli and F. Rosi. 2002. Influence of dietary conjugated linoleic acido n growth, meat quality, lipogenesis, plasma leptin and physiological variables of lipid metabolism in rabbits. J. Anim. Sci. 80:1020-1028.
Dokoupilova, A. and M. Marounek. 2007. Effect of conjugated linoleic acid (CLA) on performance and quality of meat in rabbits fed CLA-containing diets. Scientia Agriculturae Bohemica. 38:73-76.
Jiang, W., S. Nie, Z. Qu, C. Bi and A. Shan. 2014. The effects of conjugated linoleic acid on growth performance, carcass traits, meat quality, antioxidant capacity, and fatty acid composition of broilers fed corn dried distillers grains with solubles. Poultry Science. 93:1202-10. (Abstract)
Lauridsen, C., H. Mu and P. Henckel. 2005. Influence of dietary conjugated linoleic acid (CLA) and age at slaughtering on performance, slaughter- and meat quality, lipoproteins, and tissue deposition of CLA in barrows. Meat Science 69:393–399.
Li, R., X. Wang, C. Wang, M. Ma and F. Li. 2012. Growth performance, meat quality and fatty acid metabolism response of growing meat rabbits to dietary linoleic acid. Asian-Aust. J. Anim. Sci. 25:1169-1177.
320
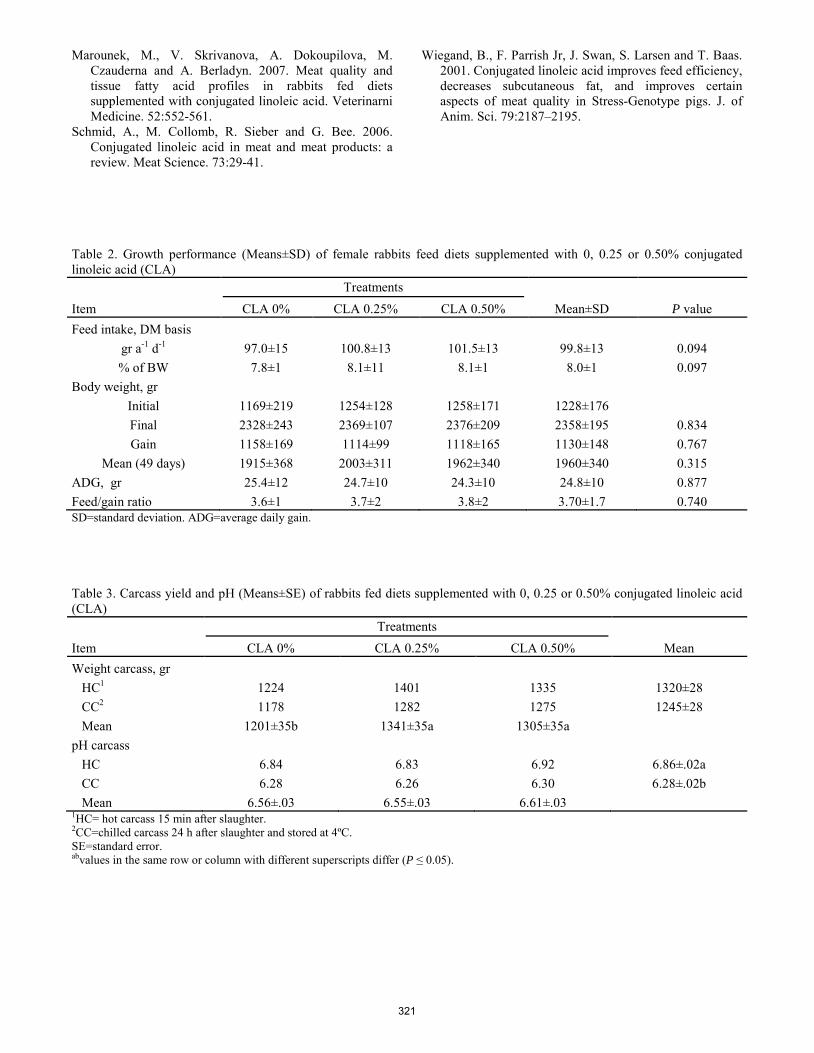
Marounek, M., V. Skrivanova, A. Dokoupilova, M. Czauderna and A. Berladyn. 2007. Meat quality and tissue fatty acid profiles in rabbits fed diets supplemented with conjugated linoleic acid. Veterinarni Medicine. 52:552-561.
Schmid, A., M. Collomb, R. Sieber and G. Bee. 2006. Conjugated linoleic acid in meat and meat products: a review. Meat Science. 73:29-41.
Wiegand, B., F. Parrish Jr, J. Swan, S. Larsen and T. Baas. 2001. Conjugated linoleic acid improves feed efficiency, decreases subcutaneous fat, and improves certain aspects of meat quality in Stress-Genotype pigs. J. of Anim. Sci. 79:2187–2195.
Table 2. Growth performance (Means±SD) of female rabbits feed diets supplemented with 0, 0.25 or 0.50% conjugated linoleic acid (CLA)
Treatments
Item CLA 0% CLA 0.25% CLA 0.50% Mean±SD P value Feed intake, DM basis
gr a-1 d-1 97.0±15 100.8±13 101.5±13 99.8±13 0.094 % of BW 7.8±1 8.1±11 8.1±1 8.0±1 0.097
Body weight, gr Initial 1169±219 1254±128 1258±171 1228±176
Final 2328±243 2369±107 2376±209 2358±195 0.834 Gain 1158±169 1114±99 1118±165 1130±148 0.767
Mean (49 days) 1915±368 2003±311 1962±340 1960±340 0.315 ADG, gr 25.4±12 24.7±10 24.3±10 24.8±10 0.877 Feed/gain ratio 3.6±1 3.7±2 3.8±2 3.70±1.7 0.740 SD=standard deviation. ADG=average daily gain. Table 3. Carcass yield and pH (Means±SE) of rabbits fed diets supplemented with 0, 0.25 or 0.50% conjugated linoleic acid (CLA) Treatments Item CLA 0% CLA 0.25% CLA 0.50% Mean Weight carcass, gr HC1 1224 1401 1335 1320±28 CC2 1178 1282 1275 1245±28 Mean 1201±35b 1341±35a 1305±35a
pH carcass HC 6.84 6.83 6.92 6.86±.02a CC 6.28 6.26 6.30 6.28±.02b Mean 6.56±.03 6.55±.03 6.61±.03
1HC= hot carcass 15 min after slaughter. 2CC=chilled carcass 24 h after slaughter and stored at 4ºC. SE=standard error. abvalues in the same row or column with different superscripts differ (P ≤ 0.05).
321
---------------------- AUTHOR INDEX ----------------------
A -------------------------------------------
Abad, J., 319
Abrams, A. N., 244
Ahola, J.K., 33
Alexander, B. M., 96
Alexander, J. A., 166
Angerer, J. P., 258
Antonio, C.M., 319
Arispe, S., 67
Ashley, A. K., 217
Ashley, R. L., 52, 88,
Austin, K. J., 22, 96, 133, 244
B -------------------------------------------
Baggerman, J. O., 38
Bailey, D. W., 99
Bartle, S. J., 225
Bauer, M. L., 81
Berardinelli, J. G., 77, 138
Berg, M. A., 22
Black, D. N., 299
Blackburn, H. D., 122
Blair, A. D., 231
Blanco-Canqui, H.,177
Boatright, J., 122
Bohnert, D. W., 17, 67
Boldt, R. J., 108
Boles, J. A., 77
Borowicz, P. P., 44
Bradford, J. A., 201
Brake, D. W., 314
Branine, M. E., 185, 235
Brummer, 268
C -------------------------------------------
Callan, R.J., 33
Cammack, K. M., 22, 133 , 244, 295
Campanili, P. R. B., 38
Cánovas, A., 104
Cappellozza, B. I., 17
Carlos-Valdez, L., 303
Carroll, H., 159
Castillo, F., 240, 303, 307, 310
Caton, J. S., 44, 291
Chase, J. L., 58
Cherry, N. M., 204
Chilcoat, K. E., 291
Clarkson, C. J., 244
Conant, G. C., 133, 244
Cooke, R. F., 17, 67
Correa-Calderón, A., 249
Crane, A. R., 27
Crawford, N. F., 126
Crosswhite, M. R., 299
Crouse, M. S., 27, 44, 291
Culbertson, M. M., 111
Cunningham, H. C., 22, 133, 244
D -------------------------------------------
Dahlen, C. R., 44, 151, 299
Damiran, D., 282, 286
de Oliveira, H. N., 104
de Souza, F. R. P., 104
Dias, M. M., 104
Diaz, I. D. P. S., 104
Domínguez, D., 240, 262, 303, 307, 310
Draney, T. D., 295
Drouillard, J. S., 189, 195
Durán, L., 303
Dwyer, J., 38
E -------------------------------------------
Ellison, M., 133, 244
Engle, T. E., 225
Enns, R. M., 99, 104, 108, 111, 114, 119, 126, 129, 249
Ericsson, S., 122
Espinoza, J., 262
F -------------------------------------------
Faulkner, D., 222
Fick, W. H., 166
Fischer, M., 33
Fletcher, M., 72
Flores-Campos, J. P., 307
Flores, M. G., 303
Funston, R. N., 231
G -------------------------------------------
Galyean, M. L., 38
Garcia, M., 235
García-Roque, I., 310
Garza, A. L., 5
Gaspers, J. J., 81
Gifford, C. A., 58, 63
Glasscock, J. L., 204
Glaze, Jr., J. B., 272
Glosson, G., 157
Gomez, B. I., 63
Gonda, M. G., 231
González, C., 240
Grandin, T., 92
Graves, J. R., 217

Grings, E. E., 314
Guarnieri, T. A., 17
Gunter, S. A., 201
Gurule, C. A., 166
H -------------------------------------------
Hall, J. B., 272
Hallford, D. M., 10, 58, 63, 180, 291
Harmoney, K. R., 209, 213
Harty, A. A., 231
Held, J. E., 27
Hernandez, A. I., 114, 249
Hernandez Gifford, J. A., 58, 63
Herrygers, K. B., 138
Herrygers, M. R., 77, 138
Hicks-Lynch, A. R., 77
Holmes, A. R., 204
Holt, T. N., 99, 119, 126
Housewright, B., 277
Hubbert, M., 217, 235
I -------------------------------------------
Ivey, S. L., 5, 85
J -------------------------------------------
Jaeger, J. R., 142, 209, 213
K -------------------------------------------
Kapphahn, M., 291
Keisler, D. H., 67
Kennedy, V. C., 81
Keyes, J.D., 146
Kincheloe, J. J., 231
Kirch, B. H., 92
Kirsch, J. D., 27
Knerr, M., 138
Knight, C. W., 222
Krehbiel, B. C., 122
L -------------------------------------------
Lamberson, W. R., 133, 244
Lardner, H., 282, 286
Larson, C. K., 185, 235
Larson, K., 286
Lemmon, A. G., 166, 173
Lemmon, J., 166, 173, 265
Lemos, B. J. M., 38
Lippolis, K. D., 33
Löest, C. A., 217, 235
Loya-Rodríguez, R. A., 307
Ludden, P. A., 295
Luna-Nevárez, G., 249
Luna-Nevárez, P., 104, 114 , 249
M -------------------------------------------
Mantilla-Rojas, C., 104

Marchetti, K., 5, 85
Marques, R., 17, 67
Marrs, S. G., 204
Mayo, C.E., 33
McCuistion, K. C., 38
McGee, A.L., 177
McKiearnan, A. N., 189, 195
McKinnon, J. J., 282
McLean, K. J., 44
McMullen, C. J., 209, 213, 265
Medrano, J. F., 104, 114, 229
Melgar, F. R., 85
Merta, P. J., 138
Metcalf, K., 138
Meyer, A. M., 22
Meza, V.M., 319
Miesner, M. D., 189, 195
Mordhorst, B., 81
Morgan, T. D., 85
Moriel, P., 17
Muir, J. P., 204
Muthukumarappan, K., 314
N -------------------------------------------
Nagaraja, T. G., 189, 195
Naumann, H. D., 10
Neville, B. W., 44, 299
O -------------------------------------------
O'Rourke, S. T., 291
Olson, K. C., 142, 149, 166, 173, 189, 195, 209, 213
Oosthuysen, E. R., 217, 235
Opheim, T. L., 38
Ortega, J. A., 240, 303, 307, 310
Ott, T. L., 58
Otto, K. C., 96
Ovinge, L. A., 38
Owens, J., 161
Owensby, L. R., 277 P -------------------------------------------
Paiva, S., 122
Parkinson, K. C., 48
Paterson, J. A., 92
Peine, J. L., 291
Penner, G. B., 286
Perz, K. A., 77, 138
Preedy, G. W., 142, 166
Prince, S. D., 258
Prosser, S. Z., 52, 88
Q -------------------------------------------
Quinn, K. E., 52, 88
Quintana, R. M., 262
R -------------------------------------------
Radunz, A. E., 22
Ramirez, S., 319
Redden, R. R., 27
Reinhardt, C. D., 225
Reynolds, L. P., 44, 291
Rigas, J., 48
Riley, D., 104
Rincón, G., 114, 249
Roacho, O., 262
Roberts, M. C., 272
Rodrigues, M. C., 17, 67
Roper, J. R., 204
Ross, T., 1
Rule, D. C., 295
S -------------------------------------------
Saad, H. M., 129
Sackey, A., 314
Salazar, A. L., 85
Sánchez-Castro, M. A., 114, 249
Sarturi, J. O., 38
Schafer, D. W., 222
Schauer, C. S., 27
Scholljegerdes, E. J., 5, 10, 72, 85, 180, 204, 235, 277
Schwandt, E. F., 225
Shaver, T.M., 177
Shaw, D. C., 166
Silva-Vázquez, R., 303
Smith, W. K., 272
Smythe, B. G., 72
Socha, M. T., 185
Soto-Casas, L. F., P29
Soto-Navarro, S. A., 10, 310
Speidel, S. E., 99, 104, 111, 114, 119, 126, 129, 249
Stalker, A., 177
Stephenson, M. B., 99
Stewart, W. C., 10, 180, 204
Stokka, G. L., 81
Stoltenow, C. L., 151
Strey, O. F., 258
Swanson, K. C., 81
Sweat, A., 48
T -------------------------------------------
Taxis, T. M., 133, 244
Taylor, C. A., 258
Teel, P. D., 258
Thomas, M. G., 99, 104, 108, 111, 114, 119, 122, 126, 129, 249
Thomson, D. U., 225
Thomson, J. M., 77, 138
Titgemeyer, E. C., 189, 195
Tolleson, D. R., 253, 258
Trejo, A., 319
Trojan, S. J., 38
U -------------------------------------------
Underwood, K. R., 231
V -------------------------------------------
Van Donkersgoed, J., 185
Vanderwall, D. K., 48
Villalobos, G., 240, 303, 307, 310
Villalobos, L. A., 268
Vonnahme, K. A., 81
W -------------------------------------------
Waggoner, J. W., 142, 209, 213
Wagner, J. J., 225
Walter, K. N., 85, 277
Weinheimer, B., 158
White, L. M., 85, 277
Whitehurst, B., 160
Whitmore, M. R., 77
Whitney, T. R., 10, 180, 204
Williams, A. F., 77
Wilson, C., 122
Winsco, K. M., 85
Wise, M. E., 72
Woiwode, R., 92
Wyatt, J. L., 96
Z -------------------------------------------
Zamorano-Algandar, R., 114, 249
Zeng, X., 119, 126