Westchester-Putnam Workforce Development Area Four-Year ...
100
http://www.westchesterputnamonestop.com/ Draft Date: 6 November 2015 Westchester-Putnam Workforce Board 120 Bloomingdale Road White Plains, NY 10605 914-995-3910 Putnam Workforce Partnership 110 Old Route 6 Center Carmel, NY 10512 845-808-1651 Westchester-Putnam Workforce Development Area Four-Year Strategic Plan 2015-2019
-
Upload
khangminh22 -
Category
Documents
-
view
1 -
download
0
Transcript of Westchester-Putnam Workforce Development Area Four-Year ...

http://www.westchesterputnamonestop.com/
Draft Date: 6 November 2015
Westchester-Putnam Workforce Board 120 Bloomingdale Road White Plains, NY 10605 914-995-3910
Putnam Workforce Partnership 110 Old Route 6 Center Carmel, NY 10512 845-808-1651
08 Fall
Westchester-Putnam Workforce Development Area
Four-Year Strategic Plan 2015-2019

http://www.westchesterputnamonestop.com/
Westchester-Putnam Workforce Development Area Four-Year Strategic Plan 2015-2019 Developed by

http://www.westchesterputnamonestop.com/
Table of Contents Table of Contents .................................................................................................................................................................................. 3 Executive Summary .............................................................................................................................................................................. 5 Key Accomplishments ......................................................................................................................................................................... 7 Workforce Investment Legislation ................................................................................................................................................ 13
Workforce Investment History .......................................................................................................................................... 13 Major Changes From Current Workforce Investment Act of 1998 .................................................................... 14 Leadership .................................................................................................................................................................................. 15 WIOA Implementation Timeline ....................................................................................................................................... 17
One-Stop System ................................................................................................................................................................................ 18 One-‐Stop Services ................................................................................................................................................... 20 Business Services ..................................................................................................................................................................... 20 Job Seeker and Underemployed Incumbent Worker Services ............................................................................. 24
Youth Services ......................................................................................................................................................... 26 Eligible Participants ............................................................................................................................................................... 26 Required Youth Services ...................................................................................................................................................... 27 Youth Work Experience Manager ..................................................................................................................................... 28
Economic and Workforce Data Analysis ..................................................................................................................................... 31 Strategic Planning Background ..................................................................................................................................................... 39 Federal and State Requirements and Context .............................................................................................. 39 History of Planning ................................................................................................................................................ 39
Strategic Planning Process .............................................................................................................................................................. 40 Vision ....................................................................................................................................................................................................... 42 Mission .................................................................................................................................................................................................... 42 Values ...................................................................................................................................................................................................... 42 Strategic Plan Goals ............................................................................................................................................................................ 43 Implementation Timeline ................................................................................................................................................................ 52 Budget and Finance ........................................................................................................................................................................... 57 Westchester Putnam WBD PY 2015 Budget .................................................................................................. 61
Performance Standards .................................................................................................................................................................... 68 Performance Tracking – One Stop Operating System (OSOS) ................................................................. 69
Appendices ................................................................................................................................................................................................ i Appendix I: Westchester Putnam Workforce Development Area Information .................................... i
Table of Contents
Westchester-Putnam Workforce
Development Area
Four-Year Strategic Plan 2015-2019

http://www.westchesterputnamonestop.com/
2015-‐2016 Workforce Development Board (WDB) ..................................................................................................... i Westchester-‐Putnam Workforce Development Area Partners ............................................................................. ii Training Providers ................................................................................................................................................................... iii
Appendix II: Local Area Unemployment Statistics ........................................................................................ iv Putnam County Local Area Unemployment Statistics .............................................................................................. iv Westchester County Local Area Unemployment Statistics ................................................................................... vii
Appendix III: Labor Market Statistics ................................................................................................................. x Current Labor Statistics for the Hudson Valley Region ............................................................................................. x Labor Market Profile – Dutchess-‐Putnam MSA ........................................................................................................... xi Labor Market Profile – Orange-‐Rockland Westchester MSA ................................................................................ xii Labor Market Profile – Sullivan County ........................................................................................................................ xiv
Appendix IV: Job Projection Data for the Mid-‐Hudson Region ............................................................... xvi Projected Job Openings in the Mid-‐Hudson Region ................................................................................................. xvi Hudson Valley Projected Job Growth with 100 or More Annual Average Openings ............................... xxvi
Appendix V: Pertinent Regulations ............................................................................................................ xxviii Appendix VI: References ................................................................................................................................... xxix Appendix VII: Assurances .................................................................................................................................. xxx

http://www.westchesterputnamonestop.com/
Date: 6 November 2015
5
Executive Summary
Background
Implementation of the Workforce Innovation and Opportunity Act brings both opportunity and challenge to the workforce development system. The current strategic plan reflects the challenges and opportunities presented by the Workforce Innovation and Opportunity Act (WIOA), which was signed into law by President Barack Obama on July 22, 2014. The first legislative reform of the public workforce system in 15 years, WIOA begins to take effect on July 1, 2015, with full implementation scheduled to begin in July 2016.
The Westchester-‐Putnam WDB welcomes the new WIOA legislation as it validates several initiatives and strategies that they have pursued. The legislation calls for a stronger Workforce Development Board. The legislation also preserves the private sector majority of the WDB and private sector chair. It further calls for the establishment of industry sectors and regional strategies. The WDB has operated sector partnerships for over six years and has lead or participated in an active role in the Hudson Valley Regional partnerships and is experienced with many of the coming changes.
Strategic planning has guided the Westchester-‐Putnam Workforce Development Area’s activities since the first plan was developed in 2000. Planning for the Westchester-‐Putnam area of the Hudson Valley requires being responsive to needs within a large area of remarkably diversity from geography to demographics to economics.
Key Accomplishments
The following are among the key accomplishments and achievement of goals from prior strategic plan (detailed in the following section, Key Accomplishments):
• Strengthened sustainable infrastructure o Increased functionality and use of online web portal
• Increased functional alignment among service partners
Executive Summary
Westchester-Putnam Workforce
Development Area
Four-Year Strategic Plan 2015-2019

http://www.westchesterputnamonestop.com/
Date: 6 November 2015
6
o Entrepreneurship programs • Built public awareness for increased business penetration
o Successful branding campaign o Business sector partnerships
• Expanded youth programs o College Internship program o Youth Summit
• Generated Revenue for special projects o Developed grant writing team to respond to opportunities o Ready to Work grant/H1B participants
Vision for the Future
The Workforce Development Board engaged in thoughtful and intensive planning sessions to define the vision to guide the development of the strategic plan.
With goals that are responsive to requirements of WIOA legislation, the plan seeks to first and foremost to create an environment where businesses and employees succeed. The WDB aspires to increase connections and communications, facilitating the use of shared technology through the web portal by both employers and job seekers.
In order to understand and meet the needs for employees, the WDB will continue to build and strengthen relationships with businesses. Customer training and skills must be matched to trending business needs, while honoring customer choice.
Developing apprenticeships will be key to preparing workers. The WDB is in the process of building an apprenticeship program with 1199 SEIU United Healthcare Workers; more apprenticeships are planned as well.
Relationships with partners will be strengthened as the role of the One-‐Stop Operator is established as responsible for oversight of partners. Through the newly-‐defined partnership agreements, the WDB will streamline and reduce costs for contracts and administration. In addition to greater efficiency, the relationships will seek opportunities for innovation and collaboration. The values of accountability and transparency will be included in all transactions.
Guided by the vision and goals of the strategic plan, the WDB looks forward to continuing to build a dynamic and effective workforce development system that strengthens the Hudson Valley economy as an integral part of the statewide system.

http://www.westchesterputnamonestop.com/
Date: 6 November 2015
7
Key Accomplishments The 2012-‐2015 Strategic Plan set forth a set of ambitious goals for the Westchester Putnam Workforce Board, with clear steps to moving forward in creating a powerful workforce system.
Goal 1 focused on building the organizational capacity by creating a sustainable infrastructure. Leveraging resources through business partnerships helped to build strategies. Refining the operational infrastructure through enhanced data, staff development and communications led to more effective operations. Web technology updates ensured that the WPWB remained at the leading edge of workforce services by providing anytime, anywhere access to meet the needs of both employers and workers seeking employment.
Goal 2 sought to engage the community and align services so that the system provided the greatest possible responsiveness for job seekers and underemployed workers. Bringing together partners including community-‐based organizations, educational institutions and economic development agencies expanded opportunities for training and employment.
Goal 3 was designed to increase awareness of the WPWB and create a strong, consistent branding image, so that businesses and the public were aware of the services. The outreach efforts were designed to promote the services, thus increasing business penetration so that more job seekers could connect to employers.
Goal 4 emphasized the importance of youth programs, aspiring to expand and strengthen services for the growing workforce of the future. Ambitious goals were fulfilled as the
Key Accomplishments
Westchester-Putnam Workforce
Development Area
Four-Year Strategic Plan 2015-2019

http://www.westchesterputnamonestop.com/
Date: 6 November 2015
8
college internship program, youth academy, youth summit and other youth programs all contributed to creating a pipeline for a workforce with credentials that meet the needs of employers. With both paid and unpaid work experiences, youth gained significant understanding of the realities of the workplace and were inspired to strive for future success.
Goal 5 spoke to the realities of creating a strong and flexible revenue stream for the future, and addressed the issues of sustainability beyond traditional funding sources. With the freedom to pursue dynamic new initiatives, the WPWB sought and attained grant funding for new programs.
The following table summarizes some of the key achievements that resulted from the 2012-‐2015 Strategic Plan.
Strategic Plan Accomplishments 2012-2015 Goals 2012-2015 Key Achievements
2012-2015 Goal 1 – Sustainable Infrastructure (Capacity Building) Build capacity for a sustainable infrastructure through partnerships and leveraging resources to provide more services with less funding
• Expanded One-‐Stop services by providing job search services at some local libraries and the Veterans Virtual Job fair through the web portal.
• Recruited dedicated, effective board members who represented the key stakeholders
• Institutionalized annual meeting and One-‐Stop Month to celebrate and acknowledge successes, recognize benefactors and beneficiaries, and promote its partners and services.
• Increased functionality and use of the Westchester-‐Putnam Web Portal by businesses and jobseekers to address their employment/workforce needs, including posting internships and job openings on the website, viewing resumes, applying for business training funds, and joining the Business Sector Partnership.

http://www.westchesterputnamonestop.com/
Date: 6 November 2015
9
Strategic Plan Accomplishments 2012-2015 Goals 2012-2015 Key Achievements
2012-2015 Goal 2 – Functional Alignment for Increased Responsiveness (Broader Community Engagement) Increase functional alignment among service partners to increase responsiveness and enhance programs to benefit job seekers and underemployed workers
• Hosted a series of events targeted to the business community, customers and youth in need of job-‐seeking assistance, facilitating workshops with Westchester Community College, Westchester Society for Human Resource Management, Volunteer Center of United Way, ACCESS-‐VR, and United Way of Westchester and Putnam. • The Business Services Team continued the partnership with Ridge Hill to assist in employee recruitment for companies such as LL Bean, Whole Foods, Lord & Taylor, Elevation Burger, and WESTMED.
• Held virtual job fairs for companies that hire people with disabilities and for veterans.
• The Business Services Team engaged in major hiring initiatives with businesses such as Sodexo and Cablevision as well as public entities such as the County Department of Corrections, the MTA and FDNY.
• Expanded training services and resources available to businesses for both new and incumbent workers through targeted skills training programs, including Hire Westchester, National Emergency Grant (NEG) and local Workforce Investment funding.

http://www.westchesterputnamonestop.com/
Date: 6 November 2015
10
Strategic Plan Accomplishments 2012-2015 Goals 2012-2015 Key Achievements
2012-2015 Goal 3 - Public Awareness to Increase Business Penetration (Outreach to Business and the Public) Promote public awareness of the One-Stops to increase business penetration and connect more job seekers to employers
• Established branding and consistent use of identity for the Westchester Putnam One Stops
• Expanded partnership on a regional basis with initiatives like the Pre-‐Apprenticeship Program for the Tappan Zee Bridge project which will encompass three local workforce areas; Westchester – Putnam, Rockland and Yonkers. • The Business Services team provided community outreach by participation in local chambers of commerce events, Industrial Development Agency events, and local county and city activities.
• Increased targeted industry Sector outreach through the Business Sector Partnership, with sectors led by distinguished senior management or executives from the private and public sector, including Regeneron Pharmaceuticals, White Plains Hospital, Boys and Girls Club of Northern Westchester, Hospitality Resource Group, WESTMED, Fenbar Industries and Concorde Staffing. • Westchester-‐Putnam Business Sector Partnership developed a new communications and marketing plan. • Implemented initiatives such as Hire Westchester, and National Emergency Grant (NEG) to expand the services and resources available to businesses. • Red Carpet Business Services Alliance in Putnam County met with business representatives and other organizations to strategize how the Red Carpet Team can better serve and address workforce issues for local businesses.

http://www.westchesterputnamonestop.com/
Date: 6 November 2015
11
Strategic Plan Accomplishments 2012-2015 Goals 2012-2015 Key Achievements
2012-2015 Goal 4 – Youth Programs (Special Attention to Pipeline Programs) Expand and strengthen youth programs to promote credential attainment and build opportunities for workplace experience that leads to high-paying jobs
• Expanded Summer Youth Employment program • Established and developed the College Internship Clearinghouse.
• Annual Youth Summit is to bring together youth from all Westchester Putnam Youth Employment Initiatives for a one day program of activities to provide and connect them to workplace programs that will strengthen their future employment goals
• Sector Partnership participated youth events with the Business Council of Westchester at high schools designed to prepare and position high school students for internships and future job opportunities with local employers.
• Westchester Library System expanded services to include involvement in the youth initiatives such as College Connection, Workplace Attributes and the New York Youth Works Program spearheaded by the Westchester-‐Putnam Workforce Investment Board. • Westchester Workforce Development Academy for Youth (WWDAY) youth employment program provided employment-‐related resources and services to youth through an in-‐school program located in six high schools in Westchester County including New Rochelle, White Plains, Peekskill, Port Chester, Mount Vernon and Nellie A. Thornton, and an out-‐of-‐school program located in the local One-‐Stop centers in White Plains and Mount Vernon and other partner locations. • The Private Sector Youth Employment program provided unsubsidized employment opportunities for Westchester County youth ages 18-‐24 through the cooperative efforts of Westchester employers

http://www.westchesterputnamonestop.com/
Date: 6 November 2015
12
Strategic Plan Accomplishments 2012-2015 Goals 2012-2015 Key Achievements
2012-2015 Goal 5 – Revenue Generation (Resource Development) Develop new options for revenue generation, including special projects that link to competitive grant opportunities
• WPWB was one of 23 national recipients of the USDOL Ready to Work grant of $10 million dollars to train and or retrain over 500 healthcare workers in the Hudson Valley for high-‐demand and high-‐paying healthcare jobs through a collaborative initiative among the Regions, Workforce Boards, One-‐Stop Centers, local colleges and universities, and healthcare businesses.

http://www.westchesterputnamonestop.com/
Date: 6 November 2015
13
Workforce Investment Legislation
Workforce Investment History
The federal government recently enacted the first legislative reform of the public workforce system, which was initially established under the Workforce Investment Act of 1998 (WIA). On July 22, 2014, President Barack Obama signed the Workforce Innovation and Opportunity Act (WIOA), which began to take effect on July 1, 2015. In addition to replacing WIA, the new WIOA legislation also amends the Adult Education and Family Literacy Act, the Wagner-‐Peyser Act, and the Rehabilitation Act of 1973.
WIOA legislation brings substantive changes to all aspects of the workforce system. These changes are intended to reform the job training system and strengthen the workforce investment
system, with the ultimate goal of increasing jobs, earnings and employment retention of workers to enhance national productivity and competitiveness.
Workforce Investment Legislation
Westchester-Putnam Workforce
Development Area
Four-Year Strategic Plan 2015-2019
WIOA’S HALLMARKS OF EXCELLENCE
• The needs of businesses and workers drive workforce solutions and local boards are accountable to communities in which they are located
• One-‐Stop Centers (or American Job Centers) provide excellent customer service to jobseekers and employers and focus on continuous improvement
• The workforce system supports strong regional economies and plays an active role in community and workforce development [Source: http://www.doleta.gov/wioa/]

http://www.westchesterputnamonestop.com/
Date: 6 November 2015
14
The following summary, which outlines the major changes from WIA, was published in the Federal Register on April 15, 2015.
Major Changes From Current Workforce Investment Act of 1998
This section contains a summary of the major changes from the current WIA. As indicated above, WIOA retains much of the structure of WIA.
Major changes in WIOA are:
• Aligns Federal investments to support job seekers and employers. The Act provides for States to prepare a single Unified State Plan that identifies a 4-‐year strategy for achieving the strategic vision and goals of the State for preparing an educated and skilled workforce and for meeting the skilled workforce needs of employers. States govern the core programs as one system assessing strategic needs and aligning them with service strategies to ensure the workforce system meets employment and skill needs of all workers and employers.
• Streamlines the governing bodies that establish State, regional and local workforce investment priorities. WIOA makes State and Local Workforce Boards more agile and well positioned to meet local and regional employers' workforce needs by reducing the size of the boards and assigning them additional responsibilities to assist in the achievement of the State and local strategic workforce vision and goals. The State Workforce Development Boards (State Boards) continue to have a majority of business representation and a business chair that work for all workers and jobseekers, including low-‐skilled adults, youth, and individuals with disabilities, while they foster innovation, and ensure streamlined operations and service delivery excellence.
• Creates a common performance accountability system and information for job s eekers and the public. WIOA ensures that Federal investments in employment, education, and training programs are evidence-‐based and data-‐driven, and accountable to participants and the public. It establishes a performance accountability system that applies across the core programs, by generally applying six primary indicators of performance: entry into unsubsidized employment at two points in time, median earnings, attainment of post-‐secondary credentials, measurable skill gains, and effectiveness in serving employers.
• Fosters regional collaboration to meet the needs of regional economies. WIOA promotes alignment of workforce development programs with regional economic development strategies to meet the needs of local and regional employers.
• Enhances access to high quality services through the network of one-‐stop system. WIOA helps jobseekers and employers acquire the services they need in centers and online, clarifies the roles and responsibilities of the one-‐stop partner programs, adds the TANF program as a required one-‐stop partner unless the

http://www.westchesterputnamonestop.com/
Date: 6 November 2015
15
Governor objects, requires competitive selection of one-‐stop operators, and requires the use by the one-‐stop system of a common one-‐stop delivery identifier or brand that is to be developed by the Secretary of Labor.
• Improves services to individuals with disabilities. WIOA stresses physical and programmatic accessibility, including the use of accessible technology to increase individuals with disabilities' access to high quality workforce services.
• Makes key investments for disconnected youth. WIOA emphasizes services to disconnected youth to prepare them for successful employment by requiring that a minimum of 75 percent of youth formula program funds be used to help OSY, in contrast to the 30 percent required under WIA. WIOA increases OSYs' access to WIOA services, including pre-‐apprenticeship opportunities that result in registered apprenticeship. It adds a requirement that at least 20 percent of formula funds at the local level be used on work-‐based training activities such as summer jobs, on-‐the-‐job training (OJT), and apprenticeship.
• Helps Employers Find Workers with the Necessary Skills. WIOA contributes to economic growth and business expansion by ensuring the workforce system is job-‐driven—matching employers with skilled individuals. WIOA requires Local Boards to promote the use of industry and sector partnerships that include key stakeholders in an industry cluster or sector that work with public entities to identify and address the workforce needs of multiple employers.
• Additionally, successful implementation of many of the approaches called for within WIOA, such as career pathways and sector strategies, require robust relationships across programs and with businesses, economic development, education and training institutions, including community colleges and career and technical education, local entities, and supportive services agencies.
[Source: Federal Register, Thursday, April 16, 2015; Department of Labor Employment and Training Administration 20 CFR Parts 601, 651, 652 et al.; Workforce Innovation and Opportunity Act; Notice of Proposed Rulemaking; Proposed Rules]
Leadership
The Westchester-‐Putnam Workforce Board (WPWB) provides policy direction and program oversight for the One-‐Stop system. Strong business representation, with key leaders in business composing at least 50 per cent of the WPWB, ensures that the system is demand-‐driven and guided by the needs of employers.
Workforce development and youth service programs in Westchester and Putnam Counties are provided through certified full-‐service One-‐Stop Career Centers, affiliate sites and other access points throughout the area.

http://www.westchesterputnamonestop.com/
Date: 6 November 2015
16
Under WIOA, the composition of the board is prescribed to ensure representation by a variety of stakeholders.
Board Composition Minimum Membership under WIOA:
• Ten Business representatives (51% majority of Board), including Chair
• Four Labor representatives (20% requirement under WIOA)
• One Adult Literacy representative
• One Vocational Rehabilitation representative
• One Higher Education representative
• One Wagner-‐Peyser representative
• One Economic Development representative

http://www.westchesterputnamonestop.com/
Date: 6 November 2015
17
WIOA Implementation Timeline
Key Dates for Implementation of the Workforce Innovation and Opportunity Act July 22, 2014 President Barack Obama signs WIOA into law
January 18, 2015 Department of Labor (DOL), Department of Education (ED) and Department of Health and Human Services (HHS) must publish Notices of Proposed Rulemaking to implement WIOA (No later than 180 days after enactment)
July 1, 2015 Provisions take effect unless otherwise noted in the Act WIA State and local plan provisions continue to apply for the first full PY Current performance accountability system remains in effect for the first full PY
July 22, 2015
Eligible Training Providers provisions are implemented by Governors and boards (not later than 12 months after enactment) Template for performance reports by state, local, and Eligible Training Providers must be developed by Secretary of Labor and Secretary of Education within 12 months after the date of enactment
January 22, 2016 DOL, ED and HHS must publish Final Rules to implement WIOA (18 months after enactment)
March 3, 2016 Deadline for state Unified Plan submission (120 days before 2nd full PY) Levels for new performance indicators are negotiated as part of approval of State Unified Plans.
June 30, 2016 DOL and ED must develop performance indicator relating to effectiveness in serving employers (prior to 2nd full PY)
July 1, 2016 One-‐Stop Infrastructure cost requirements take effect (July 1, 2016) Use of common One-‐Stop delivery identifier must be implemented (not later than start of 2nd full PY)
July 22, 2016
First plan describing research studies and multistate project priorities for a 5-‐year period is due (every 2 years from enactment) Provisions relating to subminimum wages for individuals with disabilities take effect (2 years after enactment)
July 1, 2017 Start of third full PY
July 22, 2018
Second plan describing research studies and multistate project priorities for a 5-‐year period is due (every 2 years from enactment) Independent evaluation of the programs and activities authorized in WIOA is completed (at least once every 4 years)
September 30, 2019
First multistate control group evaluation must be completed (end of Fiscal Year 2019)
Source: Adapted from Workforce Innovation and Opportunity Act (WIOA) Key Statutorily -‐ Required Implementation Dates For Programs Administered by the Department of Labor http://wdr.doleta.gov/directives/attach/TEN/WIOA-‐Key-‐Implementation-‐Dates_Acc.pdf

http://www.westchesterputnamonestop.com/
Date: 6 November 2015
18
One-Stop System
Infrastructure
The One-‐Stop system organizes outreach, events, and trainings to promote the services it provides.
During the month of May, the Westchester-‐Putnam Workforce Board has institutionalized the celebration of One-‐Stop Month to recognize individuals and businesses that have benefited from our services as well as highlight our successes. A series of events targeted to the business community and workshops are presented for customers in need of job help. Events include a networking breakfast; Youth Summit; health academic open house at Westchester Community College; Career Day; and presentations at libraries to build job seeking capabilities, including personal branding, resume formats, using social media and interview skills.
One Stop Partners Under WIOA, programs and services under the following categories are eligible to be One-‐Stop partners:
• Program authorized under Title I of WIOA • Program authorized under the Wagner Peyser Act • Adult education and literacy activities authorized under Title II of WIOA • Program authorized under Title I of the Rehabilitation Act of 1973 • Activities authorized under Title V of the Older Americans Act 1965 • Career & technical education programs at the postsecondary level authorized under the
Carl Perkins Career & Technical education Act of 2006
One Stop System
Westchester-Putnam Workforce
Development Area
Four-Year Strategic Plan 2015-2019

http://www.westchesterputnamonestop.com/
Date: 6 November 2015
19
• Activities authorized under Chapter 2 of Title II of the Trade Act of 1974 • Activities authorized under Chapter 41 of title 38, USC (Veterans services) • Employment & Training activities carried out under the Community Services Block
Grant Act. • Employment and training activities carried out by the Department of Housing & Urban
Development • Part A of Title IV of Social Security Act (TANF) • Program authorized by under the State unemployment compensation law • Program authorized under Section 212 of the Second Chance Act 2007 • Program authorized under Part A of Title IV of the Social Security Act • Program administered by Social Security Administration; including Ticket to Work and
Self-Sufficiency Program • Employment & training program a carried out by the Small Business Administration • Program authorized under section 6 (d) (4) or 6 (o) of the Food & Nutrition Act 2008 • Program under the National Community Services Act 1990 • Public library and or other appropriate Federal, State or local programs including
employment, education and training.
Westchester Putnam Web Portal
The WIB has significantly increased the services that are available to both businesses and consumers through its website, which is designed to be fast, easy and user-‐friendly:
http://www.westchesterputnamonestop.com
The Westchester County One-‐Stop Career Center website serves as a local employment portal dedicated to connecting Westchester and Putnam job-‐seekers to area businesses who need a skilled workforce. This website has the tools and information that both job applicants and businesses want, as well as a place to find and register for workshops, training, orientations and more. Available jobs may be viewed in sectors like Healthcare, Business and Professional Services, Green, Hospitality, Manufacturing, IT, Biotech and more.
The One-‐Stop website allows customers to create profiles, post resumes, apply for jobs, connect with employers and register for workshops and training. Computer workstations with internet connections are available at each of the five Employment Service Centers.
Increasing the functionality of the Westchester Putnam Web Portal will continue over the duration of the strategic plan, in order to provide both customers and businesses a seamless way to connect.

http://www.westchesterputnamonestop.com/
Date: 6 November 2015
20
One-Stop Services
Business Services
Business Services help employers connect with employees by posting jobs, providing feedback on the skills they need workers to have, giving information on workplace incentives, training incumbent workers.
The WPWB and the Westchester and Putnam One-Stop Centers offer many services for local business and industry in order to plan prepare and sustain employment opportunities. Business Services team members provide community outreach through participation in chamber events, Industrial Authority events, and local county and city activities. The business services team members work closely with economic development agencies and businesses to maintain a proactive approach to ensure that we keep pace with the needs of the communities. Some of the services that the business services team can provide employers include:
• Labor Market Information • Job Fairs • List of job openings • Locating qualified job applicants for
employers • Space for job interviews, and in some
cases, interviews via video conferencing
In the ever-‐changing workforce, the local Workforce Development Area offers On the Job Training, which provides financial assistance for the employer to train an employee to become a more productive member of the team. This provides the employee the opportunity to learn job specific skills with an area business that will prepare them for permanent employment.
The Job Matching Unit serves as a liaison between the Business Services unit and the One-‐Stop Job seekers by providing a match between the skills the employer is seeking and the
Employment Service Locations
Westchester One-Stop Career Center Hours M-F 8:30 am - 5:00 pm 120 Bloomingdale Road, 2nd Floor White Plains, NY 10605 (914) 995-3910 Putnam Workforce Partnership Hours M-F 9:00 am - 5:00 pm (8:00 am - 4:00 pm June 13 – Sep 16) 110 Old Route 6 Center Carmel, NY 10512 (845) 808-1651
Yonkers Career Center* Hours M-F 9:00 am - 5:00 pm 20 So. Broadway, Suite 1209 Yonkers, NY 10701 (914) 964-0105
Peekskill Career Center Hours M-F 8:30 am - 5:00 pm 201 James Street Peekskill, NY 10566 (914) 737-3490
Mount Vernon Career Center Hours M-F 9:00 am - 4:00 pm 100 East First Street Mt. Vernon, NY 10550 (914) 813-6555
*Yonkers Career Center is operated under the City of Yonkers, Yonkers Workforce Development Board (YWIB)

http://www.westchesterputnamonestop.com/
Date: 6 November 2015
21
One-‐Stop customers seeking employment. The goal is to give One-‐Stop customers better and more up to date employment options Red Carpet Team The Red Carpet Business Services Alliance provides services to businesses in Putnam County. Over the past five years, several organizations have gathered bimonthly to strategize about how we, as a team, might be able to serve local businesses most efficiently. The mission of the team has been to serve as the primary resource for comprehensive business services in Putnam. The team objectives are to do the following:
• Enhance communication with the business community
• Encourage and coordinate access to available programs, resources and benefits • Provide professional advice and direction to help solve business issues
Business Sector Partnerships
Outreach to specific groups to improve business services and attract businesses to use the WIB’s services is managed through a sector-‐based approach. The WPWB established the Sector Partnerships as way a to reach, engage, and provide valuable workforce development services to local businesses. Each sector partnership is led by a business leader who is responsible for championing sector workforce causes. Organizing the outreach under business clusters/sectors allows business leaders to reach out to their colleagues with guidance that is specifically targeted to their needs. The sector leaders also communicate sector needs to the WPWB, so we can respond to them. Current sectors include green, healthcare, business and professional services, biotech, advanced manufacturing and hospitality.
Employers who participate in the partnership are able to:
• Access the business services provided by the Westchester/Putnam One-‐Stop Centers
• Search a resumes database to find qualified job candidates
• Post job openings
• Receive funding to underwrite the cost of hiring new workers and upgrading the skills of their current workforce
• Keep informed about upcoming training opportunities The Sector-‐Based Incumbent Worker Training Initiative was created to help businesses in the targeted sectors address immediate incumbent worker and new employee training to improve their work related skills and competencies. This program is designed to help reduce employee turnover rates and, in effect, reduce recruitment and training costs related to hiring new workers. This program also establishes a framework for our local workforce system to deliver high quality skill development for new and current workers in a time when federal workforce funds are shrinking.

http://www.westchesterputnamonestop.com/
Date: 6 November 2015
22
The Healthcare Sector
Westchester and Putnam Counties have a thriving healthcare industry made up of hospitals, physicians’ offices, dental offices and long-‐term care facilities, as well as NorMet, the health care industry association for the region. The healthcare sector is essential to the economic vitality of the region as well as the health of its citizens. Healthcare Sector partnership activities include:
Summer Internship Program – The Westchester-‐Putnam One-‐Stop Career Center placed and underwrote the cost of summer interns.
Funded through a grant from the Walmart Foundation, English language training for incumbent workers is being provided at White Plains Hospital, Northern Westchester Hospital and Phelps Memorial Hospital.
Supervisory and Management Skills and Vocational English as a Second Language for the health care industry – Approximately 100 employees of the White Plains Hospital Center, Northern Westchester Hospital, St. John’s Riverside Hospital and Sound Shore Health System will be trained.
The Hospitality Sector
Westchester and Putnam Counties have a flourishing hospitality industry made up of hotels, conference centers, country clubs, and restaurants. The hospitality sector is essential to the economic vitality of the region as it promotes tourism and strengthens community. Hospitality Sector partnership activities include:
• English as a Second Language Training – Offered at eleven hotels and related businesses, this training provided contextualized English classes for 185 employees. The training is tailored to the needs of the employers and the employees in the industry.
• Supervisory and Management Skills for four hospitality businesses. Through this grant between 100 and 125 employees from the Crowne Plaza, The Westchester Country Club, The Westchester Marriott and the Tarrytown House will be trained onsite at the business locations.
• Action Planning, Sales, Supervisory and English Language Skills for the Hospitality Industry. The Westchester Hotel Association worked with its members, Crowne Plaza, Edith Macy, Westchester Country Club, Caperberry Events, Ritz Carlton, Westchester Marriott, Rye Town Hilton, Abigail Kirsch, Tarrytown House, and the IBM Learning Center to provide for staff training for managers, supervisors and more entry-‐level employees.
The Business and Professional Services Sector

http://www.westchesterputnamonestop.com/
Date: 6 November 2015
23
The Business and Professional Services Sector is a key growth sector in Westchester and Putnam Counties. This sector combines two sectors that were previously separate – Information Technology and Financial Services – and includes staffing agencies, accounting firms, and others that cross a variety of business sectors. The sector also includes information technology services, insurance, securities, commodity contracts, and other financial investments, real estate and related activities.
The Business and Professional Services Sector Partnership is developing a skilled workforce pipeline so that where worker shortages exist, employers have a pool of qualified job candidates from which to recruit and hire. The partnership focuses on building a pool of qualified finance workers through education and training to maximize productivity, strengthen job retention, and promote career advancement within Westchester and Putnam County’s financial industry. Business and Professional Services Sector partnership activities include:
• Sector partners partnered with WPWB to apply for major federal grants, including a grant to train workers to do jobs that are currently filled by workers from overseas with H1-‐B visas.
• The needs identified include seeking assistance with recruitment and assessment of possible job candidates and seeking sales training for staff. As a result the Westchester-‐Putnam One-‐Stop has undertaken two customized recruitment activities and referred individuals to employers who are seeking new hires.
The Biotech Sector
Westchester and Putnam Counties have a thriving biotech industry made up of life sciences, pharmaceutical, engineering, manufacturing and sales companies. Westchester and Putnam Counties employ approximately 20 percent of the biotechnology workforce in New York. Biotech is important not only to the economic vitality of the region but also the state. Biotech Sector partnership activities include:
• Mini-‐MBA – This is a public-‐private partnership among the WIB, life sciences/biotech employers, and Westchester Community College. It will focus on essential leadership skills.
• “Management Skills for New Managers” and “Harassment & Code of Conduct Training” – This is a public-‐private partnership among the WIB, life sciences/biotech employers, and Westchester Community College. The skills and curriculum are transferable to other industries.
The Manufacturing Sector
Westchester and Putnam Counties are home to manufacturing companies such as Fenbar Precision Machinists, Inc, where specific skills in advanced manufacturing are in demand.

http://www.westchesterputnamonestop.com/
Date: 6 November 2015
24
The Manufacturing sector partnership is focused on defining core skills and working with training partners to develop curricula that prepare workers to meet their needs. Manufacturing Sector partnership activities include:
• Advanced Manufacturing and Advanced Management Techniques for Area Manufacturing Companies – Three companies (FenBar Precision, Curtis Instruments and BASF) will have their employees participate in these programs designed to upgrade workers skills in the latest manufacturing and management skills.
Job Seeker and Underemployed Incumbent Worker Services
The One-‐Stop system provides all the services necessary to connect job seekers to employers and provides training for underemployed incumbent workers who meet income standards of no more than 400 percent of poverty rate.
Priority of Service legislation and local policy helps to drive the delivery system. Individuals from the following groups fall under Priority of Service:
1. TANF Recipients 2. Individuals reentering the workforce 3. Youth 4. People with disabilities 5. Veterans 6. Underemployed workers with low skills
Individual career counselors are available at each career center to guide customers in searching for jobs and/or getting training to build or improve skills. Training sessions are offered to help customers build the skills that are in demand by local employers. Free workshops help customers sharpen their job search skills. One-Stop Enrollment In the current economic environment with its accompanying layoffs, more than 23,280 customers came through our doors looking for services. At the same time, more than 500 businesses used our services to either hire new workers or train their current employees. The One-Stop Career Center enrolled 13,806 new customers from July 2011 to the present. This brings the total number of active individuals that our office assisted with employment needs to over 23,280 individuals. There were 6,726 job seekers who attended workshops and 7,044 who used the resource room. Two hundred (200) customers took the ESL Class and passed the exam. Individual Training Accounts (ITA) The One-Stop Career Center provides financial support to job-seekers to participate in job training programs that enable them to develop skills needed in today's workplace. Based on the availability of funding and the priority of service policy, One-Stop may issue Individual Training

http://www.westchesterputnamonestop.com/
Date: 6 November 2015
25
Accounts (ITAs) to pay training cost for eligible candidates to pursue training only with approved training providers. The ITA is a voucher that authorizes the training provider to provide the training and then submits an invoice to the One-Stop Career Center for payment for the value of the ITA based on the terms and conditions outlined in its contract with the county. Participating training provides must be approved by the NYSDOL and have and executed training provider contract with Westchester County. Customized Training
Customized training for workers is available under three different models, WIA-‐funded, consortium or employer-‐specific. Under the WIA regulations, customized training is designed to meet the needs of employers, which pay for no less than 50 percent of training costs. The employer guarantees to hire the individual upon successful completion of the training. Incumbent workers may receive training under this model as well as dislocated workers.
Employers with needs for training incumbent workers in specific skills may request training for their employees if they meet certain requirements.
For groups of three or more employers, WPWB will design customized training for incumbent workers. These training programs can be sector-‐customized, and the employers may apply as a consortium to have training provided that is tailored to their workers’ needs.

http://www.westchesterputnamonestop.com/
Date: 6 November 2015
26
Youth Services
Eligible Participants
Under WIOA, services are provided to eligible youth under the umbrella categories of In-‐School Youth (ages 16-‐24) and Out-‐of-‐School Youth (ages 14-‐21).
In-‐School Youth must meet the following criteria:
(i) attending school (as defined by State law);
(ii) not younger than age 14 or (unless an individual with a disability who is attending school under State law) older than age 21; (iii) a low-‐income individual; and
(iv) one or more of the following:
(I) Basic skills deficient. (II) An English language learner.
(III) An offender.
(IV) A homeless individual, a homeless child or youth, a runaway, in foster care or has aged out of the foster care system, a child eligible for assistance under section 477 of the Social Security Act, or in an out-‐of-‐home placement.
(V) Pregnant or parenting (VI) A youth with a disability.
(VII) An individual who requires additional assistance to complete an educational program or to secure or hold employment.
Out-‐of-‐School Youth are defined under the following criteria:
(i) not attending any school (ii) not younger than age 16 or older than age 24; and
(iii) one or more of the following:
(I) A school dropout. (II) A youth who is within the age of compulsory school attendance, but has not attended school for at least the most recent complete school year calendar quarter.
Regional School Locations
Peekskill High School 1072 Elm Street Peekskill, NY 10566 (914) 737-0201 White Plains Senior High School 550 North Street White Plains, NY 10605 (914) 422-2182 Port Chester Senior High School 1 Tamarack Road Port Chester, NY 10573 (914) 934-7950
New Rochelle High School 265 Clove Road New Rochelle, NY 10801 (914) 576-4502 Mount Vernon High School 100 California Road Mount Vernon, NY 10552 (914) 665-5300
Nelly Thornton High School 121 South 6th Avenue Mount Vernon, NY 10550 (914) 358-2740 Putnam Valley High School 146 Peekskill Hollow Road Putnam Valley, NY 10579 (845) 526-7847 Putnam Northern Westchester BOCES 845 Fox Meadow Road Yorktown Heights, NY (914) 245-2700

http://www.westchesterputnamonestop.com/
Date: 6 November 2015
27
(III) A recipient of a secondary school diploma or its recognized equivalent who is a low-‐income individual and is—
(aa) basic skills deficient; or
(bb) an English language learner. (IV) An individual subject to the juvenile or adult justice system
(V) A homeless individual, a homeless child or youth, a runaway, in foster care or has aged out of the foster care system, a child eligible for assistance under section 477 of the Social Security Act, or in an out-‐of-‐ home placement.
(VI) Pregnant or parenting.
(VII) A youth with a disability (VIII) A low-‐income (includes youth living in a high-‐poverty area) individual who requires additional assistance to enter or complete an educational program or to secure or hold employment.
Required Youth Services
At least 75% of local youth formula funds must be used to serve out-‐of-‐school youth. Local regions are required to procure youth programs through a competitive process for the following services:
1. Tutoring, study skills training, instruction, and evidence-‐based dropout prevention and recovery strategies that lead to completion of the requirements for a secondary school diploma or equivalent (including a recognized certificate of attendance or similar document for individuals with disabilities) or for a recognized postsecondary credential; 2. Alternative secondary school services, or dropout recovery services, as appropriate;
3. Paid and unpaid work experiences that have academic and occupational education components:
a. summer jobs and other employment opportunities throughout the school year;
b. pre-‐apprenticeship programs; c. internships and job shadowing; and
d. on-‐the-‐job training opportunities;
4. Occupational skill training, including priority for programs that lead to recognized postsecondary credentials that are aligned with in-‐demand industry sectors or occupations in the local area;
5. Education offered concurrently with workforce preparation activities and training for a specific occupation or occupational cluster;
6. Leadership development opportunities, including community service and peer-‐centered activities that encourage responsibility and other positive social and civic behaviors;
7. Supportive services;

http://www.westchesterputnamonestop.com/
Date: 6 November 2015
28
8. Adult mentoring for the period of participation and a subsequent period, totaling at least 12 months; 9. Follow-‐up services for at least 12 months after the completion of participation;
10. Comprehensive guidance and counseling (including drug and alcohol abuse counseling and referral);
11. Financial literacy education;
12. Entrepreneurial skills training; 13. Services that provide labor market and employment information about in-‐demand industry sectors or occupations available in the local area, such as career awareness, career counseling, and career exploration services; and 14. Activities that help youth prepare for and transition to postsecondary education and training.
Youth Work Experience Manager
The Business Council of Westchester (BCW) has been selected through a competitive process to manage Youth Work Experience. With an extensive network of business connections, the BCW will reach out to develop youth work experience opportunities. Under its contract with the WDB, the BCW will manage functions including the following:
§ Marketing and promotion campaigns § Worksite agreements § Supervisor handbook § Worksite orientation for supervisor and youth participants § Regular contact with worksite supervisors § Coordination with partner agencies doing work experience projects
Westchester Putnam Internship Connex program
The Westchester Putnam Internship Connex program offers a dynamic, one-‐stop portal to connect students with internship opportunities at employers in Westchester and Putnam Counties. Through their Connex internship experience, students gain valuable work experience that prepares them to enter the workforce in their chosen field of study after graduation.
Connex offers employers immediate benefits by bringing talented and motivated students into the workplace, as well as long-‐term benefits by creating a recruitment pool of potential employees who have both education and experience.
Under WIOA, the program will expand from serving college and university students to include WIOA Youth and high school students. In addition serving a wider range of youth, Connex will also expand beyond paid and unpaid internships to include additional work

http://www.westchesterputnamonestop.com/
Date: 6 November 2015
29
experience, including summer and year-‐round employment, pre-‐apprenticeship, on-‐the-‐job training, internships and job-‐shadowing opportunities.
On the Job Training (OJT)
The Business Council will promote the availability of incentives and subsidies for on the job training to its members to create increased opportunities for WIOA youth. The BCW will also reach out to participating high schools and colleges to promote OJT opportunities to their students.
Pre-Apprenticeship and Apprenticeship Programs
The BCW will reach out to its members to develop Pre-‐Apprenticeship and Apprenticeship programs to help WIOA Youth to develop industry-‐recognized credentials and to help the region’s businesses to create a pipeline of trained employees. Working with the One-‐Stop to coordinate these opportunities, the BCE will focus on industries that include healthcare, hospitality, advertising/marketing and professional services.
Workforce Development Academy for Youth (WWDAY) for Westchester and Putnam
The Workforce Development Academy for Youth (WWDAY) for Westchester and Putnam, serves economically disadvantaged youth who are 14 to 21 years old and who are high school dropouts or at-‐risk of failing or dropping out of high school. There are two major service components of this program, the in-‐school (for ages 14 to 21) and out-‐of-‐school (for ages 16 to 24).
The Workforce Development Academy for Youth (WWDAY) consists of the WIA ‘ten elements’ which include the following services:
• Summer Employment Opportunities • Comprehensive guidance and counseling • Adult Mentoring • Tutoring • Alternative Secondary School Services • Paid and unpaid work experiences • Occupational Skill Training • Leadership Development • Supportive Services • Follow-‐up
The Youth Summit
The Youth Summit brings together all the participants in WIOA Youth programs, with about 300 youth attending annually. The Youth Summit offers an interactive agenda that allows youth to hear presentations by renowned guest speakers, participate in workshops, and

http://www.westchesterputnamonestop.com/
Date: 6 November 2015
30
engage in team competitions. An on-‐site job fair brings students face-‐to-‐face with potential employers.
The Youth Advisory Council
Although WIOA does not require Youth Advisory Councils, it encourages them. The WDB has an active and enthusiastic Youth Advisory Council composed of business leaders who are committed to helping connect WIOA Youth with the business community. The Youth Advisory Council also provides a direct connection to identify the skills and experience that are in demand in the workplace.

http://www.westchesterputnamonestop.com/
Date: 6 November 2015
31
Economic and Workforce Data Analysis
Census Data and Regional Demographics
Westchester County Data
#
757,716 Population (Total, all ages)
# 498,912
Population in labor force # 41,897
Population unemployed
Putnam County Data 99,487 Population (Total, all ages)
63,643 Population of labor force age (18-64) 4.4% Unemployment rate
Source: American Community Survey 2014 Population Estimates
See Appendix II for detailed information on labor statistics for Putnam and Westchester Counties.
Covering an area of 450 square miles, Westchester County presents a challenging environment, including stark contrasts in population density, family income levels, and educational attainment. Bordered by Fairfield County, Connecticut, to the east and New York City to the south, the county is home to nearly one million residents. In the southern part of the county and near larger cities, the population density is 5,000 or more people per square mile, while the northern portion has a population density of 500 or fewer people per square mile. While Putnam County is about half the size of Westchester, with a land area of 231 square miles, its population is only about ten percent as large as Westchester.
Economic and
Workforce Data Analysis
Westchester-Putnam Workforce
Development Area
Three-Year Strategic Plan 2015-2019

http://www.westchesterputnamonestop.com/
Date: 6 November 2015
32
Its small towns and rural areas lead Putnam County to call itself “Where the Country Begins.”
Income Disparity Income disparity in Westchester County is the third largest in the nation, according to a 2014 article in the Armonk Voice.1
About one-quarter of [Westchester’s] households earn more than $150,000 annually. The flip side is that many households are living in the shadow of that wealth, with about one in seven households living on less than $25,000 in annual income. Because so many of its residents are wealthy, the county throws off the "false perception of ubiquitous affluence," while its poorer residents struggle and often feel invisible, according to the local advocacy group the Empire State Economic Security Campaign of Westchester.2
1 Income Gap in Westchester, Metro Area, Among Nation’s Widest, The Armonk Daily Voice. March 19, 2014. Retrieved from http://armonk.dailyvoice.com/news/income-gap-westchester-metro-area-among-nations-widest May 16, 2015. 2 Picchi, Anne. How high income inequality is hurting America's health. CBS News MoneyWatch, April 2, 2015. Retrieved from http://www.cbsnews.com/news/how-‐high-‐income-‐inequality-‐is-‐hurting-‐americas-‐health/ May 16, 2015.

http://www.westchesterputnamonestop.com/
Date: 6 November 2015
33
Median income ranges from a low of $49,346 in Mount Vernon to a high of $230,750 in Scarsdale, where family income is 4.7 times that of Mount Vernon families.
In contrast to the large income disparities in Westchester County, the median income ranges from a low of $86,034 to a high of $102,457 among Putnam County’s towns, a difference of just $16,423 versus Westchester’s median income spread of $181,404 between the highest and lowest income towns.
Hudson Valley Economy The Hudson Valley region shows signs of economic growth. Westchester Magazine reports that leasing activity in the first quarter of 2015 was the largest in two years, recording “488,474 square feet in transactions in the first quarter of the year, marking a whopping 70.6 percent increase in deal velocity compared with the 286,104 square feet leased the
$0 $20,000 $40,000 $60,000 $80,000 $100,000 $120,000
Carmel
Putnam
Valley
Philipstown
Patterson
Kent
Southeast
Putnam County Median Income Comparison
$0
$50,000
$100,000
$150,000
$200,000
$250,000
Scarsdale
Pound Ridge
New Castle
Lewisboro
Rye
North Castle
Pelham
North Salem
Somers
Mam
aroneck
Bedford
Harrison
Greenburgh
Mount Pleasant
Yorktown
Eastchester
Cortlandt
Ossining
White Plains
Rye
Mount Kisco
New Rochelle
Peekskill
Yonkers
Mount Vernon
Westchester County Median Income Comparison

http://www.westchesterputnamonestop.com/
Date: 6 November 2015
34
previous quarter…tenants currently in the market for office space have combined requirements totaling approximately 700,000 square feet”3
Labor Force Data, including Unemployment The most recent summary of the labor market from the New York State Department of Labor for the Hudson Valley Region (Dutchess, Orange, Putnam, Rockland, Sullivan, Ulster and Westchester Counties) indicates the following trends:
For the 12-‐month period ending in July 2015, private sector employment in the Hudson Valley increased by 10,500 or 1.4 percent, to 780,300. Five of nine private industry sectors gained jobs in July compared to a year ago. Jobs were added in educational and health services (+7,200), leisure and hospitality (+4,300), other services (+2,000), trade, transportation and utilities (+500), and construction (+200). Job losses were centered in financial activities (-‐1,700), manufacturing (-‐1,500), information (-‐300), and professional and business services (-‐200). The government sector shed 1,000 jobs over the period.
Educational and health services remain the region’s leading job generators. The sector grew by 3.9 percent over the period – its strongest July year-‐over-‐year growth in 17 years. Meanwhile, the region’s leisure and hospitality industry has continued performing admirably, especially in the Orange-‐Rockland-‐Westchester labor market area, where the sector grew by 6.2 percent-‐ its fastest July year-‐to-‐year growth on record. (Source: Labor Statistics for the Hudson Valley Region, http://www.labor.ny.gov/stats/hud/default.asp)
Annual Average Unemployment Rates and Labor Force Participation Rates
for the Past Five Calendar Years (CY).
CY 2010 CY 2011 CY 2012 CY 2013 CY 2014 Westchester County Unemployment rate (%)
7.4% 7.1% 7.3% 6.3% 5.1%
Labor Force (data in thousands)
Employment 443.5 440.3 442.7 446.1 446.2 Unemployment 35.2 33.5 34.6 29.8 24.1
CY 2010 CY 2011 CY 2012 CY 2013 CY 2014 Putnam County 7.2% 6.9% 7.1% 6.1% 4.9%
3 Westchester County Business Buzz, Westchester Magazine Digital Edition, April 23, 2015. Retrieved from http://www.westchestermagazine.com/Blogs/914INC-‐Incoming/April-‐2015/Westchester-‐County-‐Business-‐Buzz-‐April-‐23-‐2015/

http://www.westchesterputnamonestop.com/
Date: 6 November 2015
35
Unemployment rate (%)
Labor Force (data in thousands)
Employment 48.8 48.0 47.9 48.1 47.8 Unemployment 3.8 3.6 3.7 3.1 2.5 Source: New York State Department of Labor, Labor Statistics

http://www.westchesterputnamonestop.com/
Date: 6 November 2015
36
Hudson Valley Job Vacancies
As of August 2015, the following vacancies were listed on the New York State Department of Labor website.
Title Positions
Architecture and Engineering 268 Arts, Design, Sports, and Media 212 Building/Grounds Maintenance 273 Business and Financial Operations 621 Community and Social Services 407 Computer and Mathematical 780 Construction and Extraction 244
Education, Training and Library 125 Farming, Fishing and Forestry 426
Food Preparation and Serving Related 592 Healthcare Practitioner and Technical 842
Healthcare Support 504 Installation, Maintenance and Repair 322
Legal 26 Life, Physical and Social Science 209
Management 955 Office, Clerical and Secretarial 1306
Personal Care, Service, and Gaming 385 Production 414
Protective Service 342 Sales and Related 2811
Transportation and Material Moving 1401
(Source: New York State Department of Labor web site, http://labor.ny.gov/jobs/regional.shtm)

http://www.westchesterputnamonestop.com/
Date: 6 November 2015
37
Employment Data – April 2015
Putnam County Westchester County Unemployed 2,052 20,795 Employed 47,689 447,511 Total Labor Force 49,741 468,306 Unemployment Rate 4.1% 4.4% Source: Local Unemployment and Labor Force Statistics from Bureau of Labor Statistics Employment by industry shows that the largest percentage of the employed population in both Westchester County (27.5%) and Putnam County (28.3%) works in the category of educational services, health care, and social assistance.
Civilian Employed Population 16 years and over by Industry
Westchester County Putnam County
Industry Number Percent Number Percent
Agriculture, forestry, fishing and hunting, and mining 779 0.2% 148 0.3%
Construction 30,404 6.7% 4,208 8.3%
Manufacturing 19,815 4.3% 2,315 4.6%
Wholesale trade 11,063 2.4% 1,222 2.4%
Retail trade 43,271 9.5% 5,394 10.7%
Transportation and warehousing, and utilities 17,930 3.9% 1,949 3.9%
Information 15,032 3.3% 1,962 3.9%
Finance and insurance, and real estate and rental and leasing 47,433 10.4% 4,055 8.0%
Professional, scientific, and management, and administrative and waste management services 63,810 14.0% 6,042 12.0%
Educational services, and health care and social assistance 125,451 27.5% 14,297 28.3%
Arts, entertainment, and recreation, and accommodation and food services 36,638 8.0% 3,408 6.8%

http://www.westchesterputnamonestop.com/
Date: 6 November 2015
38
Other services, except public administration 27,595 6.0% 2,121 4.2%
Public administration 17,604 3.9% 3,338 6.6%
Source: U.S. Census Bureau, 2009-2013 5-Year American Community Survey
Further details are available in Appendix II: Current Labor Statistics for the Hudson Valley.

http://www.westchesterputnamonestop.com/
Date: 6 November 2015
39
Strategic Planning Background Federal and State Requirements and Context
The U.S. Department of Labor works with the State Departments of Labor, which in turn work with the local Workforce Development Boards to develop coordinated strategic plans that embody the overall priorities established by law. History of Planning
The Westchester-‐Putnam Workforce Board first engaged in a formal strategic planning process with the publication of the 2000 Strategic Plan. A second plan was developed for 2002 to 2005. In coordination with the New York State Department of Labor strategic planning initiative, the Westchester-‐Putnam Workforce Development Area prepared a Three-‐Year Strategic Plan covering July 2005 to June 2008 and a subsequent Local Plan Modification that covered July 2008 to June 2009. The WIB engaged LHC Creative Strategies for Development to assist with developing the 2012-‐2105 Strategic Plan and the current 2015-‐2019 Strategic Plan. The plans helped to align state and local initiatives. For the Local Plan Modification, local WIBs were specifically charged with developing strategies and efficiencies for dealing with reductions in funding. Implementation of the requirements under WIOA legislation provides the central focus for the 2015-‐2019 Strategic Plan.
Strategic Planning
Background
Westchester-Putnam Workforce Development Area
Four-Year Strategic Plan 2015-2019

http://www.westchesterputnamonestop.com/
Date: 6 November 2015
40
Strategic Planning Process The current strategic plan was developed under a process that included participation by key constituencies from within the Workforce Investment delivery system and from the larger community of employers, government, training providers, youth services and business coalitions.
WPWB is committed to using evidence-‐based planning and used planning resources available from the Department of Labor, including the technical assistance website at workforce3one.org.
Vision, Mission and Values Validation and Revision A key part of the strategic planning process is review of the WPWB’s vision, mission and values to ensure that they reflect the current state of the organization. In light of the new WIOA legislation, it was particularly important to revisit these key items to ensure that they aligned with the state and federal programs. The vision, mission and values were presented to the full board for review and brainstorming, and they were adjusted to meet the new federal requirements, while still embracing strong and positive goals for the WPWB.
After the suggestions were consolidated and the language revised, the WPWB reviewed and approved the revised Vision, Mission and Values.
Analysis of labor market data
Strategic Planning
Process
Westchester-Putnam Workforce Development Area
Four-Year Strategic Plan 2015-2019

http://www.westchesterputnamonestop.com/
Date: 6 November 2015
41
Plans were created in consultation with the region’s Labor Market Analyst, who provided updated data, trends and demographic information.

http://www.westchesterputnamonestop.com/
Date: 6 November 2015
42
Vision To use innovation, information, technology, and collaborative partnerships to provide individuals with tools to build in-‐demand job skills and credentials, thus developing a highly-‐qualified workforce for businesses and strengthening the regional economy.
Mission The Westchester Putnam Workforce Board provides an environment where job seekers and employers interact to meet the needs for a highly qualified regional workforce. We will strengthen partnerships with business sectors, service providers and the public education system to offer career services and various training modalities to youth and adults. Seeking innovative solutions driven by regional business needs, we will develop model programs, pursue funding opportunities, and share leading edge practices.
Values Ø Creating an Environment Where Businesses and Employees Succeed
Ø Matching Customer Training and Skills to Trending Business Needs
Ø Accountability and Transparency
Ø Innovation and Collaboration
Ø Customer Choice
Ø Streamlining Services for Efficiency
Ø Connections and Communication
Vision
Mission Values
Westchester-Putnam Workforce
Development Area
Four-Year Strategic Plan 2015-2019

http://www.westchesterputnamonestop.com/
Date: 6 November 2015
43
Strategic Plan Goals
Seven comprehensive goals have been identified for the Four-‐Year Strategic Plan. These goals, which are aligned with the Vision, Mission and Values, will guide the Westchester-‐Putnam Workforce Board in expanding and enhancing services in coordination with businesses and partners.
These goals are aligned with the WIOA legislation and are designed to help the WPWB move forward in creating a streamlined, more effective workforce system that leverages the key relationships with business sectors and partnerships with educational and community partners.
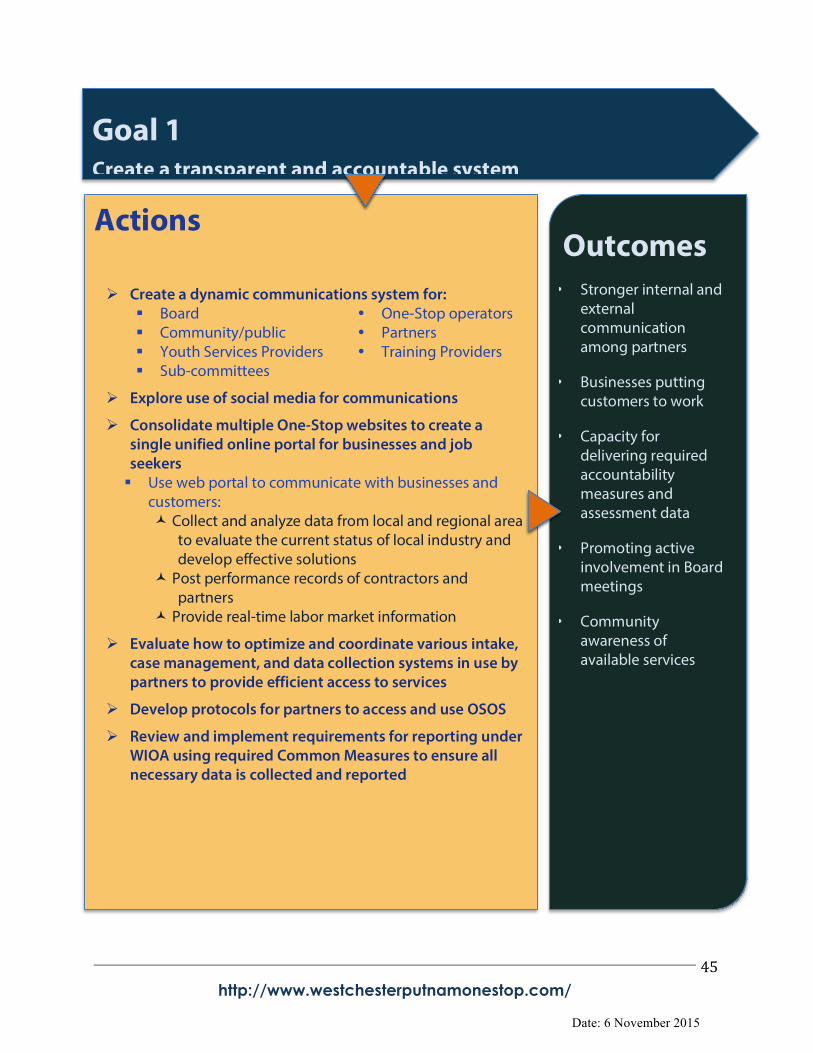
Goal 1 – Create a transparent and accountable system
Goal 2 – Expand and retool Sector Partnership strategies
Goal 3 – Build capacity and develop a strong infrastructure
Goal 4 - Serve all customers eligible for WIOA services
Goal 5 – Engage and expand partnerships
Strategic Plan Goals
Westchester-Putnam Workforce
Development Area
Four-Year Strategic Plan 2015-2019

http://www.westchesterputnamonestop.com/
Date: 6 November 2015
44
Goal 6 – Develop a strong local system with regional impact and engagement
Goal 7 – Seek funding outside of WIOA
http://www.westchesterputnamonestop.com/
Date: 6 November 2015
45
Outcomes • Stronger internal and
external communication among partners
• Businesses putting customers to work
• Capacity for delivering required accountability measures and assessment data
• Promoting active involvement in Board meetings
• Community awareness of available services
Goal 1 Create a transparent and accountable system
Actions Ø Create a dynamic communications system for:
§ Board � One-Stop operators § Community/public � Partners § Youth Services Providers � Training Providers § Sub-committees
Ø Explore use of social media for communications
Ø Consolidate multiple One-Stop websites to create a single unified online portal for businesses and job seekers § Use web portal to communicate with businesses and
customers: © Collect and analyze data from local and regional area
to evaluate the current status of local industry and develop effective solutions
© Post performance records of contractors and partners
© Provide real-time labor market information
Ø Evaluate how to optimize and coordinate various intake, case management, and data collection systems in use by partners to provide efficient access to services
Ø Develop protocols for partners to access and use OSOS
Ø Review and implement requirements for reporting under WIOA using required Common Measures to ensure all necessary data is collected and reported

http://www.westchesterputnamonestop.com/
Date: 6 November 2015
46
Outcomes • Enhanced
relationships and outcomes
• Expanded opportunities for youth
• Filling workforce needs for highly-qualified employees
• Innovative model programs and best practices
• Established industry credentials and career pathways
Goal 2 Expand and retool Sector Partnership strategies
Actions Ø Establish structure for Sector Partners to share
expertise and input on skill needs within their industries § Identify industry-recognized credentials appropriate
to the Hudson Valley economy § Work with partners to strategize innovative and
effective solutions to address workforce needs
Ø Build Sector Academies to train workers as determined by business needs
Ø Define career pathways for specific industries
Ø Provide opportunities for various training modalities, including internships, on the job training (OJT), and standard occupational skills
Ø Develop apprenticeships in cooperation with industry and labor partners
Ø Work with Sector Partners to train incumbent workers and new hires
Ø Develop industry credentials in collaboration with state-wide industry partners
Ø Enhance online portal capabilities for direct interaction between employers and job seekers

http://www.westchesterputnamonestop.com/
Date: 6 November 2015
47
Outcomes • Clearly defined
and consistent management structure
• Increased capacity for providing services
• Effective Board with representation from key organizations
• Enhanced staff development
• Compliance with WIOA requirements
• Increased awareness of One-Stop services
Goal 3 Build capacity and develop a strong infrastructure
Actions Ø Establish and enhance the role of the One-Stop Operator
as responsible for oversight § Manage One-Stop Partnerships
© Define roles of all required partners and integrate into the One-Stop system to ensure that all services are delivered
§ Meet monthly with Partners § Report to Board on services, outcomes and areas where
change is needed
Ø Implement WIOA requirements for Board composition § Review list of required representatives and propose
candidates as needed § Develop process for formal nominations for certain
groups as specified under WIOA
Ø Plan for certification of One-Stop operations § Take advantage of two-year delay § Ask board to re-certify current team of providers § Develop work plan for competitive services certification
Ø Assess space and capacity for co-location of services § Wagner-Peyser � Youth Services
Ø Train and cross-train staff: § To understand how to interpret labor market information
and make it available to customers § To use customer-centered service delivery practices
Ø Define roles and hire project managers for services: § Business Sector Manager § Youth Work Experience Manager § Project Manager for implementing projects such as Just Add
One and Workplace Attributes
Ø Streamline customer engagement and implement strategies such as Boot Camp
Ø Develop marketing and promotion strategies § Branding identity § Use of common identifier: American Job Center

http://www.westchesterputnamonestop.com/
Date: 6 November 2015
48
Outcomes • Offering
customer choice
• Preparing youth to enter the workforce with in-demand skills
• Providing high quality services to job seekers that are: Ø Accessible Ø Available
• Providing businesses with a trained skilled workforce to meet their employment needs
Goal 4 Serve all customers eligible for WIOA services
Actions Ø Expand relationships with training partners, including
colleges and universities to provide training to meet employer needs (e.g., Empire State College)
Ø Strengthen services provided through the web portal as a place where businesses and customers can interact
Ø One-Stop will work together with partners to assess who is in the customer pool and build focus on priority customer groups, drawing on experts for guidance when needed: § People with disabilities § Basic skills deficient § Low-income § TANF recipients § Youth
Ø Redefine services for In School and Out of School youth under WIOA: § Provide paid and unpaid work experience § Develop new programs in the following areas
© Financial Education © Entrepreneurial Skills Training © Access to Labor Market Information © Transition to post-secondary education
§ Support the needs of youth in these areas © Foster Care © Reentry

http://www.westchesterputnamonestop.com/
Date: 6 November 2015
49
Outcomes • Effective
services for customers with coordinated access to resources
• Eliminate silos
• Coordination of services
• Avoid duplication of efforts
• Reduced administrative costs for partners
Goal 5 Engage and Expand Partners
Actions Ø Work with partners to help them identify and understand
the benefits provided by the One-Stop
Ø Identify shared customers and differentiate between similar and unique services among partners
Ø Demonstrate how working with the One-Stop will help to streamline services and reduce administrative costs
Ø Create effective MOUs to define commitment
Ø Establish formula for allocation for sharing cost of benefits of One-Stop § May be cash or in-kind § Sliding scale to accommodate partners with smaller
budgets § Will be established by Governor if consensus is not
reached
Ø Create clear steps for partners to deliver an integrated network of services to customers, including a shared referral process
Ø Work together to identify information for each partner: § Services provided § Customers § Funding § Number Served
Ø Show how partners can take advantage of the capabilities of the One-Stop Operating System (OSOS) as a case management system

http://www.westchesterputnamonestop.com/
Date: 6 November 2015
50
Outcomes • Enhanced
regional collaboration
• Expanded opportunities for job seekers and businesses
• Defined industry credentials and certifications
Goal 6 Develop a strong local system with regional impact and engagement Actions Ø Coordinate with other providers to align with Governor’s
strategic plan
Ø Develop regional Sector strategies § Work with Sector leaders regionally and statewide to
develop and establish industry certifications and credentials
Ø Collaborate on regional initiatives: § Ready to Work § Manufacturing and Advanced Manufacturing § Hospitality § Casinos
Ø Create cooperative apprenticeship opportunities: § SEIU 1199 health care apprenticeship § Labor
Ø Access and use labor market information and economic statistics available through regional and statewide sources

http://www.westchesterputnamonestop.com/
Date: 6 November 2015
51
Outcomes • Resources to
support or enhance existing services
• Expanded opportunities to develop new services
• Potential for increased innovation
Goal 7 Seek funding outside of WIOA
Actions Ø Recruit and build pool of contract grant writers to
respond to funding opportunities
Ø Create replicable models and best practices under Sector Partnerships
Ø Explore opportunities to develop innovative programs
Ø Consider options for revenue generation

http://www.westchesterputnamonestop.com/
Date: 6 November 2015
52
Implementation Timeline
Goal 1: Create a transparent and accountable system Actions Target Date Recurs
Create a dynamic communications system for: § Board One-Stop operators § Community/public Partners § Youth Services Providers Training
Providers § Sub-committees
2016 Ongoing
Explore use of social media for communications 2016 As needed Use web portal to communicate with businesses and customers:
Collect and analyze data from local and regional §area to evaluate the current status of local industry and develop effective solutions
§ Post performance records of contractors and partners § Provide real-time labor market information
2017-2018 As needed
Evaluate how to optimize and coordinate various intake, case management, and data collection systems in use by partners to provide efficient access to services
2016-2017 Every three years
Develop protocols for partners to access and use OSOS 2016 As needed Review and implement requirements for reporting under WIOA using required Common Measures to ensure all necessary data is collected and reported
2016-2019 As
guidance is issued
Goal 2: Expand and retool Sector Partnership strategies Actions Target Date Recurs
Establish structure for Sector Partners to share expertise and input on skill needs within their industries
§ Identify industry-recognized credentials appropriate to the Hudson Valley economy
§ Work with partners to strategize innovative and effective solutions to address workforce needs
2016 Ongoing
Build Sector Academies to train workers as determined by business needs 2016-2017 Ongoing
Define career pathways for specific industries 2016-2017 As needed Provide opportunities for various training modalities, including internships, on the job training (OJT), and standard occupational skills
2016-2019 Ongoing
Develop apprenticeships in cooperation with industry and labor partners 2016-2019 Ongoing
Work with Sector Partners to train incumbent workers and new hires 2016-2019 Ongoing

http://www.westchesterputnamonestop.com/
Date: 6 November 2015
53
Goal 2: Expand and retool Sector Partnership strategies Actions Target Date Recurs
Develop industry credentials in collaboration with state-wide industry partners 2016-2017 As needed
Enhance online portal capabilities for direct interaction between employers and job seekers 2017-2018 As needed
Goal 3: Build capacity and develop a strong infrastructure Actions Target Date Recurs
Establish and enhance the role of the One-Stop Operator as responsible for oversight
§ Manage One-Stop Partnerships § Define roles of all required partners and integrate into
the One-Stop system to ensure that all services are delivered
§ Meet monthly with Partners § Report to Board on services, outcomes and
areas where change is needed
2015-2016 Ongoing
Implement WIOA requirements for Board composition § Review list of required representatives and
propose candidates as needed § Develop process for formal nominations for
certain groups as specified under WIOA
2015-2016 As terms expire
Plan for certification of One-Stop operations § Take advantage of two-year delay § Ask board to re-certify current team of providers § Develop work plan for competitive services
certification
2015-2016 One time
Assess space and capacity for co-location of services § Wagner-Peyser Youth Services
2015-2016 One time
Train and cross-train staff: § To understand how to interpret labor market
information and make it available to customers § To use customer-centered service delivery
practices
2015-2016 As needed
Define roles and hire project managers for services: § Business Sector Manager § Youth Work Experience Manager § Project Manager for implementing projects such
as Just Add One and Workplace Attributes
2015
When contract
terms expire
Streamline customer engagement and implement strategies such as Boot Camp 2015-2016 As needed

http://www.westchesterputnamonestop.com/
Date: 6 November 2015
54
Goal 3: Build capacity and develop a strong infrastructure Actions Target Date Recurs
Develop marketing and promotion strategies § Branding identity § Use of common identifier: American Job Center
2015-2016 As needed
Goal 4: Serve all customers eligible for WIOA services Actions Target Date Recurs
Expand relationships with training partners, including colleges and universities to provide training to meet employer needs (e.g., Empire State College)
2015-2016 Ongoing
Strengthen services provided through the web portal as a place where businesses and customers can interact 2017-2018 As needed
One-Stop will work together with partners to assess who is in the customer pool and build focus on priority customer groups, drawing on experts for guidance when needed:
§ People with disabilities § Basic skills deficient § Low-income § TANF recipients § Youth
2015-2016 Ongoing
Redefine services for In School and Out of School youth under WIOA:
§ Provide paid and unpaid work experience § Develop new programs in the following areas
2015-2016 Ongoing
Redefine services for In School and Out of School youth under WIOA:
§ Provide paid and unpaid work experience § Develop new programs in the following areas
§ Financial Education § Entrepreneurial Skills Training § Access to Labor Market Information § Transition to post-secondary education
§ Support the needs of youth in these areas: § Foster Care § Reentry
2015-2016 Ongoing
Goal 5: Engage and Expand Partners Actions Target Date Recurs
Work with partners to help them identify and understand the 2015 As needed

http://www.westchesterputnamonestop.com/
Date: 6 November 2015
55
Goal 5: Engage and Expand Partners Actions Target Date Recurs
benefits provided by the One-Stop Identify shared customers and differentiate between similar and unique services among partners 2015 As needed
Demonstrate how working with the One-Stop will help to streamline services and reduce administrative costs 2015 As needed
Create effective MOUs to define commitment 2015 Annual Establish formula for allocation for sharing cost of benefits of One-Stop
§ May be cash or in-kind § Sliding scale to accommodate partners with smaller
budgets § Will be established by Governor if consensus is not
reached
2015 Reviewed periodically
Create clear steps for partners to deliver an integrated network of services to customers, including a shared referral process 2015-2016 As needed
Work together to identify information for each partner: § Services provided § Customers § Funding § Number Served
2015-2016 As needed
Show how partners can take advantage of the capabilities of the One-Stop Operating System (OSOS) as a case management system
2016-2017 Ongoing
Goal 6: Develop a strong local system with regional impact and engagement Actions Target Date Recurs
Coordinate with other providers to align with Governor’s strategic plan 2016 Ongoing
Develop regional Sector strategies § Work with Sector leaders regionally and
statewide to develop and establish industry certifications and credentials
2017-2018 Ongoing
Collaborate on regional initiatives: § Ready to Work § Manufacturing and Advanced Manufacturing § Hospitality § Casinos
2016-2017 Ongoing
Create cooperative apprenticeship opportunities: § SEIU 1199 health care apprenticeship § Labor
2016-2017 Ongoing

http://www.westchesterputnamonestop.com/
Date: 6 November 2015
56
Goal 6: Develop a strong local system with regional impact and engagement Actions Target Date Recurs
Access and use labor market information and economic statistics available through regional and statewide sources 2015-2016 Ongoing
Goal 7: Seek funding outside of WIOA Actions Target Date Recurs
Recruit and build pool of contract grant writers to respond to funding opportunities 2015 As needed
Create replicable models and best practices under Sector Partnerships 2016-2017 Ongoing
Explore opportunities to develop innovative programs 2016-2017 Ongoing Consider options for revenue generation 2015-2016 Ongoing

http://www.westchesterputnamonestop.com/
Date: 6 November 2015
57
Budget and Finance Implementing workforce initiatives is inextricably linked with funding for the programs. The Westchester Putnam Workforce Board receives funding under formula dollars from federal funding allocated through the state and discretionary dollars that come from a variety of sources, including special programs and grants. The WPWB operates on a fiscal year that runs from July 1 to June 30.
Formula Funds are used for programs for youth, adults, and dislocated workers. Discretionary Funds are used for special programs like Career Pathways, or the Foster Care Summer Youth Employment program. Primary funding comes from the New York State Department of Labor. Additional funds come from sources like a grant from the United States Department of Labor, FEMA’s National Emergency Grant for remediation of Hurricanes Sandy and Irene, or from local sources like the Westchester County Department of Social Services.
The Westchester Putnam Workforce Board has demonstrated careful stewardship that allows it to stretch limited dollars through effective budgeting to cover the most possible programming. The WPWB financials show tight budgeting of allocated funds, while still achieving stated program goals and objectives.
In addition, WPWB has been committed to exploring opportunities for grant funding that will allow it to implement new and innovative programs. The WDB has also shown a willingness to take on new projects and programs with a commendable success rate.
Because of its vigilant financial planning, the WPWB remains viable and is able to weather fluctuations in funding while still delivering its key services.
Budget and Finance
Westchester-Putnam Workforce
Development Area
Four-Year Strategic Plan 2015-2019

http://www.westchesterputnamonestop.com/
Date: 6 November 2015
58
2012-‐2013 Summary
Formula Funds allocated by the State were used for administration and grants of the primary programs of the WIA for youth, adults, dislocated workers and administration.
There were a number of new allocations to Discretionary Funds in 2012-‐2013, including NEG Hurricanes Sandy and Irene. Allocations for 2012 included: Sandy -‐ $3,743,567, Irene -‐ $920,420, The Disability Employment Initiative -‐ $2,285, New York Youth Works -‐ $280,500, DSS Non-‐Custodial Parent -‐ $597,745 and NYSDOL Utility Reimbursements -‐ $105,085.
Formula Funds Program Y 2012 Allocations Youth $1,266,871 Adult $1,307,637 Dislocated Worker $1,239,785 Administration $314,320 Total 4,128,613 Discretionary Funds NEG Hurricane Sandy $3,743,567 NEG Hurricane Irene $920,421 Career Pathways $37,884 Foster Care Summer Youth Employment $50,000 DSS Non-‐Custodial Parent $597,746 Youth Build $358,342 Strive for the Future-‐Westchester $210,899 Summer TANF $378,304 Disability Employment Initiative $2,286 NYSDOL -‐ Utility Reimbursements $105,085 WCDSS Private Sector Summer Jobs $35,000 New York Youth Works $280,500 Total $10,848,646
2013-‐2014 Summary
During 2013-‐2014, Business Services expanded on-‐the-‐job training offerings: Local/County OJT, State/NEG and Hire Westchester. Throughout 2013 and continuing in 2014, Business Services processed a dramatic increase in applications for training programs, including nearly $500,000 in State NEG/OJT through an emergency Hurricane Sandy grant and over $300,000 drawn from Local County OJT funds. Formula Funds Program Y 2013-‐2014 Allocations

http://www.westchesterputnamonestop.com/
Date: 6 November 2015
59
Youth $1,099,895 Adult $1,076,153 Dislocated Worker $1,400,527 Dislocated Worker Supplemental $127,384 Administration $397,397 Total $4,533,924 Discretionary Funds NEG Hurricane Sandy $6,848,400 NEG Hurricane Irene 738,860 Career Pathways $70,500 Foster Care Summer Youth Employment $50,000 Youth Build $829,046 Strive for the Future-‐Westchester $512,500 Summer TANF $383,077 WCDSS Private Sector Summer Jobs $40,000 On-‐the-‐Job National Energy Grant $415,268 WIA Telephone $105,085 Volunteer Income Tax Assistance Program $50,000 Single Stop USA Vol Inc Tax Assistance Program $50,000 Total $14,626,660
2014-‐2015 Summary
Total Program Year 2014-‐2015 allocation was $11,597,759. Major categories for funding allocations were distributed as follows.
Formula Program Funds
a. Adult $2,003,556 (includes salaries, OTPS, programs, training and contract services/special projects)
b. Youth $1,796,211 (includes salaries, OTPS, programs, training and contract services/special projects)
c. Dislocated Worker $1,999,142 (includes salaries, OTPS, programs, training and contract services/special projects)
d. Administrative $1,059,735 (includes salaries, OTPS, and contract services/special projects)
Discretionary Program Funds e. NEG Hurricane Sandy $2,187,544 f. Youth Build $383,049 g. Strive For the Future $380,081 h. Summer TANF 2014 $442,754

http://www.westchesterputnamonestop.com/
Date: 6 November 2015
60
i. Hire Westchester-‐Putnam $129,821 j. Ready-‐to-‐Work $1,215,866 Total $11,597,759
Grant Funding
In October 2014, the WPWIB was one of 23 national recipients of the USDOL Ready to Work grant of $10 million dollars, which will train and or retrain over 500 healthcare workers in the Hudson Valley for high demand and high paying healthcare jobs. This grant will support a regional collaborative initiative among the Regions, Workforce Boards, One-‐Stop Centers, local colleges and universities, and healthcare businesses.

http://www.westchesterputnamonestop.com/
Date: 6 November 2015
61
Westchester Putnam WBD PY 2015 Budget
Westchester Putnam WBD PY 2015 Youth Programs Budget
BUDGET TOTALS
PY2015 (Jul 15-‐Jun 16) PY14 Carry Forward
PY2015 Allocation WCDSS Total
WDAY WIOA Youth $250,042 $1,086,421 $1,336,463 WDAY-‐ WCDSS Program $200,000 $200,000
Summer TANF $495,324 $495,324 Summer Foster Care $60,000 $60,000
Private Summer Sector $40,000 $40,000 YouthBuild $-‐ $346,007 $346,007
Strive For Future $-‐ $210,076 $210,076 Total $250,042 $1,642,503 $795,324 $2,687,869
PY2015 WDAY (WIOA) Youth Budget Detail
REVENUE PY 2014 Carry Forward $250,042 PY2015 Allocation $1,086,421 Total Revenue $1,336,463
EXPENDITURES In-‐House:
Salaries $60,875 Fringe $41,564 Other than personnel cost (OTPS) $40,280 Sub-‐total (In-‐house) $142,719
Contractual: Youth Work Experience $318,924 WWDAY Program $657,536 City of Mount Vernon Youth Bureau $112,774 The Guidance Center of Westchester $114,000 PNW BOCES $58,236 WESTCOP $45,851 City of White Plains Youth Bureau $95,000 The Children’s Village, Inc. $111,674 WESTHAB $120,000
Sub-‐total (Contractual) $1,119,178
11% Carry forward $217,284
Total Expenditures $1,336,463

http://www.westchesterputnamonestop.com/
Date: 6 November 2015
62
PY2015 WDAY (WCDSS) Youth Budget Detail
REVENUE PY2015 Allocation $200,000 Total Revenue $200,000
EXPENDITURES In-‐House:
Other than personnel cost (OTPS) $252 Sub-‐total (In-‐house) $252
Contractual: WWDAY Program City of Mount Vernon Youth Bureau $35,613 The Guidance Center of Westchester $36,000 PNW BOCES $18,390 WESTCOP $14,479 City Of White Plains Youth Bureau $30,000 The Children’s Village, Inc. $35,266 WESTHAB $30,000 Sub-‐total (Contractual) $199,748
Total Expenditures $ 200,000
PY2015 Summer TANF Budget Detail REVENUE
Summer TANF $495,324 Total Revenue $495,324
EXPENDITURES In-‐House:
Other than personnel cost (OTPS) $252 Sub-‐total (In-‐house) $252
Contractual: WESTCOP, Inc. $42,900 WESTHAB, Inc. $35,100 City of Peekskill Youth Bureau $38,572 The Jewish Board of Family and Children’s Services $39,000 New Rochelle Housing Authority $26,000 White Plains Youth Bureau $38,270 Mount Vernon Youth Bureau $37,889 Slater Center $32,500 Theodore D. Young Community Center $26,000 Children’s Village $39,000 The Guidance Center of Westchester $31,452 SER of Westchester $26,000

http://www.westchesterputnamonestop.com/
Date: 6 November 2015
63
PY2015 Summer TANF Budget Detail New Rochelle Youth Bureau $32,500 Sub-‐total (Contractual) $199,748
Total Expenditures $ 200,000
PY2015 Summer Employment Foster Care Budget Detail REVENUE
WCDSS $60,000 Total Revenue $60,000
EXPENDITURES County Parks & Recreation (6/1/2015-‐10/31/2015) $60,000
Total Expenditures $60,000
PY2015 Youth Build (9/2012-‐12/2015) Budget Detail REVENUE
Item Undo Budgeted WIA Budgeted Undo $192,428
PY14 Carry Forward
$153,580 Total Revenue $192,428 $153,580
EXPENDITURES Item Undo Budgeted WIA Budgeted
Salaries & Fringe $81,190 OTPS $48,943
Total In-‐House $130,133 $-‐
Contracts Westcop USDOL Youth Build $62,295
PY14 Carry Forward
$50,000 Sub-‐total $62,295 $50,000 City of Peekskill
USDOL Youth Build $-‐ PY14 Carry Forward
$103,580
Sub-‐total $103,580 Total Expenditures $192,428 $153,580

http://www.westchesterputnamonestop.com/
Date: 6 November 2015
64
PY2015 Youth Strive For The Future (9/1/2012-‐12/31/2015) Budget Detail
REVENUE Item Strive National Budgeted WIA Budgeted
Strive National $69,226 $140,850 Total Revenue $69,226 $140,850
EXPENDITURES Item Strive National Budgeted WIA Budgeted Contracts
Westhab $44,919 $140,850 Family Services of Westchester $24,306
Total Contracts $69,226 $140,850
Westchester Putnam WBD PY 2015 Adult DLW One-‐Stop Operating Budget
BUDGET TOTALS
PY2015 (Jul 15-‐Jun 16) PY14 Carry Forward
PY2015 Allocation Total
Adult $238,465 $1,057,714 $1,296,179 DLW $269,553 $1,351,642 $1,621,194
Ready-‐to-‐Work $2,954,757 $2,954,757
WCDSS Occupational Skill $100,000 $100,000 Total $508,017 $5,464,113 $5,872,130
PY2015 WIOA Adult Funding Budget Detail
REVENUE PY14 Carry Forward $238,465 PY15 Allocation $1,057,714 Total Revenue $1,296,179
EXPENDITURES In-‐House:
Salaries $234,960 Fringe $170,149 Other than personnel cost (OTPS) $120,660 Sub-‐total (In-‐house) $525,769
Contractual: Putnam $75,555 Training ( ITA/OJT) $344,791 Incumbent Worker Training $105,771

http://www.westchesterputnamonestop.com/
Date: 6 November 2015
65
PY2015 WIOA Adult Funding Budget Detail EMSI $11,500 Sector Manager $21,250 Sub-‐total (Contractual) $558,867 20% Carry forward $211,543 Sub-‐total (Contractual) $770,410
Total Expenditures $1,296,179
PY2015 DLW Funding Budget Detail REVENUE
PY14 Carry Forward $269,553 PY15 Allocation $1,351,642 Total Revenue $1,621,194
EXPENDITURES In-‐House:
Salaries $234,960 Fringe $170,149 Other than personnel cost (OTPS) $120,660 Sub-‐total (In-‐house) $525,769
Contractual: Putnam $97,732 Training ( ITA/OJT) $482,472 Incumbent Worker Training $212,143 EMSI $11,500 Sector Manager $21,250 Sub-‐total (Contractual) $825,097 20% Carry forward $270,328 Sub-‐total (Contractual) $1,095,425
Total Expenditures $1,621,194
PY2015 Ready-‐to-‐Work Budget Detail
REVENUE PY15 Allocation $2,954,757 Total Revenue $2,954,757
EXPENDITURES In-‐House:
Salaries $124,014 Fringe $73,080

http://www.westchesterputnamonestop.com/
Date: 6 November 2015
66
PY2015 Ready-‐to-‐Work Budget Detail Other than personnel cost (OTPS) $20,267 Sub-‐total (In-‐house) $197,094
Contractual: Project Manager $812,600 Web Portal $100,000 Training Costs $815,419 OJT $522,906 Stipends and Incentives $180,000 Boot Camp $240,000 Uniforms $45,000 Certificates $15,000 Promotional Material $26,738 Sub-‐total (Contractual) $2,757,663 Total Expenditures $2,954,757
PY2015 WCDSS Occupational Skills Budget Detail
REVENUE PY15 Allocation $100,000 Total Revenue $100,000
EXPENDITURES Contractual:
Various Trainings Providers (TBD) $100,000 Total Expenditures $100,000
Westchester Putnam WBD PY 2015 Budget
BUDGET TOTALS
PY2015 (Jul 15-‐Jun 16) PY14 Carry Forward
PY2015 Allocation Total
WIA Carry Forward $83,673 $83,673
Youth
$124,713 $124,713
Adult $117,524 $117,524
DLW $150,182 $150,182
Youth Build
$130,133 $130,133
Ready-‐To-‐Work
$197,094 $197,094 Total $83,673 $719,647 $803,320

http://www.westchesterputnamonestop.com/
Date: 6 November 2015
67
PY2015 DLW Funding Budget Detail REVENUE
PY14 Carry Forward $83,673 PY15 Allocation $719,647 Total Revenue $803,320
EXPENDITURES In-‐House:
Salaries $332,250 Fringe $159,862 Other than personnel cost (OTPS) $109,135 Sub-‐total (In-‐house) $601,247
Contractual: Concorde Staffing $20,000 Grant Writing Services $70,000 Other Administrative Cost $33,589 Sub-‐total (Contractual) $123,589
20% Carry forward $78,484 Total Expenditures $803,320

http://www.westchesterputnamonestop.com/
Date: 6 November 2015
68
Performance Standards Performance standards under WIOA have been modified to reflect the changes in services in the new legislation. Under WIOA, core indicators have been added to recognize factors such as credential attainment, earnings, service to employers, and training, reflecting the focus on “achieving positive outcomes for individuals served.” Other measures, including literacy and numeracy gains are eliminated under WIOA.
Where WIA allowed states to receive incentive awards for exceeding their performance levels, WIOA instead has the potential to impose sanctions on states that fail to meet their performance targets.
The proposed performance standards require revisions to the collection and evaluation of assessment data and some measures are still being developed or refined. While WIOA took effect in July 2015, the WIA performance measures continue to apply through PY 2015, ending June 30, 2016. Final regulations are scheduled to be published in January 2016, and use of WIOA Performance Standards is scheduled to begin in July 2016.
WIOA Performance Standards
Performance Measure Indicator Adults and Dislocated Worker Measures
Entry into unsubsidized employment (Entered Employment)
Measured in Q2 after exit.
Retention in unsubsidized employment (Employment Retention)
Measured in Q4 after exit.
Earnings change after entry into Measured as median earnings in Q2 after exit only.
Performance Standards
Westchester-Putnam Workforce
Development Area
Four-Year Strategic Plan 2015-2019

http://www.westchesterputnamonestop.com/
Date: 6 November 2015
69
WIOA Performance Standards Performance Measure Indicator
unsubsidized employment (Average Earnings)
Median is defined as the numerical value that separates the higher half from the lower half of earnings.
Credential Rate Percentage of participants who obtain a recognized postsecondary credential or diploma during participation or within one year after program exit.
In Program Skills Gain Percentage of participants in education leading to credential or employment during program year, achieving measurable gains.
Youth Measures Placement in Employment, Education, or Training
Measured in Q2 after exit.
Retention in Employment, Education, or Training
Percentage of participants in education, training, or unsubsidized employment; measured in Q4 after exit.
Earnings after entry into unsubsidized employment
Median earnings of participants in unsubsidized employment during Q2 after exit.
Credential rate Percentage of participants who obtain a recognized credentials or secondary diploma during participation or within one year after program exit.
In Program Skills Gain Percentage of participants in education leading to credential or employment during program year, achieving measurable gains.
Employer Measures Indicators of effectiveness in serving employers
To be determined
Performance Tracking – One Stop Operating System (OSOS) Performance data for all measures are tracked using a unified system, One Stop Operating System (OSOS). As part of WIOA, partner organizations will be trained to enter performance data into OSOS.

http://www.westchesterputnamonestop.com/
Date: 6 November 2015
i
Appendices Appendix I: Westchester Putnam Workforce Development Area Information ............ i 2015-‐2016 Workforce Development Board (WDB) ................................................................. i Westchester-‐Putnam Workforce Development Area Partners ........................................... ii Training Providers ................................................................................................................................. iii
Appendix II: Local Area Unemployment Statistics .............................................................. iv Westchester County Local Area Unemployment Statistics ................................................. vii Putnam County Local Area Unemployment Statistics ............................................................ iv
Appendix III: Labor Market Statistics ........................................................................................ x Current Labor Statistics for the Hudson Valley Region .......................................................... x Labor Market Profile – Dutchess-‐Putnam MSA ......................................................................... xi Labor Market Profile – Orange-‐Rockland Westchester MSA .............................................. xii Labor Market Profile – Sullivan County ...................................................................................... xiv
Appendix IV: Job Projection Data for the Mid-‐Hudson Region ...................................... xvi Projected Job Openings in the Mid-‐Hudson Region .............................................................. xvi Hudson Valley Projected Job Growth with 100 or More Annual Average Openingsxxvi
Appendix V: Pertinent Regulations ................................................................................... xxviii Appendix VI: References .......................................................................................................... xxix Appendix VII: Assurances ......................................................................................................... xxx
Appendices
Westchester-Putnam Workforce Development Area
Four-Year Strategic Plan 2015-2019

http://www.westchesterputnamonestop.com/
Date: 6 November 2015
i
Appendix I: Westchester Putnam Workforce Development Area Information
2015-2016 Workforce Development Board (WDB)
The Westchester-‐Putnam Workforce Development Board (WDB) provides policy directions and program oversight to the One-‐Stop Career Centers and workforce development programs in Westchester and Putnam counties. The board is appointed by Westchester County Executive Robert P. Astorino and Putnam County Executive MaryEllen Odell. The WIB members are appointed in accordance with the Federal Workforce Investment Act and represent public and private sector businesses.
Westchester Putnam Workforce Board Members Rosa Barksdale President/CEO Barksdale Health Care James Bernardo President Candela Systems Corporation Thomas Capurso Business Representative IBEW Local Union 3 Edward Cooke Council Representative Northeast Regional Council of Carpenters Joseph DiCarlo Senior VP, Human Resources WESTMED Practice Partners Richard Friedman General Manager DoubleTree by Hilton, Tarrytown Dr. Marsha Gordon President/CEO The Business Council of Westchester Richard Greenwald President Concorde Personnel Temporary Staffing Wiley Harrison President Business of Your Business, LLC
Thom Kleiner Regional Representative for the Hudson Valley New York State Department of Labor
Allison Madison President Madison Approach Staffing Daniel Magnus President Elevation Burger Anthony Marmo President Clover Heating & Cooling Kevin McGuire Commissioner Department of Social Services Dr. Belinda S. Miles President Westchester Community College
William Mooney, III Director Westchester County Office of Economic Development
Claudia Murphy Director Southern Westchester BOCES Dr. Iris Pagan Director Westchester County Youth Bureau Matthew Pepe Assistant President Construction Industry Council
Michael Piazza Commissioner of Putnam DSS Putnam County Department of Social Services
Mark Ridgeway District Manager NYSED (ACCESS-‐VR) Karl Rohde Director Putnam County Veteran Service Agency Robert O. Sanders CEO Hospitality Resource Group Inc. James D. Schutzer Vice President J.D. Moschitto & Associates, Inc. Nick Simard Vice President InspiriaMedia David Singer, Chair President Robison Oil Richard St. Paul CEO/President Law Office of Richard St. Paul, Esq., PLLC Leonard J. Vallender President Fenbar Precision Machinists, Inc.

http://www.westchesterputnamonestop.com/
Date: 6 November 2015
ii
Westchester-Putnam Workforce Development Area Partners
The following organizations are partnering with the Westchester Putnam Workforce Development Board to provide services:
• Putnam/Northern Westchester BOCES
• Southern Westchester BOCES
• Westchester Community College • NYS Department of Labor
• Putnam County Department of Social Services • Urban League of Westchester
• Westcop - Westchester Community Opportunity Program • Business Council of Westchester
• Westchester Library System • Putnam Department of Social Services
• Hudson Valley Region United Way 211

http://www.westchesterputnamonestop.com/
Date: 6 November 2015
iii
Training Providers
The following organizations are designated as Training Providers for the Westchester Putnam Workforce Development Board:
• Hudson Valley Career Training
• Heritage Auto School • Selfoss Group
• Southern Westchester BOCES • Eagle Eye Security Solutions
• Gerard Leblanc • Greyston Foundations
• Westchester School for Dental • Creative Direction Construction & Design, LLC.
• Putnam/ Northern Westchester BOCES • Hospitality Resource Group
• Big Apple Occupational Safety • Childcare Council of Westchester
• NCADD • Putnam Driving School • Enterprise Training Solution
• New York of Esthetics & Day Spa Inc. • Women’s Enterprise Development Center, Inc.
• Brewster Institute of Technology

http://www.westchesterputnamonestop.com/
Date: 6 November 2015
iv
Appendix II: Local Area Unemployment Statistics
New York State, Labor Market Regions, Metropolitan Areas, Counties, and Municipalities of at Least 25,000 Population
Data Source: Local Area Unemployment Statistics Program (Data are not seasonally adjusted. Data are preliminary and subject to revision.)
Putnam County Local Area Unemployment Statistics
PUTNAM UNEMPLOYMENT RATE
Year Jan Feb Mar Apr May June July Aug Sep Oct Nov Dec Ann. Avg.
2015 5.0% 4.9% 4.4% 4.1% 4.3% 4.3% 4.8%
2014 5.7% 5.8% 5.3% 4.5% 4.8% 4.8% 5.2% 4.9% 4.7% 4.3% 4.4% 4.2% 4.9%
2013 7.5% 7.1% 6.4% 5.9% 6.0% 6.2% 6.2% 6.0% 5.8% 5.6% 5.2% 5.0% 6.1%
2012 7.6% 7.7% 7.2% 6.8% 7.2% 7.4% 7.9% 7.2% 6.9% 6.6% 6.4% 6.6% 7.1%
2011 7.5% 7.3% 6.8% 6.6% 6.7% 7.0% 7.1% 6.9% 7.1% 6.8% 6.7% 6.9% 6.9%
2010 7.9% 7.8% 7.4% 7.0% 7.0% 7.1% 7.3% 7.1% 7.1% 6.9% 7.0% 6.8% 7.2%
2009 6.2% 6.6% 6.6% 6.3% 6.7% 6.8% 6.8% 6.8% 7.0% 6.9% 6.8% 6.9% 6.7%
2008 4.2% 4.2% 4.0% 3.7% 4.3% 4.4% 4.6% 4.7% 4.7% 4.5% 4.7% 5.1% 4.4%
2007 3.7% 3.6% 3.2% 3.0% 3.2% 3.3% 3.5% 3.3% 3.5% 3.3% 3.4% 3.5% 3.4%
2006 3.9% 3.9% 3.8% 3.6% 3.6% 3.6% 3.7% 3.4% 3.3% 3.0% 3.1% 2.9% 3.5%
2005 4.1% 4.1% 3.7% 3.5% 3.6% 3.8% 3.8% 3.5% 3.7% 3.5% 3.8% 3.4% 3.7%
2004 4.5% 4.5% 4.3% 3.8% 3.8% 4.0% 4.0% 3.7% 3.8% 3.6% 3.6% 3.7% 4.0%
2003 4.4% 4.2% 3.9% 3.7% 3.8% 4.1% 4.1% 4.0% 4.1% 3.9% 4.0% 3.8% 4.0%
2002 4.4% 4.4% 4.3% 3.9% 3.9% 4.1% 4.1% 3.7% 3.7% 3.5% 3.6% 3.6% 3.9%
2001 3.2% 3.2% 2.9% 2.6% 2.7% 3.0% 3.2% 3.4% 3.4% 3.4% 3.5% 3.6% 3.2%
2000 3.4% 3.6% 3.1% 2.6% 2.9% 2.9% 3.0% 2.9% 3.0% 2.7% 2.6% 2.4% 2.9%
1999 2.8% 3.0% 2.8% 2.8% 2.8% 3.3% 3.4% 3.0% 3.1% 2.7% 2.4% 2.1% 2.9%
1998 3.1% 3.1% 2.8% 2.4% 2.6% 2.8% 2.8% 2.6% 2.7% 2.5% 2.3% 2.3% 2.7%
1997 3.6% 3.5% 3.3% 2.9% 2.9% 3.2% 3.2% 3.1% 3.1% 2.7% 2.6% 2.4% 3.0%
1996 4.2% 4.1% 3.9% 3.6% 4.0% 3.8% 3.9% 3.4% 3.2% 3.1% 2.9% 2.8% 3.6%
1995 4.6% 4.4% 4.1% 4.1% 4.1% 4.0% 4.1% 3.9% 3.9% 3.5% 3.2% 3.2% 3.9%
1994 5.4% 5.5% 5.2% 4.6% 4.4% 4.8% 4.9% 4.7% 4.5% 4.3% 4.0% 3.8% 4.7%
1993 6.0% 5.9% 5.5% 4.8% 5.2% 5.7% 5.6% 5.4% 5.5% 5.1% 4.8% 4.6% 5.3%
1992 6.6% 7.0% 6.6% 5.8% 6.0% 6.3% 6.0% 5.8% 6.1% 5.5% 5.3% 5.3% 6.0%
1991 5.1% 5.5% 5.6% 5.0% 5.4% 5.3% 5.6% 5.3% 5.4% 5.2% 4.9% 5.2% 5.3%
1990 2.9% 3.2% 3.0% 3.0% 3.2% 3.2% 3.3% 3.3% 3.4% 3.3% 3.7% 3.7% 3.3%
PUTNAM LABOR FORCE
Year Jan Feb Mar Apr May June July Aug Sep Oct Nov Dec Ann. Avg.
2015 49,000 49,100 49,500 49,700 50,200 50,700 51,000
2014 49,900 50,200 50,500 50,000 50,400 51,000 51,200 50,500 49,600 50,100 49,800 49,300 50,200
2013 50,400 50,700 50,700 51,100 51,500 52,200 52,600 52,000 51,100 50,700 50,700 50,200 51,200

http://www.westchesterputnamonestop.com/
Date: 6 November 2015
v
PUTNAM LABOR FORCE Year Jan Feb Mar Apr May June July Aug Sep Oct Nov Dec Ann.
Avg. 2012 50,600 51,200 51,200 51,300 51,600 52,300 52,400 51,800 51,500 52,000 51,500 51,200 51,600
2011 51,100 51,300 51,500 51,400 51,600 51,900 52,200 52,100 51,300 51,800 51,500 51,500 51,600
2010 51,800 52,100 52,300 52,900 52,900 53,400 53,800 53,500 52,400 52,400 52,000 51,700 52,600
2009 55,100 54,800 54,800 55,000 55,100 56,100 56,600 55,800 54,400 54,200 54,400 53,900 55,000
2008 55,600 55,100 55,400 55,600 55,900 57,000 57,700 56,900 55,900 56,000 55,900 55,700 56,100
2007 55,300 55,000 55,100 54,900 55,100 56,600 57,200 56,100 55,300 55,500 56,000 55,800 55,700
2006 55,600 55,400 55,600 55,600 55,800 57,200 57,500 56,800 55,700 56,200 56,300 56,400 56,200
2005 55,300 55,100 55,100 55,500 55,800 56,800 57,500 57,100 55,900 56,300 56,200 56,300 56,100
2004 54,700 54,500 54,500 54,600 54,600 55,900 56,800 56,200 54,800 55,500 55,800 55,800 55,300
2003 54,100 53,900 54,000 54,100 54,000 55,100 55,400 54,900 53,700 54,200 54,500 54,400 54,400
2002 52,500 53,200 53,200 53,300 53,700 54,700 55,000 54,500 53,800 54,100 53,700 54,000 53,800
2001 52,400 52,300 52,400 52,100 52,100 53,200 53,500 52,600 52,000 52,400 52,500 52,800 52,500
2000 51,900 51,900 51,900 51,700 51,600 52,800 52,900 52,500 51,300 51,700 51,800 52,200 52,000
1999 55,300 54,600 54,200 54,200 55,100 56,900 57,000 57,000 54,500 55,100 54,900 55,200 55,300
1998 52,300 52,200 52,200 52,800 53,600 55,500 56,400 56,200 53,900 54,200 54,000 54,100 54,000
1997 50,300 49,900 50,500 50,400 51,200 53,000 54,400 54,400 52,500 52,700 52,700 52,700 52,100
1996 47,400 47,200 47,900 48,400 49,200 51,300 53,300 53,300 50,800 50,900 50,200 50,400 50,000
1995 48,200 48,100 48,000 48,200 48,600 50,100 50,800 51,300 49,000 49,100 48,600 48,500 49,000
1994 47,800 47,400 47,000 47,200 47,800 49,100 50,400 50,700 48,500 49,000 49,100 48,800 48,600
1993 47,400 47,300 47,400 47,700 48,600 50,300 51,000 51,300 48,400 48,100 47,900 47,500 48,600
1992 48,000 47,600 47,800 47,800 47,900 49,900 51,000 51,200 47,800 47,500 47,900 47,700 48,500
1991 48,000 47,700 47,900 48,200 48,400 49,900 50,800 50,100 48,100 48,300 47,800 47,600 48,600
1990 46,800 46,300 46,900 47,200 47,900 49,500 50,500 51,100 47,600 47,500 47,400 47,700 48,000
PUTNAM EMPLOYED
Year Jan Feb Mar Apr May June July Aug Sep Oct Nov Dec Ann. Avg.
2015 46,500 46,600 47,300 47,700 48,100 48,500 48,600
2014 47,000 47,200 47,800 47,800 48,000 48,600 48,500 48,100 47,300 47,900 47,600 47,200 47,800
2013 46,700 47,100 47,400 48,100 48,400 49,000 49,300 48,900 48,100 47,900 48,100 47,700 48,100
2012 46,800 47,200 47,500 47,800 47,900 48,500 48,300 48,100 48,000 48,600 48,200 47,900 47,900
2011 47,300 47,500 48,000 48,100 48,100 48,200 48,500 48,500 47,700 48,300 48,100 47,900 48,000
2010 47,700 48,100 48,400 49,200 49,300 49,600 49,800 49,700 48,700 48,800 48,400 48,200 48,800
2009 51,700 51,100 51,200 51,500 51,400 52,300 52,700 52,100 50,600 50,500 50,700 50,100 51,300
2008 53,300 52,800 53,200 53,600 53,500 54,500 55,000 54,300 53,300 53,500 53,300 52,900 53,600
2007 53,300 53,000 53,400 53,300 53,400 54,700 55,100 54,300 53,400 53,700 54,100 53,900 53,800
2006 53,400 53,300 53,500 53,600 53,800 55,100 55,400 54,900 53,800 54,500 54,600 54,800 54,200
2005 53,000 52,800 53,100 53,500 53,800 54,600 55,300 55,100 53,800 54,300 54,100 54,400 54,000
2004 52,200 52,100 52,200 52,500 52,500 53,600 54,500 54,100 52,700 53,500 53,800 53,800 53,100
2003 51,700 51,600 51,900 52,100 52,000 52,900 53,200 52,700 51,500 52,100 52,400 52,300 52,200
2002 50,200 50,800 51,000 51,200 51,600 52,500 52,800 52,500 51,900 52,100 51,800 52,000 51,700
2001 50,700 50,600 50,900 50,700 50,700 51,600 51,800 50,800 50,200 50,600 50,700 50,900 50,800

http://www.westchesterputnamonestop.com/
Date: 6 November 2015
vi
PUTNAM EMPLOYED
Year Jan Feb Mar Apr May June July Aug Sep Oct Nov Dec Ann. Avg.
2000 50,100 50,100 50,200 50,400 50,100 51,200 51,300 50,900 49,700 50,300 50,500 51,000 50,500
1999 53,800 53,000 52,700 52,700 53,500 55,000 55,100 55,300 52,800 53,600 53,600 54,000 53,800
1998 50,700 50,600 50,800 51,600 52,200 54,000 54,900 54,700 52,400 52,800 52,800 52,900 52,500
1997 48,500 48,100 48,800 49,000 49,700 51,300 52,700 52,800 50,900 51,300 51,300 51,500 50,500
1996 45,400 45,300 46,000 46,700 47,200 49,400 51,300 51,500 49,200 49,300 48,800 49,000 48,200
1995 46,000 46,000 46,000 46,200 46,600 48,100 48,700 49,300 47,100 47,400 47,100 47,000 47,100
1994 45,200 44,800 44,500 45,000 45,600 46,700 47,900 48,300 46,300 46,900 47,100 47,000 46,300
1993 44,500 44,500 44,800 45,400 46,100 47,500 48,200 48,500 45,700 45,600 45,600 45,300 46,000
1992 44,800 44,200 44,700 45,100 45,000 46,700 47,900 48,300 44,900 44,900 45,400 45,200 45,600
1991 45,500 45,100 45,200 45,800 45,800 47,300 47,900 47,400 45,500 45,800 45,500 45,100 46,000
1990 45,400 44,800 45,500 45,800 46,300 47,900 48,800 49,400 46,000 45,900 45,600 45,900 46,400
PUTNAM UNEMPLOYED
Year Jan Feb Mar Apr May June July Aug Sep Oct Nov Dec Ann. Avg.
2015 2,500 2,400 2,200 2,100 2,100 2,200 2,400
2014 2,900 2,900 2,700 2,200 2,400 2,500 2,600 2,500 2,300 2,200 2,200 2,100 2,500
2013 3,800 3,600 3,200 3,000 3,100 3,200 3,300 3,100 3,000 2,800 2,600 2,500 3,100
2012 3,800 3,900 3,700 3,500 3,700 3,900 4,100 3,700 3,600 3,500 3,300 3,400 3,700
2011 3,800 3,800 3,500 3,400 3,400 3,600 3,700 3,600 3,600 3,500 3,400 3,500 3,600
2010 4,100 4,100 3,900 3,700 3,700 3,800 3,900 3,800 3,700 3,600 3,700 3,500 3,800
2009 3,400 3,600 3,600 3,400 3,700 3,800 3,900 3,800 3,800 3,700 3,700 3,700 3,700
2008 2,300 2,300 2,200 2,100 2,400 2,500 2,700 2,700 2,600 2,500 2,700 2,800 2,500
2007 2,100 2,000 1,800 1,700 1,800 1,900 2,000 1,900 1,900 1,800 1,900 1,900 1,900
2006 2,200 2,200 2,100 2,000 2,000 2,100 2,100 1,900 1,900 1,700 1,700 1,600 2,000
2005 2,300 2,300 2,000 1,900 2,000 2,100 2,200 2,000 2,100 2,000 2,100 1,900 2,100
2004 2,500 2,500 2,400 2,100 2,100 2,200 2,300 2,100 2,100 2,000 2,000 2,000 2,200
2003 2,400 2,300 2,100 2,000 2,100 2,200 2,300 2,200 2,200 2,100 2,200 2,100 2,200
2002 2,300 2,300 2,300 2,100 2,100 2,300 2,200 2,000 2,000 1,900 2,000 2,000 2,100
2001 1,700 1,700 1,500 1,400 1,400 1,600 1,700 1,800 1,800 1,800 1,800 1,900 1,700
2000 1,800 1,800 1,600 1,400 1,500 1,500 1,600 1,500 1,500 1,400 1,400 1,300 1,500
1999 1,600 1,700 1,500 1,500 1,500 1,900 1,900 1,700 1,700 1,500 1,300 1,200 1,600
1998 1,600 1,600 1,400 1,300 1,400 1,500 1,600 1,500 1,400 1,400 1,300 1,200 1,400
1997 1,800 1,800 1,700 1,400 1,500 1,700 1,800 1,700 1,600 1,400 1,400 1,300 1,600
1996 2,000 1,900 1,800 1,800 2,000 1,900 2,100 1,800 1,600 1,600 1,500 1,400 1,800
1995 2,200 2,100 1,900 2,000 2,000 2,000 2,100 2,000 1,900 1,700 1,500 1,500 1,900
1994 2,600 2,600 2,500 2,200 2,100 2,300 2,500 2,400 2,200 2,100 2,000 1,800 2,300
1993 2,800 2,800 2,600 2,300 2,500 2,900 2,800 2,800 2,600 2,500 2,300 2,200 2,600
1992 3,200 3,300 3,200 2,800 2,900 3,200 3,100 3,000 2,900 2,600 2,500 2,600 2,900
1991 2,500 2,600 2,700 2,400 2,600 2,700 2,800 2,700 2,600 2,500 2,300 2,500 2,600
1990 1,400 1,500 1,400 1,400 1,500 1,600 1,700 1,700 1,600 1,600 1,800 1,800 1,600

http://www.westchesterputnamonestop.com/
Date: 6 November 2015
vii
Westchester County Local Area Unemployment Statistics
WESTCHESTER UNEMPLOYMENT RATE Year Jan Feb Mar Apr May June July Aug Sep Oct Nov Dec Ann.
Avg. 2015 5.3% 5.2% 4.7% 4.4% 4.6% 4.6% 5.0%
2014 5.9% 6.0% 5.5% 4.6% 5.0% 5.0% 5.4% 5.2% 5.0% 4.7% 4.7% 4.5% 5.1%
2013 7.6% 7.3% 6.6% 6.0% 6.2% 6.3% 6.4% 6.2% 6.1% 5.8% 5.4% 5.2% 6.3%
2012 7.8% 7.9% 7.4% 6.9% 7.2% 7.5% 7.8% 7.4% 7.1% 6.8% 6.5% 6.7% 7.3%
2011 7.8% 7.7% 7.1% 6.6% 6.7% 7.0% 7.2% 7.1% 7.1% 6.9% 6.8% 7.0% 7.1%
2010 8.1% 8.1% 7.7% 7.1% 7.1% 7.1% 7.4% 7.2% 7.2% 7.1% 7.2% 7.0% 7.4%
2009 6.7% 7.2% 7.1% 6.6% 7.0% 7.2% 7.2% 7.2% 7.4% 7.2% 7.0% 7.2% 7.1%
2008 4.6% 4.6% 4.4% 3.9% 4.5% 4.7% 4.9% 5.0% 5.1% 5.0% 5.2% 5.6% 4.8%
2007 4.1% 4.0% 3.6% 3.2% 3.4% 3.6% 3.9% 3.7% 3.8% 3.6% 3.7% 3.9% 3.7%
2006 4.2% 4.4% 4.1% 3.8% 3.8% 3.8% 4.0% 3.7% 3.7% 3.2% 3.3% 3.2% 3.8%
2005 4.5% 4.5% 3.9% 3.7% 3.9% 4.0% 4.1% 3.8% 4.2% 3.8% 4.0% 3.7% 4.0%
2004 5.3% 5.2% 5.1% 4.3% 4.3% 4.5% 4.4% 4.1% 4.2% 3.9% 4.0% 4.1% 4.4%
2003 4.9% 4.8% 4.4% 4.1% 4.2% 4.6% 4.5% 4.3% 4.6% 4.4% 4.5% 4.4% 4.5%
2002 5.2% 5.1% 4.9% 4.5% 4.4% 4.5% 4.5% 4.3% 4.2% 4.1% 4.2% 4.2% 4.5%
2001 3.8% 3.7% 3.4% 3.1% 3.2% 3.6% 3.7% 3.9% 4.1% 4.1% 4.3% 4.4% 3.8%
2000 4.0% 4.1% 3.7% 3.1% 3.3% 3.3% 3.4% 3.3% 3.4% 3.1% 3.2% 3.0% 3.4%
1999 3.5% 3.8% 3.5% 3.2% 3.2% 3.6% 3.7% 3.5% 3.6% 3.2% 2.9% 2.8% 3.4%
1998 3.9% 3.9% 3.6% 3.0% 3.2% 3.4% 3.3% 3.3% 3.4% 3.1% 2.8% 2.9% 3.3%
1997 4.2% 4.2% 3.8% 3.4% 3.5% 3.8% 4.0% 3.9% 3.9% 3.5% 3.2% 3.1% 3.7%
1996 4.7% 4.5% 4.4% 4.0% 4.1% 4.1% 4.5% 4.0% 4.0% 3.6% 3.5% 3.4% 4.1%
1995 4.9% 4.8% 4.4% 4.2% 4.3% 4.4% 4.8% 4.7% 4.6% 4.1% 3.9% 3.8% 4.4%
1994 5.7% 5.7% 5.4% 4.9% 4.7% 5.0% 5.2% 5.0% 4.9% 4.5% 4.2% 4.0% 4.9%
1993 6.5% 6.3% 5.8% 5.2% 5.4% 5.7% 5.6% 5.5% 5.4% 5.2% 5.0% 4.9% 5.5%
1992 6.8% 7.0% 6.5% 5.7% 5.9% 6.3% 6.2% 6.2% 6.4% 5.9% 5.8% 5.7% 6.2%
1991 5.3% 5.7% 5.6% 4.9% 5.5% 5.4% 5.5% 5.5% 5.5% 5.3% 5.2% 5.4% 5.4%
1990 3.5% 3.5% 3.2% 3.1% 3.2% 3.2% 3.5% 3.8% 3.8% 3.6% 4.1% 4.0% 3.5%
WESTCHESTER LABOR FORCE
Year Jan Feb Mar Apr May June July Aug Sep Oct Nov Dec Ann. Avg.
2015 466,200 461,600 465,200 468,700 474,200 481,600 485,100 2014 469,900 467,300 469,500 465,300 469,900 479,400 483,100 475,900 465,700 468,400 466,700 462,900 470,300
2013 474,300 470,700 470,600 473,800 477,800 488,200 490,500 482,800 473,600 469,600 471,300 466,600 475,800
2012 468,500 468,600 470,300 471,500 477,800 486,800 489,700 483,100 477,400 481,100 477,300 476,000 477,300
2011 471,400 469,700 471,500 470,900 473,200 479,400 482,500 478,800 472,900 473,600 471,700 470,800 473,900
2010 473,900 473,500 474,800 479,600 478,400 487,000 490,500 487,900 478,400 475,700 473,300 471,300 478,700
2009 489,000 486,700 486,500 487,100 488,000 497,700 501,500 494,900 482,300 480,400 481,000 476,600 487,600
2008 491,700 487,400 490,200 491,400 493,300 503,700 509,600 503,100 494,700 496,200 495,200 493,500 495,800
2007 486,600 483,800 485,200 482,400 484,200 497,500 502,800 493,900 487,000 488,400 492,200 491,000 489,600
2006 482,300 481,800 482,900 481,900 483,900 495,400 498,900 493,100 483,100 487,500 488,500 489,800 487,400

http://www.westchesterputnamonestop.com/
Date: 6 November 2015
viii
WESTCHESTER LABOR FORCE
Year Jan Feb Mar Apr May June July Aug Sep Oct Nov Dec Ann. Avg.
2005 476,500 474,900 473,600 477,000 480,300 488,400 494,900 491,000 481,400 483,900 483,600 484,200 482,500
2004 473,800 472,100 472,800 471,800 471,800 482,700 490,100 485,300 473,200 478,800 481,400 481,800 478,000
2003 469,600 468,200 469,300 469,500 468,600 479,000 480,800 476,200 466,100 470,900 473,600 472,600 472,000
2002 461,200 466,200 466,400 466,800 469,900 478,500 481,400 477,500 471,200 473,100 470,500 472,300 471,200
2001 463,000 461,200 462,400 459,000 459,600 469,400 471,800 463,800 459,700 463,400 464,600 466,800 463,700
2000 460,700 460,500 460,000 458,600 456,900 467,600 468,800 464,800 454,300 458,200 459,800 463,300 461,100
1999 451,400 449,800 450,000 448,600 450,500 464,000 466,900 460,900 453,200 454,700 454,900 456,200 455,100
1998 453,100 450,500 450,800 449,200 451,900 464,000 466,100 460,200 448,900 449,000 451,200 453,100 454,000
1997 441,300 441,700 446,100 443,900 448,900 461,100 468,400 465,700 452,200 453,900 455,600 458,700 453,100
1996 432,800 435,200 438,300 437,900 442,200 455,600 462,500 456,800 442,900 447,400 447,700 450,300 445,800
1995 433,000 432,600 434,400 432,800 433,500 445,100 452,700 447,300 433,900 437,000 437,300 436,500 438,000
1994 435,200 434,800 434,100 432,700 438,200 447,600 451,700 447,800 435,500 438,000 439,100 438,700 439,400
1993 441,900 441,300 441,800 438,500 444,600 456,600 458,300 452,600 437,900 437,800 439,100 440,800 444,300
1992 449,700 445,400 447,500 449,600 452,300 465,400 471,100 463,900 451,000 449,200 449,500 450,100 453,700
1991 457,900 456,900 457,900 462,000 461,200 472,700 478,700 469,600 458,600 455,300 452,700 453,400 461,400
1990 466,500 465,400 467,400 466,900 470,200 484,200 493,200 485,100 469,100 468,300 465,100 464,600 472,100
WESTCHESTER EMPLOYED
Year Jan Feb Mar Apr May June July Aug Sep Oct Nov Dec Ann. Avg.
2015 441,300 437,600 443,300 447,900 452,500 459,500 460,800 2014 442,200 439,100 443,600 443,700 446,400 455,300 457,200 451,200 442,400 446,400 444,900 442,100 446,200
2013 438,200 436,300 439,600 445,500 448,500 457,200 459,300 453,000 444,800 442,200 445,800 442,300 446,100
2012 432,100 431,800 435,600 438,900 443,200 450,500 451,400 447,300 443,500 448,200 446,200 443,900 442,700
2011 434,700 433,700 438,100 439,800 441,500 445,800 447,700 445,000 439,100 441,000 439,700 438,000 440,300
2010 435,700 435,300 438,300 445,800 444,700 452,200 454,200 452,700 443,800 442,100 439,100 438,100 443,500
2009 456,000 451,500 452,100 455,000 453,800 461,700 465,400 459,500 446,700 445,800 447,300 442,500 453,100
2008 469,300 465,100 468,600 472,000 471,100 480,000 484,800 478,000 469,400 471,300 469,500 465,900 472,100
2007 466,800 464,600 467,700 466,900 467,800 479,400 483,200 475,800 468,300 470,600 474,000 472,100 471,400
2006 462,100 460,600 463,100 463,600 465,500 476,400 478,800 474,900 465,400 471,600 472,200 474,200 469,000
2005 455,000 453,400 455,300 459,200 461,700 468,800 474,500 472,500 461,500 465,600 464,300 466,500 463,200
2004 448,600 447,600 448,500 451,500 451,700 460,900 468,600 465,400 453,400 459,900 462,400 462,300 456,700
2003 446,800 445,900 448,600 450,300 448,900 457,100 459,300 455,600 444,800 450,000 452,300 452,000 451,000
2002 437,100 442,300 443,600 446,000 449,300 456,900 459,500 457,100 451,400 454,000 450,500 452,700 450,000
2001 445,400 444,100 446,500 444,900 445,100 452,700 454,200 445,700 440,800 444,300 444,600 446,300 446,200
2000 442,200 441,800 443,100 444,300 441,900 452,000 452,800 449,300 438,800 443,900 445,300 449,500 445,400
1999 435,800 432,600 434,100 434,100 436,300 447,100 449,800 444,800 436,700 440,200 441,500 443,500 439,700
1998 435,400 432,800 434,700 435,600 437,700 448,200 450,500 445,000 433,900 435,000 438,300 440,100 438,900
1997 422,600 423,100 429,100 428,900 433,100 443,400 449,700 447,500 434,400 438,100 441,100 444,300 436,300
1996 412,400 415,500 419,000 420,500 424,100 436,900 441,500 438,400 425,300 431,100 432,200 435,200 427,700
1995 411,800 412,000 415,100 414,500 414,900 425,300 431,000 426,200 413,700 418,900 420,400 419,800 418,600
1994 410,300 410,000 410,700 411,700 417,700 425,300 428,400 425,400 414,300 418,400 420,500 421,200 417,800

http://www.westchesterputnamonestop.com/
Date: 6 November 2015
ix
WESTCHESTER EMPLOYED
Year Jan Feb Mar Apr May June July Aug Sep Oct Nov Dec Ann. Avg.
1993 413,300 413,700 416,300 415,700 420,400 430,600 432,700 427,500 414,100 414,800 417,300 419,400 419,700
1992 419,200 414,200 418,500 424,200 425,600 436,000 441,900 435,000 422,000 422,500 423,500 424,600 425,600
1991 433,600 431,000 432,300 439,200 435,900 447,100 452,600 444,000 433,300 431,300 429,300 428,800 436,500
1990 450,300 448,900 452,300 452,400 454,900 468,700 476,100 466,500 451,400 451,300 446,200 446,000 455,400
WESTCHESTER UNEMPLOYED
Year Jan Feb Mar Apr May June July Aug Sep Oct Nov Dec Ann. Avg.
2015 24,900 24,000 21,800 20,800 21,700 22,100 24,300 2014 27,600 28,200 25,900 21,600 23,500 24,200 25,900 24,600 23,200 22,000 21,800 20,800 24,100
2013 36,100 34,400 31,000 28,300 29,400 31,000 31,200 29,800 28,800 27,400 25,600 24,300 29,800
2012 36,400 36,800 34,700 32,600 34,600 36,300 38,300 35,800 33,900 32,900 31,200 32,100 34,600
2011 36,700 36,000 33,400 31,100 31,800 33,600 34,800 33,800 33,700 32,600 32,000 32,800 33,500
2010 38,200 38,200 36,500 33,800 33,700 34,700 36,300 35,200 34,600 33,600 34,300 33,200 35,200
2009 33,000 35,200 34,500 32,100 34,200 36,100 36,100 35,400 35,600 34,600 33,700 34,200 34,500
2008 22,400 22,300 21,600 19,400 22,200 23,600 24,900 25,200 25,300 24,900 25,700 27,600 23,700
2007 19,800 19,200 17,500 15,500 16,400 18,100 19,500 18,100 18,700 17,700 18,200 18,900 18,100
2006 20,200 21,200 19,800 18,300 18,300 19,100 20,100 18,300 17,700 15,800 16,300 15,600 18,400
2005 21,500 21,500 18,300 17,800 18,600 19,600 20,400 18,600 20,000 18,300 19,300 17,700 19,300
2004 25,200 24,500 24,300 20,200 20,100 21,700 21,500 19,900 19,700 18,900 19,100 19,500 21,200
2003 22,900 22,300 20,800 19,200 19,800 22,000 21,600 20,600 21,300 20,800 21,300 20,600 21,100
2002 24,100 23,900 22,800 20,800 20,600 21,600 21,900 20,400 19,900 19,200 19,900 19,700 21,200
2001 17,600 17,100 15,900 14,200 14,600 16,700 17,500 18,100 18,900 19,100 19,900 20,500 17,500
2000 18,500 18,800 16,900 14,200 15,000 15,600 16,000 15,500 15,500 14,300 14,500 13,800 15,700
1999 15,600 17,200 15,900 14,500 14,200 16,800 17,100 16,100 16,500 14,500 13,400 12,700 15,400
1998 17,800 17,800 16,100 13,600 14,300 15,800 15,600 15,200 15,000 14,000 12,800 13,000 15,100
1997 18,700 18,600 17,100 14,900 15,800 17,700 18,800 18,200 17,700 15,700 14,500 14,400 16,800
1996 20,300 19,700 19,300 17,300 18,100 18,700 20,900 18,300 17,600 16,300 15,500 15,100 18,100
1995 21,100 20,600 19,300 18,300 18,600 19,800 21,800 21,100 20,100 18,100 16,800 16,700 19,400
1994 24,900 24,800 23,400 21,000 20,500 22,300 23,300 22,400 21,200 19,600 18,600 17,600 21,600
1993 28,600 27,600 25,500 22,900 24,200 25,900 25,500 25,100 23,800 23,000 21,700 21,400 24,600
1992 30,500 31,200 29,000 25,500 26,800 29,300 29,200 28,900 29,100 26,700 26,000 25,500 28,100
1991 24,300 25,900 25,600 22,900 25,300 25,600 26,100 25,700 25,300 24,000 23,400 24,500 24,900
1990 16,200 16,500 15,000 14,600 15,200 15,500 17,100 18,500 17,600 16,900 18,900 18,600 16,700

http://www.westchesterputnamonestop.com/
Date: 6 November 2015
x
Appendix III: Labor Market Statistics
Current Labor Statistics for the Hudson Valley Region New York State Department of Labor http://www.labor.ny.gov/stats/hud/default.asp
Labor Market Profile Resident Civilian Labor Force and Nonfarm Employment
HUDSON VALLEY REGION July 2015, June 2015, July 2014
Category Jul 2015
Jun 2015
Jul 2014
Net Month
% Month
Net Year
% Year
Resident Civilian Labor Force 1,139,300 1,131,800 1,137,200 7,500 0.7% 2,100 0.2%
Employed 1,081,800 1,078,900 1,074,900 2,900 0.3% 6,900 0.6%
Unemployed 57,500 52,800 62,400 4,700 8.9% -‐4,900 -‐7.9%
Hudson Valley Region Unemployment Rate
5.0% 4.7% 5.5% 0.3 -‐0.5
NYS Unemployment Rate 5.4% 5.2% 6.5% 0.2 -‐1.1
US Unemployment Rate 5.6% 5.5% 6.5% 0.1 -‐0.9
Total Nonfarm 935,700 938,500 926,200 -‐2,800 -‐0.3% 9,500 1.0%
Total Private 780,300 780,000 769,800 300 0.0% 10,500 1.4%
Goods-‐producing 93,200 92,000 94,500 1,200 1.3% -‐1,300 -‐1.4%
Natural Resources, Mining and Construction 49,100 47,300 48,900 1,800 3.8% 200 0.4%
Manufacturing 44,100 44,700 45,600 -‐600 -‐1.3% -‐1,500 -‐3.3%
Service-‐Providing 842,500 846,500 831,700 -‐4,000 -‐0.5% 10,800 1.3%
Private Service-‐Providing 687,100 688,000 675,300 -‐900 -‐0.1% 11,800 1.7%
Trade, Transportation and Utilities
182,800 184,800 182,300 -‐2,000 -‐1.1% 500 0.3%
Information 16,300 16,300 16,600 0 0.0% -‐300 -‐1.8%
Financial Activities 44,000 44,700 45,700 -‐700 -‐1.6% -‐1,700 -‐3.7%
Professional and Business Services
106,500 107,000 106,700 -‐500 -‐0.5% -‐200 -‐0.2%
Education and Health Services
192,600 194,700 185,400 -‐2,100 -‐1.1% 7,200 3.9%
Leisure and Hospitality 100,800 97,100 96,500 3,700 3.8% 4,300 4.5%
Other Services 44,100 43,400 42,100 700 1.6% 2,000 4.8%
Government 155,400 158,500 156,400 -‐3,100 -‐2.0% -‐1,000 -‐0.6%

http://www.westchesterputnamonestop.com/
Date: 6 November 2015
xi
Labor Market Profile – Dutchess-Putnam MSA
Labor Market Profile Resident Civilian Labor Force and Nonfarm Employment
DUTCHESS-PUTNAM MSA July 2015, June 2015, July 2014
Category Jul 2015
Jun 2015
Jul 2014
Net Month
% Month
Net Year
% Year
Resident Civilian Labor Force 195,200 194,300 196,000 900 0.5% -‐800 -‐0.4%
Employed 185,700 185,400 185,400 300 0.2% 300 0.2%
Unemployed 9,500 8,900 10,600 600 6.7% -‐1,100 -‐10.4%
Dutchess-‐Putnam MSA Unemployment Rate 4.9% 4.6% 5.4% 0.3 -‐0.5
NYS Unemployment Rate 5.4% 5.2% 6.5% 0.2 -‐1.1
US Unemployment Rate 5.6% 5.5% 6.5% 0.1 -‐0.9
Total Nonfarm 143,100 143,900 142,700 -‐800 -‐0.6% 400 0.3%
Total Private 118,100 118,100 117,400 0 0.0% 700 0.6%
Goods-‐producing 18,100 18,200 18,600 -‐100 -‐0.5% -‐500 -‐2.7%
Natural Resources, Mining and Construction 7,600 7,600 7,900 0 0.0% -‐300 -‐3.8%
Manufacturing 10,500 10,600 10,700 -‐100 -‐0.9% -‐200 -‐1.9%
Service-‐Providing 125,000 125,700 124,100 -‐700 -‐0.6% 900 0.7%
Private Service-‐Providing 100,000 99,900 98,800 100 0.1% 1,200 1.2%
Trade, Transportation and Utilities 24,500 24,700 24,100 -‐200 -‐0.8% 400 1.7%
Wholesale Trade 3,200 3,200 3,200 0 0.0% 0 0.0%
Retail Trade 17,500 17,500 17,100 0 0.0% 400 2.3%
Transportation, Warehousing and Utilities
3,800 4,000 3,800 -‐200 -‐5.0% 0 0.0%
Information 1,900 1,900 1,900 0 0.0% 0 0.0%
Financial Activities 5,000 5,000 5,100 0 0.0% -‐100 -‐2.0%
Professional and Business Services 11,900 11,900 11,600 0 0.0% 300 2.6%
Education and Health Services 34,700 34,900 34,100 -‐200 -‐0.6% 600 1.8%
Educational Services 10,800 11,100 10,700 -‐300 -‐2.7% 100 0.9%
Health Care and Social Assistance 23,900 23,800 23,400 100 0.4% 500 2.1%
Leisure and Hospitality 15,100 14,600 15,300 500 3.4% -‐200 -‐1.3%
Other Services 6,900 6,900 6,700 0 0.0% 200 3.0%
Government 25,000 25,800 25,300 -‐800 -‐3.1% -‐300 -‐1.2%
Federal Government 1,300 1,300 1,300 0 0.0% 0 0.0%

http://www.westchesterputnamonestop.com/
Date: 6 November 2015
xii
Labor Market Profile Resident Civilian Labor Force and Nonfarm Employment
DUTCHESS-PUTNAM MSA July 2015, June 2015, July 2014
Category Jul 2015
Jun 2015
Jul 2014
Net Month
% Month
Net Year
% Year
State Government 5,800 5,800 6,000 0 0.0% -‐200 -‐3.3%
Local Government 17,900 18,700 18,000 -‐800 -‐4.3% -‐100 -‐0.6%
Local Government Education 10,100 12,100 10,300 -‐2,000 -‐16.5% -‐200 -‐1.9%
Labor Market Profile – Orange-Rockland Westchester MSA
Labor Market Profile Resident Civilian Labor Force and Nonfarm Employment
ORANGE-ROCKLAND-WESTCHESTER MSA July 2015, June 2015, July 2014
Category Jul 2015
Jun 2015
Jul 2014
Net Month
% Month
Net Year
% Year
Resident Civilian Labor Force 819,400 813,300 815,900 6,100 0.8% 3,500 0.4%
Employed 778,000 775,600 771,600 2,400 0.3% 6,400 0.8%
Unemployed 41,300 37,700 44,300 3,600 9.5% -‐3,000 -‐6.8%
Orange-‐Rockland-‐Westchester MSA Unemployment Rate 5.0% 4.6% 5.4% 0.4 -‐0.4
NYS Unemployment Rate 5.4% 5.2% 6.5% 0.2 -‐1.1
US Unemployment Rate 5.6% 5.5% 6.5% 0.1 -‐0.9
Total Nonfarm 705,000 706,500 696,600 -‐1,500 -‐0.2% 8,400 1.2%
Total Private 593,400 594,500 584,300 -‐1,100 -‐0.2% 9,100 1.6%
Goods-‐producing 66,500 65,400 67,500 1,100 1.7% -‐1,000 -‐1.5%
Natural Resources, Mining and Construction
37,900 36,300 37,500 1,600 4.4% 400 1.1%
Specialty Trade Contractors 24,900 24,300 24,700 600 2.5% 200 0.8%
Manufacturing 28,600 29,100 30,000 -‐500 -‐1.7% -‐1,400 -‐4.7%
Computer and Electronic Product Manufacturing
3,300 3,300 3,400 0 0.0% -‐100 -‐2.9%
Chemical Manufacturing 4,900 5,000 5,200 -‐100 -‐2.0% -‐300 -‐5.8%
Service-‐Providing 638,500 641,100 629,100 -‐2,600 -‐0.4% 9,400 1.5%
Private Service-‐Providing 526,900 529,100 516,800 -‐2,200 -‐0.4% 10,100 2.0%
Trade, Transportation and Utilities 141,500 143,100 141,600 -‐1,600 -‐1.1% -‐100 -‐0.1%

http://www.westchesterputnamonestop.com/
Date: 6 November 2015
xiii
Labor Market Profile Resident Civilian Labor Force and Nonfarm Employment
ORANGE-ROCKLAND-WESTCHESTER MSA July 2015, June 2015, July 2014
Wholesale Trade 27,600 27,500 28,400 100 0.4% -‐800 -‐2.8%
Merchant Wholesalers, Durable Goods 12,800 12,700 12,400 100 0.8% 400 3.2%
Retail Trade 90,500 90,900 90,300 -‐400 -‐0.4% 200 0.2%
Food and Beverage Stores 21,500 21,700 21,700 -‐200 -‐0.9% -‐200 -‐0.9%
Grocery Stores 18,100 18,200 18,500 -‐100 -‐0.5% -‐400 -‐2.2%
Health and Personal Care Stores 6,500 6,500 6,400 0 0.0% 100 1.6%
Clothing and Clothing Accessories Stores
13,000 12,900 13,200 100 0.8% -‐200 -‐1.5%
General Merchandise Stores 13,800 13,800 13,700 0 0.0% 100 0.7%
Department Stores 9,300 9,300 9,400 0 0.0% -‐100 -‐1.1%
Transportation, Warehousing and Utilities
23,400 24,700 22,900 -‐1,300 -‐5.3% 500 2.2%
-‐Utilities 4,400 4,300 4,400 100 2.3% 0 0.0%
Transportation and Warehousing 19,000 20,400 18,500 -‐1,400 -‐6.9% 500 2.7%
Information 13,300 13,300 13,600 0 0.0% -‐300 -‐2.2%
Telecommunications 4,900 4,900 4,900 0 0.0% 0 0.0%
Financial Activities 35,900 36,600 37,400 -‐700 -‐1.9% -‐1,500 -‐4.0%
Finance and Insurance 23,300 23,700 24,500 -‐400 -‐1.7% -‐1,200 -‐4.9%
Credit Intermediation and Related Activities 8,100 8,400 8,400 -‐300 -‐3.6% -‐300 -‐3.6%
Depository Credit Intermediation 5,200 5,300 5,400 -‐100 -‐1.9% -‐200 -‐3.7%
Insurance Carriers and Related Activities 9,900 10,200 10,400 -‐300 -‐2.9% -‐500 -‐4.8%
Real Estate and Rental and Leasing 12,600 12,900 12,900 -‐300 -‐2.3% -‐300 -‐2.3%
Professional and Business Services 88,500 89,200 89,100 -‐700 -‐0.8% -‐600 -‐0.7%
Professional, Scientific, and Technical Services
37,900 38,000 38,200 -‐100 -‐0.3% -‐300 -‐0.8%
Management of Companies and Enterprises 11,600 11,800 11,800 -‐200 -‐1.7% -‐200 -‐1.7%
Administrative and Support and Waste Management and Remediation Services
39,000 39,400 39,100 -‐400 -‐1.0% -‐100 -‐0.3%
Administrative and Support Services 37,300 37,800 37,000 -‐500 -‐1.3% 300 0.8%
Employment Services 8,200 8,300 7,800 -‐100 -‐1.2% 400 5.1%
Education and Health Services 141,600 143,700 135,100 -‐2,100 -‐1.5% 6,500 4.8%
Educational Services 27,100 28,200 25,800 -‐1,100 -‐3.9% 1,300 5.0%

http://www.westchesterputnamonestop.com/
Date: 6 November 2015
xiv
Labor Market Profile Resident Civilian Labor Force and Nonfarm Employment
ORANGE-ROCKLAND-WESTCHESTER MSA July 2015, June 2015, July 2014
Health Care and Social Assistance 114,500 115,500 109,300 -‐1,000 -‐0.9% 5,200 4.8%
Ambulatory Health Care Services 45,000 45,100 42,000 -‐100 -‐0.2% 3,000 7.1%
Hospitals 23,800 23,800 22,800 0 0.0% 1,000 4.4%
General Medical and Surgical Hospitals 20,600 20,600 19,900 0 0.0% 700 3.5%
Social Assistance 20,300 20,900 19,700 -‐600 -‐2.9% 600 3.0%
Leisure and Hospitality 73,300 71,000 69,000 2,300 3.2% 4,300 6.2%
Accommodation and Food Services 52,300 53,000 50,100 -‐700 -‐1.3% 2,200 4.4%
Food Services and Drinking Places 46,200 47,400 43,800 -‐1,200 -‐2.5% 2,400 5.5%
Full-‐Service Restaurants 24,300 24,200 23,900 100 0.4% 400 1.7%
Other Services 32,800 32,200 31,000 600 1.9% 1,800 5.8%
Government 111,600 112,000 112,300 -‐400 -‐0.4% -‐700 -‐0.6%
Federal Government 9,600 9,600 9,500 0 0.0% 100 1.1%
State Government 15,400 15,400 15,500 0 0.0% -‐100 -‐0.6%
Local Government 86,600 87,000 87,300 -‐400 -‐0.5% -‐700 -‐0.8%
Local Government Education 44,900 51,400 45,200 -‐6,500 -‐12.6% -‐300 -‐0.7%
Labor Market Profile – Sullivan County
Labor Market Profile Resident Civilian Labor Force and Nonfarm Employment
SULLIVAN COUNTY July 2015, June 2015, July 2014
Category Jul 2015
Jun 2015
Jul 2014
Net Month
% Month
Net Year
% Year
Resident Civilian Labor Force 35,400 34,200 35,600 1,200 3.5% -‐200 -‐0.6%
Employed 33,500 32,400 33,500 1,100 3.4% 0 0.0%
Unemployed 1,900 1,800 2,200 100 5.6% -‐300 -‐13.6%
Sullivan County Unemployment Rate 5.3% 5.3% 6.0% 0.0 -‐0.7
NYS Unemployment Rate 5.4% 5.2% 6.5% 0.2 -‐1.1
US Unemployment Rate 5.6% 5.5% 6.5% 0.1 -‐0.9
Total Nonfarm 26,900 25,900 26,800 1,000 3.9% 100 0.4%
Total Private 21,200 19,800 21,100 1,400 7.1% 100 0.5%
Goods-‐Producing 2,400 2,300 2,400 100 4.3% 0 0.0%

http://www.westchesterputnamonestop.com/
Date: 6 November 2015
xv
Labor Market Profile Resident Civilian Labor Force and Nonfarm Employment
SULLIVAN COUNTY July 2015, June 2015, July 2014
Category Jul 2015
Jun 2015
Jul 2014
Net Month
% Month
Net Year
% Year
Natural Resources, Mining and Construction 900 800 900 100 12.5% 0 0.0%
Manufacturing 1,500 1,500 1,500 0 0.0% 0 0.0%
Service-‐Providing 24,500 23,600 24,400 900 3.8% 100 0.4%
Private Service-‐Providing 18,800 17,500 18,700 1,300 7.4% 100 0.5%
Trade, Transportation and Utilities 4,500 4,500 4,500 0 0.0% 0 0.0%
Information 200 200 200 0 0.0% 0 0.0%
Financial Activities 1,000 1,000 1,000 0 0.0% 0 0.0%
Professional and Business Services 1,500 1,400 1,500 100 7.1% 0 0.0%
Education and Health Services 6,000 5,800 5,900 200 3.4% 100 1.7%
Leisure and Hospitality 4,100 3,200 4,100 900 28.1% 0 0.0%
Other Services 1,500 1,400 1,500 100 7.1% 0 0.0%
Government 5,700 6,100 5,700 -‐400 -‐6.6% 0 0.0%

http://www.westchesterputnamonestop.com/
Date: 6 November 2015
xvi
Appendix IV: Job Projection Data for the Mid-Hudson Region
Projected Job Openings in the Mid-Hudson Region
Mid-Hudson Region Projected Job Openings
SOC Occupational Titles Online Job Postings1
NYS Career Center
Participants2
2013 Annual Wage (Entry)3
2013 Annual Wage (Exp)3
Typical Education3
43-‐4051 Customer Service Representatives
807 651 $111,270 $46,830 HS diploma or equiv
41-‐2011 Cashiers 513 630 $17,030 $22,730 Less than HS
41-‐2031 Retail Salespersons 1,835 584 $17,630 $33,610 Less than HS
43-‐6011 Executive Secretaries and Executive Administrative Assistants
125 503 $48,280 $73,480 HS diploma or equiv
43-‐5081 Stock Clerks and Order Fillers 307 496 $17,090 $28,450 Less than HS
43-‐4171 Receptionists and Information Clerks
97 461 $22,030 $35,290 HS diploma or equiv
43-‐9061 Office Clerks, General 149 409 $18,390 $36,700 HS diploma or equiv
53-‐7062 Laborers and Freight, Stock, and Material Movers, Hand
323 379 $19,010 $31,750 Less than HS
11-‐1021 General and Operations Managers 292 379 $62,860 $169,900 Bachelor's
deg
11-‐9199 Managers, All Other 388 352 $62,080 $136,070 HS diploma or equiv
41-‐3099 Sales Representatives, Services, All Other
65 330 $33,110 $94,560 HS diploma or equiv
43-‐9199 Office and Administrative Support Workers, All Other
14 326 $27,150 $41,500 HS diploma or equiv
41-‐1011 First-‐Line Supervisors of Retail Sales Workers 869 321 $30,270 $61,570
HS diploma or equiv
33-‐9032 Security Guards 193 303 $20,320 $31,420 HS diploma or equiv
43-‐3031 Bookkeeping, Accounting, and Auditing Clerks
237 294 $29,390 $49,870 HS diploma or equiv
11-‐2022 Sales Managers 303 292 $86,650 $187,200 Bachelor's deg
43-‐6014 Secretaries and Administrative Assistants, Except Legal, Medical, and Executive
407 285 $25,560 $43,630 HS diploma or equiv
31-‐1014 Nursing Assistants 161 263 $25,970 $36,180 Postsecondary non-‐deg award

http://www.westchesterputnamonestop.com/
Date: 6 November 2015
xvii
Mid-Hudson Region Projected Job Openings
SOC Occupational Titles Online Job Postings1
NYS Career Center
Participants2
2013 Annual Wage (Entry)3
2013 Annual Wage (Exp)3
Typical Education3
37-‐2011 Janitors and Cleaners, Except Maids and Housekeeping Cleaners
121 251 $19,480 $37,040 Less than HS
31-‐1011 Home Health Aides 68 250 $18,030 $28,020 Less than HS
53-‐3033 Light Truck or Delivery Services Drivers
169 243 $21,580 $45,980 HS diploma or equiv
43-‐1011 First-‐Line Supervisors of Office and Administrative Support Workers
201 238 $41,420 $71,140 HS diploma or equiv
25-‐9041 Teacher Assistants 56 232 $19,550 $33,660 Some college, no deg
39-‐9021 Personal Care Aides 147 229 $20,850 $30,290 Less than HS
35-‐3031 Waiters and Waitresses 114 218 $16,900 $23,560 Less than HS
37-‐2012 Maids and Housekeeping Cleaners 136 212 $18,280 $34,900 Less than HS
11-‐3031 Financial Managers 410 206 $83,250 $184,000 Bachelor's deg
11-‐3011 Administrative Services Managers
52 201 $64,580 $139,090 Bachelor's deg
11-‐2021 Marketing Managers 384 199 $105,840 $187,200 Bachelor's deg
25-‐3099 Teachers and Instructors, All Other 179 191 $24,630 $74,290
Bachelor's deg
53-‐3022 Bus Drivers, School or Special Client
20 183 $29,390 $44,240 HS diploma or equiv
47-‐2061 Construction Laborers 26 176 $29,510 $61,980 Less than HS
49-‐9071 Maintenance and Repair Workers, General 290 170 $27,050 $53,630
HS diploma or equiv
39-‐9011 Childcare Workers 298 158 $18,980 $30,100 HS diploma or equiv
11-‐1011 Chief Executives 21 150 $112,270 $187,200 Bachelor's deg
13-‐2011 Buyers and Purchasing Agents, Farm Products 536 148 $52,910 $101,780
Bachelor's deg
35-‐2021 Food Preparation Workers 42 146 $18,620 $27,620 Less than HS

http://www.westchesterputnamonestop.com/
Date: 6 November 2015
xviii
Mid-Hudson Region Projected Job Openings
SOC Occupational Titles Online Job Postings1
NYS Career Center
Participants2
2013 Annual Wage (Entry)3
2013 Annual Wage (Exp)3
Typical Education3
43-‐9021 Data Entry Keyers 42 142 $21,240 $36,310 HS diploma or equiv
37-‐3011 Landscaping and Groundskeeping Workers 16 135 $21,080 $37,580 Less than HS
35-‐3021 Combined Food Preparation and Serving Workers, Including Fast Food
299 132 $16,870 $21,060 Less than HS
15-‐1199 Computer Occupations, All Other
542 126 $53,490 $94,690 Bachelor's deg
41-‐9099 Sales and Related Workers, All Other 36 124 $18,450 $39,670
HS diploma or equiv
47-‐2031 Carpenters 17 123 $33,490 $73,810 HS diploma or equiv
43-‐3071 Tellers 419 122 $24,060 $31,490 HS diploma or equiv
41-‐4012
Sales Representatives, Wholesale and Manufacturing, Except Technical and Scientific Products
1,255 121 $37,640 $102,340 HS diploma or equiv
51-‐9199 Production Workers, All Other 60 121 $20,530 $32,330 HS diploma or equiv
43-‐3021 Billing and Posting Clerks 18 118 $29,600 $45,960 HS diploma or equiv
21-‐1093 Social and Human Service Assistants 32 117 $24,620 $44,470
HS diploma or equiv
31-‐9092 Medical Assistants 73 116 $26,240 $40,220 Postsecondary non-‐deg award
43-‐6013 Medical Secretaries 120 115 $27,920 $44,950 HS diploma or equiv
11-‐9051 Food Service Managers 129 112 $48,960 $80,510 HS diploma or equiv
11-‐3021 Computer and Information Systems Managers 108 108 $93,310 $173,060
Bachelor's deg
43-‐5071 Shipping, Receiving, and Traffic Clerks
111 107 $19,480 $36,190 HS diploma or equiv
23-‐2011 Paralegals and Legal Assistants 83 107 $29,260 $64,820 Associate's deg
49-‐3023 Automotive Service Technicians and Mechanics 122 106 $26,800 $53,090
HS diploma or equiv
13-‐1199 Business Operations Specialists, All Other
123 102 $41,790 $93,450 HS diploma or equiv

http://www.westchesterputnamonestop.com/
Date: 6 November 2015
xix
Mid-Hudson Region Projected Job Openings
SOC Occupational Titles Online Job Postings1
NYS Career Center
Participants2
2013 Annual Wage (Entry)3
2013 Annual Wage (Exp)3
Typical Education3
11-‐9151 Social and Community Service Managers 27 102 $58,210 $92,110 Bachelor's
deg
41-‐4011 Sales Representatives, Wholesale and Manufacturing, Technical and Scientific Products
203 99 $60,800 $144,490 Bachelor's deg
15-‐1151 Computer User Support Specialists
253 98 $36,980 $66,720 Some college, no deg
29-‐2061 Licensed Practical and Licensed Vocational Nurses 150 98 $38,060 $53,220
Postsecondary non-‐deg award
29-‐1141 Registered Nurses 1,590 90 $58,430 $87,500 Associate's deg
43-‐4071 File Clerks 17 90 $17,500 $31,550 HS diploma or equiv
13-‐2082 Tax Preparers 10 90 $29,670 $54,010 HS diploma or equiv
53-‐3032 Heavy and Tractor-‐Trailer Truck Drivers 697 89 $32,100 $56,190
Postsecondary non-‐deg award
35-‐2014 Cooks, Restaurant 166 88 $20,330 $33,730 Less than HS
35-‐1012 First-‐Line Supervisors of Food Preparation and Serving Workers
318 86 $27,910 $46,740 HS diploma or equiv
27-‐1024 Graphic Designers 29 85 $34,340 $66,120 Bachelor's deg
49-‐9099 Installation, Maintenance, and Repair Workers, All Other
82 83 $26,530 $51,330 HS diploma or equiv
43-‐6012 Legal Secretaries 22 81 $40,920 $51,200 HS diploma or equiv
41-‐3031 Securities, Commodities, and Financial Services Sales Agents 226 80 $38,810 $126,940
Bachelor's deg
37-‐3019 Grounds Maintenance Workers, All Other 1 80 -‐-‐ -‐-‐ -‐-‐
13-‐2051 Financial Analysts 217 77 $57,100 $126,300 Bachelor's deg
11-‐9111 Medical and Health Services Managers 487 76 $76,250 $144,080 Bachelor's
deg
27-‐2012 Producers and Directors 37 73 $55,080 $146,710 Bachelor's deg
31-‐9099 Healthcare Support Workers, All Other
7 73 $28,570 $40,490 HS diploma or equiv

http://www.westchesterputnamonestop.com/
Date: 6 November 2015
xx
Mid-Hudson Region Projected Job Openings
SOC Occupational Titles Online Job Postings1
NYS Career Center
Participants2
2013 Annual Wage (Entry)3
2013 Annual Wage (Exp)3
Typical Education3
35-‐1011 Chefs and Head Cooks 57 72 $40,630 $68,850 HS diploma or equiv
53-‐7051 Industrial Truck and Tractor Operators 26 72 $22,780 $37,980 Less than HS
53-‐7064 Packers and Packagers, Hand 9 71 $17,160 $25,840 Less than HS
13-‐1071 Human Resources Specialists 312 70 $41,440 $84,630 Bachelor's deg
35-‐3011 Bartenders 40 67 $16,890 $22,030 Less than HS
13-‐1161 Market Research Analysts and Marketing Specialists 203 66 $43,860 $89,230
Bachelor's deg
53-‐7199 Material Moving Workers, All Other
9 66 -‐-‐ -‐-‐ -‐-‐
11-‐3121 Human Resources Managers 62 63 $89,840 $168,610 Bachelor's deg
49-‐9021 Heating, Air Conditioning, and Refrigeration Mechanics and Installers
60 63 $33,620 $61,040 Postsecondary non-‐deg award
21-‐1021 Child, Family, and School Social Workers
13 63 $34,510 $74,360 Bachelor's deg
23-‐1011 Lawyers 188 62 $76,840 $187,200 Doctoral or professional deg
51-‐2099 Assemblers and Fabricators, All Other 25 62 $17,210 $25,980
HS diploma or equiv
51-‐9198 Helpers-‐-‐Production Workers 15 62 $16,930 $27,050 Less than HS
39-‐9099 Personal Care and Service Workers, All Other
3 62 $18,830 $40,690 HS diploma or equiv
43-‐4161 Human Resources Assistants, Except Payroll and Timekeeping 51 61 $26,870 $48,270
HS diploma or equiv
43-‐3011 Bill and Account Collectors 38 61 $29,060 $50,400 HS diploma or equiv
21-‐1019 Counselors, All Other 14 61 $29,220 $48,070 Master's deg
11-‐3071 Transportation, Storage, and Distribution Managers 39 60 $70,610 $135,970 HS diploma
or equiv
39-‐9041 Residential Advisors 22 59 $20,670 $31,500 HS diploma or equiv

http://www.westchesterputnamonestop.com/
Date: 6 November 2015
xxi
Mid-Hudson Region Projected Job Openings
SOC Occupational Titles Online Job Postings1
NYS Career Center
Participants2
2013 Annual Wage (Entry)3
2013 Annual Wage (Exp)3
Typical Education3
47-‐2141 Painters, Construction and Maintenance 4 59 $25,560 $46,030 Less than HS
15-‐1121 Computer Systems Analysts 413 58 $58,310 $112,760 Bachelor's deg
41-‐3011 Advertising Sales Agents 45 58 -‐-‐ -‐-‐ -‐-‐
35-‐3041 Food Servers, Nonrestaurant 25 58 $19,610 $33,890 Less than HS
13-‐1022 Wholesale and Retail Buyers, Except Farm Products 18 58 $39,590 $77,630
HS diploma or equiv
33-‐9099 Protective Service Workers, All Other 137 57 $22,280 $36,130
HS diploma or equiv
11-‐9021 Construction Managers 77 57 $81,410 $146,970 Bachelor's deg
13-‐2099 Financial Specialists, All Other 47 57 $44,020 $110,310 Bachelor's deg
35-‐3022 Counter Attendants, Cafeteria, Food Concession, and Coffee Shop
43 57 $17,040 $23,990 Less than HS
31-‐9091 Dental Assistants 22 57 $29,150 $43,720 Postsecondary non-‐deg award
51-‐1011 First-‐Line Supervisors of Production and Operating Workers
110 54 $44,890 $82,910 Postsecondary non-‐deg award
21-‐1011 Substance Abuse and Behavioral Disorder Counselors 16 54 $29,580 $50,860
HS diploma or equiv
21-‐1099 Community and Social Service Specialists, All Other
14 54 $34,090 $65,040 Master's deg
51-‐4041 Machinists 8 54 $19,040 $43,620 HS diploma or equiv
53-‐3031 Driver/Sales Workers 34 53 $19,900 $42,450 HS diploma or equiv
43-‐5061 Production, Planning, and Expediting Clerks
91 52 $32,950 $58,420 HS diploma or equiv
37-‐2019 Building Cleaning Workers, All Other
-‐-‐ 51 -‐-‐ -‐-‐ -‐-‐
51-‐9061 Inspectors, Testers, Sorters, Samplers, and Weighers 46 51 $22,240 $49,690
HS diploma or equiv
35-‐9021 Dishwashers 43 51 $16,840 $20,660 Less than HS

http://www.westchesterputnamonestop.com/
Date: 6 November 2015
xxii
Mid-Hudson Region Projected Job Openings
SOC Occupational Titles Online Job Postings1
NYS Career Center
Participants2
2013 Annual Wage (Entry)3
2013 Annual Wage (Exp)3
Typical Education3
29-‐2071 Medical Records and Health Information Technicians 156 48 $27,750 $46,650
Postsecondary non-‐deg award
11-‐9141 Property, Real Estate, and Community Association Managers
58 48 $52,400 $86,960 HS diploma or equiv
53-‐3021 Bus Drivers, Transit and Intercity 3 48 $22,090 $45,700 HS diploma or equiv
27-‐3041 Editors 37 47 $34,930 $90,330 Bachelor's deg
17-‐3029 Engineering Technicians, Except Drafters, All Other 17 47 $45,760 $63,130
Associate's deg
25-‐2021 Elementary School Teachers, Except Special Education
8 47 $55,950 $101,270 Bachelor's deg
43-‐4081 Hotel, Motel, and Resort Desk Clerks
112 46 $17,490 $30,980 HS diploma or equiv
15-‐1131 Computer Programmers 97 46 $45,580 $100,880 Bachelor's deg
37-‐1011 First-‐Line Supervisors of Housekeeping and Janitorial Workers
21 46 $32,810 $59,110 HS diploma or equiv
25-‐2031 Secondary School Teachers, Except Special and Career/Technical Education
25 45 $54,900 $100,040 Bachelor's deg
35-‐9011 Dining Room and Cafeteria Attendants and Bartender Helpers
18 45 $16,830 $20,490 Less than HS
35-‐9099 Food Preparation and Serving Related Workers, All Other
-‐-‐ 44 -‐-‐ -‐-‐ -‐-‐
13-‐1111 Management Analysts 240 44 $51,230 $126,840 Bachelor's deg
15-‐1142 Network and Computer Systems Administrators 159 43 $56,610 $101,320
Bachelor's deg
43-‐3051 Payroll and Timekeeping Clerks 41 43 $30,380 $52,220 HS diploma or equiv
11-‐2011 Advertising and Promotions Managers
10 43 $64,060 $182,880 Bachelor's deg
13-‐2052 Personal Financial Advisors 230 42 $43,520 $179,290 Bachelor's deg
49-‐1011 First-‐Line Supervisors of Mechanics, Installers, and Repairers
59 42 $51,710 $87,810 HS diploma or equiv

http://www.westchesterputnamonestop.com/
Date: 6 November 2015
xxiii
Mid-Hudson Region Projected Job Openings
SOC Occupational Titles Online Job Postings1
NYS Career Center
Participants2
2013 Annual Wage (Entry)3
2013 Annual Wage (Exp)3
Typical Education3
21-‐1029 Social Workers, All Other 64 41 $50,130 $74,720 Bachelor's deg
41-‐1012 First-‐Line Supervisors of Non-‐Retail Sales Workers 64 41 $54,620 $142,050
HS diploma or equiv
13-‐1121 Meeting, Convention, and Event Planners
33 40 $34,220 $69,540 Bachelor's deg
11-‐3051 Industrial Production Managers 59 39 $77,760 $128,350 Bachelor's deg
43-‐5032 Dispatchers, Except Police, Fire, and Ambulance 28 39 $23,390 $49,610
HS diploma or equiv
25-‐2011 Preschool Teachers, Except Special Education 21 39 $23,810 $43,600
Associate's deg
43-‐9041 Insurance Claims and Policy Processing Clerks
39 38 $29,500 $45,790 HS diploma or equiv
47-‐2152 Plumbers, Pipefitters, and Steamfitters 25 37 $40,490 $80,590 HS diploma
or equiv
21-‐1023 Mental Health and Substance Abuse Social Workers 16 37 $37,890 $72,960
Bachelor's deg
53-‐3041 Taxi Drivers and Chauffeurs 13 37 $21,100 $42,650 Less than HS
27-‐1011 Art Directors 3 36 $69,770 $162,510 Bachelor's deg
47-‐2111 Electricians 49 35 $44,510 $88,320 HS diploma or equiv
43-‐4141 New Accounts Clerks 9 34 $28,010 $36,290 HS diploma or equiv
27-‐3031 Public Relations Specialists 118 33 $45,410 $84,990 Bachelor's deg
39-‐9032 Recreation Workers 47 33 $18,480 $34,840 Bachelor's deg
47-‐1011 First-‐Line Supervisors of Construction Trades and Extraction Workers
21 33 $52,030 $94,610 HS diploma or equiv
25-‐2052 Special Education Teachers, Kindergarten and Elementary School
4 33 $53,870 $94,310 Bachelor's deg
41-‐3021 Insurance Sales Agents 107 32 $43,200 $104,060 HS diploma or equiv
29-‐2012 Medical and Clinical Laboratory Technicians 101 32 $35,400 $56,580
Associate's deg

http://www.westchesterputnamonestop.com/
Date: 6 November 2015
xxiv
Mid-Hudson Region Projected Job Openings
SOC Occupational Titles Online Job Postings1
NYS Career Center
Participants2
2013 Annual Wage (Entry)3
2013 Annual Wage (Exp)3
Typical Education3
43-‐4111 Interviewers, Except Eligibility and Loan 70 32 $27,210 $42,020 HS diploma
or equiv
39-‐5012 Hairdressers, Hairstylists, and Cosmetologists 9 32 $17,840 $26,290
Postsecondary non-‐deg award
53-‐1021 First-‐Line Supervisors of Helpers, Laborers, and Material Movers, Hand
30 31 $35,030 $62,550 HS diploma or equiv
51-‐9111 Packaging and Filling Machine Operators and Tenders 8 31 $17,160 $30,880 HS diploma
or equiv
27-‐1025 Interior Designers 8 31 $45,970 $78,480 Bachelor's deg
47-‐4099 Construction and Related Workers, All Other
1 31 -‐-‐ -‐-‐ -‐-‐
15-‐1132 Software Developers, Applications
611 30 $64,360 $112,320 Bachelor's deg
13-‐1031 Claims Adjusters, Examiners, and Investigators 65 30 $43,710 $81,130
HS diploma or equiv
27-‐3099 Media and Communication Workers, All Other -‐-‐ 29 $27,260 $50,210
HS diploma or equiv
21-‐1012 Educational, Guidance, School, and Vocational Counselors
66 29 $41,500 $88,480 Master's deg
41-‐9022 Real Estate Sales Agents 52 29 $49,210 $112,420 HS diploma or equiv
17-‐2199 Engineers, All Other 56 27 $58,120 $110,440 Bachelor's deg
41-‐9041 Telemarketers 52 27 $24,070 $42,820 Less than HS
49-‐2022 Telecommunications Equipment Installers and Repairers, Except Line Installers
50 27 $50,400 $83,630 Postsecondary non-‐deg award
29-‐2052 Pharmacy Technicians 44 27 $22,720 $35,380 HS diploma or equiv
29-‐2041 Emergency Medical Technicians and Paramedics
22 27 $25,380 $43,240 Postsecondary non-‐deg award
43-‐9051 Mail Clerks and Mail Machine Operators, Except Postal Service
18 27 $23,850 $37,170 HS diploma or equiv
33-‐3051 Police and Sheriff's Patrol Officers 12 27 $46,270 $86,770
HS diploma or equiv
49-‐3021 Automotive Body and Related Repairers
10 27 $25,600 $47,080 HS diploma or equiv

http://www.westchesterputnamonestop.com/
Date: 6 November 2015
xxv
Mid-Hudson Region Projected Job Openings
SOC Occupational Titles Online Job Postings1
NYS Career Center
Participants2
2013 Annual Wage (Entry)3
2013 Annual Wage (Exp)3
Typical Education3
27-‐1022 Fashion Designers 6 27 -‐-‐ -‐-‐ -‐-‐
35-‐2012 Cooks, Institution and Cafeteria 1 27 $24,820 $42,470 Less than HS
47-‐3015 Helpers-‐-‐Pipelayers, Plumbers, Pipefitters, and Steamfitters
-‐-‐ 26 -‐-‐ -‐-‐ -‐-‐
13-‐2072 Loan Officers 86 26 $51,950 $128,190 Bachelor's deg
51-‐3011 Bakers 17 26 $17,490 $33,730 Less than HS
53-‐6061 Transportation Attendants, Except Flight Attendants 9 26 $17,010 $30,350
HS diploma or equiv
43-‐9011 Computer Operators 5 26 $25,470 $44,350 HS diploma or equiv
35-‐2011 Cooks, Fast Food 4 26 $16,890 $22,350 Less than HS
35-‐2019 Cooks, All Other -‐-‐ 25 -‐-‐ -‐-‐ -‐-‐
11-‐2031 Public Relations and Fundraising Managers
79 25 $92,080 $161,650 Bachelor's deg
13-‐1151 Training and Development Specialists 66 25 $38,860 $77,550
Bachelor's deg
15-‐1152 Computer Network Support Specialists 17 25 $52,100 $91,490
Associate's deg

http://www.westchesterputnamonestop.com/
Date: 6 November 2015
xxvi
Hudson Valley Projected Job Growth with 100 or More Annual Average Openings
Hudson Valley Projected Job Growth with 100 or More Annual Average Openings SO
C CO
DE
Summary Level
Title
Employmen
t 200
8
Employmen
t 201
8
Level Cha
nge
Percen
t Cha
nge
Annu
al Average
Ope
nings T
otal
Annu
al Average Ope
nings
From
Growth
Annu
al Average Ope
nings
from
Rep
lacemen
t
290000 2 Healthcare Practitioners and Technical Occupations
54180 62610 8430 15.6 1940 840 1100
390000 2 Personal Care and Service Occupations
46370 53240 6870 14.8 1770 690 1080
399000 2 Other Personal Care and Service Workers
30850 36120 5270 17.1 1220 530 690
291000 2 Health Diagnosing and Treating Practitioners
35440 41020 5580 15.7 1210 560 650
310000 3 Healthcare Support Occupations 34600 42860 8260 23.9 1200 830 370 311000 3 Nursing Psychiatric and Home
Health Aides 26280 33050 6770 25.8 940 680 260
210000 3 Community and Social Services Occupations
21570 24400 2830 13.1 760 280 480
211000 3 Counselors Social Workers and Other Community and Social Service Specialists
20150 22850 2700 13.4 720 270 450
292000 3 Health Technologists and Technicians
18100 20910 2810 15.5 710 280 430
291111 3 Registered Nurses 18890 21870 2980 15.8 630 300 330
311011 3 Home Health Aides 13640 18430 4790 35.1 620 480 140 252021 3 Elementary School Teachers
Except Special Education 11330 12580 1250 11 390 130 260
399021 3 Personal and Home Care Aides 7410 9950 2540 34.3 340 250 90 253000 3 Other Teachers and Instructors 10400 12040 1640 15.8 320 160 160 353021 3 Combined Food Preparation and
Serving Workers Including Fast Food
8850 10180 1330 15 320 130 190
311012 3 Nursing Aides Orderlies and Attendants
11140 13080 1940 17.4 300 190 110
292061 3 Licensed Practical and Licensed Vocational Nurses
5850 6980 1130 19.3 290 110 180
251000 3 Postsecondary Teachers 9640 10600 960 10 270 100 170
319000 4 Other Healthcare Support Occupations
7000 8190 1190 17 210 120 90

http://www.westchesterputnamonestop.com/
Date: 6 November 2015
xxvii
Hudson Valley Projected Job Growth with 100 or More Annual Average Openings SO
C CO
DE
Summary Level
Title
Employmen
t 200
8
Employmen
t 201
8
Level Cha
nge
Percen
t Cha
nge
Annu
al Average
Ope
nings T
otal
Annu
al Average Ope
nings
From
Growth
Annu
al Average Ope
nings
from
Rep
lacemen
t
395000 4 Personal Appearance Workers 7490 8400 910 12.1 200 90 110 193000 4 Social Scientists and Related
Workers 4880 5380 500 10.2 190 50 140
252022 4 Middle School Teachers Except Special and Vocational Education
5770 6380 610 10.6 190 60 130
253099 4 Teachers and Instructors All Other
6810 7530 720 10.6 180 70 110
359021 4 Dishwashers 3100 3480 380 12.3 170 40 130 272000 4 Entertainers and Performers
Sports and Related Workers 4830 5360 530 11 160 50 110
252011 4 Preschool Teachers Except Special Education
4830 5440 610 12.6 160 60 100
211093 4 Social and Human Service Assistants
3640 4300 660 18.1 150 70 80
399031 4 Fitness Trainers and Aerobics Instructors
3380 4320 940 27.8 150 90 60
395012 4 Hairdressers Hairstylists and Cosmetologists
5310 5860 550 10.4 140 60 80
252041 4 Special Education Teachers Preschool Kindergarten and Elementary School
3240 3790 550 17 140 60 80
291069 4 Physicians and Surgeons All Other
3850 4400 550 14.3 130 60 70
253021 4 Self-‐Enrichment Education Teachers
2880 3700 820 28.5 120 80 40
131111 4 Management Analysts 3470 3910 440 12.7 100 40 60

http://www.westchesterputnamonestop.com/
Date: 6 November 2015
xxviii
Appendix V: Pertinent Regulations § H.R.803 - Workforce Innovation and Opportunity Act, Public Law No: 113-128 (07/22/2014) § Wagner-Peyser Act, as amended (29 U.S.C. 49 et seq.); § Workforce Investment Act of 1998, as amended (29 U.S.C. 2801, et seq.); § Workforce Investment Act of 1998 regulations, 20 CFR Parts 652 and 660-671; § Priority of Service for Covered Persons Regulations (Veterans’ Priority of Service Regulations), 20 CFR 1010.100-330; § Trade Adjustment Assistance regulations, 20 CFR, part 618, 20 CFR, part 617, 29 CFR, part 90; § Trade Adjustment Assistance Extension Act of 2011 Pub. L. 112-40 (October 21, 2011); § Older Americans Act Of 1965 (OAA), Section 503(a)(1), 42 U.S.C. 3056a(a)(1); § Senior Community Service Employment Program regulations, 20 CFR 641.302-365; § Wagner-Peyser regulations, 20 CFR 653.107; § State Integrated Workforce Plan Requirements for Workforce Investment Act Title I/Wagner-Peyser Act and Department of Labor Workforce Programs (OMB No. 1205-0398); § Planning Guidance for State Unified Plans and Unified Plan Modifications Submitted under Section 501 of the Workforce Investment Act (WIA) (OMB No. 1205-0398)); § TEGL No. 15-10, Increasing Credential, Degree, and Certificate Attainment by Participants of the Public Workforce System; § TEGL No. 02-07, Leveraging Registered Apprenticeship as a Workforce Development Strategy for the Workforce Investment System; § TEGL No. 26-09, Workforce Investment Act (WIA) Waiver Policy and Waiver Decisions for PY 2009 and 2010; and, § TEGL No. 30-09, Layoff Aversion Definition and the Appropriate Use of Workforce Investment Act Funds or Incumbent Worker Training for Layoff Aversion Using a Waiver.

http://www.westchesterputnamonestop.com/
Date: 6 November 2015
xxix
Appendix VI: References Federal Register, Thursday, April 16, 2015; Department of Labor Employment and Training Administration 20 CFR Parts 601, 651, 652 et al.; Workforce Innovation and Opportunity Act; Notice of Proposed Rulemaking; Proposed Rules Labor Force and Unemployment Data for New York State, Labor Market Regions, Metropolitan Areas, Counties, and Municipalities of at least 25,000 Population, New York State Department of Labor, http://www.labor.ny.gov/stats/lslaus.shtm The Hidden Workforce: A Report on the Workforce and Educational Experiences of People with Disabilities in Westchester and Putnam Counties, New York. October 2009 (Revised February 2010) www.thehiddenworkforce.com McAleer, Gordon. “Employment Outlook for 2012”, Times Herald-Record Online, February 13, 2012. http://www.recordonline.com/apps/pbcs.dll/article?AID=/20120213/BIZ/202130317/-1/BIZ11 Perez-Johnson, Irma, Quinn Moore, and Robert Santillano. Improving the Effectiveness of Individual Training Accounts: Long-Term Findings from an Experimental Evaluation of Three Service Delivery Models. Final report. Princeton, NJ: Mathematica Policy Research, October 2011. Roberts, Sam. “Non-Hispanic Whites Are Now a Minority in the 23-County New York Region”, The New York Times, March 27, 2011. United States Department of Labor, Employment and Training Administration. Common Measures. http://www.doleta.gov/performance/guidance/tools_commonmeasures.cfm United States Department of Labor WIA Annual Report Specifications. http://www.doleta.gov/performance/guidance/WIA/WIAAnnualReportSpecifications.pdf Worker Adjustment and Retraining Notification http://www.labor.ny.gov/workforcenypartners/warn/warnportal.shtm Workforce Innovation and Opportunity Act (WIOA) – H.R. 803 as amended Common Measures and Some Uncommon WIOA Measures, FutureWork Systems. http://www.futureworksystems.com/pdf/WIOA-‐CommonMeasures_NewMeasures_Comparison.pdf

http://www.westchesterputnamonestop.com/
Date: 6 November 2015
xxx
Appendix VII: Assurances
Alignment to key obligations in the law: Assurances requires states to affirm that key obligations in the law have been met. A number of plan elements that were previously a part of the narrative are now among the 40 assurances included with the Integrated Workforce Plan. These assurances are vitally important as a commitment to upholding the requirements in the law and regulations. The assurances may form a basis for state self-monitoring of these requirements and for ETA’s monitoring of states. Many of the assurances affect the required process for developing the Integrated Workforce Plan, such as the requirements for stakeholder consultation, public comment and various policies which states must have in place.