West Coast Rock- based Fisher Safety Project 2016
61
W W e e s s t t C C o o a a s s t t R R o o c c k k - - b b a a s s e e d d F F i i s s h h e e r r S S a a f f e e t t y y P P r r o o j j e e c c t t 2 2 0 0 1 1 6 6
-
Upload
khangminh22 -
Category
Documents
-
view
5 -
download
0
Transcript of West Coast Rock- based Fisher Safety Project 2016

WWeesstt CCooaasstt RRoocckk--bbaasseedd FFiisshheerr
SSaaffeettyy PPrroojjeecctt22001166

ii
Preface and Acknowledgements
This report is an evaluation of the 2016 West Coast Rock-based Fishers Project developedby the Auckland Council, Surf Life Saving Northern Region (SLSNR), and WaterSafeAuckland Incorporated (WAI). It reports on the 11th year of the Project during which timemany people have been involved in supporting and promoting water safety to preventdrowning. Over the years, may people have given their time and energy both in a work andvolunteer capacity to promote safety among our west coast rock-based fishing community.
We would also like to thank the Iwi of Te Kawerau a Maki, and the Lusk and Woodwardfamilies for allowing some of the Angel Rings to be installed on their land and allowing usaccess to maintain them.
The project would not have been possible without the enthusiasm and skills of Reg Phillips,Auckland Council; David Butt of Surf Life Saving Northern Region; and Teresa Stanleyand Harry Aonga, WaterSafe Auckland. Stuart Leighton, Auckland Council park rangershould again be recognised for his outstanding commitment and leadership of the project inthe field.
Finally, a very special vote of thanks to the lifeguards Sarah Lodge, Chase Calahane, andNikolai Gordon. Their contribution as public fishing safety advisors, data gatherers andfront line proponents of the Project make their contribution to the success of thiscollaboration especially significant.
Report authored by:Dr Kevin Moran, Faculty of Education, The University of Auckland, Auckland, New Zealand.
Recommended reference:Moran, K. (2016, November). West Coast Rock-based Fisher Safety Project, 2016. Report to the
Auckland City Council, Surf Life Saving Northern Region and WaterSafe Auckland Inc.Auckland: WaterSafe Auckland.
Further enquiries about the report should be made to:WaterSafe AucklandPO Box 8163, Symonds Street, AucklandPh 09 306 0809; Fax 09 306 0811
Further copy of the report is available in PDF format on the WaterSafe Auckland website underCommunity/Research/ Rock Fishing at: Available in PDF format at:http://www.watersafe.org.nz/family-communities/research-and-information/rock-fishing/

iii
Executive Summary
1. BackgroundThis is the eleventh year of the West Coast Rock-based Fisher Safety Project, a
collaborative intervention by the Auckland Council, WaterSafe Auckland Inc. (WAI), and
Surf Life Saving Northern Region (SLSNR). This reports provides information on the
impact of a decade-long intervention aimed at reducing rock-based fishing fatalities and
promoting a safety culture among this high risk group of aquatic recreationalists.
2. PurposeThe purposes of this eleventh year of the project were threefold:
1) To continue the on-site rock fishing safety education promotion initiated in 2006,
2) To determine the effect of the project on Auckland’s west coast fishers’ safety
practices and beliefs,
3) To make recommendations for future rock fishing safety promotion based on the
information obtained in the survey conducted during the 2015-16 season.
3. MethodsA cross sectional study of fishers at high risk locations on Auckland’s west coast was
undertaken at the end of the summer safety campaign in 2016. For 2016, all survey data
was gathered online via an electronic version of the survey (first trialled in 2014) for on-
site completion. A total sample of 147 fishers voluntarily completed the electronic survey.
The survey sought information on participation in previous surveys, awareness of the
current fishing safety promotion, awareness of west coast angel rings as public rescue
equipment (PRE), and perceptions of fishing dangers and their capacity to manage
associated risk when fishing from rocks on Auckland’s west coast.
4. Key Findings4.1 Participant demographics: The sample was predominantly male (males 91%) and most fishers were aged
between 20-44 years (63%).
Proportionally more Asian peoples (54%) and Pasifika peoples (16%) completed
the survey, proportionally less European (21%) and Maori (2%) New Zealanders
took part.
One third (36%) had lived in New Zealand all their lives, one quarter (24%) were of
recent residency (<10 years).
For one fifth (22%) of the fishers, it was their first visit to the site where surveyed,
although familiarity with the site had increased over previous years with almost one
half (42%) having visited the site >20 times.

iv
The reason most fishers gave for fishing on the day of interview was fun and
enjoyment (65%), one fifth reported the reason was to be with friends (19%), one
tenth (11%) said it was to feed the family or have a day out from work/home (4%).
4.2 Awareness of the West Coast Rock-based Fisher Safety Project One third of fishers (36%) reported that they were aware of previous west coast
fisher safety projects (2015, 33%)
Of these, most fishers (45%) thought that the campaign had been successful, 34%
thought it highly successful, 11% felt it had been slightly successful, 9% thought it
was not successful or did not know.
Only one fifth (20%) were aware of the current 2016 Project (2015, 36%), possibly
the consequence of the survey being carried out in additional remote sites.
Of these, most (67%) identified the fishing advisors as their source of information.
Other sources included newspapers/TV (13%), retail outlets (7%), and other
sources such as friends and lifeguards (13%).
4.3. Public Rescue equipment (PREs) – angel rings, throw bags etc Most fishers (87%) had seen the on-site angel rings (2015, 75%).
Only one quarter (26%) of fishers had read the instructions on how to use the
angel rings (2015, 26%).
Most fishers (74%) thought that they could use the angel rings in an emergency
(2015, 71%).
4.4. Perceptions of Drowning Risk Fewer fishers (22%) agreed that getting swept off rocks was likely to result in their
drowning (2015, 77% agreed).
Fewer fishers (14%) agreed that drowning was a constant threat when fishing from
rocks on the west coast of Auckland (2015, 68% agreed).
Almost one half (43%) thought that other fishers were at greater risk than
themselves; 46% considered that they were strong swimmers compared with
others (2015, 46% and 38% respectively).
Fewer fishers (63%) agreed that wearing a lifejacket made rock-based fishing safer
(2015, 73% agreed).
Most (93%) avoided fishing in bad weather (2015, 92% agreed).
Most (69%) thought that turning their backs to the sea was very dangerous (2015,
73% agreed).
Most fishers (76%) thought that their swimming proficiency would get them out of
trouble (2014, 48% agreed).
Most fishers (78%) thought that their local knowledge would keep them out of
trouble (2014, 49% agreed).

v
Most fishers (86%) thought that their experience of the sea would keep them safe
when fishing from rocks (2014, 56% agreed).
4.5. Water Safety Behaviours of Fishers Fewer fishers (24%) reported often/always wearing a life-jacket/buoyancy aid
(2015, 40%).
More fishers (65%) reported never wearing any life jacket/flotation aid (2015, 38%)
Most fishers (84%) reported never consuming alcohol when fishing (2015, 84%)
Some fishers (31%) reported sometimes/often wearing gumboots/waders, one half
(50%) reported going down rocks to retrieve snagged lines (2015, 39% and 46%
respectively).
4.6 Self-reported Changes in Fishers’ Knowledge, Attitudes and Behaviours Most fishers (90%) considered that their safety knowledge had improved in the
past year (2014, 71% agreed).
Most fishers (84%) considered that their safety attitudes had improved (2014, 72%
agreed).
Most fishers (83%) of the fishers thought that their safety behaviour when fishing
had improved (2014, 70% agreed).
Most fishers thought that the safety behaviour of their mates (75%) or other fishers
(79%) had improved (2014, 29% and 30% respectively agreed).
TAKE AWAY POINTS Drowning fatalities have reduced to less than 1 per annum since the
inception of the fisher safety project Fishing populations continues to be transient, culturally and
linguistically diverse The environment continues to challenge the endeavours of safety
advocates Changes in attitudes and behaviours with regard to lifejacket use are
a cause for concern and will require further monitoring in the comingseason
Other risky behaviours (such as wearing gumboots, retrieving lines)are still proving resistant to change
Some changes in risk estimation are a cause for concern as is theperceived ability of the fishers to get themselves out of trouble byusing their swimming skills and local knowledge

vi
5. The Fishing Safety Promotion in action:
6. Summary of Key Fishing Safety Promotions, 2015-2016
Key tasks:
How much did we do?
Promotion and delivery of land based fishing resources at 5 events, andchurch/community groups and 5 workplaces
2 Pacific or Asian media promoting safer land-based fishing
2 practical & theory workshops
10 presentations to targeted groups
15 lifejackets given away to targeted groups
Bait freezers: (L) Burnsc, Manukau (R) Oscarma Fishing Tackle, Balmoral
Key Tasks for eachoutcome
Activities and Measures Due Date
Update land-based fishingsurvey
Update external evaluation tool Translate external evaluation tool Print external evaluation tool Distribute external evaluation tool
Dec 2015Dec 2015Dec 2015Dec 2015
Deliver theory/practicalworkshops
2 x Theory Workshop 2 x Practical Workshop
Jan 2016Jan 2016
Lifejackets to be used asgiveaways
Source funding for 15 lifejackets Purchase lifejackets Giveaway lifejackets
Dec 2016Jan 2016April 2016
Messaging on bait freezers Source funding Develop messaging Messaging installed at petrol stations
Dec 2015Jan 2016May 2016
Corflute developed and printedready for use
Source quote for x 1 corfluteCorflute printed
Jan-Feb 2016Jan-Feb 2016

vii
LUCKY FISHERMAN SAVED AT PIHA
09 July 2016
FISHERMAN SAVED AT PIHA
Quick acting Piha locals save fisherman washed into Piha Beach
Two friends were fishing near The Camel when one was swept into the sea. His quick
thinking friend threw him the ‘angel ring’ and told him to stay calm.
Photo: the friend who threw the Angel Ring with Westpac Rescue Helicopter.
The friend then dialed 111. The Rescue Helicopter and Piha’s 1st response were immediately
dispatched.
Source: Piha Village Voice, 9th July 2016

viii
7. RECOMMENDATIONS
It is recommended that:
1. Auckland Council: Retain the services of the safety advisors for a 2016/17 summer campaign
Continue to provide regional leadership and support future fishing safety
promotion, including the installation of angel rings and safety signage at high risk
sites.
2. WaterSafe Auckland, Surf Life Saving Northern Region and other safetyorganizations:
Consider ways of addressing the concerns highlighted in this Report by reinforcing
and extending the current provision of public safety information and resources. Thecontinued high profiling of lifejacket use seems necessary in case theslippage in attitudes and behaviours reported here is more than a temporarytrend
Commit resources and personnel to the ongoing work collaboratively with all
partners to promote best practice for West Coast fishing safety education beyond
2016-7.
3. Recreational fishers, fishing organizations, lifejacket retailers, fishingoutlets:
Adopt and endorse the fishing safety messages promoted by the 2016 West Coast
Rock-based Fisher Safety Project.
Encourage others in the rock fishing community to adopt safe practices -
especially the wearing of lifejackets when fishing at Auckland’s high-riskwest coast locations.
Support the work of frontline fishing advisors and lifeguards in their efforts to make
rock fishing a safe and happy experience.
Advocate for the promotion of rock fishing safety with community groups especially
those that are identified high-risk including new migrants, Pasifika and Asian
peoples.

ix
Table of Contents
Section
No.
Section Heading Page no.
Preface and Acknowledgements ii
Executive Summary iii-viii
Table of Contents ix
List of Tables & Figures x
Main Report 1-41
1 Background 1-3
2 Purpose and Outcomes of the Study 4
3 Methods 5-7
3.1 Procedures 5
3.2 Measures 6
3.3 Data analysis 7
4 Key Findings 8-34
4.1 Demographics of fishers 8-11
4.2 Awareness of West Coast Fishing Safety Project 12-14
4.3 Public rescue equipment (angel rings, throw bags etc) 15
4.4 Fisher perceptions of drowning risk 16-23
4.5 Water safety behaviours of fishers 24-32
4.6 Changes in fisher knowledge, attitudes and behaviours 33-34
5 Summary of Key Safety Promotions, 2015-2016 35
6 Media Reports and Releases 36-37
7 Recommendations 38
8 References 39-41
9 Appendices i-iii
9.1 Appendix 1 - Survey Questionnaire ii-iii
9.2 Appendix 2 – Supplementary analysis, 2006-2015 iv-x

x
List ofTables
Pageno.
Table 1 Survey sites Dec 2015-March 2016 6Table 2 Demographic characteristics of fishers, 2016 8Table 3 Self-identified ethnicity of Asian fishers, 2016 9Table 4 Fishing frequency at site where interviewed and other places fished, 2016 10Table 5 Participation in and estimation of success of previous Fishing Safety Projects 13Table 6 Awareness of current Rock-based Fisher Safety Project, 2016 14Table 7 Awareness and success of the Public Rescue Equipment (PRE’s), 2016 15Table 8 Fisher perceptions of the risk of drowning, 2016 16Table 9 Comparison of fisher beliefs in efficacy of preventive actions, 2015 and 2016 20Table 10 Comparison of fisher confidence in ability to cope with risk, 2015 and 2016 21Table 11 Fishers’ Self-reported water safety behaviours, 2016 24
Table 12 Summary of safety behaviours, 2016 32Table 13 Comparison of self-reported changes in fishers’ safety knowledge, attitudes
and behaviours, 2015-201633
FiguresFigure 1.Figure 2.
Trend line of fisher visits to site, 2006-2016Trend line of participation in previous fishing surveys, 2007-2016
1112
Figure 3. Trend line of the severity of risk of drowning if swept off rocks whilefishing, 2006-2016
17
Figure 4. Trend line of the severity of risk of drowning while fishing, 2006-2016 18
Figure 5. Trend line of vulnerability, comparative swimming competency, 2006-2016
19
Figure 6. Trend line of attitude change with regard to lifejacket use when fishingfrom rocks, 2006-2016
20
Figure 7. Trend line of attitude change with regard to protective value of fishers’local knowledge, 2006-2016
22
Figure 8. Trend line of attitude change with regard to protective value of fishers’experience of the sea, 2006-2016
23
Figure 9. Fishers who often/always wear a lifejacket, 2006-16 (Q13, part 1) 25Figure 10 Fishers who never wear a lifejacket, 2006-16 (Q13, part 1) 25Figure 11 Self-reported behaviours, 2006-2016
- When fishing from rocks, do you check weather beforehand? (Q13, 2)26
Figure 12. Self-reported behaviours, 2006-2016- When fishing from rocks, do you drink alcohol? (Q13, 3)
27
Figure 13. Self-reported behaviours, 2006-2016- When fishing from rocks do you wear gumboots or waders? (Q13, 4)
28
Figure 14. Self-reported behaviours, 2006-2016- When fishing from rocks, do you turn you back on the sea? (Q13, 5)
29
Figure 15.
Figure 16.
Self-reported behaviours, 2006-2016- When fishing from rocks, do you carry a cell phone? (Q13, 6)Self-reported behaviours, 2006-2016- When fishing from rocks, do you go down the rocks to retrieve? (Q13, 7)
30
31

1
1. Background
In 2006, a rock-based fisher safety campaign was launched in the Auckland region
of New Zealand to combat the spate of drowning incidents associated with fishing from
rocky foreshores. The Auckland Regional Council (ARC), WaterSafe Auckland Inc.
(WAI), and Surf Life Saving Northern Region (SLSNR) initiated a fishing safety
campaign entitled the West Coast Fishing Safety Project in the summer of 2006. The
campaign established a fishing safety education programme that would help fishers
identify and manage the risks associated with rock-based fishing on Auckland’s rugged
west coast. A survey of fishers was conducted to better understand fisher demographics,
their knowledge of fishing safety knowledge, as well as gain information on their belief
and behaviours.
The 2006 survey revealed new and alarming statistics about risky behaviours that
predisposed many fishers to harm in the highly dangerous locations in which they
fished. Many had limited safety skills and an overly optimistic view of their survival
skills in a high-risk fishing environment (Moran, 2008). In terms of survival ability, one
third (n = 81; 32%) of fishers estimated that they could not swim 25 m. Most fishers
reported limited/no ability to perform CPR (n = 155; 62%). Many took unnecessary
risks when fishing from rocks. For example, almost one half (n = 120; 48%) had gone to
the water’s edge to retrieve a snagged line and one fifth (n = 50; 20%) admitted having
consumed alcohol while fishing from rocks. Most fishers agreed that always wearing a
life jacket made fishing a lot safer (n = 177; 71%), yet almost three quarters (n = 180;
72%) admitted that they never wore a life jacket.
Fishing safety messages that address the twin dangers of overestimation of ability
and underestimation of risk, especially at high-risk fishing locations, were
recommended (Moran, 2008). The survey also revealed that the fishing population was
culturally and linguistically diverse, was of recent residency, and were not frequent
visitors to the sites where surveyed (Moran, 2006). The implications of this diversity,
the transience of the population, and the remoteness of the site of activity were
recognized barriers to be overcome in subsequent safety promotion.
The Auckland-based project is unique in that the fishing safety education
programme is conducted on-site at high-risk fishing locations with supplementary

2
promotion of safety messages via relevant media outlets of television and radio,
newspapers and magazines as well as through retail outlets and community
organizations. Static displays of fishing safety, written material and verbal advice from
the trained field officers were the educational tools used for on-site promotion of fishing
safety. The findings of the initial study were reported back to the participating
organizations who decided that the project would be continued for an additional two
years (Moran, 2006). At the end of the 3-year period in 2008, the project was extended
for another two years and the information obtained from annual surveys conducted from
2006-2010 provided the data for a paper published in 2011 entitled Rock-based fishers
safety promotion: Five years on (Moran, 2011). Similar rock-based safety interventions
have since been reported in Australia (Birch, Morgan, Arch, & Mathews, 2015; in New
South Wales, Mitchell, Ware, & Bambach, 2014).
A decade of sustained commitment by the collaborating organisations based on
an annual survey of rock-based fishers has meant that the Project has been able to grow
organically in response to observed and reported knowledge, attitudes, and behaviours
(K-A-B). Initial emphasis on finding out what fishers knew, thought and did about
safety has been able to shift safety messages in a reflexive way to influencing
behaviours most likely to our fishers at risk of drowning. Some messages (such as the
wearing of lifejackets) have been persistent, dominant, worthy of perseverance, and
ultimately resulting in life saving behaviour changes. Other messages (such as not going
down the rocks to retrieve a snagged line) have appeared more resistant to change. This
Report provides a timely overview of the current safety practices and beliefs of and a
timely opportunity to see whether the years of safety promotion have been effective.
3
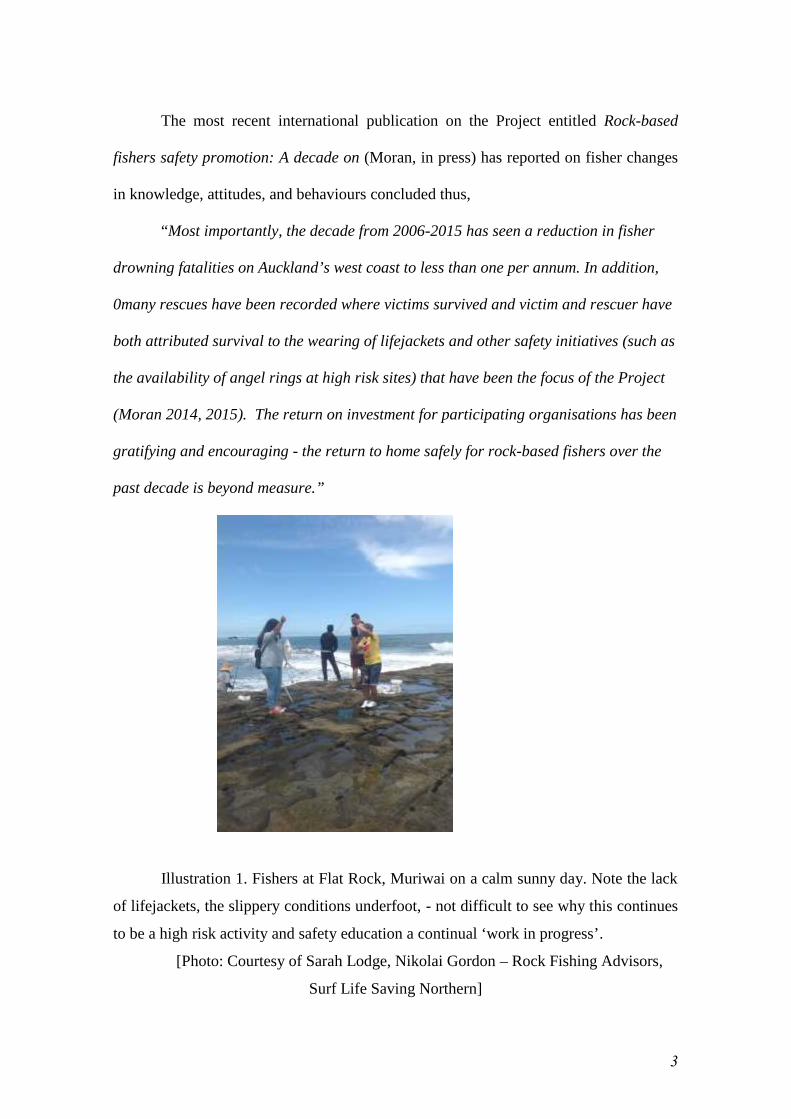
The most recent international publication on the Project entitled Rock-based
fishers safety promotion: A decade on (Moran, in press) has reported on fisher changes
in knowledge, attitudes, and behaviours concluded thus,
“Most importantly, the decade from 2006-2015 has seen a reduction in fisher
drowning fatalities on Auckland’s west coast to less than one per annum. In addition,
0many rescues have been recorded where victims survived and victim and rescuer have
both attributed survival to the wearing of lifejackets and other safety initiatives (such as
the availability of angel rings at high risk sites) that have been the focus of the Project
(Moran 2014, 2015). The return on investment for participating organisations has been
gratifying and encouraging - the return to home safely for rock-based fishers over the
past decade is beyond measure.”
Illustration 1. Fishers at Flat Rock, Muriwai on a calm sunny day. Note the lack
of lifejackets, the slippery conditions underfoot, - not difficult to see why this continues
to be a high risk activity and safety education a continual ‘work in progress’.
[Photo: Courtesy of Sarah Lodge, Nikolai Gordon – Rock Fishing Advisors,
Surf Life Saving Northern]

4
2. Purpose and Outcomes of the Study
2.1 Purpose
The purposes of this eleventh year of the project were threefold:
1) To continue the on-site rock fishing safety education promotion initiated in 2006,
2) To determine the effect of the project on Auckland’s west coast fishers’ safety
practices and beliefs, and
3) To make recommendations for future rock fishing safety promotion based on the
information obtained in the survey conducted during the 2015-16 season.
2.2 Outcomes
The specific outcomes of this Report are:
1. Ascertain the effect of on-site rock fishing safety promotion during the summer
months of 2015-16,
2. Survey fishers to find out whether they had taken part in the previous surveys
and, if so, what effect that safety campaign had had on their current
understanding and practice of water safety when fishing from rocks,
3. Survey fishers opinions on the value of safety signage and angel ring floatation
devices currently being piloted at high risk west coast fishing locations,
4. Compare and contrast:
a. fishers’ perception of drowning risk,
b. their safety behaviour and
c. self-reported changes in knowledge, attitudes and behaviours, and
5. Make recommendations and suggest future strategies that enhance fishers’
understanding and practice of safety when fishing from rocks on Auckland’s
west coast.

5
3. Methods
3.1 Procedures
As in previous years, participants in the survey were all those who were either
fishing from the chosen sites or in transit to and from the site. Rock fishing was again
defined as not only fishing with rod and reel (angling) but also included those who used
others devices such as baskets or hand lines as well as those gathering shellfish from the
rocks. Potential participants were approached, the purpose of the Project explained and
a request to voluntarily participate in an anonymous survey was made to all adult fishers
over 16 years of age.
The major difference in the data gathering was the more extensive use of the e-
questionnaire and I-pads, first trialled in 2014. The 2015-16 data was gathered using
only electronic surveys via a tablet, hard copy of the surveys (which had been available
in English, Cantonese, and Korean) were not used which meant that those with English
as a second language may have been compromised in their ability to respond to the
survey. It is possible that any bias in responses because of this need to be considered in
the interim phase of change in data gathering methodology, and must be borne in mind
when extrapolating data and making comparisons with previous findings that were
collected using conventional written questionnaire surveys.
The data gathering took place during December 2015 and March 2016 and
included several peak holiday weekdays and weekends. The sample did not include
fishers who used the sites at times outside ‘peak’ hours (such as night fishing) or fishers
who frequented other high-risk west coast locations. The sites were chosen at random
and included popular and high risk west coast fishing sites at Muriwai (including Flat
Rock, Maori Bay, Pillow Lava Bay, and Collins Bay), Piha, Karekare (including Whites
Beach, Mercer Bay), Bethells (including O’Neill Beach and Ding Bay), and Whatipu
(including Anawhata, Paratutai Rock and Nine Pin Rock) (See Table 1).

6
Table 1. Survey sites, Dec 2015- March 2016
Fishing location where interviewed n %
Muriwai (including Maori, Bay Collins Bay Pillow
Lava Bay50 34.0
Bethells beach (including O’Neill Beach, Ding
Bay)35 23.8
Whites Beach 22 15.0
Piha Beach (North and South) 20 13.6
Ninepin (including Anawhata, Whatipu) 18 12.2
Karekare 2 1.4
Total Korean 147 100%
3.2 Measures
The structured written and electronic survey (see Appendix 1) was anonymous,
designed to be completed on site, and take a maximum of 10 minutes to complete. The
questionnaire contained 14 questions, 11 of which had been included in the five
previous surveys since 2009. Five questions sought socio-demographic information on
gender, length of residency, age, ethnicity, and their previous rock fishing activity.
A question (introduced in 2014) that sought information on what was the primary
reason for the fishers fishing on the day they were surveyed. The question included five
possible responses: 1) For fun and enjoyment, 2) To feed the family, 3) To be with my
mates, and 4) To have a day out from home/work. The reason for the inclusion of this
question was to determine the accuracy of the claim that many fishers were engaged in
fishing primarily for sustenance purposes in a low wage economy.
Two questions on at-risk fishing behaviours and perceptions of drowning risk
from the earlier surveys were again included so as to compare fishing safety behaviours
and attitudes. The question on behaviours asked fishers to self-report on six behaviours

7
(for example, when rock fishing, do you wear a lifejacket/buoyancy aid) using four
response categories never, sometimes, often and always. The question on attitudes
consisted of 12 statements and required fishers to state whether they strongly agreed,
agreed, were unsure, disagreed, or strongly disagreed with the statement. A five-part
question asked fishers to estimate whether their knowledge, attitudes and behaviours (as
well as that of fishing mates and other fishers) had improved in the intervening year by
using three response categories - agree, disagree or don’t know.
As was the case in previous surveys from 2009, questions were included that
sought information on public rescue equipment that had been installed at high risk sites
in the previous 5 years. The first question asked whether fishers had seen the angel rings
in high risk locations. The second questions asked fishers to report whether they had
read the instructions accompanying each angel ring/throw bag. The third question asked
if the fisher thought they could use the equipment in an emergency situation and the
final open-ended question asked for suggestions about their installation and how they
might be made more effective.
3.3 Data analysis
Data from the completed questionnaires were entered into Microsoft Excel 2010
for statistical analysis using SPSS Version 22.0 in Windows. Descriptive statistics such
as means and proportions were used to describe the baseline characteristics of the
population. Frequency tables were generated for all questions and, unless otherwise
stated, percentages are expressed in terms of the number of respondents to each survey
question within groups. Trend lines are included in the graphics to indicate data
direction over the 11 years that the Project has been conducted.

8
4. KEY FINDINGS
The results of the 2015 survey are presented in six sections:
4.1 Demographics of Fishers
4.2 Awareness of West Coast Rock-based Fishing Safety Project
4.3 The Installation and Usage of Angel rings
4.4 Fisher Perceptions of Drowning Risk
4.5 Water Safety Behaviours of Fishers
4.6 Changes in Fishers’ Knowledge, Attitudes and Behaviours
4.1 DEMOGRAPHICS OF FISHERS
Demographically, the participants in the 2015-16 survey reflected a similar mix as
previously reported from 2006-2014. Fishers were predominantly male (91% male; 9%
female) and most (63%; n = 93) were aged between 20-44 years (see Table 2).
Proportionally more Asian peoples (54%; n = 79) completed the survey, whereas
proportionally less European (21%; n = 31) and Maori (3%; n = 4) New Zealanders
took part.
Table 2. Demographic Characteristics of Fishers, 2015-16
DemographicCharacteristic
n % Total
GenderMale 133 90.5 147
(100%)Female 14 9.5
Ethnicity
European 31 21.1
147(100%)
Maori 4 2.7Pasifika 24 16.3Asian 79 53.7Other 9 6.1
Age group
15-19 years 6 4.1
147(100%)
20-29 years 22 15.030-44 years 71 48.345-64 years 43 29.365+ years 5 3.4
Length ofresidency
< 1 year 8 5.4
147(100%)
1-4 years 8 5.45-9 years 20 13.6>10 years 58 39.5All my life 53 36.1

9
One third (36%) had lived in New Zealand all their lives, more than one third (40%; n =
58) had lived in New Zealand less than 10 years, and one quarter (24%) were of recent
residency (<10 years). The increased reporting of longer residency fishers suggests that
fishers are less likely to be unfamiliar with the activity and coastline and may have been
more completely acculturated into the aquatic lifestyle of New Zealand.
Table 3. Self-identified Ethnicity of Asian Fishers, 2015-16
Ethnic group n %
Chinese/Taiwanese 67 45.6
Korean 5 3.4
Indian 3 2.0
Other Asian (Filipino, Japanese, Vietnamese) 4 2.7
Total 79 53.7
Table 3 shows that those who self-identified as of Asian origin were predominantly
Chinese/Taiwanese (46% of survey sample; n =67), Korean (3% of survey sample; n =
5), and of other Asian origins including Indian, (2% of survey sample; n = 3) and other
Asian ethnicities (3% of survey sample; n = 4). Because the electronic version of the
survey (that was only available in English) was the only method of gathering data, no
differentiation of response by language spoken was possible in the 2015-16 survey. It is
not known how this has impacted on the accuracy of responses further electronic
surveying in other languages (Mandarin, Korean, and possibly Hindi) may be advised.

10
Table 4. Frequency at Site where Interviewed, Other Places Fished, and Reasons
for Fishing, 2015-16
How often have you fished at this site? n/%Cumulative
%
First time at site 33 22.4% 22.4%
2-5 times 28 19.0% 41.4%
6-10 times 14 9.5% 50.9%
11-20 times 11 7.6% 58.5%
>20 times 61 41.5% 100.0%
Where else have you fished?
Other Auckland west coast sites 15
Northland 3
Auckland Harbours (inc. Manukau, Waitemata) 8
Inner Hauraki Gulf (inc. Whangaparoa, Maraetai etc) 4
Outer Hauraki Gulf (inc. Coromandel, Great Barrier) 2
Other New Zealand sites
Other not specified (inc. boats)
6
5
What is the main reason for fishing today?
Fun and enjoyment 96 65.3% 65.3%
Feed the family 28 19.0% 84.3%
Be with mates 17 11.6% 95.9%
Have a day off from work/home 6 4.1% 100.0%
Fishers were asked to describe how often they had fished at the location where
they completed the questionnaire (see survey question 8, Appendix 1). Table 4 shows
that almost on quarter (22%, n = 33) reported that this was their first visit to the site and
more than one third (41%, n = 61) had visited the site up to 5 times. Cumulatively, one
half of fishers (51%) reported that they had visited the site less than 10 times. As was
the case in the previous year, more fishers (42%, n = 61) had visited the site more than
twenty times. In comparison with previous years, fishers were more likely to be regular
visitors to the sites and thus have greater experience of the west coast environment and
the vagaries of its weather, tide, and surf conditions.

11
Figure 1 shows the trend line from 2006 to 2016 of the number of fishers that
had visited the site where surveyed more than 6 times. Over the decade, the frequency
of visits to the site where the fisher was surveyed has gradually trended upwards
towards increased number of visits to the site. In 2006 at the start of the Project, 31%
had visited the site where surveyed more than 6times - by 2016, this proportion had
almost doubled to 59%.
Figure 1. Trend line of fisher visits to site, 2006-2016
Question: “How often have you fished at this location?
In addition to other indicators (such as increased length of residency), it would
appear that, after a decade of surveillance, the demographic pattern of Auckland’s West
coast rock-based fisher population may be changing. Whether this trend is likely to be
reflected in safer, greater awareness of the rock-based fishing campaign and more
informed safety behaviours continues to be a focus of future reporting.

12
4.2 AWARENESS OF WEST COAST ROCK-BASED FISHING
SAFETY PROJECT
Figure 2 shows the trend line of the number of times fishers who were aware of
previous west coast fishing safety campaigns and had completed the survey from 2006
to 2016. Over the years of the Project, the trend line suggests more fishers were aware
of the previous safety campaign although in 2016 almost two thirds (64%) were
unaware of the safety project, reinforcing previous comments about the difficulty of
reaching every fisher in remote settings on Auckland’s west coast where fishers engage
in their activity.
Figure 2. Trend line of participation in previous fishing surveys, 2007-2016
Question: “Did you take part in previous rock fishing surveys?”
Fewer fishers (36%) surveyed in 2016 reported that they had taken part in previous west
coast rock-based fishing safety surveys compared with the previous year (2015, 50%)
(See survey question 1, Appendix1). Reasons for a lack of consistency in awareness of

13
the project are hard to determine. The increased number of sites surveyed and the use of
e-surveys rather than hard copy written questionnaires available in multiple languages
are possible reasons, as are difficulties in data gathering (such weather, sea conditions)
and lack of fisher motivation to comply with surveyor requests to take part as they
become more familiar with the surveys existence each year.
Table 5 shows that, of the 53 fishers who had taken part in the previous surveys,
most (79%; n = 42) considered that the campaign had been highly successful/successful
compared with those who either considered it slightly/not successful (19%; n = 10) or
who did not know (2%; n = 1).
Table 5. Participation in, and estimation of success of, the previous projects
Did you take part in the previous rock fishing
projects?n %
Yes 53 36.1%
No 94 63.9%
Total 106 100.0%
If Yes, how successful do you think it was? n %
Highly successful 18 34.0%
Successful 24 45.3%
Slightly successful 6 11.3%
Not successful 4 7.5%
Don’t know 1 1.9%
Total 53 100.0%
When asked whether they were aware of the current fisher safety campaign,
fewer fishers (20%; n = 30) reported that they were aware of the current campaign, a
lesser proportion than that reported in the previous year (2015, 37%) (Moran, 2015).
Table 6 shows that, when those who were aware of the 2016 project were asked how
they had found out about the project, the fishing safety advisors (67%, n = 20) were
identified as the most frequent source of information (2015, 57%).

14
As was the case in previous years, many fishers had heard of the current safety
promotion through the council-employed fishing safety advisors, which once again
reinforces the benefit of engaging staff for on-site safety promotion to a group that is
characteristically diverse and who may be difficult to reach through traditional channels
such as television, retail outlets, and magazines (as indicated by the lesser recall of the
current project via these channels).
The lack of awareness of current and previous campaigns is a cause for concern
and suggest several possibilities. First, the ongoing transience of the rock-based fisher
population from year to year as previously reported seems
Table 6. Are you aware of, and how did you find out about the current (2015-16)
project?
Are you aware of the current (2015)project? n %
Yes 30 20.4%
No 117 79.6%
Total 147 100.0
If Yes, how did you find out about thecurrent project?
n %
Fishing safety advisors 20 66.7%
Newspapers/TV 4 13.3%
Retail outlets 2 6.7%
Other sources (e.g. lifeguards, friends) 4 13.3%
Total 30 100.0%

15
4.3 PUBLIC RESCUE EQUIPMENT (angel rings, throw bags etc.)
Table 7 shows that most fishers (87%; n = 128) reported having seen the angel rings at
popular fishing sites, more than in the previous year (2015, 73%) compared with
slightly more than one half of the respondents (52%; n = 67) in 2009 who reported
having seen the angel rings when they were first installed.
Table 7. Awareness of the angel rings, 2015-16
Have you seen the angel rings? n %
Yes 128 87.1%
No 19 12.9%
Have you read the angel ring instructions?
Yes 38 25.9%
No 109 74.1%
Do you think you could use one in an emergency? 38
Yes 109 74.1%
No 38 25.9%
Total 147 100.0%
When asked if they had read the associated signage and instructions on how to
use the rescue equipment in an emergency, only one quarter (26%, n = 38) of fishers
reported that they had read the instructions. Even though so few of the fishers reported
not having read the instructions, most (74%; n = 109) thought that they could use the
angel rings in an emergency. More than one quarter (26%, n = 38) reported that they did
not think they could use an angel ring in an emergency. Given the isolation of most of
the fishing locations on the west coast of Auckland, this is a major source of concern
since bystander assistance is likely to be critical in the time before lifeguards and/or
other emergency services are able to expedite a rescue response.

16
4.4 FISHER PERCEPTIONS OF DROWNING RISK
Fishers were asked to respond to a series of 12 statements relating to their perception of
the risk of drowning associated with fishing from rocks (see survey question 12,
Appendix 1). The question consisted of a 5-point scale that included the categories
strongly agree, agree, unsure, disagree and strongly disagree. For ease of
interpretation, the strongly agree/agree and disagree/strongly disagree responses were
aggregated.
Table 8. Fishers’ Perceptions of Risk of Drowning, 2015-16
Do you think that-
Stronglyagree/Agree
n %
Unsure
n %
Stronglydisagree/Disagreen %
1. Getting swept off the rocks islikely to result in my drowning 32 21.8 26 17.7 89 60.5
2. Rock fishing is no more risky thanother water activities
32 21.8 47 32.0 68 46.3
3. Drowning is a constant threat tomy life when rock fishing 21 14.3 28 19.0 98 66.6
4. I am not concerned about therisks of rock fishing
29 19.7 18 12.2 100 68.0
5. Others rock fishers are at greaterrisk of drowning than me
66 42.8 75 51.0 9 6.1
6. I am a strong swimmer comparedwith most other people
67 45.6 38 25.9 42 28.6
7. I avoid fishing in bad conditionsto reduce drowning risk
137 93.2 4 2.7 6 4.1
8. Always wearing a life jacketmakes fishing a lot safer 92 62.6 26 17.7 29 19.7
9. Turning my back to the waveswhen rock fishing is very dangerous
101 68.7 8 5.4 38 25.9
10. My local knowledge of this sitemeans I’m unlikely to get caught out 114 77.6 13 8.8 20 13.6
11. My experience of the sea willkeep me safe when rock fishing 126 85.7 13 8.8 8 5.4
12. My swimming ability means Ican get myself out of trouble 112 76.2 20 13.6 15 10.2

17
Table 8 shows responses to statements 1-3 (Question 12) that relate to fisher
perceptions of the severity of the risk of drowning when fishing from rocks (see
Appendix 1 – survey questionnaire). In contrast to previous recent surveys most fishers
disagreed that getting swept off rocks was likely to result in drowning (61%), almost
half (62%), disagreed that fishing from rocks was no more risky than other water
activities (46%), and two thirds (67%) disagreed that drowning was a constant threat to
their life when rock fishing. Unlike previous years, it appears that fishers have a greater
appreciation of the risk of drowning associated with fishing from rocks off Auckland’s
west coast. It is hoped that this heightened sensitivity of risk will promote safer fishing
practice within the fisher community.
Figure 3 shows the change in opinions on the severity of the risk of drowning
related to getting swept off the rocks. In 2016 only one fifth of fishers (22%) agreed that
getting swept off the rocks was likely to result in drowning (compared with 77% of
fishers in the previous year. The trend line suggest that, prior to the current survey,
fishers had become more aware of the risk of drowning at high risk rock based fishing
sites over the decade from 2006 -2015. The 2016 result contradicts the heightened
sensitivity towards drowning risk over the previous ten years that the project has been
running (see Figure 3a, Appendix 2 for details). The sudden reversal is difficult to
explain and will require further examination to see whether this is a trend or
idiosyncratic finding.
Figure 3. Trend line of the severity of risk of drowning if swept off rocks
while fishing, 2006-2016
Statement: “Getting swept off the rocks is likely to result in my drowning”

18
Figure 4 shows a similar upward trend in the 10 years from 2006-2015 with regard to
their awareness of the risk of drowning when engaged in fishing from rocks off the
West Coast of Auckland. In sharp contrast to the previous 10 years when most fishers
agreed that drowning was a constant threat (M = 56%), only 14% of fishers in the 2016
survey agreed that the risk of drowning was constant threat. This reduced perception of
the severity of the risk of drowning when fishing from rocks on the west coast requires
further scrutiny so as to determine whether the change is a reflection of changed
methodology of the survey (such as onsite electronic surveying, monolingual survey
format, more remote survey locations) or whether it suggest a change of attitudes. It is
again recommended that this aspect be closely monitored in subsequent surveys.
Figure 4. Trend line of the severity of risk of drowning while fishing,
2006-2015
Statement: “Drowning is a constant threat to my life when rock fishing”
Responses to statements 4-6 (Question 12) related to fisher perceptions of their
vulnerability to drowning when fishing from rocks (Table 8). Most fishers (68%)
disagreed that they were not concerned about the risk of drowning (2015, 62%), but
almost half (43%) thought that other fishers were more vulnerable to the risk of
drowning than themselves (2015, 46%) and many (37%) were unsure of this. As was
the case in 2015, many fishers (46%) considered that they were strong swimmers
compared with other people (2015, 38%). Conversely, fewer fishers in 2016 thought

19
they were poor swimmers in comparison with the previous year (2016, 29%; 2015,
45%).
Figure 5. Trend line of vulnerability, comparative swimming competency,
2006-2015
Statement: “I am a strong swimmer compared with most other people”
Responses to statements 7-9 (Question 12) related to fisher perceptions of the
efficacy of preventive action in reducing drowning risk when fishing from rocks (see
Appendix 1 – survey questionnaire). Most fishers taking part in the 2016 survey
responded positively to all three statements of the efficacy of preventive actions to
reduce drowning risk. Table 9 shows that most fishers agreed that they avoided fishing
in condition that were bad (2016, 93%; 2015, 92%), that wearing a life jacket made
fishing a lot safer (2016, 63%; 2014, 74%) and that turning your back to the sea when
fishing from rocks was very dangerous (2016, 69%; 2015, 73%).

20
Table 9. Comparison of fisher beliefs in efficacy of preventive actions,
2015 and 2016
Do you think that-
Stronglyagree/Agree
Unsure Stronglydisagree/Disagree
7. I avoid fishing in badconditions to reducedrowning risk
2016 93% 3% 4%
2015 92% 2% 6%8. Always wearing alifejacket makes fishing alot safer
2016 63% 18% 20%
2015 74% 14% 12%
9. Turning my back to thewaves when fishing is verydangerous
2016 69% 5% 26%
2015 73% 6% 21%
The shift in beliefs about the efficacy of wearing a lifejacket seen in Table 9 is
cause for concern, because closer scrutiny of responses to this question in previous
surveys has indicated a positive shift in attitudes towards the protective effect of
wearing a lifejacket. The 2016 response goes against the upward trend seen in Figure 6
and is among the lowest responses since the surveys commenced in 2006.
Figure 6. Trend line of attitude change with regard to lifejacket use when
fishing from rocks, 2006-2016
Statement: % of fishers who agree “Always wearing a life jacket makes fishing a
lot safer”

21
Responses to statements 10-12 (Question 12) related to fisher perceptions of the
self-efficacy of their preventive behaviours in reducing drowning risk when fishing
from rocks (see Appendix 8.1 – survey questionnaire) that is their confidence in their
capacity to counter the risk of drowning. In previous surveys, fishers have been
confident of their ability to keep themselves safe - their self-efficacy - the current
survey results suggest that participants in 2016 also considered themselves even more
capable of looking after themselves.
Table 10 shows a comparison of fishers’ beliefs from the 2015 and 2016 surveys
about their ability to cope with the risk associated with fishing from rocks on
Auckland’s west coast. All three statements regarding their personal experience of the
sea, their local knowledge of the site, and their confidence in their swimming
competence have increased. This suggests that more fishers in the most recent survey
fishers have increased estimates of the protective value of their cognitive knowledge
and physical competency. While evidence of increased visits to the site where surveyed
(see Table 4 and Figure 1) would support an improved local knowledge and experience,
the likely improvement in swimming competency is unsubstantiated (2016, 76%; 2015,
48%) and likely to be overly optimistic. Further assessment of fisher swimming
competency is required in order to establish the difference between real and perceived
swimming competency and any likely protective value it may have in these high risk
environments.
Table 10. Comparison of fisher confidence in ability to cope with risk, 2015 and
2016
Do you think that-Strongly
agree/Agree
Unsure Stronglydisagree/Disagree
10. My experience of thesea will keep me safe whenfishing
2016 86% 9% 5%
2015 56% 16% 28%11. My local knowledge ofthis site means I’m unlikelyto get caught out
2016 78% 9% 14%
2015 49% 16% 35%
12. My swimming abilitymeans I can get myself outof trouble
2016 76% 14% 10%
2015 48% 21% 32%

22
The trend lines over the 10 years of the Project for these components of self-
efficacy show little change in attitudes.
Figure 7. Trend line of attitude change with regard to protective value of
local knowledge, 2006-2016
Statement: % of fishers who agree “My local knowledge of this site means I’m
unlikely to get caught out”
Figure 7 shows the trend line for responses related to the protective capacity of
their local knowledge suggests that, in the prior 10 years of the Project, belief in the
protective power of their local knowledge has been consistently strong irrespective of
the consistently low frequency of visits to the site. While frequency of visits to sites had
increased slightly over the years, it is unlikely that the protective power of such
knowledge, real or imagined, will do much to minimise risk in the hazardous locations
fisher use on the west coast. The same optimism in the self-efficacy of their knowledge
of the sea was evident in the trend line shown in Figure 8.

23
Figure 8. Trend line of attitude change with regard to protective value of
fishers’ experience of the sea, 2006-2016
Statement: % of fishers who agree “My experience of the sea will keep me safe
when fishing”
When analysed in comparison with the results from the previous year,
considerable differences were evident in perceptions of swimming competency as seen
in Table 10. In 2015, one half of the fishers (48%) believed their swimming ability
would keep them out of trouble yet this perception had increased to include more than
three quarters (76%) of the fishers surveyed in 2016.

24
4.5 WATER SAFETY BEHAVIOURS OF FISHERS
Fishers were asked to report their previous water safety behaviours (see survey question
13, Appendix 1) using a four-point frequency scale including never, sometimes, often
and always in order to describe whether they had performed at-risk behaviours when
fishing from rocks. As in previous surveys, the latter two responses were aggregated
and are reported in the tables and text as often/always (see Table 11).
Table 11. Fishers’ Self-reported Water Safety Behaviours, 2015-16
When rock fishing, do you -
Never
n %
Sometimes
n %
Often/Always
n %
1. Wear a lifejacket or
other flotation device96 65.3% 16 10.9% 35 23.8%
2. Check weather/water
conditions first1 7.5% 5 3.4% 131 89.9%
3. Drink alcohol when you
are fishing124 84.4% 14 9.5% 9 6.1%
4. Wear gumboots or
waders101 68.7% 24 16.3% 22 14.9%
5. Turn your back to the
sea when fishing77 52.4% 37 25.2% 33 22.4%
6. Take a cell phone in case
of emergencies10 6.8% 2 1.4% 135 91.8%
7. Go down rocks to
retrieve snagged line74 50.3% 35 23.8% 38 25.8%
Figure 9 indicates critically important behaviour change with regards to
lifejacket use since the inception of the project with a peak in lifejacket use (50%)
occurring in 2011. The positive change in the trend line since 2006 is encouraging and
supports anecdotal evidence of greater use of lifejackets by fishers. However, the 2016
response where only one quarter (24%) of fishers report often/always wearing a
lifejacket when fishing form rocks is cause for concern. As indicated by the trend line in
Figure 9, the positive change in behaviour related to the use of life jackets/flotation
devices has consistently improved, but the most recent survey suggests some negative

25
shift in behaviour. Furthermore, it is cause for still further concern that almost two
thirds (65%) of fishers reported never wearing a lifejacket, a proportion not seen since
the first year of the Project (2006, 72%). Figure 10 shows a persistent minority of
fishers (range 72%-28%) who never wear lifejackets, whether the two thirds of fishers
who self-reported this dangerous practice in 2015-16 is an accurate representation of
lifejacket use requires corroboration via observational study and future surveying.
Figure 9. Fishers who often/always wear a lifejacket, 2006-16 (Q13, part 1)
Figure 10. Fishers who never wear a lifejacket, 2006-16 (Q13, part 1)

26
Almost all fishers (93%) reported often/always checking the weather
beforehand, and, of these most (90%) reported always checking conditions. Figure 11
shows a consistent pattern of compliance with this important safety behaviour from
2006-2015 when most fishers also reported often/always checking the weather
beforehand. From 2006 -2014, approximately three-quarters of fishers (range 72-91%)
always/often checked the weather beforehand and a small proportion (range 2-12%)
consistently never checked the weather. The continued positive trend in this behaviour
is encouraging and reflects an improved safety culture among fishers.
Figure 11. Self–reported safety behaviours, 2006-2016- When fishing from rocks do you check weather beforehand? (Q13, part 2)
Table 11 shows that most fishers (84%) reported that they never mixed alcohol
and fishing, but a proportion (16%) of fishers did sometimes/often consume alcohol
when fishing in 2016, a similar proportion to that recorded in the previous year (2015,
11% sometimes, 5% often/always). Figure 12 shows that most fishers recognised the
inherent danger of mixing alcohol consumption with high risk rock-based fishing and
abstained from alcohol use when fishing. Continued promotion of the no alcohol use in
rock fishing safety promotion is recommended.

27
Figure 12. Self–reported safety behaviours, 2006-2016
- When fishing from rocks do you drink alcohol? (Q13, part 3)
The fourth risky practice related to the wearing of waders or gumboots. Table 11
shows that more than two thirds of fishers (69%) reported that they never wore
gumboots or waders, but almost one third (31%) did, with almost 16% reporting that
they did sometimes and 15% often/always wearing gumboots or waders. This is a slight
improvement on the previous year (2015, 61% never, 22% sometimes, 17%
often/always). As in previous years, it may still be prudent to combine messaging about
protective clothing with lifejacket use. While Figure 13 shows some sign of positive
behavioural change over the decade of intervention, continued emphasis on the need for
safe clothing/footwear is recommended.

28
Figure 13. Self–reported safety behaviours, 2006-2016
- When fishing from rocks do you wear gumboots or waders? (Q13, part 4)
Table 11 shows that the dangerous practice of turning your back to the sea – was
reported by almost half (48%) fishers, with almost one quarter of fishers (25%)
sometimes and 22% often/always turning their backs to the sea at some time when
fishing from rocks. The trend line shown in Figure 14 indicates that this risky behaviour
has not changed a great deal during the decade of the Project and, of the risky
behaviours included in the decade of surveying this is the only one that has got worse.
A breakdown of response over the previous decade shows that between a quarter and
half of fishers (range 24-56%) turned their back on the sea sometimes and a smaller
proportion (range 5-15%) said they did so often. Given this continued widespread
practice and the seeming impermeability of fishers to the safety messaging around it, it
is suggested that this aspect of safety messaging be reviewed with the possibility of
suggesting alternative strategies to reduce the risk of having to turn your back to the sea
be explored.

29
Figure 14. Self–reported safety behaviours, 2006-2016
-When fishing from rocks do you turn you back on the sea? (Q13, part 5)
Fishers were asked whether they carried a cell phone for emergency use. Table 10
shows that most fishers (81%) reported that they often/always carried a cell phone, with
14% reporting that they sometimes did and 5% that they never did. This continued
widespread carriage of cell phones by fishers is encouraging and suggests that
emergency services may be better able to respond to incidents in these traditionally
remote locations. Given that the 2015 surveys reached more locations than previous
surveys and most of those sites were more isolated than previous sites surveyed, future
surveys may seek information from fishers about the cell phone coverage.
Figure 15 shows that most fishers have consistently reported carrying cell phones
when fishing off Auckland’s west coast from 2006-2015. More than three quarters of
fishers surveyed from 2006-2015 carried mobile phone, particularly valuable given the
isolated location of many of the sites. The trend line indicates that the practice is on the
increase (range 74%-95%), further research on their actual use in emergencies (possibly
via an analysis of emergency callouts requiring rescue assistance) would reinforce the
necessity of carrying them.

30
Figure 15. Self–reported safety behaviours, 2006-2015
- When fishing from rocks do you carry a cell phone (Q13, part 6)
The final self-reported behaviour related to the dangerous practice of going
down the rocks to the waters edge to retrieve a snagged line. Table 10 shows that, in
2016, one half (50%) of fishers reported that they never went down the rocks to free a
snagged line, but one quarter (35%) reported that they did sometimes and one fifth
(22%) reported that they often engaged in this risky practice (2015, 54% never, 35%
sometimes, 11% often/always). While similar responses to the previous year it is still a
cause for concern that one half (49%) of fishers sometime engage in this highly
dangerous practice is most concerning.
Figure 16 shows the trend in this behaviour over the 10 years of the project. As
was the case with wearing gumboots (Figure 13) and turning your back to the sea
(Figure 14), the frequency of this self–reported behaviour has not improved greatly over
the eleven years of the Project. As was the case in previous years, anecdotal evidence
from observations of fisher practices suggests that few fishers cut their lines in response
to snagging the line on surface or underwater rocks. Continued promotion of line
cutting as the safest way to fish from rocks is recommended.

31
Figure 16. Self–reported safety behaviours, 2006-2015- Do you go down the rocks to retrieve snagged line? (Q13, part 7)

32
Table 12. Summary of Safety Behaviours, 2016

33
4.6 CHANGES IN FISHERS’ KNOWLEDGE, ATTITUDES, ANDBEHAVIOURS
Fishers were asked to assess whether their fishing safety knowledge, attitudes,
and behaviour and that of their mates and other fishers had improved since the inception
of the Project in 2006 (see question 14, Appendix 1). Table 13 shows that most fishers
(84%) considered that their safety knowledge had improved in recent years, a small
proportion (13%) thought that it had not improved and 3% didn’t know whether it had
improved. Comparative figures for the previous year suggest that fishers perceive
similar positive change in their safety knowledge in 2016.
Table 13. Comparison of Self-Reported Changes in Fishers’ Safety Knowledge,Attitudes and Behaviours, 2015 and 2016
Do you think that - YearAgree Disagree Don’t know Total
n % n % n % n %
Your rock fishing
safety knowledge has
improved?
2016 124 84.4 19 12.9 4 2.7 147 100.0
2015 371 89.8 30 7.3 12 2.9 413 100.0
Your rock fishing
safety attitude has
improved?
2016 123 83.7 20 13.6 4 2.7 147 100.0
2015 345 83.5 55 13.3 13 3.1 413 100.0
Your rock fishing
safety behaviour has
improved?
2016 119 81.0 25 17.0 3 2.0 147 100.0
2015 341 82.6 62 15.0 10 2.4 413 100.0
Your mates’ rock
fishing behaviour has
improved?
2016 106 72.1 23 15.6 18 12.2 147 100.0
2015 308 74.6 45 10.9 60 14.5 413 100.0
Other rock fishers’
behaviour has
improved?
2016 110 74.8 13 8.8 24 16.3 147 100.0
2015 324 78.5 18 4.4 71 17.2 413 100.0

34
Most fishers (84%) believed that their safety attitudes had improved, though
some (14%) considered that their attitude had not improved or didn’t know (3%). Most
fishers (81%) also considered that their safety behaviour had improved (2015, 83%)
with 17% believing their safety behaviour had not improved and 2% not knowing if it
had.
To determine whether participants in the survey had seen an overall
improvement in safety behaviour among the fishing community, fishers were asked to
indicate whether they thought the safety behaviour of friends or other rock fishers had
improved. Table 13 shows that almost three quarters of fishers (72%) thought that the
safety behaviour of their mates had improved (2015, 75%), some (16%) thought their
mates fishing behaviour had not improved (2015, 11%). A similar positive response
about safety behaviour was reported in regards to other fishers, with three quarters of
fishers (75%) believing that other rock fishers behaviour had improved (2015, 79%) and
some (9%) believing that it had not improved (2015, 4%).
CONCLUSIONS
On the basis of the above findings, several key points are worthy of concluding
emphasis. They include:
The rock-based fisher population on Auckland’s west coast remain a
transient ever-changing population with culturally and linguistically
diverse demography.
While some evidence suggests that the fishers are more familiar with the
location at which they fish (greater frequency of visits), some self-reported
risky behaviours (such as going down the rocks to retrieve a snagged line
and the use of inappropriate footwear) still prevail.
Most significantly, lower self-reported lifejacket use is a cause for concern
and with more fishers reporting never wearing a lifejacket on the West
coast, further safety promotion is warranted. Whether the poor lifejacket
behaviour represents a negative shift in the mind set of fishers requires
corroboration by observational study and continued monitoring.

35
5 SUMMARY OF KEY SAFETY PROMOTIONS, 2015-2016
5. The Fishing Safety Promotion in action:
6. Summary of Key Fishing Safety Promotions, 2015-2016Key tasks:
How much did we do?
Promotion and delivery of land based fishing resources at 5 events, andchurch/community groups and 5 workplaces
2 Pacific or Asian media promoting safer land-based fishing
2 practical & theory workshops
10 presentations to targeted groups
15 lifejackets given away to targeted groups
Bait freezers: (L) Burnsc, Manukau (R) Oscarma Fishing Tackle, Balmoral
Key Tasks for eachoutcome
Activities and Measures Due Date
Update land-based fishingsurvey
Update external evaluation tool Translate external evaluation tool Print external evaluation tool Distribute external evaluation tool
Dec 2015Dec 2015Dec 2015Dec 2015
Deliver theory/practicalworkshops
2 x Theory Workshop 2 x Practical Workshop
Jan 2016Jan 2016
Lifejackets to be used asgiveaways
Source funding for 15 lifejackets Purchase lifejackets Giveaway lifejackets
Dec 2016Jan 2016April 2016
Messaging on bait freezers Source funding Develop messaging Messaging installed at petrol stations
Dec 2015Jan 2016May 2016
Corflute developed and printedready for use
Source quote for x 1 corfluteCorflute printed
Jan-Feb 2016Jan-Feb 2016

36
6 MEDIA REPORTS AND RELEASES
11 July 2016 Press ReleaseFor immediate release
Preparation makes the difference for rock fisher
Taking proper safety precautions, quick thinking backed by education anda swift response from volunteer lifeguards and emergency services mayhave saved a fisherman swept off the rocks at Piha on Saturday.
WaterSafe Auckland Chief Executive Officer Jonathon Webber says suchaccidents typically end in tragedy – a fatality – but this time it didn’t for severalvery good reasons. Jonathon says those factors were:
The fisherman was well prepared, wasn’t fishing alone, his companion had acellphone to call 111, and both were wearing lifejackets.
A life‐ring (angel‐ring) was available and used by the man’s companion.
The rescue involved a combined response by the emergency services:Westpac Rescue Helicopter, SurfCom (Surf Life Saving Northern Region), PihaSurf Life Saving Club, St John Ambulance and the New Zealand Police.
The impact of the West Coast Rock Fishing Safety project, a decade‐longsuccessful educational intervention that has significantly reduced fisherdrownings.
Surf Life Saving Northern Region CEO Matt Williams says all involved werepleased the fisher survived his ordeal. “But it does highlight the significant riskattached to West Coast rock‐fishing, a risk that is heightened when a big surf isrunning.”Several hands‐on, land‐based fishing workshops have been delivered in recentmonths for Auckland’s Asian communities, as part of the Safety Project, anongoing partnership between WaterSafe Auckland, Surf Life Saving NorthernRegion and Auckland Council, aimed at reducing rock fishing fatalities onAuckland’s west coast beaches. ‐Ends‐For more information or interviews contact.Jonathon WebberChief Executive Officer, WaterSafe Auckland
P: 021 555 382 E: [email protected]

37
LUCKY FISHERMAN SAVED AT PIHA
09 July 2016
Quick acting Piha locals save fisherman washed into Piha Beach
Two friends were fishing near The
Camel when one was swept into the sea. His quick thinking friend threw him the ‘angel
ring’ and told him to stay calm.
Photo: the friend who threw the Angel Ring with Westpac Rescue Helicopter.
The friend then dialed 111. The Rescue Helicopter and Piha’s 1st response were
immediately dispatched.
However a quick thinking Piha local had contacts for Piha’s ‘after hours rescue squad’ and
made contact. Piha SLSC responded immediately launching a boat at the same time the
helicopter arrived.
Photo: Very grateful friend thanking Piha 1st Response member Fiona Anderson.
Piha SLSC members plucked the very lucky fisherman from the sea still wearing his
gumboots and clutching his fishing rod.
A fabulous outcome: Piha SLSC, First Response and local knowledge working
well together.Source: Piha Village Voice, 6th July 2016

38
7. RECOMMENDATIONS
It is recommended that:
2. Auckland Council:
Retain the services of the safety advisors for a 2016/17 summer campaign
Continue to provide regional leadership and support future fishing safety
promotion, including the installation of angel rings and safety signage at high risk
sites.
4. WaterSafe Auckland, Surf Life Saving Northern Region and other safety
organizations:
Consider ways of addressing the concerns highlighted in this Report by
reinforcing and extending the current provision of public safety information and
resources. The continued high profiling of lifejacket use seems necessary in case
the slippage in attitudes and behaviours reported here is more than a temporary
trend
6 Commit resources and personnel to the ongoing work collaboratively with all
partners to promote best practice for West Coast fishing safety education beyond
2016-7.
5. Recreational fishers, fishing organizations, lifejacket retailers, fishing outlets:
Adopt and endorse the fishing safety messages promoted by the 2016 West Coast
Rock-based Fisher Safety Project.
Encourage others in the rock fishing community to adopt safe practices -
especially the wearing of lifejackets when fishing at Auckland’s high-risk west
coast locations.
Support the work of frontline fishing advisors and lifeguards in their efforts to
make rock fishing a safe and happy experience.
Advocate for the promotion of rock fishing safety with community groups
especially those that are identified high-risk including new migrants, Pasifika and
Asian peoples.

39
8. REFERENCES
Accident Compensation Corporation (2009). Review of the economic and social costs of
drowning fatalities and water-related injuries compared to prevention. October
2009.Wellington: ACC/Price Waterhouse Coopers (PwC).
Moran, K. (In press). Rock-based fisher safety promotion: A decade on. International
Journal of Aquatic Research and Education,
Moran, K. (2015). Water safety and Auckland’s west coast fishers – A decade on.
Report to the Auckland Council, Surf life Saving Northern and Watersafe
Auckland. Auckland: Watersafe Auckland. Available in PDF format at:
http://watersafe.org.nz/Community/Research/ Rock Fishing at:
http://www.watersafe.org.nz/family-communities/research-and-information/rock-
fishing/
Moran, K. (2014). Water safety and Auckland’s West Coast fishers – 2013. Report to
the Auckland Council, Surf Life Saving Northern Region and WaterSafe
Auckland Inc. Auckland: Watersafe Auckland. Available at:
Community/Research/ Rock Fishing at: http://www.watersafe.org.nz/family-
communities/research-and-information/rock-fishing/
Moran, K. (2013). Water safety and Auckland’s West Coast fishers – 2013. Report to
the Auckland Council, Surf Life Saving Northern Region and WaterSafe
Auckland Inc. Auckland: Watersafe Auckland. Available in PDF format at:
http://www.watersafe.org.nz/family-communities/research-and-information/rock-
fishing/
Moran, K. (2012). Water safety and Auckland’s west coast fishers- Report 2012. Report
to the Auckland Regional Council, Surf life Saving Northern and Watersafe
Auckland. Auckland: WaterSafe Auckland. Available in PDF format at:
http://www.watersafe.org.nz/family-communities/research-and-information/rock-
fishing/
Moran, K. (2011). Water safety and Auckland’s west coast fishers- Report 2011. Report
to the Auckland Regional Council, Surf life Saving Northern and Watersafe
Auckland. Auckland: WaterSafe Auckland. Available in PDF format at:
http://www.watersafe.org.nz/family-communities/research-and-information/rock-
fishing/

40
Moran, K. (2010). Water safety and Auckland’s west coast fishers- Report 2010. Report
to the Auckland Regional Council, Surf life Saving Northern and Watersafe
Auckland. Auckland: WaterSafe Auckland. Available in PDF format at:
http://www.watersafe.org.nz/family-communities/research-and-information/rock-
fishing/
Moran, K. (2011). Rock-based fisher safety promotion: Five years on. InternationalJournal of Aquatic Research and Education, 5(2), 164-173. Available at:http://scholarworks.bgsu.edu/cgi/viewcontent.cgi?article=1127&context=ijare
Moran, K. (2010). Water safety and Auckland’s west coast fishers- Five years on.
Report to the Auckland Regional Council, Surf life Saving Northern and
Watersafe Auckland. Auckland: WaterSafe Auckland. Available in PDF format
at: http://www.watersafe.org.nz/family-communities/research-and-
information/rock-fishing/
Moran, K. (2009). Water safety and Auckland’s west coast fishers- Report 2009. Report
to the Auckland Regional Council, Surf life Saving Northern and WaterSafe
Auckland. Auckland: WaterSafe Auckland. Available in PDF format at:
http://www.watersafe.org.nz/family-communities/research-and-information/rock-
fishing/
Moran, K. (2008). Rock fishers’ practice and perception of water safety. International
Journal of Aquatic Research and Education, 2(2), 128-139. Available at:
http://scholarworks.bgsu.edu/cgi/viewcontent.cgi?article=1243&context=ijarehttp
://scholarworks.bgsu.edu/cgi/viewcontent.cgi?article=1243&context=ijare
Moran, K. (2008, July). Water safety and Auckland’s West Coast fishers – Final report
2008. Report to the Auckland Regional Council, Surf Life Saving Northern
Region and WaterSafe Auckland. Auckland: WaterSafe Auckland Incorporated.
Available in PDF format at: http://www.watersafe.org.nz/family-
communities/research-and-information/rock-fishing/
Moran, K. (2007). Water safety and Auckland’s West Coast fishers – Follow-up report
2007. Report to the Auckland Regional Council, Surf Life Saving Northern
Region and WaterSafe Auckland. Auckland: WaterSafe Auckland Incorporated.
Available in PDF format at: http://www.watersafe.org.nz/family-
communities/research-and-information/rock-fishing/

41
Moran, K. (2006, May). Water safety and Auckland’s West Coast fishers. Report to the
Auckland Regional Council, Surf Life Saving Northern Region and WaterSafe
Auckland, Auckland: Watersafe Auckland Incorporated. Available in PDF format
at: http://www.watersafe.org.nz/family-communities/research-and-
information/rock-fishing/
New Zealand Herald (2016). Lucky escape from rogue wave drives safety message
home. New Zealand Herald, 29th October, 2016, p. A13. Available at:
http://m.nzherald.co.nz/nz/news/article.cfm?c_id=1&objectid=11736917
Statistics New Zealand (2014). 2013 Census QuickStats about culture and identity.
Accessed 4th August available at: http://www.stats.govt.nz/Census/2013-
census/profile-and-summary-reports/quickstats-culture-identity.aspx
Water Safety New Zealand (WSNZ), 2015. New Zealand land based drowning fatalities
2006-2015. Drownbase™. Wellington: WSNZ. Accessed 4th August 2015.

i
9. Appendix
9.1 Appendix 1 - The survey questionnaire9.2 Appendix 2 - 2006-16 Figures

ii
Rock-Fishing in Auckland: 2015-16
From 2006-13, Auckland’s west coast rock fishers have been asked their opinions on rock fishing water safety. Thisfollow-up survey is designed to gather further information from you about your current views. Many of the questionsask you about the possible dangers of fishing from rocks and your opinions on rock fishing safety.The survey is voluntary and anonymous, so no names will ever be known.If you have any queries about the survey please ask the rock fishing advisor who will be happy to assist you.
Date: ________________ Time: ________________ Location: ________________________
1. a) Did you take part in the Auckland westcoast rock-fishing project in the past?
6. How would you best describe yourself?
Yes No European New Zealander
Māori
Pasifika
Chinese / Taiwanese
Korean
Indian
Other (e.g. African, French, Spanish etc.)
__________________________________________
__________________________________________
If Yes, do you think the project is: Highly successful
Successful
Slightly successful
Not successful
Don’t know
2. Are you aware of the current rock fishingsafety promotion in Auckland? 7. How long have you lived in New Zealand?
Yes No Less than 1 year
If Yes, how do you know about it? Between 1-4 years
Radio Between 5-9 years
Television More than 10 years
Rock fishing advisors All my life
Newspapers
Magazines 8. How often have you fished at this location?
Retail outlets (eg fishing shops, gas stations) This my first time
Other _______________________________ Between 2-5 times
3. Are you? Between 6-10 times
Male Female Between 11-20 times
4. How old are you? More than 20 times
15-19 years
20-29 years 9. Tick ONE of the list below that best describesyour reason for fishing today:
30-44 years For fun and enjoyment
45-64 years To feed the family
65+years To be with my mates
5. Where else have you fished in the last year?
________________________________________
To have a day out from home / work

iii
10. 1 - Have you seen angel rings on the West Coast? Yes No
2 – Have you read instructions on how to use them? Yes No
3 – Do you think you could use one in an emergency? Yes No
4 – Do you have any suggestions on how to make them more effective? _____________________________
__________________________________________________________________________________________
11. Do you think that- StronglyAgree Agree Unsure Disagree Strongly
Disagree1 - Getting swept off the rocks while fishing islikely to result in my drowning
2 - Rock fishing is no more risky than otherwater activities
3 –Drowning is a constant threat to my lifewhen rock fishing 4 - I am not concerned about the risks of rockfishing
5 - Other fishers are at greater risk of drowningthan me
6 - I am a strong swimmer compared with mostother people
7 – I avoid fishing in bad conditions to reducethe risk of drowning
8 - Always wearing a lifejacket makes rockfishing a lot safer
9 - Turning my back to the waves when rock-fishing is very dangerous
10 - My local knowledge of this site means I’munlikely to get caught out
11 - My experience of the sea will keep me safewhen rock fishing
12 - My swimming ability means I can getmyself out of trouble
12. When rock fishing, do you - Never Sometimes Often Always
1 Wear a lifejacket/buoyancy aid 2 Check weather forecast beforehand 3 Drink alcohol when fishing 4 Wear gumboots or waders 5 Turn your back on the sea 6 Take a cell phone in case of emergencies 7 Go down the rocks to retrieve snagged line
13. As a result of the rock fishing project, do you believethat: Agree Disagree Don’t know
1 My knowledge of rock fishing safety has improved 2 My practice of rock fishing safety has improved 3 My attitudes towards rock fishing safety have improved 4 My rock fishing mates seem more safety conscious 5 Other rock fishers around me seem more safety conscious
Information on the locations, tides and weather is available on www.findabeach.co.nzThank you for taking part in the survey, please return this form to the Rock Fishing Advisor.

iv
Appendix 2: Supplementary Analysis, 2006-2016
Figure 1a. Number of visits to site where surveyed, 2006-2016
Figure 2a Percentage of fishers who had taken part in previous surveys, 2007-2015

v
Question 12. Opinions on safety:Severity of risk, vulnerability, efficacy of preventive actions, self-efficacy
Figure 3a. Severity of risk of drowning if swept off rocks while fishing, 2006-2015
Figure 4a. Vulnerability – swimming competency, 2006-2015

vi
Figure 5a. Efficacy of Preventive action –wearing a lifejacket, 2006-2015
Figure 6a. Self-Efficacy of Preventive action – local knowledge, 2006-2015

vii
Question 13 Self-reported behaviours
Figure 7a. Self–reported safety behaviours, 2006-2015- When fishing from rocks do you wear a lifejacket? (Q13, part 1)
Figure 8a. Self–reported safety behaviours, 2006-2015- When fishing from rocks do you check weather beforehand? (Q13, part 2)

viii
Figure 9a. Self–reported safety behaviours, 2006-2015
- When fishing from rocks do you drink alcohol? (Q13, part 3)
Figure 10a. Self–reported safety behaviours, 2006-2015
- When fishing from rocks do you wear gumboots or waders? (Q13, part 4)

ix
Figure 11a. Self–reported safety behaviours, 2006-2015
-When fishing from rocks do you turn you back on the sea? (Q13, part 5)
Figure 12a. Self–reported safety behaviours, 2006-2015
- When fishing from rocks do you carry a cell phone (Q13, part 6)

x
Figure 13a. Self–reported safety behaviours, 2006-2015- Do you go down the rocks to retrieve snagged line? (Q13, part 7)