Weekly statistics for NHS Test and Trace (England ... - GOV.UK
51
Weekly statistics for NHS Test and Trace (England) 17 to 23 February 2022 Published 3 March 2022
-
Upload
khangminh22 -
Category
Documents
-
view
1 -
download
0
Transcript of Weekly statistics for NHS Test and Trace (England ... - GOV.UK

Weekly statistics for NHS Test and Trace (England)
17 to 23 February 2022 Published 3 March 2022
Weekly statistics for NHS Test and Trace (England): 17 to 23 February 2022
2
Contents Introduction .................................................................................................................................. 5
Revisions to figures previously published .................................................................................... 6
Publication update ....................................................................................................................... 6
1. NHS Test and Trace ................................................................................................................ 7
1.1 Testing in England .............................................................................................................. 7
1.2 Contact tracing in England ............................................................................................... 21
1.3 Managed quarantine service (MQS) ................................................................................. 39
1.4 Test and Trace Support Payments ................................................................................... 42
2. Terminology ........................................................................................................................... 44
2.1 Testing .............................................................................................................................. 44
2.2 Tracing ............................................................................................................................. 46
3. Measuring the data ................................................................................................................ 48
3.1 How the data was collected .............................................................................................. 48
3.2 Future development .......................................................................................................... 48
3.3 Strengths and limitations .................................................................................................. 49
3.4 Quality .............................................................................................................................. 49
3.5 Feedback .......................................................................................................................... 50

Weekly statistics for NHS Test and Trace (England): 17 to 23 February 2022
3
Main points People tested, England: • 308,844 people tested positive for coronavirus (COVID-19) at least once1 in the week
between 10 February and 16 February 2022 – this is a decrease of 31.4% compared to the previous reporting week, where 450,345 people tested positive (3 to 9 February 2022). Data for the latest week is unavailable for this publication, please see ’Publication update’ section for more information.
Pillar 2 testing turnaround times, England: • in the current reporting week, 95.3% of pillar 2 in-person tests (125,161 tests) were
returned within 24 hours of taking a test, an increase from 94.6% of test results returned in the previous reporting week (195,082 tests)
• 91.3% of pillar 2 combined satellite and home test kits were returned with 48 hours of taking a test in the most recent week (306,545 tests), a decrease from the 91.4% of tests returned in the previous week (486,253 tests)
• since Test and Trace launched, 89.2% of pillar 2 tests have been returned within 72 hours of taking a test (102,842,968 tests)
Distance to in-person testing sites for booked polymerase chain reaction (PCR) tests, pillar 2, England: • in the latest reporting week, the median distance to in-person pillar 2 testing sites for
booked PCR tests has remained unchanged from the previous reporting week at 2.0 miles
Positive cases transferred to NHS Test and Trace: • 218,444 cases were transferred to the contact tracing system between 17 February and
23 February 2022, of which 77.4% were reached and asked to provide details of recent close contacts – this is a decrease from the 85.3% reached in the previous week
Close contacts identified by NHS Test and Trace: • in the current reporting week, 396,2732 people were identified as coming into close
contact with someone who had tested positive, a decrease from 499,267 in the previous week
1 Deduplicated for the reporting week. For information on how the number of people are tested and tested positive in a reporting week is measured see the NHS Test and Trace statistics methodology. 2 The number of people identified includes duplicates as an individual may be named as a close contact for more than one case. See NHS Test and Trace statistics methodology for more information.

Weekly statistics for NHS Test and Trace (England): 17 to 23 February 2022
4
• for those where communication details were available, 71.2% of close contacts were reached and told to self-isolate in the current reporting week (269,336 contacts), a decrease from 78.9% (373,325 contacts) in the previous reporting week reporting week
Managed Quarantine Service (MQS): MQS figures in this release do not report updated data for the latest reporting week due to a data quality issue. Work is underway to address this to ensure this data can be included in future publications. • between 10 February and 16 February 2022, 73,997 tests were processed for all
international arrivals, a 65.9% decrease from 217,039 in the week before (3 February to 9 February 2022); from 11 February 2022, passengers who qualify as fully vaccinated do not need to take any COVID-19 travel tests upon arrival in England and this explains the huge decline in the number of total tests by international arrivals
• between 10 February and 16 February 2022, 2,894 positive tests were processed for all international arrivals, a 65.5% decrease from 8,385 in the week before
Test and Trace Support Payment Scheme (TTSP): • as of 23 February 2022, local authorities have paid £264.3 million to 528,687
applicants since the start of the scheme • over the previous week, local authorities reported payments of £6.2 million to 12,329
applicants • in the current reporting week, discretionary payments made up 45.1% of all TTSP

Weekly statistics for NHS Test and Trace (England): 17 to 23 February 2022
5
Introduction The UK Health Security Agency (UKHSA) publishes weekly statistics on NHS Test and Trace (England) across all 4 testing pillars. The purpose of this publication is to provide a weekly update on the implementation and performance of NHS Test and Trace in England. For NHS Test and Trace (England), this includes: Testing: • people tested for COVID-19 • people testing positive for COVID-19 • time taken for test results to become available • distance to in-person test sites for booked PCR tests Contact tracing:
• people transferred to the contact tracing system, and the time taken for them to be
reached • close contacts identified, and the time taken for them to be reached Managed Quarantine Service (MQS):
• people quarantining at home or in a managed quarantine hotel • number of PCR tests processed by international arrivals quarantining at home or in a
managed quarantine hotel and how many of these were positive • number of international arrivals into England by country of departure, the proportion
of arrivals that tested positive and COVID-19 variants detected from the sample of PCR tests sequenced
Test and Trace Support Payments (TTSPs): • number of payments and amount paid for successful TTSP claims, by week and local
authority
Data collected for NHS Test and Trace is primarily for operational purposes and was not designed to track the spread of the virus. Studies into the spread of the virus in the UK are carried out by the Office for National Statistics (ONS). Further guidance can be found in comparing methods used in the COVID-19 Infection Survey and NHS Test and Trace, England. A list of data sources relating to the COVID-19 pandemic in the UK can be found at coronavirus (COVID-19) statistics and analysis. A breakdown of all available testing and contact tracing data in the UK can be found at Testing and contact tracing in the UK: summary of data.
Weekly statistics for NHS Test and Trace (England): 17 to 23 February 2022
6
All data used in the report can be found in the UKHSA Test and Trace data tables on the weekly collection page. A full explanation of the data sources and methods used to produce these statistics can be found in the additional methodology document for NHS Test and Trace statistics. Data and methodology for the NHS COVID-19 app are available on the NHS COVID-19 app support website.
Revisions to figures previously published Figures given in previous releases are routinely revised each week going back to the start of Test and Trace for people tested for COVID-19, people testing positive for COVID-19, pillar 2 testing turnaround times, distance to in-person PCR test sites and contact tracing, to the start of the managed quarantine service for people quarantining at home or in a managed quarantine hotel, and to 15 February 2021 for number of PCR tests reported by international arrivals quarantining at home or in a managed quarantine hotel. The figures presented are based on a data cut 5 to 6 days after the end of the reporting period. This is to give time for data relating to the end of the 7-day period to be collected. Some data may continue to be collected after this period, and therefore may need to be revised over time. Figures for pillar 1 testing turnaround times are not routinely revised as only minor changes occur to past weeks post-publication. Figures are only revised when substantial changes occur. More detail on routine revisions is given in the quality section. Note that these routine revisions to data include the local authority level contact tracing data that is made available on the the weekly collection page. As past data is revised, subtracting figures given in the previous week from figures given in the current week will not give the total number of cases for that week.
Publication update On 21 February 2022, the Prime Minister set out a new plan on living with COVID-19. Changes relevant to this publication take effect from 24 February 2022 and do not impact this week’s publication as the current reporting week covers 17 to 23 February 2022, but are expected to reflect in future publications. We are currently reviewing the impact of the changes on the publication. Due to a delay in the data supply for positive test numbers, in the most recent week ending 23 February 2022, data for Table 1 of the accompanying data tables - 'number of people tested' and 'number of people testing positive' is unavailable. The data has been refreshed up to and including week ending 16 February 2022.

Weekly statistics for NHS Test and Trace (England): 17 to 23 February 2022
7
All countries were removed from the red list on 15 December 2021. Therefore, Table 7 (Number of registered and processed PCR tests by arrivals from red list countries and territories) and Table 5 (Number of people starting their quarantine in a managed quarantine hotel, England) have been removed from this bulletin. More information can be found on the guidance for travelling to England page. Although updates to Table 21 in the accompanying data tables follow a 3-weekly cycle, the table has not been updated past 5 January 2022 due to new data not meeting the quality of historical data in this table. Work is under way to address this in a future release. Figures in the Managed Quarantine Service (MQS) section in this release do not report updated data for the latest reporting week due to a data quality issue. Work is underway to address this to ensure this data can be included in future publications.
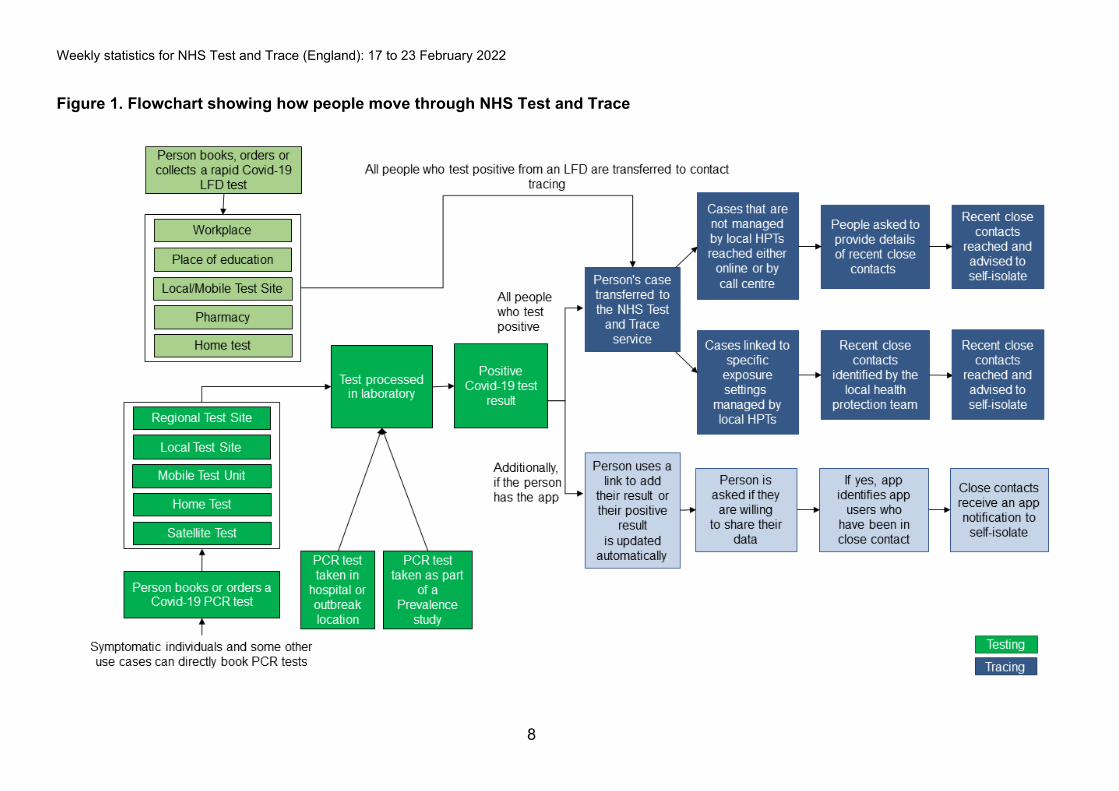
1. NHS Test and Trace NHS Test and Trace was launched in England on 28 May 2020 and ensures that anyone who develops symptoms of COVID-19 can quickly be tested to find out if they have the virus. It then helps trace recent close contacts of anyone who tests positive for COVID-19 and, if necessary, notifies them that they must self-isolate at home to help stop the spread of the virus. The flow of how people move through the NHS Test and Trace service is shown in Figure 1. More information about NHS Test and Trace can be found at NHS Test and Trace: how it works.
1.1 Testing in England NHS Test and Trace starts with an individual taking a swab test for the virus, either in pillar 1 (testing in hospitals and outbreak locations), pillar 2 (national swab testing) or pillar 4 (prevalence studies). Those who go on to test positive will have their case transferred to NHS Test and Trace for contact tracing. From 11 January 2022 in England, people who receive positive lateral flow device (LFD) test results for COVID-19 will be required to self-isolate immediately and will not be required to take a confirmatory PCR test. Statistics in this section are given for England only. Weekly figures for UK testing are available to download from the latest report in the weekly collection page and are also available daily on the and are also available daily on the coronavirus in the UK dashboard. Information on contact tracing in Scotland, Wales and Northern Ireland can be found directly from Public Health Scotland, the Welsh government, and the Northern Ireland Public Health Agency.
Weekly statistics for NHS Test and Trace (England): 17 to 23 February 2022
8
Figure 1. Flowchart showing how people move through NHS Test and Trace

Weekly statistics for NHS Test and Trace (England): 17 to 23 February 2022
9
Figure 1 shows the journey a person can take through NHS Test and Trace. This can start with either an LFD COVID-19 test, or a PCR COVID-19 test. For those taking LFD tests, they can collect their test from their workplace, place of education, pharmacy or local or mobile test site. They can also order an LFD test to be delivered to their home. From 11 January 2022 in England, people who receive positive LFD test results for COVID-19 will be required to self-isolate immediately and will not be required to take a confirmatory PCR test. PCR tests may also be taken in hospital or outbreak locations or as part of a prevalence study. Booked PCR tests can either be conducted at a regional test site, local test site or mobile test unit, or a satellite or home test can be conducted. After tests have been taken, they are sent to a laboratory for processing. Once processed, a person will be emailed or texted their result. If a person has a positive COVID-19 test result, then their case is transferred to NHS Test and Trace and can be managed in one of 2 ways. First, cases that are not managed by local health protection teams (HPTs) are reached either online or by a call centre. They are then asked to provide details of recent close contacts. These recent close contacts are then reached by NHS Test and Trace and advised to self-isolate. Second, cases that are linked to certain exposure settings are escalated to local HPTs who work to identify and reach recent close contacts and advise them to self-isolate. Additionally, if the person has the app and used the app to book their test, their positive result is updated automatically. If they have the app but booked their test via a different route, then they can use a link to add their positive result to the app. Once their positive result is entered into the app, the person is asked if they are willing to share their data and if they say yes, the app identifies other app users who have been in close contact with the person who has tested positive. Close contacts then receive an app notification to self-isolate. People tested and people testing positive, England The headline figures reported in this publication for people tested and people testing positive include both LFD tests and PCR tests, deduplicated for each reporting week.3 Information on the differences between these types of tests can be found in the NHS Test and Trace statistics methodology. From 7 January 2021, positivity rate is not calculated as part of this publication but can instead be found on the coronavirus in the UK dashboard for PCR only positive cases in England. This is because the figures in this publication include both PCR and LFD tests and it is likely that LFD tests have a different positivity rate to PCR tests due to the use of LFDs in rapid testing. As
3 Figures also include a small number of people tested using LAMP tests. See NHS Test and Trace statistics methodology for more information.

Weekly statistics for NHS Test and Trace (England): 17 to 23 February 2022
10
the number of LFD tests reported is increasing over time, a consistent positivity rate cannot be calculated using these figures. A statistical commentary on rapid testing in England along with data tables for the number of tests reported, broken down for LFD and PCR tests, is available on the weekly collection page. The number of people tested and number of people testing positive via PCR tests in each reporting week, by age, gender and local authority is also available on the weekly collection page.
Between 10 February 2022 and 16 February 2022, 3,950,615 people were tested for COVID-194 at least once.
Figure 2 shows the number of people tested for COVID-19 in each reporting week (excluding the current reporting week) by pillar since Test and Trace began. The number of people tested grew from the launch of Test and Trace until an initial peak in week ending 17 March 2021, after which numbers have fluctuated in line with school term times. In the week ending 5 January 2022, the number of people tested reached an all-time high of 8,268,482. In the reporting week 10 to 16 February 2022, 3,950,615 people were tested for COVID-19 at least once a 17.1% decrease compared to the previous reporting week where 4,764,420 were tested.
4 Deduplicated for the reporting week, methodology was revised from 15 October 2020. See NHS Test and Trace statistics methodology for more information.

Weekly statistics for NHS Test and Trace (England): 17 to 23 February 2022
11
Figure 2. Number of people tested for COVID-19 in each reporting week by pillar, England
Weekly Statistics for NHS Test and Trace page. Due to a data issue (see ‘Publication update’ section) the data in this graph does not cover the latest reporting week.

Weekly statistics for NHS Test and Trace (England): 17 to 23 February 2022
12
Between 10 February 2022 and 16 February 2022, 308,844 people tested positive for COVID-195 at least once.
Figure 3 shows the number of people tested positive for COVID-19 each reporting week by pillar since Test and Trace began. In the week ending 5 January 2022, positive cases reached an all-time high of 1,324,996, however they have since fallen. In the reporting week 10 February and 16 February 2022, 308,844 people tested positive, a 31.4% decrease from the previous reporting week. Pillar 1 tests accounted for 27,180 (8.8%) and pillar 2 tests accounted for 281,664 (91.2%) of people tested positive in the latest reporting week 10 to 16 February 2022.
5 Deduplicated for the reporting week, methodology was revised from 15 October 2020. See NHS Test and Trace statistics methodology for more information.

Weekly statistics for NHS Test and Trace (England): 17 to 23 February 2022
13
Figure 3. Number of people testing positive for COVID-19 in each reporting week by pillar, England
This data can be found in the ‘Table_1’ tab of the ‘NHS Test and Trace Statistics 28 May 2020 to 23 February 2022: data tables’ on
Weekly Statistics for NHS Test and Trace page. Due to a data issue (see ‘Publication update’ section) the data in this graph does not cover the latest reporting week.

Weekly statistics for NHS Test and Trace (England): 17 to 23 February 2022
14
Pillar 1 testing turnaround times, England Pillar 1 testing refers to swab testing for the virus in UK Health Security Agency (UKHSA) labs and NHS hospitals for those with a clinical need, and health and care workers. Since some pillar 1 tests are conducted in a hospital setting, it is not practical for those administering the tests to record the exact time that a test was taken. Therefore, the time taken to receive a COVID-19 test result is measured from the time that a test is received by a laboratory for processing to the time when the results are published to the Laboratory Information Management System (LIMS). This data is only available from 9 July 2020 due to differences in the reporting methodologies between UKHSA labs. More details can be found in the NHS Test and Trace statistics methodology.
Between 17 February and 23 February 2022, 492,071 (98.1%) of pillar 1 test results were made available within 24 hours of the laboratory receiving the test.
In the current reporting week, 501,835 pillar 1 test were reported and 492,071 (98.1%) test results were made available within 24 hours. The proportion of pillar 1 tests completed within 24 hours has increased from 97.5% to 98.1% in the current reporting week. Since reporting began, 94.8% (36,963,654 tests) of pillar 1 test results have been made available within 24 hours. Pillar 2 testing turnaround times, England There are various routes for getting tested within pillar 2 (national swab testing) which has an impact on turnaround times.6 Data on the time taken to receive a COVID-19 test result for pillar 2 is split up to reflect this. These routes include: 1. In-person tests These involve a person being tested in-person at a COVID-19 test site and include: • regional test sites, which include drive-through testing centres • local test sites7, which are similar to regional test sites but specifically for walk-ups
6 For all measures of time taken to receive a COVID-19 test result, there are a number of tests that were not completed. This covers any test where the results were not communicated, which may be because communication details (for example, phone number or email address) were not provided or were incorrect, or because the test was cancelled or abandoned, or no result was available. It also includes some tests which are still being processed.

Weekly statistics for NHS Test and Trace (England): 17 to 23 February 2022
15
• mobile testing units, which travel around the UK to increase access to COVID-19 testing; they respond to need, travelling to test people at specific sites including care homes, police stations and prisons
2. Satellite test centres These include test kits provided directly to ‘satellite’ centres at places such as care homes that have a particularly urgent or significant need. 3. Home test kits These are delivered to someone’s door so they can test themselves and their family without leaving the house. A lower proportion of home and satellite test results will be available within 24 hours of the test being taken compared to in-person tests due to differences in testing schedules and delivery of tests. Therefore, the percentage of test results received within 24 hours for in-person tests and the percentage of test results received within 48 hours for home and satellite tests are presented in this bulletin. There are normal fluctuations in this operational process which can sometimes cause the time taken to receive a test result to go over 24 hours, but still be turned around the next day. Therefore, we also provide the percentage of tests turned around the day after a test was taken where appropriate. The median turnaround times are also given as an indication of the average time taken. Turnaround times are measured and reported in 2 ways: • time from booking a test to receive a test result • time from taking a test to receive a test result All figures presented in this bulletin relate to time from taking a test. More information on these definitions is in the terminology section and the NHS Test and Trace statistics methodology. LFD tests are not included in this section on turnaround times as they do not require processing in a lab.
Between 17 February and 23 February 2022, the median time (hours) taken to receive test results has decreased for regional, local, satellite and home testing routes, while remaining the same for mobile testing units.
Table 1 below, shows the median time taken to receive test results reported by in-person testing routes (regional test sites, local test sites, and mobile testing units), satellite test

Weekly statistics for NHS Test and Trace (England): 17 to 23 February 2022
16
centres and home test kits; for the previous reporting week, current reporting week and since the launch of Test and Trace. Table 1. Median time taken (hours) to receive test results, by route, England
Median time taken (hours) to receive test result
Previous reporting
week
Current reporting
week
Since Test and Trace launched: 28 May 2020 to
23 February 2022 Regional test sites 15 14 21
Local test sites 16 15 22
Mobile testing units 13 13 20
Satellite test centres 23 21 39
Home testing kits 28 26 44 Figure 4 below, shows the median time taken to receive test results by testing route since the launch of Test and Trace. Median time for in-person testing routes reached a peak in week ending 14 October 2020, satellite test centres peaked in week ending 9 September 2020 and home test kits peak in week ending 26 August 2020. Median time taken to receive test results reported by in person testing routes are lower than satellite test centres and home test kits due to differences in testing schedules and delivery of tests.

Weekly statistics for NHS Test and Trace (England): 17 to 23 February 2022
17
Figure 4. Median time (hours) from taking a test to receiving test results by route, England
This data can be found in the ‘Table_8’ tab of the ‘NHS Test and Trace statistics 28 May 2020 to 23 February 2022: data tables’ on the Weekly Statistics for NHS Test and Trace page.

Weekly statistics for NHS Test and Trace (England): 17 to 23 February 2022
18
Between 17 February and 23 February 2022, 95.3% of in-person pillar 2 test results were received within 24 hours of taking a test.
In the current reporting week, 131,358 in-person pillar 2 tests were reported, a decrease from 206,321 tests in the previous reporting week by 36.3%. The proportion of tests received within 24 hours of taking a test was 95.3% (125,161 tests), an increase from the 94.6% received within 24 hours in the previous reporting week (195,082 tests). The time taken to receive a test result may go over 24 hours, but still be turned around the next day (see methodology for further information). In the current reporting week, 98.8% of in-person pillar 2 tests were received the next day after the test was taken (129,723 tests). This is a decrease from the 99.2% of tests in the previous reporting week (204,611 tests). In the current reporting week, 335,688 tests were reported by satellite test centres and home test kits combined, a decrease from 531,846 tests in the previous reporting week by 36.9%. Of these, 91.3% combined tests were received within 48 hours of taking a test (306,545 tests), a decrease from the 91.4% received within 48 hours in the previous reporting week (486,253 tests). 95.6% of combined tests were received within 72 hours of taking a test (320,778 tests), a decrease from the 96.1% received within 72 hours in the previous reporting week (510,923 tests). For all pillar 2 routes combined, 65.9% of test results were received within 24 hours of taking a test (307,750 tests) compared to 59.2% (436,977 tests) in the previous reporting week. Table 2. Percentage of results received within 24 hours (in-person tests) or within 48 hours (home and satellite tests), by route, England
Percentage of results received within 24 hours (in-person tests) or within 48 hours (home and satellite tests)
Previous reporting
week
Current reporting
week
Since Test and Trace launched: 28 May
2020 to 23 February 2022
Regional test sites within 24 hours 92.3 95.2 62.1
Local test sites within 24 hours 94.3 95.0 60.2
Mobile testing units within 24 hours 96.6 95.7 67.0
Satellite test centres within 48 hours 91.6 91.7 64.4
Home testing kits within 48 hours 91.0 90.6 54.6

Weekly statistics for NHS Test and Trace (England): 17 to 23 February 2022
19
Distance to in-person testing sites for booked PCR tests, pillar 2, England The distance to testing sites for booked PCR tests is calculated as the direct distance between the approximate centre of a person’s postal district and their chosen test location in straight line. This is reported as the median and associated percentiles for those who successfully booked a test at regional test sites, local test sites and mobile testing units in the latest week. More information is available in the NHS Test and Trace statistics methodology.
Between 17 February and 23 February 2022, the median distance to in-person PCR testing sites for booked tests has stayed the same at 2.0 miles.
In the current reporting week, the median distance to an in-person PCR test site has stayed the same at 2.0 miles. In the current reporting week, 90% of people who booked a test at a test centre lived 9.7 miles or less away. Figure 5 below represents the median distance (miles) to testing sites for tests booked at in-person PCR test sites. The graph includes a comparison between in-person different testing routes, which include Mobile Testing Units, Local Test Sites and Regional Test Sites. Median distance for all in-person routes peaked in September 2020 and have since reduced.

Weekly statistics for NHS Test and Trace (England): 17 to 23 February 2022
20
Figure 5. Median distance (miles) to testing sites for tests booked at an in-person PCR test site by route, England
This data can be found in the ‘Table_9’ tab of the ‘NHS Test and Trace statistics 28 May 2020 to 23 February 2022: data tables’ on the Weekly Statistics for NHS Test and Trace page.

Weekly statistics for NHS Test and Trace (England): 17 to 23 February 2022
21
1.2 Contact tracing in England Once a person has a positive test result for COVID-198 this person is transferred to NHS Test and Trace and a case is opened for them. The number of positive cases transferred to the contact tracing system may not always align with the number of people testing positive for COVID-19. There are several reasons for this which are outlined in the information for users document. Positive cases and their contacts which are linked to potential outbreaks in specific settings are handled by UKHSA local health protection teams (HPTs). These cases and contacts, previously known as complex, have been referred to as ‘cases and contacts managed by local HPTs’ since 29 October 2020. Furthermore, cases and contacts managed nationally either online or by call centres, previously known as non-complex, are referred to as ‘cases and contacts not managed by local HPTs’. For cases managed by local HPTs, their contacts are often managed at a situation rather than individual level, with advice being issued to the contact institution. Therefore, cases who were managed by local HPTs may not have been individually reached and asked to provide details of their recent close contacts. However, the cases and contacts will have been successfully dealt with. For more information on the different ways of managing cases and the outcomes of contact tracing see the terminology section. From 18 March 2021, only outbreaks in care homes are handled by HPTs. Further information is available in the NHS Test and Trace statistics methodology. Positive cases transferred to NHS Test and Trace
Between 17 February and 23 February 2022, 218,444 positive cases were transferred to NHS Test and Trace.
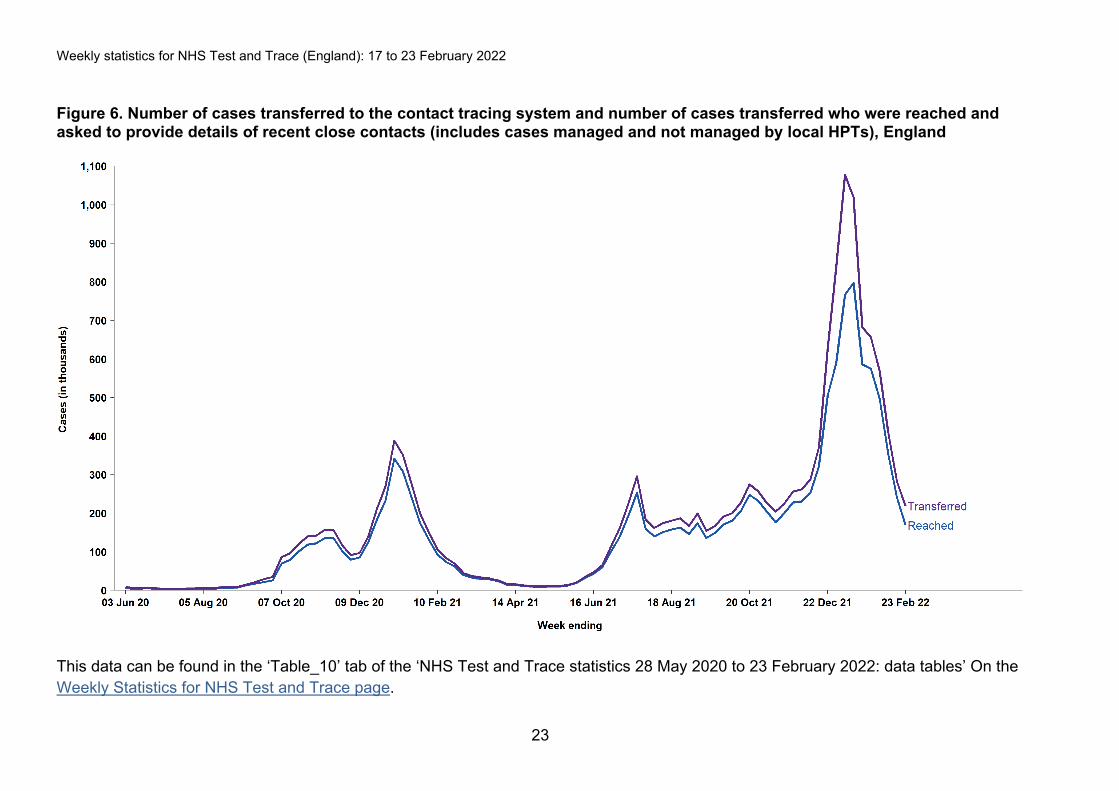
Figure 6 shows the number of cases transferred to the contact tracing system since Test and Trace began. The number of cases transferred initially peaked in week ending 6 January 2021, falling to the lowest levels since the launch of Tests and Trace in week ending 5 May 2021. Cases transferred reached the highest point since the beginning of test and trace in week ending 5 January 2022 at 1,077,182. In the current reporting week, 218,444 cases
8 All confirmed positive test results under pillar 1 and pillar 2 should be transferred. In addition, all positive virus test results as part of prevalence studies (pillar 4) are also transferred to Test and Trace. People tested under pillar 3 (serology testing to show if people have antibodies from having had COVID-19) do not have their cases transferred to NHS Test and Trace.

Weekly statistics for NHS Test and Trace (England): 17 to 23 February 2022
22
were transferred to the contact tracing system, a 22.4% decrease on the previous reporting week. Out of the cases transferred to the contact tracing system in the latest week, 77.4% were reached (169,096), 22.2% were not reached (48,529) and 0.4% had no communication details provided (819). Since Test and Trace launched, 84.4% of all cases have been reached. In the current reporting week, 0.9% of cases reached and asked to provide details of close contacts were managed by local health protection teams (HPTs) (1,453 cases), whereas 99.1% of cases were community-wide (167,643 cases) and, therefore, not managed by local HPTs.
Weekly statistics for NHS Test and Trace (England): 17 to 23 February 2022
23
Figure 6. Number of cases transferred to the contact tracing system and number of cases transferred who were reached and asked to provide details of recent close contacts (includes cases managed and not managed by local HPTs), England
This data can be found in the ‘Table_10’ tab of the ‘NHS Test and Trace statistics 28 May 2020 to 23 February 2022: data tables’ On the Weekly Statistics for NHS Test and Trace page.

Weekly statistics for NHS Test and Trace (England): 17 to 23 February 2022
24
Table 3. Cases transferred to the contact tracing system (includes cases managed and not managed by local HPTs) by whether they were reached and asked to provide contact details, England9
Cases transferred to contract tracing system
Previous reporting week
Current reporting week
Since Test and Trace launched: 28 May 2020
to 23 February 2022
People who were reached and asked to provide details of recent close contacts
240,211 (85.3%)
169,096 (77.4%)
13,318,171 (84.4%)
People who were not reached
40,082 (14.2%) 48,529 (22.2%) 2,374,508 (15.0%)
People whose communication details were not provided
1,200 (0.4%) 819 (0.4%) 96,091 (0.6%)
Total number of people transferred to contact tracing system
281,493 218,444 15,788,770
9 If NHS Test and Trace is not able to reach an individual testing positive or if no communication details are available, then it is not always possible to know if the case should be managed by a local HPT or not. Therefore, these breakdowns are not available.

Weekly statistics for NHS Test and Trace (England): 17 to 23 February 2022
25
Figure 7. Proportion of cases reached and asked to provide details of recent close contacts by upper-tier local authority (UTLA) since Test and Trace began
This data is available as an interactive map and to download as a csv on the Weekly Statistics for NHS Test and Trace page. The regional data uses a different data cut to the main publication. Therefore, cumulative totals will not exactly match. The data is available for the cumulative figures since Test and Trace launched up to the most recent week of reporting. Due to revisions that occur, each week on week’s cumulative figures cannot be subtracted from a previous week to obtain weekly data by UTLA.

Weekly statistics for NHS Test and Trace (England): 17 to 23 February 2022
26
Between 17 February and 23 February 2022, 64.4% of the people reached provided information about 1 or more close contacts.
Figure 8 represents the proportions of people transferred to contact tracing and asked to provide details of recent closed contacts, by whether they provided details or not. In the current reporting week, of the 169,096 people transferred to the contact tracing system and reached, 64.4% (108,904) provided details of one or more close contacts. This is a decrease from the 65.8% (157,956) of people who provided details of one or more close contacts from the previous reporting week. The proportion that provided details since Test and Trace launched is 73.4%. The number who were not able to give any recent close contacts refers to people who were successfully reached by NHS Test and Trace, but either had no recent close contacts or could not provide details of close recent contacts to pass on for further contact tracing (for example, recent close contact with strangers on the bus).

Weekly statistics for NHS Test and Trace (England): 17 to 23 February 2022
27
Figure 8. Proportion of people transferred to the contact tracing system (includes cases managed and not managed by local HPTs) who were reached and asked to provide details of recent close contacts by whether they provided details for contacts or not, England
This data can be found in the ‘Table_11’ tab of the ‘NHS Test and Trace statistics 28 May 2020 to 23 February 2022: data tables’ on the Weekly Statistics for NHS Test and Trace page.

Weekly statistics for NHS Test and Trace (England): 17 to 23 February 2022
28
Close contacts identified by NHS Test and Trace
Between 17 February and 23 February 2022, 396,273 close contacts were identified, a 20.6% decrease from the previous reporting week.
Figure 9 shows the number of recent close contacts identified and reached. The number of close contacts identified initially peaked in the week ending 6 January 2021, then reached a trough in the week ending 5 May 2021. Recently the number of close contacts identified peaked in week ending 12 January 2022 but have been falling since. In the current reporting week, 396,273 close contacts10 were identified, a 20.6% decrease from 499,267 in the previous reporting week. In the current reporting week, 68.0% (269,336) were reached and told to self-isolate, a decrease from the 74.8% (373,325) reached in the previous reporting week. 32.0% (126,937) were not reached, an increase from 25.2% (125,942) in the previous reporting week. Considering only the contacts where communication details were provided, 71.2% were reached and told to self-isolate in the current reporting week. This is a decrease from the 78.9% observed in the previous week.
10 The number of people identified includes duplicates as an individual may be named as a close contact for more than one case. See the NHS Test and Trace statistics methodology for more information.

Weekly statistics for NHS Test and Trace (England): 17 to 23 February 2022
29
Figure 9. Number of recent close contacts identified, England
This data can be found in the ‘Table_13’ tab in ‘NHS Test and Trace statistics 28 May 2020 to 23 February 2022: data tables’ On the Weekly Statistics for NHS Test and Trace page.

Weekly statistics for NHS Test and Trace (England): 17 to 23 February 2022
30
Between 17 February and 23 February 2022, 396,149 recent close contacts identified were not managed by local HPTs, a 20.6% decrease from the previous reporting week.
In the current reporting week, 396,149 recent close contacts identified were not managed by local HPTs, a decrease from 499,102 in the previous reporting week. 68.0% (269,212) were reached and told to self-isolate, a decrease from 74.8% (373,160) in the previous reporting week. In the current reporting week, 27.5% (108,945) were not reached, an increase from 20.1% (100,092) in the previous reporting week. 4.5% of close contacts (17,992) had no communication details provided, a decrease from 5.2% (25,850) in the previous reporting week. Since Test and Trace launched 82.5% of recent close contacts not managed by local HPTs have been reached (25,801,354 contacts). For more information on the different outcomes of contact tracing, see the terminology section.
Between 17 February and 23 February 2022, 124 recent close contacts identified were managed by local HPTs.
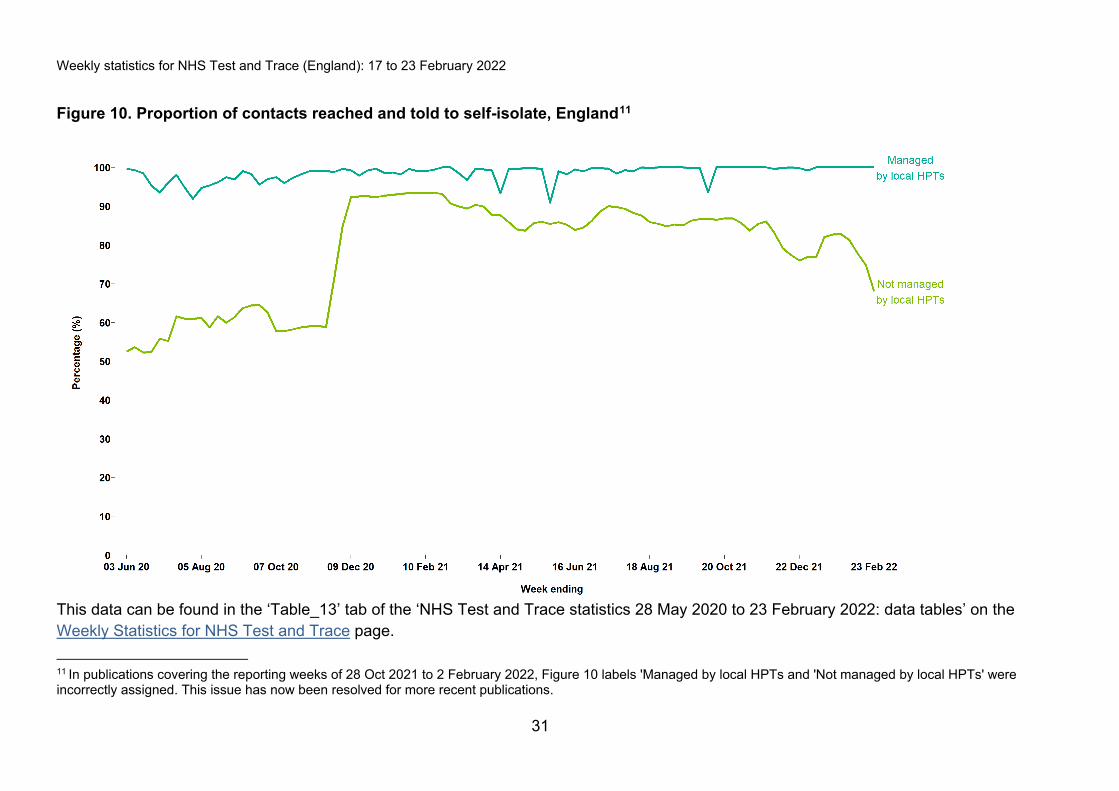
In the latest week, 124 close contacts managed by local HPTs were identified, reached, and told to isolate. This has decreased from the previous week, where 165 recent close contact managed by HPTs were identified and reached. Since Test and Trace launched, 98.1% of contacts managed by local HPTs have been reached (554,057 contacts). For contacts managed by local HPTs, contacts are managed as a whole setting and are often managed at a situation rather than individual level, with advice being issued to the contact institution. Therefore, these contacts may not have been individually reached and told to self-isolate but should have received this advice from their institution. For this reason, contacts managed by local HPTs have a higher success rate compared with community wide contacts not managed by local HPTs. Contacts managed by local HPTs are reached when the situation has been dealt with and advice has been issued to the institution, whereas contacts not managed by local HPTs must be individually contact traced (unless they are a household contact) to be classified as reached. Figure 10 represents the proportion of contacts reached and told to self-isolate, split by those managed by local HPTs and those not managed by local HPTs. There is an increase in proportion reached for those not managed by local HPTs aligning with an operational change on 18 November 2020 relating to how contacts under 18 are contacted.
Weekly statistics for NHS Test and Trace (England): 17 to 23 February 2022
31
Figure 10. Proportion of contacts reached and told to self-isolate, England11
This data can be found in the ‘Table_13’ tab of the ‘NHS Test and Trace statistics 28 May 2020 to 23 February 2022: data tables’ on the Weekly Statistics for NHS Test and Trace page.
11 In publications covering the reporting weeks of 28 Oct 2021 to 2 February 2022, Figure 10 labels 'Managed by local HPTs and 'Not managed by local HPTs' were incorrectly assigned. This issue has now been resolved for more recent publications.

Weekly statistics for NHS Test and Trace (England): 17 to 23 February 2022
32
Figure 11. Proportion of close contacts identified not managed by local HPTs who were reached and told to self-isolate by upper-tier local authority (UTLA)
This data is available as an interactive map or to download as a csv on the Weekly Statistics for NHS Test and Trace page. The regional data uses a different data cut to the main publication therefore cumulative totals will not exactly match. The data is available for the cumulative figures since Test and Trace launched up to the most recent week of reporting. Due to revisions that occur each week on week’s cumulative figures cannot be subtracted from a previous week to obtain weekly data by UTLA.
Weekly statistics for NHS Test and Trace (England): 17 to 23 February 2022
33
Between 17 February and 23 February 2022, 222,194 close contacts not managed by local HPTs were household contacts.
In the current reporting week, 56.1% of close contacts not managed by local HPTs were household contacts (222,194), a decrease from 62.8% (313,670) in the previous reporting week. 43.9% of close contacts not managed by local HPTs were not household contacts (173,955), an increase from 37.2% (185,432) in the previous reporting week. Of the household contacts, 91.6% (203,545) were reached and told to self-isolate compared to 92.3% (289,616) in the previous week. Of the non-household contacts, 37.7% (65,667) were reached and told to self-isolate compared to 45.1% (83,544) in the previous reporting week. Figure 12 represents the proportion of recent close contacts in England not managed by local HPTs that were household contacts versus those that were not household contacts.

Weekly statistics for NHS Test and Trace (England): 17 to 23 February 2022
34
Figure 12. Proportion of recent close contacts not managed by local HPTs by whether they were from the same household as the case that they were identified from, England
This data can be found in the ‘Table_14’ tab of the ‘NHS Test and Trace statistics 28 May 2020 to 23 February 2022: data tables’ on the Weekly Statistics for NHS Test and Trace page.

Weekly statistics for NHS Test and Trace (England): 17 to 23 February 2022
35
NHS Test and Trace end to end timing metrics
Between 17 February and 23 February 2022, 95.0% of contacts that were reached and told to self-isolate were reached within 3 days, a decrease from 94.3% in the previous reporting week.
Figure 13 shows the proportion of recent close contacts in England who were told to self-isolate within 3 days of the case taking a test since Test and Trace began. In the current reporting week, 95.0% (255,302) of the contacts that were reached and told to self-isolate were reached within 3 days of the case that reported them taking a test which subsequently returned a positive result compared to 94.3% (351,105) of the contacts in the previous week.

Weekly statistics for NHS Test and Trace (England): 17 to 23 February 2022
36
Figure 13. Proportion of recent close contacts who were told to self-isolate within 3 days of the case taking a test (excludes cases managed by local HPTs), England
This data can be found in the ‘Table_17’ tab in the ‘NHS Test and Trace statistics 28 May 2020 to 23 February 2022: data tables’ on the Weekly Statistics for NHS Test and Trace page.

Weekly statistics for NHS Test and Trace (England): 17 to 23 February 2022
37
The number of contacts who were reached within 3 days of the cases that identified them taking a test is an end-to-end measure, and therefore is comprised of several subsidiary measures. Table 4 provides the timing metrics from when a case is transferred into the contact tracing system. Table 4. Contact tracing timing metrics, England
Contract tracing timing metrics Previous reporting
week
Current reporting
week
Since Test and Trace launched: 28 May 2020
to 23 February 2022
Cases (not managed by local HPTs) – percentage reached and asked to provide details about close contacts within 24 hours of their case being transferred to contact tracing
82.8 85.3 78.6
Contacts who were told to self-isolate (not managed by local HPTs) –percentage who were reached within 24 hours of being identified
95.5 95.8 95.9
Contacts who were told to self-isolate, (not managed by local HPTs) – percentage who were reached within 24 hours of the originating case being transferred to the contact tracing system
71.0 69.3 70.7
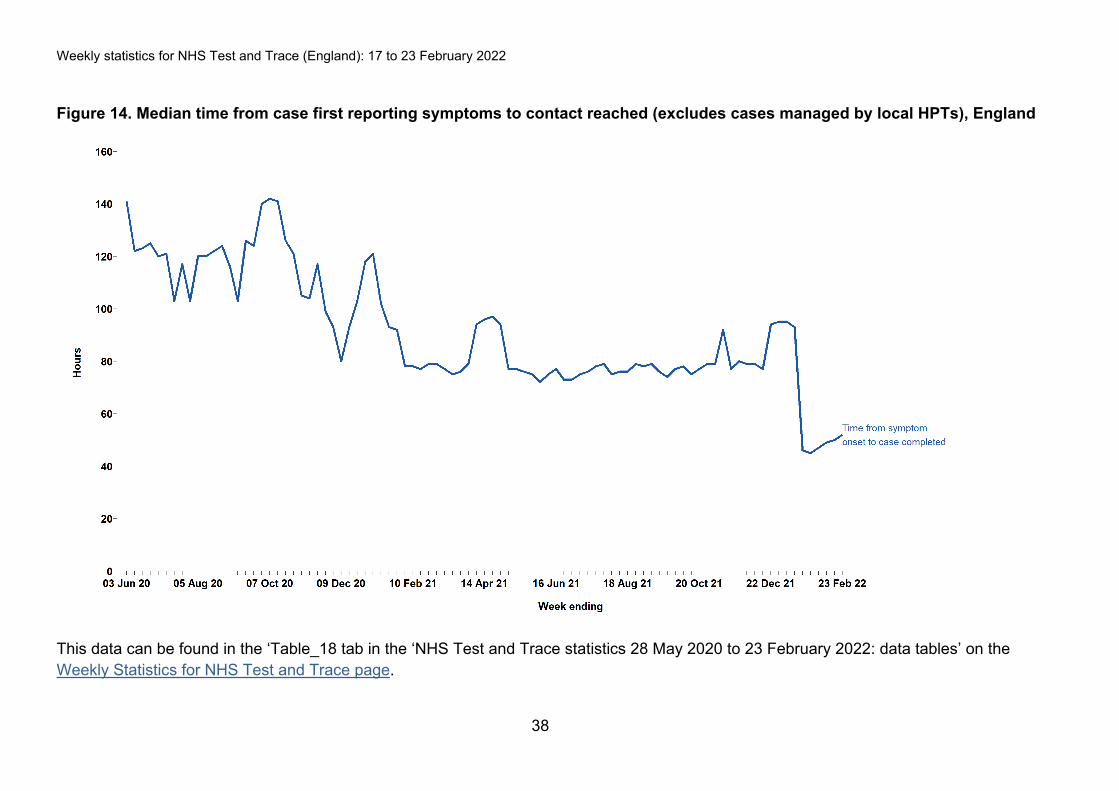
Note that because the timing statistics given in Table 4 are from when a case was transferred to the contact tracing system, delays in transferring cases to contact tracing will not be captured. However, they will be captured in the full end to end measure from when the test was taken. Figure 14 shows the median time from symptom onset to contacts reached, excluding those managed by local HPTs. The median time peaked in week ending 7 October 2020. The median time taken for contacts to be reached from the case that identified them first reporting symptoms has increased from 49 hours in the previous reporting week to 50 hours in the current reporting week. Please note this data only includes contacts reported by cases who reported to experience at least one symptom. This data is collected by asking symptomatic people who tested positive and were subsequently reached by NHS Test and Trace to recall which day they first observed COVID-19 symptoms. More information is available in the NHS Test and Trace statistics methodology.
Weekly statistics for NHS Test and Trace (England): 17 to 23 February 2022
38
Figure 14. Median time from case first reporting symptoms to contact reached (excludes cases managed by local HPTs), England
This data can be found in the ‘Table_18 tab in the ‘NHS Test and Trace statistics 28 May 2020 to 23 February 2022: data tables’ on the Weekly Statistics for NHS Test and Trace page.

Weekly statistics for NHS Test and Trace (England): 17 to 23 February 2022
39
1.3 Managed quarantine service (MQS)12
Background to the service From 4 October 2021, England’s new travel system came into effect with countries and territories categorised as either red or rest of the world. Eligible fully vaccinated passengers returning from countries and territories not on the red list could do so without needing to complete a day 8 test and must only quarantine until they receive a negative day 2 test. From 11 February 2021, fully vaccinated passengers returning from non-red countries are not required to complete any testing before they travel or after they arrive and they do not need to quarantine. Only British or Irish nationals or people with residence rights in the UK are allowed to enter the UK from a country or territory on the red list. People arriving in England who have visited or passed through a country and territory where travel to the UK is banned (red list countries and territories13) in the 10 days before arrival in England are still required to quarantine in a managed quarantine hotel. A country or territory may be designated red or rest of the world following a ministerial decision-making process. Designations of countries and territories are published by the Department for Transport and are reviewed on a regular basis. Therefore, designations of countries are subject to change and the data released will reflect the lists as they were on the date of publication. For more details see Entering the UK guidance. This bulletin contains data relating to countries and territories on the red list and those categorised as rest of the world. Table 21 in the accompanying data tables contains data for all countries and territories where a traveller has been registered in the corresponding time period. A full explanation of the data sources and methods used to produce these statistics can be found in the NHS Test and Trace statistics methodology. Under the travel system effective between 15 February 2021 and 3 October 2021, individuals
who were allowed to enter England from a red list country or territory had to quarantine for 10 days and take day 2 and day 8 PCR tests. Passengers travelling from an amber country were required to undertake Day 2 and Day 8 testing and isolate at home, whilst those coming from a green list country were required to take a Day 2 test.
Figures in this section of the bulletin do not report updated data for the latest reporting week (17 to 23 February 2022) due to a data quality issue.
12 Some figures and tables in this section have not been updated past the week ending 29 September 2021 as new statistics and tables are being developed to reflect change in MQS policy that became effective on 4 October 2021. 13 List of red list countries and territories

Weekly statistics for NHS Test and Trace (England): 17 to 23 February 2022
40
People starting quarantine All countries were removed from the red list on 15 December 2021. Therefore, there is no new data to report in this section. People taking tests Between 10 February and 16 February 2022, 73,997 registered and processed tests have been taken by people returning from overseas. International arrivals who are quarantining at home have the option to book their PCR tests through a private provider. Since the publication on 8 July 2021, these tests are included in the totals, and account for almost all of PCR tests reported by people quarantining at home. The number of tests registered and processed each week will not be the same as the number of people quarantining in that same week because: • the cohort of people starting their quarantine will not be the same cohort of people
who take their day 2 test in each week – for example, people starting their quarantine towards the end of the week will have their day 2 tests fall into the following week
• there may be differences in the population quarantining and those who are required to take a test – for example, children under 5 do not need to take a test
• passengers with a positive test on day 2 are not required to take a day 8 test • correct completion and return of test data are required by the person taking the test
to ensure that tests are correctly registered

Weekly statistics for NHS Test and Trace (England): 17 to 23 February 2022
41
Table 6. Number of registered and processed tests reported by people returning from non-red list countries, England
Registered and processed tests reported by people returning from non-red list countries
3 February to 9 February 2022: number of tests
processed and registered
10 February to 16 February 2022: number of
tests processed and registered
Day 2 – non-red list arrivals 208,835 68,544
Day 5 – non-red list arrivals Test to Release
1,439 658
Day 8 – non-red list arrivals 5,925 4,392
Total registered tests processed (non-red list arrivals)
216,241 73,613
The total number of PCR tests processed for passengers at home includes tests not registered to an individual. The full breakdown of tests registered and not registered across day 2 and day 8 for people quarantining at home can be found in Table 20b of the accompanying data tables. The total number of PCR tests processed for passengers in a hotel only includes the number of tests that have been correctly registered. Evidence of negative tests or an extended stay following a positive test must be presented by passengers in hotels before they are able to leave. When countries are moved on to the red list, an increase in passenger numbers in hotels may be seen. This will be reflected in an increase in day 2 tests. These passengers may not have had a day 8 test in the same reporting period. People quarantining in England at home can end their quarantine early through the test to release scheme. This lets people choose to pay for a private COVID-19 test where it meets the minimum testing standards after they have been in England for 5 full days. If the results of the test are negative, quarantine can be ended. If positive, quarantine should be extended for 10 days after taking the test. The private tests booked through this scheme are in addition to the day 2 and day 8 tests booked as part of the managed quarantine service. This data is now available in Table 20b of the accompanying data tables. Between 10 February and 16 February 2022, for arrivals from non-red list countries, 1,118 (1.6%) Day 2 tests were positive, compared to 205 (4.7%) Day 8 tests and 26 (4.0%) Day 5 (Test to Release) tests.

Weekly statistics for NHS Test and Trace (England): 17 to 23 February 2022
42
Risk assessment status, people tested, positivity and variants by country and territory Countries and territories are risk assessed based on data from a number of sources to determine whether they should be added to the list of countries and territories requiring quarantine at a managed quarantine hotel upon return (red list countries and territories), or at-home quarantining (amber list countries and territories). For more information on these decisions, please see the COVID-19 risk assessment methodology document. Passengers are asked to report their recent travel history when returning to the UK so that the number of positive test results taken while under managed quarantine, as well as the number of VOCs and VUIs sequenced from these positive tests, can be considered when assessing the risk of travel and whether countries and territories should be assigned to the red list. Data for risk assessment status, testing, positivity and variants by country or territory can be found in the ‘table 21’ tab of the accompanying data tables. While the other MQS data tables are updated weekly, Table 21 is updated every 3 weeks.
1.4 Test and Trace Support Payments Background on Test and Trace Support Payments The Test and Trace Support Payment scheme (TTSP) provides financial support to people on low incomes who must self-isolate if they are unable to work from home and will lose income as a result. It was introduced on 28 September 2020 and is administered by unitary and lower tier local authorities in England. The purpose of TTSP is to support people to self-isolate if they are required to do so, and to encourage more people to come forward to get tested. This helps to reduce the transmission of COVID-19. Applicants may be eligible for a payment of £500 if they are in receipt of a means-tested benefit and meet the other eligibility criteria. Information on the eligibility criteria is available online at Claiming financial support under the Test and Trace Support Payment scheme. Local authorities have also been provided with funding to make discretionary payments to individuals who are not on a means-tested benefit but will still face hardship if they must self-isolate. Local authorities are responsible for setting the discretionary criteria in their areas, enabling them to target support at residents most in need. TTSP is only available in England. However, both the Scottish and Welsh Governments run similar schemes. In Northern Ireland, people can apply for a non-repayable Discretionary

Weekly statistics for NHS Test and Trace (England): 17 to 23 February 2022
43
Support self-isolation grant if they are on a low income and are experiencing financial difficulties due to self-isolation. Successful claims Local authorities submit reporting information to NHS Test and Trace on the number of successful claims they have paid out. These statistics use the recorded payment date of the claim. Please note that some adjustments are made to the payment date for errors and missing payment dates.
Between 17 February and 23 February 2022, local authorities reported payments of £6.2 million to 12,329 applicants.
As of 23 February 2022, local authorities have reported 528,687 successful claims since the start of the scheme, totalling £264.3 million in TTSP payments. Since the start of the scheme, 56.7% have been claimed through the main scheme and 43.3% have been claimed through the discretionary scheme. In the latest week, local authorities reported payments of £6.2 million to 12,329 applicants, of which 45.1% were claimed through the discretionary scheme. Successful claims fluctuate over time as the numbers of people testing positive increase or decrease. There is also variance in the number of successful claims at local authority level. This is in part due to differences in populations, for example the proportion of the local population claiming a means-tested benefit, which impact the number of eligible applicants.

Weekly statistics for NHS Test and Trace (England): 17 to 23 February 2022
44
2. Terminology
2.1 Testing The following explains types of tests and testing routes. Pillar 1 testing Swab testing for the virus in UKHSA labs, NHS hospitals for those with a clinical need, and health and care workers Pillar 2 testing Swab testing for the virus for the wider population, through commercial partnerships14, either processed in a lab or more rapidly via LFD tests. Tests processed in a lab are carried out through several different routes: 1. In-person tests These involve a person being tested in-person at a COVID-19 test site and include: • regional test sites, which includes drive-through testing centres • local test sites15, which are similar to regional test sites but specifically for walk ups • mobile testing units, which travel around the UK to increase access to COVID-19
testing; they respond to need, travelling to test people at specific sites including care homes, police stations and prisons
2. Satellite test centres These include test kits provided directly to ‘satellite’ centres at places such as care homes that have a particularly urgent or significant need. 3. Home test kits These are delivered to someone’s door so they can test themselves and their family without leaving the house. Pillar 3 testing Serology testing to show if people have antibodies from having had COVID-19.
14 See more detail in Scaling up our testing programmes.

Weekly statistics for NHS Test and Trace (England): 17 to 23 February 2022
45
Pillar 4 testing Blood and virus testing for national surveillance support by UKHSA, ONS and research, academic and scientific partners to learn more about the prevalence and spread of the virus and for other testing research purposes. Virus testing Swab testing using PCR assay within pillars 1, 2 and pillar 4 to show if someone currently has COVID-19. Antibody testing Testing of a blood sample within pillar 3 and pillar 4 to show if people have antibodies from having had COVID-19. People tested each week This refers to people who have been tested at least once in each reporting week. Therefore, if someone had multiple tests in each week they would be counted once. People testing positive each week This refers to the number of people who tested positive at least once in each reporting week. Therefore, if someone tested positive multiple times in each week they would only be counted once. Cumulative people tested This refers to the number of people who have been tested at least once since Test and Trace launched. Cumulative people testing positive This refers to the number of people who have tested positive at least once since Test and Trace launched. For pillar 2, there are 2 measures of the time taken to receive a COVID-19 test result: 1. The time taken to receive a COVID-19 test result from time of booking is measured
from the time that a person books an appointment on the website to the time when the person receives a notification of their test result via an email or an SMS. This data is only available for regional test sites, local test sites and mobile testing units, as test booking and registration processes for home testing and satellite test centers are currently undertaken on different systems.

Weekly statistics for NHS Test and Trace (England): 17 to 23 February 2022
46
2. The time taken to receive a COVID-19 test result from time of test is measured from the time a person completes a test registration (or the time a person indicates their test was taken for home testing kits) until the time that they receive a notification of the result of their test via an email or an SMS.
2.2 Tracing The following explains terminology for contact tracing. NHS Test and Trace has 2 ways of handling cases depending on the way in which they are managed: 1. Cases and contacts managed by local HPTs (previously known as complex) UKHSA Local Health Protection Teams manage cases linked to outbreaks. Examples include someone who works or has recently visited: • a health or care setting, such as a hospital or care home • a prison or other secure setting • a school for people with special needs • critical national infrastructure or areas vital for national security
2. Cases and contacts not managed by local HPTs (previously known as non-complex) Wider online and other call centre capacity for individual community-wide cases and contacts. When a case is transferred to NHS Test and Trace, contact tracers will attempt to contact the individual, which results in one of the following 3 outcomes: 1. Reached and provided information about recent close contacts Contact tracers or local health protection teams successfully reached the individual and asked them to provide details for recent close contacts. 2. Communication details not provided People who had no communication details provided are those who were transferred to NHS Test and Trace but did not have any associated contact details (for example phone number or email address).
Weekly statistics for NHS Test and Trace (England): 17 to 23 February 2022
47
3. Not reached The number of people who were not reached includes those people who the service has been unable to reach because there has been no response to text, email and call reminders. This includes those where the communication details are invalid. It also includes people who were reached but declined to give details of close contacts. There may also be a small number of people who have not been reached but where contact tracers are still in the process of trying to make contact. When a close contact is identified, contact tracers or local HPTs will attempt to contact the individual or institution depending on the exposure setting, which results in 1 of the 3 following outcomes: 1. Reached and told to self-isolate For contacts not managed by local HPTs contact tracers successfully reached the contact and told them to self-isolate, or for household contacts where the case has opted to inform them to self-isolate. For those managed by local HPTs, advice is provided to the institution which is passed on to contacts in the specific setting. 2. Communication details not provided People who were identified as recent close contacts but didn’t have any associated contact details (for example, phone number or email address). 3. Not reached The number of contacts who were not reached includes those contacts who the service has been unable to reach because there has been no response to text, email, and call reminders. There may also be a small number of contacts who have not been reached but where contact tracers are still in the process of trying to make contact.

Weekly statistics for NHS Test and Trace (England): 17 to 23 February 2022
48
3. Measuring the data
3.1 How the data was collected Testing data for pillars 1 and 2 for England is provided by UKHSA and commercial partners. Contact tracing data is collected from management information from the NHS Test and Trace service. Details about the data sources used can be found in the NHS Test and Trace statistics methodology document.
3.2 Future development We have integrated this data with those from other parts of NHS Test and Trace, particularly testing, to provide an end-to-end view of the service that follows the user journey. So far, UK level testing data, testing data for pillars 1 and 2 in England, testing turnaround times and NHS COVID-19 app statistics have been added. Further breakdowns for contact tracing continue to be incorporated, including breakdowns for cases and contacts managed or not managed by local HPTs, geographical breakdowns, and household information. To support user needs and data transparency, additional releases have been published alongside the weekly Test and Trace publication including: • care home statistics up to 8 July 2020 • people tested for COVID-19 between 30 January and 27 May 2020 • demographic data for COVID-19 testing in England between 28 May and 26 August
2020 • weekly rapid testing statistics NHS Test and Trace continues to provide information for local authorities and their partners so that they have the information they need to help contain any outbreaks. In time, NHS Test and Trace intends to publish detailed data from across the program to support secondary analysis, for example in academic institutions. We continue to explore the feasibility of adding new breakdowns to the publication to support user needs. Over the coming months, we intend to make the following available: • additional demographic information for people tested • details of close contacts who go on to test positive The UK Statistical Authority has published a rapid review of the Test and Trace statistics. This includes recommendations on how the publication should develop it order to adhere fully to the

Weekly statistics for NHS Test and Trace (England): 17 to 23 February 2022
49
Code of Practice. These recommendations continue to influence the development of the publication in the coming weeks and months.
3.3 Strengths and limitations Given the importance of this service and the commitment of NHS Test and Trace to be open and transparent with the public it serves, this data is being released at the earliest possible opportunity. However, new IT systems and statistical outputs often take a period of time to bed in. The caveats and data quality issues in this publication should be taken into consideration when interpreting results, and this analysis should be taken in the wider context of coronavirus (COVID-19) statistics and analysis. More information on data limitations and how the figures in this publication can and cannot be used is outlined in the NHS Test and Trace methodology.
3.4 Quality These statistics have been put together by NHS Test and Trace with advice from the Office for National Statistics. As part of the quality assurance process, UKHSA ensures that all published figures are replicable and any issues impacting on the quality of the data are clearly stated within the publication. Furthermore, the figures are often triangulated with other published sources to verify trends in the data. Revisions to figures previous published Figures for people tested and people testing positive for COVID-19 in previous releases have been revised. These revisions are because: • there are sometimes delays in laboratories submitting data to UKHSA • quality checks are conducted on the data to refine figures over time Figures for pillar 2 testing turnaround times in previous releases have been revised. These revisions are because: • the figures presented are based on a data cut several days after the end of the
reporting period – some tests may continue to be being processed after this period and therefore data may need to be revised over time
Figures for contact tracing in previous releases have been revised. These revisions are because:

Weekly statistics for NHS Test and Trace (England): 17 to 23 February 2022
50
• the figures presented are based on a data cut several days after the end of the reporting period, to give time for cases reported towards the end of the 7-day period to have an outcome – some cases may continue to be in progress after this period, and therefore data may need to be revised over time
• typically, 1 week after initial publication the number of cases reached and consequently the number of contacts identified is expected to increase – similarly, the number of cases and contacts reached within 72 hours is likely to increase
More information about the revision of statistics published by UKHSA can be found in the statement on revision policy. More information on quality and how this publication adheres to the Code of Practice for statistics is available in the Statement of Compliance.
3.5 Feedback For questions about the release please refer to the Information for Users document initially. For feedback and any further questions, please contact [email protected].

Weekly statistics for NHS Test and Trace (England): 17 to 23 February 2022
51
About the UK Health Security Agency UKHSA is responsible for protecting every member of every community from the impact of infectious diseases, chemical, biological, radiological, and nuclear incidents, and other health threats. We provide intellectual, scientific, and operational leadership at national and local level, as well as on the global stage, to make the nation health secure. UKHSA is an executive agency, sponsored by the Department of Health and Social Care. © Crown copyright 2022 Version 1 Prepared by: Statistical Production For queries relating to this document, please contact [email protected] Published: March 2022 Publishing reference: GOV-11544
You may re-use this information (excluding logos) free of charge in any format or medium, under the terms of the Open Government Licence v3.0. To view this licence, visit OGL. Where we have identified any third-party copyright information you will need to obtain permission from the copyright holders concerned.