Distance Learning 2020 Week 4 Assignment #1 is p.1039 #1 ...
Upload
khangminh22Category
view
3download
0
Week 1: Assignment Calendar
Monday Tuesday Wednesday Thursday Friday 4/20 Read Newsela article and answer questions. Turn in when complete.
4/21 Read Lesson 1 in Life and Times of Carbon reading booklet and complete lesson 1 in fillable pdf workbook.
4/22 Do Lesson 2 in fillable workbook. Question 2-instead of “in groups” do by yourself. Also do the first 2 pages of Lesson 3: Carbon flow observation log
4/23 Finish Lesson 3: What is Natural about Carbon? In fillable workbook
4/24 Read Lesson 4 in reading booklet. Complete Lesson 4 in workbook: Accounting for Change…
4/27 Read Lesson 5 in reading booklet. Start Lesson 5 in workbook.
4/28 Finish Lesson 5 in workbook.
All students are responsible for completing the work following the assignment schedule. The teacher instructions for obtaining and submitting your work online
are different for each teacher, so please make sure that you are following the directions for your teacher. If you are returning written work, you must drop it off at
the school by the collection dates established by the district to receive credit. All online work must be submitted by the collection date as well for students to get
credit. All online work may be submitted early to your teacher upon completion of article and workbook.
If you need help or have questions, office hours: Dr. Libeu: Weekdays 1-3 pm. Zoom tutorials for each lesson will be announced on Schoology and will start at 1pm. If you are joining the tutorial, the expectation is that you will have completed the reading assignment before 1 pm so that you can participate in the discussion. For individual help: call (209)565-0124 between 2 pm and 3 pm, email [email protected] or message through Schoology. I will be answering emails and messages later in the afternoon. Mrs. Shade Weekdays 10:00-10:30 Zoom (518-454-721), call 10:30 –11:00 AM or email other times [email protected]
Ms. Stewart: 8:00 – 10:00 by email [email protected] or call (209) 625-9491 Monday – Friday
To obtain work online:
Dr. Libeu: Assignments with downloaded fillable pdfs are posted on Schoology
Mrs. Shade and Ms. Stewart: Download complete workbook with fillable pdfs and other materials from school website.
Online Submission of work instructions:
Dr. Libeu: Turn in your completed work to Schoology. There are individual assignments for each day.
Mrs. Shade and Ms. Stewart: Email the completed packet.
To obtain printed packets: Pick up at school following the directions on the district website.
Submission of written work from printed packets: Drop off at school following the directions on the district website.

What's the difference between weather and climate?
Do Part 1 before you read the article!
Part 1: Are they talking about climate or weather?
People like to talk about conditions that affect their lives. Climate and weather are two of those conditions. For the following statements, decide whether the statement has to do with weather or climate and click the appropriate bubble.
Climate Weather 1. What shall I wear today?
2. What equipment do I need for a camping trip next summer?
3. It has rained on my birthday for the past three years.
4. We just got three feet of snow in March. So much for global warming.
5. I wonder when I should plant the tomato seeds in my garden.
6. Our state experienced the worst drought since records began more than 120 yearsago.
7. News Flash! The drought in California has ended with the first significant stormthis year dumping more than 10 inches of rain in many locations and filling mostof the reservoirs to pre-drought conditions.
8. We can’t get low-cost flood insurance for our house anymore. The insurancecompany says this area is too big a risk.
Explain your thinking. What rule or reasoning did you use to decide if a statement is related to climate or weather?
Adapted from “Uncovering Student Ideas in Earth and Environmental science” Paige Keeley and Laura Tucker, pg. 73
Name: __________ Period:____ Teacher:_________________
Chemistry Assignment 1

Do Parts 2 and 3 after you read the article!
Part 2: Read the article “What’s the difference between weather and climate” and answer the following questions after you read the article.
It may seem counterintuitive, but cold weather events like these do not disprove global warming, because weather and climate are two different things.
1. Which sentence from the article BEST supports this idea?
a. Weather refers to the short-term conditions of the lower atmosphere, such as precipitation,
temperature, humidity, wind direction, wind speed, and atmospheric pressure.
b. The atmospheric conditions that influence weather are always fluctuating, which is why the weather is
always changing.
c. While weather refers to short-term changes in the atmosphere, climate refers to atmospheric changes
over longer periods of time, usually 30 years or more.
d. Climate conditions vary between different regions of the world and influence the types of plants and
animals that live there.
2. Which of the following claims does the author support the LEAST?
a. Climate conditions vary between different regions of the world.
b. Humans' burning of fossil fuels is a leading factor in climate change.
c. The global climate has always been in a state of flux.
d. Forecasts are important and useful for many reasons.
3. Which sentence BEST summarizes how the changing climate has affected weather?
a. The changing climate has contributed to conditions that have made extreme weather events more intense and
more frequent.
b. The changing climate has increased the overall temperatures and amounts of rain locations around the globe
are experiencing.
c. The changing climate has created violent winds and dry conditions leading to the weather phenomenon called
the Aurora Australis.
d. The changing climate has allowed the weather in most locations to remain consistent and steady over the past
100 years.
4. What role does confusion over weather and climate play in the effort to address global warming?
a. Because people sometimes confuse weather with climate, they try to make small changes to
greenhouse gas emissions that have little effect on global warming.
b. Because people sometimes confuse weather with climate, there has been little urgency to address
global warming when the weather feels normal in the short term.
c. Because people sometimes confuse weather with climate, efforts to fight global warming have only
been embraced by a handful of countries directly affected by it.
d. Because people sometimes confuse weather with climate, participation in panels on global warming
and the Paris Agreement increases when the weather is hot.
Part 3: How did reading the article change your understanding of the
difference between climate and weather?
Question 1: Review your answers for part 1. Do you still agree with all your answers?
a) If not, choose one statement and using evidence from the article explain why you now disagree
with your answer.
Question 2: How would you revise your rule or reasoning to decide if a statement is related to
climate or weather after reading this article?
b) If you do still agree with all your answers pick one statement from the list and using evidencefrom the article, explain how the article supports that your answer is correct.

This article is available at 5 reading levels at https://newsela.com.
What's the difference between weather and climate?
By National Geographic Society on 01.29.20 Word Count 1,073 Level MAX
Weather events, like this hailstorm in Marion, Kansas, are not the same as
the climate of a region. Image by Roger Hill/Science Source Image by Roger
Hill/Science Source Contrary to popular opinion, science is not divided on
the issue of climate change. The overwhelming majority
(97 percent) of scientists agree that global warming is
real, and that it is largely caused by human activity. And
yet we seem to be experiencing record-breaking cold
winters; in January 2019, a
polar vortex plunged parts of North America into Arctic
conditions. It may seem counterintuitive, but cold weather events like these do not disprove
global warming, because weather and climate are two different things. Understanding Weather
Weather refers to the short-term conditions of the lower atmosphere, such as precipitation,
temperature, humidity, wind direction, wind speed, and atmospheric pressure. It could be
sunny, cloudy, rainy, foggy, cold, hot, windy, stormy, snowing – the list goes on.
The sun drives different types of weather by heating air in the lower atmosphere at varying
rates. Warm air rises and cold air rushes in to fill its place, causing wind. These winds, along
with water vapor in the air, influence the formation and movement of clouds, precipitation and
storms.
The atmospheric conditions that influence weather are always fluctuating, which is why the
weather is always changing. Meteorologists analyze data from satellites, weather stations, and
buoys to predict weather conditions over the upcoming days or weeks. These forecasts are
important because weather influences many aspects of human activity. Sailors and pilots, for
example, need to know when there might be a big storm coming, and farmers need to plan
around the weather to plant and harvest crops. Firefighters also keep track of daily weather in
order to be prepared for the likelihood of forest fires. Weather forecasts are also useful for
military mission planning, for features of trade, and for warning people of potentially
dangerous weather conditions.
Understanding Climate
While weather refers to short-term changes in the atmosphere, climate refers to atmospheric
changes over longer periods of time, usually 30 years or more. This is why it is possible to have
an especially cold spell even though, on average, global temperatures are rising. The former is a
weather event that takes place over the course of days, while the latter indicates an overall
change in climate, which occurs over decades. In other words, the cold winter is a relatively
small atmospheric perturbation within a much larger, long-term trend of warming.

This article is available at 5 reading levels at https://newsela.com.
While weather refers to short-term changes in the atmosphere, climate refers to atmospheric
changes over longer periods of time, usually 30 years or more. This is why it is possible to have
an especially cold spell even though, on average, global temperatures are rising. The former is a
weather event that takes place over the course of days, while the latter indicates an overall
change in climate, which occurs over decades. In other words, the cold winter is a relatively
small atmospheric perturbation within a much larger, long-term trend of warming.
Despite their differences, weather and climate are interlinked. As with weather, climate takes
into account precipitation, wind speed and direction, humidity, and temperature. In fact,
climate can be thought of as an average of weather conditions over time. More importantly, a
change in climate can lead to changes in weather patterns.
Climate conditions vary between different regions of the world and influence the types of plants
and animals that live there. For example, the Antarctic has a polar climate with sub-zero
temperatures, violent winds, and some of the driest conditions on Earth. The organisms that live
there are highly adapted to survive the extreme environment. The Antarctic is known for a
weather phenomenon called the Aurora Australis, a spectacular natural light show caused by
charged particles interacting with gases in the atmosphere near Earth's magnetic poles.
By contrast, the Amazon rainforest enjoys a tropical climate. Temperatures are consistently
warm with high humidity, plenty of rainfall, and a lack of clearly defined seasons. These stable
conditions support a very high diversity of plant and animal species, many of which are found
nowhere else in the world.
Our Climate Is Changing
The global climate has always been in a state of flux. However, it is changing much faster now
than it has in the past, and this time human activities are to blame. One of the leading factors
contributing to climate change is the burning of fossil fuels such as coal, gas and oil, which we
use for transport, energy production and industry.
Burning fossil fuels releases large amounts of carbon dioxide (CO2) into the atmosphere; CO2 is
one of a group of chemicals known as greenhouse gases. They are named as such because they
allow heat from the sun to enter the atmosphere but stop it from escaping, much like the glass of
a greenhouse. The overall effect is that the global temperature rises, leading to a phenomenon
known as global warming.
Global warming is a type of climate change, and it is already having a measurable effect on the
planet in the form of melting Arctic sea ice, retreating glaciers, rising sea levels, increased
frequency and intensity of extreme weather events, and a change in animal and plant ranges.
The planet has already heated by about 0.8 degrees Celsius (1.4 degrees Fahrenheit) in the last
century, and temperatures have continued to rise.
Scientists cannot directly attribute any extreme weather events to climate change, but they are
certain that climate change makes extreme weather more likely. In 2018, at least 5,000 people
were killed and 28.9 million more required aid as a result of extreme weather events. The Indian
state of Kerala was devastated by flooding; California was ravaged by a series of wildfires; and
the strongest storm of the year, super-typhoon Mangkhut, crashed into the Philippines. It is
likely that more frequent and more severe weather events are on the horizon.

This article is available at 5 reading levels at https://newsela.com.
Climate change is not a new concept, and yet little seems to have been done about it on a global
scale. The greenhouse effect was first discovered in the 1800s, but it was not until 1988 that the
global community galvanized to form the Intergovernmental Panel on Climate Change. Since
then, leaders from around the world have committed to a series of goals to combat climate
change, the latest of which is the Paris Agreement in which 185 countries have pledged to stop
global temperatures from rising by more than 2 degrees Celsius (3.6 degrees Fahrenheit) above
preindustrial levels. In 2015, all United Nations member states agreed to the 17 Sustainable
Development Goals (SDGs) designed to "provide a shared blueprint for peace and prosperity for
people and the planet, now and into the future." SDG 13 in particular commands member states
to "take urgent action to combat climate change and its impacts."
Part of the reason the global community has been so slow to act on climate change could be the
confusion surrounding distinctions between weather and climate. People are reluctant to believe
that the climate is changing when they can look outside their window and see for themselves
that the weather appears typical.


Carbon Item Labels
Information Cards | 1–8 of 18
Aspirin: C9H8O4 (acetylsalicylic acid)
Breath of air:CO2 (about 4% carbon dioxide)
Carbonated beverage:H2CO3
CD:C16H14O3 (repeating chains composed of carbon, hydrogen, and oxygen). These chains are called “polymers.”
Charcoal: C85–98% carbon
Corn: C6H12O6 (carbohydrate)
Cotton: C6H10O5 Cotton is a form of carbohydrate that is nearly 100% cellulose
Gasoline: C8H18 (hydrocarbon)

Carbon Item Labels
Information Cards | 9–16 of 18
Glass: SiO2 (silicon dioxide) Water: H2O
Hot dog (protein):C2H4O2NR Where R is any amino acid side chain.
Limestone (cement): CaCO3 (Ca is “calcium”)
Pencil lead:graphite C (pure carbon)
Plant material:(carbohydrate): C6H12O6
Plastic:CH2==CH2
The typical plastic water bottle is a simple hydrocarbon polymer.
Seashells:CaCO3 (calcium carbonate)
Stainless steel: Fe3C (one of many possible formulas).Stainless steel varies but, usually contains between 0.2-2.1% carbon.

Carbon Item Labels
Information Cards | 17–18 of 18
Vegetable oil (fat or lipid):CH3(CH2)16COOH
Wood: C6H10O5

4 CALIFORNIA EDUCATION AND THE ENVIRONMENT INITIATIVE I Unit E.7.b. I The Life and Times of Carbon I Student Workbook
Name: __________________________________
Collecting Carbon
Lesson 1 | page 1 of 4
Carbon compounds are everywhere around us. They are in our foods, plastics, soils, in water, in the air, and in our bodies. Carbon compounds can come in three physical forms: gas, liquid, and solid. Plants
three-fourths of the dry weight of plants is carbohydrates. In other words, when you look at plant matter (the stem, leaves, roots, and grains) you are looking largely at carbohydrates. Animals (including humans) get their carbohydrates by eating plants, but they do not store much of what they consume. In fact, less than 1% of the body weight of animals is made up of
take up carbon dioxide from the air, and use photosynthesis to turn carbon dioxide into carbohydrates. Carbohydrates are carbon compounds that store energy in the forms we call
“starches” and “sugars.” About
carbohydrates.
The main forms of carbon are: nonliving (abiotic) in rocks, soils, and sediments, and in water, such as bicarbonate, carbonate; living (biotic), such as plant and animal matter and dead organic matter; and carbon-based gases, such as carbon dioxide (CO2), methane (CH4), and carbon monoxide (CO).
Chemists use a special system to describe compounds. They use a chemical formula of symbols that indicate the elements that make up chemical compounds. A chemical formula is also called a “molecular formula.” The chemical formula of carbon dioxide is CO2 indicating one carbon atom bonded to two oxygen atoms. The symbol for carbon is C; for hydrogen is H; for oxygen is O;
for silica is Si.Coal heap
Where Can We Find Carbon?
Teacher:_____________________Period:
Chemistry Assignment # 2

CALIFORNIA EDUCATION AND THE ENVIRONMENT INITIATIVE I Unit E.7.b. I The Life and Times of Carbon I Student Workbook 5
Name: _________________________________
Collecting Carbon
Lesson 1 | page 2 of 4
Part 1Instructions: Use the Carbon Information Cards in the Lesson 1 materials to complete the following table.
A B C
Item Chemical Formula How Natural Systems or People Use Carbon in This General Form
1 Aspirin
2 Breath of air
3 Carbonated beverage
4 CD
5 Charcoal
6 Corn
7 Cotton
8 Gasoline
9 Glass
Water

6 CALIFORNIA EDUCATION AND THE ENVIRONMENT INITIATIVE I Unit E.7.b. I The Life and Times of Carbon I Student Workbook
Name: _________________________________
Collecting Carbon
Lesson 1 | page 3 of 4
A B C
Item Chemical Formula How Natural Systems or People Use Carbon in This General Form
10 Hot dog (protein)
11 Limestone (cement)
12 Pencil lead (graphite)
13 Plant material
14 Plastic
15 Seashells
16 Stainless steel
17 Vegetable oil (fat or lipid)
18 Wood

CALIFORNIA EDUCATION AND THE ENVIRONMENT INITIATIVE I Unit E.7.b. I The Life and Times of Carbon I Student Workbook 7
Part 2Instructions: After you have finished with the Carbon Information Cards, brainstorm how carbon is used in different forms in nature and by people. Make notes in Column C on the Collecting Carbon chart. (3 points each)
Part 3Instructions: Independently, review your responses in Column C above and develop a summary statement that explains the importance of carbon to living organisms. (6 points)
Name: _________________________________
Collecting Carbon
Lesson 1 | page 4 of 4

Carbon Reservoir Cards
Lesson 2 | front
Ph
yto
pla
nk
ton
(aqu
atic
pla
nts)
Lim
esto
ne
de
ep o
cea
n c
arb
on
oil
an
d c
oa
l d
ep
os
its
so
ils
CO
2
Atm
os
ph
ere
Terr
estr
ial P
lan
ts
Oc
ean
sR
ock
s,
So
ils
, an
d S
ed
imen
ts

OceansCarbon dioxide (CO2) from the atmosphere is
mixed into the top surface of oceans by waves and wind. This CO2 is taken up by small aquatic plants that live near the ocean’s surface called “phytoplankton.” They take up CO2 and convert it into “plant” carbon matter. Using satellite imagery, scientists have measured huge algae “blooms” that show how carbon is distributed throughout the ocean. Overall, oceans are Earth’s second largest carbon reservoir, holding 38,000–40,000 billion metric tons of carbon. Most of this is sunk down to the deep ocean.
Aquatic animal bodies are made up of various carbon compounds. Some are able to convert carbon into calcium carbonate to form protective shells.
When aquatic organisms die, they are consumed and decomposed by microbes, and much of this matter sinks to the ocean bottom. Layers upon layers of carbon-containing seashells become compressed under the weight of the ocean and, in time, become the sedimentary rock we call limestone or marble.
AtmosphereEarth’s atmospheric gases originated during a
very active volcanic period billions of years ago. Volcanoes released carbon dioxide (CO2), water vapor, and other gases into the atmosphere. Early plants were algae. Algae took up gaseous CO2 and, with sunlight, water, and the process of photosynthesis, produced oxygen and plant matter. As more complex plants and animals evolved, atmospheric CO2 levels became fairly well-balanced by the natural processes of photosynthesis, respiration, and decomposition. Today’s atmosphere holds 766 billion metric tons of carbon.
Atmospheric CO2 levels have gone up and down throughout Earth’s history. Fossils tell us that CO2 levels have been as low as 180 parts per million (ppm, a percentage of all atmospheric gases). To-day they are at 384 ppm. CO2 is a greenhouse gas that regulates Earth’s temperature. High levels of greenhouse gases cause Earth to be warmer, while low levels cause Earth to be cooler. Other carbon-based gases found in the atmosphere include, methane (CH4) and carbon monoxide (CO).
Rocks, Soils, and SedimentsThe world’s soils hold 1100 to 1600 billion
metric tons of carbon. This is more than twice the carbon stored by living vegetation or in the
marine sediments and sedimentary rocks: they hold between 66,000,000–100,000,000 billion metric tons of carbon! Fossil fuels were formed 354 to 290 billion years ago when plants became buried under sediments and oceans. Fossil fuel deposits hold another 4000 billion metric tons.
Soil carbon comes mostly from the decomposition of plants by microbes. “Leaf litter” accumulates year after year and results in much of the carbon becoming buried and trapped in lower layers of soil.
Forests produce a lot of leaf litter, resulting in soils high in carbon. Tropical forests grow year-round and are mega-warehouses of carbon.
At the bottom of wetlands there is little or no oxygen. Here, the decomposition process is very slow. Wetlands, peat bogs, and permafrost (wet frozen lands) store tremendous amounts of carbon.
Terrestrial PlantsPlants take up carbon dioxide from the atmo-
sphere during photosynthesis. Carbon is stored by plants in leaves, stems, roots, and woody material, even roots. Because of their size, trees are able to store a large amount of carbon as “wood.” Forests are often called “the lungs of the world” because they convert so much carbon dioxide gas into oxygen. Terrestrial (land) forests of North and South America are massive carbon reservoirs.
but all plants store carbon, from small aquatic al-gae and alpine moss-like lichen to grasses, shrubs, and cactus. In total, the terrestrial plant reservoir stores 540–610 billion metric tons of carbon.
Animals depend on the oxygen created by plants, and animals eat plants or other animals. This “consumption” moves carbon up the food chain and throughout the food web.
Even though animals (including people) store carbon in various carbohydrate compounds within our bodies, the amount is very small compared to that stored by vegetation. Therefore, scientists do not consider “animals” as a carbon reservoir.
Carbon Reservoir Cards
Lesson 2 | back

8 CALIFORNIA EDUCATION AND THE ENVIRONMENT INITIATIVE I Unit E.7.b. I The Life and Times of Carbon I Student Workbook
Name: _________________________________
Moving Through the Global Carbon Cycle
Lesson 2 | page 1 of 2
Instructions: Read and complete the tasks below.
1. currently holds. (1 point each)List the four main carbon reservoirs, from greatest to smallest according to how much carbon each
2. Brainstorm how carbon moves from one reservoir to another. Use the following questionsto guide your discussion:
■■■ What function does carbon serve in each reservoir?■■■ What are the different natural processes involved in carbon movement?■■■ How do people or natural systems benefit from these functions?
the reservoir. (1 point each)On each of the lines in the illustration identify a natural process that moves carbon to or from
Natural Processes That Use Carbon
Limestonedeep ocean carbonoil and coal deposits
soilsPhytoplankton(aquatic plants)
2.
1.
3.
4.
5.
Atmosphere
Terrestrial Plants
Oceans
CO2
Rocks, Soils, and Sediments
6.
Period:____ Teacher:___________________
Chemistry Assignment #3

CALIFORNIA EDUCATION AND THE ENVIRONMENT INITIATIVE I Unit E.7.b. I The Life and Times of Carbon I Student Workbook 9
Name: _________________________________
Moving Through the Global Carbon Cycle
Lesson 2 | page 2 of 2
3. On the drawing shown add arrows between the processes and reservoirs to show the movement ofcarbon and carbon energy from one reservoir to another. (4 points)
4. Briefly describe how people and other living organisms depend on the global carbon cycle for life.Explain how carbon cycles through each carbon reservoir and describe how carbon plays an importantpart in our communities, our lifestyles, and our economy. (10 points)
5. Notice that fossil fuel deposits, such as coal, petroleum, and natural gas, are deep within the rocks,soils, and sediments reservoir. Fossil fuels were formed from buried dead plants and animals duringthe Carboniferous period about 354 to 290 million years ago. If people had not extracted fossil fuelsfrom Earth to use as energy, would this carbon be “cycling” within the global carbon cycle we havedefined today? Explain your answer. (6 points)

Carbon Flow Game Instructions1. Center the game board between all players; set the Carbon Flow Scenario Cards facedown
to one side.2. Arrange the carbon game pieces (poker chips) according to the following guide:
The red chips represent fossil fuels. Place all three in the “Rocks, Soils, and Sediments” reservoir.Add 11 more poker chips to ”Rocks, Soils, and Sediments” reservoir.Place six chips in the “Ocean” reservoir.Place two chips in the “Atmosphere” reservoir.Place two chips in the “Terrestrial Plants” reservoir.Select someone from your group to start the game and then take turns clockwise.
3. During their turn, players draw one Carbon Flow Scenario Card from the stack, read it aloud, and move the carbon game pieces to show how carbon moves from one reservoir to another during different processes. (Note: There may be situations where the carbon does not move.)
4. During each turn, players record how they believe carbon moves on their individual Carbon Flow Observation Log.
5. After all cards have been drawn, leave the game pieces on the board in place to refer to during the group discussion that follows.
Feel the Burn
1 billion tons of carbon into the atmosphere in the form of carbon dioxide. In 2006, a record-setting
Scientists estimate that for every acre burned, between 30 and 77 metric tons of carbon is released to the atmosphere. Most is in the form of CO2, but carbon monoxide and methane are also released.
Large forests are able to store massive amounts of CO2. Once burned, the lost forests and vegetation are not taking up CO2
the burned land. Even though new vegetation takes up CO2 and stores carbon, the new grasses, shrubs, and small trees are not as effective at taking up CO2 as larger trees.
Fires result in ….(Move one carbon piece to a new reservoir.)
Carbon Flow Scenario Cards
Lesson 3 | page 1 of 5

Carbon Flow Scenario Cards
Lesson 3 | page 2 of 5
Seeing the Forest Through the TreesThe process of photosynthesis takes up carbon dioxide from the atmosphere and stores the
carbon as plant material. Because of the large amount of carbon stored as wood, forests are one of the largest reservoirs of carbon on Earth.
There are currently more forests in the United States today than there were 100 years ago. During early colonization of North America, people cut down huge amounts of forests to grow crops and for wood to build early cities and homes. Over the past 100 years, North American
Appropriate forest management based on sustained yields can also help. In the past decade, forests have been getting larger in Europe and China, as well. In Europe, forests are increasing by 32 million acres each year, an area about the size of Alabama. In China, forests are increasing by 4½ million acres each year, an area about the size of Delaware.
More forests results in …(Move one carbon piece to a new reservoir.)
Our Changing LandscapeThere are 6.8 billion people on the planet today and, by 2030, this number is expected to be
9 billion. Rapid human population growth, combined with increasing resource consumption, has resulted in the widespread transformation of Earth’s land surface. We call this “land use change.”
People change the land: we build homes, cities, and roads. We clear land to grow crops and manage livestock. Worldwide, people have cleared lands about the size of South America just to grow crops. We use even more land for ranching, to graze livestock, such as cattle, goats and sheep.
Recently, the largest land use changes have occurred in developing nations, such as South America and Malaysia. People are burning or cutting tropical forests to grow food crops or to raise cattle. In recent years, people have turned to growing crops to produce ethanol, which can be made from corn, soybeans, sugar cane, and other food crops. There has been research suggesting that it might be possible to store carbon in farm and grasslands by moving to “no-till agriculture” (which reduces soil disturbance).
Both burning trees and disturbing the soil release carbon into the atmosphere. A second carbon penalty is that once a tree is cut, it can no longer take up atmospheric carbon.
Land use changes result in...(Move two carbon pieces to new reservoirs.)
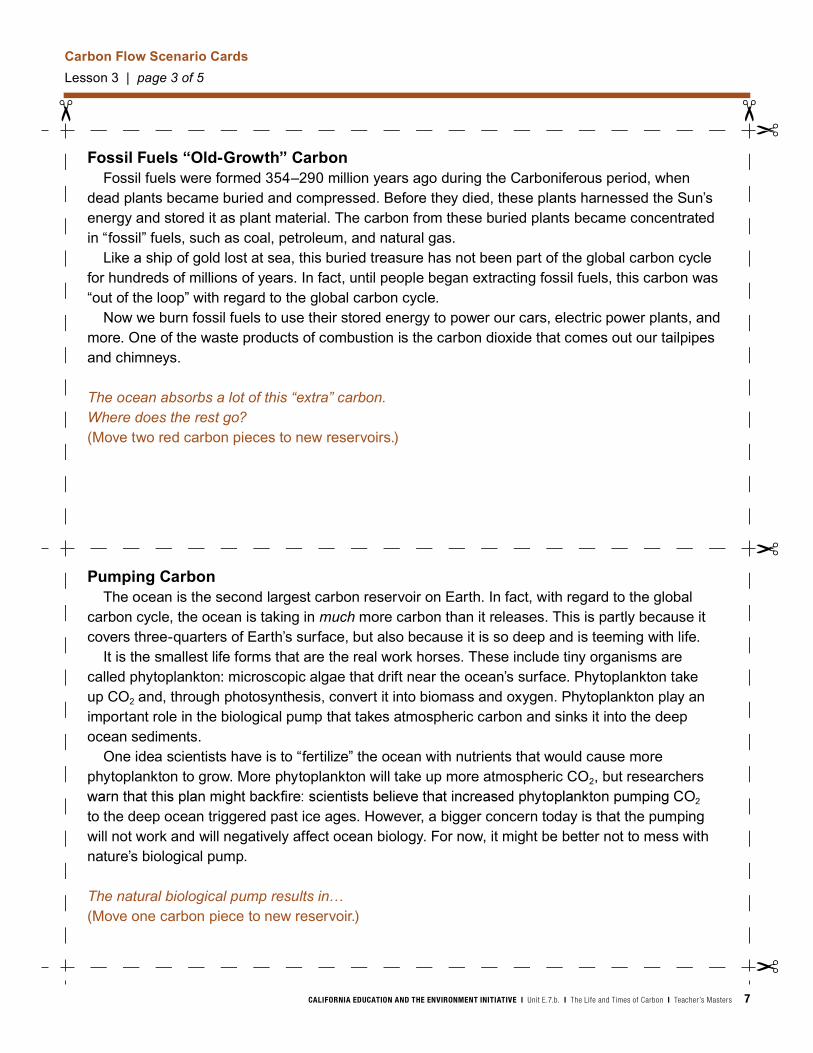
Fossil Fuels “Old-Growth” CarbonFossil fuels were formed 354–290 million years ago during the Carboniferous period, when
dead plants became buried and compressed. Before they died, these plants harnessed the Sun’s energy and stored it as plant material. The carbon from these buried plants became concentrated in “fossil” fuels, such as coal, petroleum, and natural gas.
Like a ship of gold lost at sea, this buried treasure has not been part of the global carbon cycle for hundreds of millions of years. In fact, until people began extracting fossil fuels, this carbon was “out of the loop” with regard to the global carbon cycle.
Now we burn fossil fuels to use their stored energy to power our cars, electric power plants, and more. One of the waste products of combustion is the carbon dioxide that comes out our tailpipes and chimneys.
The ocean absorbs a lot of this “extra” carbon.Where does the rest go?(Move two red carbon pieces to new reservoirs.)
Pumping CarbonThe ocean is the second largest carbon reservoir on Earth. In fact, with regard to the global
carbon cycle, the ocean is taking in much more carbon than it releases. This is partly because it covers three-quarters of Earth’s surface, but also because it is so deep and is teeming with life.
It is the smallest life forms that are the real work horses. These include tiny organisms are called phytoplankton: microscopic algae that drift near the ocean’s surface. Phytoplankton take up CO2 and, through photosynthesis, convert it into biomass and oxygen. Phytoplankton play an important role in the biological pump that takes atmospheric carbon and sinks it into the deep ocean sediments.
One idea scientists have is to “fertilize” the ocean with nutrients that would cause more phytoplankton to grow. More phytoplankton will take up more atmospheric CO2, but researchers
2 to the deep ocean triggered past ice ages. However, a bigger concern today is that the pumping will not work and will negatively affect ocean biology. For now, it might be better not to mess with nature’s biological pump.
The natural biological pump results in…(Move one carbon piece to new reservoir.)
Carbon Flow Scenario Cards
Lesson 3 | page 3 of 5

Carbon Flow Scenario Cards
Lesson 3 | page 4 of 5
How Permanent Is Permafrost?Permafrost is land that is frozen for at least two years in a row. Permafrost is common on land
near Earth’s poles, in northern regions and on alpine mountains. Like the name suggests, this ground contains frozen water.
Some plants have adapted to grow in permafrost during the short summers. When these slow-growing plants die, they are quickly frozen and buried. Winter comes quickly in permafrost regions, so the plant material does not decompose very much. In other words, the carbon stored within
methane (CH4)—another form of carbon.It is the frosty conditions that keep carbon locked in permafrost. When permafrost thaws, it
releases carbon to the atmosphere. The past decade has seen record summer heat, and scientists predict the warming trend to continue.
Thawing permafrost will result in …(Move one carbon piece to a new reservoir.)
A Wetland “Wasteland?”
with plants that have adapted to grow well in wet soil. When the vegetation dies, some will decay, releasing carbon dioxide and another carbon compound—methane (CH4)—to the atmosphere. But the vegetation can build up as sediment, forming a reservoir of carbon.
development. Between the 1780s and 1980s, 60 acres of wetlands were lost every hour across the country. In California alone, less than 9% of the state’s historic wetlands remain. Today, most California wetlands are protected from further development.
For saltwater wetlands, such as salt marshes, legal protection is not enough. Rising sea
absorber against waves. When shoreline vegetation is lost, erosion is more prevalent. Lost wetlands decrease photosynthesis and expose sediments and soils to erosion.
Wetland loss results in…(Move one carbon piece to a new reservoir.)

Cement, Our Modern Building BlockConcrete is a building material which is made from a mixture of cement, clay, gravel, sand, and
water. Cured concrete is like stone, and so buildings, bridges, and roads are expected to last a long time.
Cement is made from lime, which is made from limestone. Remember that limestone is sedimentary rock formed from the fossilized calcium carbonate remains of marine organisms. To make lime out of limestone, concrete factories heat limestone to very high temperatures. In the process of converting calcium carbonate into lime, carbon dioxide is given off and released to the atmosphere.
Overall, the cement industry produces 5% of global human-made CO2 emissions. This comes to about 900 kg of CO2 released to the atmosphere for every 1,000 kg of concrete produced.
The top three annual producers of concrete are China with 704 million metric tons, India with 100 million metric tons, and the United States with 91 million metric tons. This translates into about half the world’s total production of concrete.
Producing concrete results in…(Move one carbon piece to a new reservoir.)
Made of Wood Is GoodWood is a reservoir for carbon whether is it alive or dead. This means that wood used for
building materials and furniture is still storing some of the carbon that was in the original tree (about one-third of the original tree is able to be converted into furniture). In fact, dry wood is about 50%
much less carbon than wood that is cut for use in construction or to make furniture.Forests can be managed to protect them as a valuable ecosystem, but they can also be
managed to store as much carbon as possible. Trees in their middle years convert more carbon dioxide than when they are small saplings or slow-growing, large, old growth trees.
Forest managers believe that we can manage the amount of carbon dioxide that is in the atmosphere by maintaining and managing trees.
Cutting trees for use in construction, furniture, and other wood products results in…(Move one carbon piece to a new reservoir.)
Carbon Flow Scenario Cards
Lesson 3 | page 5 of 5

Ph
yto
pla
nk
ton
(aq
uatic
pla
nts)
de
ep
oc
ea
n c
arb
on
Lim
est
on
e
oil
an
d c
oa
l d
ep
os
its
so
ils
CO
2
Atm
os
ph
ere
Terr
est
ria
l Pla
nts
Oc
ean
sR
ock
s,
So
ils
,
an
d S
ed
imen
ts

10 CALIFORNIA EDUCATION AND THE ENVIRONMENT INITIATIVE I Unit E.7.b. I The Life and Times of Carbon I Student Workbook
Carbon Flow Observation Log
Lesson 3 | page 1 of 2
Name: _________________________________
Instructions: Complete the following task in the chart below.
Carbon flow is the movement of carbon in gaseous, dissolved, or solid form from one carbon reservoir to another. As you play the Carbon Flow Game, describe the processes at work in each scenario and record how you believe carbon flows from reservoir to reservoir in the global carbon cycle.
Carbon Flow Observation Log
Carbon Flow Card Reservoir: Carbon Started Here Reservoir: Carbon Moved Here
Feel the Burn
Seeing the Forest Through the Trees
Our Changing Landscape
Fossil Fuels “Old-Growth” Carbon

CALIFORNIA EDUCATION AND THE ENVIRONMENT INITIATIVE I Unit E.7.b. I The Life and Times of Carbon I Student Workbook 11
Name: _________________________________
Carbon Flow Observation Log
Lesson 3 | page 2 of 2
Carbon Flow Observation Log
Carbon Flow Card Reservoir: Carbon Started Here Reservoir: Carbon Moved Here
Pumping Carbon
How Permanent Is Permafrost?
A Wetland “Wasteland?”
Cement, Our Modern Building Block
Made of Wood Is Good

12 CALIFORNIA EDUCATION AND THE ENVIRONMENT INITIATIVE I Unit E.7.b. I The Life and Times of Carbon I Student Workbook
Going with the Flow
Lesson 3 | page 1 of 5
Name: _________________________________
Annual Cycle
Jan Apr Jul Oct Jan
Atmospheric Carbon DioxideMeasured at Mauna Loa, Hawaii
1960 1970 1980 1990 2000 2010
390
380
370
360
350
340
330
320
310
Car
bon
diox
ide
conc
entr
atio
n (p
pmv)
YearGraph 1. Changes in atmospheric carbon dioxide from 1958 to present. Source: R. F. Keeling, S. C. Piper, A. F. Bollenbacher, and S. J. Walker, Carbon Dioxide Research Group, Scripps Institution of Oceanography, La Jolla, California, February 2009
We know that photosynthesis results in the production of plant biomass and oxygen (O2). Biomass is the green and brown stuff of plants—leaves, stems, trunk growth, and roots. Decomposition, on the other hand, is the breakdown of biomass—including animal matter. Decomposing plant and animal matter releases CO2
season), while most plant decomposition happens in fall and winter, when trees have
to soils, the atmosphere, and the ocean. Most photosynthesis happens in the spring and summer months (the growing
lost their leaves.
Scientists have measured the annual differences in CO2 uptake by photosynthesis and CO2 emission by decomposition and respiration, and have discovered that it appears as if the Northern Hemisphere’s photosynthesizers are
“breathing”—an inhale of CO2 in spring and summer, and an exhale of CO2 in the fall.
Scientists have measured the annual carbon flow since 1958. The graph below shows that atmospheric carbon dioxide levels are highest in May just before plants rapidly increase their rates of photosynthesis, and atmospheric carbon dioxide levels are lowest near the end of the active growing season in October, before rapid decomposition releases CO2
back into the atmosphere. This “breathe in” and “exhale out” is measured in this zigzag pattern each year.
Plants provide just one example of global carbon flow. Carbon dioxide is released to the atmosphere by a variety of natural sources, and together these sources account for over 95% of Earth’s total CO2 emissions.
What Is Natural About Carbon Flow?

CALIFORNIA EDUCATION AND THE ENVIRONMENT INITIATIVE I Unit E.7.b. I The Life and Times of Carbon I Student Workbook 13
Going with the Flow
Lesson 3 | page 2 of 5
Name: _________________________________
Analyzing the Carbon Flow Game
Instructions: Using the Carbon Flow Observation Log (Student Workbook, page 10), compare your “Before Game” carbon data to the “After Game” carbon data, and complete the tasks below.
1. Complete the Carbon Flow Summary Chart below. To calculate the percentage change for each reservoir, divide the amount of “change of carbon” by the “before game carbon” amount. (For example, the “Rocks, Soils, and Sediments Reservoir” started with 14 total carbon pieces and ended with 8 total carbon pieces, for a change of -6 carbon stored.) (6 points)
-6 ÷ 14 = -42.9% change
Carbon Flow Summary Chart
Reservoir Before Game Carbon
After Game Carbon Change in carbon Percentage Change in Total
Carbon StorageRocks, Soils, and Sediments
14 8
Ocean 6 8
Atmosphere 2 7
Terrestrial Plants 2 1
2. Based on your calculations, what is the order of the carbon reservoirs from most changed to least changed? (1 point)
3. Which reservoir(s) took up more carbon than it released? (1 point)
4. As a percentage of change, which reservoir experienced the most loss of carbon? (1 point)
5. A “carbon sink’ is a reservoir that is taking up more carbon than it is releasing. Based on the scenarios played in this game, which reservoirs might we consider being carbon sinks? (1 point)

14 CALIFORNIA EDUCATION AND THE ENVIRONMENT INITIATIVE I Unit E.7.b. I The Life and Times of Carbon I Student Workbook
Instructions: Use the diagram below to complete the tasks on the next two pages.
Cycling for Carbon
Earth’s natural systems are very good at conserving energy and matter. The conservation of energy and matter is done through different natural cycles. Some scientists describe the movement of matter through cycles as a giant recycling station, where the “trash” products from one system are the “treasure” for another.
Going with the Flow
Lesson 3 | page 3 of 5
Name: _________________________________

CALIFORNIA EDUCATION AND THE ENVIRONMENT INITIATIVE I Unit E.7.b. I The Life and Times of Carbon I Student Workbook 15
Going with the Flow
Lesson 3 | page 4 of 5
Name: _________________________________
carbon energy reservoir
carbon flow global carbon cycle sink
6. of one system are the stuff of life for another.” Write a brief explanation of what is meant by the phrase, “In the carbon cycle, the waste products
Include the following:■■■ At least one example in your answer should describe one of following natural processes: the solubility pump, decomposition, forest fires, photosynthesis, respiration, sedimentation, subduction, or weathering. (1 point)
■■■ Explain how the global carbon cycle results in a movement of carbon matter and energy. (1 point)■■■ Identify one carbon “sink” and describe why or how it acts as a carbon sink. (1 point)■■■ Use the following vocabulary words in your response. (1 point each)

16 CALIFORNIA EDUCATION AND THE ENVIRONMENT INITIATIVE I Unit E.7.b. I The Life and Times of Carbon I Student Workbook
Going with the Flow
Lesson 3 | page 5 of 5
Name: _________________________________
7. In a sentence or two, hypothesize about the effects of too much carbon in the atmosphere. (1 point)


CALIFORNIA EDUCATION AND THE ENVIRONMENT INITIATIVE I Unit E.7.b. I The Life and Times of Carbon I Student Workbook 17
You have studied the different forms carbon takes (gases, rocks, plants, carbohydrates, proteins, fossil fuels, plastics, and others), the four major reservoirs that hold carbon, and the many different biogeochemical processes that move carbon throughout the global carbon cycle. Carbon is essential to living organisms, including people. The cycling of carbon by many different natural processes makes it available in different forms for us to use.
In the last lesson, you learned that a change in the amount of carbon that is moved from one
reservoir to another is called carbon flow. In this lesson, we will look more closely at the “accounting” of carbon flow: the amount of carbon cycled, and the timescales involved. Finally, we will consider recent changes in carbon flow, and how this affects the natural balance of the global carbon cycle.
Accounting for Changing Levels of Atmospheric Carbon Dioxide
Lesson 4 | page 1 of 4
Worldwide Annual Carbon Flow Between the Atmosphere and Other Reservoirs (gigatons)
ReservoirAmount of Carbon Released into the Atmosphere (Emissions)
Amount of Carbon Stored from the Atmosphere (Uptake)
Rocks, Soils, and Sediments
Carbon emission by soil respiration (decomposition by soil microbes): 60
CO2 from land use changes and burning fossil fuels: 8 (Note: This is not considered a “natural” process, but is the result of human activities.)
Measurements vary too much from location to location to accurately report data.
Ocean Released back to atmosphere from respiration and decomposition: 90
Annual CO2 uptake by biological and solubility pump processes: 92
Terrestrial Plants Carbon emission by decomposition/respiration: 50
CO2 uptake by photosynthesis: 111
Amount of carbon in each reservoir (gigatons):Rocks, Soils, and Sediments: 66,000,000 to 100,000,000Fossil Fuels: 4,000Ocean: 38,000 to 40,000Terrestrial Plants: 540 to 610Atmosphere: 766(The CO2 concentration in the atmosphere is currently increasing by about 3.2 parts per million every year.)
The table below summarizes the distribution of carbon in the four major reservoirs on Earth: rocks, soils, and sediments; the atmosphere; the ocean; and terrestrial plants. (Note: A gigaton is one billion metric tons.)
Instructions: Read the following information, review the table below, and examine the diagram on the next page as you prepare to complete this assignment.
Name: _________________________________ Period: ___ Teacher: ________________
Chemistry Assignment #5

18 CALIFORNIA EDUCATION AND THE ENVIRONMENT INITIATIVE I Unit E.7.b. I The Life and Times of Carbon I Student Workbook
Global Carbon Cycle: This diagram shows carbon flow and includes both natural processes and human activities.
Carbon Flow Data
Accounting for Changing Levels of Atmospheric Carbon Dioxide
Lesson 4 | page 2 of 4
6.3
Fos
sil f
uels
1.6
Land
-use
111
Pho
tosy
nthe
sis
60 S
oil r
espi
ratio
n
50 P
lant
res
pira
tion
92
1.7 Net flux
90
Ocean 39000Vegetation 610
Soils 1580
Stock = Billion metric tonsFlow = Billion metric tons per year
Global Carbon Cycle
Atmospheric CO2
750 (@360 ppm)+7.9 per year
(+ 3.2 per year)
1.4 Net flux
Source: http://www.globalchange.umich.edu/globalchange1/current/lectures/kling/carbon_cycle/carbon_cycle.html
Name: _________________________________
CALIFORNIA EDUCATION AND THE ENVIRONMENT INITIATIVE I Unit E.7.b. I The Life and Times of Carbon I Student Workbook 19
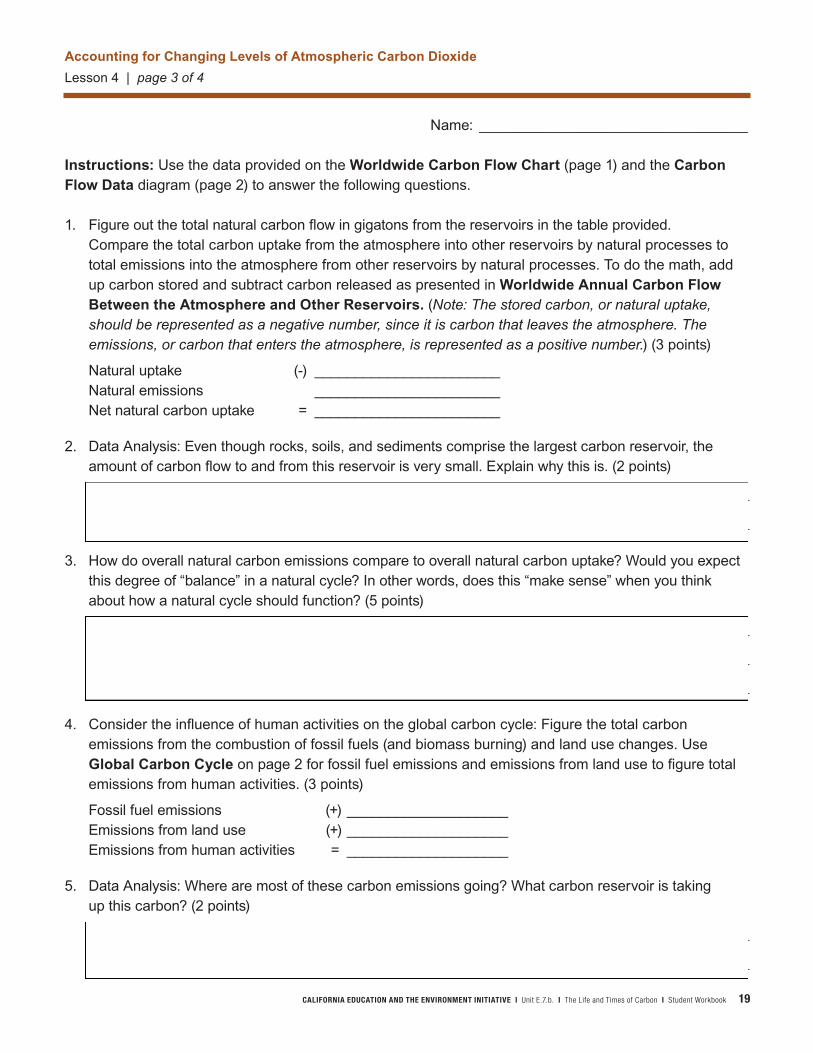
Instructions: Use the data provided on the Worldwide Carbon Flow Chart (page 1) and the Carbon Flow Data diagram (page 2) to answer the following questions.
1. Figure out the total natural carbon flow in gigatons from the reservoirs in the table provided. Compare the total carbon uptake from the atmosphere into other reservoirs by natural processes to
total emissions into the atmosphere from other reservoirs by natural processes. To do the math, add up carbon stored and subtract carbon released as presented in Worldwide Annual Carbon Flow Between the Atmosphere and Other Reservoirs. (Note: The stored carbon, or natural uptake, should be represented as a negative number, since it is carbon that leaves the atmosphere. The emissions, or carbon that enters the atmosphere, is represented as a positive number.) (3 points)
Natural uptake (-) _______________________ Natural emissions _______________________ Net natural carbon uptake = _______________________
2. Data Analysis: Even though rocks, soils, and sediments comprise the largest carbon reservoir, the amount of carbon flow to and from this reservoir is very small. Explain why this is. (2 points)
3. How do overall natural carbon emissions compare to overall natural carbon uptake? Would you expect this degree of “balance” in a natural cycle? In other words, does this “make sense” when you think about how a natural cycle should function? (5 points)
4. Consider the influence of human activities on the global carbon cycle: Figure the total carbon emissions from the combustion of fossil fuels (and biomass burning) and land use changes. Use Global Carbon Cycle on page 2 for fossil fuel emissions and emissions from land use to figure total emissions from human activities. (3 points)
Fossil fuel emissions (+) ____________________ Emissions from land use (+) ____________________ Emissions from human activities = ____________________
5. Data Analysis: Where are most of these carbon emissions going? What carbon reservoir is taking up this carbon? (2 points)
Accounting for Changing Levels of Atmospheric Carbon Dioxide
Lesson 4 | page 3 of 4
Name: _________________________________

20 CALIFORNIA EDUCATION AND THE ENVIRONMENT INITIATIVE I Unit E.7.b. I The Life and Times of Carbon I Student Workbook
Name: _________________________________
6. Figure out the “Total Carbon Flow” to or from the atmosphere including flow from human activities. (Note: A positive number indicates carbon entering the atmosphere and a negative number indicates carbon leaving the atmosphere.) (3 points)
Carbon flow from natural systems __________________ Carbon flow from human activities (+) ___________________ = ___________________
7. Data Analysis: What is the end result (in gigatons) of the “Total Carbon Flow”? (2 points)
8. What is the significance of “extra” atmospheric carbon dioxide in Earth’s atmosphere? (2 points)
9. What is really happening? Scientists are measuring an annual 3.2 billion metric tons of carbon dioxide entering our atmosphere from human activities on an annual basis. Scientists say that we are lucky: the ocean is currently taking up more carbon dioxide than it did under preindustrial conditions. Based on what you know about emissions of carbon dioxide due to human activities, explain why levels of atmospheric CO2 have steadily increased the entire time CO2 has been measured. (3 points)
10. Bringing it all together: Comparing “young” carbon to “ancient” carbon: Scientists can measure and track the amount of carbon dioxide human activities emit to the
atmosphere. Our activities are like a carbon footprint: the carbon is what our activities “leave behind.” Compare the carbon footprint of using cow pie (biomass) for energy to using fossil fuels. Compare the origin of each energy source; is it “young” or “ancient?” With regard to the global carbon cycle, why does using young versus ancient carbon energy matter? (5 points)
Accounting for Changing Levels of Atmospheric Carbon Dioxide
Lesson 4 | page 4 of 4


CALIFORNIA EDUCATION AND THE ENVIRONMENT INITIATIVE I Unit E.7.b. I The Life and Times of Carbon I Student Workbook 21
Examining Decision Factors
Lesson 5 | page 1 of 4
Name: _________________________________
Instructions: Read the assigned Biofuel News Clips (Lesson 5 materials) and answer the related questions in the spaces provided.
Redesigning Life to Make Ethanol
1. Identify the trade-offs presented in the news clip.
2. Does the author suggest a cause for the issue presented?
3. Which decision category(ies) does the group feel this issue presents: environmental, social, political,or economic?
4. What is the “big idea” of this news clip?
Period:___ Teacher:_________________
Chemistry Assignment #6

22 CALIFORNIA EDUCATION AND THE ENVIRONMENT INITIATIVE I Unit E.7.b. I The Life and Times of Carbon I Student Workbook
It’s Corn vs. Soybeans in a Biofuels Debate
5. Identify the trade-offs presented in the news clip.
6. Does the author suggest a cause for the issue presented?
7. Which decision category(ies) does the group feel this issue presents: environmental, social, political, or economic?
8. What is the “big idea” of this news clip?
Examining Decision Factors
Lesson 5 | page 2 of 4
Name: _________________________________

CALIFORNIA EDUCATION AND THE ENVIRONMENT INITIATIVE I Unit E.7.b. I The Life and Times of Carbon I Student Workbook 23
Examining Decision Factors
Lesson 5 | page 3 of 4
Name: _________________________________
Food Versus Fuel
9. Identify the trade-offs presented in the news clip.
10. Does the author suggest a cause for the issue presented?
11. Which decision category(ies) does the group feel this issue presents: environmental, social, political, or economic?
12. What is the “big idea” of this news clip?
24 CALIFORNIA EDUCATION AND THE ENVIRONMENT INITIATIVE I Unit E.7.b. I The Life and Times of Carbon I Student Workbook
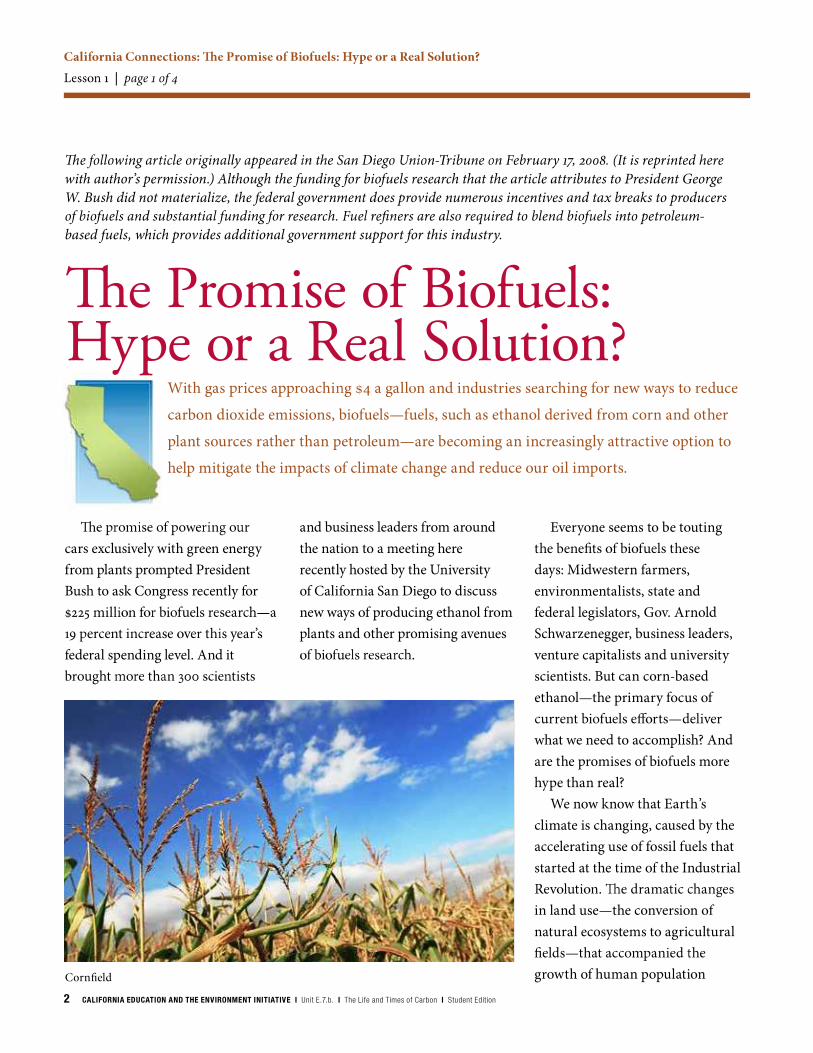
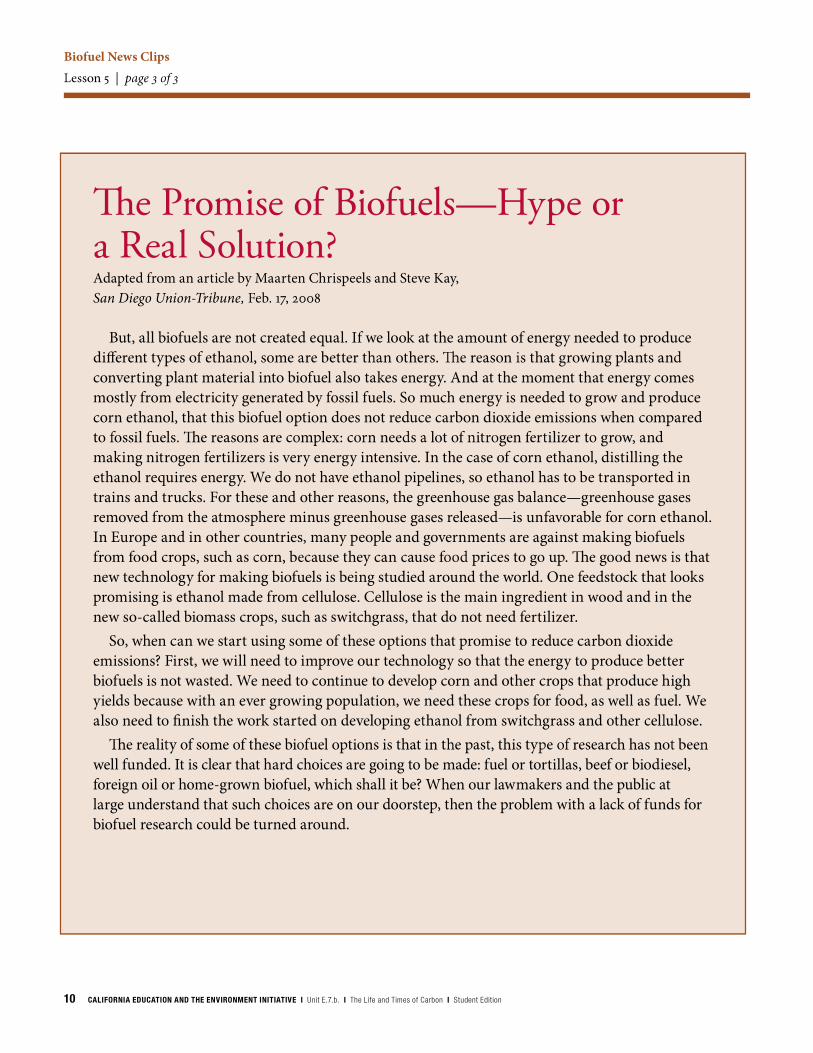
The Promise of Biofuels—Hype or a Real Solution?
13. Identify the trade-offs presented in the news clip.
14. Does the author suggest a cause for the issue presented?
15. Which decision category(ies) does the group feel this issue presents: environmental, social, political, or economic?
16. What is the “big idea” of this news clip?
Examining Decision Factors
Lesson 5 | page 4 of 4
Name: _________________________________

CALIFORNIA EDUCATION AND THE ENVIRONMENT INITIATIVE I Unit E.7.b. I The Life and Times of Carbon I Student Workbook 25
Carbon Footprint of Corn-Based Biofuel
Lesson 5 | page 1 of 2
Name: _________________________________
Is Ethanol Getting a Bum Rap? By John Carey. Business Week, May 1, 2008.
There are grains of truth in this backlash, experts say. “There are bad biofuels and good biofuels,” says Daniel Sperling, director of the Institute of Transportation Studies at the University of California at Davis. Corn-based ethanol ranks as mediocre. Yet it is only a minor cause of high food prices, and better biofuels are on the horizon. The transition to these superior fuels will get a boost from policies now being developed, with California leading the way…
Instead of throwing out biofuels, the key is to speed up the transition from corn to crops that offer more benefits. There’s a surprisingly simple way to do it: Judge fuels on how much greenhouse gas is emitted during their entire production and transport, including emissions caused by converting land from food crops and other uses to fuel crops. Then ratchet down the amount of carbon that’s allowed…
This low-carbon fuel standard approach sets the market free to pick the best fuels to meet the standard. It immediately rules out biofuels from palm oil plantations carved out of the rainforest, for instance. It would also steer farmers away from corn because of corn ethanol’s lack of substantial greenhouse gas benefits. “Almost all of the pathways for using food crops to make energy will look very bad with a carbon metric,” explains UC Davis’ Sperling, who has worked on the approach. “The low-carbon fuel standard is one of the most outstanding policy instruments we have ever developed,” he says. Make this approach widespread, and it should be possible to have our biofuels and eat our crops, too.
This article originally appeared on www.businessweek.com on May 1, 2008.
It is reprinted here with Business Week’s permission.
Instructions: Read the text below and answer the questions on the following page.

26 CALIFORNIA EDUCATION AND THE ENVIRONMENT INITIATIVE I Unit E.7.b. I The Life and Times of Carbon I Student Workbook
Instructions: Answer the following questions in the spaces provided.
1. Identify the trade-offs presented in the news clip. (1 point)
2. What does the author suggest as a cause for the issue presented? (1 point)
3. Which decision category(ies) does this issue represent: environmental, social, political or economic? Identify one and use evidence from the article to justify your answer. (4 points)
4. What is the “big idea” of this news clip? (1 point)
5. People often use the analogy of “growing on trees” (or in this case, stalks) to say that something is free. In the case of biofuels, there is concern about all the costs involved. What are some of them? (3 points)
Carbon Footprint of Corn-Based Biofuel
Lesson 5 | page 2 of 2
Name: _________________________________
Copyright © 2022 FDOKUMEN