
Web-based Spatial Training Using Handheld Touch Screen Devices
15
Martin-Dorta, N., Saorin, J. L., & Contero, M. (2011). Web-based Spatial Training Using Handheld Touch Screen Devices. Educational Technology & Society, 14 (3), 163–177. 163 ISSN 1436-4522 (online) and 1176-3647 (print). © International Forum of Educational Technology & Society (IFETS). The authors and the forum jointly retain the copyright of the articles. Permission to make digital or hard copies of part or all of this work for personal or classroom use is granted without fee provided that copies are not made or distributed for profit or commercial advantage and that copies bear the full citation on the first page. Copyrights for components of this work owned by others than IFETS must be honoured. Abstracting with credit is permitted. To copy otherwise, to republish, to post on servers, or to redistribute to lists, requires prior specific permission and/or a fee. Request permissions from the editors at [email protected]. Web-based Spatial Training Using Handheld Touch Screen Devices Norena Martin-Dorta, Jose Luis Saorin and Manuel Contero 1 Dpto. de Expresión Gráfica en Arquitectura e Ingeniería, Universidad de La Laguna, Tenerife, Spain // 1 Instituto de Bioingeniería y Tecnología orientada al Ser Humano, Universidad Politécnica de Valencia, Valencia, Spain // [email protected] // [email protected] // [email protected] ABSTRACT This paper attempts to harness the opportunities for mobility and the new user interfaces that handheld touch screen devices offer, in a non-formal learning context, with a view to developing spatial ability. This research has addressed two objectives: first, analyzing the effects that training can have on spatial visualisation using the educational content developed for this pilot study; and second, evaluating the experience of users in the use of handheld touch screen devices and their degree of satisfaction with the on-line course proposed. Two study groups were used: an experimental group, which undergoes a one week training programme, and a control group, which does no spatial training tasks during this period. The results show a significant improvement in average spatial visualisation scores among the experimental group in comparison with the control group. Students value positively the course accomplished and they expressed their preference for these multimedia contents over the conventional pencil and paper formats, and for the on-line learning over a face to face course. They also consider that having materials of this kind available in their study programme subjects and the possibility of accessing this material at any time and in any place to be a positive aspect. Keywords Spatial abilities, Spatial visualisation, Mobile learning Introduction Progress made in technology, user interfaces and recent developments in the field of communications (Wi-Fi, GPRS, 3G, etc.), have created a wide range of possibilities for users. Devices such as PDAs, mobile phones, videogames consoles, MP3/MP4 or ultra mobile PCs (UMPC), now increasingly incorporate one or more of this technologies available. Furthermore, improvement in screens and new interfaces, together with multimedia and storage capacities for podcasts, videos, photos, files, etc., eases interaction with a huge range of contents (Guerrero, 2006; Johnson, Levine & Smith, 2008). Play, in its diverse forms, constitutes an important part of children’s cognitive and social development (Piaget, 1951; Provost, 1990). Several authors have analyzed the impact of games on education and there is wide empirical evidence supporting the positive effects of computer games as instructional tools (Amory, Naicker, Vincent & Adams, 1999). Recent studies have brought attention to the educational potential of handheld devices. Some tools have been tested on these devices, indicating they strengthen and support learning in fields such as languages (Thornton & Houser, 2005; Lu, 2008; Chen & Chung, 2008), science and natural history (Facer, Joiner, D., Reid, Hull & Kirk, 2004; Sánchez, Salinas & Sáenz, 2007), and also provide an additional tool in common learning (Corlett, Sharples, Bull & Chan, 2005; Clough, Jones, McAndrew & Scanlon, 2007; Hoff, Wehling & Rothkugel, 2008; Chris, 2008). Spatial skills may be associated with success in scientific areas (Smith, 1964). Non-academic activities, such as playing with construction toys as a young child and playing three dimensional computer games seem to have strong relationship with spatial visualization ability. The potential of video games or computer games for improving spatial skills have been analyzed by numerous research (Deno, 1995; Sorby, 2007). Most recent research in the field of spatial abilities focuses on how these relate to new technologies (Rafi, Samsudin & Ismail, 2006; Rafi, Samsudin & Said, 2008,; Martin-Dorta, Saorin & Contero, 2008; Rafi & Samsudin, 2009). Our work focuses on mobility and new user interfaces that handheld touch screen devices offer, in a non-formal learning context, targeting development of spatial ability. This research has addressed two main objectives: first, analyzing the effects that training may have on spatial visualisation using the educational content developed for this pilot study; and second, evaluating students experience while using handheld touch screen devices and their degree of satisfaction with this online learning course proposed.
Transcript of Web-based Spatial Training Using Handheld Touch Screen Devices
Martin-Dorta, N., Saorin, J. L., & Contero, M. (2011). Web-based Spatial Training Using Handheld Touch Screen Devices. Educational Technology & Society, 14 (3), 163–177.
163 ISSN 1436-4522 (online) and 1176-3647 (print). © International Forum of Educational Technology & Society (IFETS). The authors and the forum jointly retain the copyright of the articles. Permission to make digital or hard copies of part or all of this work for personal or classroom use is granted without fee provided that copies are not made or distributed for profit or commercial advantage and that copies bear the full citation on the first page. Copyrights for components of this work owned by others than IFETS must be honoured. Abstracting with credit is permitted. To copy otherwise, to republish, to post on servers, or to redistribute to lists, requires prior specific permission and/or a fee. Request permissions from the editors at [email protected].
Web-based Spatial Training Using Handheld Touch Screen Devices
Norena Martin-Dorta, Jose Luis Saorin and Manuel Contero1 Dpto. de Expresión Gráfica en Arquitectura e Ingeniería, Universidad de La Laguna, Tenerife, Spain // 1Instituto de
Bioingeniería y Tecnología orientada al Ser Humano, Universidad Politécnica de Valencia, Valencia, Spain // [email protected] // [email protected] // [email protected]
ABSTRACT
This paper attempts to harness the opportunities for mobility and the new user interfaces that handheld touch screen devices offer, in a non-formal learning context, with a view to developing spatial ability. This research has addressed two objectives: first, analyzing the effects that training can have on spatial visualisation using the educational content developed for this pilot study; and second, evaluating the experience of users in the use of handheld touch screen devices and their degree of satisfaction with the on-line course proposed. Two study groups were used: an experimental group, which undergoes a one week training programme, and a control group, which does no spatial training tasks during this period. The results show a significant improvement in average spatial visualisation scores among the experimental group in comparison with the control group. Students value positively the course accomplished and they expressed their preference for these multimedia contents over the conventional pencil and paper formats, and for the on-line learning over a face to face course. They also consider that having materials of this kind available in their study programme subjects and the possibility of accessing this material at any time and in any place to be a positive aspect.
Keywords
Spatial abilities, Spatial visualisation, Mobile learning Introduction Progress made in technology, user interfaces and recent developments in the field of communications (Wi-Fi, GPRS, 3G, etc.), have created a wide range of possibilities for users. Devices such as PDAs, mobile phones, videogames consoles, MP3/MP4 or ultra mobile PCs (UMPC), now increasingly incorporate one or more of this technologies available. Furthermore, improvement in screens and new interfaces, together with multimedia and storage capacities for podcasts, videos, photos, files, etc., eases interaction with a huge range of contents (Guerrero, 2006; Johnson, Levine & Smith, 2008). Play, in its diverse forms, constitutes an important part of children’s cognitive and social development (Piaget, 1951; Provost, 1990). Several authors have analyzed the impact of games on education and there is wide empirical evidence supporting the positive effects of computer games as instructional tools (Amory, Naicker, Vincent & Adams, 1999). Recent studies have brought attention to the educational potential of handheld devices. Some tools have been tested on these devices, indicating they strengthen and support learning in fields such as languages (Thornton & Houser, 2005; Lu, 2008; Chen & Chung, 2008), science and natural history (Facer, Joiner, D., Reid, Hull & Kirk, 2004; Sánchez, Salinas & Sáenz, 2007), and also provide an additional tool in common learning (Corlett, Sharples, Bull & Chan, 2005; Clough, Jones, McAndrew & Scanlon, 2007; Hoff, Wehling & Rothkugel, 2008; Chris, 2008). Spatial skills may be associated with success in scientific areas (Smith, 1964). Non-academic activities, such as playing with construction toys as a young child and playing three dimensional computer games seem to have strong relationship with spatial visualization ability. The potential of video games or computer games for improving spatial skills have been analyzed by numerous research (Deno, 1995; Sorby, 2007). Most recent research in the field of spatial abilities focuses on how these relate to new technologies (Rafi, Samsudin & Ismail, 2006; Rafi, Samsudin & Said, 2008,; Martin-Dorta, Saorin & Contero, 2008; Rafi & Samsudin, 2009). Our work focuses on mobility and new user interfaces that handheld touch screen devices offer, in a non-formal learning context, targeting development of spatial ability. This research has addressed two main objectives: first, analyzing the effects that training may have on spatial visualisation using the educational content developed for this pilot study; and second, evaluating students experience while using handheld touch screen devices and their degree of satisfaction with this online learning course proposed.

164
Spatial abilities and improvement tools Over the last half century, spatial abilities have been given increasing recognition and, despite the fact that not so much attention has been paid to them as to verbal and numeric abilities, research accentuates their importance in the traditional fields of engineering, technology and art, as well as in almost any other aspect of life. As it has repercussions in almost all scientific and technical fields, spatial abilities remain an active field of study, especially in the engineering area. Considered as a component of intelligence throughout history, we can understand it as the ability of manipulating objects and their parts mentally in a two-dimensional and three-dimensional space. From the point of view of measuring it, we can define it as the ability to imagine rotations of 2D and 3D objects as a whole body (Spatial Relations) and the ability to imagine rotations of objects or their parts in 3D spatial by folding and unfolding (Spatial Visualisation) (Saorín, 2006). Work done in recent years has been undertaken in the areas listed below: Measuring the spatial abilities of students who come into university, by studying the prior educational factors
that could have an impact on these results: gender, age, previous experiences, etc. Measuring the effect of the Engineering Graphics subjects on the University population. The development of multimedia or web-based tools. Creating remedial courses with a view to improving the level of students coming into university. This is because
it has been found that some students arrive with deficits in this area and that it could be an indicator of possible failure in engineering studies.
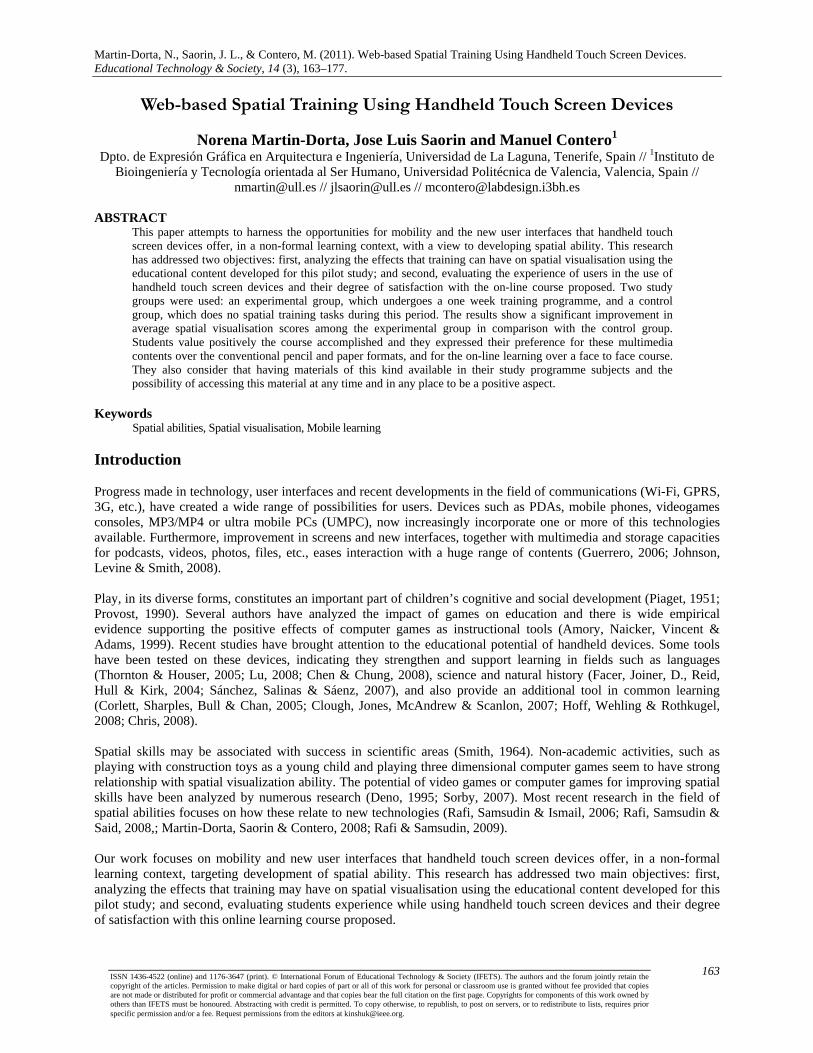
Some authors have based their work on the hypothesis that spatial abilities can be improved if the right tools are used; i.e. ones that facilitate an understanding of the concepts and the relations between two and three-dimensional representations. The appearance of new technologies has meant that, since the mid nineties, several different research groups have suggested novel tools for improving spatial abilities. Because of the breadth of their research and their continuity, it is worth highlighting the work led by Sheryl A. Sorby, in the Michigan Technological University (MTU). As a result of over ten years of research, she has published a ten module manual to improve 3D spatial visualisation (Sorby, Wysocky, & Baartmans, 2003). This allows students to work with isometric exercises by building standardised orthogonal views, cross sections, rotations, etc. with blocks. Apart from the text book, this publication comes with a flash based technology CD-ROM to complement the hard copy. This application offers interactive effects, creating the experience of a computer game for students (Figure 1a). At the University of Pennsylvania, Hollyday-Darr, Blasko & Dwyer (2000) created “Visualisation Assessment and Training Program” (Figure 1b and Figure 1c). This tool allows us to evaluate three components of spatial abilities: mental rotation, spatial visualisation and spatial perception. Rafi, Samsudin & Ismail (2006) tested the efficiency of this material in a comparative study in 2006. Some years later, these authors also developed and validated a new tool for improving mental rotation (Rafi & Samsudin, 2009). Professor Stephen W. Crown, from the Pan American University of Texas, hosts a multimedia web site on his university web site, which is comprised of a set of interactive games, tutorial videos and theory lessons that reinforce important concepts of Engineering Graphics. Tests and satisfaction surveys demonstrate that the impact of his tool on students has been a positive one (Crown, 2001) (Figure 1d). Conolly & Maicher (2005) from Purdue University, developed “Multiview Drawing”, an interactive tutorial for beginners in the world of orthographic view drawing. Given an isometric view of a piece, the programme enables students to draw a view and automatically correct the final result (Figure 1e). Illuminations (National Council of Teachers of Mathematics, 2000) is a website that was created by the United States National Council of Teachers of Mathematics and the Marco Polo Foundation. The site includes the “Isometric Drawing Tool”, an interactive applet that allows you to dynamically create isometric drawings on a template of dots (Figure 1f).
165
(a)
(b)
(c)
(d)
(e)
(f)
Figure 1. (a) Sorby’s training manual; (b) and (c) University of Pennsylvania training programme; (d) S. Crown’s interactive game; (e) Multi-view Drawing by Purdue University; (f) Isometric Drawing Tool
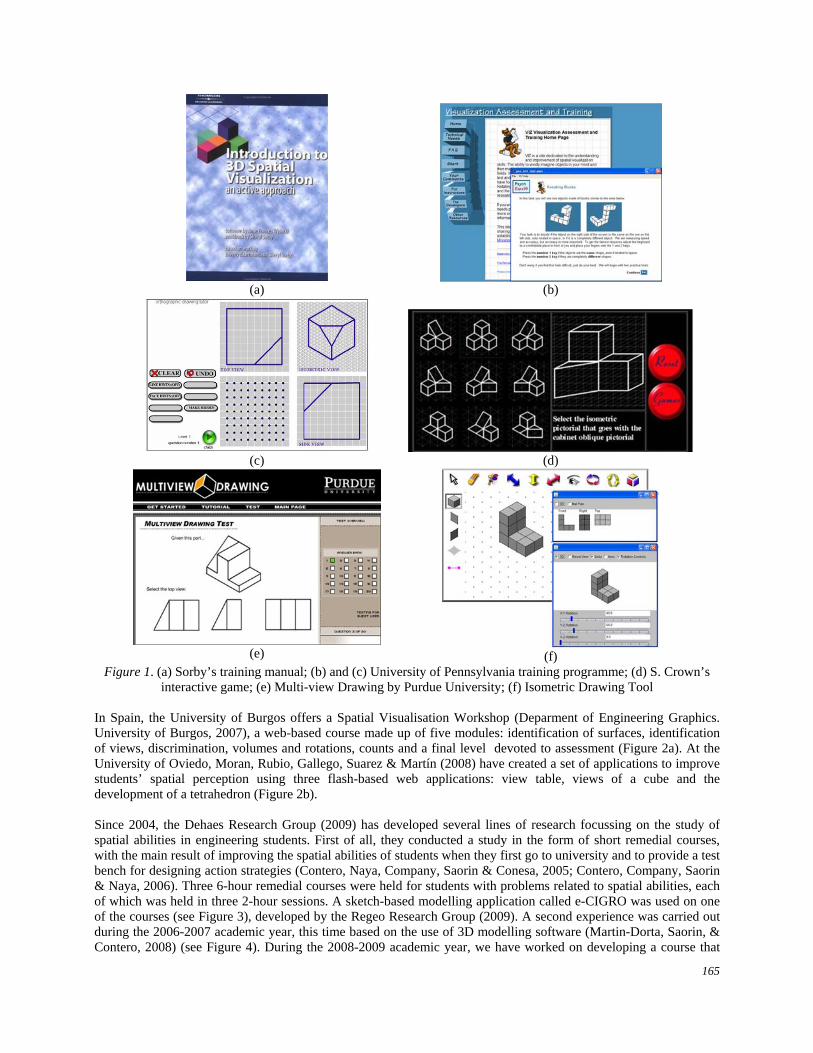
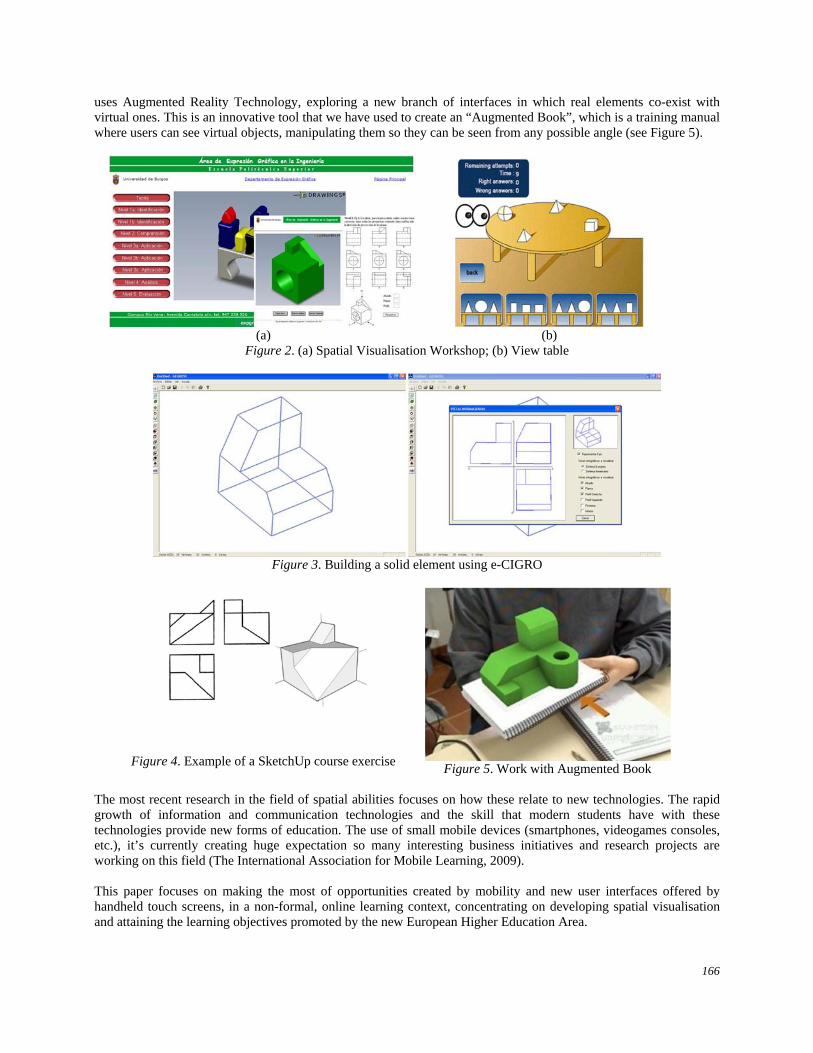
In Spain, the University of Burgos offers a Spatial Visualisation Workshop (Deparment of Engineering Graphics. University of Burgos, 2007), a web-based course made up of five modules: identification of surfaces, identification of views, discrimination, volumes and rotations, counts and a final level devoted to assessment (Figure 2a). At the University of Oviedo, Moran, Rubio, Gallego, Suarez & Martín (2008) have created a set of applications to improve students’ spatial perception using three flash-based web applications: view table, views of a cube and the development of a tetrahedron (Figure 2b). Since 2004, the Dehaes Research Group (2009) has developed several lines of research focussing on the study of spatial abilities in engineering students. First of all, they conducted a study in the form of short remedial courses, with the main result of improving the spatial abilities of students when they first go to university and to provide a test bench for designing action strategies (Contero, Naya, Company, Saorin & Conesa, 2005; Contero, Company, Saorin & Naya, 2006). Three 6-hour remedial courses were held for students with problems related to spatial abilities, each of which was held in three 2-hour sessions. A sketch-based modelling application called e-CIGRO was used on one of the courses (see Figure 3), developed by the Regeo Research Group (2009). A second experience was carried out during the 2006-2007 academic year, this time based on the use of 3D modelling software (Martin-Dorta, Saorin, & Contero, 2008) (see Figure 4). During the 2008-2009 academic year, we have worked on developing a course that
166
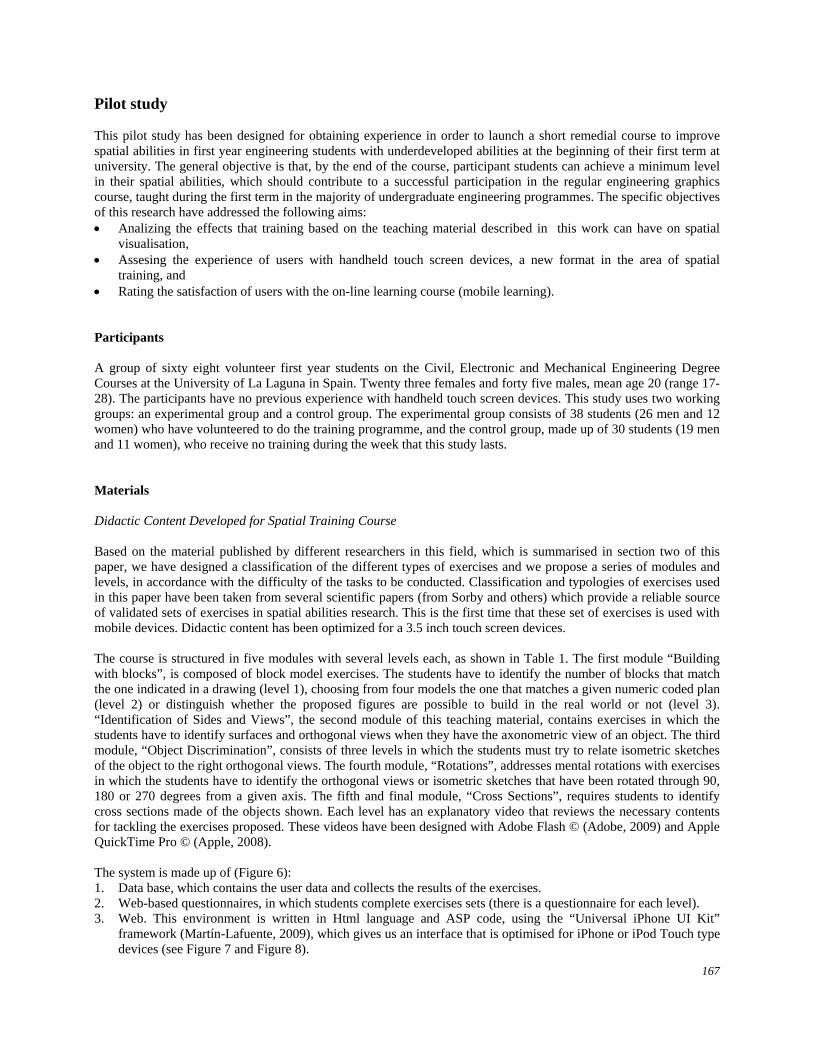
uses Augmented Reality Technology, exploring a new branch of interfaces in which real elements co-exist with virtual ones. This is an innovative tool that we have used to create an “Augmented Book”, which is a training manual where users can see virtual objects, manipulating them so they can be seen from any possible angle (see Figure 5).
(a)
(b)
Figure 2. (a) Spatial Visualisation Workshop; (b) View table
Figure 3. Building a solid element using e-CIGRO
Figure 4. Example of a SketchUp course exercise Figure 5. Work with Augmented Book
The most recent research in the field of spatial abilities focuses on how these relate to new technologies. The rapid growth of information and communication technologies and the skill that modern students have with these technologies provide new forms of education. The use of small mobile devices (smartphones, videogames consoles, etc.), it’s currently creating huge expectation so many interesting business initiatives and research projects are working on this field (The International Association for Mobile Learning, 2009). This paper focuses on making the most of opportunities created by mobility and new user interfaces offered by handheld touch screens, in a non-formal, online learning context, concentrating on developing spatial visualisation and attaining the learning objectives promoted by the new European Higher Education Area.
167
Pilot study This pilot study has been designed for obtaining experience in order to launch a short remedial course to improve spatial abilities in first year engineering students with underdeveloped abilities at the beginning of their first term at university. The general objective is that, by the end of the course, participant students can achieve a minimum level in their spatial abilities, which should contribute to a successful participation in the regular engineering graphics course, taught during the first term in the majority of undergraduate engineering programmes. The specific objectives of this research have addressed the following aims: Analizing the effects that training based on the teaching material described in this work can have on spatial
visualisation, Assesing the experience of users with handheld touch screen devices, a new format in the area of spatial
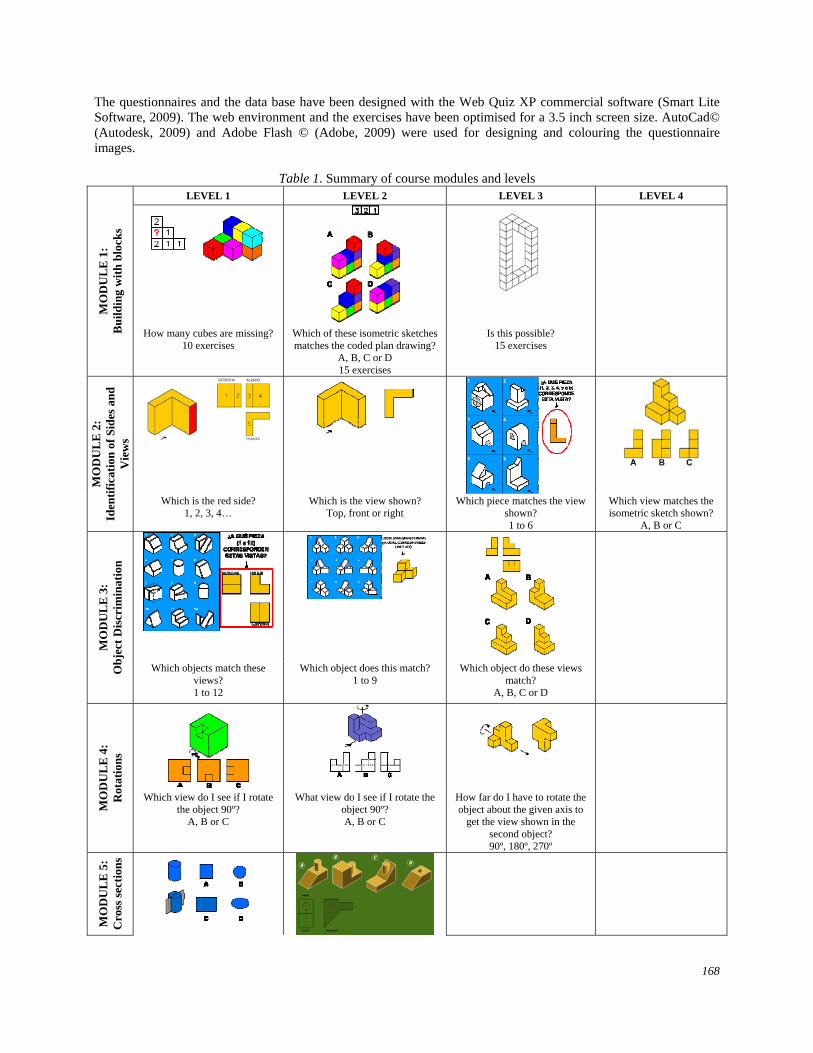
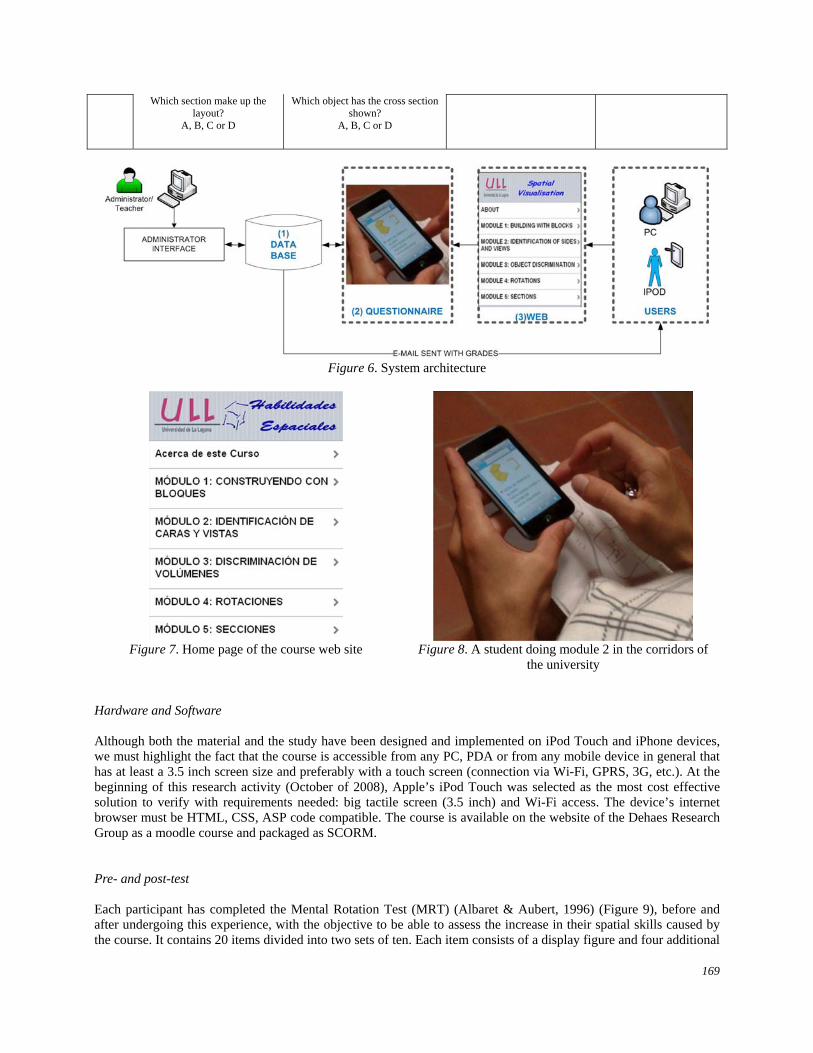
training, and Rating the satisfaction of users with the on-line learning course (mobile learning). Participants A group of sixty eight volunteer first year students on the Civil, Electronic and Mechanical Engineering Degree Courses at the University of La Laguna in Spain. Twenty three females and forty five males, mean age 20 (range 17-28). The participants have no previous experience with handheld touch screen devices. This study uses two working groups: an experimental group and a control group. The experimental group consists of 38 students (26 men and 12 women) who have volunteered to do the training programme, and the control group, made up of 30 students (19 men and 11 women), who receive no training during the week that this study lasts. Materials Didactic Content Developed for Spatial Training Course Based on the material published by different researchers in this field, which is summarised in section two of this paper, we have designed a classification of the different types of exercises and we propose a series of modules and levels, in accordance with the difficulty of the tasks to be conducted. Classification and typologies of exercises used in this paper have been taken from several scientific papers (from Sorby and others) which provide a reliable source of validated sets of exercises in spatial abilities research. This is the first time that these set of exercises is used with mobile devices. Didactic content has been optimized for a 3.5 inch touch screen devices. The course is structured in five modules with several levels each, as shown in Table 1. The first module “Building with blocks”, is composed of block model exercises. The students have to identify the number of blocks that match the one indicated in a drawing (level 1), choosing from four models the one that matches a given numeric coded plan (level 2) or distinguish whether the proposed figures are possible to build in the real world or not (level 3). “Identification of Sides and Views”, the second module of this teaching material, contains exercises in which the students have to identify surfaces and orthogonal views when they have the axonometric view of an object. The third module, “Object Discrimination”, consists of three levels in which the students must try to relate isometric sketches of the object to the right orthogonal views. The fourth module, “Rotations”, addresses mental rotations with exercises in which the students have to identify the orthogonal views or isometric sketches that have been rotated through 90, 180 or 270 degrees from a given axis. The fifth and final module, “Cross Sections”, requires students to identify cross sections made of the objects shown. Each level has an explanatory video that reviews the necessary contents for tackling the exercises proposed. These videos have been designed with Adobe Flash © (Adobe, 2009) and Apple QuickTime Pro © (Apple, 2008). The system is made up of (Figure 6): 1. Data base, which contains the user data and collects the results of the exercises. 2. Web-based questionnaires, in which students complete exercises sets (there is a questionnaire for each level). 3. Web. This environment is written in Html language and ASP code, using the “Universal iPhone UI Kit”
framework (Martín-Lafuente, 2009), which gives us an interface that is optimised for iPhone or iPod Touch type devices (see Figure 7 and Figure 8).
168
The questionnaires and the data base have been designed with the Web Quiz XP commercial software (Smart Lite Software, 2009). The web environment and the exercises have been optimised for a 3.5 inch screen size. AutoCad© (Autodesk, 2009) and Adobe Flash © (Adobe, 2009) were used for designing and colouring the questionnaire images.
Table 1. Summary of course modules and levels
MO
DU
LE
1:
Bu
ild
ing
wit
h b
lock
s
LEVEL 1 LEVEL 2 LEVEL 3 LEVEL 4
How many cubes are missing? 10 exercises
Which of these isometric sketches matches the coded plan drawing?
A, B, C or D 15 exercises
Is this possible? 15 exercises
MO
DU
LE
2:
Iden
tifi
cati
on o
f S
ides
an
d
Vie
ws
Which is the red side? 1, 2, 3, 4…
Which is the view shown? Top, front or right
Which piece matches the view shown? 1 to 6
Which view matches the isometric sketch shown?
A, B or C
MO
DU
LE
3:
Obj
ect
Dis
crim
inat
ion
Which objects match these views? 1 to 12
Which object does this match? 1 to 9
Which object do these views match?
A, B, C or D
MO
DU
LE
4:
Rot
atio
ns
Which view do I see if I rotate the object 90º?
A, B or C
What view do I see if I rotate the object 90º? A, B or C
How far do I have to rotate the object about the given axis to
get the view shown in the second object? 90º, 180º, 270º
MO
DU
LE
5:
Cro
ss s
ecti
ons
169
Which section make up the layout?
A, B, C or D
Which object has the cross section shown?
A, B, C or D
Figure 6. System architecture
Figure 7. Home page of the course web site
Figure 8. A student doing module 2 in the corridors of
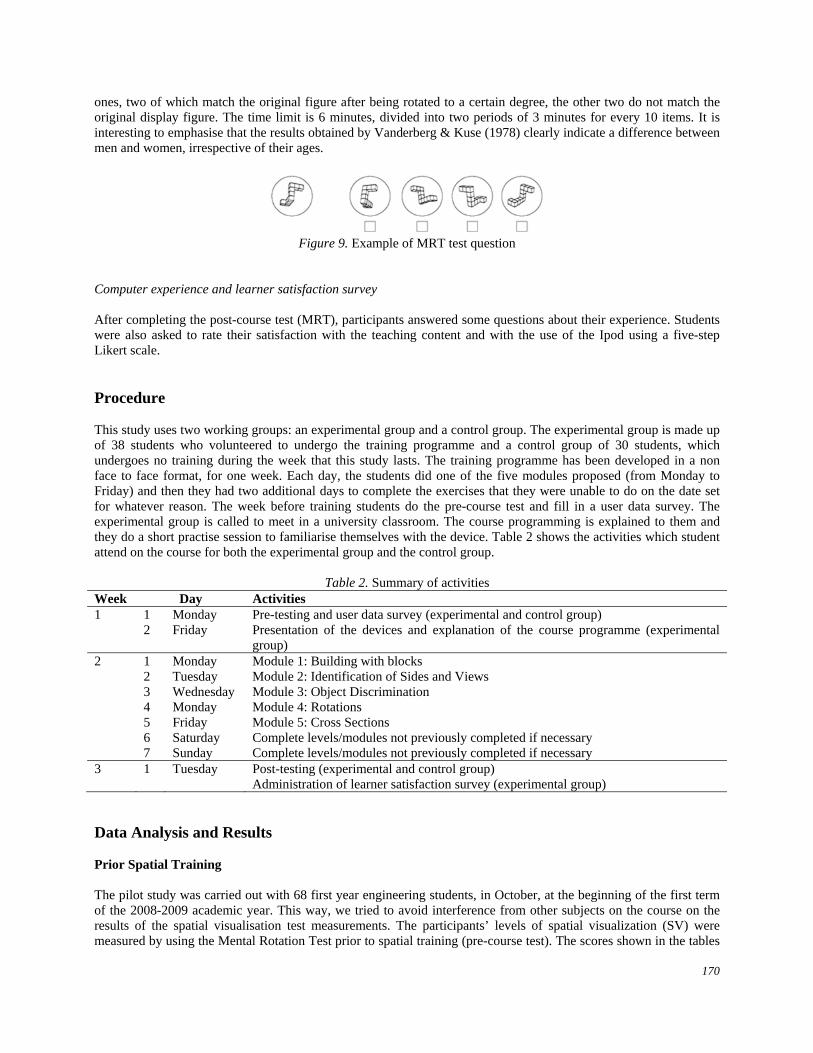
the university Hardware and Software Although both the material and the study have been designed and implemented on iPod Touch and iPhone devices, we must highlight the fact that the course is accessible from any PC, PDA or from any mobile device in general that has at least a 3.5 inch screen size and preferably with a touch screen (connection via Wi-Fi, GPRS, 3G, etc.). At the beginning of this research activity (October of 2008), Apple’s iPod Touch was selected as the most cost effective solution to verify with requirements needed: big tactile screen (3.5 inch) and Wi-Fi access. The device’s internet browser must be HTML, CSS, ASP code compatible. The course is available on the website of the Dehaes Research Group as a moodle course and packaged as SCORM. Pre- and post-test Each participant has completed the Mental Rotation Test (MRT) (Albaret & Aubert, 1996) (Figure 9), before and after undergoing this experience, with the objective to be able to assess the increase in their spatial skills caused by the course. It contains 20 items divided into two sets of ten. Each item consists of a display figure and four additional
170
ones, two of which match the original figure after being rotated to a certain degree, the other two do not match the original display figure. The time limit is 6 minutes, divided into two periods of 3 minutes for every 10 items. It is interesting to emphasise that the results obtained by Vanderberg & Kuse (1978) clearly indicate a difference between men and women, irrespective of their ages.
Figure 9. Example of MRT test question
Computer experience and learner satisfaction survey After completing the post-course test (MRT), participants answered some questions about their experience. Students were also asked to rate their satisfaction with the teaching content and with the use of the Ipod using a five-step Likert scale. Procedure This study uses two working groups: an experimental group and a control group. The experimental group is made up of 38 students who volunteered to undergo the training programme and a control group of 30 students, which undergoes no training during the week that this study lasts. The training programme has been developed in a non face to face format, for one week. Each day, the students did one of the five modules proposed (from Monday to Friday) and then they had two additional days to complete the exercises that they were unable to do on the date set for whatever reason. The week before training students do the pre-course test and fill in a user data survey. The experimental group is called to meet in a university classroom. The course programming is explained to them and they do a short practise session to familiarise themselves with the device. Table 2 shows the activities which student attend on the course for both the experimental group and the control group.
Table 2. Summary of activities Week Day Activities 1 1 Monday Pre-testing and user data survey (experimental and control group) 2 Friday Presentation of the devices and explanation of the course programme (experimental
group) 2 1 Monday Module 1: Building with blocks 2 Tuesday Module 2: Identification of Sides and Views 3 Wednesday Module 3: Object Discrimination 4 Monday Module 4: Rotations 5 Friday Module 5: Cross Sections 6 Saturday Complete levels/modules not previously completed if necessary 7 Sunday Complete levels/modules not previously completed if necessary 3 1 Tuesday Post-testing (experimental and control group)
Administration of learner satisfaction survey (experimental group) Data Analysis and Results Prior Spatial Training The pilot study was carried out with 68 first year engineering students, in October, at the beginning of the first term of the 2008-2009 academic year. This way, we tried to avoid interference from other subjects on the course on the results of the spatial visualisation test measurements. The participants’ levels of spatial visualization (SV) were measured by using the Mental Rotation Test prior to spatial training (pre-course test). The scores shown in the tables

171
are for the number of correct answers, from a maximum possible of 40 points in this test. The mean score of the pre-course test for females (n=23) and males (n=45) were 14.03 and 20.02 respectively (see Table 4). Differences attributed to “group” or “gender” factors in spatial visualisation were investigated prior to the treatments of spatial training. Gender is one of the variables considered in the majority of studies about spatial abilities. A two-way analysis of variance (2-way ANOVA) with interactions was performed to detect if there were any gender or group differences among the participants in the study. For the Mental Rotation pre-course test, there were no significant differences between these groups (experimental vs control) prior to spatial training, F(1,64) = 1.254, p = 0.267. Concerning gender, the differences in the average scores between men and women were statistically significant, F(1,64) = 8.907, p = 0.004. However, the interaction between gender and group is not shown to be significant, F(1,64) = 1.019, p = 0.317. Table 3 summarises the results of the variance analysis for the pre-MRT. Summing up, we can say the analysis shows no significant difference between the two groups from this study, however there are mean differences between gender, which agrees with the studies in the scientific literature on this subject that point to a difference in spatial visualisation levels in men and women (Vanderberg & Kuse, 1978).
Table 3. ANOVA results for MRT pre-course test by training condition and gender and their interactions
Source of variation Sum of Squares df Mean Square F Value Sig. Group 75.582 1 75.582 1.254 .267 Gender 536.788 1 536.788 8.907 .004** Group*Gender 61.420 1 61.420 1.019 .317 Error 3857.019 64 60.266 Total 4489.941 67 **p <.01 After Spatial Training For the statistical analysis, we used a two-way analysis of covariance (2-way ANCOVA), taking as the null hypothesis (H0) the fact that mean values for spatial visualisation did not vary after the end of the course. The post-MRT has been used as the dependent variable, the pre-MRT as the co-variable and the group and gender as independent variables. Moreover, different interactions between the factors (group, gender) and between the factors and the co-variables (pre-MRT) have been calculated, leaving the pre-MRT*Group interaction in the model. Table 4 shows the mean scores and the standard deviations by group and sex, obtained by the participants in the pre-course test (pre-MRT), in the post-course test (post-MRT) and the mean gain found (gain-MRT).
Table 4. Mean and Standard Deviation measures for pre- and post-course test and gain scores Group Gender N pre-MRT (std. dev) post-MRT (std. dev) gain-MRT (std. dev)
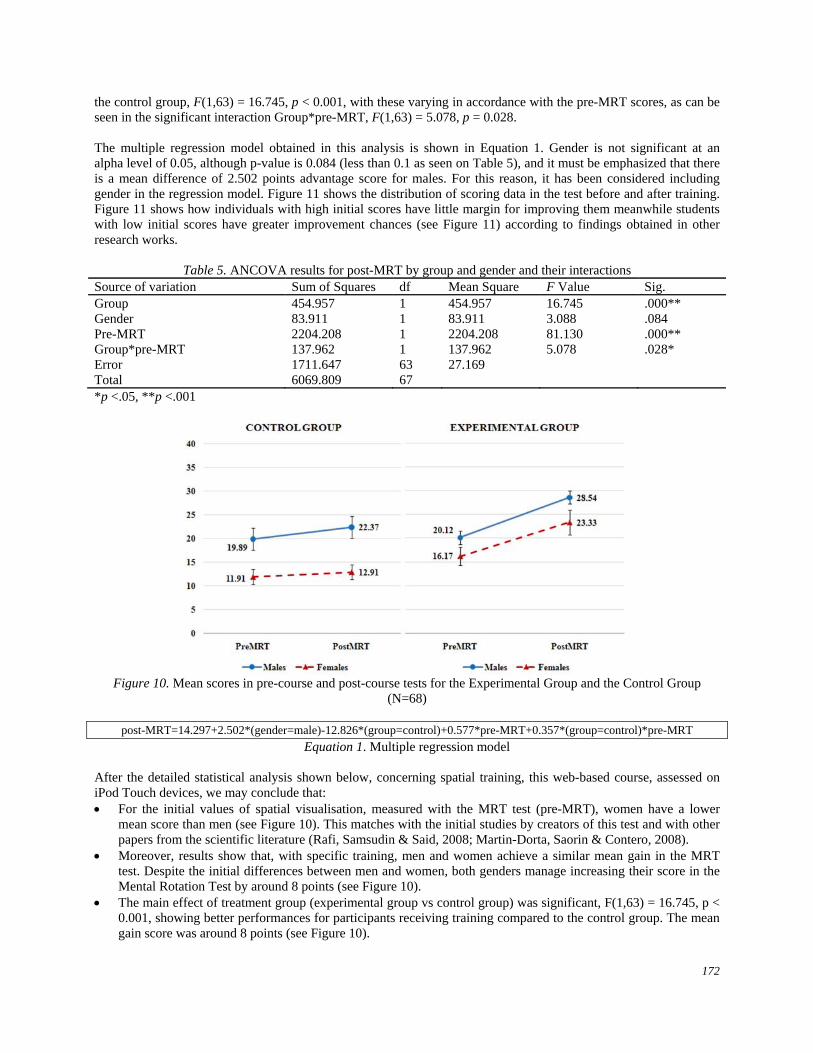
Control Males 19 19.89 (10.03) 22.37 (9.96) 2.47 (2.84) Females 11 11.91 (5.24) 12.91 (5.15) 1.00 (2.05) Total 30 16.97 (9.34) 18.90 (9.60) 1.93 (2.64) Experimental Males 26 20.12 (7.23) 28.54 (6.98) 8.42 (7.80) Females 12 16.17 (6.51) 23.33 (8.96) 7.17 (5.52) Total 38 18.87 (7.17) 26.89 (7.93) 8.03 (7.11) Total Males 45 20.02 (8.42) 25.93 (8.82) 5.91 (6.83) Females 23 14.13 (6.20) 18.35 (8.97) 4.22 (5.21) Total 68 18.03 (8.19) 23.37 (9.52) 5.34 (6.34) * Values are expressed as a mean (standard deviation). The ANCOVA analysis is summarised in Table 5. Figure 10 is a graphic presentation of the means obtained by the groups. The results are shown separately for males (M) and females (F). The analysis found a positive relationship between the pre-MRT and the post-MRT, F(1,63) = 81.130, p < 0.001, and there were no significant differences between genders F(1,63) = 3.088, p = 0.084. Significant differences were found between the experimental group and
172
the control group, F(1,63) = 16.745, p < 0.001, with these varying in accordance with the pre-MRT scores, as can be seen in the significant interaction Group*pre-MRT, F(1,63) = 5.078, p = 0.028. The multiple regression model obtained in this analysis is shown in Equation 1. Gender is not significant at an alpha level of 0.05, although p-value is 0.084 (less than 0.1 as seen on Table 5), and it must be emphasized that there is a mean difference of 2.502 points advantage score for males. For this reason, it has been considered including gender in the regression model. Figure 11 shows the distribution of scoring data in the test before and after training. Figure 11 shows how individuals with high initial scores have little margin for improving them meanwhile students with low initial scores have greater improvement chances (see Figure 11) according to findings obtained in other research works.
Table 5. ANCOVA results for post-MRT by group and gender and their interactions Source of variation Sum of Squares df Mean Square F Value Sig. Group 454.957 1 454.957 16.745 .000** Gender 83.911 1 83.911 3.088 .084 Pre-MRT 2204.208 1 2204.208 81.130 .000** Group*pre-MRT 137.962 1 137.962 5.078 .028* Error 1711.647 63 27.169 Total 6069.809 67 *p <.05, **p <.001
Figure 10. Mean scores in pre-course and post-course tests for the Experimental Group and the Control Group
(N=68)
post-MRT=14.297+2.502*(gender=male)-12.826*(group=control)+0.577*pre-MRT+0.357*(group=control)*pre-MRT
Equation 1. Multiple regression model After the detailed statistical analysis shown below, concerning spatial training, this web-based course, assessed on iPod Touch devices, we may conclude that: For the initial values of spatial visualisation, measured with the MRT test (pre-MRT), women have a lower
mean score than men (see Figure 10). This matches with the initial studies by creators of this test and with other papers from the scientific literature (Rafi, Samsudin & Said, 2008; Martin-Dorta, Saorin & Contero, 2008).
Moreover, results show that, with specific training, men and women achieve a similar mean gain in the MRT test. Despite the initial differences between men and women, both genders manage increasing their score in the Mental Rotation Test by around 8 points (see Figure 10).
The main effect of treatment group (experimental group vs control group) was significant, F(1,63) = 16.745, p < 0.001, showing better performances for participants receiving training compared to the control group. The mean gain score was around 8 points (see Figure 10).
173
Some researchers establish 60% of correct answers (around 24 points out of 40) as the minimum level of spatial ability for freshmen engineering students (Sorby, 2007). The students in this study achieved an average score around 26 points (see Table 4 and Figure 10).
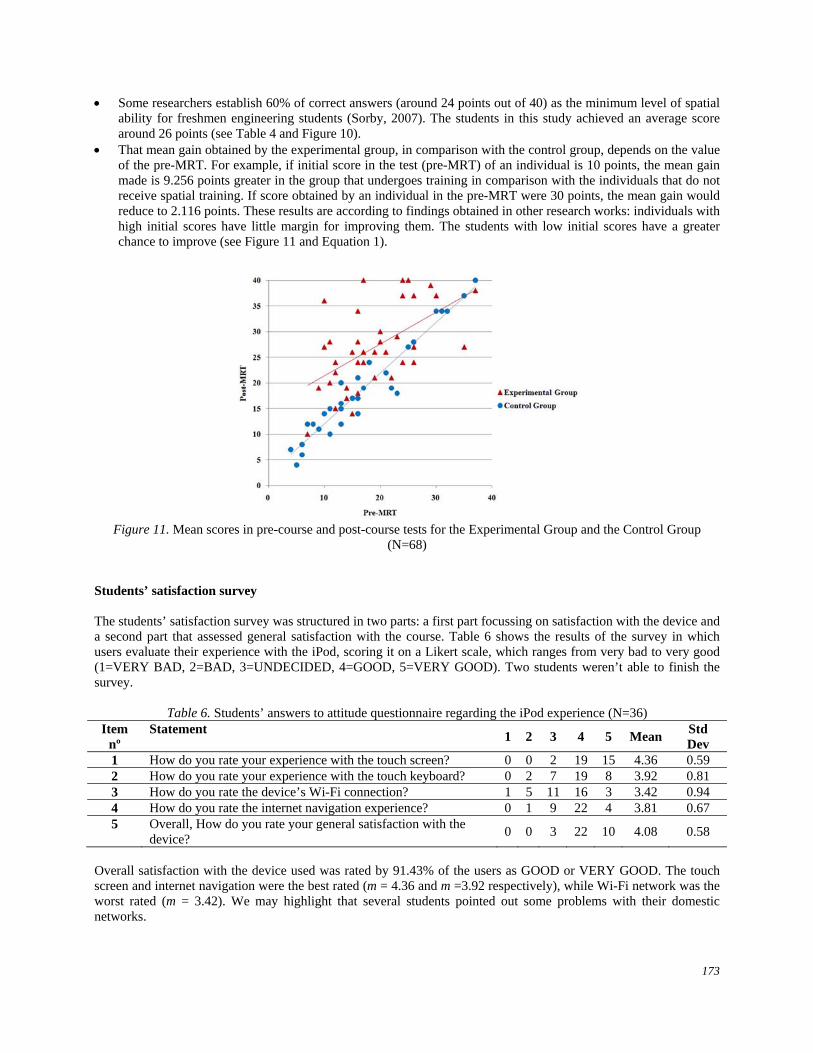
That mean gain obtained by the experimental group, in comparison with the control group, depends on the value of the pre-MRT. For example, if initial score in the test (pre-MRT) of an individual is 10 points, the mean gain made is 9.256 points greater in the group that undergoes training in comparison with the individuals that do not receive spatial training. If score obtained by an individual in the pre-MRT were 30 points, the mean gain would reduce to 2.116 points. These results are according to findings obtained in other research works: individuals with high initial scores have little margin for improving them. The students with low initial scores have a greater chance to improve (see Figure 11 and Equation 1).
Figure 11. Mean scores in pre-course and post-course tests for the Experimental Group and the Control Group
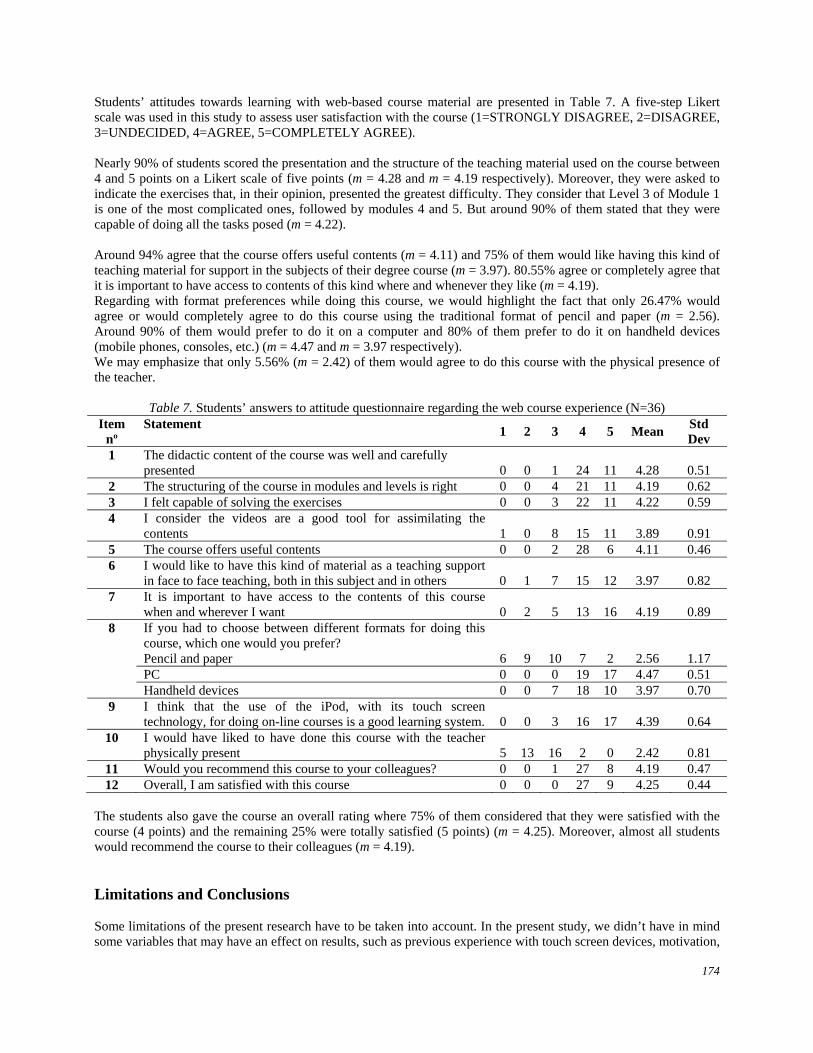
(N=68) Students’ satisfaction survey The students’ satisfaction survey was structured in two parts: a first part focussing on satisfaction with the device and a second part that assessed general satisfaction with the course. Table 6 shows the results of the survey in which users evaluate their experience with the iPod, scoring it on a Likert scale, which ranges from very bad to very good (1=VERY BAD, 2=BAD, 3=UNDECIDED, 4=GOOD, 5=VERY GOOD). Two students weren’t able to finish the survey.
Table 6. Students’ answers to attitude questionnaire regarding the iPod experience (N=36) Item
nº Statement
1 2 3 4 5 Mean Std Dev
1 How do you rate your experience with the touch screen? 0 0 2 19 15 4.36 0.59 2 How do you rate your experience with the touch keyboard? 0 2 7 19 8 3.92 0.81 3 How do you rate the device’s Wi-Fi connection? 1 5 11 16 3 3.42 0.94 4 How do you rate the internet navigation experience? 0 1 9 22 4 3.81 0.67 5 Overall, How do you rate your general satisfaction with the
device? 0 0 3 22 10 4.08 0.58
Overall satisfaction with the device used was rated by 91.43% of the users as GOOD or VERY GOOD. The touch screen and internet navigation were the best rated (m = 4.36 and m =3.92 respectively), while Wi-Fi network was the worst rated (m = 3.42). We may highlight that several students pointed out some problems with their domestic networks.
174
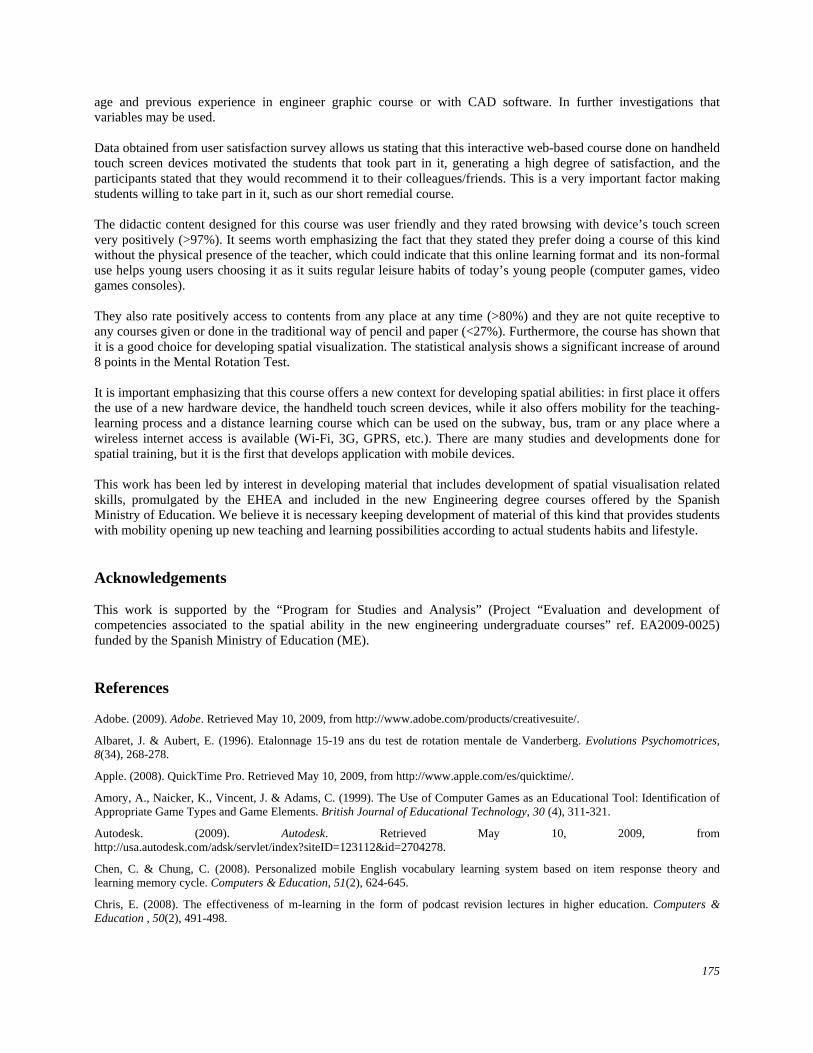
Students’ attitudes towards learning with web-based course material are presented in Table 7. A five-step Likert scale was used in this study to assess user satisfaction with the course (1=STRONGLY DISAGREE, 2=DISAGREE, 3=UNDECIDED, 4=AGREE, 5=COMPLETELY AGREE). Nearly 90% of students scored the presentation and the structure of the teaching material used on the course between 4 and 5 points on a Likert scale of five points (m = 4.28 and m = 4.19 respectively). Moreover, they were asked to indicate the exercises that, in their opinion, presented the greatest difficulty. They consider that Level 3 of Module 1 is one of the most complicated ones, followed by modules 4 and 5. But around 90% of them stated that they were capable of doing all the tasks posed (m = 4.22). Around 94% agree that the course offers useful contents (m = 4.11) and 75% of them would like having this kind of teaching material for support in the subjects of their degree course (m = 3.97). 80.55% agree or completely agree that it is important to have access to contents of this kind where and whenever they like (m = 4.19). Regarding with format preferences while doing this course, we would highlight the fact that only 26.47% would agree or would completely agree to do this course using the traditional format of pencil and paper (m = 2.56). Around 90% of them would prefer to do it on a computer and 80% of them prefer to do it on handheld devices (mobile phones, consoles, etc.) (m = 4.47 and m = 3.97 respectively). We may emphasize that only 5.56% (m = 2.42) of them would agree to do this course with the physical presence of the teacher.
Table 7. Students’ answers to attitude questionnaire regarding the web course experience (N=36) Item
nº Statement
1 2 3 4 5 Mean Std Dev
1 The didactic content of the course was well and carefully presented 0 0 1 24 11 4.28 0.51
2 The structuring of the course in modules and levels is right 0 0 4 21 11 4.19 0.62 3 I felt capable of solving the exercises 0 0 3 22 11 4.22 0.59 4 I consider the videos are a good tool for assimilating the
contents 1 0 8 15 11 3.89 0.91 5 The course offers useful contents 0 0 2 28 6 4.11 0.46 6 I would like to have this kind of material as a teaching support
in face to face teaching, both in this subject and in others 0 1 7 15 12 3.97 0.82 7 It is important to have access to the contents of this course
when and wherever I want 0 2 5 13 16 4.19 0.89 8 If you had to choose between different formats for doing this
course, which one would you prefer? Pencil and paper 6 9 10 7 2 2.56 1.17 PC 0 0 0 19 17 4.47 0.51 Handheld devices 0 0 7 18 10 3.97 0.70
9 I think that the use of the iPod, with its touch screen technology, for doing on-line courses is a good learning system. 0 0 3 16 17 4.39 0.64
10 I would have liked to have done this course with the teacher physically present 5 13 16 2 0 2.42 0.81
11 Would you recommend this course to your colleagues? 0 0 1 27 8 4.19 0.47 12 Overall, I am satisfied with this course 0 0 0 27 9 4.25 0.44
The students also gave the course an overall rating where 75% of them considered that they were satisfied with the course (4 points) and the remaining 25% were totally satisfied (5 points) (m = 4.25). Moreover, almost all students would recommend the course to their colleagues (m = 4.19). Limitations and Conclusions Some limitations of the present research have to be taken into account. In the present study, we didn’t have in mind some variables that may have an effect on results, such as previous experience with touch screen devices, motivation,
175
age and previous experience in engineer graphic course or with CAD software. In further investigations that variables may be used. Data obtained from user satisfaction survey allows us stating that this interactive web-based course done on handheld touch screen devices motivated the students that took part in it, generating a high degree of satisfaction, and the participants stated that they would recommend it to their colleagues/friends. This is a very important factor making students willing to take part in it, such as our short remedial course. The didactic content designed for this course was user friendly and they rated browsing with device’s touch screen very positively (>97%). It seems worth emphasizing the fact that they stated they prefer doing a course of this kind without the physical presence of the teacher, which could indicate that this online learning format and its non-formal use helps young users choosing it as it suits regular leisure habits of today’s young people (computer games, video games consoles). They also rate positively access to contents from any place at any time (>80%) and they are not quite receptive to any courses given or done in the traditional way of pencil and paper (<27%). Furthermore, the course has shown that it is a good choice for developing spatial visualization. The statistical analysis shows a significant increase of around 8 points in the Mental Rotation Test. It is important emphasizing that this course offers a new context for developing spatial abilities: in first place it offers the use of a new hardware device, the handheld touch screen devices, while it also offers mobility for the teaching-learning process and a distance learning course which can be used on the subway, bus, tram or any place where a wireless internet access is available (Wi-Fi, 3G, GPRS, etc.). There are many studies and developments done for spatial training, but it is the first that develops application with mobile devices. This work has been led by interest in developing material that includes development of spatial visualisation related skills, promulgated by the EHEA and included in the new Engineering degree courses offered by the Spanish Ministry of Education. We believe it is necessary keeping development of material of this kind that provides students with mobility opening up new teaching and learning possibilities according to actual students habits and lifestyle. Acknowledgements This work is supported by the “Program for Studies and Analysis” (Project “Evaluation and development of competencies associated to the spatial ability in the new engineering undergraduate courses” ref. EA2009-0025) funded by the Spanish Ministry of Education (ME). References Adobe. (2009). Adobe. Retrieved May 10, 2009, from http://www.adobe.com/products/creativesuite/.
Albaret, J. & Aubert, E. (1996). Etalonnage 15-19 ans du test de rotation mentale de Vanderberg. Evolutions Psychomotrices, 8(34), 268-278.
Apple. (2008). QuickTime Pro. Retrieved May 10, 2009, from http://www.apple.com/es/quicktime/.
Amory, A., Naicker, K., Vincent, J. & Adams, C. (1999). The Use of Computer Games as an Educational Tool: Identification of Appropriate Game Types and Game Elements. British Journal of Educational Technology, 30 (4), 311-321.
Autodesk. (2009). Autodesk. Retrieved May 10, 2009, from http://usa.autodesk.com/adsk/servlet/index?siteID=123112&id=2704278.
Chen, C. & Chung, C. (2008). Personalized mobile English vocabulary learning system based on item response theory and learning memory cycle. Computers & Education, 51(2), 624-645.
Chris, E. (2008). The effectiveness of m-learning in the form of podcast revision lectures in higher education. Computers & Education , 50(2), 491-498.
176
Clough, G., Jones, A., McAndrew, P. & Scanlon, E. (2007). Informal Learning with PDAs and Smartphones. Journal of Computer Assisted Learning, 24(5), 359-371.
Connolly, P. & Maicher, K. (2005). The developing and testing of an interactive web-based tutorial for ortographic drawing instruction and visualization enhancement. 2005 ASEE Annual conference & exposition. Retrieved October 8, 2009, from http://kellenmaicher.com/portfolio/projects/multiview.html.
Contero, M., Company, P., Saorin, J., & Naya, F. (2006). Learning support tools for developing spatial abilities in engineering design. International Journal of Engineering Education, 22 (3), 470-477.
Contero, M., Naya, F., Company, P., Saorin, J. & Conesa, J. (2005). Improving visualization skills in engineering education. IEEE Computer Graphics and Applications, 25(5), 24-31.
Corlett, D., Sharples, M., Bull, S. & Chan, T. (2005). Evaluation of a mobile learning organiser for university students. Journal of Computer Assisted Learning , 21(3), 162-170.
Crown, S. (2001). Improving visualization skills of engineering graphics students using simple javaScript web based games. Journal of Engineering Education, 9(3), 347-354.
Dehaes Research Group. (2009). Dehaes Research Group. Retrieved May 10, 2009, from http://degarin.com/dehaes/.
Deno, J.A. (1995). The relationship of previous experiences to spatial visualization ability. Engineering Design Graphics Journal, 59(3), 5-17.
Deparment of Engineering Graphics. University of Burgos. (2007). Spatial Visualisation Workshop. Retrieved May 10, 2009, from http://www2.ubu.es/expgraf/expgrain/visualizacion3d/.
Facer, K., Joiner, R., D., S., Reid, J., Hull, R. & Kirk, D. (2004). Savannah: mobile gaming and learning? Journal of Computer Assisted Learning , 20(6), 399-409.
Faux, F., McFarlane, A., Roche, N., & Facer, K. (2006). Learning with handheld technologies. Futurelab.
Guerrero, L., Ochoa, S., Pino, J. & Collazos, C. (2006). Selecting Computing Devices to Support Mobile Collaboration. Group Decision and Negotiation, 15(3), 243-271.
Guay, R. (1976). Purdue Spatial Visualization test - Visualization of Rotacions. Purdue Research Fundation.
Hoff, C., Wehling, U. & Rothkugel, S. (2009). From paper-and-pen annotations to artefact-based mobile learning. Journal of Computer Assisted Learning, 25(3), 219-237.
Hollyday-Darr, K., Blasko, D. G. & Dwyer, C. (2000). Improving cognitive visualization with a web based interactive assessment and training program. Engineering Design Graphics Journal, 64(1), 4-9.
Johnson, L., Levine, A. & Smith, R. (2008). The 2008 Horizon Report. Austin: New Media Consortium. Retrieved Novenver 10, 2009 from http://www.nmc.org/pdf/2008-Horizon-Report.pdf.
Lu, M. (2008). Effectiveness of vocabulary learning via mobile phone. Journal of Computer Assisted Learning, 24(6), 515-525.
Martin-Dorta, N., Saorin, J. & Contero, M. (2008). Development of a fast remedial course to improve the spatial abilities of engineering students. Journal of Engineering Education, 27(4), 505-514.
Martín-Lafuente, D. (2009). Universal iPhone UI Kit. Retrieved May 10, 2009, from http://code.google.com/p/iphone-universal/.
Morán, S., Rubio, R., Gallego, R., Suárez, J. & Martín, S. (2008). Proposal of interactive applications to enhance student’s spatial perception. Computers & Education, 50(3), 772-786.
National Council of Teachers of Mathematics. (2000). Illuminations. Retrieved October 8, 2009, from http://illuminations.nctm.org/ActivityDetail.aspx?ID=125.
Pérez, T. & Serrano, M. (1998). Ejercicios para el desarrollo de la percepción espacial. Alicante: Editorial Club Universitario.
Piaget, J. (1951). Play, dreams and imitation in childhood. New York, NY: W. W. Norton.
Provost, J. (1990). Work, play and type: Achieving balance in your life. Palo Alto, CA: Consulting Psychologist Press.
Rafi, A. & Samsudin, K. (2009). Practising mental rotation using interactive desktop mental rotation trainer (iDeMRT). British Journal of Educational Technology, 40(5), 889-900.
Rafi, A., Samsudin, K.A. & Ismail, A. (2006). On improving spatial ability through computer-mediated engineering drawing instruction. Educational Technology & Society, 9(3), 149-159.
Rafi, A., Samsudin, K. & Said, C. (2008). Training in spatial visualization: The effects of training method and gender. Educational Technology & Society, 11(3), 127-140.

177
Regeo Research Group. (2009). Regeo Research Group. Retrieved May 10, 2009, from http://regeo.upv.es/.
Sánchez, J., Salinas, A. & Sáenz, M. (2007). Mobile Game-Based Methodology for Science Learning. In J. Jacko (Ed.). Human-Computer Interaction, Part IV, HCII 2007, LNCS 4553 (pp. 322-331). Heidelberg, Berlin: Springer.
Saorín, J. (2006). Estudio del efecto de la aplicación de tecnologías multimedia y del modelado basado en bocetos en el desarrollo de las habilidades espaciales. Valencia: Universidad Politécnica de Valencia.
Smart Lite Software. (2009). Smart Lite Software. WebQuiz XP. Retrieved May 10, 2009, from http://eng.smartlite.it/en2/products/webquiz/index.asp.
Smith, I.M. (1964). Spatial ability- Its educational and social significance. London: The University of London Press.
Sorby, S. (2007). Developing 3D spatial skills for engineering students. Australasian Association of Engineering Education, 13, 1-11.
Sorby, S., Wysocky, A. & Baartmans, B. (2003). Introduction to 3D Spatial Visualization: An active approach. Clifton Park, NY: Thomson Delmar Learning.
The International Association for Mobile Learning. (2009). The International Association for Mobile Learning. Retrieved May 10, 2009, from http://mlearning.noe-kaleidoscope.org/.
Thornton, P. & Houser, C. (2005). Using mobile phones in English education in Japan. Journal of Computer Assisted Learning , 21(3), 217-228.
Vanderberg, S. & Kuse, A. (1978). Mental Rotation, a group test of three dimensional spatial visualization. Perceptual and motor Skills, 47, 599-604.