
Wealth Strategy Adapting portfolio construction to a different ...
8
Alternatives – A tool for the times 1 Wealth Strategy Adapting portfolio construction to a different investment landscape August 2020
-
Upload
khangminh22 -
Category
Documents
-
view
0 -
download
0
Transcript of Wealth Strategy Adapting portfolio construction to a different ...

Alternatives – A tool for the times
1
Wealth StrategyAdapting portfolio construction to a different investment landscape
August 2020

I N V E S T M E N T I N S I G H T S P a g e 2 | 8
Alex Pikoulas Chief Investment Officer
Dramatic changes in the investment landscape leading to a need to adapt.
Adapting Portfolio Construction Over the last decade the global investment landscape has shifted dramatically. Central banks are having a much larger influence on markets, the risk and return characteristics of various asset classes has changed considerably, and the investment opportunity set has broadened. This paper discusses the impact of these changes on traditional Strategic Asset Allocation (SAA), the need to evolve, and the adaptation of our investment process by introducing the Total Portfolio Approach.
Challenges with traditional SAA Traditional Strategic Asset Allocation (SAA) grew as the portfolio management tool of choice in the United States in the 1980’s. At that time, investors had very few asset classes to choose from. SAA seeks to mitigate overall portfolio volatility by combining asset classes with low or negative correlations – that is, asset classes that don’t tend to move in the same direction at the same time. The traditional 60/40 balanced portfolio of equities and bonds has not evolved significantly other than the introduction of ‘alternatives’. The SAA approach involves having target weights for each asset class determined by the asset class expected risk, return, and cross correlations. Individual investments then populate each asset class. A number of challenges have emerged with traditional SAA: - Bonds are no longer investable - Diminished benefits of traditional SAA portfolio - Today’s larger investment opportunity set - Anchoring bias We discuss these in detail below. Chart 1 - Long term interest rate decline 10 year government bond yields (%)
Source: FactSet/Lipman Burgon & Partners

I N V E S T M E N T I N S I G H T S P a g e 3 | 8
Bonds are no longer investable Government bond risk/return characteristics have changed enormously since SAA grew as the preferred portfolio construction methodology during the 1980’s and 1990’s. Nominal government bond yields have collapsed since that time from over 10% to 0% (Chart 1). Real yields (after deducting inflation) have also fallen significantly, from around 5% in the 1980’s and 1990’s to negative 1% in the United States today (Chart 2). The real yield of negative 1% on US 10-year government bonds implies that at maturity, the owner of that bond will have 10% less purchasing power with their invested capital than they had when acquiring the bond. We don’t see a place in portfolios for assets that are expected to lose real money over the long term. Chart 2 - Real interest rates negative US 10yr TIPS real yield (%)
Source: FactSet/Lipman Burgon & Partners Historically, government bonds have been viewed by many investors as safe haven assets that add diversification to portfolios. In the current environment, this assumption needs to be challenged. We assess safe haven assets against two criteria: protection and cost. How much protection or diversification does the safe haven asset provide to a portfolio, and what is the cost (or opportunity cost) of holding it? In the current very low (almost zero) nominal interest rate environment and negative real rate environment we believe government bonds no longer meet the criteria of a safe haven asset (Table 1). Table 1 - Government Bonds as a Safe Haven Asset
Source: Lipman Burgon & Partners

I N V E S T M E N T I N S I G H T S P a g e 4 | 8
Global bonds – from portfolio benefit to portfolio drag.
Diminished benefits of traditional SAA portfolio The traditional 60/40 portfolio was hugely successful when interest rates were higher. As shown below, a balanced 60/40 portfolio outperformed a 100% equity portfolio between 1995 and 2015. Lower rates since 2015 have seen the 60/40 portfolio generate 2% per annum less return than the 20 years prior, predominantly due to lower bond return. Going forward, we estimate that the traditional 60/40 portfolio is likely to only generate 5.4% per annum return, with the drag coming from record low bond returns.
Source: Lipman Burgon & Partners
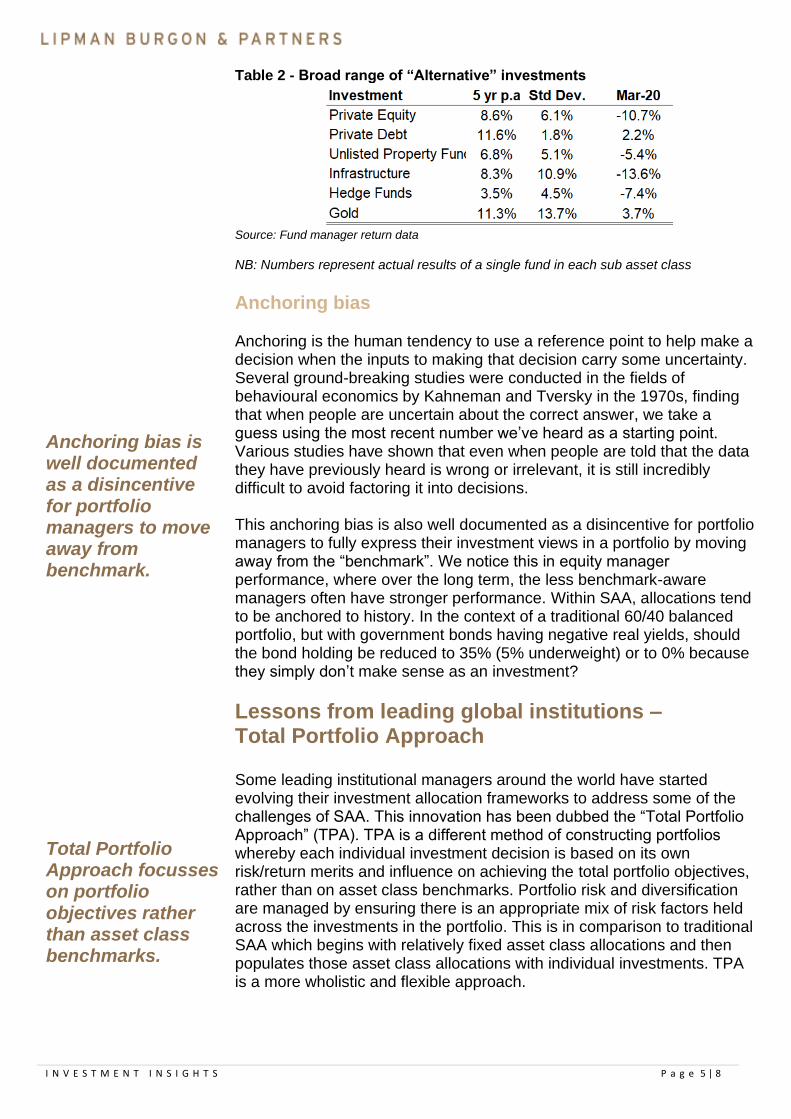
Today’s larger investment opportunity set The investment opportunity set accessible to individuals, families and small institutions has grown significantly over the last five to 10 years. Investments such as private equity, private debt, unlisted property funds, infrastructure, hedge funds and gold were much less accessible when the SAA framework was developed. From a SAA perspective, these investments are typically categorised as “alternatives” and have conventionally represented a small portion of portfolios. Combining such a broad range of investments that have very different risk and return characteristics (Table 2) makes little sense. The broad “alternative” categorisation means that the SAA framework can be limited in its ability to recognise the potential diversification, risk reduction and/or return benefits of some of these individual investment opportunities.
I N V E S T M E N T I N S I G H T S P a g e 5 | 8
Anchoring bias is well documented as a disincentive for portfolio managers to move away from benchmark. Total Portfolio Approach focusses on portfolio objectives rather than asset class benchmarks.
Table 2 - Broad range of “Alternative” investments
Source: Fund manager return data NB: Numbers represent actual results of a single fund in each sub asset class
Anchoring bias Anchoring is the human tendency to use a reference point to help make a decision when the inputs to making that decision carry some uncertainty. Several ground-breaking studies were conducted in the fields of behavioural economics by Kahneman and Tversky in the 1970s, finding that when people are uncertain about the correct answer, we take a guess using the most recent number we’ve heard as a starting point. Various studies have shown that even when people are told that the data they have previously heard is wrong or irrelevant, it is still incredibly difficult to avoid factoring it into decisions. This anchoring bias is also well documented as a disincentive for portfolio managers to fully express their investment views in a portfolio by moving away from the “benchmark”. We notice this in equity manager performance, where over the long term, the less benchmark-aware managers often have stronger performance. Within SAA, allocations tend to be anchored to history. In the context of a traditional 60/40 balanced portfolio, but with government bonds having negative real yields, should the bond holding be reduced to 35% (5% underweight) or to 0% because they simply don’t make sense as an investment?
Lessons from leading global institutions – Total Portfolio Approach Some leading institutional managers around the world have started evolving their investment allocation frameworks to address some of the challenges of SAA. This innovation has been dubbed the “Total Portfolio Approach” (TPA). TPA is a different method of constructing portfolios whereby each individual investment decision is based on its own risk/return merits and influence on achieving the total portfolio objectives, rather than on asset class benchmarks. Portfolio risk and diversification are managed by ensuring there is an appropriate mix of risk factors held across the investments in the portfolio. This is in comparison to traditional SAA which begins with relatively fixed asset class allocations and then populates those asset class allocations with individual investments. TPA is a more wholistic and flexible approach.

I N V E S T M E N T I N S I G H T S P a g e 6 | 8
The Future Fund has been a leading proponent of the Total Portfolio Approach. Institutional managers see portfolio performance advantage of 0.5%-1% for TPA.
TPA is a non-siloed way of constructing portfolios, including: - Starting with clearly specified portfolio goals - Employing one integrated process – a competition for capital among
all investment opportunities based on individual risk/return characteristics and contribution to overall portfolio outcomes
- Portfolio diversification through the risk factors of each investment rather than through asset classes
Table 3 - Total Portfolio Approach vs SAA
Source: Thinking Ahead Institute
The Future Fund has been a leading proponent of the TPA, does not operate with a fixed Strategic Asset Allocation and avoids silos across asset classes. Other institutions that moved towards this model include the Canada Pension Plan Investment Board, GIC (Singaporean sovereign wealth fund), New Zealand Superannuation Fund, TCorp (NSW government investment arm), Amundi (one of Europe’s largest asset managers) and global asset consultant Willis Towers Watson. A study of 18 institutions that have introduced TPA to their process cited the following benefits: - Better performance - over half think TPA should produce a
performance advantage of at least 50-100 bps p.a. compared to SAA - Best investment opportunities can be introduced into the portfolio and
aren’t limited by categorisation - A clear total return focus removes anchoring bias - TPA is a means of challenging assumptions, minimising unintended
exposures, accommodating diverse investment programs and building line-of-sight into the true substance of a portfolio
- A factor approach to investing is better suited to TPA than the traditional asset-class-based approach
Lipman Burgon & Partners’ implementation of TPA The TPA helps to address some shortcomings of the traditional SAA framework. As such, we believe introducing a TPA overlay to our existing SAA process makes sense. Many institutions that have implemented TPA are similarly using a blended approach with SAA. The Lipman Burgon & Partners’ (LBP) modified process will use the TPA as the initial building block for portfolios and then pass the resulting portfolio through our existing SAA framework. Using TPA in the initial portfolio construction phase helps remove the anchoring bias issues

I N V E S T M E N T I N S I G H T S P a g e 7 | 8
inherent in SAA. Passing the initial TPA driven portfolio through the existing SAA framework also helps to ensure ongoing prudent risk management in portfolios. LBP’s TPA return and risk framework will include an assessment of each individual investment and its impact on the total portfolio on the following parameters: - Long term expected return
- Short term return confidence
- Risk (adjusted standard deviation)
- Beta
- Expected performance during market stress
- Risk factor exposure (equity, credit, commodities, currency, interest
rate, liquidity, inflation, active management)
Impact on existing portfolios LBP already has a relatively flexible and pragmatic approach to implementing SAA. As a result, the implementation of TPA into our portfolio construction process will not lead to significant portfolio changes. One of the key outcomes of institutions adopting TPA is the reduction or removal of government bond investments, which is something that we have already been doing. Introducing other safe haven or defensive assets that exhibit negative correlation to equities, like gold, is aided by the introduction of TPA.
Chart 3 - LBP modified portfolio construction process
Source: Lipman Burgon & Partners

Alternatives – A tool for the times
5
Disclaimer: The information in this email is confidential and is intended to be transmitted only to the addressee. The information in this document is of a general nature and should not be relied upon as it has been prepared without taking into consideration the objectives, financial situation or needs of any particular person. As a result, before acting on this information, a person should consider its appropriateness, having regards to their objectives, financial situation and needs. Information from third parties is believed to be reliable however it has not been independently verified. While the information in the document is given by Lipman Burgon and Partners in good faith, it does not warrant that it is accurate, reliable and free from errors or omission. Subject to any terms implied by statute which cannot be excluded, neither Lipman Burgon and Partners Pty Limited or employees and associates accept any responsibility for errors in, or omissions from the information. Any opinions expressed in this email and attachments that do not relate to the official business of Lipman Burgon and Partners Pty Limited are neither given nor endorsed by it. It is the recipient’s responsibility to screen this email and any attachments for computer viruses and Lipman Burgon and Partners Pty Limited will not be liable for any damage or loss caused therefrom.
lipmanburgon.com.au
Level 9, Challis House 4 Martin Place, Sydney NSW 2000T + 61 (02) 9230 9600 F + 61 (02) 9230 9666 E [email protected]
AFS Licence No. 234972 ABN 81 070 454 787